![[農林畜牧業]年報 - 臺北市首座](https://static.fdokumen.com/doc/165x107/63225b1b117b4414ec0bdd13/--1677438919.jpg)
ANNUAL REPORT 2011 年報 - HKEXnews
183
ANNUAL REPORT 2011 年報
-
Upload
khangminh22 -
Category
Documents
-
view
1 -
download
0
Transcript of ANNUAL REPORT 2011 年報 - HKEXnews

A N N U A L R E P O R T 2 0 1 1 年報

Our Mission
Leveraging on our defined strategies, we
will work to maintain our position as the
world’s largest manufacturer of branded
athletic and casual footwear. We will
continue to develop the wholesale and
retail business in Greater China. We are
committed to deepening the strategic
relationships we have with our partners
and fulfill ing our responsibilities as an
international corporate citizen.

Contents
Corporate Overview 2
Corporate Information 4
Chairman’s Statement 7
Management Discussion and Analysis 11
Biographical Data of Directors and Senior Management 15
Directors’ Report 21
Corporate Governance Report 31
Independent Auditor’s Report 49
Consolidated Income Statement 50
Consolidated Statement of Comprehensive Income 51
Consolidated Statement of Financial Position 52
Consolidated Statement of Changes in Equity 54
Consolidated Statement of Cash Flows 56
Notes to the Consolidated Financial Statements 59
Financial Summary 165
Corporate Social Responsibility 166
ontents

2 / Yue Yuen Industrial (Holdings) Limited / Annual Report 2011
Corporate Overview
Financial and Operating Highlights for the year ended 30th September
(US$ millions, except where otherwise stated) 2011 2010 % change
Total Production Volume (million pairs) 326.6 286.4 14.0Turnover 7,045.4 5,788.2 21.7Recurrent Operating Profit 499.1 472.7 5.6Net Profit to Owners of the Company 449.8 479.5 (6.2)Recurrent Net Profit attributable to
Owners of the Company 464.6 501.2 (7.3)Total Assets 6,473.3 5,725.3 13.1Capital Expenditure 516.6 348.8 48.1EBITDA 707.5 651.3 8.6Basic Earnings Per Share (US cents) 27.28 29.08 (6.2)Dividend Per Share
Interim HK$0.34 HK$0.34 –Final (proposed) HK$0.56 HK$0.56 –Full Year (proposed) HK$0.90 HK$0.90 –
Total Equity 4,106.7 3,776.5 8.7Return on Total Equity (%) 11.8 13.1 (9.9)Gearing Ratio (%) 28.0 26.0 7.7Net Debt to Equity Ratio (%) 11.0 9.0 22.2Number of Outstanding Issued Shares (30/9) 1,648,928,486 1,648,928,486 –
Key Shareholder Value Indices
Consolidated TurnoverUS$ million
Net Profit Attributable to Owners of the CompanyUS$ million
% change
16.0% 15.9% 12.5% 19.6% 2.0% 15.4% 21.7%
2011201020092008200720062005
5,78
8 7,04
5
5,01
7
4,92
0
4,11
4
3,65
7
3,15
5
% change
1.4% 18.8% 1.4% 30.6% (0.9%) 3.2% (6.2%)
2011201020092008200720062005
450480
465
469
359
354
298
/ 3
Earnings Per ShareUS cents
Dividend Per ShareHK$
% change
1.7% 18.7% (0.9%) 30.2% (0.1%) 3.3% (6.2%)
2011201020092008200720062005
27.28
29.08
28.15
28.17
21.64
21.83
18.39
% change
5.6% 6.7% 5.0% 6.0% 0.0% 1.1% 0.0%
2011201020092008200720062005
0.90
0.90
0.89
0.89
0.84
0.80
0.75
Diversified Market Distribution
2010 Turnover by Geographical Market 2011 Turnover by Geographical Market
29.5%USA
2.6%Other Areas
39.3%Asia
5.7%South
America
20.4%Europe
2.5%Canada
21.9%Europe
5.0%South
America
40.8%Asia
2.4%Other Areas
28.5%USA
1.4%Canada
4 / Yue Yuen Industrial (Holdings) Limited / Annual Report 2011
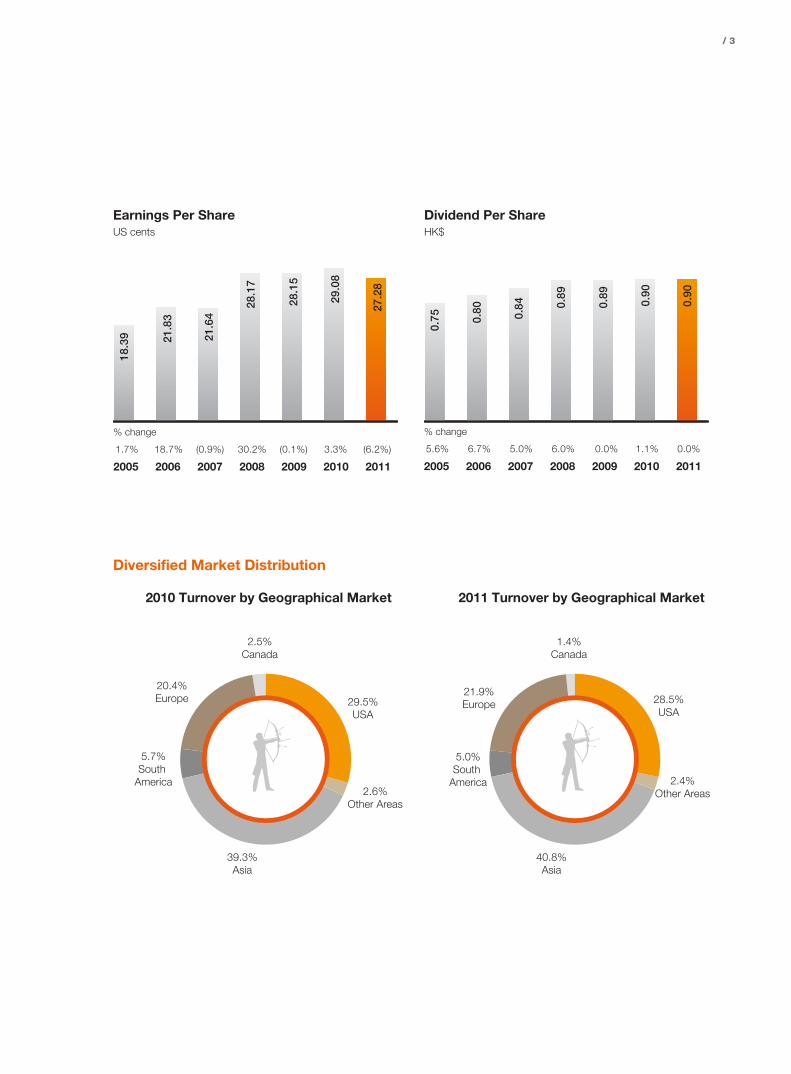
Corporate Informat ion
Executive DirectorsTsai Chi Neng (Chairman)David N. F. Tsai (Managing Director)Kuo Tai YuLu Chin Chu (retired on 4th March, 2011)Kung Sung YenChan Lu MinLi I Nan, SteveTsai Pei Chun, Patty5
Kuo Li Lien5
Lee Shao Wu
Non-executive DirectorJohn J. D. Sy1, 3 (retired on 4th March, 2011)
Independent Non-executive DirectorsLiu Len Yu1, 3, 5, 6
Leung Yee Sik1, 2, 3, 4
Huang Ming Fu1, 3, 5
Chu Li –Sheng1, 3, 5 (appointed on 28th June, 2011)
Notes:1. Member of Audit Committee2. Chairman of Audit Committee3. Member of Remuneration Committee4. Chairman of Remuneration Committee5. Member of Nomination Committee6. Chairman of Nomination Committee
Company SecretaryNg Lok Ming
Registered OfficeClarendon House2 Church StreetHamilton HM 11Bermuda
Principal Place of BusinessSuites 3307-09, 33/FTower 6, The Gateway9 Canton Road, Tsim Sha TsuiKowloon, Hong Kong
AuditorsDeloitte Touche Tohmatsu
RegistrarsTricor Secretaries Limited26/FTesbury Centre28 Queen’s Road EastHong Kong
Principal Bankers• ANZ Bank• Bank of America Merrill Lynch• Bank of China (Hong Kong) Limited• Bank of Taiwan• Bank SinoPac• BNP Paribas• Cathay Bank• China Construction Bank• Chinatrust Commercial Bank, Ltd.• Citibank, N.A.• Citic Bank International Ltd.• Credit Agricole Corporate & Investment Bank• DBS Bank Ltd.• First Commercial Bank Ltd.• Land Bank of Taiwan• Hang Seng Bank• Mizuho Corporate Bank Ltd.• Scotiabank (Hong Kong) Limited• Shin Kong Bank• Standard Chartered Bank (Hong Kong) Limited• Sumitomo Mitsui Banking Corporation• Taipei Fubon Commercial Bank Co., Ltd.• The Bank of Tokyo-Mitsubishi UFJ, Ltd.• The Hongkong and Shanghai Banking
Corporation Limited• The Shanghai Commercial & Savings Bank
SolicitorsReed Smith Richards Butler
Websitewww.yueyuen.com

/ 5
Indonesia
Jiangsu
Jiangxi
Hubei
AnhuiHenan
Bangladesh Guangdong TaiwanHong Kong
Cambodia Vietnam
Production facilities inDongguan, China
Production plant in Yangzhou, China
Production facilities in Huangjiang, China
Production plant in Zhongshan, China
Taiwan, Head Offi ce
Production plant in Vietnam Production facilities in Indonesia
Production facilities in Jiangxi, China

MANAGING FOR EXCELLENCE AND THEHIGHEST TEAM SPIRIT
/ 7
Chairman’s Statement
Fiscal 2011 was a period during which various dramatic global events occurred. First there was the powerful earthquake and tsunami that impacted Japan. Then there was the American debt ceiling debate and followed by the credit rating downgrade. Finally the refinancing of the national debt of Greece returned to the spotl ight of investor attention. Fortunately as can be observed from various data points, these events did not deter consumers globally from purchasing their desired athletic and/or casual shoes. Accordingly, leading shoe brand name companies had greater confidence that 2011 would be a better year than 2010. They decided to increase their inventory on hand and as demonstrated in their quarterly results announcements, the brand names also saw solid year on year growth in their sales of footwear. In the period the Group maintained its focus of designing innovative shoes, pursuing high quality standards for these products and ensuring the timely delivery of these products in accordance with the tight customer deadlines. Consequently for f iscal 2011, the Group exper ienced shoe manufacturing sales growth that exceeded the original expectations set at the start of the fiscal year. However during the year, the Group’s manufacturing activities did experience challenges from rising input costs related to costs such as energy, labour and materials.
I am pleased to report that the Group enjoyed year on year sales growth for its shoe manufacturing business and continued improvement in the profit earned by the retailing business, in the fiscal year ended 30th September, 2011. Consolidated turnover of the Group increased by 21.7% year-on-year to US$7,045.4 million, compared to the previous year. When looking at the business units making up the consolidated turnover figure, US$1,589.8 million was contributed by the Group’s retailing flag ship, Pou Sheng International (Holdings) Limited (“Pou Sheng”), which recorded 20.0% year-on-year sales growth. In the period, net profit attributable to owners of the Company, decreased slightly by 6.2% year-on-year to US$449.8 million. Pou Sheng on the other hand, saw net profit attributable to owners improve to US$53.7 million, compared to the previous year’s number of US$21.3 million.
During the year, the Group produced 326.6 million pairs of shoes, representing an increase of 14.0% compared to the previous year. Following last year’s trend, Asia region, which includes both manufacturing and retailing activities, represented 40.8% of the Group’s sales. The USA market was next at 28.5% and finally Europe was the other significant region at 21.9% of the Group’s sales. The remainder encompassing all smaller markets including South America, North America (excluding the USA) etc. accounted for 8.8%.
Chairman’s Statement
8 / Yue Yuen Industrial (Holdings) Limited / Annual Report 2011
Consumer spending in China continued to be stable as a consequence of the economic growth in China as well as the government policies of increasing both the payroll contributions and the minimum wage, which together led to an improvement in the living standards of workers. At the fiscal year end, the Company had 3,055 directly operated stores/counters and 3,357 sub-distributors within its Greater China retail network principally operating in the 1st, 2nd and 3rd tier cities. The continuing annual economic growth and other mandated increases in the minimum wage for the foreseeable future, provides a trajectory for increasing consuming spending in China for many years to come.
During the year the rising input costs and less efficiency in the start-up period at the new facilities did have a negative impact on the profitability of the manufacturing operations. However, factory management experience accumulated over the past twenty years of operations together with the Group’s significant resources have helped to limit this negative impact to a manageable level. Often times the Group collaborating with its brand name customers works closely to manage input costs by developing product designs that give rise to greater automation and simplicity.
The Group’s associated companies and jointly control led ent it ies in general have also found the current fiscal year to be challenging as the environment has disadvantaged smaller companies. The profit contribution from these business entities for the current year reached US$62.5 million, a decline of 39% compared to last year. Consistent with past practice, the Group is not involved in the day to day operations of these investments, but on a timely basis participates in the strategic decisions with the appropriate business partners to share the management experiences and provide the sound direction as the cases may be or as they see fit.

/ 9
Corporate Social ResponsibilityThe Group continues to invest resources to enhance productivity as well as to maintain workplace safety. The Group during the year also made various investments to protect the environment. The Sustainable Development (SD) division now leads all programs concerning corporate social responsibility (CSR) and environmentally friendly initiatives. CSR has a dual mandate in that not only does it deal with issues relating to factory and society, but it also caters to managing issues between management and factory staff . In order to further enhance CSR standards, the Group joined the Fair Labor Association (FLA) in June 2011.
Looking AheadFor the two months ended November 2011, the Group turnover stepped up by around 15% year-on-year to approximately US$1.2 billion.
The global economic environment in 2012 will still be volatile as the economic recovery is only gradually building momentum. Countries in the developed world that are grappling with significant budget deficits, will continue to emit negative headline news
on a recurring basis so that consumers in those countries may be reluctant to spend and would rather increase their savings. However given the occurrence of the European Cup in June 2012 and the Olympics in August 2012, consumers should still be inspired to purchase athletic footwear and sports apparel.
If consumer purchasing power in China continues to grow in the coming year, then the Group may see further sales growth in its retail operations.
AcknowledgementsOn behalf of the Board of Directors, I wish to thank our customers, suppliers, business associates and shareholders for their supports. I would also like to offer special thanks to our staff for their invaluable service and contribution throughout last year.
Tsai Chi NengChairman
Hong Kong29th December, 2011

LOOKING TO ACHIEVE SUSTAINABLE GROWTH

/ 11
Management Discussion and Analysis
ResultsFor the year ended 30th September, 2011, the Group recorded turnover of US$7,045.4 million, representing year-on-year growth of 21.7%, while net profit attributable to owners of the Company fell by 6.2% year-on-year to US$449.8 million. Basic earnings per share declined by 6.2% year-on-year to US27.28 cents.
Excluding all items of a one-time nature, recurrent net profit amounted to US$464.6 million, a reduction of 7.3% as compared with the previous year.
Review of OperationsGeneral overviewFootwear manufacturing activity for the Group maintained the momentum of growth in volume and turnover, but continued to experience profit margin pressure mainly due to rising raw material costs and factory wages which need joint efforts by the Group and brand names in the aspects of manufacturing excellence and supply chain improvements for fixing the negative factors.
Sales to the Group’s largest geographic market, Asia, grew at moderate pace of 26.2% compared to last year. In its second largest market, the U.S.A., there was also year on year sales growth as measured against the previous year at 17.7%. The European market managed to grow at 30.6% compared to last year. South America had sales growth of 6.2%.
Total Turnover by Geographical MarketFor the year ended 30th September
2011 2010 y-o-y US$ millions % US$ millions % % Change
U.S.A. 2,010.8 28.5 1,709.1 29.5 17.7Europe 1,541.5 21.9 1,180.4 20.4 30.6Asia 2,870.2 40.8 2,274.5 39.3 26.2South America 352.4 5.0 331.9 5.7 6.2Canada 99.2 1.4 143.6 2.5 (31.0)Other Areas 171.3 2.4 148.7 2.6 15.2
Total Turnover 7,045.4 100.0 5,788.2 100.0 21.7
Sales of athletic shoes, the key product category for the Group, grew by 20.1% year on year. The category with the strongest sales momentum, casual/outdoor shoes, grew by 31.4% year on year. Leading brand name customers in both categories were able to launch a series of new models with innovative designs to capture consumer attention and boost sales. Retail sales were also up year on year as China had solid GDP growth and consumers in China continued their purchases of well known brand name athletic footwear and apparel.
12 / Yue Yuen Industrial (Holdings) Limited / Annual Report 2011
Management Discussion and Analysis
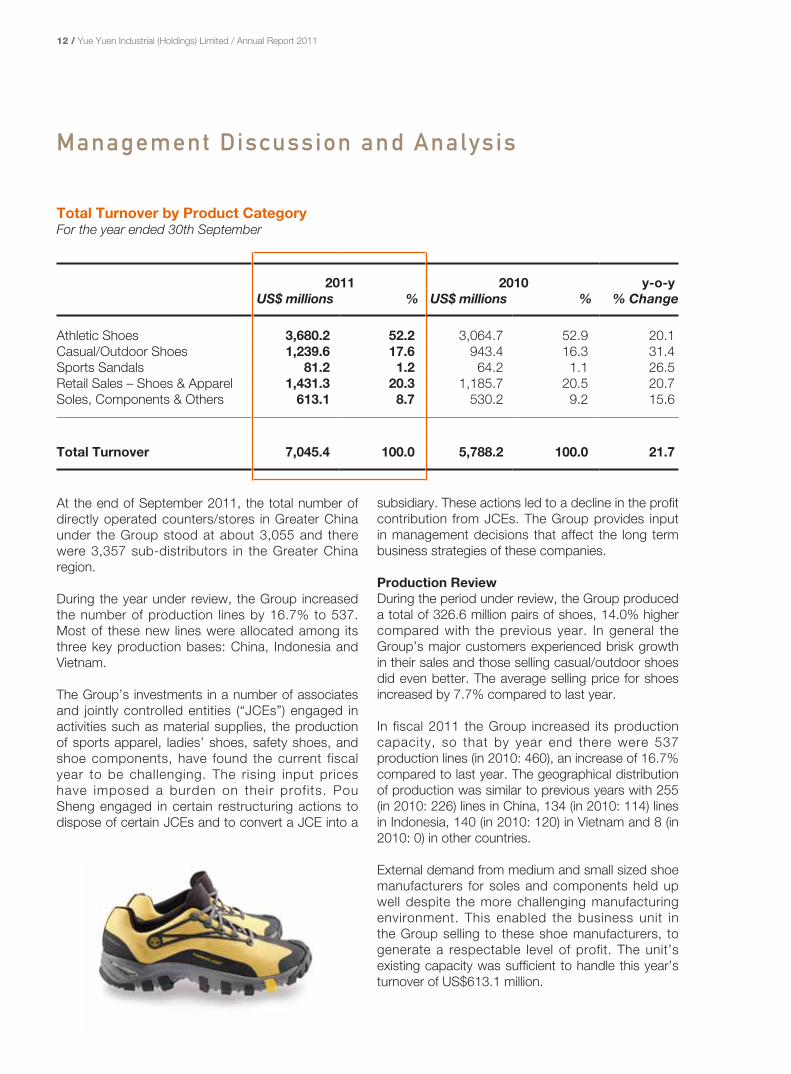
Total Turnover by Product CategoryFor the year ended 30th September
2011 2010 y-o-y US$ millions % US$ millions % % Change
Athletic Shoes 3,680.2 52.2 3,064.7 52.9 20.1Casual/Outdoor Shoes 1,239.6 17.6 943.4 16.3 31.4Sports Sandals 81.2 1.2 64.2 1.1 26.5Retail Sales – Shoes & Apparel 1,431.3 20.3 1,185.7 20.5 20.7Soles, Components & Others 613.1 8.7 530.2 9.2 15.6
Total Turnover 7,045.4 100.0 5,788.2 100.0 21.7
At the end of September 2011, the total number of directly operated counters/stores in Greater China under the Group stood at about 3,055 and there were 3,357 sub-distributors in the Greater China region.
During the year under review, the Group increased the number of production lines by 16.7% to 537. Most of these new lines were allocated among its three key production bases: China, Indonesia and Vietnam.
The Group’s investments in a number of associates and jointly controlled entities (“JCEs”) engaged in activities such as material supplies, the production of sports apparel, ladies’ shoes, safety shoes, and shoe components, have found the current fiscal year to be challenging. The rising input prices have imposed a burden on their profits. Pou Sheng engaged in certain restructuring actions to dispose of certain JCEs and to convert a JCE into a
subsidiary. These actions led to a decline in the profit contribution from JCEs. The Group provides input in management decisions that affect the long term business strategies of these companies.
Production ReviewDuring the period under review, the Group produced a total of 326.6 million pairs of shoes, 14.0% higher compared with the previous year. In general the Group’s major customers experienced brisk growth in their sales and those selling casual/outdoor shoes did even better. The average selling price for shoes increased by 7.7% compared to last year.
In fiscal 2011 the Group increased its production capacity, so that by year end there were 537 production lines (in 2010: 460), an increase of 16.7% compared to last year. The geographical distribution of production was similar to previous years with 255 (in 2010: 226) lines in China, 134 (in 2010: 114) lines in Indonesia, 140 (in 2010: 120) in Vietnam and 8 (in 2010: 0) in other countries.
External demand from medium and small sized shoe manufacturers for soles and components held up well despite the more challenging manufacturing environment. This enabled the business unit in the Group selling to these shoe manufacturers, to generate a respectable level of profit. The unit’s existing capacity was sufficient to handle this year’s turnover of US$613.1 million.
/ 13
Cost reviewWith respect to the manufacturing operations for international brands, total annual sales increased by 22.2% year on year, whereas the direct labour costs experienced an increment of 38.5%. The main material costs during the fiscal period were up 24.6% and the production overhead was up year on year by 26.6%.
Product developmentDuring the period under review, the Group spent US$153.7 mill ion in product development, an increase of 17.2% over fiscal 2010. A key role of the Group is to help the brand name customers as part of the ongoing business relationship, design shoes with features that the market research department of the brand has found to be desired by consumers. The product development expenditures encompassed items such as sample development, preparation work for the technical development package, and enhancing production efficiency. For every major brand name customer that has a research/development team, within the Group there is a corresponding independent product development centre being established to serve the said research/development team. Besides this product development work, the Group works hand in glove with its customers to refine production lead times and to use superior techniques to produce high-quality footwear.
Financial ReviewLiquidityThe Group’s financial position remained stable. As at 30th September, 2011, the Group had cash and cash equivalents of US$704 million (2010: US$622 million) and total borrowings of US$1,152 million (2010: US$979 million). The gearing ratio (total borrowings to total equity) was 28% (2010: 26%) and the net debt to equity ratio (total borrowings net of cash on hand to total equity) stood at 11% (2010: 9%). The low net debt to equity ratio reflects the Group’s desire to keep borrowings at a manageable level.
Capital expenditureCapita l expenditure increased to US$516.6 million (2010: US$348.8 million), as the Group made necessary investments for the expansion of production capacity outside the Pearl River Delta. The Group spent about US$160.7 million on constructing new factory buildings and ancillary facilities, mainly in China, Vietnam and Indonesia. Meanwhile, another US$62.4 million went into buildings and properties, and a further US$219.8 million was spent on machinery and leasehold improvements.
DividendsA final dividend of HK$0.56 per share (2010: HK$0.56) has been recommended, making the full-year dividend per share HK$0.90 (2010: HK$0.90), the same as last year.
The Group’s operating cash flow remains strong, and a suitable level of cash holdings wil l be maintained. The policy of upholding steady growth in the normal dividend payment over time remains intact. The dividend payout ratio for 2011 is 42%, which is similar to the 40% in 2010.
EmployeesAs at 30th September, 2011, the Group had about 460,000 staff employed within its various manufacturing facilities in all regions. The Group adopts a remunerat ion system based on an employee’s performance throughout the year, and offers equal opportunities to all staff. There are incentives in the form of discretionary performance bonuses to those who make creative suggestions that improve productivity.

QUALITY THAT PEOPLE CAN TRUST

/ 15
Biographical Data of Directors and Senior Management
Executive DirectorsTsai Chi Neng, aged 63, is Chairman of the Group, responsible for overall management, marketing and production. Mr. Tsai, who joined the Group in 1992, has more than 30 years of experience in the footwear business in Taiwan, Canada and the US. Over the years, he has implemented various cost control projects, creative production management scheme and experiences sharing programs that have allowed the Group to continue to grow. Mr. Tsai is also a director of certain subsidiaries of the Company. Mr. Tsai is an uncle of Mr. David, N.F. Tsai and Ms. Tsai Pei Chun, Patty. Both are executive directors of the Company.
David, N.F. Tsai , aged 61, is the Group’s Managing Director. Prior to taking up this position in 1997, he was Chairman of Pou Yuen Industrial (Holdings) Limited. Mr. Tsai has more than 30 years’ experience in the footwear sector and is well known in the industry. He has worked closely with the top management of leading global athletic and casual footwear brands. In addition to overall management, his responsibilities include high level contacts with senior brands management. Mr. Tsai is also a director of Pou Chen Corporation (“PCC”), which is a substantial shareholder of the Company with shares listed on the Taiwan Stock Exchange (“TSE”). He is a director of San Fang Chemical Industry Co., Ltd. with shares listed on the TSE, as well as chairman and a non-executive director of Pou Sheng, a non-wholly owned subsidiary of the Company, whose shares are listed on The Stock Exchange of Hong Kong Limited (“Stock Exchange”), Elitegroup Computer System Co. Ltd., whose shares are listed on the TSE, and certain subsidiaries of the Company. Mr.
Tsai is a nephew of Mr. Tsai Chi Neng, Chairman of the Company and also a cousin of Ms. Tsai Pei Chun, Patty, an executive director of the Company. Mr. Tsai personally held 4,833,000 shares in Pou Sheng as at 30th September, 2011.
Kuo Tai Yu, aged 61, is a General Manager in charge of one of the three manufacturing groups. He has over 30 years of experience in the production of footwear in Taiwan. Mr. Kuo holds a Bachelors degree from Chung Hsing University in Taiwan. Mr. Kuo is also a director of PCC, Eagle Nice (International) Holdings Limited, whose shares are listed on the Stock Exchange, and certain subsidiaries of the Company.
Kung Sung Yen, aged 57, is a General Manager of one of the three manufacturing groups. He has over 30 years of experience in the footwear industry. Mr. Kung is also a director of certain subsidiaries of the Company.

WORKING TO CREATE A BETTER SOCIETY

/ 17
Chan Lu Min, aged 57, is in charge of finance and accounting for the Group, which he joined in 2001. He has 31 years of finance and accounting experience in Taiwan. Mr. Chan is a graduate of Chung Hsing University in Taiwan. Mr. Chan is also a director of PCC, and Symphony Holdings Limited (“Symphony”), a company listed on the Stock Exchange, and certain subsidiaries of the Company. Mr. Chan personally held 681,000 shares in Pou Sheng as at 30th September, 2011.
Li I Nan, Steve, aged 70, is responsible for financial operations of the Group. He joined the Group in 1992, and has many years of experience in the footwear business, including sourcing and wholesale operations. He holds a Bachelors and a Master of Arts degree from National Chengchi University in Taiwan and the University of Southern California, respectively. He studied corporate finance and budgeting at New York University. Mr. Li is also a non-executive director of Symphony, and a director of certain subsidiaries of the Company.
Tsai Pei Chun, Patty, aged 32, graduated from the Wharton School of the University of Pennsylvania in May 2002 with a Bachelor of Science in Economics with a concentration in Finance and a College Minor in Psychology. She joined the Group in 2002 and serves as a director of the Company from 2005 with focus on the Group financial and corporate developments. Ms. Tsai currently also serves as a non-executive director of Pou Sheng. She previously served as a board director of Mega Financial Holding Company Limited, a company listed on the TSE.
Ms. Tsai is a daughter of Mr. Tsai Chi Jui, who is a deemed substantial shareholder of the Company within the meaning of Part XV of the SFO. Ms. Tsai is a niece of Mr. Tsai Chi Neng, Chairman of the Company and also a cousin of Mr. David N.F. Tsai, managing director of the Company. Ms. Tsai personally held 4,460,000 shares on Pou Sheng as at 30th September, 2011.
Kuo Li Lien, aged 54, holds a bachelor degree granted by the School of Law of Soochow University. Ms. Kuo was a senior counselor of Lee and Li, attorneys-at-law, in Taiwan (1997-2008) before she joined PCC in January 2009. Ms. Kuo is the Chief Legal Counsel of PCC. Apart from being an executive director of the Company, Ms. Kuo is a non-executive director of Pou Sheng, and also a director in a number of subsidiaries of the Company.
Lee Shao Wu , aged 47, holds a Master of International Enterprise Administration granted by China Culture University, Taiwan and a bachelor of Mechanical Engineering granted by Central University. Mr. Lee was the managing director of Barits Securities (HK) Ltd before he joined Infovision Optoelectronics (KunShan) Co., Ltd., one of the largest TFT-LCD panel manufacturers in China as CFO and vice president of administration center in 2004. Mr. Lee then joined the Company in January 2011 as Head of Investment Planning Department and was appointed as an executive director of the Company. He is also a director in a subsidiary of the Company.

18 / Yue Yuen Industrial (Holdings) Limited / Annual Report 2011
Biographical Data of Directors and Senior Management
Independent Non-executive DirectorsLiu Len Yu, aged 51, is a law professor in the Department of Law at National Cheng Chi University, a director of the Securities and Futures Investors Protection Center, and a supervisory member of the Public Interest Fund for Studying the New Trend of Economic and Financial Laws in Taiwan. Dr. Liu was formerly a commissioner at the Taiwan Fair Trade Commission, Taiwan listing review committee for the TSE and GreTai Securities Market (the OTC market) respectively. He is currently a director for public interests of TSE. Dr. Liu holds a Doctor of Laws (JSD) from Stanford Law School, Master of Laws degrees from Harvard Law School and National Chung Hsing University, and a Bachelor of Laws from National Chung Hsing University.
Leung Yee Sik, aged 50, graduated from the Hong Kong Polytechnic University and is a fellow member of the Association of Chartered Certified Accountants and an associate member of both the Hong Kong Institute of Certified Public Accountants and the Taxation Institute of Hong Kong. He had worked with KPMG and BDO Limited and is currently a partner of an accounting firm.
Huang Ming Fu, aged 71, graduated from Soochow University in Taiwan in 1964. Mr. Huang had worked for Formosa Plastics Corporation in Taiwan from 1966 to 1994. He then joined Chialease Finance Co. Ltd. until 2008 and he was the Chairman of IBT Management Corp. until October 2010, an affiliate of Industrial Bank of Taiwan. Mr. Huang is also an independent director of two TSE listed companies, namely TSRC Corporation and Alpha Networks Inc.. Mr. Huang was also a managing director of the board of Industrial Bank of Taiwan since 1999 till 2008.
Chu Li-Sheng, aged 43, holds a Bachelor in Business Administration from Tatung University and Master degree in Business Administration from National Taiwan University. Mr. Chu is an
independent director of Wellpool Co., Ltd., a company l isted on OTC market in Taiwan, a supervisor of NTU EMBA Foundation, a lecturer in the Department of Business Administration and a supervisor of Innovation Incubation Center at Asia University, a supervisor of Trade-Van Information Services Co., a company listed on TSE. Mr. Chu had worked for Le Louis Enterprise Co., Ltd. from 1993 to 2009 and he was a chairman of AVC Forum Partners from 2004 to 2009.
Senior ManagementLu Chin Chu, aged 58, is a General Manager of one of the three manufacturing groups. He has over 30 years of experience in the manufacturing of footwear and footwear materials, and is a college graduate.
Lee Chung Wen, aged 58, is an Executive Vice President of the Group and joined the Group in 1989. He graduated from National Taiwan University and is in charge of certain major brand customers’ manufacturing business in China, Vietnam and Indonesia.
Tsai Nai Kun, aged 55, is an Executive Vice President of the Group in charge of a major brand business development and operation. He is a college graduate and has 32 years of experience in the footwear business.

/ 19
Cheng Hsin Min, aged 57, joined the Group in 1980 and is an Executive Vice President engaged in a major brand research & development and production. He graduated from Fu Jen Catholic University in Taiwan and has 31 years of experience in the footwear sector.
Lin Pin Huang, aged 54, joined the Group in 1989 and is an Executive Vice President in charge of certain brand customers’ footwear business in China, Vietnam and Indonesia. He is a graduate of Tung Hai University and has over 22 years of experience in the footwear business.
Lin Cheng Tien, Jerry, aged 52, joined the Group in 1990 and is a Vice President responsible for the production, sales and marketing of certain footwear brand customers. He has more than 21 years of experience in the footwear sector.
Liu Juei Chung, aged 56, is a Vice President of the Group in charge of certain production operations at shoe and component factories. He is a college graduate and has over 32 years of experience in the sports and casual shoes business.
Chiang Ching Po, aged 63, joined the Group in 1975 and is a Vice President in charge of Group’s administration centres in China, Vietnam and Indonesia.
Huang Chin Yuan, aged 53, joined the Group in 1982 and is a Vice President, responsible for certain production sites land management.
Chen Hsin Chien, aged 55, joined the Group in 1984 and is a Vice President in charge of a production operation for a major customer in China.
Chau Chi Ming, Dickens, aged 48, is a Director, Finance & Treasury, responsible for daily financial management and treasury functions. Mr. Chau had nine years of corporate banking experience before joining the Group in 1993. He graduated from The Chinese University of Hong Kong with a Bachelors in Business Administration, majoring in Finance. He is a member of The Hong Kong Institute of Certified Public Accountants and a Fellow of The Association of Chartered Certified Accountants of the UK.

20 / Yue Yuen Industrial (Holdings) Limited / Annual Report 2011
Biographical Data of Directors and Senior Management
Chow Sai Kin, aged 60, serves as a Senior Accounting Manager overseeing the Group’s accounting activities. He graduated from The Chinese University of Hong Kong in 1975, majoring in Economics. Mr. Chow holds a Bachelors in Social Science, and has 30 years of working experience in the accounting and auditing fields. Before joining the Group in 1994, he was chief accountant at a financial institution.
Yau Suet Fong, Christina, aged 51, joined the Group in 1993 and is a Senior Manager of the Group responsible for the financial and management accounting of several major subsidiaries of the Group, tax review and special projects. She holds a Bachelor of Business (Accounting) from Charles Sturt University, Australia and has more than 20 years of accounting experience.
Ng Lok Ming, William, aged 39, is the Company Secretary and Head of Legal Department of the Group. He is primarily responsible for the company secretarial matters and legal affairs of the Group. Before joining the Group in 2007, Mr. Ng worked as a director of a computer company and the legal counsel of a listed company. Mr. Ng graduated from the University of Hong Kong with a LL.B. and a P.C.LL. in 1995 and 1996, respectively. He later obtained a LL.M. in Comparative and PRC law from
the City University of Hong Kong in 2002. Mr. Ng was admitted as a solicitor of the High Court of Hong Kong in 2001.
Shum, Jerry, aged 46, is the Head of the Investor Relations Department and joined the Group in 2008. He has a Bachelors of Arts from McGill University and holds the designations CA (Can), CPA (USA), CPA (HK) and CFA. Prior to joining the Group, he worked for various international financial institutions in the areas of investment products, debt and equity capital markets.
/ 21
Directors’ Report
The directors have pleasure in presenting their annual report and the audited consolidated financial statements for the year ended 30th September, 2011.
Principal ActivitiesYue Yuen Industrial (Holdings) Limited (the “Company”) is an investment holding company. The principal activities of the Company and its subsidiaries (hereafter collectively refer to as the “Group”) are the manufacturing, marketing and retailing of athletic footwear, athletic style leisure footwear, casual and outdoor footwear.
Results and AppropriationsThe results of the Group for the year ended 30th September, 2011 are set out in the consolidated income statement on page 50 of the annual report.
An interim dividend of HK$0.34 per share was paid to the shareholders during the year. The directors recommend the payment of a final dividend of HK$0.56 per share to the shareholders on the register of members on 14th March, 2012, amounting to approximately HK$923,400,000.
Subsidiaries, Associates and Jointly Controlled EntitiesDetails of the principal subsidiaries, associates and jointly controlled entities of the Group at 30th September, 2011 are set out in Notes 51, 52 and 53 to the consolidated financial statements, respectively.
Share CapitalDetails of the share capital of the Company are set out in Note 35 to the consolidated financial statements.
Investment PropertiesDetails of movements during the year in the investment properties of the Group are set out in Note 13 to the consolidated financial statements.
Property, Plant and EquipmentDetails of movements during the year in the property, plant and equipment of the Group are set out in Note 14 to the consolidated financial statements.
DonationsDuring the year, the Group made charitable and other donations totalling approximately US$1.3 million.
Distributable Reserves of the CompanyAs at 30th September, 2011, the Company’s reserves available for distribution to shareholders were US$918,884,000, which comprises contributed surplus of US$38,126,000, other reserve of US$43,666,000, investment revaluation reserve of US$1,052,000 and retained profits of US$836,040,000 of the Company.
Under the Companies Act 1981 of Bermuda (as amended), contributed surplus is available for distribution to shareholders. However, the Company cannot declare or pay a dividend, or make a distribution out of contributed surplus, if:
(a) the Company is, or would after the payment be, unable to pay its liabilities as they become due; or
(b) the realisable value of the Company’s assets would thereby be less than the aggregate of its liabilities and its issued share capital and share premium accounts.

22 / Yue Yuen Industrial (Holdings) Limited / Annual Report 2011
Directors’ Report
Directors and Directors’ Service ContractsThe directors of the Company during the year and up to the date of this report were:
Executive Directors:Tsai Chi Neng (Chairman)David N.F. Tsai (Managing Director)Kuo Tai YuLu Chin Chu (retired on 4th March, 2011)Kung Sung YenChan Lu MinLi I Nan, SteveTsai Pei Chun, Patty5
Kuo Li Lien5
Lee Shao Wu
Non-executive Director:John J.D. Sy1, 3 (retired on 4th March, 2011)
Independent Non-executive Directors:Liu Len Yu1, 3, 5, 6
Leung Yee Sik1, 2, 3, 4
Huang Ming Fu1, 3, 5
Chu Li-Sheng1, 3, 5 (appointed on 28th June, 2011)
Notes:1. Member of audit committee2. Chairman of audit committee3. Member of remuneration committee4. Chairman of remuneration committee5. Member of nomination committee6. Chairman of nomination committee
In accordance with Bye-Laws 86(2) and 87 of the Company’s Bye-laws, Mr. Kung Sung Yen, Mr. Li I Nan, Steve, Dr. Liu Len Yu, Mr. Leung Yee Sik and Mr. Chu Li-Sheng will retire as directors and, being eligible, offer themselves for re-election at the forthcoming annual general meeting.
The term of office of each of the non-executive directors is the period up to his retirement as required by the Company’s Bye-laws.
The Company has received, from each of the independent non-executive directors, an annual confirmation of his independence pursuant to Rule 3.13 of The Rules Governing the Listing of Securities on the Stock Exchange (the “Listing Rules”). The Company considers that all of the independent non-executive directors are independent.
No directors proposed for re-election at the forthcoming annual general meeting has a service contract with the Company or any of its subsidiaries which is not determinable by the Group within one year without payment of compensation, other than statutory compensation.

/ 23
Directors’ and Chief Executives’ Interests in SecuritiesAt 30th September, 2011, the interests or short positions of the Company’s directors, chief executives and their associates in the shares and/or underlying shares of the Company and its associated corporations (within the meaning of Part XV of the Securities and Futures Ordinance (the “SFO”)), as recorded in the register maintained by the Company pursuant to Section 352 of the SFO, or as otherwise notified to the Company and the Stock Exchange pursuant to the Model Code for Securities Transactions by Directors of Listed Issuers (the “Model Code”) contained in the Listing Rules, were as follows:
Long positionOrdinary shares of HK$0.01 each in Pou Sheng, a non-wholly owned subsidiary of the Company
Number of ordinary shares
Name of directorBeneficial
owner
Held by spouse and/or
children under 18
Held by controlled
corporation
Held by a discretionary
trust Total
Percentage of the issued share capital of Pou Sheng
David N. F. Tsai 4,833,000 – – – 4,833,000 0.11%Chan Lu Min 681,000 – – – 681,000 0.01%Tsai Pei Chun, Patty 4,460,000 – – – 4,460,000 0.10%
Other than the interest disclosed above, none of the directors nor the chief executive nor their associates had any interests or short positions in any shares, underlying shares or debentures of the Company or any of its associated corporations as at 30th September, 2011.
Interests in Competing BusinessesThe Company has a 56.05% indirect interest in Pou Sheng which is accounted for as a subsidiary of the Company. Pou Sheng is listed on the main board of the Stock Exchange. The principal business activities of Pou Sheng and its subsidiaries are the retail and wholesale sales of footwear and sportswear in the Greater China region. Pou Sheng and its subsidiaries also manufacture footwear at its factory in Taicang, PRC.
There is little potential competition between the manufacturing business of the Company and Pou Sheng. On 23rd May, 2008, the Company entered into a business separation deed with Pou Sheng to put in place certain mechanisms to separate the Company’s manufacturing businesses from those of Pou Sheng. The Company and Pou Sheng provided certain undertakings in relation to their respective manufacturing businesses. In compliance with such undertakings, the Company confirms that it would not (except through Pou Sheng and its subsidiaries) solicit or manufacture for any of the brands: Li Ning, ANTA, Kappa, 361°, Umbro and XTEP between the period from 6th June, 2008 (the date when the shares of Pou Sheng were first listed on the Stock Exchange) and up to and including 30th September, 2011. A meeting of board of directors of the Company was held on 16th December, 2008 to approve Pou Sheng to engage in the business of manufacturing two new brands, namely, Lotto and Diadora (the “New Business”), for which the Company confirmed that it did not wish to (except through Pou Sheng and its subsidiaries) take up the opportunity of the New Business between the period from 16th December, 2008 and up to and including 30th September, 2011. Another meeting of board of directors of the Company was held on 20th January, 2010 to approve Pou Sheng to engage in the business of manufacturing two new brands, namely Pony and Footzone (“Another New Business”), for which the Company confirmed that it did not wish to (except through Pou Sheng and its subsidiaries) take up the opportunity of Another New Business between the period from 20th January, 2010 and up to and including 30th September, 2011.

24 / Yue Yuen Industrial (Holdings) Limited / Annual Report 2011
Directors’ Report
Interests in Competing Businesses (continued)As at 30th September, 2011, Mr. David N.F. Tsai, Ms. Tsai Pei Chun, Patty and Ms. Kuo Li Lien, who are directors of the Company, were also directors of Pou Sheng. Mr. David N.F. Tsai and Ms. Tsai Pei Chun, Patty also hold shares in Pou Sheng. As the Company and Pou Sheng are separate listed entities run by separate and independent management teams, the directors of the Company believe that the Company is capable of carrying on its business independently of, and at arms length from, Pou Sheng. The Company intends to maintain its shareholding in Pou Sheng.
The Company also has an investment in Symphony whose shares are listed on the main board of the Stock Exchange. The principal activities of Symphony and its subsidiaries are the manufacturing and sales of footwear products. Symphony and its subsidiaries also engage in retail and wholesale business of apparel and footwear in the PRC. Mr. Chan Lu Min and Mr. Li I Nan, Steve, both of whom are directors of the Company, are also directors of Symphony. As Symphony is operated under separate and independent management, the directors of the Company believe that the Company is capable of carrying on its business independently of, and at arms length from, Symphony.
Save as described above, as at 30th September, 2011, none of the directors of the Company had any interest in a business which may compete with that of the Group and which is required to be disclosed pursuant to Rule 8.10 of the Listing Rules.
Share Incentive Schemes(a) Share Option Scheme of the Company
The Company recognises the importance of attracting talents and retaining employees by providing them with incentives and rewards through granting share-based incentives. The Company believes that this will align their interests with that of the Company. In this connection, the Company has adopted a share option scheme, the details of which are stipulated as follows:
On 27th February, 2009, the Company adopted a share option scheme (the “Scheme”) under which the Board may at its discretion grant any eligible participant share options, as it may determine appropriate. The Scheme is valid and effective for a period of ten years commencing on 27th February, 2009, after which no further options may be offered or granted.
No share options were granted under the Scheme since its adoption.
Further details of the Scheme are set out in Note 38 to the consolidated financial statements.

/ 25
Share Incentive Schemes (continued)(b) Share Incentive Scheme of Pou Sheng
On 14th May, 2008, Pou Sheng adopted a share option scheme (the “Pou Sheng Scheme”) under which the directors of Pou Sheng may at its discretion grant any eligible participant share options, as it may determine appropriate. The Pou Sheng Scheme is valid and effective for a period of ten years commencing on 14th May, 2008, after which no further options may be offered or granted.
The following table discloses movements in Pou Sheng’s share options during the year:
Date of grant
Exercise price Exercisable period
Number of options
outstanding at 1.10.2010
Granted during
the year
Lapsed/cancelled
during the year
Number of options
outstanding at 30.9.2011
HK$
Director of Pou Sheng
Chang Karen Yi-Fen 21.1.2010 1.62 21.1.2011 – 20.1.2018 570,000 – – 570,00021.1.2010 1.62 21.1.2012 – 20.1.2018 570,000 – – 570,00021.1.2010 1.62 21.1.2013 – 20.1.2018 1,140,000 – – 1,140,00021.1.2010 1.62 21.1.2014 – 20.1.2018 1,520,000 – – 1,520,00020.1.2011 1.23 20.1.2012 – 19.1.2019 – 1,250,000 – 1,250,00020.1.2011 1.23 20.1.2013 – 19.1.2019 – 1,250,000 – 1,250,00020.1.2011 1.23 20.1.2014 – 19.1.2019 – 1,250,000 – 1,250,00020.1.2011 1.23 20.1.2015 – 19.1.2019 – 1,250,000 – 1,250,000
3,800,000 5,000,000 – 8,800,000
Employees/consultants of Pou Sheng
21.1.2010 1.62 21.1.2011 – 20.1.2018 8,356,500 – (1,821,750) 6,534,75021.1.2010 1.62 21.1.2012 – 20.1.2018 8,356,500 – (1,821,750) 6,534,75021.1.2010 1.62 21.1.2013 – 20.1.2018 16,713,000 – (3,643,500) 13,069,50021.1.2010 1.62 21.1.2014 – 20.1.2018 22,284,000 – (4,858,000) 17,426,00020.1.2011 1.23 20.1.2012 – 19.1.2019 – 12,500,000 – 12,500,00020.1.2011 1.23 20.1.2013 – 19.1.2019 – 12,500,000 – 12,500,00020.1.2011 1.23 20.1.2014 – 19.1.2019 – 12,500,000 – 12,500,00020.1.2011 1.23 20.1.2015 – 19.1.2019 – 12,500,000 – 12,500,000
55,710,000 50,000,000 (12,145,000) 93,565,000
Grand total 59,510,000 55,000,000 (12,145,000) 102,365,000
Further details of the Pou Sheng Scheme are set out in Note 38 to the consolidated financial statements.
26 / Yue Yuen Industrial (Holdings) Limited / Annual Report 2011
Directors’ Report
Arrangement to Purchase Shares or DebenturesSave as disclosed in the “Share Incentive Schemes” above, at no time during the year was the Company or any of its subsidiaries a party to any arrangements to enable the directors of the Company to acquire benefits by means of the acquisition of shares in, or debt securities (including debentures) of, the Company or any other body corporate.
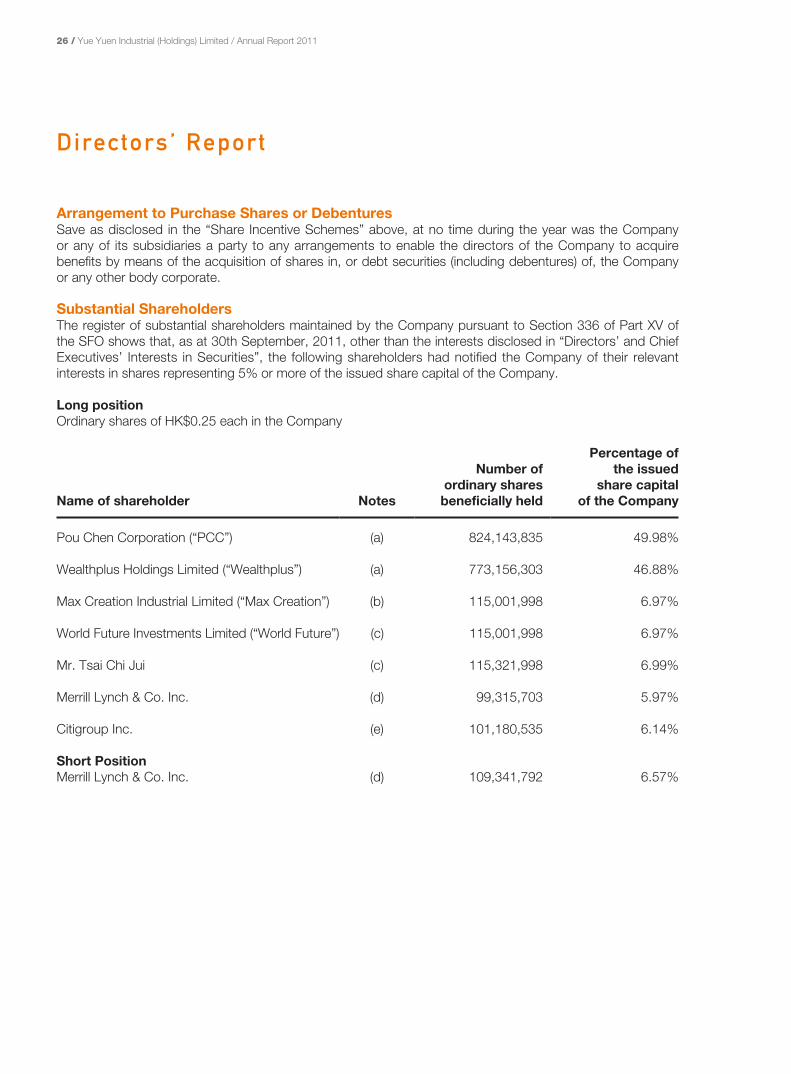
Substantial ShareholdersThe register of substantial shareholders maintained by the Company pursuant to Section 336 of Part XV of the SFO shows that, as at 30th September, 2011, other than the interests disclosed in “Directors’ and Chief Executives’ Interests in Securities”, the following shareholders had notified the Company of their relevant interests in shares representing 5% or more of the issued share capital of the Company.
Long positionOrdinary shares of HK$0.25 each in the Company
Name of shareholder Notes
Number of ordinary shares beneficially held
Percentage of the issued
share capital of the Company
Pou Chen Corporation (“PCC”) (a) 824,143,835 49.98%
Wealthplus Holdings Limited (“Wealthplus”) (a) 773,156,303 46.88%
Max Creation Industrial Limited (“Max Creation”) (b) 115,001,998 6.97%
World Future Investments Limited (“World Future”) (c) 115,001,998 6.97%
Mr. Tsai Chi Jui (c) 115,321,998 6.99%
Merrill Lynch & Co. Inc. (d) 99,315,703 5.97%
Citigroup Inc. (e) 101,180,535 6.14%
Short PositionMerrill Lynch & Co. Inc. (d) 109,341,792 6.57%

/ 27
Substantial Shareholders (continued)Notes:(a) Of the 824,143,835 ordinary shares beneficially owned by PCC, 773,156,303 ordinary shares were held by
Wealthplus as listed above and 50,987,532 ordinary shares were held by Win Fortune Investments Limited (“Win Fortune”). Both Wealthplus and Win Fortune are wholly-owned subsidiaries of PCC. Mr. David N.F. Tsai, Mr. Chan Lu Min and Mr. Kuo Tai Yu, who are directors of the Company, are also directors of PCC. Mr. Chan Lu Min, Mr. Kuo Tai Yu, Mr. Kung Sung Yen, Mr. David N.F. Tsai and Ms. Tsai Pei Chun, Patty (who are directors of the Company) are directors of Wealthplus. Mr. Chan Lu Min and Mr. David N.F. Tsai are directors of Win Fortune.
(b) Of the 115,001,998 ordinary shares beneficially owned by Max Creation, 80,494,822 ordinary shares were held by Quicksilver Profits Limited (“Quicksilver”), 20,631,440 ordinary shares were held by Red Hot Investments Limited (“Red Hot”) and 13,875,736 ordinary shares were held by Moby Dick Enterprises Limited (“Moby Dick”). Quicksilver, Red Hot and Moby Dick are wholly-owned subsidiaries of Max Creation. Mr. Tsai Chi Neng, who is a director of the Company, is also a director of Quicksilver, Red Hot and Moby Dick. Mr. Tsai Chi Neng and Mr. David N. F. Tsai (who are directors of the Company) are directors of Max Creation.
(c) World Future is deemed to be interested in 115,001,998 ordinary shares under the SFO by virtue of its interests in more than one third of the voting shares in Max Creation. Mr. Tsai Chi Jui, brother of Mr. Tsai Chi Neng, is also deemed to be interested in these 115,001,998 ordinary shares under the same section as he holds 100% of the issued share capital in World Future. In addition, Mr. Tsai Chi Jui holds 320,000 ordinary shares directly.
(d) Merrill Lynch & Co. Inc. is deemed to be interested in 35,000 ordinary shares (long position) held directly by Merrill Lynch Portfolio Managers Limited under the SFO by virtue of its interest in more than one-third of the voting shares in Merrill Lynch Portfolio Managers Limited. Merrill Lynch Portfolio Managers Limited is wholly-owned by ML Invest, Inc., which is in turn wholly-owned by Merrill Lynch Groups Inc., which is in turn wholly-owned by Merrill Lynch & Co. Inc..
Merrill Lynch & Co. Inc. is also deemed to be interested in 5,985,785 ordinary shares (long position) and 2,620,000 ordinary shares (short position) held directly by Blackrock, Inc. (for discretionary clients) under the SFO by virtue of its interest in more than one-third of the voting shares in Blackrock, Inc.. Merrill Lynch & Co. Inc. owns 49.8% of Blackrock, Inc. through various subsidiaries, namely, Princeton Services, Inc., Princeton Administrators, L.P., Merrill Lynch Investment Managers, L.P. and Fund Asset Management, L.P., which are all 99% owned by Merrill Lynch & Co. Inc. except for Princeton Services, Inc., which is wholly-owned by Merrill Lynch Group, Inc.. Merrill Lynch Group, Inc., which is wholly-owned by Merrill Lynch & Co. Inc., is also deemed to be indirectly interested in the 5,985,785 ordinary shares (long position) and 2,620,000 ordinary shares (short position) held directly by Blackrock, Inc..
In light of the above, Merrill Lynch & Co. Inc. is deemed to be interested in an aggregate of 6,020,785 ordinary shares (long position) and 2,620,000 ordinary shares (short position).
Merrill Lynch & Co. Inc. is also deemed to be interested in 93,294,918 ordinary shares (long position) and 106,721,792 ordinary shares (short position) held directly by Merrill Lynch International under the SFO by virtue of its interest in more than one-third of the voting shares in Merrill Lynch International. Merrill Lynch & Co. Inc. holds Merrill Lynch International through six wholly-owned subsidiaries namely, Merrill Lynch International Incorporated, Merrill Lynch International Holdings Inc., Merrill Lynch Europe Plc, Merrill Lynch Europe Intermediate Holdings, Merrill Lynch Holdings Limited and ML UK Capital Holdings. ML UK Capital Holdings is wholly-owned by Merrill Lynch Holdings Limited, which is in turn wholly-owned by Merrill Lynch Europe Intermediate Holdings, which is in turn wholly-owned by Merrill Lynch Europe Plc, which is in turn wholly-owned by Merrill Lynch International Holdings Inc., which is in turn wholly-owned by Merrill Lynch International Incorporated, which is in turn wholly-owned by Merrill Lynch & Co. Inc.. Merrill Lynch International is 97.2% owned by ML UK Capital Holdings.

28 / Yue Yuen Industrial (Holdings) Limited / Annual Report 2011
Directors’ Report
Substantial Shareholders (continued)Notes: (continued)(e) The 101,180,535 ordinary shares (long position) are held as to 2,384,477 ordinary shares as corporate interest,
6,169,807 ordinary shares in the capacity as custodian corporation/approved lending agent, 378,331 ordinary shares as security interest and 92,247,920 ordinary shares as trustee. Further, 646,513 ordinary shares in short position are held as corporate interest. Of the 101,180,535 ordinary shares in long position, 93,936,282 ordinary shares represent underlying interests in physically settled unlisted derivatives.
Of the 101,180,535 ordinary shares (long position) held by Citigroup Inc., 90,178 ordinary shares (long position) are directly held by Citigroup Global Markets Inc., 473,475 ordinary shares (long position) are directly held by Morgan Stanley Smith Barney Holdings LLC, 12,938 ordinary shares (long position) are directly held by Citigroup Global Markets Financial Products LLC, 2,184,362 ordinary shares (long position) are directly held by Citigroup Global Markets Limited, 92,247,920 ordinary shares (long position) are directly held by Citicorp International Limited, 6,170,982 ordinary shares (long position) are directly held by Citibank N.A. and 680 ordinary shares (long position) are directly held by Citicorp Trust South Dakota.
Of the 646,513 ordinary shares (short position) interested by Citigroup Inc., 86,588 ordinary shares (short position) are directly interested by Citigroup Global Markets Inc., 18,729 ordinary shares (short position) are directly interested by Citigroup Global Markets Financial Products LLC and 541,196 ordinary shares (short position) are directly interested by Citigroup Global Markets Limited.
Morgan Stanley Smith Barney Holdings LLC is owned as to 49% by Citigroup Global Markets Inc., which is in turn wholly-owned by Citigroup Financial Products Inc.. Citigroup Global Markets Financial Products LLC is wholly-owned by Citigroup Global Markets Holdings GmbH, which is in turn owned as to 24.3% by Citigroup Global Markets Pacific Holding Company Inc. and as to 75.7% by Citigroup Global Markets (International) Finance AG. Both Citigroup Global Markets Pacific Holding Company Inc. and Citigroup Global Markets (International) Finance AG are wholly-owned by Citigroup Financial Products Inc.. Citigroup Global Markets Limited is wholly-owned by Citigroup Global Markets Europe Limited which is in turn owned as to 64.67% by Citigroup Financial Products Inc., 35.22% by Citigroup Global Markets International LLC and 0.11% by Citigroup Global Markets (International) Finance AG. Citigroup Global Markets International LLC is wholly-owned by Citigroup Financial Product Inc.. Citigroup Financial Products Inc. is therefore deemed to be interested in an aggregate of 2,760,953 ordinary shares (long position) and 646,513 ordinary shares (short position). Citigroup Financial Products Inc. is wholly-owned by Citigroup Global Markets Holdings Inc., which is in turn wholly-owned by Citigroup Inc.
Citicorp International Limited is wholly-owned by Citigroup Holding (Singapore) Private Limited, which is in turn wholly-owned by Citigroup Asia Pacific Holding Corporation, which is in turn wholly-owned by Citibank Overseas Investment Corporation, which is in turn wholly-owned by Citibank N.A.. Citigroup Trust – Delaware, National Association is wholly-owned by Citibank N.A., which is in turn wholly-owned by Citicorp Holdings Inc., which is in turn wholly-owned by Citigroup Inc.. Citicorp Holdings Inc. is therefore deemed to be interested in an aggregate of 98,418,902 ordinary shares (long position).
Citicorp Trust South Dakota is wholly-owned by Citibank (South Dakota), National Association, which is in turn wholly-owned by Citigroup Inc.. Citibank (South Dakota), National Association is therefore deemed to be interested in an aggregate of 680 ordinary shares (long position).
In light of the above, Citigroup Inc. is deemed to be interested in an aggregate of 101,180,535 ordinary shares (long position) and 646,513 ordinary shares (short position). The above have been prepared based on the latest disclosure of interest form filed with the Company.
Other than the interests disclosed above, the Company has not been notified of any other relevant interests or short positions in the shares or underlying shares of the Company as at 30th September, 2011.
/ 29
Connected Transactions and Directors’ Interests in ContractsDetails of the transactions regarded as connected transactions for the year are set out in Note 48 (I) and (II) to the consolidated financial statements.
The independent non-executive directors of the Company have reviewed the continuing connected transactions and the Company engaged the auditor of the Company to perform certain agreed upon procedures in respect of the continuing connected transactions of the Group. The auditor has reported the factual findings on these procedures to the board of directors. Pursuant to Rule 14A.37 of the Listing Rules, the independent non-executive directors have confirmed that the transactions were entered into by the Group in ordinary course of business, on normal commercial terms or on terms no less favourable than terms available to or from independent third parties, and in accordance with the terms of the agreements governing such transactions that are fair and reasonable and in the interests of the shareholders of the Company as a whole.
Save as disclosed in Note 48 (I) and (II):
(i) no contracts of significance to which the Company, or any of its subsidiaries, was a party and in which a director of the Company had a material interest, whether directly or indirectly, subsisted at the end of the year or at any time during the year; and
(ii) there were no transactions which need to be disclosed as connected transactions in accordance with Chapter 14A of the Listing Rules.
Major Customers and SuppliersThe aggregate sales attributable to the Group’s five largest customers were approximately 51% of the Group’s total sales and the sales attributable to the Group’s largest customer were approximately 22% of the Group’s total sales for the year.
The aggregate purchases during the year attributable to the Group’s five largest suppliers were less than 30% of the Group’s total purchases.
At no time during the year, did a director, an associate of a director or a shareholder of the Company, which to the knowledge of the directors owns more than 5% of the Company’s issued share capital, have an interest in the share capital of any of the five largest customers of the Group.
Update on Directors’ Information Under Rule 13.51b(1) of the Listing RulesMr. Li I Nan, Steve, Mr. Chan Lu Min and Mr. Lu Chin Chu, the executive directors of the Company, have been appointed as the directors of a subsidiary of the Company, Prime Wise Investments Limited, which is incorporated in the British Virgin Islands.
Mr. Lee Shao Wu, the executive director of the Company, has been appointed as a director of a subsidiary of the Company, Yi Sheng Leather Co., Ltd., which is incorporated in the British Virgin Islands.
Purchase, Sale or Redemption of the Company’s Listed SecuritiesNeither the Company nor any of its subsidiaries purchased, sold or redeemed any of the Company’s listed securities during the year.

30 / Yue Yuen Industrial (Holdings) Limited / Annual Report 2011
Directors’ Report
Emolument PolicyThe emolument policy of the employees of the Group is set up by the board of directors on the basis of their merit, qualifications and competence.
The emoluments of the directors of the Company are recommended by the Remuneration Committee and are decided by the board of directors, as authorised by shareholders at the annual general meeting, having regard to the Group’s operating results, individual performance and comparable market statistics.
Pre-emptive RightsThere are no provisions for pre-emptive rights under the Company’s Bye-laws, or the laws of Bermuda, which would oblige the Company to offer new shares on a pro-rata basis to existing shareholders.
Corporate GovernanceThe Company is committed to maintain a high standard of corporate governance practices. Information on the corporate governance practices adopted by the Company is set out in the Corporate Governance Report in the annual report.
Sufficiency of Public FloatThe Company has maintained a sufficient public float throughout the year ended 30th September, 2011.
Events After the Reporting PeriodDetails of significant events occurring after the end of the reporting period are set out in Note 50 to the consolidated financial statements.
AuditorA resolution will be submitted to the annual general meeting of the Company to re-appoint Messrs. Deloitte Touche Tohmatsu as auditor of the Company.
On behalf of the Board
David N. F. TsaiManaging Director
Hong Kong29th December, 2011

/ 31
Corporate Governance Report
The Group recognizes the value and importance to achieving high corporate governance standards to enhance corporate performance and accountability.
The Company has applied the principles and has complied with the provisions of the Code on Corporate Governance Practices (the “Code”) set out in Appendix 14 to the Listing Rules throughout the year ended 30th September, 2011, with deviation from Code Provision A.4.1.
The Company periodically reviews its corporate governance practices to ensure that the practices continue to meet the requirements of the Code.
A. DirectorsA.1 The Board
PrincipleAn issuer should be headed by an effective board which should assume responsibility for leadership and control of the issuer and be collectively responsible for promoting the success of the issuer by directing and supervising the issuer’s affairs. Directors should take decisions objectively in the interests of the issuer.
The overall management of the Company’s business is vested in the Board.
The Board takes responsibility to oversee all major matters of the Company, including the formulation and approval of all policy matters, overall strategies, internal control and risk management systems, and monitoring the performance of the senior management. The directors have to take decisions objectively in the interests of the Company.
The day-to-day management, administration and operation of the Company are delegated to the Managing Director and the senior management of the Company. The delegated functions and work tasks are periodically reviewed.
The Board is composed of nine executive directors (including the Chairman and the Managing Director of the Company) and four independent non-executive directors, whose biographical details are set out in “Biographical Data of Directors and Senior Management” section on pages 15 to 20. Mr. Tsai Chi Neng, Mr. David N. F. Tsai and Ms. Tsai Pei Chun, Patty are, amongst others, members of Tsai’s family. Mr. Tsai Chi Neng is an uncle of Mr. David N. F. Tsai and Ms. Tsai Pei Chun, Patty. Mr. David N. F. Tsai and Ms. Tsai Pei Chun, Patty are cousins. Save as disclosed herein, none of the members of the Board are related to one another.
During the year, the Board at all times met the requirements of the Listing Rules relating to the appointment of at least three independent non-executive directors with at least one independent non-executive director possessing appropriate professional qualifications, or accounting or related financial management expertise.

32 / Yue Yuen Industrial (Holdings) Limited / Annual Report 2011
Corporate Governance Report
A. Directors (continued)A.1 The Board (continued)
In addition, the Company has received from each of the independent non-executive directors an annual confirmation of their independence pursuant to Rule 3.13 of the Listing Rules. These directors’ independences have been verified.
Code Provisions Compliance Actions by the Company
A.1.1The board should meet regularly and board meetings should be held at least 4 times a year at approximately quarterly intervals.
Yes The Board met six times during the year and four of them were regular Board meetings.
A.1.2Arrangements should be in place to ensure that all directors are given an opportunity to include matters in the agenda for regular board meetings.
Yes Directors were invited to include any matters which they thought appropriate in the agenda for regular Board meetings.
A.1.3Notice of at least 14 days should be given of a regular board meeting to give all directors an opportunity to attend.
Yes 14 days prior notice was normally given for regular Board meetings.
A.1.4All directors should have access to the advice and services of the company secretary.
Yes All directors have full, timely and direct access to the advice and services of the Company Secretary of the Company.
A.1.5Minutes of board meetings and meetings of board committees should be kept by a duly appointed secretary of the meeting and open for inspection.
Yes Minutes are kept by the appointed secretary of the meetings and available for inspection at the Company’s principal place of business.
A.1.6Draft and final versions of minutes of board meetings should be sent to all directors for their comment and records respectively, in both cases within a reasonable time after the board meeting is held.
Yes All draft minutes would be sent to directors for review and comment within one month after each meeting.
/ 33
A. Directors (continued)A.1 The Board (continued)
Code Provisions Compliance Actions by the Company
A.1.7There should be a procedure for directors to seek independent professional advice at the issuer’s expense.
Yes Directors are permitted to seek independent professional advice, if required, at the Company’s expenses.
A.1.8If a substantial shareholder/director has a conflict of interest in a matter to be considered by the board which the board has determined to be material, a board meeting should be held. Independent non-executive directors who have no material interest in the transaction should be present at such board meeting.
Yes The Company will continue to ensure that such matters that require Board meetings be held instead of by way of circulation.
Compliance with Recommended Best Practices• There is in place a Directors’ & Officers’ Liabilities Insurance cover; and
• Board Committees have adopted broadly the same principles and procedures as stated in A.1.1 to A.1.8 of Appendix 14 to the Listing Rules.
A.2 Chairman and Chief Executive Officer
PrincipleThere should be a clear division between the management of the board and the day-to-day management at the board level of the issuer’s business to ensure a balance of power and authority, so that power is not concentrated in any one individual.
The positions of the Chairman and the Managing Director are held by Mr. Tsai Chi Neng and Mr. David N. F. Tsai respectively.
In order to reinforce their respective independence, accountability and responsibility, the role of the Chairman is separate from that of the Managing Director. The Chairman provides leadership and is responsible for the effective functioning of the Board in accordance with good corporate governance practice and ensures the effectiveness of the Board. With the support of the senior management, the Chairman is also responsible for ensuring that the directors receive adequate, complete and reliable information in a timely manner and appropriate briefing on issues arising at Board meetings.

34 / Yue Yuen Industrial (Holdings) Limited / Annual Report 2011
Corporate Governance Report
A. Directors (continued)A.2 Chairman and Chief Executive Officer (continued)
The Managing Director focuses on managing the Company and its subsidiaries, developing and implementing objectives, policies and strategies approved and delegated by the Board. The Managing Director is in charge of the Group’s day-to-day management and operations and is also responsible for developing strategic plans and formulating the organizational structure, control systems and internal procedures and processes for the Board’s approval.
Code Provisions Compliance Actions by the Company
A.2.1The roles of chairman and chief executive officer should be separate and should not be performed by the same individual. The division of responsibilities between the chairman and chief executive officer should be clearly established and set out in writing.
Yes Division of responsibilities between the Chairman and the Managing Director is clearly defined and set out in writing. Chairman and Managing Director are served by different persons.
A.2.2 & A.2.3The chairman should ensure that all directors are properly briefed on issues arising at board meetings and they receive adequate information in a timely manner.
Yes The Chairman has a clear responsibility to ensure all the directors are properly briefed and given accurate information.
Compliance with Recommended Best PracticesClear division of responsibilities between Chairman and Managing Director has been approved and adopted by the Company. The Chairman has a clear responsibility to ensure that the Board works effectively and discusses all key and appropriate issues in a timely manner.

/ 35
A. Directors (continued)A.3 Board composition
PrincipleThe board should have a balance of skills and experience appropriate for the requirements of the business of the issuer. The Board should ensure that changes to its composition can be managed without undue disruption. The board should include a balanced composition of executive and non-executive directors (including independent non-executive directors) so that there is a strong independent element on the board, which can effectively exercise independent judgment. Non-executive directors should be of sufficient caliber and number for their views to carry weight.
The Board as a whole is responsible for reviewing the Board composition, developing and formulating the relevant procedures for appointment of directors, monitoring the appointment and succession planning of directors and assessing the independence of independent non-executive directors. The Board has reviewed its own structure, size and composition to ensure that it has a balance of expertise, skills, independence and experience appropriate to the requirements of the business of the Group.
Code Provisions Compliance Actions by the Company
A.3.1The independent non-executive directors should be expressly identified as such in all corporate communications.
Yes Composition of the Board, by category of directors, is disclosed in all corporate communications.
Compliance with Recommended Best PracticesThe Company has maintained on its website an updated list of its directors identifying their role and function and whether they are independent non-executive directors.

36 / Yue Yuen Industrial (Holdings) Limited / Annual Report 2011
Corporate Governance Report
A. Directors (continued)A.4 Appointments, re-election and removal
PrincipleThere should be a formal, considered and transparent procedure for the appointment of new directors to the board. There should be plans in place for orderly succession for appointments to the board. All directors should be subject to re-election at regular intervals. An issuer must explain the reasons for the resignation or removal of any director.
Code Provisions Compliance Actions by the Company
A.4.1Non-executive directors should be appointed for a specific term, subject to re-election.
Partial Compliance
The non-executive directors (including independent non-executive directors) of the Company were not appointed for specific terms, but are subject to retirement by rotation in accordance with the Bye-laws of the Company. Since the non-executive directors are subject to retirement by rotation and re-election at the annual general meeting (“AGM”) in accordance with the Company’s Bye-laws, the Company considers that sufficient measures have been taken to ensure that the Company’s corporate governance practice in this aspect is no less exacting than that in the Code.
A.4.2All directors appointed to fill a casual vacancy should be subject to election by shareholders at the first general meeting after their appointment. Every director, including those appointed for a specific term, should be subject to retirement by rotation at least once every three years.
Yes Every director appointed to fill a casual vacancy is subject to election by shareholders at the first AGM after the appointment. Every director is subject to retirement by rotation at least once every three years.
Compliance with Recommended Best PracticesThe Company’s circular of its AGM contained detailed information on election of directors, including details of biographies, and, if applicable, independence of all directors standing for re-election. Each of the independent non-executive directors has confirmed their independence.
/ 37
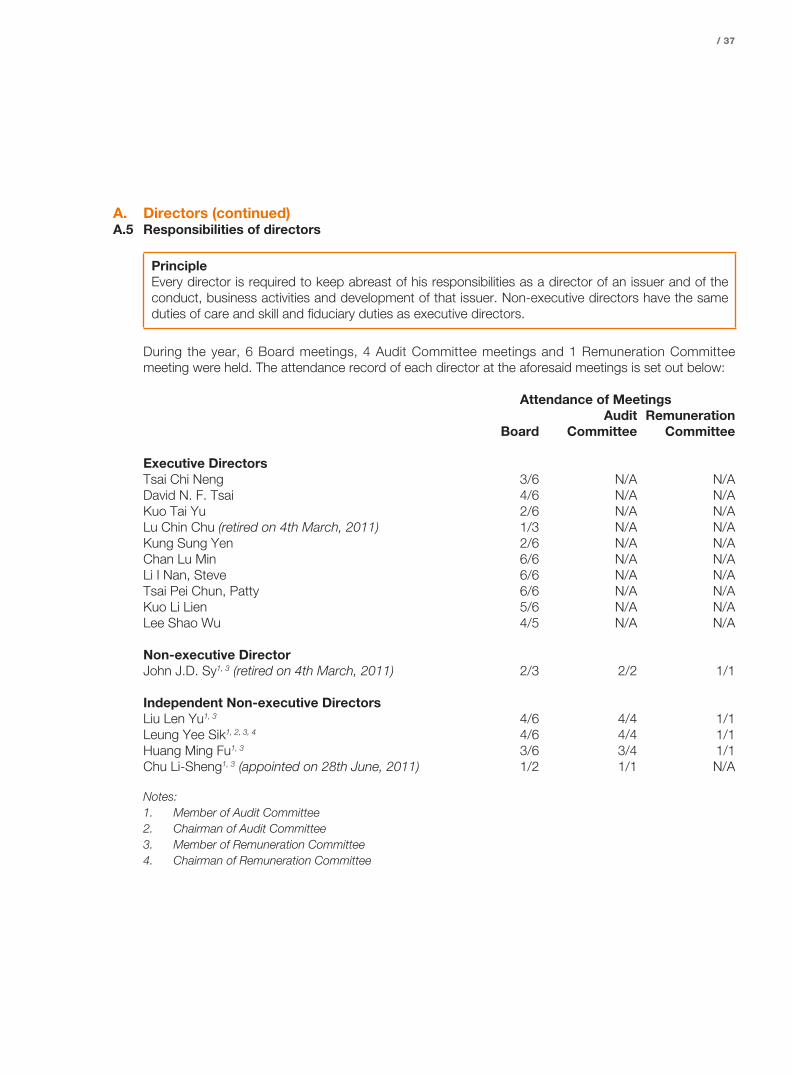
A. Directors (continued)A.5 Responsibilities of directors
PrincipleEvery director is required to keep abreast of his responsibilities as a director of an issuer and of the conduct, business activities and development of that issuer. Non-executive directors have the same duties of care and skill and fiduciary duties as executive directors.
During the year, 6 Board meetings, 4 Audit Committee meetings and 1 Remuneration Committee meeting were held. The attendance record of each director at the aforesaid meetings is set out below:
Attendance of Meetings
BoardAudit
CommitteeRemuneration
Committee
Executive DirectorsTsai Chi Neng 3/6 N/A N/ADavid N. F. Tsai 4/6 N/A N/AKuo Tai Yu 2/6 N/A N/ALu Chin Chu (retired on 4th March, 2011) 1/3 N/A N/AKung Sung Yen 2/6 N/A N/AChan Lu Min 6/6 N/A N/ALi I Nan, Steve 6/6 N/A N/ATsai Pei Chun, Patty 6/6 N/A N/AKuo Li Lien 5/6 N/A N/ALee Shao Wu 4/5 N/A N/A
Non-executive DirectorJohn J.D. Sy1, 3 (retired on 4th March, 2011) 2/3 2/2 1/1
Independent Non-executive DirectorsLiu Len Yu1, 3 4/6 4/4 1/1Leung Yee Sik1, 2, 3, 4 4/6 4/4 1/1Huang Ming Fu1, 3 3/6 3/4 1/1Chu Li-Sheng1, 3 (appointed on 28th June, 2011) 1/2 1/1 N/A
Notes:1. Member of Audit Committee2. Chairman of Audit Committee3. Member of Remuneration Committee4. Chairman of Remuneration Committee

38 / Yue Yuen Industrial (Holdings) Limited / Annual Report 2011
Corporate Governance Report
A. Directors (continued)A.5 Responsibilities of directors (continued)
Code Provisions Compliance Actions by the Company
A.5.1Every newly appointed director of an issuer should receive a comprehensive, formal and tailored induction on the first occasion of his appointment, and subsequently such briefing and professional development as is necessary, to ensure that he has a proper understanding of the operations and business of the issuer and that he is fully aware of his responsibilities under statute and common law, the Listing Rules, applicable legal requirements and other regulatory requirements and the business and governance policies of the issuer.
Yes A comprehensive information package containing an introduction to the Group’s operations, directors’ responsibilities and duties and other statutory requirements has been provided to new directors upon their appointment. They could also elect to receive briefing from the Company Secretary or Company’s legal advisor on the content of the information package as mentioned in A.5.1 of the Code.
A.5.2The functions of non-executive directors should include:– bring an independent judgement at
the board meetings;– take the lead where potential conflicts
of interests arise;– serve on the audit, remuneration,
nomination and other governance committees, if invited; and
– scrutinise the issuer’s performance, and monitor the reporting of performance.
Yes Non-executive directors are well aware of their functions and have been actively performing their functions.
A.5.3Every director should ensure that he can give sufficient time and attention to the affairs of the issuer and should not accept the appointment if he cannot do so.
Yes There is reasonably satisfactory attendance rate.
A.5.4Directors must comply with their obligations under the Model Code set out in Appendix 10.
Yes The Company has adopted the Model Code set out in Appendix 10 to the Listing Rules regarding directors’ dealings in securities. Directors have confirmed compliance with the Model Code throughout the year. The Company has also adopted written guidelines on no less exacting terms than the Model Code for the relevant employees. No incident of non-compliance of the employees’ written guidelines by the relevant employees was noted by the Company.

/ 39
A. Directors (continued)A.5 Responsibilities of directors (continued)
Compliance with Recommended Best PracticesDirectors disclose their other directorship at the time of appointment and, subsequently, at least once every year to the Company.
A.6 Supply of and access to information
PrincipleDirectors should be provided in a timely manner with appropriate information in such form and of such quality as will enable them to make an informed decision and to discharge their duties and responsibilities as directors of an issuer.
Code Provisions Compliance Actions by the Company
A.6.1Agenda and accompanying board papers should be sent in full to all directors at least 3 days before board/board committee meeting.
Yes Agenda and board papers are sent to all directors at least three days before the meetings unless it is on urgent basis.
A.6.2Management has an obligation to supply the board and its committees with adequate information in a timely manner to enable it to make informed decisions. The board and each director should have separate and independent access to the issuer’s senior management.
Yes Senior management works closely with the Board and meets each other on regular basis.
A.6.3All directors are entitled to have access to board papers. Steps must be taken to respond as promptly and fully as possible.
Yes Board papers and minutes are properly kept by the company secretarial division under legal department of the Company and are available for inspection by directors.
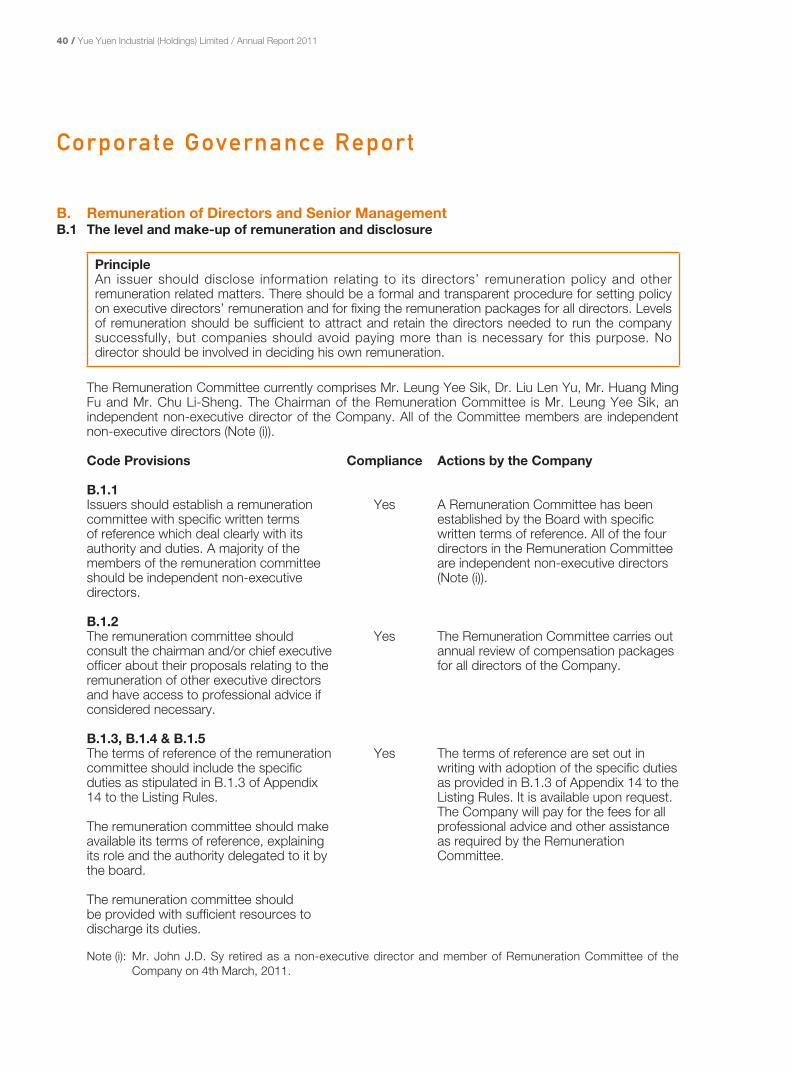
40 / Yue Yuen Industrial (Holdings) Limited / Annual Report 2011
Corporate Governance Report
B. Remuneration of Directors and Senior ManagementB.1 The level and make-up of remuneration and disclosure
PrincipleAn issuer should disclose information relating to its directors’ remuneration policy and other remuneration related matters. There should be a formal and transparent procedure for setting policy on executive directors’ remuneration and for fixing the remuneration packages for all directors. Levels of remuneration should be sufficient to attract and retain the directors needed to run the company successfully, but companies should avoid paying more than is necessary for this purpose. No director should be involved in deciding his own remuneration.
The Remuneration Committee currently comprises Mr. Leung Yee Sik, Dr. Liu Len Yu, Mr. Huang Ming Fu and Mr. Chu Li-Sheng. The Chairman of the Remuneration Committee is Mr. Leung Yee Sik, an independent non-executive director of the Company. All of the Committee members are independent non-executive directors (Note (i)).
Code Provisions Compliance Actions by the Company
B.1.1Issuers should establish a remuneration committee with specific written terms of reference which deal clearly with its authority and duties. A majority of the members of the remuneration committee should be independent non-executive directors.
Yes A Remuneration Committee has been established by the Board with specific written terms of reference. All of the four directors in the Remuneration Committee are independent non-executive directors (Note (i)).
B.1.2The remuneration committee should consult the chairman and/or chief executive officer about their proposals relating to the remuneration of other executive directors and have access to professional advice if considered necessary.
Yes The Remuneration Committee carries out annual review of compensation packages for all directors of the Company.
B.1.3, B.1.4 & B.1.5The terms of reference of the remuneration committee should include the specific duties as stipulated in B.1.3 of Appendix 14 to the Listing Rules.
The remuneration committee should make available its terms of reference, explaining its role and the authority delegated to it by the board.
The remuneration committee should be provided with sufficient resources to discharge its duties.
Yes The terms of reference are set out in writing with adoption of the specific duties as provided in B.1.3 of Appendix 14 to the Listing Rules. It is available upon request. The Company will pay for the fees for all professional advice and other assistance as required by the Remuneration Committee.
Note (i): Mr. John J.D. Sy retired as a non-executive director and member of Remuneration Committee of the Company on 4th March, 2011.

/ 41
C. Accountability and AuditC.1 Financial reporting
PrincipleThe board should present a balanced, clear and comprehensible assessment of the company’s performance, position and prospects.
Code Provisions Compliance Actions by the Company
C.1.1Management should provide such explanation and information to the board as will enable the board to make an informed assessment of the financial and other information put before the board for approval.
Yes Management is required to provide detailed report and explanation to enable the Board to make an informed assessment before approval.
C.1.2The directors should acknowledge in the Corporate Governance Report their responsibility for preparing the accounts, and there should be a statement by the auditors about their reporting responsibilities in the auditors’ report on the financial statements.
Yes Company’s directors and auditors state their respective responsibilities on page 49 of the Annual Report.
C.1.3The board’s responsibility to present a balanced, clear and understandable assessment extends to annual and interim reports, other price-sensitive announcements and other financial disclosures required under the Listing Rules, and reports to regulators as well as to information required to be disclosed pursuant to statutory requirements.
Yes The Board aims at presenting a balanced, clear and understandable assessment of the Company’s position to its shareholders and the public pursuant to all sort of statutory requirements.

42 / Yue Yuen Industrial (Holdings) Limited / Annual Report 2011
Corporate Governance Report
C. Accountability and Audit (continued)C.2 Internal controls
PrincipleThe board should ensure that the issuer maintains sound and effective internal controls to safeguard the shareholders’ investment and the issuer’s assets.
The Board is responsible for maintaining a sound and effective system of internal controls of the Group and for reviewing its effectiveness through the Audit Committee. The internal control system is designed to provide reasonable assurance against material misstatement or loss; to manage the risk of system failure; and to assist in the achievement of the Group’s objectives. In addition to safeguarding the Group’s assets, it also ensures the maintenance of proper accounting records and compliance with relevant laws and regulations.
Code Provisions Compliance Actions by the Company
C.2.1The directors should at least annually conduct a review of the effectiveness of the system of internal control of the issuer and its subsidiaries and report to shareholders that they have done so in their Corporate Governance Report. The review should cover all material controls, including financial, operational and compliance controls and risk management functions.
Yes The Board has conducted an annual review of the effectiveness of its internal control systems covering all material controls, including financial, operational and compliance controls as well as risk management functions. The Internal Audit team has prepared risk management analysis on factory operation and conducted audit or investigation accordingly.
Based on the assessments made by the Group’s Internal Audit Department, the Audit Committee and the Board considered that the key areas of the Group’s internal control systems have reasonably been implemented with room for improvement. The Internal Audit team has actively conducted audit activities and followed up any improvements which were identified.
C.2.2The board’s annual review should, in particular, consider the adequacy of resources, qualifications and experience of staff of the issuer’s accounting and financial reporting function, and their training programmes and budget.
Yes The Board’s annual review has considered the adequacy of resources, qualifications and experience of staff of the Company’s accounting and financial reporting function, and their training programmes and budget.

/ 43
C. Accountability and Audit (continued)C.3 Audit Committee
PrincipleThe board should establish formal and transparent arrangements for considering how it will apply the financial reporting and internal control principles and for maintaining an appropriate relationship with the company’s auditors. The audit committee established by an issuer pursuant to the Listing Rules should have clear terms of reference.
The Audit Committee currently comprises Mr. Leung Yee Sik, Dr. Liu Len Yu, Mr. Huang Ming Fu and Mr. Chu Li-Sheng. The Chairman of Audit Committee is Mr. Leung Yee Sik, an independent non-executive director of the Company. All of the Committee members are independent non-executive directors (Note (ii)). None of the members of the Audit Committee are a former partner of the Company’s existing external auditors.
The Audit Committee held 4 meetings during the year to review the financial results and reports, financial reporting, internal control and compliance procedures, and to make recommendations to the Board on the re-appointment of the external auditors.
Code Provisions Compliance Actions by the Company
C.3.1Full minutes of audit committee meetings should be kept by a duly appointed secretary of the meeting. Draft and final versions of minutes of the audit committee meetings should be sent to all members of the committee for their comment and records respectively, in both cases within a reasonable time after the meeting.
Yes Draft minutes prepared by the secretary of the meeting are sent to members within one month of each meeting. Full minutes are kept by the secretary of the meeting.
C.3.2A former partner of the issuer’s existing auditing firm should be prohibited from acting as a member of the issuer’s audit committee for one year after he ceases to be a partner of or to have any financial interest in the firm, whichever is the later.
Yes None of the members of the Audit Committee are former partners of the Company’s existing auditing firm.
C.3.3The terms of reference of the audit committee should include at least the following duties:– review of relationship with the issuer’s
auditors;– review of financial information of the
issuer; and– oversight of the issuer’s financial
reporting system and internal control procedures.
Yes The terms of reference have been revised to cover the scope of duties as required in this Code Provision.
Note (ii): Mr. John J.D. Sy retired as a non-executive director and member of Audit Committee on 4th March, 2011.

44 / Yue Yuen Industrial (Holdings) Limited / Annual Report 2011
Corporate Governance Report
C. Accountability and Audit (continued)C.3 Audit Committee (continued)
Code Provisions Compliance Actions by the Company
C.3.4The audit committee should make available its terms of reference, explaining its role and the authority delegated to it by the board.
Yes The terms of reference are available upon request.
C.3.5Where the board disagrees with the audit committee’s view on the selection, appointment, resignation or dismissal of the external auditors, the issuer should include in the Corporate Governance Report a statement from the audit committee explaining its recommendation and also the reason(s) why the board has taken a different view.
Not applicable Audit Committee recommended to the Board that, subject to shareholders’ approval at the forthcoming AGM, Deloitte Touche Tohmatsu be re-appointed as the external auditors of the Company.
C.3.6The audit committee should be provided with sufficient resources to discharge its duties.
Yes The Company will at its expenses provide such assistance as required by the Audit Committee.
Compliance with Recommended Best PracticesThe terms of reference of the Audit Committee have been included the following duties:
(a) to review arrangements by which employees of the Company may, in confidence, raise concerns about possible improprieties in financial reporting, internal control or other matters. The Audit Committee should ensure that proper arrangements are in place for the fair and independent investigation of such matters and for appropriate follow-up action; and
(b) to act as the key representative body for overseeing the Company’s relation with the external auditor.

/ 45
D. Delegation by the BoardD.1 Management functions
PrincipleAn issuer should have a formal schedule of matters specifically reserved to the board for its decision. The board should give clear directions to management as to the matters that must be approved by the board before decisions are made on behalf of the issuer.
Code Provisions Compliance Actions by the Company
D.1.1When the board delegates aspects of its management and administration functions to management, it must at the same time give clear directions as to the powers of management.
Yes The segregation of duties and responsibilities between the Board and the management has been defined and provided in the internal guidelines of the Company.
D.1.2An issuer should formalize the functions reserved to the board and those delegated to management.
Yes The duties of the Board include:– establishing strategic development
and direction of the Company;– setting up the objective of
management;– monitoring performance of
management; and– overseeing relationships between the
Company and its clients.
D.2 Board Committees
PrincipleBoard committees should be formed with specific written terms of reference which deal clearly with the committees’ authority and duties.
The Board has established Audit Committee, Remuneration Committee and Executive Committee with defined terms of reference. The terms of reference of the Board Committees are available upon request.
The Board Committees are provided with sufficient resources to discharge their duties and, upon reasonable request, are able to seek independent professional advice in appropriate circumstances, at the Company’s expenses.
Code Provisions Compliance Actions by the Company
D.2.1Board committees are established with sufficiently clear terms of reference.
Yes The Board has established three Board Committees (Audit Committee, Remuneration Committee and Executive Committee) with specific terms of reference.
D.2.2The terms of reference of board committees should require such committees to report back to the board.
Yes Board Committees would report to the Board their work, findings and recommendations in Board meetings.
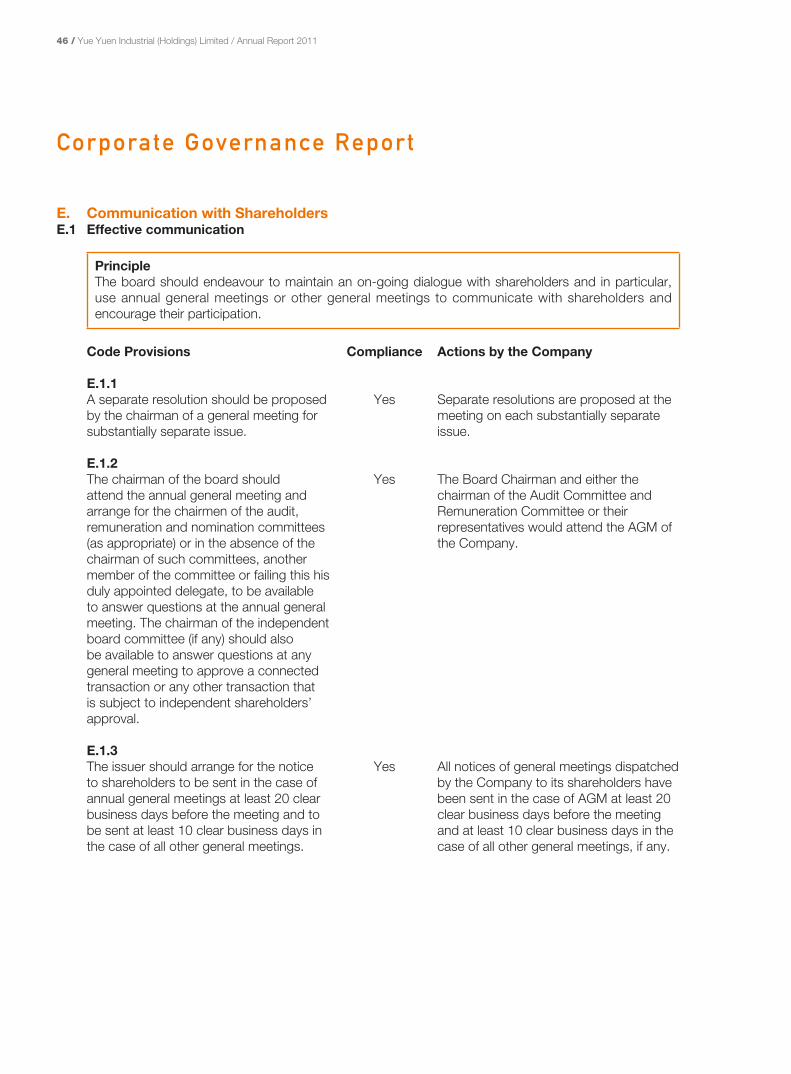
46 / Yue Yuen Industrial (Holdings) Limited / Annual Report 2011
Corporate Governance Report
E. Communication with ShareholdersE.1 Effective communication
PrincipleThe board should endeavour to maintain an on-going dialogue with shareholders and in particular, use annual general meetings or other general meetings to communicate with shareholders and encourage their participation.
Code Provisions Compliance Actions by the Company
E.1.1A separate resolution should be proposed by the chairman of a general meeting for substantially separate issue.
Yes Separate resolutions are proposed at the meeting on each substantially separate issue.
E.1.2The chairman of the board should attend the annual general meeting and arrange for the chairmen of the audit, remuneration and nomination committees (as appropriate) or in the absence of the chairman of such committees, another member of the committee or failing this his duly appointed delegate, to be available to answer questions at the annual general meeting. The chairman of the independent board committee (if any) should also be available to answer questions at any general meeting to approve a connected transaction or any other transaction that is subject to independent shareholders’ approval.
Yes The Board Chairman and either the chairman of the Audit Committee and Remuneration Committee or their representatives would attend the AGM of the Company.
E.1.3The issuer should arrange for the notice to shareholders to be sent in the case of annual general meetings at least 20 clear business days before the meeting and to be sent at least 10 clear business days in the case of all other general meetings.
Yes All notices of general meetings dispatched by the Company to its shareholders have been sent in the case of AGM at least 20 clear business days before the meeting and at least 10 clear business days in the case of all other general meetings, if any.

/ 47
E. Communication with Shareholders (continued)E.2 Voting by poll
PrincipleThe issuer should ensure that shareholders are familiar with the detailed procedures for conducting a poll.
Code Provisions Compliance Actions by the Company
E.2.1The chairman of a meeting should at the commencement of the meeting ensure that the detailed procedures for conducting a poll and then answer any questions from shareholders regarding voting by way of a poll.
Yes The chairman of a meeting has at the commencement of the meeting ensured that the procedures for conducting a poll and then answer questions from shareholders regarding voting by way of a poll. The results of the poll have been published on the websites of the Stock Exchange and the Company respectively.
Nomination of DirectorsAs at 30th September, 2011, the Company has not established nomination committee. All new appointments and re-appointments to the Board are subject to approval of the Board of Directors of the Company.
Auditors’ RemunerationDuring the year under review, the remuneration paid to the Company’s external auditors, Messrs. Deloitte Touche Tohmatsu is set out as follows:
US$’000
Audit services 2,099Non-audit services 491
2,590
The above non-audit services include the reivew of interim financial statements, professional advisory on taxation, professional services rendered in connection with the setting up of overseas companies, the field audit by the Inland Revenue Department of certain subsidiaries of the Group, the report of factual findings on agreed upon procedures in respect of connected parties transactions and the review of internal control of retail business.

48 / Yue Yuen Industrial (Holdings) Limited / Annual Report 2011
Corporate Governance Report
Information Disclosure and Investor RelationsThe Group adheres to high standards with respect to the disclosure of its financial statements, with quarterly reports of unaudited results and the monthly revenue announcement for previous month. To foster regular and contribute two-way communication amongst the Company, its shareholders and potential investors, the Group has established an Investor Relations Department to respond to enquiries from shareholders and the public. In addition, the Group is committed to maximizing the use of its website as a channel to provide updated information in a timely manner and strengthen the communication with both the shareholders and the public.
Director’s Responsibility in Respect of Financial StatementsThe directors acknowledge their responsibility for preparing the financial statements for each financial period which give a true and fair view of the financial affairs of the Group.

/ 49
Independent Auditor’s Report
TO THE MEMBERS OF YUE YUEN INDUSTRIAL (HOLDINGS) LIMITED(incorporated in Bermuda with limited liability)
We have audited the consolidated financial statements of Yue Yuen Industrial (Holdings) Limited (the “Company”) and its subsidiaries (collectively referred to as the “Group”) set out on pages 50 to 164, which comprise the consolidated statement of financial position as at 30th September, 2011, and the consolidated income statement, consolidated statement of comprehensive income, consolidated statement of changes in equity and consolidated statement of cash flows for the year then ended, and a summary of significant accounting policies and other explanatory information.
Directors’ Responsibility for the Consolidated Financial StatementsThe directors of the Company are responsible for the preparation of consolidated financial statements that give a true and fair view in accordance with Hong Kong Financial Reporting Standards issued by the Hong Kong Institute of Certified Public Accountants and the disclosure requirements of the Hong Kong Companies Ordinance, and for such internal control as the directors determine is necessary to enable the preparation of consolidated financial statements that are free from material misstatement, whether due to fraud or error.
Auditor’s ResponsibilityOur responsibility is to express an opinion on these consolidated financial statements based on our audit and to report our opinion solely to you, as a body, in accordance with Section 90 of the Bermuda Companies Act and for no other purpose. We do not assume responsibility towards or accept liability to any other person for the contents of this report. We conducted our audit in accordance with Hong Kong Standards on Auditing issued by the Hong Kong Institute of Certified Public Accountants. Those standards require that we comply with ethical requirements and plan and perform the audit to obtain reasonable assurance as to whether the consolidated financial statements are free from material misstatement.
An audit involves performing procedures to obtain audit evidence about the amounts and disclosures in the consolidated financial statements. The procedures selected depend on the auditor’s judgment, including the assessment of the risks of material misstatement of the consolidated financial statements, whether due to fraud or error. In making those risk assessments, the auditor considers internal control relevant to the entity’s preparation of the consolidated financial statements that give a true and fair view in order to design audit procedures that are appropriate in the circumstances, but not for the purpose of expressing an opinion on the effectiveness of the entity’s internal control. An audit also includes evaluating the appropriateness of accounting policies used and the reasonableness of accounting estimates made by the directors, as well as evaluating the overall presentation of the consolidated financial statements.
We believe that the audit evidence we have obtained is sufficient and appropriate to provide a basis for our audit opinion.
OpinionIn our opinion, the consolidated financial statements give a true and fair view of the state of the Group’s affairs as at 30th September, 2011 and of its profit and cash flows for the year then ended in accordance with Hong Kong Financial Reporting Standards and have been properly prepared in accordance with the disclosure requirements of the Hong Kong Companies Ordinance.
Deloitte Touche TohmatsuCertified Public Accountants
Hong Kong29th December, 2011

50 / Yue Yuen Industrial (Holdings) Limited / Annual Report 2011
Consolidated Income StatementFor the Year ended 30th September, 2011
2011 2010NOTES US$’000 US$’000
Turnover 5 7,045,373 5,788,208Cost of sales (5,489,700) (4,377,787)
Gross profit 1,555,673 1,410,421Other income 169,222 123,535Fair value changes on investment properties 13 6,955 643Fair value changes on derivative financial instruments 6 (36,144) (1,865)Impairment loss on available-for-sale investments 24 (100) (900)Selling and distribution expenses (542,283) (440,646)Administrative expenses (513,396) (454,229)Other expenses (170,076) (166,410)Gain on deemed disposal of a jointly controlled entity 41 18,767 1,267Impairment loss on investments in associates 19 (500) (1,300)Impairment loss on investments in jointly controlled entities 21 (1,500) (1,700)Finance costs 7 (37,419) (40,422)Share of results of associates 35,355 39,790Share of results of jointly controlled entities 27,174 62,679
Profit before taxation 511,728 530,863Income tax expense 8 (28,203) (35,025)
Profit for the year 9 483,525 495,838
Attributable to:Owners of the Company 449,829 479,507Non-controlling interests 33,696 16,331
483,525 495,838
US cents US centsEarnings per share 12
– Basic 27.28 29.08
– Diluted 23.15 27.19
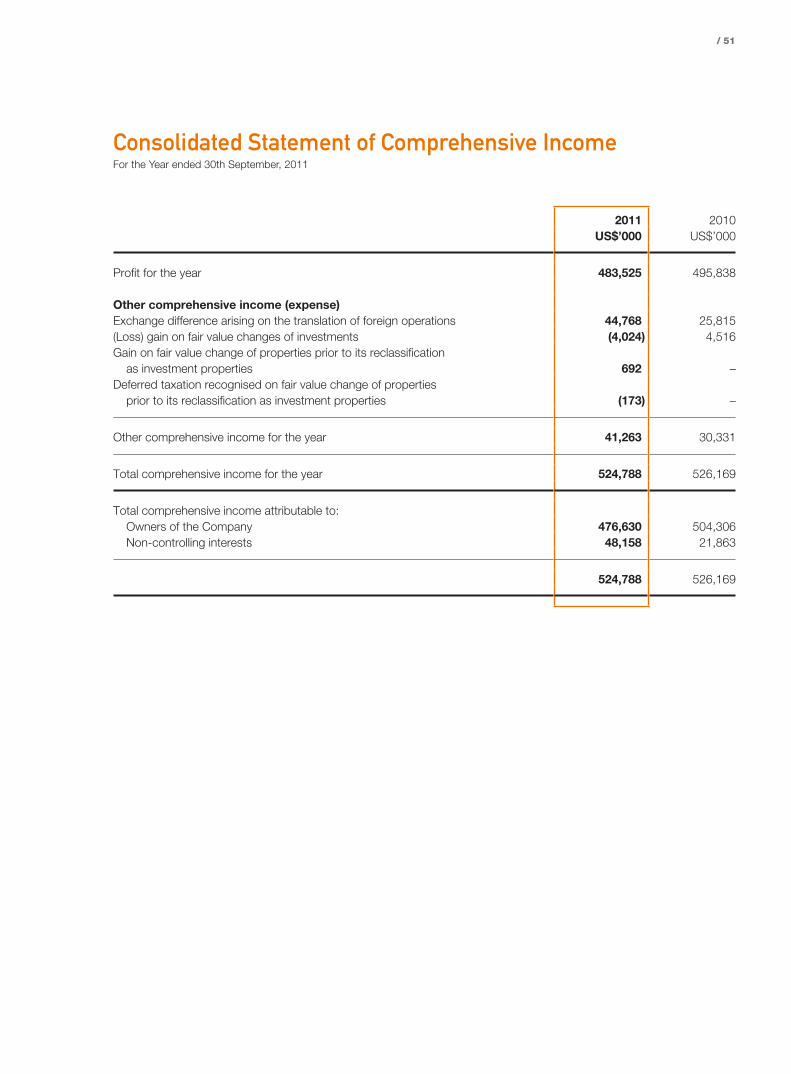
/ 51
Consolidated Statement of Comprehensive IncomeFor the Year ended 30th September, 2011
2011 2010US$’000 US$’000
Profit for the year 483,525 495,838
Other comprehensive income (expense) Exchange difference arising on the translation of foreign operations 44,768 25,815(Loss) gain on fair value changes of investments (4,024) 4,516Gain on fair value change of properties prior to its reclassification
as investment properties 692 –Deferred taxation recognised on fair value change of properties
prior to its reclassification as investment properties (173) –
Other comprehensive income for the year 41,263 30,331
Total comprehensive income for the year 524,788 526,169
Total comprehensive income attributable to:Owners of the Company 476,630 504,306Non-controlling interests 48,158 21,863
524,788 526,169

52 / Yue Yuen Industrial (Holdings) Limited / Annual Report 2011
Consolidated Statement of Financial PositionAt 30th September, 2011
2011 2010NOTES US$’000 US$’000
Non-current assetsInvestment properties 13 41,469 59,746Property, plant and equipment 14(a) 1,849,997 1,668,055Deposits paid for acquisition of property, plant and equipment 14(b) 15,156 4,704Prepaid lease payments 15 189,000 182,494Intangible assets 16 111,882 70,612Goodwill 17 233,211 218,607Investments in associates 19 382,677 349,796Amounts due from associates 20 11,155 11,083Investments in jointly controlled entities 21 352,153 341,698Deposit paid for acquisition of the remaining
interest in a jointly controlled entity 21 1,219 19,223Amounts due from jointly controlled entities 22 123,387 132,452Long-term loan receivables 23 8,311 17,642Available-for-sale investments 24 30,959 21,463Rental deposits and prepayments 25,927 22,375Derivative financial instruments 25 22,363 46,024Pledged bank deposits 26 12,507 –Deferred tax assets 34 1,978 2,293Deposit paid for proposed acquisition of a business 27 3,127 –
3,416,478 3,168,267
Current assetsInventories 28 1,087,895 776,139Trade and other receivables 29 1,152,069 1,109,315Prepaid lease payments 15 5,403 3,942Taxation recoverable 1,435 2,692Available-for-sale investments 24 938 8,227Derivative financial instruments 25 226 34,407Bank balances and cash 26 704,095 622,333
2,952,061 2,557,055Assets classified as held for sale 42(c) 104,725 –
3,056,786 2,557,055
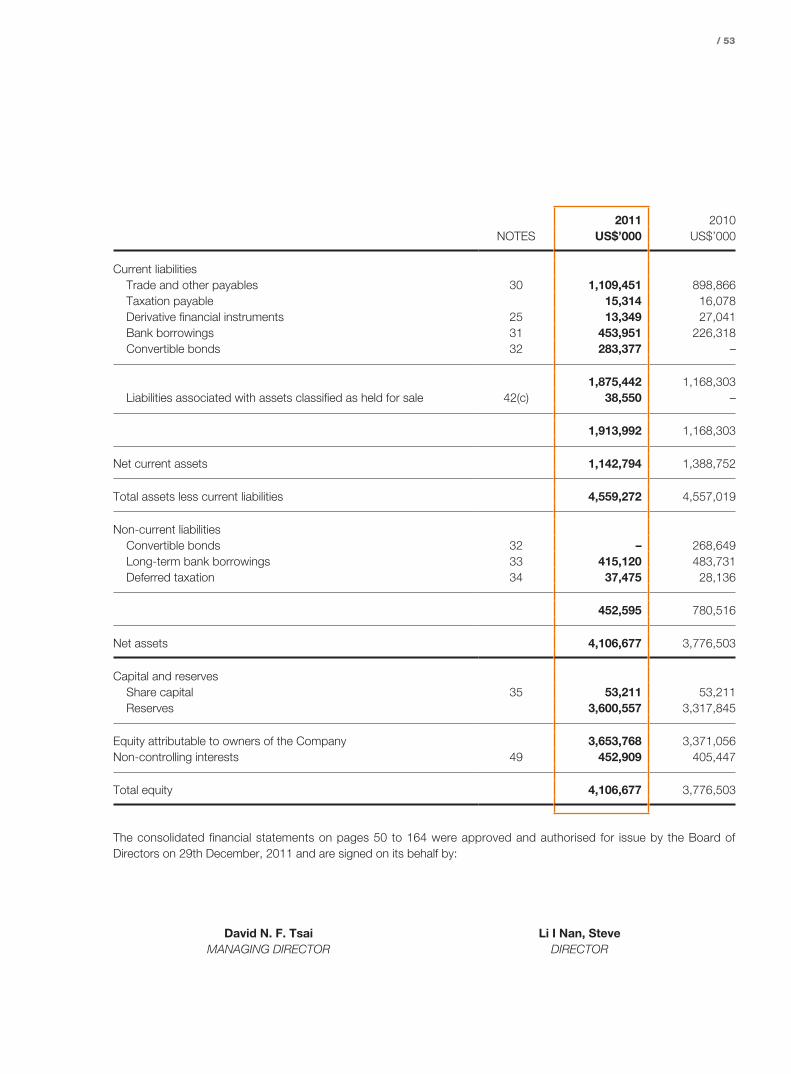
/ 53
2011 2010NOTES US$’000 US$’000
Current liabilitiesTrade and other payables 30 1,109,451 898,866Taxation payable 15,314 16,078Derivative financial instruments 25 13,349 27,041Bank borrowings 31 453,951 226,318Convertible bonds 32 283,377 –
1,875,442 1,168,303Liabilities associated with assets classified as held for sale 42(c) 38,550 –
1,913,992 1,168,303
Net current assets 1,142,794 1,388,752
Total assets less current liabilities 4,559,272 4,557,019
Non-current liabilitiesConvertible bonds 32 – 268,649Long-term bank borrowings 33 415,120 483,731Deferred taxation 34 37,475 28,136
452,595 780,516
Net assets 4,106,677 3,776,503
Capital and reservesShare capital 35 53,211 53,211Reserves 3,600,557 3,317,845
Equity attributable to owners of the Company 3,653,768 3,371,056Non-controlling interests 49 452,909 405,447
Total equity 4,106,677 3,776,503
The consolidated financial statements on pages 50 to 164 were approved and authorised for issue by the Board of Directors on 29th December, 2011 and are signed on its behalf by:
David N. F. Tsai Li I Nan, SteveMANAGING DIRECTOR DIRECTOR

54 / Yue Yuen Industrial (Holdings) Limited / Annual Report 2011
Consolidated Statement of Changes in EquityFor the Year ended 30th September, 2011
Attributable to owners of the Company
Share capital
Share premium
Investments revaluation
reserveSpecial reserve
Other reserve
Other revaluation
reserve
Property revaluation
reserve
Non-distributable reserve fund
Translation reserve
Retained profits Total
Non-controlling
interestTotal
equityUS$’000 US$’000 US$’000 US$’000 US$’000 US$’000 US$’000 US$’000 US$’000 US$’000 US$’000 US$’000 US$’000
(note a) (note b) (note c) (note d) (Note 49)
At 1st October, 2009 53,211 695,536 2,125 (16,688) 25,394 4,551 – 15,275 54,871 2,202,952 3,037,227 384,153 3,421,380
Exchange difference arising on the translation of foreign operations – – – – – – – – 20,283 – 20,283 5,532 25,815
Gain on fair value changes of investments – – 4,516 – – – – – – – 4,516 – 4,516Profit for the year – – – – – – – – – 479,507 479,507 16,331 495,838
Total comprehensive income for the year – – 4,516 – – – – – 20,283 479,507 504,306 21,863 526,169Issue of call option – – – – 18,272 – – – – – 18,272 – 18,272Recognition of equity-settled share-based payments – – – – – – – – – – – 1,578 1,578Realised on deregistration of subsidiaries – – – – – – – – (202) 202 – (125) (125)Realised on disposal of subsidiaries – – – – – – – – (770) 770 – (1,222) (1,222)Realised on disposal of jointly controlled entities – – – – – – – – (2,432) 2,432 – – –Contribution from non-controlling interests – – – – – – – – – – – 4,111 4,111Acquisition of additional interests in subsidiaries – – – – – – – – – – – (1,307) (1,307)Dividends (Note 11) – – – – – – – – – (188,749) (188,749) – (188,749)Dividends paid to non-controlling interests of subsidiaries – – – – – – – – – – – (3,604) (3,604)Transfer to non-distributable reserve fund – – – – – – – 4,094 – (4,094) – – –
At 30th September, 2010 53,211 695,536 6,641 (16,688) 43,666 4,551 – 19,369 71,750 2,493,020 3,371,056 405,447 3,776,503
Exchange difference arising on the translation of foreign operations – – – – – – – – 30,306 – 30,306 14,462 44,768
Loss on fair value changes of investments – – (4,024) – – – – – – – (4,024) – (4,024)Gain on fair value change of properties prior to
its reclassification as investment properties (Note 13) – – – – – – 692 – – – 692 – 692Deferred taxation recognised on fair value
change of properties prior to its reclassification as investment properties – – – – – – (173) – – – (173) – (173)
Profit for the year – – – – – – – – – 449,829 449,829 33,696 483,525
Total comprehensive (expense) income for the year – – (4,024) – – – 519 – 30,306 449,829 476,630 48,158 524,788Recognition of equity-settled share-based payments – – – – – – – – – – – 2,473 2,473Recognition of share-settled considerations
for acquisition of subsidiaries (Note 41) – – – – – – – – – – – 3,785 3,785Realised on deregistration of subsidiaries – – – – – – – – 965 (965) – – –Realised on deemed disposal of a jointly controlled entity – – – – – – – – (1,126) 1,126 – – –Realised on disposal of jointly controlled entities – – – – – – – – (377) 377 – – –Realised on disposal of an associate – – – – – – – – (522) 522 – – –Contribution from non-controlling interests – – – – – – – – – – – 1,886 1,886Acquisition of additional interests in subsidiaries – – – – (3,345) – – – – – (3,345) (3,778) (7,123)Dividends (Note 11) – – – – – – – – – (190,573) (190,573) – (190,573)Dividends paid to non-controlling interests of subsidiaries – – – – – – – – – – – (5,062) (5,062)Transfer to non-distributable reserve fund – – – – – – – 6,981 – (6,981) – – –
At 30th September, 2011 53,211 695,536 2,617 (16,688) 40,321 4,551 519 26,350 100,996 2,746,355 3,653,768 452,909 4,106,677
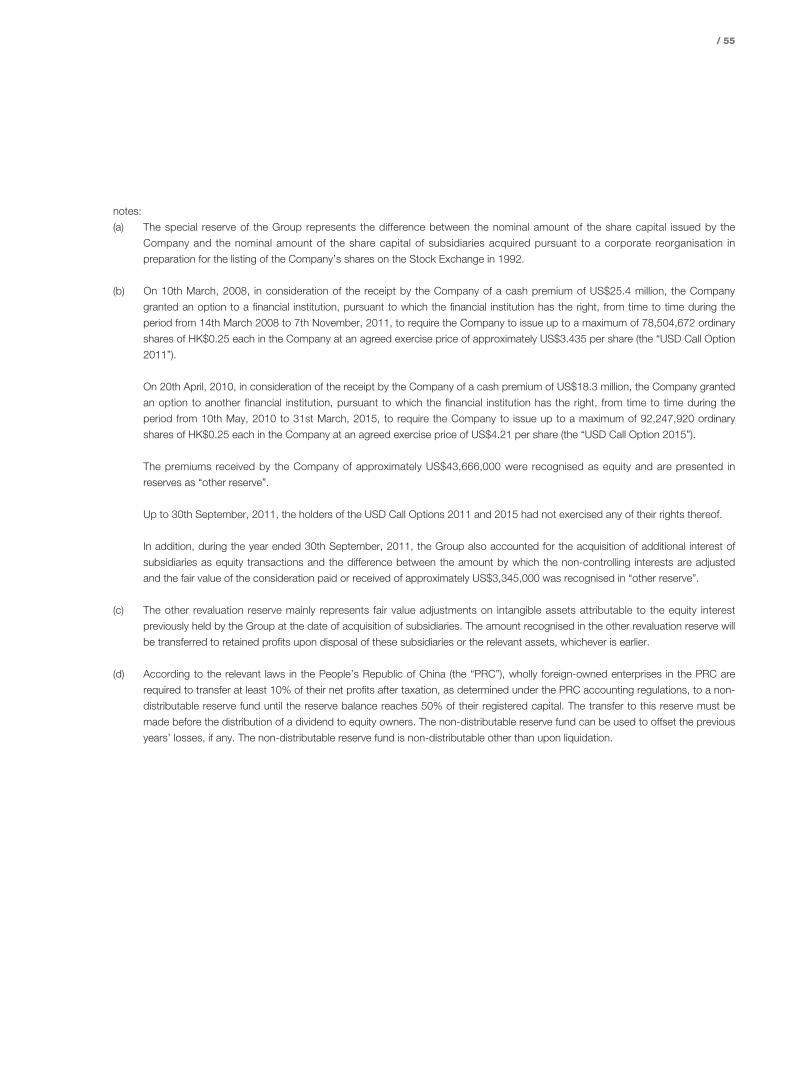
/ 55
notes:
(a) The special reserve of the Group represents the difference between the nominal amount of the share capital issued by the
Company and the nominal amount of the share capital of subsidiaries acquired pursuant to a corporate reorganisation in
preparation for the listing of the Company’s shares on the Stock Exchange in 1992.
(b) On 10th March, 2008, in consideration of the receipt by the Company of a cash premium of US$25.4 million, the Company
granted an option to a financial institution, pursuant to which the financial institution has the right, from time to time during the
period from 14th March 2008 to 7th November, 2011, to require the Company to issue up to a maximum of 78,504,672 ordinary
shares of HK$0.25 each in the Company at an agreed exercise price of approximately US$3.435 per share (the “USD Call Option
2011”).
On 20th April, 2010, in consideration of the receipt by the Company of a cash premium of US$18.3 million, the Company granted
an option to another financial institution, pursuant to which the financial institution has the right, from time to time during the
period from 10th May, 2010 to 31st March, 2015, to require the Company to issue up to a maximum of 92,247,920 ordinary
shares of HK$0.25 each in the Company at an agreed exercise price of US$4.21 per share (the “USD Call Option 2015”).
The premiums received by the Company of approximately US$43,666,000 were recognised as equity and are presented in
reserves as “other reserve”.
Up to 30th September, 2011, the holders of the USD Call Options 2011 and 2015 had not exercised any of their rights thereof.
In addition, during the year ended 30th September, 2011, the Group also accounted for the acquisition of additional interest of
subsidiaries as equity transactions and the difference between the amount by which the non-controlling interests are adjusted
and the fair value of the consideration paid or received of approximately US$3,345,000 was recognised in “other reserve”.
(c) The other revaluation reserve mainly represents fair value adjustments on intangible assets attributable to the equity interest
previously held by the Group at the date of acquisition of subsidiaries. The amount recognised in the other revaluation reserve will
be transferred to retained profits upon disposal of these subsidiaries or the relevant assets, whichever is earlier.
(d) According to the relevant laws in the People’s Republic of China (the “PRC”), wholly foreign-owned enterprises in the PRC are
required to transfer at least 10% of their net profits after taxation, as determined under the PRC accounting regulations, to a non-
distributable reserve fund until the reserve balance reaches 50% of their registered capital. The transfer to this reserve must be
made before the distribution of a dividend to equity owners. The non-distributable reserve fund can be used to offset the previous
years’ losses, if any. The non-distributable reserve fund is non-distributable other than upon liquidation.

56 / Yue Yuen Industrial (Holdings) Limited / Annual Report 2011
Consolidated Statement of Cash FlowsFor the Year ended 30th September, 2011
2011 2010NOTES US$’000 US$’000
OPERATING ACTIVITIESProfit before taxation 511,728 530,863Adjustments for:
Release of prepaid lease payments 5,060 5,385Depreciation of property, plant and equipment 208,549 179,018Reversal of allowance for inventories, net (21) (1,257)Amortisation of intangible assets 5,746 4,627Bargain purchase gain on acquisition of additional interest in a jointly
controlled entity – (338)Dividend income from available-for-sale investments (1,167) (273)Finance costs 37,419 40,422Fair value changes on investment properties (6,955) (643)Interest income (11,004) (11,631)Impairment loss on available-for-sale investments 100 900Impairment loss on trade receivables 2,206 422Impairment loss on investments in jointly controlled entities 1,500 1,700Impairment loss on investments in associates 500 1,300Impairment loss recognised on other receivables 2,014 –Written back of impairment loss on trade receivables (1,060) (653)Recognition of share-based payment expense of a listed subsidiary 2,473 1,578Loss on deregistration of an associate – 36Loss on disposal of jointly controlled entities – 8,203Loss on deemed disposal of partial interest in a jointly
controlled entity – 31Loss on disposal of property, plant and equipment 187 8,753Loss on partial redemption of convertible bonds – 460Gain on disposal of available-for-sale investments – (17)Gain on disposal of land leases (2,846) (4,931)Gain on disposal of subsidiaries 42 – (1,776)Gain on disposal of an associate (325) –Gain on deregistration of subsidiaries (764) (125)Gain on deemed disposal of a jointly controlled entity 41 (18,767) (1,267)Gain on deemed disposal of subsidiaries 42 – (85)Fair value changes on derivative financial instruments 36,144 1,865Share of results of associates (35,355) (39,790)Share of results of jointly controlled entities (27,174) (62,679)
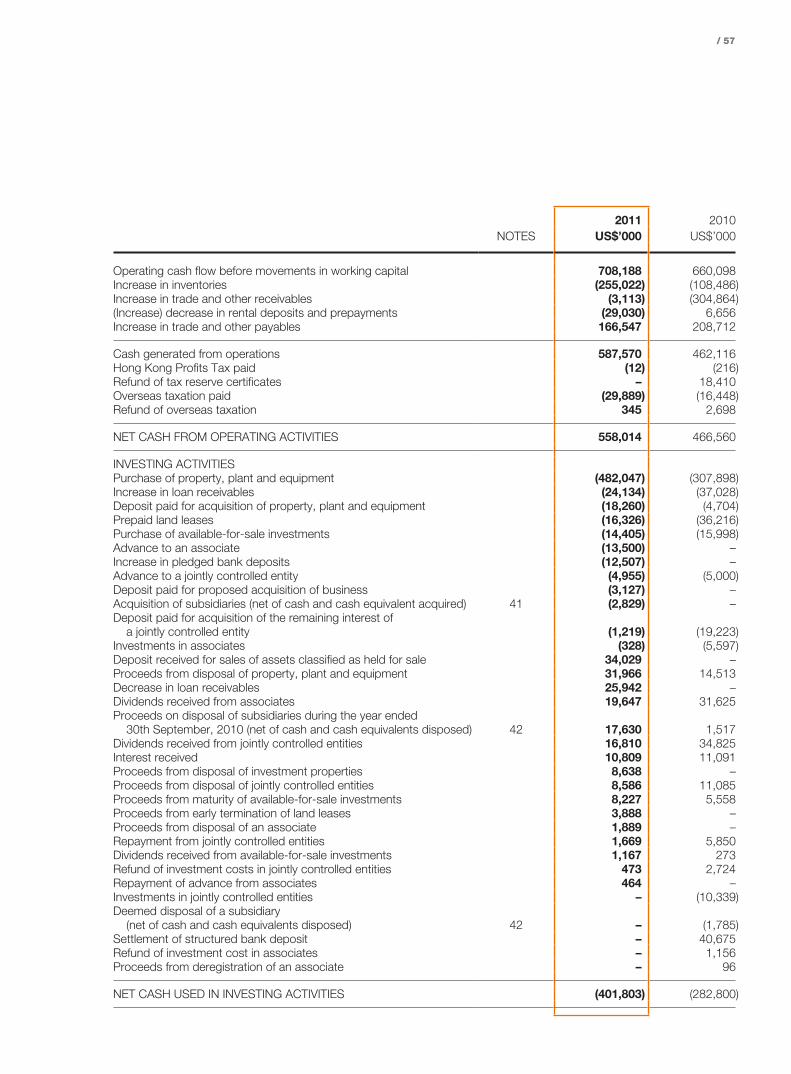
/ 57
2011 2010NOTES US$’000 US$’000
Operating cash flow before movements in working capital 708,188 660,098Increase in inventories (255,022) (108,486)Increase in trade and other receivables (3,113) (304,864)(Increase) decrease in rental deposits and prepayments (29,030) 6,656Increase in trade and other payables 166,547 208,712
Cash generated from operations 587,570 462,116Hong Kong Profits Tax paid (12) (216)Refund of tax reserve certificates – 18,410Overseas taxation paid (29,889) (16,448)Refund of overseas taxation 345 2,698
NET CASH FROM OPERATING ACTIVITIES 558,014 466,560
INVESTING ACTIVITIESPurchase of property, plant and equipment (482,047) (307,898)Increase in loan receivables (24,134) (37,028)Deposit paid for acquisition of property, plant and equipment (18,260) (4,704)Prepaid land leases (16,326) (36,216)Purchase of available-for-sale investments (14,405) (15,998)Advance to an associate (13,500) –Increase in pledged bank deposits (12,507) –Advance to a jointly controlled entity (4,955) (5,000)Deposit paid for proposed acquisition of business (3,127) –Acquisition of subsidiaries (net of cash and cash equivalent acquired) 41 (2,829) –Deposit paid for acquisition of the remaining interest of
a jointly controlled entity (1,219) (19,223)Investments in associates (328) (5,597)Deposit received for sales of assets classified as held for sale 34,029 –Proceeds from disposal of property, plant and equipment 31,966 14,513Decrease in loan receivables 25,942 –Dividends received from associates 19,647 31,625Proceeds on disposal of subsidiaries during the year ended
30th September, 2010 (net of cash and cash equivalents disposed) 42 17,630 1,517Dividends received from jointly controlled entities 16,810 34,825Interest received 10,809 11,091Proceeds from disposal of investment properties 8,638 –Proceeds from disposal of jointly controlled entities 8,586 11,085Proceeds from maturity of available-for-sale investments 8,227 5,558Proceeds from early termination of land leases 3,888 –Proceeds from disposal of an associate 1,889 –Repayment from jointly controlled entities 1,669 5,850Dividends received from available-for-sale investments 1,167 273Refund of investment costs in jointly controlled entities 473 2,724Repayment of advance from associates 464 –Investments in jointly controlled entities – (10,339)Deemed disposal of a subsidiary
(net of cash and cash equivalents disposed) 42 – (1,785)Settlement of structured bank deposit – 40,675Refund of investment cost in associates – 1,156Proceeds from deregistration of an associate – 96
NET CASH USED IN INVESTING ACTIVITIES (401,803) (282,800)
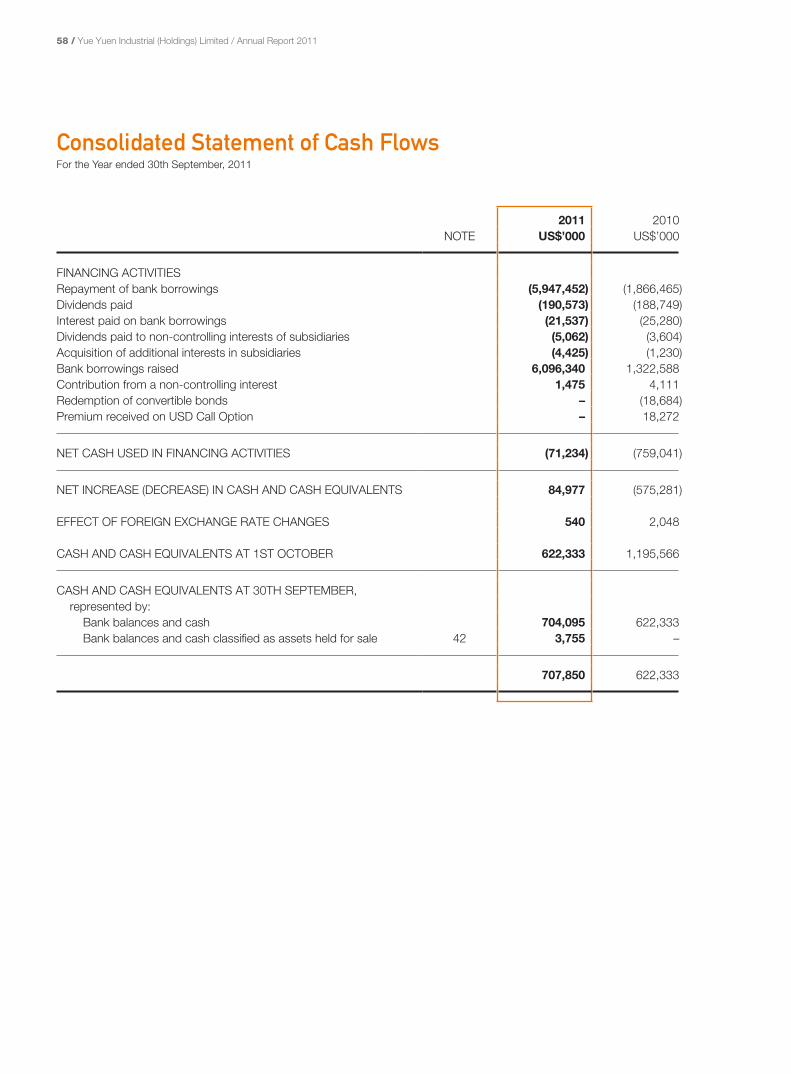
58 / Yue Yuen Industrial (Holdings) Limited / Annual Report 2011
Consolidated Statement of Cash FlowsFor the Year ended 30th September, 2011
2011 2010NOTE US$’000 US$’000
FINANCING ACTIVITIESRepayment of bank borrowings (5,947,452) (1,866,465)Dividends paid (190,573) (188,749)Interest paid on bank borrowings (21,537) (25,280)Dividends paid to non-controlling interests of subsidiaries (5,062) (3,604)Acquisition of additional interests in subsidiaries (4,425) (1,230)Bank borrowings raised 6,096,340 1,322,588Contribution from a non-controlling interest 1,475 4,111Redemption of convertible bonds – (18,684)Premium received on USD Call Option – 18,272
NET CASH USED IN FINANCING ACTIVITIES (71,234) (759,041)
NET INCREASE (DECREASE) IN CASH AND CASH EQUIVALENTS 84,977 (575,281)
EFFECT OF FOREIGN EXCHANGE RATE CHANGES 540 2,048
CASH AND CASH EQUIVALENTS AT 1ST OCTOBER 622,333 1,195,566
CASH AND CASH EQUIVALENTS AT 30TH SEPTEMBER,represented by:
Bank balances and cash 704,095 622,333Bank balances and cash classified as assets held for sale 42 3,755 –
707,850 622,333

/ 59
Notes to the Consolidated Financial StatementsFor the Year ended 30th September, 2011
1. GeneralThe Company was incorporated in Bermuda as an exempted company with limited liability and its shares are listed on the Stock Exchange. The addresses of the registered office and principal place of business of the Company are disclosed in the Corporate Information Section of the annual report.
The consolidated financial statements are presented in United States dollar (“USD”), which is also the functional currency of the Company.
The Company is an investment holding company. The principal activities of the Group are the manufacturing, marketing and retailing of athletic footwears, athletic style leisure footwear, casual and outdoor footwear.
2. Application of New and Revised Hong Kong Financial Reporting Standards (“HKFRSs”)New Standards and Interpretations applied in the current yearIn the current year, the Group has applied the following new and revised standards, amendments and interpretations (“new and revised HKFRSs”) issued by the Hong Kong Institute of Certified Public Accountants (the “HKICPA”).
HKFRSs (Amendments) Amendments to HKFRS 5, HKFRS 8, HKAS 1, HKAS 7, HKAS 17, HKAS 36 and HKAS 39 as part of Improvements to HKFRSs 2009
HKFRSs (Amendments) Amendments to HKFRS 3 (as revised in 2008) and HKAS 27 (as revised in 2008) as part of Improvements to HKFRSs 2010
HKAS 32 (Amendments) Classification of Right IssuesHKFRS 1 (Amendments) Additional Exemptions for First-time AdoptersHKFRS 1 (Amendments) Limited Exemption from Comparative HKFRS 7 Disclosures for
First-time AdoptersHKFRS 2 (Amendments) Group Cash-settled Share-based Payment TransactionsHK(IFRIC) – Int 19 Extinguishing Financial Liabilities with Equity Instruments
The application of the new and revised HKFRSs in the current year has had no material effect on the amounts reported in these financial statements and/or disclosures set out in these financial statements.
60 / Yue Yuen Industrial (Holdings) Limited / Annual Report 2011
Notes to the Consolidated Financial StatementsFor the Year ended 30th September, 2011
2. Application of New and Revised Hong Kong Financial Reporting Standards (“HKFRSs”) (continued)New and revised standards and interpretations issued but not yet effectiveThe Group has not early applied the following new or revised standards, amendments or interpretations that have been issued but are not yet effective.
HKFRSs (Amendments) Improvements to HKFRSs 2010 except for the amendments to HKFRS 3 (as revised in 2008) and HKAS 27 (as amended in 2008)1
HKAS 1 (Amendments) Presentation of Items of Other Comprehensive Income2
HKAS 12 (Amendments) Deferred Tax: Recovery of Underlying Assets3
HKAS 19 (Revised in 2011) Employee Benefits4
HKAS 24 (Revised in 2009) Related Party Disclosures1
HKAS 27 (Revised in 2011) Separate Financial Statements4
HKAS 28 (Revised in 2011) Investments in Associates and Joint Ventures4
HKFRS 1 (Amendments) Severe Hyperinflation and Removal of Fixed Dates for First-time Adopters5
HKFRS 7 (Amendments) Disclosures – Transfers of Financial Assets5
HKFRS 9 Financial Instruments4
HKFRS 10 Consolidated Financial Statements4
HKFRS 11 Joint Arrangements4
HKFRS 12 Disclosure of Interests in Other Entities4
HKFRS 13 Fair Value Measurement4
HK(IFRIC) – Int 14 (Amendments) Prepayments of a Minimum Funding Requirement1
HK(IFRIC) – Int 20 Stripping Costs in the Production Phase of a Surface Mine4
1 Effective for annual periods beginning on or after 1st January, 2011.2 Effective for annual periods beginning on or after 1st July, 2012.3 Effective for annual periods beginning on or after 1st January, 2012.4 Effective for annual periods beginning on or after 1st January, 2013.5 Effective for annual periods beginning on or after 1st July, 2011.
HKFRS 9 “Financial Instruments” (as issued in November 2009) introduces new requirements for the classification and measurement of financial assets. HKFRS 9 “Financial Instruments” (as revised in November 2010) adds requirements for financial liabilities and for derecognition.
Under HKFRS 9, all recognised financial assets that are within the scope of HKAS 39 “Financial Instruments: Recognition and Measurement” are subsequently measured at either amortised cost or fair value. Specifically, debt investments that are held within a business model whose objective is to collect the contractual cash flows, and that have contractual cash flows that are solely payments of principal and interest on the principal outstanding are generally measured at amortised cost at the end of subsequent accounting periods. All other debt investments and equity investments are measured at their fair values at the end of subsequent accounting periods.

/ 61
2. Application of New and Revised Hong Kong Financial Reporting Standards (“HKFRSs”) (continued)New and revised standards and interpretations issued but not yet effective (continued)In relation to financial liabilities, the significant change relates to financial liabilities that are designated as at fair value through profit or loss. Specifically, under HKFRS 9, for financial liabilities that are designated as at fair value through profit or loss, the amount of change in the fair value of the financial liability that is attributable to changes in the credit risk of that liability is presented in other comprehensive income, unless the presentation of the effects of changes in the liability’s credit risk in other comprehensive income would create or enlarge an accounting mismatch in profit or loss. Changes in fair value attributable to a financial liability’s credit risk are not subsequently reclassified to profit or loss. Previously, under HKAS 39, the entire amount of the change in the fair value of the financial liability designated as at fair value through profit or loss was presented in profit or loss.
HKFRS 9 is effective for annual periods beginning on or after 1st January, 2013, with earlier application permitted. The directors anticipate that HKFRS 9 that will be adopted in the Group’s consolidated financial statements for the annual period beginning on or after 1st January, 2013 and that the application of HKFRS 9 might have impact on amounts reported in respect of the Group’s financial assets. However, it is not applicable to provide a reasonable estimate of that effect until a detailed review has been completed.
The five new or revised standards on consolidation, joint arrangements and disclosures, including HKAS 27 (Revised 2011), HKAS 28 (Revised 2011), HKFRS 10, HKFRS 11 and HKFRS 12, were issued by the HKICPA in June 2011 and are effective for annual periods beginning on or after 1st January, 2013. Earlier application is permitted provided that all of these five new or revised standards are applied early at the same time. The directors of the Company anticipate that these new or revised standards will be applied in the Group’s consolidated financial statements for financial year beginning on or after 1st January, 2013 and the potential impact is described below.
HKFRS 10 replaces the parts of HKAS 27 “Consolidated and Separate Financial Statements” that deal with consolidated financial statements. Under HKFRS 10, there is only one basis for consolidation, that is control. In addition, HKFRS 10 includes a new definition of control that contains three elements: (a) power over an investee, (b) exposure, or rights, to variable returns from its involvement with the investee, and (c) ability to use its power over the investee to affect the amount of the investor’s returns. Extensive guidance has been added in HKFRS 10 to deal with complex scenarios. Overall, the application of HKFRS 10 requires extensive judgement. The directors are in the process of determining the financial impacts of the application of HKFRS 10.
HKFRS 11 replaces HKAS 31 “Interests in Joint Ventures”. HKFRS 11 deals with how a joint arrangement of which two or more parties have joint control should be classified. Under HKFRS 11, there are two types of joint arrangements: joint ventures and joint operations. The classification in HKFRS 11 is based on parties’ rights and obligations under the arrangements. In contrast, under HKAS 31, there are three different types of joint arrangements: jointly controlled entities, jointly controlled assets and jointly controlled operations.
In addition, joint ventures under HKFRS 11 are required to be accounted for using the equity method of accounting, whereas jointly controlled entities under HKAS 31 can be accounted for using the equity method of accounting or proportionate accounting. All of the Group’s jointly controlled entities are currently accounted for using the equity method of accounting. The directors are in the process of determining the financial impacts of the application of HKFRS 11.

62 / Yue Yuen Industrial (Holdings) Limited / Annual Report 2011
Notes to the Consolidated Financial StatementsFor the Year ended 30th September, 2011
2. Application of New and Revised Hong Kong Financial Reporting Standards (“HKFRSs”) (continued)New and revised standards and interpretations issued but not yet effective (continued)HKFRS 12 “Disclosures of Interests in Other Entities” is a disclosure standard and is applicable to entities that have interests in subsidiaries, joint arrangements, associates or unconsolidated structured entities. HKFRS 12 establishes disclosure objectives and specifies minimum disclosures that entities must provide to meet those objectives, which laid down that entities should disclose information that help users of financial statements evaluate the nature of the risks associated with interests in other entities and the effects of those interests on financial statements. The disclosure requirements set out in HKFRS 12 are more extensive than those in the current standards. The directors of the Company consider that significant efforts may be required to collect the necessary information for the relevant disclosures.
The directors of the Company anticipate that the application of other new or revised standards, amendments or interpretations will have no material impact on the results and the financial position of the Group.
3. Significant Accounting PoliciesThe consolidated financial statements have been prepared in accordance with HKFRSs issued by the HKICPA. In addition, the consolidated financial statements include applicable disclosures required by the Rules Governing the Listing of Securities on The Stock Exchange of Hong Kong Limited (the “Listing Rules”) and by the Hong Kong Companies Ordinance.
The consolidated financial statements have been prepared on the historical cost basis except for certain properties and financial instruments that are measured at revalued amounts or fair values, as explained in the accounting policies set out below. Historical cost is generally based on the fair value of the consideration given in exchange for goods.
The principal accounting policies are set out below.
Basis of consolidationThe consolidated financial statements incorporate the financial statements of the Company and entities controlled by the Company (its subsidiaries). Control is achieved where the Company has the power to govern the financial and operating policies of an entity so as to obtain benefits from its activities.
The results of subsidiaries acquired or disposed of during the year are included in the consolidated income statement from the effective date of acquisition or up to the effective date of disposal, as appropriate.
Where necessary, adjustments are made to the financial statements of subsidiaries to bring their accounting policies into line with those used by other members of the Group.
All intra-group transactions, balances, income and expenses are eliminated in full on consolidation.
Non-controlling interests in subsidiaries are presented separately from the Group’s equity therein.
Allocation of total comprehensive income to non-controlling interestsTotal comprehensive income and expense of a subsidiary is attributed to the owners of the Company and to the non-controlling interests even if this results in the non-controlling interests having a deficit balance.
/ 63
3. Significant Accounting Policies (continued)Basis of consolidation (continued)Changes in the Group’s ownership interests in existing subsidiariesChanges in the Group’s ownership interest in subsidiaries that do not result in the Group losing control over subsidiaries are accounted for as equity transactions. The carrying amounts of the Group’s interests and the non-controlling interests are adjusted to reflect the changes in their relative interests in the subsidiaries. Any difference between the amount by which the non-controlling interests are adjusted and the fair value of the consideration paid or received is recognised directly in equity and attributed to owners of the Company.
When the Group loses control of a subsidiary, the profit or loss on disposal is calculated as the difference between (i) the aggregate of the fair value of the consideration received and the fair value of any retained interest and (ii) the previous carrying amount of the assets (including goodwill), and liabilities of the subsidiary and any non-controlling interests. Where certain assets of the subsidiary are measured at revalued amounts or fair values and the related cumulative gain or loss has been recognised in other comprehensive income and accumulated in equity, the amounts previously recognised in other comprehensive income and accumulated in equity are accounted for as if the Company had directly disposed of the related assets (i.e. reclassified to profit or loss or transferred directly to retained profits). The fair value of any investment retained in the former subsidiary at the date when control is lost is regarded as the fair value on initial recognition for subsequent accounting under HKAS 39 or, when applicable, the cost on initial recognition of an investment in an associate or a jointly controlled entity.
Business combinationsAcquisitions of businesses are accounted for using the acquisition method. The consideration transferred in a business combination is measured at fair value, which is calculated as the sum of the acquisition-date fair values of the assets transferred by the Group, liabilities incurred by the Group to former owners of the acquiree and the equity interests issued by the Group in exchange for control of the acquiree. Acquisition-related costs are recognised in profit or loss as incurred.
At the acquisition date, the identifiable assets acquired and the liabilities assumed are recognised at their fair value, except that:
• deferred tax assets or liabilities and liabilities or assets related to employee benefit arrangements are recognised and measured in accordance with HKAS 12 “Income Taxes” and HKAS 19 “Employee Benefits” respectively;
• liabilities or equity instruments related to share-based payment transactions of the acquire or the replacement of an acquiree’s share-based payment transactions with share-based transactions of the Group are measured in accordance with HKFRS 2 “Share-based Payment” at the acquisition date; and
• assets (or disposal groups) that are classified as held for sale in accordance with HKFRS 5 “Non-current Assets Held for Sale and Discontinued Operations” are measured in accordance with that Standard.
Goodwill is measured as the excess of the sum of the consideration transferred, the amount of any non-controlling interests in the acquiree, and the fair value of the acquirer’s previously held equity interest in the acquiree (if any) over the net of the acquisition-date amounts of the identifiable assets acquired and the liabilities assumed. If, after re-assessment, the net of the acquisition-date amounts of the identifiable assets acquired and liabilities assumed exceeds the sum of the consideration transferred, the amount of any non-controlling interests in the acquiree and the fair value of the acquirer’s previously held interest in the acquiree (if any), the excess is recognised immediately in profit or loss as a bargain purchase gain.

64 / Yue Yuen Industrial (Holdings) Limited / Annual Report 2011
Notes to the Consolidated Financial StatementsFor the Year ended 30th September, 2011
3. Significant Accounting Policies (continued)Business combinations (continued)Non-controlling interests that are present ownership interests and entitle their holders to a proportionate share of the entity’s net assets in the event of liquidation may be initially measured either at fair value or at the non-controlling interests’ proportionate share of the recognised amounts of the acquiree’s identifiable net assets. The choice of measurement basis is made on a transaction-by-transaction basis. Other types of non-controlling interests are measured at either their fair value or another measurement basis required by another Standard.
Where the consideration the Group transfers in a business combination includes assets or liabilities resulting from a contingent consideration arrangement, the contingent consideration is measured at its acquisition-date fair value and considered as part of the consideration transferred in a business combination. Changes in the fair value of the contingent consideration that qualify as measurement period adjustments are adjusted retrospectively, with the corresponding adjustments being made against goodwill or gain on bargain purchase. Measurement period adjustments are adjustments that arisen from additional information obtained during the measurement period about facts and circumstances that existed as of the acquisition date. Measurement period does not exceed one year from the acquisition date.
The subsequent accounting for changes in the fair value of the contingent consideration that do not qualify as measurement period adjustments depends on how the contingent consideration is classified. Contingent consideration that is classified as equity is not remeasured at subsequent reporting dates and its subsequent settlement is accounted for within equity. Contingent consideration that is classified as an asset or a liability is remeasured at subsequent reporting dates in accordance with HKAS 39, or HKAS 37 “Provisions, Contingent Liabilities and Contingent Assets”, as appropriate, with the corresponding gain or loss being recognised in profit or loss.
When a business combination is achieved in stages, the Group’s previously held equity interest in the acquiree is remeasured to fair value at the acquisition date (i.e. the date when the Group obtains control), and the resulting gain or loss, if any, is recognised in profit or loss. Amounts arising from interests in the acquiree prior to the acquisition date that have previously been recognised in other comprehensive income are reclassified to profit or loss where such treatment would be appropriate if that interest were disposed of.
Changes in the value of the previously held equity interest recognised in other comprehensive income and accumulated in equity before the acquisition date are reclassified to profit or loss when the Group obtains control over the acquiree.
If the initial accounting for a business combination is incomplete by the end of the reporting period in which the combination occurs, the Group reports provisional amounts for the items for which the accounting is incomplete. Those provisional amounts are adjusted during the measurement period (see above), or additional assets or liabilities are recognised, to reflect new information obtained about facts and circumstances that existed as of the acquisition date that, if known, would have affected the amounts recognised as of that date.
GoodwillGoodwill arising on an acquisition of a business is carried at cost less any accumulated impairment losses, if any, and is presented separately in the consolidated statement of financial position.
For the purposes of impairment testing, goodwill is allocated to each of the cash generating units (“CGU”), or groups of CGU, that is expected to benefit from the synergies of the combination.

/ 65
3. Significant Accounting Policies (continued)Goodwill (continued)A CGU to which goodwill has been allocated is tested for impairment annually, or more frequently when there is an indication that the unit may be impaired. If the recoverable amount of the CGU is less than its carrying amount, the impairment loss is allocated first to reduce the carrying amount of any goodwill allocated to the unit, and then to the other assets of the unit on a pro-rata basis based on the carrying amount of each asset in the unit. Any impairment loss for goodwill is recognised directly in profit or loss in the consolidated income statement. An impairment loss for goodwill is not reversed in subsequent periods.
On disposal of the relevant CGU, the attributable amount of goodwill is included in the determination of the profit or loss on disposal.
Investments in associatesAn associate is an entity over which the investor has significant influence and that is neither a subsidiary nor an interest in a joint venture. Significant influence is the power to participate in the financial and operating policy decisions of the investee but is not control or joint control over those policies.
The results and assets and liabilities of associates are incorporated in these consolidated financial statements using the equity method of accounting. Under the equity method, investments in associates are initially recognised in the consolidated statement of financial position at cost and adjusted thereafter to recognise the Group’s share of the profit or loss and other comprehensive income of the associate. When the Group’s share of losses of an associate equals or exceeds its interest in that associate (which includes any long-term interests that, in substance, form part of the Group’s net investment in the associate), the Group discontinues recognising its share of further losses. Additional losses are recognised only to the extent that the Group has incurred legal or constructive obligations or made payments on behalf of that associate.
Any excess of the cost of acquisition over the Group’s share of the net fair value of the identifiable assets, liabilities and contingent liabilities of an associate recognised at the date of acquisition is recognised as goodwill, which is included within the carrying amount of the investment.
Any excess of the Group’s share of net fair value of the identifiable assets, liabilities and contingent liabilities over the cost of acquisition, after reassessment, is recognised immediately in profit or loss.
The requirements of HKAS 39 are applied to determine whether it is necessary to recognise any impairment loss with respect to the Group’s investment in an associate. When necessary, the entire carrying amount of the investment (including goodwill) is tested for impairment in accordance with HKAS 36 “Impairment of Assets” as a single asset by comparing its recoverable amount (higher of value in use and fair value less costs to sell) with its carrying amount. Any impairment loss recognised forms part of the carrying amount of the investment. Any reversal of that impairment loss is recognised in accordance with HKAS 36 to the extent that the recoverable amount of the investment subsequently increases.

66 / Yue Yuen Industrial (Holdings) Limited / Annual Report 2011
Notes to the Consolidated Financial StatementsFor the Year ended 30th September, 2011
3. Significant Accounting Policies (continued)Investments in associates (continued)Upon disposal of an associate that results in the Group losing significant influence over that associate, any retained investment is measured at fair value at that date and the fair value is regarded as its fair value on initial recognition as a financial asset in accordance with HKAS 39. The difference between the previous carrying amount of the associate attributable to the retained interest and its fair value is included in the determination of the gain or loss on disposal of the associate. In addition, the Group accounts for all amounts previously recognised in other comprehensive income in relation to that associate on the same basis as would be required if that associate had directly disposed of the related assets or liabilities. Therefore, if a gain or loss previously recognised in other comprehensive income by that associate would be reclassified to profit or loss on the disposal of the related assets or liabilities, the Group reclassifies the gain or loss from equity to profit or loss (as a reclassification adjustment) when it loses significant influence over that associate.
When a group entity transacts with its associate, profits and losses resulting from the transactions with the associate are recognised in the Group’ consolidated financial statements only to the extent of interests in the associate that are not related to the Group.
Joint venturesJointly controlled entitiesJoint venture arrangements that involve the establishment of a separate entity in which venturers have joint control over the economic activity of the entity are referred to as jointly controlled entities.
The results and assets and liabilities of jointly controlled entities are incorporated in the consolidated financial statements using the equity method of accounting. Under the equity method, investments in jointly controlled entities are initially recognised in the consolidated statement of financial position at cost and adjusted thereafter to recognise the Group’s share of the profit or loss and other comprehensive income of the jointly controlled entities. When the Group’s share of losses of a jointly controlled entity equals or exceeds its interest in that jointly controlled entity (which includes any long-term interests that, in substance, form part of the Group’s net investment in the jointly controlled entity), the Group discontinues recognising its share of further losses. Additional losses are recognised only to the extent that the Group has incurred legal or constructive obligations or made payments on behalf of that jointly controlled entity.
Any excess of the cost of acquisition over the Group’s share of the net fair value of the identifiable assets, liabilities and contingent liabilities of a jointly controlled entity recognised at the date of acquisition is recognised as goodwill, which is included within the carrying amount of the investment.
Any excess of the Group’s share of the net fair value of the identifiable assets, liabilities and contingent liabilities over the cost of acquisition, after reassessment, is recognised immediately in profit or loss.
The requirements of HKAS 39 are applied to determine whether it is necessary to recognise any impairment loss with respect to the Group’s investment in a jointly controlled entity. When necessary, the entire carrying amount of the investment (including goodwill) is tested for impairment in accordance with HKAS 36 “Impairment of Assets” as a single asset by comparing its recoverable amount (higher of value in use and fair value less costs to sell) with its carrying amount. Any impairment loss recognised forms part of the carrying amount of the investment. Any reversal of that impairment loss is recognised in accordance with HKAS 36 to the extent that the recoverable amount of the investment subsequently increases.
/ 67
3. Significant Accounting Policies (continued)Joint ventures (continued)Jointly controlled entities (continued)Upon disposal of a jointly controlled entity that results in the Group losing joint control over that jointly controlled entity, any retained investment is measured at fair value at that date and the fair value is regarded as its fair value on initial recognition as a financial asset in accordance with HKAS 39. The difference between the previous carrying amount of the jointly controlled entity attributable to the retained interest and its fair value is included in the determination of the gain or loss on disposal of the jointly controlled entity. In addition, the Group accounts for all amounts previously recognised in other comprehensive income in relation to that jointly controlled entity on the same basis as would be required if that jointly controlled entity had directly disposed of the related assets or liabilities. Therefore, if a gain or loss previously recognised in other comprehensive income by that jointly controlled entity would be reclassified to profit or loss on the disposal of the related assets or liabilities, the Group reclassifies the gain or loss from equity to profit or loss (as a reclassification adjustment) when it loses joint control over that jointly controlled entity.
When a group entity transacts with its jointly controlled entity, profits and losses resulting from the transactions with the jointly controlled entity are recognised in the Group’ consolidated financial statements only to the extent of interests in the jointly controlled entity that are not related to the Group.
Non-current assets held for saleNon-current assets are classified as held for sale if their carrying amount will be recovered principally through a sale transaction rather than through continuing use. This condition is regarded as met only when the sale is highly probable and the non-current asset (or disposal group) is available for immediate sale in its present condition. Management must be committed to the sale, which should be expected to qualify for recognition as a completed sale within one year from the date of classification.
When the Group is committed to a sale plan involving loss of control of a subsidiary, all of the assets and liabilities of that subsidiary are classified as held for sale when the criteria described above are met, regardless of whether the Group will retain a non-controlling interest in its former subsidiary after the sale.
Non-current assets classified as held for sale are measured at the lower of their previous carrying amount and fair value less costs to sell.
Revenue recognitionRevenue is measured at the fair value of the consideration received or receivable and represents amounts receivable for goods sold and services provided in the normal course of business, net of discounts and excludes sales related taxes.
Revenue from sale of goods are recognised when goods are delivered and title has passed.
Rental income, including rental invoiced in advance from properties let under operating leases, is recognised on a straight-line basis over the period of the relevant lease.
Service income is recognised when services are provided.

68 / Yue Yuen Industrial (Holdings) Limited / Annual Report 2011
Notes to the Consolidated Financial StatementsFor the Year ended 30th September, 2011
3. Significant Accounting Policies (continued)Revenue recognition (continued)Interest income from a financial asset is recognised when it is probable that the economic benefits will flow to the Group and the amount of revenue can be measured reliably. Interest income from a financial asset is accrued on a time basis, by reference to the principal outstanding and at the effective interest rate applicable, which is the rate that exactly discounts the estimated future cash receipts through the expected life of the financial asset to that asset’s net carrying amount on initial recognition.
Dividend income from investments is recognised when the shareholders’ rights to receive payment have been established.
Investment propertiesInvestment properties are properties held to earn rentals and/or for capital appreciation. Investment properties include land held for undetermined future use, which is regarded as held for capital appreciation purpose.
Investment properties are initially measured at cost, including any directly attributable expenditure. Subsequent to initial recognition, investment properties are measured at their fair values using the fair value model. Gains or losses arising from changes in the fair value of investment property are included in profit or loss for the period in which they arise.
Construction costs incurred for investment properties under construction are capitalised as part of the carrying amount of the investment properties under construction.
An investment property is derecognised upon disposal or when the investment property is permanently withdrawn from use and no future economic benefits are expected from its disposals. Any gain or loss arising on derecognition of the asset (calculated as the difference between the net disposal proceeds and the carrying amount of the asset) is included in the profit or loss in the period in which the item is derecognised.
Property, plant and equipmentProperty, plant and equipment including land and buildings held for use in the production or supply of goods or services, or for administrative purposes, other than construction in progress as described below, are stated at cost or fair value less subsequent accumulated depreciation and accumulated impairment losses, if any.
Advantage has been taken of the transitional relief provided by paragraph 80A of HKAS 16 “Property, Plant and Equipment” from the requirement to make regular revaluations of the Group’s land and buildings which had been carried at revalued amounts prior to 30th September, 1995, and accordingly no further revaluation of land and buildings is carried out. Prior to 30th September, 1995, the revaluation increase arising on the revaluation of these assets was credited to the revaluation reserve. Any future decreases in value of these assets will be dealt with as an expense to the extent that they exceed the balance, if any, on the revaluation reserve relating to a previous revaluation of the same asset. On the subsequent sale or retirement of a revalued asset, the corresponding revaluation surplus is transferred to retained profits.
Depreciation is recognised so as to write off the cost or fair value of items of property, plant and equipment, other than construction in progress, less their residual values over their estimated useful lives, using either the straight-line method or reducing balance method. The estimated useful lives, residual values and depreciation method are reviewed at the end of each reporting period, with the effect of any changes in estimate accounted for on a prospective basis.
/ 69
3. Significant Accounting Policies (continued)Property, plant and equipment (continued)Properties in the course of construction for production, supply or administrative purposes are carried at cost, less any recognised impairment loss. Costs include professional fees and, for qualifying assets, borrowing costs capitalised in accordance with the Group’s accounting policy. Such properties are classified to the appropriate category of property, plant and equipment when completed and ready for intended use. Depreciation of these assets, on the same basis as other property assets, commences when the assets are ready for their intended use.
If an item of property, plant and equipment becomes an investment property because its use has changed as evidenced by end of owner-occupation, any difference between the carrying amount and the fair value of that item at the date of transfer is recognised in other comprehensive income and accumulated in property revaluation reserve. On the subsequent sale or retirement of the asset, the relevant revaluation reserve will be transferred directly to retained profits.
An item of property, plant and equipment is derecognised upon disposal or when no future economic benefits are expected to arise from the continued use of the asset. Any gain or loss arising on the disposal or retirement of an item of property, plant and equipment is determined as the difference between the sales proceeds and the carrying amount of the asset and is recognised in profit or loss.
Intangible assetsIntangible assets acquired in a business combinationIntangible assets acquired in a business combination are recognised separately from goodwill and are initially recognised at their fair value at the acquisition date (which is regarded as their cost).
Subsequent to initial recognition, intangible assets with finite useful lives are carried at costs less accumulated amortisation and any accumulated impairment losses. Amortisation for intangible assets with finite useful lives is provided on a straight-line basis over their estimated useful lives. Alternatively, intangible assets with indefinite useful lives are carried at cost less any subsequent accumulated impairment losses.
Gains or losses arising from derecognition of an intangible asset are measured at the difference between the net disposal proceeds and the carrying amount of the asset and are recognised in the profit or loss when the asset is derecognised.
Impairment losses of tangible and intangible assets other than goodwill (see the accounting policy in respect of goodwill above)At the end of the reporting period, the Group reviews the carrying amounts of its tangible and intangible assets to determine whether there is any indication that those assets have suffered an impairment loss. If any such indication exists, the recoverable amount of the asset is estimated in order to determine the extent of the impairment loss, if any. In addition, intangible assets with indefinite useful lives are tested for impairment annually, and whenever there is an indication that they may be impaired. If the recoverable amount of an asset is estimated to be less than its carrying amount, the carrying amount of the asset is reduced to its recoverable amount. An impairment loss is recognised as an expense immediately.
Where an impairment loss subsequently reverses, the carrying amount of the asset is increased to the revised estimate of its recoverable amount, but so that the increased carrying amount does not exceed the carrying amount that would have been determined had no impairment loss been recognised for the asset in prior years. A reversal of an impairment loss is recognised as income immediately.
70 / Yue Yuen Industrial (Holdings) Limited / Annual Report 2011
Notes to the Consolidated Financial StatementsFor the Year ended 30th September, 2011
3. Significant Accounting Policies (continued)LeasingLeases are classified as finance leases whenever the terms of the lease transfer substantially all the risks and rewards of ownership to the lessee. All other leases are classified as operating leases.
The Group as lessorRental income from operating leases is recognised in profit or loss on a straight line basis over the term of the relevant lease. Initial direct costs incurred in negotiating and arranging an operating lease are added to the carrying amount of the leased asset and recognised as an expense on a straight line basis over the lease term.
The Group as lesseeLease payments are apportioned between finance expenses and reduction of the lease obligation so as to achieve a constant rate of interest on the remaining balance of the liability. Finance expenses are recognised immediately in profit or loss, unless they are directly attributable to qualifying assets, in which case they are capitalized in accordance with the Group’s policy on borrowing costs.
Contingent rentals are recognised as expenses in the periods in which they are incurred. Operating lease payments are recognised as an expense on a straight-line basis over the lease term, except where another systematic basis is more representative of the time pattern in which economic benefits from the leased asset are consumed. Contingent rentals arising under operating leases are recognised as an expense in the period in which they are incurred.
In the event that lease incentives are received to enter into operating leases, such incentives are recognised as a liability. The aggregate benefit of incentives is recognised as a reduction of rental expense on a straight-line basis, except where another systematic basis is more representative of the time pattern in which economic benefits from the leased asset are consumed.
Leasehold land and buildingWhen a lease includes both land and building elements, the Group assesses the classification of each element as a finance lease or an operating lease separately based on the assessment as to whether substantially all the risks and rewards incidental to ownership of each element have been transferred to the Group. Specifically, the minimum lease payments (including any lump-sum upfront payments) are allocated between the land and the building elements in proportion to the relative fair values of the leasehold interests in the land element and building element of the lease at the inception of the lease.
To the extent the allocation of the lease payments can be made reliably, interest in leasehold land that is accounted for as an operating lease is presented as “Prepaid lease Payments” in the consolidated statement of financial position and is amortised over the lease term on a straight-line basis. When the lease payments cannot be allocated reliably between the land and building elements, the entire lease is generally classified as a finance lease and accounted for as property, plant and equipment, unless it is clear that both elements are operating leases, in which case the entire lease is classified as an operating lease.
InventoriesInventories are stated at the lower of cost and net realisable value. Cost is calculated using the weighted average method.
/ 71
3. Significant Accounting Policies (continued)Financial instrumentsFinancial assets and financial liabilities are recognised on the consolidated statement of financial position when a group entity becomes a party to the contractual provisions of the instrument.
Financial assets and financial liabilities are initially measured at fair value. Transaction costs that are directly attributable to the acquisition or issue of financial assets and financial liabilities (other than financial assets or financial liabilities at fair value through profit or loss) are added to or deducted from the fair value of the financial assets or financial liabilities, as appropriate, on initial recognition. Transaction costs directly attributable to the acquisition of financial assets or financial liabilities at fair value through profit or loss are recognised immediately in profit or loss.
Financial assetsThe Group’s financial assets are mainly classified into financial assets at fair value through profit or loss (“FVTPL”), loans and receivables and available-for-sale financial assets. All regular way purchases or sales of financial assets are recognised and derecognised on a trade date basis. Regular way purchases or sales are purchases or sales of financial assets that require delivery of assets within the time frame established by regulation or convention in the marketplace.
Effective interest methodThe effective interest method is a method of calculating the amortised cost of a financial asset and of allocating interest income over the relevant period. The effective interest rate is the rate that exactly discounts estimated future cash receipts (including all fees paid or received that form an integral part of the effective interest rate, transaction costs and other premiums or discounts) through the expected life of the financial asset, or, where appropriate, a shorter period to the net carrying amount on initial recognition.
Interest income is recognised on an effective interest basis for debt instruments.
Financial assets at fair value through profit or lossThe financial assets at FVTPL of the Group comprise of derivatives that are not designated and effective as a hedging instrument.
Financial assets at FVTPL are measured at fair value, with changes in fair value arising from remeasurement recognised directly in profit or loss in the period in which they arise. The net gain or loss recognised in profit or loss excludes any dividend and interests earned on the financial assets.
Loans and receivablesLoans and receivables are non-derivative financial assets with fixed or determinable payments that are not quoted in an active market. Subsequent to initial recognition, loans and receivables (including long-term loan receivables, trade and other receivables, amounts due from associates and jointly controlled entities and bank balances and cash) are carried at amortised cost using the effective interest method, less any identified impairment losses. (see accounting policy on impairment loss of financial assets below).
Available-for-sale financial assetsAvailable-for-sale financial assets are non-derivatives that are either designated or not classified as financial assets at FVTPL, loans and receivables or held-to-maturity investments.

72 / Yue Yuen Industrial (Holdings) Limited / Annual Report 2011
Notes to the Consolidated Financial StatementsFor the Year ended 30th September, 2011
3. Significant Accounting Policies (continued)Financial instruments (continued)Financial assets (continued)Available-for-sale financial assets (continued)Available-for-sale financial assets are measured at fair value at the end of the reporting period. Changes in fair value are recognised in other comprehensive income and accumulated in investment revaluation reserve, until the financial asset is disposed of or is determined to be impaired, at which time, the cumulative gain or loss previously accumulated in the investment revaluation reserve is reclassified to profit or loss (see accounting policy on impairment loss of financial assets below).
For available-for-sale equity investments that do not have a quoted market price in an active market and whose fair value cannot be reliably measured and derivatives that are linked to and must be settled by delivery of such unquoted equity instruments, they are measured at cost less any identified impairment losses at each end of the reporting period subsequent to initial recognition (see accounting policy on impairment loss on financial assets below).
Impairment of financial assetsFinancial assets, other than those at FVTPL, are assessed for indicators of impairment at the end of the reporting period. Financial assets are impaired where there is objective evidence that, as a result of one or more events that occurred after the initial recognition of the financial asset, the estimated future cash flows of the financial assets have been affected.
For an available-for-sale equity investment, a significant or prolonged decline in the fair value of that investment below its cost is considered to be objective evidence of impairment.
For all other financial assets, objective evidence of impairment could include:
• significant financial difficulty of the issuer or counterparty; or• breach of contract, such as default or delinquency in interest or principal payments; or• it becoming probable that the borrower will enter bankruptcy or financial re-organisation; or• the disappearance of an active market for that financial asset because of financial difficulties.
For certain categories of financial asset, such as trade receivables, assets that are assessed not to be impaired individually are subsequently assessed for impairment on a collective basis. Objective evidence of impairment for a portfolio of receivables could include the Group’s past experience of collecting payments, an increase in the number of delayed payments in the portfolio past the credit period of 30 to 90 days and observable changes in national or local economic conditions that correlate with default on receivables.
For financial assets carried at amortised cost, an impairment loss is recognised in profit or loss when there is objective evidence that the asset is impaired, and is measured as the difference between the asset’s carrying amount and the present value of the estimated future cash flows discounted at the original effective interest rate.
For financial assets carried at cost, the amount of the impairment loss is measured as the difference between the asset’s carrying amount and the present value of the estimated future cash flows discounted at the current market rate of return for a similar financial asset. Such impairment loss will not be reversed in subsequent periods.

/ 73
3. Significant Accounting Policies (continued)Financial instruments (continued)Financial assets (continued)Impairment of financial assets (continued)The carrying amount of the financial asset is reduced by the impairment loss directly for all financial assets with the exception of trade receivables where the carrying amount is reduced through the use of an allowance account. Changes in the carrying amount of the allowance account are recognised in profit or loss. When a balance aforesaid is considered uncollectible, it is written off against the allowance account. Subsequent recoveries of amounts previously written off are credited to profit or loss.
For financial assets measured at amortised cost, if, in a subsequent period, the amount of impairment loss decreases and the decrease can be related objectively to an event occurring after the impairment losses was recognised, the previously recognised impairment loss is reversed through profit or loss to the extent that the carrying amount of the asset at the date the impairment is reversed does not exceed what the amortised cost would have been had the impairment not been recognised.
Impairment losses on available-for-sale equity investments will not be reversed in profit or loss in subsequent periods. Any increase in fair value subsequent to impairment loss is recognised directly in other comprehensive income and accumulated in investment revaluation reserve.
Financial liabilities and equity instrumentsFinancial liabilities and equity instruments issued by a group entity are classified according to the substance of the contractual arrangements entered into and the definitions of a financial liability and an equity instrument.
An equity instrument is any contract that evidences a residual interest in the assets of the Group after deducting all of its liabilities. The Group’s financial liabilities are generally classified into financial liabilities at FVTPL and other financial liabilities.
Effective interest methodThe effective interest method is a method of calculating the amortised cost of a financial liability and of allocating interest expense over the relevant period. The effective interest rate is the rate that exactly discounts estimated future cash payments through the expected life of the financial liability, or, where appropriate, a shorter period.
Interest expense is recognised on an effective interest basis.
Financial liabilities at fair value through profit or lossFinancial liabilities at FVTPL include derivatives that are not designated and effective as a hedging instrument.
Financial liabilities at FVTPL are measured at fair value, with changes in fair value arising on remeasurement recognised directly in profit or loss in the period in which they arise. The net gain or loss recognised in profit or loss excludes any interest paid on the financial liabilities.
Other financial liabilitiesOther financial liabilities including trade and other payables, bank borrowings and debt component of convertible bonds are subsequently measured at amortised cost, using the effective interest method.

74 / Yue Yuen Industrial (Holdings) Limited / Annual Report 2011
Notes to the Consolidated Financial StatementsFor the Year ended 30th September, 2011
3. Significant Accounting Policies (continued)Financial instruments (continued)Financial liabilities and equity instruments (continued)Convertible bondsConvertible bonds issued by the Company that contain both liability and conversion option component are classified separately into respective items on initial recognition. Conversion option that will be settled other than by the exchange of a fixed amount of cash or another financial asset for a fixed number of the Company’s own equity instruments is a conversion option derivative. At the date of issue, the liability component, conversion option component and other embedded derivatives are recognised at fair value.
In subsequent periods, the liability component of the convertible bonds is carried at amortised cost using the effective interest method. The conversion option derivative is measured at fair value with changes in fair value recognised in profit or loss.
Transaction costs that relate to the issue of the convertible bonds are allocated to the liability component and conversion option derivative and other embedded derivatives in proportion to the allocation of the proceeds. Transaction costs relating to the derivatives are charged to profit or loss immediately. Transaction costs relating to the liability component are included in the carrying amount of the liability component and amortised over the period of the convertible bonds using the effective interest method.
Equity instrumentsEquity instruments issued by the Company are recorded at the proceeds received, net of direct issue costs.
USD Call OptionUSD Call Option issued by the Company that will be settled by the exchange of a fixed amount of cash for a fixed number of the Company’s own equity instruments are classified as an equity instrument.
The fair value of USD Call Option on the date of issue is recognised in equity (other reserve). The USD Call Option will be transferred to share capital and share premium upon exercise of the USD Call Option. Where the USD Call Option remains unexercised at the expiry date, the amount previously recognised in other reserve will be released to the retained profits.
Derivative financial instrumentsDerivatives are initially recognised at fair value at the date derivative contracts are entered into and are subsequently remeasured to their fair value at the end of each reporting period. The resulting gain or loss is recognised in profit or loss immediately unless the derivative is designated and effective as a hedging instrument, in which event the timing of the recognition in profit or loss depends on the nature of the hedge relationship.
Embedded derivativesDerivatives embedded in non-derivative host contracts are treated as separate derivatives when their risks and characteristics are not closely related to those of the host contracts and the host contracts are not measured at fair value with changes in fair value recognised in profit or loss.

/ 75
3. Significant Accounting Policies (continued)Financial instruments (continued)Financial guarantee contractsA financial guarantee contract is a contract that requires the issuer to make specified payments to reimburse the holder for a loss it incurs because a specified debtor fails to make payment when due in accordance with the original or modified terms of a debt instrument. A financial guarantee contract issued by the Group and not designated as at fair value through profit or loss is recognised initially at its fair value less transaction costs that are directly attributable to the issue of the financial guarantee contract. Subsequent to initial recognition, the Group measures the financial guarantee contract at the higher of: (i) the amount determined in accordance with HKAS 37 “Provisions, Contingent Liabilities and Contingent Assets”; and (ii) the amount initially recognised less, when appropriate, cumulative amortisation recognised in accordance with HKAS 18 “Revenue”.
DerecognitionFinancial assets are derecognised when the rights to receive cash flows from the assets expire or, the financial assets are transferred and the Group has transferred substantially all the risks and rewards of ownership of the financial assets.
On derecognition of a financial asset in its entirety, the difference between the asset’s carrying amount and the sum of the consideration received and receivable and the cumulative gain or loss that had been recognised in other comprehensive income is recognised in profit or loss.
Financial liabilities are derecognised when the obligation specified in the relevant contract is discharged, cancelled or expires. The difference between the carrying amount of the financial liability derecognised and the consideration paid and payable is recognised in profit or loss.
Share-based payment transactionsEquity-settled share-based payment transactionsThe fair value of services received determined by reference to the fair value of the rights/options to subscribe for shares under the Group’s share incentive schemes at the grant date is expensed on a straight-line basis over the vesting period, with a corresponding increase in equity.
At the end of the reporting period, the Group revises its estimates of the number of rights/options that are expected to ultimately vest. The impact of the revision of the estimates during the vesting period, if any, is recognised in profit or loss, with a corresponding adjustment to equity.
At the time when the rights/options are exercised, the amount previously recognised in equity will be transferred to share premium of the relevant group entity. When the rights/options are forfeited after the vesting date or are still not exercised at the expiry date, the amount previously recognised in equity will be transferred to retained profits.
At the time when the rights/options are cancelled during the vesting period, the Group accounts for the cancellation as an acceleration of vesting, and recognises immediately the amount that otherwise would have been recognised for services received over the remainder of the vesting period. The amount previously recognised in equity will be transferred to retained profits upon cancellation.

76 / Yue Yuen Industrial (Holdings) Limited / Annual Report 2011
Notes to the Consolidated Financial StatementsFor the Year ended 30th September, 2011
3. Significant Accounting Policies (continued)TaxationIncome tax expense represents the sum of the tax currently payable and deferred tax.
The tax currently payable is based on taxable profit for the year. Taxable profit differs from profit as reported in the consolidated income statement because it excludes items of income or expense that are taxable or deductible in other years and it further excludes items that are never taxable or deductible. The Group’s liability for current tax is calculated using tax rates that have been enacted or substantively enacted by the end of the reporting period.
Deferred tax is recognised on temporary differences between the carrying amounts of assets and liabilities in the consolidated financial statements and the corresponding tax base used in the computation of taxable profit. Deferred tax liabilities are generally recognised for all taxable temporary differences. Deferred tax assets are recognised for all deductible temporary differences to the extent that it is probable that taxable profits will be available against which those deductible temporary differences can be utilised. Such assets and liabilities are not recognised if the temporary differences arise from goodwill or from the initial recognition (other than in a business combination) of other assets and liabilities in a transaction that affects neither the taxable profit nor the accounting profit.
Deferred tax liabilities are recognised for taxable temporary differences associated with on investments in subsidiaries, associates and joint ventures, except where the Group is able to control the reversal of the temporary difference and it is probable that the temporary difference will not reverse in the foreseeable future. Deferred tax assets arising from deductible temporary differences associated with such investments and interests are only recognised to the extent that it is probable that there will be sufficient taxable profits against which to utilise the benefits of the temporary differences and they are expected to reverse in the foreseeable future.
The carrying amount of deferred tax assets is reviewed at the end of the reporting period and reduced to the extent that it is no longer probable that sufficient taxable profits will be available to allow all or part of the asset to be recovered.
Deferred tax assets and liabilities are measured at the tax rates that are expected to apply in the period in which the liability is settled or the asset is realised, based on tax rate (and tax laws) that have been enacted or substantively enacted by the end of the reporting period.
The measurement of deferred tax liabilities and assets reflects the tax consequences that would follow from the manner in which the Group expects, at the end of the reporting period, to recover or settle the carrying amount of its assets and liabilities. Deferred tax is recognised in profit or loss, except when it relates to items that are recognised in other comprehensive income or directly in equity, in which case the deferred tax is also recognised in other comprehensive income or directly in equity respectively.

/ 77
3. Significant Accounting Policies (continued)Foreign currenciesIn preparing the financial statements of each individual group entity, transactions in currencies other than the functional currency of that entity (foreign currencies) are recorded in respective functional currency (i.e. the currency of the primary economic environment in which the entity operates) at the rates of exchanges prevailing on the dates of the transactions. At the end of the reporting period, monetary items denominated in foreign currencies are retranslated at the rates prevailing at that date. Non-monetary items carried at fair value that are denominated in foreign currencies are retranslated at the rates prevailing on the date when the fair value was determined. Non-monetary items that are measured in terms of historical cost in a foreign currency are not retranslated.
Exchange differences arising on the settlement of monetary items, and on the retranslation of monetary items, are recognised in profit or loss in the period in which they arise. Exchange differences arising on the retranslation of non-monetary items carried at fair value are included in profit or loss for the period except for differences arising on the retranslation of non-monetary items in respect of which gains and losses are recognised directly in other comprehensive income, in which cases, the exchange differences are also recognised directly in other comprehensive income.
For the purposes of presenting the consolidated financial statements, the assets and liabilities of the Group’s foreign operations are translated into the presentation currency of the Group (i.e. USD) at the rate of exchange prevailing at the end of the reporting period, and their income and expenses are translated at the average exchange rates for the year, unless exchange rates fluctuate significantly during the period, in which case, the exchange rates prevailing at the dates of transactions are used. Exchange differences arising, if any, are recognised in other comprehensive income and accumulated in equity (the translation reserve).
Research and development expenditureExpenditure on research activities is recognised as an expense in the period in which it is incurred.
An internally-generated intangible asset arising from development (or from the development phase of an internal project) is recognised if, and only if, all of the following have been demonstrated:
• the technical feasibility of completing the intangible asset so that it will be available for use or sale;• the intention to complete the intangible asset and use or sell it;• the ability to use or sell the intangible asset;• how the intangible asset will generate probable future economic benefits;• the availability of adequate technical, financial and other resources to complete the development and to use
or sell the intangible asset; and• the ability to measure reliably the expenditure attributable to the intangible asset during its development.
The amount initially recognised for internally-generated intangible asset is the sum of the expenditure incurred from the date when the intangible asset first meets the recognition criteria listed above. Where no internally-generated intangible asset can be recognised, development expenditure is charged to profit or loss in the period in which it is incurred.
Subsequent to initial recognition, internally-generated intangible assets are reported at cost less accumulated amortisation and accumulated impairment losses, on the same basis as intangible assets that are acquired separately.

78 / Yue Yuen Industrial (Holdings) Limited / Annual Report 2011
Notes to the Consolidated Financial StatementsFor the Year ended 30th September, 2011
3. Significant Accounting Policies (continued)Borrowing costsBorrowing costs directly attributable to the acquisition, construction or production of qualifying assets, which are assets that necessarily take a substantial period of time to get ready for their intended use or sale are added to the cost of those assets until such time as the assets are substantially ready for their intended use or sale. Investment income earned on the temporary investment of specific borrowings pending their expenditure on qualifying assets is deducted from the borrowing costs eligible for capitalisation.
All other borrowing costs are recognised in profit or loss in the period in which they are incurred.
Retirement benefit schemePayments to defined contribution retirement benefit plans, including state managed retirement benefit schemes and the Mandatory Provident Fund Scheme, are charged as an expense when employees have rendered service entitling them to the contributions.
4. Critical Accounting Judgments and Key Sources of Estimation UncertaintyIn the application of the Group’s accounting policies, which are described in Note 3, the directors of the Company are required to make judgments, estimates and assumptions about the carrying amounts of assets and liabilities that are not readily apparent from other sources. The estimates and associated assumptions are based on historical experience and other factors that are considered to be relevant. Actual results may differ from these estimates.
The estimates and underlying assumptions are reviewed on an ongoing basis. Revisions to accounting estimates are recognised in the period in which the estimate is revised if the revision affects only that period, or in the period of the revision and future periods if the revision affects both current and future periods.
Critical judgments in applying the entity’s accounting policiesThe following are the critical judgments, apart from those involving estimations (see below), that the directors have made in the process of applying the Group’s accounting policies and that have the most significant effect on the amounts recognised in consolidated financial statements.
(i) Property interest in landDespite the Group has paid substantially the full purchase consideration as detailed in Notes 13, 14(a) and 15, formal titles of certain of the Group’s rights to the use of the land were not yet granted from the relevant government authorities. In the opinion of the directors, the absence of formal title to these land use rights does not impair the carrying value of the relevant properties to the Group.
(ii) Intangible assetsThe directors of the Company considered that the brandnames with an aggregate carrying amount of approximately US$73,063,000 (2010: US$32,408,000), as detailed in Note 16, for all practical purposes have indefinite useful lives and are therefore not amortised until their useful lives are determined to be finite. They will be tested for impairment annually.
/ 79
4. Critical Accounting Judgments and Key Sources of Estimation Uncertainty (continued)Key sources of estimation uncertaintyThe following are the key assumptions concerning the future, and other key sources of estimation uncertainty at the end of the reporting period, that have a significant risk of causing a material adjustment to the carrying amounts of assets and liabilities within the next financial year.
(i) Estimated recoverable amounts of goodwill and brandnamesDetermining whether goodwill and brandnames are impaired requires an estimation of the value in use of the cash-generating units to which goodwill and brandname have been allocated. The value in use calculation requires the Group to estimate the future cash flows expected to arise from the cash-generating unit and a suitable discount rate in order to calculate the present value where the expected future cash flows arising from the relevant cash-generating units differ from the cash-generating units containing goodwill and brandname using a suitable discount rate. As at 30th September, 2011, the carrying amounts of goodwill and brandnames are approximately US$233,211,000 (2010: US$218,607,000) and US$73,063,000 (2010: US$32,408,000) respectively. Details of the recoverable amount calculation are disclosed in Note 18.
(ii) Estimated impairment of intangible assets with finite useful livesThe Group tests whether intangible assets which have finite useful lives have suffered any impairment whenever there is any indication that the assets may have been impaired. The recoverable amounts of these intangible assets have been determined based on the value in use, which have been estimated using discounted cash flow method. The directors consider that the recoverable amount exceeded the carrying amount of the intangible assets and no impairment was recognised during the year. Where the actual future cash flows is different from the amounts estimated when applying the discounted cash flow method, an impairment loss may arise in future years. The carrying amount of intangible assets which have finite useful lives at the end of the reporting period was approximately US$38,819,000 (2010: US$38,204,000).
(iii) Fair value of derivative financial instrumentsThe directors of the Company use their judgment in selecting an appropriate valuation technique to determine the fair value of derivative financial instruments not quoted in an active market, where the valuation techniques are those commonly applied by market practitioners. Assumptions are made based on market statistics and adjusted for specific features of the instrument. Measurements of the fair value of the JV Call Options (as defined in Note 25a) require the use of variables and assumptions about future events including (i) the underlying value of the relevant equity interests, (ii) the profitability of Pou Sheng and the Relevant Companies (as defined in Note 25a), and (iii) the share price of Pou Sheng. Details of the assumptions used and the carrying amounts of the financial instruments as at 30th September, 2011 and 2010 are disclosed in Note 25a.
5. Turnover and Segmental InformationInformation reported to the Board of Directors of the Company, being the chief operating decision maker, for the purposes of resources allocation and assessment of performance focuses specifically on the revenue analysis by principal categories of the Group’s business and the profit of the Group as a whole. The principal categories of the Group’s business are manufacturing and sales of footwear products (“Manufacturing Business”) and retail and distribution of sportswear products (“Retailing Business”) which includes the operating and leasing of large scale commercial spaces to retailers and distributors.

80 / Yue Yuen Industrial (Holdings) Limited / Annual Report 2011
Notes to the Consolidated Financial StatementsFor the Year ended 30th September, 2011
5. Turnover and Segmental Information (continued)Accordingly, the directors of the Company have determined that the Group has one operating segment, as defined in HKFRS 8. The information regarding turnover derived from the principal businesses described above is reported below.
2011 2010US$’000 US$’000
TurnoverManufacturing Business 5,604,357 4,593,188Retailing Business 1,441,016 1,195,020
Total turnover 7,045,373 5,788,208
Revenue from major productsThe following is an analysis of the Group’s revenue from its major products:
2011 2010US$’000 US$’000
Athletic shoes 3,680,208 3,064,704Casual/outdoor shoes 1,239,572 943,413Sports sandals 81,151 64,217Soles and components 548,283 477,191Retail sales – shoes and apparel 1,431,349 1,185,683Others 64,810 53,000
7,045,373 5,788,208
Geographical informationThe Group’s revenue is mainly derived from customers located in the United States of America (“USA”), Europe and the PRC. The Group’s revenue by the geographical location of the customers, irrespective of the origin of the goods, is detailed below:
2011 2010US$’000 US$’000
USA 2,010,832 1,709,146Europe 1,541,506 1,180,379PRC 1,977,072 1,597,100Others 1,515,963 1,301,583
7,045,373 5,788,208
/ 81
5. Turnover and Segmental Information (continued)Geographical information (continued)The Group’s business activities are conducted predominantly in the PRC, Vietnam and Indonesia. Information about the Group’s non-current assets by the geographical location of the assets is detailed below:
2011 2010US$’000 US$’000
PRC 1,328,906 1,271,838Indonesia 445,170 360,334Vietnam 414,146 338,268Others 45,209 37,546
2,233,431 2,007,986
Note: Non-current assets excluded goodwill, investments in associates, investments in jointly controlled entities, deposit paid for acquisition of the remaining interest in a jointly controlled entity, deferred tax assets and financial instruments.
Information about major customersRevenue from customers contributing over 10% of the total annual revenue of the Group are as follows:
2011 2010US$’000 US$’000
Customer A 1,564,860 1,308,802Customer B 1,153,476 943,077
6. Fair Value Changes on Derivative Financial Instruments
2011 2010US$’000 US$’000
(Loss) gain on changes in fair value of:
– HKD Call Option (Note 25b) (31,997) 19,853– derivatives embedded in convertible bonds (Note 32) 24,768 (14,951)– derivatives embedded in structured bank deposit (Note) – 170– JV Call Options (Note 25a) (15,601) (6,393)– other derivative financial instruments (Note 25c) (13,314) (544)
(36,144) (1,865)
Note: In prior year, the Company entered into a structured contract with a bank with a principal sum of HK$40,000,000 and contained an embedded derivative, representing a return which would vary with prevailing market exchange rate of RMB/USD. The embedded derivative was accounted separately as derivative financial instruments. The change in fair value of US$170,000 was credited to the consolidated income statements for the year ended 30th September, 2010 prior to its maturity in May 2010.

82 / Yue Yuen Industrial (Holdings) Limited / Annual Report 2011
Notes to the Consolidated Financial StatementsFor the Year ended 30th September, 2011
7. Finance Costs
2011 2010US$’000 US$’000
Interest on bank borrowings:– wholly repayable within five years 21,537 24,827– not wholly repayable within five years – 453
Effective interest expense on convertible bonds (Note 32) 15,882 15,142
37,419 40,422
8. Income Tax Expense
2011 2010US$’000 US$’000
Taxation attributable to the Company and its subsidiaries:
Current taxHong Kong Profits Tax (note i)
– current year 743 588– prior years – 22,176
PRC Enterprise Income Tax (“EIT”) (note ii)– current year 21,589 9,681– underprovision in prior years 1,041 561
Overseas taxation (note iii)– current year 5,866 3,932– underprovision in prior years – 146
29,239 37,084Deferred tax credit (Note 34) (1,036) (2,059)
28,203 35,025

/ 83
8. Income Tax Expense (continued)notes:
(i) Hong Kong
Hong Kong Profits Tax is calculated at 16.5% of the estimated assessable profits for both years.
During the period from March 2004 to March 2010, the Hong Kong Inland Revenue Department (the “HKIRD”)
issued protective profits tax assessments to certain wholly owned subsidiaries of the Group. Following a series of
subsequent negotiations, a compromised settlement with the HKIRD was reached in early June 2010 at a sum of about
US$22,176,000 as a full and final settlement of the profits tax of those subsidiaries for the years of assessment 1997/1998
to 2008/2009, that is, for the financial years ended 30th September, 1997 to 2008. This sum payable was charged to the
consolidated income statement for the year ended 30th September, 2010.
(ii) PRC
PRC EIT was calculated based on the statutory rate of 25% of the assessable profit for those subsidiaries established in
the PRC, as determined in accordance with the relevant income tax rate rules and regulations in the PRC, except for the
followings:
(a) Pursuant to the relevant laws and regulations in the PRC, certain of the Group’s PRC subsidiaries were exempted
from PRC income tax for two years starting from their first profit-making year, followed by a 50% reduction in the
applicable tax rate for the next three years. These tax holidays and concessions expired or would expire between
2009 and 2012.
For entities which were entitled to unutilised tax holidays (including two-year exemption and three-year half rate)
under the then existing preferential tax treatments, the unutilised tax holiday are allowed to be carried forward to
future years until their expiry. However, if an entity did not commence its tax holiday due to its loss position, the tax
holiday is deemed to commence from 2008 onwards. Certain PRC subsidiaries were loss-making up to 2008, their
tax holidays are therefore deemed to commence in 2008.
(b) Pursuant to《國家稅務總局財務部╱海關總署關於西部大開發稅收優惠政策問題的通知》(Caishui [2001] No.
202), the relevant state policy and with approval obtained from tax authorities in charge, certain subsidiaries which
are located in specified provinces of Western China and engaged in a specific state-encouraged industry were
subject to a preferential tax rate of 15% during the period from 2001 to 2010 when the annual revenue from the
encouraged business exceeded 70% of its total revenue in a fiscal year. Pursuant to《關於深入實施西部大開發戰略有關稅收政策問題的通知》(Caishui [2011] No. 58) issued during the current year, such preferential tax treatment
is further extended for a period of ten years from 2011 to 2020 on the condition that the enterprise is engaged in
state-encouraged industries as defined under the “Catalogue of Encouraged Industries in the Western Region”
(the “Catalogue”). Since the Catalogue has not yet been issued, it is uncertain whether certain subsidiaries could
continue to enjoy the preferential tax rate of 15% in 2011.
According to the Circular of the State Council on the Implementation of Transitional Preferential Policies for Enterprises
Income Tax (Guofa [2007] No. 39), the tax concessions from EIT as set out in (a) above continue to be applicable until the
expirations of the relevant concessions. Subject to the fulfillments of the conditions set out above, the preferential treatment
set out in (b) above continues to be applicable on the implementation of the Law of the PRC on Enterprise Income Tax.

84 / Yue Yuen Industrial (Holdings) Limited / Annual Report 2011
Notes to the Consolidated Financial StatementsFor the Year ended 30th September, 2011
8. Income Tax Expense (continued)notes: (continued)
(iii) Overseas
As stated in the Decree Law No. 58/99/M, Chapter 2, Article 12, dated 18th October, 1999, certain subsidiaries established
in Macau are exempted from Macao Complementary Tax.
Taxation arising in other jurisdictions is calculated at the rates prevailing in the respective jurisdictions.
The income tax expense for the year can be reconciled to the profit before taxation per the consolidated income statement as follows:
2011 2010US$’000 US$’000
Profit before taxation 511,728 530,863
Tax at domestic rates applicable to profits of taxable entities in the countries concerned (note) 92,703 97,079
Tax effect of share of results of associates and jointly controlled entities (11,345) (18,936)Tax effect of expenses not deductible for tax purpose 37,232 22,694Tax effect of income not taxable for tax purpose (72,292) (71,379)Tax effect of tax losses not recognised 3,940 5,366Effect of reduced and preferential tax rates granted to PRC subsidiaries (2,555) (1,507)Effect of tax exemption granted to overseas subsidiaries (20,249) (21,175)Deferred tax relating to dividend withholding tax (272) –Underprovision in prior years 1,041 22,883
Income tax expense for the year 28,203 35,025
note: As the Group operates in several different tax jurisdictions, separate reconciliations using the domestic tax rate in each
individual tax jurisdiction have been aggregated.

/ 85
9. Profit for the Year
2011 2010US$’000 US$’000
Profit for the year has been arrived at after charging:
Employee benefit expense, including directors’ emoluments– basic salaries and allowances 1,452,223 1,111,961– retirement benefit scheme contributions 40,059 32,965– share-based payment 2,473 1,578
1,494,755 1,146,504
Release of prepaid lease payments 5,060 5,385Auditor’s remuneration 2,099 1,831Amortisation of intangible assets (included in selling and distribution expenses) 5,746 4,627Depreciation of property, plant and equipment 208,549 179,018Loss on disposal of property, plant and equipment 187 8,753Loss on disposal of jointly controlled entities – 8,203Loss on deemed disposal of partial interest in a jointly controlled entity – 31Loss on deregistration of an associate – 36Impairment loss recognised on trade receivables 2,206 422Impairment loss recognised on other receivables 2,014 –Research and development expenditure (included in other expenses) 153,656 131,123Share of taxation of associates (included in share of results of associates) 6,838 4,737Share of taxation of jointly controlled entities (included in share of
results of jointly controlled entities) 9,495 9,731
and after crediting to other income:
Interest income 11,004 11,631Bargain purchase gain on acquisition of additional interest
in a jointly controlled entity – 338Dividend income from available-for-sale investments 1,167 273Net exchange gain 40,248 15,495Reversal of allowance for inventory, net 21 1,257Written back of impairment loss on trade receivables 1,060 653Gain on deemed disposal of subsidiaries (Note 42) – 85Gain on deregistration of subsidiaries 764 125Gain on disposal of land leases 2,846 4,931Gain on disposal of available-for-sale investments – 17Gain on disposal of subsidiaries (Note 42) – 1,776Gain on disposal of an associate 325 –Subsidies, rebates and other income from suppliers 32,628 21,529Utility income from provision of electricity and water supply 5,813 8,384Subcontracting income 687 8,082Gross rental income on investment properties, before deduction of direct
operating expenses of approximately US$239,000 (2010: US$199,000) 8,235 8,419
note: For the years ended 30th September, 2011 and 2010, cost of inventories recognised as an expense represents cost of sales as shown in the consolidated income statement.
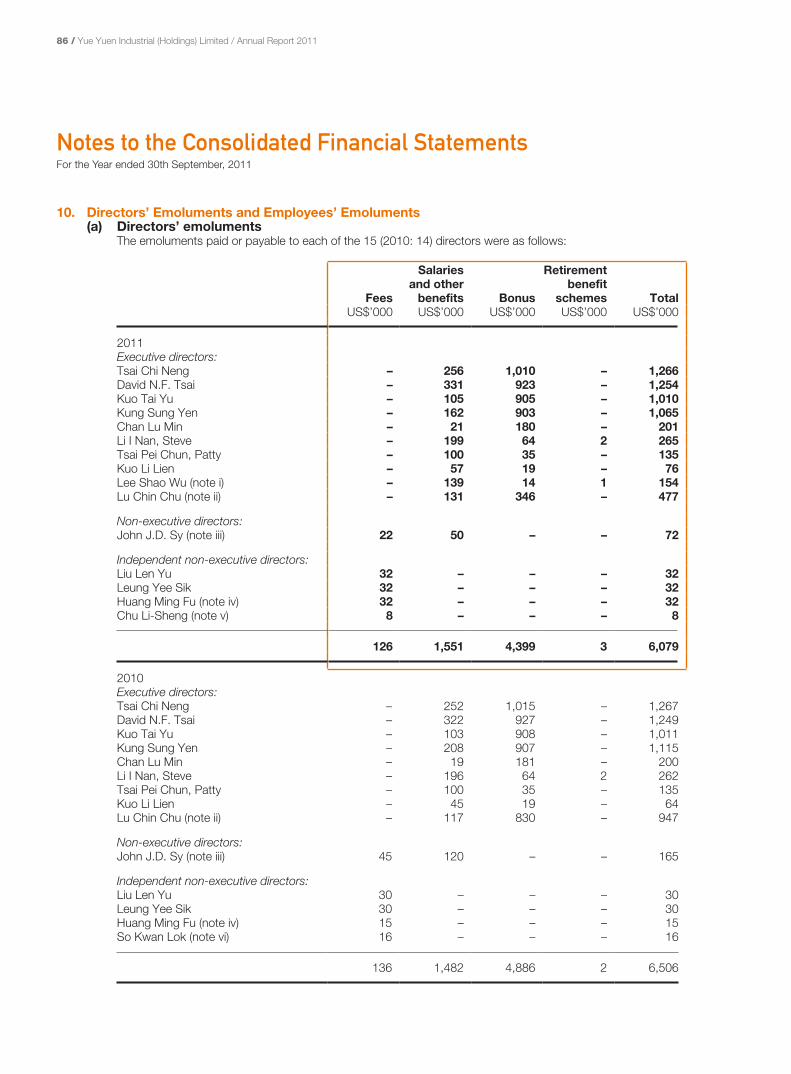
86 / Yue Yuen Industrial (Holdings) Limited / Annual Report 2011
Notes to the Consolidated Financial StatementsFor the Year ended 30th September, 2011
10. Directors’ Emoluments and Employees’ Emoluments(a) Directors’ emoluments
The emoluments paid or payable to each of the 15 (2010: 14) directors were as follows:
Fees
Salaries and other
benefits Bonus
Retirement benefit
schemes TotalUS$’000 US$’000 US$’000 US$’000 US$’000
2011Executive directors:Tsai Chi Neng – 256 1,010 – 1,266David N.F. Tsai – 331 923 – 1,254Kuo Tai Yu – 105 905 – 1,010Kung Sung Yen – 162 903 – 1,065Chan Lu Min – 21 180 – 201Li I Nan, Steve – 199 64 2 265Tsai Pei Chun, Patty – 100 35 – 135Kuo Li Lien – 57 19 – 76Lee Shao Wu (note i) – 139 14 1 154Lu Chin Chu (note ii) – 131 346 – 477
Non-executive directors:John J.D. Sy (note iii) 22 50 – – 72
Independent non-executive directors:Liu Len Yu 32 – – – 32Leung Yee Sik 32 – – – 32Huang Ming Fu (note iv) 32 – – – 32Chu Li-Sheng (note v) 8 – – – 8
126 1,551 4,399 3 6,079
2010Executive directors:Tsai Chi Neng – 252 1,015 – 1,267David N.F. Tsai – 322 927 – 1,249Kuo Tai Yu – 103 908 – 1,011Kung Sung Yen – 208 907 – 1,115Chan Lu Min – 19 181 – 200Li I Nan, Steve – 196 64 2 262Tsai Pei Chun, Patty – 100 35 – 135Kuo Li Lien – 45 19 – 64Lu Chin Chu (note ii) – 117 830 – 947
Non-executive directors:John J.D. Sy (note iii) 45 120 – – 165
Independent non-executive directors:Liu Len Yu 30 – – – 30Leung Yee Sik 30 – – – 30Huang Ming Fu (note iv) 15 – – – 15So Kwan Lok (note vi) 16 – – – 16
136 1,482 4,886 2 6,506

/ 87
10. Directors’ Emoluments and Employees’ Emoluments (continued)(a) Directors’ emoluments (continued)
notes:
(i) Mr. Lee Shao Wu was appointed as an executive director on 19th January, 2011.
(ii) Mr. Lu Chin Chu retired as an executive director on 4th March, 2011.
(iii) Mr. John J.D. Sy retired as a non-executive director on 4th March, 2011.
(iv) Mr. Huang Ming Fu was appointed as an independent non-executive director on 25th March, 2010.
(v) Mr. Chu Li-Sheng was appointed as an independent non-executive director on 28th June, 2011.
(vi) Mr. So Kwan Lok resigned as an independent non-executive director on 25th March, 2010.
Bonus was determined with reference to the Group’s operating results, individual performance and comparable market statistics.
(b) Employees’ emolumentsOf the five individuals with the highest emoluments in the Group for the year ended 30th September, 2011, four (2010: all) are directors of the Company whose emoluments are set out above. The emoluments of the remaining one individual for the year ended 30th September, 2011 were as follows:
2011 2010US$’000 US$’000
Basic salaries and other allowances 247 –Bonus 434 –Retirement benefit scheme contributions 2 –Share-based payments 240 –
923 –
The emoluments were within the following band:
2011 2010Number of employees
Number of employees
HK$7,000,001 to HK$8,000,000 1 –
During both years, no emoluments were paid by the Group to any of the directors or the five highest paid individuals (including directors and employees) as an inducement to join or upon joining the Group or as compensation for loss of office. None of the directors has waived any emoluments during both years.

88 / Yue Yuen Industrial (Holdings) Limited / Annual Report 2011
Notes to the Consolidated Financial StatementsFor the Year ended 30th September, 2011
11. Dividends
2011 2010US$’000 US$’000
Dividends recognised as distribution during the year:
2011 Interim dividend of HK$0.34 per share (2010: 2010 Interim dividend of HK$0.34 per share) 72,018 71,993
2010 Final dividend of HK$0.56 per share (2010: 2009 Final dividend of HK$0.55 per share) 118,555 116,756
190,573 188,749
The directors recommend the payment of a final dividend of HK$0.56 per share for the year ended 30th September, 2011. The proposed dividend of approximately HK$923,400,000 will be paid on or before 21st March, 2012 to those shareholders whose names appear on the Company’s register of members on 14th March, 2012.
This proposed dividend is subject to approval by the shareholders at the forthcoming annual general meeting.
12. Earnings Per ShareThe calculation of the basic and diluted earnings per share attributable to the owners of the Company is based on the following data:
2011 2010US$’000 US$’000
Earnings:
Profit for the year attributable to owners of the Company for the purpose of basic earnings per share 449,829 479,507
Effect of dilutive potential ordinary shares:Fair value changes on derivative embedded in convertible bonds (note a) (24,768) –Finance costs on convertible bonds (net of income tax) (note a) 13,261 –
Profit for the year attributable to owners of the Company for the purpose of diluted earnings per share 438,322 479,507
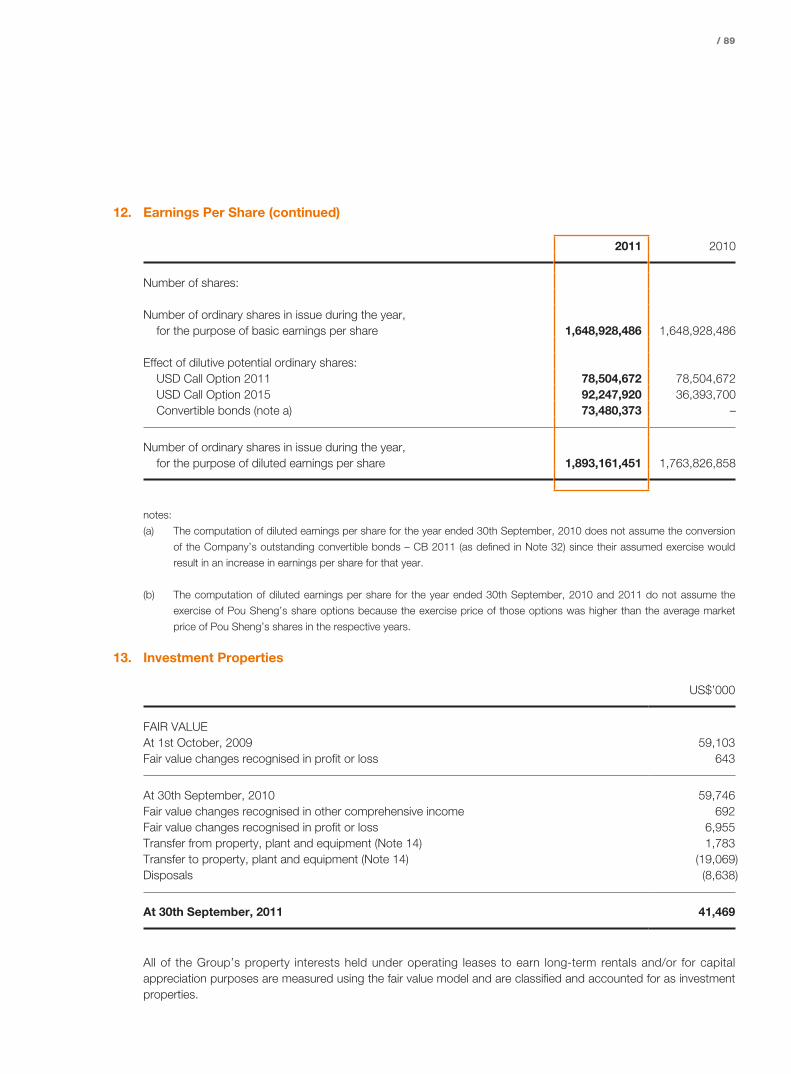
/ 89
12. Earnings Per Share (continued)
2011 2010
Number of shares:
Number of ordinary shares in issue during the year, for the purpose of basic earnings per share 1,648,928,486 1,648,928,486
Effect of dilutive potential ordinary shares:USD Call Option 2011 78,504,672 78,504,672USD Call Option 2015 92,247,920 36,393,700Convertible bonds (note a) 73,480,373 –
Number of ordinary shares in issue during the year, for the purpose of diluted earnings per share 1,893,161,451 1,763,826,858
notes:
(a) The computation of diluted earnings per share for the year ended 30th September, 2010 does not assume the conversion
of the Company’s outstanding convertible bonds – CB 2011 (as defined in Note 32) since their assumed exercise would
result in an increase in earnings per share for that year.
(b) The computation of diluted earnings per share for the year ended 30th September, 2010 and 2011 do not assume the
exercise of Pou Sheng’s share options because the exercise price of those options was higher than the average market
price of Pou Sheng’s shares in the respective years.
13. Investment Properties
US$’000
FAIR VALUEAt 1st October, 2009 59,103Fair value changes recognised in profit or loss 643
At 30th September, 2010 59,746Fair value changes recognised in other comprehensive income 692Fair value changes recognised in profit or loss 6,955Transfer from property, plant and equipment (Note 14) 1,783Transfer to property, plant and equipment (Note 14) (19,069)Disposals (8,638)
At 30th September, 2011 41,469
All of the Group’s property interests held under operating leases to earn long-term rentals and/or for capital appreciation purposes are measured using the fair value model and are classified and accounted for as investment properties.

90 / Yue Yuen Industrial (Holdings) Limited / Annual Report 2011
Notes to the Consolidated Financial StatementsFor the Year ended 30th September, 2011
13. Investment Properties (continued)As at 30th September, 2011, the fair value of the Group’s investment properties situated in the PRC of approximately US$30,319,000 (2010: US$48,526,000) has been arrived at on the basis of a valuation carried out as of that date by Knight Frank Petty Limited (“Knight Frank”), independent qualified professional valuers not connected with the Group, by reference to recent market prices for similar properties.
As at 30th September, 2011, the fair value of the Group’s investment properties situated in the USA of approximately US$11,150,000 (2010: US$11,220,000) has been determined by the directors of the Company by reference to recent market prices for similar properties. No valuation has been performed by independent qualified professional valuers.
2011 2010US$’000 US$’000
The carrying value of investment properties shown above comprises properties situated on:
– long-term leases or land use rights in the PRC 1,395 1,395– medium-term land use rights in the PRC 28,924 47,131– freehold land in the USA 11,150 11,220
41,469 59,746
As at 30th September, 2011, the Group had not obtained the formal land use rights for certain of its investment properties, the carrying value of which at that date was approximately US$5.4 million (2010: US$9.0 million). In the opinion of the directors, the absence of formal title to these land use rights does not impair their carrying value to the Group as the Group has paid substantially the full purchase consideration of these land interests and the probability of being evicted on the ground of an absence of formal title is remote.

/ 91
14. Property, Plant and Equipment/Deposits Paid for Acquisition of Property, Plant and Equipment(a) Property, plant and equipment
BuildingsFreehold
landLand andbuildings
Hotel properties
Construction in progress
Plant and machinery
Leasehold improvements
Furniture, fixtures and
equipmentMotor
vehicles TotalUS$’000 US$’000 US$’000 US$’000 US$’000 US$’000 US$’000 US$’000 US$’000 US$’000
(note i) (notes i, ii & iii)
COST OR VALUATIONAt 1st October, 2009 945,974 4,496 85,786 14,291 72,296 1,091,805 320,110 159,174 28,584 2,722,516Exchange realignment 1,665 – 188 – 64 416 1,181 505 177 4,196Additions 28,295 – – 44 109,011 120,128 25,092 22,886 6,878 312,334Reclassification 60,627 – – – (72,849) 1,564 10,154 504 – –Disposal of a subsidiary (33,541) – – – (3,039) – (298) (247) (24) (37,149)Deemed disposal of a subsidiary – – – – – (7,016) (1,113) (448) (92) (8,669)Disposals (2,294) – – (71) (129) (41,278) (28,777) (7,317) (2,146) (82,012)
At 30th September, 2010 1,000,726 4,496 85,974 14,264 105,354 1,165,619 326,349 175,057 33,377 2,911,216Exchange realignment 3,205 – 316 – – 9 3,205 715 116 7,566Additions 62,357 – – 14 160,723 183,114 36,693 36,043 7,807 486,751Acquired on acquisition of subsidiaries 2,522 – – – – 1,432 3,001 404 369 7,728Reclassification 76,980 – – – (76,980) – – – – –Disposals (1,231) – (1,887) (14) – (42,271) (28,188) (11,669) (3,805) (89,065)Transfer to investment properties
(Note 13) (1,894) – – – – – – – – (1,894)Transfer from investment properties
(Note 13) – – 19,069 – – – – – – 19,069Reclassified as held for sale (Note 42c) (30,288) – – (14,264) (52,990) – (5,324) (219) (118) (103,203)
At 30th September, 2011 1,112,377 4,496 103,472 – 136,107 1,307,903 335,736 200,331 37,746 3,238,168
Comprising:At cost 1,112,377 4,496 67,959 – 136,107 1,307,903 335,736 200,331 37,746 3,202,655At valuation – 1995 – – 35,513 – – – – – – 35,513
1,112,377 4,496 103,472 – 136,107 1,307,903 335,736 200,331 37,746 3,238,168
DEPRECIATIONAt 1st October, 2009 214,323 – 18,027 6,847 – 636,438 134,937 99,456 20,070 1,130,098Exchange realignment 100 – 15 – – 1 697 289 103 1,205Provided for the year 38,472 – 1,851 587 – 82,853 34,625 17,643 2,987 179,018Eliminated on disposal of a subsidiary (2,665) – – – – – (125) (101) (14) (2,905)Eliminated on deemed disposal of
a subsidiary – – – – – (4,386) (717) (330) (76) (5,509)Eliminated on disposals (271) – – (51) – (30,461) (20,735) (5,326) (1,902) (58,746)
At 30th September, 2010 249,959 – 19,893 7,383 – 684,445 148,682 111,631 21,168 1,243,161Exchange realignment 149 – 41 – – 3 2,813 368 59 3,433Provided for the year 41,200 – 2,384 599 – 102,005 34,296 23,690 4,375 208,549Eliminated on transfer to investment
properties (Note 13) (111) – – – – – – – – (111)Eliminated on disposals (665) – (619) (15) – (32,323) (12,475) (8,221) (2,594) (56,912)Reclassified as held for sale (Note 42) (1,530) – – (7,967) – – (269) (118) (65) (9,949)
At 30th September, 2011 289,002 – 21,699 – – 754,130 173,047 127,350 22,943 1,388,171
CARRYING VALUEAt 30th September, 2011 823,375 4,496 81,773 – 136,107 553,773 162,689 72,981 14,803 1,849,997
At 30th September, 2010 750,767 4,496 66,081 6,881 105,354 481,174 177,667 63,426 12,209 1,668,055

92 / Yue Yuen Industrial (Holdings) Limited / Annual Report 2011
Notes to the Consolidated Financial StatementsFor the Year ended 30th September, 2011
14. Property, Plant and Equipment/Deposits Paid for Acquisition of Property, Plant and Equipment (continued)(a) Property, plant and equipment (continued)
notes:
(i) As at 30th September, 2011, the Group had not obtained the formal land use rights and building ownership
certificates for certain of the properties included in buildings and land and buildings above, the carrying values
of which at that date were approximately US$119.6 million (2010: US$177.8 million) and US$5.1 million (2010:
US$17.1 million), respectively. In the opinion of the directors, the absence of formal title to these land use rights and
building ownership certificates do not impair their carrying value to the Group as the Group has paid substantially the
full purchase consideration of these land use rights and buildings and the probability of being evicted on the ground
of an absence of formal title is remote.
(ii) At 30th September, 2011, certain of the Group’s properties included in land and buildings were carried at their 1995
valuation less subsequent depreciation. If such properties had not been revalued in 1995, the carrying value of these
land and buildings would have been US$24,637,000 (2010: US$25,348,000) instead of US$24,147,000 (2010:
US$24,858,000).
(iii) In the opinion of the directors, the land and building element of certain of properties held by the Group cannot be
allocated reliably. Accordingly they are presented on a combined basis as land and buildings as above. At 30th
September, 2011, the carrying value of such properties situated in the PRC was approximately US$81,773,000 (2010:
US$66,081,000).
(iv) At the end of the reporting period, buildings with an aggregate carrying amount of approximately US$3,868,000
(2010: US$3,881,000) were pledged to secure general banking facilities granted to the Group.
Property, plant and equipment, other than construction in progress, are depreciated at the following rates per annum:
Land and buildings and Buildings Over 20 years to 50 years, or the lease terms of the relevant land whichever is shorter (straight-line method)
Freehold land NilHotel properties 3.3% – 15% (straight-line method)Plant and machinery 5% – 15% (straight-line method)Leasehold improvements 10% – 50% (reducing balance method)Furniture, fixtures and equipment 20% – 30% (reducing balance method)Motor vehicles 20% – 30% (reducing balance method)

/ 93
14. Property, Plant and Equipment/Deposits Paid for Acquisition of Property, Plant and Equipment (continued)(a) Property, plant and equipment (continued)
2011 2010US$’000 US$’000
The carrying value of the properties shown above comprises properties situated on:
Land or land use rights under long-term leases in– PRC 2,288 2,343– Indonesia 202,219 152,332
Land or land use rights under medium-term leases in– Hong Kong 1,295 2,505– PRC 469,620 459,522– Vietnam 216,588 200,146– Mexico 2,170 –– Bangladesh 10,968 –
Freehold land in Mexico 4,496 4,496Hotel properties under medium-term land use rights in the PRC – 6,881
909,644 828,225
(b) Deposits paid for acquisition of property, plant and equipmentDetails of the related capital commitments are set out in Note 45.
15. Prepaid Lease Payments
2011 2010US$’000 US$’000
The Group’s prepaid lease payments comprise leasehold land held under:
Long-term leases or land use rights in– PRC 1,243 2,629– Indonesia 31,483 31,464
Medium-term leases or land use rights in– PRC 122,923 117,342– Vietnam 38,754 35,001
194,403 186,436
Analysed for reporting purposes as:Current asset 5,403 3,942Non-current asset 189,000 182,494
194,403 186,436

94 / Yue Yuen Industrial (Holdings) Limited / Annual Report 2011
Notes to the Consolidated Financial StatementsFor the Year ended 30th September, 2011
15. Prepaid Lease Payments (continued)The Group has acquired various interests in land in the PRC, Indonesia and Vietnam and erected buildings thereon. As of 30th September, 2011, the Group had not obtained the formal title to certain of these land interests, the carrying value of which at that date was approximately US$22.6 million (2010: US$35.3 million). In the opinion of the directors, the absence of formal title to these land interest does not impair their carrying value to the Group as the Group has paid substantially the full purchase consideration of these land interests and the probability of being evicted on the ground of an absence of formal title is remote.
At the end of the reporting period, prepaid lease payments with an aggregate carrying amount of approximately US$17,012,000 (2010: US$16,669,000) were pledged to secure general banking facilities granted to the Group.
16. Intangible Assets
Customerrelationship
Non-competeagreement Brandname Total
US$’000 US$’000 US$’000 US$’000
COSTAt 1st October, 2009 4,336 38,843 31,731 74,910Exchange realignment 93 827 677 1,597
At 30th September, 2010 4,429 39,670 32,408 76,507Acquired on acquisition of
subsidiaries (Note 41) – 4,569 37,501 42,070Exchange realignment 200 1,996 3,154 5,350
At 30th September, 2011 4,629 46,235 73,063 123,927
AMORTISATIONAt 1st October, 2009 132 1,022 – 1,154Provided for the year 530 4,097 – 4,627Exchange realignment 13 101 – 114
At 30th September, 2010 675 5,220 – 5,895Provided for the year 551 5,195 – 5,746Exchange realignment 44 360 – 404
At 30th September, 2011 1,270 10,775 – 12,045
CARRYING VALUEAt 30th September, 2011 3,359 35,460 73,063 111,882
At 30th September, 2010 3,754 34,450 32,408 70,612

/ 95
16. Intangible Assets (continued)Customer relationship and non-compete agreement have finite useful lives and are amortised on a straight-line basis over the following periods:
Customer relationship 8 yearsNon-compete agreements 5 to 10 years
Addition to the Group’s intangible assets during the year arose from the acquisition of Zhejiang Yichuan Sports Goods Chain Company Limited (“Yichuan”) on 1st October, 2010 and were valued as of that date by American Appraisal China Limited (“American Appraisal”), a firm of independent professional valuers, on the following basis:
Non-compete agreements The “With and Without” method under the Income ApproachBrandnames The Relief from Royalty method under the Income Approach
Non-compete agreements were entered into by the Group with the relevant vendors in the relevant sale and purchase agreements that govern the non-competition activities by the relevant vendors upon business combinations with periods of time applied to amortise the relevant non-compete agreements.
Brandnames, representing the registered names of chains of retail stores of sportswear products and footwear products, were registered with the relevant vendors at the time of the acquisitions and whose titles were legally transferred to the Group upon completion of the relevant transactions. The Group considers the brandnames offer recognisability, profitability, versatility and an identification with positive attributes that distinguish itself from the competitors.
In estimating the fair values of the intangible assets on initial recognition, the present values of the net cash flows attributable to the intangible assets were determined using a discount rate of 14%. Other key assumptions used in the calculations related to the estimation of cash inflows/outflows which included budgeted sales and gross margin. Such estimation was based on the past performance of Yichuan and its subsidiaries and management’s expectations for the market development.
The brandnames are considered by the management of the Group as having an indefinite useful lives because they are expected to contribute to net cash inflows to the Group indefinitely. They are tested for impairment annually and whenever there is an indication that they may have been impaired. Particulars of the impairment testing are disclosed in Note 18.
17. Goodwill
US$’000
COSTAt 1st October, 2009 and 30th September, 2010 218,607Arising on acquisition of subsidiaries (Note 41B) 14,604
At 30th September, 2011 233,211
Particulars regarding impairment testing on goodwill are disclosed in Note 18.

96 / Yue Yuen Industrial (Holdings) Limited / Annual Report 2011
Notes to the Consolidated Financial StatementsFor the Year ended 30th September, 2011
18. Impairment Testing on Goodwill and Brandnames With Indefinite Useful LivesFor the purposes of impairment testing, the carrying value of brandnames and goodwill with indefinite useful lives as detailed in Notes 16 and 17, respectively, have been allocated to three groups of CGUs, as follows:
Goodwill Brandnames
2011 2010 2011 2010US$’000 US$’000 US$’000 US$’000
Manufacture and marketing of footwear materials (“Unit A”) 182,127 182,127 – –
Manufacture and marketing of sports apparel (“Unit B”) 5,724 5,724 – –
Retail sales of footwear and apparel (“Unit C”) 45,360 30,756 73,063 32,408
233,211 218,607 73,063 32,408
Management of the Group determined that there were no impairments in any of its CGUs containing goodwill and brandnames during the year ended 30th September, 2011. The basis of the recoverable amounts of the above CGUs and their principal underlying assumptions are summarised below:
The recoverable amounts of the above CGUs have been determined based on a value in use calculation. That calculation uses cash flow projections based on financial budgets approved by management covering a five-year period, and discount rates of 15%, 15% and 14% (2010: 18%, 15% and 13%) for Unit A, Unit B and Unit C respectively. The cash flows for the next five years are extrapolated using a steady growth rate of 2%, 4% and 3% (2010: 4%, 4% and 3%) for Unit A, Unit B and Unit C respectively. These growth rates are based on the forecasts of the relevant industries and do not exceed their average long-term growth rate. Other key assumptions for the value in use calculations included budgeted sales and gross margins and their related cash inflows and outflows patterns, estimated based on the units’ historical performance and management’s expectation of the market development. Management believes that any reasonably possible change in any of these assumptions would not cause the recoverable amounts of Unit A, Unit B and Unit C to fall below their respective carrying amounts.
19. Investments in Associates
2011 2010US$’000 US$’000
Cost of investments in associates (note i):Listed in Hong Kong 52,647 52,647Listed in Taiwan 88,053 88,053Unlisted 120,172 108,894
Share of post-acquisition profits and reserves, net of dividends received 123,605 101,502Less: impairment losses (note ii) (1,800) (1,300)
382,677 349,796
Fair value of listed investments (note iii) 158,913 247,346

/ 97
19. Investments in Associates (continued)Details of the Group’s principal associates at 30th September, 2011 and 2010 are set out in Note 52.
notes:
(i) Included in cost of investments is goodwill of approximately US$81,785,000 (2010: US$81,785,000) and the movements
thereon are as follows:
US$’000
COST
At 1st October, 2009 80,242
Addition 1,543
At 30th September, 2010 and 30th September, 2011 81,785
(ii) During the year ended 30th September, 2011, impairment losses of approximately US$500,000 (2010: US$1,300,000)
were recognised in profit or loss in respect of the Group’s interests in certain associates. The recoverable amounts of the
relevant associates were estimated by reference to their respective expected disposal proceeds from the joint venture
partners of the relevant associates from their anticipated disposals after the end of the reporting period.
(iii) As at 30th September, 2011, the fair value of listed investments was below the corresponding carrying value. Impairment
loss has not been provided because the Group has estimated the present value of its share of the estimated future cash
flows expected to be generated from these listed associates. In addition, the fair value of listed investments was increased
and was above their carrying values subsequent to the end of the reporting period.
The summary financial information in respect of the Group’s associates is set out below:
2011 2010US$’000 US$’000
Total assets 2,362,650 1,968,045Total liabilities (1,312,261) (1,016,349)
Net assets 1,050,389 951,696
The Group’s share of net assets of associates 302,692 269,311
Turnover 2,911,585 2,358,773
Profit for the year 108,482 106,276
The Group’s share of results of associates for the year 35,355 39,790

98 / Yue Yuen Industrial (Holdings) Limited / Annual Report 2011
Notes to the Consolidated Financial StatementsFor the Year ended 30th September, 2011
19. Investments in Associates (continued)The Group has discontinued recognition of its share of losses of certain associates. The amounts of unrecognised share of results of these associates, extracted from the relevant management accounts of the associates, both for the year and cumulatively, are as follows:
2011 2010US$’000 US$’000
Unrecognised share of profits of associates for the year (70) (846)
Accumulated unrecognised share of losses of associates 5,353 5,423
20. Amounts Due From AssociatesIncluded in the balance are loans of US$7,536,000 (2010: US$7,659,000) receivable from associates which are secured over the equity interests in relevant associates held by the other majority shareholders. These loans have no fixed repayment terms and they carry interest at the lending rate quoted by the People’s Bank of China (“PBOC”).
The other amounts included in the balance are unsecured, interest-free and have no fixed repayment terms.
Before offering any new loans to associates, the Group will assess the associates’ credit quality and the intended usages of the loans by the associates. The recoverability of the loans is reviewed throughout the year. In the opinion of the directors, the associates are of good credit quality. At 30th September, 2011, the loans was neither past due nor impaired.
All the amounts are not expected to be repaid within one year and are therefore classified as non-current.
21. Investments in Jointly Controlled Entities/Deposit Paid for Acquisition of the Remaining Interest in a Jointly Controlled Entity
2011 2010US$’000 US$’000
Cost of unlisted investments in jointly controlled entities (notes i & ii) 194,907 201,121Share of post-acquisition profits and reserves, net of dividends received 161,640 145,071Less: impairment losses (note iii) (4,394) (4,494)
352,153 341,698
Deposit paid for acquisition of the remaining interest in a jointly controlled entity (note iv) 1,219 19,223
Details of the Group’s principal jointly controlled entities at 30th September, 2011 and 2010 are set out in Note 53.
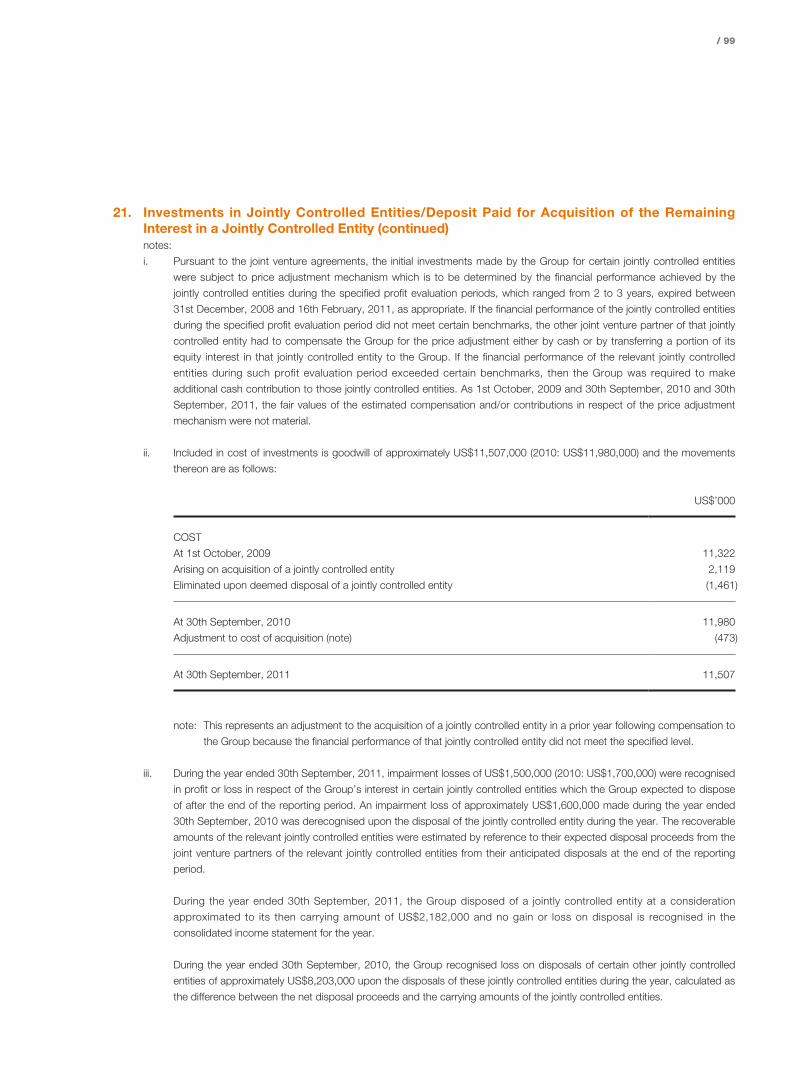
/ 99
21. Investments in Jointly Controlled Entities/Deposit Paid for Acquisition of the Remaining Interest in a Jointly Controlled Entity (continued)notes:
i. Pursuant to the joint venture agreements, the initial investments made by the Group for certain jointly controlled entities
were subject to price adjustment mechanism which is to be determined by the financial performance achieved by the
jointly controlled entities during the specified profit evaluation periods, which ranged from 2 to 3 years, expired between
31st December, 2008 and 16th February, 2011, as appropriate. If the financial performance of the jointly controlled entities
during the specified profit evaluation period did not meet certain benchmarks, the other joint venture partner of that jointly
controlled entity had to compensate the Group for the price adjustment either by cash or by transferring a portion of its
equity interest in that jointly controlled entity to the Group. If the financial performance of the relevant jointly controlled
entities during such profit evaluation period exceeded certain benchmarks, then the Group was required to make
additional cash contribution to those jointly controlled entities. As 1st October, 2009 and 30th September, 2010 and 30th
September, 2011, the fair values of the estimated compensation and/or contributions in respect of the price adjustment
mechanism were not material.
ii. Included in cost of investments is goodwill of approximately US$11,507,000 (2010: US$11,980,000) and the movements
thereon are as follows:
US$’000
COST
At 1st October, 2009 11,322
Arising on acquisition of a jointly controlled entity 2,119
Eliminated upon deemed disposal of a jointly controlled entity (1,461)
At 30th September, 2010 11,980
Adjustment to cost of acquisition (note) (473)
At 30th September, 2011 11,507
note: This represents an adjustment to the acquisition of a jointly controlled entity in a prior year following compensation to
the Group because the financial performance of that jointly controlled entity did not meet the specified level.
iii. During the year ended 30th September, 2011, impairment losses of US$1,500,000 (2010: US$1,700,000) were recognised
in profit or loss in respect of the Group’s interest in certain jointly controlled entities which the Group expected to dispose
of after the end of the reporting period. An impairment loss of approximately US$1,600,000 made during the year ended
30th September, 2010 was derecognised upon the disposal of the jointly controlled entity during the year. The recoverable
amounts of the relevant jointly controlled entities were estimated by reference to their expected disposal proceeds from the
joint venture partners of the relevant jointly controlled entities from their anticipated disposals at the end of the reporting
period.
During the year ended 30th September, 2011, the Group disposed of a jointly controlled entity at a consideration
approximated to its then carrying amount of US$2,182,000 and no gain or loss on disposal is recognised in the
consolidated income statement for the year.
During the year ended 30th September, 2010, the Group recognised loss on disposals of certain other jointly controlled
entities of approximately US$8,203,000 upon the disposals of these jointly controlled entities during the year, calculated as
the difference between the net disposal proceeds and the carrying amounts of the jointly controlled entities.

100 / Yue Yuen Industrial (Holdings) Limited / Annual Report 2011
Notes to the Consolidated Financial StatementsFor the Year ended 30th September, 2011
21. Investments in Jointly Controlled Entities/Deposit Paid for Acquisition of the Remaining Interest in a Jointly Controlled Entity (continued)notes: (continued)
iv. The entire amount as at 30th September, 2011 represented the deposit paid for acquisition of the remaining 55% of the
issued share capital of a jointly controlled entity, Hebei Zhanxin Sports Development Company Limited (“Zhanxi”) not
already held by the Group by exercising the JV Call Options granted by the Relevant Partners (as defined in Note 25a) of
Zhanxin. The JV Call Options were recognised on the consolidated statement of financial position of the Group as derivative
financial instruments, as set out in Note 25a. The principal activities of Zhanxin are retailing of sportswear and sports
footwear in the PRC. The acquisition was completed in November 2011, further details of which are set out in Note 50.
The entire amount as at 30th September, 2010 represented the deposit paid for acquisition of the remaining 50% of the
issued share capital of a jointly controlled entity, Yichuan not already held by the Group by exercising the JV Call Options
granted by the Relevant Partners (as defined in Note 25a) of Yichuan. The JV Call Options were recognised on the
consolidated statement of financial position of the Group as derivative financial instruments, as set out in Note 25a. The
principal activities of Yichuan are retailing of sportswear and sports footwear in the PRC. The acquisition was completed in
October 2010, further details of which are set out in Note 41.
The summary financial information in respect of the Group’s jointly controlled entities attributable to the Group’s interest therein which are accounted for using the equity method is set out below:
2011 2010US$’000 US$’000
Current assets 634,115 578,160
Non-current assets 273,689 219,758
Current liabilities (408,691) (353,274)
Non-current liabilities (98,822) (71,126)
Non-controlling interests (55,251) (39,306)
Income recognised in profit or loss 981,821 1,057,854
Expenses recognised in profit or loss (954,647) (995,175)
Profit for the year 27,174 62,679

/ 101
22. Amounts due from Jointly Controlled EntitiesIncluded in the balance are loans of US$45,878,000 (2010: US$58,042,000) receivable from certain jointly controlled entities which are secured over the equity interests in those jointly controlled entities held by the other joint venture partners. These loans have no fixed repayment terms and they carry interest at the lending rate quoted by PBOC.
The other amounts included in the balance are unsecured, interest-free and have no fixed repayment terms.
Before offering any new loans to jointly controlled entities, the Group will assess the jointly controlled entities’ credit quality and the intended usages of the loans by the jointly controlled entities. The recoverability of the loans is reviewed throughout the year. In the opinion of the directors, the jointly controlled entities are of good credit qualities based on their regular assessments of such and the absence of any default record in the past. At 30th September, 2011, the loans were neither past due nor impaired.
All the amounts are not expected to be repaid within one year and are therefore classified as non-current.
23. Long-Term Loan ReceivablesThese related to loan receivables due from certain former jointly controlled entities and an independent third party which carry variable interests ranging from 3.60% to 6.67% (2010: 5.31% to 5.4%) per annum. The Group has assessed the counter parties’ credit quality and the recoverability of these long-term loan receivables. In the opinion of the directors, the borrowers are of good credit qualities based on their regular assessments of such and the absence of any default record in the past.
2011 2010US$’000 US$’000
The loan receivables are expected to be repayable as follows:
Within one year 27,284 19,386More than one year, but not exceeding two years 7,506 9,156More than two years, but not exceeding three years 805 8,486
35,595 37,028Less: amount due within one year shown under current assets (Note 29) (27,284) (19,386)
Amount due after one year 8,311 17,642
Analysed as:Secured 9,046 32,899Unsecured 26,549 4,129
35,595 37,028
The collaterals for the secured portion of these loans are certain property, plant and equipments of the relevant entities. The Group is not permitted to sell or repledge the collaterals in the absence of default by the borrowers.

102 / Yue Yuen Industrial (Holdings) Limited / Annual Report 2011
Notes to the Consolidated Financial StatementsFor the Year ended 30th September, 2011
24. Available-for-Sale InvestmentsAvailable-for-sale investments comprise:
2011 2010US$’000 US$’000
Listed investments:– Equity securities listed in Hong Kong 12,538 4,167– Equity securities listed overseas 6,139 8,689
18,677 12,856
Unlisted investments:– Private entities 1,269 1,369– Funds 11,951 15,465
13,220 16,834
31,897 29,690
Analysed for reporting purpose as:Non-current assets 30,959 21,463Current assets 938 8,227
31,897 29,690
All the listed investments are stated at their fair value, determined by reference to bid prices quoted in active markets.
The unlisted private entities are equity issued by private entities incorporated overseas. The unlisted funds represent units in investment funds managed by financial institutions. The underlying assets of the funds comprise unlisted bonds issued by banks in the PRC and corporate entities.
All of the unlisted investments are measured at cost less impairment at the end of the reporting period because the range of reasonable fair value estimates was so significant that the directors of the Company are of the opinion that their fair values could not be measured reliably.
During the year ended 30th September, 2011, certain unlisted equity funds with carrying amount of US$8,227,000 were matured, which were previously carried at cost less impairment. No gain or loss was recognised in profit or loss. In addition, during the year ended 30th September, 2011, one of the private entities experienced significant financial difficulties and an impairment loss of US$100,000 (2010: US$900,000) was recognised in profit or loss.
The management considered that the available-for-sale investments as at the end of the reporting period, except for an unlisted fund of approximately US$938,000 (2010: US$8,227,000) which will mature within one year, are held for strategic purpose and are not to be disposed of in the foreseeable future.

/ 103
24. Available-for-Sale Investments (continued)The available-for-sale investments that are denominated in currencies other than the functional currency of the relevant group entities are set out below:
2011 2010US$’000 US$’000
Hong Kong dollars (“HKD”) 12,538 4,167New Taiwan dollars (“NTD”) 17,152 15,926Renminbi (“RMB”) 938 –
30,628 20,093
25. Derivative Financial Instruments
2011 2010Assets Liabilities Assets Liabilities
notes US$’000 US$’000 US$’000 US$’000
Derivatives:
Non-current:JV Call Options (a) 22,363 – 46,024 –
Current:HKD Call Option (b) 3 – 32,000 –Foreign currency derivatives (c) 223 13,349 2,407 2,219Embedded derivative in
convertible bonds 32 – – – 24,822
226 13,349 34,407 27,041
22,589 13,349 80,431 27,041
notes:
(a) JV Call Options
2011 2010
US$’000 US$’000
Financial assets:
Call options for acquisition of additional interests in subsidiaries,
associates and jointly controlled entities 22,363 46,024

104 / Yue Yuen Industrial (Holdings) Limited / Annual Report 2011
Notes to the Consolidated Financial StatementsFor the Year ended 30th September, 2011
25. Derivative Financial Instruments (continued)notes: (continued)
(a) JV Call Options (continued)In October, 2007, the Group entered into call option agreements with the other shareholders (the “Relevant Partners”) of certain subsidiaries, associates and jointly controlled entities (the “Relevant Companies”), pursuant to which the Group, in return for its payment of a premium to each of the Relevant Partners (the “Option Premium”), has the right (but not the obligation) exercisable at its discretion to acquire from each of the Relevant Partners their respective equity interests (the “Relevant Equity Interests”) in the Relevant Companies ( the “JV Call Options”).
The JV Call Options are exercisable within five years commencing from 6th December, 2008, the expiry of the first six months after dealing in the shares of Pou Sheng on the Stock Exchange commenced, and upon the mutual agreements between Pou Sheng and the Relevant Partners on certain conditions stipulated in the respective agreements in respect of the performance of the Relevant Companies during the pre-determined evaluation periods, such conditions were not yet fulfilled at the end of the reporting period other than those relating to Yichuan and Zhanxin.
Pursuant to the JV Call Options agreements, each of the Relevant Partners has agreed not to transfer or dispose of the Relevant Equity Interests during the JV Call Options exercisable period without the Group’s prior written consent. Furthermore, the consideration for acquiring the Relevant Equity Interests is to be determined based on the actual profit of the Relevant Companies attributable to the Relevant Partners during the pre-determined evaluation periods and the price earnings ratio of Pou Sheng during a specified period and after certain discount agreed between the Group and the Relevant Partners. The consideration is to be settled by the issue of shares in Pou Sheng at the average price during the same specified period and after deducting the Option Premium paid.
The value of each of the JV Call Options at 30th September, 2011 was valued by Savills Valuation and Professional Services Limited, an independent valuer, using the binomial model. The key inputs into the model include estimated earnings of the Relevant Companies and expected price earning ratio of Pou Sheng at the time of exercise of the options and further details are set out below.
2011 2010US$’000 US$’000
Derivative financial assets – JV Call Options:
Expected price earning ratio – Pou Sheng 12 24Expected volatility – Pou Sheng 37% 53%Expected volatility – the Relevant Companies 24% 34%Risk free rate 3.74% 2.36%Exercisable period 2.18 years 3.18 yearsExpected dividend yield Nil Nil
Expected volatility of Pou Sheng and the Relevant Companies was measured at the standard deviation of expected share price returns based on statistical analysis of average daily share prices of Pou Sheng and comparable companies with similar business of Pou Sheng over the past years.
During the year ended 30th September, 2010, the Group exercised the JV Call Options granted by the Relevant Partners of Yichuan for their Relevant Equity Interests thereof. As at the completion date of transactions, the transaction was completed in October 2010, the carrying amount of the relevant JV Call Options of approximately US$8,060,000 were derecognised and included as cost of investment in Yichuan. As set out in Note 41, the transaction was completed in October 2010 and the relevant JV Call Options was derecognised thereafter.
During the year ended 30th September, 2011, the Group exercised the JV Call Options granted by the Relevant Partners of Zhanxin for their Relevant Equity Interests thereof. The carrying amount of the relevant JV Call Options as at 30th September, 2011 was US$1,171,000. As at the completion date of the transaction, the carrying amount of the relevant call options were derecognised and included as cost of investment in Zhanxin. As set out in Note 50, the transaction was completed in November 2011 and the relevant JV Call Options was derecognised thereafter.

/ 105
25. Derivative Financial Instruments (continued)notes: (continued)
(b) HKD Call Option
On 10th March, 2008, the Company entered into a derivative contract with an independent third party (the “HKD Call
Option Issuer”) to purchase a cash-settled call option for the notional amount of approximately HK$2,100 million (equivalent
to approximately US$269,231,000) under which the Company has the right, but not the obligation, from time to time
on or after 14th March, 2008 up to 7th November, 2011, to require settlement in USD the net difference between the
market value of one share of the Company and the agreed price of HK$26.75 per share for each option exercised (“HKD
Call Option”). The total number of HKD Call Option that could be exercised by the Company is equivalent to 78,504,672
ordinary shares of HK$0.25 each in the Company. The Company paid a premium of US$27,994,000 for the HKD Call
Option.
The HKD Call Option is not an option to acquire or dispose of shares of the Company but a financial arrangement in which
the HKD Call Option Issuer was required to make a payment to the Company upon exercise of the HKD Call Options when
the share price was above the agreed price of HK$26.75. The option would be automatically exercised, if the share price
of the Company rose and remained above certain agreed levels for 30 consecutive days during the period from 17th May,
2008 to 17th November, 2011 for a range of share price level from HK$33.319 to HK$36.346. In such circumstance, the
HKD Call Option Issuer would automatically settle in USD the net difference between the market value of one share of the
Company and the agreed price of HK$26.75 per share of the Company for all the outstanding notional amount of the HKD
Call Option.
The Company could choose, or could be required by the HKD Call Option Issuer, in connection with the HKD Call Option,
to repurchase the shares of the Company, subject to the restrictions in the Listing Rules and the Hong Kong Code on
Share Repurchases and any such repurchase was to be made pursuant to the mandate to repurchase granted to the
directors of the Company at its annual general meeting, on the exercise of the HKD Call Option by the Company. Under the
mandate as approved at the annual general meeting of the Company on 4th March, 2011, the Company could repurchase
up to 164,892,848 shares of the Company.
Pursuant to the derivative contract, a number of 5,024,299 HKD call option was reduced as a result of a knock-out event
on 17th November, 2009 without consideration. The outstanding number of HKD Call Option that could be exercised by
the Company is equivalent to 73,480,373 (2010: 73,480,373) ordinary shares of HK$0.25 each in the Company. As at 30th
September, 2011, the HKD Call Option remained unexercised.
At the date of issue of the HKD Call Option, the initial premium paid of US$27,994,000 was recognised as a derivative
financial asset. At the end of the reporting period, the HKD Call Option was fair valued at approximately US$3,000 (2010:
US$32,000,000). The change in fair value of approximately US$31,997,000 (2010: US$19,853,000) has been accounted
for in the consolidated income statement for the year ended 30th September, 2011.
The inputs used in the Monis Model adopted by the management in determining the fair value of the HKD Call Option at
the end of the reporting period are as follows:
2011 2010
Share price HK$20.35 HK$28.75
Exercise price HK$26.75 HK$26.75
Expected dividend yield 4.4% 3.1%Volatility 33% 26%

106 / Yue Yuen Industrial (Holdings) Limited / Annual Report 2011
Notes to the Consolidated Financial StatementsFor the Year ended 30th September, 2011
25. Derivative Financial Instruments (continued)notes: (continued)(c) Foreign currency derivatives
2011 2010Assets Liabilities Assets Liabilities
notes US$’000 US$’000 US$’000 US$’000
Foreign currency derivatives:Forward contracts (i) 223 – 1,583 –Currency structured forward contracts (ii) – 13,349 824 2,219
223 13,349 2,407 2,219
notes:(i) Forward contracts
Major terms of foreign currency forward contracts are as below:
Aggregate notional amount Maturity Forward exchange rates
As at 30th September, 2011
US$11 million From October 2011 to January 2012 Sell USD/buy RMB at 6.5104 to 6.5454
As at 30th September, 2010
US$170 million From October 2010 to August 2011 Sell USD/buy RMB at 6.6790 to 6.8057
US$14 million From October 2010 to November 2010 Sell RMB/buy USD at 6.5995 to 6.6700
At the end of the reporting period, the fair values of the above forward contracts were determined based on valuations provided by counterparty banks using valuation techniques.
(ii) Currency structured forward contractsThe Group has entered into one USD/HKD structured forward contract which gives the Group the opportunities to receive variable USD amount per month if the market exchange rate ranges from 7.75 to 7.85 on the fixing date. However, the Group is obliged to buy USD/sell HKD at a fixed exchange rate of 7.75 if the market exchange rate is below 7.75, or to buy HKD/sell USD at a fixed exchange rate of 7.85 if the market exchange rate is above 7.85 for a maximum of US$14 million per month for a maximum period of 24 months. As of 30th September, 2011, the remaining maximum tenor of the contract was 7 months. However the contract is subject to knock-out under which the contract will terminate if the accumulative gains to the Group have exceeded a specified amount.
In addition, during the year ended 30th September, 2011, the Group also entered into a number of net-settled USD/RMB structured forward contracts which give the Group the opportunities to sell USD/buy RMB at rates which are better than the market plain forward rates prevailing on the trade dates of the transactions by means of receiving fixed or variable USD amounts per month under certain RMB exchange rate scenario. However, the Group is obliged to sell USD/buy RMB for certain specified amounts at rates less favourable than the then prevailing market spot rates under certain scenario of depreciation of RMB against USD beyond certain levels. As of 30th September, 2011, the theoretical maximum total notional amounts (only under the RMB depreciation scenario as mentioned above) of the outstanding USD/RMB structured forward contracts were US$984 million covering monthly settlements up to September 2013, which is less than the Group’s forecast RMB needs for the period. There are also knock out features for most contracts under which the contracts will terminate earlier under certain conditions.

/ 107
25. Derivative Financial Instruments (continued)notes: (continued)(c) Foreign currency derivatives (continued)
notes: (continued)(ii) Currency structured forward contracts (continued)
At the end of the reporting period, the fair values of the above currency structured forward contracts were determined based on valuation provided by the counterparty banks using valuation techniques.
The derivative financial instruments that are denominated in a currency other than the functional currency of the relevant group entities are set out below:
2011 2010Assets Liabilities Assets Liabilities
US$’000 US$’000 US$’000 US$’000
HKD – – – 24,822
26. Pledged Bank Deposits/Bank Balances and CashThe pledged bank deposits are placed with a bank for certain banking facilities granted to a former subsidiary of the Group. The pledged bank deposits will be released upon the settlement or termination of the relevant banking facilities.
The bank balances and short-term bank deposits are interest-bearing at market interest rate and are with an original maturity of three months or less. The bank deposits carry interest at rates ranged from 0.01% to 3.30% (2010: 0.01% to 2.35%) per annum during the year.
The bank balances and cash that are denominated in currencies other than the functional currency of the relevant group entities are set out below:
2011 2010US$’000 US$’000
USD 25,884 23,950RMB 222,484 74,975HKD 13,817 11,043NTD 2,885 1,296Vietnamese Dong (“VND”) 5,146 2,481Indonesian Rupiah (“IDR”) 10,838 5,521
281,054 119,266
27. Deposit Paid for Proposed Acqusition of A BusinessOn 30th September, 2011, the Group entered into a non-legally binding letter of intent with Shanghai Pengda Sports Goods Company Limited (“Pengda”), an independent third party, pursuant to which the Group would acquire, subject to completion of the due diligence, negotiations and the entering into a formal agreement, the tangible assets (including but not limited to the shop operating assets, property, plant and equipment and inventories) and intangible assets (including but not limited to non-competing agreements and customer relationships) in the sportswear retailing business in the PRC owned by Pengda and its related parties. The entire balance as at 30th September, 2011 arose during the year represents a refundable deposit paid to Pengda while the Group conducts the due diligence. No such balance is recognised as at 30th September, 2010.

108 / Yue Yuen Industrial (Holdings) Limited / Annual Report 2011
Notes to the Consolidated Financial StatementsFor the Year ended 30th September, 2011
28. Inventories
2011 2010US$’000 US$’000
Raw materials 338,038 232,918Work in progress 156,398 133,950Finished goods 593,459 409,271
1,087,895 776,139
29. Trade and Other Receivables
2011 2010US$’000 US$’000
Trade and bills receivables 786,946 724,151Less: allowance for doubtful debts (4,867) (3,721)
782,079 720,430Other receivables (note i) 156,379 156,637Rental deposits, unamortised mould costs and prepayments 119,719 110,190Deposits paid to suppliers 33,532 44,238Value-added tax recoverable 25,679 27,003Loan receivables (Note 23) 27,284 19,386Consideration receivable for disposal of subsidiaries (Note 41) 7,397 25,027Consideration receivable for disposal of a jointly controlled entity (note ii) – 6,404
1,152,069 1,109,315
notes:
(i) Included in other receivables are amounts due from associates, jointly controlled entities and connected parties
of US$22,804,000 (2010: US$36,293,000), US$15,246,000 (2010: US$24,096,000) and US$7,904,000 (2010:
US$9,689,000), respectively. The amounts relate to current accounts which are unsecured, non-interest bearing and
repayable on demand. The remaining balance represents mainly the deposits paid for other purchases and advances to
suppliers for purchase of materials.
(ii) The balance at 30 September, 2010, amount represents the consideration receivable from the buyer of the interests in a
jointly controlled entity which was disposed of by the Group. The amount was unsecured, non-interest bearing and fully
settled in current year.

/ 109
29. Trade and Other Receivables (continued)The Group allows credit period ranging from 30 days to 90 days which are agreed with each of its trade customers. Included in trade and other receivables are trade and bills receivables, net of allowance for doubtful debts, of approximately US$782,079,000 (2010: US$720,430,000) and an aged analysis based on invoice date at the end of the reporting period is as follows:
2011 2010US$’000 US$’000
0 to 30 days 576,200 505,50831 to 90 days 188,892 200,036Over 90 days 16,987 14,886
782,079 720,430
Before accepting any new customer, the Group assesses the potential customer’s credit quality and defines credit limits by customer. Limits attributed to customers are reviewed twice a year. Majority of the trade receivables that are neither past due nor impaired have no default payment history.
Included in the Group’s trade receivable balance are debtors with an aggregate carrying amount of approximately US$23,891,000 (2010: US$17,450,000) which were past due at the end of the reporting period but for which the Group has not provided for impairment loss because management is of the opinion that the fundamental credit quality of these customers has not deteriorated. The Group does not hold any collateral over these balances. The average age of these receivables is approximately 90 days (2010: 90 days).
Movement in the allowance account for doubtful debts during the year are as follows:
2011 2010US$’000 US$’000
Balance at beginning of the year 3,721 3,952Impairment losses recognised on receivables 2,206 422Amounts recovered during the year (1,060) (653)
Balance at end of the year 4,867 3,721
Included in the allowance for doubtful debts are individually impaired trade receivables with an aggregate balance of approximately US$4,867,000 (2010: US$3,721,000) which have either been placed under liquidation or in severe financial difficulties. The impairment recognised represents the difference between the carrying amount of the specific trade receivable and the present value of the expected recoverable amount. The Group does not hold any collateral over these balances.

110 / Yue Yuen Industrial (Holdings) Limited / Annual Report 2011
Notes to the Consolidated Financial StatementsFor the Year ended 30th September, 2011
29. Trade and Other Receivables (continued)The trade and other receivables that are denominated in currencies other than the functional currency of the relevant group entities are set out below:
2011 2010US$’000 US$’000
USD 1,765 742RMB 36,628 9,045HKD 10,753 8,347NTD 11,587 9,879VND 24,932 27,217IDR 7,446 6,916
93,111 62,146
30. Trade and Other Payables
2011 2010US$’000 US$’000
Trade and bills payables 537,680 440,538Accrued staff costs and bonus and other accruals 295,318 230,908Other payables (note i) 138,368 136,603Construction payable 53,606 65,945Receipts in advance from customers 42,703 23,437Deposits received for sale of properties (Note 42(c)) 34,029 –Consideration payable for acquisition of subsidiaries 3,280 –Consideration payable for acquisition of additional interests in subsidiaries
(note ii) 2,698 –Royalty payables 1,769 1,435
1,109,451 898,866
notes:
(i) Included in other payables are amounts due to associates, jointly controlled entities and connected parties of
US$2,474,000 (2010: US$4,454,000), US$1,030,000 (2010: US$1,082,000) and US$20,913,000 (2010: US$21,882,000),
respectively. The amounts relate to current accounts which are unsecured, non-interest bearing and repayable on demand.
The remaining balances represented mainly deposits received from customers and value-added tax payables.
(ii) Amount as at 30th September, 2011 represents the consideration payable to the vendors for the acquisition of
additional interests in certain non-wholly owned subsidiaries not yet owned by the Group during the year. The aggregate
consideration for the acquisition is US$7,123,000, of which the excess of US$3,345,000 of the difference between the
amount by which the non-controlling interest are adjusted and the fair value of the consideration paid is recognised directly
in other reserve in the consolidated statement of changes in equity.

/ 111
30. Trade and Other Payables (continued)Included in trade and other payables are trade and bills payables of approximately US$537,680,000 (2010: US$440,538,000) and an aged analysis based on the invoice date at the end of the reporting period is as follows:
2011 2010US$’000 US$’000
0 to 30 days 400,002 331,71831 to 90 days 112,925 87,154Over 90 days 24,753 21,666
537,680 440,538
The credit period on purchases of goods ranged from 30 to 90 days. The Group has financial risk management policies in place to ensure that all payables are settled within the credit timeframe.
The trade and other payables that are denominated in currencies other than the functional currency of the relevant group entities are set out below:
2011 2010US$’000 US$’000
USD 75 203RMB 83,555 49,854HKD 22,589 17,892NTD 25,682 29,094VND 8,953 7,967IDR 9,640 7,414
150,494 112,424
31. Bank Borrowings
2011 2010US$’000 US$’000
Current portion of long-term bank borrowings (Note 33) 72,975 16,284Carrying amount of bank borrowings that are not repayable within one year
from the end of reporting period but contain a repayment on demand clause – 16,197Short-term bank borrowings 380,976 193,837
Amount classified as current liabilities 453,951 226,318
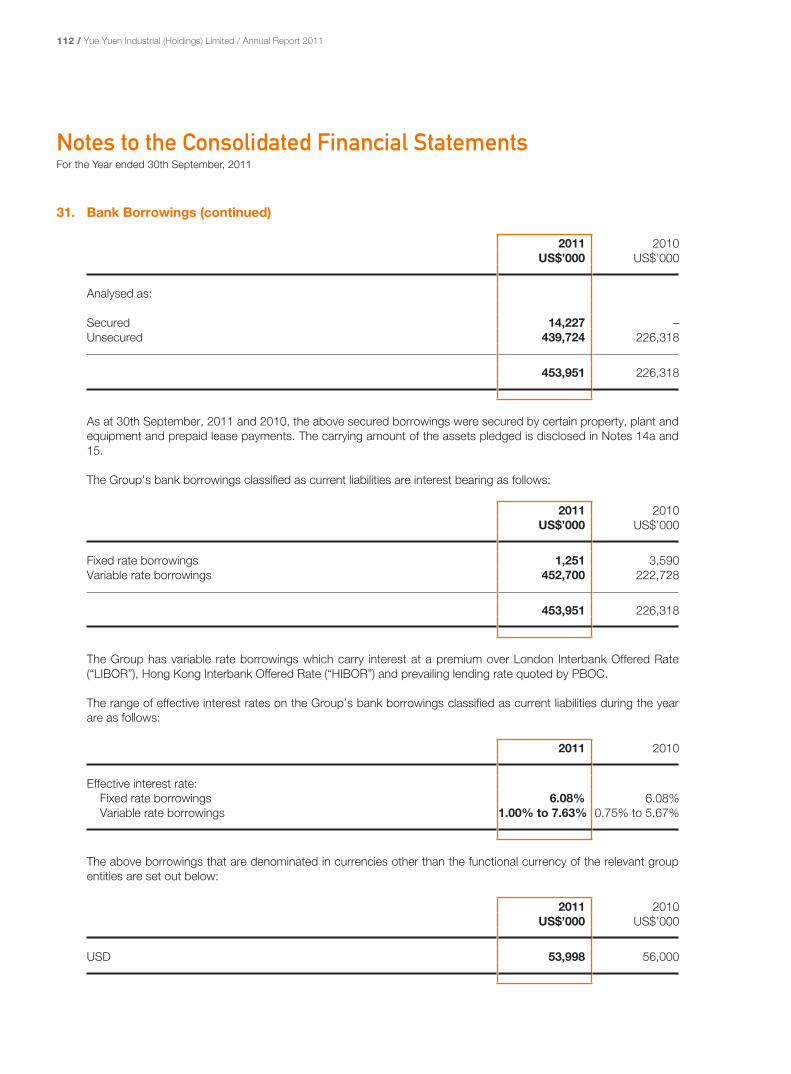
112 / Yue Yuen Industrial (Holdings) Limited / Annual Report 2011
Notes to the Consolidated Financial StatementsFor the Year ended 30th September, 2011
31. Bank Borrowings (continued)
2011 2010US$’000 US$’000
Analysed as:
Secured 14,227 –Unsecured 439,724 226,318
453,951 226,318
As at 30th September, 2011 and 2010, the above secured borrowings were secured by certain property, plant and equipment and prepaid lease payments. The carrying amount of the assets pledged is disclosed in Notes 14a and 15.
The Group’s bank borrowings classified as current liabilities are interest bearing as follows:
2011 2010US$’000 US$’000
Fixed rate borrowings 1,251 3,590Variable rate borrowings 452,700 222,728
453,951 226,318
The Group has variable rate borrowings which carry interest at a premium over London Interbank Offered Rate (“LIBOR”), Hong Kong Interbank Offered Rate (“HIBOR”) and prevailing lending rate quoted by PBOC.
The range of effective interest rates on the Group’s bank borrowings classified as current liabilities during the year are as follows:
2011 2010
Effective interest rate:Fixed rate borrowings 6.08% 6.08%Variable rate borrowings 1.00% to 7.63% 0.75% to 5.67%
The above borrowings that are denominated in currencies other than the functional currency of the relevant group entities are set out below:
2011 2010US$’000 US$’000
USD 53,998 56,000

/ 113
32. Convertible Bonds(i) Convertible bonds
Zero Coupon Convertible Bonds due 2011 (“CB 2011”)On 20th October and 2nd November, 2006, the Company issued CB 2011 with an aggregate principal sum of HK$2,100 million (equivalent to approximately US$270 million) which are listed on the Stock Exchange. CB 2011 did not bear interest.
CB 2011 was convertible at the option of the holders into ordinary shares of HK$0.25 each in the Company, at a conversion price of HK$26.75 per share, subject to anti-dilutive adjustments, at any time on or after 27th December, 2006 up to and including 7th November, 2011.
On 17th November, 2009, an aggregate principal sum of HK$134,400,000 (equivalent to approximately US$17,343,000) was redeemed by the Company upon the request of the bondholders at an aggregate consideration of HK$144,800,000 (equivalent to approximately US$18,684,000). A loss of US$460,000 was charged to the consolidated income statement on the partial redemption.
Unless previously redeemed, converted or purchased, CB 2011 was to be redeemed by the Company at 113.227 per cent of their principal amount on 17th November, 2011.
In addition, all but not some of CB 2011 could be redeemed at the option of the bondholders upon (i) a delisting the Company’s shares on the Stock Exchange or (ii) the occurrence of a change of control as defined in the CB 2011 agreement.
At 30th September, 2011, the liability component of CB 2011 with a carrying amount of US$283,377,000 (2010: US$268,649,000) and principal amount of HK$1,965,600,000 (2010: HK$1,965,600,000), equivalent to approximately US$252 million (2010: US$252 million) remained outstanding.
At 30th September, 2011, the fair value of CB 2011 based on quoted ask price was US$282,957,000 (2010: US$302,667,000).
The movement of the liability component of the convertible bonds for the year ended 30th September, 2011 is set out below:
2011 2010US$’000 US$’000
At the beginning of the year 268,649 271,337Effective interest expenses 15,882 15,142Partial redemption of CB 2011 – (17,496)Exchange difference (1,154) (334)
At the end of the year 283,377 268,649Less: amount included in current liabilities (283,377) –
Amount due after one year – 268,649
During the year ended 30th September, 2011, the effective interest rate of CB 2011 was 5.93% (2010: 5.93%).
On 17th November, 2011, CB 2011 was redeemed by the Company as set out in Note 50.

114 / Yue Yuen Industrial (Holdings) Limited / Annual Report 2011
Notes to the Consolidated Financial StatementsFor the Year ended 30th September, 2011
32. Convertible Bonds (continued)(ii) Derivative financial instruments
2011 2010US$’000 US$’000
Derivatives embedded in CB 2011:At the beginning of the year 24,822 10,568Partial redemption of CB 2011 – (728)Exchange realignment (54) 31Change in fair value (24,768) 14,951
At the end of the year – 24,822
The conversion option derivative embedded in CB 2011 was fair valued at the end of the reporting periods. The change in fair value was recognised in the consolidated income statement.
The inputs used in the Monis Model adopted by the management in determining the fair values of the derivatives embedded in CB 2011 at the end of the reporting period are as follows:
2011 2010
Share price HK$20.35 HK$28.75Exercise price HK$26.75 HK$26.75Expected dividend yield 4.4% 3.1%Volatility 33% 26%
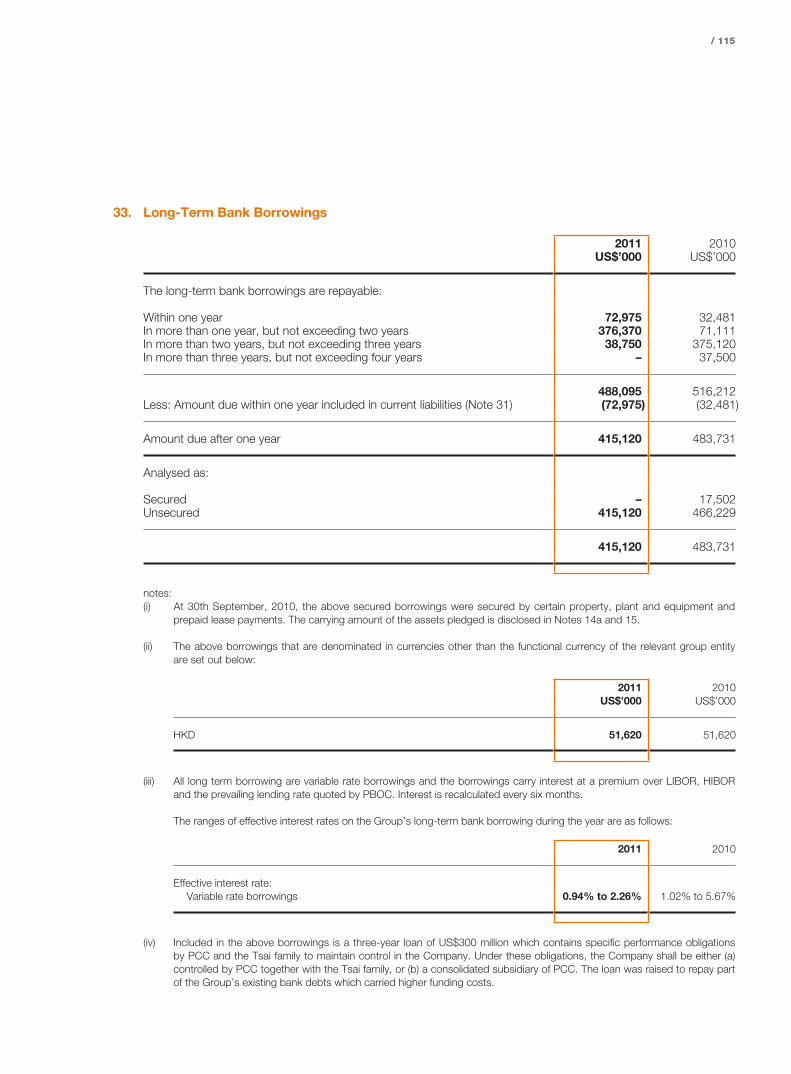
/ 115
33. Long-Term Bank Borrowings
2011 2010US$’000 US$’000
The long-term bank borrowings are repayable:
Within one year 72,975 32,481In more than one year, but not exceeding two years 376,370 71,111In more than two years, but not exceeding three years 38,750 375,120In more than three years, but not exceeding four years – 37,500
488,095 516,212Less: Amount due within one year included in current liabilities (Note 31) (72,975) (32,481)
Amount due after one year 415,120 483,731
Analysed as:
Secured – 17,502Unsecured 415,120 466,229
415,120 483,731
notes:(i) At 30th September, 2010, the above secured borrowings were secured by certain property, plant and equipment and
prepaid lease payments. The carrying amount of the assets pledged is disclosed in Notes 14a and 15.
(ii) The above borrowings that are denominated in currencies other than the functional currency of the relevant group entity are set out below:
2011 2010US$’000 US$’000
HKD 51,620 51,620
(iii) All long term borrowing are variable rate borrowings and the borrowings carry interest at a premium over LIBOR, HIBOR and the prevailing lending rate quoted by PBOC. Interest is recalculated every six months.
The ranges of effective interest rates on the Group’s long-term bank borrowing during the year are as follows:
2011 2010
Effective interest rate:Variable rate borrowings 0.94% to 2.26% 1.02% to 5.67%
(iv) Included in the above borrowings is a three-year loan of US$300 million which contains specific performance obligations by PCC and the Tsai family to maintain control in the Company. Under these obligations, the Company shall be either (a) controlled by PCC together with the Tsai family, or (b) a consolidated subsidiary of PCC. The loan was raised to repay part of the Group’s existing bank debts which carried higher funding costs.

116 / Yue Yuen Industrial (Holdings) Limited / Annual Report 2011
Notes to the Consolidated Financial StatementsFor the Year ended 30th September, 2011
34. Deferred TaxationThe major deferred tax liabilities (assets) recognised and movements thereon during the current and prior years are as follows:
Accelerated tax
depreciation
Revaluation of investment
properties
Undistributed earnings of
PRC entities
Fair value adjustments of intangible
assets on business
combinations Tax losses TotalUS$’000 US$’000 US$’000 US$’000 US$’000 US$’000
(note)
At 1st October, 2009 3,495 2,742 4,458 18,422 (1,215) 27,902Charged (credited) to profit or loss 43 161 – (1,185) (1,078) (2,059)
At 30th September, 2010 3,538 2,903 4,458 17,237 (2,293) 25,843(Credited) charged to profit or loss (267) 725 (272) (1,537) 315 (1,036)Charged to other comprehensive income – 173 – – – 173Acquired on acquisition of subsidiaries
(Note 41B) – – – 10,517 – 10,517
At 30th September, 2011 3,271 3,801 4,186 26,217 (1,978) 35,497
note: These entities include subsidiaries, associates and jointly controlled entities.
The following is the analysis of the deferred tax balances for financial reporting purpose:
2011 2010US$’000 US$’000
Deferred tax assets (1,978) (2,293)Deferred tax liabilities 37,475 28,136
35,497 25,843
At the end of the reporting period, the Group had unused tax losses of approximately US$120.3 million (2010: US$101.7 million). A deferred tax asset has been recognised in respect of such tax losses of approximately US$7.9 million (2010: US$9.2 million). No deferred tax asset has been recognised in respect of the remaining tax losses of US$112.4 million (2010: US$92.5 million) due to the unpredictability of future profit streams. Included in unrecognised tax losses are losses of US$48.8 million (2010: US$45.8 million) that will expire between 2012 and 2015 as follows, other tax losses may be carried forward indefinitely.

/ 117
34. Deferred Taxation (continued)The unused tax losses will expire as follows:
2011 2010US$’000 US$’000
2012 6,357 7,4352013 4,613 9,8452014 19,752 28,5242015 18,123 –
48,845 45,804
Deferred taxation has not been provided in respect of certain undistributed earnings of the Group’s PRC subsidiaries arising after 1st January, 2008, because the Group is able to control the timing of the reversal of the temporary differences and it is probable that the temporary differences will not reverse in the foreseeable future.
At the end of the reporting period, the aggregate amount of undistributed earnings of the Group’s PRC subsidiaries in respect of which the Group has not provided for dividend withholding tax was approximately US$246.4 million (2010: US$181.0 million).
There was no other significant unprovided deferred taxation for the year or at the end of the reporting period.
35. Share Capital
No. of shares HK$’000
Authorised:Ordinary shares of HK$0.25 each:
At 1st October, 2009, 30th September, 2010 and 30th September, 2011 2,000,000,000 500,000
Issued and fully paid:Ordinary shares of HK$0.25 each:
At 1st October, 2009, 30th September, 2010 and 30th September, 2011 1,648,928,486 412,232
US$’000
Shown in the consolidated financial statements as at 30th September, 2010 and 30th September, 2011 53,211
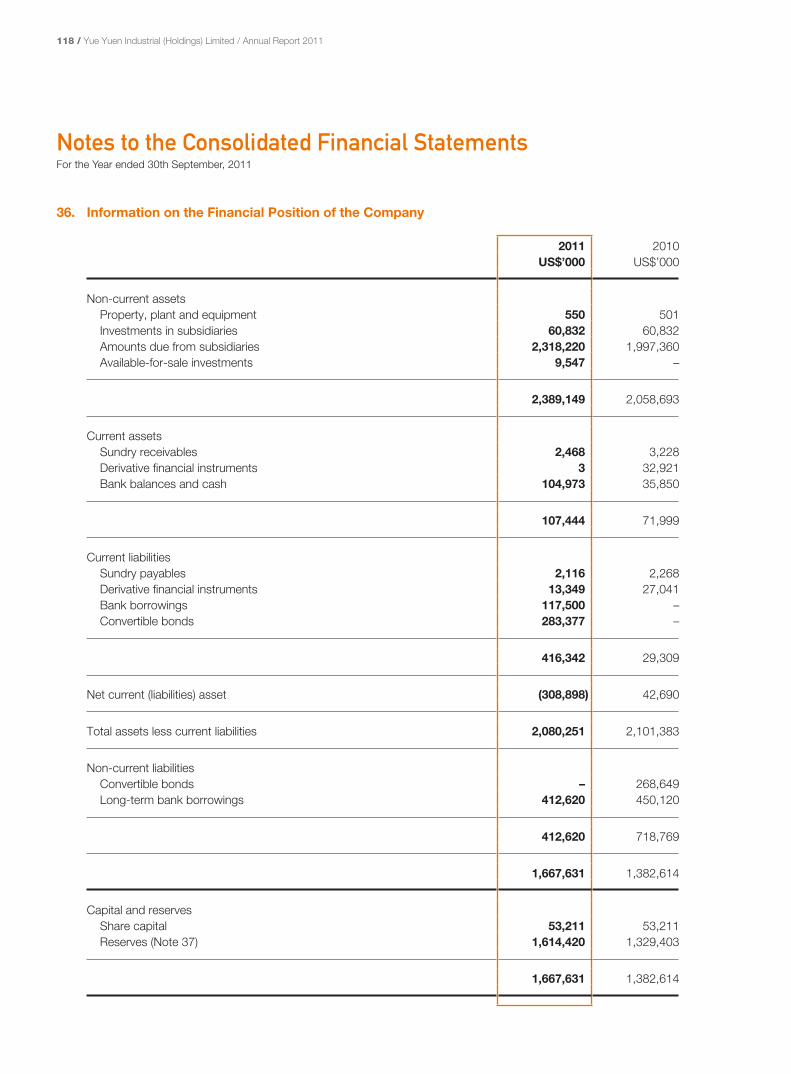
118 / Yue Yuen Industrial (Holdings) Limited / Annual Report 2011
Notes to the Consolidated Financial StatementsFor the Year ended 30th September, 2011
36. Information on the Financial Position of the Company
2011 2010US$’000 US$’000
Non-current assetsProperty, plant and equipment 550 501Investments in subsidiaries 60,832 60,832Amounts due from subsidiaries 2,318,220 1,997,360Available-for-sale investments 9,547 –
2,389,149 2,058,693
Current assetsSundry receivables 2,468 3,228Derivative financial instruments 3 32,921Bank balances and cash 104,973 35,850
107,444 71,999
Current liabilitiesSundry payables 2,116 2,268Derivative financial instruments 13,349 27,041Bank borrowings 117,500 –Convertible bonds 283,377 –
416,342 29,309
Net current (liabilities) asset (308,898) 42,690
Total assets less current liabilities 2,080,251 2,101,383
Non-current liabilitiesConvertible bonds – 268,649Long-term bank borrowings 412,620 450,120
412,620 718,769
1,667,631 1,382,614
Capital and reservesShare capital 53,211 53,211Reserves (Note 37) 1,614,420 1,329,403
1,667,631 1,382,614

/ 119
37. Reserves of the Company
Share premium
Contributed surplus
Other reserve
Investment revaluation
reserveRetained
profits TotalUS$’000 US$’000 US$’000 US$’000 US$’000 US$’000
At 1st October, 2009 695,536 38,126 25,394 – 558,669 1,317,725Profit for the year – – – – 182,155 182,155Issue of call option – – 18,272 – – 18,272Dividends (Note 11) – – – – (188,749) (188,749)
At 30th September, 2010 695,536 38,126 43,666 – 552,075 1,329,403Profit for the year – – – – 474,538 474,538Gain on fair value change
of investments – – – 1,052 – 1,052Dividends (Note 11) – – – – (190,573) (190,573)
At 30th September, 2011 695,536 38,126 43,666 1,052 836,040 1,614,420
The contributed surplus of the Company represents the difference between the aggregate net tangible assets of the subsidiaries acquired by the Company under a corporate reorganisation in 1992 and the nominal amount of the Company’s shares issued for the acquisition.
38. Share-Based Payment TransactionsThe Company and Pou Sheng, a listed subsidiary of the Company, operate share incentive schemes, particulars of which are set out below.
(i) Share option scheme of the CompanyThe Company’s share option scheme (the “Scheme”) was adopted pursuant to a resolution passed on 27th February, 2009 for the primary purpose to attract and retain personnel, to provide incentives to eligible participants to work towards enhancing the value of the Company and its shares for the benefit of the Company and its shareholders as a whole, and will expire on 26th February, 2019. Under the Scheme, the board of directors of the Company may at its discretion grant any eligible participant, including inter alia, directors and employees of the Company and its subsidiaries, share options, as it may determine appropriate.
Without prior approval from the Company’s shareholders,
(i) the total number of shares in respect of which options may be granted under the Scheme is not permitted to exceed 10% of the shares of the Company in issue at any point in time;
(ii) the number of shares issued and to be issued in respect of which options granted and may be granted to any individual in any twelve-month period is not permitted to exceed 1% of the shares of the Company in issue at any point in time. Options granted to substantial shareholders or independent non-executive directors in excess of 0.1% of the Company’s share capital or with a value in excess of HK$5 million (equivalent to US$0.6 million) must be approved in advance by the Company’s shareholders.
120 / Yue Yuen Industrial (Holdings) Limited / Annual Report 2011
Notes to the Consolidated Financial StatementsFor the Year ended 30th September, 2011
38. Share-Based Payment Transactions (continued)(i) Share option scheme of the Company (continued)
The exercise price is to be determined by the directors of the Company, and will not be less than the highest of (i) the closing price of the Company’s shares on the date of grant, (ii) the average closing price of the Company’s shares for the five business days immediately proceeding the date of grant; and (iii) the nominal value of the Company’s share.
No option has been granted, exercised nor lapsed under the Scheme since its adoption.
(ii) Share option scheme of Pou ShengPou Sheng’s share option scheme (the “Pou Sheng Scheme”) was adopted pursuant to a resolution passed on 14th May, 2008 by Pou Sheng’s shareholders for the primary purpose to attract and retain personnel, to provide incentives to eligible participants to work towards enhancing the value of Pou Sheng and its shares for the benefit of Pou Sheng and its shareholders as a whole, and will expire on 13th May 2018. Under the Pou Sheng Scheme, the board of directors of Pou Sheng may grant options to eligible persons, including directors and employees of Pou Sheng and its subsidiaries, to subscribe for shares in Pou Sheng.
Without prior approval from Pou Sheng’s shareholders,
(i) the total number of shares in respect of which options may be granted under the Pou Sheng Scheme is not permitted to exceed 10% of the shares of Pou Sheng in issue at any point in time;
(ii) the number of shares issued and to be issued in respect of which options granted and may be granted to any individual in any twelve-month period is not permitted to exceed 1% of the shares of Pou Sheng in issue at any point in time; and
(iii) options in excess of 0.1% of Pou Sheng’s share capital or with a value in excess of HK$5 million may not be granted to substantial shareholders or independent non-executive directors.
Options are exercisable over the vesting periods to be determined by the board of directors of Pou Sheng, but in no case after the 10th anniversary of the date of grant. The exercise price is determined by the board of directors of Pou Sheng, and will not be less than the highest of (i) the closing price of Pou Sheng’s shares on the date of grant, (ii) the average closing price of Pou Sheng’s shares for the five business days immediately proceeding the date of grant; and (iii) the nominal value of Pou Sheng’s share.

/ 121
38. Share-Based Payment Transactions (continued)(ii) Share option scheme of Pou Sheng (continued)
The following table discloses movements in the share options under the Pou Sheng Scheme during the year ended 30th September, 2011:
Date of grantExercise
price Exercisable period
Number of options
outstanding at 1st
October, 2009
Granted during
the year
Lapsed/cancelled
during the year
Number of options
outstanding at 30th
September, 2010
Granted during
the year
Lapsed/cancelled
during the year
Number of options
outstanding at 30th
September, 2011
HK$
Director of Pou ShengChang Karen Yi-Fen 21.1.2010 1.62 21.1.2011-20.1.2018 – 570,000 – 570,000 – – 570,000
21.1.2010 1.62 21.1.2012-20.1.2018 – 570,000 – 570,000 – – 570,00021.1.2010 1.62 21.1.2013-20.1.2018 – 1,140,000 – 1,140,000 – – 1,140,00021.1.2010 1.62 21.1.2014-20.1.2018 – 1,520,000 – 1,520,000 – – 1,520,00020.1.2011 1.23 20.1.2012-19.1.2019 – – – – 1,250,000 – 1,250,00020.1.2011 1.23 20.1.2013-19.1.2019 – – – – 1,250,000 – 1,250,00020.1.2011 1.23 20.1.2014-19.1.2019 – – – – 1,250,000 – 1,250,00020.1.2011 1.23 20.1.2015-19.1.2019 – – – – 1,250,000 – 1,250,000
– 3,800,000 – 3,800,000 5,000,000 – 8,800,000
Employees/consultants ofPou Sheng
21.1.2010 1.62 21.1.2011-20.1.2018 – 9,105,000 (748,500) 8,356,500 – (1,821,750) 6,534,75021.1.2010 1.62 21.1.2012-20.1.2018 – 9,105,000 (748,500) 8,356,500 – (1,821,750) 6,534,75021.1.2010 1.62 21.1.2013-20.1.2018 – 18,210,000 (1,497,000) 16,713,000 – (3,643,500) 13,069,50021.1.2010 1.62 21.1.2014-20.1.2018 – 24,280,000 (1,996,000) 22,284,000 – (4,858,000) 17,426,00020.1.2011 1.23 20.1.2012-19.1.2019 – – – – 12,500,000 – 12,500,00020.1.2011 1.23 20.1.2013-19.1.2019 – – – – 12,500,000 – 12,500,00020.1.2011 1.23 20.1.2014-19.1.2019 – – – – 12,500,000 – 12,500,00020.1.2011 1.23 20.1.2015-19.1.2019 – – – – 12,500,000 – 12,500,000
– 60,700,000 (4,990,000) 55,710,000 50,000,000 (12,145,000) 93,565,000
Grand total – 64,500,000 (4,990,000) 59,510,000 55,000,000 (12,145,000) 102,365,000
Exercisable as at 30th September, 2010 and 2011 – 7,104,750
At 30th September, 2011, the number of shares in respect of which options had been granted and remained outstanding under the Pou Sheng Scheme represented 2.4% (2010: 1.4%) of the issued share capital of Pou Sheng at that date.

122 / Yue Yuen Industrial (Holdings) Limited / Annual Report 2011
Notes to the Consolidated Financial StatementsFor the Year ended 30th September, 2011
38. Share-Based Payment Transactions (continued)(ii) Share option scheme of Pou Sheng (continued)
Share options granted during the year ended 30th September, 2010The total fair value of the share options granted under the Pou Sheng Scheme during the year ended 30th September, 2010 was HK$44,322,000 (equivalent to approximately US$5,709,000). The fair value of the share options granted during the year was calculated using the Binomial Option Pricing Model (the “Model”). The inputs into the Model and the estimated fair value of the share options are as follows:
Share options with a vesting
period of one year
Share options with a vesting
period of two years
Share options with a vesting
period of three years
Share options with a vesting
period of four years
v v v v v
Exercise price HK$1.62 HK$1.62 HK$1.62 HK$1.62Share price at date of grant HK$1.62 HK$1.62 HK$1.62 HK$1.62Expected life of share options 4.5 years 5.0 years 5.5 years 6.0 yearsExpected volatility 54% per annum 54% per annum 54% per annum 54% per annumExpected dividend yield 1% 1% 1% 1%Risk free rates 1.7% per annum 1.8% per annum 2.0% per annum 2.1% per annumFair value per share option HK$0.69 HK$0.72 HK$0.75 HK$0.78 v v v v v
Share options granted during the year ended 30th September, 2011Under share option scheme of Pou Sheng, certain share options were granted during the year ended 30th September, 2011. The fair values of the options determined at the date of grant using the Model was HK$30,938,000 (equivalent to US$3,982,000). The inputs into the Model and the estimated fair value of the share options at the date of grant are as follows:
Share options with a vesting
period of one year
Share options with a vesting
period of two years
Share options with a vesting
period of three years
Share options with a vesting
period of four years
v v v v v
Exercise price HK$1.23 HK$1.23 HK$1.23 HK$1.23Share price at date of grant HK$1.23 HK$1.23 HK$1.23 HK$1.23Expected life of share options 4.5 years 5.0 years 5.5 years 6.0 yearsExpected volatility 50% per annum 50% per annum 50% per annum 50% per annumExpected dividend yield 0% 0% 0% 0%Risk free rates 1.55% per annum 1.71% per annum 1.80% per annum 1.97% per annumFair value per share option HK$0.52 HK$0.55 HK$0.58 HK$0.60 v v v v v
The closing price of Pou Sheng shares immediately before the date of grant of the share options was HK$1.23 per share.

/ 123
38. Share-Based Payment Transactions (continued)(ii) Share option scheme of Pou Sheng (continued)
The Model is one of the commonly used models to estimate the fair value of the share options. The variables and assumptions used in computing the fair value of the share options are based on the directors’ best estimate. The value of a share option varies with different variables of certain subjective assumptions.
Expected volatility was determined by using the historical volatility of Pou Sheng’s share price over the past year. The early exercise assumption used in the Model has been estimated, based on management’s best estimate, for the effect of behavioural considerations.
The Group recognised a total expense of US$2,473,000 for the year ended 30th September, 2011 (2010: US$1,578,000) in relation to share options granted by Pou Sheng under the Pou Sheng Scheme.
39. Capital Risk ManagementThe Group manages its capital to ensure that entities in the Group will be able to continue as a going concern while maximising the return to shareholders through the optimisation of the debt and equity balance. The Group’s overall strategy remains unchanged from prior year.
The capital structure of the Group consists of net debt, which includes the bank borrowings and convertible bonds (net of cash and cash equivalents) and equity attributable to owners of the Company, comprising issued share capital, reserves and retained profits as disclosed in the consolidated statement of changes in equity.
The directors of the Company review the capital structure on a quarterly basis. As part of this review, the directors consider the cost of capital and the risks associated with each class of capital. Based on recommendations of the directors, the Group will balance its overall capital structure through the payment of dividends, new share issues and share repurchases as well as the issue of new debt or the redemption of existing debt.
40. Financial Instrumentsa. Categories of financial instruments
2011 2010US$’000 US$’000
Financial assetsDerivative financial instruments 22,589 80,431Loans and receivables (including cash and cash equivalents) 1,740,380 1,631,657Available-for-sale investments 31,897 29,690
Financial liabilitiesDerivative financial instruments 13,349 27,041Amortised cost 1,863,194 1,597,238

124 / Yue Yuen Industrial (Holdings) Limited / Annual Report 2011
Notes to the Consolidated Financial StatementsFor the Year ended 30th September, 2011
40. Financial Instruments (continued)b. Financial risk management objectives
The Group’s financial instruments include amounts due from associates, amounts due from jointly controlled entities, deposit paid for proposed acquisition of a business, long-term loan receivables, available-for-sale investments, derivative financial instruments, trade and other receivables, pledged bank deposits, bank balances and cash, trade and other payables, bank borrowings and convertible bonds. Details of the financial instruments are disclosed in respective notes. The risks associated with these financial instruments include market risk (currency risk, interest rate risk and other price risk), credit risk and liquidity risk. The policies on how to mitigate these risks are set out below. The management manages and monitors these exposures to ensure appropriate measures are implemented on a timely and effective manner. There has been no change to the policies on how to mitigate these risks.
Market risk(i) Currency risk
Majority of the Group’s turnover are denominated in USD. However, the Group has certain trade payables, bank balances and debt obligations that are denominated in foreign currency. As a result, the Group is exposed to fluctuations in foreign exchange rates. In order to mitigate the currency risk, the Group has entered into forward and other foreign currency contracts to hedge USD against RMB and HKD. Details of the contracts are set out in Note 25(c). The Group regularly reviews the effectiveness of these instruments and the underlying strategies in monitoring currency risk.
The carrying amounts of the Group’s monetary assets and liabilities that are denominated in currencies other than the functional currencies of relevant group entities at the end of the reporting period are as follows:
Assets Liabilities
2011 2010 2011 2010US$’000 US$’000 US$’000 US$’000
USD 27,649 24,692 54,073 56,203RMB 260,050 84,020 83,555 49,854NTD 31,624 27,101 25,682 29,094VND 30,078 29,698 8,953 7,967IDR 18,284 12,437 9,640 7,414HKD 37,108 23,557 357,586 362,983
Sensitivity analysisThe Group’s foreign currency risk is mainly concentrated on the fluctuation of USD, HKD, RMB and NTD.
Since HKD is pegged to USD, the Group does not expect any significant movements in USD/HKD exchange rate. The management expects the movement in HKD against USD is 1% while the movement in other exchange rates against USD is 5%. These percentages are therefore the sensitivity rates used when reporting foreign currency risk internally to key management personnel and represents management’s assessment of the reasonably possible change in HKD and other currencies exchange rates respectively.

/ 125
40. Financial Instruments (continued)b. Financial risk management objectives (continued)
Market risk (continued)(i) Currency risk (continued)
Sensitivity analysis (continued)If the HKD strengthen 1% (2010: 1%) against USD, the Group’s profit before taxation for the year would decrease by US$3,205,000 (2010: US$3,394,000). If the HKD weaken 1% (2010: 1%) against USD, there would be an equal and opposite impact on the profit before taxation for the year.
Other than the sensitivity on the fluctuation of HKD against USD as presented above, the following table details the Group’s sensitivity to a 5% (2010: 5%) decrease in the functional currency of the relevant group entities against the relevant foreign currencies. The following sensitivity analysis includes only outstanding monetary items denominated in foreign currencies and adjusts their translation at the year end for a 5% change in foreign currency exchange rates. A positive (negative) number below indicates an increase (decrease) in profit before taxation when the currency below strengthen 5% against the functional currencies of the relevant group entities. For a 5% (2010: 5%) weakening of these currency against the functional currency of the relevant group entities, there would be an equal and opposite impact on the profit before taxation.
2011 2010notes US$’000 US$’000
(Loss) gain in relation to:– USD (i) (1,321) (1,576)– RMB (i) 8,825 1,708– NTD (ii) 297 (100)– VND (ii) 1,056 1,087– IDR (ii) 432 251
notes:
(i) This is mainly attributable to the exposure on bank balances.
(ii) This is mainly attributable to the exposure outstanding on receivables and payables denominated in NTD,
VND and IDR.

126 / Yue Yuen Industrial (Holdings) Limited / Annual Report 2011
Notes to the Consolidated Financial StatementsFor the Year ended 30th September, 2011
40. Financial Instruments (continued)b. Financial risk management objectives (continued)
Market risk (continued)(ii) Interest rate risk
The Group is exposed to cash flow interest rate risk in relation to amounts due from associates and jointly controlled entities, loan receivables, bank balances and bank borrowings (see Notes 20, 22, 23, 26, 31 and 33 for details of these respectively) due to the fluctuation of the prevailing market interest rate. It is the Group’s policy to keep its borrowings at floating rate of interest so as to minimise the fair value interest rate risk. The directors consider the Group’s exposure of the bank balances to interest rate risk is not significant as interest bearing bank balances are within short maturity period. The management will continuously monitor interest rate fluctuation and will consider hedging significant interest rate risk should the need arise.
The Group is also exposed to fair value interest rate risk in relation to loan component of fixed-rate bank borrowings (see Notes 31 and 33 for details respectively). The management monitors interest rate exposure and will consider to repay the fixed-rate bank borrowings when significant interest rate exposure is anticipated.
The Group’s exposures to interest rates on financial liabilities are detailed in the liquidity risk management section of this note. The Group’s cash flow interest rate risk is mainly concentrated on the fluctuation of LIBOR, HIBOR and rates quoted by PBOC.
Sensitivity analysisThe sensitivity analyses below have been determined based on the exposure to interest rates for non-derivative instruments at the end of the reporting period. For amounts due from associates and jointly controlled entities, variable-rate bank borrowings, loan receivables and bank balances which carried floating interest rates over 1%, the analysis is prepared assuming the carrying amount of assets and liabilities which carried floating interest rates and outstanding at the end of the reporting period were outstanding for the whole year and the stipulated change taking place at the beginning of the financial year and held constant throughout the financial year. A 100 basis point (2010: 100 basis point) increase or decrease is used when reporting interest rate risk internally to key management personnel and represents management’s assessment of the reasonably possible change in interest rates.
If interest rates on interest-bearing amounts due from associates and jointly controlled entities, loan receivables, bank balances and bank borrowings had been 100 basis points (2010: 100 basis points) higher and all other variables were held constant, the Group’s profit before taxation for the year would decrease by US$4,459,000 (2010: decrease by US$1,826,000). If interest rates were lower by 100 basis points (2010: 100 basis points), there would be an equal and opposite impact on the profit before taxation for the year.
This is mainly attributable to the Group’s exposure to its variable-rate borrowing.

/ 127
40. Financial Instruments (continued)b. Financial risk management objectives (continued)
Market risk (continued)(iii) Other price risk
The Group’s available-for-sale equity investments, embedded derivatives of CB 2011, HKD Call Option, JV Call Options and foreign currency derivatives at the end of the reporting period exposed the Group to other price risk. The Group’s other price risk is mainly concentrated on equity instruments which operate in footwear industry. Details of those are set out in Notes 24 and 25.
Sensitivity analysis(a) Available-for-sale investments
The Group is also exposed to equity price risk through its available-for-sale equity investments. If the market price of the listed investment had increased/decreased by 10% (2010: 10%), the Group’s reserve would increase/decrease by approximately US$1,868,000 (2010: US$1,286,000) at 30th September, 2011.
(b) Embedded derivatives of CB 2011 and HKD Call OptionsIf the market price of the Company’s shares prices had been 10% (2010: 10%) higher/lower while all other input variables of the valuation models were held constant, the Group’s profit before taxation for the year would increase/(decrease) as follows:
2011 2010US$’000 US$’000
(i) Higher by 10% (2010: 10%)
Embedded derivatives of CB 2011 – (8,370)HKD Call Options – 9,512
(ii) Lower by 10% (2010: 10%)
Embedded derivatives of CB 2011 – 6,848HKD Call Options – (7,509)
(c) JV Call OptionsAs set out in Note 25a, the fair values of the JV Call Options were valued using the binomial model, which uses cash flow projections based on assumptions that are not supported by observable current market transactions nor based on available observable market data. The fair values of the JV Call Options recognised in the consolidated financial statements would have been changed significantly if one or more of those assumptions were changed.

128 / Yue Yuen Industrial (Holdings) Limited / Annual Report 2011
Notes to the Consolidated Financial StatementsFor the Year ended 30th September, 2011
40. Financial Instruments (continued)b. Financial risk management objectives (continued)
Market risk (continued)(iii) Other price risk (continued)
Sensitivity analysis (continued)(c) JV Call Options (continued)
If one of these inputs, growth rate or expected price-earning rate – Pou Sheng, to the valuation model had been 10% (2010: 10%) higher/lower while all other variables were held constant, the profit before taxation for the year ended 30th September, 2011 and 2010 would increase (decrease) as follows:
2011 2010Higher Lower Higher Lower
by 10% by 10% by 10% by 10%US$’000 US$’000 US$’000 US$’000
Growth rate 371 (325) 689 (615)Expected price-earning rate –
Pou Sheng (240) 321 (978) 1,147
In management’s opinion, the sensitivity analyses are not necessarily representative of the inherent market risk as the pricing model used in the fair value valuation of the derivatives involves multiple variables where certain variables are interdependent.
(d) Forward and other foreign currency derivativesFor the outstanding forward and other foreign currency derivatives contracts, if the market forward exchange rate of USD against RMB and HKD had been 5% and 1% (2010: 5% and 1%) higher/lower, respectively, profit before taxation for the year ended 30th September, 2011 would decrease/increase by US$1,281,000 (2010: decrease/increase by US$7,862,000) as a result of the changes in the market foreign currency forward exchange rate of USD against RMB/HKD.
In management’s opinion, the sensitivity analyses are not necessarily representative of the inherent market risk as the pricing model used in determining the fair value of the derivatives and financial liabilities are interdependent.

/ 129
40. Financial Instruments (continued)b. Financial risk management objectives (continued)
Credit riskThe Group’s maximum exposure to credit risk which will cause a financial loss to the Group due to failure to discharge an obligation by the counterparties in relation to each class of recognised financial assets is the carrying amount of those assets as stated in the consolidated statement of financial position and the guarantee given as set out in Note 46.
The Group has concentration of credit risk on certain individual customers. At the end of the reporting period, the five largest trade receivable balances accounted for approximately 42% (2010: 43%) of the trade receivables and the largest trade receivable was approximately 13% (2010: 15%) of the Group’s total trade receivables. For both years, the five largest customers, which are internationally well known companies engaging in sports footwear and sportswear business with good financial position by reference to their respective published financial statements, have good repayment history and credit quality with reference to the track records of these customers under internal assessment by the Group. The Group seeks to minimise its risk by dealing with counterparties which have good credit history.
In order to minimise the credit risk, the management of the Group has delegated a team responsible for determination of credit limits, credit approvals and other monitoring procedures to ensure that follow-up action is taken to recover overdue debts. In addition, the Group reviews the recoverable amount of each individual trade debt at the end of the reporting period to ensure that adequate impairment losses are made for irrecoverable amounts. In this regard, the directors of the Company consider that the Group’s credit risk is significantly reduced.
In addition to the credit risk on trade debts, the Group is also exposed to credit risk through its advances to, and guarantees granted to banks in respect of banking facilities utilised by its associates and jointly controlled entities. The advances are secured by the equity interests held by the other joint venture partners in these entities as collateral for the advances. In addition, because of the Group’s involvement in the management of these entities, the Group is in a position to monitor their financial performance and can take timely actions to safeguard its assets and/or to minimise its losses. Accordingly, management believes that the Group’s exposure in this regard is significantly reduced.
The Group does not have a concentration of credit risk on the advances to, and guarantees granted to banks in respect of banking facilities utilised by, its associates and jointly controlled entities as these spread across a number of entities.
The Group’s concentration of credit risk by geographical locations of customers are mainly on the USA, Europe and Asia which accounted for 30%, 20% and 41% (2010: 30%, 17% and 32%, respectively), respectively, of the trade receivables at 30th September, 2011. In order to minimise the credit risk, management intends to build a customer base with a more extensive geographical spread, which can minimise the credit risk by geographical location.
The credit risk on liquid funds is limited because the counterparties are banks and a financial institution with high reputation.

130 / Yue Yuen Industrial (Holdings) Limited / Annual Report 2011
Notes to the Consolidated Financial StatementsFor the Year ended 30th September, 2011
40. Financial Instruments (continued)b. Financial risk management objectives (continued)
Liquidity riskThe Group has net current assets of approximately US$1,142,794,000 (2010: US$1,388,752,000) as at 30th September, 2011. The Group has sufficient funds to finance its current working capital requirements taking into account of the existing banking facilities and cashflows from operations.
In the management of the liquidity risk, the Group monitors and maintains a level of cash and cash equivalents deemed adequate by the management to finance the Group’s operations and mitigate the effects of fluctuations in cash flows. The management monitors the utilisation of bank borrowings and ensures compliance with loan covenants.
The following table details the Group’s remaining contractual maturity for its financial liabilities based on the agreed repayment terms. For non-derivative financial liabilities, the table has been drawn up based on the undiscounted cash flows of financial liabilities based on the earliest date on which the Group can be required to pay. The table includes both interest and principal cash flows. To the extent that interest flows are floating rate, the undiscounted amount is derived from interest rate curve at the end of the reporting period.
In addition, the following table details the Group’s liquidity analysis for its derivative financial instruments. The tables have been drawn up based on the undiscounted contractual net cash (inflows) and outflows on derivative instruments that settle on a net basis, and the undiscounted gross (inflows) and outflows on those derivatives that require gross settlement. When the amount payable is not fixed, the amount disclosed has been determined by reference to the projected interest rates as illustrated by the yield curves existing at the end of the reporting period. The liquidity analysis for the Group’s derivative financial instruments are prepared based on the contractual maturities as the management consider that the contractual maturities are essential for an understanding of the timing of the cash flows of derivatives.
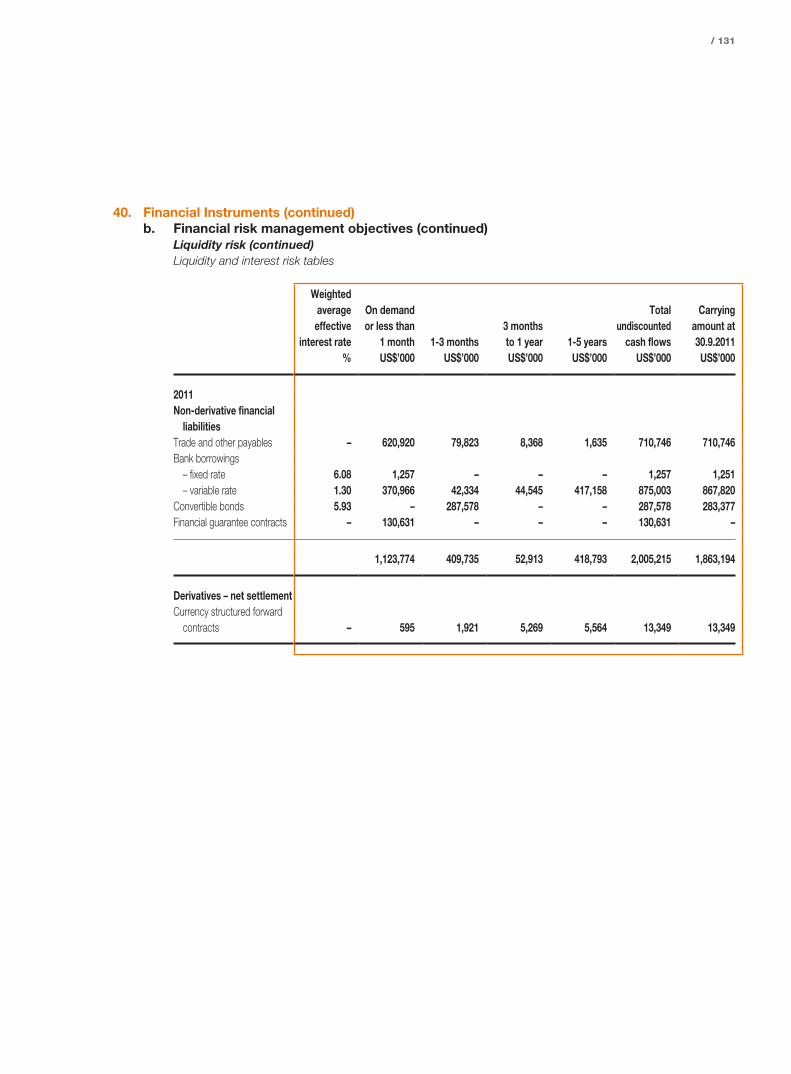
/ 131
40. Financial Instruments (continued)b. Financial risk management objectives (continued)
Liquidity risk (continued)Liquidity and interest risk tables
Weighted average effective
interest rate
On demand or less than
1 month 1-3 months3 months to 1 year 1-5 years
Total undiscounted
cash flows
Carrying amount at 30.9.2011
% US$’000 US$’000 US$’000 US$’000 US$’000 US$’000
2011Non-derivative financial
liabilitiesTrade and other payables – 620,920 79,823 8,368 1,635 710,746 710,746Bank borrowings
– fixed rate 6.08 1,257 – – – 1,257 1,251– variable rate 1.30 370,966 42,334 44,545 417,158 875,003 867,820
Convertible bonds 5.93 – 287,578 – – 287,578 283,377Financial guarantee contracts – 130,631 – – – 130,631 –
1,123,774 409,735 52,913 418,793 2,005,215 1,863,194
Derivatives – net settlementCurrency structured forward
contracts – 595 1,921 5,269 5,564 13,349 13,349

132 / Yue Yuen Industrial (Holdings) Limited / Annual Report 2011
Notes to the Consolidated Financial StatementsFor the Year ended 30th September, 2011
40. Financial Instruments (continued)b. Financial risk management objectives (continued)
Liquidity risk (continued)Liquidity and interest risk tables (continued)
Weighted average effective
interest rate
On demand or less than
1 month 1-3 months3 months to 1 year 1-5 years
Total undiscounted
cash flows
Carrying amount at 30.9.2010
% US$’000 US$’000 US$’000 US$’000 US$’000 US$’000
2010Non-derivative financial
liabilitiesTrade and other payables – 548,759 68,922 859 – 618,540 618,540Bank borrowings
– fixed rate 6.08 – – 3,752 – 3,752 3,590– variable rate 3.02 91,038 94,051 39,299 491,833 716,221 706,459
Convertible bonds 5.93 – – – 285,509 285,509 268,649Financial guarantee contracts – 136,688 – – – 136,688 –
776,485 162,973 43,910 777,342 1,760,710 1,597,238
Derivatives – net settlementCurrency structured forward
contracts – 135 182 1,089 813 2,219 2,219
Bank loans with a repayment on demand clause are included in the “on demand or less than one month” time band in the above maturity analysis. As at 30th September 2010, the aggregate principal amounts of these bank loans amounted to US$16,197,000 (2011: nil). Taking into account the Group’s financial position, the directors do not believe that it is probable that the banks will exercise their discretionary rights to demand immediate repayment. The directors believe that such bank loans would be repaid two years after the reporting date in accordance with the scheduled repayment dates set out in the loan agreements. At that time, the aggregate principal and interest cash outflows will amount to US$16,238,000.
The amounts included above for financial guarantee contracts are the maximum amounts the Group can be required to settle under the arrangement for the full guaranteed amount if that amount is claimed by the counterparty to the guarantee. Based on expectations at the end of the reporting period, the Group considers that it is more likely than not that no amount will be payable under the arrangement. However, this estimate is subject to change depending on the probability of the counterparty claiming under the guarantee which is a function of the likelihood that the financial receivables held by the counterparty which are guaranteed suffer credit losses.
The amounts included above for variable interest rate instruments for non-derivative financial liabilities is subject to change if changes in variable interest rates differ to those estimates of interest rates determined at the end of the reporting period.
/ 133
40. Financial Instruments (continued)b. Financial risk management objectives (continued)
Liquidity risk (continued)Liquidity and interest risk tables (continued)In addition to the above contractual obligation, the Group is subject to make additional cash contribution to the jointly controlled entities determined by the price adjustment mechanism as set out in Note 21, should the financial performance of the jointly controlled entities exceeds certain benchmarks.
c. Fair valueThe fair value of financial assets and financial liabilities are determined as follows:
• the fair value of financial assets and financial liabilities (excluding derivative instruments) with standard terms and conditions and traded on active liquid markets are determined with reference to quoted market bid prices and ask prices respectively;
• the fair value of other financial assets and financial liabilities (excluding derivative instruments) are determined in accordance with generally accepted pricing models based on discounted cash flow analysis;
• the fair value of the HKD Call Option and embedded derivate of CB 2011 are determined using the Monis Model;
• the fair value of the JV Call Options are determined based on the binomial model and estimated earnings of the Relevant Companies and price earning ratio of Pou Sheng; and
• the fair value of the foreign currency derivative and embedded derivative in structured bank deposit are determined using the prices provided by counter banks using valuation techniques.
Except convertible bonds as disclosed in Note 32, the directors consider that the carrying amounts of financial assets and financial liabilities recorded at amortised cost on the consolidated financial statements approximate their fair value.
Fair value measurements recognised in the statement of financial positionThe following table provides an analysis of financial instruments that are measured subsequent to initial recognition at fair value, grouped into Levels 1 to 3 based on the degree to which the fair value is observable.
• Level 1 fair value measurements are those derived from quoted prices (unadjusted) in active market for identical assets or liabilities.
• Level 2 fair value measurements are those derived from inputs other than quoted prices included within Level 1 that are observable for the asset or liability, either directly (i.e. as prices) or indirectly (i.e. derived from prices).
• Level 3 fair value measurements are those derived from valuation techniques that include inputs for the asset or liability that are not based on observable market data (unobservable inputs).

134 / Yue Yuen Industrial (Holdings) Limited / Annual Report 2011
Notes to the Consolidated Financial StatementsFor the Year ended 30th September, 2011
40. Financial Instruments (continued)c. Fair value (continued)
Fair value measurements recognised in the statement of financial position (continued)
30th September, 2011Level 1 Level 3 Total
US$’000 US$’000 US$’000
Financial assets at FVTPLDerivative financial instruments – 22,589 22,589
Available-for-sale investmentsListed equity securities 18,677 – 18,677
Total 18,677 22,589 41,266
Financial liabilities at FVTPLDerivative financial instruments – 13,349 13,349
30th September, 2010Level 1 Level 3 Total
US$’000 US$’000 US$’000 c c c c
Financial assets at FVTPLDerivative financial instruments – 80,431 80,431
Available-for-sale investmentsListed equity securities 12,856 – 12,856 c c c c
Total 12,856 80,431 93,287 c c c c
Financial liabilities at FVTPLDerivative financial instruments – 27,041 27,041 c c c c

/ 135
40. Financial Instruments (continued)c. Fair value (continued)
Fair value measurements recognised in the statement of financial position (continued)Reconciliation of Level 3 measurements of financial assets and liabilities is as follows:
Derivative financial instruments
Assets LiabilitiesUS$’000 US$’000
At 1st October, 2009 69,271 11,302Fair values changes, recognised in profit or loss 14,571 16,436Exchange realignment – 31Derecognised upon disposals of certain jointly controlled entities (2,904) –Derecognised upon partial redemption of CB 2011 – (728)Derecognised upon maturity (507) –
At 30th September, 2010 80,431 27,041Fair values changes, recognised in profit or loss (49,836) (13,692)Exchange realignment 54 –Derecognised upon disposals of certain jointly controlled entities (8,060) –
At 30th September, 2011 22,589 13,349
There were no transfers between Levels in both years.

136 / Yue Yuen Industrial (Holdings) Limited / Annual Report 2011
Notes to the Consolidated Financial StatementsFor the Year ended 30th September, 2011
41. Acquisition of SubsidiariesA. Acquisition of 75% equity interest in Yi Sheng Leather Co., Ltd. (“Yi Sheng”)
In order to take up the advantage of low production costs, the Group acquired 75% equity interest in Yi Sheng, a company incorporated in British Virgin Islands, from an independent third party, at a cash consideration of US$1,235,000 and control over Yi Sheng passed to the Group on 1st April, 2011. Yi Sheng and its subsidiaries are engaged in the manufacturing of leather products in Vietnam. This acquisition has been accounted for using the acquisition method and calculated as follows:
US$’000
Consideration transferred (Note i) 1,235Plus: non-controlling interests (25% in Yi Sheng) (Note ii) 411Less: net assets acquired and liabilities recognised (Note iii) (1,646)
-
B. Acquisition of the remaining 50% equity interest in YichuanYichuan is a limited liability company established in the PRC and is principally engaged in the sportswear retailing business. In order to strengthen the Group’s market position and geographical coverage in the PRC, the Group exercised a JV Call Option to acquire the remaining 50% equity interest in Yichuan not already held by the Group. The transaction was completed on 1st October, 2010 and control over Yichuan passed to the Group on the same date. This acquisition has been accounted for using the acquisition method and resulted in the recognition of goodwill of approximately US$14,604,000, calculated as follows:
US$’000
Goodwill arising on acquisition:
Consideration transferred (Note i) 64,470Less: net assets acquired and liabilities recognised (Note iii) (49,866)
14,604
Goodwill arose in the acquisition of Yichuan because the consideration paid for the combination effectively included amounts in relation to the benefit of expected synergies, revenue growth, future market development and the assembled workforce of Yichuan. These benefits are not recognised separately from goodwill because they do not meet the recognition criteria for identifiable intangible assets.
None of the goodwill arising on the acquisition is expected to be deductible for tax purposes.

/ 137
41. Acquisition of Subsidiaries (continued)Notes:
(i) Consideration transferred
Yi Sheng Yichuan Total
US$’000 US$’000 US$’000
The consideration for the acquisition comprises
the following:
Cash consideration (note a) 1,235 25,501 26,736
Consideration shares (note b) – 2,693 2,693
Contingently issuable shares (note c) – 1,092 1,092
Related JV Call Option (Note 25) – 8,060 8,060
Fair value of previously held interest in Yichuan (note d) – 27,124 27,124
Total consideration 1,235 64,470 65,705
notes:
(a) Acquisition of Yi Sheng
A total cash consideration of US$1,235,000 was paid during the year ended 30th September, 2011.
Acquisition of Yichuan
A total cash consideration of US$25,501,000, of which (i) US$19,223,000 was paid as deposit as at 30th
September, 2010 as set out in Note 21, (ii) US$3,139,000 was paid during the year and (iii) US$3,139,000 is payable
before 30th September, 2012. The net present value of the total cash consideration approximates to the amount of
cash paid and payable for the acquisition.
(b) The issue and allotment of 6,330,000 shares of HK$0.01 each in Pou Sheng each year for 3 years (in aggregate
18,990,000 shares of HK$0.01 each in Pou Sheng). Such issue and allotment of shares are to be completed on or
before 30th September, 2011, 30th September, 2012 and 30th September, 2013, respectively. The fair value of
these consideration shares has been determined by American Appraisal using the closing share price of Pou Sheng as
at 30th September, 2010.
During the year ended 30th September, 2011, 6,330,000 shares of Pou Sheng have been issued to the vendors of
Yichuan.

138 / Yue Yuen Industrial (Holdings) Limited / Annual Report 2011
Notes to the Consolidated Financial StatementsFor the Year ended 30th September, 2011
41. Acquisition of Subsidiaries (continued)Notes: (continued)
(i) Consideration transferred (continued)
notes: (continued)
(c) For each of the three fiscal years ending 30th September, 2013, if the audited annual after-tax profit of Yichuan for
each of the three years are not less than RMB54,710,000 (equivalent to approximately US$8,400,000), Pou Sheng
will be required to issue an additional 5,000,000 shares of HK$0.01 each in Pou Sheng to the vendors in each of the
years if the pre-determined level of after-tax profit is reached in that year. The fair value of these contingently issuable
shares as of the date of acquisition has been determined by American Appraisal, using the closing share price of
Pou Sheng as at 30th September, 2010 and with reference to management’s best estimate of the likelihood that the
profit target will be met.
The pre-determined profit level of Yichuan for the year ended 30th September, 2011 was not reached, and no
contingently issuable shares were issued.
(d) The fair value of the 50% equity interest in Yichuan previously held by the Group has been re-measured as of the
date of acquisition at US$27,124,000 by American Appraisal resulting in a gain of US$18,767,000. The fair value
is determined using the discounted cash flow approach and the guideline companies method. The significant
inputs into the model include earning to price multiples of comparable companies (in terms of products, markets,
competition, growth rate and capital structure), premium on control and market liquidity.
(e) The acquisition-related costs of the above transaction amounting to US$51,000 have been excluded from the
consideration transferred and have been recognised as an expense in the current year (included in administrative
expenses) in the consolidated income statement.
(ii) Non-controlling interests
The non-controlling interests in Yi Sheng recognised at the acquisition date were measured by reference to the non-
controlling interests’ proportionate share of the recognised amount of the net assets of Yi Sheng and amounted to
approximately US$411,000.

/ 139
41. Acquisition of Subsidiaries (continued)Notes: (continued)
(iii) Net assets acquired and liabilities recognised
Yi Sheng Yichuan Total
US$’000 US$’000 US$’000
Net assets acquired and liabilities recognised at
the date of acquisition are as follows:
Property, plant and equipment 4,087 3,641 7,728
Prepaid lease payments 645 – 645
Deposit paid for acquisition of property, plant and equipment – 480 480
Intangible assets (Note 16) – 42,070 42,070
Inventories 110 38,335 38,445
Trade and other receivables 966 23,477 24,443
Bank balances and cash 14 1,531 1,545
Trade and other payables (2,041) (31,535) (33,576)
Taxation payable – (638) (638)
Bank borrowings (2,135) (16,978) (19,113)
Deferred tax liabilities – (10,517) (10,517)
1,646 49,866 51,512
Less: non-controlling interests (411) – (411)
1,235 49,866 51,101
note: The fair value of trade and other receivables at the date of acquisition amounted to US$24,443,000 which is the
same as the gross contractual amounts of these trade and other receivable acquired. None of the contractual cash
flows of the above amount is estimated to be uncollectible.

140 / Yue Yuen Industrial (Holdings) Limited / Annual Report 2011
Notes to the Consolidated Financial StatementsFor the Year ended 30th September, 2011
41. Acquisition of Subsidiaries (continued)Notes: (continued)
(iv) Net cash outflow arising on acquisition
Yi Sheng Yichuan Total
US$’000 US$’000 US$’000
Cash consideration paid (1,235) (3,139) (4,374)
Less: bank balances and cash acquired 14 1,531 1,545
(1,221) (1,608) (2,829)
Yi Sheng had no turnover and profit of approximately US$150,000 for the year ended 30th September 2011. As the acquisition of Yi Sheng was completed on 1st April, 2011, loss of approximately US$434,000 has been included in the consolidated income statement.
Yichuan had turnover and profit of approximately US$156,871,000 and US$2,697,000, respectively, for the year ended 30th September, 2011. As the acquisition of Yichuan was completed on 1st October, 2010, such revenue and profit have been consolidated in full in the consolidated income statement.
The above transactions were accounted for using the purchase method of accounting.
42. Disposal of Subsidiaries/Deemed Disposal of Subsidiaries/Disposal Group Held for SaleA. Disposal of subsidiaries
During the year ended 30 September, 2010, the Group disposed of (i) the entire interest in Hubei Shengdao Sports Goods Company Limited and its subsidiaries to an independent third party; (ii) the entire interest in Hong Kong Dragonlight Limited and its subsidiary to another independent third party.

/ 141
42. Disposal of Subsidiaries/Deemed Disposal of Subsidiaries/Disposal Group Held for Sale (continued)A. Disposal of subsidiaries (continued)
The aggregate amounts of the assets and liabilities attributable to these subsidiaries on the respective dates of disposal were as follows:
USD’000
Net assets disposed of:Property, plant and equipment 34,244Prepaid lease payment 10,061Trade and other receivables 2,928Bank balances and cash 94Trade and other payables (21,243)Shareholder’s loan (20,927)
5,157Non-controlling interests (1,222)
3,935Assignment of shareholder’s loan 20,927Gain on disposal of subsidiaries 1,776
Total consideration 26,638
Satisfied by:Cash 1,611Consideration receivables (included in deposits, prepayments and other receivables) 25,027
26,638
Net cash inflow (outflow) arising on disposal:Cash consideration received 1,611Bank balances and cash disposed of (94)
1,517
Consideration receivables were unsecured, interest-free and would be recovered within one year. The directors of the Company had assessed the buyer’s credit quality. The directors had continuously assessed the recoverability of consideration receivables. In the opinion of the directors, the buyer was of good credit quality.
The subsidiaries disposed of during the year did not contribute significantly to the results and cash flows of the Group during the period prior to the disposal.

142 / Yue Yuen Industrial (Holdings) Limited / Annual Report 2011
Notes to the Consolidated Financial StatementsFor the Year ended 30th September, 2011
42. Disposal of Subsidiaries/Deemed Disposal of Subsidiaries/Disposal Group Held for Sale (continued)B. Deemed disposal of subsidiaries
During the year ended 30th September, 2010, the Group entered into an agreement with Din Tsun Holding Co., Ltd (“Din Tsun”) for subscription of new shares by Din Tsun in Faith Year Investments Limited (“Faith Year”) which was then a wholly-owned subsidiary of the Group. After the subscription, the Group and Din Tsun’s equity interest in Faith Year is 30% and 70%, respectively. The subscription by Din Tsun constituted a deemed disposal of 70% equity interest in Faith Year by the Group.
The amounts of the assets and liabilities attributable to the subsidiaries on the date of deemed disposal were as follows:
USD’000
Net assets disposed of:Property, plant and equipment 3,160Inventory 7,546Trade and other receivables 18,882Bank balances and cash 1,785Trade and other payables (29,494)
1,879Gain on deemed disposal of subsidiaries 85
Total consideration 1,964
Satisfied by:Fair value of retained interests in an associate 1,964
Net cash outflow arising on disposal:Bank balances and cash disposed of (1,785)
C. Disposal group held for saleOn 10th November, 2010 and 28th March, 2011, the Group entered into a sale and purchase agreement and a supplementary sale and purchase agreement, respectively, with a third party, pursuant to which the Group agreed to dispose of, and the third party agreed to acquire, a shopping mall building and the associated land use rights from the Group at an aggregate consideration of RMB285,000,000 (equivalent to US$44,556,000).
As of 30th September, 2011, the Group received from the buyer an amount of RMB194,000,000 (equivalent to US$30,329,000) as a deposit for the acquisition, which is accounted for as a deposit received for sale of properties (included in trade and other payables) in the consolidated statement of financial position. The transaction is expected to be completed in early 2012. These assets are therefore classified as held for sale at the end of the reporting period.
/ 143
42. Disposal of Subsidiaries/Deemed Disposal of Subsidiaries/Disposal Group Held for Sale (continued)C. Disposal group held for sale (continued)
In addition, during the year, the Group entered into an agreement with Must Win International Limited (“Must Win”), a non-controlling shareholder of a subsidiary of the Company, pursuant to which the Group agreed to dispose of and Must Win agreed to acquire hotel properties and certain subsidiaries, whose principal assets were buildings and the associated land use rights, at an aggregate consideration of approximately RMB235,950,000 (equivalent to US$36,999,000).
As of 30th September, 2011, the Group received from the buyer an amount of RMB23,950,000 (equivalent to US$3,700,000) as a deposit for the acquisition, which is accounted for as a deposit received for sale of properties (included in trade and other payables) in the consolidated statement of financial position. The transaction is expected to be completed in early 2012.
The aggregate classes of assets and liabilities classified as held for sale are as follows:
2011US$’000
Property, plant and equipment 93,254Prepaid lease payments 4,091Deposits paid for acquisition of property, plant and equipment 3,625Bank balance and cash 3,755
Total assets classified as held for sale 104,725
Accruals and other payables 23,550Bank borrowings 15,000
Total liabilities associated with assets classified as held for sale 38,550
43. Major Non-Cash TransactionsFor the year ended 30th September, 2011, the Group capitalised an amount due from an associate of approximately US$13,500,000 as investment in an associate in accordance with the proportionate share of that associate.
For the year ended 30th September, 2010, the major non-cash transactions were as follows:
(i) The payment of profits tax of HK$172,570,000 (equivalent to US$22,176,000) as a result of the compromised settlement reached with the HKIRD was settled by the tax reserve certificate previously purchased.
(ii) The Group capitalised an amount due from a jointly controlled entity of approximately US$14,966,000 as investment in a jointly controlled entity.

144 / Yue Yuen Industrial (Holdings) Limited / Annual Report 2011
Notes to the Consolidated Financial StatementsFor the Year ended 30th September, 2011
44. Operating LeasesThe Group as lessee
2011 2010US$’000 US$’000
Operating leases rentals in respect of:
Minimum leases payments:– leasehold land and buildings 26,684 31,216– retail shops 43,787 45,075– plant and machinery 1,428 3,328
71,899 79,619Contingent rentals:
– retail shops 130,808 101,648
202,707 181,267
At the end of the reporting period, the Group had commitments for non-cancellable future minimum lease payments in respect of leasehold land and buildings and retail shops under non-cancellable operating leases, which fall due as follows:
2011 2010US$’000 US$’000
Within one year 54,491 49,215In the second to fifth year inclusive 92,098 56,970After five years 43,140 32,810
189,729 138,995
The above lease commitments represent basic rents only and do not include contingent rents payable in respect of certain retail shops leased by the Group. In general, these contingent rents are calculated with reference to the relevant retail shops’ turnover using pre-determined formulae. It is not possible to estimate in advance the amount of such contingent rent payable.
Included in the above are commitments under non-cancellable operating leases of approximately US$23.5 million as at 30th September, 2011 which expire in 2014 (2010: US$6.4 million which expire in 2011), payable to related companies, Godalming Industries Limited (“Godalming”) and its subsidiaries, details of which are set out in Note 48(g).
/ 145
44. Operating Leases (continued)The Group as lessorAll of the Group’s investments properties held have committed tenants for the next one to ten years and rentals are fixed.
At the end of the reporting period, the Group had contracted with tenants for the following future minimum lease payments:
2011 2010US$’000 US$’000
Within one year 6,855 5,985In the second to fifth year inclusive 16,279 16,702After five years 17,687 15,017
40,821 37,704
In addition to the basic rental receipts as disclosed above, the lease agreements with certain tenants also include provisions for the payment of contingent rent to the Group. In general, these contingent rents are calculated with reference to the turnover generated by the tenants operating in the Group’s retailing complex using pre-determined formulae. It is not possible to estimate in advance the amount of such contingent rent payable. Rental income of the Group for the year was US$15,698,000 (2010: US$16,549,000), of which contingent rent amounted to US$7,463,000 (2010: US$8,130,000).
45. Commitments
2011 2010US$’000 US$’000
Capital expenditure contracted for but not provided in the consolidated financial statements in respect of:– construction of buildings 35,189 76,524– acquisition of property, plant and equipment 10,654 13,195– acquisition of the remaining interests in a jointly controlled entity 10,975 8,969
56,818 98,688
Other commitments contracted for but not provided in the consolidated financial statements in respect of:– investment in available-for-sale investments 3,512 3,520– investment in jointly controlled entities 1,626 1,556
5,138 5,076
61,956 103,764
Save as disclosed above, the Group had no other material capital commitments at 30th September, 2011 and 2010.

146 / Yue Yuen Industrial (Holdings) Limited / Annual Report 2011
Notes to the Consolidated Financial StatementsFor the Year ended 30th September, 2011
46. ContingenciesAt the end of the reporting period, the Group had contingent liabilities as follows:
2011 2010US$’000 US$’000
Guarantees given to banks in respect of banking facilities granted to
(i) jointly controlled entities– amount guaranteed 91,855 99,774– amount utilised 59,008 54,493
(ii) associates– amount guaranteed 26,269 36,914– amount utilised 17,838 22,287
(iii) a former subsidiary– amount guaranteed 12,507 –– amount utilised 12,507 –
47. Retirement Benefits SchemesThe Group operates a Mandatory Provident Fund Scheme (“MPF Scheme”) for all qualifying employees in Hong Kong under the Mandatory Provident Fund Schemes Ordinance. The assets of the MPF Scheme are held separately from those of the Group in funds under the control of an independent trustee. Under the rule of the MPF Scheme, the employer and its employees are each required to make contributions to the scheme at rate specified in the rules. The only obligation of the Group with respect of MPF Scheme is to make the required contributions under the scheme. No forfeited contribution is available to reduce the contribution payable in the future years.
The workers under subcontracting agreements and employees of the Group’s subsidiaries in the PRC are subject to retirement benefit schemes established in the PRC. Specified percentages of their payroll are contributed to retirement benefit schemes to fund the benefits. The only obligation of the Group with respect to the retirement benefit schemes is to make the required contributions under the schemes. No forfeited contributions are available to reduce the contribution payable in the future years.
/ 147
48. Connected and Related Party Transactions and BalancesDuring the year, the Group had significant transactions and balances with related parties, some of which are also deemed to be connected parties pursuant to the Listing Rules.
The transactions with these parties during the year, and balances with them at the end of the reporting period, are as follows:
(I) Connected and Related Parties
Name of party Nature of transactions/balances 2011 2010US$’000 US$’000
Substantial shareholder of the Company with significant influence:
PCC and its subsidiaries, other than members of the Group (collectively the “PCC Group”)
Purchase of raw materials and shoe-related products by the Group (note a) 963 706
Costs and expenses reimbursed and service fees paid to PCC under the Services Agreements by the Group (note b) 458,941 400,653
Tanning facilities and processing service fees paid by the Group (note c) 7,167 6,432
Rental expenses under the Rental Agreements paid by the Group (note d) 1,291 1,192
Sales of leather, moulds, finished and semi-finished shoe products and packaging boxes by the Group (note a) 24,949 20,505
Management services income received by the Group (note f) 529 3,365
Balance due from/to at 30th September and included in:– trade receivables 3,477 3,910– trade payables 38,496 44,027– other receivables (note i) 7,693 8,973– other payables (note i) 20,823 21,639
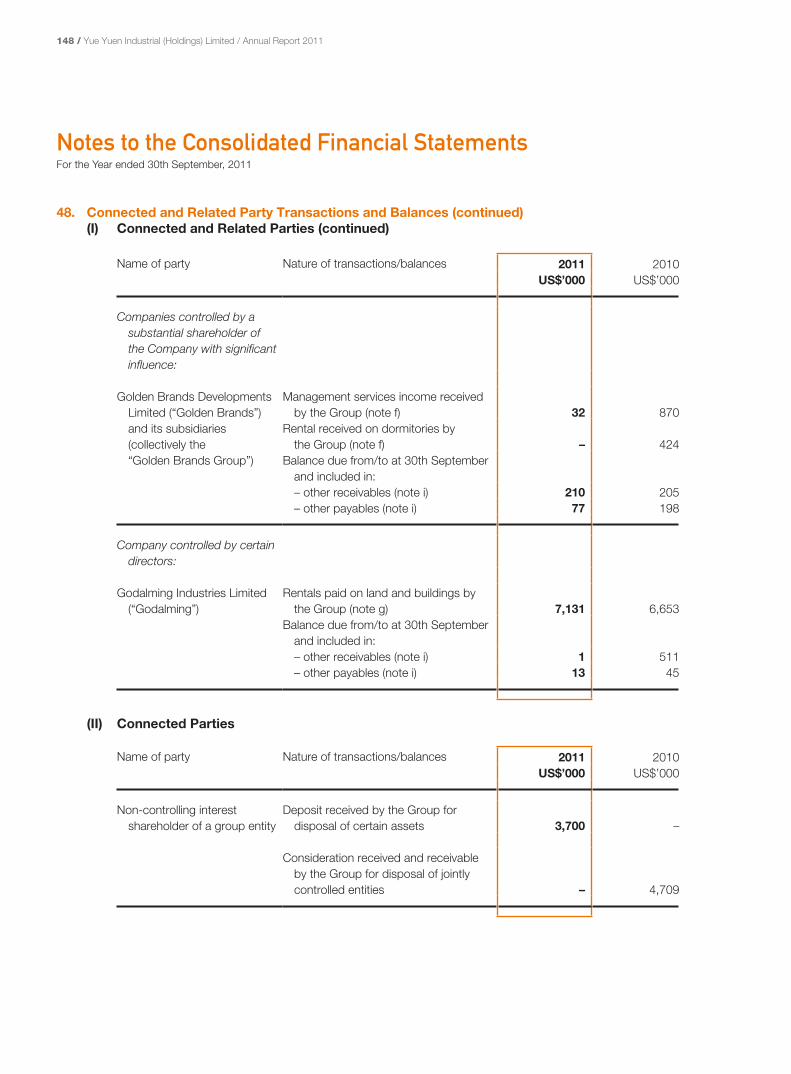
148 / Yue Yuen Industrial (Holdings) Limited / Annual Report 2011
Notes to the Consolidated Financial StatementsFor the Year ended 30th September, 2011
Name of party Nature of transactions/balances 2011 2010US$’000 US$’000
Companies controlled by a substantial shareholder of the Company with significant influence:
Golden Brands Developments Limited (“Golden Brands”) and its subsidiaries (collectively the “Golden Brands Group”)
Management services income received by the Group (note f) 32 870
Rental received on dormitories by the Group (note f) – 424
Balance due from/to at 30th September and included in:– other receivables (note i) 210 205– other payables (note i) 77 198
Company controlled by certain directors:
Godalming Industries Limited (“Godalming”)
Rentals paid on land and buildings by the Group (note g) 7,131 6,653
Balance due from/to at 30th September and included in:– other receivables (note i) 1 511– other payables (note i) 13 45
(II) Connected Parties
Name of party Nature of transactions/balances 2011 2010US$’000 US$’000
Non-controlling interest shareholder of a group entity
Deposit received by the Group for disposal of certain assets 3,700 –
Consideration received and receivable by the Group for disposal of jointly controlled entities – 4,709
48. Connected and Related Party Transactions and Balances (continued)(I) Connected and Related Parties (continued)

/ 149
48. Connected and Related Party Transactions and Balances (continued)(III) Related Parties, Other Than Connected Parties
Name of party Nature of transactions/balances 2011 2010US$’000 US$’000
Jointly controlled entities: Purchase of raw materials by the Group 165,109 130,249Purchase of sportswear products
by the Group – 215Sales of shoe-related products
by the Group 4,699 3,376Sales of sportswear products
by the Group 36,362 25,700Management service income received
by the Group 12,366 11,156Interest income received by the Group 1,629 1,116Consideration for deemed disposal of
interests in subsidiaries received by the Group (note h) – 1,964
Balance due from/to at 30th September– trade receivables 12,431 8,380– trade payables 48,147 31,405– other receivables (note i) 15,246 24,096– other payables (note i) 1,030 1,082
Associates: Purchase of raw materials by the Group 79,473 71,093Purchase of sportswear products by
the Group 1,840 –Sales of shoe-related products
by the Group 2,208 7,054Sales of sportswear products
by the Group 4,860 2,886Management service income received
by the Group 3,895 5,023Service fee paid by the Group 1,459 1,545Interest income received by the Group 661 379
Balance due from/to at 30th September– trade receivables 10,102 9,240– trade payables 16,997 13,706– other receivables (note i) 22,804 36,293– other payables (note i) 2,474 4,454
Joint venture partners of jointly controlled entities of the Group
Consideration paid and payable by the Group for acquisition of jointly controlled entities 37,346 –
Consideration received and receivable by the Group for disposal of jointly controlled entities – 12,780

150 / Yue Yuen Industrial (Holdings) Limited / Annual Report 2011
Notes to the Consolidated Financial StatementsFor the Year ended 30th September, 2011
48. Connected and Related Party Transactions and Balances (continued)(IV) Compensation of Key Management Personnel
2011 2010US$’000 US$’000
Short-term benefits 6,076 6,504Post employment benefits 3 2
6,079 6,506
The remuneration of directors and key executives is determined having regard to the performance of the individuals.
notes:
(a) During the year, the Group sold leather, moulds, finished and semi-finished shoe products and packaging boxes to PCC
Group. In addition, the Group purchased raw materials, production tools and shoe-related products from the PCC Group.
The extent of these connected sales and purchases did not exceed the limit approved by the shareholders of the Company
on 23rd December, 2008. PCC is owned indirectly through Plantagenet Group Limited as to 12.03% by members of Tsai’s
family, including certain directors of the Company, Mr. Tsai Chi Neng and Mr. David N.F. Tsai and directly as to 7.11% by
relatives of Mr. Tsai Chi Neng.
(b) Pursuant to services agreement dated 22nd February, 1997, first supplemental services agreement dated 9th January,
2007 and second supplemental services agreement dated 20th November, 2008 entered into between the Company
and PCC (collectively the “Services Agreements”), the Company has engaged PCC to provide product design and
development, know-how, technical and marketing services and to source raw materials and recruit staff in relation to
the production and sale of the Group’s products. The services to be provided by PCC may be provided by or through
members of the PCC Group. But PCC will remain fully liable for the provision of these services.
In consideration of the services provided by the PCC Group under the Services Agreements, the Company shall reimburse
the costs and expenses incurred by PCC and shall also pay to PCC the following fees:
(i) in respect of the products developed by the PCC Group and sold by the Group, 0.5% of the net invoiced amount of
such products;
(ii) in respect of materials, machinery and other goods purchased by, shipment arranged for and inspected by the PCC
Group on behalf of the Group from Taiwan, 1% of the merchandise cost invoiced to the PCC Group; and
(iii) in respect of materials, machinery and other goods sourced by PCC Group on behalf of the Group from overseas
whereby purchases are directly handled by the Group, 0.5% of the cost of merchandise invoiced to the Group.

/ 151
48. Connected and Related Party Transactions and Balances (continued)notes: (continued)
(c) Pursuant to the production agreement dated 24th December, 1996, first supplemental production agreement dated 9th
January, 2007 and second supplemental production agreement dated 20th November, 2008 (collectively the “Production
Agreements”) entered into between Prime Asia Leather Corporation, Taiwan Branch (“Prime Asia TW”), a wholly owned
subsidiary of the Company and Barits Development Corporation (“Barits”), a company which is beneficially owned by PCC as
to approximately 99.59%, Barits provides tanning facilities and processing services to Prime Asia TW for the processing of
Prime Asia TW’s raw leather into finished leather.
In consideration of the services provided by Barits under the Production Agreements, Prime Asia TW shall pay Barits a
monthly production fee (“Production Fee”) based on the followings:
(i) the cost for supplies and labour incurred by Barits;
(ii) the direct selling and general costs incurred by Barits; and
(iii) the fixed costs on the rental for land, building, equipment and machinery. The fixed monthly rental on land and
building is equivalent to the open market rental value and based on valuation report dated on 29th August, 2008, as
certified by an independent firm of professional valuers. Rental charges for equipment and machinery are calculated
by reference to the cost of the equipment and machinery plus a rate on the funding costs of the machinery
purchased.
(d) Certain subsidiaries of the Company, PCC and certain subsidiaries of the PCC Group entered into four lease agreements
on 9th January, 2007 and the respective supplemental lease agreements on 20th November, 2008 (collectively the “Rental
Agreements”) for leasing of PCC Group’s premises for a term of 3 years from 1st October, 2008. Details of the Rental
Agreements are as follows:
(i) between PCC as landlord and Pou Chien Chemical Company Limited (a wholly-owned subsidiary of the Company) as
tenant;
(ii) between Pou Yuen Technology Co., Ltd. (99.79% beneficially owned subsidiary of PCC) as landlord and Yue Dean
Technology Corporation (a wholly-owned subsidiary of the Company) as tenant;
(iii) between PCC as landlord and Yue Dean Technology Corporation (a wholly-owned subsidiary of the Company) as
tenant; and
(iv) between PCC as landlord and Pou Chien Technology Company Limited (a wholly owned subsidiary of the Company)
as tenant.
The premises under the Rental Agreements are all located in Taiwan.
The rentals on properties were based on agreed monthly rental under the Rental Agreements equivalent to the open
market rental value at the date of entering the Rental Agreements, as certified by an independent valuer in Taiwan.

152 / Yue Yuen Industrial (Holdings) Limited / Annual Report 2011
Notes to the Consolidated Financial StatementsFor the Year ended 30th September, 2011
48. Connected and Related Party Transactions and Balances (continued)notes: (continued)(e) On 20th November, 2008, Prima Asia China Leather Corporation (“Prima Asia China”), a wholly owned subsidiary of
the Company, entered into a leather splitting agreement (“Leather Splitting Agreement”) with Barits, under which Barits agreed to provide leather splitting services to Prime Asia China for a term of three years from 1st October, 2008 to 30th September, 2011.
In consideration of the services provided by Barits under the Leather Splitting Agreement, Prime Asia China shall pay Barits a monthly leather splitting fee based on the following:
(i) the market price for leather splitting fee for the service of splitting the wet blue leather into split and wet blue-split.
(ii) sales commission for the sale of the split for domestic and export sales on behalf of Prime Asia China charged at market rate based on the selling price of the split.
(iii) import and export charges incurred by Barits.
The fees for (i) and (ii) above are based on open market rates and are no less favourable than those offered by independent third parties and are subject to adjustment each quarter.
No transaction was noted in the year ended 30th September, 2011 (2010: nil).
(f) Highmark Services Limited (“Highmark”), a wholly-owned subsidiary of the Company, entered into certain supplemental management service agreements with PCC and Golden Brands on 9th January, 2007 and 20th November, 2008 for the provision of management services to PCC and Golden Brands and their subsidiaries.
In addition, Highmark entered into a lease agreement and certain supplemental lease agreements on 9th January, 2007 and 20th November, 2008 respectively with Golden Brands to lease certain dormitories within the Yue Yuen Industrial Estate, He Lu Industrial Area, Huang Jiang Town, Dongguan, the PRC (“Yue Yuen Industrial Estate”) to Golden Brands.
Golden Brands is ultimately owned as to 94.12% by Mr. Tsai Chi Jui, a substantial shareholder of the Company, and PCC is a substantial shareholder of the Company.
In consideration of the services and facilities provided by Highmark, under the above agreements, Highmark charged PCC and Golden Brands the following fees:
(i) in respect of common services provided by Highmark, approximately a 10% mark up on the aggregate costs incurred by Highmark;
(ii) in respect of the supply of electricity by Highmark, approximately the aggregate of the costs of the oil consumed with a 5% mark up and the cost of overheads incurred for the production of electricity incurred by Highmark. In respect of electricity provided by the public sector, a service fee of RMB0.16 for each Kilowatt-hour unit of electricity is charged in addition to the price charged by the public sector;
(iii) in respect of supply of water by Highmark, a charge with reference to the price charged by the local authority; and
(iv) in respect of rental, a rent that is equivalent to the open market rental value as reviewed and agreed by both parties annually.

/ 153
48. Connected and Related Party Transactions and Balances (continued)notes: (continued)
(g) Godalming is owned by Power Point Developments Limited, a company in which a former director of the Company, Mr.
Choi Kwok Keung, and a discretionary trust, the objects of which include another director of the Company, Mr. Tsai Chi
Neng and his relatives, have beneficial interests. The rentals on properties paid to Godalming were based on a tenancy
agreement dated 8th June, 1992, together with a supplemental tenancy agreement which was entered into between the
Group and subsidiaries of Godalming on 20th November, 2008 for a lease term of 3 years from 1st October, 2008.
The prevailing rent is equivalent to the open market rental value at 30th September, 2008 as certified by Knight Frank, an
independent firm of professional valuers.
(h) On 1st July, 2010, Pro Kingtex Industrial Company Limited, a non-wholly owned subsidiary of the Company, disposed
of 70% interest in a subsidiary, Faith Year Investments Limited, and its subsidiaries to a jointly controlled entity, Din Tsun
Holding Co., Ltd..
(i) The amounts due from/to are unsecured, interest-free and repayable on demand.
49. Non-Controlling Interests
Interestsattributable
to sharesheld in
subsidiaries
Share options
reserve ofa listed
subsidiary
Otherreserve of
a listedsubsidiary Total
US$’000 US$’000 US$’000 US$’000(note i) (note ii)
At 1st October, 2009 384,153 – – 384,153
Exchange difference arising on the translation of foreign operations 5,532 – – 5,532
Profit for the year 16,331 – – 16,331
Total comprehensive income for the year 21,863 – – 21,863Recognition of equity-settled share-based payments – 1,578 – 1,578Realised on deregistration of subsidiaries (125) – – (125)Realised on disposal of subsidiaries (1,222) – – (1,222)Contribution from non-controlling interests 4,111 – – 4,111Acquisition of additional interests in subsidiaries
from non-controlling interests (1,307) – – (1,307)Dividends paid to non-controlling interests of
subsidiaries (3,604) – – (3,604)
At 30th September, 2010 403,869 1,578 – 405,447

154 / Yue Yuen Industrial (Holdings) Limited / Annual Report 2011
Notes to the Consolidated Financial StatementsFor the Year ended 30th September, 2011
Interestsattributable
to sharesheld in
subsidiaries
Share options
reserve ofa listed
subsidiary
Otherreserve of
a listedsubsidiary Total
US$’000 US$’000 US$’000 US$’000(note i) (note ii)
Exchange difference arising on the translation of foreign operations 14,462 – – 14,462
Profit for the year 33,696 – – 33,696
Total comprehensive income for the year 48,158 – – 48,158Recognition of equity-settled share-based payments – 2,473 – 2,473Recognition of share-settled considerations for
acquisition of subsidiaries – – 3,785 3,785Contribution from non-controlling interests 1,886 – – 1,886Acquisition of additional interests in subsidiaries
from non-controlling interests (3,778) – – (3,778)Dividends paid to non-controlling interests of
subsidiaries (5,062) – – (5,062)
At 30th September, 2011 445,073 4,051 3,785 452,909
notes:
i. This reserve represents the amounts recognised in respect of share options granted under share-based payment
arrangement of a non-wholly-owned subsidiary.
ii. This reserve represents the amounts recognised in respect of share-settled consideration for acquisition of subsidiaries by
a listed subsidiary.
49. Non-Controlling Interests (continued)

/ 155
50. Events After the Reporting Period(i) Acquisition of remaining interest in Zhanxin
As set out in Note 25a, during the year ended 30th September, 2011, the Company exercised the call options granted by the Relevant Partners of Zhanxin for the acquisition of the 55% equity interest in Zhanxin not already held by the Group in order to expand the store network and geographical coverage of the Company in the PRC. The control of Zhanxin has been passed to the Group in November 2011 and the transaction was accounted for using purchase method.
Consideration transferred
US$’000
Cash 12,194Call option for acquisition of additional interests in Zhanxin (Note 25a) 1,171
13,365
Net assets recognisedProvisional fair value of assets and liabilities, based on their carrying amounts recorded in the unaudited financial statements of Zhanxin as at 30th November, 2011 prepared by the management and subject to an audit, recognised at the date of acquisition, are as follow:
US$’000
Property, plant and equipment (note) 1,404Inventories (note) 12,060Trade and other receivables 8,869Bank balances and cash 2,176Trade and other payables (13,144)Tax payables (56)Bank borrowings (7,383)
3,926
note: The initial accounting for the acquisition has been determined provisionally for these items as well as certain
intangible assets to be identified and recognised separately from goodwill awaiting the receipt of professional
valuation in relation to the respective fair values.
(ii) Redemption of CB 2011On 20th October, 2011, the Company entered into a loan facility with principal amount of US$350 million. Part of the proceed from the loan facility was used to redeem CB 2011 on 17th November, 2011 as set out in Note 32.

156 / Yue Yuen Industrial (Holdings) Limited / Annual Report 2011
Notes to the Consolidated Financial StatementsFor the Year ended 30th September, 2011
51. Principal SubsidiariesDetails of the Company’s principal subsidiaries at 30th September, 2011 and 2010 are as follows:
Name of subsidiary
Place ofincorporation/establishment
Issued andfully paid
share capital/registered capital
Proportion of issued andfully paid share capital/
registered capitalattributable to the Group Principal activities
2011 2010
A-Grade Holdings Limited British Virgin Islands US$9,000 56.05%+ 56.13%+ Investment holding
Bangladesh Pou Hung Industrial Ltd
Bangladesh US$145 100% 100% Manufacture and sales of footwear
Baosheng Daoji (Beijing) Trading Company Limited
PRC** US$20,000,000 56.05%+ 56.13%+ Retailing of sportswear
Baoxin (Chengdu) Trading Company Limited
PRC** US$5,000,000 56.05%+ 56.13%+ Retailing of sportswear
Bestful Properties Limited British Virgin Islands US$1 –+++ 100% Property holding
Champolian Investments Inc. British Virgin Islands US$10,000 –+++ 100% Investment holding
Chiya Vietnam Enterprise Limited
Vietnam US$700,000 –+++ 51% Manufacture of foamed cotton
Dah-Chen Shoe Materials Ltd. Vietnam US$437,500 51% 51% Manufacture of shoe pads
Dedicated Group Limited British Virgin Islands US$1,000 56.05%+ 56.13%+ Investment holding
Diodite (China) Sports Goods Co., Ltd
PRC** US$20,000,000 56.05%+ 56.13%+ Retailing of sportswear
Dragonlight (China) Sporting Goods Co., Ltd
PRC** US$66,000,000 56.05%+ 56.13%+ Investment holding
Escon Enterprises Limited British Virgin Islands US$1 100% 100% Manufacturing of leather
Farsighted International Limited British Virgin Islands US$100 56.05%+ 56.13%+ Investment holding and its subsidiaries are engaged in retailing of sportswear and sports footwear

/ 157
Name of subsidiary
Place ofincorporation/establishment
Issued andfully paid
share capital/registered capital
Proportion of issued andfully paid share capital/
registered capitalattributable to the Group Principal activities
2011 2010
Farquharson Holdings Corp. British Virgin Islands US$10,000 100% 100% Investment holding
Forearn Company Ltd. British Virgin Islands US$1 100% 100% Manufacture of shoe moulds
Giacinto Investments Limited British Virgin Islands US$10,000 100% 100% Investment holding
Gold Plenty International Limited
British Virgin Islands US$1 100% 100% Manufacture and sales of footwear
Great Pacific Investments Ltd. British Virgin Islands US$1 100% 100% Investment holding
Harbin Baosheng Sports Goods Company Limited
PRC*** RMB7,000,000 56.05%+ 56.13%+ Retailing of sportswear
Hefei Baoxun Sports Goods Trading Company Limited
PRC*** RMB1,000,000 56.05%+ 56.13%+ Retailing of sportswear
High Shine Investments Limited
British Virgin Islands US$100 51% 51% Investment holding
Highfull Developments Limited British Virgin Islands US$1 100% 100% Investment holding
Idea (Macao Commercial Offshore) Limited
Macau MOP100,000 100% 100% Manufacture and sales of footwear
Key International Co., Ltd. British Virgin Islands US$1 100% 100% Investment holding
Major Focus Management Limited
British Virgin Islands US$1 100% 100% Investment holding
Multiform Enterprises Limited British Virgin Islands US$200 100% 100% Manufacture of moulding equipment
Murata Profits Limited British Virgin Islands US$1 100% 100% Investment holding
51. Principal Subsidiaries (continued)

158 / Yue Yuen Industrial (Holdings) Limited / Annual Report 2011
Notes to the Consolidated Financial StatementsFor the Year ended 30th September, 2011
Name of subsidiary
Place ofincorporation/establishment
Issued andfully paid
share capital/registered capital
Proportion of issued andfully paid share capital/
registered capitalattributable to the Group Principal activities
2011 2010
P.T. Nikomas Gemilang Indonesia IDR56,680,000,000 99.38% 99.38% Manufacture and sales of footwear
P.T. Pou Chen Indonesia Indonesia US$24,000,000 90% 90% Manufacture and sales of footwear
P.T. Sukespermata Indonusa Indonesia IDR3,500,000,000 90% 90% Manufacture of mould and cutting for shoes
Pou Yuen Cambodia Enterprise Limited
Cambodia US$4,000,000 100% 100% Manufacture and sales of shoes
Pau Yuen Trading Corporation Taiwan NTD50,000,000 50.45%++ 50.52%++ Distribution of licenced products
Pou Chen Vietnam Enterprise Ltd.
Vietnam US$36,389,900 100% 100% Manufacture and sales of footwear
Pou Chien Chemical Company Enterprise Limited
Taiwan NTD1,268,100,000 100% 100% Manufacture of shoe materials (chemical products)
Pou Chien Chemical (Holdings) Limited
British Virgin Islands US$1 100% 100% Investment holding
Pou Ming Paper Products Manufacturing Company Limited
British Virgin Islands US$1 100% 100% Investment holding and manufacture of paper carton boxes
Pou Sheng Bermuda* HK$42,968,000 56.05% 56.13% Investment holding
Pou Sung Vietnam Co., Ltd Vietnam US$57,000,000 100% 100% Manufacture and sales of footwear
Pou Yu (Chengdu) Trading Co., Ltd
PRC** US$7,400,000 56.05%+ 56.13%+ Retailing of sportswear
Pou Yuen Industrial (Holdings) Limited
Hong Kong Ordinary – HK$12,000,000
100% 100% Investment holding and property holding
6% cumulativepreference –
HK$433,600,000
100% 100%
51. Principal Subsidiaries (continued)

/ 159
Name of subsidiary
Place ofincorporation/establishment
Issued andfully paid
share capital/registered capital
Proportion of issued andfully paid share capital/
registered capitalattributable to the Group Principal activities
2011 2010
Pouyuen Vietnam Company Limited
Vietnam US$86,406,000 100% 100% Manufacture and sales of footwear
Prime Asia China Leather Corporation
British Virgin Islands US$1,000 100% 100% Manufacture and sales of leather
Prime Asia (S.E. Asia) Leather Corporation
British Virgin Islands US$1,000 100% 100% Manufacture and sales of leather
Prime Asia Leather Corporation British Virgin Islands US$50,000 100% 100% Investment holding
Pro Kingtex Industrial Company Limited
British Virgin Islands US$13,792,810 91.68% 91.68% Manufacture of apparel
Selangor Gold Limited British Virgin Islands US$1,000 56.05%+ 56.13%+ Investment holding
Sheng Dao (Yangzhou) Sporting Goods Dev. Co., Ltd
PRC** US$66,000,000 56.05%+ 56.13%+ Investment holding
Solar Link International Inc. USA US$9,000,000 100% 100% Manufacture and sales of footwear
The Look (Macao Commercial Offshore) Company Limited
Macau MOP100,000 100% 100% Manufacture and sale of footwear
Top Units Developments Limited
British Virgin Islands US$100 51% 51% Investment holding
Upturn Investments Limited British Virgin Islands US$1 100% 100% Manufacture of paper inner boxes and carton boxes
Wellmax Business Group Limited
British Virgin Islands US$9,000 56.05%+ 56.13%+ Investment holding
Wuxi Baoyuen Sports Goods Trading Company Limited
PRC*** RMB1,000,000 56.05%+ 56.13%+ Retailing of sportswear
51. Principal Subsidiaries (continued)

160 / Yue Yuen Industrial (Holdings) Limited / Annual Report 2011
Notes to the Consolidated Financial StatementsFor the Year ended 30th September, 2011
Name of subsidiary
Place ofincorporation/establishment
Issued andfully paid
share capital/registered capital
Proportion of issued andfully paid share capital/
registered capitalattributable to the Group Principal activities
2011 2010
Yue Cheng (Kunshan) Sports Co., Ltd.
PRC** US$10,000,000 56.05%+ 56.13%+ Distribution of licenced sportswear
Yue Ming International Limited Hong Kong HK$1 56.05%+ 56.13%+ Distribution of licenced sportswear
Yue Yuen Industrial Limited Hong Kong Ordinary – HK$1,000
100% 100% Investment holding and property holding
Non-voting deferred – HK$47,000,000
100% 100%
Yue-Shen (Taicang) Footwear Co., Ltd.
PRC** US$15,000,000 56.05%+ 56.13%+ Manufacturing of sportswear
Yunnan Orientsport TradingCo., Ltd.
PRC** RMB56,100,000 28.59%++ 28.63%++ Retailing of sportswear
Yunnan Shengdao Sports Goods Company Limited
PRC*** RMB87,500,000 33.63%++ 33.68%++ Property leasing and management
YY Sports Holdings Limited British Virgin Islands US$1 56.05%+ 56.13%+ Investment holding
Zhejiang Yichuan Sports Goods Chain Company Limited
PRC**** RMB92,000,000 56.05%+ — Retailing of Sportwear
* Pou Sheng is a listed company on the Stock Exchange.** These companies are wholly-foreign owned enterprises established in the PRC.*** These companies are wholly-domestic owned enterprises established in the PRC.**** The company is sino-foreign owned enterprise established in PRC.+ These companies were wholly-owned subsdiaries of Pou Sheng as at the end of the reporting period.++ These companies were non-wholly owned subsidiaries of Pou Sheng as at the end of the reporting period.+++ These companies have been deregistered by the Company during the year.
The deferred shares carry no rights to receive notice of or to attend or vote at any general meeting of the respective companies and have no rights to dividends or to participate in any distributions on winding up.
The above table lists the subsidiaries of the Company which, in the opinion of the directors, principally affected the results or assets of the Group. To give details of other subsidiaries would, in the opinion of the directors, result in particulars of excessive length.
None of the subsidiaries had any debt securities outstanding during the year or at the end of the reporting period.
51. Principal Subsidiaries (continued)
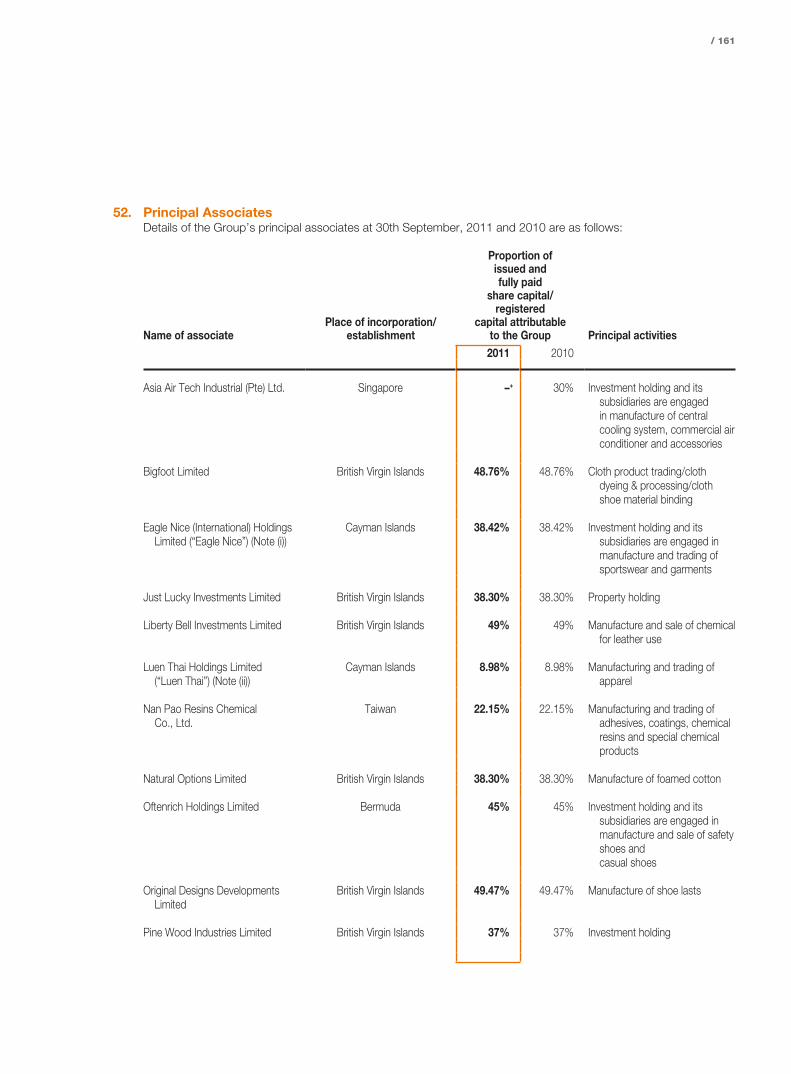
/ 161
52. Principal AssociatesDetails of the Group’s principal associates at 30th September, 2011 and 2010 are as follows:
Name of associatePlace of incorporation/
establishment
Proportion ofissued andfully paid
share capital/registered
capital attributableto the Group Principal activities2011 2010
Asia Air Tech Industrial (Pte) Ltd. Singapore –+ 30% Investment holding and its subsidiaries are engaged in manufacture of central cooling system, commercial air conditioner and accessories
Bigfoot Limited British Virgin Islands 48.76% 48.76% Cloth product trading/cloth dyeing & processing/cloth shoe material binding
Eagle Nice (International) Holdings Limited (“Eagle Nice”) (Note (i))
Cayman Islands 38.42% 38.42% Investment holding and its subsidiaries are engaged in manufacture and trading of sportswear and garments
Just Lucky Investments Limited British Virgin Islands 38.30% 38.30% Property holding
Liberty Bell Investments Limited British Virgin Islands 49% 49% Manufacture and sale of chemical for leather use
Luen Thai Holdings Limited (“Luen Thai”) (Note (ii))
Cayman Islands 8.98% 8.98% Manufacturing and trading of apparel
Nan Pao Resins ChemicalCo., Ltd.
Taiwan 22.15% 22.15% Manufacturing and trading of adhesives, coatings, chemical resins and special chemical products
Natural Options Limited British Virgin Islands 38.30% 38.30% Manufacture of foamed cotton
Oftenrich Holdings Limited Bermuda 45% 45% Investment holding and its subsidiaries are engaged in manufacture and sale of safety shoes and casual shoes
Original Designs Developments Limited
British Virgin Islands 49.47% 49.47% Manufacture of shoe lasts
Pine Wood Industries Limited British Virgin Islands 37% 37% Investment holding

162 / Yue Yuen Industrial (Holdings) Limited / Annual Report 2011
Notes to the Consolidated Financial StatementsFor the Year ended 30th September, 2011
Name of associatePlace of incorporation/
establishment
Proportion ofissued andfully paid
share capital/registered
capital attributableto the Group Principal activities2011 2010
Platinum Long John Company Limited
Taiwan 48.76% 48.76% Cloth product trading/cloth dyeing & processing/cloth shoe material binding
Prosperous Industrial (Holdings) Limited
Cayman Islands 30% 30% Investment holding and its subsidiaries are engaged in manufacture and sale of sports bags
San Fang Chemical Industry Co. Ltd. (Note (iii))
Taiwan 44.72% 44.72% Manufacture and trading of synthetic leather
Shaanxi Wuhuan Shengdao Sports Production Development Company Limited
PRC* 22.42%++ 22.45%++ Retailing of sportswear
Zhejiang Baohong Sports Goods Company Limited
PRC* 27.46%++ 27.50%++ Retailing of sportswear
* The companies are sino-foreign owned enterprises established in the PRC.+ The company was disposed of by the Company during the year.++ These companies are associates of Pou Sheng at the end of the reporting period.
Notes:(i) Eagle Nice is incorporated in Cayman Islands with its shares listed on the Stock Exchange.
(ii) Luen Thai is incorporated in Cayman Islands with its shares listed on the Stock Exchange. The Group has been in a position to exercise significant influence to participate in the financial and operating policy decisions of Luen Thai since 17th September, 2007, when one of the senior managements of the Company was appointed into the board of directors of Luen Thai and accordingly, the investment is accounted for as an associate.
(iii) The company is incorporated in Taiwan with its shares listed on the Taiwan Stock Exchange Corporation.
The above table lists the associates of the Group which, in the opinion of the directors, principally affected the results or assets of the Group. To give details of other associates would, in the opinion of the directors, result in particulars of excessive length.
52. Principal Associates (continued)

/ 163
53. Principal Jointly Controlled EntitiesDetails of the Group’s principal jointly controlled entities at 30th September, 2011 and 2010 are as follows:
Name of jointly controlled entity
Place ofincorporation/establishment
Proportion of issued and fully paid share capital/
registered capital attributableto the Group Principal activities
2011 2010
Best Focus Holdings Limited British Virgin Islands 50% 50% Investment holding and its subsidiaries are engaged in manufacture and sale of paper carton boxes
Blessland Enterprises Limited British Virgin Islands 50% 50% Manufacture of shoe pads
Cohen Enterprises Inc. British Virgin Islands 50% 50% Manufacture and sales of leather products for shoes
Din Tsun Holding Co., Ltd. British Virgin Islands 50% 50% Manufacture of apparel
Great Skill Industrial Limited British Virgin Islands 50% 50% Investment holding and its subsidiaries are engaged in manufacture and sale of plastic shoe injection
Hua Jian Industrial Holding Co., Ltd. British Virgin Islands 50% 50% Manufacture and sale of ladies shoes
Jilin Lingpao Sporting Goods Co., Ltd
PRC* 28.03%+ 28.07%+ Retailing of sportswear
Ka Yuen Rubber Factory Limited British Virgin Islands 50% 50% Manufacture and sale of rubber soles

164 / Yue Yuen Industrial (Holdings) Limited / Annual Report 2011
Notes to the Consolidated Financial StatementsFor the Year ended 30th September, 2011
Name of jointly controlled entity
Place ofincorporation/establishment
Proportion of issued and fully paid share capital/
registered capital attributableto the Group Principal activities
2011 2010
Topmost Industries Limited British Virgin Islands 50% 50% Manufacture of counters for shoes
Twinways Investments Limited British Virgin Islands 50% 50% Manufacture of injection moulds for shoe components
Well Success Investment Limited British Virgin Islands 40% 40% Investment holding and its subsidiaries are engaged in the manufacturing and sales of footwear products, and are also engaged in retail and wholesale business of apparel and footwear
Yuen Thai Industrial Company Limited
Hong Kong 50% 50% Manufacture and trading of sports and active wear
Zhejiang Yichuan Sports Goods Chain Company Limited (note)
PRC* – 28.07%+ Retailing of sportswear
* The companies are sino-foreign owned enterprises established in the PRC.+ These companies were jointly controlled entities of Pou Sheng as at the end of the reporting period.
note: This company became a subsidiary on 1st October, 2010. As at 30th September, 2010, it was a jointly controlled entity.
The above table lists the jointly controlled entities of the Group which, in the opinion of the directors, principally affected the results or assets of the Group. To give details of other jointly controlled entities would, in the opinion of the directors, result in particulars of excessive length.
53. Principal Jointly Controlled Entities (continued)
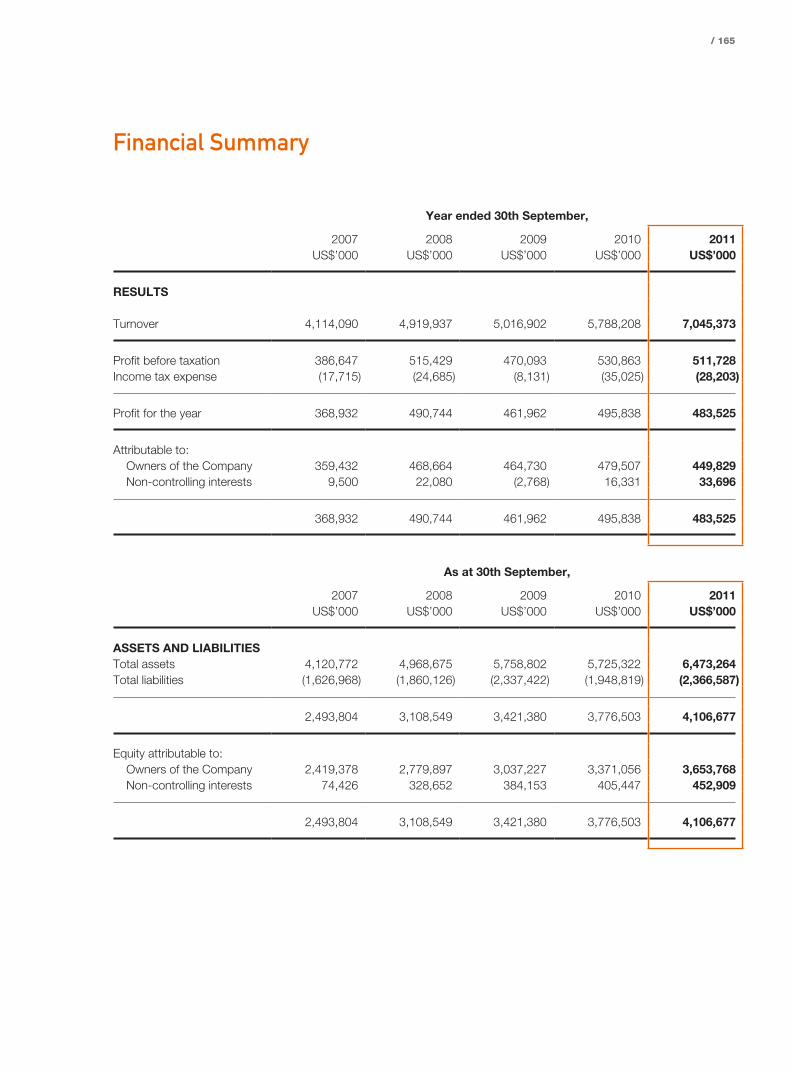
/ 165
Financial Summary
Year ended 30th September,
2007 2008 2009 2010 2011US$’000 US$’000 US$’000 US$’000 US$’000
RESULTS
Turnover 4,114,090 4,919,937 5,016,902 5,788,208 7,045,373
Profit before taxation 386,647 515,429 470,093 530,863 511,728Income tax expense (17,715) (24,685) (8,131) (35,025) (28,203)
Profit for the year 368,932 490,744 461,962 495,838 483,525
Attributable to:Owners of the Company 359,432 468,664 464,730 479,507 449,829Non-controlling interests 9,500 22,080 (2,768) 16,331 33,696
368,932 490,744 461,962 495,838 483,525
As at 30th September,
2007 2008 2009 2010 2011US$’000 US$’000 US$’000 US$’000 US$’000
ASSETS AND LIABILITIESTotal assets 4,120,772 4,968,675 5,758,802 5,725,322 6,473,264Total liabilities (1,626,968) (1,860,126) (2,337,422) (1,948,819) (2,366,587)
2,493,804 3,108,549 3,421,380 3,776,503 4,106,677
Equity attributable to:Owners of the Company 2,419,378 2,779,897 3,037,227 3,371,056 3,653,768Non-controlling interests 74,426 328,652 384,153 405,447 452,909
2,493,804 3,108,549 3,421,380 3,776,503 4,106,677

166 / Yue Yuen Industrial (Holdings) Limited / Annual Report 2011 / Corporate Social Responsibility
Corporate Social Responsibi l i ty 企業社會責任
Sustainable DevelopmentThe Group has a Sustainable Development (“SD”) division to look after Group init iat ives concerning sustainable development and specific brand name customer objectives for this area of corporate development. The SD division has deployed staff at all major compounds containing the Group’s factories: estimating 39 factory compounds spread across Guangdong province, the inner provinces of China, Indonesia, Vietnam, Cambodia and Bangladesh. At each location these staff members observe on a daily basis operations of the factories. Readiness at all time to deal with environmental and labour related incidents that have occurred in factory. Each SD team member has a good working knowledge of the factory’s procedures and systems. The human resources dedicated to SD, shows the Group’s conviction to fulfill its Corporate Social Responsibilities (“CSR”) for sustainable development.
One of the important factors for the SD division is to keep in mind at all time technology capability of dissemintating instantaneous information and the capacity of creating widespread global news. In today’s world with connectivity tools such as smart phones, the internet, e-mail, Facebook, Twitter and Youtube, information in the form of pictures, words, short videos and sound bites can easily be circulated to people of different backgrounds and different locations. Thus, SD tries to manage any factory situation detected in the Group, be it environment related or people related, SD must be on the alert that news of the situation will be heard by the media and other stakeholders. Due care must be exercised to ensure that appropriate messages are transmitted and that consideration is given to the different language interpretations that may be obtained for a given message. At times, SD staff are an easy target of aggressive provocative comments and therefore SD must maintain composure at all times to deal with such situations.
可持續發展本集團設有可持續發展部門,負責本集團可持續發展方面的工作及此企業發展範疇的特定品牌客戶目標。可持續發展部門於設有本集團工廠的所有主要廠區均派駐員工:約39個工廠區遍佈廣東省、中國內陸省份、印尼、越南、柬埔寨及孟加拉。於每個地點,該等員工每日觀察工廠的基本運作。隨時就緒處理工廠內所發生的環境及勞工相關事故。每名可持續發展團隊成員對工廠程序及系統均有深入的工作知識。本集團對可持續發展投入的人力資源彰顯其決心履行企業社會責任,以達致可持續發展。
可持續發展部門的其中一項重要元素,是時刻緊記即時傳送資訊的技術能力以及創造全球新聞廣為散播的能力。今日的世界通訊連接工具多不勝數,諸如智能手機、互聯網、電郵、Facebook、Twitter及Youtube,讓圖像、文字、短片及原聲等形式的資訊輕易傳達至不同背景、不同地域的人群。因此,可持續發展部門力求管理本集團內所發現的任何工廠情況(不論為環境相關或人事相關),其必須警覺傳媒及其他利益相關者將得知有關情況的消息。可持續發展部門必須審慎行事,確保傳遞適當信息,並考慮到就所傳遞信息可能得出的不同語言詮釋。可持續發展員工很容易成為帶有攻擊性及挑釁性評論的目標,因此必須時刻保持冷靜以處理該等情況。

/ 167
In June of this year, the Group was officially accepted as a business affiliate of the Fair Labor Association (“FLA”), a world recognized voluntary non-profit organization, who states their mission is to promote the adherence to international labour standards by combining the efforts of industry, civil society organizations, and colleges and universities to protect workers’ rights and improve working conditions worldwide. The FLA presently looks after five industries: footwear, apparel, food/agriculture, energy and pharmaceuticals. Quite a few key customers of the Group are also business affiliates of the FLA and thus now the Group has taken another step to be closer to these customers. Members of the FLA work towards a common goal espoused by the FLA: collaboration to improve workplace conditions.
The activities of the SD division are ongoing throughout the year. Each year the SD division plans and hosts activities with great detail in order to achieve key objectives. At the top of the list is looking after the production workers so that both their mental and physical needs are satisfied. Fostering closer working ties and bonding with factory management and their own family members is one aspect. Broadening their understanding of how to maintain good health, as well as providing them medical services are other areas of focus. The SD division also looks at the objectives of meeting the needs of society and the environment as well. Leading global businesses are expected to help the society at large and whenever possible protect the environment by reducing energy use, carbon and waste emission. The SD division also works to ensure the SD objectives of the brand name customers and the Group, are compatible and consistent. This is very important given the high expectations of society that leading brand name customers will avoid sweat shop labour, child labour and minimize pollution of the environment. The following are highlights of some of the more notable events.
本年六月,本集團獲正式納入公平勞動協會為商業成員。公平勞動協會為世界公認的自願性非牟利組織,其使命為透過結合行業、民間社會組織、學院及大學的努力,敦促遵守國際勞動標準,保障全球工人權利及改善工作環境。公平勞動協會現時涵蓋五個行業:鞋類、服裝、食品╱農業、能源及藥品。本集團多個主要客戶均為公平勞動協會的商業成員,故本集團現已更進一步拉近與該等客戶的關係。公平勞動協會的成員協力達致協會所支持攜手改善工作環境的共同目標。
可持續發展部門舉辦的活動於年內持續進行。每年,可持續發展部門計劃及主辦詳細的活動以達致主要目標。首要工作為照顧生產工人,配合彼等精神上及實質上的需要,其中包括拉近彼等與工廠管理層的工作關係及聯繫彼等與本身家庭成員之間的關係。其次重點範疇為豐富彼等對保持身體健康的知識,以及為彼等提供醫療服務。可持續發展部門亦負責滿足社會及環境需要的目標。各界期望具領先地位的全球企業向社會伸出援手,並盡可能透過減少耗用能源、碳及廢物排放保護環境。可持續發展部門亦致力確保品牌客戶及本集團的可持續發展目標相容一致。由於社會對大型品牌客戶避免被剝削勞工、童工以及儘量減少環境污染的期望甚高,故此項工作非常重要。下文摘錄了若干主要的活動。

168 / Yue Yuen Industrial (Holdings) Limited / Annual Report 2011 / Corporate Social Responsibility
Corporate Social Responsibi l i ty 企業社會責任
In Vietnam, the SD division was involved in many events. In January, a factory hosted a tour for the industrial engineering students of a major American universi ty. In January, a factory held a three day summit with a major brand name customer to agree and coordinate major corporate responsibility objectives. In March, a factory undertook major enhancements in the ventilation of the workers’ cafeteria where meals are served. In March, a factory hosted a tour for students studying biomedical engineering from two major American universities. In March, a factory hosted a three day seminar for workers given by the NGO Maria Stopes, regarding women & baby care. In March, a factory commemorated “the earth hour” with production staff. In March, a factory celebrated “international women’s day” with the factory workers. In April, a factory held a karaoke competit ion for factory staff providing entertainment and refreshments for the whole day. In April, a factory in collaboration with the NGO Maria Stopes, initiated a three day seminar regarding women’s health. In May, a factory hosted the environmental studies summit for a major brand name customer to discuss the latest initiative in protecting the environment. In June, a factory together with a major brand name customer hosted a football competition for the children of production line workers. In June, a factory led a social service event to visit handicapped children at an orphanage.
越南方面,可持續發展部門參與多項活動。於一月,一間工廠為美國一間知名大學的工業工程學生主辦參觀團。於一月,一間工廠與一家主要品牌客戶舉行為期三日的峰會,以協定及協調主要企業責任目標。於三月,一間工廠大幅改善工人用餐的飯堂的通風。於三月,一間工廠為美國兩間知名大學修讀生物醫學工程的學生主辦參觀團。於三月,一間工廠為工人主辦由非政府組織Maria Stopes演講有關女性及嬰兒健康的三日座談會。於三月,一間工廠與生產員工一同慶祝「地球一小時」。於三月,一間工廠與工廠工人慶祝「國際婦女日」。於四月,一間工廠為工廠員工舉辦卡拉OK比賽,提供了一整天的娛樂及茶點。於四月,一間工廠與非政府組織 Maria Stopes合作,發起有關女性健康的三日座談會。於五月,一間工廠為一家主要品牌客戶主辦環境研究峰會,以討論保護環境的最新工作。於六月,一間工廠聯同一家主要品牌客戶為生產線工人的子女主辦足球比賽。於六月,一間工廠帶領一項社會服務活動,探訪一間孤兒院的殘障兒童。

/ 169
In Indonesia, some of the events that are particularly worth mentioning are as follows. In April, a factory was awarded the top grade for its performance in meeting social accountability and fundamental environmental standards. In May, a factory worked together with PT. Maxi Aurum to provide three days of free medical service to workers. In June, a factory joined the Freedom of Association Protocol together with major brand name customers to enhance communications between factory management and the labour unions. In August, the management and workers of a factory began ‘the buka puasa’ together. In September, the management and workers of a factory together celebrated the end of Ramadhan. In August, factory management sponsored the transportation of workers to participate in the Idul Fitri holiday mass leave. In August, a factory received the top award for “on time delivery performance” from a major brand name customer. In September, a factory participated in the Indonesia supplier roundtable meeting for SAFE 2.0: Humanity and Ecology. In July, a factory football team won a knockout football competition between various supplier factories for a major brand name customer. In October, a factory held an offsite worker event at Legon Prima Beach to enhance worker collaboration. In October, a factory helped raise money for a worker to pay for a life saving medical operation. In December, one of our factories in Serang, Indonesia received the highest award for recognition of female staff needs and care from the President of Indonesia.
印尼方面,特別值得一提的若干活動如下。於四月,一間工廠就其履行達致社會問責及基本環境標準的工作獲頒最高評級。於五月,一間工廠與PT. Maxi Aurum合作向工人提供三日的免費醫療服務。於六月,一間工廠與主要品牌客戶加入結社自由公約,以加強工廠管理層與工會之間的溝通。於八月,一間工廠的管理層與工人一同開始齋戒。於九月,一間工廠的管理層與工人一同慶祝齋戒月結束。於八月,工廠管理層贊助工人參與回教新年假期大型休假的交通費。於八月,一間工廠獲一家主要品牌客戶頒發「準時交貨表現」最高獎項。於九月,一間工廠參與印尼供應商圓桌會議SAFE 2.0:人類學及生態學。於七月,一間工廠的足球隊在一家主要品牌客戶舉辦與若干供應商工廠的淘汰足球比賽中勝出。於十月,一間工廠於Legon Prima Beach舉辦外展工人活動,以提升工人合作性。於十月,一間工廠協助一名工人籌款支付一項性命攸關的手術的費用。於十二月,印尼西蘭一間工廠對女性員工需要的重視及愛護獲印尼總理頒發最高獎項。

170 / Yue Yuen Industrial (Holdings) Limited / Annual Report 2011 / Corporate Social Responsibility
Corporate Social Responsibi l i ty 企業社會責任
In the Inner provinces of China, the following were some of the events held by the SD division. In March, a factory together with a technical institute hosted a cross culture training seminar for student to gain more insight into the latest theories in organizational behavior. In April, a factory hosted a factory tour for the senior management of the sourcing division of a major brand name customer. In April, a factory participated in the employee survey of a major brand name customer as part of the brand’s ongoing monitoring of the treatment of production staff. The employees were chosen on a random basis for the survey and the evaluation assessments of these staff members concerning factory management were very positive. In May, in support of the international campaigns for women’s health, a factory organized a series of activities to promote better understanding amongst factory workers of the important aspects of women’s health. These activities included lectures, instruction programs as well as physical examinations concerning topics such as conception, diabetes, high blood pressure, pregnancy etc. In June, a factory held a handcraft competition for factory workers to create charming pieces of art using the waste materials created during the manufacturing process. In August, a factory participated in the management audit verification procedure of a major brand name and received the top grade.
For Guangdong province, the SD division devised the events as follows. In July, a factory together with a professor recognized in the field of sustainable manufacturing, held a multi-day seminar to update senior management of the Group
中國內陸省份方面,以下為可持續發展部門舉辦的若干活動。於三月,一間工廠聯同一間技術學院為學生主辦跨文化培訓座談會,讓學生增廣見聞,了解組織行為的最新理論。於四月,一間工廠為一家主要品牌客戶的採購部門高級管理層主辦工廠參觀團。於四月,一間工廠參與一家主要品牌客戶的僱員調查,作為該品牌持續監察生產員工待遇工作的一部分。該調查隨機選擇僱員,而該等員工有關工廠管理的評估結果十分正面。於五月,為支持國際婦女健康活動,一間工廠舉辦一系列活動,促進工廠工人對女性健康重要方面的更深入瞭解。這些活動包括講座、指導計劃及身體檢查,主題涵蓋懷孕、糖尿病、高血壓、妊娠等。於六月,一間工廠為工廠工人舉辦手工藝比賽,利用生產過程產生的廢料創作動人的藝術品。於八月,一間工廠參與一個主要品牌的管理審核核實程序,並獲授最高評級。
廣東省方面,可持續發展部門策劃的活動如下。於七月,一間工廠聯同可持續製造範疇認可的一名教授舉辦為期多日的座談會,為本集團高級管理層提供可持續製造
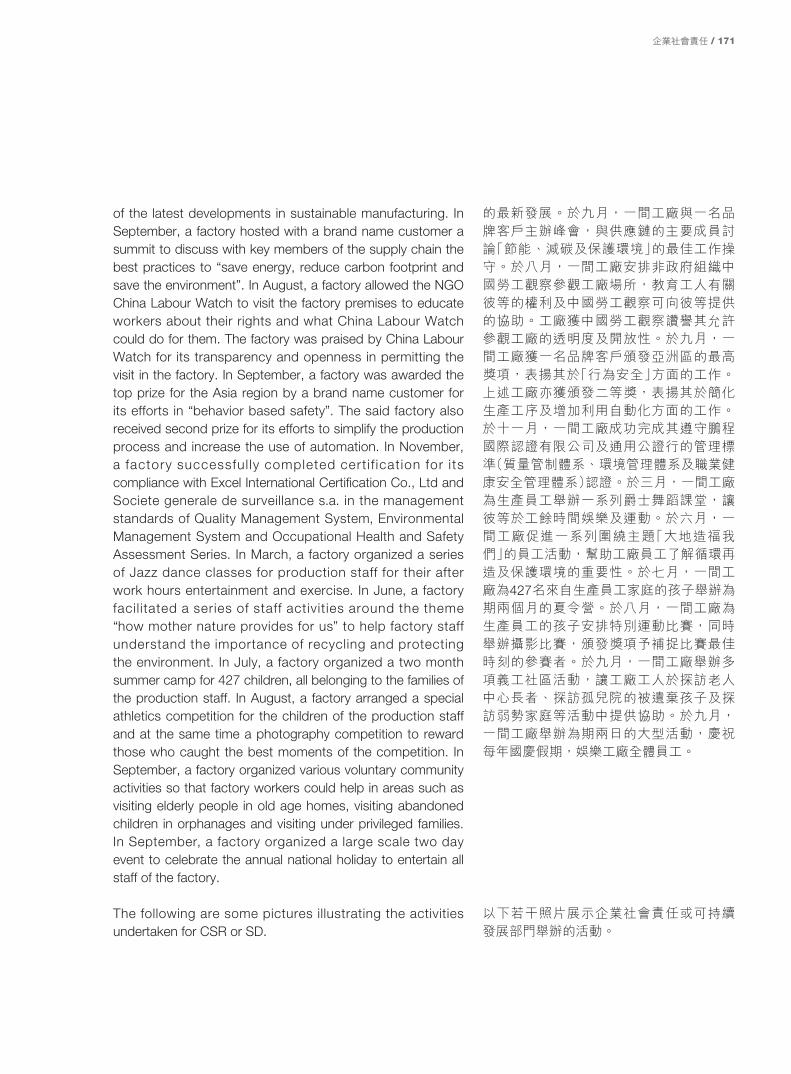
/ 171
of the latest developments in sustainable manufacturing. In September, a factory hosted with a brand name customer a summit to discuss with key members of the supply chain the best practices to “save energy, reduce carbon footprint and save the environment”. In August, a factory allowed the NGO China Labour Watch to visit the factory premises to educate workers about their rights and what China Labour Watch could do for them. The factory was praised by China Labour Watch for its transparency and openness in permitting the visit in the factory. In September, a factory was awarded the top prize for the Asia region by a brand name customer for its efforts in “behavior based safety”. The said factory also received second prize for its efforts to simplify the production process and increase the use of automation. In November, a factory successful ly completed cert i f icat ion for i ts compliance with Excel International Certification Co., Ltd and Societe generale de surveillance s.a. in the management standards of Quality Management System, Environmental Management System and Occupational Health and Safety Assessment Series. In March, a factory organized a series of Jazz dance classes for production staff for their after work hours entertainment and exercise. In June, a factory facil itated a series of staff activit ies around the theme “how mother nature provides for us” to help factory staff understand the importance of recycling and protecting the environment. In July, a factory organized a two month summer camp for 427 children, all belonging to the families of the production staff. In August, a factory arranged a special athletics competition for the children of the production staff and at the same time a photography competition to reward those who caught the best moments of the competition. In September, a factory organized various voluntary community activities so that factory workers could help in areas such as visiting elderly people in old age homes, visiting abandoned children in orphanages and visiting under privileged families. In September, a factory organized a large scale two day event to celebrate the annual national holiday to entertain all staff of the factory.
The following are some pictures illustrating the activities undertaken for CSR or SD.
的最新發展。於九月,一間工廠與一名品牌客戶主辦峰會,與供應鏈的主要成員討論「節能、減碳及保護環境」的最佳工作操守。於八月,一間工廠安排非政府組織中國勞工觀察參觀工廠場所,教育工人有關彼等的權利及中國勞工觀察可向彼等提供的協助。工廠獲中國勞工觀察讚譽其允許參觀工廠的透明度及開放性。於九月,一間工廠獲一名品牌客戶頒發亞洲區的最高獎項,表揚其於「行為安全」方面的工作。上述工廠亦獲頒發二等獎,表揚其於簡化生產工序及增加利用自動化方面的工作。於十一月,一間工廠成功完成其遵守鵬程國際認證有限公司及通用公證行的管理標準(質量管制體系、環境管理體系及職業健康安全管理體系)認證。於三月,一間工廠為生產員工舉辦一系列爵士舞蹈課堂,讓彼等於工餘時間娛樂及運動。於六月,一間工廠促進一系列圍繞主題「大地造福我們」的員工活動,幫助工廠員工了解循環再造及保護環境的重要性。於七月,一間工廠為427名來自生產員工家庭的孩子舉辦為期兩個月的夏令營。於八月,一間工廠為生產員工的孩子安排特別運動比賽,同時舉辦攝影比賽,頒發獎項予補捉比賽最佳時刻的參賽者。於九月,一間工廠舉辦多項義工社區活動,讓工廠工人於探訪老人中心長者、探訪孤兒院的被遺棄孩子及探訪弱勢家庭等活動中提供協助。於九月,一間工廠舉辦為期兩日的大型活動,慶祝每年國慶假期,娛樂工廠全體員工。
以下若干照片展示企業社會責任或可持續發展部門舉辦的活動。
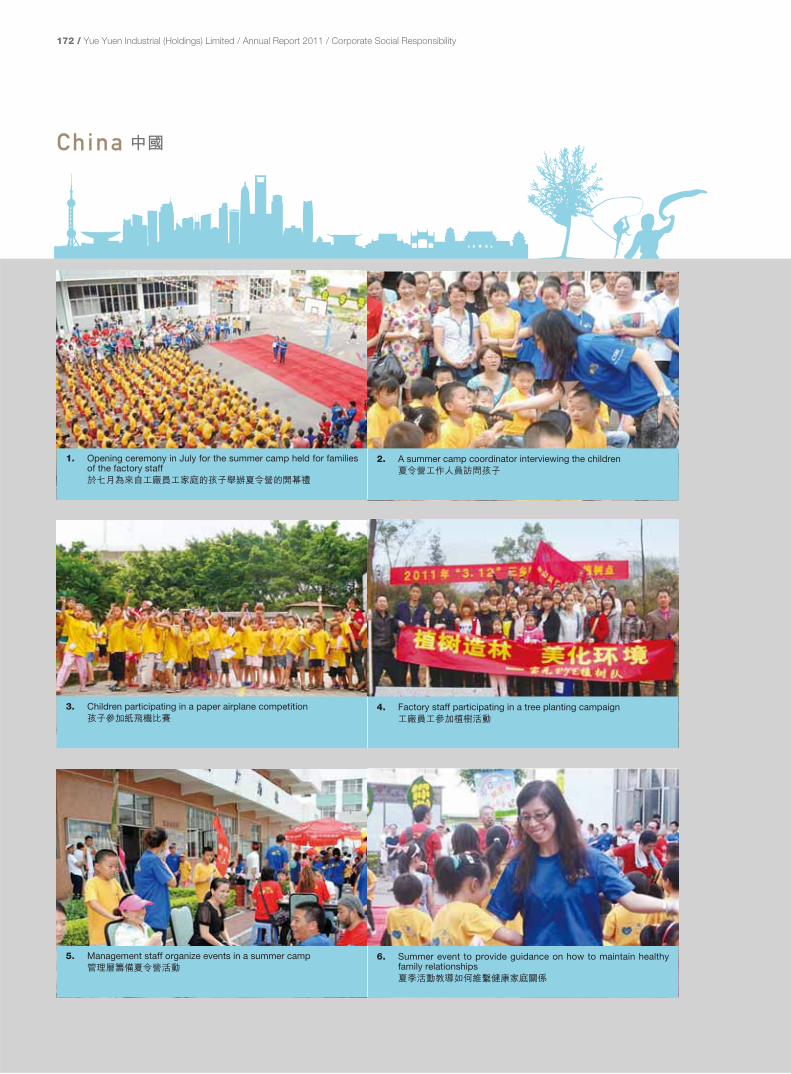
172 / Yue Yuen Industrial (Holdings) Limited / Annual Report 2011 / Corporate Social Responsibility
China
3. Children participating in a paper airplane competition
1. Opening ceremony in July for the summer camp held for families of the factory staff
5. Management staff organize events in a summer camp
2. A summer camp coordinator interviewing the children
4. Factory staff participating in a tree planting campaign
6. Summer event to provide guidance on how to maintain healthy family relationships

/ 173
9. Students from an American university visit the factory to learn about manufacturing athletic shoes
7. Factory staff participate in a stitching quality competition
11. A carnival with the theme to protect the environment
8. A summit concerning labour management practices
10. A new environmentally friendly ventilation system that reduces the air temperature by 20%
12. Community events to boost the community spirit and help provide entertainment to the workers
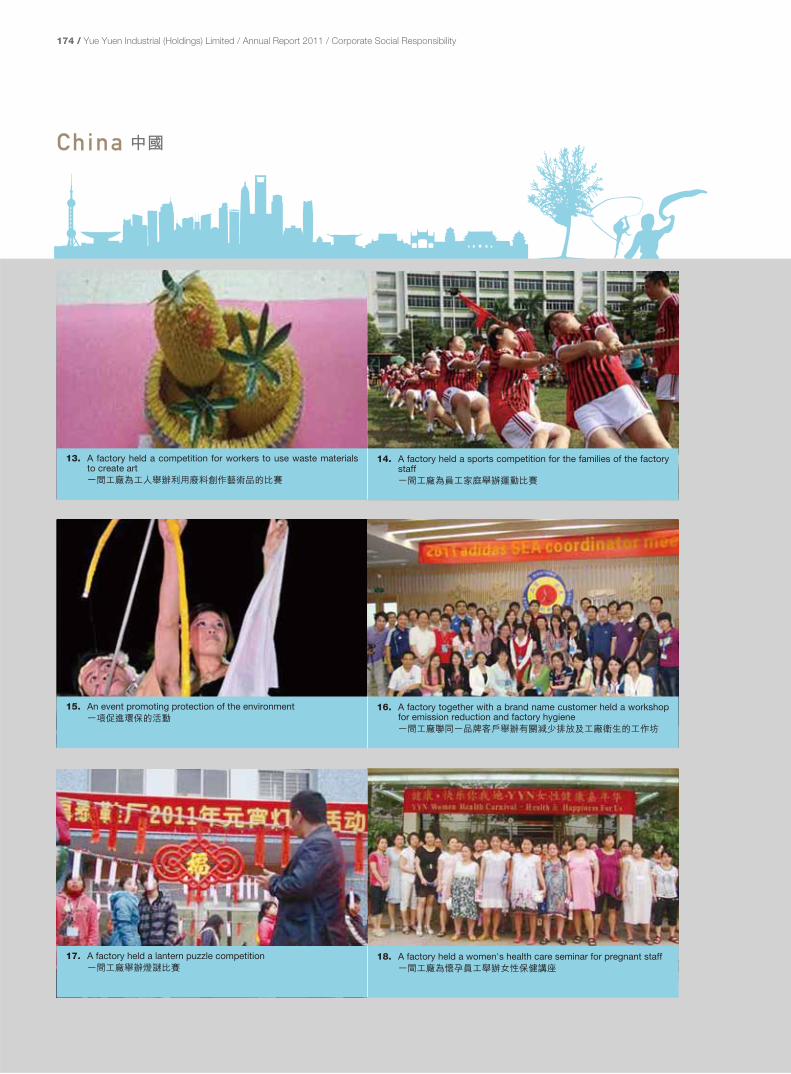
174 / Yue Yuen Industrial (Holdings) Limited / Annual Report 2011 / Corporate Social Responsibility
China
15. An event promoting protection of the environment
13. A factory held a competition for workers to use waste materials to create art
17. A factory held a lantern puzzle competition
16. A factory together with a brand name customer held a workshop for emission reduction and factory hygiene
14. A factory held a sports competition for the families of the factory staff
18. A factory held a women's health care seminar for pregnant staff

/ 175
21. A 10km run for factory management and staff
19. A factory held a Mid-Autumn dance party for the factory staff
23. A seminar for management regarding the new national labour laws
22. A factory hosted a factory visit for a group of 30 students from Hong Kong as a community service award
20. A factory held an outing event for management and staff to walk around a lake of Dongguan
24. A factory participated in the government sponsored community run

176 / Yue Yuen Industrial (Holdings) Limited / Annual Report 2011 / Corporate Social Responsibility
Indonesia
3. A soccer competition for factory workers
1. One of our factories in Serang, Indonesia received the highest award for recognition of female staff needs and care from the President of Indonesia
5. The Group participated in the summit for creating the Freedom of Association Protocol
4. A modern dance competition for factory workers
2. A factory distributed food products to needy people in the village
6. A training workshop for senior management

/ 177
9. The management team and employees of a factory celebrate the buka puasa together
7. A training workshop for the best practices for managing factory activities
11. The factory management and workers celebrate the completion of Ramadan event
10. A summit to discuss the strategies for reaching the environmental targets of a brand name customer
8. A labour union in one of the factories held the annual Gerak Jalan competition
12. A factory union held the Gerak Jalan activity as part of its annual celebration

178 / Yue Yuen Industrial (Holdings) Limited / Annual Report 2011 / Corporate Social Responsibility
Vietnam
3. A factory competition to recycle waste materials to create pieces of art
1. The children of factory staff participated in a Soccer for Kids program
5. A soccer program for the children of factory staff
4. The factory designed a chair anatomically suited to pregnant staff
2. Bringing gifts to the families of factory workers to celebrate the Lunar New Year
6. A factory held a competition to design a Christmas tree using waste materials
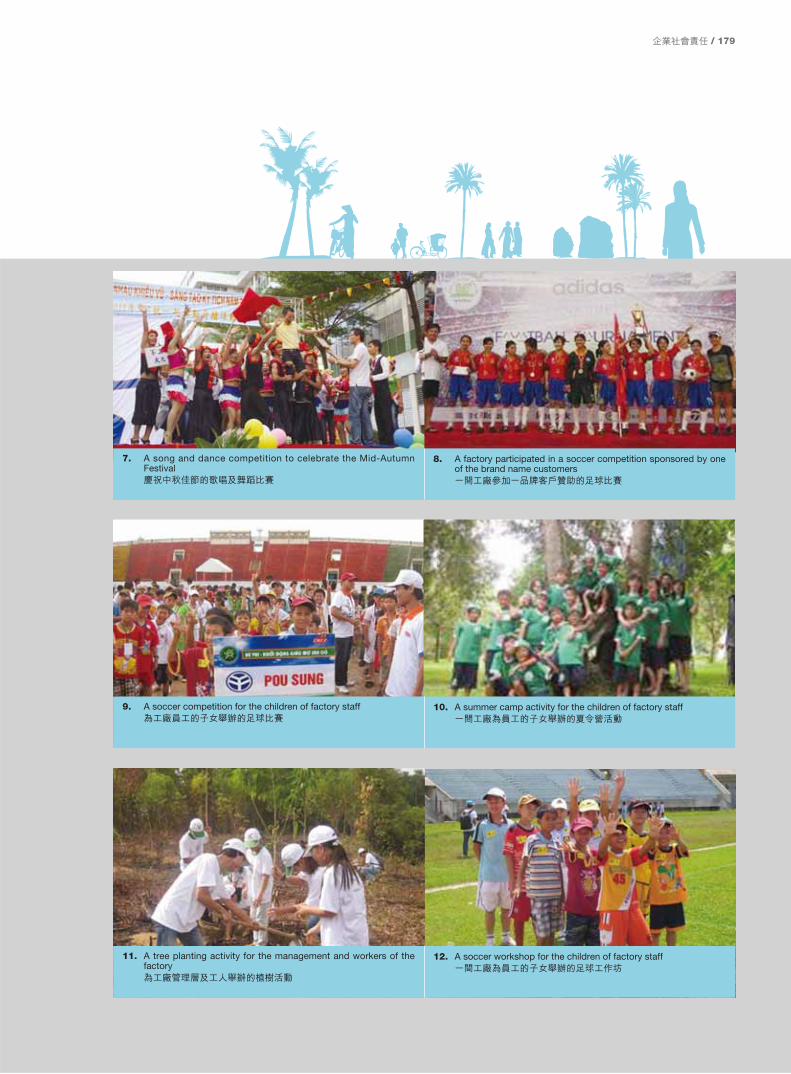
/ 179
9. A soccer competition for the children of factory staff
7. A song and dance competition to celebrate the Mid-Autumn Festival
11. A tree planting activity for the management and workers of the factory
10. A summer camp activity for the children of factory staff
8. A factory participated in a soccer competition sponsored by one of the brand name customers
12. A soccer workshop for the children of factory staff

Suites 3307-9, 33rd Floor, Tower 6 , The Gateway, 9 Canton Road, Tsimshatsui , Kowloon, Hong Kong.
香港九龍尖沙咀廣東道九號港威大廈第六座三十三樓三三零七至九室
Con
cept
, des
ign
and
prin
ting
: iO
ne F
inan
cial
Pre
ss L
imit
ed.
W
ebsi
te: w
ww
.ione
.com
.hk
Yue Yuen Industrial (Holdings) Limited裕元工業(集團)有限公司

www.yueyuen.com