Long-term absenteeism and moral hazard—Evidence from a natural experiment
Upload
khangminh22Category
view
2download
0
The Data and Relationships Behind Chronic Absenteeism
1
Outcomes
2
• Connect the why to the data collected through the chronic absenteeism indicator.
• Explore and connect tiered intervention strategy resources to improve regular school attendance.
• Introduce resources, including the new early warning system available through Single Sign On.

Building Connections Between Data and the Practice
3

Hedy Chang Attendance Works
● What resonated with you?
● What surprised you?
4

Questions to Ponder
5
• When you think about your students that are chronically absent, what barriers do you see?
• What are we currently doing to improve attendance rates?
• What do we think is already working?

6

Identifying Students at Risk Due to Absenteeism
7
Strategies for Connecting with Families from Attendance Works

Regular Attendance Conditions for Learning
● Positive conditions for learning are particularly important for underserved groups.
● Four conditions help create a conducive learning environment and positively affect attendance, motivation, engagement, achievement and student well-being.
● Four conditions also affect each other - when one condition is in place, the others are more likely to take root.
Source: https://www.attendanceworks.org/wp-content/uploads/2019/06/Attendance_Works_Using_Chronic_Absence__091619.pdf8

Absenteeism is a leading indicator and cause of educational inequity.
Opportunity Measures Observed Growth Status Post-Secondary Readiness
Leading Indicators Outcome Indicators
Engagement and
Attendance
Student Progress
Assessment Performance
Graduation Rates
9
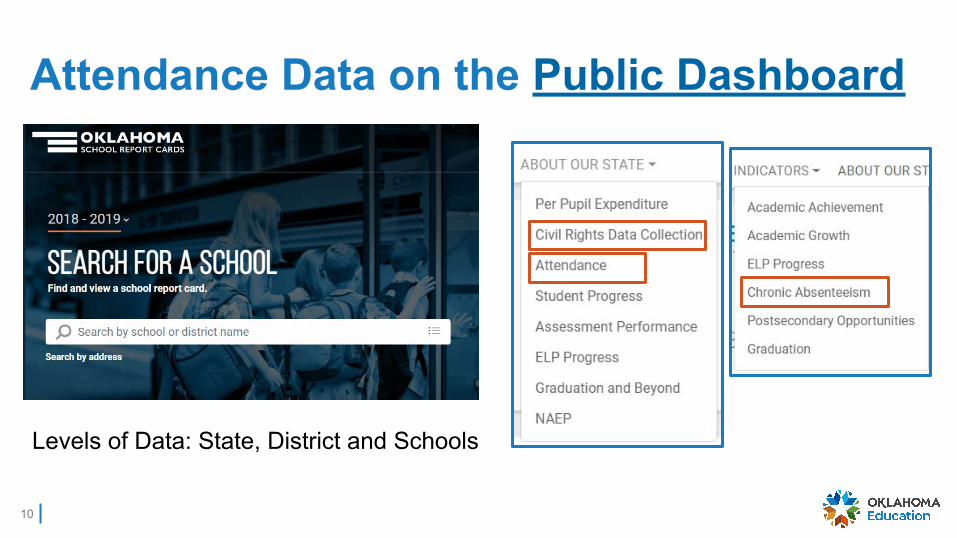
Attendance Data on the Public Dashboard
10
Levels of Data: State, District and Schools

Attendance Measures on the Public Dashboard
11
Distribution of rates across the state Distribution of rates across the state

Student Group % in Good Attendance SY 2018 (State)
% in Good Attendance SY 2019 (state)
Econ Disadvantaged 79.8% 79.1%
English Learner 85.6% 84.4%
Students with a Disability 79.3% 77.8%
Female 83.3% 83.4%
Male 84.1% 83.8%
Homeless 67.6% 64.5%
Military 89.4% 88.8%
Migrant 84.6% 86.8%
Foster 88.7% 86.1%
American Indian 81.98% 85.7%
Asian/Pacific Islander 91.3% 90.9%
Black 79.1% 76.9%
Hispanic 83.2% 82.6%
Two or More Races 81.7% 81.3%
White 85.3% 85.7%12

Rates of Good Attendance by Grade (State)
13
Cohort from one year to the nextSame Grade year-to-year

14
Use the Search Bar to find your district/site
Click
and then use the drop-down menu to select Discipline and Attendance
Click the on the Overview page to open a window that displays outcomes across all student groups.
Change years to display data for the 2017-2018 SY
Window displays outcomes for by student group and grade level
Navigating to Your Data: Public Dashboard

What can we do?
15

16
Multi-Tiered Systems of Support (MTSS)
17
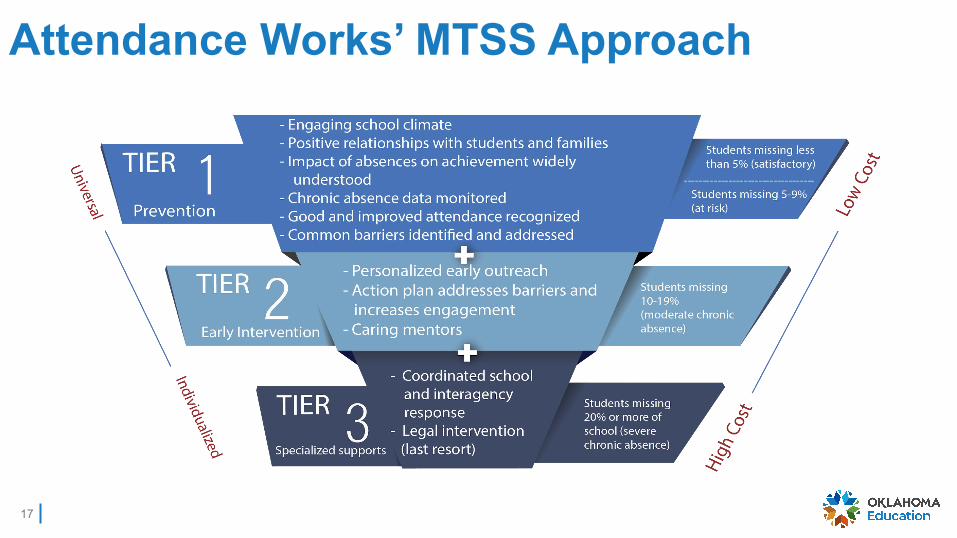
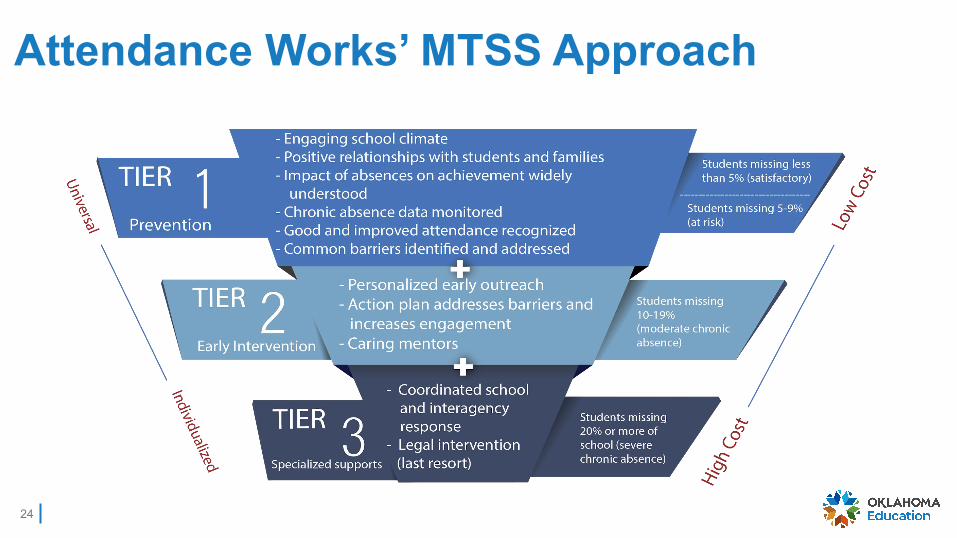
Attendance Works’ MTSS Approach
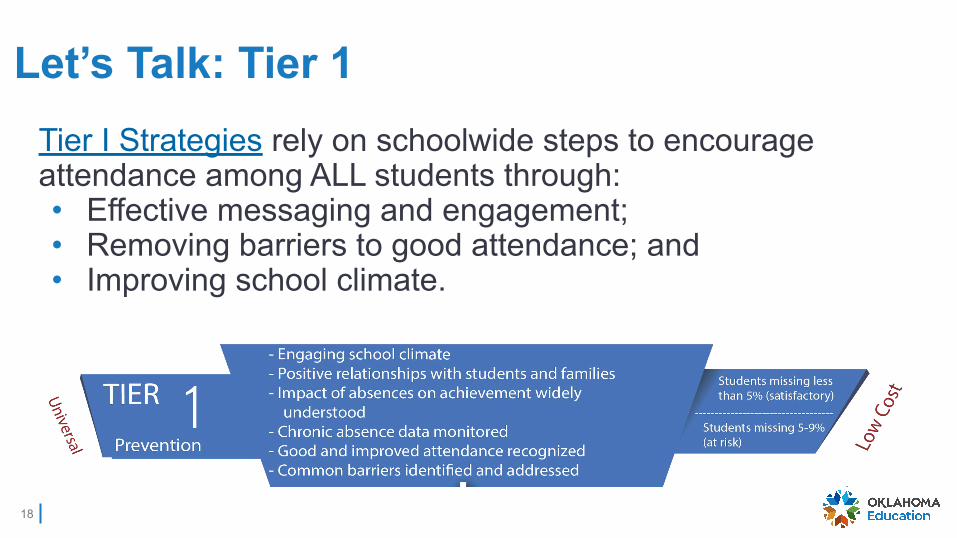
Tier I Strategies rely on schoolwide steps to encourage attendance among ALL students through:• Effective messaging and engagement;• Removing barriers to good attendance; and• Improving school climate.
18
Let’s Talk: Tier 1

19
Nudging Parents and Students Home Visits Positive Messaging Relevant - and Culturally Relevant -Curriculum Healthy School Buildings School-based Health Services Telehealth
TransportationA Safer Walk to School Breakfast for All Laundry at School Threshold Greetings Rethinking Recess Restorative Discipline Practices
Tier 1: Sample Strategies and Evidence

Tier 2 Interventions target students at greater risk of chronic absenteeism, those close to or already missing 10% of the school year.
20
Let’s Talk: Tier 2 (students missing 10-19%)

Tier 2: Sample Interventions and Evidence
21
Early Warning Systems Mentors Youth Engagement Addressing Asthma Targeted Transportation Students with Disabilities School Refusal Immigration Enforcement

Tier 3 Approaches work with the most struggling students, often involving not just schools, but also other agencies dealing with health, housing, and social services, and typically requires case management customized to the individual student and family challenges.
22
Let’s Talk: Tier 3 (students missing 20% or more)
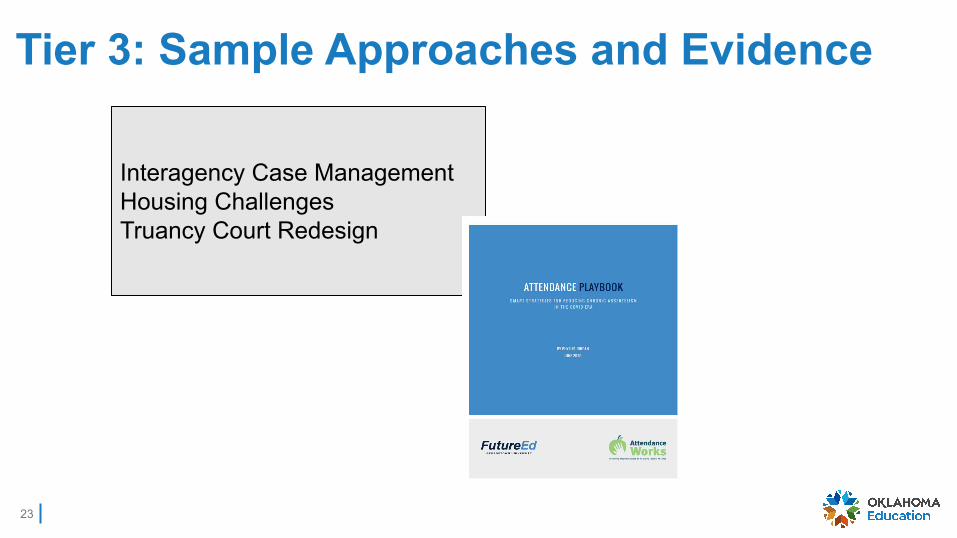
Tier 3: Sample Approaches and Evidence
23
Interagency Case Management Housing ChallengesTruancy Court Redesign
Attendance Works’ MTSS Approach
24

Resources
25

Early Warning Attendance System
26
Data Considerations, Actions and Next Steps
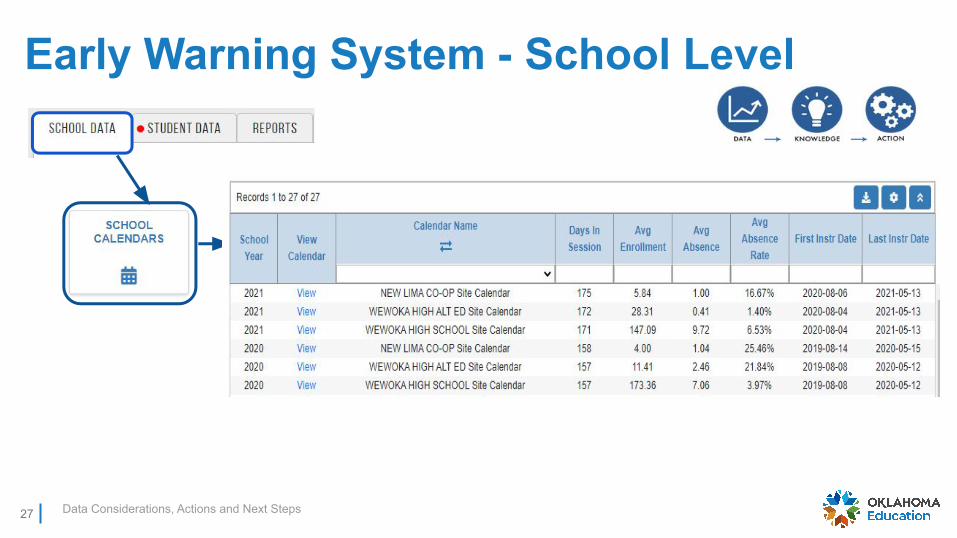
Early Warning System - School Level
27
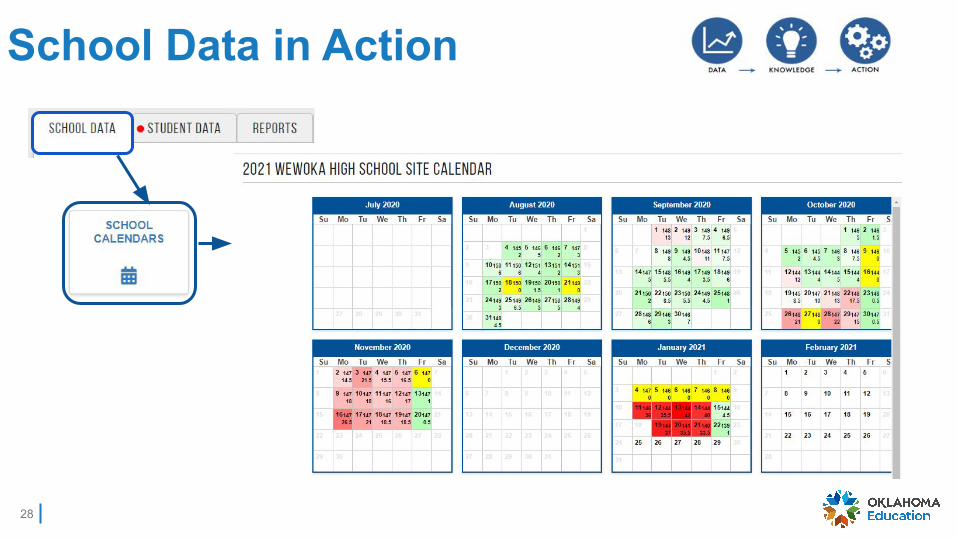
School Data in Action
28

29
Early Warning System
Click on a Student’s STN to display the student’s attendance history while enrolled at your site to monitor lost instructional time, evaluate supports and remove barriers.

30
Early Warning System - Student Level
● Student attendance data can be displayed for past years or in real-time for SY2021;
● Data can be filtered by grade level; and
● Absence Rate to show students that missed 10% or more as identified by a red box

Continuous Improvement Cycle
31
Additional Self Assessment Tools
32
✓ Actionable Data
✓ Positive Engagement
✓ Capacity Building
✓ Shared Accountability
✓ Strategic Partnerships

Actionable Data
33
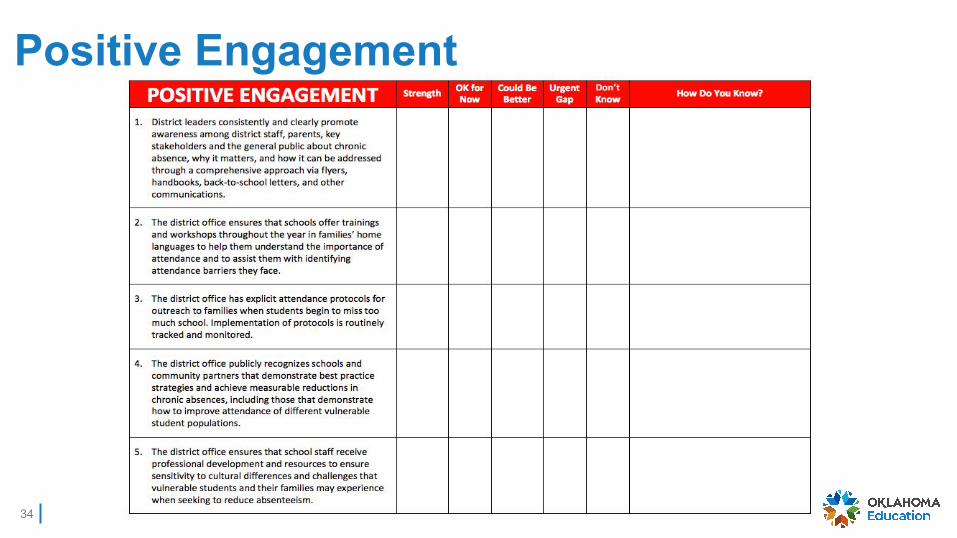
Positive Engagement
34
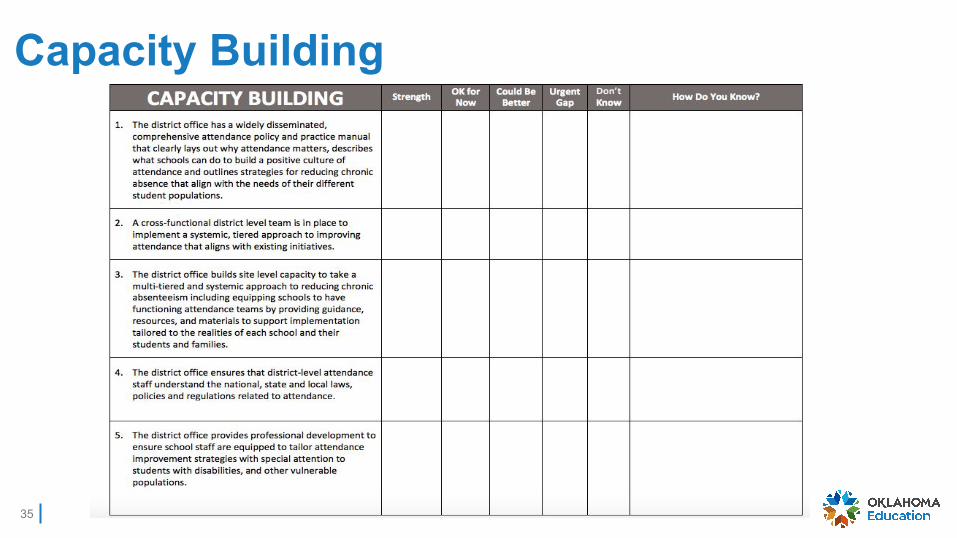
Capacity Building
35
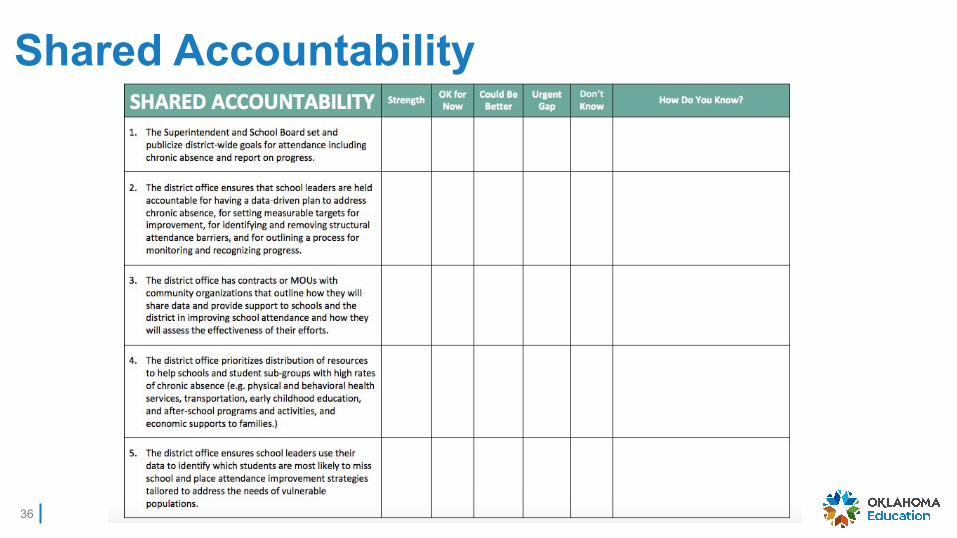
Shared Accountability
36

Strategic Partnerships
37

Statewide Resources● Student with
Disabilities and Chronic Absenteeism Guidance
● School Climate Transformation
● Attendance Toolkit
38

Next Steps
I am only one, but still I am one. I cannot do everything, but still I can do something; And because I cannot do everything I will not refuse to do the something that I can do.
~Helen Keller
39

40
Contacts
Dr. Shelly EllisDeputy Superintendent of Student [email protected]
Lesa RohrerDirector of Data [email protected]

41

Questions?
42

Rates of Good Attendance by Grade (Wewoka)
43
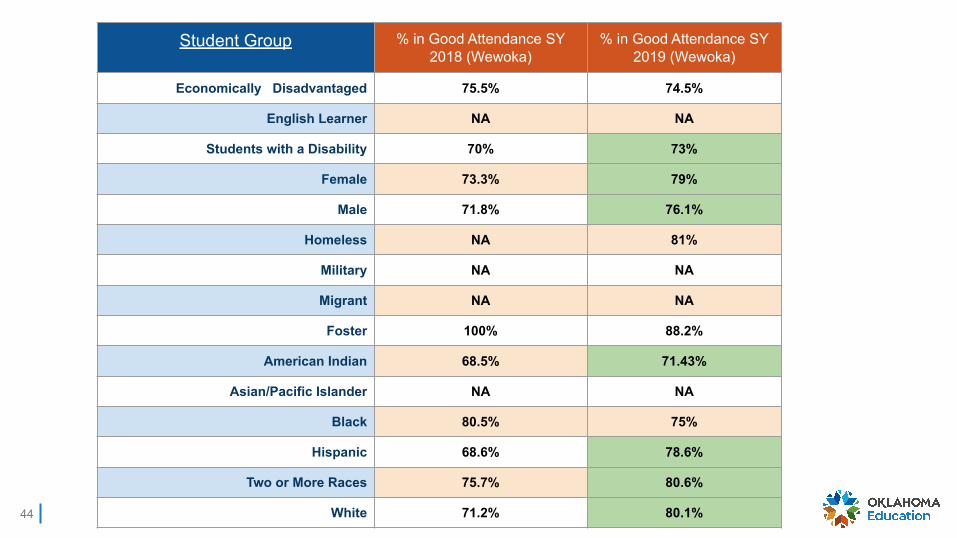
Student Group % in Good Attendance SY 2018 (Wewoka)
% in Good Attendance SY 2019 (Wewoka)
Economically Disadvantaged 75.5% 74.5%
English Learner NA NA
Students with a Disability 70% 73%
Female 73.3% 79%
Male 71.8% 76.1%
Homeless NA 81%
Military NA NA
Migrant NA NA
Foster 100% 88.2%
American Indian 68.5% 71.43%
Asian/Pacific Islander NA NA
Black 80.5% 75%
Hispanic 68.6% 78.6%
Two or More Races 75.7% 80.6%
White 71.2% 80.1%44
Copyright © 2022 FDOKUMEN