Malawi - Credit 1966 - P001650 - Public Documents - World ...
Upload
khangminh22Category
view
7download
0
Kelly, CA (2018) School absenteeism in Karonga district, north-ern Malawi: Trends, influences and the impact of cleaner burningbiomass-fuelled cookstoves. PhD (research paper style) thesis, Lon-don School of Hygiene & Tropical Medicine. DOI: https://doi.org/10.17037/PUBS.04648671
Downloaded from: http://researchonline.lshtm.ac.uk/4648671/
DOI: 10.17037/PUBS.04648671
Usage Guidelines
Please refer to usage guidelines at http://researchonline.lshtm.ac.uk/policies.html or alterna-tively contact [email protected].
Available under license: http://creativecommons.org/licenses/by-nc-nd/2.5/

School absenteeism in Karonga district, northern Malawi:
Trends, influences and the impact of cleaner burning
biomass-fuelled cookstoves
CHRISTINE ANNE KELLY
Thesis submitted in accordance with the requirements for the degree of
Doctor of Philosophy
University of London
APRIL 2018
Department of Infectious Disease Epidemiology
Faculty of Epidemiology and Population Health
LONDON SCHOOL OF HYGIENE & TROPICAL MEDICINE
Funded by the Bloomsbury Colleges consortium

1
I, Christine Anne Kelly, confirm that the work presented in this thesis is my
own. Where information has been derived from other sources, I confirm that
this has been indicated in the thesis.
__________________________ Christine A. Kelly
__________________________ Date

2
Abstract
Although Malawi achieved rapid increases in primary school enrolment following the
introduction of free primary education in 1994, the country has struggled to deliver access
to quality education in a broader sense. In a context marked by high rates of grade repetition
and dropout, and consistently poor scores on literacy and numeracy assessments, student
absenteeism has been identified as a critical cause for concern both as a symptom of
educational exclusion and as a precursor to other adverse educational outcomes. This thesis
seeks to deepen understanding of the processes that underpin primary school absenteeism
in Karonga district, northern Malawi, and the implications of missing school for students’
future educational trajectories. It additionally capitalises on opportunities offered by a large
cluster randomised trial of cleaner burning biomass-fuelled cookstoves to assess the extent
to which cookstoves improve school attendance by decreasing exposure to harmful
pollutants and reducing time and resource burdens associated with household fuel
consumption.
The mixed methods analysis combines secondary quantitative data from a large
longitudinal household survey spanning 2008-2016 and the cookstove trial implemented
from 2014-2016, with in-depth interviews and focus group discussions conducted with 48
primary school students in 2016. Findings show that students attach value to daily school
attendance, but are constrained by a complex interplay of individual-, household-, school-,
and community-level factors, including ill health, domestic responsibilities, socioeconomic
barriers, and exclusionary practices by teachers and peers. No evidence was found that
cleaner burning cookstoves influenced overall school attendance, but qualitative data
suggest that they may improve other dimensions of educational access such as timely
arrival at school. By harnessing eight years of school attendance data, the thesis also shows
that students who miss school in one survey round are consistently more likely to miss
school again the following year, as well as to repeat their grade, highlighting the critical
role school attendance monitoring can play in identifying students at risk of adverse
educational trajectories.
Findings from this study have implications for policies and programmes designed to
address absenteeism—and in particular the need for a holistic, multi-sectoral approach—as
well as for the collection and interpretation of school attendance data.

3
Acknowledgements
Among the many people and organisations that made this research possible, I am grateful
to the Bloomsbury Colleges consortium for providing a PhD studentship to carry out this
study and to the London School of Hygiene and Tropical Medicine Research Degree
Travelling Scholarship for funding my fieldwork expenses in Malawi.
My sincere thanks go to all the staff affiliated with the Karonga Prevention Study/Malawi
Epidemiology and Intervention Research Unit, including: Mia Crampin, Moffat Nyirenda,
Yoryos Ponnighaus, Manuela Kasonya, Albert Dube, Hazel Namadingo, Maisha Nyasulu,
Steffen Geis, Orphan Chirwa, Alick Mwalwanda, Mabvuto Luhanga, Joshua Sikwese,
Laurence Tembo, Jean Mwafulirwa, David Chilalika, Oddie Mwiba, Keith Branson, Jacky
Saul, Emmanuel Nyondo, and Bestina. Special thanks go to the excellent team of Aaron
Ndovi, Green Kapila, Cecilia Nyirenda and Levie Gondwe, who conducted the in-depth
interviews and focus group discussions and provided so many helpful insights.
My thanks go also to Scotch Kondowe, Karonga District Education Manager, as well as
Allan Kaonga and Waldon Gondwe of the Karonga EMIS office, for supporting this
research.
In London, I would like to thank my supervisor, Judith Glynn, and co-supervisors, Deborah
Johnston and Elaine Unterhalter, for their guidance, and Christian Bottomley for additional
statistical support. I am grateful to the LG22 crew past and present for being the most fun
and encouraging officemates I could have asked for and to the EIDN group for their helpful
feedback and moral support.
I would also like to acknowledge colleagues and friends at the Population Council,
particularly Erica Soler-Hampejsek, Satvika Chalasani, Barbara Mensch, Paul Hewett,
Barbara Miller and Stephanie Psaki for their mentorship during my four years at the Council
and for setting me on the path to this PhD.
On a personal note, huge thanks go to all of my friends, near and far, for their support and
for enriching my life in countless other ways. A very special thank you to David for reading
drafts, tracking down articles, late-night Skype sessions and all the love and laughs in

4
between. I also owe a debt of gratitude to my parents, Nancy and Michael, and brother,
James, for providing such inspiring footsteps to follow and always encouraging me to
pursue my passions.
Finally, and above all, I thank all the study participants for so generously offering their time
and experience. Taonga chomene!

5
Contents
Abstract .......................................................................................................................................2
Acknowledgements ....................................................................................................................3
List of tables ...............................................................................................................................9
List of figures ...........................................................................................................................11
Acronyms and abbreviations ....................................................................................................13
Chapter 1: Introduction .........................................................................................................15
1.1 Conceptualising educational access ................................................................................15
1.2 Educational access in Malawi .........................................................................................16
1.3 The absence of absence data ...........................................................................................18
1.4 Cleaner burning cookstoves: a recipe for improved school attendance? ........................19
1.5 Research objectives ........................................................................................................20
1.6 Thesis outline ..................................................................................................................21
References.............................................................................................................................24
Chapter 2: Literature review ..............................................................................................27
2.1 Determinants of absenteeism ..........................................................................................29
2.1.1 Individual factors .....................................................................................................29
2.1.2 Household factors ....................................................................................................32
2.1.3 School factors ..........................................................................................................37
2.1.4 Community factors...................................................................................................39
2.1.5 Summary ..................................................................................................................41
2.2 Cooking with solid fuels .................................................................................................41
2.3 Cleaner burning cookstoves ............................................................................................44
2.3.1 Health benefits .........................................................................................................45
2.3.2 Time and resource savings .......................................................................................47
2.3.3 Current research agenda ...........................................................................................48
2.4 Analytic model ................................................................................................................48
References.............................................................................................................................51
Chapter 3: Research setting and methods ........................................................................58
3.1 Historical overview .........................................................................................................58
3.2 Normative position .........................................................................................................63
3.3 Educational access in the era of the Sustainable Development Goals ............................66
3.4 Data sources ....................................................................................................................69
3.4.1 Karonga Health and Demographic Surveillance System .........................................70

6
3.4.2 The Cooking and Pneumonia Study ........................................................................74
3.4.3 Nested qualitative study ...........................................................................................77
3.5 Mixed methods design ....................................................................................................83
3.6 A note on interdisciplinarity ...........................................................................................86
3.7 Role of investigators .......................................................................................................87
References.............................................................................................................................90
Chapter 4: Determinants of absenteeism .............................................................................97
Abstract .................................................................................................................................98
Highlights .............................................................................................................................98
4.1 Introduction.....................................................................................................................99
4.1.1 Conceptual framework ...........................................................................................100
4.1.2 Education in Malawi ..............................................................................................105
4.2 Data and methods .........................................................................................................106
4.2.1 Research site ..........................................................................................................106
4.2.2 Study population ....................................................................................................107
4.2.3 Statistical methods .................................................................................................109
4.3 Results...........................................................................................................................111
4.3.1 Descriptive findings ...............................................................................................111
4.3.2 Regression results ..................................................................................................115
4.4 Discussion .....................................................................................................................122
4.5 Conclusion ....................................................................................................................126
References...........................................................................................................................129
Chapter 5: Cookstoves and absenteeism ............................................................................135
Abstract ...............................................................................................................................136
5.1 Introduction...................................................................................................................137
5.2 Methods ........................................................................................................................139
5.2.1 Trial design ............................................................................................................139
5.2.2 Study population ....................................................................................................139
5.2.3 Statistical methods .................................................................................................140
5.2.4 Nested qualitative study .........................................................................................142
5.2.5 Ethics statement .....................................................................................................143
5.3 Results...........................................................................................................................143
5.3.1 Analytic sample .....................................................................................................143
5.3.2 Baseline characteristics ..........................................................................................145
5.3.3 Absenteeism in the past four weeks .......................................................................147
5.3.4 Reasons for absenteeism ........................................................................................150

7
5.3.5 Qualitative analysis ................................................................................................151
5.4 Discussion .....................................................................................................................154
5.5 Conclusion ....................................................................................................................156
References...........................................................................................................................158
Chapter 6: Absenteeism and future educational trajectories ...........................................162
Abstract ...............................................................................................................................163
6.1 Introduction...................................................................................................................164
6.1.1 Instructional time and educational outcomes .........................................................165
6.1.2 Education in Malawi ..............................................................................................167
6.2 Methods ........................................................................................................................167
6.2.1 Study population ....................................................................................................167
6.2.2 Analysis methods ...................................................................................................168
6.2.3 Attrition analysis ....................................................................................................170
6.3 Results...........................................................................................................................171
6.3.1 Analytic cohort.......................................................................................................171
6.3.2 Absenteeism prevalence.........................................................................................173
6.3.3 Repeated absenteeism ............................................................................................174
6.3.4 Absenteeism and grade repetition ..........................................................................176
6.3.5 Cumulative absenteeism and grade attainment ......................................................179
6.4 Discussion .....................................................................................................................180
6.5 Conclusion ....................................................................................................................183
References...........................................................................................................................184
Chapter 7: Students’ experiences of absenteeism ..............................................................188
Abstract ...............................................................................................................................189
7.1 Introduction...................................................................................................................190
7.1.1 Educational access in Malawi ................................................................................192
7.2 Methods ........................................................................................................................193
7.2.1 In-depth interviews ................................................................................................194
7.2.2 Focus group discussions ........................................................................................194
7.2.3 Data collection and analysis...................................................................................195
7.2.4 Participant characteristics ......................................................................................196
7.3 Perceived value of education ........................................................................................197
7.4 Barriers to school attendance ........................................................................................199
7.4.1 Theme 1: Playing ...................................................................................................201
7.4.2 Theme 2: Working .................................................................................................203
7.4.3 Theme 3: Illness .....................................................................................................207

8
7.5 Strategies to address absenteeism .................................................................................209
7.6 Discussion .....................................................................................................................212
7.7 Conclusion ....................................................................................................................217
References...........................................................................................................................218
Chapter 8: Discussion ...........................................................................................................221
8.1 Proximal and distal determinants of primary school absenteeism ................................223
8.1.1 Socioeconomic barriers ..........................................................................................225
8.1.2 Ill health .................................................................................................................227
8.1.3 Gender differences .................................................................................................228
8.2 Impact of cleaner burning biomass-fuelled cookstoves on school attendance .............229
8.3 Relationship between absenteeism and subsequent educational outcomes ..................232
8.3.1 Using attendance data to identify students at risk of adverse educational
pathways .........................................................................................................................233
8.3.2 Interventions to arrest adverse educational trajectories .........................................236
8.4 Students’ perceptions and experiences of absenteeism ................................................237
8.5 Towards a holistic approach to educational access ......................................................240
8.6 Limitations ....................................................................................................................242
8.7 Conclusion ....................................................................................................................247
References...........................................................................................................................248
Appendices ............................................................................................................................256
Appendix to Chapter 2 ........................................................................................................257
Appendix to Chapter 3 ........................................................................................................260
A3.1 Confirmation of ethics approval for Karonga HDSS .............................................260
A3.2 Confirmation of ethics approval for nested qualitative study – LSHTM ...............261
A3.3 Confirmation of ethics approval for nested qualitative study – Malawi NHSRC ..262
A3.4 Sample HDSS individual socioeconomic survey ...................................................263
A3.5 Sample HDSS household socioeconomic survey ..................................................265
A3.6 Extract from CAPS baseline household survey .....................................................267
A3.7 Extract from CAPS follow-up household survey ..................................................269
A3.8 In-depth interview guide ........................................................................................271
A3.9 IDI timeline activity ...............................................................................................274
A3.10 Focus group discussion topic guide .....................................................................278
Appendix to Chapter 4 ........................................................................................................280
Appendix to Chapter 6 ........................................................................................................285

9
List of tables
Table 3.1 Comparison of selected sociodemographic characteristics by region ............... 62
Table 4.1 Characteristics of primary school students aged 5-20 who attended at least one
school day in the past 4 weeks ......................................................................................... 112
Table 4.2 Prevalence of and primary reason for primary school absenteeism in the past 4
weeks ................................................................................................................................ 114
Table 4.3 Results from two-level logistic regression models estimating primary school
absenteeism in the past four weeks, by sex ...................................................................... 118
Table 5.1 Baseline characteristics of intention-to-treat population, by trial group ......... 145
Table 5.2 Incidence rate ratios of absenteeism in the past four weeks, comparing
intervention to control group ........................................................................................... 148
Table 5.3 Stratified analysis of the relationship between cookstove exposure and days of
absence in the past four weeks, by sex, age and season of interview .............................. 149
Table 5.4 Stratified analysis of the relationship between cookstove exposure and days of
absence in the past four weeks among boys and girls interviewed during the rainy season,
by age ............................................................................................................................... 150
Table 6.1 Baseline characteristics of primary school cohort .......................................... 172
Table 6.2 Association between three thresholds of absenteeism in the past four weeks and
three thresholds of lagged absenteeism, among students with at least two consecutive
interviews ......................................................................................................................... 175
Table 6.3 Association between any absenteeism in the past four weeks and three thresholds
of lagged absenteeism, according to whether students were interviewed in the same month
or different months across rounds .................................................................................... 176
Table 6.4 Association between lagged absenteeism and current grade repetition, among
students with at least two consecutive interviews ............................................................ 178
Table 6.5 Association between lagged absenteeism above the 95th percentile and current
grade repetition, stratified by selected background characteristics ................................. 178
Table 6.6 Association between cumulative rounds of absenteeism over five years with
standard attended in the sixth year ................................................................................... 180
Table 7.1 Demographic characteristics of in-depth interview and focus group discussion
participants ....................................................................................................................... 197
Table 7.2 Reasons reported for missing school by boys and girls aged 12-18 in in-depth
interviews and focus groups discussions ......................................................................... 200
Table 8.1 Summary of thesis contributions ..................................................................... 224
Table A.1 Summary of studies from sub-Saharan Africa that link ill health with school
absenteeism ...................................................................................................................... 257
Table A.2 Distribution of pupils across six chosen socioeconomic indicators and
assessment of potential multicollinearity ......................................................................... 280

10
Table A.3 Results from two-level logistic regression models estimating primary school
absenteeism in the past four weeks, excluding interviews conducted within four weeks of a
school holiday, by sex ...................................................................................................... 281
Table A.4 Association between student characteristics in one survey round and non-
interview in the next ......................................................................................................... 285
Table A.5 Adjusted association between student characteristics and any absenteeism in the
past four weeks, among students with at least two consecutive interviews ..................... 287
Table A.6 Adjusted association between lagged characteristics and current grade repetition,
among students with at least two consecutive interviews ................................................ 289
Table A.7 Adjusted association between student characteristics and standard attended after
six years, among students who entered the cohort in the first three rounds .................... 291
Table A.8 Association between cumulative rounds of absenteeism over five years with total
number of repeated grades over six years, among students who entered the cohort in the
first three rounds .............................................................................................................. 292

11
List of figures
Figure 2.1 Analytic model ................................................................................................ 50
Figure 3.1 CREATE zones of exclusion ........................................................................... 69
Figure 3.2 Location of Karonga HDSS catchment area .................................................... 71
Figure 3.3 Summary of HDSS study design and data ....................................................... 74
Figure 3.4 Philips fan-assisted cookstove and solar panel ................................................ 75
Figure 3.5 Summary of CAPS study design and data ....................................................... 77
Figure 3.6 Example of IDI timeline activity ..................................................................... 80
Figure 3.7 Summary of nested qualitative study design and data ..................................... 83
Figure 3.8 Sequential mixed methods design ................................................................... 86
Figure 3.9 Timeline of research activities ......................................................................... 89
Figure 4.1 Expected direction of relationship between five dimensions of household
socioeconomic status and school absenteeism ................................................................. 103
Figure 4.2 Individual- and household-level determinants of school absenteeism .......... 105
Figure 4.3 Flow diagram of school attendance and data availability of boys and girls aged
5-20 years in the Karonga HDSS survey population, 2010-11 ........................................ 108
Figure 4.4 Prevalence of and principal reason reported for missing school in the past four
weeks, by sex and interview month ................................................................................. 116
Figure 5.1 Proposed causal pathways linking cleaner burning cookstoves with increased
school attendance ............................................................................................................. 138
Figure 5.2 Flowchart of control and intervention participants included in analysis ....... 144
Figure 5.3 Distribution of primary school absenteeism in past four weeks, by trial
group ................................................................................................................................ 147
Figure 5.4 Number of students interviewed and mean days of absence, by month and trial
group ................................................................................................................................ 148
Figure 5.5 Primary reason reported for missing school in past four weeks, by trial
group ................................................................................................................................ 151
Figure 6.1 Sources of instructional time wastage ........................................................... 166
Figure 6.2 Timing of HDSS survey administration relative to the primary school
calendar ............................................................................................................................ 168
Figure 6.3 Composition of student cohort across eight survey rounds, 2008-2016 ........ 171
Figure 6.4 Proportion of students who missed school in the past four weeks, and mean
number of days missed, by survey round ......................................................................... 174
Figure 6.5 Proportion of students who missed school in the past four weeks, and number
of students interviewed, by standard ................................................................................ 174
Figure 6.6 Survival profiles of boys and girls who entered primary school in the 2008-09
survey round ..................................................................................................................... 177

12
Figure 6.7 Standard attended after six years of primary school, by cumulative rounds in
which absenteeism was reported ...................................................................................... 179
Figure 7.1 Ecological model of distal and proximal determinants of school
absenteeism ...................................................................................................................... 196
Figure 7.2 Participant drawings of missing school while playing football or netball .... 202
Figure 7.3 Participant drawings of missing school doing agricultural work .................. 205
Figure 7.4 Participant drawings of missing school due to illness ................................... 208
Figure 7.5 Ecological model of individual-, household-, school-, and community-level
factors underpinning school absences attributed to work, as constructed from students'
narratives .......................................................................................................................... 215
Figure A.1 Map of Karonga HDSS catchment area and locations of IDI and FGD
communities ..................................................................................................................... 270

13
Acronyms and abbreviations
AOR adjusted odds ratio
CI confidence interval
CG control group
CAPS Cooking and Pneumonia Study
CREATE Consortium for Research on Educational Access, Transitions and Equity
DALY disability-adjusted life-year
DHS Demographic and Health Survey
EFA Education for All
EMIS Education Management Information System
FGD focus group discussion
FPE free primary education
GACC Global Alliance for Clean Cookstoves
HAP household air pollution from solid fuels
HDSS Health and Demographic Surveillance System
ICC intra-cluster correlation
IDI in-depth interview
IG intervention group
ILO International Labour Organization
ITT intention-to-treat
KPS Karonga Prevention Study
LSHTM London School of Hygiene and Tropical Medicine
LSTM Liverpool School of Tropical Medicine
MDG Millennium Development Goal
MEIRU Malawi Epidemiology and Intervention Research Unit
MICS Multiple Indicator Cluster Survey
NGO non-governmental organisation
NSO National Statistical Office of Malawi
OECD Organisation for Economic Co-operation and Development
OR odds ratio
PCA principal components analysis
PISA Programme for International Student Assessment

14
PM2.5 particulate matter with an aerodynamic diameter smaller than 2.5μm
PSLCE Primary School Leaving Certificate of Education
RCT randomised controlled trial
RESPIRE Randomized Exposure Study of Pollution Indoors and Respiratory Effects
SACMEQ Southern and Eastern African Consortium for Monitoring Educational
Quality
SADC Southern African Development Community
SCT Social Cash Transfer
SD standard deviation
SES socioeconomic status
SGD Sustainable Development Goal
SMS short message service
SOFIE Strengthening Open and Flexible learning for Increased Education access
UIS UNESCO Institute for Statistics
UN United Nations
UNDP United Nations Development Programme
UNESCO United Nations Educational, Scientific and Cultural Organization
UNICEF United Nations Children’s Fund
USAID United States Agency for International Development
VIF variance inflation factor
WASH water, sanitation and hygiene
WHO World Health Organization

15
Chapter 1: Introduction
It’s hard when you have missed school for a long time because you
can’t know what your classmates learnt (Mabvuto1, age 13)
Despite vast improvements in global school enrolment over recent decades, many children
attend only sporadically. This thesis seeks to deepen understanding of the processes that
underpin primary school absenteeism in Karonga district, northern Malawi, and the
implications of absenteeism for students’ future educational trajectories. Combining
quantitative and qualitative approaches, the study contributes both empirical insights about
absenteeism trends and determinants, as well as methodological reflections about the
collection of school attendance data. It also assesses the extent to which cleaner burning
biomass-fuelled cookstoves, which have the potential to reduce absenteeism by improving
household health and lowering time spent on cooking-related activities, succeed in
increasing school attendance.
1.1 Conceptualising educational access
Since the 1990 Jomtien conference on Education for All (EFA) heralded an era of
international commitment to addressing educational quality and equity, global attention and
resources have been devoted to expanding educational access. For the purpose of measuring
progress towards EFA—and particularly the goal to achieve universal primary education,
which was also enshrined as Millennium Development Goal 2—access was primarily
conceived in terms of school enrolment: according to the first EFA Global Monitoring
Report, ‘Enrolment rates are key indicators of the extent to which the education system
manages to serve all children’ (UNESCO 2002, p. 44). Although efforts to expand
enrolment fell short of achieving universal primary education by the target date of 2015,
reductions in the number of out-of-school children and adolescents by almost half in the
period since 2000 led the final EFA Global Monitoring Report to conclude: ‘Improvements
in access to education are one of the leading successes of the EFA movement’ (UNESCO
2015, p. 76).
1 All participant names are pseudonyms.

16
While increases in global school enrolment are both critical and laudable, equating
educational access with enrolment ignores other forms of marginalisation that students
experience even once in school (Jere 2012; Unterhalter 2014). In particular, this narrow
framing of access neglects the group identified by the Consortium for Research on
Educational Access, Transitions and Equity (CREATE) as ‘silently excluded’ from
education, including those students who are successfully enrolled but attend only
intermittently (Lewin 2009). Humphreys and colleagues (2015, p. 135) similarly emphasise
the importance of regular school attendance to ensure ‘sustained access’ to education.
The present study follows in this vein by conceiving of school attendance—as distinct from
enrolment—as an important and under-researched dimension of educational access.
Situated primarily within a rights-based framework, this thesis regards education as a
fundamental human right predicated on the availability of safe and well-equipped schools,
consistent and continuous attendance, equitable and inclusive participation, and
achievement of relevant and meaningful learning (Humphreys et al. 2015; Lewin 2009;
UNICEF and UNESCO 2007). Of particular concern for this thesis are those children and
young people who are enrolled in school but who attend irregularly, and as such are denied
sustained access to education.
1.2 Educational access in Malawi
Efforts to measure the prevalence of school absenteeism, as well as to understand the
processes behind it, are particularly vital in Malawi. The country became an early adopter
of the EFA goal of free primary education (FPE) when, as part of the transition to multi-
party democracy, the newly-elected government eliminated primary school fees in 1994.
Enrolment increased from 1.8 million to nearly three million children at the opening of the
1994/5 school year (Castro-Leal 1996) and primary school entry has been maintained at
nearly universal levels in the period since the introduction of FPE: according to 2014
estimates, 93.6% of children of official primary school age were attending school (National
Statistical Office 2015). Indeed, very few young people have never attended school at all—
just 2.6% and 1.3% of 15-19 year-old girls and boys, respectively, according to the 2015-
16 Malawi Demographic and Health Survey (DHS), compared with 30.3% and 19.5% in
1992 (National Statistical Office and ICF 2017; National Statistical Office and Macro
International Inc. 1994). However, despite vast improvements in primary school enrolment,
Malawi has struggled to deliver access to quality education in the broader sense (Jere 2012).

17
In particular, post-FPE education in Malawi has been marked by high rates of absenteeism,
grade repetition and dropout, as well as students’ consistently poor scores on literacy and
numeracy assessments such as those conducted by the Southern and Eastern African
Consortium for Monitoring Educational Quality (SACMEQ) (Grant et al. 2013; Mulera et
al. 2017; Ravishankar et al. 2016; Sunny et al. 2017; World Bank 2010). Numerous
commentators have traced contemporary failings in educational delivery to the rapid
implementation of FPE and the lack of appropriate supply-side investments in personnel
and infrastructure to accompany the enrolment explosion (Castro-Leal 1996; Chimombo
2009; Clemens 2007). Kendall (2007) and Kendall and Silver (2014) have further
highlighted the insufficiently transformative nature of the FPE reforms in terms of
administrative structures and educational practices, as well as the disconnect between the
social and economic benefits promised of FPE and the limited opportunities it ultimately
provided.
Importantly, too, although introducing FPE eliminated an important financial barrier to
school attendance, it did not make education ‘free’ (Kendall and Silver 2014). Household
expenditure on such items as pens, notebooks, and clothes were shown in the aftermath of
FPE to exceed the amount previously required for school fees (Kadzamira and Rose 2003),
while schools continue to solicit community contributions of money or labour to undertake
school infrastructure projects (Barnett 2013; Rose 2003). Reforms that accompanied FPE,
including removing the requirement to wear a school uniform and outlawing corporal
punishment, were also enforced inconsistently at school level, representing additional
sources of exclusion (Pridmore and Jere 2011).
In this context, absenteeism has been identified as a critical cause for concern, both as a
symptom of educational exclusion in and of itself, and as a contributing factor to adverse
educational pathways involving poor academic performance, grade repetition and dropout.
A Malawian government report entitled The Main Education Challenges Facing Malawi,
cited in Nankhuni and Findeis (2004, p. 124, emphasis added), indicated that:
[T]here is much to be done on the part of the Government and the community
themselves to enhance the perception of the benefits of education, and to overcome
the very real barriers to uninterrupted attendance that pupils in the most deprived
circumstances face.

18
Despite acknowledgement of the challenges students encounter to attend school every day,
understanding of the circumstances surrounding absenteeism remains somewhat limited.
The need to ‘identify and profile those children who fail to access school regularly’ was
recognised as an urgent priority by researchers affiliated with the SOFIE (Strengthening
Open and Flexible learning for Increased Education access) project in Malawi, which
sought to address barriers to access and achievement among vulnerable children in HIV-
affected settings (Streuli and Moleni 2008, p. 32). The present study builds on a nascent
literature in Malawi (Grant et al. 2013; Moleni 2008; Pridmore and Jere 2011; Psaki et al.
2017) to shed light on the processes underpinning absenteeism, and the implications of
missing school on future educational outcomes.
1.3 The absence of absence data
Efforts to monitor and address school absenteeism in Malawi, and elsewhere in the Global
South, are hampered by a paucity of school attendance data. Perhaps reflecting the
emphasis on enrolment as an indicator of educational access in international frameworks,
attendance data are missing from many high-profile education monitoring tools. National
Education Management Information Systems (EMIS) typically do not include indicators
for absenteeism, while cross-national survey programmes such as the DHS do not collect
school attendance data beyond binary measures of any attendance over the course of the
school year (UNICEF and UIS 2016). A comparison of 30 other large-scale household
survey series from Africa and Asia, including the Integrated Household Survey (three
countries), the Living Standard Survey (four countries), and Core Welfare Indicators
Questionnaire (five countries), found that only three of the 30 surveys included questions
on students’ attendance frequency (Education Policy and Data Center 2009). By not
accounting for regularity of attendance, these instruments not only risk overestimating the
number of young people currently in school, but they also render absent students ‘invisible’
in research and policy dialogues (Creative Associates International 2015).
Absence of national-level data is compounded in many countries by inaccurate or
incomplete recording of student attendance at the school. In Malawi, a case study of four
primary schools associated with the SOFIE project observed that registers were ‘poorly
kept’, including by some teachers who ‘had not filled in information for the entire term’
(Moleni 2008, p. 78). Routine data solicited from schools for scrutiny by Malawian district

19
education authorities also do not include measures of absenteeism (Kimura 2005),
precluding analysis of attendance patterns at administrative level.
This thesis aims to increase the visibility of school absenteeism in northern Malawi by
harnessing a rich combination of datasets collected under the auspices of the Malawi
Epidemiology and Intervention Research Unit (MEIRU, formerly known as the Karonga
Prevention Study [KPS]) (Crampin et al. 2012). I complement quantitative analysis of the
factors associated with missing school with insights from in-depth interviews and focus
group discussions among primary school students that shed light on the processes
underlying the statistical patterns observed. This design specifically addresses two
additional priorities identified by SOFIE project researchers to enhance understanding of
barriers to sustained access (Streuli and Moleni 2008). Firstly, by incorporating a nested
qualitative study, I look to ‘“unpack” the interplay between the “push” and “pull” factors
that influence access to learning’ and ‘map the processes leading to interrupted schooling’
(Streuli and Moleni 2008, pp. 31-32). Secondly, by exploiting eight years of school
attendance data collected in annual household surveys, I conduct a longitudinal analysis of
absenteeism patterns over the primary school cycle, and examine the implications of
missing school for future educational outcomes.
1.4 Cleaner burning cookstoves: a recipe for improved school attendance?
In addition to exploring absenteeism trends and influences, this thesis also assesses the
evidence for one proposed solution to irregular school attendance. Among policies and
interventions designed to mitigate the barriers to educational access, particularly for girls,
one that has gained recent traction is the distribution of cleaner burning cookstoves.
Approximately three billion people, predominantly in Africa and South Asia, rely on solid
fuels such as wood, charcoal or agricultural residues for cooking (Bonjour et al. 2013),
pollution from which is responsible for nearly three million premature deaths per year
(GBD 2015 Risk Factors Collaborators 2016). The process of fuel collection also poses a
considerable time burden, typically borne by women and school-age children (Wodon and
Beegle 2006). Cleaner burning cookstoves, which aim to reduce pollution and fuel
consumption by improving ventilation or combustion efficiency relative to traditional open
fire methods, have been widely championed as a policy solution to the hazards of cooking
with solid fuels (Ruiz-Mercado et al. 2011). The Government of Malawi launched an

20
initiative in 2013 to introduce two million cleaner burning cookstoves into Malawian
households by 2020 (Jagger and Perez-Heydrich 2016).
In addition to the anticipated health, economic and environmental benefits that frequently
motivate cookstove distribution programmes (Ruiz-Mercado et al. 2011), cookstoves also
have the potential to yield important educational payoffs, particularly for girls. The
following excerpt from the Global Alliance for Clean Cookstoves Gender Fact Sheet makes
this case:
Clean cooking solutions significantly benefit girls and women. For instance,
reducing the amount of time required to collect fuel with more efficient cookstoves
allows girls and women to engage in other activities such as income-generating
opportunities, education, or rest (Global Alliance for Clean Cookstoves n.d.).
However, while cleaner burning cookstoves have been shown to generate time and
fuelwood savings in a variety of settings (Bensch and Peters 2015; Beyene et al. 2015;
Cundale et al. 2017; García-Frapolli et al. 2010), their relationship with educational
outcomes has not been formally assessed in sub-Saharan Africa. This thesis capitalises on
unique opportunities afforded by the Cooking and Pneumonia Study (CAPS), a large cluster
randomised trial of cleaner burning biomass-fuelled cookstoves conducted in Karonga
district (Mortimer et al. 2016), to examine the impact of cookstove distribution on primary
school attendance in northern Malawi. The analysis combines a quantitative comparison of
absenteeism patterns across trial groups with insights from in-depth interviews and focus
group discussions exploring the pathways through which cookstoves influenced (or did not
influence) school attendance.
1.5 Research objectives
Against this backdrop, this thesis seeks to address the following primary and secondary
research objectives:
1. Identify the proximal and distal determinants of primary school absenteeism in
Karonga district, northern Malawi
a. Investigate gendered patterns of absenteeism levels and determinants
b. Unpack the relationship between household socioeconomic status and school
absenteeism

21
2. Assess the impact of cleaner burning biomass-fuelled cookstoves on primary school
attendance in the catchment area of the Cooking and Pneumonia Study
a. Assess whether cookstoves lead to greater reductions in absenteeism for girls
relative to boys
b. Assess whether cookstoves lead to greater reductions in absenteeism as
children’s age increases
c. Assess whether cookstoves lead to greater reductions in absenteeism during the
rainy season
3. Determine the association between absenteeism and subsequent adverse educational
pathways
a. Assess whether the same students are absent repeatedly across school years
b. Assess the relationship between absenteeism in one school year and grade
repetition in the next
c. Assess the relationship between cumulative absenteeism and grade attainment
d. Establish whether the association between absenteeism and future educational
outcomes is modified by students’ background characteristics
4. Explore students’ perceptions of the barriers to school attendance
a. Investigate the extent to which students attach value to maintaining daily school
attendance
b. Examine if or how evaluative judgements about absenteeism influence
reporting of missing school
c. Examine whether reasons reported for missing school reflect proximal and
distal determinants of absenteeism.
1.6 Thesis outline
In pursuit of these objectives, the thesis proceeds as follows:
Chapter 2: Literature review
Chapter 2 presents a narrative literature review of the individual-, household-, school-, and
community-level determinants of absenteeism previously identified in sub-Saharan Africa.
It also explores in more detail the mechanisms through which cleaner burning cookstoves
would be expected to influence school attendance. The review informs development of the
analytic framework that guides the remainder of the thesis.

22
Chapter 3: Research setting and methods
Chapter 3 provides a historical overview of the research context, including the unique
features of educational and economic development in northern Malawi. It also establishes
the study’s theoretical underpinning and situates the research within the current
international education agenda. It finally outlines the overarching research methodology by
describing the three data sources that form the basis of the analysis, and how these data
were integrated in a mixed methods design.
Chapters 4-7 are presented as standalone research papers, each containing its own literature
review and conceptual underpinning as appropriate, as well as relevant conclusions and
recommendations. Each paper is framed to address one of the four research objectives listed
above, but is not interpreted in isolation. Rather, successive papers aim to construct a
coherent narrative about school absenteeism in Karonga district, including by reinforcing,
explaining or challenging findings across chapters.
Chapter 4: Determinants of absenteeism
Research Paper 1, ‘Re-examining the link between socioeconomic status and school
absenteeism: Evidence from primary school students in northern Malawi’, uses household
survey data to identify the individual- and household-level correlates of school
absenteeism, with particular focus on the association between five indicators of
socioeconomic status (SES) and missing school. By examining different dimensions of
SES, it seeks to explore the interplay between monetary and opportunity costs of school
attendance, which emerge from Chapter 2 as prominent influences of absenteeism.
Chapter 5: Cookstoves and absenteeism
Having established in Chapter 4 that both ill health and domestic labour appear to play an
important role in inhibiting students’ school attendance, Research Paper 2, ‘From kitchen
to classroom: Assessing the impact of cleaner burning biomass-fuelled cookstoves on
primary school attendance in Karonga district, northern Malawi’, investigates whether
cleaner burning biomass-fuelled cookstoves reduced absenteeism by conferring health and
time and resource benefits on recipient households.
Chapter 6: Absenteeism and future educational trajectories
Research Paper 3, ‘Primary school absenteeism and future educational trajectories in

23
Karonga district, northern Malawi: A longitudinal analysis’, harnesses eight years of
longitudinal data to examine the relationship between school absenteeism in one survey
round and subsequent absenteeism, grade repetition and attainment, to establish the extent
to which absenteeism serves as a precursor to future adverse educational outcomes over the
course of the primary cycle.
Chapter 7: Students’ experiences of absenteeism
Research Paper 4, ‘“It is important that children should be going to school every day
because in future, they can have everything they want”: Exploring students’ perceptions
and experiences of school absenteeism in northern Malawi and the implications for
absenteeism reporting in household surveys’, approaches questions regarding the meaning
and impact of absenteeism from the perspective of students themselves, drawing on data
from in-depth interviews and focus group discussions to explore the value students place
on daily school attendance and the barriers they consider to be most problematic for
maintaining regular attendance. By shedding light on evaluative judgements that students
attach to absenteeism, it also critically reflects on the validity of school attendance data
collected in quantitative surveys, and in doing so, helps explain an apparent paradox in
absenteeism reporting observed in Research Paper 1.
Chapter 8: Discussion
Chapter 8 synthesises the key empirical and methodological contributions of the thesis,
reflects on its limitations, and identifies areas of future research. Findings have implications
both for understanding the processes underpinning primary school absenteeism in Karonga
district, as well as for the collection of school attendance data.

24
References
Barnett, E. 2013. An analysis of community involvement in primary schools in Malawi.
International Journal of Educational Development 33(5): 497-509. doi: 10.1016/
j.ijedudev.2012.06.007.
Bensch, G. & J. Peters 2015. The intensive margin of technology adoption – Experimental
evidence on improved cooking stoves in rural Senegal. Journal of Health Economics
42: 44-63. doi: 10.1016/j.jhealeco.2015.03.006.
Beyene, A., R. Bluffstone, Z. Gebreegzhiaber, P. Martinsson, A. Mekonnen & F. Vieider 2015.
Do improved biomass cookstoves reduce fuelwood consumption and carbon
emissions? Evidence from rural Ethiopia using a randomized treatment trial with
electronic monitoring. Policy Research Working Paper 7324. Washington, D.C.: World
Bank Group.
Bonjour, S., H. Adair-Rohani, J. Wolf, N.G. Bruce, S. Mehta, A. Prüss-Ustün, et al. 2013. Solid
fuel use for household cooking: Country and regional estimates for 1980–2010.
Environmental Health Perspectives 121: 784–790. doi: 10.1289/ehp.1205987.
Castro-Leal, F. 1996. Who benefits from public education spending in Malawi? Results from
the recent education reform. World Bank Discussion Papers. Washington, D.C.: The
World Bank.
Chimombo, J. 2009. Changing patterns of access to basic education in Malawi: A story of a
mixed bag? Comparative Education 45(2): 297-312. doi: 10.1080/
03050060902921003.
Clemens, M.A. 2007. The long walk to school: International education goals in historical
perspective. Working Paper 37. Washington, DC: Center for Global Development.
Crampin, A.C., A. Dube, S. Mboma, A. Price, M. Chihana, A. Jahn, et al. 2012. Profile: The
Karonga Health and Demographic Surveillance System. International Journal of
Epidemiology 41: 676-685. doi: 10.1093/ije/dys088.
Creative Associates International 2015. Preventing school dropout: Early warning system
programming guide. Washington, DC: USAID.
Cundale, K., R. Thomas, J.K. Malava, D. Havens, K. Mortimer & L. Conteh 2017. A health
intervention or a kitchen appliance? Household costs and benefits of a cleaner burning
biomass-fuelled cookstove in Malawi. Social Science & Medicine 183: 1-10. doi:
10.1016/j.socscimed.2017.04.017.
Education Policy and Data Center 2009. How (well) is education measured in household
surveys? A comparative analysis of the education modules in 30 household surveys
from 1996–2005. IHSN Working Paper No 002. International Household Survey
Network.
García-Frapolli, E., A. Schilmann, V.M. Berrueta, H. Riojas-Rodríguez, R.D. Edwards, M.
Johnson, et al. 2010. Beyond fuelwood savings: Valuing the economic benefits of
introducing improved biomass cookstoves in the Purépecha region of Mexico.
Ecological Economics 69(12): 2598-2605. doi: 10.1016/j.ecolecon.2010.08.004.
GBD 2015 Risk Factors Collaborators 2016. Global, regional, and national comparative risk
assessment of 79 behavioural, environmental and occupational, and metabolic risks or
clusters of risks, 1990-2015: A systematic analysis for the Global Burden of Disease Study
2015. The Lancet 388(10053): 1659-1724. doi: 10.1016/S0140-6736(16)31679-8.
Global Alliance for Clean Cookstoves n.d. Gender fact sheet. Washington, DC: Global Alliance

25
for Clean Cookstoves. Available from: http://cleancookstoves.org/impact-
areas/women/ [Accessed 12/10/2017].
Grant, M., C. Lloyd & B. Mensch 2013. Menstruation and school absenteeism: Evidence from
rural Malawi. Comparative Education Review 57(2): 260-284.
Humphreys, S., D. Moses, J. Kaibo & M. Dunne 2015. Counted in and being out: Fluctuations
in primary school and classroom attendance in northern Nigeria. International Journal
of Educational Development 44: 134-143. doi: 10.1016/j.ijedudev.2015.08.004.
Jagger, P. & C. Perez-Heydrich 2016. Land use and household energy dynamics in Malawi.
Environmental Research Letters 11(12): 125004.
Jere, C.M. 2012. Improving educational access of vulnerable children in high HIV prevalence
communities of Malawi: The potential of open and flexible learning strategies.
International Journal of Educational Development 32(6): 756-763. doi:
10.1016/j.ijedudev.2011.09.004.
Kadzamira, E. & P. Rose 2003. Can free primary education meet the needs of the poor?
Evidence from Malawi. International Journal of Educational Development 23: 501-
516. doi: 10.1016/S0738-0593(03)00026-9.
Kendall, N. 2007. Education for All meets political democratization: Free primary education
and neoliberalization of the Malawian school and state. Comparative Education Review
51(3): 281-304.
Kendall, N. & R. Silver 2014. The consequences of global mass education: Schooling, work
and well-being in EFA-era Malawi. In: Stomquist, N. P. & Monkman, K. (eds.)
Globalization and Education: Integration and Contestation across Cultures (Second
Edition). Lanham, Maryland: Rowman & Littlefield Education.
Kimura, H. 2005. An analysis of information management at the school level in Malawi: A case
of Lilongwe primary schools. Master’s Capstone Project, University of Massachusetts
- Amherst. Available from: http://scholarworks.umass.edu/cie_capstones/112.
Lewin, K.M. 2009. Access to education in sub-Saharan Africa: Patterns, problems and
possibilities. Comparative Education 45(2): 151-174. doi: 10.1080/
03050060902920518.
Moleni, C.M. 2008. Factors influencing access and retention in primary schooling for children
and young people affected by HIV and AIDS: Case studies from rural Malawi. SOFIE
Opening Up Access Series No 6. London: Institution of Education, University of
London.
Mortimer, K., C.B. Ndamala, A.W. Naunje, J. Malava, C. Katundu, W. Weston, et al. 2016. A
cleaner burning biomass-fuelled cookstove intervention to prevent pneumonia in
children under 5 years old in rural Malawi (the Cooking and Pneumonia Study): A
cluster randomised controlled trial. The Lancet 389(10065): 167-175. doi:
10.1016/S0140-6736(16)32507-7.
Mulera, D.M.W.J., K.K. Ndala & R. Nyirongo 2017. Analysis of factors affecting pupil
performance in Malawi’s primary schools based on SACMEQ survey results.
International Journal of Educational Development 54: 59-68. doi: 10.1016/
j.ijedudev.2017.04.001.
Nankhuni, F.J. & J.L. Findeis 2004. Natural resource-collection work and children's schooling
in Malawi. Agricultural Economics 31: 123-134. doi: 10.1016/j.agecon.2004.09.02.
National Statistical Office 2015. Malawi MDG endline survey 2014. Zomba, Malawi: National
Statistical Office.

26
National Statistical Office & ICF 2017. Malawi Demographic and Health Survey 2015-16.
Zomba, Malawi and Rockville, Maryland: NSO and ICF.
National Statistical Office & Macro International Inc. 1994. Malawi Demographic and Health
Survey 1992. Zomba, Malawi and Calverton, Maryland: National Statistical Office and
Macro International Inc.
Pridmore, P. & C. Jere 2011. Disrupting patterns of educational inequality and disadvantage in
Malawi. Compare: A Journal of Comparative and International Education 41(4): 513-
531. doi: 10.1080/03057925.2011.581518.
Psaki, S.R., B.S. Mensch & E. Soler-Hampejsek 2017. Associations between violence in school
and at home and education outcomes in rural Malawi: A longitudinal analysis.
Comparative Education Review 61(2): 354-390. doi: 10.1086/691117.
Ravishankar, V., S. El-Tayeb El-Kogali, D. Sankar, N. Tanaka & N. Rakoto-Tiana 2016.
Primary eduction in Malawi: Expenditures, service delivery, and outcomes. World
Bank Studies. Washington, DC: The World Bank.
Rose, P. 2003. Community participation in school policy and practice in Malawi: balancing
local knowledge, national policies and international agency priorities. Compare: A
Journal of Comparative Education 33(1): 47-64. doi: 10.1080/0305792032000035263.
Ruiz-Mercado, I., O. Masera, H. Zamora & K.R. Smith 2011. Adoption and sustained use of
improved cookstoves. Energy Policy 39: 7557-7566. doi: 10.1016/j.enpol.2011.03.028.
Streuli, N. & C.M. Moleni 2008. Education and HIV and AIDS in Malawi: The role of open,
distance and flexible learning. SOFIE Opening Up Access Series No. 3. London:
Institute of Education, University of London.
Sunny, B.S., M. Elze, M. Chihana, L. Gondwe, A.C. Crampin, M. Munkhondya, et al. 2017.
Failing to progress or progressing to fail? Age-for-grade heterogeneity and grade
repetition in primary schools in Karonga district, northern Malawi. International
Journal of Educational Development 52: 68-80. doi: 10.1016/j.ijedudev.2016.10.004.
UNESCO 2002. Education for All: Is the world on track? EFA Global Monitoring Report 2002.
Paris: UNESCO.
UNESCO 2015. Education for All 2000-2015: Achievements and challenges. EFA Global
Monitoring Report 2015. Paris: UNESCO.
UNICEF & UNESCO 2007. A human rights-based approach to Education for All. New York
and Paris: United Nations Children's Fund and United Nations Educational, Scientific
and Cultural Organization.
UNICEF and UIS 2016. Monitoring education participation: Framework for monitoring
children and adolescents who are out of school or at risk of dropping out. UNICEF
Series on Education Participation and Dropout Prevention, Volume 1. Geneva:
UNICEF Regional Office for Central and Eastern Europe and the Commonwealth of
Independent States.
Unterhalter, E. 2014. Measuring education for the Millennium Development Goals: Reflections
on targets, indicators, and a post-2015 framework. Journal of Human Development and
Capabilities 15(2-3): 176-187. doi: 10.1080/19452829.2014.880673.
Wodon, Q. & K. Beegle 2006. Labor shortages despite underemployment? Seasonality in time
use in Malawi. In: Blackden, C. M. & Wodon, Q. (eds.) Gender, Time Use, and Poverty
in Sub-Saharan Africa. Washington, D.C.: The World Bank.
World Bank 2010. The education system in Malawi. World Bank Working Paper No. 182.
Washington, D.C.: The World Bank.

27
Chapter 2: Literature review
This chapter begins with a narrative review of the individual-, household-, school-, and
community-level factors that have been shown to be associated with school absenteeism in
sub-Saharan Africa. This is followed by a specific examination of the pathways linking
cooking practices with school attendance, to explore the mechanisms through which cleaner
burning cookstoves would be expected to influence absenteeism. The review is used to
develop an analytic model, presented in section 2.4, which guides the remainder of the
thesis.
Papers for the narrative review were identified via literature searches of MEDLINE, Web
of Science and Google Scholar databases, backward and forward citation tracking, and
targeted searching of institutional repositories and online journals. As the exercise was
designed to be exploratory rather than systematic, it cannot claim to be exhaustive, but it
helps to shed light on the diverse range of factors that influence school attendance in sub-
Saharan Africa. I am cognisant that the factors identified may operate across multiple
levels, nor necessarily stand in isolation from each other, but for the purpose of the
synthesis, available evidence was mapped onto a model of individual-, household-,
school-, and community-level influences. The review combines findings from qualitative,
qualitative, and mixed methods studies.
I note at the outset that the measures of absenteeism used across studies differed widely.
Among quantitative studies, some analyses measured weekly school attendance in terms of
hours spent in school (Adhvaryu and Nyshadham 2012; Ainsworth et al. 2005; Burke and
Beegle 2004; Dillon 2013), while others measured attendance on the most recent school
day (Grant et al. 2013; Psaki et al. 2017), over the past week (Orkin et al. 2014; Psaki et al.
2017), two weeks (Dreibelbis et al. 2013; Grant et al. 2013), 20 days (Pufall et al. 2014a;
Pufall et al. 2014b), 30 days (Dunne et al. 2013; Siziya et al. 2007), three months (De Smedt
et al. 2012; Gray et al. 2006), school semester (Belachew et al. 2011; Guarcello et al. 2005),
or academic year (Ezenwosu et al. 2013; Ibekwe et al. 2007; Mustapha et al. 2013;
Ogunfowora et al. 2005; Orkin 2011; Psaki et al. 2017; Thuillez et al. 2010; Wolka et al.
2013). Most conceived of absenteeism as any episode of missing school, while a minority—
primarily those reporting findings from the World Health Organization’s Global School-

28
based Student Health Survey (Dunne et al. 2013; Siziya et al. 2007)—included only
unauthorised absences, or ‘truancy’. Qualitative studies explored students’ experiences of
missing school, often as part of broader narratives about vulnerability and exclusion,
without fixing temporal or definitional boundaries (Jewitt and Ryley 2014; Mason et al.
2013; McMahon et al. 2011; Mushi et al. 2012; Porter et al. 2012; Pridmore and Jere 2011;
Sommer 2009).
The sources from which absenteeism data were drawn also varied across studies. Data
collection methods included use of attendance registers or teacher reports (Chippaux and
Larsson 1991; de Clerq et al. 1998; Ezenwosu et al. 2013; McCoy et al. 2014; Ogunfowora
et al. 2005; Thuillez et al. 2010; Wolka et al. 2013), household-level surveys or interviews
with parents or caregivers (Adhvaryu and Nyshadham 2012; Ainsworth et al. 2005;
Amendah et al. 2014; Burke and Beegle 2004; Dreibelbis et al. 2013; Gray et al. 2006;
Mushi et al. 2012; Orkin 2011), or surveys, interviews, or other participatory activities with
students themselves (Belachew et al. 2011; De Smedt et al. 2012; Dillon 2013; Dunne et
al. 2013; Grant et al. 2013; Grant and Hallman 2008; Guarcello et al. 2005; Jewitt and
Ryley 2014; Mason et al. 2013; McMahon et al. 2011; Mushi et al. 2012; Mustapha et al.
2013; Orkin et al. 2014; Porter et al. 2012; Pridmore and Jere 2011; Psaki et al. 2017;
Sommer 2009). A few studies generated their own school attendance data by performing
sporadic attendance spot checks (Evans and Miguel 2007) or conducting active surveillance
(Trape et al. 1993), or were not explicit about their data source (Ibekwe et al. 2007).
Differences in the scope of absenteeism, in how data were collected, and in analytical
approaches mean that results across studies are not easily generalisable. Both the effect size
and statistical significance of associations between risk factors and absenteeism may
depend on the specific measures used (as shown in, e.g., Psaki et al. 2017), while the mode
of data collection (Baird and Özler 2012) or length of recall period (Das et al. 2012;
Kjellsson et al. 2014) have been shown to influence data quality in previous research. I am
also mindful that the specific institutional, socio-cultural, and economic contexts in which
studies were conducted limit the utility of comparison across countries (Pritchett and
Sandefur 2013). The purpose of this review, however, is not to draw definitive conclusions
about the relative importance of absenteeism influences, but rather to survey the research
landscape in order to inform subsequent analysis.

29
2.1 Determinants of absenteeism
2.1.1 Individual factors
I start by examining the range of student-level characteristics that have been linked with
school absenteeism. Perhaps surprisingly, given persistent gender inequality with respect
to educational enrolment and experience in sub-Saharan Africa (UNESCO 2016), many
studies that compared absenteeism prevalence between boys and girls did not observe
significant differences, including Grant et al. (2013) in Malawi, Ainsworth et al. (2005) in
Tanzania, Mensch and Lloyd (1998) in Kenya, Ezenwosu et al. (2013) in Nigeria, and Orkin
et al. (2014) in South Africa. Exceptions include Dreibelbis et al. (2013) who found in
western Kenya that the probability of absence for girls was slightly higher than for boys,
and Siziya et al. (2007) who observed a markedly higher prevalence of truancy among boys
in Swaziland. However, although overall levels of absenteeism were broadly similar
between boys and girls in most studies, gendered patterns of absenteeism determinants were
observed. These are noted where relevant below.
Trends by age were also evident in several studies. In their multilevel analysis of the
determinants of school attendance in Tanzania, Burke and Beegle (2004) showed that
weekly hours spent in school increased, plateaued, and then declined with age among 10-
15 year-olds. As their measure of weekly school attendance was not conditional on current
attendance status, however, their analysis may combine absenteeism and permanent school
leaving. A Kenyan study observed a similar pattern for girls (but not for boys), using
absence rather than attendance rates: among girls, the probability of absence declined from
ages 5 to 11, before increasing sharply thereafter (Dreibelbis et al. 2013). Among boys, by
contrast, the probability of absence declined steadily with age. The authors speculated that
increasing absenteeism at older ages, particularly for girls, may reflect growing domestic
responsibilities – I explore the contribution of household work to absenteeism in section
2.1.2.
Global estimates indicate that students in low-income countries lose the equivalent of
between 200 million and 500 million school days due to ill health each year (Bundy 2011).
Epidemiological research provides evidence that a wide range of health conditions are
30
associated with school absenteeism in African settings.2 These include malaria (Thuillez et
al. 2010; Trape et al. 1993), headache (Ofovwe and Ofili 2010), respiratory illness
(Mustapha et al. 2013), epilepsy (Ibekwe et al. 2007; Mushi et al. 2012), schistosomiasis
(de Clerq et al. 1998), iodine-deficiency disorders (Wolka et al. 2013), sickle cell anaemia
(Ezenwosu et al. 2013; Ogunfowora et al. 2005), vernal keratoconjunctivitis (De Smedt et
al. 2012), and guinea worm disease3 (Chippaux et al. 1992; Chippaux and Larsson 1991;
Ilegbodu et al. 1986). Although the prevalence of disease, magnitude of effect on
absenteeism, and researchers’ methodological rigour varied across condition and context
(see Table A.1 in the Appendix for a summary of study features), the preponderance of
evidence linking illness with school absenteeism highlights important connections between
student health and educational access.
A growing literature has also explored the impact of menstruation on girls’ education.
Several qualitative studies have described episodes of school absence attributable to lack
of sanitary towels, pain associated with menstrual cramps, expulsion from class after
arriving late from washing, and difficulties associated with undertaking long journeys to
school during menses (Jewitt and Ryley 2014; Mason et al. 2013; McMahon et al. 2011;
Sommer 2009). However, quantitative evidence that menstruation exerts a disproportionate
toll on girls’ school attendance is limited, although it may affect other aspects of girls’ well-
being in important ways. In Malawi, Grant and colleagues (2013) found that one-third of
female students aged 14-16 reported missing at least one day of school during their last
period, but this represented only a small proportion of total absences. Additionally, as we
saw above, they did not observe a gender difference in overall levels of absenteeism,
suggesting that menstruation did not unduly disadvantage girls with respect to school
attendance. Earlier research from Kenya showed similar findings (Mensch and Lloyd
1998). A mixed methods study from Ethiopia measured high levels of menstruation-related
absenteeism, with more than half of 595 girls aged 10-19 missing school during their last
period, but the study did not explore the extent to which girls also missed school for other
reasons, nor compare with boys’ attendance patterns (Tegegne and Sisay 2014).
2 The same factors that contribute to ill health, such as poverty, food insecurity and lack of sanitation facilities,
may also influence school attendance directly (Burke and Beegle 2004) – see section 2.1.2. However, for the
purpose of this review I discuss illness separately from these underlying determinants. 3 Guinea worm disease has been the subject of a global eradication campaign since 1980, such that just 25
cases were observed in 2016 (Carter Center 2017). Evidence linking guinea worm disease comes from the
period when annual incidence approached 3.5 million cases (1986 estimate).

31
Few studies have examined the relationship between HIV status and school attendance, as
distinct from other educational outcomes, but research from Zimbabwe showed that HIV-
positive children were no less likely to attend school regularly (defined as more than 80%
of the last 20 days) than were HIV-negative children (Pufall et al. 2014b). The authors
speculated this result could stem from the small number of HIV-positive children of school-
going age in their sample (n=94), or from slower disease progression among children who
had survived to primary school age.
Regardless of a student’s own status, however, children in countries with advanced HIV
epidemics may experience other forms of disadvantage that affect their school attendance.
Increasing attention has been paid to the potential impact of orphanhood on schooling. A
descriptive study using survey data from Malawi, Uganda and Botswana found that
absenteeism was not consistently more common among orphans than non-orphans and, in
Malawi and Uganda, that levels of absenteeism were very high among the entire primary
school population (Bennell 2005). In Tanzania, Ainsworth et al. (2005) drew more nuanced
conclusions by showing that weekly school attendance of students aged 7-14 was sensitive
to the timing of adult death. They found that attendance substantially declined for both
sexes 3-6 months prior to an adult death, presumably as children served as caregivers, but
ultimately recovered in the aftermath of parental death. In a five-year panel study of more
than 20,000 Kenyan children, Evans and Miguel (2007) observed a marked decline in
school attendance following parental death, particularly for younger girls, and a smaller
drop in attendance prior to the death. Proposed mechanisms through which orphanhood
affects school attendance include adverse economic shocks and household caregiving
responsibilities—which I will explore further in section 2.1.2—as well as intra-household
discrimination and students’ grief and distress that compromise schooling (Moleni 2008;
Pridmore and Jere 2011).
Underlying students’ decisions to attend school, particularly in the face of obstacles that
may otherwise constrain school participation, are factors including cognitive ability and
educational aspirations, which are likely to influence the desire to attend school regularly.
Innate endowments are inherently difficult to measure, but indicators of educational
motivation, attainment and achievement have been shown to be strongly associated with
school attendance. One study from Malawi showed that, among girls (but not boys), late
entry to primary school and previous grade repetition were significantly associated with

32
absenteeism in the current school year (Psaki et al. 2017), while another showed that girls
who studied at home were less likely to miss school in the previous two weeks (Grant et al.
2013). Research from Ethiopia found that the highest school grade aspired to be completed
by adolescents aged 13-17 was negatively associated with absenteeism during the previous
semester, adjusting for other factors (Belachew et al. 2011). Additionally, in their study of
Kenyan orphans described above, Evans and Miguel (2007, p. 52) showed that the impact
of parental death on school attendance was significantly larger for children with poor
baseline academic test scores, ‘suggesting that households decide to focus their increasingly
scarce resources after a parent death on more promising students’.
This passage from Evans and Miguel (2007) highlights the contribution of household
investment in education as a facilitating factor for school attendance. The next section
reviews household factors associated with creating an enabling or inhibiting environment
for sustained educational access.
2.1.2 Household factors
Just as students’ demographic characteristics were shown to influence attendance patterns
in some studies, so, too, have characteristics of other household members exhibited
significant relationships with children’s absenteeism, although not always consistently. In
Kenya, for instance, students living in female-headed households demonstrated an
increased probability of missing school (Dreibelbis et al. 2013), while the sex of household
head had no effect on children’s attendance in Tanzania (Burke and Beegle 2004). Burke
and Beegle (2004) also found that girls’ weekly attendance increased with the age of the
household head, perhaps reflecting the result from Grant et al. (2013) that girls in Malawi
who lived with their grandmothers had lower odds of absence during their last period than
those who did not.
Both quantitative and qualitative evidence from a variety of settings has highlighted the
pivotal role played by household socioeconomic factors in determining attendance patterns,
by affecting students’ ability to meet both the direct costs of schooling as well as the
opportunity costs. In Tanzania, the total value of household assets was associated with
increased hours of schooling for both girls and boys, suggesting that monetary poverty
constrained school attendance (Burke and Beegle 2004). Dreibelbis et al. (2013) observed
a similar wealth gradient with respect to school attendance in Kenya, but it was significant
33
only for girls in their multilevel model. Data showed that girls from the poorest wealth
group demonstrated a 71% increase in the probability of missing school compared to boys
in the richest wealth group and 30% compared to boys in the poorest group.
Belachew et al. (2011) investigated the relationship between severe household food
insecurity and school absenteeism in Ethiopia, and found it to be significantly associated
with missing school among students aged 13-17. Although the authors speculated that food
insecurity influenced school attendance through its effect on students’ nutrition and
cognitive development, the analysis did not adjust for measures of household wealth or
income and as such may also capture the exclusionary impact of wider socioeconomic
disadvantage. Examining the effect of agricultural production shocks on hours of schooling
in northern Mali, Dillon (2013) showed that large crop loss increased the probability of a
child aged 10-17 being withdrawn from school by 11%, but had no significant effect on
hours spent in school among those who did attend.
Other studies have emphasised the underlying role of socioeconomic factors in explaining
absenteeism associated with other forms of vulnerability. Psaki et al. (2017), for instance,
investigated the relationship between experiences of violence and educational outcomes
including absenteeism in southern Malawi. They found that boys, but not girls, who had
ever experienced domestic violence were consistently more likely to miss school than those
who had not, a result that remained robust to four different measures of school
absenteeism.4 Given that higher household wealth was consistently associated with lower
absenteeism, and employment in the past 12 months with higher absenteeism, the authors
speculated that the observed relationship with violence stemmed from underlying
socioeconomic conditions:
Boys who are at highest risk of absenteeism may be those who come from
households experiencing poverty, where violence may be chronic, and where boys
may be expected to contribute to financially supporting the family, in addition to—
or perhaps instead of—attending school (Psaki et al. 2017, p. 376).
4 The four measures used were: any absence during the past school year, absence on the past school day,
number of days missed during past school week, and whether the student considered he/she attended school
regularly.

34
Elsewhere in Malawi, Pridmore and Jere (2011) drew on interview data from 14-17 year-
old students and out-of-school counterparts to show that inability to afford school uniforms
or soap for clothes washing contributed to absenteeism, and also led to participation in
ganyu—short-term paid informal labour—to help meet these expenses. Other studies have
highlighted aspects of students’ engagement in agricultural or market work that conflict
with school attendance. Anecdotal evidence provided in Awedoba et al. (2003) regarding
household demand for schooling in Ghana suggested that households removed children
from school during peak harvest time to provide extra labour or to look after younger
siblings while their parents work. Humphreys et al. (2015) observed a similar pattern in
Nigeria, where boys and girls missed school to help their families with planting and
harvesting crops, or boys sought paid employment associated with harvest time. Qualitative
data from Ethiopia showed that students regularly participated in both household and paid
agricultural labour, but found household work to be more compatible with school
attendance because jobs could be broken down into smaller pieces to fit around the school
day (Orkin 2012). On the other hand, a review of survey data from the Understanding
Children’s Work collaboration found in Kenya that neither the type nor intensity of work
carried out by school-age children influenced absenteeism, which was uniformly low, but
increased engagement in non-market activities did raise the probability of late arrival to
school (Guarcello et al. 2005).
Several studies have focused specifically on children’s environmental resource collection
work—water, firewood, and agricultural fodder—and school attendance. A descriptive
study of 157 Tanzanian children found mixed evidence of a relationship between resource
collection and children’s schooling success: while there was some suggestion that children
who collected firewood were more likely to miss school in the past week, these children
also spent the most time doing homework (Levison et al. 2017). Focus group data indicated
that fatigue from domestic chores—although not necessarily resource collection
specifically—interfered with school performance, but that some students valued their
participation in resource collection as a means of contributing to their households (Levison
et al. 2017). A mixed methods study across 24 sites in Ghana, Malawi and South Africa
suggested that the time and exertion associated with child porterage—carrying water,
firewood, and agricultural produce—as well as the prospect of earning extra money from
commercial load carrying, contributed to tardiness and absenteeism (Porter et al. 2012).

35
Dreibelbis and colleagues (2013) investigated the impact of household water, sanitation
and hygiene (WASH) conditions on recent school absence among nearly 8000 children in
Kenya. Increased probability of recent absence was observed among boys and girls living
in households with a distant water source and among girls in households in which children
were reported to contribute to household water collection. These results suggest a conflict
between water collection and school attendance, particularly among girls, that echo
findings from Levison et al. (2017) and Porter et al. (2012). The Kenyan study also found
that presence of a household latrine was associated with better school attendance, although
statistically significant only for boys, which may reflect either a positive wealth effect, or
improved household health via reduced diarrhoea incidence from poor sanitation
(Dreibelbis et al. 2013).
Other sources of household ill health have also been shown to affect students’ school
attendance through increased caregiving responsibilities. In open-ended interviews from a
mixed methods study of educational shortfalls of young carers in South Africa, adolescents
aged 10-20 described missing school to accompany ill relatives to health facilities, to
provide home-based care, or due to inability to focus in lessons (Cluver et al. 2012). An
earlier South African study found that children under 16 years old from households in
which one or more resident adults experienced a recent illness missed significantly more
school days in the past three months than did children from healthy households, although
absenteeism was generally low and the analysis did not adjust for potential confounders
(Gray et al. 2006). Another South African study used path analysis to assess the link
between HIV/AIDS caregiving and school attendance and found no significant direct
association between caregiving duties and absenteeism, but did observe an indirect
relationship through poverty and internalising problems such as anxiety, depression, and
post-traumatic stress disorder (Orkin et al. 2014). Robson and colleagues (2006) also
highlighted the heavy emotional burden shouldered by young carers, as revealed through
in-depth interviews with young people in Zimbabwe.
In a setting comparatively less affected by HIV/AIDS, a mixed methods study from
Ethiopia also found a significant relationship between household illness and school
attendance (Orkin 2011). Controlling for sociodemographic characteristics, high levels of
absenteeism were associated with an increasing percentage of household members who
were sick for more than 30 days in the previous year. A greater proportion of sick household

36
members also increased the probability of children’s involvement in paid work, potentially
to substitute for ill household members or to cover the costs of health care. Although the
precise mechanism was not apparent from their analysis, results from Grant et al. (2013),
which showed a significant positive relationship between girls’ number of siblings and
likelihood of recent absence, suggest that students may be responsible for providing care
for younger siblings, regardless of health status.
Investigating other household-level determinants of absenteeism, Dreibelbis et al. (2013)
observed a significant relationship between distance to school and recent school attendance
in Kenya. Specifically, they found that girls, but not boys, who lived more than 20 minutes
away from the nearest primary school demonstrated an increased average probability of
absence relative to students who lived closer. Porter and colleagues (2011) also concluded
from qualitative data in Ghana that long journeys to school, combined with heavy domestic
workloads, were detrimental to daily school attendance, particularly for girls. In their
multivariable model of absenteeism determinants in Malawi, Grant et al. (2013) found that
girls who lived more than 30 minutes from school were significantly more likely to be
absent in the past two weeks than girls who lived closer. By contrast, Burke and Beegle
(2004) did not observe a significant relationship between the number of primary schools in
a community—on which distance to school would at least partly be contingent—and
weekly hours of school attendance in Tanzania.
Finally, just as students’ own abilities and aspirations influence their desire to maintain
regular attendance, so, too, does parental support for education factor in school attendance
decisions. In their qualitative study from Malawi, Pridmore and Jere (2011) suggested that
household encouragement for schooling—or lack thereof—exerted a strong influence on
attendance and attainment. According to one student from an earlier case study in Malawi:
‘[Our mother] gives us advice and also encourages us, by not allowing us to be absent
anyhow’ (Moleni 2008, p. 53). These observations echo a statistical analysis from
Swaziland, which showed, respectively, that students whose parents rarely checked
homework, rarely understood their problems and worries, and rarely provided supervision
were significantly more likely to report truancy in the past 30 days than were students
whose parents always did so (Siziya et al. 2007). The cross-sectional nature of the analysis,
however, precludes causal inference since it is also possible that parents chose not to invest
time in students who skipped school regularly.

37
A study of 68 junior high school students in Ghana found that boys’ and girls’ attendance
patterns were significantly associated with household gender attitudes: when students’
caregivers endorsed a statement that it is better to educate boys than girls, girls’ absence
rates were significantly higher—and boys’ significantly lower—than counterparts whose
caregivers disagreed with the statement (Wolf et al. 2016). Path analysis from another
Ghanaian study showed that, holding constant students’ own motivation, students whose
caregivers perceived that education imparted important skills were significantly more likely
attend school regularly than students whose caregivers did not attach the same value to
education (McCoy et al. 2014). Indeed, parents who are themselves educated may support
their children’s school attendance more strongly: in Burke and Beegle’s (2004) multilevel
analysis from Tanzania, years of maternal education was positively associated with
children’s weekly hours of school attendance, and more strongly so for girls than boys.
Paternal education was associated with increased school attendance for boys but not for
girls. On the other hand, Grant et al. (2013) did not observe a significant relationship
between either maternal or paternal education and school attendance among 14-16 year-old
girls in Malawi, although their binary measure of parental education (ever attended
primary) may have lacked the precision necessary to capture education effects.
2.1.3 School factors
We have thus far discussed individual- and household-level factors that influence school
attendance, but several studies have also explored the importance of school characteristics
in shaping attendance patterns. In particular, the classroom environment—and especially
the characteristics and conduct of fellow students and teachers—has been shown to be
associated with absenteeism. Two multivariable analyses using data from the Global
School-based Student Health Survey in Ghana and Swaziland, respectively, found that
students who experienced bullying in the previous 30 days were more likely to report
missing school during the same period (Dunne et al. 2013; Siziya et al. 2007), although in
both cases the direction of causality is not possible to discern. With respect to teacher
characteristics, an ethnographic study of junior secondary schools in Botswana and Ghana
observed that student attendance and punctuality were markedly poorer in low-performing
schools with lax or inconsistent management—manifested by teacher lateness or absence,
failure to mark student work or erratic use of disciplinary sanctions—than in high-
performing schools characterised by strong discipline (Dunne 2007). Siziya et al. (2007,

38
‘Conclusion’ para. 6) speculated in Swaziland that the increased risk of truancy observed
in lower relative to upper grades possibly stemmed from ‘laxity of behaviour amongst
lower grades students probably as a result of lower school expectations from their teachers
or themselves’.
One mechanism for instilling discipline—corporal punishment—has also received specific
attention in the literature. In their study of student motivations for learning in Ghana,
McCoy and colleagues (2014) showed that students who expressed a preference for
extrinsic motivators (i.e. economic incentives or avoidance of punishment) attended school
more often than intrinsically motivated peers, suggesting that the prospect of corporal
punishment may serve as a deterrent for absenteeism. Qualitative data from elsewhere in
Ghana, however, showed that students reported preferring to absent themselves from school
rather than risk being subject to corporal punishment for arriving late (Porter et al. 2011).
In Malawi, despite widespread experience of physical violence at school, violence was not
associated with absence during the past academic year (Psaki et al. 2017).
Pridmore and Jere (2011) identified other exclusionary school policies and practices that
promoted absenteeism in Malawi. They observed that some schools barred students from
attending for not wearing a school uniform, despite government policies stipulating that
uniforms were not required, leading to a cycle of absenteeism and potential dropout.
Moreover, when students had already missed a period of school due to illness or domestic
responsibilities, inflexible school policies often extended the duration of absence by
preventing students’ immediate return, for example by delaying readmission until the start
of the next school term. Both in Malawi (Kadzamira and Rose 2003) and elsewhere
(Humphreys et al. 2015; Orkin 2012), the school calendar has also been seen to exacerbate
absenteeism by not accommodating seasonal demands on children’s labour, or religious or
cultural traditions.
Perhaps surprisingly, evidence surrounding the impact of physical infrastructure and school
resources on student attendance is somewhat mixed. In Tanzania, Burke and Beegle (2004,
p. 344) hypothesised that ‘shortages of basic equipment such as classrooms, desks and
books, not to mention other materials like charts and maps, could be a cause of poor
enrolment, low attendance and under-development of cognitive skills.’ However, their
multilevel analysis showed that of the school-level factors included in regression models—

39
teachers per class, having a blackboard, students per textbook, and presence of
organisations in the community providing assistance to schools—none was significantly
associated with weekly hours of school attendance for girls or boys. The authors suggested
that this result could stem from the overall low level of quality of schools in the study area,
or from insufficient variation in the chosen indicators to detect an effect. Pufall et al.
(2014a) examined the relationship between school quality and school attendance among
vulnerable children in Zimbabwe, and similarly found that indices of school quality—
including measures of physical infrastructure, student- teacher ratio, fee structure and
support, community links, teaching methods, and extracurricular activities—were not
significantly related to primary or secondary school attendance, although they were
associated with other aspects of student well-being.
Focusing specifically on school WASH facilities, Dreibelbis et al. (2013) showed that
sanitation quantity—that is, number of students per latrine—and having a protected water
source at school were both unrelated to student absenteeism in Kenya, as were having
electricity, the student-teacher ratio, and the student-classroom ratio. Although the authors
speculated that limited heterogeneity of school conditions may help explain the lack of
relationship observed, they noted that an indicator of latrine quality was significantly
associated with increased attendance. This implies either that improved latrine cleanliness
reduced transmission of diarrhoea-inducing pathogens, thus improving student health, or
that students chose to absent themselves rather than use dirty latrines. With reference to
menstruation-related absenteeism in Malawi, Grant et al. (2013) found no evidence for
school-level variance in absence at last menses, suggesting that missing school during
menstruation was not sensitive to school environment. This was consistent with the finding
that school characteristics including availability and cleanliness of toilets were not
significantly associated with absenteeism in their regression models, although perceived
lack of privacy in school latrines was positively related with menstruation-related
absenteeism.
2.1.4 Community factors
A number of community-level factors, including cultural traditions, economic relations,
and infrastructural development, can also have important implications for school
attendance. A qualitative investigation of how physical insecurity affected school
attendance in two Nairobi slums demonstrated that perceived threats to personal safety (e.g.

40
dangerous routes to school) and general community insecurity (e.g. sporadic ‘wars’) were
both responsible for absenteeism (Mudege et al. 2008). In studies from rural Ghana, Malawi
and South Africa, Porter and colleagues also highlighted the contribution of treacherous
walking routes to inhibiting school attendance, particularly when routes became
impassable during the rainy season (Porter et al. 2011), or due to perceived risk of physical
attack or rape, especially among girls travelling alone (Porter et al. 2010a; Porter et al.
2010b).
Burke and Beegle (2004) also investigated the impact of the supply of educational facilities
on school attendance in their multilevel analysis of Tanzanian data. They found that
although the number of primary schools in the community had no effect on hours of school
attendance, presence of a secondary school within five kilometres of the community
increased hours of attendance for girls. This led the authors to conclude that, given that
secondary school enrolment is contingent on completion of primary school, the availability
of future secondary education factored into household decisions about investment in
primary, particularly for female students. They also found that the community prevalence
of child farm labour was negatively associated with hours of schooling, significantly so for
girls, indicating a high opportunity cost of schooling in agricultural settings.
Given the importance of ill health in inhibiting school attendance, Adhvaryu and
Nyshadham (2012) investigated the effect of access to formal-sector health services on
hours of school attendance among 7-19 year-old students with acute illness in Tanzania.
Their analysis showed that sick children who accessed formal health care were nearly 70%
more likely to attend some school in the past week and, among those who did attend, to
spend roughly 3.6 more days in school than sick non-users. No significant difference was
found in the number of hours per day of school attended – that is, ‘speedier and more
complete recovery from acute illness due to formal-sector care use induces a child to attend
more days in school, but not significantly more hours in the days he attends’ (Adhvaryu
and Nyshadham 2012, p. 380). Importantly, this analysis used methods to control for
potential self-selection into formal-sector healthcare use, for instance on the basis of disease
severity, financial means, or higher preferences for health, thus demonstrating the
importance of health service availability for mitigating the impact of illness on school
absenteeism.

41
2.1.5 Summary
Drawing on research from Malawi and elsewhere in sub-Saharan Africa, this review has
demonstrated that school attendance is influenced by a wide range of factors operating at
the individual, household, school and community level. Although results were not always
consistent across studies, which may reflect both different methodological approaches as
well as different contextual features, student ill health, domestic responsibilities including
work and caregiving, and socioeconomic constraints emerged as prominent barriers to
attendance. Many studies found no significant differences in absence rates between girls
and boys, but gendered patterns were observed with respect to absenteeism determinants,
highlighting the importance of disaggregated analysis of boys’ and girls’ experiences.
It is against this backdrop that I now explore the mechanisms through which cooking
activities would be expected to influence school attendance, and the potential for cleaner
burning biomass-fuelled to address these factors. I start with an overview of the health and
economic burdens of cooking with solid fuels.
2.2 Cooking with solid fuels
Approximately 2.8 billion people, or 41% (95% confidence interval [CI]: 37-44) of global
households, rely on solid fuels such as wood, crop residues, dung, charcoal, and coal for
cooking (Bonjour et al. 2013). Although this proportion has declined by one-third since
1980, concentrations of solid fuel use remain high in Africa and Southeast Asia. In Malawi,
fully 97% (95% CI: 84-100) of households cook with solid fuels, exceeding by some
margin the African regional average of 77% (95% CI: 74-81) (Bonjour et al. 2013).
Persistent reliance on solid fuels to some extent reflects limited penetration of
electrification, particularly in rural communities, but stems primarily from scarcity of clean
and affordable alternative cooking technologies (International Energy Agency and World
Bank 2017).
Burning solid fuels has well-documented environmental impacts, including deforestation,
soil degradation and erosion (Foell et al. 2011), but also has important consequences for
health. In particular, inefficient and incomplete combustion of solid energy sources

42
produces harmful pollutants including carbon monoxide as well as particulate matter5,
exposure to which yields health impacts of a magnitude between active and passive
smoking (Piddock et al. 2014). Smith (2002, p. 198) summarised the processes through
which households, particularly in low-income countries, are vulnerable to household air
pollution from solid fuels (HAP):
The majority of households use unprocessed solid fuels for cooking.
Traditional cooking methods have large emission rates of a number of important
health-damaging airborne pollutants.
A large proportion of household stoves are not vented with flues or hoods to take
pollutants out of the living area.
Unprocessed fuels produce enough pollution to significantly affect ‘neighbourhood’
pollution levels. As cooking is done every day at times when people are present, its
associated intake fraction—i.e. the percentage of emissions that reach people’s
breathing zones—is much higher than for outdoor pollution sources.
As a result, residents of such households, and particularly women and young children, are
exposed to peak HAP levels well in excess of WHO and national air pollution guidelines
(Bruce et al. 2000; Smith 2002). One study comparing rural and urban households near
Blantyre, Malawi found that in 80% of households studied, particulate matter levels
exceeded WHO standards by more than four times (Fullerton et al. 2009).
HAP exposure has been linked with a number of health risks, including chronic obstructive
lung disease, pneumonia, ischaemic heart disease, stroke, lung cancer, and cataracts (World
Health Organization 2014). According to the latest Global Burden of Disease Study,
attributable deaths due to HAP6 numbered 2.9 million (95% CI: 2.2 million-3.6 million) in
2015, while HAP accounted for 85.6 million (95% CI: 66.7 million-106.1 million)
disability-adjusted life-years (DALYs) (GBD 2015 Risk Factors Collaborators 2016).
Because cooking fires also contribute to outdoor, or ambient, air pollution, data from 2010
suggest that an additional 370,000 deaths and 9.9 million DALYs caused by exposure to
5 Inhalable particulate matter—particles less than 10 micrometres in aerodynamic diameter (PM10)—and
especially fine particulate matter—those less than 2.5 micrometres (PM2.5)—can penetrate deeply into the
lungs and have great health-damaging potential (Bruce et al. 2000). 6 HAP exposure was defined as annual average daily exposure to household concentrations of PM2.5,
measured in μg/m3 from solid fuel use (GBD 2015 Risk Factors Collaborators 2016).

43
ambient air pollution are attributable to household cooking with solid fuels (Smith et al.
2014).
Although much of the disease burden associated with HAP falls on adult women and young
children, as the groups with the highest exposure to smoke from cooking fires (Martin et
al. 2013), 24-hour exposure levels can still be high among household members not directly
involved in cooking (Balakrishnan et al. 2002). Among school-age populations, strong links
have been drawn between use of open fire cooking and asthma prevalence in both younger
(age 6-7) and older (age 13-14) school-age children in global studies (Wong et al. 2013).
There is also some evidence of an association between HAP and acute respiratory infections
(Gordon et al. 2014; Perez-Padilla et al. 2010).
These health impacts of HAP may have important effects on students’ school attendance.
Research from southern Nigeria demonstrated that 2.5% of children aged 7-14, and 5.7%
in rural areas, reported missing school in the past twelve months due to symptoms of
respiratory illness, although these episodes were not necessarily linked specifically to HAP
exposure (Mustapha et al. 2013). Perhaps more significantly, HAP-induced morbidity of
other household members may influence school attendance via increased caregiving
responsibilities. Existing research has not explored the extent or distribution of household
caregiving associated with HAP, but findings from previous studies of young carers in sub-
Saharan Africa suggest that students frequently miss school to provide care or compensate
for sick relatives by providing paid or household labour. Indeed, Orkin’s findings from
Ethiopia (2011), summarised in section 2.1.2, indicated that household illness increased
both school absenteeism and participation in paid work.
Thus, either through direct health effects, or through increased caregiving or work
responsibilities associated with illness of other household members, exposure to HAP via
open fire cooking may have implications for sustained school attendance that have not been
heretofore explored. Risks from open fire cooking are not, however, limited to the health
impacts of HAP. Additional dangers include scalds and burns, as well as injury or violence
experienced while collecting cooking fuel (Gordon et al. 2014). The process of gathering
fuel, typically undertaken by women and children, also absorbs considerable time—as
much as 20 hours per week in areas of diminishing environmental resources (Simon et al.
2014).

44
In its list of the hazards of cooking with solid fuels, the World Health Organization
highlights the detrimental impact that fuel gathering exerts on children’s school attendance
(World Health Organization 2014). As described in section 2.1.2, some evidence exists
from Porter et al. (2012) and Levison et al. (2017) that carrying firewood and agricultural
produce is linked with school absenteeism, although these analyses do not explore load
carrying affiliated with cooking specifically. Additional research has demonstrated
apparent trade-offs between environmental resource collection and other educational
outcomes. Economic studies from Malawi (Nankhuni and Findeis 2004), Kenya (Wagura
Ndiritu and Nyangena 2010), and Ethiopia (Bahre and Bezu 2014) each showed that simple
participation in resource collection work was compatible with current school attendance
(measured as a binary outcome). However, examining the intensity of resource collection,
and using statistical methods that accounted for potential endogeneity of school and work
allocations, the three studies found that the number of hours spent on environmental chores
was associated with a reduced likelihood of current attendance.
Nankhuni and Findeis (2004) additionally highlighted a gendered dimension: although girls
were no less likely than boys to be attending school, they were more likely to be burdened
with resource collection work. Similar observations were made in Kenya (Wagura Ndiritu
and Nyangena 2010), while in Ethiopia, girls were more likely to engage in resource
collection work but spent less time on these activities than did boys, such that the results
showed no evidence of a gender difference in the impact of resource collection intensity on
schooling (Bahre and Bezu 2014). Nankhuni (2004) further investigated the relationship in
Malawi between time spent on resource collection work and grade attainment, as measured
by attendance in senior primary school (standards 5-8). She observed that the number of
hours that children spent on resource collection was associated with lower likelihood of
attending senior primary school for girls but not for boys.
2.3 Cleaner burning cookstoves
Cleaner burning cookstoves have been widely championed as a solution to the health,
economic, and environmental burdens associated with reliance on solid fuels, as well as a
vehicle for female empowerment (Martin et al. 2013; Ruiz-Mercado et al. 2011). The
Global Alliance for Clean Cookstoves (GACC), a public-private partnership hosted by the
UN Foundation, was launched in 2010 ‘to save lives, improve livelihoods, empower
women, and protect the environment by creating a thriving global market for clean and

45
efficient household cooking solutions’ (Global Alliance for Clean Cookstoves 2016).
Corresponding efforts have been initiated by the government and NGO partners in Malawi
to encourage cookstove development and distribution (Jagger and Perez-Heydrich 2016).
The combination of health and economic benefits from cleaner burning cookstoves has
formed the basis for advocacy from the GACC and others highlighting the role clean
cooking technologies can play in expanding educational access, particularly for girls
(Global Alliance for Clean Cookstoves n.d.). The following sub-sections briefly review
existing evidence for health and time and resource gains from cleaner burning cookstoves
from randomised controlled trials (RCTs), before reflecting on potential linkages with
school attendance, which have not been examined in sub-Saharan Africa.
2.3.1 Health benefits
Cleaner burning cookstoves range from rudimentary low-cost models built in situ from
local materials, to state-of-the-art, mass produced, portable cookstoves that include
electrically-driven fans (Wathore et al. 2017). Cookstoves aim to reduce exposure to
household air pollution through one of two mechanisms: improved ventilation, typically
via a built-in chimney, vent, or flue; or increased combustion efficiency. Although
laboratory tests consistently show that cleaner burning cookstoves reduce HAP emissions
relative to traditional cooking methods (e.g. Jetter and Kariher 2009), evidence from RCTs
surrounding the effectiveness of cookstoves for mitigating the detrimental health effects of
HAP is thus far limited (Thomas et al. 2015).
Before implementation of the Cooking and Pneumonia Study (CAPS), on which this thesis
draws, only three RCTs—two in Latin America and one in India—had evaluated the effect
of biomass smoke exposure reduction interventions on health outcomes (Jary et al. 2014).
Results from a Mexican trial, which compared a locally produced wood-burning Patsari
cookstove and chimney with open fire cooking, found that only half of the 338 households
randomised to the intervention reported using the new stoves even some of the time
(Romieu et al. 2009). However, in households that regularly used the cookstove, women’s
risk of cough, wheezing, eye discomfort, headache, and back pain was significantly reduced
(Romieu et al. 2009), as was the duration of upper and lower respiratory infections in
children under five (Schilmann et al. 2015), relative to control households.

46
In the Randomized Exposure Study of Pollution Indoors and Respiratory Effects
(RESPIRE) trial in Guatemala, 534 households with a pregnant woman or young child were
randomised to receive an improved ‘plancha’ woodstove with chimney or to continue as
controls. Investigators observed a protective effect of the plancha on six respiratory
symptoms for women, but only one result was statistically significant, and no effects on
lung function were found (Smith-Sivertsen et al. 2009). In infants, the trial did not yield a
significant reduction in physician-diagnosed pneumonia in intervention households, but
risk of severe pneumonia declined by one-third (Smith et al. 2011).
The third RCT, conducted in eastern India, involved 2651 households across 44 villages,
and showed that smoke inhalation decreased for primary cooks in the first year after receipt
of a locally produced cookstove with enclosed cooking chamber and chimney, but not over
a longer time horizon (Hanna et al. 2012). Unlike the Latin American trials, Hanna et al.
(2012) also investigated potential health impacts of cookstove use among school-age
children, but found no evidence for improvements in such outcomes as cough or fever,
either in that group or in primary cooks or children under five. The authors attributed these
findings to households’ low valuation of the cookstoves, as reflected in their improper use,
poor maintenance, and declining usage rates over the course of the four-year study.
Evidence from these trials thus paints a mixed picture of the link between cleaner burning
cookstoves and improved health outcomes.7 However, several limitations should be noted.
Firstly, the absence of significant results may stem from lack of statistical power rather than
absence of a true effect. The RESPIRE trial, for instance, observed a 22% reduction in
pneumonia cases, but was powered to 25% (Brugha and Grigg 2014). Secondly, the
cookstoves tested were designed to reduce exposure to HAP primarily through venting
emissions to the outdoor environment, but cookstoves that improve combustion
efficiency—such as through an in-built fan—have the potential to yield much greater
reductions in HAP (Jetter and Kariher 2009). Finally, in view of substantial heterogeneity
in cooking practices and preferences across regions, results from trials in Latin America
and India are not necessarily transferrable to the Malawian context (Jary et al. 2014).
7 Preliminary findings from more recent trials, for instance in Nepal (Tielsch et al. 2016) and Rwanda (Kirby
2017), yield similarly mixed or inconclusive results.

47
2.3.2 Time and resource savings
A second mechanism through which cleaner burning cookstoves can improve household
well-being is via time and resource savings from diminished fuelwood requirements and
faster cooking times. Although neither the RESPIRE trial (Granderson et al. 2009), nor the
RCT in India (Hanna et al. 2012), observed any fuel use benefits associated with the
cookstove intervention, evidence from elsewhere suggests that these gains can be
substantial. Evaluation of the energy performance of the Patsari stove in Mexico, for
instance, showed that, even among households that continued using open fires for some
tasks, average reductions of fuelwood and per capita energy consumption of 67% were
observed one year after cookstove distribution (Berrueta et al. 2008), equivalent to an
average saving of 840 kg of fuelwood per standard adult per year (García-Frapolli et al.
2010).
A RCT in Ethiopia comparing injera (flat-bread) baking cookstoves to traditional cooking
methods found that average household firewood savings steadily increased over the
duration of the year-long study, from an initial 5.2 kg per week to 12.4 kg per week at the
endline assessment (Beyene et al. 2015). In Senegal, a RCT comparing a portable clay-
metal stove with traditional cooking methods showed that, after one year of use, firewood
savings in the intervention group amounted to 27 kg per week, or 30% of household
consumption, when households used new and traditional cookstoves complementarily,
rising to 40% if the new cookstoves were to be used exclusively (Bensch and Peters 2015).
The trial also found that time spent cooking was significantly lower in the intervention
group by more than 75 minutes per day (Bensch and Peters 2015).
Ultimately, time and resource savings associated with cleaner burning cookstoves are
contingent on the cookstove model, the extent to which cookstoves are used exclusively or
in combination with traditional methods, and the local availability of cooking fuel. Even
when cookstoves do yield significant economic benefits, however, little is known about the
intra-household distribution of these gains. The existence of educational payoffs of cleaner
cookstoves rests on the assumption that time savings will be passed on to school-age
children involved in fuel collection, but a study assessing willingness to adopt locally
produced cookstoves in Malawi found that, although the time spent by the primary cook
collecting firewood was an important predictor of cookstove adoption, households where
people other than the cook (e.g. children) spent more time collecting fuel had lower odds

48
of choosing a cleaner burning cookstove over an in-kind payment of equivalent value
(Jagger and Jumbe 2016). The authors therefore suggested that ‘household decision makers
prioritize the value of their time over the value of others in the household who collect fuel,
including children’ (Jagger and Jumbe 2016, p. 417).
2.3.3 Current research agenda
This brief review has indicated that, although some suggestive evidence of health and time
and resource gains derived from cleaner burning cookstoves exists, considerable gaps
remain, particularly with respect to measurement of benefits (or lack thereof) for school-
age children. Indeed, only Hanna et al. (2012) included school-age children in their
cookstove trial evaluation in any capacity, while evidence for changes in caregiving or fuel
gathering responsibilities attributable to cookstove interventions is severely lacking in this
age group. Reflecting these knowledge gaps, an international stakeholder meeting of HAP
experts identified the need to ‘[a]ssess the potential educational and economic benefits of
improved stoves or fuels that provide more free time and reduced health risks for women
and girls’ as an urgent research priority (Martin et al. 2013, Table 2). The present study
thus contributes important evidence about the relationship between cleaner burning
cookstoves and sustained educational access, by assessing the cookstoves’ impact on
primary school attendance in northern Malawi.
2.4 Analytic model
Figure 2.1 shows the analytic model, derived from the literature review, that guides the
remainder of the thesis. By adopting an ecological approach that frames individual-,
household-, school-, and community-level factors associated with school attendance as a
‘nested arrangement of structures, each contained within the next’ (Bronfenbrenner 1976,
p. 5), I aim to portray absenteeism as the outcome of multiple influences operating both
within and across levels. The model is sufficiently comprehensive to account for both
immediate (proximal) as well as underlying (distal) determinants of absenteeism (Kearney
2008).8
8 I follow the WHO in using the following definitions of proximal and distal factors: ‘proximal factors act
directly or almost directly to cause [absenteeism], and distal causes are further back in the causal chain and
act via a number of intermediary causes’ (World Health Organization 2002, p. 13).

49
Although the full set of individual-, household-, school-, and community-level factors
provide the analytic underpinning of the thesis, I focus more intensively on individual- and
household-level determinants for several reasons. Firstly, because of the hypothesised link
between absenteeism and cleaner burning cookstoves, I am particularly interested in
investigating absenteeism pathways related to household health and division of labour.
Secondly, the indicators available in the household survey which forms the basis of the
quantitative analysis (described fully in Chapter 3) relate predominantly to individual and
household characteristics, allowing for the most extensive analysis at these levels. Thirdly,
in view of the statistical limitations associated with examining school-level effects in areas
with small and/or homogeneous groups of schools (Burke and Beegle 2004; Dreibelbis et
al. 2013), a decision was taken to concentrate on unpacking individual and household
effects. Reflecting the shortcomings of the quantitative data, however, school- and
community-level factors were explored in the nested qualitative study (see Chapter 3).
The model in Figure 2.1 also demonstrates the proposed mechanisms through which the
CAPS cookstove trial would be expected to affect absenteeism. These pathways may also
be influenced in important ways by underlying individual and household factors. As we
saw above, for instance, students’ contributions to household caregiving and fuel collection
have been shown to differ widely by sex, age, number of siblings, and socioeconomic
status. The analysis adopts a gendered perspective throughout, with a view to highlighting
similarities and differences in girls’ and boys’ experiences related to school attendance.
The final component of the model examines the relationship between missing school and
future educational trajectories, while recognising the direct pathway that may also link
individual-, household-, school-, and community-level factors with future outcomes. This
aspect of the analysis is presented in Chapter 6.
Before embarking on this research, however, Chapter 3 provides an overview of historical,
economic and environmental processes that shape the contemporary educational landscape
in northern Malawi, with a view to contextualising the analyses presented in subsequent
chapters. It also describes in more detail the theoretical underpinning of the thesis, the three
parent studies from which data were drawn, and my overarching research methods.

50
Individual
Household
School
Community
Individual factors
Age
Sex
Orphanhood status
Grade attended
Grade repetition
Economic
participation
Health
Household factors
Household size/
composition
Parental education
Socioeconomic status
Distance to school
Perceived value of
education
Health
School factors
Approach to
management/discipline
Physical infrastructure
Teacher characteristics
Classmate
characteristics
School calendar
Community factors
Demand for labour
Safety/security
Physical infrastructure
Supply of schooling
Cultural/religious
practices
Environmental
resources
(Reporting of)
Student
absenteeism
Future educational
pathways
Absenteeism
Grade repetition
Grade attainment
Cleaner burning
cookstoves
Hea
lth
Tim
e/re
sourc
e
savin
gs
Figure 2.1 Analytic model

51
References
Adhvaryu, A.R. & A. Nyshadham 2012. Schooling, child labor, and returns to healthcare in
Tanzania. Journal of Human Resources 47(2): 364-396. doi: 10.1353/jhr.2012.0009.
Ainsworth, M., K. Beegle & G. Koda 2005. The impact of adult mortality and parental deaths on
primary schooling in north-western Tanzania. The Journal of Development Studies 41(3):
412-439. doi: 10.1080/0022038042000313318.
Amendah, D.D., S. Buigut & S. Mohamed 2014. Coping strategies among urban poor: Evidence
from Nairobi, Kenya. PLOS ONE 9(1): e83428. doi: 10.1371/journal.pone.0083428.
Awedoba, A.K., P.S. Yoder, K. Fair & S. Gorin 2003. Household demand for schooling in Ghana.
Calverton, Maryland: ORC Macro.
Bahre, G. & S. Bezu 2014. Environmental resource collection: implication for children's schooling
in Tigray, northern Ethiopia. Environment and Development Economics 19(2): 182-200.
Baird, S. & B. Özler 2012. Examining the reliability of self-reported data on school participation.
Journal of Development Economics 98: 89-93. doi: 10.1016/j.jdeveco.2011.05.006.
Balakrishnan, K., J. Parikh, S. Sankar, R. Padmavathi, K. Srividya, V. Venugopal, et al. 2002. Daily
average exposures to respirable particulate matter from combustion of biomass fuels in
rural households of southern India. Environmental Health Perspectives 110(11): 1069-75.
Belachew, T., C. Hadley, D. Lindstrom, A. Gabremariam, C. Lachat & P. Kolsteren 2011. Food
insecurity, school absenteeism and educational attainment of adolescents in Jimma Zone
Southwest Ethiopia: a longitudinal study. Nutrition Journal 10(29).
Bennell, P. 2005. The impact of the AIDS epidemic on the schooling of orphans and other directly
affected children in sub-Saharan Africa. The Journal of Development Studies 41(3): 467-
488. doi: 10.1080/0022038042000313336.
Bensch, G. & J. Peters 2015. The intensive margin of technology adoption – Experimental evidence
on improved cooking stoves in rural Senegal. Journal of Health Economics 42: 44-63. doi:
10.1016/j.jhealeco.2015.03.006.
Berrueta, V.M., R.D. Edwards & O.R. Masera 2008. Energy performance of wood-burning
cookstoves in Michoacan, Mexico. Renewable Energy 33(5): 859-870. doi:
10.1016/j.renene.2007.04.016.
Beyene, A., R. Bluffstone, Z. Gebreegzhiaber, P. Martinsson, A. Mekonnen & F. Vieider 2015. Do
improved biomass cookstoves reduce fuelwood consumption and carbon emissions?
Evidence from rural Ethiopia using a randomized treatment trial with electronic monitoring.
Policy Research Working Paper 7324. Washington, D.C.: World Bank Group.
Bonjour, S., H. Adair-Rohani, J. Wolf, N.G. Bruce, S. Mehta, A. Prüss-Ustün, et al. 2013. Solid
fuel use for household cooking: Country and regional estimates for 1980–2010.
Environmental Health Perspectives 121: 784-790. doi: 10.1289/ehp.1205987.
Bronfenbrenner, U. 1976. The experimental ecology of education. Educational Researcher 5(9): 5-
15.
Bruce, N., R. Perez-Padilla & R. Albalak 2000. Indoor air pollution in developing countries: a major
environmental and public health challenge. Bulletin of the World Health Organization
78(9): 1078-1092.
Brugha, R. & J. Grigg 2014. Urban air pollution and respiratory infections. Paediatric Respiratory
Reviews 15(2): 194-199. doi: 10.1016/j.prrv.2014.03.001.
Bundy, D. 2011. Rethinking School Health: A Key Component of Education for All. Washington,
DC: The World Bank. Available from: http://documents.worldbank.org/curated/en/
900271468332690641/Rethinking-school-health-a-key-component-of-education-for-all.

52
Burke, K. & K. Beegle 2004. Why children aren't attending school: The case of northwest Tanzania.
Journal of African Economies 13(2): 333-355. doi: 10.1093/jae/ejh011.
Carter Center. 2017. Guinea Worm Eradication Program. Atlanta, GA. Available from:
https://www.cartercenter.org/health/guinea_worm/ [Accessed 14/10/2017].
Chippaux, J.P., A. Banzou & K. Agbede 1992. Impact social et économique de la dracunculose:
une étude longitudinale effectuée dans deux villages du Bénin. Bulletin de l'Organisation
mondiale de la Santé 70(1): 73-78.
Chippaux, J.P. & R.W. Larsson 1991. L'absentéisme scolaire lié à la dracunculose au Bénin.
Bulletin de la Société de Pathologie Exotique 84: 775-782.
Cluver, L., D. Operario, T. Lane & M. Kganakga 2012. "I can't go to school and leave her in so
much pain": Educational shortfalls among adolescent 'young carers' in the South African
AIDS epidemic. Journal of Adolescent Research 27(5): 581-605. doi: 10.1177/
0743558411417868.
Das, J., J. Hammer & C. Sánchez-Paramo 2012. The impact of recall periods on reported morbidity
and health seeking behavior. Journal of Development Economics 98(1): 76-88. doi:
10.1016/j.jdeveco.2011.07.001.
de Clerq, D., M. Sacko, J. Behnke, F. Gilbert & J. Vercruysse 1998. The relationship between
Schistosoma haematobium infection and school performance and attendance in Bamako,
Mali. Annals of Tropical Medicine & Parasitology 92(8): 851-858.
De Smedt, S.K., J. Nkurikiye, Y.S. Fonteyne, S.J. Tuft, C.E. Gilbert & P. Kestelyn 2012. Vernal
keratoconjunctivitis in school children in Rwanda. Opthomology 119(9): 1766-1772. doi:
10.1016/j.ophtha.2012.03.041.
Dillon, A. 2013. Child labour and schooling responses to production and health shocks in northern
Mali. Journal of African Economies 22(2): 276-299. doi: 10.1093/jae/ejs025.
Dreibelbis, R., L.E. Greene, M.C. Freeman, S. Saboori, R.P. Chase & R. Rheingans 2013. Water,
sanitation, and primary school attendance: A multi-level assessment of determinants of
household-reported absence in Kenya. International Journal of Educational Development
33: 457-465. doi: 10.1016/j.ijedudev.2012.07.002.
Dunne, M. 2007. Gender, sexuality and schooling: Everyday life in junior secondary schools in
Botswana and Ghana. International Journal of Educational Development 27: 499-511. doi:
10.1016/j.ijedudev.2006.10.009.
Dunne, M., R. Sabates, C. Bosumtwi-Sam & A. Owusu 2013. Peer relations, violence and school
attendance: Analyses of bullying in senior high schools in Ghana. The Journal of
Development Studies 49(2): 285-300. doi: 10.1080/00220388.2012.671472.
Evans, D.K. & E. Miguel 2007. Orphans and schooling in Africa: A longitudinal analysis.
Demography 44(1): 35-57.
Ezenwosu, O.U., I.J. Emodi, A.N. Ikefuna, B.F. Chukwu & C.D. Osuorah 2013. Determinants of
academic performance in children with sickle cell anaemia. BMC Pediatrics 13: 189. doi:
10.1186/1471-2431-13-189.
Foell, W., S. Pachauri, D. Spreng & H. Zerriffi 2011. Household cooking fuels and technologies in
developing economies. Energy Policy 39(12): 7487-7496. doi: 10.1016/
j.enpol.2011.08.016.
Fullerton, D.G., S. Semple, F. Kalambo, A. Suseno, R. Malamba, G. Henderson, et al. 2009.
Biomass fuel use and indoor air pollution in homes in Malawi. Occupational and
Environmental Medicine 66(11): 777-783. doi: 10.1136/oem.2008.045013.
García-Frapolli, E., A. Schilmann, V.M. Berrueta, H. Riojas-Rodríguez, R.D. Edwards, M.
Johnson, et al. 2010. Beyond fuelwood savings: Valuing the economic benefits of

53
introducing improved biomass cookstoves in the Purépecha region of Mexico. Ecological
Economics 69(12): 2598-2605. doi: 10.1016/j.ecolecon.2010.08.004.
GBD 2015 Risk Factors Collaborators 2016. Global, regional, and national comparative risk
assessment of 79 behavioural, environmental and occupational, and metabolic risks or
clusters of risks, 1990-2015: A systematic analysis for the Global Burden of Disease Study
2015. The Lancet 388(10053): 1659-1724. doi: 10.1016/S0140-6736(16)31679-8.
Global Alliance for Clean Cookstoves. 2016. About. Washington, DC: United Nations Foundation.
Available from: http://cleancookstoves.org/about/ [Accessed 8/9/2017].
Global Alliance for Clean Cookstoves n.d. Gender fact sheet. Washington, DC: Global Alliance for
Clean Cookstoves. Available from: http://cleancookstoves.org/impact-areas/women/
[Accessed 12/10/2017].
Gordon, S.B., N.G. Bruce, J. Grigg, P.L. Hibberd, O.P. Kurmi, K.-b.H. Lam, et al. 2014.
Respiratory risks from household air pollution in low and middle income countries. The
Lancet Respiratory Medicine 2(10): 823-860.
Granderson, J., J.S. Sandhu, D. Vasquez, E. Ramirez & K.R. Smith 2009. Fuel use and design
analysis of improved woodburning cookstoves in the Guatemalan Highlands. Biomass and
Bioenergy 33(2): 306-315. doi: 10.1016/j.biombioe.2008.06.003.
Grant, M., C. Lloyd & B. Mensch 2013. Menstruation and school absenteeism: Evidence from rural
Malawi. Comparative Education Review 57(2): 260-284.
Grant, M.J. & K.K. Hallman 2008. Pregnancy-related school dropout and prior school performance
in KwaZulu-Natal, South Africa. Studies in Family Planning 39(4): 369-382.
Gray, G.E., R. Van Niekerk, H. Struthers, A. Violari, N. Martinson, J. McIntyre, et al. 2006. The
effects of adult morbidity and mortality on household welfare and the well-being of children
in Soweto. Vulnerable Children and Youth Studies 1(1): 15-28. doi: 10.1080/
17450120600659051.
Guarcello, L., S. Lyon & F.C. Rosati 2005. Impact of children's work on school attendance and
performance: A review of school survey evidence from five countries. UCW-SIMPOC
Working Paper. Rome: Understanding Children’s Work (UCW) Project / University of
Rome “Tor Vergata”.
Hanna, R., E. Duflo & M. Greenstone 2012. Up in smoke: The influence of household behavior on
the long-run impact of improved cooking stoves. NBER Working Paper 18033. Cambridge,
MA: National Bureau for Economic Research.
Humphreys, S., D. Moses, J. Kaibo & M. Dunne 2015. Counted in and being out: Fluctuations in
primary school and classroom attendance in northern Nigeria. International Journal of
Educational Development 44: 134-143. doi: 10.1016/j.ijedudev.2015.08.004.
Ibekwe, R.C., N.C. Ojinnaka & S.O. Iloeje 2007. Factors influencing the academic performance of
school children with epilepsy. Journal of Tropical Pediatrics 53(5): 338-343. doi:
10.1093/tropej/fmm034.
Ilegbodu, V.A., O.O. Kale, R.A. Wise, B.L. Christensen, J. Steele, James H. & L.A. Chambers
1986. Impact of guinea worm disease on children in Nigeria. American Journal of Tropical
Medicine and Hygiene 35(5): 962-964.
International Energy Agency & World Bank 2017. Sustainable Energy for All 2017—Progress
toward Sustainable Energy. Washington, DC: World Bank
Jagger, P. & C. Jumbe 2016. Stoves or sugar? Willingness to adopt improved cookstoves in Malawi.
Energy Policy 92: 409-419. doi: 10.1016/j.enpol.2016.02.034.
Jagger, P. & C. Perez-Heydrich 2016. Land use and household energy dynamics in Malawi.
Environmental Research Letters 11(12): 125004.

54
Jary, H.R., J. Kachidiku, H. Banda, M. Kapanga, J.V. Doyle, E. Banda, et al. 2014. Feasibility of
conducting a randomised controlled trial of a cookstove intervention in rural Malawi. The
International Journal of Tuberculosis and Lung Disease 18(2): 240-247. doi:
10.5588/ijtld.13.0485.
Jetter, J.J. & P. Kariher 2009. Solid-fuel household cook stoves: Characterization of performance
and emissions. Biomass and Bioenergy 33(2): 294-305. doi: 10.1016/
j.biombioe.2008.05.014.
Jewitt, S. & H. Ryley 2014. It’s a girl thing: Menstruation, school attendance, spatial mobility and
wider gender inequalities in Kenya. Geoforum 56: 137-147. doi: 10.1016/
j.geoforum.2014.07.006.
Kadzamira, E. & P. Rose 2003. Can free primary education meet the needs of the poor? Evidence
from Malawi. International Journal of Educational Development 23: 501-516. doi:
10.1016/S0738-0593(03)00026-9.
Kearney, C.A. 2008. An interdisciplinary model of school absenteeism in youth to inform
professional practice and public policy. Educational Psychology Review 20(3): 257-282.
doi: 10.1007/s10648-008-9078-3.
Kirby, M.A. 2017. Assessing use, exposure, and health impacts of a water filter and improved
cookstove distribution programme in Rwanda. PhD thesis, London School of Hygiene and
Tropical Medicine.
Kjellsson, G., P. Clarke & U.-G. Gerdtham 2014. Forgetting to remember or remembering to forget:
A study of the recall period length in health care survey questions. Journal of Health
Economics 35(Supplement C): 34-46. doi: 10.1016/j.jhealeco.2014.01.007.
Levison, D., D.S. DeGraff & E.W. Dungumaro 2017. Implications of environmental chores for
schooling: Children’s time fetching water and firewood in Tanzania. The European Journal
of Development Research. doi: 10.1057/s41287-017-0079-2.
Martin, W.J., II, R.I. Glass, H. Araj, J. Balbus, F.S. Collins, S. Curtis, et al. 2013. Household air
pollution in low- and middle-income countries: Health risks and research priorities. PLOS
Medicine 10(6): e1001455. doi: 10.1371/journal.pmed.1001455.
Mason, L., E. Nyothach, K. Alexander, F.O. Odhiambo, A. Eleveld, J. Vulule, et al. 2013. ‘We keep
it secret so no one should know’ – A qualitative study to explore young schoolgirls attitudes
and experiences with menstruation in rural western Kenya. PLOS ONE 8(11): e79132. doi:
0.1371/journal.pone.0079132.
McCoy, D.C., S. Wolf & E.B. Godfrey 2014. Student motivation for learning in Ghana:
Relationships with caregivers’ values toward education, attendance, and academic
achievement. School Psychology International 35(3): 294-308. doi: 10.1177/
0143034313508055.
McMahon, S.A., P.J. Winch, B.A. Caruso, A.F. Obure, E.A. Ogutu, I.A. Ochari, et al. 2011. ‘The
girl with her period is the one to hang her head’ Reflections on menstrual management
among schoolgirls in rural Kenya. BMC International Health and Human Rights 11(7).
Mensch, B.S. & C.B. Lloyd 1998. Gender differences in the schooling experiences of adolescents
in low-income countries: The case of Kenya. Studies in Family Planning 29(2): 167-184.
Moleni, C.M. 2008. Factors influencing access and retention in primary schooling for children and
young people affected by HIV and AIDS: Case studies from rural Malawi. SOFIE Opening
Up Access Series No 6. London: Institution of Education, University of London.
Mudege, N., E.M. Zulu & C. Izugbara 2008. How insecurity impacts on school attendance and
school dropout among urban slum children in Nairobi. International Journal of Conflict
and Violence 2(1): 98-112.

55
Mushi, D., K. Burton, C. Mtuya, J.K. Gona, R. Walker & C.R.J.C. Newton 2012. Perceptions, social
life, treatment and education gap of Tanzanian children with epilepsy: A community-based
study. Epilepsy & Behavior 23: 224-229. doi: 10.1016/j.yebeh.2011.12.003.
Mustapha, B.A., D.J. Briggs & A.L. Hansell 2013. Prevalence of asthma and respiratory symptoms
in children in a low socio-economic status area of Nigeria. The International Journal of
Tuberculosis and Lung Disease 17(7): 982-988. doi: 10.5588/ijtld.12.0434.
Nankhuni, F. 2004. Environmental degradation, resource scarcity and children's welfare in
Malawi: School attendance, school progress, and children's health. PhD thesis,
Pennsylvania State University.
Nankhuni, F.J. & J.L. Findeis 2004. Natural resource-collection work and children's schooling in
Malawi. Agricultural Economics 31: 123-134. doi: 10.1016/j.agecon.2004.09.02.
Ofovwe, G.E. & A.N. Ofili 2010. Prevalence and impact of headache and migraine among
secondary school students in Nigeria. Headache 50: 1570-1575. doi: 10.1111/j.1526-
4610.2010.01776.x.
Ogunfowora, O.B., D.M. Olanrewaju & G.I. Akenzua 2005. A comparative study of academic
achievement of children with sickle cell anemia and their healthy siblings. Journal of the
National Medical Association 97(3): 405-408.
Orkin, K. 2011. 'If God wills... next year I will send her back to school': The effects of child and
parental illness on school participation in rural Ethiopia. CREATE Pathways to Access
Research Monograph No. 60. Consortium for Research on Educational Access, Transitions
and Equity.
Orkin, K. 2012. Are work and schooling complementary or competitive for children in rural
Ethiopia? A mixed methods study. Working Paper No. 77. Oxford: Young Lives.
Orkin, M., M.E. Boyes, L.D. Cluver & Y. Zhang 2014. Pathways to poor educational outcomes for
HIV/AIDS-affected youth in South Africa. AIDS Care 26(3): 343-350. doi: 10.1080/
09540121.2013.824533.
Perez-Padilla, R., A. Schilmann & H. Riojas-Rodríguez 2010. Respiratory health effects of indoor
air pollution. The International Journal of Tuberculosis and Lung Disease 14(9): 1079-
1086.
Piddock, K.C., S.B. Gordon, A. Ngwira, M. Msukwa, G. Nadeau, K.J. Davis, et al. 2014. A cross-
sectional study of household biomass fuel use among a periurban population in Malawi.
Annals of the American Thoracic Society 11(6): 915-924. doi: 10.1513/
AnnalsATS.201311-413OC.
Porter, G., K. Hampshire, A. Abane, A. Munthali, E. Robson, M. Mashiri, et al. 2010a. Where dogs,
ghosts and lions roam: Learning from mobile ethnographies on the journey from school.
Children's Geographies 8(2): 91-105. doi: 10.1080/14733281003691343.
Porter, G., K. Hampshire, A. Abane, A. Munthali, E. Robson, M. Mashiri, et al. 2012. Child
porterage and Africa's transport gap: Evidence from Ghana, Malawi and South Africa.
World Development 40(10): 2136-2154.
Porter, G., K. Hampshire, A. Abane, A. Tanle, K. Esia-Donkoh, R.O. Amoako-Sakyi, et al. 2011.
Mobility, education and livelihood trajectories for young people in rural Ghana: a gender
perspective. Children's Geographies 9(3-4): 395-410. doi: 10.1080/
14733285.2011.590705.
Porter, G., K. Hampshire, M. Mashiri, S. Dube & G. Maponya 2010b. 'Youthscapes' and escapes in
rural Africa: Education, mobility and livelihood trajectories for young people in Eastern
Cape, South Africa. Journal of International Development 22: 1090-1101. doi:
10.1002/jid.1748.

56
Pridmore, P. & C. Jere 2011. Disrupting patterns of educational inequality and disadvantage in
Malawi. Compare: A Journal of Comparative and International Education 41(4): 513-531.
doi: 10.1080/03057925.2011.581518.
Pritchett, L. & J. Sandefur 2013. Context matters for size: Why external validity claims and
development practice don’t mix. CGD Working Paper 336. Washington, DC: Center for
Global Development.
Psaki, S.R., B.S. Mensch & E. Soler-Hampejsek 2017. Associations between violence in school and
at home and education outcomes in rural Malawi: A longitudinal analysis. Comparative
Education Review 61(2): 354-390. doi: 10.1086/691117.
Pufall, E.L., S. Gregson, J.W. Eaton, T. Masoka, E. Mpandaguta, L. Andersen, et al. 2014a. The
contribution of schools to supporting the well being of children affected by HIV in eastern
Zimbabwe. AIDS 28: S379-S387. doi: 10.1097/qad.0000000000000339.
Pufall, E.L., C. Nyamukapa, J.W. Eaton, C. Campbell, M. Skovdal, S. Munyati, et al. 2014b. The
impact of HIV on children's education in eastern Zimbabwe. AIDS Care 26(9): 1136-1143.
doi: 10.1080/09540121.2014.892564.
Robson, E., N. Ansell, U.S. Huber, W.T.S. Gould & L. van Blerk 2006. Young caregivers in the
context of the HIV/AIDS pandemic in sub-Saharan Africa. Population, Space and Place
12: 93-111. doi: 10.1002/psp.
Romieu, I., H. Riojas-Rodríguez, A.T. Marrón-Mares, A. Schilmann, R. Perez-Padilla & O. Masera
2009. Improved biomass stove intervention in rural Mexico: Impact on the respiratory
health of women. American Journal of Respiratory and Critical Care Medicine 180: 649-
656. doi: 10.1164/rccm.200810-1556OC.
Ruiz-Mercado, I., O. Masera, H. Zamora & K.R. Smith 2011. Adoption and sustained use of
improved cookstoves. Energy Policy 39: 7557-7566. doi: 10.1016/j.enpol.2011.03.028.
Schilmann, A., H. Riojas-Rodríguez, K. Ramírez-Sedeño, V.M. Berrueta, R. Pérez-Padilla & I.
Romieu 2015. Children’s respiratory health after an efficient biomass stove (Patsari)
intervention. EcoHealth 12(1): 68-76. doi: 10.1007/s10393-014-0965-4.
Simon, G.L., R. Bailis, J. Baumgartner, J. Hyman & A. Laurent 2014. Current debates and future
research needs in the clean cookstove sector. Energy for Sustainable Development
20(Supplement C): 49-57. doi: 10.1016/j.esd.2014.02.006.
Siziya, S., A.S. Muula & E. Rudatsikira 2007. Prevalence and correlates of truancy among
adolescents in Swaziland: Findings from the Global School-Based Health Survey. Child
and Adolescent Psychiatry and Mental Health 1(15). doi: 10.1186/1753-2000-1-15.
Smith-Sivertsen, T., E. Díaz, D. Pope, R.T. Lie, A. Díaz, J. McCracken, et al. 2009. Effect of
reducing indoor air pollution on women's respiratory symptoms and lung function: The
RESPIRE randomized trial, Guatemala. American Journal of Epidemiology 170(2): 211-
220. doi: 10.1093/aje/kwp100.
Smith, K.R. 2002. Indoor air pollution in developing countries: recommendations for research.
Indoor Air 12(3): 198-207. doi: 10.1034/j.1600-0668.2002.01137.x.
Smith, K.R., N. Bruce, K. Balakrishnan, H. Adair-Rohani, J. Balmes, Z. Chafe, et al. 2014. Millions
dead: How do we know and what does it mean? Methods used in the comparative risk
assessment of household air pollution. Annual Review of Public Health 35(1): 185-206.
doi: 10.1146/annurev-publhealth-032013-182356.
Smith, K.R., J.P. McCracken, M.W. Weber, A. Hubbard, A. Jenny, L.M. Thompson, et al. 2011.
Effect of reduction in household air pollution on childhood pneumonia in Guatemala
(RESPIRE): a randomised controlled trial. The Lancet 378: 1717-1726.

57
Sommer, M. 2009. Ideologies of sexuality, menstruation and risk: girls' experiences of puberty and
schooling in northern Tanzania. Culture, Health & Sexuality 11(4): 383-398. doi:
10.1080/13691050902722372.
Tegegne, T.K. & M.M. Sisay 2014. Menstrual hygiene management and school absenteeism among
female adolescent students in Northeast Ethiopia. BMC Public Health 14(1): 1118. doi:
10.1186/1471-2458-14-1118.
Thomas, E., K. Wickramasinghe, S. Mendis, N. Roberts & C. Foster 2015. Improved stove
interventions to reduce household air pollution in low and middle income countries: a
descriptive systematic review. BMC Public Health 15(650). doi: 10.1186/s12889-015-
2024-7.
Thuillez, J., M.S. Sissoko, O. Toure, P. Kamata, J.-C. Berthélemy & O.K. Doumbo 2010. Malaria
and primary education in Mali: A longitudinal study in the village of Donéguébougou.
Social Science and Medicine 71: 324-334. doi: 10.1016/j.socscimed.2010.02.027.
Tielsch, J.M., J. Katz, S.K. Khatry, L. Shrestha, P. Breysse, S. Zeger, et al. 2016. Effect of an
improved biomass stove on acute lower respiratory infections in young children in rural
Nepal: A cluster-randomised, step-wedge trial. The Lancet Global Health 4: S19. doi:
10.1016/S2214-109X(16)30024-9.
Trape, J.-F., E. Lefebvre-Zante, F. Legros, P. Druilhe, C. Rogier, H. Bouganali, et al. 1993. Malaria
morbidity among children exposed to low seasonal transmission in Dakar, Senegal and its
implications for malaria control in tropical Africa. American Journal of Tropical Medicine
and Hygiene 48(6): 748-756.
UNESCO 2016. Education for people and planet: Creating sustainable futures for all. Global
Education Monitoring Report 2016. Paris: United Nations Educational, Scientific and
Cultural Organization.
Wagura Ndiritu, S. & W. Nyangena 2010. Environmental goods collection and children's schooling.
Environment for Development Discussion Paper 10. Nairobi.
Wathore, R., K. Mortimer & A.P. Grieshop 2017. In-use emissions and estimated impacts of
traditional, natural- and forced-draft cookstoves in rural Malawi. Environmental Science &
Technology 51(3): 1929-1938. doi: 10.1021/acs.est.6b05557.
Wolf, S., D.C. McCoy & E.B. Godfrey 2016. Barriers to school attendance and gender inequality:
Empirical evidence from a sample of Ghanaian schoolchildren. Research in Comparative
and International Education 11(2): 178-193. doi: 10.1177/1745499916632424.
Wolka, E., S. Shiferaw & S. Biadgilign 2013. The effect of iodine-deficiency disorders on academic
achievement of schoolchildren in Southern Ethiopia. Public Health Nutrition 17(5): 1120-
1124. doi: 10.1017/S1368980013000931.
Wong, G.W.K., B. Brunekreef, P. Ellwood, H.R. Anderson, M.I. Asher, J. Crane, et al. 2013.
Cooking fuels and prevalence of asthma: a global analysis of phase three of the
International Study of Asthma and Allergies in Childhood (ISAAC). The Lancet
Respiratory Medicine 1(5): 386-394. doi: 10.1016/S2213-2600(13)70073-0.
World Health Organization 2002. The World Health Report 2002: Reducing Risk, Promoting
Healthy Life. Geneva: World Health Organization.
World Health Organization. 2014. Household air pollution and health: Fact sheet No.292.
Available from: http://www.who.int/mediacentre/factsheets/fs292/en/# [Accessed
18/6/2015].
58
Chapter 3: Research setting and methods
Malawi is a small, landlocked country of approximately 18 million people in south-eastern
Africa, bordered by Mozambique, Zambia, and Tanzania. Known as Nyasaland during
British colonial rule, it achieved independence in 1964. The country is consistently listed
among the poorest in the world, with an estimated per capita income of $1,073 and a rank
of 170 out of 188 countries included in the UNDP Human Development Index (United
Nations Development Programme 2016). The economy is sustained in large part by
agriculture, which constitutes approximately one-third of gross national product and two-
thirds of workers (International Monetary Fund 2017). The country is divided
administratively into three regions: Northern (comprising 6 districts); Central (comprising
9 districts and containing Lilongwe, Malawi’s capital city); and Southern (comprising 12
districts and containing Blantyre, Malawi’s largest city, and Zomba, the former seat of the
colonial government).9
This chapter begins with a brief historical overview of the colonial and immediate post-
colonial periods, helpful for understanding the origins of regional differences in
educational, environmental, and health outcomes that characterise contemporary Malawi,
and important for contextualising findings from the present study. This is followed by an
elaboration of my normative position, drawing on aspects of three educational theoretical
frameworks and situating the research within recent developments in the international
education agenda. The chapter subsequently describes the three data sources on which this
thesis draws and the overarching mixed methods strategy. It concludes with a reflection on
my involvement in the research process.
3.1 Historical overview
The first primary school in Malawi was established in 1875 at the Free Church of Scotland
Mission at Cape Maclear on the southern shore of Lake Malawi (Chimombo 2009). In 1884,
the Mission relocated to Livingstonia in what is now the Northern region, and by 1900 had
9 The six Education Divisions according to which the education sector is managed in Malawi (North, Central
West, Central East, South West, South East, Shire Highlands) form an additional administrative area between
the level of the district and the region. Because most data for Malawi is reported at the district and region
levels, I focus primarily on these in the discussion that follows unless specified otherwise. Reflecting its
relatively small size, the North Education Division covers the same geographical area as the Northern region.

59
established a network of 123 primary schools enrolling 16,000 students (Heyneman 1972).
The Free Church education system encompassed literacy, numeracy, religion, agriculture,
sports and artisan skills, in contrast to schools founded by South African Dutch Reformed
Church missionaries in the Central region, and French and Dutch Roman Catholics in the
Southern region, which focused on purely religious and moral education, with limited
emphasis on literacy (Chimombo 2009; Posner 2004). The Livingstonia Mission
additionally inaugurated the country’s first post-primary institution in 1894, which included
a teacher training college to supply the burgeoning school system, as well as instruction in
advanced technical skills (Heyneman 1972), although the relevance of technical training
for the local context was questioned (see McCracken 2008 for a detailed history of this
period). By 1911, Free Church of Scotland schools accounted for one-third of all primary
and 45% of all post-standard-three students enrolled in colonial Nyasaland (Heyneman
1972).
Efforts to introduce western education in the Northern region were particularly well
received by members of the Tumbuka tribe who, for a combination of cultural, political and
economic reasons stemming from historical subjugation by other groups, actively embraced
the new educational opportunities (Vail and White 1989). By contrast, the dominant Ngoni
and Chewa peoples initially resisted western education (Vail and White 1989), which
further heightened ethnic and regional disparities in educational outcomes. The Northern
region, however, provided limited opportunities for formal employment, as the primary
commercial and administrative centres of colonial Nyasaland, and accordingly the bulk of
private- and public-sector infrastructure, were found in the more temperate south of the
country (Kalipeni 1992). The combination of stronger educational traditions and net out-
migration meant that by 1969 Tumbukas occupied more than half of the highest-ranking
civil service positions in Malawi, despite comprising just 12% of the population (Vail, cited
in Posner 2004).
Education and economic policies after independence in 1964 attempted to redress regional
imbalances. On one hand, a number of development projects, including moving the capital
from Zomba to Lilongwe, and extending road and electricity networks throughout the
country, were intended to shift the geographical distribution of economic activity
northwards (Kalipeni 1992). On the other hand, efforts were made to limit northern
dominance in government and academic institutions, while at times actively discriminating

60
against Tumbuka scholars. These processes took place alongside efforts by President
Kumuza Banda, the first leader of newly independent Malawi, to forge a national identity
around his own Chewa culture (McNamara 2015). For instance, the 1968 convention of the
ruling Malawi Congress Party stripped Chitumbuka of its status as an official language and
barred its use in the media and in government documents (Kamwendo 2008). The policy
also established Chichewa as the universal medium of instruction for early primary
education (standards 1-4), even in non-Chichewa-speaking areas, and removed
Chitumbuka from the school curriculum.10 Places in national secondary schools were
additionally awarded on the basis of ethno-regional identity (Heyneman 1972).
The introduction of free primary education (FPE) in 1994 coincided with the liberalisation
of policies towards the Chitumbuka language, including the reinstatement of Chitumbuka
on the national radio station (Kamwendo 2005), but medium of instruction remains hotly
contested in Malawian popular discourse (see, for example, Nyondo 2016). Although FPE
increased convergence in school enrolment across regions, data from the 2015-16
Demographic and Health Survey show that levels of literacy and educational attainment in
the adult population, as well as current enrolment in primary and secondary school, remain
highest in the Northern region – see Table 3.1 (National Statistical Office and ICF 2017).
Results from the most recent Southern and Eastern Africa Consortium for Monitoring
Educational Quality (SACMEQ) assessment also indicate that students in the Northern
region achieved the highest average reading scores (Mulera et al. 2017).
While the legacy of historical processes remains visible with respect to educational
outcomes, so, too, do regional demographic and economic imbalances persist. In particular,
urban centres remain concentrated in the Central and Southern regions, such that just 12.0%
of the urban population—and approximately the same proportion of the total population—
resides in the Northern region (Manda 2013; National Statistical Office 2012).11 By
consequence, according to the latest census figures, population density is substantially
lower in the north, at 63 people per square kilometre, compared to 155 in the Central region
and 184 in the Southern region, although population growth was highest in the Northern
region during the most recent intercensal period (National Statistical Office 2008). Lower
10 The medium of instruction was English in all schools from standard 5 onwards. 11 Note, however, that Malawi is one of the least urbanised countries in the world, with approximately 16%
of the total population living in urban areas (World Bank 2017).

61
population pressure in the Northern region may help to explain the lower student-teacher
ratios observed there relative to other education divisions: 75:1 in government-funded
primary schools compared to 105:1 in the Shire Highlands, where student-teacher ratios are
highest (World Bank 2010).12 All regions, though, fall well above the Southern African
Development Community (SADC) average of 40:1 (World Bank 2010).
Pressure on land and resources is also much less acute in the Northern region than elsewhere
in the country. In their analysis of household land use and energy dynamics in Malawi,
Jagger and Perez-Heydrich (2016) showed that processes of deforestation and degradation
were most pronounced in the Central and Southern regions over the period 2004-2010,
although average fuel collection times did increase in some Northern districts, including
Karonga, suggesting increasing scarcity of resources. Earlier work by Nankhuni and
Findeis (2004) found that school-age children were more likely to participate in resource
collection work in the Northern region relative to elsewhere in Malawi, perhaps because of
the more ready availability of biomass fuels there. However, reliance on solid fuels for
cooking exceeds 97% of households in all three regions (National Statistical Office 2014).
It is against this backdrop that students’ educational access must be examined, and the effect
of cleaner burning cookstoves on school attendance considered. Students in northern
Malawi live primarily in rural settings, with limited opportunities for formal employment
outside agriculture, which may affect the value they attach to education as well as its
opportunity cost. At the same time, the historical legacy of educational development in
Northern region means that levels of school enrolment and completion, as well as academic
skills, are comparatively favourable there. In the wider context of education in sub-Saharan
Africa, however, results from the Northern region still fall well below standards for Eastern
and Southern Africa, according to SACMEQ assessments (Mulera et al. 2017). In his
analysis of contemporary education in Malawi, Chimombo (2009, p. 309) concluded:
[S]uccess stories come as part of a mixed bag where the overall picture suggests a
system that is failing in many areas. Many schools in Malawi do not have the
minimum level of resources for meaningful teaching and learning to take place,
classes are often grossly overcrowded and many take place without classrooms,
classroom furniture, or clean water and adequate sanitation being available. As a
result the system does not provide an environment conducive to the implementation
of EFA policies.
12 Other factors that contribute to relatively lower student-teacher in the Northern region include a
disproportionate number of schools (Kalipeni 1997) and inconsistent teacher deployment (World Bank 2010).

62
Table 3.1 Comparison of selected sociodemographic characteristics by region
Northern Central Southern
Highest level of education (women ages 15-49); %
None
Some primary
Completed primary
Some secondary
Completed secondary
Tertiary
4.0
49.5
15.0
20.8
7.3
3.4
12.2
54.8
7.1
15.2
6.4
4.2
14.1
53.9
7.6
16.2
6.3
1.8
Highest level of education (men ages 15-49); %
None
Some primary
Completed primary
Some secondary
Completed secondary
Tertiary
0.9
44.4
11.2
26.6
12.4
4.6
5.5
51.4
7.5
17.2
12.1
6.3
6.4
49.3
9.1
20.9
10.7
3.6
Proportion literate (ages 15-49)1; %
Women
Men
80.8
88.0
70.8
80.6
71.1
83.9
Net attendance ratio2, primary school
Boys
Girls
96.4
96.1
93.1
94.7
92.9
93.6
Gross attendance ratio3, primary school
Boys
Girls
135.5
122.6
134.5
125.2
128.1
120.3
Net attendance ratio2, secondary school
Boys
Girls
20.4
21.6
14.0
15.0
19.1
19.2
Gross attendance ratio3, secondary school
Boys
Girls
52.5
38.9
32.9
28.7
42.3
36.3
Median age at first marriage
Women (ages 20-49)
Men (ages 25-54)
18.2
23.6
18.7
23.2
17.9
22.7
Polygynous marriage (ages 15-49)4; %
Women
Men
18.1
10.7
13.5
7.0
10.9
6.6
HIV prevalence (ages 15-49); %
Women
Men
5.6
4.6
6.7
4.4
15.7
9.2
Residence and orphanhood status (ages <18); %
Not living with biological parent
One or both parents died
23.8
10.8
16.8
9.6
21.0
13.6
Source: Malawi Demographic and Health Survey 2015-16 1 Combines women/men who attended school beyond secondary level (whose literacy was not assessed)
and those who could read a whole sentence or part of a sentence. 2 For primary school, measures the percentage of the primary-school age population (age 6-13) that is
attending primary school. For secondary school, measures the percentage of the secondary-school age
population (age 14-17) that is attending secondary school. 3 Expresses the total number of primary (secondary) school students as a percentage of the official primary-
(secondary-) school-age population. 4 Measures the percentage of currently married men who report having two or more wives or currently
married women who report having one or more co-wives.

63
While Chimombo’s critique primarily highlights failures to deliver the school inputs
required to achieve Education for All, the present study investigates other aspects of
educational exclusion, as manifested in students’ absenteeism, that derive from a
combination of individual-, household-, school-, and community-level factors.
3.2 Normative position
The underlying vision of the Education for All movement and associated calls to expand
educational access can be seen to derive from multiple theoretical bases (McCowan 2011).
International stakeholders including UNESCO and UNICEF have drawn heavily on rights-
based approaches in advocating ‘the right of access to education, the right to quality
education and respect for human rights in education’ (UNICEF and UNESCO 2007, p. 27).
Efforts of other actors such as the World Bank have been moulded much more strongly by
human capital theory, which views education as an investment in knowledge and skills that
in turn generate micro- and macro-level economic returns (Rose 2003). Building on the
pioneering work of Amartya Sen, advocates of the capability approach argue that education
provides students with the freedom, both in the present and in the future, to ‘be’ and ‘do’
what they consider valuable (Unterhalter 2003; Walker 2005).
This thesis starts from the position that education is a fundamental human right that is both
‘intrinsically reasonable and socially indispensable’ (Lee 2013, p. 4). In the decades since
the 1948 Universal Declaration of Human Rights asserted that ‘everyone has the right to
education’ (United Nations 1948), international human rights discourses have emphasised
the role played by education in enhancing personal development, as well as promoting
peace, tolerance and understanding. The centrality of education to the realisation of human
rights has been reinforced in subsequent treaties including the UNESCO Convention
against Discrimination in Education (1960), the International Covenant on Economic,
Social and Cultural Rights (1966), the Convention on the Rights of the Child (1989), and
the ILO Convention on the Worst Forms of Child Labour (1999). These and other
documents commit governments to providing free basic education to all children.13
13 Human rights discourses increasingly emphasise the right to lifelong learning. Language in this thesis
referring to learners as ‘children’, ‘adolescents’ or ‘young people’ reflects the study’s focus on primary
education, but I stress that the right to education extends throughout the life course.

64
In an influential critique, Robeyns (2006, p. 70) described the tendency of public actors to
undertake the minimum commitment required to fulfil their human rights obligations:
[A] rights discourse can induce policy makers to being contented when they have
strictly followed the rules that a limited interpretation of the rights imposes on them,
even when additional efforts are necessary to meet the goal that underlies the right.
This may occur, for example, when success in achieving educational access is considered
in terms of school enrolment, without attending to the range of other factors that prevent
realisation of the right to education in the fullest sense. Although critiques regarding the
ineffective actualisation of rights in practice are certainly justified (McCowan 2011), I
conceive of the right to education in a way that emphasises dimensions beyond simple
provision of education services. I follow Katarina Tomaševski, the first UN Special
Rapporteur on the Right to Education, in defining human rights obligations that make
education not only available, but accessible, acceptable, and adaptable (Tomaševski
2001). That is, in addition to being physically present and affordable, education services
must be free from discrimination, achieve minimum quality standards, and respond to the
needs of all children. Students who miss school due to financial constraints, competing
work burdens, or unfavourable learning conditions are therefore denied their right to
education conceived in this comprehensive way.
While appealing to human rights as the primary rationale for expanding educational access,
I also draw on aspects of human capital theory to help frame the daily decision to attend
school. Proponents of human capital theory, including Schultz (1961), Becker (1964),
Mincer (1981), and Hanushek (2013), posit that the knowledge and skills acquired through
education generate higher incomes, greater productivity and, at the national level, increased
economic growth. As such, the expectation of private and social economic returns
generated from schooling motivate investments in education made by individuals,
governments and international actors including the World Bank (Rose 2003).
The daily decision to attend school can be seen to form part of this larger investment
decision, modelled as a cost-benefit analysis. In this framework, students and households
consider the benefits to be gained from going to school against the costs of attending in
determining whether to ‘invest’ in a school day. Costs in this decision include direct
expenses on school uniforms, notebooks or examination fees, as well as opportunity costs
including foregone income or domestic labour. Costs can also extend beyond economic

65
considerations to, for example, distance travelled to school. These are weighed against the
expected benefits of school attendance including improved learning outcomes, better exam
performance, and enhanced employment prospects.
Under certain conditions, then, absenteeism could be considered a rational decision if the
costs of attending school outweigh the potential gains. As Kabeer (2000, p. 94) observes:
‘Education […] may not be perceived as a need by excluded groups who have no reason to
believe that it is worth the sacrifice of current income or consumption.’ Absenteeism thus
represents a cause for concern as a signal of the failure to provide available, accessible,
acceptable and adaptable education that meets students’ needs. It also represents an
important source of inefficiency both for individuals—who delay or forego the opportunity
to reap future returns from education if absenteeism leads to exam failure and/or grade
repetition or school dropout—and for school systems that must accommodate the irregular
trajectories of frequently absent students. Since economic arguments often dominate
funding allocation decisions, particularly in low-resource contexts (Rose 2003), and also
reflect the value that households in sub-Saharan Africa have professed to place on school
attendance as a route to formal employment and financial security (Grant 2008; Posti-
Ahokas and Palojoki 2014), my analysis, particularly in Chapters 6 and 7, sheds light on
the perceived costs and benefits of school attendance in this context.
While I highlight the critical role played by school attendance in developing knowledge
and skills for future income generation, I readily acknowledge that the importance of
educational access extends beyond costs and benefits, and therefore follow Sen (cited in
Robeyns 2006, p. 75) in supplementing the theoretical foundation provided by human
capital:
[W]e must go beyond the notion of human capital, after acknowledging its relevance
and reach. The broadening that is needed is additional and cumulative, rather than
being an alternative to the “human capital” approach.
The capability approach espoused by Sen emphasises that reasons to value education stem
from both instrumental and intrinsic rationales (Robeyns 2006)—that is, education is
important both as a means to secure employment or political and social participation, and
as a worthy pursuit in and of itself. I draw on these concepts in exploring the value that
students in northern Malawi place on school attendance in northern Malawi in Chapter 7.

66
The capability approach additionally offers a lens through which to consider students’
agency in navigating the competing demands on their time and resources. As capabilities
are predicated on individuals ‘having the freedom to choose a life they have reason to
value’, notions of agency are central to this approach (Walker 2005, p. 104). Indeed, while
education frameworks from organisations subscribing to a rights-based approach are often
silent on the issue of children’s agency (Jere 2014), or regard children as the passive
recipients of ‘paternalistic benevolence’ (Ballet et al. 2011, p. 25), a rich literature among
capabilities scholars debates the complexities associated with ascribing agency to children
in the context of education decisions (e.g. Ballet et al. 2011; Baraldi and Iervese 2014; Saito
2003). For the purpose of this thesis, I start from a position of ‘considering children not
simply as recipients of freedoms, but as active social actors and agents in their communities
with their own priorities, strategies and aspirations’ (Ballet et al. 2011, p. 22). At the same
time, I recognise that students’ educational agency is heavily shaped by social, economic
and environmental circumstances, as well as by the choices of teachers, caregivers, peers,
and other actors (Vaughan 2007; Walker and Unterhalter 2007). I thus explore the range of
individual-, household-, school-, and community-level factors that influence students’
schooling decisions in Chapters 4, 5 and 7.
3.3 Educational access in the era of the Sustainable Development Goals
This doctoral research took place alongside an important evolution in international
development frameworks—namely, the transition from the Millennium Development
Goals to the Sustainable Development Goals in 2015. Although the MDGs achieved
important progress in many domains (Sachs 2012), they also attracted heavy criticism from
researchers and practitioners for being too top-down in conception, too narrow and
selective in scope, and silent in the mention of rights (Alston 2005). The SDGs, by contrast,
were informed by a much wider, multi-stakeholder consultation process; ambitiously
expanded both the geographic and thematic reach of the Goals; and drew explicitly on
rights-based approaches to development (UNESCO 2017). With particular reference to
education, whereas MGD 2 was concerned with achieving universal primary education,
SDG 4 calls for ensuring ‘inclusive and quality education for all and promot[ing] lifelong
learning’.
Although there remains some ‘conceptual confusion’ among researchers and practitioners
about the precise meaning of inclusion in education discourses (Miles and Singal 2010, p.

67
7), it is increasingly taken to imply a recognition of student diversity and an effort to meet
the all learners’ needs: ‘it is about providing a framework within which all children –
regardless of ability, gender, language, ethnic or cultural origin – can be valued equally,
treated with respect and provided with real opportunities at school’ (Thomas and Loxley,
cited in Campbell 2002, p. 14 ). The push for inclusive education, and the SDG agenda
more broadly, is founded on the conviction that education is a fundamental human right
and thus central to a just society (Ainscow et al. 2006; UNESCO 2017).
Balescut and Eklindh (2006) summarise four key features in the conceptualisation of
inclusion in education:
Inclusion is concerned with the identification and removal of barriers.
Ensuring inclusive education requires moving away from a model that attributes poor
attendance and attainment to students’ own deficiencies or lack of effort14 rather than to
external factors such as poor health, financial constraints, or discrimination that hamper
students’ participation. It thus necessitates careful investigation of students’ social, political
and economic contexts, as well as consideration of individual-, household-, school-, and
community-level factors that influence inclusion and exclusion (Sayed and Soudien 2003).
Consequently, it involves collecting a wide range of data to monitor and inform
improvements in policy and practice (Balescut and Eklindh 2006).
Inclusion is about the presence, participation and achievement of all students.
‘Presence’ is concerned both with where children are educated and how reliably and
punctually they attend; as such, daily school attendance represents an important dimension
of inclusion in education. ‘Participation’ relates to the quality of students’ educational
experiences and ‘achievement’ to learning across the curriculum, not merely results from
formal assessments (Balescut and Eklindh 2006). Inclusion thus extends crucially beyond
a concern for provision of educational services to processes that ensure meaningful learning
experiences. As Sayed and Soudien (2003, p.14) highlight:
[I]nstitutional access alone – the creation of physical space – does not answer the
call for educational inclusion. Besides issues of affordability, cultural and political
environments and practices, both within and outside of educational institutions, may
perpetuate exclusion even after students have technically been ‘placed’.
14 The SACMEQ head teacher survey that treats student absenteeism as a ‘behavioural problem’ (Hungi 2011)
is one example of this kind of approach.

68
Inclusion involves a particular emphasis on those groups of learners who may be at
risk of marginalisation, exclusion or underachievement.
Although inclusion in education concerns all children, particular consideration should be
given to those who have been traditionally marginalised. Hard to reach constituencies
include girls, especially in patriarchal societies; rural children, for whom distance to school
or transport costs may be prohibitive; ethnic minorities or indigenous groups who do not
speak the common language taught at school; children with disabilities; children with no
fixed residence; and children caught in armed conflict (Lee 2013). Education researchers
and practitioners thus assume a moral responsibility to ensure that ‘at risk’ groups are
carefully monitored, and that, when needed, appropriate steps are taken to enhance their
presence, participation and achievement in education (Balescut and Eklindh 2006).
Inclusion is a process.
Inclusion is not a fixed state to be achieved, but rather a constantly unfolding process
contingent on social, economic and political contexts (Kabeer 2000). Importantly, too,
‘inclusion’ is not simply the opposite of ‘exclusion’, but rather both are two sides of the
same coin. As Sayed, Soudien and Carrim (2003, p. 234) describe:
[A]ny attempt at inclusion will entail a form of exclusion, and in order to understand
the intent and effects of inclusionary measures, one needs to be aware of their
inherent exclusionary influences and potential outcomes. Inclusion and exclusion
need to be viewed as being conjoined, and not as diametrically opposing forces.
Responding to students’ diversity of learning needs, and reducing exclusion from and
within education, thus involve continuous evolution of policy and practice.
By embracing inclusive education, the SDGs advance meaningfully on the narrow framing
of educational access in the MDGs that prioritised school enrolment over other aspects of
the educational experience. As King (2017) has pointed out, however, the emphasis on
equity, inclusivity and quality so carefully included in SDG 4 was somewhat ‘lost in
translation’ when generating the global indicators that serve to monitor progress towards
the Goal. In particular, the indicators focus less on ‘learning needs’ and more on ‘learning
outcomes’ and limit the scope of education to reading and mathematics skills rather than
broader notions of quality. Moreover, although the indicators for SDG 4 draw attention to
some aspects of students’ presence and participation, for instance by monitoring the extent
to which students progress through school at appropriate ages, they stop short of addressing

69
the ‘silent exclusion’ of students who are enrolled in school but attend irregularly (Gilmour
and Soudien 2009; Lewin 2009).
I draw on the theoretical framework designed by researchers at the CREATE consortium
(Lewin 2009), to shine light on students in Zone 3 of CREATE’s six ‘zones of exclusion’,
which identify students at risk of adverse educational outcomes including permanent
dropout (Figure 3.1). In examining sources of exclusion, I am concerned with both active
and passive forms (Sen 2000). The former results from deliberate policies or actions that
prevent students from attending school, for example when teachers enforce strict uniform
policies or require students to wait until the start of the next school term to return after a
period of absence (Pridmore and Jere 2011). Passive exclusion, by contrast, stems from
phenomena including poverty or food shortages that result in exclusion through no
deliberate action on the part of schools or communities, but nevertheless inhibit students’
educational access.
Figure 3.1 CREATE zones of exclusion
3.4 Data sources
My analysis of the trends and influences of school absenteeism is guided by the socio-
ecological model developed in Chapter 2 and conducted using a combination of quantitative
Source: CREATE Model of Zones of Exclusion (http://www.create-rpc.org/about/exclusion/)

70
and qualitative data from primary school students in Karonga district, northern Malawi.
Key features of each of the three parent studies from which the data were derived, as well
as my overarching research design, are described in detail below.
3.4.1 Karonga Health and Demographic Surveillance System
The study was carried out in the catchment area of the Karonga Health and Demographic
Surveillance System (HDSS) in Karonga district, northern Malawi. The HDSS forms part
of a suite of data collection activities administered under the auspices of the Malawi
Epidemiology and Intervention Research Unit (MEIRU, previously known as the Karonga
Prevention Study [KPS]) in Karonga district, northern Malawi. The MEIRU research site
has supported epidemiological, clinical, and immunological studies in various guises since
1979. The project began with a total population cohort study designed to identify the risk
factors for leprosy, but subsequently shifted orientation to focus on tuberculosis and HIV,
and, more recently, non-communicable diseases. Crampin et al. (2012) provides an
overview of research activities associated with KPS/MEIRU.
The HDSS surveillance area comprises approximately 135 km2 at the southern end of
Karonga district, bounded by the shore of Lake Malawi on the eastern side, and surrounding
the port village of Chilumba (see Figure 3.2). The area is predominantly rural, with an
economy based primarily upon subsistence agriculture, petty trading and fishing. HIV
prevalence in the HDSS catchment area was estimated at 7.1% among men and 9.2%
among women in 2008/2009 (Floyd et al. 2013). The resident population is mainly
Christian and Chitumbuka-speaking (Floyd et al. 2007).
Study design
The HDSS, established in 2002, operates as a continuous registration system using village
informants for vital events, combined with an annual census covering the population of
more than 35,000 currently residing in the catchment area. As of 2007, the HDSS also
included an annual household survey capturing sociodemographic information about each
household member. Questions about school attendance were added to the survey in 2008.
During the 2007 and 2010 rounds, an additional survey module collected detailed
information about household socioeconomic indicators, including land and productive
assets, consumer durables, dwelling quality, and access to credit or other financial safety
nets. Each survey round spanned a 12-month period, from approximately September-

71
August. Surveys were administered by field staff using paper questionnaires with data
double entered in Microsoft Access and imported into Stata for secondary analysis. Sample
survey instruments are provided in Appendix A3.4 and A3.5.
Ethics statement
Data collection associated with the HDSS was reviewed and approved by the LSHTM
Research Ethics Committee (Ref #5081) and the National Health Sciences Research
Committee (NHSRC) in Malawi (Protocol #419). Before initial enumeration, meetings
were held with the Wasambo (traditional authority with responsibility for the area), group
village headmen (each representing several villages), and village headmen and ndunas
(village elders) to gain consent for conducting the baseline survey. Response rates are
traditionally very high for HDSS activities, with approximately 1% of households—
typically spiritualists or other objecting religions—refusing to participate (Crampin et al.
2012).
Figure 3.2 Location of Karonga HDSS catchment area

72
Analytic sample
The analyses presented here focus on the subset of HDSS residents attending primary
school in one or more of the eight HDSS survey rounds conducted from 2008-2016 in which
school attendance data were collected. Research Paper 1 (Chapter 4) additionally draws on
the household socioeconomic module collected in 2010-11.
Surveys were administered to household residents aged 15 or older who were at home
during the field team’s visit. As such, most school attendance data were provided by an
adult household member, usually a parent, on behalf of resident children. Because of the
household-based reporting of school attendance, I exclude from all analyses the small
proportion of permanent residents of the HDSS catchment area who were attending school
outside Karonga district and as such likely lived elsewhere during term time.15 In cases
where students were captured more than once within a single survey round, for example by
changing households, one observation per student-round is included in analyses.
Although school attendance information is available for students enrolled at both primary
and secondary levels, I restrict analyses to primary school absenteeism for several reasons.
Firstly, reflecting the very competitive nature of secondary school entry in Malawi, the
proportion of young people attending secondary school in the HDSS population is both
relatively small and highly selective. Places at government schools are rationed according
to performance on the high-stakes Primary School Leaving Certificate of Education
examination, so students who progress to secondary comprise the highest achievers at
primarily level and come disproportionately from the highest-income households (Zeitlyn
et al. 2015).16 Identifying and addressing the barriers to sustained primary school
attendance are thus of critical policy importance in order to facilitate more equitable and
inclusive access to higher levels of education.
Additionally, secondary students are more likely to live outside Karonga district during
term time than primary students, either via acceptance to prestigious national boarding
schools, limited local availability of secondary school places, or perceived higher school
15 The HDSS instrument does not capture information about students’ residence during term time (if
different). 16 Students who fail to meet the standard to government secondary schools can attend private schools, which
often have more lax entrance requirements, but many private schools in Malawi are unregulated and the
quality of education offered is highly variable (Zeitlyn et al. 2015).

73
quality elsewhere. According to HDSS data, whereas on average ~1% of primary school
students attended school outside Karonga district in a given survey round, ~15% of
secondary school students did the same.17 Recognising the critical role of the primary
school performance in determining secondary school entry, as well as concerns about the
validity of household-based reporting of school attendance for more mobile secondary
school students, the analysis therefore focuses on barriers to primary school access.
Outcome measures
The schooling section of the HDSS instrument asked respondents about the current school
enrolment status of each household resident. For residents who were currently enrolled in
school, respondents were asked if these students had attended school during the past four
weeks that school was in session, and if so, how many days or weeks they had missed
during this period. Respondents were asked to provide up to two reasons for absence for
residents who had missed school.
The survey also included two indicators of extended absenteeism: any absence of two
consecutive weeks during the previous twelve months, asked of all currently-enrolled
students; and any school interruption of one year or more from which the student
subsequently returned, asked of all household members. Although these forms of school
withdrawal are common in other contexts (e.g. Chalasani et al. 2013 in southern Malawi
and Grant and Hallman 2008 in South Africa), prevalence was too low in my primary
school sample (~1% for each outcome) to conduct a meaningful analysis. I thus derive
absence outcomes from school attendance in the past four weeks: Paper 1 (Chapter 4) uses
a binary measure of any absence during that period, Paper 2 (Chapter 5) models the number
of days a student missed during the past four weeks, and Paper 3 (Chapter 6) uses both
binary and count outcomes.
The analysis in Chapter 6 also explores the relationship between absenteeism and two
additional educational outcomes: 1) grade repetition and 2) grade attainment. The former
was derived from a combination of two survey questions, the first asking a student’s current
standard attended and the second whether he/she had repeated the standard, from which a
longitudinal schooling history was constructed by combining data across rounds. I
17 School names or locations are not collected for students attending school outside Karonga district, so the
ultimate destination of these students is unknown.

74
recognise, as previous research has noted (Jere 2012), that grade promotion in Malawi is a
subjective process, not based on standardised assessments or other transparent criteria.
However, in the absence of data on examination scores or academic skills, I consider grade
repetition to represent the best available proxy for school performance.
3.4.2 The Cooking and Pneumonia Study
The Cooking and Pneumonia Study (CAPS), a collaboration between the Liverpool School
of Tropical Medicine and the London School of Hygiene and Tropical Medicine, was a
large cluster randomised trial of cleaner burning biomass-fuelled cookstoves on health
outcomes implemented from 2014-2016. CAPS was nested within the Karonga HDSS site
in order to capitalise on existing research infrastructure as well the option to link CAPS
trial data with broader sociodemographic indicators collected in HDSS surveys. The trial
was also conducted in a second site in southern Malawi, which I do not analyse here.
CAPS’ primary objective was to assess the effect of cleaner burning cookstoves on
incidence of pneumonia in children under five years old. The trial was designed to address
shortcomings of previous cookstove trials, discussed in Chapter 2. Firstly, as the largest
study of the effects of a biomass-fuelled cookstove intervention on health outcomes to
date—involving a total of 150 community-level clusters and more than 8000 households
randomly allocated to intervention and control groups—CAPS had greater statistical power
to detect an effect on pneumonia incidence than existing trials such as RESPIRE.
Specifically, the trial was designed to provide 21,200 child-years of follow-up over the
duration of the study period and 90.3% power to detect a 20% percent reduction in the rate
of pneumonia, from five per 100 child-years in the control group to four per 100 child-years
Implementation period: 9/2007-10/2016 (school attendance data added 9/2008)
Study design: Continuous registration system + annual household survey
Inclusion criteria: Residence within geographical boundaries of HDSS (see Figure 3.2)
Data collection instruments: Household survey covering individuals (2007-2016) and
households (2007 and 2010; see Appendix A3.4 and A3.5)
Analytic sample: Young people attending primary school in Karonga district in ≥1
survey round, 2008-2016
Figure 3.3 Summary of HDSS study design and data
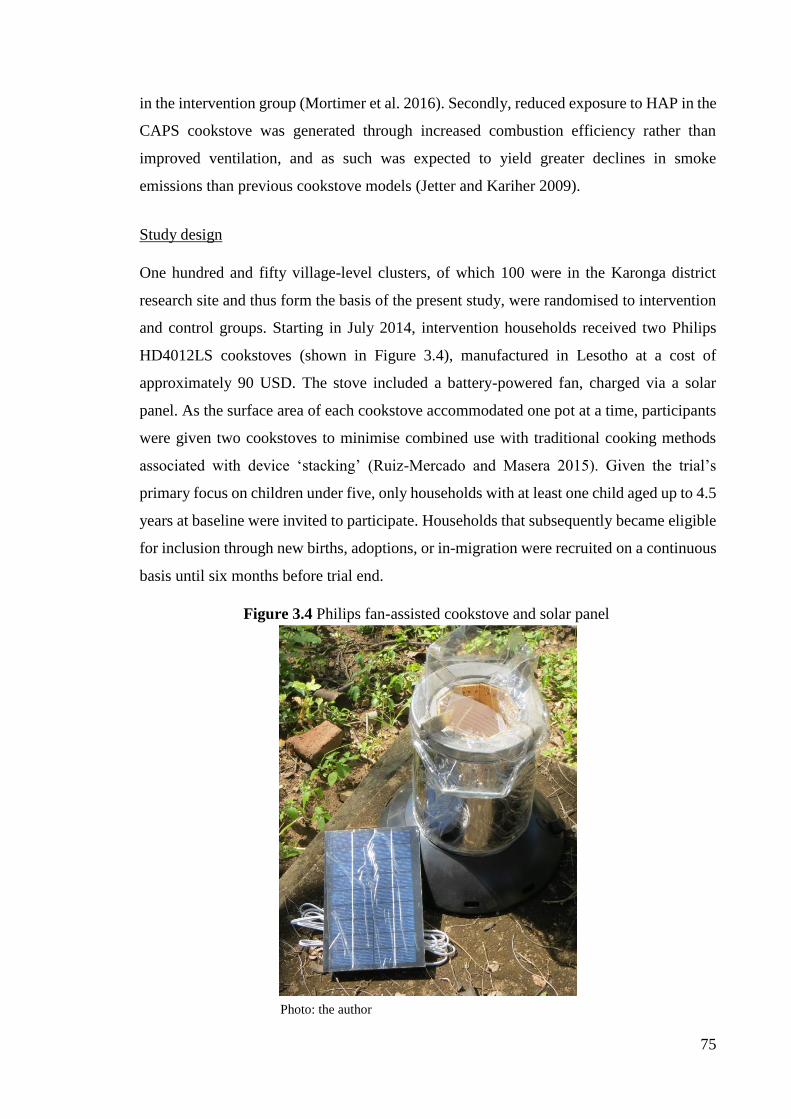
75
in the intervention group (Mortimer et al. 2016). Secondly, reduced exposure to HAP in the
CAPS cookstove was generated through increased combustion efficiency rather than
improved ventilation, and as such was expected to yield greater declines in smoke
emissions than previous cookstove models (Jetter and Kariher 2009).
Study design
One hundred and fifty village-level clusters, of which 100 were in the Karonga district
research site and thus form the basis of the present study, were randomised to intervention
and control groups. Starting in July 2014, intervention households received two Philips
HD4012LS cookstoves (shown in Figure 3.4), manufactured in Lesotho at a cost of
approximately 90 USD. The stove included a battery-powered fan, charged via a solar
panel. As the surface area of each cookstove accommodated one pot at a time, participants
were given two cookstoves to minimise combined use with traditional cooking methods
associated with device ‘stacking’ (Ruiz-Mercado and Masera 2015). Given the trial’s
primary focus on children under five, only households with at least one child aged up to 4.5
years at baseline were invited to participate. Households that subsequently became eligible
for inclusion through new births, adoptions, or in-migration were recruited on a continuous
basis until six months before trial end.
Photo: the author
Figure 3.4 Philips fan-assisted cookstove and solar panel

76
Households were visited approximately every three months over the 24-month study
period, during which time fieldworkers collected data about cookstove usage and
functionality, as well as outcomes related to child health and adult lung function not
analysed here. The visit at month 21 was omitted as the follow-up schedule was sufficiently
behind to proceed directly to the 24 month exit visit. Data were collected electronically
using smartphones and Open Data Kit software and imported into Stata for secondary
analysis (see Appendix A3.6 and A3.7 for extracts from baseline and follow-up survey
forms). Throughout the trial period, a free repair, maintenance and replacement service was
provided for damaged cookstoves. Control households received their own cookstoves at the
end of the trial. Full details of the CAPS design, procedures, and impact on incidence of
pneumonia in children under five can be found in Mortimer et al. (2016).
Ethics statement
The CAPS protocol was reviewed and approved by the Malawi College of Medicine
Research Ethics Committee (Ref P.11/12/1308) and the Liverpool School of Tropical
Medicine Research Ethics Committee (Ref 12.40). A summary of the peer-reviewed
protocol was published in The Lancet.18 Prior to implementation, community engagement
activities were conducted with village leaders and communities, and written informed
consent (or witnessed thumbprint in lieu of signature) obtained at both cluster and
household level.
Analytic sample
As the CAPS target population comprised children under five years old, trial data were
limited to characteristics of these children and the households in which they resided. In
order to examine the cookstoves’ impact on school attendance in Chapter 5, I merged the
CAPS dataset with the HDSS population register to identify young people of primary
school age resident in households enrolled in the CAPS trial. I then used data from HDSS
annual sociodemographic surveys to isolate the young people in CAPS households
currently attending primary school in Karonga district. Reflecting the inclusion criteria of
both CAPS and my study, statistical findings are therefore representative only of
households in the catchment area with both young and school-age children.
18 Available from: http://www.thelancet.com/protocol-reviews/13PRT-4689

77
3.4.3 Nested qualitative study
To supplement the existing quantitative data, I designed and conducted a nested qualitative
study in the HDSS catchment area over the period April-May 2016, consisting of semi-
structured in-depth interviews (IDIs) and focus group discussions (FGDs) with primary
school students aged 12-18 resident in CAPS intervention or control households. The
decision to collect qualitative data stemmed primarily from three motivations:
1. Explain relationships observed in quantitative analysis, particularly with respect to
mechanisms/processes
2. Interrogate the validity of proxy-reported attendance data by exploring incentives
to misreport school attendance in household surveys
3. Include children’s perspectives in analyses of absenteeism trends and influences.
These rationales were rooted in both pragmatic and political concerns—pragmatic, as
methods were chosen to best address the research objectives presented in Chapter 1 with
the time and resources available, and political, as I explicitly sought to include under-
represented voices in the research (Brannen 2005).
Although the HDSS and CAPS facilitated a rich analysis of school attendance trends,
cookstove uptake, and factors associated with missing school, they provided less insight
into the mechanisms through which observed relationships operate. With reference to the
Implementation period: 7/2014-9/2016
Study design: Cluster randomised trial
Intervention: Two Philips HD4012LS cleaner burning biomass-fuelled cookstoves
(see Figure 3.4)
Inclusion criteria: Households with children under 4.5 years old resident in HDSS
catchment area
Data collection instruments: Household survey (baseline and follow-up; see Appendix
A3.6 and A3.7 for extracts)
Analytic sample: Young people aged 5-18 years resident in CAPS households
attending primary school in Karonga district (identified using HDSS population register
and household surveys)
Figure 3.5 Summary of CAPS study design and data

78
hypothesised links between cleaner burning cookstoves and improved school attendance,
qualitative data were required to interpret the eventual quantitative comparison of school
attendance levels between CAPS intervention and control groups, in order to explore why
changes in attendance were or were not found (Lewin et al. 2009). As Stanistreet and
colleagues (2015) have highlighted, qualitative data are particularly valuable in the context
of cookstove trials to understand the processes of behaviour change. As such, the nested
qualitative study was designed to explore students’ perceptions of the extent to which
household cooking practices, and their own participation in cooking-related activities,
changed as a result of cookstove distribution, as well as to examine students’ assessments
of household health, fuel consumption and school attendance across trial groups.
More generally, qualitative data enhance ‘understanding of the intra-household dynamics
and/or social processes behind the numbers’ produced in quantitative research (Jones and
Sumner 2009, p. 41). The qualitative study was thus intended to ‘unpack’ the statistical
analysis of proximal and distal factors associated with school absenteeism, by providing
deeper understanding of household decision-making regarding education, how students
negotiated trade-offs between school attendance and other household responsibilities, and
the ‘push’ and ‘pull’ factors that influenced schooling decisions (Streuli and Moleni 2008).
The second motivation for pursuing a mixed methods strategy arose in response to an
apparent paradox between the reasons reported for missing school in the HDSS survey and
the statistical correlates of absenteeism, described fully in Chapter 4. The qualitative study
was therefore additionally conceived as an opportunity to assess the validity of self- or
proxy-reported school attendance data. In particular, by exploring normative judgements
surrounding absenteeism and punishments associated with missing school, the qualitative
data sought to assess the extent to which reports of absenteeism could be influenced by
social desirability bias (Kelly et al. 2013), which would yield under- or misreporting of
absenteeism trends and influences. Previous research has also suggested that proxy
reporters in household surveys may not be adequately informed about the characteristics or
behaviour of other household members, or wish to portray them in a particular light, such
that their accounts provide an inaccurate or incomplete picture of the outcome under study
(Bardasi et al. 2011; Dammert and Galdo 2013). The qualitative module thus served to
supplement adults’ reports of children’s school attendance and provide a limited means of
triangulating students’ attendance patterns.

79
Most importantly, however, the qualitative component sought to highlight young people’s
own perspectives as voices under-represented in household research (Jones and Sumner
2009). Consistent with a view of children as social and economic agents, and ‘experts in
their own lives’ (Langsted, cited in Orkin 2011, p. 789), IDIs and FGDs sought to explore
the value they placed on maintaining regular school attendance and the barriers to schooling
they considered to be most problematic. As the primary beneficiaries of policies or
interventions designed to improve schooling outcomes, I considered it critical to include
students’ voices in identifying both problems and solutions associated with expanding
educational access.
Study design
The qualitative study comprised 16 in-depth interviews with primary school students and
four focus group discussions with eight students per group, each with embedded
participatory activities. The design and implementation of each component is described
below.
In-depth interviews
Using the Karonga HDSS dataset as a sampling frame, IDI participants were purposively
sampled to vary by sex (8 male, 8 female), age (12-18 years); standard attended (grades 3-
8); CAPS trial group (intervention and control); and by three community types prevalent in
the HDSS catchment area (lakeside, semi-urban and rural), based on the hypothesis that
practices associated with fishing, trading, or farming, respectively, might influence school
attendance in different ways. Community types were classified on the basis of location
within the study site: those on the shore of Lake Malawi were grouped as lakeside; semi-
urban designated proximity to a large trading centre and the tarmac road connecting Malawi
and Tanzania; and rural comprised communities found in the more remote interior regions
of the HDSS catchment area (see Figure A.1 in the Appendix for a map of IDI and FGD
interview locations within the study site).
The semi-structured IDI guide (provided in Appendix A3.8) explored students’ perceptions
of the barriers to regular school attendance, their educational motivations and aspirations,
household health status, economic and domestic responsibilities, and the effect of missing
school on educational engagement. Among cookstove recipients, interviews also explored
the perceived impact of cleaner burning cookstoves on health, schooling and time

80
allocation. A gendered perspective was adopted throughout, with a view to highlighting
parallels and differences between girls’ and boys’ experiences. The guides were iteratively
updated based on feedback from eight pilot interviews, as well as from preliminary analysis
of early IDIs.
In order to gain insights of students’ time use, each IDI also included an exercise in which
participants were asked to identify the activities in which they had engaged on the most
recent school day, from among a selection of ten activity cards: attending school, doing
homework, going to the market, collecting firewood, drawing water, cooking, fishing,
farming, caregiving, and playing. Participants then placed these activities on an illustrated
timeline from morning to night and estimated the time spent engaged in each (see Figure
3.6 and Appendix A3.9). The exercise was conceived primarily as a recall tool and formed
the basis for follow-up discussion regarding potential work-school trade-offs and intra-
household labour allocation.
Focus group discussions
Participants for four FGDs were drawn from communities contiguous to those from which
IDI participants were selected to ensure comparability of community characteristics while
avoiding potential overlap of participants (see Figure A.1). Four FGDs were conducted—
one each among boys and girls in CAPS intervention and control clusters. Upon arrival in
a target cluster, ‘natural groups’ of eight participants were identified for participation in
FGDs (Green and Thorogood 2014). That is, eligible students who were already
acquainted—by virtue of living close to each other, sharing a local water source, or
attending the same school—were recruited at the household. Natural groups were selected
in preference to purposive sampling in order to facilitate greater interaction between FGD
members and gain insight into school or community norms.
Photo: Aaron Ndovi
Figure 3.6 Example of IDI timeline activity

81
For each FGD, a trained facilitator, assisted by an additional note-taker, directed the
conversation according to a topic guide developed based on findings from the IDIs as well
as from two FGD pilot sessions (see Appendix A3.10). Discussions solicited participants’
views on the value of schooling, community norms surrounding education, the primary
challenges to regular school attendance and proposed measures to reduce absenteeism. In
CAPS intervention groups, discussions also explored the perceived benefits and drawbacks
of cleaner burning cookstoves. Separate male and female FGDs were conducted to allow
for discussion of gender-specific or sensitive topics.
Perceived barriers to school attendance were explored via a ‘draw and tell’ exercise
embedded within each FGD (Driessnack 2006), when participants were asked to draw the
activities in which they, or other children they knew, engaged on days when they did not
attend school. Variants of draw and tell exercises have previously been conducted among
children in sub-Saharan African studies, including in Ethiopia to elicit views on
things/people/places they liked and disliked in their schools and neighbourhoods (Tekola
et al. 2009), in Zimbabwe on how HIV affected boys’ and girls’ schooling (Campbell et al.
2015), and in Kenya on children’s concepts of health and illness (Onyango‐Ouma et al.
2004).
Approximately 10 minutes was allocated for participants to complete their pictures, during
which time participants dispersed throughout the FGD venue so as not to be influenced by
others’ drawings. Upon reconvening, participants described their drawings and the
practices they represented, with the help of probing questions from the FGD facilitator,
while other members were encouraged to share their own observations related to the
activity their colleague had depicted.
Some critics have questioned the quality of data that drawings generate—for instance that
children depict ideas or practices that are easy to draw rather than those which hold personal
salience—and highlighted the analytical complexity of interpreting the images produced
(Backett-Milburn and McKie 1999). In my study, the drawing exercise was intended not as
a standalone data gathering exercise, but rather as a means to facilitate the exchange of
ideas in an interactive and inclusive way (Driessnack 2006; Noonan et al. 2016).
Facilitators stressed that students should not be concerned about the artistic complexity of
their drawing. I am, however, cognisant that, as others have argued (Backett-Milburn and

82
McKie 1999), drawing is not necessarily interesting or enjoyable to all young people, and
that, particularly in the context of a group activity, participants may have felt uncomfortable
taking part. While the informed consent process made clear that participants were free to
withdraw at any time, observations from pilot sessions suggested that students were
receptive to the activity, and many indeed took pride in their work. Sharing drawings also
appeared to provide a vehicle for more equitable participation in FGDs otherwise
dominated by a minority of voices. I did not observe a gender difference in the ability to
draw, as was reported in Ethiopia (Tekola et al. 2009).
Interviews and FGDs were conducted in participants’ local language, Chitumbuka, by a
skilled team of HDSS field staff. Data collection activities were audio-recorded with
participants’ consent and transcribed and translated into English by the same research team.
Four transcripts—one per interviewer—were sent for external auditing by a MEIRU
researcher based in Lilongwe. Since the errors identified during this process were minimal
and minor, no further review of transcripts was undertaken.
Training and piloting
Prior to implementing the qualitative study, I designed and facilitated a comprehensive
training programme comprising an overview of the research objectives, familiarisation with
topic guides, mock interviews, transcription practice, and ethical considerations regarding
consent and confidentiality. During this time, the team collectively agreed on substantive
changes to the topic guides based on their local knowledge and expertise, as well as on
appropriate Chitumbuka translations. Eight pilot IDIs and two pilot FGDs were conducted,
after which topic guides were further revised to reflect emerging themes.
Ethics statement
The protocol for the nested qualitative study was reviewed and approved by the LSHTM
Research Ethics Committee (Ref 10401) and the NHSRC in Malawi (Protocol 15/1/1509).
The research was additionally authorised by the Karonga District Education Office. Written
consent was received from a parent or guardian of each study participant by way of a
signature or thumbprint, in addition to written assent from participants themselves.
Changes to fieldwork plans
My original proposal for the nested qualitative study included a set of focus group

83
discussions with parents or guardians of primary school students as well as another set with
primary school teachers. Although these FGDs would have shed valuable light on school
and community norms surrounding absenteeism, practices that support or hinder school
attendance, procedures for monitoring attendance at school and in the community, and the
decision-making process regarding attending or missing school, delays in obtaining local
ethics approval meant that the time and resources available to carry out the study were
significantly less than anticipated. I therefore took the decision to focus efforts on
conducting the student IDIs and FGDs, with the consequence that school- and community-
level perspectives are comparatively under-represented in my analysis. Conversations with
teachers and district education officials during my time in Malawi, students’ perceptions of
school and community norms, as well as personal observations of local learning
environments, nevertheless provided important context—see section 3.5.
3.5 Mixed methods design
Data collection and analysis were conducted in a sequential and iterative manner, whereby
findings from preliminary analysis of the quantitative data informed design of the
qualitative component, which in turn served to corroborate, explain, expand, or challenge
Implementation period: 4/2016-5/2016
Inclusion criteria: Young people aged 12-18 years in CAPS households and attending
primary school in Karonga district
Data collection methods: In-depth interviews with timeline activity; focus group
discussions with draw and tell exercise (see Appendix A3.8, A3.9 and A3.10)
Participant selection: Purposive sampling (IDIs), natural groups (FGDs)
Topics covered:
IDIs: perceived barriers to school attendance; educational motivations and
aspirations; household health status; economic and domestic responsibilities; missing
school and educational engagement; perceived impact of CAPS cookstoves on health,
schooling and time allocation (intervention group only).
FGDs: perceived value of schooling; community norms surrounding education;
challenges to regular school attendance; proposed measures to reduce absenteeism;
perceived benefits and drawbacks of CAPS cookstoves (intervention group only).
Figure 3.7 Summary of nested qualitative study design and data

84
patterns observed in the quantitative data. Figure 3.8, adapted from Teddlie and Tashakkori
(2009, p. 277), illustrates this approach diagrammatically. Although only one of the four
research papers (Chapter 5) combines quantitative and qualitative data within a single
analysis, taken collectively, this mixed methods thesis produces a more ‘coherent, rational
and rigorous whole’ (Gorard and Taylor 2004, p. 4) than would each method achieve in
isolation.
A key feature of mixed methods research involves combining the quantitative and
qualitative components to draw ‘meta-inferences’, where ‘inferences’ comprise ‘the
researcher’s interpretations and constructions of what their participants have expressed’
(Teddlie and Tashakkori 2009, p. 288) and ‘meta-inferences’ provide an ‘overall
conclusion, explanation, or understanding developed through an integration of the
inferences obtained from the qualitative and quantitative strands of a mixed methods study’
(Tashakkori and Teddlie 2008, p. 101). The strength of meta-inferences depends on the
quality of the constituent research components as well as the effectiveness with which they
are combined (Onwuegbuzie and Johnson 2006).
I undertook several specific measures across each phase of the research process to enhance
the validity of study findings. With respect to study design, by purposively sampling
qualitative participants from the larger quantitative sample, I ensured that data generated
from both sources were directly comparable (Cresswell and Plano Clark 2011). I also
subjected both quantitative and qualitative data sources to quality checks, which resolved
inconsistencies, reduced information loss due to missing values, and validated interview
transcription and translation output. Importantly, I deliberately used each research strand
to assess the validity of the other component, such as when I explored in the qualitative
study incentives respondents may face to misreport absenteeism in the context of a
household survey. Thirdly, I grounded the processes of analysis and interpretation in
findings from previous literature (Teddlie and Tashakkori 2009). By integrating findings
from previous quantitative, qualitative and mixed methods research in the narrative review
presented in Chapter 2, I developed an analytic model that guided my subsequent research.
In particular, I used the model to identify the strengths and weaknesses of available
quantitative datasets and highlight gaps that could be addressed with qualitative data. I also
continuously reflected on the extent to which my findings corresponded with research from
elsewhere in Malawi and sub-Saharan Africa.

85
Finally, I familiarised myself as deeply as possible with the research context, both through
the historical overview summarised in section 3.1 and through personal experiences and
observations during two months in Karonga district in 2016. Although I am fully cognisant
of my cultural and linguistic distance from the data (Liamputtong 2010; Temple et al.
2006)—as a non-Chitumbuka speaker, I relied on Malawian collaborators to facilitate entry
into the study community (under the auspices of MEIRU), to conduct the IDIs and FGDs,
and to translate and transcribe the qualitative data produced—I undertook several measures
to enhance my understanding of the data. I accompanied field staff from the HDSS, CAPS,
and qualitative study teams on data collection activities, and therefore gained valuable
insight into the research process and setting. I also held weekly debriefing meetings with
the field team (Temple et al. 2006), with which to address specific queries raised by
preliminary data analysis as well gain more general understanding of the local education
system, including grading, assessment and disciplinary procedures, and practices
surrounding cooking, firewood and charcoal production. In this way, I viewed the research
team as ‘key informants’ rather than neutral transmitters of messages (Edwards, cited in
Temple and Young 2004). I additionally arranged visits to two primary schools in the study
area as well as to the Karonga District Education Office to gain further insight into students’
learning environments, the monitoring of student absenteeism at school and administrative
levels, and perceptions of teachers and education officials about children’s attendance. I
kept detailed field notes of conversations and observations made during these encounters,
which, although I did not analyse separately in the course of the study, proved valuable in
helping to interpret my findings (Teddlie and Tashakkori 2009)
Despite these efforts, I nevertheless acknowledge a number of study features that
potentially hinder validity. Because linguistic barriers precluded my direct involvement in
qualitative data collection, I was unable to react to the data in real time, and thus unable to
pursue new themes as they emerged. I was also unable to engage with the data in its original
language, which may have resulted in loss of ‘cultural meaning’ (Temple and Young 2004),
although in-depth debriefing sessions with the research team attempted to mitigate this.
Perhaps most critically, limitations with respect to the range of variables included in the
quantitative data, as well as time and resource constraints that restricted the scope of the
nested qualitative study, mean that school- and community-level voices are under-
represented. I further reflect on the implications of these omissions in Chapter 8.

86
Ultimately, by choosing to combine both quantitative and qualitative data in a single study,
I have sought to create a ‘whole’ that is ‘greater than the sum of its parts’ (Onwuegbuzie
and Johnson 2006, p. 59). While the large and representative sample from the quantitative
component provides keys insights into the individual and household level determinants of
absenteeism, the rich and nuanced data from the qualitative strand provide the detail
necessary to understand and contextualise the patterns observed, as well as fill some
important information gaps (Teddlie and Tashakkori 2009).
3.6 A note on interdisciplinarity
This thesis follows calls to think ‘beyond sectors’ for sustainable development (Waage and
Yap 2015). As such, it makes a concerted attempt to move beyond traditional sectoral
HDSS data
collection
Preliminary
quantitative data
analysis
Inferences from
quantitative data
Development of a
priori qualitative
IDI/FGD questions
Addition of new
interview
questions
In-depth
interviews and
focus group
discussions
Inferences from
qualitative data
Meta-inferences
drawn from all
data sources
Source: Adapted from Teddlie & Tashakkori 2009, p.277, citing Carwile 2005, p.63
Figure 3.8 Sequential mixed methods design

87
‘silos’ to explore potential synergies between different fields (Waage et al. 2010). Situated
primarily within the ‘gender-education-health-poverty’ thematic nexus identified within
the coverage areas of the Sustainable Development Goals (Waage et al. 2010), it seeks to
highlight reciprocal linkages between these sectors. By exploring additional linkages with
clean energy—typically part of a separate ‘climate-land-energy-water’ cluster (Boas et al.
2016)—I thus explore new connections across these thematic areas, which have received
less policy attention (Vladimirova and Le Blanc 2016).
In addition to examining synergies between sectors, I also combine research approaches
from different disciplines within sectors. Although the analysis is rooted in epidemiological
methods, it draws heavily on concepts, theories and techniques from a range of social
science disciplines, including economics, education, demography and sociology, to address
the set of research objectives outlined in Chapter 1. This interdisciplinary approach lends
itself to ‘analysing the complexity of the world’ (Mollinga 2014), and specifically to
identifying the diverse range of processes that influence school attendance in northern
Malawi. By extending the scope of inquiry beyond the boundaries of one discipline, I aim
to reach a more holistic understanding of the drivers and implications of school absenteeism
in Karonga district than could be achieved from a single perspective (Nissani 1997). The
thesis thus follows the approach advocated by Jones and Sumner (2009, p. 45), by
combining mixed methods with an interdisciplinary outlook:
[T]he multi-dimensionality of childhood well-being suggests the importance of a
cross-disciplinary, mixed methods approach that combines quantitative and
qualitative social sciences with insights from natural sciences.
3.7 Role of investigators
As described in section 3.4, this thesis is the product of multiple research programmes,
some of which preceded my PhD. Before presenting my findings, I briefly describe my
involvement with respect to these parent studies, as well as the contributions of other
investigators who appear as co-authors on one or more of the enclosed research papers.
Judith Glynn (LSHTM), Kevin Mortimer (LSTM) and Mia Crampin (MEIRU/LSHTM)
conceived of the thesis topic, and in particular the linkage between cleaner burning
cookstoves and school absenteeism using data from HDSS and CAPS, based on an existing
collaboration between the London School of Hygiene and Tropical Medicine and the

88
Liverpool School of Tropical Medicine. Prof Glynn, Deborah Johnston (SOAS), and Elaine
Unterhalter (UCL Institute of Education) secured funding for the research under the
auspices of a Bloomsbury Colleges PhD studentship, to which I successfully applied in
2014. They also served as primary and secondary supervisors, respectively, throughout my
doctoral studies. In Malawi, Albert Dube assumed responsibility for overseeing data
collection associated with the HDSS, Jullita Malava coordinated CAPS, and I managed
data collection associated with the nested qualitative study. Four members of MEIRU
staff—Levie Gondwe, Green Kapila, Aaron Ndovi and Cecilia Nyirenda—conducted the
IDIs and FGDs with primary school students.
I had no role in the either the design or evaluation of the CAPS trial, nor did I contribute
content to HDSS surveys that preceded my tenure at LSHTM, but I benefitted from
unfettered access to data from both parent studies. In compiling this thesis, I established
the overarching research objectives described in Chapter 1 as well as the analysis plan for
each individual paper. I undertook all data coding and analysis and wrote all thesis content,
under the guidance of my supervisors. In research papers, use of the pronoun ‘we’ reflects
work conducted by me with the input of co-authors.
Figure 3.9 shows the timeline of research activities vis-à-vis my doctoral research.
This chapter has set the scene for the forthcoming set of research papers by exploring the
historical, economic and environmental features of the study area that inform contemporary
trends, and describing the combination of data sources that will be employed to address the
research objectives. In recognition of the complexity of the processes driving educational
exclusion, as well as the contribution of both quantitative and qualitative approaches in
producing a nuanced understanding of absenteeism trends and influences, the thesis adopts
an interdisciplinary, mixed methods approach. The analysis begins with a statistical
analysis of the individual- and household-level determinants of primary school
absenteeism, with particular focus on unpacking the interplay between different dimensions
of socioeconomic status.

89
2007 2017 2012 2008 2009 2010 2011 2013 2014 2015 2016
First HDSS
household
survey
HDSS household
socioeconomic
survey conducted
Award of
Bloomsbury
Colleges
PhD
studentship
Start of PhD
research
Start of CAPS
enrolment
Fieldwork for
qualitative
study
Last
CAPS
follow-up
visit
Last HDSS
household
survey
School
attendance
added to HDSS
survey
Figure 3.9 Timeline of research activities

90
References
Ainscow, M., T. Booth & A. Dyson 2006. Improving Schools, Developing Inclusion. Abingdon:
Routledge.
Alston, P. 2005. Ships passing in the night: The current state of the human rights and development
debate seen through the lens of the Millennium Development Goals. Human Rights
Quarterly 27(3): 755-829.
Backett-Milburn, K. & L. McKie 1999. A critical appraisal of the draw and write technique. Health
Education Research 14(3): 387-398. doi: 10.1093/her/14.3.387.
Balescut, J. & K. Eklindh 2006. Literacy and persons with developmental disabilities: Why and
how? Background paper prepared for the Education for All Global Monitoring Report
2006, Literacy for Life. Paris: UNESCO.
Ballet, J., M. Biggeri & F. Comim 2011. Children’s agency and the capability approach: A
conceptual framework. In: Biggeri, M., Ballet, J. & Comim, F. (eds.) Children and the
Capability Approach. Basingstoke: Palgrave Macmillan.
Baraldi, C. & V. Iervese 2014. Observing children’s capabilities as agency. In: Stoecklin, D. &
Bonvin, J.-M. (eds.) Children’s Rights and the Capability Approach: Challenges and
Prospects. London: Springer.
Bardasi, E., K. Beegle, A. Dillon & P. Serneels 2011. Do labor statistics depend on how and to
whom the questions are asked? Results from a survey experiment in Tanzania. The World
Bank Economic Review 25(3): 418-447. doi: 10.1093/wber/lhr022.
Becker, G.S. 1964. Human Capital: A Theoretical and Empirical Analysis, with Special Reference
to Education. New York: National Bureau of Economic Research.
Boas, I., F. Biermann & N. Kanie 2016. Cross-sectoral strategies in global sustainability
governance: towards a nexus approach. International Environmental Agreements: Politics,
Law and Economics 16(3): 449-464. doi: 10.1007/s10784-016-9321-1.
Brannen, J. 2005. Mixed methods research: A discussion paper. ESRC National Centre for
Research Methods Review Paper. London: Institute of Institution.
Campbell, C. 2002. Conceptualisations and definitions of inclusive schooling. In: Campbell, C.
(ed.) Developing Inclusive Schooling: Perspectivies, Policies and Practicies. London:
Institute of Education.
Campbell, C., L. Andersen, A. Mutsikiwa, C. Madanhire, M. Skovdal, C. Nyamukapa, et al. 2015.
Re-thinking children׳s agency in extreme hardship: Zimbabwean children׳s draw-and-write
about their HIV-affected peers. Health & Place 31: 54-64. doi: 10.1016/
j.healthplace.2014.09.008.
Chalasani, S., C.A. Kelly, B.S. Mensch & E. Soler-Hampejsek 2013. The consequences of
schoolgirl pregnancy for educational outcomes in Malawi. International Union for the
Scientific Study of Population (IUSSP). Busan, Korea.
Chimombo, J. 2009. Changing patterns of access to basic education in Malawi: A story of a mixed
bag? Comparative Education 45(2): 297-312. doi: 10.1080/03050060902921003.
Crampin, A.C., A. Dube, S. Mboma, A. Price, M. Chihana, A. Jahn, et al. 2012. Profile: The
Karonga Health and Demographic Surveillance System. International Journal of
Epidemiology 41: 676-685. doi: 10.1093/ije/dys088.
Cresswell, J.W. & V.L. Plano Clark 2011. Designing and conducting mixed methods research (2nd
edition), Thousand Oaks, CA, SAGE Publications, Inc.
Dammert, A.C. & J. Galdo 2013. Child labor variation by type of respondent: Evidence from a
large-scale study. World Development 51: 207-220. doi: 10.1016/j.worlddev.2013.06.002.

91
Driessnack, M. 2006. Draw-and-tell conversations with children about fear. Qualitative Health
Research 16(10): 1414-1435. doi: 10.1177/1049732306294127.
Floyd, S., A.C. Crampin, J.R. Glynn, N. Madise, M. Mwenebabu, S. Mnkhondia, et al. 2007. The
social and economic impact of parental HIV on children in northern Malawi: Retrospective
population-based cohort study. AIDS Care 19(6): 781-790. doi: 10.1080/
09540120601163227.
Floyd, S., A. Molesworth, A. Dube, A.C. Crampin, R. Houben, M. Chihana, et al. 2013.
Underestimation of HIV prevalence in surveys when some people already know their
status, and ways to reduce the bias. AIDS 27(2): 233-242. doi: 10.1097/
QAD.0b013e32835848ab.
Gilmour, D. & C. Soudien 2009. Learning and equitable access in the Western Cape, South Africa.
Comparative Education 45(2): 281-295. doi: 10.1080/03050060902920989.
Gorard, S. & C. Taylor 2004. Combining Methods in Educational and Social Research,
Maidenhead, UK, Open University Press.
Grant, M.J. 2008. Children’s school participation and HIV/AIDS in rural Malawi: The role of
parental knowledge and perceptions. Demographic Research 19(45): 1603-1634. doi:
10.4054/DemRes.2008.19.45.
Grant, M.J. & K.K. Hallman 2008. Pregnancy-related school dropout and prior school performance
in KwaZulu-Natal, South Africa. Studies in Family Planning 39(4): 369-382.
Hanushek, E.A. 2013. Economic growth in developing countries: The role of human capital.
Economics of Education Review 37: 204-212. doi: 10.1016/j.econedurev.2013.04.005.
Heyneman, S.P. 1972. The formal school as a traditional institution in an underdeveloped society:
The case of northern Malawi. Paedagogica Historica 12(2): 460-472. doi: 10.1080/
0030923720120205.
Hungi, N. 2011. Characteristics of school heads and their schools. Working Paper 3. SACMEQ.
International Monetary Fund 2017. Malawi: Economic Development Document. IMF Country
Report No. 17/184. Washington, D.C.: International Monetary Fund.
Jagger, P. & C. Perez-Heydrich 2016. Land use and household energy dynamics in Malawi.
Environmental Research Letters 11(12): 125004.
Jere, C.M. 2012. Improving educational access of vulnerable children in high HIV prevalence
communities of Malawi: The potential of open and flexible learning strategies.
International Journal of Educational Development 32(6): 756-763. doi: 10.1016/
j.ijedudev.2011.09.004.
Jere, C.M. 2014. Addressing educational access and retention of orphaned and vulnerable children
in high HIV prevalence communities in rural Malawi: A flexible approach to learning. PhD
thesis, Institute of Education, University of London.
Jetter, J.J. & P. Kariher 2009. Solid-fuel household cook stoves: Characterization of performance
and emissions. Biomass and Bioenergy 33(2): 294-305. doi: 10.1016/
j.biombioe.2008.05.014.
Jones, N. & A. Sumner 2009. Does mixed methods research matter to understanding childhood
well-being? Social Indicators Research 90: 33-50.
Kabeer, N. 2000. Social exclusion, poverty and discrimination towards an analytical framework.
IDS Bulletin 31(4): 83-97. doi: 10.1111/j.1759-5436.2000.mp31004009.x.
Kalipeni, E. 1992. Population redistribution in Malawi since 1964. Geographical Review 82(1): 13-
28. doi: 10.2307/215402.
Kalipeni, E. 1997. Gender and regional differences in schooling between boys and girls in Malawi.
The East African Geographical Review 19(1).

92
Kamwendo, G.H. 2005. Language planning from below: An example from northern Malawi.
Language Policy 4(2): 143-165. doi: 10.1007/s10993-005-3514-8.
Kamwendo, G.H. 2008. The bumpy road to mother tongue instruction in Malawi. Journal of
Multilingual and Multicultural Development 29(5): 353-363. doi: 10.1080/
01434630802147858.
Kelly, C.A., E. Soler-Hampejsek, B.S. Mensch & P.C. Hewett 2013. Social desirability bias in
sexual behavior reporting: evidence from an interview mode experiment in rural Malawi.
International Perspectives on Sexual and Reproductive Health 39(1): 14-21. doi:
10.1363/3901413.
King, K. 2017. Lost in translation? The challenge of translating the global education goal and targets
into global indicators. Compare: A Journal of Comparative and International Education
47(6): 801-817. doi: 10.1080/03057925.2017.1339263.
Lee, S.E. 2013. Education as a human right in the 21st century. Democracy and Education 21(1):
Article 1. Available from: https://democracyeducationjournal.org/home/vol21/iss1/1.
Lewin, K.M. 2009. Access to education in sub-Saharan Africa: Patterns, problems and possibilities.
Comparative Education 45(2): 151-174. doi: 10.1080/03050060902920518.
Lewin, S., C. Glenton & A.D. Oxman 2009. Use of qualitative methods alongside randomised
controlled trials of complex healthcare interventions: methodological study. BMJ 339. doi:
10.1136/bmj.b3496.
Liamputtong, P. 2010. Performing Qualitative Cross-Cultural Research. Cambridge: Cambridge
University Press.
Manda, M.A.Z. 2013. Situation of urbanisation in Malawi report. Mzuzu: Alma-Urac for Malawi
Government Ministry of Lands and Housing.
McCowan, T. 2011. Human rights, capabilities and the normative basis of ‘Education for All’.
Theory and Research in Education 9(3): 283-298. doi: 10.1177/1477878511419566.
McCracken, J. 2008. Politics and Christianity in Malawi 1875-1940: The Impact of the Livingstonia
Mission in the Northern Province. Zomba, Malawi: Kachere Series.
McNamara, T. 2015. English, community and opportunity in northern Malawi. The Australian
Journal of Anthropology 26(3): 456-469. doi: 10.1111/taja.12155.
Miles, S. & N. Singal 2010. The Education for All and inclusive education debate: Conflict,
contradiction or opportunity? International Journal of Inclusive Education 14(1): 1-15. doi:
10.1080/13603110802265125.
Mincer, J. 1981. Human capital and economic growth. NBER Working Paper No. 803. Cambridge,
MA: National Bureau of Economic Research.
Mollinga, P. Interdisciplinarityand international development. LIDC Inaugural Lecture, 2014
London. Available from: http://www.lidc.org.uk/events/lidc-inaugural-lecture-
interdisciplinary-and-international-development
Mortimer, K., C.B. Ndamala, A.W. Naunje, J. Malava, C. Katundu, W. Weston, et al. 2016. A
cleaner burning biomass-fuelled cookstove intervention to prevent pneumonia in children
under 5 years old in rural Malawi (the Cooking and Pneumonia Study): A cluster
randomised controlled trial. The Lancet 389(10065): 167-175. doi: 10.1016/S0140-
6736(16)32507-7.
Mulera, D.M.W.J., K.K. Ndala & R. Nyirongo 2017. Analysis of factors affecting pupil
performance in Malawi’s primary schools based on SACMEQ survey results. International
Journal of Educational Development 54: 59-68. doi: 10.1016/j.ijedudev.2017.04.001.
Nankhuni, F.J. & J.L. Findeis 2004. Natural resource-collection work and children's schooling in
Malawi. Agricultural Economics 31: 123-134. doi: 10.1016/j.agecon.2004.09.02.

93
National Statistical Office 2008. Population and Housing Census 2008. Zomba, Malawi: National
Statistical Office.
National Statistical Office 2012. Statistical Year Book. Zomba, Malawi: National Statistical Office.
National Statistical Office 2014. Integrated Household Panel Survey 2010-2013 household socio-
economic characteristics report. Zomba, Malawi: National Statistical Office.
National Statistical Office & ICF 2017. Malawi Demographic and Health Survey 2015-16. Zomba,
Malawi and Rockville, Maryland: NSO and ICF.
Nissani, M. 1997. Ten cheers for interdisciplinarity: The case for interdisciplinary knowledge and
research. The Social Science Journal 34(2): 201-216. doi: 10.1016/S0362-3319(97)90051-
3.
Noonan, R.J., L.M. Boddy, S.J. Fairclough & Z.R. Knowles 2016. Write, draw, show, and tell: A
child-centred dual methodology to explore perceptions of out-of-school physical activity.
BMC Public Health 16(1): 326. doi: 10.1186/s12889-016-3005-1.
Nyondo, E. 2016. What's in a mother tongue? The Nation, 16 March.
Onwuegbuzie, A.J. & R.B. Johnson 2006. The validity issue in mixed research. Research in the
Schools 13(1): 48-63.
Onyango‐Ouma, W., J. Aagaard‐Hansen & B.B. Jensen 2004. Changing concepts of health and
illness among children of primary school age in Western Kenya. Health Education
Research 19(3): 326-339. doi: 10.1093/her/cyg034.
Orkin, K. 2011. ‘See first, think later, then test’: How children's perspectives can improve economic
research. The European Journal of Development Research 23(5): 774-791. doi:
10.1057/ejdr.2011.46.
Posner, D.N. 2004. The political salience of cultural difference: Why Chewas and Tumbukas are
allies in Zambia and adversaries in Malawi. American Political Science Review 98(04):
529-545. doi: 10.1017/S0003055404041334.
Posti-Ahokas, H. & P. Palojoki 2014. Navigating transitions to adulthood through secondary
education: Aspirations and the value of education for Tanzanian girls. Journal of Youth
Studies 17(5): 664-681. doi: 10.1080/13676261.2013.853871.
Pridmore, P. & C. Jere 2011. Disrupting patterns of educational inequality and disadvantage in
Malawi. Compare: A Journal of Comparative and International Education 41(4): 513-531.
doi: 10.1080/03057925.2011.581518.
Robeyns, I. 2006. Three models of education: Rights, capabilities and human capital. Theory and
Research in Education 4(1): 69-84. doi: 10.1177/1477878506060683.
Rose, P. 2003. From the Washington to the Post-Washington Consensus: The influence of
international agendas on education policy and practice in Malawi. Globalisation, Societies
and Education 1(1): 67-86. doi: 10.1080/1476772032000061824.
Ruiz-Mercado, I. & O. Masera 2015. Patterns of stove use in the context of fuel–device stacking:
Rationale and implications. EcoHealth 12(1): 42-56. doi: 10.1007/s10393-015-1009-4.
Sachs, J.D. 2012. From Millennium Development Goals to Sustainable Development Goals. The
Lancet 379(9832): 2206-2211. doi: 10.1016/S0140-6736(12)60685-0.
Saito, M. 2003. Amartya Sen's capability approach to education: A critical exploration. Journal of
Philosophy of Education 37(1): 17-33. doi: 10.1111/1467-9752.3701002.
Sayed, Y. & C. Soudien 2003. (Re)Framing education exclusion and inclusion discourses. IDS
Bulletin 34(1): 9-19. doi: 10.1111/j.1759-5436.2003.tb00055.x.
Sayed, Y., C. Soudien & N. Carrim 2003. Discourses of exclusion and inclusion in the South: Limits
and possibilities. Journal of Educational Change 4(3): 231-248. doi: 10.1023/
B:JEDU.0000006162.07375.aa.

94
Schultz, T.W. 1961. Investment in human capital. The American Economic Review 51(1): 1-17.
Sen, A. 2000. Social exclusion: Concept, application and scrutiny. Social Development Papers No.
1. Manila, Philippines: Office of Environment and Social Development, Asian
Development Bank.
Stanistreet, D., L. Hyseni, M. Bashin, I. Sadumah, D. Pope, M. Sage, et al. 2015. The role of mixed
methods in improved cookstove research. Journal of Health Communication 20(sup1): 84-
93. doi: 10.1080/10810730.2014.999896.
Streuli, N. & C.M. Moleni 2008. Education and HIV and AIDS in Malawi: The role of open,
distance and flexible learning. SOFIE Opening Up Access Series No. 3. London: Institute
of Education, University of London.
Tashakkori, A. & C. Teddlie 2008. Quality of inferences in mixed methods research: Calling for an
integrative framework. In: Bergman, M. M. (ed.) Advances in Mixed Methods Research.
London: SAGE Publications Ltd.
Teddlie, C. & A. Tashakkori 2009. Foundations of Mixed Methods Research: Integrating
Qualitative and Qualitative Approaches in the Social and Behavioral Sciences. Thousand
Oaks, CA: SAGE Publications, Inc.
Tekola, B., C. Griffin & L. Camfield 2009. Using qualitative methods with poor children in urban
Ethiopia: Opportunities and challenges. Social Indicators Research 2009(90): 73-87. doi:
10.1007/s11205-008-9313-9.
Temple, B., R. Edwards & C. Alexander. 2006. Grasping at context: Cross language qualitative
research as secondary qualitative data analysis. Forum: Qualitative Social Research 7. doi:
10.17169/fqs-7.4.176. Available from: http://www.qualitative-research.net/index.php/fqs/
article/view/176.
Temple, B. & A. Young 2004. Qualitative research and translation dilemmas. Qualitative Research
4(2): 161-178. doi: 10.1177/1468794104044430.
Tomaševski, K. 2001. Human rights obligations: Making education available, accessible,
acceptable and adaptable. Right to Education Primers No. 3. Stockholm: Swedish
International Development Cooperation Agency.
UNESCO 2017. Unpacking Sustainable Development Goal 4 Education 2030. Paris: United
Nations Educational, Scientific and Cultural Organization.
UNICEF & UNESCO 2007. A human rights-based approach to Education for All. New York and
Paris: United Nations Children's Fund and United Nations Educational, Scientific and
Cultural Organization.
United Nations 1948. Universal Declaration of Human Rights. Available from:
http://www.un.org/en/universal-declaration-human-rights/ [Accessed 3/4/2018].
United Nations Development Programme 2016. Human Development Report 2016: Human
Development for Everyone. New York: United Nations Development Programme.
Unterhalter, E. 2003. Education, capabilities and social justice. Paper commissioned for the EFA
Global Monitoring Report 2003/4, The Leap to Equality.
Vail, L. & L. White 1989. Tribalism and the political history of Malawi. In: Vail, L. (ed.) The
Creation of Tribalism in Southern Africa. Berkeley: University of California Press.
Vaughan, R. 2007. Measuring capabilities: An example from girls' schooling. In: Walker, M. &
Unterhalter, E. (eds.) Amartya Sen's Capability Approach and Social Justice in Education.
Basingstoke: PALGRAVE MACMILLAN.
Vladimirova, K. & D. Le Blanc 2016. Exploring links between education and sustainable
development goals through the lens of UN flagship reports. Sustainable Development
24(4): 254-271. doi: 10.1002/sd.1626.

95
Waage, J., R. Banerji, O. Campbell, E. Chirwa, G. Collender, V. Dieltiens, et al. 2010. The
Millennium Development Goals: A cross-sectoral analysis and principles for goal setting
after 2015. The Lancet 376(9745): 991-1023. doi: 10.1016/S0140-6736(10)61196-8.
Waage, J. & C. Yap (eds.) 2015. Thinking Beyond Sectors for Sustainable Development, London:
Ubuiquity Press Ltd. doi: 10.5334/bao.
Walker, M. 2005. Amartya Sen’s capability approach and education. Educational Action Research
13(1): 103-110. doi: 10.1080/09650790500200279.
Walker, M. & E. Unterhalter 2007. The capability approach: Its potential for work in education In:
Walker, M. & Unterhalter, E. (eds.) Amartya Sen's Capability Approach and Social Justice
in Education. Basingstoke: PALGRAVE MACMILLAN.
World Bank 2010. The education system in Malawi. World Bank Working Paper No. 182.
Washington, D.C.: The World Bank.
World Bank. 2017. Urban population (% of total). Available from: https://data.worldbank.org/
indicator/SP.URB.TOTL.IN.ZS [Accessed 4/9/2017].
Zeitlyn, B., K.M. Lewin, J. Chimombo & E. Meke 2015. Inside private secondary schools in
Malawi: Access or exclusion? International Journal of Educational Development 43: 109-
117. doi: 10.1016/j.ijedudev.2015.05.008.

96
London School of Hygiene & Tropical Medicine Keppel Street, London WC1E 7HT www.lshtm.ac.uk Registry T: +44(0)20 7299 4646 F: +44(0)20 7299 4656 E: [email protected]
RESEARCH PAPER COVER SHEET
PLEASE NOTE THAT A COVER SHEET MUST BE COMPLETED FOR EACH RESEARCH PAPER
INCLUDED IN A THESIS.
SECTION A – Student Details
Student Christine Kelly
Principal Supervisor Judith Glynn
Thesis Title
School absenteeism in Karonga district, northern Malawi:
Trends, influences and the impact of cleaner burning biomass-
fuelled cookstoves
If the Research Paper has previously been published please complete Section B, if not
please move to Section C
SECTION B – Paper already published
Where was the work published?
When was the work published?
If the work was published prior to registration for your research degree, give a brief rationale for its inclusion
Have you retained the copyright for the work?*
Choose an item.
Was the work subject to academic peer review?
Choose an item.
*If yes, please attach evidence of retention. If no, or if the work is being included in its published
format, please attach evidence of permission from the copyright holder (publisher or other author)
to include this work.
SECTION C – Prepared for publication, but not yet published
Where is the work intended to be published?
International Journal of Educational Development
Please list the paper’s authors in the intended authorship order:
Christine A. Kelly, Deborah Johnston, Elaine Unterhalter,
Amelia C. Crampin, Albert Dube, Judith R. Glynn
Stage of publication Submitted
SECTION D – Multi-authored work
For multi-authored work, give full details of your role in the research included in the paper and in the preparation of the paper. (Attach a further sheet if necessary)
With input from co-authors, I designed
the study, managed the data, conducted
the analysis and wrote the manuscript
Student Signature: Date:
Supervisor Signature: Date:

97
Chapter 4: Determinants of absenteeism
Re-examining the link between socioeconomic status and school
absenteeism: Evidence from primary school students in northern Malawi
Ms Christine A. Kelly (corresponding author)
Faculty of Epidemiology and Population Health
London School of Hygiene and Tropical Medicine
Keppel St, London WC1E 7HT
United Kingdom
Email: [email protected]
Dr Deborah Johnston
Department of Economics
SOAS
Prof Elaine Unterhalter
UCL Institute of Education
Dr Amelia C. Crampin
Malawi Epidemiology and Intervention Research Unit / London School of Hygiene and
Tropical Medicine
Mr Albert Dube
Malawi Epidemiology and Intervention Research Unit
Prof Judith R. Glynn
Faculty of Epidemiology and Population Health
London School of Hygiene and Tropical Medicine

98
Abstract
This paper explores the ways that five dimensions of socioeconomic status—agricultural
wealth, non-agricultural household wealth, credit access, parental education and household
occupation—influence children’s primary school attendance in both complementary and
opposing ways. Drawing on data from 9,851 students in Karonga district, northern Malawi
over the 2010-2011 school year, we find that absenteeism for both girls and boys was
associated with increasing levels of agricultural wealth but with decreasing levels of other
socioeconomic indicators. We highlight that primary school absenteeism is not restricted
to children from the poorest households if multiple dimensions of socioeconomic status are
considered.
Highlights
Socioeconomic status is conceptualised in five dimensions.
16% of primary school students missed one or more days of school in the past four
weeks.
Absenteeism was associated with increasing levels of agricultural wealth but with
decreasing levels of other socioeconomic indicators.
Primary school absenteeism in Malawi is not restricted to the poorest children if
multiple dimensions of SES are considered.

99
4.1 Introduction
Links between poverty and school enrolment, attendance and attainment are well attested
in the education literature (e.g. Filmer 2005; Lewin 2009; Lewin and Sabates 2012;
UNESCO 2016). Both within and across countries, children living in the poorest
households are more likely to have never attended school and to drop out early (UNESCO
2016). Poverty prevents students from meeting the direct or indirect costs of schooling, and
encourages their participation in activities for which the social and economic returns are
higher (Kendall 2007). However, macro-level models that show an inverse relationship
between income and school attendance or attainment (e.g. UNESCO 2016) obscure
complex household-level processes that help determine children’s educational outcomes.
Indeed, previous research has recognised that ‘loss of schooling cannot be accounted for
solely by poverty’ (Pridmore and Jere 2011, p. 520), while studies of rural households in
low-income countries have shown that adverse educational pathways are not necessarily
restricted to the most deprived (Bhalotra and Heady 2003; Hazarika and Sarangi 2008;
Shimamura and Lastarria-Cornhiel 2010).
Analyses of the relationship between poverty and school attendance, particularly in
agricultural contexts, requires a nuanced approach. Exclusive reliance on a single indicator
of monetary poverty—such as household income—may not provide a comprehensive
picture of the socioeconomic mechanisms behind educational exclusion. This paper
explores the relationship between five dimensions of socioeconomic status (SES) and
school absenteeism among primary school students in northern Malawi. As described
further below, it specifically acknowledges the independent, and potentially opposing,
ways that agricultural wealth, non-agricultural household wealth, credit access, parental
education and household occupation influence children’s school attendance.
The analysis focuses specifically on school absenteeism, as opposed to non-enrolment,
grade repetition, or dropout, which have received considerably more attention in policy
discourse and international education targets including the Sustainable Development Goals.
Absenteeism, however, represents an important precursor to these adverse educational
outcomes. Students who miss school regularly are likely to be less exposed to curriculum
content (Abadzi 2004), and vulnerable to exclusionary practices from teachers and peers
(Lockheed and Harris 2005) or to disengagement from education (Kearney 2008), all of
which may increase risk of poor performance, grade repetition and dropout. Identifying

100
students most at risk of irregular school attendance is therefore critical to arrest adverse
educational trajectories, but where school absences have been formally evaluated—for
example during assessments conducted by the Southern and Eastern African Consortium
for Monitoring Educational Quality (SACMEQ) (e.g. Milner et al. 2011)—analyses
typically document simple levels and reported reasons for absenteeism, without exploring
the wider set of proximal and distal determinants of missing school.
In examining the relationship between different dimensions of SES and school attendance,
this paper aims to highlight the role of household-level influences of absenteeism, and in
particular, the multiple socioeconomic processes associated with missing school. The
analysis harnesses a large dataset of primary school students in a rural area of Karonga
district, northern Malawi. Malawi became an early adopter of the Education for All goal of
fee-free primary education in 1994, but its education system remains characterised by poor
rates of retention, completion and skills acquisition (Taylor and Spaull 2015; World Bank
2010). In light of these continued challenges, detailed investigation of the extent of and
reasons for absenteeism in Malawi is opportune.
4.1.1 Conceptual framework
Previous research has established both conceptual and empirical links between different
dimensions of SES and children’s school attendance, although they are rarely examined
collectively, as is our aim here. Drawing on previous literature, we start by building a
conceptual model of the expected relationships between five indicators of SES—household
wealth, agricultural wealth, credit access, parental education and household occupation—
and school attendance, with which to inform the subsequent analysis.
Common measures of household wealth, such as income, consumption, or asset ownership,
reflect a household’s ability to meet the direct or indirect costs of schooling, which have
been identified as key barriers to daily school attendance across sub-Saharan Africa.
Monetary poverty has prevented children from attending school regularly due to lack of
soap to wash clothes (Pridmore and Jere 2011), inability to pay school fees on time (Mukudi
2004), lack of money for transport (Porter et al. 2011), or food insecurity (Belachew et al.
2011). Poverty also raises the opportunity cost of schooling, causing students miss school
in order to perform household chores, work in the family business, or earn additional
income through paid labour (Huisman and Smits 2009). We would therefore expect to

101
observe a negative relationship between household wealth and school absenteeism, such
that children from wealthier households are less likely to miss school than their poorer
counterparts.
Land and livestock ownership is typically strongly associated with household income (Basu
et al. 2010) so could be predicted to demonstrate the same negative relationship with school
absenteeism as household wealth. However, in the absence of functioning labour markets,
access to these productive assets may in fact increase students’ propensity to miss school
via increased demand for child labour (Cockburn and Dostie 2007). Large landowners who
cannot hire sufficient workers to meet labour demand may instead be forced to employ their
children (Bhalotra and Heady 2003)—at least until the household is so well-off it will not
want resident children to work (Basu et al. 2010)—with adverse consequences for students’
school attendance. Using data from Ghana and Pakistan, Bhalotra and Heady (2003)
identified a ‘wealth paradox’ in school attendance among students in Pakistan (but not in
Ghana), in which girls from households with larger farms were more likely to spend fewer
hours in class, relative to girls from households with smaller land endowments.
Even in the absence of market failures, there may be additional incentives for children to
gain experience working on family farms if they stand to inherit the land in their adult years
(Bhalotra and Heady 2003), or if the expected returns to education are low (Rolleston
2009). Children in agricultural households may also increase their share of household
chores if farm work absorbs all available adult effort (Webbink et al. 2012), with negative
implications for school attendance. The nature of the relationship between agricultural
wealth and school absenteeism is therefore ambiguous, and may not simply align with that
of household wealth.
Previous research suggests that access to credit plays a greater role than household income
per se in determining children’s school enrolment, since income constraints can be
compensated for by borrowing (Ersado 2005). In the same way, households with access to
credit may be able to better weather temporary economic shocks that could otherwise result
in children’s absenteeism than those with no means of smoothing income fluctuations
(Amendah et al. 2014). Hazarika and Sarangi (2008) showed in Malawi, however, that
improved access to microcredit increased children’s involvement in domestic work as
compensation for parents’ participation in credit-stimulated household enterprises.

102
Although the authors did not find a significant impact of credit access on children’s school
attendance, they posited that reduced leisure time and work-induced fatigue would lead to
adverse educational outcomes. A subsequent Malawian study showed that agricultural
credit uptake delayed school enrolment among young female children, but found limited
evidence of a trade-off between school attendance and domestic chores (Shimamura and
Lastarria-Cornhiel 2010). Thus, as with agricultural wealth, the observed relationship
between credit access and school absenteeism cannot necessarily be predicted a priori.
Education status is frequently used as an indicator of human capital to capture knowledge
or skills-related assets (Galobardes et al. 2007), and is also typically correlated with income
and earning potential (Burke and Beegle 2004). Parental education may thus yield a direct
income effect on children’s school attendance, as well as reflect a general preference for
education. We would therefore expect to observe lower absenteeism levels among children
with comparatively highly educated parents.
Like education, occupation is strongly related to income, so household occupation has
potentially important implications for children’s education through its impact on material
resources (Galobardes et al. 2007). Household heads engaged in occupations where
education is valued may also make greater effort to ensure that resident children attend
school regularly. On the other hand, household occupation may adversely affect school
attendance via demand for child labour. The opportunity cost of school attendance will
likely be higher for children in households engaged in labour-intensive livelihoods, such as
farming, relative to those in non-manual occupations (Huisman and Smits 2009). This has
been reflected in seasonal patterns of absence that correspond with demanding periods in
the agricultural calendar (Hadley 2010). The association between parental occupation and
children’s absenteeism thus depends on the relative importance of income, preferences and
labour demand in household schooling decisions.
Figure 4.1 summarises the expected relationships between each dimension of household
socioeconomic status and school absenteeism diagrammatically.

103
Analyses of the relationship between SES and absenteeism must equally consider other
factors that influence students’ school attendance, or confound the relationship between
SES and absenteeism. Gender relationships play a role in the value that households attach
to education for different members (Kazeem et al. 2010), or to the type or intensity of work
allocated to boys and girls (Lyon et al. 2013), which may affect the regularity with which
they attend school. Studies from Ghana, Malawi and South Africa have also shown that
male and female students face different challenges with respect to school journeys, with
parents more reluctant to allow daughters than sons to walk long distances, cross rivers, or
use busy roads to get to school (Avotri et al., cited in Porter et al. 2011). The perceived risk
of physical attack or rape, particularly when travelling alone, disproportionately affects
girls (Porter et al. 2010a; Porter et al. 2010b).
Students’ age and birth order may similarly affect their ability to attend school daily,
especially when domestic and economic responsibilities are distributed unequally among
household members. Evidence from Nepal suggests that older siblings, particularly girls,
assume a greater burden of domestic work than do younger children, increasingly so with
each additional younger sibling (Edmonds 2006). Older students have also been shown in
Mali to substitute for adult labour in the event of parental illness or other labour shortage
(Dillon 2013), or in Malawi to sacrifice their own educational needs to facilitate their
younger siblings’ attendance (Pridmore and Jere 2011).
Household
socioeconomic
status
Household wealth
Agricultural wealth
Access to credit
Parental education
Household head
occupationa
School
absenteeism
Negative
Positive / negative
Positive / negative
Negative
Negative
Figure 4.1 Expected direction of relationship between five dimensions of household
socioeconomic status and school absenteeism
a Expected relationship when moving from more manual to less manual occupation

104
Household size and composition influence children’s school attendance in a number of
potentially opposing ways. Large households may have greater difficulty meeting the costs
of schooling for all resident children, but may equally have more incomes on which to
draw. Similarly, child labour demands, and resulting absenteeism, may be greater in large
households due to having more members to support, but if work responsibilities are
allocated between more members, this may increase time available for schooling (Webbink
et al. 2012). The sex of the household head has also been shown to influence the school
attendance of resident children through varying levels of investment in education. Research
from seven sub-Saharan African countries suggests that, for a given level of socioeconomic
resources, students living in female-headed households experience better schooling
outcomes than those living in male-headed households, although absenteeism was not
measured specifically (Lloyd and Blanc 1996). Conversely, Dreibelbis et al. (2013) found
that boys and girls living in female-headed households in Kenya demonstrated increased
probabilities of missing school relative to peers in male-headed households.
The value households place on educating resident children may also depend on the
relationship of these children to the household head. Child fostering in low-income
countries is common both as a means of facilitating better access to education through
extended kinship networks and to help meet labour demands in recipient households (Grant
and Yeatman 2014), so can either enhance or reduce students’ school attendance.
Particularly in HIV-affected areas of sub-Saharan Africa, orphanhood also results in
children living with caregivers other than their biological parents. While the actual event
of parental death has been linked with periods of school absence (Ainsworth et al. 2005;
Evans and Miguel 2007), intra-household discrimination against orphans who live with
caregivers can also prevent them from attending school regularly (Pridmore and Jere 2011).
Finally, households’ investment in children’s education—and indeed students’ own desire
to attend school daily—is likely to be influenced by children’s motivation and aptitude, or
perceptions thereof. Data from Kenya has suggested that caregivers choose to direct scarce
household resources towards the most promising students (Evans and Miguel 2007), while
a study of Ethiopian adolescents has shown that absenteeism was inversely related to
students’ educational aspirations (Belachew et al. 2011). In the context of Malawi, where
school dropout is high and progression to secondary school is determined on the basis of
high stakes entrance exams (de Hoop 2011), we would thus expect school absenteeism to

105
decrease with grade attained as the composition of students remaining in school becomes
more selective, and as proximity to exams approaches.
Combining the five socioeconomic dimensions of interest, as well as other individual- and
household-level factors that may influence absenteeism, Figure 4.2 shows the model used
to guide the empirical analysis.
4.1.2 Education in Malawi
Discussion of school attendance and absence in Malawi must be understood in the context
of expanding education provision over the past twenty years. Malawi became one of sub-
Saharan Africa’s first adopters of free primary education (FPE) when the government
abolished primary school fees in 1994. Within six months of the announcement the number
of enrolled primary school students nearly doubled (Chisamya et al. 2012), but the limited
planning and rapid implementation of FPE placed considerable strain on personnel and
infrastructure (Chimombo 2009). Despite maintaining nearly universal enrolment in the
Individual factors
Sex Age
Parental education Orphanhood status
Relationship to household head Recent economic participation Grade attended
Grade repetition School attended
Household factors
Household wealth
Agricultural wealth Access to credit Primary occupation Number of household members
Younger household members
Sex of household head Distance to school
Season of interview Household
Individual
(Reporting of)
School
absenteeism
Note: Socioeconomic factors highlighted in bold; individuals nested within households
Figure 4.2 Individual- and household-level determinants of school absenteeism

106
early years of primary school, which consists of eight grades (‘standards’), high rates of
grade repetition and dropout characterise the system: according to UNESCO’s estimates,
the primary school completion rate stands at 54% (UNESCO 2016). Malawian students
also perform consistently poorly on standardised assessments relative to counterparts in
regional neighbours. For example, in the latest set of SACMEQ tests in 2007, just 63% of
Malawian students in standard 6 demonstrated functional literacy and 40% functional
numeracy, compared to figures approaching 90% in both subjects among counterparts in
Kenya, Tanzania and Swaziland (Taylor and Spaull 2015).
Among studies that have examined absenteeism in Malawi, all have found relatively high
levels. The 2007 SACMEQ assessment found that standard 6 students missed an average
of 1.7 school days in the past month (Milner et al. 2011), while a cross-country comparison
of weekly absence rates using data from the 2005-6 Multiple Indicator Cluster Surveys
(MICS) showed that 15% of Malawian students aged 10-19 missed two or more school
days in the preceding week, second only to Guinea-Bissau among the twelve sub-Saharan
African countries studied (Loiaza and Lloyd 2008).19 According to a school-based survey
of 1,675 adolescents from Malawi’s southern region, 20% of primary school students aged
14-16 were absent on the most recent school day and more than half missed at least one
school day in the previous two weeks (Grant et al. 2013). Thus, despite sustained efforts to
expand education provision, irregular school attendance poses an issue of concern.
4.2 Data and methods
4.2.1 Research site
This paper uses data from the Karonga Health and Demographic Surveillance System
(HDSS), which has collected annual sociodemographic data about a population of more
than 30,000 people since 2002, and school attendance information since 2008. Data for the
present analysis are drawn from the 2010-2011 survey, when the most comprehensive set
of economic indicators was collected. The survey was conducted in ~7,250 households in
the catchment area over the 12-month period from September-August, mirroring the school
calendar. Respondents were household members aged 15 years or older who were at home
at the time of the field team’s visit; as such, most school attendance data was provided by
19 Absenteeism was lowest in Cote d’Ivoire, with fewer than 2% of students reportedly missing two or more
days in the previous week.

107
an adult household member, usually a parent, on behalf of resident children.
The study site, which covers approximately 135 km2 in Karonga district, northern Malawi
(see Figure 3.2), is predominantly rural, with an economy based upon subsistence
agriculture, petty trading and fishing (Crampin et al. 2012). The climate is hot and dry from
September to November, followed by the rainy season December-April, and a cool and dry
period May-August (National Statistical Office 2012). The farming season begins with
planting in November; the peak harvest period typically occurs between February and April
(Hazarika and Sarangi 2008).
The area is populated mainly by members of the Tumbuka tribe, who are patrilineal,
predominantly Christian, and represent approximately 9% of the Malawian population
(Floyd et al. 2007; National Statistical Office 2008). HIV prevalence in the HDSS
catchment area was estimated at 7.1% among men and 9.2% among women in 2008/2009
(Floyd et al. 2013).
4.2.2 Study population
The analytic sample comprises 5,231 boys and 4,620 girls aged 5-20 years, enrolled in
Karonga district primary schools at the time of the 2010-2011 survey and for whom relevant
data were available. Thirty-seven boys and 45 girls who attended schools outside Karonga
district were excluded from the analysis, as were 22 boys aged older than 20 years who
were reported to attend primary school.20 To avoid the problem of perfect correlation with
absenteeism in regression models (i.e. where no absenteeism was reported among students
in the same school), 68 boys and 90 girls from schools with fewer than 15 male or female
observations, respectively, were additionally omitted. Where possible, missing values for
students’ background characteristics were recovered based on observations from previous
survey rounds, but the analytic sample excludes 172 boys and 162 girls missing one or more
covariates (see Figure 4.3). Sixty boys and 52 girls for whom the number of absence days
was missing, but for whom no reason for absenteeism was provided, were coded as not
having missed school.
20 As a result of delayed entry, temporary withdrawal from school, and grade repetition, it is common for
Malawian students to remain in primary school beyond age 14 (World Bank 2010). One survey question
(about recent economic participation) was asked only of students aged 5-20 so the analysis is restricted to
these ages.

108
School outside
Karonga district
37
Karonga district
primary school
5527
<15 male students
68
≥15 male students
5459
Missing recent
attendance data
14
Did not attend 4 wks
42
Attended past 4 wks
5403
No absences
4372
Absent past 4 weeks
859
Missing covariate
data
172
Out of school
709
Completed
primary
772
Enrolled in
primary
5566
HDSS male sample
7131
Missing school
enrolment data
84
School outside
Karonga district
45
Karonga district
primary school
4918
<15 female students
90
≥15 female students
4828
Missing recent
attendance data
17
Did not attend 4 wks
29
Attended past 4 wks
4782
No absences
3903
Absent past 4 weeks
717
Missing covariate
data
162
Out of school
888
Completed
primary
1068
Enrolled in
primary
4963
HDSS female sample
6997
Missing school
enrolment data
78
Missing school
attended
2
Figure 4.3 Flow diagram of school attendance and data availability of boys (left) and girls (right) aged 5-20 years in the Karonga Health and
Demographic Surveillance System (HDSS) survey population, 2010-11

109
4.2.3 Statistical methods
Analyses were conducted in Stata 14.2 (College Station, TX). A binary measure of any
absence from school in the past four weeks, among those who had attended at least one
day, served as the primary outcome variable. The indicator excludes the small proportion
of boys and girls who were enrolled in school but did not attend at all in the past four weeks
(see Figure 4.3). These individuals would be more appropriately considered ‘temporary
dropouts’ (Ananga 2011), whose reasons for non-attendance may differ from those students
whose absences were more short-term in nature.
Independent variables included the five socioeconomic dimensions shown in Figure 4.1:
agricultural wealth, non-agricultural wealth, household credit access, parental education,
and household head occupation. Two asset indices were generated using principal
components analysis (PCA) (Howe et al. 2008; Vyas and Kumaranayake 2006) to capture
household and agricultural wealth, respectively. The household wealth index included
ownership of 15 durable goods,21 a variable indicating the household’s ability to buy
bathing soap in the past four weeks, and eight measures of housing quality, based on
classifications used in the 2010 Malawi Demographic and Health Survey (National
Statistical Office and ICF Macro 2011).22 Continuous variables, such as the number of
rooms per household member, were normalised between 0 and 1 and combined with the
remaining binary variables in the PCA. The resultant asset score was divided into quintiles
representing increasing household wealth.
The second index captured agricultural wealth by combining the number of land plots
owned and cultivated by the student’s household; the number of plots cultivated but not
owned; sales of maize, rice and groundnut crops; ownership of cattle, chicken, goats, pigs,
ducks, and doves; and ownership of a hoe, plough, panga, axe, wheelbarrow, fishing net,
canoe and oxcart. An index score was generated using PCA, from which agricultural wealth
quintiles were created.
Households with access to credit were defined as those that received a loan from a bank,
21 These 15 goods were: table, chairs, clock, bed, mattress, radio, bicycle, sewing machine, mobile phone,
tape/CD player, electric fan, iron, television, refrigerator and clay water pot. 22 The eight measures of housing quality were: dwelling ownership, number of rooms per household member,
finished walls, concrete floor, iron roof, VIP latrine or flush toilet, improved water source, and access to
electricity.

110
microcredit institution or employer in the past year, or those in which one or more members
belonged to a savings group. We recognise that this indicator is neither an exhaustive
measure of a household’s borrowing options, nor entirely exogenous, since households who
are most concerned with ensuring that their children do not miss school may also be most
likely to take measures to mitigate against income-related absences (Hazarika and Sarangi
2008). However, by extending our measure of credit access beyond just those households
that have received a bank loan, we attempt to include households with the potential to
borrow, and not only those who have exercised the possibility.
Finally, binary measures of maternal and paternal education (less than primary/completed
primary) were generated, and the principal occupation of the household head grouped to
compare farming and fishing households with other skilled and unskilled occupations.
Table A.2 in the Appendix shows the distribution of students according to each dimension
of SES, as well as tests for potential multicollinearity between the indicators. Although
each of the SES measures was significantly associated with household wealth, the pairwise
correlation coefficients, as well values of the variance inflation factor (VIF) for the six
indicators in combination, suggest that sufficient variation exists to allow all six measures
to be included simultaneously in multivariable regression models without encountering
multicollinearity (Chen et al., n.d.).
Additional covariates comprised the range of characteristics listed in Figure 4.2. Individual-
level variables reflected students’ demographic characteristics, educational attainment,
orphanhood and residence status, as well as participation in economic activities in the past
four weeks. The survey defined economic activities as farming, fishing, gathering natural
products, piece work, preparing and selling food or beverages, selling goods manufactured
by the household, or providing a service. Household-level variables included the number of
household members, the number of household members younger than the index student and
the sex of the household head. Distance to school was calculated from the GPS coordinates
of each student’s household and school using the geodist command in Stata.23 Finally, we
also investigate temporal patterns in absenteeism, by generating a variable indicating the
season of interview (hot, wet or cool). The relationship of the survey respondent to the
23 Note that this variable measures the straight-line distance between the household and school and not
necessarily the actual distance students travel.

111
index student (informant type) was also recorded, but was not ultimately included in
regression models due to overlap with the relationship to household head.
Following a descriptive exploration of absenteeism prevalence and reported reasons for
missing school, two-level logistic regression models estimate the individual- and
household-level correlates of absenteeism in the past four weeks. Models were conducted
in a stepped fashion to investigate the relationship between the six socioeconomic
indicators and absenteeism 1) in isolation, 2) in combination and 3) upon conditioning for
other background characteristics. Covariates were measured contemporaneously with
absenteeism. Correlation of observations within households was accounted for in
regression models by including household random effects, which also allows for
examination of heterogeneity among households. In order to assess gendered patterns of
absenteeism, separate male and female regression models were estimated.
4.3 Results
4.3.1 Descriptive findings
Table 4.1 compares the characteristics of boys and girls in the analytic sample. Female
students were significantly younger than their male counterparts, attended earlier standards,
and were less likely to have repeated their current standard. A slightly but significantly
higher proportion of boys than girls undertook economic activities in the previous four
weeks (17.8% vs. 15.8%, p=0.007), and the activities in which students engaged also
significantly differed along gendered lines. The majority of both boys and girls who
participated in economic activities engaged in farming, but a higher proportion of boys did
so than girls (85.6% vs 79.0%). Boys were also more likely to take part in piece work and
fishing, while girls were more likely to provide a service, gather natural products, and
prepare or sell food or beverages.
At the household level, most household heads were male and engaged in subsistence
farming, but girls were slightly more likely than boys to live in households with heads in
skilled occupations. With respect to interview characteristics, most surveys were
administered during the wet season (December-April), with comparatively few occurring
during the hot season at the start of the school year. The vast majority of survey responses
were provided by household proxy respondents, as opposed to students themselves.

112
Table 4.1 Characteristics of primary school students aged 5-20 who attended at least
one school day in the past 4 weeks Boys (N=5231) Girls (N=4620)
Socioeconomic characteristics n % n % Household wealth quintile
Lowest 1,069 20.4 903 19.5 2 1,079 20.6 912 19.7 3 1,047 20.0 926 20.0 4 1,043 19.9 929 20.1 Highest 993 19.0 950 20.6
Agricultural wealth quintile †
Lowest 995 19.0 964 20.9 2 1,029 19.7 934 20.2 3 1,048 20.0 931 20.2 4 1,079 20.6 904 19.6 Highest 1,080 20.6 887 19.2
Household access to credit (bank loan or savings group) No 4,149 79.3 3,630 78.6 Yes 1,082 20.7 990 21.4
Father's education None/primary 3,221 61.6 2,801 60.6 Post-primary 2,010 38.4 1,819 39.4
Mother's education None/primary 4,418 84.5 3,864 83.6 Post-primary 813 15.5 756 16.4
Occupation of household head **
Subsistence farmer/herder 3,553 67.9 3,058 66.2 Fisherman 266 5.1 215 4.7 Other non-skilled 726 13.9 636 13.8 Skilled 557 10.6 610 13.2 Not working 129 2.5 101 2.2
Individual characteristics Age (years) ***
5-11 3,116 59.6 2,997 64.9 12-14 1,216 23.2 1,132 24.5 ≥15 899 17.2 491 10.6
Standard *
1-4 3,205 61.3 2,807 60.8 5-7 1,520 29.1 1,427 30.9 8 506 9.7 386 8.4
Repeated current standard ***
No 3,507 67.0 3,355 72.6 Yes 1,724 33.0 1,265 27.4
Father died No 4,598 87.9 4,099 88.7 Yes 633 12.1 521 11.3
Mother died No 4,977 95.1 4,418 95.6 Yes 254 4.9 202 4.4

113
Table 4.1 continued Characteristics of primary school students aged 5-20 who attended
at least one school day in the past 4 weeks Boys (N=5231) Girls (N=4620)
n % n %
Relationship to household head ***
Child 3,890 74.4 3,297 71.4 Step-child 133 2.5 162 3.5 Grandchild 862 16.5 769 16.6 Other 345 6.6 392 8.5
Economic participation past 4 weeks **
None 4,300 82.2 3,892 84.2 Yes 931 17.8 728 15.8
Primary economic activity, among those with economic participation ***
Farming 797 85.6 575 79.0 Providing a service 35 3.8 57 7.8 Buying/selling other people's products 28 3.0 33 4.5 Fishing 16 1.7 0 0.0 Piece work 14 1.5 4 0.5 Gathering natural products 6 0.6 11 1.5 Preparing/selling food/beverages 17 1.8 31 4.3 Selling own goods 7 0.8 8 1.1 Other 3 0.3 1 0.1 Unknown/missing 8 0.9 8 1.1
Household characteristics Number of household members
1-4 763 14.6 694 15.0 5-8 3,598 68.8 3,189 69.0 ≥9 870 16.6 737 16.0
Number of younger residents *
0-1 2011 38.4 1,818 39.4 2-3 2,327 44.5 2,102 45.5 ≥4 893 17.1 700 15.2
Sex of household head Male 4,305 82.3 3,778 81.8 Female 926 17.7 842 18.2
Distance to school †
<1 km 2,887 55.2 2,567 55.6 1-2 km 1,745 33.4 1,590 34.4 >2 km 599 11.5 463 10.0
Season of interview Hot (Sept-Nov) 848 16.2 696 15.1 Wet (Dec-Apr) 2,779 53.1 2,478 53.6 Cool (May-Aug) 1,604 30.7 1,446 31.3
Survey Informant type *
Self 87 1.7 106 2.3 Parent 3,781 72.3 3,248 70.3 Other 1,363 26.1 1,266 27.4
† p<0.1 * p<0.05 ** p<0.01 *** p<0.001
Notes: Excludes 37 boys and 45 girls were enrolled in schools outside Karonga district; 68 boys and 90
girls were attending schools with fewer than 15 male and female observations, respectively, in the
catchment area; and 172 boys and 162 girls missing one or more characteristic. P-values refer to chi-
squared tests for independence of the distributions across categories between boys and girls.

114
Table 4.2 shows the prevalence of school absenteeism among male and female students
enrolled in primary school in Karonga district. Among those who had attended school in
the four weeks preceding the survey, 16.0% (16.4% of boys, 15.5% of girls) missed one or
more days during this period. Most of these students missed four days or fewer, but
approximately one-fifth missed five or more. No significant gender differences were
observed in either the prevalence of absenteeism or the number of school days missed.
The reasons reported for missing school were also very similar for boys and girls. The
majority of absences for both sexes were attributed to illness (72.3% for boys, 75.7% for
girls), while considerably smaller proportions were ascribed to lack of money for transport,
meals or school supplies and to lack of interest in school. Absences attributed to household
chores were consistently low, as were those attributed to participation in economic
activities, although a significantly higher proportion of boys than girls were absent for the
latter reason (1.9% versus 0.7%, p=0.04).
Table 4.2 Prevalence of and primary reason for primary school
absenteeism in the past 4 weeks; n(%)
Boys
(N=5231)
Girls
(N=4620)
Missed ≥1 day 859 (16.4) 717 (15.5)
Number of days missed (among absentees)
1 169 (19.7) 164 (22.9)
2-4 505 (58.8) 405 (56.5)
≥5 185 (21.5) 148 (20.6)
Primary reason for missing school
Illness (own) 621 (72.3) 543 (75.7)
No money transport/meals/supplies 59 (6.9) 44 (6.1)
No interest in school 43 (5.0) 35 (4.9)
Parental illness/death 32 (3.7) 24 (3.4)
Economic activities 16 (1.9) 5 (0.7)
Household chores 10 (1.2) 12 (1.7)
Caregiving, household child 12 (1.4) 7 (1.0)
Caregiving, household adult 7 (0.8) 3 (0.4)
Other 42 (4.9) 36 (5.0)
Reason missing 17 (2.0) 8 (1.1)
† p<0.1 * p<0.05 ** p<0.01 *** p<0.001 Notes: Respondents could list up to two reasons for absence but multiple reasons
were provided for only 14 (1.6%) boys and 16 girls (2.2%). The table includes only
the first, or most important, reason listed. The ‘other’ category includes no money
for fees, distance to school, suspension from school, poor school quality, household
instability, and other unspecified responses. No significant differences were found
in chi-squared tests for independence of absence days or reasons by sex.

115
Figure 4.4 explores temporal patterns in school attendance reporting by presenting
absenteeism prevalence for boys and girls, as well as corresponding reasons reported for
missing school, according to month of interview. The superimposed seasonal boundaries
indicate that absenteeism was highest among households interviewed during the hot season
at the start of the school year, as well as those interviewed in the middle of the rainy season.
The figure also investigates the extent to which reporting of absenteeism may be influenced
by the timing of survey administration relative to school holidays. Although the survey
question explicitly specified absences during the most recent four weeks that school was in
session, there is some evidence—particularly around the December break—that reporting
of absenteeism was lower during or closely following a school holiday. This could reflect
a genuine improvement in attendance in the weeks surrounding a school break, that
respondents included school holidays in the four-week absenteeism reporting period thus
reducing the window of risk, or that respondents forgot about episodes of absenteeism when
it was longer ago.
4.3.2 Regression results
Table 4.3 presents unadjusted (Model 1) and adjusted (Models 2 and 3) odds ratios for
absenteeism in the past four weeks among girls and boys who attended at least one day of
school during that period. Several of the SES indicators demonstrated strong and significant
associations with student absenteeism across all three model specifications, but in opposite
directions. After adjusting for all other covariates, absenteeism decreased with household
wealth quintile for both boys and girls (boys adjusted odds ratio (AOR) 0.86 [95%
confidence interval (CI) 0.75-0.98]; girls AOR 0.84 [0.72-0.96]). Household credit access,
too, was consistently associated with lower absenteeism for both boys and girls (boys AOR
0.53 [0.35-0.80]; girls AOR 0.60 [0.39-0.93]), although the relationship was slightly
attenuated relative to the unadjusted model. By contrast, absenteeism increased with
agricultural wealth quintile (boys AOR 1.24 [1.09-1.41]; girls AOR 1.34 [1.17-1.54]).
Absenteeism was also higher in unadjusted models among students living in households in
which the primary occupation of the household head was in agriculture, and among boys
with less educated fathers, but these effects did not persist once other socioeconomic
indicators were included in Model 2.

116
A number of relationships with other individual- and household-level characteristics are
also notable. Firstly, boys—but not girls—who were attending standard 8 were signficantly
less likely to miss school relative to students in the four earliest standards (AOR 0.38 [0.20-
0.74]), but students of both sexes who had repeated their current standard were more likely
Figure 4.4 Prevalence of and principal reason reported for missing school in
the past four weeks, by sex and interview month
Notes: Grey boxes indicate periods of school holiday: 11 December 2010-2 January 2011, 9
April 2011-24 April 2011, 9 July 2011-4 September 2011. Brackets designate approximate
seasonal boundaries: hot (September-November), wet (December-April), and cool (May-
August). Reasons for absence were not provided for 17 boys and 8 girls.

117
to be absent (boys AOR 1.28 [0.98-1.66]; girls AOR 1.31 [0.96-1.76]). Boys who had
participated in economic activities in the previous two weeks were considerably more likely
to miss school than those who had not (AOR 1.83 [1.29-2.60]), but there was no association
for girls in the multivariable model.
At the household level, girls and boys in households with nine or more members were
significantly less likely to miss school than students from the smallest households. The
number of younger household members was additionally associated with absenteeism for
girls: female students living with four or more younger children were significantly more
likely to be absent than those with one or none (AOR 1.73 [1.02-2.94]). For girls, but not
boys, living more than 1 km from school was associated with increased absenteeism.
Echoing the descriptive findings, some seasonal patterns in absenteeism were also
observed, with students from households interviewed during the wet season (boys only)
and the cool season (girls and boys) significantly less likely to miss school than those
interviewed during the hot season. The values of rho from Model 3 show that household-
level variance contributed 65% and 67% of the total variance in absenteeism by boys and
girls, respectively, thus demonstrating the importance of accounting for household effects
even after adjusting for all covariates.
In light of the finding from Figure 4.4 that reporting of absenteeism may differ according
to proximity to school holidays, we performed a sensitivity analysis to compare levels and
determinants of absenteeism in the full sample with those in the subset of students
interviewed four or more weeks after a school break. The overall prevalence of absenteeism
increased for boys from 16.4% in the full sample to 18.9% in the subsample and for girls
from 15.5% to 18.4%. Indeed, combining both sexes, the difference in absenteeism
prevalence between those interviewed during or within four weeks after a school holiday
(11.9%) and those interviewed four or more weeks after a school break (18.7%) was
striking and highly significant (p<0.001). Decreasing the analytic sample to include only
the latter group altered the seasonal distribution of interviews and reduced the precision of
estimates, but yielded few substantive differences compared to the full models (see
Appendix Table A.3). The positive relationship between absenteeism and agricultural
wealth and the negative relationship with household credit access remained strong and
robust for both sexes. The negative association between absenteeism and household wealth
also persisted, but lost statistical significance in Models 1 and 3.

118
Table 4.3 Results from two-level logistic regression models estimating primary school
absenteeism in the past four weeks, by sex
Boys (N=5231)
Absent past
4 weeks;
n(%)
Model 1: Unadjusted Model 2: Adjusted
SES only
Model 3: Adjusted
all factors
OR (95% CI) AOR (95% CI) AOR (95% CI)
Socioeconomic factors
Household wealth quintile 0.86 (0.77-0.95) ** 0.83 (0.73-0.94) ** 0.86 (0.75-0.98) *
Lowest 184 (17.2)
2 196 (18.2)
3 191 (18.2)
4 153 (14.7)
Highest 135 (13.6)
Agricultural wealth quintile 1.29 (1.16-1.44) *** 1.34 (1.19-1.51) *** 1.24 (1.09-1.41) **
Lowest 119 (12.0)
2 158 (15.4)
3 165 (15.7)
4 193 (17.9)
Highest 224 (20.7)
Household credit access
No 738 (17.8) 1 1 1 Yes 121 (11.2) 0.41 (0.28-0.61) *** 0.49 (0.32-0.73) ** 0.53 (0.35-0.80) **
Father's education
None/primary 563 (17.5) 1 1 1 Post-primary 296 (14.7) 0.72 (0.54-0.96) * 0.89 (0.65-1.22) 0.97 (0.70-1.34)
Mother's education
None/primary 724 (16.4) 1 1 1 Post-primary 135 (16.6) 0.97 (0.66-1.41) 1.36 (0.91-2.04) 1.43 (0.95-2.17) †
Occupation of household head
Subsistence farmer/herder 631 (17.8) 1 1 1 Fisherman 39 (14.7) 0.64 (0.32-1.28) 0.82 (0.41-1.64) 1.49 (0.70-3.18) Other non-skilled 108 (14.9) 0.63 (0.41-0.99) * 0.89 (0.56-1.41) 1.00 (0.62-1.62) Skilled 67 (11.8) 0.46 (0.27-0.77) ** 0.82 (0.47-1.44) 0.92 (0.52-1.62) Not working 15 (11.6) 0.50 (0.18-1.35) 0.57 (0.21-1.53) 0.70 (0.25-1.97)
Individual factors
Age group (years)
5-11 502 (16.1) 1 1 12-14 223 (18.3) 1.24 (0.94-1.63) 1.26 (0.85-1.85) ≥15 134 (14.9) 1.00 (0.72-1.39) 1.29 (0.75-2.22)
Current standard
1-4 546 (17.0) 1 1 5-7 257 (16.9) 1.13 (0.87-1.46) 0.88 (0.59-1.30) 8 56 (11.1) 0.54 (0.34-0.85) ** 0.39 (0.20-0.74) **
Repeated current standard
No 546 (15.6) 1 1 Yes 313 (18.2) 1.37 (1.06-1.77) * 1.28 (0.98-1.66) †
Father died
No 761 (16.6) 1 1 Yes 98 (15.5) 0.89 (0.60-1.32) 1.13 (0.71-1.79)

119
Table 4.3 continued Results from two-level logistic regression models estimating primary school
absenteeism in the past four weeks, by sex
Boys (N=5231)
Absent past
4 weeks;
n(%)
Model 1:
Unadjusted
Model 2: Adjusted
SES only
Model 3: Adjusted
All factors OR (95% CI) AOR (95% CI) AOR (95% CI)
Mother died
No 822 (16.5) 1 1
Yes 37 (14.6) 0.67 (0.36-1.24) 0.73 (0.38-1.39)
Relationship to household head
Child 661 (17.0) 1 1 Step-child 23 (17.3) 0.91 (0.41-2.04) 0.96 (0.42-2.17) Grandchild 126 (14.6) 0.79 (0.54-1.15) 0.96 (0.63-1.48) Other 49 (14.2) 0.68 (0.40-1.14) 0.77 (0.44-1.35)
Economic participation in past 4 weeks
No 652 (15.2) 1 1 Yes 207 (22.2) 1.99 (1.44-2.74) *** 1.83 (1.29-2.60) **
Household factors
Number of household members
1-4 133 (17.4) 1 1 5-8 619 (17.2) 0.94 (0.64-1.37) 0.86 (0.55-1.36) ≥9 107 (12.3) 0.47 (0.27-0.81) ** 0.42 (0.22-0.81) *
Number of younger residents
0-1 334 (16.6) 1 2-3 378 (16.2) 0.93 (0.72-1.21) 0.91 (0.67-1.23) ≥4 147 (16.5) 1.09 (0.76-1.57) 1.01 (0.63-1.62)
Sex of household head
Male 730 (17.0) 1 1 Female 129 (13.9) 0.66 (0.44-0.98) * 0.74 (0.46-1.18)
Distance to school (km)
<1 km 470 (16.3) 1 1 1-2 km 271 (15.5) 1.02 (0.75-1.40) 0.81 (0.58-1.14) >2 km 118 (19.7) 1.40 (0.91-2.14) 1.20 (0.74-1.94)
Season of interview
Hot (Sept-Nov) 193 (22.8) 1 1 Wet (Dec-Apr) 468 (16.8) 0.48 (0.32-0.72) *** 0.42 (0.25-0.71) **
Cool (May-Aug) 198 (12.3) 0.25 (0.16-0.39) *** 0.18 (0.08-0.39) ***
School fixed effects No No Yes
sigma_u 2.55 (2.21-2.93) 2.47 (2.14-2.86) rho 0.66 (0.60-0.72) *** 0.65 (0.58-0.71) *** † p<0.1 * p<0.05 ** p<0.01 *** p<0.001
Notes: All models include household random effects. Model 3 additionally includes a dummy School ID variable.
Sigma_u and rho not shown for unadjusted models.

120
Table 4.3 continued Results from two-level unadjusted and adjusted regression models estimating
primary school absenteeism in the past four weeks, by sex Girls (N=4620)
Absent past
4 weeks;
n(%)
Model 1:
Unadjusted
Model 2: Adjusted
SES only
Model 3: Adjusted
All factors
OR (95% CI) AOR (95% CI) AOR (95% CI)
Socioeconomic factors
Household wealth quintile 0.84 (0.75-0.95) ** 0.80 (0.70-0.92) ** 0.84 (0.72-0.96) *
Lowest 152 (16.8)
2 154 (16.9)
3 160 (17.3)
4 146 (15.7)
Highest 105 (11.1)
Agricultural wealth quintile 1.35 (1.20-1.52) *** 1.39 (1.23-1.59) *** 1.34 (1.17-1.54) ***
Lowest 109 (11.3)
2 125 (13.4)
3 149 (16.0)
4 151 (16.7)
Highest 183 (20.6)
Household credit access
No 610 (16.8) 1 1 1
Yes 107 (10.8) 0.47 (0.31-0.72) *** 0.55 (0.36-0.84) ** 0.60 (0.39-0.93) *
Father's education
None/primary 448 (16.0) 1 1 1
Post-primary 269 (14.8) 0.93 (0.68-1.27) 1.31 (0.93-1.84) 1.33 (0.94-1.89)
Mother's education
None/primary 614 (15.9) 1 1 1
Post-primary 103 (13.6) 0.79 (0.52-1.20) 0.99 (0.63-1.54) 1.08 (0.68-1.71)
Occupation of household head
Subsistence farmer/herder 527 (17.2) 1 1 1
Fisherman 20 (9.3) 0.29 (0.12-0.69) ** 0.39 (0.17-0.93) * 0.57 (0.23-1.42)
Other non-skilled 87 (13.7) 0.65 (0.40-1.06) † 0.93 (0.57-1.54) 1.22 (0.72-2.06)
Skilled 68 (11.1) 0.40 (0.23-0.67) ** 0.70 (0.40-1.23) 0.95 (0.53-1.69)
Not working 15 (14.9) 0.56 (0.18-1.74) 0.69 (0.23-2.11) 0.77 (0.24-2.42)
Individual variables
Age group (years)
5-11 444 (14.8) 1 1
12-14 190 (16.8) 1.32 (0.97-1.79) † 1.44 (0.93-2.23)
≥15 83 (16.9) 1.38 (0.90-2.11) 1.34 (0.71-2.53)
Current standard
1-4 441 (15.7) 1 1
5-7 217 (15.2) 1.00 (0.75-1.34) 0.80 (0.53-1.22)
8 59 (15.3) 1.26 (0.77-2.05) 1.00 (0.50-1.99)
Repeated current standard
No 496 (14.8) 1 1
Yes 221 (17.5) 1.44 (1.07-1.93) * 1.30 (0.96-1.76) †
Father died
No 641 (15.6) 1 1
Yes 76 (14.6) 0.89 (0.56-1.43) 1.05 (0.62-1.77)

121
Table 4.3 continued Results from two-level logistic regression models estimating primary school
absenteeism in the past four weeks, by sex
Girls (N=4620)
Absent past
4 weeks;
n(%)
Model 1:
Unadjusted
Model 2: Adjusted
SES only
Model 3: Adjusted
All factors
OR (95% CI) AOR (95% CI) AOR (95% CI)
Mother died
No 689 (15.6) 1 1
Yes 28 (13.9) 0.69 (0.35-1.40) 0.84 (0.41-1.74)
Relationship to household head
Child 537 (16.3) 1 1
Step-child 28 (17.3) 1.13 (0.53-2.40) 1.03 (0.47-2.23)
Grandchild 116 (15.1) 0.84 (0.56-1.27) 1.00 (0.63-1.59)
Other 36 (9.2) 0.38 (0.21-0.67) ** 0.44 (0.24-0.80) **
Economic participation in past 4 weeks
No 585 (15.0) 1 1
Yes 132 (18.1) 1.40 (0.96-2.04) † 1.01 (0.67-1.51)
Household variables
Number of household
members
1-4 100 (14.4) 1 1
5-8 530 (16.6) 1.32 (0.86-2.05) 0.92 (0.55-1.52)
≥9 87 (11.8) 0.66 (0.36-1.22) 0.40 (0.19-0.83) *
Number of younger residents
0-1 263 (14.5) 1 1
2-3 326 (15.5) 1.20 (0.89-1.61) 1.14 (0.82-1.61)
≥4 128 (18.3) 1.70 (1.13-2.57) * 1.73 (1.02-2.94) *
Sex of household head
Male 592 (15.7) 1 1
Female 125 (14.9) 0.89 (0.58-1.35) 1.13 (0.68-1.87)
Distance to school (km)
<1 km 343 (13.4) 1
1-2 km 295 (18.6) 1.83 (1.30-2.58) ** 1.87 (1.29-2.69) **
>2 km 79 (17.1) 1.62 (0.96-2.72) † 1.64 (0.93-2.89) †
Interview variable
Season of interview
Hot (Sept-Nov) 123 (17.7) 1 1
Wet (Dec-Apr) 431 (17.4) 0.92 (0.58-1.44) 1.11 (0.60-2.05)
Cool (May-Aug) 163 (11.3) 0.38 (0.23-0.64) *** 0.27 (0.12-0.62) **
School fixed effects No No Yes
sigma_u 2.66 (2.26-3.14) 2.60 (2.20-3.08)
rho 0.68 (0.61-0.75) *** 0.67 (0.59-0.74) ***
† p<0.1 * p<0.05 ** p<0.01 *** p<0.001
Notes: All models include household random effects. Model 3 additionally includes a dummy School ID variable.
Sigma_u and rho not shown for unadjusted models.

122
4.4 Discussion
Data from the 2010-11 Karonga HDSS household survey in northern Malawi show that
16% of primary school students missed school in the previous four weeks, and nearly one-
fifth of those who were absent missed five days or more. Echoing previous studies in
Malawi and elsewhere in sub-Saharan Africa (Ainsworth et al. 2005; Ezenwosu et al. 2013;
Grant et al. 2013; Mensch and Lloyd 1998; Orkin et al. 2014), no significant differences in
absenteeism prevalence between boys and girls were observed. The reported causes of
absenteeism were also very similar by sex, with the majority of absences attributed to
student illness and much smaller proportions related to financial constraints or lack of
interest in school. A slightly higher proportion of boys’ absenteeism was attributed to
economic participation than for girls, but prevalence of such absences was very low overall.
Multivariable regression analysis suggested, by contrast, a central role for socioeconomic
factors as determinants of missing school, as well as some important sex-specific
differences in the proximal and distal correlates of primary school absence. Consistent with
the ‘wealth paradox’ previously observed in rural communities (Bhalotra and Heady 2003),
absenteeism for both boys and girls was associated with increasing levels of agricultural
wealth—measured in terms of land ownership, crop sales, and productive assets—but with
decreasing levels of other socioeconomic indicators, including non-agricultural household
wealth and credit access.24 These findings demonstrate how different measures of SES act
in opposing ways, and how analysis of multiple SES dimensions produces a more complete
picture of the socioeconomic processes behind educational exclusion.
That missing school was associated with increasing levels of agricultural wealth suggests
that children engage in farm work, or domestic activities that compensate for others’ farm
work, which compete with school attendance. Several other results support this narrative.
Peaks in absenteeism reporting, particularly in the hot season and mid-rainy season,
correspond to periods of high agricultural labour demand associated with planting and
harvest. Moreover, participation in economic activities such as farming, fishing and
gathering of natural products, was significantly associated with missing school for boys
24 The theoretical model subsequently developed by Basu et al. (2010) suggests that there exists a threshold
above which increased land ownership will not lead to greater child labour, even in the market conditions
described by Bhalotra and Heady (2003). Such threshold effects were not observed with respect to agricultural
wealth index score and school absenteeism.

123
(but not for girls). Overall, a slightly higher proportion of boys than girls was reported to
participate in economic activities, which is perhaps surprising given that time use research
in Malawi has shown that women and girls undertake more hours of work than do men and
boys (Webbink et al. 2012; Wodon and Beegle 2006). However, a substantial proportion
of female labour, particularly at younger ages, is devoted to tasks including cooking,
laundry and cleaning, which were not included in the economic activities solicited by the
HDSS survey question. This could thus explain why no relationship between economic
participation and school attendance was observed among female students.
On the other hand, girls in households with four or more younger residents were
significantly more likely to miss school than were counterparts living with one or no
younger children, suggesting that older girls may be tasked with caring for younger
siblings, to the detriment of their school attendance. It may also indicate that older girls
contribute a greater share of other household tasks (Edmonds 2006), or sacrifice their own
schooling needs to help support younger children (Pridmore and Jere 2011). Grant et al.
(2013) similarly found a significant positive association between a student’s number of
siblings and absenteeism among girls in southern Malawi. For both boys and girls,
absenteeism was significantly lower in households with nine or more members, relative to
those with 1-4 members, perhaps reflecting more thinly distributed work burdens in larger
households, which result in less disruption to children’s school attendance (Johnston et al.
2015; Wittenberg 2005).
The significant relationship between decreasing household wealth and missing school
suggests that monetary poverty additionally plays a role in preventing children’s school
attendance. While the higher opportunity cost of schooling among poor households may
further explain students’ participation in household work and income-generating activities,
monetary poverty constrains households’ ability to meet the financial costs associated with
schooling. Lack of school uniform (Pridmore and Jere 2011), expenses on pens and
notebooks (Kadzamira and Rose 2003) or transport costs (Porter et al. 2011) have all been
linked with school absenteeism in other Malawian studies.
That household credit access was associated with lower propensity to miss school implies
that credit helps households weather the financial burden attached to school attendance,
including unexpected income shocks that have been shown to result in students’

124
absenteeism or permanent withdrawal (Amendah et al. 2014; Dillon 2013). However, we
cannot rule out that savings group membership or receipt of loans simply reflect improved
access to financial institutions among some households, or else unmeasured household
characteristics, including diligence and foresight, which contribute to favourable
educational outcomes.
Although the regression results provide compelling evidence of a relationship between
absenteeism and household SES, only 6.5% of absences were attributed by HDSS survey
respondents to lack of funds for schooling expenses and just 2.7% to household chores or
economic work. By contrast, 73.8% were reportedly caused by student illness. There can
be no doubt that poor health represents an important barrier to school attendance, given the
range of epidemiological studies that have linked illness to absenteeism in sub-Saharan
Africa (Brooker et al. 2000; de Clerq et al. 1998; Ezenwosu et al. 2013; Ibekwe et al. 2007;
Mushi et al. 2012; Mustapha et al. 2013; Ofovwe and Ofili 2010; Ogunfowora et al. 2005;
Thuillez et al. 2010; Trape et al. 1993; Wolka et al. 2013). Without data about students’
health status we can cannot corroborate episodes of illness-related absence, but the
observed discrepancy between reported reasons for missing school and the statistical
correlates of absenteeism may reflect relative over-reporting of illness-related absences and
under-reporting of economically-driven absences, particularly those associated with child
labour. In particular, survey respondents may have adjusted their reporting to conform to
societal expectations about what constitutes an ‘acceptable’ reason for missing school
(Kelly et al. 2013). Although child labour is not itself socially proscribed in many parts of
sub-Saharan Africa (Dillon et al. 2012), missing school in order to work would generally
be looked upon less favourably: in schools visited by the first author in the HDSS catchment
area, absences related to illness were much less likely to be met with sanctions than were
absences for other reasons, which may also encourage survey participants to attribute recent
absences to ill health.
Given that the reasons for absenteeism were typically provided by an adult informant as
opposed to the student him/herself, the reliance on proxy reporters—who may lack
knowledge about the daily activities of all household children, or wish to portray them in a
particular light—could represent an additional source of reporting bias. A recent study from
Peru that compared child and proxy reporting of child labour found a discrepancy of 17
percentage points in nationally-representative child labour statistics, with parents

125
systematically underreporting child labour relative to children (Dammert and Galdo 2013).
However, a similar interview experiment from Tanzania did not find any significant
differences between self and proxy reports in either the amount or type of child labour
(Dillon et al. 2012).
This study’s reliance on survey data may have affected prevalence estimates of absenteeism
as well. A methodological analysis by Baird and Özler (2012) found that adolescent girls
in Malawi overstated their school enrolment and attendance relative to administrative data
from a cash transfer experiment and attendance registers maintained by schools. Equally,
Barrera-Osorio et al. (2011) showed in a Colombian cash transfer experiment that self-
reported attendance and enrolment figures were consistently higher than in monitored
attendance and administrative enrolment data. Although incentives to inflate attendance
reporting are likely to be higher in the context of a programme or intervention than in
household-based survey research, it remains possible that survey participants under-
reported absenteeism.
As the absenteeism survey question covered the previous four weeks that school was in
session, participant recall may have proved additionally problematic. We saw, for instance,
that reporting of absenteeism was lower in interviews conducted during school holidays,
particularly in December. Although excluding interviews from within four weeks of
holiday periods did not change the nature of regression results, the discrepancy in the
prevalence of absenteeism suggests that respondents may have failed to remember or report
episodes of absenteeism from weeks prior to a school break. Ultimately, without an
objective measure of attendance—such as physical spot checks or well-kept school
registers—it is difficult to assess the extent or direction of reporting bias. If misreporting
did occur, however, it is more likely to produce underestimates of absenteeism, so the
results presented here can perhaps best be considered a lower bound.
This study would have benefited from detailed time use data with which to examine the
relative burdens posed by household responsibilities or economic activities, and
particularly agricultural work. We were also missing measures of student aptitude or
aspirations, as well as community characteristics including value of schooling or labour
market conditions, which influence decision-making surrounding school attendance and
time allocation (Burke and Beegle 2004). However, factors such as grade repetition,

126
parental education and occupation, which were included in regression models, may proxy
for some of these unmeasured characteristics. Notably, girls and boys who had repeated
their current standard were significantly more likely to miss school, suggesting that
absenteeism is indeed related to poor school performance. Conversely, boys in standard 8
were much less likely to miss school than their counterparts in lower grades, presumably
because of the importance of the Primary School Leaving Certificate of Education exam
for determining secondary school entry. This same pattern, though, was not observed for
female students, which could reflect selectivity in the female sample: given that dropout is
higher among girls than boys in late adolescence (Sabates et al. 2010), it is possible that
girls who faced barriers to regular school attendance—or were less motivated to attend
school—had already dropped out in earlier standards. Indeed, Table 4.1 indicates that
female students in the HDSS were younger, less likely to attend standard 8, and less likely
to have repeated their current standard.
It should finally be noted that, given the cross-sectional nature of the analysis, and
acknowledged limitations with respect to variable range, the potential endogeneity of SES
and school attendance is not accounted for here. Our results provide an indication of the
relationship between socioeconomic factors and students’ absenteeism, but causal
inferences should be drawn with caution.
4.5 Conclusion
While this paper confirms the oft-cited link between monetary poverty and school
absenteeism, it highlights that primary school absenteeism in Malawi is not restricted to
children from the poorest households if multiple dimensions of SES are considered.
Students who scored poorly on the household wealth index were more likely to miss school,
but so too were students in households with high levels of agricultural wealth.
These findings have a number of implications. Firstly, when conceptualising the link
between SES and school attendance, nuanced analysis is required. Exclusive reliance on a
single indicator of SES produces a limited picture of the multiple socioeconomic
mechanisms that drive educational exclusion. By extension, when designing interventions
such as cash transfer schemes that aim to reduce the opportunity cost of schooling, careful
attention should be paid both to appropriately targeting recipient households and to the
potential (and unintended) impact on child labour when cash transfers increase investments

127
in agricultural assets (Covarrubias et al. 2012). Even when increased work demands do not
reduce school attendance, they may nevertheless negatively affect students’ educational
performance through injury, fatigue, or lack of time to study (Hazarika and Sarangi 2008;
Heady 2003).
This analysis has also highlighted the importance of individual- and household-level factors
as barriers to school attendance. While schools remain effective sites for delivery of
programmes to reduce absenteeism, school-based interventions should acknowledge the
constraints students face at home. Adjusting the school calendar so that it does not conflict
with periods of high labour demand, or designing more flexible means of curriculum
delivery, represent possible options for accommodating the needs of children living in
agricultural communities (Kadzamira and Rose 2003; Orkin 2012; Pridmore and Jere
2011).
Finally, this research has demonstrated the need for critical reflection regarding the
potential omissions and biases inherent in household survey data. Better collection and
monitoring of administrative attendance data would help not only to keep track of
absenteeism levels in a more systematic way, but could be used to identify students at risk
of subsequent adverse schooling outcomes, allowing for targeted interventions.

128
Acknowledgements
Data collection for the Karonga Health and Demographic Surveillance System was funded
by a Wellcome Trust programme grant (grant numbers 079828/Z/06 and 096249/Z/11).
The first author’s doctoral studies were additionally supported by the Bloomsbury Colleges
PhD Studentship and the London School of Hygiene and Tropical Medicine Research
Degree Travelling Scholarship. The authors thank the Karonga HDSS field team, data
officers and all survey participants.

129
References
Abadzi, H. 2004. Education for all or just for the smartest poor? Prospects 34(3): 271-289.
Ainsworth, M., K. Beegle & G. Koda 2005. The impact of adult mortality and parental deaths on
primary schooling in north-western Tanzania. The Journal of Development Studies 41(3):
412-439. doi: 10.1080/0022038042000313318.
Amendah, D.D., S. Buigut & S. Mohamed 2014. Coping strategies among urban poor: Evidence
from Nairobi, Kenya. PLOS ONE 9(1): e83428. doi: 10.1371/journal.pone.0083428.
Ananga, E.D. 2011. Typology of school dropout: The dimensions and dynamics of dropout in
Ghana. International Journal of Educational Development 31: 374-381. doi: 10.1016/
j.ijedudev.2011.01.006.
Baird, S. & B. Özler 2012. Examining the reliability of self-reported data on school participation.
Journal of Development Economics 98: 89-93. doi: 10.1016/j.jdeveco.2011.05.006.
Barrera-Osorio, F., M. Bertrand, L.L. Linden & F. Perez-Calle 2011. Improving the design of
conditional transfer programs: Evidence from a randomized education experiment in
Colombia. American Economic Journal: Applied Economics 3(2): 167-195. doi: 10.1257/
app.3.2.167.
Basu, K., S. Das & B. Dutta 2010. Child labor and household wealth: Theory and empirical
evidence of an inverted-U. Journal of Development Economics 91(1): 8-14. doi: 10.1016/
j.jdeveco.2009.01.006.
Belachew, T., C. Hadley, D. Lindstrom, A. Gabremariam, C. Lachat & P. Kolsteren 2011. Food
insecurity, school absenteeism and educational attainment of adolescents in Jimma Zone
Southwest Ethiopia: a longitudinal study. Nutrition Journal 10(29).
Bhalotra, S. & C. Heady 2003. Child farm labor: The wealth paradox. The World Bank Economic
Review 17(2): 197-227. doi: 10.1093/wber/lhg017.
Brooker, S., H. Guyatt, J. Omumbo, R. Shretta, L. Drake & J. Ouma 2000. Situation analysis of
Malaria in school-aged children in Kenya – What can be done? Parasitology Today 16(5):
183-186. doi: 10.1016/S0169-4758(00)01663-X.
Burke, K. & K. Beegle 2004. Why children aren't attending school: The case of northwest Tanzania.
Journal of African Economies 13(2): 333-355. doi: 10.1093/jae/ejh011.
Chen, X., P. Ender, M. Mitchell & C. Wells. Logistic Regression Diagnostics. UCLA: Statistical
Consulting Group. Available from: http://www.ats.ucla.edu/stat/stata/webbooks/
logistic/chapter3/statalog3.htm [Accessed 11 Nov 2016].
Chimombo, J. 2009. Changing patterns of access to basic education in Malawi: A story of a mixed
bag? Comparative Education 45(2): 297-312. doi: 10.1080/03050060902921003.
Chisamya, G., J. DeJaeghere, N. Kendall & M.A. Khan 2012. Gender and Education for All:
Progress and problems in achieving gender equity. International Journal of Educational
Development 32(6): 743-755. doi: 10.1016/j.ijedudev.2011.10.004.
Cockburn, J. & B. Dostie 2007. Child work and schooling: The role of household asset profiles and
poverty in rural Ethiopia. Journal of African Economies 16(4): 519-563. doi: 10.1093/jae/
ejl045.
Covarrubias, K., B. Davis & P. Winters 2012. From protection to production: Productive impacts
of the Malawi Social Cash Transfer scheme. Journal of Development Effectiveness 4(1):
50-77. doi: 10.1080/19439342.2011.641995.

130
Crampin, A.C., A. Dube, S. Mboma, A. Price, M. Chihana, A. Jahn, et al. 2012. Profile: The
Karonga Health and Demographic Surveillance System. International Journal of
Epidemiology 41: 676-685. doi: 10.1093/ije/dys088.
Dammert, A.C. & J. Galdo 2013. Child labor variation by type of respondent: Evidence from a
large-scale study. World Development 51: 207-220. doi: 10.1016/j.worlddev.2013.06.002.
de Clerq, D., M. Sacko, J. Behnke, F. Gilbert & J. Vercruysse 1998. The relationship between
Schistosoma haematobium infection and school performance and attendance in Bamako,
Mali. Annals of Tropical Medicine & Parasitology 92(8): 851-858.
de Hoop, J. 2011. Selective schools and education decisions: Evidence from Malawi. Working
Paper. Tinbergen Institute and VU University Amsterdam.
Dillon, A. 2013. Child labour and schooling responses to production and health shocks in northern
Mali. Journal of African Economies 22(2): 276-299. doi: 10.1093/jae/ejs025.
Dillon, A., E. Bardasi, K. Beegle & P. Serneels 2012. Explaining variation in child labor statistics.
Journal of Development Economics 98(1): 136-147. doi: 10.1016/j.jdeveco.2011.06.002.
Dreibelbis, R., L.E. Greene, M.C. Freeman, S. Saboori, R.P. Chase & R. Rheingans 2013. Water,
sanitation, and primary school attendance: A multi-level assessment of determinants of
household-reported absence in Kenya. International Journal of Educational Development
33: 457-465. doi: 10.1016/j.ijedudev.2012.07.002.
Edmonds, E.V. 2006. Understanding sibling differences in child labor. Journal of Population
Economics 19(4): 795-821. doi: 10.1007/s00148-005-0013-3.
Ersado, L. 2005. Child labor and schooling decisions in urban and rural areas: Comparative
evidence from Nepal, Peru, and Zimbabwe. World Development 33(3): 455-480. doi:
10.1016/j.worlddev.2004.09.009.
Evans, D.K. & E. Miguel 2007. Orphans and schooling in Africa: A longitudinal analysis.
Demography 44(1): 35-57.
Ezenwosu, O.U., I.J. Emodi, A.N. Ikefuna, B.F. Chukwu & C.D. Osuorah 2013. Determinants of
academic performance in children with sickle cell anaemia. BMC Pediatrics 13: 189. doi:
10.1186/1471-2431-13-189.
Filmer, D. 2005. Gender and wealth disparities in schooling: Evidence from 44 countries.
International Journal of Educational Research 43(6): 351-369. doi:
10.1016/j.ijer.2006.06.012.
Floyd, S., A.C. Crampin, J.R. Glynn, N. Madise, M. Mwenebabu, S. Mnkhondia, et al. 2007. The
social and economic impact of parental HIV on children in northern Malawi: Retrospective
population-based cohort study. AIDS Care 19(6): 781-790. doi: 10.1080/
09540120601163227.
Floyd, S., A. Molesworth, A. Dube, A.C. Crampin, R. Houben, M. Chihana, et al. 2013.
Underestimation of HIV prevalence in surveys when some people already know their
status, and ways to reduce the bias. AIDS 27(2): 233-242. doi: 10.1097/
QAD.0b013e32835848ab.
Galobardes, B., J. Lynch & G.D. Smith 2007. Measuring socioeconomic position in health research.
British Medical Bulletin 81-82(1): 21-37. doi: 10.1093/bmb/ldm001.
Grant, M., C. Lloyd & B. Mensch 2013. Menstruation and school absenteeism: Evidence from rural
Malawi. Comparative Education Review 57(2): 260-284.
Grant, M.J. & S. Yeatman 2014. The impact of family transitions on child fostering in rural Malawi.
Demography 51(1): 205-228. doi: 10.1007/s13524-013-0239-8.

131
Hadley, S. 2010. Seasonality and access to education: The case of primary education in sub-Saharan
Africa. CREATE Pathways to Access Research Monograph No. 31. Consortium for
Research on Educational Access, Transitions and Equity.
Hazarika, G. & S. Sarangi 2008. Household access to microcredit and child work in rural Malawi.
World Development 36(5): 843-859. doi: 10.1016/j.worlddev.2007.05.008.
Heady, C. 2003. The effect of child labor on learning achievement. World Development 31(2): 385-
398. doi: 10.1016/S0305-750X(02)00186-9.
Howe, L.D., J.R. Hargreaves & S.R. Huttly 2008. Issues in the construction of wealth indices for
the measurement of socio-economic position in low-income countries. Emerging Themes
in Epidemiology 5(1): 1-14. doi: 10.1186/1742-7622-5-3.
Huisman, J. & J. Smits 2009. Effects of household- and district-level factors on primary school
enrollment in 30 developing countries. World Development 37(1): 179-193. doi: 10.1016/
j.worlddev.2008.01.007.
Ibekwe, R.C., N.C. Ojinnaka & S.O. Iloeje 2007. Factors influencing the academic performance of
school children with epilepsy. Journal of Tropical Pediatrics 53(5): 338-343. doi:
10.1093/tropej/fmm034.
Johnston, D., S. Stevano, H. Malapit, E. Hull & S. Kadiyala 2015. Agriculture, gendered time use,
and nutritional outcomes. IFPRI Discussion Paper 01456. Washington, DC: IFPRI.
Kadzamira, E. & P. Rose 2003. Can free primary education meet the needs of the poor? Evidence
from Malawi. International Journal of Educational Development 23: 501-516. doi:
10.1016/S0738-0593(03)00026-9.
Kazeem, A., L. Jensen & S.C. Stokes 2010. School attendance in Nigeria: Understanding the impact
and intersection of gender, urban-rural residence, and socioeconomic status. Comparative
Education Review 54(2): 295-319. doi: 10.1086/652139.
Kearney, C.A. 2008. An interdisciplinary model of school absenteeism in youth to inform
professional practice and public policy. Educational Psychology Review 20(3): 257-282.
doi: 10.1007/s10648-008-9078-3.
Kelly, C.A., E. Soler-Hampejsek, B.S. Mensch & P.C. Hewett 2013. Social desirability bias in
sexual behavior reporting: evidence from an interview mode experiment in rural Malawi.
International Perspectives on Sexual and Reproductive Health 39(1): 14-21. doi:
10.1363/3901413.
Kendall, N. 2007. Education for All meets political democratization: Free primary education and
neoliberalization of the Malawian school and state. Comparative Education Review 51(3):
281-304.
Lewin, K.M. 2009. Access to education in sub-Saharan Africa: Patterns, problems and possibilities.
Comparative Education 45(2): 151-174. doi: 10.1080/03050060902920518.
Lewin, K.M. & R. Sabates 2012. Who gets what? Is improved access to basic education pro-poor
in Sub-Saharan Africa? International Journal of Educational Development 32(4): 517-528.
doi: 10.1016/j.ijedudev.2012.02.013.
Lloyd, C.B. & A.K. Blanc 1996. Children's schooling in sub-Saharan Africa: The role of fathers,
mothers, and others. Population and Development Review 22(2): 265-298. doi:
10.2307/2137435.
Lockheed, M.E. & A.M. Harris 2005. Beneath education production functions: The case of primary
education in Jamaica. Peabody Journal of Education 80(1): 6-28.
Loiaza, E. & C.B. Lloyd 2008. Adolescents and education in Africa. Unpublished manuscript.

132
Lyon, S., M. Ranzani & F.C. Rosati 2013. Unpaid household services and child labour.
Understanding Children's Work Programme Working Paper Series. Rome: Understanding
Children’s Work (UCW) Programme.
Mensch, B.S. & C.B. Lloyd 1998. Gender differences in the schooling experiences of adolescents
in low-income countries: The case of Kenya. Studies in Family Planning 29(2): 167-184.
Milner, G.D., D. Mulera & T. Chimuzu 2011. The SACMEQ III project in Malawi: A study of the
conditions of schooling and the quality of education. Southern and Eastern African
Consortium for Measuring Educational Quality.
Mukudi, E. 2004. The effects of user-fee policy on attendance rates among Kenyan elementary
schoolchildren. International Review of Education 50(5/6): 447-461.
Mushi, D., K. Burton, C. Mtuya, J.K. Gona, R. Walker & C.R.J.C. Newton 2012. Perceptions, social
life, treatment and education gap of Tanzanian children with epilepsy: A community-based
study. Epilepsy & Behavior 23: 224-229. doi: 10.1016/j.yebeh.2011.12.003.
Mustapha, B.A., D.J. Briggs & A.L. Hansell 2013. Prevalence of asthma and respiratory symptoms
in children in a low socio-economic status area of Nigeria. The International Journal of
Tuberculosis and Lung Disease 17(7): 982-988. doi: 10.5588/ijtld.12.0434.
National Statistical Office 2008. 2008 Population and Housing and Census Results. Zomba,
Malawi: National Statistical Office.
National Statistical Office 2012. Statistical Year Book. Zomba, Malawi: National Statistical Office.
National Statistical Office & ICF Macro 2011. Malawi Demographic and Health Survey 2010.
Zomba, Malawi and Calverton, Maryland: NSO and ICF Macro.
Ofovwe, G.E. & A.N. Ofili 2010. Prevalence and impact of headache and migraine among
secondary school students in Nigeria. Headache 50: 1570-1575. doi: 10.1111/j.1526-
4610.2010.01776.x.
Ogunfowora, O.B., D.M. Olanrewaju & G.I. Akenzua 2005. A comparative study of academic
achievement of children with sickle cell anemia and their healthy siblings. Journal of the
National Medical Association 97(3): 405-408.
Orkin, K. 2012. Are work and schooling complementary or competitive for children in rural
Ethiopia? A mixed methods study. Working Paper No. 77. Oxford: Young Lives.
Orkin, M., M.E. Boyes, L.D. Cluver & Y. Zhang 2014. Pathways to poor educational outcomes for
HIV/AIDS-affected youth in South Africa. AIDS Care 26(3): 343-350. doi: 10.1080/
09540121.2013.824533.
Porter, G., K. Hampshire, A. Abane, A. Munthali, E. Robson, M. Mashiri, et al. 2010a. Where dogs,
ghosts and lions roam: Learning from mobile ethnographies on the journey from school.
Children's Geographies 8(2): 91-105. doi: 10.1080/14733281003691343.
Porter, G., K. Hampshire, A. Abane, A. Tanle, K. Esia-Donkoh, R.O. Amoako-Sakyi, et al. 2011.
Mobility, education and livelihood trajectories for young people in rural Ghana: a gender
perspective. Children's Geographies 9(3-4): 395-410. doi: 10.1080/
14733285.2011.590705.
Porter, G., K. Hampshire, M. Mashiri, S. Dube & G. Maponya 2010b. 'Youthscapes' and escapes in
rural Africa: Education, mobility and livelihood trajectories for young people in Eastern
Cape, South Africa. Journal of International Development 22: 1090-1101. doi:
10.1002/jid.1748.

133
Pridmore, P. & C. Jere 2011. Disrupting patterns of educational inequality and disadvantage in
Malawi. Compare: A Journal of Comparative and International Education 41(4): 513-531.
doi: 10.1080/03057925.2011.581518.
Rolleston, C. 2009. The determination of exclusion: evidence from the Ghana Living Standards
Surveys 1991-2006. Comparative Education 45(2): 197-218. doi: 10.1080/
03050060902920617.
Sabates, R., K. Akyeampong, J. Westbrook & F. Hunt 2010. School drop out: Patterns, causes,
changes and policies. Background paper prepared for the Education for All Global
Monitoring Report 2011. Paris: UNESCO.
Shimamura, Y. & S. Lastarria-Cornhiel 2010. Credit program participation and child schooling in
rural Malawi. World Development 38(4): 567-580. doi: 10.1016/j.worlddev.2009.11.005.
Taylor, S. & N. Spaull 2015. Measuring access to learning over a period of increased access to
schooling: The case of Southern and Eastern Africa since 2000. International Journal of
Educational Development 41: 47-59. doi: 10.1016/j.ijedudev.2014.12.001.
Thuillez, J., M.S. Sissoko, O. Toure, P. Kamata, J.-C. Berthélemy & O.K. Doumbo 2010. Malaria
and primary education in Mali: A longitudinal study in the village of Donéguébougou.
Social Science and Medicine 71: 324-334. doi: 10.1016/j.socscimed.2010.02.027.
Trape, J.-F., E. Lefebvre-Zante, F. Legros, P. Druilhe, C. Rogier, H. Bouganali, et al. 1993. Malaria
morbidity among children exposed to low seasonal transmission in Dakar, Senegal and its
implications for malaria control in tropical Africa. American Journal of Tropical Medicine
and Hygiene 48(6): 748-756.
UNESCO 2016. Education for people and planet: Creating sustainable futures for all. Global
Education Monitoring Report 2016. Paris: United Nations Educational, Scientific and
Cultural Organization.
Vyas, S. & L. Kumaranayake 2006. Constructing socio-economic status indices: How to use
principal components analysis. Health Policy and Planning 21(6): 459-468. doi:
10.1093/heapol/czl029.
Webbink, E., J. Smits & E. De Jong 2012. Hidden child labour: Determinants of housework and
family business work of children in 16 developing countries. World Development 40(3):
631-642.
Wittenberg, M. 2005. The school day in South Africa. CSSR Working Paper No. 113. Cape Town:
University of Cape Town Centre for Social Science Research.
Wodon, Q. & K. Beegle 2006. Labor shortages despite underemployment? Seasonality in time use
in Malawi. In: Blackden, C. M. & Wodon, Q. (eds.) Gender, Time Use, and Poverty in Sub-
Saharan Africa. Washington, D.C.: The World Bank.
Wolka, E., S. Shiferaw & S. Biadgilign 2013. The effect of iodine-deficiency disorders on academic
achievement of schoolchildren in Southern Ethiopia. Public Health Nutrition 17(5): 1120-
1124. doi: 10.1017/S1368980013000931.
World Bank 2010. The education system in Malawi. World Bank Working Paper No. 182.
Washington, D.C.: The World Bank.

134
London School of Hygiene & Tropical Medicine Keppel Street, London WC1E 7HT www.lshtm.ac.uk Registry T: +44(0)20 7299 4646 F: +44(0)20 7299 4656 E: [email protected]
RESEARCH PAPER COVER SHEET
PLEASE NOTE THAT A COVER SHEET MUST BE COMPLETED FOR EACH RESEARCH PAPER
INCLUDED IN A THESIS.
SECTION A – Student Details
Student Christine Kelly
Principal Supervisor Judith Glynn
Thesis Title
School absenteeism in Karonga district, northern Malawi:
Trends, influences and the impact of cleaner burning
biomass-fuelled cookstoves
If the Research Paper has previously been published please complete Section B, if not
please move to Section C
SECTION B – Paper already published
Where was the work published?
When was the work published?
If the work was published prior to registration for your research degree, give a brief rationale for its inclusion
Have you retained the copyright for the work?*
Choose an item.
Was the work subject to academic peer review?
Choose an item.
*If yes, please attach evidence of retention. If no, or if the work is being included in its published
format, please attach evidence of permission from the copyright holder (publisher or other author)
to include this work.
SECTION C – Prepared for publication, but not yet published
Where is the work intended to be published?
PLOS ONE
Please list the paper’s authors in the intended authorship order:
Christine A. Kelly, Amelia C. Crampin, Kevin
Mortimer, Albert Dube, Jullita Malava, Deborah
Johnston, Elaine Unterhalter, Judith R. Glynn
Stage of publication Submitted
SECTION D – Multi-authored work
For multi-authored work, give full details of your role in the research included in the paper and in the preparation of the paper. (Attach a further sheet if necessary)
With input from co-authors, I designed
and coordinated the qualitative study,
managed the data, conducted the
analysis and wrote the manuscript
Student Signature: Date:
Supervisor Signature: Date:

135
Chapter 5: Cookstoves and absenteeism
From kitchen to classroom: Assessing the impact of cleaner burning
biomass-fuelled cookstoves on primary school attendance in Karonga
district, northern Malawi
Christine A. Kelly1*, Amelia C. Crampin1,2, Kevin Mortimer3,4, Albert Dube2, Jullita
Malava2, Deborah Johnston5, Elaine Unterhalter6, Judith R. Glynn1
1 London School of Hygiene and Tropical Medicine, London, UK
2 Malawi Epidemiology and Intervention Research Unit, Chilumba/Lilongwe, Malawi
3 Liverpool School of Tropical Medicine, Liverpool, UK
4 Malawi Liverpool Wellcome Trust Programme, Blantyre, Malawi
5 SOAS University of London, London, UK
6 UCL Institute of Education, London, UK
* Corresponding author:
Email: [email protected]

136
Abstract
Household air pollution from burning solid fuels is responsible for an estimated 2.9 million
premature deaths worldwide each year and 4.5% of disability-adjusted life years, while
cooking and fuel collection pose a considerable time burden, particularly for women and
children. Cleaner burning biomass-fuelled cookstoves have the potential to lower exposure
to household air pollution as well as reduce fuelwood demand by increasing the combustion
efficiency of cooking fires, which may in turn yield ancillary benefits in other domains.
The present paper capitalises on opportunities offered by the Cooking and Pneumonia
Study (CAPS), the largest randomised trial of biomass-fuelled cookstoves on health
outcomes conducted to date, the design of which allows for the evaluation of additional
outcomes at scale. This mixed methods study assesses the impact of cookstoves on primary
school absenteeism in Karonga district, northern Malawi, in particular by conferring health
and time and resource gains on young people aged 5-18. The analysis combines quantitative
data from 6168 primary school students with 16 in-depth interviews and four focus group
discussions carried out in the same catchment area in 2016. Negative binomial regression
models find no evidence that the cookstoves affected primary school absenteeism overall
(IRR 0.92 [95% CI 0.71-1.18], p=0.51). Qualitative analysis suggests that the cookstoves
did not sufficiently improve household health to influence school attendance, while the time
and resource burdens associated with cooking activities—although reduced in intervention
households—were considered to be compatible with school attendance in both trial arms.
More research is needed to assess whether the cookstoves influenced educational outcomes
not captured by the attendance measure available, such as timely arrival to school or hours
spent on homework.
Keywords
Malawi; cookstoves; household air pollution; primary school attendance

137
5.1 Introduction
Ninety-five percent of households in Malawi rely on biomass fuels such as wood, charcoal
or crop residues for cooking (Jary et al. 2014), often in poorly ventilated environments.
Household air pollution from solid cookfuels (HAP) is responsible for an estimated 2.9
million premature deaths worldwide each year from causes including pneumonia, stroke,
ischaemic heart disease, chronic obstructive pulmonary disease, and lung cancer (GBD 2015
Risk Factors Collaborators 2016; World Health Organization 2014), and contributes 4.5% of
global disability-adjusted life years (Lim et al. 2012). Among school-age children
specifically, there is some evidence of an association between HAP and acute respiratory
infections as well as asthma (Gordon et al. 2014; Perez-Padilla et al. 2010; Wong et al.
2013).
Cleaner burning biomass-fuelled cookstoves, which have better fuel efficiency than
traditional open fire cooking methods and reduce harmful emissions, have been advocated
as a means to reduce morbidity and mortality associated with cooking with solid fuels.
Outcomes of existing randomised controlled trials, however, have principally targeted
women and young children, as the groups with the highest exposure to solid fuel emissions,
and have typically not explored the cookstoves’ impact on other household members,
particularly adolescents. Moreover, less is known about the potential ancillary benefits of
cookstoves in domains beyond health (Martin et al. 2013; Ruiz-Mercado et al. 2011). The
present study fills an important research gap by assessing the effect of cleaner burning
biomass-fuelled cookstoves on school attendance of young people in northern Malawi.
Two possible mechanisms are explored: 1) reduced household air pollution leading to
improved health and associated reductions in caregiving responsibilities, and 2) reduced
fuel consumption leading to lower time and resource costs associated with acquiring fuel,
both yielding increased school attendance (Figure 5.1). Although the impact of cooking-
related activities on school attendance has not been formally assessed in sub-Saharan
Africa, the contributions of ill health and caregiving to absenteeism are well established.
Research from southern Nigeria has specifically highlighted respiratory illness as a reason
for absenteeism (Mustapha et al. 2013). The authors found that 2.5% of children aged 7-14
years, including 5.7% of children in rural areas, reported missing school in the past twelve
months due to symptoms of respiratory illness, although episodes were not necessarily
linked to HAP exposure.

138
Cleaner burning cookstoves may also reduce school absenteeism by improving the health
of other household members. Several studies from sub-Saharan Africa have highlighted the
responsibility schoolchildren bear for providing care or performing household or economic
labour in the event of a family illness, to the detriment of their school attendance. Research
from Ethiopia showed that, controlling for sociodemographic factors, high levels of
absenteeism were significantly associated with the percentage of household members who
were sick for more than 30 days in the previous year (Orkin 2011). Analyses of orphanhood
in Kenya and Tanzania found that children’s school attendance declined not only in the
wake of a parental death, but also in the months leading up to it, presumably as students
served as caregivers (Ainsworth et al. 2005; Evans and Miguel 2007). Interviews from a
mixed methods study in South Africa indicated that adolescents missed school to
accompany ill relatives to health facilities or provide home-based care (Cluver et al. 2012).
Thus, potential health improvements for both school-age children and other household
members through reduced exposure to cooking-related pollutants could yield significant
payoffs with respect to school attendance.
The second pathway focuses on time and resource savings linking cleaner burning
cookstoves with reduced absenteeism. Even in healthy households, students regularly
participate in domestic or market activities that can compete with school attendance. Data
from UNICEF Multiple Indicator Cluster Surveys in Malawi show that boys and girls spend
an average of 9 and 12 hours per week, respectively, on household work, and an additional
3 and 4 hours on family business work (Webbink et al. 2012). Water and fuelwood
collection have been identified as particularly burdensome for school-going children
(Nankhuni and Findeis 2004). A mixed methods study across 24 sites in Ghana, Malawi
and South Africa suggested that the time and exertion associated with child porterage—
carrying water, firewood, and agricultural produce—as well as the prospect of earning extra
Cleaner burning
cookstove
Reduced air
pollution
Improved
household health Increased school
attendance Reduced fuel
consumption
Lower time/
resource costs
Figure 5.1 Proposed causal pathways linking cleaner burning cookstoves with increased
school attendance

139
money from commercial load carrying, contributed to tardiness and absenteeism (Porter et
al. 2012). By reducing the duration and/or frequency of domestic fuelwood collection, as
well as speeding up cooking times of household meals, cleaner burning cookstoves may
thus play an important role in improving school attendance. Moreover, although the vast
majority (94.8%) of households in Karonga district, Malawi, collect their own firewood for
cooking, 4.6% purchase their wood supplies (Jagger and Perez-Heydrich 2016). Reduced
expenditure on firewood associated with cleaner burning cookstoves may enable
households to better meet schooling costs, including exercise books, pens and clothes,
which have been shown to amount to approximately 6% per child of the total financial
resources of the poorest Malawian households (Kadzamira and Rose 2003).
5.2 Methods
5.2.1 Trial design
This paper harnesses opportunities offered by the Cooking and Pneumonia Study (CAPS),
a large cluster randomised trial of cleaner burning biomass-fuelled cookstoves conducted
in Karonga district, northern Malawi, in which one hundred community-level clusters were
randomised to intervention or control groups.25 A full description of the study design and
randomisation procedures is available in Mortimer et al. (2016). Starting in July 2014,
intervention households received two Philips HD4012LS cookstoves with cooking pots and
a solar panel with which to charge the in-built battery-powered fan, as well as user training.
As the trial’s primary outcome of interest was incidence of pneumonia in children under
five years old (Mortimer et al. 2016), cookstoves were distributed only to households with
children below 4.5 years at baseline, as well as on a continuous basis to eligible in-migrating
households or those into which children under five were born, adopted or fostered over the
course of the two-year follow-up period. The CAPS team visited households approximately
every three months to collect information about cookstove usage and functionality. A free
repair, maintenance and replacement service was provided for damaged cookstoves and
solar panels. Control households received their own cookstoves at the end of the trial.
5.2.2 Study population
To examine the impact of cookstoves on primary school attendance, we identified young
25 An additional 50 clusters were randomised in a second site in southern Malawi (see Mortimer et al. 2016
), but these are not included here.

140
people of primary school age resident in households enrolled in the CAPS trial. Primary
school in Malawi comprises eight grades but, in light of the frequency of late entry and
grade repetition among Malawian students (Sunny et al. 2017), we included children aged
5-18. The total number of absence days in the past four weeks that school was in session
was collected as part of the annual household survey of the Karonga Health and
Demographic Surveillance System (HDSS) (Crampin et al. 2012), which formed the
catchment area of the CAPS trial. School attendance reports were drawn from the first
HDSS interview that took place at least 60 days after the household was enrolled in CAPS.
A threshold of 60 days was chosen to allow for a short cookstove adjustment period—for
instance, to deplete existing stocks of firewood—and in light of the HDSS survey design
in which absenteeism over the past four weeks was retrospectively reported. Schooling
information was provided by household members aged 15 years or older who were at home
at the time of the field team’s visit; as such, most respondents were parents or other adult
relatives reporting on behalf of resident children.
The primary analysis followed intention-to-treat (ITT) principles, where the ITT population
consisted of primary school students aged 5-18 living in CAPS intervention or control
households at the time of enrolment, and who had at least one follow-up CAPS and HDSS
survey. A per-protocol analysis was also conducted for comparison, excluding students
who changed cookstove exposure status between CAPS enrolment and the first eligible
HDSS survey by: 1) moving from an intervention household to a new household in a control
cluster, 2) moving from a control household to a new intervention household, or 3) moving
from a cookstove to a non-cookstove household within an intervention cluster. It also
excluded students living in households that reported not using the cookstove exclusively in
the CAPS visit closest to the HDSS schooling interview—that is, households that did not
use the cookstove as a result of breakage, mechanical failure, or personal preference, or that
continued to use open fire cooking methods alongside the cookstove for at least some
household meals. Finally, the per-protocol analysis excluded students from households for
whom data from a CAPS follow-up visit were not available within three months of the
HDSS survey.
5.2.3 Statistical methods
Negative binomial regression modelling was used to compare absenteeism across trial
groups to reflect overdispersion in the distribution of absence days. All regression models

141
included cluster robust standard errors to account for the clustered trial design.
Multivariable models adjusted for the following pre-specified covariates, informed by the
analyses presented in Mortimer et al. (2016) and in Chapter 4 of this thesis: age, sex, current
grade attended, repetition of current grade, maternal death, paternal death, maternal
education, paternal education, total number of household members, number of younger
household members, relationship to household head, sex of household head, household
socioeconomic status, co-residence with a regular smoker, and exposure to sources of
household smoke other than cooking. Socioeconomic status was constructed by using
principal components analysis (Howe et al. 2008; Vyas and Kumaranayake 2006) to
generate a wealth index combining ownership of ten durable goods, two variables
indicating a shortage of food or bathing soap in the past year, and two variables indicating
a household’s access to an improved water source or improved toilet facility. A variable
indicating the HDSS survey round was also included in regression models to control for
survey-specific differences in absenteeism reporting, as was the month of interview to
account for seasonal differences in absenteeism. A further variable indicating whether
HDSS survey took place during term time or school holiday was additionally included,
alongside a variable specifying the number of months between CAPS enrolment and the
HDSS survey to adjust for potential changes in cookstove usage over time.
By adding appropriate interaction terms to each regression model, subgroup analyses were
also conducted to investigate the following secondary hypotheses:
1. Cookstoves will lead to greater reductions in absenteeism for girls relative to boys,
due to diminished cooking, fuel collection and caregiving responsibilities, which
are predominantly carried out by girls.
2. Cookstoves will lead to greater reductions in absenteeism as children’s age
increases, as older children assume more responsibility for caregiving and
household chores. This analysis is guided by the age thresholds stipulated by ILO
Convention No. 138 for child work burdens, namely <12, 12-14, and 15+
(International Labour Organization).
3. Greater reductions in absenteeism will be observed among children interviewed in
the rainy season (December-April) relative to in the dry season, due to the increased
propensity to cook indoors during the rainy season and the larger anticipated health

142
benefit of using cookstoves rather than open fires in a poorly ventilated
environment.
5.2.4 Nested qualitative study
To corroborate the quantitative comparisons and elucidate the proposed mechanisms at play
(Stanistreet et al. 2015), a nested qualitative study was conducted in April-May 2016
involving 16 in-depth interviews (IDIs) and four focus group discussions (FGDs) among
male and female primary school students aged 12-18. The qualitative sample was
purposively selected using the HDSS and CAPS datasets to ensure distribution across trial
arms, variation by age and school grade attended, as well as representation from the three
community types present in the study area: lakeshore, roadside, and rural agricultural.
Interviews and FGDs solicited students’ perceptions of the barriers to regular school
attendance, household and community support for schooling, intra-household allocation of
domestic responsibilities and household health status. To gain particular insight into the
time students spent on cooking and fuelwood collection, IDIs additionally included an
exercise whereby participants were asked to fill a timeline with the activities in which they
had engaged on the previous school day, choosing from a selection of ten illustrated activity
cards.26 Among cookstove recipients, IDIs also explored the perceived impact of cleaner
burning cookstoves on health, schooling and time allocation. In-depth interview and FGD
topic guides were iteratively updated to reflect emerging themes from the pilot phase and
from preliminary data analysis.
Qualitative activities were conducted by a team of four trained interviewers/facilitators in
the participants’ local language, Chitumbuka, and subsequently transcribed and translated
into English by the same research team. As a validity check, four IDI transcripts—one per
interviewer—were externally audited for completeness and accuracy by a bilingual
consultant. Since errors identified during this process were minimal and minor, no
additional review of the remaining transcripts was undertaken. The final transcripts were
uploaded into NVivo software for coding and thematic analysis (Guest et al. 2012), with
particular focus on aspects of students’ narratives that supported or undermined the
pathways linking cookstoves and school attendance shown in Figure 5.1.
26 The activity cards were: attending school, doing homework, going to the market, collecting firewood,
drawing water, cooking, fishing, farming, caregiving, and playing.

143
5.2.5 Ethics statement
Ethical approval for the qualitative study was obtained from the National Health Sciences
Research Committee (NHSRC) in Malawi (Protocol #15/11/1509) and the London School
of Hygiene and Tropical Medicine Research Ethics Committee (Ref #10401). Written
consent was received from a parent/guardian of each study participant, in addition to written
assent from participants themselves. Data collection associated with the Karonga HDSS
and CAPS underwent separate review processes (NHSRC Protocol #419 and LSHTM Ref
#5081; and Malawi College of Medicine Research and Ethics Committee P.11/12/1308 and
Liverpool School of Tropical Medicine Research Ethics Committee Ref #12.40,
respectively).
5.3 Results
5.3.1 Analytic sample
Of the 4848 households enrolled in the CAPS trial in Karonga district, 59 (30 intervention,
29 control) withdrew from the study, became ineligible, left the study area or were lost to
follow-up before completing a CAPS follow-up visit. An additional 1442 (756 intervention,
686 control) had no resident school-age children. In the remaining 3347 households, 8129
young people aged 5-18 were identified (4194 intervention, 3935 control). Of these, 750
(431 intervention, 319 control) were excluded as they had no post-CAPS schooling survey
before or within 30 days after the conclusion of the trial, and a further 930 (492 intervention,
438 control) were not currently attending primary school in Karonga district. Among
eligible students, 281 (103 intervention, 178 control) were missing outcome or covariate
data, leaving an ITT sample of 3168 and 3000 in the intervention and control groups,
respectively (Figure 5.2). The per-protocol sample further excluded 57 children (50
intervention, 7 control) who changed cookstove status before the first schooling interview;
1150 from intervention households that reported not using the cookstove exclusively during
the closest CAPS follow-up period to the schooling survey, including 92 in households that
did not use the cookstove at all; and 177 (69 intervention, 108 control) for whom CAPS
data within three months of the HDSS schooling survey were not available. Thus, the per-
protocol sample consisted of 1899 children in intervention households and 2885 in control
households (Figure 5.2).

144
Figure 5.2 Flowchart of control and intervention participants included in analysis
2351 households enrolled
in CAPS
686 households with only
children <5 years old
3616 children (1514
households) with post-
CAPS schooling survey 439 children excluded (6
school status missing,
240 not attending school,
161 attending secondary,
32 attending school
outside Karonga district) 3177 children (1416
households) attending
primary school in
Karonga district
3000 children (1357
households) in ITT
analysis
2885 children (1299
households) in per
protocol analysis
177 children excluded
(161 children missing
absenteeism data, 16
missing covariate data)
319 children with no
post-CAPS schooling
survey
115 children excluded (7
cookstove status changed,
108 no CAPS data within
3 months of schooling
survey)
2322 households with ≥1
CAPS follow-up period
29 households with no
CAPS follow-up period
1636 households with
3935 children aged 5-18
2497 households enrolled
in CAPS
756 households with only
children <5 years old
431 children with no
post-CAPS schooling
survey
492 children excluded (2
school status missing,
306 not attending school,
154 attending secondary,
30 attending school
outside Karonga district)
3271 children (1431
households) attending
primary school in
Karonga district
3168 children (1404
households) in ITT
analysis
1899 children (844
households) in per
protocol analysis
103 children excluded
(82 children missing
absenteeism data, 21
missing covariate data)
1269 children excluded
(50 cookstove status
changed, 1150 non-
exclusive cookstove use,
69 no CAPS data within
3 months of schooling
survey)
2467 households with ≥1
CAPS follow-up period
30 households with no
CAPS follow-up period
1711 households with
4194 children aged 5-18
3763 children (1552
households) with post-
CAPS schooling survey
Control group Intervention group

145
5.3.2 Baseline characteristics
Table 5.1 shows individual- and household-level baseline characteristics of the ITT sample.
Household data were drawn from the CAPS baseline survey, but this did not include
individual-level information about household members aged 5 or over. Hence, individual
data were taken from the nearest available HDSS survey before CAPS enrolment, or up to
30 days afterward. Data were not available for 97 children who were not interviewed prior
to CAPS enrolment. Additionally, since the HDSS survey and CAPS enrolment occurred
on average 168 days apart (180 days intervention, 156 control), time-varying characteristics
such as school enrolment and parental survival may not reflect children’s status at the start
of the CAPS trial. Nevertheless, the table demonstrates that both individual- and household-
level characteristics were reasonably balanced between intervention and control groups.
Table 5.1 Baseline characteristics of intention-to-treat population, by trial group
Control Intervention
Household characteristics (N=1357) (N=1404)
n % n %
Sources of cooking fuela
Firewood 1329 97.9 1383 98.5
Crop residues 804 59.2 802 57.1
Charcoal 378 27.9 307 21.9
Other 20 1.5 11 0.8
Cooking location, dry season
Outside, roof only 314 23.1 345 24.6
Outside, walls and roof 706 52.0 725 51.6
Outside, open air 281 20.7 271 19.3
Outside veranda 26 1.9 20 1.4
Inside, kitchen 20 1.5 31 2.2
Inside, living space 10 0.7 12 0.9
Cooking location, rainy season
Outside, roof only 294 21.7 331 23.6
Outside, walls and roof 782 57.6 781 55.6
Outside, open air 11 0.8 16 1.1
Outside veranda 117 8.6 113 8.0
Inside, kitchen 93 6.9 101 7.2
Inside, living space 60 4.4 62 4.4
Sources of household smoke exposurea
Resident smoker 186 13.7 229 16.3
Burning rubbish 941 69.3 967 68.9
Cooking business 295 21.7 343 24.4
Burning bricks 137 10.1 103 7.3
Kerosene lamp 64 4.7 61 4.3
Socioeconomic quintile
Lowest 277 20.4 322 22.9
2 259 19.1 299 21.3
3 254 18.7 275 19.6
4 266 19.6 258 18.4
Highest 301 22.2 250 17.8

146
Table 5.1 continued Baseline characteristics of intention-to-treat population, by
trial group
Individual characteristics
Control
(N=3000)
Intervention
(N=3168)
n % n %
Age
5-11 2000 66.7 2155 68.0
12-14 641 21.4 669 21.1
≥15 359 12.0 344 10.9
Mean (years) 9.94 9.93
Sex Male 1515 50.5 1642 51.8
Female 1485 49.5 1526 48.2
Among students with baseline interview: (N=2947) (N=3124)
School status Not attending 360 12.2 375 12.0
Attending standard 1-4 1856 63.0 2003 64.1
Attending standard 5-7 665 22.6 694 22.2
Attending standard 8 66 2.2 52 1.7
Repeated current standard (if attending school) Yes 672 26.0 789 28.7
No 1915 74.0 1960 71.3
Days of absence in past 4 weeks (if attending school) 0 1952 75.5 2021 73.5
1 258 10.0 303 11.0
2-4 258 10.0 313 11.4
≥5 90 3.5 99 3.6
Missing 29 1.1 13 0.5
Mean days, all students 0.67 0.70
Mean days, conditional on absence 2.81 2.67
Mother died Yes 77 2.6 57 1.8
No 2870 97.4 3067 98.2
Father died Yes 193 6.5 187 6.0
No 2754 93.5 2937 94.0
Mother's education None/primary 2362 80.1 2524 80.8
More than primary 585 19.9 600 19.2
Father's education None/primary 1750 59.4 1945 62.3
More than primary 1197 40.6 1179 37.7
Relationship to household head Child 2422 82.2 2624 84.0
Step-child 116 3.9 116 3.7
Grandchild 261 8.9 250 8.0
Niece/nephew 53 1.8 60 1.9
Other 95 3.2 74 2.4
Mean days between baseline and CAPS
enrolmentb 156.4 180.6 a Multiple responses possible.
b Each participant’s baseline interview was assigned as the closest before CAPS enrolment or up to
30 days afterward.

147
5.3.3 Absenteeism in the past four weeks
Figure 5.3 shows the distribution of absence days in the past four weeks among students in
the ITT sample, by cookstove status. Overall, students in the intervention group missed an
average of 0.81 days in the past four weeks, relative to 0.88 days in the control group.
Similar proportions of students in each arm—26.9% intervention, 27.8% control—missed
one or more days of school, and among those who were absent, the mean number of days
missed was also very similar across groups: 3.0 among intervention students, 3.1 among
controls. Figure 5.4 charts the mean days of absence by month of interview among
intervention and control students, as well as the total number of students interviewed in
each month. With the exception of a sharp peak in September when very few students were
interviewed, rates of absenteeism were fairly flat across the school year, and consistently
higher in the control group over the period January-June. As a result of the clustered nature
of data collection, the distribution of interviews across the school year varied across trial
groups; as such, multivariable regression models adjust both for a student’s month of
interview, as well as whether he/she was interviewed outside of term time.
0
10
20
30
40
50
60
70
80
0 5 10 15 20
%
Intervention (N=3168)
0
10
20
30
40
50
60
70
80
0 5 10 15 20
%Control (N=3000)
Days of absence in past 4 weeks
Figure 5.3 Distribution of primary school absenteeism in past four weeks, by trial group
%

148
Results from negative binomial regression models suggest that, although the rate of
absenteeism was slightly lower among cookstove recipients, there was no evidence that the
CAPS trial yielded measurable improvements in school attendance in either the crude or
adjusted analysis (adjusted incidence rate ratio (IRR) 0.92 [95% confidence interval (CI)
0.71-1.18]; Table 5.2). The per-protocol analysis gave similar results (adjusted IRR 0.93
[0.71-1.23]). Alternative specifications of the per-protocol sample—such as excluding only
households that reported not using the cookstove at all, or only those that reported
continuing to use open fire cooking methods for every, rather than any, household meal—
did not change the nature of these findings.
Table 5.2 Incidence rate ratios of absenteeism in the past four weeks, comparing
intervention to control group Unadjusted
IRR 95% CI p-value
Adjusted
IRR 95% CI p-value
ITT sample (N=6168) 0.92 0.72-1.19 0.53 0.92 0.71-1.18 0.51
Per-protocol sample (N=4784) 0.93 0.71-1.22 0.60 0.93 0.71-1.23 0.61
Notes: Results from negative binomial regression models with cluster robust standard errors. IRR=incidence
rate ratio; CI=confidence interval. Adjusted model also includes: age, sex, current grade attended, repetition
of current grade, maternal death, paternal death, maternal education, paternal education, number of total
household members, number of younger household members, relationship to household head, sex of
household head (taken from HDSS schooling survey), household socioeconomic status, coresidence with a
regular smoker, exposure to sources of household smoke other than cooking (taken from CAPS baseline
survey), the month of HDSS interview, HDSS survey round, interview timing relative to school holidays, and
months between CAPS enrolment and HDSS survey. The intra-class correlation was estimated at 0.04.
0.0
0.5
1.0
1.5
2.0
2.5
3.0
3.5
4.0
0
100
200
300
400
500
600
700
Mea
n d
ay
s o
f a
bse
nce
Stu
den
ts i
nte
rvie
wed
Control (N) Intervention (N) Control (mean) Intervention (mean)
Figure 5.4 Number of students interviewed and mean days of absence, by month and trial
group

149
The stratified analyses presented in Table 5.3 investigate the relationship between
cookstove status and absenteeism by sex, age, and season. Although the adjusted IRRs
showed absenteeism reductions in the hypothesised groups—namely, female cookstove
recipients, students in the older age categories, and students interviewed during the rainy
season—no conclusive evidence for effect modification was found. To investigate whether
combining these subgroups yielded cookstove-related attendance benefits, separate models
were run for girls and boys among students interviewed during the rainy season. These did
provide some evidence that the cookstoves were associated with reduced absenteeism
among girls aged 15 or older (Table 5.4), but this category comprised relatively few
students.
Table 5.3 Stratified analysis of the relationship between cookstove exposure and days of absence
in the past four weeks, by sex, age and season of interview Unadj.
IRR
95% CI p-value p-value
interaction
Adj.
IRR
95% CI p-value p-value
interaction
ITT sample (N=6168)
1) By sex
Male (N=3157)
Female (N=3011)
0.96
0.88
0.73-1.27
0.67-1.17
0.77
0.39
0.52
0.97
0.87
0.74-1.27
0.64-1.17
0.82
0.35
0.40
2) By age (years)
<12 (N=4155)
12-14 (N=1310)
≥15 (N=703)
0.92
0.87
1.03
0.72-1.19
0.61-1.22
0.63-1.66
0.54
0.41
0.91
0.73
0.94
0.88
0.88
0.72-1.21
0.65-1.20
0.55-1.40
0.62
0.43
0.60
0.89
3) By season
Dry (N=4252)
Rainy (N=1916)
0.95
0.81
0.73-1.24
0.48-1.35
0.71
0.41
0.58
0.97
0.81
0.75-1.25
0.48-1.37
0.80
0.43
0.55
Per-protocol sample (N=4784)
1) By sex
Male (N=2456)
Female (N=2328)
0.98
0.86
0.73-1.32
0.62-1.20
0.92
0.38
0.40
1.01
0.84
0.76-1.37
0.60-1.18
0.90
0.32
0.23
2) By age (years)
<12 (N=3220)
12-14 (N=1015)
≥15 (N=549)
0.93
0.81
1.18
0.71-1.22
0.52-1.25
0.68-2.03
0.61
0.34
0.55
0.43
0.95
0.84
1.00
0.71-1.27
0.57-1.23
0.59-1.68
0.74
0.36
0.99
0.71
3) By season
Dry (N=3179)
Rainy (N=1605)
0.99
0.75
0.75-1.32
0.43-1.31
0.96
0.31
0.38
0.99
0.73
0.74-1.33
0.41-1.30
0.96
0.29
0.35
Notes: Stratum-specific IRRs from three unadjusted and adjusted negative bionomial regression models with cluster
robust standard errors and interactions between cookstove status and 1) sex, 2) age group, and 3) season.
IRR=incidence rate ratio; CI=confidence interval. All adjusted models include the covariates listed in Table 5.2,
with the exception of Model 3, which excludes month of interview due to collinearity with interview season. Wald
tests were used to assess evidence for interaction.

150
Table 5.4 Stratified analysis of the relationship between cookstove exposure and days of absence in
the past four weeks among boys and girls interviewed during the rainy season, by age
Unadj.
IRR
95% CI p-value p-value
interaction
Adj.
IRR
95% CI p-value p-value
interaction
Boys: ITT sample (N=996)
Overall 0.75 0.46-1.24 0.27 -- 0.62 0.39-0.99 0.045 --
By age
<12 (N=669)
12-14 (N=200)
≥15 (N=127)
0.78
0.64
0.74
0.47-1.29
0.27-1.48
0.25-2.22
0.33
0.29
0.60
0.88
0.63
0.47
0.89
0.40-0.99
0.23-0.94
0.29-2.75
0.05
0.03
0.84
0.44
Boys: Per-protocol sample (N=834)
Overall 0.72 0.40-1.29 0.27 -- 0.59 0.35-0.98 0.04 --
By age
<12 (N=557)
12-14 (N=168)
≥15 (N=109)
0.74
0.48
0.83
0.41-1.36
0.17-1.41
0.25-2.70
0.34
0.18
0.76
0.67
0.59
0.35
1.04
0.35-0.99
0.13-0.92
0.33-3.35
0.046
0.03
0.94
0.27
Girls: ITT sample (N=920)
Overall 0.87 0.46-1.65 0.67 -- 0.68 0.38-1.24 0.21 --
By age
<12 (N=664)
12-14 (N=182)
≥15 (N=74)
1.11
0.52
0.46
0.57-2.16
0.24-1.14
0.17-1.21
0.77
0.10
0.11
0.04
0.79
0.58
0.32
0.43-1.46
0.26-1.33
0.14-0.75
0.45
0.20
0.009
0.12
Girls: Per-protocol sample (N=771)
Overall 0.79 0.41-1.52 0.48 -- 0.71 0.39-1.28 0.26 --
By age
<12 (N=565)
12-14 (N=149)
≥15 (N=57)
1.05
0.41
0.31
0.54-2.03
0.17-1.00
0.06-1.62
0.89
0.050
0.16
<0.001
0.88
0.51
0.20
0.47-1.64
0.21-1.27
0.04-1.02
0.69
0.15
0.053
0.14
Notes: Pooled and stratum-specific IRRs from unadjusted and adjusted negative bionomial regression models
with cluster robust standard errors, among girls and boys interviewed during the rainy season. Stratum-specific
IRRs generated by interacting cookstatus and age group. IRR=incidence rate ratio; CI=confidence interval. All
adjusted models include the covariates listed in Table 5.2. Wald tests were used to assess evidence for interaction.
5.3.4 Reasons for absenteeism
Figure 5.5 shows that, among members of the ITT sample who were absent in the past four
weeks, no difference in the distribution of reasons reported for missing school was found
between the intervention and control groups. In both cases, the vast majority of absences
(75.1% in the intervention group, 79.5% in the control group) were attributed to illness,
while household chores, economic activities and caregiving were reported to make
consistently negligible contributions to absenteeism. Although no school fees are charged
for primary education in Malawi, approximately 10% of absences (10.6% intervention,
8.0% control) were attributed to lack of money for school supplies, transport or meals.

151
5.3.5 Qualitative analysis
Data from IDIs and FGDs confirmed that ill health represented an important cause of school
absence. However, many of the sicknesses described would not be expected to derive from
HAP exposure, such as malaria and stomach ache. Indeed, most participants did not
perceive any change in household health status resulting from the cookstoves: ‘Sickness is
sickness, it just comes’ (Male, intervention group (IG)). One IDI participant did observe,
however, that her sister suffered fewer asthma attacks since receiving the cookstoves—
‘[She] used to be sick but now has changed […] Doesn’t get sick often nowadays’ (Female,
IG)—which may have had positive implications for school attendance.
Although the perceived health benefits of the cookstoves were less pronounced than
anticipated, there was nearly universal agreement among students from intervention
households that the cookstoves produced time and resource savings. Many participants
observed that the cookstoves used considerably less fuel than traditional open fire cooking,
which reduced fuel collection burdens:
On three stones [open fire] methods we used more firewood but now we use little
firewood. (Female, IG)
When using little firewood, it doesn’t take time to go and fetch for the firewood.
(Female, IG)
0%
10%
20%
30%
40%
50%
60%
70%
80%
90%
100%
Intervention (N=851) Control (N=835)
Reason missing
Other
Economic activities
Caregiving (adult/child)
Parent/guardian illness
Household chores
No money
Illness (own)
Figure 5.5 Primary reason reported for missing school in past four weeks, by trial group

152
Because the cookstoves needed only small pieces of wood and biomass, which could be
readily found, another participant noticed time savings from not needing to chop firewood:
For three stone method, it requires you to first put the stones but when using a
cookstove you just insert the small pieces of firewood and set fire. For three stone
method, you need also to take an axe and cut firewood which is a waste of time.
(Male, IG)
Participants also agreed that cooking meals was noticeably quicker when using the
cookstoves, partly because households were given two units and cooking pots and so could
prepare multiple dishes at once, but also because the cookstove fire burned much more
efficiently: ‘When cooking using the cookstove, the food cooks fast […] Because when
using the cookstove, the fire goes direct to the pot unlike when using three stones the fire
gets wasted’ (Female, IG).
While these insights provide support for the hypothesis that the cookstoves yielded
important time and resource savings, it is less clear that these savings translated into
reduced school absenteeism. In particular, evidence that cooking or resource collection
interfered with daily school attendance was limited, even in the control group. Among
students, primarily girls, who reported collecting fuelwood, all described doing so on
weekends or holidays, or during free time after school, such that it was compatible with
school attendance:
Interviewer (I): [D]o you ever fetch firewood?
Participant (P): Yes but I usually do this on Saturdays.
I: […] Have you ever missed school because of fetching firewood?
P: I have never since we fetch firewood on Saturdays when we don’t go to school.
(Female, control group (CG))
I: So when maybe you are fetching maize cobs, how long do you take?
P: I don’t take time, maybe only one hour. (Female, CG)
A minority of participants indicated that their households purchased wood or charcoal for
cooking, but did not comment on any changes in expenditure as a result of the cookstoves.
As anticipated, responsibility for cooking itself was borne predominantly by female
household members, and often discussed in gendered terms. One male focus group
participant observed, for example, that: ‘Girls can sometimes be told to miss school so that

153
they should just cook food when we [boys] are at the farm and when we come back from
the farm, we should find that the food is already cooked’ (Male, CG). Among female
participants, however, cooking was portrayed as largely compatible with school attendance,
with students taking responsibility for the afternoon or evening meals upon return from
school. As such, cooking-related absences were rarely reported, although one FGD
participant described missing school to help with other aspects of food preparation: ‘If
maybe at home they are expecting visitors, they say don’t go to school, you have to chase
that chicken for visitors who are coming’ (Female, IG). None of the cookstove recipients
linked the cookstove to any changes in school attendance.
Instead, students reported a number of barriers to school attendance that were unrelated,
either directly or indirectly, to cooking activities. In addition to ill health, these included
engaging in household agricultural work or informal paid labour to help raise funds for
schooling expenses, or school-related issues such as lack of uniform or supplies. There was
some suggestion, however, that the cookstoves improved other educational outcomes not
captured by our measure of school attendance. For instance, two participants observed that
reduced time to cook breakfast in the morning resulted in fewer late arrivals to school:
I go early to school when I cook on new cookstoves rather than on three stone
cookstoves which requires more time to prepare fire. (Male, IG)
I: What is the change that you have noticed about time you go to school?
P: We cook food very fast and eat earlier and then we rush to school.
I: So you mean you go to school early?
P: Yes. (Female, IG)
Even when cooking or fuelwood collection does not directly compete with schooling,
reduced time burdens associated with these activities may allow students to spend more
time studying or resting, with positive implications for school performance. Although most
IDI participants reported having adequate time to combine household work and self-study,
when asked a hypothetical question about how they would use any time savings from
reduced domestic burdens, 11 of 16 indicated that they would spend the extra time on
reading, writing or homework, including the following students:
I: Do you have enough time in your day to spend on school and homework here
at home?
P: Yes.

154
I: If you could spend less time on doing household chores, how would you use
the extra time in your day?
P: I can use it to read my school notes and also revising what I got wrong at school.
I: Is there any other thing you can also do?
P: Apart from that, I can also be doing my homework […]
I: Suppose you have done your homework but still more you have extra time,
how would you use it?
P: Then I can be drawing water in preparation for tomorrow. (Female, IG)
I: Do you have enough time in your day to spend on school and homework?
P: Yes.
I: If you could spend less time on doing household chores, how would you use
the extra time in your day?
P: I can use it for reading.
I: Why reading?
P: (Silence)
I: Is there anything else you could do apart from reading?
P: After reading if I still have time then I can use it to cook.
I: Suppose you have finished cooking.
P: Then to play with my friends. (Female, CG)
5.4 Discussion
This study combined quantitative and qualitative data to assess the impact of cleaner
burning biomass-fuelled cookstoves on primary school attendance in northern Malawi and
found that the CAPS intervention had no measurable impact on primary school attendance
overall. These findings echo a separate evaluation of the CAPS trial’s primary outcome,
which found no evidence that the cookstoves reduced the incidence of pneumonia in
children under five years old (Mortimer et al. 2016). The authors of the latter study
speculated that the cookstoves did not sufficiently reduce exposure to air pollution in a
context where other forms of smoke exposure including burning rubbish, brick burning and
tobacco smoking were prevalent (Mortimer et al. 2016).
The target population of the CAPS trial consisted of children under five years old, so data
were not collected from school-age household members with which to assess the direct
impact of the cookstoves on adolescent health. Most participants in the qualitative study
did not perceive a change in household health after receiving the cookstoves, although there
was some suggestion that the cookstoves reduced asthma exacerbations. Strong links have
been drawn between open fire cooking and asthma prevalence in both younger (age 6-7)

155
and older (age 13-14) school-age children in global studies (Wong et al. 2013), but asthma
is reported to be uncommon among children in Malawi, comprising just 0.6% of cases
admitted to hospital (Gordon and Graham 2006). Although the CAPS evaluation found that
the cookstoves significantly reduced burns among children under five (Mortimer et al.
2016), it is likely that students’ caregiving responsibilities did not diminish to a sufficient
degree to observe a population-level impact on school attendance.
Qualitative data confirmed that students perceived time and resource savings associated
with the cookstoves, consistent with findings from a CAPS socioeconomic study carried
out among primary cooks (Cundale et al. 2017). Evidence that these savings translated into
improvements in school attendance, however, was minimal. In particular, participants from
both trial groups indicated that cooking-related responsibilities were compatible with
school attendance. Wodon and Beegle (2006), using data from the 2004 Malawi Second
Integrated Household Survey, examined the contribution of various activities to household
labour and found that the time associated with fuelwood collection—between 0.1 and 0.5
hours per week for rural boys aged 5-14 and 0.4-1.2 hours for rural girls, depending on the
month—was relatively limited, suggesting that it could be successfully combined with
schooling. As reflected in our qualitative findings, larger time burdens were associated with
agricultural labour and, for girls, also with other household chores including cooking,
laundry, cleaning and water collection (Wodon and Beegle 2006). The present study would
benefit from detailed time use data from the larger survey sample to quantify the time
burdens attached to fuel collection and cooking among household members in control and
intervention clusters, to identify other activities that inhibit regular school attendance, and
to establish the extent to which students complete homework or engage in non-school-
related educational activities such as reading or listening to the radio. Hourly, rather than
daily, school attendance data would also have enabled an examination of the cookstoves’
impact on a more nuanced set of school attendance outcomes, including timely arrival at
school, which the qualitative data suggest may have improved in intervention households.
While the primary analysis followed ITT principles, the per-protocol analysis excluded
students from households that did not report using the cookstove exclusively during the
follow-up period corresponding to the schooling survey. Three percent of students lived in
households in which the cookstove was not used at all, while a further 33% came from
households that continued using open fire cooking methods alongside the cookstove. Non-

156
and concurrent use of cookstoves has been noted in cookstove trials in a variety of settings
(e.g. Hanna et al. 2012; Piedrahita et al. 2016; Romieu et al. 2009; Ruiz-Mercado and
Masera 2015) and highlights the difficulty of implementing interventions involving
behaviour change. Even employing a strict per protocol definition there was no evidence
of benefit of the cookstoves on absenteeism, with the possible exception of older girls
interviewed during the rainy season. The latter finding merits further research.
This study has demonstrated the value of supplementing quantitative evaluation measures
with qualitative data, as a way of corroborating and explaining the quantitative findings.
Insights from IDIs and FGDs were particularly helpful in shedding light on the proposed
mechanisms (or lack thereof) between cleaner burning cookstoves and school absenteeism.
The scope of the qualitative study was, however, limited by the time and resources
available. A pre-/post-intervention interview design, as well as a larger sample size and a
more explicit focus on seasonality, would have provided greater depth, particularly with
respect to changing perceptions surrounding health, time use, and schooling.
5.5 Conclusion
This mixed methods study combined quantitative and qualitative data to assess the impact
of cleaner burning cookstoves on primary school absenteeism in Karonga district, northern
Malawi. Taken together, the findings indicate that the cookstoves did not yield measurable
reductions in primary school absenteeism, but suggest that they might confer other school-
related benefits not captured by the outcome measure available. On this evidence,
interventions that aim to increase school participation should more directly target the
barriers to school attendance that are salient in this population, including cost constraints
and non-HAP-related illness. An appreciation of context is important, however: Malawi’s
northern region, where the study was located, is characterised both by comparatively
favourable educational outcomes (National Statistical Office and ICF Macro 2011; World
Bank 2010), as well as higher forest cover than the two southerly regions (Government of
Malawi 2009). Interventions from settings where rates of absenteeism are higher and
fuelwood more scarce may yield different results.

157
Acknowledgements
We gratefully acknowledge the study team and support staff associated with the Karonga
HDSS, CAPS, and the nested qualitative study, and especially all study participants, for
their valued contributions. Special thanks are due to Levie Gondwe, Green Kapila, Aaron
Ndovi, and Cecilia Nyirenda for conducting the in-depth interviews and focus group
discussions and to the following people for their assistance in facilitating this study: Yoryos
Ponnighaus, Moffat Nyirenda, Manuela Kasonya, Steffen Geis, Orphan Chirwa, Alick
Mwalwanda, Mabvuto Luhanga, Joshua Sikwese, Laurence Tembo, Jean Mwafulirwa,
David Chilalika, Oddie Mwiba, Hazel Namadingo, Maisha Nyasulu, Keith Branson, and
Jacky Saul. We also thank Christian Bottomley for his statistical guidance.

158
References
Ainsworth, M., K. Beegle & G. Koda 2005. The impact of adult mortality and parental deaths on
primary schooling in north-western Tanzania. The Journal of Development Studies 41(3):
412-439. doi: 10.1080/0022038042000313318.
Cluver, L., D. Operario, T. Lane & M. Kganakga 2012. "I can't go to school and leave her in so
much pain": Educational shortfalls among adolescent 'young carers' in the South African
AIDS epidemic. Journal of Adolescent Research 27(5): 581-605. doi: 10.1177/
0743558411417868.
Crampin, A.C., A. Dube, S. Mboma, A. Price, M. Chihana, A. Jahn, et al. 2012. Profile: The
Karonga Health and Demographic Surveillance System. International Journal of
Epidemiology 41: 676-685. doi: 10.1093/ije/dys088.
Cundale, K., R. Thomas, J.K. Malava, D. Havens, K. Mortimer & L. Conteh 2017. A health
intervention or a kitchen appliance? Household costs and benefits of a cleaner burning
biomass-fuelled cookstove in Malawi. Social Science & Medicine 183: 1-10. doi:
10.1016/j.socscimed.2017.04.017.
Evans, D.K. & E. Miguel 2007. Orphans and schooling in Africa: A longitudinal analysis.
Demography 44(1): 35-57.
GBD 2015 Risk Factors Collaborators 2016. Global, regional, and national comparative risk
assessment of 79 behavioural, environmental and occupational, and metabolic risks or
clusters of risks, 1990-2015: A systematic analysis for the Global Burden of Disease Study
2015. The Lancet 388(10053): 1659-1724. doi: 10.1016/S0140-6736(16)31679-8.
Gordon, S. & S. Graham 2006. Epidemiology of respiratory disease in Malawi. Malawi Medical
Journal 18(3): 134-146.
Gordon, S.B., N.G. Bruce, J. Grigg, P.L. Hibberd, O.P. Kurmi, K.-b.H. Lam, et al. 2014.
Respiratory risks from household air pollution in low and middle income countries. The
Lancet Respiratory Medicine 2(10): 823-860.
Government of Malawi 2009. Malawi Biomass Energy Strategy. Lilongwe: Ministry of Natural
Resources, Energy and Environment.
Guest, G., K.M. MacQueen & E.M. Namey 2012. Applied Thematic Analysis, Thousand Oaks, CA,
SAGE Publications, Inc.
Hanna, R., E. Duflo & M. Greenstone 2012. Up in smoke: The influence of household behavior on
the long-run impact of improved cooking stoves. NBER Working Paper 18033. Cambridge,
MA: National Bureau for Economic Research.
Howe, L.D., J.R. Hargreaves & S.R. Huttly 2008. Issues in the construction of wealth indices for
the measurement of socio-economic position in low-income countries. Emerging Themes
in Epidemiology 5(1): 1-14. doi: 10.1186/1742-7622-5-3.
International Labour Organization. ILO Conventions and Recommendations on child labour.
Available from: http://ilo.org/ipec/facts/ILOconventionsonchildlabour/lang--en/index.htm
[Accessed 23/3/2017].
Jagger, P. & C. Perez-Heydrich 2016. Land use and household energy dynamics in Malawi.
Environmental Research Letters 11(12): 125004.
Jary, H.R., J. Kachidiku, H. Banda, M. Kapanga, J.V. Doyle, E. Banda, et al. 2014. Feasibility of
conducting a randomised controlled trial of a cookstove intervention in rural Malawi. The
International Journal of Tuberculosis and Lung Disease 18(2): 240-247. doi:
10.5588/ijtld.13.0485.

159
Kadzamira, E. & P. Rose 2003. Can free primary education meet the needs of the poor? Evidence
from Malawi. International Journal of Educational Development 23: 501-516. doi:
10.1016/S0738-0593(03)00026-9.
Lim, S.S., T. Vos, A.D. Flaxman, G. Danaei, K. Shibuya, H. Adair-Rohani, et al. 2012. A
comparative risk assessment of burden of disease and injury attributable to 67 risk factors
and risk factor clusters in 21 regions, 1990–2010: A systematic analysis for the Global
Burden of Disease Study 2010. The Lancet 380: 2224-2260. doi: 10.1016/S0140-
6736(12)61766-8.
Martin, W.J., II, R.I. Glass, H. Araj, J. Balbus, F.S. Collins, S. Curtis, et al. 2013. Household air
pollution in low- and middle-income countries: Health risks and research priorities. PLOS
Medicine 10(6): e1001455. doi: 10.1371/journal.pmed.1001455.
Mortimer, K., C.B. Ndamala, A.W. Naunje, J. Malava, C. Katundu, W. Weston, et al. 2016. A
cleaner burning biomass-fuelled cookstove intervention to prevent pneumonia in children
under 5 years old in rural Malawi (the Cooking and Pneumonia Study): A cluster
randomised controlled trial. The Lancet 389(10065): 167-175. doi: 10.1016/S0140-
6736(16)32507-7.
Mustapha, B.A., D.J. Briggs & A.L. Hansell 2013. Prevalence of asthma and respiratory symptoms
in children in a low socio-economic status area of Nigeria. The International Journal of
Tuberculosis and Lung Disease 17(7): 982-988. doi: 10.5588/ijtld.12.0434.
Nankhuni, F.J. & J.L. Findeis 2004. Natural resource-collection work and children's schooling in
Malawi. Agricultural Economics 31: 123-134. doi: 10.1016/j.agecon.2004.09.02.
National Statistical Office & ICF Macro 2011. Malawi Demographic and Health Survey 2010.
Zomba, Malawi and Calverton, Maryland: NSO and ICF Macro.
Orkin, K. 2011. 'If God wills... next year I will send her back to school': The effects of child and
parental illness on school participation in rural Ethiopia. CREATE Pathways to Access
Research Monograph No. 60. Consortium for Research on Educational Access, Transitions
and Equity.
Perez-Padilla, R., A. Schilmann & H. Riojas-Rodríguez 2010. Respiratory health effects of indoor
air pollution. The International Journal of Tuberculosis and Lung Disease 14(9): 1079-
1086.
Piedrahita, R., K.L. Dickinson, E. Kanyomse, E. Coffey, R. Alirigia, Y. Hagar, et al. 2016.
Assessment of cookstove stacking in Northern Ghana using surveys and stove use monitors.
Energy for Sustainable Development 34: 67-76. doi: 10.1016/j.esd.2016.07.007.
Porter, G., K. Hampshire, A. Abane, A. Munthali, E. Robson, M. Mashiri, et al. 2012. Child
porterage and Africa's transport gap: Evidence from Ghana, Malawi and South Africa.
World Development 40(10): 2136-2154.
Romieu, I., H. Riojas-Rodríguez, A.T. Marrón-Mares, A. Schilmann, R. Perez-Padilla & O. Masera
2009. Improved biomass stove intervention in rural Mexico: Impact on the respiratory
health of women. American Journal of Respiratory and Critical Care Medicine 180: 649-
656. doi: 10.1164/rccm.200810-1556OC.
Ruiz-Mercado, I. & O. Masera 2015. Patterns of stove use in the context of fuel–device stacking:
Rationale and implications. EcoHealth 12(1): 42-56. doi: 10.1007/s10393-015-1009-4.
Ruiz-Mercado, I., O. Masera, H. Zamora & K.R. Smith 2011. Adoption and sustained use of
improved cookstoves. Energy Policy 39: 7557-7566. doi: 10.1016/j.enpol.2011.03.028.
160
Stanistreet, D., L. Hyseni, M. Bashin, I. Sadumah, D. Pope, M. Sage, et al. 2015. The role of mixed
methods in improved cookstove research. Journal of Health Communication 20(sup1): 84-
93. doi: 10.1080/10810730.2014.999896.
Sunny, B.S., M. Elze, M. Chihana, L. Gondwe, A.C. Crampin, M. Munkhondya, et al. 2017. Failing
to progress or progressing to fail? Age-for-grade heterogeneity and grade repetition in
primary schools in Karonga district, northern Malawi. International Journal of Educational
Development 52: 68-80. doi: 10.1016/j.ijedudev.2016.10.004.
Vyas, S. & L. Kumaranayake 2006. Constructing socio-economic status indices: How to use
principal components analysis. Health Policy and Planning 21(6): 459-468. doi:
10.1093/heapol/czl029.
Webbink, E., J. Smits & E. De Jong 2012. Hidden child labour: Determinants of housework and
family business work of children in 16 developing countries. World Development 40(3):
631-642.
Wodon, Q. & K. Beegle 2006. Labor shortages despite underemployment? Seasonality in time use
in Malawi. In: Blackden, C. M. & Wodon, Q. (eds.) Gender, Time Use, and Poverty in Sub-
Saharan Africa. Washington, D.C.: The World Bank.
Wong, G.W.K., B. Brunekreef, P. Ellwood, H.R. Anderson, M.I. Asher, J. Crane, et al. 2013.
Cooking fuels and prevalence of asthma: A global analysis of phase three of the
International Study of Asthma and Allergies in Childhood (ISAAC). The Lancet
Respiratory Medicine 1(5): 386-394. doi: 10.1016/S2213-2600(13)70073-0.
World Bank 2010. The education system in Malawi. World Bank Working Paper No. 182.
Washington, D.C.: The World Bank.
World Health Organization. 2014. Household air pollution and health: Fact sheet No.292.
Available from: http://www.who.int/mediacentre/factsheets/fs292/en/# [Accessed
18/6/2015].

161
London School of Hygiene & Tropical Medicine Keppel Street, London WC1E 7HT www.lshtm.ac.uk Registry T: +44(0)20 7299 4646 F: +44(0)20 7299 4656 E: [email protected]
RESEARCH PAPER COVER SHEET
PLEASE NOTE THAT A COVER SHEET MUST BE COMPLETED FOR EACH RESEARCH PAPER
INCLUDED IN A THESIS.
SECTION A – Student Details
Student Christine Kelly
Principal Supervisor Judith Glynn
Thesis Title
School absenteeism in Karonga district, northern Malawi:
Trends, influences and the impact of cleaner burning biomass-
fuelled cookstoves
If the Research Paper has previously been published please complete Section B, if not
please move to Section C
SECTION B – Paper already published
Where was the work published?
When was the work published?
If the work was published prior to registration for your research degree, give a brief rationale for its inclusion
Have you retained the copyright for the work?*
Choose an item.
Was the work subject to academic peer review?
Choose an item.
*If yes, please attach evidence of retention. If no, or if the work is being included in its published
format, please attach evidence of permission from the copyright holder (publisher or other author)
to include this work.
SECTION C – Prepared for publication, but not yet published
Where is the work intended to be published?
International Review of Education
Please list the paper’s authors in the intended authorship order:
Christine A. Kelly, Deborah Johnston, Elaine Unterhalter,
Albert Dube, Amelia C. Crampin, Judith R. Glynn
Stage of publication Not yet submitted
SECTION D – Multi-authored work
For multi-authored work, give full details of your role in the research included in the paper and in the preparation of the paper. (Attach a further sheet if necessary)
With input from co-authors, I designed
the study, managed the data, conducted
the analysis and wrote the manuscript
Student Signature: Date:
Supervisor Signature: Date:

162
Chapter 6: Absenteeism and future
educational trajectories
Primary school absenteeism and future educational trajectories in
Karonga district, northern Malawi: A longitudinal analysis
Christine A. Kelly1, Deborah Johnston2, Elaine Unterhalter3, Albert Dube4, Amelia C.
Crampin1,4, and Judith R. Glynn1
1 London School of Hygiene and Tropical Medicine
2 SOAS, University of London
3 UCL Institute of Education
4 Malawi Epidemiology and Intervention Research Unit

163
Abstract
School attendance forms one element of the production function of learning, whereby years
of schooling, school and teacher characteristics, household characteristics and household-
level school inputs including daily attendance and school supplies combine to determine a
student’s achievement. The link between school attendance and educational outcomes may,
however, be more uncertain in low-resource settings where the marginal productivity of
class time is relatively poor and absenteeism represents one of many threats to instructional
time. This study exploits longitudinal data from the annual household survey of the
Karonga Health and Demographic Surveillance System to investigate the relationship
between school absenteeism and future educational trajectories for more than 7,000 primary
school students in northern Malawi. Pooling a maximum of eight observations per student,
we find that students who were absent in one survey round were more likely to be absent
again in the next round, and to repeat their school grade. A measure of cumulative absence
over multiple survey rounds was also significantly associated with lower grade attainment
after six years. Although our analysis cannot establish a causal relationship between
absenteeism and subsequent adverse educational outcomes, attendance records can
nevertheless provide an important early warning system to identify students at risk of future
grade repetition and dropout.

164
6.1 Introduction
Although Malawi has achieved great strides in recent decades with respect to expanding
primary school enrolment, students’ trajectories through school are far from smooth.
Taniguchi (2015) showed that one-quarter of standard (grade) 5 and 7 students across 30
schools in Nkhata Bay did not progress to the next grade after one academic year, while
Sunny et al. (2017) found that 39% of primary students in Karonga district had repeated
their current grade. Repetition not only increases students’ risk of school dropout (Branson
et al. 2014), but it also represents a large and costly source of inefficiency for a school
system (Glick and Sahn 2010), which may compromise its ability to deliver high-quality
education. In Malawi, the World Bank has estimated that, because of repetition and
dropout, twenty-three student-years are required to produce one graduate of the eight-year
primary cycle (World Bank 2010).
School absenteeism has been identified as an important risk factor for adverse educational
pathways, such as in the framework designed by the Consortium for Research on
Educational Access, Transitions and Equity (CREATE) to describe educational zones of
exclusion, where ‘precursors to dropout include repetition, low achievement, temporary
withdrawals, [and] low attendance’ (Lewin 2009, pp. 156-7). However, empirical evidence
linking absenteeism with subsequent educational outcomes is limited in sub-Saharan
African settings, where under-resourced classrooms, poor learning outcomes, and multiple
threats to instructional time may reduce the marginal benefit of school attendance (Abadzi
2004; Lavy 2015; Rivkin and Schiman 2015).
Analyses of data from the Southern and Eastern African Consortium for Monitoring
Educational Quality (SACMEQ) have shown that increased absenteeism is significantly
associated with lower literacy and numeracy scores in Kenya (Hungi and Thuku 2010a),
Tanzania (Yu and Thomas 2008) and pooled analyses of 14 member countries (Hungi and
Thuku 2010b; Yu and Thomas 2008). Because the SACMEQ studies rely on cross-sectional
data, however, they are unable to establish the temporal sequence of absenteeism relative
to other adverse educational outcomes, while SACMEQ’s focus on standard 6 students does
not capture the experience of many primary school students in light of high repetition and
dropout rates (Barnett 2013). Sunny et al. (2017) and Taniguchi (2015) use two rounds of
longitudinal data to show in Malawi that absenteeism in one year is significantly associated
165
with grade repetition in the next, although Taniguchi, too, only includes students at
advanced stages of primary school (standards 5 and 7 at baseline). The relatively short time
horizon of both studies, moreover, precludes examination of the accumulation of
absenteeism over time and its relationship with longer-term educational pathways.
Additionally, as none of the existing studies focus on absenteeism specifically, as distinct
from other individual-, household- and school-level risk factors for poor achievement or
grade progression, they do not explore potential thresholds of absenteeism that are
particularly problematic for student trajectories. They also do not assess possible
interactions between absenteeism and such characteristics as sex, age, socioeconomic
status, and standard attended to identify the students for whom missing school has the
greatest adverse impact.
This paper harnesses a longitudinal dataset of 7,823 primary school students from Karonga
district, northern Malawi, to investigate the following research questions:
1. To what extent are the same students absent repeatedly across school years?
2. Are students who miss school in one year more likely to repeat their grade in the
next year? Is there a dose-response relationship between days of school missed and
likelihood of repetition?
3. How is cumulative absenteeism over multiple school years related to long-term
educational trajectories, as measured by grade attainment?
4. Is the association between absenteeism and grade repetition modified by students’
background characteristics?
6.1.1 Instructional time and educational outcomes
According to economic theory, school attendance forms one element of the production
function of learning, whereby years of schooling, school and teacher characteristics,
household characteristics and household-level school inputs including daily attendance and
school supplies combine to determine a student’s achievement (Glewwe and Kremer 2005).
Research from the United States (Goodman 2014; Gottfried 2011) has convincingly shown
that students’ performance on school examinations or standardised tests is significantly
associated with their number of absence days.
The link between school attendance and educational outcomes may, however, be more

166
uncertain in low-resource settings. An analysis of the impact of instructional time27 on
Programme for International Student Assessment (PISA) test scores found that the positive
impact of teaching hours was much smaller in developing countries relative to OECD
members (Lavy 2015), suggesting that the marginal benefit of class time is lower in
resource-constrained environments where learning outcomes are poor. Importantly, Lavy’s
developing country sample comprised entirely middle-income economies including
Mexico, Thailand and Turkey, and not very low-income countries comparable with
Malawi. Were data available from low-income contexts, this may further widen the
disparities observed with respect to productivity of class time. Rivkin and Schiman (2015),
also using PISA data, showed that the return to instructional time was lower in low-quality
classroom environments, as measured by an index of characteristics including student
attendance and behaviour. This finding suggests that frequent absences of classmates, or
lax school management styles that facilitate frequent student absences (Dunne 2007), may
hamper the learning even of students who regularly attend, thereby reducing the relative
disadvantage of absentees.
Moreover, absenteeism has been identified as only one of a number of threats to
instructional time. Figure 6.1, adapted from Abadzi (2004) and modelled on classroom
observations in low-income settings, shows that school closures, teacher absenteeism, class
time away from task, as well as student absenteeism, all reduce students’ exposure to
curriculum content. In this learning environment, we might not expect absenteeism to have
as large an impact on student performance as it would in a context without other
instructional time constraints.
27 Note that instructional time in these analyses is measured by the length of the official school day, rather
than any measure of students’ actual attendance – see Goodman (2014) on this important distinction.
Source: Adapted from Abadzi 2004. Education for all or just for the smartest poor? Prospects 34(3), p.274.
Remaining after teacher absenteeism
Remaining after student absenteeism
Official class time
Remaining after school closures (strikes, weather, teacher training, extra holidays)
Class time devoted to any learning task
Learning time relevant
to curriculum
Figure 6.1 Sources of instructional time wastage

167
6.1.2 Education in Malawi
Malawi became one of the first countries in sub-Saharan Africa to eliminate primary school
fees when it introduced free primary education in 1994. While the policy led to a large and
immediate increase in student enrolment, its limited planning and rapid implementation
placed considerable strain on personnel and infrastructure (Chimombo 2009), which
continue to be stretched by rapid population growth (World Bank 2010). According to
surveys carried out in 2007 under the auspices of SACMEQ, 46% of standard 6 students
attended schools that were reported to be in good physical condition; 12% attended schools
that had electricity; half attended classes that met the Ministry of Education’s standard of
sixty students per teacher; and just 35% had teachers who demonstrated appropriate
subject-specific knowledge in reading or maths (Milner et al. 2011). Findings from the
World Bank’s Quality of Service Delivery Survey of 2014/15 indicated that, on average,
teachers were scheduled to teach for less than four hours per day, while 20% of instructional
time was spent off-task, and only 25% on active learning, according to classroom
observations (Ravishankar et al. 2016).
Malawian students also score consistently poorly on standardised assessments relative to
peers in neighbouring countries; in the latest set of SACMEQ tests in 2007, just 63% of
Malawian standard 6 students demonstrated functional literacy and 40% functional
numeracy, compared to figures approaching 90% in both subjects among counterparts in
Kenya, Tanzania and Swaziland (Taylor and Spaull 2015). Students in Karonga district
were among the top performing students in Malawi, but on average achieved scores well
below the SACMEQ mean (Mulera et al. 2017). In this context, we might not expect to
observe as strong or consistent a relationship between school attendance and performance
as has been found in other settings.
6.2 Methods
6.2.1 Study population
Data for this analysis come from the Karonga Health and Demographic Surveillance
System (HDSS), which includes an annual household survey covering a population of
approximately 35,000 people in Karonga district, northern Malawi (Crampin et al. 2012).
Using the eight survey rounds in which school attendance data were collected—spanning
the period 2008-2016—we establish an open cohort of primary school students, who enter

168
School year
starts in Jan.
School year
starts in Sept.
First school
attendance data,
Sept. 2008
Blue dotted boxes show the duration of each academic year during
the study period. Orange striped boxes designate the timing of each
of the eight rounds of household survey administration, 2008-2016.
Figure 6.2 Timing of HDSS survey administration relative to the primary school calendar
the cohort when they start standard 1. Students who entered primary school in 2008
therefore contribute a maximum of eight observations to the analysis, whereas students who
entered in the 2014-5 survey round contribute two observations. After cohort entry, students
do not contribute observations in survey rounds in which they were not enrolled in school,
were resident in the study area but attending school outside Karonga district, had left the
catchment area, had died, or were not interviewed for any other reason. As surveys were
administered to household members aged 15 or over who were at home at the time of the
field team’s visit, most information was provided by adult household members—primarily
parents—on behalf of resident children. For each child, survey respondents were asked to
report if he/she had attended school during the past four weeks that school was in session,
and if so, how many days he/she had been absent during that period.
Each survey was administered over a 12-month period roughly corresponding with the
academic calendar, except during the first two surveys when the school year transitioned
from a January to a September start (see Figure 6.2).
6.2.2 Analysis methods
The analysis capitalises on longitudinal data from the HDSS to examine the relationship
between absenteeism and three subsequent educational outcomes: 1) absenteeism, 2) grade
repetition, and 3) grade attainment. For each set of analyses, three thresholds of absence
are compared—generated separately for each survey round—in order to investigate
whether students who experience the most absenteeism suffer worse outcomes. To reflect
differences in the distribution of absenteeism across survey rounds (see Figure 6.4), and
2008 2009 2010 2011 2012 2013 2014 2015 2016

169
that our measure of absenteeism can provide only a snapshot of attendance at one point in
the school year, relative rather than absolute thresholds are used: 1) any episode of absence
in the past four weeks, 2) a period of absence above the 90th percentile and 3) a period of
absence above the 95th percentile for that survey round. Students who breached these
absence thresholds are compared to all other students.
After a brief description of absenteeism trends over time and by standard attended, we
investigate the extent to which absenteeism is repeated by the same individuals across
rounds. We run a logistic regression model estimating the association between missing
school in one round and the probability of being absent at least once in the next round
(separate models for each of the three absenteeism thresholds), among cohort members with
at least two consecutive interviews. Students contribute one observation for each pair of
interviews across rounds, up to a maximum of 7 observations; we use individual random
effects to account for non-independence of observations. Multivariable models adjust for
demographic characteristics including sex, current age, age started primary, standard and
school attended, as well as household factors that have been shown to influence school
attendance (see Chapter 4): parental education, parental death, household head occupation,
sex of household head, and household size and age distribution.28 To account for variation
in the school calendar, as well as any seasonal differences in the timing of survey
administration across rounds, multivariable analyses also adjust for both the survey round
and month of interview. Models are restricted to students attending 23 schools with at least
ten observations per round to avoid the problem of perfect correlation of absenteeism and
school.
We then turn to examine the relationship between absenteeism in one survey round and
grade repetition in the next, using logistic regression models with individual random
effects. Once again, students contribute one observation per pair of consecutive interviews
and separate models are run for each of the three absenteeism thresholds defined above.
Multivariable models contain the same covariates as listed for the first analysis, but are
lagged one round behind the grade repetition measure, to examine the effect of absenteeism
and other factors in one year on repetition the following year. By adding appropriate
28 Note that although agricultural variables were shown in Chapter 4 to be highly related to absenteeism,
these variables were not collected in the HDSS survey after 2010-11 so could not be examined here.

170
interaction terms to each model, we also assess whether the effects of absenteeism differ
by any of the observed background characteristics.
We finally investigate the long-term impact of cumulative absenteeism in past rounds on
future grade attained. Cumulative absenteeism is measured by the number of rounds a
student’s absenteeism breached the three respective thresholds defined above, among
students interviewed in consecutive rounds. To allow a sufficient period of follow-up, we
restrict this analysis to students who entered the cohort in the first three years of the study,
and who were interviewed continuously for six years. Linear regression models estimate
the relationship between the cumulative measure of absenteeism over the first five years of
school with standard attended in the sixth year. Multivariable models adjust for individual
and household characteristics measured contemporaneously with the outcome.
6.2.3 Attrition analysis
Of the 7,823 students who entered the cohort before the last survey round in 2015-16 (see
Figure 6.3), 28.0% missed at least one interview between cohort entry and the last survey
round. Of these, 23.2% exited the cohort after their first interview, 49.7% completed
multiple interviews but left the cohort before the end of the study period, while the
remaining 27.1% were present at the end of the study period following an earlier
interruption. Overall, of the 38,451 person-rounds possible among the students who entered
the cohort before the 2015-2016 survey, 33,383 (86.8%) were observed. However, because
consecutive interviews are required for the longitudinal analysis, a maximum of 24,817
person-rounds (64.5%) are available after eliminating single, isolated interviews.
Table A.4 in the Appendix shows results from a random effects logistic regression model
estimating the relationship between students’ characteristics in one round and non-
interview in the next. Missing data were not associated with absenteeism status, nor with
age or standard attended, but were linked to other background characteristics. Controlling
for other factors, female students were more likely to miss an interview, as were those who
were not the biological child of the household head or were living in a female-headed
household. Students in non-farming households, and those with more educated fathers,
were less likely to be followed up than peers in agricultural households or whose fathers
had not progressed beyond primary school. Attrition was also associated with smaller
household size, and with having one or more resident younger than the index student. For

171
the purpose of this paper, we adjust all models for covariates that are shown to be associated
both with non-interview and with the outcomes of interest, under the assumption that
attrition is independent within strata of these covariates (Greenland et al. 2008).
6.3 Results
6.3.1 Analytic cohort
Figure 6.3 shows the composition of the primary school cohort across the eight survey
rounds, 2008-2016. Approximately 1,000 children entered standard 1 in each successive
round29, while very few left school, died, or transferred to schools outside Karonga district
during the study period. Students were interviewed an average of 3.8 times (range 1-8), or
4.5 times (range 2-8) in the analytical sample of students interviewed in at least two
consecutive rounds. In light of Malawi’s eight-year primary cycle, as well as high repetition
rates in the sample, the educational trajectories of most students are truncated. Cohort
members in the latter stages of primary school thus represent an increasingly selective
student sample by virtue of having progressed through the primary cycle without repeating.
29 Note that the students who entered primary school in the last survey round—shown in the striped box—are
not included in the analysis as they lack follow-up time.
Note: The 1173 students who entered primary school during the 2015-16 survey
round (shown in the striped box) are excluded from the analysis.
0
1000
2000
3000
4000
5000
6000
7000
8000
9000
10000
2008-09 2009-10 2010-11 2011-12 2012-13 2013-14 2014-15 2015-16
Nu
mb
er o
f st
ud
ents
Survey round
Entered grade 1 Repeated grade Progressed to next gradeDied Not attending school School outside KarongaLeft catchment area Not interviewed
Figure 6.3 Composition of student cohort across eight survey rounds, 2008-2016

172
Table 6.1 shows individual and household baseline characteristics of the 7,236 students
who entered the primary school cohort before the 2015-16 round and were interviewed in
two or more consecutive rounds. Approximately equal numbers of male and female
students entered the cohort during the study period. Students had a mean age of 6 years old
at baseline, which matched the official age of primary school entry, but just over one third
entered the cohort before age 6 and 17% entered at age 7 or older.30 The majority of students
lived in households engaged in subsistence farming, with 10.6% residing with household
heads in skilled occupations, including teachers, health professionals, or managers of large
organisations. Approximately 5% and 2% of cohort entrants were paternal or maternal
orphans, respectively.
Table 6.1 Baseline characteristics of primary school cohort
Sex
Male
Female
n (%)
3693 (51.0)
3543 (49.0)
Age
≤5
6
7
≥8
Mean years (SD)
2470 (34.2)
3531 (48.8)
1044 (14.4)
191 (2.6)
6.4 (0.76)
Father’s education
Primary or less
More than primary
Missing
4322 (59.7)
2842 (39.3)
72 (1.0)
Mother’s education
Primary or less
More than primary
Missing
5763 (79.6)
1452 (20.1)
21 (0.3)
Father’s survival status
Alive
Died
Missing
6876 (95.0)
353 (4.9)
7 (0.1)
Mother’s survival status
Alive
Died
7110 (98.3)
126 (1.7)
Relationship to household head
Child
Step-child
Grandchild
Niece/nephew
Other
5734 (79.2)
166 (2.3)
1083 (15.0)
77 (1.1)
176 (2.4)
30 Note, however, that not all 7 year-olds entered primary school late, depending on the timing of interview
relative to the student’s birthday.

173
Table 6.1 continued Baseline characteristics of primary
school cohort
Sex of household head
Male
Female
n (%)
6118 (84.5)
1118 (15.5)
Occupation of household head
Subsistence farmer/herdsman
Fisherman
Other non-skilled
Skilled
Not working
Missing
4968 (68.7)
372 (5.1)
1011 (14.0)
735 (10.2)
109 (1.5)
41 (0.6)
Number of household members
1-4
5-8
9+
Mean members (SD)
1179 (16.3)
5121 (70.8)
936 (12.9)
6.3 (2.0)
Number of younger members
None
1
2
≥3
Mean younger members (SD)
1698 (23.5)
3145 (43.5)
1967 (27.2)
426 (5.9)
1.2 (0.85)
Survey round of cohort entry
2008-09
2009-10
2010-11
2011-12
2012-13
2013-14
2014-15
1004 (13.9)
1059 (14.6)
1038 (14.3)
869 (12.0)
1118 (15.5)
1084 (15.0)
1064 (14.7) Note: Restricted to analytic sample of students interviewed in two or
more consecutive rounds and who entered the cohort before 2015-16
6.3.2 Absenteeism prevalence
Figures 6.4 and 6.5 show the overall prevalence of absenteeism by survey round (Figure
6.4) and standard attended (Figure 6.5), among cohort members with non-missing data.
Levels of reported absence varied somewhat across rounds, both in terms of the proportion
of students who missed school in the previous four weeks and the number of days missed.
Prevalence of absenteeism was highest in standard 1 and declined with successive grades.31
Attendance data were missing for approximately 4% of observations.
31 Although very few students reached standard 8 in the cohort under study, a previous analysis by the authors
with a larger sample of standard 8 students also showed that absenteeism was lowest in the final year of
primary school (see Chapter 4).

174
6.3.3 Repeated absenteeism
We now investigate the extent to which students who reported absenteeism in each survey
round are the same or different students across time. That is, we seek to assess whether
students who are absent in one round are more or less likely than their peers who were not
absent to miss school in the next round. Table 6.2 shows results from unadjusted and
0
1
2
3
4
5
6
0
10
20
30
40
2008-09 2009-10 2010-11 2011-12 2012-13 2013-14 2014-15 2015-16
Mea
n d
ay
s o
f a
bse
nce
% o
f st
ud
ents
Survey round
% absent in past 4 weeks % missing attendance data
Mean school days missed -- all students Mean school days missed -- absent students
Figure 6.5 Proportion of students who missed school in the past four weeks, and
mean number of days missed, by survey round
0
5
10
15
20
25
0
1,000
2,000
3,000
4,000
5,000
6,000
7,000
8,000
1 2 3 4 5 6 7 8Standard attended
% o
f st
ud
ents
Nu
mb
er o
f st
ud
ents
Number of students entering standard
% absent in past 4 weeks
% missing attendance data
Figure 6.4 Proportion of students who missed school in the past four weeks, and
number of students interviewed, by standard
Figure 6.4 Proportion of students who missed school in the past four weeks, and
mean number of days missed, by survey round
Figure 6.5 Proportion of students who missed school in the past four weeks, and
number of students interviewed, by standard

175
adjusted logistic regression models assessing the association between lagged (i.e. in
roundt-1) and current (roundt) absenteeism, using the three round-specific thresholds: 1) any
in the past four weeks, 2) absenteeism above the 90th percentile and 3) absenteeism above
the 95th percentile. The results confirm that, among students with at least two consecutive
rounds of attendance information, absenteeism in the previous round was significantly
associated with missing school in the current round, and particularly when current
absenteeism breached the highest absenteeism thresholds. No evidence for differences in
levels of absenteeism between male and female students, nor for effect modification by
background characteristics, was found (see Table A.5 in the Appendix for full model
results).
Table 6.2 Association between three thresholds of absenteeism in the past four weeks and
three thresholds of lagged absenteeism, among students with at least two consecutive
interviews
By way of sensitivity analysis, we also compared absenteeism patterns of students whose
interview pairs occurred during the same calendar month across rounds with those who
were interviewed in different months, to ensure that the timing of survey administration did
not drive the observed relationship between current and lagged absenteeism. Focusing on
any absenteeism in the past four weeks as the outcome variable, the stratified models show
OR 95% CI p-value AOR 95% CI p-value
Any absenteeism in past 4 weeks (N=21,834 [6,765])
Model 1: Any lagged absenteeism 1.18 1.07-1.30 0.001 1.14 1.03-1.25 0.009
Model 2: Lagged absenteeism >90 %ile 1.18 1.04-1.34 0.010 1.12 0.99-1.27 0.080
Model 3: Lagged absenteeism >95 %ile 1.13 0.95-1.33 0.168 1.11 0.94-1.32 0.220
Absenteeism > 90th percentile past 4 weeks (N=21,834 [6,765])
Model 1: Any lagged absenteeism 1.34 1.18-1.52 <0.001 1.28 1.13-1.46 <0.001
Model 2: Lagged absenteeism >90 %ile 1.49 1.22-1.81 <0.001 1.37 1.13-1.67 0.002
Model 3: Lagged absenteeism >95 %ile 1.29 1.00-1.65 0.047 1.19 0.93-1.53 0.171
Absenteeism > 95th percentile past 4 weeks (N=21,834 [6,765])
Model 1: Any lagged absenteeism 1.55 0.33-1.82 <0.001 1.41 1.20-1.66 <0.001
Model 2: Lagged absenteeism >90 %ile 1.71 1.35-2.16 <0.001 1.54 1.22-1.96 <0.001
Model 3: Lagged absenteeism >95 %ile 1.58 1.11-2.26 0.011 1.43 1.00-2.04 0.050
Notes: Table shows results from a logistic regression model with individual random effects. The first number
in brackets designates total observations; the second in square brackets shows the number of students who
contributed observations. Students contributed an average of 3.2 observations. Adjusted models also include:
sex, age group, age started primary, standard attended, relationship to household head, father’s education,
mother’s education, father’s survival status, mother’s survival status, occupation of household head, number
of household members, number of younger household members, interview month, school attended, change of
school across rounds, and survey round. Sample was restricted to students attending schools with at least 10
observations per round. Note that 190 observations from one school were dropped for predicting failure
perfectly in models with absenteeism >95th percentile as the exposure. See Table A.5 for full model results.

176
that, among students interviewed in the same calendar month, evidence for the association
between current and lagged absenteeism consistently lost statistical significance,
suggesting that the relationship in the full model does not result simply from seasonal
patterns of absence (Table 6.3). Indeed, the association between any lagged absenteeism
and current absenteeism was strongest among students interviewed in different months
across rounds (AOR: 1.26 [1.14-1.39]).
Table 6.3 Association between any absenteeism in the past four weeks and three thresholds
of lagged absenteeism, according to whether students were interviewed in the same month
or different months across rounds
6.3.4 Absenteeism and grade repetition
We now examine whether the grade progression of students who missed school was
measurably worse than for peers who did not experience absenteeism. Figure 6.6 plots the
survival profile for each grade in primary school, among male and female students who
entered the cohort in the first survey round and were therefore observed for the (theoretical)
duration of the eight-year primary cycle. It calculates the cumulative probability of
reaching each grade on the first attempt, accounting for the probability of progressing
through each previous grade without repeating or dropping out. The curves indicate that
promotion rates to standards 2 and 4 were lowest for both boys and girls, and highest for
standards 7 and 8, although it should be noted that the sample from which these
probabilities were generated becomes increasingly selective at later grades. Although
promotion rates for girls were slightly higher than for boys at nearly every grade, the
OR 95% CI p-value AOR 95% CI p-value
Students interviewed in same month across rounds (N=8,389 [4,802])
Model 1: Any lagged absenteeism 1.14 0.99-1.31 0.060 1.10 0.96-1.27 0.183
Model 2: Lagged absenteeism >90 %ile 1.23 1.00-1.52 0.047 1.11 0.90-1.37 0.340
Model 3: Lagged absenteeism >95 %ile 1.26 0.95-1.66 0.105 1.18 0.89-1.56 0.245
Students interviewed in different months across rounds (N=13,445 [5,777])
Model 1: Any lagged absenteeism 1.35 1.22-1.48 <0.001 1.26 1.14-1.39 <0.001
Model 2: Lagged absenteeism >90 %ile 1.27 1.09-1.47 0.002 1.22 1.05-1.43 0.012
Model 3: Lagged absenteeism >95 %ile 1.16 0.94-1.42 0.170 1.16 0.94-1.44 0.168
Notes: Table shows results from a logistic regression model with individual random effects. The first number
in brackets designates total observations; the second in square brackets shows the number of students who
contributed observations. Students contributed an average of 1.7 and 2.3 observations in the two models,
respectively. Adjusted models also include the same covariates as listed in notes for Table 6.2. Sample was
restricted to students attending schools with at least 10 observations per round.

177
probability of children entering standard 1 and progressing to standard 8 without repeating
or dropping out was very low for both sexes: just 4% for boys and 5% for girls.32
Table 6.4 shows results from a logistic regression model estimating the relationship
between absenteeism in the previous survey round and current grade repetition for the three
thresholds of absenteeism, each compared to all other students. It indicates that lagged
absenteeism was significantly associated with grade repetition in all three cases, but the
effect size increased with days of absence. Thus, students whose absenteeism fell in the
uppermost 5%—missing more than 4-10 days in the past four weeks, depending on the
round—were significantly more likely to repeat their next grade than students who missed
less than this (AOR 1.37 [1.19-1.57]).
32 Although there is some variation across school year cohorts for the years observed, average promotion rates
combining all members of the longitudinal sample are similar to those shown in Figure 6.6.
Notes: Data points show the cumulative probability of reaching each respective standard on the first
attempt, accounting for the probability of passing through each previous standard without repeating or
dropping out. Individual promotion rates for each standard are shown in brackets.
0
0.1
0.2
0.3
0.4
0.5
0.6
0.7
0.8
0.9
1
Std 1 Std 2 Std 3 Std 4 Std 5 Std 6 Std 7 Std 8
Cu
mu
lati
ve
pro
ba
bil
ity
Boys
Girls
0.06 (0.75) 0.05 (0.85) 0.09 (0.62)
0.14 (0.68)
0.21 (0.53)
0.39 (0.67)
0.58 (0.58)
0.51 (0.51)
0.32 (0.63)
0.16 (0.49)
0.09 (0.59) 0.06 (0.60) 0.04 (0.67) 0.04 (0.87)
Girls Boys
N=435 N=504
N=350 N=404
N=345 N=418
N=303 N=367
N=236 N=264
N=110 N=102
N=27 N=26
Figure 6.6 Survival profiles of boys and girls who entered primary school in the 2008-09
survey round

178
Table 6.4 Association between lagged absenteeism and current grade repetition, among
students with at least two consecutive interviews
Consistent with Figure 6.6, boys were more likely than girls to repeat their grade (see Table
A.6 in the Appendix), but no gender differences in terms of the effect of absenteeism on
repetition were observed. The relationship between absenteeism and repetition was,
however, significantly modified by age at primary school entry. Taking the highest
absenteeism threshold as the exposure variable, the stratum-specific adjusted odds ratio for
lagged absenteeism was 1.16 (0.94-1.43) for students who started primary by age 5, but
2.29 (1.46-3.59) for those who started at age 7 or later (Table 6.5). Similarly, although
students living with a household head engaged in a skilled occupation were significantly
less likely to repeat their grade compared to peers in subsistence farming households, the
association between absenteeism and grade repetition was largest in skilled households
(stratum-specific AOR 2.24 [1.41-3.57]).
Table 6.5 Association between lagged absenteeism above the 95th percentile and
current grade repetition, stratified by selected background characteristics
OR 95% CI p-value AOR 95% CI p-value
Model 1: Any absenteeism 1.22 1.15-1.30 <0.001 1.19 1.12-1.27 <0.001
Model 2: Absenteeism >90 %ile 1.36 1.23-1.50 <0.001 1.28 1.16-1.42 <0.001
Model 3: Absenteeism >95 %ile 1.48 1.29-1.69 <0.001 1.37 1.19-1.57 <0.001
Notes: Table shows results from logistic regression models with individual random effects. N=22,933
representing 6,960 individuals contributing an average of 3.3 observations. Adjusted models also include:
sex, age group, standard attended (lagged), age started primary school, occupation of household head
(lagged), sex of household head (lagged), relationship to household head (lagged), mother’s survival status
(lagged), father’s survival status (lagged), mother’s education, father’s education, number of household
members (lagged), number of younger household members (lagged), month of interview (lagged), school
attended (lagged), change of school across rounds, and survey round. Sample restricted to students attending
schools with at least 10 observations per round. See Table A.6 for full model results.
Stratum-
specific AOR
95% CI p-value p-value
interaction
Age started primary
Early (age 5 or younger)
On time (age 6)
Late (age 7 or older)
1.16
1.43
2.29
0.94-1.43
1.17-1.73
1.46-3.59
0.174
<0.001
<0.001
0.021
Occupation of household head
Subsistence farmer
Fisherman
Other unskilled
Skilled
Not working
1.26
1.04
1.87
2.24
1.17
1.07-1.47
0.55-1.97
1.26-2.77
1.41-3.57
0.37-3.73
0.005
0.914
0.002
0.001
0.787
0.072
Notes: Table shows results from logistic regression models with individual random effects.
N=22,933 representing 6,960 individuals contributing an average of 3.3 observations. Likelihood
ratio were tests used to assess evidence for interaction between lagged absenteeism and
background characteristics. See Table 6.4 for list of adjusted model covariates. Sample restricted
to students attending schools with at least 10 observations per round.

179
6.3.5 Cumulative absenteeism and grade attainment
Having examined the association between absenteeism in one round and grade repetition
in the next, we now investigate the relationship between cumulative absenteeism over five
years on grade attainment after six years. Figure 6.7 shows the standard attended after six
years among students who entered the primary school cohort in the first three survey
rounds, by cumulative rounds of absenteeism. Standard attended significantly declined with
rounds of reported absenteeism: students with no reported absences had completed on
average 4.4 standards (SD 0.98, range 2-7) of the expected six, while those who had missed
school in one round had completed 4.3 standards (SD 1.01, range 1-7), and those who had
missed school in multiple rounds had completed 4.1 standards (SD 1.04, range 1-7,
differences significant at p<0.05).
Table 6.6 shows results from linear regression models estimating the relationship between
standard attended six years after cohort entry and the number of times in the first five
surveys the student’s absenteeism exceeded the three round-specific thresholds. In both
unadjusted and adjusted models, the number of rounds of reported absenteeism
demonstrated a significantly negative association with grade attended for all three
Note: Restricted to students who entered the primary school cohort in the first three survey rounds and
who attended school continuously for six years. Cumulative absenteeism designates the number of
rounds over the first five surveys that a student reported absenteeism.
Figure 6.7 Standard attended after six years of primary school, by cumulative rounds
in which absenteeism was reported
0
5
10
15
20
25
30
35
40
45
1 2 3 4 5 6 7
%
Standard attended
None (N=814)
1 round (N=748)
2+ rounds (N=513)

180
absenteeism thresholds.33 Wald tests confirm that the coefficients for Models 2 and 3,
respectively, are significantly different from the coefficient for Model 1 at p<0.05,
demonstrating that students who breached the highest absenteeism thresholds lagged
further behind peers who were absent less than this.
Table 6.6 Association between cumulative rounds of absenteeism over five years with
standard attended in the sixth year Unadjusted coefficient
(95% CI)
p-value Adjusted coefficient
(95% CI)
p-value
Model 1: Any absenteeism -0.11 (-0.16, -0.07) <0.001 -0.09 (-0.13, -0.04) <0.001
Model 2: Absenteeism >90 %ile -0.20 (-0.28, -0.13) <0.001 -0.15 (-0.22, -0.08) <0.001
Model 3: Absenteeism >95 %ile -0.22 (-0.33, -0.12) <0.001 -0.18 (-0.28, -0.08) <0.001
Notes: Table shows results from linear regression model, N=2,075. Sample restricted to students who entered the
primary school cohort in the first three survey rounds, were interviewed continuously for six years, and attended
schools with at least 10 observations per round for the duration of the period. Cumulative absenteeism measures
the number of rounds that students’ absenteeism breached the three respective thresholds. Adjusted model
includes the same set of covariates listed in Table 6.2. See Table A.7 for full model results.
Attending a higher standard was also significantly associated with being female, having
more educated parents, living in a household with a skilled head, and with larger household
size (see Table A.7 in the Appendix). Standard attended was negatively associated with the
number of younger household members.
6.4 Discussion
This analysis has investigated the relationship between school absenteeism and subsequent
educational outcomes by capitalising on longitudinal school attendance data rarely
available in sub-Saharan African contexts. Even in a low-resource setting, and with very
crude measures of school absenteeism, our results are consistent with the education
production function, whereby daily school attendance contributes to attainment and
achievement through exposure to curriculum content. We show both that students who were
absent in one school year were more likely than their peers who were not absent to miss
school the following year, and that students at the uppermost end of the absenteeism
33 Results from a Poisson regression model with the outcome variable measured as count variable of the
cumulative number of repetitions over six years (shown in Table A.8 in the Appendix) corroborate this result.

181
distribution were more likely to experience adverse educational pathways than were peers
who missed less school.
However, we cannot necessarily conclude that absenteeism has a direct impact on student
performance. It is probable, for instance, that absenteeism and grade repetition are jointly
determined by low academic ability or motivation, limited perceived returns to schooling,
inadequate household support for education, or other unmeasured factors. Alternatively,
frequent absenteeism may send signals about students’ commitment to schooling,
independent of actual performance, which affects their promotion prospects. Evidence from
case studies of four Ghanaian students indeed suggests that teachers factor attendance
records into promotion decisions: according to one student, he repeated ‘because the
teachers said I was not serious about my attendance’ (Dunne and Ananga 2013, p. 200). A
comparison of high and low achieving schools in Jamaica—as determined by predicted
composite measures of math and reading—similarly found that students who attended
school irregularly and lagged behind academically were considered ‘non-starters’ by
teachers in poorly performing schools, and consequently neglected in lessons (Lockheed
and Harris 2005: 20).
Nevertheless, despite uncertainty about the underlying mechanism, by showing that
frequent absenteeism is related to subsequent adverse educational outcomes, attendance
records can provide an early warning system to identify students at risk of future grade
repetition and dropout, as has been advocated in other settings (Henry et al. 2012; Neild et
al. 2007; UNICEF and UIS 2016). Large-scale surveys that monitor daily attendance—as
distinct from enrolment and retention—are increasing in sub-Saharan Africa, for instance
through SACMEQ in Southern and Eastern Africa, or the Uwezo initiative, which has
collected attendance data across Kenya, Uganda and Tanzania as part of national literacy
and numeracy assessments (Uwezo 2011). In monitoring outputs, however, absenteeism is
typically reported as a school- or region-wide average (e.g. Milner et al. 2011; Uwezo 2016;
Uwezo Tanzania 2013), which masks variation in attendance at the individual level.
Moreover, one-off or cross-sectional measures of absenteeism do not account for repeated
absences over time, which we have shown to affect a substantial subset of students. Our
results highlight the importance of appropriately identifying students with long or frequent
periods of absence whose risk of adverse educational outcomes is highest (Gottfried 2014;
UNICEF and UIS 2016).

182
By including interactions between absenteeism and students’ background characteristics,
we have also identified subgroups for whom missing school is most detrimental for future
educational pathways. We found that the relationship between absenteeism and subsequent
grade repetition was modified by age of primary school entry, such that the association was
significantly strongest among students who started school after the official age. Previous
research in Malawi has highlighted that overage students are subject to ridicule and
humiliation from younger classmates, particularly if they are physically larger than other
students, leading to emotional disengagement from school, which may in turn contribute to
both absenteeism and repetition (USAID 2014). Alternatively, students who start school
late may come from households who face financial barriers to schooling (Wils 2004), which
similarly promotes both absenteeism and repetition. Indeed, research from South Africa has
shown that households spend less money on school fees, transportation and other school
expenses for children who are overage for grade (Anderson et al. 2001), which may signal
a lack of investment in the education of overage students—or a corresponding inability to
pay—that influences students’ capacity to attend regularly and perform well. Finally,
children who enrol late miss learning experiences at a time when they are most receptive
to learning basic skills and establishing foundations for future cognitive development
(Lewin and Sabates 2012), which may exacerbate the detrimental impact of absenteeism
on grade progression.
We also saw that the association between absenteeism and repetition was strongest among
students living with a household head engaged in a skilled occupation. Since these students
were least likely to repeat a grade overall, this suggests that grade progression for students
in skilled households was more sensitive to school attendance than for students from other
backgrounds who face other barriers—including poverty, labour demands, or lower
perceived returns to schooling—that inhibit achievement and attainment. Interestingly, we
did not observe a gender difference in either the extent of absenteeism or the relationship
between absenteeism and grade progression. Girls were less likely than boys to repeat their
grade, but were also more likely to be lost to follow-up, so it is possible that girls who
experienced more adverse educational outcomes were not observed.
A number of limitations to this analysis should be noted. Firstly, school attendance data
were available only for a four-week period, rather than for the whole school year, so our
results provide a snapshot of student absenteeism that may not reflect trends over a longer

183
period. However, that repeated absenteeism was more common among students
interviewed in different months across school years, rather than those interviewed in the
same month, suggests that relationships are not driven simply by seasonal patterns of
absenteeism. Attendance data were also drawn from household surveys rather than school
attendance registers or other administrative sources, and may thus be subject to social
desirability or recall bias associated with self-reported data (Rosenman et al. 2011).
Moreover, most attendance data were provided by proxy respondents—typically parents—
on behalf of resident students, which may additionally have influenced the accuracy of
reporting (Bardasi et al. 2011; Dammert and Galdo 2013). Pooling data for the same
students across multiple survey rounds, however, increases confidence in the robustness of
our findings. Finally, because only eight rounds of survey data were available, we cannot
observe the educational outcomes of the majority of students who progressed through the
primary cycle in more than that time. While this would likely influence the distribution of
absenteeism and grade repetition by standard, as well as the survival profiles shown in
Figure 6.6, we would expect that by observing only the top performing students at the latter
stages of primary school, the relationship between absenteeism and repetition would, if
anything, be underestimated. The study would benefit from the addition of literacy and
numeracy assessments to better evaluate the links between academic skills, school
attendance and grade progression.
6.5 Conclusion
Taken together, our results highlight the importance of daily attendance monitoring of
primary school students both within and across school years, as a means of identifying those
at risk of subsequent adverse educational pathways. More research is needed to ascertain
the precise mechanism linking absenteeism with grade repetition, but efforts to address
financial barriers to school attendance, as well as increasing support for remedial
programmes for frequently absent students, particularly those who are overage for grade,
represent potentially promising policy prescriptions.

184
References
Abadzi, H. 2004. Education for all or just for the smartest poor? Prospects 34(3): 271-289.
Anderson, K.G., A. Case & D. Lam 2001. Causes and consequences of schooling outcomes in South
Africa: Evidence from survey data. Social Dynamics 27(1): 37-59. doi: 10.1080/
02533950108458703.
Bardasi, E., K. Beegle, A. Dillon & P. Serneels 2011. Do labor statistics depend on how and to
whom the questions are asked? Results from a survey experiment in Tanzania. The World
Bank Economic Review 25(3): 418-447. doi: 10.1093/wber/lhr022.
Barnett, E. 2013. An analysis of community involvement in primary schools in Malawi.
International Journal of Educational Development 33(5): 497-509. doi: 10.1016/
j.ijedudev.2012.06.007.
Branson, N., C. Hofmeyr & D. Lam 2014. Progress through school and the determinants of school
dropout in South Africa. Development Southern Africa 31(1): 106-126. doi: 10.1080/
0376835X.2013.853610.
Chimombo, J. 2009. Changing patterns of access to basic education in Malawi: A story of a mixed
bag? Comparative Education 45(2): 297-312. doi: 10.1080/03050060902921003.
Crampin, A.C., A. Dube, S. Mboma, A. Price, M. Chihana, A. Jahn, et al. 2012. Profile: The
Karonga Health and Demographic Surveillance System. International Journal of
Epidemiology 41: 676-685. doi: 10.1093/ije/dys088.
Dammert, A.C. & J. Galdo 2013. Child labor variation by type of respondent: Evidence from a
large-scale study. World Development 51: 207-220. doi: 10.1016/j.worlddev.2013.06.002.
Dunne, M. 2007. Gender, sexuality and schooling: Everyday life in junior secondary schools in
Botswana and Ghana. International Journal of Educational Development 27: 499-511. doi:
10.1016/j.ijedudev.2006.10.009.
Dunne, M. & E.D. Ananga 2013. Dropping out: Identity conflict in and out of school in Ghana.
International Journal of Educational Development 33(2): 196-205. doi: 10.1016/
j.ijedudev.2012.04.005.
Glewwe, P. & M. Kremer 2005. Schools, teachers, and education outcomes in developing countries.
CID Working Paper No. 122. Cambridge, MA: Harvard University.
Glick, P. & D.E. Sahn 2010. Early academic performance, grade repetition, and school attainment
in Senegal: A panel data analysis. The World Bank Economic Review 21(1): 93-120.
Goodman, J. 2014. Flaking out: Student absences and snow days as disruptions of instructional
time. NBER Working Paper 20221. Cambridge, MA: National Bureau of Economic
Research.
Gottfried, M.A. 2011. The detrimental effects of missing school: Evidence from urban siblings.
American Journal of Education 117(2): 147-182. doi: 10.1086/657886.
Gottfried, M.A. 2014. Chronic absenteeism and its effects on students’ academic and
socioemotional outcomes. Journal of Education for Students Placed at Risk (JESPAR)
19(2): 53-75. doi: 10.1080/10824669.2014.962696.
Greenland, S., S. Lanes & M. Jara 2008. Estimating effects from randomized trials with
discontinuations: the need for intent-to-treat design and G-estimation. Clinical Trials 5(1):
5-13. doi: 10.1177/1740774507087703.
Henry, K.L., K.E. Knight & T.P. Thornberry 2012. School disengagement as a predictor of dropout,
delinquency, and problem substance use during adolescence and early adulthood. Journal
of Youth and Adolescence 41(2): 156-166. doi: 10.1007/s10964-011-9665-3.

185
Hungi, N. & F.W. Thuku 2010a. Differences in pupil achievement in Kenya: Implications for policy
and practice. International Journal of Educational Development 30(1): 33-43. doi:
10.1016/j.ijedudev.2009.05.001.
Hungi, N. & F.W. Thuku 2010b. Variations in reading achievement across 14 southern African
school systems: Which factors matter? International Review of Education 56(1): 63-101.
doi: 10.1007/s11159-009-9148-x.
Lavy, V. 2015. Do differences in schools' instruction time explain international achievement gaps?
Evidence from developed and developing countries. Economic Journal 125(588): F397-
F424. doi: 10.1111/ecoj.12233.
Lewin, K.M. 2009. Access to education in sub-Saharan Africa: Patterns, problems and possibilities.
Comparative Education 45(2): 151-174. doi: 10.1080/03050060902920518.
Lewin, K.M. & R. Sabates 2012. Who gets what? Is improved access to basic education pro-poor
in Sub-Saharan Africa? International Journal of Educational Development 32(4): 517-528.
doi: 10.1016/j.ijedudev.2012.02.013.
Lockheed, M.E. & A.M. Harris 2005. Beneath education production functions: The case of primary
education in Jamaica. Peabody Journal of Education 80(1): 6-28. doi.
Milner, G.D., D. Mulera & T. Chimuzu 2011. The SACMEQ III project in Malawi: A study of the
conditions of schooling and the quality of education. Southern and Eastern African
Consortium for Measuring Educational Quality.
Mortimer, K., C.B. Ndamala, A.W. Naunje, J. Malava, C. Katundu, W. Weston, et al. 2016. A
cleaner burning biomass-fuelled cookstove intervention to prevent pneumonia in
children under 5 years old in rural Malawi (the Cooking and Pneumonia Study): A
cluster randomised controlled trial. The Lancet 389(10065): 167-175. doi: 10.1016/
S0140-6736(16)32507-7.
Mulera, D.M.W.J., K.K. Ndala & R. Nyirongo 2017. Analysis of factors affecting pupil
performance in Malawi’s primary schools based on SACMEQ survey results. International
Journal of Educational Development 54: 59-68. doi: 10.1016/j.ijedudev.2017.04.001.
Neild, R.C., R. Balfanz & L. Herzog 2007. An early warning system. Educational Leadership
65(2): 28-33.
Ravishankar, V., S. El-Tayeb El-Kogali, D. Sankar, N. Tanaka & N. Rakoto-Tiana 2016. Primary
eduction in Malawi: Expenditures, service delivery, and outcomes. World Bank Studies.
Washington, DC: The World Bank.
Rivkin, S.G. & J.C. Schiman 2015. Instruction time, classroom quality, and academic achievement.
Economic Journal 125(588): F425-F448. doi: 10.1111/ecoj.12315.
Rosenman, R., V. Tennekoon & L.G. Hill 2011. Measuring bias in self-reported data. International
Journal of Behavioural & Healthcare Research 2(4): 320-332. doi:
10.1504/IJBHR.2011.043414.
Sunny, B.S., M. Elze, M. Chihana, L. Gondwe, A.C. Crampin, M. Munkhondya, et al. 2017. Failing
to progress or progressing to fail? Age-for-grade heterogeneity and grade repetition in
primary schools in Karonga district, northern Malawi. International Journal of Educational
Development 52: 68-80. doi: 10.1016/j.ijedudev.2016.10.004.
Taniguchi, K. 2015. Determinants of grade repetition in primary school in sub-Saharan Africa: An
event history analysis for rural Malawi. International Journal of Educational Development
45: 98-111. doi: 10.1016/j.ijedudev.2015.09.014.

186
Taylor, S. & N. Spaull 2015. Measuring access to learning over a period of increased access to
schooling: The case of Southern and Eastern Africa since 2000. International Journal of
Educational Development 41: 47-59. doi: 10.1016/j.ijedudev.2014.12.001.
UNICEF and UIS 2016. Monitoring education participation: Framework for monitoring children
and adolescents who are out of school or at risk of dropping out. UNICEF Series on
Education Participation and Dropout Prevention, Volume 1. Geneva: UNICEF Regional
Office for Central and Eastern Europe and the Commonwealth of Independent States.
USAID 2014. Report for study on student repetition and attrition in primary education in Malawi.
USAID.
Uwezo 2011. Improving learning outcomes in East Africa 2009-2013. Uwezo East Africa Strategic
Plan. Nairobi: Uwezo.
Uwezo 2016. Are our children learning? Uwezo Kenya sixth learning assessment report. Nairobi:
Twaweza East Africa.
Uwezo Tanzania 2013. Are our children learning? Annual learning assessment report 2012. Dar es
Salaam: Twaweza East Africa.
Wils, A. 2004. Late entrants leave school earlier: Evidence from Mozambique. International
Review of Education 50(1): 17-37. doi: 10.1023/B:REVI.0000018201.53675.4b.
World Bank 2010. The education system in Malawi. World Bank Working Paper No. 182.
Washington, D.C.: The World Bank.
Yu, G. & S.M. Thomas 2008. Exploring school effects across southern and eastern African school
systems and in Tanzania. Assessment in Education: Principles, Policy & Practice 15(3):
283-305. doi: 10.1080/09695940802417525.

187
London School of Hygiene & Tropical Medicine Keppel Street, London WC1E 7HT www.lshtm.ac.uk Registry T: +44(0)20 7299 4646 F: +44(0)20 7299 4656 E: [email protected]
RESEARCH PAPER COVER SHEET
PLEASE NOTE THAT A COVER SHEET MUST BE COMPLETED FOR EACH RESEARCH PAPER
INCLUDED IN A THESIS.
SECTION A – Student Details
Student Christine Kelly
Principal Supervisor Judith Glynn
Thesis Title
School absenteeism in Karonga district, northern Malawi:
Trends, influences and the impact of cleaner burning biomass-
fuelled cookstoves
If the Research Paper has previously been published please complete Section B, if not
please move to Section C
SECTION B – Paper already published
Where was the work published?
When was the work published?
If the work was published prior to registration for your research degree, give a brief rationale for its inclusion
Have you retained the copyright for the work?*
Choose an item.
Was the work subject to academic peer review?
Choose an item.
*If yes, please attach evidence of retention. If no, or if the work is being included in its published
format, please attach evidence of permission from the copyright holder (publisher or other author)
to include this work.
SECTION C – Prepared for publication, but not yet published
Where is the work intended to be published?
Compare
Please list the paper’s authors in the intended authorship order:
Christine A. Kelly, Elaine Unterhalter, Levie Gondwe,
Aaron Ndovi, Green Kapila, Cecilia Nyirenda, Deborah
Johnston, Amelia C. Crampin, Judith R. Glynn
Stage of publication Not yet submitted
SECTION D – Multi-authored work
For multi-authored work, give full details of your role in the research included in the paper and in the preparation of the paper. (Attach a further sheet if necessary)
With input from co-authors, I designed
the study, managed the data, conducted
the analysis and wrote the manuscript
Student Signature: Date:
Supervisor Signature: Date:

188
Chapter 7: Students’ experiences of absenteeism
‘It is important that children should be going to school every day because
in future, they can have everything they want’: Exploring students’
perceptions and experiences of school absenteeism in northern Malawi
and the implications for absenteeism reporting in household surveys
Christine A. Kelly1, Elaine Unterhalter2, Levie Gondwe3, Aaron Ndovi3, Green Kapila3,
Cecilia Nyirenda3, Deborah Johnston4, Amelia C. Crampin1,3, and Judith R. Glynn1
1 London School of Hygiene and Tropical Medicine
2 UCL Institute of Education
3 Malawi Epidemiology and Intervention Research Unit
4 SOAS, University of London

189
Abstract
Although school enrolment has increased markedly in recent decades, persistent
absenteeism inhibits sustained educational access. Monitoring of absenteeism in
household- or school-based surveys is typically restricted to quantitative tabulations of
reasons for missing school, which overlook the dynamic set of underlying processes that
influence school attendance decisions, as well as the incentives students or caregivers may
face to misreport absenteeism causes. This study uses data from in-depth interviews and
focus group discussions with 48 primary school students in Karonga district, northern
Malawi, to explore perceptions and experiences of school absenteeism. Analysis shows that
students attach a form of moral significance to maintaining regular school attendance as a
signal of commitment to education that is somewhat divorced from their daily realities.
Many participants held absentees responsible for their own poor attendance, despite
acknowledging a variety of household, school and community constraints on school
attendance. As such, evaluative judgements about absenteeism influenced the way students
discussed missing school, as well as proposals to improve attendance. Students’ insights
have important implications both for understanding the drivers of absenteeism and for
interpreting school attendance data collected in quantitative surveys.

190
7.1 Introduction
Global school enrolment has increased markedly in recent decades such that the number of
out of school children and adolescents has fallen by almost half in the period since 2000
(UNESCO 2015). Although much work remains to be done to reach those children who
have yet to enter school, substantial barriers of access to quality education remain even
among those successfully enrolled. Humphreys et al. (2015) applied four distinctive
meanings to phases of access: access as enrolment, access as sustained attendance, access
to the classroom once in school, and access to the curriculum for meaningful learning. The
focus of this paper is on the second of these phases, which has received limited attention in
the literature, but is critical for ensuring that all children achieve the promise of Education
for All (Lewin 2009).
School absenteeism, which is widespread in many sub-Saharan African countries (Loiaza
and Lloyd 2008), is detrimental not only to absentees’ attainment and achievement
(Gottfried 2010), but can also interfere with the learning of students who regularly attend
by disrupting teaching rhythms and creating negative peer effects (Wittenberg 2005).
‘Arriving late at school’, ‘absenteeism’, and ‘skipping classes’ were the three most common
student behavioural problems reported by head teachers in large-scale surveys conducted
in the 15 member countries of the Southern and Eastern African Consortium for Monitoring
Educational Quality (SACMEQ) (Hungi 2011). Efforts to understand barriers to sustained
attendance in SACMEQ and other surveys have principally relied on quantitative national
or regional-level tabulations of reported absence rates and associated reasons for missing
school (e.g. Milner et al. 2011). While a useful starting point, categorising episodes of
absence into static frequencies neglects the ‘dynamic, multi-layered, constantly negotiated
social process’ inherent in school attendance decisions (Humphreys et al. 2015, p. 141).
We have previously used household survey data from northern Malawi to explore the range
of individual- and household-level characteristics associated with missing school in the past
four weeks (Chapter 4), and the relationship between absenteeism and future educational
trajectories (Chapter 6). The analysis in Chapter 4 advanced beyond simple reported
reasons for absenteeism to identify a range of underlying risk factors for missing school,
but was nevertheless limited by the selection of background variables available in the
survey, crude or static measures of complex concepts such as motivation or aspirations,
and, critically, inability to explore the mechanisms underlying observed relationships. The

191
paper also revealed an apparent paradox with respect to absenteeism reporting: while
statistical analysis suggested that participation in agricultural labour contributed to student
absenteeism, work-related absences were rarely acknowledged by survey respondents.
Qualitative data that delve beneath statistical aggregations, such as those we have gathered
here, are therefore critical for understanding the intricate interplay of factors that inhibit
sustained access to education, as well as incentives students or caregivers may face to
misreport absenteeism in household surveys.
Our previous research was predicated on the assumption that students implicitly value
school attendance and as such are prevented from attending only by external constraints,
rather than by lack of interest or desire to attend. However, in settings where school quality
is low and learning outcomes poor, students may feel their time can better be spent engaged
in income-generating or leisure activities instead of attending school. Indeed, as Rolleston
(2009, p. 198) has highlighted, for some children:
[N]on-attendance at school may be better considered in terms of a rational choice,
for example, where school quality and relevance is judged to be poor despite being
available and affordable, or where children’s current earnings are judged to be high
in relation to the net benefits of schooling.
Econometric evidence from Egypt supports the view that students’ school attendance
decisions are informed by perceptions of the school environment: holding constant
students’ own ability and achievement, Hanushek et al. (2008) found that students in lower-
quality schools were more likely to leave school and complete fewer grades than students
attending higher-quality schools, although they could not unpack the particular aspects of
quality that most influenced these choices.
Understanding the barriers to sustained educational access therefore requires an
appreciation of both ‘push’ and ‘pull’ factors that influence students’ school attendance
(Streuli and Moleni 2008). In particular, qualitative data is needed to explore the value that
students place on attending school every day, what informs the significance that school
attendance holds in their lives, what factors they consider to be most disruptive to sustained
attendance, and what can be done to mitigate absenteeism in their communities.
After describing the educational context in Malawi, this paper uses data from in-depth
interviews and focus group discussions with 48 primary school students in Karonga district,
192
northern Malawi to explore these questions. In doing so, we focus particularly on two areas
in which qualitative data can address identified shortcomings of existing quantitative
survey research. Firstly, we examine the extent to which distilling episodes of absence into
a single, proximal reason for missing school—as, for instance, in SACMEQ reports (e.g.
Milner et al. 2011)—obscures complex underlying processes that have different
implications for identifying and addressing absenteeism risk. Secondly, we assess whether
evaluative judgments about absenteeism influence the way students talk about missing
school, and explore the implications for interpreting school attendance data collected in
surveys. Our analysis thus aims both to enhance understanding of the drivers of school
absenteeism and to inform collection of attendance data.
7.1.1 Educational access in Malawi
Malawi became one of the pioneers of free primary education (FPE) in sub-Saharan Africa
when, as part of the transition to multiparty democracy in 1994, the new government
eliminated primary school fees. The FPE initiative led to an immediate explosion in primary
school enrolment from 1.8 million to nearly three million students (Castro-Leal 1996), but
the limited planning, particularly with respect to supply-side investments, resulted in
pressures on personnel and infrastructure by which the education system remains
characterised (Chimombo 2009). Increased focus on primary schooling additionally
diverted resources away from the secondary and tertiary sectors (Bloom et al., cited in Frye
2012), such that the proportion of students enrolled in secondary and higher education
institutions in Malawi is well below SADC and African averages (World Bank 2010). At
the same time, however, FPE was accompanied by an influx of ideological campaigns from
government outlets, newspapers, radio programmes, and non-governmental organisations
establishing education as the route to ‘bright futures’ in high-skilled formal-sector careers,
which produced ‘a wide gap between the actual opportunities provided by the educational
reforms and the social imaginary surrounding them’ (Frye 2012, p. 1579). We thus consider
how this disconnect between students’ aspirations and their daily realities manifests in their
discussion of school attendance.
Furthermore, although the elimination of primary school fees removed one important
financial barrier to primary school attendance, significant schooling costs endure (Kendall
and Silver 2014). Expenditures on such items as exercise books, pens and clothes remain
prohibitively expensive for some households (Kadzamira and Rose 2003), while

193
community involvement in education is primarily ‘extractive’, founded on contributions of
money or labour to finance physical infrastructure projects (Barnett 2013; Rose 2003).
Studies have also shown that, although the 1994 reforms formally eliminated the
requirement to wear a school uniform and the administration of corporal punishment, these
practices continue to be enforced at many schools (Pridmore and Jere 2011), representing
additional sources of exclusion.
Our previous analysis of household survey data from Karonga district provided evidence
that participation in household labour contributed to primary school absenteeism (Chapter
4). Students living in households intensively engaged in agriculture—as measured by
ownership of relatively larger endowments of land, livestock and other productive assets—
were significantly more likely to miss school than peers in less ‘agriculture-rich’
households, even after adjusting for other measures of household socioeconomic status.
This result suggests that agricultural households are characterised by greater demand for
child farm labour that competes with school attendance, although the actual extent to which
children engaged in agricultural work was not discernible from the survey.
Consistent with other survey research in Malawi (Grant et al. 2013; Milner et al. 2011), the
most common reason reported for missing school in Karonga district was student ill health,
followed in much smaller proportions by inability to meet the costs of schooling and lack
of interest in school. Despite the apparent importance of agricultural labour for school
absenteeism, absences attributed to involvement in household chores or economic activities
were consistently negligible (Chapters 4 and 5). It is against this backdrop that we seek to
gain a deeper understanding of the constraints that students perceive to impede school
attendance, as well as to assess the extent to which reasons reported for absenteeism
faithfully reflect the processes underpinning educational exclusion.
7.2 Methods
Data collection activities consisted of in-depth interviews (IDIs) and focus group
discussions (FGDs) with 48 male and female primary school students aged 12-18 years
attending schools within the catchment area of the Karonga Health and Demographic
Surveillance System (HDSS) (Crampin et al. 2012). The HDSS includes a large annual
household survey of sociodemographic characteristics of a population of more than 35,000
people, including approximately 10,000 primary school students, which formed the basis

194
of our previous quantitative analyses of absenteeism trends and determinants in Karonga
district (Chapters 4-6).
7.2.1 In-depth interviews
Using the Karonga HDSS dataset as a sampling frame, 16 IDI participants (8 male, 8
female) were purposively sampled (Schatz 2012) to vary by age (12-18 years), standard
attended (grades 3-8), and community type (lakeside, semi-urban and rural) in order to
capture a range of students’ experiences. The semi-structured IDI guide explored students’
perceptions of the barriers to regular school attendance, their educational motivations and
aspirations, household health status, economic and domestic responsibilities, and the effect
of missing school on educational engagement.34 The guide was iteratively updated based
on feedback from eight pilot interviews, as well as from preliminary analysis of early IDIs.
In order to gain insights of students’ daily time use, each IDI also included an exercise in
which participants were asked to identify the activities in which they had engaged on the
most recent school day, from among a selection of ten activity cards: attending school,
doing homework, going to the market, collecting firewood, drawing water, cooking,
fishing, agricultural work, caregiving, and playing. The activity formed the basis for follow-
up discussion regarding potential work-school trade-offs and intra-household labour
allocation. IDIs were conducted in the local language, Chitumbuka, by co-authors Gondwe,
Kapila, Ndovi and Nyirenda, and lasted approximately 1.2 hours (Range: 55 minutes - 1
hour 56 minutes).35
7.2.2 Focus group discussions
Participants for the four FGDs were drawn from communities contiguous to those from
which IDI participants were selected. Upon arrival in a target cluster, ‘natural groups’
(Green and Thorogood, 2014) of eight participants were identified for participation in
FGDs. In contrast to IDIs, which focused on participants’ own experiences, FGDs solicited
participants’ views on community norms surrounding education, and observations of the
primary challenges to school attendance among both themselves and their peers. Topic
34 This study was also nested within a randomised controlled trial of cleaner burning biomass-fuelled
cookstoves (Mortimer et al. 2016), so IDIs additionally addressed the relationship between cookstove
allocation and school attendance. Insights from this aspect of the study are presented elsewhere (Chapter 5). 35 Kelly, a non-Chitumbuka speaker, observed approximately one-third of the IDIs and three of the four
FGDs.

195
guides were informed by preliminary findings from IDIs as well as two FGD pilot sessions.
Separate male and female FGDs were conducted to allow for discussion of gender-specific
or sensitive topics.
Perceived barriers to school attendance were explored via a ‘draw and tell’ activity
(Driessnack 2006) embedded within each FGD. Participants were asked to draw the
activities in which children in their community engaged on days when they did not attend
school. The primary purpose of the exercise was to facilitate the exchange of ideas in an
interactive and inclusive way (Driessnack 2006; Noonan et al. 2016). With the help of
probing questions from the FGD facilitator, participants described their drawings and the
practices they represented, while other members were encouraged to share their own
observations related to the activity their colleague had depicted. FGDs were conducted in
Chitumbuka by the same research team in central community locations—deliberately not
school facilities—and lasted between one and two hours (range: 1 hour 25 minutes - 1 hour
49 minutes).
7.2.3 Data collection and analysis
In-depth interviews and FGDs were conducted in May 2016, during the third and final
school term. Each was audio-recorded and transcribed into English by the lead
interviewer/facilitator. Where possible, participants were matched with interviewers by
sex, but in light of the composition of the team—three men and one woman—it was not
possible in all cases. Given the longstanding presence of HDSS activities in the area (see
Crampin et al. 2012 for an overview), research personnel were highly familiar to students
and their families, which may have reduced participants’ reticence in IDIs/FGDs, while
evidence from the pilot phase suggested that girls were willing—unprompted—to broach
potentially sensitive topics with male interviewers.36
Transcripts from IDIs and FGDs were read repeatedly by the first author, and any queries
resolved with the research team. As a validity check, four IDI transcripts—one per
interviewer—were externally audited for completeness and accuracy by a bilingual
consultant. Since errors identified during this process were minimal and minor, no
additional review of the remaining transcripts was undertaken.
36 Elsewhere in Malawi, Poulin (2010) has shown that propensity to report sexual activity among unmarried
young women was not linked to interviewer sex. She emphasised the importance of building trust between
interviewers and participants as a means of eliciting sensitive information.

196
Data were analysed using an ecological approach (Smith et al. 1997), framing a student’s
environment as a ‘nested arrangement of structures, each contained within the next’
(Bronfenbrenner 1976, p. 5). We sought to explore how individual-, household-, school-,
community-level factors—and the interactions between them—influenced students’ school
attendance. In particular, we examined the relationship between proximal, or immediate,
causes of absenteeism and distal, or underlying, factors that created the conditions for
missing school (Figure 7.1). Analysis consisted first of grouping students’ experiences or
accounts of absenteeism by proximal cause, before mapping the network of underlying
factors that students implicitly or explicitly linked with each reason for missing school.
Reflecting SACMEQ teacher reports that missing school, skipping classes and arriving late
are all disruptive to teaching and learning (Hungi 2011), in conceptualising absenteeism we
include any student-specific loss of lesson time.
7.2.4 Participant characteristics
Table 7.1 shows the sociodemographic characteristics of students who participated in IDIs
and FGDs.37 Participants were on average 14 years old (14.5 male, 14.0 female) and
attended standards 3-8. Approximately one-third of participants (37.5% male, 33.3%
female) had repeated their current standard. Most participants came from households
primarily engaged in subsistence farming.
37 Written informed consent (or a thumb print in lieu of signature) was obtained from a parent or guardian of
each IDI or FGD participant before written assent was received from participants themselves. All parents and
students approached for study participation provided consent. The study protocol was reviewed and approved
by the London School of Hygiene and Tropical Medicine Research Ethics Committee in the UK (ref no.
10401) and the National Health Sciences Research Committee in Malawi (ref no. 15/1/1509).
Community
School
Household
Individual Proximal
determinant
Primary school
absenteeism
Distal determinants
Figure 7.1 Ecological model of distal and proximal determinants of school absenteeism

197
Table 7.1 Demographic characteristics of in-depth interview and focus group discussion
participants IDIs FGDs
Boys (N=8) Girls (N=8) Boys (N=16) Girls (N=16)
Age
12
13
14
15
16
17
18
Mean
0
4
1
0
1
1
1
14.6
1
2
4
0
1
0
0
13.8
0
5
3
5
2
1
0
14.4
3
3
5
3
0
1
1
14.1
Standard attended
3
4
5
6
7
8
Mean
1
1
0
1
3
2
6.3
0
1
1
3
2
1
6.1
1
1
4
4
5
1
5.9
0
3
3
3
4
3
6.1
Repeated current standard
Yes
No
3
5
1
7
6
10
7
9
Household head
occupation*
Farmer
Fisherman
Other unskilled
Teacher/health worker
4
1
1
2
6
1
0
1
11
4
1
0
15
0
1
0
Community type
Semi-urban
Lakeside
Rural
3
2
3
3
2
3
8†
8
8†
8 * Drawn from HDSS dataset for IDI participants, self-reported for FGD participants. † One pair of FGDs took place in communities bridging lakeside and semi-urban areas.
7.3 Perceived value of education
Before examining perceived barriers to school attendance, we first explore the extent to
which participants attached value to attending school every day. Although numerous
commentators have highlighted the resource constraints and poor learning outcomes by
which Malawian schools are characterised (e.g. Chimombo 2009; Mulera et al. 2017), as
well as the disconnect between the social and economic promises of FPE and the limited
opportunities it ultimately provided (Frye 2012; Kendall and Silver 2014), participants
universally stressed the importance of daily attendance. Study participants emphasised the
instrumental role (Robeyns 2006) of education in general and school attendance
specifically in securing financial security for themselves and their families:

198
Davie38: The best part about going to school is that it gives you future wealth.
Edith: It is important that children should be going to school every day because in
future, they can have everything they want.
Although most participants came from households engaged in subsistence agriculture,
fishing or petty trading, the majority had ambitions to pursue skilled professions including
nursing, teaching or law, reflecting the ‘bright futures’ rhetoric of Malawi’s post-FPE era
(Frye 2012). These choices were rooted primarily in material concerns, and backed with
little practical knowledge about what training or qualifications would be required, or even
what the job involved, perhaps reflecting limited exposure to people in these positions in
their communities (Unterhalter 2012).39 Sixteen year-old Kondwani, for instance, reported
without hesitation that he wanted to become a doctor but, when probed, expressed
considerable uncertainty about his motivation:
Interviewer: So what kind of work you want to do when you reach form three [grade
11] as you have stated?
Kondwani: I want to be a doctor.
Interviewer: Why do you want to be a doctor?
Kondwani: (Short pause)
Interviewer: Or what things motivate you to be a doctor?
Kondwani: (Silent) I don’t know it in details.
Interviewer: Why do you like the profession of doctor?
Kondwani: I want to cure people and the salary is better off.
Despite observations by the research team of crowded classrooms, shortages of desks and
blackboards and other resource constraints, participants did not identify school quality as
detrimental to their educational experience. Rather, they identified benefits of physical
presence in the classroom associated with accessing material that would be required for
exams or increasing comprehension of curriculum content. These contributed to
participants’ perceptions of the value of school attendance and coloured their arguments
against absenteeism:
Adamson: I think it is important that we go to school every day otherwise when those
things that we miss when we are absent from school come during examinations
38 All participants have been assigned pseudonyms. 39 Indeed, one of the most ‘visible’ jobs in the community was with the HDSS research programme. Two
participants aspired to work at the HDSS research site, including Alice, 12, who indicated, ‘That's the only
job which can be easy for me to get. […] I can say I just admire the way [HDSS] staff ride their motorbikes.’

199
we may find ourselves failing because we were not there when they were being
taught.
Enoch: [W]hen teachers write notes, they explain to us some of the difficult words so
that we should easily study the notes. They explain those words to us so that we
should know their meanings and if you have just copied notes from your friends,
you can’t know the meaning of such words. You also can’t study properly the
notes that you have just copied.
A second, pervasive argument for maintaining regular school attendance, also deeply
rooted in post-FPE imagery, emphasised attendance—independent of academic
performance—as a signal of commitment to education. Proponents of this view used
language that established students with regular attendance as morally superior to students
who missed school (Frye 2012). Dorothy, 14, drew a distinction between her own
dedication to schooling with that of her peers, including some members of her FGD, who
failed, in her view, to take education sufficiently seriously: ‘Some of us we go to school to
play while some go to school with an aim of getting educated and staying well in future.’
Absentees were described in openly pejorative terms as ‘spend[ing] time smoking Indian
hemp’ (McDonald) or ‘always think[ing] about men and going to entertain themselves in
beer halls’ (Dorothy), and as such were considered undeserving of educational
opportunities and resources. When asked a hypothetical question about how households
should allocate funds for children’s education, several students proposed using absenteeism
as a means of signalling which children did not merit financial support:
Justice: The money should be spent on children who go to school every day without
missing. There are other children who sometimes attend school and sometimes
miss, so in this way parents know that they can spend money on this child not that
one.
The value that students attached to daily school attendance thus derived both from its
instrumental role in imagined future economic trajectories, as well as for its symbolic
importance in signalling commitment to education. However, although all participants
emphasised the importance of daily school attendance in the abstract, these views did not
necessarily reflect actual attendance patterns.
7.4 Barriers to school attendance
Citing their own personal experiences, as well as observations of peers in their community,

200
participants listed a wide variety of reasons for missing school, linked to health (personal
illness, household caregiving, or funeral attendance), household or economic labour
(farming, fishing, herding, brick building, or domestic chores), leisure activities (playing
football or netball), inability to meet schooling costs (examination fees, school uniform,
notebooks and pens, soap for washing clothes), school-related disciplinary issues (sent
away for arriving late, lack of uniform or inappropriate haircut) or other aspects of school
routine (not wanting to sweep the school compound on the opening day of term, not
attending on days after exams). Table 7.2 summarises the proximal reasons identified for
missing school in IDIs—based on students’ reports of absence over the course of the school
year in which they were interviewed—and FGDs—based on participants’ drawings of
activities in which children engage when they are not attending school.40
Table 7.2 Reasons reported for missing school by boys and girls aged 12-18 in in-depth
interviews and focus groups discussions
40 The number of activities participants could draw was not limited and ranged from one to four. Note that
the instructions to the drawing activity did not require students to isolate the immediate cause of absence –
see section 7.4.1 below for a discussion of this point.
Reason
IDIs FGDs
Boys (N=8) Girls (N=8) Boys (N=16) Girls (N=16)
Health/caregiving
Own illness/injury
Other’s illness/caregiving
Funeral
4
2
1
7
1
0
3
0
0
6
2
1
Work
Agricultural work (farming,
herding, food processing)
Fishing
Household chores (cooking,
cleaning, drawing water)
3
0
0
1
0
0
11
4
1
8
0
5
Leisure activities
Football
Netball
0
0
0
0
0
6
2
4
School factors
Lack of soap/clothes/notebooks
Avoid sweeping on opening
day
Sent home for arriving late
Sent home for haircut
No learning taking place
3
1
1
0
1
2
0
0
0
0
0
0
0
1
0
1
0
1
0
0
Other 1 1 2 0 Notes: Reasons for missing school taken from IDI participant reports of absence during the past school
year and activities drawn in FGD drawings. Individuals are counted once per row; multiple responses
possible.

201
We focus on three frequent proximal causes of absence discussed in IDIs and FGDs—
playing, working, and missing school due to illness—to explore the intersecting influences
of individual-, household-, school-, and community-level factors on school attendance. The
selected proximal causes correspond with common reasons reported for absence in previous
Malawian student surveys (Grant et al. 2013; Milner et al. 2011) and thus serve to illustrate
how qualitative data can deepen our understanding of quantitative tabulations. In particular,
as shown below, students’ accounts demonstrate how a single proximal cause of absence
obscures complex underlying processes, while also reflecting evaluative judgements made
about absenteeism.
7.4.1 Theme 1: Playing
Although no IDI participant reported missing school to engage in leisure activities, boys
and girls in three of the four FGDs identified playing football as a common reason for
absence in their communities. Some participants described taking part in matches during
school hours, while 17 year-old Adamson described how he sometimes missed school
because he was still tired from having travelled the night before to play a distant opposing
team. Elsewhere in the FGD, however, he revealed that he sometimes lacked motivation to
attend school because he was so much older than his classmates:
Adamson: When you have problems with the lessons you may think that going to
school is not good because at times when you fail to answer questions correctly
you are beaten and even laughed at by even younger classmates and if this happens
quite often one may choose to stay away from school. This is what brings my spirit
down.
Adamson’s experience at school, and particularly the humiliation and ridicule associated
with being substantially overage for grade41, may thus explain the decision to devote his
time playing football rather than concentrating on school. Similarly, Enoch,14, suggested
that it is the children who ‘don’t mind about school’ who absent themselves to play football:
‘That child decides to miss school even if he can see his friends going to school, he just
concentrates on playing football with older men.’
41 Adamson was attending standard 7 at the time of interview, making him at least four years behind the
expected age.

202
Enoch’s description also implies that community-level practices facilitate football-related
absenteeism. In particular, he suggests that matches organised by adult men not only accept,
but may attract, school-age players. Other participants confirmed that community matches
were typically held during school hours, particularly during the dry season, and that
temptation played a role in drawing boys out of school to play: ‘When other children miss
school because of playing football, they take their ball and play near the school. They do
this so that we should also desire to play football with them like during break time’ (Justice).
While the games described by male participants involved only other boys or men, female
students were also reported to miss school while playing football or netball: ‘Most of the
times when there is a football match girls too have their game’ (Adamson). However,
although multiple female FGD participants drew pictures of girls playing games during
school hours, they each faced different underlying causes of absenteeism:
Flora: I missed school because clothes were dirty [and because I had] nothing to do at
home played the ball.42
Cynthia: This one [pictured in drawing] missed school because her parents didn’t have
money to pay for examination, that is why was playing the ball at home.
42 The translation reflects use of the Chitumbuka word ‘bola’, which is a generic term for ‘ball’ that can apply
to football or netball. Flora’s drawing depicted football, Cynthia’s netball.
Figure 7.2 Participant drawings of missing school while playing football or netball

203
The wording of the instructions for the drawing exercise asked participants to draw the
activities in which they or their peers engaged on days when they did not attend school, and
as such did not require students to isolate the causal factors preceding absence. Thus, in the
case of Flora and Cynthia, the proximal cause of absenteeism relates to inability to meet
costs associated with schooling. Nevertheless, participants’ choice of drawing, combined
with subsequent discussion, help to illustrate how students’ decisions to play games during
school time were shaped by a combination of distal determinants, including age, classroom
environment, household poverty and school costs.
7.4.2 Theme 2: Working
Absences related to some form of work, and in particular agricultural labour, were the most
common images depicted in the drawing activity and also frequently reported in IDIs (see
Table 7.2). As with playing, however, the circumstances surrounding these episodes were
not uniform for all participants. The passages below demonstrate the range of participants’
experience (emphasis added):
Enoch: Sometimes children miss school when they don’t have food, so parents send
them to dig cassava at the farm.
Charity: When they [my grandparents] discover that there is too much work it’s when
they ask me to accompany them so that we can work together, finish the work
quickly and go to school on the next day.
Mabvuto: Sometimes a child attends school irregularly because of lacking clothes. He
tries his best to search for piece work so that the money realised from that work
should be used to buy clothes.
Bernard: I usually go to school late. […] This is usually when my father asks me to
take our cattle to where they usually graze and thereafter go and fetch water before
we can leave for school.
These narratives depict two distinct types of work-related absence: some students were
pulled away from school due to household labour shortages or lack of food at home, while
others were pushed into agricultural work due to inability to meet the direct or indirect costs
of schooling. The amount of control students expressed to exert with respect to work-related
absences also differed widely: in some cases, children reported lacking household decision-
making power to determine their own attendance; in others, they assumed responsibility for

204
weighing work-school trade-offs and taking strategic decisions to miss school to facilitate
longer term educational participation. Indeed, students’ use of initiative to secure the
income needed to meet school costs was considered another sign of commitment to
education:
Justice: If your parents tell you that they don’t have school fees and you indeed agree
to discontinue your education, it means such kind of children don’t like school. If
you like school, you try every effort in order to find school fees.
Children’s ability to find piece work was dependent on community characteristics including
demand for (child) labour, but also on gendered expectations about students’ economic and
domestic roles. Although one female FGD participant suggested piece work as a means of
sourcing school funds, and boys also described how girls helped traders sell their goods on
weekly market days, girls did not discuss engaging in paid work with the same frequency
as boys. Indeed, Edith indicated that it was harder for girls to secure independent incomes
to support their schooling: ‘[M]ost of the times we girls face challenges to continue with
our education while boys they continue because they can manage to find money and clothes
on their own.’
Participants suggested that household support for schooling, which influenced not only the
importance households placed on daily attendance, but also the financial contribution they
made towards school costs, was a critical determinant of work-related absences. Justice
described how some parents made sure to find the resources needed for their children’s
schooling, while others left children responsible for meeting their own expenses:
Justice: Sometimes other children miss school because of lacking clothes, so they
search for a piece work in order to earn money for buying clothes. There are other
parents who put much interest in their children’s education by buying them clothes
so that they should work hard in class. There are also other parents who don’t mind
about their children’s education and the children find clothes for themselves, so
this is what happens.
Participants further suggested that household support for education was moderated by
characteristics of household decision makers, as well as of students themselves. For
instance, Gift, 13, reported that although his parents bought school clothes for his younger
siblings, they did not do so for him and his brother because ‘they say we are elders,’ and
by implication responsible for sourcing their own funds.

205
While paid work for these students represented a coping strategy to facilitate long-term
school participation, others suggested that the monetary rewards associated with paid
agricultural work outweighed the benefits of attending school: ‘[C]hildren of our age like
money and doing piece works. So during the time when we go to school, they think of
going to do piece works’ (Enoch). Although these children’s decisions could be considered
rational if the money they earn from piece work exceeds the expected benefit from
schooling (Rolleston 2009), the tone of Enoch’s remark is derogatory, reflecting his view
that students who prioritise work over school attendance lack sufficient commitment to
education.
For many other students, work-related absences involved providing unpaid household
labour. In these instances, participants described being withdrawn from school largely
against their wishes, but lacking leverage to negotiate their attendance. Dorothy described
one such scenario: ‘Other pupils miss school because their parents tell them that if you
don’t go work in the garden you will not eat nsima.43 So they miss school and work in the
garden so that they can be able to take nsima at home.’ Some participants, however,
expressed an ability to renegotiate their domestic workloads to avoid missing school. Alice,
12, described being asked to stay home to help with household chores, particularly if
resident adults were ill or away, but resisting these requests:
43 Nsima is a staple food made from maize flour.
Figure 7.3 Participant drawings of missing school doing agricultural work

206
Interviewer: Do they tell you sometimes not to go to school?
Alice: Sometimes but I refuse to do that. […] I normally tell them that I will find you
in the afternoon; I have to go to school first.
Students identified a variety of underlying factors they believed to increase the propensity
of being withdrawn from school to help with agricultural work. Some suggested that parents
who were not themselves educated were more likely to keep their children at home:
Joseph: Parents want to make their children fail to succeed with their education because
they are uneducated. […] They say that we should just go to the farm. If the parents
really like school, they can encourage their children.
Similarly, other participants indicated that when students lived with relatives other than
their parents—relatives with less vested interest in supporting these children’s education—
they were more likely to be pulled out of school: ‘If your parents passed away and if you
stay with relatives they like telling children to miss school and do household chores’
(Dorothy). This applied particularly when there were no other children with which to share
work burdens. Emmanuel, 17, who lived with his uncle, described how he bore the brunt
of agricultural labour demands because ‘My uncle’s children are young, they cannot work
in the garden, so I [go] alone.’
Labour assignments additionally reflected household gender roles. Although participants
indicated that both boys and girls missed school to conduct farm work such as clearing
fields or harvesting, other activities were more strongly gender-demarcated. Grazing cattle,
for instance, was ‘the duty of boys’ while drawing water for domestic use ‘is only for girls
not boys’ (Edith). Some female participants suggested the conflict between work and
school attendance, particularly with respect to other household tasks including sweeping
and washing dishes, was exacerbated by gendered divisions of labour. Several female
students felt that girls were disproportionately asked to miss school to engage in domestic
chores, both because such chores were not considered boys’ responsibility, but also as
preparation for marriage:
Elizabeth: It doesn’t happen to both [boys and girls], they [parents] order girls to miss
school because they dislike them thinking they will already get married because
girls are used to getting married earlier hence they are not concerned with the girl
child.

207
Dorothy: The girl child is the one who is supposed to learn and do household chores
because she gets married [and taken to husband’s home].
Some boys did themselves report missing school to do domestic chores, but these episodes
were largely precipitated by absence or incapacity of female household members and thus
represented largely exceptional circumstances.
In summary, students’ absences related to a single proximal cause of absence—namely,
work—ultimately resulted from very different causal pathways. Some students were pulled
out of school into household labour, while others were pushed into paid work to help meet
the costs of schooling. The necessity to undertake agricultural or domestic work, as well as
students’ ability to navigate work-school trade-offs, were themselves influenced by a
network of underlying factors. Moreover, the circumstances surrounding work-related
absences sent different signals about commitment to education: students were respected for
using initiative to source funding for schooling costs, but derided for prioritising paid work
over education if perceived to be for reasons other than economic necessity.
7.4.3 Theme 3: Illness
In both IDIs and FGDs, student ill health was frequently cited as a cause of missing school,
for reasons including headache, stomach ache, dizziness or malaria. The language used to
describe illness-related absences, however, differed from when discussing other episodes
of missing school. In contrast to other absences more explicitly linked to external factors,
episodes of illness were considered unavoidable and beyond students’ control. Students
drew distinctions between ‘valid’ reasons for absenteeism, in which category illness was
implicitly included, and others—such as playing football—that signalled a lack of
commitment to schooling. A number of participants implied that illness was the only
circumstance that could cause them to miss school, including Mary, 16, who asserted, ‘[I]f
I don’t go to school, that means I am sick.’ In fact, evidence from one IDI suggests that, for
some students, illness-related absenteeism did not count as ‘missing school.’ Memory
insisted three times in succession that she had attended every day of the school year,
including by taking measures to mitigate potential absences, before ultimately
acknowledging missing school recently as a result of sickness:

208
Interviewer: Now I would like to ask you about some times you might have missed
school. Think of your attendance over the course of school year, are there
particular times of the year that you miss school more than others?
Memory: No I have never missed school.
Interviewer: Let’s say a month or a certain time when you missed school more than
another time?
Memory: No I go, I don’t miss school. If maybe my clothes are dirty, I wash them.
Interviewer: Would you say you miss school on some days of the week more than other
days?
Memory: No I go every day, I don’t miss school.
Interviewer: How many days of school have you missed in the past four weeks that
school was in session?
Memory: It’s only one week when I was sick.
Although illness itself was considered to be inevitable, students did describe how the impact
of ill health on school attendance was modified by a series of background characteristics.
In particular, parental encouragement once again proved to be an important factor in
decisions about whether to miss school on days when students felt unwell:
Interviewer: How do your parents encourage you on school issues?
Benjamin: When I want to miss school, they force me to go to school.
Interviewer: Do you actually mean when you decide not to go to school on your own?
Benjamin: Yes, like when I become sick. They ask me if the headache is severe and
when I say no, it’s when they tell me to go to school.44
44 Benjamin’s father was a teacher at the local primary school, which may explain the particular importance
attached to education in his household
Note: ‘kuchipatala’ means ‘hospital’ in Chitumbuka
Figure 7.4 Participant drawings of missing school due to illness

209
Nearly all participants also described receiving medicine or hospital treatment (e.g. for
malaria) during episodes of ill health. Access to these services, often facilitated by family
members, may have played an important role in limiting the duration of absence or indeed
preventing absences before they occurred. Thus, although illness-related absences were not
discussed in the context of household-, school-, or community-level determinants in the
same way as other proximal causes, some participants nevertheless mentioned distal factors
that influenced both their decision to miss school, as well as their ability to return to school
quickly after a period of absence. Evidence also suggested that by considering illness as
beyond students’ control, illness-related absences were not subject to the same moral
judgements as those attached to absences deriving from other factors. We will return to this
idea in the next section.
7.5 Strategies to address absenteeism
Despite acknowledging a range of structural barriers to school attendance, most participants
nevertheless considered students responsible for their own absenteeism. Indeed, most
suggestions to improve attendance in their communities revolved around correcting
personal failings, rather than addressing external constraints (emphasis added):
Adamson: [W]e need to take the responsibility of checking if our hair needs cutting
and ask for money before we are sent away from school.
Lusungu: I think to reduce absenteeism we need to keep our clothes clean all the time
and we should ask for soap from our parents.
Adamson: [If] we children stop concentrating on football this can help us concentrate
more on school.
Edith: What can help to reduce absenteeism is when we work hard in school.
In assigning responsibility for attendance to students themselves, participants typically
favoured enforcing strict punishments for students who missed school or arrived late. They
considered these punishments necessary to prevent future episodes of absenteeism or late
arrival, to deter other students from following a bad example, or to live up to the standard
of behaviour expected of committed students:
Justice: It’s necessary that a student who misses school should be punished because if
they fail to punish him, he becomes happy and decides to miss school again. He

210
even boasts that there is nothing that teachers do when I miss school. If they give
him a punishment after missing school, he knows that missing school is bad.
Edith: It is good to punish them [students who arrive late] because it is the duty of a
pupil to go to school early.
The language used by participants—that missing school is ‘bad’, that a student’s ‘duty’ is
to arrive on time—reinforces the idea that school attendance holds a form of moral
significance for students that is divorced from their daily realities. Indeed, Grace, 14,
described arriving late to school due to a heavy burden of household chores, but
nevertheless found being punished ‘fair’ since it reflected that ‘getting to school late was
wrong’:
Interviewer: Why were you late for school?
Grace: My mother was not home so I had a lot of things to do.
Interviewer: What were you doing?
Grace: I was sweeping around the house, cleaning dishes and mopping in the house.
[…]
Interviewer: What did the teacher do about your lateness?
Grace: I was given punishment.
Interviewer: What time did you do this punishment?
Grace: I did the punishment after knocking off.
Interviewer: What kind of punishment did you do?
Grace: I was made to clear the football ground.
Interviewer: For how long did you do that?
Grace: For a very short time.
Interviewer: Did you see it as a fair punishment?
Grace: I think it was fair.
Interviewer: Did you get any lesson from the punishment?
Grace: Yes I did.
Interviewer: What lesson did you learn?
Grace: That getting to school late was wrong.
Another participant demonstrated how students conceptually separated the moral
significance of school attendance from their own personal experiences. Early in one FGD,
Joseph, 15, indicated that his least favourite part about school was being sent to dig a
rubbish pit after arriving late. However, when discussing the hypothetical case of how to
treat peers who had similarly arrived late, he concluded: ‘It’s necessary that they should be
punished […] because they missed school.’

211
Punishments for absence or late arrival included manual jobs—sweeping the school yard,
slashing grass, cleaning the toilets—or corporal punishment—being whipped or beaten by
the teacher. Ironically, some of the punishments administered for missing school resulted
in further exclusion from lesson time. Late-arriving students reported, for instance, being
told to complete manual tasks before being allowed to join lessons, or alternatively being
assigned a punishment to undertake during break time that spilled over into the next lesson.
In the most extreme cases, students were sent home from school and told to return the next
day, as Davie, 13, described:
Davie: It was raining, so I was unable to see the sun rising. When I woke up, I went to
the toilet, took a bath and went to school. There [at school] I found that my
classmates were already in class and the teacher was teaching. When I knocked at
the door, the teacher said that I should go back home and come early tomorrow
because I was late.
The prospect of corporal punishment or strenuous manual labour additionally deterred
some students from attending school at all: ‘If maybe you go to school late then they
[teachers] beat you. […] [S]ometimes I just feel like not going because I am afraid of the
teacher that she might beat me’ (Jane).
Reflecting greater appreciation for the external constraints that students face, as well as the
detrimental impact of harsh punishment on continued school participation, some
participants expressed more nuanced views about how to treat late or absent students. In
particular, they suggested that the circumstances surrounding each absence should be
considered before administering punishment. As we saw in the reporting of illness-related
absenteeism, students drew a distinction between what they considered to be ‘valid’ reasons
for missing school and other, less acceptable reasons. They applied this distinction to the
administration of punishments:
Adamson: I feel it is necessary [to punish absent students] if they were absent for no
valid reason. For instance if this particular child was absent because clothes are
dirty and didn’t have the money to buy soap or the teacher himself had sent the
child home so that he can have his hair cut and unfortunately didn't have the money
to go to the barbershop the child need not be punished. If however the child does
not give any genuine reason he deserves to be punished so that he would not do it
again in future.
Adamson contrasts economic barriers to school attendance, which he classifies as excusable
reasons for absence, with others that would not be considered ‘genuine’ reasons for missing

212
school. Several participants reported that their teachers similarly considered the reason for
absence before taking punitive action. In some schools, teachers also involved students’
caregivers when determining the reason for absence, recognising that sometimes parents or
relatives are responsible for withdrawing children from school:
Emmanuel: When a pupil misses school our class teacher sends the child to call the
parent so the class teacher and parent will discuss issues in the office, mainly
asking the parent reasons why the child miss school. […] [I]f the parent fails to
give a genuine reason for the absenteeism the pupil is punished but if the parent
gives a genuine reason the pupil will just be advised.
Given that teachers consider the reasons for missing school when administering
punishments, this suggests that students (and parents) face incentives to misreport the
causes of absence in cases when the true reason would not be considered ‘genuine’. In her
IDI, Alice indeed indicated that on days when she missed school, she sent her friends to tell
her teacher that she was unwell, even if she actually stayed home for other reasons: ‘[I]f
my grandmother is sick and there’s no one to help her, I don’t go to school. I send my
friends to tell the teacher that I am sick while it is my grandmother who is sick.’
Judgements about absenteeism, which took a moralising form, thus shaped how students
assigned blame for missing school, holding students themselves responsible for
maintaining their own attendance. However, just as the significance students placed on
school attendance was divorced from the actual constraints they faced, so, too, was
students’ advocacy of strict punishments for others distinct from their own personal
aversion to being punished for missing school. A minority of participants, for their part,
proposed solutions for absenteeism that extended beyond the punishment of absent
students, by targeting household-level constraints. Enoch proposed that ‘Parents should be
told not to tell children to miss school anyhow,’ while Gloria concluded that ‘If our parents
don’t give us a lot of work at home, absenteeism can be reduced.’
7.6 Discussion
Drawing on in-depth interviews and focus group discussions with primary school students,
we have investigated the benefits that students attribute to regular school attendance as well
as the barriers to schooling they perceive to be problematic. Reflecting imagery from
Malawi’s post-FPE period (Frye 2012), participants emphasised the instrumental value of
education as a route to high-skilled careers and future financial security, although this was

213
rarely backed by practical knowledge of how to achieve these aspirations. As significant
was the symbolic importance students attached to regular attendance and hard work as a
signal of commitment to education, which formed a crucial part of their student identities.
Despite acknowledging household-, school- and community-level barriers that impeded
attendance, participants nevertheless associated absenteeism more with students’ personal
failings than with structural constraints. Echoing Margaret Frye’s observations (2012, p.
1600) among secondary schoolgirls in Malawi, framing educational aspirations as
‘expressions of personal virtue’ based on ‘effort and striving’ rather than actual academic
success allowed students to claim moral superiority over their frequently absent peers, even
if their own personal and economic circumstances also necessitated missing school.
Participants’ accounts of absenteeism were frequently imbued with evaluative judgements
that influenced how they discussed their experiences or those of their peers. In particular,
students made distinctions between ‘genuine’ or ‘valid’ absences, and other reasons for
missing school that reflected badly on a student’s character. Although ill health was
considered an acceptable—and indeed unavoidable—reason for absence, one participant
(Memory) went further by appearing to exclude illness-related absences entirely from her
conception of ‘missing school,’ which she interpreted to reflect a lack of commitment or
readiness for schooling in a way that suffering ill health did not.
These findings may have important implications for the reporting of absenteeism in
quantitative surveys. In particular, they suggest that the distinction drawn by students and
teachers between valid and inappropriate absences, and especially the punishments attached
to the latter, give students (and parents) incentives to misattribute the reasons for missing
school. Comparing the reasons reported for absenteeism in the Karonga HDSS household
survey with statistical analysis of individual and household-level determinants of missing
school, the discussion in Chapter 4 speculated that absences attributable to agricultural
work were relatively under-reported by survey respondents in comparison to illness-related
absences. Evidence from Alice’s interview, in which she publicly attributed missing school
to her own ill health when in fact she stayed home to help her grandmother, provides
support for inflated reporting of illness-related absences.
Evaluative judgements about absenteeism may also lead participants to avoid reporting it
altogether in quantitative surveys. A longitudinal analysis from southern Malawi showed

214
that school-going adolescents were more likely to retract reports of sexual activity across
survey rounds than were their out-of-school peers, leading the authors to speculate that
reporting of premarital sexual behaviour violated student identities that presumed
abstinence (Soler-Hampejsek et al. 2013). To the extent that absenteeism also violates this
student identity, adolescents may be reluctant to acknowledge episodes of missing school
in household surveys.
Our findings additionally highlight how distilling episodes of absence into a single
proximal reason for missing school obscures complex underlying processes that create the
conditions for absenteeism. Participants referred implicitly or explicitly to a range of
individual-, household-, school- and community-level factors that influenced daily
attendance patterns. Taking the example of absences attributed to agricultural work, Figure
7.5 summarises the complex network of distal influences on school attendance, as
constructed from students’ narratives. It corroborates the importance of absenteeism
determinants identified in previous statistical analyses, including sex, household size,
household age distribution, and ownership of land and livestock (Chapter 4), but also
highlights the role of less tangible factors including academic engagement and parental
encouragement as key facilitators or mitigators of absence.
Despite acknowledgment of these underlying influences, students nevertheless held
absentees largely responsible for their own poor attendance. Many participants supported
enforcing strict punishments for absent or late students, even as they disliked receiving such
punishments themselves. This finding mirrors research from Ghana showing that 94% of
girls across 13 schools reported being whipped by teachers but only 15% questioned
corporal punishment as a means of administering discipline (Parkes and Heslop 2011). In
Malawi, Kendall (2007) has also described how corporal punishment in the Northern region
has historically been considered an integral part of discipline and socialisation processes.
Interactions with a head teacher at a rural northern school during her ethnographic study
revealed resistance to the FPE reforms outlawing corporal punishment:
Schools […] are places where we teach our children how to live properly; how to be
respectful, educated, and modern. Above all else, this requires discipline—to do well
on high-stakes exams, behave properly in society, and survive in the formal
employment market. To make school a place where discipline is neither taught nor
enforceable would fundamentally destroy children’s opportunities to succeed
(Kendall 2007, p. 292).

215
Distal determinants
Proximal determinant
Financial assets
Food security
Occupation
Encouragement
Parental education
Size
Land/livestock ownership
Labour demand
Hou
seh
old
Birth order Interest in school
Academic performance Age
Relationship
to household
head Sex
Ind
ivid
ual
Cost (direct/indirect)
Sch
ool
Gender norms Availability of ganyu
Co
mm
un
ity
Work School
absenteeism
Figure 7.5 Ecological model of individual-, household-, school-, and community-level factors underpinning school absences attributed to
work, as constructed from students' narratives

216
Students’ support for punishments suggests may then reflect an acceptance of physical and
psychological violence in the classroom context, but also implies a perceived association
between absenteeism with personal failings such that strict punishments are considered
deserved. In practice, however, the prospect of corporal punishment was shown to deter
some participants from attending school, while other punishments for absence or late
arrival—such as manual labour or being sent home—served only to compound losses to
instructional time (Humphreys et al. 2015).
Reform of classroom practices thus forms an important component of efforts to mitigate
absenteeism. Interestingly, however, although numerous students described exclusionary
practices including administration of punishments, being sent home for lack of uniform or
long hair, or due to fees levied by the school, none proposed changing these practices in
order to reduce school absenteeism, echoing observations by Moleni (2008) in a case study
elsewhere in Malawi. In a mixed methods study of students in Kenya, Tanzania, Nigeria
and South Africa, Unterhalter (2012) observed similar silences, which she attributed to lack
of exposure to different ways of life, particularly in rural communities, that prevent students
from articulating and challenging the constraints they face. Tellingly, Unterhalter’s findings
showed that students in rural districts with the poorest classroom conditions were less likely
than counterparts in peri-urban areas, where schooling conditions were better, to mention
school quality issues as obstacles to educational participation. In understanding
absenteeism, then, we must be mindful of what students do not say as well as what they do,
and seek to recognise the circumstances that may lead children not to express some of the
real obstacles they face (Unterhalter 2012).
Several limitations of the data presented require noting. Firstly, although the ‘draw and tell’
activity proved effective as a means of soliciting participants’ ideas in an inclusive and
creative way, it is possible that participants’ image choices were motivated by how easy
they were to draw rather than by their personal salience. However, as the purpose of the
activity was to stimulate conversation, and participants were observed to introduce new
ideas unrelated to their drawings, we believe we have captured descriptions of the leading
barriers to school attendance. We cannot rule out, though, that despite assuring participants
of confidentiality and separating data collection activities from a school setting, participants
were reluctant to critique practices at school or at home that contributed to absenteeism,
which provides an alternate explanation for the omissions described above. Finally,
217
although the sampling procedure ensured that a wide range of student voices were included
in the study, the number of stratifications meant that comparisons by age, grade, or
community environment were not undertaken. Including interviews with parents or
guardians, as well as with teachers and education officials, would have helped to
contextualise the data presented here.
7.7 Conclusion
Using rich data from in-depth interviews and focus group discussions with primary school
students, we have explored students’ perceptions and experiences of school absenteeism in
Karonga district, northern Malawi. Findings suggest that maintaining regular school
attendance holds moral significance for students that influences how they discuss missing
school, which may have important implications for the interpretation of existing school
attendance data. Students’ perspectives are critical for understanding the complex set of
processes that facilitate absenteeism, which may be obscured by a single proximal cause.
Our data indicate the need for policies that attend to household-, school-, and community-
level constraints that students face.

218
References
Barnett, E. 2013. An analysis of community involvement in primary schools in Malawi.
International Journal of Educational Development 33(5): 497-509. doi: 10.1016/
j.ijedudev.2012.06.007.
Bronfenbrenner, U. 1976. The experimental ecology of education. Educational Researcher 5(9): 5-
15.
Castro-Leal, F. 1996. Who benefits from public education spending in Malawi? Results from the
recent education reform. World Bank Discussion Papers. Washington, D.C.: The World
Bank.
Chimombo, J. 2009. Changing patterns of access to basic education in Malawi: A story of a mixed
bag? Comparative Education 45(2): 297-312. doi: 10.1080/03050060902921003.
Crampin, A.C., A. Dube, S. Mboma, A. Price, M. Chihana, A. Jahn, et al. 2012. Profile: The
Karonga Health and Demographic Surveillance System. International Journal of
Epidemiology 41: 676-685. doi: 10.1093/ije/dys088.
Driessnack, M. 2006. Draw-and-tell conversations with children about fear. Qualitative Health
Research 16(10): 1414-1435. doi: 10.1177/1049732306294127.
Frye, M. 2012. Bright futures in Malawi’s new dawn: Educational aspirations as assertions of
identity. American Journal of Sociology 117(6): 1565-1624. doi: 10.1086/664542.
Gottfried, M.A. 2010. Evaluating the relationship between student attendance and achievement in
urban elementary and middle schools. American Educational Research Journal 47(2): 434-
465. doi: 10.3102/0002831209350494.
Grant, M., C. Lloyd & B. Mensch 2013. Menstruation and school absenteeism: Evidence from rural
Malawi. Comparative Education Review 57(2): 260-284.
Hanushek, E.A., V. Lavy & K. Hitomi 2008. Do students care about school quality? Determinants
of dropout behavior in developing countries. Journal of Human Capital 2(1): 69-105. doi:
10.1086/529446.
Humphreys, S., D. Moses, J. Kaibo & M. Dunne 2015. Counted in and being out: Fluctuations in
primary school and classroom attendance in northern Nigeria. International Journal of
Educational Development 44: 134-143. doi: 10.1016/j.ijedudev.2015.08.004.
Hungi, N. 2011. Characteristics of school heads and their schools. Working Paper 3. SACMEQ.
Kadzamira, E. & P. Rose 2003. Can free primary education meet the needs of the poor? Evidence
from Malawi. International Journal of Educational Development 23: 501-516. doi:
10.1016/S0738-0593(03)00026-9.
Kendall, N. 2007. Education for All meets political democratization: Free primary education and
neoliberalization of the Malawian school and state. Comparative Education Review 51(3):
281-304.
Kendall, N. & R. Silver 2014. The consequences of global mass education: Schooling, work and
well-being in EFA-era Malawi. In: Stomquist, N. P. & Monkman, K. (eds.) Globalization
and Education: Integration and Contestation across Cultures (Second Edition). Lanham,
Maryland: Rowman & Littlefield Education.

219
Lewin, K.M. 2009. Access to education in sub-Saharan Africa: Patterns, problems and possibilities.
Comparative Education 45(2): 151-174. doi: 10.1080/03050060902920518.
Loiaza, E. & C.B. Lloyd 2008. Adolescents and education in Africa. Unpublished manuscript.
Milner, G.D., D. Mulera & T. Chimuzu 2011. The SACMEQ III project in Malawi: A study of the
conditions of schooling and the quality of education. Southern and Eastern African
Consortium for Measuring Educational Quality.
Moleni, C.M. 2008. Factors influencing access and retention in primary schooling for children and
young people affected by HIV and AIDS: Case studies from rural Malawi. SOFIE Opening
Up Access Series No 6. London: Institution of Education, University of London.
Mulera, D.M.W.J., K.K. Ndala & R. Nyirongo 2017. Analysis of factors affecting pupil
performance in Malawi’s primary schools based on SACMEQ survey results. International
Journal of Educational Development 54: 59-68. doi: 10.1016/j.ijedudev.2017.04.001.
Noonan, R.J., L.M. Boddy, S.J. Fairclough & Z.R. Knowles 2016. Write, draw, show, and tell: A
child-centred dual methodology to explore perceptions of out-of-school physical activity.
BMC Public Health 16(1): 326. doi: 10.1186/s12889-016-3005-1.
Parkes, J. & J. Heslop 2011. Stop Violence Against Girls in School: A cross-country analysis of
baseline research from Ghana, Kenya and Mozambique. Instutite of Education, University
of London for ActionAid International.
Poulin, M. 2010. Reporting on first sexual experience: The importance of interviewer-respondent
interaction. Demographic Research 22(11): 237-288. doi: 10.4054/DemRes.2010.22.11
Pridmore, P. & C. Jere 2011. Disrupting patterns of educational inequality and disadvantage in
Malawi. Compare: A Journal of Comparative and International Education 41(4): 513-531.
doi: 10.1080/03057925.2011.581518.
Robeyns, I. 2006. Three models of education: Rights, capabilities and human capital. Theory and
Research in Education 4(1): 69-84. doi: 10.1177/1477878506060683.
Rolleston, C. 2009. The determination of exclusion: evidence from the Ghana Living Standards
Surveys 1991-2006. Comparative Education 45(2): 197-218. doi: 10.1080/
03050060902920617.
Rose, P. 2003. Community participation in school policy and practice in Malawi: balancing
local knowledge, national policies and international agency priorities. Compare: A
Journal of Comparative Education 33(1): 47-64. doi: 10.1080/0305792032000035263.
Schatz, E. 2012. Rationale and procedures for nesting semi-structured interviews in surveys or
censuses. Population Studies 66(2): 183-195.
Smith, E.P., C.M. Connell, G. Wright, M. Sizer, J.M. Norman, A. Hurley, et al. 1997. An ecological
model of home, school, and community partnerships: Implications for research and
practice. Journal of Educational & Psychological Consultation 8(4): 339.
Soler-Hampejsek, E., M.J. Grant, B.S. Mensch, P.C. Hewett & J. Rankin 2013. The effect of school
status and academic skills on the reporting of premarital sexual behavior: Evidence From a
longitudinal study in rural Malawi. Journal of Adolescent Health 53(2): 228-234. doi:
10.1016/j.jadohealth.2013.03.008.

220
Streuli, N. & C.M. Moleni 2008. Education and HIV and AIDS in Malawi: The role of open,
distance and flexible learning. SOFIE Opening Up Access Series No. 3. London: Institute
of Education, University of London.
UNESCO 2015. Education for All 2000-2015: Achievements and challenges. EFA Global
Monitoring Report 2015. Paris: UNESCO.
Unterhalter, E. 2012. Inequality, capabilities and poverty in four African countries: Girls’ voice,
schooling, and strategies for institutional change. Cambridge Journal of Education 42(3):
307-325. doi: 10.1080/0305764X.2012.706253.
Wittenberg, M. 2005. The school day in South Africa. CSSR Working Paper No. 113. Cape Town:
University of Cape Town Centre for Social Science Research.
World Bank 2010. The education system in Malawi. World Bank Working Paper No. 182.
Washington, D.C.: The World Bank.

221
Chapter 8: Discussion
Combining rich quantitative and qualitative data sources from Karonga district, northern
Malawi, this thesis sought to identify the determinants of absenteeism among primary
school students, contribute to the evidence base surrounding the potential for cleaner
burning biomass-fuelled cookstoves to reduce absenteeism, determine the relationship
between absenteeism and subsequent educational outcomes, and explore the value students
themselves place on maintaining regular school attendance. Although absenteeism has been
identified as an important issue of concern in Malawi (Jere 2012; Pridmore and Jere 2011;
Streuli and Moleni 2008), it is worth noting that the prevalence of absenteeism observed in
this study was considerably lower than observed elsewhere. Measures are not directly
comparable, but data from the 2010-11 Karonga HDSS showed that 16% of students aged
5-18 were reported to have missed school in the past four weeks (Chapter 4), while in
southern Malawi, Grant et al. (2013) found using 2007 data that 52% of primary school
students aged 14-16 had missed school in the past two weeks and 20% on the most recent
school day. Indeed, reported absenteeism levels in Karonga district compare favourably
even with figures from some high-income countries: according to 2015 data from the
National Center for Education Statistics in the United States, 48% of grade 4 students and
55% of grade 8 students missed at least one day of school in the previous month (National
Center for Education Statistics 2015a).
This variation in absenteeism prevalence could stem from a number of factors, both
empirical and methodological. Firstly, because school attendance reports in the Karonga
HDSS came primarily from adult proxy informants, as opposed to student self-reports
collected in the study from southern Malawi (Grant et al. 2013) and the US survey (National
Center for Education Statistics 2015b), the validity of reporting across the studies may
differ. In particular, proxy reports of absenteeism may be affected by misinformation or
lack of awareness about children’s attendance patterns (Bardasi et al. 2011), which may
have led to under-reporting of absenteeism in the HDSS. In a case study of four Malawian
schools, Moleni (2008, p. 51) noted ‘a lack of close supervision from some guardians’
regarding children’s school attendance, which may cause them to report it inaccurately.

222
Findings presented in Chapter 7 also suggest that evaluative judgements about missing
school could additionally have influenced reporting in the HDSS in ways that might not
apply in other settings, especially where missing school is not punished or considered
socially proscribed. The differences in recall periods between the two Malawian studies—
missing school in the past four weeks versus past two weeks/past day—may have
additionally influenced participants’ ability to report absenteeism accurately (Das et al.
2012), although extrapolation of the figures from southern Malawi suggest that differences
in absence rates between the two sites may be even more stark than they appear.
Finally we saw in Chapters 4 and 6 that levels of absenteeism differed by standard attended
and students’ history of grade repetition, so variation in sample composition by age and
grade likely contributes to discrepancies in absenteeism measures. In particular, the sample
for the southern Malawian study comprised students aged 14-16 attending standards 4-8
(Grant et al. 2013), which, although selected to reflect the ‘typical’ education experience
of adolescents in southern Malawi, excluded the minority of students who progressed
through school at the correct age-for-grade. Given that my results indicate that students
who had not repeated their school grade demonstrated lower levels of absenteeism, figures
reported by Grant et al. (2013) may overestimate overall absence levels in upper primary
school.
Bearing in mind these important methodological differences, the comparatively low
prevalence of absenteeism in northern Malawi may also reflect the strong historical
educational traditions that characterise the area, described in Chapter 3. In an ethnographic
study undertaken in the years following the transition to free primary education, and
covering all three regions of Malawi, Kendall (2007, pp. 292-3) observed of a northern
community, ‘Education and literacy mattered in people’s lives and perceived opportunities
in a way that was not evident in the other regions studied.’ Indeed, by focusing on
identifying and addressing episodes of absenteeism, the analyses presented here do not
account for activities that schools and communities already undertake to support children’s
schooling, which may be additionally reflected in prevalence measures.
The characteristics of the Malawian education system more broadly must also be
considered when reflecting on patterns of absenteeism. Given the highly competitive nature
of secondary school entry, as well as the introduction of school fees at secondary level,

223
students’ primary school attendance may be influenced by the perceived likelihood of
progressing to secondary education. We saw in Chapter 4, for instance, that students
attending standard 8 were significantly less likely to miss school than counterparts in earlier
grades, presumably because of the importance placed on the Primary School Leaving
Certificate of Education (PSLCE) examination (but potentially also due to selectivity of
students who progress so far through school). On the other hand, a negative feedback loop
generated by the bottleneck at the transition to secondary education may negatively affect
attendance decisions at earlier stages. Research from Tanzania described in Chapter 2
showed that presence of a secondary school within 5 km of a community increased hours
of primary school attendance for girls, suggesting that the availability (or absence) of future
secondary education opportunities factored into household decisions about investment in
primary, particularly for female students (Burke and Beegle 2004).
Even if absenteeism prevalence is lower in this study relative to regional or global
comparisons, irregular school attendance nevertheless remains an important barrier to
sustained educational access. My findings suggest that absent students were subject to a
number of exclusionary practices at home and at school (Chapter 7), and absenteeism was
also linked with future adverse educational outcomes (Chapter 6), such that understanding
the drivers of absenteeism forms an essential component of strategies to address ‘silent
exclusion’ from education (Lewin 2009).
The following sections discuss the contributions and implications of thesis findings,
according to the four research objectives outlined in Chapter 1. Table 8.1 summarises this
discussion.
8.1 Proximal and distal determinants of primary school absenteeism
The analyses presented in this thesis have highlighted the complex network of individual-,
household-, school-, and community-level processes that underpin school absenteeism in
Karonga district. Both in the literature review in Chapter 2 and in the analysis that followed,
socioeconomic barriers and student ill health emerged as particularly prominent sources of
absence in the study community.

224
Table 8.1 Summary of thesis contributions
Research objective Key findings Implications Limitations 1: Identify distal and proximal
determinants of absenteeism Household agricultural and non-
agricultural wealth are significantly
associated with recent absenteeism, but in
opposite directions
Student ill health is most common reason
reported for missing school
No difference in absenteeism prevalence
between boys and girls, but some
determinants differ
Complex relationship between
agricultural productivity, child work
and school attendance in rural settings
Absenteeism not restricted to poorest
households if multiple dimensions of
SES are considered
Some suggestion of relative over-
reporting of illness-related absences
No time use data to measure
participation in household work
No health data to assess disease
burden among school-age
population
Analysis is cross-sectional so
causal inferences drawn with
caution
2: Assess relationship between
cookstoves and absenteeism No conclusive evidence that cookstoves
influenced absenteeism overall
Some suggestion that cookstoves
improved attendance of older female
students during the rainy season
Time and resource savings widely
perceived; few observed health impacts
Cookstoves may influence other
educational outcomes – e.g. timely
arrival at school
Cookstove interventions should form
part of wider clean energy strategy
No time use data to establish
cookstove impact on resource
collection and cooking times
No health outcome data for
school-age population
3: Establish relationship
between absenteeism and
subsequent educational
trajectories
Absenteeism in one survey round
associated with absenteeism and grade
repetition in the next survey round
Dose-response relationship observed
between missed days and repetition
Stronger association between
absenteeism and grade repetition among
students who entered primary late
Absenteeism serves as observable
precursor to adverse educational
trajectories
Students who are behind age-for-
grade are particularly at risk
Cannot establish causal
relationship between absenteeism
and future outcomes
Loss to follow up may introduce
bias
‘Snapshot’ measure of
absenteeism does not capture
trends across the school year
4. Explore students’
perceptions and experiences of
absenteeism
Students attach a form of moral
significance to attending school daily
Absenteeism driven by complex
underlying processes
Some reasons for absence (e.g. illness)
considered more ‘valid’ than others
Evaluative judgements about missing
school may influence reporting of
absenteeism in household surveys
Distilling episodes of absenteeism into
single proximal cause obscures
complex underlying processes
Holistic approach needed to
understand and address absenteeism
Time and resource constraints
limited study scope
Sample size precluded subgroup
comparisons
Participant drawings may not
reflect activities with most
salience

225
8.1.1 Socioeconomic barriers
In both quantitative and qualitative analyses, socioeconomic factors acted as constraints on
school attendance through a diversity of mechanisms. The analysis from Chapter 4 showed
that multiple dimensions of SES were strongly associated with missing school in the past
four weeks, but in opposite directions. In particular, students living in households with high
levels of non-agricultural wealth were less likely to miss school than those in poorer
households, adjusting for other measures of SES. By contrast, students from households
characterised by high levels of agricultural wealth were significantly more likely to miss
school. These findings echo the agricultural ‘wealth paradox’ observed in other settings,
whereby larger endowments of land and productive assets increase demand for household
child labour and consequent withdrawal from school (Bhalotra and Heady 2003).
Findings from IDIs and FGDs confirmed the salience of agricultural work as a reason for
absence in the study area. Farming activities were the most common image depicted in the
‘draw and tell’ activity among both boys and girls, while several IDI participants also
experienced recent work-related absences. Students described two distinct pathways
between agricultural work and absenteeism. According to the first mechanism, students
were pulled out of school to provide needed labour on household farms—consistent with
the observed statistical concentration of absenteeism in the most agriculture-rich
households. Alternatively, students were pushed out of school due to prohibitive monetary
costs, leading either to participation in paid work to finance school costs, particularly
among boys, or to engagement in household work somewhat by default. This pattern is
consistent with the finding from Chapter 4 that monetary poverty—measured in terms of
household asset ownership and dwelling quality—was significantly associated with
missing school, after adjusting for agricultural wealth. Indeed, although Malawi abolished
primary school fees in 1994, students listed a number of other school-related expenses,
including for pens and notebooks, school uniforms, or examination fees—as in other
Malawian studies (Kadzamira and Rose 2003; Pridmore and Jere 2011)—for which
inability to pay led to absenteeism.
These findings underscore the importance of both monetary and opportunity costs of
schooling as influences on school attendance, which may operate in different ways. Several
implications follow for research and policy. With respect to operationalising
socioeconomic status, this thesis has highlighted the multidimensional nature of household

226
SES and the observation that school absenteeism is not restricted to the poorest students if
measures of agricultural wealth are considered. Accordingly, nuanced analysis is required
when identifying socioeconomic sources of educational exclusion.
Efforts to address socioeconomic barriers to school attendance, for example through cash
transfers, must be equally cognisant of the opposing incentives that rural households face.
Unconditional or conditional cash transfers have been widely advocated as a means to
facilitate improved educational participation among poor households in low- and middle-
income countries (Glewwe and Muralidharan 2015). In 2006, the Government of Malawi
launched the Social Cash Transfer (SCT) programme, in which ultra-poor and labour
constrained households received an unconditional monthly payment designed to alleviate
household hunger and improve children’s well-being (Kilburn et al. 2017). As of December
2015 the SCT had reached 163,000 households across 18 districts (Abdoulayi et al. 2017),
but has not yet been introduced in Karonga. Evaluations of the SCT programme have found
significant improvements in school attendance among children in recipient households,
even in the absence of conditions attached to the transfer (Abdoulayi et al. 2017; Miller and
Tsoka 2012). Kilburn et al. (2017) showed that the primary mechanism through which the
SCT increased attendance was via greater household expenditure on such items as uniforms
and notebooks, which had previously excluded children from school.45
The impact of the SCT on children’s work participation, however, was more nuanced.
Abdoulayi et al. (2017) found that children’s involvement in informal piece work (ganyu)
declined in SCT households, but participation in domestic agricultural activities and
household chores increased. An earlier analysis similarly found that the SCT reduced child
labour outside the home while increasing involvement in household farm work
(Covarrubias et al. 2012). These findings suggest that, although cash transfers may alleviate
household financial pressures and in turn release children from performing paid work,
labour-constrained households rely on children to intensify their domestic agricultural
activities (Covarrubias et al. 2012; Miller and Tsoka 2012). Indeed, Abdoulayi et al. (2017)
and Covarrubias et al. (2012) both showed that investment in productive assets including
hoes, sickles, and livestock increased in SCT recipient households, which may explain the
45 Although the requirement to wear a school uniform was formally eliminated in 1994, school policies that
still enforce the uniform policy, or ridicule from classmates for not having a uniform, continue to result in
exclusion (Moleni 2008).

227
increased demand for household child labour. Although greater work demands did not
appear to interfere with school attendance (Abdoulayi et al. 2017; Kilburn et al. 2017;
Miller and Tsoka 2012), they may nevertheless negatively affect pupils’ educational
performance through injury, fatigue, or lack of time to study (Hazarika and Sarangi 2008;
Heady 2003). At the same time, however, children have been shown to derive pride and
enhanced self-esteem from their ability to provide for themselves and their families, as well
as to learn skills for securing future livelihoods, through their participation in household
work (Aufseeser et al. 2017). Design and evaluation of cash transfer programmes, and other
interventions designed to address household poverty, must therefore carefully consider the
complex relationship between financial assets, agricultural productivity and school
attendance in rural settings.
8.1.2 Ill health
In addition to socioeconomic factors, a number of other barriers to school attendance
emerged as important constraints. In particular, the most common reason reported for
missing school in the HDSS was student ill health, echoing previous survey research from
Malawi (Grant et al. 2013; Milner et al. 2011): in the 2010-11 school year, nearly three-
quarters of absences in the previous four weeks were attributed to illness (Chapter 4).
Despite suggestions in both quantitative (Chapter 4) and qualitative (Chapter 7) data of
relative over-reporting of illness-related absences, which I will discuss further in section
8.4, findings nevertheless suggest that student ill health posed an important barrier to
sustained school attendance. In IDIs and FGDs, students described missing school due to
malaria attacks, as well as more generic symptoms including dizziness, headache and
stomach ache. Addressing preventable illness in this community could thus have an
important impact on school attendance.
With specific reference to malaria, this study lacked prevalence and incidence data with
which to measure disease risk, but other research from Malawi has emphasised that school-
age populations bear a high malaria burden. According to a study from Zomba district,
60.0% of school children (ages 5-21) were infected with Plasmodium falciparum
(Mathanga et al. 2015), while in Blantyre, Thyolo and Chikhwawa, children aged 6-15
years had almost five times the odds of rainy season malaria infection than both younger
children and adults (Walldorf et al. 2015). School-aged children in southern Malawi have
also been shown to use bed nets significantly less frequently than household members of

228
other ages (Buchwald et al. 2016), and to be taken for treatment less frequently than
younger children (Walldorf et al. 2015). Although no Malawian study has quantified the
contribution of malaria to school absenteeism, other research from African settings suggests
that absences attributable to malaria constitute 13-50% of annual school days missed from
preventable medical causes (Brooker et al. 2000).
School health programmes, such as those that target malaria, thus represent a promising
means to enhance educational access. In framing school health as ‘a key component of
Education for All’, Bundy (2011) emphasised the critical role schools can play as sites for
health interventions that improve students’ attendance and ability to learn. Indeed, reduced
absenteeism, as well as time and resource savings associated with ready access to treatment,
were identified by both students and parents as among the key benefits of a recent school-
based malaria diagnosis and treatment programme implemented in southern Malawi
(Mphwatiwa et al. 2017). According to one student:
When you are sick, you do not have to be absent from school you still come; you go to
[…] receive medication and go back to class. Our parents are very happy because they
are not having any problem with taking us to the health facility to receive treatment so
they say they are able to save money (Mphwatiwa et al. 2017).
The 2015 Global Burden of Disease Study indicates that, in addition to malaria, major
contributors to morbidity and mortality among children and adolescents in Malawi include
iron-deficiency anaemia, skin and soft tissue infections, and diarrhoeal diseases (The
Global Burden of Disease Child Adolescent Health Collaboration 2017). More research is
needed to identify the health conditions that lead to preventable school loss in northern
Malawi, and for which appropriate and effective treatment measures can be designed. I
review evidence for absences related to household air pollution, and the potential for
cleaner burning cookstoves to improve school attendance, in section 8.2 below.
8.1.3 Gender differences
Consistent with previous studies in Malawi (Grant et al. 2013) and elsewhere in sub-
Saharan Africa (Ainsworth et al. 2005; Loiaza and Lloyd 2008; Mensch and Lloyd 1998;
Orkin et al. 2014), I did not observe a difference in the prevalence of absenteeism between
boys and girls. However, some determinants of missing school did follow a gendered
pattern. For instance, the analysis in Chapter 4 showed that the number of household

229
members younger than the index student was associated with absenteeism for girls but not
for boys, suggesting that girls assume greater responsibility for caregiving or household
chores, a hypothesis supported by the qualitative data presented in Chapter 7 as well as
previous literature (Lloyd et al. 2008; Wodon and Beegle 2006). Indeed, IDI and FGD
participants described gendered divisions of labour that influenced their education. Echoing
findings in Kendall and Kaunda (2015), some girls perceived that it was easier for boys to
secure the paid work necessary to finance schooling expenses, which may explain why a
significant positive relationship between participation in economic activities and school
absence was observed for boys but not for girls in Chapter 4. Additionally, many domestic
tasks that were not included in the survey’s definition of economic activities, including
drawing water for cooking and cleaning and sweeping the compound, were considered
exclusively in girls’ domain. Although these activities were less frequently mentioned as
barriers to school attendance than was agricultural work in Chapter 7, they are nevertheless
indicative of the extra burden girls bear to combine household responsibilities with school
attendance (UNICEF 2016).
Some girls also described how familial expectations about marriage meant that households
were less willing to invest in girls’ education. Quantitative research among students in
Ghana similarly showed that household gender attitudes were significantly related to
attendance patterns: when students’ caregivers endorsed a statement that it is better to
educate boys than girls, girls’ absence rates were significantly higher—and boys’
significantly lower—than counterparts whose caregivers disagreed with the statement
(Wolf et al. 2016). In the Ghanaian study, as in the present one, overall levels of
absenteeism were equal across sexes, but I echo the authors in advocating that:
[R]esearchers and practitioners must look beyond the raw rates of school attendance
[…] to understand the patterns of barriers that may uniquely limit access to school
for boys versus girls. Targeting the specific types of barriers faced by different
groups of children from different contexts may provide the most efficient way to
improving overall access and parity (Wolf et al. 2016, p. 189).
8.2 Impact of cleaner burning biomass-fuelled cookstoves on school attendance
Against this backdrop of health and economic barriers to school attendance, I capitalised
on opportunities offered by the Cooking and Pneumonia Study to examine the effect of
cleaner burning biomass-fuelled cookstoves on absenteeism. I hypothesised that reduced

230
household air pollution and fuelwood demand resulting from the cookstoves could improve
school attendance via both health and time/resource savings, particularly for girls relative
to boys, and older students relative to younger students, due to greater resource collection
and caregiving duties undertaken by these subgroups. I also expected to observe more
pronounced cookstove benefits during the rainy season, when most cooking activities are
conducted indoors.
The analysis in Chapter 5 ultimately showed that, although school absenteeism was slightly
lower in the intervention group than in the control group, no statistically significant
differences in attendance were found in either the intention-to-treat or per protocol
analyses. Similarly, subgroup analyses suggested a differential effect of cookstove
ownership on absenteeism in the expected directions—namely, among girls, older children,
and during the rainy season—but none of these results was statistically significant.
Combining all three subgroups, there was some indication that cookstoves yielded greater
attendance benefits among older girls interviewed during the rainy season, a finding that
merits further in-depth research.
Qualitative data helped shed light on why the cookstoves did not appear to yield the
anticipated school attendance benefits. Although nearly all participants in the qualitative
study observed time and resource savings associated with the cookstoves, echoing the
perceptions of primary household cooks interviewed in Cundale et al. (2017), cooking and
fuel collection activities were considered to be compatible with school attendance in both
trial groups due to the ready availability of fuelwood and agricultural residues in the trial
community. Instead, students listed a range of alternative impediments to schooling,
particularly related to (non-pollution-related) illness and other domestic responsibilities, as
described in section 8.1. Time and resource savings from cookstoves—and corresponding
school attendance gains—may, however, be greater in settings where environmental
resources are more depleted. Future trials should explore this hypothesis further by
comparing intra-household time allocations across settings with different levels of
environmental degradation.
Few participants perceived any changes in household health after receiving the cookstoves,
consistent with the finding that the CAPS trial had no effect on incidence of pneumonia in
children under five (Mortimer et al. 2016). One student did, however, observe that her sister

231
suffered fewer asthma exacerbations after CAPS enrolment. The latter finding, which
reflects previous studies linking biomass cooking to asthma in school-age populations
(Wong et al. 2013), warrants further research in the context of a cookstove trial. More
generally, by recognising school-age children as important and relatively neglected
stakeholders in health research (Mokdad et al. 2016), future studies can fill important gaps
in the evidence base surrounding the health impacts of clean cooking technologies in this
population.
However, as in previous cookstove trials (e.g. Hanna et al. 2012; Romieu et al. 2009), CAPS
demonstrated the difficulties associated with achieving sustained and consistent behaviour
change. A large fraction of households reported continuing to use traditional cooking
methods alongside the cookstove, such that 64% of households used the cookstove
exclusively for all meals at time of follow-up. Household cooks reported reverting to three
stone fires when the cookstoves were damaged or not properly charged, when preparing
large volumes of food that the cookstoves could not accommodate, or when cooking some
foodstuffs that they considered more amenable to open fire cooking (Cundale et al. 2017).
Evidence from cookstove acceptability studies in other settings has confirmed that although
households value time and resource savings associated with more efficient cookstoves, they
also demonstrate a diverse range of preferences with respect to cookstove capacity and
functionality (Rosenbaum et al. 2015). Continued innovation is required to develop a
variety of high-quality cookstove models that increase the choice of clean cooking
technologies among households, while enhancing acceptability (Rehfuess et al. 2014). For
instance, recent biomass cookstove prototypes field tested in Malawi have included a small
electricity generator sufficient to charge mobile phones, lights or radios, in order to increase
their appeal in off-grid rural communities (O'Shaughnessy et al. 2014; O'Shaughnessy et
al. 2015). In addition to supply-side measures, however, efforts to increase cookstove
uptake should also include appropriately tailored communication and community
engagement strategies to facilitate sustained cookstove use (Barnes et al. 2015).
Importantly, too, cooking represents just one of several sources of damaging air pollution,
so isolated programmes of cookstove distribution may not be sufficient to improve
household health (Ezzati and Baumgartner 2017). Baseline data from CAPS reported in
Table 5.1 showed that approximately 70% of households regularly burned their rubbish,

232
and smaller proportions reported daily or almost daily smoke exposure from brick
production or paraffin/kerosene lighting, as well as tobacco smoking. Other research from
Malawi has similarly highlighted elevated levels of environmental smoke exposure
(Brouwer et al. 1997; Das et al. 2017). Strategies to address HAP must therefore form part
of a comprehensive clean and affordable energy strategy, combined with safe waste
disposal, to reduce solid fuel combustion.
Nevertheless, although the analysis from Chapter 5 suggested that cleaner burning
cookstoves did not influence school attendance, there was some indication that they
improved timely arrival at school. Future research should thus explore linkages between
clean energy technologies and other aspects of educational access. In particular, time and
resource savings attributable to cookstove use may translate into greater opportunity to
engage in non-school educational activities, including studying or listening to the radio.
Students may also benefit from improved concentration in lessons if cookstoves enable
them to eat breakfast before school more regularly than with time-consuming traditional
methods. As highlighted by Vladimirova and Le Blanc (2016), synergies between the
energy and education sectors are under-exploited in the policy community, so opportunities
to widen the scope of the research agenda to explore the educational impacts of other forms
of clean energy technology should also be pursued. Increased access to solar powered or
electric lighting, for instance, has the potential to enhance learning outcomes by allowing
students to complete homework at night—or indeed other household responsibilities that
compete with schooling—although existing evidence from African settings is mixed
(Furukawa 2014; Peters and Sievert 2016).
8.3 Relationship between absenteeism and subsequent educational outcomes
Having examined the factors associated with school absenteeism, and assessed one
potential intervention to address it, the analysis presented in Chapter 6 investigated the
relationship between absenteeism and future educational pathways by exploiting eight
years of longitudinal school attendance data. Findings showed that, even using the fairly
crude measures of absenteeism available in the HDSS, students who were absent in one
survey round were more likely to be absent again in the next round, and to repeat their
school grade. A dose-response relationship was observed between absenteeism and
repetition, with students who missed more school increasingly likely to fall behind. A

233
measure of cumulative absence over multiple survey rounds was also significantly
associated with lower grade attainment after six years.
Combined with the observation from Chapter 4 that students who were repeating their
current grade were more likely to have missed school in the past four weeks, these results
suggest a cycle of silent exclusion in which absenteeism and repetition are mutually
reinforcing. While my analysis cannot establish a causal relationship between absenteeism
and repetition—and indeed it is likely that both are jointly influenced by monetary poverty,
domestic responsibilities, and other forms of vulnerability—one male FGD participant also
described how humiliation and ridicule associated with being overage for grade promoted
disengagement from school (Chapter 7). Research by USAID in Malawi similarly showed
that being laughed at by classmates and feeling ‘too big for their class’ contributed to
absenteeism and school withdrawal (USAID 2014, p. 21). In Chapter 6, the relationship
between absenteeism and grade repetition was significantly stronger among students who
entered primary school late relative to those who entered early, providing further indication
that students who were overage for grade were particularly vulnerable to adverse
educational trajectories.
These observations suggest two primary implications:
1) In light of the link between absenteeism and adverse educational trajectories, school
attendance data can be used to identify students at risk of future repetition and
dropout.
2) Interventions targeted specifically at students who are overage for grade are needed
to arrest cycles of exclusion involving absenteeism and repetition.
8.3.1 Using attendance data to identify students at risk of adverse educational pathways
Given the observed link between absenteeism and future absence and repetition, school
attendance data can play an important role in identifying students at risk of adverse
educational trajectories, but lack of appropriate monitoring mechanisms often renders
frequently absent students ‘invisible’ in the classroom (Creative Associates International
2015; Jere 2012). As discussed in Chapter 1, National Education Management Information
Systems (EMIS) typically do not include indicators for absenteeism, while cross-national
survey programmes such as the DHS do not account for students’ attendance frequency

234
(UNICEF and UIS 2016). At school level, numerous commentators have lamented the poor
quality of daily attendance registers, including one South African study that dismissed them
as ‘notoriously unreliable’ (Hochfeld et al. 2016, p. 8) and observations in Malawi that they
were ‘poorly kept’ (Moleni 2008, p. 78). By not monitoring the regularity of school
attendance, official enrolment estimates may not only overestimate the number of students
currently in school, but education authorities also miss opportunities to use absenteeism
patterns to identify students at risk of repetition or dropout.
A recent set of USAID programmes to prevent school dropout in Cambodia, India,
Tajikistan and Timor-Leste explicitly centred around development of an ‘early warning
system’ as part of its strategy to keep students in school (Creative Associates International
and Mathematica Policy Research 2015b). The early warning system harnessed
administrative data including daily attendance and class performance to identify at-risk
students, to whom targeted responses ranging from increased teacher attention to home
visits were directed. These efforts were complemented by community engagement
activities to raise awareness about the importance of school attendance. The pilot from
Cambodia—the only country to test the early warning system in isolation from other
interventions—found that after two years of implementation in 107 schools, the early
warning system reduced dropout by 6% overall, and 11% among at-risk students, compared
to in 107 control schools (Creative Associates International and Mathematica Policy
Research 2015a).
A school-based intervention in Malawi under the auspices of the SOFIE project
(Strengthening Open and Flexible learning to Increase Educational access), which included
a package of measures to support the learning of children at risk of dropout, similarly
highlighted the value of improved attendance monitoring for arresting adverse educational
outcomes. The programme evaluation found that school dropout was lowest in the subset
of intervention schools where teachers were trained to keep registers of vulnerable students
in which they recorded their attendance, progress and participation in lessons (Jukes et al.
2014; Pridmore and Jere 2011). Interestingly, too, reductions in dropout were particularly
large among students not selected for participation in the wider programme, which the
authors attributed to spillovers from enhanced monitoring mechanisms:
[A]cross the majority of intervention schools, participants reported a notable
improvement in record-keeping, monitoring of pupil attendance and follow-up of

235
all pupils, not just those in the SOFIE clubs. […] In this way, it was less easy for
habitual absentees, or those who had temporarily withdrawn, to slip through the net
and to dropout permanently (Jukes et al. 2014, p. 199).
Enhancing school attendance data collection mechanisms thus forms a critical component
of strategies to address silent exclusion from education. In recognition of the importance of
high-quality and timely school attendance data, several innovative electronic data
collection systems have been developed in sub-Saharan Africa, which also facilitate real-
time monitoring and analysis by local and national stakeholders. UNICEF’s eduTrac
monitoring system in Uganda, for instance, uses mobile phones to collect attendance data
from teachers via weekly SMSs.46 Tanzania’s tablet-based School Information System
harnesses FHI 360’s all-in-one (internet or SMS) transmission technology to collect daily
attendance data.47
While electronic systems have a number of potential advantages, including quicker data
entry compared to paper-based registers, reduced costs of data transmission and automated
generation of attendance reports (Bernbaum and Moses 2011; Mohandes 2017), early
evidence suggests that take-up and acceptability are low. The pilot study of the Ndi Hano!
(Here I Am) programme in Rwanda, which used SMS technology to collect daily
attendance data, found that only one-third of teachers submitted attendance records during
the first two months of implementation and, of these, more than half sent only ten messages
or fewer during that period (Center for Education Innovations 2015). Explanations for
limited uptake included technological errors, unacceptable time burdens, and lack of
systematic data collection procedures at school level. With other programmes including
eduTrac and Tanzania’s School Information System still in their infancy, ‘it is too early to
determine the precise links between education progress and such approaches to data’,
although they hold promise (UNESCO Institute for Statistics (UIS) and UNICEF 2015, p.
55). Continued research is needed to develop and evaluate systems that produce timely and
accurate attendance data, while meeting users’ needs.
Importantly, however, data collection systems must be nested in monitoring structures that
avoid incentivising misrecording of student absenteeism. Several commentators, for
46 More information at: https://www.rapidsms.org/projects/edutrac/ 47 More information at: http://www.fhi360bi.org/user/tanzaniaSIS/

236
instance, have argued that tying attendance records to school resource allocation decisions
encourages inflated reporting of attendance levels (Humphreys et al. 2015; Ravishankar et
al. 2016). A recent World Bank report instead advocated apportioning school grants on the
basis of a measure of ‘effective pupil years’, which would consider grade progression over
and above reported attendance in funding decisions, although an ‘ideal’ measure would also
account for students’ actual learning (Ravishankar et al. 2016, p. 53). Unannounced spot
checks by education authorities to verify the accuracy of attendance data, as well as clear
communication strategies that make clear how high-quality data can be used to benefit
students and schools, represent additional strategies to improve reporting (National Forum
on Education Statistics 2009; UNICEF and UIS 2016).
8.3.2 Interventions to arrest adverse educational trajectories
Although all students stand to benefit from improved school record keeping, the analyses
in Chapters 4, 6 and 7 suggested that students who were repeating their grade and/or
overage for their class were particularly at risk of adverse educational outcomes and hence
merited targeted interventions. This observation is echoed by the evaluation of the SOFIE
programme in Malawi, which found that the intervention was particularly effective at
reducing dropout among older students (aged 14-20 years in standard 6), despite age not
being used as a criterion to identify at-risk students (Jukes et al. 2014).
As previous research has noted (Jere 2012), grade promotion in Malawi is norm-based and
highly subjective. Indeed, many focus group participants in the present study supported
requiring frequently absent students to repeat their grade, regardless of their academic
ability or extenuating circumstances.48 During one school visit, a head teacher also shared
the perception that absent students were not interested in school, which, as in Dunne and
Ananga’s (2013) case studies in Ghana, may influence grade promotion decisions. To the
extent, however, that absenteeism and grade repetition among overage students stem from
poor academic performance and disengagement from school, programmes that support the
learning of students who have fallen behind represent a critical policy response to arrest
48 The following exchange from a girls’ FGD demonstrates this point:
Facilitator: Why are we saying they should repeat that class if they have been absent for a long time? […]
Patricia: It will make her/him work hard so that he/she should pass.
Facilitator: Suppose he/she didn’t fail but because he/she was absent too much what should be done?
Edith: That child must repeat that class.

237
adverse trajectories. Measures proposed by the Malawi Education Sector Plan 2008-2017,
and the follow-up covering 2013-2018, include expansion of remedial education
programmes for failing students to reduce the repetition rate in government schools
(Ministry of Education‚ Science and Techology 2008; Ravishankar et al. 2016). These
initiatives may also serve to improve attendance by re-engaging students who fall behind,
but few studies have assessed the link between remedial instruction and time spent in school
(Glewwe and Muralidharan 2015).
According to a 2011 survey from 10 districts in Malawi, approximately 70% of schools
offered some form of remedial support outside of class time, but 5% asked students to pay
for these sessions (Nampota et al. 2012). Moleni (2008) additionally noted that some
teachers cut short timetabled classes in order to force children to attend private lessons after
school, but many students found the fees for these lessons to be prohibitive. Research is
therefore required to establish the coverage of current remedial education programmes,
their effectiveness for improving attendance and grade progression, and non-exclusionary
methods of provision, as well as alternative models of curriculum delivery to complement
formal education structures (Jere 2012; Yates 2008). More generally, in-depth study of
schools with lower average repetition rates and higher rates of promotion and learning
achievement is needed to enhance understanding of the performance features of these
schools and their student populations, and to develop appropriate policy prescriptions
(Ravishankar et al. 2016).
8.4 Students’ perceptions and experiences of absenteeism
Having identified statistical relationships between absenteeism and individual and
household characteristics, and an association between missing school and future
educational outcomes, the thesis finally sought to delve beneath quantitative
representations of school attendance to shed light on young people’s experiences of
educational access (Camfield 2011). While exploring students’ perceptions of the value of
education and the primary barriers to sustained attendance, it also sought to make two
additional methodological contributions: firstly, to highlight the extent to which distilling
episodes of absence into a single reason for missing school obscures complex underlying
processes, and secondly, to examine the incentives participants in quantitative surveys face
to misreport absenteeism levels or determinants.

238
We saw in Chapter 7 that, even in the context of relatively over-crowded and under-
resourced Malawian schools (Chimombo 2009), IDI and FGD participants attached
importance to attending school every day. The value derived from daily school attendance
reflected both a vision of education as a route to ‘bright futures’ in formal employment
(Frye 2012; Kendall and Silver 2014), and its contribution to a student identity forged on
commitment to education. In particular, framing educational aspirations as ‘expressions of
personal virtue’ based on ‘effort and striving’ rather than actual academic success (Frye
2012, p. 1600) allowed students to claim moral superiority over their frequently absent
peers, even if their own personal and economic circumstances also necessitated missing
school.
Corroborating the findings from Chapter 4, students identified a range of constraints on
school attendance including ill health and domestic responsibilities. However, absences
attributed to the same proximal cause were influenced by a dynamic and interacting set of
individual-, household-, school-, and community-level circumstances. Some of these
factors—including age, sex, financial resources, and household composition—served to
‘thicken’ or ‘thin’ students’ agency with respect to attending school (Klocker 2007).
Participants in the qualitative study, for instance, described how households’ pressing
economic needs, combined with unequal power relations and prevailing gender norms,
limited their range of options with respect to school attendance and their ability to
circumvent attendance barriers (Chapter 7). However, even in the context of external
constraints, some participants reported using initiative to secure funding for school
supplies, to pre-emptively wash clothes, or to renegotiate household workloads in order to
facilitate sustained school attendance. Previous research among female students in a
Tanzanian technical and vocational school has similarly demonstrated a range of creative
ways in which they exercised agency to navigate challenging circumstances and achieve
desired goals (DeJaeghere 2016). Future education research would benefit from further
attention to students’ coping strategies and personal agency in the face of structural
constraints (Jere 2014); recent analysis by Wilson-Strydom (2017) exploring interactions
between students’ resilience, agency and social context at a South African university
represents an illuminating example of this approach.
When seeking to understand the drivers of absenteeism, results from Chapter 7 caution
against the reduction of complex absenteeism processes into a single reason for missing

239
school. As Figure 7.5 demonstrates, absences attributed simply to ‘work’—as in the
SACMEQ Malawi report (Milner et al. 2011)—overlook the very different underlying
mechanisms leading to work-related absence, discussed in section 8.1, which suggest
different policy solutions. Importantly, too, we saw from participants’ FGDs that some
explanations for absence were considered by teachers and peers to be more ‘valid’ than
others. One participant (Alice) acknowledged telling her teacher she missed school due to
illness, when she in fact stayed home to help her grandmother. Another (Memory) went
further by excluding illness-related absences entirely from her conception of ‘missing
school’. These insights provide a possible explanation for the paradox observed in Chapter
4, whereby absenteeism was significantly associated with agricultural wealth for boys and
girls and economic participation (boys only) but work-related absences were rarely reported
by HDSS survey respondents.
Indeed, if moral judgements about missing school promote general under-reporting of
absenteeism (Baird and Özler 2012; Özler 2013), this may contribute to the relatively low
prevalence of absenteeism observed in Chapters 4 and 5. Perhaps tellingly, of the three IDI
participants who were interviewed in the same week as the HDSS household survey was
conducted, all three described missing school in the two weeks prior to the IDI, while none
of their caregivers attributed any absences to these students in the household survey.
Although by no means a perfect validation measure, this provides some indication of
discord between accounts of absenteeism in the quantitative and qualitative data sources.
Future methodological research is needed to establish whether variation stems from use of
proxy versus self-reports, issues with recall, or different propensities to acknowledge
absenteeism in surveys relative to in-depth interviews.
Reflecting moral significance attached to school attendance, as well, perhaps, of inability
to challenge the constraints they face (Unterhalter 2012), most students held absentees
personally responsible for their own poor attendance. Nevertheless, their narratives also
suggest several measures that could mitigate absenteeism in the study area. IDI and FGD
participants described exclusionary practices carried out by schools and teachers, including
sending students away for lack of uniform or for having long hair. A combination of
inflexible school policies, as well social expectations surrounding neatness, continue to
necessitate uniform use. As Moleni (2008, p. 41) observed elsewhere in Malawi:

240
Socio-cultural norms expect children to bathe daily, put on body lotion […] and
clean clothes and be neat in appearance. When a lack of basic necessities prevents
this, children, particularly adolescents, are likely to feel uncomfortable going to
school. Teachers reinforce these requirements and school regulations insist on the
wearing of uniform – an additional cost for the household to bear.
Relaxing school uniform policies or distributing free uniforms to those who have difficulty
affording them thus have the potential to enhance educational access (Evans et al. 2009;
Jere 2012). Measures to reframe harsh school discipline policies and encourage greater
inclusivity in the classroom (Jere 2012), as well as to address the costs of schooling and
improve student health—as discussed in section 8.1—may also yield important attendance
benefits.
These findings suggest that, particularly in rural contexts with limited variability in school
conditions, factors including uniform and discipline policies may hold more salience for
students’ attendance decisions than school inputs such as classrooms or textbooks that are
typically included in quantitative analyses, but for which limited evidence of impact on
attendance has been observed (Burke and Beegle 2004; Dreibelbis et al. 2013). More
generally, this thesis has demonstrated the value of mixed methods approaches to
understanding the influences of absenteeism, in which qualitative data collected from
young people both elucidate and challenge observed quantitative relationships reported by
proxy respondents. Absenteeism monitoring systems, as well as strategies to address the
barriers to school attendance, should therefore be informed by in-depth qualitative data in
addition to quantitative trends (National Forum on Education Statistics 2009; UNICEF and
UIS 2016).
8.5 Towards a holistic approach to educational access
The analyses presented here underscore the complexity of processes driving absenteeism
and suggest that no single ‘silver bullet’ can mitigate the diversity of underlying forces.
Although this thesis has identified several targeted interventions that hold promise based
on the findings described, it has additionally demonstrated the ineffectiveness of a single-
input intervention previously championed as a means to improve school attendance,
particularly for girls—namely, cleaner burning cookstoves (Global Alliance for Clean
Cookstoves n.d.). Achieving sustained access to education will ultimately require a
coordinated range of reforms that address both immediate causes of absenteeism and wider

241
structural constraints. As Unterhalter (2015) has argued, ‘the problem of children not
attending school, or attending irregularly, is a social, economic and political problem, with
complex, highly contextual reasons’. As such, solutions to the forms of ‘silent exclusion’
highlighted in the CREATE conceptual framework entail implementing processes of social
change that are equally complex.
Moreover, although ensuring continuous and consistent attendance is a crucial step towards
an expanded vision of educational access, meaningful learning depends on more than
physical presence in the classroom. Interventions or policies that serve to increase
attendance without transforming the underlying processes that give rise to imbalances in
educational access threaten the sustainability of access improvements and run the risk of
perpetuating exclusion (Kabeer 2000; Sayed et al. 2003). Cash transfers or bursaries to
increase girls’ education, for example, are ‘insufficient’ without addressing the ‘structural
constraints that make these bursaries necessary in the first place’ (Kendall and Kaunda
2015, p.36). As Miles and Singal (2010, p.12) highlight:
Inclusive education offers an opportunity for EFA [Education for All] to begin to
make distinctions between ‘moral’ and ‘mechanical’ reforms. A commitment to
providing education for all children is not about ‘bums on seats’, but about revisiting
our conceptions about schooling and the purpose of education.
Indeed, enhancing inclusion in one respect—namely, by reducing student absenteeism—
may lead to new forms of exclusion with regard to participation or achievement (Sayed et
al. 2003). For example, without corresponding investments in teaching, infrastructure and
management systems, increasing student attendance could serve only to reduce school
quality for all learners by further stretching available resources (Miller and Tsoka 2012).
Alternatively, students who attend school regularly may still suffer from ‘unfavourable
terms of inclusion’ (Sen 2000, p.28), for instance if they are forced to sit at the back of the
class, are taught in a language they do not understand, or experience discrimination and
violence. The assumption, therefore, that ‘getting children to attend school equals the
realization of their right to education […] often conflicts with reality’ (Tomaševski 2001).
Fulfilling children’s right to available, accessible, acceptable and adaptable education, as
well as well as maximising individual and social returns to schooling, thus requires looking
beyond attendance to other dimensions of access—including access to the classroom and
to the curriculum (Humphreys et al. 2015)—that ensure meaningful learning experiences.

242
It also requires a multi-sectoral outlook, not only to address the network of underlying
exclusionary processes, but also to ensure that young people can reap the benefits of
education through appropriate future employment opportunities (Tomaševski 2001).
Indeed, as McCowan (2011, p. 289) highlights, the three defining principles of human
rights—indivisibility, interrelatedness, and interdependence—imply that the right to
education cannot exist in isolation:
If we see educational rights as involving all three of these [principles], it will be
necessary not only for people to have access to educational experiences, but also to
have their full set of human rights upheld within the institution and to develop those
capacities necessary for exercising and defending those rights throughout their life.
In this way, rights to adequate nutrition, health, freedom of expression and so forth
would need to be upheld in conjunction with the right to education, with the
different rights being mutually reinforcing.
Circumstances including ill health, undernourishment, fatigue and anxiety have been
shown in sub-Saharan Africa to affect students’ ability to concentrate and learn effectively
(Bundy et al. 2009; Cluver et al. 2012; Jewitt and Ryley 2014; Levison et al. 2017; Orkin
2011), thus reinforcing the need for a comprehensive approach to the delivery of inclusive
education.
8.6 Limitations
Limitations associated with each analysis are discussed in their respective chapters, but I
reflect here on some broader limitations to the scope of the thesis. Firstly, while I have
explored a wide range of barriers to school attendance, and engaged in an ‘international
interdisciplinary research conversation’ (Slee 1997, p. i) advocated by scholars of inclusive
education, I did not explicitly target some of the ‘hard to reach’ groups identified in Chapter
3 as requiring particular attention. I did not, for instance, explore forms of marginalisation
associated with disability, concern for which formed the central basis of inclusive education
movements (Balescut and Eklindh 2006). The 2008 Malawi Population and Housing
Census indicates that 2.8% of 5-14 year-olds report having difficulty seeing, speaking,
hearing, walking/climbing or another form of disability (National Statistical Office 2010),
a figure which likely underestimates true prevalence given the challenges associated with
collecting data on child disability (Cappa et al. 2015). A situation analysis in Malawi
entitled From exclusion to inclusion: Promoting the rights of children with disabilities
revealed that disabled children were less likely than non-disabled peers to attend school,

243
and that those who did attend experienced a range of exclusionary pressures including
bullying, lack of specialised teaching, poorly adapted school facilities and limited
household support that severely hampered their educational trajectories (Munthali et al.
2013). Although a series of disability questions were added to the HDSS annual survey in
2014, they were only asked to participants aged 18 and older, thus precluding an estimation
in this thesis of either the prevalence of disability among the primary school-aged cohort
or its relationship with school absenteeism. Urgent research is therefore required to inform
efforts address to the access needs of disabled children in this context.
The present study also did not examine the impact of HIV/AIDS on educational access.
The prevalence of HIV in the Northern region is lower than elsewhere in Malawi (see Table
3.1), but it nevertheless affects a substantial proportion of households in the study area
(Chihana et al. 2012), and as such represents a potentially important dimension of
educational exclusion not captured here. Earlier research examining the impacts of parental
HIV on children in Karonga district showed that parental HIV was associated with
increased orphanhood, non-residence with parents, and child migration (Floyd et al. 2007;
Hosegood et al. 2007), but no differences in grade attainment between students with HIV-
positive and HIV-negative parents was observed (Floyd et al. 2007). The analysis in
Chapter 4 found that neither a student’s orphanhood status nor relationship to household
head were significantly associated with absenteeism in the past four weeks, but previous
studies suggest that school attendance patterns are sensitive to the timing of parental death,
which was not accounted for here (Ainsworth et al. 2005; Evans and Miguel 2007).
On the other hand, the SOFIE intervention in Malawi found that children identified as
vulnerable by their communities on the basis of such characteristics as orphanhood status
actually experienced better educational outcomes than their peers who were not classified
as at-risk (Jukes et al. 2014). One possible explanation, as suggested by the authors, was
that ‘children who were perceived as being at-risk by their communities were not, in fact,
those most at risk’ (Jukes et al. 2014, p. 197). As the sampling design and topic guides for
my qualitative study were informed primarily by the cookstove intervention, IDIs and
FGDs did not focus on HIV/AIDS as distinct from more general forms of illness and
household caregiving, so I was unable to further examine the particular impact of
HIV/AIDS on students’ school attendance and experience.

244
In setting absenteeism as the primary outcome, this thesis additionally did not highlight the
range of supportive factors that enabled students’ consistent school attendance. These
factors may also help to explain the cookstoves’ observed lack of impact on absenteeism.
Kendall and Kaunda (2015, pp. 26-27) have noted profound ‘cultural shifts’ following the
transition to FPE and multi-party democracy in Malawi which have led to an embrace of
education, particularly for girls, and more gender-equitable notions among teachers and
caregivers of boys’ and girls’ ability—although girls’ onset of puberty moderates these
views (see also Grant 2012). Previous qualitative research among both parents and youth
in Malawi has confirmed the high value that households place on education and the
measures that some caregivers undertake to sustain children’s schooling, including taking
on additional paid labour to finance school costs, reducing children’s household work
responsibilities, migrating or harnessing extended family networks to arrange access to
(better) schools, and providing emotional support or encouragement (Grant 2008; Kendall
and Kaunda 2015; Moleni 2008; van Blerk and Ansell 2006). The qualitative data presented
in Chapter 7 suggest an important role for household support in facilitating sustained
access, not least by buying school uniforms and supplies, but also by emphasising the
importance of education for future life outcomes. We additionally saw in Chapter 2 that
students in Swaziland whose parents always helped with homework, engaged with
problems and provided supervision, were less likely to report truancy than those whose
parents rarely did each of these things (Siziya et al. 2007). Research among orphaned
students in Uganda has shown that perceived support from an important adult was
positively associated with future educational aspirations (Ssewamala et al. 2010).
Students’ wider peer interactions or social networks may also represent important
supportive factors. Recent qualitative research among adolescents in rural Malawi revealed
that in-school youth engaged in activities with their student peers that facilitated their
continued school participation, including helping each other with homework, sharing
school supplies, and advising against romantic relationships that would derail their
academic progress (Rock et al. 2016). Students also benefitted from opportunities to
socialise and discuss their problems with friends. Importantly, however, participants in the
study by Rock and colleagues (2016), as well as in the present one, additionally described
fighting, bullying, teasing and stigmatisation among classmates such that peer influence
can by no means be considered universally positive. Nevertheless, in shifting focus away

245
from barriers to educational access, there is much to learn about the social interactions that
support students’ sustained attendance.
In light of the data and resource limitations described in Chapter 3, school- and community-
level practices that may similarly support students’ attendance are also under-explored. As
documented in my field notes from two school visits, a number of initiatives that
deliberately targeted students’ attendance were already undertaken by schools and
communities in the study area. These efforts included parent-initiated school feeding
programmes, distribution of notebooks and pens, community mothers’ groups, and
mobilisation of religious and traditional leaders, although they were at times implemented
inconsistently. The impact of such initiatives on educational access merit further in-depth
study.
In response to apparent discrepancies in the reporting of absenteeism in the HDSS survey,
as well as enduring questions about the impact of proxy- vs. self-reported measures of
school attendance, this study would have additionally benefitted from a methodological
component to more robustly validate the household survey data. For instance, conducting
attendance spot checks at schools in the study area to coincide with the timing of HDSS
survey administration would have provided an objective measure of school attendance
against which survey reports could be compared. Although evaluative judgements about
missing school described in Chapter 7 suggest that absenteeism would, if anything, be
under-reported in the HDSS, I am ultimately unable to determine either the extent or
direction of reporting bias.
Finally, by focusing on trends and influences of school absenteeism, this thesis has, by
definition, targeted students who are already enrolled in school. I therefore did not
investigate the constraints that prevent children from attending school at all, nor those that
keep students who have left school from returning. Although very few children in Malawi
have never enrolled in school (National Statistical Office and ICF 2017), these children
represent the most marginalised and hence merit specific attention in future research
(Streuli and Moleni 2008). Similarly, as one-quarter of students who enter primary school
drop out before reaching standard 8 (National Statistical Office 2015), and many more do
not successfully complete the PSLCE exam (de Hoop 2011), there can be no doubt that
addressing the needs of out-of-school children and adolescents is of critical importance.

246
My focus on currently enrolled students may additionally have introduced ‘survivor bias’,
stemming from systematic differences between young people who persist in school and
those who never enrol or drop out early.49 For instance, we saw in Chapter 4 that girls were
less likely than boys to repeat their school grades and were on average younger than their
male counterparts attending primary school, suggesting that poorly performing girls may
be withdrawn from school while boys are permitted to repeat. Alternatively, as suggested
by evidence from the Malawi Longitudinal Study of Families and Health, differences in
educational trajectories observed after age 14 may result from girls’ more rapid and
successful progression through primary school rather than by increased dropout rates
(Grant 2008). In either case, an analytic sample comprised only of currently-enrolled
students will over-represent boys with low attainment but who remain in school.
The analysis in Chapter 6 attempted to mitigate survivor bias by assembling an open cohort
of students as they entered standard 1. In this way, results were not influenced by
unobserved educational trajectories preceding the HDSS surveys, and by focusing on (at
most) the first eight years of schooling, when rates of dropout were negligible (see Figure
6.3),50 school dropout would not be expected to influence the observed relationship between
absenteeism and grade repetition. It is possible, however, that differential sample attrition
from loss to follow-up introduced an alternative source of bias.
The cross-sectional analysis presented in Chapter 4 may have been more susceptible to
survivor bias by not accounting for students who had already completed or dropped out of
primary school, especially among those in late adolescence when sex-specific enrolment
rates sharply diverge (Sabates et al. 2010). By instead including only the students aged 5-
20 years currently attending primary school in the 2010-11 school year, the analytic sample
over-represents poorly performing students (primarily boys) at advanced ages who have
prolonged their primary education without dropping out. Accordingly, this analysis may
49 This scenario is analogous to the ‘healthy worker bias’ observed in epidemiological research assessing
associations between occupational exposures and health outcomes. This type of analysis is susceptible to two
forms of bias: firstly, where healthy individuals are more likely to be hired for formal employment, and
secondly, where healthy workers persist longer in the workforce (Buckley et al. 2015). 50 An early version of the analysis presented in Chapter 6 defined school dropout as one of the educational
outcomes of interest, but two few school leavers were identified during the eight-year period of observation
to conduct a meaningful analysis.

247
not generate findings applicable to all primary students, but it nevertheless reflects the
experience of those currently enrolled.
8.7 Conclusion
Through a mixed methods analysis of household survey data and IDIs and FGDs with
primary school students, this thesis has highlighted the complex range of processes that
underpin school absenteeism in Karonga district, northern Malawi. The analyses presented
here suggest that no single ‘silver bullet’ can mitigate the diversity of underlying
exclusionary processes. Improving school attendance thus requires a holistic approach that
attends both to the social, economic and institutional context as well as to the multi-sectoral
drivers of absenteeism.
Efforts to address ‘silent exclusion’ from education will also benefit from robust and timely
data to increase the visibility of absent students. This thesis has highlighted the dearth of
data available from both administrative and survey-based sources, as well as the diversity
in absenteeism measures that limits comparability of patterns across studies. At the same
time, it has demonstrated the utility of school attendance data—even crudely measured—
in establishing a link between current absenteeism and future adverse educational
trajectories, and has advocated for the development of early warning systems to identify
students at risk of future repetition and dropout. Bolstering data collection systems at local
level, raising the profile of irregular attendance in national and international monitoring
frameworks, and complementing these with insights from in-depth qualitative studies can
help to mobilise attention and resources to the issue of silent exclusion and inform efforts
to effect educational social change (Sachs 2012).
Finally, although ensuring continuous and consistent attendance is a crucial step towards
an expanded vision of educational access, meaningful learning depends on more than
physical presence in the classroom. Beyond achieving sustained attendance, then,
continued efforts must be made to ensure that students receive an education that is high-
quality, inclusive and equitable, and in which they can participate fully.
248
References
Abdoulayi, S., G. Angeles, C. Barrington, K. Brugh, S. Handa, K. Kilburn, et al. 2017. Evaluating
the effectiveness of an unconditional social cash transfer programme for the ultra poor in
Malawi 3ie Grantee Final Report. New Delhi: International Initiative for Impact Evaluation
(3ie).
Ainsworth, M., K. Beegle & G. Koda 2005. The impact of adult mortality and parental deaths on
primary schooling in north-western Tanzania. The Journal of Development Studies 41(3):
412-439. doi: 10.1080/0022038042000313318.
Aufseeser, D., M. Bourdillon, R. Carothers & O. Lecoufle 2017. Children's work and children's
well-being: implications for policy. Development Policy Review: n/a-n/a. doi:
10.1111/dpr.12215.
Baird, S. & B. Özler 2012. Examining the reliability of self-reported data on school participation.
Journal of Development Economics 98: 89-93. doi: 10.1016/j.jdeveco.2011.05.006.
Balescut, J. & K. Eklindh 2006. Literacy and persons with developmental disabilities: Why and
how? Background paper prepared for the Education for All Global Monitoring Report
2006, Literacy for Life. Paris: UNESCO.
Bardasi, E., K. Beegle, A. Dillon & P. Serneels 2011. Do labor statistics depend on how and to
whom the questions are asked? Results from a survey experiment in Tanzania. The World
Bank Economic Review 25(3): 418-447. doi: 10.1093/wber/lhr022.
Barnes, B., J. Rosenbaum, S. Mehta, K.N. Williams, K. Jagoe & J. Graham 2015. Behavior change
communication: A key ingredient for advancing clean cooking. Journal of Health
Communication 20(sup1): 3-5. doi: 10.1080/10810730.2014.996305.
Bernbaum, M. & K. Moses 2011. EQUIP2 lessons learned in education: Education Management
Information Systems. Washington, DC: FHI 360.
Bhalotra, S. & C. Heady 2003. Child farm labor: The wealth paradox. The World Bank Economic
Review 17(2): 197-227. doi: 10.1093/wber/lhg017.
Brooker, S., H. Guyatt, J. Omumbo, R. Shretta, L. Drake & J. Ouma 2000. Situation analysis of
Malaria in school-aged children in Kenya – What can be done? Parasitology Today 16(5):
183-186. doi: 10.1016/S0169-4758(00)01663-X.
Brouwer, I.D., J.C. Hoorweg & M.J. van Liere 1997. When households run out of fuel: Responses
of rural households to decreasing fuelwood availability, Ntcheu District, Malawi. World
Development 25(2): 255-266. doi: 10.1016/S0305-750X(96)00100-3.
Buchwald, A.G., J.A. Walldorf, L.M. Cohee, J.E. Coalson, N. Chimbiya, A. Bauleni, et al. 2016.
Bed net use among school-aged children after a universal bed net campaign in Malawi.
Malaria Journal 15: 127. doi: 10.1186/s12936-016-1178-9.
Buckley, J.P., A.P. Keil, L.J. McGrath & J.K. Edwards 2015. Evolving methods for inference in
the presence of healthy worker survivor bias. Epidemiology 26(2): 204-212. doi:
10.1097/ede.0000000000000217.
Bundy, D. 2011. Rethinking School Health: A Key Component of Education for All, Washington,
DC, The World Bank. Available from: http://documents.worldbank.org/curated/en/
900271468332690641/Rethinking-school-health-a-key-component-of-education-for-all
Bundy, D., C. Burbano, M. Grosh, A. Gelli, M. Jukes & L. Drake 2009. Rethinking School Feeding:
Social Safety Nets, Child Development, and the Education Sector Washington, DC, The
World Bank. Available from: http://siteresources.worldbank.org/EDUCATION/
Resources/278200-1099079877269/547664-1099080042112/DID_School_Feeding.pdf

249
Burke, K. & K. Beegle 2004. Why children aren't attending school: The case of northwest Tanzania.
Journal of African Economies 13(2): 333-355. doi: 10.1093/jae/ejh011.
Camfield, L. 2011. ‘A girl never finishes her journey’: Mixing methods to understand female
experiences of education in contemporary Ethiopia. Research Papers in Education 26(4):
393-412. doi: 10.1080/02671520903350297.
Cappa, C., N. Petrowski & J. Njelesani 2015. Navigating the landscape of child disability
measurement: A review of available data collection instruments. ALTER - European
Journal of Disability Research / Revue Européenne de Recherche sur le Handicap 9(4):
317-330. doi: 10.1016/j.alter.2015.08.001.
Center for Education Innovations. 2015. Ndi Hano (Here I am)!. Available from:
http://www.educationinnovations.org/program/ndi-hano-here-i-am#[Accessed 25/9/2017].
Chihana, M., S. Floyd, A. Molesworth, A.C. Crampin, N. Kayuni, A. Price, et al. 2012. Adult
mortality and probable cause of death in rural northern Malawi in the era of HIV treatment.
Tropical Medicine & International Health 17(8): e74-e83. doi: 10.1111/j.1365-
3156.2012.02929.x.
Chimombo, J. 2009. Changing patterns of access to basic education in Malawi: A story of a mixed
bag? Comparative Education 45(2): 297-312. doi: 10.1080/03050060902921003.
Cluver, L., D. Operario, T. Lane & M. Kganakga 2012. "I can't go to school and leave her in so
much pain": Educational shortfalls among adolescent 'young carers' in the South African
AIDS epidemic. Journal of Adolescent Research 27(5): 581-605. doi:
10.1177/0743558411417868.
Covarrubias, K., B. Davis & P. Winters 2012. From protection to production: productive impacts
of the Malawi Social Cash Transfer scheme. Journal of Development Effectiveness 4(1):
50-77. doi: 10.1080/19439342.2011.641995.
Creative Associates International 2015. Preventing school dropout: Early warning system
programming guide. Washington, DC: USAID.
Creative Associates International & Mathematica Policy Research 2015a. Do early warning systems
and student engagement activities reduce dropout? Findings from the school dropout
prevention pilot program impact evaluation in Cambodia. Report submitted to the U.S.
Agency for International Development. Washington, DC: Creative Associates
International, Inc.
Creative Associates International and Mathematica Policy Research 2015b. Do early warning
systems and student engagement activities reduce dropout? Findings from the four country
school dropout prevention pilot program impact evaluation. Report submitted to the U.S.
Agency for International Development. Washington, DC: Creative Associates
International, Inc.
Cundale, K., R. Thomas, J.K. Malava, D. Havens, K. Mortimer & L. Conteh 2017. A health
intervention or a kitchen appliance? Household costs and benefits of a cleaner burning
biomass-fuelled cookstove in Malawi. Social Science & Medicine 183: 1-10. doi:
10.1016/j.socscimed.2017.04.017.
Das, I., P. Jagger & K. Yeatts 2017. Biomass cooking fuels and health outcomes for women in
Malawi. EcoHealth 14(1): 7-19. doi: 10.1007/s10393-016-1190-0.
Das, J., J. Hammer & C. Sánchez-Paramo 2012. The impact of recall periods on reported morbidity
and health seeking behavior. Journal of Development Economics 98(1): 76-88. doi:
10.1016/j.jdeveco.2011.07.001.
de Hoop, J. 2011. Selective schools and education decisions: Evidence from Malawi. Working
Paper. Tinbergen Institute and VU University Amsterdam.

250
DeJaeghere, J. 2016. Girls’ educational aspirations and agency: Imagining alternative futures
through schooling in a low-resourced Tanzanian community. Critical Studies in Education:
1-19. doi: 10.1080/17508487.2016.1188835.
Dreibelbis, R., L.E. Greene, M.C. Freeman, S. Saboori, R.P. Chase & R. Rheingans 2013. Water,
sanitation, and primary school attendance: A multi-level assessment of determinants of
household-reported absence in Kenya. International Journal of Educational Development
33: 457-465. doi: 10.1016/j.ijedudev.2012.07.002.
Dunne, M. & E.D. Ananga 2013. Dropping out: Identity conflict in and out of school in Ghana.
International Journal of Educational Development 33(2): 196-205. doi:
10.1016/j.ijedudev.2012.04.005.
Evans, D., M. Kremer & M. Ngatia 2009. The impact of distributing school uniforms on children's
education in Kenya. Working paper. Washington, D.C.: The World Bank.
Evans, D.K. & E. Miguel 2007. Orphans and schooling in Africa: A longitudinal analysis.
Demography 44(1): 35-57.
Ezzati, M. & J.C. Baumgartner 2017. Household energy and health: where next for research and
practice? The Lancet 389(10065): 130-132. doi:10.1016/S0140-6736(16)32506-5.
Floyd, S., A.C. Crampin, J.R. Glynn, N. Madise, M. Mwenebabu, S. Mnkhondia, et al. 2007. The
social and economic impact of parental HIV on children in northern Malawi: Retrospective
population-based cohort study. AIDS Care 19(6): 781-790. doi: 10.1080/
09540120601163227.
Frye, M. 2012. Bright futures in Malawi’s new dawn: Educational aspirations as assertions of
identity. American Journal of Sociology 117(6): 1565-1624. doi: 10.1086/664542.
Furukawa, C. 2014. Do solar lamps help children study? Contrary evidence from a pilot study in
Uganda. The Journal of Development Studies 50(2): 319-341. doi: 10.1080/
00220388.2013.833320.
Glewwe, P. & K. Muralidharan 2015. Improving school education outcomes in developing
countries: Evidence, knowledge gaps, and policy implications. RISE Working Paper
15/001.
Global Alliance for Clean Cookstoves n.d. Gender fact sheet. Washington, DC: Global Alliance for
Clean Cookstoves. Available from: http://cleancookstoves.org/impact-areas/women/
[Accessed 12/10/2017].
Grant, M.J. 2008. Children’s school participation and HIV/AIDS in rural Malawi: The role of
parental knowledge and perceptions. Demographic Research 19(45): 1603-1634. doi:
10.4054/DemRes.2008.19.45.
Grant, M. J. 2012. Girls' schooling and the perceived threat of adolescent sexual activity in rural
Malawi. Culture, Health & Sexuality 14 (1): 73-86. doi: 10.1080/13691058.2011.624641.
Grant, M., C. Lloyd & B. Mensch 2013. Menstruation and school absenteeism: Evidence from rural
Malawi. Comparative Education Review 57(2): 260-284.
Hanna, R., E. Duflo & M. Greenstone 2012. Up in smoke: The influence of household behavior on
the long-run impact of improved cooking stoves. NBER Working Paper 18033. Cambridge,
MA: National Bureau for Economic Research.
Hazarika, G. & S. Sarangi 2008. Household access to microcredit and child work in rural Malawi.
World Development 36(5): 843-859. doi: 10.1016/j.worlddev.2007.05.008.
Heady, C. 2003. The effect of child labor on learning achievement. World Development 31(2): 385-
398. doi: 10.1016/S0305-750X(02)00186-9.

251
Hochfeld, T., L. Graham, L. Patel, J. Moodley & E. Ross 2016. Does school breakfast make a
difference? An evaluation of an in-school breakfast programme in South Africa.
International Journal of Educational Development 51(Supplement C): 1-9. doi:
10.1016/j.ijedudev.2016.07.005.
Hosegood, V., S. Floyd, M. Marston, C. Hill, N. McGrath, R. Isingo, et al. 2007. The effects of
high HIV prevalence on orphanhood and living arrangements of children in Malawi,
Tanzania, and South Africa. Population Studies 61(3): 327-336. doi:
10.1080/00324720701524292.
Humphreys, S., D. Moses, J. Kaibo & M. Dunne 2015. Counted in and being out: Fluctuations in
primary school and classroom attendance in northern Nigeria. International Journal of
Educational Development 44: 134-143. doi: 10.1016/j.ijedudev.2015.08.004.
Jere, C.M. 2012. Improving educational access of vulnerable children in high HIV prevalence
communities of Malawi: The potential of open and flexible learning strategies.
International Journal of Educational Development 32(6): 756-763. doi:
10.1016/j.ijedudev.2011.09.004.
Jere, C.M. 2014. Addressing educational access and retention of orphaned and vulnerable children
in high HIV prevalence communities in rural Malawi: A flexible approach to learning. PhD
thesis, Institute of Education, University of London.
Jewitt, S. & H. Ryley 2014. It’s a girl thing: Menstruation, school attendance, spatial mobility and
wider gender inequalities in Kenya. Geoforum 56: 137-147. doi: 10.1016/
j.geoforum.2014.07.006.
Jukes, M.C.H., C.M. Jere & P. Pridmore 2014. Evaluating the provision of flexible learning for
children at risk of primary school dropout in Malawi. International Journal of Educational
Development 39(Supplement C): 181-192. doi: 10.1016/j.ijedudev.2014.07.006.
Kabeer, N. 2000. Social exclusion, poverty and discrimination towards an analytical framework.
IDS Bulletin 31(4): 83-97. doi: 10.1111/j.1759-5436.2000.mp31004009.x.
Kadzamira, E. & P. Rose 2003. Can free primary education meet the needs of the poor? Evidence
from Malawi. International Journal of Educational Development 23: 501-516. doi:
10.1016/S0738-0593(03)00026-9.
Kendall, N. 2007. Education for All meets political democratization: Free primary education and
neoliberalization of the Malawian school and state. Comparative Education Review 51(3):
281-304. doi.
Kendall, N. & Z. Kaunda 2015. Girls, schooling, and reproductive realities in Malawi. In: Stacki,
S. L. & Baily, S. (eds.) Educating Adolescent Girls Around the Globe: Challenges and
Opportunities. Abingdon: Routledge.
Kendall, N. & R. Silver 2014. The consequences of global mass education: Schooling, work and
well-being in EFA-era Malawi. In: Stomquist, N. P. & Monkman, K. (eds.) Globalization
and Education: Integration and Contestation across Cultures (Second Edition). Lanham,
Maryland: Rowman & Littlefield Education.
Kilburn, K., S. Handa, G. Angeles, P. Mvula & M. Tsoka 2017. Short-term impacts of an
unconditional cash transfer program on child schooling: Experimental evidence from
Malawi. Economics of Education Review 59(Supplement C): 63-80. doi:
10.1016/j.econedurev.2017.06.002.
Klocker, N. 2007. An example of 'thin' agency: Child domestic workers in Tanzania. In: Panelli,
R., Punch, S. & Robson, E. (eds.) Global Perspectives on Rural Childhood and Youth:
Young Rural Lives. Abingdon: Taylor & Francis Group.

252
Levison, D., D.S. DeGraff & E.W. Dungumaro 2017. Implications of environmental chores for
schooling: Children’s time fetching water and firewood in Tanzania. The European Journal
of Development Research. doi: 10.1057/s41287-017-0079-2.
Lewin, K.M. 2009. Access to education in sub-Saharan Africa: Patterns, problems and possibilities.
Comparative Education 45(2): 151-174. doi: 10.1080/03050060902920518.
Lloyd, C.B., M. Grant & A. Ritchie 2008. Gender differences in time use among adolescents in
developing countries: Implications of rising school enrollment rates. Journal of Research
on Adolescence 18(1): 99-120. doi.
Loiaza, E. & C.B. Lloyd 2008. Adolescents and education in Africa. Unpublished manuscript.
Mathanga, D.P., K.E. Halliday, M. Jawati, A. Verney, A. Bauleni, J. Sande, et al. 2015. The high
burden of malaria in primary school children in southern Malawi. The American Journal of
Tropical Medicine and Hygiene 93(4): 779-789. doi: 10.4269/ajtmh.14-0618.
McCowan, T. 2011. Human rights, capabilities and the normative basis of ‘Education for All’.
Theory and Research in Education 9(3): 283-298. doi: 10.1177/1477878511419566.
Mensch, B.S. & C.B. Lloyd 1998. Gender differences in the schooling experiences of adolescents
in low-income countries: The case of Kenya. Studies in Family Planning 29(2): 167-184.
Miles, S. & N. Singal 2010. The Education for All and inclusive education debate: Conflict,
contradiction or opportunity? International Journal of Inclusive Education 14(1): 1-15. doi:
10.1080/13603110802265125.
Miller, C. & M. Tsoka 2012. Cash transfers and children's education and labour among Malawi's
poor. Development Policy Review 30(4): 499-522. doi: 10.1111/j.1467-7679.2012.00586.x.
Milner, G.D., D. Mulera & T. Chimuzu 2011. The SACMEQ III project in Malawi: A study of the
conditions of schooling and the quality of education. Southern and Eastern African
Consortium for Measuring Educational Quality.
Ministry of Education‚ Science and Techology 2008. National Education Sector Plan 2008-2017 –
A Statement. Lilongwe: Ministry of Education Science and Techology.
Mohandes, M.A. 2017. Class attendance management system using NFC mobile devices. Intelligent
Automation & Soft Computing 23(2): 251-259. doi: 10.1080/ 10798587.2016.1204749.
Mokdad, A.H., M.H. Forouzanfar, F. Daoud, A.A. Mokdad, C. El Bcheraoui, M. Moradi-Lakeh, et
al. 2016. Global burden of diseases, injuries, and risk factors for young people's health
during 1990-2013: A systematic analysis for the Global Burden of Disease Study 2013. The
Lancet 387(10036): 2383-2401. doi: 10.1016/S0140-6736(16)00648-6.
Moleni, C.M. 2008. Factors influencing access and retention in primary schooling for children and
young people affected by HIV and AIDS: Case studies from rural Malawi. SOFIE Opening
Up Access Series No 6. London: Institution of Education, University of London.
Mortimer, K., C.B. Ndamala, A.W. Naunje, J. Malava, C. Katundu, W. Weston, et al. 2016. A
cleaner burning biomass-fuelled cookstove intervention to prevent pneumonia in children
under 5 years old in rural Malawi (the Cooking and Pneumonia Study): A cluster
randomised controlled trial. The Lancet 389(10065): 167-175. doi: 10.1016/S0140-
6736(16)32507-7.
Mphwatiwa, T., S. Witek-McManus, A. Mtali, G. Okello, P. Nguluwe, H. Chatsika, et al. 2017.
School-based diagnosis and treatment of malaria by teachers using rapid diagnostic tests
and artemisinin-based combination therapy: experiences and perceptions of users and
implementers of the Learner Treatment Kit, southern Malawi. Malaria Journal 16(1): 318.
doi: 10.1186/s12936-017-1964-z.

253
Munthali, A., M. Tsoka, J. Milner & P. Mvula 2013. From exclusion to inclusion: Promoting the
rights of children with disabilities. Lilongwe: UNICEF Malawi and Ministry of Disability
and Elderly Affairs.
Nampota, D., C. Jere, L. Chiwaula, E. Meke & E. Kadzamira 2012. UNICEF Child Friendly
Schooling (CFS): Baseline survey 2011. Research report prepared for UNICEF Malawi.
Zomba: Centre for Educational Research and Training.
National Center for Education Statistics. 2015a. Average National Assessment of Educational
Progress (NAEP) reading and mathematics scale scores of 4th-, 8th-, and 12th-graders
and percentage absent from school, by selected characteristics and number of days absent
in the last month: 2013 and 2015. Washington, DC: US Department of Education.
Available from: https://nces.ed.gov/programs/digest/d15/tables/dt15_227.50.asp
[Accessed 27/9/2017].
National Center for Education Statistics 2015b. Reading student questionnaire 2015 -- Grade 4.
National Assessment of Educational Progress. Washington, DC: US Department of
Education.
National Forum on Education Statistics 2009. Every school day counts: The Forum guide to
collecting and using attendance data NFES 2009–804. Washington, DC: National Center
for Education Statistics, U.S. Department of Education.
National Statistical Office 2015. Malawi MDG endline survey 2014. Zomba, Malawi: National
Statistical Office.
National Statistical Office 2010. Disability and the Elderly. Population and Housing Census 2008
Analytical Report: Volume 11. Zomba, Malawi: National Statistical Office.
National Statistical Office & ICF 2017. Malawi Demographic and Health Survey 2015-16. Zomba,
Malawi and Rockville, Maryland: NSO and ICF.
O'Shaughnessy, S.M., M.J. Deasy, J.V. Doyle & A.J. Robinson 2014. Field trial testing of an
electricity-producing portable biomass cooking stove in rural Malawi. Energy for
Sustainable Development 20(Supplement C): 1-10. doi: 10.1016/j.esd.2014.01.009.
O'Shaughnessy, S.M., M.J. Deasy, J.V. Doyle & A.J. Robinson 2015. Adaptive design of a
prototype electricity-producing biomass cooking stove. Energy for Sustainable
Development 28(Supplement C): 41-51. doi: 10.1016/j.esd.2015.06.005.
Orkin, K. 2011. ‘See first, think later, then test’: How children's perspectives can improve economic
research. The European Journal of Development Research 23(5): 774-791. doi:
10.1057/ejdr.2011.46.
Orkin, M., M.E. Boyes, L.D. Cluver & Y. Zhang 2014. Pathways to poor educational outcomes for
HIV/AIDS-affected youth in South Africa. AIDS Care 26(3): 343-350. doi:
10.1080/09540121.2013.824533.
Özler, B. 2013. Economists have experiments figured out. What’s next? (Hint: It’s Measurement).
Development Impact: News, views, methods and insights from the world of impact
evaluation. Available from: http://blogs.worldbank.org/impactevaluations/economists-
have-experiments-figured-out-what-s-next-hint-it-s-measurement [Accessed 4/5/2017].
Peters, J. & M. Sievert 2016. Impacts of rural electrification revisited – the African context. Journal
of Development Effectiveness 8(3): 327-345. doi: 10.1080/19439342.2016.1178320.
Pridmore, P. & C. Jere 2011. Disrupting patterns of educational inequality and disadvantage in
Malawi. Compare: A Journal of Comparative and International Education 41(4): 513-531.
doi: 10.1080/03057925.2011.581518.

254
Ravishankar, V., S. El-Tayeb El-Kogali, D. Sankar, N. Tanaka & N. Rakoto-Tiana 2016. Primary
eduction in Malawi: Expenditures, service delivery, and outcomes. World Bank Studies.
Washington, DC: The World Bank.
Rehfuess, E.A., E. Puzzolo, D. Stanistreet, D. Pope & N.G. Bruce 2014. Enablers and barriers to
large-scale uptake of improved solid fuel stoves: A systematic review. Environmental
Health Perspectives 122(2): 122-130. doi: 10.1289/ehp.1306639.
Rock, A., C. Barrington, S. Abdoulayi, M. Tsoka, P. Mvula & S. Handa 2016. Social networks,
social participation, and health among youth living in extreme poverty in rural Malawi.
Social Science & Medicine 170: 55-62. doi: 10.1016/j.socscimed.2016.10.005.
Romieu, I., H. Riojas-Rodríguez, A.T. Marrón-Mares, A. Schilmann, R. Perez-Padilla & O. Masera
2009. Improved biomass stove intervention in rural Mexico: Impact on the respiratory
health of women. American Journal of Respiratory and Critical Care Medicine 180: 649-
656. doi: 10.1164/rccm.200810-1556OC.
Rosenbaum, J., E. Derby & K. Dutta 2015. Understanding consumer preference and willingness to
pay for improved cookstoves in Bangladesh. Journal of Health Communication 20(sup1):
20-27. doi: 10.1080/10810730.2014.989345.
Sabates, R., K. Akyeampong, J. Westbrook & F. Hunt 2010. School drop out: Patterns, causes,
changes and policies. Background paper prepared for the Education for All Global
Monitoring Report 2011. Paris: UNESCO.
Sachs, J. 2012. From Millennium Development Goals to Sustainable Development Goals. The
Lancet 379(9832): 2206-2211. doi: 10.1016/S0140-6736(12)60685-0.
Sayed, Y., C. Soudien & N. Carrim 2003. Discourses of exclusion and inclusion in the South: Limits
and possibilities. Journal of Educational Change 4(3): 231-248. doi:
10.1023/B:JEDU.0000006162.07375.aa.
Sen, A. 2000. Social exclusion: Concept, application and scrutiny. Social Development Papers No.
1. Manila, Philippines: Office of Environment and Social Development, Asian
Development Bank.
Siziya, S., A.S. Muula & E. Rudatsikira 2007. Prevalence and correlates of truancy among
adolescents in Swaziland: Findings from the Global School-Based Health Survey. Child
and Adolescent Psychiatry and Mental Health 1(15). doi: 10.1186/1753-2000-1-15.
Slee, R. 1997. Editorial: Supporting an international interdisciplinary research conversation.
International Journal of Inclusive Education 1(1): 1-4. doi: 10.1080/1360311970010101.
Ssewamala, F.M., L. Karimli, C.-K. Han & L. Ismayilova 2010. Social capital, savings, and
educational performance of orphaned adolescents in Sub-Saharan Africa. Children and
Youth Services Review 32(12): 1704-1710. doi: 10.1016/j.childyouth.2010.07.013.
Streuli, N. & C.M. Moleni 2008. Education and HIV and AIDS in Malawi: The role of open,
distance and flexible learning. SOFIE Opening Up Access Series No. 3. London: Institute
of Education, University of London.
The Global Burden of Disease Child Adolescent Health Collaboration 2017. Child and adolescent
health from 1990 to 2015: Findings from the global burden of diseases, injuries, and risk
factors 2015 study. JAMA Pediatrics 171(6): 573-592. doi: 10.1001/
jamapediatrics.2017.0250.
Tomaševski, K. 2001. Human rights obligations: Making education available, accessible,
acceptable and adaptable. Right to Education Primers No. 3. Stockholm: Swedish
International Development Cooperation Agency.
UNESCO Institute for Statistics (UIS) and UNICEF 2015. Fixing the broken promise of Education
for All: Findings from the Global Initiative on Out-of-School Children. Montreal: UIS.

255
UNICEF 2016. Harnessing the power of data for girls: Taking stock and looking ahead to 2030.
New York: UNICEF.
UNICEF and UIS 2016. Monitoring education participation: Framework for monitoring children
and adolescents who are out of school or at risk of dropping out. UNICEF Series on
Education Participation and Dropout Prevention, Volume 1. Geneva: UNICEF Regional
Office for Central and Eastern Europe and the Commonwealth of Independent States.
Unterhalter, E. 2012. Inequality, capabilities and poverty in four African countries: girls’ voice,
schooling, and strategies for institutional change. Cambridge Journal of Education 42(3):
307-325. doi: 10.1080/0305764X.2012.706253.
Unterhalter, E. 2015. No silver bullets for education policy. Available from:
http://www.lidc.org.uk/blog/2015/07/24/no-silver-bullets-education-policy. [Accessed
19/10/2017]
USAID 2014. Report for study on student repetition and attrition in primary education in Malawi.
USAID.
van Blerk, L. & N. Ansell 2006. Children's experiences of migration: Moving in the wake of AIDS
in southern Africa. Environment and Planning D: Society and Space 24(3): 449-471. doi:
10.1068/d65j.
Vladimirova, K. & D. Le Blanc 2016. Exploring links between education and sustainable
development goals through the lens of UN flagship reports. Sustainable Development
24(4): 254-271. doi: 10.1002/sd.1626.
Walldorf, J.A., L.M. Cohee, J.E. Coalson, A. Bauleni, K. Nkanaunena, A. Kapito-Tembo, et al.
2015. School-age children are a reservoir of malaria infection in Malawi. PLOS ONE 10(7):
e0134061. doi: 10.1371/journal.pone.0134061.
Wilson-Strydom, M. 2017. Disrupting structural inequalities of higher education opportunity:
“Grit”, resilience and capabilities at a South African university. Journal of Human
Development and Capabilities 18(3): 384-398. doi: 10.1080/19452829.2016.1270919.
Wodon, Q. & K. Beegle 2006. Labor shortages despite underemployment? Seasonality in time use
in Malawi. In: Blackden, C. M. & Wodon, Q. (eds.) Gender, Time Use, and Poverty in Sub-
Saharan Africa. Washington, D.C.: The World Bank.
Wolf, S., D.C. McCoy & E.B. Godfrey 2016. Barriers to school attendance and gender inequality:
Empirical evidence from a sample of Ghanaian schoolchildren. Research in Comparative
and International Education 11(2): 178-193. doi: 10.1177/1745499916632424.
Wong, G.W.K., B. Brunekreef, P. Ellwood, H.R. Anderson, M.I. Asher, J. Crane, et al. 2013.
Cooking fuels and prevalence of asthma: A global analysis of phase three of the
International Study of Asthma and Allergies in Childhood (ISAAC). The Lancet
Respiratory Medicine 1(5): 386-394. doi: 10.1016/S2213-2600(13)70073-0.
Yates, C. 2008. Keeping children in school: A review of open education policies in Lesotho and
Malawi. SOFIE Opening Up Access Series No. 5. London: Institute of Education,
University of London.

256
Appendices
Appendix A

257
Appendix to Chapter 2
Table A.1 Summary of studies from sub-Saharan Africa that link ill health with school absenteeism
Study authors Year Country Risk factor(s) Study
population Sample size Study design
Measurement of
absenteeism Key findings Notes
Chippaux &
Larsson
1991 Benin Guinea worm
disease (GWD)
School-age
children (6-15
years)
Community
surveillance
377; national
survey:
193,295
(neither
separated by
sex)
Longitudinal
(community
surveillance) +
cross-sectional
national survey
1) From community
surveillance: Number of
days of incapacity due to
GWD
2) Absence on day of
national survey
From community surveillance:
strong association between
incidence of GWD and absence in
communities with a school; no
significant association in
communities with no school. From
national survey: 14% of registered
students absent on day of survey;
absenteeism common among
students with GWD, but small
proportion of absenteeism overall
Analysis purely bivariate;
Measure of absenteeism
attributable to GWD relies
on teacher report.
Chippaux,
Banzou and
Agbede
1992 Benin Guinea worm
disease (GWD)
Two villages in
Zou Province
250 inhabitants
(25 enrolled in
school)
Longitudinal From community
surveillance: Number of days
of incapacity due to GWD
Absenteeism due to physical
incapacity = 365 student-days per
year for 25 enrolled students; 20%
of students missed >30 days during
school year
Small sample size; cannot
disaggregate by/control for
background factors
de Clercq et al. 1998 Mali Schisto-
somiasis
Primary school
students aged
6-16 years
294 boys, 286
girls
Cross-sectional From teacher rating: 1 (rarely
absent), 2 (absent from time
to time), 3 (often absent)
Significant increase in absenteeism
with age and intensity of
Schistosomiases infection
Limited control of
sociodemographic factors;
Possible bias if students
absent on day of stool
sample collection were not
followed up for testing
De Smedt et al. 2012 Rwanda Vernal kerato-
conjunctivitis
(VKC)
Children aged
8-14 years
3,041 (not
separated by
sex)
Cross-sectional From self reports: Number of
school days missed for ocular
reason in past 3 months
36% of children with VKC missed
school for ≥ 1 day for an ocular
reason in past 3 months; Children
with severe VKC more likely to
miss > 1 week of school than less
affected children
Study took place at end of
long dry season when VKC
at its peak, so possible that
VKC does not result in loss
of as much schooling at other
times of the year

258
Study authors Year Country Risk factor(s) Study
population Sample size Study design
Measurement of
absenteeism Key findings Notes
Ezenwosu et al. 2013 Nigeria Sickle cell
anaemia (SCA)
Primary school
students aged
5-11 years
90 SCA
patients, 90
matched
students (55
boys, 35 girls
each)
Matched cohort From school registers:
Number of days of absence
in past year
Mean number of days of absence
significantly higher among children
with SCA than among non-SCA
counterparts (15.9 days vs. 7.7
days, p<0.001)
No control of background
factors; relatively small
sample size
Ibekwe et al. 2007 Nigeria Epilepsy Primary school
students aged
5-14 years
50 epileptic
children, 50
matched
counterparts
(36 boys, 14
girls each)
Matched cohort Number of days of absence
in past year (data source
unclear)
Mean number of days of absence
significantly higher among children
with epilepsy than among
counterparts (15.3 days vs. 9.4
days, p<0.001)
Methods suggest that
selection of cases not
exhaustive; small sample
size
Ilegbodu et al. 1986 Nigeria Guinea worm
disease (GWD)
6-14 year-old
students
1,495 (768
boys, 727 girls)
Cross-sectional From school registers:
1) Proportion of class absent
during school year
2) Average duration of
absence
GWD was primary cause of
absenteeism; peak absenteeism
associated with guinea worm
season. Average duration of
absence for GWD=9 weeks vs. 1
week for non-GWD absence.
Absenteeism measures and
causes rely on teacher
reports (with some follow-up
to relatives in doubtful
cases); analysis purely
descriptive
Mushi et al. 2012 Tanzania Epilepsy 6-14 year-old
children with
epilepsy &
their carers
38 carers (35
female, 3
males)
reporting for/
with 18 boys &
20 girls with
epilepsy
Qualitative From carer interviews:
Episodes of missing school or
classes
Half of carers’ children did not
attend school regularly; Factors
impairing school attendance
included ongoing seizures, learning
difficulties, behavioural problems
& distance to school.
Findings context-specific;
Possible that information
withheld due to stigma
associated with epilepsy;
Study does not target
absenteeism specifically
Mustapha,
Briggs and
Hansell
2013 Nigeria Respiratory
illness
State school
students aged
7-14 years
675 boys, 722
girls
Cross-sectional From self-reports: Any
absence from school in past
12 months due to respiratory
illness
2.5% of children reported school
absenteeism due to respiratory
illness; more likely among rural
children and (marginally) females
Possibility of residual
confounding by social class;
potential for selection bias as
rural schools generally
smaller with younger
students
Ofovwe & Ofili 2010 Nigeria Headache Secondary
school students
aged 11-18
years
1675 (809 girls,
870 boys)
Cross-sectional From self-reports: Absences
attributable to headache
19.5% of students reported
headache, 13.5% diagnosed with
migraine (9.2% among boys, 18.2%
among girls, p<0.001). 76.8% of
migraineurs reported negative
Limited control of
sociodemographic factors;
measure or
duration/frequency of
absenteeism not specified

259
impact on quality of life, of whom
14.3% reported absenteeism.
Study authors Year Country Risk factor(s) Study
population Sample size Study design
Measurement of
absenteeism Key findings Notes
Ogunfowora,
Olanrewaju and
Akenzua
2005 Nigeria Sickle cell
anaemia (SCA)
School-age
children aged
6-17 years
52 SCA
patients (29
boys, 23 girls),
42 siblings (26
boys, 16 girls)
Matched cohort From school registers:
Number of days of school
absence in past school year
Mean number of days of absence
significantly higher among SCA
children than siblings (9.3 days vs.
4.1 days, p<0.05)
No control of background
factors; small sample size
Pufall et al. 2014 Zimbabwe Childhood
vulnerability
Young people
aged 6-24
>5000 (sample
derived from
survey of 5520
2-17 year-
olds); not
separated by
sex
Longitudinal From self-reports: <80%
attendance in previous 20
school days
Being HIV+ not associated with
any education measures; Young
carers significantly less likely to
attend secondary school, but no
difference at primary level; All
types of orphan significantly less
likely to be in correct grade for age,
but no difference in attendance
Attendance measure
conflates enrolment and
absenteeism (those not
enrolled coded as attending
<80%); Small number of
HIV+ children (n=94)
Thuilliez et al. 2010 Mali Malaria Primary school
children
227 children
(81 girls, 146
boys)
Longitudinal From teacher records:
Number of school days
missed in past school year
Malaria was most common reason
for absence, accounting for 14.5 of
45.5 school days lost
Early treatment of malaria
cases reduced duration of
absence; study does not link
absenteeism with
background characteristics
Trape et al. 1993 Senegal Malaria School children
aged 7-11 years
419 children
(not separated
by sex)
Longitudinal From active surveillance:
Proportion of total student-
days missed during
observation period
Low levels of absenteeism
observed: 6.7% of 2817 school
days (Jun 1987), 3.0% of 3970
school days (Nov 1987), and 2.3%
of 4411 school days (Feb 1988);
Proportion of medical-related
absenteeism due to malaria varied
considerably by season: 36% in
Nov, 6% in Feb, 3% in June
Study does not link malaria-
related absenteeism to
background characteristics;
Unit of analysis is student-
days, not students
Wolka et al. 2013 Ethiopia Iodine-
deficiency
disorders
Primary school
children aged
6-12 years
270 children
with goitre
(122 boys, 148
girls), 264
without (123
boys, 141 girls)
Comparative
cross-sectional
From school records: Non-
attendance at school during
school hours for ≥5 days in
last academic year
Significantly higher absenteeism
among students with goitre than
without (34.1% vs. 27.3%, p<0.05)
Study does not link goitre to
absenteeism in multivariable
context

260
Appendix to Chapter 3
A3.1 Confirmation of ethics approval for Karonga Health and Demographic
Surveillance System

261
A3.2 Confirmation of ethics approval for nested qualitative study – LSHTM

262
A3.3 Confirmation of ethics approval for nested qualitative study – Malawi NHSRC

263
A3.4 Sample HDSS individual socioeconomic survey

264

265
A3.5 Sample HDSS household socioeconomic survey

266

267
A3.6 Extract from CAPS baseline household survey

268

269
A3.7 Extract from CAPS follow-up household survey

270
IDI cluster
FGD cluster
Figure A.1 Map of Karonga HDSS catchment area and locations of IDI
and FGD communities

271
A3.8 In-depth interview guide
In-depth interview with primary school children – English topic guide
Introductory/’ice breaker’ questions:
Information about the household: How many are you? Who do you live with? What is
your house like? What does the household head do for work?
Information about the participant: What are your favourite things to do? What do you
like to eat most? What is your favourite football team?
Information about participant’s schooling history: What school do you go to? What
age did you start school? Have you repeated any grades? Why did you repeat?
Information about participant’s school: How many standards does it teach? How
many teachers does it have? What are the school hours? Does it operate single or
double shifts? About how many pupils are in the participant’s class? Does the
participant go for extra lessons?
Thank you for taking part in this interview. The first questions I will ask you have to do with
your feelings towards going to school.
What are the best parts about going to school? What are the worst parts?
How many years do you want to stay in school? Until you have finished what
standard/form? Why do you want to reach this level (or why do you not want to
progress further)? What do you want to do when you finish school?
Tell me about your journey to school [Probe about distance, time, with whom the
participant travels]. Are there parts that are difficult or dangerous? In what way(s)?
Now I would like to ask you about some times you might have missed school.
Think about your attendance over the course of a school year. Are there particular
times of the year that you miss school more than others? [Possible probe: for example,
a season or month, or the time surrounding a particular holiday?] Why is this the
case?
Would you say that you miss school on some days of the week more than other days?
Why is this the case?
How many days of school have you missed in the past 4 weeks that school was in
session? [Note: since it has now been 1 month since the Easter holidays, this can just
refer to absences during the third term]
Now think about the last time you were absent from school. When was this? How many
days of school did you miss? Why didn’t you go to school during that period?
Since the start of the school year, have you ever missed school because you were
feeling ill? If yes: Tell me about the last time you missed part or all of a school day
because of illness. What happened? How much school did you miss? [Probe about
type of illness, etc.]

272
Would you say that you frequently arrive late or leave early from school? [Probe for
how often: every day, every week, once in a while, never] Why does this happen?
Now I’d like to find out more about all the things you do during the day. These could be things
that you do at home, at school, or just for fun.
Activity 1 (see separate sheet)
For each activity listed in Activity 1 (except homework and time at school), ask:
o When you do [activity name], what kinds of things do you do? Is it always
your responsibility to do [activity name], or are there others in the household
who also do [activity name]?
o Since this school year started, have you ever done [activity name] during
school hours? If no: how do you manage to combine [activity name] with
school attendance?
o If yes: Tell me about the last time you missed part or all of a school day because
of [activity name]. What happened? How much school did you miss? Was it
possible to catch up on the lessons you missed?
For activities that the participant did not report undertaking in Activity 1, ask:
o You said that you did not do [activity name] yesterday. When was the last time
you did [activity name]? Whose responsibility is it in the household to do
[activity name]? [If more than one year ago or never, move on to next activity;
if school or homework, move on to next activity]
o When you do [activity name], what kinds of things do you do?
o Since this school year started, have you ever done [activity name] during
school hours? If no: how do you manage to combine [activity name] with
school attendance?
o If yes: Tell me about the last time you missed part or all of a school day because
of [activity name]: What happened? How much school did you miss?
Did you do any other activities yesterday that we haven’t talked about?
o If yes: What else did you do?
o Since this school year started, have you ever done [activity name] during
school hours?
o If yes: Tell me about the last time you missed part or all of a school day because
of [activity name]: What happened? How much school did you miss? Was it
possible to catch up on the lessons you missed?
Specific activity questions
o What cooking methods do you use in your household? Do they differ according
to what foods you eat? What is the kitchen like [Possible probe: inside, outside,
separate to the house, attached to the house]? How regularly are you involved
in cooking, or in the kitchen while others are cooking? What about your
siblings?

273
o What fuel do you use for cooking (e.g. firewood, charcoal, agricultural
produce)? Where does your household source this cooking fuel? Who normally
collects the cooking fuel? How long does this take?
o How would you describe the health of the people living in your household?
Since the school year started, has anyone been sick? If yes: What was he/she
suffering from? Who looked after him/her or performed his/her normal
household chores?
In this last part of the interview, I would like to ask you about how you decide whether or not
to go to school. [Note that this is not the last section for cookstove recipients]
The last time you were absent, did someone else tell you not to attend school or did
you decide on your own? Did your siblings (or anyone else from the household) also
miss school on that day?
Since this school year started, were you ever told to stay home from school on a day
that you wanted to go? Who told you to stay home and why?
Since this school year started, have you ever skipped school when your
parents/guardians thought you were there? What did you do instead of going to school?
Was anyone else with you [Possible probes: for example, your friends, your siblings,
your boyfriend/girlfriend]?
Now think about your teacher at school. Have there been any days since the school
year started when your teacher has not come to school? When was the last time this
happened? What did you do when your teacher wasn’t there?
Is there anything about your current school, your classmates, or your teacher that stops
you going to school some days? If yes: Tell me about the last time this happened.
Do you have enough time in your day to spend on school and homework? If you could
spend less time on work/chores, how would you use the extra time in your day?
Extra questions for CAPS intervention group only:
Since receiving the new cookstove, have you noticed any difference in the amount of
cooking fuel the household needs for meals?
Since receiving the new cookstove, have you noticed any difference in the amount of
time it takes to cook meals? Is the amount or type of food your household makes the
same or different than before?
Aside from cooking, do the cookstove or cookstove parts have any other uses?
Since receiving the new cookstove, have you noticed any changes in your own health,
or of someone in your household? If yes: what kind(s) of changes?
Since receiving the new cookstove, have you noticed any changes in how much you
miss school or arrive late?
Thank you very much for taking part in this study.

274
A3.9 IDI timeline activity
Activity 1: Timeline (during IDIs with primary school students)
Materials
Illustrated paper timeline, indicating morning, afternoon, evening and night
Pictures illustrating the following activities:
Collecting water
Collecting firewood
Farming/gardening
Fishing
Selling/buying goods (e.g. at the market)
Caring for family members (older or younger)
Going to school
Doing homework
Cooking
Playing
18 stones, beans or other local material
Instructions
Instruct the participant to think about how he/she spent the previous day (or the last school
day). In particular, did the participant spend time doing any of the pictured activities? He/she
should pick out from the list of 10 activities the ones that he/she engaged in the previous day
(or the last school day). For each activity identified, the participant should place the image of
the activity along the timeline according to what time of day he/she carried that activity out.
If the participant is unsure, probe: “Was it in the morning, in the middle of the day, in the
evening, or throughout the day?” Multiple copies of each image are available in the event that
the participant undertook the activity more than once in the day. Repeat the process for each
activity pictured.
Once the timeline is complete (the participant does not have to include all the activities if
he/she did not do them the previous day), ask him/her to divide up the 18 stones across each
activity to indicate how long he/she spent doing that activity. Note that it may help to think
about each stone as representing approximately 1 hour, but the objective is to determine the
relative time spent on each activity so activities that take a long time (e.g. attending school)
should have more stones than shorter activities (e.g. cooking).
Record the timeline the participant has created using the accompanying form.

275
Notes about activities
Collecting water
Participants should mention every time the previous day they went to fetch water from a source outside
the immediate household. Be sure to include water collection both at home and at school. If the
participant’s household has piped water, note this on the Activity Sheet.
Collecting firewood
Participants should mention every time the previous day they went to collect firewood, or other similar
material for cooking (e.g. charcoal, agricultural produce).
Farming/gardening
Participants should describe the time spent the previous day working in the farm or garden, whether
for their own household or for someone else.
Fishing
Participants should describe the time spent the previous day engaging in fishing, whether on a boat,
diving, or from the shore. This could also include activities related to fishing such as repairing nets.
Buying/selling goods
Participants should describe the time spent the previous day selling goods or services, or taking part in
other similar income-generating activities not otherwise mentioned, either for their own household or
on behalf of someone else. This could include both formal and informal work. This activity can also
include purchasing goods or services for the household; the nature of the activity (whether buying or
selling) should be specified on the Activity Sheet.
Caregiving
Participants should describe the time spent the previous day looking after someone else. This could
include minding a younger sibling or providing care to an ill relative (older or younger).
Going to school
Participants should indicate whether they attended school the previous day, and whether it was for the
whole day or part of the day. If they participated in any other activities during the school day, these
should be listed separately.
Doing homework
Participants should describe the time spent doing homework the previous day. Time spent helping
others with their homework should also be included, but should be indicated in the Notes section of
the Activity Sheet.
Cooking
Participants should describe the time spent the previous day engaging in cooking-related activities,
including food preparation, cooking, and washing up.
Playing
Participants should mention every time the previous day they engaged in leisure activities. These
include but are not limited to: playing sports or games; talking with friends; participating in singing,
dancing or drama; watching TV; listening to the radio; swimming, etc.
*If there are any doubts about how to classify a particular activity, use your judgment and make notes
on the Activity Sheet*
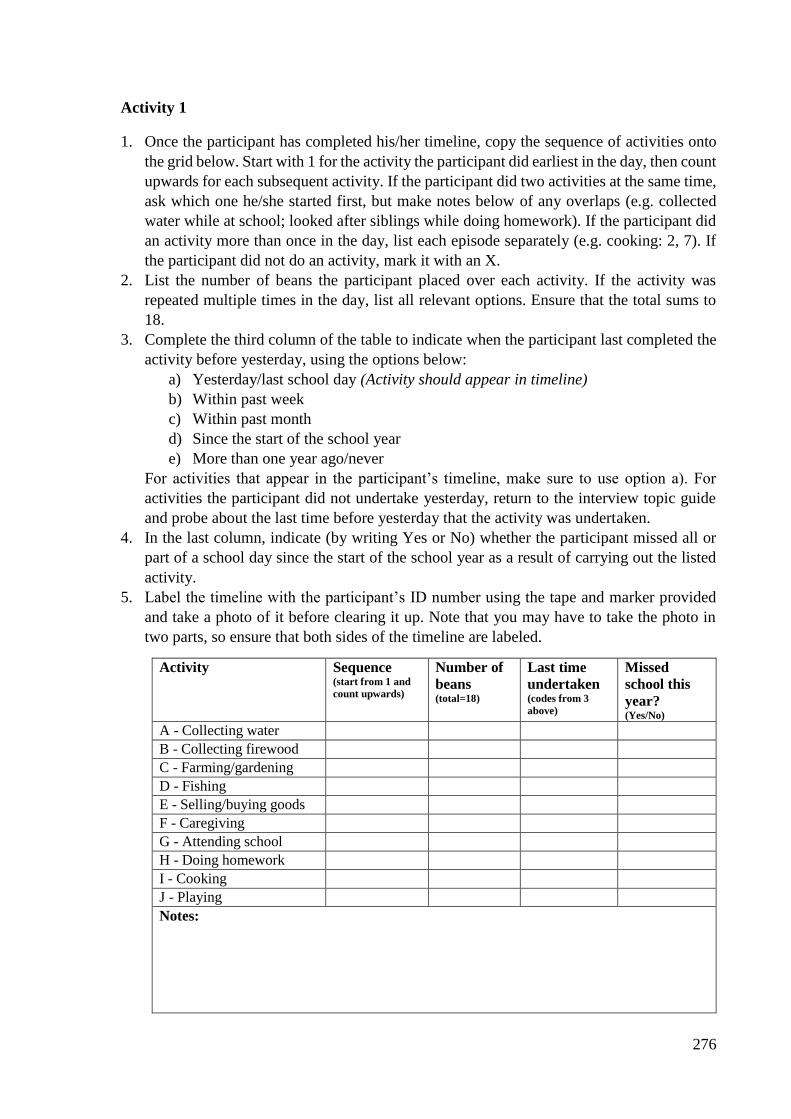
276
Activity 1
1. Once the participant has completed his/her timeline, copy the sequence of activities onto
the grid below. Start with 1 for the activity the participant did earliest in the day, then count
upwards for each subsequent activity. If the participant did two activities at the same time,
ask which one he/she started first, but make notes below of any overlaps (e.g. collected
water while at school; looked after siblings while doing homework). If the participant did
an activity more than once in the day, list each episode separately (e.g. cooking: 2, 7). If
the participant did not do an activity, mark it with an X.
2. List the number of beans the participant placed over each activity. If the activity was
repeated multiple times in the day, list all relevant options. Ensure that the total sums to
18.
3. Complete the third column of the table to indicate when the participant last completed the
activity before yesterday, using the options below:
a) Yesterday/last school day (Activity should appear in timeline)
b) Within past week
c) Within past month
d) Since the start of the school year
e) More than one year ago/never
For activities that appear in the participant’s timeline, make sure to use option a). For
activities the participant did not undertake yesterday, return to the interview topic guide
and probe about the last time before yesterday that the activity was undertaken.
4. In the last column, indicate (by writing Yes or No) whether the participant missed all or
part of a school day since the start of the school year as a result of carrying out the listed
activity.
5. Label the timeline with the participant’s ID number using the tape and marker provided
and take a photo of it before clearing it up. Note that you may have to take the photo in
two parts, so ensure that both sides of the timeline are labeled.
Activity Sequence (start from 1 and
count upwards)
Number of
beans (total=18)
Last time
undertaken (codes from 3
above)
Missed
school this
year? (Yes/No)
A - Collecting water B - Collecting firewood C - Farming/gardening D - Fishing E - Selling/buying goods F - Caregiving G - Attending school H - Doing homework I - Cooking J - Playing Notes:

277
Use the following letters to indicate the placement of each activity along the timeline (in the case of multiple episodes of the same activity, the
same letter may be used more than once):
A – Collecting water F – Caregiving
B – Collecting firewood G – Going to school
C – Farming/gardening H – Doing homework
D – Fishing I – Cooking
E – Selling/buying goods J – Playing
Early morning: wake up – 8:00 Late morning: 8:00-12:00 Afternoon: 12:00-16:00 Evening/night: 16:00-sleep

278
A3.10 Focus group discussion topic guide
Focus group discussion with primary school children
Thank you for taking part in this discussion today. We are interested in hearing your opinions and
experiences about going to school in this community. We also understand that there are some days
when children are not able to go to school so we would like to hear about the reasons you think this
happens. Everything you say is important to us, so please try to take turns speaking and make sure
everyone in the group has a chance to share. Please also avoid using real names during the discussion.
Ice breakers
What are your favourite activities that happen in this community? (e.g. dances, sporting
events)
Tell me about your school. How many teachers does it have? How many classrooms?
What are your favourite foods?
What sports/teams do you like?
Etc.
Now let us discuss your views about going to school in this community.
What are the best parts about going to school?
What are the worst parts about going to school?
What level of education should children achieve? Is this the same for boys and girls? [Probe
for similarities and differences]
Do parents talk to children in this community about how far they would like their children to
go with education? If yes: What level of education do parents in this community think children
should reach? [Note similarities and differences between parents’ and children’s aspirations]
Do most children your age go to primary school in this community? If no: why not? How
common is it for children in this community to proceed to secondary school? What stops
children from going to secondary?
If a family doesn’t have enough money to send all its children to school, what criteria should
it use to decide which ones should go?
Is it important that children attend school every day or is it enough that they attend sometimes?
Now I will give each of you a piece of paper and pencils. Imagine a day when you or someone you
know was absent from school. Please draw a picture of what this person was doing during the day that
he/she wasn’t at school. Afterwards we will talk a bit about your drawings. [Allow approximately 10
minutes for drawing]
What did you draw and why? Do boys and girls miss school for the same reasons? [Probe for
similarities and differences]
How often are children absent from school in this community? [Possible probes: Regularly?
Sometimes? Rarely? Never?] Would you say absenteeism is a big problem? Why or why not?
Is it more important that children help their households or attend school?
What do you think can be done to reduce absenteeism at school?
How often are teachers absent from school in this community? Would you say teacher
absenteeism is a big problem? What happens to lessons when teachers miss school?

279
Do teachers ever ask students to do personal errands (e.g. fetch water)? If yes: Do students
miss lessons because of these errands?
Now I would like to ask some questions about how easy or hard it is for students to keep up at school
after they are absent.
Is it difficult to keep up with lessons after missing school? How can absent students catch up
when they return to school?
Imagine your class at school has 60 pupils, but today there are only 50 because 10 are absent.
What are the advantages and disadvantages for the 50 pupils who have come? Do they learn
any differently to when the whole class is there? In what way(s)?
Should students be punished for being late or absent? Should students be excluded from school
or have to repeat their standard if they are absent too much? Why or why not?
[CAPS intervention group only:] Finally, I would like to ask you a few questions about the cookstoves
your household received as part of another KPS research study.
What are the best parts about the new cookstoves? What are the downsides?
Would you and your household like to continue using these cookstoves in the future? Why or
why not?
Aside from cooking, do the cookstove or cookstove parts have any other uses?
Thank you very much for taking part in this study.

280
Appendix to Chapter 4
Table A.2 Distribution of pupils across six chosen socioeconomic indicators and assessment of potential multicollinearity
Household wealth Chi-squared
test
Spearman's
rho
Variance
Inflation
Factor (VIF) Lowest 2 3 4 Highest
Agricultural wealth n % n % n % n % n % 909.5 *** 0.236 *** 1.17
Lowest 678 34.4 396 19.9 244 12.4 244 12.4 397 20.4
2 500 25.4 435 21.8 466 23.6 274 13.9 288 14.8
3 403 20.4 467 23.5 362 18.3 430 21.8 317 16.3
4 270 13.7 405 20.3 473 24.0 472 23.9 363 18.7
Highest 121 6.1 288 14.5 428 21.7 552 28.0 578 29.7
Household head occupation >1800 *** 0.310 *** 1.20
Subsistence farmer/herder 1630 82.7 1509 75.8 1434 72.7 1275 64.7 763 39.3
Fisherman 90 4.6 123 6.18 128 6.5 82 4.2 58 3.0
Other non-skilled 136 6.9 201 10.1 257 13.0 347 17.6 421 21.7
Skilled 54 2.7 102 5.12 113 5.7 214 10.9 684 35.2
Not working 62 3.1 56 2.81 41 2.1 54 2.7 17 0.9
Maternal education 558.9 *** 0.227 *** 1.17
None/primary 1835 93.1 1800 90.4 1737 88.0 1568 79.5 1342 69.1
Post-primary 137 6.9 191 9.59 236 12.0 404 20.5 601 30.9
Paternal education 872.3 *** 0.294 *** 1.24
None/primary 1563 79.3 1453 73.0 1201 60.9 1069 54.2 736 37.9
Post-primary 409 20.7 538 27.0 772 39.1 903 45.8 1207 62.1
Household credit access 462.8 *** 0.203 *** 1.07
No 1748 88.6 1711 85.9 1549 78.5 1544 78.3 1227 63.1
Yes 224 11.4 280 14.1 424 21.5 428 21.7 716 36.9
*** p<0.001
Notes: Chi-squared tests and Spearman’s correlations were performed using pairwise comparisons of each SES indicator against the household wealth index.
VIF values result from performing collinearity diagnostics on all SES indicators in combination. The VIF for household wealth was 1.36.

281
Table A.3 Results from two-level logistic regression models estimating primary school absenteeism in the past four
weeks, excluding interviews conducted within four weeks of a school holiday, by sex
Boys (N=3164)
Absent past
4 weeks;
n(%)
Model 1: Unadjusted Model 2: Adjusted
SES only
Model 3: Adjusted
All factors
OR (95% CI) AOR (95% CI) AOR (95% CI)
Socioeconomic factors
Household wealth quintile 0.91 (0.81-1.03) 0.86 (0.74-1.00) * 0.92 (0.79-1.07)
Lowest 129 (20.4) 2 121 (19.1) 3 131 (19.7) 4 116 (17.7) Highest 100 (17.3)
Agricultural wealth quintile 1.28 (1.13-1.45) *** 1.32 (1.15-1.52) *** 1.23 (1.06-1.43) **
Lowest 80 (14.5) 2 111 (17.1) 3 109 (17.4) 4 151 (22.0) Highest 146 (22.5)
Household credit access
No 521 (20.7) 1 1 1 Yes 76 (11.8) 0.35 (0.22-0.56) *** 0.37 (0.23-0.60) *** 0.41 (0.25-0.67) ***
Father's education
None/primary 392 (20.1) 1 1 1 Post-primary 205 (16.9) 0.71 (0.51-0.99) * 0.80 (0.55-1.16) 0.88 (0.60-1.29)
Mother's education
None/primary 491 (18.6) 1 1 1 Post-primary 106 (20.0) 1.11 (0.73-1.68) 1.49 (0.94-2.34) † 1.59 (0.99-2.55) †
Occupation of household head Subsistence farmer/herder 438 (19.9) 1 1 1 Fisherman 17 (12.7) 0.40 (0.16-1.01) † 0.49 (0.19-1.23) 0.76 (0.28-2.08) Other non-skilled 77 (18.3) 0.82 (0.49-1.36) 1.15 (0.68-1.95) 1.06 (0.61-1.86) Skilled 55 (16.0) 0.67 (0.38-1.19) 1.17 (0.63-2.17) 1.07 (0.57-2.03) Not working 11 (14.7) 0.60 (0.19-1.90) 0.64 (0.21-2.01) 0.72 (0.21-2.40)
Individual variables
Age (years)
5-11 352 (18.5) 1 1 12-14 148 (20.2) 1.17 (0.84-1.62) 1.03 (0.65-1.63) ≥15 97 (18.4) 1.12 (0.76-1.64) 1.22 (0.64-2.31)
Current standard 1-4 365 (19.0) 1 1 5-7 192 (20.8) 1.34 (0.99-1.82) †
1.24 (0.78-1.97) 8 40 (12.6) 0.56 (0.33-0.95) * 0.46 (0.21-0.97) *
Repeated current standard
No 375 (18.0) 1 1 Yes 222 (20.6) 1.33 (0.98-1.78) †
1.32 (0.97-1.81) †
Father died
No 526 (19.0) 1 1 Yes 72 (17.8) 0.85 (0.54-1.34) 1.09 (0.64-1.86)

282
Table A.3 continued Results from two-level logistic regression models of primary school absenteeism in the past
four weeks, excluding interviews conducted within four weeks of a school holiday, by sex
Boys (N=3164)
Absent past
4 weeks;
n(%)
Model 1:
Unadjusted
Model 2: Adjusted
SES only
Model 3: Adjusted
All factors
OR (95% CI) AOR (95% CI) AOR (95% CI)
Mother died
No 579 (19.3) 1 1 Yes 18 (11.5) 0.39 (0.18-0.86) * 0.48 (0.21-1.09) †
Relationship to household
head
Child 463 (19.9) 1 1 Step-child 17 (21.8) 1.07 (0.42-2.71) 1.15 (0.44-3.03) Grandchild 87 (15.9) 0.67 (0.44-1.04) †
0.79 (0.48-1.29) Other 30 (14.2) 0.53 (0.28-1.01) †
0.56 (0.28-1.11) †
Economic participation in past 4 weeks No 450 (17.5) 1 1 Yes 147 (24.7) 1.86 (1.28-2.70) ** 1.72 (1.14-2.58) **
Household variables
Number of household
members
1-4 92 (18.5) 1 1 5-8 442 (20.5) 1.21 (0.78-1.87) 1.16 (0.69-1.94) ≥9 63 (12.4) 0.47 (0.25-0.89) * 0.47 (0.22-1.01) †
Number of younger residents 0-1 237 (19.0) 1 1 2-3 260 (18.8) 0.95 (0.70-1.29) 0.84 (0.59-1.19) ≥4 100 (18.6) 1.08 (0.71-1.65) 0.94 (0.54-1.62)
Sex of household head
Male 497 (19.4) 1 1 Female 101 (16.7) 0.72 (0.46-1.11) 0.93 (0.55-1.58)
Distance to school (km)
<1 km 311 (18.3) 1 1 1-2 km 200 (17.7) 1.02 (0.71-1.45) 0.76 (0.51-1.13) >2 km 86 (25.5) 1.80 (1.09-2.98) * 1.19 (0.67-2.11)
Interview variables
Season of interview
Hot (Sept-Nov) 168 (22.4) 1 1 Wet (Dec-Apr) 354 (18.5) 0.63 (0.42-0.94) * 0.81 (0.46-1.43) Cool (May-Aug) 75 (14.9) 0.38 (0.21-0.67) ** 0.08 (0.01-0.59) *
School fixed effects No No Yes
sigma_u 2.28 (1.91-2.71) 2.22 (1.85-2.67)
rho
0.61 (0.53-0.69) *** 0.60 (0.51-0.68) ***
† p<0.1 * p<0.05 ** p<0.01 *** p<0.001
Notes: All models include household random effects. Model 3 additionally includes a dummy School ID variable.
Nine observations from three schools drop from model 3 for predicting failure perfectly. Sigma_u and rho not shown
for unadjusted models.

283
Table A.3 continued Results from two-level logistic regression models of primary school absenteeism in the past
four weeks, excluding interviews conducted within four weeks of a school holiday, by sex
Girls (N=2800)
Absent past
4 weeks;
n(%)
Model 1:
Unadjusted
Model 2: Adjusted
SES only
Model 3: Adjusted
All factors
OR (95% CI) AOR (95% CI) AOR (95% CI)
Socioeconomic factors
Household wealth quintile 0.89 (0.77-1.02) † 0.82 (0.70-0.97) * 0.87 (0.73-1.03)
Lowest 100 (19.2)
2 112 (20.1)
3 126 (20.6)
4 96 (16.7)
Highest 82 (15.4)
Agricultural wealth quintile 1.38 (1.19-1.60) *** 1.45 (1.23-1.69) *** 1.42 (1.20-1.69) ***
Lowest 75 (14.1)
2 78 (13.7)
3 113 (19.2)
4 123 (21.2)
Highest 127 (23.9)
Household credit access
No 441 (20.1) 1 1 1
Yes 75 (12.4) 0.44 (0.26-0.72) ** 0.48 (0.29-0.81) ** 0.57 (0.34-0.97) *
Father's education
None/primary 325 (19.1) 1 1 1
Post-primary 191 (17.4) 0.86 (0.59-1.25) 1.21 (0.81-1.83) 1.29 (0.84-1.97)
Mother's education
None/primary 440 (18.9) 1 1 1
Post-primary 76 (16.1) 0.76 (0.47-1.25) 0.96 (0.57-1.62) 1.07 (0.62-1.84)
Occupation of household head
Subsistence farmer/herder 378 (19.7) 1 1 1
Fisherman 12 (11.2) 0.36 (0.12-1.06) † 0.50 (0.17-1.47) 0.71 (0.22-2.24)
Other non-skilled 64 (18.2) 0.89 (0.49-1.60) 1.36 (0.74-2.48) 1.47 (0.77-2.80)
Skilled 48 (13.6) 0.44 (0.23-0.84) * 0.78 (0.39-1.53) 0.75 (0.37-1.53)
Not working 14 (19.2) 0.72 (0.22-2.43) 0.90 (0.27-2.95) 1.12 (0.32-3.91)
Individual variables
Age (years)
5-11 330 (18.0) 1 1
12-14 124 (18.4) 1.11 (0.76-1.61) 1.14 (0.67-1.95)
≥15 62 (21.5) 1.53 (0.92-2.54) 1.18 (0.55-2.51)
Current standard
1-4 321 (18.8) 1 1
5-7 151 (17.4) 0.95 (0.67-1.34) 0.92 (0.55-1.53)
8 44 (20.0) 1.51 (0.83-2.74) 1.36 (0.59-3.15)
Repeated current standard
No 357 (17.8) 1 1
Yes 159 (20.0) 1.51 (1.05-2.16) * 1.45 (1.01-2.09) *
Father died
No 463 (18.8) 1 1
Yes 53 (15.7) 0.67 (0.38-1.18) 0.85 (0.46-1.60)

284
Table A.3 continued Results from two-level logistic regression models of primary school absenteeism in the past
four weeks, excluding interviews conducted within four weeks of a school holiday, by sex
Girls (N=2800)
Absent past
4 weeks;
n(%)
Model 1:
Unadjusted
Model 2: Socio-
economic factors
Model 3:
Multivariable
OR (95% CI) AOR (95% CI) AOR (95% CI)
Mother died No 495 (18.5) 1 1 Yes 21 (17.5) 0.66 (0.28-1.52) 0.81 (0.34-1.93)
Relationship to household
head Child 384 (19.6) 1 1 Step-child 23 (22.3) 1.38 (0.58-3.28) 1.41 (0.58-3.45) Grandchild 88 (17.3) 0.80 (0.50-1.30) 1.05 (0.60-1.83) Other 21 (9.2) 0.28 (0.14-0.58) ** 0.32 (0.15-0.67) **
Economic participation in past 4 weeks No 421 (18.1) 1 1 Yes 95 (20.2) 1.25 (0.80-1.96) 0.91 (0.56-1.47)
Household variables Number of household
members 1-4 71 (16.4) 1 1 5-8 389 (20.2) 1.47 (0.88-2.45) 1.00 (0.55-1.82) ≥9 56 (12.8) 0.59 (0.28-1.23) 0.36 (0.15-0.86) *
Number of younger residents 0-1 193 (17.3) 1 1 2-3 239 (18.6) 1.15 (0.82-1.63) 1.06 (0.71-1.58) ≥4 84 (21.2) 1.59 (0.97-2.62) †
1.69 (0.89-3.22) Sex of household head
Male 426 (18.9) 1 1 Female 90 (16.5) 0.73 (0.44-1.20) 1.05 (0.57-1.92)
Distance to school (km) <1 km 239 (15.6) 1 1-2 km 218 (21.7) 1.75 (1.17-2.62) ** 1.67 (1.07-2.60) *
>2 km 59 (22.3) 1.97 (1.06-3.67) * 1.72 (0.85-3.47) Interview variables Season of interview
Hot (Sept-Nov) 108 (17.8) 1 1 Wet (Dec-Apr) 349 (20.0) 1.23 (0.76-1.99) 1.93 (0.95-3.91) †
Cool (May-Aug) 59 (13.3) 0.54 (0.28-1.05) † 0.60 (0.12-3.06)
School fixed effects No No Yes
sigma_u 2.52 (2.06-3.07) 2.49 (2.02-3.06)
rho 0.66 (0.56-0.74) *** 0.65 (0.55-0.74) *** † p<0.1 * p<0.05 ** p<0.01 *** p<0.001
Notes: All models include household random effects. Model 3 additionally includes a dummy School ID variable.
Four observations from three schools drop from model 3 for predicting failure perfectly. Sigma_u and rho not shown
for unadjusted models.

285
Appendix to Chapter 6
Table A.4 Association between student characteristics in one
survey round and non-interview in the next AOR 95% CI p-value
Absent past 4 weeks (any)
No
Yes
1
0.95
0.84-1.07
0.384
Sex
Male
Female
1
1.26
0.14-1.39
<0.001
Age group
≤8
9-11
≥12
1
0.91
1.22
0.79-1.05
0.92-1.62
0.207
0.162
Standard attended
1-3
4-5
6-8
1
1.00
0.81
0.84-1.19
0.55-1.20
0.988
0.292
Age started primary
Early (age 5 or younger)
On time (age 6)
Late (age 7 or later)
1
0.99
1.00
0.89-1.09
0.82-1.23
0.917
0.980
Father died
No
Yes
1
0.99
0.82-1.20
0.913
Mother died
No
Yes
1
0.87
0.62-1.22
0.417
Father’s education
None/primary
More than primary
1
1.15
1.03-1.28
0.012
Mother’s education
None/primary
More than primary
1
0.96
0.84-1.09
0.514
Household head occupation
Subsistence farming
Fishing
Other unskilled
Skilled
Not working
1
1.39
1.11
1.47
1.34
1.13-1.71
0.96-1.29
1.26-1.72
0.96-1.89
0.002
0.168
<0.001
0.088
Sex of household head
Male
Female
1
1.20
1.04-1.37
0.011
Number of household members
1-4
5-8
≥9
1
0.55
0.44
0.48-0.63
0.36-0.55
<0.001
<0.001
Number of younger members
None
1
2
≥3
1
1.30
1.47
1.40
1.13-1.49
1.26-1.73
1.15-1.70
<0.001
<0.001
0.001

286
Table A.4 continued Association between student characteristics
in one survey round and non-interview in the next AOR 95% CI p-value
Relationship to household head
Child
Step-child
Grandchild
Niece/nephew
Other
1
2.58
1.39
2.71
3.21
2.03-3.27
1.20-1.62
1.94-3.77
2.56-4.02
<0.001
<0.001
<0.001
<0.001
Month of interview (lagged)
January
February
March
April
May
June
July
August
September
October
November
December
1
0.92
0.94
0.97
0.58
0.83
0.62
2.37
1.23
1.01
0.90
0.94
0.72-1.19
0.72-1.22
0.73-1.29
0.43-0.80
0.59-1.15
0.45-0.86
1.73-3.26
0.86-1.74
0.75-1.36
0.67-1.20
0.71-1.24
0.534
0.625
0.836
0.001
0.254
0.004
<0.001
0.253
0.941
0.475
0.673
Survey round
2008-09
2009-10
2010-11
2011-12
2012-13
2013-14
2014-15
1
0.87
0.72
0.61
0.61
0.57
0.86
0.67-1.13
0.55-0.93
0.47-0.79
0.48-0.79
0.45-0.73
0.68-1.09
0.281
0.011
<0.001
<0.001
<0.001
0.218 Notes: Results from logistic regression model with individual random effects.
N=25,164 representing 7,504 individuals contributing an average of 3.4
observations. Models also include a variable designating school attended (not
shown). Sample restricted to students attending schools with at least 10
observations per round.

287
Table A.5 Adjusted association between student characteristics and any absenteeism in
the past four weeks, among students with at least two consecutive interviews AOR 95% CI p-value p-value
interaction
Lagged absenteeism in past 4 weeks (any)
No
Yes
1
1.14
1.03-1.25
0.009
--
Sex
Male
Female
1
1.01
0.94-1.08
0.870
0.448
Age group
≤8
9-11
≥12
1
1.04
1.25
0.95-1.14
1.06-1.48
0.381
0.008
0.885
Standard attended
1-3
4-5
6-8
1
0.79
0.65
0.71-0.88
0.53-0.80
<0.001
<0.001
0.416
Age started primary
Early (age 5 or younger)
On time (age 6)
Late (age 7 or later)
1
0.97
1.05
0.90-1.04
0.91-1.21
0.360
0.488
0.339
Father died
No
Yes
1
1.03
0.88-1.19
0.728
0.968
Mother died
No
Yes
1
1.09
0.85-1.40
0.482
0.878
Father’s education
None/primary
More than primary
1
0.92
0.85-1.00
0.039
0.908
Mother’s education
None/primary
More than primary
1
0.93
0.84-1.02
0.127
0.327
Household head occupation
Subsistence farming
Fishing
Other unskilled
Skilled
Not working
1
1.00
1.01
0.89
1.20
0.84-1.20
0.91-1.13
0.78-1.02
0.89-1.62
0.991
0.841
0.093
0.234
0.923
Sex of household head
Male
Female
1
1.16
1.04-1.29
0.008
0.682
Number of household members
1-4
5-8
≥9
1
0.84
0.67
0.75-0.94
0.57-0.78
0.004
<0.001
0.507
Number of younger members
None
1
2
≥3
1
1.03
1.17
1.31
0.92-1.15
1.04-1.32
1.15-1.50
0.659
0.007
<0.001
0.739
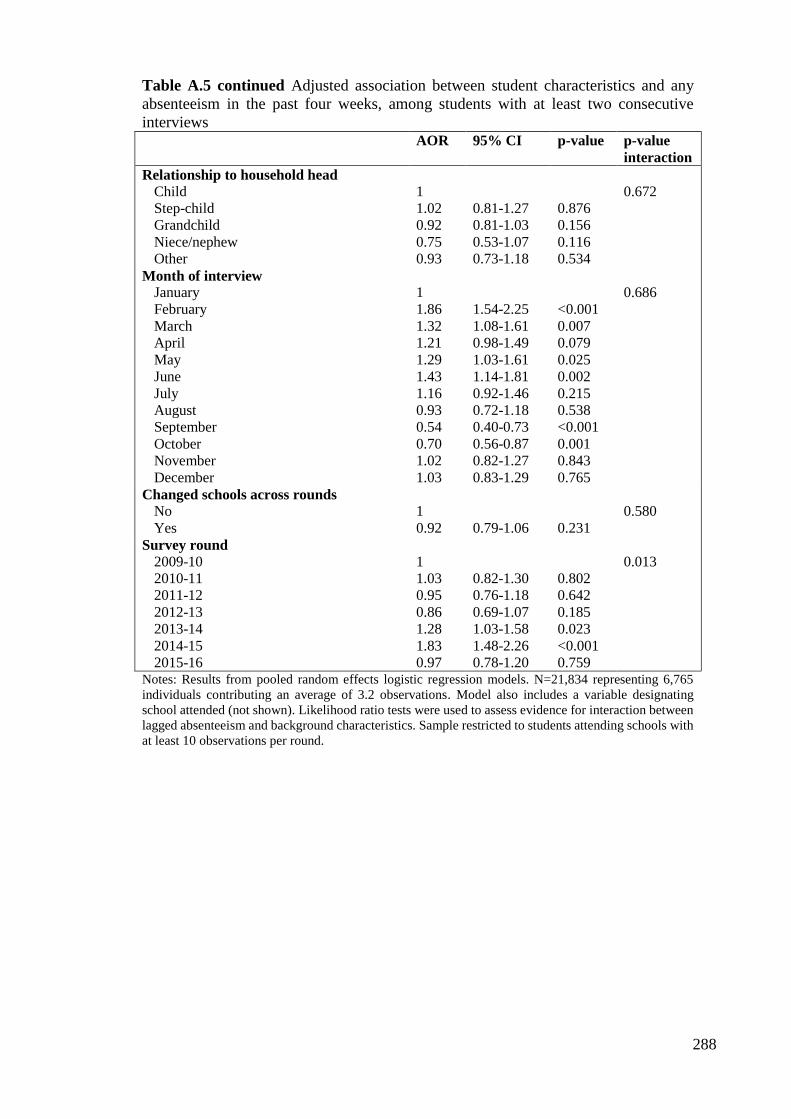
288
Table A.5 continued Adjusted association between student characteristics and any
absenteeism in the past four weeks, among students with at least two consecutive
interviews AOR 95% CI p-value p-value
interaction
Relationship to household head
Child
Step-child
Grandchild
Niece/nephew
Other
1
1.02
0.92
0.75
0.93
0.81-1.27
0.81-1.03
0.53-1.07
0.73-1.18
0.876
0.156
0.116
0.534
0.672
Month of interview
January
February
March
April
May
June
July
August
September
October
November
December
1
1.86
1.32
1.21
1.29
1.43
1.16
0.93
0.54
0.70
1.02
1.03
1.54-2.25
1.08-1.61
0.98-1.49
1.03-1.61
1.14-1.81
0.92-1.46
0.72-1.18
0.40-0.73
0.56-0.87
0.82-1.27
0.83-1.29
<0.001
0.007
0.079
0.025
0.002
0.215
0.538
<0.001
0.001
0.843
0.765
0.686
Changed schools across rounds
No
Yes
1
0.92
0.79-1.06
0.231
0.580
Survey round
2009-10
2010-11
2011-12
2012-13
2013-14
2014-15
2015-16
1
1.03
0.95
0.86
1.28
1.83
0.97
0.82-1.30
0.76-1.18
0.69-1.07
1.03-1.58
1.48-2.26
0.78-1.20
0.802
0.642
0.185
0.023
<0.001
0.759
0.013
Notes: Results from pooled random effects logistic regression models. N=21,834 representing 6,765
individuals contributing an average of 3.2 observations. Model also includes a variable designating
school attended (not shown). Likelihood ratio tests were used to assess evidence for interaction between
lagged absenteeism and background characteristics. Sample restricted to students attending schools with
at least 10 observations per round.

289
Table A.6 Adjusted association between lagged characteristics and current grade
repetition, among students with at least two consecutive interviews AOR 95% CI p-value p-value
interaction
Absenteeism (lagged)
Below 95th percentile
Above 95th percentile
1
1.37
1.19-1.57
<0.001
--
Sex
Male
Female
1
0.79
0.75-0.84
<0.001
0.200
Age group
≤8
9-11
≥12
1
0.69
0.75
0.64-0.75
0.63-0.91
<0.001
0.001
0.416
Standard attended (lagged)
1-3
4-5
6-8
1
1.09
0.91
0.99-1.21
0.70-1.18
0.174
0.472
0.899
Age started primary
Early (age 5 or younger)
On time (age 6)
Late (age 7 or later)
1
0.97
1.13
0.92-1.03
1.01-1.26
0.336
0.034
0.021
Father died (lagged)
No
Yes
1
0.99
0.87-1.13
0.920
0.224
Mother died (lagged)
No
Yes
1
1.01
0.82-1.24
0.921
0.202
Father’s education
None/primary
More than primary
1
0.78
0.73-0.83
<0.001
0.194
Mother’s education
None/primary
More than primary
1
0.73
0.67-0.79
<0.001
0.330
Household head occupation (lagged)
Subsistence farming
Fishing
Other unskilled
Skilled
Not working
1
1.09
0.94
0.76
1.01
0.95-1.25
0.86-1.03
0.68-0.84
0.78-1.29
0.240
0.184
<0.001
0.965
0.072
Sex of household head (lagged)
Male
Female
1
0.94
0.86-1.03
0.207
0.510
Number of household members
(lagged)
1-4
5-8
≥9
1
0.86
0.82
0.79-0.94
0.73-0.93
0.001
0.002
0.667
Number of younger members (lagged)
None
1
2
≥3
1
1.18
1.22
1.20
1.09-1.28
1.12-1.34
1.08-1.34
<0.001
<0.001
0.001
0.780

290
Table A.6 continued Adjusted association between lagged characteristics and current
grade repetition, among students with at least two consecutive interviews
AOR 95% CI p-value p-value
interaction
Relationship to household head
(lagged)
Child
Step-child
Grandchild
Niece/nephew
Other
1
0.98
1.08
0.86
1.08
0.81-1.18
0.98-1.18
0.65-1.14
0.89-1.31
0.831
0.115
0.290
0.442
0.765
Month of interview (lagged)
January
February
March
April
May
June
July
August
September
October
November
December
1
1.06
0.97
1.14
1.00
1.11
1.08
0.63
0.98
0.88
0.92
1.18
0.92-1.22
0.84-1.12
0.97-1.33
0.84-1.18
0.92-1.34
0.90-1.29
0.52-0.78
0.80-1.21
0.75-1.04
0.78-1.08
1.01-1.38
0.426
0.658
0.118
0.992
0.281
0.397
<0.001
0.877
0.138
0.305
0.032
0.053
Changed schools across rounds
No
Yes
1
1.09
0.98-1.21
0.096
0.337
Survey round
2009-10
2010-11
2011-12
2012-13
2013-14
2014-15
2015-16
1
0.71
0.94
0.75
0.80
0.79
0.77
0.59-0.84
0.80-1.11
0.64-0.88
0.68-0.94
0.68-0.93
0.66-0.90
<0.001
0.459
0.001
0.006
0.003
0.001
0.136
Notes: Results from pooled random effects logistic regression models. N=22,933 representing 6,960
individuals contributing an average of 3.3 observations. Models also include a variable designating
school attended (not shown; p-value for interaction=0.426). Likelihood ratio tests were used to assess
evidence for interaction between lagged absenteeism and background characteristics. Sample
restricted to students attending schools with at least 10 observations per round.

291
Table A.7 Adjusted association between student characteristics and standard attended
after six years, among students who entered the cohort in the first three rounds Adjusted
coefficient
95% CI p-value p-value
interaction
Cumulative absenteeism above
95% percentile (lagged)
-0.18
-0.27, -0.08
<0.001
--
Sex
Male
Female
1
0.23
0.15, 0.32
<0.001
0.945
Age started primary
Early (age 5 or younger)
On time (age 6)
Late (age 7 or later)
1
-0.03
0.02
-0.12, 0.06
-0.14, 0.18
0.525
0.772
0.229
Father died
No
Yes
1
0.06
-0.11, 0.23
0.497
0.851
Mother died
No
Yes
1
-0.07
-0.34, 0.20
0.594
0.711
Father’s education
None/primary
More than primary
1
-0.24
-0.28, -0.19
<0.001
0.017
Mother’s education
None/primary
More than primary
1
-0.23
-0.29, -0.18
<0.001
0.226
Household head occupation
Subsistence farming
Fishing
Other unskilled
Skilled
Not working
1
-0.01
0.04
0.21
-0.24
-0.21, 0.18
-0.09, 0.16
0.05, 0.36
-0.54, 0.06
0.892
0.573
0.008
0.118
0.470
Sex of household head
Male
Female
1
0.06
-0.06, 0.19
0.331
0.664
Number of household members
1-4
5-8
≥9
1
0.15
0.21
-0.01, 0.31
-0.01, 0.41
0.065
0.041
0.092
Number of younger members
None
1
2
≥3
1
-0.15
-0.20
-0.26
-0.30, 0.002
-0.35, -0.04
-0.42, -0.11
0.053
0.012
0.001
0.189
Relationship to household head
Child
Step-child
Grandchild
Niece/nephew
Other
1
0.22
-0.01
-0.03
-0.09
-0.08, 0.51
-0.15, 0.13
-0.40, 0.35
-0.38, 0.19
0.152
0.886
0.890
0.519
0.767
Survey round
2013-14
2014-15
2015-16
1
0.02
-0.02
-0.08, 0.13
-0.13, 0.09
0.639
0.715
0.806
Notes: Results from linear regression model, N=2,075. Models also include a variable designating

292
school attended (not shown; p-value for interaction=0.883). Sample restricted to students attending
schools with at least 10 observations per round.
Table A.8 Association between cumulative rounds of absenteeism over five years with
total number of repeated grades over six years, among students who entered the cohort in
the first three rounds Unadjusted IRR
(95% CI)
p-value Adjusted IRR
(95% CI)
p-value
Model 1: Any absenteeism 1.06 (1.03-1.10) <0.001 1.05 (1.01-1.09) 0.005
Model 2: Absenteeism >90 %tile 1.11 (1.06-1.17) <0.001 1.09 (1.03-1.15) 0.001
Model 3: Absenteeism >95 %tile 1.12 (1.05-1.21) 0.001 1.11 (1.03-1.19) 0.006
Notes: Table shows results from Poisson regression model, N=2,075. IRR=incidence rate ratio. Sample
restricted to students who entered the primary school cohort in the first three survey rounds, were interviewed
continuously for six years, and attended schools with at least 10 observations per round for the duration of
the period. Cumulative absenteeism measures the number of rounds that students’ absenteeism breached the
three respective thresholds. Adjusted model includes the same set of covariates shown in Table A.7.
Copyright © 2022 FDOKUMEN