The “Conducting Master”: An Interactive, Real-Time Gesture Monitoring System Based on...
18
This article was downloaded by: [McGill University Library] On: 17 May 2013, At: 14:21 Publisher: Taylor & Francis Informa Ltd Registered in England and Wales Registered Number: 1072954 Registered office: Mortimer House, 37-41 Mortimer Street, London W1T 3JH, UK International Journal of Human-Computer Interaction Publication details, including instructions for authors and subscription information: http://www.tandfonline.com/loi/hihc20 The “Conducting Master”: An Interactive, Real-Time Gesture Monitoring System Based on Spatiotemporal Motion Templates Pieter-Jan Maes a , Denis Amelynck a , Micheline Lesaffre a , Marc Leman a & D. K. Arvind b a Institute for Psychoacoustics and Electronic Music (IPEM), Department of Musicology, Ghent University , Ghent , Belgium b Centre for Speckled Computing, Edinburgh University , Edinburgh , Scotland Accepted author version posted online: 19 Sep 2012.Published online: 14 May 2013. To cite this article: Pieter-Jan Maes , Denis Amelynck , Micheline Lesaffre , Marc Leman & D. K. Arvind (2013): The “Conducting Master”: An Interactive, Real-Time Gesture Monitoring System Based on Spatiotemporal Motion Templates, International Journal of Human-Computer Interaction, 29:7, 471-487 To link to this article: http://dx.doi.org/10.1080/10447318.2012.720197 PLEASE SCROLL DOWN FOR ARTICLE Full terms and conditions of use: http://www.tandfonline.com/page/terms-and-conditions This article may be used for research, teaching, and private study purposes. Any substantial or systematic reproduction, redistribution, reselling, loan, sub-licensing, systematic supply, or distribution in any form to anyone is expressly forbidden. The publisher does not give any warranty express or implied or make any representation that the contents will be complete or accurate or up to date. The accuracy of any instructions, formulae, and drug doses should be independently verified with primary sources. The publisher shall not be liable for any loss, actions, claims, proceedings, demand, or costs or damages whatsoever or howsoever caused arising directly or indirectly in connection with or arising out of the use of this material.
Transcript of The “Conducting Master”: An Interactive, Real-Time Gesture Monitoring System Based on...
This article was downloaded by: [McGill University Library]On: 17 May 2013, At: 14:21Publisher: Taylor & FrancisInforma Ltd Registered in England and Wales Registered Number: 1072954 Registered office: Mortimer House,37-41 Mortimer Street, London W1T 3JH, UK
International Journal of Human-Computer InteractionPublication details, including instructions for authors and subscription information:http://www.tandfonline.com/loi/hihc20
The “Conducting Master”: An Interactive, Real-TimeGesture Monitoring System Based on SpatiotemporalMotion TemplatesPieter-Jan Maes a , Denis Amelynck a , Micheline Lesaffre a , Marc Leman a & D. K. Arvind ba Institute for Psychoacoustics and Electronic Music (IPEM), Department of Musicology, GhentUniversity , Ghent , Belgiumb Centre for Speckled Computing, Edinburgh University , Edinburgh , ScotlandAccepted author version posted online: 19 Sep 2012.Published online: 14 May 2013.
To cite this article: Pieter-Jan Maes , Denis Amelynck , Micheline Lesaffre , Marc Leman & D. K. Arvind (2013): The“Conducting Master”: An Interactive, Real-Time Gesture Monitoring System Based on Spatiotemporal Motion Templates,International Journal of Human-Computer Interaction, 29:7, 471-487
To link to this article: http://dx.doi.org/10.1080/10447318.2012.720197
PLEASE SCROLL DOWN FOR ARTICLE
Full terms and conditions of use: http://www.tandfonline.com/page/terms-and-conditions
This article may be used for research, teaching, and private study purposes. Any substantial or systematicreproduction, redistribution, reselling, loan, sub-licensing, systematic supply, or distribution in any form toanyone is expressly forbidden.
The publisher does not give any warranty express or implied or make any representation that the contentswill be complete or accurate or up to date. The accuracy of any instructions, formulae, and drug doses shouldbe independently verified with primary sources. The publisher shall not be liable for any loss, actions, claims,proceedings, demand, or costs or damages whatsoever or howsoever caused arising directly or indirectly inconnection with or arising out of the use of this material.

Intl. Journal of Human–Computer Interaction, 29: 471–487, 2013Copyright © Taylor & Francis Group, LLCISSN: 1044-7318 print / 1532-7590 onlineDOI: 10.1080/10447318.2012.720197
The “Conducting Master”: An Interactive, Real-Time GestureMonitoring System Based on Spatiotemporal Motion Templates
Pieter-Jan Maes1, Denis Amelynck1, Micheline Lesaffre1, Marc Leman1, and D. K. Arvind2
1Institute for Psychoacoustics and Electronic Music (IPEM), Department of Musicology, Ghent University, Ghent, Belgium2Centre for Speckled Computing, Edinburgh University, Edinburgh, Scotland
Research in the field of embodied music cognition has shownthe importance of coupled processes of body activity (action) andmultimodal representations of these actions (perception) in howmusic is processed. Technologies in the field of human–computerinteraction (HCI) provide excellent means to intervene into, andextend, these coupled action-perception processes. In this arti-cle this model is applied to a concrete HCI application, calledthe “Conducting Master.” The application facilitates multipleusers to interact in real time with the system in order toexplore and learn how musical meter can be articulated intobody movements (i.e., meter-mimicking gestures). Techniques areprovided to model and automatically recognize these gesturesin order to provide multimodal feedback streams back to theusers. These techniques are based on template-based methodsthat allow approaching meter-mimicking gestures explicitly froma spatiotemporal account. To conclude, some concrete setups arepresented in which the functionality of the Conducting Master wasevaluated.
1. INTRODUCTIONDevelopments in technology have resulted in new forms
of human–computer interaction (HCI) that can be used tointervene with the coupled action–perception mechanisms ofmusic processing. The resulting knowledge about the action–perception mechanisms in turn contributes toward the develop-ment of new interactive technologies, with applications in musiceducation and music-based rehabilitation and entertainment.The central idea in the theory of embodied music cognition isthat music processing is based on coupled action and percep-tion processes (Godøy & Leman, 2010; Leman, 2007). This isbased on the insight that the human brain’s modality-specific
This work is part of the EmcoMetecca project supported bythe Flemish Government (http://www.ipem.ugent.be/EmcoMetecca).We thank Bart Moens for his help with the Java coding, Ivan Schepersand Raven van Noorden for the technical assistance, and the Centrefor Speckled Computing (http://www.specknet.org) for providing theOrient Motion Capture system.
Address correspondence to Pieter-Jan Maes, IPEM, Departmentof Musicology, University of Ghent, Blandijnberg 2, Ghent 9000,Belgium. E-mail: [email protected]
systems support a situation-grounded system (cf. Barsalou,1999, 2008) that is rooted in human action. In music processing,this situation-grounded system is known to involve the coordi-nation of various processing modalities. These include diversesensory modalities, such as auditory, visual, and touch; motormodalities including fine-control of body parts and expres-sive gesturing; and other modalities related to cognitive andemotive processing (Alluri et al., 2011, Brown, Martinez, &Parsons, 2004; Chen, Penhune, & Zatorre, 2008; Koelsch, Fritz,Müller, & Friederici, 2006; Zatorre, Chen, & Penhune, 2007).In addition, there is growing evidence in favor of the idea thatthe visual modality (e.g., Eldridge, Saltzman, & Lahav, 2010;Meyer, 1993; Nijs, Moens, Lesaffre, & Leman, 2012), as well asmotor modality (Mahon, 2008; Pazzaglia, Pizzamiglio, Pes, &Aglioti, 2008; Phillips-Silver & Trainor, 2005; Serino et al.,2010), may support the auditory modality for music processing.
Based on these insights, we introduce a general, concep-tual model that can be extended to various HCI designs inthe domain of music and multimedia (see Figure 1). Theunderlying rationale is that HCI technology can facilitate theintervention into, and accordingly augment, the coupled action–perception mechanisms of music processing. In this article,the model is applied to a concrete HCI application called the“Conducting Master,” which enables users to learn how toarticulate musical meter into body movements, or what weterm as meter-mimicking gestures. When interacting with theConducting Master, the meter-mimicking gestures of the usersare picked up by the system in real time and processed to pro-vide direct multimodal feedback about how these gestures relateto the metrical structure of the music. Users can perceive thisfeedback and adjust their actions accordingly to match the musi-cal meter. It is intended that, as a result of interacting with thesystem, users learn to embody the concept of musical meter andto link it further to multimodal representations. According to theaforementioned grounded theory (Barsalou, 1999, 2008) andthe embodied music cognition theory (Godøy & Leman, 2010;Leman, 2007), this must help users to better understand the con-cept of meter and its discrimination when listening to music.Before we advance, we first define some key terms that are usedfrequently throughout this article.
471
Dow
nloa
ded
by [
McG
ill U
nive
rsity
Lib
rary
] at
14:
21 1
7 M
ay 2
013

472 P.-J. MAES ET AL.
ModelingRecognition
Gestural interface
Multimodal feedback
PERCEPTION
ACTION
FIG. 1. Schematic overview of the conceptual human–computer interactionmodel underlying the design of the Conducting Master.
Meter: Meter (or metrical structure) in music, indicated bythe time signature, refers to the periodically repeated basicpattern of strong and weak accented beats (i.e., pulsegroup). One such basic pattern, or pulse group, constitutesa bar (i.e., measure) of music. In general, the accentua-tion pattern characterizes the meter as being divided intoeither two beats (i.e., duple meter; strong–weak) or threebeats (i.e., triple meter; strong–weak–weak), which givesthe music a more “march-like” or “waltz-like” feeling,respectively. The meter can be considered as the mostbasic “rhythm” underlying music. However, this does notexclude additional accents, which might occur at metricallyweak places (e.g., syncopation). However, most often, theseadditional accents can be understood only with reference(as deviations) to the underlying metrical structure.
Meter-mimicking gesture: This is a gesture that articulatesthe timing and accentuation of a basic metrical pattern, orpulse group, i.e., when a beat occurs and how strongly itis accentuated. This gesture, which corresponds to one barof music, can then be repeated continuously in time withthe music. Each repetition of a particular meter-mimeticgesture is termed a cycle or a gestural cycle.
Gestural model: A gestural model is conceived as the spa-tiotemporal representation of a meter-mimicking gesturearticulating a basic metrical pattern. This model is inferredfrom a series of a repetitively performed meter-mimeticgesture in response to music and stored as a two-dimensional spatiotemporal motion template (see Section4.1. Gesture Modeling).
The procedure for the use of the Conducting Master is dividedinto three steps. First, users familiar with musical meter—suchas music teachers or parents—need to select the music (from aplaylist) and to perform meter-mimicking gestures in response
to the music (played as an audio file). From this performance,the system calculates a gestural model (in the form of a two-dimensional spatiotemporal motion template), which is storedin a database together with the corresponding music (storedas a .wav file). This gestural model serves as a reference inthe subsequent steps of the procedure. It serves as a refer-ence because it represents a specific meter-mimicking gesturethat correctly articulates the meter in the corresponding music.Of course, this is only one possible way of articulating a spe-cific meter. Multiple gestural models relating to the same ordifferent music (and meters) can be created and stored in thedatabase. In the second step of the procedure, novice userslearn to perform these reference models aided by an audiovisualmonitoring service that provides direct, multimodal feedbackof the users’ performances. In the final step of the procedure,once the users have learnt to imitate specific gestural models,they can automatically query and retrieve the music indexedwith a specific gestural model by performing the particulargesture.
The Conducting Master has been implemented within theMax/MSP/Jitter environment (http://cycling74.com) as a col-lection of computational algorithms with a graphical user-interface (see Figure 2). The platform consists of three mod-ules that roughly correspond to the three steps in the proce-dure described previously: one module for gesture modeling(see Section 4.1. Gesture Modeling), one module for gesturevisualization (see Section 5.2. Visual Monitoring Aid), andone module for gesture recognition (see Section 4.2. GestureRecognition). The algorithms rely on methods based on spa-tiotemporal motion templates that capture the positional aspectsof the gestures together with temporal information related tothe metrical structure of music. Gesture modeling based onsimple machine-learning algorithms requires users to performa series of a specific meter-mimicking gesture in response tomusic. Also, movement features can be extracted, which relateto the expressivity and spatiotemporal accuracy of the user’smovement performance (see Section 5.1. Extraction of GesturalDescriptors). The visualization module enables the gesturalmodels to be viewed together with the spatial trajectory of thenew, real-time gestural input. The recognition module com-pares the new gestural input with existing models to provideusers a measure of how well their gestures match the ref-erence models stored in the database. The comparison relieson a template-matching technique based on cross-correlationcomputation. The recognition algorithms form the basis forthe gesture-based music query and retrieval function of theConducting Master. Section 3. Data Acquisition discusses sev-eral interface devices for capturing the gestural input of theuser(s).
The Conducting Master resembles other conducting sys-tems (see Johanssen & Nakra, 2010, for an overview). Forexample, the focus on expressivity extends research that takesinto account expressive cues conveyed in conducting gestures(Camurri, Canepa, & Volpe, 2007; Friberg, 2005; Kolesnik &
Dow
nloa
ded
by [
McG
ill U
nive
rsity
Lib
rary
] at
14:
21 1
7 M
ay 2
013

THE “CONDUCTING MASTER” 473
Wanderley, 2004; Marrin & Picard, 1998; Swaminathan et al.,2009). However, the spatiotemporal account has not yet beenexplored in this context. Systems are restricted to either thetemporal or the spatial domains. Examples of the first sort(i.e., temporal domain) mostly involve beat and tempo detection(Bertini & Carosi, 1993; Borchers, Hadjakos, & Mühlhäuser,2006; Bradshaw & Ng, 2008; Haflich & Burns, 1983; Morita,Hashimoto, & Ohteru, 1991), whereas the second sort relatesto the gestural control of timbre (cf. instrument emphasis;Argueta, Ko, & Chen, 2009; Camurri et al., 2007; Lee, Karrer, &Borchers, 2006; Segen, Gluckman, & Kumar, 2002), anddynamics control (Bertini & Carosi, 1993; Haflich & Burns,1983; Mathews, 1991; Morita et al., 1991).
The rest of this article is structured as follows. We begin byintroducing the basic concepts underlying the approach to spa-tiotemporal gesture processing (Section 2. The SpatiotemporalApproach). Then, we discuss some motion capture devicesfor facilitating gestural input into the system (Section 3.Data Acquisition). Next, we describe the modeling (Section4.1. Gesture Modeling) and recognition algorithms (Section4.2. Gesture Recognition) based on a method using spa-tiotemporal motion templates. We then discuss the dif-ferent modes of real-time feedback that the ConductingMaster provides about users’ performances based on themodeling and recognition functionality (Section 5. MultimodalFeedback). Finally, we present a scenario in which the func-tionality of the Conducting Master was evaluated (Section6. Evaluation study) followed by conclusions (Section 7.Conclusion).
2. THE SPATIOTEMPORAL APPROACHUnderlying the entrainment of body movement to music,
there exists a spatiotemporal reference frame that encodestemporal information inherent to certain musical and soundpatterns into the spatial deployment of gestures (e.g., Brown,Martinez, & Parsons, 2006; Küssner, Gold, Tidhar, Prior, &Leech-Wilkinson, 2011; Leman & Naveda, 2010; Maes, Leman,Lesaffre, Demey, & Moelants, 2010; Naveda & Leman, 2010).These spatiotemporal frames of reference exist as motormemory patterns carried out physically when engaged in amusical activity (such as listening to music, dancing to music,and creating music) and they relate to people’s structuraland expressive understanding of the music and sound (cf.action–perception coupling). Related to musical meter, thesespatiotemporal frames of reference are manifested as repeti-tively performed trajectory shapes attributing temporal pointsin music to specific locations in space (cf. Naveda & Leman,2010). This trajectory shape can be related to the concept ofbasic gesture, already explored in the 1920s and 1930s of the20th century by Becking (1928) and Truslit (1938) (see Repp,1993, for an overview). Related to this concept of basic gesture,Naveda and Leman (2010) introduced a method based on con-cepts of topology for analyzing gestural relationships in space.The idea behind this Topological Gesture Analysis method isto reduce the full trajectory shape covered by a basic gesture toonly those points that correspond to important “landmarks” inthe temporal flow of music (points in time with metrical grav-ity, called beat points, or metrical beat levels). Because of therepetitive nature of gestures synchronized to metrical patterns,
1
2
3
4
5
FIG. 2. Graphical user interface of the Conducting Master with a modular design. (color figure available online).
Dow
nloa
ded
by [
McG
ill U
nive
rsity
Lib
rary
] at
14:
21 1
7 M
ay 2
013

474 P.-J. MAES ET AL.
point clouds are formed corresponding to certain metrical lev-els (Nevada & Leman, 2010). The topological structure inherentin these point clouds reveals aspects of expressivity and syn-chronization accuracy (see Section 5.1. Extraction of GesturalDescriptors).
The underlying rationale for the design of the ConductingMaster is to bring these concepts and methodologies into thedomain of real-time HCI. As is explained in detail in Section4.1. Gesture Modeling, the modeling algorithms facilitate theinference of a basic gesture model from a series of a repeti-tively performed meter-mimicking gesture (i.e., training data).This basic gesture model is considered as a spatiotemporal rep-resentation indicating the spatial deployment of gestures withrespect to the temporal metrical pattern in the music. The modelcan then be visualized in synchrony with the music (see Section5.2. Visual Monitoring Aid) in order that other users can learn toperform the specific gesture. Moreover, the Conducting Masterenables real-time Topological Gesture Analysis to be performedon recorded training data in order to inform users about aspectsof expressivity and synchronization accuracy (see Section 5.2.Visual Monitoring Aid).
3. DATA ACQUISITIONA crucial requirement for the Conducting Master is its ability
to capture users’ gestures. An important aspect is its flexibilityto accommodate different, existing gestural interface devices;to track simultaneously multiple body parts of the user; and tofacilitate multiuser input. By default, the Conducting Mastertracks the position of the hand or both hands of the user,although movement of the head and torso can also be trackedif required. This ability distinguishes the Conducting Masterfrom contemporary conducting techniques in which meter isusually articulated using the right hand (see Johannsen & Nakra,2010). Also, these techniques often require the use of a con-ducting baton. A baton is traditionally used to exaggerate andextend a conductor’s gestures in order that musicians see moreclearly the conductor’s actions. Also various HCI conduct-ing systems have used batons as gestural interface devices(e.g., Keane & Gross, 1989; Lee et al., 2006; Mathews, 1991;Morita et al., 1991). Both functions of the conducting batonare not of relevance to the Conducting Master. Nevertheless,a baton can be used when interacting with the ConductingMaster to stimulate the user’s imagination of being a realconductor.
Another important aspect is the ability to express the posi-tion and displacement of the hands in a body-relative coordinateframe instead of one fixed to a reference position in “absolute”space. This avoids that body displacement affects the coordi-nates of the hands. A selection of motion capture and sensingsystems exist that can be used for this purpose with their cor-responding advantages and disadvantages. In this section, wediscuss in more detail three systems that have been used as agestural interface device for the Conducting Master.
The first option is to use an optical motion capture (mocap)system that is able to track infrared reflecting markers usinga constellation of infrared cameras. We used the OptiTracksystem from NaturalPoint with related Arena software (http://www.naturalpoint.com/optitrack/). To obtain the spatial coordi-nates of the hands relative to the body, one attaches markersin rigid body constellations to the body-center (i.e., torso) andthe hands. The OptiTrack system provides streams of three-dimensional position and orientation data of the three rigidbodies with respect to a coordinate frame fixed to a specificposition and orientation of the mocap space. These data arestreamed to Max/MSP through the Open Sound Control (OSC)protocol at a sample rate of 100 Hz. In Max/MSP, we cre-ated algorithms that subtract the (x, y, z) coordinates of the torsofrom those of the hands and, subsequently, rotate these valuesaccording to the orientation of the torso. This resulted in thedevelopment of a body-relative coordinate system in which theposition of the hands is defined (see Figure 3), ready for furtherprocessing by other computational services of the ConductingMaster (modeling, monitoring, and recognition). The biggestadvantage of the OptiTrack is the high spatial and temporalresolution resulting in accurate and “clean” data, and is there-fore an ideal system for controlled experiments in a laboratoryenvironment. However, the two main disadvantages are theproblems of occlusion and the lack of portability. First, the sys-tem is vulnerable to visual occlusion, i.e., data are lost when amarker cannot be detected by any of the cameras. Second, theextensive setup makes it difficult to use outside the laboratoryin more ecologically valid environments such as in schools or athome.
FIG. 3. Orientation of the coordinate system relative to the body-center.
Dow
nloa
ded
by [
McG
ill U
nive
rsity
Lib
rary
] at
14:
21 1
7 M
ay 2
013

THE “CONDUCTING MASTER” 475
A second option we explored was the use of a motion-sensing technology based on inertial sensors, namely, theOrient Motion Capture system (http://homepages.inf.ed.ac.uk/ayoung9/orient.html). This was the first real-time, fully wire-less, full-body, three-dimensional motion capture system usinginertial sensors (Young, Ling, & Arvind, 2007, 2010). TheOrient speck device is attached to the subject’s body segmentand consists of three-axis accelerometers, gyroscopes, and mag-netometers in combination with a low-power processor and a2.4 GHz radio. The position of the hand relative to the body-center is tracked by measuring the orientation of the torso (i.e.,body-center), upper arm, and forearm. These three body seg-ments are modeled as a tree of rigid bodies connected by joints,starting from the torso as the root, with the arms branching offthe torso. The posture of the model is reconstructed by travers-ing the tree from the root, and each body segment is rotated tothe orientation as calculated by the Orient speck that determinesthe end-point of the body segment. In this way the position ofthe hands can be estimated in a body-relative coordinate sys-tem. As before, these data are streamed to Max/MSP via theOSC protocol at a sample rate of 100 Hz. The biggest advan-tage of the Orient system is that it addresses the drawbacks ofthe optical mocap system: The lightweight specks are portableand the data collected are ecologically valid; and the system isnot vulnerable to occlusion and can be extended to motion cap-ture of multiple subjects. The disadvantage is that the estimationof motion can be disturbed by distortions in the magnetic fieldin the capture environment.
A third option is to use the Microsoft Kinect for XBox 360(http://xbox.com/kinect). Using infrared video technology, thesystem is able to determine the three-dimensional positionsof the hands and body-center (i.e., torso). These data can bestreamed to Max/MSP through the use of the Sensebloom/
OSCeleton software. In a manner similar to the preprocessingperformed on the OptiTrack data, the (x, y, z) coordinates of thetorso can be subtracted from those of the hands to determinetheir positions in a body-relative coordinate system. However,rotation around the vertical axis of the body cannot be handledby the system. Also, the spatial and temporal resolution of thedata is inferior compared with the previous two systems. Themain advantages of the system, however, are that the subjectneed not wear any devices or markers and its portability, whichit shares with the Orient. Also, similar to the other systems, it ispossible to track movement of multiple users at the same time.
4. GESTURE MODELING AND RECOGNITIONThe primary function of the modeling and recognition
modules implemented in the Conducting Master is to trans-form the gestures of users in relation to the musical meterinto multimodal feedback streams (see Section 5. MultimodalFeedback) Accordingly, these feedback streams can inform theusers how to correct their actions and contribute toward animproved, multimodal representation of musical meter. In this
section, a template-based method is presented to facilitate aspatiotemporal approach to gesture modeling and recognition.At first glance, methods based on hidden Markov modelingor dynamic time warping might be suitable candidates (e.g.,Bévilacqua, Guédy, Schnell, Fléty, & Leroy, 2007; Bévilacquaet al., 2010). These methods require, during the learning stages,few training samples (e.g., Artieres, Marukatat, & Gallinari,2007; Rajko, Qian, Ingalls, & James, 2007) and a small numberof parameters (e.g., Rajko & Qian, 2008). However, they exhibitsome degree of invariance to local warping (compression andstretching) of the time-axis (Bishop, 2009), which is a problemgiven that the Conducting Master has adopted a spatiotemporalapproach to meter-mimicking gestures. Therefore, the template-based method we propose in this article provides a properalternative (Bobick & Davis, 2001; Lv, Nevatia, & Lee, 2005;Maes, Amelynck, & Leman, 2012; Müller & Röder, 2006).
All the required algorithms are java-scripted into real-timefunctioning objects operating on the Max/MSP/Jitter platform(http://www.cycling74.com). Nonetheless, despite the complex-ity of the inner algorithmic architecture, the usability of thegraphical user interface is made as intuitive as possible (seeFigure 14) using both hand gestures and traditional mousecontrol.
4.1. Gesture ModelingThe purpose of the modeling module implemented in the
Conducting Master is to derive a basic gesture model froma series of a repetitively performed meter-mimicking gesture(see Figure 4). The spatiotemporal representation in the modelexplicitly determines the spatial deployment of hand gestures incorrespondence with the temporal metrical structure of music.By default, the model parameters consist of the position ofboth hands in a person’s coronal dimension (i.e., left/right andup/down direction). However, the Conducting Master allowsthat other movement parameters can be added or removedat the user’s will (e.g., movement in front/back direction,velocity, etc.).
The Conducting Master allows users to start with their ownmusic playlist, which is configured and imported as a .txt filein which reference is made to music stored as .wav files on thecomputer. By default, four of the basic time signatures, (i.e.,2/4, 3/4, 4/4, 6/8) are supported by the Conducting Master.However, more time signatures can be added as long as themusic complies with some requirements. First, the music needsto have a strict tempo (expressed in beats per minute, bpm).As will be explained in more detail, variation in tempo wouldconflict with the method based on spatiotemporal motion tem-plates. Another requirement is that the music must begin with adownbeat (i.e., the accented first beat of a pulse group). Thisprovides a reference to link movement data with the tempo-ral structure of meter into a spatiotemporal motion template.Once the music is selected, users record a series of a repeti-tively performed meter-mimicking gesture in response to the
Dow
nloa
ded
by [
McG
ill U
nive
rsity
Lib
rary
] at
14:
21 1
7 M
ay 2
013

476 P.-J. MAES ET AL.
Gestural interface
Multimodal feedback
ACTION
PERCEPTION
Infer a spatiotemporal model from a series of a repetitively performed
meter-mimicking gesture
Motor simulation of
musical meter
FIG. 4. Schematic overview of the gesture modeling concept and functionality.
1 2 3 4 5 6 7 8 9 101112131415161718... n
1...
p
...Y hand (R)X hand (R)Y hand (L)X hand (L)
Time (samples)
Sequences 1 2 3 4 5 6 7 8 9 10 11 12 13 14 15 16 17 18 ... n
...Y hand (R)X hand (R)Y hand (L)X hand (L)
Time (samples)
1 51 101 151 200
−0.2
−0.1
0
0.1
0.2
0.3
0.4
0.5
0.6
X c
oord
inat
e rig
ht h
and
(m)
Time (samples)1 51 101 151 200
−0.2
−0.1
0
0.1
0.2
0.3
0.4
0.5
0.6
X c
oord
inat
e rig
ht h
and
(m)
Time (samples)
FIG. 5. Top left: A schematic of an m × n × p template in which training data are stored. Each cube holds a sample of a specific parameter at a specific momentin time. Bottom left: Example of the content stored in the grey cubes indicated on the template above where n = 200 (i.e., 200 samples defining one gestural cyclesynchronized with the meter in the music, here with a time signature of 4/4) and p = 20 (i.e., 20 cycles of a repeated meter-mimicking gesture). Top right: Aschematic of an m × n template representing a basic gesture model inferred from the training data. Bottom right: Example of the content stored in the gray cubesindicated on the template above where n = 200.
music. The incoming position data of the hands are storedconsecutively in a multidimensional feature array forming thespatiotemporal motion template. As can be seen in Figure 5 (topleft), the result is a template of dimension m×n×p, where mis the number of gestural parameters, n is the number of sam-ples defining one meter-mimicking gesture (i.e., one gesturalcycle corresponding to one bar of music), and p is the numberof consecutive cycles performed of the same meter-mimickinggesture. As can be seen, the horizontal axes of the templaterepresent the temporal dimension, whereas the vertical axisdefines the spatial dimension. The value of n is fixed anddepends on the sample rate of the incoming movement data
(SR), the tempo of the music (i.e., bpm), and the number ofbeats per bar of music (BpB) according to the following for-mula: n = (60 × BpB × SR)/bpm.. For example, a sample rateof 100 Hz combined with a tempo of 120 bpm and a timesignature of 4/4 gives a value for n of 200. This means that onecycle of a specific gestural parameter is defined by 200 samples.The fact that we have for each moment in the temporal struc-ture of the music a spatial attribute of the gesture performedin response to it defines the template as being a spatiotemporalrepresentation.
The complete data set stored in the spatiotemporal motiontemplate functions as training data from which a model can
Dow
nloa
ded
by [
McG
ill U
nive
rsity
Lib
rary
] at
14:
21 1
7 M
ay 2
013

THE “CONDUCTING MASTER” 477
be derived based on machine-learning techniques. Two strate-gies (a parametric and nonparametric method) are proposed tomodel repetitive cycles of a meter-mimicking gesture performedin response to particular music (see Figure 4). Both strategiesare based on regression models, with time as the independentvariable and the spatial coordinates as the dependent variables,but they do differ in the way data are stored.
For nonparametric methods (i.e., instance-based learningtechniques), the data are the model. In other words the data fromthe users’ performances for one particular meter-mimickinggesture are stored for further use in the application. However,in the interest of optimizing storage and speed of calculations,all performances are not stored but reduced to one single modelperformance per meter-mimicking gesture. This is achievedby reducing the performances down to one single value ateach time stamp. Three methods that in essence are K-NearestNeighborhood regressions include calculation of the mean,determination of the median, and calculation of the midrange.The advantage of this approach is its simplicity and ease ofuse in correlation analysis. A major disadvantage, however, isthe lack of smoothness. In addition, the mean and midrangemethods suffer from sensitivity to outliers.
Parametric methods describe the performance data as a func-tion (closed form) in terms of the given parameters. A first-orderlinear regression model was a trivial choice, but it was quiteobvious that such a simple model would be inappropriate andhigher order models had to be considered. Two models wereinvestigated: polynomial and a B-spline regression models.Both of these methods produce smooth data models. The time
series of the spatial coordinates also suggested a segmenta-tion into time intervals corresponding to the musical metricalstructure (e.g., four time intervals for a 4/4 time signature).B-spline regression accounts for this by placing breakpoints atthese locations. In addition, continuity at these breakpoints isachieved without any continuity constraints for the first andsecond derivatives. The explanation is that meter-mimickinggestures can be very disruptive at these breakpoints. B-splineregression achieves this by placing the correct number of addi-tional knots at these breakpoints. A summary of all the modelsis presented in Figure 6.
Validation of the models. An experiment was conductedinvolving six male participants with musical background todetermine which of the modeling techniques was best suitedfor the purposes of the Conducting Master. They were askedto perform repetitive cycles of various meter-mimicking ges-tures with their dominant hand in response to two audio stimuli,each consisting of 35 bars of a repetitive metrical pattern inthe form of metronome ticks at a tempo of 120 bpm. The firststimulus presented a 4/4 time signature, and the other was a3/4 time signature. In defining the model (see Section 4.1.Gesture Modeling), only the last 30 bars were taken into accountto enable participants to get acquainted with the task in thefirst five bars. The (x, y) coordinates of the dominant hand rel-ative to the body-center were recorded with the Orient MotionCapture system (see Section 3. Data Acquisition). For each per-formance, one obtained a spatiotemporal motion template withdimensions 2 × 200 × 30 for the stimulus with a time signatureof 4/4, and dimensions 2 × 150 × 30 for the stimulus with a
−60 −40 −20 0 20 40−20
0
20
40
60
80
100
12 3
4
Mean Model
Y p
ositi
on (
cm)
X position (cm)−60 −40 −20 0 20 40
−20
0
20
40
60
80
100
12 3
4
Median Model
Y p
ositi
on (
cm)
X position (cm)−60 −40 −20 0 20 40
−20
0
20
40
60
80
100
1
23
4
Range Model
Y p
ositi
on (
cm)
X position (cm)
−60 −40 −20 0 20 40−20
0
20
40
60
80
100
123
4
Polynomial Regression Model
Y p
ositi
on (
cm)
X position (cm)−60 −40 −20 0 20 40
−20
0
20
40
60
80
100
12 3
4
Cubic Spline Model
Y p
ositi
on (
cm)
X position (cm)
FIG. 6. Visualization of the five models inferred from a performance of one participant on a 4/4 time signature. Note. The polynomial regression model shownis an order 10 model. The B-spline model shown is a cubic spline model.
Dow
nloa
ded
by [
McG
ill U
nive
rsity
Lib
rary
] at
14:
21 1
7 M
ay 2
013
478 P.-J. MAES ET AL.
0 2 4 6 8 10 12 14 16 18 200.12
0.14
0.16
0.18
0.2
0.22
0.24
0.26
0.28
0.3
Polynomial Order
NR
MS
E
Model Validation
PolynomialRegression
SplineRegression
Range
Mean
Median
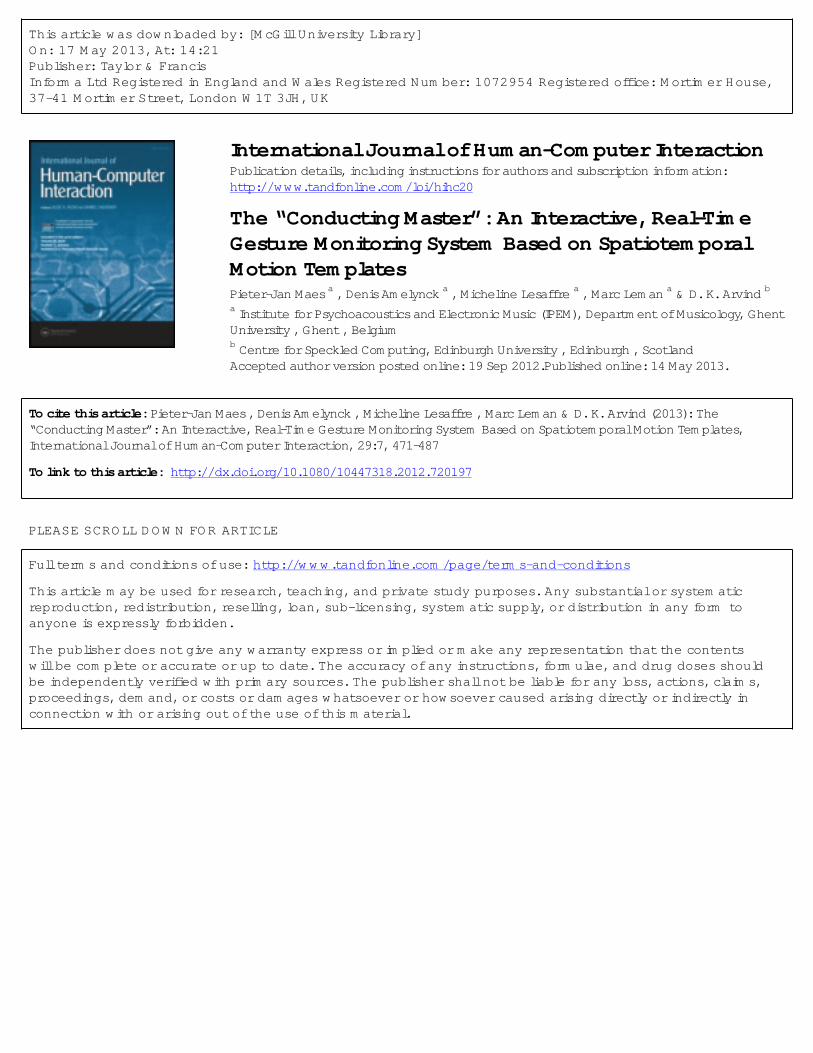
FIG. 7. Results of cross-validation. Note. NRMSE-normallzed root meansquare error.
time signature of 3/4. The experiment produced a training setof 24 data structures that were used to evaluate the differentmodeling techniques.
The goodness of the fit was assessed for the different modelsusing the leave-one-out-cross validation technique. For everymodel the normalized root mean square error (NRMSE) wascalculated as shown in Equation 1, and this value determinedthe “best” fitting model.
NRMSE =
√∑ni=1 (yi − yi)2
n
(ymax − ymin)(1)
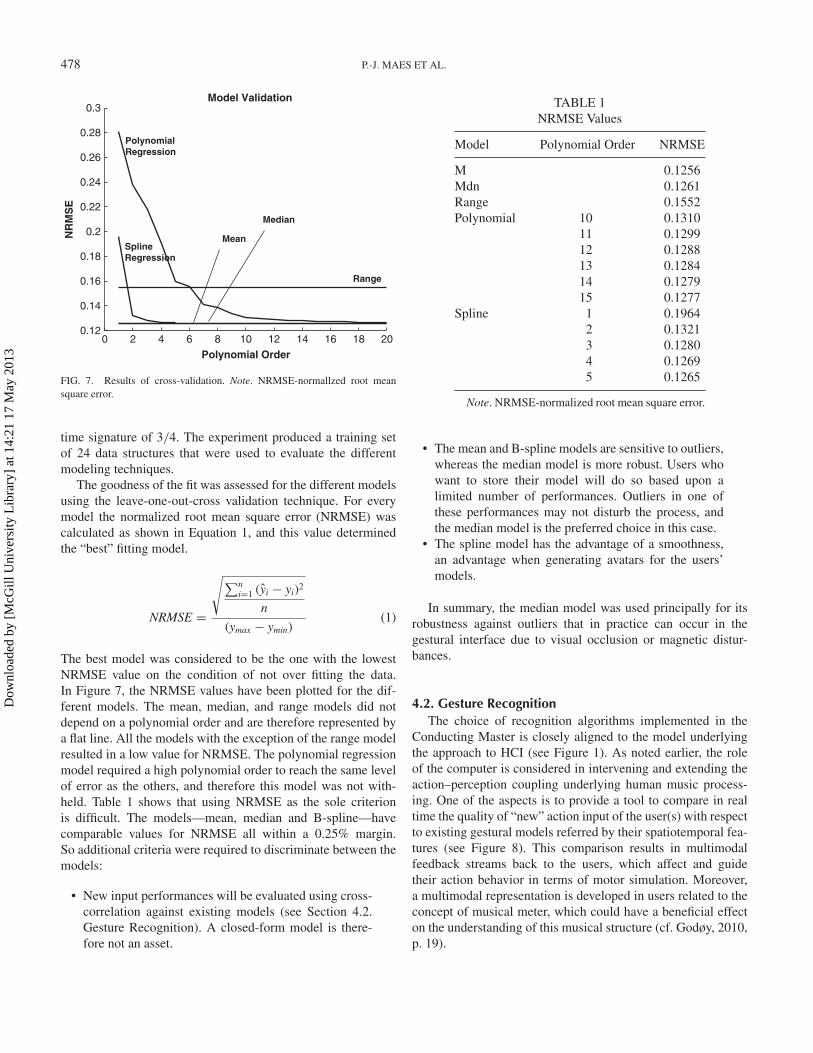
The best model was considered to be the one with the lowestNRMSE value on the condition of not over fitting the data.In Figure 7, the NRMSE values have been plotted for the dif-ferent models. The mean, median, and range models did notdepend on a polynomial order and are therefore represented bya flat line. All the models with the exception of the range modelresulted in a low value for NRMSE. The polynomial regressionmodel required a high polynomial order to reach the same levelof error as the others, and therefore this model was not with-held. Table 1 shows that using NRMSE as the sole criterionis difficult. The models—mean, median and B-spline—havecomparable values for NRMSE all within a 0.25% margin.So additional criteria were required to discriminate between themodels:
• New input performances will be evaluated using cross-correlation against existing models (see Section 4.2.Gesture Recognition). A closed-form model is there-fore not an asset.
TABLE 1NRMSE Values
Model Polynomial Order NRMSE
M 0.1256Mdn 0.1261Range 0.1552Polynomial 10 0.1310
11 0.129912 0.128813 0.128414 0.127915 0.1277
Spline 1 0.19642 0.13213 0.12804 0.12695 0.1265
Note. NRMSE-normalized root mean square error.
• The mean and B-spline models are sensitive to outliers,whereas the median model is more robust. Users whowant to store their model will do so based upon alimited number of performances. Outliers in one ofthese performances may not disturb the process, andthe median model is the preferred choice in this case.
• The spline model has the advantage of a smoothness,an advantage when generating avatars for the users’models.
In summary, the median model was used principally for itsrobustness against outliers that in practice can occur in thegestural interface due to visual occlusion or magnetic distur-bances.
4.2. Gesture RecognitionThe choice of recognition algorithms implemented in the
Conducting Master is closely aligned to the model underlyingthe approach to HCI (see Figure 1). As noted earlier, the roleof the computer is considered in intervening and extending theaction–perception coupling underlying human music process-ing. One of the aspects is to provide a tool to compare in realtime the quality of “new” action input of the user(s) with respectto existing gestural models referred by their spatiotemporal fea-tures (see Figure 8). This comparison results in multimodalfeedback streams back to the users, which affect and guidetheir action behavior in terms of motor simulation. Moreover,a multimodal representation is developed in users related to theconcept of musical meter, which could have a beneficial effecton the understanding of this musical structure (cf. Godøy, 2010,p. 19).
Dow
nloa
ded
by [
McG
ill U
nive
rsity
Lib
rary
] at
14:
21 1
7 M
ay 2
013

THE “CONDUCTING MASTER” 479
Gestural interface
Multimodal feedback
ACTION
PERCEPTION
Compare new input with existing models
Motor simulation of
musical meter
FIG. 8. Schematic overview of the gesture recognition concept and functionality.
1 2 3 4 5 ... n 1 2 3 4 5 ... n 1 2 3 4 5 ... n
input buffer template
model template
Y hand (R)X hand (R)Y hand (L)X hand (L)
Time (samples)
FIG. 9. A schematic representation of the template matching method based oncross-correlation.
The comparison between “new,” real-time meter-mimickinggestures and existing models functioning as spatiotemporalreferences is handled by algorithms applying a template-matching method based on cross-correlation computation (cf.Maes et al., 2012) as shown in the schematic in Figure 9. Sucha method should be able to recognize small deviations fromthe model in space as well as in time. Small spatial deviations(movements slightly more to the left or right, higher or lower,forward or backward) should not necessarily be translated aserrors. Similarly, scaling up or down the size of gestures shouldalso not be reflected as an error. Using NRMSE as the errormeasure is not appropriate as it does punish spatial transla-tion and scaling errors. A better indicator in this applicationis the Pearson product–moment correlation coefficient r (seeEquation 2). It is a measure of the size and direction of the lin-ear relationship between the two variables—the new gesturalinput and the gestural model. A performance exactly match-ing the reference model would result in a correlation coefficientthat is equal to 1, whereas a total absence of similarity betweeninput gesture and reference model would lead to a correlationcoefficient of 0.
r =∑N
i=1 (X − μX)(Y − μY )
(N − 1)σXσY(2)
Timing deviations can be compensated by calculating thelinear relationship between the gestural input and model as afunction of a time lag (cf. cross-correlation). If a time lag win-dow of n samples is applied in both directions, then we obtaina vector of (n + 1) r values. The maximum value is chosen andoutputted together with the corresponding time lag. This timelag informs the users, with an objective measure, whether theyanticipate or delay the model reference.
As illustrated in Figure 5, the data of the parameters of thenew gestural input are stored in a buffer with a length of n sam-ples, where n is the number of samples contained in one gesturalcycle. This implies that an input can be properly matched to astored model only after the execution of one complete gesturalcycle. From then on, a reliable r (with corresponding time lag) isdelivered directly each time a new position sample is received.Because we apply cross-correlation, the input buffer has to beshifted relative to the model to obtain the lag-dependent r. Also,because multiple parameters are stored, we obtain m values ofwhich the mean is taken to obtain a proper r.
5. MULTIMODAL FEEDBACKAll of the following computational services that facilitate
multimodal feedback are based on the modeling and recog-nition algorithms presented in the previous sections. In con-cept, the multimodal feedback algorithms serve two purposes,as explained before. First, they inform users how to adapttheir actions in order to synchronize these with the meterin the music. Second, they contribute to the development ofa multimodal representation of meter and thereby groundingthe concept of musical meter into the various modal-specificsystems involved in human music processing. Similar to themodeling and recognition algorithms, all multimodal feedbackservices are programmed on the Max/MSP/Jitter platform andintegrated into the modular design of the graphical user inter-face. The feedback services are divided into three separatemodules. The first one (Section 5.1. Extraction of GesturalDescriptors) extracts gestural descriptors from a recorded seriesof a repetitively performed meter-mimicking gesture. Thesedescriptors relate to the expressiveness and spatiotemporalaccuracy of the performed gestures. The second one (Section
Dow
nloa
ded
by [
McG
ill U
nive
rsity
Lib
rary
] at
14:
21 1
7 M
ay 2
013

480 P.-J. MAES ET AL.
5.2. Visual Monitoring Aid) enables users to learn to per-form specific meter-mimicking gestures stored in audiovisualdatabases assisted by real-time visual feedback of their ownactions. Finally, the third one (Section 5.3. Interactive Gesture-Based Music Querying and Retrieval Application) provides agesture-based music querying and retrieval game in which thequality of a performance is assigned a numerical score (from0 to 10) and related visual and auditory feedback.
5.1. Extraction of Gestural DescriptorsWhen users have recorded a series of a repetitively per-
formed meter-mimicking gesture in response to music, thesystem is able to extract gestural descriptors from the recordeddata. These descriptors relate to the expressivity of the per-formed gestures (i.e., “range,” “curvature,” “spatial dispersion,”and “temporal dispersion”) or they provide an indication ofthe spatiotemporal accuracy of a performance (“spatial disper-sion” and “temporal dispersion”). The descriptors are calculatedeither from the spatiotemporal motion template in which thetraining data are stored (i.e., “spatial dispersion” and “tempo-ral dispersion”) or from the spatiotemporal motion template inwhich the gestural model is stored (i.e., “range” and “curva-ture”). In the following sections, we describe these descriptorsin more detail.
Range. The range (cf. size) of a gestural model is con-ceived as the distance between the minimum and maximumpositional values in both (x, y) dimensions (see Figure 3). It hasbeen shown that the size of hand gestures that people make inresponse to music can reveal how people perceive this musicin terms of expressiveness (Camurri, Mazzarino, Ricchetti,Timmers, & Volpe, 2004; Davidson, 1994; Maes et al., 2010).Large gestures indicate that music is perceived as intense andforceful, whereas small gestures indicate that music is perceivedas being calmer and more delicate. Therefore, an indication ofthe size of a gestural model could be used to make users awareof the expressive qualities of this movement feature and tostimulate them to explore this feature when simulating musicalmeter.
Curvature. The curvature (see Figure 10) specifies theamount by which the actual covered trajectory (i.e., dashed line)between two data points (A and B) deviates from a straightline (i.e., blocked line) in terms of distance. According toEquation 3, the measure of curvature is defined as the proportionbetween the cumulative sum of Euclidean distances betweensuccessive samples (N) from start-point A to end-point B inrelation to the Euclidean distance between A and B.
curvature =∑N−1
i=1
√(xi+1 − xi)2 + (yi+1 − yi)2√
(xB − xA)2 + (yB − yA)2(3)
Based on the gestural model, the curvature (trajectory shape)is calculated between two (x, y) coordinates corresponding tosuccessive metrical beat levels. In this way, k measures were
A B
S3
S7S1
S2
S5
S6
S4
FIG. 10. Schematic representation of a trajectory shape (i.e., dashed line) con-sisting of seven (i.e. N) samples (s1 to s7) starting in Point A and ending in B.Note. The blocked line represents a straight line between Point A and B (colorfigure available online).
obtained, where k is the number of beats per bar. The meanof the k values gives a global value defining the curvature ofa gestural model. Curvature is an expressive descriptor that isoften mentioned in the context of research on expressive ges-tures (Camurri, Volpe, De Poli, & Leman, 2005; Chi, Costa,Zhao, & Badler, 2000; Laban, 1963).
Spatial dispersion. Spatial dispersion is a measure thatindicates how users consistently attribute a specific location inspace occupied by the hands to specific metrical beat levels inthe music. For example, one can speak of a high consistencywhen there is a low variance in the spatial position occupiedby a hand at the moment of the downbeat and vice versa.According to the context, the rate of consistency can be indica-tive of the expressiveness of meter-mimicking gestures, as wellas for the meter-mimicking skills of the users. In the case ofthe former, music that is expressive of emotional turmoil orinstability is likely to correspond to meter-mimicking gestureswith a lower consistency than gestures in response to music thatis expressive of a sense of rigidness and balance. Concerningthe latter, users who are not yet able to discriminate meteror to perform a particular meter-mimicking gesture will mostlikely have a lower consistency than users that do have theseskills.
Spatial dispersion is calculated from a spatiotemporal motiontemplate that contains a set of training data (see Figure 5, left).Recall that the training data consists of movement data recordedfrom a series of a repetitively performed meter-mimicking ges-ture in response to music selected from a playlist (see Section4.1. Gesture Modeling). As shown in Figure 5, the Time axisdefines individual bars of music (i.e., n samples) in which themetrical beat levels have fixed positions (e.g., the downbeat isalways the first sample). The position of the other beat levelsdepends on the tempo and time signature of the music and thesample rate of the motion capture device. As the Sequence axisdefines the different bars occurring in the music, a set of trainingdata contains for each metrical beat level p (x, y) coordinates,forming a topological point cloud (see Figure 5). The median
Dow
nloa
ded
by [
McG
ill U
nive
rsity
Lib
rary
] at
14:
21 1
7 M
ay 2
013

THE “CONDUCTING MASTER” 481
−50 −40 −30 −20 −10 0 10 20
10
20
30
40
50
60
70
x value (cm)
y va
lue
(cm
)
−15 −10 −5 0 5 10 15 205
10
15
20
25
30
stdX
stdY
x value (cm)
y va
lue
(cm
)
FIG. 11. Visualization of the spatial dispersion per metrical beat level. Note. The right image shows a detail of the first metrical beat level. The way the ellipsesare shown in the graphical user interface to the users can be seen in Figures 2 and 13.
of the x and y values of the distribution of the point cloud cor-responds to the x and y value of the model (see Section 4.1.Gesture Modeling). The dispersion of the point cloud aroundthese medians is expressed in terms of the standard deviation ofthe distributions. The values of the standard deviations are con-sidered to form the lengths of the major and minor semi-axes ofan ellipse (see Figure 11). The dispersion is then expressed asthe area of that ellipse. However, to compensate for differencesin range between performed gestures, we express the standarddeviation with respect to a unit range. Therefore, Equation 4 isused to calculate the dispersion of a metrical beat level:
spatialDispersion = πσxσy
4rangexrangey(4)
The topological dispersion value provides an objective,quantifiable measure of how well meter-mimicking gesturesare performed in terms of consistency and focus. Moreover,it could be used in longitudinal studies monitoring the pro-gression of users’ performances over time. On the other hand,the topology of point cloud data provides qualitative infor-mation about the expressiveness of meter-mimicking gesturesperformed as response to specific music. Accordingly, it couldprovide valuable insights in how people perceive music and howthey attribute expressiveness and meaning to music.
Temporal dispersion. To obtain the spatial dispersion, themetrical references in the music (defined by the horizontalaxes of a spatiotemporal motion template) were “projected”onto the spatial trajectories of the different gestural param-eters. The spatial dispersion indicated the spatial locationsdescribed by the hand(s) when beats were heard in the music.The temporal dispersion is calculated by applying the processin reverse; the gestural references in response to music are pro-jected on the temporal metrical structure of the music. Theassumption here is that cues can be detected in the gesturesperformed in response to music, which are intended to articu-late the beats in the music. The timing of these gestural cues
can then be compared to the actual occurrence of the beats inthe music. A distribution of p values for each metrical beatlevel (see Figure 12) is obtained for all the gestural cyclescontained in a training set. The mean and standard deviationof this distribution could provide insights on the timing qual-ities of the user that performed the gestures. However, such adescriptor is problematic as the user has a free choice to per-form any kind of meter-mimicking gesture in response to themusic. It is difficult to detect gestural beat points in a stan-dardized way—metrical beat levels can be encoded as peaks inacceleration, sudden changes in orientation, and maximum andminimum values in the x- and y-coordinates. The decision inthis project was to implement a method for gestural beat detec-tion based on finding peaks in acceleration (see Figure 12). Thismeans that not all meter-mimicking gestures are appropriateto extract temporal dispersion, but if the users restrict them-selves to certain meter-mimicking gestures, then they have amethod to monitor their timing qualities with respect to musicalmeter.
5.2. Visual Monitoring AidThe main purpose of the audiovisual monitoring aid is
to provide visual feedback of gestural models (in the XYdimension, see Figure 3) in synchrony with the correspondingmusic. Once a model was obtained, according to the proce-dures explained in Section 4.1. Gesture Modeling, users canstore this gestural model (i.e., a two-dimensional spatiotempo-ral template) together with the corresponding music (i.e., theaudio files onto which the meter-mimicking gestures were per-formed to obtain the gestural model) in an audiovisual database.Multiple gestural models could then be created and stored in thedatabase together with the corresponding music. Users are ableto browse these databases in the monitoring module and selecteither a musical piece or a gestural model. In both cases, theaim for the user is to learn to perform meter-mimicking ges-tures in response to the corresponding music by imitating the
Dow
nloa
ded
by [
McG
ill U
nive
rsity
Lib
rary
] at
14:
21 1
7 M
ay 2
013

482 P.-J. MAES ET AL.
0 100 200 300 400 500 600 700 800 900 1000
MBL 4
MBL 3
MBL 2
MBL 1
peaks
Time (samples)
−20 −10 0 10 200
2
4
6
8
10
12 Mean = 2.36Std = 2.3431
Time lag (samples)
Num
ber
of o
ccur
ence
(N
= 3
0)
−20 −10 0 10 200
2
4
6
8
10
12 Mean = 3.7586Std = 3.842
Time lag (samples)
Num
ber
of o
ccur
ence
(N
= 3
0)
−20 −10 0 10 200
2
4
6
8
10
12 Mean = 3.1923Std = 3.1625
Time lag (samples)
Num
ber
of o
ccur
ence
(N
= 3
0)
−20 −10 0 10 200
2
4
6
8
10
12 Mean = 3.2963Std = 2.3007
Time lag (samples)
Num
ber
of o
ccur
ence
(N
= 3
0)
FIG. 12. Results of the temporal dispersion measures for a series of a repetitively performed meter-mimicking gesture (N = 30). To detect beat points in thetrajectory shape, we looked for peaks in acceleration. The figure shows the timing differences in the first five bars (i.e., 1,000 samples) of a performance betweendetected beat points (i.e. peaks) and the beat points in the music (i.e., metrical beat level 1 [MBL 1] to metrical beat level 4 [MBL 4]).
FIG. 13. The audiovisual monitoring aid (color figure available online).
reference model as closely as possible. The visualization of thegestural model is synchronized to the playback of the music.Moreover, to support the motor simulation learning process,users are provided with direct and continuous visual feedback
of their own gestures (see Figure 13). This visual feedback oftheir own actions enables comparison with the reference model,to which they respond by regulating their actions to match themetrical structure of the music.
Dow
nloa
ded
by [
McG
ill U
nive
rsity
Lib
rary
] at
14:
21 1
7 M
ay 2
013

THE “CONDUCTING MASTER” 483
5.3. Interactive Gesture-Based Music Querying andRetrieval Application
This module enables a gesture-based music querying andretrieval service, where musical fragments can be retrieved fromthe audiovisual database in response to specific gestures thatare indexed to them. The recognition algorithms based on atemplate-matching method, presented in Section 4.2. GestureRecognition, are central to this service. Input gestures arematched against all the models stored in the database, and theone that most closely resembles the input is chosen and theindexed music (i.e., .wav file) is retrieved and played back.Users are informed about the degree of similarity between theirperformance and the reference model, which is expressed as anumerical score between −1 and 1 representing the correlationcoefficient r calculated by the template-matching algorithms(see Section 4.2. Gesture Recognition). The r value is also dis-played visually with a slider ranging from −1 to 1, and inan auditive manner with the metronome volume changing inresponse to the r value. The time gap is expressed numeri-cally and also visually indicated to the users as to whether theirgestures anticipate or delay with respect to the timing of thereference model. Attributing a score to their performance isintended to challenge users to improve as in a game that canbe played by more than one user simultaneously.
6. EVALUATION STUDYThe different aspects of the interaction design in the
Conducting Master were evaluated in an ecologically validcontext. The aim of this test was to ensure that the differentalgorithms in the Conducting Master did perform to specifica-tion, and that the visual monitoring aid did help users in learningto perform meter-mimicking gestures. For this purpose, 23 par-ticipants (17 female, 6 male; M = 16.65 year, SD = 0.57 year)were recruited and divided into four groups (three groups ofsix and one group of five participants). After an introduction tothe Conducting Master, three participants in each group wereasked to volunteer in the first part of the test while the oth-ers were isolated. In this modeling part, the three participantswere asked to perform with their dominant hand a series ofa specific meter-mimicking gesture in response to a musicalpiece they could choose from a pre-prepared playlist. All themusical pieces were played at a strict tempo of 120 bpm andhad a time signature of 4/4. The movement data of the dom-inant hand were captured with the infrared optical OptiTracksystem as explained in Section 3. Data Acquisition. From thecaptured data, a spatiotemporal model was created as explainedin Section 4.1. Gesture Modeling for each of the three perfor-mances. These models were then stored in a database togetherwith the corresponding music. In the second part (i.e., recog-nition part), the group was united and five people were askedto learn to perform a randomly assigned meter-mimicking ges-ture with the help of the audiovisual monitoring aid (see Section5.2. Visual Monitoring Aid). Because the gestures were fairly
easy, they only had two minutes to learn the specific gesture.After these two minutes, they had to perform a “test” in whichthey were asked to retrieve the music corresponding to theirspecific gesture and to keep on performing for another tenbars. During these performances, the correlation coefficient rwas recorded, indicating how well each performance matchedthe corresponding reference model stored in the audiovisualdatabase.
A second test was conducted with seven children in the thirdclass of primary school (4 male, 3 female; M = 8.14 years, SD =0.38 years), three of whom had started music lessons half a yearbefore. However, none of them was acquainted with a meterdiscriminating task. The hypothesis was formulated that chil-dren’s capacities to discriminate metrical structures in musicalfragments would increase thanks to the use of the ConductingMaster. A test was developed that provided a quantitative mea-sure of the discrimination skills of the children before and after(pre- and posttest) the instruction session with the ConductingMaster. In the pre- and posttest, children were asked to synchro-nize drum tapping with the metrical structure of eight musicalstimuli played as audio files. The stimuli consisted of four sim-ple children’s songs that were familiar to the children. Eachstimulus had a version that was played at a tempo of 80 bpmand another version that was played at a tempo of 120 bpm.Two of the four stimuli had a time signature of 2/4, and theother two had a time signature of 3/4. It was hypothesizedthat the timing and accentuation patterns of the drum strokeswould match the metrical structure of the musical meter bet-ter in the posttest compared to the pretest, due to the trainingwith the Conducting Master. The user experience of the chil-dren was also evaluated during the instruction session for theConducting Master, by asking them to fill in a short question-naire after the instruction session with queries relating to aspectsof amusement, comprehensibility, interest, feedback, andchallenge.
The instruction phase was split into a first session of 90 min,followed by a second session of 75 min on different days. Theexperimenters prepared in advance an audiovisual database witheight meter-mimicking gestures and corresponding children’ssongs, which had time signatures of 2/4 and 3/4 in equal num-bers. For each stimulus, a version was played at a strict tempoof 120 bpm and then at 80 bpm. Each session in turn is dividedinto two parts: First, the children learned to perform the gesturalmodels with the help of the audiovisual monitoring system (itwas made possible that two children could do this at the sametime) and the motion was captured with the Kinect (see Section3. Data Acquisition); second, the querying and retrieval system(see Section 5.3. Interactive Gesture-Based Music Querying andRetrieval Application) was used (again by two children at atime) to obtain a score on how well they performed with respectto the models. The data that were analyzed consisted of drum-tapping data during the synchronization task performed duringthe pre- and posttests, and answers to the questionnaire on theuser experience.
Dow
nloa
ded
by [
McG
ill U
nive
rsity
Lib
rary
] at
14:
21 1
7 M
ay 2
013

484 P.-J. MAES ET AL.
6.1. Results and DiscussionThe first aim of the evaluation was to investigate whether the
different algorithms of the Conducting Master did perform asintended in an ecologically valid environment. This was indeedthe case, as no major problems such as computer crashes, unduedelays, or CPU overload were experienced, and the main algo-rithms for modeling, template matching, and visual feedbackworked as expected. The second aim was to examine whetherusers were able to learn how to perform meter-mimicking ges-tures using the audiovisual monitoring aid. For this purpose, thecorrelation coefficients (r) obtained in the recognition part ofthe experiment were analyzed. For each performance, a timeseries of correlation values (100 Hz) from 10 bars of music wasobtained and the mean and standard deviation were calculated(see Figure 14). It was observed that all but one performancehad a very high rate of similarity with respect to the referencemodels and relatively low standard deviation values, indicatingconsistency in their performances. Calculating the mean of allperformances gives an r value of .80 (SD = .16).
The first aim of the second evaluation study was to testthe hypothesis that the ability to simulate the metrical pat-tern of music into body movements increased the participants’skills to discriminate these structures in unfamiliar musical frag-ments. Support for this hypothesis could provide grounds forintroducing the system in an educational context. However,the analysis of the drum-tapping data obtained from the pre-and posttests did not provide sufficient evidence. Althoughthere seemed to be some tendencies of improvements in skillsfor articulating timing and accentuation, no definite claimscan be made concerning this research question. Probably, theinstruction sessions with a total duration of 2 hr and 45 minwas too short for this purpose. Another important issue worthmentioning is the lack of a strong methodological foundationunderlying the instruction sessions. More research needs tobe conducted to define a methodological framework in whichthe Conducting Master could be used for educational means(cf. Chaiklin, 2007; Hornbaek & Stage, 2006; Koutsabasis &Vosinakis, 2012). The second aim was to rate the experience
1 2 3 4 5 6 7 8 9 10 11 12 13 14 15 16 17 18 19 200
0.2
0.4
0.6
0.8
1
Cor
rela
tion
Coe
ffici
ent (
r)
Performances
FIG. 14. Plot representing the mean of the correlation coefficient (r) of eachperformance together with the standard deviation.
of the children using the Conducting Master by means of aquestionnaire (see Figure 15) relating to aspects of amusement(Question 1), interest (Question 2), challenge (Question 3), edu-cational value (Question 4), and comprehensibility (Questions5, 6, and 7). The questions concerning the comprehensibility oftheir involvement with the Conducting Master (Questions 5, 6,and 7) were rated high without any exception (see Figure 15).In general, children seemed to be amused by the instruction ses-sions (Question 1). As to aspects of interest, challenge, andeducational value (respectively, Questions 2, 3, and 4), thechildren seemed less convinced.
7. CONCLUSIONA gesture-based HCI system called the Conducting Master
that helps users to articulate musical meter into body move-ments is presented. Toward this end, a conceptual model hasbeen introduced that integrates the interactive system withthe coupled action-perception mechanisms of human musicprocessing. The mediation of digital technology has allowedaugmented, multimodal feedback to be provided to the usersfor their meter-mimicking gestures. In response, users’ gesturescan be adapted in order to synchronize them with the musicalmeter. Moreover, the use of multimodal feedback informationgrounds the concept of musical meter into the various modal-specific systems involved in the human processing of music.We approached gesture processing explicitly using a spatiotem-poral model. As a result, findings of research on the role ofmotor simulation for human music processing has been real-ized as a practical application. The shape of the gestures isunderstandable and easy to visualize and therefore used easilyto instruct the shape of gestures to users. Indeed, an evalu-ation study showed that users managed, in a relatively shortperiod, to learn how to perform specific meter-mimicking ges-tures in response to music. Also, the results of a user studyshowed that they clearly understood the intended behavior andwhether they were doing it correctly. Another valuable contribu-tion to other HCI conducting systems is the explicit link that ismade between the spatial trajectory of gestures and the tempo-ral framework outlined by musical meter. This is facilitated bythe introduction of spatiotemporal motion templates that storedpositional information of gestures together with a reference tothe metrical structure of music and served as the foundationfor the techniques for gesture modeling and recognition. Also,this link between the spatial components of gestures and thetemporal aspects of meter is visualized dynamically (i.e., insynchrony with the music). The geometric aspect of shape isexpressed to the users and the quality of the effort, which werefacilitated by the spatiotemporal motion templates for extract-ing various gestural descriptors indicating expressiveness andspatiotemporal accuracy. However, further research needs to beundertaken on the methodology and pedagogy for integratingthe Conducting Master into music education and music-basedtherapy and rehabilitation.
Dow
nloa
ded
by [
McG
ill U
nive
rsity
Lib
rary
] at
14:
21 1
7 M
ay 2
013

THE “CONDUCTING MASTER” 485
I found it easy to follow the instructions
I always understood what to do
It was clear whether I was doing it right
I learned something
I found the the lesson challenging
I found the lesson interesting
I amused myself
Strong
ly dis
agre
e
Disagr
ee
Neithe
r agr
ee n
or d
isagr
ee
Agree
Strong
ly ag
ree
FIG. 15. Results of the questionnaire to asses participants’ user experience. Note. Questions were rated on a 5-point Likert scale. The dots represent the mean ofthe participants’ ratings, and the lines indicate the standard deviation.
REFERENCESAlluri, V., Toiviainen, P., Jääskeläinen, I., Glerean, E., Sams, M., & Brattico,
E. (2011). Large-scale brain networks emerge from dynamic processing ofmusical timbre, key and rhythm. NeuroImage, 59, 3677–3689.
Argueta, C., Ko, C., & Chen, Y. (2009). Interacting with a music conductingsystem. In J. Jacko (Ed.), HCI-2 (LNCS) (Vol. 5611, pp. 654–663). Berlin,Germany: Springer-Verlag.
Artieres, T., Marukatat, S., & Gallinari, P. (2007). Online handwritten shaperecognition using segmental hidden Markov models. IEEE Transactions onPattern Analysis and Machine Intelligence, 29, 205–217.
Barsalou, L. (1999). Perceptual symbol systems. Behavioral and BrainSciences, 22, 577–660.
Barsalou, L. (2008). Grounded cognition. Annual Review of Psychology, 59,617–645.
Becking, G. (1928). Der musikalische Rhtyhmus als Erkenntnisquelle [Musicalrhythm as a source of insight]. Augsburg, Germany: Benno Filser.
Bertini, G., & Carosi, P. (1993). Light baton system: A system for conduct-ing computer music performance. Journal of New Music Research, 22,243–257.
Bévilacqua, F., Guédy, F., Schnell, N., Fléty, E., & Leroy, N. (2007). Wirelesssensor interface and gesture-follower for music pedagogy. Proceedingsof the Conference on New Interfaces for Musical Expression (NIME).pp. 124–129.
Bévilacqua, F., Zamborlin, B., Sypniewski, A., Schnell, N., Guédy, F., &Rasamimanana, N. (2010). Continuous realtime gesture following andrecognition. In S. Kopp & I. Wachsmuth (Eds.), Gesture in embodiedcommunication and human–computer interaction (LNCS) (Vol. 5934, pp.73–84). Berlin, Germany: Springer-Verlag.
Bishop, C. (2009). Pattern recognition and machine learning. Berlin, Germany:Springer-Verlag.
Bobick, A., & Davis, J. (2001). The representation and recognition of actionusing temporal templates. IEEE Transactions on Pattern Analysis andMachine Intelligence, 23, 257–267.
Borchers, J., Hadjakos, A., & Mühlhäuser, M. (2006). MICON a music standfor interactive conducting. Proceedings of the Conference on New Interfacesfor Musical Expression (NIME), 254–259.
Bradshaw, D., & Ng, K. (2008). Analyzing a conductor’s gestures withthe Wiimote. Proceedings of the Electronic Visualisation and the ArtsConference (EVA), 22–24.
Brown, S., Martinez, M., & Parsons, L. (2004). Passive music listeningspontaneously engages limbic and paralimbic systems. Neuroreport, 15,2033–2037.
Brown, S., Martinez, M., & Parsons, L. (2006). The neural basis of humandance. Cerebral Cortex, 16, 1157–1167.
Camurri, A., Canepa, C., & Volpe, G. (2007). Active listening to a virtualorchestra through an expressive gestural interface: The Orchestra Explorer.Proceedings of the Conference on New Interfaces for Musical Expression(NIME), 56–61.
Camurri, A., Mazzarino, B., Ricchetti, M., Timmers, R., & Volpe, G. (2004).Multimodal analysis of expressive gesture in music and dance perfor-mances. In A. Camurri & G. Volpe (Eds.), Gesture in embodied communi-cation and human-computer interaction (LNCS) (Vol. 2915, pp. 357–358).Berlin, Germany: Springer-Verlag.
Camurri, A., Volpe, G., De Poli, G., & Leman, M. (2005). Communicatingexpressiveness and affect in multimodal interactive systems. IEEEMultimedia, 12, 43–53.
Chaiklin, S. (2007). Modular or integrated? An activity perspective for design-ing and evaluating computer-based systems. International Journal ofHuman–Computer Interaction, 22, 173–190.
Chen, J., Penhune, V., & Zatorre, R. (2008). Listening to musical rhythmsrecruits motor regions of the brain. Cerebral Cortex, 18, 2844–2854.
Chi, D., Costa, M., Zhao, L., & Badler, N. (2000). The EMOTE model foreffort and shape. Proceedings of the Conference on Computer Graphics andInteractive Techniques (CGIT), 173–182.
Davidson, J. (1994). What type of information is conveyed in the body move-ments of solo musician performers. Journal of Human Movement Studies,6, 279–301.
Eldridge, M., Saltzman, E., & Lahav, A. (2010). Seeing what you hear:Visual feedback improves pitch recognition. European Journal of CognitivePsychology, 22, 1078–1091.
Friberg, A. (2005). Home conducting: Control the overall musical expressionwith gestures. Proceedings of the International Computer Music Conference(ICMC), 479–482.
Dow
nloa
ded
by [
McG
ill U
nive
rsity
Lib
rary
] at
14:
21 1
7 M
ay 2
013

486 P.-J. MAES ET AL.
Godøy, R. (2010). Gestural affordances of musical sound. In R. Godøy &M. Leman (Eds.), Musical gestures: Sound, movement, and meaning. NewYork, NY: Routledge. pp. 103–125.
Godøy, R., & Leman, M. (2010). Musical gestures: Sound, movement, andmeaning. New York, NY: Routledge.
Haflich, F., & Burns, M. (1983). Following a conductor: The engineering of aninput device. Proceedings of the International Computer Music Conference(ICMC).
Hornbaek, K., & Stage, J. (2006). The interplay between usability evalua-tion and user interaction design. International Journal of Human-ComputerInteraction, 21, 117–123.
Johannsen, G., & Nakra, T. (2010). Conductors’ gestures and their mapping tosound synthesis. In Musical gestures: Sound, movement, and meaning. NewYork, NY: Routledge. pp. 264–298.
Keane, D., & Gross, P. (1989). The MIDI baton. Proceedings of theInternational Computer Music Conference (ICMC). pp. 151–154.
Koelsch, S., Fritz, T., Müller, K., & Friederici, A. (2006). Investigating emotionwith music: An fMRI study. Human Brain Mapping, 27, 239–250.
Kolesnik, P., & Wanderley, M. (2004). Recognition, analysis and performancewith expressive conducting gestures. Proceedings of the InternationalConference of Music Perception and Cognition (ICMPC).
Koutsabasis, P., & Vosinakis, S. (2012). Rethinking HCI education fordesign: Problem-based learning and virtual worlds at an HCI designstudio. International Journal of Human–Computer Interaction, 28,485–499.
Küssner, M., Gold, N., Tidhar, D., Prior, H., & Leech-Wilkinson, D. (2011).Synaesthetic traces: Digital acquisition of musical shapes. Proceedings ofthe Supporting Digital Humanities (SDH).
Laban, R. (1963). Modern educational dance. London, UK: Macdonald andEvans.
Lee, E., Karrer, T., & Borchers, J. (2006). Toward a framework for interac-tive systems to conduct digital audio and video streams. Computer MusicJournal, 30, 21–36.
Leman, M. (2007). Embodied music cognition and mediation technology.Cambridge, MA: MIT Press.
Leman, M., & Naveda, L. (2010). Basic gestures as spatiotemporal referenceframes for repetitive dance/music patterns in Samba and Charleston. MusicPerception, 28, 71–91.
Lv, F., Nevatia, R., & Lee, M. (2005). 3D human action recognitionusing spatio-temporal motion templates. Proceedings of the InternationalConference on Computer Vision in Human-Computer Interaction (ICCV-HCI), 120–130.
Maes, P.-J., Amelynck, D., & Leman, M. (2012). Dance-the-Music: An educa-tional platform for the modeling, recognition and audiovisual monitoring ofdance steps using spatiotemporal motion templates. EURASIP Journal onAdvances in Signal Processing, 2012(1).
Maes, P.-J., Leman, M., Lesaffre, M., Demey, M., & Moelants, D. (2010). Fromexpressive gesture to sound: the development of an embodied mapping tra-jectory inside a musical interface. Journal on Multimodal User Interfaces,3, 67–78.
Mahon, B. (2008). Action recognition: Is it a motor process? Current Biology,18, R1068–R1069.
Marrin, T., & Picard, R. (1998). The ‘Conductor’s Jacket’: A device for record-ing expressive musical gestures. Proceedings of the International ComputerMusic Conference (ICMC), 215–219.
Mathews, M. (1991). The radio baton and conductor program, or: Pitch, themost important and least expressive part of music. Computer Music Journal,15(4), 37–46.
Meyer, H. (1993). A computer system to improve violin intonation (Unpublisheddoctoral dissertation). New York, NY: Teachers College, ColumbiaUniversity.
Morita, H., Hashimoto, S., & Ohteru, S. (1991). A computer music system thatfollows a human conductor. IEEE Computer Magazine, pp. 44–53.
Müller, M., & Röder, T. (2006). Motion templates for automatic classificationand retrieval of motion capture data. Proceedings of the ACM/EurographicsSymposium on Computer Animation (SCA), 137–146.
Naveda, L., & Leman, M. (2010). The spatiotemporal representation of danceand music gestures using Topological Gesture Analysis (TGA). MusicPerception, 28, 93–111.
Nijs, L., Moens, B., Lesaffre, M., & Leman, M. (2012). The Music PaintMachine: Stimulating self-monitoring through the generation of creativevisual output using a technology-enhanced learning tool. Journal of NewMusic Research, 41, 79–101.
Pazzaglia, M., Pizzamiglio, L., Pes, E., & Aglioti, S. (2008). The sound ofactions in apraxia. Current Biology, 18, 1766–1772.
Phillips-Silver, J., & Trainor, L. (2005). Feeling the beat: Movement influencesinfant rhythm perception. Science, 308, 1430.
Rajko, S., & Qian, G. (2008). HMM parameter reduction for practical ges-ture recognition. Proceedings of the IEEE International Conference onAutomatic Face and Gesture Recognition (FG), 1–6.
Rajko, S., Qian, G., Ingalls, T., & James, J. (2007). Real-time gesture recogni-tion with minimal training requirements and on-line learning. Proceedingsof the IEEE Conference on Computer Vision and Pattern Recognition(CVPR), 1–8.
Repp, B. (1993). Musical motion: Some historical and contemporary perspec-tives. Proceedings of the Stockholm Music Acoustics Conference, 128–135.
Segen, J., Gluckman, J., & Kumar, S. (2002). Visual interface for conductingvirtual orchestra. Proceedings of the International Conference on PatternRecognition (ICPR), 276–279.
Serino, A., De Filippo, L., Casavecchia, C., Coccia, M., Shiffrar, M., & Làdavas,E. (2010). Lesions to the motor system affect action perception. Journal ofCognitive Neuroscience, 22, 413–426.
Swaminathan, D., Thornburg, H., Ingalls, T., Rajko, S., James, J., Campana,E., . . . Leistikow, R. (2009). Capturing expressive and indicative quali-ties of conducting gesture: an application of temporal expectancy models.In R. Kronland-Martinet, S. Ystad, & K. Jensen (Eds.), Computer musicmodeling and retrieval. Sense of sounds (LNCS) (Vol. 4969, pp. 34–55).Berlin, Germany: Springer-Verlag.
Truslit, A. (1938). Gestaltung und Bewegung in der Musik [Shape andMovement in Music]. Berlin, Germany: Chr. Friedrich Vieweg.
Young, A., Ling, M., & Arvind, D. (2007). Orient-2: A realtime wireless pos-ture tracking system using local orientation estimation. Proceedings of theWorkshop on Embedded Networked Sensors, 53–57.
Young, A., Ling, M., & Arvind, D. (2010). Distributed estimation of lin-ear acceleration for improved accuracy in wireless inertial motion cap-ture. Proceedings of the IEEE International Conference on InformationProcessing in Sensor Networks (IPSN), 256–267.
Zatorre, R., Chen, J., & Penhune, V. (2007). When the brain plays music:Auditory-motor interactions in music perception and production. NatureReviews Neuroscience, 8, 547–558.
Dow
nloa
ded
by [
McG
ill U
nive
rsity
Lib
rary
] at
14:
21 1
7 M
ay 2
013

THE “CONDUCTING MASTER” 487
ABOUT THE AUTHORSPieter-Jan Maes is currently working as a PostdoctoralResearcher at the Department of Music Research (IDMIL) atMcGill University. His research interests are grounded in theembodied music cognition paradigm and cover the relationshipbetween movement, sound, and musical meaning. He devel-ops human-computer interaction applications for the musiceducation, performance and gaming sector.
Denis Amelynck is master in engineering and works asa Ph.D. candidate at IPEM (University of Ghent). MachineLearning is one of his principal interests. His most recentresearch concerns Bayesian modeling of musical gestures pro-viding musicologists with new insights in the embodied musiccognition paradigm.
Micheline Lesaffre works as a Postdoctoral Researcherat IPEM (University of Ghent). Her main concentration over the
last period has been on user-oriented analysis, the usabilityof music tools, user experiences, and social-economic issuesrelated to stakeholders in the cultural and creative sector.
Marc Leman is “Methusalem” Professor in systematicmusicology at Ghent University and director of IPEM. Hisresearch activities are related to embodied music cognition,including musical meaning formation, the effect of music onhuman cognition and emotion, and the understanding of ges-tures.
D. K. Arvind is a Professor in the School of Informatics,Edinburgh University, where he holds the Chair in DistributedWireless Computation. He is the Director of the Centrefor Speckled Computing with research interests in thedesign of miniature networked embedded systems targeted atapplications in healthcare, digital media, and environmentalmonitoring.
Dow
nloa
ded
by [
McG
ill U
nive
rsity
Lib
rary
] at
14:
21 1
7 M
ay 2
013