The composition of polyphenols and methylxanthines in teas and herbal infusions
8
The composition of polyphenols and methylxanthines in teas and herbal infusions Dunja Horz ˇic ´, Draz ˇenka Komes * , Ana Belšc ˇak, Karin Kovac ˇevic ´ Ganic ´ , Damir Ivekovic ´ , Damir Karlovic ´ Faculty of Food Technology and Biotechnology, University of Zagreb, Pierottijeva 6, 10000 Zagreb, Croatia article info Article history: Received 22 April 2008 Received in revised form 5 November 2008 Accepted 7 December 2008 Keywords: Antioxidant capacity HPLC Methylxanthines Polyphenols Tea abstract The popularity of tea is increasing on the global aspect because of its role as a significant source of phe- nolic compounds in human diet. The purpose of this study was to determine and compare the phenolic and methylxanthine composition as well as the antioxidant capacity of white, green, Oolong and black teas, and chamomile and linden infusions depending on the extraction conditions (water temperature and multiple extractions). The content of total phenols and total flavonoids in teas and herbal infusions was determined by using UV/vis spectrophotometric methods, whilst individual polyphenols (phenolic acids and flavan-3-ols) and methylxanthines were identified and quantified by using high performance liquid chromatography coupled with photodiode array detection. In order to determine the antioxidant capacity of teas the 2,2-diphenyl-1-picrylhydrazyl (DPPH) and 2,2-azino-bis(3-ethylbenzthiazoline-6- sulphonic acid) (ABTS) radical scavenging assays were applied. The highest content of phenolic com- pounds was determined in green tea, which also demonstrated the highest antioxidant capacity, whilst herbal infusions were characterised with the lowest content of phenolic compounds, as well as the lowest antioxidant capacity. The highest content of caffeine, as the most abundant methylxanthine, was deter- mined in black tea. Extraction at 100 °C is the most effective to extract the highest content of polyphenols and methylxanthines in all studied teas. Ó 2008 Elsevier Ltd. All rights reserved. 1. Introduction In recent years, researchers have paid particular attention to the biologically active ingredients, especially alkaloids and polyphe- nols in food and beverages due to their positive effects on human health. Tea is one of the most commonly consumed beverages throughout the world. Beside the attractive aroma and specific taste, its popularity is also a result of its potentially health-promot- ing properties. Numerous epidemiological studies link tea con- sumption to a reduction of the risk of cardiovascular diseases (Hertog, Hollman, Katan, & Kromhout, 1993; Young, Hotovec, & Romero, 1967), high cholesterol levels (Maron et al., 2003; Vinson, Teufel, & Wu, 2004), diabetes (Vinson & Zhang, 2005), arthritis (Haggi et al., 1999), ostheoporosis (Hegarty, May, & Khaw, 2000) and dental caries (Otake, Makimura, Kuroki, Nishihara, & Hirasawa, 1991). These beneficial effects of tea have been attributed to the antioxidant properties of polyphenolic compounds, particularly of the catechin derivatives: ()-epicatechin, ()-epigallocatechin gal- late, ()-epigallocatechin, ()-epicatechin gallate, (+)-gallocate- chin, and (+)-catechin (Roberts & Wood, 1953). In addition to the polyphenols, tea leaves are an important source of methylxan- thines (caffeine, theobromine and theophylline) as well as amino acids (theanine), minerals and trace elements such as potassium, magnesium, calcium, nickel and zinc, which are essential to human health (Fernandez, Pablos, Martin, & Gonzalez, 2002). Methylxan- thines have physiological and pharmacological effects on some body systems, including the central nervous, cardiovascular, gas- trointestinal, respiratory and renal systems (Nehlig, Daval, & Debry, 1992; Spiller, 1998). Four types of tea are produced from the leaves of Camellia sinen- sis: white tea, green tea (both unfermented), Oolong tea (semi-fer- mented) and black tea (fermented). The fermentation of tea leaves induces enzymatic oxidation of catechins and leads to formation of two major pigments in black tea, theaflavins and thearubigins, which contribute to characteristic bright orange–red colour of black tea (Coggon, Moss, Graham, & Sanderson, 1973). In contrast with some Asian countries such as China and India, where tea drinking is a ritual and a life style, in many European countries tea consumption is infrequent and people still prefer various types of fruit teas or traditional herbal infusions (e.g. chamomile and lin- den). Tea consumption also differs, depending on the type of tea consumed and tea preparation. Habitually, in some parts of the world, tea is infused several times (repeated extractions) or pre- pared with water at different temperature. Due to the potential beneficial health effects related to tea drinking, it is interesting to closely determine and compare the chemical composition of dif- ferent teas and herbal infusions. Moreover, there is no data avail- able that shows bioactive composition of different teas and herbal infusions depending on various extraction conditions, 0308-8146/$ - see front matter Ó 2008 Elsevier Ltd. All rights reserved. doi:10.1016/j.foodchem.2008.12.022 * Corresponding author. Tel.: +385 1 4826252; fax: +385 1 4826251. E-mail address: [email protected] (D. Komes). Food Chemistry 115 (2009) 441–448 Contents lists available at ScienceDirect Food Chemistry journal homepage: www.elsevier.com/locate/foodchem
-
Upload
independent -
Category
Documents
-
view
3 -
download
0
Transcript of The composition of polyphenols and methylxanthines in teas and herbal infusions

Food Chemistry 115 (2009) 441–448
Contents lists available at ScienceDirect
Food Chemistry
journal homepage: www.elsevier .com/locate / foodchem
The composition of polyphenols and methylxanthines in teas and herbal infusions
Dunja Horzic, Drazenka Komes *, Ana Belšcak, Karin Kovacevic Ganic, Damir Ivekovic, Damir KarlovicFaculty of Food Technology and Biotechnology, University of Zagreb, Pierottijeva 6, 10000 Zagreb, Croatia
a r t i c l e i n f o
Article history:Received 22 April 2008Received in revised form 5 November 2008Accepted 7 December 2008
Keywords:Antioxidant capacityHPLCMethylxanthinesPolyphenolsTea
0308-8146/$ - see front matter � 2008 Elsevier Ltd. Adoi:10.1016/j.foodchem.2008.12.022
* Corresponding author. Tel.: +385 1 4826252; fax:E-mail address: [email protected] (D. Komes).
a b s t r a c t
The popularity of tea is increasing on the global aspect because of its role as a significant source of phe-nolic compounds in human diet. The purpose of this study was to determine and compare the phenolicand methylxanthine composition as well as the antioxidant capacity of white, green, Oolong and blackteas, and chamomile and linden infusions depending on the extraction conditions (water temperatureand multiple extractions). The content of total phenols and total flavonoids in teas and herbal infusionswas determined by using UV/vis spectrophotometric methods, whilst individual polyphenols (phenolicacids and flavan-3-ols) and methylxanthines were identified and quantified by using high performanceliquid chromatography coupled with photodiode array detection. In order to determine the antioxidantcapacity of teas the 2,2-diphenyl-1-picrylhydrazyl (DPPH) and 2,2-azino-bis(3-ethylbenzthiazoline-6-sulphonic acid) (ABTS) radical scavenging assays were applied. The highest content of phenolic com-pounds was determined in green tea, which also demonstrated the highest antioxidant capacity, whilstherbal infusions were characterised with the lowest content of phenolic compounds, as well as the lowestantioxidant capacity. The highest content of caffeine, as the most abundant methylxanthine, was deter-mined in black tea. Extraction at 100 �C is the most effective to extract the highest content of polyphenolsand methylxanthines in all studied teas.
� 2008 Elsevier Ltd. All rights reserved.
1. Introduction
In recent years, researchers have paid particular attention to thebiologically active ingredients, especially alkaloids and polyphe-nols in food and beverages due to their positive effects on humanhealth. Tea is one of the most commonly consumed beveragesthroughout the world. Beside the attractive aroma and specifictaste, its popularity is also a result of its potentially health-promot-ing properties. Numerous epidemiological studies link tea con-sumption to a reduction of the risk of cardiovascular diseases(Hertog, Hollman, Katan, & Kromhout, 1993; Young, Hotovec, &Romero, 1967), high cholesterol levels (Maron et al., 2003; Vinson,Teufel, & Wu, 2004), diabetes (Vinson & Zhang, 2005), arthritis(Haggi et al., 1999), ostheoporosis (Hegarty, May, & Khaw, 2000)and dental caries (Otake, Makimura, Kuroki, Nishihara, & Hirasawa,1991). These beneficial effects of tea have been attributed to theantioxidant properties of polyphenolic compounds, particularly ofthe catechin derivatives: (�)-epicatechin, (�)-epigallocatechin gal-late, (�)-epigallocatechin, (�)-epicatechin gallate, (+)-gallocate-chin, and (+)-catechin (Roberts & Wood, 1953). In addition to thepolyphenols, tea leaves are an important source of methylxan-thines (caffeine, theobromine and theophylline) as well as aminoacids (theanine), minerals and trace elements such as potassium,
ll rights reserved.
+385 1 4826251.
magnesium, calcium, nickel and zinc, which are essential to humanhealth (Fernandez, Pablos, Martin, & Gonzalez, 2002). Methylxan-thines have physiological and pharmacological effects on somebody systems, including the central nervous, cardiovascular, gas-trointestinal, respiratory and renal systems (Nehlig, Daval, &Debry, 1992; Spiller, 1998).
Four types of tea are produced from the leaves of Camellia sinen-sis: white tea, green tea (both unfermented), Oolong tea (semi-fer-mented) and black tea (fermented). The fermentation of tea leavesinduces enzymatic oxidation of catechins and leads to formation oftwo major pigments in black tea, theaflavins and thearubigins,which contribute to characteristic bright orange–red colour ofblack tea (Coggon, Moss, Graham, & Sanderson, 1973). In contrastwith some Asian countries such as China and India, where teadrinking is a ritual and a life style, in many European countriestea consumption is infrequent and people still prefer various typesof fruit teas or traditional herbal infusions (e.g. chamomile and lin-den). Tea consumption also differs, depending on the type of teaconsumed and tea preparation. Habitually, in some parts of theworld, tea is infused several times (repeated extractions) or pre-pared with water at different temperature. Due to the potentialbeneficial health effects related to tea drinking, it is interestingto closely determine and compare the chemical composition of dif-ferent teas and herbal infusions. Moreover, there is no data avail-able that shows bioactive composition of different teas andherbal infusions depending on various extraction conditions,

442 D. Horzic et al. / Food Chemistry 115 (2009) 441–448
especially multiple extractions. Therefore, the aim of this study isto compare the content of polyphenols and methylxanthines inteas and herbal infusions, as well as their antioxidant capacity,and to determine the effect of different extraction conditions(water temperature and multiple extractions) on the content ofthese biologically active compounds, in order to define the optimalextraction conditions for each type of tea.
2. Experimental
2.1. Chemicals
Folin–Ciocalteu, formic acid, ammonium peroxodisulphate, so-dium carbonate, formaldehyde and hydrochloric acid were of ana-lytical grade and supplied from Kemika (Zagreb, Croatia). DPPH(2,2-diphenyl-1-picrylhydrazyl) was supplied from Fluka (Buchs,Switzerland) and methanol (HPLC grade) was purchased from J.T.Baker (Deventer, Netherlands). Trolox (6-hydroxy-2,5,7,8-tetrame-thylchromane-2-carboxylic acid), ABTS (2,20-azino-bis(3-ethyl-benzthiazoline-6-sulphonic acid)diammonium salt) as well ascaffeine (CF), theobromine (TB), theophylline (TP), (�)-epicatechin(EC), (�)-epigallocatechin gallate (EGCG), (�)-epicatechin gallate(ECG), (+)-gallocatechin (GC), (�)-gallocatechin gallate (GCG), (+)-catechin (C), gallic acid (GA), chlorogenic acid (CHLA), ferulic acid(FA), caffeic acid (CA), p-coumaric acid (p-coumA) and vanillic acid(VA) were obtained from Aldrich (Sigma–Aldrich Chemie, Stein-heim, Germany).
2.2. Sample preparation
Six types of tea in loose leaf form: Pai Mu Tan-superior (Chinesewhite tea, WT), Gyokuro (Japanese green tea, GT), Formosa FineOolong (Taiwanese Oolong tea, OT), Lingia (Indian black tea, BT),Linden (Croatian herbal tea, LT) and Chamomile (Croatian herbaltea, CT) were purchased from a local market. In order to simulatehousehold brewing conditions for a cup of tea, teas were preparedusing an aqueous extraction procedure. Tea samples (2.0 g) werepoured with 200 ml of deionised water heated to 60, 80, and100 �C and stirred with a glass rod for 3 min. Both tea extractsand herbal infusions were then filtered through a tea strainer. Inorder to study the effect of multiple extractions on the polyphenoland methylxanthine content of tea samples, each sample was ex-tracted three times at the same conditions (80 �C/3 min). To deter-mine the effect of milk or lemon juice on the antioxidant capacityof tea samples, 5 ml of milk or freshly squeeze lemon juice wasadded to 100 ml of tea extract.
2.3. Determination of total phenol and total flavonoid content
Total phenol content (TPC) in teas and herbal infusions wasdetermined spectrophotometrically according to the modified Fo-lin–Ciocalteu method described by Lachman, Hosnedl, Pivec, andOrsák (1998). The method is based on the reduction of phospho-tungstic acid (H3P[W3O10]4) in alkaline solution to phosphotung-stic blue. The absorbance of formed phosphotungstic blue isproportional to the number of aromatic phenolic groups and isused for their quantification, with gallic acid as the standard.Briefly, to a volume of 0.5 ml of a sample, 2.5 ml Folin–Ciocalteu’sreagent, 30 ml distilled water and 7.5 ml of 20% Na2CO3 was addedand diluted to 50 ml with distilled water. After 2 h, the absorbancewas measured at 765 nm against blank.
To determine total flavonoid content (TFC), formaldehyde wasadded to tea extracts. Flavonoids containing characteristic 5,7-dihydroxy moiety react with formaldehyde forming methyl deri-vates at positions C-6 or C-8. These methyl derivatives are stillreactive and undergo further reaction with other flavonoid
molecules, leading to the formation of condensed products andtheir precipitation from the solution. Precipitated flavonoids wereseparated from the solution by filtration and non-flavonoid phe-nols remaining in the filtrate were determined by Folin–Ciocalteumethod, as described previously. TFC was calculated as the differ-ence between TPC and non-flavonoid phenol content. The resultswere expressed as mg/l of gallic acid equivalents (GAEs) (Kramling& Singleton, 1969). All measurements were performed in triplicate.
2.4. HPLC analysis of phenolic compounds and methylxanthines
Varian HPLC system (Varian, Walnut Creek, USA) consisting ofPro Star Solvent Delivery System 230 and Pro Star 330 photodiodearray detector (PDA) and controlled by Star ChromatographyWorkstation Version 5 software was used for HPLC analysis ofsamples. Separation was performed using a reversed-phase Pinna-cle II C-18 column (Restek, USA) (250 mm � 4.6 mm � 5 lm). Thesamples were filtered through a 0.45 lm membrane filter (nylonmembranes, Supelco, USA) and 20 ll of each sample was injectedfor HPLC analysis. The solvent compositions used were 3% formicacid (solvent A) and HPLC grade methanol (solvent B) at a flow rateof 1 ml/min. The elution was performed with a gradient starting at2% B to reach 32% B at 20 min, 40% B at 30 min and 95% B at 40 min,and becoming isocratic for 5 min. Chromatograms were recordedat 278 nm. PDA detection was performed by recording the absor-bance of the eluate between 200 and 400 nm, with a resolutionof 1.2 nm. Phenolic compounds were identified by comparing theretention times and spectral data with those of authentic stan-dards. All analyses were repeated three times.
2.5. Determination of antioxidant capacity
2.5.1. Free radical scavenging ability by the use of DPPH radicalThis method is based on the reduction of stable DPPH (2,2-di-
phenyl-1-picrylhydrazyl) radical by antioxidants in a methanolicsolution. In the presence of antioxidants the purple colour of theDPPH radical solution changes to a bright yellow and the intensityof this change can be monitored spectrophotometrically (Blois,1958). The samples were analysed according to the method re-ported by Brand-Williams, Cuvelier, and Berset (1995). In brief, avolume of 3.8 ml of methanolic DPPH solution, c(DPPH) = 0.094mmol/l, was added to 200 ll of diluted sample and the free radicalscavenging capacity of the sample was evaluated by measuring theabsorbance at 517 nm immediately after the addition of DPPH(t = 0) and at 1 min intervals, until the radical scavenging reactionreached to steady state. The results were expressed as the percent-age of reduction (inhibition) of the DPPH (Q), which is defined byfollowing expression: Q ¼ 100 � ðA0 � AsÞ=A0 where A0 is the initialabsorbance and As is the value of absorbance after the reactionreached to steady state (Yen & Duh, 1994). All determinations wereperformed in triplicate.
2.5.2. Free radical scavenging ability by the use of ABTS radical cationDetermination of antioxidant capacity of teas and herbal infu-
sions was performed by Trolox Equivalent Antioxidant Capacity(TEAC) method adapted for flow injection analysis (FIA) (Ivekovic,Milardovic, Roboz, & Grabaric, 2005). TEAC method is based on thescavenging of stable blue–green ABTS radical cation (ABTS*+),which is formed either by chemical (Re et al., 1999; Van der Berg,Haenen, Van der Berg, & Bast, 1999) or enzymatic (Arnao, Cano, &Acosta, 2001; Lemanska et al., 2001) oxidation of ABTS severalhours prior to the analysis. The amount of ABTS radical cation scav-enged by antioxidants is measured by monitoring the decrease ofabsorbance of ABTS radical cation, and compared with the decreaseof absorbance produced by the addition of a known amount ofTrolox, a water soluble vitamin E analogue. In order to avoid the

0
250
500
750
1000
1250
1500
1750
2000
60°C 80°C(1st)
2nd 3rd 100°C 60°C 80°C(1st)
2nd 3rd 100°C 60°C 80°C(1st)
2nd 3rd 100°C 60°C 80°C(1st)
2nd 3rd 100°C 60°C 80°C(1st))
2nd 3rd 100°C
60°C 80°C(1st)
2nd 3rd 100°C
CILIBTOTGTWT
mg
GA
E/l
Total nonflavonoids Total flavonoids
Fig. 1. Total nonflavonoid and flavonoid content in teas and herbal infusions affected by water temperatures and multiple extractions at 80 �C (1st extraction, 2nd extractionand 3rd extraction of the same sample – WT-white tea, GT-green tea, OT-oolong tea, BT-black tea, LI-linden infusion and CI-chamomile infusion). Results are expressed as mgGAE/l ± SD.
D. Horzic et al. / Food Chemistry 115 (2009) 441–448 443
time consuming step of ABTS radical cation preparation, in thiswork we employed the FIA modification of TEAC method, basedon the electrochemical production of ABTS radical cation in theelectrolysis flow-cell forming the part of FIA system (Ivekovicet al., 2005). A 0.1 mol/l phosphate buffer solution (pH = 7.40)was used as a carrier stream, and the solution of ABTS radical cat-ion generated electrochemically was employed as a second (re-agent) stream. Both streams were pumped at a flow rate of0.5 ml/min. The carrier and reagent streams were mixed by passingthrough a mixing coil and the absorbance at 734 nm was moni-tored by a detector placed just after the mixing coil. For the anal-ysis an aliquot of 20 ll of diluted sample was injected into thecarrier stream. The height of the FIA peak obtained by the sampleinjection (DAsample) was compared with the height of the peak pro-duced by the injection of 0.6 mmol/l Trolox solution (DATrolox). TheTEAC values were then determined according to the formula:TEAC ¼ DAsample � cðTroloxÞDATrolox, and expressed as equivalentconcentration of Trolox.
2.6. Statistical analysis
The results were statistically analysed using the Statistica 6.0software to determine the mean value and standard error. The ef-fect of water temperature and multiple extractions on the contentof extracted polyphenols and methylxanthines were analysed byANOVA and Duncan’s multiple range test.
3. Results and discussion
Total phenol content (TPC) and total flavonoid content (TFC) ofwhite, green, Oolong and black teas, linden and chamomile infu-sions, affected by water temperatures (60, 80, and 100 �C) and mul-tiple extractions (1st, 2nd and 3rd), are presented in Fig. 1. As canbe seen, TPC of teas decreases in the following order:GT > BT > OT > WT at water temperatures of 60 and 80 �C, andBT > GT > OT > WT at water temperature of 100 �C. In case of infu-sions, it decreases in following orders: CI > LI, CI = LI and CI > LI atwater temperatures of 60, 80 and 100 �C, respectively. The ob-tained results confirmed previously published data (Perva-Uzunal-
ic et al., 2006) that water at higher temperature extracted higherTPC and TFC, which reached to their maximum values at 100 �C.As shown in Fig. 1 green tea was recognised as the richest sourceof both total phenols (1380 mg/l GAE at 60 �C and 1830 mg/l GAEat 100 �C) and flavonoids (1070 mg/l GAE at 60 �C and 1280 mg/lGAE at 100 �C), whilst herbal infusions, especially linden, containedthe lowest content of TPC and TFC. At 80 �C TPC and TFC in lindeninfusion were 230 and 65 mg/l GAE, respectively.
Multiple extractions of individual teas and herbal infusions at80 �C yielded significantly (p < 0.05) lower TPC and TFC: 1st extrac-tion > 2nd extraction P 3rd extraction. The 2nd extraction stillyields a certain TPC and TFC, exhausting the original plant materialof these compounds. As a consequence, TPC and TFC in the 3rd ex-tracts were the lowest and in herbal infusions almost negligible,making the 3rd extraction fairly inefficient. Black tea extractsresulting from 2nd and 3rd extraction contained the highest TPCas well as TFC of all repeated extracts. Analysis of variance andDuncan’s multiple range test point out a significant influence ofmultiple extractions (p < 0.05) on TPC and TFC.
Table 1 summarises the contents of identified flavan-3-ols intested teas affected by water temperature. From the group of fla-van-3-ols (�)-epicatechin (EC), (�)-epigallocatechin-3-gallate(EGCG), (�)-epicatechin-3-gallate (ECG), (+)-gallocatechin (GC),(�)-gallocatechin-3-gallate (GCG), (+)-catechin (C) and (�)-epigal-locatechin (EGC) were identified. These molecules with high nutra-ceutical potential are colourless and water-soluble compoundswhich impart bitterness and astringency to tea extracts (Wang,Provan, & Helliwell, 2000). The most abundant phenolic compoundin all tested teas was EGCG, with the highest content determined ingreen tea, prepared at 100 �C (370 mg/l). In comparison with otherteas, green tea contained the highest content of almost all identi-fied flavan-3-ols, except GC and ECG (most abundant in black teaprepared at 100 �C). Lower content of the flavan-3-ol monomersis expected for the fully fermented black tea, whilst intermediatecontent is anticipated for the partially fermented Oolong tea (Kil-martin & Hsu, 2003). In chamomile infusion only EGCG and ECGwere extracted at all water temperatures and in all repeated ex-tracts, whilst EGC and EC were extracted only in infusion preparedat 80 �C. The water temperature showed significant influence
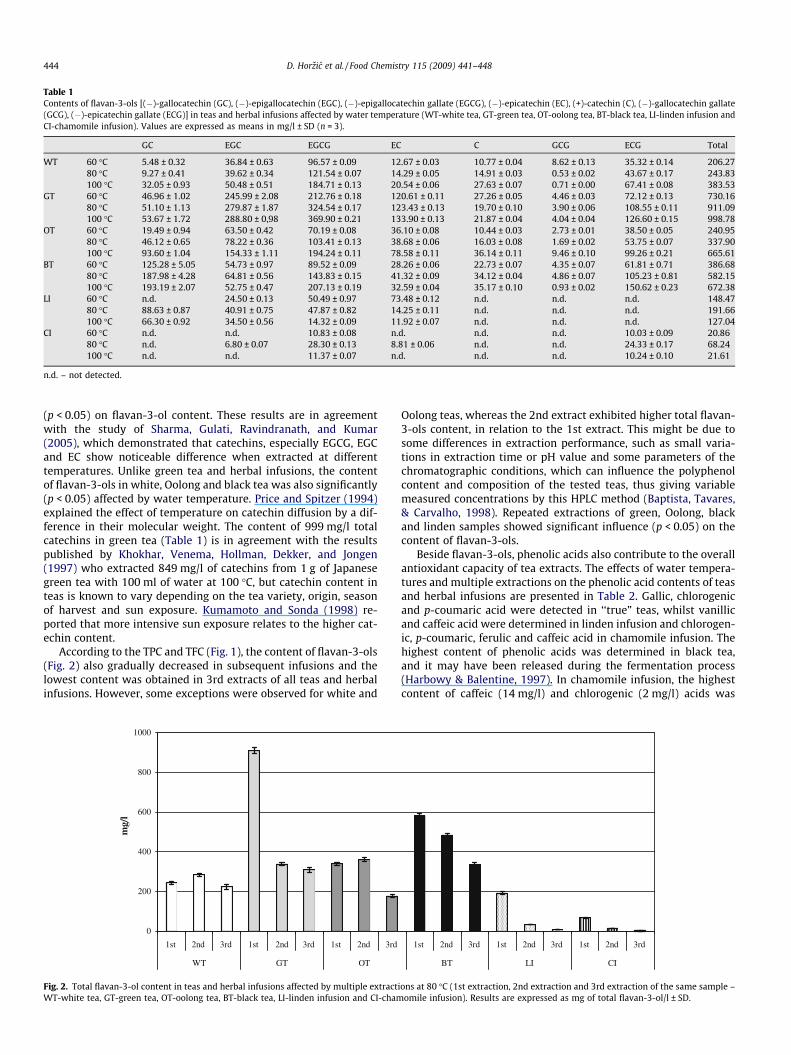
Table 1Contents of flavan-3-ols [(�)-gallocatechin (GC), (�)-epigallocatechin (EGC), (�)-epigallocatechin gallate (EGCG), (�)-epicatechin (EC), (+)-catechin (C), (�)-gallocatechin gallate(GCG), (�)-epicatechin gallate (ECG)] in teas and herbal infusions affected by water temperature (WT-white tea, GT-green tea, OT-oolong tea, BT-black tea, LI-linden infusion andCI-chamomile infusion). Values are expressed as means in mg/l ± SD (n = 3).
GC EGC EGCG EC C GCG ECG Total
WT 60 �C 5.48 ± 0.32 36.84 ± 0.63 96.57 ± 0.09 12.67 ± 0.03 10.77 ± 0.04 8.62 ± 0.13 35.32 ± 0.14 206.2780 �C 9.27 ± 0.41 39.62 ± 0.34 121.54 ± 0.07 14.29 ± 0.05 14.91 ± 0.03 0.53 ± 0.02 43.67 ± 0.17 243.83100 �C 32.05 ± 0.93 50.48 ± 0.51 184.71 ± 0.13 20.54 ± 0.06 27.63 ± 0.07 0.71 ± 0.00 67.41 ± 0.08 383.53
GT 60 �C 46.96 ± 1.02 245.99 ± 2.08 212.76 ± 0.18 120.61 ± 0.11 27.26 ± 0.05 4.46 ± 0.03 72.12 ± 0.13 730.1680 �C 51.10 ± 1.13 279.87 ± 1.87 324.54 ± 0.17 123.43 ± 0.13 19.70 ± 0.10 3.90 ± 0.06 108.55 ± 0.11 911.09100 �C 53.67 ± 1.72 288.80 ± 0,98 369.90 ± 0.21 133.90 ± 0.13 21.87 ± 0.04 4.04 ± 0.04 126.60 ± 0.15 998.78
OT 60 �C 19.49 ± 0.94 63.50 ± 0.42 70.19 ± 0.08 36.10 ± 0.08 10.44 ± 0.03 2.73 ± 0.01 38.50 ± 0.05 240.9580 �C 46.12 ± 0.65 78.22 ± 0.36 103.41 ± 0.13 38.68 ± 0.06 16.03 ± 0.08 1.69 ± 0.02 53.75 ± 0.07 337.90100 �C 93.60 ± 1.04 154.33 ± 1.11 194.24 ± 0.11 78.58 ± 0.11 36.14 ± 0.11 9.46 ± 0.10 99.26 ± 0.21 665.61
BT 60 �C 125.28 ± 5.05 54.73 ± 0.97 89.52 ± 0.09 28.26 ± 0.06 22.73 ± 0.07 4.35 ± 0.07 61.81 ± 0.71 386.6880 �C 187.98 ± 4.28 64.81 ± 0.56 143.83 ± 0.15 41.32 ± 0.09 34.12 ± 0.04 4.86 ± 0.07 105.23 ± 0.81 582.15100 �C 193.19 ± 2.07 52.75 ± 0.47 207.13 ± 0.19 32.59 ± 0.04 35.17 ± 0.10 0.93 ± 0.02 150.62 ± 0.23 672.38
LI 60 �C n.d. 24.50 ± 0.13 50.49 ± 0.97 73.48 ± 0.12 n.d. n.d. n.d. 148.4780 �C 88.63 ± 0.87 40.91 ± 0.75 47.87 ± 0.82 14.25 ± 0.11 n.d. n.d. n.d. 191.66100 �C 66.30 ± 0.92 34.50 ± 0.56 14.32 ± 0.09 11.92 ± 0.07 n.d. n.d. n.d. 127.04
CI 60 �C n.d. n.d. 10.83 ± 0.08 n.d. n.d. n.d. 10.03 ± 0.09 20.8680 �C n.d. 6.80 ± 0.07 28.30 ± 0.13 8.81 ± 0.06 n.d. n.d. 24.33 ± 0.17 68.24100 �C n.d. n.d. 11.37 ± 0.07 n.d. n.d. n.d. 10.24 ± 0.10 21.61
n.d. – not detected.
444 D. Horzic et al. / Food Chemistry 115 (2009) 441–448
(p < 0.05) on flavan-3-ol content. These results are in agreementwith the study of Sharma, Gulati, Ravindranath, and Kumar(2005), which demonstrated that catechins, especially EGCG, EGCand EC show noticeable difference when extracted at differenttemperatures. Unlike green tea and herbal infusions, the contentof flavan-3-ols in white, Oolong and black tea was also significantly(p < 0.05) affected by water temperature. Price and Spitzer (1994)explained the effect of temperature on catechin diffusion by a dif-ference in their molecular weight. The content of 999 mg/l totalcatechins in green tea (Table 1) is in agreement with the resultspublished by Khokhar, Venema, Hollman, Dekker, and Jongen(1997) who extracted 849 mg/l of catechins from 1 g of Japanesegreen tea with 100 ml of water at 100 �C, but catechin content inteas is known to vary depending on the tea variety, origin, seasonof harvest and sun exposure. Kumamoto and Sonda (1998) re-ported that more intensive sun exposure relates to the higher cat-echin content.
According to the TPC and TFC (Fig. 1), the content of flavan-3-ols(Fig. 2) also gradually decreased in subsequent infusions and thelowest content was obtained in 3rd extracts of all teas and herbalinfusions. However, some exceptions were observed for white and
0
200
400
600
800
1000
1st 2nd 3rd 1st 2nd 3rd 1st 2nd 3rd
WT GT OT
mg/
l
Fig. 2. Total flavan-3-ol content in teas and herbal infusions affected by multiple extractiWT-white tea, GT-green tea, OT-oolong tea, BT-black tea, LI-linden infusion and CI-cham
Oolong teas, whereas the 2nd extract exhibited higher total flavan-3-ols content, in relation to the 1st extract. This might be due tosome differences in extraction performance, such as small varia-tions in extraction time or pH value and some parameters of thechromatographic conditions, which can influence the polyphenolcontent and composition of the tested teas, thus giving variablemeasured concentrations by this HPLC method (Baptista, Tavares,& Carvalho, 1998). Repeated extractions of green, Oolong, blackand linden samples showed significant influence (p < 0.05) on thecontent of flavan-3-ols.
Beside flavan-3-ols, phenolic acids also contribute to the overallantioxidant capacity of tea extracts. The effects of water tempera-tures and multiple extractions on the phenolic acid contents of teasand herbal infusions are presented in Table 2. Gallic, chlorogenicand p-coumaric acid were detected in ‘‘true” teas, whilst vanillicand caffeic acid were determined in linden infusion and chlorogen-ic, p-coumaric, ferulic and caffeic acid in chamomile infusion. Thehighest content of phenolic acids was determined in black tea,and it may have been released during the fermentation process(Harbowy & Balentine, 1997). In chamomile infusion, the highestcontent of caffeic (14 mg/l) and chlorogenic (2 mg/l) acids was
1st 2nd 3rd 1st 2nd 3rd 1st 2nd 3rd
BT LI CI
ons at 80 �C (1st extraction, 2nd extraction and 3rd extraction of the same sample –omile infusion). Results are expressed as mg of total flavan-3-ol/l ± SD.
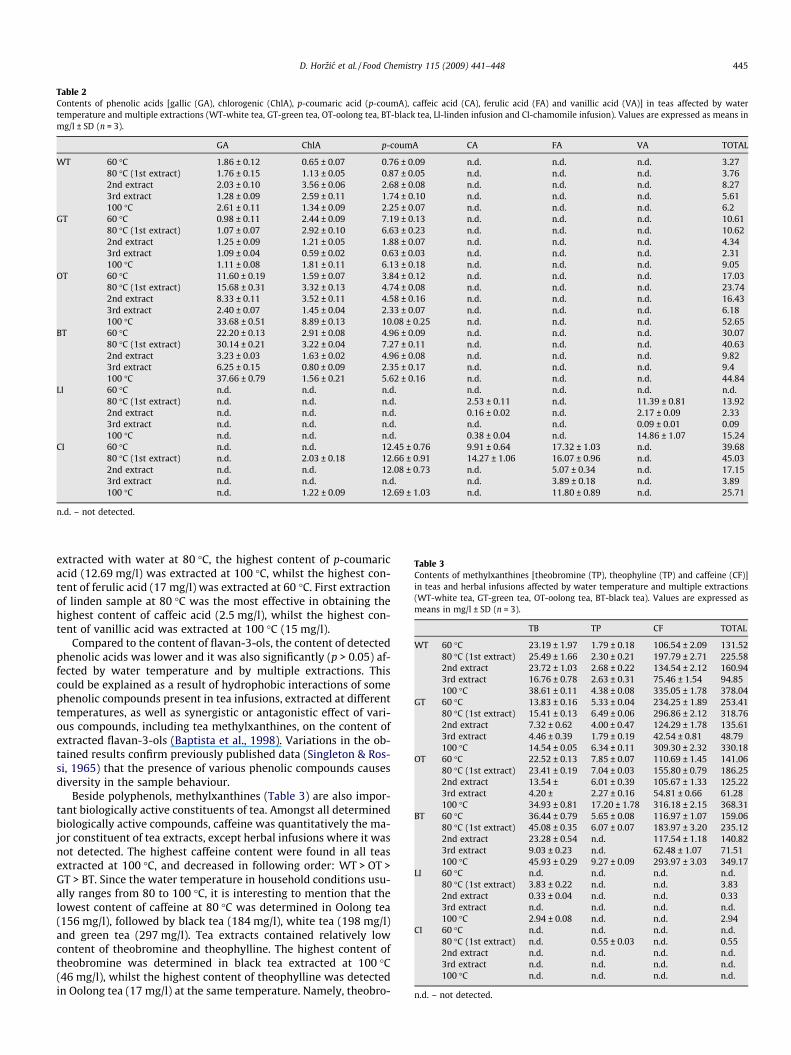
Table 2Contents of phenolic acids [gallic (GA), chlorogenic (ChlA), p-coumaric acid (p-coumA), caffeic acid (CA), ferulic acid (FA) and vanillic acid (VA)] in teas affected by watertemperature and multiple extractions (WT-white tea, GT-green tea, OT-oolong tea, BT-black tea, LI-linden infusion and CI-chamomile infusion). Values are expressed as means inmg/l ± SD (n = 3).
GA ChlA p-coumA CA FA VA TOTAL
WT 60 �C 1.86 ± 0.12 0.65 ± 0.07 0.76 ± 0.09 n.d. n.d. n.d. 3.2780 �C (1st extract) 1.76 ± 0.15 1.13 ± 0.05 0.87 ± 0.05 n.d. n.d. n.d. 3.762nd extract 2.03 ± 0.10 3.56 ± 0.06 2.68 ± 0.08 n.d. n.d. n.d. 8.273rd extract 1.28 ± 0.09 2.59 ± 0.11 1.74 ± 0.10 n.d. n.d. n.d. 5.61100 �C 2.61 ± 0.11 1.34 ± 0.09 2.25 ± 0.07 n.d. n.d. n.d. 6.2
GT 60 �C 0.98 ± 0.11 2.44 ± 0.09 7.19 ± 0.13 n.d. n.d. n.d. 10.6180 �C (1st extract) 1.07 ± 0.07 2.92 ± 0.10 6.63 ± 0.23 n.d. n.d. n.d. 10.622nd extract 1.25 ± 0.09 1.21 ± 0.05 1.88 ± 0.07 n.d. n.d. n.d. 4.343rd extract 1.09 ± 0.04 0.59 ± 0.02 0.63 ± 0.03 n.d. n.d. n.d. 2.31100 �C 1.11 ± 0.08 1.81 ± 0.11 6.13 ± 0.18 n.d. n.d. n.d. 9.05
OT 60 �C 11.60 ± 0.19 1.59 ± 0.07 3.84 ± 0.12 n.d. n.d. n.d. 17.0380 �C (1st extract) 15.68 ± 0.31 3.32 ± 0.13 4.74 ± 0.08 n.d. n.d. n.d. 23.742nd extract 8.33 ± 0.11 3.52 ± 0.11 4.58 ± 0.16 n.d. n.d. n.d. 16.433rd extract 2.40 ± 0.07 1.45 ± 0.04 2.33 ± 0.07 n.d. n.d. n.d. 6.18100 �C 33.68 ± 0.51 8.89 ± 0.13 10.08 ± 0.25 n.d. n.d. n.d. 52.65
BT 60 �C 22.20 ± 0.13 2.91 ± 0.08 4.96 ± 0.09 n.d. n.d. n.d. 30.0780 �C (1st extract) 30.14 ± 0.21 3.22 ± 0.04 7.27 ± 0.11 n.d. n.d. n.d. 40.632nd extract 3.23 ± 0.03 1.63 ± 0.02 4.96 ± 0.08 n.d. n.d. n.d. 9.823rd extract 6.25 ± 0.15 0.80 ± 0.09 2.35 ± 0.17 n.d. n.d. n.d. 9.4100 �C 37.66 ± 0.79 1.56 ± 0.21 5.62 ± 0.16 n.d. n.d. n.d. 44.84
LI 60 �C n.d. n.d. n.d. n.d. n.d. n.d. n.d.80 �C (1st extract) n.d. n.d. n.d. 2.53 ± 0.11 n.d. 11.39 ± 0.81 13.922nd extract n.d. n.d. n.d. 0.16 ± 0.02 n.d. 2.17 ± 0.09 2.333rd extract n.d. n.d. n.d. n.d. n.d. 0.09 ± 0.01 0.09100 �C n.d. n.d. n.d. 0.38 ± 0.04 n.d. 14.86 ± 1.07 15.24
CI 60 �C n.d. n.d. 12.45 ± 0.76 9.91 ± 0.64 17.32 ± 1.03 n.d. 39.6880 �C (1st extract) n.d. 2.03 ± 0.18 12.66 ± 0.91 14.27 ± 1.06 16.07 ± 0.96 n.d. 45.032nd extract n.d. n.d. 12.08 ± 0.73 n.d. 5.07 ± 0.34 n.d. 17.153rd extract n.d. n.d. n.d. n.d. 3.89 ± 0.18 n.d. 3.89100 �C n.d. 1.22 ± 0.09 12.69 ± 1.03 n.d. 11.80 ± 0.89 n.d. 25.71
n.d. – not detected.
Table 3Contents of methylxanthines [theobromine (TP), theophyline (TP) and caffeine (CF)]in teas and herbal infusions affected by water temperature and multiple extractions(WT-white tea, GT-green tea, OT-oolong tea, BT-black tea). Values are expressed asmeans in mg/l ± SD (n = 3).
TB TP CF TOTAL
WT 60 �C 23.19 ± 1.97 1.79 ± 0.18 106.54 ± 2.09 131.5280 �C (1st extract) 25.49 ± 1.66 2.30 ± 0.21 197.79 ± 2.71 225.582nd extract 23.72 ± 1.03 2.68 ± 0.22 134.54 ± 2.12 160.943rd extract 16.76 ± 0.78 2.63 ± 0.31 75.46 ± 1.54 94.85100 �C 38.61 ± 0.11 4.38 ± 0.08 335.05 ± 1.78 378.04
GT 60 �C 13.83 ± 0.16 5.33 ± 0.04 234.25 ± 1.89 253.4180 �C (1st extract) 15.41 ± 0.13 6.49 ± 0.06 296.86 ± 2.12 318.762nd extract 7.32 ± 0.62 4.00 ± 0.47 124.29 ± 1.78 135.613rd extract 4.46 ± 0.39 1.79 ± 0.19 42.54 ± 0.81 48.79100 �C 14.54 ± 0.05 6.34 ± 0.11 309.30 ± 2.32 330.18
OT 60 �C 22.52 ± 0.13 7.85 ± 0.07 110.69 ± 1.45 141.0680 �C (1st extract) 23.41 ± 0.19 7.04 ± 0.03 155.80 ± 0.79 186.252nd extract 13.54 ± 6.01 ± 0.39 105.67 ± 1.33 125.223rd extract 4.20 ± 2.27 ± 0.16 54.81 ± 0.66 61.28100 �C 34.93 ± 0.81 17.20 ± 1.78 316.18 ± 2.15 368.31
BT 60 �C 36.44 ± 0.79 5.65 ± 0.08 116.97 ± 1.07 159.0680 �C (1st extract) 45.08 ± 0.35 6.07 ± 0.07 183.97 ± 3.20 235.122nd extract 23.28 ± 0.54 n.d. 117.54 ± 1.18 140.823rd extract 9.03 ± 0.23 n.d. 62.48 ± 1.07 71.51100 �C 45.93 ± 0.29 9.27 ± 0.09 293.97 ± 3.03 349.17
LI 60 �C n.d. n.d. n.d. n.d.80 �C (1st extract) 3.83 ± 0.22 n.d. n.d. 3.832nd extract 0.33 ± 0.04 n.d. n.d. 0.333rd extract n.d. n.d. n.d. n.d.100 �C 2.94 ± 0.08 n.d. n.d. 2.94
CI 60 �C n.d. n.d. n.d. n.d.80 �C (1st extract) n.d. 0.55 ± 0.03 n.d. 0.552nd extract n.d. n.d. n.d. n.d.3rd extract n.d. n.d. n.d. n.d.100 �C n.d. n.d. n.d. n.d.
n.d. – not detected.
D. Horzic et al. / Food Chemistry 115 (2009) 441–448 445
extracted with water at 80 �C, the highest content of p-coumaricacid (12.69 mg/l) was extracted at 100 �C, whilst the highest con-tent of ferulic acid (17 mg/l) was extracted at 60 �C. First extractionof linden sample at 80 �C was the most effective in obtaining thehighest content of caffeic acid (2.5 mg/l), whilst the highest con-tent of vanillic acid was extracted at 100 �C (15 mg/l).
Compared to the content of flavan-3-ols, the content of detectedphenolic acids was lower and it was also significantly (p > 0.05) af-fected by water temperature and by multiple extractions. Thiscould be explained as a result of hydrophobic interactions of somephenolic compounds present in tea infusions, extracted at differenttemperatures, as well as synergistic or antagonistic effect of vari-ous compounds, including tea methylxanthines, on the content ofextracted flavan-3-ols (Baptista et al., 1998). Variations in the ob-tained results confirm previously published data (Singleton & Ros-si, 1965) that the presence of various phenolic compounds causesdiversity in the sample behaviour.
Beside polyphenols, methylxanthines (Table 3) are also impor-tant biologically active constituents of tea. Amongst all determinedbiologically active compounds, caffeine was quantitatively the ma-jor constituent of tea extracts, except herbal infusions where it wasnot detected. The highest caffeine content were found in all teasextracted at 100 �C, and decreased in following order: WT > OT >GT > BT. Since the water temperature in household conditions usu-ally ranges from 80 to 100 �C, it is interesting to mention that thelowest content of caffeine at 80 �C was determined in Oolong tea(156 mg/l), followed by black tea (184 mg/l), white tea (198 mg/l)and green tea (297 mg/l). Tea extracts contained relatively lowcontent of theobromine and theophylline. The highest content oftheobromine was determined in black tea extracted at 100 �C(46 mg/l), whilst the highest content of theophylline was detectedin Oolong tea (17 mg/l) at the same temperature. Namely, theobro-

Table 4Antioxidant capacity of teas and herbal infusions evaluated by DPPH and ABTS assays, affected by water temperatures, multiple extractions and addition of milk and lemon (WT-white tea, GT-green tea, OT-oolong tea, BT-black tea, LI-linden infusion, CI-chamomile infusion). Values are expressed as% of inhibition ± SD, and mmol/l Trolox ± SD (n = 3).
WT GT OT BT LI CI
DPPH (% inhibition)60 �C 85.22 ± 5.8 86.13 ± 4.1 87.96 ± 8.2 86.86 ± 4.6 66.12 ± 3.9 65.13 ± 6.580 �C (1st extract) 85.77 ± 3.4 88.50 ± 3.6 88.87 ± 7.3 88.32 ± 5.2 68.23 ± 8.1 71.10 ± 4.72nd extract 72.78 ± 4.9 33.39 ± 0.7 76.24 ± 7.3 78.16 ± 8.2 38.63 ± 3.1 48.25 ± 3.63rd extract 51.08 ± 3.7 21.05 ± 2.0 35.42 ± 2.9 52.76 ± 4.6 36.41 ± 0.7 45.97 ± 2.9100 �C 88.32 ± 9.9 89.23 ± 8.7 89.59 ± 4.9 89.42 ± 7.1 67.92 ± 2.8 69.57 ± 3.7ABTS (mmol/l Trolox)60 �C 3.21 ± 0.19 8.12 ± 0.22 4.44 ± 0.16 7.95 ± 0.23 0.58 ± 0.02 0.27 ± 0.0180 �C (1st extract) 5.21 ± 0.2 9.78 ± 0.31 6.22 ± 0.08 8.79 ± 0.25 0.96 ± 0.13 0.95 ± 0.142nd extract 3.74 ± 0.11 4.95 ± 0.27 4.13 ± 0.21 6.34 ± 0.29 0.54 ± 0.06 0.20 ± 0.023rd extract 2.35 ± 0.13 1.74 ± 0.11 2.27 ± 0.09 4.39 ± 0.17 0.17 ± 0.03 0.10 ± 0.01milk 4.43 ± 0.09 6.34 ± 0.15 6.04 ± 0.11 6.82 ± 0.16 – –lemon 5.39 ± 0.08 6.21 ± 0.23 6.40 ± 0.11 8.82 ± 0.24 1.32 ± 0.17 1.12 ± 0.09100 �C 6.6 ± 0.09 10.47 ± 0.04 7.73 ± 0.40 9.38 ± 0.18 0.80 ± 0.07 0.72 ± 0.07
446 D. Horzic et al. / Food Chemistry 115 (2009) 441–448
mine is found in younger leaves, which are the choice leaves usedin the production of black tea because of their high polyphenolcontent (Graham, 1992). Therefore, black teas should contain moretheobromine than other teas. According to the obtained results, thecontent of extracted theobromine amounts to approximately 1/10of the extracted caffeine content, which corresponds to the datafound in earlier research (Friedman et al., 2005). Herbal infusionstested in this study contained limited content of methylxanthines,with theobromine detected in linden infusion and very low contentof theophylline detected in chamomile infusion. The results ob-tained in this study suggested that multiple extractions of the ana-lysed teas and herbal infusions also affected the totalmethylxanthines content (Table 3). Total methylxanthine contentdecreased in the following sequence: 1st extract > 2nd ex-tract > 3rd extract, exhibiting an average 3.8-fold difference be-tween the 1st and 3rd extracts of all teas, whilst the subsequentextracts of herbal infusions showed almost negligible content oftotal methylxanthines.
Obtained results (i.e. high TPC) suggest considerable antioxi-dant capacity of tested teas. The methods used to measure antioxi-dant capacity are extremely dependent on the reactionconditions and the substrates or products; all do not yield the samevalues for the activity. In order to obtain more reliable results,Fukumoto and Mazza (2000) suggested that antioxidant capacityshould be measured using more than one method, by detectingthe primary and secondary oxidation products. In this study twomethods, DPPH assay and flow injection assay with electrochemi-cally generated ABTS radical cation, were used. Measurement ofthe antioxidant capacity using DPPH radical scavenging assay hasbeen widely spread due to its simplicity and reproducibility (Kitts,Wijewickreme, & Hu, 2000). Teas with higher inhibition percent-age values (Table 4), react faster with the stable free DPPH radical,and reach their steady states before the others. Green tea and Oo-long tea reached their plateau state after 10 min, followed by blacktea (after 15 min), white tea (after 20 min) and herbal infusions(30 min). These results indicate that the DPPH radical scavengingability of the tested samples can be predicted based on the previ-ously determined total phenol content (Katsube et al., 2004). Itshould be emphasised that the antioxidant capacity of tea is nota property of a single phytochemical compound, but is widely dis-tributed amongst the phenolic constituents (Simonetti, Pietta, &Testolin, 1997) and that the polyphenols identified in this paperrepresent a part of the total polyphenols found in tea.
Beside DPPH assay, an improved TEAC decolourisation assay-based flow injection analysis (FIA) method for evaluation of theantioxidant capacity was used. Antioxidant capacity of studied teasand herbal infusions, determined by scavenging the ABTS radical
(Table 4), decreased in the following order: green tea > blacktea > Oolong tea > white tea > chamomile infusion � linden infu-sion. The percent inhibition determined by DPPH assay (Table 4),displays slightly different sequence of antioxidant capacities ofteas and infusions: Oolong tea > black tea > green tea > whitetea > chamomile infusion > linden infusion. According to these re-sults, antioxidant capacity of tea extracts also increased with watertemperature (60 �C < 80 �C < 100 �C) and decreased with the num-ber of repeated extractions (1st extraction > 2nd extraction > 3rdextraction). The water temperature and repeated extractionsshowed significant influence (p < 0.05) on the antioxidant capacity.
The addition of milk as well as lemon juice to teas, particularlyblack teas, provides a means of lowering the astringency of the teaextracts. The results of some in vitro tests have produced diverseresults, which indicate that phenolic compounds interact withthe lipid fraction (Langley-Evans, 2000), or with casein proteins(Arts et al., 2002) in milk. These interactions could lower the anti-oxidant capacity (Langley-Evans, 2000) or produce no change at all(Richelle, Tavazzi, & Offord, 2001). Adding squeezed lemon juice toblack tea clears the liquid, quickly transforming it from a dark,nearly opaque brown to transparent orangey yellow. Namely, thehydrogen ions derived from the citric acid in the lemon juice, sup-press the ionisation of thearubigins (tannins), the polyphenols thatimpart brown colour to the tea. This reaction decolorizes thearub-igins and eliminates their astringency, so strong black tea becomesmore palatable by this way (Haslam, 2003). Lemon juice is alsoused as an addition to various herbal infusions. In this study the ef-fect of milk and lemon juice addition (5%) on the antioxidantcapacity of tea extracts was tested (Table 4). The addition of lemonjuice to tea extracts did not show a significant effect on their anti-oxidant capacity (p > 0.05). In green tea the antioxidant capacityslightly decreased, whilst in other tested teas and herbal infusionsit was the same, or its value was even slightly increasing. The addi-tion of milk to the tea extracts caused a significant decrease(p < 0.05) in the antioxidant capacity from 3% (Oolong tea) to 35%(green tea).
The significant linear correlation was confirmed between TPCand antioxidant capacity of tea and herbal extracts prepared atall water temperature (rABTS = 0.91, rDPPH = 0.71) as well as betweenTFC and their antioxidant capacity (rABTS = 0.89, rDPPH = 0.66).
The relationship between the chemical structures (includingsterical structures) and the free radical-scavenging activities oftea catechins (EGCG, EGC, EC) and their corresponding epimers(GCG, GC, (+)-C) is very complex. The antioxidant activity respondsbroadly to the tenet that the structures with the most hydroxylgroups exert the highest antioxidant activity, with the catechinisomers being more than twice as effective as vitamins E and C
D. Horzic et al. / Food Chemistry 115 (2009) 441–448 447
(Rice-Evans, Miller, & Paganga, 1996). Also, the relationship be-tween the steric hindrance and the accessibility of the radical cen-tre of various radicals to each polyphenol could also influence theantioxidant capacity of tea (Yoshida et al., 1989).
According to previous findings by Rice-Evans et al., 1996 whostudied the antioxidant activity of the polyphenolic constituentsof green tea in relation to their relative compositions, the orderof contribution to the antioxidant effectiveness in green teawas epigallocatechin � epigallocatechin gallate� epicatechin gal-late = epicatechin > catechin. Sun and Ho (2001) established the or-der of antiradical capacities of green tea components obtained in areaction with DPPH radical: EGCG > ECG > EGC > gallic acid > EC >BHT > 1,3,7-trimethyluric acid > caffeine. This order agrees partlywith previous data on the antioxidant activity of tea catechins.According to these statements the scavenging abilities of EGCGand ECG are stronger even if the steric hindrance of EGC, GC, ECand (+)-C is smaller than that of EGCG and GCG, indicating thatthe presence of a gallate group at the 3 position plays the mostimportant role in their abilities to scavenge free radicals (Guoet al., 1999).
The results of this study indicated that the antioxidant capacityof teas and infusions determined by both ABTS and DPPH assays,corresponds to their content of EGCG. EGCG was the most abun-dant polyphenol in all tested teas and in chamomile infusion. Inlinden infusion GC was the most abundant compound.
The content of EGCG was the highest in green tea prepared at100 �C, it was 369.90 mg/L, which accounts for 20.2% of total poly-phenol content. In order to confirm the structure-antioxidantcapacity relationship additional correlations were performed be-tween the content of EGCG, determined in all tested teas and infu-sions prepared at 100 �C, and their antioxidant capacity, and a highcorrelation was obtained (rABTS = 0.900 and rDPPH = 0.750). Accord-ing to these results, EGCG is the most efficient radical scavengerand contributes the most to the antioxidant potential of the testedteas, which agrees with previous findings (Guo et al., 1999; Rice-Evans, Miller, & Paganga, 1996).
4. Conclusion
This study provides a reliable set of informations regardingcomposition, polyphenolic content and antioxidant capacity ofteas frequently consumed all over the world. Using a combinationof spectrophotometric methods, FIA method for the evaluation ofantioxidant capacity, HPLC analysis, and varying the extractionconditions, white, green, Oolong and black tea extracts as wellas linden and chamomile infusions were characterised in termsof their polyphenolic content and antioxidant properties. Greentea was recognised as the richest source of both total phenolsand flavonoids, whilst herbal infusions, especially linden con-tained the lowest TPC and TFC. By increasing the water tempera-ture for the extraction, higher TPC and TFC were obtained,reaching their maximum when boiling water was used (100 �C),whilst multiple extractions of individual tea samples yielded sig-nificantly lower TPC and TFC: 1st extraction > 2nd extrac-tion P 3rd extraction. EGCG was recognised as the mostabundant phenolic compound, whilst caffeine was quantitativelythe major constituent of tea infusions, except herbal infusionswhere it was not detected. The highest content of these com-pounds was extracted at 100 �C. The values of the antioxidantcapacity of the extracts obtained by both DPPH and ABTS assayswere in accordance with the TPC and TFC. The addition of lemonjuice to tea extracts did not show a significant effect on their anti-oxidant capacity, whilst the addition of milk to the tea extractscaused a significant decrease in the antioxidant capacity from3% (Oolong tea) to 35% (green tea).
References
Arnao, M. B., Cano, A., & Acosta, M. (2001). The hydrophilic and lipophiliccontribution to total antioxidant activity. Food Chemistry, 73, 239–244.
Arts, M. J. T. J., Haenen, G. R. M. M., Wilms, L. C., Beetstra, S. A. J. N., Heijnen, C. G. M.,Voss, H.-P., et al. (2002). Interactions between flavonoids and proteins: Effect onthe total antioxidant capacity. Journal of Agricultural and Food Chemistry, 50(5),1184–1187.
Baptista, J. A. B., Tavares, J. F. P., & Carvalho, R. C. B. (1998). Comparison of catechinsand aromas among different green teas using HPLC/SPME-GC. Food ResearchInternational, 31(10), 729–736.
Blois, M. S. (1958). Antioxidant determinations by the use of a stable free radical.Nature, 181, 1199–1200.
Brand-Williams, W., Cuvelier, M. E., & Berset, C. (1995). Use of a free radical methodto evaluate antioxidant activity. Lebensmittel-Wissenschaft und-Technologie, 28,25–30.
Coggon, P., Moss, G. A., Graham, H. N., & Sanderson, G. W. (1973). The biochemistryof tea fermentation: Oxidative degallation and epimerization of the tea flavanolgallates. Journal of Agricultural and Food Chemistry, 21(4), 727–733.
Fernandez, P. L., Pablos, F., Martin, M. J., & Gonzalez, A. G. (2002). Study of catechinand xanthine tea profiles as geographical tracers. Journal of Agricultural and FoodChemistry, 50, 1833–1839.
Friedman, M., Kim, S. Y., Lee, S. J., Han, G. P., Han, J. S., Lee, K. R., et al. (2005).Distribution of catechins, theaflavins, caffeine and theobromine in 77 teasconsumed in the United States. Journal of Food Science, 70(9), 550–559.
Fukumoto, L. R., & Mazza, G. (2000). Assessing antioxidant and prooxidant activitiesof phenolic compounds. Journal of Agricultural and Food Chemistry, 48,3597–3604.
Graham, H. N. (1992). Green tea composition and polyphenol chemistry. PreventiveMedicine, 21(3), 334–350.
Guo, Q., Zhao, B., Shen, S., Hou, J., Hu, J., & Xin, W. (1999). ESR study on the structure– antioxidant activity relationship of tea catechins and their epimers. Biochimicaet Biophysica Acta, 1427, 13–23.
Haggi, T. M., Anthony, D. D., Gupta, S., Ahmad, H., Lee, M.-S., Kumar, G. K., et al.(1999). Prevention of collagen induced arthritis in mice by a polyphenolicfraction from green tea. Proceedings of the National Academy of Sciences of theUnited States of America, 96(8), 4524–4529.
Harbowy, M., & Balentine, D. A. (1997). Tea chemistry. Critical Reviews in PlantScience, 16, 415–480.
Haslam, E. (2003). Thoughts on thearubigins. Phytochemistry, 64(1), 61–73.Hegarty, V. M., May, H. M., & Khaw, K. T. (2000). Tea drinking and bone mineral
density in older women. American Journal of Clinical Nutrition, 71, 1003–1007.Hertog, M. G. L., Hollman, P. C. H., Katan, M. B., & Kromhout, D. (1993). Estimation of
daily intake of potentially anticarcinogenic flavonoids and their determinants inadults in the Netherlands. Nutrition and Cancer, 20, 21–29.
Ivekovic, D., Milardovic, S., Roboz, M., & Grabaric, S. B. (2005). Evaluation ofantioxidant activity by flow injection analysis method with electrochemicallygenerated ABTS radical cation. Analyst, 130, 708–714.
Katsube, T., Tabata, H., Ohta, Y., Yamasaki, Y., Anuurad, E., Shiwaku, K., et al. (2004).Screening for antioxidant activity in edible plant products: Comparison of low-density lipoprotein oxidation assay, DPPH radical scavenging assay, and Folin–Ciocalteau assay. Journal of Agricultural and Food Chemistry, 52, 2391–2396.
Khokhar, S., Venema, D., Hollman, P. C. H., Dekker, M., & Jongen, W. (1997). A RP-HPLC method for the determination of tea catechins. Cancer Letters, 114(1),171–172.
Kilmartin, P. A., & Hsu, C. F. (2003). Characterisation of polyphenols in green,Oolong, and black teas and in coffee, using cyclic voltammetry. Food Chemistry,82, 501–512.
Kitts, D. D., Wijewickreme, A. N., & Hu, C. (2000). Antioxidant properties of a NorthAmerican ginseng extract. Molecular and Cellular Biochemistry, 203, 1–10.
Kramling, T. E., & Singleton, V. E. (1969). An estimate of the nonflavonoid phenols inwines. American Journal of Enology and Viticulture, 20(2), 86–92.
Kumamoto, M., & Sonda, T. (1998). Evaluation of the antioxidative activity of tea byan oxygen electrode method. Bioscience, Biotechnology and biochemistry, 62(1),175–177.
Lachman, J., Hosnedl, V., Pivec, V. & Orsák, M. (1998). Polyphenols in cereals andtheir positive and negative role in human and animal nutrition. In Proceedingsof conference cereals for human health and preventive nutrition, (pp. 118–125).Brno.
Langley-Evans, S. C. (2000). Consumption of black tea elicits an increase in plasmaantioxidant potential in humans. International Journal of Food Sciences andNutrition, 51(5), 309–315.
Lemanska, K., Szymusiak, B., Tyrakowska, B., Zielinski, R., Soffers, A. E. M. F., &Rietjens, I. M. C. M. (2001). The influence of pH on antioxidant properties andthe mechanism of antioxidant action of hydroxyflavones. Free Radical Biologyand Medicine, 31(7), 869–881.
Maron, D. J., Lu, G. P., Cai, N. S., Wu, Z. G., Li, Y. H., Chen, H., et al. (2003). Cholesterol-lowering effect of a theaflavin-enriched green tea extract: A randomizedcontrolled trial. Archives of Internal Medicine, 163(12), 1448–1453.
Nehlig, A., Daval, J., & Debry, G. (1992). Caffeine and the central nervous system:Mechanisms for action, biochemical, metabolic and psychostimulant effects.Brain Research Reviews, 17, 139–170.
Otake, S., Makimura, M., Kuroki, T., Nishihara, Y., & Hirasawa, M. (1991). Anticarieseffects of polyphenolic compounds from Japanese green tea. Caries Research, 25,438–443.

448 D. Horzic et al. / Food Chemistry 115 (2009) 441–448
Perva-Uzunalic, A., Škerget, M., Knez, Z., Weinreich, B., Otto, F., & Grüner, S. (2006).Extraction of active ingredients from green tea (Camellia sinensis): Extractionefficiency of major catechins and caffeine. Food Chemistry, 96(4), 597–605.
Price, W. E., & Spitzer, J. C. (1994). The kinetics of extraction of individual flavanolsand caffeine from Japanese green tea (Sen Cha Uji Tsuyu) as a function oftemperature. Food Chemistry, 50, 19–23.
Re, R., Pellegrini, N., Proteggente, A., Pannala, A., Yang, M., & Rice-Evans, C. (1999).Antioxidant activity applying an improved ABTS radical cation decolourisationassay. Free Radical Biology and Medicine, 26, 1231–1237.
Rice-Evans, C., Miller, N. J., & Paganga, G. (1996). Structure – antioxidant activityrelationships of flavonoids and phenolic acids. Free Radical Biology and Medicine,20(7), 933–956.
Richelle, M., Tavazzi, T., & Offord, E. (2001). Comparison of the antioxidant activity ofcommonly consumed polyphenolic beverages (coffee, cocoa, and tea) preparedper cup serving. Journal of Agricultural and Food Chemistry, 49, 3438–3442.
Roberts, E. A. H., & Wood, D. J. (1953). Separation of tea polyphenols on paperchromatograms. Biochemical Journal, 53, 332–336.
Sharma, V., Gulati, A., Ravindranath, S. D., & Kumar, V. (2005). A simple andconvenient method for analysis of tea biochemicals by reverse phase HPLC.Journal of Food Composition and Analysis, 18, 583–594.
Simonetti, P., Pietta, P. G., & Testolin, G. (1997). Polyphenol content and totalantioxidant activity potential of selected Italian wines. Journal of Agriculturaland Food Chemistry, 45, 1152–1155.
Singleton, V. L., & Rossi, J. A. (1965). Colorimetry of total phenolics withphosphotungstic acid reagents. American Journal of Enology and Viticulture, 16,144–158.
Spiller, G. A. (1998). Basic metabolism and physiological effects of themethylxanthines. In G. A. Spiller (Ed.), Caffeine (pp. 225–231). Boca Raton:CRC Press.
Sun, T., & Ho, C. T. (2001). Antiradical efficiency of tea components. Journal of FoodLipids, 8, 231–238.
Vinson, J. A., Teufel, K., & Wu, N. (2004). Green and black teas inhibit atherosclerosisby lipid, antioxidant, and fibrinolytic mechanisms. Journal of Agricultural andFood Chemistry, 52, 3661–3665.
Vinson, J. A., & Zhang, J. (2005). Black and green teas equally inhibit diabeticcataracts in a streptozotocin-induced rat model of diabetes. Journal ofAgricultural and Food Chemistry, 53(9), 3710–3713.
Van der Berg, R., Haenen, G. R. M. M., Van der Berg, H., & Bast, A. (1999).Applicability of an improved Trolox equivalent antioxidant capacity (TEAC)assay for evaluation of antioxidant capacity measurements of mixtures. FoodChemistry, 66, 511–517.
Yen, G. C., & Duh, P. D. (1994). Scavenging effect of methanolic extracts of peanuthulls on free-radical and activeoxygen species. Journal of Agricultural and FoodChemistry, 42, 629–632.
Yoshida, T., Mori, K., Hatano, T., Okumura, T., Uehara, I., Komagoe, K., et al. (1989).Studies on inhibition mechanism of autoxidation by tannins and flavonoids. V.Radical scavenging effects of tannins and related polyphenols on 1, 1-diphenyl-2-picrylhydrazyl radical. Chemical and Pharmaceutical Bulletin, 37(7),1919–1921.
Young, W., Hotovec, R. L., & Romero, A. G. (1967). Tea and atherosclerosis. Nature,216, 1015–1016.
Wang, H., Provan, G. J., & Helliwell, K. (2000). Tea flavonoids: Their functions,utilisation and analysis. Trends in Food Science and Technology, 11, 152–160.