The Comparative Effects of Analytical and Synthetic - Ijisrt
31
Volume 6, Issue 2, February – 2021 International Journal of Innovative Science and Research Technology ISSN No:-2456-2165 IJISRT21FEB332www.ijisrt.com 525 The Comparative Effects of Analytical and Synthetic Approaches on Students’ Conceptual Understanding of Derivatives: The Case of Dr. Abdulmejid Hussein College of Teachers Education, Jijiga, Ethiopia. BY PRINCIPAL INVESTIGATOR: MAMUSH ENDALE KELECHA BSc and MEd in Mathematics from Addis Ababa and Haramaya Universities Ethiopia, respectively (Mathematics Lecturer in JigjigaUniversity ) CO-INVESTIGATOR: TEWODROS DEMISSIE WORKU MEd in Mathematics Education from Addis Abeba University Ethiopia ( Mathematics Lecturer in Jigjiga University ) February, 2021 Jigjiga, Ethiopia
-
Upload
khangminh22 -
Category
Documents
-
view
0 -
download
0
Transcript of The Comparative Effects of Analytical and Synthetic - Ijisrt

Volume 6, Issue 2, February – 2021 International Journal of Innovative Science and Research Technology
ISSN No:-2456-2165
IJISRT21FEB332www.ijisrt.com 525
The Comparative Effects of Analytical and Synthetic
Approaches on Students’ Conceptual Understanding
of Derivatives: The Case of Dr. Abdulmejid Hussein
College of Teachers Education, Jijiga, Ethiopia.
BY
PRINCIPAL INVESTIGATOR: MAMUSH ENDALE KELECHA
BSc and MEd in Mathematics from Addis Ababa and Haramaya Universities Ethiopia, respectively
(Mathematics Lecturer in JigjigaUniversity )
CO-INVESTIGATOR: TEWODROS DEMISSIE WORKU
MEd in Mathematics Education from Addis Abeba University Ethiopia
( Mathematics Lecturer in Jigjiga University )
February, 2021
Jigjiga, Ethiopia

Volume 6, Issue 2, February – 2021 International Journal of Innovative Science and Research Technology
ISSN No:-2456-2165
IJISRT21FEB332www.ijisrt.com dxxvi
ABSTRACT
This study sought to investigate the effect of analytic and synthetic teaching-learning approaches
on understanding of concepts of derivative in introductory calculus course. The subjects of this study
were 2nd year mathematics students in Dr. Abdulmejid Hussein College of Teachers Education in
Somali Regional State. A total of Eight-two students were participated in two equal sections, each
section contained 41 students, in the study. The students in the two sections were arbitrarily assigned
as control group and experimental group andtaught by synthetic approach and analytic approach,
respectively.
As tools of data collection, Achievement Tests were used for the pre-test, the post-test and the
delayed post-test to serve as data for student performance. The pre-test was given just before the
experiment began and the post-test was given immediately upon completion of the experiment. The
two groups were also tested again after three weeks for the delayed post-test to see which of the
approaches resulted in better long term learning. The means of the aggregate mean performance
scores were compared by the use of independent sample t-test at 05probability level. Results revealed
that there was no significant mean difference between the two sections on the pre-test and delayed
post-test scores but there was a significant mean difference between the post-test scores, in favor of
the section taught by the analytic teaching approach. Preference towards the teaching method used
was also investigated. The result of the five-point scale preference Questionnaire revealed that most of
the students in the analytic group preferred the analytic approach whereas the synthetic group
students preferred the synthetic approach. The preference of the students towards the respective
teaching approach used was also compared using t-test. It showed a significant mean difference. The
effect of the students’ preference towards the respective methods on their performance was also
analyzed using Linear Regression and obtained no significant effect. A systematic classroom
observation check list for eight successive periods also supported this result. It was recommended that
course instructors in mathematics should implement the analytic approach as often as necessary to
tap into its many advantages in maximizing students’ educational outcome in mathematics regardless
of their preference.
Keywords:-Analytical Method, Synthetic Method, Teaching of Derivative Concepts.

Volume 6, Issue 2, February – 2021 International Journal of Innovative Science and Research Technology
ISSN No:-2456-2165
IJISRT21FEB332www.ijisrt.com 527
I. INTRODUCTION
1.1 Background
Mathematics plays a key role in the advancement of Sciences, Technology, Industries, Medicine and
Social Sciences as a whole. Even, computer itself is a machine built up on the principle of Mathematics and
its invention helps to bring a paradigm shift in data communication and processing efficiently which in turn
contributes to accelerate economic revolution of the ever growing society. However, many students turn out
to be very miserable and inattentive in a mathematics class after being taught a topic and discover they could
not memorize or recall such a concept with ease.
Of greater concern to teachers is that this attitude is carried over by the students to college or university
level. Gordon (1997) found that many college students have a weak grasp of mathematical concepts, and
that students weak in algebra in upper secondary school are not only weak in mathematics but also have a
negative attitude toward the subject. These students only memorize algorithms or procedures and do not
understand the meaning behind the procedures used (Gordon, ibid). In fact some students do not realize
there is meaning in mathematics and that concepts exist for every procedure applied. They believe that
solving mathematics problems means to run many operations using symbols without meaning (Oaks, 1992).
The reason for this difficulty may vary but this could sometimes be related to the teaching method
being used to explain such topics. Udeinya and Okabiah (1991) blamed poor performance of students in
mathematics on poor methods and approaches to teaching which has reduced the level of motivation.
Harbor-Peters (2001) asserted that the issue of poor performance in mathematics examinations was due to
problem of teaching methods. There has also been an increasing awareness by those concerned with
mathematics education that the conventional methods of teaching mathematics, has not been very
successful. For effective teaching to take place, the skillful mathematics Instructor needs to use many
different methods and techniques at his disposal. A carefully designed teaching method can make teaching
and learning effective (Chianson, M.M 2008).
An instructor of mathematics has a variety of methods and techniques which s/he might use in her/his
everyday classroom teaching. The main objective of these methods is to make teaching learning process
more interactive and effective. There are various kinds of teaching methods and techniques by which a
teacher educator can select the most relevant one keeping in view the needs of the learner and its relevance
to the contents. Some of the commonly suggested and fairly used teaching methods of mathematics courses
in college of teachers’ education are project method, heuristic method, inductive and deductive methods and
analytical and Synthetic methods (Revised Curriculum June 2009; Addis Ababa, Ethiopia). To grasp on the
subject matter of mathematics it is necessary to use multiple methods in the teaching learning process at all
level. It is generally observed that the students solve a question or set of questions quickly by using a
technique or formula already learnt in the class but they have no understanding about the hidden logic that
how it done. Prior is the deductive or synthetic approach to find a solution for a question but later is the
inductive reasoning of analytic approach.
Mathematics learning for understanding is not easy. Many students fail to understand the concepts
taught to them. They solve problems by memorizing formulae and procedures teachers have taught them.
The students merely put the required figures into the formula to arrive at the answer (Miller, 1992).
Lack of understanding in mathematics often can make students lose interest in the subject and affect
their mathematics achievement. The ability to use procedures and understand concepts in mathematics are
two things necessary in learning mathematics (Hiebert and Carpenter, 1992). Understanding in mathematics
learning generally involves actions to know concepts and principles related to the procedures and relating or
creating meaningful relationships between existing concepts and newly-learnt concepts (Boroody and
Ginsburg, 1990).
Volume 6, Issue 2, February – 2021 International Journal of Innovative Science and Research Technology
ISSN No:-2456-2165
IJISRT21FEB332www.ijisrt.com 528
Here in this study, the researcher planned to overhaul which method is more appropriate to teach some
selected topics from high level mathematics course offered in teacher education institute. That is, focus of
this study is to carefully examine the comparative effectiveness of the analytical and synthetic methods of
teaching mathematics courses of the Department of Mathematics in Dr.Abdulmejid Hussein Memorial
College of Teachers Education (Dr. A.H-CTE).
The topics that will be discussed during the study are attached in appendices (See appendixVI); under
the title derivatives there are topics to be covered during class discussion in the research which are intended
to address the learning objectives stated as follows. At the end of the discussion of the derivative and its
application each student should be able to: State and give examples of important theorems such as the mean
value theorem, the fundamental theorem of calculus etc.; Apply the different techniques of differential
calculus to investigate the analytic and geometric properties of elementary functions; Formulate and solve
properties of the elementary functions; and Formulate and solve practical problems in related rates and
extreme values.
1.2 Statements of the problem
Nowadays, in the 21th century, Ethiopia has recognized that the development of the country very much
depends on the development of science and technology, and hence on Science and Mathematics education.
Ethiopia has recently designed a strategy through which 70% of the university/Tertiary level education
enrollment would be in science and technology. This scenario has created a unique and challenging situation
whereby Science and Mathematics education is put to the spotlight.On the other hand Science and
Mathematics education faces numerous challenges that call for immediate improvements (Eshetu, 2009).
In mathematics education as in all areas of education, the problem is quantity: the quantity of facts the
students must learn, the quantity of procedures the students must master, and the quantity of concepts the
students must understand (Glynna, 1993). According to his contention, the student must acquire this quantity
of knowledge within constraints of his or her time and abilities. However, the instructor’s understanding of
learning theory and effective teaching strategies facilitates or hinders the student’s acquisitions of
knowledge; as does student management of his or her learning. According to Patel (2003) many people seem
to think that mathematics is, for some unknown reason, a purely deductive science. He added that this is not
very surprising: mathematics is, in our educational system, often presented as a purely deductive science.
Students are not asked to invent or contrive their own mathematical concepts; instead, they are given certain
mathematical concepts. Students are no asked to formulate strict and easy definitions of these mathematical
concepts; instead, they are given certain definitions.
Knowledge about how to teach mathematics differs in important ways from content knowledge
possessed by professionals in other mathematics-related disciplines (Hill et al., 2008). Mathematics teachers
must know not only the content they teach, but also how students’ knowledge of mathematics is developed
and structured; how to manage internal and external representations of mathematical concepts; how to make
students’ understanding of mathematics visible; and how to diagnose student misunderstandings and
misconceptions, correct them, and guide them in reconstructing complex conceptual knowledge of
mathematics (Fennema and Franke, 1992; Darling-Hammond, 1999; Cohen and Hill, 2000; Ball et al.,
2001).
“Central to raising student achievement in mathematics is improving the quality of mathematics
teaching. Students who receive high-quality instruction experience greater and more persistent achievement
gains than their peers who receive lower-quality instruction (Rivkin et al., 2005; Wright et al., 1997).”
The analytical and synthetic teaching approaches are among the teaching and learning methodologies
which possess sound psychological principles that can overcome the limitations of the existing system of

Volume 6, Issue 2, February – 2021 International Journal of Innovative Science and Research Technology
ISSN No:-2456-2165
IJISRT21FEB332www.ijisrt.com 529
instruction at college level. Thus, these methods need to be examined as to its applicability in teaching the
course.
According to Rubio and Valle (2004), the empirical research shows that the use of the analysis
(“numerical analysis”) of the analytical method of numerical exploration fosters the development of the
student’s ability to establish and produce meanings for: a) the numerical relationships between the
unknowns; b) the relationships between them and the data; and; c) the comparison between two quantities
which represent the same in the problem, that is, that they are equivalent regarding their meaning.
However, there is really no basis as to which method is more favorable to the students: Learning the
topic analytically or synthetically? Few studies have been made on the comparative effects of analytical and
synthetic teaching approaches on students’ understanding of mathematics concepts. These results do not
show an overwhelming superiority of either method.
The method under consideration is analytic and synthetic approach of teaching mathematics. Analysis
and synthesis, as scientific methods, always go hand in hand; they complement one another. Every synthesis
is built upon the results of a preceding analysis, and every analysis requires a subsequent synthesis in order
to verify and correct its results. In this context, to regard one method as being inherently better than the
other, is meaningless. There are, however, important situations in which one method can be regarded as
more suitablethan the other. This concerns the question of which method is most appropriate as the primary
method or chief point of departure for the study of a given system or object of scientific inquiry (Ritchey,
1996).
Based on the researcher’s observation from his more than six years of teaching at Dr.Abdulmejid
Hussein College of Teachers Education (Dr. A.H-CTE) and formal and informal discussion with his partners
he understood that teacher-educators are more familiar and apply usually the synthetic method than the
analytical method. And also, as indicated in Dr. A.H-CTE Business Processing Reengineering (BPR) study
paper only15% of the instructors employ participatory approach; this shows most instructors in the college
use the conventional teaching approach; The Performance Gap is85%.From this point of view, the
researcher became interested in comparing these two methods, namely; analytical and synthetic teaching
methods. The researcher also hoped to get results that would clearly support one of the approaches and to
find out the most suitable ways to teach mathematics in general and the concepts of Derivatives in particular.
Research Question: In the course of the study, the following research questions were formulated and this
study hopedanswer:
1. Which method of teaching (analysis and synthesis) is more effective for students to understand the
concepts of derivatives? i.e., effect of the two methods?
2. What is the preference/inclination of the students towards the method of teaching used?
3. Do the students’ preference/inclination towards the method used affect their achievement?
4. What is the long term (retention) comparative effect of the analysis and synthesis teaching approaches on
the students’ learning of the concepts of derivatives?
1.3. Objectives of the Study
1.3.1. General objective of the study
The general objective of this study was aimed at investigating an instructional strategy that is better
suited to effectively yield students’ understanding of the concepts of derivatives, specifically, to compare the
effects of analytic and synthetic teaching approaches on the students’ understanding of the concepts of
derivatives.
Volume 6, Issue 2, February – 2021 International Journal of Innovative Science and Research Technology
ISSN No:-2456-2165
IJISRT21FEB332www.ijisrt.com 530
1.3.2. Specific objectives of the study
The researcher intended to explore the following specific research objectives through this limited but
highly devoted study:
1. To identify the comparative effects of the two methods on students’ understanding of the concepts of
derivatives.
2. To examine the preference of the students towards the analytical and synthetic teaching methods used.
3. To investigate the effects of the students’ preference towards the analytical and synthetic teaching
methods used on their achievement.
4. To compare the long term (retention) effects of the analytical and synthetic teaching methods on the
students’ learning of the concepts of derivatives.
1.4. Hypothesis
To guide the investigation, the following null hypotheses were formulated and tested in this research:
H01. There is no significant difference between the mean achievement scores of the students taught through
the analytic and synthetic teaching approaches.
H02. There is no significant difference between the mean preferences scores of students towards the
respective method used, namely; the analytic and synthetic teaching approaches.
H03. The students preference towards the respective method used has no significant effect on their
achievement.
H04. There is no significant mean difference between analytic and synthetic teaching approaches on the
students’ retention of the concepts of derivative.
1.5. Significance of the Study
There is a strong desire and need to change the way we teach mathematics. The importance of a study
that introduces and measures the achievement outcomes for a teaching strategy is enhanced by the fact that
efforts have been made every time to update a curriculum and instructional methods to positively affect
students’ experiences in mathematics. The harmonized curriculum of Ethiopian Higher Education is one
indication of this fact.
This study sought to find out the teaching strategy that could increase the conceptual understanding of
second year major mathematics diploma students on the concepts of derivative.
Accordingly, the results of this study may have the following significant ramifications on the promotion
of the teaching and learning process of mathematics.
It may help to determine more suitable method of teaching mathematics with respect to the analytic and
synthetic approaches.
The study may provide valuable information to the academic officials and mathematics instructors
concerning designing of effective teaching strategies as to preference for analytic and synthetic
approaches.
It may help future researches to identify the relative effectiveness of the analytic and synthetic teaching
approaches for better long term learning of mathematics.
The study may also add to the limited number of empirical studies on analytic and synthetic teaching
approaches in advanced mathematics topics.
Because of the nature of the problem, the study may have ramification on other undergraduate
mathematics programs as well as secondary analytic and synthetic teaching approaches were fairly long
time ago. So this study can bring a fresh insight about the approaches in a new context.
The results of this study may serve as a baseline study for further study on this area.
1.6. Scope of the study
This study was delimited to second year major mathematics students at Dr. A.H-CTE and to the content
elements of derivatives. The main objective is to determine the comparative effectiveness of analytic and

Volume 6, Issue 2, February – 2021 International Journal of Innovative Science and Research Technology
ISSN No:-2456-2165
IJISRT21FEB332www.ijisrt.com 531
synthetic teaching approaches on students’ understanding by considering the concepts of derivatives. The
research mainly focused on the comparative study of the two methods rather than other methods mentioned
in the curriculum of mathematics courses for diploma program due to the more appropriateness of the
methods to teach concept of derivatives. This is because, some studies recommend analytic and synthetic
approaches to teach algebra and geometry subjects and the concepts of algebra and geometry are commonly
there to teach the concept of derivatives.
The results of this study should have been more conclusive and can have convincing power, if it had
included representatives from other sisterly college of teacher’s education and other topics from the diploma
program course syllabuses. But due to time and budget constraints and little access of resources, the study
were limited to only second major mathematics students at Dr. A.H-CTE and to the content elements of
derivatives. Moreover, the absence of related research works on the comparative effect of Analytic and
Synthetic strategies on students’ achievement in Ethiopia was another limiting factor of this research. Thus,
the researcher had to relay mainly on the study materials and experiences of other countries sources. All
these might have affected the outcome of this research.
1.7. Definition of Terms
Achievement: the relative performance of the analytical and synthetic group students on the concepts of
derivatives determined by the post-test.
Analysis/separation into components: “the separation of something into its constituents in order to find out
what it contains, to examine individual parts, or to study the structure of the whole ” (Ritchey, 1996).
Inductive reasoning: Generalizing from a set of examples; “logical thought process that attempts to reach
conclusions by reasoning from specific instances or cases to general rules, principles, laws or conditions”
(Glynna, 1993).
Analytical Approach: According to Trowbridge (1986), it proceeds from unknown to known facts. In this
method the problem is analysed to find out the relations. A statement is analysed into simpler statements and
then truth is discovered. It is based on inductive reasoning and critical thinking. All the related facts are
analysed to seek help in proceeding to the known conclusion.
Analytical Approach: In this study, it is considered as a non-conventional approach since its Student–
centered Approach; students are active participants; Facilitates students’ conceptual understanding, gives
opportunity to develop the skills of thinking and reasoning; Student gains confidence and understanding;
Method suits the learner and the subject.
Example: It is a fact or a thing which represents a general rule of derivative and applications of derivative
that the instructor presented to start with and the students discover the general rule or principles or the
instructor used to clarify the general rules or principles of the derivative and applications of derivatives. It
took of the forms objects, pictures, models, simple diagrams, illustrations, or verbal instances of the
happenings being discussed.
Preference/Inclination: the view that one person, object, or course of action is more desirable than another
or a choice based on such a view. That means the students’ teaching or learning preference with respect to
the analytic or synthetic approach as identified by the preference questionnaire.
Generalization: It is central to both analytical and synthetic teaching approaches. Generalization is used in
this study in the sense of that it is the task of summing up in a single statement characteristics, traits, features
which are alike or unlike.

Volume 6, Issue 2, February – 2021 International Journal of Innovative Science and Research Technology
ISSN No:-2456-2165
IJISRT21FEB332www.ijisrt.com 532
Synthesis: combining of various components into whole: “the process of combining different ideas,
influences, or objects into a new whole” (Ritchey, 1996).
Deductive reasoning: Applying a generalization to a particular instance; “ logical thought process that
attempts to reach conclusions by reasoning from general rules, principles, laws or conditions to specific
instances or cases” (Glynna, 1993)
Synthetic Approach: It is just opposite to the analytical method. In this method we proceed from known to
unknown as synthesis means combing together various parts. In mathematics various facts are collected and
combined to find out the result which is unknown (Rehman, 2000). According to Katozai (2002), it is the
process of putting together known bits of information to reach the point where unknown information
because obvious and true.
Synthetic Approach: In this study, it is considered as a conventional approach since its Teacher–centered
method, students are passive listeners; Students rely on rote memory; No opportunity to develop the skills of
thinking and reasoning, understanding is hampered; Students lack confidence to do other type of sums.
Retention/permanence: The relative long term learning of the analytic and synthetic group. students
determined by the delayed post-test.
Understanding: Something an individual has achieved when he or she handles a concept as a part of mental
network.
Teacher-Educator: It stands for an instructor teaching in higher institute.
Teacher: It stands for teachers who are teaching in primary and secondary schools.
II. SYNTHESIS OF THE RELATED LITERATURE
The related literatures are used to develop a framework that serve as a guide in conducting of the study.
And also, the following basic issues of the study with respect to the analytic and synthetic approaches are
captured from the related literature to get clear image of in accomplishing the planned objectives of this
study.
"Synthesis ... is the process in which we begin from principles and [proceed to] build up theorems and
problems.... while analysis is the process in which we begin with a given conclusion or proposed problem
and seek the principles by which we may demonstrate the conclusion or solve the problem."
I. Procedure
Approach Description Procedure
Synthesis
Begin with Cause infer
Effect
the laws and principles theorems and problems
Analysis
Begin with Effect infer
Cause
theorems and problemsthe laws and principles
Or conclusion or proposed problem
Buildup
Seek

Volume 6, Issue 2, February – 2021 International Journal of Innovative Science and Research Technology
ISSN No:-2456-2165
IJISRT21FEB332www.ijisrt.com 533
II. Experimentation
System Stimuli Response
Teaching Approaches and
Concepts of Derivative
Synthesis/Analysis
Approaches
Preference/Retention/Achievement
(Source: Richey, 1996)
The following conceptual frame work is drawn to get insight of the right path that leads towards the final
destination of this study.
Figure 2. Framework of the study
III. RESEARCH METHODOLOGY
This section discusses the method employed, subjects of the study, research design, tools used to collect
data, treatments and method of data analysis and interpretation to address each research question.
To analyse the comparative effectiveness of both the analytical and synthetic methods, an experiment
was conducted in the class of second year Mathematics students in section A and B in the Dr. A.H-CTE.
Formerly, it was proposed two instructors to teach both the control and experimental groups, but upon
the advisor comment the researcher himself taught both groups by using analytic and synthetic. It was
thought that no two individuals have absolutely equal efficiency and effectiveness in applying same method
and illustrating his/her knowledge to deliver a lesson in two different classes as far as human nature
concerns.
3.1. Description of the Study Area
Dr. Abdulmejid Hussein College of Teachers’ Education (Dr. A.H-CTE) is governmental memorial
Teachers Education Institute (TEI) which is after called the famous former Ethiopian ambassador to UN, Dr.
Abdulmejid Hussein. It is located at Jig-jiga town in Somali regional state of eastern Ethiopia. Jig-jiga town
presently serves as the seat of the Somali Region Government State. It is located 638 km east of Addis-
Ababa, close to the Somalia border. The official language is Af-Somalia, but Oromiffa, Guragigna and
Amharic are also spoken. Dr. A.H-CTE has established since 1999 with the mission to produce active and
creative, knowledge proficiency, skillful and responsible primary school teachers who can actively
participate in the building of education system particularly in the region and the country in general.
Teaching Approaches:
- Analytic Approach
- Synthetic Approach
Student Characteristics:
- Feelings toward the
approaches
- Achievement
- Retention/Permanence
- Preference/ Inclination
Approach
more
suitable
than the
other

Volume 6, Issue 2, February – 2021 International Journal of Innovative Science and Research Technology
ISSN No:-2456-2165
IJISRT21FEB332www.ijisrt.com 534
3.2. Subjects of the Study
The target population of the study was Second year students attending Mathematics as a major study
area in Dr. A.H-CTE found in Jig-Jiga town of Somali National Regional State, Ethiopia. The target
population in each section was 41 and they were a total population of 82 students (See table-1). They
enrolled for the course Introduction to Calculus (Math162) during the research time (the academic year
2019/20). This course was offered in four credit hours and five contact hours per week. To conduct the
study, the population of students kept in their original sections as they were, but the sections were assigned
into control and experimental groups by drawing to avoid the biasness. The table below summarizes the
number of students that took part in the study.
Table 1. Second Year Mathematics Students in each Section taking part in the study
Departments Section # of Students
M F Sub-total
Mathematics A 41 - 41
Mathematics B 41 - 41
Total 82 - 82
3.3. Research Design
Design of the Study
The research design was experimental research that consists of independent and dependent variables.
The independent variables were analytic and synthetic teaching approaches (instruction methods). The
dependent variables were students’conceptual understanding of derivatives and the students’ preference
towards the two methods applied in the study. For this purpose two equivalent groups were formed. A Pre–
DAT (Pre Derivative Achievement Test), Post-DAT (Post Derivative Achievement Test) and RET-DAT
(Retention Derivative Achievement Test; delayed post-test) experimental-control group design was used in
this research.
The control group was taught by synthetic method while experimental group was taught by analytical
method and both the groups were kept away from each other so that one could not influence the performance
of other. The duration of the classroom teaching was fifty minutes with Cr.Hr./Ct. Hr.= 4/5 and seven weeks
for whole experiment. Design of the experimental procedure is depicted by the following table.
Table 2. The research design: Pretest- posttest and delayed post-test group design
Section Group
Name
Test-1 Treatment Test-2 Test-3 Questionnaire
C Control
group
Pre–
DAT
Synthetic
Approach
Post-
DAT
RET-DAT
Preference
E Experimental
group
Pre–
DAT
Analytical
Approach
Post-
DAT
RET-DAT
TIME
The table shows the research design: Pretest- posttest and delayed post-test group design.Section C
and E represents the analytical and Synthetic groups, respectively. The course content for both the
groups is same but the only difference between the two groups was the method of teaching.
3.4 Instrumentation
As seen in the framework (see table above), there were three major issues to be addressed in the study:
achievement, preference and retention. Hence, instruments were designed make sure that data was
Volume 6, Issue 2, February – 2021 International Journal of Innovative Science and Research Technology
ISSN No:-2456-2165
IJISRT21FEB332www.ijisrt.com 535
collected to address the issues. All the data used in this research was primary data. Since there were no
standardized instruments regarding the research design, the tools used in this research were developed by the
researcher along with the mathematics department staff members at Dr. A.H-CTE and considering the
theories and principles of analysis and synthesis approaches reviewed from the related literature. All the
instruments used to collect the data were pilot tested to establish the reliability and mathematics department
staff members ascertained their validity before being used for data collection.
Tests
Tests were constructed to know the prior knowledge before the experiment, the relative achievement
and long term learning after the treatments of the students in the two groups. The detail explanations of the
different tests are presented as follows.
i. Pre-DAT :-This is a test that was given to the two groups to check the prior knowledge of the students
about the concepts of derivatives and its applications and to equalize the two groups on their previous
knowledge about the given contents (see Appendix-I). It was prepared by the researcher in collaboration
with the mathematics department staff members. The total number of question items was 14 of each
question item is worth three points and the total possible maximum point is 42 (see Appendix –). The pre-
test was pilot tested on 20 third year students of mathematics department at Dr.A.H-CTE to establish its
reliability using Kuder-Richardson reliability coefficient or Cronbach alpha, . It was also validated by
group of mathematics department staff members at Dr. A.H-CTE. A researcher make Pre DAT was
distributed among the students to analyse the performance of students before the experiment.
ii. Post-DAT:-This is a test that was given to the two groups after completing the treatment to assess their
comparative achievements of the covered concepts in the experiment (see Appendix-). The Post-DAT
was prepared by the researcher in collaboration with the mathematics department staff members at Dr.
A.H-CTE which covers the whole unit to be discussed during the experiment. The total number of
question was 18 of each question item is worth three points and the total possible maximum point is 54
(see Appendix-VII). It was pilot tested on 24 second year students of mathematics department at Harar
College of Teachers Education (HCTE). Its reliability was calculated using Kuder-Richardson reliability
coefficient or Cronbach alpha, . A table of specification regarding the objectives of the syllabus
according to the Bloom’s taxonomy of educational objectives (1956) was used to check content validity
of the test. Difficulty level and way of constructing the statements of the test items was also validated by
the group of mathematics instruction. The research advisor also commented it regarding its type and
composition. When we use a table of specifications for the objectives, this becomes a matter of matching
test items with the specified objectives in the table. After conducting the experiment, a researcher make
post testwas distributed among the students of two groups.
iii. Ret DAT/Delayed post-Test:- The delayed post- test was administered after the experiment had been
completed about three weeks later together with the mid-term examination of the course compiled with
items from the subsequent derivative chapter to see the comparative long term/retention effects of the
analysis and synthesis teaching approaches on the students’ learning of the concepts of derivatives (see
Appendix-). Basically, the fundamental structures of the Post-DAT and Ret DAT (delayed post-test) are
the same. In order to avoid memory effect, the two tests were not exactly the same, but only some
difference among the question items. The delayed post-test was a part of the students’ course
examination. It was to measure whether there was any difference in the students’ learning between the
teaching experiment with the post-test and later acquisition during the course or during self study.
iv. The Questionnaire:-This was used to measure the student’s preference with respect to the teaching
method used (the analysis or synthesis approach) during the experiment (see appendix-). It was also used
to investigate whether the students understanding of the concepts they taught was affected by their
preference towards the respective method of teaching used for each group. The questionnaire was

Volume 6, Issue 2, February – 2021 International Journal of Innovative Science and Research Technology
ISSN No:-2456-2165
IJISRT21FEB332www.ijisrt.com 536
developed by the researcher based on the principles of analysis or synthesis learning style preference.
Efforts had been made in designing the questionnaire so as to exactly express the students learning and
teaching preference corresponding to the analysis and synthesis approaches. It has 22 items and
constructed in 5-point Likert scale from strongly disagree (1) to strongly agree (5). It was pilot tested for
24 second year mathematics department students at HCTE and its reliability was estimated using Kuder-
Richardson reliability coefficient or Cronbach alpha, . The contents of the questionnaire were validated
by group of mathematics instructors.
v. Systematic Classroom Observation Checklist: -This was used to collect information about the
students’ active involvement in the teaching and learning process in the two groups through check lists. A
check list was prepared by the researcher together with the staff members of mathematics department at
Dr. A.H-CTE in such a way that the researcher can observe students participations, attaining the lesson,
asking questions, giving a response for the asked questions, their interest to learn etc in the two groups
and it consisted of 10 items. The class room observation was taken place for eight successive classes in
both groups by the researcher and each item in the check list was observed eight times.
3.5. Treatment
Leibniz was among the first to define analysis and synthesis as modern methodological concepts:
"Synthesis ... is the process in which we begin from principles and [proceed to] build up theorems and
problems, ... while analysis is the process in which we begin with a given conclusion or proposed problem
and seek the principles by which we may demonstrate the conclusion or solve the problem."(Cited by
Ritchey, 1991)
Experimental group was treated by analytical approach, and students were more active participant in the
teaching–learning process. And also, Control group was treated by synthetic approach; this is the
conventional way of teaching mostly encourages rigor memorization of formulas/ principles or etc,
specifically a more teacher-driven lesson, textbook problems solved by their teacher. The role of the student
just they receive information from their teacher.
The two classes were receive instruction on the same material: Definition of derivatives, Differentiable
functions and differentiation on intervals, Derivatives of combination of functions, The chain Rule, Higher
derivatives, Implicit differentiation, Related rates, Max-Min theorem (Extreme value theorem), Graphical
discussion of the hypothesis of the max-min theorem, Rolle's and the Mean value theorem, Applications,
Monotonic functions, The first and second derivative tests, Extreme value problems. The contents are taken
from the Harmonize Curriculum for Linear Diploma program for College of Teachers Education in
Mathematics of Ethiopia (2009). The same textbook is used in both classes and the same assignments and
exercises are given. Both classes received 3 and ½ weeks instruction on the unit. There was four
contact/class hours per week. The length of each class time was 50 minutes per- period, four days per week
and the overall experiment was completed in seven weeks.
3.6. Methods of Data Analysis
This section describes us how the quantitative data which are collected by the researcher are
summarized or described. The quantitative data was collected, coded, tabulated, analyzed, described and
interpreted subjecting to both descriptive and inferential statistics.
For the related analysis of test results of the students descriptive statistics (such as mean, standard
deviation etc.) was used. Data was also analyzed using inferential statistics to test the stated null hypotheses
and according to the collected data appropriate statistical tools and computer software package (i.e.
SPSS16.0 for windows) was used.
Volume 6, Issue 2, February – 2021 International Journal of Innovative Science and Research Technology
ISSN No:-2456-2165
IJISRT21FEB332www.ijisrt.com 537
The Pre-DAT: The independent sample t-test was utilized to examine whether there is a significant mean
difference between the experimental group and the control group scores of the test. A t-test comparison
between the two groups based on their Pre-DAT results was performed to check whether there is any
statically significant prior knowledge difference about the concepts of derivative.
The post-DAT: - Here to analyze the results of the Post DAT the researcher made two ways of analysis.
First the results of post-DAT of both groups were compared by using t-test to see which method lead to
better immediate learning of the given concepts. Second ANOVA is also performed to statistically control
the pre-test and to refine further the result of the post-test for safe conclusion about the relative effectiveness
of the analytical and synthetic teaching approaches.
The preference rated scale: The mean difference of the students’ preference scope on the rated scale was
compared by using t-test. Linear Regression analysis was used to determine the effect of the students’
preference towards the respective teaching approach used on their performance in the post-test. It was also
analyzed using Mann-Whitney U-test to compare the two groups on their mean score difference of each
item.
Classroom observation: The systematic classroom observation was analyzed using frequency distribution
method.
The delayed post-test: The researcher also looked at the results of the delayed post-test to see which group
had reached higher scores by the time. The results of the post-test and the delayed post-test were also
compared applying the paired t-test to see which approach leads to better long-term acquisition with in
groups.
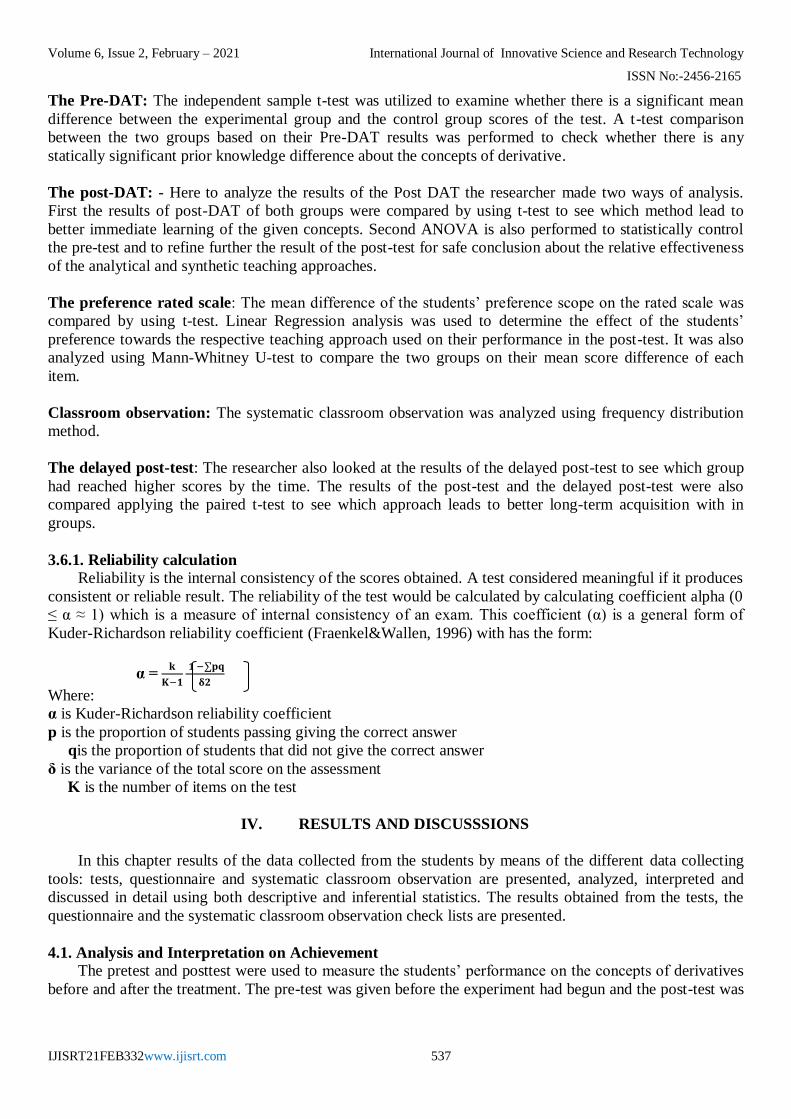
3.6.1. Reliability calculation
Reliability is the internal consistency of the scores obtained. A test considered meaningful if it produces
consistent or reliable result. The reliability of the test would be calculated by calculating coefficient alpha (0
≤ α ≈ 1) which is a measure of internal consistency of an exam. This coefficient (α) is a general form of
Kuder-Richardson reliability coefficient (Fraenkel&Wallen, 1996) with has the form:
α = 𝐤
𝐊−𝟏
1 −∑𝐩𝐪
𝛅𝟐
Where:
α is Kuder-Richardson reliability coefficient
p is the proportion of students passing giving the correct answer
qis the proportion of students that did not give the correct answer
δ is the variance of the total score on the assessment
K is the number of items on the test
IV. RESULTS AND DISCUSSSIONS
In this chapter results of the data collected from the students by means of the different data collecting
tools: tests, questionnaire and systematic classroom observation are presented, analyzed, interpreted and
discussed in detail using both descriptive and inferential statistics. The results obtained from the tests, the
questionnaire and the systematic classroom observation check lists are presented.
4.1. Analysis and Interpretation on Achievement
The pretest and posttest were used to measure the students’ performance on the concepts of derivatives
before and after the treatment. The pre-test was given before the experiment had begun and the post-test was

Volume 6, Issue 2, February – 2021 International Journal of Innovative Science and Research Technology
ISSN No:-2456-2165
IJISRT21FEB332www.ijisrt.com 538
given upon the completion of the experiment to see which method resulted in better achievement of the
students on the learned concepts.
Under this section, both descriptive and inferential statistics were used to answer the research questions
and to test the stated null hypothesis based on the results obtained from the pre-test and post-test.
4.1.1. Descriptive Statistics
Descriptive statistics is presented here to identify the summarized means, standard deviations and
standard error means of the students’ achievement on the concepts of derivatives as measured by the pretest
and posttest of both groups. Since the maximum score values from the pre-test and post-test were different,
the results are converted in to percentage to see the mean gain difference of the two groups.
Table 1. Descriptive statistics related to the percentage of scores on the pretest and posttest in both
groups
Test Group N Mean% SD S.E.M
Pretest Analytical 41 20.79 8.84 1.35
Synthetic 41 20.10 7.16 1.09
Posttest Analytical 41 56.56 12.36 1.89
Synthetic 41 50.81 12.29 1.87
Difference Analytical 41 35.77 15.48 2.36
Synthetic 41 30.71 7.24 2.35
SD=Standard Deviation S.E.D=Standard Error Mean
As can be seen from Table 1, the mean scores of the students on the pre-test in both groups were almost
the same with the analytic group scored a mean of 20.79 percent with standard deviation 8.84 where as the
synthetic group scored a mean of 20.10 percent with standard deviation 7. 16. This result indicates that the
students’ achievement on the concepts of derivatives before the treatment was the same. Similarly, the
means score of the analytic group on the post-test was 56.56 percent with standard deviation 12.36 and the
mean score of the synthetic group on the post-test was 50.81 percent with standard deviation 12.29. In the
post-test, the means score of the analytic group was higher than the synthetic group. A mean score
difference between the pre-test and the post-test was also observed in both groups (35.77 percent for analytic
and 30.71 percent of synthetic ) in which theanalytic group students demonstrated better improvement than
the synthetic group students.
The standard deviation of the scores in the pre-test of both groups was very small as compared to the
standard deviation of the scores in the post-test of both groups. This indicates that there was no great
variation among the students on their prior knowledge on the given concepts. But after the experiment, the
actual learning took place hence the variation of scores among the students.
4.1.2. The pre-test and post-analysis using t-test
In this section, the independent sample t-test was used to check the existence of significance mean
difference between the students in the analytic and synthetic groups based on the pre-test and post-test
results at probability level of = 0.05. Mean achievement and mean difference scores of the students in
each group were analyzed and interpreted based on the t-test results (see Table 2).
According to Morgan, et. at (2004), when investigating the difference between two unrelated or
independent groups (in this case the analytic and synthetic groups) on an approximately normal dependent
variable, it is appropriate to choose an independent samples t-test if the following assumptions are not
markedly violated.
1. The variance of the dependent variable in the two populations is equal.
2. The dependent variable is normally distributed within each population.

Volume 6, Issue 2, February – 2021 International Journal of Innovative Science and Research Technology
ISSN No:-2456-2165
IJISRT21FEB332www.ijisrt.com 539
3. The data are independent (scores of one participant are not related systematically to scores of others).
Table 2.Independent Samples t-test Comparison between Analytic and Synthetic Groups on the pre-
test
Group N Mean SD t MD P df
Analytical 41 8.73 3.58 .384 .29 .703 80
Synthetic 41 8.44 2.96
Based on the analyzed data results displayed in Table 2, the students’ prior knowledge about the
concepts of derivatives was identified by the pre-test which was given just before the experiment had been
implemented. Independent sample t-test was used to determine significance of the mean difference scores of
the two groups, and it was interpreted as follows:
The mean score of students in the analytic group was 8.73 (SD = 3.58), and the mean score of students
in the synthetic group was 8.44 (SD = 2.94) at (t= .403, MD = .29, P >.05). This shows that students in the
two groups had no significant prior knowledge difference on the concepts of derivatives. Results from the
pre-test suggest that the two groups were equivalent with respect to their prior knowledge on the selected
concepts.
The null hypothesis regarding the first research question was stated as:
H01. There is no significant difference between the mean achievement scores of the students taught through
the analytic and synthetic teaching approaches.
Table 3. Independent Samples t-test Comparison between analytic and synthetic Groups on Post –test
Group N Mean SD t MD P df
Analytical 41 30.54 6.43 1.942 3.1 .039 80
Synthetic 41 27.44 7.24
In order to determine the comparative effects of the analytic and synthetic teaching approaches on the
students’ understanding of the concepts of derivatives and achievement test was given to the students in the
two groups few days later after the experiment had been completed and their mean score difference was
compared using t-test (see Table 3). The mean scores of the students in the analytic group was 30.54 (SD =
6.43).
And the mean scores of the students from the synthetic group was 27.44 (SD=7.24). The results in
Table 3 convey that, even if the difference is not to that much exaggerated, there is a significant mean
difference (MD=3.1) in the scores of the students between the analytic and synthetic group at P<.05. Hence,
the stated null hypothesis is rejected and the alternative hypothesis is confirmed. From this result it can be
concluded that analytic teaching approach has greater effect than the syntheticapproach on the students’
understanding of the concepts of derivatives. Students taught by the analytic teaching approach performed
significantly better than students taught by the synthetic teaching approach.
4.1.3. Analysis of Covariance (ANCOVA) for the Pretest and Posttest using Pretest as Covariance
The analysis of covariance was used to assess whether the mean difference between the analytic and
synthetic groups on the post-test score was significant when the scores in the pre-test was statically
controlled. The post-test was as dependent variable, the treatment used with respect to both groups as fixed
factor and the pretest as covariate.

Volume 6, Issue 2, February – 2021 International Journal of Innovative Science and Research Technology
ISSN No:-2456-2165
IJISRT21FEB332www.ijisrt.com 540
Table 4. ANCOVA- analysis of the pre-test and post test using the pre-test as covariance
Source Dependant Type III Mean
Variable Sum of Square df square F Sig.
Corrected 787.507(a) 2 393.753 2.576 .086
Model
Intercept 37734.726 1 37734.726 246.903 .000
Group Post-test 657.718 1 657.718 .041
Pre-test 150.809 1 150.809
.323
Error 12685.051 79
Total 258664.000 82
Corrected
Total 13472.558 81
Significance is at = .05
Table 4 indicates that the treatment (both analytic and synthetic approaches) has highly significant
effect F (1, 79) = 4.304, P < .05. However, the covariate (pre-test) is no longer significant F (1, 79) = .987, P
> .05. After controlling the difference on scores of the pre-test, there was still a significant difference
between the students in the analytic and synthetic groups in their score in the post-test. This result suggested
that performance on the post-test was significantly and uniquely influenced by the treatment after accounting
its effect on the pre-test score.
4.2. Analysis and Interpretation on Preference
Through this questionnaire the researcher sought to identify the students’ attitudinal dispositions
towards the analytic or synthetic teaching-learning approaches accompanied by the given treatments. He
wanted to know how the students experience (feel) about their learning preference with respect to the
analytic and synthetic approaches.
A questionnaire, prepared by the researcher, was used to assess the students’ teaching-learning
preference with respect to the analytic or synthetic approaches. It comprised of 22 items of which 11 times
are for analytic approach and 11 items are for synthetic approach (see Appendix- IV). So that from this
arrangement of the items the students can choose their preference without any hesitation between the given
alternatives.
Since the analytic and synthetic approaches are pair-wise opposite dimensions, the items are arranged
pair-wise and compiled in one paper. They were rated in five-point Likert-type scale: Strongly Agree,
Agree, Natural, Disagree, and Strongly Disagree. The items were coded as Strongly Agree=1, Agree=2,
Neutral=3, Disagree=4 and Strongly Disagree=5 for the items with the synthetic approach connotation. But
the way of coding for the items with the analytic approach implications were reverse. This way of coding
has the implication that if a student is strongly agree with the statement for the synthetic approach
implication, then she/he is strongly disagree with the statement which has analytic approach implication
with the same idea.
The scores of the twenty two statements were summed to get a total score for each student in both
groups and the descriptive Statistics for the total score is presented in table 5. In reporting and interpreting
the descriptive statistics presentation of the preference rated scale towards the analytic or synthetic teaching-
learning preference score was classified as follows.
The average score of each student for all the items in the rated scale was calculated. Then, if the
average score of the student is above 3 it was labeled as “proponent of analytic”, if it is below 3 “proponent

Volume 6, Issue 2, February – 2021 International Journal of Innovative Science and Research Technology
ISSN No:-2456-2165
IJISRT21FEB332www.ijisrt.com 541
of synthetic” and if it is 3 “neutral”. Based on this result, to describe the frequency of number of students
who responded for the rated scales of the preference a cross tabulation was used.
Under this section it was analyzed extensively in both qualitative and quantitative way to compare the
mean scores preference rated scale with respect to each learning preferences of the two groups. The total
mean score of the students’ preference for each item in the two groups was also compared by U-test.
Table 5. Preference *Group Cross tabulation
Group Preference Total
Analytic Neutral Synthetic
Analytic 41 0 0 41
Synthetic 8 3 30 41
Total 49 3 30 82
Based on the result displayed in Table 5, it is observed that 41 students from the analytic group
preferred the analytic approach and no student from the analytic group preferred the synthetic approach.
Three students from the synthetic group responded “Neutral”. Thirty (30) students from the synthetic group
preferred the synthetic approach and eight students from the synthetic group preferred the analytic approach.
The result showed that the intervention during the experiment created a great influence on the students’
preference with respect to the analytic and synthetic approach. From this it can be concluded that both the
analytic and synthetic teaching methods were suitable approaches for the students to learn the concepts of
derivatives.
Table 6. Analysis of the preference rated scale scores using frequency, percentage and U-test
Item Group No. Mean U- test
X1
X2
X3
X4
X5
X6
X7
X8
X9
X10
X11
X12
Analytic
Synthetic
Analytic
Synthetic
Analytic
Synthetic
Analytic
Synthetic
Analytic
Synthetic
Analytic
Synthetic
Analytic
Synthetic
Analytic
Synthetic
Analytic
Synthetic
Analytic
Synthetic
Analytic
Synthetic
Analytic
41
41
41
41
41
41
41
41
41
41
41
41
41
41
41
41
41
41
41
41
41
41
41
4.2927
3.8293
2.7561
1.6341
4.4634
4.1951
2.6341
1.3415
4.5610
4.2927
2.8049
1.5854
4.4878
4.3659
2.7317
1.4390
4.3659
4.2927
2.8293
1.4634
4.5610
4.4634
2.5610
.026 *
.000 *
.039 *
.000 *
.020 *
.000 *
.303
.000 *
.660
.000 *
.457
.000 *

Volume 6, Issue 2, February – 2021 International Journal of Innovative Science and Research Technology
ISSN No:-2456-2165
IJISRT21FEB332www.ijisrt.com 542
X13
X14
X15
X16
X17
X18
X19
X20
X21
X22
Synthetic
Analytic
Synthetic
Analytic
Synthetic
Analytic
Synthetic
Analytic
Synthetic
Analytic
Synthetic
Analytic
Synthetic
Analytic
Synthetic
Analytic
Synthetic
Analytic
Synthetic
Analytic
Synthetic
41
41
41
41
41
41
41
41
41
41
41
41
41
41
41
41
41
41
41
41
41
1.6341
4.5610
4.0732
2.5122
1.4878
4.5366
4.3415
2.7073
1.7317
4.5854
4.2683
2.6829
1.3171
4.5610
4.2439
2.5610
1.5366
4.5122
4.2439
3.1463
1.6098
.004 *
.000 *
.088
.000 *
.022 *
.000 *
.022 *
.000 *
.070
.000 *
Grand Total Analytic
Synthetic
3.6098
2.8814
Source: Data collected and analyzed
Since the analytical and synthetic approaches are pair-wise opposite dimensions, the 22 items analyzed
pair-wise as disclosed in Table 6 and interpreted as follows.
Items X1 and X2
Table 6 indicates that the mean score of the students in both groups for item 1 which says “When I
solve problems on derivatives, I often just see the solutions but then I have to struggle to figure out the steps
to get to them” was inclined to the analytic approach connotation of the rated scale of the statement. The
mean score of the students to the rated scale in the synthetic group exceeds the mean score of students in the
analytic group (Mean =3.39 for analytic and Mean = 3.66 for synthetic groups). The students reflected their
strong agreement by indicating their response to the reverse statement of this item (X2) the mean score for
the rated scale to be 3.32 for the analytic group and 3.32 for the synthetic group. This shows both groups
scored equal mean for the statement which is inclined to synthetic approach implication. The nonparametric
independent sample of Mann-Whitney U-test also reveals that there is no significant mean score difference
between the analytic and synthetic group students (U = .000 for X 1 and U = 1.000 for X2). The students in
both groups have the judgment that they have to figure out all necessary steps in solving mathematical
problems so as to accept the solution is correct.
Regarding to this situation, Prince and Felder (2006) stated that a better way to motivate students is
analytic/inductive teaching method, in which the instructor begins with specific, such as experimental data
to interpret, a case study to analyze, or a complex real world problem to solve. Students grappling with these
challenges quickly recognize the need for facts, skills and a conceptual understanding, at which points the
teacher provides and helps students figure things out for themselves. Cornu (1991) assured that students
seem to be very pragmatic when they learn about limits. They focus on the problem solving not so much on
the theory. This shows that it is needed to direct efforts tothose activities which favor students’ deep

Volume 6, Issue 2, February – 2021 International Journal of Innovative Science and Research Technology
ISSN No:-2456-2165
IJISRT21FEB332www.ijisrt.com 543
comprehension of mathematical concepts rather than to the mere transmission of formal definitions and
using them blindly to solve problems.
ItemsX3 and X4
The mean score of the students response for X3, which says “It is more important tome that an
instructor lay out the material in clear sequential steps”, was3.44 for analytic and 3.56 for synthetic groups
(Table 6) and for its reverse statement was3.37 for analytic and2.61 for synthetic groups (item X 4). From
this it can be observed that students in both groups put their judgment that it would be better for them if an
instructor presented his material in clear sequential steps. But the responses of the students for the
syntheticconnotation of the statement was observed a considerable difference between the analytic and
synthetic group students in which the synthetic group students need an instructor to give them an over-all
picture of the materials first. The U-test shows that mean score difference of the students in both groups has
no significant difference for theanalytic connotation of the statement (U= .059), but there is significant
difference for thesynthetic connotation of the statement (U = .000). The reason for observing considerable
numbers of students in the synthetic group agreed with both dimension of the statement might be due to the
synthetic intervention during the experiment. In light of this, when the concept of derivatives considered in
the analytic treatment students meet notion of derivative in an informal intuitive way where the tasks are
from situations where they can easily see the outcome. This can create a feeling of control and the students
think they know what the concept is about even if they could not solve in more demanding task where they
would have to master meaning of the formal definition.
ItemsX5 and X6
The mean score of the students for item 5 was 3.34 for analytic and 3.02 for synthetic group (Table 6)
and for its reverse statement was 3.66 for analytic and 2.40 for synthetic group (item X6). The U-test
ascertained that there is no significant mean score difference between the analytic and synthetic group
students for the analytic approach connotation of the statement in which the synthetic group students
responded a neutral preference, but a significant mean difference was observed for the deductive/synthetic
connotation of the statement (U = .000 for item X5 and U = .000 for item X6). This result shows that the
students in the analytic group reflected their tendency towards the idea of the statement that calls for detail
information, while the students in the synthetic group was eager to know the big picture of a given
information, missing its detail. Regarding these approaches, Felder (1988) suggested that a student favoring
the sequential learning style would respond well to an instructor who presents information in a step-by-step
fashion. It also follows that a student favoring the global learning style would respond well to an instructor
who presents information in a holistic (big-picture) fashion.
ItemsX7 and X 8
The mean score of the students for X7, which says “When I have to perform a task on derivative, I
prefer to come up with new way of doing it”, was 3.61 for analytic and 3.10 for synthetic groups (Table 6)
and for its reverse statement 3.51 was for analytic and 2.49 for synthetic (item X8). The students in both
groups responded in supporting the analytic connotation of the statement, but a significant mean difference
was observed in their response for the synthetic connotation of the statement by which the analytic group
students oppose the analytic connotation and the synthetic group students support the synthetic connotation
of the statement (U = .000 for X7 and U= .000 for X8).
For the synthetic implication of the statement by which the analytic group students oppose the synthetic
implication and the synthetic group students support the analytic implication of the statement. This has the
implication that the students are more satisfied if they involved in an innovative way of solving a
mathematical problems rather than solving a problem by substituting to the existing formula. It can have the
implication that a highly structured presentation of the contents arose students' interest too.
ItemsX9 and X10

Volume 6, Issue 2, February – 2021 International Journal of Innovative Science and Research Technology
ISSN No:-2456-2165
IJISRT21FEB332www.ijisrt.com 544
Students in the analytic and synthetic groups responded for X9, which says “I prefer contents that
emphasize concrete material (facts, data)”, of mean 4.02 and 3.90 respectively (Table 6) and on its reverse
statement was 3.37 for analytic and3.37 for syntheticfor the rated scale of the statement. Both groups scored
equal mean for the statement inclined to synthetic implication (X10). Students in both groups arose their
interests when they were provided with concrete materials, i.e. facts, data. The nonparametric U-test
compilation reveals that there is no significant mean difference in both dimension of the statement (U = .000
for X 9) and there is no significance mean difference between the analytic and synthetic group students ( U
= 1.000 for item 10). Regarding the idea of this item, Applebaum (2001) expressed the power of
inductive/analytic method of teaching to develop students’ insight learning. According to his contention the
advantage of analytic method of teaching lies in its maximum vicinity and in the fact that it develops
intuition and creates condition for the insight and impressing rise by providing concrete materials. The
analytic method of teaching can considerably activate the students’ creative activity.
Item X11 and X12
The students’ response for X11 reflect a remarkable difference on their standpoint regarding the relative
presentation of example first then the generalization or the generalization first then example by the mean
scoring of 3.83 the analytic and 2.44 the synthetic groups (Table 6) and 3.49 the analytic and 2.15 the
synthetic groups (X12). The non-parametric independent sample of Mann-Whitney U-test also reveals that
there is significance mean score difference between the analytic and synthetic group students (U=.000 for
X11) and there is no significance mean difference between the analytic and synthetic group students (U=
1.000 for X12). The students in the analytic group preferred deriving the rules for themselves from examples
where as the students in the synthetic group favored being given the rule first. The result of this item
conveys that the students in both groups were highly influenced by the intervention of the methods used.
The students in the synthetic group were interested with examples after the presentation of the generalization
to sense it in particular case.
Items X13 and X14
The students’ response for X13, which says “When I learn derivative, I prefer to learn the rules as I go
along”, reflected in the way that they were treated by scoring of mean 3.85 for the analytic group and 2.71
for the synthetic group students (Table 6) and on its reverse statement was 3.29 for analytic and
2.56synthetic (X14) for the rated scale of the statement. It is obtained a significant mean difference between
the two groups in both dimensions of the statement (U = .000 for X 13 and U = .000 for X 14). Both analytic
and synthetic groups preferred the statement inclined to the respective approach in which they were taught.
Items X15 and X16
The students in both groups responded for the statement “I prefer to learn the concepts of l derivatives
in the sequence of Specific examples, General rule, Practice” (X15) of mean 3.78 for analytic and 2.51 for
synthetic group (Table 6). The students in the analytic group gave a neutral response for the reverse of this
statement (X16) with mean score 3.02where as the students in the synthetic group supported it with mean
score 2.32. In both dimensions of the statements, there is a significant mean difference between the two
groups (U = .000 for X15 and U = .000 for X16). This indicates that the students in both groups were
influenced by the given treatments.
Items X17 and X18
For X 17, which says “I understand the concepts of derivatives better when the teacher presents a
whole range of examples”, the students I both groups favored it with mean scores 3.90 for the analytic and
3.37 for the synthetic group (Table 6). Even if both groups supported the given statement, a significant mean
difference is observed on their score on the rated scale (U = .022 for X17). The students reflected their
opposition for the synthetic connotation of the statement (X18) with mean score 3.34 for the analytic group
and 3.05 for the synthetic group. Again, a significance mean difference is obtained between the two groups
(U= .000 for X18) for rated scale statement inclined to synthetic implication. Example in mathematics

Volume 6, Issue 2, February – 2021 International Journal of Innovative Science and Research Technology
ISSN No:-2456-2165
IJISRT21FEB332www.ijisrt.com 545
education provides some thing as raw material for inductive reasoning, as a particular instances for a
generality, and creates an environment for practice.
According to Watson and Mason (2005) ideas, key feature of examples is that they are chosen from a
range of possibilities and it is vital that learners appreciate that range. According to these authors contention
whenever students encounter a mathematical statement that is not immediately obvious, the natural thing to
do is to construct or call upon an example so as to see the general through intimate experience of the
particular. Examples in mathematics context help the students to detect and express a structured essence
which lies behind several apparently different situations and out of these can arise a new unifying concept
and an associated collection of definitions and theorems.
ItemsX19 and X20
The students in the analytic and synthetic groups scored of mean 3.85 and3.00 respectively on X 19
(Table 6), which says “I develop a clear image about the idea of the content, when I proceed from specific to
general”, and their mean scores on the reverse idea of the item is 3.07 for analytic and 2.44 for synthetic
group (item X20). Significant mean difference is detected on both items,X19 (U =.000) and X 20 (U =
.000.070) between the two groups.
ItemsX21 and X22
For X 21, which says “I feel most engaged, when I provide with more examples, practical problems and
observational data to interpret”, scored a mean of 3.66 for the analytic group and 2.51 for the synthetic
group (Table 6). The analytic group students preferred the given statement but the synthetic group students
did not. For the synthetic dimension of the statement, the synthetic group students preferred but the analytic
group students did not by scoring mean of 2.34 for the synthetic group and 3.63 for the analytic group
(X22). In both dimensions of the statement, a significant mean difference is obtained between the two
groups (U =.000 for X21 and U = .000 for X22)
Generally, the students in both groups biased for their preference towards the approaches in which they
were treated in the experiment. The grand mean of the total mean scores of each items ascertained this fact
(Grand mean = 3.54 for analytic and Grand mean = 2.86 for synthetic)
The null hypothesis regarding the students in both group means score difference on the preference rated
scale was stated and tested as follows.
H02. There is no significant difference between the mean preference-scores of students towards the
respective method used.
Table 7. Independent t-test comparison of mean scores on preference rated scale towards the analytic
or synthetic approaches in both groups.
Group N Mean SD t MD P df
Analytical 41 79.41 2.49 21.501 16.02 .000 80
Synthetic 41 63.39 3.67
As it can be observed from Table 7, the mean scores of the students in the analytic group on the
preference rated scale was 78.09 (SD = 6.36) and the mean scores of the students in the synthetic group on
the preference rated scale was 63.19 (SD = 2.05). Table 7 conveys that there is significant mean difference
between the students’ score on the preference rated scale towards the analytic or synthetic approaches (t =
14.63, MD = 14.91, P = .000).
As it can be observed from Table 7, the means scores on the students' preference show that the analytic
group students preferred the analytic approach where as the synthetic group students preferred the synthetic

Volume 6, Issue 2, February – 2021 International Journal of Innovative Science and Research Technology
ISSN No:-2456-2165
IJISRT21FEB332www.ijisrt.com 546
approach. This result agrees with result presented in Table 5 result reveals that the students in both groups
favored the respective method implemented in the treatment.
4.3. Analysis and Interpretation on Preference and Achievement
A null hypothesis regarding the third research question was stated and tested as follows:
H03. The students’ preference towards the respective method used has no significant effect on their
achievement.
The Linear Regression analysis here is used to determine where he teaching methodologies used with
respect to both groups could significantly predict the achievement of the students in the post test over and
above the effect of the students’ preference towards the respective methodologies. In other words, it is
intended to identify whether the students’ preference towards the respective method used was significantly
affected or not for the students’ mean difference scores in the post test.
In order to investigate the extent to which the preference variation towards the respective approaches
employed was attributable in performance of the post-test, Linear Regression was performed.
Table 8. Summary Table for Regression of Preference on Post-test
Mode R Adjusted Std. Error
1 R Square R Square of the Estimate Change Statistics
R Square F Sig. F
Change Change df1 df2 Change
1 .179(a) .032 .02 6.714 .032 2.76 1 80 .100
The result in Table 8 illustrate the proportion of variance explained by the preference variable on the
post-test variable. The preference of the students towards the approaches accounted for 2.0% of the total
variability in performance in the post-test as measured by the Adjusted R Squared and this was not
significant contribution (F ( 1, 80) = 2.7666, P = .100). As a result of the Regression analyses, the students’
preference towards the respective method used has no significant effect on their achievement. Hence, the
stated null hypothesis is supported.
4.4. Analysis and Interpretation on the Delayed Post-test
A delayed post-test was administered within three weeks time of completing the experiment to compare
the long term effects of the analytic and synthetic teaching approaches on the students’ learning the concepts
of derivatives. It was given together with the students’ mid-term course exam. In the immediate post-test a
slight preference was found in favor of the analytic approach. But the means or of the synthetic group
students was not far behind.
Both descriptive and inferential statistics was used to analyze the results from the delayed post-test. The
mean, standard deviation and standard error is summarized by the descriptive statistics. An inferential
statistic was used to answer the research question regarding to the comparative effects of the analytic and
synthetic teaching approaches for long term learning of the students. The independent sample t-test was used
to compare the mean score difference of the analytic and synthetic group students. A paired t-test was also
performed to determine which method resulted in better long term learning within the group.

Volume 6, Issue 2, February – 2021 International Journal of Innovative Science and Research Technology
ISSN No:-2456-2165
IJISRT21FEB332www.ijisrt.com 547
Table 9. Descriptive Statistics for the delayed post-test
Test Group N Mean SD SE
Analytical 41 33.93 5.58 .87
Delayed Post-test
Synthetic 41 33.90 5.71 .89
SD= Standard Deviation S.E = Standard Error
Based on the results displayed in Table 9, the mean scores of the analytic group students was 33.93 (SD
= 5.58) and the mean scores of the synthetic group students was 33.90 (SD = 5.71). This shows that the
students in the two groups reached the same level of understanding at this time.
The null hypothesis regarding to the comparative long term effects of the analytic and synthetic
teaching approaches on the students’ learning was stated and tested as follows.
H04. There is no significant mean difference between analytic and synthetic teaching approaches on the
students’ retention of the concepts of derivatives.
Table 10. Independent Samples t-test Comparison between analytic and synthetic Groups on the
delayed post-test
Group N Mean SD t MD P df
Analytical 41 33.93 3.58 .023 .024 .982 80
Synthetic 41 33.90 2.96
Table 10 displays the means score of the students in the two groups. The students mean score in both
groups according to the delayed post-test was very high (33.93) for analytic and (33.90) for synthetic groups
as expected. The mean difference score in the two groups was not statistically significant ( P> .05). The
result of this test convey a permissible reason from the natural of the used contents as the students met in
the subsequent chapters with deep conceptual structures and more practical applications. When students
learn the application of differentiation and integrations chapters they introduced exclusively using the
concepts of limits and continuity. As a result, the stated null hypothesis is supported.
In addition to the aforementioned reason since the delayed post-test was given along with the normal
schedule of mid-term examination for the course, the students were well prepared and did better. As a result
of this the students in the two groups reached the same level of performance on the concepts of derivatives
after they completed the subsequent unit of the course. Therefore, the study seems remained as inconclusive
of the superiority of one of the approaches in the long term learning by considering the concepts of
derivatives. Based on this result, the analytic and synthetic teaching approaches are equally effective for
long term learning of the students on the concepts of derivatives.
Table 11. Difference between the post-test in both participant groups
I. Analytic Group
Paired Samples Statistics
Mean N
Std.
Deviation
Std. Error
Mean
Pair 1 Ret.-
DAT(54) 33.9268 41 5.58297 .87191
Post-
DAT(54) 30.5366 41 6.43466 1.00493

Volume 6, Issue 2, February – 2021 International Journal of Innovative Science and Research Technology
ISSN No:-2456-2165
IJISRT21FEB332www.ijisrt.com 548
Paired Samples Test
Paired Differences
t Df
Sig. (2-
tailed)
Mean
Std.
Deviation
Std.
Error
Mean
95% Confidence
Interval of the
Difference
Lower Upper
Pair 1 Ret.-
DAT(54) -
Post-
DAT(54)
3.39024 8.80022 1.37436 .61255 6.16794 2.467 40 .018
II. Synthetic group
Paired Samples Statistics
Mean N
Std.
Deviation
Std. Error
Mean
Pair 1 Ret.-
DAT(54) 33.9024 41 5.70879 .89156
Post-
DAT(54) 27.4390 41 7.23895 1.13053
Paired Samples Test
Paired Differences
t Df
Sig. (2-
tailed)
Mean
Std.
Deviation
Std.
Error
Mean
95% Confidence
Interval of the
Difference
Lower Upper
Pair 1 Ret.-
DAT(54) -
Post-
DAT(54)
6.46341 8.28884 1.29450 3.84713 9.07970 4.993 40 .000
The two post-tests were also compared to each other with in the group to see which one of them
resulted in better long term learning. Table 11 presents the difference between the groups in the post-tests.
Paired samples t-test was utilized to see the comparative effects of the methods in case of the immediate and
long term learning within the group. As Table 11 indicates, the differences between the first and second
post-tests of the analytic group was significant ( P = .002). The students in the analytic group exhibited
much difference in long term learning in the given content elements. Similarly, the synthetic group students
demonstrated a significant difference in the two post-test scores in favor of the delayed post-test (P = .000).
4.4. The Dominant Method
As could be seen from the presentation of the approaches and from the results of the analyzed data, it
seems difficult to pick out which one of the methods is more dominate for the students to learn mathematical

Volume 6, Issue 2, February – 2021 International Journal of Innovative Science and Research Technology
ISSN No:-2456-2165
IJISRT21FEB332www.ijisrt.com 549
concepts. In this study it was obtained that the students in the analytic group performed significantly better
than the students in the synthetic group on the post test.
According to the result of this study, the analytic method played more dominate role than the synthetic
approach as per the students’ achievement.
The result obtained from the survey indicates that both methods equally created a favorable condition
for learning the concepts of derivatives. The students in the analytic group actually prefer the analytic
approach and the students in the synthetic group prefer the synthetic approach as the students in the analytic
group wanted to derive the rules themselves while the students in the synthetic group wanted the rules to be
explained to them. By having to work out the rules by themselves, the students in the analytic group need to
use more time to actually understand them, thus, the rules can be easy to remember. On the other hand, it
seems that if the students are already aware of the concepts used in mathematics teaching, the synthetic
approach might help them to internalize the rules as they have the tools to compare the new information to
their previous knowledge about the concept.
The students in both groups did not show significant difference in long term learning as determine by
the delayed post-test. Based on this result, the two methods are equally important for the long term learning
of the given concepts. Hence, in terms of the retention level either method did not show superiority of the
other.
To get supportive evidence for the results obtained from the collected data, a classroom observation was
conducted and it is analyzed below.
4.5.1. Analysis of systematic classroom observation results
Systematic classroom observations check lists were prepared and conducted for eight successive
periods to gather information about the overall practices of the students in both groups. The observed
practices for each checkpoint were summarized and a tally mark (/) was used to indicate the extent of
presence of the checked activity under each column during the teaching and learning process. For indicating
to what extent each activity was practiced in each class was labeled based on the judgment that the indicated
percent of the total number of students was used.
o Most = indicates above 75% of the total students in each group demonstrated the observed behavior.
o Many = indicates from 59% to 75% of the total students in each group demonstrated the observed
behavior.
o Some = indicates from 25% to 50% of the total students in each group demonstrated the observed
behavior.
o Few = indicates below 25% of the total students in each group demonstrated the observed behavior.
o None = was mean that the observed behavior was not demonstrated.
The Students’ over all classroom practice was observed using the following check points:
o Students active involvement in the learning process
o Students’ conscious effort to learn
o Students’ ability in formulating and structuring a problem
o Completing the given classroom exercises and assignments
o Students curiosity to ask a question and to give a response
o Students ability to draw a conclusion based on the given information
o Students ability to solve problems using formulas and definitions
o Students’ ability to justify a generalization using a counter example
o Students’ ability to refuse a generalization using a counter example
o Students’ involvement time on task

Volume 6, Issue 2, February – 2021 International Journal of Innovative Science and Research Technology
ISSN No:-2456-2165
IJISRT21FEB332www.ijisrt.com 550
Table 12. Analysis of systematic classroom observation by frequency distribution
Group No Most (>75%) Many (50-75%) Some (25-50%) Few (25%) None
f % f % f % f % f %
Analytical 34 42.5 30 37.5 16 20 0 0 0 0
Synthetic 20 25 32 40 26 32.5 2 2.5 0 0
Table 12 displays the results that 36 (45%) out of the total observed times of the eight periods each
activity was practiced by above 75% of the total students in the analytic group, while 21 (26.25%) out of the
total observed times of each activity in eight periods were practiced by above 75% of the total students in
the synthetic group. Under the remaining columns of Table 12 the total sum of times of each activities
practiced by the synthetic group exceed the total sum f times of each activity practiced by the analytic group.
No activity was indicated under “None” in both groups and no activity was practiced by “Few” in the
analytic groups.
This can have the implication that once the students being familiarized with the concepts of derivatives,
they developed a curiosity that lead them to ask for an explanation of unclear ideas and to give a response
regarding their perception of the content, to devote their time and energy in the learning task. This
systematic class room observation checked that techniques that use an authentic (real-world, professionally
relevant) situations and problems have the opportunity to provide contexts for the students actively involved
in the teaching and learning process. The inductive approach was endowed with this power. The students in
the inductive group were evoked their curiosity through the well structured examples used to introduce and
to develop the formal definitions of the contents.
The students in the deductive group were also superior in completing the given classroom exercises and
assignments and their ability to solve problems using formulas and definitions. According to Senk (1985)
the analytic approach encourages to students to explore, to generalize, to refute a generalization, to
formulate a generalization and explain it. Peard (1976) proposed that learners should be made to arrive at
generalization through activities and if there is no counter example to it, it may be proved deductively.
The students’ ability to justify a generalization using a counter example was greater in the inductive
group, when the generalization was formulated by themselves through explorations and considering
different cases. But it was observed in the synthetic group the students’ wide spread difficulties in exploring
examples and in constructing and exposing their problems. It was observed through the check lists that when
the concepts of derivatives were presented by representing concrete environmental facts, the students put
efforts to understand fully the meaning of the concise formalized definitions of the concepts. Juter (2006)
pointed out that students can devote a lot of every and time if they are exited and curious about the subject
and if there is something that derives them to make sense of what they are doing with.
V. SUMMAR, CONCLUSION AND RECOMMENDATION
After all presentation, analysis and interpretation of the data obtained during the research, this chapter
contains a summary of the results, conclusions and recommendations.
5.1. Summary
This study was designed to examine the comparative effects of two teaching approaches, the analytic
and syntheticon students’ understanding of the concepts of derivatives from calculus-I.The pre-DAT, Post-
DAT and delayed post-DAT equivalent group design was used in this study. The derivatives unit from
calculus-I was the same for both the analytic and synthetic treatments. The analytic treatment followed
basically an example rule paradigm in this treatment, numerous examples were worked by the instructor and
students before a rule or principle was stated. Following the examples, the students were encouraged, via

Volume 6, Issue 2, February – 2021 International Journal of Innovative Science and Research Technology
ISSN No:-2456-2165
IJISRT21FEB332www.ijisrt.com 551
questions, to formulate a principle or generalization of their won. The synthetic treatment was also basically
a rule-example paradigm. A rule or principle was stated and explained for the students, after which several
examples were worked by the instructor and students together in class. The rule or principle was written for
the students by the instructor while it was being stated. The treatment was lasted for about three and one half
weeks with four periods of teaching per week and fifty minutes per a period.
Previous research results do not show an overwhelming superiority of either method in mathematics
achievement. In this study it was intended to uncover the relative effectiveness of these two methods on
students’ understanding by considering the concepts of derivatives. Eighty-two (82) second year
mathematics department students at Dr. A.H-CTE were subjects of this study. Two groups were formed
consisted of 41 students each. The independent variables for this study were the analytic and synthetic
teaching approaches and the pre-test result and the students’ preference were a covariate. The students’
achievement and retention were the dependent variables.
A diagnostic pre-test was used as a covariate for equating the two groups. The overall achievement of
the students was measured by the post-test. A questionnaire consisted 22 items was administered to examine
the students’ learning preference with respect to the analytic or synthetic approaches as well as to determine
the effect of the students’ preference towards the respective method used n their performance on the post-
test. A systematic class room observation check list was prepared to observe the overall practices of the
students in the class in both groups and it was conducted for eight successive periods. A delayed post-test
was also given two both groups after three weeks of the experiment.
Results from the achievement post-test as well as the delayed post-test were analyzed using independent
t-test and an analysis of covariance was also used to statistically control the pre-test score and to refine
further the result of the post-test. Results from the questionnaires and the systematic classroom observations
were analyzed extensively in a qualitative was as well as quantitatively. The students’ preference towards
the respective method was compare using t-test and its influence on their achievement was also analyzed
using the Linear Regression.
The result of the t-test analysis revealed that the students in the two groups mean score difference on the
pre-test was not significant (MD = .233, P > .05). This indicates that the students in the two groups were
equivalent according to their prior knowledge about the concepts of derivatives.
The t-test mean difference comparison on the post- score of the students in the two groups ascertained
that students taught by the analytic teaching approach performed significantly better than their counter part
taught by the synthetic teaching approach (MD = 2.977, P < .05)
Most of the students in both groups preferred to the respective teaching approach implemented during
the experiment. The analytic group students preferred the analytic approach where as the synthetic group
students preferred the synthetic approaches. Based on the U-test results a significant mean difference is
observed on the items 4, 6, 8, 11. 12, 13, 14, 15, 16, 19, 21, and 22. But there was no significant mean
difference between the two groups on the items 1, 2, 3, 5, 7, 9, 10, 17, 18 and 20. Based on the grand mean,
the students in both group also confirmed their agreement with the respective approach used ( 3.51 for the
inductive and 2.87 for the deductive group) and their preference towards the respective method showed no
significant effect on their performance on the post-test.
The students mean score in both groups according to the delayed post-test was very high (34.67) for
analytic and (34.74) for synthetic groups. The mean difference score in the two groups was not statistically
significant ( P> .05), but paired samples t-test comparison in case of the immediate and long term learning
within the group showed that the differences between the post-test and delayed post-test of the analytic and

Volume 6, Issue 2, February – 2021 International Journal of Innovative Science and Research Technology
ISSN No:-2456-2165
IJISRT21FEB332www.ijisrt.com 552
synthetic group was significant ( P = .002 for analytic and P = .000 for synthetic ) in favor of the long term
learning.
5.2. Conclusion
The study reported preliminary findings on the relative effectiveness of the analytic and synthetic
teaching approaches for the students’ understanding by considering the derivative concepts from calculus-I.
Based on the results of this study, the following conclusion can be drawn.
o The students in the analytic and synthetic groups were equivalent in their prior knowledge about the
concepts of derivative before the experiment.
o The students taught by the analytic teaching approach performed significantly better than their counter
part taught by the synthetic teaching approach in the immediate post-test.
o The analytic teaching approach reflected its favor for the students’ understanding of the concepts of
derivative.
o The students in the analytic group seemed more convinced by the generalization they formulated than by
the rule given to them by the instructor.
o Both the analytic and synthetic teaching approaches appeal to the students a preferable method of
teaching and learning approach for the concepts of derivative.
o Both the analytic and synthetic teaching approaches are equally effective for the long term learning of the
students on the concepts of derivative.
5.3.Recommendation
It is the concern of scholars in the field of education to create favorable situations for the improvement
of the teaching learning process. This small study on the comparison of the relative effectiveness of the
analysis and synthesis methods of teaching will contribute to the enhancement of mathematics instruction.
Taking the results of this study into great consideration, the researcher has the following important
recommendation to the stake holders in the education system.
- Course instructors in mathematics should implement the analysis approach as often as it is necessary to
tap its many advantages in enhancing students' learning and maximizing achievement in mathematics.
- In order to avoid the mismatch between students' performance of learning style and teacher-educators
teaching methods with respect to the analysis and synthesis approaches, it would be much better if
teacher-educators follow analysis approach in an introductory courses and synthesis approach in
advanced courses.
- The analysis method should be employed wisely and sparingly, restricted only rules that can be perceived
and defined quickly; otherwise a lot of valuable class time can be wasted on futile and frustrating
guessing.
- In this study, it was simply measured the overall achievement of the students on the concepts of
derivatives. But, it would have been necessary to consider and classify the students' understanding with
respect to different knowledge categories. Therefore, the researchers recommends that a further
investigation needs to conduct for determining effects of the two methods on students' factual knowledge,
procedural skills and conceptual understanding of derivatives.
- In the study, no factors was considered of which in one or the other way could affect the results obtained
through the treatments implement in both the analytic and synthetic groups. Some of the factors one must
consider along to those methodologies are sex, demographic back grounds of the students, their
motivation to study mathematics courses in college for their future career, the students' ability level etc.
must be included.
6. REFERENCES

Volume 6, Issue 2, February – 2021 International Journal of Innovative Science and Research Technology
ISSN No:-2456-2165
IJISRT21FEB332www.ijisrt.com 553
[1]. Allen, N. B. R. 1992. A study of metacognitive skills as influenced by expressive writing in college
introductory algebra classes. Doctoral dissertation, Louisiana State University. Dissertation Abstracts
Internationa, 53, 432A.
[2]. Anderson , L.W., and Sosniak, L.A. (Eds.). 1994. Bloom's taxonomy: a forty-year retrospective.
Ninety-third yearbook of the National Society for the Study of Education, Pt.2 ., Chicago , IL .,
University of Chicago Press.
[3]. Ball, D. L., Lubienski, S. T., andMewborn, D. S. 2001. Research on teaching mathematics: The
unsolved problem of teachers’ mathematical knowledge. In V. Richardson (Ed.), Handbookof research
on teaching (4th ed., pp. 433–456). New York: Macmillan.
[4]. Bloom, B., Englehart, M., Furst, E., Hill, W. &Krathwohl, D. 1956. Taxonomy of educational
objectives: The classification of educational goals. Handbook I: Cognitive domain New York:
Longmans.
[5]. Borasi, R. and Rose, B. J. 1989. Journal writing and mathematics instructions. Educational
[6]. Studies in Mathematics, 20, 347- 65.
[7]. Borko, H., Eisenhart, M., Brown, C. A., Underhill, R. G., Jones, D., andAgard, P. C. 1992. Learning to
teach hard mathematics: Do novice teachers and their instructors give up too easily? Journal for
Research in Mathematics Education, 23(3), 194-222.
[8]. Burton, L. and Morgan, C. 2000. Mathematicians writing. Journal for Research in Mathematics
Education, 31, 420 - 453.
[9]. Carpenter, T. P., and Fennema, E.1992. Cognitively guided instruction: Building on the knowledge of
students and teachers. International Journal of Educational Research, 17(5), 457–470.
[10]. Carpenter, T. P., Fennema, E., and Franke, M. L. 1996. Cognitively guided instruction: A knowledge
base for reform in primary mathematics instruction. Elementary School Journal, 97(1), 3–20.
[11]. Casado, M. 2000. Teaching methods in higher education: A student perspective. Journal of Hospitality
& Tourism Education, 12, 65-70.
[12]. Chianson, M.M. 2008. Cooperative learning: in Kurumeh, M.S. andOpala, M.F (eds) Innovative
TeachingApproaches of Mathematics Education in the 21st Century. Vol. 1, Pp: 27-40. Makurdi:
Nigeria. AzabenPress.
[13]. Darling-Hammond, L. 1999. Teacher quality and student achievement: A review of state policy
evidence. Seattle: University of Washington, Center for the Study of Teaching and Policy.
[14]. Eshetu , A. 2009. Science and mathematics secondary education in Ethiopia An Option paper presented
at the Technical Workshop on Science and Mathematics Secondary Education in Africa (SEIA) Follow-
up Program.
[15]. Fennema, E., andFranke, M. L. 1992. Teachers’ knowledge and its impact. In D. A. Grouws (Ed.),
Handbook of research on mathematics teaching and learning (pp. 147–164). New York: Macmillan.
[16]. Ferrini-Mundy, J. and Lauten, D. 1993: Teaching and Learning Calculus. In: Wilson, P.S. (Ed.),
Research Ideas for the Classroom (pp.155–176). NewYork: Macmillan.
[17]. Filloy, E. and Rubio, G. 1993. “Didactic Models, Cognition and Competence in the Solutions of
Arithmetic and Algebra Word Problems in Hirabayashi”, In. et al. (eds). Proceedings ofthe 17th
International Conference for the Psychology of Mathematics Education, Vol.I, pp. 154-161. University
of Tsukuba, Japan.
[18]. Glynna,R., 1993. A comparison of inductive and deductive teaching strategies utilizing graphical
calculator capabilities. A Doctorial dissertation in Texas Tech University.
[19]. Gordon, S. 1997. Functioning in the Real World: A Precalculus Experience. New York: Addison
Wesley.
[20]. Harbor Peters, V.F.A 2001. Unmasking Some Aversive Aspect of School Mathematics and Strategies
for Averting them. Inaugural Lecture: 5 th, July.
[21]. Harel and Trgalova. 1996. Higher Mathematics Education. In: Bishop, A.J.et.al (eds). International
Handbook of Mathematics Education. (pp 675-700). Netherlands
[22]. Hesson, M. and Shad, K. F. 2007. A student –centered Learning Model, American Journal of Applied
Science 4, 628-636.

Volume 6, Issue 2, February – 2021 International Journal of Innovative Science and Research Technology
ISSN No:-2456-2165
IJISRT21FEB332www.ijisrt.com 554
[23]. Hiebert, J. and Carpenter, T. P. 1992. Learning and teaching with understanding. In D. Grouws
(Ed).,handbooks forresearch in mathematics teaching and learning (pp. 65 -97). New York:
MacMillan.
[24]. Hill, H.C., Schilling, S. G., and Ball, D.L. (2004). Developing measures of teachers’ mathematics
knowledge for teaching. Elementary School Journal, 105, 11-30.
[25]. Hunt, D., Haidet, P., Coverdale, J., and Richards, B. (2003). The effect of using team learning in an
evidence-based medicine course for medical students. Teaching and Learning in Medicine, 15(2), 131-
139.
[26]. Jones, T. (1990). Towards a typology of educational uses of hypermedia. In D.H. Norrie and H.-W. Six
(Eds.) Lecture Notes in Computer Science. Proceedings of the 3rd International Conference on
Computer Assisted Learning (pp. 265-76). Hagen, FRG.
[27]. Katozai, M.A. (2002). Senior English Teacher: A Book for Preparation for PCS. University
Publishers’. Peshawar.
[28]. Khalid, T.M. (1976). Education: An Introduction to Educational Psychology and History, Anmol
Publishers. Karachi.
[29]. LeGere, A. (1991). Collaboration and writing in the mathematics classroom. Mathematics Teacher, 21,
pp. 166 - 71.
[30]. Lewy's Introduction to B. Riemann, GesammelteMathematischeWerke(Dover, New York, 1953); L.
Steen (ed.) Mathematics Today (New York, 1985); D. Struik, A Concise History of Mathematics (New
York, 1967).
[31]. Marwaha, P. (2009). The Teaching of Mathematics, Accessed on 20th of May, 2010.
http://www.articlesbase.com/writing-articles/the-teaching-of-mathematics-
1058849.html#ixzz0oS8BiIK3
[32]. Miller, L. D. (1992). Begin mathematics class with writing. Mathematics Teacher, 85(5), pp. 354 - 355.
[33]. MOE, (2009). Revised Mathematics course Catalogue for Diploma Teacher Training Linear Program;
Addis Ababa, Ethiopia Revised Curriculum.
[34]. Mulugetaetal., (2002). Curriculum, Aims and Objectives in the Teaching of MathematicsAddis Ababa:
Educational Media Agency Ministry of Education pub.
[35]. Oaks, A. and Rose, B. (1992). Writing as a tool for expanding student conception of mathematics.
Paper presented at the 7th International Congress on Mathematics Education. Working Group 7:
Language and Communication in the Classroom, Quebec.
[36]. Orton, A. (1983). Students’ understanding of differentiation. Educational Studies in Mathematics, 14,
235 -250.
[37]. Patel, R., (2003). Innovations in teaching of Mathematics. Lecture way made college of education
VallabhVidyyanagar.
[38]. Perkins, D. and Blythe, T. (1994). Putting understanding up front. Educational Leadership, 51(5), 4 -7.
[39]. Qualters, D. (2001). Do students want to be active? The Journal of Scholarship of Teaching and
Learning, 2(1), 51-60.
[40]. Rehman, M. (2000). Teaching of Science and Mathematics, University of Peshawar. Peshawar.
[41]. Ritchey, T. (1991). Revised Version (1996). Analysis and Synthesis on Scientific Method- Based on a
study by Bernhard Riemann, System Research, Vol. 8 No. 4. pp-21-24.
[42]. Rivkin, S. G., Hanushek, E. A., andKain, J. F. (2005). Teachers, schools, and academic achievement.
Econometrica, 73(2), 417–458.
[43]. Rubio, G. and Valle, R.D. (2004). The Competent use of the Analytic Method in the Solution of
Algebraic Word Problems. A didactical model based on a numerical approach with junior high
students’, Proceedings of the 28th Conference of the International Group for the Psychology of
Mathematics Education. Vol. 4.pp 129-136. Universidad NacionalAutónoma de México. CCH Sur.
[44]. Skemp, P. R. (1976). Relational Understanding and Instrumental Understanding. Mathematics Teaching
77, 20–26.

Volume 6, Issue 2, February – 2021 International Journal of Innovative Science and Research Technology
ISSN No:-2456-2165
IJISRT21FEB332www.ijisrt.com 555
[45]. Skemp, R. R. (1976). Relational understanding and instrumental understanding. Mathematics Teaching
77, 20 – 26.
[46]. Skemp, R. R. (1979). Intelligence, learning, and action. New York: Wiley.
[47]. The Webster Comprehensive Dictionary. (1982). Encyclopedic ed. Vol. I & II. Ferguson Publishing
Company. Chicago.
[48]. Trowbridge. (1986). Becoming a Secondary School Science Teacher, 4th ed. Merrill Publishing
Company. Columbus.
[49]. Udeinya, C.S and Okabiah, O.S (1991): Special methods of Teaching Science Subjects Enugu: ABIC.
[50]. Wright, S. P., Horn, S. P., and Sanders, W. L. (1997). Teacher and classroom context effects on student
achievement: Implications for teacher evaluation. Journal of Personnel Evaluationin Education, 11,
57–67.