The clustering of health-related occupational stressors among temporary wage-earners
21
The clustering of health-related occupational stressors among contemporary wage-earners Christophe Vanroelen, and Fred Louckx Department of Medical Sociology, Vrije Universiteit, Brussels, Belgium Guy Moors Department of Research Methods and Techniques, Faculty of Social Sciences, University of Tilburg, The Netherlands Katia Levecque Research Foundation Flanders and Department of Sociology, University of Ghent, Belgium In this study, it is investigated whether a typology can be imposed upon a sample of wage-earners, based on their exposure to a broad number of occupational stressors: quantitative, emotional, and physical demands, repetitive movements, atypical schedules, low job control, relationships with superiors, job insecurity, and bullying behaviour. Also associations between this typology and measures of emotional problems (EP) and musculoskeletal complaints (MC) are tested. Logistic regression and a latent class cluster analysis are performed on a representative sample of 10,074 Flemish (Belgian) employees. Five clusters are revealed: ‘‘low stress’’, ‘‘high stress’’, ‘‘manual- passive’’, ‘‘human contact’’, and ‘‘high demand’’. These clusters are showing a clear socioeconomic distribution and distinct associations with EP and MC— with the ‘‘high stress cluster’’ being the most problematic. Health-damaging occupational stress clusters are prevalent at both higher and lower socioeconomic positions. This is suggesting a complex relationship between occupational stressors and socioeconomic health variations. Correspondence should be addressed to Christophe Vanroelen, Department of Medical Sociology, Vrije Universiteit, Laarbeeklaan 103, 1090 Brussels, Belgium. E-mail: [email protected] This research is facilitated by the research grant OZR-1005, assigned to the first author by the Research Council of the Vrije Universiteit, Brussels. For this study the data from the ‘‘Flemish Quality of Labour Monitor, 2004’’, originated and owned by the Socio-Economic Council of Flanders, are used. The content of this article is the full responsibility of the authors. The authors like to thank the owners of the database for giving permission to use their data for the purpose of scientific research. EUROPEAN JOURNAL OF WORK AND ORGANIZATIONAL PSYCHOLOGY 2010, 19 (6), 654–674 Ó 2010 Psychology Press, an imprint of the Taylor & Francis Group, an Informa business http://www.psypress.com/ejwop DOI: 10.1080/13594320903043393 Downloaded By: [Universiteit Van Tilburg] At: 11:13 25 November 2010
Transcript of The clustering of health-related occupational stressors among temporary wage-earners

The clustering of health-related occupational stressors
among contemporary wage-earners
Christophe Vanroelen, and Fred LouckxDepartment of Medical Sociology, Vrije Universiteit, Brussels, Belgium
Guy MoorsDepartment of Research Methods and Techniques, Faculty of Social Sciences,
University of Tilburg, The Netherlands
Katia LevecqueResearch Foundation Flanders and Department of Sociology, University of
Ghent, Belgium
In this study, it is investigated whether a typology can be imposed upon asample of wage-earners, based on their exposure to a broad number ofoccupational stressors: quantitative, emotional, and physical demands,repetitive movements, atypical schedules, low job control, relationships withsuperiors, job insecurity, and bullying behaviour. Also associations betweenthis typology and measures of emotional problems (EP) and musculoskeletalcomplaints (MC) are tested. Logistic regression and a latent class clusteranalysis are performed on a representative sample of 10,074 Flemish (Belgian)employees. Five clusters are revealed: ‘‘low stress’’, ‘‘high stress’’, ‘‘manual-passive’’, ‘‘human contact’’, and ‘‘high demand’’. These clusters are showing aclear socioeconomic distribution and distinct associations with EP and MC—with the ‘‘high stress cluster’’ being the most problematic. Health-damagingoccupational stress clusters are prevalent at both higher and lowersocioeconomic positions. This is suggesting a complex relationship betweenoccupational stressors and socioeconomic health variations.
Correspondence should be addressed to Christophe Vanroelen, Department of Medical
Sociology, Vrije Universiteit, Laarbeeklaan 103, 1090 Brussels, Belgium.
E-mail: [email protected]
This research is facilitated by the research grant OZR-1005, assigned to the first author by the
Research Council of the Vrije Universiteit, Brussels. For this study the data from the ‘‘Flemish
Quality of Labour Monitor, 2004’’, originated and owned by the Socio-Economic Council of
Flanders, are used. The content of this article is the full responsibility of the authors. The
authors like to thank the owners of the database for giving permission to use their data for the
purpose of scientific research.
EUROPEAN JOURNAL OF WORK AND
ORGANIZATIONAL PSYCHOLOGY
2010, 19 (6), 654–674
Ó 2010 Psychology Press, an imprint of the Taylor & Francis Group, an Informa business
http://www.psypress.com/ejwop DOI: 10.1080/13594320903043393
Downloaded By: [Universiteit Van Tilburg] At: 11:13 25 November 2010

Keywords: Belgium; Emotional problems; Latent class cluster analysis;Musculoskeletal complaints; Occupational stress; Wage-earners.
In the past 40 years the content of work in Western societies has shifted from
the ‘‘ideal type’’ of predominantly routine manual labour and its organiza-
tion in a bureaucratic industrial labour process, towards the flexible
combination of skills in problem-identifying and problem-solving processes
for the production of material and immaterial goods and services (Acker-
man, Goodwin, Dougherty, & Gallagher, 1998). This has resulted in the
emergence of new health-related nonmaterial occupational stressors
(Siegrist & Theorell, 2006). Another important aspect of change is situated
in the employment relationship: The postwar psychological contract of
‘‘standard and relatively permanent employment for work well done’’ has
become increasingly blurred (Cooper, 2002). Instead, nowadays employment
relations are increasingly characterized by uncertainty, as a consequence of
short-term contracts and threatened job security, flexible work hours, limited
social protection, etc. (Benach & Muntaner, 2007; Cooper, 2002). For most
of these new occupational stressors, the effects on health and well-being are
well documented, but their structuring within the population often remains
unclear. The principal aim of this article is to present a typology of wage-
earners according to their exposure to a broad set of health-related
occupational stressors and, subsequently, to test associations of this typology
with outcomes of emotional problems and musculoskeletal complaints.
In reacting to the developments described, occupational health research
has expanded its scope beyond the traditional physical exposures towards
these new nonmaterial work characteristics (Janssen, de Jonge, & Bakker,
1999). Probably the most important contribution comes from occupa-
tional stress models, such as the Demand–Control Model (DC Model;
Karasek, 1979), which are catching the psychosocial work environment in
a number of ‘‘stress dimensions’’. In the DC Model it is assumed that
high demands of work and low control over the work environment have
negative consequences for job performance, mental well-being, and
various physical health outcomes (Rydstedt, Devereux, & Sverke, 2007).
Later on, studies inspired by the DC framework have introduced
additional stressors. Social relationships with co-workers and supervisors
are the best-established addition (Johnson & Hall, 1994). In addition,
other (contemporary) stressors have been added to the models: physical
and emotional demands, atypical work schedules, job insecurity, etc. For
most of these stressors associations with the considered outcomes have
been found previously. Low social support is associated with higher
frequencies of mental health problems and musculoskeletal complaints
THE CLUSTERING OF OCCUPATIONAL STRESSORS 655
Downloaded By: [Universiteit Van Tilburg] At: 11:13 25 November 2010

(Vanroelen, Levecque, & Louckx, 2009a), and exposure to bullying
behaviour and emotional demands are related to indicators of mental
health problems (Rydstedt et al., 2007). General physical demands show
clear associations with musculoskeletal complaints (Leroux, Dionne,
Bourbonnais, & Brisson, 2005) and mixed results for mental health
complaints (de Croon, Blonk, de Zwart, Frings-Dresen, & Broersen,
2002; Laaksonen, Rahkonen, Martikainen, & Lahelma, 2006). Stressors
related to flexible and atypical employment relationships, such as
excessive hours of work (Sekine, Chandola, Martikainen, Marmot, &
Kagamimor, 2006), nonstandard schedules (Bildt & Michelsen, 2002), and
job insecurity (Mauno, Kinnunen, Makikangas, & Natti, 2005) are also
related with mental health complaints. Musculoskeletal complaints are
higher in workers engaged in nonstandard schedules (Trinkoff, Le,
Geiger-Brown, Lipscomb, & Lang, 2006) or experiencing job insecurity
(Cole, Ibrahim, Shannon, Scott, & Eyles, 2001).
In reality, however, mental and physical distress is determined by
complex patterns of exposure to various stressors (Benach, Muntaner,
Benavides, Amable, & Jodar, 2002). Nevertheless, occupational stressors
extending the traditional accounts of demand and control are often
analysed as ‘‘single risk factors’’, without considering their structuring in
the population. Indeed, some occupational stress research has adopted a
more ‘‘structural approach’’ by rearranging a broader number of job
stressors into dimensions. For instance, the Job Demands–Resources
Model can be conceived as an expansion of the DC Model, incorporating
different types of work demands (physical, environmental, and flexibility-
related demands) and buffering resources (job control, rewards, support)
(Demerouti, Bakker, Nachreiner, & Schaufeli, 2001). The Effort–Reward-
Imbalance–Model (ERI; Siegrist, 2002) and the recent concept of
employment strain (Clarke, Lewchuk, de Wolff, & King, 2007) have
introduced notions of uncertainty and unfairness as distinct dimensions.
However, also these extended or complimentary dimensional stress
models remain variable-oriented (Bergman & Magnusson, 1997). This
dominant approach in occupational stress research is very suitable for
identifying risk factors, but it is less preoccupied with the general
distribution and structuring of different types of stressors (Harenstam,
Karlqvist, Bodin, Nise, & Scheele, 2003). Exactly these issues are linking
the psychosocial experience of stress to wider causes of social inequality,
as well as to social differences in health and well-being. Therefore, in this
article, a typological or person-oriented approach (Bergman & Magnusson,
1997) is adopted. We are describing an empirical typology of wage-
earners according to their specific patterns of exposure to a broad
number of occupational stressors. This holistic approach (de Fruyt, 2002),
is furthering insights into the complexity of the psychosocial work
656 VANROELEN ET AL.
Downloaded By: [Universiteit Van Tilburg] At: 11:13 25 November 2010

environment as a ‘‘node’’ that combines different types of potentially
stressful experiences. For the analyses, data from a representative sample
of wage-earners in the Flemish region of Belgium is used.
In the first section of the article, the effects on emotional problems and
musculoskeletal complaints, of a broad number of separate types of
occupational stressors are tested. These stressors are a mix of single items
(e.g., overtime work or bullying) and dimensions based on different summed
items (e.g., quantitative demands or control). Subsequently, a latent class
cluster analysis (McCutcheon, 1987) is performed on these stressors. Different
from the structural covariance approach, which is used to identify latent
dimensions, the principal aim of this approach is to identify an empirical
typology of workers according to specific characteristics. Hence, in this article
the mutual relationship between the stressors is researched from the perspective
of categorizing wage-earners based on similar patterns of exposure. Initially this
approach is exploratory, since no theoretical expectations regarding the
number or type of clusters are defined beforehand. However, the clusters
discovered are given substantial interpretation according to their characteristics
and with reference to current theoretical frameworks on the organization of
work and employment relations. In the final section of the article associations
between the typology and the health outcomes are analysed.
METHOD
Participants
The study is based on data from the Flemish Quality of Labour Monitor
(QLM), a survey conducted by the Socio-Economic Council of Flanders in
2004. It concerns a random sample extracted out of the official personnel
registry of all wage-earners living in the Flemish region of Belgium. This
region encompasses about 60% of the Belgian inhabitants and has a
population of some 2,400,000 wage-earners. Because the official personnel
registry is used as the source for recruitment, the sample obtained provides a
good reflection of the Flemish labour market. From the initial sample of
20,000 wage-earners who received a postal questionnaire, 12,095 returned a
usable copy (60.6% response rate). Subsequently, 996 individuals were
excluded because they had stopped working as wage-earners between the
time of sampling and the completion of their questionnaires. After
respondents with missing values on one or more of the occupational
stressors were excluded, a final number of 10,074 individuals was obtained,
upon which the analyses for this article are based. The listwise deletion,
however, did not bias the distribution of the sample according to some
central characteristics, such as gender, age, skill levels, or occupational
categories.
THE CLUSTERING OF OCCUPATIONAL STRESSORS 657
Downloaded By: [Universiteit Van Tilburg] At: 11:13 25 November 2010

Measures
Psychosocial scales. The questionnaire contains 44 individual items,
each coded into four answering categories: ‘‘always’’, ‘‘often’’, ‘‘sometimes’’,
or ‘‘never’’ (Bourdeaud’hui, Janssens, & Vanderhaeghe, 2004). Theoretically
they represent four dimensions: job control (job autonomy—11 items, and
task variation—6 items), quantitative demands (11 items), emotional
demands (7 items), and the relationship with direct superiors (9 items).
These scales are all taken from the Dutch ‘‘VBBA quality of labour
questionnaire’’ (van Veldhoven, Meijman, Broersen, & Fortuin, 2002). The
VBBA quality of labour questionnaire has been tested frequently and the
measurement scales are found to be one-dimensional, reliable, and valid
(Evers, van Vliet-Mulder, & Groot, 2000; Vanroelen, Levecque, & Louckx,
2009b). In the current dataset the scales are showing Cronbach’s alpha
values ranging from .80 to .91. The psychosocial scales are constructed by
summing the individual item scores, using a coding from 0 to 3. If missing
values on a scale were randomly distributed and were not reaching over a
third of all items in a scale, mean substitution is used. If these conditions
were not satisfied, the scale score of a respondent is coded as missing. All
total scale scores are standardized to a 0–100 range, from favourable (0) to
unfavourable or problematic (100). For the analyses in this article, the
psychosocial scales are categorized into tertiles.
Physical working conditions. The physical workload is measured with
eight items: vibrations, noise, extreme temperatures, dangerous substances,
dangerous situations, heavy tasks, inconvenient working postures, and
repetitive movements of hands and arms. Based on an unrotated principal
components analysis, these items—except repetitive movements—are
recoded into one dimension representing the general physical workload
(Cronbach’s alpha¼ .85). For the construction of this indicator, the same
procedure as described previously is applied. The indicator for repetitive
movements of hands and arms is used as a single item dichotomy, indicating
the frequency of repetitive movements as ‘‘never or sometimes’’ and ‘‘often
or always’’. The latter category has a prevalence of 35% (Table 1).
Other working conditions. The type of work schedule is a dichotomous
variable with as categories: ‘‘fixed day work’’ and ‘‘atypical work schedules’’
(e.g., night work, rotating shift systems, and nonstandard daytime shifts).
The majority of the respondents (75%) is engaged in daytime work
schedules. Overtime work is represented as a dichotomous variable,
consisting of the categories ‘‘never or sometimes’’ and ‘‘always or often’’
(33%). In addition, subjective job insecurity is included as the chance of
becoming unemployed being ‘‘inexistent to low’’ versus ‘‘very high to
658 VANROELEN ET AL.
Downloaded By: [Universiteit Van Tilburg] At: 11:13 25 November 2010
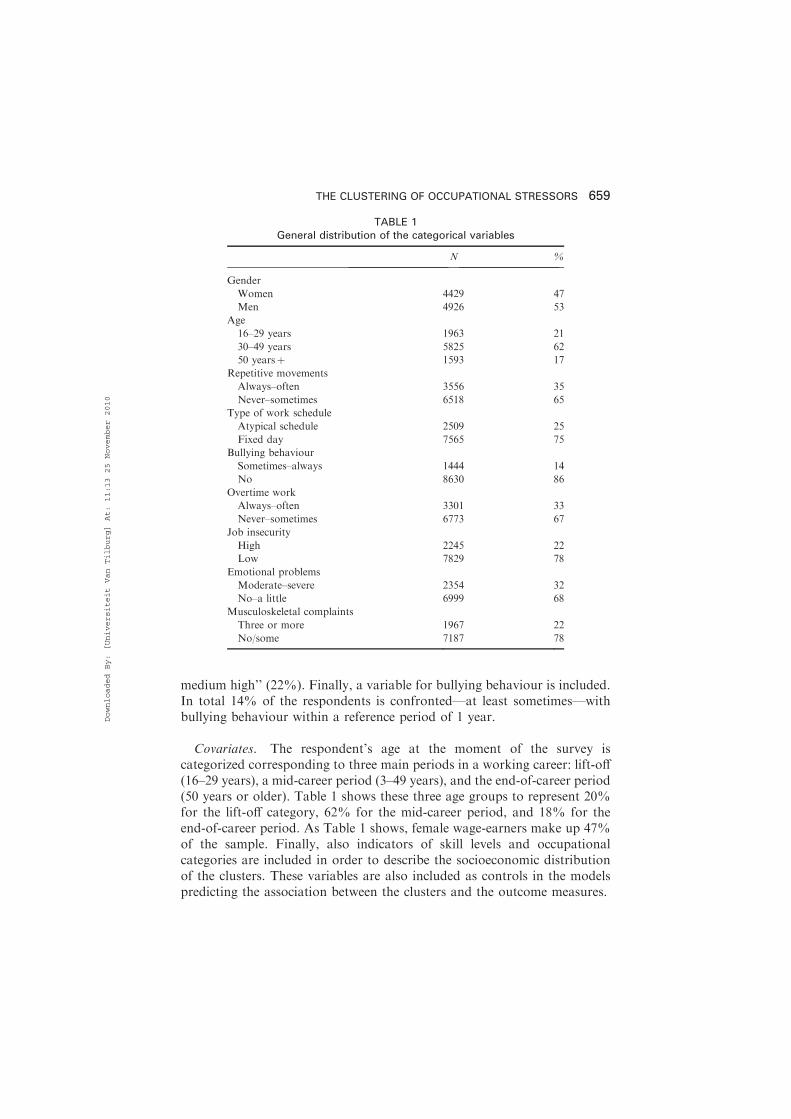
medium high’’ (22%). Finally, a variable for bullying behaviour is included.
In total 14% of the respondents is confronted—at least sometimes—with
bullying behaviour within a reference period of 1 year.
Covariates. The respondent’s age at the moment of the survey is
categorized corresponding to three main periods in a working career: lift-off
(16–29 years), a mid-career period (3–49 years), and the end-of-career period
(50 years or older). Table 1 shows these three age groups to represent 20%
for the lift-off category, 62% for the mid-career period, and 18% for the
end-of-career period. As Table 1 shows, female wage-earners make up 47%
of the sample. Finally, also indicators of skill levels and occupational
categories are included in order to describe the socioeconomic distribution
of the clusters. These variables are also included as controls in the models
predicting the association between the clusters and the outcome measures.
TABLE 1
General distribution of the categorical variables
N %
Gender
Women 4429 47
Men 4926 53
Age
16–29 years 1963 21
30–49 years 5825 62
50 yearsþ 1593 17
Repetitive movements
Always–often 3556 35
Never–sometimes 6518 65
Type of work schedule
Atypical schedule 2509 25
Fixed day 7565 75
Bullying behaviour
Sometimes–always 1444 14
No 8630 86
Overtime work
Always–often 3301 33
Never–sometimes 6773 67
Job insecurity
High 2245 22
Low 7829 78
Emotional problems
Moderate–severe 2354 32
No–a little 6999 68
Musculoskeletal complaints
Three or more 1967 22
No/some 7187 78
THE CLUSTERING OF OCCUPATIONAL STRESSORS 659
Downloaded By: [Universiteit Van Tilburg] At: 11:13 25 November 2010

Outcome measures. Two outcomes are considered: emotional problems
and musculoskeletal complaints. For each of these outcomes a reference
period of 2 weeks is applied. Emotional problems is assessed with a single
question: ‘‘To what extent were you bothered with emotional problems,
such as anxiety, depressive feelings, feelings of irritation, or dejection during
the last 2 weeks?’’ The original five answering categories are dichotomized
into ‘‘not at all or a little’’ versus ‘‘moderately, rather, or very much’’ (32%).
The indicator for musculoskeletal complaints is based on a combination of
four self-reported health complaints: backache, pain in the neck and
shoulders, muscular pains in the limbs, and a tingling or numb feeling in the
limbs. These four indicators are summed together and then dichotomized
into ‘‘less than three’’ versus ‘‘three or more’’ complaints. In this sample
22% of the respondents has reported three or more musculoskeletal
complaints.
Procedure
As a consequence of the mixed measurement levels of the independent
variables and the dichotomous outcomes measures, a categorical approach
is appropriate. In a first phase, associations of gender, age, and the
occupational stressors with emotional problems and musculoskeletal
complaints are assessed, making use of a standard logistic regression
procedure. Two models are tested. In Model 1, each occupational stressor is
assessed separately, controlled for gender and age. In Model 2 all
occupational stressors are included at the same time, together with gender
and age. The effects are interpreted in terms of odds ratios (ORs) with 95%
confidence intervals (CIs). In addition, the predictive strength of the
individual variables and the complete Model 2 is reported using Nagelkerke
pseudo R2-measures.
In the second phase, a latent class cluster analysis (LCA cluster) is
conducted on the occupational stressors. The best-fitting latent class model
is obtained by stepwise extending the number of clusters, until a
parsimonious well-fitting model is obtained. For model selection formal
indicators of model fit—the log likelihood-statistic (L2) and the Bayesian
Information Criterion (BIC)—are used. In addition, also the more heuristic
method of substantial interpretation of the relations between the clusters
and the original stressors is used.
For the best-fitting cluster solution, probability scores for each
respondent to belong to one particular cluster are calculated. In a traditional
cluster approach respondents are exclusively assigned to a particular cluster
(modal assignment). Modal assignment, however, has the disadvantage of
not taking into account the probability of misclassification, e.g., the amount
of dissimilarity between a cluster profile and the profile of an actual
660 VANROELEN ET AL.
Downloaded By: [Universiteit Van Tilburg] At: 11:13 25 November 2010

respondent with regard to the exposure to the stressors. Misclassification
may seriously distort the composition of the latent categories (Yamaguchi,
2000). For that reason it is preferred to use the latent class probability
scores, which take into account measurement error (Moors, 2003).
In the final section, the probability scores, representing the extend of
similarity between the respondents and the particular clusters, are related to
the health outcomes in a logistic regression analysis. Here too, the
explanatory strength of the models is reported in the form of pseudo R2-
measures. Parameter effects are reported again as ORs (and CIs). The
original probability scores of the clusters are transformed into percentages.
As a result, the ORs of the clusters are to be interpreted as the effect of a 1%
increase in the probability of a respondent to correspond with the response
pattern of that cluster. All analyses are performed using SPSS 16.0, except
for the latent class cluster analyses, where the software program lEM is used
(Vermunt, 1997).
RESULTS
Effects of the individual stressors
From Table 2 it can be seen that gender is significantly associated with
emotional problems: women have a higher prevalence than men. The
differences according to the age categories are not significant. In association
with musculoskeletal complaints, a small but significantly higher prevalence
of women, compared to men exists. The association with age categories
shows a higher prevalence of musculoskeletal complaints in older
respondents.
In relation with emotional problems, all job stressors included in this
study, except the type of work schedule, show significant gender and age-
controlled effects. The strongest associations are seen for a problematic
relationship with superiors (R2¼ .085), being exposed to bullying
(R2¼ .068), high emotional (R2
¼ .054), and quantitative demands
(R2¼ .073). Each time the most adverse tertile has the highest prevalence
of emotional problems. In the mutually controlled Model 2, the categorical
differences become reduced. The associations with physical demands, the
type of work schedule, and overtime work are no longer significant.
Associations with musculoskeletal complaints are reported for each of the
gender and age-controlled job stressors, except for overtime work. The
strongest effects are seen for high physical demands (R2¼ .050), low control
over the work environment (R2¼ .044), a high number of repetitive
movements (R2¼ .060), a problematic relationship with superiors
(R2¼ .033), and exposure to bullying (R2
¼ .026). Again, the most adverse
categories of the stressors are showing the highest prevalence of
THE CLUSTERING OF OCCUPATIONAL STRESSORS 661
Downloaded By: [Universiteit Van Tilburg] At: 11:13 25 November 2010

TABLE2
Main
effects
oftheindividualworkingconditionsin
relationwithemotionalproblemsandmusculoskeletalcomplaints
(ORs–95%
CIs)
Emotionalproblems
Musculoskeletalcomplaints
R2
Model
1Model
2R2
Model
1Model
2
Gender
Man
.007
1.00***
1.00***
.002
1.00***
1.00***
Woman
1.40(1.27–1.54)
1.48(1.33–1.65)
1.24(1.21–1.37)
1.48(1.32–1.66)
Age 16–29years
.001
1.00
1.00
.015
1.00***
1.00***
30–49years
1.08(0.96–1.22)
0.95(0.84–1.08)
1.40(1.22–1.60)
1.37(1.19–1.59)
50yearsþ
1.14(0.98–1.33)
1.06(0.89–1.25)
2.20(1.87–2.60)
2.53(2.12–3.02)
Quantitativedem
ands
Low
dem
ands
.073
1.00***
1.00***
.043
1.00***
1.00***
Middle
dem
ands
1.53(1.35–1.75)
1.12(0.97–1.28)
1.71(1.49–1.96)
1.33(1.15–1.54)
Highdem
ands
3.66(3.22–4.15)
1.95(1.68–2.26)
2.91(2.54–3.33)
1.79(1.53–2.10)
Emotionaldem
ands
Low
dem
ands
.054
1.00***
1.00***
.009
1.00***
1.00***
Middle
dem
ands
1.67(1.48–1.89)
1.44(1.26–1.65)
1.30(1.15–1.47)
1.31(1.14–1.50)
Highdem
ands
3.11(2.74–3.52)
2.22(1.91–2.58)
1.57(1.38–1.79)
1.41(1.20–1.65)
Physicaldem
ands
Low
dem
ands
.007
1.00***
1.00
.050
1.00***
1.00***
Middle
dem
ands
1.40(1.25–1.58)
1.07(0.94–1.22)
2.08(1.80–2.40)
1.64(1.41–1.91)
Highdem
ands
1.71(1.51–1.93)
1.03(0.89–1.19)
3.97(3.44–4.59)
2.49(2.12–2.91)
Repetitivemovem
ents
Low
.013
1.00***
1.00**
.060
1.00***
1.00***
High
1.57(1.43–1.73)
1.19(1.07–1.34)
2.71(2.44–3.00)
1.87(1.67–2.10)
Typeofwork
schedule
Fixed
daytimework
.001
1.00
1.00
.004
1.00***
1.00
Atypicalschedule
1.10(0.99–1.23)
0.90(0.79–1.02)
1.39(1.24–1.55)
0.93(0.82–1.06)
(continuedoverleaf)
662
Downloaded By: [Universiteit Van Tilburg] At: 11:13 25 November 2010
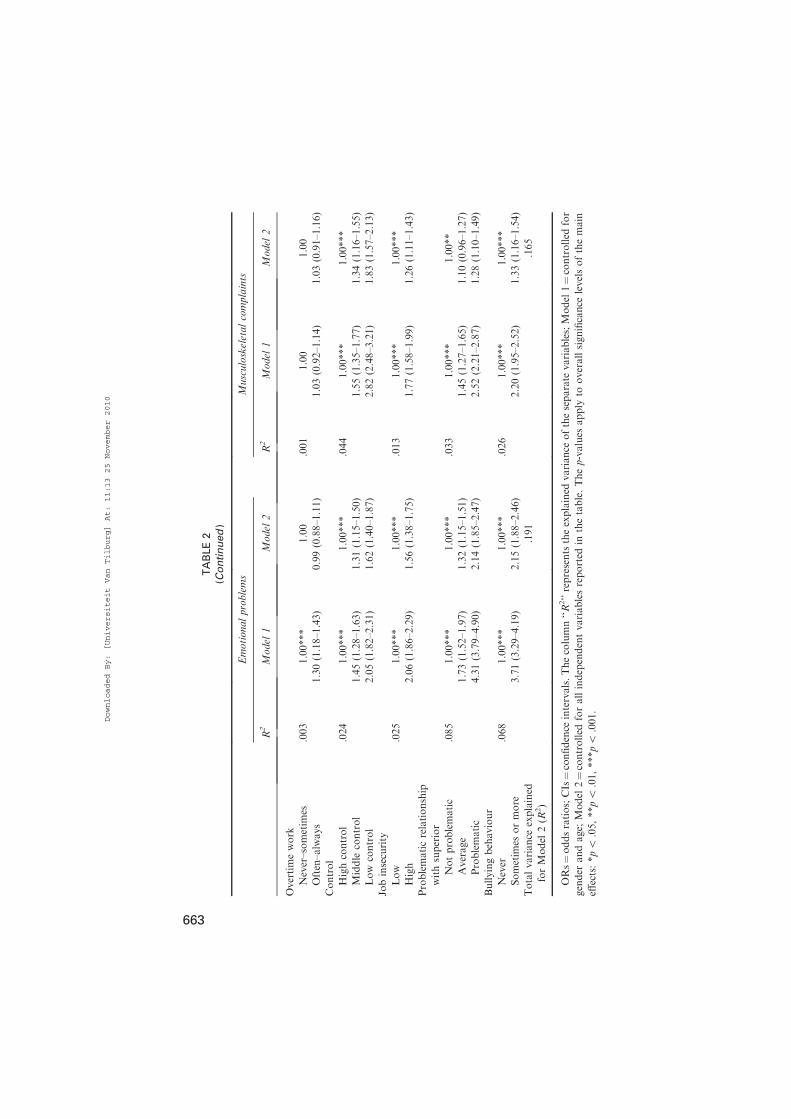
TABLE2
(Continued)
Emotionalproblems
Musculoskeletalcomplaints
R2
Model
1Model
2R2
Model
1Model
2
Overtimework
Never–sometim
es.003
1.00***
1.00
.001
1.00
1.00
Often–always
1.30(1.18–1.43)
0.99(0.88–1.11)
1.03(0.92–1.14)
1.03(0.91–1.16)
Control
Highcontrol
.024
1.00***
1.00***
.044
1.00***
1.00***
Middle
control
1.45(1.28–1.63)
1.31(1.15–1.50)
1.55(1.35–1.77)
1.34(1.16–1.55)
Low
control
2.05(1.82–2.31)
1.62(1.40–1.87)
2.82(2.48–3.21)
1.83(1.57–2.13)
Jobinsecurity
Low
.025
1.00***
1.00***
.013
1.00***
1.00***
High
2.06(1.86–2.29)
1.56(1.38–1.75)
1.77(1.58–1.99)
1.26(1.11–1.43)
Problematicrelationship
withsuperior
Notproblematic
.085
1.00***
1.00***
.033
1.00***
1.00**
Average
1.73(1.52–1.97)
1.32(1.15–1.51)
1.45(1.27–1.65)
1.10(0.96–1.27)
Problematic
4.31(3.79–4.90)
2.14(1.85–2.47)
2.52(2.21–2.87)
1.28(1.10–1.49)
Bullyingbehaviour
Never
.068
1.00***
1.00***
.026
1.00***
1.00***
Sometim
esormore
3.71(3.29–4.19)
2.15(1.88–2.46)
2.20(1.95–2.52)
1.33(1.16–1.54)
Totalvariance
explained
forModel
2(R
2)
.191
.165
ORs¼oddsratios;CIs¼confidence
intervals.Thecolumn‘‘R2’’representstheexplained
variance
oftheseparate
variables;Model1¼controlled
for
gender
andage;
Model
2¼controlled
forallindependentvariablesreported
inthetable.Thep-values
apply
tooverallsignificance
levelsofthemain
effects:*p5
.05,**p5
.01,***p5
.001.
663
Downloaded By: [Universiteit Van Tilburg] At: 11:13 25 November 2010

musculoskeletal complaints. In Model 2, all categorical differences diminish.
The effects of the type of work schedule and the middle tertile of a
problematic relationship with superiors become insignificant in Model 2.
Identification of a typology of wage-earners
Table 3 shows seven subsequent models at each step being extended with
one additional cluster. In assessing the formal fit of the subsequent models,
the L2 and BIC-values are used. BIC is a parsimony index that belongs to
the family of Bayesian estimation procedures, making a correction to the L2-
statistic for the number of model parameters and the sample size. The lower
the values of BIC, the better a model fits the data. The indications of model
fit are improving with each additional latent class being added.
However, there is a clear break in the dropping rate of the BIC-values
(DBIC) around the four-category solution. This is an indication for an
optimal number of latent classes around that point. As a consequence, the
latent class probabilities from the models with three to six latent classes are
investigated in more detail. The latent class probabilities can be used to
attach a substantive meaning to the clusters. They are an expression of the
proportion of the categories of the manifest variables represented in the
categories of the latent variable(s). As such, they are comparable with factor
loadings in ordinary factor analysis. As a general rule, clusters with only a
small prevalence or with little substantial meaning or contrast with other
clusters are indications that the number of appropriate clusters in a model is
exceeded (see Table 4 for the final solution).
In comparing the different models (the comparison results are not
shown), starting from the three-clusters solution, it becomes clear that some
clusters consistently emerge in each model: a cluster of respondents
TABLE 3
Comparison of the model fit of the latent class cluster solutions
Latent class models L2 DF p-value BIC DBIC
Model 1 (respondents in 1 cluster) 16,665.04 7760 .001 754,864.41
Model 2 (respondents in 2 clusters) 12,361.15 7744 .001 759,020.82 4303.89
Model 3 (respondents in 3 clusters) 8,787.29 7728 .001 762,447.20 3426.38
Model 4 (respondents in 4 clusters) 8,039.03 7712 .005 763,047.97 600.77
Model 5 (respondents in 5 clusters) 7,595.40 7696 .791 763,344.12 296.15
Model 6 (respondents in 6 clusters) 7,245.50 7680 .999 763,546.54 202.42
Model 7 (respondents in 7 clusters) 6,886.48 7664 1.000 763,758.08 211.54
The clusters are incorporating the following manifest variables: quantitative demands,
emotional demands, overtime work, physical demands, repetitive movements of hands and
arms, type of work schedule, problematic control, subjective job insecurity, relationship with
superiors, bullying behaviour.
664 VANROELEN ET AL.
Downloaded By: [Universiteit Van Tilburg] At: 11:13 25 November 2010

reporting high demands (high quantitative and emotional demands, overtime
work); a low stress cluster (low probabilities of each of the stressors), and a
‘‘high stress’’ cluster (high probabilities on each of the stressors, except for
emotional demands and overtime work). Model 4 provides an additional
TABLE 4
Probabilities of the manifest variables in the clusters of the final model
Clusters
Low
stress Passive-manual
Human
contact
High
demand
High
stress
Overall proportion of the cluster .261 .242 .208 .180 .109
Quantitative demands
Low demands .688 .386 .134 .035 .025
Middle demands .296 .465 .384 .429 .258
High demands .016 .150 .482 .536 .717
Emotional demands
Low demands .477 .657 .000 .090 .189
Middle demands .415 .331 .359 .459 .427
High demands .108 .011 .641 .452 .384
Overtime work
Never–sometimes .864 .874 .516 .279 .714
Often–always .136 .126 .484 .721 .286
Physical demands
Low demands .485 .193 .139 .553 .066
Middle demands .320 .333 .462 .348 .221
High demands .195 .475 .399 .100 .713
Repetitive movements
Low .807 .483 .711 .820 .221
High .193 .517 .289 .180 .779
Type of work schedule
Fixed daytime work .835 .651 .644 .996 .570
Atypical schedule .165 .349 .356 .005 .430
Problematic job control
High control .507 .071 .335 .648 .012
Middle control .375 .279 .439 .316 .150
Low control .119 .651 .226 .036 .838
Job insecurity
Low .874 .725 .810 .847 .483
High .126 .275 .190 .153 .517
Problematic relationship
with superior
Not problematic .637 .246 .161 .312 .032
Average .296 .487 .378 .464 .141
Problematic .068 .267 .461 .224 .827
Bullying behaviour
No .976 .915 .702 .957 .573
Sometimes–always .024 .085 .298 .043 .427
THE CLUSTERING OF OCCUPATIONAL STRESSORS 665
Downloaded By: [Universiteit Van Tilburg] At: 11:13 25 November 2010

manual-passive cluster, showing high associations with low control over the
work environment, physical demands, repetitive movements, job insecurity,
and atypical work schedules. The extra cluster in Model 5 is labelled as
human contact, with high probabilities of emotional demands, overtime
work, and moderately high probabilities of a problematic relationship with
superiors, bullying behaviour, quantitative demands, physical demands, and
atypical work schedules. The associations between the clusters of Model 5
and the stressors are reported in Table 4. When a sixth cluster is added, the
human contact cluster of the five-category solution becomes divided into a
cluster with more or less the same characteristics as the human contact
cluster from Model 5—and a smaller cluster, being only substantially
different from that human contact cluster regarding the proportion of
atypical work schedules. In sum, the solution with five clusters, labelled as
‘‘passive’’, ‘‘human contact’’, ‘‘high demand’’, ‘‘high stress’’, and ‘‘low
stress’’ is selected as the most appropriate compromise between sensitivity
and parsimony. From a substantial point of view, this solution presents a
TABLE 5
Descriptive distribution of the cluster probabilities over gender, age, and occupational
categories
N
Low
stress Passive-manual
Human
contact
High
demand
High
stress
Mean/overall proportion .261 .242 .208 .180 .109
Gender (Eta) .081*** .064*** .016 .015 .030**
Woman 4429 .290 .222 .212 .176 .101
Man 4926 .235 .262 .203 .184 .115
Age (Eta) .050*** .053*** .036** .027* .028*
16–29 years 1963 .271 .274 .190 .165 .100
30–49 years 5825 .248 .237 .215 .185 .114
50 yearsþ 1593 .292 .223 .202 .182 .100
Skill levels (Eta) .081*** .297*** .134*** .470*** .179***
Unskilled 4125 .281 .327 .166 .077 .149
Semiskilled 3300 .268 .227 .247 .163 .095
Experts 1855 .208 .074 .233 .448 .037
Occupational categories (Eta) .144*** .456*** .322*** .550*** .257***
Nonmanual, routine 2874 .305 .247 .196 .148 .103
Un/semischooled manual 1371 .214 .465 .087 .018 .216
Schooled manual 2003 .260 .374 .153 .056 .157
Educational professionals 819 .305 .060 .271 .338 .026
Healthcare professionals 760 .257 .112 .452 .082 .097
Other professionals 754 .280 .089 .207 .385 .040
Middle management 720 .177 .066 .304 .416 .036
Higher management 451 .132 .019 .216 .618 .016
F-tests and their corresponding p-values, indicating the significance of the difference between
the categories of a variable: *p5 .05, **p5 .01, ***p5 .001.
666 VANROELEN ET AL.
Downloaded By: [Universiteit Van Tilburg] At: 11:13 25 November 2010

clear and stable typology with a distinct profile according to the stressors
included in the model (Table 4).
The final solution shows also a distinct pattern of association with
gender, age, skill levels, and occupational categories (Table 5). The low
stress cluster (26.1% of the total sample) is somewhat more prevalent in
women, lower skilled and nonmanual routine workers, and educational
and other professionals. The passive-manual cluster (24.2%) is more
prevalent among male and younger workers, as well as among unskilled
and manual wage-earners. The human contact cluster (20.8%) shows
clearly higher proportions at the semiskilled and expert levels and in
healthcare and middle management occupations. The high demand cluster
(18%) is more prevalent among experts and in professional and
managerial occupations. Finally, 10.9% of the sample belongs to the
high stress cluster, showing higher proportions in unskilled workers and
workers in manual occupations.
Health effects of the final cluster solution
In Table 6, the results of a logistic regression analysis, testing the
associations of the final cluster solution with the outcomes are shown.
The cluster variables are an expression of the degree of correspondence of
actual respondents with each of the specific clusters. For example, a specific
respondent may have a 60% overlap with the typical response pattern of the
manual-passive cluster, 10% with human contact, 5% with high demand,
TABLE 6
Main effects of the clusters with emotional problems and musculoskeletal complaints
(ORs – 95% CIs)
Clusters
Emotional problems Musculoskeletal complaints
Model 1 Model 2 Model 1 Model 2
Low stress 1.000 1.000 1.000 1.000
Manual-
passive
1.007
(1.005–1.010)
1.008
(1.006–1.011)
1.012
(1.010–1.015)
1.010
(1.008–1.013)
Human
contact
1.020
(1.017–1.022)
1.021
(1.018–1.023)
1.013
(1.011–1.016)
1.015
(1.012–1.017)
High demand 1.010
(1.008–1.012)
1.009
(1.006–1.011)
1.004
(1.002–1.007)
1.009
(1.006–1.012)
High stress 1.029
(1.027–1.032)
1.030
(1.028–1.032)
1.029
(1.026–1.031)
1.027
(1.024–1.029)
Variance
explained (R2)
.156 .163 .142 .157
Model 1: Effects of the clusters controlled for gender and age; Model 2: All effects controlled
for gender, age, skill levels, occupational categories, and mutual effects of the clusters.
THE CLUSTERING OF OCCUPATIONAL STRESSORS 667
Downloaded By: [Universiteit Van Tilburg] At: 11:13 25 November 2010

5% with high stress, and 20% with low stress. For each individual, the
proportions of all clusters sum to 100%. As a result, the association of the
cluster variables with the outcomes needs to be conceived as the effect of a
1% increase in the overlap with the response pattern of a specific cluster. In
relation with emotional problems, the respondent from our example would
have an odds for experiencing emotional problems of 1.815 [1 þ ((60*0.7) þ
(10*2.0) þ (5*1.0) þ (5*2.9))] times higher than a respondent completely
overlapping with the low stress cluster.
In Model 1, the gender and age-controlled effects of the clusters are
reported. In Model 2, the effects are additionally controlled for skill levels
and occupational categories. With respect to the explained variances, Model
1 of the clusters can be compared with Model 2 of the separate stressors. For
both outcomes, the simplification of the model into a typology of clusters
implies a certain loss of explanatory strength. The cluster typology explains
15.6% of the variance in emotional problems and 14.2% of the variance in
musculoskeletal complaints, compared to respectively 19.1% and 16.5% for
the models incorporating the separate stressors.
The individual effects of the clusters have to be interpreted with the low
stress cluster as the reference. For both outcomes, all other clusters have
significantly higher odds. Furthermore, the effect of additional controlling
variables in Model 2 is very limited. The highest odds ratios in association
with emotional problems are seen for the high stress cluster (1.030) and the
human contact cluster (1.021). In relation with musculoskeletal complaints,
the highest odds ratio is also reported for the high stress cluster (1.027), and
the deviations from the reference of the other clusters are all more or less
situated on the same level.
DISCUSSION
Occupational stress models have been of enormous value for the under-
standing of the impact of working conditions of a nonmaterial nature on
various health outcomes. This study fits into a recent trend towards
expanding traditional occupational stress models. The results show that
each of the included occupational stressors is associated with at least one of
the health outcomes. In addition to these individual stressor–distress
associations, our findings suggest that the included stressors are structured
into five different clusters of workers: ‘‘low stress’’, ‘‘high stress’’, ‘‘manual-
passive’’, ‘‘human contact’’, and ‘‘high demand’’.
Respondents in the low stress cluster have the lowest levels of exposure to
each of the stressors, as well as the most advantageous health outcomes. The
cluster on the other side of the typology is characterized by high exposure to
each of the stressors—except emotional demands and overtime work, as well
as a high prevalence of the outcomes. The high stress cluster could be a
668 VANROELEN ET AL.
Downloaded By: [Universiteit Van Tilburg] At: 11:13 25 November 2010

reflection of a trait effect, such as negative affectivity (Burke, Brief, &
George, 1993). The trait-like contamination of associations between self-
reported stressors and strains has been the object of much discussion
(Spector, Fox, & van Katwyk, 1999). Without entering into that discussion,
we would like to point at two elements in our analyses that support the
assumption of the cluster being composed of real stressful situations. First,
some of the stressors are more ‘‘objectively assessable’’—for example,
physical demands or types of work schedule. Second, there are significant
associations between the high stress cluster and socioeconomic character-
istics. As a result, to consider this cluster as the reflection of a personality
trait would have the unlikely implication that respondents with high scores
share a social class-distributed, personality deficit (Karasek et al., 1998). The
high stress cluster can be related to a high strain or isostrain job situation in
the DC(S) Model (Karasek et al., 1998), although the amount of adverse
working conditions is broader. The concept of precariousness (Benach &
Muntaner, 2007; Clarke et al., 2007), which can be described as a
combination of temporality, powerlessness, a lack of rewards, and generally
adverse working conditions (Benach & Muntaner, 2007), may therefore
provide a better description.
Given these two extremes, the other clusters take in-between positions.
The manual-passive cluster refers to characteristics of low job control and
high physical demands, in combination with low quantitative demands.
This cluster is more or less in line with the passive job quadrant in
Karasek’s DC Model, which also shows associations with manual and
lower end service work (Kristensen, Borg, & Hannerz, 2002). The human
contact cluster shows higher loadings on bullying and a problematic
relationship with superiors, demands in general and, more specifically,
emotional demands. These stressors are all related to personal relation
skills and role expectations. Jobs requiring such skills have been described
as emotional or affective labour (Hardt, 1999). In our data this cluster is
most present in educational and healthcare professionals and managerial
occupations. Although emotional and social-relational stressors are often
neglected, the curbing of one’s emotions at work and negatively perceived
social contacts are related to strong distress outcomes (Labianca & Brass,
2006; Thompson & McHugh, 2002). Finally, the high demand cluster is
predominantly defined by overtime work, high quantitative, and
emotional demands. This cluster is overrepresented in (educational)
professionals and managerial occupations. New management principles of
accountability and delayering of power structures may increase pressure
on professionals and managerial employees (Vilrokx, 1999). In addition,
a pattern of work intensification is seen throughout Europe, predomi-
nantly affecting the higher end occupations (Parent-Thirion, Fernandez,
Hurley, & Vermeylen, 2007).
THE CLUSTERING OF OCCUPATIONAL STRESSORS 669
Downloaded By: [Universiteit Van Tilburg] At: 11:13 25 November 2010

In interpreting the results, one should keep in mind that the data originate
from a cross-sectional sample. Consequently, inferences on causality can
only be made on the basis of prior conceptual assumptions. The same
empirical limitations exist with regard to the nature and impact of the
occupational stress dimensions. Although they are only measured at a cross-
section in time, they are assumed to be chronic stressors. In other words,
because they are attached to relatively fixed social roles (occupational
positions), they are assumed to have a relatively enduring character. This is a
common underlying assumption in occupational stress research. In addition,
some other possible occupational stressors than those included in our
analyses can be thought of, like additional types of job demands or reward-
related characteristics. Such additional stressors may modify our cluster
composition. Therefore, replication studies on data incorporating other
stressors are desirable. Another point is the simplicity of the outcome of
emotional problems. Previous studies in Belgium have, however, shown that
a one-item measure does not necessarily perform worse in indicating general
emotional problems, compared to multiitem scales (Levecque, Lodewyckx, &
Bracke, 2008).
Apart from limitations, related to the data, a major issue concerns the
merits additionally provided by our typological approach, compared to
the various dimensionally oriented studies in occupational stress research.
The originality of the typological approach predominantly lies in its
preoccupation with the structuring and social distribution of the stressors. It
is related to the holistic-interactionist framework in developmental psychol-
ogy (Bergman & Magnusson, 1997). Where a dimensional approach finds it
difficult to translate its findings into properties characterizing individuals, in
the holistic approach, the constituting elements are given meaning from the
role they play in the total functioning of the individual—given a specific
problem and setting (Bergman & Magnusson, 1997). In addition, the
typological approach traces back to the old sociological practice of using
ideal types for describing social reality. Ideal typical sociology uses
exaggeration of certain specific features in order to get a deeper under-
standing of the complexities of social reality (Hagenaars & Halman, 1989).
After all, individuals are not one-dimensional beings. However, it is not the
intension to classify each individual into one or another category, but rather
to compare their differences and similarities to some ideal-typical references
(Prandy, 2002). Precisely at this point lies the advantage of the latent class
clustering methodology. LCA clustering is very similar to more traditional
methods of cluster analysis (McLachlan & Basford, 1988). However, it
provides a probability-based, instead of an ad hoc classification of objects on
the basis of distance measures. As a result, the researcher is provided with
formal statistical indicators informing the choice for one solution or another.
Respondents can be classified into clusters according to the model-based
670 VANROELEN ET AL.
Downloaded By: [Universiteit Van Tilburg] At: 11:13 25 November 2010

posterior membership probabilities, using the method of modal assignment.
However, from that moment—indeed—respondents become allocated to an
ideal type, neglecting their degree of dissimilarity with this ideal type
(Yamaguchi, 2000). Therefore, faithful to the initial aims of the ideal-typical
approach as a means of reducing the complexity of the social reality by
creating a discrete number of references, we have chosen to interpret our
results in terms of LCA probability scores. Accordingly, each respondent’s
degree of similarity with a specific ideal type can be expressed as a probability
of belonging to that cluster. We are convinced that this approach is the most
realistically possible way of grasping the reality of individual situations,
shaped at the intersection of different characteristics, without slipping down
from ideal types towards ‘‘stereotypes’’ (Prandy, 2002).
A practical advantage provided by this typological approach is that it
enables the identification of risk profiles. Such profiles, from a policy point
of view, are crucial for targeting categories with specific needs—and,
consequently, differentiating policy interventions. For example, different
nonmaterial demands tend to occur simultaneously, while they collapse with
a pattern of relatively high control and low physical demands. That profile,
in turn, is more prevalent in ‘‘higher end occupations’’. Such a risk profile
will have limited benefits from providing more participation and control
over work planning, although these may be identified as important risk
dimensions in the general population. In contrast, the higher end
occupations may rather gain from a repartition of work tasks, decreasing
the number of (conflicting) demands, or from interventions aimed at
harmonizing family and work life. In addition, the results are also
enlightening for the links between occupational stress experiences and
socioeconomic health inequalities in wage-earners. The idea of a segmented
labour market, with ‘‘good-quality jobs’’ at the high end of the socio-
economic ladder and ‘‘unhealthy jobs’’ at the lower end, is challenged. Our
finding of high demand cluster points at specific risk points for health and
well-being is associated with typical high-end jobs as well. As a result,
occupational stress has, at the same time, a reinforcing and moderating
effect on health inequalities. Such a picture is usually obscured in the
traditional ‘‘single risk factor approach’’ of occupation stress research.
REFERENCES
Ackerman, F., Goodwin, N. R., Dougherty, L., & Gallagher, K. (1998). The changing nature of
work. Washington, DC: Island Press.
Benach, J., & Muntaner, C. (2007). Precarious employment and health: Developing a research
agenda. Journal of Epidemiology and Community Health, 61, 276–277.
Benach, J., Muntaner, C., Benavides, F. G., Amable, M., & Jodar, P. (2002). A new
occupational health agenda for a new work environment. Scandinavian Journal of Work
Environment and Health, 28, 191–196.
THE CLUSTERING OF OCCUPATIONAL STRESSORS 671
Downloaded By: [Universiteit Van Tilburg] At: 11:13 25 November 2010

Bergman, L. R., & Magnusson, D. (1997). A person-oriented approach in research on
developmental psychopathology. Development and Psychopathology, 9, 291–319.
Bildt, C., & Michelsen, H. (2002). Gender differences in the effects from working conditions on
mental health: A 4-year follow-up. International Archives of Occupational and Environmental
Health, 75, 252–258.
Bourdeaud’hui, R., Janssens, J., & Vanderhaeghe, S. (2004). Informatiedossier Vlaamse
werkbaarheidsmonitor. Indicatoren voor de kwalitieit van de arbeid op de Vlaamse
arbeidsmarkt 2004. Brussels: STV-Innovatie & Arbeid.
Burke, M. J., Brief, A. P., & George, J. M. (1993). The role of negative affectivity in
understanding relations between self-reports of stressors and strains: A comment on the
applied-psychology literature. Journal of Applied Psychology, 78, 402–412.
Clarke, M., Lewchuk, W., de Wolff, A., & King, A. (2007). ‘‘This just isn’t sustainable’’:
Precarious employment, stress and workers’ health. International Journal of Law and
Psychiatry, 30, 311–326.
Cole, D. C., Ibrahim, S. A., Shannon, H. S., Scott, F., & Eyles, J. (2001). Work correlates of
back problems and activity restriction due to musculoskeletal disorders in the Canadian
national population health survey (NPHS) 1994–5 data. Occupational and Environmental
Medicine, 58, 728–734.
Cooper, C. L. (2002). The changing psychological contract at work. Occupational and
Environmental Medicine, 59, 355.
De Croon, E. M., Blonk, R. W. B., de Zwart, B. C. H., Frings-Dresen, M. H. W., & Broersen, J.
P. J. (2002). Job stress, fatigue, and job dissatisfaction in Dutch lorry drivers: Towards an
occupation specific model of job demands and control. Occupational and Environmental
Medicine, 59, 356–361.
De Fruyt, F. (2002). A person-centered approach to P-E fit questions using a multiple-trait
model. Journal of Vocational Behavior, 60, 73–90.
Demerouti, E., Bakker, A. B., Nachreiner, F., & Schaufeli, W. B. (2001). The job demands-
resources model of burnout. Journal of Applied Psychology, 86, 499–512.
Evers, A., van Vliet-Mulder, J. C., & Groot, C. J. (2000). Documentatie van tests en testresearch
in Nederland. Testresearch. Assen, The Netherlands: Van Gorcum & Comp BV.
Hagenaars, J. A., & Halman, L. C. (1989). Searching for ideal types: The potentialities of latent
class analysis. European Sociological Review, 5, 81–96.
Hardt, M. (1999). Affective labour. Boundary 2, 26, 89–100.
Harenstam, A., Karlqvist, L., Bodin, L., Nise, G., & Scheele, P. (2003). Patterns of working and
living conditions: A holistic, multivariate approach to occupational health studies.Work and
Stress, 17, 73–92.
Janssen, P. P. M., de Jonge, J., & Bakker, A. B. (1999). Specific determinants of intrinsic work
motivation, burnout and turnover intentions: A study among nurses. Journal of Advanced
Nursing, 29, 1360–1369.
Johnson, J. V., & Hall, E. M. (1994). Social support in the work environment and
cardiovascular disease. In S. Shumaker & S. Czajkowski (Eds.), Social support and
cardiovascular disease. New York: Plenum Press.
Karasek, R., Kawakami, N., Brisson, C., Houtman, I. L. D., Bongers, P. M., & Amick, B.
(1998). The job content questionnaire (JCQ): An instrument for internationally comparative
assessments of psychosocial job characteristics. Journal of Occupational Health Psychology,
3, 322–355.
Karasek, R. A. (1979). Job demands, job decision latitude, and mental strain: Implications for
job redesign. Administrative Science Quarterly, 24, 285–308.
Kristensen, T. S., Borg, V., & Hannerz, H. (2002). Socioeconomic status and psychosocial work
environment: Results from a Danish national study. Scandinavian Journal of Public Health,
30, 41–48.
672 VANROELEN ET AL.
Downloaded By: [Universiteit Van Tilburg] At: 11:13 25 November 2010

Laaksonen, M., Rahkonen, O., Martikainen, P., & Lahelma, E. (2006). Associations of
psychosocial working conditions with self-rated general health and mental health among
municipal employees. International Archives of Occupational and Environmental Health, 79,
205–212.
Labianca, G., & Brass, D. J. (2006). Exploring the social ledger: Negative relationships and negative
asymmetry in social networks in organizations. Academy of Management Review, 31, 596–614.
Leroux, I., Dionne, C. E., Bourbonnais, R., & Brisson, C. (2005). Prevalence of musculoskeletal
pain and associated factors in the Quebec working population. International Archives of
Occupational and Environmental Health, 78, 379–386.
Levecque, K., Lodewyckx, I., & Bracke, P. (2008). Psychological distress, depression and
generalized anxiety in Turkish and Moroccan immigrants in Belgium. Social Psychiatry and
Psychiatric Epidemiology, 44(3), 188–197.
Mauno, S., Kinnunen, U., Makikangas, A., & Natti, J. (2005). Psychological consequences of
fixed-term employment and perceived job insecurity among health care staff. European
Journal of Work and Organizational Psychology, 14, 209–237.
McCutcheon, A. L. (1987). Latent class analysis. Newbury Park, CA: Sage.
McLachlan, G. J., & Basford, K. E. (1988). Mixture models: Inference and application to
clustering. New York: Marcel Dekker.
Moors, G. (2003). Estimating the reciprocal effect of gender role attitudes and family formation:
A log-linear path model with latent variables. European Journal of Population—Revue
Europeenne de Demographie, 19, 199–221.
Parent-Thirion, A., Fernandez, M. E., Hurley, J., & Vermeylen, G. (2007). Fourth European
working conditions survey. Dublin, Ireland: European Foundation for the Improvement of
Living and Working Conditions.
Prandy, K. (2002). Ideal types, stereotypes and classes. British Journal of Sociology, 53, 583–601.
Rydstedt, L. W., Devereux, J., & Sverke, M. (2007). Comparing and combining the demand-
control-support model and the effort reward imbalance model to predict long-term mental
strain. European Journal of Work and Organizational Psychology, 16, 261–278.
Sekine, M., Chandola, T., Martikainen, P., Marmot, M., & Kagamimor, S. (2006).
Socioeconomic inequalities in physical and mental functioning of Japanese civil servants:
Explanations fromwork and family characteristics. Social Science andMedicine, 63, 430–445.
Siegrist, J. (2002). Effort-reward imbalance at work and health. In P. L. Perrewe & D. C.
Ganster (Eds.), Historical and current perspectives on stress and health (pp. 261–291).
Amsterdam: JAI Elsevier.
Siegrist, J., & Theorell, T. (2006). Socio-economic position and health: The role of work and
employment. In J. Siegrist & M. Marmot (Eds.), Social inequalities in health: New evidence
and policy implications (pp. 73–100). Oxford, UK: Oxford University Press.
Spector, P. E., Fox, S., & van Katwyk, P. T. (1999). The role of negative affectivity in employee
reactions to job characteristics: Bias effect or substantive effect? Journal of Occupational and
Organizational Psychology, 72, 205–218.
Thompson, P., & McHugh, D. (2002).Work organisations (3rd ed.). Basingstoke, UK: Palgrave.
Trinkoff, A. M., Le, R., Geiger-Brown, J., Lipscomb, J., & Lang, G. (2006). Longitudinal
relationship of work hours, mandatory overtime, and on-call to musculoskeletal problems in
nurses. American Journal of Industrial Medicine, 49, 964–971.
Vanroelen, C., Levecque, K., & Louckx, F. (2009a). Psychosocial working conditions and self-
reported health in a representative sample of wage-earners: A test of the different hypotheses
of the Demand-Control-Support-Model. International Archives of Occupational and
Environmental Health, 82, 329–342.
Vanroelen, C., Levecque, K., & Louckx, F. (2009b). The scale reliability and socio-economic
distribution of Post-Fordist health-related occupational stressors in a representative sample
of wage-earners. Manuscript submitted for publication.
THE CLUSTERING OF OCCUPATIONAL STRESSORS 673
Downloaded By: [Universiteit Van Tilburg] At: 11:13 25 November 2010

Van Veldhoven, M., Meijman, T. F., Broersen, J. P. J., & Fortuin, R. J. (2002). Handleiding
VBBA. Amsterdam: SKB Vragenlijst Services.
Vermunt, J. K. (1997). lEM: A general programme for the analysis of categorical data
[Computer software]. Tilburg, The Netherlands: Department of Methodology and Statistics,
Tilburg University.
Vilrokx, J. (1999). Towards the denaturing of class relations? The political economy of the firm
in global capitalism. In P. Leisink (Ed.), Globalisation and labour relations (pp. 57–77).
Cheltenham, UK: Edward Elgar.
Yamaguchi, K. (2000). Multinomial logit latent-class regression models: An analysis of the
predictors of gender-role attitudes among Japanese women. American Journal of Sociology,
105, 1702–1740.
Original manuscript received 3 November 2008
Revised manuscript received 12 May 2009
First published online February 2010
674 VANROELEN ET AL.
Downloaded By: [Universiteit Van Tilburg] At: 11:13 25 November 2010