The Childhood Asperger Syndrome Test (CAST): Test-retest reliability in a high scoring sample
14
http://aut.sagepub.com Autism DOI: 10.1177/1362361307075710 2007; 11; 173 Autism Carol Brayne Carrie Allison, Jo Williams, Fiona Scott, Carol Stott, Patrick Bolton, Simon Baron-Cohen and scoring sample The Childhood Asperger Syndrome Test (CAST): Test–retest reliability in a high http://aut.sagepub.com/cgi/content/abstract/11/2/173 The online version of this article can be found at: Published by: http://www.sagepublications.com On behalf of: The National Autistic Society can be found at: Autism Additional services and information for http://aut.sagepub.com/cgi/alerts Email Alerts: http://aut.sagepub.com/subscriptions Subscriptions: http://www.sagepub.com/journalsReprints.nav Reprints: http://www.sagepub.co.uk/journalsPermissions.nav Permissions: http://aut.sagepub.com/cgi/content/refs/11/2/173 SAGE Journals Online and HighWire Press platforms): (this article cites 8 articles hosted on the Citations at SODERSJUKHUSET on September 17, 2008 http://aut.sagepub.com Downloaded from
-
Upload
independent -
Category
Documents
-
view
6 -
download
0
Transcript of The Childhood Asperger Syndrome Test (CAST): Test-retest reliability in a high scoring sample

http://aut.sagepub.com
Autism
DOI: 10.1177/1362361307075710 2007; 11; 173 Autism
Carol Brayne Carrie Allison, Jo Williams, Fiona Scott, Carol Stott, Patrick Bolton, Simon Baron-Cohen and
scoring sampleThe Childhood Asperger Syndrome Test (CAST): Test–retest reliability in a high
http://aut.sagepub.com/cgi/content/abstract/11/2/173 The online version of this article can be found at:
Published by:
http://www.sagepublications.com
On behalf of:
The National Autistic Society
can be found at:Autism Additional services and information for
http://aut.sagepub.com/cgi/alerts Email Alerts:
http://aut.sagepub.com/subscriptions Subscriptions:
http://www.sagepub.com/journalsReprints.navReprints:
http://www.sagepub.co.uk/journalsPermissions.navPermissions:
http://aut.sagepub.com/cgi/content/refs/11/2/173SAGE Journals Online and HighWire Press platforms):
(this article cites 8 articles hosted on the Citations
at SODERSJUKHUSET on September 17, 2008 http://aut.sagepub.comDownloaded from

autism © 2007SAGE Publicationsand The National
Autistic SocietyVol 11(2) 173–185; 075710
1362-3613(200703)11:2
The Childhood AspergerSyndrome Test (CAST)Test–retest reliability in a high scoring sample
C A R R I E A L L I S O N University of Cambridge, UK
J O W I L L I A M S University of Cambridge, UK
F I O N A S C O T T University of Cambridge, UK
C A R O L S T O T T University of Cambridge, UK
P A T R I C K B O L T O N University of Cambridge, UK
S I M O N B A R O N - C O H E N University of Cambridge, UK
C A R O L B R A Y N E University of Cambridge, UK
Introduction
The Childhood Asperger Syndrome Test (CAST)1 is a parentnaire based on ICD-10 (World Health Organization, 1993) a(American Psychiatric Association, 1994) criteria designed to id
at SODERSJUKHUSET on September 17, 2008pub.com
K E Y W O R D S
Aspergersyndrome;
autism;childhoodscreening;pervasive
developmentaldisorder;
reliability
A B S T R A C T The Childhood Asperger Syndrome Test (CAST) is a 37-item parental self-completion questionnaire designed to screen forhigh-functioning autism spectrum conditions in epidemiologicalresearch. The CAST has previously demonstrated good accuracy for useas a screening test, with high sensitivity in studies with primary schoolaged children in mainstream schools. This study aimed to investigatetest–retest reliability of the CAST in a high scoring sample. To this end,73 parents filled in the second CAST (CAST-2) within approximately 2months of the first administration of the CAST (CAST-1). Agreementabove and below the cut-point of 15 was investigated. The kappastatistic for agreement (<15 versus ≥15) was 0.41. It was found that70 percent (95% CI: 58, 80) of children did not move across the cut-point of 15. The correlation between the two test scores was 0.67(Spearman’s rho). The CAST shows moderate test–retest reliability in ahigh scoring sample, further evidence that it is a relatively robust screen-ing tool for epidemiological research.
A D D R E S S Correspondence should be addressed to: C A R R I E A L L I S O N , AutismResearch Centre, Douglas House, 18b Trumpington Road, Cambridge CB2 8AH, UK. e-mail: [email protected]
173
al question-nd DSM-IVentify subtle
www.sagepublications.comDOI: 10.1177/1362361307075710
http://aut.sageDownloaded from

manifestations of autism spectrum conditions, and in particular Aspergersyndrome. The questionnaire includes 31 key items contributing to a child’stotal score, along with six control questions on general development. TheCAST has been used in population-based epidemiological research as ascreen for autism spectrum conditions in primary school aged children,and previous studies have shown reasonable sensitivity and specificity whenusing a screening cut-point of ≥15 (Scott et al., 2002). In this pilot study,all the children with a diagnosis of Asperger syndrome scored at 15 orabove while none of the typically developing children scored above 15. TheCAST has good validity (see Williams et al., 2005), and it is also import-ant to assess its reliability and stability over time.
Test–retest reliability of the CAST was investigated in a previous study(Williams et al., 2006). The aim of that study was to examine the test–retestreliability in a population sample according to the score categories currentlyused for sampling in research, and also treating the CAST as a scale. TheCAST showed good agreement between screen results at or above, andbelow, a cut-point of 15 with a kappa statistic of 0.70. This study was basedon a sample from mainstream schools, and therefore only a small proportionof children scored above the cut-point on the CAST. An important aspectof test–retest reliability of a screening instrument is to establish the stabilityof the screen near the proposed cut-point. A comparison between test–retest reliability in published autism screening tests has been reviewed else-where (Williams et al., 2006). The aim of the present study is to examinethe test–retest reliability of the CAST in a sample enriched by childrenscoring at or above the cut-point of 15, as well as a proportion of thosescoring 12–14.
Methods
Data collectionA total of 11,635 CAST questionnaires were distributed via schools through-out Cambridgeshire to parents/caregivers of children aged 5 to 9 years old.The CAST was distributed in class registration and returned to the researchteam by parents using a Freepost envelope. Minimum personal informationwas collected. Those children who scored above the cut-point of 15, andthose who scored between 12 and 14, were invited for a full diagnosticassessment. At the time of assessment, parents/caregivers were asked tocomplete a second identical copy of the CAST (CAST-2). It was intendedthat the CAST-2 would be completed within 2 months of the first CAST(CAST-1), and data were collected on the exact time interval between thetwo administrations of the CAST. Typically, the CAST-2 was given to the
A U T I S M 11(2)
174
at SODERSJUKHUSET on September 17, 2008 http://aut.sagepub.comDownloaded from
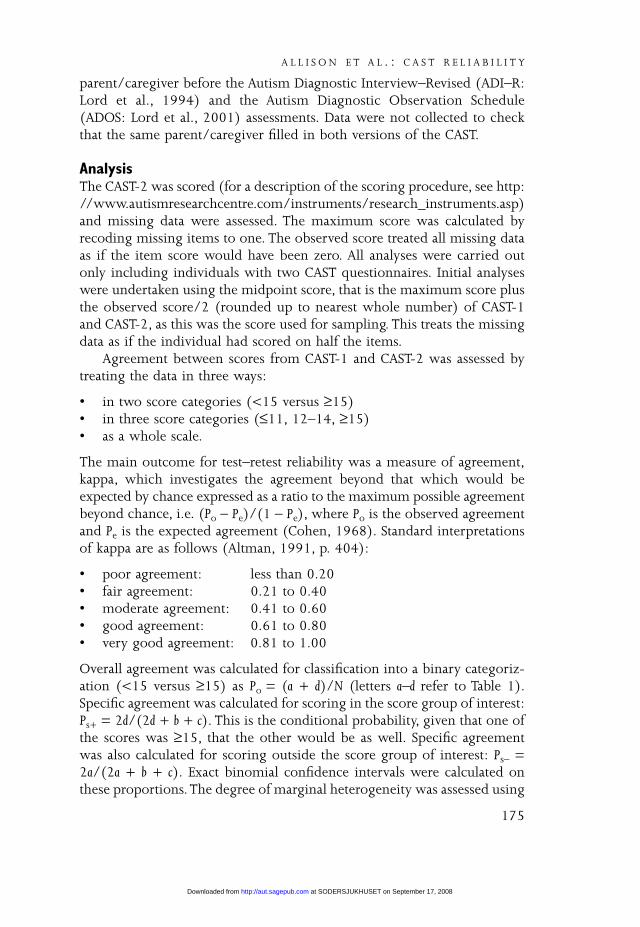
parent/caregiver before the Autism Diagnostic Interview–Revised (ADI–R:Lord et al., 1994) and the Autism Diagnostic Observation Schedule(ADOS: Lord et al., 2001) assessments. Data were not collected to checkthat the same parent/caregiver filled in both versions of the CAST.
AnalysisThe CAST-2 was scored (for a description of the scoring procedure, see http://www.autismresearchcentre.com/instruments/research_instruments.asp)and missing data were assessed. The maximum score was calculated byrecoding missing items to one. The observed score treated all missing dataas if the item score would have been zero. All analyses were carried outonly including individuals with two CAST questionnaires. Initial analyseswere undertaken using the midpoint score, that is the maximum score plusthe observed score/2 (rounded up to nearest whole number) of CAST-1and CAST-2, as this was the score used for sampling. This treats the missingdata as if the individual had scored on half the items.
Agreement between scores from CAST-1 and CAST-2 was assessed bytreating the data in three ways:
• in two score categories (<15 versus ≥15)• in three score categories (≤11, 12–14, ≥15)• as a whole scale.
The main outcome for test–retest reliability was a measure of agreement,kappa, which investigates the agreement beyond that which would beexpected by chance expressed as a ratio to the maximum possible agreementbeyond chance, i.e. (Po – Pe)/(1 – Pe), where Po is the observed agreementand Pe is the expected agreement (Cohen, 1968). Standard interpretationsof kappa are as follows (Altman, 1991, p. 404):
• poor agreement: less than 0.20• fair agreement: 0.21 to 0.40• moderate agreement: 0.41 to 0.60• good agreement: 0.61 to 0.80• very good agreement: 0.81 to 1.00
Overall agreement was calculated for classification into a binary categoriz-ation (<15 versus ≥15) as Po = (a + d)/N (letters a–d refer to Table 1).Specific agreement was calculated for scoring in the score group of interest:Ps+ = 2d/(2d + b + c). This is the conditional probability, given that one ofthe scores was ≥15, that the other would be as well. Specific agreementwas also calculated for scoring outside the score group of interest: Ps– =2a/(2a + b + c). Exact binomial confidence intervals were calculated onthese proportions. The degree of marginal heterogeneity was assessed using
A L L I S O N E T A L . : C A S T R E L I A B I L I T Y
175
at SODERSJUKHUSET on September 17, 2008 http://aut.sagepub.comDownloaded from

an exact binomial test of each marginal proportion occurring, that is theprobability of b given N of b + c (X ~ Bin(b + c, b)). A two-sided exactbinomial test was applied, so the probability was doubled. This tested thenull hypothesis that the marginal proportions were equal, that is that thechildren were as likely to move down a score group as up a score groupacross time.
Overall agreement and the kappa coefficient were calculated across allthree score groups (≤11, 12–14, ≥15). In addition, a weighted kappacoefficient was calculated to take into account the fact that movementacross one score group was less important than movement across two scoregroups. Standard weights were used: 1 for no change of score group, 0.5for change of one group, and 0 for change of two groups (Cohen, 1968;cited in StataCorp, 2001).
As the score boundaries for sampling are still provisional, it wasvaluable to analyse the reliability of the CAST as a whole scale. Descriptivestatistics of the score distribution at CAST-1 and CAST-2 were given. As thedistribution of scores did not follow a normal distribution, it was appro-priate to use non-parametric statistical measures. A Spearman’s rho corre-lation coefficient was calculated to describe the association between CAST-1and CAST-2 scores. It should be noted that correlation coefficients providelimited information as two measures can be perfectly correlated but stillbiased with respect to one another, that is, there may be perfect correla-tion but no agreement (Bland and Altman, 1986). In light of this, aWilcoxon signed-rank test was used to verify whether there was a signifi-cant difference between the two test scores.
Three sensitivity analyses were carried out to investigate the effect ofmissing data as follows:
• All missing data at CAST-1 and CAST-2 were recoded as zero to give anobserved score.
• All missing data at CAST-1 and CAST-2 were recoded as 1 to give amaximum score.
• The analyses were repeated using observed score at time 1 and maximumscore at time 2, to model the most extreme effect of missing data onany observed difference in scores.
All analyses were carried out using SPSS (version 11.5) and STATA (version7.0).
Results
A total of 74 questionnaires from the second administration of the screen-ing test (CAST-2) were available from the assessment sample, completed
A U T I S M 11(2)
176
at SODERSJUKHUSET on September 17, 2008 http://aut.sagepub.comDownloaded from

between 13 and 330 days after their original CAST (CAST-1). The mediannumber of days between questionnaire administrations was 54 (IQR34–110). One questionnaire was excluded on the basis that the child hadbeen incorrectly sampled, leaving 73 questionnaires available from bothadministrations.
Two score categories (<15 versus ≥≥15)Agreement was investigated when categorizing children into the ≥15 or<15 score group (Table 1). The kappa statistic for the binary categorizationshowed that there was moderate agreement between the scores at the twoadministrations of the CAST (kappa = 0.41, p < 0.001), applying Altman’s(1991) categorization. The overall agreement for categorizing an individualin the ≥15 score group at both tests was 69.9 percent (95% CI: 58, 80).The specific agreement Ps+ in the ≥15 category was 73.8 percent (95% CI:63, 83). The specific agreement Ps– for categorizing the individual in the<15 score group both times was 64.5 percent (95% CI: 51, 76). Marginalheterogeneity was indicated (X ~ Bin(22, 4) two-sided, p = 0.004), thatis, children were no more likely to decrease in score group than to increasein score group, and children tended to move down a group more oftenthan up.
Three score categories (≤≤11, 12–14, ≥≥15)A total of 39 (53%) individuals did not move score groups. Four children(5%) increased their CAST score so as to move up a score group (Table 2),moving from the middle to the highest score group; 19 (26%) of indi-viduals moved down one score group; and 11 (15%) of individuals moveddown two score groups. There were no children at CAST-1 in the low scoregroup since this study was conducted on children who were sampled dueto their middle or high score status at CAST-1.
The overall agreement in the categorizations across all three score groups(≤11, 12–14, and ≥15) was P0 = 53 percent (95% CI: 41, 65). The weightedkappa was 0.25 (p < 0.0001).
A L L I S O N E T A L . : C A S T R E L I A B I L I T Y
177
Table 1 Agreement between CAST-1 and CAST-2 (<15 versus ≥≥15) (N = 73)
CAST-2
<15 ≥15 Total
CAST-1 <15 20 (a) 4 (b) 24 (a + b)≥15 18 (c) 31 (d) 49 (c + d)Total 38 (a + c) 35 (b + d) 73 (N)
at SODERSJUKHUSET on September 17, 2008 http://aut.sagepub.comDownloaded from
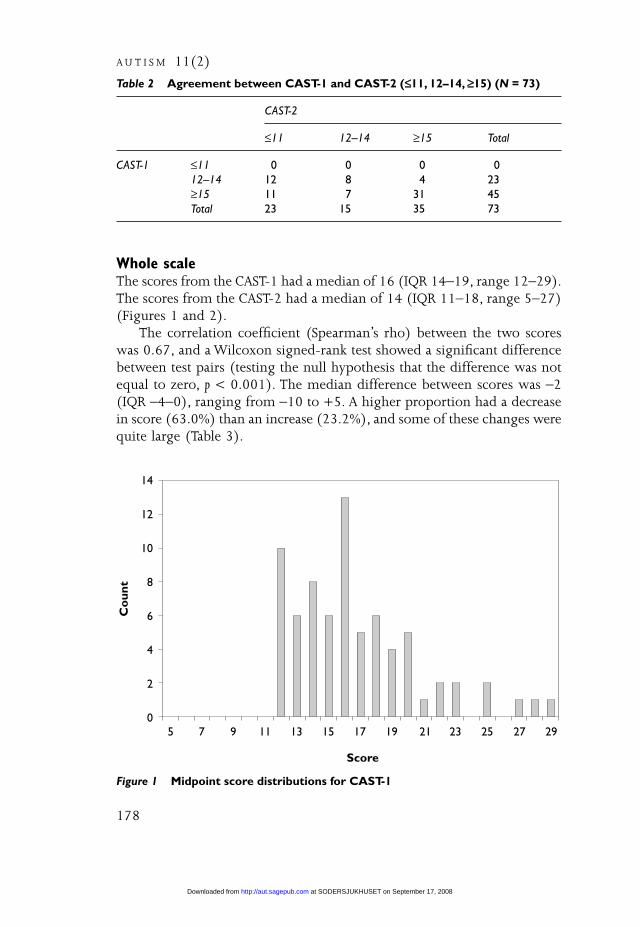
Whole scaleThe scores from the CAST-1 had a median of 16 (IQR 14–19, range 12–29).The scores from the CAST-2 had a median of 14 (IQR 11–18, range 5–27)(Figures 1 and 2).
The correlation coefficient (Spearman’s rho) between the two scoreswas 0.67, and a Wilcoxon signed-rank test showed a significant differencebetween test pairs (testing the null hypothesis that the difference was notequal to zero, p < 0.001). The median difference between scores was –2(IQR –4–0), ranging from –10 to +5. A higher proportion had a decreasein score (63.0%) than an increase (23.2%), and some of these changes werequite large (Table 3).
A U T I S M 11(2)
178
Table 2 Agreement between CAST-1 and CAST-2 (≤≤11, 12–14, ≥≥15) (N = 73)
CAST-2
≤11 12–14 ≥15 Total
CAST-1 ≤11 0 0 0 012–14 12 8 4 23≥15 11 7 31 45Total 23 15 35 73
Figure 1 Midpoint score distributions for CAST-1
Co
unt
Score
14
12
10
8
6
4
2
05 7 9 11 13 15 17 19 21 23 25 27 29
at SODERSJUKHUSET on September 17, 2008 http://aut.sagepub.comDownloaded from

A L L I S O N E T A L . : C A S T R E L I A B I L I T Y
179
Table 3 Score difference: CAST-2 minus CAST-1
Score difference Frequency % Cumulative %
–10 1 1.4 1.4–8 2 2.7 4.1–7 5 6.8 11.0–6 5 6.8 17.8–5 3 4.1 21.9–4 8 11.0 32.9–3 11 15.1 47.9–2 7 9.6 57.5–1 4 5.5 63.0–0 10 13.7 76.7–1 7 9.6 86.3–2 5 6.8 93.2–3 2 2.7 95.9–4 2 2.7 98.6–5 1 1.4 100.0
Total 73 100 100
Figure 2 Midpoint score distributions for CAST-2
Co
unt
Score
14
12
10
8
6
4
2
05 7 9 11 13 15 17 19 21 23 25 27 29
at SODERSJUKHUSET on September 17, 2008 http://aut.sagepub.comDownloaded from

Sensitivity analysis 1Twenty-five (34%) of the CAST-1 questionnaires and 20 (27%) of theCAST-2 questionnaires had some missing data (Table 4). Five items fromCAST-1 had between 5 and 6 percent missing data, as did two differentitems from CAST-2. When data were analysed treating all missing data asif the item score would have been zero (observed score), the indices ofagreement did not alter. The kappa statistic for agreement across the <15and ≥15 score groups was 0.46 (p < 0.001), and the overall agreement was72.6 percent (95% CI: 61, 82). Children were still more likely to decreasein score group than to increase in score group. When scoring in threecategories, the weighted kappa increased to 0.29, indicating that there wasfair test–retest reliability. When using the observed score, for CAST-1 themedian score was 16 (IQR 13–18, range 9–29), and for CAST-2 the medianscore was 14 (IQR 10–18, range 5–27). The correlation between the twotest results was 0.66 (Spearman’s rho), and the Wilcoxon signed-rank teststill showed a significant difference between test pairs (p = 0.001). Themedian difference between scores at CAST-1 and CAST-2 was –2 (IQR–4.5–1, range –10–5).
Sensitivity analysis 2When data were analysed treating all missing data as if the item score wouldhave been 1 (maximum score), the indices of agreement dropped slightly.The kappa statistic for agreement across the <15 and ≥15 score groups was0.36 (p < 0.001), and the overall agreement was 68 percent (95% CI: 57,79). Children were still more likely to decrease in score group than to
A U T I S M 11(2)
180
Table 4 Number of missing items on CAST-1 and CAST-2
Number of missing items CAST-1 CAST-2
N (%) N (%)
0 48 (65.8) 53 (72.6)1 13 (17.8) 12 (16.4)2 4 (5.5) 3 (4.1)3 3 (4.1) 1 (1.4)4 1 (1.4) 1 (1.4)5 1 (1.4) 06 2 (2.7) 07 0 1 (1.4)8 0 2 (2.7)9 1 (1.4) 0
Total 73 73
at SODERSJUKHUSET on September 17, 2008 http://aut.sagepub.comDownloaded from

increase in score group. When scoring in three categories, the weightedkappa dropped to 0.23, indicating that there was fair test–retest reliability.The median score was 16 (IQR 14–19, range 12–29), and for CAST-2 themedian score was 15 (IQR 11–18.5, range 5–27). The correlation betweenthe two test results was 0.65 (Spearman’s rho), and the Wilcoxon signed-rank test still showed a significant difference between test pairs (p = 0.001).The median difference between scores at CAST-1 and CAST-2 was –2 (IQR–4–0, range –10–+5).
Sensitivity analysis 3When data were analysed using the observed score at CAST-1 and themaximum score at CAST-2, the indices of agreement dropped slightly. Thekappa statistic for agreement across the <15 and ≥15 score groups was 0.31(p < 0.007), and the overall agreement was 66 percent (95% CI: 54, 76).Children were now no more likely to decrease in score group than toincrease in score group. When scoring in three categories, the weightedkappa dropped to 0.25, indicating that there was fair test–retest reliability.The correlation between the two test results was 0.62 (Spearman’s rho),and the Wilcoxon signed-rank test still showed a significant differencebetween test pairs (p = 0.003). The median difference between scores atCAST-1 and CAST-2 was –2 (IQR –4–+1.5, range –9–+5).
Discussion
Main findingsIn this sample, overall there was moderate test–retest reliability betweenscreen results using the CAST (CAST-1) and a CAST retest (CAST-2) withinan average of 2 months. This was demonstrated by a kappa statistic of 0.41(<15 versus ≥15), and the finding that 73.8 percent of children did notmove between score groups. As a cut-point of 15 continues to be used forscreening in epidemiological research, it was extremely important to estab-lish what level of reliability the CAST has in a high scoring sample. It wasinformative to discover that children were more likely to move down scoregroups over time.
As an extreme sample was approached in this study, it is important toconsider whether the statistical phenomenon of regression to the meancould explain the significant downward movement of scores on secondadministration of the CAST. In this case, the percentage of regression to themean was calculated at 33 percent,2 indicating that regression to the meanmay partly explain this downward trend. This may also be partly explainedby missing data, as the effect disappears in the third sensitivity analysis.
A L L I S O N E T A L . : C A S T R E L I A B I L I T Y
181
at SODERSJUKHUSET on September 17, 2008 http://aut.sagepub.comDownloaded from
As the 12–14 group has also been used for sampling in epidemiologi-cal research in order to assess whether any autism spectrum condition casesare found amongst those scoring below the cut-point, it was valuable todiscover that the test-retest reliability across all scoring groups was fair witha weighted kappa of 0.25 across three score groups.
The score cut-points on the CAST are still provisional. It was useful tofind a moderate correlation between the scores at CAST-1 and CAST-2 inthe sampling group, treating the CAST as a whole scale. The Wilcoxonsigned-rank test showed a possible difference between score distributionsat CAST-1 and CAST-2, which may in part reflect the time lag betweenadministrations or a developmental effect related to the acquisition of skills.Alternatively, this difference could point towards increased parental obser-vation of their child following administration of CAST-1, and deciding thatbehaviours they thought their child was exhibiting were not in fact evident.When the effect of missing data was examined, the difference between scoredistributions was still present. It is therefore likely to be an importantdifference in terms of whether or not a child would be selected for furtherassessment in an epidemiological study.
The CAST was found to have moderate test–retest reliability, which waslower than previously published studies of autism screening tests. Forexample, the Autism Spectrum Disorders in Adults Screening Questionnaire(ASDASQ) (Nylander and Gillberg, 2001) reported a correlation of 0.82(Spearman’s rho), whilst on the CAST it was 0.67. However, no otherpublished study has investigated test–retest reliability in a sample enrichedby individuals with high scores, therefore making a comparison betweenthis and other studies impossible. However, a related study examiningtest–retest reliability of the CAST in a population sample revealed a corre-lation of 0.83 (Williams et al., 2006), as well as a kappa statistic of 0.70(<15 versus ≥15), indicating good test–retest reliability. It is also difficultto make further comparisons with other tests due to the different statisti-cal measures used; however, both the Autism Spectrum Quotient (AQ) usedto screen adults (Baron-Cohen et al., 2001) and the High-FunctioningAutism Spectrum Screening Questionnaire (ASSQ) used to screen childrenand adolescents with normal intelligence or mild mental retardation(Ehlers et al., 1999) reported high correlation coefficients (0.7 and 0.96respectively).
Strengths and weaknesses of the study and further researchA proportion of the questionnaires had missing data. The effect of missingdata was examined by investigating the extremes of possible scores, theminimum and maximum that the individual could have received. Theagreement and reliability indices were similar in both cases, and therefore
A U T I S M 11(2)
182
at SODERSJUKHUSET on September 17, 2008 http://aut.sagepub.comDownloaded from
we can be confident that missing data did not affect the overall test–retestreliability of the CAST.
This study of test–retest reliability was carried out in a small, higherscoring sample than previously studied. It was not possible to ensure thatthe same parent completed both questionnaires, which may partially explainmovement between scores groups as parents may disagree in their percep-tions of social and communication skills in their child. Also, although themedian time interval between questionnaire administrations was within2 months, over 25 percent of CAST-2 questionnaires were completed 3months or more after CAST-1. Furthermore, the CAST-2 was completed atthe time of assessment and it was not possible to ensure that it wasadministered before the ADI–R. Although most participants were given theCAST-2 prior to the ADI–R, some may have been given it afterwards tocomplete; the lower CAST score at retest could be explained by the possi-bility that some parents may have benefited from taking part in the ADI–Rbefore completing the CAST for a second time, in that after the ADI–R theyhad a greater understanding of the areas that the CAST questionnaire wastrying to draw on.
Whilst this study points to the conclusion that the CAST near the cut-point of 15 is relatively unstable, it is useful to identify that the CAST scoredecreases over time. If it were the case that there was a trend towards anincreased score at CAST-2, this could mean that there is a potential for anincrease in the rates of false negatives, as the cut-point of 15 is used forsampling. This investigation is part of a large epidemiological study, one aimof which is to investigate the prevalence of autism spectrum conditions.
It may be useful to administer the CAST a second time for the highscoring (15+) and medium scoring (12–14) individuals prior to selectingthem for assessment. This may serve to reduce the number of screen falsepositives and save resources. However, it is first important to establishwhether children whose score at retest may have taken them below thescreen cut-point later received a research diagnosis. This is currently beinginvestigated.
Conclusion
The CAST has shown moderate test–retest reliability in a small sample ofchildren who score over and around the cut-point of 15. These resultssuggest that the CAST is relatively robust for screening for autism spectrumconditions in epidemiological research. The CAST can be recommended asa screening test for autism spectrum conditions in epidemiological studies,but it is not appropriate to recommend the use of the CAST as a generalpopulation screening test in a public health or educational setting as there
A L L I S O N E T A L . : C A S T R E L I A B I L I T Y
183
at SODERSJUKHUSET on September 17, 2008 http://aut.sagepub.comDownloaded from

is insufficient evidence regarding the effectiveness of a screening programmeas a whole (National Screening Committee Child Health Subgroup, 2005).The development of this screening test, however, contributes to the bodyof evidence required to decide whether screening may be appropriate inthe future.
AcknowledgementsWe are grateful to the Shirley Foundation for their generosity in funding thisstudy. The Shirley Foundation also funded the accompanying production ofa brief television documentary (‘Asperger Syndrome: A Different Mind’) tohelp raise awareness among teachers in primary schools (www.jkp.com).Simon Baron-Cohen was also supported by the MRC during the period ofthis work. We are grateful to the schools that participated, and to the parentswho gave up their time to complete the questionnaires.
A U T I S M 11(2)
Notes1 The CAST is available in two articles (Scott et al., 2002; Williams et al., 2006) and
electronically at: http://www.autismresearchcentre.com/instruments/research_instruments.asp.
2 This was estimated as Prm = 100(1 – r), where Prm is the percentage of regressionto the mean, and r is the correlation between CAST-1 and CAST-2.
ReferencesA LT M A N, D. (1991) Practical Statistics for Medical Research 1st ed. London: Chapman &
Hall.A M E R I C A N P S Y C H I AT R I C A S S O C I AT I O N (1994) Diagnostic and Statistical Manual of Mental
Disorders, 4th edn (DSM-IV). Washington, DC: APA.B A RO N-C O H E N, S . , W H E E LW R I G H T, S . , S K I N N E R, R . , M A RT I N, J. & C L U B L E Y, E .
(2001) ‘The Autism-Spectrum Quotient (AQ): Evidence from AspergerSyndrome/High-Functioning Autism, Males and Females, Scientists andMathematicians’, Journal of Autism & Developmental Disorders 31 (1): 5–17.
B L A N D, J.M . & A LT M A N, D.G. (1986) ‘Statistical Methods for Assessing Agreementbetween Two Methods of Clinical Measurement’, Lancet 1 (8476): 307–10.
C O H E N, J. (1968) ‘Weighted Kappa: Nominal Scale Agreement with Provision forScaled Disagreement or Partial Credit’, Psychological Bulletin 70: 213–20.
E H L E R S , S . , G I L L B E R G, C. & W I N G, L . (1999) ‘A Screening Questionnaire forAsperger Syndrome and Other High-Functioning Autism Spectrum Disorders inSchool Age Children’, Journal of Autism & Developmental Disorders 29 (2): 129–41.
L O R D, C. , RU T T E R , M. & L E C O U T E U R, A . (1994) ‘Autism DiagnosticInterview–Revised: A Revised Version of a Diagnostic Interview for Caregivers ofIndividuals with Possible Pervasive Developmental Disorders’, Journal of Autism &Developmental Disorders 24 (5): 659–85.
L O R D, C. , RU T T E R , M. , D I L AVO R E , P.C. & R I S I , S . (2001) Autism Diagnostic ObservationSchedule. Los Angeles, CA: Western Psychological Services.
NAT I O NA L S C R E E N I N G C O M M I T T E E C H I L D H E A LT H S U B G RO U P (2005) ‘NationalScreening Committee Policy on Screening for Autism’, retrieved 15 February 2006
184
at SODERSJUKHUSET on September 17, 2008 http://aut.sagepub.comDownloaded from

from http://libraries.nelh.nhs.uk/screening/viewResource.asp?categoryID=1330&uri=http%3A//libraries.nelh.nhs.uk/common/resources/%3Fid%3D60310.
N Y L A N D E R, L . & G I L L B E R G, C. (2001) ‘Screening for Autism Spectrum Disorders inAdult Psychiatric Out-Patients: A Preliminary Report’, Acta Psychiatrica Scandinavica103 (6): 428–34.
S C OT T, F. J. , B A RO N-C O H E N, S . , B O LTO N, P. & B R AY N E , C. (2002) ‘The CAST(Childhood Asperger Syndrome Test): Preliminary Development of a UK Screen forMainstream Primary-School-Age Children’, Autism 6 (1): 9–31.
S TATAC O R P (2001) Stat Statistical Software: Release 7.0. College Station, TX: StataCorporation.
W I L L I A M S , J. , S C OT T, F. , S TOT T, C. , A L L I S O N, C. , B O LTO N, P. ,B A RO N-C O H E N, S . & B R AY N E , C. (2005) ‘The CAST (Childhood AspergerSyndrome Test): Test Accuracy’, Autism 9 (1): 45–68.
W I L L I A M S , J. , A L L I S O N, C. , S C OT T, F. , S TOT T, C. , B O LTO N, P. ,B A RO N-C O H E N, S . & B R AY N E , C. (2006) ‘The Childhood Asperger SyndromeTest (CAST): Test–Retest Reliability’, Autism 10 (4): 415–27.
WO R L D H E A LT H O R G A N I Z AT I O N (1993) The ICD-10 Classification of Mental and BehaviouralDisorders: Diagnostic Criteria for Research. Geneva: WHO.
A L L I S O N E T A L . : C A S T R E L I A B I L I T Y
185
at SODERSJUKHUSET on September 17, 2008 http://aut.sagepub.comDownloaded from