The Changing Face of the Tyre Industry and Implications for the Synthetic Rubber Industry APIC 2014...
38
©LMC International, 2013 1 26/05/2014 The Changing Face of the Tyre Industry and Implications for the Synthetic Rubber Industry APIC 2014 May 2014 Robert Simmons (Head of Tyre & Rubber Research) [email protected]
-
Upload
independent -
Category
Documents
-
view
2 -
download
0
Transcript of The Changing Face of the Tyre Industry and Implications for the Synthetic Rubber Industry APIC 2014...

©LMC International, 2013 1 26/05/2014
The Changing Face of the Tyre Industry and Implications for the Synthetic Rubber Industry
APIC 2014
May 2014
Robert Simmons (Head of Tyre & Rubber Research) [email protected]

©LMC International, 2013 2 26/05/2014
Overview
• Understanding the tyre market
• Vehicle sales (OE Tyre Sales)
• Replacement Tyre Sales
• Tyre Production
• Implications for the synthetic rubber industry

©LMC International, 2013 3 26/05/2014
Drivers of Tyre Demand
Vehicle Sales
Vehicle Production
Scrapping rate/vehicle lifecycle
Vehicle Parc
No. of Tyres per Vehicle Replacement Ratio
OE Tyre Demand (LV 28% MHCV 21%)
Replacement Tyre Demand (LV 72% MHCV 79%)
Total Tyre Demand
Trade in Tyres
Production of Tyres

©LMC International, 2013 4 26/05/2014
Tyre demand depends on vehicle ownership,
both for sales of new vehicles (OE tyre sales)
and replacement tyre sales. As incomes rise
so vehicle ownership increases.
IndiaIndonesia
China
Thailand
TurkeyBrazil
MexicoRussia Taiwan
Korea
Malaysia
UKJapan
Spain Germany
FranceItalyCanada
USA
0
100
200
300
400
500
600
700
800
900
1000
0 10,000 20,000 30,000 40,000 50,000 60,000
GDP per Capita
No o
f LV
per 1,0
00 p
op
ula
tion

©LMC International, 2013 5 26/05/2014
Strong growth in emerging market GDP during
the 2000s encouraged vehicle ownership.
Advance economies are picking up in 2014, but
emerging markets are weak
-4%
-2%
0%
2%
4%
6%
8%
2000 2002 2004 2006 2008 2010 2012 2014 2016 2018
GD
P g
row
th
Advanced Emerging Advanced Emerging

©LMC International, 2013 6 26/05/2014
This can be seen in new vehicle sales
-10% -5% 0% 5% 10% 15% 20%
WORLD
Asean
China
East Asia
Eastern Europe
India
NAFTA
South America
EU-27
Annual % change in LV vehicle sales
2012 2013 2014
38%

©LMC International, 2013 7 26/05/2014
In the longer term, vehicle ownership levels
are low in the emerging markets
0
100
200
300
400
500
600
700
800
900
1,000
Nig
eria
India
Ph
ilipp
ines
Indo
nesia
Chin
aC
olo
mbia
Venezu
ela
Thaila
nd
WO
RLD
Turkey
Sou
th A
fric
aU
krain
eB
razil
Chile
Arg
entin
aR
om
an
iaM
exic
oTaiw
an
Russia
Hung
ary
Slo
vakia
Kore
aM
ala
ysia
Czech
Denm
ark
Sw
ed
en
Po
land
Belg
ium
/Lux
Neth
erla
nd
sIre
land
Po
rtug
al
Slo
venia
UK
Gre
ece
Sw
itzerla
nd
Jap
an
Sp
ain
Au
stria
Germ
any
Norw
ay
Fra
nce
Italy
Fin
lan
dC
an
ada
Au
stralia
New
Zeala
nd
USA
No. of LV
(p
er 1,0
00 p
op
ula
tion)

©LMC International, 2013 8 26/05/2014
The growth of vehicle density follows an S-
curve.
0
100
200
300
400
500
600
700
800
900
1900 1910 1920 1930 1940 1950 1960 1970 1980 1990 2000 2010
Den
sity
(veh
icle
s p
er
1,0
00 p
op
ula
tion
)
Japan US UK

©LMC International, 2013 9 26/05/2014
The emerging markets are entering the rapid
growth stage, developed markets are
approaching stagnation.
0
50
100
150
200
250
300
350
400
2000 2001 2002 2003 2004 2005 2006 2007 2008 2009 2010 2011 2012
Emer
ging
mar
ket d
ensi
ty
600
625
650
675
700
725
750
775
800
Western Europ
e Density
Brazil India Russia
China China (Urban) Western Europe

©LMC International, 2013 10 26/05/2014
The same is true within China
0
50
100
150
200
250
0 20,000 40,000 60,000 80,000 100,000
GDP per capita (RMB)
Car
den
sit
y p
er
1,0
00 p
op
ula
tio
n
Fujian
Jiangsu
Zhejiang
Beijing
Tianjin
Shandong
Guangdong
Jiangsu
Zhejiang
Beijing
Tianjin
Shanghai
Guizhou
Tibet
Gansu
Yunnan

©LMC International, 2013 11 26/05/2014
Growing incomes in emerging markets point to
strong emerging market demand for vehicles
(and OE tyres). Advanced market sales grow
modestly.
0
10
20
30
40
50
60
70
2000 2002 2004 2006 2008 2010 2012 2014 2016 2018
Veh
icle
Sale
s (
mn
un
its)
Mature Emerging

©LMC International, 2013 12 26/05/2014
• Number of vehicles on the road (vehicle parc)
• Vehicle use (incomes, fuel prices, economic activity)
• Road and weather conditions
• Type of tyre fitted (dependent upon legislation, tyre
labelling, individual preference)
• Retreading (raw material prices, economic activity)
Replacement tyre sales (the largest
component of demand) are determined by:

©LMC International, 2013 13 26/05/2014
With growing vehicle sales, parc growth in recent years has been dominated by emerging markets.
0% 5% 10% 15% 20%
WORLD
ASEAN
Central Europe
China
East Asia
Eastern Europe
India
Middle East
NAFTA
Oceania
South America
Western Europe
Parc growth (5yr annual average)
LV MHCV

©LMC International, 2013 14 26/05/2014
Emerging market vehicle sales build parc.
Developed market sales are mainly for parc
replacement
0
5
10
15
20
25
2000 2002 2004 2006 2008 2010 2012
Veh
icle
sale
s (m
n u
nit
s)
-
50
100
150
200
250
Veh
icle P
arc (m
n u
nits)
USA China USA Parc China Parc

©LMC International, 2013 15 26/05/2014
Global replacement ratios began to recover
2013. However, the trend was not the same
across regions
90%
95%
100%
105%
110%
2000 2002 2004 2006 2008 2010 2012 2014 2016 2018
LV
rep
lacem
en
t ra
tio
240%
260%
280%
300%
320%
MH
CV
rep
lacem
en
t ratio
LV MHCV

©LMC International, 2013 16 26/05/2014
The strongest growth was in Asia and the Americas.
-14% -12% -10% -8% -6% -4% -2% 0% 2% 4% 6% 8% 10%
WORLD
ASEAN
China
East Asia
E Europe
India
NAFTA
S America
EU
2012 2013

©LMC International, 2013 17 26/05/2014
This reflects growth in the number of miles driven
2,500
2,600
2,700
2,800
2,900
3,000
3,100
3,200
2000
2001
2002
2003
2004
2005
2006
2007
2008
2009
2010
2011
2012
2013
2014
0.70
1.20
1.70
2.20
2.70
3.20
3.70
4.20
Gaso
line p
rices (S
/gallo
n)
US miles driven US miles driven US gasoline price
Dis
tan
ce t
ravell
ed
(12 m
th a
vera
ge (
bn
mil
es)

©LMC International, 2013 18 26/05/2014
85
90
95
100
105
110
115
120
125
2001 2002 2003 2004 2005 2006 2007 2008 2009 2010 2011 2012 2013
Dis
tan
ce d
riven
(2001 =
100)
UK (MHCV) UK (LV) France (All)
Miles driven are also picking up in Europe

©LMC International, 2013 19 26/05/2014
As the light vehicle parc increases so do
replacement tyre sales. Almost all growth is in
emerging markets.
0
100
200
300
400
500
600
700
800
2000 2002 2004 2006 2008 2010 2012 2014 2016 2018
Re
pla
ce
me
nt
Sa
les
(m
n u
nit
s)
Advanced Emerging

©LMC International, 2013 20 26/05/2014
Emerging market demand is changing the tyre
industry as demand has risen strongly in these
markets
1,100
1,200
1,300
1,400
1,500
Wo
rld
Ch
ina
S.A
meric
a
AS
EA
N
Mid
dle
East
Ind
ia
E.E
uro
pe
Oth
er
E.A
sia
Eu
rop
e
N.A
meric
a
Wo
rldT
ota
l ty
res s
ale
s (
'000 u
nit
s)
Tyre sales growth 2004-13
©LMC International, 2013 21 26/05/2014
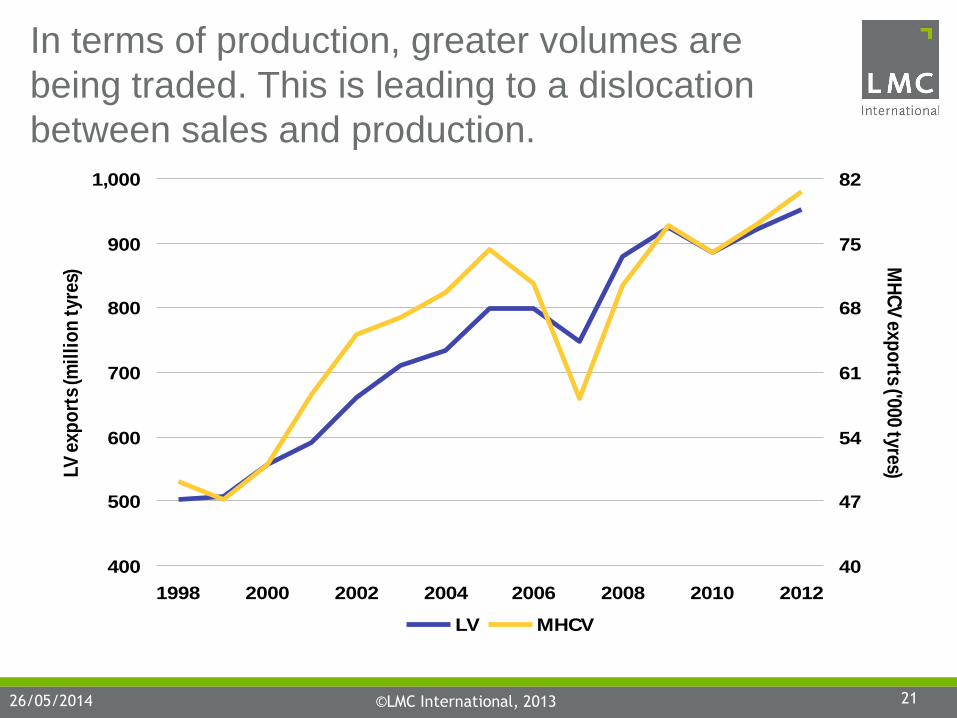
In terms of production, greater volumes are
being traded. This is leading to a dislocation
between sales and production.
400
500
600
700
800
900
1,000
1998 2000 2002 2004 2006 2008 2010 2012
LV
exp
ort
s (m
illi
on
tyre
s)
40
47
54
61
68
75
82
MH
CV
exp
orts ('0
00 ty
res)
LV MHCV

©LMC International, 2013 22 26/05/2014
North America and EU-27 are the largest net
importers …
-150
-125
-100
-75
-50
-25
0
25
50
75
100
125
NA
FTA
EU
-27
Oth
er E
uro
pe
E. A
sia
S. A
merica
M. E
ast
Oce
ania
ASEA
N
Chin
a
Ind
ia
Oth
er
LV
net Im
port
s (m
n u
nit
s)
Net Imports 2011 Net Imports 2000

©LMC International, 2013 23 26/05/2014
Imports are largely for the replacement market, these reached close to record levels in 2013
20%
30%
40%
50%
60%
70%
80%
2000 2001 2002 2003 2004 2005 2006 2007 2008 2009 2010 2011 2012 2013
Imp
ort
s %
of re
pla
cem
en
t sa
les
US LV Imports % replacement US MHCV Imports % replacement
EU LV Imports % replacement EU MHCV Imports % replacement

©LMC International, 2013 24 26/05/2014
Imports to the US grew strongly in 2013 with the ending of duties on Chinese imports
70
80
90
100
110
120
130
140
150
160
170
180
190
2001 2004 2007 2010 2013 2016
US L
igh
t V
eh
icle
Tyre
Im
po
rts (m
illi
on
s)
SAAR Moving Average Annual Forecast

©LMC International, 2013 25 26/05/2014
Imports are dominated by low cost producers. Chinese imports dropped between 2010 and 2012 with the introduction of an import duty, but grew strongly in 2013. Total imports did not fall.
0
20
40
60
80
100
120
140
160
180
200
2005 2006 2007 2008 2009 2010 2011 2012 2013
Ch
ina
(%)
US
LV
Tyre
Im
po
rts (
Mil
lio
ns)
0%
5%
10%
15%
20%
25%
30%
35%
40%
45%
50%
Asean China East Asia Other NAFTA China %

©LMC International, 2013 26 26/05/2014
US trade values shows the difference in price between imports and a US produced (exported) tyre. An imported Chinese tyre is half the price of a US exported tyre.
0
20
40
60
80
100
120
140
Taiw
an
Ch
ina
Vie
tnam
Ind
on
esia
Th
aila
nd
Co
sta
Ric
a
Ch
ile
Mexic
o
Ph
ilipp
ines
Ko
rea
Slo
vakia
Can
ad
a
Jap
an
Ru
ssia
Ro
man
ia
Bra
zil
Fra
nce
Italy
Po
rtug
al
UK
Germ
an
y
Hu
ng
ary
Czech
Tyre
un
it p
rice (
$)
Import unit values export unit values
2013

©LMC International, 2013 27 26/05/2014
Combining sales with trade shows a strong increase in tyre production in emerging markets, while advanced market production has fallen
1,100
1,200
1,300
1,400
1,500
1,600
Wo
rld
Ch
ina
AS
EA
N
Ind
ia
E.A
sia
Mid
dle E
ast
E.E
uro
pe
S.A
merica
Oth
er
Eu
rop
e
N.A
merica
Wo
rldT
ota
l ty
res
sale
s ('0
00 u
nit
s)
Production growth 2004-13

©LMC International, 2013 28 26/05/2014
Implications for synthetic rubber: tyre production and weight determine demand. Tyre sizes and hence weights are increasing
6
8
10
12
14
16
18
20
2000 2002 2004 2006 2008 2010 2012
LV
tyre
weig
ht
(kg
) m
a
30
35
40
45
50
55
60
M/H
CV
tyre
weig
ht (k
g) m
a
Car LCV MHCV

©LMC International, 2013 29 26/05/2014
0%
10%
20%
30%
40%
50%
60%
70%
80%
90%
100%
2007 2008 2009 2010 2011 2012 2013
To
tal
14 15 16 17 18
OE tyre sizes are increasing (for example: EU)

©LMC International, 2013 30 26/05/2014
As with the tyre industry, demand is growing strongly in emerging markets. Unlike in the tyre industry, much of this demand is met from advanced market exports
-800
-600
-400
-200
0
200
400
N A
meric
a
S A
meric
a
Eu
rop
e
E E
uro
pe
East A
sia
AS
EA
N
Ch
ina
Ind
ia
Oth
er
Net
imp
ort
s (
'000 t
on
nes)
SBR BR

©LMC International, 2013 31 26/05/2014
However, capacity is increasing in the emerging
markets. This is placing pressure on exporters
0
50
100
150
200
250
300
350
2003 2005 2007 2009 2011 2013
Pro
du
cti
on
/im
po
rts (
'000 t
on
nes)
66%
69%
72%
75%
78%
81%
84%
87%
Self-s
uffic
ien
cy (%
)
Imports SBR
China SBR

©LMC International, 2013 32 26/05/2014
For polybutadiene rubber, Chinese self
sufficiency is increasing, but capacity utilisation
has fallen
0
100
200
300
400
500
600
700
800
900
2000 2002 2004 2006 2008 2010 2012
Pro
du
cti
on
('0
00
to
nn
es
)
10%
20%
30%
40%
50%
60%
70%
80%
90%
100%
se
lf-su
fficie
nc
y/C
ap
ac
ity u
tilisa
tion
(%)
Production Capacity utilisation Self sufficiency
China BR

©LMC International, 2013 33 26/05/2014
New capacity has also been commissioned in
other net importing regions (India and ASEAN)
0
50
100
150
200
250
300
350
2000 2001 2002 2003 2004 2005 2006 2007 2008 2009 2010 2011 2012 2013
Net
imp
ort
s (
'000 t
on
nes)
ASEAN India
Net SBR imports

©LMC International, 2013 34 26/05/2014
Changing raw materials:
pressure to reduce CO2 leads to demand for
low rolling resistance tyres. Starts with OE
80
100
120
140
160
180
200
1995 1997 1999 2001 2003 2005 2007 2009 2011 2013 2015 2017 2019
Gra
ms C
O2/k
m
EU average CO2 emissions

©LMC International, 2013 35 26/05/2014
Tyre labelling enhances this across the tyre
spectrum. Demand is not static moving towards
different raw materials (sSBR, enhanced
sSBR,etc.)
GCFEFCEEECEBCCCBCABCBBBA
0
20
40
60
80
100
120
140
Rating (Rolling Resistance/Wet Grip)
List
Pri
ce (€
)
Budget Quality Premium
195/65/15/H

©LMC International, 2013 36 26/05/2014
• The focus of vehicle and tyre demand growth is moving to the emerging markets
as incomes have risen.
• In 2014, demand from in many emerging markets has slowed, however, the
underlying story still holds. Demand is growing in the Advanced markets.
• In addition, tyre trade is increasing, with increasing volumes produced in low cost
countries and shipped to the advanced markets. This further encourages tyre
production in emerging markets.
• The focus of advanced market production is OE, the most technological advanced
tyres. Pressure to reduce CO2 emissions is leading to demand for new materials.
• Synthetic rubber capacity is increasing in emerging markets which is placing
pressure on exporters.
Conclusions

©LMC International, 2013 37 26/05/2014
Thank You www.lmc.co.uk
Acknowledgments:

©LMC International, 2013 38 26/05/2014
This presentation and its contents are to be held confidential by the client, and are not to be disclosed, in whole or in part, in
any manner, to a third party without the prior written consent of LMC International.
While LMC has endeavoured to ensure the accuracy of the data, estimates and forecasts contained in this presentation,
any decisions based on them (including those involving investment and planning) are at the client’s own risk.
LMC International can accept no liability regarding information analysis and forecasts contained in this presentation.
© LMC International, 2014
All rights reserved
New York
1841 Broadway
New York, NY 10023
USA
T +1 (212) 586-2427
F +1 (212) 397-4756
Oxford
4th Floor, Clarendon House
52 Cornmarket Street
Oxford OX1 3HJ
UK
T +44 1865 791737
F +44 1865 791739
Kuala Lumpur
B-03-19, Empire Soho
Empire Subang
Jalan SS16/1, SS16
47500 Subang Jaya
Selangor Darul Ehsan
Malaysia
T +603 5611 9337
Singapore
16 Collyer Quay #21-00
Singapore 049318
Singapore
Tel: +65 6818 9231