THE CASE OF METAL PRODUCTS FACTORIES IN ADDIS ...
103
THE EFFECTS OF RESOURCE MANAGEMENT ON PRODUCTIVITY: THE CASE OF METAL PRODUCTS FACTORIES IN ADDIS ABABA SINTAYEHU ZELEKE EJERIE MASTER OF BUSINESS ADMINISTRATION ADDIS ABABA SCIENCE AND TECHNOLOGY UNIVERSITY DECEMBER 2018
-
Upload
khangminh22 -
Category
Documents
-
view
2 -
download
0
Transcript of THE CASE OF METAL PRODUCTS FACTORIES IN ADDIS ...
i
THE EFFECTS OF RESOURCE
MANAGEMENT ON PRODUCTIVITY: THE CASE OF
METAL PRODUCTS FACTORIES IN ADDIS ABABA
SINTAYEHU ZELEKE EJERIE
MASTER OF BUSINESS ADMINISTRATION
ADDIS ABABA SCIENCE AND TECHNOLOGY UNIVERSITY
DECEMBER 2018
ii
THE EFFECTS OF RESOURCE MANAGEMENT ON
PRODUCTIVITY: THE CASE OF METAL PRODUCTS FACTORIES IN
ADDIS ABABA
By
SINTAYEHU ZELEKE EJERIE
A Thesis Submitted to
The College of Natural and Social Science for the Partial Fulfillment of the Requirement for
the Degree of Master of Business Administration in
Industrial Management
ADDIS ABABA SCIENCE AND TECHNOLOGY UNIVERSITY
DECEMBER 2018
ADDIS ABABA, ETHIOPIA

iii
Declaration
I hereby declare that this thesis entitled “The Effects of Resource Management on
Productivity: The case of Metal Products Factories in Addis Ababa” is my original work
and has not been presented or submitted partially or in full by any other person for a degree in
any other university, and that all sources of materials used for the purpose of this proposal
have been duly acknowledged.
Name: Sintayehu Zeleke Signature: ____________Date:___________

iv
Certificate
This is to certify that the thesis prepared by Mr. Sintaehu Zeleke Ejerie entitled “The
Effects of Resource Management on Productivity: The case of Metal Products Factories
in Addis Ababa” and submitted in fulfillment of the requirements for the Degree of Master
of Business Administration in Industrial Management complies with the regulations of the
University and meets the accepted standards with respect to originality and quality.
Signed by Examining Board
Examiner: __________________________Signature:_____________Date: ______________
Examiner: __________________________Signature:_____________Date: ______________
Thesis Advisor:______________________Signature:_____________Date:______________

v
Abstract
There are dramatic evolutions in the market environment and every organization strives to
keep itself in business. Major competition has shifted from the market to the production floor
where manufacturing costs can be cut down, productivity and profitability boosted for firms
to compete favorably. Trends in the sector showed that there were gaps between demand and
supply in metal products sector in the country and also, the metal and steel industries in the
country are operating at around 38 percent of their installed capacity. Based on this created
gap and low efficiency on the sector, researcher investigated the organizational resources
(human resource, working capital, raw material and technology) management taken as a
variable to measure its effect on productivity. Hence, the broad objective of the study is to
analyze the Effects of Resource Management on Productivity the case of Metal Products
Factories in Addis Ababa. This study used quantitative and qualitative research
methodology, data types which were collected through questionnaires, observation and
interview. The study used both primary and secondary data with a mixed research approach.
The researcher designated descriptive (mean, standard devotion) and inferential
(correlation, regression) statistics in this study. The Studied companies were selected based
on geographical location and products homogeneity. Probability (stratified) and non-
probability (purposive) sampling designs were used in this study. The necessary annual
report data used for the purpose of this study covered three successive years from 2014/15 up
to 2016/17. The correlation and regression analysis result clarified that all independent
variables (human resource management, working capital management, raw material
management and technology management) were strong positive significant effect on
productivity. As the result the Ethiopian metal products firms need to give a special attention
on the way an organization manages its human resources, raw material, working capital and
technologies have a significant effects on the organization’s performance. On regards to
Resources- Human resource, working capital, raw material and technology managements are
vital to the studied firms become win the compaction that bearing higher productivity turns to
butter value to customer that leading to higher share in the market
Key word: Resource Management, Productivity, Human resource management, Raw material
management, Working Capital management, Technology management.

vi
Acknowledgments
Above all, I thank the almighty God because He gave me the strength to complete my courses
and the thesis work. I am really grateful to my thesis advisor Dr. Delessa Daba for his
guidance and enthusiastic support throughout the research undertaking.
My heartfelt appreciation to my wife, W/ro Serkalem Gessess, My children Yonathan and
Yeroson for their help and patient during my study and preparation of this thesis. Their
endless support, encouragement and understanding throughout my good times and hard times
are too meaningful to me.
I would like to appreciate top management, middle management, supervisor/senior
employees of Kaliti metal products factory, Sunny Steel Pipe manufacturing PLC, Osaka
engineering plc, Mame Steel Plc those individuals who devoted their precious time to
respond to my questionnaire and interview.
Finally, I would like to thank Metal Industry Development Institute directors and employees
for their useful date provided.
Thanks to GOD who made all things possible.

vii
Table of Contents
Certificate ________________________________________________________________ iii
Declaration _______________________________________________________________ iv
Abstract___________________________________________________________________v
Acknowledgments__________________________________________________________ vi
Table of Content __________________________________________________________ vii
Lists of tables ______________________________________________________________x
Lists of Figures ____________________________________________________________ xi
List of Abbreviations ______________________________________________________ xii
CHAPTER ONE ____________________________________________________________1
INTRODUCTION __________________________________________________________1
1.1. Background of the study_________________________________________________1
1.2. Statements of the Problem _______________________________________________3
1.3. Research Objectives ____________________________________________________6
1.3.1. General Objective _________________________________________________6
1.3.2. Specific Objective_________________________________________________6
1.4. Development of Hypothesis ______________________________________________6
1.5. Significant of the Research_______________________________________________7
1.6. The Scope of the Study__________________________________________________7
1.7. Limitation of the Research _______________________________________________7
1.8. Organization of the Study________________________________________________8
1.9. Definition of Key Terms_________________________________________________8
CHAPTER TWO_________________________________________________________10
RELATED LITRATURE REVIEW __________________________________________10
2.1. Theoretical Review____________________________________________________10
2.1.1. Working Capital Management and productivity_________________________13
2.1.2. Human Resource Management and Productivity ________________________15
2.1.3. Raw Material Management and Productivity ___________________________20
2.1.4. Technology Management and Productivity ____________________________26
2.1.5. Factors Influencing Productivity_____________________________________31
2.1.6. Productivity Measurement _________________________________________31
2.1.7. Productivity Improvement _________________________________________33
2.1.8. Productivity Indicators ____________________________________________33
viii
2.2. Empirical Review _____________________________________________________34
2.2.1. Related Empirical Review _________________________________________35
2.2.2. Summaries of Empirical Studies_____________________________________44
2.2.3. Literature Gap ___________________________________________________47
2.3. Conceptual Frame Work________________________________________________47
CHAPTER THREE _________________________________________________________49
RESEARCH METHODOLOGY _______________________________________________49
3.1. Research Design ______________________________________________________49
3.2. Sources of Data_______________________________________________________49
3.3. Research Approach____________________________________________________50
3.4. Population of the Study ________________________________________________50
3.5. Sample Design _______________________________________________________51
3.6. Sampling Frames _____________________________________________________51
3.7. Sampling Unit________________________________________________________51
3.8. Sample Size _________________________________________________________51
3.9. Sampling Technique ___________________________________________________52
3.10. Methods of Data Collection____________________________________________53
3.11. Data Analysis Method ________________________________________________53
3.11.1.Model Specification ______________________________________________53
3.12. Validity and Reliability _______________________________________________54
3.12.1.Reliability ______________________________________________________54
3.12.2.Validity ________________________________________________________55
3.13. Ethical Considerations________________________________________________55
CHAPTER FOUR __________________________________________________________57
DATA PRESENTATION, ANALYSIS AND INTERPRITATION____________________57
4.1. Demographic Characteristics of Respondents _______________________________57
4.2. Relation of Resources Management among Productivity ______________________60
4.3. Effects of Resource Management on Productivity____________________________62
4.3.1. The Effects of Raw Materials Management on Productivity _______________64
4.3.2. The effect of Human Resource Management on Productivity ______________64
4.3.3. The effects of Working Capital Management on Productivity______________64
4.3.4. The effects of Technology Management on Productivity__________________64
4.4. Summary of Hypothesis ________________________________________________65
4.5. Summary of Major Findings_____________________________________________65
ix
CHAPTER FIVE ___________________________________________________________67
CONCLUSIONS AND RECOMMENDATIONS__________________________________67
5.1. Conclusions _________________________________________________________67
5.1.1. On Effects of Raw Material Management _____________________________67
5.1.2. On Effects of Human Resource Management __________________________67
5.1.3. On effects of Working Capital Management ___________________________68
5.1.4. On Effects of Technology Management _______________________________68
5.2. Recommendations ____________________________________________________69
Reference _________________________________________________________________71
Bibliography_______________________________________________________________79
Appendix _________________________________________________________________80
Appendix - A ______________________________________________________________81
Appendix - B ______________________________________________________________85
Appendix – C ______________________________________________________________88
Correlation and Regression Analysis Result ______________________________________88
Full correlation _____________________________________________________________88
x
Lists of Tables
Table 2.1: Summary for the Deference between Production and Productivity 14
Table 2.2: Summary of Related Literatures 46
Table 3.1: Population of the Study 53
Table 3.2: Sampling size 54
Table 3.3: Reliability of data collection instrument 57
Table 3.4: Reliability statistic 57
Table 4.1: Demographic characteristics 59
Table 4.2: Respondent’s opinion about the effects of RMM on productivity 61
Table 4.3: Respondent’s opinion about the effects of HRM on productivity 61
Table 4.4: Respondent’s opinion about the effects of WCM on productivity 62
Table 4.5: Respondent’s opinion about the effects of TM on productivity 62
Table 4.6: Full correlation 63
Table 4.7: Partial correlation 63
Table 4.8: Model Summary 66
Table 4.9: ANOVA test 66
Table 4.10: Coefficients 66
Table 4.11: Summary of overall outcome of the research hypothesis 68
xi
Lists of Figures
Figure 2.1: Production system 11
Figure 2.2: Dynamic Concept of Productivity 13
Figure 2.3: Supply chain flow chart 25
Figure 2.4: How information technology influences all aspects of the
manufacturing enterprise 29
Figure 2.5: The key steps of an effective productivity measurement system 32
Figure 2.6: Models of Conceptual Frame Work 48
Figure 4.1: Models of conceptual frame work Results 66
xii
List of Abbreviations
AACCSA Addis Ababa Chamber of Commerce & Sectoral Associations
AGOA African Growth and Opportunity Act
ANOVA Analysis of variance
BMI Basic Metal Industry
CAD Computer Aided Design
CIM Computer Integrated Manufacturing
CSA Central Statistics Agency
EMOI Ethiopian Ministry of Industry
EOQ Economic Order Quantity
ERCA Ethiopian Revenue and Customs Authority
ERP Enterprise resource planning
GDP Growth Domestic product
GTP Growth and Transformation Plan
HRM Human Resource Management
ICT Information Communication Technology
IJSER International Journal of Scientific & Engineering Research
IS Information system
KPI Key Performance Indicators
MOFED Ministry of Finance and Economic Development
MOI Ministry of Industry
R and D Research and Development
SCH Supply Chain Management
TQM Total Quality Management
WIP Work-In-Process
1
CHAPTER ONE
INTRODUCTION
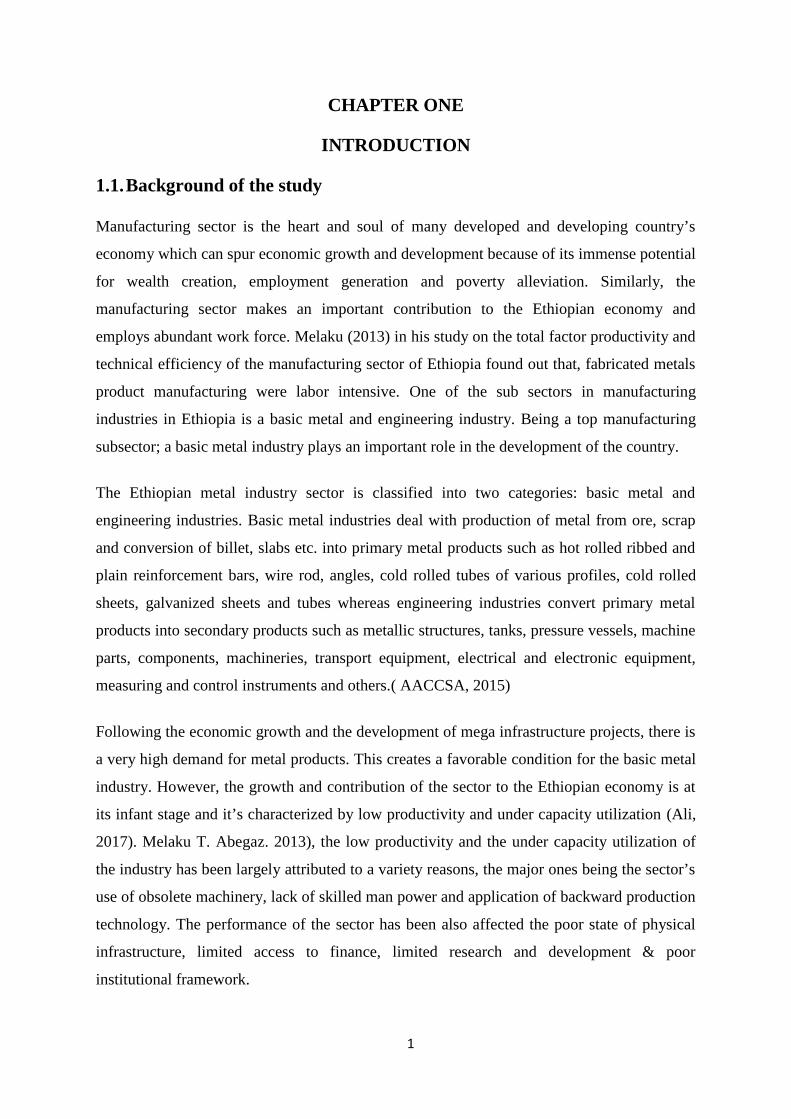
1.1.Background of the study
Manufacturing sector is the heart and soul of many developed and developing country’s
economy which can spur economic growth and development because of its immense potential
for wealth creation, employment generation and poverty alleviation. Similarly, the
manufacturing sector makes an important contribution to the Ethiopian economy and
employs abundant work force. Melaku (2013) in his study on the total factor productivity and
technical efficiency of the manufacturing sector of Ethiopia found out that, fabricated metals
product manufacturing were labor intensive. One of the sub sectors in manufacturing
industries in Ethiopia is a basic metal and engineering industry. Being a top manufacturing
subsector; a basic metal industry plays an important role in the development of the country.
The Ethiopian metal industry sector is classified into two categories: basic metal and
engineering industries. Basic metal industries deal with production of metal from ore, scrap
and conversion of billet, slabs etc. into primary metal products such as hot rolled ribbed and
plain reinforcement bars, wire rod, angles, cold rolled tubes of various profiles, cold rolled
sheets, galvanized sheets and tubes whereas engineering industries convert primary metal
products into secondary products such as metallic structures, tanks, pressure vessels, machine
parts, components, machineries, transport equipment, electrical and electronic equipment,
measuring and control instruments and others.( AACCSA, 2015)
Following the economic growth and the development of mega infrastructure projects, there is
a very high demand for metal products. This creates a favorable condition for the basic metal
industry. However, the growth and contribution of the sector to the Ethiopian economy is at
its infant stage and it’s characterized by low productivity and under capacity utilization (Ali,
2017). Melaku T. Abegaz. 2013), the low productivity and the under capacity utilization of
the industry has been largely attributed to a variety reasons, the major ones being the sector’s
use of obsolete machinery, lack of skilled man power and application of backward production
technology. The performance of the sector has been also affected the poor state of physical
infrastructure, limited access to finance, limited research and development & poor
institutional framework.
2
Therefore, firms have been using as one of strategic tools that came to the production floor
where manufacturing costs can be cut down, productivity and profitability boosted for firms
to compete favorably. So that resource management is fundamental to the survival of metal
factories and economy. To be this industrial sector contribution to the country’s GDP and
also to create good investment climate the Ethiopian government is taking a number of
remedial measures. The government provides variety of incentives for investors engaging in
the basic metal production. On the other hand, to meet the skilled manpower demand of the
industry various trainings which are aligned with industry strategies are conducted by
colleges and universities. The government also promotes apprenticeship programmers for
students by creating university–industry linkage. In addition, the construction of industrial
parks and simplification of business regulations via the introduction of a single window
service is paying off by luring investors into the manufacturing industry.
Productivity growth is a crucial source of growth in living standards. Productivity growth
means more value is added in production and this means more income is available to be
distributed. It is crucial to the welfare of industrial firm as well as for the economic progress
of the country. Productivity can be managed in different levels – on national, sector or
enterprise level. At firm level higher productivity can be achieved through efficient and
effective managing resources.
High productivity refers to doing the work in a shortest possible time with least expenditure
on inputs without sacrificing quality and with minimum wastage of resources (S. A. Kumar
and N. Suresh; 2008, p. 171). Resource can be a person, an asset, material or capital that can
be used to create value. Every organization needs three main resources to survive (Nicholas,
B., John, V. R. 2010,) they include: -Financial resources, Physical resource which include
material and Human resource. (Nkechi, A. O. 2014) in every area of organization, human and
material resources play an indispensable role. In organizational studies, resource management
is the efficient and effective development of an organization's resources when they are
needed. Such resources may include financial resources, inventory, human skills, production
resources, or information technology (Wikipedia).
Therefore, it is an important part for any profit making business entities managing such
resources systematically. Organizational Resource Management is an approach to guiding the
entire entity to success. Some slight, but significant, modifications derive a basic definition
of ORM as: A management system that makes optimum use of all available resources –

3
equipment, procedures and people – to achieve organizational goals and enhance
the efficiency and value of operations.
At organizational level it is crucial managing- skilled manpower, working capital, source of
finance, new technology, flow of inventory, work improvement, optimal use of material,
waste reduction and improving work environment. Similarly, firms in the basic metal
industry strive for a higher productivity in order to survive and to be competitive in the
industry. The important factor that enables organization to stay competitive is by managing
the available resources efficiently and effectively. Besides to be more competitive in the
turbulent economy firms should devise a mechanism to enter a wider market by operating
strategically. Firm’s strategy should place a road map to penetrate global markets by adopting
the advanced technology, fulfilling social responsibility and reducing manufacturing costs by
innovation. In a similar, to attain higher productivity business processes and operations need
to be monitored continuously. Therefore, this study was conducted on the effects of resource
management on productivity in a basic metal manufacturing industry.
1.2. Statements of the Problem
Industrialization plays an important role in economic development. In this regard, the
manufacturing sector plays a key role in growth process. Despite the importance of
industrialization in Sustainable Economic Growth, the sector has encountered with a serious
growth problem that leads to insignificant contribution to GDP (Metal, Lather and Textile
performance to GDP 0.4, 6.0 and 1.4 % respectively) Dametew (2017). The Government of
Ethiopia has prioritized a few industries to lead its ambitious industrialization agenda,
namely, sugar, textile and garments, and leather products industries. These sectors are
prioritized because of their expected linkages with the agricultural sector and the desire to
exploit the country’s potential comparative advantage in labour-intensive products. These
priority industries are expected to be exported-oriented in order to generate the financial
resources needed for capacity expansion in other manufacturing industries. This strategy
sounds consistent with the country’s natural resource endowments and may allow the country
to take advantage of preferential trade arrangements such as The African Growth and
Opportunity Act (AGOA) (Admasu, S., 2017).
Ethiopian government through a time lists a priority sectors have been updated; the flower
industry and some import-substituting industries (such as metal and engineering, chemicals
4
and pharmaceuticals) were sequentially added. Ethiopia’s goal is to transform the country to
an industrialized economy and increase the per capita income of its citizens to middle-income
levels by 2025. Phase two is a phase where diversification in the existing priority industry
takes place along with emerging of new key industries. Among such industries the percentage
share of heavy metal and chemical industries will gradually increase. According to the
Central Statistical Agency, recently there are 241 medium and large scale sized firms of
metals and engineering manufacturing producers.(CSA, 2014).
At the end of the 2nd phase, the share of the manufacturing sector to the GDP is targeted to
reach 12%. The share of the manufacturing sector to GDP will finally reach 17%. The last
planning phase extends from year 2021 to 2025 which focus on building up and further
enhancing the capacity of high tech industries and the deepening and expansion of heavy
metal and chemical industries with strong linkages with other sectors including the existing
light industries. But medium and large factories as well as the light and small manufacturing
shared respectively 4% and 1.2% throughout the past decade. Among the industry sector, the
contribution of manufacturing and construction to GDP was 4.2% and 5.6%. This is due to
the low and inefficiency of the production and productivity of the manufacturing sector
(MOFED, 2014).
The strategic pillars of the GTP II (Growth and Transformation Plan) related to
manufacturing include; developing light and small manufacturing enterprises that are globally
competent and leading in Africa and establishing a foundation for further growth of the
strategic heavy industries which ultimately enable Ethiopia to become an industrialized
country by 2025 (source: GTP II, PP 38). This is, however, an over ambitious plan. First of
all, our experiences over the past ten years tells that, despite the sector level growth, the
much needed structural transformation has never even showed a sign of change. The metal
and steel industries in the country are operating at around 38 percent of their installed
capacity. It shows us they operate under efficiency (survey interview). Based on articles of
Pawlos Belete the current operating performance is very low as compared to the world
average which currently stands around 85 percent. So what are the reasons for the Ethiopian
firms perform below the world average.
Despite the efforts by the government, the metal sector faces serious growth problem that
affects contribution to GTP. Actually the main issues should be unavailability of locally using
raw material resources. Due to depend on 95% imported materials (survey interview) rather
5
than local resources, consequently of these the manufacturing sector is still infancy and have
full of problems. In the industrial development policy of Ethiopia, the metal and metal
products industry has the objective to play important role in import substitution. But some
indicators show that industry has been affected by chronic financial scarcity, boosting volume
of production and becoming competitive both in the domestic and international markets are
serious issues.
According to Metal Industry and Development Institute annual report, country’s annually
imported and local manufacturing achieved 1,274,943 ton and 1,502,651 ton respectively
(Appendix B ) this shows that local manufacturer cannot be fulfills the demand for local
market. It indicates that a demand and supply gap in the market existed (CSA).
Hence, the gap that created by local manufacturer was taken by the researcher to further
investigated. According to the Ethiopian GTP the annual per capital metal consumption of
the country is set to reach 34.2 kg in 2014/2015 but the actual value is 11.2 kg we can
compare with the global average of annual per capital steel were 216.6 kg (Dametew AW,
Ebinger F, 2017).
In order to attain the government gaol, as well as for their survival metal industry sectors are
raising many problems to be productivity as well as profitability. They have also a resource
and resource management constraint. Researchers’ have a general knowledge on the current
problems on metal factories; so that , lack of skilled manpower, lack of spare parts, locally
unavailability of raw material, lack of quality raw materials , lack of working capital, weak
customers handling system, Problem on relationship with supplier, problems on adopting
new technology, employees resistance to change, lack of transport and logistics, lack of
specialized training center, lack of the capacity on innovation and design and development
center are some of the issues needs highly attention by stakeholders.
Therefore, the researcher was answered such question at what extent the effects of resources
management on productivity in metal products factories were farther investigated in this
study based on problem statement and literatures review some variables were taken within
conceptual frame work. This study was conducted to investigate the reason why the basic
metal performance was under efficiency. Therefore; by investigating the above stated effects
of resources on productivity in metal products sub sector, by answering related issues and

6
what actually the sector achieved now is the main concern on this research paper. So from the
above indicated problems, researcher was answered by taken from the most organizational
resources as variables - human resource management, working capital management, raw
material management and technology management. Although studies about the effects of
resource management on productivity in basic metal industry have conducted in some
countries, as far as the researcher knowledge there are very few empirical evidence about the
productivity of basic metal industry in Ethiopia were reviewed. Thus, this study was
conducted to add empirical evidence and to narrow the research gap in the area of the Effects
of Resource Management on Productivity the case of Metal Products Factories in Addis
Ababa.
1.3. Research Objectives
1.3.1. General Objective
The general objective of this study is to assess the effects of resource Management on
Productivity the case of Metal Products Factories in Addis Ababa.
1.3.2. Specific Objective
To examine the effects of human resource management on productivity.
To examine the effects of raw material resource management on productivity.
To examine the effects of working capital management on productivity.
To examine the effects of technology management on productivity.
1.4. Development of Hypothesis
Based on the literature review and the hypothesized connections presented in the conceptual
framework the following alternative and null hypotheses were tested at (0.05) significance
level.
1. Hypothesis 1
(H1): Human resource management has impact on firm’s productivity.
2. Hypothesis 2
(H1): Raw material resource management has positively effect to firm’s productivity.
3. Hypothesis 3
(H1): Working capital management has strong effect on firm’s productivity.
4. Hypothesis 4
(H1): Technology resource management has positively effect on firm’s productivity.
7
1.5. Significant of the Research
Based on the finding researcher was identified from metal industries; the causes of lower
productivity, constraints and performance gaps. And finding will be used as an input to
increase productivity, improve efficiency and for better competitiveness in the sub sector.
Through that finding also helpful how resource utilization, what are risks they have,
opportunities and threats that are facing to productivity and ensure sustainability for growth
and development, what are the basic and priority areas that needs to support and suggesting
possible solution with the alternative management resource system. Furthermore, this study is
relevant for the academia because it fills a literature gap on the topic area. The study is
therefore a source of reference for researchers, students and academicians who have interest
in the subject matter.
1.6. The Scope of the Study
The scope of the study is limited by Geographical, firm’s sizes and year of establishments.
The research is limited to basic metal manufacturing industries (specifically products like
steel hollow section, corrugated sheet, cut to size (plain and rolled products), and normal roof
caver. There are many resources in an organization to be taken all as variables are
unmanageable to conduct the study because in terms of time, finance, and research
manageability. Therefore, because of highly significant effects on organizational productivity
and profitability out of many organizational resources researcher was taken four variables for
this study. It is supported by (S. Anil Kumar and N. Suresh; 2008), (Nicholas, B., John, V.
R.; 2010) and (Nkechi, A. O. 2014) and et al. Accordingly to the purpose of this topic the
variables- human resource management, Working capital management, raw material
management, and technology management are independent, whereas productivity is the
dependent variable. The necessary annual report data used for the purpose of this study
covered three successive years from 2014/15 up to 2016/17. The target populations were
including key persons which are top management, middle management and supervisor/senior
employees found in four metal product factories in Addis Ababa.
1.7. Limitation of the Research
There are many variables which effects productivity; to accomplished this study researchers’
tried only to select four variables (human resource management, Working capital
management, raw material management, and technology management are independent,
whereas productivity is the dependent variable). The study was conducted in four sampled
8
basic metal firms and covered metal factories which are geographically found in Addis
Ababa Ethiopia. Addis Ababa regions are the place where the majority metal industries
located, thus the selected sample industries can be considered to be sufficient indicatives of
the metal industries in Ethiopia as a whole.
1.8. Organization of the Study
The study focuses on the effects of resource management on productivity in metal products
factories in Addis Ababa city. Chapter one is caver introductory view to the reader about the
thesis work, background, the statement of problem, research objectives, significant, scope,
hypothesis, limitation, and definition of terms. Chapter two covers literature review that in
detail the literature available of resource management on productivity. Theoretical review,
empirical review, literature gap, and conceptual frame work are included. Methodology of the
study is presented in the third chapter. The fourth chapter explains data analysis and
presentation and interpretation of the result. Finally, the fifth chapter of this study contains
the summary of findings, conclusion and recommendations.
1.9. Definition of Key Terms
Following are operational definitions of some of the most commonly used terms in this study.
Resource Management:- The process of using a company's resources in the most efficient
way possible. These resources can include tangible resources such as goods and equipment,
financial resources, and labor resources such as employees.
Productivity - a ratio of production output to the input required to produce it–is one measure
of production efficiency. Productivity is defined as a total output per one unit of a total input.
Control management must implement control processes to maintain or improve productivity.
Human resource management - defined as a process in which human resources are
recruited and mobilized in such a way that it helps in achieving the objective of the
organization. Concerned with the people dimension in management under which the
consideration is given towards recruitment and selection, development, motivation and
maintenance of human resources in an organization.
Raw Material Management - Raw material management is critical to the overall
performance of any manufacturing concern. Beside demand and other forces like
competitor’s actions and general price index; raw material situation in terms of efficient
9
management and effective planning determines the activity level, the turn-over and the
ultimate profit in a given company (Akindipe, O. S. 2014).
Working Capital Management:- The process of managing activities and processes related
to working capital. This level of management serves as a check and balances system to ensure
that the amount of cash flowing into the business is enough to sustain the company's
operations. This is an ongoing process that must be evaluated using the current level of assets
and liabilities.
Technology management – can contribute to sustainable competitive advantage. This is
because, creating and sustaining competitive advantage requires more than operational
efficiency and cost minimization. For technology intensive companies, creating competitive
advantage is related to capability of managing technological assets (Cruickshank, et al 2015).

10
CHAPTER TWO
RELATED LITRATURE REVIEW
2.1. Theoretical Review
This chapter presents the theoretical foundation of the effects of resource management on
productivity and relationship, history, principles and concepts on the topics. Before
describing productivity definitions production and production system, concepts, relationship
with each other’s should be clarified. The wealth of a country is measured by its gross
national product—the output of goods and services produced by the nation in a given time.
Goods are physical objects, something we can touch, feel, or see. Services are the
performance of some useful function such as banking, medical care, restaurants, clothing
stores, or social services.
Production is concerned with the transformation of a range of inputs into the required
outputs (products) having the requisite quality level. Production is defined as the step-by-step
conversion of one form of material into another form through chemical or mechanical process
to create or enhance the utility of the product to the user (customer). To get the most value
out of our resources, we must design production processes that make products most
efficiently. Once the processes exist, we need to manage the operation so they produce goods
most economically. Managing the operation means planning for and controlling the
resources used in the process: labor, capital, and material. All are important, but the major
way in which management plans and controls is through the flow of materials. The flow of
materials controls the performance of the process. If the right materials in the right quantities
are not available at the right time, the process cannot produce what it should. Labor and
machinery will be poorly utilized. The profitability, and even the existence, of the company
will be threatened (J. R. Tony Arnold, Stephen N. Chapman, Lloyd M. Clive, 2011).
The transformation process typically uses common resources such as labor, capital (for
machinery and equipment, materials, etc.), and space (land, buildings, etc.) to effect a change.
Economists call these resources the “factors of production” and usually refer to them as labor,
capital, and land.
Resource in its organizational context, is defined as ‘anything that could be thought of as a
strength or weakness of a given firm’ including tangible and intangible assets (Wernerfelt,
11
1984; 172). According to Senyucel (2009) there are three main organizational resources:
human resource, financial resource and technological resources.
Resource management is the efficient and effective development of an organization's
resources when they are needed. In any organization there is the need to utilize available
resources for better performance. The term, management of organizational resources, refers
to proper utilization of such resources as assets, information, human, financial, Inventory,
knowledge and Equipment. Many organizations fail to reach their set targets due to lack of
proper management of these resources. This study brief describes how to manage
organizational resources. How to manage organizational resources remains one of the
fundamental organizational management questions. The resource management for individuals
and also enterprises are fundamental for survival. Resources should be well managed to get
value for Successful productivity management is the key to their survival in today’s highly
competitive environment. An organization’s productivity can be effectively raised only if it is
managed in a holistic manner. Productivity management is a journey of continuous
improvements involving employees at all levels.
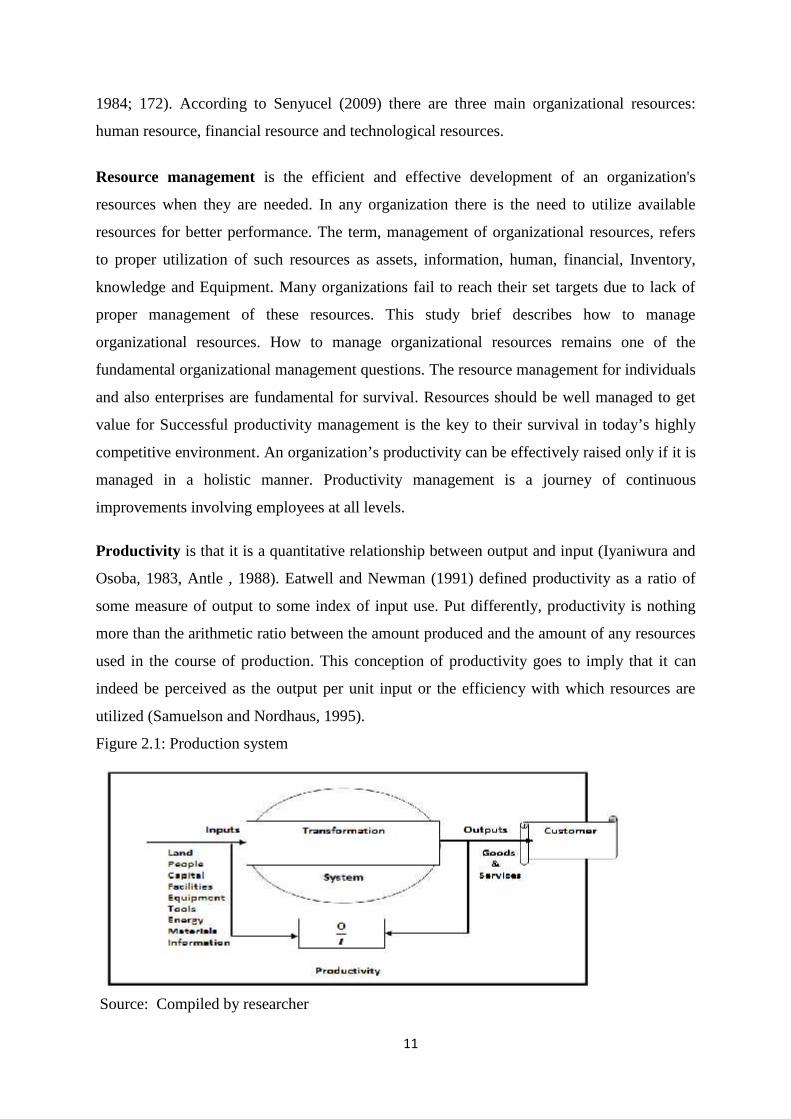
Productivity is that it is a quantitative relationship between output and input (Iyaniwura and
Osoba, 1983, Antle , 1988). Eatwell and Newman (1991) defined productivity as a ratio of
some measure of output to some index of input use. Put differently, productivity is nothing
more than the arithmetic ratio between the amount produced and the amount of any resources
used in the course of production. This conception of productivity goes to imply that it can
indeed be perceived as the output per unit input or the efficiency with which resources are
utilized (Samuelson and Nordhaus, 1995).
Figure 2.1: Production system
Source: Compiled by researcher
12
Productivity as a source of growth has moved to center stage in analyses of growth of
developing economies in recent years. Earlier, the focus was mainly on the growth of capital,
through greater mobilization of resources. As investment levels have increased substantially
in most developing countries and the scope for further increases becomes more limited,
attention has naturally turned to productivity improvements which offer a complementary
route to growth by getting more out of limited resources. (Ahluwalia 1991:191)
To improve productivity products must be designed to satisfy customer need with optimum
consumption of resources without generation of waste in the manufacturing process. Three
perspectives have dominated the field of productivity namely economics, industrial
engineering, and administration. These perspectives have complicated a search for any
precise definition of the concept ‘productivity’. To put it bluntly, the definition of
productivity is complex and this is because it is both a technical and managerial concept. It is
perceived that the more different are the goals of the different individuals, institutions and
bodies that have a stake in productivity as a problem, the more different their definitions of
productivity will be (Oyeranti, G. A. (2000).
The least controversial definition of productivity is that it is a quantitative relationship
between output and input. Productivity can be managed in different levels – on national,
sector or enterprise level. Productivity in its broad sense is a measure of how efficiently and
effectively resources are used as inputs to produce outputs, products or services of the quality
needed by society. As an efficient measure, high productivity implies that production inputs
are fully utilized and waste is minimized. Effectiveness, on the other hand, means that
outputs (and activities and processes) contribute to the attainment of the organization’s
specific goals, whether these meeting customers’ demands, the achievement of business aims
or a contribution to attaining the social, economic and ecological objectives of the society
(Daneil K. and Tibebe. B., 2007)
High productivity provides several benefits. At the macroeconomic level, productivity
improves a country’s living standards because more goods and services are produced at better
prices, inflation and interest rates tend to be stable, and gross domestic product (GDP) tends
to be high. At the microeconomic level, high productivity can increase people’s real income
and improve their ability to purchase goods and services, enjoy leisure activities, access
better housing and education, and contribute to social and environmental programs (KS, M.
F., Krishnaiah, K.)

13
Surbhi. S., (2017) the level of productivity, in the production, determines the profitability,
efficiency and performance of the enterprise, i.e. the higher the productivity of the firm the
greater will be the earning capacity. It aims at determining the relationship between the input
and output, in a particular production process. In short, it is nothing but attaining the highest
possible outcome, while consuming minimum factors of production. Productivity is often
misconstrued with production, but there exists a difference, in the sense that production
indicates the volume of output, whereas productivity is the output generated from the
resources employed by the company.
Figure 2.2: Dynamic Concept of Productivity
Source: Surbhi. S., 2017
Competition triggers productivity, as intense competition results in higher productivity,
which in turn provides better value to the customers, leading to higher share in the market.
Table 2.1: Summary for the Deference between Production and Productivity
Basis for Comparison Production Productivity
Meaning
Production is a function of anorganization which is associated with theconversion of range of inputs into desiredoutput.
Productivity is a measure ofhow efficiently resources arecombined and utilized in thefirm, for achieving the desiredoutcome.
What is it? Process Measure
Represents Numbers of units actually produced. Ratio of output to input
Expression Absolute terms Relative terms
Determines Value of outputEfficiency of factors ofproduction
Source: Compiled based on the researcher’s secondary data
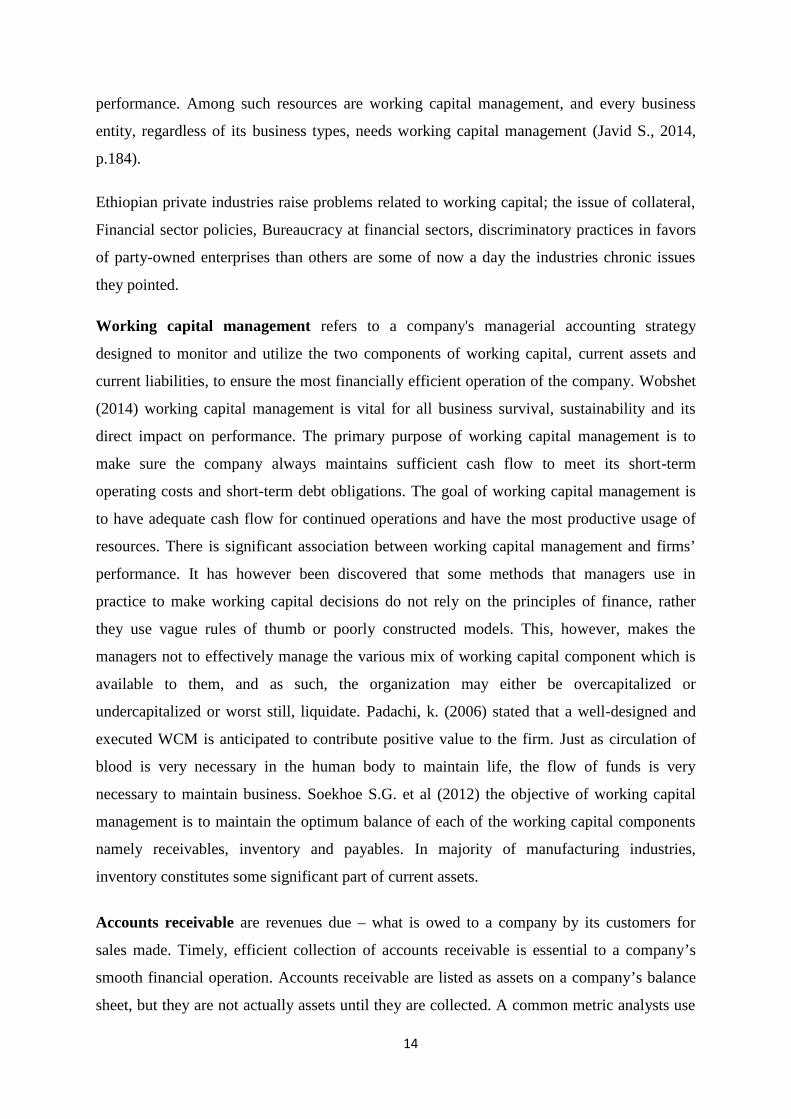
2.1.1. Working Capital Management and productivity
For any business sector needs sufficient resources to keep it going and ensures that such
resources are maximally utilized to enhance its profitability and overall organizational
14
performance. Among such resources are working capital management, and every business
entity, regardless of its business types, needs working capital management (Javid S., 2014,
p.184).
Ethiopian private industries raise problems related to working capital; the issue of collateral,
Financial sector policies, Bureaucracy at financial sectors, discriminatory practices in favors
of party-owned enterprises than others are some of now a day the industries chronic issues
they pointed.
Working capital management refers to a company's managerial accounting strategy
designed to monitor and utilize the two components of working capital, current assets and
current liabilities, to ensure the most financially efficient operation of the company. Wobshet
(2014) working capital management is vital for all business survival, sustainability and its
direct impact on performance. The primary purpose of working capital management is to
make sure the company always maintains sufficient cash flow to meet its short-term
operating costs and short-term debt obligations. The goal of working capital management is
to have adequate cash flow for continued operations and have the most productive usage of
resources. There is significant association between working capital management and firms’
performance. It has however been discovered that some methods that managers use in
practice to make working capital decisions do not rely on the principles of finance, rather
they use vague rules of thumb or poorly constructed models. This, however, makes the
managers not to effectively manage the various mix of working capital component which is
available to them, and as such, the organization may either be overcapitalized or
undercapitalized or worst still, liquidate. Padachi, k. (2006) stated that a well-designed and
executed WCM is anticipated to contribute positive value to the firm. Just as circulation of
blood is very necessary in the human body to maintain life, the flow of funds is very
necessary to maintain business. Soekhoe S.G. et al (2012) the objective of working capital
management is to maintain the optimum balance of each of the working capital components
namely receivables, inventory and payables. In majority of manufacturing industries,
inventory constitutes some significant part of current assets.
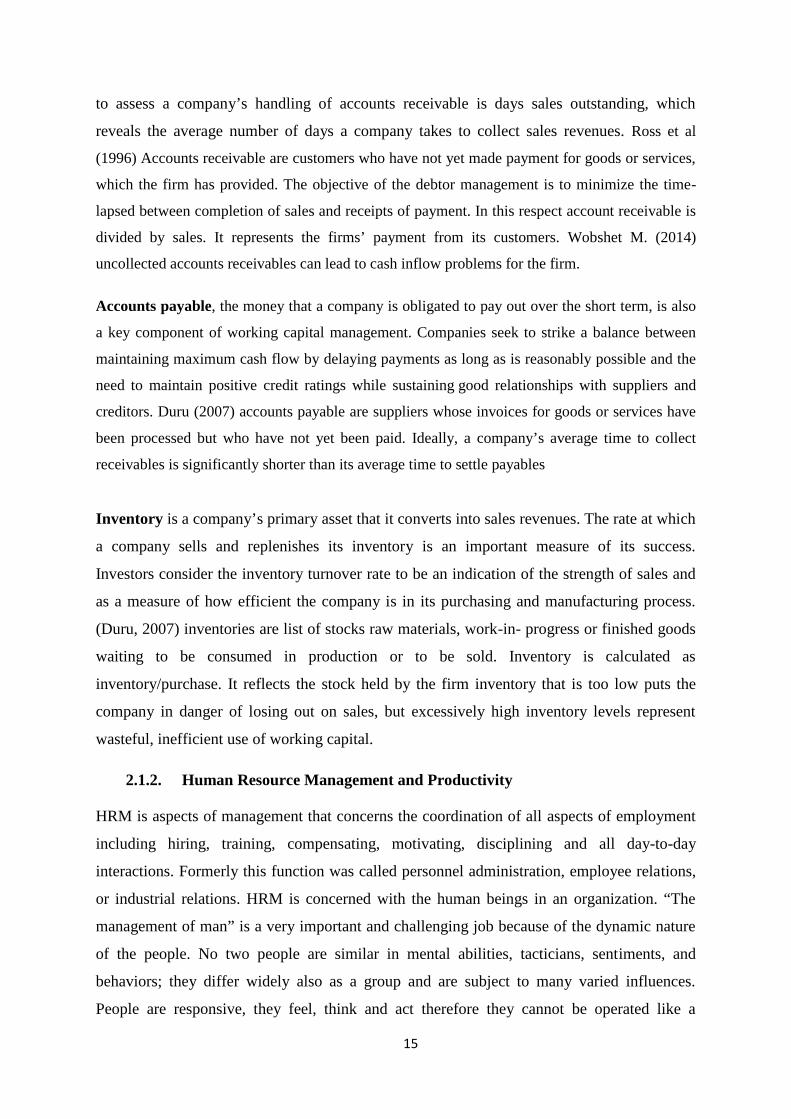
Accounts receivable are revenues due – what is owed to a company by its customers for
sales made. Timely, efficient collection of accounts receivable is essential to a company’s
smooth financial operation. Accounts receivable are listed as assets on a company’s balance
sheet, but they are not actually assets until they are collected. A common metric analysts use
15
to assess a company’s handling of accounts receivable is days sales outstanding, which
reveals the average number of days a company takes to collect sales revenues. Ross et al
(1996) Accounts receivable are customers who have not yet made payment for goods or services,
which the firm has provided. The objective of the debtor management is to minimize the time-
lapsed between completion of sales and receipts of payment. In this respect account receivable is
divided by sales. It represents the firms’ payment from its customers. Wobshet M. (2014)
uncollected accounts receivables can lead to cash inflow problems for the firm.
Accounts payable, the money that a company is obligated to pay out over the short term, is also
a key component of working capital management. Companies seek to strike a balance between
maintaining maximum cash flow by delaying payments as long as is reasonably possible and the
need to maintain positive credit ratings while sustaining good relationships with suppliers and
creditors. Duru (2007) accounts payable are suppliers whose invoices for goods or services have
been processed but who have not yet been paid. Ideally, a company’s average time to collect
receivables is significantly shorter than its average time to settle payables
Inventory is a company’s primary asset that it converts into sales revenues. The rate at which
a company sells and replenishes its inventory is an important measure of its success.
Investors consider the inventory turnover rate to be an indication of the strength of sales and
as a measure of how efficient the company is in its purchasing and manufacturing process.
(Duru, 2007) inventories are list of stocks raw materials, work-in- progress or finished goods
waiting to be consumed in production or to be sold. Inventory is calculated as
inventory/purchase. It reflects the stock held by the firm inventory that is too low puts the
company in danger of losing out on sales, but excessively high inventory levels represent
wasteful, inefficient use of working capital.
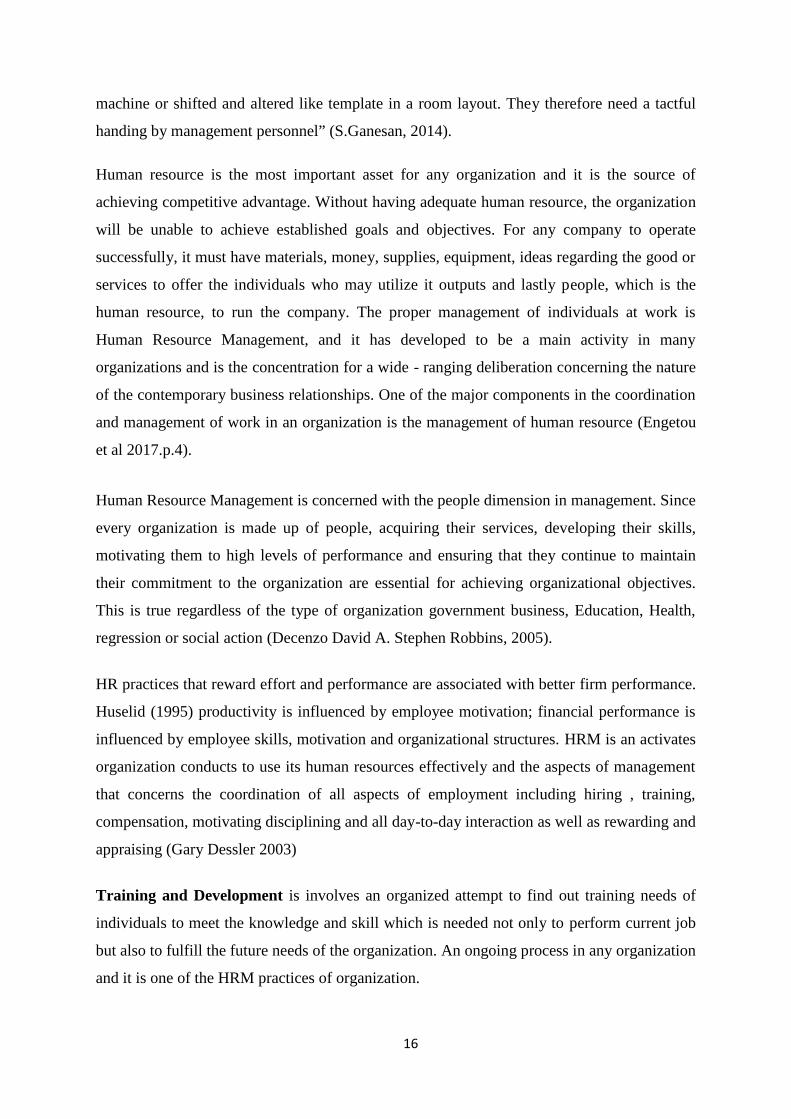
2.1.2. Human Resource Management and Productivity
HRM is aspects of management that concerns the coordination of all aspects of employment
including hiring, training, compensating, motivating, disciplining and all day-to-day
interactions. Formerly this function was called personnel administration, employee relations,
or industrial relations. HRM is concerned with the human beings in an organization. “The
management of man” is a very important and challenging job because of the dynamic nature
of the people. No two people are similar in mental abilities, tacticians, sentiments, and
behaviors; they differ widely also as a group and are subject to many varied influences.
People are responsive, they feel, think and act therefore they cannot be operated like a
16
machine or shifted and altered like template in a room layout. They therefore need a tactful
handing by management personnel” (S.Ganesan, 2014).
Human resource is the most important asset for any organization and it is the source of
achieving competitive advantage. Without having adequate human resource, the organization
will be unable to achieve established goals and objectives. For any company to operate
successfully, it must have materials, money, supplies, equipment, ideas regarding the good or
services to offer the individuals who may utilize it outputs and lastly people, which is the
human resource, to run the company. The proper management of individuals at work is
Human Resource Management, and it has developed to be a main activity in many
organizations and is the concentration for a wide - ranging deliberation concerning the nature
of the contemporary business relationships. One of the major components in the coordination
and management of work in an organization is the management of human resource (Engetou
et al 2017.p.4).
Human Resource Management is concerned with the people dimension in management. Since
every organization is made up of people, acquiring their services, developing their skills,
motivating them to high levels of performance and ensuring that they continue to maintain
their commitment to the organization are essential for achieving organizational objectives.
This is true regardless of the type of organization government business, Education, Health,
regression or social action (Decenzo David A. Stephen Robbins, 2005).
HR practices that reward effort and performance are associated with better firm performance.
Huselid (1995) productivity is influenced by employee motivation; financial performance is
influenced by employee skills, motivation and organizational structures. HRM is an activates
organization conducts to use its human resources effectively and the aspects of management
that concerns the coordination of all aspects of employment including hiring , training,
compensation, motivating disciplining and all day-to-day interaction as well as rewarding and
appraising (Gary Dessler 2003)
Training and Development is involves an organized attempt to find out training needs of
individuals to meet the knowledge and skill which is needed not only to perform current job
but also to fulfill the future needs of the organization. An ongoing process in any organization
and it is one of the HRM practices of organization.

17
Investment in human resources became an important part for the organizations’ strategies in
order to be able to compete globally. Therefore, it is necessary to pay attention to the talented
human elements in contemporary organizations as it is the most important elements towards
excellence and success. Besides, changes and developments in technology and economy
create new issues in the field of human resources as the organization alone cannot deal with
these challenges without considering and investment on talented human capital Karam et al.
(2017).
According to Kulkarni (2013), the success of any organization depends upon the quality of
the work force, but in order to maintain the quality of the work force, many organizations
come across a number of obstacles. These obstacles include attraction of the qualitative
workforce towards the organization, recruitment of intelligent, dynamic as well as
enthusiastic people in the organization, motivation of current employees with different
techniques and retention of the current workforce for maintaining the organizational status in
the competitive market. For surviving the business and becoming a successful pillar in the
market; training is a tool that can help in gaining competitive advantages.
According to Paynes (2008), both training and development programs seek to change the
skills, knowledge, or attitudes of employees required by the job post. Programmers may be
focused on improving an individual’s level of self-awareness, competency and motivation to
perform his or her job well. This in turn makes employees feel that they are part of the
organization’s family. It creates a sense of belonging in employees, enhances the employee’s
skills, and motivates while improving financial gain. This in the long run makes employees
feel indebted to the organization.
According to Armstrong, training is systematic application of formal processes to impart
knowledge and help people to acquire the skills necessary for them to perform their jobs
satisfactorily. Training should be systematic in that it is specifically designed, planned and
implemented to meet defined needs. It is provided by people who know how to train and the
impact of training is carefully evaluated. The concept was originally developed for the
industrial training boards in the 1960s, consists of a simple four-stage model:
1. Identify training needs.
2. Decide what sort of training is required to satisfy these needs.
3. Use experienced and trained trainers to implement training.
4. Follow up and evaluate training to ensure that it is effective.
18
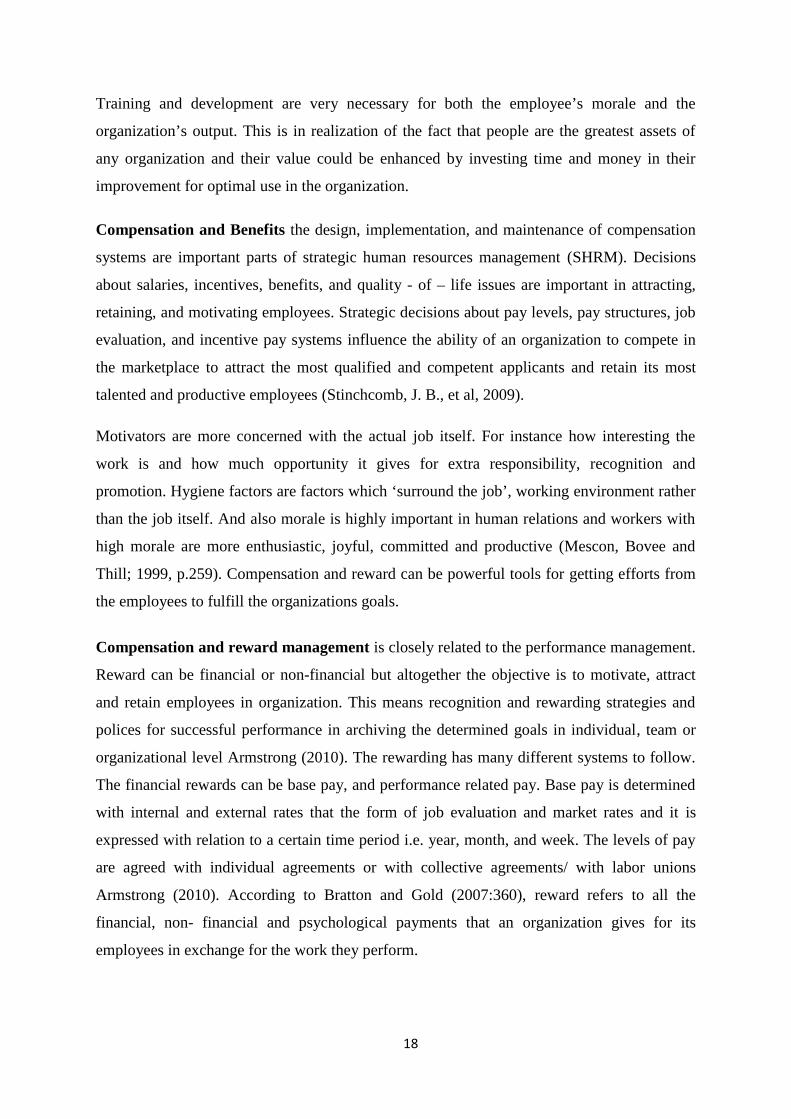
Training and development are very necessary for both the employee’s morale and the
organization’s output. This is in realization of the fact that people are the greatest assets of
any organization and their value could be enhanced by investing time and money in their
improvement for optimal use in the organization.
Compensation and Benefits the design, implementation, and maintenance of compensation
systems are important parts of strategic human resources management (SHRM). Decisions
about salaries, incentives, benefits, and quality - of – life issues are important in attracting,
retaining, and motivating employees. Strategic decisions about pay levels, pay structures, job
evaluation, and incentive pay systems influence the ability of an organization to compete in
the marketplace to attract the most qualified and competent applicants and retain its most
talented and productive employees (Stinchcomb, J. B., et al, 2009).
Motivators are more concerned with the actual job itself. For instance how interesting the
work is and how much opportunity it gives for extra responsibility, recognition and
promotion. Hygiene factors are factors which ‘surround the job’, working environment rather
than the job itself. And also morale is highly important in human relations and workers with
high morale are more enthusiastic, joyful, committed and productive (Mescon, Bovee and
Thill; 1999, p.259). Compensation and reward can be powerful tools for getting efforts from
the employees to fulfill the organizations goals.
Compensation and reward management is closely related to the performance management.
Reward can be financial or non-financial but altogether the objective is to motivate, attract
and retain employees in organization. This means recognition and rewarding strategies and
polices for successful performance in archiving the determined goals in individual, team or
organizational level Armstrong (2010). The rewarding has many different systems to follow.
The financial rewards can be base pay, and performance related pay. Base pay is determined
with internal and external rates that the form of job evaluation and market rates and it is
expressed with relation to a certain time period i.e. year, month, and week. The levels of pay
are agreed with individual agreements or with collective agreements/ with labor unions
Armstrong (2010). According to Bratton and Gold (2007:360), reward refers to all the
financial, non- financial and psychological payments that an organization gives for its
employees in exchange for the work they perform.
19
Some literature indicates that the labor/ skills market in Ethiopia is highly underdeveloped.
Hence, the labor market couldn’t allocate this important industrial input properly. And
developing a properly functioning labor market in the country takes time. For instance,
breaking the vicious circle of the low wage leading to low productivity and thereby to low
enterprise profit which again yielding to low wage takes time. Presently, wages and salaries
in the strategic manufacturing sector are very low which is not adequate to finance daily
subsistence. Because of this, many of the hardworking labors are forced to migrate to other
sectors primarily to the service sector that in turn leads the manufacturing enterprises to stay
in the lower productivity and competitiveness trap. Since profit of the manufacturing
enterprises is low they cannot raise the salary of their employees. Breaking this vicious and
developing a freely operating industrial labor market is time, finance and energy consuming
which is hard to attain them.
Three propositions on the link between HRM and organizational performance: 1) HR
practices can make a direct impact on employee characteristics such as engagement,
commitment, motivation and skill; 2) if employees have these characteristics it is probable
that organizational performance in terms of productivity, quality and the delivery of high
levels of customer service will improve; and 3) if such aspects of organizational performance
improve, the financial results achieved by the organization will improve.
The determinant of firm productivity is the incentive system in place. Several works by
Edward Lazear has shown that monetary and non-monetary rewards enhance productivity
(Lazear, 2000). Another determinant of firm productivity is the quality of management
practices in firms. Notable works in this field include Bloom and Van Reenen (2010).
Ulrich, D. (1997) this quality of HR index was related to four financial measures:
market/book value (market value of the firm based on stock price divided by firm’s assets,
which represents “value added” by management), productivity (dollar value of sales divided
by number of employees), market value (stock price X outstanding shares), and sales. All
four financial measures increased dramatically with the quality of HR practices. HRM can be
measured in terms of their organizational performance and employee’s productivity.
According to Ravi K. G. (2017) managers must work through people to achieve the
objectives of the organization. So the nine areas was identified which are Employ the Right
People, Encourage Innovation and Creativity in the Work Place, Have Flexible Work

20
Schedules, Reward employees on the Basis of Performance, Install a Reliable Time Tracking
System, Have the Right Tools of Trade, Have a Clean and Comfortable Working
Environment, Keep the Employees Informed, and Create Incentive Programs. The most
successful strategies are those that develop an intrinsic push towards productivity. The HR
can achieve very little success if it attempts to push the employees to achieve productivity.
Therefore, the theoretical literature clearly suggests that the behavior of employees within
firms has important implication for organizational performance and that human resource
management practice can effect individuals employee performance through their influence
over employees skill and motivation and through organizational structures. If there was a
poor HRM practice, it was highly productivity is affected. So based on the deferent literature
the effects of HRM practices and policies on the organizational productivity are a highly
significant.
2.1.3. Raw Material Management and Productivity
Raw material management is critical to the overall performance of any manufacturing
concern. Beside demand and other forces like competitor’s actions and general price index;
raw material situation in terms of efficient management and effective planning determines the
activity level, the turn-over and the ultimate profit in a given company. The determination of
economic order quantity (EOQ), re-order level and minimum/maximum stock levels is
important in raw material management in any manufacturing outfit (Akindipe, Olusakin S,
2014, p.37)
Raw materials are basic un-fabricated materials which have not undergone in any operation
since they are received from the suppliers. Managing raw material availability for current and
future needs, when do order make, where is the right region to supply on the globe are
majority of manufacturing industries problems. Manufacturing companies attain significant
savings from effective materials management. Effective management of inventory can lead to
a reduction in cost, resulting in a significant saving. A potential saving on total cost through
effective raw material management are achievable in various types of materials to be
managed in any organization include purchased materials, work-in-progress (WIP), materials
and finished goods.
Materials Management is a tool to optimize performance in meeting customer service
requirements at the same time adding to profitability by minimizing costs and making the
21
best use of available resources. The basic objective of Materials Management as explained by
Banjoko (2000) and Jacobs et al., (2009) is to ensure that the right item is bought and made
available to the manufacturing operations at the right time, at the right place and at the lowest
possible cost. Telsang (2010) asserts that a manufacturing firm generally carries the
following types of inventories: Raw materials, Work-in-Process Inventories, Finished Goods
Inventories, Maintenance, Tools Inventory, and Miscellaneous Inventories.
Materials management is a concept which brings together the responsibility for determining
the manufacturing requirement that is scheduling the manufacturing processes and procuring,
storing and dispensing materials (Ondiek, 2009). Materials Management is a tool to optimize
performance in meeting customer service requirements at the same time adding to
profitability by minimizing costs and making the best use of available resources (Jeruto K. et
al (2014).
Barker (1989) articulated that improvement in continuity of supplies with reduced lead times,
reduction in inventories with reduced obsolescence and surplus, improvement in cooperation
and communications with reduced duplication of effort, reduction in material costs,
improvement in quality control, improvement in status control, and quicker identification of
problems are the main benefits of Materials Management in organization. J.R.Tony. Armold,
S.N.Chapman, L.M.Clive (2008) manufacturing creates wealth by adding value to goods. To
improve productivity and wealth, a company must first design efficient and effective systems
for manufacturing. It must then manage these systems to make the best use of labor, capital,
and material. One of the most effective ways of doing this is through the planning and control
of the flow of materials into, through and out of manufacturing.
There are three elements to a material flow system: supply, manufacturing planning and
control, and physical distribution. They are connected, and what happens in one system
affects the others. Traditionally, there are conflicts in the objectives of a company and in the
objectives of marketing, finance, and production. The role of materials management is to
balance these conflicting objectives by coordinating the flow of materials so customer service
is maintained and the resources of the company are properly used. So that without adequate
planning for materials resources, the overall performance of an organization may be crippled.
Manufacturing companies attain significant savings from effective materials management.
Effective management of inventory can lead to a reduction in cost, resulting in a significant
22
saving. A potential saving on total cost through effective raw material management is
achievable. The various types of materials to be managed in any organization include
purchased materials, work-in-progress (WIP), materials and finished goods indeed. Under
raw material the quality of raw material and raw material transportation (logistics) are farther
described here.
Quality of raw material in the early 1950’s, quality management practices developed
rapidly in Japanese plants, and become a major theme in Japanese management philosophy.
New quality systems have evolved from the foundations of Deming, (1981), Juran and the
early Japanese practitioners of quality. Juran uses the idea of fitness for use. Fitness for use
should be judged from the customer’s point of view and not from either the manufacturer’s or
seller’s perspective. Quality evolution can be four stages: inspection, quality control, quality
assurance. TQM is a management philosophy, a paradigm, a continuous improvement
approach to doing business through a new management model. TQM is composed of three
paradigms: Total: Involving the entire organization, Quality: conformance to requirements
(meeting customer requirements) Management: Science and art or manner of planning,
controlling, directing and the like. David Garvin, a Harvard expert on quality, there are eight
dimensions of quality: performance, features, reliability, conformance, durability,
serviceability, aesthetics and perceived quality.
In some literature also quality of a product, measured against some objective standard,
includes appearance, performance characteristics, durability, serviceability, and other
physical characteristics; timeliness of delivery; cost; appropriateness of documentation and
supporting materials; and so on.
Quality has moved beyond manufacturing into service, distribution, healthcare, education and
others sectors. Based on BMI urbanization and steel intensity go hand in hand. In the
preliminary stages of a country’s (Ethiopia) urbanization, steel intensity increases with the
need for new infrastructure for improved connectivity, efficient use of natural resources, and
creation of sophisticated transport hubs. Increased population density means taller buildings,
housing constructions are requiring more high-quality steel. Demand for machinery also
increases as more of the population urbanizes to find employment industries that are steel-
intensive. This is one of the market advantages for metal manufacturing factories but in the
other side the sector had the problems on material quality, availability, problems of material
cost, material warehouse problems, material delay for manufacturing from suppliers are the
23
main constrains. The researchers were found that some factories were implementing the ISO
standard to be won the computation on marketing. To ensure high performance product
supplier materials management systems are critical task for basic metal industries.
According to quality management, it is important to have a strong focus on satisfying
customers, and Naor et al. (2008 p.671) state that companies need to possess a high level of
flexibility to adapt to faster changing customer needs. The quality of finished product
depends more on the skill of the operators, machineries and the quality of the raw material.
Skill full operators can minimize the probability of defects to be occurred. The basic concept
of productivity is always the relationship between the quality and quantity of goods or service
produced and the quantity of resource used to produce them. So, productivity is also
increasingly linked with quality of output, input, and process itself.
To specify the various physical and mechanical properties of the finished metal products,
various tests, both destructive and nondestructive, are performed. Metallurgical, hardness,
tension, ductility, compression, fatigue, impact, wear, corrosion, creep, machinability,
radiography, magnetic particle, ultrasonic, and eddy current are some of the major tests that
are performed by quality control.
Lysons (2006) logistics management is the process of strategically managing the acquisition,
movement and storage of materials, parts and finished inventory (and the related information
flows) through the organization and its marketing channels in such a way that current and
future profitability is maximized through the cost-effective fulfillment of orders. Stevenson
(2006, p.697), however, views logistics as the movement of materials and information in a
supply chain. He further explained that, materials included all of the physical items used in a
production process.
According to the Council of Logistics Management, a nonprofit organization of business
personnel, it is the process of planning, implementing, and controlling the efficient, effective
flow and storage of goods, services, and related information from point of origin to point of
consumption for the purpose of conforming to customer requirements. Indeed, following Hax
and Candea’s (1984) treatment of production-inventory systems, logistical decisions are
typically classified in the following way. The strategic level: deals with decisions that have a
long-lasting effect on the firm. This includes decisions regarding the number, location and
24
capacities of warehouses and manufacturing plants, or the flow of material through the
logistics network.
The tactical level: typically includes decisions that are updated anywhere between once every
quarter and once every year. This includes purchasing and production decisions, inventory
policies and transportation strategies including the frequency with which customers are
visited. The operational level: refers to day-to-day decisions such as scheduling, routing and
loading trucks.
Currently the term supply chain management is more describe and inclusive logistic
management. Supply Chain Management (SCM) is a strategic coordination of business
function within a business organization and through its supply chain for the purpose of
integrating supply and demand management (Stevenson 2007). According to Ubani (2012),
the primary objective of SCM is to reduce risks and uncertainties into supply chain, thereby
positively affecting inventory levels, operations and production cycle times, processes and
ultimately end users service levels. In basic supply chain, the components contributed are
linked to each other.
Asli Koprulu (2007, p.2) a supply chain is characterized by the flow of goods, services,
money, and information both within and among business entities including suppliers,
manufacturers, and customers. It also includes all types of organizations engaged in
transportation, warehousing, information processing, and materials handling. Sourcing,
procurement, production scheduling, manufacturing, order processing, inventory
management, warehousing, and, finally, customer service are the functions performed
throughout the supply chain. The ultimate goal of SCM is to meet customers’ demand more
efficiently by providing the right product, in the right quantity, at the right location, on the
right time, and in the right condition. As Ferguson, B. R. (2000) supply chain management
affects virtually every aspect of a company’s business. Supply chain management
[influences] plan-buy-make-move-and-sell. Enhanced revenues, tighter cost control, more
effective asset utilization, and better customer service are just the beginning. Thompson and
his colleagues have identified five areas in which supply chain management can have a direct
effect on corporate value. They include: Profitable growth, Working capital reductions,
Fixed-capital efficiency, Global tax minimization and Cost minimization.
25
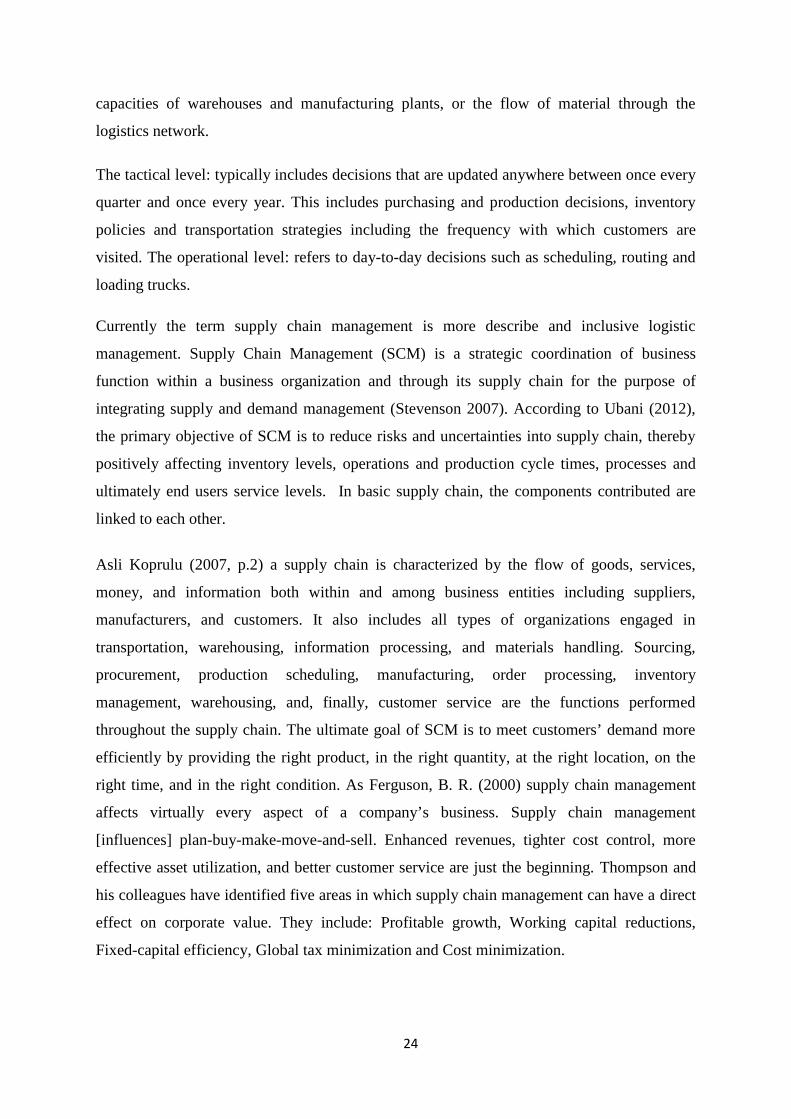
Figure 2.3: Supply chain flow chart
Source: Buang, et al, 2014
The economic order quantity (EOQ) theory was proposed by (Harris, 1913) to determine
the optimal inventory level. EOQ refers to an inventory level that can minimize both
inventory holding cost and inventory ordering cost (Lwiki et al, 2013). The EOQ model is
used to determine an optimal ordering size that will minimize the sum of ordering and
carrying costs (Ziukov, 2015). This model was found on the assumption that demand equals
annual total quantity ordered by the firm at any point in time (Milicevic, Davidovic &
Stefanovic, 2010). The EOQ model considers a trade-off between storage cost and ordering
cost when making a decision on the quantity to use when replenishing inventory items.
Ordering frequency is usually reduced by a larger amount of quantity ordered, hence reduced
ordering cost but increases storage costs and requires a larger space for storage too (Schwarz,
2008). The EOQ method is used in determining an optimal order quantity which will
minimize total inventory cost. The EOQ is very useful tool for inventory control and it can be
applied to finished goods inventories, work- in- progress inventories and raw material
inventories. It regulate the purchase and storage of inventory in a way to ensure that an even
production flow at the same time restricting excess investment on inventories (Kumar, 2016).
Therefore for our case factories practice of integration, collaboration, and the trend of
managing the SC from supplier to the customer is traditional. Currently the researcher did not
found on basic metal factories (sampled factories) that were implemented logistics
information tracking system (ERP). They are still working manually. Basically the logistics
sector must grow at the same rate as the industry sector, taking into account the recent
Information flow Product flow
RAW MATERIAL SUPPLYCUSTMOR
RETAILER WHOLESALER DISTRIBUTOR FACTORY
26
changes in the Ethiopian Shipping and Logistics enterprise, it is essential to address the
implementation problems related to the multimodal transportation system. The quality service
delivery at the ports and inland transport need to be highly improved commensurate with the
envisioned industrial development process in the country (MOI 2013). The sampled factories
have also serious weaknesses on adopting new technology and skilled man power for raw
material management. Because of a poor raw material management practice unbalanced
customer demand and supply was created. So if the flow of raw material management system
is well, the will be better organization productivity.
2.1.4. Technology Management and Productivity
Technology management can also be defined as the integrated planning, design, optimization,
operation and control of technological products, processes and services, a better definition
would be the management of the use of It is very important for an organization to manage its
technology strategically because when it is not well managed, it might result into a big loss in
the organization. Managing technology involves planning, designing, optimizing, operation
and control of technological products technology for human advantage.
Technology is a system of knowledge, skills, experience and organization that is used to
produce and utilize goods and services. Technology has become a crucial and indispensable
part of almost every kind of business. Without the role of technology in business, many
businesses simply could not survive. Just imagine a multinational organization or a small
business enterprise trying to operate without the use of a telephone or computer – the role of
technology in business continues to change the way we live and work. Modern manufacturing
support systems are implemented using computer systems. Computer technology is used to
implement automation of the manufacturing systems in the factory as well. The systems help
us to design the products, plan the production, control the operations, and perform the various
businesses that operate throughout the enterprise.
Information system (IS) is vital to any organization. A successful and quality IS can bring
enhanced efficiency and effectiveness in operation, possible better business performance and
stronger organizational culture. Quality information system is a system which contains
relevance, accurate, complete, comprehensive, detail, flexible, reliable and timeliness
information so as to ensure streamline its operations into a cohesive functioning unit, support
business decision-making by providing management with critical data, and they serve to
27
enhance the organization’s communication, reduce human labor, support short- and long-term
organizational goals, improving employees’ productivity and distribute complex information.
Technology is a body of knowledge devoted to creating tools, processing actions and the
extracting of materials. The term Technology is wide, and everyone has their way of
understanding its meaning. We use technology to accomplish various tasks in our daily lives,
in brief; we can describe technology as products and processes used to simplify our daily
lives. We use technology to extend our abilities, making people the most crucial part of any
technological system. The concept of technology does not only relate to the technology that
embodies in the product but it is also associated with the knowledge or information of it use,
application and the process in developing the product (Bozeman, 2000).
Technology has two primary components: (1) A physical component which comprises items
such as products, tooling, equipment, blueprints, techniques and processes; and (2) an
informational component which consists of know-how in management, marketing,
production, quality control, reliability, skilled labor and functional areas Vinod Kumar, Uma
Kumar, Aditha Persaud (1999). Firms that adopt new technologies (for example, computer-
aided design and control) and at the same time invest in skills (for example, training in
computer literacy and technical skills) are expected to realize greater productivity gains than
those that do not. Boothby, D., Dufour, A. & Tang, J. (2010) we use technology to
accomplish various tasks, so technology comes in different forms. Some types of
technologies are communication, construction, Assistive, Medical Information, Entitlement,
and business are and the like. In manufacturing sector using advanced information
technology software sophisticated task will simplified. In any industry using automation
Production System and Computer Integrated Manufacturing can enhance productivity as well
as better quality products, efficient working process and can create good working condition to
the employees.
Automation can improve product quality, increase labor productivity, reduce labor cost,
mitigate the effects of labor shortages, reduce or eliminate routine manual and clerical tasks,
reduce lead time, and improve worker safety (Mikell P. Groover, 2007). Mikell P. Groover
(2007) Computerized Manufacturing Support Systems, automation of the manufacturing
support systems is aimed at reducing the amount of manual and clerical effort in product
design, manufacturing planning and control, find the business functions of the firm. Nearly

28
all modern manufacturing support systems are implemented using computer systems. Indeed,
computer technology is used to implement automation of the manufacturing systems in the
factory as well.
According to S. A. Kumar et al (2008), the term computer integrated manufacturing (ClM)
denotes the pervasive use of computer systems to design the products, plan the production,
control the operations, and perform the various business- related functions needed in a
manufacturing firm. True CIM involves integrating all of these functions in one system that
operates throughout the enterprise. Other terms are used to identify specific elements of the
CIM system. For example, computer-aided design (CAD) denotes the use of computer
systems to support the product design function. Computer-aided manufacturing (CAM)
denotes the use of computer systems to perform functions related to manufacturing
engineering, such as process planning and numerical control part programming. Some
computer systems perform both CAD and CAM are used to indicate the integration of the
two into one system. Computer-integrated manufacturing includes CAD/CAM, but it also
includes the firm’s business functions that are related to manufacturing. All these benefits fall
into three categories; increase quality, decrease cost, and improve safety.
Mikell P. Groover (2002) companies undertake projects in manufacturing automation and
computer-integrated manufacturing for a variety of good reasons. Some of the reasons used to
justify automation are the following:1) to increase labor productivity , to reduce labor cost, to
mitigate the effects of labor shortages, to reduce or eliminate routine manual and clerical
tasks of working condition, to improve worker safety, to improve product quality, to reduce
manufacturing lead time, to accomplish processes that cannot be done manually and to avoid
the high cast of not automating.
Nowadays, Information system is vital to any organization. A successful and quality IS can
bring enhanced efficiency and effectiveness in operation, possible better business
performance and stronger organizational culture. IS means not only capture process and
disseminate information but good and quality information system. Quality information
system is a system which contains relevance, accurate, complete, comprehensive, detail,
flexible, reliable and timeliness information so as to ensure streamline its operations into a
cohesive functioning unit, support business decision-making by providing management with
critical data, and they serve to enhance the organization’s communication, reduce human
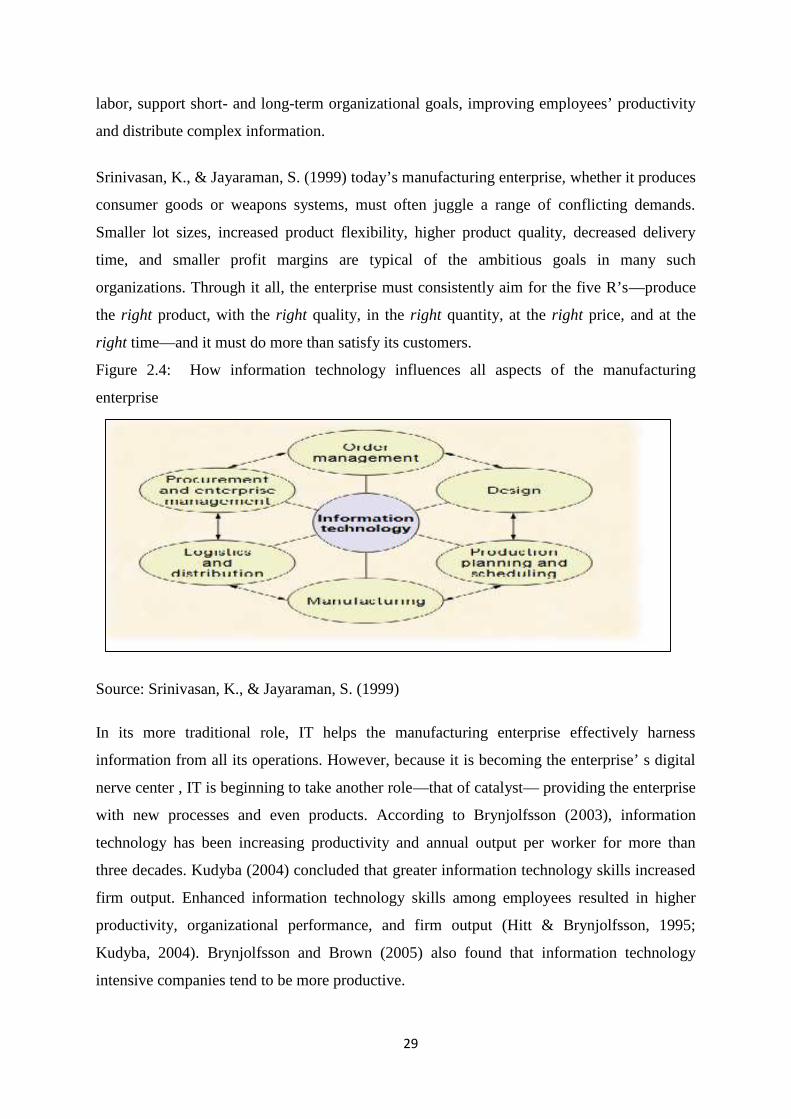
29
labor, support short- and long-term organizational goals, improving employees’ productivity
and distribute complex information.
Srinivasan, K., & Jayaraman, S. (1999) today’s manufacturing enterprise, whether it produces
consumer goods or weapons systems, must often juggle a range of conflicting demands.
Smaller lot sizes, increased product flexibility, higher product quality, decreased delivery
time, and smaller profit margins are typical of the ambitious goals in many such
organizations. Through it all, the enterprise must consistently aim for the five R’s—produce
the right product, with the right quality, in the right quantity, at the right price, and at the
right time—and it must do more than satisfy its customers.
Figure 2.4: How information technology influences all aspects of the manufacturing
enterprise
Source: Srinivasan, K., & Jayaraman, S. (1999)
In its more traditional role, IT helps the manufacturing enterprise effectively harness
information from all its operations. However, because it is becoming the enterprise’ s digital
nerve center , IT is beginning to take another role—that of catalyst— providing the enterprise
with new processes and even products. According to Brynjolfsson (2003), information
technology has been increasing productivity and annual output per worker for more than
three decades. Kudyba (2004) concluded that greater information technology skills increased
firm output. Enhanced information technology skills among employees resulted in higher
productivity, organizational performance, and firm output (Hitt & Brynjolfsson, 1995;
Kudyba, 2004). Brynjolfsson and Brown (2005) also found that information technology
intensive companies tend to be more productive.

30
Productivity comes from working smarter, which normally requires new production
technologies and techniques. Productivity gains from information technology can be realized
in three ways: decrease information technology costs and business benefits remain the same;
increase business benefits and information technology costs remain the same; or decrease
information technology costs and business benefits increase (Brynjolfsson, 2003;
Brynjolfsson & Hitt, 1998; Keller, 2004). Mahmood and Mann (2005) concluded that
companies which invest more in information technology appear to achieve a higher level of
performance and productivity.
T. RAVICHANDRAN (2014) on the resource-based theory to examine how information
systems (IS) resources and capabilities affect firm performance. A basic premise is that a
firm’s performance can be explained by how effective the firm is in using information
technology (IT) to support and enhance its core competencies.
According to Smith (2008), an information technology investment can increase productivity,
but only if the investment is included in a plan that integrates organizational changes and
improved business processes. Information technology is a tool that can increase productivity
and improve an organization’s performance. In other words, IT need fairly a long time within
which the employee learns how to work and apply it in practice. So, IT capital impact could
be negative in short term, when the labor does not have high skill to use IT (Badescu and
Garces-Ayerbe 2009).
Enterprise resource planning software (ERP) defined by American Inventory and
Production Control System dictionary: “Enterprise Resource Planning: An accounting
oriented information system for identifying and planning the enterprise-wide resources to
make ship and account for customer orders.” Again in encyclopedia, it has defined as an
integrated computer-based application used to manage internal and external resources,
including tangible assets, financial resources, material and human resources. Basically, an
ERP combines several traditional management functions into a logically integrated system
and facilitate the flow of information across these functions. It is designed to model and
automate basic processes across the organization over a centralized database and eliminates
the need of disparate systems maintained by various units of the organization.
The impact of ICT investments on service delivery and business value is an important issue
for researchers, resource managers and other stakeholders. IT business value and service
delivery include productivity enhancement, profitability improvement, improved work
31
relations, competitive advantage and efficient use of resources at both intermediate level and
organizational level (M.P. Muriithi, 2011). In order to compete and win in today’s global
market field, better management of resources is an important criterion. Implementation of
ERP controls different functions and enhance company efficiency. Latest technologies
equipped with in ERP software package helps in better controlling and management of data.
If implementation of ERP is done according to company goals, it assures you more return on
investment, reducing inventory cost, better order tracking, proper utilization and
management of resources, enhances operational process and maximizes the return on
investment rates, enhancing the customer relationship management, increases the quality of
services, shortens delivery times and enhances the performance rate offered by companies,
error controlling, better planning and coordination of business resources so as to achieve
maximum profit.
Machinery’s found in manufacturing industries in Ethiopia whose establishment dates back to
the 1950 are still on production, which operates the early 20th century techniques. On the
other hand some latest machine is now emerging but there were a problem on skilled man
power. Human resources of any organization hold the key to its survival, profitability and
sales growth which entails prosperity, future economic and social development. Hence, the
decision to improve productivity through technology is necessary and it is not enough by
investing on new technology adoption but also it needs well managed. Otherwise, the
consequence is losing productivity.
2.1.5. Factors Influencing Productivity
Factors influencing productivity can be classified broadly into two categories as examined by
Hyder (2011), Telsang (2010) and Stevenson (2007) to include: Controllable or internal
factors which are products, plant and equipment, Technology, material, human, work
methods, management style, financial, sociological, worker participation, incentive schema,
quality cycle, work hours and conditions etc. whereas uncontrollable or external factors are
structural adjustments economic and social, natural resource, government policy,
infrastructure etc.
2.1.6. Productivity Measurement
Productivity measurement is basically a process of identifying the appropriate measures or
metrics to be used, and the computation of their results to determine the effectiveness and
efficiency of the resources used. In a factory, it might be measured based on the number of

32
hours it takes to produce a good while in service industry, might be measured based on the
income generated by an employee divided by his/her salary.
A productivity measure is expressed as the ratio of output to inputs used in a production
process, i.e. output per unit of input. Productivity is a crucial factor in production
performance of firms and nations. Increasing national productivity can raise living standards
because more real income improves people’s ability to purchase goods and services, enjoy
leisure, improve housing and education and contribute to social and environmental programs.
Productivity growth also helps businesses to be more profitable. There are many different
definitions of productivity and the choice among them depends on the purpose of the
productivity measurement and/or data availability. (Wikipedia, the free encyclopedia)
According to Asian Productivity Organization the four productivity levers are: Enhance
Sales Revenue (Output), Increase Output per Unit Cost of Production (Output), Optimize
Labor Utilization (Input), and Optimize Capital Utilization (Input). Once the productivity
levers are established, a structured approach could be adopted to measure the key
productivity indicators and productivity indicators in each of the productivity levers.
Figure 2.5: The key steps of an effective productivity measurement system
Source: George Wong) Asian Productivity Organization
3Develop theProductivityIndicators to
be usedDetermine
Process Areaand to bemeasured
1
5Review the
Results
4Implement theMeasurement
System
2Determine
Process Areasto be
measured
6Executeprocess
Improvement
7Evaluate andfollow up tobe measured
33
Based on the topic – human resource management, raw material management, working
capital management and technology management were detailed reviewed under here.
2.1.7. Productivity Improvement
Productivity measurement and improvement goes hand in hand, because one cannot improve
what one cannot measure. Muthiah et al (2006) the most established methodologies among
manufacturing plants are Agile manufacturing, Lean manufacturing, Six Sigma, Lean and Six
Sigma , Theory of constraints (TOCs) , TQM , Toyota production system (TPS) etc.
Improvements can be realized by: achieving more output for the same input, achieving the
same output from less input, achieving much more output for slightly more input and getting
slightly less output for much less input
There are six lines of attack to improve the productivity ratio of an organization, namely:,
Improve basic process by research and development (long term), Improve and provide new
plant, equipment, and machinery (long term), Simplify product and reduce variety (medium
term), Improve existing methods and procedures (short term), Improve the planning of work
and the use of manpower (short term) and Increase the overall effectiveness of employees
(short term)
2.1.8. Productivity Indicators
Some indicators are commonly used by management to measure the overall productivity
performance of an organization. Some of under productivity indicators:- Labor productivity,
Direct labor productivity, Capital productivity, Energy productivity, Raw material
productivity, Direct cost productivity, Material productivity and total factor productivity.
In most businesses, the employees represent both an organization's biggest expense, and its
most valuable asset. This means the company's productivity, and ultimately, its profitability
depend on making sure all of its workers perform up to, if not exceed their full potential. To
survive and prosper in today's economic times, companies can no longer manage using
financial measures alone. Businesses have to track non-financial measures such as speed of
response and product quality; externally focused measures, such as customer satisfaction and
brand preference; and forward looking measures, such as employee satisfaction, retention and
succession planning.
Key Performance Indicators (KPIs) are a company's measurable goals, typically tied to an
organization’s strategy, as revealed through performance management tools such as the
34
Balanced Scorecard. Most goals are achieved not through the efforts of a single person, but
by multiple people in a variety of departments across an organization. Performance
management experts agree that cascading and aligning goals across multiple owners creates a
"shared accountability" that is vital to a company's success. The company then uses its Key
Performance Indicators as the foundation to analyze and track performance and base key
strategic decisions regarding staffing and resources.
2.1. Empirical Review
The empirical review section is basically bringing the previous research studies or that
conducted with similar to fields of study. All previous research was conducted more: human
resource, working capital, raw material and technology variables independently taken as one
of a topic in their studies. Empirically productivity is defined as the relationship between the
amount of output produced (goods and services) relative to the amount of inputs/resources
(labor, machinery, equipment, raw materials, energy, etc.) used.
1. Partial productivity (output relative to one class of input). This includes Labor productivity
(output produced relative to labor resources used number of labor hours or number of
persons); Capital productivity (output produced relative to capital input); and Material
productivity (output produced relative to materials used).
2. Total factor productivity (the ratio of net output to the sum of associated labor and capital
(factor) inputs). By “net output,” it means total output minus intermediate goods and
services purchased. Note that the denominator of this ratio is made up of only the labor
and capital input factors.
3. Total productivity (the ratio of total output to the sum of all input factors used). Thus, a
total productivity measure reflects the joint impact of all the inputs in producing the
output. There are many different productivity measures. The choice between them depends
on the purpose of productivity measurement and, in many instances, on the availability of
data.
Single Factor Measurements
Labor Productivity
Quantity (or value) of output / labour hrs
Quantity (or value) of output / shift
Machine Productivity
35
Quantity (or value) of output / machine hrs
Energy Productivity
Quantity (or value of output) / kwh
Capital Productivity
Quantity (or value) of output / value of input
All-factors measure = Goods or Services produced/ All inputs used to produce them
Total tangible output = Total Productivity / total tangible input
All-Factor Productivity = Output /Labor + Materials + Overhead
Productivity may also be considered as a measure of performance of the economy as a whole.
Mathematically,
Productivity = Output Value/Input
Value Factor Productivity = Output due to the factor/ Input factor employed
Productivity will is calculate by using Value Added ratio in the addition method namely
Value Added = Labor Cost + Financial Cost + Capital Cost ±Profit/Loss for the Year + Tax
(indirect tax).
2.2.1. Related Empirical Review
According to Lucy (2000), productivity improvement is an increase in productivity and
involves the use of high quality resources to produce outputs that are of constant or better
quality. For many organizations, inventory control perhaps is the single most important
control technique that have direct relationships with production, marketing, purchasing and
financial policy.
Padachi (2006) in his study also the trends in working capital management and its impact on
firms’ performance: analysis of Mauritian small manufacturing firms, to identify the causes
for any significant difference between the industries. The dependent variable return on total
assets is used as a measure of profitability and the relation between working capital
management and corporate profitability was investigated for a sample of 58 small
manufacturing firms, using panel data analysis for the period 1998-2003. The key variable
used in the analysis was inventories days, accounts receivables days, accounts payable days
and cash conversion cycle.
Thus it can be deduced that the companies have monitored the accounts receivable
reasonably well and this could be partly due to their need for generating funds from the
operating activities instead of relying from outside funds. The prefabricated metal product is
36
financing 85% of its assets out of current liabilities and this over-reliance may be a threat to
the industry’s survival.
This implies that these two industries can operate with a relatively low investment in fixed
assets as compared to the other industries like printing and garments where the production
tend to be heavily mechanized. Another plausible reason could be that the Mauritian small
manufacturing firms have been more concerned about current operations than about longer
term issues like capacity and technology.
DURU et al (2014) this study examined the impact of working capital management on the
profitability of Nigerian quoted Manufacturing firms. The working capital variables studied
comprise accounts payable, accounts receivable, cash conversion cycle, stock/inventory
turnover and liquidity. This study also used sales growth and Debt as control variables.
Secondary sources of data were sourced from the Annual Reports of the 22 manufacturing
firms selected for this study for the period 2000-2011. Five Hypotheses were estimated with
the use of generalized least square multiple regression. The findings of the study show that,
accounts payable ratio had negative relationship with the industries’ profitability. On the
other hand, accounts Receivable ratio had positive and significant relationship with
profitability of the firms studied.
Ghanavati, et al, (2012) did the research on the effect of working capital management over
the performance of firms listed in Tehran Stock Exchange. Average Collection Period,
Inventory Turnover in days, Average Payment Period, Cash Conversion Cycle, and Net
Trading Cycle were used to assess working capital management, and Net Operating
Profitability was used to assess firms’ performance. The findings of studying 50 different
companies during the time period between 2006 and 2009 by using a multi- regression model
showed that there is a negative and significant relationship between the variables of Average
Collection Period, Inventory Turnover in day, Average Payment Period, Net Trading Cycle
and the performance of firms Listed in Tehran Stock Exchange. In other words, managers can
increase the profitability of their companies reasonably, by reducing Collection Period,
Inventory Turnover, and Payment Period.
According to Tacsir et al (2015), ICT as a driver of firm productivity in developed countries.
However, the evidence about the impacts of ICT on services and manufacturing and
particularly for developing countries is scarce. This paper focuses on understanding the
determinants of investments in ICT at firm level and how this adoption ultimately affects
37
innovation and productivity of Uruguayan services firms vise a manufacturing. Results show
that ICT investments are more subject to economies of scale than other types of investments,
are important for obtaining product or process innovations in services and its absence
conspires against non-technological (organizational or marketing) innovations. Both ICT and
other innovation investments are positively associated with productivity in services but only
ICT affect productivity in manufacturing. Interestingly, the absence of investment in ICT is
associated with lower levels of productivity.
P.V.C. Okoye et al (2013) did a research on “The Effect of Human resource Development on
organizational productivity.” The study aims to determine the extent at which effective
human resource development can enhance productivity in order to reduce poor performance
in organization, to determine the efficiency of human resource training and development in
organization growth, to ascertain if human resource development have any significant impact
on organizational profitability, to determine and identify the factors affecting human resource
development and organizational productivity and to ascertain the attitude of the senior
management and other employees on the need for proper utilization of available human
resources which have tremendous effect on the firm’s profitability. The five research
questions and three hypotheses were formulated in line with the objectives of the study. To
achieve the aims of the study, data were collected from both primary and secondary source.
Data collected were analyzed by use of means, variance and standard deviation and the three
hypothesis formulated were tested using z-test statistical tool. The findings from this study
are as follows: 1) the human resources development is very vital to any organization ranging
from small to large scale enterprise since it is well known that no business can exist entirely
without human being. 2) It shows that one of the major functions of human resource
development is the engagement of people to work in order to achieve sales growth and
profitability. 3) The method of training and development as gathered from the interview
contract by the researcher are just by reason of the problems. The company has for instance,
the company train less of its employee through role play because of lack of fund to engage in
such training. 4) From the data gathered, we discovered that the use of qualified staff in the
company under study brings about increase in productivity. This means that human resources
employed in any organization whether profit or nonprofit oriented, small or large scale should
be able to manipulate other resources of the company to see to their full efficient utilization
so that productivity will positively affected.

38
Abri, A. G., & Mahmoudzadeh, M. (2015). The aim of this research was to assess the impact
of information technology (IT) on the productivity and efficiency of manufacturing industries
in Iran. The data were collected from 23 Iranian manufacturing industries during 2002–2006
and the methods such as Efficiency Data envelopment analysis and panel data used to study
the subject. Results obtained by the above two methods represent that IT has a positive and
statistically significant effect on the productivity of manufacturing industries. It will be more
in high IT-intensive industries than the other industries. But, there is no significant difference
between the growth of labor productivity in IT-producing and IT-using industries.
According to Ince, H., Imamoglu, S. Z., & Turkcan, H. (2016) raw materials are cost drivers,
particularly in raw material intensive production processes. At the latest since the recent rise
in prices on international commodities markets it is an own best interest of enterprises to
reduce these costs and to obtain therewith competitive advantages. Therefore, the increase of
resource productivity is in almost all sectors a long pursued strategic business objective.
Ince, H., Imamoglu, S. Z., & Turkcan, H. (2016) did the study on the Effect of Technological
Innovation Capabilities and Absorptive Capacity on Firm Innovativeness. In today’s rapidly
changing environment, firms have to adapt to these conditions and open to innovations in
order to survive. Technological innovation capabilities make it possible for firms to response
to changes rapidly and to acquire technological innovation strategies and innovative outputs.
Absorptive capacity enabling the firms to obtain the information necessary, allows firms to
make the external knowledge useful, to take opportunities in the market, to come to a leading
position and to develop new capabilities. Technological innovation capabilities and
absorptive capacity are critical factors of innovativeness and thereby competitiveness. The
extensive literature review is undertaken to develop the three hypotheses and explain the
relationships among three variables technological innovation capabilities, absorptive capacity
and innovativeness. It is concluded that; absorptive capacity has a positive impact on
technological innovation capabilities and moreover technological innovation capability and
absorptive capacity have a positive impact on innovativeness.
Fagerberg J. (2000) did a research on the Technological progress, structural change and
productivity growth: The relationship between the economic structure of a country and its
productivity growth has received a lot of attention in recent decades. For instance, several
theoretical models in this area now suggest that countries that specialize in technologically
progressive industries will enjoy high rates of growth compared to other countries. This paper
39
focuses on the impact of specialization and structural changes on productivity growth in
manufacturing, using a sample of 39 countries and 24 industries between 1973 and 1990. The
results show that while structural change on average has not been conducive to productivity
growth, countries that have managed to increase their presence in the technologically most
progressive industry of this period (electronics) have experienced higher productivity growth
than other countries. The results reported indicate that structural change still matters, but in a
different way than before. The main difference concerns the role played by new technologies
in generating structural change. In the first half of the 20th century, growth of output,
productivity and employment were strongly correlated. New technology, in this case the
electronics revolution, has expanded productivity at a very rapid rate, particularly in the
electrical machinery industry.
According to Kasahara, H., & Rodrigue, J.(2008), developing nations where it is believed
that importing new technologies is a significant source of productivity and economic growth.
Through adoption and imitation of imported technologies, countries can take advantage of
research and development (R&D) abroad to improve the efficiency of domestic production.
Fagerberg, J. (2000) several theoretical models in this area now suggest that countries that
specialize in technologically progressive industries will enjoy high rates of growth compared
to other countries. This paper reports a survey of 1000 firms in Singapore about their
adoption and implementation of advanced manufacturing Technology (AMT). Statistical
analysis such as factor analysis and discriminate analysis were used to identify those
"successful factors" that contribute positively to adoption and implementation of advanced
manufacturing technology. From the 27 "successful factors" studied, showed that project
team integrity, strategic planning and Project championship, and technical knowledge are
significant, and training at all levels is instrumental in reducing uncertainties in AMT
implementation. The results also indicated that firm size and financial availability
differentiate successful from unsuccessful firms in AMT adoption and implementation.
Although firms with large financial resources are likely to be more successful, large firms, in
terms of the number of employees, are not necessarily beneficial to AMT and
implementation.
Hall, B. H., & Khan, B. (2003) did a research the contribution of new technology to
economic growth can only be realized when and if the new technology is widely diffused and
used. Diffusion itself results from a series of individual decisions to begin using the new
40
technology, decisions which are often the result of a comparison of the uncertain benefits of
the new invention with the uncertain costs of adopting it. An understanding of the factors
affecting this choice is essential both for economists studying the determinants of growth and
for the creators and producers of such technologies.
According to Nakamura, T., & Ohashi, H. (2008), examines the impact of new technology on
plant‐level productivity in the Japanese steel industry during the 1950's and 1960's. We
estimate the production function, considering the differences in technology between the
refining furnaces owned by a plant. We find that a more productive plant was likely to adopt
the new technology and that the adoption would be expected to occur immediately following
the peak of the productivity level achieved with the old technology. The adoption of the new
technology primarily accounted not only for the industry's productivity slowdown but also for
the industry's remarkable growth.
UNDP (2017) did a study on 55 private and public manufacturing enterprises were requested
to rate problems they face while in operation. The firms were selected from seven industry
groups: food and beverage, textile, garment, leather, plastic, chemicals, and metal industries.
Constraints were identify Power interruption and foreign exchange constraint at the top
electric power, shortage of domestic raw materials, and poor internet services access to credit
in particular operational loan, weak market demand, high lease price of land, excessive
control by regulating institutions, excessive tax, absence of level playing field for
competition, unnecessarily and long bureaucratic red tapes to get land, expensive raw
materials from abroad, and poor quality of domestic raw materials were the main constrain in
sampled industries.
Yibeltal (2017) did in this study to examine the technical efficiency of metals and
engineering industry of Ethiopia. The data set utilized during the years 2010 to 2014. The
data was extracted from the CSA annual manufacturing survey raw data bases. The study
consists of maximum 146 and minimum 105 individual firms‟ observations throughout the
panel period of five years. The study further identifies that the average technical efficiency of
Metals and Engineering industries vary among the industries and yearly average seems to be
unstable during the study period. Therefore, in order to effectively utilize the potential of the
industries, efforts have to be made in improving investment intensity, financial and non-
41
financial capital access, availing raw material access and infrastructural and institutional
development.
Alie et al. (2017) did the study to determine the demand and supply performance of the
Ethiopian basic metal industries (BMIs) over the period of 2010/11 to 2016/17 and then how
they balance demand and supply, so as to improve firm performance and competitiveness.
The collected primary and secondary data was analysis using fish bone diagram and
correlation analysis. The basic metal product demand and supply are used as variables to
evaluate the relative efficiency of basic metal industries in the country. Since the study
examines the gap between demand and supply of basic metal products in country wide. In
addition, the study also shows the possible impacts of non-equilibrium demand and supply
performances of basic metal products. This unbalanced demand and supply were occurred
due to insufficient raw material, low production capacity, problems on management systems,
poor market chain ,problems on information exchange, power supply fluctuations, QMS and
warehouse problems were investigated as principal causes on the deficiency of metal product
supply’s. Beside, the study indicates that due the above constraints the performance and
global competitiveness of basic metal industry is poor and infant. Finally the study indicates
that, proper management support and people involvements, supply chain integration,
implementation of quality management systems, material management system, improved
manufacturing process, and proper warehouse design and systems are some solutions that
suggested improving the performance and competitiveness of basic metal industries. This
deficiency supply of basic metal products is reducing the performance and global
competitiveness of basic metal industries. Based on filed observation and literature survey
data of this study indicates that insufficient raw material, power supply fluctuations, old
production & manufacturing processes, information shearing, improper leader ship systems,
infrastructure problems(landlocked), and poor quality management systems(TQM, Kaizen
etc.) are the major constraints investigates in basic metal industries. Though due to the above
factors there were unbalanced demand and supply of basic metal products occurred.
Ultimately negative supply and positive demand on basic metal products were formulated in
a country wide. In addition to this, due to such influences the market shearing, the
performance and competitiveness of basic metal industries are still infant. Nevertheless
achieving sustainability and competitive advantage of the industry, it needs to be an effort to
positive balance between demand and supply of basic metal products.

42
Dametew AW, et al (2017) did the study on the Performance Analysis of Manufacturing
Industries for System Improvement in Ethiopia basic metal sector. This research paper uses
industrial survey 86 Ethiopian basic metal sectors and literature review, raw material
performance, productivity, technological capability, supply chain integration and job creation
and labor force performances were investigated. Discuss related to manufacturing industries
growth, performance, economic contribution, challenges, strengths and performances were
assed and also according to the result high cost of international market, problems on foreign
currency, logistics and public infrastructure, warehouse problems, outdated technology,
system are the main constraints of the sectors that reduce the performance and
competitiveness of the sectors. Those constraints, the overall performance and GDP
contribution of the sector is recorded on 0.4% of the five light manufacturing sectors. The
challenges and constraints grouped in to four themes including institutional inefficiency,
physical constraints, government inefficiency, system and strategies problems and
miscellaneous and these needs for remedial actions.
Dirk J. Van Wasbeek (2004) did a study on the human management practice on four
manufacturing and four service companies in Addis Ababa. The researcher is claim that
Ethiopian human resource management practice differ from West. Due to different culture
factors, economic system, political system and legal and industrial relations. The findings are
the importance of human resource management is not uniformly understood at all the study
companies.
Mohammed (2014) did research mainly focused to assess the performance and
competitiveness of the steel manufacturing industries and to identify their gap and develop a
competitive model that will indicate intervention areas based on international best practices.
The researcher was identifying the performance factors that affect the competitiveness cost,
technology, quality, marketing and Time/delivery time (on logistics). 10 interviews and 54
questionnaires were designed. The researcher was identified that cost, quality, technological,
marketing and delivery time are the critical challenges in the steel manufacturing industries
that affect their competitiveness. Power interruption, lack of scrap and distribution are the
challenges mentioned as major problems of the day. The respondents also gave emphasis on
the points that in most cases the quality of products are not competent, new technology
transferring system is very limited and innovation trends are very low. Accordingly more
than 85 % of the respondents for interview questions mentioned raw materials shortage,
43
foreign currency (hard-currency) shortage, electrical power supply, interruption and
fluctuation, availability of skilled manpower, marketing and technological problem,
standardization and quality problems, insufficient competence level of employee, insufficient
trends on research and development are seriously affect the industries. Hence, the finding
linkage among industries and between industries and leading institutes and associations
should be strengthening further to solve the problems. The industries should also develop
strategies to improve the above challenges and rational solutions that help promote the
industries for better competitiveness have to be developed from the concerned government
institutions. Therefore, trainings and skill development programs should be arranged by
common effort of industries, developmental partners, government, and educational and other
institutes. Concerning the market issues, although some initiations for import of billet and
bulk purchase for rebar manufacturer was made by the government to support the industries,
it is also required from the government to involve and give privileges for local manufacturers
on large procurement processes of rebar and other construction inputs to be supplied by the
local manufacturers.
Demissie M. (2015) conducted a research to assess the training and development practices in
Metal Industry Development Institute in Ethiopian. This research paper assessed the training
and development practices which the institute offers to its own employees. A sample of 62
employees was selected from four core directorate and HR department, and 59 questionnaires
which enclosed multiple closed ended questions were distributed and all collected. According
to the data collected the findings shows that; trainings sponsored do not have tight link with
the objective of the institute, there is no well documented training manual, internationally
accepted training steps (Training Need Analysis, Design, Development, Implementation,
Evaluation) have not been applied, trainees are not selected based on the training policy of
the institute, profiles of employees also does not considered for selection. Based on the
findings, the researcher recommended, the institute to carefully revise its training practices
for the success of training and organizational objectives.
However, this issue rise to attract the attention of researchers in Ethiopia. Thus, while
searching on internet, browsing through the books and journals the researcher didn’t find
directly enough related to research topics carried out in Addis Ababa as well as in Ethiopia.
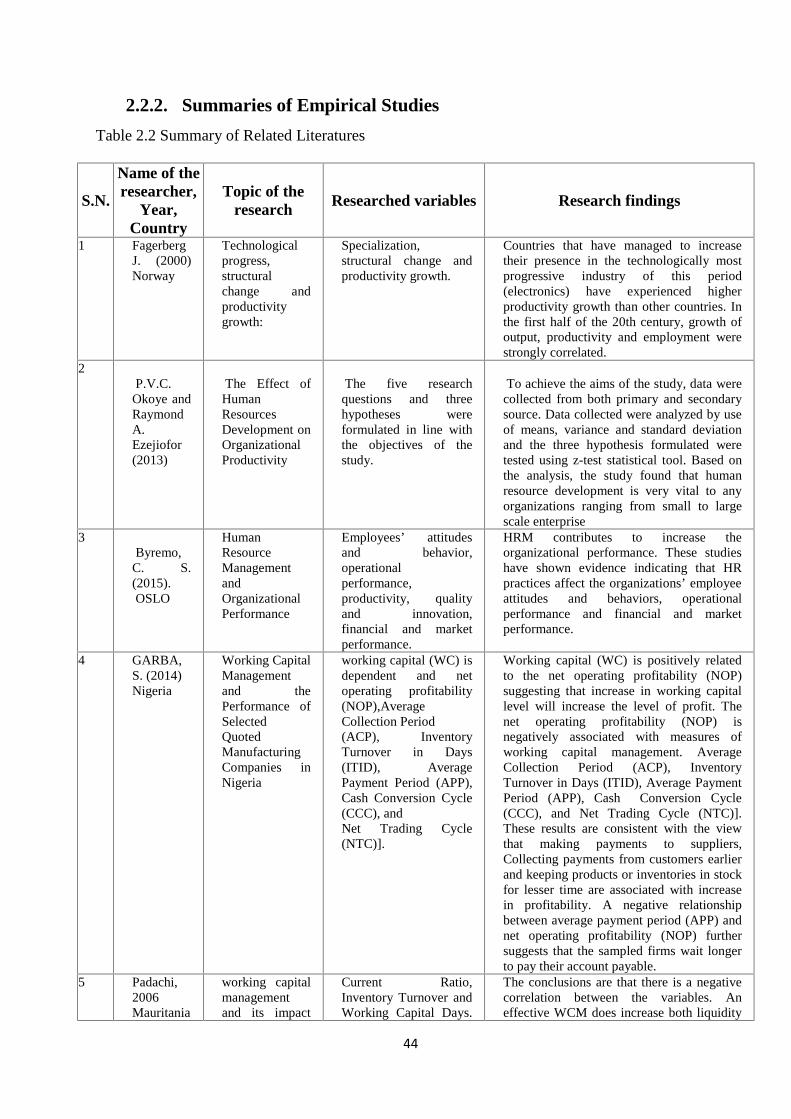
44
2.2.2. Summaries of Empirical Studies
Table 2.2 Summary of Related Literatures
S.N.
Name of theresearcher,
Year,Country
Topic of theresearch Researched variables Research findings
1 FagerbergJ. (2000)Norway
Technologicalprogress,structuralchange andproductivitygrowth:
Specialization,structural change andproductivity growth.
Countries that have managed to increasetheir presence in the technologically mostprogressive industry of this period(electronics) have experienced higherproductivity growth than other countries. Inthe first half of the 20th century, growth ofoutput, productivity and employment werestrongly correlated.
2P.V.C.
Okoye andRaymondA.Ezejiofor(2013)
The Effect ofHumanResourcesDevelopment onOrganizationalProductivity
The five researchquestions and threehypotheses wereformulated in line withthe objectives of thestudy.
To achieve the aims of the study, data werecollected from both primary and secondarysource. Data collected were analyzed by useof means, variance and standard deviationand the three hypothesis formulated weretested using z-test statistical tool. Based onthe analysis, the study found that humanresource development is very vital to anyorganizations ranging from small to largescale enterprise
3Byremo,
C. S.(2015).OSLO
HumanResourceManagementandOrganizationalPerformance
Employees’ attitudesand behavior,operationalperformance,productivity, qualityand innovation,financial and marketperformance.
HRM contributes to increase theorganizational performance. These studieshave shown evidence indicating that HRpractices affect the organizations’ employeeattitudes and behaviors, operationalperformance and financial and marketperformance.
4 GARBA,S. (2014)Nigeria
Working CapitalManagementand thePerformance ofSelectedQuotedManufacturingCompanies inNigeria
working capital (WC) isdependent and netoperating profitability(NOP),AverageCollection Period(ACP), InventoryTurnover in Days(ITID), AveragePayment Period (APP),Cash Conversion Cycle(CCC), andNet Trading Cycle(NTC)].
Working capital (WC) is positively relatedto the net operating profitability (NOP)suggesting that increase in working capitallevel will increase the level of profit. Thenet operating profitability (NOP) isnegatively associated with measures ofworking capital management. AverageCollection Period (ACP), InventoryTurnover in Days (ITID), Average PaymentPeriod (APP), Cash Conversion Cycle(CCC), and Net Trading Cycle (NTC)].These results are consistent with the viewthat making payments to suppliers,Collecting payments from customers earlierand keeping products or inventories in stockfor lesser time are associated with increasein profitability. A negative relationshipbetween average payment period (APP) andnet operating profitability (NOP) furthersuggests that the sampled firms wait longerto pay their account payable.
5 Padachi,2006Mauritania
working capitalmanagementand its impact
Current Ratio,Inventory Turnover andWorking Capital Days.
The conclusions are that there is a negativecorrelation between the variables. Aneffective WCM does increase both liquidity
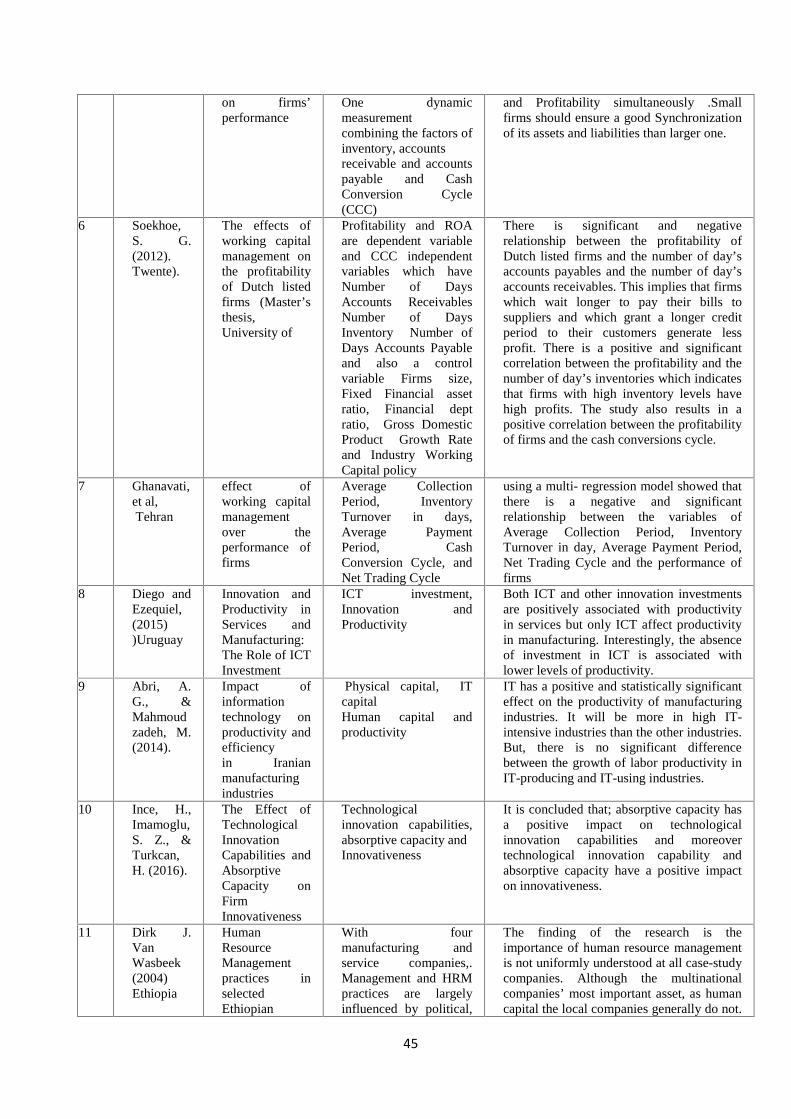
45
on firms’performance
One dynamicmeasurementcombining the factors ofinventory, accountsreceivable and accountspayable and CashConversion Cycle(CCC)
and Profitability simultaneously .Smallfirms should ensure a good Synchronizationof its assets and liabilities than larger one.
6 Soekhoe,S. G.(2012).Twente).
The effects ofworking capitalmanagement onthe profitabilityof Dutch listedfirms (Master’sthesis,University of
Profitability and ROAare dependent variableand CCC independentvariables which haveNumber of DaysAccounts ReceivablesNumber of DaysInventory Number ofDays Accounts Payableand also a controlvariable Firms size,Fixed Financial assetratio, Financial deptratio, Gross DomesticProduct Growth Rateand Industry WorkingCapital policy
There is significant and negativerelationship between the profitability ofDutch listed firms and the number of day’saccounts payables and the number of day’saccounts receivables. This implies that firmswhich wait longer to pay their bills tosuppliers and which grant a longer creditperiod to their customers generate lessprofit. There is a positive and significantcorrelation between the profitability and thenumber of day’s inventories which indicatesthat firms with high inventory levels havehigh profits. The study also results in apositive correlation between the profitabilityof firms and the cash conversions cycle.
7 Ghanavati,et al,Tehran
effect ofworking capitalmanagementover theperformance offirms
Average CollectionPeriod, InventoryTurnover in days,Average PaymentPeriod, CashConversion Cycle, andNet Trading Cycle
using a multi- regression model showed thatthere is a negative and significantrelationship between the variables ofAverage Collection Period, InventoryTurnover in day, Average Payment Period,Net Trading Cycle and the performance offirms
8 Diego andEzequiel,(2015))Uruguay
Innovation andProductivity inServices andManufacturing:The Role of ICTInvestment
ICT investment,Innovation andProductivity
Both ICT and other innovation investmentsare positively associated with productivityin services but only ICT affect productivityin manufacturing. Interestingly, the absenceof investment in ICT is associated withlower levels of productivity.
9 Abri, A.G., &Mahmoudzadeh, M.(2014).
Impact ofinformationtechnology onproductivity andefficiencyin Iranianmanufacturingindustries
Physical capital, ITcapitalHuman capital andproductivity
IT has a positive and statistically significanteffect on the productivity of manufacturingindustries. It will be more in high IT-intensive industries than the other industries.But, there is no significant differencebetween the growth of labor productivity inIT-producing and IT-using industries.
10 Ince, H.,Imamoglu,S. Z., &Turkcan,H. (2016).
The Effect ofTechnologicalInnovationCapabilities andAbsorptiveCapacity onFirmInnovativeness
Technologicalinnovation capabilities,absorptive capacity andInnovativeness
It is concluded that; absorptive capacity hasa positive impact on technologicalinnovation capabilities and moreovertechnological innovation capability andabsorptive capacity have a positive impacton innovativeness.
11 Dirk J.VanWasbeek(2004)Ethiopia
HumanResourceManagementpractices inselectedEthiopian
With fourmanufacturing andservice companies,.Management and HRMpractices are largelyinfluenced by political,
The finding of the research is theimportance of human resource managementis not uniformly understood at all case-studycompanies. Although the multinationalcompanies’ most important asset, as humancapital the local companies generally do not.
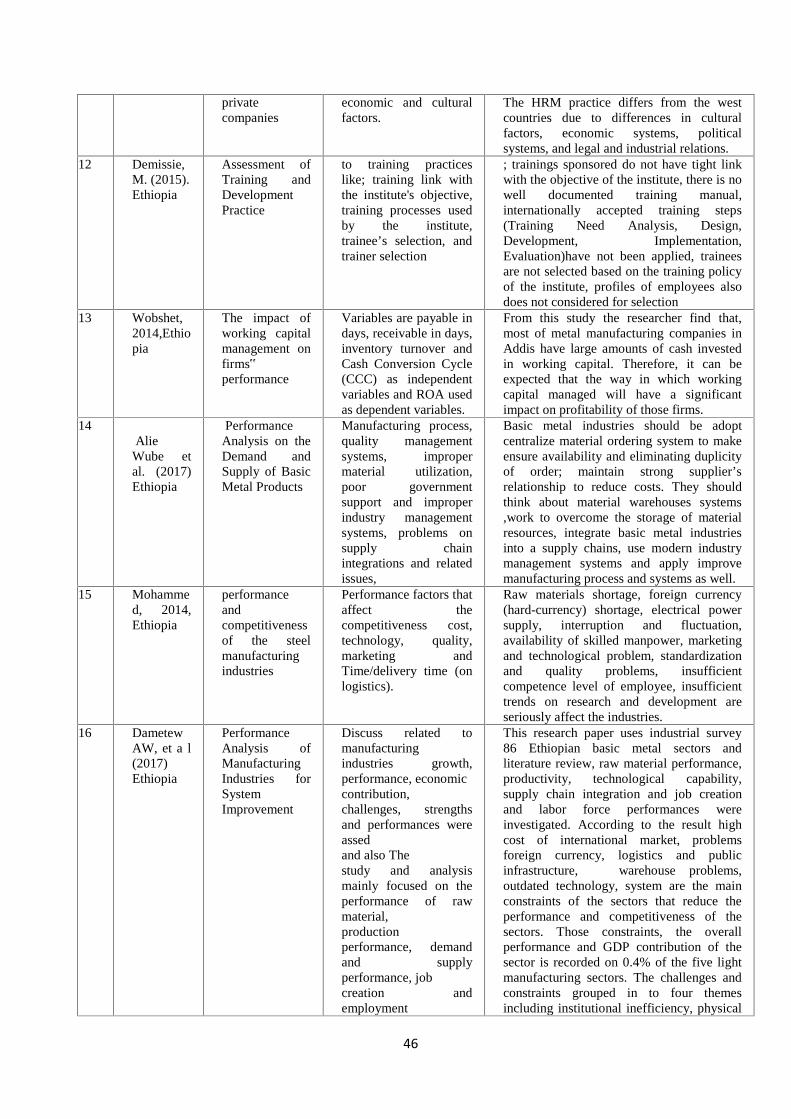
46
privatecompanies
economic and culturalfactors.
The HRM practice differs from the westcountries due to differences in culturalfactors, economic systems, politicalsystems, and legal and industrial relations.
12 Demissie,M. (2015).Ethiopia
Assessment ofTraining andDevelopmentPractice
to training practiceslike; training link withthe institute's objective,training processes usedby the institute,trainee’s selection, andtrainer selection
; trainings sponsored do not have tight linkwith the objective of the institute, there is nowell documented training manual,internationally accepted training steps(Training Need Analysis, Design,Development, Implementation,Evaluation)have not been applied, traineesare not selected based on the training policyof the institute, profiles of employees alsodoes not considered for selection
13 Wobshet,2014,Ethiopia
The impact ofworking capitalmanagement onfirms‟performance
Variables are payable indays, receivable in days,inventory turnover andCash Conversion Cycle(CCC) as independentvariables and ROA usedas dependent variables.
From this study the researcher find that,most of metal manufacturing companies inAddis have large amounts of cash investedin working capital. Therefore, it can beexpected that the way in which workingcapital managed will have a significantimpact on profitability of those firms.
14Alie
Wube etal. (2017)Ethiopia
PerformanceAnalysis on theDemand andSupply of BasicMetal Products
Manufacturing process,quality managementsystems, impropermaterial utilization,poor governmentsupport and improperindustry managementsystems, problems onsupply chainintegrations and relatedissues,
Basic metal industries should be adoptcentralize material ordering system to makeensure availability and eliminating duplicityof order; maintain strong supplier’srelationship to reduce costs. They shouldthink about material warehouses systems,work to overcome the storage of materialresources, integrate basic metal industriesinto a supply chains, use modern industrymanagement systems and apply improvemanufacturing process and systems as well.
15 Mohammed, 2014,Ethiopia
performanceandcompetitivenessof the steelmanufacturingindustries
Performance factors thataffect thecompetitiveness cost,technology, quality,marketing andTime/delivery time (onlogistics).
Raw materials shortage, foreign currency(hard-currency) shortage, electrical powersupply, interruption and fluctuation,availability of skilled manpower, marketingand technological problem, standardizationand quality problems, insufficientcompetence level of employee, insufficienttrends on research and development areseriously affect the industries.
16 DametewAW, et a l(2017)Ethiopia
PerformanceAnalysis ofManufacturingIndustries forSystemImprovement
Discuss related tomanufacturingindustries growth,performance, economiccontribution,challenges, strengthsand performances wereassedand also Thestudy and analysismainly focused on theperformance of rawmaterial,productionperformance, demandand supplyperformance, jobcreation andemployment
This research paper uses industrial survey86 Ethiopian basic metal sectors andliterature review, raw material performance,productivity, technological capability,supply chain integration and job creationand labor force performances wereinvestigated. According to the result highcost of international market, problemsforeign currency, logistics and publicinfrastructure, warehouse problems,outdated technology, system are the mainconstraints of the sectors that reduce theperformance and competitiveness of thesectors. Those constraints, the overallperformance and GDP contribution of thesector is recorded on 0.4% of the five lightmanufacturing sectors. The challenges andconstraints grouped in to four themesincluding institutional inefficiency, physical
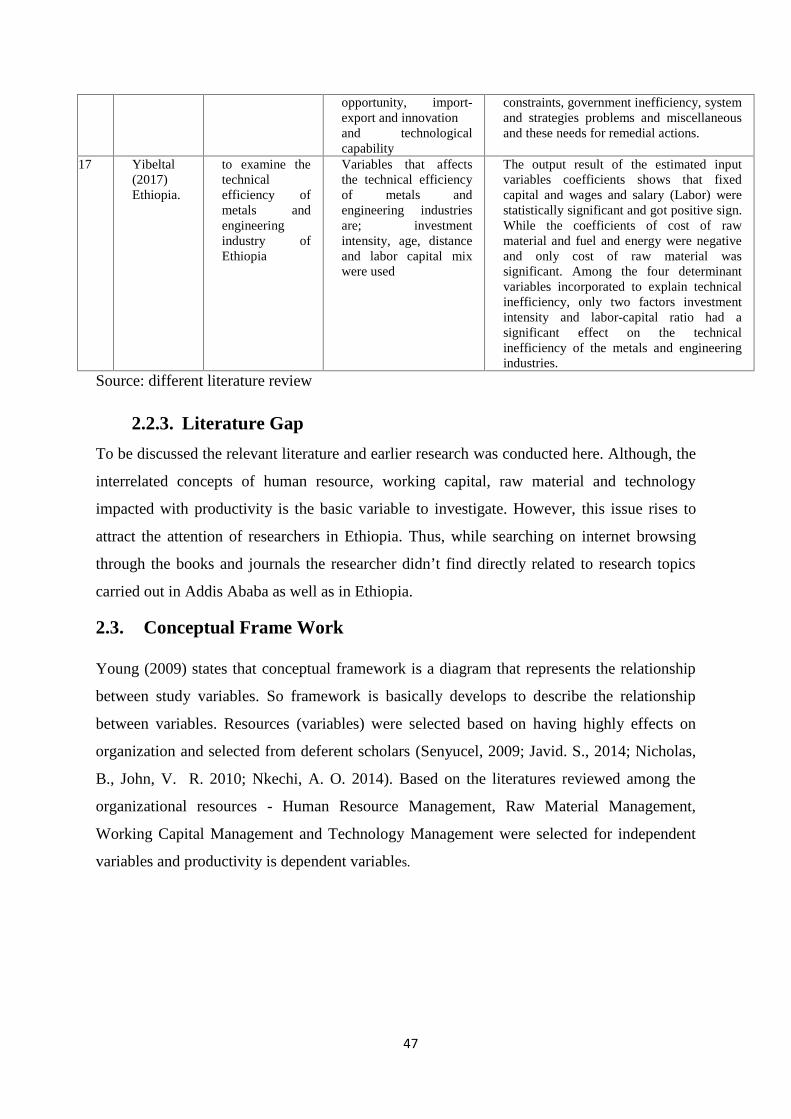
47
opportunity, import-export and innovationand technologicalcapability
constraints, government inefficiency, systemand strategies problems and miscellaneousand these needs for remedial actions.
17 Yibeltal(2017)Ethiopia.
to examine thetechnicalefficiency ofmetals andengineeringindustry ofEthiopia
Variables that affectsthe technical efficiencyof metals andengineering industriesare; investmentintensity, age, distanceand labor capital mixwere used
The output result of the estimated inputvariables coefficients shows that fixedcapital and wages and salary (Labor) werestatistically significant and got positive sign.While the coefficients of cost of rawmaterial and fuel and energy were negativeand only cost of raw material wassignificant. Among the four determinantvariables incorporated to explain technicalinefficiency, only two factors investmentintensity and labor-capital ratio had asignificant effect on the technicalinefficiency of the metals and engineeringindustries.
Source: different literature review
2.2.3. Literature Gap
To be discussed the relevant literature and earlier research was conducted here. Although, the
interrelated concepts of human resource, working capital, raw material and technology
impacted with productivity is the basic variable to investigate. However, this issue rises to
attract the attention of researchers in Ethiopia. Thus, while searching on internet browsing
through the books and journals the researcher didn’t find directly related to research topics
carried out in Addis Ababa as well as in Ethiopia.
2.3. Conceptual Frame Work
Young (2009) states that conceptual framework is a diagram that represents the relationship
between study variables. So framework is basically develops to describe the relationship
between variables. Resources (variables) were selected based on having highly effects on
organization and selected from deferent scholars (Senyucel, 2009; Javid. S., 2014; Nicholas,
B., John, V. R. 2010; Nkechi, A. O. 2014). Based on the literatures reviewed among the
organizational resources - Human Resource Management, Raw Material Management,
Working Capital Management and Technology Management were selected for independent
variables and productivity is dependent variables.
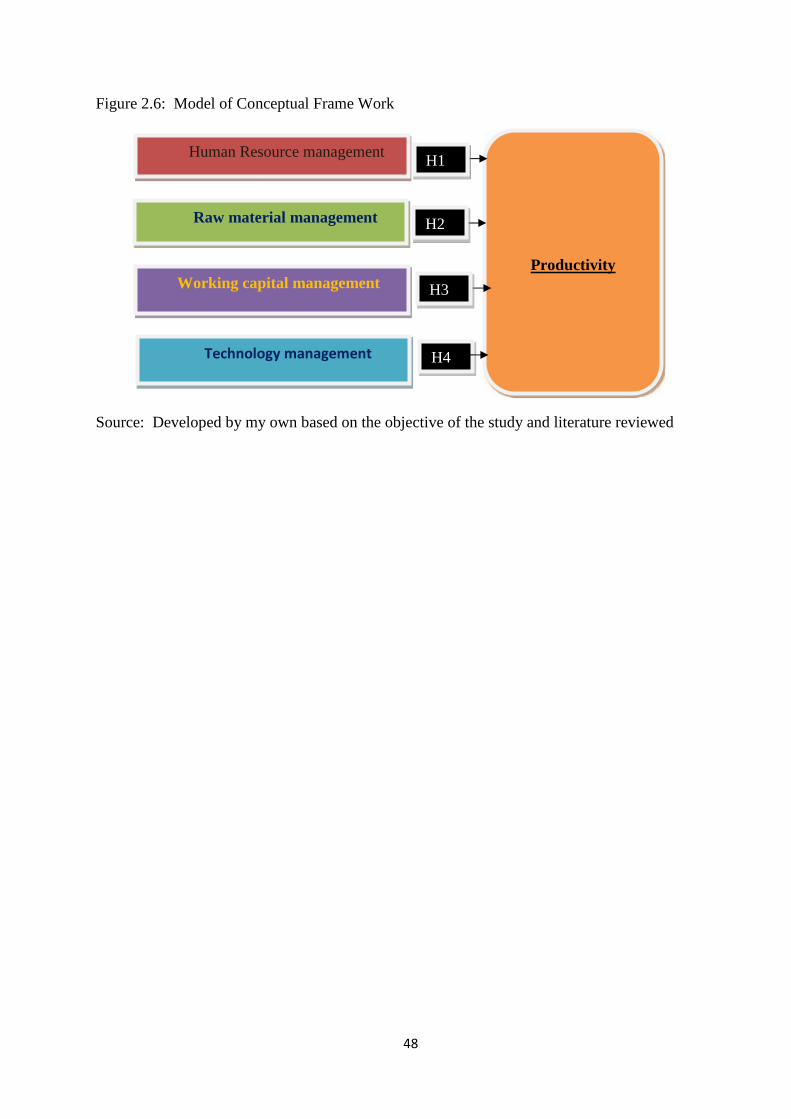
48
ProductivityWorking capital management
Raw material management
H1
H3
H2
Technology management
Human Resource management
H4
Figure 2.6: Model of Conceptual Frame Work
Source: Developed by my own based on the objective of the study and literature reviewed
49
CHAPTER THREE
RESEARCH METHODOLOGY
3.1. Research Design
A research design is the arrangement of conditions for collection and analysis of data in a
manner that aims to combine relevance to the research purpose with economy in procedure
C.R. Kothari (2004). Research design is obviously a plan and which incorporates a
framework of what the research is going to do from writing the basic questions & their
operational implications to the final analysis of data. The purpose of this research is to
examine the effects of resource management the case of metal products factory in Addis
Ababa. Therefore, Addis Ababa regions are the place where the majority metal industries
located, thus the selected sample industries can be considered to be sufficient indicatives of
the metal industries in Ethiopia as a whole. The sample size and the specific metal industries
are chosen considering required acceptance sampling number, industries profile regarding the
year of establishment, type of products and production performance (Appendix B). In
addition to that it was selected based on geographical distribution and minimum survey cost
had been into considered. Therefore, the target population for the study was top management,
middle management and supervisors /senior employees.
Both Descriptive and Exploratory research design were used. Here in this research both
qualitative and quantitative study approaches were employed and also both types (probability
and non-probability) sampling were implemented for this study. The investigator was
collected data from both primary and secondary sources. The researcher used “five-point
Likert scale. Therefore, the researcher has preferred to use descriptive and inferential
statistics in this study. Finally collected raw data was interpreted by Microsoft Excel and
SPSS version 20 software and presented in the form of graphs, tables, and charts.
3.2. Sources of Data
Both primary (interview, questioner, observation) and secondary data were collected from
Published and unpublished documents which are relevant to the study was taken from
(published in books, journals, previous research work, annual reports, internet sources and
manuals of the companies).
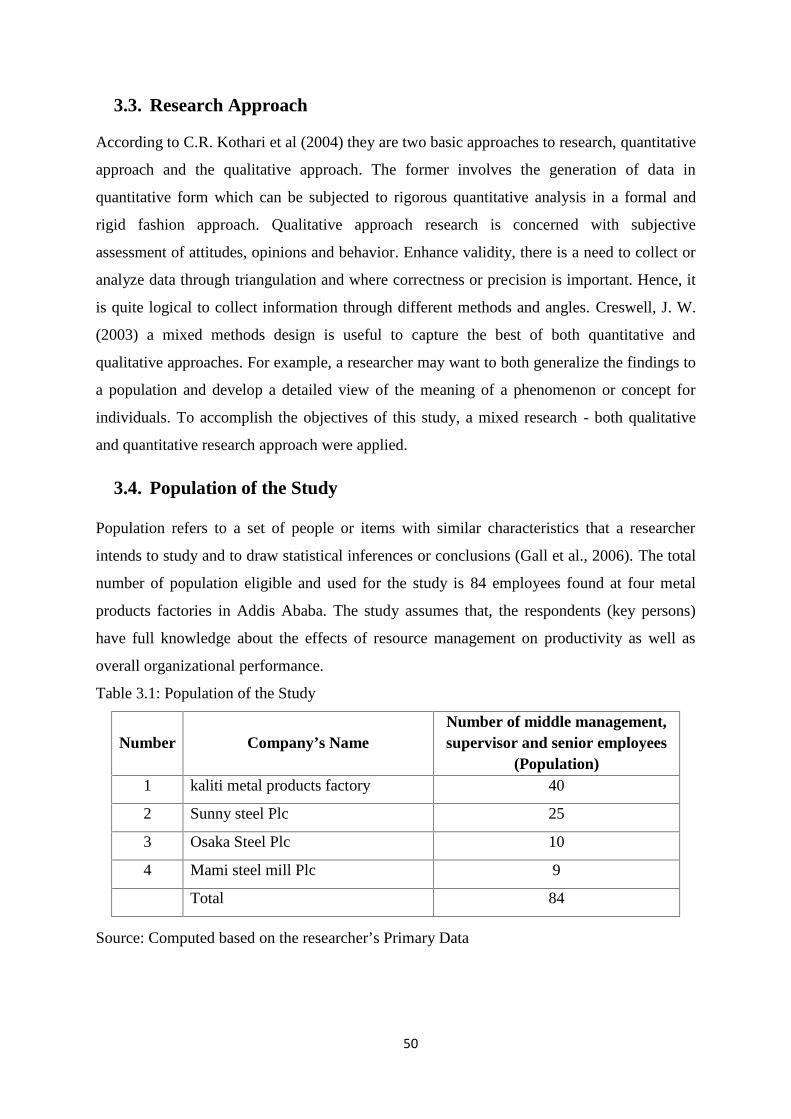
50
3.3. Research Approach
According to C.R. Kothari et al (2004) they are two basic approaches to research, quantitative
approach and the qualitative approach. The former involves the generation of data in
quantitative form which can be subjected to rigorous quantitative analysis in a formal and
rigid fashion approach. Qualitative approach research is concerned with subjective
assessment of attitudes, opinions and behavior. Enhance validity, there is a need to collect or
analyze data through triangulation and where correctness or precision is important. Hence, it
is quite logical to collect information through different methods and angles. Creswell, J. W.
(2003) a mixed methods design is useful to capture the best of both quantitative and
qualitative approaches. For example, a researcher may want to both generalize the findings to
a population and develop a detailed view of the meaning of a phenomenon or concept for
individuals. To accomplish the objectives of this study, a mixed research - both qualitative
and quantitative research approach were applied.
3.4. Population of the Study
Population refers to a set of people or items with similar characteristics that a researcher
intends to study and to draw statistical inferences or conclusions (Gall et al., 2006). The total
number of population eligible and used for the study is 84 employees found at four metal
products factories in Addis Ababa. The study assumes that, the respondents (key persons)
have full knowledge about the effects of resource management on productivity as well as
overall organizational performance.
Table 3.1: Population of the Study
Number Company’s NameNumber of middle management,supervisor and senior employees
(Population)1 kaliti metal products factory 40
2 Sunny steel Plc 25
3 Osaka Steel Plc 10
4 Mami steel mill Plc 9
Total 84
Source: Computed based on the researcher’s Primary Data

51
3.5. Sample Design
A sample design is a definite plan for obtaining a sample from a given population. It refers to
the technique or the procedure the researcher would adopt in selecting items for the sample
C.R. Kothari (2004). The target population for the study was top management, middle
management and supervisors /senior employees of metal products factories. They are two
types of sampling design. Probability sampling: In probability sample, every unit in the
population has equal chances for being selected as a sample unit. Non–probability sampling:
In non-probability sampling, units in the population have unequal or zero chances for being
selected as a sample unit. Hence, researchers used both sampling techniques: probability
sampling and non-probability sampling.
3.6. Sampling Frames
Sampling frame of the study is populations that the researcher was intended to draw and
indicate in sample frame. Sample shall be representative because the sample generalization is
given for the entire population. Therefore under this study the sampling frames were carried
out at kaliti metal products factory, Sunny steel Plc, Osaka Steel Plc and Mami steel mill Plc.
which consists of only Top management, middle management, supervisor/senior employees
in each factories.
3.7. Sampling Unit
Sampling unit is the individuals whose characteristics are to be measured in the analysis or a
sampling unit can refer to any single person, animal, plant, product or ‘thing’ being
researched. The sampling unit for this study was 69 individual employed that drown from
target population.
3.8. Sample Size
(C.R. Kothari, 2004) having decided how to select the sample, you have to determine the
sample size. The research proposal should provide information and justification about sample
size. It is not necessarily true that the bigger the sample, the better the study. Beyond a certain
point, an increase in sample size will not improve the study. It is better to make extra effort to
get a representative sample rather than to get a very large sample. Therefore, based on the
objects of the study the appropriate sample size, A simplified formula for proportions
Yamane (1967) provides to calculate sample sizes. A 95% confidence level and P = .5 are
assumed.
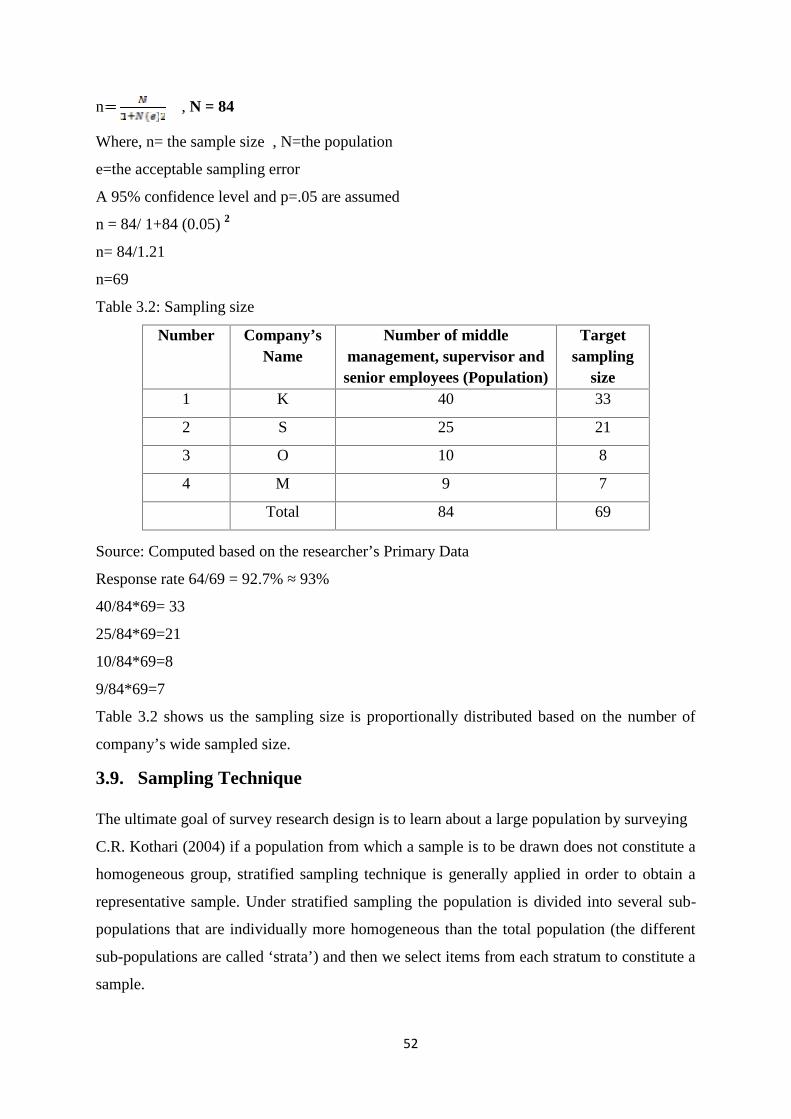
52
n , N = 84
Where, n= the sample size , N=the population
e=the acceptable sampling error
A 95% confidence level and p=.05 are assumed
n = 84/ 1+84 (0.05) 2
n= 84/1.21
n=69
Table 3.2: Sampling size
Number Company’sName
Number of middlemanagement, supervisor andsenior employees (Population)
Targetsampling
size1 K 40 33
2 S 25 21
3 O 10 8
4 M 9 7
Total 84 69
Source: Computed based on the researcher’s Primary Data
Response rate 64/69 = 92.7% ≈ 93%
40/84*69= 33
25/84*69=21
10/84*69=8
9/84*69=7
Table 3.2 shows us the sampling size is proportionally distributed based on the number of
company’s wide sampled size.
3.9. Sampling Technique
The ultimate goal of survey research design is to learn about a large population by surveying
C.R. Kothari (2004) if a population from which a sample is to be drawn does not constitute a
homogeneous group, stratified sampling technique is generally applied in order to obtain a
representative sample. Under stratified sampling the population is divided into several sub-
populations that are individually more homogeneous than the total population (the different
sub-populations are called ‘strata’) and then we select items from each stratum to constitute a
sample.
53
Based on the objective of the research probability sampling (stratified sampling) was
designed to select the target population to classified based on job position. They were
assumed that a key person of the organization so that they have a general knowledge to be
answered the designed question. Non probability sampling (purposive sampling) was
designed for questioner (middle management and supervisor/senior employees) and interview
for Top management was designed.
3.10. Methods of Data Collection
The researcher used semi-structured interview and questionnaire for this particular research.
The questionnaires contained demographic information of the respondents in terms of age,
sex, educational status and work experience: The researcher used “five-point Likert scale
from 1 to 5 rating from Null to Very high. The total population for this study was 84 people
which are found in four factories. 69 questioners were distributed according to the sampling
size. Out of 69 it was collected 64 and the response rate of 93%. The interviewees were
conducted with top management’s members in four factories that are relevant to topics,
believed to have a quite good understanding of the subject matter and able to discusses the
issues `clearly.
3.11. Data Analysis Method
The collected data was analyzed, interpreted, and discussed by using quantitative and
qualitative method of analyses. After completion of data collection, descriptive and
inferential statistical analyses were employed to analyze and interpret the raw data. The
Collected data is checked for consistency and then frequencies and percentages were used to
show response distribution. Correlation analysis was used to identify the relationship between
the dependent and independent variables under consideration and regression analysis was
used since it shows the impact of the independent variables on the dependent variable.
Microsoft Excel application and SPSS version 20 software tools to interpreted the collected
data. Data were presented by using different statistical tools such as graphs, tables, and
charts.
3.11.1. Model Specification
To analyses the data collected via the survey instrument, an appropriate statistical procedure
were been used. The hypotheses were analyzed and tested via regression analysis, with the
aid of SPSS (Statistical Package for Social Sciences). From the formulated methodologies,
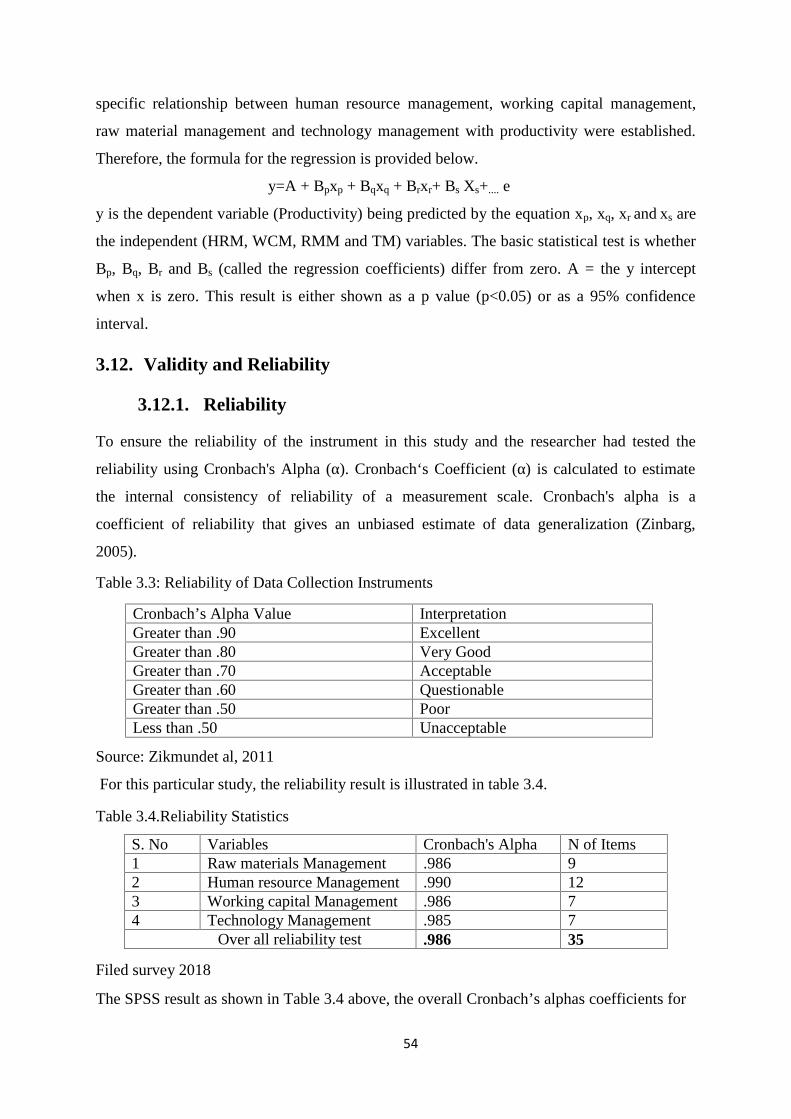
54
specific relationship between human resource management, working capital management,
raw material management and technology management with productivity were established.
Therefore, the formula for the regression is provided below.
y=A + Bpxp + Bqxq + Brxr+ Bs Xs+.... e
y is the dependent variable (Productivity) being predicted by the equation xp, xq, xr and xs are
the independent (HRM, WCM, RMM and TM) variables. The basic statistical test is whether
Bp, Bq, Br and Bs (called the regression coefficients) differ from zero. A = the y intercept
when x is zero. This result is either shown as a p value (p<0.05) or as a 95% confidence
interval.
3.12. Validity and Reliability
3.12.1. Reliability
To ensure the reliability of the instrument in this study and the researcher had tested the
reliability using Cronbach's Alpha (α). Cronbach‘s Coefficient (α) is calculated to estimate
the internal consistency of reliability of a measurement scale. Cronbach's alpha is a
coefficient of reliability that gives an unbiased estimate of data generalization (Zinbarg,
2005).
Table 3.3: Reliability of Data Collection Instruments
Cronbach’s Alpha Value InterpretationGreater than .90 ExcellentGreater than .80 Very GoodGreater than .70 AcceptableGreater than .60 QuestionableGreater than .50 PoorLess than .50 Unacceptable
Source: Zikmundet al, 2011
For this particular study, the reliability result is illustrated in table 3.4.
Table 3.4.Reliability Statistics
S. No Variables Cronbach's Alpha N of Items1 Raw materials Management .986 92 Human resource Management .990 123 Working capital Management .986 74 Technology Management .985 7
Over all reliability test .986 35
Filed survey 2018
The SPSS result as shown in Table 3.4 above, the overall Cronbach’s alphas coefficients for
55
expected scale items were 0.986. Therefore, the expected scale was used demonstrate
Excellent reliability.
3.12.2. Validity
Validity is the extent to which the instrument measures what it is intended to measure,
whereas reliability refers to the consistency of the measuring instrument yields the same
result when repeating the same thing when the entity being measured hasn’t changed (Leedy
and Ormrod, 2010). This study is obvious face validity because it was developed an
assessment and evaluation frame work based more of on primary data obtained from
interview response from top level managers, and questionnaire response of middle level
manager, supervisors/ senior who actually expected as skilled and professional. All
interviewee were asked the same set of very simple in a plain English language open ended as
much as possible structured question well-matched with the knowledge of the interviewee
was prepared. And also all interviewee had been given chance to ask for clarification without
any pre condition, if not understand what they had been asked. The process of interviewing
could be done again under the same situation in order to establish reliability thus it is possible
to generalize based on the actual finding of the study process. The researcher was used
observation, interviews, documents, annual reports as instruments of data gathering which are
found to be relevant to the study. So the validity and reliability of the qualitative and
quantities research is ascertained by triangulation. Multicollinearity (or collinearity) occurs
when there are high inter-correlations among some set of the predictor variables. If the
tolerance value is lower than 1-R2 than there is a probability a problem with multicollinearity.
In other words, multicollinearity happens when two or more predictors contain much of the
same information. If any of the Variation Inflation Factor values exceeds 5 or 10, it implies
that the associated regression coefficients are poorly estimated because of multicollinearity
(Montgomery, et al 2001). It can be removed by merging the same variables or dropping
variables and also by changing sampling size.
3.13. Ethical Considerations
The interview questions and questionnaires clearly hold parts which explain the intent of the
researcher, and that the information from the respondent will not serve for personal
identification. And the consent of the respondent and relevant authority and enterprise has
been obtained to get the information needed. Thus the research proposal had been approved
by the assigned steady leader from the university before the researcher gathered data. To

56
undertake the research, the questionnaire ensuring participant’s secrecy or confidentiality that
information is obtained from them cannot be disclose to the third party. Hence, the
respondent’s rights to privacy, to be fully informed consent or permission and confidentiality
or secrecy was addressed individually. Respondent’s name and other identifying information
were not used in the study. Finally, the appropriate acknowledgement was made for the use
of numerous works of others.
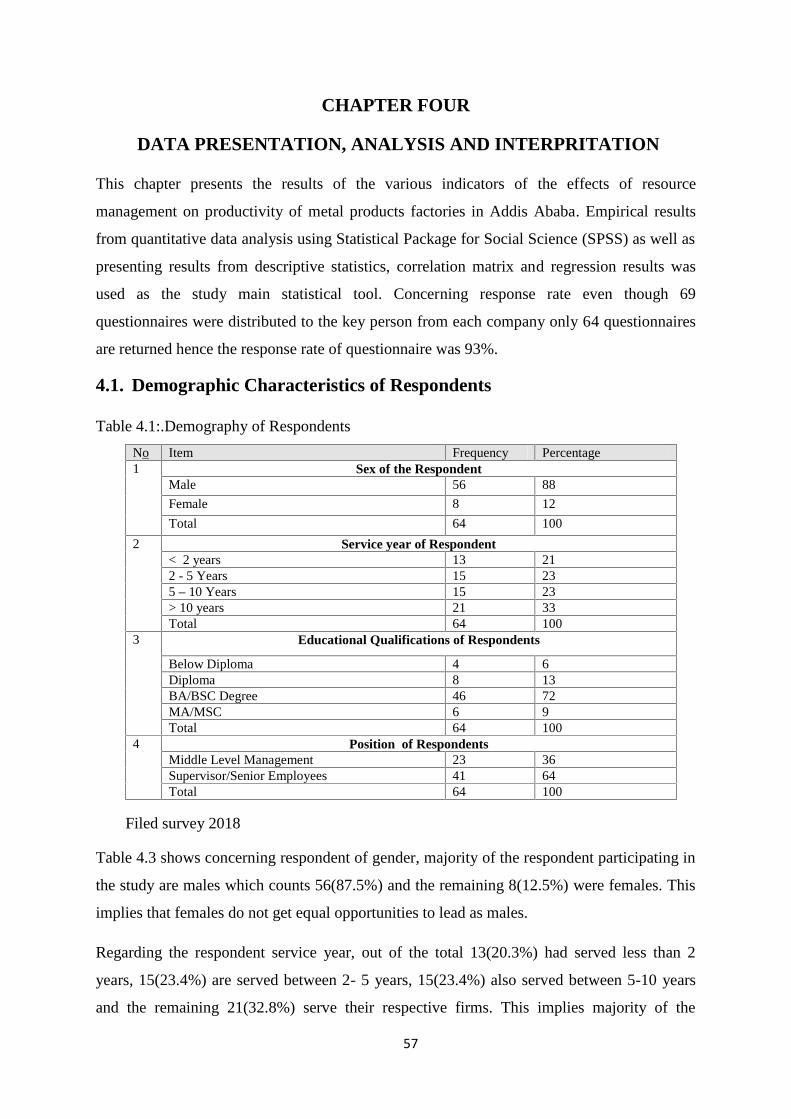
57
CHAPTER FOUR
DATA PRESENTATION, ANALYSIS AND INTERPRITATION
This chapter presents the results of the various indicators of the effects of resource
management on productivity of metal products factories in Addis Ababa. Empirical results
from quantitative data analysis using Statistical Package for Social Science (SPSS) as well as
presenting results from descriptive statistics, correlation matrix and regression results was
used as the study main statistical tool. Concerning response rate even though 69
questionnaires were distributed to the key person from each company only 64 questionnaires
are returned hence the response rate of questionnaire was 93%.
4.1. Demographic Characteristics of Respondents
Table 4.1:.Demography of Respondents
No Item Frequency Percentage1 Sex of the Respondent
Male 56 88
Female 8 12
Total 64 100
2 Service year of Respondent< 2 years 13 212 - 5 Years 15 235 – 10 Years 15 23> 10 years 21 33Total 64 100
3 Educational Qualifications of Respondents
Below Diploma 4 6Diploma 8 13BA/BSC Degree 46 72MA/MSC 6 9Total 64 100
4 Position of RespondentsMiddle Level Management 23 36Supervisor/Senior Employees 41 64Total 64 100
Filed survey 2018
Table 4.3 shows concerning respondent of gender, majority of the respondent participating in
the study are males which counts 56(87.5%) and the remaining 8(12.5%) were females. This
implies that females do not get equal opportunities to lead as males.
Regarding the respondent service year, out of the total 13(20.3%) had served less than 2
years, 15(23.4%) are served between 2- 5 years, 15(23.4%) also served between 5-10 years
and the remaining 21(32.8%) serve their respective firms. This implies majority of the
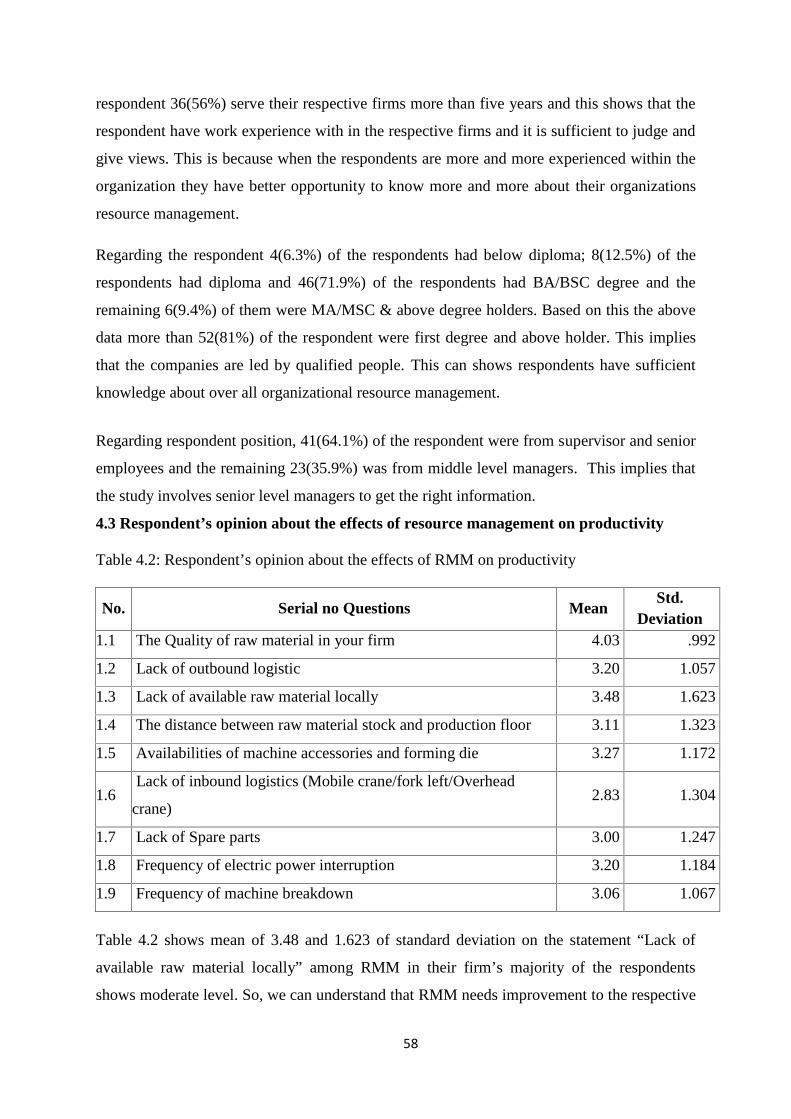
58
respondent 36(56%) serve their respective firms more than five years and this shows that the
respondent have work experience with in the respective firms and it is sufficient to judge and
give views. This is because when the respondents are more and more experienced within the
organization they have better opportunity to know more and more about their organizations
resource management.
Regarding the respondent 4(6.3%) of the respondents had below diploma; 8(12.5%) of the
respondents had diploma and 46(71.9%) of the respondents had BA/BSC degree and the
remaining 6(9.4%) of them were MA/MSC & above degree holders. Based on this the above
data more than 52(81%) of the respondent were first degree and above holder. This implies
that the companies are led by qualified people. This can shows respondents have sufficient
knowledge about over all organizational resource management.
Regarding respondent position, 41(64.1%) of the respondent were from supervisor and senior
employees and the remaining 23(35.9%) was from middle level managers. This implies that
the study involves senior level managers to get the right information.
4.3 Respondent’s opinion about the effects of resource management on productivity
Table 4.2: Respondent’s opinion about the effects of RMM on productivity
No. Serial no Questions MeanStd.
Deviation1.1 The Quality of raw material in your firm 4.03 .992
1.2 Lack of outbound logistic 3.20 1.057
1.3 Lack of available raw material locally 3.48 1.623
1.4 The distance between raw material stock and production floor 3.11 1.323
1.5 Availabilities of machine accessories and forming die 3.27 1.172
1.6Lack of inbound logistics (Mobile crane/fork left/Overhead
crane)2.83 1.304
1.7 Lack of Spare parts 3.00 1.247
1.8 Frequency of electric power interruption 3.20 1.184
1.9 Frequency of machine breakdown 3.06 1.067
Table 4.2 shows mean of 3.48 and 1.623 of standard deviation on the statement “Lack of
available raw material locally” among RMM in their firm’s majority of the respondents
shows moderate level. So, we can understand that RMM needs improvement to the respective

59
firms by implementing resource management software like inventory, logistic with inbound
and out bound supply chain integration.
Table 4.3: Respondent’s opinion about the effects of HRM on productivity
No. Serial no Questions Mean Std. Deviation2.1 Required training and development given by the firm 2.77 1.0952.2 Lack of skilled manpower 2.80 1.0262.3 Employee job satisfaction 2.89 .9112.4 Absenteeism 2.78 1.0762.5 Rate of labour turnover 3.31 1.0372.6 Loyalty of employees 3.42 .8692.7 Motivation given to workers 2.94 1.0672.8 Incentives/ recognition for best performance of workers 2.59 1.2312.9 Placement of the right person on the right job 3.17 1.0322.10 Leadership competence 3.20 .8942.11 Cooperation and teamwork in your work place 3.48 .9592.12 Working Environments 3.09 1.137
Table 4.3 shows mean of 3.48 and .959 of standard deviation on the statement “Cooperation
and teamwork in your work place” among HRM in their firm’s majority of the respondents
shows moderate level. So, we can understand as HRM needs to improvement productivity by
giving a special attention for cooperation within their employees’.
Table 4.4: Respondent’s opinion about the effects of WCM on productivity
No. Serial no Questions Mean Std. Deviation3.1 Shortage of working capital 3.03 1.1543.2 Efficient use of working capital 3.39 1.1213.3 Efficient utilization of budget 3.42 1.0203.4 Cost control techniques 3.28 1.0613.5 Accounts receivable 3.39 .9193.6 Account payable 3.41 .9713.7 Cycle time from raw material to production and sales 3.47 1.023
Table 4.4 shows mean of 3.47 and 1.023 of standard deviation on the statement “Cycle time
from raw material to production and sales” among WCM in their firm’s majority of the
respondents shows moderate level. So, we can understand as WCM needs improvement the
process from the beginning of raw material, manufacturing, store and finally to sale. Just by
implementing inbound management system.

60
Table 4.5: Respondent’s opinion about the effects of TM on productivity
No. Serial no Questions Mean Std. Deviation
4.1 Trends in adopting new technology in your firm 2.98 1.091
4.2 Information communication system between your firm and
your customers (consumers and suppliers).2.88 1.016
4.3 Automated machines installed in your factories 3.08 .997
4.4 The impacts of using old technology machine 3.19 .957
4.5 Resistance to new technology in your firm 2.83 1.001
4.6 Information technology improves the processing time and
better information for decision making in your company.3.17 .901
4.7 Information technology facilitates the automation of core
business processes in your firm3.16 .877
Table 4.5 shows mean of 3.19 and 0.957 of standard deviation on the statement “The impacts
of using old technology machine” among TM in their firm’s majority of the respondents
shows moderate level. So, we can understand as the impacts of using old machine needs
improvement otherwise they are encountered highly maintenance and also cannot be
competent, and cannot keep quality of products. So replacing advanced technology machine
is so important for respective firms.
4.2. Relation of Resources Management among Productivity
Table 4.6: Full correlation
Productivity RMM HRM WCM TM
ProductivityPearson Correlation 1 .987** .979** .978** .972**
Sig. (1-tailed) .000 .000 .000 .000N 64 64 64 64 64
RMMPearson Correlation .987** 1 .982** .981** .969**
Sig. (1-tailed) .000 .000 .000 .000N 64 64 64 64 64
HRMPearson Correlation .979** .982** 1 .980** .985**
Sig. (1-tailed) .000 .000 .000 .000N 64 64 64 64 64
WCMPearson Correlation .978** .981** .980** 1 .959**
Sig. (1-tailed) .000 .000 .000 .000N 64 64 64 64 64
TMPearson Correlation .972** .969** .985** .959** 1Sig. (1-tailed) .000 .000 .000 .000N 64 64 64 64 64
**. Correlation is significant at the 0.01 level (2-tailed).
Field survey 2018
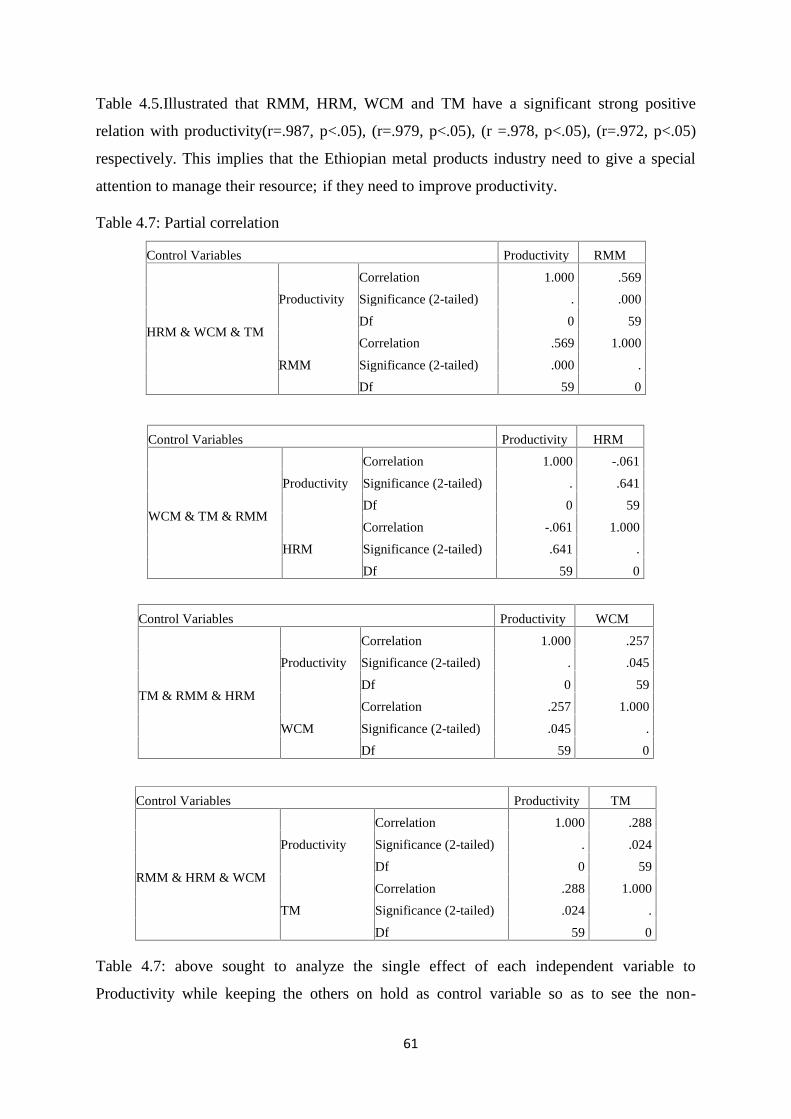
61
Table 4.5.Illustrated that RMM, HRM, WCM and TM have a significant strong positive
relation with productivity(r=.987, p<.05), (r=.979, p<.05), (r =.978, p<.05), (r=.972, p<.05)
respectively. This implies that the Ethiopian metal products industry need to give a special
attention to manage their resource; if they need to improve productivity.
Table 4.7: Partial correlation
Control Variables Productivity RMM
HRM & WCM & TM
Productivity
Correlation 1.000 .569
Significance (2-tailed) . .000
Df 0 59
RMM
Correlation .569 1.000
Significance (2-tailed) .000 .
Df 59 0
Control Variables Productivity HRM
WCM & TM & RMM
Productivity
Correlation 1.000 -.061
Significance (2-tailed) . .641
Df 0 59
HRM
Correlation -.061 1.000
Significance (2-tailed) .641 .
Df 59 0
Control Variables Productivity WCM
TM & RMM & HRM
Productivity
Correlation 1.000 .257
Significance (2-tailed) . .045
Df 0 59
WCM
Correlation .257 1.000
Significance (2-tailed) .045 .
Df 59 0
Control Variables Productivity TM
RMM & HRM & WCM
Productivity
Correlation 1.000 .288
Significance (2-tailed) . .024
Df 0 59
TM
Correlation .288 1.000
Significance (2-tailed) .024 .
Df 59 0
Table 4.7: above sought to analyze the single effect of each independent variable to
Productivity while keeping the others on hold as control variable so as to see the non-
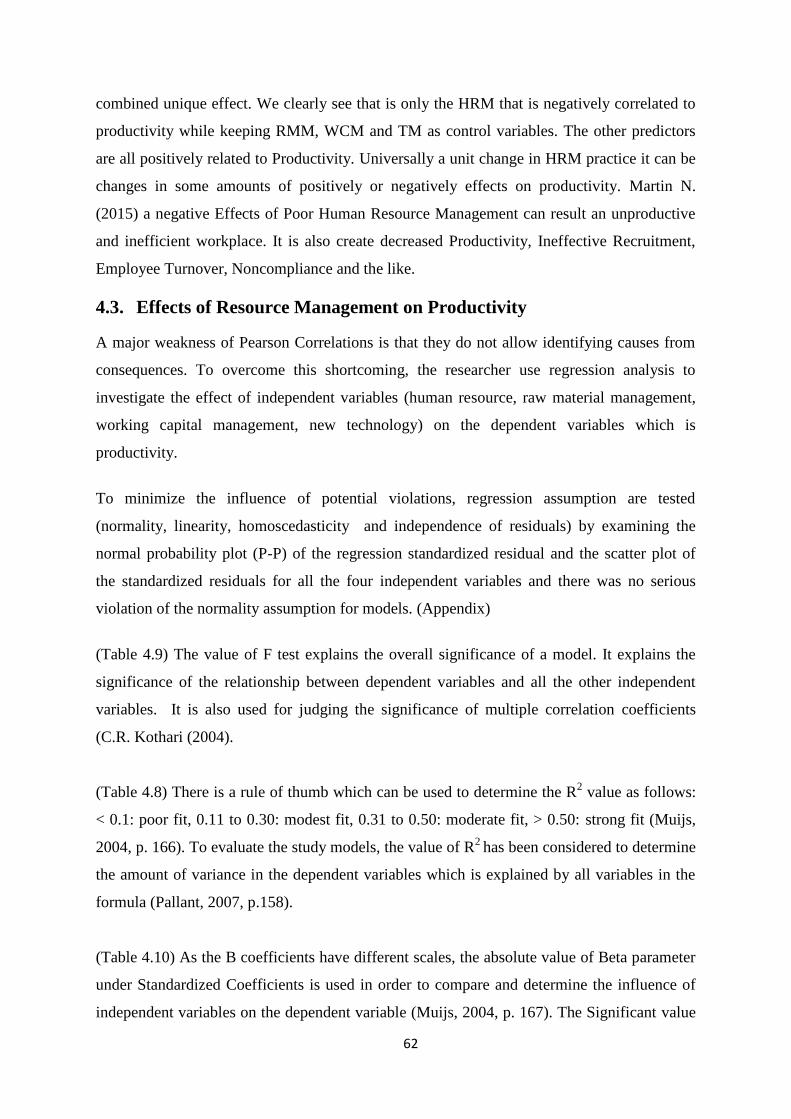
62
combined unique effect. We clearly see that is only the HRM that is negatively correlated to
productivity while keeping RMM, WCM and TM as control variables. The other predictors
are all positively related to Productivity. Universally a unit change in HRM practice it can be
changes in some amounts of positively or negatively effects on productivity. Martin N.
(2015) a negative Effects of Poor Human Resource Management can result an unproductive
and inefficient workplace. It is also create decreased Productivity, Ineffective Recruitment,
Employee Turnover, Noncompliance and the like.
4.3. Effects of Resource Management on Productivity
A major weakness of Pearson Correlations is that they do not allow identifying causes from
consequences. To overcome this shortcoming, the researcher use regression analysis to
investigate the effect of independent variables (human resource, raw material management,
working capital management, new technology) on the dependent variables which is
productivity.
To minimize the influence of potential violations, regression assumption are tested
(normality, linearity, homoscedasticity and independence of residuals) by examining the
normal probability plot (P-P) of the regression standardized residual and the scatter plot of
the standardized residuals for all the four independent variables and there was no serious
violation of the normality assumption for models. (Appendix)
(Table 4.9) The value of F test explains the overall significance of a model. It explains the
significance of the relationship between dependent variables and all the other independent
variables. It is also used for judging the significance of multiple correlation coefficients
(C.R. Kothari (2004).
(Table 4.8) There is a rule of thumb which can be used to determine the R2 value as follows:
< 0.1: poor fit, 0.11 to 0.30: modest fit, 0.31 to 0.50: moderate fit, > 0.50: strong fit (Muijs,
2004, p. 166). To evaluate the study models, the value of R2 has been considered to determine
the amount of variance in the dependent variables which is explained by all variables in the
formula (Pallant, 2007, p.158).
(Table 4.10) As the B coefficients have different scales, the absolute value of Beta parameter
under Standardized Coefficients is used in order to compare and determine the influence of
independent variables on the dependent variable (Muijs, 2004, p. 167). The Significant value
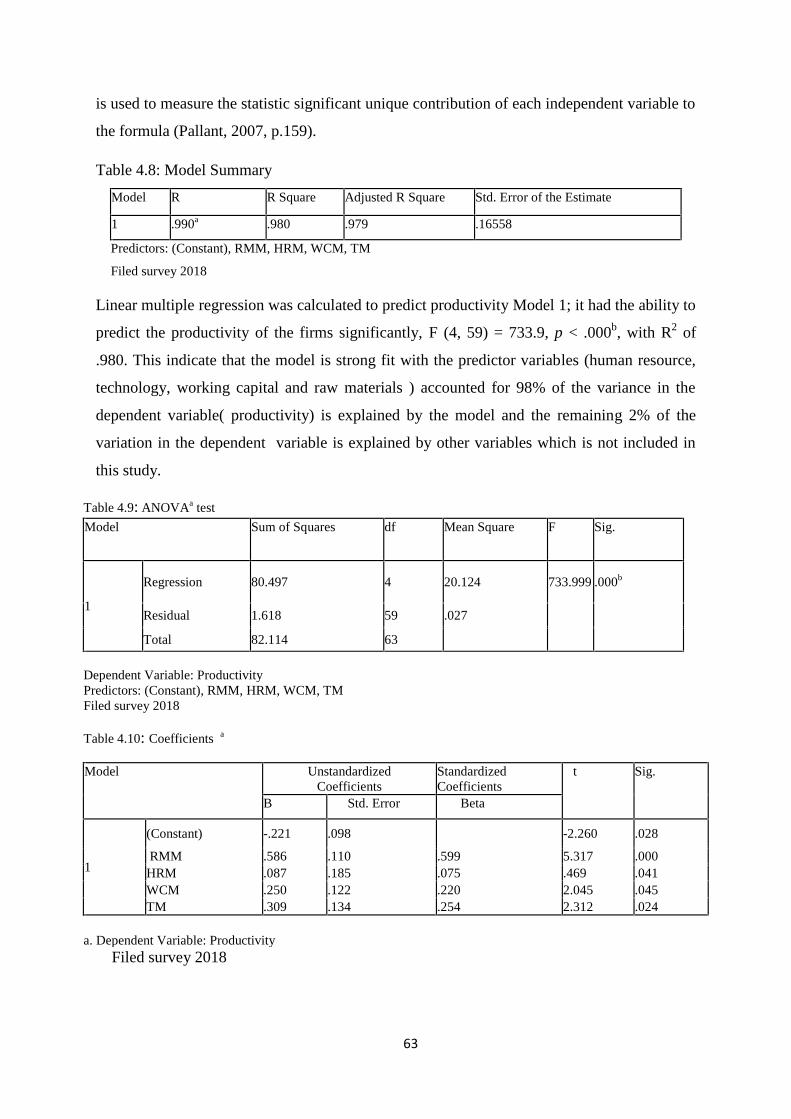
63
is used to measure the statistic significant unique contribution of each independent variable to
the formula (Pallant, 2007, p.159).
Table 4.8: Model Summary
Model R R Square Adjusted R Square Std. Error of the Estimate
1 .990a .980 .979 .16558
Predictors: (Constant), RMM, HRM, WCM, TM
Filed survey 2018
Linear multiple regression was calculated to predict productivity Model 1; it had the ability to
predict the productivity of the firms significantly, F (4, 59) = 733.9, p < .000b, with R2 of
.980. This indicate that the model is strong fit with the predictor variables (human resource,
technology, working capital and raw materials ) accounted for 98% of the variance in the
dependent variable( productivity) is explained by the model and the remaining 2% of the
variation in the dependent variable is explained by other variables which is not included in
this study.
Table 4.9: ANOVAa test
Model Sum of Squares df Mean Square F Sig.
1
Regression 80.497 4 20.124 733.999 .000b
Residual 1.618 59 .027
Total 82.114 63
Dependent Variable: ProductivityPredictors: (Constant), RMM, HRM, WCM, TMFiled survey 2018
Table 4.10: Coefficients a
Model UnstandardizedCoefficients
StandardizedCoefficients
t Sig.
B Std. Error Beta
1
(Constant) -.221 .098 -2.260 .028
RMM .586 .110 .599 5.317 .000HRM .087 .185 .075 .469 .041WCM .250 .122 .220 2.045 .045TM .309 .134 .254 2.312 .024
a. Dependent Variable: ProductivityFiled survey 2018

64
4.3.1. The Effects of Raw Materials Management on Productivity
Regarding the effects of raw materials management on productivity, table 4.8., shows that
raw material management have positive significant effects on productivity (β =.599, p
<.001).This means that; if we improve the raw material management ; the productivity of the
respective firms will also improve by .599 unit of standard deviations if other factors remain
constant. This implies raw materials management affects the productivity of the metal
products factory significantly uness and otherwise they give special attention. The finding of
this study also supports by (J.R.Tony. Armold and S.N. Chapman, L.M.Clive, 2008) to
improve productivity and wealth, a company must first design efficient and effective systems
for manufacturing. It must then manage these systems to make the best use of material. One
of the most effective ways of doing this is through the planning and control of the flow of
materials into, though, and out of manufacturing and this finally leads to manufacturing
creates wealth by adding value to goods.
4.3.2. The effect of Human Resource Management on Productivity
The effect of human resource management on productivity is analyzed using linear multiple
regression method with a two-tailed significance level of 5% (α= .05) and the result is
analyze and interpreted based on (table 4.8) for the model.From the coefficient table we can
observe that human resource practice have positive significant effect on productivity (β
=.075, p =.041). This means if we improve the human resource practice; the productivity of
the firms will improve by .075 units of standard deviations, if other factors remain the same.
And this implies that the human resource practice of the metal products firm have a positively
impact on the productivity of respective firms.
4.3.3. The effects of Working Capital Management on Productivity
Regarding working capital management we observe from table 4.8, working capital have
significant effect on productivity (β =.220, p =.045).This leads to, if we improve the working
capital management; the productivity of the respective firms will improve by .220 units of
standard deviations, if other factors hold constant. Because the main objective of WCM is to
maintain the optimum balance of each account, namely; receivables, inventory, and payables
that influence firm’s productivity & performance (Flibeck & Krueger, 2005).
4.3.4. The effects of Technology Management on Productivity
Regarding technology we observe from table 4.8, technology management have significant
effect on productivity (β =.254, p =.024).This leads to if we improve the technology

65
management; the productivity of the respective firms will improve by .254 units of standard
deviations, if other factors hold constant. The finding of this study support with to
Brynjolfsson (2003) technology has been increasing productivity and annual output per
worker for more than three decades. Kudyba (2004) concluded that greater technology skills
increased firm output. Enhanced technology skills among employees resulted in higher
productivity, organizational performance, and firm output (Hitt & Brynjolfsson, 1995;
Kudyba, 2004). S. A. Kumar et al (2008) computer integrated manufacturing benefits fall into
three categories; increase quality, decrease cost, and improve safety. Brynjolfsson and Brown
(2005) also found that technology intensive companies tend to be more productive.
Therefore, the predictive model of the study is:
y=A + Bpxp + Bqxq + Brxr+ BsXs+.... e
Productivity = -.221 + .599(RMM) + .075 (HRM) + .220 (WMC) + .254(TM) +.098
4.4. Summary of Hypothesis
Table 4.11: Summary of overall outcome of the research hypothesis
Hypothesis Result
1 H1: Raw material resource management has positively impact to firm’sproductivity.
β =.599 , p=.000Ho : RejectedH1: Accepted
2 H1: Human resource management has impact on firm’s productivity β =.075 , p =.041Ho : RejectedH1: Accepted
3 H1: Working capital management practices have strong relation to firm’sproductivity.
β =.220 , p=.045Ho : RejectedH1: Accepted
4 H1: Technology adoptions have positively impact on firm’s productivity β =.254 , p=.024Ho : RejectedH1: Accepted
Filed survey 2018
4.5. Summary of Major Findings
From table 4.8., shows that raw material management have positive significant effects on
productivity (β =.599, p =0.000). In similar manner the interview from top management of
the sample factory support the above regression result; the metal factory, implemented raw
material management practice in their respected firms to improve productivity because the
top management understand that, when they reduce waste productivity would improve and
hence based on the nature of raw material they practice raw material management but the
implementation it is not as such effective because of lack of skill and luck of motivation of
worker specially in production floor as expected.
From table 4.8 it is observed that human resource management have positive significant
effect on productivity (β =.075, p =.041). In similar manner the interview from top
66
management of the sample factory support the above regression result; i.e when they make
best and transparent the human resource practice in their respective factory like (provision of
sufficient training & development for their employee, when they implement incentive system,
when they give reward, when there is salary increment based on performance and when there
is promotion based on performance the productivity of their respected factory shows
improvement but some time when salary increment is biased productivity of the respected
firms decline & some employees are motivated to leave the factory for certain period and
these kind of action affect the productivity of their factory.
From table 4.8, working capital management have significant effect on productivity (β =.220,
p =.045). In similar way from the interview we understand that, majority of the factory top
management believed that working capital have positive significant effect on productivity by
smoothening the operation of the factory especially in provision of resources for operation
and to execute obligations of the respected firms without headache but without proper
managing working capital did nothing.
From table 4.8, technology management have significant effect on productivity (β =.254, p
=.024). In line with the above researcher and scholar from the interview; we can understand
that some factories were implemented new technology and improve their productivity but
they exposed highly for machine spare part cost and managing of the technology but some of
them even if they understand that, technology improve productivity, they prefer to stick with
the old fashion operating system since the initial capital requirement to adopt the technology
needs huge funds and skilled employees.
Figure 4.1: Models of conceptual frame work Results
Source: Filed survey 2018
0.024
Working CapitalManagement
Humana ResourceManagement
Raw MaterialManagement
TechnologyManagement
Productivity
0.045
0.041
0.000
67
CHAPTER FIVE
CONCLUSIONS AND RECOMMENDATIONS
5.1.Conclusions
The study has investigated the effect of resource management on the productivity of the
Ethiopian metal products manufacturing in Addis Ababa. Based on the finding of the study,
the following conclusions are drawn.
5.1.1. On Effects of Raw Material Management
From table 4.8., shows that raw material management have positive significant effects on
productivity (β =.599, p <.001). from the interview understand that, the metal factory,
implemented raw material management practice in their respected firms to improve
productivity because the top management understand that, when they reduce waste
productivity would improve and hence based on the nature of raw material they practice
raw material management but the implementation it is not as such effective because of lack
of skill and luck of motivation of worker specially in production floor as expected. Raw
material are a crucial for any manufacturing sector, and have significant impact on the
productivity of respective firms, Since the basic objective of materials management as
explained by Banjoko (2000) and Jacobs et al. (2009) is to ensure that the right item is
bought and made available to the manufacturing operations at the right time, at the right
place and at the lowest possible cost. Yibeltal (2017) in order to effectively utilize the
potential of the industries, efforts have to be made in improving investment intensity,
financial and non-financial capital access, availing raw material access and infrastructural
and institutional development.
5.1.2. On Effects of Human Resource Management
From the regression analysis, on table 4.8 it is observed that human resource management
have positive significant effect on productivity (β =.075, p =.041). In similar manner the
interview from top management of the sample factory support the above regression. Human
resource management have a significant effect on productivity, as the result firms needs to
give a special attention to the human resource to boost their productivity because unless and
other wise firms improve the managements of their human resource through development and
68
training and establishing of incentive system in their practices to boost morale of employees
and to reduce mobility, since motivation and mobility affect significantly the productivity
levels. This is empirically supported by P.V.C. Okoye et al (2013) the study found that
human resource development is very vital to any organizations ranging from small to large
scale enterprise.
5.1.3. On effects of Working Capital Management
Working capital management have significant effect on productivity (β =.220, p =.045). In
similar way from the interview we understand that, majority of the factory top management
believed that working capital have positive significant effect on productivity by smoothening
the operation of the factory especially in provision of resources for operation and to execute
obligations of the respected firms without headache but without proper managing working
capital did nothing.
Since the objective of WCM is to maintain the optimum balance of each account, namely;
receivables, inventory, and payables that influence firm’s productivity & performance
(Flibeck & Krueger, 2005).
5.1.4. On Effects of Technology Management
Technology management have significant effect on productivity (β =.254, p =.024). Now a
day’s technology is becoming one of the effective weapons in the computation world and
hence the study finding also shows that technology have significant effect on productivity.
This is empirically supported by Fagerberg, J. (2000). In the first half of the 20th century,
growth of output, productivity and employment were strongly correlated. It is also supported
by Diego and Ezequiel, (2015) both ICT and other innovation investments are positively
associated with productivity in services but only ICT affect productivity in manufacturing.
Interestingly, the absence of investment in ICT is associated with lower levels of
productivity.
Unsal, E et al (2015) Technology Management (TM) can contribute to sustainable
competitive advantage. This is because, creating and sustaining competitive advantage
requires more than operational efficiency and cost minimization. For technology intensive
companies, creating competitive advantage is related to capability of managing technological
assets (Skilbeck and Cruickshank,
69
5.2. Recommendations
Based on the findings and conclusions of the study, the following recommendations are
forwarded to Ethiopian metals products manufacturing company.
Regarding the raw materials, the Ethiopian metal products firms needs to established
/improve/ raw material handling system to reduce the wastage amount implementing
KAIZEN and to improve the productivity and also they need to adopt SCM for efficient
manage inbound and outbound relationship, Implement Total Quality Management of the
products, inventory management, transportation operation management, warehousing
management. Since the effects of raw materials is significant to the productivity of the firms.
By establish material management handling techniques to boost the utilization of raw
material in doing so, they can improve the productivity of their respective firms.
Regarding the human resource management, the study findings show that the Ethiopian metal
products industry they have a gap on handling of their man power due to absence of
incentive and reward policy, less attention are given to safety and skilled man power, lack of
training and development programs, lack of promotion policy, lack of creating good working
environment lack of Recognition, Appreciation, Interpersonal relationship and Innovation
policy are seen the major gaps on this industry; since human resource practice have
significant effect on productivity the respective firm needs to take corrective actions on these
trends in their respective firms to boost their productivity.
Regarding working capital management, majority of the respondent agreed that the working
capital management practice is above average hence still it needs improvement specially on
efficient utilization of working capital, efficient utilization of budget, cost control techniques
and account receivable turn over and account payable turnover rate to utilize their resources
efficiently by giving appropriate training for top management and finance personnel to
improve the productivity of their respective firms. In addition to this the concerned
government bodies need to give special emphasis in solving of the foreign currency problem
by giving special privilege to local manufacturer than the finished product importer since
they add value and giving job opportunity and also helps the country in transforming the
technology. Financial sector in Ethiopia should be give equal opportunities for their working
capital. Working capital need a special attention because it affects productivity of firm’s
significantly. The metal products factory need to manage these components properly to run

70
their respective firms day to day operations efficiently and to become profitable and
productive.
Regarding the technology management, the Ethiopian metal products industry have a gap on
Information exchange between higher and lower management, adopting the necessary
technology to simplify the operation because of the nature of the machine. Exchange
information without paper, to reduce production time and production costs, create customer
handling system, implementing enterprise resource planning, adopting online business to
stand and survive. Efficient utilization of the information technology is necessary because
technology have a significant effect on productivity. As the result the Ethiopian metal
products top management need to take a corrective action in utilizing of the information
technology to exchange information at the required time to minimize the gap between their
employees and automating of their machineries to increase productivity. As the result the
Ethiopian metal products and respective firms need to give a special attention like the other
resources to become productive and competent enough and also to survive and win the
competition in the market. Hence, the decision to improve productivity through technology is
necessary and it is not enough by investing on new technology adoption but also it needs well
managed. Otherwise, the consequence is losing productivity.
71
Reference
AACCSA, 2015 Competitiveness of Ethiopian Industries: The Case of Metal & Metal
Products Industry
Abri, A. G., & Mahmoudzadeh, M. (2015). Impact of information technology on productivity
and efficiency in Iranian manufacturing industries. Journal of industrial engineering
international, 11(1), 143-157.
Admasu, S., (2017). Productive Capacity and Economic Growth in Ethiopia http://www
.un.org/en/development/desa/papers
Ahluwalia, I. J. (1991). Productivity and growth in Indian manufacturing. New Delhi.
Akindipe, O. S. (2014). The role of raw material management in production operations.
International Journal of Managing Value and Supply Chains, 5(3), 37.
Alie D. & Frank E., Birhanu B. (2017). Performance Analysis on the Demand and Supply of
Basic Metal Products: Focused On Ethiopian Basic Metal Industries.. International
Journal of Scientific and Engineering Research. 8.
Antle, J. M., & Capalbo, S. M. (1988). An introduction to recent developments in production
theory and productivity measurement. Agricultural productivity: Measurement and
explanation.
Armstrong, M. (2010) “A Handbook of Human Resource Management Practice”;
Arnold, J.T.,Chapman, S. N., & Clive, L. M. (2011).Introduction to materials management.
Pearson Higher Ed.
Badescu M, Garce´s-Ayerbe C (2009) The impact of information technologies on firm
productivity: empirical evidence from Spain. Technovation 29:122–129
Banjoko, S. A. (2000). Production and Operations Management, Saban Publishers,
Barker, T., (1989) Essentials of Materials Management, McGraw Hill Book Company.
Boothby, D., Dufour, A., & Tang, J. (2010). Technology adoption, training and productivity
performance. Research Policy, 39(5), 650-661.
Bozeman, B. (2000). Technology Transfer and Public Policy: A Review of Research and
Theory. Research Policy, 29, 627-655. http://dx.doi.org/10.1016/S0048-
7333(99)00093-1 Accessed on 09 Jul. 2018.
Bratton, J. (2007). Strategic human resource management. Human Resource Management
içinde, Der: John Bratton,-Gold, Jeffrey, London: Palgrave Macmillan, London, 37-
71.

72
Brynjolfsson, E. (2003). The IT Productivity Gap, http:// ebusiness. mit.edu/ erik/ Optimize/
pr_roi.html. Accessed on 20 Aug. 2018.
Brynjolfsson, E., Hitt, L. M. (1998). Beyond the Productivity Paradox Communications of
the ACM 41(8), 49 - 55.
Brynjolfsson, E.,Brown, P.(2005).VII Pillars of IT Productivity.Optimize.Manhasset 4(5),26
-31.
Buang, R. R., Ramli, S. H., & Hassan, S. (2014). Supply Chain Quality Management in
Services Sector: A Research at UniKL, MARA Higher Education Institute.
Buffa, E. S. (1961). Modern production management. Wiley.
Byremo, C. S. (2015). Human Resource Management and Organisational Performance: Does
HRM lead to better organisational performance?
C.R. Kothari. (2004) Research methodology. 3rd edit. New Age International (P) Ltd.,
Publishers.
Dametew AW, Ebinger F (2017) Performance Analysis of Manufacturing Industries for
System Improvement. Ind Eng Manage 6: 228. doi:10.4172/2169-0316.1000228
Daniel K. and Tibebe B., “Work simplification for productivity improvement’’ Journal of
EEA,2007, VoL 24, pp. 44.
Decenzo, D. A., Robbins, S. P., & Verhulst, S. L. (2005). Fundamentals of human resource
management. Hoboken Wiley.
Deming, W. E. (1981). Improvement of quality and productivity through action by
management. National productivity review, 1(1), 12-22.
Demissie, M. (2015). Assessment of training and development practices: the case of metal
industry development institute (doctoral dissertation, st. Mary's university).
Dirk J. Van Wasbeek, 2004, Human Resource Management Practice in selected Ethiopian
privet companies, Dissertation, Robert Kenned College, Swaziland.
DURU, A. N. D., & NWAKAEGO, A. (2014). PG/PH. D/2007/46775 PG/PH. D/2007/46775
Eatwell, J.M. and Newman,P. (1991) “The New Palgrave: A Dictionary of Economics” vols.
3, 4 .& 12, Macmillan, Tokyo.
Engetou, E. (2017). The impact of training and development on organizational performance.
Fagerberg, J. (2000). Technological progress, structural change and productivity growth: a
comparative study. Structural change and economic dynamics, 1.
Ferguson, B. R. (2000). Implementing supply chain management. Production and Inventory
Management Journal, 41(2), 64.
73
Filbeck , G., Krueger, T. M. (2005).An Analysis of Working Capital Management. Mid-
American Journal of Business, 20 (2), 11-18.
Gall , M.D., Gall, J. P. & Borge, W. R. (2006). “Educational Research: An Introduction”.
(8th Ed.). New York: Pearson.
Garba, s. (2014). The effects of working capital management on the profitability of listed
nigerian conglomerate companies (doctoral dissertation, school of post graduate
studies, bayero university, kano).
Gary Dessler, Human Resource Management (Upper saddle River, New Jersey: Prentice
Hall, 2003),2.
Ghanavati Elham, Taghizadeh Khanqah Vahid, Akbari khosroshahi Mohsen, Ebrati
Mohammadreza, Working Capital Management and Corporate Performance:
Evidence from Iranian Companies, Procedia - Social and Behavioral Sciences,
Volume 62, 2012, Pages 1313-1318, ISSN 1877-0428, https:// doi.org/ 10.1016/
j.sbspro.2012.09.225.
Gray, D. E. (2013). Doing research in the real world. Sage.
Groover, M. P. (2007). Automation, production systems, and computer-integrated
manufacturing. Prentice Hall Press.
Hall, B. H., & Khan, B. (2003). Adoption of new technology (No. w9730). National bureau
of economic research.
Hax, A. C., & Candea, D. Production and inventory management, 1984.
Hitt L, Brynjolfsson E. (1995). Productivity, Profit, and Consumer Welfare: Three Different
Measures of Information technology's Value. MIS Quarterly 20(2), 121 – 143
Huselid, M A (1995). The impact of human resource management practices on turnover,
productivity and corporate financial performance, Academy of Management Journal,
38 (3), pp 635–72
Hyder S. (2011) Productivity in Industrial Engineering. prayasek.wordpress.com
Ince, H., Imamoglu, S. Z., & Turkcan, H. (2016). The effect of technological innovation
capabilities and absorptive capacity on firm innovativeness: a conceptual framework.
Procedia-Social and Behavioral Sciences, 235, 764-770.
Iyaniwura, O. and Osoba, A.M. (1983) “Measuring Productivity; Conceptual and Statistical
Problems: Improvement of Statistics” in Osoba
J.R.TonyArmold, S.N.Chapman, L.M.Clive, 2008), Introduction to materials management,
3rd edition
74
Jacobs, R. F., Chase, R. B and Aquilano, N. J. (2009) Operations and Supply Management,
McGraw Hill, Boston
Javid, S., & Dalian, P. R. (2014). Effect of Working Capital Management on SME’s
Performance in Pakistan. European Journal of Business and Management, 6(12), 206-
220.
Jeruto Keitany, P., & Richu, S. (2014). ASSESSMENT OF THE ROLE OF MATERIALS
MANAGEMENT ON ORGANIZATIONAL PERFORMANCE-A CASE OF NEW
KENYA COOPERATIVE CREAMERIES LIMITED, ELDORET KENYA.
European Journal of Material Sciences, 1(1), 1-10.
Juran, A.Blanton Godfrey, 1999, USA, Juran’s Quality Handbook, MCGraw-Hill
Karam, a. K. D., ab yazid, m. S., khatibi, a., & azam, s. F. (2017). Human resource
management and talent management towards organizational success of aluminium
industry in united arab emirates (uae): a measurement model.european Journal of
Human Resource Management Studies.
Kasahara, H., & Rodrigue, J. (2008). Does the use of imported intermediates increase
productivity? Plant-level evidence. Journal of development economics, 87(1), 106-
118.
Keller, E. (2004). What Is Your IT Productivity MSI22 (2), 33 - 34
Koprulu, A., & Albayrakoglu, M. M. (2007). Supply chain management in the textile
industry: a supplier selection model with the analytical hierarchy process. ISAHP,
Viña Del Mar, Chile.
KS, M. F., & Krishnaiah, K. Productivity Improvement in a Manufacturing Industry.
Kudyba, S. (2004). The productivity pay-off from effective allocation of IT and non-IT
labour. International Labour Review 143(3), 235 – 247
Kulkarni, P. P. (2013). A literature review on training & development and quality of work
life. Researchers World, 4(2), 136.
Kumar, R. (2016). Economic Order Quantity (EOQ) Model. Global Journal of Finance and
Economic Management, 5(1), 1-5
Kumar, S., & Kumar, N. (2016).An inventory model for deteriorating items under inflation
and permissible delay in payments by genetic algorithm. Cogent Business &
Management,3(1),1239605.https:/ /doi.org/ 10.1080/ 23311975 .2016.1239605
Accessed on 12 Jun. 2018.
75
Kumar, V., Kumar, U., & Persaud, A. (1999). Building technological capability through
importing technology: the case of Indonesian manufacturing industry. The Journal of
Technology Transfer, 24(1), 81-96.
Lazear, E. P. (2000). Performance Pay and Productivity. American Economic Review, 90(5),
1346-1361.
Leedy PD & Ormrod JE. (2010). Practical research: planning and design (9th edition).
Lucy , T. (2000). Management Accounting. D. P. Publication Ltd. Akhni 142-144 UX Bridge
RD Shepherd London W.R. & A.W.R
Lwiki, T., Ojera, P. B., (2013). The Impact of Inventory Management Practices on Financial
Performance of Sugar Manufacturing Firms in Kenya. International Journal of
Business, Humanities and Technology, 3(5), 75 – 85
Lysons, K., & Farrington, B. (2006). Purchasing and supply chain management. Pearson
Education.
M.P.Muriithi, “Information and communication Technology and Service Delivery”, Master
Thesis, University of Nirobi, Kenye, 2011.
Mahmood, A. M., Mann G. J. (2005). Information Technology Investments and
Organizational Productivity and Performance: An Empirical Investigation. Journal of
Organizational Computing and Electronic Commerce 15 (3), 185 - 202.
Melaku T. Abegaz. 2013. Total Factor Productivity and Technical Efficiency in the Ethiopian
Manufacturing Sector. EDRI Working Paper 010. Addis Ababa: Ethiopian
Development Research Institute.
Mescon, M. H., Bovee, C.L., Thill, J. V.(1999). Business Today, Prentice Hall.
Mikell P. Groover., 2002. Automation, Production Systems, and Computer-Integrated
Manufacturing (3rd ed.). Prentice Hall Press, Upper Saddle River, NJ, USA.
Milicevic, N., Davidovic, M. & Stefanovic, M. (2010). Financial Effects of Inventory
Management in Trading Companies - EOQ Model. Economics and Organization,
9(4), 507 – 519
Mohammed Muzeyin ( 2014), “Enhancing the competitiveness of Ethiopian steel
manufacturing industry”, Master thesis, Addis Ababa university , Ethiopia, 2014
Montgomery, D.C., peck, E.A., Vining, G.G. (2001). Introduction to linear regression
analysis, 3rd edition, Wiley, New York
Muijs, D. (2004). Doing quantitative research in education with SPSS. 1st edition.

76
Muthiah, K. M., & Huang, S. H. (2006). A review of literature on manufacturing systems
productivity measurement and improvement. International Journal of Industrial and
Systems Engineering.
Nakamura, T., & Ohashi, H. (2008). Effects of technology adoption on productivity and
industry growth: A study of steel refining furnaces. The Journal of Industrial
Economics,
Naor, M., Goldstein, S. M., Linderman, K. W., & Schroeder, R. G. (2008). The role of
culture as driver of quality management and performance: infrastructure versus core
quality practices. Decision Sciences, 39(4), 671-702.
Nicholas, B. And John V.R. (2010) Human Resource Management and Productivity
http://www.nber.org/papers/w16019
Nkechi, A. O. (2014). Effective Strategies for the Improvement of Human and Material
Resources Management in the Nigerian Local Government System. International
Review of Management and Business Research, 3(2), 1264.
Ondiek, G. O. (2009). Assessment of Materials Management in the Kenyan Manufacturing
Firms. Exploratory Survey of Manufacturing Firms Based in Nairobi. Journal of
Social Sciences, 22(8), 88-110.
P. V. C. Okoye & Ezejiofor, R. A. (2013). The effect of human resources development on
organizational productivity. International Journal of Academic Research in Business
and Social Sciences, 3(10), 250.
Padachi, K. (2006). Trends in working capital management and its impact on firms’
performance: an analysis of Mauritian small manufacturing firms. International
Review of business research papers
Pallant, J. (2007). SPSS survival manual: A step by step guide to data analysis using SPSS
for Windows version 15. 3rd edition. Berkshire, England: Open University Press.
Paynes, E. J. (2008). Human Resource Management for Public and Non – profit
Organization, 3nd edition.
Ravi K. G. (2017)9 Ways HR can Easily Increase Employee Productivity https://www.
smallbizdaily.com/hr-increase-employees-productivity/Accessed on 20 Oct.2018.
S. A. Kumar, and N. Suresh, Production and operation Management, New Age International
Limited, Punlishers, India, 2008.
S. Ganesan, International Journal of Business and Administration Research Review, Vol.l,
Issue.6, July - Sep, 2014, ISSN -2348-0653, P. 147.
Samuelson, P.A. and Nordhaus, W. D. (1995) “Economics” 15th edition,

77
Schwarz, L. B. (2008). The Economic Order-Quantity (EOQ) Model. Purdue University
Senyucel, Z. (2009). Managing the Human Resource in the 21st century. BookBoon.
Smith, J. (2008). Information technology's influence on productivity (Doctoral dissertation,
University of Nebraska at Omaha).
Srinivasan, K., & Jayaraman, S. (1999). The changing role of information technology in
manufacturing. Computer, 32(3), 42-49.
Stevenson W.J. (2007) Operations Management. Instructors Edition McGraw-Hill, Irwin
www.mhhe.com
Stinchcomb, J. B., McCampbell, S. W., & Leip, L. A. (2009). The future is now: Recruiting,
retaining and developing the 21st century jail workforce. Center for Innovative Public
Policies, Incorporated.
Surbhi.S.(2017). Difference Between Production and Productivity https:// key differences.
com/difference-between-production-and-productivity.html. Accessed on 25 Sep.2018.
T. Ravichandran, chalermsak lertwongsatien & chalermsak lertwongsatien (2014) effect of
information systems resources and capabilities on firm performance: A Resource-
Based Perspective, Journal of Management Information Systems, 21:4, 237-276, DOI:
10.1080/07421222.2005.11045820
Tacsir, Ezequiel & Aboal, Diego. (2015). Innovation and Productivity in Services and
Manufacturing. The Role of ICT Investment. IDB Working Paper Series.
Telsang M. (2010) Industrial Engineering and Production Management S.Chand’s and
Company Ltd. ISBN: 81 – 219 – 1773 – 5
Ubani E.C. (2012) Production and Operations Management: Concepts, Strategy and
Applications. Ultimate Press Company Owerri. ISBN:978-978-51063 -0-5
Ulrich, D. (1997). Measuring human resources: an overview of practice and a prescription for
results. Human Resource Management: Published in Cooperation with the School of
Business Administration, The University of Michigan and in alliance with the Society
of Human Resources Management, 36(3), 303-320.
Unsal, E., & Cetindamar, D. Skilbeck , Cruickshank (2015). Technology management
capability: Definition and its measurement. European International Journal of Science
and Technology, 4(2), 181-196.
W. Harris (1913), Operations and Supply Chain, https://www.mbaskool.com/business-
concepts/operations-logistics-supply-chain-terms/6729-harris-wilson-eoq-ebq-
model.html
78
Wernerfelt, B. (1984). A resource based view of the firm. Strategic management journal,
5(2), 171-180.
Wobshet M.,‘ Impact of Working Capital Management on Firms’ Performance: The Case of
Selected Metal Manufacturing Companies in Addis Ababa’ Master thesis, JIMMA
UNIVERSITY, Ethiopia, 2014
Yamane, Taro. (1967): Statistics: An Introductory Analysis, 2nd Ed., New York: Harper and
Row.
Yibeltal G. (2017). Technical efficiency and determinants of the Ethiopian Metals and
Engineering industries, http://www.eeaecon.org/sites/default/files/forms/Yibeltal.pdf.
Young, Pauline, V., Scientific Social Surveys and Research, Prentice Hall, New Delhi, 1995
Zinbarg, M., (2005), Research Methods, 1st Ed, Pearson Publishers, New Jersey
Ziukov, S. (2015). A Literature Review on Models of Inventory Management under
Uncertainty. Business Systems and Economics, 5 (1), 26-35
79
Bibliography
Business Dictionary: http://www.businessdictionary.com.Accessed on 10 Nov. 2018.
Defining the Concepts of Technology and Technology Transfer: A Literature
Analysis. International Business Research. 5. 61-71. 10.5539/ibr.v5n1p61. Accessed
on 19 Sep. 2018.
Gboyega A. Oyeranti. Concept and Measurement of Productivity
http://www.cenbank.org/out/ Publications/occasional papers/rd/2000/Abe-00-1.PDF
Accessed on 27 Jun. 2018.
George Wong. Asian Productivity Organization. Handbook for SME productivity
measurement and Analysis for APOs
Machine tool enterprises in Bangalore. Management Research News, 31(9), 659-669.
Macmillan ; London : Maxwell Macmillan International. management-nillos/
Martin N. (2015) https://www.linkedin.com/pulse/negative-effects-poor-human- resource-
Accessed on 23 Jul. 2018.
Morris Tanenbaum, William K. Holstein, production systems, https://www.britannica.com/
technology/production-system. Accessed on 13 Aug. 2018.
Plenert, Gerhard. The eManager: Value Chain Management in an eCommerce World. Dublin,
Ireland: Blackhall Publishing, 2001.
Productivity-improvement https://yogesh77.wordpress.com/2010/07/05/ productivity-
improvement/ Accessed on 03 Oct. 2018.
Steel - Raw Materials, Manufacturing Processes, Quality Control, Byproducts /waste, The
Future - Iron, Furnace, Molten, and Air - JRank Articles http://science.
jrank.org/pages /6488/ Steel.html# ixzz5OcIoBOXo. Accessed on 21 Jun. 2018.

80
Appendix

81
Appendix - A
ADDIS ABABA SCIENCE AND TECHNOLOGY UNIVERSITY
Field of study: MBA in Industrial Management
Researcher: Sintayehu Zeleke
E-mail: [email protected]
Mobile No: +251911184205
Advisor: Dr. Dellesa Daba
Code ................
Thesis Title: Effects of Resource Management on Productivity the case of Metal
Products Factories in Addis Ababa.
Hereby, I would like to express my gratitude for your dedicated cooperation. Had it not been
your genuine cooperation of filling this questionnaire, it would have not been possible to
conduct this research paper. This questionnaire is conducted for the purpose of research
submitted to partial fulfillment of the requirement for the Degree of Master of Business
Administration in Industrial Management. Therefore, I assure you that the information
obtained from this questionnaire will be kept confidential and will not be transferred to other
parties for any other purpose.
Thank you for taking your time to fill the questionnaire!
A. Questionnaires for middle management and supervisor. Please tick √ for your response.
Respondent Profile
1. Your current position: 1. Middle management 2.Supervisor/senior employee
2. Gender: 1. Male 2. Female
3. Qualification level:
1. Below diploma 2. College diploma 3.BA/BSc 4.MA/MSc & Above
4. Your work experience in this factory:
1. Below 2 years 2. 2-5 years
3. 5-10 years 4. Above 10 years
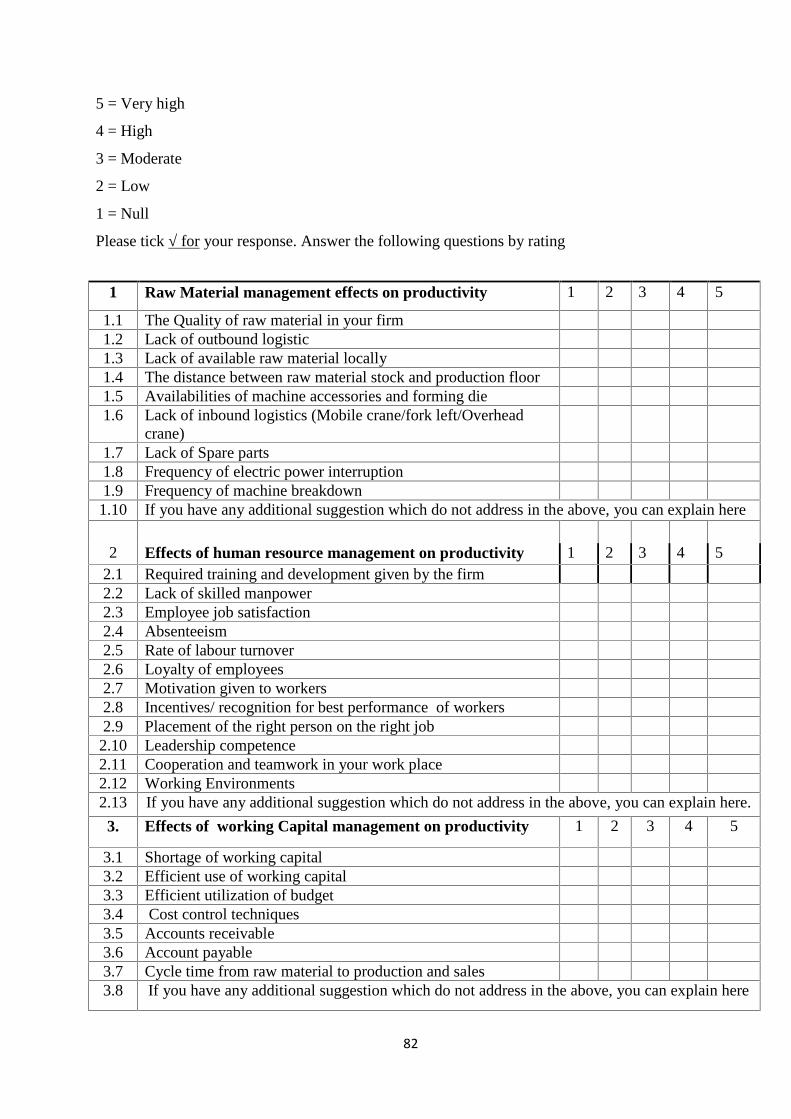
82
5 = Very high
4 = High
3 = Moderate
2 = Low
1 = Null
Please tick √ for your response. Answer the following questions by rating
1 Raw Material management effects on productivity 1 2 3 4 5
1.1 The Quality of raw material in your firm1.2 Lack of outbound logistic1.3 Lack of available raw material locally1.4 The distance between raw material stock and production floor1.5 Availabilities of machine accessories and forming die1.6 Lack of inbound logistics (Mobile crane/fork left/Overhead
crane)1.7 Lack of Spare parts1.8 Frequency of electric power interruption1.9 Frequency of machine breakdown1.10 If you have any additional suggestion which do not address in the above, you can explain here
2 Effects of human resource management on productivity 1 2 3 4 52.1 Required training and development given by the firm2.2 Lack of skilled manpower2.3 Employee job satisfaction2.4 Absenteeism2.5 Rate of labour turnover2.6 Loyalty of employees2.7 Motivation given to workers2.8 Incentives/ recognition for best performance of workers2.9 Placement of the right person on the right job2.10 Leadership competence2.11 Cooperation and teamwork in your work place2.12 Working Environments2.13 If you have any additional suggestion which do not address in the above, you can explain here.
3. Effects of working Capital management on productivity 1 2 3 4 5
3.1 Shortage of working capital3.2 Efficient use of working capital3.3 Efficient utilization of budget3.4 Cost control techniques3.5 Accounts receivable3.6 Account payable3.7 Cycle time from raw material to production and sales3.8 If you have any additional suggestion which do not address in the above, you can explain here
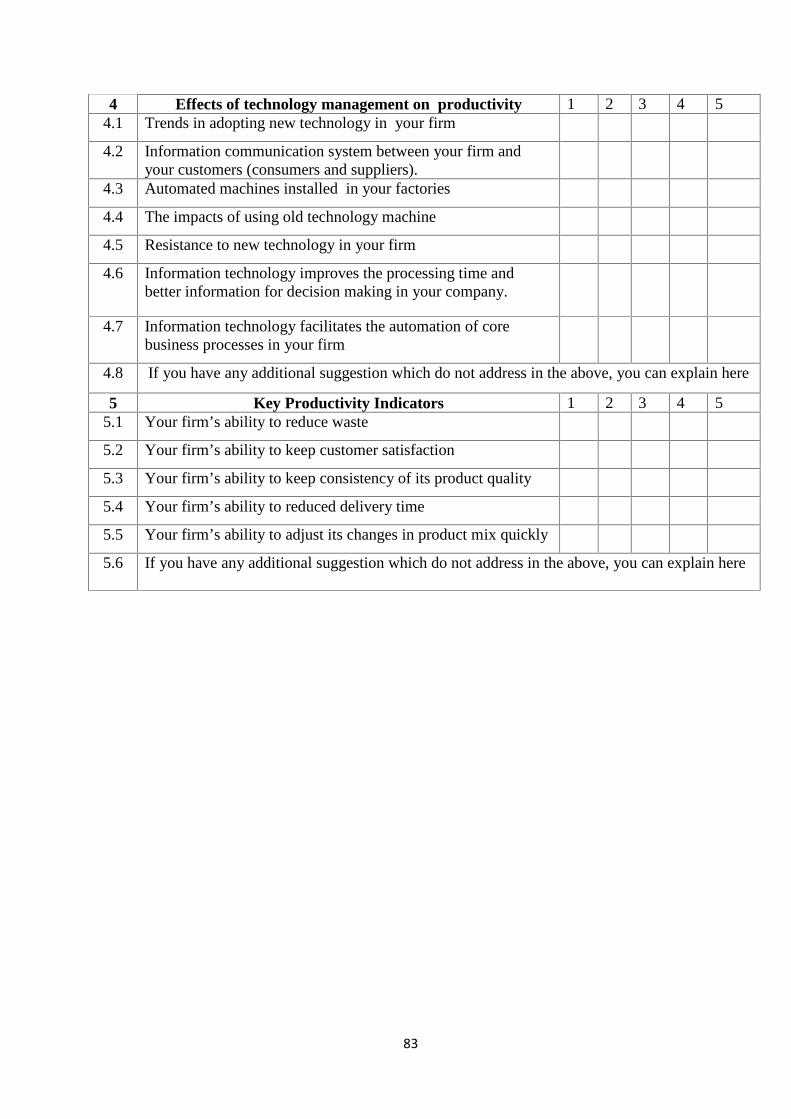
83
4 Effects of technology management on productivity 1 2 3 4 54.1 Trends in adopting new technology in your firm
4.2 Information communication system between your firm andyour customers (consumers and suppliers).
4.3 Automated machines installed in your factories
4.4 The impacts of using old technology machine
4.5 Resistance to new technology in your firm
4.6 Information technology improves the processing time andbetter information for decision making in your company.
4.7 Information technology facilitates the automation of corebusiness processes in your firm
4.8 If you have any additional suggestion which do not address in the above, you can explain here
5 Key Productivity Indicators 1 2 3 4 55.1 Your firm’s ability to reduce waste
5.2 Your firm’s ability to keep customer satisfaction
5.3 Your firm’s ability to keep consistency of its product quality
5.4 Your firm’s ability to reduced delivery time
5.5 Your firm’s ability to adjust its changes in product mix quickly
5.6 If you have any additional suggestion which do not address in the above, you can explain here

84
B. Interviewer questions designed to top management
1. How could you explain the effect of human resource management on productivity in the case
of your factory?
2. How could you explain the effect of raw material management practice on productivity in
your factory?
3. Do you think, working capital management affects the productivity of your factory
positively?
4. How could you explain the effects of technology management relative to productivity in the
case of your factory?

85
Appendix - B
Maximum imported and Local attainable as a base year.
No product type 2007E.C Net Wt. (Ton) 2008E.C Net Wt. (Ton) 2009E.CNet Wt. (Ton)
ImportedLocal
AttainableImported Local Attainable Imported
LocalAttainable
1 Aluminum profile 5,568 468 5,836 1,431 4,583 2,0552 Hollow section 63,509 48,642 144,981 80,370 108,568 87,7073 Rebar 518,559 386,270 974,804 408,259 688,823 441,3364 Roofing tiles 48,868 144,019 75,834 137,013 79,517 134,3635 Wire and nails 50,040 34,118 69,030 30,906 69,805 28,006
Source: Basic Metal Industry
Three year best performanceS.No
Item From 2007 to 2009 E.C best performance (Taken as base year) in Ton
No product typeImported
(1)
Localfactories
Attainable(2)
DesignCapacity
(3)
Gapbetween 1&2
Gapbetween 3&2
1 Aluminum profile 5,836 2,055 8,100 3,781 6,045
2 Hollow section 144,981 87,707 597,063 57,274 509,3563 Rebar 974,804 441,336 2,573,359 533,467 2,132,0234 Roofing tiles 79,517 144,019 676,440 (64,502) 532,421
5 Wire and nails 69,805 34,118 104,470 35,688 70,352
1,274,943 709,235 3,959,432 565,709 3,250,197
Source: Basic Metal Industry
Import vs Local manufacturer attainable annually
No product type Imported(Ton) Average Local Manufacturers Attainable(Ton)
1 Aluminum profile 5,836 2,5842 Hollow section 144,981 158,2483 Rebar 974,804 941,6414 Roofing tiles 79,517 325,8205 Wire and nails 69,805 74,359
Total 1,274,943 1,502,652
Source: Basic metal
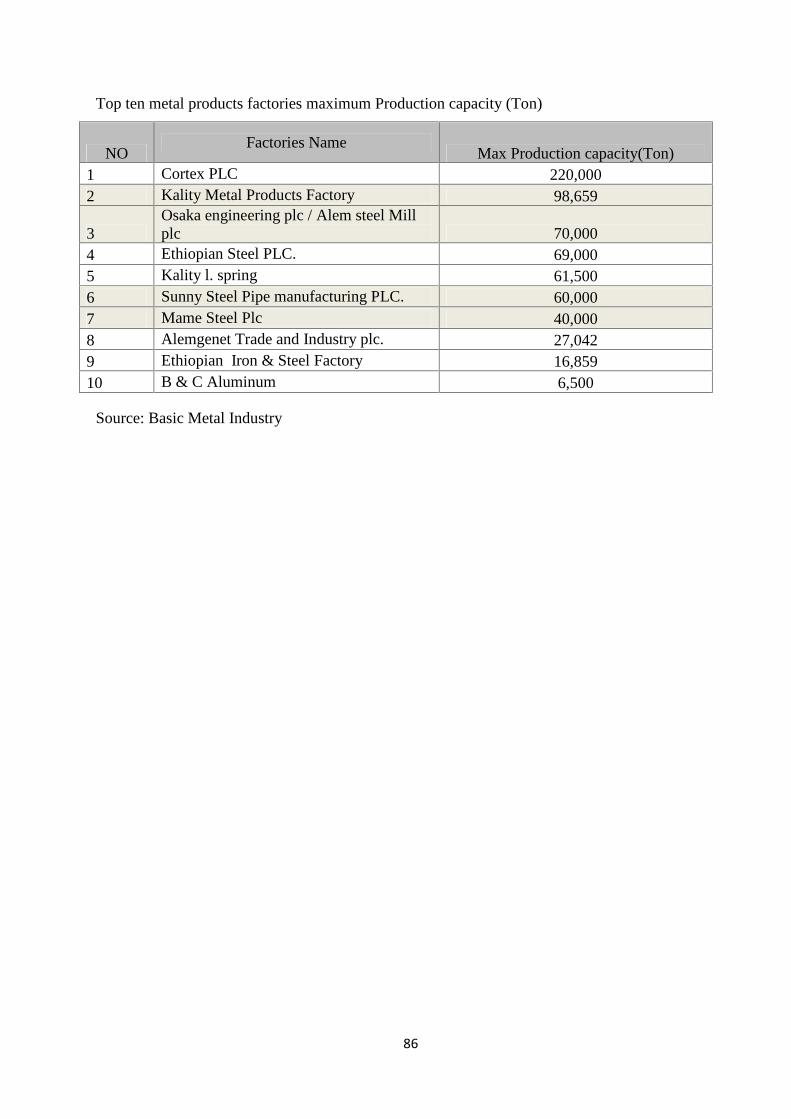
86
Top ten metal products factories maximum Production capacity (Ton)
NOFactories Name
Max Production capacity(Ton)1 Cortex PLC 220,0002 Kality Metal Products Factory 98,659
3Osaka engineering plc / Alem steel Millplc 70,000
4 Ethiopian Steel PLC. 69,0005 Kality l. spring 61,5006 Sunny Steel Pipe manufacturing PLC. 60,0007 Mame Steel Plc 40,0008 Alemgenet Trade and Industry plc. 27,0429 Ethiopian Iron & Steel Factory 16,85910 B & C Aluminum 6,500
Source: Basic Metal Industry
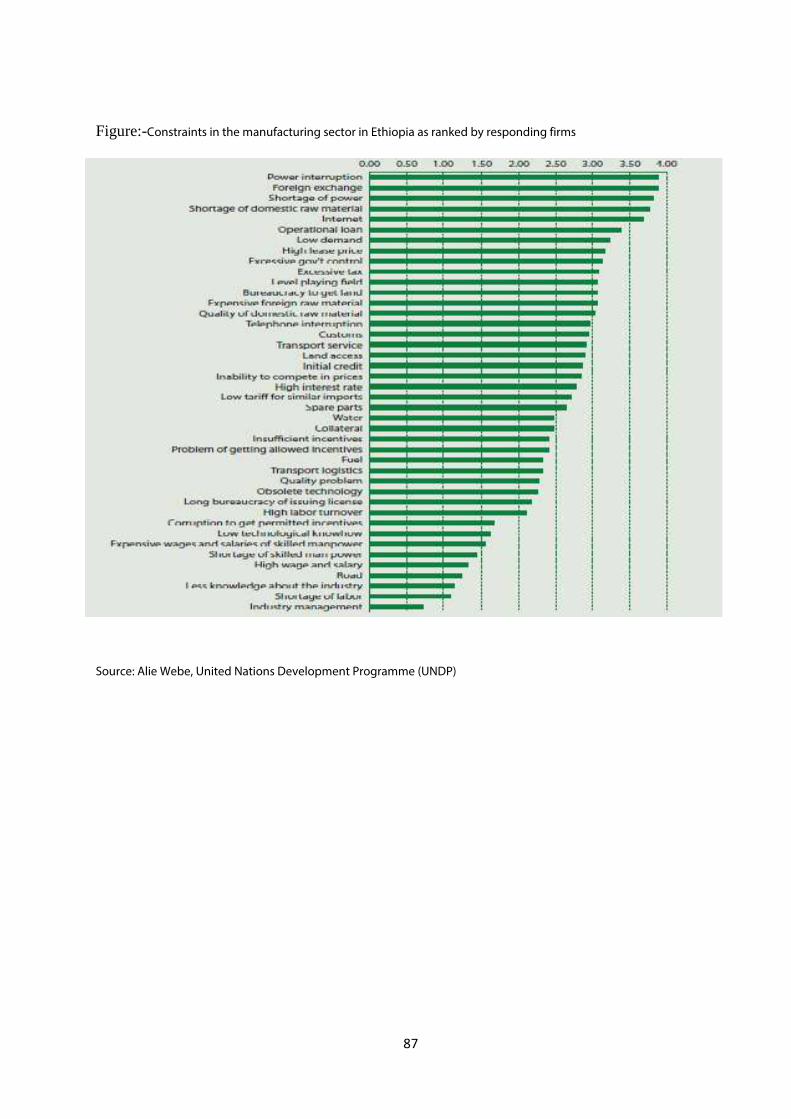
87
Figure:-Constraints in the manufacturing sector in Ethiopia as ranked by responding firms
Source: Alie Webe, United Nations Development Programme (UNDP)
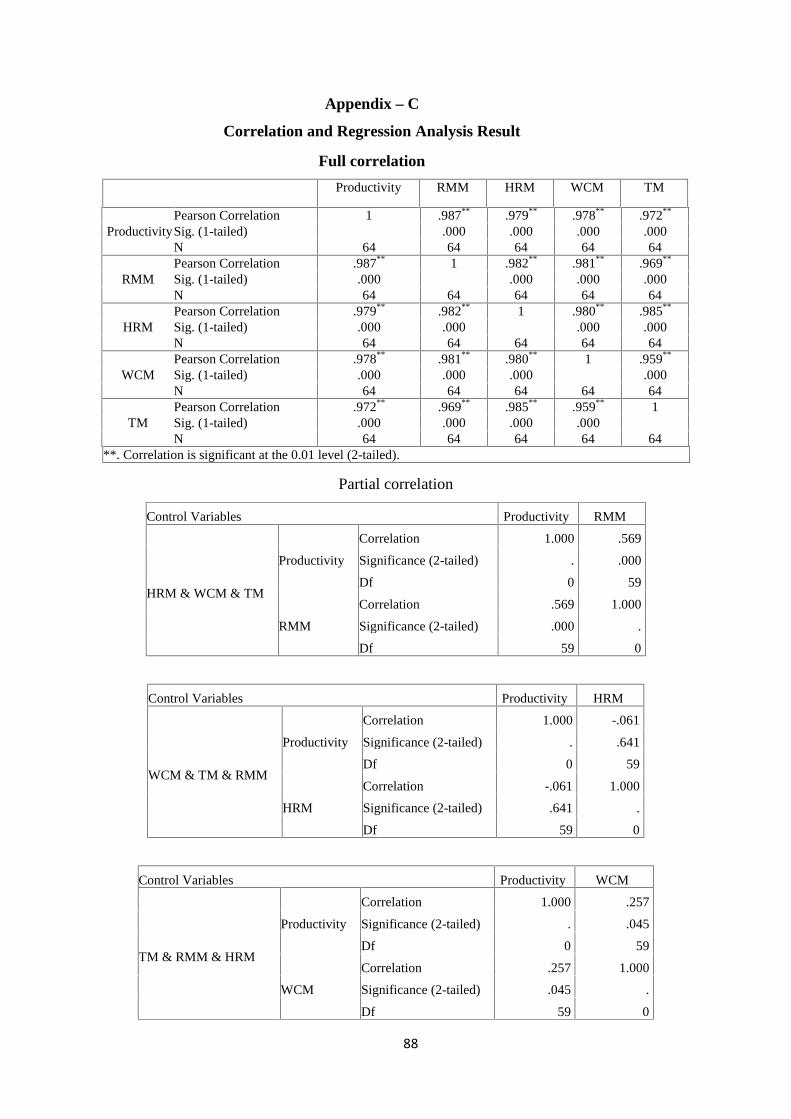
88
Appendix – C
Correlation and Regression Analysis Result
Full correlation
Productivity RMM HRM WCM TM
ProductivityPearson Correlation 1 .987** .979** .978** .972**
Sig. (1-tailed) .000 .000 .000 .000N 64 64 64 64 64
RMMPearson Correlation .987** 1 .982** .981** .969**
Sig. (1-tailed) .000 .000 .000 .000N 64 64 64 64 64
HRMPearson Correlation .979** .982** 1 .980** .985**
Sig. (1-tailed) .000 .000 .000 .000N 64 64 64 64 64
WCMPearson Correlation .978** .981** .980** 1 .959**
Sig. (1-tailed) .000 .000 .000 .000N 64 64 64 64 64
TMPearson Correlation .972** .969** .985** .959** 1Sig. (1-tailed) .000 .000 .000 .000N 64 64 64 64 64
**. Correlation is significant at the 0.01 level (2-tailed).
Partial correlation
Control Variables Productivity RMM
HRM & WCM & TM
Productivity
Correlation 1.000 .569
Significance (2-tailed) . .000
Df 0 59
RMM
Correlation .569 1.000
Significance (2-tailed) .000 .
Df 59 0
Control Variables Productivity HRM
WCM & TM & RMM
Productivity
Correlation 1.000 -.061
Significance (2-tailed) . .641
Df 0 59
HRM
Correlation -.061 1.000
Significance (2-tailed) .641 .
Df 59 0
Control Variables Productivity WCM
TM & RMM & HRM
Productivity
Correlation 1.000 .257
Significance (2-tailed) . .045
Df 0 59
WCM
Correlation .257 1.000
Significance (2-tailed) .045 .
Df 59 0

89
Control Variables Productivity TM
RMM & HRM & WCM
Productivity
Correlation 1.000 .288
Significance (2-tailed) . .024
Df 0 59
TM
Correlation .288 1.000
Significance (2-tailed) .024 .
Df 59 0
Model Summary
Model R R Square Adjusted R Square Std. Error of the Estimate
1 .990a .980 .979 .16558
ANOVA
Model Sum of Squares df Mean Square F Sig.
1
Regression 80.497 4 20.124 733.999 .000b
Residual 1.618 59 .027
Total 82.114 63
Coefficients
Model UnstandardizedCoefficients
StandardizedCoefficients
t Sig.
B Std. Error Beta
1
(Constant) -.221 .098 -2.260 .028
RMM .586 .110 .599 5.317 .000HRM .087 .185 .075 .469 .041WCM .250 .122 .220 2.045 .045TM .309 .134 .254 2.312 .024
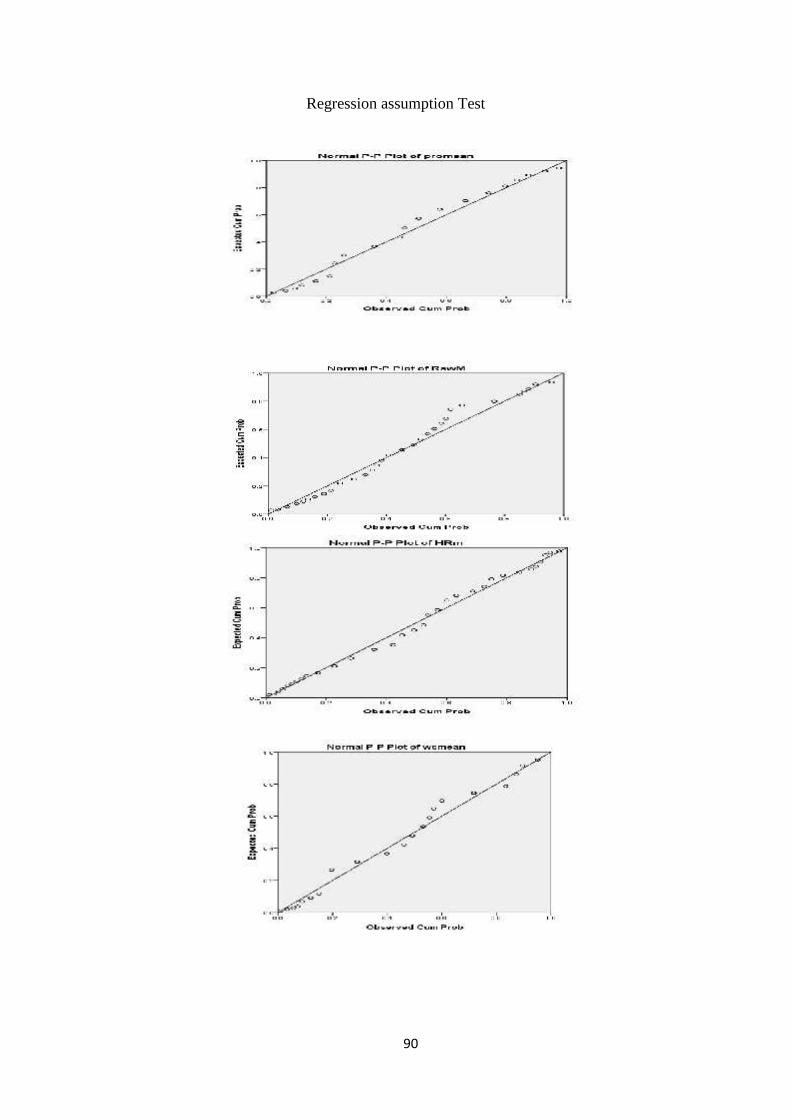
90
Regression assumption Test

91