THE CARRIER POWERPOINT TEMPLATE
77
INVESTOR DAY February 10, 2020
-
Upload
khangminh22 -
Category
Documents
-
view
0 -
download
0
Transcript of THE CARRIER POWERPOINT TEMPLATE

INVESTOR DAY
February 10, 2020
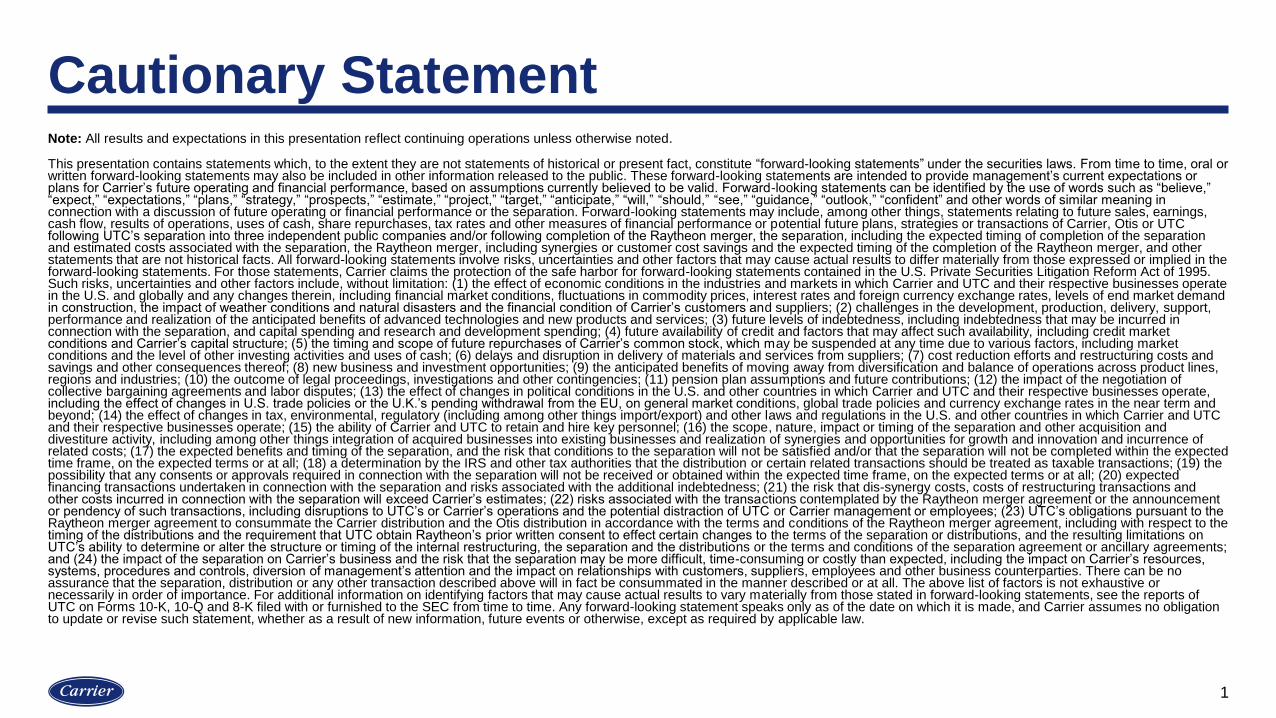
Cautionary StatementNote: All results and expectations in this presentation reflect continuing operations unless otherwise noted.
This presentation contains statements which, to the extent they are not statements of historical or present fact, constitute “forward-looking statements” under the securities laws. From time to time, oral or written forward-looking statements may also be included in other information released to the public. These forward-looking statements are intended to provide management’s current expectations or plans for Carrier’s future operating and financial performance, based on assumptions currently believed to be valid. Forward-looking statements can be identified by the use of words such as “believe,” “expect,” “expectations,” “plans,” “strategy,” “prospects,” “estimate,” “project,” “target,” “anticipate,” “will,” “should,” “see,” “guidance,” “outlook,” “confident” and other words of similar meaning in connection with a discussion of future operating or financial performance or the separation. Forward-looking statements may include, among other things, statements relating to future sales, earnings, cash flow, results of operations, uses of cash, share repurchases, tax rates and other measures of financial performance or potential future plans, strategies or transactions of Carrier, Otis or UTC following UTC’s separation into three independent public companies and/or following completion of the Raytheon merger, the separation, including the expected timing of completion of the separation and estimated costs associated with the separation, the Raytheon merger, including synergies or customer cost savings and the expected timing of the completion of the Raytheon merger, and other statements that are not historical facts. All forward-looking statements involve risks, uncertainties and other factors that may cause actual results to differ materially from those expressed or implied in the forward-looking statements. For those statements, Carrier claims the protection of the safe harbor for forward-looking statements contained in the U.S. Private Securities Litigation Reform Act of 1995. Such risks, uncertainties and other factors include, without limitation: (1) the effect of economic conditions in the industries and markets in which Carrier and UTC and their respective businesses operate in the U.S. and globally and any changes therein, including financial market conditions, fluctuations in commodity prices, interest rates and foreign currency exchange rates, levels of end market demand in construction, the impact of weather conditions and natural disasters and the financial condition of Carrier’s customers and suppliers; (2) challenges in the development, production, delivery, support, performance and realization of the anticipated benefits of advanced technologies and new products and services; (3) future levels of indebtedness, including indebtedness that may be incurred in connection with the separation, and capital spending and research and development spending; (4) future availability of credit and factors that may affect such availability, including credit market conditions and Carrier’s capital structure; (5) the timing and scope of future repurchases of Carrier’s common stock, which may be suspended at any time due to various factors, including market conditions and the level of other investing activities and uses of cash; (6) delays and disruption in delivery of materials and services from suppliers; (7) cost reduction efforts and restructuring costs and savings and other consequences thereof; (8) new business and investment opportunities; (9) the anticipated benefits of moving away from diversification and balance of operations across product lines, regions and industries; (10) the outcome of legal proceedings, investigations and other contingencies; (11) pension plan assumptions and future contributions; (12) the impact of the negotiation of collective bargaining agreements and labor disputes; (13) the effect of changes in political conditions in the U.S. and other countries in which Carrier and UTC and their respective businesses operate, including the effect of changes in U.S. trade policies or the U.K.’s pending withdrawal from the EU, on general market conditions, global trade policies and currency exchange rates in the near term and beyond; (14) the effect of changes in tax, environmental, regulatory (including among other things import/export) and other laws and regulations in the U.S. and other countries in which Carrier and UTC and their respective businesses operate; (15) the ability of Carrier and UTC to retain and hire key personnel; (16) the scope, nature, impact or timing of the separation and other acquisition and divestiture activity, including among other things integration of acquired businesses into existing businesses and realization of synergies and opportunities for growth and innovation and incurrence of related costs; (17) the expected benefits and timing of the separation, and the risk that conditions to the separation will not be satisfied and/or that the separation will not be completed within the expected time frame, on the expected terms or at all; (18) a determination by the IRS and other tax authorities that the distribution or certain related transactions should be treated as taxable transactions; (19) the possibility that any consents or approvals required in connection with the separation will not be received or obtained within the expected time frame, on the expected terms or at all; (20) expected financing transactions undertaken in connection with the separation and risks associated with the additional indebtedness; (21) the risk that dis-synergy costs, costs of restructuring transactions and other costs incurred in connection with the separation will exceed Carrier’s estimates; (22) risks associated with the transactions contemplated by the Raytheon merger agreement or the announcement or pendency of such transactions, including disruptions to UTC’s or Carrier’s operations and the potential distraction of UTC or Carrier management or employees; (23) UTC’s obligations pursuant to the Raytheon merger agreement to consummate the Carrier distribution and the Otis distribution in accordance with the terms and conditions of the Raytheon merger agreement, including with respect to the timing of the distributions and the requirement that UTC obtain Raytheon’s prior written consent to effect certain changes to the terms of the separation or distributions, and the resulting limitations on UTC’s ability to determine or alter the structure or timing of the internal restructuring, the separation and the distributions or the terms and conditions of the separation agreement or ancillary agreements; and (24) the impact of the separation on Carrier’s business and the risk that the separation may be more difficult, time-consuming or costly than expected, including the impact on Carrier’s resources, systems, procedures and controls, diversion of management’s attention and the impact on relationships with customers, suppliers, employees and other business counterparties. There can be no assurance that the separation, distribution or any other transaction described above will in fact be consummated in the manner described or at all. The above list of factors is not exhaustive or necessarily in order of importance. For additional information on identifying factors that may cause actual results to vary materially from those stated in forward-looking statements, see the reports of UTC on Forms 10-K, 10-Q and 8-K filed with or furnished to the SEC from time to time. Any forward-looking statement speaks only as of the date on which it is made, and Carrier assumes no obligation to update or revise such statement, whether as a result of new information, future events or otherwise, except as required by applicable law.
1

Agenda
2
Timing Topics Presenter
8:00am - 9:00am Registration
9:00am - 10:20am
Carrier Overview David Gitlin President & CEO
HVAC-Commercial Chris Nelson President, HVAC-Commercial
HVAC-Residential Matthew Pine President, HVAC-Residential
10:20am - 10:45am Break
Refrigeration David Appel President, Refrigeration
Fire & Security Jurgen Timperman President, Fire & Security
Financial Tim McLevish CFO
Q&A All Presenters
12:15pm - 1:15pm Reception
10:45am - 12:15pm

3
TM
We’ve forged entire industries. We’ve
built iconic brands. We’ve pioneered
more than 100 years of firsts. And now,
as an independent, focused company,
our best days are ahead of us.
This is the new Carrier –
and Change is in the Air.

This document does not contain any export controlled technical data.
Why Carrier
4
Megatrends drive sustained industry growth
Strong foundation with leading positions
Runway to drive accelerated top and bottom line
growth
Portfolio optionality enables further value creation

Carrier Overview
5
Sales* $18.6B
Adj. Op Profit** $2.6B
Adj. Op Profit %** 14.2%
*Total Carrier sales net of ($0.4B) of eliminations**2019 Standalone proforma adjusted operating profit. See appendix for additional information regarding these non-GAAP measures
Americas
EMEA
Asia Pacific
Americas
EMEA
Asia Pacific
~53,000
EMPLOYEES
SALES
MIX
SALES
New Equipment
Services and Aftermarket
Sales $9.7B
Adj. Op** $1.6B
Adj. Op %** 16.9%
HVACFire &
SecurityRefrigeration
Sales $5.5B
Adj. Op** $0.7B
Adj. Op %** 13.5%
Sales $3.8B
Adj. Op** $0.5B
Adj. Op %** 13.5%
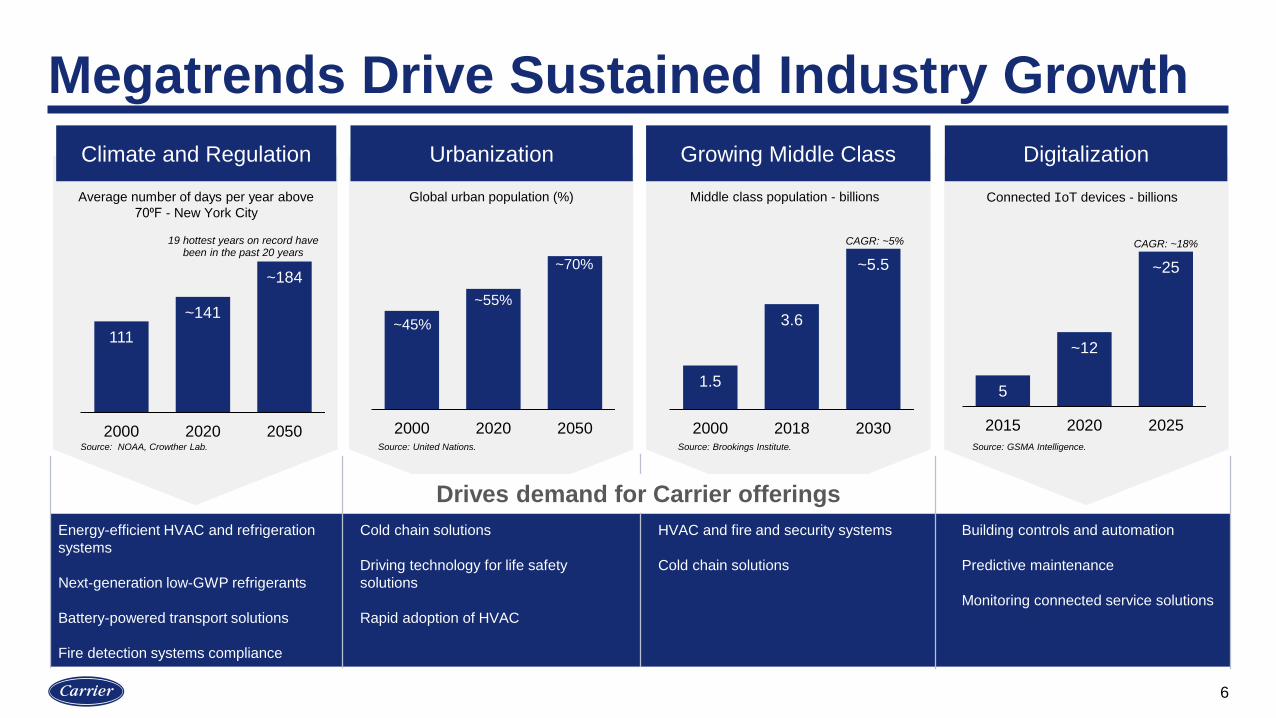
Megatrends Drive Sustained Industry Growth
6
Climate and Regulation Urbanization Growing Middle Class Digitalization
111
~141
~184
2000 2020 2050 2000 2020 2050
Average number of days per year above
70⁰F - New York City
1.5
3.6
~5.5
2000 2018 2030
Global urban population (%) Middle class population - billions Connected IoT devices - billions
5
~12
~25
2015 2020 2025
Energy-efficient HVAC and refrigeration
systems
Next-generation low-GWP refrigerants
Battery-powered transport solutions
Fire detection systems compliance
Cold chain solutions
Driving technology for life safety
solutions
Rapid adoption of HVAC
HVAC and fire and security systems
Cold chain solutions
Building controls and automation
Predictive maintenance
Monitoring connected service solutions
Drives demand for Carrier offerings
Source: United Nations. Source: Brookings Institute.Source: NOAA, Crowther Lab. Source: GSMA Intelligence.
~45%
~55%
~70%
19 hottest years on record have been in the past 20 years
CAGR: ~5% CAGR: ~18%
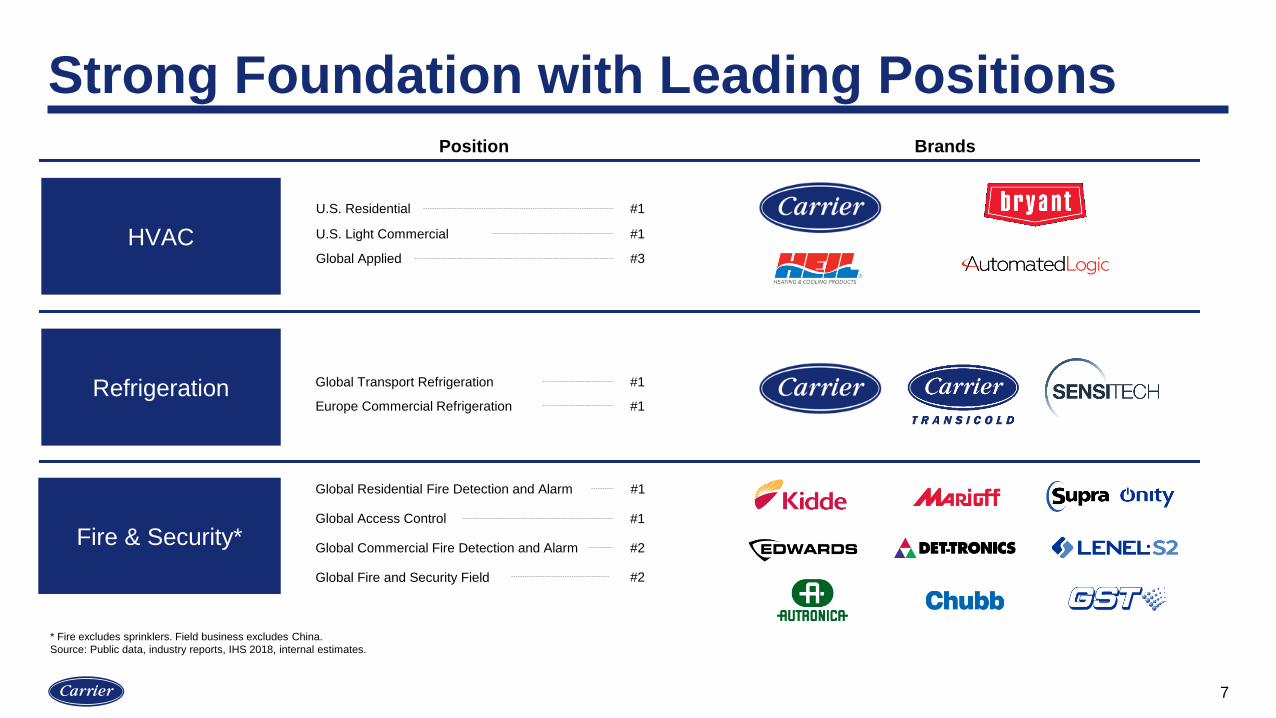
Strong Foundation with Leading Positions
7
Position
HVAC
Refrigeration
Brands
U.S. Residential
U.S. Light Commercial
Europe Commercial Refrigeration
#1
#1
#1
Global Applied #3
Global Transport Refrigeration #1
Global Residential Fire Detection and Alarm
Global Fire and Security Field
Global Commercial Fire Detection and Alarm
#1
#2
#2
Global Access Control #1
Fire & Security*
* Fire excludes sprinklers. Field business excludes China.
Source: Public data, industry reports, IHS 2018, internal estimates.
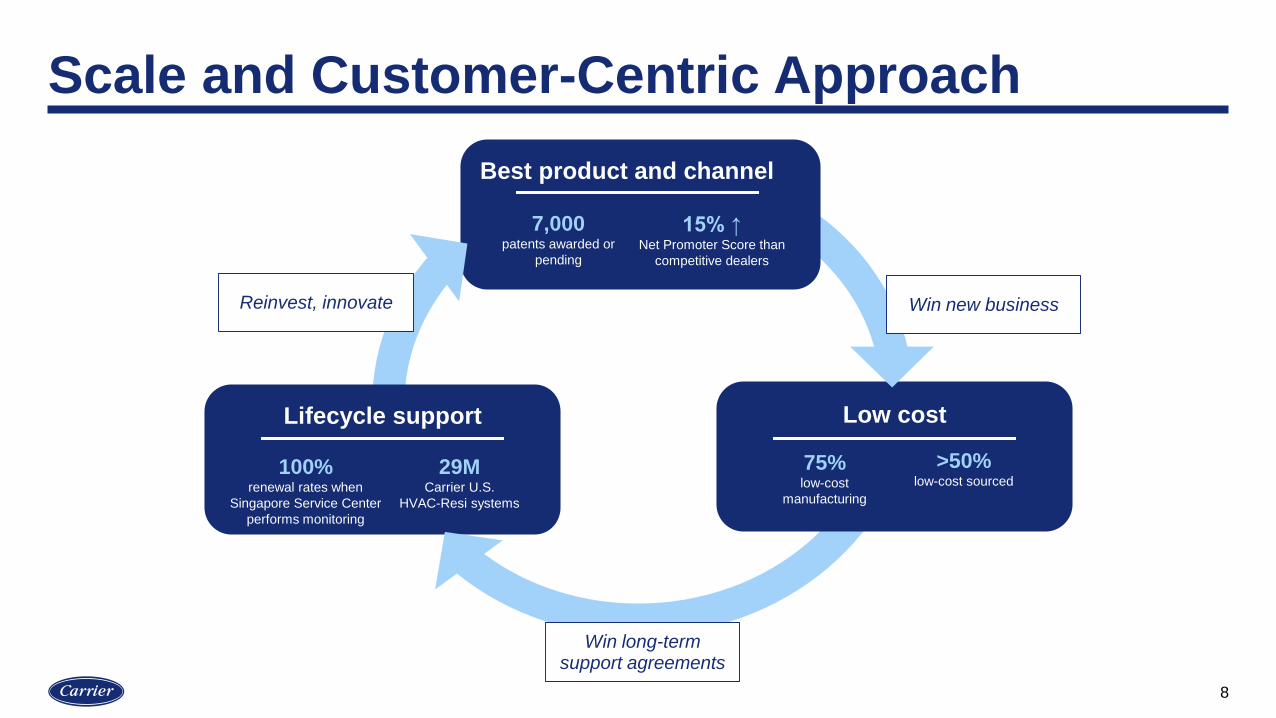
Scale and Customer-Centric Approach
8
Lifecycle support
Win new business
Win long-term support agreements
Reinvest, innovate
29MCarrier U.S.
HVAC-Resi systems
100%renewal rates when
Singapore Service Center
performs monitoring
Low cost
75%low-cost
manufacturing
>50% low-cost sourced
Best product and channel
7,000patents awarded or
pending
15% ↑Net Promoter Score than
competitive dealers
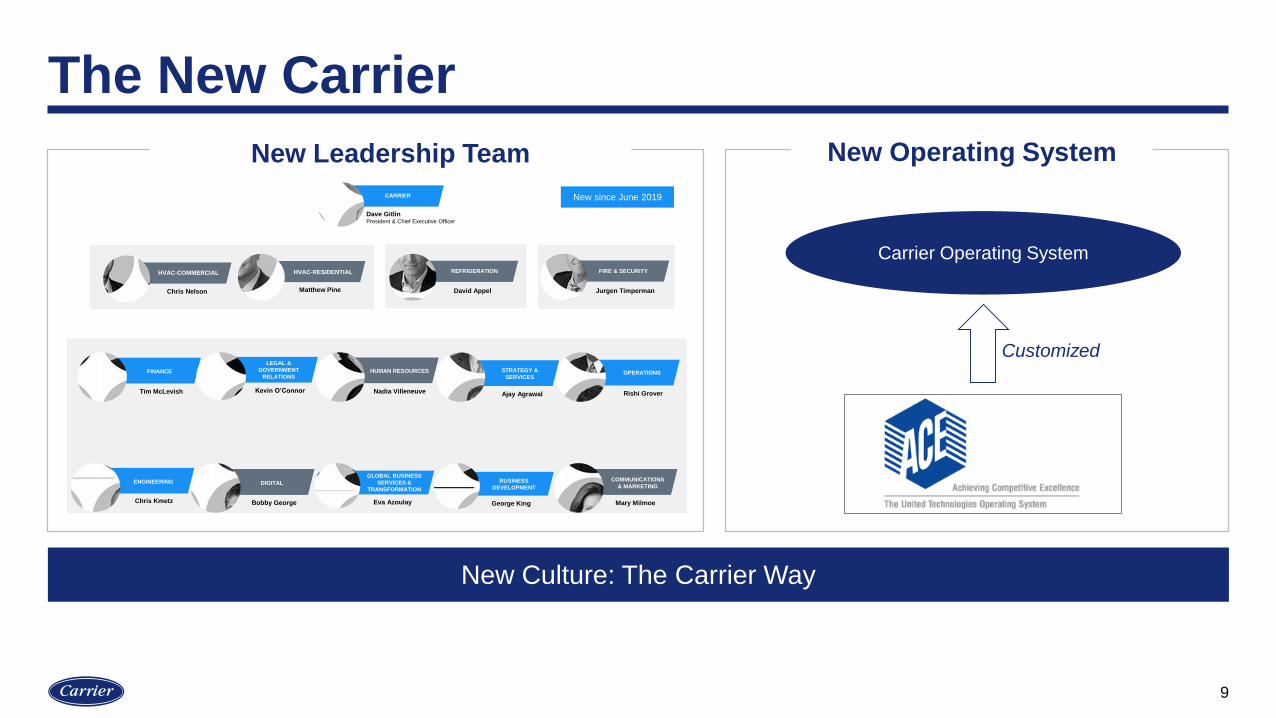
The New Carrier
9
Chris Nelson
COMMERCIAL HVAC RESIDENTIAL HVAC REFRIGERATION
Jurgen Timperman
FIRE & SECURITY
Matthew Pine David Appel
Dave GitlinPresident & Chief Executive Officer
CARRIER New since June 2019
George King
BUSINESS
DEVELOPMENT
Mary Milmoe
COMMUNICATIONS
& MARKETING
Bobby George
DIGITAL
Chris Kmetz
ENGINEERING
Tim McLevish
FINANCE
Eva Azoulay
GLOBAL BUSINESS
SERVICES &
TRANSFORMATION
Nadia Villeneuve
HUMAN RESOURCES
Kevin O’Connor
LEGAL &
GOVERNMENT
RELATIONS
Rishi Grover
OPERATIONS
Ajay Agrawal
STRATEGY &
SERVICES
New Leadership Team New Operating System
New Culture: The Carrier Way
Chris Nelson
COMMERCIAL HVAC RESIDENTIAL HVAC REFRIGERATION
Jurgen Timperman
FIRE & SECURITY
Matthew Pine David Appel
Dave GitlinPresident & Chief Executive Officer
CARRIER New since June 2019
George King
BUSINESS
DEVELOPMENT
Mary Milmoe
COMMUNICATIONS
& MARKETING
Bobby George
DIGITAL
Chris Kmetz
ENGINEERING
Tim McLevish
FINANCE
Eva Azoulay
GLOBAL BUSINESS
SERVICES &
TRANSFORMATION
Nadia Villeneuve
HUMAN RESOURCES
Kevin O’Connor
LEGAL &
GOVERNMENT
RELATIONS
Rishi Grover
OPERATIONS
Ajay Agrawal
STRATEGY &
SERVICES
HVAC-RESIDENTIALHVAC-COMMERCIAL
New since June 2019
Carrier Operating System
Customized
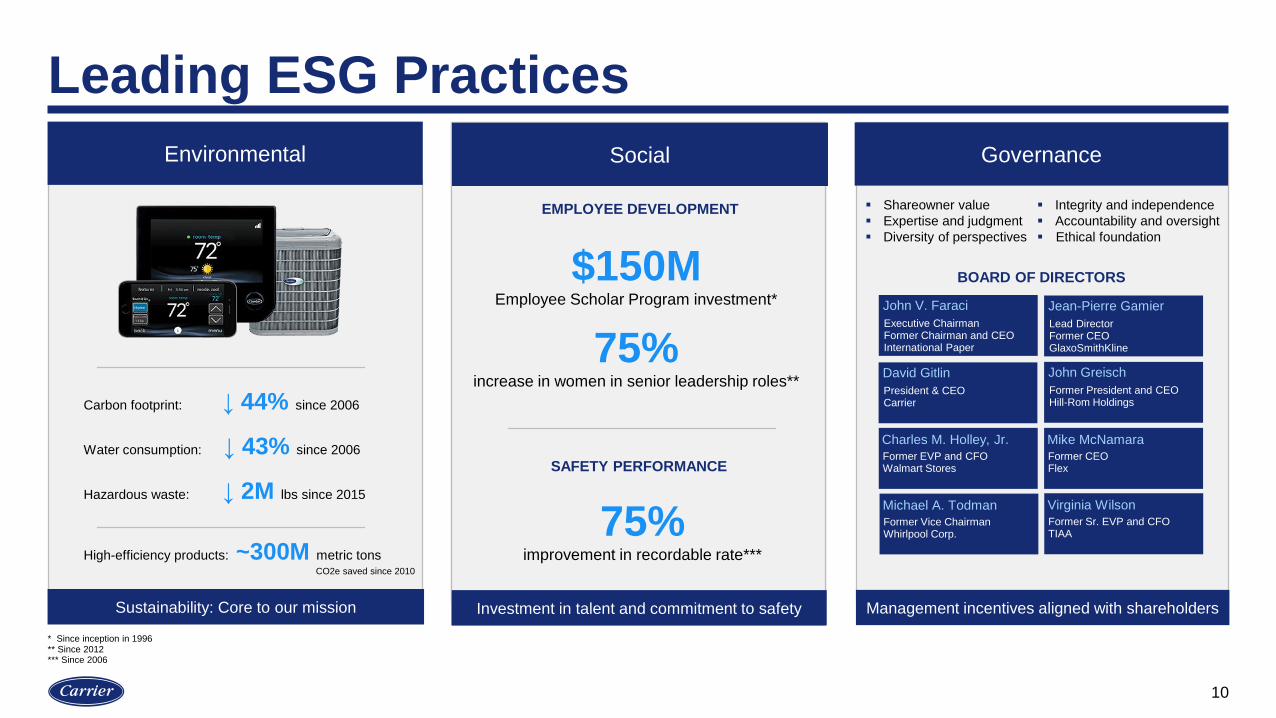
Leading ESG Practices
10
Environmental
$150MEmployee Scholar Program investment*
8,400Degrees granted*
* Since inception in 1996** Since 2012*** Since 2006
Social
Carbon footprint: ↓ 44% since 2006
Water consumption: ↓ 43% since 2006
Hazardous waste: ↓ 2M lbs since 2015
High-efficiency products: ~300M metric tons
Governance
Shareowner value
Expertise and judgment
Diversity of perspectives
Sustainability: Core to our mission Investing in talent development … Management incentives aligned with shareholders
CO2e saved since 2010
Integrity and independence
Accountability and oversight
Ethical foundation
BOARD OF DIRECTORS
Executive ChairmanFormer Chairman and CEOInternational Paper
John V. Faraci
Former EVP and CFOWalmart Stores
Charles M. Holley, Jr.
Lead DirectorFormer CEOGlaxoSmithKline
Jean-Pierre Gamier
Former CEOFlex
Mike McNamara
President & CEOCarrier
David Gitlin
Former Vice ChairmanWhirlpool Corp.
Michael A. Todman
Former President and CEOHill-Rom Holdings
John Greisch
Former Sr. EVP and CFOTIAA
Virginia Wilson
$150MEmployee Scholar Program investment*
75%increase in women in senior leadership roles**
Social
Investment in talent and commitment to safety
EMPLOYEE DEVELOPMENT
SAFETY PERFORMANCE
75%improvement in recordable rate***

Strategic Focus to Drive Top and Bottom Line Growth
11
Strengthen and Grow CoreIncrease Product Extensions and
Geographic CoverageGrow Services and Digital
Increase share Grow the pie:
Additional equipment sales
Grow the pie:
Recurring revenue streams
Increasing sales force: ~500 employees
Increasing R&D spending: ~$50M
Targeted initiatives
Examples: VRF, China expansion,
cold chain
Increasing attachment rates
Tiered service offerings

Digital to Drive Top and Bottom Line Growth
12
RUN
GROW
TRANSFORM
Optimize industrial productivity
Applying digital tools to enhance customer value and increase attachment rates
New value propositions and integrated
offerings
Financial impact
Digital maturity
70% of our workloads to the cloud
within 36 months
Increase customer portal use by 2X in 36 months
Increase refrigeration connected products
by 3X in 18 months

Carrier 600 to Drive Top and Bottom Line Growth
13
~600M
0
100
200
300
400
500
600
700
2020 2021 2022
Supply Chain
Factory
General and Administrative
Cumulative Cost Reduction Target
Su
pp
ly C
hain
Facto
ryG
en
era
l &
Ad
min
istr
ati
ve
(vs. 2019, $M)
Su
pp
ly C
hain
Facto
ryG
en
era
l an
d
Ad
min
istr
ati
ve
Low cost
High cost
Low cost
High cost
2019 2022
Low-cost make
Hours
Low-cost buy
Spend
Low-cost buy
Spend
Global Business Services
~1.2X
2019 2022
Automated hours
~2X
2019 2022
Shared services and automation(G&A/sales)
~150
bps
2019 2022
(G&A employees performing shared service roles)
~2.5X

Portfolio Optionality Enables Further Value Creation
14
Disciplined portfolio review process
Focused
Differentiated
Synergistic
Growth / marginBest results as part of Carrier
Best use of capital
Future state
Strategic
fit
Financial
profile
Best
Owner
Aligns with portfolio
Revenue and cost synergies
Accelerates growth and margin expansion
Meets M&A and JV financial criteria
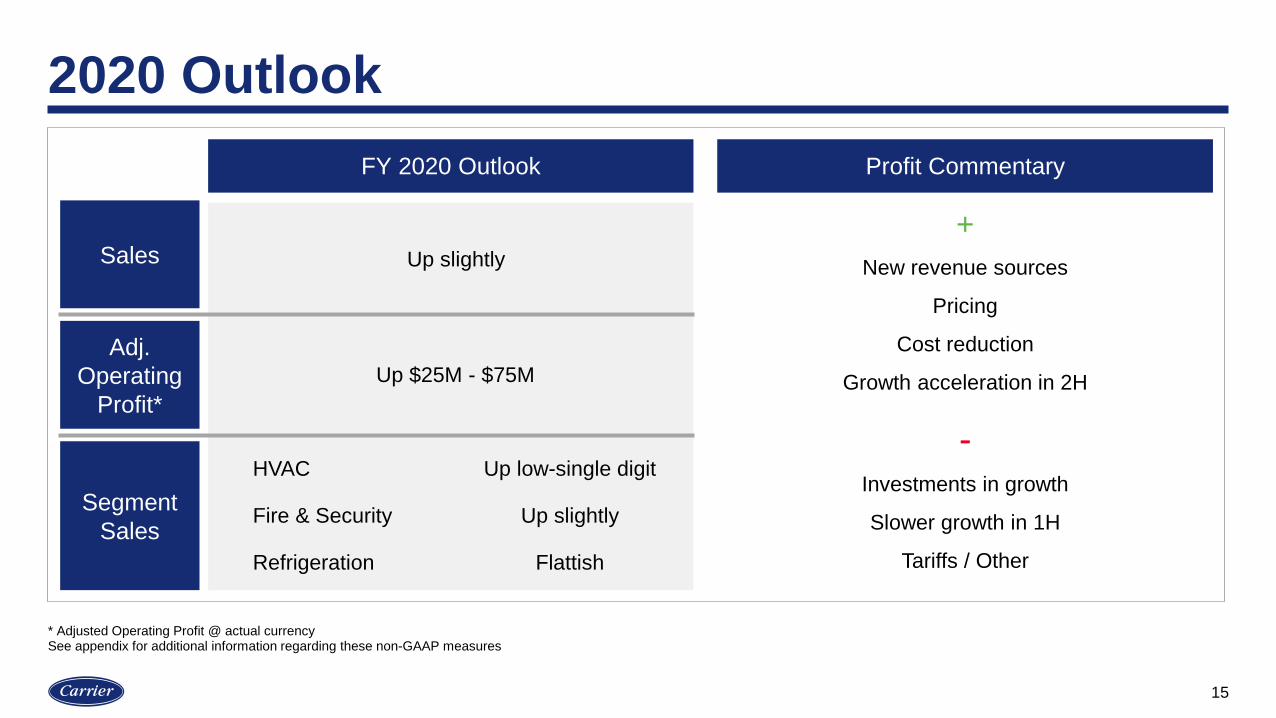
2020 Outlook
15
FY 2020 Outlook
Up slightly
HVAC Up low-single digit
Fire & Security Up slightly
Refrigeration Flattish
Up $25M - $75M
Sales
Segment
Sales
Profit Commentary
+
-
New revenue sources
Pricing
Cost reduction
Growth acceleration in 2H
Investments in growth
Slower growth in 1H
Tariffs / Other
Adj.
Operating
Profit*
* Adjusted Operating Profit @ actual currency See appendix for additional information regarding these non-GAAP measures

Medium-term Expectations
16
Sales
Free Cash Flow1
Adjusted EPS1
Up mid-single digits
90 – 100% cash conversion
Up high-single digits
1 See appendix for additional information regarding non-GAAP measures
This document does not contain any export controlled technical data
Key Takeaways
TM
17
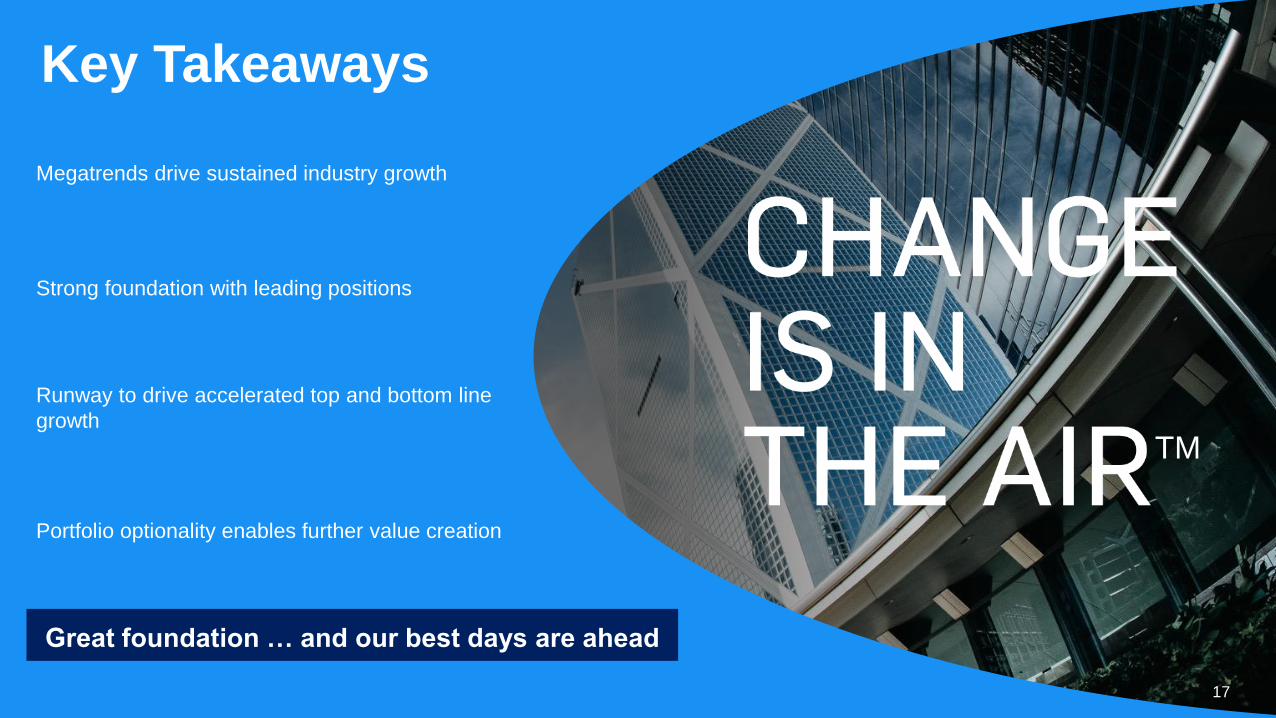
Great foundation … and our best days are ahead
Megatrends drive sustained industry growth
Strong foundation with leading positions
Runway to drive accelerated top and bottom line
growth
Portfolio optionality enables further value creation

HVAC
Chris Nelson and Matthew Pine
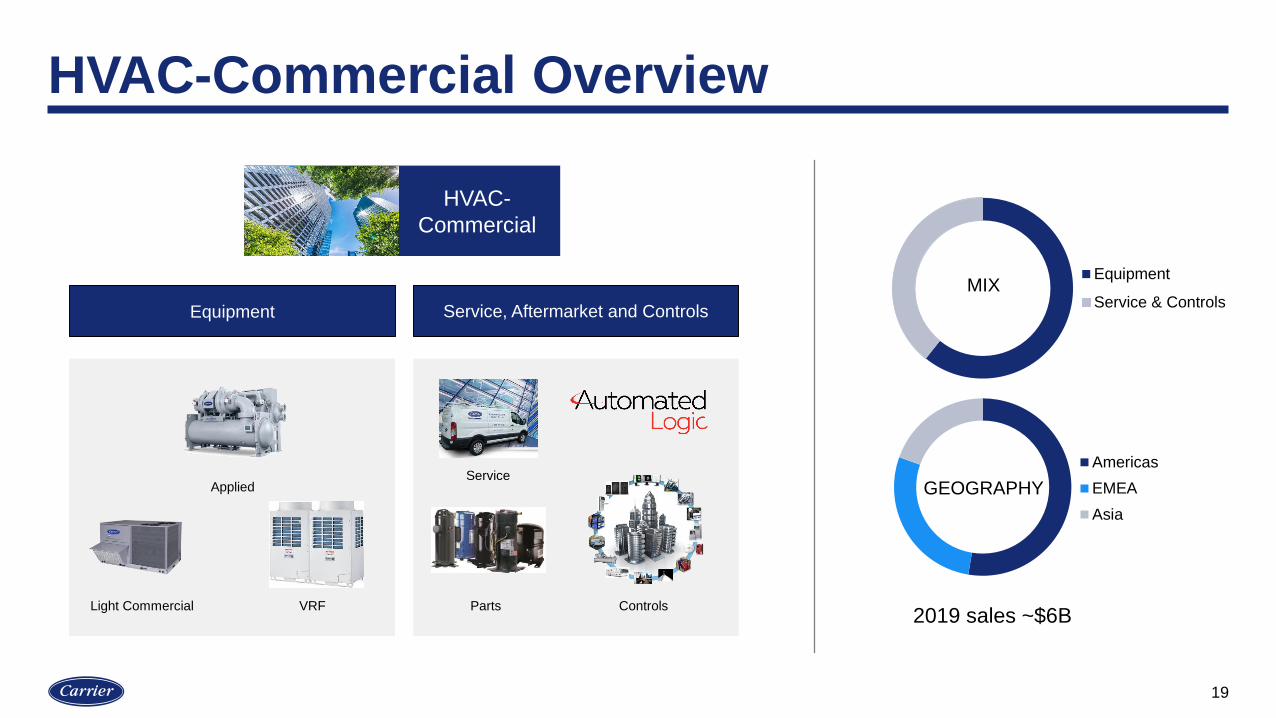
HVAC-Commercial Overview
19
HVAC-
Commercial
Equipment
Service & Controls
Americas
EMEA
Asia
MIX
GEOGRAPHY
2019 sales ~$6B
Equipment Service, Aftermarket and Controls
Service
Light Commercial Parts ControlsVRF
Applied

Industry Trends Support Sustained Growth
Urbanization
Higher demand for
new equipment
Climate and Regulation
Accelerated demand for
high-efficiencyproducts
Growing Installed Base
Access to data will drive
service opportunities
20
Digitalization
Service demand will
grow above GDP
Global sales channel~25% of equipment sales are
high efficiencyService branches in 40+
countries400M+ sq. feet monitored
Building energy consumption
10 12 14 16 18 20 22 24
Carrier global installed base
HVAC
40%
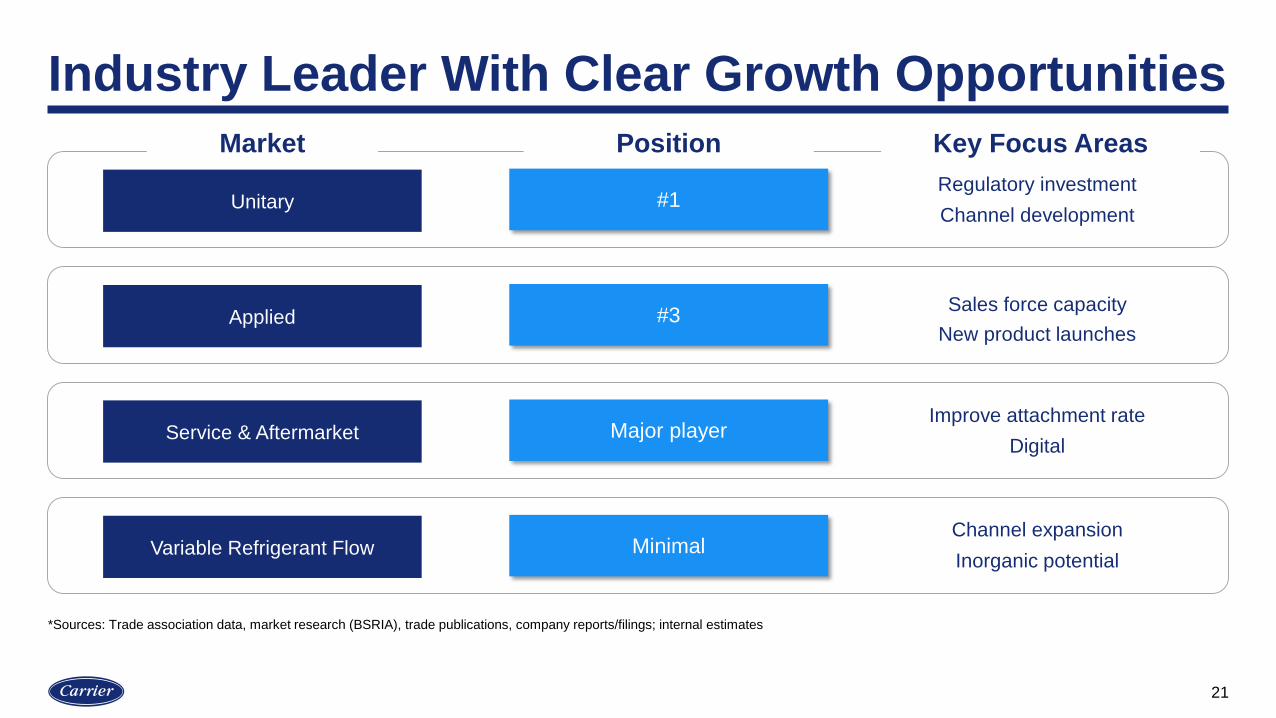
Industry Leader With Clear Growth Opportunities
21
*Sources: Trade association data, market research (BSRIA), trade publications, company reports/filings; internal estimates
AppliedSales force capacity
New product launches
UnitaryRegulatory investment
Channel development
Variable Refrigerant FlowChannel expansion
Inorganic potential
Service & AftermarketDigital
Improve attachment rate
Market Position Key Focus Areas
#3
#1
Minimal
Major player
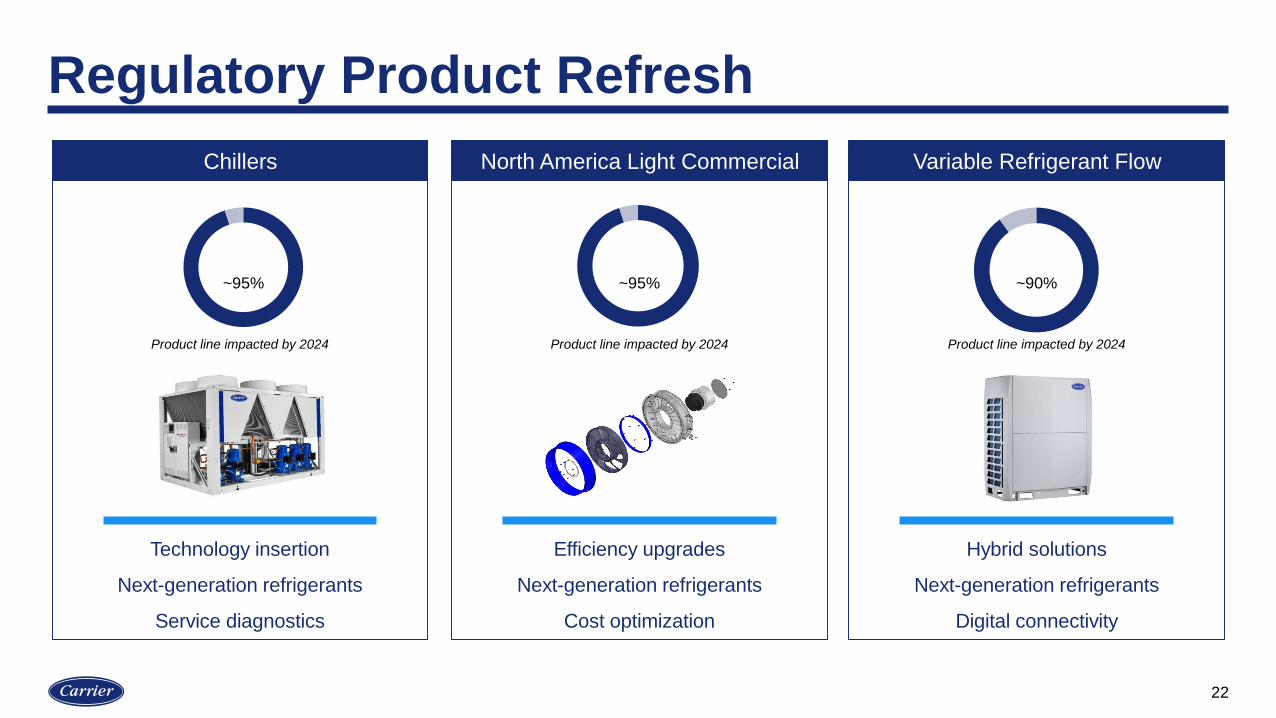
Regulatory Product Refresh
22
Chillers Variable Refrigerant FlowNorth America Light Commercial
Technology insertion
Next-generation refrigerants
Service diagnostics
Efficiency upgrades
Next-generation refrigerants
Cost optimization
Hybrid solutions
Next-generation refrigerants
Digital connectivity
Product line impacted by 2024Product line impacted by 2024 Product line impacted by 2024
~95% ~95% ~90%

Growth Strategies
Grow the base
Sales force capacity
Right products
Rapidly grow VRF Accelerate service growth
Digital offeringExpansion in China
Strengthen and Grow CoreIncrease Product Extensions and Geographic Coverage
Grow Services and Digital
23
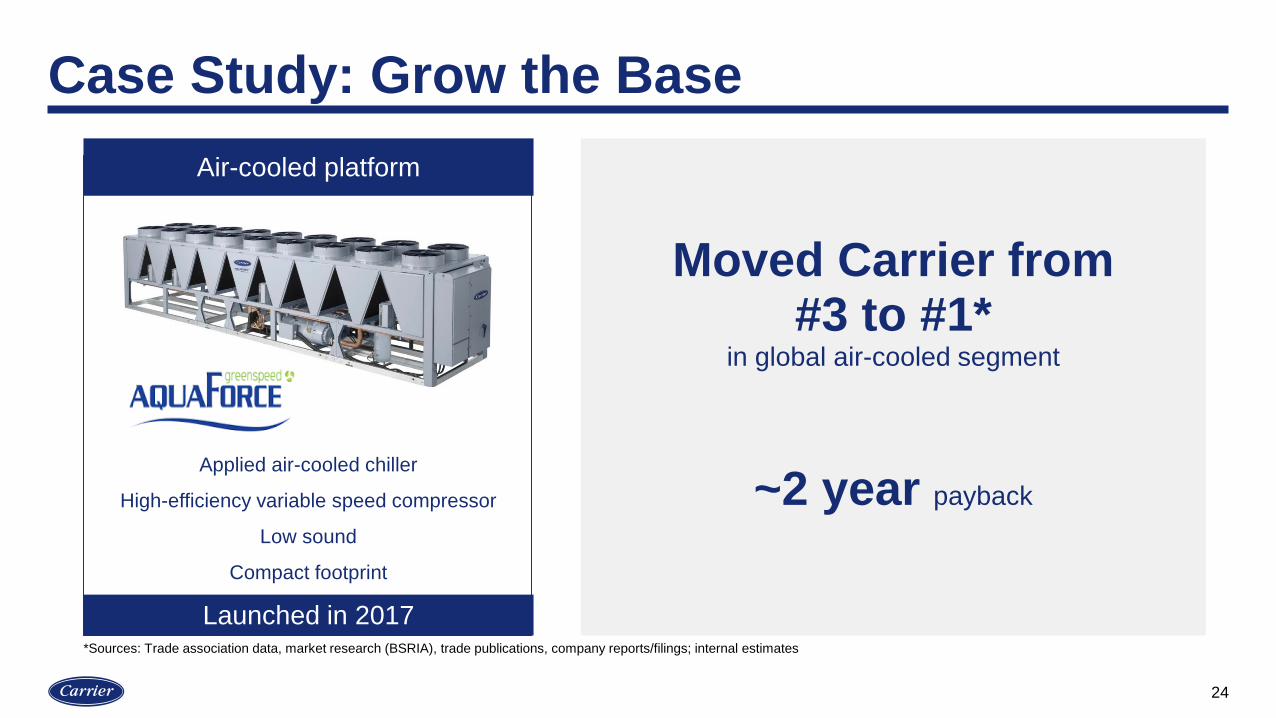
Case Study: Grow the Base
24
Air-cooled platform
Launched in 2017
Applied air-cooled chiller
High-efficiency variable speed compressor
Low sound
Compact footprint
~2 year payback
Moved Carrier from #3 to #1*
in global air-cooled segment
*Sources: Trade association data, market research (BSRIA), trade publications, company reports/filings; internal estimates

Carrier 600
25
HVAC-Commercial
Leverage global supply chain opportunity while continuing to drive productivity
Supply Chain
Factory
Field
~40%commonality*
improvement in global air-cooled
scroll chiller platform
~15%reductionsquare feet by 2022
Supply chain example
Factory example
*Source: Internal engineering analysisInternal engineering analysis

Wrap-up
Global business with iconic brand
Opportunity to grow in excess of core markets
Accelerate service growth through improved attachment
Focused investment in product and sales force
Cost productivity expected to fuel investments
26

HVAC
Chris Nelson and Matthew Pine

HVAC-Residential Overview
28
Brands Leadership DistributionStrong brand portfolio Core products Most trusted network
HVAC -NA Residential
Net Promoter Score®
15%higher than
competitive
dealers
Air Conditioner /
Heat Pump
Gas furnaces
Small packagedSegment share
Valu
e M
id
P
rem
ium
Source: KeyStat. Net Promoter Score is a trademark of
Satmetrix Systems, Inc., Bain & Company, Inc., and Fred
Reichheld
Source: AHRI, industry reports, investor presentations & internal
estimates
#1
#1
#1

Trends Support Industry Growth
29
Housing StartsReplacement Cycle
Expect low interest rates to
continue to drive near-term growth
Continued replacement strength
through coming years
Unemployment Rate %
Unemployment
50 year low in unemployment driving strong consumer confidence
9.3%8.5%
7.9%
6.7%5.6%
5.0% 4.7%4.1% 3.9% 3.5%
2010 2011 2012 2013 2014 2015 2016 2017 2018 2019
Source: U.S. Bureau of Labor Statistics. Seasonally adjusted. Annual, end of period

Differentiation
30
Ducted Air Conditioner / Heat Pump
Gas FurnacesDuctless Air Conditioner /
Heat PumpDigitalization
Industry leadershipwith Q2 launch
Outperform industry in highSEER product sales
42 SEER: industry-leadingefficiency*
Most comprehensivelineup
Interactive technician app
Reduce “time on wrench”
*Source: AHRI Unitary Small Equipment Operations Manual cites 9,000 Btu/h single zone ductless 42 SEER rating (1/22/18).
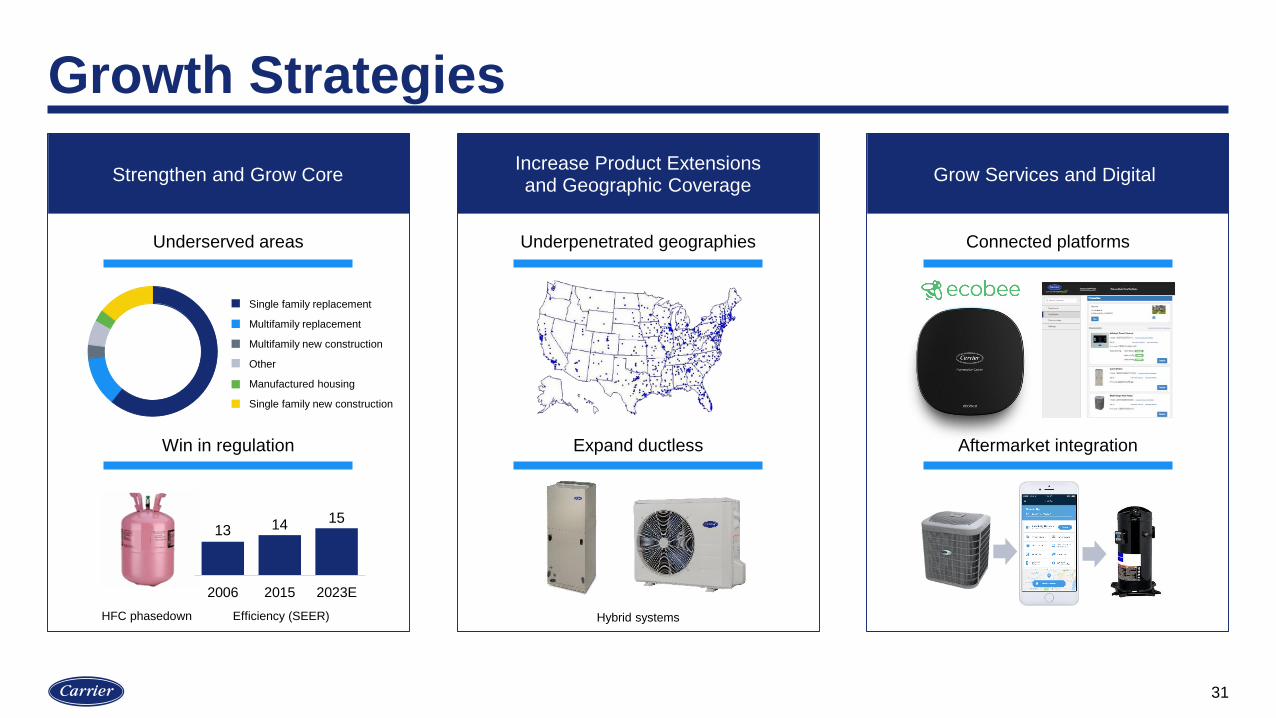
Growth Strategies
31
Win in regulation
Underpenetrated geographiesUnderserved areas
Aftermarket integration
Connected platforms
HFC phasedown
Expand ductless
Hybrid systemsEfficiency (SEER)
13 14 15
2006 2015 2023E
Single family replacement
Multifamily replacement
Multifamily new construction
Other
Manufactured housing
Single family new construction
Strengthen and Grow CoreIncrease Product Extensions and Geographic Coverage
Grow Services and Digital

Accelerated Product Innovation
32
Gas Furnaces/CoilsAir Conditioner / Heat Pump Small Packaged
Product line impacted by 2023
Design for regulation
Material substitution
Digital connectivity
Blower efficiency
Heat transfer technology
Digital connectivity
Air management
Reduced emissions
Variable speed technology
Product line impacted by 2023
~100% ~85% ~100%
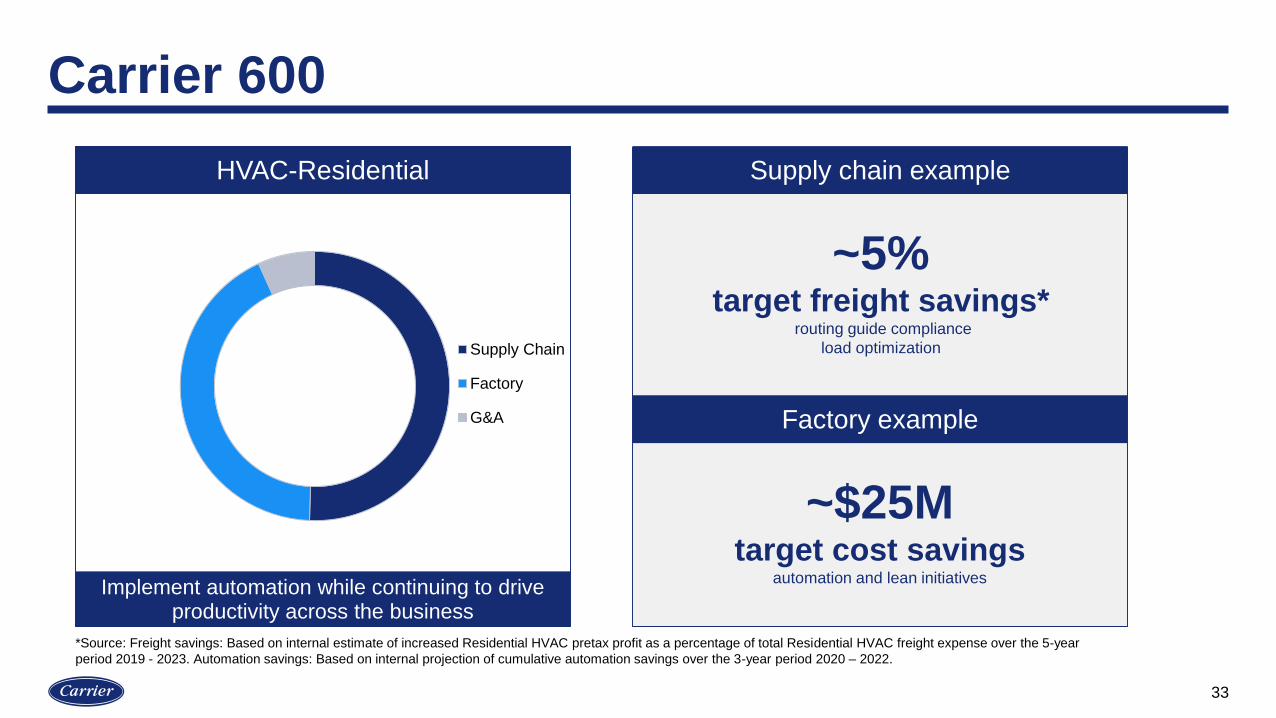
Carrier 600
33
HVAC-Residential
Implement automation while continuing to drive productivity across the business
Supply Chain
Factory
G&A
~5%target freight savings*
routing guide compliance
load optimization
~$25Mtarget cost savings
automation and lean initiatives
Supply chain example
Factory example
*Source: Freight savings: Based on internal estimate of increased Residential HVAC pretax profit as a percentage of total Residential HVAC freight expense over the 5-year
period 2019 - 2023. Automation savings: Based on internal projection of cumulative automation savings over the 3-year period 2020 – 2022.
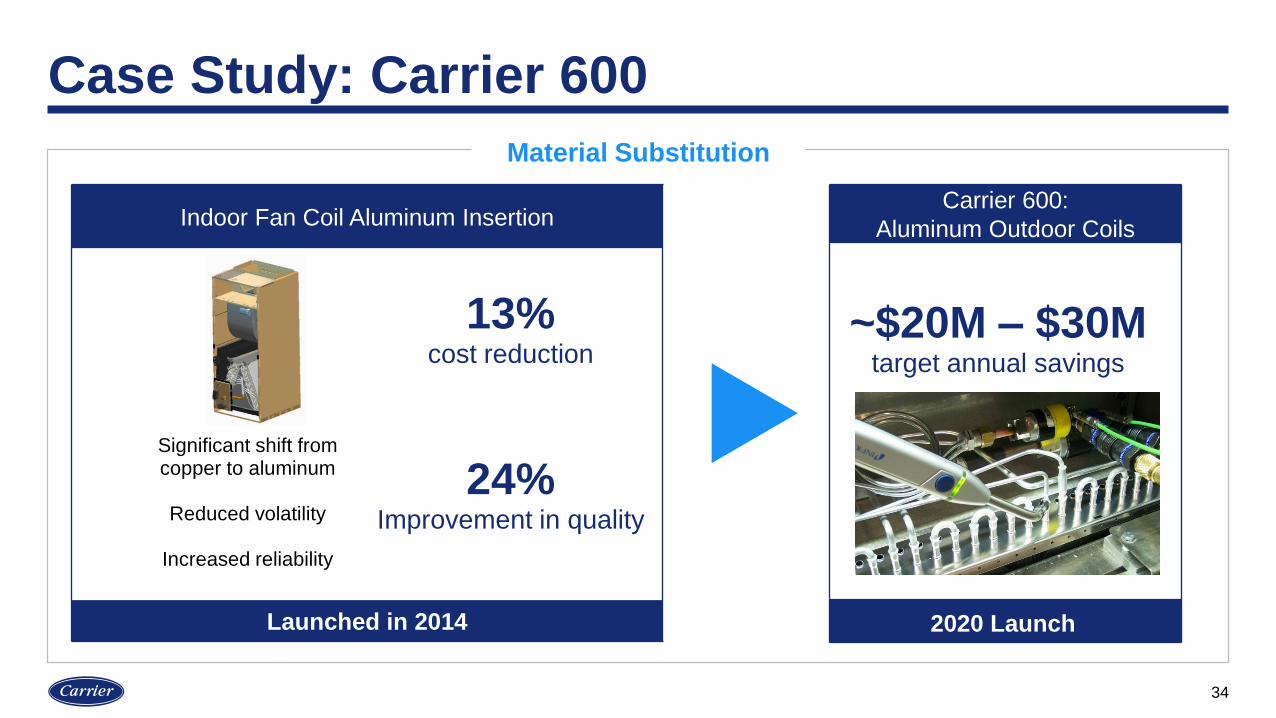
Case Study: Carrier 600
34
Indoor Fan Coil Aluminum Insertion
Launched in 2014
Significant shift from copper to aluminum
Reduced volatility
Increased reliability
13%cost reduction
24%Improvement in quality
Carrier 600:
Aluminum Outdoor Coils
2020 Launch
~$20M – $30Mtarget annual savings
Material Substitution

Wrap-up
Residential HVAC industry leader
Strong brands, products and distribution network
Focus on underserved markets and geographies
Investing in R&D and digital to drive growth
Continued focus on cost excellence
35

36
TM
We’ve forged entire industries. We’ve
built iconic brands. We’ve pioneered
more than 100 years of firsts. And now,
as an independent, focused company,
our best days are ahead of us.
This is the new Carrier –
and Change is in the Air.

REFRIGERATION
David Appel
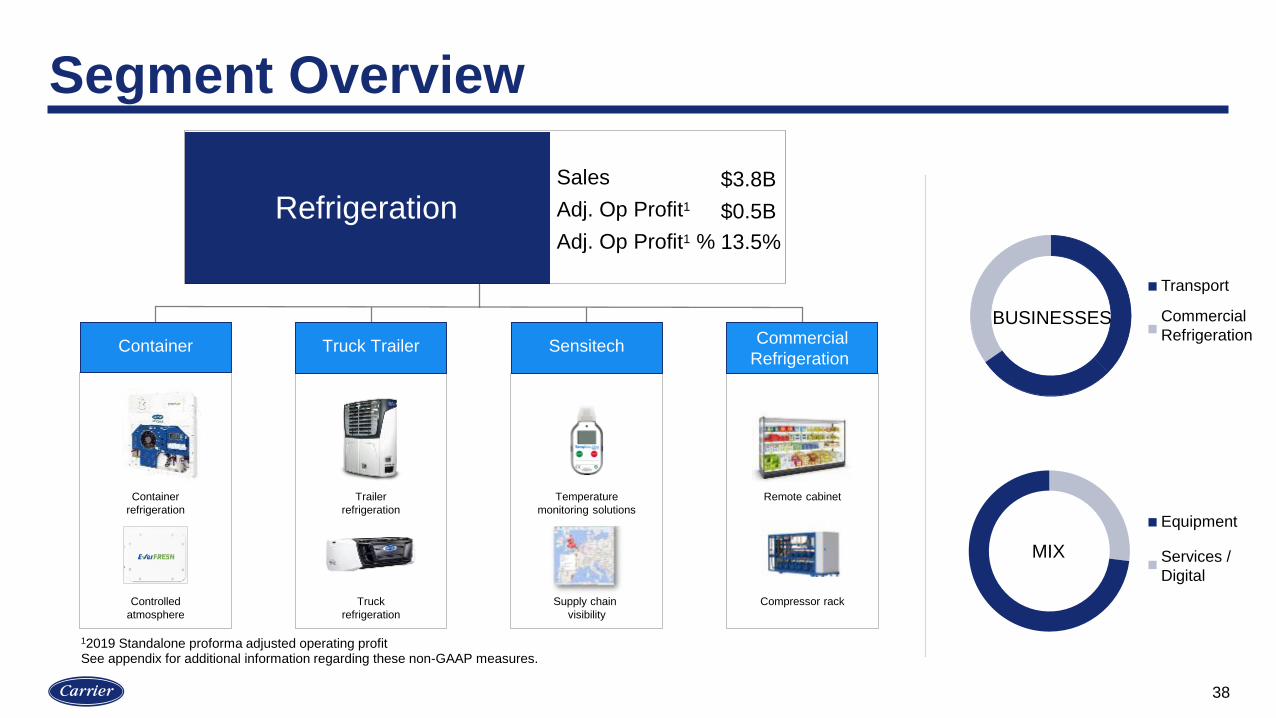
Segment Overview
38
Asia
Asia
AsiaEMEA Americ
EquipmentMIX
BUSINESSES
Sales
Adj. Op Profit1
Adj. Op Profit1 %
Refrigeration$3.8B
$0.5B
13.5%
Truck
refrigeration
Temperature
monitoring solutions
Supply chain
visibility
Remote cabinetContainer
refrigeration
Controlled
atmosphere
Compressor rack
Trailer
refrigeration
Commercial
Refrigeration Container Truck Trailer Sensitech
12019 Standalone proforma adjusted operating profit See appendix for additional information regarding these non-GAAP measures.
Transport
Commercial
Refrigeration
Equipment
Services /
Digital
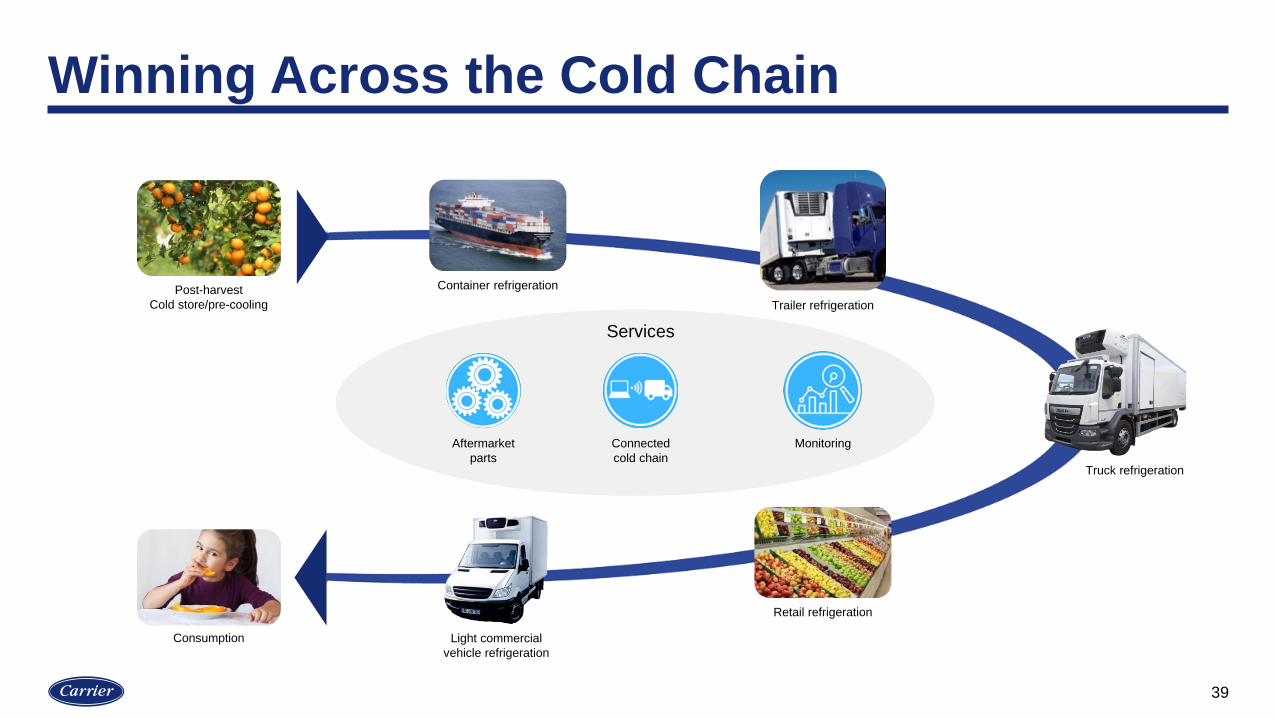
Winning Across the Cold Chain
Trailer refrigeration
Light commercial
vehicle refrigeration
Retail refrigeration
Container refrigeration Post-harvest
Cold store/pre-cooling
Aftermarket
parts
Connected
cold chain
Monitoring
Services
Consumption
Truck refrigeration
39
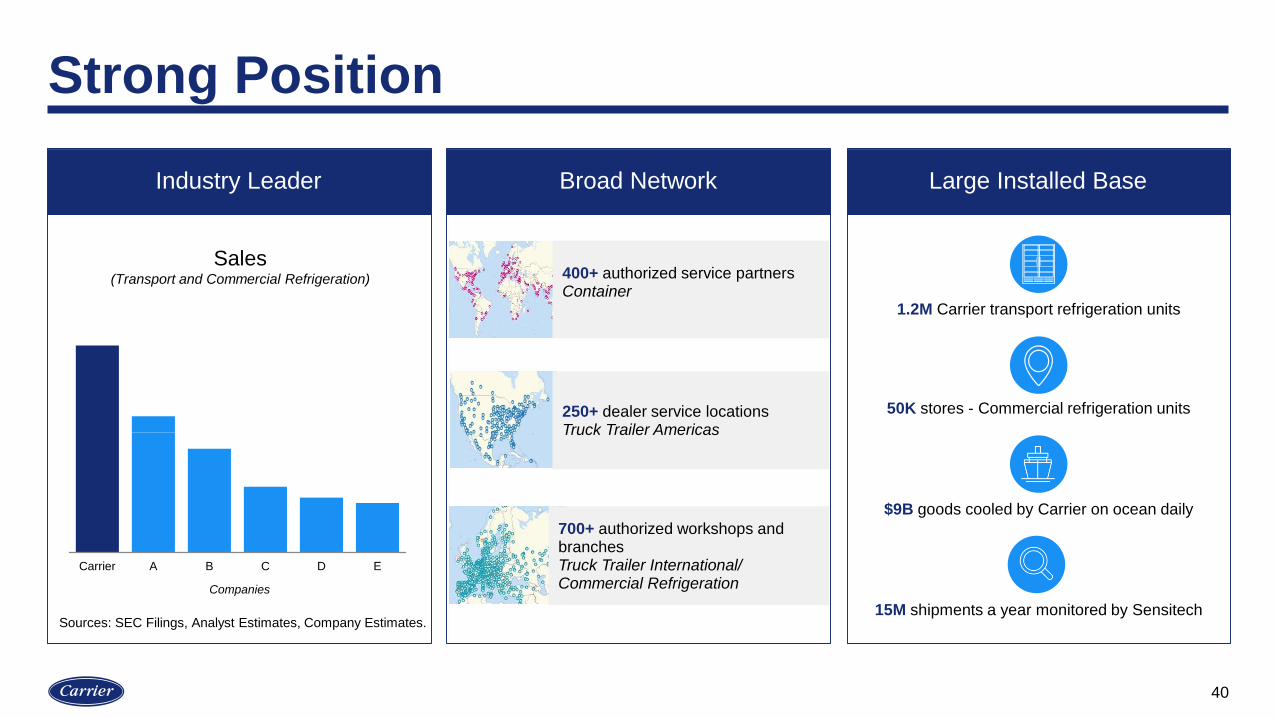
Strong Position
40
Industry Leader Broad Network Large Installed Base
1.2M Carrier transport refrigeration units
50K stores - Commercial refrigeration units
$9B goods cooled by Carrier on ocean daily
15M shipments a year monitored by Sensitech
250+ dealer service locationsTruck Trailer Americas
400+ authorized service partners Container
700+ authorized workshops and branchesTruck Trailer International/ Commercial Refrigeration
Carrier A B C D E
Sources: SEC Filings, Analyst Estimates, Company Estimates.
Sales(Transport and Commercial Refrigeration)
Companies
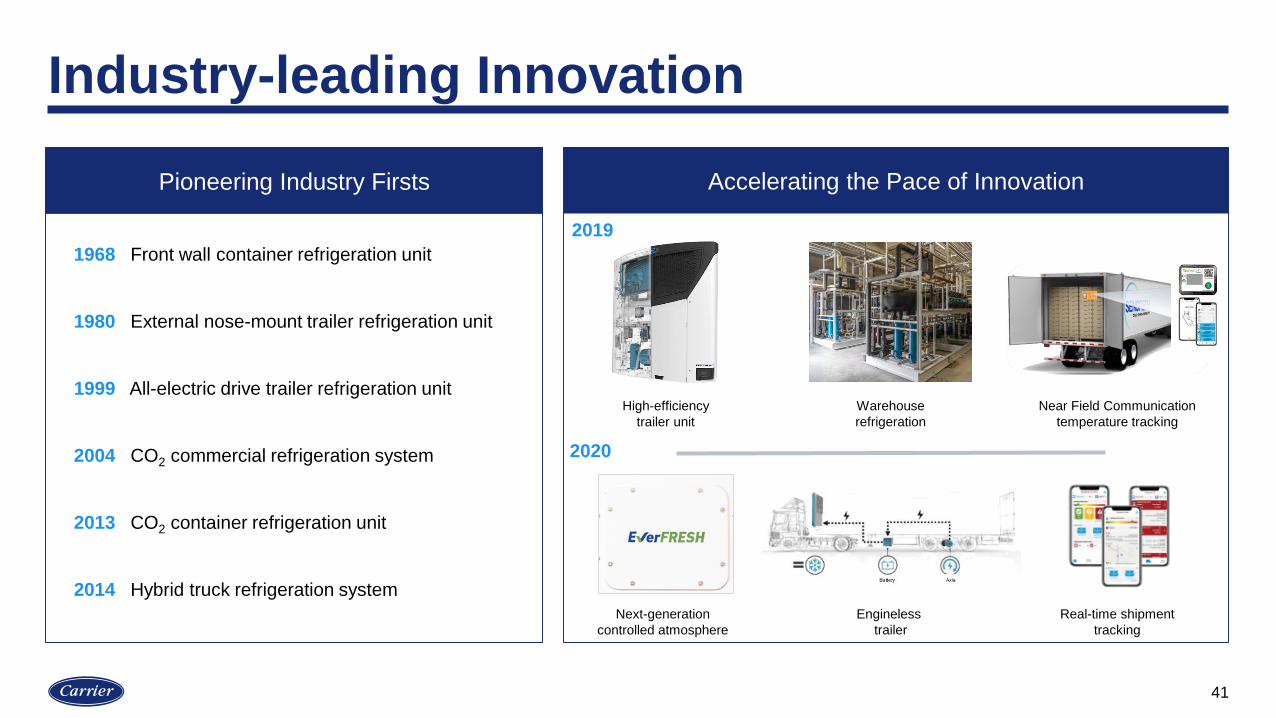
Industry-leading Innovation
41
Optimizing the Cold Chain
Near Field Communication
temperature tracking
Warehouse
refrigeration
High-efficiency
trailer unit
Real-time shipment
tracking
Engineless
trailer
Next-generation
controlled atmosphere
1968 Front wall container refrigeration unit
1980 External nose-mount trailer refrigeration unit
1999 All-electric drive trailer refrigeration unit
2004 CO2 commercial refrigeration system
2013 CO2 container refrigeration unit
2014 Hybrid truck refrigeration system
Pioneering Industry Firsts Accelerating the Pace of Innovation
2019
2020

Industry Trends Support Sustained Growth
42
RegulationPopulation Growth Digitalization
50% of perishable food waste could be saved with refrigeration
27% growth for active cargo tracking
Need for alternative refrigerants and power sources
Societal demand for refrigeration
Less emissions and noise
More real-time data and analytics
6
63
2020 2050
People fed
Food produced
1/3wasted
Population
7.7B
9.7B
Sources: United Nations, Food and Agriculture Organization, European Commission, IoT Business News.
Sustainable cold chain solutions
Urbanization
Increased transport refrigeration capacity
Longer distances for food and perishables
Innovative products and services
Greener products Large installed base
2020 2021 2024 2027 2030
6
63
45
31
2421
European HFC phase down
% vs. baseline
2020 2050

Transport Refrigeration Markets
43
(Units, 000’s)
96 97 98 99 00 01 02 03 04 05 06 07 08 09 10 11 12 13 14 15 16 17 18 19 20 96 97 98 99 00 01 02 03 04 05 06 07 08 09 10 11 12 13 14 15 16 17 18 19 20
Container North America Trailer
4% CAGR(1996 -2019)
3% CAGR(1996 -2019)
Sources: Seabury/Drewry, IHS Markit, ACT
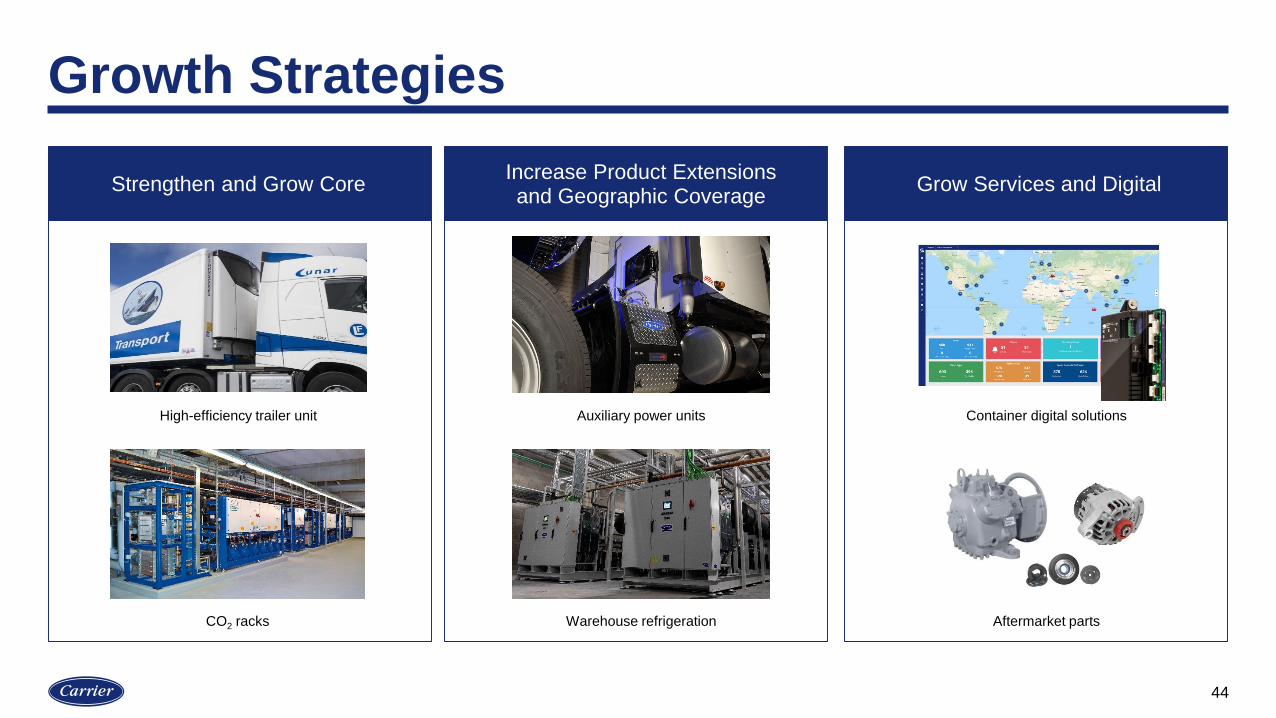
Growth Strategies
44
Digital and
aftermarket
Auxiliary power unitsHigh-efficiency trailer unit
CO2 racks Warehouse refrigeration
Container digital solutions
Aftermarket parts
Strengthen and Grow CoreIncrease Product Extensions and Geographic Coverage
Grow Services and Digital

Case Study: Leveraging CO2 Systems for Growth
45
04 05 06 07 08 09 10 11 12 13 14 15 16 17 18 19 20E
Warehouse refrigeration
Container
Trailer
• Attractive growth potential• Technical and cost advantages over ammonia• Well positioned for ramp up
• Proven performance • Unit replacement growth potential
• Leverages container technology• Addresses global refrigerant/environmental regulations• Prototype units in customer field trials
Food Retail Installed Base Opportunities
CO2 racks
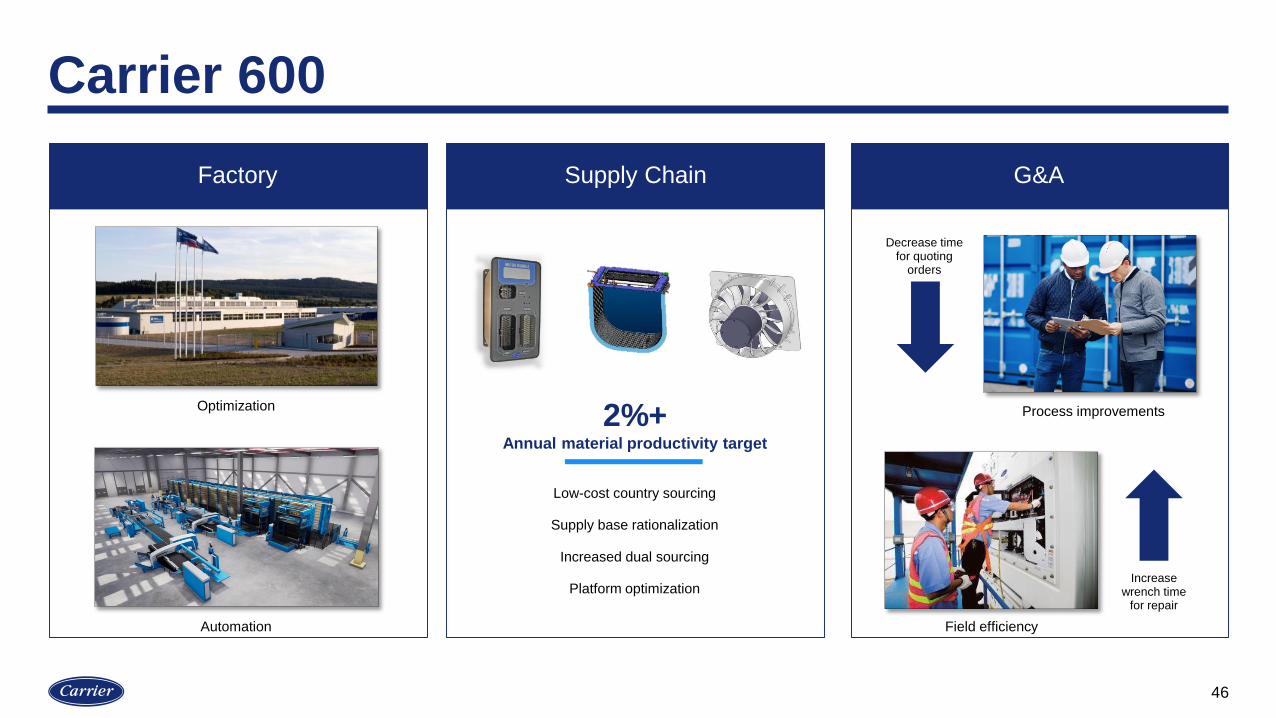
Carrier 600
46
Factory Supply Chain G&A
Automation
Optimization Process improvements
Field efficiency
2%+ Annual material productivity target
Increase wrench time
for repair
Decrease time for quoting
orders
Low-cost country sourcing
Supply base rationalization
Increased dual sourcing
Platform optimization

Wrap-up
Industry-leading businesses
World class technology
Solid long-term fundamentals
Runway for growth
47

FIRE & SECURITY
Jurgen Timperman
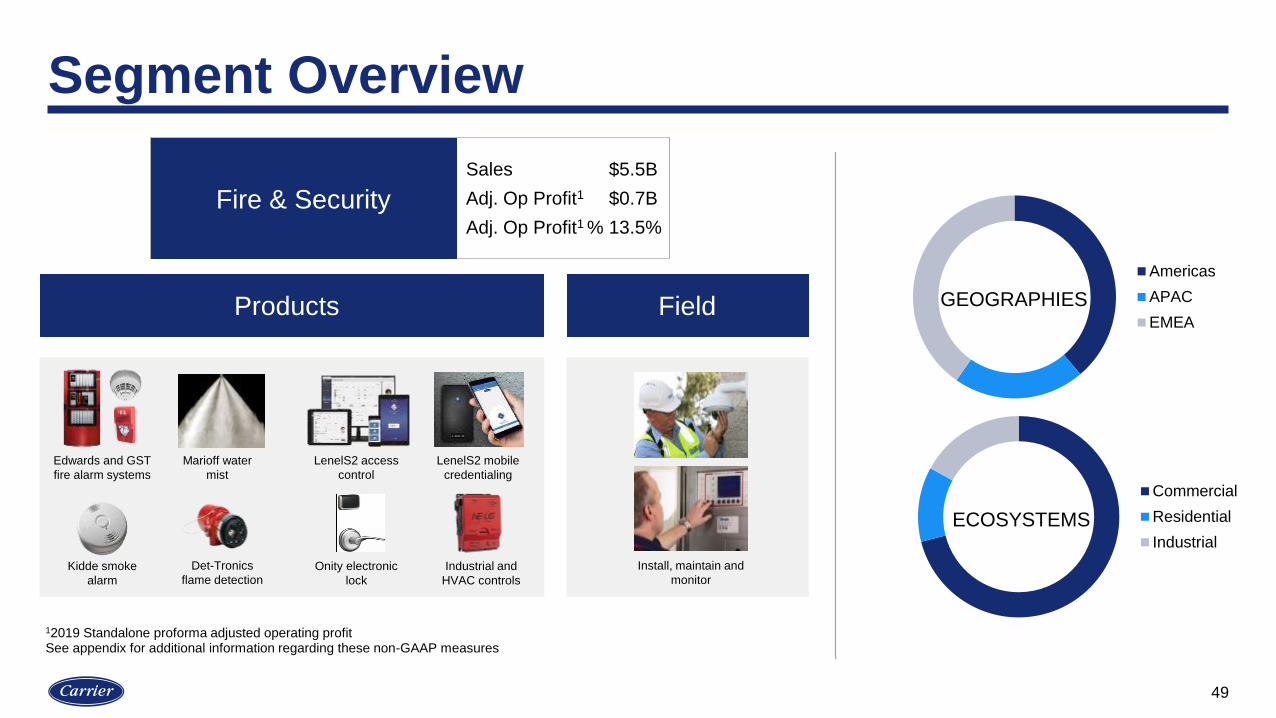
Segment Overview
49
Americas
APAC
EMEA
Fire & Security
GEOGRAPHIES
Commercial
Residential
Industrial
ECOSYSTEMS
Det-Tronics
flame detectionKidde smoke
alarm
LenelS2 access
control
LenelS2 mobile
credentialing
Onity electronic
lock
Install, maintain and
monitor
FieldProducts
Industrial and
HVAC controls
Edwards and GST
fire alarm systems
Marioff water
mist
Sales $5.5B
Adj. Op Profit1 $0.7B
Adj. Op Profit1 % 13.5%
12019 Standalone proforma adjusted operating profit See appendix for additional information regarding these non-GAAP measures

Megatrends Driving Sustainable Growth
50
Sources: Public data, internal estimates.
4M+ high-rise buildings worldwide with 3.5M over next 20 years
>1.5M people move to cities each week globally, 90% in emerging marketsUrbanization
Increased need for
intelligent safety &
security management
Increased consumer
pull for residential
fire protection
Growing Middle
Class
Asia Pacific share of global middle class to reach ~65% by 2030
China average home ownership rate is ~90% vs. ~70% in the U.S.
10B+ connected devices in buildings by 2021
14M+ identity frauds reported in 2018
Increased demand for
access control and
identity managementDigitalization
<30% of U.S. homes protected to NFPA standard, no in-home regulation in China
$10B+ global under-protected residential fire market
Increased regulatory
push for residential
fire protection
Climate and
Regulation
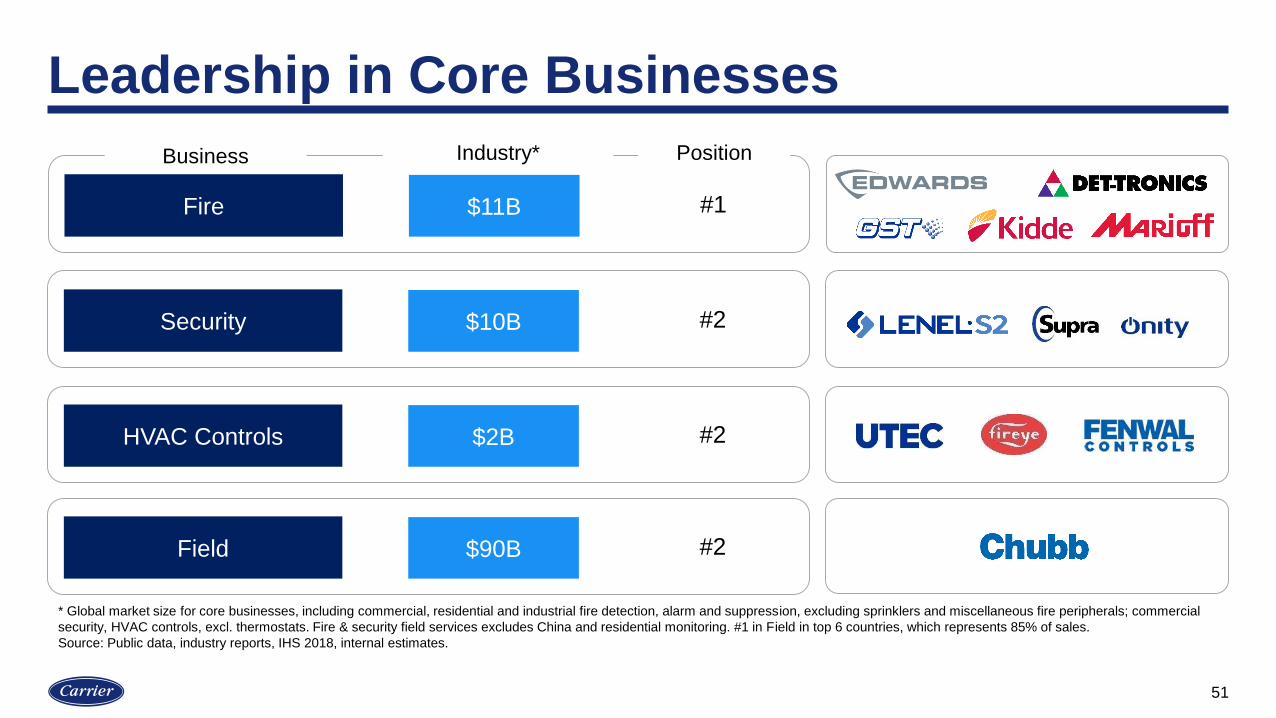
Leadership in Core Businesses
51
Fire $11B
Business Industry* Position
#1
Security $10B #2
HVAC Controls $2B #2
Field $90B #2
* Global market size for core businesses, including commercial, residential and industrial fire detection, alarm and suppression, excluding sprinklers and miscellaneous fire peripherals; commercial
security, HVAC controls, excl. thermostats. Fire & security field services excludes China and residential monitoring. #1 in Field in top 6 countries, which represents 85% of sales.
Source: Public data, industry reports, IHS 2018, internal estimates.

Growth Strategies
52
Strengthen and Grow CoreIncrease Product Extensions and Geographic Coverage
North America residential fire
Innovation and platforming
China/Asia fire
Global controls
Access solutions
Service excellence & productivity
Grow Services and Digital
<30% protected to
NFPA standards
SHAREin North America vs. Europe and Asia
Field revenue per tech growth
+3%
7X
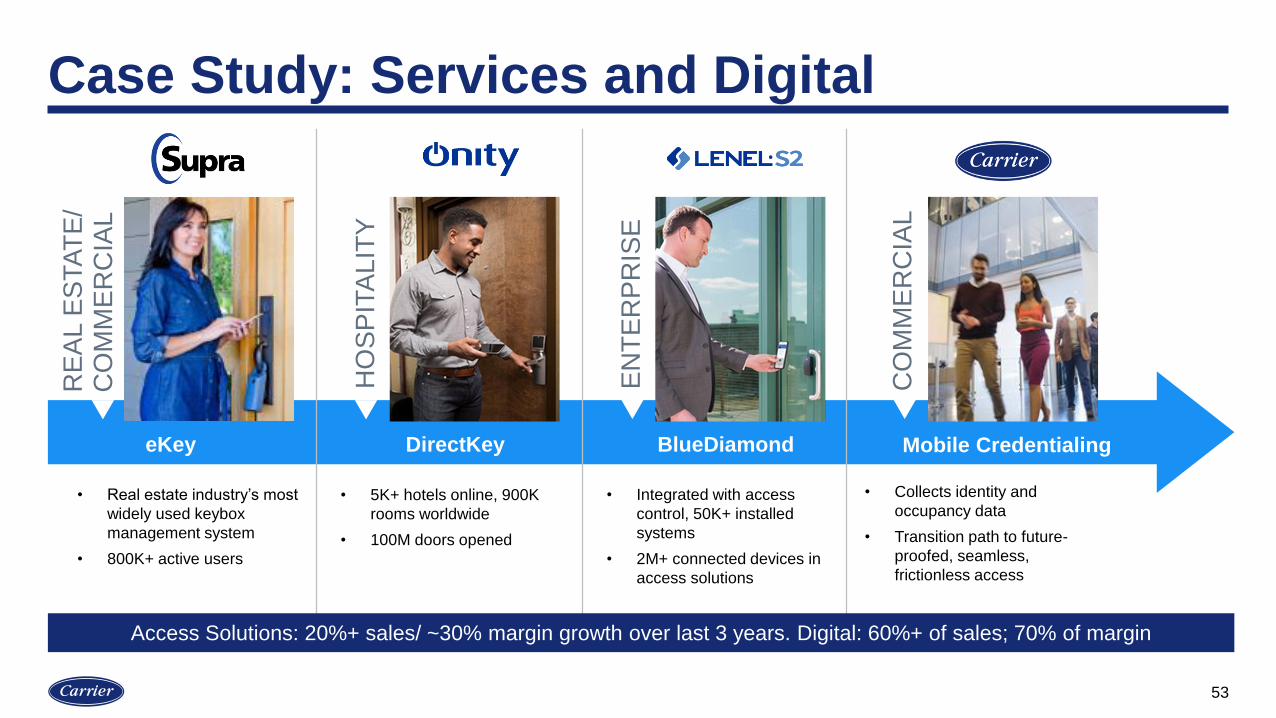
Case Study: Services and Digital
53
RE
AL E
STA
TE
/ C
OM
ME
RC
IAL
HO
SP
ITA
LIT
Y
EN
TE
RP
RIS
E
CO
MM
ER
CIA
L
eKey DirectKey BlueDiamond
• 5K+ hotels online, 900K
rooms worldwide
• 100M doors opened
• Real estate industry’s most
widely used keybox
management system
• 800K+ active users
• Integrated with access
control, 50K+ installed
systems
• 2M+ connected devices in
access solutions
• Collects identity and
occupancy data
• Transition path to future-
proofed, seamless,
frictionless access
Mobile Credentialing
Access Solutions: 20%+ sales/ ~30% margin growth over last 3 years. Digital: 60%+ of sales; 70% of margin

Carrier 600
54
Factory Supply Chain G&A
Supply chain: ~4% supplier
reduction, 18% inventory turns
improvement over last 4 years
Material productivity: strong
track record of ~2% per year
Footprint optimization: 60%+ reduction over last 9 years
Automation: 13% reduction in
manufacturing employees over
same period
COEs and shared services:
50%+ G&A headcount reduction
and 30%+ indirect labor
reduction over last 9 years
Wrap-up
Leader with iconic brands
Large installed base to drive margin accretive digital services
Significant opportunity in under-protected fire and adjacencies
Targeted investment in R&D and sales force expansion
Operational efficiency and productivity
55

FINANCIAL OVERVIEW
Timothy McLevish
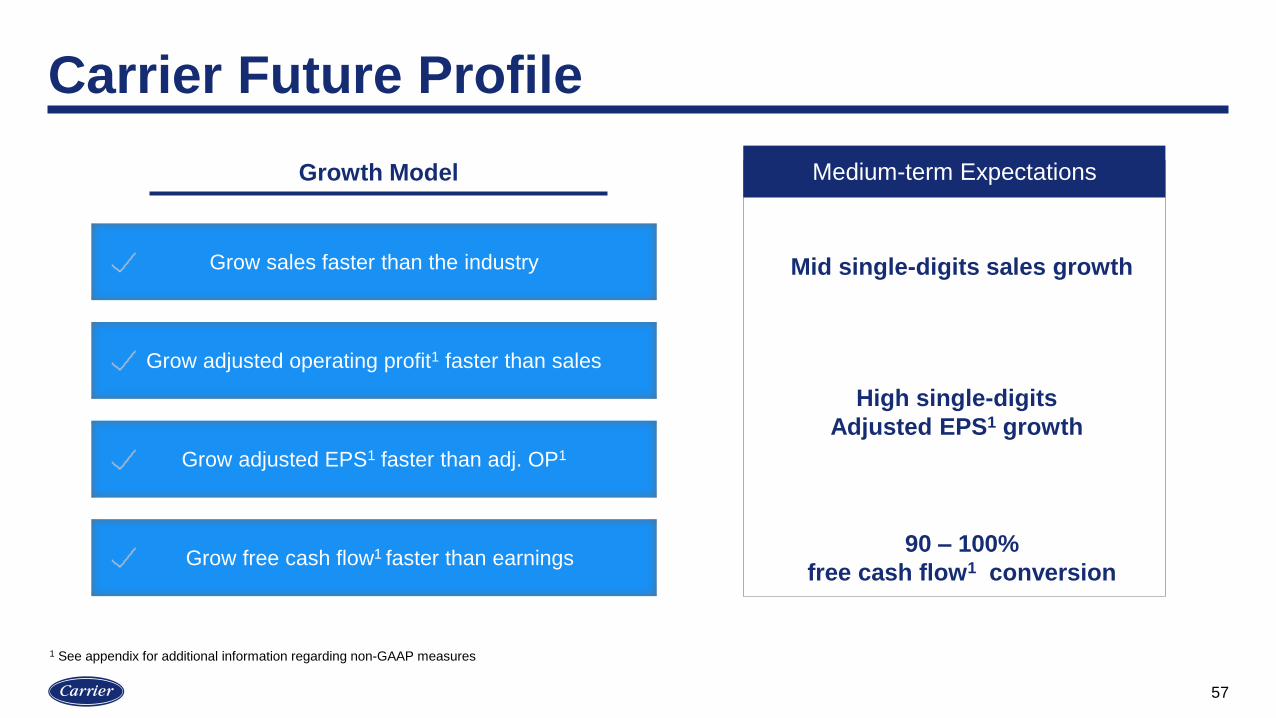
Carrier Future Profile
57
Growth Model
Mid single-digits sales growth
90 – 100%
free cash flow1 conversion
Medium-term Expectations
High single-digits
Adjusted EPS1 growth
Grow sales faster than the industry
Grow adjusted operating profit1 faster than sales
Grow adjusted EPS1 faster than adj. OP1
Grow free cash flow1 faster than earnings
1 See appendix for additional information regarding non-GAAP measures
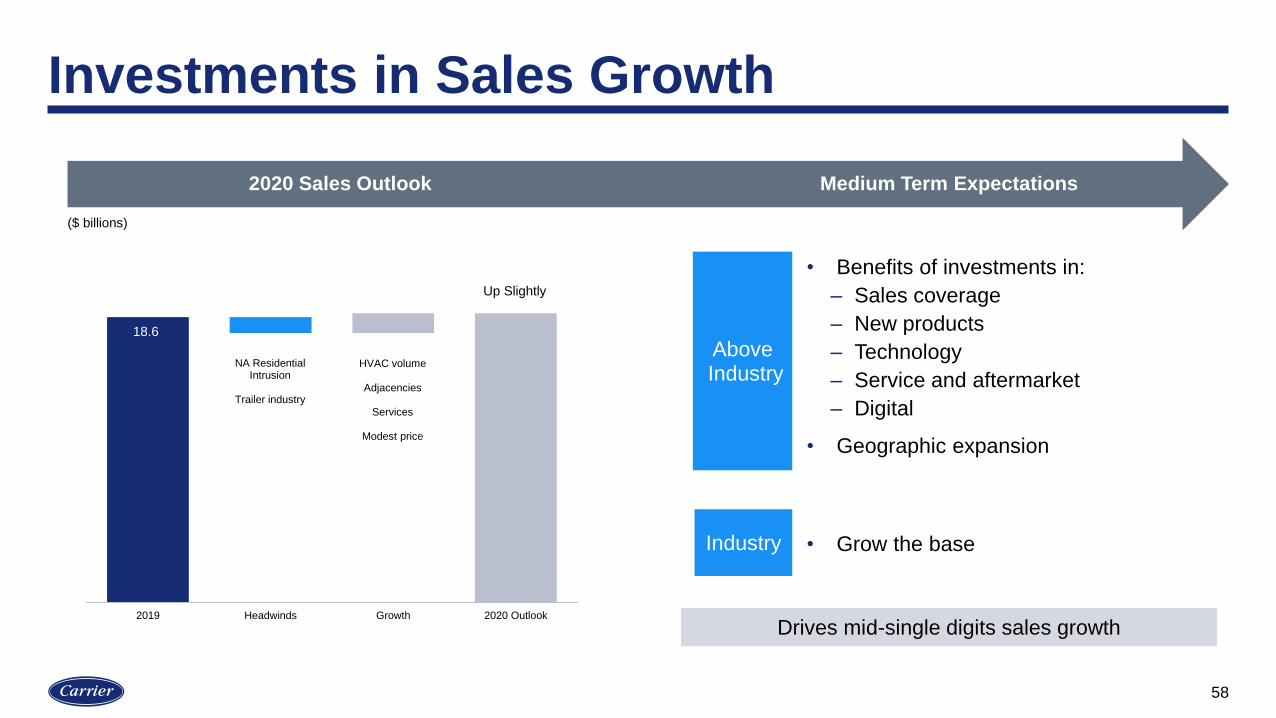
Investments in Sales Growth
58
18.6
18.4
2019 Headwinds Growth 2020 Outlook
Drives mid-single digits sales growth
AboveIndustry
Industry • Grow the base
2020 Sales Outlook Medium Term Expectations
Up Slightly
NA ResidentialIntrusion
Trailer industry
HVAC volume
Adjacencies
Services
Modest price
($ billions)
• Benefits of investments in:
– Sales coverage
– New products
– Technology
– Service and aftermarket
– Digital
• Geographic expansion
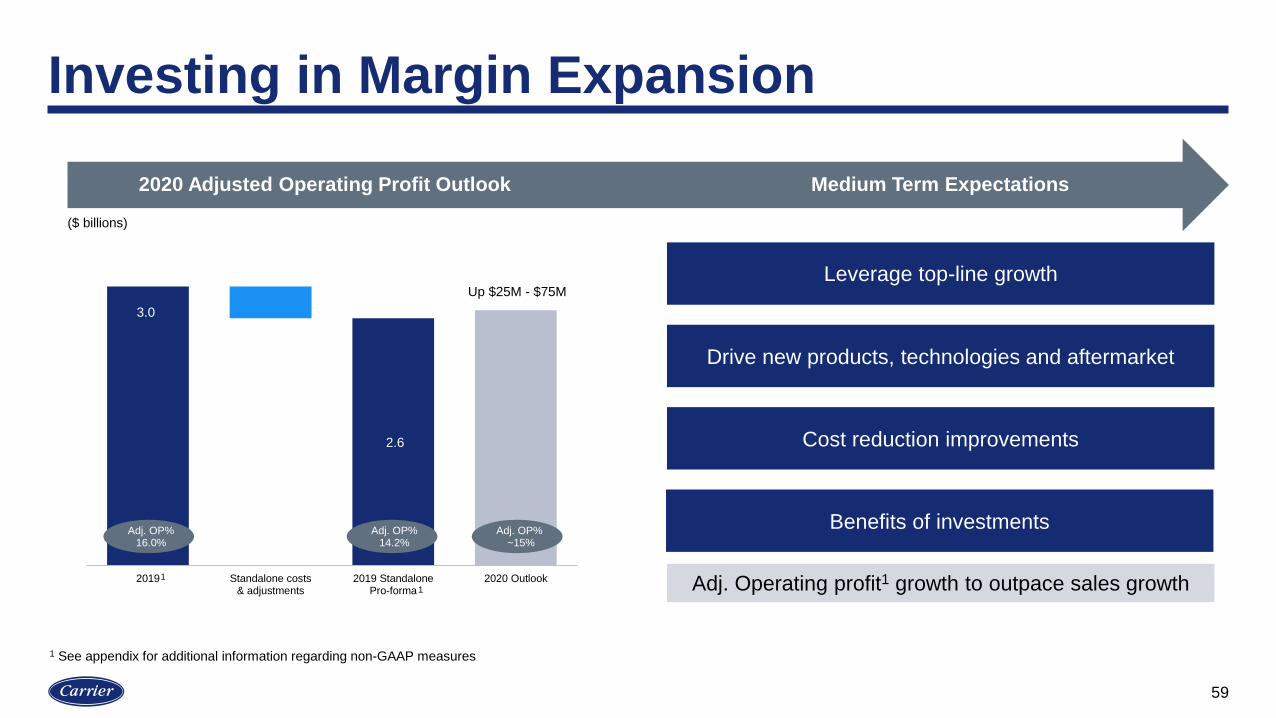
Investing in Margin Expansion
59
2020 Adjusted Operating Profit Outlook Medium Term Expectations
3.0
2.6
2019 Standalone costs& adjustments
2019 StandalonePro-forma
2020 Outlook
Adj. OP%~15%
Up $25M - $75M
Adj. Operating profit1 growth to outpace sales growth
Leverage top-line growth
Drive new products, technologies and aftermarket
Cost reduction improvements
Benefits of investments
($ billions)
1 See appendix for additional information regarding non-GAAP measures
1
1
Adj. OP% 16.0%
Adj. OP% 14.2%

Cash Flow Profile
60
1.8
2019 Standalone costs &adjustments
2020 Outlook
2020 Free Cash Flow Outlook Medium Term Expectations
($ billions)
Grow free cash flow1 faster than earnings
Working capital improvements
Capital spend expected to moderate
Improve joint venture conversion
1.3 – 1.4
1 See appendix for additional information regarding non-GAAP measures
1

Balanced Capital Allocation
61
Investment grade credit rating
Healthy and competitive dividend
Disciplined approach to M&A
Share repurchase program as appropriate

2020 Outlook
62
Adj. Operating Profit Growth1
(actual & constant currency)Up $25M - $75M
Shares Outstanding
(diluted)~880M
Interest Expense TBD
Adj. Effective Tax Rate1 ~ 26%
Capital Expenditures $350 - $400M
Free Cash Flow1 $1.3 - $1.4B
Organic Sales1 Up slightly
HVAC Up low-single digit
Fire & Security Up slightly
Refrigeration Flattish
Profit and Cash FlowSales
Organic1 Segment Sales
1 See appendix for additional information regarding non-GAAP measures
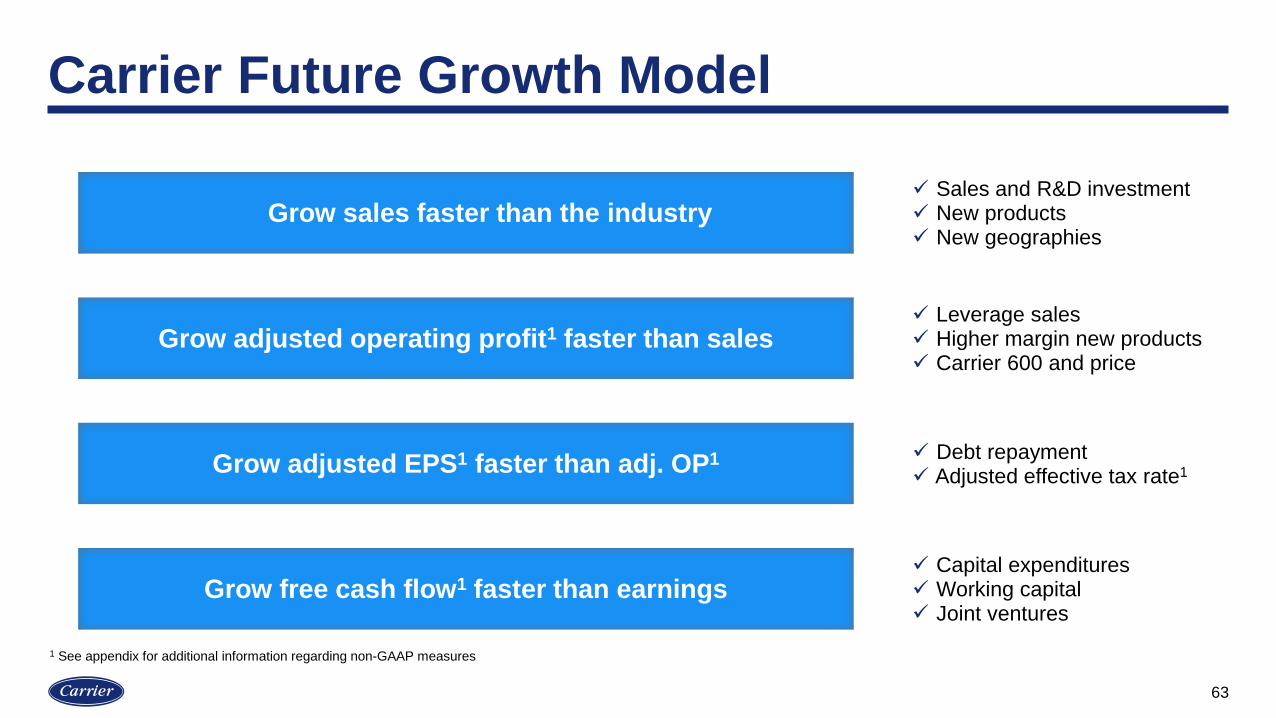
Carrier Future Growth Model
63
Grow sales faster than the industry
Grow adjusted operating profit1 faster than sales
Grow adjusted EPS1 faster than adj. OP1
Grow free cash flow1 faster than earnings
Sales and R&D investment New products New geographies
Leverage sales Higher margin new products Carrier 600 and price
Debt repayment Adjusted effective tax rate1
Capital expenditures Working capital Joint ventures
1 See appendix for additional information regarding non-GAAP measures
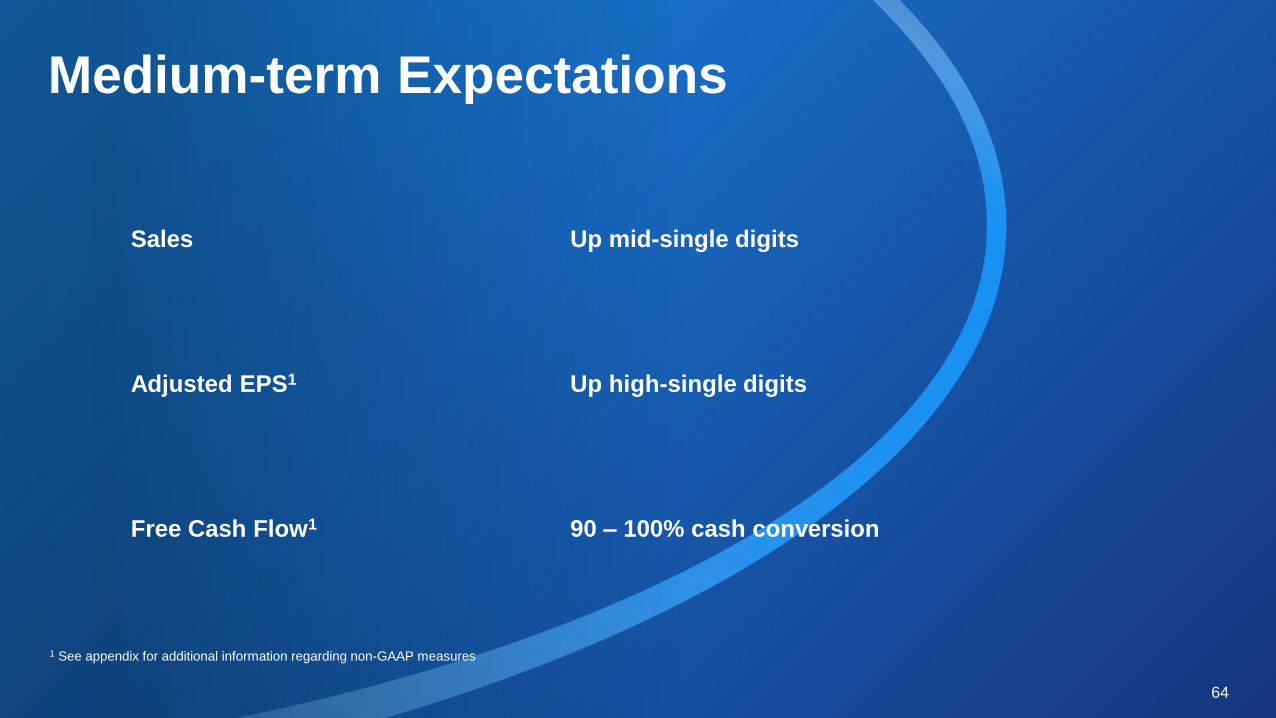
Medium-term Expectations
64
Sales
Free Cash Flow1
Adjusted EPS1
Up mid-single digits
90 – 100% cash conversion
Up high-single digits
1 See appendix for additional information regarding non-GAAP measures

Q&A

66
TM

APPENDIX

Use and Definitions of Non-GAAP Financial Measures
Carrier Global Corporation (“Carrier”) reports its financial results in accordance with accounting principles generally accepted in the United States (“GAAP”).
We supplement the reporting of our financial information determined under GAAP with certain non-GAAP financial information. The non-GAAP information presented provides investors with additional useful information, but should not be considered in isolation or as substitutes for the related GAAP measures. Moreover, other companies may define non-GAAP measures differently, which limits the usefulness of these measures for comparisons with such other companies. We encourage investors to review our financial statements and publicly-filed reports in their entirety and not to rely on any single financial measure.
Adjusted net sales, organic sales, adjusted operating profit, adjusted net income, adjusted earnings per share (“EPS”), and the adjusted effective tax rate are non-GAAP financial measures. Adjusted net sales represents consolidated net sales from continuing operations (a GAAP measure), excluding significant items of a nonoperational nature (hereinafter referred to as “other significant items”). Organic sales represents consolidated net sales (a GAAP measure), excluding the impact of foreign currency translation, acquisitions and divestitures completed in the preceding twelve months and other significant items. Adjusted operating profit represents income from continuing operations (a GAAP measure), excluding restructuring costs and other significant items. Adjusted net income represents net income from continuing operations (a GAAP measure), excluding restructuring costs and other significant items. Adjusted EPS represents diluted earnings per share from continuing operations (a GAAP measure), excluding restructuring costs and other significant items. The adjusted effective tax rate represents the effective tax rate (a GAAP measure), excluding restructuring costs and other significant items. For the business segments, when applicable, adjustments of net sales, operating profit and margins similarly reflect continuing operations, excluding restructuring and other significant items. GAAP financial results include the impact of changes in foreign currency exchange rates (“AFX”). We use the non-GAAP measure “at constant currency” or “CFX” to show changes in our financial results without giving effect to period-to-period currency fluctuations. Under U.S. GAAP, income statement results are translated in U.S. dollars at the average exchange rate for the period presented. Management believes that the non-GAAP measures just mentioned are useful in providing period-to-period comparisons of the results of the Company's ongoing operational performance.
Standalone pro forma sales and adjusted operating profit and margin are non-GAAP financial measures and adjust Carrier’s net sales and operating profit and margin previously reported by United Technologies Corporation (“UTC”) to include all sales and costs directly attributable to Carrier, costs for certain functions and services performed by UTC that were directly charged to Carrier and estimated costs associated with Carrier being a standalone public company. Management believes Standalone financial measures are useful in assessing the company as a standalone company compared to its historical performance as a business segment of UTC.
Free cash flow is a non-GAAP financial measure that represents cash flow from operations (a GAAP measure) less capital expenditures. Management believes free cash flow is a useful measure of liquidity and an additional basis for assessing Carrier’s ability to fund its activities, including the financing of acquisitions, debt service, repurchases of Carrier's common stock and distribution of earnings to shareholders.
A reconciliation of the non-GAAP measures to the corresponding amounts prepared in accordance with GAAP appears in the tables in this Appendix. The tables provide additional information as to the items and amounts that have been excluded from the adjusted measures.
When we provide our expectation for standalone pro forma adjusted operating profit, adjusted EPS, adjusted operating profit, adjusted effective tax rate, organic sales and free cash flow on a forward-looking basis, a reconciliation of the differences between the non-GAAP expectations and the corresponding GAAP measures (expected diluted EPS from continuing operations, operating profit, the effective tax rate, sales and expected cash flow from operations) generally is not available without unreasonable effort due to potentially high variability, complexity and low visibility as to the items that would be excluded from the GAAP measure in the relevant future period, such as unusual gains and losses, the ultimate outcome of pending litigation, fluctuations in foreign currency exchange rates, the impact and timing of potential acquisitions and divestitures, and other structural changes or their probable significance. The variability of the excluded items may have a significant, and potentially unpredictable, impact on our future GAAP results.
68

Carrier Operating Results ReconciliationFinancials as reported under UTC
69
($USD, Millions)
2019
Net Sales 18,608
Operating Profit 2,697
Restructuring 126
Other significant items of a non-operational nature (a) 155
Adjusted Operating Profit 2,978
Adjusted Operating Profit Margin 16.0%
(a) Details of other significant items of a non-operational nature
2019 Approximately $108 million of pre-tax charges related to an investment impairment
Approximately $34 million of pre-tax charges related to a consultant contract termination
Approximately $13 million of pre-tax costs associated with the Company's intention to separate [from UTC]
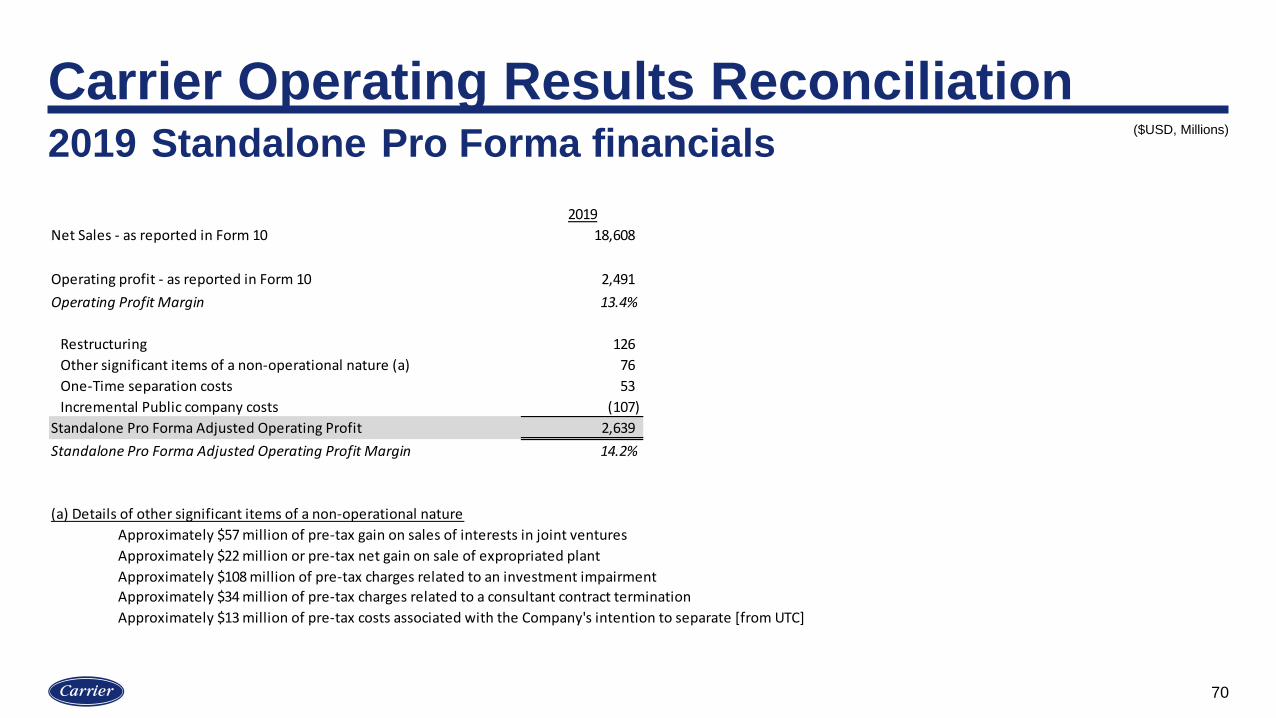
Carrier Operating Results Reconciliation2019 Standalone Pro Forma financials
70
2019
Net Sales - as reported in Form 10 18,608
Operating profit - as reported in Form 10 2,491
Operating Profit Margin 13.4%
Restructuring 126
Other significant items of a non-operational nature (a) 76
One-Time separation costs 53
Incremental Public company costs (107)
Standalone Pro Forma Adjusted Operating Profit 2,639
Standalone Pro Forma Adjusted Operating Profit Margin 14.2%
(a) Details of other significant items of a non-operational nature
Approximately $57 million of pre-tax gain on sales of interests in joint ventures
Approximately $22 million or pre-tax net gain on sale of expropriated plant
Approximately $108 million of pre-tax charges related to an investment impairment
Approximately $34 million of pre-tax charges related to a consultant contract termination
Approximately $13 million of pre-tax costs associated with the Company's intention to separate [from UTC]
($USD, Millions)
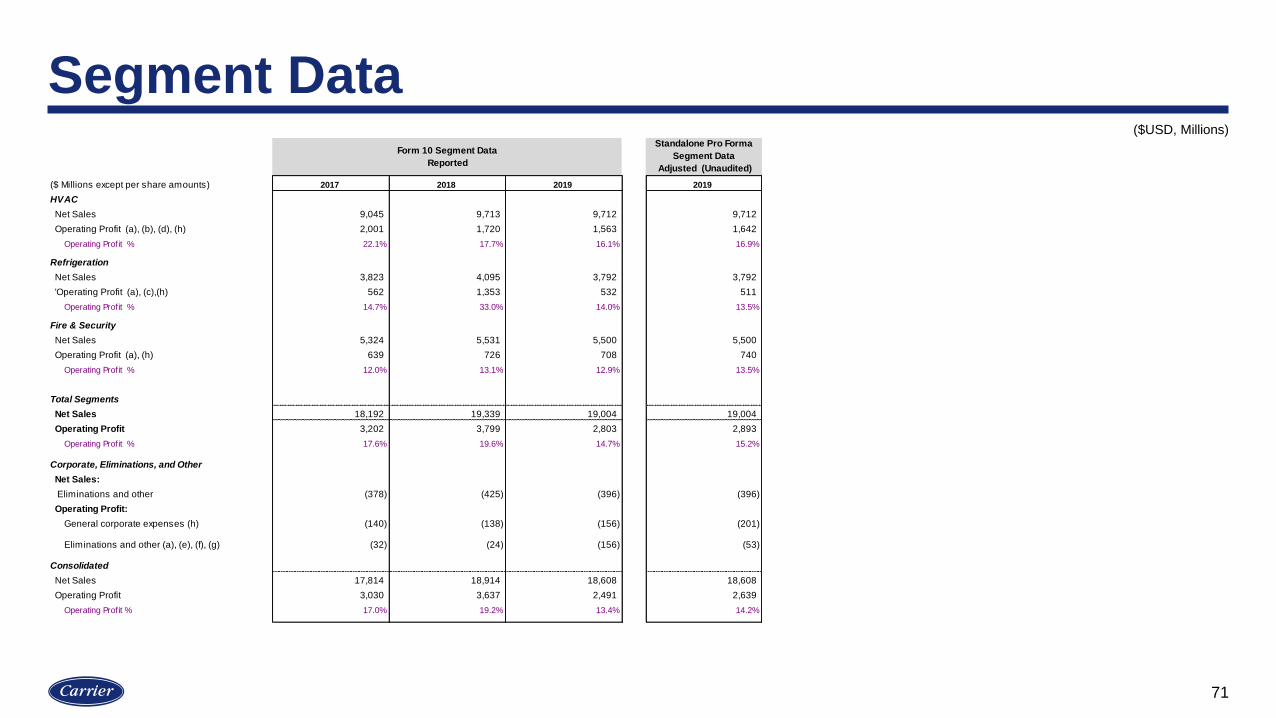
Segment Data
71
Standalone Pro Forma
Segment Data
Adjusted (Unaudited)
($ Millions except per share amounts) 2017 2018 2019 2019
HVAC
Net Sales 9,045 9,713 9,712 9,712
Operating Profit (a), (b), (d), (h) 2,001 1,720 1,563 1,642
Operating Profit % 22.1% 17.7% 16.1% 16.9%
Refrigeration
Net Sales 3,823 4,095 3,792 3,792
'Operating Profit (a), (c),(h) 562 1,353 532 511
Operating Profit % 14.7% 33.0% 14.0% 13.5%
Fire & Security
Net Sales 5,324 5,531 5,500 5,500
Operating Profit (a), (h) 639 726 708 740
Operating Profit % 12.0% 13.1% 12.9% 13.5%
Total Segments
Net Sales 18,192 19,339 19,004 19,004
Operating Profit 3,202 3,799 2,803 2,893
Operating Profit % 17.6% 19.6% 14.7% 15.2%
Corporate, Eliminations, and Other
Net Sales:
Eliminations and other (378) (425) (396) (396)
Operating Profit:
General corporate expenses (h) (140) (138) (156) (201)
Eliminations and other (a), (e), (f), (g) (32) (24) (156) (53)
Consolidated
Net Sales 17,814 18,914 18,608 18,608
Operating Profit 3,030 3,637 2,491 2,639
Operating Profit % 17.0% 19.2% 13.4% 14.2%
Form 10 Segment Data
Reported
($USD, Millions)
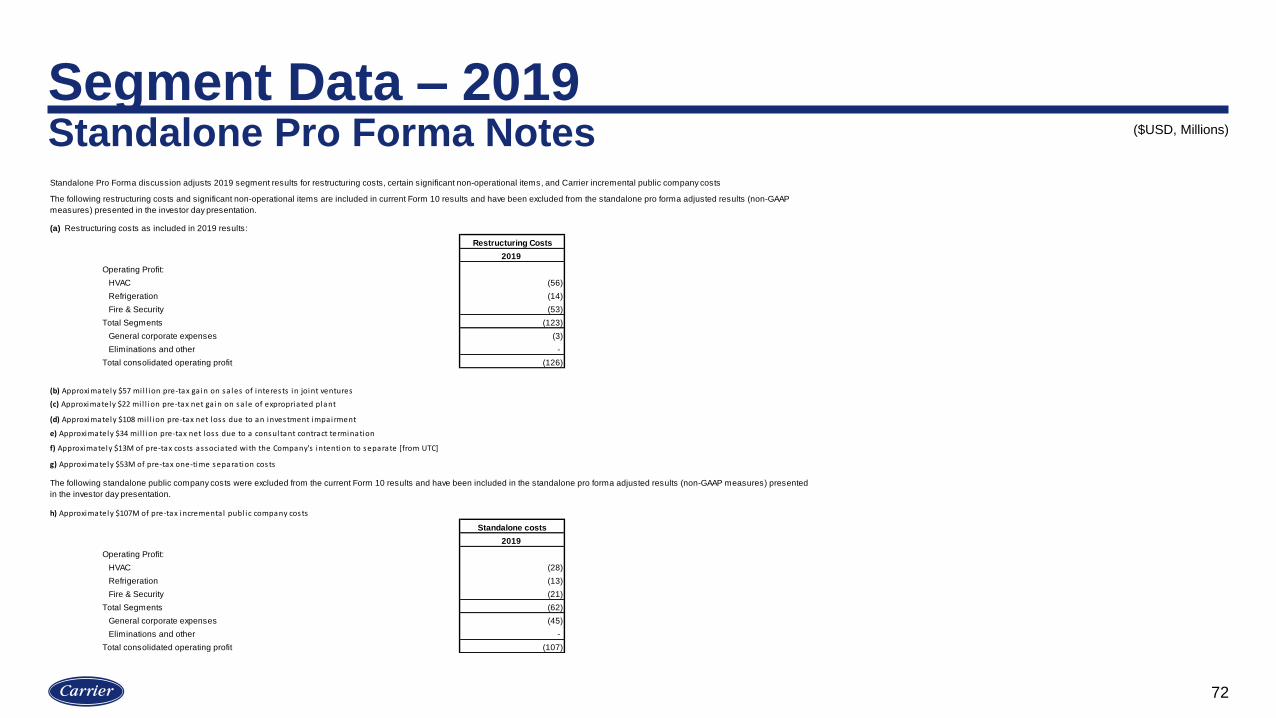
Segment Data – 2019 Standalone Pro Forma Notes
72
Standalone Pro Forma discussion adjusts 2019 segment results for restructuring costs, certain significant non-operational items, and Carrier incremental public company costs
(a) Restructuring costs as included in 2019 results:
Restructuring Costs
2019
Operating Profit:
HVAC (56)
Refrigeration (14)
Fire & Security (53)
Total Segments (123)
General corporate expenses (3)
Eliminations and other -
Total consolidated operating profit (126)
(b) Approximately $57 mi l l ion pre-tax ga in on sa les of interests in joint ventures
(c) Approximately $22 mi l l ion pre-tax net ga in on sa le of expropriated plant
e) Approximately $34 mi l l ion pre-tax net loss due to a consultant contract termination
f) Approximately $13M of pre-tax costs associated with the Company's intention to separate [from UTC]
g) Approximately $53M of pre-tax one-time separation costs
h) Approximately $107M of pre-tax incremental publ ic company costs
Standalone costs
2019
Operating Profit:
HVAC (28)
Refrigeration (13)
Fire & Security (21)
Total Segments (62)
General corporate expenses (45)
Eliminations and other -
Total consolidated operating profit (107)
The following restructuring costs and significant non-operational items are included in current Form 10 results and have been excluded from the standalone pro forma adjusted results (non-GAAP
measures) presented in the investor day presentation.
(d) Approximately $108 mi l l ion pre-tax net loss due to an investment impairment
The following standalone public company costs were excluded from the current Form 10 results and have been included in the standalone pro forma adjusted results (non-GAAP measures) presented
in the investor day presentation.
($USD, Millions)
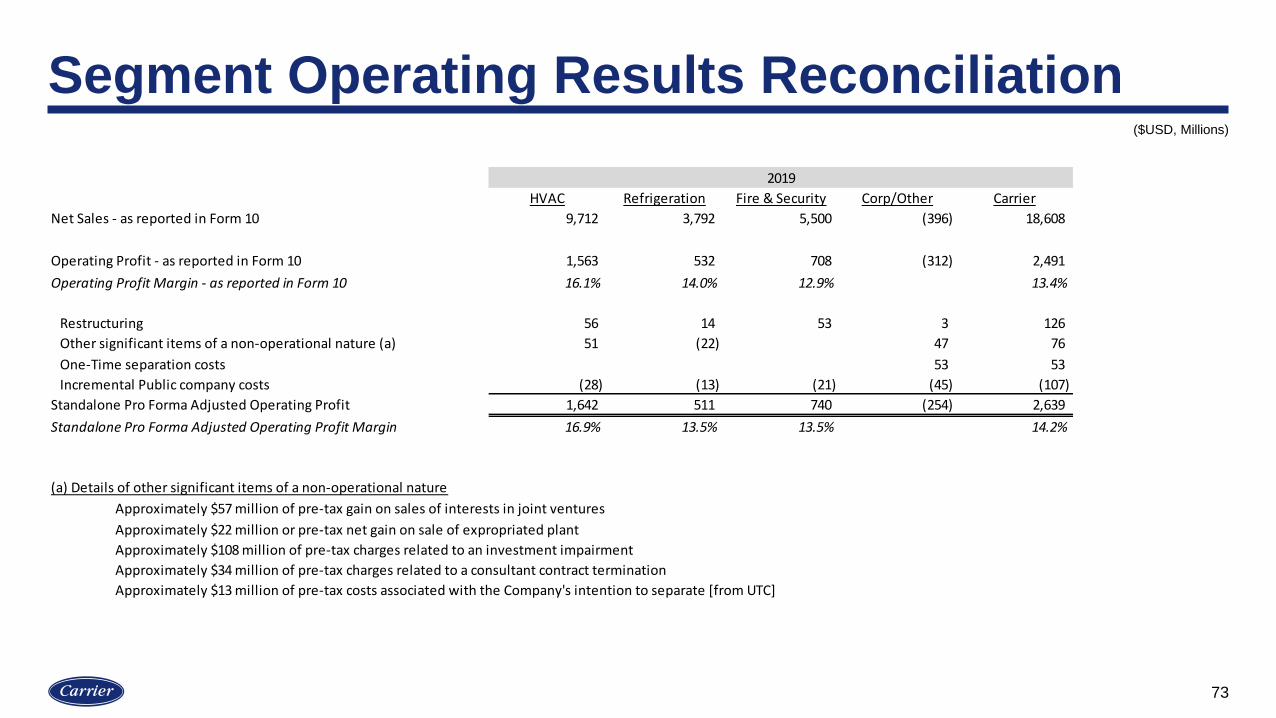
Segment Operating Results Reconciliation
73
HVAC Refrigeration Fire & Security Corp/Other Carrier
Net Sales - as reported in Form 10 9,712 3,792 5,500 (396) 18,608
Operating Profit - as reported in Form 10 1,563 532 708 (312) 2,491
Operating Profit Margin - as reported in Form 10 16.1% 14.0% 12.9% 13.4%
Restructuring 56 14 53 3 126
Other significant items of a non-operational nature (a) 51 (22) 47 76
One-Time separation costs 53 53
Incremental Public company costs (28) (13) (21) (45) (107)
Standalone Pro Forma Adjusted Operating Profit 1,642 511 740 (254) 2,639
Standalone Pro Forma Adjusted Operating Profit Margin 16.9% 13.5% 13.5% 14.2%
(a) Details of other significant items of a non-operational nature
Approximately $57 million of pre-tax gain on sales of interests in joint ventures
Approximately $22 million or pre-tax net gain on sale of expropriated plant
Approximately $108 million of pre-tax charges related to an investment impairment
Approximately $34 million of pre-tax charges related to a consultant contract termination
Approximately $13 million of pre-tax costs associated with the Company's intention to separate [from UTC]
2019
($USD, Millions)

Free Cash Flow Reconciliation
74
2019
Net cash flows provided by operating activities - as reported in Form 10 2,002
Capital Expenditures - as reported in Form 10 (243)
Free Cash flow 1,759
($USD, Millions)
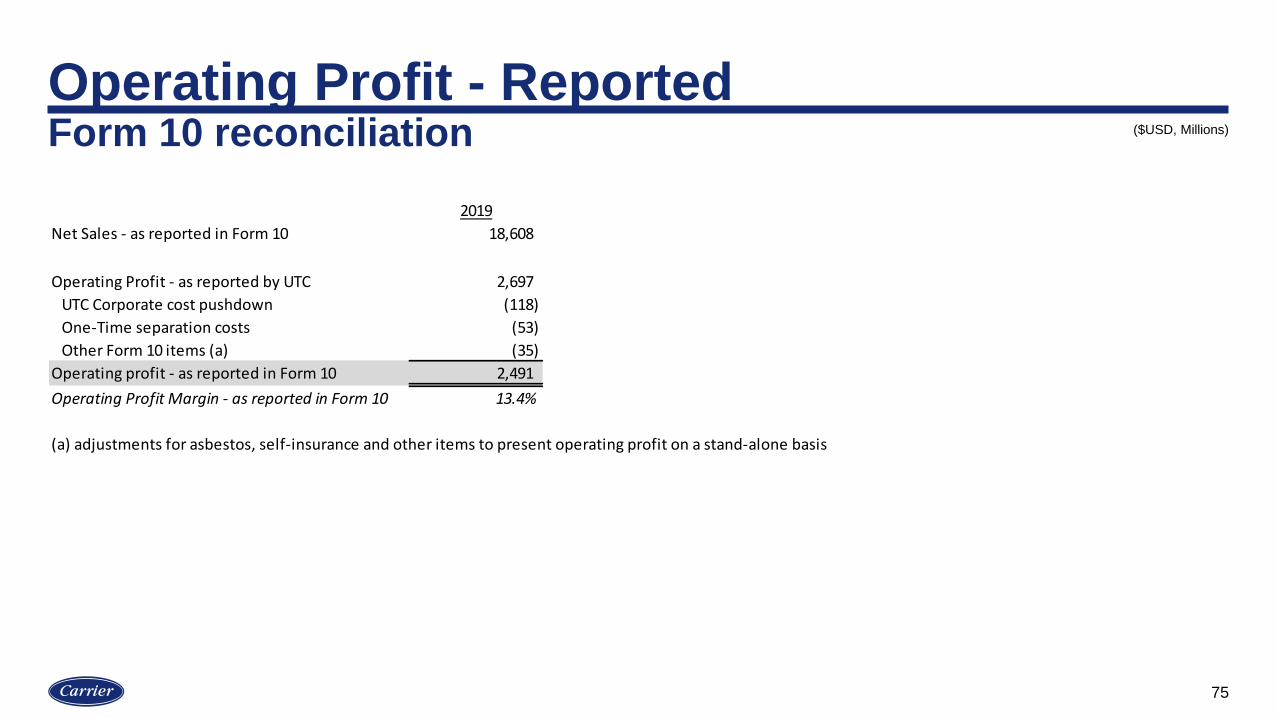
75
Operating Profit - ReportedForm 10 reconciliation
2019
Net Sales - as reported in Form 10 18,608
Operating Profit - as reported by UTC 2,697
UTC Corporate cost pushdown (118)
One-Time separation costs (53)
Other Form 10 items (a) (35)
Operating profit - as reported in Form 10 2,491
Operating Profit Margin - as reported in Form 10 13.4%
(a) adjustments for asbestos, self-insurance and other items to present operating profit on a stand-alone basis
($USD, Millions)

76
Operating Profit – AdjustedStandalone Pro Forma reconciliation
2019
Net Sales - as reported in Form 10 18,608
Adjusted Operating Profit - as reported by UTC 2,978
UTC Corporate cost pushdown (118)
Incremental Public company costs (107)
Other significant items of a non-recurring/non-operational nature (a) (79)
Other Form 10 items (b) (35)
Standalone Pro Forma Adjusted Operating Profit 2,639
Standalone Pro Forma Adjusted Operating Profit Margin 14.2%
(a) Details of other significant items of a non-operational nature
Approximately $57 million of pre-tax gain on sales of interests in joint ventures
Approximately $22 million or pre-tax net gain on sale of expropriated plant
(b) adjustments for asbestos, self-insurance and other items to present operating profit on a stand-alone basis
($USD, Millions)