The burden of crime in the EU: A comparative analysis of the European Survey of Crime and Safety (EU...
142
European Survey of Crime and Safety, 2005 Highlights and Policy Implications: Research Report: Jan van Dijk, Robert Manchin, John van Kesteren and Gergely Hideg (2007) “The Burden of Crime in the EU: A Comparative Analysis of the European Survey of Crime and Safety”. Gallup Europe, Brussels Downloadable from www.intervict.nl Other papers from the EU ICS 2005 can be downloaded from: www.europeansafetyobservatory.eu/ Gergely Hideg & Robert Manchin (Gallup): Drug-related Problems in Europe’s Neighbourhoods Gergely Hideg & Robert Manchin (Gallup): Environment and Safety in European Capitals Nyiri Zsolt, Phd (Gallup): Crime and Security in European Capitals Bernd Kühnrich & Harald Kania (Max Planck Institute): Attitudes Towards Punishment in the European Union
-
Upload
independent -
Category
Documents
-
view
1 -
download
0
Transcript of The burden of crime in the EU: A comparative analysis of the European Survey of Crime and Safety (EU...
European Survey of Crime and Safety, 2005 Highlights and Policy Implications: Research Report: Jan van Dijk, Robert Manchin, John van Kesteren and Gergely Hideg (2007) “The Burden of Crime in the EU: A Comparative Analysis of the European Survey of Crime and Safety”. Gallup Europe, Brussels Downloadable from www.intervict.nl
Other papers from the EU ICS 2005 can be downloaded from: www.europeansafetyobservatory.eu/
Gergely Hideg & Robert Manchin (Gallup): Drug-related Problems in Europe’s Neighbourhoods
Gergely Hideg & Robert Manchin (Gallup): Environment and Safety in European Capitals
Nyiri Zsolt, Phd (Gallup): Crime and Security in European Capitals Bernd Kühnrich & Harald Kania (Max Planck Institute): Attitudes Towards Punishment in the European Union


Jan van Dijk - UNICRI, Turin - INTERVICT, Tilburg University Robert Manchin - Gallup Europe, Brussels John van Kesteren - INTERVICT, Tilburg University Gegerly Hideg - Gallup Europe, Brussels with the assistence of Sami Nevala - HEUNI, Helsinki
EU ICS 2005: Burden of Crime in the EU
2H
igh
ligh
ts
HighlightsA European consortium comprising Gallup Europe1; UNICRI, Italy, Gallup Hungary, the Max Planck Institute, Germany, CEPS/INSTEAD, Luxembourg and GeoX Ltd., Hungary conducted a sample survey among inhabitants of the European Union about their experiences with crime and law enforcement. The survey was carried out in the 15 old member states of the Union plus Poland, Hungary and Estonia. The study was co-funded by the European Commission, DG RTD. Preliminary results were presented at a workshop convened at Gallup/EU headquarters in Brussels on 21 November, 2005. The event was attended by representatives of the EC and stakeholders from several member states.
Besides the current volume, a series of working papers have also been drafted, each of them dealing with a particular aspect of safety and criminality in a more in-depth way. The analyses and research data are available on the consortium website at http://www.gallup-europe.be/EU ICS.
Victimisation Rates
Key results indicate that levels of common crimes such as burglaries, thefts, robberies and assaults have decreased significantly over the past ten years everywhere in the Union, with the possible exceptions of Belgium and Ireland.
In 2004 levels of crime were most elevated in Ireland, the United Kingdom, Estonia, The Netherlands and Denmark and lowest in Spain, Hungary, Portugal and Finland. Factors associated with high levels of crime include urbanization and the proportion of young people in the population.
Risks of crime victimisation varied by type of crime. Risks of being assaulted were found to be highest in the United Kingdom, Ireland the Netherlands, Belgium, Sweden and Denmark. Risks were lowest in Italy, Portugal, Hungary, Spain and France. Rates of violent crime were found to be associated with the levels of consumption of alcohol per population.
Experiences with sexual violence were reported most often by women in Ireland, Sweden, Germany and Austria and least often in Hungary, Spain, France and Portugal.
The survey also addressed experiences of the public with special crime problems. Respondents were asked whether they had personally been in contact in their area with drugs-related problems such as drugs dealing or syringes left in parks. Such experiences were most common
1 the leader of the consortium, representing Gallup Hungary, Gallup Luxembourg, and Gallup UK as well
EU ICS 2005: Burden of Crime in the EU
3H
igh
lig
hts
in Greece, Portugal, Luxembourg, Spain and Italy and least common in Finland, Sweden, Hungary and Denmark.
The survey asked respondents whether they had been requested to pay bribes to public officials over the past twelve months. Positive answers were given most often by inhabitants of Greece, Poland, Hungary and Estonia. Bribe-seeking was least common in Finland, the UK, Sweden, the Netherlands and Ireland. Results are roughly in line with the rankings on the Corruption Perception Index of Transparency International, a Berlin- based NGO.
Respondents were also asked about any experiences with crimes motivated by hatred against minorities. Rates of such ‘hate crimes’ were most pronounced in France, Denmark, the United Kingdom and the Benelux countries. The lowest levels were recorded in Italy, Portugal, Greece and Austria. On average 15 % of the immigrants in the European Union were victimised once or more by a ‘hate crime’ in the course of 2004.
Security Concerns
Section 3 of this report deals with security concerns of EU residents. It discusses experiences of crime victims with regards to their treatment by the police as well as opinions of the general public on crime, local policing and criminal justice
The respondents were asked how they assess the chance of becoming a victim of burglary in the coming year and how safe they feel on the street after dark. The first is a rational consideration and the responses roughly correlate with the actual burglary rates in a country. The second item deals with fear; it does not correlate with actual victimisation but correlates very high with exposure to drugs related problems. Most afraid are the populations of Poland and Greece. The Danish and Finnish population are the least fearful.
Those who had been victimized by any crime were asked whether they had reported the incident to the police. The rate of reporting by victims varies by type of crime, the more serious a crime is, the higher the reporting rates. Variation in reporting rates among the 18 EU countries was limited: Between forty and seventy percent of crimes were reported to the police.
Victims that reported were subsequently asked how they rated their treatment by the police. The judgments of crime victims showed considerable disparity across the Union, with opinions being least favourable in Estonia, Greece, Hungary, Italy and Portugal and most favourable in Denmark, Ireland, Luxembourg and Austria.
All respondents were asked to rate the performance of their local police in controlling crime. In most countries public opinions on police performance were slightly improved compared to results of previous polls. Opinions were most critical of the police in Poland and Estonia and most favourable in Finland, Denmark, Austria and Ireland.
An index was constructed of perceived police performance on the basis of reporting rates, opinions of victims and of the general public. Countries with the best scores on this
EU ICS 2005: Burden of Crime in the EU
4C
OP
YR
IGH
T
comprehensive index were Austria, Denmark, Belgium, Germany and Sweden. Opinions were
least positive in Poland, Greece, Estonia and Italy.
The survey asked respondents about the use of special measures to protect themselves against
burglary. The use of electronic burglar alarms has increased significantly in the past ten years
across the Union. Over 30 percent of the households in the United Kingdom and Ireland have a
burglar alarm, but less than 10 percent of the households in Poland and Estonia. Also the use of
other measures such a special door locks has increased. Although the EU ICS only asks for
measures against burglary, there is reason to believe that security precautions against other
crimes have increased as well. This may well explain the drop in property crime in Europe.
Respondents were lastly asked to express their opinions on the punishment most suitable for a
recidivist burglar, e.g. imprisonment or a community service order. Those in Estonia, Hungary,
the United Kingdom and Ireland were most likely to favour imprisonment. Support for
imprisonment was least common among respondents from Portugal, France, Austria, Poland
and Finland. The upward trend in support for imprisonment seems to have reached a plateau in
most countries.
Crime and Safety Profiles
The country profiles presented in this section allow readers to assess at a glance how their
country of interest relates to the EU mean, excluding the country at issue itself. The results
present a country’s crime and justice profile in a nutshell.
EU ICS 2005: Burden of Crime in the EU
5C
on
ten
ts
Contents
Highlights.................................................................................................................................... 2Contents........................................................................................................................................5I. Introduction...............................................................................................................................7
Background to the European Union International Crime Survey .........................................7The content of the EU ICS....................................................................................................8
Methodology of the EU ICS 2005...........................................................................................11
Mode of the survey .............................................................................................................11
Coverage .............................................................................................................................11
Sampling .............................................................................................................................12
Weighting............................................................................................................................16
II. Victimisation .........................................................................................................................17
Introduction ............................................................................................................................17
Overall victimisation by common crime in 2004 and before .................................................18
Level of crime in 2004........................................................................................................18
Correlates of crime..............................................................................................................20
Correlates of crime..............................................................................................................20
Vehicle-related crimes............................................................................................................25
Theft of cars ........................................................................................................................26
Thefts from or out of cars ...................................................................................................28
Motorcycle theft...................................................................................................................30
Bicycle theft ........................................................................................................................33
Patterns of vehicle theft across Europe ...............................................................................35
Theft and Burglary..................................................................................................................36
Burglary ..............................................................................................................................36
Theft of personal property and pickpocketing ....................................................................40
Contact crimes ........................................................................................................................43
Robbery...............................................................................................................................44
Sexual offences ...................................................................................................................44
Assaults and threats.............................................................................................................46
Correlates of violence .........................................................................................................50
Hate crimes .............................................................................................................................51
Non-conventional crimes........................................................................................................54
Consumer fraud...................................................................................................................54
Corruption ...........................................................................................................................55
Exposure to drugs-related problems ...................................................................................58
European crime trends revisited .............................................................................................60
Property crimes ...................................................................................................................60
Contact crimes ....................................................................................................................61
III. Security Concerns ................................................................................................................63
Fear of Crime..........................................................................................................................63
The likelihood of burglary ..................................................................................................63
EU ICS 2005: Burden of Crime in the EU
6I.
Intro
du
ction
Relationship with national burglary risks and victimisation experience.............................63
Relationship with national risks and victimisation experience ...........................................66
Reporting crime to the police..................................................................................................67
Reporting to the police ........................................................................................................78
General attitudes to the police ................................................................................................79
A comprehensive index of police performance...................................................................79
Security precautions................................................................................................................81
Relationship between risks and victimisation experience ...................................................85
Attitudes to punishment ..........................................................................................................85
IV. Crime and Safety Profiles ....................................................................................................90
Introduction.............................................................................................................................90
Country profiles ......................................................................................................................91
Appendices .................................................................................................................................97
References...............................................................................................................................97
Appendix A: List of tables and graphs ...................................................................................99
Appendix B: Additional tables Chapter 2.............................................................................102
Appendix C: Additional tables for Chapter 3 .......................................................................113
Appendix D: Telescoping effect in EU ICS .........................................................................118
EU ICS 2005: Burden of Crime in the EU
7I.
Intr
od
uct
ion
I. Introduction
Background to the European Union International Crime Survey
The EU International Crime Survey (EU ICS) is carrying on the traditions of the International Crime Victim Survey (ICVS) which was initiated in 1987 by a group of European criminologists with expertise in national crime surveys (Van Dijk, Mayhew, Killias, 1990).
The survey was set up with the purpose of producing estimates of victimisation that can be used for comparative purposes. The survey has evolved into the world’s premier program of fully standardised surveys looking at householders’ experience of common crime in different countries. There have so far been four main rounds of the ICVS. After the first round in 1989 the surveys were repeated in 1992, 1996 and 2000. The 2005 EU ICS carries on the main trends of the earlier ICVS sweeps. ICVS has to date been carried out once or more in over 75 countries across the world, coordinated by the United Nations Interregional Criminal Justice Research Institute (UNICRI) in Turin, Italy.
For the execution of the EU ICS in the member countries of the European Union a consortium was set up, and comprising UNICRI in Turin, Italy, Max Planck Institute for Foreign and International Criminal Law in Freiburg, Germany, CEPS/INSTEAD in Luxembourg and GeoX in Hungary, led by Gallup Europe2 in Brussels. The consortium received a grant from the European Commission, DG Research, to carry out the EU ICS survey in 2005 among the 15 old Member States of the EU, and the consortium committed to include at least three of the newly acceded members (Poland, Estonia and Hungary).
In this report key findings are presented on the level of victimisation by common crime and public responses in 18 EU member countries in 2005. In parallel, a panel of experts is preparing a report with the key results of the global ICVS 2005 covering over 35 countries including non-EU European countries as well as the USA, Canada, Australia, Japan and several developing countries, using the EU ICS data.
Fieldwork for the EU ICS was conducted by Gallup Europe in the 15 old EU Member States and Hungary. Data collection in Estonia (Jüri Saar et.al., 2004) and Poland (Gruszczynska et.al., 2005) was organized independently in 2004 / 2005, using elements of the same
standarised methodology, including the adjusted ICVS questionnaire.
Thanks to the co-funding from the European Commission the current survey achieved fuller participation and greater methodological standardization than the earlier European ICVS waves.
2 also representing a network of European Gallup offices: Gallup Hungary, Gallup Luxembourg, Gallup UK
EU ICS 2005: Burden of Crime in the EU
8I.
Intro
du
ction
The content of the EU ICS
The EU ICS is similar to most crime surveys of householders with respect to the types of crime it covers. EU ICS inherited its core questions from ICVS. It is largely confined to counting crimes against clearly identifiable individuals, excluding children below 16 years of age. The types of crime included cover the bulk of ‘common crimes’ such as theft, burglary, robbery and assault. Through a set of special questions the survey also collects information on non-conventional crimes such as petty corruption (bribe-seeking by public officials) and consumer fraud.
For the crimes it covers, the EU ICS asks about incidents that by and large accord with legal definitions of offences, using colloquial language. Household burglary, for example, is captured by the question ‘did anyone get into your house or flat without permission, and steal or try to steal something?’. Respondents are asked about victimisation by ten types of common crime that they themselves or their household may have experienced.
Household crimes are those which can be seen as affecting the household at large, and respondents report on all incidents known to them. The questionnaire covered as separate household crimes: car theft (including joyriding), theft from or out a car, motorcycle theft, bicycle theft, burglary and attempted burglary.
For personal crimes, respondents report on what happened to them personally. Types of personal crimes included are sexual incidents (including rapes and other sexual assaults), threats/assaults (including assaults with force), robbery and personal theft (including pickpocketing).
A distinction can also be drawn between property and contact crime. All of the former, with the exception of ‘theft of personal property’, are what were described above as ‘household crimes’ (i.e., respondents were asked about the experience of the household as a whole).
Respondents are asked first about their experience of crime over the last five years. Those who mention an incident of any particular type are asked when it occurred: in the first months of the current year (2005), in the last year (in this case 2004), or before that. Information presented in this report is mainly on percentages of respondents victimised in the course of 2004.
All those who say they have been victimised over the five-year period are asked a number of follow-up questions about what happened - whether the police were notified, for instance, and whether they were satisfied with their treatment by the police. A few other crime-related questions are asked of all respondents. They include opinions on general police performance, what respondents would recommend as a sentence for a recidivist burglar and the use of precautionary measures against crime. Results on these latter issues are presented in a separate report.
The primary objective of the EU ICS is to compare levels of crime across countries independent of police records. Using the data from the earlier ICVS surveys that have now been repeated several times in many countries, the EUICS results can also be used to compare
EU ICS 2005: Burden of Crime in the EU
9I.
Intr
od
uct
ion
trends in crime over time. Because of the comparability issues with ICVS and the longitudinal aspect of the series, changes to the questionnaire have always been kept to a minimum. The most important changes to the ICVS questionnaire for the 2005 EU ICS are:
An additional newly designed question on ‘hate crimes’ including those against immigrants;
Inclusion of a question on exposure to drug-related problems previously used in three Eurobarometer surveys;
Deletion of the question on car vandalism and of some secondary questions to reduce the length of the interview.
The core ICVS module was extended into some further important aspects, for which analysis is still undergoing.
tackling cultural bias in reporting levels of the level of insecurity. It has been widely documented that different cultures report similar experiences differently. Of course this makes international comparisons of data on personal safety very difficult. While crime incidences are thought to be reported in a more consistent manner across nations (however the evaluation of certain episodes or incidents might differ country-by-country, but even by demographics, whether or not these incidents qualify as crimes or not) the perception – and therefore the expression – of personal safety is very different. In our questionnaire we used multiple ways to capture and tackle such differences:
- experienced safety approach: instead of simply asking a general perception of safety (How safe do you generally feel when walking … ) we asked respondents to roughly reconstruct their previous day and to report actual incidences of unsafe experiences. We expected that such experience-based inquiry will lead to very different levels compared to the general question that is also asked in the questionnaire.
- checking of scale use: with modifying some of the scales we are now able to compare the national tendencies to use scales, and with the help of the vignette questions we will also be able to evaluate the social desirability of reporting satisfaction versus extreme satisfaction.
- the vignettes we used will help us to evaluate how people perceive the position of someone with a near-perfect life who has a not very serious problem. We expect to find cultures / nations, where near perfect is enough, and we will find nations, where only perfect is satisfactory.
- objective evaluation will be performed with the aid of factual questions that are related heavily to mood and well-being. We asked respondents whether or not they have experienced at least 2 hours of sunshine yesterday, and how many days they have in the month of the interview with at least 2 hours of
EU ICS 2005: Burden of Crime in the EU
10I.
Intro
du
ction
sunshine. The information we gathered will be matched with real life weather data, and the results will show whether or not nations have a tendency to report weather (and on this path, other factual information related to their lives) optimistically, pessimistically, or just factually.
- addressing the geographical dimension of crime and safety. So far, very little has been done to capture the geographical aspect of safety and criminality. Police usually tries to dram city maps, where they mark the locations of different crimes. EU ICS attempts to draw similar maps in the capital cities in each of the 17 participating countries and regions, adding perceptions of safety, happiness, and recent unsafe experiences. There are points in the questionnaire where we were collecting information that helps us to put the collected information in a geographical context.
- this survey attempted to estimate the coverage error stemming from the increased number of people using mobile phones only: we asked the close network of our respondents, whether or not they have any members with mobile phone only (i.e. without a landline home telephone) and we have added a Finnish mobile only subsample to see how much the main indicators change if those increasing groups are included in the survey, too.
- In certain capital city subsamples we asked about satisfaction with the city life, to compare that to criminality: how differences in crime and safety influence other dimensions of the general urban experience.
- finally, we included some questions about hate crime the very first time (whether or not respondents or their family members were subjects of a crime that was partly or completely motivated by prejudices regarding religion, race or colour, ethnicity, nationality or sexual orientation). To capture the increasing tensions across Europe in terms of religion and ethnicity, we also included a few questions that describes the respondents’ religious background and immigrant status.
The full English source version and the locally used EU ICS questionnaires are available from the consortium’s website ( www.gallup-europe.be/EU ICS).
EU ICS 2005: Burden of Crime in the EU
11 I
.In
tro
du
ctio
n
Methodology of the EU ICS 20053
Mode of the survey
Most EU ICS interviews have been carried out with CATI telephone methodology. Telephone surveys have, from the outset, been widely implemented during the ICVS rounds especially in the more industrialised countries with high telephone penetration rates (above 70 percent). Interviews were carried out via fixed (landline) telephones, with the exception of Finland where a sub-sample was interviewed via mobile phones. The average duration of the interview was 23.2 minutes.
The CATI technique has evolved over the years. Twelve of the countries were surveyed using an Internet-based CATI server that made the questionnaire available in many languages from a single location. The use of this technique makes the interviewing process more flexible and efficient.
Included in the report are results from surveys conducted in Poland and Estonia where the interviews were carried out face to face in the respondent’s home.
Coverage
The current dataset covers 18 countries of the European Union:
Austria Belgium Denmark EstoniaFinland FranceGermany Greece Ireland Italy Luxembourg The Netherlands Poland Portugal Spain Sweden United Kingdom (England/Wales, Scotland and Northern Ireland)
3 More information on the methodology of the survey can be found on the Consortium’s website ( www.gallup-europe.be/EU ICS
EU ICS 2005: Burden of Crime in the EU
12I.
Intro
du
ction
In addition, there was separate data collection for Northern Ireland and Scotland. Both regions have of course been included in the United Kingdom data. In this report focussing on EU country findings, results of the Northern Ireland and Scotland studies are presented in footnotes on an ad hoc basis.
The subjects of the survey are residents of 16 years of age or older in the above countries.
The surveys in Poland and Estonia were done in close consultation with, but not under the direct supervision of the consortium. These two countries have adopted the ICVS methodology to conduct regular ‘national’ victimisation surveys. The questionnaire used was similar to the EU ICS 2005 questionnaire. Only some additional items added to the EU ICS-questionnaire at a later stage, are missing.
Sampling
In each participating country, the samples of the study were uniformly selected along the same design in each participating country, with the exceptions of Poland and Estonia. The samples used for the EU ICS were designed to provide the most complete coverage with the least bias. Therefore Random Digit Dialling (RDD) samples of landline telephone numbers were used in most countries to carry out the interviews. This means that telephone numbers were not selected from a list, but were generated randomly. The Random Digit Dialling of telephone numbers, stratified using ‘NUTS 2’ or similar regional strata, guarantees a solid and cost effective coverage of the population in a country.
The surveys done in Estonia and Poland used randomly selected persons drawn from official national registration. These samples were also stratified by local area.
In Finland, the emerging trend among specific population groups to exclusively use mobile phones – notably young people – necessitated an additional sample of persons exclusively owning mobile phones. These owners were identified through a nationwide screener survey. Although the group of exclusive mobile users differed in many respects from the general Finnish population their inclusion in the sample did not alter victimisation rates much. The exclusive use of mobile phones is currently most advanced among young people in Finland but its growing popularity may soon cause problems with landline- based sampling in other EU countries as well.
Sample size
The targeted number of actual interviews in most countries was 2000. The samples were divided into a larger national part (with a targeted size of 1200) and a relatively smaller capital city part (targeted N = 800). There were no additional interviews done in the capital cities of Luxembourg, Poland and Estonia.
The table below illustrates the actual sample sizes in each country for both sub-samples and overall.
EU ICS 2005: Burden of Crime in the EU
13I.
Intr
od
uct
ion
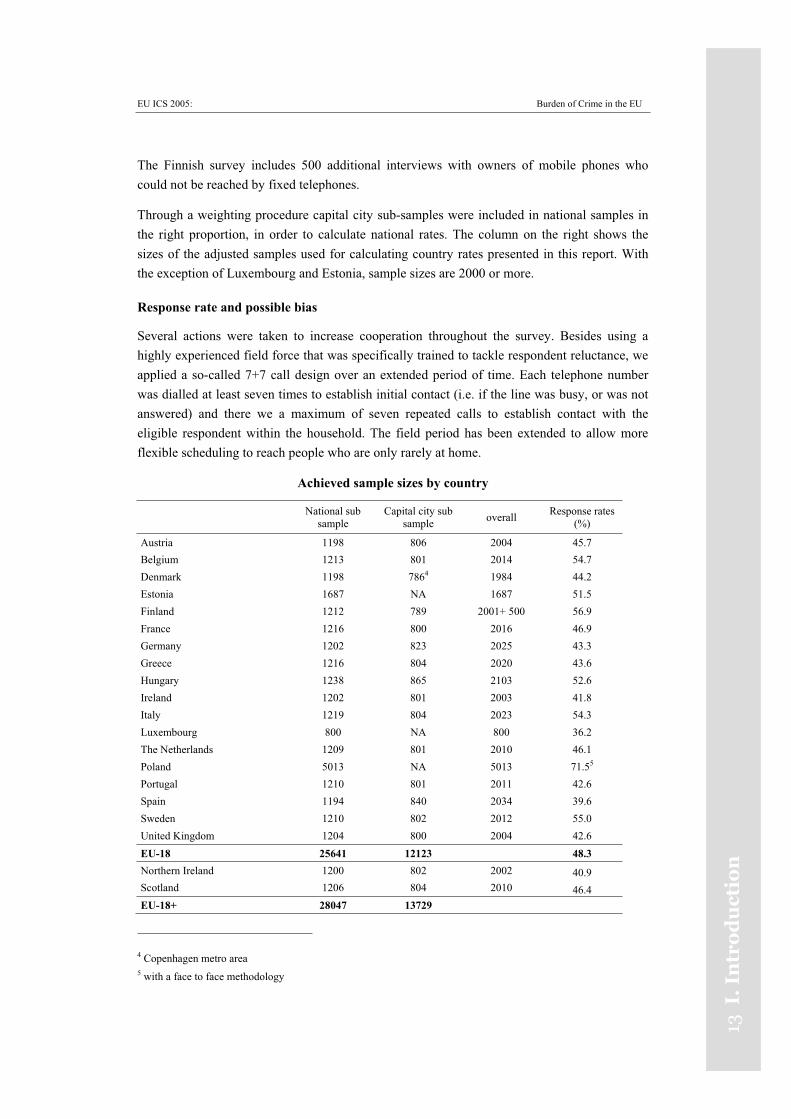
The Finnish survey includes 500 additional interviews with owners of mobile phones who could not be reached by fixed telephones.
Through a weighting procedure capital city sub-samples were included in national samples in the right proportion, in order to calculate national rates. The column on the right shows the sizes of the adjusted samples used for calculating country rates presented in this report. With the exception of Luxembourg and Estonia, sample sizes are 2000 or more.
Response rate and possible bias
Several actions were taken to increase cooperation throughout the survey. Besides using a highly experienced field force that was specifically trained to tackle respondent reluctance, we applied a so-called 7+7 call design over an extended period of time. Each telephone number was dialled at least seven times to establish initial contact (i.e. if the line was busy, or was not answered) and there we a maximum of seven repeated calls to establish contact with the eligible respondent within the household. The field period has been extended to allow more flexible scheduling to reach people who are only rarely at home.
Achieved sample sizes by country
National sub sample
Capital city sub sample overall Response rates
(%)
Austria 1198 806 2004 45.7 Belgium 1213 801 2014 54.7 Denmark 1198 7864 1984 44.2 Estonia 1687 NA 1687 51.5 Finland 1212 789 2001+ 500 56.9 France 1216 800 2016 46.9 Germany 1202 823 2025 43.3 Greece 1216 804 2020 43.6 Hungary 1238 865 2103 52.6 Ireland 1202 801 2003 41.8 Italy 1219 804 2023 54.3 Luxembourg 800 NA 800 36.2 The Netherlands 1209 801 2010 46.1 Poland 5013 NA 5013 71.55
Portugal 1210 801 2011 42.6 Spain 1194 840 2034 39.6 Sweden 1210 802 2012 55.0 United Kingdom 1204 800 2004 42.6 EU-18 25641 12123 48.3 Northern Ireland 1200 802 2002 40.9 Scotland 1206 804 2010 46.4 EU-18+ 28047 13729
4 Copenhagen metro area 5 with a face to face methodology
EU ICS 2005: Burden of Crime in the EU
14I.
Intro
du
ction
Achieved response rates ranged from 36.9% in Luxembourg to 56.9% in Finland (landlines only), averaging 46.9% overall in the 17 countries where sampling and interviewing was carried out over the telephone. The overall response rates achieved during the EU ICS are slightly better than the one of the first ICVS sweep in 1989 but remain below the levels obtained in the three subsequent ICVS sweeps (see Van Kesteren, Mayhew, Nieuwbeerta, 2000).
Unfortunately, reduced response rates are a common trend in CATI-based survey research in Europe. They raise the issue how far respondents who are successfully interviewed differ from those who refuse to co-operate, or who cannot be reached. A related issue is to what extent variability in response levels upsets comparability. The issue is not straightforward. First, good (or poor) response may simply reflect the number of recalls or interviewer performance, saying little about the nature of those who are (or not) interviewed in terms of crime risks. Second, response rates may also reflect the willingness of those in different countries to be interviewed by phone. Again this may be of little relevance in terms of the characteristics of those who are or who are not interviewed. Third, though, there is the possibility that when response is low, bias is introduced. The effect could be in two opposing ways depending on whether low response is due to high non-contract rates or high refusal rates.
Where low response is due to high rates of non-contact, people are omitted who may be more liable to victimisation because they are residentially more unstable, or simply away from home more. Victims therefore could be under-represented, with the effect that victimisation risks in countries where non-contact is high is understated. Studies outside the victimisation field indicate that non-contacts to telephone surveys register higher on ‘negative’ social indicators such as ill-health. Sparks et al.'s (1977) in their London crime survey, too, found that those who had reported crimes to the police were more difficult to locate for interview than those who did not report a crime. In the EU ICS the selected numbers were contacted up to seven times after the initial contact with the household. No relationship was found between the number of recalls and rates of victimisation: those interviewed after many recalls reported the same rates of victimisation as those contacted more easily. If no recalls would have been made, this would not have resulted in different victimisation rates. Low response due to non-contact seems not to affect crime victimisation findings much.
Surveys with low response rates due to high rates of refusals, on the other and, may pick up people ‘with more to say’ (refusers having ‘less to say'). On this view, victims would be over-represented, with the effect that victimisation risks in countries where refusal rates are higher are overestimated relative to those where response is better. Looking at the ICVS specific experience there are indications that those interviewed who had initially declined show slightly,
EU ICS 2005: Burden of Crime in the EU
15I.
Intr
od
uct
ion
but not significantly, lower victimisation rates because they have ’less to tell’ (Mayhew, Van Dijk, 1997)6.
As a global test with the ICVS, leaving aside the distinction between refusals and non-contact, overall response rates in 54 individual surveys were correlated with overall victimisation rates. There was a very slight tendency for victimisation rates to be lower in surveys with higher response rates, but the result was statistically insignificant (r = -0.19; ns).
It cannot be ruled out, though; that response effects have different implication in different countries (such that low responses rate in one country influences the victimisation count in a way that does not occur in another). Nevertheless the weight of current evidence supposes that countries with comparatively low response levels have neither inflated nor deflated counts of victimisation relative to other countries (Van Kesteren, Mayhew, Nieuwbeerta, 2000).
Response error
Crime surveys are prone to various response errors. For one, certain groups (e.g. the better educated) seem more adept at remembering and articulating incidents of victimisation. Second, and more important, respondents may forget to report less serious incidents, or they may ‘telescope in’ the more serious incidents which happened before the period they are asked about. If respondents are allowed to report only about incidents that happened over the past twelve months, many of them will report older incidents as well. In the EU ICS this telescoping effect should be reduced by initially asking about experience in the past five years. However, respondents interviewed in the course of 2005 may have been inclined to ‘telescope’ into 2005 victimisations that have happened last year (2004). Such telescoping would deflate victimisation rates for 2004. Third, some people may fail to realise an incident is relevant, or may be reticent to talk about some incidents, for instance sexual incidents, or those involving people they know. The EU ICS will at any rate only measure crimes that respondents are prepared to reveal to interviewers.
There is no way of knowing whether response errors are constant across country. The tendency to forget more trivial incidents of crime may be relatively universal, as may be ‘forward telescoping’ of more salient incidents. Some types of differential ‘response productivity’ may also be constant, at least within the EU. However, whether respondents differ across countries in preparedness to talk to interviewers about victimisation is possibly more questionable.
Cultural sensitivity may apply most to some forms of assaults, and to sexual incidents. It may also be that respondents in different countries have different cultural thresholds for defining certain behaviours as crime. For EU countries, one might optimistically contend that common cultural and legal backgrounds, and the globalisation of markets and mass media information, result in fairly universal definitions about most conventional crimes. Certainly, the ICVS 6 In a test made in the context of the 1996 British Crime Survey, people who said they did not want to be interviewed were pressed by interviewers to give some very short answers about the extent of their victimisation over the last year. Comparisons between these ‘crude’ victimisation rates and those of respondents who agreed to be interviewed showed no consistent difference (Lynn, 1997).
EU ICS 2005: Burden of Crime in the EU
16
shows that victims in industrialised countries hold strikingly similar views about the relative seriousness of different offence types about which they are asked (see Van Dijk , 1999).
In principle, ICVS fieldwork had been largely executed within the first three months of the year, although there have been exceptions. In the current EU ICS study, fieldwork was planned for January-February 2005. Due to administrative delays fieldwork in most countries did not commence before May/June 2005. Interviewing later in the year may have posed special problems. The delayed fieldwork may have resulted into more forward time-telescoping in countries where the interviews were executed latest. This factor may then have compromised comparability of one-year victimisation rates by deflating the 2004 victimisation rates of these countries. Focused analyses of response patterns were conducted to assess the possible magnitude of such effects. The results did not reveal evidence of major distortions due to forward time-telescoping7.
Weighting
Results in this report are based on data which have been weighted to make the samples as representative as possible of national populations aged 16 or more in terms of gender, regional population distribution, age, and household composition.
The following weighting operations were carried out to compensate for over- and under sampling of particular groups within the population in the primary samples:
The 2-stage sampling (random selection of a household and a random selection of a person within that household) means that people from small (single-person) households are by definition over-represented and people from large household are underrepresented. Weight variables are used to compensate for this.
Weighting was done to compensate for the over-sampling of inhabitants of the capital cities in the primary, total samples.
Weighting was also done to bring the samples in line with the distribution on age, gender andregion within the country according to census data. For example: since it is known that young men are more difficult to reach for interviews and are therefore generally under-represented, weight variables are introduced to correct for unequal response propensities.
For this report, individual weights were used rather than household weights and each country carried equal weight in computing EU averages. The latter choice results in under-weighting of the larger EU countries in the mean rates. These choices are made to maintain comparability with the published results of the 1989, 1992, 1996 and 2000 ICVS
7 Analyses suggests that possible telescoping / memory effects have had only limited influence in EU ICS. For details on the explorative analysis see appendix D.
EU ICS 2005: Burden of Crime in the EU
17II
.V
icti
mis
ati
on
II. Victimisation
Introduction
Rates of victimisation are expressed in this report as prevalence rates. Prevalence victimisation rates are the percentage of those aged 16 or over, who experienced a specific crime once or more. Results presented here mainly refer to the percentage of the population victimised by a specific crime in the course of 2004 per country (national one-year prevalence victimisation rates). Although prevalence rates do not reflect the number of times people are victimised during a year, they are a valid measure of the level of crime experienced by the public across countries.
This EUICS report focuses on the presentation of the following key findings:
The overall one-year victimisation prevalence rates in 2004 (percentage of population victimised by any of the ten common crimes included in the survey). Where available, using the historic ICVS data, prevalence victimisation rates of previous years have been added in order to determine trends over time. For most countries at least one prevalence rate from a previous year is available8.
Prevalence rates for the ten different types of victimisation by common crime measured by the EU ICS and for three subcategories of crime (pickpocketing, sexual assault and assault with force). Where available, rates from previous years have been added to determine possible trends over time.
Prevalence rates for consumer fraud and corruption. Since these questions were added to the questionnaire at a later stage, only small amounts of historical data are available.
Prevalence rates for exposure to drug-related disorders. Historical data are available from Eurobarometer studies.
Prevalence rates for hate crimes experienced by immigrants. No historical data are available.
Readers are reminded that survey results are estimates, the accuracy of which rests upon the sample size and the observed percentage. With sample sizes of 2000 per country actual percentages in the population vary within confidence limits of – approximately- 0.5 to 1.5 %. In the case of a victimisation rate of 5, for example, there is a 90 % certainty that the true rate among the population lies in the range between 4.2% and 5.8%. Throughout the report, margins of error at the 90 % confidence level have been indicated in the graphs presenting key results.
Since victimisation rates often show variations across countries of several percentage points, it is almost always the case that countries at the top - or at the bottom - of the rankings have population rates that are statistically significantly different from the European mean. In many cases,
8 The 1989 ICVS was done in Greece, Ireland, Hungary and Luxemburg. ICVS-based studies in the capital cities only have previously been executed in Hungary and Greece.
EU ICS 2005: Burden of Crime in the EU
18II.
Victim
isatio
n
differences between countries can be checked against results of the ICVS surveys. In most cases, the ranking of countries is confirmed by results of studies in previous years.
Overall victimisation by common crime in 2004 and before
Level of crime in 2004
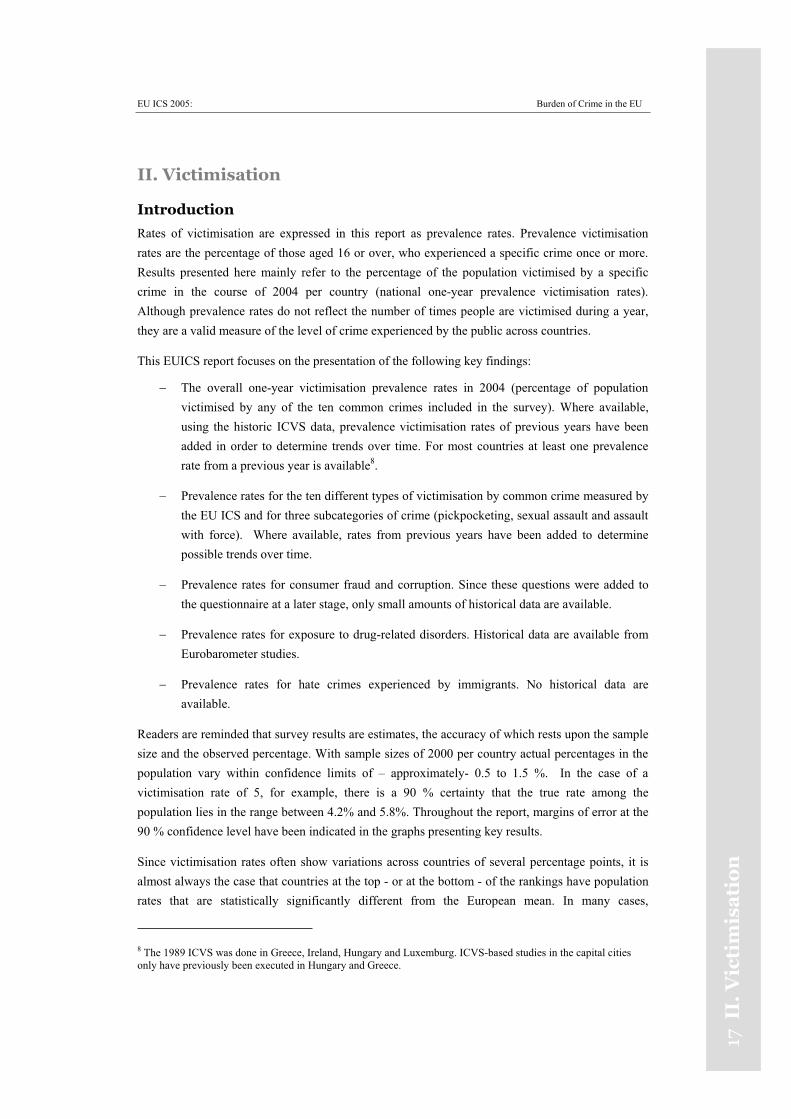
The first result to be reported on is the percentage of people per country victimised once or more in 2004 by any of the ten common crimes - the overall one-year victimisation prevalence rate. This result is a simple measure for the overall risk of crime in 18 countries of the EU.
Figure 2.1 Prevalence victimisation rates for 10 common crimes in 2004 9and results from earlier ICVS surveys
9 England & Wales (21.8%), Scotland (13.3%) and Northern Ireland (20.3%).
0 5 10 15 20 25 30
Spain
Hungary
Portugal
France
Austria
Greece
Italy
Finland
Luxembourg
Germany
AVERAGE
Poland
Sweden
Belgium
Denmark
Netherlands
Estonia
United Kingdom
Ireland
Percentage
20051999199519911988
EU ICS 2005: Burden of Crime in the EU
19 I
I.V
icti
mis
ati
on
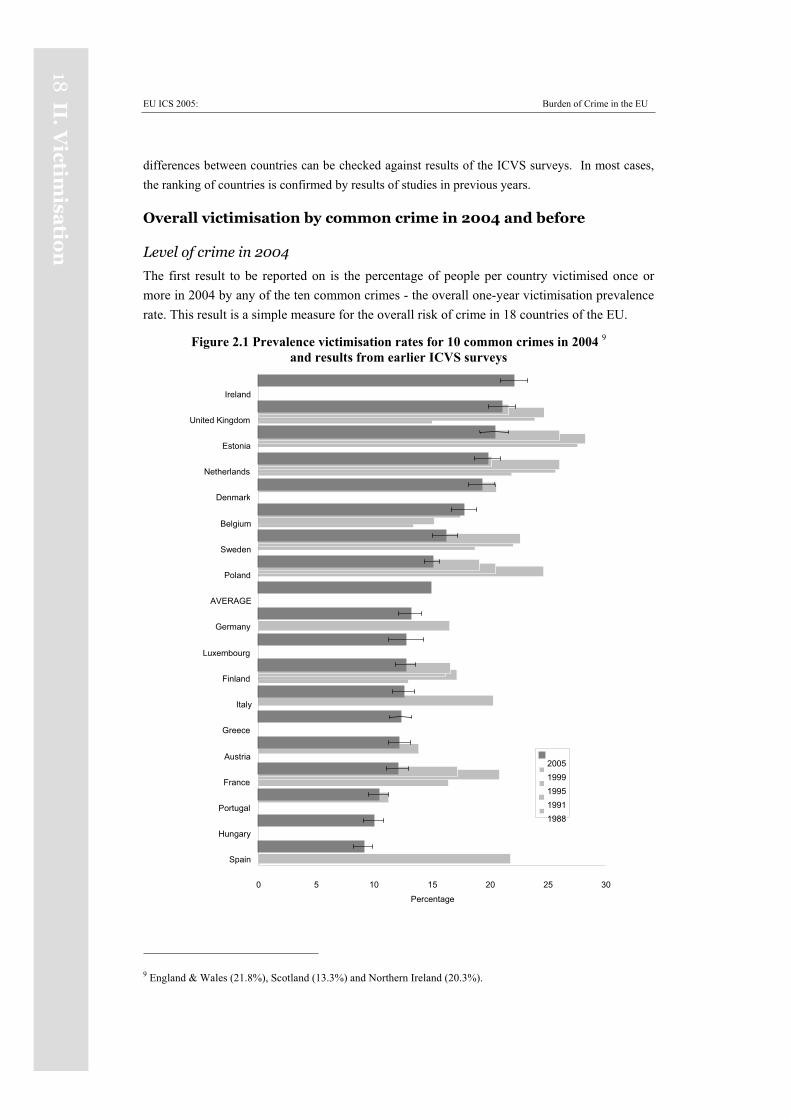
Almost fifteen percent of the population of the 18 EU countries has been a victim of any crime in 2004. The five countries with the highest overall prevalence victimisation rates in 2004 are Ireland, the United Kingdom, Estonia, the Netherlands, Denmark and Belgium. All these countries have overall victimisation rates that are statistically significantly higher than the average of the 18 EU countries. These countries have the darkest colour in figure two, a geographical crime map of the EU. These five countries can be regarded as suffering from comparatively high levels of common crime within the European context. Differences between these countries may be the result of sampling error.
The lowest levels of crime were found in Spain, Hungary, Portugal, France, Austria, and Greece. These countries all have risks significantly below the European average and can be regarded as low crime countries in a EU context.
Countries with medium to high levels of crime, not significantly different from the EU mean, include Poland, Sweden, Germany and Luxemburg.
Figure 2.2 Levels of crime across Member States of the European Union in 2004
One-year victimisation rate for 10 crimes in 2004
19.8 - 22.1 (3)15.0 - 19.7 (5)12.2 - 14.9 (5)
9.0 - 12.1 (5) (29)
EU ICS 2005: Burden of Crime in the EU
20II.
Victim
isatio
n
Correlates of crime
No association was found between indicators of wealth or economic equality and levels of overall crime. High crime countries include both relatively affluent countries (Ireland, Denmark and the Netherlands) and some of the least affluent (Poland, Estonia). The category of low crime countries is equally diverse. It includes both relatively affluent countries, such as Austria, and less prosperous ones, such as Hungary and Portugal. Within the European context, levels of common crime seem to be neither associated with poverty nor with national wealth.
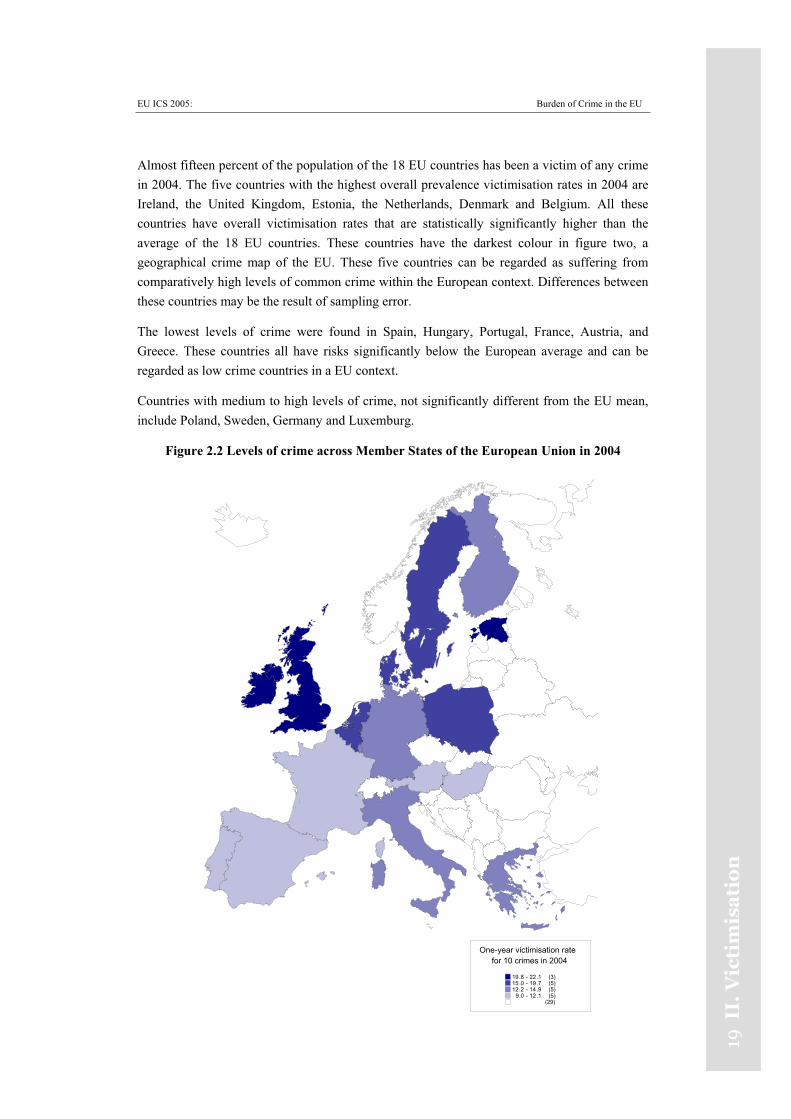
Other macro factors known to be associated with levels of common crime are urbanisation and the proportion of young adolescents in the population (Van Dijk, 1999). Within Europe, urbanisation, defined as the proportion living in urban areas, is higher than in other world regions but still varies significantly across countries (United Nations, 2002). People living in urban areas make up 58.5% of the population in Finland, 59.3 % in Ireland and 60.3% in Greece. More urbanized countries include Belgium (97.4%), the United Kingdom (89.5%) and the Netherlands (89.6%).
Figure 2.3 Urbanisation and level of common crime in 17 European countries
Fin
PorHun
AusIta
Spa
FraGer Lux
Swe
Bel
Den NldUK
Gre
Pol
Est
0
10
20
30
40 50 60 70 80 90 100
Percentage of population in urban areas in 2001
One
yea
r pre
vale
nce
rate
s fo
r 10
crim
es Ire
Urbanisation can explain some of the variation in overall levels of crime across European countries. The correlation coefficient between urbanisation and crime was fairly weak (r= .30).
EU ICS 2005: Burden of Crime in the EU
21 I
I.V
icti
mis
ati
on
The main outlier was Ireland. Without Ireland the correlation is stronger (r= .50).10 Figure 2.3 shows the position of European countries on the two dimensions of urbanisation and level of common crime. Ireland is marked in the graph but excluded in computing the correlation and regression line.
The urbanisation factor, then, goes some way in explaining the inter-country variation in crime across the EU, such as the comparatively high levels of crime in the United Kingdom and the Netherlands and the low rates in Finland and Greece. As said, the comparatively high level of crime in Ireland is at odds with the country’s relatively low level of urbanisation (which is at the level of Finland and Greece).
Proportions of young people also vary across European countries within a range of 10.6 in Italy, 11.0 in Germany to 15.1 in Estonia, 15.9 in Ireland and 16.7 in Poland ( -source- : http://epp.eurostat.cec.eu.int). The correlation between proportion of young people and levels of crime was positive but statistically insignificant (r= .23).
Trends in over all crime
Figure 2.1 allows a comparison of the 2005 EU ICS rates with rates recorded in the earlier rounds of the ICVS for most countries. Available trend data point to a general downward trend in victimisation by common crime across the EU since 1988. The mean victimisation rates of participating EU countries went from 16.9 in 1988 to 21.6 in 1992 and to 21.6 in 1996. It fell slightly to 19.3 in 2000, and steeply decreased to 14.9 in 2004.
According to ICVS data, the level of common crime in Europe reached a plateau around 1995 and has shown a steady decline over the past ten years. The level of crime in Europe has now fallen back to the levels of 1990. Although this report focuses on crime within the EU, it seems worth mentioning here that levels of common crime have recently shown declining trends in the USA, Canada, Australia and other industrialised countries as well (Van Kesteren, Mayhew, Nieuwbeerta, 2000).
In the 15 countries where it is possible to compare old and new data, with the exception of Belgium, rates of previous years were higher than those of 2004.
ICVS-based prevalence rates for 1988, 1992, 1996, 2000 and 2005 EU ICS are available for the United Kingdom, the Netherlands and Finland. The three countries show roughly identical trends. Rates went up between 1989 and 1992/1996 and subsequently decreased between 1996 and 2000. In Finland, the 2004 rates were much lower than those of 2000. Further declines since 2000 were also recorded in the Netherlands and the United Kingdom11.
10 The correlation between urbanization and rates of victimisation by violent crime (threats/assaults) was somewhat stronger (r= .60; excluding Ireland).
11 The ICVS trends are broadly in line with those emerging from the British and Dutch national crime surveys, indicating drops in over all crime of 40% over the past ten years (-sources-: www.homeoffice.gov.uk/rds/pdfso5/hosb1105tab201.xls; www.wodc.nl)

EU ICS 2005: Burden of Crime in the EU
22II.
Victim
isatio
n
Poland, for which national data are available since 1990, shows a clear and consistent downward trend. From a European perspective, Poland has turned from a high crime into a medium crime country.
Crime trends in France are fully in line with the European pattern. After a clear increase between 1988 and 1996, the level of crime has dropped significantly, especially over the past four years.
In Sweden, decreases in crime seem to have been somewhat delayed. The 2000 ICVS sweep still showed a small increase for Sweden, putting it in the category of high crime countries. Between 2000 and 2004 Swedish crime dropped dramatically and the level is now in the medium range.
Belgium is, as mentioned, the only European country where levels of crime have not shown a decrease. Belgium was recorded by the ICVS as a comparatively low crime country in 1988 but it has now moved into the category of countries with levels of crime above the European mean.
As said, no ICVS trend data are available on Ireland. According to Irish surveys crime has gone up steeply since 1998 (Central Statistical Office Ireland, 2004).
EU ICS 2005: Burden of Crime in the EU
23II
.V
icti
mis
ati
on
Trends in context
The drop in crime across 18 different European countries as well as in the US, Australia (Johnson, 2005) and many other developed countries cannot be attributed to one single factor.
The general consensus is that changing demographics, among other factors, have played a causal role in the decreases in crime across the Western world. Since the bulk of common crimes are committed by young males, the proportion of adolescents in societies makes, as said, a difference to the levels of crime. Within the EU (15 countries) the proportion of the population aged 15 to 24 years decreased from 14.1 in 1993 to 12.2 in 2004 ( http://epp.eurostat.cec.eu.int).
Another factor that is often cited to explain the drop in crime in the Western world is better policing and/or more severe sentencing. It is possible that the general trend towards more severe sentencing has contributed to the drop in crime by acting as a deterrent on some classes of (potential) offenders and/or through incapacitating a larger proportion of career offenders.
Within the European context this explanation is far from straightforward, though, since sentencing policies show considerable variation across countries and crime has gone down across the board. Prison populations have since the early nineties gone up in many EU countries but not consistently so. Between 1995 and 2000 rates went down, for example, in Sweden, France, Poland and Finland (European Sourcebook, 2003). Sentencing policies in Europe as a whole are considerably less punitive than in the USA (Farrington, Langlan, Tonry, 2004) and yet crime is falling just as steeply in Europe as it is in the USA. No relationship between the severity of sentencing of countries and trends in national levels of crime is therefore in evidence.
Perhaps a more significant factor inhibiting crime across the Western world is the universal growth in the possession and use of private security measures by households and companies over the past few decades. ICVS-based trend data on the use of precautionary measures confirm that in all Western countries, without exception, the use of measures to prevent property crimes such as car thefts and household burglaries has risen drastically over the past 15 years (more details on anti-burglary devices are given in a second report, titled “Security concerns of EU residents”. Since decrease in crime has been most pronounced in precisely these types of crime and less so, if at all, in categories of contact crimes, increased use of crime prevention measures may indeed be the common factor behind the near universal decrease in overall levels of crime in the Western world.
Victimisation rates and police-recorded crimes
The methodology of victimisation surveys has been developed to obtain estimates of the true levels of common crime, unaffected by reporting patterns of the public and/or recording practices of the police. If standardised questionnaires and data collection techniques are used, the surveys can also be harnessed for comparisons of crime levels across countries, disregarding differences in legal definitions and procedures.
EU ICS 2005: Burden of Crime in the EU
24II.
Victim
isatio
n
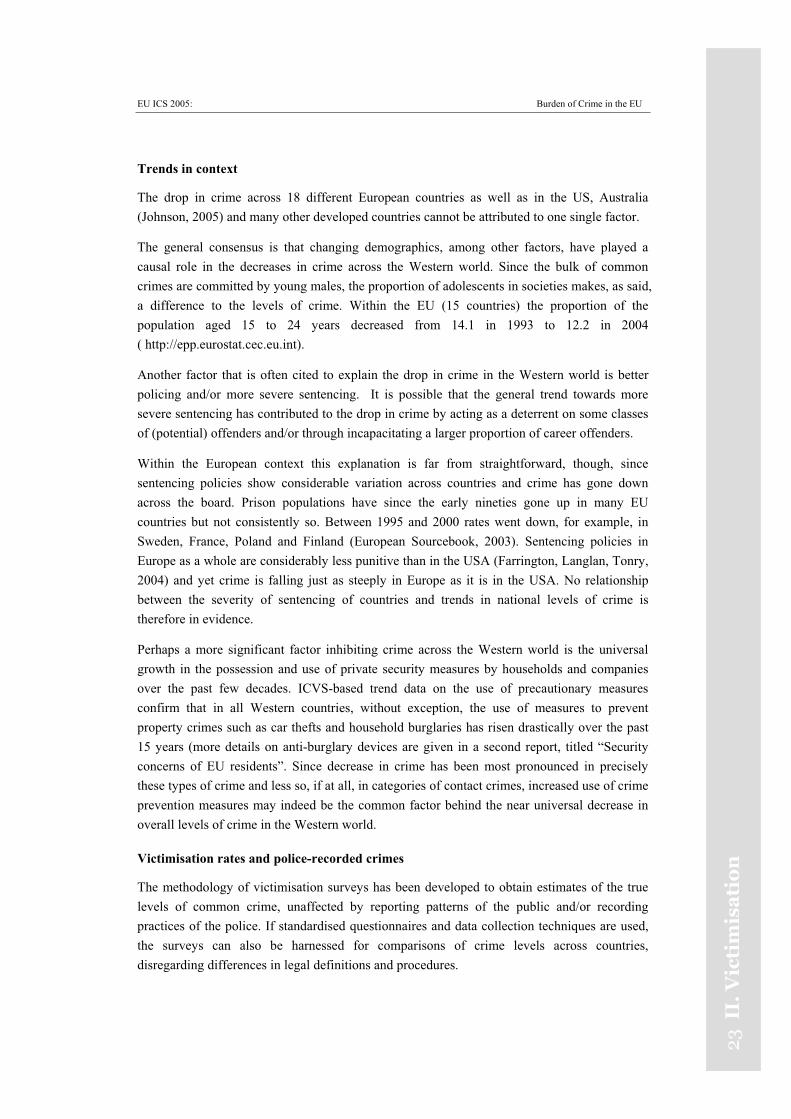
Collecting statistics on police recorded crimes has not, as in the USA, been harmonised. In recent years serious efforts have been made by a working group of European criminologists to collect crime statistics using standardised definitions (European Sourcebook,2003). Although the authors themselves caution against drawing any conclusions from police recorded crime figures about the distribution of actual levels of crime across countries, police statistics continue to be used for that purpose (Van Dijk, 2007). The EU ICS provides a welcome opportunity to compare rankings of EU countries according to victimisation by any crime and numbers of police recorded crimes per 100,000 population. Figure 2.4 shows the results.
Figure 2.4 Rates of victimisation by any crime in 2004 and police recorded crimes per 100,000 population in 2000
Fr
Den
Sweden
Ireland
Por
UK
GerNed
Hun
Fin
Estonia
Aus
0
2000
4000
6000
8000
10000
12000
14000
0 10 20 30One year prevalence rates for 10 crimes
Offi
cial
Rec
orde
d O
ffenc
es p
er 1
00,0
00 p
opul
atio
n
PolGre
Lux
Spa
The number of crimes recorded by the police bears hardly any relationship to the ICVS-based measure of crime. The countries with the highest numbers of police recorded crimes are Sweden, Finland, United Kingdom and Denmark. According to the EU ICS, the level of crime is relatively low in Finland and medium to high in Sweden. Countries with the lowest numbers of police-recorded crimes include Estonia and Ireland, both countries with levels of crime significantly above the European mean, according to the EU ICS.
Comparison of European statistics on police recorded crime with survey-based estimates of the true levels of crime confirm that police figures cannot be reliably used to compare levels of crime across EU countries and should not be used for that purpose. It is open to debate whether in the context of the EU police figures can be used to determine trends in crime over time (Van Dijk, 2006). We will revert to this issue at the end of this report.
EU ICS 2005: Burden of Crime in the EU
25II
.V
icti
mis
ati
on
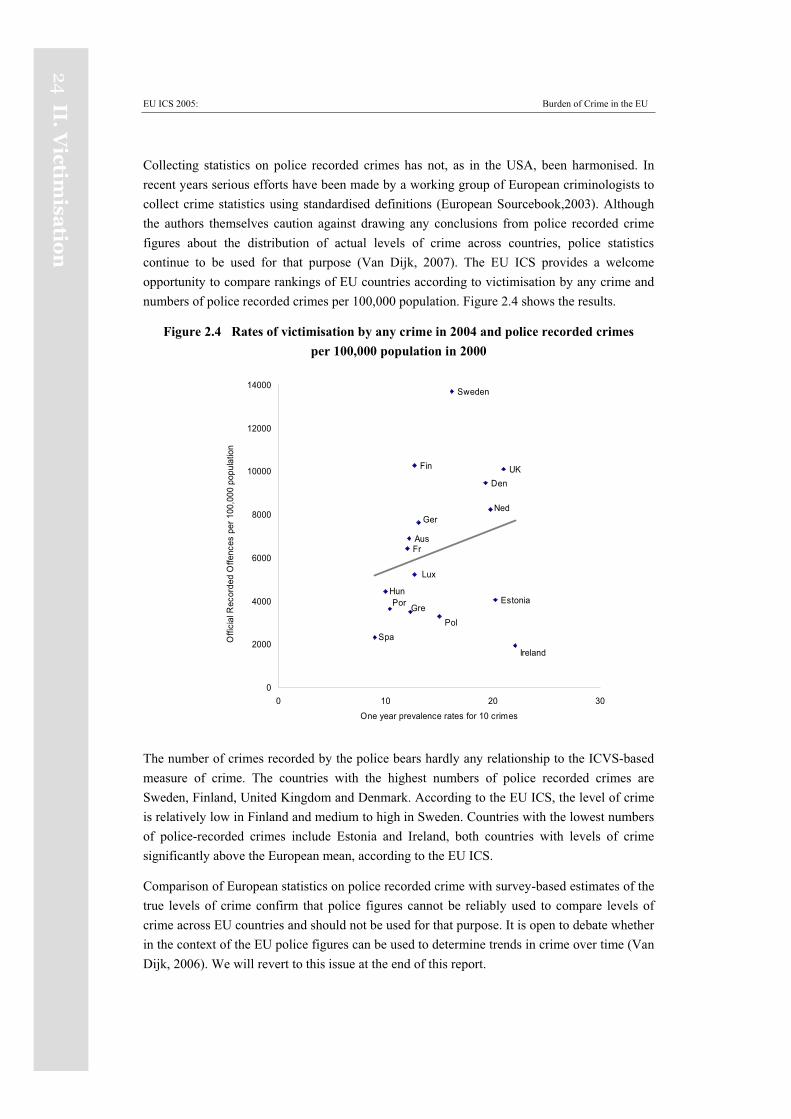
Vehicle-related crimes
The EU ICS contains a series questions on crimes related to vehicles owned by the household, including cars, motorcycles and bicycles. The first questions relate to cars, vans and trucks (called ‘cars’ for simplicity hereafter). The relevant crimes are (i) theft of a car and (ii) theft from or out of a car.
Figure 2.5 One year prevalence rates for theft of a car in 200412 and results from earlier surveys
0 1 2 3 4
Austria
Germany
Hungary
Greece
Finland
Estonia
Belgium
Sweden
Luxembourg
France
Poland
AVERAGE
Italy
Netherlands
Spain
Ireland
Denmark
Portugal
United Kingdom
Percentage
20041999199519911988
12 Victimization rates for England & Wales (1.8%), Scotland (1.4%) and Northern Ireland (0.3%).
EU ICS 2005: Burden of Crime in the EU
26II.
Victim
isatio
n
Theft of cars
At the global level an obvious factor determining national levels of car theft are national levels of car ownership. Where car ownership is rare, such as in parts of Asia and Africa, fewer cars are stolen (Van Dijk, 1999). Within the EU, car ownership levels have risen almost everywhere, most of all in Spain and Portugal and in the three new member countries, Estonia, Poland and Hungary. Elsewhere, for example in the United Kingdom, ownership has remained stable. Ownerships rates have, since 1988, converged towards a European mean of 86%. National ownership now varies within a range of 61 % in Estonia to 92 % in Luxemburg.
Car ownership is currently most common in Luxemburg (92%), France (91%), Italy (90 %) and Belgium. The lowest rates are still found among the three new members: Estonia (61%), Poland (64%) and Hungary (70%). Comparatively low rates are also evident in Greece (77%) and Portugal (78%).
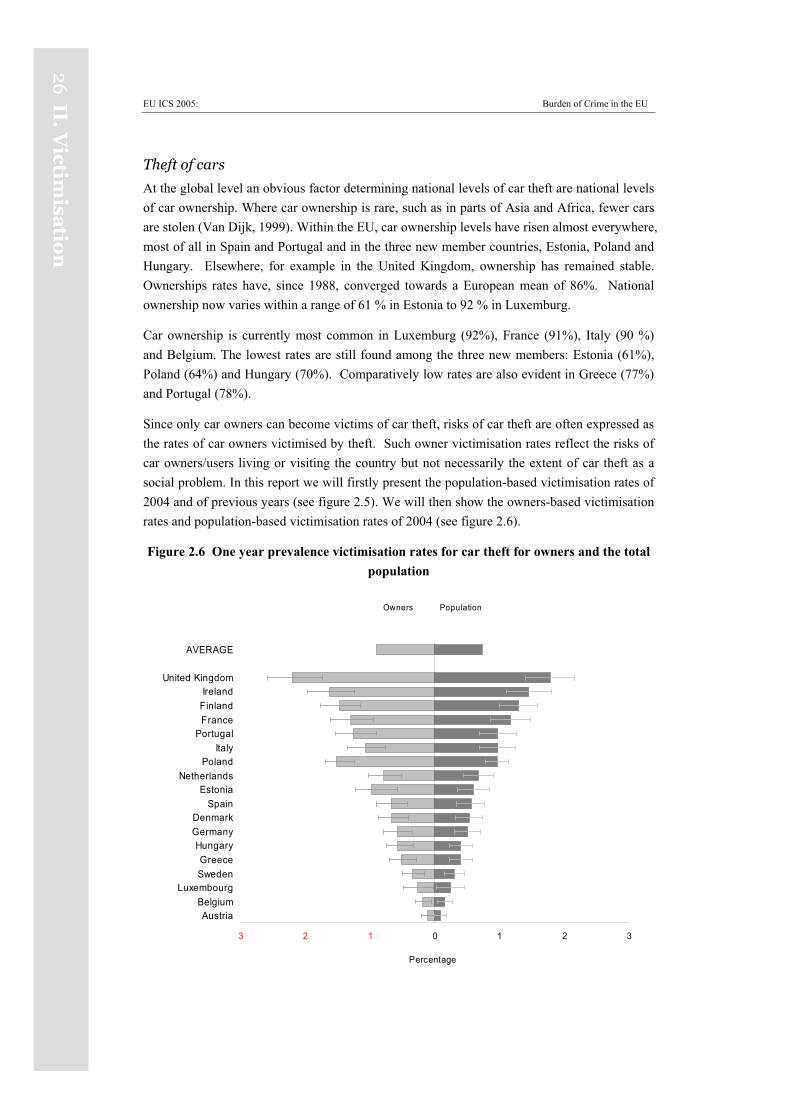
Since only car owners can become victims of car theft, risks of car theft are often expressed as the rates of car owners victimised by theft. Such owner victimisation rates reflect the risks of car owners/users living or visiting the country but not necessarily the extent of car theft as a social problem. In this report we will firstly present the population-based victimisation rates of 2004 and of previous years (see figure 2.5). We will then show the owners-based victimisation rates and population-based victimisation rates of 2004 (see figure 2.6).
Figure 2.6 One year prevalence victimisation rates for car theft for owners and the total population
Owners Population
3 2 1 0 1 2 3
AustriaBelgium
LuxembourgSwedenGreece
HungaryGermanyDenmark
SpainEstonia
NetherlandsPoland
ItalyPortugal
FranceFinlandIreland
United Kingdom
AVERAGE
Percentage
EU ICS 2005: Burden of Crime in the EU
27II
.V
icti
mis
ati
on
The European victimisation rate for owners is 0.9. Ranking countries in terms of car owners’ victimisation rates is very similar to that of the victimisation rates per 100 population shown above, with the exception of Estonia and, to a slightly lesser extent, in Poland. The owners’ victimisation rates in this country, where car ownership rates is still comparatively low, ranks somewhat higher than their general prevalence rates. The correlation between the country rankings on these two measures is nevertheless near perfect (r= 0.99).
Car ownership levels, car theft rates and owners risks
The higher ownership victimisation rates in low car ownership countries, such as Poland and Estonia, suggest that risks among car owners of having their cars stolen are higher in countries where fewer cars are available. Previous analyses at both the European and global level have not confirmed this hypothesis (Van Kesteren, Mayhew, Nieuwbeerta, 2000; Van Dijk,1999). In fact, risks for car owners tend to increase as target availability in a country does. A European example of a country with fairly high rates of ownership where owners are nevertheless more at risk is the United Kingdom. Broadly speaking, these consistently found results suggest that a plentiful supply of cars generates more car crime, even to the extent that risks for owners go up with availability of targets.
Trends in car theft and ‘joyriding’
Cars are stolen for two main reasons: either for 'joyriding' (when the car is usually recovered), or for extended personal use, resale or stripping13. On average, one in two stolen cars was eventually recovered. Victims in Poland (34%) and Hungary (35%) were least likely to get their cars back. Recovery rates were highest in Sweden (93%), Finland (94%), Ireland (84%) and Portugal (74%), indicating more thefts for 'joyriding'. These patterns are very consistent over time for countries in previous sweeps. Over the years the ‘recovery rates’ in many European countries have shown a distinct downward trend, indicating a gradual shift towards more professional theft.
Car theft has shown a near universal downward trend since 1993, with the largest drops recorded in France, Italy, Sweden and the United Kingdom.
The overall risks for owners to be victimised by car theft have almost everywhere gone down substantially. The downward trend in car thefts in Europe cannot be explained by a decrease in car ownership. As stated, car ownership rates in Europe have actually gone up. The most plausible factor driving down car theft rates across Europe is improved and more widely used anti-theft measures such as steering column locks, alarms and electronic ignition systems. These measures are likely to have had the greatest impact on levels of joy-riding and other forms of non-professional theft. More advanced measures, such as tracking devices that reveal the position of the car, exist but are not used often enough (yet) to have an impact on national
13 Within the category of ‘joyriding’ a further distinction must be made between theft for the purpose of transportation as such and theft for the purpose of driving a stolen car at high speed for ‘kicks’.

EU ICS 2005: Burden of Crime in the EU
28II.
Victim
isatio
n
return rates of stolen cars. The future will learn whether this measure will be effective in reducing the levels of car theft.
Consistent with this assumption is the finding that the proportion of cars recovered has shown a downward trend since 1992. Fewer cars are stolen in Europe thanks to improved security. If cars are stolen, it is more often by professional gangs using sophisticated techniques or violence.
Thefts from or out of cars
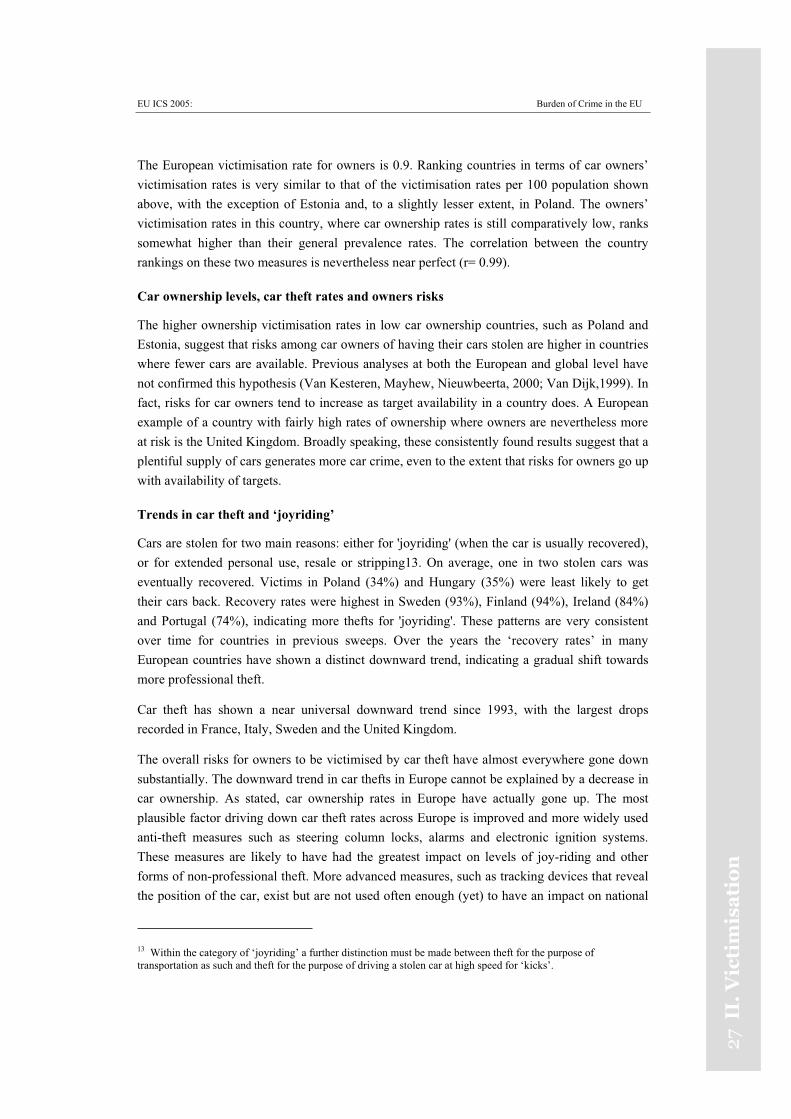
Respondents were also asked about thefts from a car, van or truck. This coveres items left in the vehicle (such as coats), equipment within it (such as audio equipment and mobile telephones), and parts taken off it (such as wing mirrors and badges). Figure 2.7 shows national results.
Having something stolen from or out of a car was much more common than having the car itself stolen. The mean European victimisation rate was 3.5 %. Prevalence rates were highest in Estonia, the United Kingdom, Ireland and Portugal. The lowest risks were in Hungary, Greece, Germany, Denmark and Finland: two percent or less were victimised.
As was the case with car theft, risks of theft from cars among car owners are higher than among the public. The mean European owners’ victimisation rate was 4.3%. Ranking of countries according to owners’ victimisation differs only marginally from the ranking of general prevalence rates.
Almost all countries show downward trends in theft from or out of cars. Significant drops in this type of ‘petty theft’ were observed in Estonia, the United Kingdom, the Netherlands, France, Spain, Italy and Germany. As with car theft, improved security and the use of more precautionary measures, such as removing portable audio equipment, may have contributed to this fall. Since this type of petty crime is known to be often committed by drug addicts, the drop could perhaps be seen as a side-effect of more effective drug control and treatment policies, although impact evaluations of such policies are not generally available (EMCDDA, 2004).
EU ICS 2005: Burden of Crime in the EU
29II
.V
icti
mis
ati
on
Figure 2.7 One year prevalence victimization rates for theft from a car in 200414
and results from earlier surveys
0 2 4 6 8 10
Greece
Germany
Hungary
Finland
Italy
Austria
Spain
Luxembourg
Denmark
France
AVERAGE
Netherlands
Poland
Sweden
Belgium
Portugal
Ireland
United Kingdom
Estonia
Percentage
20041999199519911988
14 Victimization rates England & Wales (6.0%) Northern Ireland (4.9%)Scotland (2.3%)
EU ICS 2005: Burden of Crime in the EU
30II.
Victim
isatio
n
Motorcycle theft
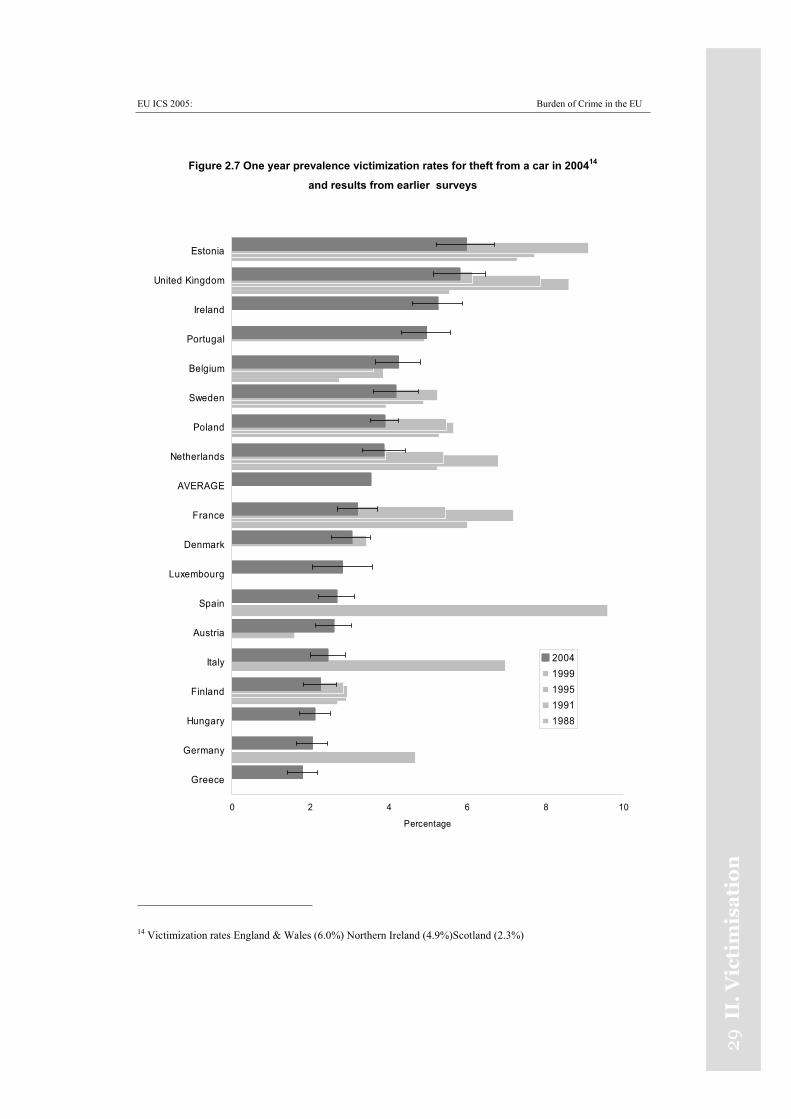
There were very different levels of motorcycle ownership in the 18 countries. On average, 20% of European households own one or more motorcycle, defined as a ‘motorised two wheeler’. Ownership was most common in Italy (33% had a motorised two-wheeler), Greece (32%) and Sweden (25%). Other countries with more than 20% ownership were Finland, Austria, the Netherlands and Germany. In several countries ownership rates have gone up over the past 10 or 15 years, including in Scandinavia.
Figure 2.8 One year prevalence rates for theft of a motorcycle or moped in 2004 15
and results from earlier ICVS surveys
0.0 0.5 1.0 1.5 2.0
Luxembourg
Portugal
Hungary
Austria
Poland
Finland
Belgium
Germany
Spain
Ireland
France
AVERAGE
Netherlands
Denmark
Greece
Sweden
United Kingdom
Italy
Percentage
20041999199519911988
15 Victimisation rates in England and Wales (.8%) Northern Ireland (.3%) Scotland (.2%)
EU ICS 2005: Burden of Crime in the EU
31 I
I.V
icti
mis
ati
on
The European victimisation rate for motorcycle theft is 0.3%. The highest rates were in Italy, the United Kingdom, Greece and Denmark. The trends in motorcycle theft are diverse. A clear and consistent upward trend is evident in the United Kingdom. Stable trends can be seen in Sweden, Finland and Denmark, countries with falling general crime rates. The drop in theft is considerable in Poland and Belgium. The upward trend may only in part be attributed to the modest rise in motorcycle ownership.
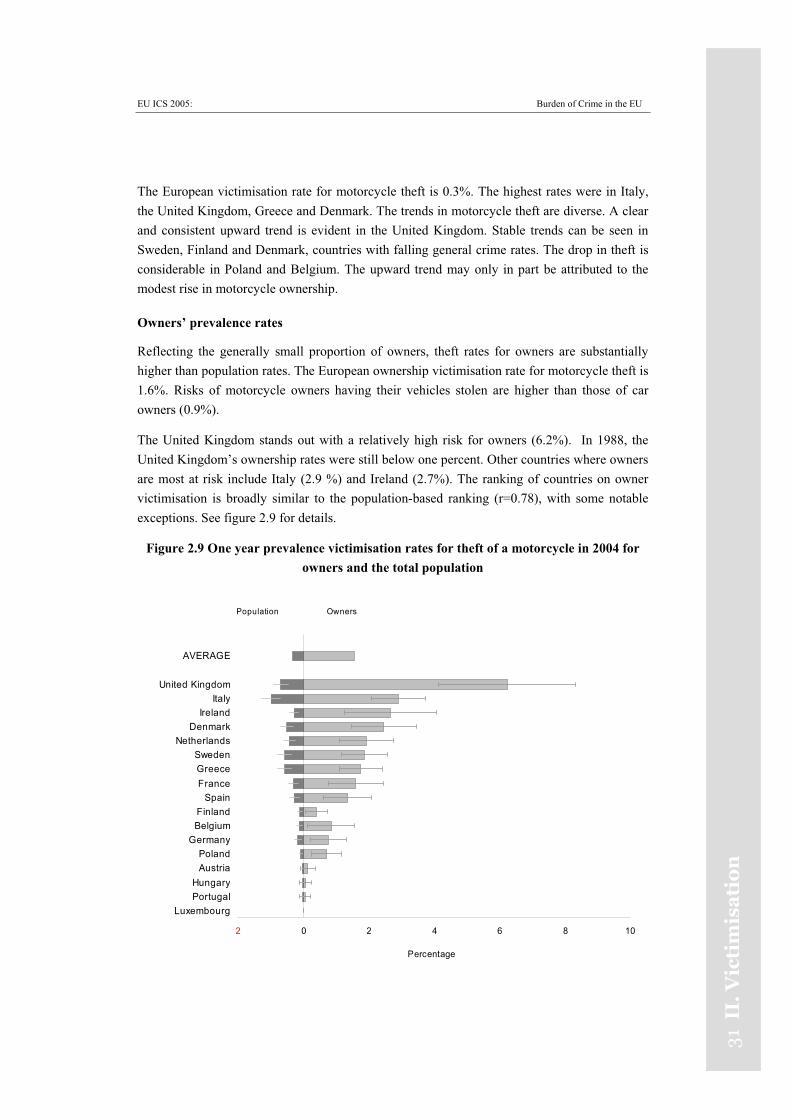
Owners’ prevalence rates
Reflecting the generally small proportion of owners, theft rates for owners are substantially higher than population rates. The European ownership victimisation rate for motorcycle theft is 1.6%. Risks of motorcycle owners having their vehicles stolen are higher than those of car owners (0.9%).
The United Kingdom stands out with a relatively high risk for owners (6.2%). In 1988, the United Kingdom’s ownership rates were still below one percent. Other countries where owners are most at risk include Italy (2.9 %) and Ireland (2.7%). The ranking of countries on owner victimisation is broadly similar to the population-based ranking (r=0.78), with some notable exceptions. See figure 2.9 for details.
Figure 2.9 One year prevalence victimisation rates for theft of a motorcycle in 2004 for owners and the total population
Population Owners
2 0 2 4 6 8 10
LuxembourgPortugalHungary
AustriaPoland
GermanyBelgiumFinland
SpainFranceGreeceSweden
NetherlandsDenmark
IrelandItaly
United Kingdom
AVERAGE
Percentage

EU ICS 2005: Burden of Crime in the EU
32II.
Victim
isatio
n
Motor cycle ownership, thefts and owners’ risks
Generally, motorcycle thefts were most common where motorcycles were more commonly owned, though the United Kingdom and Ireland (where ownership is in the middle range) are exceptions. Even risks for owners tend to be higher in countries where ownership is more common, for example in Italy. In other words, a more plentiful supply of targets appears to encourage rather than dampen theft ‘demand’. One reason for this may simply be that in those countries more offenders are used to and able to ride motorcycles.
EU ICS 2005: Burden of Crime in the EU
33 I
I.V
icti
mis
ati
on
Bicycle theft
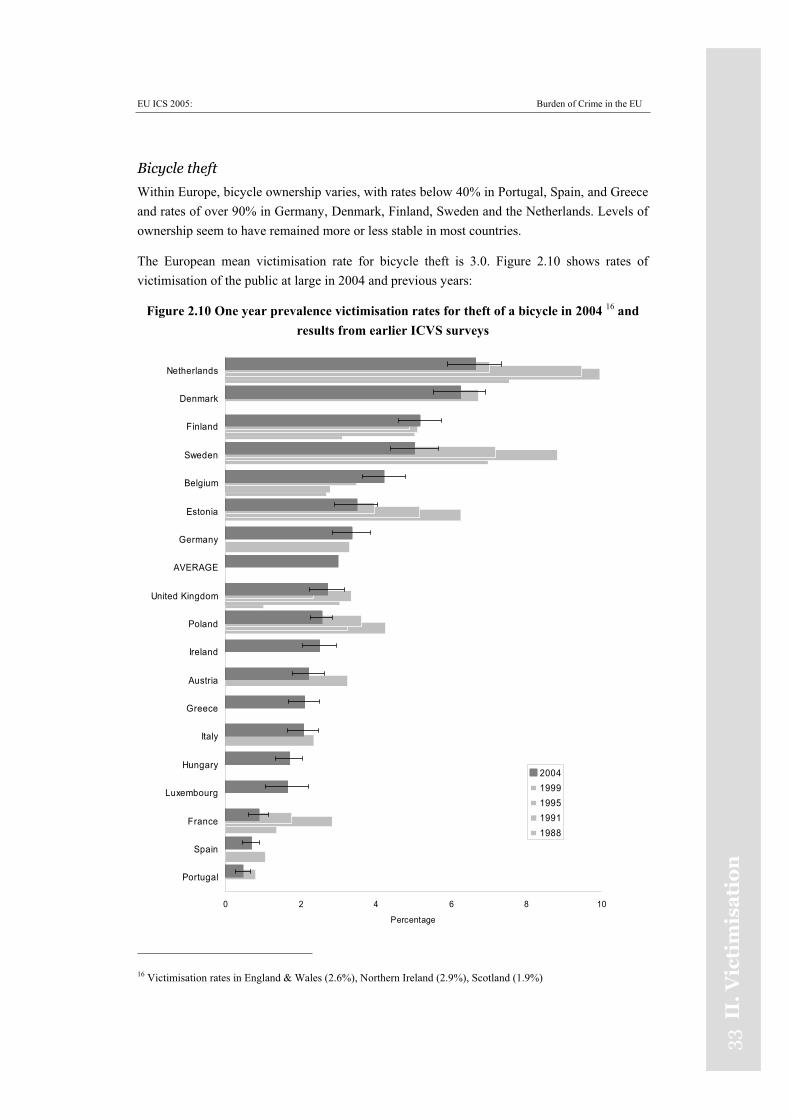
Within Europe, bicycle ownership varies, with rates below 40% in Portugal, Spain, and Greece and rates of over 90% in Germany, Denmark, Finland, Sweden and the Netherlands. Levels of ownership seem to have remained more or less stable in most countries.
The European mean victimisation rate for bicycle theft is 3.0. Figure 2.10 shows rates of victimisation of the public at large in 2004 and previous years:
Figure 2.10 One year prevalence victimisation rates for theft of a bicycle in 2004 16 and results from earlier ICVS surveys
0 2 4 6 8 10
Portugal
Spain
France
Luxembourg
Hungary
Italy
Greece
Austria
Ireland
Poland
United Kingdom
AVERAGE
Germany
Estonia
Belgium
Sweden
Finland
Denmark
Netherlands
Percentage
20041999199519911988
16 Victimisation rates in England & Wales (2.6%), Northern Ireland (2.9%), Scotland (1.9%)
EU ICS 2005: Burden of Crime in the EU
34II.
Victim
isatio
n
The highest population-based bicycle theft risks were in the Netherlands, Denmark, Finland and Sweden (5% or more). The lowest risks were in Portugal, Spain and France (below 1%).
Trends are dissimilar across countries. The Netherlands, Sweden, Estonia and France show distinct falls in the level of bicycle theft. In the Netherlands bicycle theft rates are now back at the level they were in 1988. Bicycle theft rates have remained stable in Belgium, Finland and Denmark. Bicycle theft rate has increased since 1988 in the United Kingdom and declined between 1995 and 2000. Rates in 2004, however, are slightly higher than in 200017.
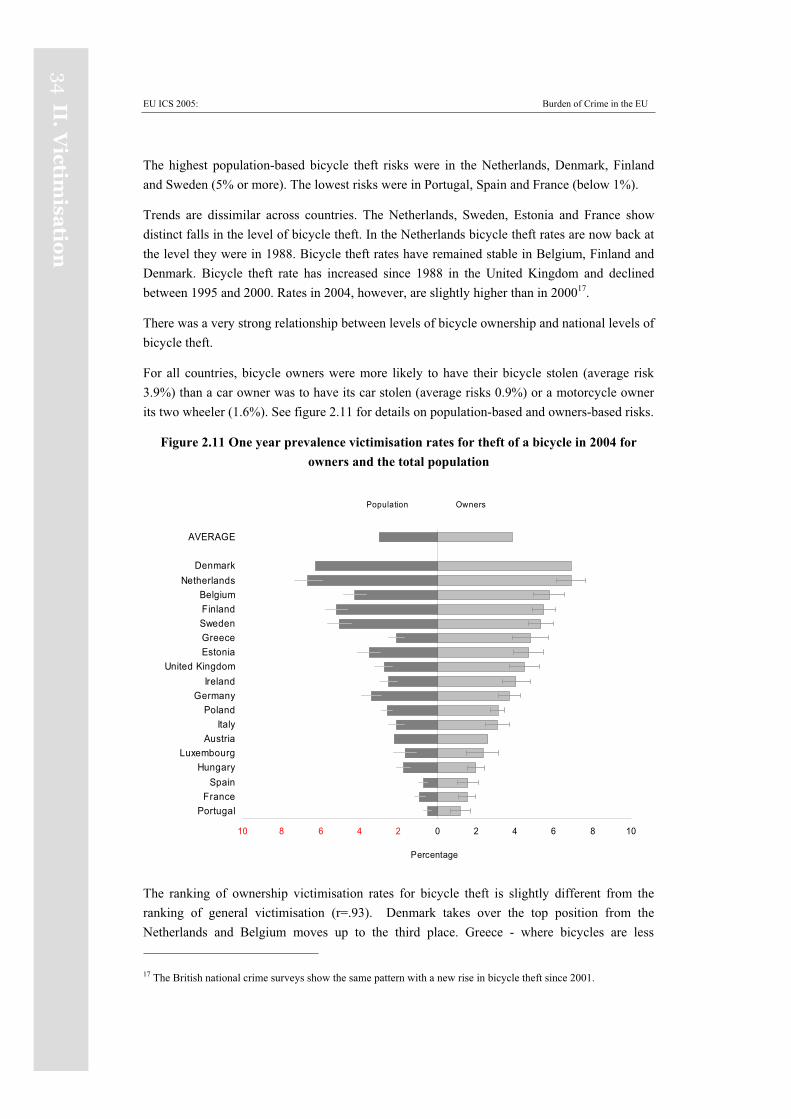
There was a very strong relationship between levels of bicycle ownership and national levels of bicycle theft.
For all countries, bicycle owners were more likely to have their bicycle stolen (average risk 3.9%) than a car owner was to have its car stolen (average risks 0.9%) or a motorcycle owner its two wheeler (1.6%). See figure 2.11 for details on population-based and owners-based risks.
Figure 2.11 One year prevalence victimisation rates for theft of a bicycle in 2004 for owners and the total population
Population Owners
10 8 6 4 2 0 2 4 6 8 10
PortugalFrance
SpainHungary
LuxembourgAustria
ItalyPoland
GermanyIreland
United KingdomEstoniaGreeceSwedenFinlandBelgium
NetherlandsDenmark
AVERAGE
Percentage
The ranking of ownership victimisation rates for bicycle theft is slightly different from the ranking of general victimisation (r=.93). Denmark takes over the top position from the Netherlands and Belgium moves up to the third place. Greece - where bicycles are less 17 The British national crime surveys show the same pattern with a new rise in bicycle theft since 2001.
EU ICS 2005: Burden of Crime in the EU
35II
.V
icti
mis
ati
on
common - moves up from the twelfth to the sixth place. The United Kingdom scores below the European average on population-based bicycle theft but above the average for owner-based thefts.
Patterns of vehicle theft across Europe
Previous analysis of ICVS results has shown a strong inverse relationship between rates of car theft and rates of bicycle theft, even when multivariate analysis has, for instance, taken into account the level of urbanisation, GDP, and levels of other crimes (Van Dijk, 1991; Mayhew, 1991). Thus, in countries where bicycle ownership is high and bicycle theft relatively common, stealing cars occurs less often. For example, low car theft rates are found in Finland and Germany - and previously in the Netherlands - countries where almost all households own one or more bicycles. Motorcycle ownership seems also to be inversely related to car theft, with Greece and Italy being two cases in point.
A broad explanation of the links between bicycle / motorcycle ownership and car theft is that young people in some European countries, such as the United Kingdom and Ireland, are more accustomed to driving cars. In Sweden, the Netherlands and Germany, young people tend to be more attuned to the use of bicycles, and in Italy and Greece, to motorcycles. These general patterns of preferred vehicle use are reflected in national patterns of vehicle theft. Patterns of vehicle theft in Europe provide an example of how crime patterns are shaped by the routine activities of the population.
The strong inverse relationship between bicycle ownership and car theft also suggests that those looking for illegal, short distance transportation will make do with a bicycle or motorcycle if there are plenty available. Consistent with this interpretation is that in typical low bicycle countries, such as the United Kingdom and France, a larger proportion of all car thefts qualify as cases of ‘joyriding’ (because the car is eventually recovered) than elsewhere, e.g. in Germany and the Netherlands. This finding led Van Dijk, Mayhew and Killias (1990) to hypothesize that “On the market of illegal transportation, bicycles could be a substitute for cars, if bicycles are in sufficient supply’.
Over the past ten years, improved anti-theft security has reduced opportunities for ‘joyriding’, especially in countries where such crimes were relatively common (i.e. the United Kingdom). This may have increased vulnerability of the available bicycles and motorcycles. Sharp increase in motorcycle thefts in the United Kingdom, along with the stable rates of bicycle theft, confirms that two wheelers act as ‘substitute goods’ for (better protected) cars on the market for illegal use of vehicles. Improved security of cars seems to have caused a displacement from ‘joyriding’ to thefts of two wheelers in countries where in the recent past joyriding was common.
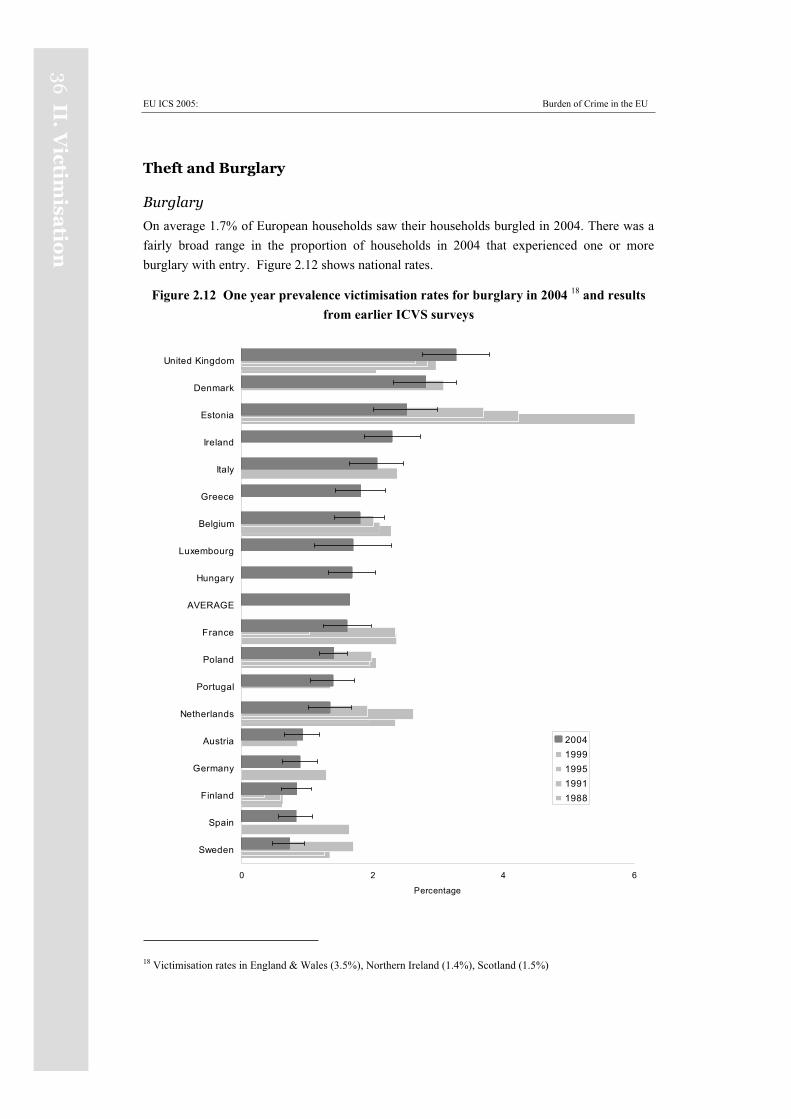
EU ICS 2005: Burden of Crime in the EU
36II.
Victim
isatio
n
Theft and Burglary
Burglary
On average 1.7% of European households saw their households burgled in 2004. There was a fairly broad range in the proportion of households in 2004 that experienced one or more burglary with entry. Figure 2.12 shows national rates.
Figure 2.12 One year prevalence victimisation rates for burglary in 2004 18 and results from earlier ICVS surveys
0 2 4 6
Sweden
Spain
Finland
Germany
Austria
Netherlands
Portugal
Poland
France
AVERAGE
Hungary
Luxembourg
Belgium
Greece
Italy
Ireland
Estonia
Denmark
United Kingdom
Percentage
20041999199519911988
18 Victimisation rates in England & Wales (3.5%), Northern Ireland (1.4%), Scotland (1.5%)
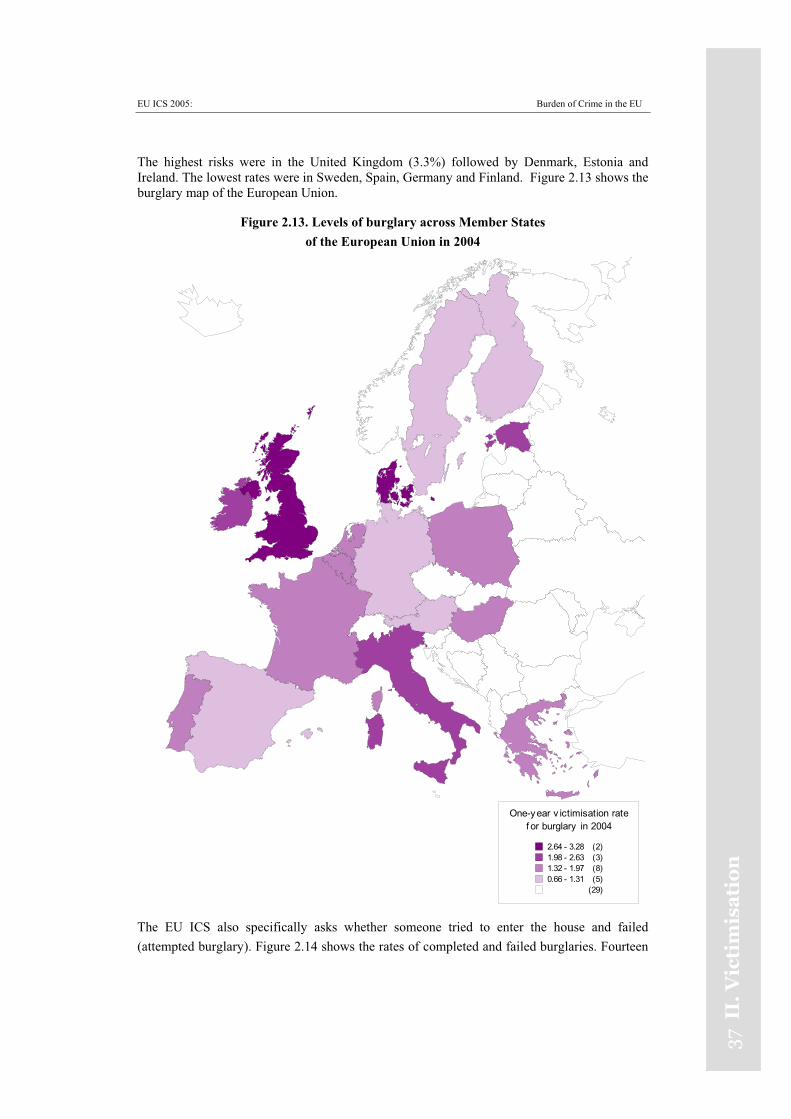
EU ICS 2005: Burden of Crime in the EU
37II
.V
icti
mis
ati
on
The highest risks were in the United Kingdom (3.3%) followed by Denmark, Estonia and Ireland. The lowest rates were in Sweden, Spain, Germany and Finland. Figure 2.13 shows the burglary map of the European Union.
Figure 2.13. Levels of burglary across Member States of the European Union in 2004
One-y ear v ictimisation ratef or burglary in 2004
2.64 - 3.28 (2)1.98 - 2.63 (3)1.32 - 1.97 (8)0.66 - 1.31 (5)
(29)
The EU ICS also specifically asks whether someone tried to enter the house and failed (attempted burglary). Figure 2.14 shows the rates of completed and failed burglaries. Fourteen
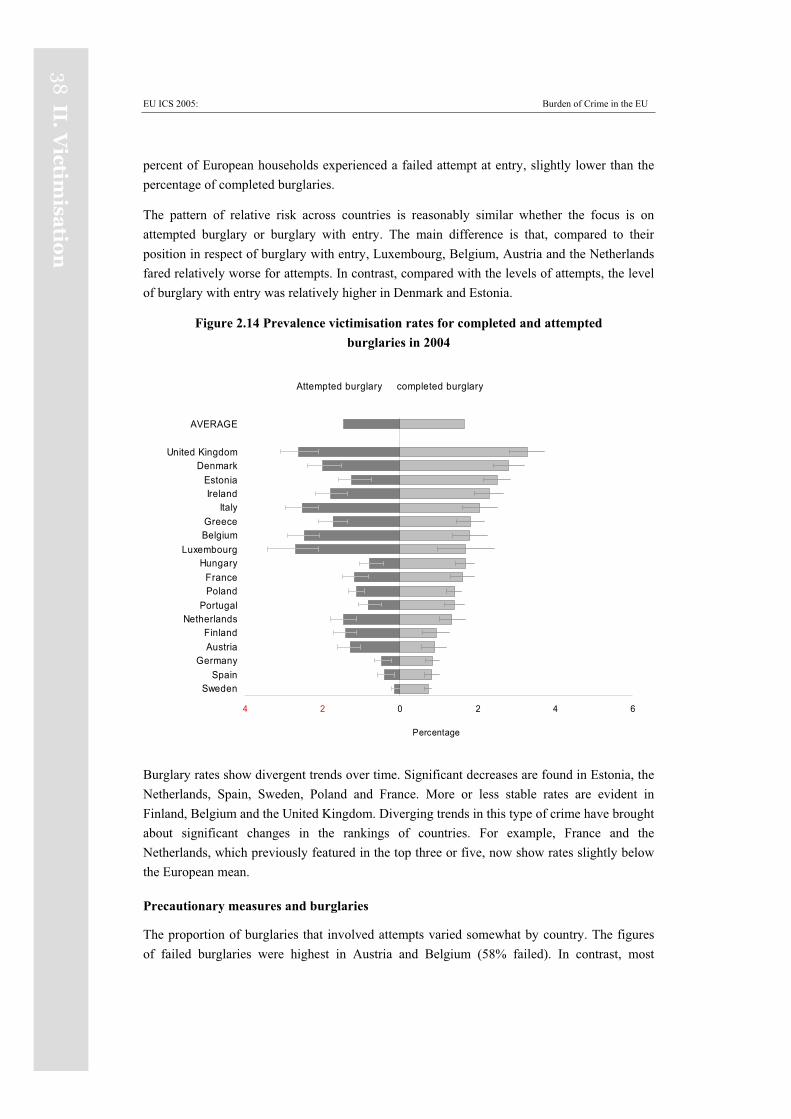
EU ICS 2005: Burden of Crime in the EU
38II.
Victim
isatio
n
percent of European households experienced a failed attempt at entry, slightly lower than the percentage of completed burglaries.
The pattern of relative risk across countries is reasonably similar whether the focus is on attempted burglary or burglary with entry. The main difference is that, compared to their position in respect of burglary with entry, Luxembourg, Belgium, Austria and the Netherlands fared relatively worse for attempts. In contrast, compared with the levels of attempts, the level of burglary with entry was relatively higher in Denmark and Estonia.
Figure 2.14 Prevalence victimisation rates for completed and attempted burglaries in 2004
Attempted burglary completed burglary
4 2 0 2 4 6
SwedenSpain
GermanyAustriaFinland
NetherlandsPortugal
PolandFrance
HungaryLuxembourg
BelgiumGreece
ItalyIreland
EstoniaDenmark
United Kingdom
AVERAGE
Percentage
Burglary rates show divergent trends over time. Significant decreases are found in Estonia, the Netherlands, Spain, Sweden, Poland and France. More or less stable rates are evident in Finland, Belgium and the United Kingdom. Diverging trends in this type of crime have brought about significant changes in the rankings of countries. For example, France and the Netherlands, which previously featured in the top three or five, now show rates slightly below the European mean.
Precautionary measures and burglaries
The proportion of burglaries that involved attempts varied somewhat by country. The figures of failed burglaries were highest in Austria and Belgium (58% failed). In contrast, most
EU ICS 2005: Burden of Crime in the EU
39 I
I.V
icti
mis
ati
on
burglars in Sweden and Finland got into the house: only about a quarter or less burglaries involved attempts.
It stands to reason that in countries where burglar alarms or other precautionary measures are more common a larger proportion of all burglaries fail in the sense that the burglar did not gain entry. In the past, the ICVS results have lent some support to this. The same pattern broadly holds true in the current analysis of EU countries, although results are not statistically significant. A clear outlier in the relationship is the United Kingdom with the highest rates of burglar alarms and a moderately low proportion of failed burglaries.
Many countries show a clear upward trend in the use of burglar alarms and/or special locks since 1990, a trend that is likely to have started even before 1990. Reductions in levels of burglary might well be the result of improved security among those households most at risk. Improved security among a sufficient proportion of households may have dissuaded potential burglars from committing burglaries. There is more elaborate information on crime prevention in the next section of this report “Security concerns of EU residents” .
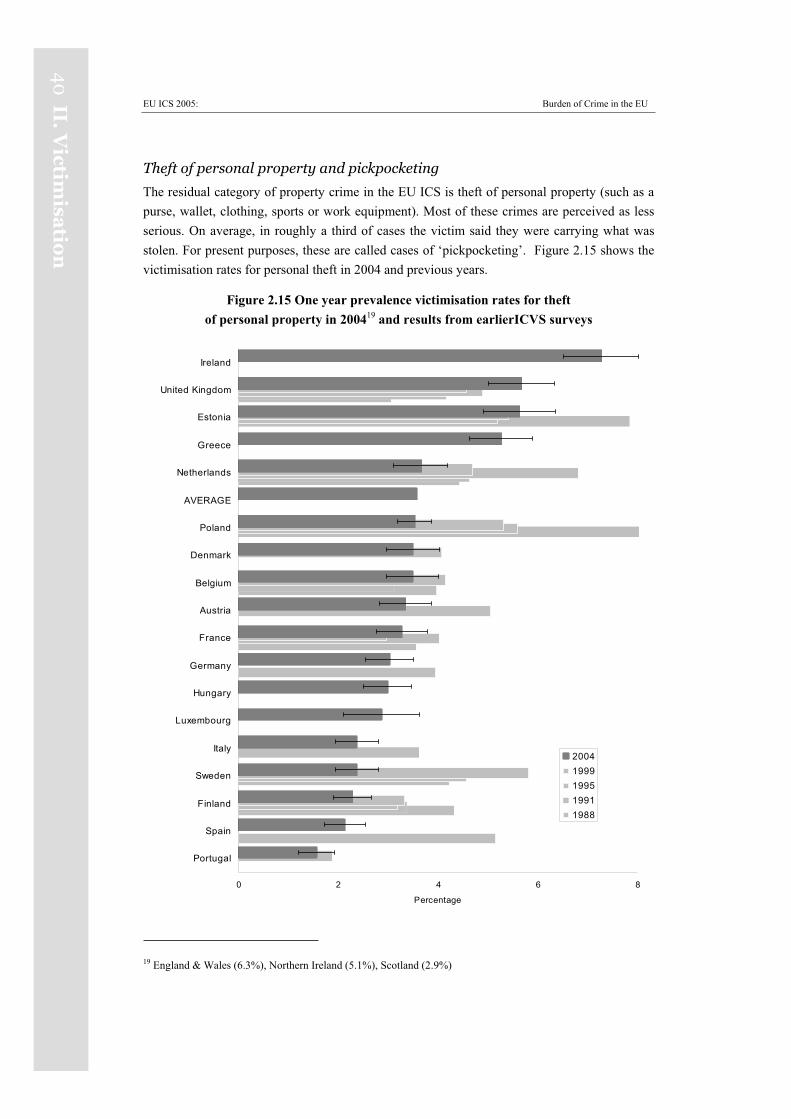
EU ICS 2005: Burden of Crime in the EU
40
II.V
ictimisa
tion
Theft of personal property and pickpocketing
The residual category of property crime in the EU ICS is theft of personal property (such as a purse, wallet, clothing, sports or work equipment). Most of these crimes are perceived as less serious. On average, in roughly a third of cases the victim said they were carrying what was stolen. For present purposes, these are called cases of ‘pickpocketing’. Figure 2.15 shows the victimisation rates for personal theft in 2004 and previous years.
Figure 2.15 One year prevalence victimisation rates for theft of personal property in 200419 and results from earlierICVS surveys
0 2 4 6 8
Portugal
Spain
Finland
Sweden
Italy
Luxembourg
Hungary
Germany
France
Austria
Belgium
Denmark
Poland
AVERAGE
Netherlands
Greece
Estonia
United Kingdom
Ireland
Percentage
20041999199519911988
19 England & Wales (6.3%), Northern Ireland (5.1%), Scotland (2.9%)
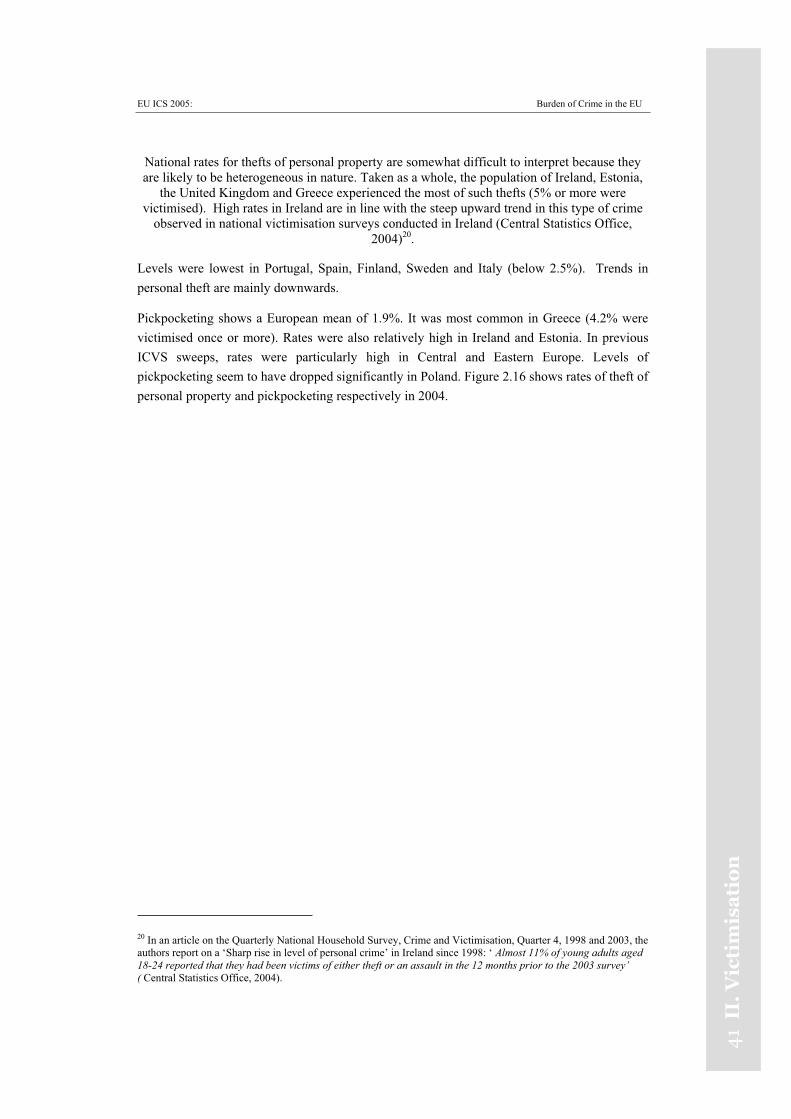
EU ICS 2005: Burden of Crime in the EU
41
II.
Vic
tim
isa
tio
n
National rates for thefts of personal property are somewhat difficult to interpret because they are likely to be heterogeneous in nature. Taken as a whole, the population of Ireland, Estonia,
the United Kingdom and Greece experienced the most of such thefts (5% or more were victimised). High rates in Ireland are in line with the steep upward trend in this type of crime
observed in national victimisation surveys conducted in Ireland (Central Statistics Office, 2004)20.
Levels were lowest in Portugal, Spain, Finland, Sweden and Italy (below 2.5%). Trends in personal theft are mainly downwards.
Pickpocketing shows a European mean of 1.9%. It was most common in Greece (4.2% were victimised once or more). Rates were also relatively high in Ireland and Estonia. In previous ICVS sweeps, rates were particularly high in Central and Eastern Europe. Levels of pickpocketing seem to have dropped significantly in Poland. Figure 2.16 shows rates of theft of personal property and pickpocketing respectively in 2004.
20 In an article on the Quarterly National Household Survey, Crime and Victimisation, Quarter 4, 1998 and 2003, the authors report on a ‘Sharp rise in level of personal crime’ in Ireland since 1998: ‘ Almost 11% of young adults aged 18-24 reported that they had been victims of either theft or an assault in the 12 months prior to the 2003 survey’ ( Central Statistics Office, 2004).
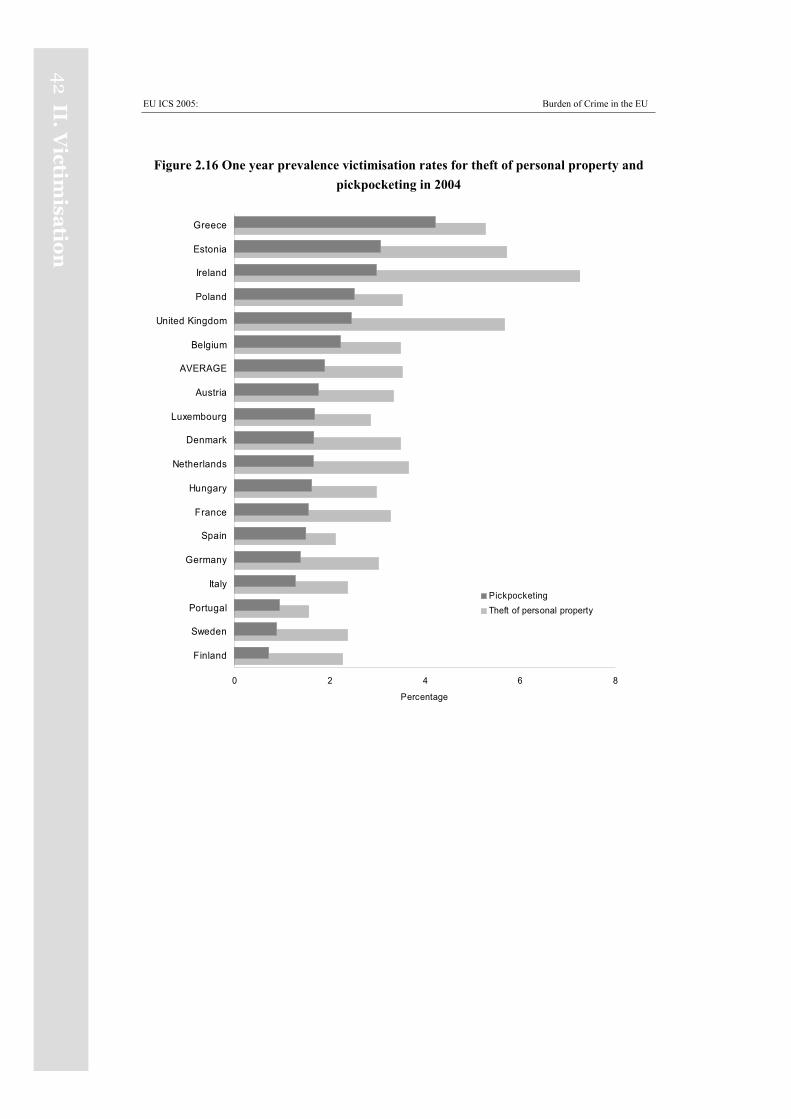
EU ICS 2005: Burden of Crime in the EU
42
II.V
ictimisa
tion
Figure 2.16 One year prevalence victimisation rates for theft of personal property and pickpocketing in 2004
0 2 4 6 8
Finland
Sweden
Portugal
Italy
Germany
Spain
France
Hungary
Netherlands
Denmark
Luxembourg
Austria
AVERAGE
Belgium
United Kingdom
Poland
Ireland
Estonia
Greece
Percentage
PickpocketingTheft of personal property
EU ICS 2005: Burden of Crime in the EU
43
II.
Vic
tim
isa
tio
n
Contact crimes
The three contact crimes in the EU ICS are robbery, sexual incidents, and assaults & threats. Sexual incidents are divided into sexual assault and what victims described as offensive sexual behaviour. Assaults and threats can be separated into assaults with force and threats only.
It should be borne in mind that risks are relatively low for each type of contact crime. Firm conclusions about relative vulnerability are therefore hard to draw.
Figure 2.17 One year prevalence victimisation rates for robbery in 2004 21 and results from earlier ICVS surveys
0 1 2 3 4
Italy
Finland
Germany
Netherlands
Austria
Luxembourg
France
Hungary
AVERAGE
Portugal
Denmark
Sweden
Belgium
Poland
United Kingdom
Spain
Greece
Estonia
Ireland
Percentage
20041999199519911988
21 England & Wales (1.4%), Northern Ireland (1.1%), Scotland (0.9%)
EU ICS 2005: Burden of Crime in the EU
44
II.V
ictimisa
tion
Robbery
The average European victimisation rate for robbery is 1%. Figure 2.17 shows distribution across countries.
The risk of robbery was comparatively low in all countries. On the face of it, risks were highest in 2004 in Ireland and lowest in Finland and Italy. Trends over time are mainly downwards, but not universally. Significant drops in robberies were observed in Spain (compared to 1988), Poland and Estonia. Rates in the United Kingdom, Belgium, Denmark and Sweden seem to have increased slightly, although rates are statistically indistinguishable.
Details of robbery
About 6 in 10 victims said that more than one offender was involved - similar to previous ICVS sweeps. Money was actually stolen in about half of the cases.
Robbery victims were asked whether the offender(s) carried a weapon of some sort. On average, just over a quarter of victims (29%) said the offender(s) did - similar to the findings in previous sweeps. Weapons were actually used in about 4 in 10 incidents where a weapon was present, again as found in previous ICVS sweeps.
The small numerical base makes it difficult to draw out differences between countries. But on the face of it, those in Portugal and Spain were most likely to say a weapon was carried.
In most cases, a knife had been carried (the average was one in two weapon incidents). Robbery offenders carried a gun in less than a fifth of weapon incidents on average. Of all robberies less than 6% were at gun-point. According to results of previous ICVS sweeps the use of guns in robberies was much less common in Europe than in the USA or Latin America. In the USA, 28% of robberies were at gun-point in 1988, and in Brazil more than half of all robberies are made at gun-point (Van Dijk, 1999).
Sexual offences
The question put to respondents was:
"First, a rather personal question. People sometimes grab, touch or assault others for sexual reasons in a really offensive way. This can happen either at home, or elsewhere, for instance in a pub, the street, at school, on public transport, in cinemas, on the beach, or at one's workplace. Over the past five years, has anyone done this to you? Please take your time to think about this."
Measuring sexual incidents is extremely difficult in victimisation surveys, since perceptions as to what is unacceptable sexual behaviour may differ across countries, as well as readiness to report incidents to an interviewer over the phone. It is feasible that women in countries where gender equality is less advanced are less inclined to report sexual incidents, thereby deflating the national rates. The measures, then, need to be interpreted with great caution.
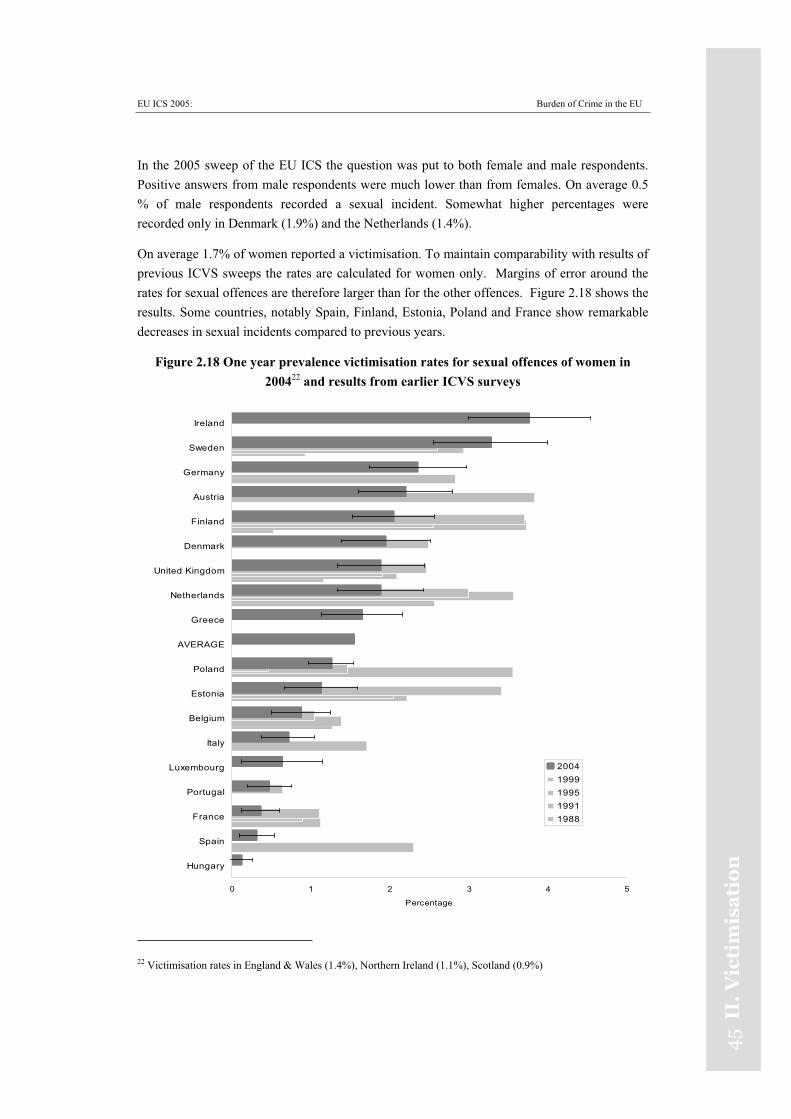
EU ICS 2005: Burden of Crime in the EU
45
II.
Vic
tim
isa
tio
n
In the 2005 sweep of the EU ICS the question was put to both female and male respondents. Positive answers from male respondents were much lower than from females. On average 0.5 % of male respondents recorded a sexual incident. Somewhat higher percentages were recorded only in Denmark (1.9%) and the Netherlands (1.4%).
On average 1.7% of women reported a victimisation. To maintain comparability with results of previous ICVS sweeps the rates are calculated for women only. Margins of error around the rates for sexual offences are therefore larger than for the other offences. Figure 2.18 shows the results. Some countries, notably Spain, Finland, Estonia, Poland and France show remarkable decreases in sexual incidents compared to previous years.
Figure 2.18 One year prevalence victimisation rates for sexual offences of women in 200422 and results from earlier ICVS surveys
0 1 2 3 4 5
Hungary
Spain
France
Portugal
Luxembourg
Italy
Belgium
Estonia
Poland
AVERAGE
Greece
Netherlands
United Kingdom
Denmark
Finland
Austria
Germany
Sweden
Ireland
Percentage
20041999199519911988
22 Victimisation rates in England & Wales (1.4%), Northern Ireland (1.1%), Scotland (0.9%)
EU ICS 2005: Burden of Crime in the EU
46
II.V
ictimisa
tion
Sexual assaults
Respondents reporting victimisation by sexual offences were asked for details about what happened. Sexual incidents can be broken down into sexual assaults and incidents of a less serious nature. Sexual assaults (i.e., incidents described as rape, attempted rape or indecent assaults) were less common than offensive sexual behaviour. For all countries combined, only 0.4 % reported sexual assaults.
About one in a hundred women in Sweden, the United Kingdom, Ireland, the Netherlands and Denmark reported sexual assaults, and differences between these countries are statistically negligible. Women in Hungary, Spain and Portugal were least at risk, though again; the differences in risk are statistically weak compared to other countries in the medium range.
Details of sexual offences
Looking at what women said about the 'last incident' that had occurred, and taking all countries together since numbers are small, offenders were known in about half of the incidents described as both offensive behaviour and sexual assault. In over a third they were known by name and in about a tenth by sight only.
In cases where the perpetrator was known by name, it was an ex-partner (spouse or boy friend) in 22%, colleague or boss in 17%, current partner in 16% and close friend in 16% of the cases. These results are very similar to those in the previous sweeps.
Most sexual incidents involved only one offender (78%). In 8 % of the cases three or more offenders were involved. Weapons were only very rarely involved in sexual offences (11%).
Assaults and threats
The question asked of respondents to identify assaults and threats was:
'Apart from the incidents just covered, have you over the past five years been personally attacked or threatened by someone in a way that really frightened you, either at home or elsewhere, such as in a pub, in the street, at school, on public transport, on the beach, or at your workplace?'
Overall, 3% of respondents indicated that they had been a victim of an assault with force or a threat of force. There were higher than average rates in the United Kingdom, Ireland, and the Netherlands (4% and above). Levels were lowest in Italy, Portugal, Hungary, and Spain (below 2%). Figure 2.19 shows national rates.
As with sexual incidents, differences in definitional thresholds cannot be ruled out in explaining the pattern of results. However, this should not be overstated. When asked to assess the seriousness of what had happened, there is fair consistency across countries in how seriously incidents are viewed (Van Kesteren, Mayhew, Nieuwbeerta, 2000).
The same countries where the rates of sexual offences have gone down also showed declining trends in threats/assault: Spain, Estonia, Finland, Poland and France.
EU ICS 2005: Burden of Crime in the EU
47II
.V
icti
mis
ati
on
Details of threats/assaults
Looking at what was said about the 'last incident', and again taking all countries together, offenders were known in about half the incidents of both assaults and threats. Men, though, were less likely to know the offender(s) than women. The latter finding indicates that violence against women is of a different nature.
One offender is involved in 60 % of violent crimes against women, compared to 40 % in cases of violence against men.
Taking assaults and threats together again, for all countries combined weapons were said to have been used (if only as a threat) in just under 20% of incidents. The figure was higher with male victims than with female victims. In more than 40% of incidents in which a weapon was used, victims mentioned a knife, and in 12% a gun. In one in five cases the attack resulted in injuries of which half required medical treatment.
From a global perspective, the rate of gun-related attacks in European countries is comparatively low. As said, the same is true for street robberies at gun-point.
Although the prevalence rates for threats/assaults in Europe are roughly similar to those in the USA, homicide rates are five times higher in the USA (1 per 100,000 in Europe and 5.5 in the USA). The more serious nature of violent crime in the USA might be related to higher ownership rates in handguns. According to the EU ICS 4 % of EU households own one or more guns. The gun ownership rate in the USA is 29%.
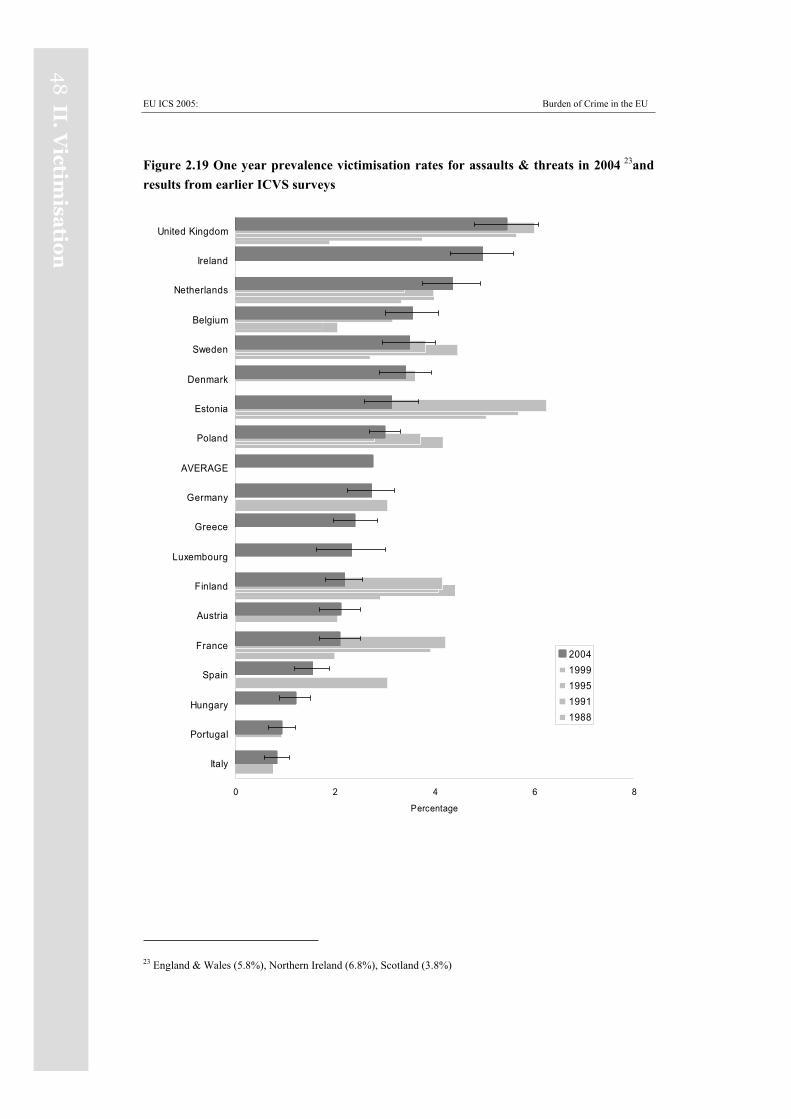
EU ICS 2005: Burden of Crime in the EU
48
II.V
ictimisa
tion
Figure 2.19 One year prevalence victimisation rates for assaults & threats in 2004 23and results from earlier ICVS surveys
0 2 4 6 8
Italy
Portugal
Hungary
Spain
France
Austria
Finland
Luxembourg
Greece
Germany
AVERAGE
Poland
Estonia
Denmark
Sweden
Belgium
Netherlands
Ireland
United Kingdom
Percentage
20041999199519911988
23 England & Wales (5.8%), Northern Ireland (6.8%), Scotland (3.8%)
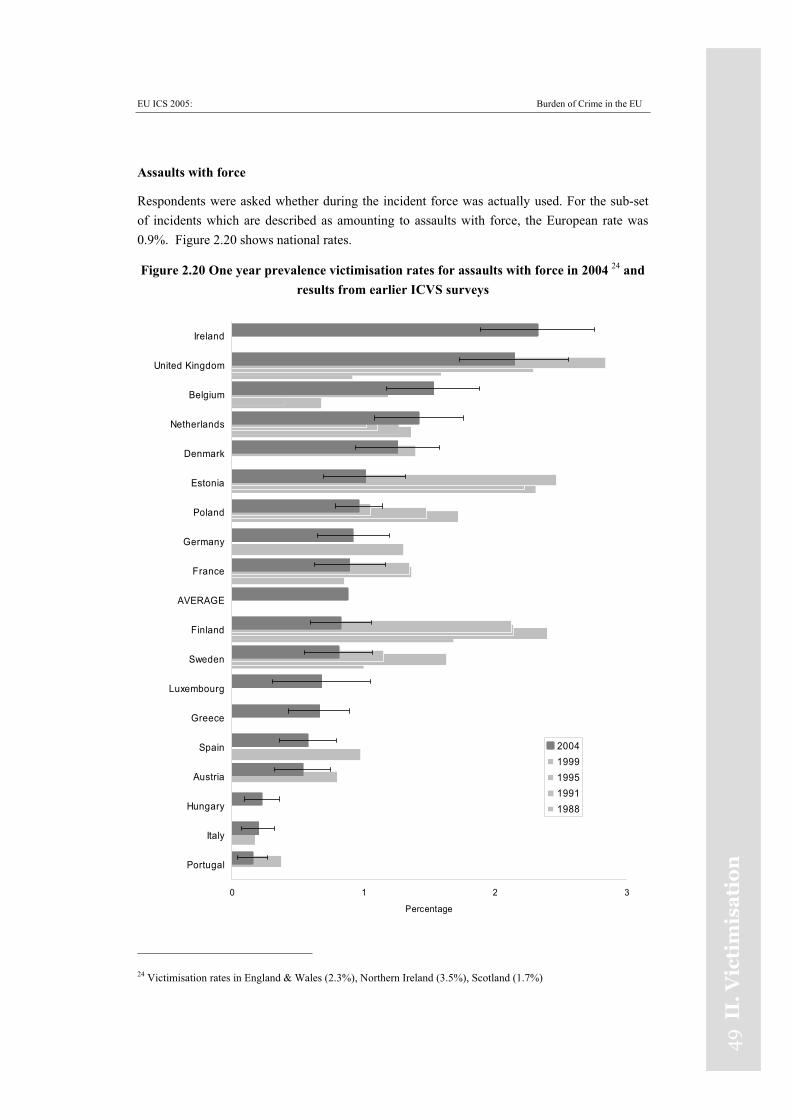
EU ICS 2005: Burden of Crime in the EU
49II
.V
icti
mis
ati
on
Assaults with force
Respondents were asked whether during the incident force was actually used. For the sub-set of incidents which are described as amounting to assaults with force, the European rate was 0.9%. Figure 2.20 shows national rates.
Figure 2.20 One year prevalence victimisation rates for assaults with force in 2004 24 and results from earlier ICVS surveys
0 1 2 3
Portugal
Italy
Hungary
Austria
Spain
Greece
Luxembourg
Sweden
Finland
AVERAGE
France
Germany
Poland
Estonia
Denmark
Netherlands
Belgium
United Kingdom
Ireland
Percentage
20041999199519911988
24 Victimisation rates in England & Wales (2.3%), Northern Ireland (3.5%), Scotland (1.7%)
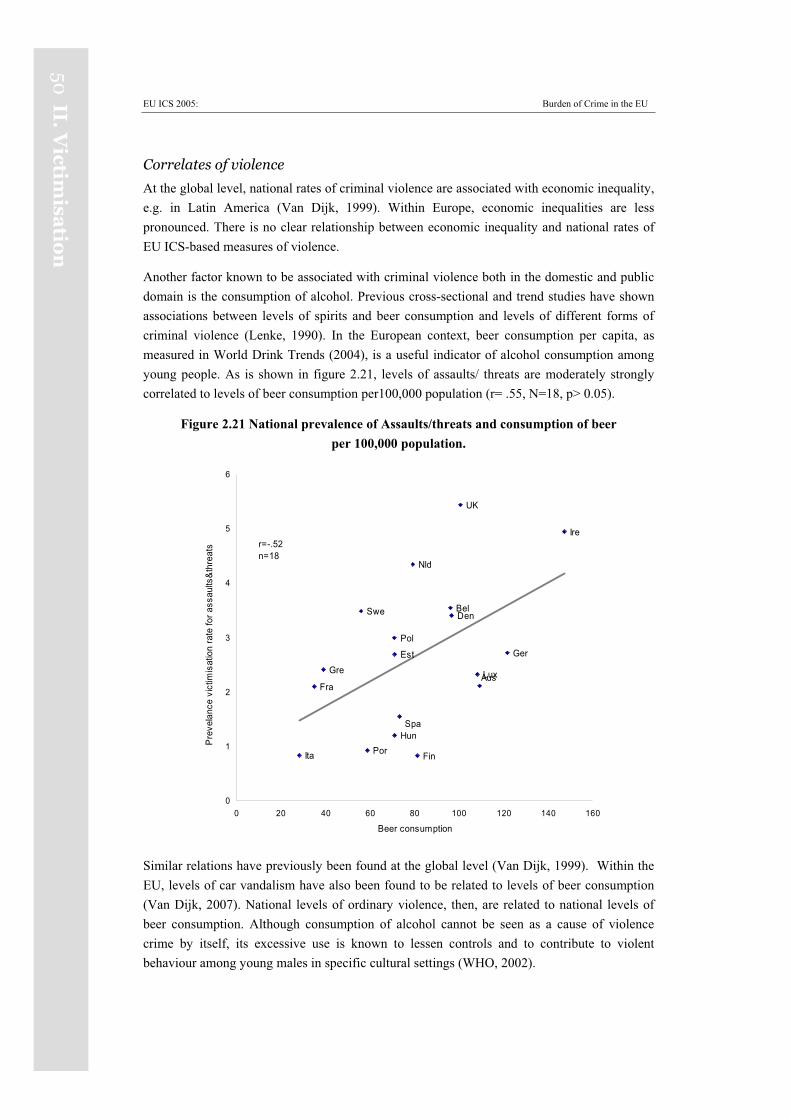
EU ICS 2005: Burden of Crime in the EU
50II.
Victim
isatio
n
Correlates of violence
At the global level, national rates of criminal violence are associated with economic inequality, e.g. in Latin America (Van Dijk, 1999). Within Europe, economic inequalities are less pronounced. There is no clear relationship between economic inequality and national rates of EU ICS-based measures of violence.
Another factor known to be associated with criminal violence both in the domestic and public domain is the consumption of alcohol. Previous cross-sectional and trend studies have shown associations between levels of spirits and beer consumption and levels of different forms of criminal violence (Lenke, 1990). In the European context, beer consumption per capita, as measured in World Drink Trends (2004), is a useful indicator of alcohol consumption among young people. As is shown in figure 2.21, levels of assaults/ threats are moderately strongly correlated to levels of beer consumption per100,000 population (r= .55, N=18, p> 0.05).
Figure 2.21 National prevalence of Assaults/threats and consumption of beer per 100,000 population.
Est
Fin
Den
Nld
Aus
Swe
Fra
Hun
Bel
Ire
Ger
UK
Por
Gre
Spa
Lux
Ita
Pol
0
1
2
3
4
5
6
0 20 40 60 80 100 120 140 160
Beer consumption
Pre
vela
nce
vict
imis
atio
n ra
te fo
r ass
aults
&th
reat
s r=-.52n=18
Similar relations have previously been found at the global level (Van Dijk, 1999). Within the EU, levels of car vandalism have also been found to be related to levels of beer consumption (Van Dijk, 2007). National levels of ordinary violence, then, are related to national levels of beer consumption. Although consumption of alcohol cannot be seen as a cause of violence crime by itself, its excessive use is known to lessen controls and to contribute to violent behaviour among young males in specific cultural settings (WHO, 2002).
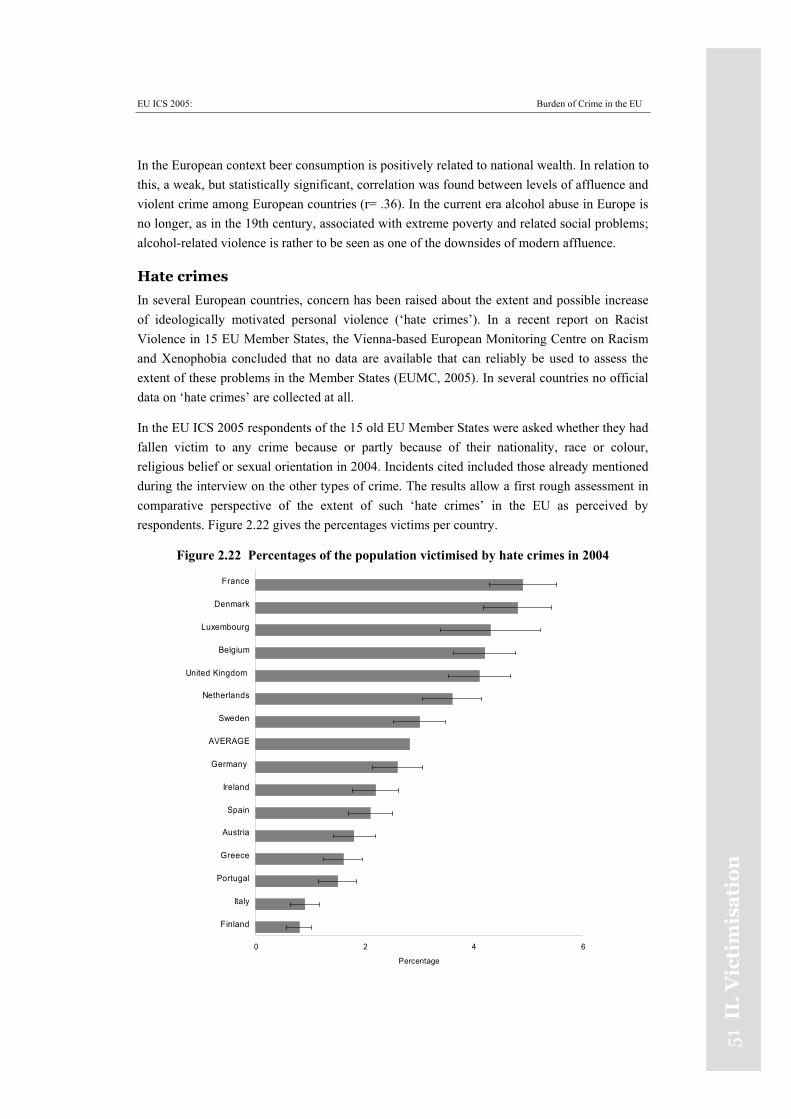
EU ICS 2005: Burden of Crime in the EU
51II
.V
icti
mis
ati
on
In the European context beer consumption is positively related to national wealth. In relation to this, a weak, but statistically significant, correlation was found between levels of affluence and violent crime among European countries (r= .36). In the current era alcohol abuse in Europe is no longer, as in the 19th century, associated with extreme poverty and related social problems; alcohol-related violence is rather to be seen as one of the downsides of modern affluence.
Hate crimes
In several European countries, concern has been raised about the extent and possible increase of ideologically motivated personal violence (‘hate crimes’). In a recent report on Racist Violence in 15 EU Member States, the Vienna-based European Monitoring Centre on Racism and Xenophobia concluded that no data are available that can reliably be used to assess the extent of these problems in the Member States (EUMC, 2005). In several countries no official data on ‘hate crimes’ are collected at all.
In the EU ICS 2005 respondents of the 15 old EU Member States were asked whether they had fallen victim to any crime because or partly because of their nationality, race or colour, religious belief or sexual orientation in 2004. Incidents cited included those already mentioned during the interview on the other types of crime. The results allow a first rough assessment in comparative perspective of the extent of such ‘hate crimes’ in the EU as perceived by respondents. Figure 2.22 gives the percentages victims per country.
Figure 2.22 Percentages of the population victimised by hate crimes in 2004
0 2 4 6
Finland
Italy
Portugal
Greece
Austria
Spain
Ireland
Germany
AVERAGE
Sweden
Netherlands
United Kingdom
Belgium
Luxembourg
Denmark
France
Percentage
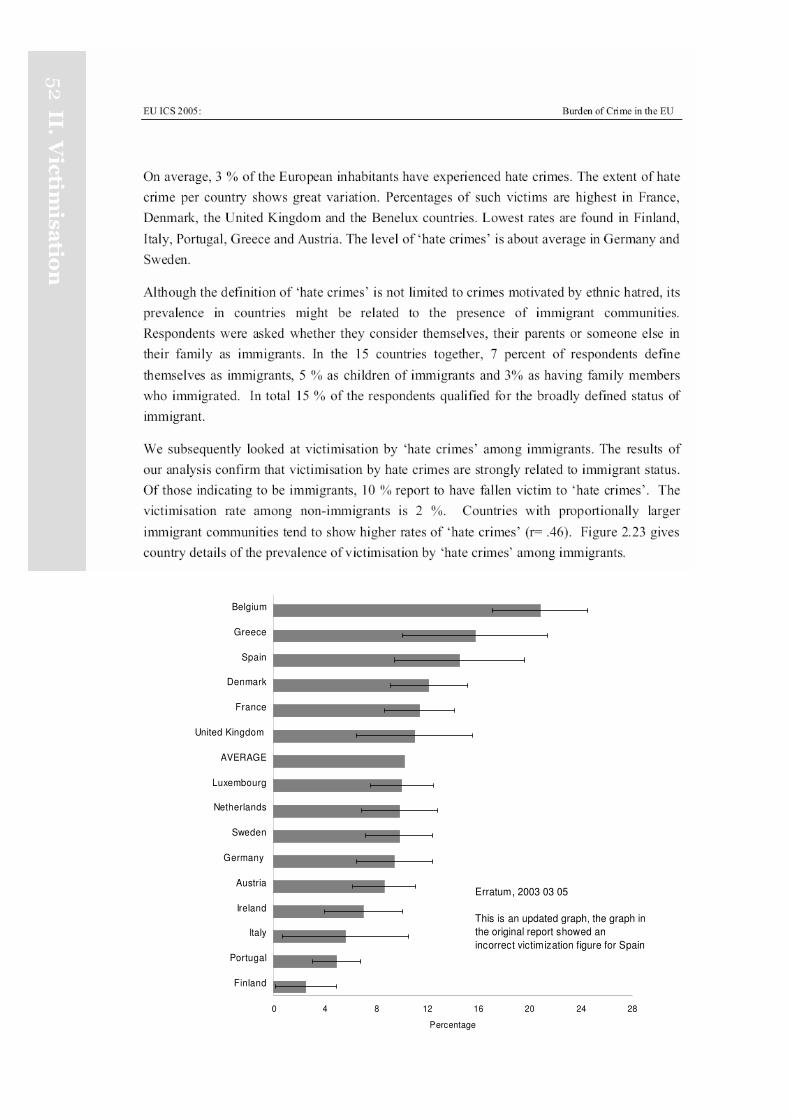
0 4 8 12 16 20 24 28
Finland
Portugal
Italy
Ireland
Austria
Germany
Sweden
Netherlands
Luxembourg
AVERAGE
United Kingdom
France
Denmark
Spain
Greece
Belgium
Percentage
Erratum, 2003 03 05
This is an updated graph, the graph in
the original report showed an
incorrect victimization figure for Spain
EU ICS 2005: Burden of Crime in the EU
53II
.V
icti
mis
ati
on
Immigrant rates of victimisation by ‘hate crimes’ show a different ranking of countries than general victimisation. Among the immigrant communities, victimisation is most common in Belgium, Greece, Spain, followed by Denmark, France and the United Kingdom. The lowest rates are found in Finland, Portugal, Italy and Ireland.
The analysis of victimisation rates of those indicating a religious affiliation showed insignificant results. Respondents that practice a religion showed similar victimisation rates for ‘hate crimes’ as those who do not. Within the immigrant communities, however, religion was positively related to victimisation. People of immigrant status who are religious, 12% had been victimised, compared to 9% of those who are not. In Belgium, Denmark and Sweden, 20% of religious immigrants had experienced a ‘hate crime’ in 2004. Rates were also high in Greece (18%), France (15%) and the United Kingdom (14%).
A further preliminary analysis was made of rates of victimisation by any of the ten types of common crimes included in the questionnaire among immigrants. Nineteen percent of the immigrants had been victimised by any crime once or more in 2004. Among religious immigrants the percentage was 20. The victimisation rate of non-immigrants is significantly lower (15%), regardless of religious status. Immigrant status enhances the risk of being criminally victimised.
One explanation of the higher rates of victimisation of immigrants might be their relatively young average age and their predominant residence being in big cities, both known risk factors of criminal victimisation. The other explanation is that the phenomenon of ‘hate crimes’ has become so common that it drives up victimisation by crime among immigrants.
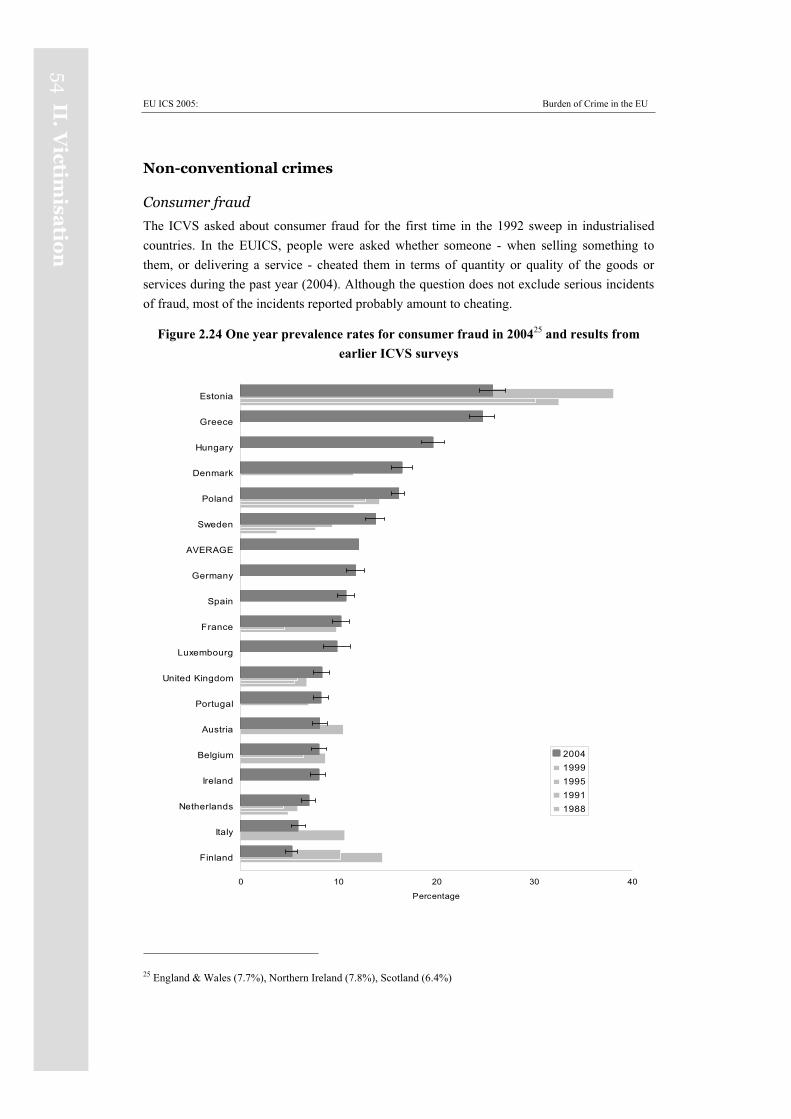
EU ICS 2005: Burden of Crime in the EU
54II.
Victim
isatio
n
Non-conventional crimes
Consumer fraud
The ICVS asked about consumer fraud for the first time in the 1992 sweep in industrialised countries. In the EUICS, people were asked whether someone - when selling something to them, or delivering a service - cheated them in terms of quantity or quality of the goods or services during the past year (2004). Although the question does not exclude serious incidents of fraud, most of the incidents reported probably amount to cheating.
Figure 2.24 One year prevalence rates for consumer fraud in 200425 and results from earlier ICVS surveys
0 10 20 30 40
Finland
Italy
Netherlands
Ireland
Belgium
Austria
Portugal
United Kingdom
Luxembourg
France
Spain
Germany
AVERAGE
Sweden
Poland
Denmark
Hungary
Greece
Estonia
Percentage
20041999199519911988
25 England & Wales (7.7%), Northern Ireland (7.8%), Scotland (6.4%)
EU ICS 2005: Burden of Crime in the EU
55II
.V
icti
mis
ati
on
On average, 12 % of respondents said in 2005 they experienced some type of consumer fraud over the past twelve months. Greece, Estonia, Hungary, Denmark and Poland had relatively high rates, i.e. 13 % or more were victimised. Levels of fraud were lowest in Finland, Italy, the Netherlands and Ireland. Few countries show any clear trends.
Results in the countries of the earlier ICVS sweeps, results were largely similar. Analyses at the global level have shown a relationship between the size of the informal sector of the economy and the level of fraud (Van Dijk, 2006). Where the informal sector is relatively large, regulatory arrangements to protect consumers are likely to be less effective. Deficiencies in this sphere may explain the high levels of consumer fraud in countries with economies in transition.
Many victims (about 45% overall) did not specify where the fraud had taken place, but just over a third mentioned shops, and about one in ten mentioned building or construction work. Few incidents were reported to the police, but other agencies were notified about more incidents.
Corruption
The 1996 ICVS introduced a question on street level corruption, chiefly to set the experience of those in industrialised countries alongside countries elsewhere in the world. People were asked in the 2005 EU ICS:
"In some countries, there is a problem of corruption among government or public officials. During 2004, did any government official, for instance a customs officer, a police officer, a judge or inspector in your country ask you, or expected you to pay a bribe for his or her services?"
Whereas on average nearly one in five people in the developing world reported incidents involving corruption, and about one in eight in Eastern European countries (Zvekic, 1998, Van Dijk, 2000), corruption was very uncommon in industrialised countries in ICVS sweeps of the ICVS. Figure 2.25 shows the results of the EU ICS 2005.
Within the EU, only 1.4 % reported any incident, with most countries showing rates below 0.5 %. Greece stood out with a percentage of 13.5 %. As had been the case in the previous sweeps, corruption was also high in Poland, Hungary and Estonia. Government officials and police officers have been cited as bribe-takers most often. Rates in Denmark, France and Portugal are relatively low but yet significantly higher than many other European countries. Results of previous sweeps also showed relatively high rates in France and Portugal.
The rates of actual experiences with officials asking or expecting bribes were compared with the scores on the Corruption Perception Index of Transparency International, a composite index of experts’ perceptions of general levels of corruption (Transparency International, 2005). Rankings on the two indicators of corruption were strongly related to each other (r= .73). Figure 2.26 shows results.
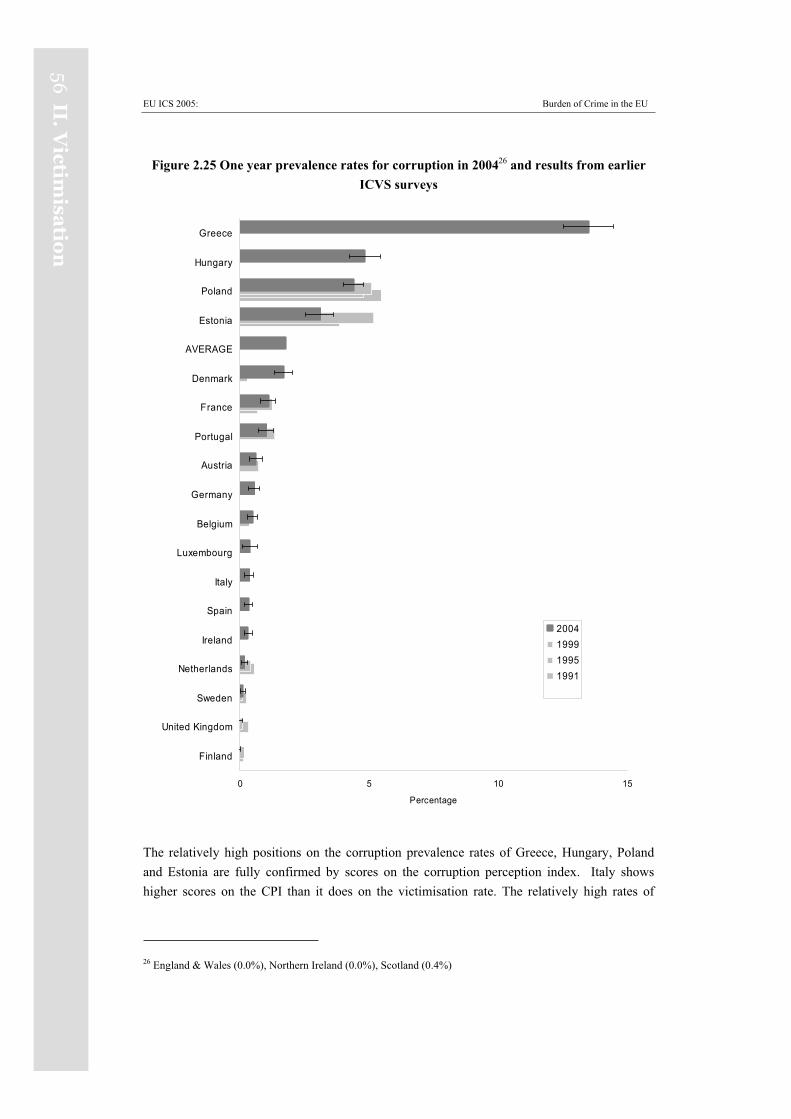
EU ICS 2005: Burden of Crime in the EU
56II.
Victim
isatio
n
Figure 2.25 One year prevalence rates for corruption in 200426 and results from earlier ICVS surveys
0 5 10 15
Finland
United Kingdom
Sweden
Netherlands
Ireland
Spain
Italy
Luxembourg
Belgium
Germany
Austria
Portugal
France
Denmark
AVERAGE
Estonia
Poland
Hungary
Greece
Percentage
2004199919951991
The relatively high positions on the corruption prevalence rates of Greece, Hungary, Poland and Estonia are fully confirmed by scores on the corruption perception index. Italy shows higher scores on the CPI than it does on the victimisation rate. The relatively high rates of
26 England & Wales (0.0%), Northern Ireland (0.0%), Scotland (0.4%)
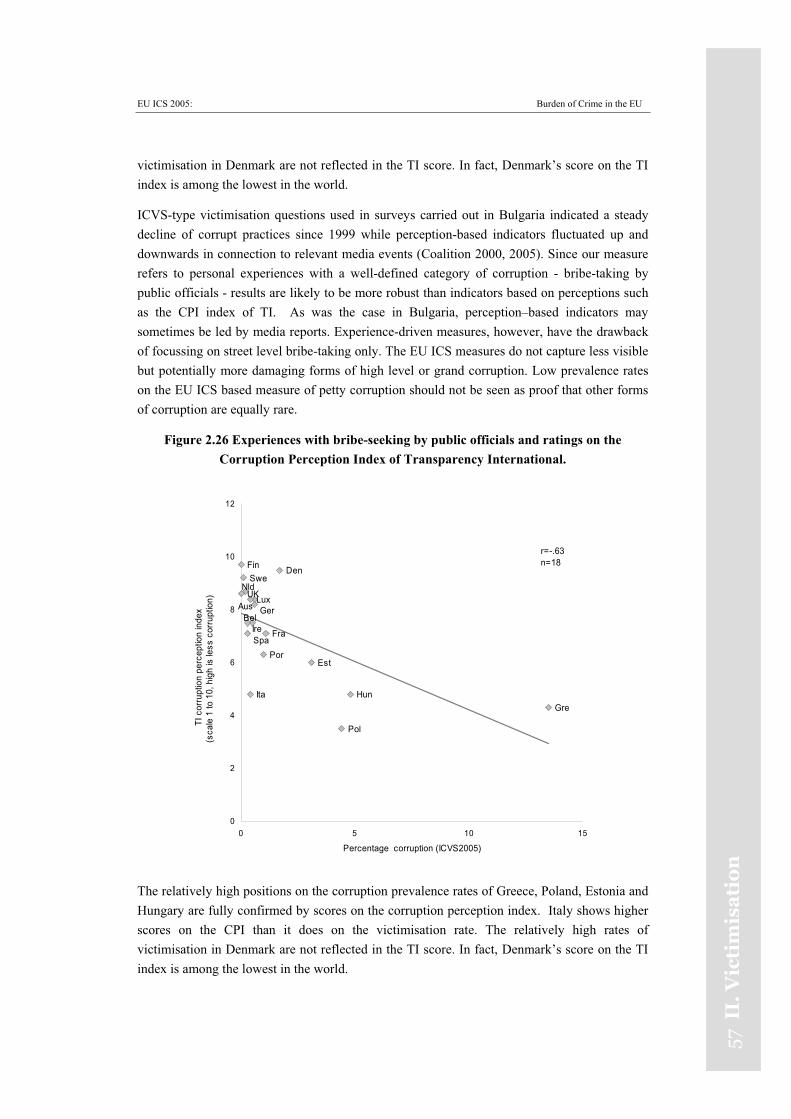
EU ICS 2005: Burden of Crime in the EU
57II
.V
icti
mis
ati
on
victimisation in Denmark are not reflected in the TI score. In fact, Denmark’s score on the TI index is among the lowest in the world.
ICVS-type victimisation questions used in surveys carried out in Bulgaria indicated a steady decline of corrupt practices since 1999 while perception-based indicators fluctuated up and downwards in connection to relevant media events (Coalition 2000, 2005). Since our measure refers to personal experiences with a well-defined category of corruption - bribe-taking by public officials - results are likely to be more robust than indicators based on perceptions such as the CPI index of TI. As was the case in Bulgaria, perception–based indicators may sometimes be led by media reports. Experience-driven measures, however, have the drawback of focussing on street level bribe-taking only. The EU ICS measures do not capture less visible but potentially more damaging forms of high level or grand corruption. Low prevalence rates on the EU ICS based measure of petty corruption should not be seen as proof that other forms of corruption are equally rare.
Figure 2.26 Experiences with bribe-seeking by public officials and ratings on the Corruption Perception Index of Transparency International.
Est
Fin Den
Nld
Aus
Swe
Fra
Hun
BelIre
Ger
UK
Por
Gre
Spa
Lux
Ita
Pol
0
2
4
6
8
10
12
0 5 10 15
Percentage corruption (ICVS2005)
TI c
orru
ptio
n pe
rcep
tion
inde
x (s
cale
1 to
10,
hig
h is
less
cor
rupt
ion)
r=-.63n=18
The relatively high positions on the corruption prevalence rates of Greece, Poland, Estonia and Hungary are fully confirmed by scores on the corruption perception index. Italy shows higher scores on the CPI than it does on the victimisation rate. The relatively high rates of victimisation in Denmark are not reflected in the TI score. In fact, Denmark’s score on the TI index is among the lowest in the world.
EU ICS 2005: Burden of Crime in the EU
58II.
Victim
isatio
n
ICVS-type victimisation questions used in surveys carried out in Bulgaria indicated a steady decline of corrupt practices since 1999 while perception-based indicators fluctuated up and downwards in connection to relevant media events (Coalition 2000, 2005).
Exposure to drugs-related problems
Following the general methodological approach of the ICVS, a question was designed on personal experiences of respondents with drug-related problems in the area of residence (Van Dijk, 1996). The question asks:
‘Over the last 12 months, how often were you personally in contact with drug-related problems in the area where you live? For example seeing people dealing in drugs, taking or using drugs in public places, or by finding syringes left by drug addicts?’
This item was included in a set of ICVS-based questions used in the framework of the Eurobarometer (INRA, 1996). The item was also used in subsequent Eurobarometer surveys in 2000 and 2002 (EORG, 2003) and was added to the EU ICS questionnaire used in the EU-15 and Hungary.
Figure 2.27 provides an overview of the trends from country to country in 1996, 2000, 2002 and 2005.
Overall, in the EU-16, 20 % experienced drugs-related problems often or from time to time over the last twelve months in 2004/2005. The trend data show a steady growth in exposure to such problems among the EU-15 from 13 % in 1996, to 17% in 2000 and 2002 and 21 % in 2005.
The highest scores were found in 2005 in Greece, Luxembourg, Spain and Portugal. In these countries respondents were least likely to record that they never experienced such problems. Lowest scores were found in Finland, Sweden, Hungary and Denmark.
Country rates show divergent trends since 1996. The United Kingdom, Sweden and Finland showed lower rates in 2005 than before. The United Kingdom, Sweden and the Netherlands have descended in the country rankings on this measure.
Contact of the general public with drug-related problems cannot be seen as an indicator of the actual level of drugs consumption. In some countries drugs-related phenomena stay more underground than in others as a result of more repressive policies towards use and possession. No strong relationships were found between the extent of the public’s exposure to drugs and
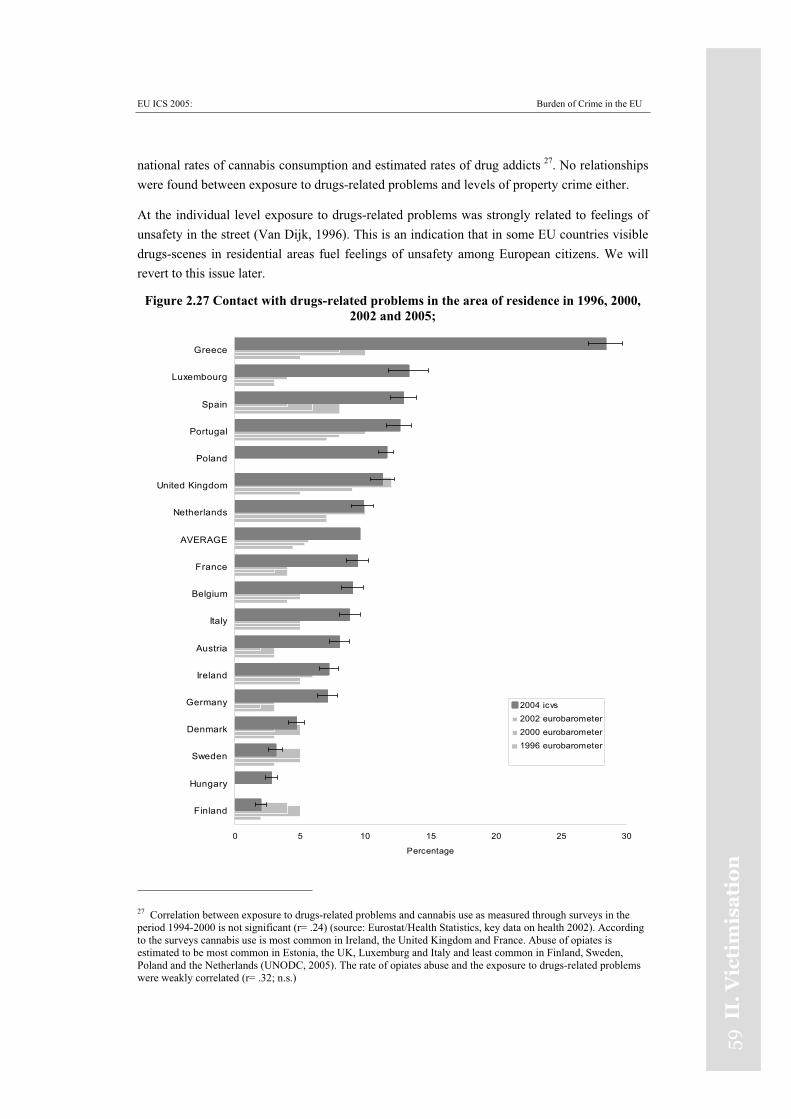
EU ICS 2005: Burden of Crime in the EU
59II
.V
icti
mis
ati
on
national rates of cannabis consumption and estimated rates of drug addicts 27. No relationships were found between exposure to drugs-related problems and levels of property crime either.
At the individual level exposure to drugs-related problems was strongly related to feelings of unsafety in the street (Van Dijk, 1996). This is an indication that in some EU countries visible drugs-scenes in residential areas fuel feelings of unsafety among European citizens. We will revert to this issue later.
Figure 2.27 Contact with drugs-related problems in the area of residence in 1996, 2000, 2002 and 2005;
0 5 10 15 20 25 30
Finland
Hungary
Sweden
Denmark
Germany
Ireland
Austria
Italy
Belgium
France
AVERAGE
Netherlands
United Kingdom
Poland
Portugal
Spain
Luxembourg
Greece
Percentage
2004 icvs2002 eurobarometer2000 eurobarometer1996 eurobarometer
27 Correlation between exposure to drugs-related problems and cannabis use as measured through surveys in the period 1994-2000 is not significant (r= .24) (source: Eurostat/Health Statistics, key data on health 2002). According to the surveys cannabis use is most common in Ireland, the United Kingdom and France. Abuse of opiates is estimated to be most common in Estonia, the UK, Luxemburg and Italy and least common in Finland, Sweden, Poland and the Netherlands (UNODC, 2005). The rate of opiates abuse and the exposure to drugs-related problems were weakly correlated (r= .32; n.s.)
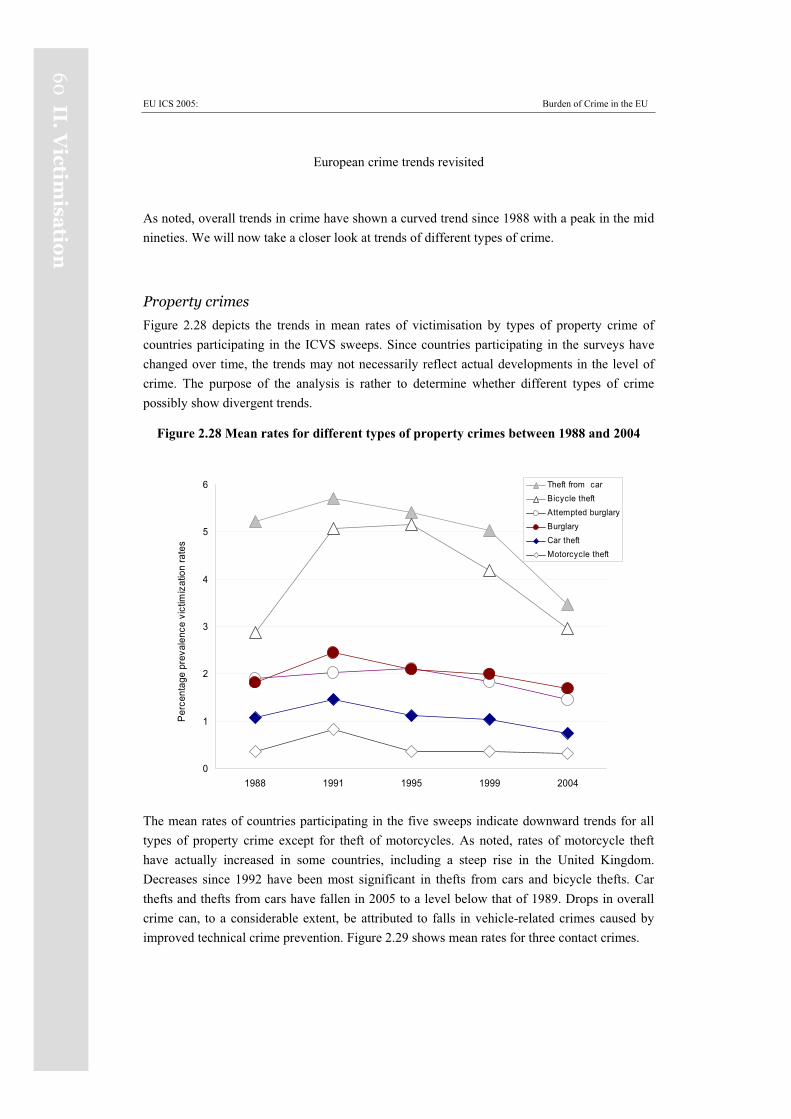
EU ICS 2005: Burden of Crime in the EU
60
II.V
ictimisa
tion
European crime trends revisited
As noted, overall trends in crime have shown a curved trend since 1988 with a peak in the mid nineties. We will now take a closer look at trends of different types of crime.
Property crimes
Figure 2.28 depicts the trends in mean rates of victimisation by types of property crime of countries participating in the ICVS sweeps. Since countries participating in the surveys have changed over time, the trends may not necessarily reflect actual developments in the level of crime. The purpose of the analysis is rather to determine whether different types of crime possibly show divergent trends.
Figure 2.28 Mean rates for different types of property crimes between 1988 and 2004
0
1
2
3
4
5
6
1988 1991 1995 1999 2004
Perc
enta
ge p
reva
lenc
e vi
ctim
izat
ion
rate
s
Theft from carBicycle theftAttempted burglaryBurglaryCar theftMotorcycle theft
The mean rates of countries participating in the five sweeps indicate downward trends for all types of property crime except for theft of motorcycles. As noted, rates of motorcycle theft have actually increased in some countries, including a steep rise in the United Kingdom. Decreases since 1992 have been most significant in thefts from cars and bicycle thefts. Car thefts and thefts from cars have fallen in 2005 to a level below that of 1989. Drops in overall crime can, to a considerable extent, be attributed to falls in vehicle-related crimes caused by improved technical crime prevention. Figure 2.29 shows mean rates for three contact crimes.
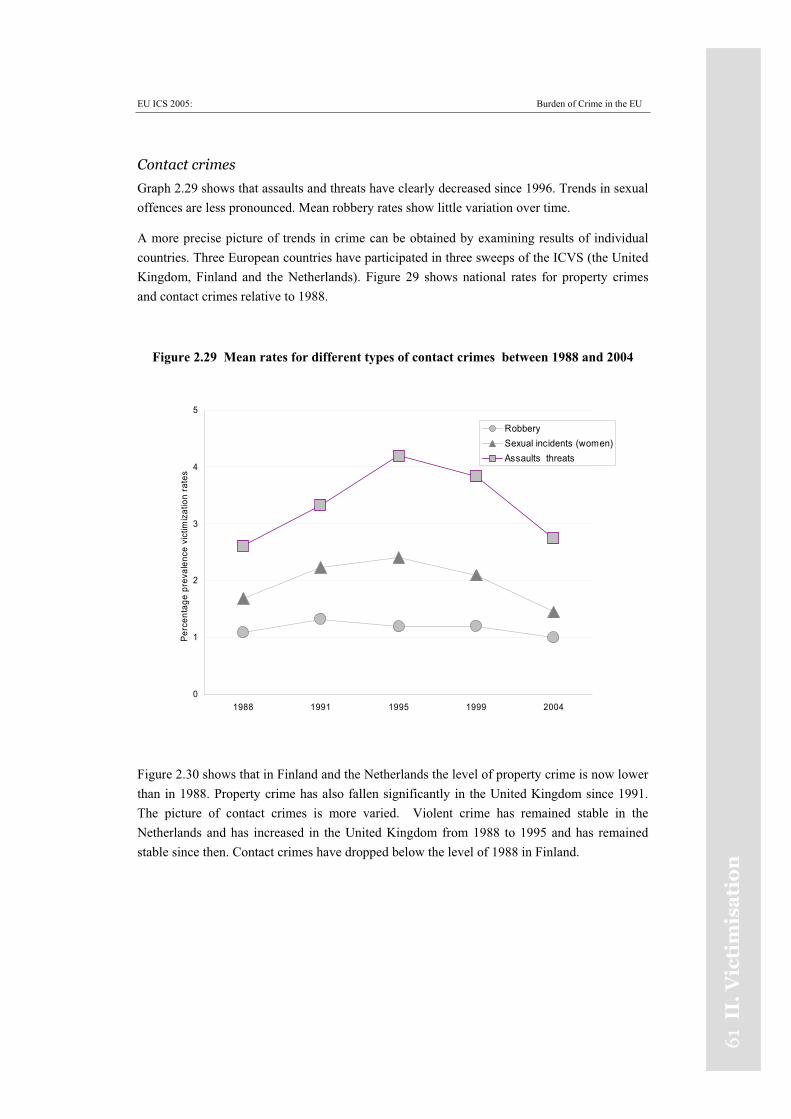
EU ICS 2005: Burden of Crime in the EU
61
II.
Vic
tim
isa
tio
n
Contact crimes
Graph 2.29 shows that assaults and threats have clearly decreased since 1996. Trends in sexual offences are less pronounced. Mean robbery rates show little variation over time.
A more precise picture of trends in crime can be obtained by examining results of individual countries. Three European countries have participated in three sweeps of the ICVS (the United Kingdom, Finland and the Netherlands). Figure 29 shows national rates for property crimes and contact crimes relative to 1988.
Figure 2.29 Mean rates for different types of contact crimes between 1988 and 2004
0
1
2
3
4
5
1988 1991 1995 1999 2004
Perc
enta
ge p
reva
lenc
e vi
ctim
izat
ion
rate
s
RobberySexual incidents (women)Assaults threats
Figure 2.30 shows that in Finland and the Netherlands the level of property crime is now lower than in 1988. Property crime has also fallen significantly in the United Kingdom since 1991. The picture of contact crimes is more varied. Violent crime has remained stable in the Netherlands and has increased in the United Kingdom from 1988 to 1995 and has remained stable since then. Contact crimes have dropped below the level of 1988 in Finland.
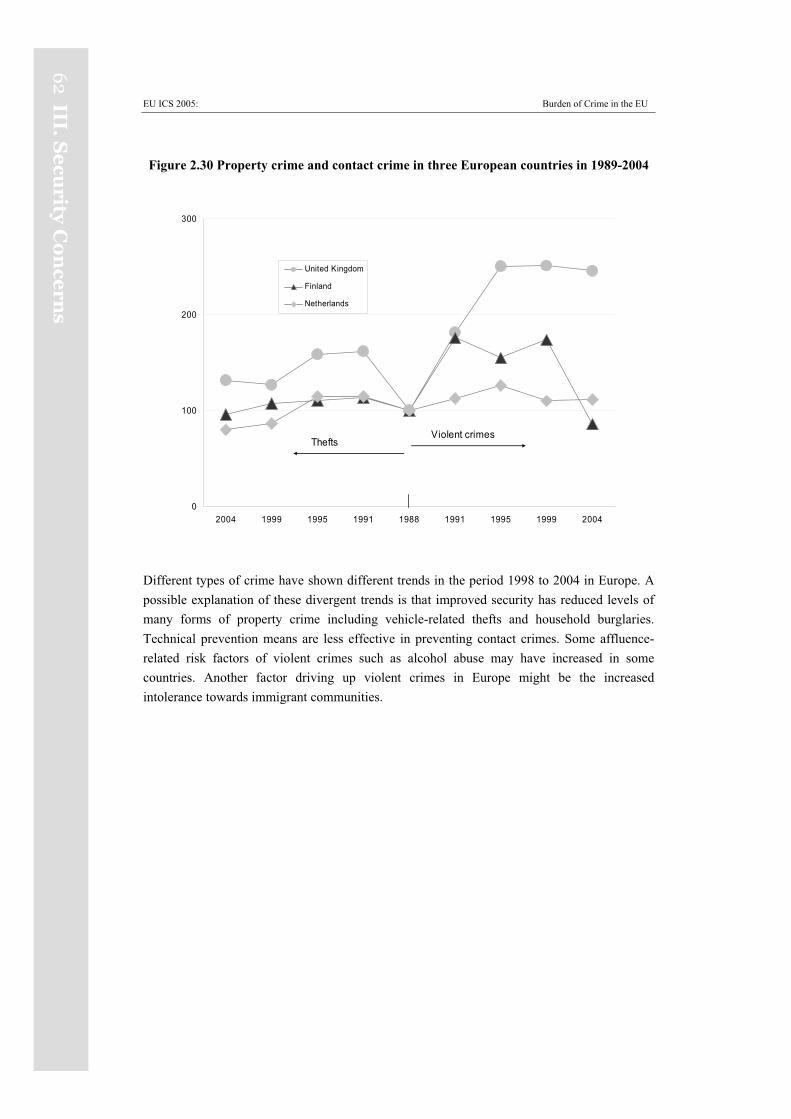
EU ICS 2005: Burden of Crime in the EU
62
III.S
ecu
rityC
on
cern
s
Figure 2.30 Property crime and contact crime in three European countries in 1989-2004
0
100
200
300
2004 1999 1995 1991 1988 1991 1995 1999 2004
United Kingdom
Finland
Netherlands
TheftsViolent crimes
Different types of crime have shown different trends in the period 1998 to 2004 in Europe. A possible explanation of these divergent trends is that improved security has reduced levels of many forms of property crime including vehicle-related thefts and household burglaries. Technical prevention means are less effective in preventing contact crimes. Some affluence-related risk factors of violent crimes such as alcohol abuse may have increased in some countries. Another factor driving up violent crimes in Europe might be the increased intolerance towards immigrant communities.
EU ICS 2005: Burden of Crime in the EU
63
III.
Se
curi
tyC
on
cern
s
III. Security Concerns
Fear of Crime
The likelihood of burglary
The EU ICS provides a measure on concern about burglary through a question which asks respondents how likely they think it is that they will be burgled in the coming year. Figure 3.1 shows the percentage of people who rated the chance of burglary as “very likely” or “likely”.
The population of Greece (49%), Italy (43 %), France (about 38%) and Portugal (35%) were most pessimistic. There was least concern in the Scandinavian countries (under 20%), Austria and the Netherlands.
Figure 3.1 shows results on feelings about the likelihood of burglary for several countries that have participated in the EU ICS and the ICVS more than once. Concern about burglary has changed over time – essentially rising in general between 1989 and 1992 and falling thereafter. Steep drops in recent years have occurred in France, Portugal, Estonia, Poland, the Netherlands and Sweden.
Relating ICVS trends in national burglary levels to trends in worry about burglary shows that perceptions of the likelihood of burglary broadly matches trends in ICVS burglary levels. In the countries in which there was the strongest fall in concern, actual levels of burglary also fell more than the average. There are a few inconsistencies at the level of individual countries, and sampling error could explain this to a degree.
The ranking of countries is reasonably stable over the years. For example, those in Italy, France and England and Wales have been consistently more worried about the likelihood of burglary.
Relationship with national burglary risks and victimisation experience
The ICVS has previously found that perceptions of the likelihood of burglary at national level are strongly related to national risks of burglary: i.e., countries where the highest proportions feel vulnerable to burglary in the coming year are those where risks are highest. In the 2000 sweep, a relationship was again found between the proportions of those thinking burglary was very likely and national burglary rates. In the 2005 EU ICS data this relationship has become much less clear (r = +.27).
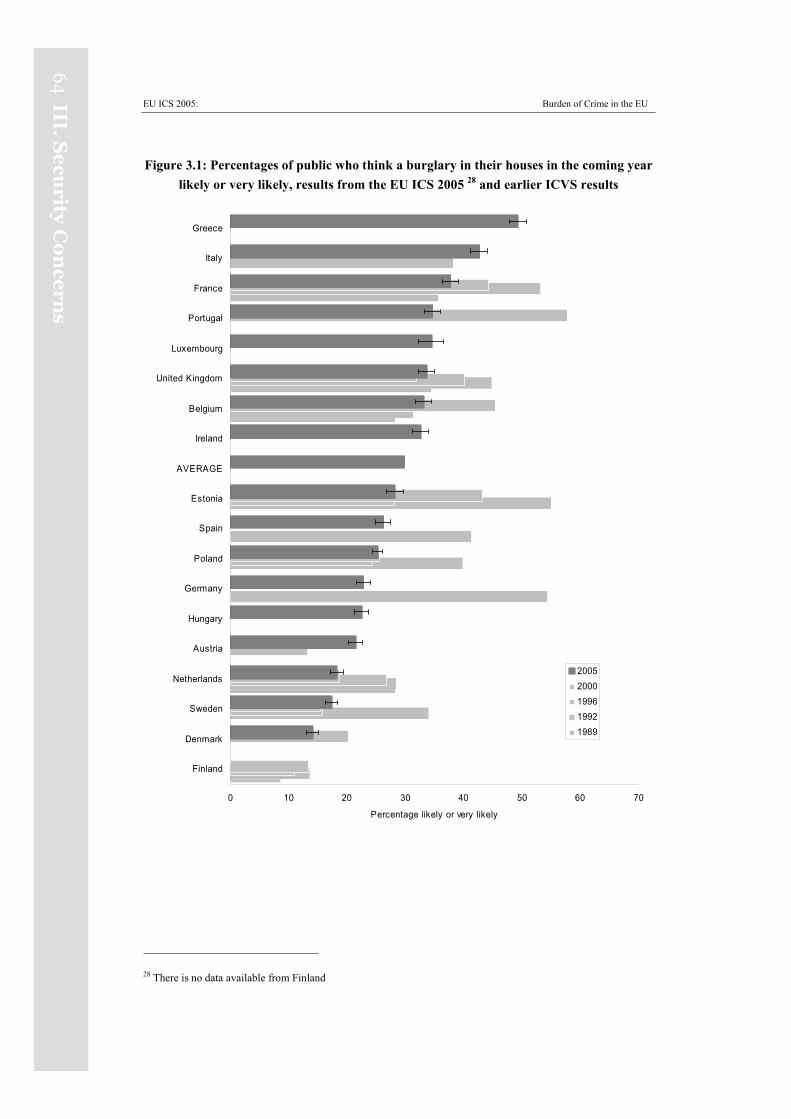
EU ICS 2005: Burden of Crime in the EU
64
III.S
ecu
rityC
on
cern
s
Figure 3.1: Percentages of public who think a burglary in their houses in the coming year likely or very likely, results from the EU ICS 2005 28 and earlier ICVS results
0 10 20 30 40 50 60 70
Finland
Denmark
Sweden
Netherlands
Austria
Hungary
Germany
Poland
Spain
Estonia
AVERAGE
Ireland
Belgium
United Kingdom
Luxembourg
Portugal
France
Italy
Greece
Percentage likely or very likely
20052000199619921989
28 There is no data available from Finland
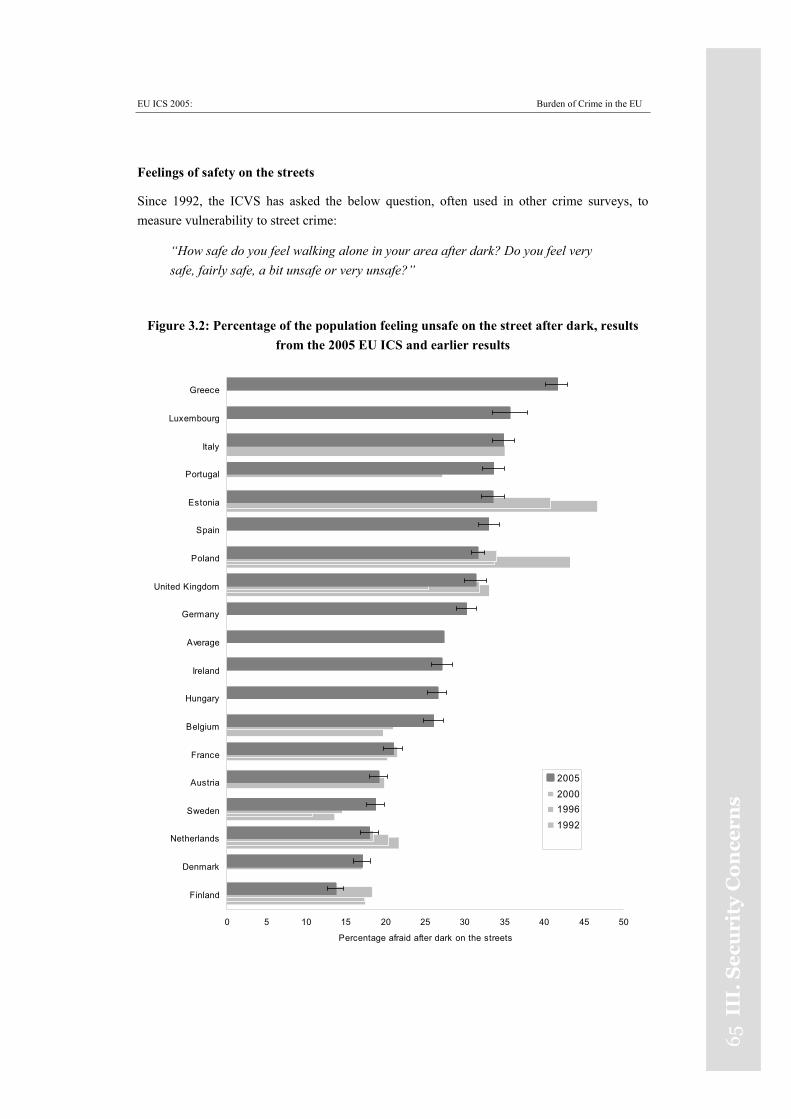
EU ICS 2005: Burden of Crime in the EU
65
III.
Se
curi
tyC
on
cern
s
Feelings of safety on the streets
Since 1992, the ICVS has asked the below question, often used in other crime surveys, to measure vulnerability to street crime:
“How safe do you feel walking alone in your area after dark? Do you feel very safe, fairly safe, a bit unsafe or very unsafe?”
Figure 3.2: Percentage of the population feeling unsafe on the street after dark, results from the 2005 EU ICS and earlier results
0 5 10 15 20 25 30 35 40 45 50
Finland
Denmark
Netherlands
Sweden
Austria
France
Belgium
Hungary
Ireland
Average
Germany
United Kingdom
Poland
Spain
Estonia
Portugal
Italy
Luxembourg
Greece
Percentage afraid after dark on the streets
2005200019961992
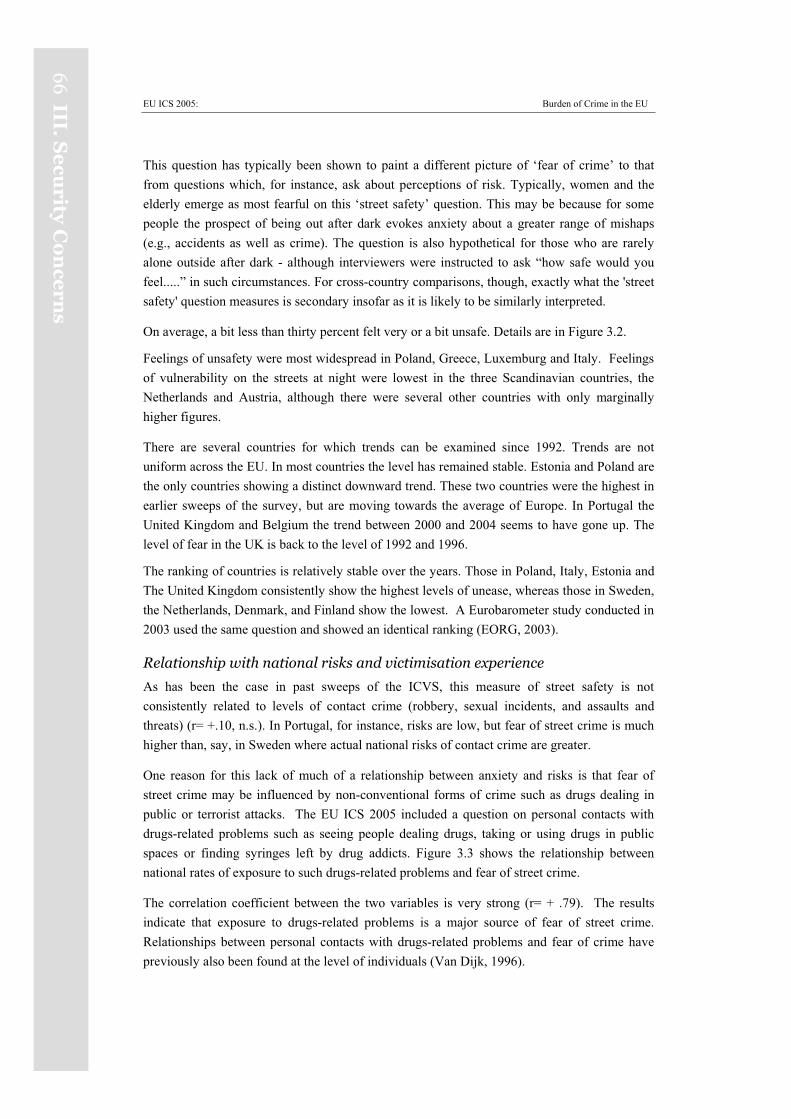
EU ICS 2005: Burden of Crime in the EU
66
III.S
ecu
rityC
on
cern
s
This question has typically been shown to paint a different picture of ‘fear of crime’ to that from questions which, for instance, ask about perceptions of risk. Typically, women and the elderly emerge as most fearful on this ‘street safety’ question. This may be because for some people the prospect of being out after dark evokes anxiety about a greater range of mishaps (e.g., accidents as well as crime). The question is also hypothetical for those who are rarely alone outside after dark - although interviewers were instructed to ask “how safe would you feel.....” in such circumstances. For cross-country comparisons, though, exactly what the 'street safety' question measures is secondary insofar as it is likely to be similarly interpreted.
On average, a bit less than thirty percent felt very or a bit unsafe. Details are in Figure 3.2.
Feelings of unsafety were most widespread in Poland, Greece, Luxemburg and Italy. Feelings of vulnerability on the streets at night were lowest in the three Scandinavian countries, the Netherlands and Austria, although there were several other countries with only marginally higher figures.
There are several countries for which trends can be examined since 1992. Trends are not uniform across the EU. In most countries the level has remained stable. Estonia and Poland are the only countries showing a distinct downward trend. These two countries were the highest in earlier sweeps of the survey, but are moving towards the average of Europe. In Portugal the United Kingdom and Belgium the trend between 2000 and 2004 seems to have gone up. The level of fear in the UK is back to the level of 1992 and 1996.
The ranking of countries is relatively stable over the years. Those in Poland, Italy, Estonia and The United Kingdom consistently show the highest levels of unease, whereas those in Sweden, the Netherlands, Denmark, and Finland show the lowest. A Eurobarometer study conducted in 2003 used the same question and showed an identical ranking (EORG, 2003).
Relationship with national risks and victimisation experience
As has been the case in past sweeps of the ICVS, this measure of street safety is not consistently related to levels of contact crime (robbery, sexual incidents, and assaults and threats) (r= +.10, n.s.). In Portugal, for instance, risks are low, but fear of street crime is much higher than, say, in Sweden where actual national risks of contact crime are greater.
One reason for this lack of much of a relationship between anxiety and risks is that fear of street crime may be influenced by non-conventional forms of crime such as drugs dealing in public or terrorist attacks. The EU ICS 2005 included a question on personal contacts with drugs-related problems such as seeing people dealing drugs, taking or using drugs in public spaces or finding syringes left by drug addicts. Figure 3.3 shows the relationship between national rates of exposure to such drugs-related problems and fear of street crime.
The correlation coefficient between the two variables is very strong (r= + .79). The results indicate that exposure to drugs-related problems is a major source of fear of street crime. Relationships between personal contacts with drugs-related problems and fear of crime have previously also been found at the level of individuals (Van Dijk, 1996).
EU ICS 2005: Burden of Crime in the EU
67
III.
Se
curi
tyC
on
cern
s
Figure 3.3: Exposure to drugs-related problems and afraid on the street after dark
ItaLuxSpa
GrePor
UK
Ger
IreBel
Hun
Fra
Swe
Aus
Nld
Den
Fin
0
10
20
30
40
50
60
0 10 20 30 40 50Percentage afraid after dark on the street
Res
pond
ents
hav
ing
witn
esse
d dr
ug-r
elat
ed a
ctiv
ity in
the
neig
hbou
rhoo
d
.
Reporting crime to the police
This section concentrates mainly on the issue of reporting victimisation to the police. It considers how reporting rates vary across offence types, and across countries. The reasons for not reporting are then considered: how these differ for different types of victimisation. After this, we look at reasons for reporting to the police – again in relation to different offence types. The section then moves onto what victims who reported felt about the police response: how many were satisfied with it, and if they were not, why not. Finally, we consider how people in general – both victims and non-victims - feel about the performance of the police in their local area.
Reporting to the police
The frequency with which victims (or relatives and friends on their behalf) report offences to the police is strongly related to the type of offence involved. In most countries, almost all cars and motorcycles stolen were reported, as well as most burglaries with entry. About two-thirds of thefts from cars were reported, and rather more than half of bicycle thefts and robberies. Only about a third of all assaults and threats were drawn to the attention of the police, although
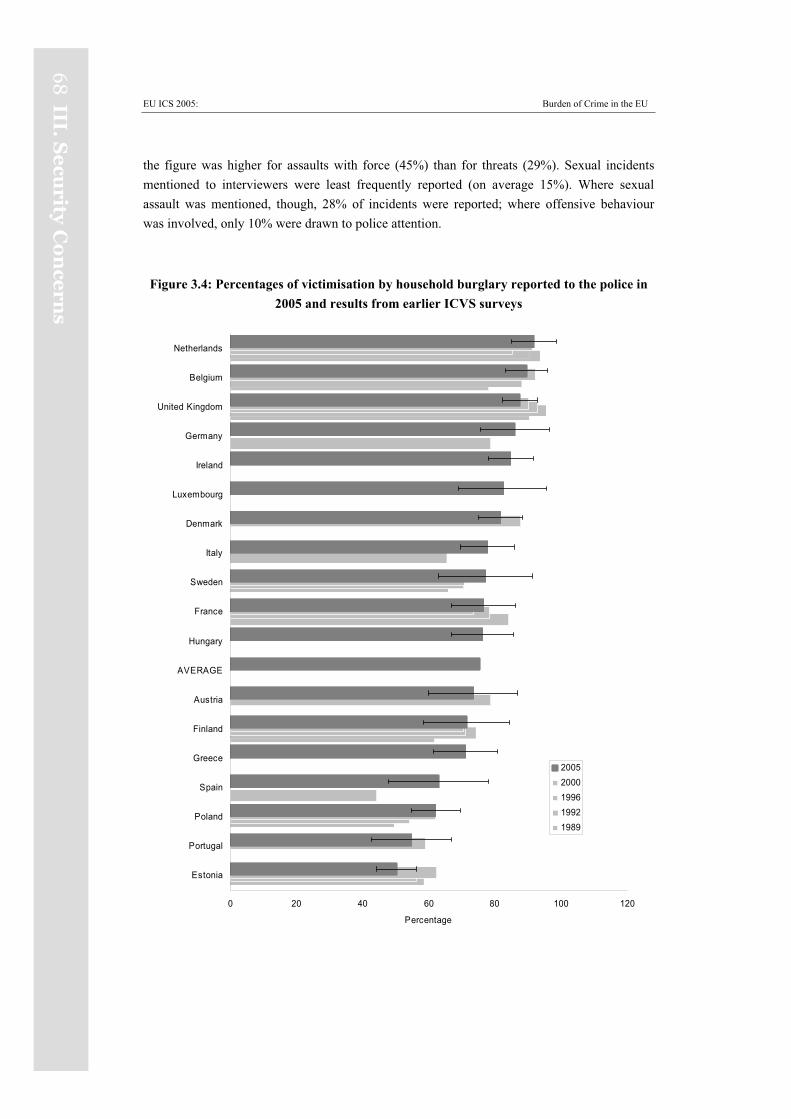
EU ICS 2005: Burden of Crime in the EU
68
III.S
ecu
rityC
on
cern
s
the figure was higher for assaults with force (45%) than for threats (29%). Sexual incidents mentioned to interviewers were least frequently reported (on average 15%). Where sexual assault was mentioned, though, 28% of incidents were reported; where offensive behaviour was involved, only 10% were drawn to police attention.
Figure 3.4: Percentages of victimisation by household burglary reported to the police in 2005 and results from earlier ICVS surveys
0 20 40 60 80 100 120
Estonia
Portugal
Poland
Spain
Greece
Finland
Austria
AVERAGE
Hungary
France
Sweden
Italy
Denmark
Luxembourg
Ireland
Germany
United Kingdom
Belgium
Netherlands
Percentage
20052000199619921989
EU ICS 2005: Burden of Crime in the EU
69
III.
Se
curi
tyC
on
cern
s
In the 18 countries as a whole, roughly half of the five crimes were reported to the police. The highest reporting rates (around 60%) were in Austria, Estonia, Belgium and Sweden. The lowest were in Finland, Poland and Spain.
Reporting levels were calculated for five offences for which levels of reporting are most variable across countries and/or experience of victimisation is comparatively high. 29 The offences are thefts from cars, bicycle theft, burglary with entry, attempted burglary and thefts of personal property.
Reporting rates are going down in the UK, the Netherlands and Finland, this is partly caused by the composition of the crimes that are reported. There is no consistent trend while studying the reporting rates for individual crimes. Reporting rates are going up in Poland and Estonia.
Relative levels of reporting are broadly consistent over the sweeps, and where there are changes they are not always statistically robust.
Figure 3.4 shows reporting percentages for burglaries in 2004. The results confirm that reporting patterns have remained stable.
Reasons for not reporting to the police
In the ICVS, all victims who did not report were asked why not in relation to five crimes – burglary with entry, thefts from cars, robbery, sexual incidents, and assaults and threats. (The last three are termed ‘contact crimes’). More than one reason could be given. Those who did report were also asked to say why they had done so, and this is discussed later.
Table 3.1 shows reasons for not reporting the five crimes for 16 Western countries and Japan together as found in the ICVS 2000 (Van Kesteren, Mayhew and Nieuwbeerta, 2000). That the incident was 'not serious enough' was by far the most important reason for not bringing in the police. About four in ten non-reporters mentioned this, and even more when thefts from cars went unreported. A quarter of victims felt it was inappropriate to call the police, or said they or the family solved it. The idea that the police could do nothing was mentioned fairly frequently (e.g., by one in five victims of thefts of cars who did not report). Few victims mentioned fear or dislike of the police as a reason for not reporting, although it was mentioned slightly more often in relation to contact crime. Fear of reprisals was also infrequently mentioned, though it was mentioned rather more often in relation to contact crime than the two property crimes.
29 Omitted are car and motorcycle thefts (which are usually reported and are relatively uncommon), and robbery (for which numbers per country are small). Also omitted are sexual incidents and assaults/threats. Here, the proportion reported will be influenced by, respectively, the ratio of sexual assaults to offensive sexual behaviour, and assaults to threats.
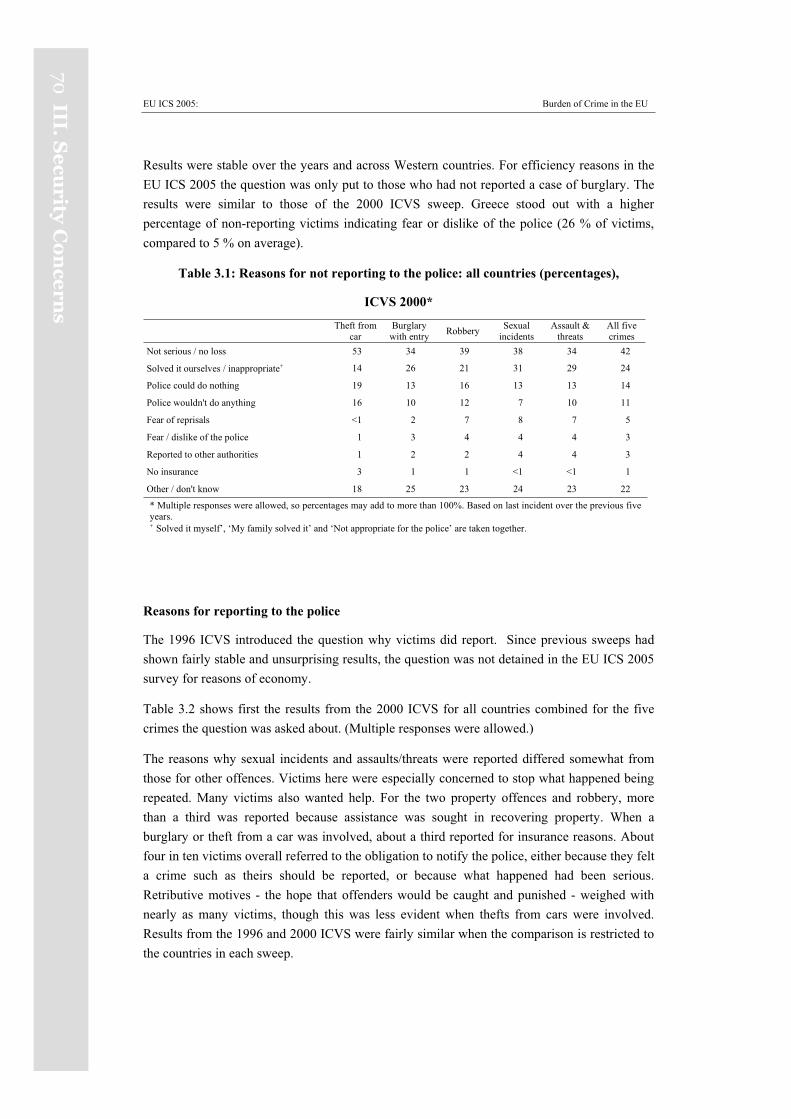
EU ICS 2005: Burden of Crime in the EU
70III.
Se
curity
Co
nce
rns
Results were stable over the years and across Western countries. For efficiency reasons in the EU ICS 2005 the question was only put to those who had not reported a case of burglary. The results were similar to those of the 2000 ICVS sweep. Greece stood out with a higher percentage of non-reporting victims indicating fear or dislike of the police (26 % of victims, compared to 5 % on average).
Table 3.1: Reasons for not reporting to the police: all countries (percentages),
ICVS 2000*
Theft from car
Burglary with entry Robbery Sexual
incidents Assault &
threats All five crimes
Not serious / no loss 53 34 39 38 34 42
Solved it ourselves / inappropriate 14 26 21 31 29 24
Police could do nothing 19 13 16 13 13 14
Police wouldn't do anything 16 10 12 7 10 11
Fear of reprisals <1 2 7 8 7 5
Fear / dislike of the police 1 3 4 4 4 3
Reported to other authorities 1 2 2 4 4 3
No insurance 3 1 1 <1 <1 1
Other / don't know 18 25 23 24 23 22
* Multiple responses were allowed, so percentages may add to more than 100%. Based on last incident over the previous five years.
Solved it myself’, ‘My family solved it’ and ‘Not appropriate for the police’ are taken together.
Reasons for reporting to the police
The 1996 ICVS introduced the question why victims did report. Since previous sweeps had shown fairly stable and unsurprising results, the question was not detained in the EU ICS 2005 survey for reasons of economy.
Table 3.2 shows first the results from the 2000 ICVS for all countries combined for the five crimes the question was asked about. (Multiple responses were allowed.)
The reasons why sexual incidents and assaults/threats were reported differed somewhat from those for other offences. Victims here were especially concerned to stop what happened being repeated. Many victims also wanted help. For the two property offences and robbery, more than a third was reported because assistance was sought in recovering property. When a burglary or theft from a car was involved, about a third reported for insurance reasons. About four in ten victims overall referred to the obligation to notify the police, either because they felt a crime such as theirs should be reported, or because what happened had been serious. Retributive motives - the hope that offenders would be caught and punished - weighed with nearly as many victims, though this was less evident when thefts from cars were involved. Results from the 1996 and 2000 ICVS were fairly similar when the comparison is restricted to the countries in each sweep.
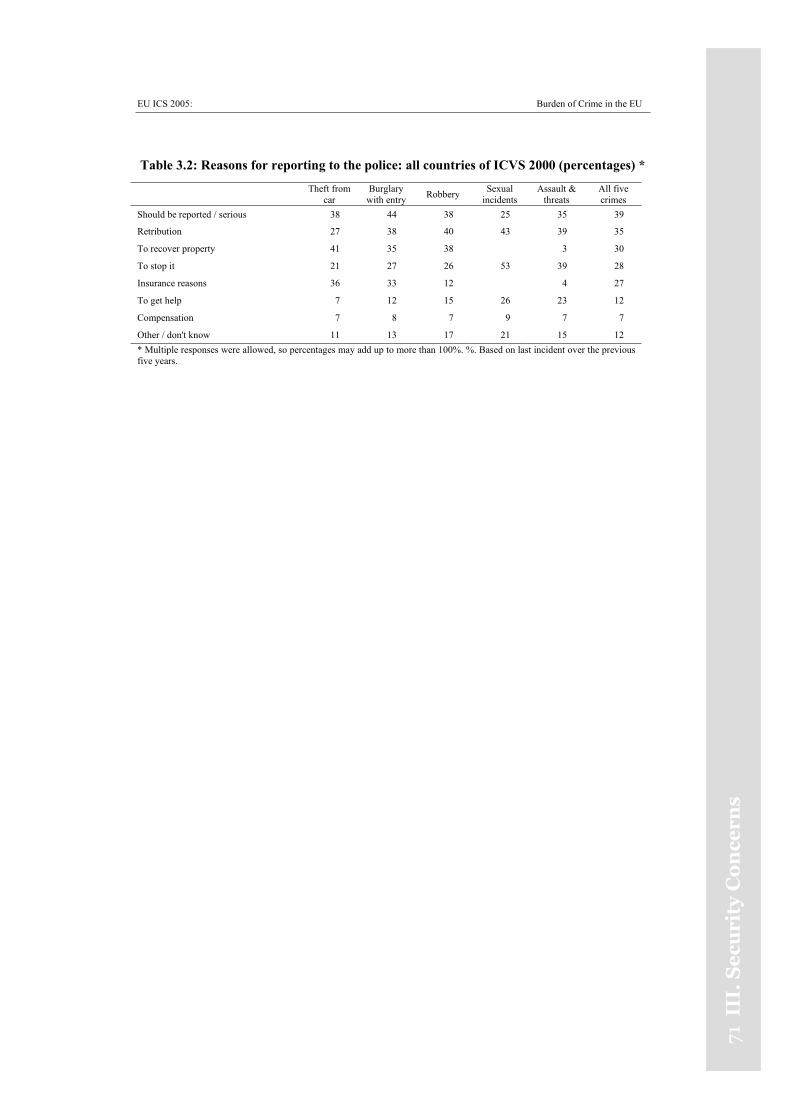
EU ICS 2005: Burden of Crime in the EU
71II
I.S
ecu
rity
Co
nce
rns
Table 3.2: Reasons for reporting to the police: all countries of ICVS 2000 (percentages) *
Theft from car
Burglary with entry Robbery Sexual
incidents Assault &
threats All five crimes
Should be reported / serious 38 44 38 25 35 39
Retribution 27 38 40 43 39 35
To recover property 41 35 38 3 30
To stop it 21 27 26 53 39 28
Insurance reasons 36 33 12 4 27
To get help 7 12 15 26 23 12
Compensation 7 8 7 9 7 7
Other / don't know 11 13 17 21 15 12 * Multiple responses were allowed, so percentages may add up to more than 100%. %. Based on last incident over the previous five years.
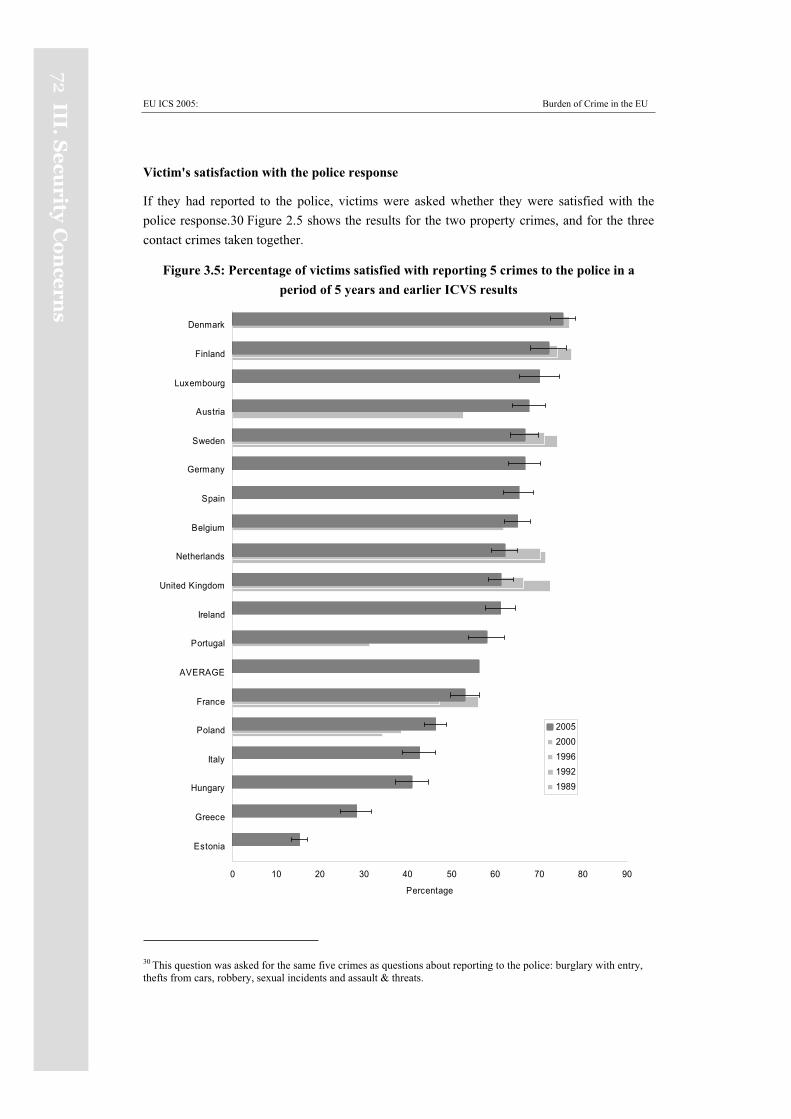
EU ICS 2005: Burden of Crime in the EU
72 III.S
ecu
rityC
on
cern
s
Victim's satisfaction with the police response
If they had reported to the police, victims were asked whether they were satisfied with the police response.30 Figure 2.5 shows the results for the two property crimes, and for the three contact crimes taken together.
Figure 3.5: Percentage of victims satisfied with reporting 5 crimes to the police in a period of 5 years and earlier ICVS results
0 10 20 30 40 50 60 70 80 90
Estonia
Greece
Hungary
Italy
Poland
France
AVERAGE
Portugal
Ireland
United Kingdom
Netherlands
Belgium
Spain
Germany
Sweden
Austria
Luxembourg
Finland
Denmark
Percentage
20052000199619921989
30 This question was asked for the same five crimes as questions about reporting to the police: burglary with entry, thefts from cars, robbery, sexual incidents and assault & threats.
EU ICS 2005: Burden of Crime in the EU
73II
I.S
ecu
rity
Co
nce
rns
Those in Denmark (81%), Finland and Luxembourg were most satisfied after reporting burglaries and thefts from cars, although figures in several other countries were not far behind. Victims of contact crime in Denmark, however, were relatively less satisfied when reporting contact crime. Those in Sweden ranked higher in their assessment of how the police handled contact crimes reported than they did property crimes. The police response was considered least satisfactory in Estonia, Greece, Hungary, Italy and Poland.
For the countries in the 1996 and 2000 sweep of the ICVS, the picture was generally similar with respect to relative levels of satisfaction with the police on reporting. Those in Poland and France, for instance, ranked comparatively low in assessments of police performance in 1996, as they did in 2000; those in Finland ranked police performance relatively highly in both years. The main changes were confined to three countries. In the United Kingdom, the Netherlands and Sweden, victims who reported were less happy with the police response in 2005 than in 2000 and 1996.
Reasons for dissatisfaction with the police
Those respondents who indicated that they were not satisfied with the way the police handled the matter were asked why not. (Multiple responses were again allowed). Results for all five crimes for the 18 countries combined are in table 3.3.
Overall, the main reason for dissatisfaction was that the police ‘did not do enough'. This held across all five crimes, and was the complaint of two in three who answered. The second cause for dissatisfaction was that the ‘police were not interested' – mentioned by about half. The next most common complaint overall was that no offender had been caught. The exception was assaults and threats, where impoliteness on the part of the police was mentioned more often. An explanation for this might be that the police think that some assault incidents involve a degree of victim responsibility. For theft from cars and burglary with entry, around a quarter were dissatisfied because the police did not recover any stolen goods.
Table 3.3: Reasons for dissatisfaction with the police after reporting: all countries (percentages) EU ICS 2005
Theft from car
Burglary with entry Robbery Sexual
incidents Assaults &
threats All five crimes
Did not do enough 63 68 68 63 71 66
Were not interested 52 56 56 60 56 54
Did not find offender 55 58 56 58 42 54
Did not recover goods 52 49 36 .. .. 48
Gave no information 44 44 40 49 37 42
Impolite 20 25 29 34 25 22
Were slow to arrive 22 30 25 23 29 25
Other/don't know 19 36 26 44 29 14 1 Multiple responses were allowed, so percentages may add up to more than 100%. %. Based on last incident over the previous five years.
EU ICS 2005: Burden of Crime in the EU
74III.
Se
curity
Co
nce
rns
Forty percent of reporting victims expressed dissatisfaction with information received. Victims were most dissatisfied with lack of feedback information from the police when they reported sexual incidents. These levels of dissatisfaction are remarkable considering the binding instructions of the European Commission concerning the rights of victims to receive information ‘in particular as from their first contact with law enforcement agencies (Council Framework Decision of 15 March 2001 on the Standing of Victims in Criminal Proceedings, SEC (2004).
One in five victims mentioned impoliteness as a source of dissatisfaction. One in three of those reporting sexual incidents did. Again, considering the EC 2001 instructions on the rights of crime victims to be treated with respect for their dignity, this is a disappointing result.
Results for individual countries are based on a very small numerical base since answers are based only on those who (a) were victim of one of the five crimes; (b) reported to the police; and (c) were not satisfied. Comparisons across sweeps are difficult because all response categories showed higher overall percentages in the last study. To monitor compliance with the 2001 EC Framework Decision at the country level, the EU ICS ought to be repeated among larger samples of the general public.
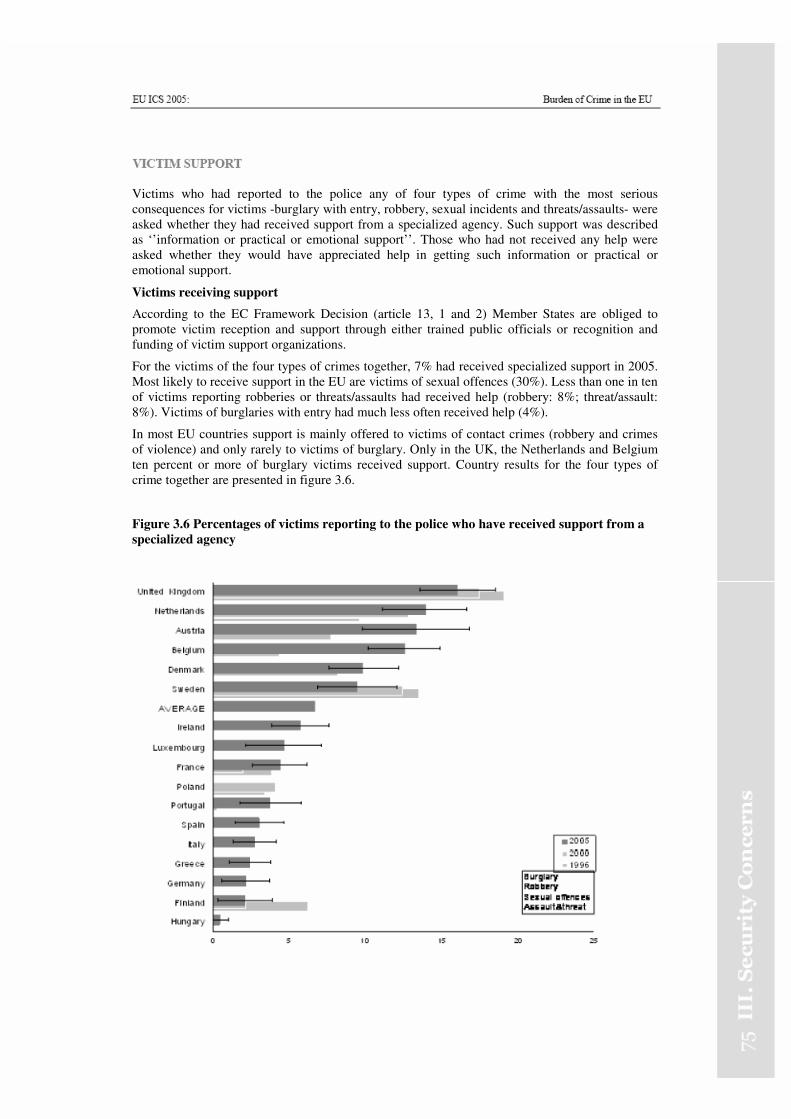
Victims who had reported to the police any of four types of crime with the most serious
consequences for victims -burglary with entry, robbery, sexual incidents and threats/assaults- were
asked whether they had received support from a specialized agency. Such support was described
as ‘’information or practical or emotional support’’. Those who had not received any help were
asked whether they would have appreciated help in getting such information or practical or
emotional support.
Victims receiving support
According to the EC Framework Decision (article 13, 1 and 2) Member States are obliged to
promote victim reception and support through either trained public officials or recognition and
funding of victim support organizations.
For the victims of the four types of crimes together, 7% had received specialized support in 2005.
Most likely to receive support in the EU are victims of sexual offences (30%). Less than one in ten
of victims reporting robberies or threats/assaults had received help (robbery: 8%; threat/assault:
8%). Victims of burglaries with entry had much less often received help (4%).
In most EU countries support is mainly offered to victims of contact crimes (robbery and crimes
of violence) and only rarely to victims of burglary. Only in the UK, the Netherlands and Belgium
ten percent or more of burglary victims received support. Country results for the four types of
crime together are presented in figure 3.6.
Figure 3.6 Percentages of victims reporting to the police who have received support from a
specialized agency
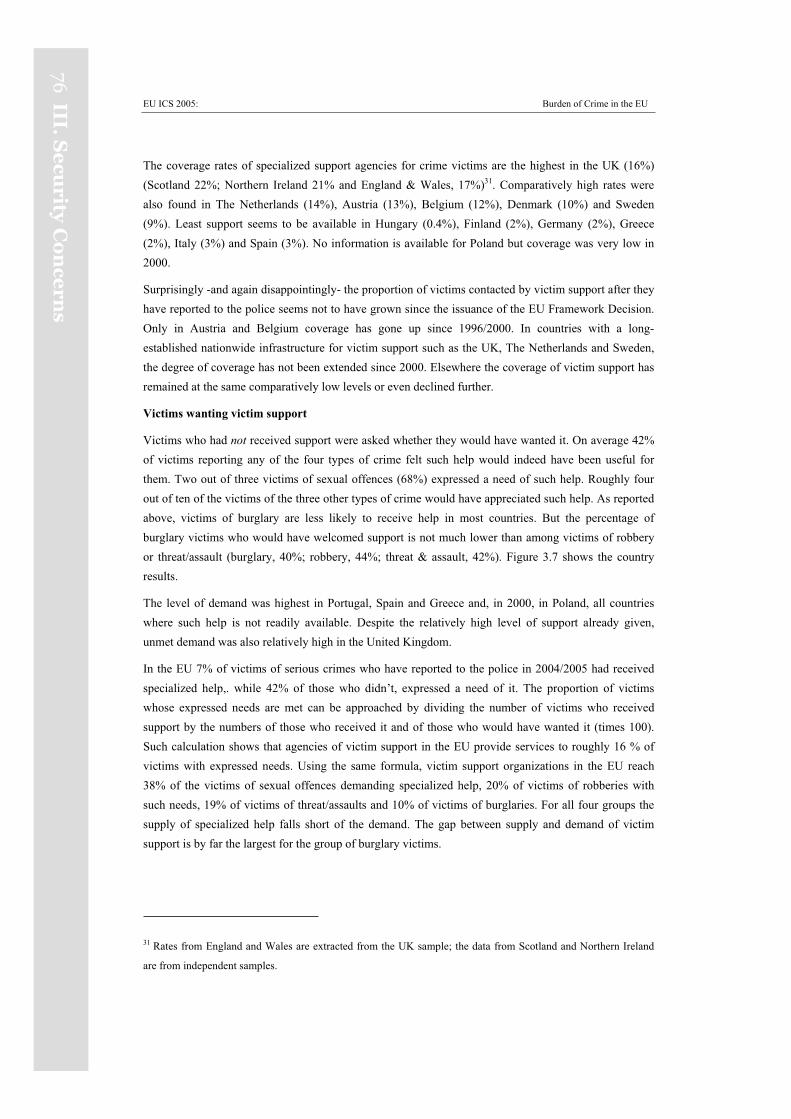
EU ICS 2005: Burden of Crime in the EU
76III.
Se
curity
Co
nce
rns
The coverage rates of specialized support agencies for crime victims are the highest in the UK (16%) (Scotland 22%; Northern Ireland 21% and England & Wales, 17%)31. Comparatively high rates were also found in The Netherlands (14%), Austria (13%), Belgium (12%), Denmark (10%) and Sweden (9%). Least support seems to be available in Hungary (0.4%), Finland (2%), Germany (2%), Greece (2%), Italy (3%) and Spain (3%). No information is available for Poland but coverage was very low in 2000.
Surprisingly -and again disappointingly- the proportion of victims contacted by victim support after they have reported to the police seems not to have grown since the issuance of the EU Framework Decision. Only in Austria and Belgium coverage has gone up since 1996/2000. In countries with a long-established nationwide infrastructure for victim support such as the UK, The Netherlands and Sweden, the degree of coverage has not been extended since 2000. Elsewhere the coverage of victim support has remained at the same comparatively low levels or even declined further.
Victims wanting victim support
Victims who had not received support were asked whether they would have wanted it. On average 42% of victims reporting any of the four types of crime felt such help would indeed have been useful for them. Two out of three victims of sexual offences (68%) expressed a need of such help. Roughly four out of ten of the victims of the three other types of crime would have appreciated such help. As reported above, victims of burglary are less likely to receive help in most countries. But the percentage of burglary victims who would have welcomed support is not much lower than among victims of robbery or threat/assault (burglary, 40%; robbery, 44%; threat & assault, 42%). Figure 3.7 shows the country results.
The level of demand was highest in Portugal, Spain and Greece and, in 2000, in Poland, all countries where such help is not readily available. Despite the relatively high level of support already given, unmet demand was also relatively high in the United Kingdom.
In the EU 7% of victims of serious crimes who have reported to the police in 2004/2005 had received specialized help,. while 42% of those who didn’t, expressed a need of it. The proportion of victims whose expressed needs are met can be approached by dividing the number of victims who received support by the numbers of those who received it and of those who would have wanted it (times 100). Such calculation shows that agencies of victim support in the EU provide services to roughly 16 % of victims with expressed needs. Using the same formula, victim support organizations in the EU reach 38% of the victims of sexual offences demanding specialized help, 20% of victims of robberies with such needs, 19% of victims of threat/assaults and 10% of victims of burglaries. For all four groups the supply of specialized help falls short of the demand. The gap between supply and demand of victim support is by far the largest for the group of burglary victims.
31 Rates from England and Wales are extracted from the UK sample; the data from Scotland and Northern Ireland
are from independent samples.
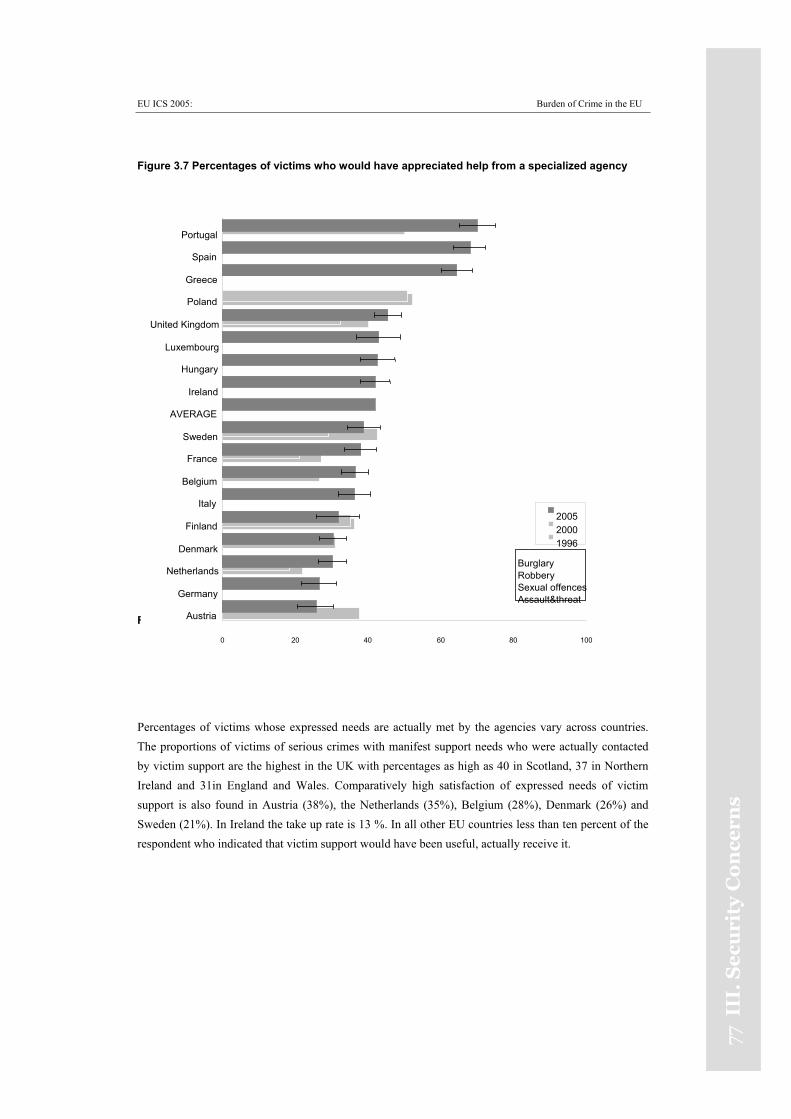
EU ICS 2005: Burden of Crime in the EU
77II
I.S
ecu
rity
Co
nce
rns
Figure 3.7 Percentages of victims who would have appreciated help from a specialized agency
Figure 3.7 Percentages of victims who would have appreciated help from a specialized agency
Percentages of victims whose expressed needs are actually met by the agencies vary across countries. The proportions of victims of serious crimes with manifest support needs who were actually contacted by victim support are the highest in the UK with percentages as high as 40 in Scotland, 37 in Northern Ireland and 31in England and Wales. Comparatively high satisfaction of expressed needs of victim support is also found in Austria (38%), the Netherlands (35%), Belgium (28%), Denmark (26%) and Sweden (21%). In Ireland the take up rate is 13 %. In all other EU countries less than ten percent of the respondent who indicated that victim support would have been useful, actually receive it.
0 20 40 60 80 100
Austria
Germany
Netherlands
Denmark
Finland
Italy
Belgium
France
Sweden
AVERAGE
Ireland
Hungary
Luxembourg
United Kingdom
Poland
Greece
Spain
Portugal
200520001996
BurglaryRobberySexual offencesAssault&threat
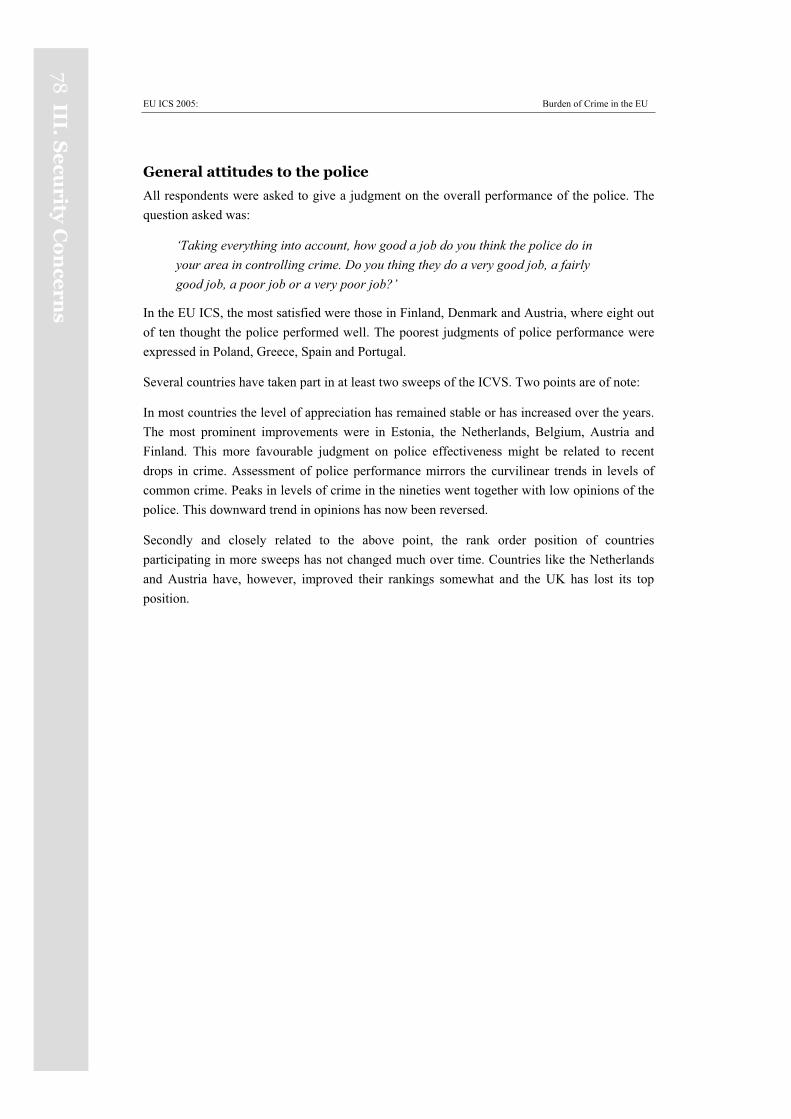
EU ICS 2005: Burden of Crime in the EU
78III.
Se
curity
Co
nce
rns
General attitudes to the police
All respondents were asked to give a judgment on the overall performance of the police. The question asked was:
‘Taking everything into account, how good a job do you think the police do in your area in controlling crime. Do you thing they do a very good job, a fairly good job, a poor job or a very poor job?’
In the EU ICS, the most satisfied were those in Finland, Denmark and Austria, where eight out of ten thought the police performed well. The poorest judgments of police performance were expressed in Poland, Greece, Spain and Portugal.
Several countries have taken part in at least two sweeps of the ICVS. Two points are of note:
In most countries the level of appreciation has remained stable or has increased over the years. The most prominent improvements were in Estonia, the Netherlands, Belgium, Austria and Finland. This more favourable judgment on police effectiveness might be related to recent drops in crime. Assessment of police performance mirrors the curvilinear trends in levels of common crime. Peaks in levels of crime in the nineties went together with low opinions of the police. This downward trend in opinions has now been reversed.
Secondly and closely related to the above point, the rank order position of countries participating in more sweeps has not changed much over time. Countries like the Netherlands and Austria have, however, improved their rankings somewhat and the UK has lost its top position.
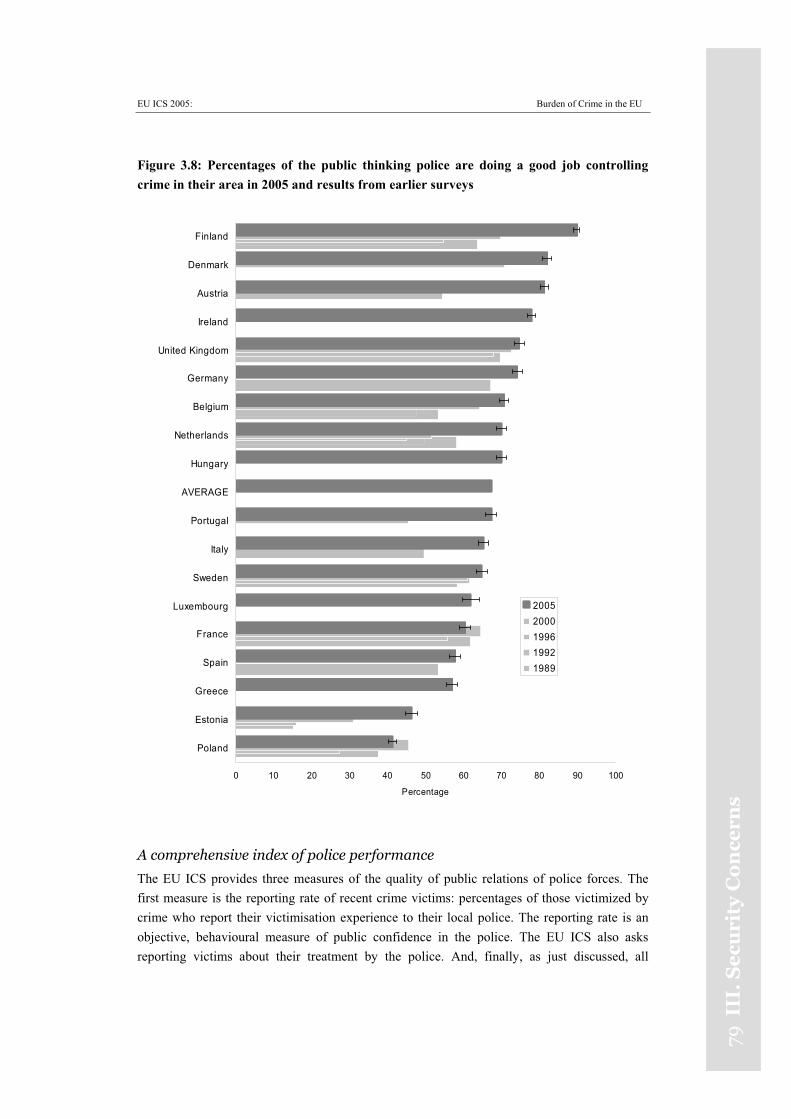
EU ICS 2005: Burden of Crime in the EU
79II
I.S
ecu
rity
Co
nce
rns
Figure 3.8: Percentages of the public thinking police are doing a good job controlling crime in their area in 2005 and results from earlier surveys
0 10 20 30 40 50 60 70 80 90 100
Poland
Estonia
Greece
Spain
France
Luxembourg
Sweden
Italy
Portugal
AVERAGE
Hungary
Netherlands
Belgium
Germany
United Kingdom
Ireland
Austria
Denmark
Finland
Percentage
20052000199619921989
A comprehensive index of police performance
The EU ICS provides three measures of the quality of public relations of police forces. The first measure is the reporting rate of recent crime victims: percentages of those victimized by crime who report their victimisation experience to their local police. The reporting rate is an objective, behavioural measure of public confidence in the police. The EU ICS also asks reporting victims about their treatment by the police. And, finally, as just discussed, all
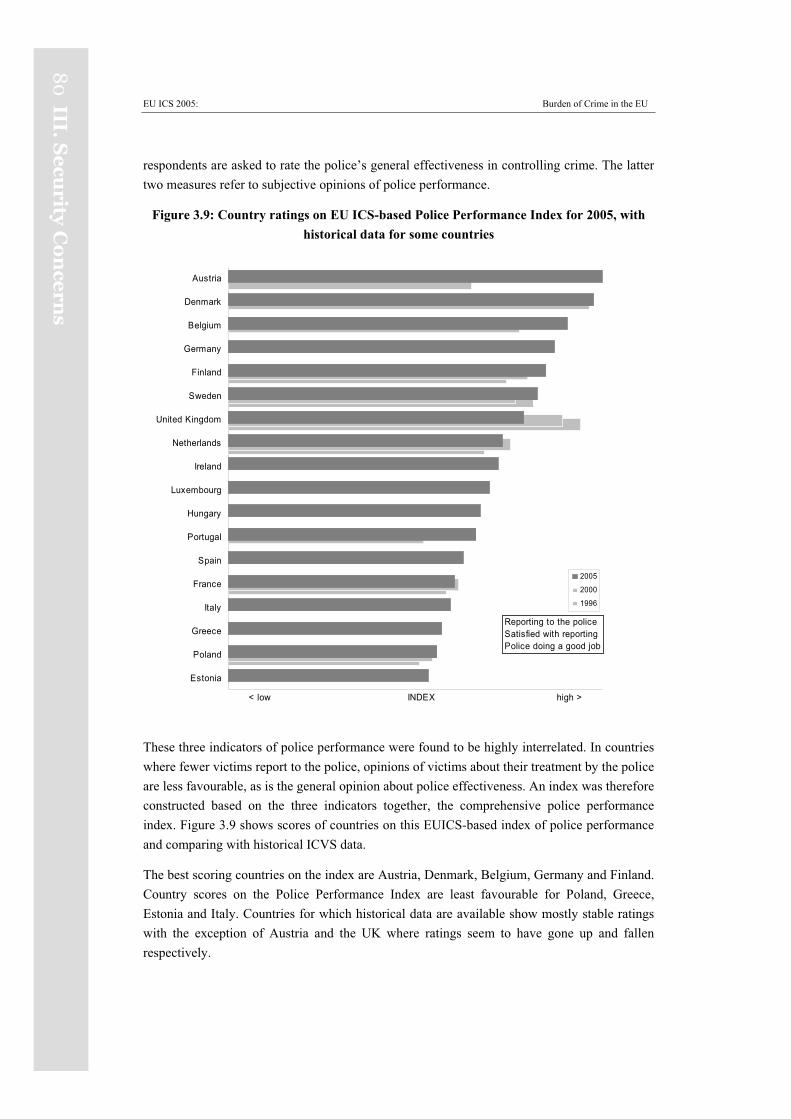
EU ICS 2005: Burden of Crime in the EU
80
III.S
ecu
rityC
on
cern
s
respondents are asked to rate the police’s general effectiveness in controlling crime. The latter two measures refer to subjective opinions of police performance.
Figure 3.9: Country ratings on EU ICS-based Police Performance Index for 2005, with historical data for some countries
Estonia
Poland
Greece
Italy
France
Spain
Portugal
Hungary
Luxembourg
Ireland
Netherlands
United Kingdom
Sweden
Finland
Germany
Belgium
Denmark
Austria
< low INDEX high >
2005
2000
1996
Reporting to the policeSatisfied with reportingPolice doing a good job
These three indicators of police performance were found to be highly interrelated. In countries where fewer victims report to the police, opinions of victims about their treatment by the police are less favourable, as is the general opinion about police effectiveness. An index was therefore constructed based on the three indicators together, the comprehensive police performance index. Figure 3.9 shows scores of countries on this EUICS-based index of police performance and comparing with historical ICVS data.
The best scoring countries on the index are Austria, Denmark, Belgium, Germany and Finland. Country scores on the Police Performance Index are least favourable for Poland, Greece, Estonia and Italy. Countries for which historical data are available show mostly stable ratings with the exception of Austria and the UK where ratings seem to have gone up and fallen respectively.
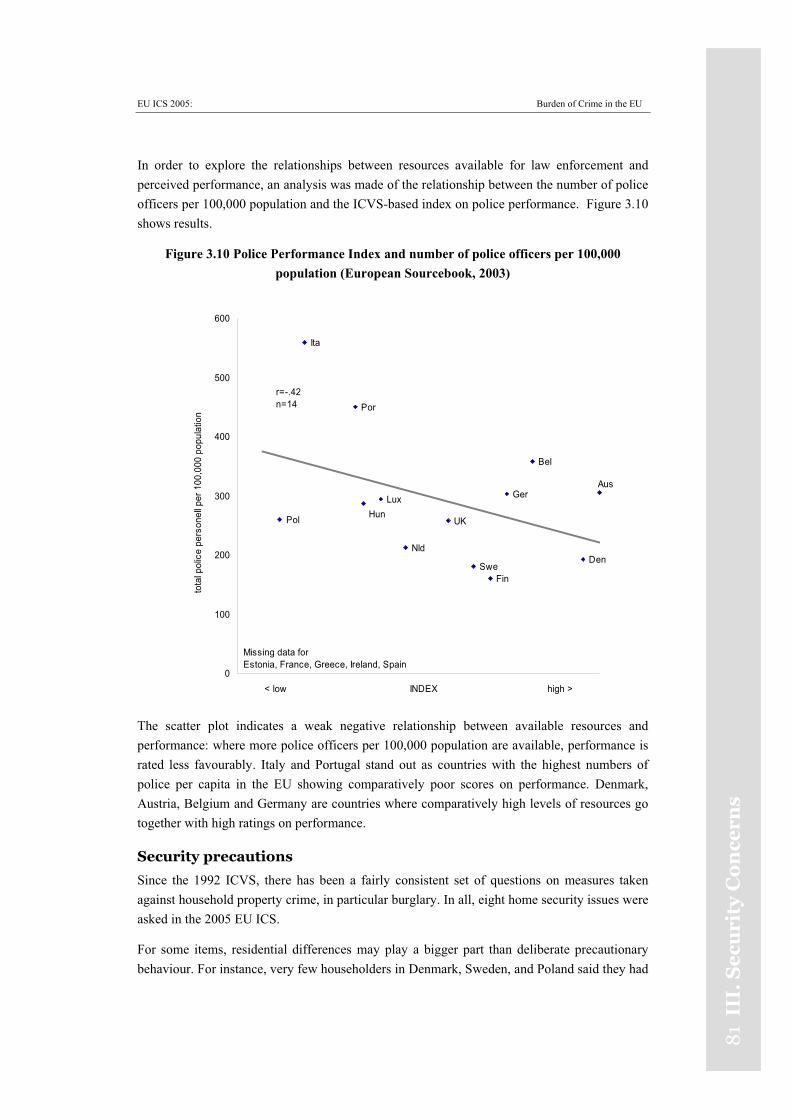
EU ICS 2005: Burden of Crime in the EU
81
III.
Se
curi
tyC
on
cern
s
In order to explore the relationships between resources available for law enforcement and perceived performance, an analysis was made of the relationship between the number of police officers per 100,000 population and the ICVS-based index on police performance. Figure 3.10 shows results.
Figure 3.10 Police Performance Index and number of police officers per 100,000 population (European Sourcebook, 2003)
Pol
Ita
Lux
Por
UK
Ger
Bel
Hun
Swe
Aus
NldDen
Fin
0
100
200
300
400
500
600
< low INDEX high >
tota
l pol
ice
pers
onel
l per
100
,000
pop
ulat
ion
Missing data forEstonia, France, Greece, Ireland, Spain
r=-.42n=14
The scatter plot indicates a weak negative relationship between available resources and performance: where more police officers per 100,000 population are available, performance is rated less favourably. Italy and Portugal stand out as countries with the highest numbers of police per capita in the EU showing comparatively poor scores on performance. Denmark, Austria, Belgium and Germany are countries where comparatively high levels of resources go together with high ratings on performance.
Security precautions
Since the 1992 ICVS, there has been a fairly consistent set of questions on measures taken against household property crime, in particular burglary. In all, eight home security issues were asked in the 2005 EU ICS.
For some items, residential differences may play a bigger part than deliberate precautionary behaviour. For instance, very few householders in Denmark, Sweden, and Poland said they had
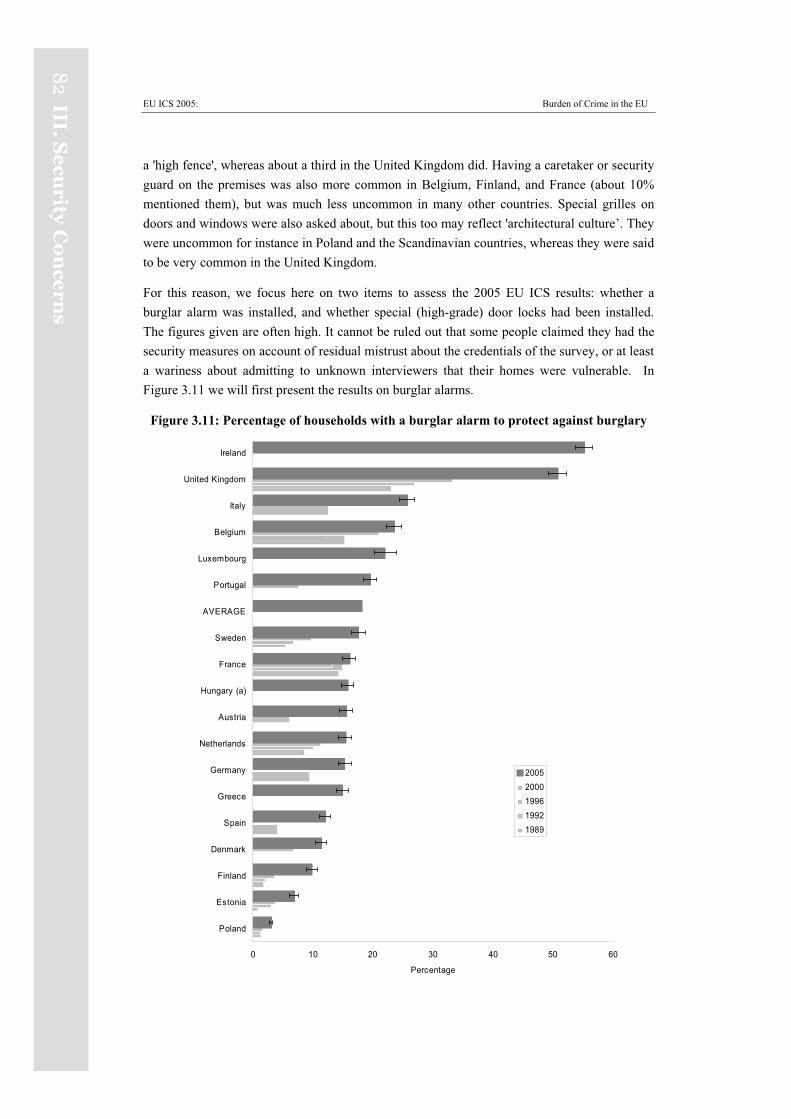
EU ICS 2005: Burden of Crime in the EU
82
III.S
ecu
rityC
on
cern
s
a 'high fence', whereas about a third in the United Kingdom did. Having a caretaker or security guard on the premises was also more common in Belgium, Finland, and France (about 10% mentioned them), but was much less uncommon in many other countries. Special grilles on doors and windows were also asked about, but this too may reflect 'architectural culture’. They were uncommon for instance in Poland and the Scandinavian countries, whereas they were said to be very common in the United Kingdom.
For this reason, we focus here on two items to assess the 2005 EU ICS results: whether a burglar alarm was installed, and whether special (high-grade) door locks had been installed. The figures given are often high. It cannot be ruled out that some people claimed they had the security measures on account of residual mistrust about the credentials of the survey, or at least a wariness about admitting to unknown interviewers that their homes were vulnerable. In Figure 3.11 we will first present the results on burglar alarms.
Figure 3.11: Percentage of households with a burglar alarm to protect against burglary
0 10 20 30 40 50 60
Poland
Estonia
Finland
Denmark
Spain
Greece
Germany
Netherlands
Austria
Hungary (a)
France
Sweden
AVERAGE
Portugal
Luxembourg
Belgium
Italy
United Kingdom
Ireland
Percentage
20052000199619921989
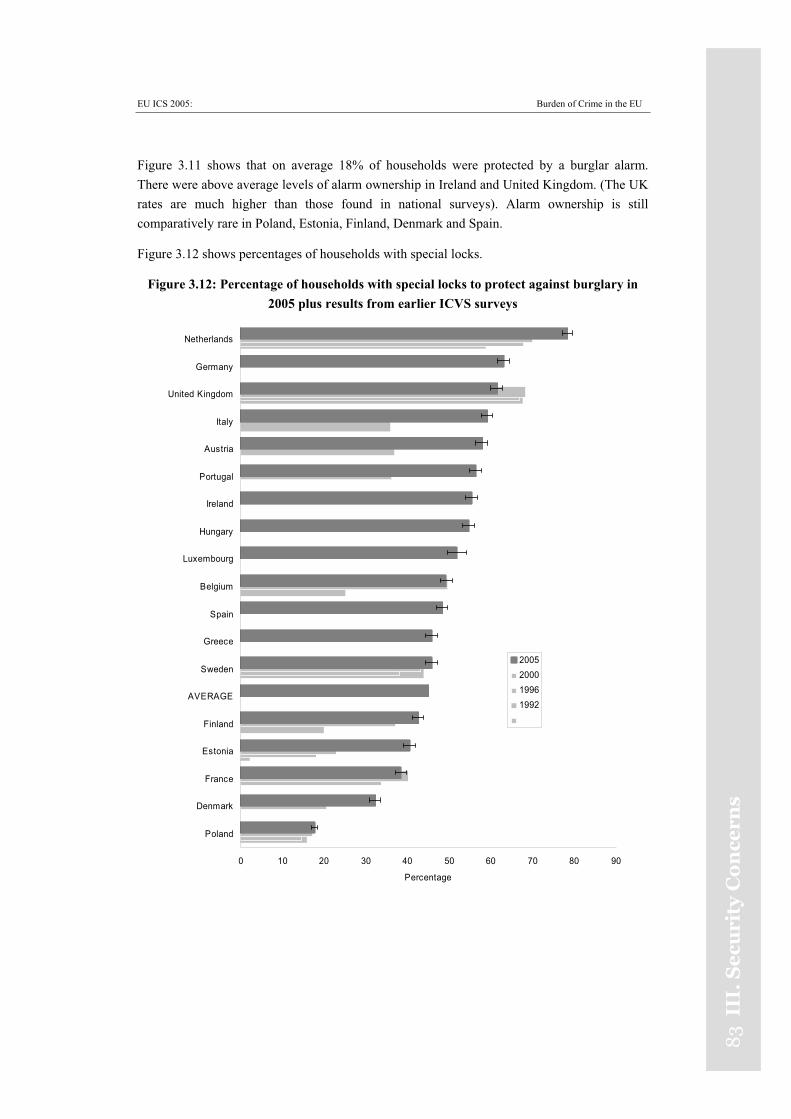
EU ICS 2005: Burden of Crime in the EU
83
III.
Se
curi
tyC
on
cern
s
Figure 3.11 shows that on average 18% of households were protected by a burglar alarm. There were above average levels of alarm ownership in Ireland and United Kingdom. (The UK rates are much higher than those found in national surveys). Alarm ownership is still comparatively rare in Poland, Estonia, Finland, Denmark and Spain.
Figure 3.12 shows percentages of households with special locks.
Figure 3.12: Percentage of households with special locks to protect against burglary in 2005 plus results from earlier ICVS surveys
0 10 20 30 40 50 60 70 80 90
Poland
Denmark
France
Estonia
Finland
AVERAGE
Sweden
Greece
Spain
Belgium
Luxembourg
Hungary
Ireland
Portugal
Austria
Italy
United Kingdom
Germany
Netherlands
Percentage
2005200019961992
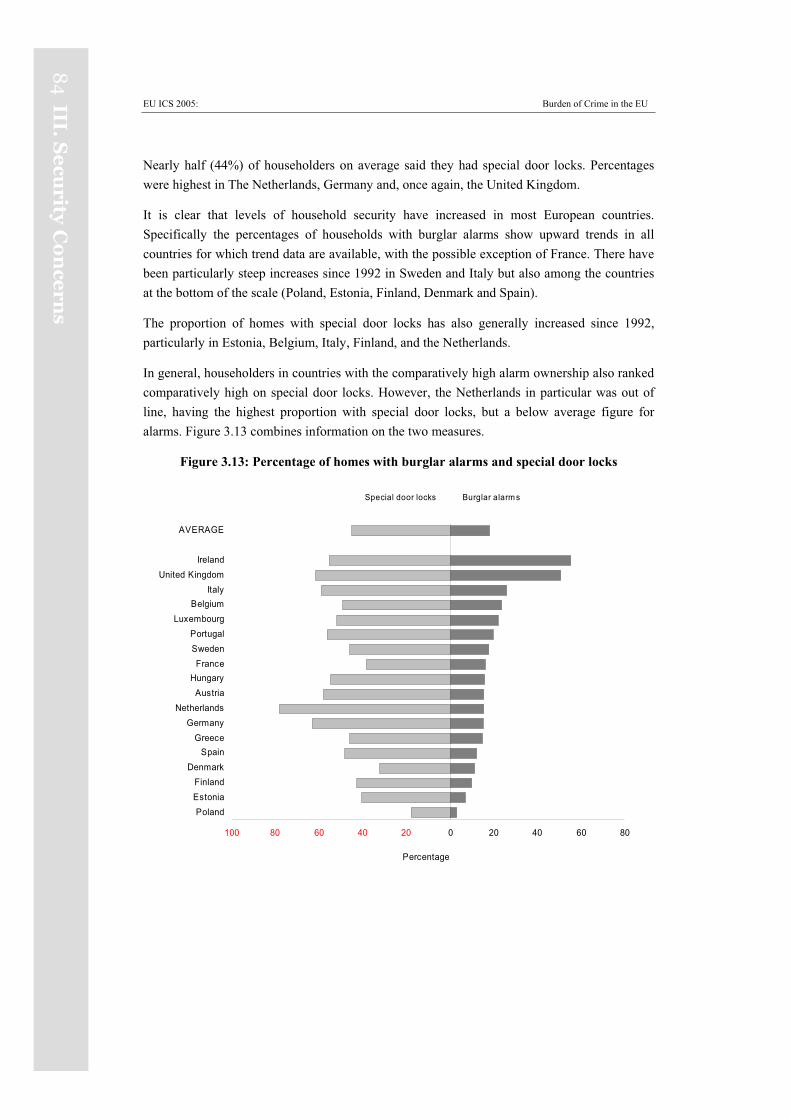
EU ICS 2005: Burden of Crime in the EU
84
III.S
ecu
rityC
on
cern
s
Nearly half (44%) of householders on average said they had special door locks. Percentages were highest in The Netherlands, Germany and, once again, the United Kingdom.
It is clear that levels of household security have increased in most European countries. Specifically the percentages of households with burglar alarms show upward trends in all countries for which trend data are available, with the possible exception of France. There have been particularly steep increases since 1992 in Sweden and Italy but also among the countries at the bottom of the scale (Poland, Estonia, Finland, Denmark and Spain).
The proportion of homes with special door locks has also generally increased since 1992, particularly in Estonia, Belgium, Italy, Finland, and the Netherlands.
In general, householders in countries with the comparatively high alarm ownership also ranked comparatively high on special door locks. However, the Netherlands in particular was out of line, having the highest proportion with special door locks, but a below average figure for alarms. Figure 3.13 combines information on the two measures.
Figure 3.13: Percentage of homes with burglar alarms and special door locks
Special door locks Burglar alarm s
100 80 60 40 20 0 20 40 60 80
PolandEstoniaFinland
DenmarkSpain
GreeceGermany
NetherlandsAustria
HungaryFrance
SwedenPortugal
LuxembourgBelgium
ItalyUnited Kingdom
Ireland
AVERAGE
Percentage
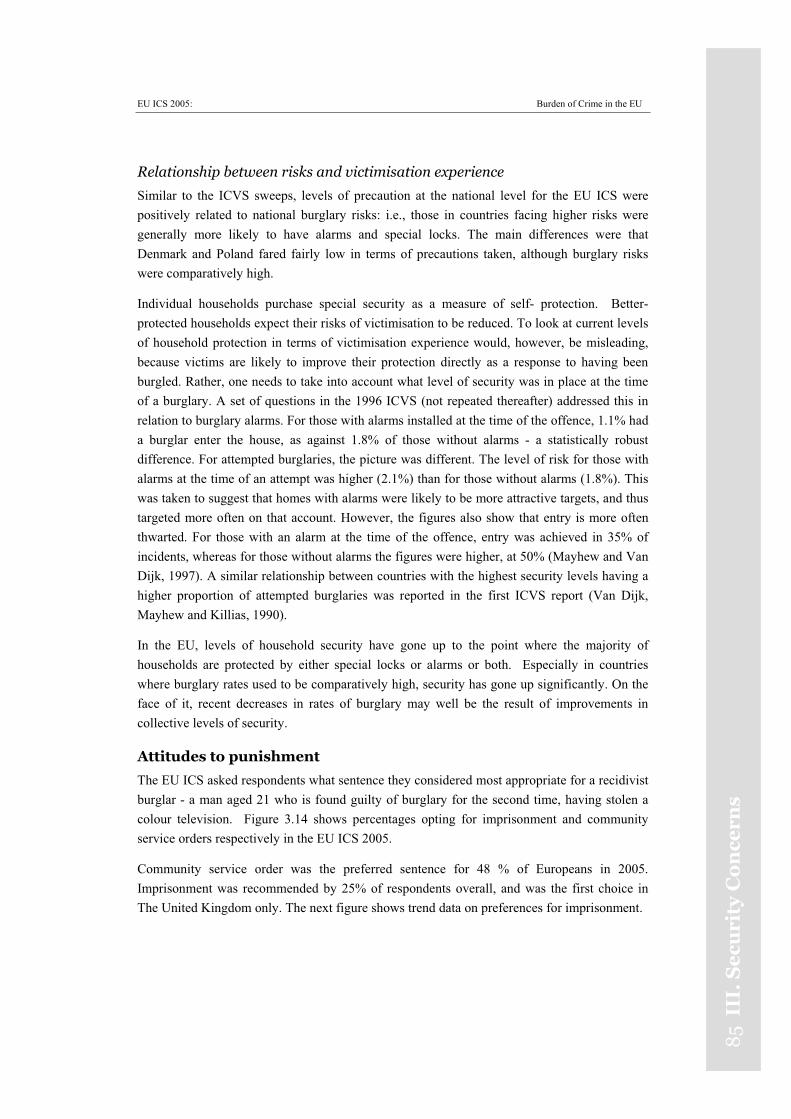
EU ICS 2005: Burden of Crime in the EU
85
III.
Se
curi
tyC
on
cern
s
Relationship between risks and victimisation experience
Similar to the ICVS sweeps, levels of precaution at the national level for the EU ICS were positively related to national burglary risks: i.e., those in countries facing higher risks were generally more likely to have alarms and special locks. The main differences were that Denmark and Poland fared fairly low in terms of precautions taken, although burglary risks were comparatively high.
Individual households purchase special security as a measure of self- protection. Better- protected households expect their risks of victimisation to be reduced. To look at current levels of household protection in terms of victimisation experience would, however, be misleading, because victims are likely to improve their protection directly as a response to having been burgled. Rather, one needs to take into account what level of security was in place at the time of a burglary. A set of questions in the 1996 ICVS (not repeated thereafter) addressed this in relation to burglary alarms. For those with alarms installed at the time of the offence, 1.1% had a burglar enter the house, as against 1.8% of those without alarms - a statistically robust difference. For attempted burglaries, the picture was different. The level of risk for those with alarms at the time of an attempt was higher (2.1%) than for those without alarms (1.8%). This was taken to suggest that homes with alarms were likely to be more attractive targets, and thus targeted more often on that account. However, the figures also show that entry is more often thwarted. For those with an alarm at the time of the offence, entry was achieved in 35% of incidents, whereas for those without alarms the figures were higher, at 50% (Mayhew and Van Dijk, 1997). A similar relationship between countries with the highest security levels having a higher proportion of attempted burglaries was reported in the first ICVS report (Van Dijk, Mayhew and Killias, 1990).
In the EU, levels of household security have gone up to the point where the majority of households are protected by either special locks or alarms or both. Especially in countries where burglary rates used to be comparatively high, security has gone up significantly. On the face of it, recent decreases in rates of burglary may well be the result of improvements in collective levels of security.
Attitudes to punishment
The EU ICS asked respondents what sentence they considered most appropriate for a recidivist burglar - a man aged 21 who is found guilty of burglary for the second time, having stolen a colour television. Figure 3.14 shows percentages opting for imprisonment and community service orders respectively in the EU ICS 2005.
Community service order was the preferred sentence for 48 % of Europeans in 2005. Imprisonment was recommended by 25% of respondents overall, and was the first choice in The United Kingdom only. The next figure shows trend data on preferences for imprisonment.
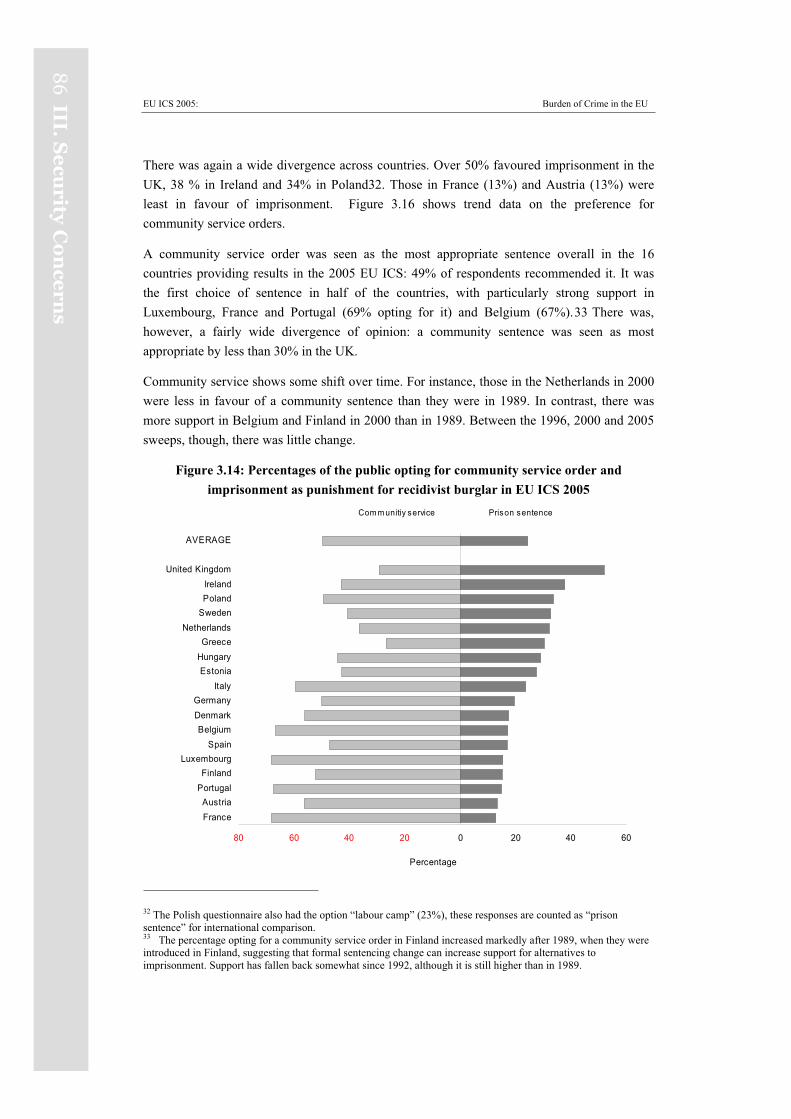
EU ICS 2005: Burden of Crime in the EU
86
III.S
ecu
rityC
on
cern
s
There was again a wide divergence across countries. Over 50% favoured imprisonment in the UK, 38 % in Ireland and 34% in Poland32. Those in France (13%) and Austria (13%) were least in favour of imprisonment. Figure 3.16 shows trend data on the preference for community service orders.
A community service order was seen as the most appropriate sentence overall in the 16 countries providing results in the 2005 EU ICS: 49% of respondents recommended it. It was the first choice of sentence in half of the countries, with particularly strong support in Luxembourg, France and Portugal (69% opting for it) and Belgium (67%).33 There was, however, a fairly wide divergence of opinion: a community sentence was seen as most appropriate by less than 30% in the UK.
Community service shows some shift over time. For instance, those in the Netherlands in 2000 were less in favour of a community sentence than they were in 1989. In contrast, there was more support in Belgium and Finland in 2000 than in 1989. Between the 1996, 2000 and 2005 sweeps, though, there was little change.
Figure 3.14: Percentages of the public opting for community service order and imprisonment as punishment for recidivist burglar in EU ICS 2005
Com m unitiy service Prison sentence
80 60 40 20 0 20 40 60
FranceAustria
PortugalFinland
LuxembourgSpain
BelgiumDenmarkGermany
ItalyEstonia
HungaryGreece
NetherlandsSwedenPolandIreland
United Kingdom
AVERAGE
Percentage
32 The Polish questionnaire also had the option “labour camp” (23%), these responses are counted as “prison sentence” for international comparison. 33 The percentage opting for a community service order in Finland increased markedly after 1989, when they were introduced in Finland, suggesting that formal sentencing change can increase support for alternatives to imprisonment. Support has fallen back somewhat since 1992, although it is still higher than in 1989.
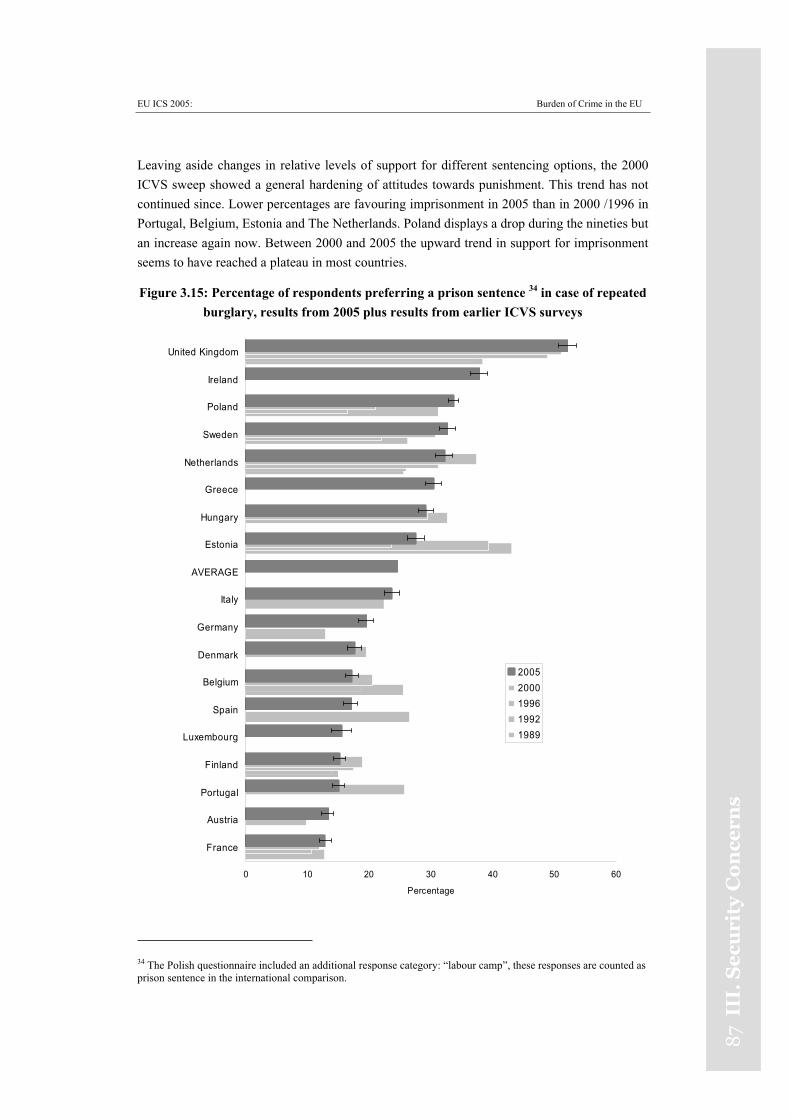
EU ICS 2005: Burden of Crime in the EU
87
III.
Se
curi
tyC
on
cern
s
Leaving aside changes in relative levels of support for different sentencing options, the 2000 ICVS sweep showed a general hardening of attitudes towards punishment. This trend has not continued since. Lower percentages are favouring imprisonment in 2005 than in 2000 /1996 in Portugal, Belgium, Estonia and The Netherlands. Poland displays a drop during the nineties but an increase again now. Between 2000 and 2005 the upward trend in support for imprisonment seems to have reached a plateau in most countries.
Figure 3.15: Percentage of respondents preferring a prison sentence 34 in case of repeated burglary, results from 2005 plus results from earlier ICVS surveys
0 10 20 30 40 50 60
France
Austria
Portugal
Finland
Luxembourg
Spain
Belgium
Denmark
Germany
Italy
AVERAGE
Estonia
Hungary
Greece
Netherlands
Sweden
Poland
Ireland
United Kingdom
Percentage
20052000199619921989
34 The Polish questionnaire included an additional response category: “labour camp”, these responses are counted as prison sentence in the international comparison.
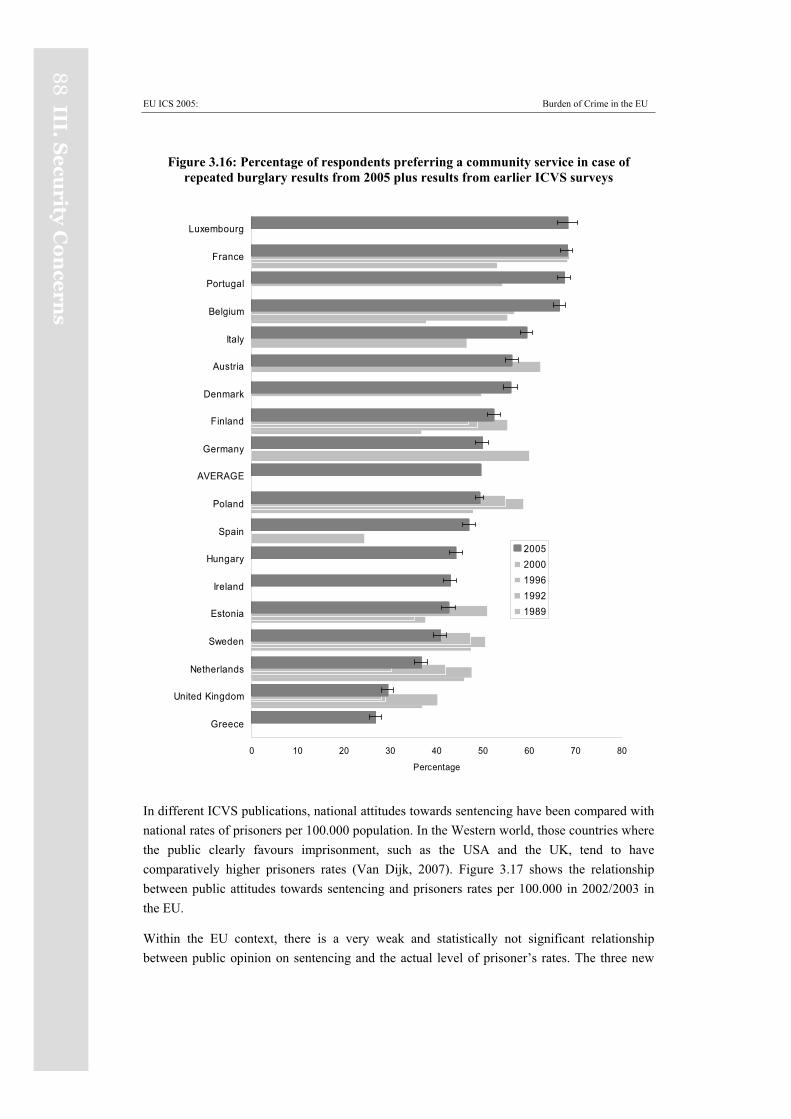
EU ICS 2005: Burden of Crime in the EU
88
III.S
ecu
rityC
on
cern
s
Figure 3.16: Percentage of respondents preferring a community service in case of repeated burglary results from 2005 plus results from earlier ICVS surveys
0 10 20 30 40 50 60 70 80
Greece
United Kingdom
Netherlands
Sweden
Estonia
Ireland
Hungary
Spain
Poland
AVERAGE
Germany
Finland
Denmark
Austria
Italy
Belgium
Portugal
France
Luxembourg
Percentage
20052000199619921989
In different ICVS publications, national attitudes towards sentencing have been compared with national rates of prisoners per 100.000 population. In the Western world, those countries where the public clearly favours imprisonment, such as the USA and the UK, tend to have comparatively higher prisoners rates (Van Dijk, 2007). Figure 3.17 shows the relationship between public attitudes towards sentencing and prisoners rates per 100.000 in 2002/2003 in the EU.
Within the EU context, there is a very weak and statistically not significant relationship between public opinion on sentencing and the actual level of prisoner’s rates. The three new
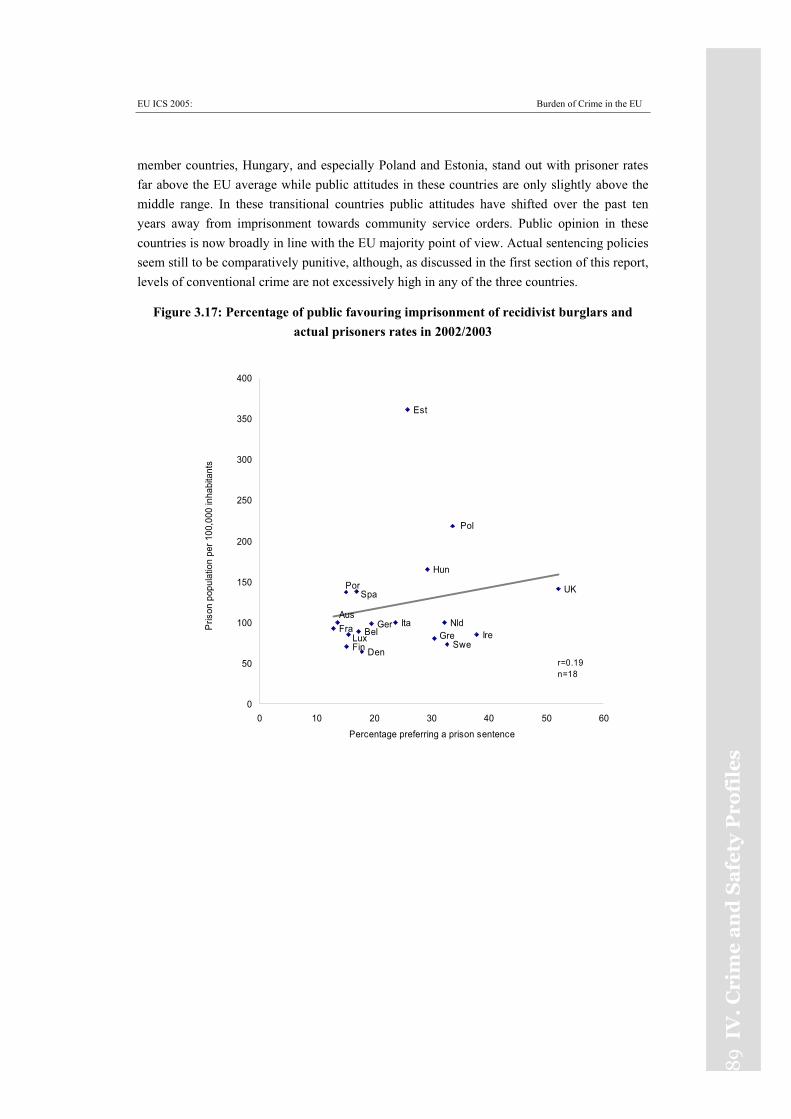
EU ICS 2005: Burden of Crime in the EU
89
IV.
Cri
me
an
dS
afe
tyP
rofi
les
member countries, Hungary, and especially Poland and Estonia, stand out with prisoner rates far above the EU average while public attitudes in these countries are only slightly above the middle range. In these transitional countries public attitudes have shifted over the past ten years away from imprisonment towards community service orders. Public opinion in these countries is now broadly in line with the EU majority point of view. Actual sentencing policies seem still to be comparatively punitive, although, as discussed in the first section of this report, levels of conventional crime are not excessively high in any of the three countries.
Figure 3.17: Percentage of public favouring imprisonment of recidivist burglars and actual prisoners rates in 2002/2003
Pol
Est
ItaLux
Spa
Gre
Por UK
GerIreBel
Hun
Fra
Swe
AusNld
DenFin
0
50
100
150
200
250
300
350
400
0 10 20 30 40 50 60
Percentage preferring a prison sentence
Pris
on p
opul
atio
n pe
r 100
,000
inha
bita
nts
r=0.19n=18
EU ICS 2005: Burden of Crime in the EU
90
IV.
Crim
ea
nd
Sa
fety
Pro
files
IV. Crime and Safety Profiles
Introduction
Many of those reading reports on results of the crime and victimisation surveys have a special interest in how individual countries are faring in terms of crime and safety compared to other countries. The country profiles presented below allow readers to assess at a glance how their country of interest relates to the EU mean, excluding the country at issue itself. The results present a country’s crime and justice profile in a nutshell.
The profiles are presented in eight-sided ‘radar pictures’, with each corner representing values on one of the eight selected crime and justice indicators. The average scores for the other EU member states on these indicators are set to one, resulting in a circular shape constituting the EU benchmark. The scores for each country are computed relative to this average and projected into the figure. When a country’s value on an indicator lies inside the benchmark figure, the score for the country is below that of the 17 other countries. If it lies outside the benchmark, it is higher than the EU mean. The more a country’s graphic profile deviates from the benchmark figure in shape or size, the more a country deviates from the EU mean in terms of crime or justice.
The 5 indicators on crime used to draw up the country profiles are (clockwise, starting on top):
Overall victimization by 10 crimes;
Burglary as the quintessential crime against households;
Robbery as a typical violent crime ;
Percentage of the population that has been in contact with drugs- related problems;
Victimization by hate crimes.
Details on these five indicators are discussed in detail in chapter 2 on victimisation. The profiles are completed with scores on the three indicators of official and informal responses to crime presented in chapter 3: Security Concerns. These indictors are:
Police performance index;
Percentage of households having a burglar alarm installed;
Percentage of the population that prefers a prison sentence as punishment for a young recidivist burglar.
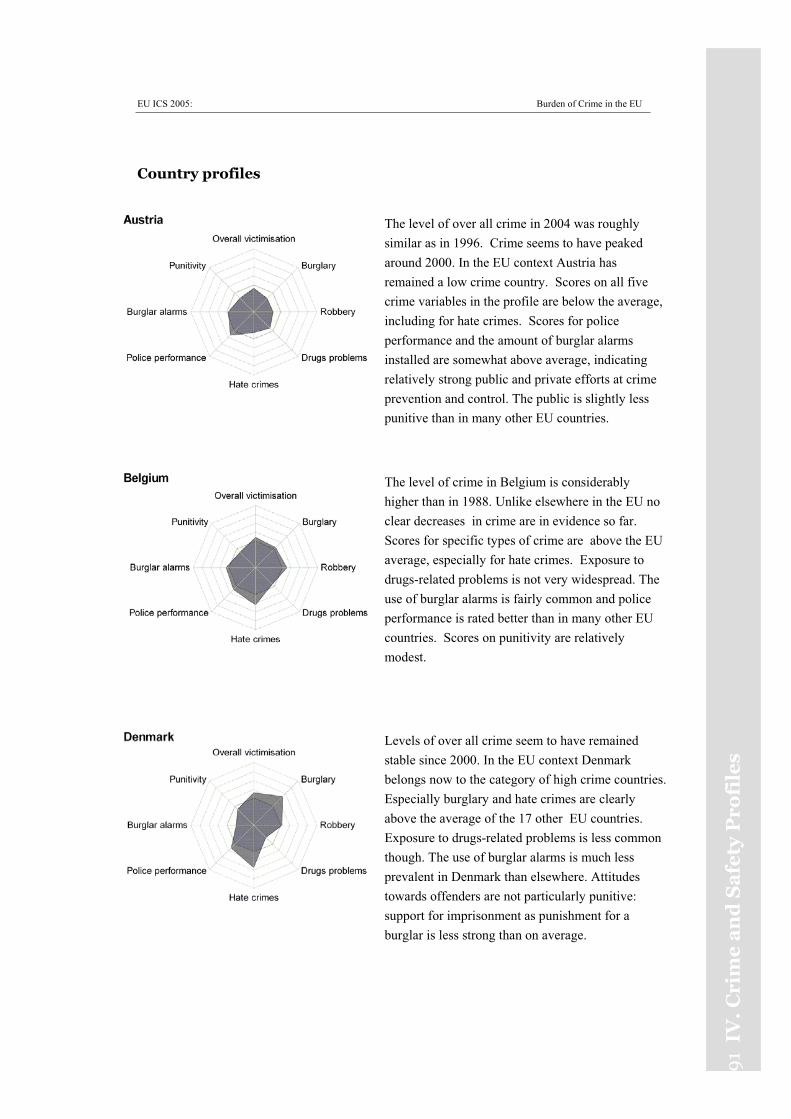
EU ICS 2005: Burden of Crime in the EU
91
IV.
Cri
me
an
dS
afe
tyP
rofi
les
Country profiles
The level of over all crime in 2004 was roughly similar as in 1996. Crime seems to have peaked around 2000. In the EU context Austria has remained a low crime country. Scores on all five crime variables in the profile are below the average, including for hate crimes. Scores for police performance and the amount of burglar alarms installed are somewhat above average, indicating relatively strong public and private efforts at crime prevention and control. The public is slightly less punitive than in many other EU countries.
The level of crime in Belgium is considerably higher than in 1988. Unlike elsewhere in the EU no clear decreases in crime are in evidence so far. Scores for specific types of crime are above the EU average, especially for hate crimes. Exposure to drugs-related problems is not very widespread. The use of burglar alarms is fairly common and police performance is rated better than in many other EU countries. Scores on punitivity are relatively modest.
Levels of over all crime seem to have remained stable since 2000. In the EU context Denmark belongs now to the category of high crime countries. Especially burglary and hate crimes are clearly above the average of the 17 other EU countries. Exposure to drugs-related problems is less common though. The use of burglar alarms is much less prevalent in Denmark than elsewhere. Attitudes towards offenders are not particularly punitive: support for imprisonment as punishment for a burglar is less strong than on average.
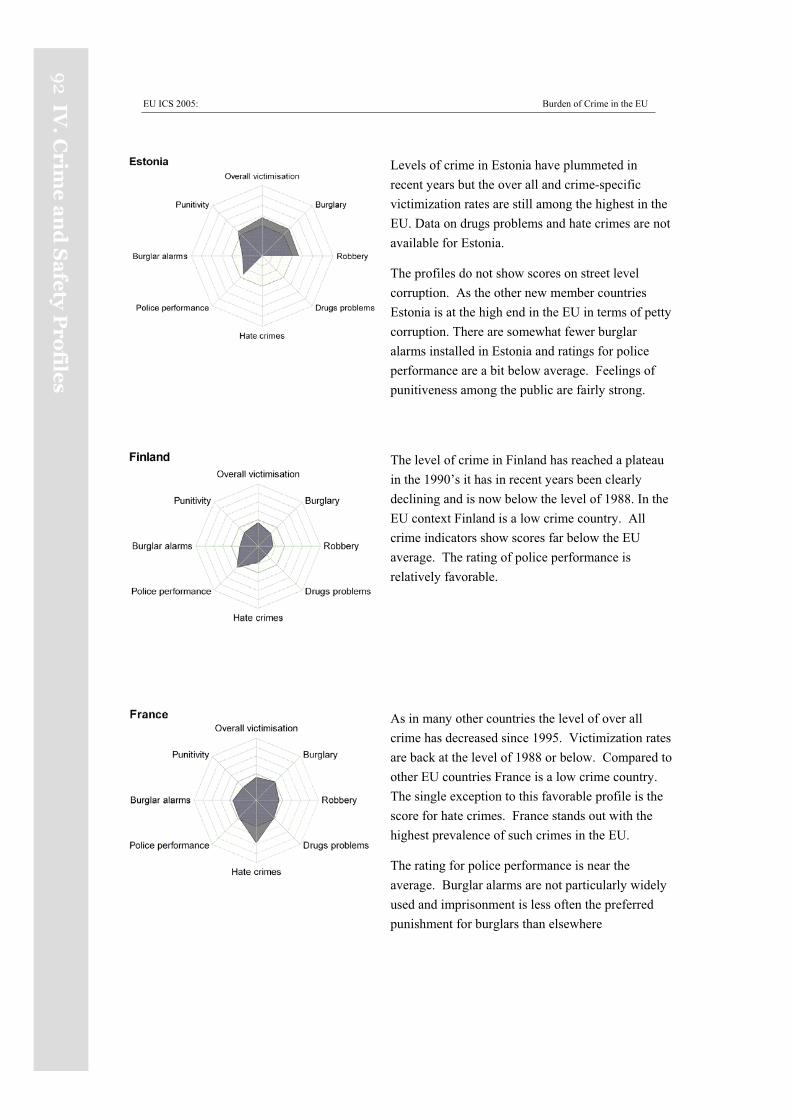
EU ICS 2005: Burden of Crime in the EU
92
IV.
Crim
ea
nd
Sa
fety
Pro
files
Levels of crime in Estonia have plummeted in recent years but the over all and crime-specific victimization rates are still among the highest in the EU. Data on drugs problems and hate crimes are not available for Estonia.
The profiles do not show scores on street level corruption. As the other new member countries Estonia is at the high end in the EU in terms of petty corruption. There are somewhat fewer burglar alarms installed in Estonia and ratings for police performance are a bit below average. Feelings of punitiveness among the public are fairly strong.
The level of crime in Finland has reached a plateau in the 1990’s it has in recent years been clearly declining and is now below the level of 1988. In the EU context Finland is a low crime country. All crime indicators show scores far below the EU average. The rating of police performance is relatively favorable.
As in many other countries the level of over all crime has decreased since 1995. Victimization rates are back at the level of 1988 or below. Compared to other EU countries France is a low crime country. The single exception to this favorable profile is the score for hate crimes. France stands out with the highest prevalence of such crimes in the EU.
The rating for police performance is near the average. Burglar alarms are not particularly widely used and imprisonment is less often the preferred punishment for burglars than elsewhere
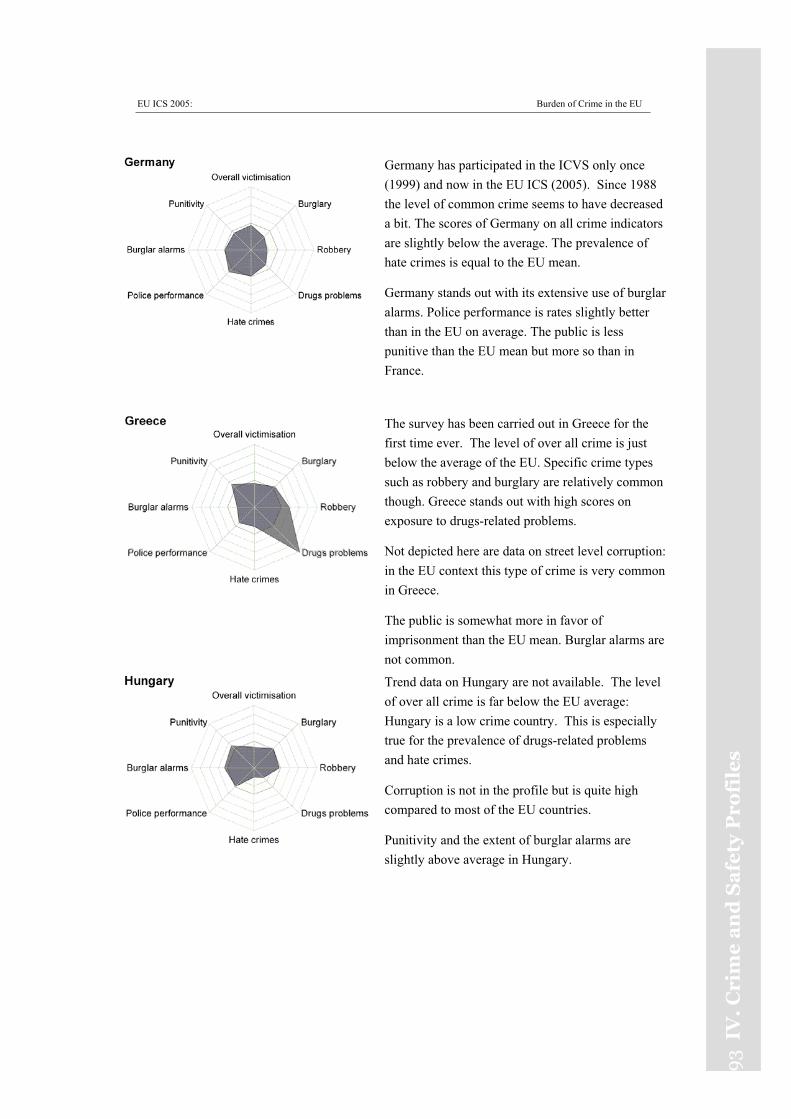
EU ICS 2005: Burden of Crime in the EU
93 I
V.
Cri
me
an
dS
afe
tyP
rofi
les
Germany has participated in the ICVS only once (1999) and now in the EU ICS (2005). Since 1988 the level of common crime seems to have decreased a bit. The scores of Germany on all crime indicators are slightly below the average. The prevalence of hate crimes is equal to the EU mean.
Germany stands out with its extensive use of burglar alarms. Police performance is rates slightly better than in the EU on average. The public is less punitive than the EU mean but more so than in France.
The survey has been carried out in Greece for the first time ever. The level of over all crime is just below the average of the EU. Specific crime types such as robbery and burglary are relatively common though. Greece stands out with high scores on exposure to drugs-related problems.
Not depicted here are data on street level corruption: in the EU context this type of crime is very common in Greece.
The public is somewhat more in favor of imprisonment than the EU mean. Burglar alarms are not common.
Trend data on Hungary are not available. The level of over all crime is far below the EU average: Hungary is a low crime country. This is especially true for the prevalence of drugs-related problems and hate crimes.
Corruption is not in the profile but is quite high compared to most of the EU countries.
Punitivity and the extent of burglar alarms are slightly above average in Hungary.
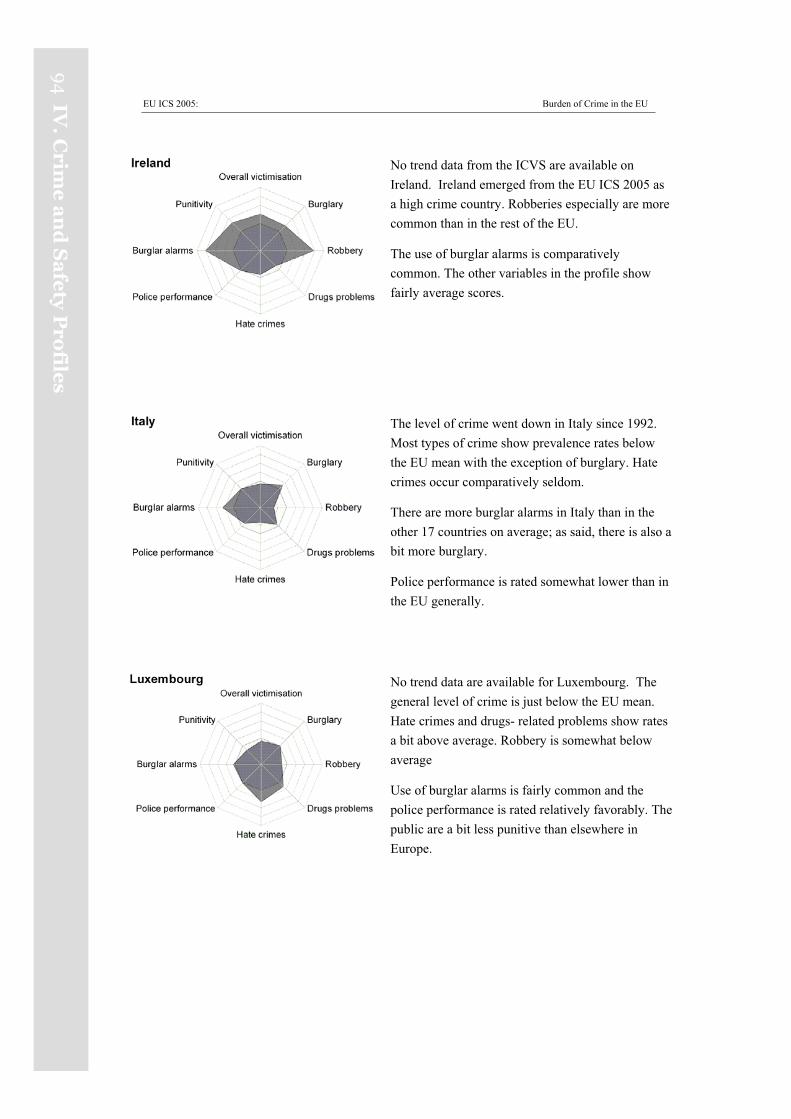
EU ICS 2005: Burden of Crime in the EU
94
IV.
Crim
ea
nd
Sa
fety
Pro
files
No trend data from the ICVS are available on Ireland. Ireland emerged from the EU ICS 2005 as a high crime country. Robberies especially are more common than in the rest of the EU.
The use of burglar alarms is comparatively common. The other variables in the profile show fairly average scores.
The level of crime went down in Italy since 1992. Most types of crime show prevalence rates below the EU mean with the exception of burglary. Hate crimes occur comparatively seldom.
There are more burglar alarms in Italy than in the other 17 countries on average; as said, there is also a bit more burglary.
Police performance is rated somewhat lower than in the EU generally.
No trend data are available for Luxembourg. The general level of crime is just below the EU mean. Hate crimes and drugs- related problems show rates a bit above average. Robbery is somewhat below average
Use of burglar alarms is fairly common and the police performance is rated relatively favorably. The public are a bit less punitive than elsewhere in Europe.
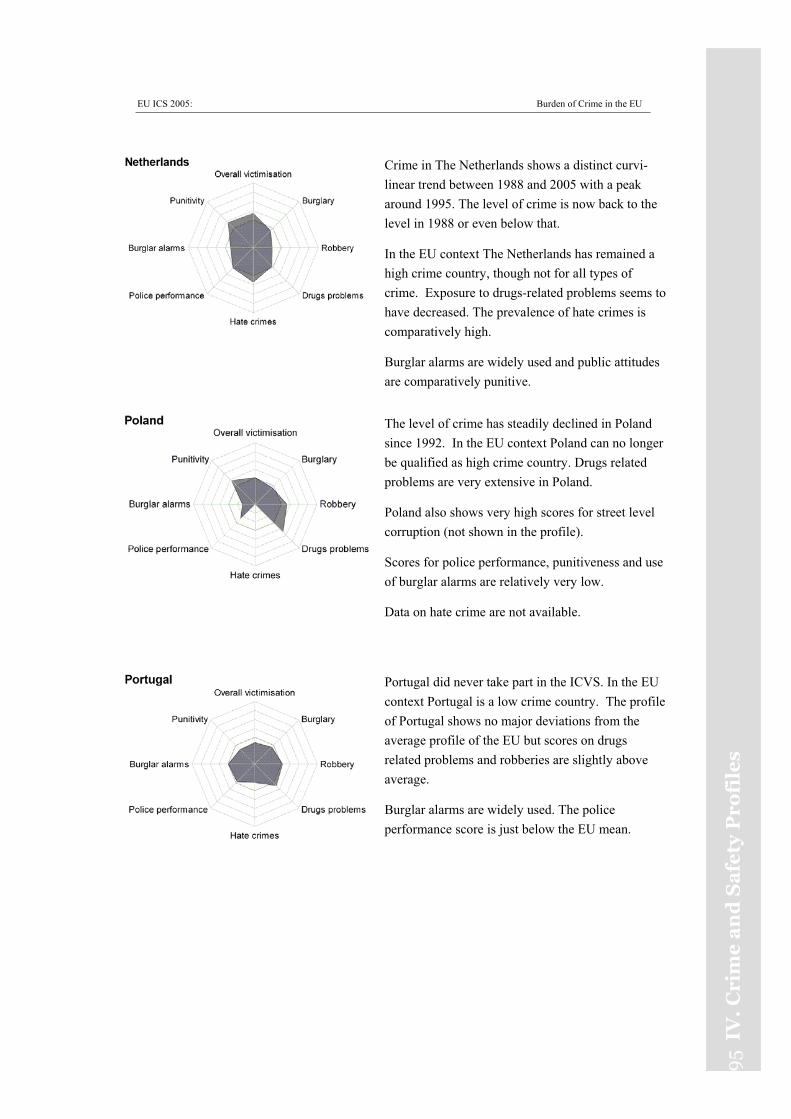
EU ICS 2005: Burden of Crime in the EU
95
IV.
Cri
me
an
dS
afe
tyP
rofi
les
Crime in The Netherlands shows a distinct curvi-linear trend between 1988 and 2005 with a peak around 1995. The level of crime is now back to the level in 1988 or even below that.
In the EU context The Netherlands has remained a high crime country, though not for all types of crime. Exposure to drugs-related problems seems to have decreased. The prevalence of hate crimes is comparatively high.
Burglar alarms are widely used and public attitudes are comparatively punitive.
The level of crime has steadily declined in Poland since 1992. In the EU context Poland can no longer be qualified as high crime country. Drugs related problems are very extensive in Poland.
Poland also shows very high scores for street level corruption (not shown in the profile).
Scores for police performance, punitiveness and use of burglar alarms are relatively very low.
Data on hate crime are not available.
Portugal did never take part in the ICVS. In the EU context Portugal is a low crime country. The profile of Portugal shows no major deviations from the average profile of the EU but scores on drugs related problems and robberies are slightly above average.
Burglar alarms are widely used. The police performance score is just below the EU mean.
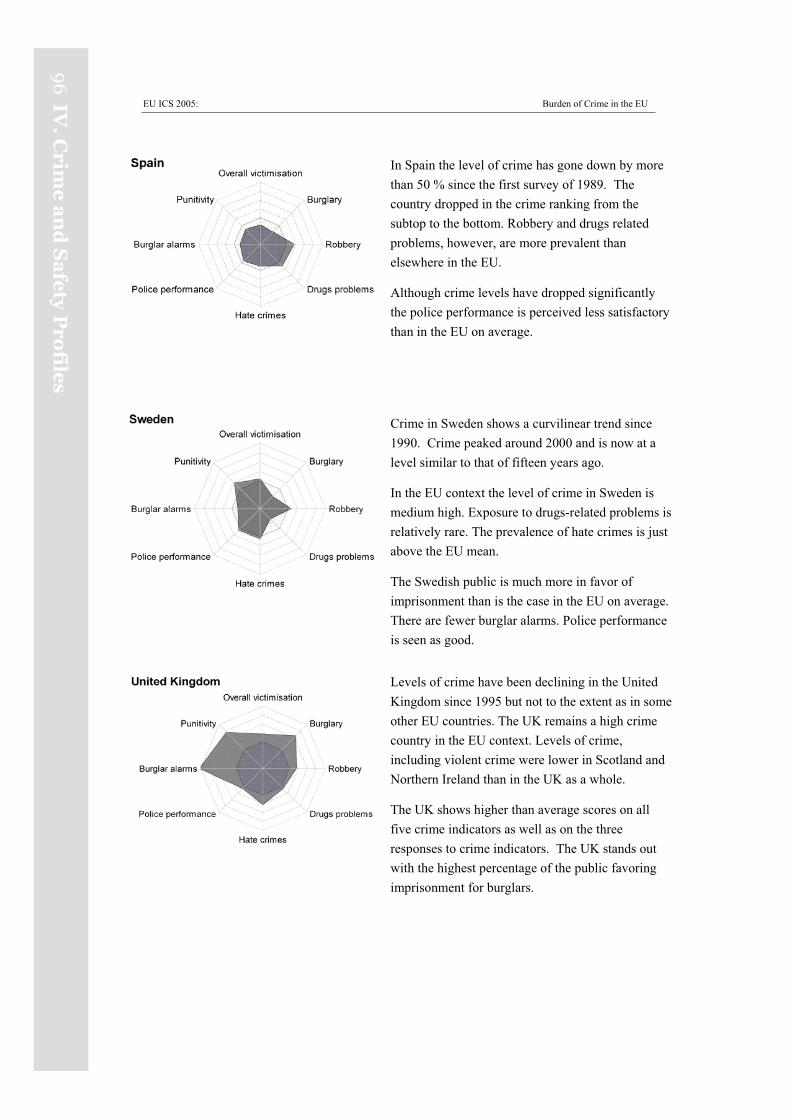
EU ICS 2005: Burden of Crime in the EU
96
IV.
Crim
ea
nd
Sa
fety
Pro
files
In Spain the level of crime has gone down by more than 50 % since the first survey of 1989. The country dropped in the crime ranking from the subtop to the bottom. Robbery and drugs related problems, however, are more prevalent than elsewhere in the EU.
Although crime levels have dropped significantly the police performance is perceived less satisfactory than in the EU on average.
Crime in Sweden shows a curvilinear trend since 1990. Crime peaked around 2000 and is now at a level similar to that of fifteen years ago.
In the EU context the level of crime in Sweden is medium high. Exposure to drugs-related problems is relatively rare. The prevalence of hate crimes is just above the EU mean.
The Swedish public is much more in favor of imprisonment than is the case in the EU on average. There are fewer burglar alarms. Police performance is seen as good.
Levels of crime have been declining in the United Kingdom since 1995 but not to the extent as in some other EU countries. The UK remains a high crime country in the EU context. Levels of crime, including violent crime were lower in Scotland and Northern Ireland than in the UK as a whole.
The UK shows higher than average scores on all five crime indicators as well as on the three responses to crime indicators. The UK stands out with the highest percentage of the public favoring imprisonment for burglars.
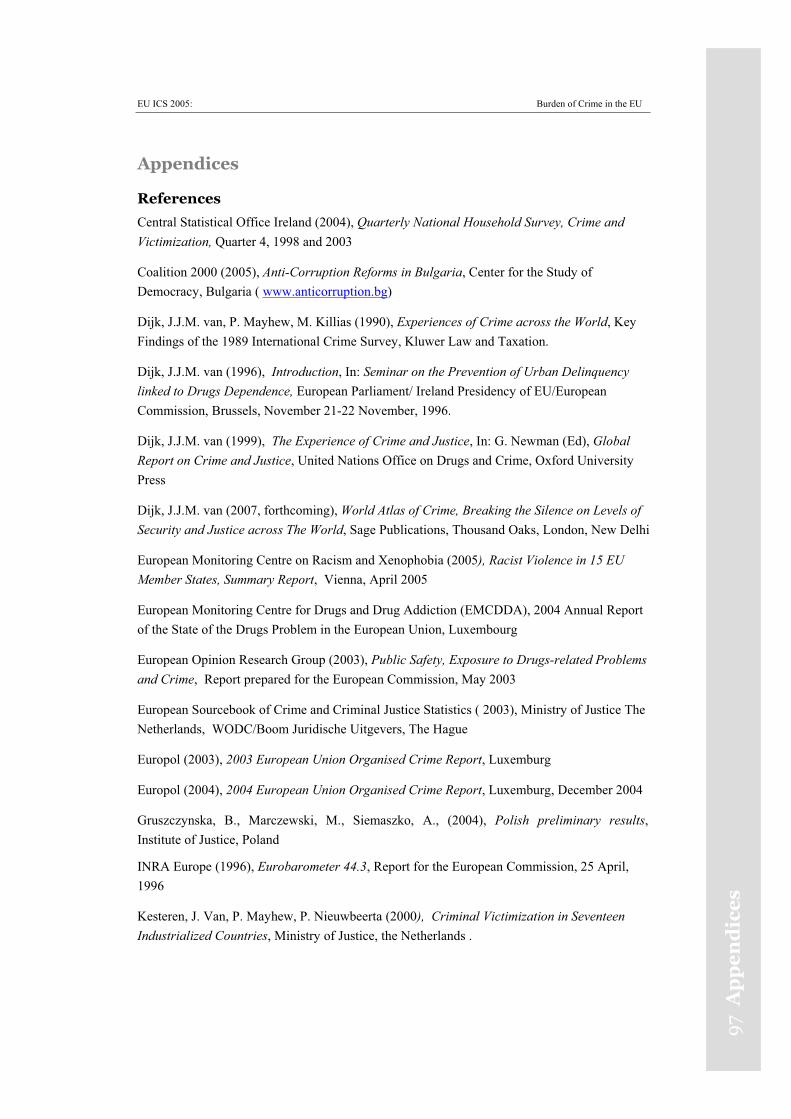
EU ICS 2005: Burden of Crime in the EU
97
Ap
pe
nd
ice
s
Appendices
References
Central Statistical Office Ireland (2004), Quarterly National Household Survey, Crime and Victimization, Quarter 4, 1998 and 2003
Coalition 2000 (2005), Anti-Corruption Reforms in Bulgaria, Center for the Study of Democracy, Bulgaria ( www.anticorruption.bg)
Dijk, J.J.M. van, P. Mayhew, M. Killias (1990), Experiences of Crime across the World, Key Findings of the 1989 International Crime Survey, Kluwer Law and Taxation.
Dijk, J.J.M. van (1996), Introduction, In: Seminar on the Prevention of Urban Delinquency linked to Drugs Dependence, European Parliament/ Ireland Presidency of EU/European Commission, Brussels, November 21-22 November, 1996.
Dijk, J.J.M. van (1999), The Experience of Crime and Justice, In: G. Newman (Ed), Global Report on Crime and Justice, United Nations Office on Drugs and Crime, Oxford University Press
Dijk, J.J.M. van (2007, forthcoming), World Atlas of Crime, Breaking the Silence on Levels ofSecurity and Justice across The World, Sage Publications, Thousand Oaks, London, New Delhi
European Monitoring Centre on Racism and Xenophobia (2005), Racist Violence in 15 EU Member States, Summary Report, Vienna, April 2005
European Monitoring Centre for Drugs and Drug Addiction (EMCDDA), 2004 Annual Report of the State of the Drugs Problem in the European Union, Luxembourg
European Opinion Research Group (2003), Public Safety, Exposure to Drugs-related Problems and Crime, Report prepared for the European Commission, May 2003
European Sourcebook of Crime and Criminal Justice Statistics ( 2003), Ministry of Justice The Netherlands, WODC/Boom Juridische Uitgevers, The Hague
Europol (2003), 2003 European Union Organised Crime Report, Luxemburg
Europol (2004), 2004 European Union Organised Crime Report, Luxemburg, December 2004
Gruszczynska, B., Marczewski, M., Siemaszko, A., (2004), Polish preliminary results,Institute of Justice, Poland
INRA Europe (1996), Eurobarometer 44.3, Report for the European Commission, 25 April, 1996
Kesteren, J. Van, P. Mayhew, P. Nieuwbeerta (2000), Criminal Victimization in Seventeen Industrialized Countries, Ministry of Justice, the Netherlands .
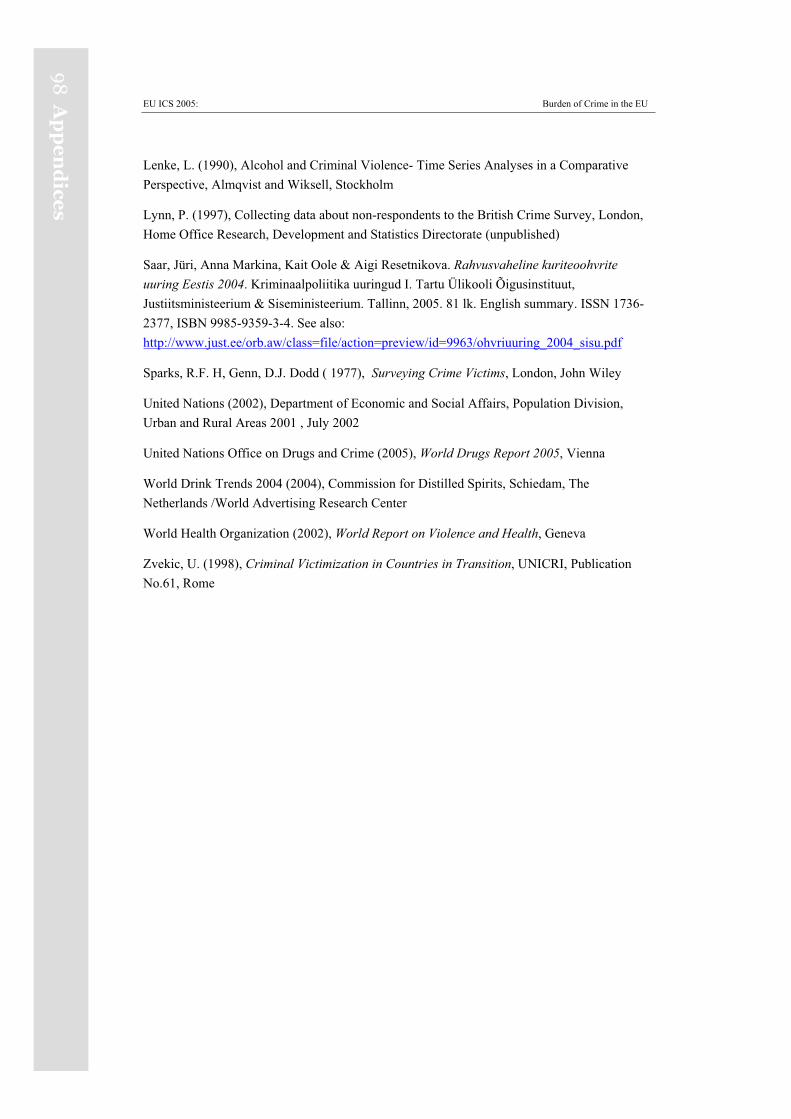
EU ICS 2005: Burden of Crime in the EU
98
Ap
pe
nd
ices
Lenke, L. (1990), Alcohol and Criminal Violence- Time Series Analyses in a Comparative Perspective, Almqvist and Wiksell, Stockholm
Lynn, P. (1997), Collecting data about non-respondents to the British Crime Survey, London, Home Office Research, Development and Statistics Directorate (unpublished)
Saar, Jüri, Anna Markina, Kait Oole & Aigi Resetnikova. Rahvusvaheline kuriteoohvrite uuring Eestis 2004. Kriminaalpoliitika uuringud I. Tartu Ülikooli Õigusinstituut, Justiitsministeerium & Siseministeerium. Tallinn, 2005. 81 lk. English summary. ISSN 1736-2377, ISBN 9985-9359-3-4. See also: http://www.just.ee/orb.aw/class=file/action=preview/id=9963/ohvriuuring_2004_sisu.pdf
Sparks, R.F. H, Genn, D.J. Dodd ( 1977), Surveying Crime Victims, London, John Wiley
United Nations (2002), Department of Economic and Social Affairs, Population Division, Urban and Rural Areas 2001 , July 2002
United Nations Office on Drugs and Crime (2005), World Drugs Report 2005, Vienna
World Drink Trends 2004 (2004), Commission for Distilled Spirits, Schiedam, The Netherlands /World Advertising Research Center
World Health Organization (2002), World Report on Violence and Health, Geneva
Zvekic, U. (1998), Criminal Victimization in Countries in Transition, UNICRI, Publication No.61, Rome
EU ICS 2005: Burden of Crime in the EU
99
Ap
pe
nd
ice
s
Appendix A: List of tables and graphs
Chapter 2
2.1 Prevalence victimization rates for 10 common crimes in 2004 and results from earlier surveys
2.2 Levels of crime across Member States of the European Union in 2004
2.3 Urbanization and level of common crime in 17 European countries
2.4 Rates of victimization by any crime in 2004 and police recorded crimes per 100,000 population in 2000
2000
2.5 One year prevalence rates for theft of a car in 2004 and results from earlier surveys
2.6 One year prevalence victimisation rates for car theft for owners and the total population
2.7 One year prevalence victimisation rates for theft from a car in 2004 and results from earlier surveys
2.8 One year prevalence rates for theft of a motorcycle or moped in 2004 and results from earlier surveys
2.9 One year prevalence victimization rates for theft of a motorcycle in 2004 for owners and the total
population
2.10 One year prevalence victimization rates for theft theft of a bicycle in 2004 and results from earlier
surveys
2.11 One year prevalence victimization rates for theft theft of a bicycle in 2004 for owners and the total
population
2.12 One year prevalence victimization rates for burglary in 2004 and results from earlier surveys
2.13 Levels of burglary across Member States of the European Union in 2004
2.14 Prevalence victimization rates for completed and attempted burglaries in 2004
2.15 One year prevalence victimization rates for theft of personal property in 2004 and results from earlier
surveys
2.16 One year prevalence victimization rates for theft of personal property and pickpocketing in 2004
2.17 One year prevalence victimization rates for robbery in 2004 and results from earlier surveys
2.18 One year prevalence victimization rates for sexual offences of women in 2004 and results from earlier
surveys
2.19 One year prevalence victimization rates for assaults & threats in 2004 and results from earlier surveys
2.20 One year prevalence victimization rates for assaults with force in 2004 and results from earlier surveys
2.21 National prevalence of Assaults/threats and consumption of beer per 100,000 population
2.22 Percentages of the population victimized by hate crimes in 2004
2.23 Percentages of immigrants victimized by hate crimes in 2004
EU ICS 2005: Burden of Crime in the EU
100
Ap
pe
nd
ices
2.24 One year prevalence rates for consumer fraud in 2004 and results from earlier surveys
2.25 One year prevalence rates for corruption in 2004 and results from earlier surveys
2.26 One year prevalence rate for Corruption 2005 EU ICS and Corruption Perception Index 2004
2.27 Contact with drugs-related problems in the area of residence in 1996, 2000, 2002 and 2005
2.28 Mean rates for different types of property crimes between 1988 and 2004
2.29 Mean rates for different types of contact crimes between 1988 and 2004
2.30 Trends in thefts and violent crimes, relative to 1988 in three countries (1988 is set to 100)
Chapter 3
tables
3.1 Reasons for not reporting to the police: all countries (percentages), ICVS 2000
3.2 Reasons for reporting to the police: all countries (percentages) ICVS 2000
3.3 Reasons for dissatisfaction with the police after reporting: all countries (percentages) , EU ICS
2005
graphs
3.1 Percentages of public who think a burglary in their houses in the coming year likely or very
likely, results from the EU ICS 2005[1] and earlier surveys
3.2 Percentage of the population feeling unsafe on the street after dark, results from the 2005 EU
ICS and earlier results
3.3 Exposure to drugs-related problems and afraid on the street after dark
3.4 Percentages of victimisation by household burglary reported to the police in 2004
3.5 Percentage of victims satisfied with reporting 5 crimes to the police in a period of 5 years plus
earlier results
3.6 Percentages of the public thinking police is doing a good job controlling crime in their area
3.7 Country ratings on EU ICS-based Police Performance Index for 2004, with historical data for
some countries
3.8 Police Performance Index and number of police officers per 100,000 population ( European
Sourcebook, 2003)
3.9 Percentage of households with a burglar alarm to protect against burglary in 2005 plus results
from the earlier surveys
3.10 Percentage of households with special locks to protect against burglary in 2005 plus results
EU ICS 2005: Burden of Crime in the EU
101
Ap
pe
nd
ice
s
from the earlier surveys
3.11 Percentage of homes with burglar alarms and special door locks
3.12 Percentages of the public opting for community service order and imprisonment as
punishment for recidivist burglar in EU ICS 2005
3.13 Percentage of respondents preferring a prison sentence in case of repeated burglary results
from 2005 plus earlier results
3.14 Percentage of respondents preferring a community service in case of repeated burglary results
from 2005 plus earlier results
3.15 Percentage of public favouring imprisonment of recidivist burglars and actual prisoners rates
in 2002/2003


EU ICS 2005: Burden of Crime in the EU
102
Ap
pe
nd
ices
Appendix B: Additional tables Chapter 2
B2.1 Victimisation in the year preceding the survey
B2.2 Victimisation in the 5 years preceding the survey
B2.3 One year victimisation rates for owners of vehicles
B2.4 Details on sub-crimes: pickpocketing, sexual assault and assaults with force
B2.5 Additional crimes
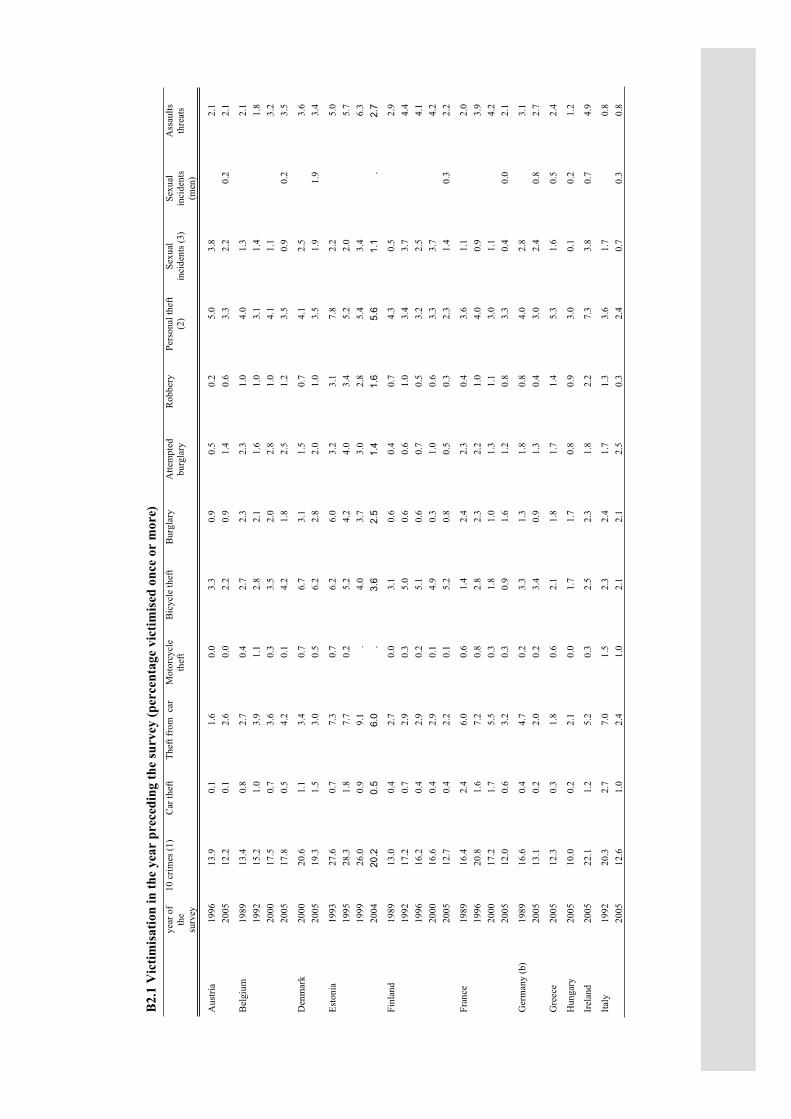
B2.
1 V
ictim
isat
ion
in th
e ye
ar p
rece
ding
the
surv
ey (p
erce
ntag
e vi
ctim
ised
onc
e or
mor
e)
year
of
the
surv
ey
10 c
rimes
(1)
Car
thef
t Th
eft f
rom
car
Mot
orcy
cle
thef
t Bi
cycl
e th
eft
Bur
glar
y A
ttem
pted
bu
rgla
ry
Rob
bery
Pe
rson
al th
eft
(2)
Sexu
al
inci
dent
s (3)
Se
xual
in
cide
nts
(men
)
Ass
aults
th
reat
s
Aus
tria
1996
13
.9
0.1
1.6
0.0
3.3
0.9
0.5
0.2
5.0
3.8
2.
1
2005
12
.2
0.1
2.6
0.0
2.2
0.9
1.4
0.6
3.3
2.2
0.2
2.1
Bel
gium
19
89
13.4
0.
8 2.
7 0.
4 2.
7 2.
3 2.
3 1.
0 4.
0 1.
3
2.1
19
92
15.2
1.
0 3.
9 1.
1 2.
8 2.
1 1.
6 1.
0 3.
1 1.
4
1.8
20
00
17.5
0.
7 3.
6 0.
3 3.
5 2.
0 2.
8 1.
0 4.
1 1.
1
3.2
20
05
17.8
0.
5 4.
2 0.
1 4.
2 1.
8 2.
5 1.
2 3.
5 0.
9 0.
2 3.
5
Den
mar
k 20
00
20.6
1.
1 3.
4 0.
7 6.
7 3.
1 1.
5 0.
7 4.
1 2.
5
3.6
20
05
19.3
1.
5 3.
0 0.
5 6.
2 2.
8 2.
0 1.
0 3.
5 1.
9 1.
9 3.
4
Esto
nia
1993
27
.6
0.7
7.3
0.7
6.2
6.0
3.2
3.1
7.8
2.2
5.
0
1995
28
.3
1.8
7.7
0.2
5.2
4.2
4.0
3.4
5.2
2.0
5.
7
1999
26
.0
0.9
9.1
. 4.
0 3.
7 3.
0 2.
8 5.
4 3.
4
6.3
20
04
20.2
0.5
6.0
.3.
62.
51.
41.
65.
61.
1.
2.7
Finl
and
1989
13
.0
0.4
2.7
0.0
3.1
0.6
0.4
0.7
4.3
0.5
2.
9
1992
17
.2
0.7
2.9
0.3
5.0
0.6
0.6
1.0
3.4
3.7
4.
4
1996
16
.2
0.4
2.9
0.2
5.1
0.6
0.7
0.5
3.2
2.5
4.
1
2000
16
.6
0.4
2.9
0.1
4.9
0.3
1.0
0.6
3.3
3.7
4.
2
2005
12
.7
0.4
2.2
0.1
5.2
0.8
0.5
0.3
2.3
1.4
0.3
2.2
Fran
ce
1989
16
.4
2.4
6.0
0.6
1.4
2.4
2.3
0.4
3.6
1.1
2.
0
1996
20
.8
1.6
7.2
0.8
2.8
2.3
2.2
1.0
4.0
0.9
3.
9
2000
17
.2
1.7
5.5
0.3
1.8
1.0
1.3
1.1
3.0
1.1
4.
2
2005
12
.0
0.6
3.2
0.3
0.9
1.6
1.2
0.8
3.3
0.4
0.0
2.1
Ger
man
y (b
) 19
89
16.6
0.
4 4.
7 0.
2 3.
3 1.
3 1.
8 0.
8 4.
0 2.
8
3.1
20
05
13.1
0.
2 2.
0 0.
2 3.
4 0.
9 1.
3 0.
4 3.
0 2.
4 0.
8 2.
7
Gre
ece
2005
12
.3
0.3
1.8
0.6
2.1
1.8
1.7
1.4
5.3
1.6
0.5
2.4
Hun
gary
20
05
10.0
0.
2 2.
1 0.
0 1.
7 1.
7 0.
8 0.
9 3.
0 0.
1 0.
2 1.
2
Irel
and
2005
22
.1
1.2
5.2
0.3
2.5
2.3
1.8
2.2
7.3
3.8
0.7
4.9
Italy
19
92
20.3
2.
7 7.
0 1.
5 2.
3 2.
4 1.
7 1.
3 3.
6 1.
7
0.8
20
05
12.6
1.
0 2.
4 1.
0 2.
1 2.
1 2.
5 0.
3 2.
4 0.
7 0.
3 0.
8
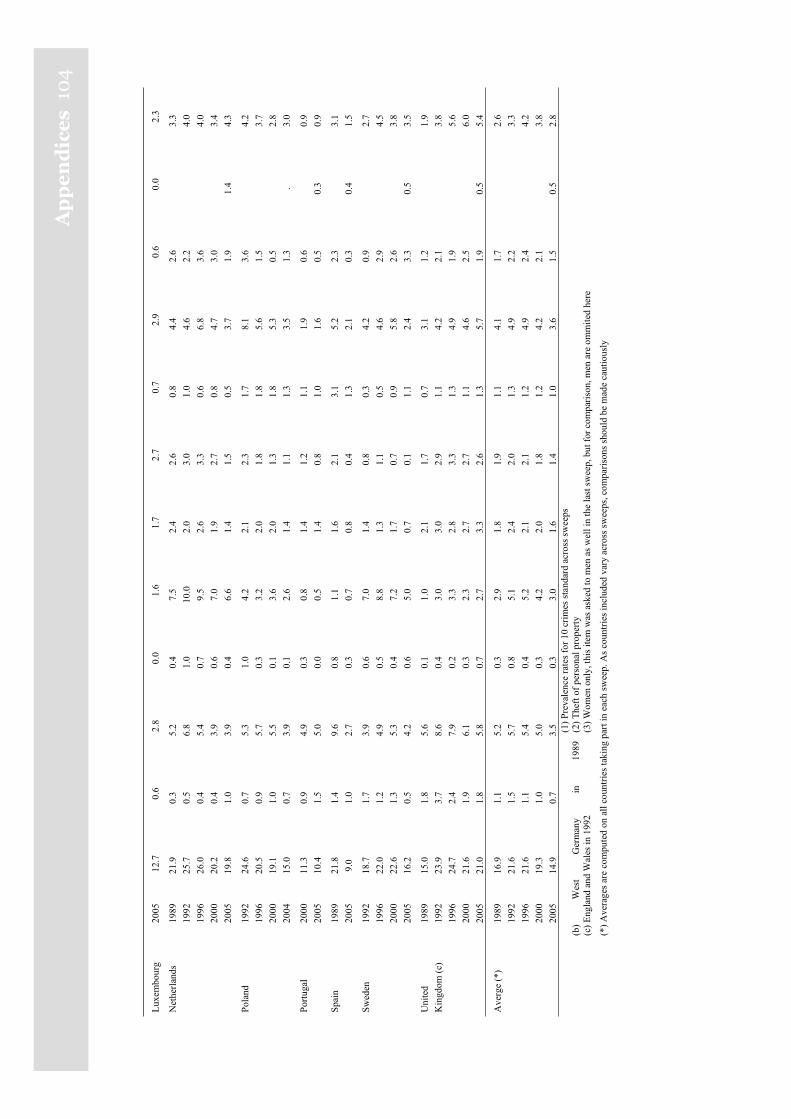
Ap
pe
nd
ice
s10
4
Luxe
mbo
urg
2005
12
.7
0.6
2.8
0.0
1.6
1.7
2.7
0.7
2.9
0.6
0.0
2.3
Net
herla
nds
1989
21
.9
0.3
5.2
0.4
7.5
2.4
2.6
0.8
4.4
2.6
3.
3
1992
25
.7
0.5
6.8
1.0
10.0
2.
0 3.
0 1.
0 4.
6 2.
2
4.0
19
96
26.0
0.
4 5.
4 0.
7 9.
5 2.
6 3.
3 0.
6 6.
8 3.
6
4.0
20
00
20.2
0.
4 3.
9 0.
6 7.
0 1.
9 2.
7 0.
8 4.
7 3.
0
3.4
20
05
19.8
1.
0 3.
9 0.
4 6.
6 1.
4 1.
5 0.
5 3.
7 1.
9 1.
4 4.
3
Pola
nd
1992
24
.6
0.7
5.3
1.0
4.2
2.1
2.3
1.7
8.1
3.6
4.
2
1996
20
.5
0.9
5.7
0.3
3.2
2.0
1.8
1.8
5.6
1.5
3.
7
2000
19
.1
1.0
5.5
0.1
3.6
2.0
1.3
1.8
5.3
0.5
2.
8
2004
15
.0
0.7
3.9
0.1
2.6
1.4
1.1
1.3
3.5
1.3
. 3.
0
Portu
gal
2000
11
.3
0.9
4.9
0.3
0.8
1.4
1.2
1.1
1.9
0.6
0.
9
2005
10
.4
1.5
5.0
0.0
0.5
1.4
0.8
1.0
1.6
0.5
0.3
0.9
Spai
n 19
89
21.8
1.
4 9.
6 0.
8 1.
1 1.
6 2.
1 3.
1 5.
2 2.
3
3.1
20
05
9.0
1.0
2.7
0.3
0.7
0.8
0.4
1.3
2.1
0.3
0.4
1.5
Swed
en
1992
18
.7
1.7
3.9
0.6
7.0
1.4
0.8
0.3
4.2
0.9
2.
7
1996
22
.0
1.2
4.9
0.5
8.8
1.3
1.1
0.5
4.6
2.9
4.
5
2000
22
.6
1.3
5.3
0.4
7.2
1.7
0.7
0.9
5.8
2.6
3.
8
2005
16
.2
0.5
4.2
0.6
5.0
0.7
0.1
1.1
2.4
3.3
0.5
3.5
Uni
ted
19
89
15.0
1.
8 5.
6 0.
1 1.
0 2.
1 1.
7 0.
7 3.
1 1.
2
1.9
Kin
gdom
(c)
1992
23
.9
3.7
8.6
0.4
3.0
3.0
2.9
1.1
4.2
2.1
3.
8
1996
24
.7
2.4
7.9
0.2
3.3
2.8
3.3
1.3
4.9
1.9
5.
6
2000
21
.6
1.9
6.1
0.3
2.3
2.7
2.7
1.1
4.6
2.5
6.
0
2005
21
.0
1.8
5.8
0.7
2.7
3.3
2.6
1.3
5.7
1.9
0.5
5.4
Ave
rge
(*)
1989
16
.9
1.1
5.2
0.3
2.9
1.8
1.9
1.1
4.1
1.7
2.
6
1992
21
.6
1.5
5.7
0.8
5.1
2.4
2.0
1.3
4.9
2.2
3.
3
1996
21
.6
1.1
5.4
0.4
5.2
2.1
2.1
1.2
4.9
2.4
4.
2
2000
19
.3
1.0
5.0
0.3
4.2
2.0
1.8
1.2
4.2
2.1
3.
8
2005
14
.9
0.7
3.5
0.3
3.0
1.6
1.4
1.0
3.6
1.5
0.5
2.8
(b)
Wes
t G
erm
any
in
1989
(c) E
ngla
nd a
nd W
ales
in 1
992
(1) P
reva
lenc
e ra
tes f
or 1
0 cr
imes
stan
dard
acr
oss s
wee
ps
(2) T
heft
of p
erso
nal p
rope
rty
(3) W
omen
onl
y, th
is it
em w
as a
sked
to m
en a
s wel
l in
the
last
swee
p, b
ut fo
r com
paris
on, m
en a
re o
mm
ited
here
(*
) Ave
rage
s are
com
pute
d on
all
coun
tries
taki
ng p
art i
n ea
ch sw
eep.
As c
ount
ries i
nclu
ded
vary
acr
oss s
wee
ps, c
ompa
rison
s sho
uld
be m
ade
caut
ious
ly
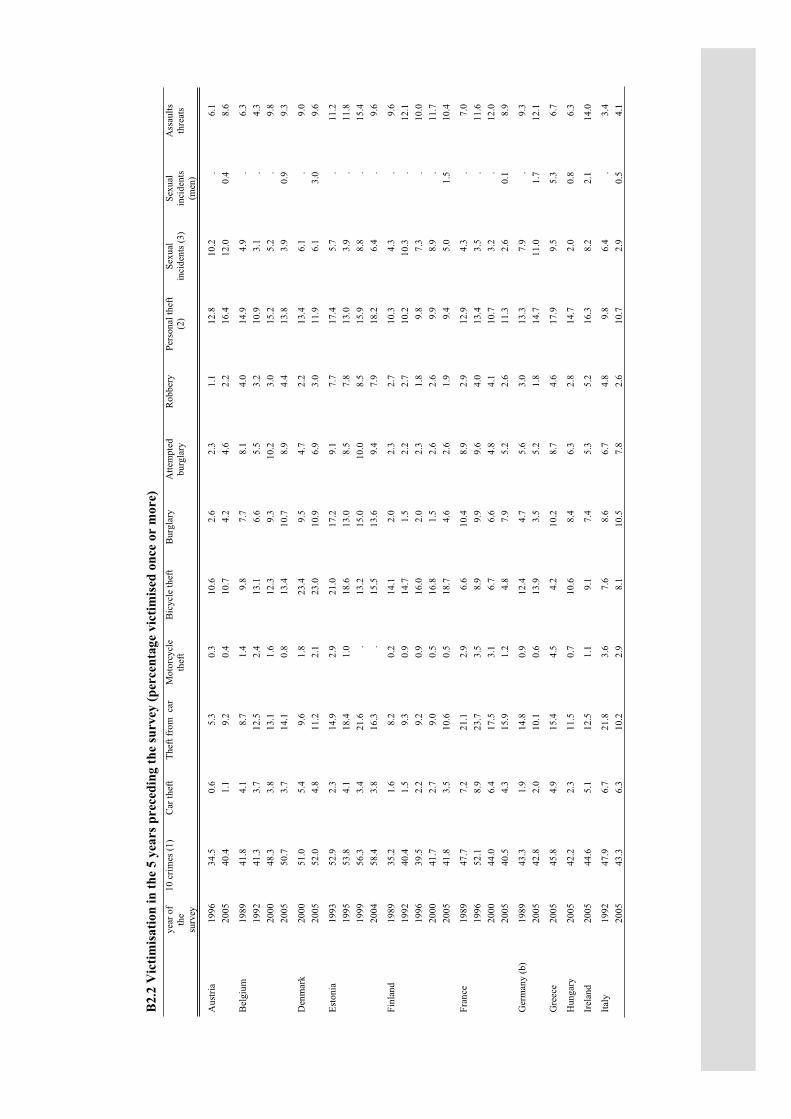
B2.
2 V
ictim
isat
ion
in th
e 5
year
s pre
cedi
ng th
e su
rvey
(per
cent
age
vict
imis
ed o
nce
or m
ore)
ye
ar o
f th
e su
rvey
10 c
rimes
(1)
Car
thef
t Th
eft f
rom
car
Mot
orcy
cle
thef
t Bi
cycl
e th
eft
Bur
glar
y A
ttem
pted
bu
rgla
ry
Rob
bery
Pe
rson
al th
eft
(2)
Sexu
al
inci
dent
s (3)
Se
xual
in
cide
nts
(men
)
Ass
aults
th
reat
s
Aus
tria
1996
34
.5
0.6
5.3
0.3
10.6
2.
6 2.
3 1.
1 12
.8
10.2
.
6.1
20
05
40.4
1.
1 9.
2 0.
4 10
.7
4.2
4.6
2.2
16.4
12
.0
0.4
8.6
Bel
gium
19
89
41.8
4.
1 8.
7 1.
4 9.
8 7.
7 8.
1 4.
0 14
.9
4.9
. 6.
3
1992
41
.3
3.7
12.5
2.
4 13
.1
6.6
5.5
3.2
10.9
3.
1 .
4.3
20
00
48.3
3.
8 13
.1
1.6
12.3
9.
3 10
.2
3.0
15.2
5.
2 .
9.8
20
05
50.7
3.
7 14
.1
0.8
13.4
10
.7
8.9
4.4
13.8
3.
9 0.
9 9.
3
Den
mar
k 20
00
51.0
5.
4 9.
6 1.
8 23
.4
9.5
4.7
2.2
13.4
6.
1 .
9.0
20
05
52.0
4.
8 11
.2
2.1
23.0
10
.9
6.9
3.0
11.9
6.
1 3.
0 9.
6
Esto
nia
1993
52
.9
2.3
14.9
2.
9 21
.0
17.2
9.
1 7.
7 17
.4
5.7
. 11
.2
19
95
53.8
4.
1 18
.4
1.0
18.6
13
.0
8.5
7.8
13.0
3.
9 .
11.8
1999
56
.3
3.4
21.6
.
13.2
15
.0
10.0
8.
5 15
.9
8.8
. 15
.4
20
04
58.4
3.
8 16
.3
. 15
.5
13.6
9.
4 7.
9 18
.2
6.4
. 9.
6
Finl
and
1989
35
.2
1.6
8.2
0.2
14.1
2.
0 2.
3 2.
7 10
.3
4.3
. 9.
6
1992
40
.4
1.5
9.3
0.9
14.7
1.
5 2.
2 2.
7 10
.2
10.3
.
12.1
1996
39
.5
2.2
9.2
0.9
16.0
2.
0 2.
3 1.
8 9.
8 7.
3 .
10.0
2000
41
.7
2.7
9.0
0.5
16.8
1.
5 2.
6 2.
6 9.
9 8.
9 .
11.7
2005
41
.8
3.5
10.6
0.
5 18
.7
4.6
2.6
1.9
9.4
5.0
1.5
10.4
Fran
ce
1989
47
.7
7.2
21.1
2.
9 6.
6 10
.4
8.9
2.9
12.9
4.
3 .
7.0
19
96
52.1
8.
9 23
.7
3.5
8.9
9.9
9.6
4.0
13.4
3.
5 .
11.6
2000
44
.0
6.4
17.5
3.
1 6.
7 6.
6 4.
8 4.
1 10
.7
3.2
. 12
.0
20
05
40.5
4.
3 15
.9
1.2
4.8
7.9
5.2
2.6
11.3
2.
6 0.
1 8.
9
Ger
man
y (b
) 19
89
43.3
1.
9 14
.8
0.9
12.4
4.
7 5.
6 3.
0 13
.3
7.9
. 9.
3
2005
42
.8
2.0
10.1
0.
6 13
.9
3.5
5.2
1.8
14.7
11
.0
1.7
12.1
Gre
ece
2005
45
.8
4.9
15.4
4.
5 4.
2 10
.2
8.7
4.6
17.9
9.
5 5.
3 6.
7
Hun
gary
20
05
42.2
2.
3 11
.5
0.7
10.6
8.
4 6.
3 2.
8 14
.7
2.0
0.8
6.3
Irel
and
2005
44
.6
5.1
12.5
1.
1 9.
1 7.
4 5.
3 5.
2 16
.3
8.2
2.1
14.0
Italy
19
92
47.9
6.
7 21
.8
3.6
7.6
8.6
6.7
4.8
9.8
6.4
. 3.
4
2005
43
.3
6.3
10.2
2.
9 8.
1 10
.5
7.8
2.6
10.7
2.
9 0.
5 4.
1
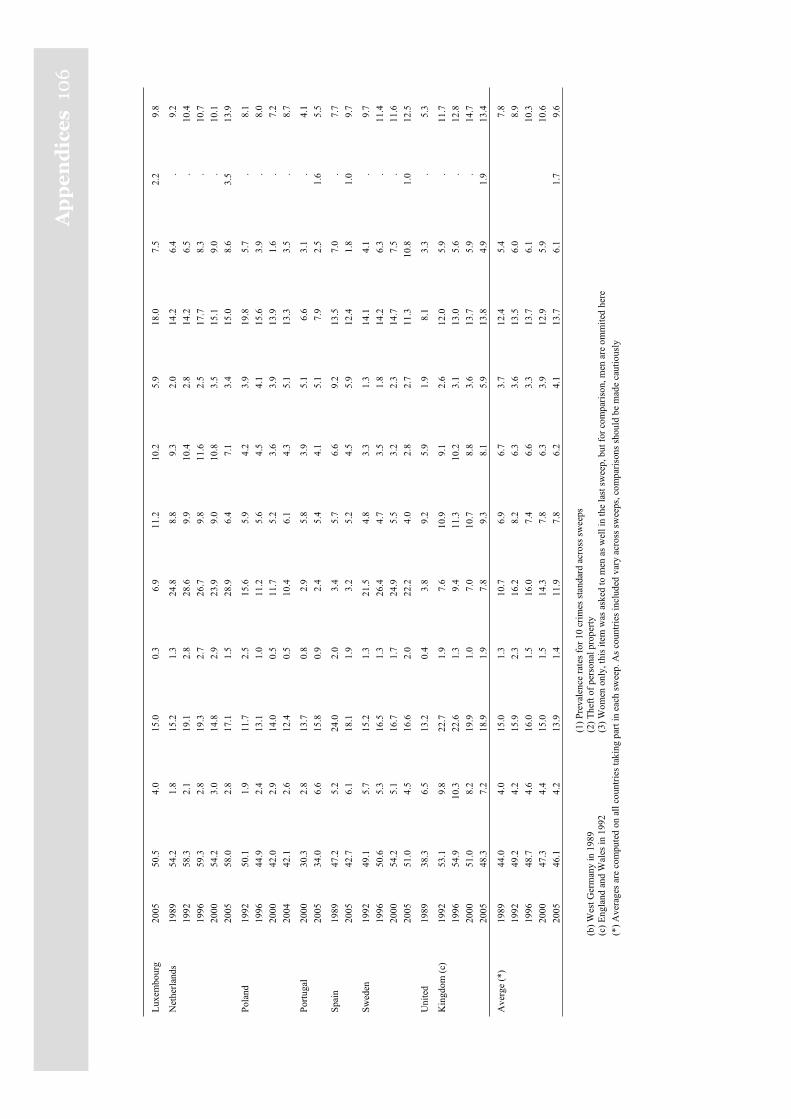
Ap
pe
nd
ice
s10
6
Luxe
mbo
urg
2005
50
.5
4.0
15.0
0.
3 6.
9 11
.2
10.2
5.
9 18
.0
7.5
2.2
9.8
Net
herla
nds
1989
54
.2
1.8
15.2
1.
3 24
.8
8.8
9.3
2.0
14.2
6.
4 .
9.2
19
92
58.3
2.
1 19
.1
2.8
28.6
9.
9 10
.4
2.8
14.2
6.
5 .
10.4
1996
59
.3
2.8
19.3
2.
7 26
.7
9.8
11.6
2.
5 17
.7
8.3
. 10
.7
20
00
54.2
3.
0 14
.8
2.9
23.9
9.
0 10
.8
3.5
15.1
9.
0 .
10.1
2005
58
.0
2.8
17.1
1.
5 28
.9
6.4
7.1
3.4
15.0
8.
6 3.
5 13
.9
Pola
nd
1992
50
.1
1.9
11.7
2.
5 15
.6
5.9
4.2
3.9
19.8
5.
7 .
8.1
19
96
44.9
2.
4 13
.1
1.0
11.2
5.
6 4.
5 4.
1 15
.6
3.9
. 8.
0
2000
42
.0
2.9
14.0
0.
5 11
.7
5.2
3.6
3.9
13.9
1.
6 .
7.2
20
04
42.1
2.
6 12
.4
0.5
10.4
6.
1 4.
3 5.
1 13
.3
3.5
. 8.
7
Portu
gal
2000
30
.3
2.8
13.7
0.
8 2.
9 5.
8 3.
9 5.
1 6.
6 3.
1 .
4.1
20
05
34.0
6.
6 15
.8
0.9
2.4
5.4
4.1
5.1
7.9
2.5
1.6
5.5
Spai
n 19
89
47.2
5.
2 24
.0
2.0
3.4
5.7
6.6
9.2
13.5
7.
0 .
7.7
20
05
42.7
6.
1 18
.1
1.9
3.2
5.2
4.5
5.9
12.4
1.
8 1.
0 9.
7
Swed
en
1992
49
.1
5.7
15.2
1.
3 21
.5
4.8
3.3
1.3
14.1
4.
1 .
9.7
19
96
50.6
5.
3 16
.5
1.3
26.4
4.
7 3.
5 1.
8 14
.2
6.3
. 11
.4
20
00
54.2
5.
1 16
.7
1.7
24.9
5.
5 3.
2 2.
3 14
.7
7.5
. 11
.6
20
05
51.0
4.
5 16
.6
2.0
22.2
4.
0 2.
8 2.
7 11
.3
10.8
1.
0 12
.5
Uni
ted
19
89
38.3
6.
5 13
.2
0.4
3.8
9.2
5.9
1.9
8.1
3.3
. 5.
3
Kin
gdom
(c)
1992
53
.1
9.8
22.7
1.
9 7.
6 10
.9
9.1
2.6
12.0
5.
9 .
11.7
1996
54
.9
10.3
22
.6
1.3
9.4
11.3
10
.2
3.1
13.0
5.
6 .
12.8
2000
51
.0
8.2
19.9
1.
0 7.
0 10
.7
8.8
3.6
13.7
5.
9 .
14.7
2005
48
.3
7.2
18.9
1.
9 7.
8 9.
3 8.
1 5.
9 13
.8
4.9
1.9
13.4
Ave
rge
(*)
1989
44
.0
4.0
15.0
1.
3 10
.7
6.9
6.7
3.7
12.4
5.
4
7.8
19
92
49.2
4.
2 15
.9
2.3
16.2
8.
2 6.
3 3.
6 13
.5
6.0
8.
9
1996
48
.7
4.6
16.0
1.
5 16
.0
7.4
6.6
3.3
13.7
6.
1
10.3
2000
47
.3
4.4
15.0
1.
5 14
.3
7.8
6.3
3.9
12.9
5.
9
10.6
2005
46
.1
4.2
13.9
1.
4 11
.9
7.8
6.2
4.1
13.7
6.
1 1.
7 9.
6
(b) W
est G
erm
any
in 1
989
(c) E
ngla
nd a
nd W
ales
in 1
992
(1) P
reva
lenc
e ra
tes f
or 1
0 cr
imes
stan
dard
acr
oss s
wee
ps
(2) T
heft
of p
erso
nal p
rope
rty
(3) W
omen
onl
y, th
is it
em w
as a
sked
to m
en a
s wel
l in
the
last
swee
p, b
ut fo
r com
paris
on, m
en a
re o
mm
ited
here
(*) A
vera
ges a
re c
ompu
ted
on a
ll co
untri
es ta
king
par
t in
each
swee
p. A
s cou
ntrie
s inc
lude
d va
ry a
cros
s sw
eeps
, com
paris
ons s
houl
d be
mad
e ca
utio
usly
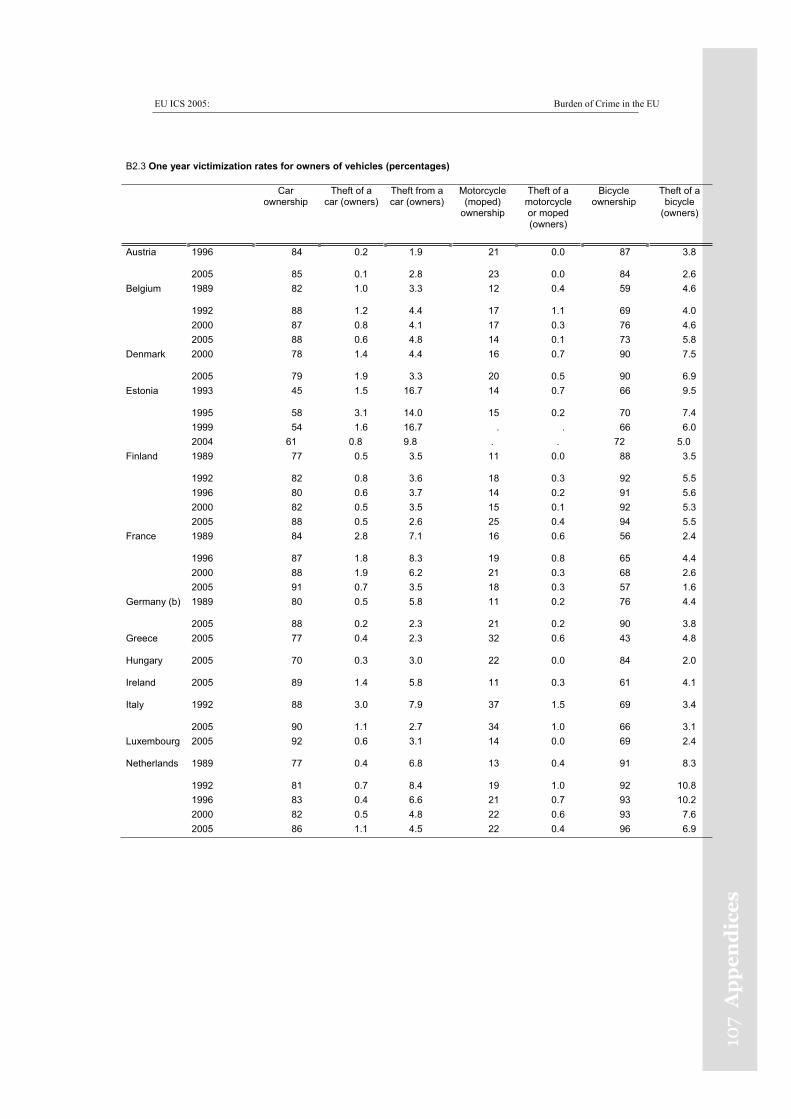
EU ICS 2005: Burden of Crime in the EU
107
Ap
pe
nd
ice
s
B2.3 One year victimization rates for owners of vehicles (percentages)
Car ownership
Theft of a car (owners)
Theft from a car (owners)
Motorcycle (moped)
ownership
Theft of a motorcycle or moped (owners)
Bicycle ownership
Theft of a bicycle
(owners)
Austria 1996 84 0.2 1.9 21 0.0 87 3.8
2005 85 0.1 2.8 23 0.0 84 2.6 Belgium 1989 82 1.0 3.3 12 0.4 59 4.6
1992 88 1.2 4.4 17 1.1 69 4.0 2000 87 0.8 4.1 17 0.3 76 4.6 2005 88 0.6 4.8 14 0.1 73 5.8 Denmark 2000 78 1.4 4.4 16 0.7 90 7.5
2005 79 1.9 3.3 20 0.5 90 6.9 Estonia 1993 45 1.5 16.7 14 0.7 66 9.5
1995 58 3.1 14.0 15 0.2 70 7.4 1999 54 1.6 16.7 . . 66 6.0 2004 61 0.8 9.8 . . 72 5.0 Finland 1989 77 0.5 3.5 11 0.0 88 3.5
1992 82 0.8 3.6 18 0.3 92 5.5 1996 80 0.6 3.7 14 0.2 91 5.6 2000 82 0.5 3.5 15 0.1 92 5.3 2005 88 0.5 2.6 25 0.4 94 5.5 France 1989 84 2.8 7.1 16 0.6 56 2.4
1996 87 1.8 8.3 19 0.8 65 4.4 2000 88 1.9 6.2 21 0.3 68 2.6 2005 91 0.7 3.5 18 0.3 57 1.6 Germany (b) 1989 80 0.5 5.8 11 0.2 76 4.4
2005 88 0.2 2.3 21 0.2 90 3.8 Greece 2005 77 0.4 2.3 32 0.6 43 4.8
Hungary 2005 70 0.3 3.0 22 0.0 84 2.0
Ireland 2005 89 1.4 5.8 11 0.3 61 4.1
Italy 1992 88 3.0 7.9 37 1.5 69 3.4
2005 90 1.1 2.7 34 1.0 66 3.1 Luxembourg 2005 92 0.6 3.1 14 0.0 69 2.4
Netherlands 1989 77 0.4 6.8 13 0.4 91 8.3
1992 81 0.7 8.4 19 1.0 92 10.8 1996 83 0.4 6.6 21 0.7 93 10.2 2000 82 0.5 4.8 22 0.6 93 7.6 2005 86 1.1 4.5 22 0.4 96 6.9
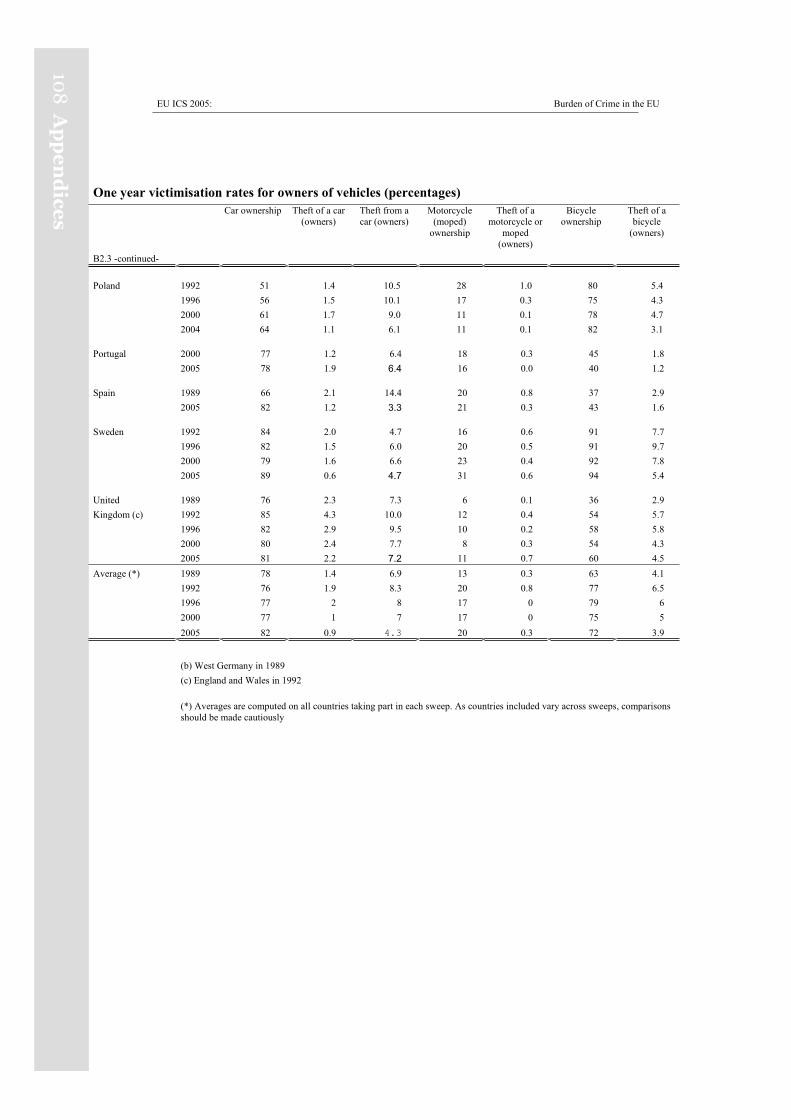
EU ICS 2005: Burden of Crime in the EU
108
Ap
pe
nd
ices
One year victimisation rates for owners of vehicles (percentages)
B2.3 -continued-
Car ownership Theft of a car (owners)
Theft from a car (owners)
Motorcycle (moped)
ownership
Theft of a motorcycle or
moped (owners)
Bicycle ownership
Theft of a bicycle
(owners)
Poland 1992 51 1.4 10.5 28 1.0 80 5.4 1996 56 1.5 10.1 17 0.3 75 4.3 2000 61 1.7 9.0 11 0.1 78 4.7 2004 64 1.1 6.1 11 0.1 82 3.1
Portugal 2000 77 1.2 6.4 18 0.3 45 1.8 2005 78 1.9 6.4 16 0.0 40 1.2
Spain 1989 66 2.1 14.4 20 0.8 37 2.9 2005 82 1.2 3.3 21 0.3 43 1.6
Sweden 1992 84 2.0 4.7 16 0.6 91 7.7 1996 82 1.5 6.0 20 0.5 91 9.7 2000 79 1.6 6.6 23 0.4 92 7.8 2005 89 0.6 4.7 31 0.6 94 5.4
United 1989 76 2.3 7.3 6 0.1 36 2.9 Kingdom (c) 1992 85 4.3 10.0 12 0.4 54 5.7 1996 82 2.9 9.5 10 0.2 58 5.8 2000 80 2.4 7.7 8 0.3 54 4.3 2005 81 2.2 7.2 11 0.7 60 4.5 Average (*) 1989 78 1.4 6.9 13 0.3 63 4.1 1992 76 1.9 8.3 20 0.8 77 6.5 1996 77 2 8 17 0 79 6 2000 77 1 7 17 0 75 5 2005 82 0.9 4.3 20 0.3 72 3.9
(b) West Germany in 1989 (c) England and Wales in 1992
(*) Averages are computed on all countries taking part in each sweep. As countries included vary across sweeps, comparisons should be made cautiously
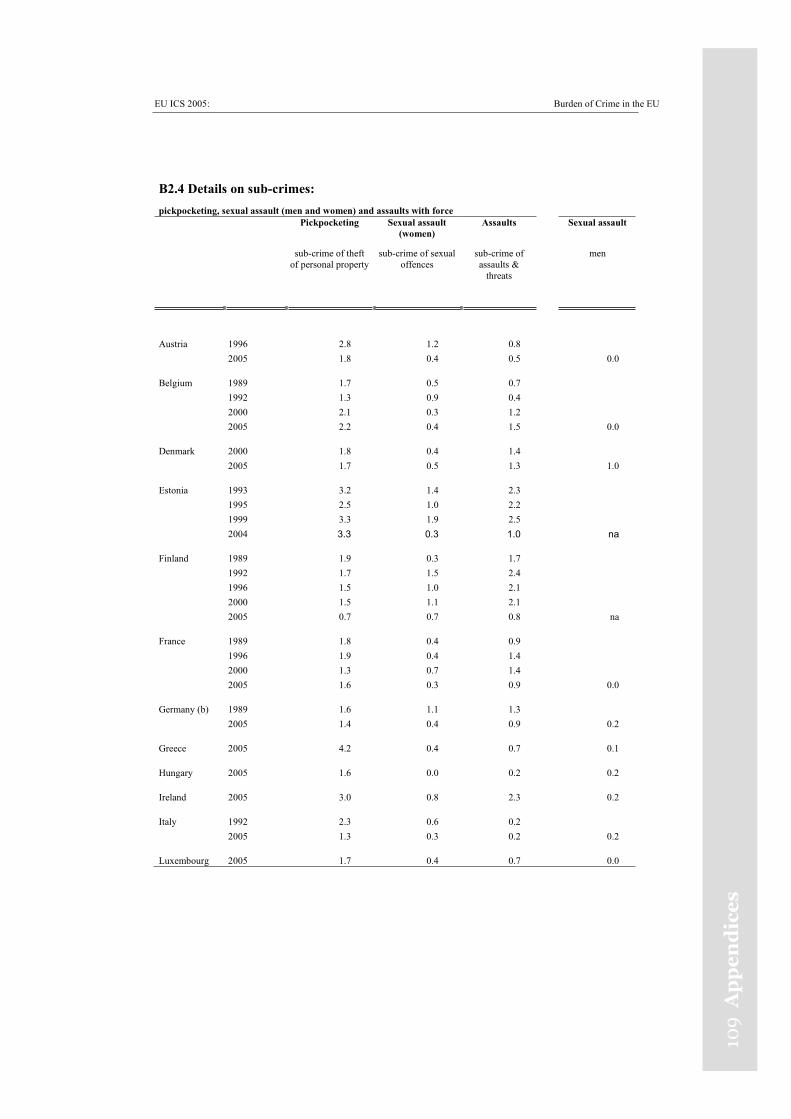
EU ICS 2005: Burden of Crime in the EU
109
Ap
pe
nd
ice
s
B2.4 Details on sub-crimes: pickpocketing, sexual assault (men and women) and assaults with force
Pickpocketing Sexual assault (women)
Assaults Sexual assault
sub-crime of theft of personal property
sub-crime of sexual offences
sub-crime of assaults &
threats
men
Austria 1996 2.8 1.2 0.8 2005 1.8 0.4 0.5 0.0
Belgium 1989 1.7 0.5 0.7 1992 1.3 0.9 0.4 2000 2.1 0.3 1.2 2005 2.2 0.4 1.5 0.0
Denmark 2000 1.8 0.4 1.4 2005 1.7 0.5 1.3 1.0
Estonia 1993 3.2 1.4 2.3 1995 2.5 1.0 2.2 1999 3.3 1.9 2.5 2004 3.3 0.3 1.0 na
Finland 1989 1.9 0.3 1.7 1992 1.7 1.5 2.4 1996 1.5 1.0 2.1 2000 1.5 1.1 2.1 2005 0.7 0.7 0.8 na
France 1989 1.8 0.4 0.9 1996 1.9 0.4 1.4 2000 1.3 0.7 1.4 2005 1.6 0.3 0.9 0.0
Germany (b) 1989 1.6 1.1 1.3 2005 1.4 0.4 0.9 0.2
Greece 2005 4.2 0.4 0.7 0.1
Hungary 2005 1.6 0.0 0.2 0.2
Ireland 2005 3.0 0.8 2.3 0.2
Italy 1992 2.3 0.6 0.2 2005 1.3 0.3 0.2 0.2
Luxembourg 2005 1.7 0.4 0.7 0.0
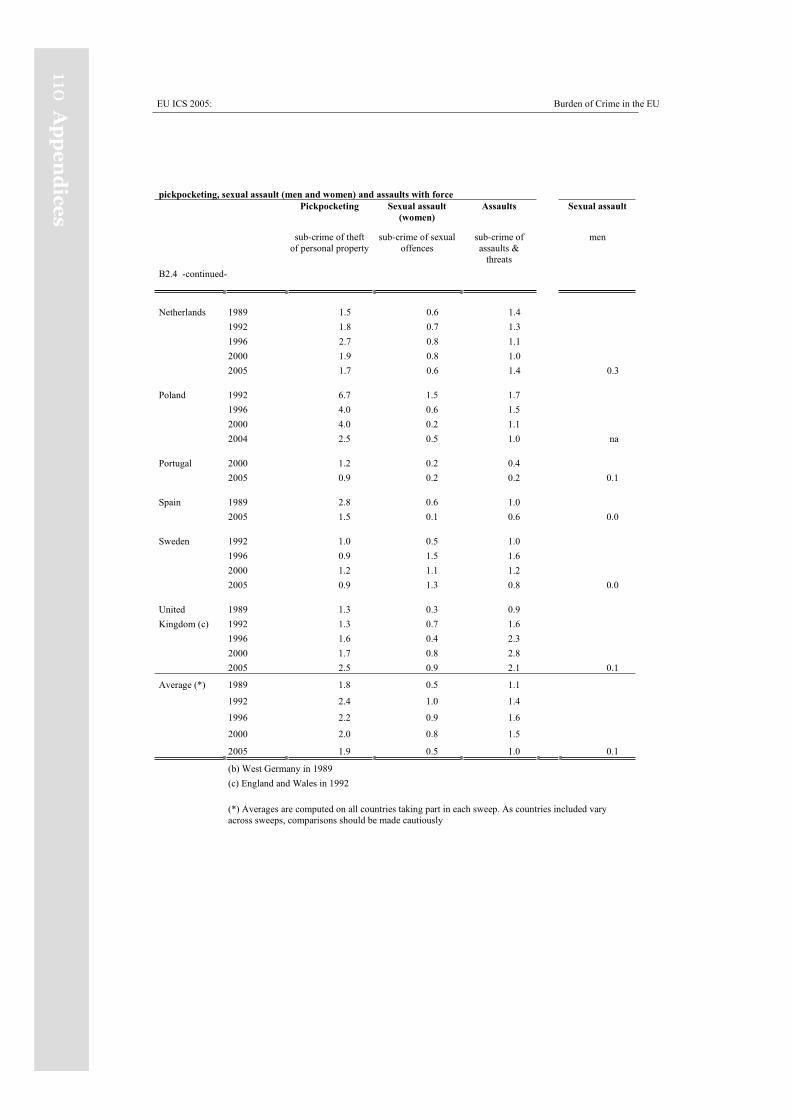
EU ICS 2005: Burden of Crime in the EU
110A
pp
en
dice
s
pickpocketing, sexual assault (men and women) and assaults with force Pickpocketing Sexual assault
(women) Assaults Sexual assault
B2.4 -continued-
sub-crime of theft of personal property
sub-crime of sexual offences
sub-crime of assaults &
threats
men
Netherlands 1989 1.5 0.6 1.4 1992 1.8 0.7 1.3 1996 2.7 0.8 1.1 2000 1.9 0.8 1.0 2005 1.7 0.6 1.4 0.3
Poland 1992 6.7 1.5 1.7 1996 4.0 0.6 1.5 2000 4.0 0.2 1.1 2004 2.5 0.5 1.0 na
Portugal 2000 1.2 0.2 0.4 2005 0.9 0.2 0.2 0.1
Spain 1989 2.8 0.6 1.0 2005 1.5 0.1 0.6 0.0
Sweden 1992 1.0 0.5 1.0 1996 0.9 1.5 1.6 2000 1.2 1.1 1.2 2005 0.9 1.3 0.8 0.0
United 1989 1.3 0.3 0.9 Kingdom (c) 1992 1.3 0.7 1.6 1996 1.6 0.4 2.3 2000 1.7 0.8 2.8 2005 2.5 0.9 2.1 0.1
Average (*) 1989 1.8 0.5 1.1
1992 2.4 1.0 1.4
1996 2.2 0.9 1.6
2000 2.0 0.8 1.5
2005 1.9 0.5 1.0 0.1
(b) West Germany in 1989 (c) England and Wales in 1992
(*) Averages are computed on all countries taking part in each sweep. As countries included vary across sweeps, comparisons should be made cautiously
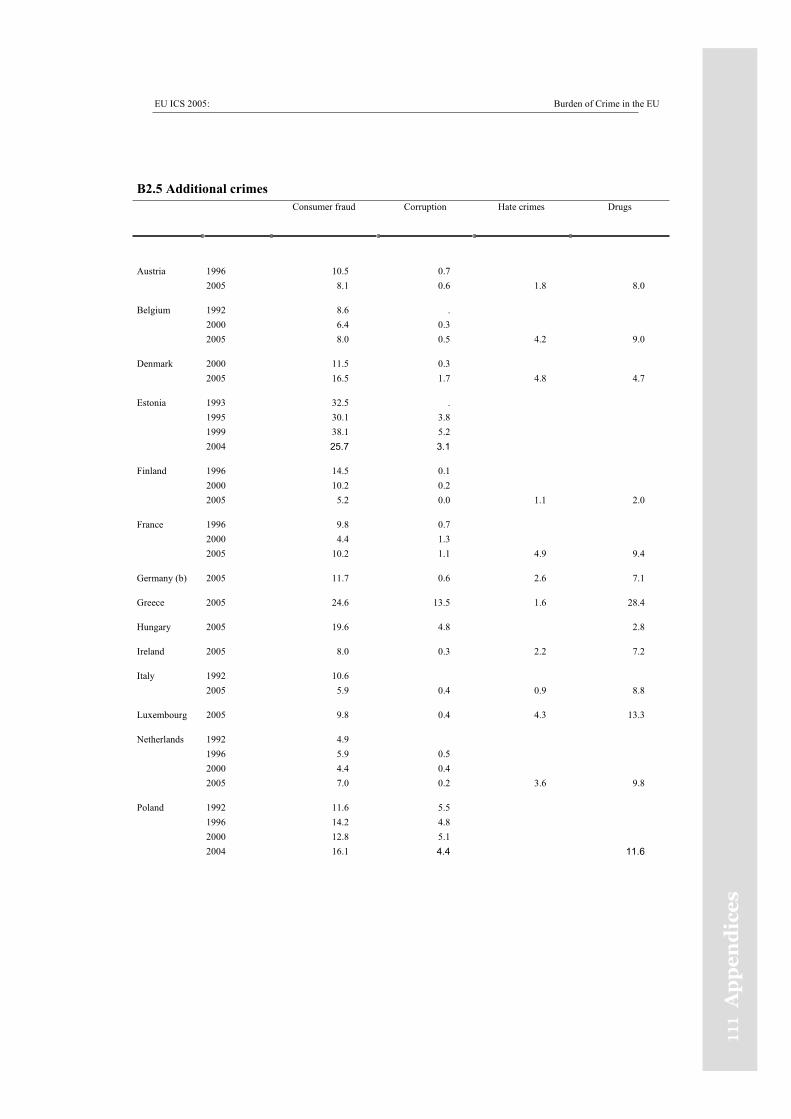
EU ICS 2005: Burden of Crime in the EU
111
Ap
pe
nd
ice
s
B2.5 Additional crimes Consumer fraud Corruption Hate crimes Drugs
Austria 1996 10.5 0.7 2005 8.1 0.6 1.8 8.0
Belgium 1992 8.6 . 2000 6.4 0.3 2005 8.0 0.5 4.2 9.0
Denmark 2000 11.5 0.3 2005 16.5 1.7 4.8 4.7
Estonia 1993 32.5 . 1995 30.1 3.8 1999 38.1 5.2 2004 25.7 3.1
Finland 1996 14.5 0.1 2000 10.2 0.2 2005 5.2 0.0 1.1 2.0
France 1996 9.8 0.7 2000 4.4 1.3 2005 10.2 1.1 4.9 9.4
Germany (b) 2005 11.7 0.6 2.6 7.1
Greece 2005 24.6 13.5 1.6 28.4
Hungary 2005 19.6 4.8 2.8
Ireland 2005 8.0 0.3 2.2 7.2
Italy 1992 10.6 2005 5.9 0.4 0.9 8.8
Luxembourg 2005 9.8 0.4 4.3 13.3
Netherlands 1992 4.9 1996 5.9 0.5 2000 4.4 0.4 2005 7.0 0.2 3.6 9.8
Poland 1992 11.6 5.5 1996 14.2 4.8 2000 12.8 5.1 2004 16.1 4.4 11.6
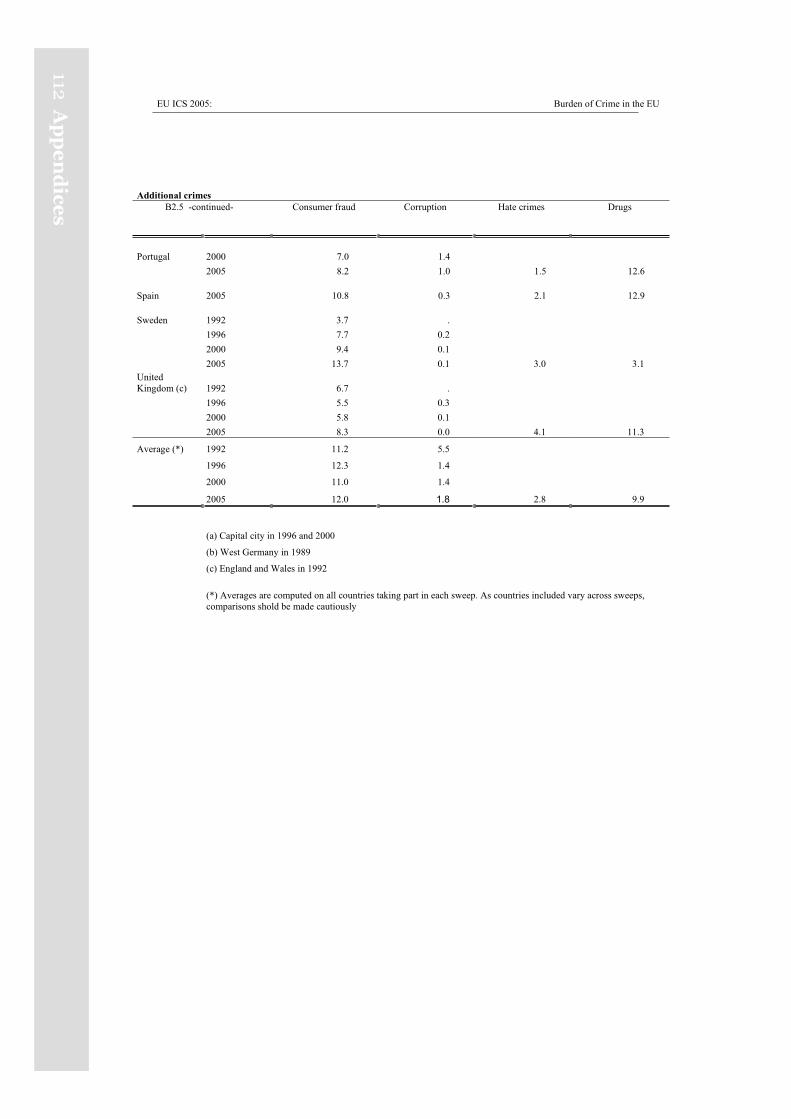
EU ICS 2005: Burden of Crime in the EU
112 Ap
pe
nd
ices
Additional crimes B2.5 -continued- Consumer fraud Corruption Hate crimes Drugs
Portugal 2000 7.0 1.4 2005 8.2 1.0 1.5 12.6
Spain 2005 10.8 0.3 2.1 12.9
Sweden 1992 3.7 . 1996 7.7 0.2 2000 9.4 0.1 2005 13.7 0.1 3.0 3.1 United Kingdom (c) 1992 6.7 . 1996 5.5 0.3 2000 5.8 0.1 2005 8.3 0.0 4.1 11.3
Average (*) 1992 11.2 5.5
1996 12.3 1.4
2000 11.0 1.4
2005 12.0 1.8 2.8 9.9
(a) Capital city in 1996 and 2000
(b) West Germany in 1989
(c) England and Wales in 1992
(*) Averages are computed on all countries taking part in each sweep. As countries included vary across sweeps, comparisons shold be made cautiously

EU ICS 2005: Burden of Crime in the EU
113
Ap
pe
nd
ice
s
Appendix C: Additional tables for Chapter 3
C3.1 police
Reporting burglary to the police Satisfied with report Police doing a good job
C3.2 Risk and fear of crime Likelihood of burglary next year - percentage replying likely of very likely Percentage that feels unsafe on the streets after dark in local area
Preventive measures against burglary Percentage of household with a burglar alarm Percentage of households with special door locks
Punishment in case of a recidivist burglar Percentage preferring a prison sentence Percentage preferring a community service
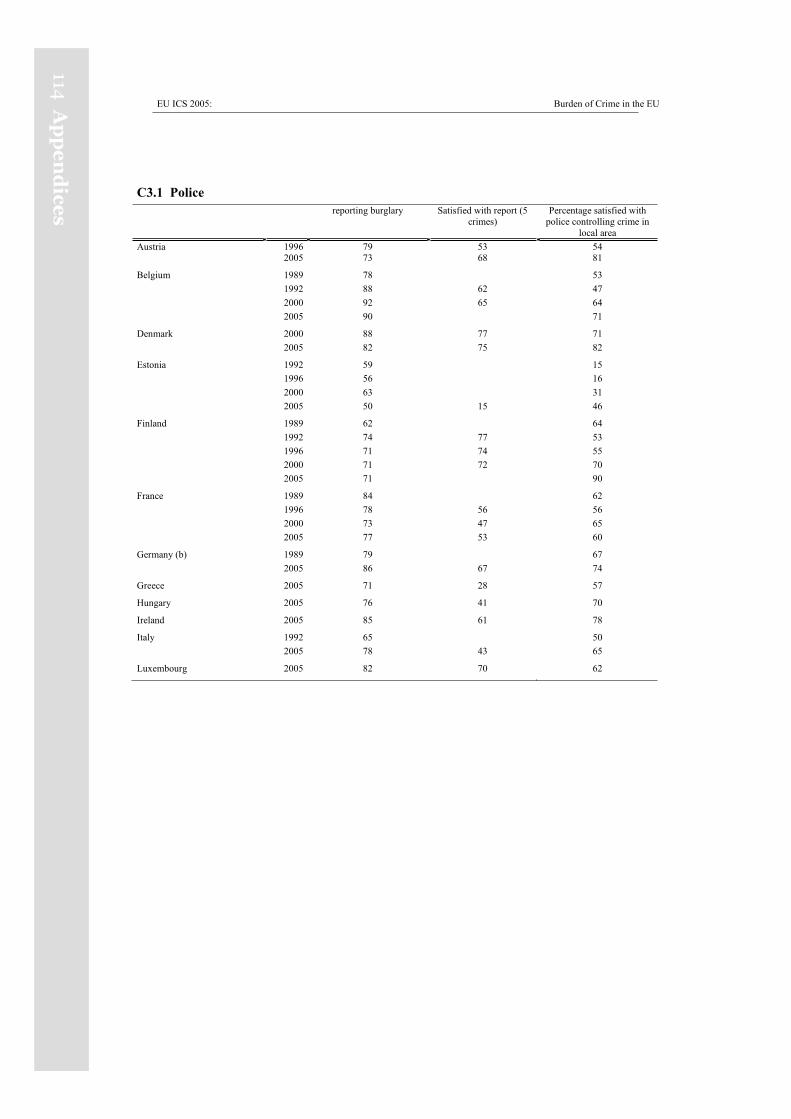
EU ICS 2005: Burden of Crime in the EU
114A
pp
en
dice
s
C3.1 Police reporting burglary Satisfied with report (5
crimes) Percentage satisfied with
police controlling crime in local area
Austria 1996 79 53 54 2005 73 68 81
Belgium 1989 78 53 1992 88 62 47 2000 92 65 64 2005 90 71
Denmark 2000 88 77 71 2005 82 75 82
Estonia 1992 59 15 1996 56 16 2000 63 31 2005 50 15 46
Finland 1989 62 64 1992 74 77 53 1996 71 74 55 2000 71 72 70 2005 71 90
France 1989 84 62 1996 78 56 56 2000 73 47 65 2005 77 53 60
Germany (b) 1989 79 67 2005 86 67 74
Greece 2005 71 28 57
Hungary 2005 76 41 70
Ireland 2005 85 61 78
Italy 1992 65 50 2005 78 43 65
Luxembourg 2005 82 70 62
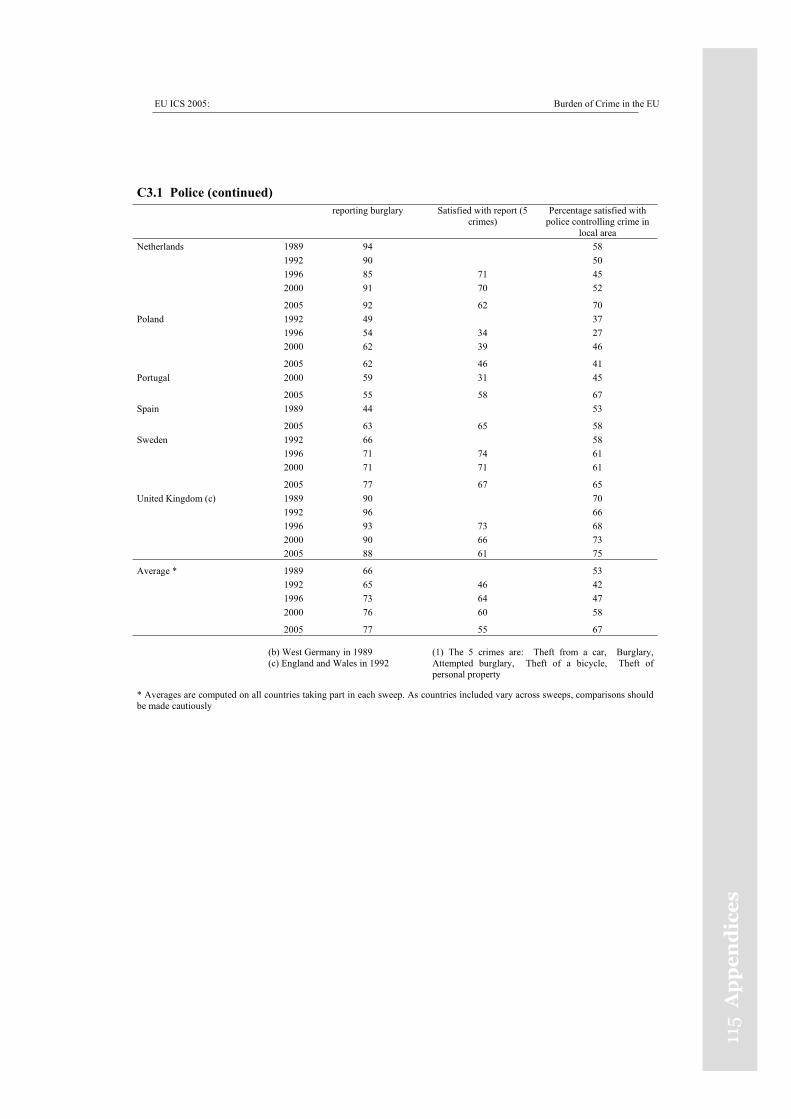
EU ICS 2005: Burden of Crime in the EU
115
Ap
pe
nd
ice
s
C3.1 Police (continued) reporting burglary Satisfied with report (5
crimes) Percentage satisfied with
police controlling crime in local area
Netherlands 1989 94 58 1992 90 50 1996 85 71 45 2000 91 70 52
2005 92 62 70 Poland 1992 49 37 1996 54 34 27 2000 62 39 46
2005 62 46 41 Portugal 2000 59 31 45
2005 55 58 67 Spain 1989 44 53
2005 63 65 58 Sweden 1992 66 58 1996 71 74 61 2000 71 71 61
2005 77 67 65 United Kingdom (c) 1989 90 70 1992 96 66 1996 93 73 68 2000 90 66 73 2005 88 61 75
Average * 1989 66 53 1992 65 46 42 1996 73 64 47 2000 76 60 58
2005 77 55 67
(b) West Germany in 1989 (c) England and Wales in 1992
(1) The 5 crimes are: Theft from a car, Burglary, Attempted burglary, Theft of a bicycle, Theft of personal property
* Averages are computed on all countries taking part in each sweep. As countries included vary across sweeps, comparisons shouldbe made cautiously
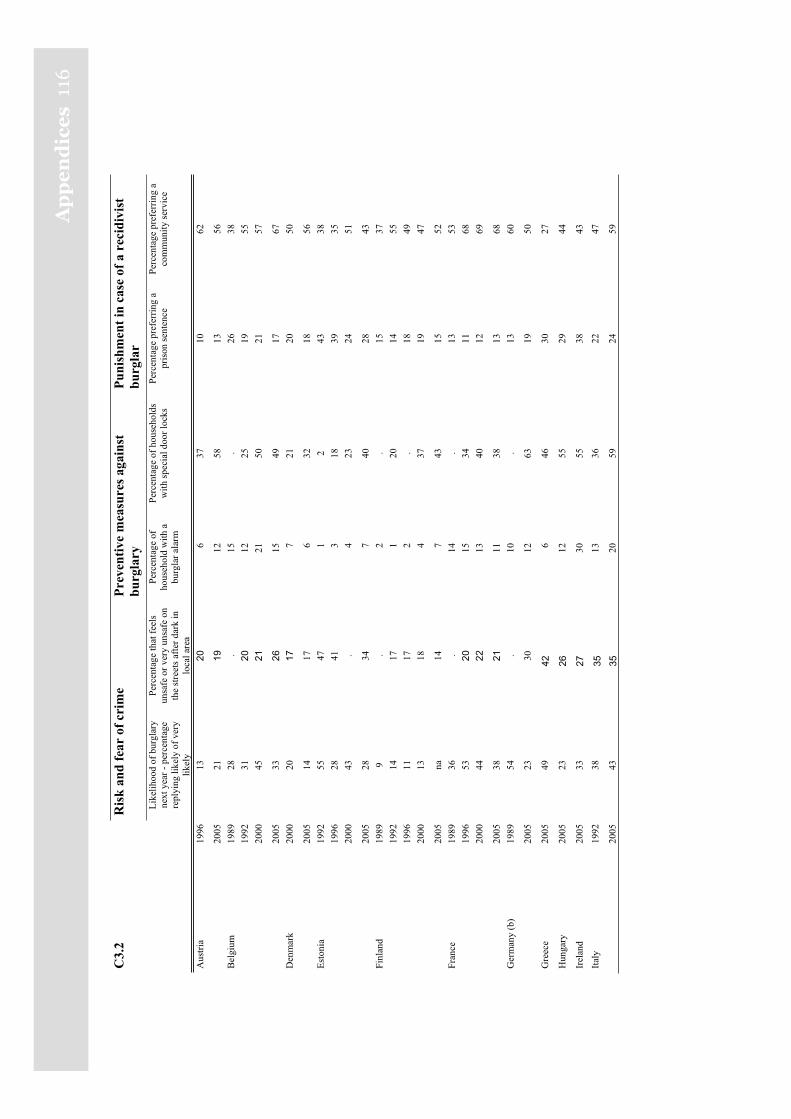
Ap
pe
nd
ice
s11
6
C3.
2
Ris
k an
d fe
ar o
f cri
me
Prev
entiv
e m
easu
res a
gain
st
burg
lary
Pu
nish
men
t in
case
of a
rec
idiv
ist
burg
lar
Like
lihoo
d of
bur
glar
y ne
xt y
ear -
per
cent
age
repl
ying
like
ly o
f ver
y lik
ely
Perc
enta
ge th
at fe
els
unsa
fe o
r ver
y un
safe
on
the
stre
ets a
fter d
ark
in
loca
l are
a
Perc
enta
ge o
f ho
useh
old
with
a
burg
lar a
larm
Perc
enta
ge o
f hou
seho
lds
with
spec
ial d
oor l
ocks
Pe
rcen
tage
pre
ferr
ing
a pr
ison
sent
ence
Pe
rcen
tage
pre
ferr
ing
a co
mm
unity
serv
ice
Aus
tria
1996
13
20
637
10
62
20
05
21
1912
58
13
56
B
elgi
um
1989
28
.
15
. 26
38
1992
31
20
12
25
19
55
20
00
45
2121
50
21
57
20
05
33
2615
49
17
67
D
enm
ark
2000
20
17
7 21
20
50
20
05
14
17
6 32
18
56
Es
toni
a 19
92
55
47
1 2
43
38
19
96
28
41
3 18
39
35
2000
43
.
4 23
24
51
20
05
28
34
7 40
28
43
Fi
nlan
d 19
89
9 .
2 .
15
37
19
92
14
17
1 20
14
55
1996
11
17
2
. 18
49
2000
13
18
4
37
19
47
20
05
na
14
7 43
15
52
Fr
ance
19
89
36
. 14
.
13
53
19
96
53
2015
34
11
68
2000
44
22
13
40
12
69
20
05
38
2111
38
13
68
G
erm
any
(b)
1989
54
.
10
. 13
60
20
05
23
30
12
63
19
50
Gre
ece
2005
49
42
6 46
30
27
Hun
gary
20
05
23
2612
55
29
44
Irel
and
2005
33
27
30
55
38
43
Italy
19
92
38
3513
36
22
47
20
05
43
3520
59
24
59
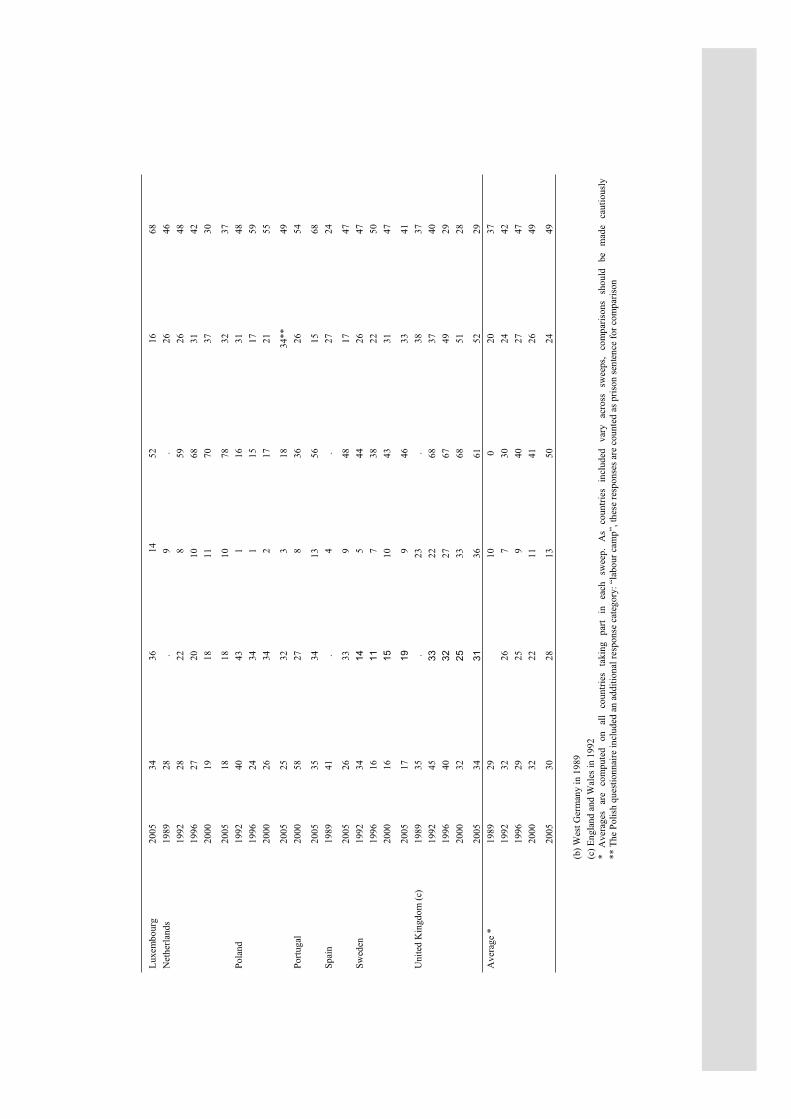
Luxe
mbo
urg
2005
34
36
14
52
16
68
N
ethe
rland
s 19
89
28
. 9
. 26
46
1992
28
22
8
59
26
48
19
96
27
20
10
68
31
42
20
00
19
18
11
70
37
30
20
05
18
18
10
78
32
37
Pola
nd
1992
40
43
1
16
31
48
19
96
24
34
1 15
17
59
2000
26
34
2
17
21
55
20
05
25
32
3 18
34
**
49
Portu
gal
2000
58
27
8
36
26
54
20
05
35
34
13
56
15
68
Spai
n 19
89
41
. 4
. 27
24
20
05
26
33
9 48
17
47
Sw
eden
19
92
34
145
44
26
47
19
96
16
117
38
22
50
20
00
16
1510
43
31
47
20
05
17
199
46
33
41
Uni
ted
Kin
gdom
(c)
1989
35
.
23
. 38
37
1992
45
33
22
68
37
40
19
96
40
3227
67
49
29
2000
32
25
33
68
51
28
20
05
34
3136
61
52
29
A
vera
ge *
19
89
29
10
0
20
37
19
92
32
26
7 30
24
42
1996
29
25
9
40
27
47
20
00
32
22
11
41
26
49
20
05
30
28
13
50
24
49
(b
) Wes
t Ger
man
y in
198
9
(c) E
ngla
nd a
nd W
ales
in 1
992
* A
vera
ges
are
com
pute
d on
al
l co
untri
es
taki
ng
part
in
each
sw
eep.
A
s co
untri
es
incl
uded
va
ry
acro
ss
swee
ps,
com
paris
ons
shou
ld
be
mad
e ca
utio
usly
** T
he P
olis
h qu
estio
nnai
re in
clud
ed a
n ad
ditio
nal r
espo
nse
cate
gory
: “la
bour
cam
p”, t
hese
resp
onse
s are
cou
nted
as p
rison
sent
ence
for c
ompa
rison
EU ICS 2005: Burden of Crime in the EU
118 A
pp
en
dice
s
Appendix D: Telescoping effect in EU ICS
The ICVS (International Crime Victimisation Survey, predecessor to the EU ICS) fieldwork was largely executed within the first three months of the year, although there have been exceptions. In the current study fieldwork was planned for January-February 2005. Due to administrative delays fieldwork in most countries did not commence before May/June 2005. Interviewing later in the year may have posed special problems. The delayed fieldwork may have resulted into more forward time-telescoping in countries where the interviews were executed latest. This factor may then have compromised comparability of one-year victimisation rates by deflating the 2004 victimisation rates of these countries. Focused analyses of response patterns were conducted to assess the possible magnitude of such effects.
In order to better understand the problem of telescoping, we present how the specific annual victimization rate questions in EU ICS (and previously in the various IVCS waves) were constructed.
First, EU ICS asks about each crime if they happened in the past five years. If the respondent gives an affirmative answer, the question goes on asking which year has the actual victimization happened: this year, last calendar year, or earlier. Interviewers are instructed to record multiple victimizations with at least one occurrence in the past calendar year as “past calendar year” – the question does not allow multiple answers.
The key in telescoping is of course the focus on past calendar year, instead of the previous 12 months. Interviews past January are suspected to be more and more prone to memory effects, however the direction of these effects are not always clear, as we will show. Principally, in a situation of stable (or decreasing) crime rates, victimisation rates for the first six months of 2005 should not be higher than half the rates for 2004. Comparatively high 2005 rates may indicate that older incidents may have been forward “telescoped” into 2005 and/or that minor incidents from 2004 have been altogether forgotten.
To correct for possible distortions from forward time telescoping or memory decay, victimisations placed in the current year (2005) were added to victimisations placed in the reference year (2004) and divided by the total number of months in both years together. Using this averaged monthly rate, corrected 2004 rates were calculated for all countries, for all crimes, and for each crime type separately.
The graph on the next page shows an overall summary of the findings. In short, we do not find any clear evidence to forward telescoping (or forward telescoping of even earlier experiences balance out the effect the forward telescoping from past to current year).
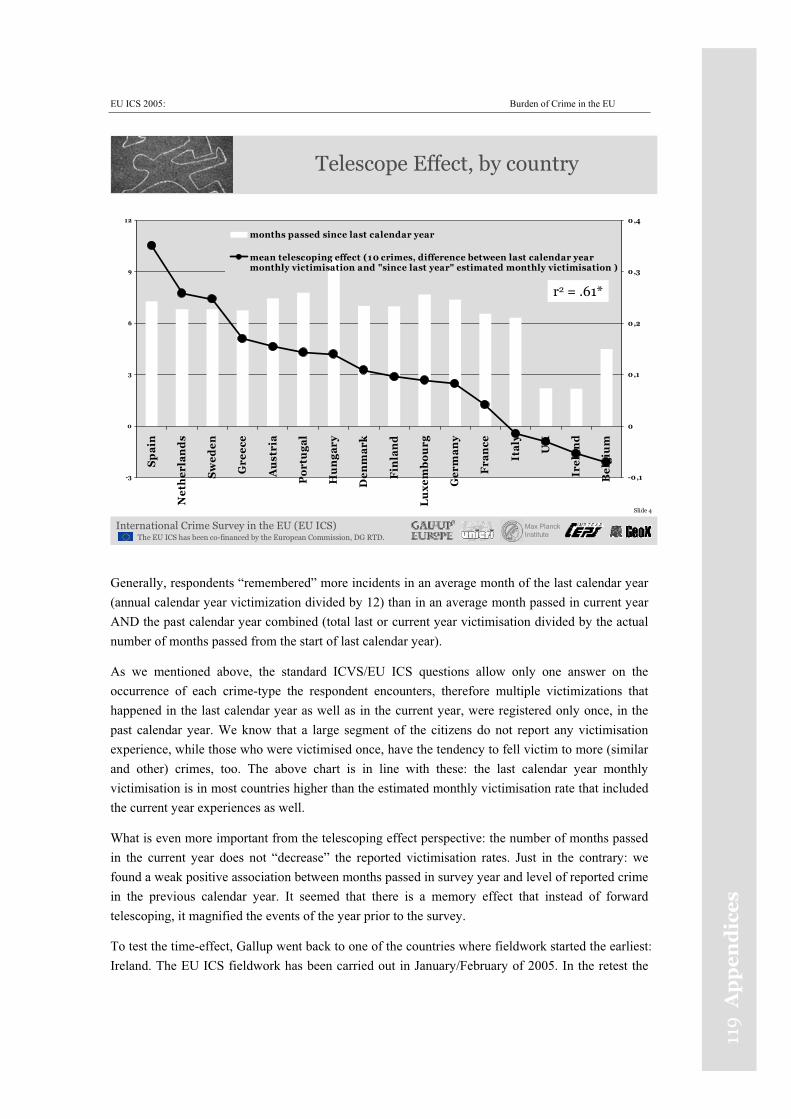
EU ICS 2005: Burden of Crime in the EU
119
Ap
pe
nd
ice
s
Slide 4
International Crime Survey in the EU (EU ICS)The EU ICS has been co-financed by the European Commission, DG RTD.
Max PlanckInstitute
Telescope Effect, by country
-3
0
3
6
9
12
Sp
ain
Ne
the
rla
nd
s
Sw
ed
en
Gre
ece
Au
stri
a
Po
rtu
ga
l
Hu
ng
ary
De
nm
ark
Fin
lan
d
Lu
xe
mb
ou
rg
Ge
rma
ny
Fra
nce
Ita
ly
UK
Ire
lan
d
Be
lgiu
m
-0,1
0
0,1
0,2
0,3
0,4
months passed since last calendar year
mean telescoping effect (10 crimes, difference between last calendar yearmonthly victimisation and "since last year" estimated monthly victimisation )
r2 = .61*
Generally, respondents “remembered” more incidents in an average month of the last calendar year (annual calendar year victimization divided by 12) than in an average month passed in current year AND the past calendar year combined (total last or current year victimisation divided by the actual number of months passed from the start of last calendar year).
As we mentioned above, the standard ICVS/EU ICS questions allow only one answer on the occurrence of each crime-type the respondent encounters, therefore multiple victimizations that happened in the last calendar year as well as in the current year, were registered only once, in the past calendar year. We know that a large segment of the citizens do not report any victimisation experience, while those who were victimised once, have the tendency to fell victim to more (similar and other) crimes, too. The above chart is in line with these: the last calendar year monthly victimisation is in most countries higher than the estimated monthly victimisation rate that included the current year experiences as well.
What is even more important from the telescoping effect perspective: the number of months passed in the current year does not “decrease” the reported victimisation rates. Just in the contrary: we found a weak positive association between months passed in survey year and level of reported crime in the previous calendar year. It seemed that there is a memory effect that instead of forward telescoping, it magnified the events of the year prior to the survey.
To test the time-effect, Gallup went back to one of the countries where fieldwork started the earliest: Ireland. The EU ICS fieldwork has been carried out in January/February of 2005. In the retest the
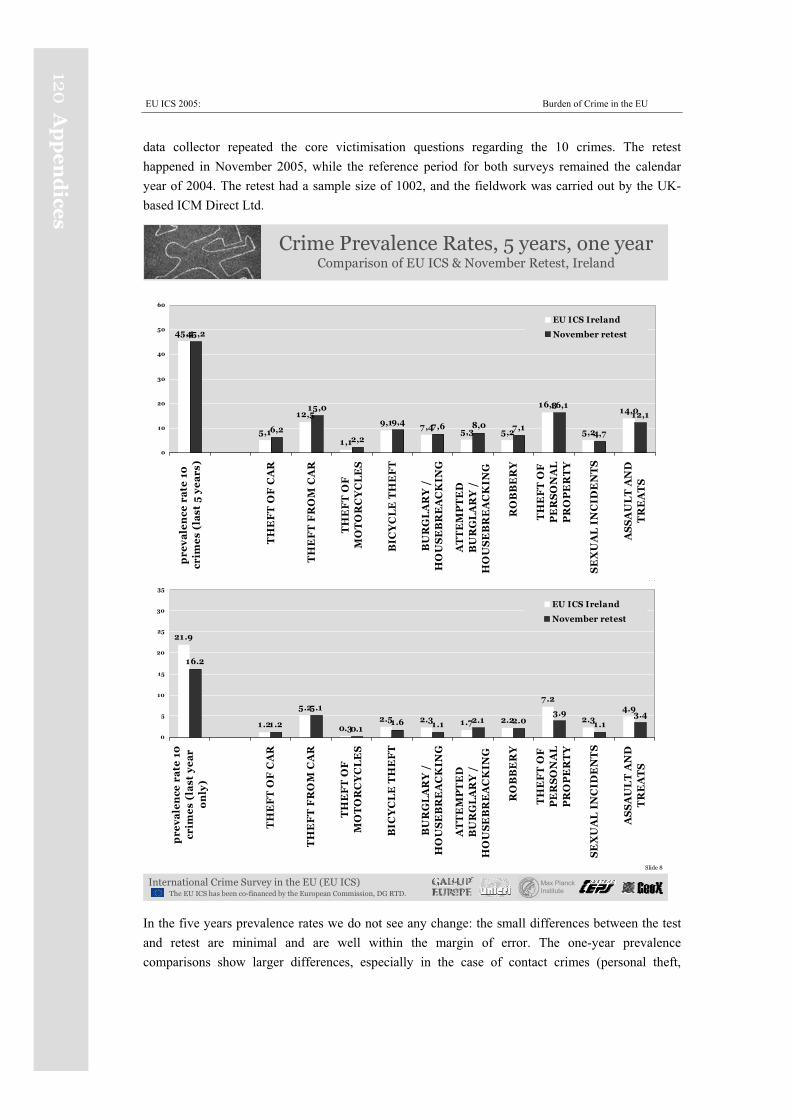
EU ICS 2005: Burden of Crime in the EU
120A
pp
en
dice
s
data collector repeated the core victimisation questions regarding the 10 crimes. The retest happened in November 2005, while the reference period for both surveys remained the calendar year of 2004. The retest had a sample size of 1002, and the fieldwork was carried out by the UK-based ICM Direct Ltd.
Slid
Crime Prevalence Rates, 5 years, one yearComparison of EU ICS & November Retest, Ireland
45,4
5,1
12,5
1,1
9,1 7,4 5,3 5,2
16,3
5,2
14,0
45,2
6,2
15,0
2,2
9,4 7,6 8,0 7,1
16,1
4,7
12,1
0
10
20
30
40
50
60
pre
va
len
ce r
ate
10
crim
es
(la
st 5
ye
ars
)
TH
EF
T O
F C
AR
TH
EF
T F
RO
M C
AR
TH
EF
T O
FM
OT
OR
CY
CL
ES
BIC
YC
LE
TH
EF
T
BU
RG
LA
RY
/H
OU
SE
BR
EA
CK
ING
AT
TE
MP
TE
DB
UR
GL
AR
Y /
HO
US
EB
RE
AC
KIN
G
RO
BB
ER
Y
TH
EF
T O
FP
ER
SO
NA
LP
RO
PE
RT
Y
SE
XU
AL
IN
CID
EN
TS
AS
SA
UL
T A
ND
TR
EA
TS
EU ICS Ireland
November retest
Slide 8
International Crime Survey in the EU (EU ICS)The EU ICS has been co-financed by the European Commission, DG RTD.
Max PlanckInstitute
21.9
1.2
5.2
0.32.5 2.3 1.7 2.2
7.2
2.34.9
16.2
1.2
5.1
0.11.6 1.1 2.1 2.0
3.91.1
3.4
0
5
10
15
20
25
30
35
pre
va
len
ce r
ate
10
crim
es
(la
st y
ea
ro
nly
)
TH
EF
T O
F C
AR
TH
EF
T F
RO
M C
AR
TH
EF
T O
FM
OT
OR
CY
CL
ES
BIC
YC
LE
TH
EF
T
BU
RG
LA
RY
/H
OU
SE
BR
EA
CK
ING
AT
TE
MP
TE
DB
UR
GL
AR
Y /
HO
US
EB
RE
AC
KIN
G
RO
BB
ER
Y
TH
EF
T O
FP
ER
SO
NA
LP
RO
PE
RT
Y
SE
XU
AL
IN
CID
EN
TS
AS
SA
UL
T A
ND
TR
EA
TS
EU ICS Ireland
November retest
In the five years prevalence rates we do not see any change: the small differences between the test and retest are minimal and are well within the margin of error. The one-year prevalence comparisons show larger differences, especially in the case of contact crimes (personal theft,
EU ICS 2005: Burden of Crime in the EU
121
Ap
pe
nd
ice
s
assaults-threats, sexual incidents). In the retest we found a lower annual rate for each of these crimes, especially in the case of assaults and threats. This is the indication of a possible memory decay that occurs in relation to crimes of lesser importance; we slowly forget about being threatened by someone. Similarly, we do not necessary store the memories of small thefts for a long time.
But as far as the more serious crime types are involved (theft of a more significant property such as car, or other vehicle, robbery, burglary, etc.) memory effects do not play a role, the measured levels almost exactly matched those from January.
The charts also show that the classic forward telescoping scenario, when people report disproportional high crime experience for one year compared to five years: instead of the 1:5 ratio35 – or less, as we currently witness decreasing crime experience throughout Europe – on average, we rather find a 1:3 ratio of the annual victimisation and the five year victimisation experience.
As far as forward time telescoping on a shorter term is concerned – however, we cannot exactly assess its effects due to the nature of the questions/variables we had at disposal – the retest almost duplicated the result of the initial measurement. The difference between the calendar year monthly average victimisation and the monthly victimisation of the total duration passed show almost exactly the same difference in January/February and in November.
35 Aad van der Veen: Aspects Of Reliability: The 1:5 Year Ratio, http://www.unicri.it/wwk/publications/books/series/understanding/09_ASPECTS_OF_RELIABILITY.pdf
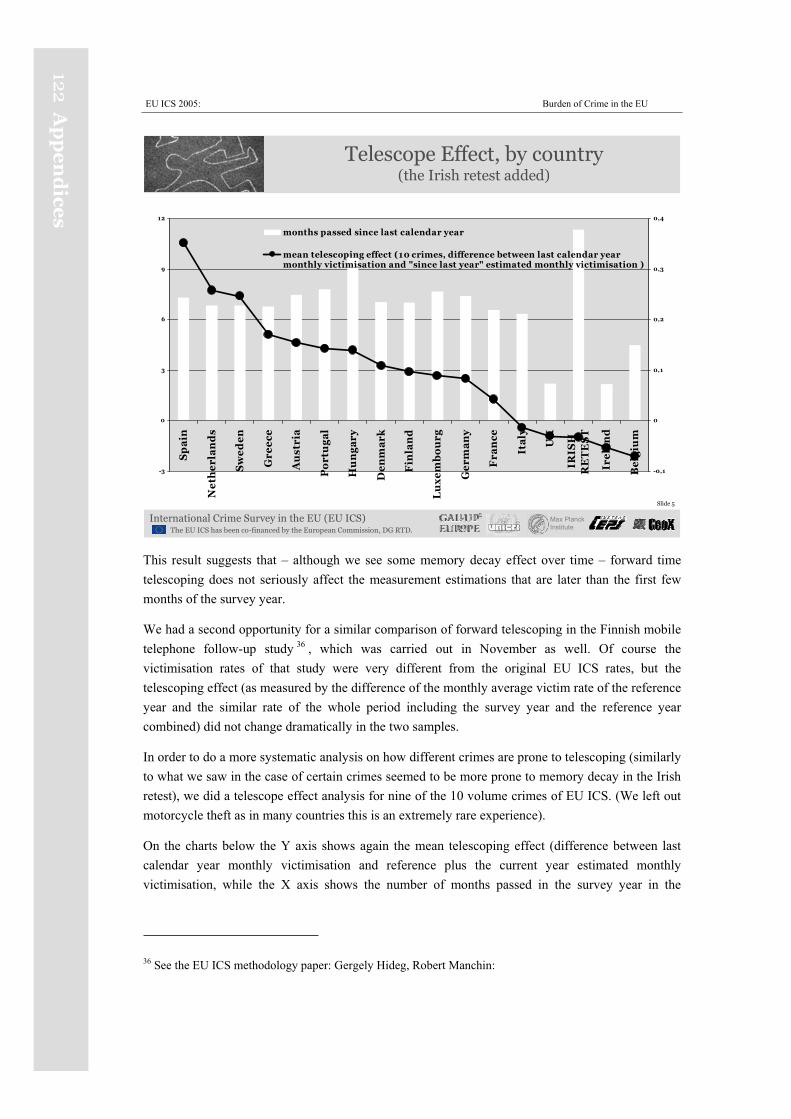
EU ICS 2005: Burden of Crime in the EU
122A
pp
en
dice
s
Slide 5
International Crime Survey in the EU (EU ICS)The EU ICS has been co-financed by the European Commission, DG RTD.
Max PlanckInstitute
Telescope Effect, by country (the Irish retest added)
-3
0
3
6
9
12
Sp
ain
Ne
the
rla
nd
s
Sw
ed
en
Gre
ece
Au
stri
a
Po
rtu
ga
l
Hu
ng
ary
De
nm
ark
Fin
lan
d
Lu
xe
mb
ou
rg
Ge
rma
ny
Fra
nce
Ita
ly
UK
IRIS
HR
ET
ES
T
Ire
lan
d
Be
lgiu
m
-0,1
0
0,1
0,2
0,3
0,4
months passed since last calendar year
mean telescoping effect (10 crimes, difference between last calendar yearmonthly victimisation and "since last year" estimated monthly victimisation )
This result suggests that – although we see some memory decay effect over time – forward time telescoping does not seriously affect the measurement estimations that are later than the first few months of the survey year.
We had a second opportunity for a similar comparison of forward telescoping in the Finnish mobile telephone follow-up study 36 , which was carried out in November as well. Of course the victimisation rates of that study were very different from the original EU ICS rates, but the telescoping effect (as measured by the difference of the monthly average victim rate of the reference year and the similar rate of the whole period including the survey year and the reference year combined) did not change dramatically in the two samples.
In order to do a more systematic analysis on how different crimes are prone to telescoping (similarly to what we saw in the case of certain crimes seemed to be more prone to memory decay in the Irish retest), we did a telescope effect analysis for nine of the 10 volume crimes of EU ICS. (We left out motorcycle theft as in many countries this is an extremely rare experience).
On the charts below the Y axis shows again the mean telescoping effect (difference between last calendar year monthly victimisation and reference plus the current year estimated monthly victimisation, while the X axis shows the number of months passed in the survey year in the
36 See the EU ICS methodology paper: Gergely Hideg, Robert Manchin:
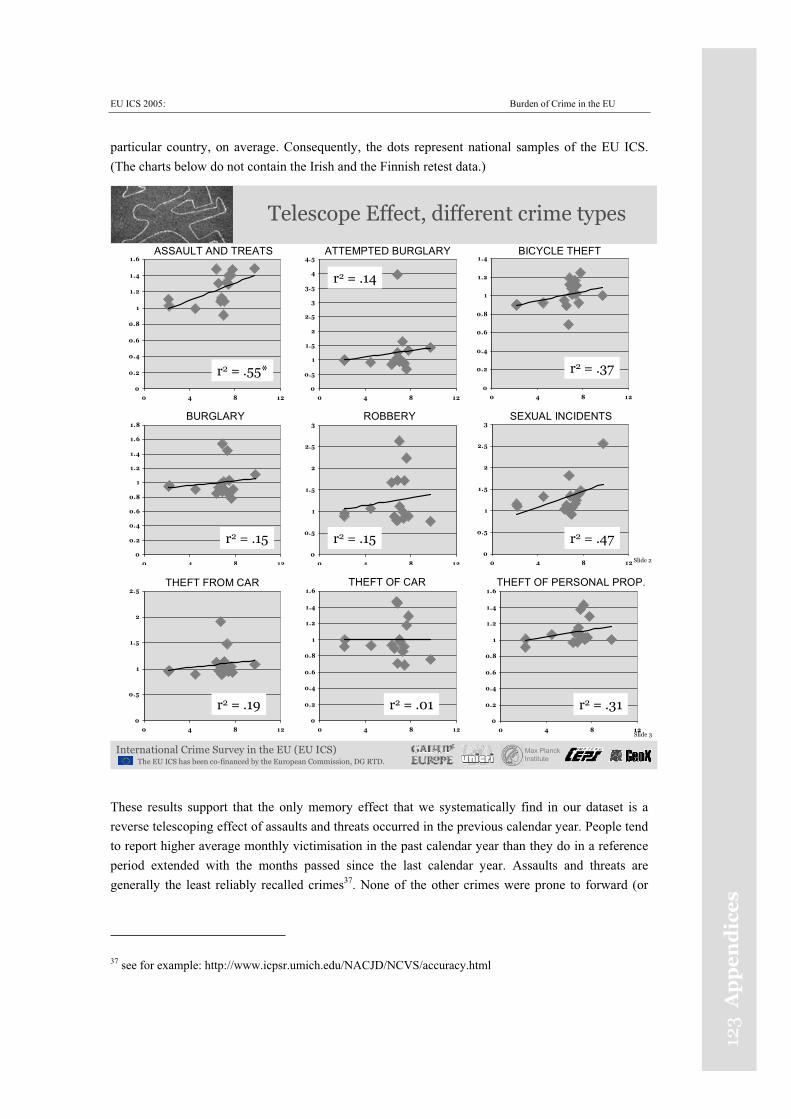
EU ICS 2005: Burden of Crime in the EU
123
Ap
pe
nd
ice
s
particular country, on average. Consequently, the dots represent national samples of the EU ICS. (The charts below do not contain the Irish and the Finnish retest data.)
Slide 2
Telescope Effect, different crime types
0
0.2
0.4
0.6
0.8
1
1.2
1.4
1.6
0 4 8 12
0
0.5
1
1.5
2
2.5
3
3.5
4
4.5
0 4 8 12
0
0.2
0.4
0.6
0.8
1
1.2
1.4
0 4 8 12
0
0.2
0.4
0.6
0.8
1
1.2
1.4
1.6
1.8
0 4 8 12
0
0.5
1
1.5
2
2.5
3
0 4 8 12
0
0.5
1
1.5
2
2.5
3
0 4 8 12
ASSAULT AND TREATS ATTEMPTED BURGLARY BICYCLE THEFT
BURGLARY ROBBERY SEXUAL INCIDENTS
r2 = .55*
r2 = .14
r2 = .37
r2 = .15 r2 = .15 r2 = .47
Slide 3
International Crime Survey in the EU (EU ICS)The EU ICS has been co-financed by the European Commission, DG RTD.
Max PlanckInstitute
0
0.5
1
1.5
2
2.5
0 4 8 12
0
0.2
0.4
0.6
0.8
1
1.2
1.4
1.6
0 4 8 120
0.2
0.4
0.6
0.8
1
1.2
1.4
1.6
0 4 8 12
THEFT FROM CAR THEFT OF CAR THEFT OF PERSONAL PROP.
r2 = .19 r2 = .01 r2 = .31
These results support that the only memory effect that we systematically find in our dataset is a reverse telescoping effect of assaults and threats occurred in the previous calendar year. People tend to report higher average monthly victimisation in the past calendar year than they do in a reference period extended with the months passed since the last calendar year. Assaults and threats are generally the least reliably recalled crimes37. None of the other crimes were prone to forward (or
37 see for example: http://www.icpsr.umich.edu/NACJD/NCVS/accuracy.html
EU ICS 2005: Burden of Crime in the EU
124A
pp
en
dice
s
reverse) telescoping: the difference between the two monthly rates was not the function of the time passed in each country since the last calendar year.
As a summary, we can conclude that while memory effects might played a role in a decreased reporting of smaller contact crimes in countries where fieldwork was carried out later, we do not see evidence of telescoping for the previous year annual victimisation even if the fieldwork occurred almost a year after the reference year. Forward time telescoping/memory decay might have occurred in case corrected monthly rates are significantly higher than the 2004 only rates. In only two countries, Greece and Spain, corrected rates for over all victimisation were more than two percent points higher than actual rates. This result suggests that possible telescoping / memory effects have had only limited influence. In fact differences between the actual and recalculated rates may have been caused by other factors such as distribution of victimisation, and the type of question itself, where we do not allow multiple recording of victimisation experience and we force multiple occurrences to be registered in the reference year.