econom ics - University of Debrecen Publishing Platform
192
2017 3-4 Vol. 11. Number 3-4. 2017 http://www.apstract.net Applied Studies In Agribusiness And Commerce duck production demographic change dairy industry beef production wastewater treatment tourism & gastronomy economics research Aberdeen, Belgorod, Belgrade, Budapest, Berlin, Cork, Debrecen, Fayetteville, Hohenheim Kazan, Kiev, Nitra, Novi-Sad, Podgorica, Prague, Stavropol, Ulan-Bator, Warsaw, Wageningen, Zagreb
-
Upload
khangminh22 -
Category
Documents
-
view
4 -
download
0
Transcript of econom ics - University of Debrecen Publishing Platform

www.opalmedia.huTypography:
2017201720173-4Vol. 11. Number 3-4. 2017
Vol.
11. N
umbe
r 3-4
. 201
7A
pplie
d St
udie
s In
Agr
ibus
ines
s And
Com
mer
ce
http://www.apstract.netApplied Studies In Agribusiness And Commerce
duck
pro
duct
ion
dem
ogra
phic
cha
nge
dairy
indu
stry
beef
pro
duct
ion
was
tew
ater
trea
tmen
t
tour
ism &
gas
tron
omy
econ
omic
s rese
arch
ContentsPreface ......................................................................................................................................................................................................... 4HUNGARIAN ENDEAVOURS FOR THE ENHANCEMENT OF ECONOMIC RELATIONS IN SOUTHEAST ASIA FOCUSING ON A NEW PARTNERSHIP WITH VIETNAM – László Kozár – György Iván Neszmélyi ...................................... 5DETERMINING FAIR RENTAL VALUE OF LAND IN THE HUNGARIAN VALUATION PRACTICE – A METHODOLOGICAL APPROACH – Ferenc Buzás – László Posta – Sándor Kiss – István Mező ................................................. 13CLIMATE CHANGE EFFECTS ON SKI TOURISM – Piroska Béki .................................................................................................... 19RECRUITING RECENT GRADUATES TO WORK AT AGRICULTURAL ENTERPRISES: SIBERIAN REGION CASE STUDY – Andrey Babenko – Leonid Mukhin ............................................................................................ 27INFRASTUCTURAL BACKGROUND OF THE EVERYDAY PHYSICAL EDUCATION IN HUNGARIAN HIGH SCHOOLS – Henrietta Varga Szépné – Éva Katona – Dénes Páll – Ildikó Balatoni ................................................................... 31INCREASING PALINKA RECOGNITION WITH TOURISM AND GASTRONOMY – Imre Milan Harcsa ..................................... 37WHAT DIFFERENTIATES THE ENTREPRENEURS FROM NON-ENTREPRENEURS ON NATURE AND NURTURE? Syed Zaheer Abbas Kazmi – Samiuddin Khan – Andras Nabradi ............................................................................................................ 45REASONS FOR AND OBSTACLES TO CYCLING IN OPINIONS OF RESIDENTS OF DEBRECEN, HUNGARY Nikolett Kosztin – József Tőzsér – László Csernoch – Ildikó Balatoni ..................................................................................................... 53ECONOMIC ISSUES OF DUCK PRODUCTION: A CASE STUDY FROM HUNGARY Szilvia Molnár – László Szőllősi ............................................................................................................................................................... 61ALLOCATION OF STRUCTURAL FUNDS BEFORE AND AFTER THE BREXIT: AN EXERCISE IN THE ECONOMICS OF CAKE-SHARING – Wim Heijman ................................................................................... 69PROTECTED GEOGRAPHICAL INDICATION RECOGNITION AND WILLINGNESS TO PAY: A CASE OF GROJEC APPLE – Bruce L. Ahrendsen – Edward Majewski ............................................................................................. 73COMPOSITE INDICATORS AND SUSTAINABLE DEVELOPMENT OF REGIONAL AGRICULTURE APPLIED TO THE STAVROPOL TERRITORY IN RUSSIA – Anastasia Chaplitskaya – Wim Heijman – Johan Van Ophem ............................. 81AGRICULTURAL TRADE POLICY: ‘AMERICA FIRST’? – Bruce L. Ahrendsen .............................................................................. 89THE ROLE OF SOCIAL MEDIA IN GASTRONOMY INDUSTRY Éva Görgényi Hegyes – Balázs Máté – Seyyed Amir Vafaei – Mária Fekete Farkas ............................................................................... 95GLOBAL TENDENCIES IN PORK MEAT - PRODUCTION, TRADE AND CONSUMPTION – István Szűcs - Viktoria Vida .................................................................................................................................................................... 105BREAD CONSUMPTION HABITS IN THE GLUTEN FREE DIET – Tünde Csapóné Riskó – Ádám Péntek – Troy Wiwczaroski .................................................................................................................... 113COST ANALYSIS OF PIG SLAUGHTERING: A HUNGARIAN CASE STUDY – László Szőllősi – Szilvia Molnár – Krisztina Ladányi – Laura Karnai – István Szűcs .......................................................................... 121HUNGARIAN DAIRY AND BEEF PRODUCTION SECTOR TECHNICAL EFFICIENCY COMPARSION USING DEA – Krisztián Kovács - Ratnesh Pandey ........................................................................................................................................................ 131ENERGY ALTERNATIVES IN LARGE-SCALE WASTEWATER TREATMENT – Zoltán Gabnai ................................................. 141ANALYSIS THE ADVANCED ICT USAGE OF THE HUNGARIAN SME SECTOR FOR PREPARING A DOMESTIC AGRI-FOOD RESEARCH – Szilvia Botos – János Felföldi – László Várallyai – Ádám Péntek – Róbert Szilágyi ............................. 147DIFFERENCES OF THE PRIMARY ENERGY CONSUMPTION OF THE COUNTRIES ALL OVER THE WORLD – Judit Tóth – Róbert Magda ..................................................................................................................................................................... 155 HUMAN RESOURCE ASPECT OF AGRICULTURAL ECONOMY – CHALLENGES OF DEMOGRAPHIC CHANGE – Alexandra Rajczi – Péter Vörös – Krisztina Dajnoki ............................................................................................................................. 163 EMPIRICAL RESEARCH ON CORPORATE STRATEGIES IN HUNGARIAN DAIRY INDUSTRY – Eszter Szabó-Szentgróti – Gábor Szabó-Szentgróti – Zoltán Szakály .................................................................................................... 169 DEMOGRAPHIC AND LIFESTYLE ATTRIBUTES WITH A FUNDAMENTAL ROLE IN FOOD SUPPLEMENT CONSUMPTION (EXPLORATORY RESEARCH) – Zsófia Nábrádi ................................................................................................. 171
Aberdeen, Belgorod, Belgrade, Budapest, Berlin, Cork, Debrecen, Fayetteville, Hohenheim Kazan, Kiev, Nitra, Novi-Sad, Podgorica, Prague, Stavropol, Ulan-Bator, Warsaw, Wageningen, Zagreb


Applied Studies in Agribusiness and Commerce
Official Periodical of the International MBA Networkin Agribusiness and Commerce AGRIMBA
Vol. 11. Number 3-4. 2017
centerprintNYOMDA • DEBRECEN

Editor in Chief: Dr. Johan van Ophem, Wageningen University, The Netherlands
Deputy Editors:Prof. Dr. dr. Hc. András Nábrádi, University of Debrecen, Hungary, Prof. Dr. dr. Hc. Wim Heijman, Wageningen University, The Netherlands
Executive Editorial Board:Dr. Andrei Babenko, Tomsk State University, Russia, Dr. Erdenechuluun Tumur, Mongolian State University, Mongolia
Dr. Guzalia Klychova, Kazan State Agrarian University, Russia, Dr. Ivana Ticha, Czech University of Life Sciences PragueDr. Josip Juracak, University of Zagreb, Croatia, Dr. Kalna Dubinyuk Tetyana, NULES Kiev, Ukraine
Dr. Ksenia Matveeva, Kazan State Agrarian University, Russia, Dr. László Kárpáti, California Consulting, Ltd. HungaryDr. Mario Njavro, University of Zagreb, Croatia, Dr. Olena Slavkova, Sumy National Agrarian University, UkraineDr. Olga Lisova, Stavropol State Agrarian University, Russia, Dr. Shamil Validov, Kazan Federal University, Russia
Dr. Svyatoslav Serikov, Stavropol State Agrarian University, Russia, Dr. Tatiana Litvinenko, Belgorod State Agricultural Academy, RussiaProf. David McKenzie, Scotland Rural College, Scotland, Prof. Dr. Breslavets Pavel, Belgorod State Agricultural Academy, Russia
Prof. Dr. Bruce Ahrendsen, University of Arkansas Fayetteville, USA, Prof. Dr. Dragoljub Janković, Mediterranean University, MontenegroProf. Dr. Edward Majewski, University of Life Sciences Warsaw, Poland, Prof. Dr. Jan Hron, Czech University of Life Sciences Prague, Czeh Republic
Prof. Dr. Peter Bielik, Slovak Univerity of Agriculture, Slovakia, Prof. Dr. Zorica Vasilević, University of Belgrade, SerbiaProf. Dr. Harry Bremmers, Wageningen University, The Netherlands, Dr. Faid Gul, National University of Modern Languages, Islamabad, Pakistan
Prof. Dr. Mieczyslaw Adomowicz, Pope John Paul II State School of Higher Vocational Education in Biała Podlaska, Poland
Honorary Editors:Dr. Ranjith Ihalanayake, Victoria University Melbourne, Australia, Prof. Dr. Csaba Csáki, Corvinus Universty, Hungary
Prof. Dr. Csaba Forgács, Corvinus Universty, Hungary, Prof. Dr. dr. mpx. Hc. József Popp, University of Debrecen, HungaryProf. Dr. István Kapronczai, Research Institute of Agricultural Economics, Hungary, Prof. Dr. Mária Vincze, Babes Bolyai University, Romania
Prof. Dr. Ramesh B., Goa University, India, Prof. Dr. Reiner Doluschitz, Hohenheim University Stuttgart, GermanyProf. Dr. Zoltán Lakner, Corvinus University, Hungary, Prof. Dr. Zoltán Szakály, University of Debrecen, Hungary
Dr. Akimi Fujimoto, Tokio University of Agriculture, Japan, Dr. Garth Entwistle, Scotland Rural College, Aberdeen, UK,Dr. Jim Booth, Aberdeen, Scotland, UK, Dr. Judit Ipate, Romanian Academy of Sciences CSRAB, Bucharest, Romania
Dr. Mary McCarthy, University College Cork, Ireland, Dr. Robert Kowalski, University of Wolverhampton, UK,Dr. Simon Heath, ICA, Gent, Belgium, Prof. Dr. Ajay Kr. Singh, Delhi School of Professional Studies and Research Delhi, India,Prof. Dr. Anu Singh, Guru Gobind Singh Indraprastha University, India, Prof. Dr. Csaba Forgács, Corvinus Universty, Hungary
Prof. Dr. Elena Botezat, University of Oradea, Romania, Prof. Dr. K.V. Bhanu Murthy, University of Delhi, India,Prof. Dr. Nebojsa Novković, University of Novi Sad, Serbia, Prof. Dr. Patrick De Groote, Hasselt University, Belgium,
Prof. Dr. Qin Fu, Chinese Academy of Agricultural Sciences, Bejing, China, Prof. Dr. Slobodan Ceranić, University of Belgrade, Serbia,Prof. Dr. Xavier Gellynck, University Gent, Belgium, Prof. Dr. Govinda Prasad Acharya, Tribhuvan University Kathmandu, Nepal
Prof. Dr. dr. Hc. Harald von Witzke, Humbold University, Berlin, Germany, Prof. Dr. dr. Hc. Mark Cochran, University of Arkansas, Fayetteville USA,Prof. Dr. Danilo Tomic, Serbian Association of Agricultural Economists, Belgrade, Serbia,
Prof. Dr. Drago Cvijanović, Balkan Scientific Association of Agricultural Economists, Serbia
Reviewer Board of this Issue:Adrián Nagy, András Nábrádi, Andrey Babenko, Anetta Müller, Attila Bai, Bruce Ahrendsen, Csaba Fogarassy, Csaba Forgács,
Csaba Juhász, Edward Majewski, Éva Bácsné Bába, Garth Entwistle, Gergely Ráthonyi, György Szabados, István Szűcs, Josip Juracak, Judith Ipate, Katalin Vargáné Csobán, Kinga Rátonyi-Ódor, Krisztián Kovács, László Kárpáti, Marietta Kiss, Mario Njavro, Peter Balogh,
Peter Bielik, Péter Huszka, Péter Popovics, Róbert Magda, Serikov Svyatoslav, Tatiana Litvinenko, Viktória Vida, Wim Heijman, Wojciech Florkowski, Zoltán Szakály, Zsolt Csapó
Associate Editor:Dr. Krisztián Kovács, University of Debrecen, HungaryDr. László Szőllősi, University of Debrecen, Hungary
English Editor:Dr. Troy B. Wiwczaroski, University of Debrecen, Hungary
George Seel, University of Debrecen, Hungary
APPLIED STUDIES IN AGRIBUSINESS AND COMMERCEOfficial Periodical of the International MBA Network in Agribusiness and Commerce:
APSTRACT®©AGRIMBA
Editor in Chief: Dr. Johan van Ophem, Wageningen University, The NetherlandsEditorial office: University of Debrecen, Faculty of Economics and Business,
APSTRACT Ed.office Debrecen, Böszörményi út 138. H–4032 Phone/Fax: (36-52) 526-935
Executive publisher: Univesity o f Debrecen, Faculty of Economics and Business, HungaryPublishing House: Center-Print Publishing House, Hungary – www.centerprint.hu
Typography: Opal System Graphics www.opalsystem.com
HU-ISSN 1789-221X – Electronic Version: ISSN 1789-7874
Home Page: http://www.apstract.net • E-mail: [email protected]

ContentsPreface .............................................................................................................................................................4
HUNGARIAN ENDEAVOURS FOR THE ENHANCEMENT OF ECONOMIC RELATIONS IN SOUTHEAST ASIA FOCUSING ON A NEW PARTNERSHIP WITH VIETNAM László Kozár – György Iván Neszmélyi ......................................................................................................................5
DETERMINING FAIR RENTAL VALUE OF LAND IN THE HUNGARIAN VALUATION PRACTICE – A METHODOLOGICAL APPROACH Ferenc Buzás – László Posta – Sándor Kiss – István Mező ..............................................................................................13
CLIMATE CHANGE EFFECTS ON SKI TOURISM Piroska Béki ..................................................................................................................................................... 19
RECRUITING RECENT GRADUATES TO WORK AT AGRICULTURAL ENTERPRISES: SIBERIAN REGION CASE STUDY Andrey Babenko – Leonid Mukhin .......................................................................................................................... 27
INFRASTUCTURAL BACKGROUND OF THE EVERYDAY PHYSICAL EDUCATION IN HUNGARIAN HIGH SCHOOLS Henrietta Varga Szépné – Éva Katona – Dénes Páll – Ildikó Balatoni ............................................................................... 31
INCREASING PALINKA RECOGNITION WITH TOURISM AND GASTRONOMY Imre Milan Harcsa ............................................................................................................................................. 37
WHAT DIFFERENTIATES THE ENTREPRENEURS FROM NON-ENTREPRENEURS ON NATURE AND NURTURE? Syed Zaheer Abbas Kazmi - Samiuddin Khan - Andras Nabradi ...................................................................................... 45
REASONS FOR AND OBSTACLES TO CYCLING IN OPINIONS OF RESIDENTS OF DEBRECEN, HUNGARY Nikolett Kosztin – József Tőzsér – László Csernoch – Ildikó Balatoni ................................................................................ 53
ECONOMIC ISSUES OF DUCK PRODUCTION: A CASE STUDY FROM HUNGARY Szilvia Molnár – László Szőllősi ............................................................................................................................. 61
ALLOCATION OF STRUCTURAL FUNDS BEFORE AND AFTER THE BREXIT: AN EXERCISE IN THE ECONOMICS OF CAKE-SHARING Wim Heijman .................................................................................................................................................... 69
PROTECTED GEOGRAPHICAL INDICATION RECOGNITION AND WILLINGNESS TO PAY: A CASE OF GROJEC APPLE Bruce L. Ahrendsen – Edward Majewski .................................................................................................................. 73
COMPOSITE INDICATORS AND SUSTAINABLE DEVELOPMENT OF REGIONAL AGRICULTURE APPLIED TO THE STAVROPOL TERRITORY IN RUSSIA Anastasia Chaplitskaya – Wim Heijman – Johan Van Ophem ......................................................................................... 81
AGRICULTURAL TRADE POLICY: ‘AMERICA FIRST’? Bruce L. Ahrendsen ............................................................................................................................................ 89
THE ROLE OF SOCIAL MEDIA IN GASTRONOMY INDUSTRY Éva Görgényi Hegyes – Balázs Máté – Seyyed Amir Vafaei – Mária Fekete Farkas ............................................................... 95
GLOBAL TENDENCIES IN PORK MEAT - PRODUCTION, TRADE AND CONSUMPTION István Szűcs - Viktoria Vida .................................................................................................................................105
BREAD CONSUMPTION HABITS IN THE GLUTEN FREE DIET Tünde Csapóné Riskó – Ádám Péntek – Troy Wiwczaroski ............................................................................................ 113
COST ANALYSIS OF PIG SLAUGHTERING: A HUNGARIAN CASE STUDY László Szőllősi – Szilvia Molnár – Krisztina Ladányi – Laura Karnai – István Szűcs ............................................................ 121
HUNGARIAN DAIRY AND BEEF PRODUCTION SECTOR TECHNICAL EFFICIENCY COMPARSION USING DEA Krisztián Kovács - Ratnesh Pandey ........................................................................................................................ 131
ENERGY ALTERNATIVES IN LARGE-SCALE WASTEWATER TREATMENT Zoltán Gabnai ................................................................................................................................................. 141
ANALYSIS THE ADVANCED ICT USAGE OF THE HUNGARIAN SME SECTOR FOR PREPARING A DOMESTIC AGRI-FOOD RESEARCH Szilvia Botos – János Felföldi – László Várallyai – Ádám Péntek – Róbert Szilágyi .............................................................. 147
DIFFERENCES OF THE PRIMARY ENERGY CONSUMPTION OF THE COUNTRIES ALL OVER THE WORLD Judit Tóth – Róbert Magda .................................................................................................................................. 155
HUMAN RESOURCE ASPECT OF AGRICULTURAL ECONOMY – CHALLENGES OF DEMOGRAPHIC CHANGE Alexandra Rajczi – Péter Vörös – Krisztina Dajnoki ................................................................................................... 163
EMPIRICAL RESEARCH ON CORPORATE STRATEGIES IN HUNGARIAN DAIRY INDUSTRY Eszter Szabó-Szentgróti – Gábor Szabó-Szentgróti – Zoltán Szakály ................................................................................ 169
DEMOGRAPHIC AND LIFESTYLE ATTRIBUTES WITH A FUNDAMENTAL ROLE IN FOOD SUPPLEMENT CONSUMPTION (EXPLORATORY RESEARCH) Zsófia Nábrádi ................................................................................................................................................. 181

PREFACE
From 19-24 June 2017 the biyearly AGRIMBA-AVA tool place in Debrecen, Hungary. The conference was well-organised by our colleagues from the Faculty of Economics and Business from the University of Debrecen.
The program covered a wide variety of topics, some very topical, as is demonstrated in the selection of papers that is presented in this special issue of APSTRACT.
Among the very topical paper we find a paper in American trade policy with the catchy title Agricultural policy : America first? , and another on the allocation of structural funds before and after the Brexit, an exercise in the economics of cake sharing. At a more local topical level this issue contains papers in the role of social media in gastronomy industry , reasons for and obstacles to cycling, palinka recognition within tourism and gastronomy.
The are several papers on topical lifestyle issues as on the role of demographic and lifestyle attributes with respect to food supplements, another one on bread consumption in a gluten free diet and a third one everyday physical education.
Related to lifestyles, are two papers on consumer behaviour of food consumption . One paper discusses global consumption of pork meat and a second paper is on the effect of protected geographical indication recognition and the willingness to pay , the case of the Grojec apple.
Hungarian agricultural sector. Attention in one pare is paid to the economics of duck production, in another on the technical efficiency of dairy and beef production, in a third paper on corporate on strategies in the dairy industry.
Three papers discuss other aspects of Hungarian economic life. One paper is a methodological approach in determining rental values of land, a second one is the application of advanced ICT in small and medium sized enterprises in the agro food sector, and a third one relates to the enhancements of Hungarian relations in Southeast Asia, Vietnam in particular.
Human resources is the topic of three papers. One paper is on the nature-nurture issues in entrepreneurship, another one analysis the challenge of demographic change in the agricultural economy and a third paper is on the recruitment of graduates in Siberian agricultural enterprises.
Sustainability comes to the fore in papers. One paper is on the construction of a composite sustainability indicator and regional development applied to the Stavropol region in Russia, a second paper is on energy alternatives in large-scale waste water management, a third paper discusses the effect of climate change on ski tourism. A fourth paper concerns the differences of primary energy consumption across countries.
The next AVA-AGRIMBA conference will be organised in Ulaanbaatar in Mongolia in June 2019.
Wageningen, April 2018
Johan A.C. van Ophem

APSTRACT Vol. 11. Number 3-4. 2017. pages 5-12. ISSN 1789-7874
DOI: 10.19041/APSTRACT/2017/3-4/1
Applied Studies in Agribusiness and Commerce – APSTRACT Center-Print Publishing House, Debrecen SCIENTIFIC PAPER
HUNGARIAN ENDEAVOURS FOR THE ENHANCEMENT OF ECONOMIC RELATIONS IN SOUTHEAST ASIA FOCUSING ON A NEW
PARTNERSHIP WITH VIETNAM László Kozár1 – György Iván Neszmélyi2
1Professor, Head of Institute of Commerce, Budapest Business School – University of Applied Sciences2Associate Professor, Institute of Commerce, Budapest Business School – University of Applied Sciences
Abstract: Beyond a brief review of the economic integration process among the states of the ASEAN region, the authors of the present study aimed to examine and analyze the main economic, social and political characteristics of the Hungaro-ASEAN relations. The importance of the topic of this research is underlined by the fact that the Hungarian government considers big importance to the improvement of the foreign economic rela-tions with Asian economies. This intention was expressed by a new foreign economic strategy „Eastern opening” announced by the government in 2012, even though the foreign trade statistical figures did not justify its success by now.The authors believe that increasing opening towards Asia serves Hungarian economic interests. Therefore, it is a right and desirable direction to proceed, they consider that in the background of the modest results there might be the insufficient knowledge of the market mechanisms, the ac-tors of the local supply chains and the potential partners. They believe that in order to make the Hungarian foreign economic endeavours in this direction more successful a more thorough examination of the local characteristics – including the actual demand arising at the targeted markets - is necessary. This opinion is prevalent to not only the Asian „Giants”, like China, India and Japan, but also to smaller states, like the ASEAN members, which – together - in terms of population and economic performance – reach the dimensions of an economic great power as well.Furthermore, the integration of the ten Southeast Asian countries develops rapidly, which is coupled by their increasing weight in the world trade. The dynamic economic and social development in the ASEAN region – and in parallel with this the growing demands and purchasing power - may encourage the Hungarian ventures in theory. However, there are still very few Hungarian entrepreneurs, who are ready to enter the market in the region and able in long run to operate there successfully.It is a well-known fact that the since the regime has changed in Hungary, foreign trade became strongly concentrated towards the EU members. The ASEAN countries – because of the geographic distance and by other reasons - definitely cannot mean an alternative of the EU market, however in a certain extent they can relieve this one-sided concentration and may provide additional opportunities for the Hungarian export of goods, and rather to the export of Hungarian services and know-how.The ratio of the ASEAN region within the entire Hungarian foreign trade turnover is small nowadays, furthermore – according to the statistical figures – this region is rather an import resource for Hungary than being an export market. This fact – just itself – is should not be considered as problem. When the amount of the import exceeds the amount of exports, that means that it is more worthwhile to do business with suppliers from there countries than with others.By and large all this is prevalent to the field of the agricultural trade as well: Hungary imports a range of commodities which cannot be produced by domestic farmers or in Europe (spices, tropical fruits, etc.). It is obvious that the ASEAN region cannot be the major market for the Hungarian agricultural export, not even in long run. However, there are still a lot of opportunities to enlarge the turnover of goods and services and enhance the co-operation in this geographic region. In the last chapter, the authors outlined an example in case of Vietnam – co-operation of joint public warehousing of agricultural commodities – which may be a good example for the promising potential opportunities. In contrast with the majority of the ASEAN countries, the Hungaro-Vietnamese political and economic relations had started much earlier than the regime was changed in Hungary. However, the potential advantages arose from this fact – the network of connections and the sympathy of Viet-namese professionals graduated in Hungary, the reputation and popularity of Hungarian agricultural products and technologies, the achievements of R&D in the field of agriculture – could not be utilized from Hungarian side. Vietnam, however still preserved its socialist political establishment, but in terms of its economic development strategy and economic policy has gradually been standing on the basis of market orientation. Vietnam, with its population of ninety million shows a rapid and successful development and it means good opportunities even for Hungarian entrepreneurs. It would be a mistake to leave these potentials unused.
László Kozár – György Iván Neszmélyi
Keywords: Southeast Asia, Europe, Regional integration, Eastern opening, Trade (JEL Classification: F14, Q17, R11, N75)
6 László Kozár – György Iván Neszmélyi
APSTRACT Vol. 11. Number 3-4. 2017. pages 5-12. ISSN 1789-7874
INTRODUCTION
Soon the 50th anniversary of the day will be celebrated when - on the 8th August, 1967 - five developing countries of Southeast-Asia (the Philippines, Indonesia, Malaysia, Singapore and Thailand) signed the Bangkok Declaration, which launched a loose alliance of governments – the Association of South-East Asian Nations (ASEAN). The Permanent Secretariat of ASEAN resides in Jakarta, the capital city of Indonesia. Brunei, after having gained her independence, joined the organisation in 1984, Vietnam in 1995 and Laos and Myanmar in 1997 and at last Cambodia joined to the Association in 1999.
The declared aims of this regional organisation are the promotion of economic growth and the acceleration of social and cultural development in the region. However, there were also other important political and security considerations for creating ASEAN, which included: a) prevention of political conflicts in the region, which could lead to, or provoke the intervention of an outside power, b) to create a forum for handling disputes between member nations, c) to bring stability to the social and economic systems of the member nations.
Despite the current financial crisis in the Far East the ASEAN region has managed to hold its position as one of the most dynamically developing regions in the world economy. The member states express a keen interest in broadening the forms of cooperation among themselves. In January, 1992 ASEAN announced the future development of AFTA (ASEAN Free Trade Area) for the period 1993 to 2008, with the gradual phasing out of customs restrictions within the Association. In 1995 the deadline for the completion of AFTA was brought forward to 2003.
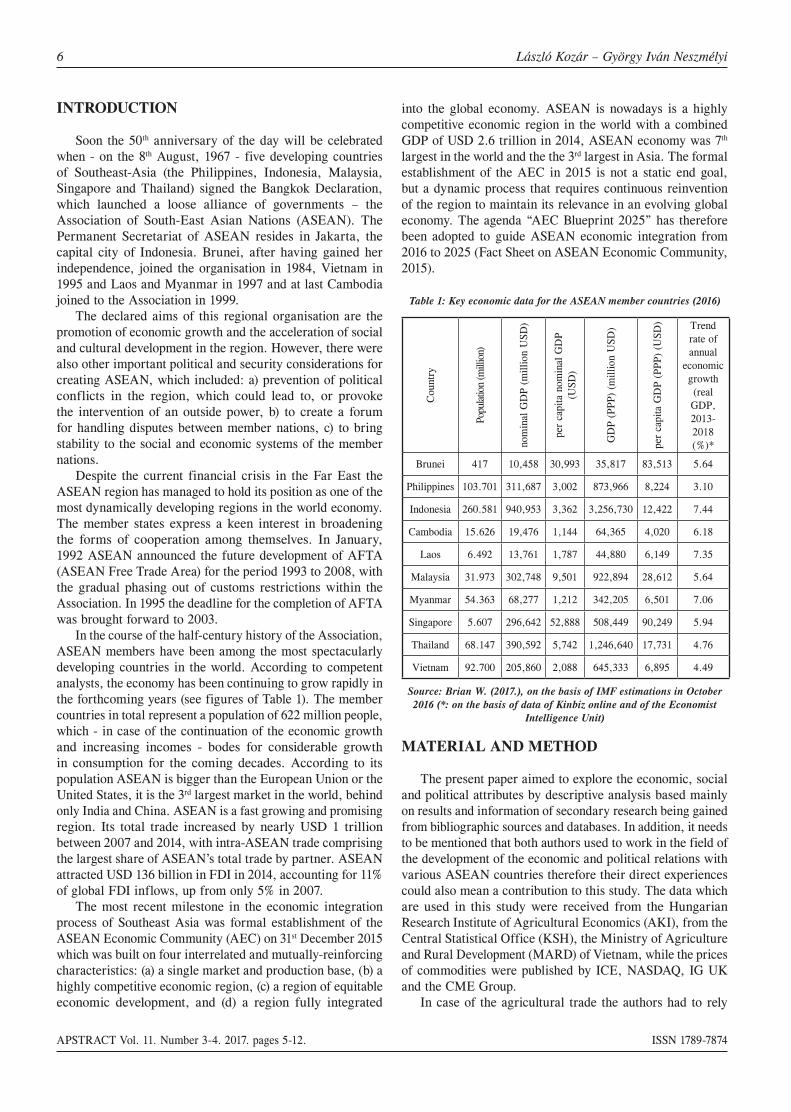
In the course of the half-century history of the Association, ASEAN members have been among the most spectacularly developing countries in the world. According to competent analysts, the economy has been continuing to grow rapidly in the forthcoming years (see figures of Table 1). The member countries in total represent a population of 622 million people, which - in case of the continuation of the economic growth and increasing incomes - bodes for considerable growth in consumption for the coming decades. According to its population ASEAN is bigger than the European Union or the United States, it is the 3rd largest market in the world, behind only India and China. ASEAN is a fast growing and promising region. Its total trade increased by nearly USD 1 trillion between 2007 and 2014, with intra-ASEAN trade comprising the largest share of ASEAN’s total trade by partner. ASEAN attracted USD 136 billion in FDI in 2014, accounting for 11% of global FDI inflows, up from only 5% in 2007.
The most recent milestone in the economic integration process of Southeast Asia was formal establishment of the ASEAN Economic Community (AEC) on 31st December 2015 which was built on four interrelated and mutually-reinforcing characteristics: (a) a single market and production base, (b) a highly competitive economic region, (c) a region of equitable economic development, and (d) a region fully integrated
into the global economy. ASEAN is nowadays is a highly competitive economic region in the world with a combined GDP of USD 2.6 trillion in 2014, ASEAN economy was 7th largest in the world and the the 3rd largest in Asia. The formal establishment of the AEC in 2015 is not a static end goal, but a dynamic process that requires continuous reinvention of the region to maintain its relevance in an evolving global economy. The agenda “AEC Blueprint 2025” has therefore been adopted to guide ASEAN economic integration from 2016 to 2025 (Fact Sheet on ASEAN Economic Community, 2015).
Table 1: Key economic data for the ASEAN member countries (2016)
Cou
ntry
Popu
latio
n (m
illio
n)
nom
inal
GD
P (m
illio
n U
SD)
per
capi
ta n
omin
al G
DP
(USD
)
GD
P (P
PP)
(mill
ion
USD
)
per
capi
ta G
DP
(PPP
) (U
SD) Trend
rate of annual
economic growth (real GDP, 2013-2018 (%)*
Brunei 417 10,458 30,993 35,817 83,513 5.64
Philippines 103.701 311,687 3,002 873,966 8,224 3.10
Indonesia 260.581 940,953 3,362 3,256,730 12,422 7.44
Cambodia 15.626 19,476 1,144 64,365 4,020 6.18
Laos 6.492 13,761 1,787 44,880 6,149 7.35
Malaysia 31.973 302,748 9,501 922,894 28,612 5.64
Myanmar 54.363 68,277 1,212 342,205 6,501 7.06
Singapore 5.607 296,642 52,888 508,449 90,249 5.94
Thailand 68.147 390,592 5,742 1,246,640 17,731 4.76
Vietnam 92.700 205,860 2,088 645,333 6,895 4.49
Source: Brian W. (2017.), on the basis of IMF estimations in October 2016 (*: on the basis of data of Kinbiz online and of the Economist
Intelligence Unit)
MATERIAL AND METHOD
The present paper aimed to explore the economic, social and political attributes by descriptive analysis based mainly on results and information of secondary research being gained from bibliographic sources and databases. In addition, it needs to be mentioned that both authors used to work in the field of the development of the economic and political relations with various ASEAN countries therefore their direct experiences could also mean a contribution to this study. The data which are used in this study were received from the Hungarian Research Institute of Agricultural Economics (AKI), from the Central Statistical Office (KSH), the Ministry of Agriculture and Rural Development (MARD) of Vietnam, while the prices of commodities were published by ICE, NASDAQ, IG UK and the CME Group.
In case of the agricultural trade the authors had to rely

APSTRACT Vol. 11. Number 3-4. 2017. pages 5-12. ISSN 1789-7874
Hungarian Endeavours For The Enhancement Of Economic Relations In Southeast Asia Focusing On... 7
on the classification of the Hungarian statistical trade system which uses four categories as follows: I. Alive animals, animal products (01-05) II. Plant products (06-14), III. Animal and plant fat, oil and wax (15) and IV. Food products, beverages and tobacco (16-24). Even though this classification does not comprise several types of goods, especially various raw materials, which may have either agricultural or mineral origin the statistical system does not make a proper differentiation among them. However, the aggregate figures deriving from the sum of the mentioned four categories of products can well represent the trends and approximate figures of the agricultural trade.
The main trends in foreign trade
Hungary’s relations to some countries of the ASEAN region were already established in the 1950’s and 1960’s. The partnerships to Vietnam, and the previously socialist Cambodia and Laos can by now be seen as well established (bearing in mind that behind the development of political and economic relations stood the interests of the Socialist Bloc, representing the interests of the Soviet Union, not particularly Hungary).
Hungary’s relations to the other countries in the region have been more recent. Relations started developing with Thailand, Malaysia and Singapore in the 1980’s and 90’s. Although an economic partnership was formed with Indonesia in the second half of the 1950’s, this relationship was setback by the political changes there in 1965, and only began developing again in the second part of the 1980’s. Hungary has very modest economic relations with the other two ASEAN nations,
Brunei and Myanmar. Hungary never had particular contacts with Brunei, but used to have more intense connections with the once “socialist” Burma until the end of the eighties. The ruling military junta and the international political isolation of Myanmar since 1988 have provided an unfavourable economic environment for the maintenance of previous relations.
The aim of this paper is to explore the importance of the Asia and within Asia the ASEAN region with the view of suggesting diversification of the foreign market structure as it has been strongly focused on the European Union. In 2015 79.2 % of Hungarian exports were dispatched to and 76.5 % of Hungarian imports derived from the member states of the European Union. Asian countries – including China, India, Japan, ASEAN members and other countries – totaled in 5.7 % in Hungarian exports and 12.8 % (Külkereskedelem 2015, KSH, 2016). According to Zéman, Z. (2017) in setting strategic objectives and issues it is useful to make distinction between strategic and tactical decisions. Strategic decisions receive a wide range of support, the are qualitative types of decisions, which include or reflect the goals and objectives. Our suggestion coincides with the intention of the Hungarian government which has recently launched its new foreign economic strategy called Eastern opening and Southern opening with the view of increasing trade activity with Asian, African and Latin-American countries.
Foreign trade with the surveyed region was compared with the total volume of Hungarian foreign trade. The data in Tables 2 and 3 shows that trade with ASEAN countries represented only a small and slightly shrinking fraction of the total of Hungary’s foreign trade turnover, although it is evident that Hungarian imports exceeded the exports to the
Table 2: Hungarian exports to the Southeast Asian region (USD)
2010 2011 2012 2013 2014 2015
Brunei 239.262 399.570 323.727 178.081 2.501.108 1.466.158
Indonesia 64.077.078 71.552.975 24.039.680 38.986.581 36.943.548 49.067.893
Cambodia 146.139 261.968 6.078.143 1.269.448 255.204 795.384
Laos 4.912.772 13.032 21.598 73.772 403.117 316.676
Myanmar 175.901 20.583 27.280.316 1.112.443 4.025.484 4.465.280
Malaysia 96.170.718 235.488.083 158.124.885 137.660.396 117.013.864 116.483.549
Philippines 29.430.985 6.719.789 14.218.040 9.424.727 14.814.028 17.439.317
Singapore 587.059.160 835.326.282 402.014.248 284.561.368 209.852.740 195.683.123
Thailand 126.618.518 200.581.854 119.231.106 71.355.030 92.961.587 85.136.390
Vietnam 41.891.118 45.627.861 44.024.932 59.600.513 85.245.257 67.188.205
ASEAN total 950.721.651 1.395.991.997 795.356.675 604.222.359 564.015.937 538.041.975
Total Hungarian Exports
94.749.270.305 111.217.664.285 102.830.359.466 108.014.977.779 112.536.910.627 100.299.052.690
ASEAN proportion of
the above1,00 1,26 0,77 0,56 0,50 0,54
Source: Own compilation from data of the Research Institute of Agricultural Economy (AKI), Budapest, 2016
8 László Kozár – György Iván Neszmélyi
APSTRACT Vol. 11. Number 3-4. 2017. pages 5-12. ISSN 1789-7874
region between 2010 and 2015. During this period both total Hungarian exports and imports grew (the total exports from around 94.7 to 100.3 bln USD, imports 87.4 to 90.7 bln USD).
It would be difficult to discover straight trends as figures altered from year to year, but in terms of Hungarian exports to ASEAN countries it looks that the top year was 2011 (almost 1.4 bln USD) and from then a shrinking trend can be seen until 2015 (538 M USD). In terms of Hungarian exports to ASEAN the shrinking trend can be explained mostly with the drop in Hungarian exports to Singapore, Thailand and Malaysia. Hungarian exports started to grow to Myanmar and Brunei during these years from nearly ground zero, but besides them the only ASEAN country is Vietnam, where Hungarian exports grew since 2010. It also looks well that from the point of Hungarian exports to ASEAN the top year was 2011. As for the import figures we may also decline during this period (from around 1.8 bln USD to a bit less than 1.5 bln USD). Hungarian imports from several ASEAN countries (Indonesia, Malaysia, Thailand and Vietnam) grew during this six-year period while shrinking imports could be seen from Singapore and the Philippines). In spite of the fact that ASEAN region has a small share within the Hungarian foreign trade activity, there are several countries where trade relations and other types of co-operation have been steadily growing. The best example for the latter is Vietnam.
It is also worthwhile to see what can be the reasons of the relatively low and shrinking figures of the export performance of Hungary to this region. A previous research (Neszmélyi, 1999) pointed out the comprehensive political and economic metamorphosis in Hungary during the early 1990’ when the fragmentation privatization of the former, state owned Hungarian foreign trade companies narrowed the new business entities’ econo-geographic radius, and the increasing focus on the European markets.
Kiss, J. (1993) refers to another previous research, undertaken by Gáspár and Sass at the beginning of the nineties, suggested that the poor export performance of Hungary to the Southeast-Asian region was largely due to the country’s export-structure, as the exports mostly consisted of on mass-products with a high demand of resource inputs (raw materials, semi-finished products) and high transporting costs. But since then – during the recent 20-25 years - a lot of things changed. Hungary is a well functioning market economy which successfully overcame the negative impacts of the economic crisis of 2008-2009, and during the examined period in macro-figures the overall trend is positive. Besides the considerable geographic distance and the different business culture (Madlenak and Madlenakova, 2015) (another reason might be the lack of capital might prevent Hungarian SMEs to open towards Southeast Asia as exporters or even in capacity of FDI investors. Behind the growing in imports there lies a global trend in diversification. This can be seen, for example, by the export of certain vehicles or semi-conductors from Malaysia or Singapore, which are less expensive than from other sources.
The characteristics of Hungary’s agricultural trade with the Southeast Asian region
Much of the land mass of the ASEAN countries is situated in the tropical zone, so this region may serve as a source of imports for Hungary for products and crops which cannot be grown domestically. The most important goods are: spices, cocoa, coffee, certain tropical fruits. The export of Hungarian food to the region is by comparison very modest. The export of bulk products (e.g. cereals), incur very high transportation costs due to the great distances involved. Added to this, Hungary can not compete with goods of many bigger
Table 3: Hungarian imports from the Southeast-Asian region (USD)
2010 2011 2012 2013 2014 2015
Brunei 2.537 495 39 . 1.080 59
Indonesia 74.556.978 107.690.891 66.469.580 95.901.942 121.997.745 141.997.110
Cambodia 52.632 545.063 505.213 291.557 9.430 330.237
Laos 3.780 362 . 12.002 3.063 24.444
Myanmar 11.179 11.296 . 351.881 47.970 48.441
Malaysia 161.000.953 240.425.243 326.451.804 208.890.971 253.097.678 320.958.023
Philippines 313.637.209 212.476.025 161.000.043 156.790.818 177.567.781 189.065.595
Singapore 952.648.628 854.215.891 583.517.900 622.609.987 514.374.090 331.428.521
Thailand 270.355.693 284.681.307 293.178.869 378.863.015 379.446.263 420.125.493
Vietnam 28.409.426 35.974.957 44.630.786 48.650.438 50.557.933 75.670.728
ASEAN total 1.800.679.015 1.736.021.530 1.475.754.234 1.512.362.611 1.497.103.033 1.479.648.651
Total Hungarian Imports
87.434.153.437 101.375.449.297 94.307.658.338 99.307.020.938 104.188.086.493 90.770.226.393
ASEAN proportion of the above
2,06 1,71 1,56 1,52 1,44 1,63
Source: Own compilation from data of the Research Institute of Agricultural Economy (AKI), Budapest, 2016

APSTRACT Vol. 11. Number 3-4. 2017. pages 5-12. ISSN 1789-7874
Hungarian Endeavours For The Enhancement Of Economic Relations In Southeast Asia Focusing On... 9
countries, like American products which are shipped to Asia in large scale at more reasonable costs and prices or even as aid. However, despite this during the recent decades it happened that Hungary did manage to export even wheat to the region (for example to Indonesia), on several occasions. However, the majority of the profit from such trade goes to middlemen.
The prospects are better for highly processed goods, although problems are also associated with these. Potential exporters tend to be ignorant or ill-informed of local tastes and market conditions (channels, market regulations, etc). Hungarian entrepreneurs can not generally afford market opening business, with the associated traveling and marketing costs, market research, etc. Most of them find the cost of breaking into the markets either too high or too risky.
But, as Erdei-Késmárki-Gally Sz. and Fenyvesi L. (2012) underlined there is a continuous growth of food consumption in the world, there is a growing demand for agricultural produce and food (this effect is significant in certain developing countries) and simultaneously there is more and more demand for producing industrial raw materials and developing ‘non-food’ agricultural crops (Erdei-Késmárki-Gally Sz. and Fenyvesi L. 2012).
According to Zsarnóczai J. S. the improvement of the food security thus the increase of food safety is an issue of basic importance thus – using the international, e.g. from the possibility of projects being supported by resources of the European Union, it is an important task to find the most efficient ways of the spreading of advanced technologies and modern methods (Zsarnóczai J. S. 1997, 1979).
However, it is positive fact that in the recent years Hungary re-opened several diplomatic missions and commercial representation offices in the region (like in Kuala Lumpur and Ho Chi Minh City) so their on-site activity might generate
positive value added in the trade turnover and also in the field of the bilateral FDI relations with these countries.
When we have a look at the figures of the Hungarian export to the ASEAN countries, it is well visible that proportionally it is a relatively low fraction within the amount of entire Hungarian agro-export. However, there can be seen a growing trend as from 2010 to 2015 its value has been more than tripled (from about 9,1 M USD to 32,1 M USD), while the overall Hungarian agricultural export also grew during this period, but at a lower extent (from about 7,8 bln USD to 8,8 bln USD). It is also visible that the main export market of these goods for Hungary is Vietnam. From 2010 to 2015 the overall agricultural imports to Hungary also grew, from about 4,9 bln USD to 5,4 bln, and also agricultural imports from ASEAN region also grew from 23 M USD to 30 M USD. It has to be added as well that both export and import figures were higher in years from 2011 to 2014 than in 2010 or in 2015. The biggest source of agricultural imports for Hungary from the ASEAN region was Malaysia in this period, Indonesia, Thailand and Vietnam are also significant import sources (Tables 4 and 5).
Aside from direct trade, or trade through intermediaries, there are also other possible opportunities for advantageous cooperation in the agricultural food industry sphere, for example, the setting-up of joint venture companies, or research and development collaborations. In Thailand there is a government scheme to turn the opium plantations in the northern part of the country into areas for the cultivation of other crops of the temperate climate zone. In the Philippines there is also a central project to improve the quality characteristics of maize production – in the case of both of these, Hungarian expertise could be used. With regard to Vietnam, the “traditional” relationship, based on the former “socialist fraternity” has successfully been converted to a new,
Table 4: Hungarian agricultural exports to the Southeast-Asian region (million USD)
2010 2011 2012 2013 2014 2015
Brunei 0 0 0 0 0 0
Indonesia 269.592 636.742 411.446 551.976 2.157.354 3.269.075
Cambodia 38.699 49 0 67.473 11 57.593
Laos 0 0 0 18.094 0 0
Myanmar 0 8.328 0 0 2.034.556 3.683.969
Malaysia 9.495 172.091 494.126 401.483 1.244.669 2.545.611
Philippines 44.829 48.171 46.420 94.628 171.562 45.040
Singapore 755.537 1.498.705 2.813.152 3.813.399 7.414.559 4.712.311
Thailand 382.155 458.421 726.579 669.014 1.116.534 1.744.439
Vietnam 7.628.148 6.877.315 1.951.294 4.023.578 20.704.172 16.052.937
ASEAN total 9.128.455 9.699.822 6.443.017 9.639.645 34.843.417 32.110.975
Total Hungarian agro-export 7.758.703.876 10.004.239.672 10.373.175.097 10.637.476.999 10.274.086.113 8.774.143.170
ASEAN proportion of the above 0,12 0,10 0,06 0,09 0,34 0,37
Source: Own compilation from data of the Research Institute of Agricultural Economy (AKI), Budapest, 2016

10 László Kozár – György Iván Neszmélyi
APSTRACT Vol. 11. Number 3-4. 2017. pages 5-12. ISSN 1789-7874
business-oriented type of relationship which was extended to various fields of business. In the field of agriculture mention must be made about experiments to introduce Hungarian seed varieties, for example hybrid maize, vegetables and fruits into the market, as well as to produce from Hungarian seeds in cooperation with Vietnamese partners. Another co-operation initiative in the field of animal feed manufacturing in the frames of a joint venture is under elaboration.
Proposal for entering the Vietnamese market by a Hungarian know-how export
The international competition is really sharp on the market of Vietnam – the country with its 95 million inhabitants - and Hungarian companies do not have an easy job to cope with Japanese, South Korean, American, German, or Chinese competitors who are present there and whose market share is
u students who graduated at Hungarian universities, including the agricultural higher education from the nineteen-sixties to the change of political system. Most of these alumni students are retired by now, even though many of them used to be in important positions either in corporate managers or leading
v u v the broadening of partnerships in the last quarter century. Hungary failed to take advantage of this opportunity, thus it has to rely on this human basis which is more and more limited for the future from now. However, based on our personal
v , market provides still plenty of opportunities for the Hungarian
, u introduce an own research-based know-how export possibility which could be a basis of a well elaborated business proposal.
Public Warehousing and the warehouse recipe, as collateral,
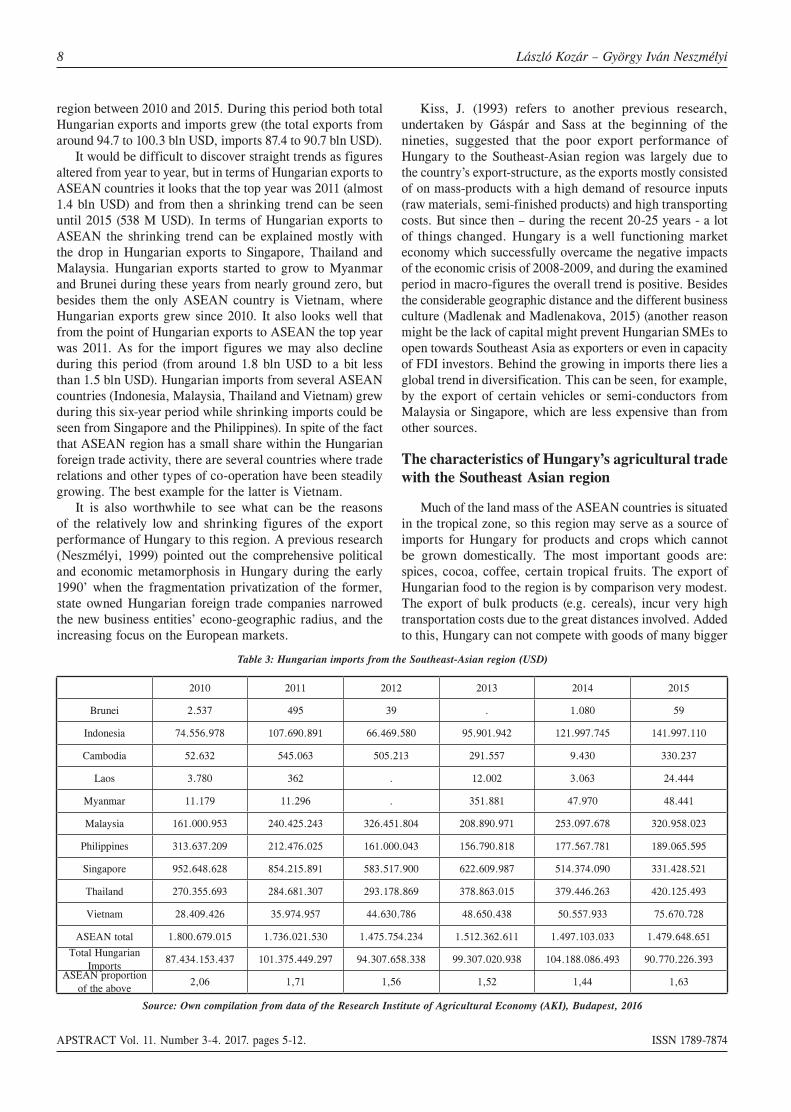
with very long tradition, especially in countries with a large agricultural sector, like Belgium, the Netherlands, the United States and Hungary. Hungary has 150 years long history in this field. In the period between the political system change in 1990 and the EU accession in 2004 the Public Warehousing and the Lombard Financing became a true success story in the financing of the agricultural products. Regarding the agricultural and food sector size in the economy of Vietnam, which has more than 6% of GDP-growth per annum, and which figure is much higher, then in cases of countries above, it seems a reasonable idea to create and develop this kind of business in Vietnam. The country has a huge production basis, one of the world leader producers and exporters in case of rice and coffee and the productivity shows increasing trend. (Figure1). This activity can be a completely new long-term investment with short ROI, based on a successful Hungarian know-how export.
Figure 1 The production area and quantity in Vietnam (1996-2015)
Source: Ministry of Agriculture and Rural Development of Vietnam (MARD)
Table 5: Hungarian agricultural imports from select countries of the Southeast-Asian region (USD)
2010 2011 2012 2013 2014 2015
Brunei 0 0 0 0 0 0
Indonesia 2.986.126 5.494.265 4.629.240 3.645.508 4.986.760 4.638.023
Cambodia 64 136.852 478.686 269.120 1 178.089
Laos 0 0 0 12.002 0 24.444
Myanmar 0 0 0 0 0 35.538
Malaysia 9.689.765 18.161.981 17.411.840 16.262.527 17.080.064 16.002.502
Philippines 424.695 200.260 665.962 711.659 751.070 1.575.175
Singapore 278.482 572.146 436.081 351.735 482.038 237.967
Thailand 4.956.452 4.666.627 4.019.210 4.418.025 3.744.350 2.726.978
Vietnam 4.677.554 5.514.646 4.024.144 3.456.142 4.916.219 4.378.695
ASEAN total 23.013.138 34.746.777 31.665.163 29.126.718 31.960.502 29.797.411
Total Hungarian agro-imports 4.923.470.630 6.188.377.799 5.730.419.399 5.932.331.564 6.206.151.597 5.386.171.239
ASEAN proportion of the above 0,47 0,56 0,55 0,49 0,51 0,55
Source: Own compilation from data of the Research Institute of Agricultural Economy (AKI), Budapest, 2016

APSTRACT Vol. 11. Number 3-4. 2017. pages 5-12. ISSN 1789-7874
Hungarian Endeavours For The Enhancement Of Economic Relations In Southeast Asia Focusing On... 11
Due to the complexity of Public Warehousing activity, in case of a successful implementation, this presence can also help a few Hungarian enterprises, operating in related fields of business to enter the markets of the Southeast Asian region. Based on the current information available, the potential dimensions of the Public Warehousing market can be illustrated just in the cases of the three most important agricultural products (see in Table 6). Thus, the value of the three main agricultural products is nearly USD 27 billion every year and it is increasing year by year. Furthermore, Vietnam imports 5-6 million tons of wheat in value of USD 1.5 billion may also be involved in Public Warehousing. The Hungarian grain market ranges about 10-12 million tons/year, in value it means approximately USD 2.8 billion, that is only one tenth of the Vietnamese, and even less than just the Vietnamese coffee market by USD 1.2 billion. Before Hungary joined the European Union - in the EU’s pre-accession period – noticeable amount of liquidity (HUF 200 billion ≈ USD 690 million) was involved into the Hungarian underfinanced agricultural market by Public Warehousing based Lombard credits annually, which was a major help to the production sector. The creditability of the agricultural sector was very low at that time due to the traditional approach of banks.
Table 6: The most important agricultural products in Vietnam, 2016
Product Production1,000 tons
PriceUSD/tons
Valuemillion USD
Coffee 1,700 ~2,300 4,000 Rice 46,000 ~ 460 21,000 Corn 6,000 ~ 260 1,600
Summa 53,700 - ~ 26,600
Source: Own compilation from data of: ICE, NASDAQ, IG UK, CME Group, FAO.
Based on the Hungarian and European experience, 65% of the yearly harvest was stored and financed by producers, traders and processing companies. Approximately 35% of the whole production needed extra financing possibilities based on Public Warehousing. In the United States, which has one of the most developed PW system, this ratio is more than 50%. There are no exact figures available from Vietnam at the moment, but, because of the current agricultural financing shortage, this proportion must be much higher! It probably reaches the level of 15-20 billion USD.
The Vietnamese agriculture sector, similarly to the Hungarian agriculture in the nineties, suffers of the lack of financing. The production sector has serious loss because of the partial lack of sufficient storage capacity, which causes more than one million tons of wastes just in case of rice, even more than the effect of the low dumping prices of both the rice and the coffee as well. Vietnam has the highest production level in ASEAN region as clearly illustrated in Figure 2, but it is not reflected in revenues, as Vietnamese average export prices are 30% lower than the same of Thailand according to our information.
Figure 2: Rice production, crop yields in Southeast Asian countries. 1980-2014
Source: Own compilation from data of FAO.
Taking into account of our experience and our investigations, the Public Warehousing sector which should be carried out with the cooperation of Hungarian firms and by their know-how export, could re-valorize these agricultural commodities which are produced at high standards and in large quantities. This would result in great success in the Vietnamese agricultural sector in one hand, and could open the way for a number of Hungarian companies to reach a new market of nearly 100 million people on the other hand.
The implementation of such a new and very significant development creates the opportunity of engaging in warehouse construction, logistic development, product handling and manipulation, ventilation, sanitation and other professional fields of development for Hungarian companies. The Lombard Financing system of commodities should be based on local banks primarily, but this market would open the possibility for Hungarian commercial banks, insurance companies and other financial servicing firms for involvement. Finally, mention must be made about one more significant point. A strong and successful Hungarian presence in Vietnam could be considered as a positive precedent and this pattern might be used for the exploration of the markets of other ASEAN countries.
CONCLUSION
The ASEAN region represents a small fraction of total Hungarian foreign trade. The growing weight and importance of the ASEAN countries in the world economy, their dynamic social and economic development should encourage Hungarian companies to find it worthwhile to be much more open to this region of the world. For Hungary today the ASEAN region is primarily still rather an import source than export market. Nevertheless, the region cannot be a principal target for agricultural or even industrial exports from Hungary, but the present results and figures could be further grown.
For the latter, the potential possibility we described in the last chapter of the study - in case of Vietnam, - could be a good example.

12 László Kozár – György Iván Neszmélyi
APSTRACT Vol. 11. Number 3-4. 2017. pages 5-12. ISSN 1789-7874
REFERENCES
Brian, W. (2017): ASEAN should have four countries with over a trillion dollar GDP by 2030 (List of ASEAN countries’ GDP). March 27, 2017 https://www.nextbigfuture.com/2017/03/asean-should-have-four-countries-with.html
Economic Outlook for Southeast Asia, China and India 2016 - Enhancing Regional Ties OECD, 2016, 34 p. http://www.oecd.org/dev/asia-pacific/SAEO2016_Overview%20with%20cover%20light.pdf
Erdei-Késmárki-Gally Sz. – Fenyvesi L. (2012): Tendencies and challenges in global agriculture. Problems of World Agriculture, Warsaw University of Life Sciences, Warsaw, 12 (XXVII) No 3: pp. 47-53.
Fact Sheet on ASEAN Economic Community Jakarta: ASEAN Secretariat, December 2015 ISBN 978-602-0980-65-2, 4 p.-ng na-tions), Külgazdaság, 1993. 4. 47-59 pp.
Kiss, J. (1993): Magyarország és a fejlődő országok gazdasági kapcsolatairól Külgazdaság, Vol. 1993 No. 4. 47. - 59. pp.
Külkereskedelem 2015. (Foreign Trade in 2015) KSH (Central Statistic office, Budapest), 15 July 2016, 15. p. https://www.ksh.hu/docs/hun/xftp/idoszaki/kulker/kulker15.pdf
Madlenak, R., Madlenakova, L. (2015). The Differences in Online Advertising Acceptance in China and Slovakia. In Proceedings of the 2015 International Conference on Management Engineering and Management Innovation (Vol. 3, pp. 45-49).
Neszmélyi, Gy. (1999.): Main Characteristics and Prospects for For-eign Trade Relations Between Hungary and the ASEAN Countries Hungarian Agricultural Research, Budapest, 1999, Vol. 8, Mo. 3. 19-22 pp. ISSN: 1216-4526.
Neszmélyi, Gy.: A magyar külkereskedelem Délkelet-Ázsiában (Macroeconomical trends of the Southeast-Asian countries). Gaz-dálkodás Vol. 15. No. 6., 1996. 55-60 pp.
Zéman, Z. (2017): A vezetői számvitel funkcionális kapcsolata a vállalati belső kontroll környezettel (The functional relationship between management accounting and the internal corporate con-trol environment). JURA, Pécs, Vol. 2017 No. 1. 193 – 198 pp. http://jura.ajk.pte.hu/JURA_2017_1.pdf
Zsarnóczai J. S. (1979): Gazdasági fejlődés és tervgazdálkodás Szíriában. (Economic development and planeconomy in Syria). MTA Közgazdasági Szemle (= Economic Review), No 9, Septem-ber 1979,1103-1118. p., ISSN 0023-4346
Zsarnóczai J. S. (1997): Közel-Kelet élelmiszerhelyzetének kilátá-sai (= Perspective of food condition in Middle East). Gazdálkodás (= Agricultural Economy) 41 year, No: 11. 55-61 p. HU ISSN 0046-5518
Other sources from internet:
http://ap.fftc.agnet.org
https://www.cmegroup.com
http://www.nasdaq.com/
https://www.ice.com/
www.ig.com/uk
www.mard.gov.vn/en
www.eiu.com/

APSTRACT Vol. 11. Number 3-4. 2017. pages 13-18. ISSN 1789-7874
DOI: 10.19041/APSTRACT/2017/3-4/2
Applied Studies in Agribusiness and Commerce – APSTRACT Center-Print Publishing House, Debrecen SCIENTIFIC PAPER
DETERMINING FAIR RENTAL VALUE OF LAND IN THE HUNGARIAN VALUATION PRACTICE –
A METHODOLOGICAL APPROACH Ferenc Buzás1, László Posta1, Sándor Kiss2 & István Mező2
University of Debrecen1, Biblio-Markt Ltd.2
Abstract: The directive of 1666/2015. (IX. 21.) called ’Land for Farmers!’ has changed not only the legal terms and conditions but also the eco-nomic basis of land use in the relation of land use and resulting derivative demand. Institutionalized rental fees can be modified to market level only if it is confirmed by qualified expert’s report hired by the new land owner. Setting a fair rental value has quite a few methodological approaches. Due to the lack of a legally recommended calculation process, authors hereby are presenting a method to calculate fair rental value that is benefi-cial for both renter and owner. Foreign rental conditions related to the topic are also concerned in the article.
INTRODUCTION
The recently privatisation of state owned agricultural lands raised several questions and problems in Hungarian agriculture, but one of the most controversial was the measure of the rental value. The rental value of the state owned lands
u market level (1250 HUF/Gcv1*) – but after the privatisation it can be modified by the new owners. Fair rent helps producers and landlords estimate returns from cash, share and flexible rental arrangements. The most important question for the renter and land lord is that how much can be the fair rental value, which can be acceptable on long term for both
Modification of land rent by the two partners can be made by the opinion of an expert. In most cases land market based evaluation is accepted, but in many cases there are problems with comparison data of local Land Administration Office. In cases of some localities there are no concrete values concluded, but because of combined rent it is tied to an amount of yield, while within a family or among relatives land rents are altered from market values. In many cases recorded data are not punctual enough.
Nowadays, due to subsidies and raised level of average agricultural incomes there is a demand dominancy in land market. On the other hand in the field of land use supply and demand is differential (Naárné et al., 2013) In some territories, mainly in localities with good land quality, owners make competition among the potential users or tenants, while
1 Gcv - Gold crown value – measure unit, which indicates the quality of the agricultural land
in other territories tenants try to reduce the land rent because of the risk of the market and the weather.
So, consideration of land rent is not a responsibility of the expert. Concluding a fair rental value, local specialties and values have to be considered, but the long term interests of the owners and users also have to be counted. The method of land market based value alone is not eligible for these requirements, yield based evaluation is also recommended, which provides the long term interest of both sides. For determining the fair rental value, authors devised a potential method, which is eligible for the high expectations.
LITERATURE REVIEW
Land rental value in the European Union
A lease (rent) is an agreement that gives someone ability to use or possess real or personal property for a designated period of time in return for some type of payment. Theoretically, if markets are perfect and transaction costs insignificant, then agricultural land prices and rents are expected to change in parallel.
At the present there are no exact data about the land prices and rents from EU member countries. Through the Eurostat and the relevant national authorities, the European Commission tries to launch of a common methodology agreed between the Member States (EC, 2016).
In the EU the farmland sales market regulations are different from the rental market regulations. (Naárné – Tóth, 2005). Three types of rental market regulations exist: rental price regulations, the tenancy duration regulations
Keywords: land rent, rental value, land valuation method, land use (JEL Classification: Q15)

14 Ferenc Buzás – László Posta – Sándor Kiss – István Mező
APSTRACT Vol. 11. Number 3-4. 2017. pages 13-18. ISSN 1789-7874
and quantitative land rent regulations. In one third of the EU the maximum rental prices are set by the government. The duration of rental contracts is regulated in some EU countries and influences the rental market’s responsiveness to agricultural policy changes. The main institutional regulations are presented in the Table 1. The importance of land renting is typically higher in countries with strong rental market regulations, such as France and Belgium, they have the highest share of rented area (77% and 75%) among all the EU countries.
Table 1. Rental market regulations in some EU countries
Min/Max rental price
Min/Max, average tenancy duration
Other rental marketregulations & norms
Belgium Max rentMin 9/Max 27(99)
Usually 9-
Finland No Max 10 Average 5-6 -
FranceMin & Max rent
Min 1/Max 25 Usually 9 or 18
Inheritable rental contracts,
automatically renewed
Germany No No Average 6-11.5Subject to state
approvalGreece Min rent No <4 years -
Ireland No NoConacre rental
agreements
Italy NoNo; average arable
crops 2-5, fruit crops 5-10
Possibility of contracting with the assistance of farmer
associationsNetherlands Max rent Min 6 (until 2007) -
Spain No Min 5 -Sweden No No -
United Kingdom No
In Scotland for new 2003 Act tenancies
max 5, min 15
Northern I. - conacre rental agree-ments;
Scotland - Traditional short duration
tenancies; England - traditional tenancies
& farm business tenancies
Source: Swinnen et al., 2010
The value of the rent is influenced by several way (Swinen et al., 2010). Agricultural policy especially the subsidies has dominant influence on rents. The impact of SPS on land rents appears to be stronger than on land sale prices. Developments in rental prices were heterogeneous: since 1992 real rental prices declined by around 25% in Finland and increased by around 55% in Spain (Strelecek et al, 2010). Trying to estimate the impact of subsidies on farmland value, the empirical studies effected by Swinnen et. al (2008) shows that the land price elasticity of 1% increase in subsidies/returns, varied between - 0,12 - 0,69. Similar result found O’Neill and Hanrahan (2013), they study point out that the high degree of inertia in rents means that the impact of previously capitalised agricultural policy persists through time. Rental prices for agricultural land tend to be more regulated by the government than purchase prices.
Van Herck et al (2013) analysed the impact of increasing direct payments on land rents in six new EU member states. They find that up to 25 eurocents per additional euro of direct payments is capitalised in land rents.
G. Breusted and H. Habermann (2009) reveal that the marginal incidence of regional per-hectare premiums in the EU is significantly higher than one. This is on first sight controversial since the subsidy more than fully capitalizes into the land rental price, in addition other important determinant of rental prices can be the regional livestock density, as well.
It must be mentioned that the dynamics of land prices and rents generated by the supports of EU states can be followed in the states waiting for EU accession (Bojnec, 2011). These procedures, however, are realized much faster in these developing areas than in Western-European countries, where land prices and rents were disposed in centuries (Clark, 2001). In the overseas there are partial differences compared to European price dynamics. In those areas reaction to declining crop prices and farm incomes was relatively flexible concerning land prices and rents (Dobbins – Cook, 2016). Similar effect - though not a unique exception – could be observed in several member states of the EU as well. (Good – Boyle, 2017).
Land prices and land rents in Hungary
Land prices differs largely by regions and by counties, in 2014 the difference between the maximum and minimum values was 53%. We can’t find serious differences between the Western and Eastern part of the country, the prices are determined more by the land quality, and local factors (location, accessibility, economic and demographic situation etc.) (Buzás - Kiss, 2012).
Figure 1: Land prices and growth rate (previews year=100%) in Hungary
Source: Hungarian Central Statistical Office (2014) - by the data of
National Tax and Customs Administration
According to data of Central Statistical Office (2014), 73% of total agricultural land sold in 2014 was arable land, 12% forest and 11% meadow or grass land. The remaining 4% was vineyard and orchard. There were essential differences between regions of the country. Sale of arable land was dominant throughout the country. With 34% Bács-Kiskun county showed the lowest

APSTRACT Vol. 11. Number 3-4. 2017. pages 13-18. ISSN 1789-7874
Determining Fair Rental Value Of Land In The Hungarian Valuation Practice... 15
rate, while Győr-Moson-Sopron county had the highest figure with 86%. From 2014 the increase in land prices have changed from region to region and rate of growth has been decreasing.
Figure 2: The rental value of arable land and the change of the rent in Hungary by counties
Source: Hungarian Central Statistical Office (2014)
According to the data of Central Statistical Office, 57% of arable land are used as rent. In Trans-Danubian areas the ratio is higher (66%), while in the Great Plain and Northern regions the ratio is 51%. There are significant differences between types of land use in different regions. In Hajdú-Bihar county rent is also spread, but mainly owners cultivate land.
As for rental fees, significant heterogeneity can be traced in different regions and counties as well. While the Northern part of the Great Plain represents rates of the national average, due to its favourable disposition, Hajdú-Bihar county belongs to the highest rated regions concerning rental fees. Concerning the average rental value of Western and Eastern counties we can’t find great differences (43 589 HUF/ha and 44 270 HUF/ha), which can be explained probably by the average land quality (19,69 Gcv/ha respectively 20,23 Gcv/ha).
Figure 3: The changes in land price and land rental value of arable land in the last years.
0
10000
20000
30000
40000
50000
2009 2010 2011 2012 2013 2014 2015
Ren
tal v
alue
0
200000
400000
600000
800000
1000000
1200000
Land
pric
e
Rental value (HUF/ha) Arable land price (HUF/ha)
Source: Hungarian Central Statistical Office (2014)
Joining the EU in 2004 and thus getting agricultural subsidies has influenced national land market conditions in a big way. By 2013, the rate of EU support in Hungary reached the average EU level, and thus, through derivative demand, it was a price sensitive factor concerning both sale price and rental fee of land. Based on empirical experience, growth in EU support leads to increasing land prices and rental fees.
Figure 4: The ratio and connections between land price and value of the rent – by counties
0200000400000600000800000
100000012000001400000
Baranya
Békés
Csongrá
d
Győr-Moso
n-S.
Heves
Komáro
m-Eszterg
om Pest
Szabolc
s-Szat
már-B.
Vas Zala
Land
pric
e
010000200003000040000500006000070000
Rent
al v
alue
Land price (HUF/ha) Rental value (HUF/ha)
Source: Hungarian Central Statistical Office (2014)
In the majority of the counties, rental fees were 4-6% of market price of land. However, in Trans-Danubian areas rental fees were usually below 4% of market price, i.e. relatively high land prices combined with lower rental fees, while in eastern regions, rental fees were 6,8% of market price.
Figure 5: Rental value and the quality of the arable land by counties
010 00020 00030 00040 00050 00060 00070 000
Bara
nya
Bács
-
Béké
s
Bors
od-
Cso
ngrá
d
Fejé
r
Győ
r-
Haj
dú-
Hev
es
Jász
-
Kom
árom
-
Nóg
rád
Pest
Som
ogy
Szab
olcs
-
Toln
a
Vas
Vesz
prém Za
la05101520253035
Rental value (HUF/ha) Land quality (Gc/ha)
Source: own graph, by the data of Hungarian Central Statistical Office (2014)
Empirical Analysis
We tried to determine the connection between the land price, rental value and land quality – for that reason we made a correlation analyses. The results of correlation test can be seen in the Table 2.

16 Ferenc Buzás – László Posta – Sándor Kiss – István Mező
APSTRACT Vol. 11. Number 3-4. 2017. pages 13-18. ISSN 1789-7874
Table 2: The results of correlation test
Rental value Land quality
Land price 0,760 0,652
Rental value 0,420
Land quality 0,420
Source: own calculation, by the data of Hungarian Central Statistical Office (2014)
As it can be seen in Table 2. we found significant correlation between land price and rental value, and land price and land quality, but correlation is low between rental value and land quality.
The methodological basis of determining land rental fee
Unanimously accepted legal regulation or methodology for determining rental fee of land in Hungary is not available. In such cases, guidelines of land valuation are to be applied. Decree of 54/1997. (VIII. 1.) Annex No.1. contains the methodology of market comparison assessment, while Annex No.2. contains the methodology of income yield-based assessment approach.
Methodology of assessment is based on both national regulations and European Valuation Standards (EVS 2003) set by The Group of European Valuers (TEGOVA), including S4.01.-S4.76. parts and GN7.37 (for capitalisation method) and S.4.01.-S.4.76, GN7.49 (for market approach). The details of calculations and the detailed methodology are used by the proper decision of the valuer, which many times can be controversial.
A. The market data comparison approach
Principles of assessment are based on territorial, land quality and land use concept. Within the principle of territorial concept, zoning, location, and accessibility are to be concerned based on representative data available from the Land Administration Office of the district governmental offices. Basic data must be analyzed and filtered by descriptive statistics (average, median, modus, minimum and maximum figures).
Due to the fact that concerning Gold crown value (which is used for measuring the quality of land) there might be significant differences between average data and actual land quality, it is of crucial importance that the assessment is made by an expert. Thus, based on the concept of land quality, comparative data and land size are also taken into consideration (Szűcs, 1998). Unit-based land rental fee must be corrected in accordance with land use concept, i.e. territorial size, rate of irrigation, landmarks and cultivation limiting/aiding elements (Naárné, 2009) Correction must always be explained and should not be over +/- 30%.
To determine the final rental market value: the corrected average rental value (HUF/ha) can multiplied with the size of the land (ha).
B. Income based approachLand rent concept
David Ricardo said: “Rent is that portion of the produce of earth which is paid to landlord for the use of original and indestructible powers of the soil.”
According to the theoretical principles of economics, land rent is the temporary transfer of land use right in exchange of rental fee. It occurs when the advantages outweigh all disadvantages for both parties. The lease is a contract subject to legal effect and includes a fixed fee paid to the owner.
There are different ways to calculate land income (rent) in economic theory. However, in practice there are two applied methods:
a. Income method based on capitalization b. The residual value method
The basis of rental fee is land income (as annuity). Land income means interest on land capital and/or the yield of the capital invested in the land – or part of it. It is actually part of the profit that remains after the deduction of opportunity cost of capital invested (excluding land capital). In conclusion, it is the land owner who is entitled to land income. In case of cultivation of self-owned land, no differentiation is necessary.
a.) The rent (income) capitalisation – inverse method
In accordance with the above mentioned, in the case of capitalization concept, the basis of calculation should be the realized sales price of land in the region, and market comparison approach should be applied (i.e. unit-based (specific) value calculation based on territorial, land quality and land use concept).
– income based method is based on capitalization of rent , i.e. theoretical rental fee can be calculated from land value with the help of the formula
– land income (rental fee) = land value x interest rate of capitalization + land tax*
*Note: It is determined by local governments.
The land value (price) – can be determined by market comparison approach
For capitalisation rate – can used the average capitalisation rate of the mortgage banks. The current value of capitalisation rate of major mortgage banks in Hungary are presented in the Table 3.
When defining capitalization rate, it is accepted to apply public interest rates announced by mortgage banks applied in land evaluation. However, in some cases it is more precise to calculate the ratio of average sale price and average rental fee typical in the given region or location. A fair approach is to calculate the ratio of the two and thus represent local and national tendencies, as well.

APSTRACT Vol. 11. Number 3-4. 2017. pages 13-18. ISSN 1789-7874
Determining Fair Rental Value Of Land In The Hungarian Valuation Practice... 17
Table 3: Capitalisation rate recommended by the mortgage banks fordetermining land (and rental)values
Budapest Rural areaMin. Max. Min. Max.
Arable land, meadow 4,5% 5,5% 5% 6%Orchard, vineyard 8% 9% 8% 9,5%
Source: own calculation (averages) in 2017, based on banks information sources
In the EU, the capitalization rate moved in 2007 on the scale of 0.83% (Belgium) to 4.26% (Sweden). In six states (Czech Republic, Denmark, Germany, Netherlands, Finland and Slovakia), the capitalization rate oscil lated within 2–3% (Strelek et. al).
b.) The method of residual value
The other applied method is based on residual value, i.e. alternative cost of capital is deducted from entrepreneurial income:
land rental fee = value of production – (production cost + interest on fixed and current assets invested in production)
The final rental fee can be set by the ratio of the two: market based value and income capitalisation value. It is highly necessary when free market value attitude is limited, rights to exercise, shared ownership (land versus infrastructure), etc.
RESULTS, CONCLUSIONS
In practice, the renter is motivated to find land below market value, while the owner is motivated to lease or sell their land above this value. Final value is defined by bargaining power.
In case of market comparison approach, it is possible to calculate rental fee related to the given time and location (microenvironment). However, income based approach is a method that allows us to see macro-environmental effects in the long run. By the application of a combined method, the future interest of both the renter and the owner is correctly represented.
In the current practice in Hungary the increase of land prices generated by the supports has raised the rents as well, which is an advantage for land owners, while a definite disadvantage for tenant farmers. However, the new budget directives for agricultural policy in the EU are to partly decrease the supports, which will have an effect on profits, and indirectly will affect rental market, too. It is the landowners’ interest to calculate a balanced return of capital and rent in the long run. To do so, it is of crucial importance that alternative costs show a return and at the same time, economic profit is also realized. For the realisation of these two conditions, when calculating rents, not only the self-generating market pricing needs to be considered, but also the profit producing ability of the tenants. The method recommended by the authors fulfils both conditions.
REFERENCES
Bojnec S. (2011): Land Markets in the EU Candidate Countries of Croatia, Former Yugoslavia Republic of Macedonia and Turkey. Factor Markets Working Paper no.1. September 2011.
Buzás F.- Kiss S. (2012): A termőföldértékelés tapasztalatai – Javaslatok a vonatkozó jogszabályi háttér átdolgozásához. A termőföldpiac és az értékelés kérdései – EUFIM szakmai konfer-encia 2012. márc. 23. Magyar Ingatlanszövetség. Budapest.
Clark G. (2001): Land Rental Values and the Agrarian Economy: England and Wales, 1500-1912. European Review of Economic History 6(03).
Dobbins C. – Cook K. (2016): Indiana Farmland Values and Cash Rents Continue Downward Adjustments. Purdue Agricultural Eco-nomics Report.
EUROPEAN COMMISSION - EUROSTAT Directorate E: Sec-toral and regional statistics (2016): Agricultural Land Prices and Rents data for the European Union.
European Comission (2016): Agricultural Land Prices and Rents data for the European Union. Research Paper. Directorate E: Sec-toral and regional statistics. Reference: AAP WG/2017/1/16 Ver-sion 1.0
F. Strelecek - J. Lososova- R. Zdenek (2010): The relations be-tween the rent and price of agricultural land in the EU countries Agric. Econ. – Czech, 56, 2010 (12): 558–568.
G. Breustedt – H. Habermann (2009): Determinants of Agricul-tural Cash Rents in Germany: A Spatial Econometric Analysis for Farm-Level Data - University of Kiel, Germany. Contributed Paper prepared for presentation at the International Association ofAgricultural Economists Conference, Beijing.
J. Swinnen – P. Ciaian - A. Kancs (2008): Study on the Function-ing of Land Markets in the EU Member States under the Influence of Measures Applied under the Common Agricultural Policy - Fi-nal Report. Centre for European Policy Studies (CEPS). Bruxelles.
J. Swinnen – P. Ciaian - A. Kancs – Vranken L. (2010): EU Land Markets and the CAP e-version. Centre for European Policy Stud-ies. Bruxelles.
J. Swinnen – P. Ciaian - A. Kancs (2008): Study on the Function-ing of Land Markets in the EU Member States under the Influence of Measures Applied under the Common Agricultural Policy - Fi-nal Report. Centre for European Policy Studies (CEPS) Brussels.
K. Van Herck J. Swinnen – L. Vranken (2013) : Direct Payments and Land Rents Evidence from New Member States. Compara-tive Analysis of Factor Markets for Agriculture across the Member States. Working Paper. No. 62. Bruxelles.
KSH (Hungarian Central Statistical Office - 2014): Mezőgazdasági termőföldárak és bérleti díjak, 2015. Budapest.
Naárné Tóth Zs. (2009): A termőföld közgazdasági értéke és piaci ára. Agroinform Kiadó. Budapest.
Naárné Tóth Zs.- Tóth T. (2005): Földtulajdon és földhasználat főbb összefüggései hazánkban. Agronapló. 2005. 10 sz.
Naárné Tóth Zs.– Baranyai Zs.– Vinogradov Sz. (2013): A szántóföld árának és közgazdasági értékének összefüggései Mag-yarországon. LV. Georgikon Napok.
P. Good – G. Boyle (2017): Land Market Review and Outlook 2017. Society of Chartered
Surveyors Ireland – Teagasc Agricultural Economics and Farm Surveys Department. Dublin.

18 Ferenc Buzás – László Posta – Sándor Kiss – István Mező
APSTRACT Vol. 11. Number 3-4. 2017. pages 13-18. ISSN 1789-7874
S. O’Neill and K. Hanrahan (2013): An Analysis of the Capitalisa-tion of CAP Payments into Land Rental Rates in Ireland. Com-parative Analysis of Factor Markets for Agriculture across the Member States. Working Paper. No. 68. Bruxelles.
Szűcs I. (1998): A föld ára és bére. Agroinform Kiadó. Budapest.

APSTRACT Vol. 11. Number 3-4. 2017. pages 19-26. ISSN 1789-7874
DOI: 10.19041/APSTRACT/2017/3-4/3
Applied Studies in Agribusiness and Commerce – APSTRACT Center-Print Publishing House, Debrecen SCIENTIFIC PAPER
CLIMATE CHANGE EFFECTS ON SKI TOURISM Piroska Béki¹
¹Marketing and Tourism Institute, Tourism and Catering Department, University of Miskolc. Egyetemváros, Miskolc 3515
Abstract: Nowadays, climate change poses a common recurring problem in our everyday life. The weather forecasts tend to be inaccurate, the swiftly changing weather often makes fun of the people. The same unpredictability applies for forecasting the amount of precipitation or snowing. The major problem in ski tourism consists in the gradual shift of seasons, namely there is no snow in December yet, while at Easter-time we can count on such an enormous amount of snow. I’d like to present this climate condition and offer a sort of way out of this problem.In my empirical study, I have carried out document-analysis along the data collection phase, and I made half-structured deep-interviews, as well. My research questions were the following: How is the winter season affected by climate change or by the lack of snow? Due to the unreliable climatic conditions what is the estimated ratio of drop in tourism in the season? How much shorter is a skiing-season and how does it affect the operation of the local ski-school? What are the features of pre, and post peak-season tourists’ emergence? How and for how long can a smaller ski-resort be maintained? What is the biggest challenge, problem at the ski-resorts along the state border? First of all, I’d like to present and tackle the various solutions emerged facing the challenges of climate change effects related to skiing, on the other hand, I have made some personal interviews with Hungarian ski instructors working abroad and also with managers of Austrian ski schools trying to find out the various answers and reactions they have hammered out coping with the new challenges and difficulties in ski tourism.Hungary can not be considered a skiing nation, although more and more people tend to take up skiing and get involved in this special field of sport tourism. The number of ski slopes being built and developed is increasing, yet the Hungarians ski-lovers tend to visit rather the foreign sport centers for the time being. The reasons mostly involve the various length and versatile difficulty level of the ski slopes. We should also take into account the challenging conditions imposed by climate change on the smaller winter sport centers and the way they can cope with it and also compete with other sport centers with similar features.Climate change affects considerably the operation of skiing season, and the service providers must adapt to the new conditions. Many resort venues struggle for survival, though most of the local self-governments are clearly aware of the importance of ski-tourism, particularly in Austria.
INTRODUCTION
Tourism proves to be a global issue. At the beginning of the 21st century, in the developed regions of the world leisure-time spending has become organic part of everyday-life, thus it has constantly played an important rejuvenating factor in economy. Obviously, tourism is not independent from the socio-economic transformations, either. Sport and tourism are supposed to be two ’mega-fields’ of our society involving millions of people. Both areas significantly affect the social, cultural and economic lives of countries as well as their foreign relations. Their ensuing merger resulted in the emergence of sport-tourism and its rapid dynamic development, too (RÖTHIG, 1992; DREYER, 2002; BÁNHIDI, 2007, BORBÉLY and MÜLLER 2008, MÜLLER et al. 2008).
The nuisance effects of climate-change upon tourism and catering have gained more ground and awareness along the last decade. Moreover, due to the negative trends in climate change several intensive development projects have been
implemented for creating and providing snow-sure resorts in winter tourism.
Ski-tourism emerged only a few decades ago as a new kind of service and primary motivational objective in mass-tourism. It has spread primarily across the West-European countries. At the early stage it used to be the active leisure-time touristic activity of the elite, while the number of winter-holiday makers started to increase with launching of the second and even third holidays among workers. The various skiing package-tour offers of the travel agencies generally provide similar complex touristic services used and paid for by great bulk of common customers.
The soaring popularity and development of winter tourism stems from the advanced by-services of the ski-slopes and resorts, the slopes have become snow-sure (thanks to the effective application of snow-cannons) and they also provide higher level facilities for the lovers of winter-sports. Thus, an increasing number of tourists tend to choose the domestic ski-resorts, as well, which are more cost-effective and affordable
Keywords: climate change, ski tourism, winter sport centers (JEL Code: Z32)

20 Piroska Béki
APSTRACT Vol. 11. Number 3-4. 2017. pages 19-26. ISSN 1789-7874
than the facilities provided by the resorts of the neighbouring countries. According to the surveys – in our country – around 5% of the population gets actively involved in ski-tourism, each year (sielok.hu). The ski-lovers’ primary choice is still Austria, where Hungary stands consistently on the 10th position among the international group of outstanding ski-tourists-sender countries. For instance, a record number of Hungarian winter tourists arrived in Austria in 2013. Based upon the figures of Statistik Austria, 479,083 Hungarian tourists spent altogether 1,622,437 guest-nights in Austria. The biggest number of Hungarian tourists visited Stayermark, Salzburg province, Carinthia and Vienna (Österreich Werbung Budapest).
In my study, from one hand, I wish to present the opportunities and problems facing the smaller ski-resorts along our state-border, the way people react to the challenges posed by climate-change; from the other hand, I tend to unveil the findings of my interview-based survey conducted among Hungarian ski-instructors working abroad and managers of Austrian ski-schools, too, concerning their alternative proposals on the new unfolding challenges and problems.
MATERIALS AND METHODSTourism and climate-change
Tourism, based upon its diversity can be listed and structured in many different ways. Among its categories there are quite many overlappings, thus the clear ramification is pretty difficult. At the 1989 World Tourism Organisation (WTO) conference held in The Hague, regarding its primary motivation tourism was split into two major categories: professional and leisure-time tourism (MICHALKÓ, 2004). This is quite an important issue to be emphasized, since professional tourism, which proves to be one of the most developing areas of tourism, had not been dealt with separately before the conference.
Nowadays, many consider tourism as being the most characteristic industrial field and product of our modern age. Tourism proves to be a complex social issue, where the environment holds an important role. Tourism must be regarded closely together with its environment in all cases. There is a tight interaction and mutual dependence between tourism and environment, since some factors of environment do affect tourism while the latter has its own reaction and impact upon the environment, though the scale of the two impacts cannot be considered equal and balanced.
Leiper (1981) considered to carry out the research of tourism in multi, - and interdisciplinary way. In his model, the key dimensions of tourism are to be: the tourists, the sender areas, travelling, destinations and the tourism-field (Fig. 1). In our days, the research of tourism is featured by the application of vast scale of theoretical approaches and methods. A common platform of all the various theories, approaches, ideas and models could greatly benefit and promote the dissemination of scientific know-how in tourism (PÉTER, 2010).
Figure 1.: The system of tourism extended
(LEIPER, 1981:75)
Generally, climate researchers provide weather-related figures linked to climate change, which do correlate with tourism. Factors, like sense of heat and stress (temperature indices), physical criteria (wind, rain, snow, ice and UV-radiation, extremities, etc.) and aesthetic factors (such as, visibility, sunny periods, cloudiness, day-length etc.) (DE FREITAS, 2003; MATZARAKIS, 2006). Climate and weather conditions prove to be important factors of tourists’ adventures and experiences of well-being, which interfere with the various weather-types and tourism relying upon threshold indices (GATES, 1975; BARBIERE, 1981; BESANCENOT, 1989, MÜLLER et al. 2011, MÜLLER et al. 2016). Earth’s global surface temperatures in 2017 ranked as the second warmest since 1880, according to an analysis by NASA (2017).
There have been several studies carried out on the effects of climate change upon tourism, though quite often the researches tended to focus primarily on certain aspects of tourism, only (OECD, 2007; UNWTO–UNEP–WMO, 2008; SCOTT, 2011). It has been revealed that the impact and effect of changing weather conditions upon tourism are quite diverse and versatile (MATZARAKIS et al. 2004; 2007; AMELUNG et al. 2007; SCOTT, 2006; SCOTT and MCBOYLE 2007), taken into account the correlation between weather/climate, climate change and tourism too (MATZARAKIS, 2006; 2010). In this study, the focus tends to be cast on winter tourism, particularly concentrating on the problem-sphere defined by the lack of precipitation and snow.
From sport-tourism to ski-tourism
Sport, as one form and way of spending time outdoors in nature, proves to play an indispensable role in promoting and facilitating environmentally conscious lifestyle and attitude…

APSTRACT Vol. 11. Number 3-4. 2017. pages 19-26. ISSN 1789-7874
Climate Change Effects On Ski Tourism 21
Quite many studies deal with the supply and demand, economic factors of sport-tourism and also with the motivation of target groups (BÁNHIDI, 2007; BÁNHIDI et al. 2006; BORBÉLY and MÜLLER 2015, DOBAY, 2008; MÜLLER et al 2007, PREUSS, 2004, MÜLLER et al. 2006, MOSONYI et al 2013). Sport and tourism, two major industrial fields have experienced significant development and rise in the recent decades (DÓCZI, 2008). The autonomous independence-trend of sport-tourism within tourism proves to be the result of intensive classification process (FÖLDESINÉ, 2005). The terminology in itself refers to such travel forms that primarily imply sport-related objectives and motives: to do sports, to take part in competitions, to support teams, fan-group travels and to visit sport sights and facilities. Furthermore, based on the various sport-fields, sport-tourism can be split into as many fields as the number of sport-related activities exists, such as: biking, skiing, horse-riding, water-sports etc (BÉKI, 2015, KÖNYVES and MÜLLER 2001).
Consequently, the term of sport-tourism tends to function as a cluster-term involving all kinds of sport-related activities, which can also be broken down into indoors and outdoors activities. The outdoor-activities evidently are exposed to the climatic conditions. It is commonly known, that the sport facilities on higher altitudes are more affected by the warmer climate – especially – the winter sport conditions and all the linked sport activities (SCOTT et al. 2003, 2006; 2011). According to the surveys made by Matzarakis and Tinz (2008), the climate change conditions and its consequences in the alpine regions will be the following:
a. changes in some aspects of climate-tourism,b. risks and dangers posed by climatic and other natural
disasters,c. changes in snow-conditions,d. changes in bio-diversity (HALL, 2010).The skiing-season might as well be shortened in the
middle-altitude mountain regions, thus the winter-sport facilities would be available only at the higher altitude resorts of these mountains. In the Alps, the snow-sure slopes and resorts would start at 1,500 m altitude and by the end of the 21st century the snow-coverage would also shrink with 50% (OECD, 2007). With each 1°C rise in average temperature the snow-border would climb 150 meters higher in the mountains, and, as a result the snow-coverage would decrease, respectively (ENDLER and MATZARAKIS 2011).
An area can expect financial gains in case it can assure and provide snowy skiing facilities for the winter-tourists, namely to be snow-sure. The most common method for defining ’snow-sureness’ proves to be the 100-day rule. Namely, if a terrain is available for skiing for a time period of at least 7 seasons out of ten, for at least 100 days between 1 December and 15 April, and the snow-depth is at least of 30-50 cm, then it can be considered to be snow-sure (ENDLER and MATZARAKIS 2011). This method is applied by the OECD-study (2007), as well, and the findings reveal that a temperature rise of 2°C in Europe would result in significant drop of snow-cover in the Alps; only 60% of present ski-resorts would remain snow-sure. During the outstandingly
warm winter of 2006 many ski-resorts could not continuously operate from December to April, with the exception of slopes where snow-cannons were used, too (WOLFSEGGER et al. 2008; STEIGER and MAYER 2008; STEIGER, 2010; 2011).
It is an expected trend in the future to face the shrinking of skiing days as well as the increasing amount of artificial snow-making facilities. In some particular cases the various effects may be beneficiary as well, in case they combine the opportunities in the pre and post-peak-season, for example they may link the diverse touristic activities together (SERQUET and REBETEZ 2011).
METHODS AND THE SAMPLE
In my empirical study, I have carried out document-analysis along the data collection phase, and I made half-structured deep-interviews, as well. I analysed the sielok.hu database, the KSH database and the Austrian OWB database documents.The subject of my deep-interviews were meant to be experts of winter-sports, who run ski-businesses or operate ski-facilities (n = 6), furthermore I questioned ski-instructors (n = 20) who are involved in skiing during the whole winter season. The pre-arranged list of questions was posed personally or via Skype meetings.
My research questions were the following:How is the winter season affected by climate change or
by the lack of snow? Due to the unreliable climatic conditions what is the
estimated ratio of drop in tourism in the season?How much shorter is a skiing-season and how does it
affect the operation of the local ski-school? What are the features of pre, and post peak-season
tourists’ emergence? How and for how long can a smaller ski-resort be
maintained? What is the biggest challenge, problem at the ski-resorts
along the state border?
RESULTS AND DISCUSSIONThe condition of ski-slopes based upon the research study
The interviews shared various approaches when trying to find appropriate answers for the questions concerned. Without precipitation and missing cold weather the ski resorts cannot start their winter operations. During the winter months, particularly in December, the travel agencies cannot assure their tourist customers whether they would be able to ski or not at the chosen ski resorts. Thus, a new term popped up in tourism industry, namely the snow-guarantee. This idea instigates and facilitates customers to invest into winter-travels to ski-resorts even in December, in the worst case they would get a refund. The peak-season periods are usually exempt from this service. The last 5 years’ experiences manifest that mostly the glaciers are able to provide appropriate number and quality of ski-slopes in December period, from which the current season seems fortunately enough to be an exception.

22 Piroska Béki
APSTRACT Vol. 11. Number 3-4. 2017. pages 19-26. ISSN 1789-7874
All my interviewees, without exception, reassured me that the ski-resorts badly needed cold weather in the current season. The water-stock reserves and the ensuing cold weather can provide the necessary good level ski-slope conditions with the application of snow-cannons. The winter season usually lasts for 3.5-4 months from mid-December until end of March or mid-April. The experiences of the previous 5 years, though let us consider that the heavy snow-falls usually occur at the beginning of April, all the same the majority of the ski-tourist finish their winter holidays by the end of March. April is not commonly considered a month for skiing, thus the ski-resorts with good snow quality and depth are forced to close their doors, though with some progressive shift and change in mentality and the season could be prolonged with a one month later start and finish winter holiday re-scheduling. This shift naturally needs time since the idea of white Christmas and similar climatic concepts prevail in mentality.
The changing climatic and weather conditions pose serious problems for the tour-guides as well as for the ski-instructors. From one hand, if there is not enough snow that is a problem, from the other hand if it is too much that is another issue, too. In other words, it means that if there is too much and deep snow it may cause avalanche disaster, therefore it must be diminished with targeted explosions so the slopes must be closed, too. Many ski-slope accommodations are basically inaccessible, especially in case they can be reached only by cable-car. The summit lodges constitute outstanding marketing power and are attractive among winter-tourists just because their sheer venue, though in case of big snow-fall or avalanches they can become stranded or cut off from civilization for several days. Strong winds are meant to pose another hazard factor in the mountains, which may lead to closing of the slopes and ski-lifts. For the time being, there are no solutions for these issues which are furthermore aggravated by the inaccurate weather forecast reports. The third problem stemming from climate change proves to be the sc. inverse effect, which assumes the phenomenon that in the populated valleys it is often much colder than up on the mountains. It can occur even stunning temperature difference of 10 degrees, which results in heavy snow-fall in the lower valleys and rain in the mountains. The hot winds then the rain make big changes in the snow conditions in the mountains, even ruining the built-up basements of the resorts. Not to mention the dangers posed by the rapidly changing temperature scales, too.
Since the snowy period of the winter holiday has shortened furthermore many countries have launched the system of winter school-breaks it all contribute to jammed and overcrowded resorts and slopes in a peak season. This effect also involves the conditions of the resorts and accommodations, which are mostly empty in December while are overbooked in January-February. Many bigger slopes try to expand and develop their lodges and services, which result in the creation of small ski-resort villages along the slopes as part of their marketing survival strategy. The interviewees claimed that they have experienced no decline in the number of winter tourists; however the skiers tend to accumulate.
This may cause serious problems when the capacities of the available ski-slopes diminish due to the lack of snow and cold weather. It also results in extremely dangerous and risky cases of having only a few available slopes overflowed by skiers. Furthermore, the deterioration of slopes also accelerates, which may cause bumpy and icy slopes for the afternoon hours, other danger factors for the skiers.
The local ski-school try to adapt to the new circumstances by hiring less full-time ski-instructors, in the peak-season – January, February – they tend to employ ski-instructors with definite short-term contracts. Unfortunately, this causes, quality deterioration, as the manager of Amigos ski-school from Mariazell asserted, since the schools cannot easily and quickly find skilful, experienced instructors for a short term, therefore they are forced to hire even instructors they would not employ at all in normal situations. Another option for the ski-schools is to obtain multi-functional employees, who can work in the schools as well as in the lodges, hütte or in case the school possesses accommodation, they can deal with those services, too. This is quite rare, though. Nowadays, ski-schools tend to employ instructors who can cope with instructing any kind of winter sports not exclusively skiing.
In the pre-season period, namely in December, one can witness the lack of tourists; their number has been plummeting due to the unpredictable and unreliable snow-conditions. The ski-lovers rather undertake the risks of using overcrowded slopes with queues of skiers in peak-season, when the snow-sure resorts operate with full gear. The hotels and travel agencies are keen on filling up these low-profile gap-periods with all kind of side-services and programmes, such as ski-tests, or venues of ski-world cups, even though they cannot compete with the snow-sure bookings of the peak-season period.
Two years ago, for instance in the late season of Kreischberg due to the late heavy snow-fall in April the ski lift operator company made a decision to prolong the operational period with a week. Despite the perfect snow-conditions there were only very few skiers on the slopes who could heartfully enjoy the unforgettable great conditions. The company accounted for financial loss that week so this elongated operation idea was cancelled.
The lower altitude slopes can benefit from their special micro-climatic conditions preserving cold weather and snow-cover. The slopes facing North and safe from extreme weather conditions prove to be much more snow-sure. Praebichl is located on lower altitude, yet surrounded by mountain passes, thus it possesses a special cold micro-climate with cold air-masses stuck in the valley. This fact, from one hand contributes to better slopes and snow-conditions, on the other hand, it has usually 5 degrees colder temperatures than the neighbouring settlements. There are no high mountains in Lower-Austria, though its ski-slopes and resorts enjoy great popularity among winter tourists, typically for one-day trippers. The largest Austrian province used to have more than 60 ski-slopes, this number has fallen to almost half by the present days. On the ruthless field of market-economy the crisis started with the bankruptcy of the mono-ski-lift slopes and the process developed further on.

APSTRACT Vol. 11. Number 3-4. 2017. pages 19-26. ISSN 1789-7874
Climate Change Effects On Ski Tourism 23
Then, by the first half of the 2000’s years the bigger slopes went bankrupt as well, first – the snow-sure - Hohenberg-Gschwendt, near Aegyd declared bankruptcy, and since then the ski-trekkers gained ground on the abandoned slopes until nature takes them over, definitely. Maria Schutz-Sonnwendstein followed track a few years later, when the ski-resort near Semmeringen lacked the necessary funds for development, despite several projects, business plans e.g. to connect it with Hirschenkogel. The plans evaporated quickly and Sonnwendstein got locked down.
Türnitz came to join the club soon as well, facing serious financial problems; consequently both Lower-Austrian ski-resorts last only in our memories. In the summer of 2012 even Höchkar, the border-area snow-paradise came into dangerous spotlight: who might have imagined that the most snow-sure ski-resort of the province struggles with serious problems. Finally, thanks to the cooperation of the locals, it has survived the crisis, unlike St.Corona, lying among the hills of Wechsel, which was forced to close down after the skiing season of 2012, causing real headache for the lodge and shelter-providers of the area. Joining St.Corona also Königsberg closed down, soon.
The Austrian Hebalm reporting economic financial problems went bankrupt 2 years ago. This ski-resort was considered to be among the smaller ones in Austria. Interestingly enough, they referred to the 2009 global financial crisis as primary reason for closing down. Back then they realised that the slope-lodges were short of capacities around the ski-slopes. They also interpreted this problem as a consequence of the mentality-shift of the skiing customers who tended to prefer the bigger resorts also choosing versatile services after the crisis. Tourists choosing the smaller slopes also expect it to be close by not travel too much for it. Maintaining and developing the resorts and slopes demand investors in order to be competitive with the bigger ones.
Mariazell have also struggled for survival in the recent years, luckily the colder weather arrived and the water-reservoirs proved to be sufficient for snow-cannoning the slopes.
Two Swiss ski-resorts, first from among the European ski-resorts, reacting to the new conditions have undertaken the idea of offering lower-priced ski passes in case of bad weather conditions. On cloudy, snowy days they offer half-price ski passes and tickets. The two ski-resorts of two Swiss cantons have made cooperation agreement with the University of St.Gallen and the meteorological institute so as to provide weather-related passes for their skiing customers. The worse might the predictable weather be, the cheaper they offer their ski-passes. Provided the weather forecast includes the ’partly sunny spots or partly snowy’ phrases, the ski-passes can get 18% cheaper. It seems that the ’cloudy, but snowy’ weather forecast is considered to be even worse since the passes drop with 28%. And the worst weather scenario proves to be the ’cloudy but strong snow-fall’ prediction when the prices drop 50% for the daring skiers.
ACKNOWLEDGEMENT
Climate change affects considerably the operation of skiing season, and the service providers must adapt to the new conditions. Many resort venues struggle for survival, though most of the local self-governments are clearly aware of the importance of ski-tourism, particularly in Austria. The local ski-schools provide more and more opportunities and the local service-providers tend to accommodate and adapt to the needs of the Hungarian customers. The present trend relies on the idea of ’the bigger the slope, the cheaper is skiing’. If we have paid for something, than we should get the utmost benefits from it. However, pushing the prices down also implies quality-deterioration. Increasing number of Austrian lodges and hotels are taken over by Hungarian operators, who cannot provide the common high-quality services for the lower prices. Many venues display the ’we can also speak Hungarian’ inscription which may result in serious business advantages.
The problem behind the closing down of the neighbouring ski-resorts proves to be quite complex with multiple contributing factors. From one hand, there is the ensuing customer-drop after the 2008 global financial crisis, than on the other hand the effects of the much warmer and drier winters experienced along the recent years. While in the Western Austrian provinces there was a record-amount of snow last year, in Lowe-Austria the big snow-fall arrived much later. The weather fronts coming from the West tend to be weaker and numberless ski-resorts and slopes are located on lower altitudes at around 1,000 ms or so, or even lower.
Thirdly, the biggest problem for the border-area ski-resorts lies in their one-day ski-centre status. As such, they can generate much lower income, not to mention their significant exposure to the changing weather and snow-conditions, since in case of bad weather or poor snow much less winter-tourists tend to arrive. From among the winter resorts in the province, primarily and almost exclusively the Semmering-valley resorts are free of this kind of problems, though this is valid especially for Stuhleck resort, which belongs to Stayermark.
Not even the glaciers can operate all year round for 365 days, what’s more, snow-cannons have also appeared at 3,000 m altitude for the last 10 years. This process seems to be unstoppable, since the glaciers are continuously melting and the snow-border is being pushed higher. At Pitztalon there is a snow-making machine in operation which can produce snow on a given temperature on the spot and they just simply spread it on the slopes.
Experts say that the Alpine ski resorts are facing the loss of up to 70% of their snow cover by the end of the century and this is a real tragedy. Last year the Swiss Alps had their driest December since records began 150 years ago. 2016 was the third year in a row with little snow at Christmas, when many families go for skiing.
The question remains that for how long in the future we would be able to enjoy the natural environment of the ski-slopes, whether this process is sustainable and where it would end up.

24 Piroska Béki
APSTRACT Vol. 11. Number 3-4. 2017. pages 19-26. ISSN 1789-7874
REFERENCES
Amelung B, Blazejczyk K, Matzarakis A. (2007) (eds): Climate change and tourism: assessment and coping strategies. Maastricht–Warsaw–Freiburg, ISBN: 978-00-023716-4
Bánhidi M. (2007): Sporttudomány és turizmus. Magyar Sport-tudományi Szemle 8. 30, 2007/2, 32-38.
Bánhidi M. Dobay B. Starhon, GK., Edvy, L. (2006): Kutatási programok a földrajzi környezet és sport összefüggéseinek megis-meréséhez. Napjaink környezeti problémái - globálistól lokálisig Pannon Egyetem, Georgikon Kar, Keszthely.
Barbiere EB. (1981): O Fator Climático nos Sistemas Territoriais de Recreação. Revista brasileira de geographia 1981. 18(2):145–265
Béki P. (2015): Rekreáció-menedzsment. A tananyag elkészíté-sét a ‚’3.misszió’’ Sport és tudomány a társadalomért Kelet-Mag-yarországon TÁMOP-4.1.2.E-15/1/Konv-2015-0001 számú projekt támogatta. A projekt az Európai Unió támogatásával, az Európai Szociális Alap társfinanszírozásával valósult meg. Campus kiadó, Debrecen. ISBN 978-963-9822-42-9
Besancenot JP. (1989): Climat et tourisme. Masson: Collection Géographie, Paris, 1989. ISBN 2 225 818 169
Borbély A., Müller A. (2008): A testi-lelki harmónia összefüggé-sei és módszertana. Valóság-Térkép-6. PEM tanulmányok (Kiadja: a Professzorok az Európai Magyarországért Egyesület, Bp. szer-keszti: dr. Koncz István)
Borbély A., Müller A. ( 2015): Sport és Turizmus. Campus Kiadó, Debrecen. ISBN 978-963-9822-36-8
de Freitas CR. (2003): Tourism climatology: evaluating environ-mental information for decision making and business planning in the recreation and tourism sector. Int J Biometeor 2003.48:45–54
Dobay B. (2008): Sportturizmus kutatásában alkalmazott mód-szerek. XXI. Didmattech Konferencia, 2008. okt. 29-30., Eszter-házy Károly Főiskola, Eger,
Dóczi T. (2008): Sportturizmus Magyarországon a számok tükrében. Magyar Szociológiai Társaság konferenciája, Veszprém, 2008. november 14.
Dreyer A. (2002): Sport und turismus. Wirtschaftliche, Soziolo-gische und Gesundheitliche Aspekte des Sport-Turismus. Universi-tatsverlag, Wiesbaden.
Endler C, Matzarakis A. (2011): Analysis of high resolution simu-lations for the Black Forest region from a point of view of tourism climatology—a comparison between two regional climate models (REMO and CLM). Theor Appl Climatol 103:427–440
Földesiné, Sz Gy.(2005): Sportturizmus: új kihívások és straté-giák. Kalokagathia, 18 (1-2). 92-114.
Gates AD. (1975): Le climat des Maritimes en fonction du tour-isme et des loisirs de plein air. Environment Canada, Toronto.
Hall CM. (2010): Tourism and biodiversity: more significant than climate change? J Herit Tour 5(4):253–266
Könyves E. Müller A. (2001): Szabadidős programok a falusi tur-izmusban. Könyv. Szaktudás Kiadó Ház, Budapest.
Leiper, N. (1981): Towards a Cohesive Curriculum in Tourism: The Case for a Distinct Discipline. Annals of Tourism Research, 1981:8, 69-83.
Matzarakis A (2006): Weather and climate related information for tourism. Tour Hosp Plan Dev 2006: 3:99–115
Matzarakis A.(2007): Assessment method for climate and tourism
based on daily data. In: Matzarakis A, de Freitas CR, Scott D (eds) Developments in tourism climatology. Commission Climate, Tourism and Recreation, International Society of Biometeorology. 2007.
Matzarakis A. (2010): Climate change: temporal and spatial di-mension of adaptation possibilities at regional and local scale. In: Schott C (ed) Tourism and the implications of climate change: is-sues and actions. Emerald Group Publishing. Bridging Tourism Theory and Practice, 2010 vol. 3, 237–259
Matzarakis A, de Freitas C, Scott D (2004) (eds): Advances in tourism climatology. Berichte des Meteorologischen Institutes der Universität Freiburg Nr. 12
Matzarakis A, de Freitas CR, Scott D (2007) (eds) Developments in tourism climatology. ISBN 978-3-00-024110-9
Matzarakis A, (2008): Tinz B. Tourismus an der Küste sowie in Mittel und Hochgebirge: Gewinner und Verlierer. In: Lozán JZ, Graßl H, Jendritzky G, Karbe L, Reise L (eds) Warnsignal Klima: Gesundheitsrisiken Gefahren für Menschen, Tiere und Pflanzen. GEO/ Wissenschaftliche Auswertungen, 2008. 247–252
Michalkó, G. (2004): A turizmuselmélet alapjai, Kodolányi János Főiskola, Székesfehérvár, 2004..
Müller A. Széles Kovács Gy. Seres J. Bocz Á. (2009): A sítáborok megítélése a Szegedi Tudományegyetem JGYTFK „sportszakos” hallgatói körében. In: Acta Academiae Pedagogicae Agriensis. XXXV. Kötet. 2009. 57-68.
Müller A. Széles Kovács Gy. Seres J. Bocz Á. (2007): A sport-táborok szerepe az Eszterházy Károly Főiskolán. In: Acta Aca-demiae Pedagogicae Agriensis. XXXIV. Kötet. 2007. 105-117.
Müller A. Könyves E. Várhelyi T. Mondok A. (2008): Új utakon a testnevelő tanárképzés Egerben - A sportszakos hallgatók utazási szokásainak, és a sítáborozás kínálati elemeivel való elégedettségé-nek vizsgálata. ECONOMICA. 2008.1. 85-95.
Müller A. Kerényi E. Könyves E. Effect of Climate Therapy and Rehabilitation in Mátra Medical Institute Applied Studies in Agri-business and Commerce – APSTRACT.5. (3-4.) Debrecen, Agro-inform Kiadó. 2011.40-42.
Mosonyi A. Könyves E. Fodor I. Müller A. Leisure activities and travel habits of College students int he light of a survey. Applied Studies in Agribusiness and Commerce - Apstract. Vol.7. iss.1. pp. 53-57. 2013.
Müller A. Barcsák B. Boda J. E. (2016): Health tourism the cave-bath of Miskolctapolca. In: György Juhász, Enikő Korcsmáros, Erika Huszárik (szerk.) Korszerű szemlélet a tudományban és az oktatásban. Gazdaságtudományi szekció: Zborník medzinárodnej vedeckej konferencie Univerzity J. Selyeho – 2016 „Súcasné aspe-kty vedy a vzdelávania”. Sekcie ekonomických vied. 278 p. Kon-ferencia helye, ideje: Komárno, Szlovákia, 2016.09.13-2016.09.14. Komárno: Selye János Egyetem, 2016. 233-245.
OECD (2007): Climate change in the European Alps—adapting winter tourism and natural hazards management. Hrsg. von S. Agrawala (eds) OECD, Paris.2007.
Péter, Zs. (2010): A turizmus térségi folyamatainak összefüg-gései, különös tekintettel az észak-magyarországi régióra, PhD értekezés, Miskolci Egyetem, GTK. 2010.
Preuss, H. (2004): The Economics of Staging the Olimpics. A comparison of the games. MPG Books LTD. Bodmin, Cornwall. 2004. 1972-2008.. ISBN: 1843768933
Röthig, P.(1992): Sportwissenschaftliches Lexikon. Hofmann, Schorndorf. 1992.

APSTRACT Vol. 11. Number 3-4. 2017. pages 19-26. ISSN 1789-7874
Climate Change Effects On Ski Tourism 25
Scott D. (2006): Global environmental change and mountain tour-ism. In: Gössling S, Hall CM (eds) Tourism and global environ-mental change. Routledge, London. 2006.
Scott D. Why sustainable tourism must address climate change. J Sustain Tour. 2011. 19(1):17.34
Scott D, Matthews L. (2011): Climate, tourism & recreation: a bibliography—2010 edition. Department of Geography and Envi-ronmental Management, University of Waterloo, Waterloo. 2011.
Scott D, (2007): McBoyle G. Climate change adaptation in the ski industry. Mitig Adapt Strateg Glob Chang 2007. 12(8):1411–1431
Scott D, McBoyle G, Mills B. (2003): Climate change and the skiing industry in southern Ontario (Canada). Clim Res 2003. 23:171– 181
Scott D, McBoyle G, Minogue A, Mills B.(2006): Climate change and the sustainability of ski-based tourism in Eastern North Amer-ica: a reassessment. J Leis Res 2006. 14:376–398
Serquet G, Rebetez M (2011): Climatic change, relationship between tourism demand in the Swiss alps and hot summer air temperatures associated with climate change. Clim Change 2011. 108:291–300. doi:10.1007/s10584-010-0012-6
Steiger R (2010): The impact of climate change on ski season length and snowmaking requirements in Tyrol, Austria. Clim Res 2010. 43:251–262
Steiger R (2011): The impact of snow scarcity on ski tourism. An analysis of the record warm season 2006/07 in Tyrol (Austria). Tourism Rev 2011. 66(3):4–13
Steiger R, Mayer M (2008): Snowmaking and climate change. Fu-ture options for snow production in Tyrolean ski resorts. Mt Res Dev. 2008. 28:292–298. doi:10.1659/mrd.0978
UNWTO–UNEP–WMO (2008): Climate change and tourism— re-sponding to global challenges. UNWTO Madrid, Spain 2008.
Wolfsegger C, Gössling S, Scott D Climate change risk appraisal in the Austrian ski industry. Tour Rev Int 2008. 12:13–23
https://www.ncei.noaa.gov/news/global-climate-201712?position=0&list=XPLk-qDkISLA2H-PlP82IKLnmWd4TJU5qWILo8n9iFr4 (retrived: 01.01.2018)


APSTRACT Vol. 11. Number 3-4. 2017. pages 27-30. ISSN 1789-7874
DOI: 10.19041/APSTRACT/2017/3-4/4
Applied Studies in Agribusiness and Commerce – APSTRACT Center-Print Publishing House, Debrecen SCIENTIFIC PAPER
RECRUITING RECENT GRADUATES TO WORK AT AGRICULTURAL ENTERPRISES: SIBERIAN REGION
CASE STUDY Andrey Babenko1, Leonid Mukhin2
1Department of Agricultural Biology, Tomsk State University, 36 Lenin Ave., Tomsk, Russia, 634050e -mail: [email protected]
2Department of Employment and Practice, Tomsk State University, 36 Lenin Ave., Tomsk, Russia, 634050e -mail: [email protected]
Abstract: The authors present the results of the analysis of the employment of graduates of agricultural specialties in the Siberian Federal District of the Russian Federation. In the Siberian Federal District, more than 20 universities are engaged in the training of specialists in agriculture. The universities pay special attention to the employment of their graduates and often have their own programs of graduates’ employment.The article is devoted to discussing the reasons why the graduates consider the work in the rural area to be unattractive (low standards of living conditions compared with town, lack of quality education for children and possibilities for professional development, etc.) The necessity of realiza-tion of the state strategy intended to support graduates of agricultural specialties is grounded, including assigning the status of civil servants to social workers in rural areas and attracting successful entrepreneurs to the village and creating conditions for the development of the entrepre-neurial environment.
Corresponding author: Andrey Babenko, [email protected]
INTRODUCTION
All Russian universities pay special attention to the employment of their graduates: contacts are established with the leading industrial enterprises, new employers are being sought, targeted educational programs are being formed, etc. Graduates of agricultural training areas that will work in rural areas, of course, are given special attention.
A long-lasting rural youth drain trend in Russia has resulted in acute shortage in professionals in agricultural business. There are programs aimed at recruiting young professionals to work at agricultural enterprises in a number of rural regions in Russia. To cope with this situation and inspire young professionals to move to rural regions the program “Young professionals in the rural area” was introduced. Within the program young professionals are given lump sum cash payment, soft real estate purchase loan and subsidy to cover travel expenses to get to the place of their employment.
The government allowance intended to support young professionals is not taxed. For a person to take part in this social program they are to work for the enterprise not less than 5 years after getting the allowance. Besides, their professional activity should be related to their specialty. For the time being the program is intended to continue until 2020. In accordance
with the federal law, the estate purchase loans are given at the expense of allocating subsidies to federal subjects of the Russian Federation from the federal budget. The subsidies are allocated in accordance with the program of rural area development.
Universities have their own programs of graduates’ employment. In particular, Tomsk State University (TSU) has a department of support for those graduates who have difficulties with employment. A great number of vacant positions in rural areas are offered; as a result, about 70% of TSU graduates work within specialty.
MATERIALS AND METHODS
We used the official data presented on the website of the Ministry of Education and Science (www.graduate.edu.ru) to analyze the employment of university graduates. The research of vacancies and career opportunities for young specialists was carried out according to the All-Russian vacancy database of the Employment Service (Rostrud), which is available on the website trudvsem.ru. We also surveyed the graduates of agricultural specialties who graduated from the TSU in 2007-2016.
Keywords: employment programs, agricultural enterprises, Siberian Federal District. (JEL Code: J21)

28 Andrey Babenko – Leonid Mukhin
APSTRACT Vol. 11. Number 3-4. 2017. pages 27-30. ISSN 1789-7874
RESULTS AND DISCUSSION
The largest institute at Tomsk State University, the institute of biology, ecology, soil science, agriculture and forestry, annually produces about 220 young specialists in various areas of training. About 35% of them continue to take master or postgraduate courses, 15-17% graduates do not apply for a job (because of doing military service, maternity leave or some other reasons), all the rest are employed by the organizations, institutions, private companies in Tomsk and nearby towns. Only some graduates (7 people in 2015, 5 - in 2016) go to work in rural areas, as a rule, to the places they are from.
The exchange of information with colleagues from other universities of the Siberian Federal District, own statistical studies suggest that a similar situation develops with the employment of graduates in other Siberian universities.
In Siberia, 22 universities are engaged in the training of specialists for agriculture. In 2014 and 2015, 3231 and 3,290 specialists with a higher education of all levels (bachelors, specialists, masters) were trained in the group of specialties “Agriculture, Forestry and Fisheries” in 8 universities in the Siberian Federal District (Table 1). The share of graduates of these specialties in the number of the other universities’ graduates is less than 30 people per year. We studied the statistics of employment of the graduates specialising in agriculture, for example, agronomy, including agro engineering and agro-chemistry, animal science, animal medicine, etc. In 2017, the Ministry of Education published the monitoring of the employment of graduates in 2015. For comparison, Table 1 provides the information on graduates in 2014-2015. It should be noted that the percentage of employed graduates changes insignificantly from year to year.
Table 1 Number of graduates in Siberian universities in agricultural specialties
UniversityYear Percentage
of employed graduates, % 2014 2015
Burjat State Agricultural University 268 370 76
Gorno-Altaisk State University 50 44 78
Irkutsk State Agricultural University 306 436 65
Krasnoyarsk State Agricultural Univer-sity
1084 902 72
Kemerovo State Agricultural Institute 359 375 72
Novosibirsk State Agricultural Univer-sity
650 565 77
Omsk State Agricultural University 445 479 80
Tyva State University 69 119 78
Total graduates: 3231 3290 73
The data on the employment of graduates of universities are available on the website of the Ministry of Education and Science www.graduate.edu.ru. The share of employment of graduates of the agricultural profile is 72.6%, which is slightly lower than the average for other specialties, which is about 75%.
Unfortunately, there are no available data on how many young professionals are employed each year in rural areas, it can be assumed that their number is much less.
For the time being, the regions in Siberia offer 212 vacant positions for the agronomists, about 40 of them include employer-rented housing. The salary is 12,000 – 25,000 rubles (individually - up to 40,000 rub.) For the sake of fairness, it should be noted that the enterprise inviting a young specialist often additionally guarantees him payment of rented housing, which is from 5 to 15 thousand rubles. At the same time, in the Krasnodar Territory, out of the offered 75 vacant places, the majority designates a salary of 20,000 rubles, and more than a third of vacancies here presume a salary of 40,000 rubles. These are the data from the all-Russian vacancy database (trudvsem.ru).
Unlike most large industrial enterprises, even large agroholdings do not conduct targeted mass recruitment of young professionals and often do not even have their own sites on the Internet. When a need for such workers arises, they publish vacancies for example on trudvsem.ru or hh.ru. More often, they apply directly to the relevant educational institutions of the region. At the time of the preparation of the article, it was not possible to find any agro-holding site on the Internet, on which there was a description of the personnel policy for attracting university graduates.
The reasons why university graduates do not seek to leave for work in the rural area are as follows:
- rural settlements fail to provide the same comfortable living conditions as in the city. Even young people who came to study in the city from the countryside do not want to return home, having met the amenities of city life;
– low assessment of the prospects for personal growth, prospects for career development in agriculture. Despite the numerous programs of “rural development” and the rise in agriculture, work in rural areas is assessed as not very promising;
– low level of wages in agricultural enterprises, especially in regions with unfavourable climate, which include all regions of Siberia.
While preparing for the 2006 All-Russian Agricultural Census a study was conducted that showed the most significant reasons for the lack of aspiration of people to work in the countryside:
– low quality of workplaces, lack of modern equipment, irregular working conditions;
– lack of public transport; – poor quality of medical care, lack of quality education
for children; – lack of opportunities for quality rest; – lack of professional and career prospects (the most crucial
indicator in terms of stability in rural areas) [PETRIKOV et.al, 2005].
Thus, the unpopularity of agricultural enterprises, as employment opportunities for university graduates, is explained by the low social prestige of life in rural areas and the ineffectiveness of working conditions. In various regions of Russia there were regional programs for attracting young specialists to the countryside.

APSTRACT Vol. 11. Number 3-4. 2017. pages 27-30. ISSN 1789-7874
Recruiting Recent Graduates To Work At Agricultural Enterprises: Siberian Region Case Study 29
For example, in the Nizhny Novgorod region, graduates of universities - doctors and teachers were allocated funds for the purchase or construction of a separate cottage. In the Ryazan region were provided lifting in the amount of 86,000 rubles. Such programs have been adopted in the regions of the Siberian Federal District. For example, within the framework of the programme “Staffing of the AIC of the Krasnoyarsk Territory”, “Providing affordable housing for young professionals in the countryside”. Students in the period of study make an agreement with the farm, where they will come to work after receiving the diploma. According to the agreement, their salary should be at least 15,000 rubles and if the young family chooses to stay in the village, the local budget will finance 70% of the housing cost. However, sometimes the conditions of the programs do not allow anyone to participate in them, for example, the requirement to immediately pay the remaining 30% of the cost of housing. As a rule, young families do not have such means [MUKHIN, ABRAMOV, 2011].
Unfortunately, numerous agricultural development programs, declared, including at the highest level, do not give the desired result due to the lack of a systematic approach.
A state strategy is needed to create federal agro-corporations using the latest achievements of agricultural science and practice. In connection with this, some innovations will certainly be useful:
1. Assigning the status of civil servants to social workers in rural areas. Doctors, teachers in schools, public transport drivers, other specialists, provided they achieve a certain length of specialty, work in rural areas receive such a status. Such innovation will significantly increase the prestige of work in rural areas and, most importantly, improve the quality of the services provided. Young specialists - graduates of universities of relevant specialties will receive an additional incentive to find employment in rural settlements.
2. Attracting successful entrepreneurs to the village and creating conditions for the development of the entrepreneurial environment [LAVRUKHINA, 2011]. Working out of special programs of grants, loans, state support of credits for those who decided to develop their business in rural areas. Special conditions should be created for entrepreneurs creating new enterprises within the framework of state agricultural holdings.
Attracting successful entrepreneurs to create infrastructure in rural areas is a fundamental issue of future reform. Unfortunately, the training of entrepreneurs in universities is limited to information about the registration of an enterprise, the opening of a bank account and other formalities. “Entrepreneurship” no one teaches and does not know how to teach. It is extremely rare to train or educate students working entrepreneurs who are able to demonstrate and broadcast the necessary business and personal “entrepreneurial” qualities.
Training of people with a pronounced entrepreneurial vein should become a distinctive feature of training on the specialty “Rural, Forestry and Fisheries”. Together with the introduction of special programmes to support entrepreneurship in the countryside, this will give a powerful impetus to the development of agriculture.
REFERENCES
Lavrukhina Е. А. (2011): Paradoxes of agrarian colleges graduates job placement, Higher education in Russia 2011; № 2:126 - 130.
Petrikov А.V., Jabnykh R.G., Uzun V.J., Кorbut L.S., Rodionova G.A., Platonova L.S., Zinchenko A.P., Petukhova A.V., Baikov V.E., Еphanova О.А., Lavrukhina Е.А., Epikhina A.V. (2005): All-Russian agricultural census: problems, methodology, recom-mendations, Encyclopedia of Russian villages, Мoscow, 2005 ISBN: 5-88367-055-5
Abramov O.K., Mukhin L.N. (2015): Staffing of the Innovative Economy. In: Soldatova AN, Minkova SL, editors. INNOVA-TION-2015, Proceedings of the XI International School-Confer-ence of students, graduate students and young scientists; 2015 May 21-23; Tomsk. Publishing house «STT», 2015: 595-600.
Internet sources:
www.graduate.edu.ru [read October 22th, 2017]
www. trudvsem.ru [read December 10th, 2017]

APSTRACT Vol. 11. Number 3-4. 2017. pages 31-36. ISSN 1789-7874
DOI: 10.19041/APSTRACT/2017/3-4/5
Applied Studies in Agribusiness and Commerce – APSTRACT Center-Print Publishing House, Debrecen SCIENTIFIC PAPER
INFRASTUCTURAL BACKGROUND OF THE EVERYDAY PHYSICAL EDUCATION
IN HUNGARIAN HIGH SCHOOLS Henrietta Varga Szépné1 – Éva Katona2 – Dénes Páll3 – Ildikó Balatoni4
1,2,3,4 University of Debrecen1 [email protected], 2 [email protected],
3 [email protected], 4 [email protected]
Abstract: The Hungarian government is dedicated to supporting a healthy and sporty life-style, thus in the past years the number of initiatives directed to publicizing and promoting sports has increased considerably. The new Law of Public Education has put the emphasis on physical edu-cation and on organizing other sport events in schools. This led to the introduction, in a phasing-out manner, of the every-day physical education (PE).We were interested to know the infrastructural background of PE including the number and size of sports halls available for the students, how many classes can they accommodate at the same time, and when were they constructed. To this end a survey was conducted through telephone, contact-ing 200 high schools in 19 counties of Hungary. Do the schools have their own swimming pools, or do they conduct after-hours sports events. Data were analyzed using the EvaSys program.The time of construction of the schools and their sports halls spans a wide range between the years 1530 and 2005. So do the number of students, between 150-1200. Nineteen of the schools have none, 67% has one, and 18.8% two sports halls. The size of these halls is also very variable, while in some schools it is only 25 m2, in others it can be as large as 2295m2. In most cases the halls can accommodate one or two classes in parallel. Afternoon classes are held in 87% of the schools, and include basketball, fencing, and soccer, among others. However, only eleven of the interviewed high schools have swimming pools.Research has called the attention to the fact that the exercise of Hungarian youth is too little. This puts the emphasis on the promotion of physi-cal activity in schools. While there are large differences in the infrastructural background in the schools involved in the survey, they all strive to conduct after-hours sport events.
INTRODUCTION
Physical activity is an essential part of a healthy lifestyle. The beneficial physiological effects of regular exercise are proven. Regular sports activity boosts heart and lung function, reduces blood lipid levels and blood pressure, it also reduces the risk of type 2 diabetes and the risk of developing cancer and aids in maintaining body weight (Oja et al. 2016). It contributes to healthy growth in childhood and adolescence and to the proper development of bone, muscle and nervous system (Pavlik et al. 2001; Pavlik, 2013). It also has a beneficial effect on mental capacity, and social interactions (Harsha, 1995).
There is a correlation between leisure time activities pursued by the youth and other elements of their lifestyle, such as their value system, health behavior and social situation (Pikó, 2005). Conversation and games are important elements in student extracurricular activities. Leisure time spent with family is typical of weekend and school break periods (Kinyó and Bús 2015).
The so-called “Hungarian Youth” large sample research that has been carried every four years since 2000 attempts to assess and track social and sociological characteristics, lifestyle, leisure time activities and cultural consumption habits of the 15-29 age groups (Perényi, 2014). The results of the 2016 survey - which involved 8000 young individuals between the ages of 15-29 - show that the ratio of those who perform regular extracurricular sports activities has not changed since 2012, only nearly a third of the respondents do regular physical activities. The circle of friends fundamentally determines how leisure time is spent (Bauer et al. 2016).
The results of Hungarian time-budget surveys carried out at the millennium and in 2010 reflect that daily average time-budget devoted to active leisure time activities fell by nearly 30% during the period between the two surveys in the age groups between 15 and 19 years. While young people spent 13.7% of their leisure time on such activities in 2000 (44 minutes), in 2010 they only spent 10.0% (31 minutes). Nowadays, Hungarians in their twenties spend an average of 9 minutes a day with physical activity (Bittner, 2013).
Keywords: youth, sport, high school, sport infrastructure (JEL Code: Z28)

32 Henrietta Varga Szépné – Éva Katona – Dénes Páll – Ildikó Balatoni
APSTRACT Vol. 11. Number 3-4. 2017. pages 31-36. ISSN 1789-7874
Researchers of the report entitled “Health and lifestyle of adolescents, 2010” came to the conclusion that gender and age significantly influences the regularity and length of physical activity (Németh and Költő 2011). The ratio of physically inactive students regarding the length of extracurricular sports activities is increasing in senior years of school. At the same time, younger age groups devote far greater time to passive leisure time activities than to sports (Pikó, 2002).
Physical activity, the need to care for the body, and inactive lifestyle are all present at the same time in today’s society as there is no time for regular physical activity because of the accelerated lifestyle (Pikó and Keresztes 2007).
The Eurostat publication entitled „Youth in Europe” (2009) describes the characteristics of leisure time activities among the youth. Over 66% of the age group between 16 and 24 uses the internet daily and more than 80% uses the World Wide Web to communicate, search for information and to take advantage of online services. The survey also covered data on health, including obesity. The published data reflects that in Hungary 21.1% of age group between 15 and 24 and 39.6% of the age group between 25 and 34 are overweight. According to genders, 26.7% of men and 15.0% of women in the age group between 15 to 24, while 52.4% of men and 26.8% of women in the age group between 25 to 34 have weight problems.
In seven-year-olds, every fourth girl and every fifth boy fell into the overweight or the obese category in Hungary in 2010 (Martos, 2010). According to a research in Eger, 25,8% of nursery children (preschool age between 3–6 years), have obesity (Müller et al. 2017).
Objective quantification of changes in physical performance as a result of development in childhood raises a number of problems in certain preferred life stages (adolescences and youth). Surveys regarding fitness levels at a national scale have not been carried out in previous decades. Although Hungarian researchers carried out examinations regarding the physical development and strength of the age group from 3 to 18 in 1982-1984 and 2003-2006 (National Growth Survey), motor performance was not included in them (Karsai et al. 2013).
In spite of the fact that the health condition of the population is fundamentally determined by health behavior and childhood habits, as international data also supports, we do not possess such data. At the same time, the consequences of the lack of or reduced physical activity have been proven by a number of studies. This justified the introduction of everyday physical education in Hungary in 2012 and probably also led to the indirect assessment of youth fitness condition within the framework of a national survey. The National Unified Student Fitness Test (NETFIT®) was developed for this purpose, as the compulsory method of Hungarian public education since the beginning of the 2014/2015 school year.
Assessment of national data pointed out (Kaj et al. 2017), that increased development is needed in 3 categories out of the examined 9, these are body mass index, body fat percentage and endurance shuttle run. Researchers found, as a result of surveys made in the 2015/16 school year, that school grades (8th and 12th grades) first leaving the ascending system of
everyday physical education performed better than their peers who do not participate in everyday physical education yet, which is an important result at international level as well (Kaj et al. 2017).
It seems obvious, based on the above, that the everyday physical activity of young people is primarily determined by the physical education in schools. However, this not only requires an adequate number of lessons, namely a minimum of one physical education lesson per day, but also the presence of an infrastructural background.
As a result of previous research, we described sports facility availability at Hungarian sports schools (Balatoni et al. 2016). Our present study examines whether Hungarian high schools possess the infrastructure required for everyday physical education.
MATERIALS AND METHODS
Our research focused on high schools. The survey was done using a questionnaire based on a telephone interview. A total of 200 high schools were involved in 19 counties of Hungary and Budapest. The first group of our questions was aimed at the year the school gymnasiums were constructed, the number of gymnasiums and their capacities. These were followed by questions regarding afternoon sports activities and their lengths. The data were evaluated using the Evasys program (http://www.vsl.hu).
RESULTS AND DISCUSSION
Figure 1 – Percent of schools included in the survey in the counties of Hungary
Source: Own compilation based on HCSO data
We compared the number of high schools in the counties of Hungary, using the database of the Hungarian Central Statistics Office (HCSO), to the number of questionnaires we completed. The percentage of involved institutions was represented by using a color scale (Figure 1). This clearly shows that 30-60% of the institutions were involved in 40% of the counties. Based on the above we consider our survey to be representative.

APSTRACT Vol. 11. Number 3-4. 2017. pages 31-36. ISSN 1789-7874
Infrastuctural background of the everyday physical education in Hungarian high schools 33
The first question of the questionnaire was aimed at the date of construction of the specific school. This showed a period from 1530 to 2005, which is a very wide range. Most constructions were in the period between the Second World War and the change of regime.
Specific questions were also aimed at determining the date when the gymnasiums were constructed. The dates of constructions of schools and gymnasiums are presented in the same graph (Figure 2).
Figure 2 – Date of construction (school and gymnasium)
Source: Own compilation based on our questionnaires.
This also shows that the number of gymnasium constructions increased after the Second World War (Figure 2). In 115 of the cases the gymnasium was constructed in the same year as the school.
Figure 3 – Distribution of the number of schools with given number of students
Source: Own compilation based on our questionnaires.
Student numbers in the schools involved in the survey also varied widely, between 100 and 1200 students, as depicted in Figure 3. In most schools, there are between 200 and 800 students.
Figure 4 – Distribution of the number of schools with given number of sports halls
Source: Own compilation based on our questionnaires.
We also examined the number of gymnasiums per schools. As shown in Figure 4 in 67% of the cases there is 1, while in 19% of the cases there are 2 gymnasiums per school. High schools with more than 2 gymnasiums can be found in 11 counties. However, close to 10% of the schools do not have a gymnasium at all.
Figure 5 – Distribution of surface area of sports halls
Source: Own compilation based on our questionnaires.
When examining the surface area of gymnasiums in 29% of the high schools one finds this between 100 and 200 m2. In 40% of the cases the sizes are less than or equal to 100 m2, 201-300 m2, and 501-600 m2 (Figure 5).

34 Henrietta Varga Szépné – Éva Katona – Dénes Páll – Ildikó Balatoni
APSTRACT Vol. 11. Number 3-4. 2017. pages 31-36. ISSN 1789-7874
Figure 6 – Number of classes the sports halls can accommodate at a given time
Source: Own compilation based on our questionnaires.
We were also interested in determining how many classes the gymnasiums can accommodate simultaneously. In 48% of the cases 1, while in 37% of the cases they can accommodate 2 classes simultaneously (Figure 6).
Figure 7 – The presence of a stand in the sports hall
Source: Own compilation based on our questionnaires.
22.1% of the gymnasiums have grandstands based on the responses we received (Figure 7).
Figure 8 – Number of schools with the given number of persons who can use the stand
Source: Own compilation based on our questionnaires.
Their capacities typically vary from 50 to 500 spectators (Figure 8).
Figure 9 – The presence of a swimming pool in the surveyed schools
Source: Own compilation based on our questionnaires.
Only 5.5% of the schools have their own swimming pools (Figure 9).
Figure 10 – Length of the swimming pool
Source: Own compilation based on our questionnaires.
These are typically 20 or 25-meter-long swimming pools (Figure 10).
Figure 11 – Afterhours sports classes according to discipline
Source: Own compilation based on our questionnaires.

APSTRACT Vol. 11. Number 3-4. 2017. pages 31-36. ISSN 1789-7874
Infrastuctural background of the everyday physical education in Hungarian high schools 35
The most common afternoon sports activity is basketball. This is followed by volleyball, general physical education, soccer and handball (Figure 11). It can be said that ball games lead among the most common afternoon sports activities.
Figure 12 – Number of days in a week with afterhours sports classes
Source: Own compilation based on our questionnaires.
Due in part to the fact that two lessons per week can be replaced with certified sports activities at sports associations or organizations, only 44.4% of the schools hold some kind of afternoon sports activities every day (Figure 12). Unfortunately 19.4 % of the schools does not hold afternoon sports trainings at all as they claim that the gymnasiums are required for everyday physical education lessons in the afternoons too, so there is no opportunity to accommodate other sports trainings.
CONCLUSIONS
A number of studies pointed out the role of youth sports in preserving health. As appropriate
infrastructure is also required to pursue adequate sports activities at school, a number of studies have examined the sports facility availability of local communities in general (Isgor and Powell, 2011; Todd, 2014; Abbott et al., 2014; Bezold et al., 2017;) and specifically of educational institutions (Judge et al., 2013; Patil and Metri, 2016).
All these studies pointed out that the built environment, whether it is the gymnasiums in schools or facilities around schools, contribute to increasing student physical activity. We believe that the development of sports facilities improves the sports conditions of all generations. Education for a sporty lifestyle must start in childhood and the everyday physical education introduced in an ascending system as part of the modification in the 2012 Act on Public Education can play a significant role in this.
Here we evaluated the data of 200 high schools in Hungary as part of our research. 18.8% of the schools have 2 gymnasiums, while 9.6% have no separate facility for accommodating physical education lessons. About 50% of the gymnasiums are suitable for accommodating 1, while 37% are suitable for accommodating 2 classes simultaneously. The most common sports for afternoon sports activities are ball
games. Overall, it can be said that 90% of the high schools in Hungary have a gymnasium for accommodating everyday physical education. At the same time, the compulsory physical education lessons can only be provided in the afternoons in a significant number of cases, which occupies time and place from other, competitive sports activities. Therefore, it would be important by all means to improve the infrastructure for sports activities in Hungarian schools/high schools.
The gymnasium-construction program was initiated to achieve this, which aims to establish the conditions and opportunities for all students to pursue advanced physical education. Providing new and reconstructing of existing gymnasiums in educational institutions is necessary in order to achieve this (National Sports Strategy, 2007). The total budget devoted to gymnasium construction or large-scale renovation was 16 billion HUF in the period of 1995-2002 in schools managed by local governments, which is 8000 HUF per child. Sports life and access to sports facilities are least provided in settlements with less than 2500 inhabitants. 20% of the country’s population lives in such settlements. At least 100 new gymnasiums should be constructed in the next 2 years within the facility development program serving both medium- and long-term objectives.
Our survey reflected the improved availability of facilities originating from the gymnasium development strategy of previous years. As of today 90% of Hungarian high schools have a gymnasium to provide everyday physical education. Most of these are suitable for performing physical education exercises, at the same time it must be emphasized that, on the one hand, swimming pools are present only in a few schools and, on the other hand, public education institutions with gymnasiums cannot always fulfill their tasks related to everyday physical education as part of the curriculum. As children represent the most important assets of our future therefore we must make all efforts to ensure conditions for their healthy lifestyle.
ACKNOWLEDGEMENTS
The research was supported by the Regional Development Fund within the framework of the GINOP-2.3.2-15-2016-00062 project entitled „Developing the quality of life in Eastern Hungary: Nutrition, performance biological and experimental biotechnology research and equipment development for preventing and treating human diseases”.
REFERENCES
2011. évi CXC. törvény a nemzeti köznevelésről
65/2007. (VI. 27.) OGY határozat a Sport XXI. Nemzeti Sportstra-tégiáról http://mkogy.jogtar.hu/?page=show&docid=a07h0065.OGY Approached 2016.
Abbott G, Backholer K, Peeters A, Thornton L, Crawford D, Ball K. (2014): Explaining educational disparities in adiposity: the role of neighborhood environments. Obesity (Silver Spring). 2014; 22(11):2413-9.

36 Henrietta Varga Szépné – Éva Katona – Dénes Páll – Ildikó Balatoni
APSTRACT Vol. 11. Number 3-4. 2017. pages 31-36. ISSN 1789-7874
Balatoni I, Kith N, Kosztin N, Csernoch L. (2016): The system of sports schools in respect with youth-training in Hungary. J. Educ. Health Sport. 2016; 6(13): 42-53.
Bauer B, Pillók P, Ruff T, Szabó A, Szanyi F. E, Székely L. (2016): Ezek a mai magyar fiatalok! Magyar Ifjúsági Kutatás 2016 Az if-júságkutatás első eredményei. 2016. Magyar Ifjúság Kutatás 2017.
Bezold CP, Stark JH, Rundle A, Konty K, Day SE, Quinn J, Neck-erman K, Roux AV. (2017): Relationship between Recreational Re-sources in the School Neighborhood and Changesin Fitness in New York City Public School Students. J Urban Health. 2017; 94(1):20-29.
Bittner Z. (2013): A 15-29 éves korosztály tevékenység szerkezete az időmérleg-vizsgálatok tükrében. [Activity structure of the 15-19-year- old generation in light of the time-scale surveys.] TÁ-MOP-4.2.3-12/1/KONV-2012-0016 Tudománykommunikáció a Z generációnak projekt keretében. TÁMOP Kiadó. Pécsi Tudo-mányegyetem. 2013.
Eurostat (2009): Youth in Europe. A statistical portrait: Statistical books. Publications Office of the European Union. Luxembourg. 2009. from: http://pjp-eu.coe.int/documents/1017981/1668203/YouthinEurope.pdf/40f42295-65e4-407b-8673-95e97026da4a Ap-proached October 2016.
Harsha DW. (1995): The benefits of physical activity in childhood. Am J Med Sci, 1995. 310. 1. S109-13.
Isgor Z, Powell LM. (2011): Availability of commercial physical activity facilities and physical activity outside of school among high school students. J Phys Act Health. 2011; 8(5):707-15.
Judge LW1, Petersen JC, Bellar DM, Craig BW, Gilreath EL. (2013): CSCS certification and school enrollment impacts upon high school strength facilities, equipment, and safety. J Strength Cond Res. 2013; 27(9):2626-33.
Kaj M, Vass Z, Király A, Hernádi Á, Csányi T. (2017): A mag-yar 10–18 éves tanulók egészségközpontú fizikai fittségi állapo-ta (2016); Kutatási jelentés a Nemzeti Egységes Tanulói Fittségi Teszt (NETFIT®) 2015/2016. tanévi országos eredményeiről, Magyar Diáksport Szövetség. Budapest. 2017. from: http://www.mdsz.hu/wp-content/uploads/2017/01/1.sz_.mell%C3%A9klet_-Kutata%CC%81si-jelente%CC%81s-2017.pdf Approached January 2017.
Karsai I, Kaj M, Csányi T, Ihász F, Marton O, Vass Z. (2013): Magyar 11-19 éves iskolások egészségközpontú fittségi állapotának keresztmetszeti vizsgálata. Első jelentés az Országos Reprezentatív Iskolai Fittség mérési Program eredményeiről. Magyar sporttudo-mányi szemle. 2013. 14. 4: 9-18.
Kinyó L, Bús E. (2015): Az iskolai és iskolán kívüli társas te-vékenységek jellemzői és összefüggései az online adatgyűjtésből származó háttéradatokkal 9−12 éves diákok körében. Iskolakultúra. 2015. 25. 4.
Martos É. (2010): Folyamatosan nő az elhízott gyerekek száma. In: http://www.webbeteg.hu/cikkek/elhizas/10859/folyamatosan-no-az-elhizott-gyerekek-szama
Müller A, Bíró M, Boda E, Herpainé LJ. (2017): Az óvodások testtömegének és sportolási szokásainak összefüggései egy egri kutatás tükrében. Acta Academiae Paedagogicae Agriensis Nova Series: Sectio Sport 44: pp. 191-203. 2017
Németh Á, Költő A. (2011): Serdülőkorú fiatalok egészsége és élet-módja. Országos Gyermekegészségügyi Intézet. Budapest. 2011.
Oja P, Kelly P, Pedisic Z, Titze S, Bauman A, Foster C, Hamer M, Hillsdon M, Stamatakis E. (2016): Associations of specific types of sports and exercise with all-cause and cardiovascular-disease mortality: a cohort study of 80306 British adults. Br J Sports Med, 2016. 28.
Patil S, Metri VD. (2016): A survey of physical education and sports facilities and achievement in government and aided high-schools at Koppal taluk. International Journal of Applied Research 2016; 2(2): 265-268.
Pavlik G, Olexo Z, Osvath P, Sidó Z, Frenkl R. (2001): Echocar-diographic characteristics of male athletes of different age. Br J Sports Med, 2001. 35. 95–99.
Pavlik G. (2013): Élettan – Sportélettan. Medicina Könyvkiadó Zrt. Budapest. 2013.
Perényi Sz. (2014): A mozgás szabadsága! A szabadidősport társadalmi, gazdasági és egészségügyi megközelítései. Debrecen. 2014.
Pikó B, Keresztes N. (2007): Sport, lélek, egészség. Akadémia kiadó. Budapest. 2007.
Pikó B. (2002): Egészségtudatosság serdülőkorban. Akadémia ki-adó. Budapest. 2002.
Pikó B. (2005): Középiskolás fiatalok szabadidő-struktúrája, értékattitűdjei és egészségmagatartása. Szociológiai Szemle. 2005. 2. 88-99.
Todd S. (2014): Bournemouth and Poole sports facilities strategy and action plan 2014-26. Bournemouth Borough Council. 2014.

APSTRACT Vol. 11. Number 3-4. 2017. pages 37-44. ISSN 1789-7874
DOI: 10.19041/APSTRACT/2017/3-4/6
Applied Studies in Agribusiness and Commerce – APSTRACT Center-Print Publishing House, Debrecen SCIENTIFIC PAPER
INCREASING PALINKA RECOGNITION WITH TOURISM
AND GASTRONOMY Imre Milan Harcsa
University of Debrecen, Faculty of Economics and [email protected]
Abstract: The history of Hungarian palinka distillation dates back thousands of years. Palinka is a special product; its quality features are being increasingly recognized and appreciated by consumers. Our national drink went through considerable transformations in the past years, as it left the village environment behind and has become a Hungaricum, popular with young people. The authorization of home distilling in September 2010 was a key factor in its gaining ground in the country. In connection with this topic, the international practice of beverage tourism has been reviewed. After that, the Hungarian practice was examined, including the selection of palinka festivals, thematic palinka tours and palinka product ranges in 19 counties and in Budapest based on a total of 100 restaurants. Using SWOT analysis I revealed the strengths, weaknesses, opportuni-ties and threats of palinka gastronomy and pálinka industry. Overall, it was found that the popularity of pálinka is increasing, but the thematic pálinka tours have not yet widened, and there is a need for more procedures supported by community marketing.
INTRODUCTION
Increased globalization resulted in the recognition and promotion of values and traditions have become significant for each nation. Palinka is a Hungarian national treasure, which is to be preserved and cultivated. Over the last ten years palinka has come a long way, it has left behind its limited context of ’peasants’ drink, and it has become our favourite national drink and treasure. Agricultural Marketing Centrum has been a key player in this process since it provided an increasing amount of resources for the popularization of palinka, palinka culture, and civilized palinka consumption. Also, focus on quality by manufacturers, their efforts, expertise, and cooperation were also the requirements of achieving the above mentioned. This process was also facilitated by the abolition of the excise tax of subcontract distillation and the authorization of home distilling (up to the volume of 43 hectolitre degree is equivalent of 86 litre 50 volume percent of distillate). Palinka festivals and fairs are organized in various parts of the country, and several palinka songs have already been created. “The number of expert distilleries is increasing, new palinka houses are opened, palinka tastings and palinka festivals are staged. Palinka has its saint (Saint Michael, 6th December); it has its town, the order of knights and even palinka sanctification has already taken place in the Franciscan church in Miskolc” (Balazs, 2012). Palinka has grown up to become the counterpart of other national drinks
both in its quality and price. The present study seeks to present the new and potential avenues to promote civilized palinka consumption, in particular, opportunities provided by tourism and gastronomy. The web page maintained by Hungarian Tourism Agency lists merely 20 results if places for palinka tasting are searched for. (I1) In contrast, the number of search results surges to 80 or above 100 (the dominant value) if Austrian, German or French tasting places are looked for. According to my hypothesis, the recognition of Hungaricum palinka widely known mostly in Hungary can be promoted by special means provided by tourism and gastronomy.
MATERIAL AND METHODS
As I work in a family business engaged in palinka subcontract distillation, I personally experience the impact of the changes of the legislative environment exerted on enterprises; in this way, I am capable of monitoring the direct feedback of subcontract distillers’ clients. The study is primarily based on secondary research. Information was collected on international alcohol tourism through literatute rewievs and then it was described the Hungarian practice. A short introduction was given of the system of home distilling institutions and its effect on the improvement of quality. It was carried out the related SWOT analysis, where examined the strengths, weaknesses, opportunities and threats of palinka gastronomy and palinka industry. In addition it was made a
Keywords: palinka tourism, tours and festivals, burgeon of palinka sortiment (JEL Code: Z30, E83)

38 Imre Milan Harcsa
APSTRACT Vol. 11. Number 3-4. 2017. pages 37-44. ISSN 1789-7874
survey where the popularity of palinka in certain restaurant and catering facilities was measured.
RESULTSInternational practice
The cognac route called “Etapes du cognac” offers three paths along the river Charente, where the secrets of cognac preparation and still used ancient methods can be discovered. Those interested are offered one-day, one-weekend or one-week long program packages. (I2)
Genuss Region Marketing, of which loose translation is “a marketing office for a gourmet region” is prospering in Austria. Certain regions have been classified into various categories in terms of specific and outstanding specialities and they were labelled as “gourmet” regions. In Austria 116 regions have been granted the honorary title of the gourmet region due to certain special dishes or products. The “Austrian gourmet region” title can merely be awarded to regions which take pride in their outstandingly high-level regional specialties. The “office” seeks to coordinate the numerous gourmet regions, support them with marketing materials, collect sponsors, stage venues and sell the products prepared in the region through web shops. It is in cooperation with the local ministry of the food industry and provides potential opportunities for them to introduce their products and activities in foreign countries. (I3) One of these regions is Ober-Grafendorf, where the cornel festival called ”Pielachtaler Dirndlkirtag” is organized in October on an annual basis. Peter Aradi, palinka master, founder of the “Cornel Association” claims that interested people get an opportunity to visit a well-organised exhibition and fair that offers jewellery, buttons, cosmetic products, jams, mustard, syrups, liquors, chocolate, desserts, various dishes and naturally, distillates made of cornel. They can also take part in walking tours in the town and nearby plantations stretching for 5 km. It is enriched by a machine exhibition, a competition of various distillates, music and dance programs.
A catering industrial complex in Germany is similarly focusing on a specific fruit, i.e. strawberry. The fact that accommodations and playgrounds with programs for children are available in the vicinity of the plant indicates that progress has been made, and the products can be purchased online as well. (I4)
Situation in Hungary
Geza Balazs, linguist and ethnographer used the expression “palinka tourism” back in 2008. In his Ph.D. thesis Laszlo Kopcsay used this notion likewise in the same year, but mentioned it as “a not-yet-existing potential market attraction”. Edit Szollosi, palinka master, claimed in 2016 that we could not talk about well-organized palinka tourism, only separate, isolated initiatives. The authors agree that specifically in those regions, those areas have a reasonable chance to create palinka tourism where traditional alcohol culture is closely linked to palinka consumption. What is the meaning of the expression? Building on the precedent set by
the existing and often quoted wine tourism, palinka tourism is classified as a branch of agritourism, where the agricultural source material is represented by fruits (or marc) and the food industrial plant by the palinka distillery, the product is the palinka manufactured and stored on the spot, whereas these products are introduced in palinka tasting venues.
Authorization of home distillation – improvement of quality
Kopcsay (2008, 88.p.) in his doctoral dissertation discussed the situation of Hungarian palinka as follows: “The greatest threat for palinka is still posed by the black market. Clearly, even if it sparks conflicts, it must be stated that at present, subcontract distilleries and gastronomy hinder the sale and credibility improvement of high-quality palinka. The Hungarian government could be a potential partner in finding a solution for this issue...” Private distillers suffer from the same accusations on multiple occasions: they are said to produce millions of litres of palinka at home, without control.
The present government of Hungary pledged to grant the right of free palinka distillation again in the previous election campaign. As of 27 September 2010 the practice of the previously not available home palinka distillation was introduced. Home distillers are natural persons above 18 years who prepare distillates from raw materials from their own orchards by using their own distilling equipment. In the case of home distillation or subcontract distillation, the end product is distillate, whereas the end product in a commercial distillery is labelled palinka, although the base materials, the process of production and the applied technologies are the same. The distinction was required for the protection of Hungarikum palinka. (Harcsa, 2016)
Naturally, good and poor quality products are equally produced in commercial practice, home distillation and subcontract distillation. However, since the legalisation of home distillation the most excellent experts and academic professors in the country have substantially contributed to spreading the know-how of palinka preparation.
A number of NQR (National Qualifications Register) trainings launched at the Faculty of Food Industry, Corvinus University, Hungary and Palinka master training courses (providing students with BSc qualification) are worth mentioning. Post-graduate technical training courses are also offered for students by well-renowned palinka experts.
It must be noted that the first Hungarian “palinka agency”, engaged in the organization of palinka tours, competitions, professional programs, trainings, was established by the graduates of the first year to boost the further development of palinka, our national treasure.
Since home distillers have been able to participate in competitions with their products, the quality of their palinka is increasing year by year in the practice of home distillers and on commercial level likewise.
Two registered home distillers and their results are the following:

APSTRACT Vol. 11. Number 3-4. 2017. pages 37-44. ISSN 1789-7874
Increasing Palinka Recognition With Tourism And Gastronomy 39
Pálinkárium, Gyenesei - István Gyenesei - prolific Hungarian, European and world champion of palinka preparation.
Pavlinkárium - Csaba Pavlicsek - the best home distiller in Hungary (2014), medal winner at world and European palinka preparation championships
Palinka festivals, palinka tourism
Tourism should rely on thematic palinka tours and festivals as equal, complementary elements of a single system providing an attraction for customers. (Michalko, 2007) In Hungary palinka tourism is not yet fully organized, although several initiatives have emerged, which must be strengthened and developed. They may be realized in rural areas where large-scale fruit production is carried out and the key element of traditional alcohol culture is palinka, but several other products are also available. To achieve this goal, high-level additional programs will be required.
“Festivals can be defined as a series of regular venues structured around one or several topics on one or multiple sites with programs dedicated to culture, art, gastronomy, sport or other issues that seek to provide their audience with outstandingly high level, entertaining recreation experience by transmitting values and spreading information.” (Hungarian Festival Association)
Sandor Lovasz organized the first palinka festival in Gyula in 2000. He discusses how the original idea was put into practice in one of the chapters of the book “Good Hungarian palinka”. (Dlusztus and Soos, 2014) Since then the festival has taken on an international dimension, its programs offer palinka and distillate competitions and various other initiatives follow its footsteps to promote palinka consumption. Examples are the “Debreczen Palinka and Sausage Festival or the free palinka day celebrating “home made” palinka in Zemplen.
Festivals are important for consumers, as they can find the whole range of products manufactured by multiple producers on one site at a given date. This is relevant, as the product range comprises innumerable tastes and odours in excess to the basic ones. One might build up a totally different picture of palinka: it is not merely a prickly, smelly, unpleasant drink, but also a treat full of fruits with pleasant odour and taste. “Certain festival seasons aim at imparting information. Not customer recruitment. The ultimate goal is to raise the awareness of a lot of people that palinka is a tasty drink and to maintain permanent interest in it. If this succeeds, people will be eager to get information about it. This is the starting point of training new customers and this is different from urging people to booze. Very different! This is the moment of developing a taste for this premium category drink and praising its high quality. The acknowledgement of the Hungarian national drink” (Guth, 2008)
The Bekesi Plum Palinka Path crosses three settlements: Bekes, Bekescsaba and Gyula. Bekesi Szilva is a fruit distillate bearing a protected geographical indication that can be prepared from red plum in 17 settlements in Bekes County. The Path can join the representative facilities of local
gastronomy, restaurants and touristic enterprises. Bekesi Szilvapalinka Centrum: A centre with a facility for
palinka tasting with a seating capacity of 42 and a hall with a seating capacity of 80 for hosting nationwide venues in the middle of Bekes town. I personally had the chance to admire it and Figure 1. presents the photo of the building.
Figure 1. Building of the Bekesi Szilvapalinka Centrum. Source: Author’s photo, 11.08. 2016.
Arpad Palinka Tanya: A distilling plant in the northern part of Bekescsaba, operating for more than 10 years. Young entrepreneurs safeguard its expansion in terms of product range and services based on their knowledge and experience learnt from their fathers in the framework of the newly established Kisret Manufactory Ltd. It includes a tasting and exhibition facility with a seating capacity of 24 where they can showcase their own premium palinka products and touristic program packages.
Gyulai Palinka Tasting Facility is situated along the bypass road of Highway 44, not far from the Romanian border, in the outskirts of Gyula. It is operated by the Gyulai Palinka Manufactory Ltd. It has a facility for palinka tasting with a seating capacity of 42 where visitors can get an understanding of plum production and processing.
Bekesi Szilvapalinka Information Office: It is situated in the centre of Gyula and it is jointly operated by three enterprises through Palinkaway Ltd. It is in charge of coordination, providing information, organization and assistance for tourist groups and selling the products of three enterprises.
The Szatmar-Beregi Plum Path (Figue 2 shows it’s map) is not a typical palinka path. The stops along the thematic route raise awareness of palinka as well as the preparation of plum jam and tourists can try their hands at preparing their own plum jam. In addition, they can have an insight into the process of plum drying. Figure 2. shows the map of the plum path. “The path is highly popular due to the fact that settlements attempt to revive their local and village celebrations with initiatives to enrich their programs” claimed Dr. Arpad Hanusz, Director of the Institute of Tourism and Geological Sciences, College of Nyiregyhaza. He added that
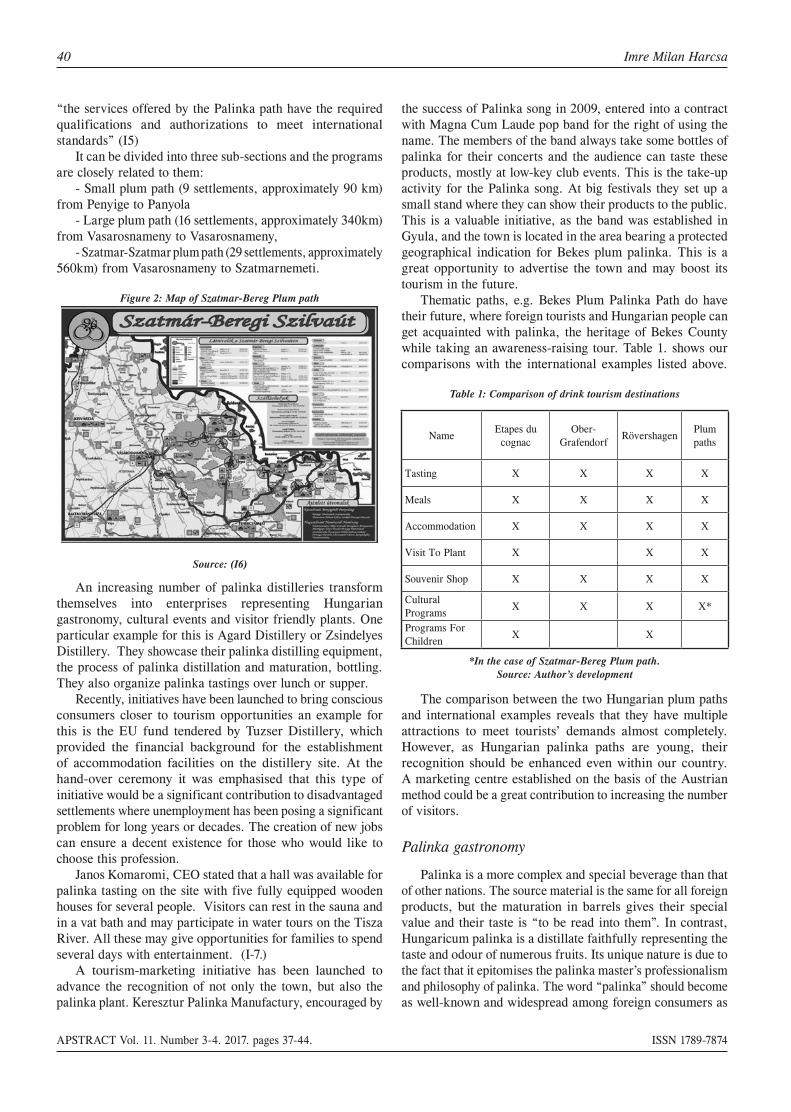
40 Imre Milan Harcsa
APSTRACT Vol. 11. Number 3-4. 2017. pages 37-44. ISSN 1789-7874
“the services offered by the Palinka path have the required qualifications and authorizations to meet international standards” (I5)
It can be divided into three sub-sections and the programs are closely related to them:
- Small plum path (9 settlements, approximately 90 km) from Penyige to Panyola
- Large plum path (16 settlements, approximately 340km) from Vasarosnameny to Vasarosnameny,
- Szatmar-Szatmar plum path (29 settlements, approximately 560km) from Vasarosnameny to Szatmarnemeti.
Figure 2: Map of Szatmar-Bereg Plum path
Source: (I6)
An increasing number of palinka distilleries transform themselves into enterprises representing Hungarian gastronomy, cultural events and visitor friendly plants. One particular example for this is Agard Distillery or Zsindelyes Distillery. They showcase their palinka distilling equipment, the process of palinka distillation and maturation, bottling. They also organize palinka tastings over lunch or supper.
Recently, initiatives have been launched to bring conscious consumers closer to tourism opportunities an example for this is the EU fund tendered by Tuzser Distillery, which provided the financial background for the establishment of accommodation facilities on the distillery site. At the hand-over ceremony it was emphasised that this type of initiative would be a significant contribution to disadvantaged settlements where unemployment has been posing a significant problem for long years or decades. The creation of new jobs can ensure a decent existence for those who would like to choose this profession.
Janos Komaromi, CEO stated that a hall was available for palinka tasting on the site with five fully equipped wooden houses for several people. Visitors can rest in the sauna and in a vat bath and may participate in water tours on the Tisza River. All these may give opportunities for families to spend several days with entertainment. (I-7.)
A tourism-marketing initiative has been launched to advance the recognition of not only the town, but also the palinka plant. Keresztur Palinka Manufactury, encouraged by
the success of Palinka song in 2009, entered into a contract with Magna Cum Laude pop band for the right of using the name. The members of the band always take some bottles of palinka for their concerts and the audience can taste these products, mostly at low-key club events. This is the take-up activity for the Palinka song. At big festivals they set up a small stand where they can show their products to the public. This is a valuable initiative, as the band was established in Gyula, and the town is located in the area bearing a protected geographical indication for Bekes plum palinka. This is a great opportunity to advertise the town and may boost its tourism in the future.
Thematic paths, e.g. Bekes Plum Palinka Path do have their future, where foreign tourists and Hungarian people can get acquainted with palinka, the heritage of Bekes County while taking an awareness-raising tour. Table 1. shows our comparisons with the international examples listed above.
Table 1: Comparison of drink tourism destinations
NameEtapes du cognac
Ober-Grafendorf
RövershagenPlum paths
Tasting X X X X
Meals X X X X
Accommodation X X X X
Visit To Plant X X X
Souvenir Shop X X X X
Cultural Programs
X X X X*
Programs For Children
X X
*In the case of Szatmar-Bereg Plum path.Source: Author’s development
The comparison between the two Hungarian plum paths and international examples reveals that they have multiple attractions to meet tourists’ demands almost completely. However, as Hungarian palinka paths are young, their recognition should be enhanced even within our country. A marketing centre established on the basis of the Austrian method could be a great contribution to increasing the number of visitors.
Palinka gastronomy
Palinka is a more complex and special beverage than that of other nations. The source material is the same for all foreign products, but the maturation in barrels gives their special value and their taste is “to be read into them”. In contrast, Hungaricum palinka is a distillate faithfully representing the taste and odour of numerous fruits. Its unique nature is due to the fact that it epitomises the palinka master’s professionalism and philosophy of palinka. The word “palinka” should become as well-known and widespread among foreign consumers as

APSTRACT Vol. 11. Number 3-4. 2017. pages 37-44. ISSN 1789-7874
Increasing Palinka Recognition With Tourism And Gastronomy 41
the Hungarian salami or goulash. Kopcsay (2008, 89. p..) summarised the relationship of
palinka consumption and gastronomy as follows: “The other custom, i.e. its consumption as an aperitif before meals has become outdated. In the culture of healthy food there is no reason to consume a short, strong alcoholic drink on an empty stomach. In European countries with a developed beverage consumption culture, short drinks are never consumed before meals. It means that if traders seek to boost palinka consumption, they should identify and redefine the motivations behind it. The task is quite simple, as several countries have already addressed this problem and as a result they consume short drinks as digestives at the end of their meals...”
This hypothesis could have been valid in 2008, as from the viewpoint of marketing, quality palinka became well-known among consumers at about that time. The author was right that the motivations behind palinka consumption must be redefined. The ideal solution is palinka gastronomy, the current trend. Palinka nor merely fulfils the aperitif or digestive roles, but it will become an integral part of meals.
The recommended method of palinka gastronomy is the so-called palinka supper where the courses are served with palinka for the guests, just like in the case of wine suppers, or the dishes can also be prepared by using palinka as an ingredient.
The simplest and most guest-oriented style is when the source materials of palinka are the same as those of the dish. This simple solution offers pleasant experiences, although it might get boring over time.
Beverages might appear to be tastier when consumed during food intake. If beverages are selected appropriately, they might improve the value of the perfectly prepared dish. However, the pleasant taste of dishes can be easily destroyed by choosing the wrong beverage. Contrary to misconceptions, beverages are not to be consumed after swallowing one or two mouthfuls of food. They can harmonise when they are in the mouth simultaneously. This might prove that they support, enhance, enrich each other, i.e. harmonise, or, on the contrary, one of them suppresses the other.
The selection of beverages with their additional taste and odour may enhance the gastronomic value of certain dishes and harmonise with them: professional matching will intensify, i.e. highlight or supplement the taste of dishes. Some examples of dishes prepared with palinka are the following:
“Potatoe cream soup made of stewed potatoes, served with roasted Mangalica ham and pear palinka
Pig kidney soup matured in grape palinka served with dumplings in marrow
Smoked Mangalica ham with lentils salad mixed with quince palinka, served with celery chips
Pork tenderloin matured in apple palinka, filled with forest mushrooms, served with chive sauce
Knuckle filled with oven-baked sour cabbage and smoked sausage topped with plum palinka served with roasted onion and potatoes
Oven baked pork spare rib topped with apple palinka, served with potatoes and bacon
Oven baked cuts filled with marrow and smoked knuckle, baked with onion and potatoes, topped with plum palinka” (Krizl, 2014)
It is important to note that if palinka is an ingredient, dishes are to be prepared in a different way than in the case of wine. As the valuable aromas of palinka can be easily lost, it will be used after heat treatment, as the final step of cooking.
Palinka may represent a new trend of using herbal extracts due to various vegetable distillates. Examples for this are beetroot, wild garlic, tomatoes, carrot, asparagus and celery distillates. The alcohol yield of vegetables is very low, therefore their prices run high; however, they add a piquant flavour to dishes.
However, the remaining ingredients in the dish are relevant, as they can soften or suppress the taste of palinka. Typical additives of this nature are black pepper, or a significant quantity of mint that can induce the same effect. If dishes are too spicy or hot, they might reduce the pleasant aroma of palinka.
Preparation technology is also crucial for certain dishes but when it comes to palinka, it takes an even more significant role. This means that the given palinka is to be selected in terms of taste sensation in the mouth and alcohol content to match the given dish perfectly and to create full harmony. For example: the consumption of Irsai Oliver grape palinka is a perfect match for goose liver pie. After this course, caramelized raisins and brioche are served. In this case, the Irsai Oliver grape palinka is almost “too much”. Without raisins the match would be perfect. Raisins are too sweet whereas the liver is soft and the brioche is crispy. In this instance the ratio of taste and odour should be carefully examined. Let us suppose that the characteristic nature of the goose liver and the brioche requires spicier palinka and the spices will be harmonically balanced by the sweet raisins. Carefully prepared Aszu marc palinka of 45 V/V% can be the best choice for this purpose. Naturally, palinka gastronomy is subjective, but when we seek the harmony of the meal, objectivity is also needed, as much as it is possible.
Brill Palinka House has been the first in Hungary to organize a competition of dishes prepared with palinka. They called for the public to send recipes, which were prepared by the chef of the distillery and then the jury evaluated them. Brill Palinka House has been a front-runner with not merely with the palinka competition to promote palinka gastronomy, but also with the preparation of vegetable distillates. Edit Krizl, the owner of Brill Palinka House claims that vegetable distillates are exclusively added to the dishes at the end of the cooking phase to preserve aromas and to make the dishes even more intensive.
SWOT analysis on the situation of palinka gastronomy and overall industry
The SWOT analysis (shown in Table 2) is suitable tool for examined the internal and external environment of palinka gastronomy highlighting its strengths and weaknesses, clarifying the inner qualities, potentials and threats as well as external conditions.

42 Imre Milan Harcsa
APSTRACT Vol. 11. Number 3-4. 2017. pages 37-44. ISSN 1789-7874
Table 2: SWOT analysis of palinka gastronomy and overall industry.
Strengths Weaknesses• wide range of excellent
fruits as a base material• good quality distillates• palinka culture on the riselike; thematic palinka path,
palinka competitions, palinka books, palinka dishes, palinka cookbook
• special palinka shops awilable
• continuous innovations carry out a procedure
• Palinka trademark, palinka excellence label
• lack of gastronomic supply matching the dishes
• limited palinka choice at restaurants
• too many interest organizations
• the palinka is less known abroad
• Community marketing is weak
• Palinka has not uniform standard evaluation system
Opportunities Threats• the scope of palinkas with
a protected geographical indication is expanding
• tender opportunities• access to the international
market• increasing the number of
palinka paths• development of gourmet
consumers• matured and embedded
“agyas” palinka gain ground
• introduction of the obligation to examine the product
• disunity among professionals
• frequent changes in the regulatory environment
• further increase of excise tax
• traditional fruit speci-es (e.g. Jonatan apple) disappear
• illicit palinka distillation and sale
Source: Author’s development
One of the strengths to be pointed out is the Hungarian climate, which is excellent for fruit growing. Consequently, sufficient amounts of fruits with excellent nutritional values are available for palinka source materials.
The image of palinka has seen a considerable transformation in recent decades. This is reflected by the fact that today high quality and super premium quality palinka types are available that might compete with the best whisky. The culture of quality palinka consumption is on the rise; moreover, the culture of “prestige consumption” is emerging. The key issue here is not the alcohol content of the product, but the experience of its consumption.
In our days, consumers have a good understanding of the advantages of tulip glasses and the needless of palinka cooling. Sellers and customers are getting more conscious and the culture of palinka is under perceptible development. Several restaurants offers palinka dishes and palinka
cookbooks are also available. (I9) Palinka competitions are organized in every part of Hungary, the most important are the Quintessence comtetition (Onga) and the Brillante (Gyula).
Layman customers might need help in their purchases that is not available in great supermarkets, whereas provided in restaurants. Nevertheless, special palinka shops can pride themselves with the widest possible product range and professional shop assistants. Such examples include the Hungarian Palinka House Shops in Budapest and in numerous towns in the countryside or Kiraly Palinkarium and Hungarikum in Gyor.
Producers and professionals continuously seek to make innovations to meet the greatest possible consumer demand. The range of palinka and distillate types is steadily growing. Palinka perfume has already been produced in Pannonhalma that lends itself to flavouring desserts. (Szucs, 2008)
Weaknesses include the fact that sometimes there is a lack of gastronomic supply recommended for palinka consumption. In addition to palinka, festivals typically focus on a single product, e.g. Budavar Palinka and Sausage Festival, Debreczen ZAMAT Palinka and Sausage Festival.
In some cases, restaurants merely have a limited mix of palinka products and even if they can offer rarities, those are manufactured by the same producer.
The production of palinka has a lot of related professional organizations. Their activities, not specified in detail, are the following: Hungarian Alcohol Industry Association and Product Council, Palinka National Council, Hungarian Palinka Order of knighthood, Palinka Guild Association, Pannon Distillers Egyesülete, Délkelet-Magyarországi Palinkafőzők Egyesülete, Kisüsti Palinkafőzők Országos Association, Nograd County Palinka Friends Association, and three small orders of knighthood; Szabolcsi, Szatmar-Beregi and Bükki. The front of palinka production is characterised by multiple and conflicting interests, unity is merely ostensible, moreover, it is nonexistent.
Opportunities include the fact that at present we have six products under EU protection and four ones bear protected designation of geographical indication at the national level. Nagykunsag plum and Nagykunsag quince palinka were placed on the list mentioned above in 2016. The opportunities offered by the protection have not yet been fully exploited in terms of awareness raising (marketing) and tasting (organoleptic tests) and the development of distribution chains.
Distilling plants and thus the sector itself should be supported by further aids and tender opportunities. The development of subcontract distilleries typically operating as micro-enterprises should be a key issue.
The owner of Agard palinka distilling plant claims that “palinka is world-famous in Hungary”. This is a situation to be changed by entry to foreign markets, which can merely be achieved by state support and active marketing activities. Hungary represented itself at the TopShelf exhibition and Drinks Fair in Australia, 2014. “Palinka was regarded as a unique product by each and every visitor. They attempted to compare it to some other products but to no avail, due to
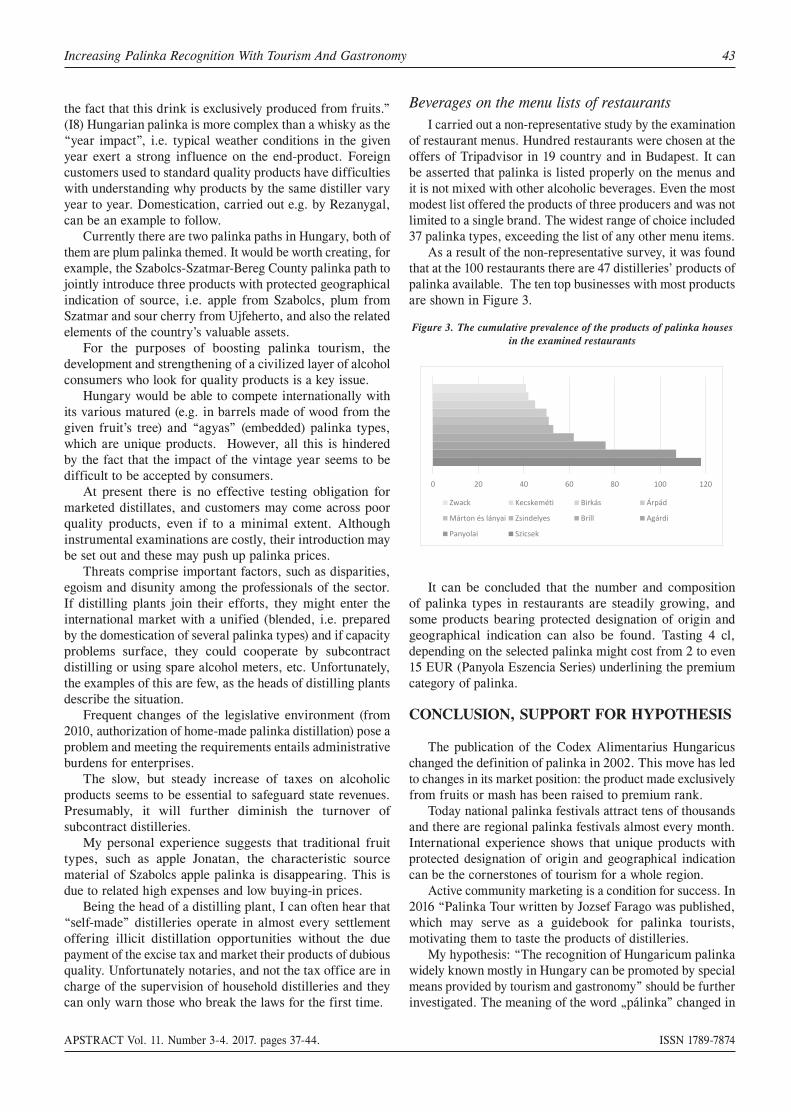
APSTRACT Vol. 11. Number 3-4. 2017. pages 37-44. ISSN 1789-7874
Increasing Palinka Recognition With Tourism And Gastronomy 43
the fact that this drink is exclusively produced from fruits.” (I8) Hungarian palinka is more complex than a whisky as the “year impact”, i.e. typical weather conditions in the given year exert a strong influence on the end-product. Foreign customers used to standard quality products have difficulties with understanding why products by the same distiller vary year to year. Domestication, carried out e.g. by Rezanygal, can be an example to follow.
Currently there are two palinka paths in Hungary, both of them are plum palinka themed. It would be worth creating, for example, the Szabolcs-Szatmar-Bereg County palinka path to jointly introduce three products with protected geographical indication of source, i.e. apple from Szabolcs, plum from Szatmar and sour cherry from Ujfeherto, and also the related elements of the country’s valuable assets.
For the purposes of boosting palinka tourism, the development and strengthening of a civilized layer of alcohol consumers who look for quality products is a key issue.
Hungary would be able to compete internationally with its various matured (e.g. in barrels made of wood from the given fruit’s tree) and “agyas” (embedded) palinka types, which are unique products. However, all this is hindered by the fact that the impact of the vintage year seems to be difficult to be accepted by consumers.
At present there is no effective testing obligation for marketed distillates, and customers may come across poor quality products, even if to a minimal extent. Although instrumental examinations are costly, their introduction may be set out and these may push up palinka prices.
Threats comprise important factors, such as disparities, egoism and disunity among the professionals of the sector. If distilling plants join their efforts, they might enter the international market with a unified (blended, i.e. prepared by the domestication of several palinka types) and if capacity problems surface, they could cooperate by subcontract distilling or using spare alcohol meters, etc. Unfortunately, the examples of this are few, as the heads of distilling plants describe the situation.
Frequent changes of the legislative environment (from 2010, authorization of home-made palinka distillation) pose a problem and meeting the requirements entails administrative burdens for enterprises.
The slow, but steady increase of taxes on alcoholic products seems to be essential to safeguard state revenues. Presumably, it will further diminish the turnover of subcontract distilleries.
My personal experience suggests that traditional fruit types, such as apple Jonatan, the characteristic source material of Szabolcs apple palinka is disappearing. This is due to related high expenses and low buying-in prices.
Being the head of a distilling plant, I can often hear that “self-made” distilleries operate in almost every settlement offering illicit distillation opportunities without the due payment of the excise tax and market their products of dubious quality. Unfortunately notaries, and not the tax office are in charge of the supervision of household distilleries and they can only warn those who break the laws for the first time.
Beverages on the menu lists of restaurantsI carried out a non-representative study by the examination
of restaurant menus. Hundred restaurants were chosen at the offers of Tripadvisor in 19 country and in Budapest. It can be asserted that palinka is listed properly on the menus and it is not mixed with other alcoholic beverages. Even the most modest list offered the products of three producers and was not limited to a single brand. The widest range of choice included 37 palinka types, exceeding the list of any other menu items.
As a result of the non-representative survey, it was found that at the 100 restaurants there are 47 distilleries’ products of palinka available. The ten top businesses with most products are shown in Figure 3.
Figure 3. The cumulative prevalence of the products of palinka houses in the examined restaurants
0 20 40 60 80 100 120
Zwack Kecskeméti Birkás Árpád
Márton és lányai Zsindelyes Brill Agárdi
Panyolai Szicsek
It can be concluded that the number and composition of palinka types in restaurants are steadily growing, and some products bearing protected designation of origin and geographical indication can also be found. Tasting 4 cl, depending on the selected palinka might cost from 2 to even 15 EUR (Panyola Eszencia Series) underlining the premium category of palinka.
CONCLUSION, SUPPORT FOR HYPOTHESIS
The publication of the Codex Alimentarius Hungaricus changed the definition of palinka in 2002. This move has led to changes in its market position: the product made exclusively from fruits or mash has been raised to premium rank.
Today national palinka festivals attract tens of thousands and there are regional palinka festivals almost every month. International experience shows that unique products with protected designation of origin and geographical indication can be the cornerstones of tourism for a whole region.
Active community marketing is a condition for success. In 2016 “Palinka Tour written by Jozsef Farago was published, which may serve as a guidebook for palinka tourists, motivating them to taste the products of distilleries.
My hypothesis: “The recognition of Hungaricum palinka widely known mostly in Hungary can be promoted by special means provided by tourism and gastronomy” should be further investigated. The meaning of the word „pálinka” changed in

44 Imre Milan Harcsa
APSTRACT Vol. 11. Number 3-4. 2017. pages 37-44. ISSN 1789-7874
2002 with the appearance of the new Hungarian Food Codex. In addition the Palinka Law came into force in 2008. Thanks to these facts a number of changes have started in Hungary from that time. Whereas earlier palinka was hidden behind commercial alcoholic drinks (cherry, plum, pear and mixed “palinka”) on the shelves of department stores and we could only find one or two branded products (Kecskemeti, Futyulos), now they are offered on separate shelves for customers, and restaurants rank it first on their lists of short drinks.
REFERENCES
Balazs G.: 1998. A magyar palinka. (The hungarian palinka)Aula Publisher, Bp. 23-154 p.
Balazs G.: 2008. A magyar palinka folklorja es nevkincse. (The folklore and appellations of the hungarian palinka) In: The red mail coach. 2008/spring. 23-32 p.
Balazs G.: 2012. Nagy parlat es palinkakonyv, Inter Nonprofit Ltd., Bp, 147 p.
Dlusztus I. – Soos K. 2013. A jo magyar palinka. (Good Hungar-ian palinka ) Our Homeland Publisher, Szeged, 238-241. p.
Farago J. (2016): Palinkatura. (Palinka tour) Alinea Publisher, Bp, 208 p.
Guth R.: Te palinkazol? (Are you drinking palinka?) In Palinka World;1 (2): 42-43.
Harcsa I. M. (2016): A magyarorszagi palinkafőzés jogszabályi változásai és hatásai. (Legislative changes and impacts of the Hun-garian palinka distillation) In: ars boni, IV. 2016/No. 1. 25-42. p.
Kopcsay L. (2007) Lehet-e a palinka turisztikai vonzero Mag-yarorszagon? (Can the palinka be a touristical attraction in Hun-gary?) The Village 2007.XXII. No. 3.
Kopcsay, L. (2008) A területileg differenciált italkultúra szerepe a magyar turizmusban (The role of regionally differentiated bev-erage culture in Hungarian tourism. Doctoral (PhD) dissertaion, University of Pecs Faculty of Natural Sciences Doctoral School of Geosciences. link: old.foldrajz.ttk.pte.hu/phd/phdkoord/nv/dis-szert/disszertacio_kopcsay_nv.pdf
Krizl E. (2014): Palinkagasztronomia eloadas. (Palinka gastron-omy presentation) Corvinus University of Budapest, PowerPoint presentation.
Michalko G. (2007): Magyarorszag modern turizmusfoldrajza, (Modern tourism geography of Hungary) Dialog Campus Pub-lisher, Bp, 288 p.
Szollosi E. (2016): Palinkaturizmus eloadas. (Palinka tourism pre-sentation) Szent Istvan University, PowerPoint presentation, 2016. november 12
Szucs P. (2008): Amikor az ital megismeri az embert. (When pal-inka recognizes a man) In: Palinka World I. Year, No. 3, 26-28 p.
I1: http://gasztronomia.itthon.hu/palinkakostolo-helyek (access: 2017.03.23)
I2: http://ee.france.fr/hu/information/cognac-pineau-charentes-borvideke (access: 2017.03.23)
I3: http://www.gr-marketing.at/ (access: 2017.03.23)
I4: http://www.karls.de/roevershagen.html (access: 2017.03.23)
I5: http://www.turizmusonline.hu/tt_itthon/cikk/tematikus_utak_magyarorszagon (access: 2016.11.15)
I6: http://slideplayer.hu/slide/2162904/ (access: 2016.11.18)
I7: http://www.palinkafozes.com/hirek/20150727_turisztikai-szallashelyfejlesztes-valosult-meg-tuzseri-palinkafozdeben (access: 2016.11.18)
I8:https://businesstraveller.hu/desztinaciok/ausztraliaban-is-hodit-a-magyar-palinka-1120514 (access: 2017.03.23)
I9: https://palinkatona.wordpress.com/palinkas-etelek/ (access: 2018.01.23)

APSTRACT Vol. 11. Number 3-4. 2017. pages 45-52. ISSN 1789-7874
DOI: 10.19041/APSTRACT/2017/3-4/7
Applied Studies in Agribusiness and Commerce – APSTRACT Center-Print Publishing House, Debrecen SCIENTIFIC PAPER
WHAT DIFFERENTIATES THE ENTREPRENEURS FROM NON-ENTREPRENEURS ON NATURE AND
NURTURE? Syed Zaheer Abbas Kazmi1 - Samiuddin Khan2 - Andras Nabradi31Faculty of Economics and Business University of Debrecen, Hungary
Faculty of Management Sciences, National University of Modern Languages (NUML), Islamabad Pakistan [email protected]
2Swat College of Science and Technology. Mangora Swat, Pakistan [email protected] 3Faculty of Economics and Business, University of Debrecen, Hungary
Abstract: Based on the importance and contribution of entrepreneurship in economic development, it is vital to know that what underlying factors may promote the spirit of entrepreneurship? The entrepreneurship literature suggests two kinds of broader influencers or predictors for entrepreneurs and non-entrepreneurs “nature” and “nurture”. In this study “nature” includes the psychological or personality related factors; self-confidence, locus of control, risk-taking propensity and trust levels. The “nurture” is explained by the effects from society in general and friends and family in particular. To answer the question “What differentiates the entrepreneurs from non-entrepreneurs on nature and nurture?” we collected data through questionnaire from 155 respondents. The 70 respondents were entrepreneurs and 85 were non-entrepreneurs. Step-wise discriminant analysis was used to determine the discriminating factors for entrepreneurs from non-entrepreneurs. Results indicate that societal impacts, risk taking propensity and trust levels were significantly discriminating the two groups; entrepreneurs and non-entrepreneurs. The study has important implications for policy makers, academicians, researchers and potential entrepreneurs.
INTRODUCTION
Entrepreneurship is one of the most vital ingredients in the economic development of a society. As in developing nations, small and medium scale businesses are the main sources of income generation, job creation and poverty alleviation. Entrepreneurship is essentially important for the economic development of every country (Amiri and Marimei, 2012) As per the Government of Pakistan’s Small and Medium Enterprises Development Authority (SMEDA), (2017) SMEs in Pakistan are about 90% of all the enterprises; they employ nearly 80% of the non-agricultural labor force of the country; and they contribute approximately 40% share to the annual GDP. Pakistan has enormous entrepreneurship potential. Entrepreneurial activity is however limited mainly for the lack of government policy (Chemin, 2010), Socio-cultural constraints (Muhammad et al, 2017), financial and other barriers (SMEDA 2017), and also, the entrepreneurship education is mostly focused on “about entrepreneurship” in the developing countries (Kazmi and Nabradi, 2017). The education about entrepreneurship makes the students aware
about entrepreneurship by providing overview and orientation; it however has less impact on creating entrepreneurs.
Many authors have defined entrepreneurship in different perspectives. The word “entrepreneur” originates from the French verb “entreprendre” (Kirby, 2004). It appeared in the French dictionary in 1723 (Kates, 2015). Richard Cantillon (1730) viewed entrepreneur as self-employed and bearer of uncertainty. Since the year 1730, there have been many definitions of entrepreneur and entrepreneurship. The debate that entrepreneurs are born or made can long be traced in the entrepreneurship research literature. The trait theories of entrepreneurship hold the notion that entrepreneurs exist because of their entrepreneurial traits or personality characteristics or traits. This thesis can be termed as the “nature” of entrepreneurs. The behavior theories of entrepreneurship hold that entrepreneurs are made because of the society. This view about entrepreneurs stresses upon the “nurture” of entrepreneurs. Despite a large body of research on the trait and behavior or nature and nurture of entrepreneurs, this study has made significant contribution as in some cultures, some of the trait and behavior aspects
Keywords: self-confidence, trust levels, locus of control, societal impacts, discriminant analysis (JEL Code: L26, M13)

46 Syed Zaheer Abbas Kazmi - Samiuddin Khan - Andras Nabradi
APSTRACT Vol. 11. Number 3-4. 2017. pages 45-52. ISSN 1789-7874
of entrepreneurs were found significant and in other cultures they were not. This is evident in a recent study conducted in India by Richa (2017). Our study is conducted in a developing society – Pakistan. It is important for the body of knowledge, research community and practitioners to know that what factors hold significant for the people to become entrepreneurs from the nature and nurture aspects.
The entrepreneurship research literature is rich with the discussion on the “nature and nurture” of entrepreneurs or born versus made of the entrepreneurs. Classical theories of entrepreneurship stress the role of personality traits – the nature of entrepreneurs (Schumpeter, 1911; Knight, 1921; Kihlstrom and Laffont, 1979). Relatively new studies employing the two-group research designs to compare entrepreneurs from non-entrepreneurs emphasized greater importance on the “nurture” relative to “nature” in determining the choice to become an entrepreneur (Nicolaou et al., 2008; Zhang et al., 2009; Nicolaou and Shane, 2010). More recently, Henrekson and Sanandaji (2017) concluded that all the business owners are not entrepreneurs. In search of the true Schumpeterian Entrepreneurs, they analyzed data of 996 self- made billionaires published by the Forbes Magazine between 2010 and 2015. Owoseni and Akanbi, (2011) propose that the entrepreneurial success mainly relies on the individual qualities and the situational factors. They suggested three basic and five ancillary qualities of relatively more prosperous entrepreneurs. The three main qualities are: internal Locus of control, Risk taking behavior and Need for achievement (McClelland, 1961; Ahmed, 1985; Perry, 1986; Lorrain, 1988; Hood, 1993; Begley, 1987; Mengel, 1972; Dart, 1971; Meyer, 1961; Liles, 1974; Broehl, 1987). While the five ancillary factors are need for power, tolerance of ambiguity, Endurance, need for affiliation and need for autonomy. (Hornaday, 1970, 1982; Vesper ,1990; Wainer and Rubin, 1969; Begley, 1987; Bellu, 1987). Gartner, (1988) stated that most researchers are unsatisfied with the psychological traits approach as it is unable to define the behavior and performance of the entrepreneur. These researchers have come to the conclusion that the predictability of entrepreneurs, non-entrepreneurs, successful and failed entrepreneurs cannot be determined from the personality features of the individuals. This notion is also justified by Low and MacMillan (1988) by stating that “entrepreneurs tend to defy aggregation”. Since, the contradiction between in-born and made-up entrepreneurs exists from very beginning. However, it would be unfair to attribute the success of entrepreneurial activity to either of the features. Gartner (1988) and Vesper (1980) suggest that establishing a business entity is the result of many factors. A previous research by (Sandberg & Hofer, 1987) also claims that individual involvement and entrepreneurial success cannot be estimated from a group of variables. Similarly, other researchers have attributed diverse methods, unreliable results, different unit of analysis, and different set of samples to the failure of psychological traits approach. Still, studies regarding personalities are crucial for evaluating the entrepreneurial success being a major part of interest (Rauch & Frese, 2000). But researchers have deduced some
factors which are directly associated with entrepreneurial preferences (Koh, 1996). Three factors are regarded as the most crucial. These are moderate risk taking attitude, high need for achievement and internal locus of control (Korunka et al., 2003).
This study, encompasses five independent variables namely- self-confidence, locus of control, risk taking attitude, societal impacts and trust levels. Self-Confidence (SC), Locus of Control (LC), Risk-Taking Propensity (RTP) and Trust Level (TL) from the nature aspect of entrepreneurs. For the nurture aspects, Societal Impacts (SI) were used to determine their impacts on the career decisions of entrepreneurs and non-entrepreneurs. These variables are aimed to be tested for the two groups- entrepreneurs and non-entrepreneurs. After applying the discriminant analysis, it will become evident that which of the five independent variables significantly discriminates among the two groups.
Self Confidence is Similar to Bandura’s (1977b) self efficacy. Perceived self-belief or confidence in one’s own abilities to carry-out specific tasks. When people have a strong belief in their capabilities and skills that they can start and manage a business venture successfully, it does increase their chances of becoming an entrepreneur. Intellectual and non-intellectual skills can assure higher entrepreneurial success rates. It contributes substantially towards the entrepreneurial success. Self-confidence refers to the individual’s trust in himself to carry on the business activities. It is regarded as one of the crucial factors in initiating and undertaking an entrepreneurial activity. In other words, individuals with high self-confidence are also likely to take relatively more risks. Entrepreneurs are generally seen as those in control of their own ambitions and their endeavors which are supposed to be employed in order to achieve such goals (Koh, 1996). For these goals the entrepreneurs are expected to possess a certain level of self-confidence (Robinson et al., 1991a). The importance of self-confidence is necessitated by Koh, (1992) by stating that self-confidence is an integral psychological constituent in entrepreneurial success. It is a common proposition that entrepreneurs are expected to score relatively higher than non-entrepreneurs self-confidence. (Ho and Koh, 1992, Robinson et al., 1991a).
Locus of Control was first proposed by Rotter (1966). It is an Individual’s perception of his or her ability to exercise control over the environment. Internals believe that they have control over their environment. Externals view their lives as controlled by external factors. It has been emphasized as an important distinguishing feature of entrepreneurs by many including Hornaday and Aboud, (1971) and Miller, (1983). Since locus of control depicts the reasons of good and bad events in one’s life. It is a general proposition that individuals with internal locus of control are more likely to be good organizers and hence good entrepreneurs. On the other hand, entrepreneurs are generally seen as relatively more or moderate risk takers as successful entrepreneurship involves bold decisions in some cases.
Schumpeter (1954) acknowledges J. S. Mill for publicizing the term risk-taking among economists. Mill (1848) included

APSTRACT Vol. 11. Number 3-4. 2017. pages 45-52. ISSN 1789-7874
What Differentiates The Entrepreneurs From Non-Entrepreneurs On Nature And Nurture? 47
risk-taking as a function of entrepreneur. It is the propensity to take chances in the face of loss. Entrepreneurs’ preference for moderate level of risks is also emphasized by many others including McBer and Co., 1986.
Dyer (1996) and Kwon and Suh (2004) emphasized the importance of trust in the success of the business. Trust is the general probability that another person should be relied upon in his or her commitments (Rotter, 1967); (Morgan and Hunt 1994). Since, trust is an abstract concept; it can be defined in various perspectives as per the need of the author. In our case, we would talk about the business trust, as all business transactions include trust at some level (Huang and Wilkinson, 2006). The business trust between the business stakeholders including customers, suppliers and employees develops over a period of time. As in businesses, many parties are involved which are mostly interdependent and besides that their also involves factor of uncertainty. That’s why; trust is mostly needed in such cases (Huang et al., 2006). Trust is actually the assurance of expectations from both parties. In classical view, trust is the general probability that another person should be relied upon in his or her commitments (Rotter, 1967). Morgan and Hunt (1994) consider trust in a situation where one party is sure about the commitment of exchange of other party. Lyman, (2003) proposed three qualities of trust, these are: trust is rooted in the ability of an individual to consider others as credulous, they will do what they promise and they will stay ethical in business transactions. As stated earlier, trust is the name of reliance on your colleagues, subordinates and off courses other business stakeholders. Since trust is based on probability, therefore it can be regarded as a business risk. As a conclusion it can be inferred that trust is a crucial factor in businesses and social relationships. In businesses it can act as a source of cohesion between the team members or employees and other business stakeholders. While in social relationships, trust is important to sustain such good relations. Traditionally, businesses have faced serious problems due to breach of trust which have also led to inefficient governance. Based on the importance of trust in business, Spekman (1988) regard it as “the cornerstone of strategic partnership”. It was also found that trust deficiency can affect the stakeholder’s commitment
and also the overall business success. Similarly, Morgan et al. (1994) asserts that relationship, commitments and the overall success, both are based on high levels of trust. Dyer (1996); Kwon and Suh (2004) also emphasized the importance of trust in the success of the business. It was concluded that business success is dependent on high trust levels among the business stakeholders. On the other hand, Huang and Wilkinson (2006) proposed a research model regarding trust which shows that trust has a direct relation with business generally and its success more specifically.
Effects of society in shaping an individual’s decision regarding choosing business rather than being an employee are really important aspects of entrepreneurship. It is an important factor for the entrepreneurial success (Gnyawali and Fogel, 1994). Societal impacts refer to the effects of society in shaping an individual decision regarding choosing business rather than being an employee, it is also regarded as a crucial factor regarding the entrepreneurial success. It was also inferred that societal factors may be as important as technical assistance, information and credit availability. Similarly, Mokry (1988) regard local communities as an important element in developing entrepreneurial activities. Lui and Wong (1994) suggested that the Hong Kong’s economy is prone to Chinese nationals because: the economic development over the years have led towards opening many business opportunities and these opportunities are in the form of small businesses which are more useful to ordinary individuals. On the other hand, adverse public attitude in Czech and Slovak Republics discouraged entrepreneurs (Swanson & Webster, 1992). They also suggested that developing a social bias against entrepreneurs, may result into social injustice. Relatives, close friends and family members can help the entrepreneur in resources allocation, credit raising, utilizing social contact and help in various decisions making (Kao, 1993). Social norms along with cultural attitude may also lead to efficient business development (Grundsten, 2004). Scholten et.al, (2004) believe that perceptions about the entrepreneurship have a direct positive impact on entrepreneurial intent. Those cultures which support entrepreneurship; develop proper mechanisms to encourage it (Vesper, 1983). Contrary to that, Lui and Wong
THEORETICAL FRAMEWORK
Figure 1. Theoretical Framework

48 Syed Zaheer Abbas Kazmi - Samiuddin Khan - Andras Nabradi
APSTRACT Vol. 11. Number 3-4. 2017. pages 45-52. ISSN 1789-7874
(1994) proposes the cultural value assessment contradicts the proposition of “strategizing behavior”. Strategizing behavior is the behavior which focuses on the attainment of goals through the use of strategic actions. This notion is also sustained by Stites (1985). A study carried out on Taiwanese industrial workers concluded that the Chinese business ethics are more trustworthy, that emphasizes the gap between cultural value assessment and strategizing behaviors (Harrell−s, 1985). People around and individual can have a strong positive impact on the individual in involving in an entrepreneurial activity. For instance in China, entrepreneurs are seen more likely to encourage people around him/her to initiate their own entrepreneurial ventures. Besides that these individuals are also motivated by their close friends, relatives and family members (Kao, 1993; Siu & Martin, 1992).
RESEARCH QUESTION:What differentiates the entrepreneurs from non-
entrepreneurs on nature and nurture?
RESEARCH DESIGN AND METHODOLOGY
A sample size of total of 155 respondents was selected, 70 among them were entrepreneurs while 85 were non- entrepreneurs. The data was collected in the geographical limits of Rawalpindi and Islamabad, Pakistan. Entrepreneurs- for this study are defined as individuals who started their business and secured a peculiar growth from their counter-parts in the first two years through innovation or those individuals who have survived their business in the first five years of their entrepreneurial careers. Data collection has been carried out through a detailed questionnaire. All questions regarding the five independent variables are on 5-point Likert-scale; while the demographic section is placed separately.
In order to check the internal consistency, reliability analysis was conducted for five predictor variables of the instrument.
The results were found acceptable. The cronbach alpha for predictor variables were, 0.83, 0.77, 0.81, 0.76 and 0.80 for locus of control, risk taking propensity, societal impacts, self-confidence and trust levels respectively. The data collection was carried through personal administration. As, it is likely to increase the responsiveness of the respondents. Personal administration also includes relatively more involvement of the researcher and the respondent. As, in few cases the respondents were not educated enough to understand the contents of the question therefore the researcher had to guide the respondent throughout the data collection phase. A reasonable effort was made to obtain unbiased responses for the questions in the questionnaire. The data analysis is divided into two sections, first section is the data description while in second section a discriminant analysis is used to find out the significantly discriminating independent variables in two groups- entrepreneurs and non- entrepreneurs.
RESULTS
The demographic analysis showed that majority of the sampled respondents lived in urban or semi-urban areas (74.3 percent). Most of the respondents were male (94 percent) therefore, the sample was skewed for gender. Gender is taken as a control variable in this study as men in general, are relatively more encouraged to start their business while, the females generally, prefer to stay at home and assume the responsibilities as house-wives. Similarly, education was also considered as the control variable. As, most of the educated individuals were considered to be more inclined toward employment in banking and other professions than entrepreneurship.
Table 1 shows that entrepreneurs and non-entrepreneurs are significantly discriminated in terms of societal impacts, risk taking propensity and trust levels. However, locus of control and self-confidence were statistically insignificant in differentiating between entrepreneurs and non-entrepreneurial groups.
Figure 2. Descriptive Statistics

APSTRACT Vol. 11. Number 3-4. 2017. pages 45-52. ISSN 1789-7874
What Differentiates The Entrepreneurs From Non-Entrepreneurs On Nature And Nurture? 49
Table 2 indicates that entrepreneurial entry decisions are highly correlated with societal impacts, self-confidence, and risk taking propensity. The table also illustrates that societal impacts, self-confidence, trust levels and risk taking propensity have a positive effect on entrepreneurial career decisions while locus of control is negatively correlated with entrepreneurial entry decisions. Similarly, self-confidence and societal impacts are also positively correlated with each other while risk taking propensity and locus of control are negatively related with each other.
Table 2
It is also evident from table 2 that the relationship between career entry decisions with societal impacts and trust levels is positively significant while locus of control is negatively related with career decision. However, the impact is observed to be insignificant. It is inferred that the individuals who choose to be entrepreneurs are relatively more risk raking as compared to non-entrepreneurs. As starting own business means increasing your risk levels, however, the reward is more appealing that is in the form of more financial freedom and independence. Hence entrepreneurship demonstrates a risk in itself. When the entrepreneurs look at the rewards and still undergo the entrepreneurial decision, it reveals relatively high level of optimism. The score for locus of control is less than 3 in all cases. It depicts that the individual’s entrepreneurial entry decisions are not affected by the fact that they “Attribute others for good and bad events in their lives.” Societal impacts
have an overall mean of more than 3, showing that the sampled respondents are significantly influenced by the society in general and by friends, family & relatives specifically. It also shows that the society provides material resources and moral support to the entrepreneurs, hence encouraging them to initiate their own businesses. A higher mean score on self-confidence exhibits individual willingness to get more independence and a need for achievement. As evident from the correlation matrix, trust level is highly correlated with an individual’s risk taking propensity. It justifies the notion that trusting people in business illustrates a risk in itself. That’s why entrepreneurs have scored high on risk taking propensity.
DISCRIMINANT ANALYSIS
A discriminant analysis is normally used when the dependent variable is on dichotomous (nominal) scale while independent variables are on ordinal scale. Since the entrepreneurial entry decisions are represented on a dichotomous scale- entrepreneurs and non-entrepreneurs. Therefore, a step-wise discriminant analysis has been used in this study. Notably, entrepreneurs’ group is represented by a numeric value of 1 while the non-entrepreneurs are represented by a numeric value of 0. The analysis is carried out to estimate significant and insignificant variables for the two groups- entrepreneurs and non-entrepreneurs.
Table 3 provides the significant variables with their respective canonical discriminant coefficients and Wilk’s lambda statistics.
Table 3
Table 1T-Analysis of Entrepreneurs and Non-Entrepreneurs on Study Variables (N = 155)
Entrepreneurs (n=70)
Non-entrepreneurs (n=85)
95% CI Cohen’s D
Variables M(SD) M(SD) t(155) LL UL
TL 3.1(0.6) 3.3(0.7) 2.49* 0.43 0.05 .35
RTP 3.0(0.6) 3.3(0.7) 3.1* 0.49 0.11 .45
LC 3.5(0.5) 3.7(0.9) 0.6 0.29 0.18 .08
SC 3.3(0.7) 3.3(0.8) 0.4 0.26 0.16 .06
SI 2.7(0.6) 2.4(0.7) 3.8* 0.09 0.51 .45
Note: CI - Confidence Interval; LL - Lower Limit; UL - Upper Limit; SC = Self-confidence, LC=Locus of control, RTP=Risk taking propensity, TL= Trust levels, SI= Societal impacts
p < .05.

50 Syed Zaheer Abbas Kazmi - Samiuddin Khan - Andras Nabradi
APSTRACT Vol. 11. Number 3-4. 2017. pages 45-52. ISSN 1789-7874
Table. 3 demonstrates that Societal impacts, risk taking propensity and trust levels are significantly discriminating among the two groups- i.e. entrepreneurs and non-entrepreneurs. It can be deduced from this study that, Societal impacts, risk taking propensity and trust levels might have initially induced the individuals to take different decisions like starting own venture or working for someone else. The t-values also indicate a relatively more importance of the variables. A study of group centroids is necessary in order to elaborate the discriminant function. The centroid values were .301 and -.27 for entrepreneurs and non-entrepreneurs respectively. It suggests that values closer to .301 would be related to entrepreneurs while those near to -.27 belong to the non-entrepreneurial group. The cutoff score (-.0015) being the average of two centroids, indicates that individuals who score below the cut off value on societal impacts, risk taking propensity and trust levels are more likely to belong to the non-entrepreneurial group. Or contrary to that, if the score is high than the cutoff value then there is a probability that the individual belongs to the entrepreneurial group.
DISCUSSION
The present study focuses on effect of the factors such as self-confidence, locus of control, risk taking propensity, societal impacts, and trust levels on the career entry decisions of individuals in Pakistan. By employing step-wise discriminant analysis, a good model fit was given in order to know about the differentiating factors among entrepreneurs and non-entrepreneurs. The most distinguishing factor among entrepreneurs and non-entrepreneurs was societal impacts. Likewise, among the psychological factors risk taking propensity and trust levels were also found as important discriminators. Self-confidence was found to be positively related while locus of control was negatively correlated with entrepreneurial entry decisions. The correlation matrix indicated that risk taking propensity and trust levels were negatively correlated with each other. A moderate risk taking is normally seen in the entrepreneurs, this study has also validated the results of previous studies (Hornaday & Aboud, 1971; Miller, 1983). Since trust levels were also related with risk taking propensity, trust levels were also found as a significant discriminator in this study (Morgan and Hunt, 1994; Huang and Wilkinson, 2006). Similarly, the effect of Societal impacts was also in line with the findings from the literature (Gnyawali and Fogel ,1994; Mokry ,1988; Lui and Wong 1994). As a limitation, this study has not incorporated many other variables that may also differentiate entrepreneurs from non-entrepreneurs. Future studies are expected to enhance the scope of such studies by including such other variables.
The study at one hand is constrained by various limitations- the current sample size was relatively small. A larger sample size is recommended for an extended generalizability. Similarly, this study was bound to the geographical limits of Rawalpindi and Islamabad, Pakistan so future studies should also include other geographical areas. Besides, a sound effort
was made to get unbiased results; biasness in certain cases cannot be avoided.
CONCLUSION
Predicting an individual’s chances of entrepreneurial entry decisions based on merely psychological characteristics is not sufficient therefore; this study has also included the contribution of societal impacts on entrepreneurial decisions. Hence, It is concluded from this study that although the five independent variables namely- self-confidence, locus of control, societal impacts, trust levels and risk taking propensity were important, however results of this study indicate that societal impacts, risk taking propensity and trust levels were significantly discriminating among the two groups- the entrepreneurs and non-entrepreneurs in terms of entrepreneurial entry decisions. This study is rather more helpful for economic decision makers in terms of igniting economic growth through entrepreneurship. Similarly, it is also evident from the study that the availability of a conducive environment can substantially increase the entrepreneurship rates in the country.
ACKNOWLEDGEMENTS:
We acknowledge the efforts and cooperation of Mr. Ishtiaq Ahmed. his extended support enabled us to conduct the study.
Technical support of Mr. Hassan Raza (Lecture, NUML, Islamabad, Pakistan) is highly appreciated. He helped us throughout the data analysis and interpretation.
REFERENCES
Ahmed, S. (1985). “n Ach, risk aversion propensity, locus of control and entrepreneurship”, Personality and Individual dif-ferences, 6, 781-791.
Andrea Asoni, (2011, “Intelligence, Self-confidence and Entre-preneurship” IFN Working Paper No. 887, 2011, Research Institute of Industrial Economics (IFN)
Asoni, Andrea, What Drives Entrepreneurship?” Unpublished Manuscript (2011), University of Chicago.
Begley, T.M. & D.P. Boyd (1987). “Psychological characteris-tics associated with performance in entrepreneurial firms and smaller businesses”, Journal of Business Venturing, 2, 79-93.
Bhide, Amar (2000) The Origin and Evolution of New Busi-nesses, Oxford University Press, London.
Broehl, W.G. (1978). The Village Entrepreneurs. Cambridge: Harvard University Press.
Bruyat, C. and Julien, P.A. (2001). “Defining the field of re-search in entrepreneurship”, Journal of Business Venturing, 16(2), 165-80. Owoseni, O.O. and Akanbi, P.A. (2010). En-trepreneurial Intentions: A Theoretical Framework. Journal of Management and Corporate Governance, (1): 115.
Card, David, Using geographic variation in college proximity to estimate the return to schooling”, in L. N. Christo_des, E.. K. Grant and R. Swidinsky (Eds.), Aspects of labour mar-

APSTRACT Vol. 11. Number 3-4. 2017. pages 45-52. ISSN 1789-7874
What Differentiates The Entrepreneurs From Non-Entrepreneurs On Nature And Nurture? 51
ket behaviour: essays in honor of John Vanderkamp (Toronto, Canada: University of Toronto Press, 1995).
Carree, M.A. and Thurik, A.R. (2003). “The impact of entre-preneurship on economic growth”, in Audretsch, D.B. and Acs, Z.J. (Eds), Handbook of Entrepreneurship Research, Kluwer Academic, Boston, MA/Dordrecht, 437-471.
Changing Minds (2012). http://changingminds.org/explana-tions/trust/what_is_trust.htm. Access on 20th June 2012.
Cochran, T. (1971) “The Entrepreneur in Economic Change”, in Entrepreneurship and Economic Development, The Free Press.
Dart, J. (1971). “The development of a classification system for entrepreneurial types with a special investigation of the po-tential of Achievement Motivation and its correlates to dis-criminate between these types”, DBA dissertation, University of Colorado, Boulder.
Davidsson, P. (1989). Continued entrepreneurship and small firm growth, EFI, Stockholm, Ekonomiska Forsknings Insti-tute.
Dyer, J.H. (1996), “How Chrysler Created an American Kei-retsu,” Harvard Business Review.pp. 42-56.
Eberwein, Curtis, John C. Ham and Robert J. LaLonde, \The Impact of Being Offered and Re- ceiving Classroom Training on the Employment Histories of Disadvantaged Women: Evi-dence from Experimental Data”, Review of Economic Studies 64:4 (1997), 655-682.
Fracaro, K.E. (2008). Keys to Attaining Employee Trust. Pro-fessional Development. http://www.ncmahq.org/files/Articles/CM0808%20-%20Professional%20Development.pdf. Access on 20th June 2012.
Gartner, W.B. (1989), “’Who is an entrepreneur?’ Is the wrong question” Entrepreneurship Theory and Practice, 5, 47-67.
Gibb, A.A. (2002a). In pursuit of a new ‘enterprise’ and ‘en-trepreneurship’ paradigm for learning: creative destruction, new values, new ways of doing things and new combinations of knowledge. International Journal of Management Reviews, 4(3), 233-269.
Gnyawali, R., & Fogel, D.S. (1994). Environments for entre-preneurship development: Key Dimension. Entrepreneurship Theory Practice, 18(4), 43-62.
Grundsten, H. (2004). Entrepreneurial Intentions and the En-trepreneurial Environment. A Study of Technology-Based New Venture Creation, Doctoral dissertation. Helsinki University of Technology, Finland.
Hall, D.T. (2002). Careers in and out of Organizations, Sage Publications, Thousand Oaks, CA.
Ham, John C. and Robert J. LaLonde, \The E_ect of Sample Selection and Initial Conditions in Duration Models: Evidence from Experimental Data on Training” Econometrica 64:1 (1996), 175-205
Harrell, S. (1985). Why do the Chinese work so hard? Reflec-tions on an entrepreneurial ethic. Modern China, 11(2), 203-26.
Hisrich R.D. and Peters, M.P. (2006). Entrepreneurship. New-Delhi: Tata McGraw-Hill Company Limited.
Hood, J.N. & J.E. Young (1993). “Entrepreneurship’s areas of development: a survey of top executives in successful firms”, Journal of Business Venturing, 8(1), 115-135.
Hornaday, J.A. & J. Aboud (1971), “Characteristics of success-
ful entrepreneurs.” Personnel Psychology, 24: 141-153.
Hornaday, J.A. and Bunker, C. S. (1970). The Nature of the Entrepreneur. Personnel Psychology, 23: 47- 54.
Hornaday, R. H. (1992). Thinking about entrepreneurship: A fuzzy set approach. Journal of Small Business Management, 30(4): 12-24.
Huang, Y., and Wilkinson, I. F. (2006). Understanding power and trust in interfirm relationships: A dynamic perspective. Pp.1-13
Iyer, Rajkamal and Antoinette Schoar (2007), “Are There Cultural Determinants of Entrepreneurship?” Sloan Business School, MIT, working paper.
Kao, J. (1993). The worldwide web of Chinese business. Har-vard Business Review, MarchApril, 24-36.
Kazmi, S. Z., Abbas, & Nabradi, A. (2017). New Venture Creation - The Influence of Entrepreneurship Education on Students’. APSTRACT - APPLIED STUDIES IN AGRIBUSI-NESS AND COMMERCE, 11(1-2), 147-154. doi:10.19041/AP-STRACT/2017/1-2/18
Khanka, S. S. (2005). Entrepreneurial Development. Ram Nagar, New-Delhi: S. Chand and Company Limited.
Koh, H. C. (1996). Testing hypotheses of entrepreneurial char-acteristics: A study of Hong- Kong MBA students. Journal of Managerial Psychology, 11 (3): 12-25.
Korunka, C., Frank, H., Lueger, M., & Mugler, J. (2003). The entrepreneurial personality in the context of resources, envi-ronment, and the startup process-A configurational approach. Entrepreneurship Theory and Practice, 28 (1): 23-42.
Kwon, I.W.G., & Suh, T. (2004), “Factors affecting the level of trust and commitment in supply chain relationships” The Journal of Supply Chain Management: A Global Review of Purchasing and Supply, pp.4-20
Lazear, E. (2002) “Entrepreneurship” Working paper 9109, National Bureau of Economic Research, Cambridge, Massa-chusetts.
Liles, P.R. (1974). New business venture and the entrepreneur. Irwin, Homewood, III.
Lorrain, J & L. Dussault (1988). Relation between psycho-logical characteristics, administrative behaviors and success of founder entrepreneurs at the start-up stage. Frontiers of Entre-preneurship Research: 150-164.
Low, M. B., & MacMillan, I. C. (1988). Entrepreneurship: Past research and future challenges. Journal of Management, 14(2): 139-161.
Lui, T. L., & Wong, T.W.P. (1994). Chinese Entrepreneurship in Context, Hong Kong: Hong Kong Institute of Asia-Pacific Studies, the Chinese University of Hong Kong, Hong Kong.
Lumpkin, G.T., & Dess, G. G. (1996). Clarifying the entre-preneurial orientation construct and linking it to performance. Academy of Management Review. 21(1): 135-172
Lyman, A. (2003). Building trust in the workplace: Why trust brings out the best in your employees. Great Place Work insti-tute, Melcrum Publishing Ltd, 3(1), pp.24-27. 15
McClelland, D. (1961) The Achieving Society, Princeton: D. Van Nostrand.
McClelland, D. C. (1961). The achieving society. Princeton, NJ: Van Nostrand .

52 Syed Zaheer Abbas Kazmi - Samiuddin Khan - Andras Nabradi
APSTRACT Vol. 11. Number 3-4. 2017. pages 45-52. ISSN 1789-7874
McGhee, P.E and V.C. Crandall. (1968) “Beliefs in Internal-Ex-ternal Control of Reinforcement and Academic Performance”, Child Development.
Mealli, Fabrizia and Stephen Pudney, Occupational Pensions and Job Mobility in Britain: Estimation of a Random-Effects Competing Risks Model” Journal of Applied Econometrics 11:3 (1996), 293-320
Mengel, R.H. (1972).Entrepreneurship in microelectronic in-dustry. Doctoral dissertation, University of Texas, Austin.
Meyer, H.H., Walker, W.B. & Litwin, G.H. (1961).”Motive patterns and risk preferences associated with entrepreneur-ship.” Soc. Psychol., 63: 570-574.
Miller, D., & Friesen, P (1978). Archetypes of strategy formu-lation. Management Science, 24: 921- 933.
Mokry, B.W. (1988). Entrepreneurship and Public Policy: Can Government Stimulate Business Startups? New York: Quorum Books.
Morgan, R.M. & Hunt, S. D. (1994). “The Commitment-Trust Theory of Relationship Marketing” Journal of Marketing, (58),July 1994, pp. 20-38.
Morgan, R.M. & Hunt, S. D. (1994). “The Commitment-Trust Theory of Relationship Marketing” Journal of Marketing, (58), July 1994, pp. 20-38.
Owoseni Omosolape Olakitan and Akanbi Paul Ayobami, (2011) “An Investigation of Personality on Entrepreneurial Success” Journal of Emerging Trends in Economics and Management Sciences (JETEMS) 2 (2): 95-103, © Scholarlink Research Insti-tute Journals, 2011 (ISSN: 2141-7024)
Perry, C., R. MacArthur & B. Cunnington (1986). Need for achievement and locusof control of Australian small business owner-managers and super entrepreneurs. International Small Business Journal, 4 (4): 55-64.
Rauch, A., & Frese, M. (2000). Psychological approaches to entrepreneurial success: A general model and an overview of findings. In C. L. Cooper & I. T. Robertson (Eds.), Interna-tional Review of Industrial and Organizational Psychology :101-142.
Robinson, P.B., Stimpson, D.V., Huefner, J.C., Hunt, H.K. (1991a), “An attitude approach to the prediction of entrepre-neurship”, Entrepreneurship Theory and Practice, Vol. 15 No.4, pp.13-32.
Rotter, J. B. (1967), “A New Scale for the Measurement of In-terpersonal Trust”. Journal of Persoanlity, Vol.35(4), 651-665.
Sandberg, W.R. & Hofer, C.W. (1987). Strategy, industry struc-ture and the entrepreneur. Journal of Business Venturing, ( 2): 25-28.
Scholten, V., Kemp, R., & Omta, O. (2004). Entrepreneurship for Life: The Entrepreneurial Intention among Academics in the Life Sciences, Paper presented at the 2nd Eu-ropean Summer University Conference 2004, Enschede, The Netherlands, pp. 1-15.
Sexton, D.L. & N.B. Bowman (1983). ”Comparative Entre-preneurship Characteristics of Students”. In J. Hornaday, J.Timmons, & K. Vesper (Eds.), Frontiers of Entrepreneurship Research. Wellesley, MA: Babson College: 465–478.
Simeon Djankov Yingyi Qian Gérard Roland Ekaterina Zhuravskaya ,(2007) “What Makes a Successful Entrepreneur? Evidence from Brazil”. Available at: http://eml.berkeley.edu/~groland/pubs/brazilent0907.pdf
Siu, W., & Martin, R. G. (1992). Successful entrepreneurship in Hong Kong. Long Range Planning, 25(6), 87-93. 16
Spekman, R.E. (1988), “Strategic Supplier Selection: Under-standing Long-Term Buyers Relationship,” Business Horizon, pp. 75- 81.
Stites, R.W. (1985). Industrial work as an entrepreneurial strat-egy. Modern China, 11(2), 227-46.
Swanson, D., & Webster, L. (1992). Private sector manufac-turing in the Czech and Slovak Republic: A survey of firms. Washington, DC: The World Bank.
Vesper, K. H. (1980). New venture strategies. Englewood Cliffs, NJ: Prentice Hall.
Young, Frank W. (1971) “A Macro sociological Interpretation of Entrepreneurship”, in Entrepreneurship and Economic De-velopment, The Free Press.
Kates, S. (2015) Origin and Evolution of the Term” Entrepre-neur” in English.

APSTRACT Vol. 11. Number 3-4. 2017. pages 53-60. ISSN 1789-7874
DOI: 10.19041/APSTRACT/2017/3-4/8
Applied Studies in Agribusiness and Commerce – APSTRACT Center-Print Publishing House, Debrecen SCIENTIFIC PAPER
REASONS FOR AND OBSTACLES TO CYCLING IN OPINIONS OF RESIDENTS OF DEBRECEN, HUNGARY
Nikolett Kosztin – József Tőzsér – László Csernoch – Ildikó BalatoniUniversity of Debrecen
e-mail: [email protected]
Abstract: It is a basic aim of the European Union that due to the developments in 2014-2020 the bicycle would become one of the most often used transportation, touristic, and sports equipment. We were interested to see to what extent is bicycling present in the transportation system of Debrecen and what are the most important reasons for its residents to use the bicycles. The dedication of Debrecen to promote cycling is clearly proven by the number of newly built or resurfaced bike paths and by the fact that the University of Debrecen has introduced – alone in the region – UniBike which is a bicycle renting system brought forth by the need of its students.Here we present the developments that took place in the North Plain Region in the past few years. We have also analyzed the national and European strategies and reports on bicycling. A survey was conducted among the youth of Debrecen to explore their cycling habits. The data were evaluated using the EvaSys program.Until the end of 2011 with the help of different funds 862 km of bike paths had been built in Hungary. In the North Plain Region due to funds totaling 777 million HUF 15.7 km long bike paths had been constructed until 2015. The development of tourism in this direction is promoted by the web-pages and brochures offering bicycle-tours around Debrecen. Nevertheless, bicycling in the neighboring townships is present not as an instrument for sports and/or tourism, rather as a mean of transportation.It is a clear goal in Europe and thus in Hungary to have bike paths that can provide the means of safe cycling. In parallel, it is also important to promote the benefits of bicycling, including positive physiological effects, cost-effectiveness, and environment-friendliness to increase the propor-tion of those who select bicycling as an alternative.
INTRODUCTION
Nowadays physical activity is proven to influence health condition favorably. A 30-minute, medium intensity sports activity per day reduces the risk of cardiovascular diseases, stroke, and type 2 diabetes (Warburton et al., 2006; Matthews et al. 2000). A wide scope study carried out in Copenhagen pointed out that regular, daily cycling significantly reduces the risk of the abovementioned diseases (Andersen et al., 2000). Several research studies have dealt with the important role that cycling plays in preserving health since the publication of these research results (for review see e.g. Veisten et al., 2011).
Several other studies describe the role and significance of cycling in the preference system of various target groups. Müller et al. (2013, 2017) evaluated the American recreation fitness trends. They found that leisure service providers - who mostly offer life time type circulation booster recreational sports -including cycling, to the elderly target groups as a way of improving the overall fitness have an interest in exploiting the exponentially expanding market.
Bicycle-ergometer test was used during a research carried out among the elderly (Juhász et al., 2015) to examine the
cardiorespiratory system of physically active and inactive elderly people. Results showed that the physically active group performed better regarding the aerobic capacity during the ergometric examination, which was later confirmed by the results of another examination (a 6-minute walk) as well. Regular recreational sports activity among the elderly also proved to be beneficial on the cardiorespiratory endurance. The results therefore highlight the importance of recreational training among the elderly. Research also shows that swimming and cycling were the most popular leisure activity in the active group among the highly educated and elderly individuals (Balatoni et al. 2016).
Boda et al. (2016) carried out research among pre-school children and found that swimming and cycling ranks high in popularity among the regular sports activities of children between the age of 3 and 7 as they learn the technical basis of these sports at this age.
The research on camping habits of elementary and high school students (Nagy and Müller, 2008), included questions on preferences regarding the choices they would make about the leisure activities during camp. High school students chose cycling after horse riding, while elementary school students
Keywords: bicycle paths, sport, transport, development, tourism, environmental benefits (JEL Code: I15)

54 Nikolett Kosztin – József Tőzsér – László Csernoch – Ildikó Balatoni
APSTRACT Vol. 11. Number 3-4. 2017. pages 53-60. ISSN 1789-7874
preferred cycling after hiking, which means that cycling ranks high in the preference system of both elementary and high school students.
The survey which involved students majoring in sports (Müller 2009), included questions regarding the most typical activities and physical exercises during trips and the researchers found that bathing and swimming were chosen by 66.7% of the students. The second most common physical activity was hiking (62.8%) the third most popular activity was skiing (49%). Surprisingly, cycling was less popular (13.9%), which is probably due to the lack of infrastructural background in bicycle tourism. Research among students of Economics provided opposite results, since these students chose cycling first during their trips (Mosonyi et al., 2013).
It is not surprising therefore, that integrating walking and cycling into the daily activities of young people became a decisive element of a number of strategies and several authors have dealt with the usefulness of walking or cycling to school (Brug et al., 2012; Faulkner et al., 2009; Ghekiere et al., 2014). At the same time it is important to point out that not only the psychophysical, i.e. the “am I in the mood to cycle” aspects of using bicycles but also aspects determined by the built environment are significant (Goodman, 2013; Fraser and Lock, 2011; Mertens et al., 2016).
Because of its positive impact on health and physical endurance, cycling – either as a form of transportation or leisure activity – should be promoted by all means. It is both a fundamental European Union and a Hungarian objective that bicycles should become one of the most popular forms of transportation as well as tourism and sports equipment as a result of developments between 2014 and 2020. Hungary has favorable conditions for developing bicycle tourism and the ratio of road cycling is already significant thanks to the settlements in the Great Hungarian Plains. (The majority of the population already uses bicycles as a form of transportation in the villages).
Establishing an everyday urban cycling culture for a transportation purpose could provide the solid foundation for bicycle tourism. The greatest challenge in promoting environmentally friendly transportation is persuading motorists to stop looking at their cars as an essential part of transportation. Establishing the conditions of leisure cycling and developing standard of local services are fundamental for improving cycling links between cities and settlements. Developments therefore must originate from local needs as the objective is to make cycling an everyday part of life for an increasing number of people. Tourism can be based on this basic need and infrastructure.
Bicycle-friendly route means the construction of properly developed networks (with road signs, attractions and bicycle-friendly services) of accessible and safe bike paths. Its elements can be bike paths and lanes separated from vehicle traffic, low-traffic public roads, agricultural and forest paths, flood barriers etc.
Therefore the development of cycling could be beneficial for
– improving the overall health of the population and pro-moting a healthy lifestyle,
– reducing both CO2 emission and promoting environ-mental protection,
– creating jobs through the development of bicycle tour-ism and generating government (tax) revenues,
– increasing bicycle sales, which also develops small- and medium-size enterprises and results economic de-velopment,
– possibly reducing fatal road accidents as bicycle cul-ture would develop (National Bicycle Concept/Nemzeti Kerékpáros Koncepció, 2013).
The city of Debrecen is dedicated to developing transportation in this area. This is supported by the fact that cycle paths have been constructed and renovated in recent years, as well as the introduction of UniBike, a bike rental system – unique in the region – at the University of Debrecen, which was justified by the needs and requirements of the students (http://www.unibike.hu). For these reasons, our research was aimed at finding out the degree to which cycling is present in the transportation of Debrecen and the reason why the population of the city chooses cycling.
MATERIALS AND METHOD
On the one hand, our research was based on available data. We analyzed studies (An interim assessment of cycling development in the 2007-13 period/ A kerékpáros közlekedésfejlesztés időközi értékelése a 2007-13-as időszakban, Kukely, 2014, National Strategic Report based on 1083/2006 EK/Nemzeti Stratégiai Jelentés, Bojcsev et al., 2014, National Transport Infrastructure Development Strategy/ Nemzeti Közlekedési Infrastruktúra-Fejlesztési Stratégia 2014.; TeKer, 2011) planned studies (Berencsi, 2016; EcoConsult, 2009)and strategic documents for the Northern Great Plains region(Könyves et al., 2006), and Debrecen (Sustainable urban mobility plan of Debrecen/ Debrecen fenntartható városi mobilitási terve 2016; Badalay et al. 2017).
Data collection was based on questionnaires, which involved interviewing adults on their cycling habits. Subjects were visited by interviewers asking them to complete the questionnaire. Subjects were selected based on a randomized probe to ensure a proper representation of the students and staff of the University of Debrecen. Questionnaires were self-made and a test measurement was conducted to ensure that the questions are clear and understandable, the possible answers are appropriate, and to assess the time necessary to complete the survey. Based on the experience gained from the test measurement the questionnaire was updated and the updated version was used in the final survey. The data of the test measurement are not included into the results presented here. The research lasted from January to May in 2017 in Debrecen at the University, and the surveys were on a voluntarily basis. Respondents were visited at their workplace or at the site of their education during the day.
We assessed a total of 851 questionnaires and analyzed them with EvaSys application software (http://www.vsl.hu).

APSTRACT Vol. 11. Number 3-4. 2017. pages 53-60. ISSN 1789-7874
Reasons for and obstacles to cycling in opinions of residents of Debrecen, Hungary 55
RESULTS AND DISCUSSIONThe tourism development strategy of the Northern Great
Plains region has defined the promoting of cycling area among its development directions years ago. The city of Debrecen and its region is dedicated to constructing new and renovating old bike paths. Until the end of 2011 with the help of different funds 862 km of bike paths had been built in Hungary. In the North Plain Region due to funds totaling 777 million HUF 15.7 km long bike paths had been constructed until 2015. The development of tourism in this direction is promoted by the web-pages and brochures offering bicycle-tours around Debrecen (Tóthné et al., 2015; Bocsi, 2013).
Of the 851 surveyed subjects 69.1 % were women, 30.6% men, while 51.7% were university students between the ages of 18 and 24, the remaining half of the surveyed subjects are employed and between the ages of 25 and 65. The average age was 30.0±11.4 years (mean±SD), the age distribution is presented in Table 1. Of the respondents 83.3% have their own bicycles.
Figure 1 - Frequency of sports activities among respondents
Source: Own compilation based on our questionnaires.
We asked respondents whether they were actively involved in sports activities. 18% do not do sports at all, 43.1% occasionally do sports, and 36.2% do sports in their free time 2-3 times weekly. 2.6% of the respondents officially compete in some kind of sports (Figure 1).
Figure 2 - Distance between residence and workplace/university
Source: Own compilation based on our questionnaires.
26% live less than 2 km from their workplace/university and 33.9% within 5 km. 19.7% said that they lived farther than 10 km (Figure 2).
Table 1. - Frequency of bicycle use
Age group in years(number of persons)
18-24(441)
25-35(150)
36-50(201)
51-65(59)
use bike daily regardless of the weather
5* 20.7 14.9 13.2
use bike daily depending on the weather
9.9 26.9 17 30.2
use bike weekly 10.9 7.6 8.5 1.9
use bike monthly 3.1 4.1 1.6 1.9
use bike occasionaly 41.4 22.8 36.7 34
do not use bike 29.8 17.9 21.3 18.9
*Data are presented as percentile values giving 100% for each age group.
Note that 10.6% of all respondents said that they use a bicycle daily regardless of the weather and an additional 15.8% also use it daily depending on the weather. 25% does not use a bicycle at all (Table 1). 47.4 % of all those respondents who cycle primarily use the bicycle in their free time for leisure and excursions. 19.2% plus 10,8% goes to work and school by bicycle, an additional 15% use it for shopping and also when taking care of administrative duties (Table 2).

56 Nikolett Kosztin – József Tőzsér – László Csernoch – Ildikó Balatoni
APSTRACT Vol. 11. Number 3-4. 2017. pages 53-60. ISSN 1789-7874
Table 2 - The aim of bicycle use
Age group in years
(number of persons)
18-24
(441)
25-35
(150)
36-50
(201)
51-65
(59)
going to work 0.9* 45.9 37.1 37.5
going to school 19.3 1.4 0 0
free time for leisure and excursions
53.8 32.4 43.8 45.8
shopping, administrative duties
15.6 14.9 15.7 12.5
sport 7.1 4.1 1.1 4.2
other 3.3 1.4 2.2 0
*Data are presented as percentile values giving 100% for each age group.
Figure 3 - Motivation for more cycling. Data are presented as mean±SD
more bike paths
joined by friends
own better bicycle
guided bike tours
more leisure time
Ave
rage
ratin
g
0
1
2
3
4
5
6
Source: Own compilation based on our questionnaires.
We were interested in finding out what would motivate respondents to do more cycling. They were asked to rate on a scale of one to five the different possibilities. Although results were examined according to both genders and age groups, no significant differences were found in these respects. Respondents would primarily be motivated by more bike paths and more leisure time for doing more cycling. Further motivation would be if friends and family members could also join in (Figure 3). The least motivating would be if there were more guided bike tours (although 54.7% of the respondents have never been on a guided bike tour).
Figure 4 - Obstacles of cycling (multiple choices were possible)
Source: Own compilation based on our questionnaires.
When exploring the obstacles of cycling 26.6% of the respondents answered that “I do not know a safe route to get to where I want to go”. Other frequent responses included “long distance”, “lack of safe storage”, and “cannot solve issues related to administration, shopping, child transportation if I am with a bike” (Figure 4).
Figure 5 - Possibilities of promoting cycling (multiple choices were possible)
Source: Own compilation based on our questionnaires.
50.5% of the respondents answered that providing benefit services for cyclists and 39.4% suggested better tour routes for cycling as a way to promote cycling in Debrecen (Figure 5).

APSTRACT Vol. 11. Number 3-4. 2017. pages 53-60. ISSN 1789-7874
Reasons for and obstacles to cycling in opinions of residents of Debrecen, Hungary 57
Figure 6 - Possibilities of improving cycling in Debrecen (multiple choices were possible)
Source: Own compilation based on our questionnaires.
We asked respondents what they felt is needed to be improved to promote cycling in Debrecen. The respondents suggested more, better (in surface quality), and safer bike paths complemented with increasing the number of safe bike storage facilities (Figure 6).
Figure 7 - Advantages of cycling(multiple choices were possible)
Source: Own compilation based on our questionnaires.
The surveys clearly reflected that respondents are fully aware of the positive impacts of cycling on health and environment (Figure 7).
CONCLUSIONS
Our research involved 851 employees and students at the University of Debrecen on surveying their cycling habits. 83.3% of the respondents have their own bicycles, 59.9% live within 5 km of their workplace but only 26.4% said that they use their bicycles daily and only 47.4 % of the respondents cycle in their free time.
Suggestions for development primarily included safety (both regarding route and storage), and better development of bike path networks. Beyond the aforementioned motivation factors, more free time and being joined by family members and friends are worth mentioning. These observations are in line with those international studies, which thoroughly examined the role that cycling plays in urban transport beyond maintaining health and found that the built environment and within this especially bike paths that can be safely used and facilities suitable for storing bicycles as well as bike paths in proximity to home and workplace play a decisive role in improving the cycling habits of the population (Oja et al., 2011; Rojas-Roeda et al., 2011; Vuori, 2011).
Furthermore, it is important to mention that a number of examinations have also pointed out the economic benefits of cycling beyond its role in maintaining health. According to findings, over half of the journeys taken by car were less than 8 kilometers in distance in the United States and the social costs including damage to property and lost working time, air pollution and costs of illnesses caused by air pollution, as well as costs related to physical inactivity and the consequent obesity are close to 400 billion USD (Manson et al., 2015). Naturally, it cannot be expected that all of these journeys, which can be taken by bicycles in fifteen minutes, will actually be taken by bicycles but even a small change could result in significant savings considering the consequent expenditures.
The clear objective is, therefore to develop bike paths in Europe, including Hungary which provide the possibility of safe cycling. In parallel, the advantages of cycling, such as positive physiological effects, cost-efficiency and environmental awareness must be promoted in order to increase the number of those in the population which prefers this alternative.
ACKNOWLEDGMENTS
The research was supported by the Regional Development Fund within the framework of the GINOP-2.3.2-15-2016-00062 project entitled „Developing the quality of life in Eastern Hungary: Nutrition, performance biological and experimental biotechnology research and equipment development for preventing and treating human diseases”.
REFERENCES
A kerékpáros közlekedésfejlesztés időközi értékelése a 2007-13-as időszakban. 2012; Viteco Kft. – Terra Studio Kft from: https://www.palyazat.gov.hu/a_kerekparos_kozlekedesfejlesz-tes_idokozi_ertekelese_a_2007_13_as_idoszakban 2017. 05. 16.
Andersen LB, Schnchr P, Schroll M, Hein HO (2000): All-cause mortality associated with physical activity during leisure time, work, sports and cycling to work. Archives of Internal Medicine, 2000; 160:1621-1628.
Badalay E, Kelló B, Kiss A, Plank E, Szőke B.: Debrecen fenntartható városi közlekedésfejlesztési terve. Tanulmányterv. Debrecen from: http://portal.debrecen.hu/upload/File/Egyeb/dmjvKozlekedesfejlesztesiTerve_2.pdf 2017.05.17.

58 Nikolett Kosztin – József Tőzsér – László Csernoch – Ildikó Balatoni
APSTRACT Vol. 11. Number 3-4. 2017. pages 53-60. ISSN 1789-7874
Balatoni I, Kith N, Csernoch L. (2016): Időskori sportolási szo-kások vizsgálata Észak-kelet Magyarországon. Magyar Sport-tudományi Szemle. 2016; 68:4-8.
Berencsi M. (2016): Kerékpáros közlekedés aktuális kérdései és jövője. 2016; Közlekedésfejlesztési Koordinációs Központ, Balatonföldvár
Bocsi S. (2013): Jelentés a kerékpárút hálózat fejlesztésére fordí-tott pénzeszközök felhasználásának ellenőrzéséről (párhuzamos ellenőrzés a Szlovák Számvevőszékkel). Állami Számvevőszék. 2013; Budapest from: http://www.environmental-auditing.org/Portals/0/AuditFiles/Hungary13006j000.pdf, 2017. 05. 17.
Bojcsev A, Molnár Á, Pámer Z. (2014): Cross-border bike „Kerékpáros turizmus a magyar-horvát határtérségben” Work-shop-sorozat összefoglaló tanulmánya. Dél-Dunántúli Region-ális Fejlesztési Ügynökség Közhasznú Nonprofit Kft, 2014; Pécs from: https://www.pvfzrt.hu/userfiles/dokumentumok/CBB%20tanulmany_final_hu.pdf 2017.05.17.
Brug J, van Stralen MM, te Velde SJ, Chinapaw MJM, De Bourdeaudhuij I, Lien N, Bere E, Maskini V, Singh AS,Maes L, Moreni L, Jan N, Kovacs E, Lobstein T, Manios Y. (2012): Differences in Weight Status and Energy-Balance Related Be-haviours among Schoolchildren across Europe: The ENERGY-Project. PLoS ONE, 2012; 7:e347-42.
Conference TERD Nagy Zs, Müller A. (2008): Az általános iskolai tanulók és a középiskolai tanulók táborválasztási mo-tivációs értékei. Harmadfokú képzés, felnőttképzés és regional-izmus. Régió és oktatás sorozat V. kötet. 265-270., Debreceni Egyetem. Magyarország. Debrecen. 2008. június 22-24.
Conference Textbook of Invited Lectures Boda EJ, Müller A, Bíró M, Széles-Kovács Gy, Nagy Zs, Ráthonyi-Ódor K, Lengy-elné Hargitai A, Dobay B, Hidvégi P. (2016): A study on at-titude to health among kindergarten children. Elena Bendíková, P Mičko (szerk.) Physical Activity, Health and Prevention: In-ternational Scientific Conference; 2016; 106:15-24.
Debrecen fenntartható városi mobilitási terve. 2016 from: http://portal.debrecen.hu/upload/File/Hirek/Mobilitasi_terv_%20tarsadalmi_egyeztetes.pdf 2017. 05. 16.
EconoConsult Kft. és COWI Magyarország Kft (2009): A kerékpáros turizmus fejlesztési stratégiája. 2009
Faulkner GEJ, Buliung RN, Flora PK, Fusco C. (2009): Ac-tive school transport, physical activity levels and body wight of children and youth: A systematic review. Preventive Medicine 2009; 48: 3-8.
Fraser SD, Lock K. (2011): Cycling for transport and public health: a systematic review of the effect of the environment on cycling. The European Journal of Public Health 2011; 21:738-743.
Ghekiere A, van Cauwenberg J, De Geus B, Clarys P, Cardon G, Salmon J, De Bourdeaudhuij I, Deforche B. (2014): Critical Environmental Factors for Transportation Cycling in Children: A Qualitative Study Using Bike-Alongf Interviews. PLoS ONE, 2014; Vol. 9.
Goodman A. (2013): Walking, Cycling and Driving to Work in the English and Welsh 2011 Census:Trends, Socio-Econom-ic Patterning and Relevance to Travel Behaviour in General. PLoS ONE 2013; 8:e71790.
Juhász I, Kopkáné Plachy J, Kiszela K, Biró M, Müller A, Révész L. (2015): Időskorúak rekreációs fizikai aktivitásának hatása a kardiorespiratorikus rendszerre. Magyar Sporttudo-mányi Szemle 2015; 3. 16a63). 4–8.
Könyves E, Süli-Zakar I, Pető K., Hanusz Á, Várhelyi T.
(2006): Az Észak-alföldi régió turizmusfejlesztési straté-giája 2007-2013. Magyar Turizmus Zrt, 2006; Szolnok from: http://2010-2014.kormany.hu/download/8/8e/20000/eszak-Al-fuld.pdf 2017. 05. 15.
Kukely Gy. (2014): Komplex Kerékpáros Program 2014-2020. 2014,Közlekedésfejlesztési Koordinációs Központ from:http://kerekparosklub.hu/sites/default/files/turisztika/Letolthe-to/Komplex_Kerekparos_Program_2014-2020_Terra.pdf 2017.05.17.
Mason J, Fulton L, McDonald Z. (2015): A Global High Shift Cycling Scenario:The Potential for Dramatically Increasing Bicycle and E-bike Use in Cities Around the World,with Esti-mated Energy, CO2, and Cost Impacts. 2015.
Matthews CE, Jurj AL, Shu X-O, Li H-L, Yang G, Li Q, Gao Y-U, Zheng W. (2000): Influence of exercises, walking, cy-cling and overall non exercise physical activity on mortality in Chinese women. American Journal of Epidemiology 2000; 165:1, 1343-1350.
Mertens L, Van Dyck D, Ghekiere A, De Bourdeaudhuij I, Deforche B, Van de Weghe N, Van Cauwenberg J. (2016): Which environmental factors most strongly influence a street’s appeal for bicycle transport among adults? A conjoint study us-ing manipulated photographs. International Journal of Health Geograpgics 2016; 15:31
Mosonyi A, Könyves E, Fodor I Müller A.( 2013): Leisure ac-tivities and travel habits of College students in the light of a survey. Apstract 2013; Vol.7.num.1. 53-57.p.
Müller A. (2009): A szabadidős tevékenységek kínálati el-emeinek vizsgálata az egészségtudatos magatartás kialakí-tásában. Habilitációs értekezés. Szervezés- és gazdálkodás tu-dományok. Debreceni Egyetem ATC AVK 2009; 78.p.
Müller A, Bíró M, Hidvégi P, Váczi P, Plachy J, Juhász I, Hajdú P, Seres J. (2013): Fitnesz trendek a rekreációban. Acta Academiae Agriensis. XL 2013, 25-35.
Müller A, Bíró M, Bodolai M, Hidvégi P, Váczi P, Dávid L, D Szántó Á. (2017): A 2016-os fitnesztrendek helye és szerepe a rekreációban. Acta academiae Agriensis sectio Sport, Nova Series Tom. XLIV. 2017; 91-102.
Nemzeti Fejlesztési Ügynökség Nemzeti Stratégiai Jelentés a 1083/2006/EK 29.alapján 2012; from: https://www.palyazat.gov.hu/download.php?objectId=26810 2017. 05. 15.
Nemzeti Kerékpáros Koncepció /National Bicycle Concept/ 2013; from: http://www.ketosz.hu/sites/default/files/Nemzeti_Ker%C3%A9kp%C3%A1ros_Koncepci%C3%B3_2014-2020_final_0.pdf 2017.05.15.
Nemzeti Közlekedési Infrastruktúra-Fejlesztési Straté-gia.Nemzeti Fejlesztési Minisztérium 2014; from:http://www.kormany.hu/download/b/84/10000/Nemzet i%20K%C3%B6zleked%C3%A9si%20Infrastrukt%C3%BAra-fejleszt%C3%A9si%20Strat%C3%A9gia.pdf 2017.05.16.
Oja P, Titze S, Baumann A,de Geus B, Krenn P, Reger-Nash B, Kohlberger T. (2011): Health benefits of cycling a systematic review.Scandinavian Journal of Medicine and Science in Sports 2011; 21:496-509.
Rojas-Rueda D, de Nazelle A, Tainio M, Nieuwenhuijsen MJ. (2011): The health risks and benefits of cycling in urban envi-ronments compared with car use:health impact assesment study. BMJ 2011; 343:d4521.
TeKerTermészetjáró és kerékpáros turizmus, úthálózat és közle-kedés fejlesztése. 2011; from: http://kerekparosklub.hu/sites/de-fault/files/teker_.pdf 2017.05.15.

APSTRACT Vol. 11. Number 3-4. 2017. pages 53-60. ISSN 1789-7874
Reasons for and obstacles to cycling in opinions of residents of Debrecen, Hungary 59
Tóthné Kiss K, Vida C, Literáti G. (2015): Tanulmány a 2007-2013. évi EU költségvetési időszakban Magyarország részére juttatott közösségi támogatások összefoglaló bemutatásáról, értékeléséről. Állami Számvevőszék 2015; Budapest from: https://www.asz.hu/storage/files/files/Publikaciok/Elemzesek_tanulmanyok/2015/2007_2013_eu_koltsegvetesi_idoszakban_magyarorszag_reszere_ juttatott_kozossegi_tamogatasok_os-szefoglalo_bemutatasa_ertekelese.pdf?ctid=855 2017. 05. 16.
Veisten K, Flügel S, Ramjerdi F, Minken H. (2011): Cycling and walking for transport: Estimating net health effects from comparition of different transport mode users’ self-reported physical activity. Health Economics Review 2011; 1:3.
Vuori I. (2011): Promoting Cycling: A Review of Interventions. Sport Med 2011; 21:6, 542-544.
Warlburton DER, Nicol CW, Bredin SSD. (2006): Healt bene-fints of physical activity: the evidence. Canadian Medical As-sociation Journal 2006; 174(6), 801-809.


APSTRACT Vol. 11. Number 3-4. 2017. pages 61-68. ISSN 1789-7874
DOI: 10.19041/APSTRACT/2017/3-4/9
Applied Studies in Agribusiness and Commerce – APSTRACT Center-Print Publishing House, Debrecen SCIENTIFIC PAPER
ECONOMIC ISSUES OF DUCK PRODUCTION: A CASE STUDY FROM HUNGARY
Szilvia Molnár1 – László Szőllősi21PhD Student, University of Debrecen, e-mail: [email protected]
2associate professor, University of Debrecen, e-mail: [email protected]
Abstract: The Hungarian waterfowl sector is characterised by export orientation, as 55-57% of the revenue comes from exports, so its importance is high in the national economy. The production of slaughter animals in the duck sector has doubled in the last decade. The objective of the study is to examine production parameters, as well as the cost and profit situation of broiler duck production and to reveal the correlations between the factors with a case study through the example of a Hungarian company. The production parameters and cost data of the investigated farm (2014-2016, 96 production cycles) were analysed using descriptive statistical methods, correlation and regression analysis. The results show that the average cost of the duck produced in intensive, closed farming system was between 72.6 and 101.7 eurocent kg-1. The most significant cost items were feed (52-63%) and chicken cost (14-19%). The sales price decreased from 112.9 eurocent kg-1 to 98.4 eurocent kg-1 during the examined period, resulting in a profit from -3.3 to 25.7 eurocent kg-1, and overall profitability was decreasing. The study also revealed that there was no correlation between average cost and final bodyweight, while the correlation between average cost and reared period was weak. At the same time, the relationship between average cost and average daily weight gain, mortality, feed conversion ratio was moderate. In addition, the European Production Efficiency Factor (EPEF) can be adapted to the duck sector as strong, positive relationship can be scientifically verified between the indicator and average cost. There is a close correlation between the sold live weight per m2 and the amount of feed used per m2, as well as between the final bodyweight and the amount of feed used to rear a duck, while the correlation between average cost and the sold live weight per m2 is weak.
INTRODUCTION
The duck meat production of the world increased by 153% from 1.74 million tons to 4.39 million tons between 1993 and 2013. On a world scale, China has a significant role in duck meat production. In 2013, 68% of the total produced amount of duck meat originated from the Asian country, which tripled its production from 982 thousand tons to 2999 thousand tons in the examined period. The European Union (EU-28) provided 11% of the duck meat production of the world in 2013, as its output increased by 87% in the examined period (FAO, 2017).
On a world scale, duck meat export increased from 67 thousand tons to 266 thousand tons between 1993 and 2013. In 2013, China was the most significant exporting country, exporting 91 thousand tons of duck meat during the year, which is almost twice as much as the respective amount a decade earlier; therefore, 34% of all global duck meat export was performed by China. Hungary and France are the second and third biggest exporting countries. These two countries had nearly similar share (14%) of the global duck meat export in 2013. The duck meat export of Hungary increased from 30 thousand tons to 37 thousand tons (+27%) between 2003 and 2013. The French export increased more significantly
from 14 thousand tons to 37 thousand tons during this period (+176%) (FAO, 2017).
According to FAO (2017) data, the duck meat import of the world increased from 81 thousand tons to 187 thousand tons (+130%) in the last two decades. Similarly to the export data, China has a significant role in import, too, importing 39 thousand tons of duck meat in 2013, which is nearly 30% lower than before (56 thousand tons). Germany increased its duck meat import significantly from 19 thousand tons to 32 thousand tons (+60%) in the examined period. In addition, Saudi Arabia and France also import a notable amount of duck meat, with the formed increasing its import quantity from 1.5 thousand tons to 18 thousand tons and the latter from 0.8 tons to 13 thousand tons between 2003 and 2013.
The Hungarian poultry sector can be characterised by a high level of self-sufficiency (142% in 2015) and export orientation (AVEC, 2016). The different subsectors of the poultry sector achieve significant export revenue. 55-57% of revenue originates from export activities in the case of duck and goose; therefore, these sectors are of significant important from the national economic aspect (Csorbai, 2015). In addition, while the animal population decreased in certain subsectors (turkey), the Hungarian duck population increased from 2.7 million to 4 million between 2003 and 2016 (HCSO, 2017).
Keywords: broiler duck production, production parameters, cost and profit, correlation and regression analysis(JEL Code: Q13, Q19 )

62 Szilvia Molnár – László Szőllősi
APSTRACT Vol. 11. Number 3-4. 2017. pages 61-68. ISSN 1789-7874
Accordingly, the slaughter duck production also extended significantly (+90%) from 51.4 thousand tons to 100.8 during the recent years and this increase has been constant since 2008 (Bábáné Demeter, 2017). The proportion of the duck subsector is constantly increasing within waterfowl production and it amounted to around three quarters in 2015. The broiler duck subsector has been dynamically developing and the demand for this product is favourable, which may potentially generate growth, but partially at the expense of the goose subsector (Csorbai, 2015). At the same time, the Polish broiler duck production also started to grow. In 2013, only around 5-7 million ducks were slaughtered in Poland, but Polish producers are expected to be a significant competitor within 1-2 years (Kállay, 2014). The major part of Hungarian slaughter duck production is broiler duck for meat consumption purposes, while fattened duck only has a smaller share. Between 2005 and 2015, the members of the Hungarian Poultry Product Board – which cover around two thirds of the Hungarian duck production – produced 86% of broiler duck production in Hungary. In the recent years, Cherry Valley was one of the most widespread breeds in the Hungarian broiler duck production (Kozák and Szász, 2016). The breeding activity of Cherry Valley resulted in the production of commercial hybrids whose feed conversion is effective and their viability is also good under normal commercial circumstances. The majority of production costs is represented by feed costs; therefore, the reduction of feed conversion ratio (FCR) has a major impact on the profitability of duck production. In addition, the improvement of the effectivity of feed conversion results in less manure (Rae, 2014).
In accordance with the data published by Molnár and Látits (2016), the Hungarian poultry meat consumption (26.46 kg per person per year) consists of 20.02 kg chicken, 0.22 kg hen, 2.96 kg turkey, 2.43 kg duck and 0.84 kg goose per person per year. This amount of consumed poultry meat mainly originates from Hungarian sources and import only has a moderate share. It can be observed that the extent of Hungarian duck meat consumption is low and significant part of the produced amount is sold on foreign markets. The products of the waterfowl sector, including broiler duck, have been facing a great demand in specific markets of Western Europe, mainly in Germany and France (Bogenfürst, 2008). This observation is also reinforced by Comtrade (2017) data, according to which the main export markets of Hungary were Germany, the Czech Republic, Slovakia, the United Kingdom, Austria, France, Belgium and China in 2016. Around 23% of all exported duck meat was sold in Germany.
Compared to the seasonal character of goose meat, the consumption of duck meat is more balanced and there is a constant level of demand on the market; therefore, demand and supply are in balance. Duck products are sought after by a wider range of consumers and its consumption is constant throughout the whole year, almost becoming a product of daily consumption and it can be sold during the whole year, with the exception of some shorter cycles. During the recent years, the change of consumer needs resulted in a constant shift of demand from goose to broiler duck; moreover, consumers tend
to prefer semi-processed or processed broiler duck instead of whole duck. Accordingly, the quality and combination of processing also change. One decade ago, duck was mainly sold as whole duck, while this share reduced to 40-50% for today and the consumer demand for convenience products has been constantly growing (Dunn, 2008; Avar, 2015).
The aim of this study is to examine the production parameters and cost and profit relations of broiler duck production, as well as revealing connections between each factor through the example of a Hungarian enterprise as a case study.
MATERIALS AND METHODS
In order to implement the objectives of this study, primary data collection was performed between 2014 and 2016 in relation to 96 production cycles of a specific plant of an enterprise which plays a significant role in the Hungarian waterfowl production. Therefore, the obtained results refer to the examined plant, but they can be generalised in certain topics. Data collection referred to various production parameters (established population, mortality, amount of feed used, sold amount, etc.) and economic data (detailed cost data, sales price). Using the collected data, physical efficiency indicators were derived in relation to the poultry sector, such as mortality rate (%) daily bodyweight gain (g per day), final bodyweight (kg per duck), feed conversion ratio (FCR) (kg per kg), sold live weight per 1 m2 of barn (kg per m2) and European Production Efficiency Factor (EPEF). Descriptive statistics (mean, standard deviation, relative standard deviation, minimum, maximum, frequency) were performed during the processing of both primary data and derived indexes. The derived indexes were first calculated for each rotation and mean of the whole period was calculated as a next step. Also, descriptive statistics were used for the processing of the collected economic primary data (output price, various cost items). As a next step, the correlation between production parameters and average cost were analysed using correlation and regression analysis. Data processing was performed with Microsoft Excel and IBM SPSS Statistics 20.
RESULTS AND DISCUSSION
Production on the examined farm is carried out in 12 barns of 1000 m2 size each using a rotation system, i.e., the population is placed in a nursery barn (1000 m2) at a higher density and ducks are moved to three rearing barns in two weeks. This way, 4000 m2 useful barn surface is needed to rear a batch of duck. The barns were built around the 1970s and they are equipped with a modern automatic feeding and watering system using Chore Time technology. The heating of the buildings is performed with brooders and cross ventilation is used. The breed used at the farm was Cherry Valley, which has two types available on the market (Cherry Valley SM3 Medium and Cherry Valley SM3 Heavy). According to the data provided by the breeding company, Cherry Valley SM3 Medium is capable of reaching a slaughter weight of 3.45 kg

APSTRACT Vol. 11. Number 3-4. 2017. pages 61-68. ISSN 1789-7874
Economic Issues Of Duck Production: A Case Study From Hungary 63
in a 42-day-long rearing period in the case of 1.93 kg kg-1 FCR and 2% mortality rate, while Cherry Valley SM3 Heavy may reach 3.55 kg by the end of the 42-day-long rearing period with 1.88 kg kg-1 FCR and 2% mortality rate (Cherry Valley, 2017). However, these performances can only be reached in exceptional cases under farming conditions. During the Hungarian performance analysis of the Cherry Valley SM3 Medium broiler duck in 2012 (Czinder and Meleg, 2012), 3.31 kg average weight, 2.16 kg kg-1 FCR and 1.75% mortality rate were documented at densities of 8 ducks m-2 (nursery) and 4 ducks m-2 (rearing) in 42 days. In the case of the Super Heavy breed, the results of the 2016 experiments (Czinder and Meleg, 2016) were 3.67 kg average weight, 2.16 kg kg-1 FCR and 3.45% mortality rate at densities of 7.4 ducks m-2 (nursery) and 3.7 ducks m-2 (rearing) in 42 days.
Table 1 shows the specific cost and profit relations of the examined farm, averaged over the 96 production cycles between 2014-2016. The average cost of duck farming was 87.3 eurocent kg-1 in the given period, ranging between 72.6 eurocent kg-1 and 101.7 eurocent kg-1. The standard deviation of the index was 4.3 and the relative standard deviation was 5.0%. Around 86-91% of production costs are provided by material costs, the most significant part of which is represented by feed (52-63%) and day-old duckling (19-24%) costs, which together represent more than 70% of all production costs. The cost of veterinary medicine is less significant, but it has a high relative standard deviation value (64.1%). Similarly, the cost of litter also has a lower share (4%), but its relative standard deviation is 26%. The change of this value is greatly affected by ventilation and changes in weather, since rainy weather calls for the use of more litter. Personnel costs amount to 6-8% of production costs, while the share of depreciation is 2-3%. The reason for the relatively low share of depreciation is the old and obsolete barn. Machinery and overhead costs (insurance and authority fees, management costs, etc.) are insignificant, typically ranging between 1-2%.
The sales price of duck was between 98.4 and 112.9 eurocent kg-1 between 2014-2016, with the average sales price being 100.7 eurocent kg-1. The observed prices are in accordance with the trend of slaughter duck buying-in prices reported by HCSO (2017), but they are around 3 eurocent below that level. According to the Hungarian data, the buying-in price of slaughter duck dropped by nearly 14% between 2014 and 2016 and producers could sell duck to abattoirs/processing plants at 103.9 eurocent kg-1 on average in the given period. Given the sales prices of the enterprise, the average profit of its activity was 13.5 eurocent kg-1, ranging between -3.3 and 25.7 eurocent kg-1 and the relative standard deviation of it was rather high (40.8%). Altogether, as a result of decreasing prices, deteriorating profit was observed during the three examined years. Also, different profitability values were observed in each production cycle with an average ratio of 16%, ranging between -3 and 35%.
Based on the production cost per m2, it can be concluded that the average cost per m2 of rearing a production cycle at the farm is 11.9 EUR. The profit to be realised is between 13.3-18.2 EUR m-2, with the average value being 15.6 EUR
m-2; therefore, the potential profit was between -0.5 and 4.1 EUR m-2.
Table 1. Cost and profit relations of broiler duck production (2014-2016; n=96) Unit: eurocent kg-1
Description MeanStandard deviation
Relative standard deviation
(%)
Min.1 Max.1
Material costs 77.3 4.1 5.4 62.8 89.5
Day-old duckling 13.8 0.9 6.1 11.8 16.0
Feed 50.5 3.5 6.9 38.0 59.2
Energy 4.6 0.8 17.4 3.6 6.2
Litter 3.6 0.9 26.0 1.3 8.7
Veterinary medicine 0.6 0.4 64.1 0.2 2.2
Services2 3.4 0.5 14.6 2.2 4.9
Other3 0.8 0.1 16.2 0.5 1.1
Labour costs 5.9 0.6 9.5 5.1 7.2
Depreciation 1.9 0.1 6.7 1.7 2.4
Machinery costs 1.3 0.7 53.7 0.3 2.1
Direct production costs 86.5 4.3 5.0 72.0 100.9
Overheads 0.8 0.2 28.3 0.5 1.8
Total production costs 87.3 4.3 5.0 72.6 101.7
Sales price 100.7 3.7 3.7 98.4 112.9
Profit 13.5 5.5 40.8 -3.3 25.7
Cost-related profitability (%)4 15.7 6.7 42.7 -3.2 35.4
1Values shall not be summed up.2animal health and animal husbandry services, waste disposal, transport, loading, other services etc.3parts, repair and maintenance, work clothes, cleaning agents etc.4profit/total production cost×100
Source: own calculation
Table 2 shows the main production parameters of the farm with reference to the examined period. The stocking density was between 19.2-24.3 ducklings per m2 during the nursery period. This value is more than twice as high as the experimental data published by Czinder and Meleg (2012) (8 ducklings per m2). The population moved to

64 Szilvia Molnár – László Szőllősi
APSTRACT Vol. 11. Number 3-4. 2017. pages 61-68. ISSN 1789-7874
the rearing barn can only be estimated by calculating with 50% of the mortality rate of the whole fattening period. Accordingly, the density used during the rearing period was between 6.3-8.0 ducks per m2, with the average value being 6.6 ducks per m2. This value is 65% higher than the data reported by Czinder and Meleg (2012) (4 ducks per m2). The average mortality rate was 3.4% in the 96 rotations, which is nearly twice as high as the value obtained during the Hungarian farm performance analysis (Czinder and Meleg, 2012). Based on the analysis of the whole data series, it can be concluded that the sample range (5.4%) and relative standard deviation of mortality (30.4%) are high, which is due to the high stocking density and the shortcomings of the applied breeding technology and the resulting negative impacts of changing weather circumstances (e.g. summer heat). The final bodyweight was 3.09 kg per duck and the sample range of the index (0.85 kg per duck) was relatively high, but the relative standard deviation was low (5.2%). The average weight on the farm was 0.22 kg (6.6%) lower than the experimental results (Czinder and Meleg, 2012). At the farm, the usual number of rearing days is 42 with a low relative standard deviation (5.7%). The average daily weight gain expresses the two indexes and its value was 72.8 g per day, which is 6 g less than the value calculated from the data reported by Czinder and Meleg (2012) (78.8 g per day). FCR, which fundamentally affects average cost, was 2.24 kg kg-1 on average and the sample range of the index was 0.76 kg kg-1, while the relative standard deviation was 6.1%. The farm FCR was only 0.08 kg kg-1 (3.7%) higher than the values obtained as a result of the farm level performance analysis (Czinder and Meleg, 2012).
The efficiency of production can also be expressed as a complex index (EPEF), which includes both the mortality rate and the FCR, as well as the number of rearing days and the final bodyweight (Nabizadeh, 2012; Lückstäd, 2014; Szőllősi and Szűcs, 2014). This index is usually used in broiler chicken farming to compare the physical efficiency of different farms/barns/production cycle. However, since broiler duck production is similarly intensive as broiler chicken farming and it is performed using a closed technology, the index was adapted to duck farming. At the examined farm, the value of EPEF ranged between 245-382, with the average value being 316. Calculating from the production data published by C
Czinder and Meleg (2012), the EPEF value was 358 which suggests that the physical efficiency of the examined farm is 12% less favourable. However, this index does not include the intensity of the barn (sold live weight per m2
as a result of stocking density) which reduces average cost through average fixed costs. On average, the examined farm produces 15.5 kg live weight on one m2, which is 2.5 kg (19%) higher than the value calculated from experimental data (Czinder and Meleg, 2012).
Table 2. Production indexes of broiler duck production (n=96)
Des
crip
tion
Qua
ntity
uni
ts
Mea
n
Stan
dard
de
viat
ion
Rel
ativ
e st
an-
dard
dev
iatio
n (%
)
Min
.
Max
.
Stocking density – nursery1
ducklings per m2 20.8 0.9 4.4 19.2 24.3
Stocking density – rearing2
ducks per m2 6.6 0.3 4.5 6.3 8.0
Rearing period days 42.4 2.4 5.7 37.0 49.0
Final bodyweightkg per duck
3.1 0.2 5.2 2.7 3.6
Average daily weight gain
g per day 72.8 4.2 5.7 61.3 82.5
Feed Conversion Ratio
kg per kg 2.2 0.1 6.1 2.0 2.8
Mortality rate % 3.4 1.0 30.4 1.5 6.9
Sold live weight3 kg per m2 15.5 1.1 7.2 13.1 18.5
EPEF4 - 315.9 29.8 9.4 245.1 382.4
1Nursing is performed on a barn size of 1000 m2.2Rearing is performed on a barn size of 3000 m2. This index is an estimated value based on the assumption that the mortality rate during nursing is 50% of the total mortality rate.3Projection base is 4000 m2 in the case of sold live weight (nursery and rearing barns).4EPEF = ((100 – mortality rate) × final bodyweight) / (FCR × number of rearing days) × 100
Source: own calculation
The distribution of each index was shown on histograms by supplementing the calculated statistical data. The number of rearing days was 42 in 26% of production cycles and 43 in 20% of production cycles (Figure 1). The distribution of mortality rate is shown in Figure 2, which leads to the conclusion that mortality rate was between 2-4% in 78% of cases. During the examined period, extremely high mortality above 6% was observed in four cases (4%). The establishment of these production cycles was usually performed in the summer, which is the reason for the high mortality rate. FCR was between 2.1-2.3 kg kg-1 in 63% of cases. The maximum FCR value was 2.8 kg kg-1 which was observed in only one case (Figure 3). The final bodyweight was between 3-3.1 kg per duck most frequently, which represents 35% of the examined production cycles, while ducks were fattened to 3.1-3.2 kg in 21% of cases (Figure 4). Figure 5 shows that EPEF ranged between 301-340 in 52% of production cycles, while average cost was between 85-90 eurocent kg-1 in 49% of cases (Figure 6).

APSTRACT Vol. 11. Number 3-4. 2017. pages 61-68. ISSN 1789-7874
Economic Issues Of Duck Production: A Case Study From Hungary 65
Figure 1. Share of rearing period (n=96)Source: own calculation
1 3 5 4
13
25
19
7 7 5 3 2 2
0
5
10
15
20
25
30
37 38 39 40 41 42 43 44 45 46 47 48 49
Prod
. cyc
le (p
cs)
Rearing period (day)
2
14
20
25
16
4 8
3 0
2 2
0
5
10
15
20
25
30
1,50
-1,9
9
2,00
-2,4
9
2,50
-2,9
9
3,00
-3,4
9
3,50
-3,9
9
4,00
-4,4
9
4,50
-4,9
9
5,00
-5,4
9
5,50
-5,9
9
6,00
-6,4
9
6,50
-6,9
9
Prod
. cyc
le (p
cs)
Rate of mortality (%)
11
3228
18
1 3 2 1
0
5
10
15
20
25
30
35
2,01
-2,1
0
2,11
-2,2
0
2,21
-2,3
0
2,31
-2,4
0
2,41
-2,5
0
2,51
-2,6
0
2,61
-2,7
0
2,71
-2,8
0
Prod
. cyc
le (p
cs)
FCR (kg/kg)
2
9 13
34
20
7 6 3 2
05
10152025303540
2,71
-2,8
0
2,81
-2,9
0
2,91
-3,0
0
3,01
-3,1
0
3,11
-3,2
0
3,21
-3,3
0
3,31
-3,4
0
3,41
-3,5
0
3,51
-3,6
0
Prod
. cyc
le (p
cs)
Final bodyweight (kg/pcs)
5 7
12
31
1916
5 1
0
5
10
15
20
25
30
35
240-
259
260-
279
280-
299
300-
319
320-
339
340-
359
360-
379
380-
399
Prod
. cyc
le (p
cs)
EPEF
1 1
25
47
16
5 1
05
101520253035404550
70-74 75-89 80-84 85-89 90-94 95-99 100-104
Prod
. cyc
le (p
cs)
Average cost (eurocent/kg)
Figure 3. Share of FCR value (n=96)Source: own calculation
1 3 5 4
13
25
19
7 7 5 3 2 2
0
5
10
15
20
25
30
37 38 39 40 41 42 43 44 45 46 47 48 49
Prod
. cyc
le (p
cs)
Rearing period (day)
2
14
20
25
16
4 8
3 0
2 2
0
5
10
15
20
25
30
1,50
-1,9
9
2,00
-2,4
9
2,50
-2,9
9
3,00
-3,4
9
3,50
-3,9
9
4,00
-4,4
9
4,50
-4,9
9
5,00
-5,4
9
5,50
-5,9
9
6,00
-6,4
9
6,50
-6,9
9
Prod
. cyc
le (p
cs)
Rate of mortality (%)
11
3228
18
1 3 2 1
0
5
10
15
20
25
30
35
2,01
-2,1
0
2,11
-2,2
0
2,21
-2,3
0
2,31
-2,4
0
2,41
-2,5
0
2,51
-2,6
0
2,61
-2,7
0
2,71
-2,8
0
Prod
. cyc
le (p
cs)
FCR (kg/kg)
2
9 13
34
20
7 6 3 2
05
10152025303540
2,71
-2,8
0
2,81
-2,9
0
2,91
-3,0
0
3,01
-3,1
0
3,11
-3,2
0
3,21
-3,3
0
3,31
-3,4
0
3,41
-3,5
0
3,51
-3,6
0
Prod
. cyc
le (p
cs)
Final bodyweight (kg/pcs)
5 7
12
31
1916
5 1
0
5
10
15
20
25
30
35
240-
259
260-
279
280-
299
300-
319
320-
339
340-
359
360-
379
380-
399
Prod
. cyc
le (p
cs)
EPEF
1 1
25
47
16
5 1
05
101520253035404550
70-74 75-89 80-84 85-89 90-94 95-99 100-104
Prod
. cyc
le (p
cs)
Average cost (eurocent/kg)
Figure 5. Share of EPEF value (n=96)Source: own calculation
1 3 5 4
13
25
19
7 7 5 3 2 2
0
5
10
15
20
25
30
37 38 39 40 41 42 43 44 45 46 47 48 49
Prod
. cyc
le (p
cs)
Rearing period (day)
2
14
20
25
16
4 8
3 0
2 2
0
5
10
15
20
25
30
1,50
-1,9
9
2,00
-2,4
9
2,50
-2,9
9
3,00
-3,4
9
3,50
-3,9
9
4,00
-4,4
9
4,50
-4,9
9
5,00
-5,4
9
5,50
-5,9
9
6,00
-6,4
9
6,50
-6,9
9
Prod
. cyc
le (p
cs)
Rate of mortality (%)
11
3228
18
1 3 2 1
0
5
10
15
20
25
30
35
2,01
-2,1
0
2,11
-2,2
0
2,21
-2,3
0
2,31
-2,4
0
2,41
-2,5
0
2,51
-2,6
0
2,61
-2,7
0
2,71
-2,8
0
Prod
. cyc
le (p
cs)
FCR (kg/kg)
2
9 13
34
20
7 6 3 2
05
10152025303540
2,71
-2,8
0
2,81
-2,9
0
2,91
-3,0
0
3,01
-3,1
0
3,11
-3,2
0
3,21
-3,3
0
3,31
-3,4
0
3,41
-3,5
0
3,51
-3,6
0
Prod
. cyc
le (p
cs)
Final bodyweight (kg/pcs)
5 7
12
31
1916
5 1
0
5
10
15
20
25
30
35
240-
259
260-
279
280-
299
300-
319
320-
339
340-
359
360-
379
380-
399
Prod
. cyc
le (p
cs)
EPEF
1 1
25
47
16
5 1
05
101520253035404550
70-74 75-89 80-84 85-89 90-94 95-99 100-104
Prod
. cyc
le (p
cs)
Average cost (eurocent/kg)
Figure 2. Share of mortality rate (n=96)Source: own calculation
1 3 5 4
13
25
19
7 7 5 3 2 2
0
5
10
15
20
25
30
37 38 39 40 41 42 43 44 45 46 47 48 49
Prod
. cyc
le (p
cs)
Rearing period (day)
2
14
20
25
16
4 8
3 0
2 2
0
5
10
15
20
25
30
1,50
-1,9
9
2,00
-2,4
9
2,50
-2,9
9
3,00
-3,4
9
3,50
-3,9
9
4,00
-4,4
9
4,50
-4,9
9
5,00
-5,4
9
5,50
-5,9
9
6,00
-6,4
9
6,50
-6,9
9
Prod
. cyc
le (p
cs)
Rate of mortality (%)
11
3228
18
1 3 2 1
0
5
10
15
20
25
30
35
2,01
-2,1
0
2,11
-2,2
0
2,21
-2,3
0
2,31
-2,4
0
2,41
-2,5
0
2,51
-2,6
0
2,61
-2,7
0
2,71
-2,8
0
Prod
. cyc
le (p
cs)
FCR (kg/kg)
2
9 13
34
20
7 6 3 2
05
10152025303540
2,71
-2,8
0
2,81
-2,9
0
2,91
-3,0
0
3,01
-3,1
0
3,11
-3,2
0
3,21
-3,3
0
3,31
-3,4
0
3,41
-3,5
0
3,51
-3,6
0
Prod
. cyc
le (p
cs)
Final bodyweight (kg/pcs)
5 7
12
31
1916
5 1
0
5
10
15
20
25
30
35
240-
259
260-
279
280-
299
300-
319
320-
339
340-
359
360-
379
380-
399
Prod
. cyc
le (p
cs)
EPEF
1 1
25
47
16
5 1
05
101520253035404550
70-74 75-89 80-84 85-89 90-94 95-99 100-104
Prod
. cyc
le (p
cs)
Average cost (eurocent/kg)
Figure 4. Share of final bodyweight (n=96)Source: own calculation
1 3 5 4
13
25
19
7 7 5 3 2 2
0
5
10
15
20
25
30
37 38 39 40 41 42 43 44 45 46 47 48 49
Prod
. cyc
le (p
cs)
Rearing period (day)
2
14
20
25
16
4 8
3 0
2 2
0
5
10
15
20
25
30
1,50
-1,9
9
2,00
-2,4
9
2,50
-2,9
9
3,00
-3,4
9
3,50
-3,9
9
4,00
-4,4
9
4,50
-4,9
9
5,00
-5,4
9
5,50
-5,9
9
6,00
-6,4
9
6,50
-6,9
9
Prod
. cyc
le (p
cs)
Rate of mortality (%)
11
3228
18
1 3 2 1
0
5
10
15
20
25
30
35
2,01
-2,1
0
2,11
-2,2
0
2,21
-2,3
0
2,31
-2,4
0
2,41
-2,5
0
2,51
-2,6
0
2,61
-2,7
0
2,71
-2,8
0
Prod
. cyc
le (p
cs)
FCR (kg/kg)
2
9 13
34
20
7 6 3 2
05
10152025303540
2,71
-2,8
0
2,81
-2,9
0
2,91
-3,0
0
3,01
-3,1
0
3,11
-3,2
0
3,21
-3,3
0
3,31
-3,4
0
3,41
-3,5
0
3,51
-3,6
0
Prod
. cyc
le (p
cs)
Final bodyweight (kg/pcs)
5 7
12
31
1916
5 1
0
5
10
15
20
25
30
35
240-
259
260-
279
280-
299
300-
319
320-
339
340-
359
360-
379
380-
399
Prod
. cyc
le (p
cs)
EPEF
1 1
25
47
16
5 1
05
101520253035404550
70-74 75-89 80-84 85-89 90-94 95-99 100-104
Prod
. cyc
le (p
cs)
Average cost (eurocent/kg)
Figure 6. Share of average cost (n=96)Source: own calculation
1 3 5 4
13
25
19
7 7 5 3 2 2
0
5
10
15
20
25
30
37 38 39 40 41 42 43 44 45 46 47 48 49
Prod
. cyc
le (p
cs)
Rearing period (day)
2
14
20
25
16
4 8
3 0
2 2
0
5
10
15
20
25
30
1,50
-1,9
9
2,00
-2,4
9
2,50
-2,9
9
3,00
-3,4
9
3,50
-3,9
9
4,00
-4,4
9
4,50
-4,9
9
5,00
-5,4
9
5,50
-5,9
9
6,00
-6,4
9
6,50
-6,9
9
Prod
. cyc
le (p
cs)
Rate of mortality (%)
11
3228
18
1 3 2 1
0
5
10
15
20
25
30
35
2,01
-2,1
0
2,11
-2,2
0
2,21
-2,3
0
2,31
-2,4
0
2,41
-2,5
0
2,51
-2,6
0
2,61
-2,7
0
2,71
-2,8
0
Prod
. cyc
le (p
cs)
FCR (kg/kg)
2
9 13
34
20
7 6 3 2
05
10152025303540
2,71
-2,8
0
2,81
-2,9
0
2,91
-3,0
0
3,01
-3,1
0
3,11
-3,2
0
3,21
-3,3
0
3,31
-3,4
0
3,41
-3,5
0
3,51
-3,6
0
Prod
. cyc
le (p
cs)
Final bodyweight (kg/pcs)
5 7
12
31
1916
5 1
0
5
10
15
20
25
30
35
240-
259
260-
279
280-
299
300-
319
320-
339
340-
359
360-
379
380-
399
Prod
. cyc
le (p
cs)
EPEF
1 1
25
47
16
5 1
05
101520253035404550
70-74 75-89 80-84 85-89 90-94 95-99 100-104
Prod
. cyc
le (p
cs)
Average cost (eurocent/kg)

66 Szilvia Molnár – László Szőllősi
APSTRACT Vol. 11. Number 3-4. 2017. pages 61-68. ISSN 1789-7874
Table 3. Results of correlation and regression analysis (n=96)
Dependent variable
Independent variable (x)
R R2 F p Constant
Average cost (eurocent kg-1)
Final bodyweight (kg per duck)
0.227 0.051 5.092 0.026 106.207
Average cost (eurocent kg-1)
Rearing period (days)
0.469 0.220 26.538 0.000 51.667
Average cost (eurocent kg-1)
Daily weight gain (g per day)
0.657 0.431 71.332 0.000 136.838
Average cost (eurocent kg-1)
Mortality (%)
0.521 0.271 34.969 0.000 79.856
Average cost (eurocent kg-1)
FCR (kg kg-1)
0.668 0.446 75.722 0.000 39.555
Average cost (eurocent kg-1)
EPEF 0.861 0.742 270.144 0.000 126.856
Average cost (eurocent kg-1)
Sold live weight (kg m-2)
0.332 0.110 11.624 0.001 107.394
Sold live weight (kg m-2)
Feed use (kg m-2)
0.780 0.608 145.756 0.000 6.597
Final bodyweight (kg per duck)
Feed use (kg per duck)
0.750 0.562 120.492 0.000 1.728
Source: own calculation
As a next step, correlation and regression analysis was carried out to examine the correlation between production parameters and average cost (Table 3). Based on the obtained results, there is a weak1 correlation (R=0.227, p<0.05) between average cost and final bodyweight and the 0.1 kg increase of bodyweight results in 6.131 eurocent reduction (y=-6.131x+106.207) of average cost. However, the linear model explains only 5% of average cost (R2=0.051). On the contrary, moderate correlation (p<0.05) can be observed if average cost is compared to the number of rearing days, daily weight gain, mortality rate and FCR. Based on the obtained results, it can be concluded that one extra rearing day increases average cost by 0.839 eurocent (y=0.839x+51.667), whole 1 g of extra daily weight gain decreases average cost by 0.68
1 Based on Pearson’s coefficient of correlation, the following target values were used to determine the closeness of correla-tions: weak: 0.0-0.4, moderate: 0.4-0.7, strong: 0.7-0.9, very strong: above 0.9 (Sváb 1967 cit. Mészáros 1981).
eurocent (y=-0.68x+136.838). 1%-point increase of mortality increases average cost by 2.169 eurocent (y=2.169x+79.856), while the 0.1 kg deterioration of FCR increases average cost by 2.13 eurocent (y=21.347x+39.555). The regression models to be used explain 22% of average cost in relation to rearing days, 43% in relation to daily weight gain, 27% concerning mortality rate and 45% with reference to feed conversion ratio.
In addition, based on the obtained findings, it can be emphasised that the EPEF, which is used as an expression of the physical efficiency of broiler chicken production with a complex index, can be adapted to the duck sector, since there is a strong positive correlation between the index and the average cost of production (R=0.861, p<0.05) which is scientifically verified. Based on the linear regression model (y=-0.125x+126.856) – which explains 74% of average cost (R2=0.742) – it can be concluded that a 10-unit improvement of the EPEF value results in a 1.25 eurocent reduction of average cost.
The correlation between the amount of live weight sold per 1 m2 and the amount of feed used per m2 is strong (R=0.780, p<0.05) and the linear regression model (y=0.256x+6.597) explains 61% of the dependent variable. One extra kg feed use per m2 increases the produced live weight per m2 by 0.256 kg. Also, a close positive correlation was observed between the final bodyweight and total amount of feed used to rear a duck (R=0.750). The linear regression model (y=0.197x+1.728) explains 56% of the sold live weight per 1 m2. On the contrary, there is a weak correlation (R=0.332, p<0.05) between average cost and the sold live weight per 1 m2 and the respective regression model (y=-1.300x+107.394) explains only 11% of average cost. 1 kg increase of the sold live weight per 1 m2 results in 1.3 eurocent reduction of average cost.
Table 4. Multivariate linear regression models (n=96)
Model Predictors R R2 p
1 x1: FCR (kg kg-1) 0.668 0.446 0.00
2x1: FCR (kg kg-1)x2: Mortality (%)
0.836 0.699 0.00
3
x1: FCR (kg kg-1)x2: Mortality (%)x3: Final bodyweight (kg per duck)
0.881 0.776 0.00
4
x1: FCR (kg kg-1)x2: Mortality (%)x3: Final bodyweight (kg per duck)x4: Rearing period (days)
0.906 0.820 0.00
Dependent variable (y): Average cost (eurocent kg-1)Source: own calculation
The correlation between several factors at the same time (FCR, mortality rate, final bodyweight and rearing period) and average cost was observed with a multivariate linear regression

APSTRACT Vol. 11. Number 3-4. 2017. pages 61-68. ISSN 1789-7874
Economic Issues Of Duck Production: A Case Study From Hungary 67
models applied stepwise method (Table 4). It was concluded that the correlation between these factors is very strong (R=0.906, p<0.05). The multivariate linear regression model can be described as
y=20.033x1+1.425x2-11.149x3+0.494x4+51.032where x1: FCR, x2: mortality rate, x3: final bodyweight
and x4: rearing period and it explains 82% of average cost (R2=0.820).
CONCLUSIONS
As a result of research, it can be concluded that the largest proportion of the production cost of broiler duck is material cost, which is determined by the cost of feed and day-old duckling. The average cost of broiler duck production of the examined enterprise was between 72.6-101.7 eurocent kg-1 in the period between 2014-2016, with the average being 87.3 eurocent kg-1. Sales prices were mostly higher than production costs and production was profitable on average (16%), however, profitability decreased. Depending on the technological level of the examined farm, broiler duck production is suitable for reaching 3.0-3.2 kg average weight during 42 days of life, while FCR is 2.1-2.3 kg kg-1 and mortality rate is between 2-4%, while the stocking density was 6.6 ducks per m2 during the rearing period. Based on the examination of the correlation between the various production parameters and average cost, it can be concluded that there is a weak correlation between average cost and final bodyweight, as well as between average cost and sold live weight per m2. Moderate correlation was found between average cost and the rearing period, daily weight gain, mortality and FCR. In addition, there was a close correlation between average cost, EPEF, sold live weight per m2 and the amount of feed used per m2, as well as the final bodyweight and the amount of feed needed to rear a duck. A very strong correlation was observed between average cost and final bodyweight, FCR, mortality rate and rearing period at the same time. Furthermore, it was concluded that EPEF, which is widely used in evaluating the efficiency of slaughter chicken rearing, can be adapted also to broiler duck production, since there is a strong positive correlation between average cost and this index. The correlations presented in this study will be used in preparing the economic simulation model of broiler duck production which is planned to be the next step of research work.
REFERENCES
AVAR L. (2015): Jobb a kacsa, mint a liba. Magyar Mezőgazdaság 70, 14-15.
AVEC (2016): Annual Report 2016. 52 p. Available at: http://www.avec-poultry.eu/annual-reports-overview/annual-report-2016.
BÁBÁNÉ DEMETER E. (ed.) (2017): Statisztikai jelentések – Vágóhi-dak élőállat-vágása. 10(2), Agrárgazdasági Kutató Intézet, Budapest, 12. Available at: https://www.aki.gov.hu/publikaciok/dokumentum/f:96702/2017.+IIII.+h%C3%B3+(2017.+2.+sz%C3%A1m).
BOGENFÜRST F. (2008): A víziszárnyas ágazat helyzete és jövőbeni kilátásai Magyarországon. Állattenyésztés és takarmányozás 57(5), 403-414.
CHERRY VALLEY (2017): Cherry Valley SM3 Product Specification. Cherry Valley Farms Ltd. Available at: http://www.cherryvalley.co.uk/enquiriesandspecifications.
CZINDER K., MELEG I. (2012): Cherry Valley SM3 Medium pec-senyekacsa üzemi teljesítményvizsgálatának eredményei 2012. 20 p. Available at: http://portal.nebih.gov.hu/documents/10182/45539/Zarojelentes_Cherry_Valley_SM3_Medium__2013.01.28._vegleges-doc.pdf/4a900668-bef1-43b8-9192-6856b346f030.
CZINDER K., MELEG I. (2016): Cherry Valley SM3 Super Heavy pecsenyekacsa üzemi teljesítményvizsgálatának eredményei 2016. 18 p. Available at: http://portal.nebih.gov.hu/documents/10182/43858/Cherry+Valley+SM3+Super+Heavy+pecsenyekacsa+%C3%BCzemi+teljes%C3%ADtm%C3%A9nyvizsg%C3%A1lat%C3%A1nak+eredm%C3%A9nyei+-2016..pdf/f8624e2e-2c9a-457f-a2b7-ac4dd964ebe4.
COMTRADE (2017): UN Comtrade Database, Available at: http://com-trade.un.org/.
CSORBAI A. (2015): A magyar baromfiipar és az ágazatok helyzete, lehetőségei, versenyképessége, avagy előre vagy hátra? Baromfi Hír-mondó – Az Agrofeed Kft. baromfi hírlevele 22(3), 5-7.
DUNN N. (2008): Wisenhof’s single-source secret to success. Poultry International 47, 10-13.
FAO (2017): Food and Agroculture Organization of the United Nations’ database. Available at: http://www.fao.org/statistics/en/.
HCSO (2017): Statisztikai tükör, 2017.03.06. Állatállomány, 2016.12.01. Hungarian Central Statistical Office. 4 p. Available at: https://www.ksh.hu/docs/hun/xftp/idoszaki/allat/allat1612.pdf.
HNB (2017): Hungarian National Bank: Exchange rates. Available at: http://www.mnb.hu/arfolyam-lekerdezes.
KÁLLAY B. (2014): Kacsatermelési integráció Mélykúton. Barom-fiágazat 14(1), 54-57.
KOZÁK J., SZÁSZ S. (2016): Mai irányok a víziszárnyas-tenyésztés-ben. Állattenyésztés és Takarmányozás 65(4), 47-73.
LÜCKSTAD C (2014): A strategic approach to salmonella control in poultry. International Hatchery Practice 24(5), 15-17.
MÉSZÁROS S. (1981): Összefüggés-vizsgálatok. In: Alapismeretek az operációkutatáshoz (ed.: CSÁKI CS., MÉSZÁROS S.). Mezőgazdasági Kiadó. Budapest. 42.
MOLNÁR GY., LÁTITS M. (2016): A lúd ágazat eredményei és ak-tuális feladatai. Baromfi Termék Tanács. XVIII. Kiskunfélegyházi Libafesztivál – Szakmai Konferencia. 2016. szeptember 9.
NABIZADEH A. (2012): The effect of inulin on broiler chicken intesti-nal microflora, gut morphology, and performance. J. Animal and Feed Sciences 21, 725-734. https://doi.org/10.22358/jafs/66144/2012
RAE A. (2014): Successful duck breeding – progress through technol-ogy. International Hatchery Practice 28(6), 6-9.
SZŐLLŐSI L., SZŰCS I. (2014): An economic approach to broiler pro-duction: a case study from Hungary. Annals of the Polish Association of Agricultural and Agribusiness Economists 16(3), 275-281.
SVÁB J. (1967): Biometriai módszerek a mezőgazdasági kutatásban. Mezőgazdasági Kiadó. Budapest.
Supported through the New NatioNal excelleNce program of the miNiStry of humaN capacitieS


APSTRACT Vol. 11. Number 3-4. 2017. pages 69-72. ISSN 1789-7874
DOI: 10.19041/APSTRACT/2017/3-4/10
Applied Studies in Agribusiness and Commerce – APSTRACT Center-Print Publishing House, Debrecen SCIENTIFIC PAPER
ALLOCATION OF STRUCTURAL FUNDS BEFORE AND AFTER THE BREXIT: AN EXERCISE IN THE
ECONOMICS OF CAKE-SHARINGWim Heijman
Wageningen University, The Netherlandse-mail: [email protected]
Abstract: What impact has the Brexit on the allocation of money from the structural funds? As the UK is a net contributor to the EU budget, the budget for Structural and Cohesion Policy will shrink. This will have an impact on the allocations of the structural funds to the remaining members of the EU. In order to estimate the allocation of the structural funds to the remaining EU members an allocation model is developed in this article. It appears that the model results do not only show the sharing of the cake, but also the size of it.
INTRODUCTION
EU’s budget contains two major parts: The Common Agricultural Policy (CAP) and the regional and structural policy dealing with the allocation of the Structural Funds. These funds include: European Regional Development Fund, European Social Fund, Cohesion Fund, European Solidarity Fund, Instrument for Pre-Accession (IPA). The European Agricultural Fund for Rural Development is also an instrument of structural policy but is an instrument of the CAP (2nd pillar). Roughly the break-down of the EU-budget of € 1020 Billion for the 7-years period 2014-2020 is as follows (Table 1):
Table 1: EU Budget 2014-2020
Item Billions of Euro %
CAP 410 40
Regional and Cohesion Policy
350 34
Other 260 26
Total 1020 100
Source: EC (2017)
It is foreseen that The Rural Development Fund will spend € 95 Billion in the period
indicated. The British contribution to the total budget is estimated at 13.5% of the total amount which equals around € 138 Billion (Statista, 2017). In the remainder of this article I aim to estimate the financial consequences of the Brexit for the allocation of the structural funds. First I will indicate
the distribution in the 7-years period 2014-2020. Then I will estimate what would have happened if the funds would have been allocated in the situation the UK would have left before 2014. Finally I will develop an allocation model to estimate the budget and allocation of the funds for the period 2020-2026.
SHARING THE CAKE AFTER BREXIT
Assume that the British contribution to the budget B of the structural funds had been withdrawn for the period 2014-2020 and that the UK-share suk in the allocation of the funds had to be reallocated over the remaining member states. The
new share nis of each of these member states would become:
,1 uk
ini s
ss−
=
In which si is the member state’s original share in allocation of structural funds. Further the new budget Bn, without the British contribution, equals:
( ) ,1 BbB ukn −=In which buk represents the share of the British contribution
in the total budget B of the structural funds. The new allocation
niA to each of the remaining member states can now be
computed as:
Keywords: EU Budget, Structural and Cohesion Policy, Allocation of structural funds, Economics of cake-sharing(JEL Code: F00, Q00)

70 Wim Heijman
APSTRACT Vol. 11. Number 3-4. 2017. pages 69-72. ISSN 1789-7874
( )( )
( )( ) ,11
11
iuk
uki
uk
ukni A
sbBs
sbA
−−=
−−=
With Ai for the original allocation from the structural funds to a member state. The conclusion is that the remaining member states receive a larger share of a smaller cake. The net outcome of this depends on the values of buk and suk. If
buk = suk, the new allocation niA will be equal to the original
allocation Ai; if buk < suk, niA > Ai; if buk < suk,
niA <
Ai. Because the British share buk in the budget B equals 13.5% and the British share suk in the allocation equals 3.14%,
the remaining country’s allocation niA will be reduced by
approximately 10.7%. Figure 2 presents this situation.
Figure 1: Allocations for the period 2014-2020, with the UK (left bars) and without the UK (right bars).
0
10
20
30
40
50
60
70
80
90
Belg
ium
Irela
ndPo
land
Mal
taG
reec
eAu
stria
Ger
man
ySl
ovak
iaRo
man
iaLi
thua
nia
Fran
ceDe
nmar
kCy
prus
Port
ugal
Luxe
mbo
urg
Czec
h Re
publ
icU
nite
d Ki
ngdo
mSw
eden
Esto
nia
Net
herla
nds
Finl
and
Latv
iaIta
lySp
ain
Terr
itoria
l co-
oper
atio
nBu
lgar
iaHu
ngar
ySl
oven
iaCr
oatia
mill
iárd
Source: EC (2015), http://ec.europa.eu/regional_policy/en/funding/available-budget/, own calculations.
It appears that especially Poland benefits from the present allocation. In the period indicated Poland is planned to receive around 2.5 times as much as Italy, which is the number 2 in the ranking. For a country like Hungary Brexit before 2014 would have meant a decrease of the present budget from 21.5 billion to 19.2 Billion Euro for the period 2014-2020.
Taking only into account Brexit with respect to the forecast of the budget and budget allocation for the period 2021-2027 is useful for a first approach. For a more sophisticated estimation of the budget and its allocation over the member states a model is needed.
AN ALLOCATION MODEL
In order to estimate how the structural funds could be allocated after 2020 I developed the following simple model (See also Heijman and Koch, 2011):
,δγβα iis
i IPeA i=with Si for the per member country share of the NUTS-2
Regions with a per capita GDP below 75% of the EU average; Pi for the total population per country and Ii for the per capita GDP per country. The difference between Heijman and Koch’s model is the introduction of the variable S.1 The idea behind it is that NUTS-2 regions with a GDP per head below 75% of the EU-average are likely to be eligible for EU-funding of regional projects. The introduction of the variable in the model will probably lead to a higher percentage of the variance explained (R2) compared to its original version, which include only the variables P and I. The model will be estimated in its linear transformation:
,lnlnlnln iiii IPSA δγβα +++=
in which and are elasticities. The data used for this model are presented in Table 2.
Table 2: Share Si of under 75% of the average EU GDP regions (NUTS-2), total population and GDP per capita per member state
Member State Si Population (adj.)GDP/capita
Belgium 0.4 12.3428608 44300
Ireland 0.5 5.4964302 68574
Poland 0.9375 32.6892954 12271
Malta 1 0.3857144 21272
Greece 0.846154 8.8714312 34832
Austria 0.111111 9.3535742 44600
Germany 0.2 78.107166 46352
Slovakia 1 4.7250014 18440
Romania 0.875 13.4035754 9615
Lithuania 1 2.3142864 13674
France 0.692308 69.7178778 49489
Denmark 0.2 6.0750018 56500
Cyprus 0 1.0607146 20600
Portugal 0.714286 8.7750026 23930
Luxembourg 0 0.6750002 118538
Czech Republic 0.875 10.7035746 19100
United Kingdom 0.459459 74.250022 45731
Sweden 0 12.1500036 56703
Estonia 1 1.1571432 14600
Netherlands 0.083333 17.4535766 54640
Finland 0.2 5.6892874 53616
Latvia 1 1.446429 15097
Italy 0.428571 61.232161 41259
Spain 0.473684 38.3785828 41565
Territorial Co-operation 0 18.3875 3100
Bulgaria 1 5.5928588 6300
Hungary 0.857143 9.0642884 13231
Slovenia 1 1.928572 28398
Croatia 1 3.375001 13400
Source: StatisticsTimes (2017), Eurostat (2016).
1 The reason why I use iseβ instead of isβ is that in the linear transformation I make use of natural logarithms. If si = 0, which is the case in some countries, the natural logarithm isln does not exist.

APSTRACT Vol. 11. Number 3-4. 2017. pages 69-72. ISSN 1789-7874
Allocation of Structural Funds before and after the Brexit: An exercise in the economics of... 71
In order to make the make the model work I have allocated a population of around 18.4 million people to the extra-territorial region, which is the average number of inhabitants of all the present member states. This is about 3.6% of the total EU population. This percentage is used to reduce the population numbers of all the member states. Further we assume that the people populating the extra territorial region are producing €31,000 per capita which is about the EU average GDP per capita.
RESULTS
The linear regression procedure gave the following results (t-values in brackets):
( ) ( ) ( ) ( )88.0
,ln95.0ln93.067.117.29ln (1)2
75.394.1069.342.10
=
−++=−
R
IPSA iiii
The constant and the variables involved are all highly significant. If the model is estimated without S, the result is (with t-values in brackets):
( ) ( ) ( )
81.0
,ln63.1ln89.022.37ln (2)2
74.769.843.17
=
−+=
R
IPA iii
Apparently Model (1) explains a higher percentage of the variance than Model (2), the original model (Heijman and Koch, 2011).
On the basis of the model I am now able to estimate the allocation for the period 2021-2027 and compare it to the period 2014-2020 (Figure 3).
Figure 2: Model allocations of the structural funds for the period 2021-2027 (right bars) compared to the actual allocations for the period
2014-2020 (left bars), excluding the UK.
0
10
20
30
40
50
60
70
80
90
Belg
ium
Irela
ndPo
land
Mal
taGr
eece
Aust
riaGe
rman
ySl
ovak
iaRo
man
iaLi
thua
nia
Fran
ceDe
nmar
kCy
prus
Port
ugal
Luxe
mbo
urg
Czec
h Re
publ
icSw
eden
Esto
nia
Net
herla
nds
Finl
and
Latv
iaIta
lySp
ain
Terr
itoria
l co-
oper
atio
nBu
lgar
iaHu
ngar
ySl
oven
iaCr
oatia
Allo
catio
ns (B
illio
ns)
Model (1) allocates an amount of around € 315 Billion for the period 2021-2027, which is around10% less than the original budget of € 350 Billion for the period 2014-2020. Roughly, this equals the budget cut necessary because of the Brexit.
It appears that especially the new member states Romania and Bulgaria may look forward to a higher allocation from the structural funds in the period 2021-2027, probably due to the relatively low absorption capacity in the present period. Central European member states like Poland, Czech Republic,
Slovakia and Hungary may expect some reduction. The model estimates a significant decrease in the allocation to South European members Italy, Spain, Greece and Portugal. Remarkably, also the Territorial Cooperation is expected to lose a substantial part of its subsidies. Germany will also lose part of it, where other West European members, like France may look forward to an increase.
CONCLUSION
Because at present the UK is a net payer to the EU budget, the budget will probably cut by more than 10% in the period 2021-2027 relative to the present period. From around € 350 Billion the budget for Structural and Cohesion Policy will be reduced to around € 315 Billion. In the first approach the budget for the remaining members was cut by this percentage. However, it is not only the Brexit that will influence the budget and the budget allocation. In order to find out the consequences for the remaining members in a more sophisticated way an allocation model was developed, based upon three variables: share of low income NUTS-2 regions on national level, total population and GDP per head.
This model was used not only to estimate the ‘cake-sharing’, but also the total size of the ‘cake’. On the basis of the model it could be estimated that the necessary budget for 2021-2027 would be 10% less than in the previous period, which is in line with the financial consequences of Brexit. Further, especially Romania and Bulgaria would receive larger allocations from the funds, where the allocations towards South Europe would be significantly less. A number of East European members and Germany would receive smaller amounts, where France and other West European members would receive larger allocations.
REFERENCES
EC (2015), http://ec.europa.eu/regional_policy/en/funding/avail-able-budget/
EC (2017). http://ec.europa.eu/budget/mff/preallocations/index_en.cfm
Eurostat (2016). http://ec.europa.eu/eurostat/statistics-explained/index.php/GDP_at_regional_level
Heijman W. and T. Koch, 2011. The allocation of financial re-sources of the EU Structural Funds and Cohesion Fund during the period 2007-2013. Agricultural Economics (Czech Academy of Agricultural Sciences), Vol. 57, pp. 49-56.
Statista (2017). https://www.statista.com/statistics/316691/europe-an-union-eu-budget-share-of-contributions/
StatisticsTimes (2017). http://statisticstimes.com/economy/europe-an-countries-by-gdp-per-capita.php


APSTRACT Vol. 11. Number 3-4. 2017. pages 73-80. ISSN 1789-7874
DOI: 10.19041/APSTRACT/2017/3-4/11
Applied Studies in Agribusiness and Commerce – APSTRACT Center-Print Publishing House, Debrecen SCIENTIFIC PAPER
PROTECTED GEOGRAPHICAL INDICATION RECOGNITION AND WILLINGNESS TO PAY:
A CASE OF GROJEC APPLEBruce L. Ahrendsen1 and Edward Majewski2
1 Department of Agricultural Economics and Agribusiness, University of Arkansas Division of Agriculture, 217 Agriculture Building, Fayetteville, Arkansas 72701 USA, [email protected]
2 Department of Economics and Organisation of Management, Warsaw University of Life Sciences, Nowoursynowska 166, 02-787 Warsaw, Poland, [email protected]
Abstract: The Grojec region of Poland is an important region for apple production and accounts for 40 percent of domestic apple production. Apple growers from the region made an attempt to strengthen their competitive position through registering their apples as Protected Geographical Indication (PGI) products. The European Commission’s PGI allows food producers to obtain market recognition and a premium price for their products. Although the Grojec Apple received PGI registration in 2011, little has been done to promote apples with the PGI label. Two important research questions are addressed: 1) Does the Polish market recognize Grojec Apple PGI, and 2) Does the market value Grojec Apple PGI? Logit and regression models are estimated using survey data collected during an International MBA in Agribusiness and Commerce study week in Warsaw. Only 22% of consumers recognize Grojec Apple PGI. Yet, 70% of consumers indicate they are willing to pay more for the product and their average willingness to pay (WTP) premium is 32%.Results indicate use of the PGI label may be effective in improving sales and profit margins for Grojec Apple producers and their affiliated coopera-tives. Older consumers are more likely to indicate a WTP premium. Males, smaller households, and consumers less sensitive to apple price indicate a higher WTP premium. An advertising campaign promoting Grojec Apple PGI as a better product may be effective at increasing consumer likeli-hood to pay more and WTP premium. Although “Grojec” is already familiar to most consumers in central Poland as a region for apples, a Grojec Apple with PGI label would assure consumers they are purchasing apples from the Grojec region and the apples are high quality.
INTRODUCTION
The Grojec region of Poland is an important region for apple production and accounts for 40 percent of domestic apple production. A large portion of Polish apple production was exported to Russia until the Russian Federation decreed a ban on imports of agricultural products, including apples, from the European Union (EU), United States (US), and other countries on 6 August 2014. The Russian ban of agricultural products was in retaliation of Western economic sanctions placed on the Russian Federation for its annexation of the Crimea (Kraatz, 2014). Even prior to the ban, the Russian Federation placed an embargo on fruit and vegetable imports from Poland for sanitary reasons in late July 2014, which occurred only a few days after the EU and US placed financial and economic sanctions on Russia (Kraatz, 2014). Thus, a large share of the market for Polish apples was suddenly taken away.
Faced with such a situation, what market alternatives are there for Polish apple producers? An obvious response is to promote apples and grow market share in Poland and elsewhere
in the EU and beyond. The EU’s Protected Geographical Indication (PGI) is a way to obtain market recognition and a premium price for a product (European Commission, 2012). Although the Grojec region had received a PGI for the name “Jabłka Grójeckie” on 5 October 2011, little has been done to promote apples with the Grojec Apple PGI. This raises two important research questions undertaken in this article: 1) Does the Polish market recognize the Grojec Apple PGI product, and 2) Does the market value Grojec Apple as a PGI product?
Survey data were collected from 176 consumers at two supermarkets in Warsaw on 3 June 2016. Logit models are estimated to identify factors associated with: 1) the likelihood of recognizing the PGI registered product Grojec Apple, and 2) the likelihood of willing to pay more for the Grojec Apple with PGI. For consumers willing to pay more, a regression model is estimated to identify factors associated with how much more they are willing to pay.
The results and recommendations are expected to assist marketers of Grojec Apples and other PGI products develop a
Keywords: Poland, apple, willingness to pay, protected geographical indication, logit regression(JEL Code: D12, Q13, Q18)

74 Bruce L. Ahrendsen – Edward Majewski
APSTRACT Vol. 11. Number 3-4. 2017. pages 73-80. ISSN 1789-7874
marketing plan to grow market share and profits. Although the Russian ban on agricultural product imports has resulted in an economic hardship for Polish apple producers, adjustments to their marketing plans may lead to improved economic results in the long run.
GROJEC APPLES
Poland is a leading producer of apples in the EU with a 26% share, and the fourth in the World at about 4% share, after China, United States, and Turkey (Agencja Rynku Rolnego, 2014). A dynamic increase of production of apples in the most recent period indicates a growing importance of the apple sector (Figure 1).
Such trend in the production is to some extent from the 9% rise in the area of apple orchards, but mainly the increase in production is from an increase in yields. On average, yield more than doubled from about 10 tonnes per ha in 2005 to about 20 tonnes per ha in 2016, which is due to technological advancements and growing harvests from newly planted apple trees. Yet, average yields of apples in Poland are relatively low, but this is because of fragmented farm structure of farms in Poland. Yields in small scale apple farms are usually much below the country average, but in specialized farms yields at the level 30-40 tonnes per hectare may be considered standard.
Along with the production increase, exports of Polish apples grew until 2013. However, there was a noticeable decline in the volume in Polish apple exports after a ban on imports of some goods to Russia from the EU area was introduced in August 2014. Russia was historically the main export market for Polish apples. Apple exports to Russia in the years 2012 and 2013 amounted to about 60% of total exports in terms of volume and value and fell to practically null following the Russian import ban.
The Grojec region, located 50 km south of Warsaw, the
capital of Poland, is referred to in Poland as “the biggest orchard of Europe”. The first plantations of apple trees were established in the Grojec region as early as the 16th century, of which apples were sent to the court of the Polish kings. Significant development of apple cultivation in this region was started in the late nineteenth century. At present, around 40% of apples in Poland are produced in the region.
Apples from this area are characterized by specific acidity, averaging 5% higher than apples of the same variety from other regions. Another distinguishing feature of these fruits is the very strong blush resulting from the higher—also on average 5%—colorants under the skin (mainly anthocyanins and carotenoids). The unique advantages of the grojeckie apples are due to the climatic and soil conditions. There is a special microclimate, characterized by low temperatures at night, in the period preceding fruit harvest. These factors affect the specific and expressive taste of apples.
Grojec Apples were entered in the EU Register as a PGI on 5 October 2011. Apple producers are required to follow Integrated Production (IP) or GLOBALGAP specifications (Association Grojec Orchards, 2017). Fulfilling all the requirements allows producers to sell apples with the PGI logo. PGI logo used as one of the promotion tools should increase the effectiveness of promotional activities and strengthen the position of Grojec apple producers in domestic and foreign markets.
GEOGRAPHIC INDICATION OF PRODUCTS
There are various methods for indicating products are specific to particular geographic areas or have a traditional character. For the EU, “Foodstuff products which have specific characteristics such as traditional production methods or characteristic attributable to a specific region may be granted the EU quality logo” (European Commission, 2017b). There are three indications in the EU: Protected Designation
Figure 1. Poland apple production and exports, 2000-2016
Source: Author calculations based on IERiGZ (2016) and Fresh-Market.pl (2017)
000
10001 0020002 00
00000
000
2000 2002 200 200 2010 2012 201 201 201 201
hosa
n to
nnes
arveste Exporte

APSTRACT Vol. 11. Number 3-4. 2017. pages 73-80. ISSN 1789-7874
Protected Geographical Indication Recognition And Willingness To Pay: A Case Of Grojec Apple 75
of Origin (PDO), Protected Geographical Indication (PGI), and Traditional Specialty Guaranteed (TSG). These are intended to guarantee a particular foodstuff or agricultural product come from a specific region and/or follow a particular traditional production process.
PDO provides the strongest connection to the geographic territory by requiring all aspects of production, processing, and preparation originate from the region. As of 1 July 2017, there are 618 PDO registered products (45%) out a total of 1377 registered products for the EU countries (European Commission, 2017a). Of these, 143 products (23%) are in the “fruits, vegetables, and cereals, fresh or processed” category, which includes apples.
The PGI designation identifies products whose quality or reputation is linked to the place or region where it is produced, processed or prepared. However unlike PDO, the ingredients used in the production process of PGI products need not necessarily come from the geographical area. Within the EU countries, the majority of registered products are PGI with 703 (51%). Among the PGI products, 220 (31%) are in the category “fruits, vegetables, and cereals, fresh or processed”. At only 56 (4%), the TSG designation has the fewest number of registered products. TSG products have traditional character from either composition or means of production, although without a link to a particular geographic area.
Poland has 37 registered products (8 PDO, 20 PGI, and 9 TSG), which is relatively few when compared to 1377 for all EU countries. All six of the Polish products in the “fruits, vegetables, and cereals, fresh or processed” category are PGI, including Grojec Apples.
BACKGROUND LITERATURE
Bicskei (2014) provides an overview of studies on consumers’ awareness of PGI and PDO in the EU. Estimates of consumer awareness varied from a low of 3% to a high of 68%. However, the author notes two studies with higher estimates should be expected to have higher awareness, since they focused on consumers of regional products that might be more likely to be aware of geographic indicators. Without the two studies, the estimates of awareness varied from 3% to 14%. The author points out that the probability of recognizing geographic indicators is positively correlated with the number of EU registered geographic indicators in the study region. With such low levels of recognition, PGI and PGO are far behind other designations such as Fair Trade and Bio.
Deselnicu et al. (2013) give a review of geographical indication food valuation studies from around the world and conducts a meta-analysis of studies since the 1990s that estimate price premiums for agriculture products with a geographical indication. They note a price difference between a product with a geographic indicator and a similar product without the indicator is one measure of the indicator’s success. Various methodologies have been used to estimate the price premium including hedonic, contingent valuation, and random utility models. As an example, Botonaki and Tsakiridou (2004) use a random utility model to estimate the consumers’ willingness
to pay for a Greek quality wine with a geographic indication label. They found for their Athens-based survey of consumers that 49% had heard of the particular geographic indication label and consumers were willing to pay a 20% premium on average for the product with a geographic indicator. The probability of willingness to pay was related to consumer age, education, family status, and confidence in the geographic indicator.
McCluskey et al. (2007) investigated the amount US consumers were willing to pay more for a Washington state Gala apple. They found consumers’ willingness to pay (WTP) more was related to consumer age and age squared, employment status, household size, and subjective sensory attributes in considering an ideal apple.
More recent studies citing Deselnicu et al. (2013) include Bontemps, Bouamra-Mechemache, and Simioni (2013) and Garavaglia and Mariani (2015) among others. Bontemps, Bouamra-Mechemache, and Simioni (2013) found geographic indicators reduced the exiting risk of cheese firms in France implying a positive impact on sustained competitiveness and firm survival. Garavaglia and Mariani (2015) find the location of the consumer relative to area of production of the certified product impacts consumer WTP, such that a consumer located in the same area as the production has a lower WTP premium than a consumer located in a different area.
METHODOLOGY
The analysis seeks to answer the questions: does the Polish market recognize Grojec Apple PGI; and does the market value Grojec Apples as a PGI product? These are dichotomous choices, such that a binomial logistic (logit) model or cumulative normal (probit) model are appropriate for their analysis. Both models have bell shaped distributions, although the logistic tends to have heavier tails than the normal (Amemiya, 1981). Since many of the explanatory variables in the present study are binary, the data yielded are more likely to be represented by a distribution with larger tails. For this reason the logit model is selected instead of the probit model (Johnson et al., 2010), although the choice between the two models usually does not make much difference in most applications (Greene, 2012).
Two logit models are estimated to identify factors associated with: 1) the likelihood of recognizing the PGI product, and 2) the likelihood of willing to pay more for a premium apple with a PGI logo. Following Greene (2012), let Y = 1 when the consumer recognizes PGI (or is willing to pay more) and Y = 0 when the consumer does not recognize PGI (or is not willing to pay more). The logit model is:
P(Yi = 1) = F(Xi, = Xi’ 1 + X ’ 1
P(Yi = 0) = 1 – F(Xi, = 1 1 + Xi’ ,
where P(Yi = 1) is the probability the ith consumer recognizes PGI (or is willing to pay more), Xi is the ith row of a matrix of explanatory variables that has dimension n

76 Bruce L. Ahrendsen – Edward Majewski
APSTRACT Vol. 11. Number 3-4. 2017. pages 73-80. ISSN 1789-7874
x k, is a k x 1 vector of parameter coefficients, n is the number of consumers, and k is the number of coefficients. Pi is regressed on the explanatory variables Xi.
Coefficients of parameter estimates are interpreted as influencing the probability of recognizing PGI (or willingness to pay more). Coefficients with positive values increase the probability and coefficients with negative values decrease the probability. This is based on the logarithm of the probability ratio, log(Pi / (1 – Pi)), i.e., the logs-odds ratio.
For those consumers willing to pay more for an apple with PGI, a regression model is estimated to identify factors associated with how much more they are willing to pay.
yi = Wi’ + i i N 0,
where yi is the percent more consumers are willing to pay given they are willing to pay more, Wi is a vector of explanatory variables, and is a vector of parameters coefficients. It is assumed error term i is normally distributed with mean zero and constant variance 2.
DATA
Survey data were collected from 176 consumers at two supermarkets in Warsaw on 3 June 2016. The survey was
Table 1. Variable definitions and summary statistics
Variable Definition Mean Std Dev Min Max
RECOG_PGIEquals 1 if knows “Protected Geographical Indication” (PGI), 0 otherwise
0.28 0.45 0 1
RECOG_GROJEC_PGIEquals 1 if heard of the product “Grojec Apple” with PGI, 0 otherwise
0.22 0.42 0 1
PAY_MOREEquals 1 if willing to pay more for premium apple with PGI logo, 0 otherwise
0.70 0.46 0 1
WTPa Amount more willing to pay for premium apple with PGI logo, in percent
22.43 38.14 0 400
AGE Consumer age in years 42.89 17.68 14 93
AGE_SQUARED Consumer age squared 2150 1746 196 8649
FEMALE Equals 1 if female, 0 otherwise 0.66 0.48 0 1
HSEHOLD_NUMBER Number of people in consumer’s household 2.53 1.25 1 6
I_PRICEPrice importance equals: 1 very unimportant, 2 unimportant, 3 neither unimportant nor important, 4 important, 5 very important
3.10 1.53 1 5
SHOP_SUPERMKTShare of total apple purchases made at supermarkets/hypermarkets, in percent
47.17 42.73 0 100
ONLINEEquals 1 if would like to order goods online and pick up at the market, 0 otherwise
0.35 0.48 0 1
BETTEREquals 1 if indicated Grojec Apple with PGI logo is associated with better characteristic (luxury, exceptional taste, outstanding, or high quality) than other apples, 0 otherwise
0.85 0.36 0 1
INTERACT_ADVERTEquals 1 if indicated advertising involving personal interaction (stands in markets/fairs, barbeque in orchard, brand representative) is best for them, 0 otherwise
0.64 0.48 0 1
MALLEquals 1 if survey was at shopping Mall store location, 0 otherwise
0.33 0.47 0 1
n = 176, number of consumers surveyed on 3 June 2016 at two supermarkets in Warsaw, Poland
a WTP mean and standard deviation equals 31.84% and 41.13% for n = 124 observations where PAY_MORE > 0
Note: Right axis is average response to the importance of each characteristic, where 1 is very unimportant, 2 is unimportant, 3 is neither unimportant nor important, 4 is important, and 5 is very important.
Source: Survey data, Warsaw, Poland, 2016

APSTRACT Vol. 11. Number 3-4. 2017. pages 73-80. ISSN 1789-7874
Protected Geographical Indication Recognition And Willingness To Pay: A Case Of Grojec Apple 77
initiated as part of a case study during the International MBA in Agribusiness and Commerce1 study week held at the Warsaw University of Life Sciences. The survey consisted of questions related to the consumer’s impression of “Grojec”, recognitions of PGI label and Grojec Apple with PGI label, willingness to pay for Grojec Apple, personal shopping characteristics, and importance of various apple characteristics as well as demographics, such as gender, age, and number of household members.
The average age of consumers in the survey is 43 and 66% are female (Table 1). The average number of members in a consumer’s household is 2.5. Consumers were asked about the importance of various apple characteristics when purchasing an apple. Taste of the apple is the most important characteristic on average, followed by apple firmness, variety, country of origin, color, price, size, and region of origin (Figure 2). Variety, color, firmness, taste, and size are sensory variables that are unique to the apple, whereas country and region appeals to a consumer’s sense of place, and price is an economic variable.
The consumers were asked about the share of apples they purchased at different types of stores. The largest share of apple purchases by consumers are at supermarkets/hypermarkets (47%), followed by farmers’ markets/bazaars (40%) and local/small shops (12%). At 35%, a large share of consumers indicated they would like to order goods online (ONLINE) and pick them up at the store.
The data indicate the vast majority (88%) of consumers associate the word “Grojec” with apples, fruit orchards, and pears, and the association with apples dominates for 68% of consumers. Among the consumers, 28% indicated they know what PGI is (RECOG_PGI). In particular to the
1 For more information about the International MBA in Ag-ribusiness and Commerce and the AGRIMBA Network, see http://agrimba.net/.
Grojec Apple with PGI, 22% of the consumers had heard about the product (RECOG_PGI_GROJEC). These levels of recognition are not necessarily low since other studies have found lower levels of geographical indicator recognition (Bicskei, 2014). Moreover, the recognition levels are not low considering Poland has relatively few indicators with 37 PDO, PGI, and TSG registered products when compared to other EU countries, and there is generally a positive correlation between number of indicators present in the country and indicator recognition (Bicskei, 2014).
All consumers received a definition and explanation of PGI after they responded to the question on recognition of PGI. Consumers were then asked if they are willing to pay more for a premium apple if it is labeled with a PGI logo (PAY_MORE), and 70% of the consumers indicated they are willing to pay more. For the consumers who responded they are willing to pay more, they were asked how much more in percent they would be willing to pay (WTP premium). The data indicates those willing to pay more are willing to pay 32% more than the regular price on average. Deselnicu et al. (2013) found an average WTP premium of 15%, although only a little more than half of the studies in their sample were based on European consumers and only 9% had PGI certifications. When they limited their sample to only studies on European consumers, they found the PDO percentage premium was higher than the average PGI percentage premium. They also found produce and olive oil studies based on European consumers have an insignificant WTP premium relative to wine studies, whereas grain, meat, and cheese studies had statistically significant WTP premiums.
Consumers were asked about what characteristic they associate with a Grojec Apple with PGI label. The majority (85%) of consumers thought a Grojec Apple with PGI label as being a better apple because they associated it with high quality (40%), being outstanding (20%), having exceptional taste (14%), or being luxurious (11%). Only 15% of consumers
0 001 012 02
0
0
0
0%10%20%
0%0%0%0%0%0%0%
100%
Co ntr egion ariet Color ir ness aste i e Price
% of ans ers i portant an ver i portant average
Figure 2. Importance of characteristics when purchasing apples

78 Bruce L. Ahrendsen – Edward Majewski
APSTRACT Vol. 11. Number 3-4. 2017. pages 73-80. ISSN 1789-7874
thought a Grojec Apple with PGI label is comparable to other apples. Most consumers (64%) indicated advertising involving personal interaction, such as stands at supermarkets and fairs, barbeques with apple tasting at orchard, and meeting a brand representative, would be more effective on them than passive advertising, such as television, press/internet, and billboards/posters.
RESULTS
The estimated logit and regression models coefficients are displayed in Table 2. All models are estimated by maximum likelihood using SAS 9.4 software.
Recognize Grojec Apple with PGI
The logit equation estimating whether a consumer recognizes Grojec Apple with PGI label (RECOG_GROJEC_PGI) has three significant explanatory variables not counting the constant term. As expected, consumers who know about PGI products are more likely to know about the product Grojec Apple with PGI label. This result implies Grojec Apple product recognition may improve and Grojec Apple producers and affiliated producer cooperatives may benefit, as well as producers of other PGI and PDO registered products, if there was better awareness and understanding of PGI and PDO labels. Consumers who want to purchase products online and pick them up at the store are more likely to know about Grojec Apple with PGI than other consumers. This may mean online consumers are more interested in purchasing Grojec Apple with PGI. Consumers who believe interactive advertising is more effective for them are more likely to know about the Grojec Apple with PGI than are consumers who believe
passive advertising is effective. Efforts to better promote the Grojec Apple may be best spent through advertising by utilizing product stands at markets and food fairs and encouraging consumer visits to orchards.
Willingness to pay more
The logit model for the likelihood of consumer willingness to pay more (PAY_MORE) has five significant explanatory variables. AGE and AGE_SQUARED have positive and negative signs, respectively. The likelihood of willingness to pay more increases with consumer age, but at a decreasing rate as indicated by the negative sign on AGE_SQUARED. Consumers interested in shopping online and picking up at the store are more likely to be willing to pay more. Although the ONLINE variable is about general shopping, it may be even more important to have a PGI registration for produce items. The PGI may give consumers confidence the product will meet their expectations and standards for quality when they pick up the product at the store. The positive sign on the BETTER coefficient is expected. Consumers who associate better apple characteristics with a Grojec Apple with PGI label are more likely to be willing to pay more. Finally, consumers shopping at the mall location of the supermarket are less likely to be willing to pay more than those shopping at its stand-alone location.
Willingness to pay premium
A regression model is estimated to identify factors associated with the WTP premium a consumer is willing to pay for a Grojec Apple with PGI label provided the consumer indicated they would be willing to pay more. The
Table 2. Coefficient estimates and significance
Dependent variable
RECOG_GROJEC_PGI PAY_MORE Log WTP
Independent variable Coefficient estimates Coefficient estimates Coef. estimates
RECOG_PGI 1.043 **
RECOG_GROJEC_PGI 0.224 -1.617 ***
AGE 0.069 0.097 ** 0.018
AGE_SQUARED -0.001 -0.001 * 0.000
FEMALE 0.330 -0.393 -1.113 ***
HSEHOLD_NUMBER -0.048 -0.063 -1.024 ***
I_PRICE -0.036 -0.046 -0.185 **
SHOP_SUPERMKT 0.005 -0.002 0.000
ONLINE 1.080 ** 0.701 * -0.563
BETTER 1.568 *** 1.123 ***
INTERACT_ADVERT 0.884 * -0.245 -0.449
MALL -0.623 -0.637 * -0.896 **
Constant -4.463 *** -1.950 5.779 ***
n 176 176 124
Notes: Significant at * p < 0.10, ** p < 0.05, *** p < 0.01
APSTRACT Vol. 11. Number 3-4. 2017. pages 73-80. ISSN 1789-7874
Protected Geographical Indication Recognition And Willingness To Pay: A Case Of Grojec Apple 79
WTP premium is measured in percent. However, since the distribution of the WTP premium is highly skewed to the right, the dependent variable is the log of the WTP premium.
The regression results reveal six significant explanatory variables, excluding the constant term, affect the WTP premium. Most of the estimated coefficients have negative signs. These negative signs should be interpreted as a willingness to pay a lesser amount more, i.e., a lower WTP premium, since all of the observations in the regression sample indicated a willingness to pay more. Consumers who recognize Grojec Apple with PGI label have a positive WTP premium, although the premium is less than consumers who do not recognize the product. This is somewhat surprising, although not unexpected. The means of the WTP premiums for consumers recognizing and not recognizing Grojec Apple with PGI are 26% and 34% respectively. This result may be somewhat related to the result found by Garavaglia and Mariani (2015). They found location impacts consumer WTP premium, such that a consumer located in the same area as the production has a lower WTP premium than a consumer located in a different area. They attribute the result to differences in the information set of consumers. Although consumer place of residence is unknown and all consumers are presented with PGI information in the study presented here, consumers familiar with Grojec Apple may have more experience, i.e., information, with Grojec Apple which could impact their decision to have a lower WTP premium.
FEMALE is negative meaning female consumers have a lower WTP premium than male consumers. For household number, the WTP premium decreases as there are more members in the household. Larger households are more likely to have budget constraints that would limit their ability to pay more. The importance of apple price in consumers purchase decision is negatively related to WTP premium, such that the WTP premium decreases as apple price importance increases. These consumers are more price sensitive and, thus, their WTP premium is less. As expected, consumers who associate better apple characteristics with a Grojec Apple with PGI label have a higher WTP premium than consumers who believe the apple is similar to other apples. Consumers shopping at the mall location of the supermarket have a lower WTP premium than consumers shopping at the stand-alone location.
CONCLUSIONS
Logit models were estimated using survey data to identify factors associated with: 1) the likelihood consumers recognize the PGI registered product Grojec Apple, and 2) the likelihood of willing to pay more for the Grojec Apple with PGI. For consumers willing to more, a regression model was estimated to identify factors associated with their WTP premium. Only 22% of the consumers recognized Grojec Apple with PGI. Yet, 70% of consumers indicated they would be willing to pay more. And for those consumers willing to pay more, the average premium they are willing to pay was 32%.
The results of the analysis revealed a number of factors associated with the likelihoods of recognition and willingness
to pay more for Grojec Apple with PGI by consumers. Use of the PGI label may be effective in improving sales and profit margins for Grojec Apple producers and their affiliated cooperatives. Older consumers are more likely to be willing to pay a premium, although not necessarily a higher WTP premium than younger consumers. For consumers willing to pay more, females, larger households, and consumers more sensitive to apple price pay less of a WTP premium than males, smaller households, and consumers less sensitive to apple price.
An advertising campaign that shows Grojec Apple with PGI to be a better product may be effective at increasing consumers’ likelihood to pay more and paying a higher premium for the product. Although “Grojec” is already familiar to most consumers in central Poland as a region of orchards and apples, a Grojec Apple with PGI label would assure consumers they are purchasing apples from the Grojec region and the apples are high quality.
Ideally a larger number of consumers and measures of consumer education and household income would have been included in the survey. However, the data are quite good considering the survey design and data collection occurred during one day of an International MBA in Agribusiness and Commerce study week.
ACKNOWLEDGEMENTS
The authors gratefully acknowledge the support of the Dean of Economic Sciences at the Warsaw University of Life Sciences (WULS), the “Apple” team of Aleksandra Fraj, Mykhailo Bilaniuk, Thao Trinh, Joanna Kozak, Filip Frątczak, Martyna Piotrowska, and Olga Wielgołaska who participated in the 2016 study week of the International MBA in Agribusiness and Commerce at WULS, and the assistance of Dr. Heather Price.
This work was supported, in part, by the USDA National Institute of Food and Agriculture, Hatch/Multistate project 1005079. However, any opinions, findings, conclusions, or recommendations expressed in this publication are those of the authors and do not necessarily reflect the view of the U.S. Department of Agriculture, University of Arkansas, or Warsaw University of Life Sciences.
REFERENCES
Amemiya, T. (1981): Qualitative response models: a survey. Jour-nal of Economic Literature, 19(1):1483-1536.
Agencja Rynku Rolnego. (2014): Rynek owoców w Polsce (Fruit market in Poland). Agricultural Market Agency, Warsaw, Poland, ISBN 978-83-64002-51-9, accessed January 29 2018 at: http://www.kowr.gov.pl/uploads/rynek-owocow2014-pl.pdf.
Association Grojec Orchards. (2017): Jabłka grójeckie, accessed July 17 2017 at: http://www.trzyznakismaku.pl/produkty/jablka-grojeckie.
Bicskei, M. (2014): Are protected designation of origin and geo-graphical indication distinguished by consumers? an overview and synthesis of empirical evidence. In Social identity in the provi-

80 Bruce L. Ahrendsen – Edward Majewski
APSTRACT Vol. 11. Number 3-4. 2017. pages 73-80. ISSN 1789-7874
sion and protection of cultural goods, PhD, Faculty of Econom-ics, University of Göttingen, Göttingen, Germany, pp. 48-62, ac-cessed July 17 2017 at: https://ediss.uni-goettingen.de/bitstream/handle/11858/00-1735-0000-0022-5DCB-F/Bicskei_Disserta-tion_2014.12.19.pdf?sequence=1#page=52.
Bontemps C, Bouamra-Mechemache Z, Simioni M. (2013): Qual-ity labels and firm survival: some first empirical evidence. Euro-pean Review of Agricultural Economics, July 1; 40(3):413-439, DOI: doi.org/10.1093/erae/jbs034.
Botonaki, A, Tsakiridou E. (2004): Consumer response evalu-ation of a Greek quality wine. Acta Agriculturae Scandi-navica, Section C – Food Economics, June; 1(2):91–98, DOI: 10.1080/16507540410024515.
Deselnicu OC, Costanigro M, Souza-Monteiro DM, McFadden DT. (2013): A meta-analysis of geographical indication food valu-ation studies: what drives the premium for origin-based labels. Journal of Agricultural and Resource Economics, 38(2):204-219, accessed July 14 2017 at: http://purl.umn.edu/158285.
European Commission. (2012): Introduction – EU agricultural product quality policy. Executive Agency for Health and Consum-ers, Better Training for Safer Food, slide 11, accessed February 26 2017.
European Commission. (2017a): Database of origin and registra-tion (DOOR). Agriculture and Rural Development, accessed July 14 2017 at: http://ec.europa.eu/agriculture/quality/door/list.html;jsessionid=pL0hLqqLXhNmFQyFl1b24mY3t9dJQPflg3xbL2YphGT4k6zdWn34%21-370879141.
European Commission. (2017b): Quality policy: foodstuff and ag-ricultural products. Agriculture and Rural Development, accessed July 14 2017: https://ec.europa.eu/agriculture/quality/schemes/foodstuff_en.
Fresh-market pl. (2017): Export of apples from Poland. Various issues, accessed July 17 2017 at: http://www.fresh-market.pl//eksport_jablek_z_polski_w_2016_roku,p1969493902 and http://www.fresh-market.pl/owoce_i_warzywa/owoce/jablka/eksport_jablek_z_polski_w_2014_roku,p72109316.
Garavaglia C, Mariani P. (2015): How much do consumers value PDO certifications? estimates of WTP for PDO dry-cured ham in Italy. In 145th Seminar, April 14-15, 2015, Parma, Italy Apr (No. 200376), European Association of Agricultural Econo-mists, accessed July 17 2017 at AgEcon Search: http://purl.umn.edu/200376.
Greene, WH. (2012): Econometric analysis. 7th ed. Upper Saddle River, New Jersey: Prentice Hall.
IERiGZ (2016): Rynek owocow i warzyw – stan i perspektywy (Fruit and vegetables market – status and prospects). Ministry of Agriculture and Rural Development, Institute of Agricultural Eco-nomics and Food Economy, Warsaw, Poland, December, Issue 49, ISSN 1231-2584.
Johnson RJ, Doye D, Lalman DL, Peel DS, Raper KC, Chung C. (2010): Factors affecting adoption of recommended management practices in stocker cattle production. Journal of Agricultural and Applied Economics, February; 42(1):15-30, accessed July 17 2017 at: https://ageconsearch.umn.edu/bitstream/57153/2/jaae223.pdf.
Kraatz, S. (2014): The Russian embargo: impact on the economic and employment situation in the EU. European Parliament, Em-ployment and Social Affairs Briefing, PE 536.291, October, pp. 1-10, accessed February 26 2017 at: http://www.europarl.europa.eu/RegData/etudes/BRIE/2014/536291/IPOL_BRI(2014)536291_EN.pdf.
McCluskey JJ, Mittelhammer RC, Marin AB, Wright KS. (2007): Effect of quality characteristics on consumers’ willingness to pay for Gala apples. Canadian Journal of Agricultural Economics, June; 55(2):217-231, DOI: 10.1111/j.1744-7976.2007.00089.x.

APSTRACT Vol. 11. Number 3-4. 2017. pages 81-88. ISSN 1789-7874
DOI: 10.19041/APSTRACT/2017/3-4/12
Applied Studies in Agribusiness and Commerce – APSTRACT Center-Print Publishing House, Debrecen SCIENTIFIC PAPER
COMPOSITE INDICATORS AND SUSTAINABLE DE-VELOPMENT OF REGIONAL AGRICULTURE APPLIED
TO THE STAVROPOL TERRITORY IN RUSSIAAnastasia Chaplitskaya1 – Wim Heijman2 – Johan van Ophem3
1 Stavropol State Agrarian University, 12 Zootechnicheskiy Ln, Stavropol, 3550371 [email protected]
2,3 Wageningen University and Research, Hollandseweg 1, 6706KN Wageningen2 [email protected], 3 [email protected]
Abstract: The aim of this paper is to understand and evaluate agricultural sustainability in the Stavropol Territory by means of a composite indicator. In particular, the paper applies principal component analyses to calculate a composite sustainability index by integration of selected economic, social and environmental indicators. The results demonstrate the utility of analyzing several indicators in conjunction. The results also may indicate which variables influence development of regional agriculture. This information is important in order to design agricultural support policy and to implement an increase the sustainability of the agriculture sector.
INTRODUCTION
State regulation of agricultural development requires a systematic analysis of the states and trends of the industry, an assessment of the impact of the constantly changing business environment, and an identification of the possible positive changes and negative consequences. Such analysis is relevant for the industry in general and at the level of individual regions, wherein a considerable proportion of the agricultural sector occur. The Stavropol Territory accounts for a considerable proportion of the agricultural sector in Russia. Agriculture is important to the overall economic activity in the Stavropol Territory. There are about 300 large and medium sized agricultural enterprises, 15 thousand peasant (farmer) households and more than 400 thousand individual (subsidiary) farms in the Stavropol Territory.
The Stavropol Territory is a region in southern Russia. The total population as of 1 January, is 2799.5 thousand people, including 1627.5 thousand urban residents and 1172.0 thousand rural residents. The distance from Stavropol to Moscow is 1621 km. It has a total of 62.2 thousand. The climate of the temperate zone is Atlantic continental in the north and mountain climate of the North Caucasus region in the south.
Stavropol Territory is one of the leaders of corn production in the Russian Federation. According to the Ministry of Agriculture of Stavropol Territory, the recent years have been
quite positive. Its gross yield reaches 8.6 million tons per hectare under favourable weather conditions, but may decline in 1.7 times at the worst weather conditions. Wheat is the most important cultivated crop in the region and is responsible for 80% of the grain.
Crop production is the foundation for agribusiness in the Stavropol Territory. It provides feed for livestock and poultry, and raw material for processing plants that contributes to agribusiness sustainability.
Livestock production is also a contributor and socially important to the agricultural sector in the Stavropol Territory. Livestock production in the Stavropol Territory is ranked second for highest number of poultry and tenth for cow population and milk production out of all regions in the Russian Federation.
Historically the main specialization of sheep breeding was the production of fine wools in the Stavropol Territory. Its share in the turnover of the sub-sector’s gross product reached 70-80%. In 2016 production in the region reached 7.2 thousand tons of wool. The majority of that production comes from peasant farms – (40.2%) and personal subsidiaries – (31.9%). The Stavropol Territory takes second place among Russian regions in terms of wool production and exported wool to India, China and European countries, as well as supplying the needs of the domestic textile industry.
The role and importance of regional agriculture has increased. It performs an important function in meeting the
Keywords: sustainability, composite indicators, principle component analysis, agricultural policy.(JEL Code: O13, Q11)

82 Anastasia Chaplitskaya – Wim Heijman – Johan van Ophem
APSTRACT Vol. 11. Number 3-4. 2017. pages 81-88. ISSN 1789-7874
needs of the state in agricultural production, for domestic consumption and for export deliveries. Stavropol Territory became one of the top 10 regions in agricultural production turnover in 2015 (175.7 RUB billion) (Table 1).
Because of the importance of the Stavropol Territory agricultural sector, not only at the regional and country’s development level, but also for worldwide supply, there is growing interest in the search for balance between socio-economic development and the proper use of natural resources to pursue sustainable agricultural development in Stavropol Region.
Despite some positive trends in the development of agriculture in the Stavropol Territory, the sustainability of this economic sector is not achieved yet. Today, however, this sector of the national economy is undergoing significant difficulties associated with a reduction in the profitability of agricultural enterprises and, the lack of the rural resource potential, primarily land and labor. Despite the existence of regulations in the sector, e.g. Federal Law ‘On the Development of Agriculture (Federal law 2015), the Federal target Program ‘Sustainable Rural Development for 2014-2017 and for the period up to 2020 (Federal Target Program 2012) and others, it is necessary to enhance the state regulation of the industry, since the country’s national security and social protection of the rural population are mainly depending on it. Existing problems can be largely solved by improving the tools and methods of regulation based on new scientific approaches in the finance and credit, information and consulting, and staffing directions of state regulation of agriculture. Directions of state support must be determined in the process of strategic planning of agriculture development at the regional level as a whole and at the level of individual enterprises to meet social
objectives. At the same time the strategic management of the agricultural enterprises should be closely linked to programs of state support of the agricultural sector because there are not enough own sources.
This study aims to analyse the Stavropol region agricultural sector by considering economic, social and ecological dimensions. Each of the three dimensions is equal components for sustainable growth. They should not be considered separately and each must be integrated in developing a sustainability framework (von Hauff et.al, 2009). Hence the research question is how to assess agricultural sustainable development for the Stavropol Territory with a composite indicator which can be used to develop policies that are consistent with maximizing social welfare in the region and improving sustainability in the agricultural sector of the Stavropol Territory.
LITERATURE REVIEW
Over the last years, the concept of “sustainable economic development” has come into the international practice. The term was used in the report of the World Commission on Environment and Development (WCED, 1987) headed by the Prime Minister of Norway Gro Harlem Brundtland in 1987 and it became widespread after the United Nations conference on the Environment and Development in June 1992 in Rio de Janeiro. The formal definition for sustainable development was established.
The sustainable development seeks to meet the needs of the present generation without compromising the ability of future generations to meet their own needs, which means enabling people now and in the future, to achieve a satisfactory level
Table 1. Agricultural production in Russia by region 2001-2015, for the top 10 regions for the year 2015, in billions of RUB (actual prices)
Region 2001 2002 2003 2004 2005 2006 2007 2008 2009 2010 2011 2012 2013 2014 2015
1Krasnodar region
60.1 63.4 66.8 88.1 97.1 111.2 142.4 185.3 175.2 201.6 239.2 234.5 254.7 286.5 333.6
2 Rostov region 34.8 36.6 41.3 56.9 61.5 67.6 79.7 115.8 102.4 118.1 149.0 154.7 161.3 191.3 229.3
3 Belgorod region 19.5 19.6 22.9 26.4 32.7 39.1 56.3 75.7 86.5 98.1 134.6 149.3 155.4 188.2 218.1
4Republic of Tatarstan
39.4 39.0 44.9 53.7 61.6 71.6 93.5 117.3 116.5 100.8 150.4 150.1 160.2 186.0 213.7
5 Voroneg region 22.1 23.2 28.8 29.3 31.7 35.9 52.9 69.0 75.3 68.2 101.5 125.5 143.9 158.9 200.2
6 Stavropol region 24.5 26.6 30.8 41.5 44.5 50.6 69.1 76.4 67.7 84.3 103.5 101.2 122.8 149.0 175.7
7Republic of Bashkortostan
35.8 42.9 49.1 55.3 60.4 70.9 81.6 105.1 103.8 88.6 108.9 106.8 126.4 136.9 152.1
8 Altai Territory 30.8 30.5 35.2 41.5 39.8 46.4 57.1 69.2 76.4 83.3 93.8 94.3 114.7 113.9 140.4
9Volgograd region
22.3 23.7 28.7 33.1 33.0 39.4 53.3 70.7 65.7 64.3 76.1 83.9 89.9 107.8 125.2
10 Tambov region 12.5 13.2 15.7 16.3 18.5 21.3 28.3 35.6 37.4 36.6 52.0 60.0 72.3 93.5 124.2
Data Source: Federal State Statistics Service

APSTRACT Vol. 11. Number 3-4. 2017. pages 81-88. ISSN 1789-7874
Composite Indicators And Sustainable Development Of Regional Agriculture Applied To The Stavropol... 83
of social and economic development and, human and cultural fulfilment, making at the same time, a reasonable use of land resources and preserving the species and natural habitats. (WCED 1987)
In a broad sense, sustainable development strategy aims to achieve harmony between people (with each other), society and nature.
Regarding the definition above, Elkington (1998) proposed the concept of the ‘triple bottom line’ of sustainability, which is the triangulation of People, Planet, Profit, and considers seven dimensions of transformation that must occur to achieve harmonization among economic factors, environmental quality and social justice. Environmental and social problems most severely affect the vulnerable population of developing countries; however, there is barely research available on these regions. (Seuring and Gold 2013)
The common concept of “sustainable economic development” is mostly used with respect to the entire national economy.
The problem of sustainability of agricultural production is significantly more complex than in other sectors of the economy. Most of the main areas of research concerning the sustainability of agriculture have traditionally focussed on refinement of measurement methods and the nature of yield fluctuations, the identification of synchronous and asynchronous fluctuations in gross output, construction of yield forecasts with variations in weather conditions and the development of methods of industrial risks insurance.
The stability of natural ecosystems characterizes stocks and annual growth of organic substance. In turn, the structure of production systems are a certain set of economic resources and their stability is dependent on the ratio of different elements, such as labour, technology and the organization of production. In this context, the sustainable development of individual companies creates objective prerequisites for sustainable development of the economy for the entire region. If considering the sustainability of development in the agricultural sector as a synchronous interaction between participants in the proceedings with nature and action of biological systems, where despite the impact of the external environment, the rational combination of resources and demand. In this case we can regard the sustainable development of the agrarian and industrial complex as the ability of subjects of this type of reproduction to maintain continuously and dynamically a rational proportion between the factors of agricultural production and the necessary rate of development in the context of the economic risks and uncertainties.
Definition of sustainable agricultural developmentBased on the arguments above, it seems necessary to
define the term sustainable economic development in relation to agriculture. The definition is:
Ensuring the sustainable development of the agrarian sector is reached by a balanced solution to the agrarian economic and social problems of agriсultural development whilst avoiding the destruction and reduction of its natural resource potential. This along with maintaining and improving the enabling environment, - and meeting the needs of present
and future generations of people in agricultural production, primarily in environmentally safe foods.
METHOD OF ANALYSIS
There have been some Russian studies about the theoretical basis of diagnosis and evaluation of the agricultural sector’s development. They are presented by Afanasev and Uzbashev (1996), Boyko (1986), and Zagaytov (1999). Models to increase economic sustainability of agricultural production are described by Granberg (2007). The systematic approach to the study of regional features of the agricultural sector as a whole has been used by Petrikova (2009), Korobeynikov (2011), Jakobsson et al. (2012), Emelynova et al. (2015) and others. Despite the presence of scientific and practical achievements in the field of sustainable development of the agrarian sector, further clarification and systematic study is needed. There is no uniform approach for the selection of criteria and indicators which allow to obtain reliable estimates about sustainability.
Based on the existing research literature about sustainable development of Russian agriculture, few studies are found on evaluation of agricultural sustainability for the Stavropol Territory as a whole and evaluation of its municipality’s evaluation is even rarer.
Analysis of objectives, criteria and guidelines for the sustainable development of agriculture shows that it is characterized multiple objectives, multiple criteria and a number of uncontrollable fundamental factors of different
u u u v complex web of interaction and very diverse factors in the
, v , In this case it has been suggested to analyse agricultural sustainability by aggregating this multidimensional set of indicators into a single composite indicator. This approach has been used by Stockle et al. (1994), Andreoli and Tellarini (2000), Sands and Podmore (2000), Riesgo and Gomez-Limon (2005, 2006), and Gomez-Limon and Riesgo (2009). At the same time, the evaluation methods of sustainable development of agriculture at the regional level are still not shaped. Thus, the need for solving regional problems of sustainable development, the lack of methodological basis of modeling in this area determines the relevance of the topic of the research. The research results can be used to support consistence policies which maximizes social welfare in the region and which indicates the potential improvements of sustainability in the agriculture of the Stavropol Territory.
The main principles of the composite indicators method is the basis for the development of a system of indicators of sustainable development of agriculture. It allows us to explore the major trends of sustainable development of the socio-economic system as a whole. Unfortunately, the use of the composite indicators method to study the sustainability of agriculture development at the regional level is still in an early stage. The effectiveness of state regulation of the agrarian sector both at the federal and at the regional level requires a systematic evaluation of the results, resulting in choosing the most rational course of action.

84 Anastasia Chaplitskaya – Wim Heijman – Johan van Ophem
APSTRACT Vol. 11. Number 3-4. 2017. pages 81-88. ISSN 1789-7874
Various methods for calculating a composite indicator are in existence. Last-mentioned efforts include the development of headline indicators, aggregate indices, goal-oriented indicators, and green accounting system. Some initial composite indices were Measure of Economic Welfare (MEW) by Nordhaus and Tobin (1973), Index of Social Progress (ISP) by Estes (1974), Physical Quality of Life Index (PQLI) by Morris (1979), and Economic Aspects of Welfare (EAW) by Zolotas (1981) and Brekke (1997).
In the 1990s other indices appeared for measuring the aggregate performance of the economy or sustainability, e.g. Human Development Index (HDI) by the United Nations Development Programme (UNDP, 1990), Sustainable Progress Index (SPI) by Krotcheck and Narodoslawsky (1994), Index for Sustainable Economic Welfare (ISEW) by Daly and Cobb (1989), Barometer of Sustainability by International Union for Conservation of Nature and Natural Resources - International Development Research Center (IUCN-IDRC, 1995).
Some of the most recently developed indices include the Compass of Sustainability by At Kisson (2005), and Environmental Sustainability Index (ESI) by Yale University’s Center for Environmental Law and Policy in collaboration with Columbia University’s Center for International Earth Science Information Network (CIESIN), and the World Economic Forum (2005).
Indicators and composite indicators are increasingly recognised as a useful tool for policy making and public communication in conveying information on countries’ performance in the field such as environment, economy, society, or technological development (Singh et al., 2007)
The main difficulty in measuring and monitoring agricultural sustainability is that it is a dynamic rather than statistic concept and needs a high level of observation, such as at the national level. Whereas most agricultural scholars believe that measuring sustainability at the farm level is the most precise method, policies at higher levels (such as national) are increasingly affecting policies at lower levels (such a farm). It is necessary to understand the interaction between all levels because each level finds its explanation of mechanism in the level below, and its significance in the levels above (Hayati et-al., 2011).
Official methods of evaluating the effectiveness of Russian agriculture are represented in the annual national report on the results of implementation of “State Program on development of agriculture and regulation of agricultural products, raw materials and food for 2013-2020” (Russian Government, 2012). This report essence is to compare its data with theoretically achieved agriculture performance during the reporting period in the context of priorities put forward by the program. Official methods do allow tracing rational expenditures of budgetary funds, which, in turn, are reflected in the dynamics of the main socio-economic indicators of the country’s agriculture and each constituent entity of the Federation individually.
The practical significance of the research is to develop a methodology that can simplify the assessment procedure of
sustainability of the agriculture sector at the regional level by considering a multidimensional perspective. The study’s results will demonstrate the advantages and disadvantages of various methods used to construct composite sustainability indicators (CSIs) demonstrating the usefulness of analyzing several of these indicators in order to obtain more robust results. The results demonstrate the utility of analyzing several indicators in conjunction. The results also may indicate which variables influence development of regional agriculture. This information is important in order to design agricultural support policy and to implement an increase the sustainability of the agriculture sector.
SELECTION OF SUSTAINABILITY INDICATORS
An analysis of sustainable development publications led to the conclusion that the greatest difficulty is the formation of indicators of sustainable development at the regional and municipal level.
Since previous studies have used a wide range of variables in their models, it should be taken into account that indicators need to be country, regional and farm specific. Indicators also depend on the development stage of the region and the intended use of the CSI ( QIU Hua-Jiao et. al. 2005).
We proposed a complete set of indicators for agricultural sustainability assessment at the regional level in the Stavropol Territory conceptualizing the effects of the current economic situation, on the basis of sustainable agriculture principals which are mentioned in the Federal Law ‘On the Development of Agriculture (Federal law, 2015), the Federal target Program ‘Sustainable Rural Development for 2014-2017 and for the period up to 2020 (Federal Target Program, 2012) and literature review (Table 2).
Table 2. Indicators for measuring agricultural sustainability
Type of dimension
IndicatorUnit of
measurement
EconomicAgricultural Gross Domestic Product(AGRGDP)
RUB
Land productivity (LANDPROD) RUB/ha
Labor productivity (LABOURPR) RUB per
capita
Environmental Organic fertilization (FORGANIC) tonn
Soil cover for agriculture (SOIL) haEmissions of most air pollutants from stationary sources (EMAIRPOLL)
tonn
SocialProportion of rural population (RURALPOP)
%
Share of rural and residents’ income (WAGESHARE)
%
Composite Sustainability Index (CSI).The main principle of CSI is aggregation of a combination
of multidimensional indicators to formulate a composite indicator. It is a very flexible approach because multiple measurements are summarized for ease of interpretation and comparison. The data requirement is a range of measurements

APSTRACT Vol. 11. Number 3-4. 2017. pages 81-88. ISSN 1789-7874
Composite Indicators And Sustainable Development Of Regional Agriculture Applied To The Stavropol... 85
based on the set of selected indicators (Rigby et al., 2001).Composite indicators are highly recognized as a useful
tool for policy making and public communication in passing on information on countries’ and regions’ performance in various fields, such as environment, economy, society or technological development.
There are five methodological issues for CSI creation (Gomez-Limon and Riesgo, 2009):
– selection of the all the variables to be used in the CSI; – multivariate analysis – normalization of each of these variables; – assigning weights to each variable which reflect that
variable’s contribution to that particular dimension of sustainability;
– aggregation of these normalized values to create the multi-dimensional CSI;
– presentation of the CSI.
A composite indicator is based on sub-indicators that have no common meaningful unit of measurement and there is no obvious way of weighting these sub-indicators (Singh et al., 2008). Each sub-indicator has to be relevant to the phenomenon to be measured. In our case it is sustainable development of agriculture. All sub-indictors have to be presented by high quality data. In some cases it may be necessary to drop some data points or to construct some missing ones. For repairing any gaps in the data, mean substitution or correlation results methods could be applied.
For the first stage of selection of all the variables to be used in the CSI (1), information was complete for 10 years of observations (2005-2014) within three dimensions (economic, social and environmental). Thus, there are no gaps in the data.
Before the second stage (3), it is necessary to perform a statistical test to check that there is no significant correlation between indicators within the selected base of indicators, i.e., to avoid double counting in the aggregation stage. Also, it is necessary to identify groups of indicators that are statistically similar, in order to simplify interpretation of the results (Gomez-Limon and Riesgo, 2009). We implemented Principle Component Analysis, which is used to assess relationships between the sub-indicators. In order to eliminate the impact of different sub- indicators within each dimension and for further aggregation of indicators, there is a need to normalize the indicator data (3), because they usually have different measure units. Many techniques for normalizing the indicators exist in the literature. We have chosen the re-scaling in a range [0, 1] (Freudenberg, 2003).
Min-max (1)
where Ikj is normalised indicator for variable k and year i,
After normalization the scores of indicators range between 0 (the worst value, meaning the least sustainable option) and 1 (the best value, corresponding with the most sustainable option). (Gomez-Limon and Riesgo, 2009).
RESULTS
Multivariate analysis (2)The multivariate analyis consists of verifying the
relationship between the variables and thus preventing the mistake of selecting random variables that do not maintain links among themselves, which may compomise the results of the research (OECD, 2008).
Multivariate analysis must be conducted before the construction of composite indicator in order to make the best methodological decision on the standardisation processes, weighting, and aggregation on the variables analyzed (OECD, 2008). The varialbles were analyzed statistically. To achieve this, a priciple component analysis was performed in order to summarize the amount of information in the origional set of variables and eliminate those that do not reduce the quality of information of the theoretical model (Schuschny and Soto, 2009).
The correlation matrix for variables introduced in Table 2 is presented in Table 3. The results of correlation matrix identified that all variables have an acceptable correlation cofficient (Table 3).
Table 3. Principle component analysis (correlation)
The estimation of the principle component analyses test shows that the KMO (Kaiser-Meyer-Olkin) coefficient has a value of 0.673, which also exceeds the minimum acceptable value of 0.500 (Table 4).
Considering the variance explained, two main components can be built from the set of individual variables, which explains 88% of the variance.
Table 4. Extracted principle components
Component
Extraction sums of squared loadings
Rotation sums of squared loadings
Tot
al
(eig
enva
lue)
% o
f va
rian
ce
Cum
ulat
ive
%
Tot
al
(eig
enva
lue)
% o
f va
rian
ce
Cum
ulat
ive
%
1 5,035 62,93 62,93 4,974 62,17 62,17
2 2,017 25,21 88,14 2,077 25,97 88,14
Kaiser-Meyer-Olkin measure of sampling adequacy 0.673
The criteria that support the choice of these two

86 Anastasia Chaplitskaya – Wim Heijman – Johan van Ophem
APSTRACT Vol. 11. Number 3-4. 2017. pages 81-88. ISSN 1789-7874
components was the Kaiser criterion which excludes variables with eigenvalues below 1 and accepts only variables with a variance higher than 1.
The cumulative variance method considers 60% as a minimum percentage of variance explained for the social sciences is 60% (Garcia-Sanchez et.al, 2015). Therefore, two selected components are selected since they accumulated explain 88, 14% of the information variance.
For understanding the meaning of these components, rotated factor loadings of the different indicators are analysed (Table 5). Table 5 illustrates the composition of the components formed from the combination of the variables. We blanked the loadings of indicators with greater than or equal to 0.3 in absolute value are in bold to indicate they are more significant. The data in Table 5 demonstrate that AGRGDP and FORGANIC are variables with high component loadings in more than one component simultaneously. In this context, the orthogonal rotation ‘varimax’ was executed to try to improve the results and make them clearer.
Table 5. Principal component analysisRotated Component Loading
Component 1 Component 2
AGRGDP 0,738 0,561RURALPOP -0,972 -0,137LANDPROD 0,956 0,226LABOURPR 0,962 0,226WAGESHARE 0,921 -0,285FORGANIC 0,888 -0,349SOIL -0,056 0,862EMAIRPOLL -0,077 -0,835Explained variance 0.62 0.26Proportion of Variance 0.71 0.29
Extraction method: Principle component analysis (Varimax rotation)
Aggregation of indicators
Once the principle components are extracted, the calculations of sub sustainability indicators (SSIji) corresponding to each of the principle components j, are needed. This was done by calculating a weighted aggregation of indicators:
(2),
Where SSIji is the sub sustainability indicator for the component j and the year i, the represents the weight of indicator k in the component j and wkj is the normalized indicator k achieved in the year i. The weights wkj are obtained from the factor loadings rotation matrix mentioned above by following the next expression:
(3),
Where factor_loadingkj is the value of the factor loading k in the principle component j (see Table 4), and eigenvaluej is the eigenvalue of the jth principle component (see Table 5).
The weights of each indicator are showen in Table 6. The weights are obtained from the priciple component analysis (PCA).
Table 6. Assigned weights for each component as determined by the principle component analysis
Domain weight
Weight of the
Respective Component
Weight Score (wi)
Resulting Weight
( wi = 1)
AGRGDP 0.152 0.29 0.044 0.051
RURALPOP 0.189 0.71 0.135 0.154
LANDPROD 0.184 0.71 0.131 0.149
LABOURPR 0.186 0.71 0.132 0.151
WAGESHARE 0.171 0.71 0.121 0.138
FORGANIC 0.158 0.71 0.113 0.128
SOIL 0.358 0.29 0.104 0.118
EMAIRPOLL 0.336 0.29 0.097 0.111
Finally, the CSI can be calculated as a weighted aggregation of the sub sustainability indicators:
(4),
where CSI is the value of the composite indicator for the year i and aj is the weight applied to the sub sustainability indicator j. These weights are calculated as follows:
(5).
For the period from 2005-2014 the calculation of composite indicator of sustainable agricultural development was made and showed in Table 7 and Figure 1. Comparative data of sustainability indicator allows us to make a conclusion about the overall positive trends of sustainability in agricultural development. According to the calculation data show, the most auspicious year in terms of sustainability was 2014.
Table 7. Results of agricultural CSI in the Stavropol Territory
Year Agricultural CSI2005 -0,0522006 0,1332007 0,1072008 0,2642009 0,1752010 0,1872011 0,2692012 0,2892013 0,3652014 0,545

APSTRACT Vol. 11. Number 3-4. 2017. pages 81-88. ISSN 1789-7874
Composite Indicators And Sustainable Development Of Regional Agriculture Applied To The Stavropol... 87
Figure 1. CSI of agricultural development in the Stavropol Territory
CONCLUSION AND DISCUSSION
For understanding the regional agriculture sustainability of the Stavropol Territory, this paper develops a comprehensive evaluation model of sustainability of agricultural development to calculate the score of agricultural sustainability in the that region in the period from 2005-2014. By using PCA analyses, this paper runs the regional evaluation of agricultural sustainability of the Stavropol Territory. The results show (Figure 1) that composite index of sustainable agricultural development changed over the past 10 years.
The results indicate highly positive dynamics of the composite indicator of agricultural development; however, a decline occurs from 2006 to 2007 and from 2008 to 2009. These declines are due not to the solvability of environmental problems and the sharp decline in the quality of life in the post-crisis period. Such as unsolved problems of utilization of production and consumption wastes, pollution of water
, , v u , u
of rural residential areas and deterioration of the quality of medical and educational services.
Some weak areas were diagnosed, when we considered v u
period. In spite of declines in the share of rural population in total population, sustainable development has a highly positive development trend (Figure 1). These declines are most likely due to internal and external migrations. The smaller share of population has higher effect on the number of farms and as a result more unused land. We recommend, as one of the best alternative in terms of the sustainable development, creating supportive environment (legislation at the regional level) for the development of agro-tourism or rural tourism. Thanks to agro-tourism business, it may be driving-force for further sustainable development.
Despite the availability of data from Federal State Statistics Service, the present research has some limitations in number of indicators, especially for the environmental dimension, leading to a decrease in the variables regarded in the construction of composite index. u u u the results, such that a complete picture of agricultural development cannot be provided. The data should be supplemented with other indicators. From the literature, the perception agricultural development has on the environment is that the consideration of environmental issues means higher cost and an ecosystem approach should be applied.
Future research should address the indicated limitations; it is important to collect data from other regions and perform analysis to see if the Stavropol region results are robust, e.g. compare results for the Krasnodar region to the Stavropol region in terms of economic and territorial position. Extension of the selection of variables in the analysis might be considered as well as the use of other methods of aggregation and weighting the base indicators for constructing the composite indicator, e.g. Analytic Hierarchy Process (AHP) or Data Envelopment Analysis (DEA).
The prospects of using this integrated approach of sustainability evaluation, as described in this paper, in the practice of managing the development of agriculture should be noted, because it allows:
– to give a quantitative description of the influence of individual factors on the development of agriculture;
– consider the impact of individual factors on agricul-tural development dynamics;
– to justify complex conditions for sustainable develop-ment of agriculture;
– use the data obtained to form a system of measures to ensure sustainable development of agriculture, which can be used in the process of making managerial deci-sions both at the regional and national levels.
REFERENCES
Afanas’ev VN., Uzbashev MM. (1996): Time series analysis and forecasting: Finance and Statistics, 1996: 336
Andreoli M. and Tellarini V., (2000): Farm sustainability eval-uation: methodology and practice. Agriculture, Ecosystems and Environment, Vol. 77(1) pp.43-52. Permanent link to this docu-ments: https://doi.org/10.1016/S0167-8809(99)00091-2
Boyko IP, (1986). Problems of sustainability of agricultural pro-duction. Leningrad: Leningrad State University, 1986:170
Brekke K A. (1997): Economic growth and the environment: on the measurement of income and welfare. Lyme, Cheltenham: Edward Elgar.
Daly HE., Cobb JB. (1989): For the Common Good: Redirect-ing the Economy Towards the Community, the Environment and a Sustainable Future. Boston.
Elkington J. (1998): Cannibals with forks - the triple bottom line of 21st century business. Gabriola Island: New Society Publishers, 1998.
Freudenberg, M. (2003) Composite indicators of country per-formance: a critical assessment. OECD, Paris
García-Sánchez IM, das Neves Almeida TA, de Barros Camara RP (2015): A proposal for a Composite Index of Environmental Performance (CIEP) for countries, Journal Ecological Indica-tors, Vol.48 pp. 171-188
Gomez-Limon, JA., Riesgo L. (2000): Alternative approaches on constructing a composite indicator to measure agricultural sustainability European Association of Agricultural Econo-mists. 107th Seminar; 2008 Jan 30-Feb 1, Sevilla, Spain.
Gómez-Limón, JA., Riesgo L. (2009): Alternative approaches to the construction of a composite indicator of agricultural sus-tainability: an application to irrigated agriculture in the Du-

88 Anastasia Chaplitskaya – Wim Heijman – Johan van Ophem
APSTRACT Vol. 11. Number 3-4. 2017. pages 81-88. ISSN 1789-7874
ero basin, Spain Journal of Environmental Management, Vol. 90(11) pp.3345-3362. Permanent link to this documents: https://doi.org/10.1016/j.jenvman.2009.05.023
Granberg AG. (2007): Basics of regional economics. Moscow: Epsom, 2007: 493.
Jakobsson C., Norrgren L., Karlsson I., Levengood J.(2012) Ecosystem Health and Sustainable Agriculture, Book 1: Sus-tainable Agriculture, The Baltic University Program, , Uppsa-la: Uppsla University Press, 2012:505
Korobeynikov DA. (2011): Methodological approaches to as-sessing the sustainability of regional agriculture. IL Vorotniko-va, editor. Problems and prospects of sustainable agricultural development: materials of the International scientific-practical conference dedicated to the 80th anniversary of the Department of Economics and Organization of AIC; Saratov, 2011:144-149.
Emelyanova LL., Kropinova EG., Voloshenko KJ. (2015): The integrated approach to sustainable development of rural areas: the case for the agricultural sector in the Kaliningrad region of the Russian Federation Int. J. of Agricultural Resources, Gov-ernance and Ecology, Vol. 20 Iss 2, pp.158
Estes, R. (1974): A Comprehensive Corporate Social Reporting Model. Federal Accountant, pp. 9–20.
Federal Law (2015) On the development of agriculture, 12.02.2015, No. 11-FL. Legal information system ‘Consultant - Plus’. Accessed on 10.10.2016, http://base.consultant.ru
Federal Target Program (2012) Sustainable Rural Development for 2014-2017 and for the period up to 2020, Decree of the Russian Federation of Nov 8, 2012, No.2071-p. Accessed on 10.10.2016, http://mcx.ru/documents/document/show/16518.htm
IUCN/IDRC (The World Conservation Union/International De-velopment Research Center) (1995): Assessing progress towards sustainability: A new approach. In: Thadeus, Trzuna (Eds.), A Sustainable World: Defining and Measuring Sustainable Devel-opment. IUCN/IDRC, Sacramento, pp. 152–172.
Krotscheck C., Narodoslawsky M. (1994): The sustainable pro-cess index – a new dimension in ecological evaluation. Ecologi-cal Engineering, June.
Lockeretz W. (1998): Open questions in sustainable agriculture, American Journal of Alternative Agriculture, Vol. 3: pp.174-181
Nardo M., Saisana M., Saltelli A., Tarantola, S. (2005b): Tools for composite indicators building. Joint Research Centre-Euro-pean Commission, Ispra (Italy), 2005
Morris M D., Measuring the Condition of the World’s Poor: The Physical Quality of Life Index .New York: Pergamum Press, 1979.
Nardo M., Saisana M., Saltelli A., Tarantola S., Hoffman A., Giovannini E. (2005a): Handbook on constructing compos-ite indicators: methodology and user guide. OECD Statistics Working Paper. OECD, Paris, 2005
Nordhaus, William D. and Tobin J (1972): ‘Is growth obsolete?’ Economic Growth. 50th anniversary colloquium V. Columbia University Press for the National Bureau of Economic Research. New York. Reprinted in Milton Moss (ed.) ‘The Measurement of Economic and Social Performance’, Studies in Income and Wealth, Vol. 38, National Bureau of Economic Research, 1973.
OECD/EU/JRC (2008), Handbook on Constructing Compos-ite Indicators: Methodology and User Guide, OECD Publish-ing, Paris.Permanent link to this document: http://dx.doi.
org/10.1787/9789264043466-en
Petrikova AM (2009) Sustainable development of rural areas. Moscow: VIAPI named after. AA Nikonov, 2009: 272
QIU Hua-jiao, CHANG Xin, CHENG Xu and ZHU Wan-bin (2005). The Analysis and Design of Agricultural Sustainability Indicators System. Scientia Agricultura Sinica, 6(4): 475– 486. https://doi.org/ 10.1016/S1671-2927(07)60072-8.
Riesgo, L. and Gómez-Limón, J.A. (2005). Análisis de esce-narios de políticas para la gestión pública de la agricultura de regadío. Economía Agraria y Recursos Naturales 5(9): 81-114.
Riesgo, L. and Gómez-Limón, J.A. (2006). Multi-criteria poli-cy scenarios analysis for public regulation of irrigated agricul-ture. Agricultural Systems 91(1-2):1-28.
Rigby, D., Woodhouse, P., Young, T. and Burton, M. (2001). Constructing a farm level indicator of sustainable agricultural practice. Ecological Economics 39(3): 463-478.
Sands, GR. and Podmore TH. (2000). A generalized environ-mental sustainability index for agricultural systems. Agricul-ture, Ecosystems & Environment 79(1):29-41
Seuring, S., Gold, S. (2013) Sustainability management beyond corporate boundaries: from stakeholders to performance, Jour-nal of Cleaner Production 2013; 56: 1-6.
Schuschny A., Soto H.(2009) Guía metodológica diseño de indicadores compuestos de desarrollo sostenible Comisión Económica para América Latina y el Caribe (CEPAL), Nacio-nes Unidas, Chile, 2009
Singh RK., Murty HR., Gupta SK., Dikshit AK. (2007): Devel-opment of composite sustainability performance index for steel industry, Ecological Indicators; 7(3):565-588.
State Program (2012) State Program for Development of Ag-riculture and Regulation of Markets of Agricultural Products, Raw Materials and Food for 2013–2020, Government Decree of 14.07.2012 No. 717. Accessed on 10.05.2016, http://govern-ment.ru/gov/results/19885/
Stockle C.O., Papendick R.I., Saxton K.E., Campbell GS., van Evert F.K. (1994): A framework for evaluating the sustainabil-ity of agricultural production systems, American Journal of Al-ternative Agriculture 1994; 9(1-2):45-50.
The state program of development of agriculture and regulation of the markets of agricultural production, raw materials and the food for 2013–2020 (2012). Accessed on 10.10.2016 http://www.mcx.ru/documents/document/v7_show/16834.342.htm
United Nations Development Program, Human Development Report (1990): New York: Oxford University Press, various years.
von Hauff M., Kleine A. (2009) Sustainability in 3D – A Plea for Three Dimensions of Sustainability Nachhaltigkeit in 3D – Plädoyer für drei Nachhaltigkeitsdimensionen, GAIA 18/1: 29–31.
World commission on environment and development. (1987), Our common future. London: Oxford University Press, 1987:383.
Zagaitov IB., Ternovih KS., Korotchenkov VI., Kamalyan AK. (1999): Agribusiness Economics: General laws of development of agriculture. Voronezh: named after Bolkhovitinov EA., 1999: 287.
Zolotas, X. (1981): Economic growth and declining social wel-fare. New York: New York University Press

APSTRACT Vol. 11. Number 3-4. 2017. pages 89-94. ISSN 1789-7874
DOI: 10.19041/APSTRACT/2017/3-4/13
Applied Studies in Agribusiness and Commerce – APSTRACT Center-Print Publishing House, Debrecen SCIENTIFIC PAPER
AGRICULTURAL TRADE POLICY: ‘AMERICA FIRST’?
Bruce L. Ahrendsen1
1 Department of Agricultural Economics and Agribusiness, University of Arkansas, 217 Agriculture Building, Fayetteville, Arkansas 72701 USA,
Abstract: There has been a growing openness and importance in trade over time as indicated by an increasing ratio of trade to gross domestic product for the World. However, some recent movements have been more protectionist and less open to trade. The potential impacts of less trade are explored with the United States (US) taken as an example. Trade agreements have been important in increasing trade by the US, particularly for US agriculture which has had a trade surplus since 1959.Countries should benefit from trade according to economic theory. However, stances taken by the US administration during the first half of 2017 have resulted in the withdrawal of the US from the Trans-Partnership Agreement and an announced renegotiation of the North American Free Trade Agreement. With falling US farm income, the potential undoing of trade agreement benefits, and possible trade retaliations, US agriculture is concerned about any potential disruption in exports and losses from less trade. In addition, US consumers and importers of US agriculture should be concerned about a potential decrease in trade.
INTRODUCTION
International trade has occurred for centuries, even before there were nations. The Silk Road, as an example, stretched through regions of Eurasia from the West to East. Trade contributed to the development of civilizations along the route. In general there has been a growing openness in trade over time. However, recently there have been some movements that are more protectionist and less open. For example, Britain voted to exit the European Union, which is commonly referred to as Brexit, and there has been speculation the Netherlands, France, and Greece could have similar votes and outcomes (Meredith, 2017). And then there was the 2016 United States (US) presidential campaign and stances taken by the Trump administration during the first half of 2017 that calls for ‘America First’ policies (White House, 2017a, 2017b, 2017c). Any actions corresponding to protectionist policies may directly and/or indirectly result in barriers to trade and less trade. Based on economic theory, the consequence of such actions is that people will lose on average. The italics are added to note that there are likely winners and losers in the countries when they have less trade, although, according to economic theory, the ‘losses’ are expected to outweigh the ‘winnings’ in each country. And as will be discussed, US agriculture and those who import US agricultural products
could have large losses if trade agreements are suspended since they have benefited greatly from trade agreements.
Although agricultural policy may include domestic conservation, renewable energy, farm support, food and nutrition assistance, as well as immigration and foreign aid, the focus of this article is on trade. Next are brief reviews of the economics of trade and trade agreements. Then a presentation and discussion on total trade and agricultural trade follows. The article ends with some concluding comments.
TRADE ECONOMICS
The idea people will lose on average from a loss of trade can be thought of as the opposite of people will win on average from trade. Statements about the advantages of specialization and trade can be attributed to Adam Smith (1776) in his Wealth of Nations. There are advantages from trade among countries when one country has a cost advantage, or absolute advantage, in the production of some items. Even if one country is better than other countries at producing all goods, there are benefits to trade from the comparative advantage of producing a good by one country relative to other countries (Ricardo, 1821). Voluntary trade between countries is to their mutual benefit, which can be measured in the increasing national incomes of both countries (Grennes, 1984). We can continue by having
Keywords: Agriculture, policy, trade, trade agreement(JEL Code: Q18)
90 Bruce L. Ahrendsen
APSTRACT Vol. 11. Number 3-4. 2017. pages 89-94. ISSN 1789-7874
an economic discussion about trade resulting in consumer and producer surplus and barriers to trade resulting in inefficiencies and deadweight losses. But to put it succinctly, people on average lose from lost trade.
As a result of trade, there can be particular groups or sectors that are ‘winners’ and ‘losers’ both between countries and within countries. Consider trade of automobiles as an example. The initial importation of automobiles into the US from Japan benefited US automobile consumers and Japanese manufacturers and their employees. However, it hurt both Japanese automobile consumers because of higher automobile prices and US automobile manufacturers and their employees with loss of income and jobs. Whereas automobile consumers were located throughout the US, automobile manufacturers and their employees were mostly located in the upper Midwestern US. US automobile consumers were ‘winners’ and automobile manufacturers and their employees were ‘losers’, however, the benefits of trade outweighed the losses for both countries and people benefited on average.
There can be good trade agreements and better trade agreements depending on a country’s perspective. Although all countries gain from trade, they may not benefit equally. Moreover, there may be a certain amount of art to making a deal (Trump and Schwartz, 1987). Besides the economics of international trade, there are the sciences of political science, sociology, and psychology to be considered. There may be a possibility to negotiate from a position of strength. If the US can negotiate from a position of strength, perhaps bilateral trade negotiations may result in a relatively better trade agreement from the perspective of the US, although likely relatively worse trade agreement from the perspective of the trading partner. And even then, certain groups within the US may benefit and other groups may be in a worse position. For example, the US manufacturing sector has a trade deficit and agricultural sector has a trade surplus. A trade agreement may be negotiated to favor US manufacturing relative to agriculture. This may be done in an attempt to obtain less of a trade deficit, but also because manufacturing directly impacts more people than agriculture with 12.298 million people employed in the manufacturing sector and 1.140 million people in the agricultural sector at the end of 2016 (US Department of Labor, 2017). However, negotiating along this line of reasoning may be more in the realm of political science than economics by ignoring the economics of comparative advantage.
TRADE AGREEMENTS
There have been a number of trade agreements that have created opportunities for US agriculture, including the General Agreement on Tariffs and Trade (GATT) in 1947 to the North American Free Trade Agreement (NAFTA) in 1994 (USDA, FAS, 2017a) and until recently in 2017 the possibility of the Trans-Pacific Partnership (TPP). GATT’s purpose was to promote international trade and economic prosperity through “…increasing standards of living, ensuring full employment and a large and steadily growing volume of
real income and effective demand, developing the full use of the resources of the world and expanding the production and exchange of goods”. And GATT intended to meet these objectives by “…the substantial reduction of tariffs and other barriers to trade and to the elimination of discriminatory treatment in international commerce” (GATT, 1986). There were a number of rounds of multinational negotiations under the framework and organization of GATT, with the Uruguay round being the last, ending in 1994. GATT subsequently became the World Trade Organization in 1995.
TPP began negotiations in 2010 and had 12 nations when the Agreement was signed in 2015. The 12 nations included Canada, Chile, Mexico, Peru, and US on the eastern side of the Pacific and Australia, Brunei, Japan, Malaysia, New Zealand, Singapore, and Vietnam on the western side. Although signed in 2015, TPP had yet to be ratified by all 12 nations, including the US. It was estimated total US agricultural exports would increase 2.6% by 2032 if TPP was implemented and imports would increase by 1.5% for a net increase in the US balance of trade for agriculture (US International Trade Commission, 2016). However, the effect of TPP on total US trade was estimated to expand the total trade deficit, although by a very small percentage. Thus, the trade surpluses of agriculture were estimated to be more than offset by trade deficits in manufacturing, natural resources, and energy and service sectors. Even with an expanding trade deficit, US annual real income, real gross domestic product (GDP), and employment were estimated to be higher by 0.23%, 0.15% and 0.07% if TPP was implemented. Although TPP was estimated to result in these positive outcomes, President Trump on his first day in the White House on 23 January 2017 withdrew the US from TPP.
NAFTA has been particularly important to Canada, Mexico, and US, the signatories of the Agreement. Since NAFTA’s implementation in 1994, US agricultural exports to Canada and Mexico have grown 327% from $8.9 billion in 1993 to $38.1 billion in 2016 (USDA, ERS, 2017a). The share of total US agricultural exports to Canada and Mexico has increased from 20.8% in 1993 to 28.2% in 2016. And US exports accounted for about 60% of Canadian agricultural imports and about 70% of Mexican agricultural imports (USDA, FAS, 2017b). Yet, President Trump notified Congress on 18 May 2017 his administration intended to renegotiate NAFTA with Canada and Mexico after a required 90-day consultation period with Congress.
The US Administration’s withdrawal from TPP, renegotiation and potential withdrawal from NAFTA (White House, 2017a), and other trade discussions have agricultural groups and farmers worried about trade policy (Good, 2017). US agricultural exports have increased following implementation of NAFTA and other trade agreements (USDA, FAS, 2017c). And US net farm income, in nominal and real dollars, is expected to fall in 2017 for the fourth straight year since a high in 2013 and to the lowest level since 2009 in nominal dollars and since 2002 in real dollars (USDA, ERS, 2017b). With the potential undoing of trade agreement benefits, falling income, large amounts of supplies

APSTRACT Vol. 11. Number 3-4. 2017. pages 89-94. ISSN 1789-7874
Agricultural Trade Policy: ‘America First’? 91
and stocks for many agricultural commodities, and potential trade retaliations, farmers are concerned about any potential disruption in exports.
WORLD AND UNITED STATES TRADE
The importance of international trade in the World has been increasing. Trade as a percent of GDP is frequently used as a measure of trade importance, where trade is the sum of exports and imports of goods and services. For the World as a whole, trade as a percent of GDP increased from 23.6% in 1962 to 60.9% in 2008 and 60.7% in 2012 before slipping slightly for three years to 58.0% in 2015 (World Bank, 2017). The US and European Union (EU) have had similar patterns as the World. For the US, trade as a percent of GDP was only 8.9% in 1962 and increased to a high of 30.9% in 2011 and then fell to 28.0% in 2015. The lower ratio for the US may be explained by the US being a large economy in which interregional trade substitutes for international trade (Grennes, 1984). For the EU, trade was much higher at 38.0% of GDP in 1962 and increased to 83.3% in 2015 and then decreased slightly to 82.7% in 2016. The much higher ratio for the EU is explained by the inclusion of trade between EU Member States. Without the inter-EU trade, the EU ratio was 32.1% in 2014 (European Commission, 2016), which is comparable to the US. The World, US, and EU all experienced decreases in the ratio in 2009 which coincided with the recession that was taking place in most countries at the time.
As far as US exports of all goods in 2016, the destinations were led by the EU (United Kingdom, followed by Germany, Netherlands, France, etc.) with Canada a close second, and then came Mexico and China for a total of $1453.2 billion to all countries (United Nations, 2016). US imports of goods totaled $2249.7 billion in 2016 and came from China, closely followed by the EU (Germany, followed by United Kingdom, France, Italy, etc.), and then Mexico and Canada. Obviously bilateral trade (sum of exports and imports) is important between the US and the EU and these countries. The EU led the way in US bilateral trade, followed by China, Canada, and Mexico. The balance of trade (exports minus imports) for the US was -$796.5 billion in 2016 and by far the largest trade deficit was with China, followed by EU (Germany, Italy, France, etc.), Japan, and Mexico. Trade deficits for the US have occurred every year since 1975.
Unlike the trade deficit in all goods for the US, the balance of trade for agriculture has had a trade surplus every year since 1959 (Cooke, Melton, and Ramos, 2017). After five years of particularly large agricultural trade surpluses of $30 billion or more (Figure 1), trade balances are smaller in 2015, 2016, and the forecast for 2017 with an expected average of $21.5 billion. The decline in agricultural trade surplus is due to slower world economic growth and a stronger US dollar relative to the currencies of major US agricultural markets and competitors (Cooke et al., 2016).
Figure 1. US agricultural trade and trade balance
Source: USDA, ERS, 2017c
Figure 2. Leading US agricultural export destinations and import sources, 2016
Source: USDA, ERS, 2017c

92 Bruce L. Ahrendsen
APSTRACT Vol. 11. Number 3-4. 2017. pages 89-94. ISSN 1789-7874
NAFTA is certainly important for the trade of all goods among the US, Canada, and Mexico as well as for agricultural trade. In fiscal year 2016, Canada and Mexico were among the top three US trading partners for agricultural exports and imports (Figure 2). Canada ($20.34 billion) led the way for US agricultural exports, followed closely by China ($19.17 billion) and Mexico ($17.66 billion), and then the EU ($11.65 billion). For US agricultural imports in 2016, Mexico ($22.51 billion) was the number one supplier, then Canada (21.46 billion), EU (20.41 billion), and China ($4.25 billion) a distant fourth.
CONCLUDING COMMENTS
The ‘America First’ agenda has been championed by the US administration during its first six months in office in 2017. And although the ‘America First’ slogan has been parodied many times, including the initial parody ‘The Netherlands Second’ (Donadio and Stack, 2017), ‘America First’ policies may put trade at risk and have negative impacts for the US and its trading partners, particularly for US agriculture.
US agriculture is one of the few sectors of the US economy with a trade surplus. In part this surplus is because the US has a comparative advantage in agriculture relative to many other countries. Since trade agreements have allowed the US agricultural trade surplus to grow over time, trade disruption and US withdrawal from trade agreements may potentially result in US agriculture being more negatively impacted than other sectors of the economy. US agriculture is not alone in this. Importers of US agriculture may also be negatively impacted by having fewer choices and higher prices.
ACKNOWLEDGEMENTS
This work was supported, in part, by the USDA National Institute of Food and Agriculture, Hatch/Multistate project 1005079. However, any opinions, findings, conclusions, or recommendations expressed in this publication are those of the author and does not necessarily reflect the view of the U.S. Department of Agriculture or the University of Arkansas.
REFERENCES
Cooke B, Melton A, Ramos S. (2017): U.S. agricultural trade in 2016: major commodities and trends. Amber Waves, May 1, ac-cessed May 24 2017 at: https://www.ers.usda.gov/amber-waves/2017/may/us-agricultural-trade-in-2016-major-commodities-and-trends/.
Cooke B, Nigatu G, Heerman K, Landes M, Seeley R. (2016): Glob-al macroeconomic developments drive downturn in U.S. agricul-tural exports. US Department of Agriculture, Economic Research Service, AES-94, July, accessed May 24 2017 at: https://www.ers.usda.gov/webdocs/publications/35809/59822_aes-94.pdf?v=42563
Donadio R, Stack L. (2017): Hearing ‘America First,’ European nations jockey to be second. The New York Times, February 6, accessed May 24 2017 at: https://www.nytimes.com/2017/02/06/world/europe/europe-trump-parody-videos.html.
European Commission. (2016): The EU in the world – international trade. Eurostat, Statistics Explained, August 17, accessed May 24 2017 at: http://ec.europa.eu/eurostat/statistics-explained/index.php/
The_EU_in_the_world_-_international_trade.
GATT. (1986): The text of the general agreement on tariffs and trade. Geneva, July, accessed June 7 2017 at: https://www.wto.org/english/docs_e/legal_e/gatt47_e.pdf.
Good K. (2017): Agricultural trade and Trump. Farm Policy News, University of Illinois at Urbana-Champaign, April 19, accessed April 20 2017 at: https://farmpolicynews.illinois.edu/2017/04/agri-cultural-trade-trump/.
Grennes T. (1984): International economics. Englewood Cliffs, New Jersey: Prentice-Hall Inc.
Meredith S. (2017): Nexit, Frexit or Grexit? The countries that could follow Britain out of the EU. CNBC, Europe News, Febru-ary 13, accessed June 6 2017 at: http://www.cnbc.com/2017/02/13/nexit-frexit-or-grexit-the-countries-that-could-follow-britain-out-of-the-eu.html.
Ricardo D. (1821): On the principles of political economy and taxa-tion. Third edition, London: The Electric Book Company, 2001.
Smith A. (1776): An inquiry into the nature and causes of the wealth of nations. London: Electric Book Company, 2001.
Trump DJ, Schwartz T. (1987): Trump: the art of the deal. New York: Random House.
United Nations UN Comtrade Database. (2016): International trade in goods based on UN comtrade data, accessed May 24 2017 at: https://comtrade.un.org/.
US Department of Agriculture, Economic Research Service. (2017a): Top 15 U.S. agricultural export destinations, by calendar year, U.S. value. Foreign Agricultural Trade of the United States, April 17, accessed June 8 2017 at: https://www.ers.usda.gov/data-products/foreign-agricultural-trade-of-the-united-states-fatus/calendar-year/.
US Department of Agriculture, Economic Research Service. (2017b): Farm income statements, U.S. and states. Updated Feb-ruary 7, accessed June 8 2017 at: https://www.ers.usda.gov/data-products/farm-income-and-wealth-statistics/data-files-us-and-state-level-farm-income-and-wealth-statistics/.
US Department of Agriculture, Economic Research Service. (2017c): Outlook for U.S. agricultural trade. June 9, accessed July 7 2017 at: https://www.ers.usda.gov/topics/international-markets-trade/us-agricultural-trade/outlook-for-us-agricultural-trade/.
US Department of Agriculture, Foreign Agricultural Service. (2017a): Trade agreements create opportunities for U.S. agriculture. May 3, accessed May 24 2017 at: https://www.fas.usda.gov/data/trade-agreements-create-opportunities-us-agriculture-0.
US Department of Agriculture, Foreign Agricultural Service. (2017b): Comparison of market shares for agricultural imports by country in 2016. June 25, accessed July 6 2017 at: https://www.fas.usda.gov/data/comparison-market-shares-agricultural-imports-country-2016.
US Department of Agriculture, Foreign Agricultural Service. (2017c): U.S. Agricultural exports pre- & post-trade agreement. May 15, accessed May 24 2017 at: https://www.fas.usda.gov/data/us-agricultural-exports-pre-and-post-trade-agreements.

APSTRACT Vol. 11. Number 3-4. 2017. pages 89-94. ISSN 1789-7874
Agricultural Trade Policy: ‘America First’? 93
US Department of Labor, Bureau of Labor Statistics. (2017): Quar-terly Census of Employment and Wages. Manufacturing and agri-culture, forestry, fishing and hunting, fourth quarter 2016, accessed June 7 2017 at: https://data.bls.gov/cew/apps/data_views/data_views.htm#tab=Tables.
US International Trade Commission. (2016): Trans-Pacific partner-ship agreement: Likely impact on the U.S. economy and on specific industry sectors. Publication number 4607, investigation number TPA-105-001, May, accessed June 7 2017 at: https://www.usitc.gov/publications/332/pub4607.pdf.
White House. (2017a): America first foreign policy and trade deals working for all-Americans. President Donald J. Trump, accessed May 23 2017 at https://www.whitehouse.gov/america-first-foreign-policy.
White House. (2017b): Presidential executive order on buy Ameri-can and hire American. Executive order, April 18, accessed May 23 2017 at: https://www.whitehouse.gov/the-press-office/2017/04/18/presidential-executive-order-buy-american-and-hire-american.
White House. (2017c): Presidential executive order addressing trade agreement violations and abuses. Executive order, April 29, ac-cessed May 23 2017 at: https://www.whitehouse.gov/presidential-actions/presidential-executive-order-addressing-trade-agreement-violations-abuses/.
World Bank. (2017): Trade (% of GDP). World Bank national ac-counts data and OECD national accounts data files, July 20, ac-cessed July 21 2017 at: http://data.worldbank.org/indicator/NE.TRD.GNFS.ZS.


APSTRACT Vol. 11. Number 3-4. 2017. pages 95-104. ISSN 1789-7874
DOI: 10.19041/APSTRACT/2017/3-4/14
Applied Studies in Agribusiness and Commerce – APSTRACT Center-Print Publishing House, Debrecen SCIENTIFIC PAPER
THE ROLE OF SOCIAL MEDIA IN GASTRONOMY INDUSTRY
Éva Görgényi Hegyes1 – Balázs Máté2 – Seyyed Amir Vafaei3 – Mária Fekete Farkas4
1 Szent István University, Hungary H-2100 Gödöllő, Páter K. u. 1., [email protected] Szent István University
3 Szent István University, [email protected] Szent István University, [email protected]
Abstract: Considering the rapidly changing business environment, staying competitive is a key issue and challenge for companies in the 21st cen-tury. The criteria of a company’s success and competitiveness is the changing behavior of the different economic actors and its influence. Through the information society came to the fore, the use of diverse information technology tools and methods has become a significant influence factor in terms of the entrepreneurs or company management and also the customers or other partners. Due to the rapid expansion of new technology developments, the role and importance of social media is continuously increasing. Also statistics show that one of the most regularly used IT tool is the social media and the different web 2.0 applications.The current study is intended to provide a better understanding how social media can emphasize the competitiveness of companies and format the consumer behavior in a special sector – the rapidly developing gastronomy industry. This paper presents an empirical research about the role of social media in the above mentioned industry based on the primary data which are gathered through a survey performed in Hungary. Beyond the empirical results presented, the paper also aims to provide some recommendations for research methodology – based on the international litera-ture review and the Authors’ own experiences – both in gastronomy industry’s and customers’ point of view. Through the analysis the research hypotheses were examined and the most important correlations were identified between the survey results and the Authors’ initial supposition.
INTRODUCTION
Due to the rapid expansion of different technology innovations, also marketing rules and activities have radically changed in the last few decades. Furthermore, organizations have been affected or influenced by the global recession and financial crisis not only in Hungary, but all over the world. Firms had to find new tactics, strategies and solutions because of these new challenges regardless of industry. While they are developing new strategies and trying to understand better their customers’ changing behaviors and attitudes, they become to use new solutions offered by the continuously developing information and communication technology. Recently, one of the most conspicuous tools which organizations have used to achieve their goals and reach their target audience is social media, with its all means (KIRTIS and KARAHAN 2011). This type of mobile communication enables individuals to move and generate, transmit, receive and share different kinds of information and interact with each other regardless of financial resources, time and location (ŽIVKOVIĆ et al. 2014). “Due to its particularly cost reducing effects, it’s considered that it has become the most preferred marketing driver among business environment under economic turmoil” (KIRTIS and KARAHAN 2011).
As stated in Internet World Stats data (2017), the number of internet users is continuously increasing globally year by year – nowadays more than the half of total population (more than 3.6 billion people) uses Internet in the world. The tendency represents a significant and impressive growth (918%) between 2000 and 2016. While the world’s biggest social networking site, Facebook has got over 1.6 billion users globally (1.23 billion daily active users on average), on the most famous microblogging site Twitter, there are 313 million active users (who log in at least once a month) and 500 million tweets per day. At the same time, on the video sharing site YouTube, more than 6 billion hours of video are watched every month, and there are over 1 billion monthly active users (SOCIALBAKERS, 2017).
The existence and wide availability of the Internet have fundamentally changed the way how consumers search and access information, or share their own experiences with others through feedbacks. Businesses are focusing on the opportunities offered by information technology in order to get new markets. Currently social media applications are used to analyze, monitor and talk to customers in real time regardless of location. These tools can provide an environment that allows the study and analysis of massive marketing data,
Keywords: social media, gastronomy, consumer behavior, marketing strategy, communication.(JEL Code: D83, L83, M31, Z33)
96 Éva Görgényi Hegyes – Balázs Máté – Seyyed Amir Vafaei – Mária Fekete Farkas
APSTRACT Vol. 11. Number 3-4. 2017. pages 95-104. ISSN 1789-7874
sales strategy, advertising campaign, and the direct dealing with the client. The effective marketing communications do not lie in what you say, but how you say it, considering the marketing channels and creativity of the message. Through social networks, companies have developed new markets and increased existing ones since social networks allow them to interact with existing and potential clients and to address in a faster way the comments, suggestions and doubts they have (RODRÍGUEZ et al. 2015).
Nowadays use of social media has become a crucial factor in the daily life of both organizations and individuals, especially in service economy. This trend can be observed also in case of gastronomy industry as part of tourism – use of social media applications is especially important for tourism in service sector, which is information-intensive activity. According to LOVELOCK and WIRTZ (2007), “the size of the service sector is increasing around the world, in both developed and emerging countries”. Building successful service-based brand in tourism means that each offer should be a unique value proposition based on the customer experience. Online marketing communication tools are significant components of the tourists’ decision-making process and enables them to participate in the co-creation of their own experiences, thus creating and adding value to their visit (BUHALIS and LAW 2008; NEUHOFER et al., 2013). However, according to UNWTO (2012) only a small number of the food tourism organizations such as restaurants engaged with tools and applications offered by digital world such as blogs or social networks. Numerous studies demonstrated that online engagement contributes to consumer loyalty, increased satisfaction, trust, commitment, word of mouth and value co-creation therefore this area should be improved in the future (VIVEK et al. 2012; SO et al. 2012).
The current situation of tourism, especially in gastronomy requires from restaurants to exploit more effectively these new communication channels. The circumstances of restaurants in Hungary are very difficult because of the recession – the number of local guests rapidly and significantly decreased while the number of well-known and high quality restaurants is continuously increasing. The highest rate of population who never goes to restaurant is in Hungary (17%), and only 28% of the total population goes there at least once annually (compared with 68-78% in France) (BARNÓTH, 2014). Therefore, also restaurants have to use other communication channels and count other sources such as culinary tourism or gastro-tourism as a form of tourism which has been created by the changing consumption habits. In order to influence also the local guests’ restaurant choosing habits and behaviors, restaurants need to modify their communication and marketing strategy through providing continuously updated and reliable information with use of different social media applications. Furthermore, after the recession it is crucial to examine the different communication tools in order to reach the guests effectively.
Although using social media is getting popular day by day (STATISTA, 2018), there is still lack of information about different usage of social media in different scopes and
zones. The current paper is intended to summarize the most important literature in terms of social media and gastronomy industry. The main objective is to find the role of social media in the restaurant choosing habits of guests – how the social media applications can influence the consumer behavior and decision making process.
LITERATURE REVIEWSocial media definition and classification
Nowadays social media plays a crucial role in online communication, especially in life of the Generation Y’s or Digital Natives (born after 1981) (BOLTON et al. 2013). To understand the definition of social media it is essential to distinguish this term from the term of web 2.0 which is a platform, spanning all connected devices. The term of social media was firstly used in 2004 to describe the new way of utilizing the World Wide Web by the software developers and end-users (KAPLAN and HAENLEIN, 2010). The most comprehensive definition was determined by O’Reilly in 2005: a platform delivering software as a continually-updated service that enables more people to use it better, consuming and remixing data from multiple sources, allows remixing by others and creating network effects through an architecture of participation (O’REILLY, 2005; EVANS, 2014, BOULOS and WHEELERT 2007). KAPLAN and HAENLEIN (2010) define social media as the group of different online applications “that build on the ideological and technological foundations of Web 2.0 and that allow the creation and exchange of User Generated Content”.
The following list summarizes the most important social media channels, as the classification of social media, with a short description and provides some example platforms:
– blogs (e.g. WordPress, HealthLiveBlog): sites that contains regularly-updated, date-stamped entries, dis-played in reverse chronological order;
– collaborative projects (e.g. Google Groups): online fo-rums or discussion sites that allow certain groups of people to collaborate, work together in order to create online content;
– media sharing sites (e.g. YouTube, Flickr): contact channel that enables people to share different media content (photos, videos, clips etc.) with others;
– microblogging (e.g. Twitter, Tumblr): allow users to share small amounts of digital content – such as short sentences, video links or images. The main difference in compared with blogs is the smaller content size;
– podcasts (e.g. Podomatic): series of digital media con-tent (audio or video) distributed in websites.
– reviews and rating sites (e.g. FourSquare, TripAdvisor, Amazon, Booking.com): websites that enable the users to share their own opinions, feedbacks related to other people, products, services etc.;
– social networking sites (e.g. Facebook, LinkedIn): on-line communities for information sharing, social con-nection and other interactions;
– virtual game and social worlds (e.g. World of War-

APSTRACT Vol. 11. Number 3-4. 2017. pages 95-104. ISSN 1789-7874
The role of social media in gastronomy industry 97
craft): the group of platforms that simulate a three-dimensional world in which users can interact with others in this environment (similar to real life);
– wikis (e.g. Wikipedia): websites that enable users to edit and publish easily documents (interlinking pages) using a simple language and a web browser.
– widgets/badgets/gadget buttons: small applications that can be easily shared or embedded in other sites.
(KAPLAN and HAENLEIN 2010; RYAN, 2014)
IMPORTANCE OF SOCIAL MEDIA IN MARKETING STRATEGY
In the last few decades, communication needs and habits have been drastically changed – the rapid expansion of the Internet has shifted the focus from the use of traditional media tools (such as TV, radio, newspapers etc.) to exploiting of opportunities offered by the online world (especially social media) regardless of location and industry. In this paper traditional communication methods mean the typical ATL and BTL tools – such as television, radio, newspapers, PR, DM, POS, newsletters and traditional online communication (web 1.0) – while social media or web 2.0 applications will be categorized as the new way for marketing communication. Table 1 represents the main differences between traditional media and social media:
Internet users – especially young people – prefer the online opportunities and platforms offered by the Internet against traditional media. During its 15-year history, online social media has reached its current situation, when it has become
the distributor of information, ideas and different works and has merged the functions of traditional media. Due to the fact that interactive content of social media is created by its users it seems to users a more democratic way of communication that emphasizes individuals, group affiliation and immensity of views. In addition to its main advantages, the speed is what makes it more consistent with the needs of young generation than traditional media (NMHH, 2017).
Because of the above-mentioned characteristics as advantages of the social media, it has become more and more important in marketing communication. Although KOT et al. (2016) state that the mostly used medium to find information about a product and the execution of purchase is the search engine and social networks do not have a significant effect to the customers’ purchasing decisions, different web 2.0 applications can be effectively used in case of online communication campaigns. The emergence of costumer-to-costumer communication has made it possible for one user (individual or organization) to share information with hundreds or thousands of other people (MANGOLD and FAULDS 2009). Hence, the appearance and spread of social media has made it necessary to rethink the original marketing promotional mix. MANGOLD and FAULDS (2009) created a new paradigm presents the power and impact of discussions and consumer using social media – showed by Figure 1. Nowadays there are some relevant trends that are representing in this new paradigm. One of the most important facts is that Internet has become a mass media opportunity – consumers use Internet for searching and sharing information, contacting with each other, reviewing the feedback of other people, etc.
Table 1 Differences between traditional media and social media
Source: Mangold and Faulds 2009

98 Éva Görgényi Hegyes – Balázs Máté – Seyyed Amir Vafaei – Mária Fekete Farkas
APSTRACT Vol. 11. Number 3-4. 2017. pages 95-104. ISSN 1789-7874
Moreover, consumers’ media usage habits also have been changed – they have more control over their media consumption through social media as they turned away from opportunities offered by traditional media. In the last few years use of social media has become to influence the people’ decision making process –social media can enable organizations to change their consumers’ decisions and behaviors. This phenomenon is due to the fact that social media has become more and more credible source of information.
Figure 1 New communications paradigm
Source: Mangold and Faulds 2009
The study performed by SOCIAL MEDIA EXAMINER (2016) also confirms that social media marketing has become an important pillar for businesses. Major findings are listed below:
Video has become essential – a significant 60% of marketers use video in their marketing activity and 73% plan on increasing their video use. Moreover, live video is a hot topic – a significant 50% of marketers plan on using live video services such as Facebook Live and Periscope, and 50% want to learn more aboutlive video;
Snapchat is on a growth trajectory – although only 5% of marketers are using Snapchat, 16% plan on increasing their Snapchat activities and 28% of marketers want to learn more about Snapchat;
The domination of Facebook is continuous – it is the most important social network for marketers. When asked to select their most important platform, 55% of marketers
chose Facebook, followed by LinkedIn at 18%. Plus, 67% of marketers plan on increasing their Facebook marketing activities;
Facebook and YouTube hold the top platforms for future plans – at least 63% of marketers plan on increasing their use of these particular social media sites;
Many marketers are unsure about their Facebook marketing – a significant 40% of marketers don’t know if Facebook traffic has declined in the last 12 months and 35% aren’t sure if their Facebook marketing is effective;
Facebook ads dominate – 86% of social marketers regularly use Facebook ads;
Tactics and engagement are top areas marketers want to master – at least 90% of marketers want to know the most effective social tactics and the bestways to engage their audience with social media.
According to the research about the Internet usage by the individuals in Hungary, National Media and Infocommunications Authority (NMHH) states that in 2016 (as in 2015), 95% of the analyzed population (at least 16 years old Internet users who use the Internet weekly) visited social networking sites at least once a week during the previous half year of the research. Based on its research the domination of the two market leaders – Facebook and YouTube – is obvious in Hungary, thus the popularity of the other social media applications is very low. Facebook was visited by 5.1 million users weekly, followed by YouTube with 4.3 million users and the others with 2.9 million users. The most relevant and serious growth was reached by Instagram in 2016 while Pinterest has likely become to catch up. It is interesting fact – compared with the US – Twitter did not manage to reach the critical mass in Hungary which would be essential for a significant growth (NMHH, 2017).
Although it is obvious that use of different social media applications is continuously increasing in the European Union – as can be seen in Figure 2 – , only 36% of enterprises (for example restaurants) used these type of diverse marketing communication tools in 2017. Furthermore, it is noticeable that 26% of enterprises in the EU used only one of the four
Figure 2: Enterprises using social media in the European Union (% of enterprises)
Source: Eurostat, 2017

APSTRACT Vol. 11. Number 3-4. 2017. pages 95-104. ISSN 1789-7874
The role of social media in gastronomy industry 99
types of social media. Hence, there is a great market potential in social media usage especially in Hungary (EUROSTAT, 2017).
It is also important to distinguish the purposes for which enterprises were exploiting social media in 2017: it might be to reach its customers, business partners or other organizations; or it might be for communication inside the enterprise or for specific purposes such as to recruit employees. Based on the Eurostat Statistics (2017) Figure 3 demonstrates that 40 % of EU enterprises used social media to develop the enterprise’s image or market products. The second main reason for using social media (only 27 %) is to obtain or respond to customers’ opinions, reviews or questions. As concerns communication inside the enterprise, 13 % of enterprises reported to have used social media to exchange views, opinions or knowledge within the enterprise (EUROSTAT, 2017).
GASTRONOMY AS A SCIENCE
The importance of gastronomy as part of tourism is continuously increasing day–by-day. This fact is verified by the Committee on Culture and Education of the European Parliament who approved a motion for European Parliament Resolution on the European gastronomic heritage in 2014: cultural and educational aspects. “It recognizes the importance of food and gastronomy as artistic and cultural expression and fundamental pillars of family and social relationships” (CAVICCHI and CIAMPI STANCOVA 2016).
According to IVANOVIĆ et al. (2008) gastronomy is part of the experience economy. Recently, due to the strong competition and spread of mass tourism, the communication of hotels and restaurants is influenced not only by different marketing strategies such as STP (segmentation, targeting and positioning) marketing but also by those guests and partners who can add value to their businesses. Gastronomy is not easy
to define, as can be seen from the huge number of definitions determined by the different Authors. A simple and easily manageable explanation of gastronomy is that it is concerned with the enjoyment of food and beverages. However, for the gourmet and gastronome, it essentially requires a broader definition: this is the enjoyment of good food and good beverage, in good company.
Based on the definition and classification of gastronomy written by IVANOVIĆ et al. (2008) the following types of gastronomy can be distinguished:
Practical gastronomy: contains the practice and study of the preparation, production and service of the different foods and beverages, from different countries around the world, i.e. the cuisines. If we mention practical gastronomy we also think about the techniques and standards involved in the conversion of raw produce into aesthetic, nationally, regionally and culturally specific edible products, complete dishes and menus (MORGAN, 2006). It is such an area where the chef and the food and beverage professional can be supremely active and creative.
Theoretical gastronomy: supports practical gastronomy with a process approach, focused on recipes, cookery books and other writing. It records various procedures and methods that must be carried out in order to maximize the productivity and success.
Technical gastronomy: it is more than knowledge of specifications for plant and machinery, and how they can effect productions and service. Technical gastronomy is a line between the small-scale operation and mass manufacture. It is also about the evaluation of convenience foods, new and evolutionary plant, newer production methods such as sous vide, and the skills and equipment required to place these into production and safely monitor performance of them over trial periods. Research and development technicians, development chefs and food scientists, operational specialists, consultant
Figure 3: Enterprises using social media, by purpose of use (% of enterprises)
Source: Eurostat, 2017

100 Éva Görgényi Hegyes – Balázs Máté – Seyyed Amir Vafaei – Mária Fekete Farkas
APSTRACT Vol. 11. Number 3-4. 2017. pages 95-104. ISSN 1789-7874
chefs and group chef executives work in this area.Food gastronomy is dealing with food and beverages and
also their genesis. Fundamentally, the role of wine, and other beverages, in relation to food is to harmonize, in order to maximize the enjoyment.
Gastronomy therefore provides a platform for a better understanding of how food and beverage resources are used in a particular situation. Through gastronomy it is possible to build a picture of the similarities of different approaches used in diverse countries and cultures. (IVANOVIĆ et al. 2008)
Gastro-tourism is a relatively new concept – it is a novel form of cultural tourism, which focuses on the values of local communities and blends the exploration of local and regional traditions, as well as the treasures of gastronomy (UNWTO, 2012). Due to the global recession Hungarian restaurants had to find new strategies for the new challenges in order to increase the number of guests and stay competitive – they have become to exploit the opportunities offered by the gastro-tourism. In Hungary, the restaurants sub-sector is the largest in terms of enterprise numbers, turnover and employment in the hospitality sector. Restaurants accounted for 49% of all hospitality sector turnover in 2010, and 54% of all employment. However, the circumstances of restaurants is relatively difficult in Hungary - due to the financial crisis local population became to decrease their expenses, and there was a radically decline in the rate and absolute number of local guests in the restaurants. For example a report written by AC Nielsen states that the highest rate of population who never goes to restaurant is in Hungary (17%), and only 28% of the total population goes there at least once annually (compared with 68-78% in France) in the European Union (BARNÓTH, 2014). On the other hand, the development of gastro-tourism is not enough, restaurants sector should reach also the local people. The home and office food delivery business model have been identified as a key area of opportunity going forward, due to the development of IT and telecommunications capability – such as the different social media applications (ERNST&YOUNG, 2013).
RESEARCH HYPOTHESES
In this part, we first would like to address the role of social media in Hungary regarding gastronomy industry and see what kind of restaurants are preferred by social media users. Moreover, we will discuss about the gender and focused group. In general, the following 3 hypotheses are presented:
H1: Social media have a huge impact on the guest’s decision making processes regarding gastronomy industry in Hungary.
H2: Social media users are sensitive to prices while they are looking for their preferred restaurants in Hungary.
H3: There is a difference between genders in terms of social media in gastronomy industry in Hungary.
Research methodologyIn the first step, we undertook a conceptual exploration
of the relationship of social media and gastronomy industry
by means of a systematic review of academic literature. In the second step, this research did quantitative analysis by considering the entire hypothesis based on the designed questionnaire by marketing experts work in a marketing consultant company. This company basically has ordinary registered marketing participants and the questionnaire was distributed among them.
In fact, we are looking for certain relationships and the differences among groups in this research. Therefore, “hypothesis testing” is the purpose of this study. Among different types of data-collection methods, we collected data from regular participants by conducting an “internet-based survey questionnaire” which participants were asked to answer the questionnaire which includes 37 different questions. Some of them are open questions and the rest of the them are designed using 4 Likert scale which determine importance with answers of the following type: very important, relatively important, less important, not important.
In addition, time horizon is “one-shot”, because data are gathered just once from 20th of May till 10th of June. Moreover, none of the variables were manipulated, so the extent of researchers’ interference is “minimal”.
The collected data were analyzed using demographic analysis and descriptive analysis in order to test the hypotheses.
Data analysis and resultsIn order to reach our objectives, through the Epanel which
was created by the online marketing consultant company as already mentioned. For this research, a total of 256 different users with different ids have participated in the survey.
Table 2 presents some of the demographic results such as gender, place of residence and age range.
Table 2 Demographic results
Source: own edition (2017)

APSTRACT Vol. 11. Number 3-4. 2017. pages 95-104. ISSN 1789-7874
The role of social media in gastronomy industry 101
As Table 2 shows, mostly women participated in this survey and the main reason was, this topic is more popular among the females according to the manager of the marketing consultant company.
HYPOTHESIS 1:
As already mentioned, the main objective was to study the role and impact of social media in Hungary regarding gastronomy industry. Out of the 37 questions 11 questions were included in the questionnaire to test this hypothesis. Descriptive analysis was done and as Figure 4 shows, just for 14% of participants highly preferred to refer social media in order to find a proper restaurant is important in Hungary.
Figure 4 Participants ratio’s sensitiveness regarding using social media during decision making process
Source: own edition, 2017
Unlike our expectations, most of the participants didn’t look for information when they are surfing on the net in order to find their preferred restaurants. Therefore, first hypothesis is rejected.
HYPOTHESIS 2:
One of the controversial questions which made our mind busy was what types of restaurants people prefer when they are looking for through different types of social media. In order to find the right answer, four questions based on their salary, how much they are willing to spend in an occasion, frequency of going to a restaurant and finally how they categorize different types of restaurants were asked. Table 3 illustrates how our Hungarian participants categorized restaurants based on expenses.
Table 3 Types of restaurant
Cheap Medium High Class Luxury
Less than 5000 HUF
5000-10000 HUF
10000-15000 HUF
More than 15000 HUF
Source: own edition (2017)
As already mentioned, 55% of respondents did not care of the information in social media about restaurants and gastronomy industry in Hungary. In order to avoid any kind of biases and for checking the second hypothesis, those answers were extracted which belong to people who care very or relatively important to the information in different types of social media. Results are shown in Figure 5 for those who care very important and in Figure 6 for those who care relatively important.
Figure 5 Preferred restaurants ratio based on those who care important to data in social media
Source: own edition (2017)Figure 6 Preferred restaurants ratio based on those who care relatively
important to data in social media
Source: own edition (2017)

102 Éva Görgényi Hegyes – Balázs Máté – Seyyed Amir Vafaei – Mária Fekete Farkas
APSTRACT Vol. 11. Number 3-4. 2017. pages 95-104. ISSN 1789-7874
As Figure 5 and 6 show, those participants who are willing to find a proper restaurant through different types of social media, they prefer medium and cheap ranges ones. According to this result, second hypothesis is accepted.
HYPOTHESIS 3:
Which gender is willing to surf on the net more than the other in order to find a proper restaurant? For analyzing this hypothesis, just 45% of the respondents’ answers were used again based on 5 different questions in the designed questionnaire. Those answers which belong to people who care and trust very or relatively important to the information in different types of social media. Figure 7 belongs to those who care very important and Figure 8 relates to respondents who care relatively important.
Figure 7 Gender classification for those who care very important to data in social media
Source: own edition (2017)
Figure 8 Gender classification for those who care relatively important to data in social media
Source: own edition (2017)
As already mentioned in the literature, women are using social media more frequently than men. Based on the results from our survey, women are more sensitive to the information concerning gastronomy industry and they trust more than men to different types of social media. Consequently, third hypothesis is also accepted.
CONCLUSION
Despite the many threats and various weaknesses it possesses, there is no doubt, that social media usage is growing rapidly and it is gradually influencing our life and decisions. As gastronomy industry has several specialties, the use of social media is a relatively new challenge in this field. Based on the literature review it is essential to mention that there are no sophisticated and fully-developed methods of social media usage in gastronomy industry, however, based on the continuously increasing number of researches it is obvious that different actors are looking for new opportunities and ways to understand the changing needs and habits of consumers. The new challenges caused by global recession and innovations of information technologydemonstrate the need to use social media in different types of organizations for example in gastronomy industry – this IT tool is the most effective way for knowledge transfer in all sectors in the 21st century. This study is intended to contribute to the application and necessity of social media in the special area of gastronomy industry and also the development of research methodology. Based on the survey the following conclusions were also listed:
It seems our participants who can be a sample of Hungarians don’t care so much to the social media information about the gastronomy industry, specially choosing a restaurant in Hungary and it’s totally unlike the results which done by researchers in western countries.
The social media information are referred, when people are looking for a restaurant in the range of 5000-10000 HUF.
Women are willing to get information through the social media in the scope of gastronomy more than men.
As a recommendation, restaurants should focus of the group of women who can be reached effectively through the different social media applications. Ranking of the restaurants was also recommended in order to advertise and communicate effectively through social media applications:
Cheap restaurants. Less than 5000 HUFIn the range of 5 000 – 10000 HUFIn the range of 10 000 – 15000 HUFLuxury restaurants: More than 15000 HUFResults and implications of analysis need further empirical
confirmation, hence a representative research is planned in future work, which examines deeply the consumers’ restaurant choosing habits and also the social media usage of different types of restaurants in Hungary.

APSTRACT Vol. 11. Number 3-4. 2017. pages 95-104. ISSN 1789-7874
The role of social media in gastronomy industry 103
REFERENCES
Barnóth, K. (2014): A Miskolc belvárosi hagyományos éttermi vendéglátás és a vele kapcsolatos marketingtevékenység elemzése, Miskolci Egyetem: Miskolc
Bolton, R.N., Parasuraman, A., Hoefnagels, A., Kabadayi, S., Gruber, T., Loureiro, Y.K., Migchels, N. and Solnet, D. (2013): Understanding Gen Y and their use of social media: a review and research agenda’, Journal of Service Management, 24(3): 245-267.
Boulos M.N.K. and Wheelert, S., (2007): Blackwell Publishing Ltd The emerging Web 2.0 social software: an enabling suite of sociable technologies in health and health care education’, Health Information and Libraries Journal, 24: 2-23
Buhalis, D., and Law, R. (2008): Progress in information technol-ogy and tourism management: 20 years on and 10 years after the Internet — The state of eTourism research, Tourism Management, 29(4): 609-623.
Cavicchi, A. and Ciampi Stancova, K. (2016): Food and gastrono-my as elements of regional innovation strategies. European Com-mission, Joint Research Centre, Institute for Prospective Techno-logical Studies, Spain.
Ernst&Young (2013): The hospitality sector in Europe, Available at: http://www.ey.com/Publication/vwLUAssets/The_Hospital-ity_Sector_in_Europe/$FILE/EY_The_Hospitality_Sector_in_Eu-rope.pdf Approached October 6, 2017
Eurostat (2017): Social media – statistics on the use by enterpris-es, Available at: http://ec.europa.eu/eurostat/statistics-explained/index.php/Social_media_-_statistics_on_the_use_by_enterprises Approached February 4, 2018
Evans, R., (2014): The use of web 2.0 technologies in business, Lecture note, Cranfield University, Cranfield, United Kingdom
Kaplan, A.M. and Haenlein, M. (2010): Users of the world, unite! The challenges and opportunities of Social Media’, Business Hori-zons, 53(1): 59-68
Kirtis, A.K. and Karahan, F. (2011): To Be or Not to Be in So-cial Media Arena as the Most CostEfficient Marketing Strategy after the Global Recession’, 7th International Strategic Manage-ment Conference, Procedia Social and Behavioral Sciences, pp. 260-268.
Kot, S., Ferencová, M. and Kakalejcík, L. (2016): Using of Se-lected Social Media in Slovakia and Poland – Comparative Study’. Mediterranean Journal of Social Sciences, 7(3): 113-120.
Lovelock and Wirtz (2007): Services Marketing: People, Technol-ogy, Strategy, 6th edition, Pearson: New Jersey
Mangold, W.G. and Faulds, D.J. (2009): Social media: The new hybrid element of the promotion mix, Business Horizons, 52(4): 357-365
Morgan, J.L. (2006): Culinary creation an introduction to foodser-vice and world cuisine, 1st edition, Taylor&Francis Ltd.: New York
Neuhofer, B., Buhalis, D., and Ladkin, A. (2013): Experiences, co-creation and technology: A conceptual approach to enhance tourism experiences’, Tourism and global change: On the edge of something big. CAUTHE 2013 Conference Proceedings, 546-555.
NMHH (2017): Internet usage by individuals – Online survey 2016, Available at: http://nmhh.hu/dokumentum/187704/lakos-sagi_internethasznalat_2016.pdf Approached June 10, 2017
O’Reilly, T. (2005): What is web 2.0. Available at: http://www.oreilly.com/pub/a/web2/archive/what-is-web-20.html Approached June 20, 2015
Rodríguez, O.S., Chaisatit, N. and Hernández, A.D.C.B (2015): Marketing through Social Networks in Touristic and Gastron-omy Industry in Manzanillo, Colima, México’, Global Review of Research in Tourism, Hospitality and Leisure Management (GRRTHLM) An Online International Research Journal, 1(1): 268-274.
Ryan, D. (2014): Understanding digital marketing: marketing strategies for engaging the digital generation, 3rd edn. London: Kogan Page
So, K.F., King, C. and Sparks, B. (2012): Consumer engagement with tourism brands: scale development and validation’, Journal of Hospitality and Tourism Research, 38(3): 304-329.
Socialbakers (2017): Free Social Media Statistics, Available at: https://www.socialbakers.com/statistics/ Approached January 27, 2017
Social Media Examiner (2016): 2016 Social Media Marketing In-dustry Report, Available at: https://www.socialmediaexaminer.com/wp-content/uploads/2016/05/SocialMediaMarketingIndus-tryReport2016.pdf Approached January 27, 2017
Solis, B. (2015): The Conversation Prism, Available at: https://conversationprism.com/ Approached June 20, 2015
Statista (2018): Number of social media users worldwide 2010-2021. Available at: https://www.statista.com/statistics/278414/number-of-worldwide-social-network-users/ Approached February 5, 2018
United Nations World Tourism Organisation (UNWTO) (2012): Global report on food tourism. UNWTO: Madrid.
Vivek, S.D., Beatty, S.E. and Morgan, R.M. (2012): Consumer engagement: exploring consumer relationships beyond purchase’, Journal of Marketing Theory and Practice, 20(2): 122-146.
Živković, R., Gajić, J. and Brdar, I. (2014): The impact of social media on tourism, Impact of Internet on business activities in Ser-bia and worldwide - E-business in tourism and hospitality industry, Proceedings, pp. 758-761.


APSTRACT Vol. 11. Number 3-4. 2017. pages 105-112. ISSN 1789-7874
DOI: 10.19041/APSTRACT/2017/3-4/15
Applied Studies in Agribusiness and Commerce – APSTRACT Center-Print Publishing House, Debrecen SCIENTIFIC PAPER
GLOBAL TENDENCIES IN PORK MEAT - PRODUCTION, TRADE AND CONSUMPTION
István Szűcs1 - Viktoria Vida2
1University of Debrecen, Faculty of Economics and Business, Institute of Applied Economics Sciences, Böszörményi street 138., Debrecen, Hungary 4032
2University of Debrecen, Faculty of Economics and Business, Institute of Applied Economics Sciences, Böszörményi street 138., Debrecen, Hungary 4032
Abstract: World meat production is anticipated to stagnate in 2016, rising by a mere 0.3% to 320.7 million tonnes. Increases in output are ex-pected in the United States, Brazil, the EU, India and the Russian Federation, while reduced production is foreseen for China, Australia and South Africa. Global meat trade is forecast to recover in 2016, growing by 2.8% to 30.6 million tonnes, which would represent a return to trend, after a fall in 2015.World production of pig meat in 2016 is forecast to decrease marginally, by 0.7% to 116.4 million tonnes, thus registering a second year of virtual stagnation. As in 2015, lower output in China, which accounts for almost half the world total, is the main reason for the slowdown. An unfavour-able feed-pork price ratio in the country and new environmental regulations have caused farmers to reduce breeding sows, stalling growth. China’s production is projected to be 54 million tonnes, down 2.5% from the previous year. Elsewhere in Asia, the Philippines and Vietnam could boost output. Also, production in Japan and the Republic of Korea may expand, as the industry recovers from outbreaks of PED, which reduced piglet numbers in the previous two years. Recovery from the effects of PED has been faster in the United States, where a second year of growth is antici-pated, when production could increase by 1.9% to a record 11.3 million tonnes. Output in Mexico also continues to recover, following a PED out-break in 2014, and may rise in 2016 by 2.0% to 1.3 million tonnes. Pork meat trade could experience a second year of growth, increasing by 4.4% to 7.5 million tonnes – a record level. Lower international prices have stimulated trade. Most of the principal importing countries are anticipated to increase their purchases, including Mexico, China, the Russian Federation, the United States, Japan, the Republic of Korea and Australia. In response to rising demand, exports are projected to grow, in particular those of the United States, Canada, the EU and Brazil (FAO, 2016).Summarizing, in this study we wish to examine how evolve the world pork meat production, trade and consumption, and to demonstrate the main consuming countries, highlighting the role of China, as it is the most populated country in the world with its 1.4 billion inhabitants.
INTRODUCTION
Pork meat has played a major role in human food for thousands of years. Its production and consumption are related to the development of the production culture of agriculture. During the course of history it can be observed that with the increase in the level of agricultural production, the consumption of pork was also increased. Pig breeding is an outstanding livestock sector in every continent. Although many cultures do not consume pork (e.g. Mohammedans, Jews) according to their religious laws, but the pig livestock sector is the largest number in the world (BALOGH et al., 2000).
The market situation for the (pork) meat sector is generally characterised by high nominal output prices, underpinned on the demand side by rising incomes from rapid growth in the developing countries, and on the supply side by high input costs, notably for feed grains, energy related inputs and labour. The combined effect of higher output prices and increased
production costs tend to favour production in developing countries, where low input production systems prevail. Meat production growth has slowed, notably for poultry which in the past has experienced the highest rates of output increases. Meat demand in developing countries continues to be strong as higher incomes and urbanisation lead to food consumption changes favouring increased proteins from animal sources in diets. Consumption levels have risen substantially in many emerging economies, particularly in China and other fast growing Asian countries in the last decade (OECD, 2016).
This is the reason why we examine in detail the world pork meat market, because at present and in the future it will be one of the most important meat types in the human nutrition.
MATERIAL AND METHODS
u , u in structure: production, trade (export and import data),
Keywords: meat production, trade pig sector, pork meat.(JEL Code: Q13, Q12)

106 István Szűcs - Viktoria Vida
APSTRACT Vol. 11. Number 3-4. 2017. pages 105-112. ISSN 1789-7874
and consumption – as mentioned in the title .The current publication examines the role of pig meat in different countries of the world. To illustrate and describe the production, trade and consumption of pork, several databases were used. To demonstrate the world market for pig meat and on the European path we used reports of the USDA (United States Department of Agriculture), of the OECD, of the FAO (Food and Agricultural Organization of the United Nations), of the EUROPEAN COMMISSION. The data for the EU-28 were extracted from EUROSTAT database. Tables and graphs of this publication have been prepared on the basis of the publications materials and databases mentioned above.
RESULTS AND DISCUSSION
Pig meat production is 117 million tonnes in 2015, projected to grow 1.4%, reaching 127 million tonnes to 2025, or 36% of the world’s meat supply (OECD-FAO, 2013). Table 1. represents the pork meat production, trade, utilization in 2015 and 2016 in the world.
Table 1: World pork meat production, trade, utilization (2015-2016)1000 tonnes, carcass weight equivalent
CountriesProduction Import Export Utilization
2015 2016 2015 2016 2015 2016 2015 2016
Asia 66 425 65 181 3 957 4 107 220 200 70 410 69 133
China 55 392 54 017 1 583 1 661 127 102 57 078 55 617
Japan 1 254 1 280 1 286 1 325 2 2 2 545 2 605
Africa 1 365 1 364 302 303 33 34 1 635 1 632
Central America
1 840 1 869 1 048 1 147 158 178 2 730 2 837
Mexico 1 323 1 349 845 930 137 157 2 030 2 123
South America
5 662 5 769 192 188 864 948 4 990 5 009
North America
13 172 13 424 853 884 3 353 3 533 10 617 10 786
USA 11 121 11 334 605 647 2 164 2 262 9 510 9 731
Canada 2 051 2 090 244 233 1 188 1 272 1 103 1 051
Europe 28 266 28 276 538 598 2 545 2 596 26 260 26 279
European Union
23 354 23 279 13 12 2 416 2 488 20 951 20 803
Russia 3 069 3 139 415 478 34 35 3 450 3 582
Oceania 508 520 302 327 35 36 776 811
World 117 239 116 402 7 193 7 554 7 208 7 525 117 418 116 487
Source: own construction from FAO database, 2017
We can see in Table 1. the production of pork in 2015 is the highest in Asia (66 425 thousand tonnes), including China’s largest production (55 392 thousand tonnes). Production of Japan is negligible. But from another point of view, it is interesting to note, that Japan alone produces nearly as much as the African continent. Japan imported the same amount of pork than it produces. Much of the production data of Central America (1.84 million tonnes) comes from Mexico (1.3 million
tonnes). In South America’s production we can mention the pork meat production of Brazil (3.5 million tonnes), Chile (524 thousand tonnes) and Argentina (475 thousand tonnes). In North America the pig meat production gives the United States of America (11.1 million tonnes) and Canada (2 million tonnes). China has the biggest rate in the table, the second highest pork production has the European Union (23.3 million tonnes). Russia’s pork production (around 3 million tonnes) means almost as much as two other continents: Arica and Central America.
According to the FAO’s 2016 forecasts, total meat production in the world will increase to 320.6 million tonnes, including pork production (116.4 million tonnes), which will continue to represent the highest share, but poultry production (116.2 million tonnes) is close to pig meat and it is projected to even exceed it in the coming years (FAO, 2016). According to the mid-term projection of USDA by 2025, USA pig meat emissions can reach 12.6 million tonnes by 2025.
The TOP-10 countries are playing the most important role in the global pork meat production that is demonstrated in the Figure 1. According to the available data, the share of the TOP-10 producer countries is app. 88% form the global pork production. We have to highlight the role of China, because its share ( 46%) is higher than EU and the US production together.
Figure 1: Share of Top-10 pork-producing countries from the global
production
Philippines(1%)
Mexico(1%)
Japan(1%)
Vietnam(2%)
Canada(2%)
Russia(2%)
China(46%)
Others(12%)
European Union(20%)
United States(10%)
Brazil(3%)
OthersChina European Union United States Brazil RussiaVietnam Canada Philippines Mexico Japan
Source: own construction from USDA FAS, 2017; FAO, 2017 in print
Anonymous 1.
Pig meat production will also grow after 2016, driven by China, where herd size is expected to stabilise after years of substantial reductions (a drop of 25 million pigs between 2012 and 2015). Another factor contributing to China’s output expansion in the coming years is further consolidation of the pork sector (OECD-FAO, 2016).
Trade in pig meat in 2016 is expected to experience a second year of growth, increasing by 4.4 to 7.5 million tonnes
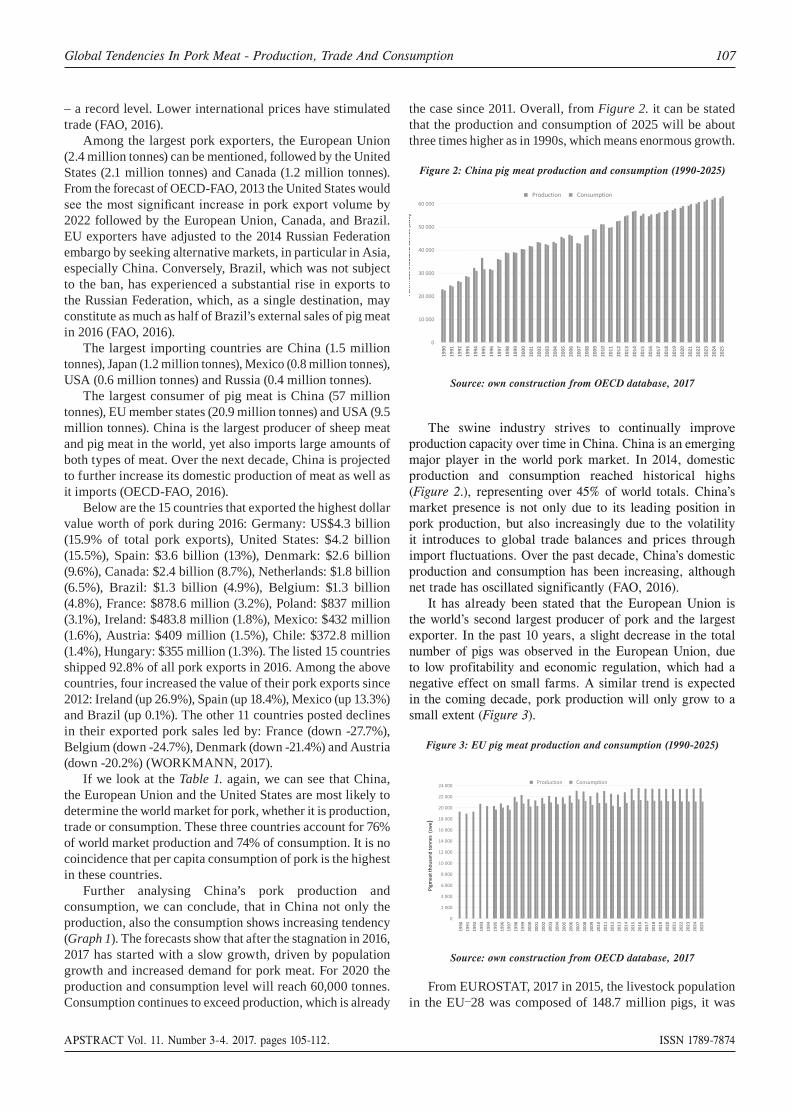
APSTRACT Vol. 11. Number 3-4. 2017. pages 105-112. ISSN 1789-7874
Global Tendencies In Pork Meat - Production, Trade And Consumption 107
– a record level. Lower international prices have stimulated trade (FAO, 2016).
Among the largest pork exporters, the European Union (2.4 million tonnes) can be mentioned, followed by the United States (2.1 million tonnes) and Canada (1.2 million tonnes). From the forecast of OECD-FAO, 2013 the United States would
v u 2022 followed by the European Union, Canada, and Brazil. EU exporters have adjusted to the 2014 Russian Federation embargo by seeking alternative markets, in particular in Asia, especially China. Conversely, Brazil, which was not subject to the ban, has experienced a substantial rise in exports to the Russian Federation, which, as a single destination, may constitute as much as half of Brazil’s external sales of pig meat in 2016 (FAO, 2016).
The largest importing countries are China (1.5 million tonnes), Japan (1.2 million tonnes), Mexico (0.8 million tonnes), USA (0.6 million tonnes) and Russia (0.4 million tonnes).
The largest consumer of pig meat is China (57 million tonnes), EU member states (20.9 million tonnes) and USA (9.5 million tonnes). China is the largest producer of sheep meat and pig meat in the world, yet also imports large amounts of both types of meat. Over the next decade, China is projected to further increase its domestic production of meat as well as it imports (OECD-FAO, 2016).
Below are the 15 countries that exported the highest dollar value worth of pork during 2016: Germany: US$4.3 billion (15.9% of total pork exports), United States: $4.2 billion (15.5%), Spain: $3.6 billion (13%), Denmark: $2.6 billion (9.6%), Canada: $2.4 billion (8.7%), Netherlands: $1.8 billion (6.5%), Brazil: $1.3 billion (4.9%), Belgium: $1.3 billion (4.8%), France: $878.6 million (3.2%), Poland: $837 million (3.1%), Ireland: $483.8 million (1.8%), Mexico: $432 million (1.6%), Austria: $409 million (1.5%), Chile: $372.8 million (1.4%), Hungary: $355 million (1.3%). The listed 15 countries shipped 92.8% of all pork exports in 2016. Among the above countries, four increased the value of their pork exports since 2012: Ireland (up 26.9%), Spain (up 18.4%), Mexico (up 13.3%) and Brazil (up 0.1%). The other 11 countries posted declines in their exported pork sales led by: France (down -27.7%), Belgium (down -24.7%), Denmark (down -21.4%) and Austria (down -20.2%) (WORKMANN, 2017).
If we look at the Table 1. again, we can see that China, the European Union and the United States are most likely to determine the world market for pork, whether it is production, trade or consumption. These three countries account for 76% of world market production and 74% of consumption. It is no coincidence that per capita consumption of pork is the highest in these countries.
Further analysing China’s pork production and consumption, we can conclude, that in China not only the production, also the consumption shows increasing tendency (Graph 1). The forecasts show that after the stagnation in 2016, 2017 has started with a slow growth, driven by population growth and increased demand for pork meat. For 2020 the production and consumption level will reach 60,000 tonnes. Consumption continues to exceed production, which is already
the case since 2011. Overall, from Figure 2. it can be stated that the production and consumption of 2025 will be about three times higher as in 1990s, which means enormous growth.
Figure 2: China pig meat production and consumption (1990-2025)
0
10 000
20 000
0 000
40 000
0 000
60 000
1990
1991
1992
1993
1994
1995
1996
1997
1998
1999
2000
2001
2002
2003
2004
2005
2006
2007
2008
2009
2010
2011
2012
2013
2014
2015
2016
2017
2018
2019
2020
2021
2022
2023
2024
2025
Production Consumption
Pork
mea
t tho
usan
d to
nnes
(cw
e)
0
2 000
4 000
6 000
8 000
10 000
12 000
14 000
16 000
18 000
20 000
22 000
24 000
1990
1991
1992
1993
1994
1995
1996
1997
1998
1999
2000
2001
2002
2003
2004
2005
2006
2007
2008
2009
2010
2011
2012
2013
2014
2015
2016
2017
2018
2019
2020
2021
2022
2023
2024
2025
Production Consumption
Pim
eat t
hous
and
tonn
es (
cwe)
Source: own construction from OECD database, 2017
The swine industry strives to continually improve production capacity over time in China. China is an emerging major player in the world pork market. In 2014, domestic production and consumption reached historical highs (Figure 2.), representing over 45% of world totals. China’s market presence is not only due to its leading position in pork production, but also increasingly due to the volatility it introduces to global trade balances and prices through import fluctuations. Over the past decade, China’s domestic production and consumption has been increasing, although net trade has oscillated significantly (FAO, 2016).
It has already been stated that the European Union is the world’s second largest producer of pork and the largest exporter. In the past 10 years, a slight decrease in the total number of pigs was observed in the European Union, due to low profitability and economic regulation, which had a negative effect on small farms. A similar trend is expected in the coming decade, pork production will only grow to a small extent (Figure 3).
Figure 3: EU pig meat production and consumption (1990-2025)
0
10 000
20 000
0 000
40 000
0 000
60 000
1990
1991
1992
1993
1994
1995
1996
1997
1998
1999
2000
2001
2002
2003
2004
2005
2006
2007
2008
2009
2010
2011
2012
2013
2014
2015
2016
2017
2018
2019
2020
2021
2022
2023
2024
2025
Production Consumption
Pork
mea
t tho
usan
d to
nnes
(cw
e)
0
2 000
4 000
6 000
8 000
10 000
12 000
14 000
16 000
18 000
20 000
22 000
24 000
1990
1991
1992
1993
1994
1995
1996
1997
1998
1999
2000
2001
2002
2003
2004
2005
2006
2007
2008
2009
2010
2011
2012
2013
2014
2015
2016
2017
2018
2019
2020
2021
2022
2023
2024
2025
Production Consumption
Pim
eat t
hous
and
tonn
es (
cwe)
Source: own construction from OECD database, 2017
From EUROSTAT, 2017 in 2015, the livestock population in the EU-28 was composed of 148.7 million pigs, it was

108 István Szűcs - Viktoria Vida
APSTRACT Vol. 11. Number 3-4. 2017. pages 105-112. ISSN 1789-7874
approximately 1.7 times as high as the population of cattle. The largest pig population is in Spain (28 367 thousand pigs),
’ u Germany (27 652 thousand pigs). The number of pigs in France has been steadily decreasing since 2005. While in 2005 there were 15 123 thousand pigs, it dropped by 13% by 2015, while last year France’s pig population was only 13 307 thousand pigs. The number of pigs in Denmark (12 702 thousand pigs) and in the Netherlands (12 453 thousand pigs) is constantly increasing.
Table 2: The EU’s pork meat production by country (2005-2015)1000 tonnes
Cou
ntri
es
2005
2006
2007
2008
2009
2010
2011
2012
2013
2014
2015
Austria 509 505 531 526 533 542 544 530 528 526 528
Belgium 1013 1006 1063 1056 1082 1124 1108 1110 1131 1118 1124
Bulgaria 75 75 76 47 38 37 48 49 52 54 61
Croatia 135 137 156 148 78 89 88 86 80 69 73
Cyprus 55 53 55 59 58 57 55 52 49 43 43
Czech Rep.
380 359 360 336 285 276 263 240 234 236 228
Denmark 1793 1749 1802 1707 1583 1666 1718 1604 1589 1594 1599
Estonia 38 35 38 40 31 32 33 36 37 41 42
Finland 204 208 213 217 206 203 202 193 194 186 192
France 2274 2263 2281 2277 2004 2010 1998 1957 1939 1944 1968
Germany 4500 4662 4985 5114 5241 5443 5598 5459 5474 5507 5562
Greece 130 123 122 119 118 114 115 115 109 96 90
Hungary 454 489 499 460 389 416 387 346 337 369 409
Ireland 205 209 205 202 196 214 234 241 239 254 276
Italy 1515 1556 1603 1606 1588 1633 1570 1621 1625 1328 1486
Latvia 38 38 40 41 25 23 23 24 26 28 29
Lithuania 106 106 99 76 41 55 59 59 67 67 66
Luxem-bourg
11 10 10 10 9 10 10 10 11 12 12
Malta 9 8 8 9 7 8 7 6 6 6 6
Netherl. 1297 1265 1290 1318 1275 1288 1347 1332 1307 1371 1456
Poland 1926 2071 2091 1888 1608 1741 1811 1695 1684 1838 1906
Portugal 327 339 364 381 373 384 384 362 346 360 377
Romania 466 468 491 455 222 234 263 282 308 325 330
Slovakia 140 122 114 102 70 69 57 54 52 34 45
Slovenia 32 34 33 31 24 25 23 21 19 20 20
Spain 3168 3235 3439 3484 3291 3369 3469 3466 3431 3620 3855
Sweden 275 264 265 271 261 263 256 233 234 236 234
United Kingdom
706 697 739 740 720 772 806 825 833 862 898
Source: own construction from EUROSTAT database, 2017
The quantity of pig meat produced in the EU-28 stood at 23.0 million tonnes in 2015. Cultural/religious particularities may explain many of the differences observed in their structure of livestock rearing and meat production. For example, Turkey is a largely Muslim country and as such many of its citizens abstain from eating pork. The same is true in some of the Balkan countries, for example, in parts of Kosovo, Bosnia and Herzegovina and Albania (EUROSTAT, 2017).
This is the reason why in Table 2. we concentrate only the European Union members pork meat production in 2005-2015, not the whole Europe.
According to Table 2. among the EU Member States, the three largest producers are Germany (5.5 million tonnes), Spain (3.8 million tonnes) and France (1.9 million tonnes) in 2015. There is a minimum difference between France and Poland (1.9 million tonnes) pork production, followed closely by Denmark (1.6 million tonnes), the Netherlands and Italy (1.4 to 1.4 million tonnes). Hungary is the 11th place in the ranking. With 150 million pigs and a yearly production of about 22-23 million tonnes carcass weight the EU is the world’s second biggest producer of pig meat after China and also the biggest exporter of pig meat and pig meat products. The
u u 111 u 1 its total production. Most of the EU’s pig meat exports go to East Asia, in particular China (EUROPEAN COMMISSION, 2017).
In Figure 4. we compare China and the European Union export and import data. The export data of the European Union are seen from 1995, the other data are from 1990. Based on the OECD data that the EU, as the world’s largest exporter of pork has doubled the export data from the year 2000 by 2016. In the future, there will be a slowly growing trend until 2025 when it reaches 2400 thousand tonnes. The import of pork meat in the EU is negligible, it does not reach 20 thousand tonnes. China’s pork meat export is also at a lower level, it is around 300 thousand tonnes, and it will be slightly reduced in the future. The pork meat import of China started to grow from 2008, and China maintained the increasing trend from this year. The majority of EU pork meat exports transported to China and Hong Kong.
Highly populated Japan and China incurred the highest deficits in the international trade of pork. In turn, this negative cash flow highlights Japan’s and China’s competitive disadvantage for this specific product category but also signals opportunities for pork-supplying countries that help satisfy powerful Asian consumer demand (WORKMAN, 2017).
Figure 4: China and EU pig meat export and import (1990-2025)
0200400600800
1 0001 2001 4001 6001 8002 0002 2002 400
1990
1991
1992
1993
1994
1995
1996
1997
1998
1999
2000
2001
2002
2003
2004
2005
2006
2007
2008
2009
2010
2011
2012
2013
2014
2015
2016
2017
2018
2019
2020
2021
2022
2023
2024
2025
China Imports China Exports EU Imports EU Exports
Pork
mea
t tho
usan
d to
nnes
(cw
e)
Source: own construction from OECD database, 2017

APSTRACT Vol. 11. Number 3-4. 2017. pages 105-112. ISSN 1789-7874
Global Tendencies In Pork Meat - Production, Trade And Consumption 109
Considering the export-import data of EU, it can be concluded, that almost half of the export delivered to China. Another major target markets were Japan and Hong Kong, Japan 10%, Hong Kong rose 31% in exports. In the future, we can expect significant changes, because on 6 July a consensus was reached on the Japan-EU Economic Partnership Agreement (JEEPA). The terms of the agreement offer significant benefits to the European pig meat industry, as Japanese tariffs on EU imports will be cut significantly. Pig meat is already the primary EU agricultural export to Japan. For UK producers, Brexit will prevent the full benefits of this trade deal from being felt directly. Nonetheless, if the close trading relationship between the UK and EU is maintained, any boost to demand for EU pork, and support to prices, could also be felt here in the UK. For example, Denmark is the largest EU supplier to Japan and some of the cuts are similar to those shipped to the UK (WILKINS, 2017).
After we analysed the production and trade of pork meat, we can move up to the consumption of pork. Table 3. shows the total consumption of meat in the world by meat type. The most consumed meat in the world is poultry, far behind the pork (there is exactly 1 kilogram of difference between the two meat types in 2015). The third most popular type of meat is the beef and veal (6.43 kilogram/capita/year), this is half of the pig or poultry consumption. The sheep meat consumption is very low (eight times less than poultry consumption, and more than seven times less than pork consumption), because it is consumed only in parts of the world more often.
According to the OECD forecast in Table 3. we can see stagnation in case of the pork, the beef and veal and the sheep meat, the kilogram/capita/year consumption increasing negligible from 2015 to 2025. Only poultry meat shows a nearly 1 kg increase in the future from 13.4 kilogram/capita/year to 14.2 kilogram/capita/year. One of the main reasons for this may be that, the world’s population grows in those countries where the consumption of pork is subject to religious restrictions, therefore, the poultry comes to the fore.
Table 3: World meat consumption (facts and forecast: 2015-2025)Kg/capita/year11
App
ella
tion
2015
2016
2017
2018
2019
2020
2021
2022
2023
2024
2025
Poultry meat (rtc)1
13,48 13,65 13,78 13,83 13,86 13,93 13,98 14,03 14,09 14,14 14,20
Pig meat (cwe)
12,48 12,43 12,43 12,46 12,49 12,50 12,51 12,52 12,53 12,54 12,54
Beef and veal (cwe)
6,43 6,49 6,50 6,51 6,56 6,58 6,60 6,62 6,63 6,65 6,67
Sheep meat (cwe)
1,71 1,72 1,73 1,75 1,77 1,80 1,82 1,84 1,86 1,87 1,89
Source: own construction from OECD database, 2017
v u v u
1 c.w.e. is carcass weight equivalent, r.t.c. is ready to cook equivalent.
by country and region. The next graph (Figure 5.) demonstrate data of the TOP-20 countries in case of per capita pork consumption.
Figure 5: Per capita pork consumption in the TOP-20 countries (kg/capita/year; carcass weight)
40,9 40,8 40,2 39,7
36,9 36,9
33,5
29,2
25,5 25,1 24,9 24,722,9 22,5 22,3
21,220,2
18,5 18,2 17,9
0
5
10
15
20
25
30
35
40
45
Chi
na/H
K/M
acau
Euro
pean
Uni
on
Mon
tene
gro
Taiw
an
Serb
ia
Sout
h K
orea
Bela
rus
Uni
ted
Stat
es
Viet
nam
Nor
way
Can
ada
Aust
ralia
Sing
apor
e
Chi
le
New
Zea
land
Rus
sia
Japa
n
The
Bah
amas
Uru
guay
Mex
ico
kg/c
apita
/yea
r (ca
rcas
s w
eigh
t)
Source: own construction from USDA FAS, 2017; FAO, 2017 in print Anonymous 1.
According to the USDA (2017) and FAO (2017) data the shares of meat types from the global meat consumption is the next (2015): pork 40.1%; poultry 34.1%; beef 21.0% and mutton/goat 4.8%.
If we look closer to pork meat consumption data in Table 4., we can see, that in North America the major meat type is poultry, the second the beef, and only on the third position can
01 01 0 u ,
of beef and pig meat consumption we can see stagnation, and consumption of sheep meat will decrease. Latin America and Caribbean is the same situation.
In Brazil the pork meat consumption is increasing 2 kilogram/capita/year from 2013-2015 to 2025. One of the reasons for this is the Russian embargo. The EU could not deliver to Russia, so Brazil taking advantage of the situation, became one of Russia’s major suppliers. After the restriction was lifted, and the EU member countries also deliver to Russia, Brazil uses the remaining pig livestock, and pork meat for boosting internal consumption.
In Africa the meat consumption level is very low compare with the other continent. We can see a slight increase of beef and veal and sheep meat consumption, and the poultry consumption will stagnate to 2025. The pork meat is the least consumed meat type, due to religious restrictions (e.g. Jewish, Muslim religions).
In relation to the consumption of pig meat in the EU Member States, it can be stated that it is high level in worldwide
, average (12.5 kg/capita/ year). This is largely due to the fact that European culture traditionally prefers pork consumption. According to FAO’s latest data, the highest pork consumption in 2013 is in Austria and Germany (51-52 kg/capita/ year) and in Spain (49 kg/capita/ year), Poland (46 kg/capita/ year), Italy (40 kg/capita/ year), the Netherlands (36 kg/capita/ year), France (33 kg/capita/ year). Overall, the consumption level of pork is high in

110 István Szűcs - Viktoria Vida
APSTRACT Vol. 11. Number 3-4. 2017. pages 105-112. ISSN 1789-7874
the European Union biggest pig producer countries, an exception is Denmark, where it does not reach the level of consumption of 25 kg/capita/ year. Not only here, but also in 17 other Member States, it is not reaching the level of consumption of the EU average (Belgium, Denmark, Estonia, Finland, France, Greece, Hungary, Ireland, Latvia, Malta, the Netherlands, Portugal, Romania, Slovakia, Slovenia, Sweden, United Kingdom). Each Member States - without exception –reach the world’s average per capita consumption of pork. Despite these high pork consumption values, when we look back we can say that in recent years, consumption levels have fallen in almost every country. Most of the lost pork meat was replaced by poultry meat because in the EU there is a general tendency for the consumption of poultry meat to rise at the expense of pork.
Table 4. Per capita meat consumption by country and region (facts and forecast)
Kg/capita/year, carcass weight equivalent
AppellationTime period
Beef Sheep Pork Poultry
North America2013-15 24,43 0,44 21,14 44,33
2025 24,80 0,39 22,55 48,25
Brazil2013-15 25,62 0,40 11,36 38,37
2025 25,74 0,37 13,13 42,88
Latin America and Caribbean
2013-15 17,18 0,54 9,51 30,81
2025 17,08 0,55 10,33 33,76
Africa2013-15 3,90 2,31 0,98 3,90
2025 3,96 2,40 1,07 3,85
European Union2013-15 10,61 1,83 32,17 22,11
2025 10,49 1,86 32,36 23,67
Asia and Pacific2013-15 2,91 1,73 12,81 8,47
2025 3,36 1,99 13,24 9,44
BRICS2013-15 4,35 1,63 16,02 10,22
2025 4,73 1,94 16,96 11,43
Source: own construction from OECD-FAO Agriculture statistics
database, 2017
In Asia pork being the continent’s most popular protein source. It can be observed for all types of meat that the consumption (according to the forecast in Table 4.) is growing.
Per capita pig meat consumption in China was 38 kg in 2012, up 13% in ten years (FAO, 2016). Some studies suggest refrigerators2 have led to an increase in meat purchases by allowing consumers to store meat longer, making consumption more convenient and practical. The effects of refrigerator ownership on home pork meat consumption have not been widely studied, even though this has been a major trend in China for many years. The OECD-FAO, 2013 outlook suggests that meat demand in China will continue to increase over the next ten years but these projections may over or underestimate actual growth depending on the net effect of
2 The increase in refrigerator purchases is explained in part by rising household incomes, but also by subsidised consumer purchases. Purchases of refrigerators were subsidised in Shandong, Henan and Sichuan Provinces from late 2007 and were implemented throughout China by early 2009. Refrigerator ownership has expanded most rapidly in rural areas.
increased household refrigeration. In rural China, the potential for increased household refrigeration is still very large. If, for example, the net effect is positive, there could be a stronger expansion in future meat demand than might otherwise be expected based on price, income and diet trends. Greater than anticipated increases in meat demand would lead to higher prices of meats in China as well as some combination of increased meat production, with more use of grain and oilseed meal in feed, or more meat imports compared to the current Outlook projections (OECD-FAO, 2013).
Another reason of this high per capita pork meat consumption is, that pigs have been at the centre of Chinese culture, cuisine and family life for thousands of years. Pork is the country’s essential meat. In Mandarin the word for “meat” and “pork” are the same. The pig is one of the 12 signs of the Chinese zodiac: those born in that year are said to be diligent, sympathetic and generous. Pigs signify prosperity, fertility and virility. Poems, stories and songs celebrate them. Miniature clay pigs have been found in graves from the Han Dynasty (206BC-220AD). Historians think people in southern China
, 10,000 years ago. Almost every rural home once had a pig, not least because, well into the Communist era, the animals were part of the household recycling system. From trotter to tail, the Chinese eat the whole hog. Still, for much of China’s history, pigs were a luxury consumed only rarely, sometimes extremely rarely. That has changed dramatically. The average Chinese now eats 38
u , v person than they ate in 1979. Until the 1980’s 95% of Chinese
v Today just 20% come from these backyard farms, the other come from industrial facilities, often owned by the state or by multinationals, produce as many as 100,000 swine a year.
v ’ v support the eating pork), some of it in frozen form and some the live. This aims to keep pork affordable and reasonably priced: when pigs become too expensive, the government releases some of its stock onto the market; if they become too
, v u Other pro-pork policies include grants, tax incentives, cheap loans for farms and free animal immunisation - all intended to boost intensive pig farming and to keep plates loaded high with Chinese pork. The ambition of China continues to be to devour as large a slice of the pork pie as possible (LUXI COUNTY, 2014).
China desire for pork has serious consequences for the country’s economy and its environment, also for the world.
Among developing countries, Asia continues to occupy a key position in overall consumption growth. In China, the world’s largest meal consumer, demand by the livestock sector (both the poultry and pig industry) is expected to grow at a slower pace. In most other Asian countries, consumption could keep expanding at about average rates (FAO, 2016).
In the longer term, in Asia’s fast growing consumption the principal driver of production is demand, with time lags associated with biological and technical limits depending on the type of meat. The demand for meat is determined by many

APSTRACT Vol. 11. Number 3-4. 2017. pages 105-112. ISSN 1789-7874
Global Tendencies In Pork Meat - Production, Trade And Consumption 111
factors, including cultural habits and religious observances. These factors do not change much over a decade. For example, India is largely a vegetarian country, and its per capita meat consumption is less than 5 kg per capita r.w.t. p.a. People in many countries do not eat pig meat at all. Location also affects meat demand, as for instance in coastal areas or near large bodies of water, where the local population may have greater
u u u
Population demographics may also play an important role. People in cities tend, although not in all cases, to eat more meat than in the countryside. Countries in fast transition to higher urban and lower rural populations may see meat consumption rising more rapidly. Changing age structure affects the evolution of consumption as older people tend to consume less than younger people. In the context of globalisation and the so-called westernisation of diets, key drivers of meat demand are real prices and incomes (OECD-FAO, 2013).
Overall, the global demand for meat is growing, but at different rates in different regions. In Europe and the United States (the biggest meat producers in the 20th century), consumption is growing slowly, or is even stagnating. On the other hand, the booming economies in Asia and elsewhere, will see around 80% of the growth in the meat sector by 2022. The biggest growth will be in China and India because of huge demand from their new middle classes (MEAT ATLAS, 2014).
SUMMARY
Summarizing the production, we can conclude, that China’s pork production is defining. Alone is larger than Europe’s, North and South America’s pork production combined. From this we can conclude that China’s pork production trend has a significant impact on the world’s production of pork and, in fact, alone can influence the development of world pork production (e.g. more than half of the world’s feed crops will soon be eaten by Chinese pigs).
It has already been established that the European Union is the world’s second largest producer of pork and the largest exporter. In the past 10 years, a slight decrease was observed in the total number of pigs in the European Union, one reason is the low profitability and economic regulation, which have a negative effect on small farms. There will be a similar tendency in the coming decade, pork production will only grow slightly, the causes are declining prices, environmental aspects and the expected slow decline in EU consumption. Despite this, the EU will continue to produce for export for the purpose of world demand, favorable feed-in tariffs and to increase the competitiveness of the EU pigmeat sector.
These are the reasons why we examined in detail China and the EU pork meat market, as right now and in the future they will be the most decisive in the pork. China is the largest pork producer and consumer in the world (EU is the second largest producer, and the biggest exporter), they have a significant impact of world pork production, trade and consumption as well.
REFERENCES
Anonymous 1. (2017): PorkCheckoff, http://www.pork.org/pork-quick-facts/home/stats/u-s-pork-exports/top-10-pork-producing-countries/#worldexportshares
BALOGH P. – NÁBRÁDI A. – SZŰCS I. (2000): A sertéshús-termelés gazdasági kérdései. ISBN: 9799633562993. Szaktudás Kiadó Ház Zrt.
BETHAN WILKINS (2017): „Japan to reduce tariffs on EU pig meat”. In: Agriculture and Horticulture Development Board (AHDB). http://pork.ahdb.org.uk/prices-stats/news/2017/july/ja-pan-to-reduce-tariffs-on-eu-pig-meat/
DANIEL WORKMAN (2017): „Pork Exports by Country”. May, 2017. http://www.worldstopexports.com/pork-exports-by-country/
EUROPEAN COMMISSION (2017): Agriculture and rural devel-opment - EU Meat Market Observatory - Pigmeat
EUROSTAT (2017): Statistical books - Key figures on enlargement countries, 2017 edition. ISBN 978-92-79-62167-3. Publications of-fice of the European Union, Belgium. 74-75 p.
EUROSTAT statikus táblák: https://www.ksh.hu/docs/hun/euro-stat_tablak/index.html
FAO: Food and Agricultural Organization of the United Nations (2016): Food Outlook - Biannual Report On Global Food Markets. ISSN 1560-8182 (Online). June 2016. 44-46, 109p. http://www.fao.org/3/a-I5703E.pdf
LUXI COUNTY J. (2014): “Swine in China - Empire of the pig”. In: The Economist. ISSN: 0013-0613. Published by Econo-mist Newspaper Ltd. 2014.12.20. https://www.economist.com/news/christmas-specials/21636507-chinas-insatiable-appetite-pork-symbol-countrys-rise-it-also
MEAT ATLAS (2014): Facts and figures about the animals we eat. Published by Heinrich Böll Foundation, Berlin and Friends of the Earth Europe, Brussels. January, 2014. 10, 24-25 p. https://www.foeeurope.org/sites/default/files/publications/foee_hbf_me-atatlas_jan2014.pdf
OECD-FAO (2013): Agricultural Outlook 2013-2022. ISBN 978-92-64-19422-9. OECD Publishing. 99-103 p.
OECD-FAO (2016): Agricultural Outlook 2016-2025 Special fo-cus: Sub-Saharan Africa. ISBN 978-92-64-25323-0. OECD Pub-lishing, Paris. June, 2016. 107-108 p.
USDA (United States Department of Agriculture) (2016): Agricul-tural Projections to 2025. February 2016. https://www.usda.gov/oce/commodity/projections/


APSTRACT Vol. 11. Number 3-4. 2017. pages 113-120. ISSN 1789-7874
DOI: 10.19041/APSTRACT/2017/3-4/16
Applied Studies in Agribusiness and Commerce – APSTRACT Center-Print Publishing House, Debrecen SCIENTIFIC PAPER
BREAD CONSUMPTION HABITS IN THE GLUTEN FREE DIET
Tünde Csapóné Riskó1 – Ádám Péntek2 – Troy Wiwczaroski31 University of Debrecen, Faculty of Economics and Business, Institute of Marketing and Commerce, 138
Böszörményi Str, Debrecen, Hungary, 4032 E-mail: [email protected] University of Debrecen, Faculty of Economics and Business, Institute of Applied Informatics and Logistics, 138
Böszörményi Str, Debrecen, Hungary, 4032 E-mail: [email protected] University of Debrecen, Faculty of Economics and Business, Institute of Business Communication and Professional
Language Studies, 138 Böszörményi Str, Debrecen, Hungary, 4032 E-mail: [email protected]
Abstract: Gluten is a protein found in many grain products. Celiac disease is a genetic autoimmune disorder characterized by sensitivity to gluten. When a person with celiac disease consumes gluten, his/her immune system perceives the gluten to be a harmful substance and reacts negatively. The only treatment for individuals with celiac disease is lifelong adherence to a gluten-free diet. It is one of the most frequent and well defined of all lifelong diseases. In Hungary, 1-2 % of the population is said to be affected, but only every 10th has been diagnosed. Bread is a basic and frequently consumed food made principally from wheat. Gluten is the main structure-forming protein in flour, and is responsible for the elastic characteristics of dough, and contributes to the crumb structure and appearance of many baked products. Gluten removal results in major prob-lems for bakers. Currently many gluten-free products available on the market are of low quality, exhibiting poor mouth feel and flavour. People wishing to eat bread in the gluten-free diet basically have two options: buying or baking the bread for themselves. There are several gluten-free bread brands are available on the Hungarian market. The price, ingredients, texture, colour, softness of the available breads are different. There is a rather good choice in gluten-free flour mixtures on the Hungarian market, as well. The composition of these mixtures are also different. The aim of our empirical research was to investigate the gluten-free bread consumption habits of people following gluten-free diet. The research was carried out using Google forms in January 2017. Size of the sample is 196. The online form was shared in four closed gluten free Facebook groups in Hungary since they are really active in sharing information concerning gluten-free lifestyle and diet.Summarizing, in this study we wish to examine how evolve the world pork meat production, trade and consumption, and to demonstrate the main consuming countries, highlighting the role of China, as it is the most populated country in the world with its 1.4 billion inhabitants.
INTRODUCTION
Celiac disease is a chronic, autoimmune disorder which is the result of an immune system response to the ingestion of gluten in susceptible persons. (Gluten is a generalised term that describes the storage proteins found in the common cereal grains wheat, rye, barley and their derivatives.) This immune response to gluten damages the small intestine and leads to malabsorption of nutrients and related health issues. The most common activators are stress, trauma and viral infections. Roughly 10-20% of first-degree relatives of those with celiac disease have the condition triggered in their lifetime. This disease is permanent and damage to the small intestine occurs always when gluten is consumed, regardless of whether or not symptoms are present. Celiac disease affects about 1 in 100 individuals worldwide, or over 3 million people in the United States alone. Although most patients remain undiagnosed as a result of variation in the severity and range of symptoms
that a patient experiences. As regards the U.S. approximately 80% of those with celiac disease are undiagnosed (I1, I8, PANAGIOTOU and KONTOGIANNI, 2017). There are variations in the rate of prevalence in the different countries. In Europe, the rate of prevalence is 1%, but in Germany, this rate is only 0.2%, while in Finland and Sweden, the rates are 2-3% (I2). “Serological studies have shown the prevalence of celiac disease to be approximately 1% in the UK, the current prevalence of diagnosed celiac disease varies between 0.05% and 0.27% (SANDERS et al., 2003, VAN HEEL and WEST, 2006 in NELSON et al., 2007:410).” In Hungary, 1-2 % of the population is said to be affected, but only every 10th has been diagnosed (I3). Some symptoms of gluten-related disorders such as celiac disease or non-celiac gluten sensitivity are more likely to appear in women than men in general (I5). Figure 1 shows the rates of celiac disease worldwide.
Keywords: celiac disease, gluten-free diet, bread. (JEL Code: M31)

114 Tünde Csapóné Riskó – Ádám Péntek – Troy Wiwczaroski
APSTRACT Vol. 11. Number 3-4. 2017. pages 113-120. ISSN 1789-7874
Figure 1. A global map of celiac disease
Source: I2
THE CELIAC DISEASE
A lifelong strict adherence to gluten-free diet is the only treatment currently available (SVERKER et al., 2007). Medicines usually are not required unless there is an accompanying condition, such as osteoporosis or dermatitis herpetiformis. It may take several months or longer for the small intestine to completely recover. Improvement can be measured by regular monitoring of the antibody blood tests used for screening, and by improved health. When one follows a gluten-free diet, blood tests should eventually come back to normal. It should be emphasised that this indicates good control of celiac disease and not a cure. Gluten-free diet is always required until another form of treatment is discovered (I1).
It has to be noted that celiac disease is now one of the most common gastrointestinal conditions in European populations and the clinical effectiveness of gluten-free diets in its treatment has been well documented (MAKI and COLLIN, 1997, MEARIN et al., 2005, HOLMES et al., 1989, VALDIMARSSON et al., 1996 in LOWDON, 2007).
One of the main problems individuals face in attempting to rearrange their lives is the lateness in which they are most often diagnosed with the disease. In the UK today, the average age of diagnosis for celiac disease is 45 years, with 25% of sufferers being diagnosed only after the age of sixty. Unlike in children, symptoms causing individuals to seek out a doctor for a diagnosis are often a trifle of what younger patients experience. Thus, diagnosis is not easy. More telling is, however, how difficult it is for older, yet newly-diagnosed patients to stick to their new dietary regimens (LOWDON, 2007). The risk of complications stemming from celiac disease are many and include links to osteoporosis and intestinal cancers. Therefore, the ability to manage one’s diet may greatly impact both life expectancy and quality of life. In addition to the link to crippling conditions, such as osteoporosis and type 1 diabetes, there are dangers of combined diagnoses of unmanaged celiac disease and non-diagnosed lactose intolerance. (KEMPPAINEN et al., 1999, HOLMES et al., 1989 in NELSON et al., 2007). New patients, especially adults, must clearly recognize that their new, gluten-free diets represent lifelong obligations, should they want
to continue to live productive lives into their golden years. For those who would avoid gluten without a clear diagnosis for their own supposedly health lifestyle choices, there is great danger in that avoidance leading to missed and false diagnoses, should digestive and metabolism-based symptoms appear later in life. Those who have been diagnosed and who do follow their new diets unfailingly they can enjoy long, symptom-free, healthy lives (I1).
THE GLUTEN-FREE DIET
On a gluten-free diet, wheat, rye and barley and any foods or ingredients derived from them must be removed from the diet. These food stuffs can include, for example, any form of bread product or bakery item, practically all noodle-type foods, such as Italian pastas and lasagne pastas, as well as most other forms of bakery items containing gluten in their flour-based mixtures. As one source notes, some food stuffs available for purchase also contain gluten where many consumers least suspect them, such as in sauces for all kinds of ethnic foods, widely used salad dressings, packaged powder mixtures for and ready-made soups, as well as a wide range of popular processed foods (I4). Beverages are also on the list of gluten-containing items and these include practically all types of beer and malted beverages, although there are also further fermented drinks containing gluten in various forms (I8). Many consumers attempt to avoid gluten by purchasing oats, as this grain does not contain gluten. However, data shows that even oats are often sold in an already contaminated form, having come into contact with or been mixed with wheat during production and/or processing (I4). Thus, people with celiac disease must ensure that they possess a carefully prepared list of all those foods that they are allowed to eat and consistently, dutifully, follow it. In preparing such a list, four main categories may be used to somewhat simplify matters:
– foods that are naturally gluten-free – natural gluten free grains and flours – especially produced gluten-free products – distilled vinegars and alcoholic beverages, as well as
gluten-free certified wines and beers (Compare PAN-AGIOTOU and KONTOGIANNI, 2017, I8).
It is important to emphasise that gluten is often found in many food products that one would not expect, and gluten-containing ingredients can be found in almost any processed food product. Therefore, it is important to always check food labels. Consumers who are affected should make their purchases with caution and look for certified gluten-free products. Cross-contamination is a health threat to those suffering from celiac disease, and simply looking for such products as oat-containing foods instead of wheat-containing foods is dangerous. Cross-contamination is also a problem once food stuffs are brought into the home, and can occur whenever:
– foods are made on common surfaces – with utensils that have been improperly cleaned after
preparing gluten-containing foods – difficult to clean equipment is utilized for both gluten-

APSTRACT Vol. 11. Number 3-4. 2017. pages 113-120. ISSN 1789-7874
Bread Consumption Habits In The Gluten Free Diet 115
free and gluten containing foods – common household food preparation appliances are
used and improperly cleaned, including toasters, strainers and flour sifters. Celiac disease sufferers may have to purchase two sets of each appliance
– oil is used to deep-fry food and then reused for suppos-edly gluten-free food preparation
– spreadable condiments, including e.g. mustard, ketch-up, mayonnaise, or margarine are applied with a knife to gluten-containing baked goods and then the knife is reinserted into a jar or container. The condiment becomes contaminated (I8).
Indeed, cross-contact contamination in the kitchen is preventable, but only with careful preparation and care. Those suffering from gluten-triggered illnesses may have to arrange their homes by physically separating items, and owning duplicate sets of utensils, tableware, cookware and any number of food preparation and serving paraphernalia. Additionally, the actual physical cleaning and cleansing of spaces and rooms used to prepare and serve meals has to be reorganized to ensure almost hospital operating room thoroughness in eliminating gluten in all its contaminant forms from air, surfaces and utilized items (I6).
CONVENTIONAL BREAD IN HUMAN NUTRITION
A true foundation of the human diet, bread has been present as an indispensable part of human meals for thirty thousand years. Bread provides us with vital energy, nutrients and other ingredients essential for good health, digestion and metabolism. As some one-half of the average individual’s daily energy should be provided in the form of carbohydrates (including starch), bread is a necessary part of daily food intake (I9). Medical and nutritional research emphasize the importance of bread and other baked foods for nourishment (I10). While the consumption of white bread has decreased in the last 20 years on the Hungarian bakery market, it is still among the 5 most frequently consumed foods. Crescent rolls and other types of rolls are also frequently consumed, since they are among the 10 most frequently consumed foods in Hungary. ¾ of the population over 15 years consumes white bread several days per week, 58 % on a daily basis. The average consumption of bread was 50 kg, crescents 60 pcs, rolls 150 pcs per year per capita in 2010 in Hungary. Bread was purchased 67 times in a year, which comes to purchase every 5th day by Hungarian households (I7).
GLUTEN-FREE BREADS
Research shows that, unfortunately, many of the gluten-free bread products obtainable in shops and supermarkets are of poor quality and taste. Other complaints include reports of their dry, crumbling texture, which are unpleasing for consumers used to fresh, moist baked goods (YLIMAKI et al., 1991; ARENDT et al., 2002; GALLAGHER et al., 2003). FRIIS (1996) reports on the difficulties in completely removing
all traces of allergenic protein from bread components in production. Research proves that residual gliadin can actually aggravate celiac disease and cause symptoms to continue in sufferers (CICLITIRA et al., 1985; THOMPSON 2001; SANCHEZ et al., 2002). GUJRAL et al. (2003) report that while rice flour enjoys hypoallergenic properties, its low protein content and inability to be used properly in kneading make bread preparation using rice flour a continuing challenge (Compare also KADAN et al., 2001 and McCARTHY et al., 2005).
Therefore, finding substitutes for gluten, at least in the bakery sector, represents a formidable technological problem. Gluten, good or bad, remains a necessary protein for baking bread with an agreeable, tasty structure that consumers want when making their baked goods purchases. Without gluten, dough loses its elasticity and becomes difficult to form. This is why gluten-free baked goods look like they do and are not moist, but crumby in consistency. Thus, many gluten-free products for sale today are still of comparably low quality, unpalatable and undesired (ARENDT et al., 2002). Overcoming these shortcomings will take a great deal of research and development. Although such activities have been ongoing for years, satisfactory substitutes are commonly not present on store shelves (Compare GALLAGHER et al., 2004).
Table 1. Gluten-free flours and their role in gluten-free bakery products
Name of flour Why and how to use it?
Sorghum flourgluten free baking staple; adds protein with a mild taste
White rice flour/brown rice flour
either one is great in a gluten free baking mix recipe
Sweet rice flour great for breads and pizzas
Tapioca starch/floura thickener; also works well in combination with other flours
Potato starcha thickener for gravy; adds moisture to baked goods
Arrowroot starch one of the most neutral thickeners for gravyTeff flour great for desserts, has a slightly sweet flavorBuckwheat flour great for waffles and pancakes
Quinoa floura great source of protein in baked goods; has nice nutty taste
Certified oat flourit has to be certified gluten-free; good in breads
Coconut flourgreat for desserts; coconut pairs well with anything sweet
Almond mealgreat for desserts, makes delicious crusts for pies
Hazelnut meal great for special desserts
Source: based on I 11
People wishing to eat bread in the gluten free diet basically have two options: buying or baking the bread for themselves. There are several gluten-free bread brands available on the Hungarian market. Ingredients, texture, colour, softness of these breads are different. There is a good choice in gluten-free flour mixtures on the Hungarian market, as well. The composition of these mixtures are also different. Table 1 shows some gluten-free flours and their role in gluten-free bakery products.

116 Tünde Csapóné Riskó – Ádám Péntek – Troy Wiwczaroski
APSTRACT Vol. 11. Number 3-4. 2017. pages 113-120. ISSN 1789-7874
MATERIALS AND METHODS
Bread is a basic and frequently consumed food made principally from wheat. Bread (gluten-free of course) is consumed by people with celiac disease, as well. The aim of our empirical research was to investigate the gluten-free bread consumption habits of people with celiac disease. Since there is rather good choice of gluten-free breads and gluten-free bread flour mixtures are available on the Hungarian market, we wanted to investigate how often and to which main meals the respondents eat bread and whether they buy or bake the bread for themselves. In both cases (buying – baking) we investigated the motivations, frequencies and preferred brands, as well. A Web based survey was carried out in January 2017 in Hungary. The online questionnaire was shared in four closed gluten-free Facebook groups since they are really active in sharing information concerning gluten free lifestyle and diet. Size of the sample is 196. In the questionnaire the following question types were applied: dichotomous questions, multiple choice questions, rating scale questions, and demographic questions.
Almost 89.7% of the respondents is female and 10.3% male. 24.4% lives in the capital of Hungary (Budapest), 20.5% in county centres, 25.6% in other towns and 29.5% in other settlement types. There are seven NUTS 2 regions of Hungary, our respondents are representing all the NUTS 2 regions. By level of education half of the respondents (50%) has higher education background while 38.5% has high school background. Regarding the legal status of respondents 41% is active white-collar worker, 21.8% is active blue-collar worker, while 20.5% was student. Regarding the marital status of respondents 62.8% is married, 29.5% is single and 7.7% is divorced. Regarding the financial situation of respondents 44.9% has average income.
RESULTS AND DISCUSSION
With the first question we wanted to reveal how often our respondents eat bread. Figure 2 shows the results.
Figure 2. The frequency of gluten-free bread consumption
0
several times per
ayonce a ay
two three timesper weekonce a week
less often
Source: Own research, 2017
There is a saying that “Hungarians eat bread with bread”. Furthermore, leftover bread is often used to thicken soups and stews. As Figure 1 shows bread is essential part of the Hungarian dining habits. It is consumed mostly several times per day. It is rooted in our traditions, habits and traditional meals that are always consumed with bread, such as the traditional Hungarian goulash soup or our great variety of stews. Breakfast is one of the most important main meals in Hungary.
Breakfast is the most important main meal in Hungary. The traditional Hungarian breakfast is based on bread, rolls and crescents. In addition to breakfast, most Hungarian mothers prepare bread, or roll-based sandwiches for their children for elevenses. As Figure 3 shows, breakfast almost cannot be imagined without bread in Hungary.
Figure 3. Frequency of gluten-free bread consumption to main meals
60
2 26
34
4
61
4
47
11
0
20
40
60
80
100
Breakfast unch inner
never
sometimes
always
aily every two three ays weekly less often
Source: Own research, 2017
As Figure 2 and 3 shows bread plays an important role in the Hungarian dining habits. Gluten-free breads are different from the conventional ones regarding their characteristics (ingredients, colour, softness, etc.). The availability of these breads are also different, they cannot be purchased so easily like conventional breads. If the buying possibilities of consumers are limited (e.g. they live in villages), it is reasonable for them to buy bread less often but in these cases they buy a bigger amount that is enough for them for a week or even for more. Another possible reason for the low buying frequency (50%) that respondents may complete the bought bread with self-baked breads. The investigation reveals that 51.3 % of the respondents mainly buys the gluten-free bread. Figure 4 shows the gluten free-bread buying frequencies.
Figure 4. Gluten-free bread buying frequency
60
2 26
34
4
61
4
47
11
0
20
40
60
80
100
Breakfast unch inner
never
sometimes
always
aily every two three ays weekly less often
Source: Own research, 2017

APSTRACT Vol. 11. Number 3-4. 2017. pages 113-120. ISSN 1789-7874
Bread Consumption Habits In The Gluten Free Diet 117
Hungarian purchases are generally based on conventional shops including small shops, supermarkets and hypermarkets, as well. The popularity of online shopping is continuously increasing, but so far not as common as the conventional ways of shopping. Figure 5 supports this general fact with the place of purchase of gluten-free beads. Special shops offering foodstuff and dietary supplements for people following special diets are available mainly in bigger towns. As Figure 5 shows respondents prefer these special shops, then supermarkets and multi stores are the most frequent places of purchasing gluten free-bread. In special shops the choice of gluten free breads is rather wide and probably the personal atmosphere and trust are also included in this result. The most obvious reason for buying gluten-free bread in supermarkets and multi stores is that this item is just simply added to the shopping list and it is purchased together with the regularly bought products.
Figure 5. Location of gluten-free bread purchases
0
10
2030
40
50
60
70
80
special shop multi store supermarket WEB shop
always often sometimes never
Source: Own research, 2017 (%)
We asked them if they are loyal to a certain bread brand, if they buy the same bread brand all the time. The research revealed that our respondents are careful. 39.7% of the respondents said: Yes, mainly; 30.8% said: Yes, always and only 29.5% said: No. The most common bread brands (Schär, Mester Család, Nutri Free, Glutenix, Enjoy Free, Spar Free From, Glulu) that are widely available in Hungary were listed and the respondents were requested to mark how often (always, often, sometimes, never) they buy those brands. The investigation revealed that Schär, Enjoy Free and Mester Család are the most popular bread brands as Table 2 shows the results.
Table 2. Preferred bread brands
Which brand do you buy? always often
Schär (1) 54% 45%
Mester Család (3) 7% 16%
Nutri Free 0% 7%
Glutenix 3.5% 7%
Enjoy Free (Aldi) (2) 28.5/ 18%
Spar Free From 3.5% 7%
Glulu 3.5% 0%
Total 100% 100%
Source: Own research, 2017
We asked our respondents if they are satisfied with the gluten free bread choice in Hungary. 48.7% of the respondents said: No; 37.2% said: Yes, partly and only 14.1 % said: Yes, totally. We also asked them if they are satisfied with the quality of gluten free breads in Hungary. 46.2% of the respondents said: No; 43.6% said: Yes, partly; and only 10.2% said: Yes, totally. Gluten-free products are more expensive than conventional food products, so we wanted to know the opinion of our respondents how satisfied they are with the prices of gluten free breads in Hungary. As a summary, we can state that they consider the prices are rather expensive, as listed below (Expensive: 44.9% - Unrealistically expensive: 34.6% - Slightly expensive: 19.2% - Yes, the price is correct: 1.3%).
These results (choice, quality, price) can realistically ground the following result, as 74.4% of the respondents bake bread although the bread baking frequencies are different. We wanted to find out the reasons why they bake bread. The results are as follows: Not satisfied with the quality of the available bread: 23.1%; The price of bread is high: 23.1%; Trust only homemade bread: 11.5% mentioning the most frequent answers only. We asked our respondents how often they bake bread. 21.8% of the respondents bakes bread two times a week, 24.4% once a week, 25.6% less often, 2.6% gave other answer. Brand loyalty was a question again. We asked our respondents if they are loyal to a certain brand when buying gluten-free bread flour. The results are as follows: Yes mainly, but try some other brands as well: 57.7% - Yes, always: 21.8% - No: 17.9% - Other answer: 2.6%. Thus, we can state that our respondents are loyal to their ordinary brands. We wanted to find out the out of the listed gluten-free bread flour brands (Anna Panni, Doves Farm, Mester Család, Amisa, Barbara, Bauck Hof, Dia-Welness, Emese, FE-MINI, Glutenix, “Own mixture”, Nutri free, Szafi free) which are the most popular ones. Out of these brands Szafi free (19.2%) proved to be the most popular one, following by “Own mixture” and Nutri free with 10.3%, respectively, and Mester Család with 9%.
As can be seen, it is common among the respondents to bake bread. There are several possibilities to bake bread, such as an electric oven, gas oven or bread machine. 47.4% of the respondents bake bread in an electric oven, 16.7% in a gas oven, while 11.5% in a bread machine. The rest does not bake bread or named other options.
As has already been mentioned, the characteristics of gluten-free breads are different comparing them to conventional breads. We wanted to find out how the ideal bread looks like for the respondents. We listed the following characteristics for them: soft, white, brown, grainy, round shape, soft for long time period. They had to mark their opinion on a Likert scale 1-7. Only the most frequent responses are introduced here now:
Soft:important: 43.5% + very important: 43%
White: not important at all: 27%Brown: neutral: 26%

118 Tünde Csapóné Riskó – Ádám Péntek – Troy Wiwczaroski
APSTRACT Vol. 11. Number 3-4. 2017. pages 113-120. ISSN 1789-7874
Grainy: neutral: 22%Shape: not important at all: 24%Soft for long time period:
important: 45% + very important: 35%
Our investigation revealed that softness and softness that is long-lasting are the most important characteristics of the “ideal bread”. It should not be white at all and the shape is also not important at all. If it should be brown or grainy, the most frequent answer was: “neutral”.
CONCLUSIONS
Based on our empirical research, we can state: bread is essential part of the Hungarian dining habits.
Gluten-free bread is consumed mostly several times per day,breakfast almost cannot be imagined without bread in
Hungary even in the gluten-free diet, – 51.3 % of the respondents mainly buys the gluten-free
bread, – 50% of the respondents less often than weekly buys
gluten-free bread, while 24% buys it on a weekly basis, – respondents prefer special shops when purchasing glu-
ten free-bread, – more than 2/3 of the respondents are loyal to a certain
brand when buying gluten-free bread, – among the respondents Schär, Enjoy Free and Mester
Család are the most popular bread brands, – choice and quality of gluten free breads is acceptable,
while the price is considered to be high in Hungary, – 74.4% of the respondents bake bread although the
bread baking frequencies are different – more than ¾ of our respondents are loyal to their ordi-
nary brands when buying gluten-free bread flour – among the respondents Szafi free, “Own mixture”,
Nutri free and Mester Család are the most popular gluten-free bread flour brands.
It is still a challenge for bakeries to improve the quality of gluten-free breads. The prices of gluten-free foodstuffs are higher than the conventional ones. There is an economic burden for people with celiac disease, since it is not optional for them to choose these special gluten-free foodstuffs. Loyalty to certain brands is strong among the respondents that provides opportunity for producers to develop new products that could be introduced into this special market presumably easier.
During our secondary and primary research, we realized that the consumption habits and lifestyle of people following gluten-free diet is rather complex. Investigation their bread consumption habits proved to be a challenging topic since bread plays important role even in their diet. We realised that this research direction would be worth continuing and widening. Thus, we have drawn up several more prospective and challenging research directions, such as
Reasons for following gluten-free diet. Since not only people with celiac disease follow this diet, family members may also follow the same diet for practical reasons, some
people believe this diet as a healthy diet, some people believe they can lose some weight, and it is among the fashion diets, as well.
The gluten-free market is considerably increasing year by year. It is a huge market, even gluten-free dog and cat feeds are available on the market. What are the reasons behind this extraordinary development of the market?
No doubt that it is a costly diet, it would be worth investigating the extra costs of this diet in Hungary comparing traditional menus and gluten-free menus with the same dietary values. Moreover some international comparison would also be interesting.
Subsidisation of celiac people (because of the high costs of the obligatory diet) in international comparison.
Psychological aspects of the gluten-free diet.Possibilities of people following gluten-free diet in tourism
and catering (how this industry can meet their needs, their strict dietary restrictions).
Statistical methods should be applied to show the appropriate differences in figures and trends in all the above mentioned research directions.
REFERENCES
Arendt E. K., O’Brien C. M., Schober T. J., Gallagher E., Gorm-ley T. R. (2002): Development of gluten-free cereal products, Farm Food 12:21-27.
Ciclitira P. J., Cerio R., Ellis H. J., Maxton D., Nelufer J. M., Ma-cartney J. M. (1985): Evaluation of a gliadin containing gluten free product in celiac patients, Human Nutr. Clin. Nutr. 39:303-308.
Friis S. U. (1996): Celiac disease. Pathogenesis and clinical as-pects. PhD thesis. Department of Medical Biochemistry and Ge-netics. University of Copenhagen: Denmark.
Gallagher E., Gormley T. R., Arendt E. K. (2003): Crust and crumb characteristics of gluten free breads, Journal of Food Engi-neering 56:153-161.
Gallagher E., Gormley T. R., Arend E.K. (2004): Recent advances in the formulation of gluten-free cereal-based products, Trends in Food Science & Technology 15 (2004) 143-152. doi: 10.1016/j.tifs.2003.09.012
Gujral H. S., Rosell C. M., Carbonell J. V., Rosell C. M. (2003): Effect of cyclodextrinase on dough rheology and bread quality from rice flour, J. Agric. Food Chem. 51:3814-3818.
Kadan R. S., Robinson M. G., Thibodeaux D. P., Pepperman A. B. (2001): Texture and other physicochemical properties of whole rice bread, Journal of Food Science 66:940-944.
Lowdon J. (2007): Coeliac disease and dietitians – are we getting it right? Journal of Human Nutrition and Dietetics, 2007 Sept; 20, pp. 401-402 doi:10.1111/j.1365-277X.2007.00820.x
McCarthy D. F., Gallagher E., Gormley T. R., Schober T. J., Ar-endt E. K. (2005): Application of Response Surface Methodology in the Development of Gluten-Free Bread, Cereal Chemistry, Vol. 82, No. 5, 2005: 609-615. doi: 10.1094/CC-82-0609
Nelson M., Mendoza N., McGough N. (2007): A survey of provi-sion of dietetic services for coeliac disease in the UK, Journal of Human Nutrition and Dietetics, 2007, 20, pp. 403-411
Panagiotou S., Kontogianni M.D. (2007): The economic burden of gluten-free products and gluten-free diet: a cost estimation analysis

APSTRACT Vol. 11. Number 3-4. 2017. pages 113-120. ISSN 1789-7874
Bread Consumption Habits In The Gluten Free Diet 119
in Greece, Journal of Human Nutrition and Dietetics, 2017 May 8. doi: 10.1111/jhn.12477
Sanchez H. D., Osella C. A., de la Torre M. A. (2002): Optimisa-tion of gluten free bread prepared from corn starch, rice flour and cassava starch, Journal of Food Science 67:416-419.
Sverker A., Östlund G., Hallert C., Hensing G. (2007): Shar-ing life with a gluten-intolerant person – the perspective of close relatives, Journal of Human Nutrition and Dietetics, 2007 Oct; 20(5):412-422.
Thompson, T. 2001. Wheat starch, gliadin and the gluten free diet. J. Am.
Diet. Assoc. 101:1456-1459.
Thompson, T. 2001. Wheat starch, gliadin and the gluten free diet. J. Am.
Diet. Assoc. 101:1456-1459.
Thompson, T. 2001. Wheat starch, gliadin and the gluten free diet. J. Am.
Diet. Assoc. 101:1456-1459.
Thompson, T. 2001. Wheat starch, gliadin and the gluten free diet. J. Am.
Diet. Assoc. 101:1456-1459.
Thompson, T. 2001. Wheat starch, gliadin and the gluten free diet. J. Am.
Diet. Assoc. 101:1456-1459.
Thompson, T. 2001. Wheat starch, gliadin and the gluten free diet. J. Am.
Diet. Assoc. 101:1456-1459.
Thompson, T. 2001. Wheat starch, gliadin and the gluten free diet. J. Am.
Diet. Assoc. 101:1456-1459
Thompson, T. 2001. Wheat starch, gliadin and the gluten free diet. J. Am.
Diet. Assoc. 101:1456-1459.
Thompson T. (2001): Wheat starch, gliadin and the gluten free diet, J. Am. Diet. Assoc. 101:1456-1459
Ylimaki G., Hawrysh Z. J., Hardin R. T., Thomson A. B. R. (1991): RSM in the development of rice flour yeast breads: Sensory evaluation, Journal of Food Science 56:751-755, 759.
I1: https://www.gluten.org/resources/getting-started/celiac-dis-ease-2/ [accessed Jun 10, 2017].
I2: http://www.drschaer-institute.com/us/professional-articles/a-global-map-of-celiac-disease-1229.html [accessed Jun 10, 2017].
I3: https://glutenerzekeny.hu/wp-content/uploads/2015/10/glu-tenerzenyseg-tajekoztato-kiadvany-201510.pdf [accessed Jun 10, 2017].
I4: https://www.gluten.org/wp-content/uploads/2015/01/EDU_GFDietFctMyths_.pdf [accessed Jun 10, 2017].
I5: https://www.gluten.org/wp-content/uploads/2015/08/EDU_WomenGlutenDisorders.pdf [accessed Jun 10, 2017].
I6: http://nfsmi-web01.nfsmi.olemiss.edu/documentlibraryfiles/PDF/20120327113749.pdf [accessed Jun 12, 2017].
I7: http://www.piackutatasok.hu/2011/11/gfk-friss-pekaruknal-kis-boltok.html [accessed Jun 12, 2017].
I8: https://www.gluten.org/wp-content/uploads/2016/11/EDU_Get-ting-Started-on-a-Gluten-Free-Diet.pdf [accessed Jun 10, 2017].
I9: http://www.eufic.org/en/healthy-living/article/bread-a-nutri-tious-staple [accessed Jul 15, 2017].
I10: http://medical-best-help.com/en/pages/688749 [accessed Jul 15, 2017].
I11: http://gluten-free-bread.org/how-to-make-gluten-free-bread-flour-mix [accessed Jul 29, 2017].


APSTRACT Vol. 11. Number 3-4. 2017. pages 121-130. ISSN 1789-7874
INTRODUCTION
The world’s population doubled during the last 50 years, while the meat production of the world increased more than fourfold. Poultry meat production increased the most, followed by pork and beef (Kozák, 2015). According to the predictions of OECD-FAO (2017), a further increase in population is expected, potentially reaching 10 billion people by 2060. It is the task of the near future to provide the world’s population with proper quality food with high nutrient content that is important for maintaining a healthy life. On a worldwide scale, foods of animal origin represent an increasingly high proportion of total food; therefore, animal husbandry and the connected processing industry have a significant role in feeding the world (Horn and Sütő, 2014). Based on the related predictions, the meat production of the world is expected to increase by 32 million tons in the upcoming decade.
The aim of this study is to evaluate the cost of pig slaughter and cutting through the case study of a medium-scale plant in Hungary. This paper is looking for answers to the following questions: 1) What is the “output” amount and value during pig slaughter and cutting? 2) How much is the direct cost of processing in the case of a medium-scale slaughterhouse and which are the main cost items? 3) How does capacity
utilisation affect the costs of slaughter and cutting? 4) What impact does the change of minimum wage1, guaranteed living wage2 and employer’s contributions in Hungary in 2017 have on slaughter and cutting costs? Accordingly, two hypotheses were formulated. H1) At the plant, based on the current level of capacity utilisation, the direct cost of slaughter and cutting was between 16.1-19.4 EUR per pig in the examined period, the largest share of which was represented by labour costs. H2) The current level of capacity utilisation is low and its improvement could potentially result in reducing the cost of slaughter and cutting to even 12.9 EUR per pig.
Pig production and processing background
Poultry meat production nearly doubled in the last two decades, while the amount of pork production increased by a much lesser extent of 51%. As a result, the amount of poultry meat produced in the world in 2016 (116.8 million tons) exceeded the amount of pork produced in the same year (116.4 million tons), but the proportion of poultry and pork
1 u u 2 guaranteed living wage: for workers employed in jobs require at
least intermediate skills
DOI: 10.19041/APSTRACT/2017/3-4/17
Applied Studies in Agribusiness and Commerce – APSTRACT Center-Print Publishing House, Debrecen SCIENTIFIC PAPER
COST ANALYSIS OF PIG SLAUGHTERING: A HUNGARIAN CASE STUDY
László Szőllősi1, Szilvia Molnár2, Krisztina Ladányi2, Laura Karnai2, István Szűcs1 1 associate professor, University of Debrecen
2 PhD student, University of DebrecenE-mail: [email protected]
Abstract: The scale of Hungarian slaughterhouses is small in international comparison and the cost of slaughter and cutting a pig of average live weight is relatively high at 16.1-19.4 EUR on average. The aim of this study is to evaluate the cost of pig slaughter and cutting through the case study of a medium-scale plant in Hungary. Based on data from the enterprise, a calculation was performed in relation to the “output” quantity of pig slaughter and cutting, as well as its value and the cost and cost structure of processing. The capacity of the examined plant and its utilisation were analysed and cost reductions were estimated for various increases of output. In 2015, the direct cost of slaughter and cutting was 18.9 EUR per pig for the medium-scale plant which processed 100 thousand pigs. When the purchase cost of pigs is excluded, labour costs accounted for the highest share (30%) of costs, followed by services (29%) and energy costs (21%). For this reason, the level of wages and employer’s contributions has a rather high significance. Analysis showed that significant increases in Hungarian minimum wage and guaranteed living wage in 2017 resulted in an estimated 7% increase in the cost of slaughter and cutting compared to 2015, despite the decrease of contributions. The capacity utilisation of the plant was a low 28% when compared to a single 8-hour shift considered full capacity. The cost of slaughter and cutting was estimated to be reduced to 14.2-17.0 EUR per pig if the plant operated at full capacity. This may be considered a lower bound estimate of cost because there are numerous restricting factors on optimising capacity utilisation, such as: 1) number of live animals available for purchase and related logistics; 2) cooling capacity availability; 3) labour availability; 4) market position of the enterprise and potential for marketing additional pig meat products. Enterprises of this scale are recommended to consider producing more value-added products and, accordingly, investing in product development.
László Szőllősi – Szilvia Molnár – Krisztina Ladányi – Laura Karnai – István Szűcs
Keywords: meat industry, slaughterhouse, capacity utilisation, economies of scale, slaughtering costs (JEL Classification: Q13, Q19)

122 László Szőllősi – Szilvia Molnár – Krisztina Ladányi – Laura Karnai – István Szűcs
APSTRACT Vol. 11. Number 3-4. 2017. pages 121-130. ISSN 1789-7874
produced was different in the various examined countries and regions. In 2016, the EU28 produced 65% more pork (23.6 million tons) than poultry (14.3 million tons) and this proportion is not expected to significantly change in the upcoming decade either (FAO, 2017; OECD-FAO, 2017).
The amount of pork produced in the world is expected to increase to around 128 million tons by 2026 (FAO, 2017, OECD-FAO, 2017). In 2014, around half of the produced amount of pork originated from China, which increased its output by 84% since 1994 and it has been the main pork producer of the world for years. The US (9%), Germany (4.8%) and Spain (3.1%) are also considered to be significant producers. The ten biggest pork producers of the world provide around 78% of the total produced amount. The pork production of the EU28 increased to a smaller extent from 20.6 million tons to 22.6 million tons (+10%) over the same period and provided 20% of the pork produced in the world in 2014. In the EU, France, Poland, Denmark and the Netherlands produced significant amounts of pork in addition to Germany and Spain (FAO, 2017).
Pig slaughtering in the EU decreased by 10% between 2006 and 2012, but it has been constantly increasing since 2012, reaching 257 million pigs in 2016. The following distribution of slaughtered pigs was observed in accordance with the SEUROP3 classification in 2016 (EU average): 57% S, 34% E, 7% U and 2% R (EC, 2017).
In Hungary, pig farming and pork production have always been of great significance. In the 1980s, the pig population consisted of 10 million pigs, but it decreased to 6 million in 1991 following the economic and political restructuring. The downfall of the sector continued after the turn of the millennium. As a result, the pig population dropped to less than 3 million by the end of 2016, leading to a significant reduction of the amount of slaughter pigs from nearly 800 thousand tons to 587 thousand tons between 2000 and 2015 (HCSO, 2017). In parallel with decreasing pig population, the number of farms with pigs had a greater reduction, in particular small farms and a concentration process can be witnessed which is favourable from the aspect of economies of scale. At the same time, the significant decrease of pork purchase prices in recent years caused severe problems for producers (Béládi et al., 2017; Jankuné Kürthy, 2017). Popp et al. (2015) consider the unorganised product path, the lack of integration, the strong presence of underground economy, low efficiency, the prevailing low technological level, the non-competitive genetic background, the lack of connection with food retail trade, the low level of qualification and research and development, the relatively high volatility of feed prices, the high indebtedness and non-creditworthiness of enterprises, the uncertainty of the land market and the lack of consumer consciousness to be among the critical factors limiting pig farming. Also, the pig slaughter in Hungarian slaughterhouses
3 Pig carcases are graded according to their estimated lean-meat content: S: 60% or more; E: 55-59%; U: 50-54%; R: 45-49%; O: 40-44%; P: less than 40% (Council Regulation (EEC) No 3220/84).
is generally of lower quality than the EU average with a SEUROP classification for Hungary of 32% S, 52% E, 10% U, and 1.2% in R/O/P classes (NFCSO, 2017).
The fluctuation of the number of pig slaughters in slaughterhouses is smaller than the fluctuation of the pig population and the reduction of the population cannot be traced in the number of slaughters. While 4.28 million pigs were slaughtered in Hungary in 2004, the increase to 4.68 million in 2016 (Bábáné Demeter, 2017) may be attributed to pig imports. Hungarian slaughterhouses used to process pigs produced in Hungary only, but the Hungarian meat industry has made up for the shortage in Hungarian pig production following the EU accession from import sources. However, these imports have contributed to the increase of costs especially due to the exchange rate that became unfavourable in 2009 (Udovecz and Nyárs 2009; FM 2015). Hungary has a slaughter capacity of processing around 8 million pigs in 2017, but the number of pigs slaughtered in Hungary following the EU accession is only around 4-4.5 million pigs. Due to the existing spare capacities, the Hungarian meat industry has low efficiency (FM 2015, Bene et al. 2016). According to Gila (2017), the average cost of slaughter and cutting in 2017 is between 16.1-19.4 EUR per pig in Hungarian slaughterhouses, considering average live weight. This cost is rather high in international comparison.
Average cost (AC) has two components: average variable cost (AVC) and average fixed cost (AFC). The utilisation of production capacities is an important component of competitive production, because AFC decreases with an increase of capacity utilisation, while AVC does not depend on the utilisation of production capacities in the case of such production scales. Accordingly, one of the most efficient ways of reducing average cost (AC), ceteris paribus, is to improve capacity utilisation in Hungarian slaughterhouses.
Some of the Hungarian plants which slaughter and cut pigs also produce meat products. In the case of enterprises performing both activities, 70-80% of their revenue originate from the production of meat products and only 20-30% originate from selling cuts. A concentration can be observed in the sector, but there are signs of specialisation: slaughter and cutting and the production of meat products are becoming increasingly separate from each other (Udovecz and Nyárs, 2009; FM, 2015).
According to the currently prevailing international tendencies, medium enterprises may disappear from the market by 2025 and the current actors need to decide whether to develop their plants in order to reach larger scale or to conform to the needs of niche markets by shifting to the production of special meat products (Mulder, 2015). The reason for this phenomenon is that enterprises which choose their strategy inappropriately and are unable to adapt to the changing environment may easily become the targets of large enterprises. Medium-sized processors lose their efficiency and competitiveness on the market due to their scale (Mulder, 2015). In the opinion of the authors of this paper, this scenario is too pessimistic, even though the tendency of medium-sized plants facing decreasing competitiveness is real. However, it

APSTRACT Vol. 11. Number 3-4. 2017. pages 121-130. ISSN 1789-7874
Cost analysis of pig slaughtering: a hungarian case study 123
is unlikely that these enterprises would disappear by 2025. The only way to increase competitiveness in the market of mass products is to reduce average cost, the most obvious method of which is to increase scale, improve efficiency and optimise the utilisation of existing capacities (Vernooij, 2015).
On a worldwide scale, it can be concluded that meat production can be considered a concentrated and specialised sector which calls for proper expertise and raw material, the latter of which is especially true in the case of meat processing as economies of scale and efficiency represent competitive advantage. In the early 1990s, a powerful development of the meat industry started in China, when large enterprises imported modern production lines, special processing procedures and complete technologies. On a world scale, giant companies which have the biggest capacity mostly use technology suitable for processing various types of meat, not just one. These enterprises operate by achieving both efficiency and economies of scale. JBS, the world’s largest meat industry company is operated on the basis of similar principles, performing the primary and further processing of beef, pork, poultry and mutton. Based on its processing capacity, the company is capable of slaughtering 100 thousand cattle, 70 thousand pigs, 12 million chickens and 25 thousand sheep per day (Zhou et al., 2012; Belk et al., 2014; Bene et al., 2016).
Currently, the biggest Hungarian slaughterhouse is capable of slaughtering around 1 million pigs per year, which can be regarded medium scale in comparison with the capacity of enterprises that are significant on a world scale (MCS Vágóhíd Zrt., 2017; Hungary Meat Kft., 2017). Therefore, economies of scale is also a problem that the Hungarian meat industry has to face. In the case of larger scale, slaughter and cutting can be performed at lower costs, which makes the products leaving the processing plants more competitive.
Based on these presented factors and the thoughts of Popp et al. (2015) and FM (2015), it can be concluded that the Hungarian pig sector and meat industry are currently in a difficult situation and Hungary is not competitive on an international scale with regard to the price of the produced products (basically mass products) due to the efficiency problems appearing along the product chain (breeding, fattening, processing).
Main phases of the slaughter and cutting technology
The food safety chain of the meat industry ranges from “farm to fork” and it involves feed production, primary meat production, animal transport, slaughter and processing, selling, the related logistics services and consumption (Deák et al., 2006). This study only focuses on primary meat processing, while presenting its technological steps. The fundamental “raw material” of primary meat processing is the live animal itself, i.e., pig in this case (Jankóné, 2006). In regards to pig slaughter and processing, it is necessary to use the following classification of partial processes: 0) preparation of slaughter; 1) pig slaughter; 2) preparation (for boning); 3) boning, cutting open and removal of intestines, cutting; 4)
production of end product; and 5) fat processing and packing (Sutus, 2013). The preparatory phase of slaughter involves the cleaning of the pig and veterinary duties. Stress pigs endure during transport may result in mortality. In order to avoid this problem, transport is followed by a resting period, during which animals are subjected to veterinary examination, which is the prerequirement of issuing a slaughter permit (Biró, 2014; Dikeman and Devine, 2014). The first step of the actual processing procedure is stunning, the aim of which is to reach an unconscious state. The next step is stabbing. At this stage, the objective is to extract as much blood as possible (Anonymus, 2001; Dióspatonyi, 2016). Stunned pigs are hanged upside down by their hind legs on a conveyor line which takes them along the cutting line; thereby providing easier access for veterinarians and butchers who perform processing (Anonymus, 2001). As a next step, pigs are taken to the scalding tunnel, where they are sprinkled with 64°C hot water spray. The proper cleaning of the animal starts with washing down its entire body surface using a closed body washing equipment which loosens up the follicles, thereby making it possible to (manually or mechanically) remove body hair without damaging the skin (Dióspatonyi, 2016). Dehairing is usually performed mechanically, while plucking is done manually, using a scraper (Hinrichsen, 2010). As a next step, hair and bristle remains are burnt in the singeing furnace. Flaming is done using 600-800°C gas flame, while singeing is performed with 1000-1200°C gas flame. The aim of this operation is to burn the fluffs and sterilise the body surface. The next step is the final cleaning, during which the burnt fluffs and epithelial cells are removed and the whole skin surface is cleaned. The head and limbs – which are difficult to clean – are also cleaned in this step, deformed hooves and ear fungus are removed and hooves are cut out (Madsen et al., 2006; Jankóné, 2006). Following the final cleaning, the actual processing is performed, during which the by-products are removed from the main product of slaughter. The first operation of cutting open the carcass is to remove and tie the large intestine. The next step is to cut through the sternum and open the rib cage. Then, the abdominal cavity is opened and the internal organs, such as the ventricular and intestinal tract, the tongue, lungs and heart are removed. During this process, the spleen and kidneys are also removed and the intestinal ligaments are cut, so that the pluck can be removed from the abdominal cavity. After the removal of offal, the spinal column is split in two either manually or mechanically to obtain what is called a half pig share. (Madsen et al., 2006; Jankóné, 2006; Dióspatonyi, 2016). Processing in the slaughterhouse also includes the total or partial trimming of fat. If the meat is placed on the market as unprocessed meat, the fat is trimmed entirely, but if ham and chuck are produced, the fat is not trimmed. The final steps are weighing, classification and cooling (Dióspatonyi, 2016).
MATERIALS AND METHODS
The research objective was achieved using primary data collection involving a medium-scale Hungarian enterprise

124 László Szőllősi – Szilvia Molnár – Krisztina Ladányi – Laura Karnai – István Szűcs
APSTRACT Vol. 11. Number 3-4. 2017. pages 121-130. ISSN 1789-7874
performing pig slaughter and processing. The production and technological data referring to slaughter and cutting (production process, used resources – mechanical resources, labour and purchased stocks – and their quantity, amount of slaughtered pigs, average weight at the time of slaughter, yearly stock value expressed in kg, etc.), as well as economic data (purchase prices of live pig, detailed general ledger cost data) were collected. In addition, the data and information of the annual reports of the examined enterprise between 2012 and 2016 were used. Financial data were collected and processed in HUF and were converted into EUR using the 2015 mean HUF/EUR exchange rate of 309.9. This paper relies on the primary data and information collected and related calculations regarding the work operations and costs of only the modelled plant, i.e., the slaughter and cutting plant that is the focus of this study.
Based on the technological process of pig slaughter and cutting and the 2015 stock data of the enterprise expressed in kg, the output values of processing were derived for one pig and, accordingly, the stock value of the raw material. In order to determine the latter value, the basis of calculation was selected to be the average purchase price in 2015 and the values of various by-products were also taken into consideration.
In order to determine the cost of slaughter and cutting, a post calculation structure was used on the basis of the general ledger cost items of 2015. Direct production costs represent the cost items directly related to the production process at the plant during the implementation of each work operation. This category encompasses simple direct costs which can be charged to the given cost bearer by means of direct assignment, as well as the divided costs which can be charged to the given cost bearer by means of assignment on an activity or casual basis, using a certain division basis. Overhead costs of the plant and the enterprise were not taken into consideration during calculation. Costs arising in the plant were available to us only at the plant level, as the enterprise does not separate them in accordance with the different phases of processing. Specific costs (values referring to a slaughter pig, 100 kg live weight and 100 kg carcase weight) were calculated from the direct costs of the plant. In order to evaluate the cost of slaughter and cutting, cost calculation was performed without the value of live animals, i.e., the cost of the most significant raw material.
In order to examine the impact of increasing capacity utilisation on costs by means of increasing output, it was necessary to separate fixed costs and variable costs. Based on the data in the income statements of the enterprise between 2012-2016, the response rate [1] of all costs of the enterprise was determined which expresses the proportion of variable costs compared to the total costs of the enterprise [2] (Maczó and Horváth, 2001; Kresalek, 2003).
Cost response rate = Extent of cost change (%)
Extent of cost characteristic change (%) [1]
Proportion of variable costs (%) = Cost response rate × 100 [2]
Production value was used as a cost characteristic and the values of the four examined years (2012-2013, 2013-2014, 2014-2015 and 2015-2016) were averaged. As a next step, the relative proportions of fixed and variable costs were determined at enterprise-level without the cost of live animals – which is typically a variable cost. These rates were used at the plant level also, presuming similar proportions of variable and fixed costs. Therefore, these assumed values are the estimated proportions of fixed and variable costs at the plant level. These proportions are assumed to be constant as the level of production increase. Furthermore, a sensitivity analysis was done based on expert opinion of possible alternative values for the proportions of fixed and variable costs. Accordingly, calculations were performed both with lower and higher rate of variable costs in comparison with the assumed value. Consequently, slaughter and cutting costs demonstrated in correlation with increasing the output were calculated with different response rates.
In Hungary, minimum wage and guaranteed living wage significantly increased in 2016 and 2017 and the amount of contribution to be paid by the employer greatly decreased in 2017. The impact of the change of wage level and contributions on slaughter and cutting costs (ceteris paribus) was examined in 2016 and 2017, compared to 2015.
RESULTS AND DISCUSSION
The annual revenue of the examined enterprise was between 16.2 and 20.7 million EUR during 2012-2016, with the average value being 18.5 million EUR. On average, nearly 95% of revenue originated from domestic sales and 5% of it was from exports. 96-97% of the revenue from domestic sales represents the revenue from stocks produced by the enterprise, i.e., fresh and chilled half pig shares, pork cuts, pluck, other by-products and meat products. A significant part of this share is sold by retail chains. The enterprise also operates its own shop where they directly sell their own and purchased products. The trade realised in this shop contributes 2-3% to the revenue of domestic sales. In addition, the enterprise also performs hired work of slaughtering and boning pigs, representing 0.5-1% of its domestic turnover. The export sales of the enterprise are mostly directed toward other EU Member States (Germany, Romania, Poland, Slovakia), and includes selling unprocessed pig intestines, bacon and fat to Slovakia, fat and trimmings to Poland and tenderloin to Romania.
Around 100 thousand pigs are slaughtered per year in the examined medium-scale Hungarian plant, which equals around 400 pigs per day if one calculates with 250 workdays per year on average. Pigs are slaughtered every second day for 4.5 hours per day in the plant and the remaining working hours are spent with cutting, boning and producing casings. The maximum hourly capacity of the plant is slaughtering 200 pigs, but the actually realised throughput capacity is 180. This value lags behind the larger Western European processing plants which usually apply more modern technology. The usual capacity is 200-400 slaughtered pigs per hour in Western Europe, while this number is 1000 in the US (WATTAgNet, 2008).

APSTRACT Vol. 11. Number 3-4. 2017. pages 121-130. ISSN 1789-7874
Cost analysis of pig slaughtering: a hungarian case study 125
Based on the operational data of the enterprise, the live weight of pigs is 111 kg at the time of slaughter, which is approximately the same as the relevant international data (Rasmussen 2006). The scale of the examined enterprise calls for the use of direct manual labour of around 100 people, 60% of whom are skilled and 40% are unskilled labourers. The high proportion of the latter is explained by the fact that the work procedures of processing, which do not call for any qualifications, can also be performed by unskilled labourers.
Three phases of processing are performed in the plant, while meat products are produced in a separate plant unit. As mentioned above, this study focuses on the work operations and costs of only the slaughter and cutting plant. By following the main work processes (Table 1), it can be concluded that, based on the processing of slaughter pigs of 111 kg live weight (100%), meat output can be derived as follows: 89.66 kg (80.77%) qualified pig with fat (warm carcase weight), 87.3 kg (78.65%) cold half pig share with fat, 85.69 kg (77.20%) cold half pig share with fat without the head, 62.58 kg (56.38%) cold half pig share without fat and head and 53.82 kg (48.49%) chopped and boned meat. The purchase price of live pig was between 110-123 EUR per 100 kg between 2012 and 2016, with the average being 113.7 EUR per 100 kg in 2015. Based on the examined production process, the stock value of raw material – which amounts to a significant proportion of average costs – is 141.6 EUR per 100 kg of cold half pig share with fat, 143.7 EUR per 100 kg of cold half pig share with fat without the head, 178.9 EUR per 100 kg of cold half pig share without fat and head and 200.6 EUR per 100 kg of chopped and boned meat products.
Of the 100 thousand pigs slaughtered in the plant, 30%
(2 619 tons) is sold by the enterprise as cold half pig share with fat. 17% of the meat to be further processed is sold as cold half pig share without fat (751 tons), which is 12% of all slaughtered live animals. 58% of slaughtered animals (3 122 tons) is sold as chopped and boned meat products and a small proportion is used for producing various meat products within the enterprise. The presented cost relations are to be interpreted along this product structure and the related processing structure.
The total direct production cost of processing 100 thousand slaughter pigs was 14.5 million EUR, nearly 87% of which represented the cost of live animals (12.6 million EUR). The direct production cost arising during processing – without the cost of live animals – was 1.9 million EUR per year. In the plant, the slaughter and cutting cost of a pig was 18.90 EUR in 2015, which, projected to live weight, was 17.02 EUR per 100 kg, while it was 21.54 EUR per 100 kg of carcase weight (Table 2). If only the cost directly related to slaughter and cutting is taken into consideration, it can be concluded that labour cost is the largest cost item (30%), despite the fact that manual labour is employed at the prevailing minimum wage and the guaranteed living wage. Used services (29%) and energy costs (21%) also represent significant shares. Of the used services, trade and marketing fees/expenses amounted to nearly 200 thousand EUR in the given year. The enterprise pays these fees/expenses to retail chains on various legal grounds. These costs amounted to 1-1.5% of the revenue of 2015. Other costs include depreciation (7%), indirect material (6%) and packaging material (4%).
Under the current circumstances in terms of output level (slaughter and cutting of 100 thousand slaughter pigs per year)
Table 1. Output and raw material stock value against the level of processing
Phase No. DescriptionQuantity
(kg per pig)Proportion
(%)Proportion
(%)Value
(EUR per pig)Value
(EUR per 100 kg)
I.
1. Live weight 111.00 100.00 - 126.17 113.66
2. By-products (offal) 4.17 3.76 - 1.90 45.52
3. Waste 17.17 15.47 - - -
4. Qualified pig with fat (warm carcase) (1-2-3) 89.66 80.77 100.00 124.27 138.60
5. Flare fat 1.91 1.72 2.13 0.62 32.27
6. Half pig share with fat, feet and head (warm carcase) (4-5) 87.75 79.05 97.87 123.65 140.92
7. Cooling loss 0.45 0.40 0.50 - -
8. Half pig share with fat, feet and head (warm carcase) (6-7) 87.30 78.65 97.37 123.65 141.64
9. Head, ears 1.61 1.45 1.80 0.50 30.78
10. Half pig share with fat, without the head (warm carcase) (6-9) 86.14 77.60 96.07 123.16 142.97
11. Cooling loss 0.45 0.40 0.50 - -
12. Half pig share with fat, without the head (cold carcase) (10-11) 85.69 77.20 95.57 123.16 143.72
II.
13. Half pig share with fat, without the head (cold carcase) 85.69 77.20 100.00 123.16 143.72
14. Fat 23.11 20.82 26.97 11.22 48.53
15. Half pig share without fat and head (cold carcase) (13-14) 62.58 56.38 73.03 111.94 178.88
III.
16. Half pig share without fat and head (cold carcase) 62.58 56.38 100.00 111.94 178.88
17. By-products (bone, cartilages, joints, etc.) 8.76 7.89 14.00 3.97 45.26
18. Chopped and boned meats total (16-17) 53.82 48.49 86.00 107.98 200.63
Source: own calculation based on enterprise data collection

126 László Szőllősi – Szilvia Molnár – Krisztina Ladányi – Laura Karnai – István Szűcs
APSTRACT Vol. 11. Number 3-4. 2017. pages 121-130. ISSN 1789-7874
and a throughput level of 180 pigs per hour, pig slaughter is performed every second day for 4.5 hours per day. In the remaining time, workers perform boning, chopping and the production of casings. Based on the throughput capacity of the plant, 1440 pigs can be slaughtered in one single shift per day (8 hours per shift), which, calculating with 250 workdays per year, equals to the slaughter of 360 thousand slaughter pigs per year. As a comparison, the current level of capacity utilisation is 28%. At the same time, these types of plants should operate at least in two shifts in order to utilise their capacity as best as possible, thereby reducing their specific slaughter costs which would result in slaughtering up to 720 thousand slaughter pigs per year. As a comparison, the current level of capacity utilisation is only 14%. However, increasing the amount of processed pigs is limited by the amount of live animals that can be brought in from the vicinity of the plant, as well as the related logistics and the cooling capacity available to the enterprise. A significant proportion of the cooling capacity is currently hired. Lack of skilled and unskilled labour is another
restricting factor both in the case of the examined enterprise and on a national level, while the current market position of the enterprise and the related potentially marketable amount of products also poses a limitation.
As a next step, the influence of increasing the number of processed slaughter pigs on the direct cost of slaughter and cutting was examined, assuming that the above mentioned restricting factors are eliminated. In accordance with the methodological section, the cost response rate calculated on the basis of the 2012-2016 income statements of the enterprise was 0.952, which means that 95.2% of the enterprise’s total costs are variable costs and 4.8% are fixed costs (Table 3). If the cost of live animals (i.e. 80.2% of all production costs) is deducted from variable costs, the proportion of variable costs excluding live animals is 15.1%. Consequently, it can be concluded that 75.9% of costs excluding live animals is variable costs and 24.1% is fixed costs. As a next step, it was assumed that the direct production costs excluding live animals (1.9 million EUR) of the slaughter and cutting plant
Table 2. Slaughter and cutting costs of the plant (2015)
No. DescriptionPlant value1
(EUR)Value per pig
(EUR/pig)
Value per live weight2
(EUR/100kg)
Value per carcase weight3
(EUR/100kg)
Distribution4
(%)
1. Live animals 12 616 798 126.17 113.66 143.79 -2. Packing material 74 895 0.75 0.67 0.85 4.03. Raw material – total ( 1-2) 12 691 693 126.92 114.34 144.64 4.04. Cleaning products 16 763 0.17 0.15 0.19 0.95. Maintenance material 75 353 0.75 0.68 0.86 4.06. Working and protective clothes 11 884 0.12 0.11 0.14 0.67. Material used in production 13 198 0.13 0.12 0.15 0.78. Other material 4 298 0.04 0.04 0.05 0.29. Indirect material – total ( 4-8) 121 497 1.21 1.09 1.38 6.410. Electric energy 118 038 1.18 1.06 1.35 6.211. Gas 77 809 0.78 0.70 0.89 4.112. Water 11 381 0.11 0.10 0.13 0.613. Fuel for vehicles 189 058 1.89 1.70 2.15 10.014. Energy – total ( 10-13) 396 286 3.96 3.57 4.52 21.015. Trade and marketing costs 198 545 1.99 1.79 2.26 10.516. Working clothes handling costs 48 403 0.48 0.44 0.55 2.617. Cold store, freezing 57 115 0.57 0.51 0.65 3.018. Meat inspection 54 743 0.55 0.49 0.62 2.919. Cost of hazardous waste 47 002 0.47 0.42 0.54 2.520. Maintenance costs 36 037 0.36 0.32 0.41 1.921. Live animal qualification 20 123 0.20 0.18 0.23 1.122. Laboratory analyses 7 348 0.07 0.07 0.08 0.423. Transport and loading costs 49 264 0.49 0.44 0.56 2.624. Other used services 34 095 0.34 0.31 0.39 1.825. Used services – total ( 15-24) 552 675 5.53 4.98 6.67 29.226. Other services 32 369 0.32 0.29 0.37 1.727. Material costs – total (3+9+14+25+26) 13 794 520 137.95 124.27 157.21 62.328. Wages 446 079 4.46 4.02 5.08 23.629. Employer’s contributions 127 133 1.27 1.15 1.45 6.730. Labour costs ( 28-29) 573 212 5.73 5.16 6.53 30.331. Depreciation 138 754 1.39 1.25 1.58 7.332. Direct costs – total (27+30+31) 14 506 487 145.06 130.69 165.32 -33. Direct costs excluding live animals (32-1) 1 889 688 18.90 17.02 21.54 100.0
1Based on the processing of 100 thousand slaughter pigs • 2Slaughter weight: 111 kg per pig 3Value in the case of 111 kg slaughter weight: 89.66 kg per pig • 4Excluding live animals
Source: own calculation based on enterprise data collection

APSTRACT Vol. 11. Number 3-4. 2017. pages 121-130. ISSN 1789-7874
Cost analysis of pig slaughtering: a hungarian case study 127
are in conformity with the proportions shown at the enterprise level; therefore, the direct production cost were divided into variable costs (1.4 million EUR) and fixed costs (0.5 million EUR) (Table 4). As a result, 75.9% of the slaughter and cutting costs excluding live animals is variable costs, which means that the response rate of slaughter and cutting costs is 0.759, depending on the given output.
Table 3. The proportion of fixed and variable costs at the enterprise level
DescriptionDistribution
(%)
Distribution excluding live
animals(%)
Variable costs 95.2 -of which: Cost of live animals 80.2 -
Further variable costs excluding live animals
15.1 75.9
Fixed costs 4.8 24.1Source: own calculation based on enterprise data collection
Table 4. The proportion of fixed and variable costs in the plant
DescriptionValue(EUR)
Distribution excluding
live animals(%)
Distribution (%)
Direct production cost 14 506 487 - 100.0of which: – Cost of live animals
12 616 798 - 87.0
– Direct cost excluding cost of live animals
1 889 688 - 13.0
of which: variable costs 1 434 646 75.9 9.9fixed costs 455 042 24.1 3.1
– Total variable costs 14 051 444 - 96.9Source: own calculation based on enterprise data collection
The study also includes sensitivity analysis based on an expert’s estimation of a ±0.1 deviation (i.e. ±10% in the proportion of variable costs) to the cost response rate calculated for slaughter and cutting costs. As a next step, it was analysed how slaughter and cutting costs change as a result of different output levels and different cost response rates (Table 5). The higher the proportion of fixed costs are, i.e. the lower the cost response rate is, the more the specific slaughter and cutting costs can be decreased, depending on the amount of processed slaughter pigs. If the number of slaughter pigs processed is increased by 20% in comparison with the current level, the specific slaughter and cutting costs can be reduced by 2.3-5.7%. If the plant performed slaughter for 4 hours each day, output would reach 180 thousand pigs and specific costs could be reduced by 6-15% to 16.0-17.7 EUR per pig. If the enterprise could utilise its yearly slaughter and cutting capacity of 360 thousand pigs in accordance with a single shift per day (8 hours per shift), the direct cost of slaughter and cutting one pig could even be between 14.2-17.0 EUR.
Based on the data obtained from the enterprise, the direct costs of slaughter and cutting of pigs were determined for 2015. However, since the largest proportion of direct costs excluding live animals is represented by labour costs, it was necessary to examine how the changes to laws for minimum wage, guaranteed living wage and employer’s contributions in 2016 and 2017 (ceteris paribus) affect processing costs (Table 6). In 2016, both minimum wage and guaranteed living wage increased by 5.7%, which is estimated to have resulted in a 5.7% increase in labour costs and 1.74% increase in slaughter and cutting costs. There were even more significant changes in these terms in 2017. Despite the fact that the rate
Table 5. Slaughter and cutting costs by production and cost response levels, in EUR per pig
Slaughter and cutting costs Number of slaughtered pigs (thousand pigs per year)
Cos
t res
pons
e ra
te
100 120 140 160 180 200 270 360
0.659 18.90 17.82 17.06 16.48 16.03 15.68 14.84 14.25
0.709 18.90 17.98 17.33 16.84 16.45 16.15 15.44 14.93
0.759 18.90 18.14 17.60 17.19 16.87 16.62 16.03 15.61
0.809 18.90 18.30 17.87 17.54 17.29 17.09 16.63 16.29
0.859 18.90 18.45 18.14 17.90 17.71 17.57 17.22 16.98
Source: own calculation based on enterprise data collection
Table 6. Slaughter and cutting costs at various wage and contribution levels
Description Unit 2015 2016 2017Minimum wage EUR/month 339 358 411Guaranteed living wage EUR/month 394 416 520Employer’s contributions rate % 28.5 28.5 23.5Wages EUR 446 079 471 636 571 539Employer’s contributions EUR 127 133 134 416 134 312Labour costs EUR 573 212 606 052 705 851Directs costs excluding live animals EUR 1 889 688 1 922 52 2 022 327Directs costs excluding live animals EUR per pig 18.90 19.23 20.22Amount of change (2015=100%) % 100.00 101.74 107.02
Source: own calculation based on enterprise data collection

128 László Szőllősi – Szilvia Molnár – Krisztina Ladányi – Laura Karnai – István Szűcs
APSTRACT Vol. 11. Number 3-4. 2017. pages 121-130. ISSN 1789-7874
of contributions paid by the employer decreased by 5%, the minimum wage increased by 14.9% and guaranteed living wage increased by 24.8% in comparison with 2016. These changes are estimated to have increased labour costs by 16.5% and slaughter and cutting costs by 5.2%. Altogether, the slaughter and cutting of a slaughter pig costs 7% more for the plant at the 2017 level of wages and contributions (ceteris paribus) than in 2015. In short term due to limited financial resources the enterprise couldn’t perform technological development to make substitution of labour and to increase labour efficiency. Therefore, the cost-increasing effects of changes to law for minimum wage, guaranteed living wage and contributions couldn’t be reduced.
CONCLUSIONS
The net outputs of product relative to live pig weight processed in the examined plant are 78.7% cold half pig share with fat, 77.2% cold half pig share without the head, 56.4% cold half pig share without fat and head, and 48.5% chopped and boned meat products. The purchase price of live pig was 113.7 EUR per 100 kg in 2015. Consequently, the stock value of raw material was 141.6 EUR per 100 kg for cold half pig share with fat, 143.7 EUR per 100 kg for cold half pig share with fat and without the head, 178.9 EUR per 100 kg for cold half pig share without fat and head and 200.6 EUR per 100 kg for chopped and boned meat products.
Based on the cost calculation results, it can be concluded that the direct production cost of slaughter and cutting, excluding the cost of live animals, was 18.9 EUR per pig in the case of processing 100 thousand pigs per year in the examined Hungarian mid-scale enterprise in 2015. Consequently, the first part of hypothesis H1, i.e. “At the plant, based on the current level of capacity utilisation, the direct cost of slaughter and cutting was between 16.1-19.4 EUR per pig in the examined period” is accepted. Labour costs represented the highest share (30%) within the cost structure, followed by used services (29%) and energy cost (21%) when the cost of live animal is excluded. Consequently, the second part of hypothesis H1 “the largest share of which was represented by labour costs” can also be accepted. This shows the significance of the change of Hungarian wage and contribution standards for the meat industry, since it has a great impact on processing costs. Based on changes to the wage and contribution standards, it was estimated that slaughter and cutting costs would be 7% higher in 2017 compared to 2015, and are attribute to significant increase in minimum wage (14.9%) and guaranteed living wage (24.8%), as well as a 5% decrease in employer’s contributions in 2017. The increase in wage level and lack of labour in the processing industry call for modernisation and automatization, in conformity with the tendency shown by the European meat processing industry in the last two decades (EC, 2011).
Compared to the plant capacity of a daily single 8-hour shift (processing 360 slaughter pigs per year), the current work schedule – 4.5 hours of slaughtering every second day – results in a low level of capacity utilisation (28%). According
to the calculation performed in this study, an increase of capacity utilisation could result in reducing the direct cost of slaughter and cutting to an estimated 14.2-17.0 EUR per pig in the case of processing 360 thousand slaughter pigs per year. Consequently, the first part of hypothesis H2 (“The current level of capacity utilisation is low”) can be accepted, but the second part (“its improvement could potentially result in reducing the cost of slaughter and cutting to 12.9 EUR per pig”) is rejected. At the same time, there are several restricting factors concerning the optimum utilisation of capacities within both the external and internal environment of the enterprise. In order to increase output and improve capacity utilisation, the enterprise primarily needs to increase the amount of live animals brought in, which can only be provided with reliable supplier relations and long-term agreements. However, the structure and tendency of the current pig product chain in Hungary – decreasing pig population, many small-scale processing plants with underutilised capacities – pose further restrains. Cooling capacity is another limitation. The extension of cooling capacity is recommended for the enterprise, if its additional cost is less than the cost savings that could be achieved by better utilisation of slaughtering and cutting capacity as well as availability of sufficient capital. Covering the increasing demand for labour in relation to extending production is also a problematic issue both for the enterprise and at a national level. In parallel with increasing output, current markets also need to be extended and new ones have to be built up. As a result, the amount of products to be produced is also fundamentally affected. It has to be added that even if this enterprise processed 360 thousand pigs per year, it would still be considered small-scale in international comparison. Although not analysed here, it is recommended for the enterprise to consider a shift to producing higher value end products and, accordingly, to invest in product development, which, again, may be restricted by existing and available financial resources.
REFERENCES
Anonymus (2001): Slaughter-line for pigs is completed. An auto-mated evisceration progress is integrated into the slaughter-line at Danish Crown. Fleischwirtschaft 81(5), 111-115.
Bábáné Demeter E. (ed.) (2017): Statisztikai jelentések – Vágóhi-dak élőállat-vágása, 2016. I-XII. hónap. 10(1), Agrárgazdasági Kutató Intézet, Budapest, 9. Available at: http://repo.aki.gov.hu/2424/1/2017_01_vagas.pdf
Belk K.E., Woerner D.R., Delmore R.J., Tatum J.D., Yang H., So-fos J.N. (2014): The meat industry: do we think and behave globally or locally? Meat Science 98(3), 556-560. http://dx.doi.org/10.1016/j.meatsci.2014.05.023
Béládi K., Kertész R., Szili V. (2017): A főbb mezőgazdasági ágaza-tok költség- és jövedelemhelyzete 2013-2015. Agrárgazdasági Ku-tató Intézet, Budapest. 38-44. http://dx.doi.org/10.7896/ai1704
Bene A., Dudás Gy., Garay R., Kürthy Gy., Székelyhidi K., Darvas-né Ördög E., Felkai B.O., Györe D., Radóczné Kocsis T. (2016): A magyarországi élelmiszeripar helyzete és jövőképe. Agrárgazdasági Kutató Intézet, Budapest. 8., 52. http://dx.doi.org/10.7896/at1603

APSTRACT Vol. 11. Number 3-4. 2017. pages 121-130. ISSN 1789-7874
Cost analysis of pig slaughtering: a hungarian case study 129
Biró G. (2014): Élelmiszer-higiénia. Agroinform Kiadó, Budapest, 235-321.
Council Regulation (EEC) No 3220/84 of 13 November 1984. De-termining the Community scale for grading pig carcases. Official Journal of the European Communities. No L 301. Brussels, 20 No-vember 1984. 1-3. Available at: http://eur-lex.europa.eu/legal-con-tent/EN/TXT/PDF/?uri=CELEX:31984R3220&from=en
Deák T., Kiskó G., Maráz A., Mohácsiné F.Cs. (2006): Élelmiszer-mikrobiológia. Mezőgazda Kiadó, Budapest, 215-217.
Dikeman M., Devine C. (2014): Encyclopedia of Meat sciences. Second edition. Academic Press, London, 453-465.
Dióspatonyi I. (2016): A húsfeldolgozás technológiája. Available at: http://www.chemonet.hu/hun/food/technol/husipar/husipar.html#3
EC (2011): Study on the competitiveness of the European meat processing industry. European Commission, Enterprise & Indus-try Magazine, Publications Office of the European Union, Lux-emburg, 83-234. Available at: http://www.sustainicum.at/files/projects/342/en/additional/report_compmeat_en.pdf, http://dx.doi.org/10.2769/11795
EC (2017): DG AGRI Dashboard: Pigmeat. European Commis-sion, Agricultural and Rural Development, 18 January. Available at: https://ec.europa.eu/agriculture/sites/agriculture/files/market-observatory/meat/pigmeat/doc/dashboard-pig_en.pdf
FAO (2017): Food and Agriculture Organization of the United Na-tion’s database. Available at: http://www.fao.org/statistics/en/
FM (2015): Magyarország közép- és hosszú távú élelmiszeripari fej lesztési stratégiája – 2014-2020., Földművelésügyi Minisztérium, Budapest, 30-31. 23 April. Available at: http://www.kormany.hu/download/f/82/60000/%C3%89FS.pdf
Gila É. (2017): Szakértői vélemény. A hazai húsipar komplex fe-jlesztési koncepciójának megalapozása c. interaktív workshop. Deb-recen, Hungary, 17 January.
HCSO (2017): Hungarian Central Statistical Office’s database. Available at: www.ksh.hu
Hinrichsen L. (2010): Manufacturing technology in the Danish pig slaughter industry. Meat Science 84(2), 271-275. https://doi.org/10.1016/j.meatsci.2009.03.012
Horn P., Sütő Z. (2014): A világ baromfihús-termelése és az előállítás versenyképessége. Acta Agraria Kaposváriensis 18(1), 14-29.
Hungary Meat Kft. (2017): Company profile. Website. Available at: http://www.hungarymeat.com/index_hun.html
Jankóné F.J. (2006): Élelmiszeripari technológiák. Szeged, 28-35. Available at: http://food.atw.hu/technologia/elemit.pdf
Jankuné Kürthy Gy. (2017): A magyarországi húsipar helyzete a szá-mok tükrében. A hazai húsipar komplex fejlesztési koncepciójának megalapozása c. interaktív workshop. Debrecen, 2017. január 17.
Kozák J. (2015): A világ hústermelésének, kereskedelmének és fogyasz tásának tendenciái. Gazdálkodás 59(1), 20-34.
Kresalek P. (2003): Tervezés a vállalkozások gyakorlatában. Perfekt Rt., Budapest, 225-226.
Maczó K., Horváth E. (ed.) (2001): Controlling a gyakorlatban. Ver-lag Dashöfer Szakkiadó Kft. 176-190.
Madsen N.T., Nielsen J.U., Monsted J.K. (2006): Automation – the meat factory of the future. Proceedings of ICoMST. The Nether-lands: Wageningen Academic Publishers. 35-42. Available at: http://www.icomst.helsinki.fi/previous_congress/ICoMST%2052/ICoM-STpresentations/Thursday/Madsen.pdf
MCS Vágóhíd Zrt. (2017): Available at: http://mcs.hu/
Mulder N.D. (2015): Poultry in motion: 10 golden rules for winners in the EU poultry industry. Rabobank Industry Note #495. June 2015. 8-9. Available at: https://www.farminguk.com/content/knowl-edge/Golden%20rules%20for%20winners%20in%20the%20EU%20poultry%20industry(6740-485-7875-6287).pdf
NFCSO (2017): A minősítésre kötelezett vágóhidak sertésvágásának alakulása 2016-ban. National Food Chain Safety Office. Available at: https://sertesinfo.aki.gov.hu/publikaciok/publikacio/a:1045/A+min%C5%91s%C3%ADt%C3%A9sre+k%C3%B6telezett+v%C3%A1g%C3%B3hidak+sert%C3%A9sv%C3%A1g%C3%A1s%C3%A1nak+alakul%C3%A1sa+2016-ban
OECD-FAO (2017): OECD-FAO Agricultural Outlook 2017-2026. Available at: http://stats.oecd.org/Index.aspx?datasetcode=HIGH_AGLINK_2017#
Popp J., Szakály Z., Pető K., Harangi-Rákos M. (2015): A sertéste-nyésztés helyzete a globális kihívások tükrében. Állattenyésztés és Takarmányozás 64(3), 207-225.
Rasmussen J. (2006): Costs in international pig production. Danish Bacon and Meat Council, Department for Housing and Production Systems.
Sutus I. (2013): Mezőgazdasági vállalkozások könyvvizsgálatának speciális feladatai. Magyar könyvvizsgálói Kamara, Ágazati Mód-szertani Füzetek. 95-108.
Udovecz G., Nyárs L. (2009): A sertéságazat versenyesélyei Magyar országon. Állattenyésztés és Takarmányozás 58(5), 451-466.
Vernooij A. (2015): The EU pork industry: competitive power is key! Rabobank Industry Note #509. September 2015. 1-7. Available at: http://hugin.info/133178/R/1956040/712377.pdf
WATTAgNet (2008): Is this the meat factory of the future? 27 March. Available at: http://www.wattagnet.com/articles/874-is-this-the-meat-factory-of-the-future
Zhou G., Zhang W., Xu X. (2012): China’s meat industry revo-lution: challenges and opportunities for the future. Meat Science 92(3), 188-196. https://doi.org/10.1016/j.meatsci.2012.04.016


APSTRACT Vol. 11. Number 3-4. 2017. pages 131-140. ISSN 1789-7874
DOI: 10.19041/APSTRACT/2017/3-4/18
Applied Studies in Agribusiness and Commerce – APSTRACT Center-Print Publishing House, Debrecen SCIENTIFIC PAPER
HUNGARIAN DAIRY AND BEEF PRODUCTION SECTOR TECHNICAL EFFICIENCY COMPARSION USING DEA
Krisztián Kovács - Ratnesh PandeyUniversity of Debrecen
Faculty of Economics and BusinessDepartment of Farm Management and Corporate Planning
E-mail: [email protected]
Abstract: To examine and compare the technical efficiency of dairy sector and the beef sector, this research introduced the main indicators of milk and beef production in the world, EU and Hungarian aggregates. Based on the data it can be said that the milk and beef production of Hungary does not occupy any significant position in the world as well as in the European Union neither today nor even in the past. If Hungry must compete in the European counties and international market, their dairy sector must focus to increase of their production efficiency as the key breakthrough point. This paper we compared technical efficiency of both dairy and beef sectors in total, for the year 2014 and 2015 separately and based on the farm size. The specific objectives of the research are: comparing dairy and beef farms efficiency in Hungary. Based on the results, we can deter-mine which sector in Hungary is more effective. The second objective is to compare the efficiencies of both the sectors in 2014 and 2015 separately and from the results we can determine which year was more effective in terms of production efficiency and the third objective of the research is technical efficiency comparison of certain economic sizes for both sectors. In the research, we used (KOVACS, 2009) deterministic (DEA) model adapted to the Hungarian dairy farms and beef farms. For the dairy farms milk and dairy products as well as meat (other income). The input factors originated from the domestic AKI - FADN database.Summarizing the results of the research it can be conclude that the dairy sector is more effective than the beef sector in Hungary. In terms of years compared 2014 was more effective for both sector as compared with 2015. In regards to the farm size almost the same result in evaluating the scale of efficiency, which means that large economies can in most cases, manage resources more efficiently than small farms. In the examined years, based on the results of the DEA model, the VRS technical efficiency of the test for these two years was 72.90% for the dairy farms and 63.60% for the beef farms, which means that the dairy sector is more efficient than the beef sector in Hungary. The VRS technical efficiency of the research was 82.10% in 2014 and 75.10% in 2015 for the dairy farms and 77.50% in 2014 and 68.90% in 2015 for the beef farms, which means that both the dairy sector and the beef sectors followed the same trend and were more efficient in 2014 compared to the efficiency in 2015. The large size dairy farms were most effective in Hungary in the examined period (90.90%). VRS technical efficiency for small farms is 88% and the total number of small, the technical efficiency medium farms was 72.80% For the beef sector VRS technical efficiency for small farms is 71.30% and the technical efficiency medium farms was 74.40% and 70% of the beef meat producing farms in Hungary are medium sized. So, the conclusion is the small size dairy farms have a higher VRS efficiency than the small size beef farms whereas medium sized beef farms had higher VRS efficiency than the medium size dairy farms. As a conclusion, both dairy and beef sectors in Hungary have the potential to overcome technology and knowledge constraints and attain the upmost attainable productivity level through improvements in; farmer volume of production i.e. output, beef cattle technologies, and advertising, and the efficiency of the technology transfer process.
INTRODUCTION
Milk and meat have a play a very vital role in human nutrition, therefore milk and meat production is a significant subject in the global food supply chain, particularly in emerging economies. As milk and meat are one of the most important part of global nutrition supply it is essential to increase production efficiency of the meet the huge demand of the beef meat and dairy products for the very fast growing
population. From an economics, financial and social point of view, increasing the efficiency level of the milk production and meat production from the non-dairy cattle is a very important for both European Union (EU) and Hungarian agriculture sector as well.
The world milk production has shown a continuous rising trend in the last three decades, world milk production has increased by more than 50 percent, from 500 million tonnes in 1983 to 802 million tonnes in 2014. (FAOSTAT 2014).
Keywords: efficiency, DEA, dairy sector, beef sector, Hungary. (JEL Code: Q13)

132 Krisztián Kovács - Ratnesh Pandey
APSTRACT Vol. 11. Number 3-4. 2017. pages 131-140. ISSN 1789-7874
The biggest milk producer in the world is Asia (39%) The second largest milk producer is Europe (28%) followed by the American continent (North-, Central-, South America and the Caribbean) which represents 23% of the total milk production in the world (FAOSTAT 2014). Hungary accounts for 1880949 Tonnes of milk, which is 0.84% of total Europe production (FAOSTAT 2014).
Beef is the third most widely consumed meat in the world, accounting for about 25% of meat production worldwide, after pork and poultry at 38% and 30% respectively. It is interesting to see India is the largest producer and exporter of buffalo meat in the world. The biggest Beef Meat producer in the world is the American continent (North-, Central-, South America and the Caribbean (45%) The second largest Beef Meat producer is Asia (26%) followed by the Europe which represents 15% of the total Beef Meat production in the world (FAOSTAT 2014). Hungary produces 25800 tonnes of beef meat, which accounts for 0.25% of total Europe production (FAOSTAT 2014).
The European Union produced 151.58 million tonnes of whole fresh cow milk in 2014 (EUROSTAT, 2015), of which Hungary accounted for 1.536 million tonnes of fresh cow milk which was merely 1.01 percent of the total EU production. As per Figure 1, which represents the milk production in Hungary observed over the period of 2011 to 2015, the milk production was relatively stable, in 2012, 2013 and 2014. However, the price went down rapidly in 2015.
Figure 1: The cow milk production in Hungary (whole, fresh) from 2011 to 2015 (million litres)
1 667
1 7651 726
1 8261 890
1 500
1 600
1 700
1 800
1 900
2 000
2011 2012 2013 2014 2015
cow
's m
ilk,m
illio
n lit
res
312000 309000
252000 256000 249000
050000
100000150000200000250000300000350000
2010 2011 2012 2013 2014
Dairy
cow
s
Source: KSH 2016
Figure 2: The total number of dairy cows in Hungary from 2010 to 2014
1 667
1 7651 726
1 8261 890
1 500
1 600
1 700
1 800
1 900
2 000
2011 2012 2013 2014 2015
cow
's m
ilk,m
illio
n lit
res
312000 309000
252000 256000 249000
050000
100000150000200000250000300000350000
2010 2011 2012 2013 2014
Dairy
cow
s
Source: KSH 2016.
If we observe the Figure 1 and Figure 2 during the examined period the number of cows decreased in Hungary, but the milk production was quite steady and saw an increasing trend. The reason for this is the growing performance of the cows. The average milk production per year per cow (Figure 3) is the highest in 2012 (7 533 kg); and lowest in 2010 (5 400 kg).
Figure 3: The average milk production per cow in Hungary from 2011 to 2015 (kg)
5400 5542
7194 6925 7533
0
2000
4000
6000
8000
2010 2011 2012 2013 2014
Milk
pro
duct
ion
per c
ow(k
g)
23 23 26
28 29
0
5
10
15
20
25
30
35
2013 2014 2015 2016 2017*Be
ef m
eat (
thou
sand
to
nnes
)
88 91 103 108 112
0
20
40
60
80
100
120
2013 2014 2015 2016 2017*
Bovi
ne li
vest
ock
( tho
usan
d)
Source: KSH 2016
If we observe Figure 4, where we can see the total beef meat production in Hungary from 2013 to 2017.It must be noted that the values for year 2017 are forecasted values. Beef production has seen an increasing trend in the past 4 years and is expected to increase slightly this year.
Figure 4: The beef production in Hungary from 2011 to 2015 (thousand tonnes)
5400 5542
7194 6925 7533
0
2000
4000
6000
8000
2010 2011 2012 2013 2014
Milk
pro
duct
ion
per c
ow(k
g)
23 23 26
28 29
0
5
10
15
20
25
30
35
2013 2014 2015 2016 2017*
Beef
mea
t (th
ousa
nd
tonn
es)
88 91 103 108 112
0
20
40
60
80
100
120
2013 2014 2015 2016 2017*
Bovi
ne li
vest
ock
( tho
usan
d)
Source: EUROSTAT 2017
We can see in the Figure 5 the total bovine livestock in Hungary from 2013 to 2017.it also follows the same increasing trend like the beef meat production in the last 4 years and is expected to increase a little this year. The bovine livestock in Hungary increased from 88 thousand in 2013 to 108 thousand in 2016. This year Hungary has forecasted to have 112 thousand bovine livestock (ESTAT 2017).
Figure 5: The total bovine livestock in Hungary from 2013 to 2017
5400 5542
7194 6925 7533
0
2000
4000
6000
8000
2010 2011 2012 2013 2014
Milk
pro
duct
ion
per c
ow(k
g)
23 23 26
28 29
0
5
10
15
20
25
30
35
2013 2014 2015 2016 2017*
Beef
mea
t (th
ousa
nd
tonn
es)
88 91 103 108 112
0
20
40
60
80
100
120
2013 2014 2015 2016 2017*
Bovi
ne li
vest
ock
( tho
usan
d)
Source: EUROSTAT 2017Figure 6: The total beef meat production in Hungary
from 2011 to 2015 (kg)
261,36
252,75 252,43
259,26 258,93
245,00
250,00
255,00
260,00
265,00
2013 2014 2015 2016 2017*
Mea
t pro
duce
d/
boni
ve li
vest
ockk
g)
Source: EUROSTAT 2017

APSTRACT Vol. 11. Number 3-4. 2017. pages 131-140. ISSN 1789-7874
Hungarian Dairy And Beef Production Sector – Technical Efficiency Comparsion Using Dea 133
Figure 6 illustrate beef meat produced per livestock. If we observe the trend we can see the quantity of meat produced per livestock is almost the same with just slight variations. Meat produced per was livestock was maximum in 2013, 261.36 kg per livestock and minimum in 2014, 252.43 kg per livestock. In 2016 in increased to 259.26 kg per livestock and in 2017 it is forecasted to decrease very little and will be 258.93 kg per livestock.
The Hungarian farms both dairy and beef should have to increase their technical efficiency, else they will reduce their production potential, now it seems that they are producing extensively, but in a big volume per farm. The measuring was limited by measuring one input and one output performance of the farms. Thus, the measuring of the inputs and the outputs was separately, during the following chapters the efficiency performance measuring regard with respect to all inputs and all output as many authors called (FARRELL, 1957; BEGUM el. al. 2009; COELLI et. all 2005., TAUER, 1998; JAFORULLAH AND WHITEMAN, 1999; STOKES et al., 2007) in the literature the “multiple input and output measurement”.
Over-all, efficiency is a very wide concept, it is necessary to define precisely what does it means, what are the factors that effect it, what are the evaluation pointers and which methods could be used to calculate the efficiency for single farm. Increasing efficiency should be a priority for both the European Union and Hungarian farms to ensure that a single dairy can also produce competitively and efficiently for both national as well as global markets in an economically, socially and ecologically sustainable way.
In Hungary, due low level of market concentration the producers in both dairy and beef sectors the producers are the price takers and the processors are the ones who set the price for them. If the producers want to increase their profits, then they must try to increase their efficiency level. As noted by BAUER et al. (1998), policy makers are mainly interested in the potential impact of their decisions on firms Performance. A firm that is inefficient is wasting inputs because it does not produce the maximum attainable output, given the quantity of inputs used, and hence the possibility of reducing average costs. Irrespective of whether a developed or developing economy is under consideration, findings from the study of technical efficiency have far-reaching policy implications.
Studying farm efficiency and the potential sources of inefficiency are therefore important from a practical and a policy point of view. On the one hand, farmers could use this information to improve their performance and policymakers could use this knowledge to identify and target public interventions to improve farm productivity and farm income (SOLÍS et al., 2009).
This research focuses on estimating and comparing the levels of technical efficiency (TE) among dairy farms industry and beef industry in Hungary. The estimation of technical efficiency will be carried using Data Envelopment Analysis (DEA). The results produced will help us to determine which of the two industry is more profitable and effective.
OBJECTIVE OF THE RESEARCH
The first objective of the research is to compare dairy and beef farms efficiency in Hungary. Based on the results, we can find which sector in Hungary is more effective. The second objective is to compare the efficiencies of both the sectors in 2014 and 2015 separately and from the results we can find which year was more effective in terms of production efficiency and the third objective of the research is technical efficiency comparison of certain economic sizes for both sectors. Here I have classified and compared farm sizes into three groups: small farms (EU size classes 3-5); medium farms (EU size classes 6-9) and large farms (EU size category 10-14). The research questions of this thesis are: What is technical efficiency of the dairy sector and the beef sector in Hungary? The dairy farms in which year (2014 or 2015) was more efficient compared to their national frontier? Which farm size in Hungary was the most efficient in both dairy and beef sector?
A literature study will be performed in two directions. Firstly, literature on the overviews of the world and Hungarian dairy industry and beef industry will be examined. Secondly, the efficiency measurement technique in the both the sectors will be studied.
The next step will be the determination of dairy farm criteria and beef meat production criteria and build up our database for 2014 and 2015. These data might be available from various sources but mainly the AKI (Research Institute of Agricultural Economics) - FADN database. For the country, related data following database will have be used: FAOSTAT, EUROSTAT. The theoretical background and some expert guidance from the supervisor will help to assess the efficiency measuring procedure.
To study the determinants of technical efficiency we use data envelopment analysis (DEA), which is a non-parametric approach to estimate frontier functions and the calculation of efficiency measures (e.g., TAUER, 1998; JAFORULLAH AND WHITEMAN, 1999; STOKES et al., 2007).
MATERIALS AND METHODS
In this research, we use a database from the European Farm Accountancy Data Network (FADN). The idea of the FADN was launched in 1965, after Council Regulation 79/65 established the legal basis for the organization of the network. It contains an annual survey carried out by the Member States of the European Union (EU). The agencies accountable in the European Union for the process of the FADN gather each year accountancy data from a sample of the agricultural holdings in the European Union. Resulting from nationwide surveys, the FADN is the solitary source of micro-economic data that is consistent, because the bookkeeping principles are the identical for all member countries. Holdings are selected to be a part of the survey based on sample plans established at the level of every respective region in the EU. The survey does not cover all the agricultural holdings in the EU, but only those which due to their size could be considered commercial

134 Krisztián Kovács - Ratnesh Pandey
APSTRACT Vol. 11. Number 3-4. 2017. pages 131-140. ISSN 1789-7874
which means the very small land holdings which are non-commercial are not a part of the survey. The method applied intends to give illustrative data along three dimensions that is, region, economic size and type of farming (FADN 2017).
The database contains farm level data, where the input and output data express with monetary units (−). The dataset organized by yearly for every farm, so this makes the panel dataset (FADN 2017).
Table 1: classification of test holdings size classes
ClassesEU size
categoriesSTE limits euro
Does not form part of the FADN
(I) Below 2000 EUR
(II) from 2000 - 4000 EUR
(1) small farms (3-5)
(III) from 4 000 - 8000 EUR(IV) from 8000 - 15000 EUR
(V) from 15000 - 25000 EUR
(2) Medium farms (6-9)
(VI) from 25 000 - 50 000 EUR(VII) from 50 000 - 100 000 EUR(VIII) from 100 000 - 250 000 EUR
(IX) from 250 000 - 500 000 EUR
(3) Large farms (10-14)
X from 500 000 -750 000 EUR(XI) from 750 000 - 1 000 000 EUR(XII) from 1 000 000 - 1 500 000 EUR(XIII) from 1 500 000 - 3 000 000 EUR
(XIV) 3 000 000 EUR or above Source: Own classification system based on the Commission
Regulation (EC) No 1242/2008
If we see Table 1 we will observe the FADN classifies land holding in three classes that is small farms which includes categories (III – V) and the farm revenue ranges from 2000 euros to 25,000 euros depending on the farm category, the medium farms comprise of categories (VI – IX) and the farm revenue ranges from 25,000 euros to 500,000 euros and the large farms comprise of categories (X – XIV) and the farm revenue ranges from 500,000 euros to 3,000,000 euros or above. We can also observe that farms with revenue of less than 2000 euros are not considered to be the part of FADN database.
In this research, we choose the dairy farms and beef production farms from Hungary for 2014 and 2015. We mainly focus on those dairy farms, whose revenues from cow’s milk production and beef producing farms whose revenue form beef meat production are at least 75% of their total revenues for every year. We compare the efficiencies for the following:
Dairy sector efficiency and the beef sector efficiency.Both sectors efficiencies in the year 2014 & 2015 separately.Efficiencies for both the sectors based on the farm size
(small, medium, large).After the input data deflation, we have used (KOVACS
2009; KOVACS 2016) deterministic (DEA) model modified as per Hungarian dairy farms in which the output variables were the cow’s milk and milk products variable (values expressed in EUR in the database under the following code: SE216); and as another income, they sold beef and veal variable (values expressed in EUR in the database under the following code: SE220).
For the dairy farms model, the five input variables were, namely:
(1) Total fixed assets: It includes land associated to agricultural activity and the buildings and is expressed in EUR, these assets remain constant all the time, or at least for a prolonged time to serve the population of economic activity and they do not wear out are not, or only slightly wear out during production. This is shown as the following code in the FADN database: SE441.
(2) Total current assets: The current assets comprise (stocks and other rotating equipment) and expressed in EUR is basically the value of the breeding animals which wear during production, or stocks wholly destroyed, or else pass through the target assets, so that continuous replacement is essential. This is shown as the following code in the FADN database: SE465
(3) Labour Input: It contains the total number of working hours. This is shown as the following code in the FADN database: SE011
(4) Major cost items: This input factors include the biggest three categories of costs and is expressed in EUR. These are usually the highest per capita livestock feed costs, but it represents a significant cost item in energy costs as well. The unit cost of energy includes fossil fuels and electrical energy costs, as well as the value of the plant and lubricants as well. The third component of this category of categories other direct costs, which is the biggest factor in the cost of veterinary expenses, but includes a variety of tests, or storage costs that can be directly charged to the sector. It is listed with the following code in the FADN database: SE310 + SE330 + SE345.
(5) Dairy cows: This category includes female sex cattle on the farm European livestock units (LSU), which are held primarily for milk production. European livestock units of the dairy cow are 1, while younger than two years old calves take account of between 0.4 and 0.6. This is stated in the following codes in the FADN database: SE085.
Both input and output factors of the model were derived from the Hungarian FADN database. The 87 185 data points were analysed in the model, which includes data from about 1646 dairy farms in Hungary.
For the beef farm model, there was only one output variable which was beef meat variable (values expressed in EUR) in the database under the following code: SE220).
In the model, we have used five input variables for the beef sector, namely:
(1) Total fixed assets: It includes land associated to agricultural activity and the buildings and is expressed in EUR, these assets remain constant all the time, or at least for a prolonged time to serve the population of economic activity and they do not wear out are not, or only slightly wear out during production. This is shown as the following code in the FADN database: SE441.
(2) Total current assets: The current assets comprise (stocks and other rotating equipment) and expressed in EUR is basically the value of the breeding animals which wear during production, or stocks wholly destroyed, or else pass

APSTRACT Vol. 11. Number 3-4. 2017. pages 131-140. ISSN 1789-7874
Hungarian Dairy And Beef Production Sector – Technical Efficiency Comparsion Using Dea 135
through the target assets, so that continuous replacement is essential. This is shown as the following code in the FADN database: SE465
(3) Labour input: It contains the total number of working hours. This is shown as the following code in the FADN database: SE011
(4) Major cost items: This input factors include the biggest three categories of costs and is expressed in EUR. These are usually the highest per capita livestock feed costs, but it represents a significant cost item in energy costs as well. The unit cost of energy includes fossil fuels and electrical energy costs, as well as the value of the plant and lubricants as well. The third component of this category of categories other direct costs, which is the biggest factor in the cost of veterinary expenses, but includes a variety of tests, or storage costs that can be directly charged to the sector. It is listed with the following code in the FADN database: SE310 + SE330 + SE345.
(5) Livestock: This category includes cattle on the farm European livestock units (LSU), which are held primarily for beef meat production. This is stated in the following codes in the FADN database: SE090.
Both input and output factors of the model were derived from the Hungarian FADN database. The 3 074 data points were analysed in the model, which includes data from about 55 beef producing farms in Hungary. As it can be seen there are a very few beef producing farms reason being it’s more expensive to produce and people prefer other meats like pork and chicken.
After the organization of the collected data from the FADN database as possible model variables, we performed the data deflation and cleared the outlier values, then finally merged the data for the year 2014 and 2015. After all, of this, we could start to filter the database in accordance with the categorization criteria, such as the creation of sub-databases with our categories. Such categorization criteria were:
– Both years from 2014 and 2015; – Both sectors Dairy and beef respectively. – farm size (small, medium and large);In addition to these categorical terms, we used the research
method (DEA) to compare both the sectors efficiencies. We presumed output orientation for the DEA model, which suggests that the for the farms in research, we estimate how much production amounts can be proportionally increased (maximized) without varying the input quantities used. For the result, it has no effect assuming input or output orientation, the two results must be the same. The results obtained by this research can be useful for the milk production and the beef production farms in the database. To make an effective countrywide inference, the data should be weighted by the farms’ relative national weight. Its performance inside the technical efficiency measurement model will make the model too complex and cause undependable results. This can be evaded if the model itself is not applied to the weights, but individual efficiency values provided by the model are weighted at the end of the procedure. In the weighting procedure, weighted statistical averages were calculated
for each categorization criteria for each category. This is more time-consuming, but we think it gives more reliable results than the model built by the weighted method. At the frontier estimation, it does not matter that a point in the model represents 5 or 50 holdings (or decision making units (DMU)). In the method, the categorization criteria weights play an important role at the post-weighing efficiency results. The relative economic weights used in the model came from AKI adopted by the EU.
During the research, efficiency indicators of dairy farms and beef producing farms were analysed for the year 2014 and 2015. We also explore the efficiency level of small, medium and large holdings. The last examination focused on the technical efficiency of both the sectors in total and their comparison. Naturally, efficiency values should also be weighted at the end to draw national-level conclusions. To do so, a weighted statistical average was calculated using the AKI’s FADN system adopted weights calculated for each category. The weighting missed on the year’s category, because here the results will not affect the weights.
The secondary database provided by the AKI (Research Institute of Agricultural Economics) included financial data from 212 holdings for the dairy farms and 55 holdings for the beef production farms in the reviewed period. After filtering out the data points in the model and the data outliers, which included a negative value, as cost cannot be interpreted as a negative value, or none of the emissions. Though, the final output of the model will not be affected by removal of the negative values due to the large number of elements to the model.
The following tables provide an overview of the data used in the structure, and average categories. The first table shows the two output and six input factors averages each year. It also includes the number of farms each year entered the model is based on the FADN database.
The Table 2 gives an overview of two output factors i.e. revenue from milk and revenue from meat for both years, the sum of total output for both the years and the average output from milk and meat per farm. It represents all the input factors for the year 2014 and 2015 along with the total and the average input per farm for all the factors. Lastly, we can see the number of milk producing dairy farms in Hungary. If we observe the Table 2 carefully, we can see that the revenue from milk decreased slightly in 2015 compared to 2014 and the average revenue from milk per dairy farm was EUR 450471. The revenue from meat also followed the same trend as it decreased slightly in 2015 and the average revenue from meat per dairy farm was EUR 63868. All the input factors were used more in 2015 as compared to 2014 that contributed to decrease in the technical efficiency of the dairy farms in 2015. The reason for this was the input was increased but the output decreased which is not a good sign for any industry. We can observe in the table below that average working hours per farm was 31 576 hours per year and average dairy cow per farm was 194.The total number of dairy farms during the observed period were 202 after removing the data outliers and the negative values.

136 Krisztián Kovács - Ratnesh Pandey
APSTRACT Vol. 11. Number 3-4. 2017. pages 131-140. ISSN 1789-7874
Table 2: Output and input factors the average values for the years under review for dairy farms
Year 2014 2015 TotalAverage/
FarmRevenue from milk (EUR)
45 987 433 45 007 636 90 995 069 450 471
Revenue from meat(EUR)
6 501 499 6 399 787 12 901 286 63 868
Fixed Assets(EUR) 91 606 087 100 768 750 192 374 837 952 351Current Assets(EUR) 48 351 638 52 674 427 101 026 065 500 129Working Hours(Hours)
3 054 443 3 323 971 6 378 414 31 576
Major costs Items(EUR)
39 638 548 43 627 940 83 266 488 412 210
Dairy Cows(LSU) 17 957 2 1176 39 133 194
Number of Farms 93 109 202
Source: Own calculation based on the AKI FADN database
The Table 3 gives an overview of one output factors i.e. revenue from meat for both years, the sum of total output for both the years and the average output from meat per farm. It also presents the five input factors namely 1) fixed assets 2) current assets 3) number of working hours 4) major cost items and 5) livestock. It represents all the input factors for the year 2014 and 2015 along with the total and the average input per farm for all the factors. Lastly, we can see the number of beef meat producing farms in Hungary. If we observe the table 3.2.2 carefully we can see that the revenue from beef meat increased slightly in 2015 compared to 2014 and the average revenue from beef meat per farm was EUR 38 701. All the input factors were used less in 2015 as compared to 2014. We can observe in the table below that average working hours per farm was 5 254 hours per year and average non-dairy livestock per farm was 87. The total number of beef meat producing farms during the observed period were 55 after removing the data outliers.
Table 3: Output and input factors the average values for the years under review for beef production farms
Year 2014 2015 TotalAverage/
FarmRevenue from milk (EUR)
45 987 433 45 007 636 90 995 069 450 471
Revenue from meat(EUR)
6 501 499 6 399 787 12 901 286 63 868
Fixed Assets(EUR)
91 606 087 100 768 750 192 374 837 952 351
Current Assets(EUR)
48 351 638 52 674 427 101 026 065 500 129
Working Hours(Hours)
3 054 443 3 323 971 6 378 414 31 576
Major costs Items(EUR)
39 638 548 43 627 940 83 266 488 412 210
Dairy Cows(LSU)
17 957 2 1176 39 133 194
Number of Farms
93 109 202
Source: Own calculation based on the AKI FADN database
Technical efficiency is the ability of the farmer to obtain maximal output from a given set of inputs. In other words: “By how much can output quantities be proportionally expanded without altering the input quantities used?” (COELLI et. al. 2005) The DEA (Data Envelopment Analysis), was developed by CHARNES, COOPER AND RHODES (1978), is a non-parametric method used to estimate the technical efficiencies of a group of “Decision Making Units (DMUs)” who use common inputs to produce common outputs. The DEA is widely commended as an appropriate method for determining efficiency, along with production opportunities, which are supposed to be one of the prevalent interests of Operational Research and Management Science (CHARNES et al., 1994). As per the definition of efficiency, the DEA is a mathematical optimization technique, which estimates the efficiency of each DMU by maximising the ratio of a weighted sum of its outputs to a weighted sum of its inputs while ensuring that the efficiencies of other units do not exceed 100%. The DEA-method is built on a model of linear programming to describe the technical efficiency points, in case of constant or variable returns to scale.
The primary and widely applied model was the input orientated CRS models, which explains the subsequent linear programming problem for each firm to get the efficiency score:
max u,v (u’yi / v’xi),constrains: u’yj / v’xj ≤ 1,
j=1,2,...,N, (1) u,v ≥ 0
max ϕλ ϕ, constrains: - ϕ yj + Yλ ≥ 0,
xi - Xλ ≥ 0, (2) N1’λ = 1λ ≥ 0,
The constant returns to scale statement is acceptable if the firms in the sample are working at an optimal scale, but in practicality the firms with lacking competition do not act like that. Banker, CHARNES AND COOPER (1984) proposed a model, which can help in the case of variable returns to scale (VRS) situation. This model is quite similar to the CRS model except by addition of a convexity constraint (N1’− = 1) to the model, which accounts for the variable returns to scale.
The model regarding to BANKER, CHARNES AND COOPER (1984) and COELLI AND PERELMAN (1996) represents an output oriented model, when the firms have fixed amount of resources (capital, land, livestock, and labour) and want to produce maximum output (milk, calf). This model is very much alike the input orientated model.
Thus, the formula of an output orientated VRS model is the following:
max u,v (u’yi / v’xi),constrains: u’yj / v’xj ≤ 1,
j=1,2,...,N, (1) u,v ≥ 0
max ϕλ ϕ, constrains: - ϕ yj + Yλ ≥ 0,
xi - Xλ ≥ 0, (2) N1’λ = 1λ ≥ 0,
where the N1 is an N*1 vector of ones moreover 1≤ϕ and ϕ 1 is the proportional rise in output that can be attained by the i-th firm, with input amounts held constant. 1 ϕ govern the technical efficiency score, which lies amid zero and one.

APSTRACT Vol. 11. Number 3-4. 2017. pages 131-140. ISSN 1789-7874
Hungarian Dairy And Beef Production Sector – Technical Efficiency Comparsion Using Dea 137
Thus if we assume output-orientated technical efficiency of 80 percent for a farm, that means the farm can increase outputs by 20 percent without changing inputs.
The DEA VRS formula covers the data points more tightly and gives higher or equal efficiency scores than the CRS model. The difference between the VRS and CRS technical efficiency scores is the scale inefficiency.
RESULTS AND DISCUSSION
The test’s results say that the model variables of effectiveness of the Hungarian dairy farms produce an average of 72.90% based on DEA method. This means that effective backup solution lies in an increase average of 27.10% of the Hungarian milk producing farms. This means the Hungarian milk producing farms can still have an opportunity to increase the efficiency by 27.10% to use the input resources in the most effective way i.e. to get the maximum output.
Figure 7: DEA value VRS technical efficiency of the test years for the dairy sector
82,10% 75,10%
10,00%20,00%30,00%40,00%50,00%60,00%70,00%80,00%90,00%
100,00%
2014 2015
VRS
tech
nica
l effi
cien
cy
72,90%
63,60%
58,00% 60,00% 62,00% 64,00% 66,00% 68,00% 70,00% 72,00% 74,00%
dairy farms
beef farms
VRS TECHNICAL EFFICIENCY %
SECT
ORS
dairy farms beef farmsEfficiency 72,90% 63,60%
Source: Own calculation based on the AKI FADN database
Among research objectives, technical efficiency comparison of certain economic farm sizes. Here we have classified and compared farm sizes into three groups (KOVACS 2016): small farms (EU size classes 3-5); medium farms (EU size classes 6-9) and large farms (EU size category 10-14). VRS technical efficiency for small farms is 88% and the total number of small farms were only 32, the technical efficiency medium farms was 72.80% and the number of medium sized farms were 123, so the maximum milk producing dairy farms in Hungary are medium sized and for the large farms the technical efficiency was 90.90% and the number of farms were 47. The average efficiency is thus achieved was 83.90% in the sample.
Comparison of technical efficiency for whole dairy and beef sector
Figure 8 illustrates the output-oriented DEA model VRS efficiency results of the outcome, it shows the evolution of the economy in the event of VRS technical efficiency review for the years 2014 and 2015 together for 202 milk production farms and 55 beef production farms. The VRS technical efficiency of the test for these two years was 72.90% for the dairy farms and 63.60% for the beef farms, which means that the dairy sector is more efficient than the beef sector in Hungary.
Figure 8: DEA VRS technical efficiency comparison for the dairy sector and the beef sector
82,10% 75,10%
10,00%20,00%30,00%40,00%50,00%60,00%70,00%80,00%90,00%
100,00%
2014 2015
VRS
tech
nica
l effi
cien
cy
72,90%
63,60%
58,00% 60,00% 62,00% 64,00% 66,00% 68,00% 70,00% 72,00% 74,00%
dairy farms
beef farms
VRS TECHNICAL EFFICIENCY %
SECT
ORS
dairy farms beef farmsEfficiency 72,90% 63,60%
Source: Own calculation based on the AKI FADN database
The test’s results say that the model variables of effectiveness of the Hungarian dairy farms produce an average of 72.90% and the beef farms produce an average of 63.60% based on DEA method. This means the Hungarian milk producing farms can still have an opportunity to increase the efficiency by 27.10% and the beef farms can increase their efficiency by 36.40% to become 100% effective which means they can produce the maximum output from the from given inputs(resources).
This is obviously understood from the results above that the dairy sector in Hungary was predominantly effective than the beef sector in the period under review. The reason is that as a product milk and milk products are much more popular and in demand when compared to the beef meat and, beef meat is not the most popular meat in Hungary due to this the reason big market players do not invest in the beef sector as we previously saw there were no large farms for beef production.
To conclude we can say that yes even if the dairy sector is more efficient than the beef sector still the efficiency of dairy sector is not that high and there is a lot of scope for improvement in this sector to make more effective utilisation of resources keeping in mind increasing demands and to increase the profitability. As far as the beef is concerned it is one of the most nutritious meat and very popular across the world. There is a huge opportunity of growth both in domestic market as well as for exporting in this sector as we can see the efficiency is very low. To increase this efficiency number, it is very important to use the latest technology and involve big players to invest in this sector.
Comparison of technical efficiency for dairy and beef sector in 2014 with 2015
Figure 9. illustrates the output-oriented DEA model VRS efficiency results of the outcome, it shows the evolution of the economy in the event of VRS technical efficiency review for the years 2014 and 2015 separately for 202 milk production farms and 55 beef production farms. The VRS technical efficiency of the test was 82.10% in 2014, 75.10% in 2015 for the dairy farms, 77.50% in 2014, and 68.90% in 2015 for the beef farms, which means that both the dairy sector and the beef sectors were more efficient in 2014 compared to the efficiency in 2015.
The Hungarian milk producing farms can still had an opportunity to increase the efficiency by 17.90% in 2015

138 Krisztián Kovács - Ratnesh Pandey
APSTRACT Vol. 11. Number 3-4. 2017. pages 131-140. ISSN 1789-7874
but it was surprising to see that the instead of increasing the technical efficiency decreased by 7 % in 2015 which is an alarming sign for the Hungarian dairy sector. The beef farms had an opportunity increase their efficiency by 22.50% to become 100% effective which means they can produce the maximum output from the from given inputs(resources) but following the same trend like the dairy sector instead of increasing the efficiency fell by 8.6 % in the year 2015.
It is obvious from the results above that both the dairy sector and the beef sector in Hungary was more effective in 2014 than in the year 2015. This is a very bad situation for both the dairy as well as the beef sector as for both sectors the efficiency has gone down, it is very important to reflect on what can be the possible reasons for this and use the resources in more effective and to be competitive within Hungarian as well as in the international markets.
Figure 9: DEA value VRS technical efficiency comparison for the dairy sector and the beef sector in the year 2014 with 2015
dairy beef2014 82,10% 77,50%2015 75,10% 68,90%
60,00%
65,00%
70,00%
75,00%
80,00%
85,00%
VRS
tech
nica
l effi
cien
cy %
2014 2015
Source: Own calculation based on the AKI FADN database
To conclude we can say that the year 2014 was more effective than the year 2015 for both the dairy sector, the beef sector high, and there is a lot of possibility for improvement for both sectors to make more effective utilisation of resources keeping in mind increasing demands and to increase the profitability.
The focus must be trying to get rid of the decreasing trends of efficiency for sectors and plan in the right way to use in an effective way and to increase our efficiencies in both the sectors in the next few year, yes, it is not possible to be 100% effective in one year but the intention ideas and the vison specially of large farms must be to reach 100% efficiency.
Comparison of technical efficiency for dairy and beef sector for the specific farm dimensions
Figure 10. represents the output-oriented DEA model VRS efficiency results of the comparison of both dairy and beef sector for certain economic farm sizes. Here I have classified and compared farm sizes into three groups: small farms (EU size classes 3-5); medium farms (EU size classes 6-9). The results of the analysis carried out using DEA and can be observed in Figure 10. It can be seen VRS technical efficiency for small farms is 88% and the total number of small farms were only 32, the technical efficiency medium farms was 72.80% and the number of medium sized farms were 123, also the maximum milk producing dairy farms in
Hungary are medium sized. For the beef sector VRS technical efficiency for small farms is 71.30% and the total number of small farms were only 16, the technical efficiency medium farms was 74.40% and the number of medium sized farms were 39, so 70% of the beef meat producing farms in Hungary are medium sized.
It must be noted that in Hungary for milk producing there are large sized farms as discussed in the previous section but we will not mention in this part there are no large sized farms for beef meat production therefore we cannot compare the two sectors based on this criterion.
If we see Figure 10, it can be observed from the data that the small size dairy farms have a higher VRS efficiency than the small size beef farms whereas medium sized beef farms were have higher VRS efficiency than the medium size dairy farms. But difference in the efficiencies of medium sized farms of both the sectors is only 1.6% which is not very significant considering the number of dairy farm are much higher than the number of beef farms.
Figure 10: DEA value VRS technical efficiency comparison for the dairy sector and the beef sector for the specific farm dimensions
dairy farms beef farms small size farm 88% 71,30% medium size farm 72,80% 74,40%
0%10%20%30%40%50%60%70%80%90%
100%
VRS
teec
hnic
al e
ffici
ency
%
small size farm medium size farm
Source: Own calculation based on the AKI FADN database
The efficiency of small size farms 88%, while the efficiency of the medium size farms only 72.8% for the dairy sector and the difference in their efficiencies is 15% which is quite high this is due to the fact, that small farms can take advantage of their size advantage and better able to adapt to local needs and local conditions better. However, for the beef sector this difference between efficiencies of small and medium sized farms is only 3.1% latter being more effective.
One of the challenge for the Hungarian milk and beef producing farms is to increase the efficiency of medium sized farms which have standard of production value (STE) from EUR 25 thousand to EUR 500 thousand, due to two reasons mainly because the maximum number of milk and beef producing farms in Hungary are medium size and if they can increase their efficiency than it will automatically increase the efficiencies of both the sectors.
For the small size farm, which are the least in terms of percentage of farm size in Hungary for both the sectors small farms do not contribute a lot in the milk production given that they are very few in numbers, hence even if the efficiency of these farms is increased it will not help in increasing the technical efficiency of the whole sector by a large extent.
To sum up it can be said that both dairy and beef sectors in Hungary have the potential to overcome technology and

APSTRACT Vol. 11. Number 3-4. 2017. pages 131-140. ISSN 1789-7874
Hungarian Dairy And Beef Production Sector – Technical Efficiency Comparsion Using Dea 139
knowledge constraints and attain the upmost attainable productivity level through improvements in; farmer volume of production i.e. output, beef cattle technologies, and advertising, and the efficiency of the technology transfer process.
In line with the general objective of the research, the findings are the following during the research:
Based on the results of the DEA model, VRS technical efficiency review for the years 2014 and 2015 together for 202 milk production farms and 55 beef production farms. The VRS technical efficiency of the test for these two years was 72.90% for the dairy farms and 63.60% for the beef farms, which means that the dairy sector is more efficient than the beef sector in Hungary.
The VRS technical efficiency of the test was 82.10 in 2014 and 75.10% in 2015 for the dairy farms and 77.50% in 2014 and 68.90% in 2015 for the beef farms, which means that both the dairy sector and the beef sectors followed the same trend and were more efficient in 2014 compared to the efficiency in 2015.
The large size dairy farms were most effective in Hungary in the examined period (90.90%). VRS technical efficiency for small farms is 88% and the total number of small, the technical efficiency medium farms was 72.80% For the beef sector VRS technical efficiency for small farms is 71.30% and the technical efficiency medium farms was 74.40% and 70% of the beef meat producing farms in Hungary are medium sized. So the conclusion is the small size dairy farms have a higher VRS efficiency than the small size beef farms whereas medium sized beef farms had higher VRS efficiency than the medium size dairy farms. But difference in the efficiencies of medium sized farms of both the sectors is only 1.6% which is not very significant considering the number of dairy farm are much higher than the number of beef farms.
This research can help the decision-maker, to know the magnitude of efficiency and the judgment of the areas to be developed. In the manufacture capacity of dairy farms and in the number of animals, the dominance of medium size farms over large farms in Hungary can be observed. It can be suggested that the further development direction should be concentrated towards large farms, while the latter’s economies have fewer reserves, but they represent a larger volume of production at nationwide level. For the beef sector, it the 70% of the farms are medium sized farms and they represent the maximum production volume, it can be suggested to concentrate on the medium sized farms more than the small sized farms.
REFERENCES
Banker, R.D., A. Chames and W.W. Cooper (1984), “Some Models for Estimating Technical and Scale Inefficiencies in Data Envelopment Analysis”, Management Science, 30, 1078- 1092.
Bauer, P.W., Berger, A.N., Ferrier, G.D., and Humphrey, D.B. (1998): Consistency conditions for regulatory analysis of finan-cial institutions: a comparison of frontier efficiency models. Journal of Economics and Business 50: 85–114.
Begum I.A., Buysse J., Alam M. J., Huylenbroeck G. V: (2009); An application of Data Envelopment Analysis (DEA) to Evaluate Economic Efficiency of Poultry Farms in Bangladesh; presentation at the International Association of Agricultural Economists Conference, Beijing, China, August 16-22, 2009.
Charnes, A., Cooper, W. W., and Rhodes, E. (1978). Measur-ing the efficiency of decision making units. European Journal of Operational Research, 2:429–444.
Coelli T., Rao D.S.P., O’Donell C.J., Battese G.E. (2005): An introduction to efficiency.
EUROSTAT (2015): Milk and meat production in the EU coun-tries http://ec.europa.eu/eurostat/statisticsexplained/index.php/Archive:Milk_and_dairy_production_statistics.
EUROSTAT (2017): http://ec.europa.eu/eurostat/statisticsex-plained/index.php/Milk_and_milk_product_statistics
FADN (2017): Research Institute of Agricultural Economics (AKI), Budapest, http://ec.europa.eu/agriculture/rica/database/database_en.cfm
FAOSTAT (2014). http://www.fao.org/faostat/en/#data/QL
Farrell, M. J. (1957): The measurement of productive ef-ficiency. Journal of the Royal Statistical Society, Series A 120(3):253–281.
Jaforullah, M., and J. Whiteman. 1999. Scale efficiency in the New Zealand dairy industry: A non-parametric approach. Aust., Journal of Agricultural and Resource Economics 43:523–541.
Kovacs K. (2009): Dairy farms efficiency analysis before the quota system abolishment”; APSTRACT Vol. 8. Number 2–3. 2014 pages 147–157; ISSN 1789-7874
Kovacs K. (2016): PHD thesis, Debrecen, Economic efficiency assessment of Hungarian dairy farms.
KSH (2016): http://www.ksh.hu/docs/eng/xstadat/xstadat_long/h_omf001c.html?down=111
Solís, D., B. Bravo-Ureta, and R. Quiroga. (2009): Technical efficiency among peasant farmers participating in natural re-source management programs in Central America. Journal of Agricultural Economics 60:202–219.
Stokes, J. R., P. R. Tozer, and J. Hyde. (2007): Identifying effi-cient dairy producers using data envelopment analysis. Journal of Dairy Science 90:2555–2562.
Tauer, L. W. (1998): Productivity of New York dairy farms measured by non-parametric Malquist indices. Journal of Agri-cultural Economics 49:234–249.


APSTRACT Vol. 11. Number 3-4. 2017. pages 141-146. ISSN 1789-7874
DOI: 10.19041/APSTRACT/2017/3-4/19
Applied Studies in Agribusiness and Commerce – APSTRACT Center-Print Publishing House, Debrecen SCIENTIFIC PAPER
ENERGY ALTERNATIVES IN LARGE-SCALE WASTEWATER TREATMENT
Zoltán Gabnai11University of Debrecen, Faculty of Economics and Business,
Institute of Applied Economics, Department of Business Economics4032 Debrecen, 138. Böszörményi St.E-mail: [email protected]
Abstract: In my article, after describing the characteristics of recent wastewater treatment activity, I introduce different traditional and innova-tive energetic opportunities of the compulsory waste management activities at large-scale operational level, covering national and international examples. Furthermore, the wastewater-based biomethane production and the certain plant’s energy self-sufficiency are highlighted topics as well. In the former case, it is possible to utilize the wastewater-based biomethane as fuel (and even to operate own vehicle fleet), while the second one gives the opportunity for the internal usage of produced electricity and waste heat, which can also result in significant cost-savings. As an ad-ditional option, algae-based wastewater post treatment is presented, based on the conditions of a Hungarian wastewater treatment plant, which biogas production efficiency and thus energy self-sufficiency has developed favourably due to the technological improvements. These plants may have a twofold role in the future: they are responsible for the compulsory waste management activity and on the other hand they can serve as excellent raw material mines.
INTRODUCTION
The global population growth, economic development and increase in living standards result in increasing the (1) quantity of waste and by-products, (2) level of environment pollution and (3) energy demand. So, there are strict compulsory environmental regulations and obligations. All of these result in growing demand for similar technologies and solutions:
Efficient, environmentally friendly by-products / waste management.
Efficient, environmentally responsible and material-saving operation, where energy production is also conducted in.
According to the information in Table 1., there are big differences between the continents regarding the number of plants/settlements and the total produced and treated quantity of wastewater. In Europe, more than 70% of the whole quantity is treated, while in Asia, this proportion is less than 50% (FAO, 2016). In addition, most of the produced wastewater is treated in large-scale wastewater treatment plants. The main influencing factors are the population of the given country, the living standards, the economic conditions of the country or area, the level of technology and the size of settlements and plants.
Table 1: Characteristics of wastewater treatment on Earth
Continent CountryNumber of
plantsTotal quantity
(billion m3)
Treated quantity
(billion m3)Africa 2 000 pcs 13.0 7.0Of which: RSA 923 pcs 3.5 1.9 Egypt 372 pcs 7.1 4.0America 21 000 pcs 97.0 56.0Of which: USA 16 583 pcs 60.4 41.0 Mexico 2 289 pcs 7.5 3.1 Canada 1 265 pcs 6.6 5.6Asia 8 000 pcs 130.0 62.0Of which: China 3 272 pcs 38.0 26.6 Japan 2 148 pcs 16.9 11.6Europe 47 000 pcs 52.0 37.0Of which: Germany 9 933 pcs 5.3 5.2
United
Kingdom8 035 pcs 4.1 4.0
Russia 7 836 pcs 12.3 n.a. Poland 4 253 pcs 2.3 1.4 France 3 280 pcs 3.8 3.7 … Hungary 593 pcs 0.2 n.a.Australia 580 pcs 2.1 2.0
Source: FAO, 2016.
Keywords: wastewater treatment, activated sludge, biogas, algae, biomethane. (JEL Code: Q25)

142 Zoltán Gabnai
APSTRACT Vol. 11. Number 3-4. 2017. pages 141-146. ISSN 1789-7874
In the developed countries, the produced wastewater is primarily treated in large-scale wastewater treatment plants. The wastewater treatment activity is such an obligation for both the settlements and agricultural and industrial plants, in which besides the proper purification effect it is important to strive for effective operation and to minimize operating costs and/or maximize revenues. Besides the energetic opportunities, many macro elements can be separated during the treatment process.
These bigger plants generally operate based on the activated sludge process. This process was invented in England in the beginning of the 20th century. It has since been adopted worldwide as a secondary biological treatment for domestic wastewaters and consists essentially of an aerobic treatment that oxidizes organic matter to CO2, H2O, NH4, and new cell biomass. Air is provided by using diffused or mechanical aeration (BITTON, 2005). This type of wastewater treatment process is globally used for treating sewage and/or industrial wastewaters using aeration and a biological floc (sludge), which is composed of bacteria and protozoa.
A conventional activated sludge process includes the following:
Aeration tank, where aerobic oxidation of organic matter is carried out.
Sedimentation tank, which is used for the sedimentation of microbial flocs (sludge) produced during the oxidation phase in the aeration tank. A portion of the sludge in the clarifier is recycled back to the aeration basin and the remainder is wasted to maintain a proper F/M (food to microorganisms ratio) (STERRITT and LESTER, 1988; BITTON, 2005).
Wastewater treatment plants are frequently ranked as the top individual energy consumers run by municipalities. Therefore, energy consumption for wastewater treatment is a matter of concern on a microeconomic scale and saving potentials need to be explored (WETT et al., 2007).
The wastewater treatment plants cannot be considered as only the place of the compulsory treating and purification activity but as like excellent raw material mines. An additional opportunity is to utilize the macroelements and the CO2-content of flue-gas with algae and utilize the produced algae as fodder, bio-fuel or for other purposes (BAI, 2011).
The efficient operation of these plants is crucial nowadays. There are different opportunities connected to the energetics of this process. The most common option in large-scale treatment plants is the biogas production based on the produced sludge. Anaerobic digestion is the only energy-positive technology widely used in wastewater treatment (JENICEK et al., 2012).
The biogas process
The history of discovering biogas dates back to the 17th century, when Shirley discovered the marsh gas in 1677. In 1776, Volta found that it is a combustible material, and Dalton detected its methane-content in 1804. After that, the development of the method was rather fast: the first biogas plant was implemented in the Indian Mantunga in 1856, and the biogas was used for public lighting in Exeter in England (BAI, 1998).
Based on the data of EUROBSERV’ER (2014), the EU produced almost 13,380 ktoe of biogas in 2013 with more than 14,000 operating anaerobic digesters. Germany is responsible for the 50% of the produced biogas, while Hungary has a midfield position regarding the amount of produced biogas. There are three different category concerning the origin of the produced biogas. These categories, and the proportion of them are shown below:
Landfill gas: 22%Sewage sludge gas (urban and industrial): 9%Others biogas (decentralised agricultural plant, municipal
solid waste methanisation plant, centralised co-digestion plant): 69%.
Biogas plants in Hungary were primarily implemented with the purpose of waste management and most of them produce electricity and heat (in cogeneration) from the produced biogas. This fact can be justified by the direct heat utilization: it is almost impossible to use biogas only for thermal energy production in larger sizes during the summer period (BAI, 2015).
Biogas and wastewater treatment
The biogas technology was firstly used in wastewater treatment plants in Germany in 1920. Nowadays, there are 32 biogas plants which operate based on wastewater treatment plants in Hungary, typically in middle-sized and larger settlements. The overall capacity of the biogas plants is more than 19.5 MWp, and most of the biogas plants operate in cogeneration (both electricity and heat production) (HUNGARIAN BIOGAS ASSOCIATION, 2017; PAN-LNG PROJECT, 2016).
Energy opportunities: minimizing operation costs and/or maximizing revenues
Two important options are the wastewater-based biomethane production and the energy self-sufficiency of certain plants. In the former case, it is possible to utilize the wastewater-based biomethane as fuel (and even to operate own vehicle fleet), while the latter one gives the opportunity for the internal usage of produced electricity and waste heat, which can also result in significant cost-savings.
Biomethane production is primarily gaining in popularity with the countries of the European Union, because it enables them to reduce their reliance on natural gas imports (EUROBSERV’ER, 2014). In the EU, there are three hundred plants in 15 countries recently, where biomethane is produced from biogas. Fuel production from the wastewater-based biogas was firstly implemented in Finland, where one hundred biomethane-fueled vans and buses operated in 1941.
In Hungary, there are two plants, which produce biomethane. The first one is in Kaposvár, where the produced biomethane is feeded into the natural gas pipeline. The plant started to operate in September 2015, which investment cost was one billion HUF. The annual biomethane production is five billion m3. The main raw materials are waste sugar

APSTRACT Vol. 11. Number 3-4. 2017. pages 141-146. ISSN 1789-7874
Energy Alternatives In Large-Scale Wastewater Treatment 143
beet and sewage sludge. The second city is Zalaegerszeg, where the produced biomethane is used as fuel by the city’s public transport vehicle fleet (twelve vans and three buses). In Zalaegerszeg, the operation started in September 2011, and the investment cost was 140 million HUF (120 million HUF for the biogas clarification system and 20 million HUF for the implementation of the filling station). The daily biomethane production is 3,600 m3. The main raw material of the plant is sewage sludge and wastes from meat industry. The production cost of the biomethane is 0.52 EUR/m3 (0.8 l gasoline/m3 biomethane) (PAN-LNG PROJECT, 2016), which is less than half of the recent price of the gasoline in 2017.
Minimization of energy consumption and thus the operating costs has become nowadays a major goal for wastewater treatment plant (WWTP) operators. Many researchers started to investigate various aspects of the possibilities of energy self-sufficiency in WWTPs (CHUDOBA et al., 2011; SVARDAL and KROISS, 2011; BALMÉR and HELLSTRÖM, 2012; JENICEK et al., 2012). According to SCHWARZENBECK et al. (2008) and BALMÉR and HELLSTRÖM (2012), the easiest way to increase biogas production and improve the WWTP’s energy balance is to supply an external organic substrate. However, NOWAK et al. (2011) reported examples in which WWTP’s self-sufficiency was achieved without the need for such organic substrates.
MATERIALS AND METHODS
There are various energy opportunities regarding the large-scale wastewater treatment activity. Concerning the topics of biomethane utilization and energy self-sufficiency, this article is written mostly for review purpose. In the case of biogas production and self-sufficiency, a special solution could be adoptable into the traditional wastewater treatment system, which is the algal post-treatment. The designing of carbon-dioxide passivation in algae ponds can be based on different aspects. The amount of CO2 or the required purification capacity (amount of residual micro and macro elements in the wastewater) can fundamentally determine the sizing issues. For the purpose of proper photosynthetic activity, separation of the substrate and transparent water is needed (with a maximum water depth of 0.5-0.6 m).
The basic data provided by the Debrecen WWTP are the following:
– amount of produced biogas: ~2,360 thousand Nm3/year (3-years average)
– composition of biogas: 58-62% methane (CH4), 27-31% carbon dioxide (CO2), 1% other gases
– heating value of biogas: 23.2 MJ/Nm3
– electric capacity: 1.79 MW – amount of produced electricity: 6,275 MWh/year (3-
year average)
(Source: DEBRECEN WATERWORKS, 2017)
Due to the lack of exact data regarding the characteristics of CO2-emission factor of WWTPs, the determination of this factor was prepared based on the amounts of national
CO2-emission and electricity production data concerning the cogeneration power plants (Figure 1-2.).
Figure 1: CO2-emission and electricity production of Hungarian power plants
- 5 000 000
10 000 000 15 000 000 20 000 000 25 000 000 30 000 000 35 000 000 40 000 000 45 000 000
CO2 emission (t) Electricity production (MWh)t, MWh
- 0,100 0,200 0,300 0,400 0,500 0,600 0,700
t CO2/MWh
t CO2/MWh Log. (t CO2/MWh)
Source: Author’s construction based on data of MAVIR Hungarian Independent Transmission Operator Company
(Data of the Hungarian Electricity System, 2015)
Figure 2: CO2-emission factor of Hungarian power plants (2000-2015)
- 5 000 000
10 000 000 15 000 000 20 000 000 25 000 000 30 000 000 35 000 000 40 000 000 45 000 000
CO2 emission (t) Electricity production (MWh)t, MWh
- 0,100 0,200 0,300 0,400 0,500 0,600 0,700
t CO2/MWh
t CO2/MWh Log. (t CO2/MWh)
Source: Author’s own calculations and construction based on data of MAVIR Hungarian Independent Transmission Operator Company
(Data of the Hungarian Electricity System, 2015)
In order to determine the value of CO2-emission factor (0,32 t CO2/MWh) in 2017, a logarithmic trend has been fitted to the curve based on the data of the previous years.
Value of CO2-kvote was estimated based on the actual price of CO2: 6,94 EUR/tCO2 (BLOOMBERG, 2017).
RESULTS AND DISCUSSION
The minimization of the WWTP’s energy consumption
According to the study of JENICEK et al. (2013), the energy content of sewage is several times higher than the energy required for its efficient treatment. Their results show that, due to the anaerobic digestion of the sludge produced during wastewater treatment, the goal of energy self-sufficient sewage wastewater treatment plants is a realistic opportunity. With the optimizations, biogas production increased significantly to 12.5 m3 per population equivalent per year. In turn, this led to an equally significant increase in specific energy production from approximately 15 to 23.5

144 Zoltán Gabnai
APSTRACT Vol. 11. Number 3-4. 2017. pages 141-146. ISSN 1789-7874
kWh per population equivalent per year. WETT et al. (2007) presented experiences from Central Europe that point towards large energy saving potentials of typically 30-50%, which are just gradually being exploited nowadays. The large-scale municipal WWTP in Strauss (Austria) has already reached a positive energy balance without any relevant co-substrates.
Figure 3. shows the characteristics of energy management of Debrecen WWTP.
Figure 3: Electricity management of the Debrecen WWTP (May 2015 – July 2017)
Source: Author’s construction based on Debrecen Waterworks Plc.,
2017
The improvement in biogas production is primarily due to the increased pre-sedimentation step with Fe and C addition, which results in higher energy production. The increasing share of the produced electricity results in higher level of energy self-sufficiency, due to increased biogas production. This level significantly changed from approx. 65% (2015) to 92-95% (2017). Besides the increased electricity production, higher amount of heat production was another advantageous effect, which could serve the energy self-sufficiency as well in the digesters. For about eight months, the WWTP provides waste heat to one of the city’s housing estates.
The amount of consumed biogas and natural gas shows that the changes in technology have led to an increase in monthly biogas production. The decreasing amount of purchased natural gas is due to the fact that the surplus biogas has provided sufficient energy source to trigger the reduction in natural gas consumption and thus reduce the operating cost of the WWTP. In addition, the plant has been able to produce higher amount of electricity based on the biogas production, as it is shown in Table 1. All of these result in significant savings in energy costs (TRUZSI et al., 2017).
In the case of large-scale wastewater treatment, it is important to pay attention to the different by-products such as the large quantities of sewage sludge or the CO2-content of the flue gas generated during the combustion of the produced biogas. The former one can be utilized primarily as fertilizer or as a valuable component of compost, while the latter one offers an excellent opportunity for use in algae ponds. In this
case, the micro and macro elements of purified wastewater can be further utilized. Based on the study of WANG et al. (2010) and LI et al. (2011), the following reduction effect can be achieved during a 14-21 days-long algae treatment: nitrogen content (82-89%), phosphorus content (40-81%), chemical oxygen demand (39-91%).
Algae can also play an important role in the containment of pollutants. In many cases, the lack of carbon dioxide occurs as an important limiting factor, because the natural CO2-concentration is only 0.039 v/v% (390 ml/l) in the air and only 0.7 ml (1.4 g/l) diffuses into the water in equilibrium. Therefore, CO2 gas emitted by the biogas plant can be used for replacing it. On the other hand, algae can utilize the micro and macro elements remaining in the outgoing wastewater. The initial data concerning size (energy capacity) and capacity utilization are based on the characteristics of the Debrecen WWTP, while the CO2-fixation effect and potential yield of algae (regarding Chlorella Vulgaris specie) are based on the study of BAI et al. (2012, 2017).
According to the calculations based on the data of Debrecen WWTP, the operation hours are 3505 annually, which corresponds to the national average. In my calculations, I have determined the potential CO2-emission capacity, CO2-fixation and CO2-emission concerning algae post treatment and thus algae production (Table 2.)
Table 2: Theoretical potential of CO2-fixation by algae in the Debrecen WWTP
Title Measure Value
CO2-emission t CO2 2008
CO2-fixation by algae t CO2 527
CO2-emission in production t CO2 79
CO2-kvote EUR/t 6.94
Value of saved CO2 EUR 3,109
Amount of algae t 2,394
Algae yield t/ha 248
Surface of algae ponds hectare 10
Source: own construction
Table 2. shows that CO2-fixation capacity of algae is approx. 527 thousand tons, while the value of CO2 saved by the algae breeding is 3,109 EUR. According to my calculations, the estimated amount of produced algae is 2,394 tons and the necessary surface of algae ponds is 10 hectares. For this reason, a 20-22 hectares territory near the Debrecen WWTP (which should be recultivated in the near future) could be a suitable location. The produced algae biomass could be utilized for bioenergy production or for other purposes as well.
APSTRACT Vol. 11. Number 3-4. 2017. pages 141-146. ISSN 1789-7874
Energy Alternatives In Large-Scale Wastewater Treatment 145
CONCLUSIONS
In the future, wastewater treatment facilities will increasingly claim their role as resource recovery plants, instead of nutrient removal systems. This recovery will be realized not only in terms of water and nutrients but also of energy. I would like to highlight the importance and possibilities of waste and by-product utilization as raw material, where rational, prudent and sustainable utilization is crucial, based on detailed economic calculations and feasibility studies. All of the above mentioned technological solutions could have many advantages, although the main problem regarding these technical solutions is the high investment cost. Biomethane production using cost-efficient biogas-cleaning technologies could serve petrol independence, which could be an important issue in the future. Emission reduction in the downtowns could be a positive effect as well, while the available cost saving of the biomethane production is more than 40% + VAT compared to the fossil fuels. Nevertheless, the biomethane production and utilization are in the early stage of development. It has little significance in Hungary nowadays, and has concurrences like electric and LPG powered transport. One of the main problems of the biogas technology is the utilization of waste heat during the summer period, which can significantly determine the economic characteristics of the given plant. As opportunities for the waste heat of wastewater-based biogas plants, utilization in district heating system, agricultural activities (dryer, greenhouse or as technological heat) should be also mentioned. Another by-product is the generated CO2 from the flue gas. Utilizing through successful algae breeding, the expected value of the produced algae could exceed the arising costs. The estimated amount of produced algae is 2,394 tons and the necessary surface of algae ponds is 10 hectare, while the value of saved CO2 is approximately 3,109 EUR. Furthermore, better quality of outgoing water is ensured during this process.
ACKNOWLEDGEMENTS
I would like to express my gratitude to the Debrecen Waterworks for the assistance regarding plant operation data.
REFERENCES
Bai A. (1998): A mezőgazdasági és élelmiszeripari mellékter-mékek energetikai hasznosításának gazdasági összefüggései. Disszertáció. Debreceni Agrártudományi Egyetem, Debrecen. 168 p.
Bai A. (2011): Újabb generációs bio-üzemanyagok perspektívái, Magyar Tudomány 2011, 172(7): 861-871.
Bai A., Stündl L., Bársony P., Fehér M., Jobbágy P., Herpergel Z., Vaszkó G. (2012): Algae production on pig sludge, Agron-omy for Sustainable Development 2012, 32(3): 611-618. DOI: 10.1007/s13593-011-0077-2
Bai A. (2015): Helyi közlekedés és hulladékgazdálkodás, Mag-yar Energetika, 2015, 22(1): 21-25.
Bai A., Popp J., Pető K., Szőke I., Harangi-Rákos M., Gab-nai Z. (2017): The Significance of Forests and Algae in CO2 Balance: A Hungarian Case Study, Sustainability 2017, 9: 857. DOI: 10.3390/su9050857
Balmér P., Hellström D. (2012): Performance indicators for wastewater treatment plants, Water Science and Technology, 2012, 65(7): 1304-1310. DOI: 10.2166/wst.2012.014
Bitton G. (2005): Activated sludge process, Wastewater Mi-crobiology, 3rd ed. John Wiley & Sons, Inc. 2005 ISBN: 9780471650713. DOI: 10.1002/0471717967
Bloomberg (2017): Energy, Emissions. Data accessed: 20.05.2017. Available online: https://www.bloomberg.com/en-ergy.
Chudoba P., Sardet C., Palko G., Guibelin E. (2011): Main fac-tors influencing anaerobic digestion of sludge and energy ef-ficiency at several large WWTP in central Europe, Journal of Residuals Science & Technology 2011, 8(2): 89-96.
EurObserv’ER (2014): Biogas Barometer. Data accessed: 10.05.2017. Available online: http://www.energies-renouvel-ables.org/observ-er/stat_baro/observ/baro224_Biogas_en.pdf.
FAO (2016): Number of municipal wastewater treatment facili-ties. Data accessed: 18.09.2016. Available online:
http://www.fao.org/nr/water/aquastat/data/query/results.html?regionQuery=true&yearGrouping=SURVEY&yearRange.fromYear=1960&yearRange.toYear=2015&varGrpIds=4515®Ids=9805,9806,9807,9808,9809&includeRegions=true&showValueYears=true&categoryIds=-1&XAxis=YEAR&showSymbols=true&showUnits=true&hideEmptyRowsColoumns=true&_hideEmptyRowsColoumns=on&lang=en&query_type=glossary.
FAO (2016): Treated municipal wastewater (10^9 m3/year). Data accessed: 18.09.2016. Available online: http://www.fao.org/nr/water/aquastat/data/query/results.html?regionQuery=true&yearGrouping=SURVEY&yearRange.fromYear=1960&yearRange.toYear=2015&varGrpIds=4270®Ids=9805,9806,9807,9808,9809&includeRegions=true&showValueYears=true&categoryIds=-1&XAxis=YEAR&showSymbols=true&showUnits=true&hideEmptyRowsColoumns=true&_hideEmptyRowsColoumns=on&lang=en&query_type=glossary.
Hungarian Biogas Association (2017). Data accessed: 18.05.2017. Available online: http://www.biogas.hu/2/frameset
Jenicek P., Bartacek J., Kutil J., Zabranska J., Dohanyos M. (2012): Potentials and limits of anaerobic digestion of sewage sludge: energy self-sufficient municipal wastewater treatment plant?, Water science and technology 2012, 66(6): 1277-1281. DOI: 10.2166/wst.2012.317
Jenicek P., Kutil J., Benes O., Todt V., Zabranska J., Dohanyos M. (2013): Energy self-sufficient sewage wastewater treatment plants: is optimized anaerobic sludge digestion the key?, Water Science and Technology 2013, 68(8): 1739-1744.
Li Y., Chen Y. F., Chen P., Min M., Zhou W., Martinez B., Zhu J., Ruan R. (2011): Characterization of a microalga Chlo-rella sp. well adapted to highly concentrated municipal waste-water for nutrient removal and biodiesel production, Biore-source Technology 2011, 102(8): 5138-5144. DOI: 10.1016/j.biortech.2011.01.091

146 Zoltán Gabnai
APSTRACT Vol. 11. Number 3-4. 2017. pages 141-146. ISSN 1789-7874
MAVIR Hungarian Independent Transmission Operator Com-pany (2015): Data of the Hungarian Electricity System. Avail-able online: Data accessed: 16.05.2017. http://mavir.hu/docu-ments/10258/154394509/VER-statisztika+2015+-+Final_1.pdf/f9111e9f-b7cf-44fc-a0b6-bb391f3e8144
Nowak O., Keil S., Fimml C. (2011): Examples of energy self-sufficient municipal nutrient removal plants. Water Science and Technology 2011, 64(1): 1-6. DOI: 10.2166/wst.2011.625
PAN-LNG Project (2016): PAN-LNG Project Study 1.7. Data accessed: 16.01.2017. Available online: http://www.panlng.eu/wp-content/uploads/2016/06/1_7_PAN-LNG_biogaz.pdf.
Schwarzenbeck N., Pfeiffer W., Bomball E. (2008): Can a wastewater treatment plant be a powerplant? A case study, Water science and technology 2008, 57(10): 1555-1561. DOI: 10.2166/wst.2008.215
Sterritt R. M., Lester J. N. (1988): Microbiology for environ-mental and public health engineers. E. & FN Spon. Agris 1988, FAO
Svardal K., Krois H. (2011): Energy requirements for waste water treatment, Water Science and Technology 2011, 64(6): 1355-1361. DOI: 10.2166/wst.2011.221
Truzsi A., Bodnár I., Fülöp Z. (2017): A debreceni szennyvíz-tisztító telep biogáz termelő fermentációs folyamatainak nyo-mon követése kémiai módszerekkel. Monitoring of Debrecen WWTP biogas fermentation processes by chemical methods, International Journal of Engineering and Management Sciences 2017, 2(1): 79-83. DOI: 10.21791/IJEMS.2017.1.15.
Wang L., Li Y., Chen P., Min M., Chen Y., Zhu J., Ruan R. R. (2010): Anaerobic digested dairy manure as a nutrient sup-plement for cultivation of oil-rich green microalgae Chlorella sp, Bioresource Technology 2010, 101(8): 2623-2628. DOI: 10.1016/j.biortech.2009.10.062
Wett B., Buchauer K., Fimml C. (2007): Energy self-sufficien-cy as a feasible concept for wastewater treatment systems. In: IWA Leading Edge Technology Conference, Singa-pore: Asian Water. 2007: 21-24.

APSTRACT Vol. 11. Number 3-4. 2017. pages 147-154. ISSN 1789-7874
DOI: 10.19041/APSTRACT/2017/3-4/20
Applied Studies in Agribusiness and Commerce – APSTRACT Center-Print Publishing House, Debrecen SCIENTIFIC PAPER
ANALYSIS THE ADVANCED ICT USAGE OF THE HUNGARIAN SME SECTOR FOR PREPARING
A DOMESTIC AGRI-FOOD RESEARCH
Szilvia Botos1 – János Felföldi2 – László Várallyai3 – Ádám Péntek4 – Róbert Szilágyi5University of Debrecen, Faculty of Economics and Business,
Institute of Applied Informatics and Logistics, H-4032 Debrecen, Böszörményi Str. 138.1 [email protected] [email protected]
3 [email protected] [email protected]
Abstract: In the Hungarian agro-food sector SMEs have a key role but regarding the tendency of the performance of SME sector, comparing to EU-28 average, the performance of Hungarian SME sector has gradually worsened between 2008 and 2015 while the EU average has an increas-ing trend. ICT can help enterprises and this article is an overview of the ICT situation of Hungarian SMEs. It is important to analyse in detail the ICT usage characteristics of agro SMEs in the food supply chain because these ICT devices, tools and services are crucial to smooth the informa-tion flow within the chain. For all these reasons our work aims to find out how Hungarian agro-food SMEs use ICT and how ICT adoption affect their business procedures, performance and development. A striking observation to emerge from the data comparison is the difference among SMEs and large enterprises regarding the usage of the different basic and advanced ICT solutions. A much bigger percent of large companies use advanced ICT then SMEs and mainly small enterprises are lagging behind as the attitudes of medium sized enterprises are rather similar to the large ones. In Hungary small enterprises in agro-food industry are in difficult financial state and for them free Cloud Computing services can offer good opportunities as they do not have initial costs. ICT adoption is very important to them as ICT sector is a dynamically growing sector and if customers and partners of an enterprise adapt faster to these technological innovations, it may have a negative effect on the different processes, performance and financial results of the organisation. In this article our aim was to determine the main question groups for our questionnaire which focus mainly on ICT solutions supporting the quality of communication and relationship between partners. As the basic IT tools are avail-able in the major part even in the SMEs besides large companies, the two main issues will be the usage of advanced online services and the usage of high quality ICT solutions.
INTRODUCTION
Agriculture and food industry have a specific role in the Hungarian economy. Soil is one of the main natural resources and environmental circumstances (e.g. soil quality, climatic conditions, and water supply) are more than favourable for agricultural production. All the natural conditions for creating a strong and developing agro-food sector are in place supported by a deeply rooted tradition of cultivating arable corps, vegetable and fruit, breeding animal and producing high quality food. But the role of agro-food sector has been decreasing for decades because of the adverse economic environment surrounding the enterprises operating in these sectors and their international position is weak as well. The
situation of agro-food SMEs is particularly unstable and vulnerable as they suffer severe economic disadvantages (e.g. productivity, bargaining power, partnerships or the volume of marketable production) compared to the large companies cultivating agricultural crops and other plants or producing food, causing negative effects on social and economic development. Because of this, we need to find tools helping the agro-food SMEs (Small and Medium sized enterprises) to be profitable despite the difficult economic environment, to start growing, to strengthen their competitive position and to exploit their capacities. As many processes in the world, different economic sectors also moving towards integration so enterprises in agro-food industry also require a supply chain level approach, connecting to other players of the chain.
Keywords: small and medium sized enterprises, agro-food, information and communications technology. (JEL Code: M15)
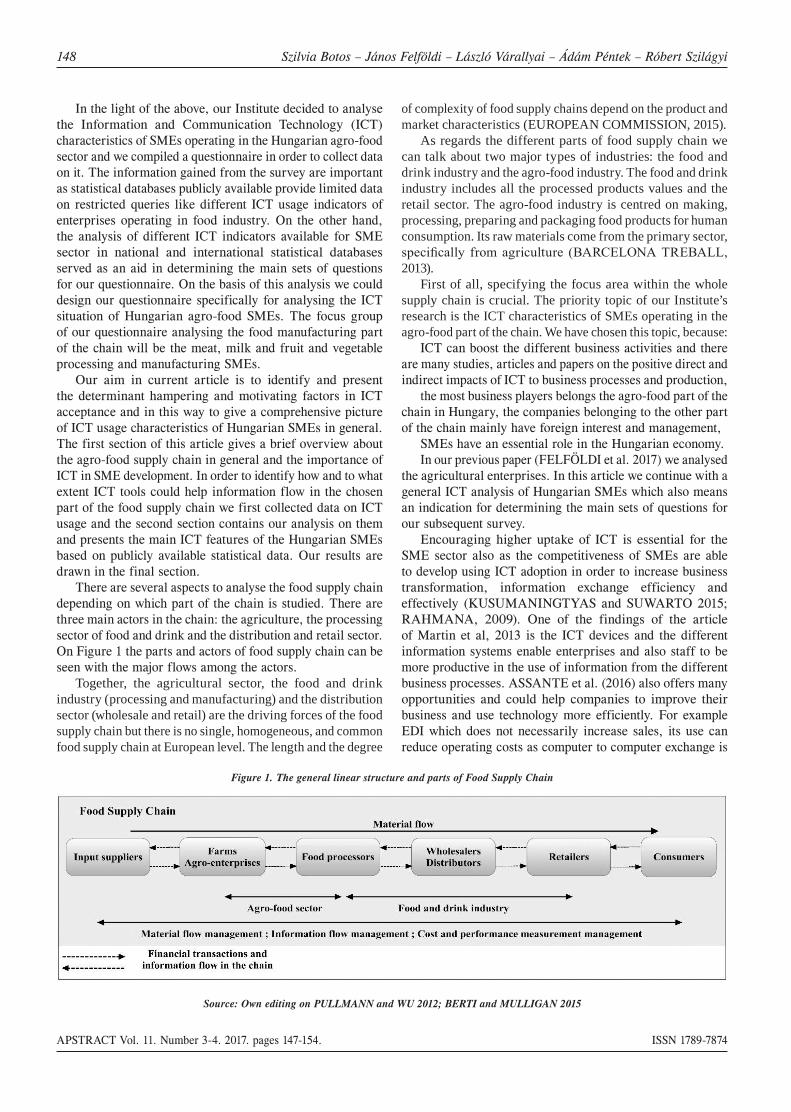
148 Szilvia Botos – János Felföldi – László Várallyai – Ádám Péntek – Róbert Szilágyi
APSTRACT Vol. 11. Number 3-4. 2017. pages 147-154. ISSN 1789-7874
In the light of the above, our Institute decided to analyse the Information and Communication Technology (ICT) characteristics of SMEs operating in the Hungarian agro-food sector and we compiled a questionnaire in order to collect data on it. The information gained from the survey are important as statistical databases publicly available provide limited data on restricted queries like different ICT usage indicators of enterprises operating in food industry. On the other hand, the analysis of different ICT indicators available for SME sector in national and international statistical databases served as an aid in determining the main sets of questions for our questionnaire. On the basis of this analysis we could design our questionnaire specifically for analysing the ICT situation of Hungarian agro-food SMEs. The focus group of our questionnaire analysing the food manufacturing part of the chain will be the meat, milk and fruit and vegetable processing and manufacturing SMEs.
Our aim in current article is to identify and present the determinant hampering and motivating factors in ICT acceptance and in this way to give a comprehensive picture of ICT usage characteristics of Hungarian SMEs in general. The first section of this article gives a brief overview about the agro-food supply chain in general and the importance of ICT in SME development. In order to identify how and to what extent ICT tools could help information flow in the chosen part of the food supply chain we first collected data on ICT usage and the second section contains our analysis on them and presents the main ICT features of the Hungarian SMEs based on publicly available statistical data. Our results are drawn in the final section.
There are several aspects to analyse the food supply chain depending on which part of the chain is studied. There are three main actors in the chain: the agriculture, the processing sector of food and drink and the distribution and retail sector. On Figure 1 the parts and actors of food supply chain can be seen with the major flows among the actors.
Together, the agricultural sector, the food and drink industry (processing and manufacturing) and the distribution sector (wholesale and retail) are the driving forces of the food supply chain but there is no single, homogeneous, and common food supply chain at European level. The length and the degree
of complexity of food supply chains depend on the product and market characteristics (EUROPEAN COMMISSION, 2015).
As regards the different parts of food supply chain we can talk about two major types of industries: the food and drink industry and the agro-food industry. The food and drink industry includes all the processed products values and the retail sector. The agro-food industry is centred on making, processing, preparing and packaging food products for human consumption. Its raw materials come from the primary sector,
u u N , 2013).
First of all, specifying the focus area within the whole supply chain is crucial. The priority topic of our Institute’s research is the ICT characteristics of SMEs operating in the agro-food part of the chain. We have chosen this topic, because:
ICT can boost the different business activities and there are many studies, articles and papers on the positive direct and indirect impacts of ICT to business processes and production,
the most business players belongs the agro-food part of the chain in Hungary, the companies belonging to the other part of the chain mainly have foreign interest and management,
SMEs have an essential role in the Hungarian economy.In our previous paper (FELFÖLDI et al. 2017) we analysed
the agricultural enterprises. In this article we continue with a general ICT analysis of Hungarian SMEs which also means an indication for determining the main sets of questions for our subsequent survey.
Encouraging higher uptake of ICT is essential for the SME sector also as the competitiveness of SMEs are able to develop using ICT adoption in order to increase business transformation, information exchange efficiency and effectively (KUSUMANINGTYAS and SUWARTO 2015; RAHMANA, 2009). One of the findings of the article of Martin et al, 2013 is the ICT devices and the different information systems enable enterprises and also staff to be more productive in the use of information from the different business processes. ASSANTE et al. (2016) also offers many opportunities and could help companies to improve their business and use technology more efficiently. For example EDI which does not necessarily increase sales, its use can reduce operating costs as computer to computer exchange is
Figure 1. The general linear structure and parts of Food Supply Chain
Source: Own editing on PULLMANN and WU 2012; BERTI and MULLIGAN 2015

APSTRACT Vol. 11. Number 3-4. 2017. pages 147-154. ISSN 1789-7874
Analysis The Advanced Ict Usage Of The Hungarian Sme Sector For Preparing A Domestic Agri-Food... 149
much less expensive than traditional methods of document exchange. The use of EDI can also speed up and reduce errors in information sharing (FÜZESI et al. 2016b). One of the objectives of the work of GÁL et al. (2013) also was to elaborate a decision-support system as over the past years the profitability and competitiveness of the Hungarian bovine sector has been declining, so it is of high priority to ensure tools for decision-makers that makes farming more efficient. In their article summarizing a vast amount of literature on this research field, TARUTÉ and GATAUTIS (2014) found that technology itself is not as important as the induced social and economic achievements thus in the case of the indicators chosen the evaluation of how ICT affect economic processes is important and ask only just for those. To create business process management systems using mobile or cloud technologies could allow supply chains and the stakeholders to break through in today’s industry because of their significantly lower entry cost (BERTI and MULLIGAN 2015), but SME sector means a bottleneck in use of ICT tools for decades besides the households, mainly in rural regions (PIERSON, 2005; STRUZAK, 2010; OECD, 2015). One of the principal weaknesses of Hungarian SMEs is the low innovation ability as well (including ICT usage) and performance (SZIRA, 2014).
The main problem is the low diffusion of ICT as ICT adoption is a complex process (KUSUMANINGTYAS and SUWARTO 2015) for a number of reasons and a key challenge for ICT in the agriculture sector is information management, both within specific domains and across the whole supply chain from farm to fork (BREWSTER et al. 2012). Another challenge to be faced is the general lack of a long-term strategic vision of SMEs as using ICT can bring benefits only after a period of adoption although the length of this period is influenced by several factors and one of them is the quality of internal and external interactions (CONSOLI, 2012). TARUTÉ and GATAUTIS (2014) also highlighted that marketing, external and internal communication, networking and resource planning are the key areas that ICT impacts the most. This problem can be observed also in enterprises operating Hungarian meat sector. With respect to the present income relations of the branch, the investment recovery time is too long (FÜZESI, 2016a). The amount spent on the IT systems of the sector in 2009 was approximately 0.6% of the revenue, which changed to 0.7% by 2016. The rate is extremely low, it must be emphasized that IT investments should be increased to increase the competitiveness of the sector (FÜZESI, 2016a).
In the case of inbound and outbound logistics where the communication with suppliers would be cheaper and faster through supply chain management or the usage of e-commerce, e-marketing and CRM techniques also could improve the performance of marketing and sales activities. Most SMEs across the world are increasingly adopting various ICTs to enhance their e-readiness status to identify, acquire, organise, disseminate and apply information for informed decision making (ONGORI and MIGIRO 2010), but according to RAMÍREZ-MEDINA (2009) more company consider
important and innovative the usage of e-technologies than are introduced. Even so, despite the difficulties, a relatively dynamic increase was observed in the usage of advanced ICT solutions in agro-food enterprises as well. For instance in the Hungarian meat sector there was a 22% increase from 28% (2009) to 50% (2016) in the rate of enterprises using integrated systems which is a result of the availability of funding resources for introducing ERP systems on the one hand and the partner expectations on the other hand (FÜZESI, 2016a).
Partner expectations also had an effect on the use of EDI as it has mainly concentrated on larger companies, but only because of pressure from their business partners or competitors, smaller companies often started to use EDI. Other recent surveys also found agro-food SMEs are getting interested in practical, close to market applications and they started to recognize the advantages of using the Cloud. For instance, SASVÁRI (2016) made a comparison on Cloud Computing usage between Austrian and Hungarian enterprises and the results suggest that SMEs consider the high-level mobility and remote access to information systems while large enterprises the faster information flows as advantages.
TARUTÉ and GATAUTIS (2014) mentioned in their article the study of MATTHEWS (2007) that identified three distinct stages (basic, substantial and sophisticated) in ICT use in small businesses. This classification was useful in the preparation work of our questionnaire because these three stages are true for today’s companies and in order to design our questionnaire elements we had to divide the statistical indicators into these three classes. For this, we overviewed several publications on the impact of ICT on SMEs performance and classified the different ICT indicators into the above mentioned classes. Furthermore, according to GUO and JIN (2009) the usage of basic ICT and e-commerce just helps survival, it does not mean economic advantage for the enterprises in a market where there is high degree of competition. If rural SMEs want to be competitive now, they need to extra services which increase the satisfaction of partners and customers and the safety of business transactions. The article reviewing a high number of publications of CONSOLI (2012) summarizes well the determinant factors of ICT usage and impacts of ICT on SMEs and highlighted that the analysis of these factors is very important to understand how to stimulate SMEs to invest in new ICTs to acquire competitive advantages and good business performance. KALOXYLOS et al. (2013) deal with the influence of different Internet-based services in their article and they have presented the SmartAgrifood architecture that aims at building an integrated food chain that will allow data to be transferred bi-directionally in an automatic and simple way. It is important, because as POPPE et al. (2013) explain, by improving the interoperability of data which are being generated in agriculture and the rest of the food chain, the processes can be optimized and data-intensive food chains have the potential to alleviate many of the current sustainability and food safety issues.
Agro-food enterprises operate in a complex and dynamic

150 Szilvia Botos – János Felföldi – László Várallyai – Ádám Péntek – Róbert Szilágyi
APSTRACT Vol. 11. Number 3-4. 2017. pages 147-154. ISSN 1789-7874
environment and to meet increasing demands of consumers, government and business partners, enterprises continuously have to work on innovations of products, processes and ways of cooperation in agro-food supply chain networks (WOLFERT et al. 2010). Innovations in different processes can make products more suitable for global distribution, and innovations in management and ICT allows supply chains to become more responsive to the increasingly sophisticated food demands of consumers (DANI, 2015). In the case of agro-food SMEs relevant and reliable information is needed regarding the ingredients of a product and the production processes so that companies may recall their products in case of a food safety problem (FÜZESI et al. 2016a). However, those ICT tools which used for tracing the products – and which must be used in many cases in accordance with food safety legislations – not only provide information for food safety but for management and these information could be vital for smooth the material flows and for maintain continuity of information flows which could increase the efficiency and reduce costs.
In summary, it is important to analyse in detail the ICT usage characteristics of agro SMEs in the food supply chain because these ICT devices, tools and services are crucial to smooth the information flow within the chain. For all these reasons our future work aims to find out how Hungarian agro-food SMEs use ICT and how ICT adoption affect their business procedures, performance and development.
MATERIALS AND METHODS
The used data set in current article derived from the database of Eurostat. Descriptive statistics were made in order to obtain a comprehensive picture on ICT characteristics of Hungarian SME sector and to determine their situation among the EU-28 Member States. The data presented are percentages and all graphs the unit is percentage of all enterprises in all cases. Standard deviation was calculated for each indicator to determine the distribution of the values of the different countries and the results showed normal distribution. On the basis of SD we can say there were not significant differences among the Member States. The differences were higher in the case of basic ICT indicators and lower in the case of the advanced ICT indicators which means that enterprises did not reach a high usage percentage even in well performing countries regarding ICT readiness. To exclude outliers we
used frequency and the results showed there was only one outlier. For calculating frequency we divided the ranges into quartiles and the number of items were adequate (5-10) in the case of all indicators in the bin ranges with one exception. Finland was excluded from the analysis in the case of the ‘Integration with partners’ indicator. We thus presented the indicators as bin ranges containing the values of all Member States between the minimum and maximum values and highlighted the values of Hungary.
RESULTS AND DISCUSSION
The agro-food industry – the first part of the chain – is the second largest segment of the EU: more than 12 million farms produce agricultural products for processing by about 290,000 enterprises in the food and drink industry (EUROPEAN COMMISSION, 2015b). Agro-food industry has a major importance in the Hungarian economy as well. In Hungary, 62.9% of the overall territory (9.3 million hectares) are utilized for agricultural activities. Eighty per cent of the total territory of Hungary is agricultural production area and more than half (59%) of this area is arable land. Almost 1 million farmers work in this sector and there are over 5,000 registered food businesses in the country. The expenditure for food and non-alcoholic beverages from the total annual living expenditure (per capita) is 23.1% in Hungary (HCSO, 2014; FLANDERS, 2015). Agro-food processing industry means higher added value and thus it contributes to the GDP in higher proportion than the simple production of primer agricultural products. The sector has a key importance even in compared to the other EU-members’ food industry, so keeping and developing the competitive advantage is crucial.
SME sector is also especially important to the overall Hungarian economy as they mean approximately 99%
from the total operating enterprises, it provides jobs for 73.8% of the employees in business sector and they produce
about 50% of the Gross Value Added (HCSO, 2015). In the Hungarian agro-food sector SMEs also have a key
role. 98% of the agricultural holdings are SMEs – however they only use 36% of the agricultural land. They represent almost the half of the total amount of agricultural standard
output and 84% of agricultural employees are directly employed by small and medium sized holdings. The
features of SMEs operating in food and drink industry is
Figure 3. The change of performance of Hungarian SMEs compared to EU-28 between 2008 and 2015
Source: HCSO, 2016

APSTRACT Vol. 11. Number 3-4. 2017. pages 147-154. ISSN 1789-7874
Analysis The Advanced Ict Usage Of The Hungarian Sme Sector For Preparing A Domestic Agri-Food... 151
similar to the agricultural contribution structure. According to Hungarian Statistical Agency, in 2015 the number of
agro-food enterprises (including agriculture, forestry and fishing and manufacturing of food products, beverages and
tobacco products) was almost 5% of the total number of enterprises operating in the Hungarian economy (HCSO, 2015). The characteristics of SMEs in the Hungarian food
and drink industry is shown on Figure 2.
Figure 2. Contribution of enterprises to the food and beverages
industry by size in Hungary, 2015
Data source: EUROSTAT, 2017
Regarding the tendency of performance of the SME sector, comparing to EU-28 average, the performance of Hungarian SME sector has gradually worsened between 2008 and 2015 as shown on Figure 3.
We can see that the performance of Hungary is on the wane while the EU average has an increasing trend. ICT can help enterprises and this article is an overview of the ICT situation of Hungarian SMEs. As we discussed in the literature review, we analysed mainly the online presence and the usage of basic and advanced online services of SMEs and large enterprises. Figure 4. reports the online presence of enterprises of the EU Member States by size in 2016 by three different indicators shown separately the values of small, medium and large enterprises. The difference between the best and the worst country can be seen on the range lines highlighting the data of Hungary.
Figure 4. Online presence of small, medium and large enterprises of
EU Member States in 2016 (in percentage of enterprises)
Data source: EUROSTAT, 2016
v difference in three senses: among the different forms of online presence, among Member States and among enterprises of
u u
usage rate is not satisfactory as around half of the enterprises had a website and paid to advertise on the internet in 2016, however, this is one of the most important and the most
u are lagging behind the larger companies by 15 per cent. A striking observation to emerge from the data comparison is the difference among SMEs and large enterprises regarding the usage of social networks or multimedia content sharing websites. The usage rate of the latter is relatively low in the case of small enterprises, but medium sized and large companies are performing well as this opportunity is an advanced ICT tool while having a website or advertising online count basic tools but the range and the proportion of enterprises using this
In order to determine the situation of Hungary among
EU Member States we divided the data set into quartiles and Hungary was in the lower quartile of all EU Member States with its 2016 usage values in almost all cases. Hungary,
v , , but in the case of the latter two indicators it was among the last and ranked ahead only Romania, Bulgaria and Slovakia and besides these Lithuania and Czech Republic in terms of the third indicator. Scandinavian countries top the rank in each cases with Denmark, Sweden and Netherlands and in some cases Estonia also belongs to the leader group. It is remarkable that Malta has the highest values in the case of the
, u , say Malta performs above the EU average.
In terms of why enterprises use social media there are considerably differences and Figure 5 demonstrates well the usage rate of social media for basic and advanced purposes.
u and customer relationship management, while the last two aim at involving other partners of the chain (customers, business partners and other organisations) into their business procedures and creating opportunity for innovation.
Although the usage rate of social media is high, there are considerable differences regarding the purposes. The graph below shows large enterprises use social media for multiple purposes including advanced ones than the small enterprises using it mainly for marketing purposes. It is worthwhile noting that in the case of the latter two purposes the usage rate is weak even in the case of large enterprises.

152 Szilvia Botos – János Felföldi – László Várallyai – Ádám Péntek – Róbert Szilágyi
APSTRACT Vol. 11. Number 3-4. 2017. pages 147-154. ISSN 1789-7874
Figure 5. Social media use of small, medium and large enterprises of
EU Member States in 2016 by purpose (in percentage of enterprises)
Data source: EUROSTAT, 2016
Regarding the values of the four indicators appreciable differences were found not only between SMEs and large
u v u
are higher, the last two indicators show a smaller range and the highest values are low and less than half of the enterprises use social media to involve customers in development of innovation of goods or services or collaborate with business partners or other organisations. This result indicates, for supply chain, that enterprises use social media for marketing purposes mainly for communication with customers. With business partners or other organisations they do not use these opportunities and apart from sales customers are not involved in other business processes such as innovation of goods or services. The graph also shows small companies are very behind, medium sized enterprises have similar characteristics than large companies, the gap between them is small.
(sending and receiving eInvoices suitable for automated processing) presented on Figure 6.
Figure 6. Integration with partners of small, medium and large enterprises of EU Member States in 2016 (in percentage of enterprises)
Data source: EUROSTAT, 2016
Finland was not included in the analysis because of its u
Slovenia either. The lowest percentage of enterprises use eInvoices are mainly Southern European countries but the United Kingdom and Luxembourg are also belongs to this
group. Regarding Hungary, large companies have relatively high position in the two indicators and a high proportion of medium-sized companies receive eInvoices. Concerning the
, v v v u , 11 of the enterprises send eInvoices to their partners.
The situation of Hungarian SMEs regarding to the use of Cloud services is far under the average of EU-28 and its level is shown on Figure 7.
Figure 7. Use of pay Cloud Computing services of small, medium and large enterprises of EU Member States in 2016
Data source: EUROSTAT, 2016
Our position is very poor even the average usage ratio is
indicators. Only a few percentage (3-16%) of Hungarian SMEs buy cloud computing services over the internet and with this result Hungary is in the lowest quartiles in this term as well.
In this article our aim was to determine the main question groups for our questionnaire which focus mainly on ICT solutions supporting the quality of communication and relationship between partners. As the basic IT tools are available in the major part even in the SMEs besides large companies, the two main issues will be the usage of advanced online services and the usage of high quality ICT solutions. Thus the following question groups are planned to be in the questionnaire:
– Use of social media and its purposes – Use of free and pay Cloud Computing services – ICT solutions supporting integration with partners
u u from public databases. Thus we used general statistics to create question groups and questions for our questionnaire in order to understand ICT situation targeted taking into account the
u u account the characteristics of the Hungarian agro-food SMEs to be involved into the survey and pay particular attention to solutions suitable to help them such as open source software and applications or free Cloud services. By understanding the level and features of usage of these ICT tools help us to determine the related issues as the different hampering or motivating factors or the economic impacts.
differences in some cases among enterprises of different

APSTRACT Vol. 11. Number 3-4. 2017. pages 147-154. ISSN 1789-7874
Analysis The Advanced Ict Usage Of The Hungarian Sme Sector For Preparing A Domestic Agri-Food... 153
sizes. A much bigger percent of large companies use advanced ICT solutions then SMEs and mainly small enterprises are lagging behind as the attitudes of medium sized enterprises are similar to the large ones. In Hungary small enterprises in
u u free Cloud Computing services can offer good opportunities as they do not have initial costs. ICT adoption is very important to them as ICT sector is a dynamically growing sector and if customers and partners of an enterprise adapt faster to these technological innovations, it may have a negative effect on
, u the organisation. Our institute set the detailed analysis of the food chain as an objective and in the frame of this work we will evaluate the usage rate of the advanced ICT solutions, the motivating and hampering factors of SMEs operating in agro-food sector.
REFERENCES
Assante D, Castro M, Hamburg I, Martin S. (2016): The Use of Cloud Computing in SMEs. Procedia Computer Science, Vol 83. pp. 1207-1212.
Barcelona Treball. (2013): Agro-Food Industry – Sector Report 2013. Available at: http://w27.bcn.cat/porta22/images/en/Barcelona_treball_Informe_sectorial_Agro_food_industry_gen2013_en_tcm43-4016.pdf
Berti G, Mulligan C. (2015): ICT & the Future of Food and Agricul-ture. Industry Transformation – Horizon Scan: ICT & the Future of Food. Telefonaktiebolaget LM Ericsson, Stockholm, Sweden.
Brewster C, Wolfert S, Sundmaeker H. (2012): Identifying the ICT challenges of the Agri-Food sector to define the Architectural Require-ments for a Future Internet Core Platform. Proceedings eChallenges e-2012, Lisbon, Portugal. pp. 1-8.
Consoli D. (2012): Literature analysis on determinant factors and the impact of ICT in SMEs. Procedia – Social and Behavioral Sciences, Vol 62 pp. 93-97.
Dani S. (2015): Food Supply Chain Management and Logistics – From Farm to Fork. Kogan Page, London, Philadelphia, New Delhi.
European Commission. (2015): Background on the EU food supply chain: an important economic sector.
Available at: http://ec.europa.eu/competition/sectors/agriculture/over-view_en.html
Eurostat databases
Felföldi J, Botos Sz, Péntek Á, Szilágyi R, Várallyai L. (2017): Study-ing the ICT management of agri-food sector on supply chain level – the first stage: analysis of agricultural ICT usage. In: Anastasios Karasav-voglou, Persefoni Polychronidou (editors) Agricultural Sector Issues in the European Periphery: Productivity, Export and Development Chal-lenges. Wilmington: Vernon Press, 2017. pp. 35-50.
Flanders Investment & Trade. (2015): Agro & Food Sector in Hungary. Flanders Investment & Trade, Budapest, Hungary.
Füzesi I, Lengyel P, Csobán K, Szilágyi R. (2016a): Analysis of ICT Support in Hungarian Meat Sector. Agrárinformatika / Journal of Ag-ricultural Informatics, Vol. 72 pp. 60-69.
Füzesi I, Lengyel P, Szilágyi R, Ráthonyi G. (2016b): Application of EDI Technologies in the Food Supply Chains. Journal of EcoAgriTour-ism, Vol. 121 Iss 32 pp. 69-77.
Gál T, Nagy L, Dávid L, Vasa L, Balogh P. (2013): Technology plan-ning system as a decision support tool for dairy farms in Hungary. Acta Polytechnica Hungarica, Vol. 10 Iss 8 pp. 231-244.
Guo Q, Jin B. (2009): Development of E-business and Networking in Rural Small and Medium-sized Enterprises. Information Science and Engineering (ICISE). Nanjing, China, pp. 2912-2915.
Hungarian Central Statistical Office (HCSO) databases
Kaloxylos A, Wolfert J, Verwaart T, Terol CM, Brewster C, Robbemond R, Sundmaker H. (2013): The Use of Future Internet Technologies in the Agriculture and Food Sectors: Integrating the Supply Chain. Pro-cedia Technology, Vol. 8 pp. 51-60.
Kusumaningtyas N, Suwarto DH. (2015): ICT Adoption, Skill and Use Differences among Small and Medium Enterprises Managers Based on Demographic Factors. Procedia – Social and Behavioral Sciences, Vol. 169 pp. 296-302.
Martin FM, Ciovica L, Cristescu MP. (2013): Implication of Human Capital in the Development of SMEs through the ICT Adoption. Pro-cedia Economics and Finance 6. pp. 748-753.
Matthews P. (2007): ICT assimilation and SME expansion. Journal of International Development, Vol. 19 Iss 6 pp. 817-827
OECD. (2015): OECD Digital Economy Outlook 2015. OECD Publish-ing, Paris, France.
Ongori H, Migiro SO. (2009): Information and communication tech-nologies adoption in SMEs: literature review. Journal of Chinese En-trepreneurship, Vol. 2 Iss 1 pp. 93-104. Emerald Group Publishing Limited. Available at: www.emeraldinsight.com/1756-1396.htm
Pierson J. (2005): The take-up of ICT by micro-enterprises: An assess-ment of the bottlenecks and of European initiatives. Communication & Strategies, Vol. 57 1st quarter. p.25.
Poppe KJ, Wolfert S, Verdouw C, Verwaart T. (2013): Information and Communication Technology as a Driver for Change in Agri-food Chains. EuroChoices, Vol. 12. Iss 1 pp. 60- 65.
Pullman M, Wu Z. (2012): Food Supply Chain Management – Eco-nomic, Social and Environmental Perspectives. Routledge, New York, USA.
Rahmana A. (2009): Peranan Teknologi Informasi dalam Peningka-tan Daya Saing Industri Kecil Menengah. Seminar Nasional Aplikasi. Teknologi Informasi 2009
Ramírez-Medina, JA. (2009): Enterprise 2.0 Readiness Index. pp. 2677-2684. In: PICMET 2009 Proceedings, August 2-6, Portland, Or-egon USA. IEEE ISBN 978-1-890843-20-5 Department of Engineer-ing and Technology Management Portland State University, Maseeh College of Engineering & Computer Science Portland, Oregon USA. August 2-6 2009
Sasvári P. (2016): The analysis of the knowledge and use of Cloud Computing among enterprises in Austria and Hungary. Gradius, Vol. 3 Iss 1 pp. 478-484.
Struzak R. (2010): Broadband Internet in EU Countries: Limits to Growth. IEEE Communication Magazine, Vol. 48 Iss 40 pp. 52-57.
Szira Z. (2014): The situaton of the SME sector in Hungary. In: Man-agement, Enterprise and Benchmarking – In the 21st Century. Econpa-pers, Budapest, Hungary. pp. 107-118.
Taruté A, Gatautis R. (2014): ICT impact on SMEs performance. Pro-cedia – Social and Behavorial Sciences, 110. pp. 1218-1225.
Wolfert S, Verdouw CN, Verloop CM, Beulens AJM. (2010): Orga-nizing information integration in agri-food – A method based on a service-oriented architecture and living lab approach. Computers and Electronics in Agriculture, Vol. 70. pp. 389-405.


APSTRACT Vol. 11. Number 3-4. 2017. pages 155-162. ISSN 1789-7874
DOI: 10.19041/APSTRACT/2017/3-4/21
Applied Studies in Agribusiness and Commerce – APSTRACT Center-Print Publishing House, Debrecen SCIENTIFIC PAPER
DIFFERENCES OF THE PRIMARY ENERGY CONSUMPTION OF THE COUNTRIES
ALL OVER THE WORLD
Judit Tóth1 – Róbert Magda2
Szent István University, Faculty of Economic and Social Sciences2100 Gödöllő, Páter Károly utca 1.
1 [email protected] [email protected]
Abstract: The global energy consumption is continuously growing, because the population of Earth and the standard of living expands day by day. As a result, the emission of greenhouse gases increases further more. The various countries use the different types of fuels in varying amount.In this study we have examined the primary energy consumption of the countries, according to the BP Statistical Review of World Energy June 2016 (BP, 2016), based upon their usage of fuels.The assay resulted in a 7 cluster model. With one exception, each cluster contains a resource, which is used in a much larger amount than in the other clusters. As a result, we may differentiate between an average cluster, and the clusters of countries that use primarily hydropower, nuclear energy, renewable energy, coal, fossil oil, and natural gas.We have examined if there is any connection between the location of a country in a cluster and its HDI, as well as the countries’ competitiveness.
INTRODUCTION
Presently one of the greatest challenges for human kind is how to solve the substitution of the rapidly declining energy. The need to decrease the addiction to fossil oil and natural gas has existed for several decades. The energy crisis of the 1970’s made the world realize that the economies of certain countries extremely depend from others, which export primarily fossil oil and natural gas. After recognizing this situation, several countries took steps to accelerate experiments and researches regarding the substitution of fossil oil. Since 1975, in several countries, experiments were made with the support of the government, among others in the USA at the Forest Products Laboratory, in Cincinnati, Ohio, and also in Canada at the Intergroup Consulting Economists Ltd., in Winnipeg, Manitoba. The problem of solving the substitution of fossil oil remains present in the experimental and research activities. In 2005, in the 125th anniversary edition of Science magazine the editors named 25 questions which established the mainspring of today’s experimental and theoretical researches. Among these questions we may find the following: What and when can replace the cheap fossil oil? (KERR and SERVICE 2005).Researches of today are not only justified by minimization
of economic dependence but also by the fact that one of the biggest challenges of the 21th century is to find a solution for problems caused by the climate change.
Developing technological solutions increasing energy efficiency is often induced by more efficient production and consumption technological solutions solve environmental problems, as the better we optimise resource usage, the less we have to actually consume of them. Sadly, in many cases, we can observe the Jevons paradox occuring, which says that increasing efficiency necessarily causes the consumption to increase as well (JEVONS, 1866). For example, efficient fuel usage comes with the increase of cars on the roads, and miles travelled (KEMP et al. 1998; YORK, 2006).
One of the major difficulties with the fossil energy carriers is that these substances increase the carbon dioxide quantity of the atmosphere and thus are responsible for global warming. The United Nations Framework Convention on Climate Change (UNFCCC) established the Kyoto Protocol in 1997. This treaty aims to stabilize the greenhouse gas concentration of the atmosphere in order to ease the foreseen effects of global warming (UNITED NATIONS FRAMEWORK CONVENTION ON CLIMATE CHANGE, 2017). One of the shortcomings of the Kyoto Protocol is that it did not offer
Keywords: carbon dioxide (CO2) emissions, Human Development Index, Global Competitiveness Index, primary energy consumption, renewable energy. (JEL Code: Q42, Q43, Q35, Q01, P28, P18)

156 Judit Tóth – Róbert Magda
APSTRACT Vol. 11. Number 3-4. 2017. pages 155-162. ISSN 1789-7874
any technological solutions regarding the problem and it only prescribed obligations, among others to regulate emission, for the first world countries up to the end of 2012. Based upon the collected data, it soon became clear that on a global scale the emission of the greenhouse gases, which reside in the atmosphere for a considerable amount of time, continuedto grow steadily.
In the nineteen fifties, Kuznets created his ‘Economic Growth and Income Inequality’, in which he stated that in society, the inequality of income will initially increase based on national income, but if it approaches a certain baseline, these inequalities begin to diminish (KUZNETS, 1955). Grossman and Krueger’s ‘Economic Growth and the Environment’ (GROSSMANN and KRUEGER 1995) stressed that there’s a connection between harmful environmental load, and national income.
In multiple countries of the EU and the OECD the statement that environmental load increases to a certain level of GDP, after which it decreases. This caused many to conclude that growth turns into development at some point. The theory was proven at long-term, with our current economic growth methods, the curve signaling environmental load may begin to increase again. The curve shaped like an upside-down U was determined when describing contamination causing local and short-term costs. Long-term costs divided more in terms of area, like carbon-dioxide emission, quantity often increases with income (SZLÁVIK, 2013).
LITERATURE REVIEW
The Emission of Carbon Dioxide
Countries with well developed economies were fairly successful in decreasing the emission of CO2, however, these results are counterbalanced by the emission of developing economies, mostly in Asia. As a result, the net emission of carbon dioxide continues to grow.
Figure 1 CO2 emission deriving from fuel burning (Global Energy Statistical Yearbook, 2016)
Due to this tendency, the parties of the 1992 Framework Agreement for Climate Change of the UN initiated another reconciliation in 2005 which started a long series of negotiations lasting up to10 years. This resulted in publishing the Paris Agreement. The long term goal of the agreement was to secure that the global warming is kept well under 2 Celsius degrees compared to the rate before industrialization. In addition to this, „we have to aim” that global warming does not exceed 1,5 Celsius degree. We must also aim to stop the increase of global emission „as soon
as possible” and after that rapidly decrease global emission in the second half of the 21st century (PARIS AGREEMENT ON CLIMATE CHANGE, 2016). The alternatives of fossil fuels are the renewable energy carriers which help to decrease the emission of gases that are responsible for the greenhouse effect.
Primary Energy Use Today
Since the key factors - such as the increase of population and living standards -, are influencing energy use globally we may expect a large growth of energy use. It is true in general that if the quality of living increases, the per capita use of energy will increase. In fact, the use of energy can be explained as a combination of three factors: population, per capita GDP and the energy intensity of economy, that is, energy used for one unit of the GDP. According to predictions, until 2040 the absolute rate of energy demand will increase, although the increment percent will decrease.
Research Methodology
In this study we have examined the primary energy consumption of different countries based on the BP Statistical Review of World Energy June 2016 (BP, 2016), according to their usage of fuels. The comparison of data regarding to certain countries was simplified due to the fact that we did not use the raw data of the tables, but based upon these, we defined the ratio of certain fuels in percentage. Therefore we could eliminate the differences deriving from the size of economy in various countries.
DATA ANALYSIS AND RESULTS
Examining the sample consisting of 72 units we can see that the economy of an average country uses oil in 38%, gas in 30%, coal in 16%, nuclear energy in somewhat more than 4%, hydropower in 8,5% and other renewable energy sources in the remaining 3,5%.
Figure 2 Regional Fuel Usage in 2015(BP, 2016)

APSTRACT Vol. 11. Number 3-4. 2017. pages 155-162. ISSN 1789-7874
Differences Of The Primary Energy Consumption Of The Countries All Over The World 157
Table 1 Descriptive Statistics, (by the authors,2017)
foss
iloi
l
natu
ral
gas
coal
nucl
ear
ener
gy
hydr
o po
wer
rene
wab
le
ener
gy
N Valid 72 72 72 72 72 72
Mean 37,91% 29,91% 16,06% 4,17% 8,45% 3,50%
Median 36,76% 23,80% 10,59% 0,00% 3,63% 1,86%
Std. Deviation
14,91% 21,85% 17,00% 7,96% 11,52% 4,58%
Range 81,14% 89,93% 68,43% 41,41% 66,08% 25,16%
Minimum 5,44% 1,52% 0,00% 0,00% 0,00% 0,00%
Maximum 86,58% 91,44% 68,43% 41,41% 66,08% 25,16%
According to Table 1, the differences varied for individual resources: e.g. we can see an 80 percentagepoint difference between the lowest and highest values of oil, a nearly 90 percentage point difference in gas, only 40 percentage point difference in case of nuclear energy and merely 25 percentage point difference in renewable energy resources. The standard deviations reveal similar results. In order to provide equal role for each sources during the cluster analysis, we used standardized values. During standardization the average ratio became ”0” and 1 standard deviation became the basic unit of measurement. In other words, +1 means that in a certain country the ratio of a given type of energy resource is exactly 1 standard deviation larger than the average.
The clusters were created by hierarchic clustering, by using the Ward method. Within the individual steps, this method combines the existing clusters so that the inner heterogeneity of the new clusters would grow minimally.
The survey resulted in a 7 cluster model. The characteristics of this model can be viewed in Table 2.
According to Table 2 we can see that each cluster contains one resource which is used in a considerably greater rate than in the other clusters. The only exception is cluster 2 which contains the most average values. Furthermore, we may state that in cluster 5, 6 and 7 the dominant portion of energy (in some cases 90%) derives from 2-3 resources as follows: in cluster 5 primarily fossil oil and secondarily natural gas (together 88,5%); in cluster 6 primarily natural gas and secondarily fossil oil (together 93,8%); and finally in cluster 7 primarily coal, secondarily oil (together 84,6%) complemented by natural gas (these three together already make up to 93,8%). In the rest of the clusters the total consumption divides among several resources. Table 3 contains the place of the various states within the clusters.
Connections among the Use of Various Resources
We have examined if any connection among the percentages of the use of various resources exist. We have predicted, and the test had certainly proved it that if an economy leans on oil on a large scale, it uses nuclear energy in a lesser percentage; if a country leans on natural gas on a large scale, it uses
Table 2 The Characteristics of Clusters (by the authors, 2017)
Ward Method fossil oil natural gas coal nuclear energy hydro power renewable energy
Cluster 1
Mean 37,2% 19,4% 11,3% 2,2% 26,9% 2,8%
Std. Deviation 8,4% 8,7% 11,6% 5,4% 12,4% 3,3%
Cluster 2
Mean 41,0% 22,7% 24,3% 4,3% 4,4% 3,5%
Std. Deviation 8,3% 9,9% 9,5% 5,8% 4,7% 2,4%
Cluster 3
Mean 24,3% 15,5% 21,5% 23,6% 9,6% 5,5%
Std. Deviation 7,5% 9,7% 15,1% 8,4% 10,8% 4,5%
Cluster 4
Mean 42,5% 23,8% 13,5% 3,5% 3,2% 13,3%
Std. Deviation 5,5% 7,9% 5,3% 4,4% 3,2% 5,5%
Cluster 5
Mean 59,3% 29,2% 5,5% 0,2% 4,2% 1,6%
Std. Deviation 13,3% 15,9% 7,7% 0,5% 7,5% 2,0%
Cluster 6
Mean 25,4% 68,4% 2,4% 0,8% 2,8% 0,2%
Std. Deviation 10,8% 14,2% 3,7% 1,9% 3,9% 0,3%
Cluster 7
Mean 24,2% 9,2% 60,4% 0,9% 3,3% 2,0%
Std. Deviation 3,6% 5,4% 6,0% 0,9% 3,4% 1,8%
Total
Mean 37,9% 29,9% 16,1% 4,2% 8,5% 3,5%
Std. Deviation 14,9% 21,8% 17,0% 8,0% 11,5% 4,6%

158 Judit Tóth – Róbert Magda
APSTRACT Vol. 11. Number 3-4. 2017. pages 155-162. ISSN 1789-7874
coal, hydropower and other renewable energy sources on a lesser percentage. However, countries that use more coal, other renewable energy resources (not hydropower) as well as nuclear energy are more likely to be used. The usage of other renewables correlates positively with the use of nuclear energy and hydropower. Generally the correlations tend to be weaker than average.
The results of our study reflect the aspirations of the countries. China which belongs to the „coal” cluster, aims to decrease its excessive „coal-addiction”. Therefore, during the last two decades the renewable energy sector of China became a number one factor within the entire renewable energy investment sector and capacity. In the single year of 2015, China established a larger capacity of wind power and solar energy than any other country (REN21, 2016).
Figure 3Solar Cell Capacity in 2015 (Gigawatt)(REN21, 2016)
Figure 4 Wind Power 2015 (Gigawatt)(REN21, 2016)
India, another significant member of the „coal” cluster, also obliged to produce renewable energies. By 2022, India plans to establish the capacity of 175 GW renewable energy, out of this 100GW solar energy, 75GWhydropower, wind power, biomass and other renewable energy resources produced by small works. By 2030, India also plans to increase the rate of non-fossil energy carriers up to 40% within the electric energy sector. The country simultaneously aims to liquidate the shortage of energy and to increase renewable energy. Furthermore, the government of India attempts to secure a non-stop, 24 hour electricity supply for each household by 2022 and provide electric power for every single village by 2019. In accordance with the announced government program, a significant increase can be experienced in the renewable energy sector of India within the last two years. (Krishnaswamy, n.d.)
South Africa, which also belongs to the „coal” cluster, is the only African country which possesses a nuclear power plant. Originally South Africa meant to establish 6 to 8 nuclear
Table 3 The place of countries (by the authors, 2017)
1. Cluster (hydropower)
2. Cluster (average)
3. Cluster (nuclear energy)
4. Cluster (renewable energy)
5. Cluster (fossil oil)
6. Cluster (natural gas)
7. Cluster (coal)
Austria Australia Bulgaria DenmarkChina Hong Kong SAR
Algeria China
Brazil Belgium Czech Republic Germany Ecuador Argentina India
Canada Chile Finland Ireland Egypt Azerbaijan Kazakhstan
Colombia Greece France Italy Kuwait Bangladesh Poland
New Zealand Hungary Slovakia Portugal Lithuania Belarus South Africa
Norway Indonesia Sweden Spain Mexico Iran
Other Africa Israel Ukraine United Kingdom Netherlands Pakistan
Other Asia Pacific Japan Other Middle East Qatar
Other Europe & Eurasia
MalaysiaOther S. & Cent. America
Russian Federation
Peru Philippines Saudi Arabia Trinidad & Tobago
Switzerland Romania Singapore Turkmenistan
Venezuela South Korea ThailandUnited Arab Emirates
Vietnam Taiwan Uzbekistan
Turkey
US

APSTRACT Vol. 11. Number 3-4. 2017. pages 155-162. ISSN 1789-7874
Differences Of The Primary Energy Consumption Of The Countries All Over The World 159
power plants, but constructions came to a halt in 2016, and the execution was postponed. In 2007 the country began the construction of two new coal-fed power plants, which were supposed to start operating in 2011, however, the constructions have not been completed even by the beginning of 2016. South Africa introduced the Renewable Energy Independent Power Producer’s Procurement Programme (REIPPPP) in 2011. This program aimed to add 3,75 GW capacity to the network. The program proved to be very successful, even exceeded the original goal mainly by the purchase procedures. (JOUBERT, n.d.)
The Composition of Clusters According to HDI
The theoretical base of creating HDI originates from the Nobel-Prize winner Amartya Sen. Sen differentiates among the possibilities which may be defined as the resources available to humans, and the accomplishments achieved through these resources. This distinction is based on the theory that individuals -playing an active role shaping their lives – judge the accessible realizations in a different manorin accordance with their various preferences.Therefore, if we only evaluate life quality through the actual living conditions than we partially compare different preferences. Consequently, the theories of resource aspects, which include the conception of human development, measure quality of life based on the scale of available resources for individuals, which are sufficient for reaching the highly valued living conditions (BERGER- SCHMITT, 2000).
One of the biggest advantages of the index is that - due to its complex nature - it means an alternative that displays reality in a more complete manner to one-dimensional approaches. However, it’s value - thanks to the small data requrement - when compared to indicator systems - its value can be calculated for multiple countries, making comparisons possible, and its simple construction makes it easy to use (STREETEN, 1994; SAGAR-NAJAM, 1998; ZAPF, 2000).
During our research we employed HDI categories as follows: – HDI Category 4 equals extremely high HDI – HDI Category 3 equals high HDI – HDI Category 2 equals average HDI – HDI Category 1 equals low HDINone of the examined countries belonged to the low HDI
group. The analysis did not include the combined categories (e.g. Other Africa, Other Europe & Eurasia and Taiwan).
Figure 5 The composition of clusters according to HDI (by the authors, 2017)
Figure 5 reveals that the countries of cluster 4, using renewable energies on a larger scale, obtain an extremely high HDI, and in cluster 2 and 3 we find a larger proportion of countries with extremely high HDI. The proportion of countries characterized by average HDI was the highest in cluster 6 (relying on natural gas) and 7 (relying on coal).
Connections among the Countries’ Competitiveness
There is no commonly accepted formula to measure competitiveness. The Global Competitiveness Index (GCI), created by the World Economic Forum, examines competitiveness along 12 aspects. It consists of three sub indexes: the sub index of basic requirements (this includes institutions, infrastructure, the macroeconomic environment, healthcare and primary education), the sub index of increasing effectivity (this includes the parameters characterizing the higher education and trainings, the market as well as labormarket effectivity, the development of the financial market, the availability of technology and the size of market), as well as the sub index of innovation and refinement (which helps to analyse the refinement of innovation and business procedures). GCI results from the collective calculation of these twelve aspects (THE GLOBAL COMPETITIVENESS REPORT, 2016)
The countries included into the analyses were ranked between 1 and 132 based on their competitiveness. During the examination we used GCI categories as follows:
– Countries ranked 1-44 establish GCI category group 1, or high GCI
– Countries ranked 45-88 establish GCI category group 2, or average GCI
– Countries ranked 89-132 establish GCI category group 3, or low GCI
Figure 6 The composition of clusters based on GCI (by the authors, 2017)
Figure 6 demonstrates that the countries of cluster 4 (which use renewable energy resources on a larger scale) are the best in competitiveness as well as the countries of cluster 7, or „coal” cluster and cluster 2 or „average” cluster which are also found at the top of the competitiveness ranking. Based on the analysis the countries with the lowest competitiveness are found in cluster 6 or „natural gas” cluster.

160 Judit Tóth – Róbert Magda
APSTRACT Vol. 11. Number 3-4. 2017. pages 155-162. ISSN 1789-7874
Cluster 4 (Countries using renewable energy resources on a larger scale)
Each country of cluster 4 (which uses renewable energy sources on a larger scale) is a member of the European Union. In case of cluster 4 in which the countries use renewable energy resources other than hydropower on the largest scale, the average and median of HDI, GNI and competitiveness index is the highest.
As Figure 7 demonstrates, the transformation of energy production continues rapidly in Europe.
Figure 7 Facilities producing net electric energy in the European Union 1995-2015 (MW)
(THE EUROPEAN WIND ENERGY ASSOCIATION)
In the past twenty years, in EU countries the expansion of capacity basically regarded three technologies, the wind power plants, the gas-powered electricity production and the solar cell systems. In countries of cluster 4 the use of alternative energy sources became more and more a priority, e.g. in Portugal 48% of electric energy production originated from renewable energy in 2015, out of which a significant portion, 22% was consisted of wind power. This ratio is only higher in Denmark, where wind power plants provide 42% of electric energy production. At the same time, wind power makes up only 20% in Spain, 13% in Germany and 11% in the United Kingdom (ZERO). In Portugal between May 7 and 11, 2016 the electric power needs were covered solely by renewable resources for 107 hours. This meant close to 90% of the total usage. A similar event happened in Germany on May 8, 2016. Due to the favourable weather conditions (windy and sunny weather) the electricity production deriving from renewable energy resources increased outstandingly – these plants produced 87% of the daily supplies. The changing of the structure of the energy sector will be a long procedure. Because of the large amount and long term funds the energy system can only transform slowly. Germany could have become a front runner in the production of renewable energy because, due to the oil crises, it significantly increased the budgetary spending for research and development (R&D) already during the seventies in order to promote the exploitation of renewable energy sources. The necessity of these investments was boosted by the catastropheofChernobyl. Thanks to the several decadeslong, steady R&D budgetary support, a wide research development network was formed by scientists, small and medium size businesses and large firms. This network focuses on renewable energy from basic research to technological production.
CONCLUSION
One of the most important issues of our time is the secure energy supply of economies as well as the moderation of the carbon dioxide emission and harms deriving from it.
The growth of global energy need continues in our present times. Therefore, it is crucial what type of energy resources we use, how effectively we are able to use energy, since these factors are closely connected to the amount of carbon dioxide emission. The issues of energy efficiency and renewable energies cannot be separated from each other. The diversification of the energy sector is one possible way to answer these questions, and therefore the politicians in charge must consider them and must build their strategies based upon them. The energy sector of countries in certain clusters does not reveal any characteristics of diversification. In case of the countries in cluster 5, which use primarily fossil oil and secondarily natural gas, these sources together, provide 88,5% of the applied energy, while in cluster 6 where the countries use primarily natural gas and secondarily fossil oil the two sources make up 93,8% of the combined usage. According to the predictions, the oil and gas supplies will not drain during the following decades because continuously new deposits are discovered and new exploitation technologies are introduced. The most difficult question is how to determine the price of oil and gas since these are largelyaffected by political event.(PÁPAY, 2015)
According to this study, the importance of the renewable energy sources other than hydropower is larger in economies where the competitiveness index, HDI and the GNI is higher. In other words the first world economies use renewable energies on a larger scale. The economies of the „coal” cluster are also committed to improve the usage of renewal energy. China became world leader in increasing the capacity of wind power and solar energy in 2015. The energy produced by the renewable power plants becomes ever cheaper since technologies improve continuously. Investments pay off more due to the lower and lower price of energy. In addition to this, due to the governmental support more and more renewable power plants are constructed. Europe stands by climate protection efforts and supports the production and use of renewable energy. Hopefully, as a result, Hungary will also benefit from the lower energy prices.
REFERENCES
AZ ÉGHAJLATVÁLTOZÁSRÓL SZÓLÓ PÁRIZSI MEGÁLL-APODÁS. (2016). Az Európai Unió Tanácsa: http://www.consil-ium.europa.eu/hu/policies/climate-change/timeline/ Approached 14. 05. 2017
BERGER-SCHMITT, R.-H.-H. N. (2000). Conceptual frame-work and structure of a European system of social indicators. Mannheim: EUreporting Working Paper, No. 9.
BP. (2016). BP Energy Outlook: http://www.bp.com/en/global/cor-porate/energy-economics/energy-outlook/energy-outlook-down-loads.html Approached 03.05. 2017
APSTRACT Vol. 11. Number 3-4. 2017. pages 155-162. ISSN 1789-7874
Differences Of The Primary Energy Consumption Of The Countries All Over The World 161
GLOBAL ENERGY STATISTICAL YEARBOOK (2016) https://yearbook.enerdata.net/#CO2-emissions-data-from-uel-combus-tion.html Approached 03.05. 2017
GROSSMAN, G. M., KRUEGER, A. B., (1995) The Quarterly Journal of Economics,110, 2, pp.353-77.
JEVONS, S. W. (1866): The Coal Question. An Inquiry Concern-ing the Progress of the Nation and the
Probable Exhaustion of Our Coal-Mines. Macmillan, London.
JOUBERT, L. (n.d.). A NÉMET ENERGIAÁTMENET KÖNYVE https://book.energytransition.org/hu/node/78 Approached 27.05. 2017
KEMP , R.–SCHOT, J.–HOOGMA , R. (1998): Regime Shifts to Sustainability Through Processes of Niche Formation: The Ap-proach of Strategic Niche Management. Technology Analysis & Strategic Management, Vol. 10. Iss 2. pp.175–195.
KERR , R.,- SERVICE, R. (2005). What Can Replace Cheap Oil—and When. Science, 309 (5731), 101.
KUZNETS, S. (1955), The American Economic Review, XLV,1, pp.1-28.
THE GLOBAL COMPETITIVENESS REPORT (2016). http://reports.weforum.org/global-competitiveness-index/ Approached 14.05. 2017.
KRISHNASWAMY, S. (n.d.). A NÉMET ENERGIAÁTMENET KÖNYVE: https://book.energytransition.org/hu/node/78 Ap-proached 27.05. 2017.
REN21. (n.d.). RENEWABLES 2016 GLOBAL STATUS RE-PORT: http://www.ren21.net/wp-content/uploads/2016/06/GSR_2016_Full_Report.pdf Approached 21.05. 2017.
PÁPAY , J. (2015). Konvencionális és nem konvencionális kőolaj- és földgázkitermelő eljárások.
Magyar Tudomány, 176. évfolyam 2015/11. pp. 1285-1294.
SAGAR, AMBUJ D.-ADIL NAJAM (1998). The Human Devel-opment Index: a critical review. Ecological Economics: (25), pp. 249-264.
STREETEN, P. (1994). Human development: means and ends. The American Economic Review: Papers and Proceedings, Vol. 84. Iss 2, pp. 232-237.
SZLÁVIK, J. (2013). Fenntartható gazdálkodás. Budapest: COM-PLEX KIADÓ KFT.
UNITED NATIONS PARIS AGREEMENT ON CLIMATE CHANGE (2015). Paris Agreement: http://unfccc.int/paris_agree-ment/items/9485.php Approached14.05. 2017.
UNITED NATIONS FRAMEWORK CONVENTION ON CLI-MATE CHANGE. (n.d.). Kyoto Protocol: http://unfccc.int/kyoto_protocol/items/2830.php Approached14.05. 2017.
ZAPF, W.( 2000) Social reporting in the 1970s and in the 1990s. Social Indicators Research, Vol. 51. Iss 1 pp.1-15.
ZERO. (n.d.). http://zero.ong/consumo-de-eletricidade-em-portu-gal-foi-assegurado-durante-mais-de-4-dias-seguidos-por-fontes-renovaveis/ Approached 14.05. 2017.
YORK, R. (2006): Ecological Paradoxes: William Stanley Jevons and the Paperless Office. Human
Ecology Review, Vol. 13. Iss 2. pp.143–147.


APSTRACT Vol. 11. Number 3-4. 2017. pages 163-168. ISSN 1789-7874
DOI: 10.19041/APSTRACT/2017/3-4/22
Applied Studies in Agribusiness and Commerce – APSTRACT Center-Print Publishing House, Debrecen SCIENTIFIC PAPER
HUMAN RESOURCE ASPECT OF AGRICULTURAL ECONOMY – CHALLENGES OF DEMOGRAPHIC
CHANGE
Alexandra Rajczi1 – Péter Vörös2 – Krisztina Dajnoki31University of Kaposvár Doctoral School of Management and Organizational Science
e-mail: [email protected] of Kaposvár Direction of Economic and Engineering
e-mail: [email protected] of Debrecen Faculty of Economics And Business Institute of Management and Organization Sciences
e-mail: [email protected]
Abstract: Over the past decades, the agrarian policy has tried to contribute to the catching-up of the rural areas with varying dynamism and aid scheme. However, its result is significantly below expectations. Nowadays, the age composition of the population living in rural areas reveals an unfavourable picture; the rate of the elderly, deprived persons and people being inactive from the aspect of employment is high and it is also combined with the low educational levels. The young generations and intellectuals leave the rural areas and, consequently, the rate of the active population continues to grow narrow as well as the proportion of young and skilled employees decreases. As a consequence of changes in the past decades, the rate of agricultural employment has not led to an intensive change but a failing change in extensive direction which lays off jobs. Nowadays, this process also determines the Hungarian rural society. In the sector, the need for employment diminishes as a result of the development in technology and due to the expansion of services sector. The purpose of our study is to present and analyse the human resources of our country’s agriculture by skill level and age group and compare it with the needs of companies, by doing this we try to compare supply and demand. In details, based on secondary data source, we investigate the agricultural labour force and try to confront it with the advertisements of job search portals (three of our job search portals based on our predefined criteria), by which we achieve a current picture of the agricultural human resource circumstances.
INTRODUCTION
Our country’s agricultural economy has an age-old history, our natural conditions are more favourable than average so, as a consequence, it is ensured that a crop outcome in appropriate quality and optimum quantity can be achieved. The nonpareil agro-ecological potential of the Carpathian Basin is the major natural treasure for Hungary. Our country’s natural and climatic conditions are excellently capable of carrying out agricultural activities. The current troubles and problems of the Hungarian agricultural sector are significantly rooted in the agrarian policy after the change of regime. During this period, the economic rationality has been overshadowed. As a part of the social and economic change of regime, transformation of ownership and operating structures determined the performance of agriculture and the utilization of labour force. Agriculture of the 90s was characterized by
a decreasing employment and an increasing unemployment. Agriculture plays a decisive role in the rural employment as well as it provides and maintains a livelihood for the rural population. Due to the progresses of restitution and privatization and after abolishing the structure of large-scale industry, the employment has been reduced to its fraction. The change of regime has clearly stricken the largest blow against the rate of employment by laying off more than 1.6 million jobs countrywide. Among the sectors, labour force in the agriculture has been drastically reduced. After the liquidation of large establishments, the employees massively become unemployed which has led to an increased depopulation of rural areas (TAKÁCS, 2010). Currently, the employment level of rural areas plays a key role in the European Union thus in our country as well. Both the EU’s agrarian policy and the government policies make numerous efforts to contribute to the recovery in the rate of rural employment.
Keywords: agriculture, rate of employment, ageing society, generational change, labour force. (JEL Code: J43)

164 Alexandra Rajczi – Péter Vörös – Krisztina Dajnoki
APSTRACT Vol. 11. Number 3-4. 2017. pages 163-168. ISSN 1789-7874
Position of employment of agricultural sector in the national economy
The performance of our agrarian economy has diminished over the past decades. The rural towns and villages have grown poor as well as the rate of unemployment has intensified drastically (SZABÓ, 2010). BOJNEC and FERTŐ (2009) studied the competitiveness of foreign countries in five European countries in their study. The authors have shown that competitiveness in the five Central European countries between 1995 and 2005 is determined by natural factors and human resources supply. Based on the data of Table 1, it can be stated that, while the performance of agriculture has contributed 7.1% to the production of GDP and 8.4% to the Gross Value Added in the mid-1990s, these values indicate only 3.7% and 4.4% by 2014. The agricultural investment was 2.9 % in 1995, it increased to 4.3% in the year of our accession to the European Union and to 6.1% in 2014 which can be significantly attributed to the incentives ensured by the enhanced subsidy system. The agricultural investment has strengthened by 1.8 percentage points during 10 years after our accession of 2004.
Table 1: Role of agriculture in the national economy (%)
Year
Gross Domestic Product (GDP)
Gross Value Added
Investment Employment
1995 7.1 8.4 2.9 8
2000 4.9 5.8 4.7 6.6
2004 4.3 5.1 4.3 5.3
2010 3 3.6 4.8 4.6
2011 3.9 4.7 5.6 4.9
2012 3.8 4.5 5.8 5
2013 3.7 4.4 5.9 4.7
2014 3.7 4.4 6.1 4.6
Source: own editing based on data of KSH (2015)
The role of agriculture was decisive in the employment until the change of regime, mainly in the rural regions. Its proportion had been 8% in the employment in the mid-1990s but this value regressed to 4.6% by 2014. Nowadays, an intensifying expansion of the services sector is increasingly determinative in our country, similarly to the international trends. The sector basically requiring labour has generated a decrease in the employment by applying modern technologies and tightening the diversification of production structure. Over the past decades, the higher income available in other sectors of the national economy and the more favourable living conditions have enhanced the outflow of labour force from the sector. The decrease in the employment has largely reorganized the structure of national economy sectors (BÍRÓ et al, 2012). This turnaround has led to shrinkage in utilization of human resource of productive sectors and an expansion of the services sector. In Poland, the rural population accounts for 39% of the country’s population. Polish agriculture remained very fragmented. Agriculture accounts for 3.4%
of the country’s GDP and 12-14% of the total employed. Despite the fragmented ownership structure based on family farms, Polish agriculture showed better results in the decade following EU accession than in Hungary (POTORI et al, 2014). In Figure 1, we can see the trend in number of employees in terms of the national economy as a whole, the agricultural sector and food industry from the year of the regime change to 2014.
Figure 1: Number of employees in the national economy, agriculture and food industry
Source: own editing based on data of KSH (2015)
Employment of both the national economy and the agricultural sector show decreasing trends until the mid-1990s but this regression has a lower measure in the national economy. In the first decade of 2000s, a slight growth can be experienced in number of employees of the national economy while the decline of agricultural sector deepened further. In 2010, the decreasing trend in agricultural sector took a turn and a slight growth was experienced, in parallel, an enlargement in the employment can also be observed in the national economy. In parallel with the development of technology, a decrease in the human resource utilization can be predicted in the agrarian economy (POPP, 2014).
Role of self-employment in the agriculture
Nowadays, the European Union’s agriculture is increasingly driven towards the dual structure. On one side, there are goods producing professional large plants which produce a significant part of commodities on a considerable proportion of the territory. On the contrary, there are such small farms which are typically disadvantageous from economic or natural aspects and they mostly produce for self-sufficiency and possibly for local markets in addition (VARGA, 2014). The decline in number of employees in the agricultural sector can be justified by the transformation in production structure and the expansion of individual farming (POTORI and UDOVECZ, 2004). There are structural differences between family farms in the European Union. One of the advantages of family farms is flexibility, based on low transaction costs. The future of family farming is closely related to the difference between agricultural and urban income. According to the authors, family farms will play an

APSTRACT Vol. 11. Number 3-4. 2017. pages 163-168. ISSN 1789-7874
Human resource aspect of agricultural economy – challenges of demographic change 165
important role in the structure of agriculture in the European Union (DAVIDOVA and THOMPSON, 2014). The individual farmers carry out their farming in this form partly due to the fact that the chance for finding paid employment is low, the opportunities of becoming self-employed are attractive and it implies relative benefits as well as it is incentive to take over the family pattern (SCHARLE, 2000). Figure 2 illustrates the age composition of number of individual farmers.
Figure 2: Number of farmers in individual farms, by age group
Source: own editing based on data of KSH (2015)
Based on the results, it can be stated the number of farmers are the highest in the Great Plain region considering the individual farms, however, it can be observed that people over 65 are represented in the highest number within the region. Among the age-groups, increasingly young age-groups take part in the farming in lower and lower number. The rate of young age-group between 14 and 24 years can be considered extremely low. In case of the Transdanubia region which has also favourable natural conditions, the older generation is also determinative considering the age composition of farmers. Central Hungary has farmers in low number in terms of individual farms, due to its central location. By analysing the data, we can see the age composition of people farming individually indicates an unfavourable trend in different regions of our country: the rate of older people is high and the rate of younger people is extremely low so it would be necessary to incite and motivate the younger generations for the opportunities provided by the agriculture. However, the agricultural labour force management is influenced by such factors which do not affect any other sectors; one of the most environmental factors is the geographical fixity. The location of a plant largely determines the supply-demand relation of labour force (BUZÁS et al, 2000). Moreover, many organizations are using more and more temporary workers today (GRIFFIN, 2013), and this is also a specification of the agricultural sector.
MATERIALS AND METHODS
To carry out the study, we conducted desk research/secondary analysis based on domestic literature sources. According to BABBIE (2007) “Secondary analysis is a form of research in which the data collected and processed by one
researcher are reanalyzed-often for a different purpose-by another.” The study analyzes domestic agricultural enterprises based on the data collected by the Central Statistical Office. The analysis works with statistically closed 2015 public data. In the interest of better illustration, we have prepared diagrams and tables of the data collected by the Central Statistical Office using the Microsoft Excel program. As a more empirical method, we also investigated three of our job search portals based on our predefined criteria. We have collected the expectations for four jobs to be filled in and summarized in a table, which had relevance with the agricultural sector. Based on our research and the secondary data examined and our own research, conclusions and recommendations were formulated.
Quality of human resource staff of the agriculture
Challenges of today appear not only in political and economic areas but the demographical processes and their consequences play a key role. The ageing population, the incresingly higher levels of education as well as the change in image of the traditional family model can be ranged among the trends influencing those human resource activites which can be observed in composition of world population (BOKOR et al, 2010). However, contrary to the national economic trend, the agriculture is not determined by the higher level of education but the qualification and the lack of appropriate quality.
Service providing is currently the most dinamically developing sector in the world economy. A considerable part of employees works in this sector in the developed countries. Due to this, the employment structure has changed in the developed industrialised countries. A large number of labour force has become needless as a consequence of technological developments in the traditional productive sectors, thus in the agriculture as well. By a higher level organization of processing, the production of products requires lower physical labour force, consequently, the tertiary sector has become a sector employing one of the biggest labour force in the developed countries. Due to the scientific results and technological developments, we are increasingly nearing towards the knowledge-based economy where the knowledge, skills and intelligence of human is determinative (BERDE, 2003) and the existence of those personal competences (e.g. motivation, persistence) is also determining which contribute to the achievment of goals and a successful working (GERGELY and NAGY, 2015). In Figure 4, the distribution of people having agricultural qualification can be seen by region and age-group.

166 Alexandra Rajczi – Péter Vörös – Krisztina Dajnoki
APSTRACT Vol. 11. Number 3-4. 2017. pages 163-168. ISSN 1789-7874
Figure 3: Distribution of persons with agricultural qualification, by age group
Source: own editing based on data of KSH (2015)
Based on the results, it can be stated that the rate of people having agricultural qualification is mainly composed of the 30 – 59 old age-group. It can also be stated that in all the three of the examined regions, the age group of over 60 is twice as the age of 29 years. It is deemed to highlight that only 13 % of age-group under 29 have agricultural qualification. In the agricultural sector, a significant part of the labour force has only the needed diligence and the knowledge handed down from father to son so they find themselves among the long-term unemployed persons (MAGDA, 2011).
Next, the people having agricultural qualification will be analysed according to their highest educational level completed successfully (Figure 4).
Figure 4: Distribution of persons with agricultural qualification, by their highest educational level completed successfully
Source: own editing based on data of KSH (2015)
The share of highly educated people is the highest in the Central Hungarian region due to its central location and the capital; this fact is justified by the central jobs requiring higher intellectual work decisively. In Transdanubia, the share of people having professional qualification and no maturity and the share of highly educated persons are the same while the
number of people having maturity and professional certificate simultaneously is higher. In the Northern Hungarian and Great Plain regions collectively, the stock of people achieving the education attainment is increasing in parallel with the rise in level of educational attainment.
In case of people having completed higher education, those civil society organizations can assist to stay in field and find a job where they can build the theoretical knowledge in practice, helping to succeed in the long term (SZABADOS and PIEROG, 2011).
By examining job search portals ‘careerjet’, ‘agroinform’ and ‘profession’, relatively few vacancies can be found where employees is wanted in agricultural sector in rural areas (Table 2).
Table 2: Main expectations and competences in agricultural job advertisements
Job search portal No. 1
Job search portal No. 2
Job search portal No. 3
Machine Operator
Experience, reliability
Reliability, physical capacity
Independence, accuracy
-
Animal Caretaker
Reliability, independence
Secondary vocational qualification, experience, strong physique
Executive Director
Good mana-gement skills, reliability, honesty, experience
-
Higher specialised qualification, knowledge of foreign languages, professional experience
Adviser
Agrarian qualification, result-oriented approach, good communication skills, self-confidence
-
Higher agrarian qualification, good interpersonal skills, independence, taking of responsibility
Source: own editing based on data of careerjet.hu, agroinform.com and profession.hu (2016)
In case of majority of advertisements placed by rural plants, practising an occupation is not subject to professional qualifications but rather the professional experience, accuracy, autonomy at work and reliability are highlighted. However, there are some job advertisements – managerial, consulting and other jobs requiring intellectual work decisively – where the existence of minimum secondary qualification is a must. In case of jobs like these ones, inter alia, the good communication skills, self-confidence, resoluteness and result-oriented approach also confer a benefit.

APSTRACT Vol. 11. Number 3-4. 2017. pages 163-168. ISSN 1789-7874
Human resource aspect of agricultural economy – challenges of demographic change 167
CONCLUSIONS
The agrarian economy of our country provided the income for the people living in rural areas for a long time; both the agricultural sector and the food industry had a leading role during this period. The structure of agriculture was such that ensured the rural employment. Nowadays, number of agricultural employees can be considered to be extremely low due the privatisation procedures launched after the change of regime. This resulted in the development of an increasingly growing unemployment in the rural villages and towns, which has been consequently depopulated and this feature still determines the region now. And, in case of the existing employees, the lack of educational attainment and quality can be experienced. This circumstance means further difficulties since the agricultural sectors essentially need labour in addition to a higher level of technology. Considering the number of age composition employed in the agriculture, the older age-group is determining. Incitement of the younger age-group becomes justified, a generational change would be necessary in the agricultural sector. The results of the job seeks indicated that relatively few vacancies were found where employees were wanted in agricultural sector in rural areas, this may also led to the migration of the youth. Catching up the rural areas of Hungary and contributing to the growth are required to realize the sustainability in the future. Stopping the negative progresses experienced in rural areas being disadvantageous from aspects of demography, qualification and economy is requiring such a new and full rural development strategy which leads to that a competitive agrarian structure can evolve and an increase in number of employees become available as well.
REFERENCES
Agroinform (2016): Mezőgazdaság álláshirdetések. http://www.agroinform.com/aprohirdetes/allas-1187/c1. Letöltés ideje: 2016.05.17.
Babbie, E. (2007): The Practice of Social Research. Thom-son Wadsworth, Belmont.
Berde Cs. (2003): Menedzsment a mezőgazdaságban – Veze-tési módszerek és sajátosságok. Szaktudás Kiadó Ház, Bu-dapest.
Bertalan P., Geszti Sz., Pintér A. (2007): A globalizáció és a magyar mezőgazdaság versenyképessége. Közép- és Kelet-Európa integrálódása az egységes európai térségbe, Székes-fehérvár.
Bíró Sz., Hamza E., Molnár A., Rácz K., Székely E., Tóth K., Tóth O., Varga E. (2012): A mezőgazdasági foglalkozta-tás bővítésének lehetőségei vidéki térségeinkben. Agrárgaz-dasági Kutató Intézet, Budapest.
Bojnec S., Fertő I. (2009): Determinants of agro-food trade competition of Central European Countries with the Euro-pean Union. China Economic Review, 20 (2).
Bokor A., Szőts-Kováts K., Csillag S., Bácsi K., Szilas R. (2010): Emberi erőforrás menedzsment. Aula Kiadó Kft., Budapest.
Buzás Gy., Nemessályi Zs., Pfau E., Pupos T., Salamon L., Somogyi S., Szakál F., Székely Cs. (2000): Mezőgazdasági Üzemtan I. Mezőgazdasági Szaktudás Kiadó, Budapest.
Careerjet álláskereső portál (2016): Mezőgazdaság, erdészet, halászat álláshirdetések. http://www.careerjet.hu/wkeres/allasok?c=mezogazdasag -erdeszet-halaszat&l=Magyar orsz%C3%A1g&lid=125322&b=101&cid=12 Letöltés ideje: 2016.05.17.
Davidova S., Thomson, K. J. (2014): Family Farming in the Enlarged EU: Concepts, challenges and prospects. In 142nd Seminar, May 29-30, 2014, Budapest, Hungary. European Association of Agricultural Economists.
Gergely É., Nagy R. (2015): Gazdasági szakos hallgatók tan-ulási motivációjának és személyes kompetenciáinak vizsgála-ta. Közép-Európai Közlemények VIII. évfolyam:(4. szám, No.31.) pp. 197-205.
Griffin, R. (2013): Management. 11th Ed. Cengage Learn-ing, Mason.
Központi Statisztikai Hivatal (2015): A mezőgazdaság szerepe a nemzetgazdaságban. http://www.ksh.hu/docs/hun/xftp/ido-szaki/mezo/mezoszerepe15.pdf Letöltés ideje: 2016.05.02.
Központi Statisztikai Hivatal (2010): A gazdálkodók száma az egyéni gazdaságokban, korcsoportok szerint.
http://www.ksh.hu/docs/hun/stabla/amo/tablamo_2_7.html Letöltés ideje: 2016.05.08.
Központi Statisztikai Hivatal (2011): A mezőgazdasági képzéstől a pályaelhagyásig.
http://www.ksh.hu/docs/hun/xftp/idoszaki/pdf/mkepzes.xls Letöltés ideje: 2016.05.12.
Magda S., Bíró B. (2011): Mezőgazdaság – vidék – foglalkoz-tatás. Magyar Tudomány, 2011.8.
Popp J. (2014): Hatékonyság és foglalkoztatás a magyar mezőgazdaságban. Gazdálkodás, 58. évfolyam, 2014.2.
Potori N., Chmielinski P., Karwat-Wozniak B. (2014): A comparison of the agro-food sectors in Poland and Hungary from a macro perspective. Research Institute of Agricultural Economics, 2014, 9.
Potori N., Udovecz G. (2004): Az EU csatlakozás várható hatásai a magyar mezőgazdaságban. Agrárgazdasági Kutató Intézet, Budapest.
Profession (2016): Mezőgazdaság, környezet álláshirde-tések. https://www.profession.hu/allasok/mezogazdasag-ko-rnyezet/1,21 Letöltés ideje: 2016.05.17.
Scharle Á. (2000): Önfoglalkoztatás, munkanélküliség és családi kisvállalkozások Magyarországon. Közgazdasági Szemle, 47. évfolyam.
Szabados Gy. − Pierog A. (2011): Önkéntesség és a civilek. In: Szele Bálint (szerk.) Tehetséggondozási workshopok a Kodolányi János Főiskolán 3.. Székesfehérvár: Kodolányi Já-nos Főiskola (KJF), pp. 65-70.
Szabó Gy. (2010): Föld- és területrendezés. Nyugat-mag-yarországi Egyetem, Székesfehérvár.
Takács J. (2010): A mezőgazdaság és élelmiszeripar üzemi szerkezete. Szaktudás Kiadó, Budapest.
Varga É. (2014): Törpegazdaságok Magyarországon és az Európai Unió déli tagországaiban.
Gazdálkodás, 58. évfolyam,. 2014.2.


APSTRACT Vol. 11. Number 3-4. 2017. pages 169-180. ISSN 1789-7874
DOI: 10.19041/APSTRACT/2017/3-4/23
Applied Studies in Agribusiness and Commerce – APSTRACT Center-Print Publishing House, Debrecen SCIENTIFIC PAPER
EMPIRICAL RESEARCH ON CORPORATE STRATEGIES IN HUNGARIAN DAIRY INDUSTRY
Eszter Szabó-Szentgróti1 – Gábor Szabó-Szentgróti2 – Zoltán Szakály3
1Assistant Professor at the Faculty of Economic Science, Kaposvár University, [email protected]
2Associate Professor at the Faculty of Economic Science, Kaposvár University, [email protected]
3Full Professor at the Faculty of Economics and Business, University of Debrecen, [email protected]
Abstract: Corporate strategy has never been as important as it is nowadays. Markets are changing rapidly because of consumer demands, innova-tions, information flow and economic changes. Our paper concentrates on Hungarian dairy industry (hereinafter dairy) and four main objectives were defined to be analysed: (1) domestic dairy company features, (2) main strategic characteristics, (3) how companies’ strategy resonates on the consumer side and (4) companies’ financial background were analysed as well. A company database was made in order to prepare for the primary research and to understand better the nature of today’s market. B2B (26 companies) and B2C (503 people) surveys were used in order to gain primary data. In 2017 132 Hungarian companies were observed in milk processing, but 44% of the market participants are not present in dairy competition. It is a fairly fragmented market structure because 10-20% of the annual turnover is accumulated among the 80-90% of competitors. The factor analysis of the data proved that the dairy companies followed m strategies at the same time; and it is assumed that most of them are unconscious. Strategically, the majority of the dairy sector is not up-to-date and modern enough. SMEs sector management skills and strategic preparedness are considered to be out-of-date and insufficient. Strategic planning can possibly have an influence on financial results, which was only partly proved by the analysed criteria system. The production and use of own raw milk supplies might make companies experience financial benefits. Nearly 78% of the respondents would rather purchase goods made from own raw material. The willingness to pay a higher price for this was in average 5-15%.
INTRODUCTION AND OBJECTIVES
In our globalized world the way companies think and do business have changed and are constantly changing. The insecurity of global markets, the problem of sustainability, and the constant changes of consumer demand are just a few of local and global challenges. Companies are facing hard times to become and stay competitive. The secret of successful companies is made up from several components, one of which is surely the well-chosen competitive strategy. Multinational companies mostly utilize different kinds of strategies and tend to adjust it to the country’s capabilities. In our research topic mostly SMEs are involved, therefore this sector will be emphasized in the literature review.
This paper is part of a complex PhD dissertation research. The main goal of this study was to examine if dairy company strategies are effective enough in order to satisfy consumer
needs and produce financial benefits. Therefore the following objectives and sub-objectives were defined in the present study:
1. Dairy companies’ outlook: economic forms, location and headquarter, regional location, number of active/closing firms, company size, market shares and con-centration levels.
2. Explore main strategic characteristics of the companies that took part in the survey: – Strategic planning and generic strategy, product
portfolio analyses – Raw material base analysis: farm produced milk vs.
purchased raw milk, price analyses (purchased and produced), and main contractual tools for favour-able supplier relation.
– Sale: distribution channels, B2B milk prices3. Based on the objectives (2) mentioned an analysis was
Keywords: dairy market, Hungary, corporate strategy, SMEs, survey. (JEL Code: L1, L66)

170 Eszter Szabó-Szentgróti – Gábor Szabó-Szentgróti – Zoltán Szakály
APSTRACT Vol. 11. Number 3-4. 2017. pages 169-180. ISSN 1789-7874
made how companies’ strategy resonates on the con-sumer side.
Look into the companies’ financial background. With this analysis we aim to find a relationship between economic performance and strategic attributes.
Besides these aims the complex PhD research contains analysis about dairy cooperation practices that we published in another publication. In order to understand some aspects of this study a few results will be presented here, too.
LITERATURE REVIEW
Nowadays the influence of SMEs is constantly growing. Similarly to Europe, 99,8% of companies are considered as SMEs in Hungary (MULLER et al. 2015). This sector gives 72,5% of total Hungarian employment nationally and the contribution to GVA1 is 54,4% in comparison to all companies (CHIKÁN, 2016). SMEs are emphasized more due to the higher number of SME companies and higher market infuence. Internationalization, innovations (incl.: technological innovations) are not a large- and mammoth company „speciality” any more (KNIGHT, 2001). Enterprises in the SME sector need different strategy approaches both in Hungary and internationally.
SMEs survival rate and business entry is different all over the world depending on the business environment. Discrepancies in productivity result in inequal wages in SME sector compared to large companies (NORTH and VARVAKIS, 2016). MUSSO and FRANCIONI (2014) studied the international strategy of Italian SMEs and although their research was limited to one region, they had a conclusion of non-systematic and passive SME behaviour. Disparity in business environment has effects on SMEs in the USA and China as well. Chinese SMEs mainly use cost leadership strategy due to low wages; and differentiation strategy is not commonly used whereas higher purchasing power enable American SMEs to have more strategy opportunities (PARNELL et al. 2015). GHAURI and KIRPALANI (2015) compared to the performance of SMEs and according to the study the following order was found: (1) EU-28 countries, (2) USA, (3) Japan, (4) Brasil, (5) India, (5) Russia. Although Hungary is part of EU 28, Hungarian SME performance was experienced as very low.
Our domestic SME sector mainly contains family businesses and forced entrepreneurs. Hungarian SMEs are underdeveloped compared to the international level, but internationalization and innovation are more and more experienced (VARGA, 2015). Varga said that management of the Hungarian SMEs was based on their own insufficent knowledge and despite preforming strategic management they accomplished operational tasks. In many cases they do not have a written strategy. HUGYI and TAKÁCSNÉ (2011) almost came to the same conclusion and their research harmonizes with the establishments of SALAMONNÉ H. (2000) and KARDA (2009). Furthermore, the Hungarian SME sector
1 Gross value added
has innovation shortage and shareholder communication is not conceptual and productive enough (SÁRA et al. 2014). They believe that domestic SME innovation strategy is rather an „illusion innovation”, which mostly means fusion or acquisition. Besides this, they emphasized financial shortage as the main trigger of innovation knowledge and implementation, thus non-technological innovations are considered as an excellent possibility for domestic SMEs. We agree with the observation of POLERECKI (2011), whereas Hungarian SMEs need time in order to close up, because Western-European SMEs have experience of decades. His research concentrated on the marketing activity of domestic SMEs (focused on dairy and meat industry) and he had a conclusion of insufficient marketing strategy and incompetent managers as well.
It is difficult to describe the strategies of Hungarian SMEs. Furthermore according to the cited authors there is an agreement on the lack of strategy, therefore we think that the main strategy is rather ’ad-hoc’ in order to survive. But at the same time SALAMONNÉ H. (2008) distinguishes positioning- and expansive strategies on the SME market. She cites M. E. Porter, whereas upward pressure on economic growth has harmful effects, thus companies need to find a distinguishing factor in order to gain a unique position (positioning strategy). Expansive strategy means that the company grows in size either vertically or horizontally. According to the author, approximately two-third parts of companies use positioning strategy in Hungary, while expansive strategy is used by every third company. Based on a current research (TERNAI and BORBÁSNÉ, 2015) joining to a cluster could be an effective strategy as well. They analysed eBest software platform that enables SMEs to work together, build networks and help management actions. This platform can support removing obstacles from the ways of getting information, communication or cooperations.
As far as we need to summarize the strategic directions of the Hungarian SMEs, it can be said that there are significant shortcomings because conscious strategic planning is not typical, but survival strategies induced by financial shortage are more determinant. We agree that non-technological innovation could be an excellent possibility for domestic SMEs. Furthermore, innovations in cooperation are also a great improvement possibility as far as they are not able to manage innovations on their own.
After the Hungarian political transformation (1989), the ownership of the dairy sector changed. Hungary lost the socialist markets, thus milk production decreased dramatically. Due to the multiplying effects dismissals grew, which resulted in a lower level of consumption. The dairy sector – besides other industries – suffered from multiply shocks, therefore capacities became under-utilized. Foreign investments appeared and by the year 1997 60% of dairy companies had foreign ownership. This ratio was the highest in 2000 with 62,7% (it was only 27% in 1992) (BUDAY-SÁNTHA, 2011). During the years of political transformation state owned companies were suffering from capital shortage and most of the investments were realized at foreign owned

APSTRACT Vol. 11. Number 3-4. 2017. pages 169-180. ISSN 1789-7874
Empirical Research On Corporate Strategies In Hungarian Dairy Industry 171
firms. Approximately 50% of the capacity is used in Hungary (BORBÉLY et al. 2013). This is an estimation, no measurement has been made for ages.
According to TEÁOR ’082 classification, our milk processing belongs to manufacturing industry, and in 2014 this sector contributed to GDP with 23,5% . Thus manufacturing is the most important economic activity. Within manufacturing, food industry had 2% contribution to GDP in 2014 (KSH, 2016). Dairy industry is the third most significant sector within food industry and in 2014 it gave 9,2% of the total food production. This means 251,8 billion HUF gross production value (FM – AKI, 2015). Compared to 2004 in 2012 dairy industry domestic sales decreased by 30-40%. But at the same time export sales grew by approximately 10%. Dumping of import goods and decrease of purchasing power caused mainly this decline (KSH, 2013).
Considering employment issues, manufacturing industry is the most important sector because it ensured 21,6% of the total employment in Hungary in 2016. Within it, the food industry gave 3,3% of the total employment and this ratio was quite the same in the last few years (KSH, 2016). KENDI (2013) made a comparison between Danish and Hungarian employment in the food indusrty, and he came to a conclusion that Hungarian employment level exceeded not only the Danish but EU average as well. The author also emphasizes that Hungarian employment level does not have to decrease below the EU average, because many unique factors have influence on employment level such as mechanization, technology, density of population or production potential.
Giant international dairy companies mostly operate in co-opeartive form, which includes farmers and manufacturers. If we concentrate on EU, mostly Danish and Dutch co-operatives are worth mentioning first. They operate in producer-manufacturer integration and these co-operates are fully market based, the government does not intervene in their operation. Similarly to dairy companies in the USA, they work purely on economic basis where the focus is on the product and the main goal is income growth for members (SZABÓ G. G., 2005). According to MAYNARD and FRANKLIN (2003) the main strategic element of the market leader dairy companies is innovation (therefore R&D activity). They studied cancer preventive features of funcional milk products, because they believed that value added milk product (with higher CLA level in this case) had higher market potential and the market would pay an extra price for them.
SZABÓ (1996), POLERECKI (2011) and RÓZSA and TÁLAS (2014) studied Hungarian dairy company strategies. SZABÓ (1996) made five different groups: (1) foreign owned big companies, (2) big companies with Hungarian ownership, (3) small companies with Hungarian ownership, (4) small local enterprises and (5) small specialised companies. Since this classification the domestic dairy sector has changed. POLERECKI (2011) examined marketing strategy, he created four groups: (1) careful price competitor, (2) connection
2 v u Community 2008 (identical with NACE Rev.2. )
oriented, (3) inconsistents, (4) developing optimists. The author suggested niche marketing as an emerging opportunity for small dairy firms. RÓZSA AND TÁLAS (2014) revealed that dairy companies with Hungarian ownership could rise their financial preformance and market share in the last few years.
MATERIAL AND METHOD
Secondary research
The main domestic statistical data were provided by the Hungarian Central Statistical Office (HCSO) database. Our source of public data of companies was provided by the electronic database of the Ministry of Justice and Opten Company Information database. Our main sources regarding our international secondary research were the database of EISZ (JSTOR, ScienceDirect, SpringerLink).
Based on the HCSO data we have created a database that includes the most important data of the milk processing companies in Hungary. The purpose of the database was to prepare for the primary research and to understand better the nature of today’s market. With the help of the database we laid down the main characteristics and specialties of the milk processing market. The main parameters of the database are presented in Table 1.
Table 1.: The main parameters of milk processing companies’ database
Goal of the database 1. Preparation for the primary research2. Laying down the characteristics/specialties of the market
Sources used 1. Electronic Company Information Service, Ministry of Justice2. Opten Company Information Service
Steps of creating the database
1. Main filter condition: main activity 10513 TEÁOR code 08’ 2. Input the examined characteristics into database (Microsoft Excel)3. Summarize of information, filtering data4. Actualization of data in case of new annual report
Number of companies 1324
Examined features
1. Economic form 2. Location, headquarter details3. Regional location4. Number of active/closing companies5. Company size6. Market share 7. Market concentration
Source: own data
Primary research
The primary research of this study can be divided in two parts, which are shown in Table 2. The B2B survey was anonymous, thus we did not include the names of the companies in our study.
3 Milk processing4 Data known at the latest update (January 2017).
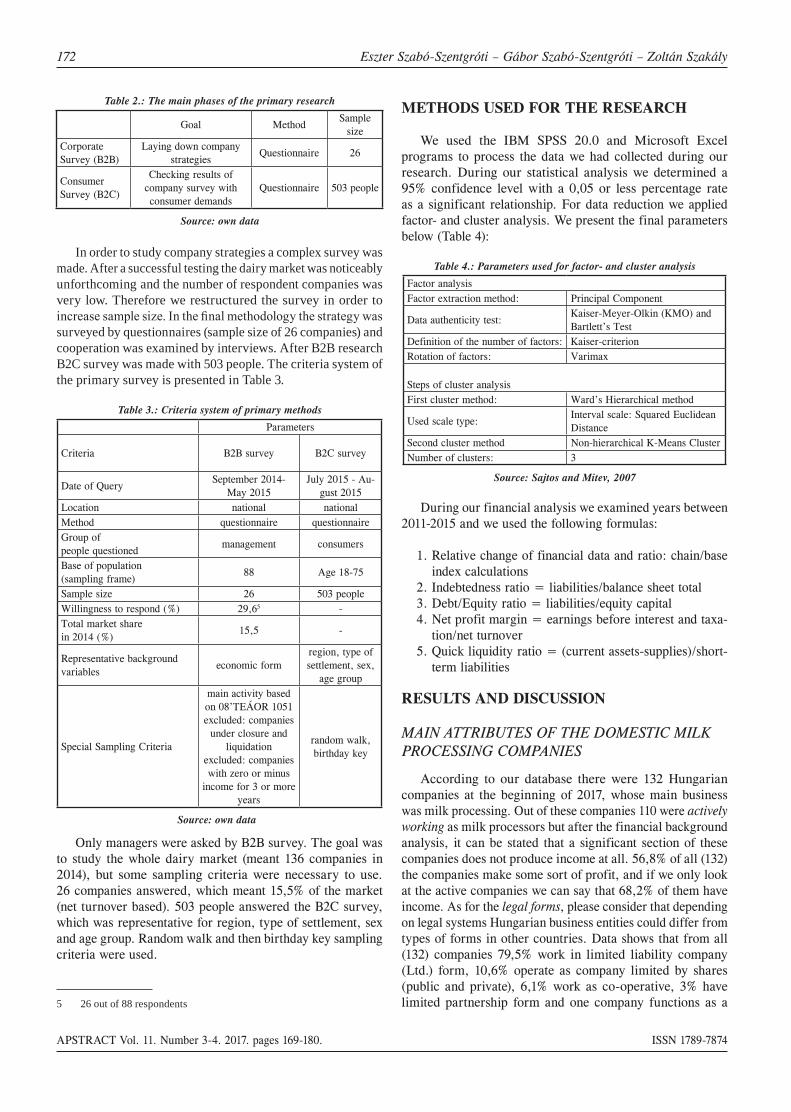
172 Eszter Szabó-Szentgróti – Gábor Szabó-Szentgróti – Zoltán Szakály
APSTRACT Vol. 11. Number 3-4. 2017. pages 169-180. ISSN 1789-7874
Table 2.: The main phases of the primary research
Goal MethodSample
sizeCorporate Survey (B2B)
Laying down company strategies
Questionnaire 26
Consumer Survey (B2C)
Checking results of company survey with consumer demands
Questionnaire 503 people
Source: own data
In order to study company strategies a complex survey was made. After a successful testing the dairy market was noticeably unforthcoming and the number of respondent companies was very low. Therefore we restructured the survey in order to
surveyed by questionnaires (sample size of 26 companies) and cooperation was examined by interviews. After B2B research B2C survey was made with 503 people. The criteria system of the primary survey is presented in Table 3.
Table 3.: Criteria system of primary methods
Parameters
Criteria B2B survey B2C survey
Date of Query September 2014-
May 2015July 2015 - Au-
gust 2015Location national nationalMethod questionnaire questionnaireGroup ofpeople questioned
management consumers
Base of population(sampling frame)
88 Age 18-75
Sample size 26 503 peopleWillingness to respond (%) 29,65 -Total market sharein 2014 (%)
15,5 -
Representative background variables
economic formregion, type of settlement, sex,
age group
Special Sampling Criteria
main activity based on 08’TEÁOR 1051excluded: companies
under closure and liquidation
excluded: companies with zero or minus
income for 3 or more years
random walk, birthday key
Source: own data
Only managers were asked by B2B survey. The goal was to study the whole dairy market (meant 136 companies in 2014), but some sampling criteria were necessary to use. 26 companies answered, which meant 15,5% of the market (net turnover based). 503 people answered the B2C survey, which was representative for region, type of settlement, sex and age group. Random walk and then birthday key sampling criteria were used.
5 26 out of 88 respondents
METHODS USED FOR THE RESEARCH
We used the IBM SPSS 20.0 and Microsoft Excel programs to process the data we had collected during our research. During our statistical analysis we determined a 95% confidence level with a 0,05 or less percentage rate as a significant relationship. For data reduction we applied factor- and cluster analysis. We present the final parameters below (Table 4):
Table 4.: Parameters used for factor- and cluster analysis
Factor analysisFactor extraction method: Principal Component
Data authenticity test: Kaiser-Meyer-Olkin (KMO) and Bartlett’s Test
Definition of the number of factors: Kaiser-criterionRotation of factors: Varimax
Steps of cluster analysisFirst cluster method: Ward’s Hierarchical method
Used scale type: Interval scale: Squared Euclidean Distance
Second cluster method Non-hierarchical K-Means ClusterNumber of clusters: 3
Source: Sajtos and Mitev, 2007
During our financial analysis we examined years between 2011-2015 and we used the following formulas:
1. Relative change of financial data and ratio: chain/base index calculations
2. Indebtedness ratio = liabilities/balance sheet total3. Debt/Equity ratio = liabilities/equity capital4. Net profit margin = earnings before interest and taxa-
tion/net turnover5. Quick liquidity ratio = (current assets-supplies)/short-
term liabilities
RESULTS AND DISCUSSION
MAIN ATTRIBUTES OF THE DOMESTIC MILK PROCESSING COMPANIES
According to our database there were 132 Hungarian companies at the beginning of 2017, whose main business was milk processing. Out of these companies 110 were actively working as milk processors but after the financial background analysis, it can be stated that a significant section of these companies does not produce income at all. 56,8% of all (132) the companies make some sort of profit, and if we only look at the active companies we can say that 68,2% of them have income. As for the legal forms, please consider that depending on legal systems Hungarian business entities could differ from types of forms in other countries. Data shows that from all (132) companies 79,5% work in limited liability company (Ltd.) form, 10,6% operate as company limited by shares (public and private), 6,1% work as co-operative, 3% have limited partnership form and one company functions as a

APSTRACT Vol. 11. Number 3-4. 2017. pages 169-180. ISSN 1789-7874
Empirical Research On Corporate Strategies In Hungarian Dairy Industry 173
joint venture. In the process of closing down 77,3% of the 22 companies are Ltds., 9% are company limited by shares and 13,6% are limited partnerships. Eleven companies were founded in 2016, six of them as Ltds., three as co-operatives and two as company limited by shares. Concerning company size6 from the 110 active firms 53,6% (59) belong to micro, small and medium enterprise (MSMEs) sized business and 7,3% (8) are considered as large companies. In 43 (39,1%) cases no employee data was available, but they had no or negligible turnover, therefore they are assumed to be micro or small firms as well. It is notable that one small company works as company limited by shares. Four of the market leaders (see Figure 1. below) are considered as medium sized firms (Danone, Kőröstej, Naszálytej, Fino-Food) and six from the top processors are classified as large companies (Sole-MiZo, Alföldi Tej, Tolnatej, FrieslandCampina, Pannontej, Wassim Sajt). As of the regional distribution, 37,9 % (most of the companies) are located in the Central Hungarian Region. We found a strong positive relation between the number of companies7 and the development8 of the region (correlation factor= 0,87), although the location of headquarters does not show the real picture as very often no production takes place here. There is a poor relation between the regional development and the number of factory sites (correlation factor= 0,096). The reason for this seems to be that most of the milk processing factories were built where former active ones used to be functioning.
Based on the net income data we present below the milk processing market leaders in the last couple of years (Figure 1).
Figure 1.: The 10 highest market share of milk processing companies in Hungary
0%2%4%6%8%
10%12%14%16%18%
2011 2014 2015
Source: own calculation based on annual reports
Sole-MiZo and Alföldi Tej were market leaders in the three analysed years, their market position did not change. Danone9 and FrieslandCampina lost their market share compared to 2011, but they are still among the first five companies. In 2014 and 2015 Tolnatej’s position was more favourable compared to 2011. It is worth paying attention to Wassim Sajt (owned
6 based on number of employees
8 based on GDP (KSH, 2014) 01 u u
by Kőröstej) because it was founded in 2009 and in 2011 no market share was experienced.
Dairy industry concentration is a worldwide phenomenon. In order to examine the domestic concentration level, we calculated CR ratios (Table 5) and Lorenz curve (Figure 2.).
Table 5.: Concentration rates in domestic diary sector (%)10
2008 2011 2014 2015
CR2 29,14 27,85 29,30 29,90
CR3 43,59 39,74 39,26 39,14
CR4 60,08 51,56 47,14 48,37
CR5 66,80 60,22 54,78 54,96
CR6 72,42 66,72 61,01 60,62
CR7 77,77 73,12 65,85 65,56
CR8 81,93 77,03 70,18 70,17
Source: own calculation based on annual reports
In 2015 the first two market leader companies owned almost 30% of the market’s turnover, while eight companies of the highest turnover owned 70% of the market. From 2008 concentration levels fell back by 10-12%, except in case of CR2 and CR3. According to CR rates, Hungarian dairy market is medium concentrated but it was stronger in 2008. Analysing dairy market concentration with Lorenz curve gives us a slightly different picture.
Figure 2.: Lorenz curve of the Hungarian milk processing market (2015)
0%
10%
20%
30%
40%
50%
60%
70%
80%
90%
100%
0,00% 20,00% 40,00% 60,00% 80,00% 100,00%
Acc
umul
ated
pro
porti
on o
f com
plet
e in
com
e
Ratio of (milk processing) companies
Total equity Lorenz curve
Source: own calculation based on net income data
Figure 2 shows that 80-90% of the market participants own 10-15% of the turnover, therefore 10-20% of the participant means the market leader firms. Compared to CR ratios stronger concentration is outlined by Lorenz curve.
10 based on net income

174 Eszter Szabó-Szentgróti – Gábor Szabó-Szentgróti – Zoltán Szakály
APSTRACT Vol. 11. Number 3-4. 2017. pages 169-180. ISSN 1789-7874
In sum we can state that the phenomenon of concentration is present to some extent in our domestic milk processing market, although based on the CR rates it can be determined as rather average or medium-strong. The Lorenz curve shows a more concentrated market, but it is still different from the international process, because in the Western European market the common structure is monopole or oligopol.
B2B SURVEY RESULTSStrategy
Corporate strategy is crucial for market success, but the management is responsible for how efficient this corporate strategy will be. Our B2B research allowed us to analyse the following factors: (1) is there any difference between strategy planners and non-planners; (2) what kind of genetic strategy and product portfolio (3) are used by the analysed companies?
Based on the B2B primary data almost 35% of the companies have a planned written strategy. 77% from them do not require help from consulting firms and only two dairy companies considered to use such a service in the future. We applied 13 questions11 in order to examine what kind of strategy was used. On their own admission the questioned groups state that they use the differentiation strategy mostly. They were mainly focusing on giving the consumer better valued products, but cost leadership strategy was used at the lowest extent (average was below 2,8). In order to position themselves on the market milk product companies have to follow consumer needs and market trends but according to the answers, companies just more or less follow milk market trends (Likert-scale average: 3,4).
We made factor analysis to understand better the strategy of companies. From these 13 variables we gained four components that have 70% of explanatory power (total variance explained). Based on the Bartlett’s test (p=0,000) and Kaiser-Meyer-Olkin test (p=0,349) we can say that the data are not suitable for factor analysis. On the basis of the outcome of the paradox results and the rotated component matrix test, we came to the conclusion that some variables did not only favour one factor but one variable might take part in more factors at the same time. This means that the milk processing companies tested in the research do not necessarily use one strategy, they might use two or more at the same time. Hybrid strategy is commonly used by firms, in this case we have to examine if dairy companies combine strategies deliberately or at random.
Considering product range, we can see that ¾ of the questioned groups produce sour dairy products. However, this is not the major leading product and the income made from these products are also not too considerable. Little more than half of the factories produce mature cheese and other cheese products, which is slightly surprising despite the low rate of cheese consumption in Hungary (12,9 kg/capita) compared to the European average (19,1 kg/capita)12. Because of its
11 Likert scale from 1 to 5 12 KSH, 2015 and CDIC, 2015
added value, the income it creates is proportionately higher (together with heat-treated products) so mature cheese turns out to be one of the leading products. Less than 1/3 of the companies produce liquid milk. This group of products has the lowest added value, and based on the answers, the income these products add is far less than those of mature cheese and heat-treated dairy products. The two lowest value products were butter/”butter products”13 and cream. This result is due to lower consumption. Still, more companies produce these products than liquid milk. No question that the first on the list of leading products is mature cheese, because most of the companies named this product as their leading product. Approximately ¼ of the companies named more products as their leading product, furthermore it is obvious that it barely influences the amount of leading products of a company, whether they have or do not have a strategic planning.
Financial analyses were made in order to examine if companies with strategy plan had better financial performance. The average net turnover was around two billion HUF in case of companies in the sample (Table 6.)
Table 6.: Average values of the analysed financial data, 2011-201514
2015 2014 2013 2012 2011Net turnover
Sample average15 2 279 363 2 400 753 2 228 572 2 103 656 1 890 974
SP16 3 731 847
3 973 521 3 867 021 3 367 899 3 142 826
WSP 1 553 121 1 666 794 1 463 962 1 471 535 1 306 777Operating income
Sample average
4 111 13 361 -1 797 -7 196 -7 231
SP -11 214 -95 795 -137 134 -129 013 -151 770WSP 11 774 64 301 61 360 53 712 60 220
Profit/loss balanceSample average
-6 494 -4 220 -21 636 -19 929 -24 014
SP -23 259 -95 178 -149 494 -130 022 -155 724WSP 1 889 38 227 38 030 35 118 37 451
Source: own calculation based on annual report data
Firms with written strategy had on average one or one and a half billion higher turnover than companies without a written strategy. It is confusing that operating income and net turnover show an opposite tendency. After analysing the firms, it seems that the efficiency of the independent and non-independent companies is different. By independent companies we mean those enterprises that are not part of other companies and do not own another company either, they are independent both legally and in decision. Non-independent companies are ones that are part of other companies or own another company, not independent legally and in decision. We made a conclusion that independent companies have significantly lower net turnover compared to non-independent firms, but
13 similar to cream cheese products in English speaking countries14 data in thousand HUF15 All companies answered (n=26)16 SP: strategy planning, WSP: without strategy planning

APSTRACT Vol. 11. Number 3-4. 2017. pages 169-180. ISSN 1789-7874
Empirical Research On Corporate Strategies In Hungarian Dairy Industry 175
they have favourable profit/loss balance. Non-independent companies had negative profit/loss balance in every analysed year. This result seems to indicate income reallocations in case of dependent companies. According to the relative change of these indicators, companies with written strategy showed a more favourable tendency (Table 7.) We considered a growth when negative value has improved to the next year but remained still negative. Regarding these results we needed further analyses in order to ascertain strategic planning influence, therefore four more indicators were examined (debt ratio, D/E ratio, net profit margin and quick liquidity ratio). Based on the results we can say that strategic planning can possibly have an influence on financial results, which was only partly backed by the analysed criteria system (Table 7.). Neither groups’ (SP, WSP) financial performance was clearly better than the other. Net turnover, earnings before interest and taxation and balance sheet total values were examined in order to estimate company growth, but neither groups (SP, WSP) showed favourable company growth compared to the other group.
Table 7.: Criteria system of companies with strategic planning and without strategic planning17
With strategic planning (SP)
Without strategic planning (WSP)
Net turnover (value)more favourable (in every analysed year)
Operating income (value)
more favourable (in every analysed year)
Profit/loss balance (value)
more favourable (in every analysed year)
Net turnover (relative change)
neither group is dominant
Operating income (relative change)
more favourable (in every analysed year)
Profit/loss balance (relative change)
more favourable (in every analysed year)
Indebtedness ratio higher (in four analysed years)
D/E ratiomostly higher (in three
analysed years)
Net profit marginmore favourable (in four analysed years)
Quick liquidity ratio higher (in four analysed years)
Company growth neither group is dominant
Source: own calculation based on annual reports
Based on the strategy results it is assumed that analysed companies mostly use or combine their strategy randomly. The most important signs of “stuck in the middle” strategy are low profitability, low market share (PORTER, 2006) and unsteady management (KÖNCZÖL, 2007). Profit margin had a negative average value in all analysed years18. High number of negative EBIT is the reason for this tendency and no difference was
17 Analysed years: 2011, 2012, 2013, 2014, 2015. In case of relative change 2011=100%. 18 (2011: -12,98%, 2012: -95,25%, 2013: -534,42%, 2014: -6,29%, 2015: -13,24%)
experienced in case of companies with capital shortage or with solid financial background. We mentioned above (see objectives) that some of the cooperation results would be introduced here in order to understand better some aspects. During the cooperation interviews we gained meaningful information about management attitude to the strategy. Half of the managers did not mention possible solutions as success factors of cooperation or they did not want to deal with that issue. They said that no concept was made how to start and manage a cooperation. Based on the interviews with the company leaders we drew the conclusion that most of them did not handle this ’’problem” on the level a leader should do. By that we mean that creating and maintaining partnerships require a modern approach of management, which as we could see was not yet present on this market. On the other hand, insignificant number of managers with concepts of strategy plans try to reach their market goals alone and do not wait for partners to come.
Raw material supply (raw milk)
50% of the questioned groups have an own dairy farm. From this group most of them (69,2%) have one personal estate. 84,6% of those who own one estate are exclusive owners, the rest own a 50% share in average. 54% of the respondent groups must buy the raw materials from other resources. Within this group 38,5% can cover 15-20% of their needs for raw milk. 46% relies partly or fully on its own supplies. 67% of the production of micro- and small companies are made up from their own supplies. Medium-sized enterprises rely on their own supply at a rate of at least 35%, but it is more typically around 50-70%. These data in case of large companies are significantly lower.
Companies without dairy farm or insignificant own raw milk basis are using numerous strategic tools in order to maintain strong relation with suppliers. Most of the companies (38,9%) use contracts longer than one year. Almost 25% pay higher milk price than competitors and also 25% reduce their payment deadline. Although professional counselling between farmers and manufacturers (11,1%) is another tool but not determinant. Companies without dairy farms apply at least two tools and most of the manufacturers with own milk basis do not use these maintaining strategy tools. No relation was experienced between frequency of application and financial situation or company size.
The financial data of the self-supplied raw material production is as follows: based on the net turnover, operating income and profit/loss balance, those companies with own produced raw material supplies (apart from how raw milk cover their base material needs) have done better in value during the years examined, although the dynamics of change shows an unbalanced tendency.
We have distinguished two different groups of raw material base (RM1, RM2) with the following attributes (Table 8).

176 Eszter Szabó-Szentgróti – Gábor Szabó-Szentgróti – Zoltán Szakály
APSTRACT Vol. 11. Number 3-4. 2017. pages 169-180. ISSN 1789-7874
Table 8.: Criteria system in case of different own produced raw milk supply
Raw material base 1 (RM1)19
Raw material base 2 (RM2)
Net turnover (value)
more favourable (in every analysed year)
Operating income (value)
more favourable (in four analysed years)
Profit/loss balance (value)
more favourable (in every analysed year)
Net turnover (relative change)
more favourable (in three analysed years)
Operating income (relative change)
more favourable (in every analysed year)
Profit/loss balance (relative change)
more favourable (in every analysed year)
Indebtedness ratio higher (in every analysed year)
D/E ratiomostly higher (in three
analysed years)
Net profit marginmore favourable (in four
analysed years)
Quick liquidity ratio
higher (in every analysed year)
Source: own calculation based on annual reports
Producing and using their own raw material supplies, companies might experience financial benefits, but we had to consider that nationwide known companies that own a dairy farm thus work with a higher rate of capacity rarely use their raw milk supplies, they determine the performance of the group ’’RM2”.
After studying the purchase price of raw milk as raw material, it is clear that the change of the average price of these materials followed the change of national prices in the past four years (Table 9.).
Table 9.: Purchased and own produced raw milk prices (HUF/l)
2010 2011 2012 2013
Purchase market price (excluding own farm)
83,5 84,6 85,4 96,3
Purchase market price (national average)20 71,5 86,1 86,6 96,1
Milk production cost (own farm)
n.a.21 n.a. n.a. n.a.
Source: PÁIR, 2014 and own calculation
There was a significant difference between the two average rates in 2010, when the national average was well below the average rate of the companies tested. We wanted to analyse if
19 RM1: total or very high own raw material coverage, RM2: most of raw milk must be purchased from the market.20 PÁIR, 201421 not available
the use of own produced raw milk is more cost-effective than buying it from the market, but none of the companies could give us information regarding the costs of using own raw milk materials. However, if we want to estimate a price, according to KŐMŰVES and LUKÁCS (2015) large farms produce around 70-80 HUF, while small farms produce around 90-110 HUF on average. This price depends on capital adequacy, farm size, feeding and market demand.
Sales
Among the respondents, a domestic milk processing company typically has six wholesale and 33 small-scale partners. Only a few groups use direct sales, which is surprising because the method is getting more and more popular. SZAKÁLY et al. (2008) also pointed out its existence. Direct salesmanship happens in the form of customers buying products directly in the shops of the companies.
As a matter of fact, 44% of all products sold by responding enterprises are private labelled goods. There was no significant difference between the commercial products in terms of the size and the financial performance of the companies. There is not a significant difference for which commercial partner they are producing, but Spar, Lidl and Tesco are three of the main partners. Other partners mentioned were CBA, Penny, Aldi, Coop, Auchan and Metro.
According to managers the biggest problems for them is to sell their products. They mentioned that retail companies (for example hyper- and supermarkets) have stronger bargaining position and they cannot compete with cheap foreign dairy products. In accordance with company managers, they would like to create differentiable products but it has higher costs, which is not compensated for in price well by the market. Those companies that have a lower income feel the differentiating strategy to be more pricy. Furthermore, companies with higher income feel better the price compensation of differentiated products on a retail market. From this we drew the conclusion that the size of a company – based on income – can mean a bargaining, negotiating power.
Comparison of dairy company strategies to consumer feedback
In our research we made a B2C survey about dairy product consumption. In this paper we focus on the comparison between the processing and the consuming groups on the basis of the previously mentioned factors.
Main strategy directions
While testing the generic strategies we found out that most of the processing groups follow a differentiation strategy, but when we examined more closely it was obvious that most of them applied more than one strategy. According to most of the consumers, they consume dairy products as part of their

APSTRACT Vol. 11. Number 3-4. 2017. pages 169-180. ISSN 1789-7874
Empirical Research On Corporate Strategies In Hungarian Dairy Industry 177
healthy diet (4,4)22, also reliability and product traceability (4,12) were mentioned as main reasons. Interestingly, the demand for unique products (3,31) comes later.
In the course of testing how well consumers know the producer and the brand, and the difference between them, it was clear that people who live healthy lives consciously are the ones who are aware of the manufacturers and do not mix it up with the definition of brand/branding (p=0,016). The test on knowing the brands had a positive result, identifying 74,1% (n=385) of the products. This ratio was 59,5% (n=451) in case of manufacturer identification. However, in many cases the answers were not exact or were sketchy. Two observations are definitely worth mentioning: Many consumers thought margarine to be a dairy product and most of the consumers could not connect the products to a brand and its producer (for example if the product’s name is not associated with the company’s name).
As for product composition, there is a difference between the producers and the consumers, especially on butter. According to B2C results, butter was the second most consumed product after liquid milk. We find the reason to be the notional misconception between butter and margarine that was presented before by other researchers (HUSZKA and POLERECZKI 2008; BERKE, 2003). Repositioning of this product can open up new markets and possibilities for producer groups. In case of the other dairy products we did not experience a sharp difference between the producer and the consumer groups.
After factor analysis we made cluster analysis (all factors p=0,000) and three clusters were identified, which are helpful to a better design for a company strategy. It turned out that ’Mass product consumers’ (n=157) could be addressed from most sides. Besides assuring the low price and availability, they can be addressed with the issues of health and taste. For them repositioning of the mass products could also be effective. Furthermore, we believe that people of this group are most likely to choose imported goods if those are cheaper than domestic ones. That is why they need to be oriented towards Hungarian products. The ’Open for innovation’ group (n=195) can be easily addressed from a point of view where new products are presented. It would be beneficial for producers to produce unique, functional products for this group, the ability to afford these products would not mean a problem to them. The disadvantage of this group is that their loyalty is hard to maintain, their demands need to be observed constantly. As for the ’Hypocrite local patriarchs’ (n=151) it is difficult to determine the needs of this group. Emphasizing localism is seemingly important to them, so they are probably open to local products. However, this group is full of contradictions, because they tend to buy products that are not necessarily local as they claim.
In case of private labelled products we can speak about a significant market because nearly 80% of consumers buy such products. As for the processing side, we can state that nearly 44% (on average) of manufactured products are private
22 Likert-scale average: 1-minimum, 5-maximum
labelled goods. In this case we find the producing attitude satisfactory as a nearly 50% is a large proportion in the production of commercial brands. It is important for them to be present on the market with unique and own brands.
Raw material base
The analysis showed that 50% of respondents had a milk producing site of their own but only 29,2% produced liquid milk as a product. The leftover is probably exported because of the higher purchase prices. After cheese and heat-treated milk products, liquid milk is the most often mentioned ready-made product. The results of the consumer survey showed however that liquid milk is the most commonly consumed dairy product, especially among women (p=0,027). The corporate survey revealed that the profitability of liquid milk fell behind of cheese and heat-treated products. The consumer answers showed us that the liquid milk (and other dairy products) could be repositioned by using own raw materials. Nearly 80% would rather buy from producers who make the raw material themselves. In this case 5-15% would be the extra cost that the market could still tolerate, therefore the processor might settle a hypothetic reservation price. Women are more willing to purchase such goods than men (p=0,008). In particular women aged between 18 and 39 (p=0,013) could well be targeted with these products. Basically wealthier customers would pay a raised price (p=0,007). If producing own raw material could be done in an economical way and selling price of these product could be higher, it would definitely result in a competitive advantage instead of buying it from other farmers which would increase the final price. Corporate strategy could be built on focusing on the own base material.
Main distribution channels
From the corporate side it was shown that retail and wholesale stores (chains) were the main actors of daily product sales; direct marketing was marginally present. According to customer replies the main places of purchase are still the hyper and supermarkets as well as discount shops (Tesco, Spar, Lidl, Penny Market). The two sides of consumers and producers correlate in this aspect. And another thing is that consumers show a greater demand for direct selling as opposed to companies. Processors will have to pay more attention to this sort of demand in the future. Direct selling can be developed in two ways in case of the companies. The first one is to run own shops in towns/villages, or even in markets. Secondly, online selling will prove to be an extremely good alternative of producers considering direct selling. Mainly those processors have to consider this opportunity that make unique products (e.g.: special flavour or texture), but due to their size, they are not capable of producing vast supplies of ready-made goods and being present on the national retail market. Although the distribution of food products online in particular perishable ones, is still at an early phase, in our opinion the digital world will make a change.

178 Eszter Szabó-Szentgróti – Gábor Szabó-Szentgróti – Zoltán Szakály
APSTRACT Vol. 11. Number 3-4. 2017. pages 169-180. ISSN 1789-7874
CONCLUSIONS
Market structure
We can conclude that the Hungarian dairy industry shows a rather diverse picture. Currently 44% of the market participants are not present in the dairy competition. We have to talk about a fairly fragmented market structure because 10-20% of the annual turnover is accumulated among the 80-90% of the competitors. On the other hand, the concentration values and the Lorenz curve showed a concentrated market. In the light of the Western European milk processing market structure we can state that the one here does fall behind in comparison.
Suggestion: In our case the market structure would be „healthier” only if the mentioned enterprises, currently not participating in the competition, left the market. A monopole or oligopol processing structure could not be necessarily realised in Hungary. There is a need for middle-sized and large companies which are present nationwide with their products and at the same time smaller ones producing unique products are also desirable. To achieve this, a scale of value added products and modern corporate strategy are inevitable.
Strategy
Besides the special Hungarian dairy market structure we still suppose that there are enterprises where a competent strategy results in measurable financial effect. Based on this research, we can state that although we can identify a connection between strategic planning and financial result, the data do not support a related tendency. We have to bear in mind that during the years analysed the domestic dairy market faced a number of challenges like quota elimination, Russian embargo, Chinese import, and military conflicts. In our opinion the respondent companies’ strategy does not show an effectiveness to influence the financial outcome significantly. Strategically, the majority of the dairy sector is not up-to-date and modern enough. This observation of ours is parallel to those of other researchers’ findings who drew the same conclusion as far as the small and middle sized sector management skills and strategic preparedness are concerned23.
After a factor analysis we proved that the dairy companies followed several strategies at the same time. However, the results suggested they mostly used them unconsciously because during the examination of the financial effects some relations could be shown but we had expected a more definite relation thus we attributed this to a less effective strategy. In addition, the random strategy is supported by another observation: the executives frequently showed attitudes without concept.
Suggestion: If strategic planning does not exist yet, enterprises should introduce one. Where it already exists, it should be made more precise in accordance with consumer demands. We think planning a strategy does not depend on
23 Varga (2015), Hugyi and Takácsné (2011), Salamonné Huszti (2000), Karda (2009), Sára and colleagues (2014)
the size of the company. It is vital for managers to acquire and deepen strategic skills.
Within strategy, during the examination of raw material basis we could conclude that half of the respondents owned a milk producing site. Slightly over half of them are forced to purchase the majority of raw material from elsewhere. Also, less than half of the manufacturers are capable of covering 10-20% of their need for raw milk on average. The rest of companies mostly or completely cover the annual need from their own raw material. The enterprises with own farms perform better financial results than the ones without own raw milk basis, but the dynamics of positive results is more fluctuating. In case of raw material coverage the „Raw material basis 2” values are better, which is due to knowing the processors with more nationwide popularity among consumers. Concerning manufacturing price analyses, none of the companies could give us information regarding the costs of using own raw milk materials.
Suggestion: It is highly recommended to make financial analysis of each division. It would be important to examine the level and efficiency of milk production. The findings, however, are interesting because the own produced raw material for the purpose of secure raw material supplies means a strategic advantage.
Consumer feedback
Nearly 78% of respondents would rather purchase goods made from own raw material. The willingness to pay higher price for this was 5-15% on average. The main target customers could be women under40 with a salary of higher than average.
Suggestion: In this strategy we suggest using marketing tools that really make the customer be aware of such positive features of the product. If the production of the raw material can be done at lower cost than the raw material purchased and the end product was sold at higher cost, this would definitely mean a competitive advantage. As liquid milk profitability falls behind that of higher value added products, it is advisable to reposition this product accordingly.
We can claim that there was a significant difference between the customer and manufacturer side in terms of the range of products, particularly those of butter. It might be caused by the notional confusion of butter and margarine, which had already been proved by former researchers. In case of other dairy products there was no such significant difference between the customer and the manufacturer. Neither have we found extreme difference among the demand for commercial brands. Analysing selling/purchasing channels we found no significant difference as for purchasing points, either. But at the same time we raised attention for the opportunities of direct marketing, especially the possible spread of online food product distribution.
Suggestion: Repositioning butter might open new markets for processors. Exploiting direct marketing channels could become part of a future strategy, especially among low-capacity manufacturers with unique products.
After analysing customer interrogations it became clear
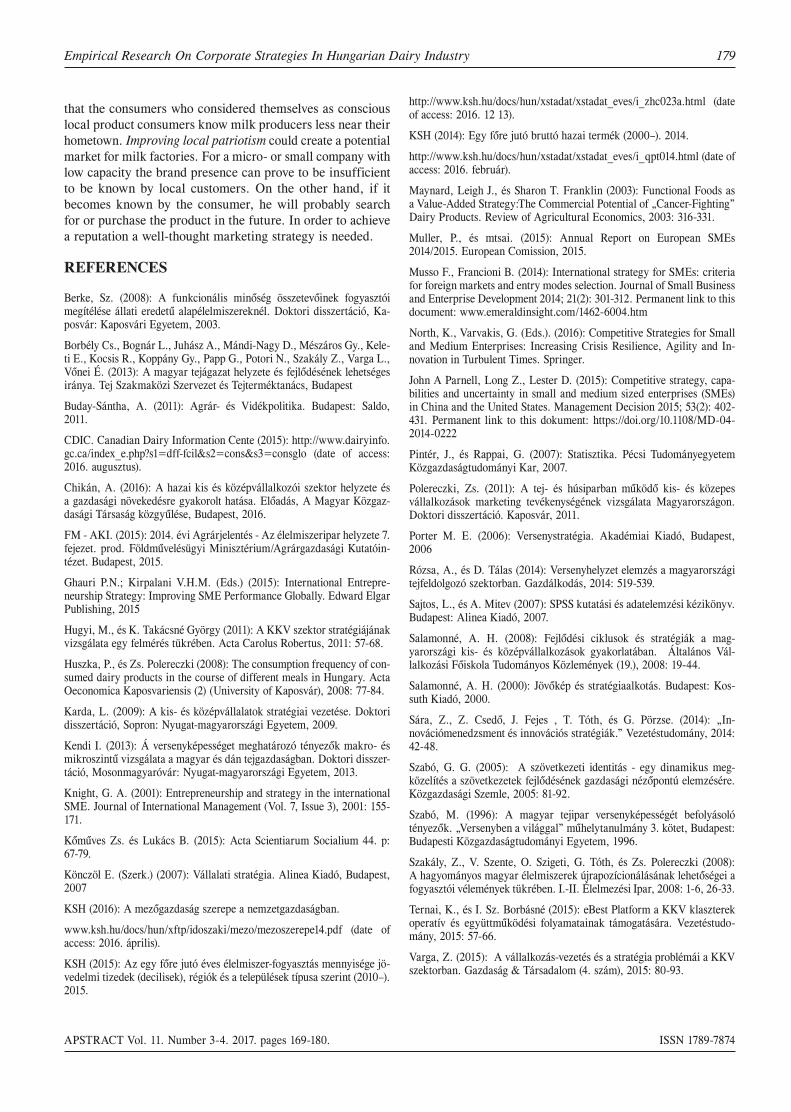
APSTRACT Vol. 11. Number 3-4. 2017. pages 169-180. ISSN 1789-7874
Empirical Research On Corporate Strategies In Hungarian Dairy Industry 179
that the consumers who considered themselves as conscious local product consumers know milk producers less near their hometown. Improving local patriotism could create a potential market for milk factories. For a micro- or small company with low capacity the brand presence can prove to be insufficient to be known by local customers. On the other hand, if it becomes known by the consumer, he will probably search for or purchase the product in the future. In order to achieve a reputation a well-thought marketing strategy is needed.
REFERENCES
Berke, Sz. (2008): A funkcionális minőség összetevőinek fogyasztói megítélése állati eredetű alapélelmiszereknél. Doktori disszertáció, Ka-posvár: Kaposvári Egyetem, 2003.
Borbély Cs., Bognár L., Juhász A., Mándi-Nagy D., Mészáros Gy., Kele-ti E., Kocsis R., Koppány Gy., Papp G., Potori N., Szakály Z., Varga L., Vőnei É. (2013): A magyar tejágazat helyzete és fejlődésének lehetséges iránya. Tej Szakmaközi Szervezet és Tejterméktanács, Budapest
Buday-Sántha, A. (2011): Agrár- és Vidékpolitika. Budapest: Saldo, 2011.
CDIC. Canadian Dairy Information Cente (2015): http://www.dairyinfo.gc.ca/index_e.php?s1=dff-fcil&s2=cons&s3=consglo (date of access: 2016. augusztus).
Chikán, A. (2016): A hazai kis és középvállalkozói szektor helyzete és a gazdasági növekedésre gyakorolt hatása. Előadás, A Magyar Közgaz-dasági Társaság közgyűlése, Budapest, 2016.
FM - AKI. (2015): 2014. évi Agrárjelentés - Az élelmiszeripar helyzete 7. fejezet. prod. Földművelésügyi Minisztérium/Agrárgazdasági Kutatóin-tézet. Budapest, 2015.
Ghauri P.N.; Kirpalani V.H.M. (Eds.) (2015): International Entrepre-neurship Strategy: Improving SME Performance Globally. Edward Elgar Publishing, 2015
Hugyi, M., és K. Takácsné György (2011): A KKV szektor stratégiájának vizsgálata egy felmérés tükrében. Acta Carolus Robertus, 2011: 57-68.
Huszka, P., és Zs. Polereczki (2008): The consumption frequency of con-sumed dairy products in the course of different meals in Hungary. Acta Oeconomica Kaposvariensis (2) (University of Kaposvár), 2008: 77-84.
Karda, L. (2009): A kis- és középvállalatok stratégiai vezetése. Doktori disszertáció, Sopron: Nyugat-magyarországi Egyetem, 2009.
Kendi I. (2013): Á versenyképességet meghatározó tényezők makro- és mikroszintű vizsgálata a magyar és dán tejgazdaságban. Doktori disszer-táció, Mosonmagyaróvár: Nyugat-magyarországi Egyetem, 2013.
Knight, G. A. (2001): Entrepreneurship and strategy in the international SME. Journal of International Management (Vol. 7, Issue 3), 2001: 155-171.
Kőműves Zs. és Lukács B. (2015): Acta Scientiarum Socialium 44. p: 67-79.
Könczöl E. (Szerk.) (2007): Vállalati stratégia. Alinea Kiadó, Budapest, 2007
KSH (2016): A mezőgazdaság szerepe a nemzetgazdaságban.
www.ksh.hu/docs/hun/xftp/idoszaki/mezo/mezoszerepe14.pdf (date of access: 2016. április).
KSH (2015): Az egy főre jutó éves élelmiszer-fogyasztás mennyisége jö-vedelmi tizedek (decilisek), régiók és a települések típusa szerint (2010–). 2015.
http://www.ksh.hu/docs/hun/xstadat/xstadat_eves/i_zhc023a.html (date of access: 2016. 12 13).
KSH (2014): Egy főre jutó bruttó hazai termék (2000–). 2014.
http://www.ksh.hu/docs/hun/xstadat/xstadat_eves/i_qpt014.html (date of access: 2016. február).
Maynard, Leigh J., és Sharon T. Franklin (2003): Functional Foods as a Value-Added Strategy:The Commercial Potential of „Cancer-Fighting” Dairy Products. Review of Agricultural Economics, 2003: 316-331.
Muller, P., és mtsai. (2015): Annual Report on European SMEs 2014/2015. European Comission, 2015.
Musso F., Francioni B. (2014): International strategy for SMEs: criteria for foreign markets and entry modes selection. Journal of Small Business and Enterprise Development 2014; 21(2): 301-312. Permanent link to this document: www.emeraldinsight.com/1462-6004.htm
North, K., Varvakis, G. (Eds.). (2016): Competitive Strategies for Small and Medium Enterprises: Increasing Crisis Resilience, Agility and In-novation in Turbulent Times. Springer.
John A Parnell, Long Z., Lester D. (2015): Competitive strategy, capa-bilities and uncertainty in small and medium sized enterprises (SMEs) in China and the United States. Management Decision 2015; 53(2): 402-431. Permanent link to this dokument: https://doi.org/10.1108/MD-04-2014-0222
Pintér, J., és Rappai, G. (2007): Statisztika. Pécsi Tudományegyetem Közgazdaságtudományi Kar, 2007.
Polereczki, Zs. (2011): A tej- és húsiparban működő kis- és közepes vállalkozások marketing tevékenységének vizsgálata Magyarországon. Doktori disszertáció. Kaposvár, 2011.
Porter M. E. (2006): Versenystratégia. Akadémiai Kiadó, Budapest, 2006
Rózsa, A., és D. Tálas (2014): Versenyhelyzet elemzés a magyarországi tejfeldolgozó szektorban. Gazdálkodás, 2014: 519-539.
Sajtos, L., és A. Mitev (2007): SPSS kutatási és adatelemzési kézikönyv. Budapest: Alinea Kiadó, 2007.
Salamonné, A. H. (2008): Fejlődési ciklusok és stratégiák a mag-yarországi kis- és középvállalkozások gyakorlatában. Általános Vál-lalkozási Főiskola Tudományos Közlemények (19.), 2008: 19-44.
Salamonné, A. H. (2000): Jövőkép és stratégiaalkotás. Budapest: Kos-suth Kiadó, 2000.
Sára, Z., Z. Csedő, J. Fejes , T. Tóth, és G. Pörzse. (2014): „In-novációmenedzsment és innovációs stratégiák.” Vezetéstudomány, 2014: 42-48.
Szabó, G. G. (2005): A szövetkezeti identitás - egy dinamikus meg-közelítés a szövetkezetek fejlődésének gazdasági nézőpontú elemzésére. Közgazdasági Szemle, 2005: 81-92.
Szabó, M. (1996): A magyar tejipar versenyképességét befolyásoló tényezők. „Versenyben a világgal” műhelytanulmány 3. kötet, Budapest: Budapesti Közgazdaságtudományi Egyetem, 1996.
Szakály, Z., V. Szente, O. Szigeti, G. Tóth, és Zs. Polereczki (2008): A hagyományos magyar élelmiszerek újrapozícionálásának lehetőségei a fogyasztói vélemények tükrében. I.-II. Élelmezési Ipar, 2008: 1-6, 26-33.
Ternai, K., és I. Sz. Borbásné (2015): eBest Platform a KKV klaszterek operatív és együttműködési folyamatainak támogatására. Vezetéstudo-mány, 2015: 57-66.
Varga, Z. (2015): A vállalkozás-vezetés és a stratégia problémái a KKV szektorban. Gazdaság & Társadalom (4. szám), 2015: 80-93.


APSTRACT Vol. 11. Number 3-4. 2017. pages 181-188. ISSN 1789-7874
DOI: 10.19041/APSTRACT/2017/3-4/24
Applied Studies in Agribusiness and Commerce – APSTRACT Center-Print Publishing House, Debrecen SCIENTIFIC PAPER
DEMOGRAPHIC AND LIFESTYLE ATTRIBUTES WITH A FUNDAMENTAL ROLE IN FOOD
SUPPLEMENT CONSUMPTION (EXPLORATORY RESEARCH)
Zsófia Nábrádi(Institute of Marketing and Trade University of Debrecen Faculty of Economics
and Business Institute of Marketing and Trade ) 138.Böszörményi út Debrecen 4032
Abstract: The worldwide proportion of food supplement consumers has been steadily increasing, more than 50% of the Hungarian population tends to buy at least one type of dietary supplement. In most cases, the purchase and consumption of food supplements are not based on medical indications but depends on consumers’ individual decisions. The study of consumer groups enables the investigation of typicalities which have an impact on attitudes related to the consumption of food additives. The present study explores the demographical factors determining the global consumption of dietary supplements by secondary research. It sought to explore the typical features of consumer lifestyles in line with the research findings, based on previously specified criteria, through qualitative focus group examinations. My study focused on subjects who bought and purchased at least one type of food supplement in the previous year and placed a high emphasis on healthy diet and lifestyle in their everyday lives. The consumption of dietary supplements indicates growth with age and it is more common among women. Consumers with higher qualifications and incomes tend to buy products with vitamins and minerals in a greater proportion. The identification of nutrition factors revealed that the proportion of those who do not need extra nutrient intake is high among food supplement consumers. It is primarily true of women having a healthy lifestyle (they typically consume high amounts of vegetables and fruits, they are physically active, non-smokers and do not use alcohol); moreover, their socio-economic status is typically high. The findings of my quantitative research suggest that the purchase and consumption of dietary supplements are most characteristic of the “Successful”, “Quality oriented- successful” and “Loyal to the brand - modest” groups in the lifestyle-based consumer segments. The investigated sample showed ambiguous attitudes towards product quality and willingness to pay in all the three batches. Nevertheless, it can be established, when consumers buy food supplements, brand sensitivity proves to be a dominant factor in addition to - typically Hungarian - price sensitivity. Based on lifestyle factors, the current research may bring us closer to the exploration of the motivational and attitude patterns of consumers’ food supplement purchases.
INTRODUCTION
Definition of dietary supplements, consumption patternsThe definition of dietary supplements varies all over the
world. DSHEA (Dietary Supplement Health and Education Act) lays down the regulatory framework of dietary supplements in the United States of America. As for its definition, the following are considered dietary supplements:
– elements to supplement diet; – which do not replace conventional meals; – may not be marketed as conventional food products; – can be taken by mouth in the form of capsules, tablets,
pastilles or liquid;
– are not considered as homoeopathic products or local applications (BROWN, 2017).
According to the American Food and Drug Administration (FDA), dietary supplements include all (non-tobacco) products to compensate for diets, including one or more ingredients of the following: vitamins, minerals, amino acids, medical plants or other herbal products; and/or the concentrates, ingredients or combinations of these elements. (AKILEN, et al., 2014).
In Hungary, the 37/2004. (IV. capsules, pills 26.) ESZCSM (Ministry of Health, Social and Family Affairs) Decree is in accordance with the EU decree on food supplements. Under the Decree, food supplements are concentrated sources of nutrients or other substances with a nutritional or physiological
Keywords: dietary supplement consumption, lifestyle. (JEL Code: I12, M31)

182 Zsófia Nábrádi
APSTRACT Vol. 11. Number 3-4. 2017. pages 181-188. ISSN 1789-7874
effect, either alone or combined. Supplements may be used to correct conventional diet, and they come in different forms from traditional foodstuffs (LUGASI, 2014).The coherent position of the EU lays down that beneficial claims for food supplements shall be communicated to consumers instead of the reduction of disease risk claims. However, the literature on the subject has highlighted numerous consumer misconceptions and revealed that customers purchase these preparations to treat various kinds of diseases.
Dietary supplements come in various forms and types on the market; however, the present study discusses merely vitamin and nutrient consumption. In 2017, the EUROMONITOR survey found that Hungarians pay increasing attention to preserving their health to avoid severe health problems. Although enriched/functional foods and beverages play an important role on the market, the majority of Hungarian people have higher confidence in the efficiency of tablets (and more specifically in vitamins and minerals) (EUROMONITOR, 2017). A survey by the Nutrition Business Journal on sales in the food supplement industry in 2015 showed that the purchase of dietary supplements including vitamins and minerals accounted for 43% of total purchases (JOHNSON, 2015). The consumption of vitamins is the most representative in various food supplements. DICKINSON et al. (2014) survey findings suggest that the following products are considered the most popular in America:
Table 1. Most frequently consumed vitamins and minerals in the USA
Product Use (%)
Multivitamin 71
Omega-3 or fish oil 33
Vitamin D 32
Vitamin C 32
Vitamin B complex 25
Magnesium 12
Glucosamine/Chondroitin 12
Source: Author’s development based on Dickinson et al. (2014)
Several previous studies have confirmed that the consumption of food supplements is growing with age and is much higher among women (BAILEY et al. 2011, 2013; RADIMER et al. 2004; DICKINSON&MACKAY, 2014; ROVIRA et al. 2013). The identification of nutrition factors revealed that the proportion of those who do not need extra nutrient intake is high among food supplement consumers. It is primarily true of women having a healthy lifestyle (who typically consume high amounts of vegetables and fruits, are physically active, non-smokers and do not use alcohol); moreover, their socio-economic status is typically high (VANTANPARAST et al., 2010). REEDY et al. (2005) researched the factors of health-conscious behaviour and their findings show that food supplement users tend to consume higher amounts of vegetables and fruits.
An American survey has confirmed that vitamin D intake in high-risk consumer groups (e.g. small children and menopausal women) is critically low (PAJOR et al., 2017). It is true of vitamin consumption through both nutrition and food supplements. In Hungary, data on dietary supplement intake are not available, although a survey on consumer habits has drawn attention to the emerging phenomenon in our country. OGYÉI investigation findings suggest that the vitamin D intake of the population is at a critically low level, equal to the level in their 2009 data. Whereas the intake of certain vitamins (C, B1, B6, B12 and niacin) is consistent with recommendations in Hungary in both genders, it must be underlined that vitamin intake for the great proportion of the population is lower than expected. Interestingly, the survey findings conclude that there is a major divergence between male and female vitamin intake, in favour of men (OGYÉI, 2016).
The survey based on the preceding approximately 20 years carried out by NHANES (National Health and Nutrition Examination Surveys) has made a powerful case that the consumption of food additives is more widespread among those with higher qualifications than those of lower socioeconomic status (DICKINSON&MACKAY, 2014); the same applies to Hungary. The statement that a considerable proportion of consumers with regular physical activity purchases at least one type of dietary supplement can be considered globally true. The exception to this is a survey made in Mediterranean countries, Girona and Spain (ROVIRA et al., 2013), which failed to find a significant correlation between food supplement consumption and regular physical activity. The examination of other lifestyle factors proves that there is a significant correlation between smoking and the use of food supplements. Therefore, it can be stated that those who smoked previously but quit this habit, are more likely to consume dietary supplements than those who have never smoked or smoke currently (KNUDSEN et al., 2002; DICKINSON & MACKAY, 2014). Obesity investigations suggest that healthy, overweight and obese individuals consume food supplements in approximately the same proportion. A study by RADIMER at al. (2004) on alcohol consumption have found that individuals who consume wine, beer or short drinks more than four times per month, consume some dietary supplement with higher probability. Their research samples indicate that those who consume alcohol less frequently or never, will use food supplements with lower probability.
BAILEY at al. (2013) findings establish that American adults purchase food supplements to maintain and safeguard their health. However, the purchase of most products fails to follow medical advice, i.e. consumers bring their personal decisions on buying the food supplements. It supports the inverse hypothesis mentioned in several previous research papers that consumers bestow a significant role to dietary supplements in preventing the development of adverse conditions (BAILEY, 2013).

APSTRACT Vol. 11. Number 3-4. 2017. pages 181-188. ISSN 1789-7874
Demographic And Lifestyle Attributes With A Fundamental Role In Food Supplement Consumption 183
MATERIALS AND METHODS
Lifestyle-based consumer segments were developed in Hungary in 2010 (VERES et al., 2010). Veres at al. have explored the demographic factors in specific groups, their attitudes related to purchase, consumption, brands and also their preferred hobbies and spare-time activities. Their research findings enable the formation of three broad categories, which include the following lifestyle groups:
Table 2. Lifestyle categories and included groups
Consumer “elite”Successful Quality-oriented, successful
Consumer middle-layer Prestige consumer Stay-at-home, selectiveLoyal to the brand, modest
Who lag behind Stay-at-home, laggingAdventurous, lagging Conservative, poor
Source: Author’s development based on Veres et al. (2010)
All the above-listed consumer layers include values and attitudes to explain their group membership. These values and attitudes follow the financial positions or consumer statuses to some extent, but they are partially independent of them. Research on attitudes towards food supplement consumption has been unprecedented so far in Hungary. My paper sought to address the question which group(s) appear among consumers and users of food supplements among the previously defined lifestyle segments. My secondary research results indicate that the purchase and use of dietary supplements are significantly higher among consumers with specific demographical and lifestyle features. Accordingly, my research included subjects who satisfied the following criteria:
– consumed at least one type of dietary supplement in the previous year
– have higher education qualifications – are above 25 years – healthy nutrition is a priority – do regular physical activity My qualitative research - 8 participants (5 women and
three men) - was based on focus group interviews, where the scenario was divided into three broad areas. The first part explored attitudes to the purchase and consumption of food supplements. The second part determined lifestyle-based consumer segments, whereas the third one identified group attitudes.
RESULTS AND DISCUSSION
Attitudes towards food supplement purchase and consumption
The investigated samples indicate three crucial motivational factors in the use of dietary supplements. In purchasing these preparations, the key drivers are health maintenance and immune system boost. Previous research has underlined numerous consumer misconceptions stating
that food supplement intake is suitable for the treatment of certain health issues. In my survey, the relationship between the application of food supplements and disease prevention and/or treatment was the subject of discussions. Research participants were active and they regularly performed some physical exercises. The significance of increasing performance was an outstanding motivational factor for them.
The group members provided homogeneous replies to questions related to dietary supplement consumption. On that basis, it may be considered that the most preferred products include vitamins (especially vitamins C, D, E, K and multivitamins) and minerals (potassium and magnesium). In purchasing specific products, prices and brands are determinants, whereas the origin of dietary supplements is less influential. Customers buy domestic and import food supplements, attributing higher credibility to specific brands.
Purchase locations are typically pharmacies, drug stores and body shops. Online shopping is also widespread among the group members, although they merely purchase trusted preparations which “work well” for them. Consumers search for information both online and offline; however, a reference person is crucial for them (e.g. a doctor, a dietician, a pharmacist or a trainer). Their willingness to spend on food supplements goes hand in hand with their income levels, although it can be stated that the study group members were all willing to pay a higher purchase price for food supplements.
Identification of lifestyle-based consumer segments and group attitudes
My research sample matched with three lifestyle segments determined by Veres et al. It can be claimed that the consumer clusters where the purchase and use of dietary supplements were the most typical, consisted of the “Consumer elite”, and the “Consumer middle layer” groups. The next section of my paper will describe the three lifestyle groups which showed similarities with the ones identified in Veres et al. research.
“Quality oriented successful”
Who belong to this group purchase exclusively good quality products, and are loyal to their favorite brands. Their brand-choice is based on quality, they never buy unknown brands. Brands are their key factors for bringing a decision on quality; a certain brand suits them and typical of them. They think that the use or consumption of the chosen brands say a lot about the person. Their brand preferences reflect the choices of their close acquaintances. They often test new products and spend much time on outer appearance, follow fashion, enjoy shopping for clothes. They spend a lot on toiletries and cosmetics, sometimes buy unnecessary products. If they find an attractive product, buy it immediately, regardless of its quality. They like spending time with the family. They spend more time on sports than the average. They are outgoing, likes taking family, friends, acquaintances to restaurants, pubs, discos, etc. They visit friends or invite guests more often than the average. They are active internet users, like

184 Zsófia Nábrádi
APSTRACT Vol. 11. Number 3-4. 2017. pages 181-188. ISSN 1789-7874
watching films, listening to popular music and reading weekly newspapers.
Group attitude towards the purchase and use of food supplements. “I only trust a well-established brand, as unknown brands might pose a potential risk to health. “Successful”
If they come to like something (e.g. a product), they will be loyal to it, and usually buy the well-known brands. They are loyal to brands believed to be of good quality, as quality is crucial for them. They think that buying a good quality product is more economical, although more costly, as it “will pay off”. They like spending free time with the family. If they stay at home, they like watching TV, but not series. They are relatively active internet users. They rather avoid shopping, it is true of both shopping for food and clothes, and “shopping” is not among their preferred activities. Their financial means can be regarded good. They like popular music, printed press and read books rarely.
Group attitude towards the purchase and use of food supplements. “I buy my preferred products; quality is important for me”.
“Loyal to brand, modest”
Their shopping is typically thrifty but they consider brands significant. They buy the well-known brands, and are loyal to preferred brands. They intend to buy merely good quality products, their interest in bargains and sales is lower than the average. They think that buying branded products is much more economical, as quality “will pay off”. They test new products very often, spend relatively little on toiletries and cosmetics, but attempt to care about appearance. They usually refuse to pay more for good quality and ignore the brands used in their environment. They spend their free time by going out. Watching TV and series are less frequent for them than the average, but they prefer films. Listening to popular music is very typical of them, they are also regular internet users. Entertainment with family, friends, acquaintances (restaurant, pub, disco, etc.) is considerably more frequent in this group than the average.
Group attitude towards the purchase and use of food supplements. “My shopping is thrifty, I will not pay for good quality, but I am loyal to certain products”.
My research identified further lifestyle segments which the respondents regarded strange for themselves. The question sets related to the purchase of food supplements highlight the opinions of the participants: one group can be regarded negative, two ones are neutral, all the others are users of food supplements. The findings are illustrated in the figure below.
Figure 1. Consumption of dietary supplements in specific lifestyle segments.
Involvement, identical consumer
groups
Quality-oriented, successful
Successful
Involvement, different consumer
groups
Prestige consumer
Stay-at-home, selective
Loyal to brand, modest
Neutral
Adventurous, lagging
Conservative, poor
Negative
Stay-at-home, lagging
Source: Author’s development
Veres et al. carried out an investigation based on education levels and social-statuses in lifestyle groups. My secondary research for the identification of the demographical factors of certain lifestyle groups showed similar results. The findings on the purchase and use of food supplements lead the author to consider the “Stay-at-home lagging” lifestyle group negative. Age-wise, it consists of an older consumer layer with lower or intermediate levels of education, low income and insufficient access to durable goods. The neutral category implies the “Adventurous, lagging” and the “Conservative, poor” groups among lifestyle segments. In terms of educational levels, both groups are about the average; examination on their social status showed heterogeneity, but they fail to show a considerable shift in either direction.
The purchase and use of food supplements are mostly typical of the “Consumer middle layer” and the Consumer elite” segment groups. My research isolated the groups with which my sample showed similarities among the ones involved in purchase and use, displaying different attitude patterns. The study participants and the “Consumer elite” segment group showed the same attitudes. The “Successful” and the “Quality oriented, successful” groups have a higher than average level of education. As for their social status, the “Successful” group represents a higher, whereas the “Quality oriented, successful” a somewhat lower level. It may result from the age factor, as the latter group consisted of primarily young people. In the middle-layer groups, the identification of the “Loyal to brand, modest” group was decisive. It is the youngest group among the lifestyle segments. In the survey by Veres et al. the average age of members was 29.6, whereas they were representing a higher-than-average education level. However, due to their average age (young), their purchase of consumer durables was not regarded significant.
Segments in the “Consumer middle-layer” included groups whose attitudes the participants could not accept, nevertheless they thought that they represented a considerable purchasing power on the market of food supplements. The members of the “Prestige consumer” group are mostly older people, approximating the age of 60. Their education level is average. Their status group belongs to a lower category, and it may stem from the high proportion of pensioners. The “Stay-at-home, selective” group consists of the young middle generation. Their level of education is considerably higher

APSTRACT Vol. 11. Number 3-4. 2017. pages 181-188. ISSN 1789-7874
Demographic And Lifestyle Attributes With A Fundamental Role In Food Supplement Consumption 185
than the average. A relatively high proportion of the group is included in the group of high social status.
CONCLUSION
Lifestyle-based consumer profiles related to the use of dietary supplements have been undiscovered by researchers so far. The purchase and use of food supplements can be considered higher among consumers with specific demographical and lifestyle characteristics. The current investigation sought to disclose consumer attitudes towards food supplements in this social layer. An in-depth study of lifestyle based consumption would be recommendable in various aspects to get a good understanding of consumer layers. Furthermore, quantitative and qualitative research activities can be relevant to gain a sound knowledge of consumer groups and thus the distinctive features of consumption and spending.
ACKNOWLEDGMENT
This research was supperted by EFOP-3.6.2-16-2017-00003 Sport, recreaction and health industry cooperation research network
REFERENCES
Akilen R., Tsiami A., Robinson N. (2014): Individuals at risk of metabolic syndrome are more likely to use a variety of di-etary supplement, Advances in Integrative Medicine 1 pp. 131-137 Permanent link to this document: http://dx.doi.org/10.1016/j.aimed.2014.12.003
Bailey R. L., Fulgoni V. L., Keast D. R., Dwyer J. T. (2011): Di-etary supplement use is associated with higher intakes of minerals from food sources, The American Journal of Clinical Nutrition, 94 (5) pp. 1376-1381 Permanent link to this document: http://dx.doi.org/10.3945/ajcn.111.020289.
Bailey R. L., Gahche J. J., Miller P. E., Thomas P. R., Dwyer J. T. (2013): Why US adults use dietary supplements, JAMA Internal Medicine, 173 (5) pp. 355-361 Permanent link to this document: http://dx.doi.org/10.1001/jamaintermed.2013.2299.
Brown A. C. (2017): An overview of herb and dietary supplement efficacy, safety and government regulations in the United States with suggested improvements. Part 1 of 5 series, Food and Chemi-cal Toxicology 107 pp. 449-471 Permanent link to this document: http://dx.doi.org/101016/j.fct.2016.11.001
Dickinson A., Blatman J., El-Dash N., FrancoJ. C. (2014): Con-sumer usage and reasons for using dietary supplements: report of a series of surveys, Journal of the American College of Nutrition 33 (2.) pp. 176-182
Dickinson A., MacKay D. (2014): Health habits and other characteristics of dietary supplement users: a review, Nutri-tion Journal 13:14 Permanent link to this document: https://doi.org/10.1186/1475-2891-13-14
Euromonitor International (2017): Country Report Vitamins in Hungary http://www.euromonitor.com/vitamins-in-hungary/report
Johnson J. (2015): NBJ Supplement Business Report: a Tough Year for Supplements by the Numbers http://www.newhope.com/man-aging-your-business/2015-nbj-supplement-business-report-tough-year-supplements-numbers
Knudsen V.K., Rasmussen L.B., Haraldsdóttir J, Ovesen L, Bülow I, Knudsen N, Jørgensen T, Laurberg P, Perrild H. (2002): Use of dietary supplements in Denmark is associated with health and former smoking, Public Health Nutrition 5 (3) pp. 463-468 Perma-nent link to this document: https://doi.org/10.1079/PHN2001276
Lugasi A. (2014): Az étrend-kiegészítők kockázati tényezői, Mag-yar Tudomány 175 (11) 2014/11 pp. 1354-1365
Országos Gyógyszerészeti és Élelmezés-egészségügyi Intézet (OGYÉI) (2016): Étrend-kiegészítők Permanent link to this docu-ment: https://www.ogyei.gov.hu/etrend_kiegeszitok/
Pajor E.M., Eggers S.M., Curfs, Oenema A., de Vries H. (2017): Why do Dutch people use dietary supplements? Exploring the role of socio-cognitive and psychosocial determinants, Appetite 114 pp. 161-168 Permanent link to this document: http://dx.doi.org/10.1016/j.appet.2017.03.036
Radimer K., Bindewald B., Hughes J., Ervin B., Swanson C., Pic-ciano M.F. (2004): Dietary Supplement Use by US Adults: Data from the National Health and Nutrition Examination Survey, 1999–2000, American Journal of Epidemiology 160 (4) pp. 339-349 Permanent link to this document: https://doi.org/10.1093/aje/kwh207
Reedy J., Haines P.S., Campbell M.K. (2005): Differences in fruit and vegetable intake among categories of dietary supplement us-ers, Journal of the American Dietetic Association, 105 pp. 1749-1756 Permanent link to this document: https://doi.org/10.1016/j.jada.2005.08.009
Rovira M. A., Grau M., Castañer O., Covas M.I., Schröder H.; REGICOR Investigators (2013): Dietary supplement use and health-related behaviors in a Mediterranean population, Journal of Nutrition Education and Behavior, 45 (5) pp. 386-391 Permanent link to this document: https://doi.org/10.1016/j.jneb.2012.03.007
Vatanparast H., Adolphe J. L., Whiting S. J. (2010): Socio-eco-nomic status and vitamint/mineral supplement use in Canada, Health Reports, 21 (4), pp. 19
Veres Z. (ed) (2010): Életstílus alapú fogyasztói szegmensek Mag-yarországon, Study Volume, University of Szeged, ISBN 978-963-306-071-1


www.opalmedia.huTypography:
20173-4Vol. 11. Number 3-4. 2017
Vol.
11. N
umbe
r 3-4
. 201
7A
pplie
d St
udie
s In
Agr
ibus
ines
s And
Com
mer
ce
http://www.apstract.netApplied Studies In Agribusiness And Commerce
duck
pro
duct
ion
dem
ogra
phic
cha
nge
dairy
indu
stry
beef
pro
duct
ion
was
tew
ater
trea
tmen
t
tour
ism &
gas
tron
omy
econ
omic
s rese
arch
ContentsPreface ......................................................................................................................................................................................................... 4HUNGARIAN ENDEAVOURS FOR THE ENHANCEMENT OF ECONOMIC RELATIONS IN SOUTHEAST ASIA FOCUSING ON A NEW PARTNERSHIP WITH VIETNAM – László Kozár – György Iván Neszmélyi ...................................... 5DETERMINING FAIR RENTAL VALUE OF LAND IN THE HUNGARIAN VALUATION PRACTICE – A METHODOLOGICAL APPROACH – Ferenc Buzás – László Posta – Sándor Kiss – István Mező ................................................. 13CLIMATE CHANGE EFFECTS ON SKI TOURISM – Piroska Béki .................................................................................................... 19RECRUITING RECENT GRADUATES TO WORK AT AGRICULTURAL ENTERPRISES: SIBERIAN REGION CASE STUDY – Andrey Babenko – Leonid Mukhin ............................................................................................ 27INFRASTUCTURAL BACKGROUND OF THE EVERYDAY PHYSICAL EDUCATION IN HUNGARIAN HIGH SCHOOLS – Henrietta Varga Szépné – Éva Katona – Dénes Páll – Ildikó Balatoni ................................................................... 31INCREASING PALINKA RECOGNITION WITH TOURISM AND GASTRONOMY – Imre Milan Harcsa ..................................... 37WHAT DIFFERENTIATES THE ENTREPRENEURS FROM NON-ENTREPRENEURS ON NATURE AND NURTURE? Syed Zaheer Abbas Kazmi – Samiuddin Khan – Andras Nabradi ............................................................................................................ 45REASONS FOR AND OBSTACLES TO CYCLING IN OPINIONS OF RESIDENTS OF DEBRECEN, HUNGARY Nikolett Kosztin – József Tőzsér – László Csernoch – Ildikó Balatoni ..................................................................................................... 53ECONOMIC ISSUES OF DUCK PRODUCTION: A CASE STUDY FROM HUNGARY Szilvia Molnár – László Szőllősi ............................................................................................................................................................... 61ALLOCATION OF STRUCTURAL FUNDS BEFORE AND AFTER THE BREXIT: AN EXERCISE IN THE ECONOMICS OF CAKE-SHARING – Wim Heijman ................................................................................... 69PROTECTED GEOGRAPHICAL INDICATION RECOGNITION AND WILLINGNESS TO PAY: A CASE OF GROJEC APPLE – Bruce L. Ahrendsen – Edward Majewski ............................................................................................. 73COMPOSITE INDICATORS AND SUSTAINABLE DEVELOPMENT OF REGIONAL AGRICULTURE APPLIED TO THE STAVROPOL TERRITORY IN RUSSIA – Anastasia Chaplitskaya – Wim Heijman – Johan Van Ophem ............................. 81AGRICULTURAL TRADE POLICY: ‘AMERICA FIRST’? – Bruce L. Ahrendsen .............................................................................. 89THE ROLE OF SOCIAL MEDIA IN GASTRONOMY INDUSTRY Éva Görgényi Hegyes – Balázs Máté – Seyyed Amir Vafaei – Mária Fekete Farkas ............................................................................... 95GLOBAL TENDENCIES IN PORK MEAT - PRODUCTION, TRADE AND CONSUMPTION – István Szűcs - Viktoria Vida .................................................................................................................................................................... 105BREAD CONSUMPTION HABITS IN THE GLUTEN FREE DIET – Tünde Csapóné Riskó – Ádám Péntek – Troy Wiwczaroski .................................................................................................................... 113COST ANALYSIS OF PIG SLAUGHTERING: A HUNGARIAN CASE STUDY – László Szőllősi – Szilvia Molnár – Krisztina Ladányi – Laura Karnai – István Szűcs .......................................................................... 121HUNGARIAN DAIRY AND BEEF PRODUCTION SECTOR TECHNICAL EFFICIENCY COMPARSION USING DEA – Krisztián Kovács - Ratnesh Pandey ........................................................................................................................................................ 131ENERGY ALTERNATIVES IN LARGE-SCALE WASTEWATER TREATMENT – Zoltán Gabnai ................................................. 141ANALYSIS THE ADVANCED ICT USAGE OF THE HUNGARIAN SME SECTOR FOR PREPARING A DOMESTIC AGRI-FOOD RESEARCH – Szilvia Botos – János Felföldi – László Várallyai – Ádám Péntek – Róbert Szilágyi ............................. 147DIFFERENCES OF THE PRIMARY ENERGY CONSUMPTION OF THE COUNTRIES ALL OVER THE WORLD – Judit Tóth – Róbert Magda ..................................................................................................................................................................... 155 HUMAN RESOURCE ASPECT OF AGRICULTURAL ECONOMY – CHALLENGES OF DEMOGRAPHIC CHANGE – Alexandra Rajczi – Péter Vörös – Krisztina Dajnoki ............................................................................................................................. 163 EMPIRICAL RESEARCH ON CORPORATE STRATEGIES IN HUNGARIAN DAIRY INDUSTRY – Eszter Szabó-Szentgróti – Gábor Szabó-Szentgróti – Zoltán Szakály .................................................................................................... 169 DEMOGRAPHIC AND LIFESTYLE ATTRIBUTES WITH A FUNDAMENTAL ROLE IN FOOD SUPPLEMENT CONSUMPTION (EXPLORATORY RESEARCH) – Zsófia Nábrádi ................................................................................................. 171
Aberdeen, Belgorod, Belgrade, Budapest, Berlin, Cork, Debrecen, Fayetteville, Hohenheim Kazan, Kiev, Nitra, Novi-Sad, Podgorica, Prague, Stavropol, Ulan-Bator, Warsaw, Wageningen, Zagreb