The Best of India in Pharmaceuticals.pdf - IBEF
72
-
Upload
khangminh22 -
Category
Documents
-
view
1 -
download
0
Transcript of The Best of India in Pharmaceuticals.pdf - IBEF
India Brand Equity FoundationApparel House, # 519-22, 5th Floor
Sector 44, Gurgaon 122003Haryana, India
Tel: +91 124 449 9601Fax: +91 124 449 9615
Email: [email protected]
Web: www.ibef.orgwww.brandindiapharma.in
India Brand Equity Foundation (IBEF) is a Trust established by the
Ministry of Commerce, Government of India. IBEF’s
primary objective is to promote and create international
awareness of the Made in India label in markets overseas and to
facilitate the dissemination of knowledge of Indian products
and services. Towards this objective, IBEF works closely with stakeholders across government
and industry.


AN INTRODUCTION
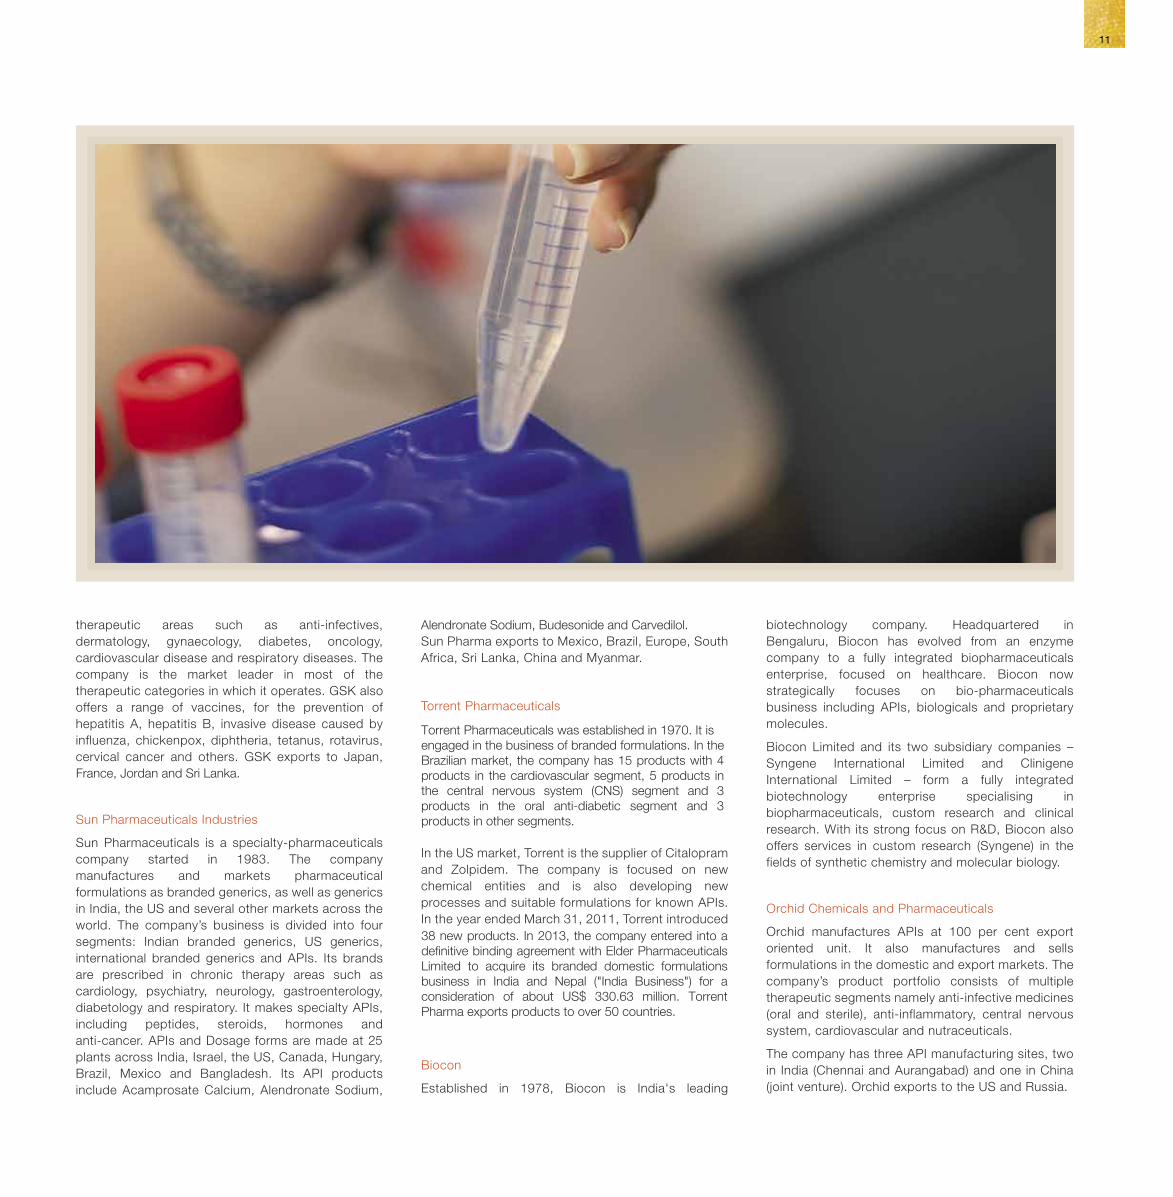
The Indian pharmaceutical industry has been consistently advancing rapidly, expanding on a global scale. Pharmaceutical exports from India have grown at a CAGR of 21 per cent over the last decade. India today ranks amongst the top global generic formulation exporters in volume terms and accounts for about 10 per cent of the global pharmaceutical industry in volume terms. A producer of high quality and affordable pharma products, India today is aptly described as the Pharmacy of the World.
Indian pharmaceutical manufactures comply with global regulatory standards.
India accounts for 36.9 per cent (3,411) of the 9,296 Drug Master Files (DMFs) filed with the USA, which is the highest outside of the USA (as on December 31, 2013) and is home to about 1,400 WHO GMP approved manufacturing units. India has been accredited with approximately 1,105 CEPs, more than 950 TGA approvals and 584 sites approved by the USFDA. India has gained significant strengths in the area of biopharmaceuticals, generics, over-the-counter (OTC) drugs, drug delivery mechanisms, alternative medicine, contract research and manufacturing.
A major growth driver for generics globally, the Indian pharma industry is spearheaded by a strong talent base and manufacturing excellence. The capability of the Indian pharma industry to produce high quality products at reasonable prices offers solutions to many countries to manage health expenses for their increasing populace.
The Best of India in Pharmaceuticals showcases the strengths and successes of the Indian pharmaceutical industry, which make India a Responsible Healthcare provider.
AN INTRODUCTION
The Indian pharmaceutical industry has been consistently advancing rapidly, expanding on a global scale. Pharmaceutical exports from India have grown at a CAGR of 21 per cent over the last decade. India today ranks amongst the top global generic formulation exporters in volume terms and accounts for about 10 per cent of the global pharmaceutical industry in volume terms. A producer of high quality and affordable pharma products, India today is aptly described as the Pharmacy of the World.
Indian pharmaceutical manufactures comply with global regulatory standards.
India accounts for 36.9 per cent (3,411) of the 9,296 Drug Master Files (DMFs) filed with the USA, which is the highest outside of the USA (as on December 31, 2013) and is home to about 1,400 WHO GMP approved manufacturing units. India has been accredited with approximately 1,105 CEPs, more than 950 TGA approvals and 584 sites approved by the USFDA. India has gained significant strengths in the area of biopharmaceuticals, generics, over-the-counter (OTC) drugs, drug delivery mechanisms, alternative medicine, contract research and manufacturing.
A major growth driver for generics globally, the Indian pharma industry is spearheaded by a strong talent base and manufacturing excellence. The capability of the Indian pharma industry to produce high quality products at reasonable prices offers solutions to many countries to manage health expenses for their increasing populace.
The Best of India in Pharmaceuticals showcases the strengths and successes of the Indian pharmaceutical industry, which make India a Responsible Healthcare provider.
T
Figure 3: State-wise share of pharmaceuticals
manufacturing formulations.
Sources: Department of Pharmaceuticals Annual Report 2010-11, IMaCS Analysis
Company Annual sales Achievements (US$, million)
pharmaceuticals company.
-lowering molecule
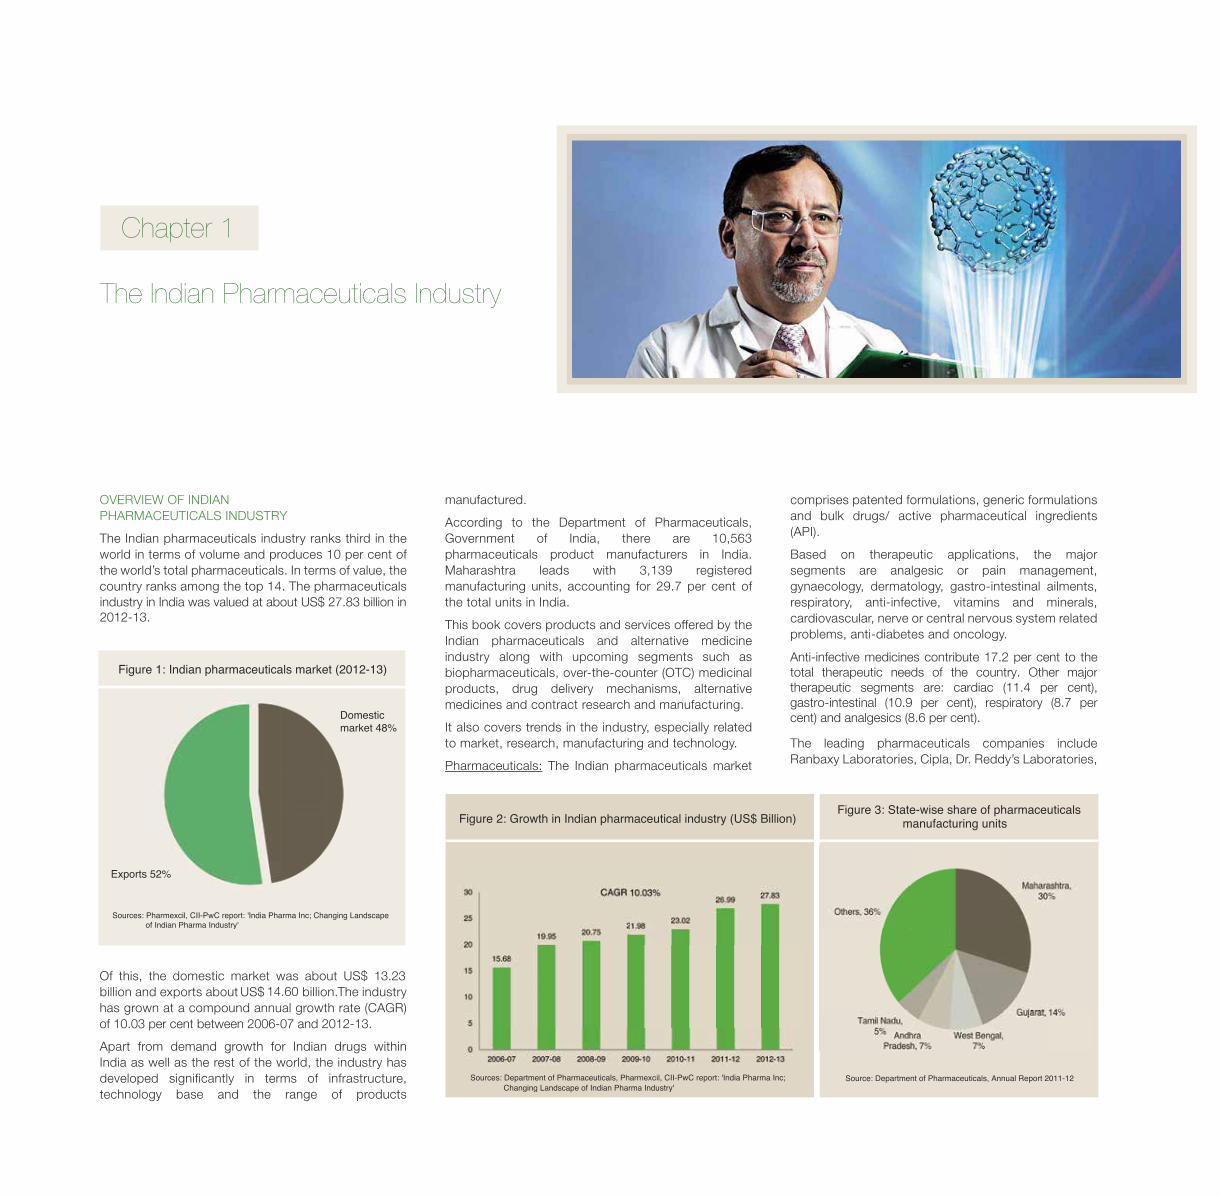
industry in India was valued at about US$ 27.83 billion in2012-13.
13.2314.60
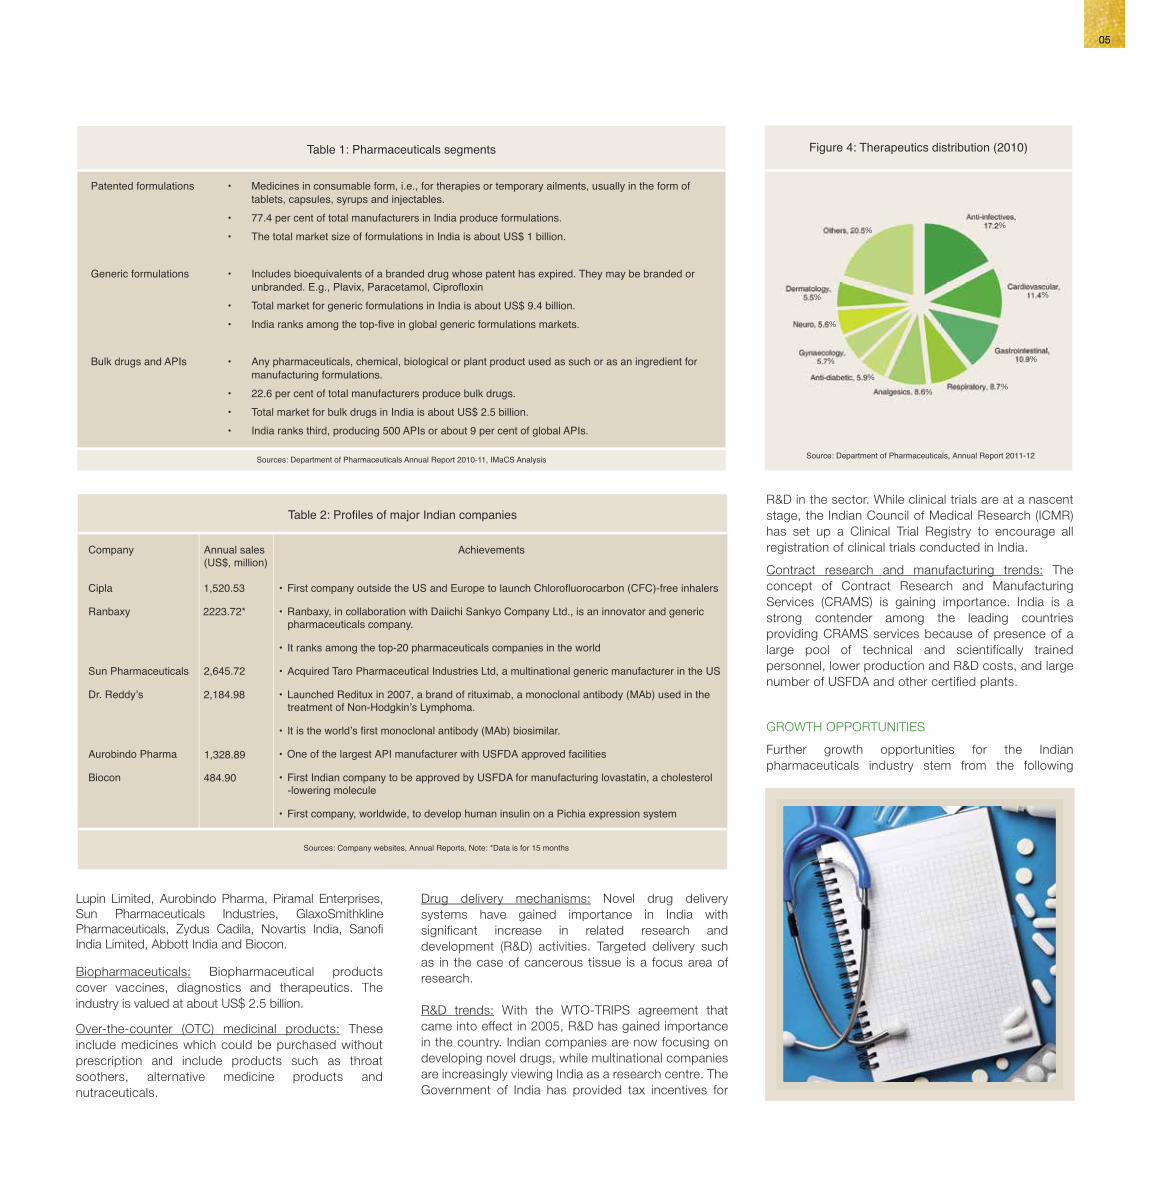
Anti-infective medicines contribute 17.2 per cent to thetotal therapeutic needs of the country. Other majortherapeutic segments are: cardiac (11.4 per cent),gastro-intestinal (10.9 per cent), respiratory (8.7 percent) and analgesics (8.6 per cent).
Lupin Limited, Aurobindo Pharma, Piramal Enterprises,Sun Pharmaceuticals Industries, GlaxoSmithklinePharmaceuticals, Zydus Cadila, Novartis India, SanofiIndia Limited, Abbott India and Biocon.
industry is valued at about US$ 2.5 billion.
1,520.53
2223.72*
2,645.72
2,184.98
1,328.89 One of the largest API manufacturer with USFDA approved facilities
484.90
Sources: Company websites, Annual Reports, Note: *Data is for 15 months
Source: Department of Pharmaceuticals, Annual Report 2011-12
of 10.03 per cent between 2006-07 and 2012-13.
Domesticmarket 48%
Exports 52%
Sources: Pharmexcil, CII-PwC report: 'India Pharma Inc; Changing Landscapeof Indian Pharma Industry'
Figure 1: Indian pharmaceuticals market (2012-13)
Figure 2: Growth in Indian pharmaceutical industry (US$ Billion)
Sources: Department of Pharmaceuticals, Pharmexcil, CII-PwC report: 'India Pharma Inc;Changing Landscape of Indian Pharma Industry'
manufacturing units
Source: Department of Pharmaceuticals, Annual Report 2011-12
T
Figure 3: State-wise share of pharmaceuticals
manufacturing formulations.
Sources: Department of Pharmaceuticals Annual Report 2010-11, IMaCS Analysis
Company Annual sales Achievements (US$, million)
pharmaceuticals company.
-lowering molecule
industry in India was valued at about US$ 27.83 billion in2012-13.
13.2314.60
Anti-infective medicines contribute 17.2 per cent to thetotal therapeutic needs of the country. Other majortherapeutic segments are: cardiac (11.4 per cent),gastro-intestinal (10.9 per cent), respiratory (8.7 percent) and analgesics (8.6 per cent).
Lupin Limited, Aurobindo Pharma, Piramal Enterprises,Sun Pharmaceuticals Industries, GlaxoSmithklinePharmaceuticals, Zydus Cadila, Novartis India, SanofiIndia Limited, Abbott India and Biocon.
industry is valued at about US$ 2.5 billion.
1,520.53
2223.72*
2,645.72
2,184.98
1,328.89 One of the largest API manufacturer with USFDA approved facilities
484.90
Sources: Company websites, Annual Reports, Note: *Data is for 15 months
Source: Department of Pharmaceuticals, Annual Report 2011-12
of 10.03 per cent between 2006-07 and 2012-13.
Domesticmarket 48%
Exports 52%
Sources: Pharmexcil, CII-PwC report: 'India Pharma Inc; Changing Landscapeof Indian Pharma Industry'
Figure 1: Indian pharmaceuticals market (2012-13)
Figure 2: Growth in Indian pharmaceutical industry (US$ Billion)
Sources: Department of Pharmaceuticals, Pharmexcil, CII-PwC report: 'India Pharma Inc;Changing Landscape of Indian Pharma Industry'
manufacturing units
Source: Department of Pharmaceuticals, Annual Report 2011-12
05
%
%
%
%
%
%%
%
%
%
T
Figure 3: State-wise share of pharmaceuticals
manufacturing formulations.
Sources: Department of Pharmaceuticals Annual Report 2010-11, IMaCS Analysis
Company Annual sales Achievements (US$, million)
pharmaceuticals company.
-lowering molecule
industry in India was valued at about US$ 27.83 billion in2012-13.
13.2314.60
Anti-infective medicines contribute 17.2 per cent to thetotal therapeutic needs of the country. Other majortherapeutic segments are: cardiac (11.4 per cent),gastro-intestinal (10.9 per cent), respiratory (8.7 percent) and analgesics (8.6 per cent).
Lupin Limited, Aurobindo Pharma, Piramal Enterprises,Sun Pharmaceuticals Industries, GlaxoSmithklinePharmaceuticals, Zydus Cadila, Novartis India, SanofiIndia Limited, Abbott India and Biocon.
industry is valued at about US$ 2.5 billion.
1,520.53
2223.72*
2,645.72
2,184.98
1,328.89 One of the largest API manufacturer with USFDA approved facilities
484.90
Sources: Company websites, Annual Reports, Note: *Data is for 15 months
Source: Department of Pharmaceuticals, Annual Report 2011-12
of 10.03 per cent between 2006-07 and 2012-13.
Domesticmarket 48%
Exports 52%
Sources: Pharmexcil, CII-PwC report: 'India Pharma Inc; Changing Landscapeof Indian Pharma Industry'
Figure 1: Indian pharmaceuticals market (2012-13)
Figure 2: Growth in Indian pharmaceutical industry (US$ Billion)
Sources: Department of Pharmaceuticals, Pharmexcil, CII-PwC report: 'India Pharma Inc;Changing Landscape of Indian Pharma Industry'
manufacturing units
Source: Department of Pharmaceuticals, Annual Report 2011-12
05
%
%
%
%
%
%%
%
%
%
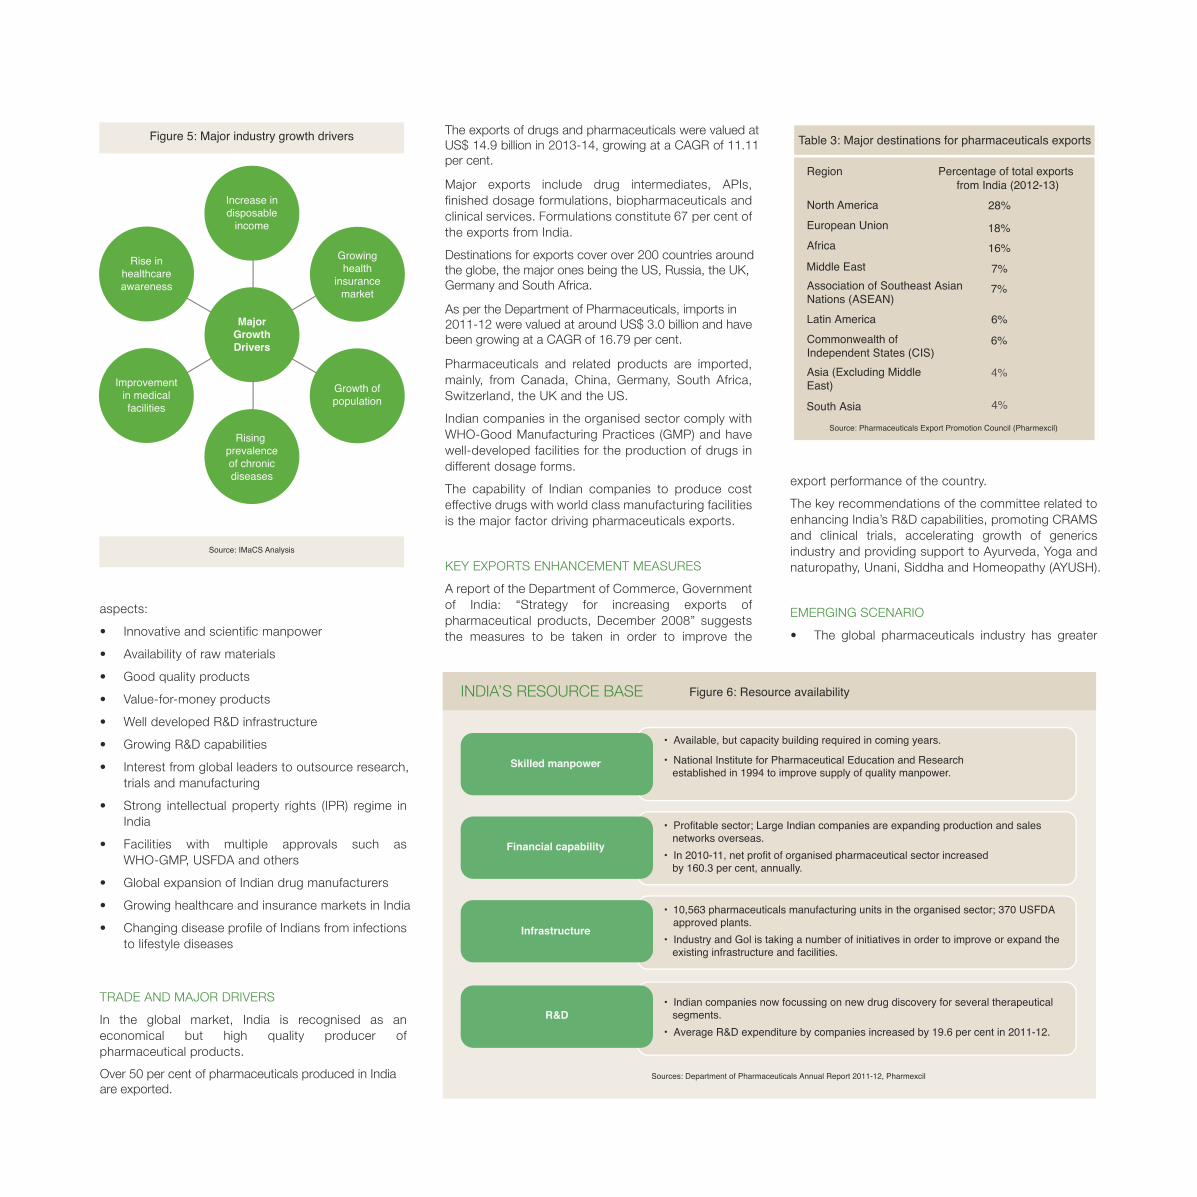
Figure 5: Major industry growth drivers
Increase in
income
Rise inhealthcareawareness
Growinghealth
insurancemarket
Growth ofpopulation
Rising prevalenceof chronicdiseases
Improvementin medicalfacilities
MajorGrowthDrivers
Source: IMaCS Analysis
Skilled manpower
Financial capability
Infrastructure
R&D
networks overseas.
existing infrastructure and facilities.
segments.
Region Percentage of total exports North America European Union
Figure 8: Imports of pharmaceuticals to India
Figure 9: Major demand drivers for exports
Source: IMaCS Analysis
Increasingcertificationfrom WHO,USFDA,
MHRA. etc.
Complexsynthesis
Cost effective drugs,
exports market
Over 50 per cent of pharmaceuticals produced in Indiaare exported.
The exports of drugs and pharmaceuticals were valued atUS$ 14.9 billion in 2013-14, growing at a CAGR of 11.11per cent.
Destinations for exports cover over 200 countries aroundthe globe, the major ones being the US, Russia, the UK,Germany and South Africa.
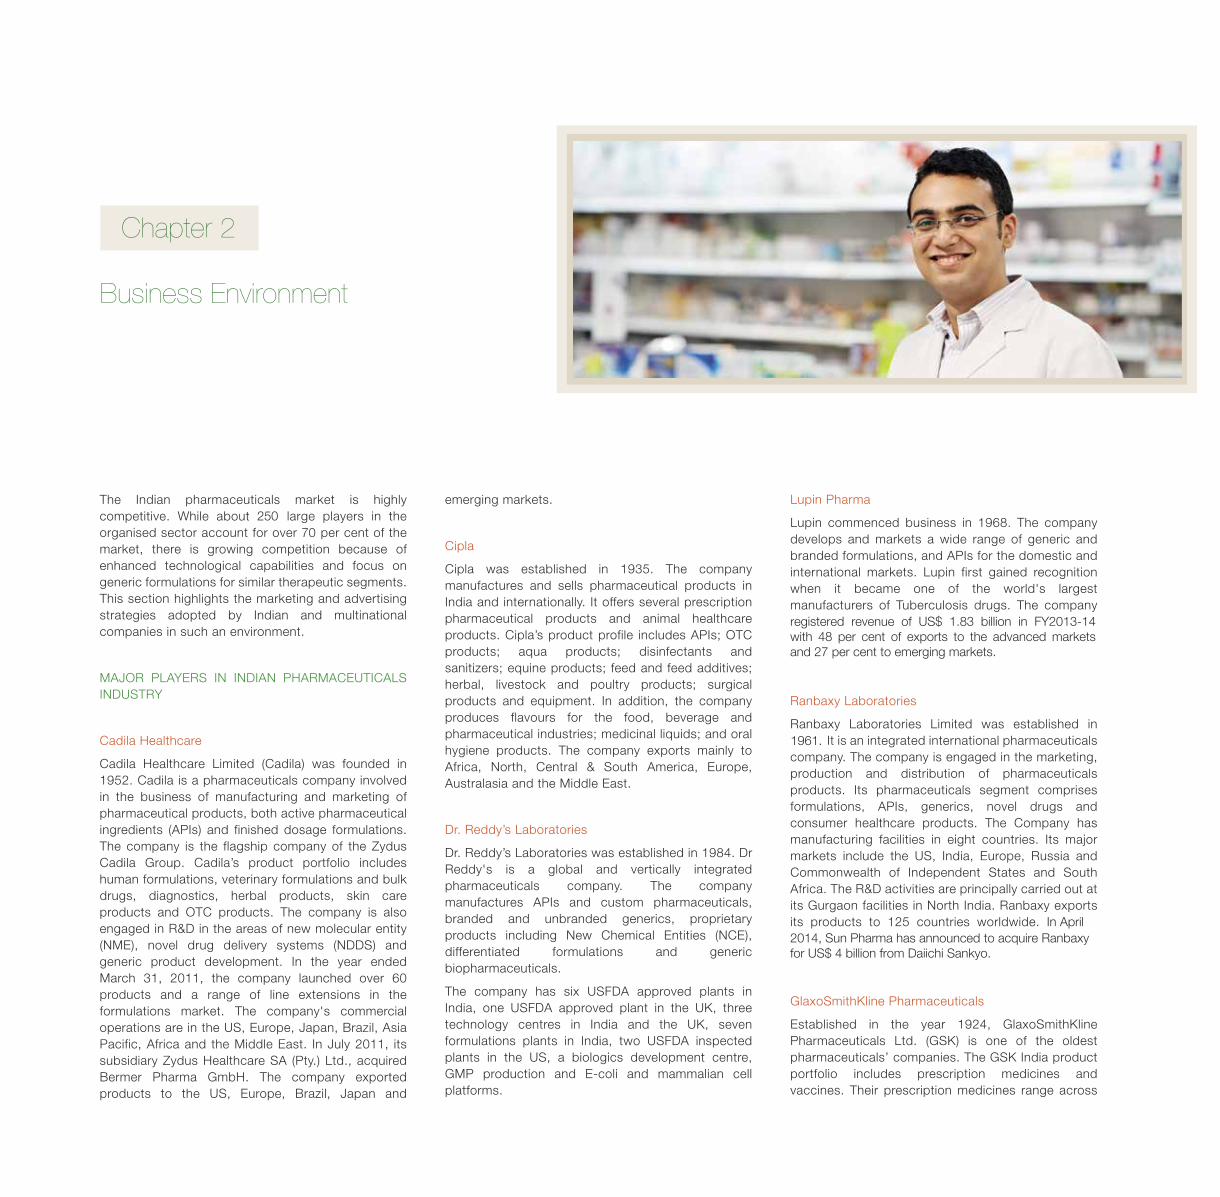
As per the Department of Pharmaceuticals, imports in2011-12 were valued at around US$ 3.0 billion and havebeen growing at a CAGR of 16.79 per cent.
10,563 pharmaceuticals manufacturing units in the organised sector; 370 USFDA approved plants.
Average R&D expenditure by companies increased by 19.6 per cent in 2011-12.
Sources: Department of Pharmaceuticals Annual Report 2011-12, Pharmexcil
Drugs worth US$ 97 billion will go off-patent in the USbetween 2011 and 2015.
Source: Department of Pharmaceuticals Annual Report 2012-13
67
Association of Southeast AsianNations (ASEAN)Latin AmericaCommonwealth ofIndependent States (CIS)Asia (Excluding MiddleEast)
South Asia
28%
18%16%Africa
7%Middle East
7%
6%
6%
4%
4%
Source: Pharmaceuticals Export Promotion Council (Pharmexcil)
from India (2012-13)
Source: Pharmexcil
CAGR: 16.79%
CAGR: 11.11%
Figure 7: Growth of drugs and pharmaceuticals export
CAGR: 16.79%
CAGR: 11.11%
07
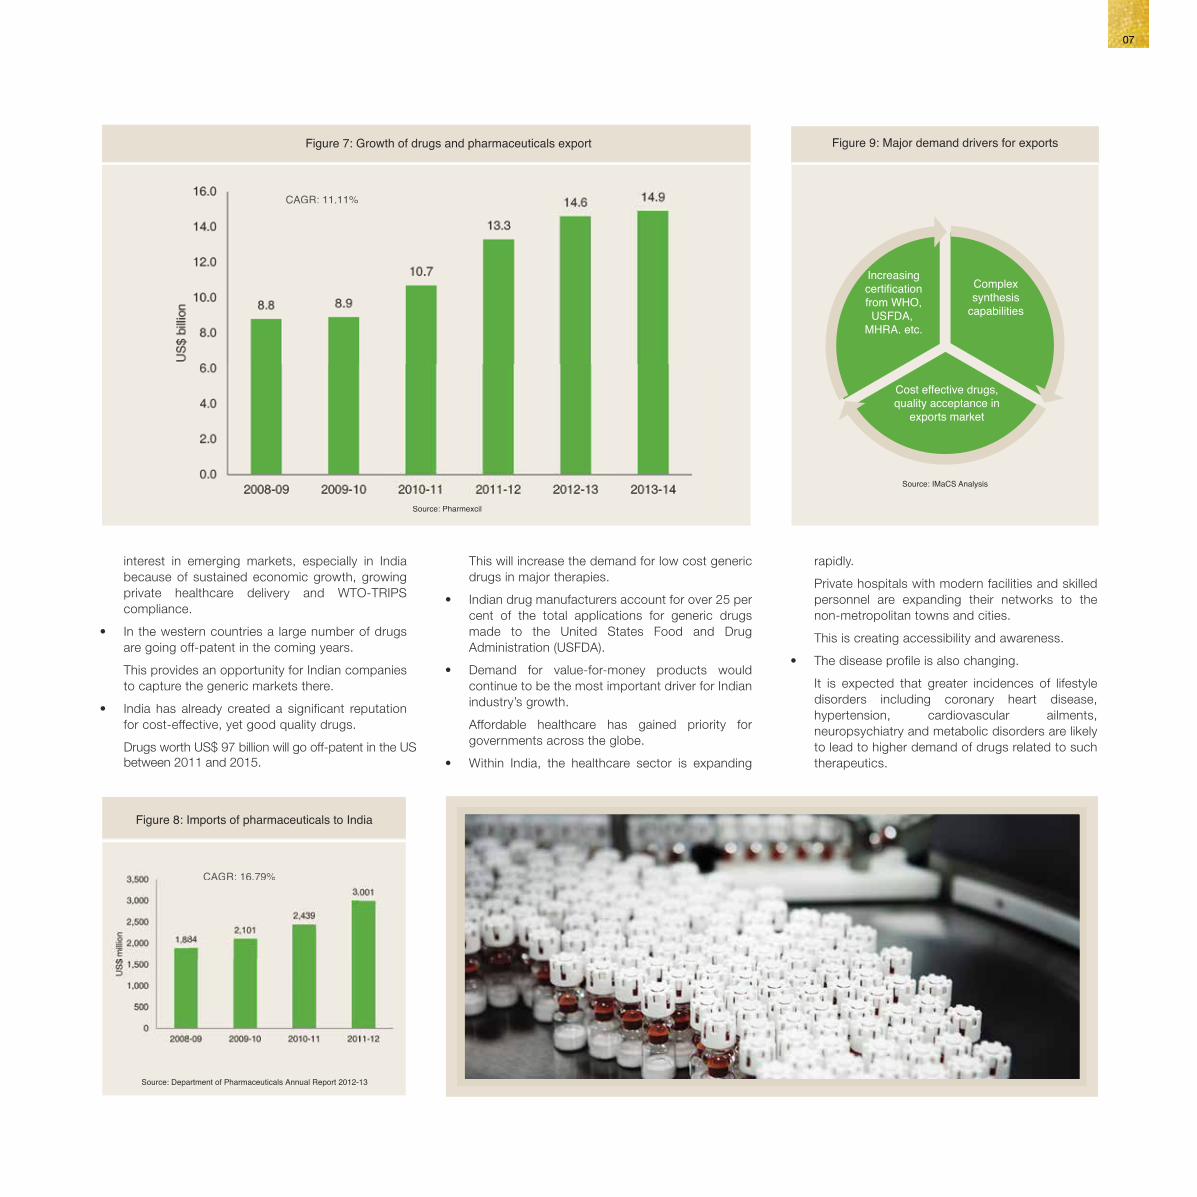
Figure 5: Major industry growth drivers
Increase in
income
Rise inhealthcareawareness
Growinghealth
insurancemarket
Growth ofpopulation
Rising prevalenceof chronicdiseases
Improvementin medicalfacilities
MajorGrowthDrivers
Source: IMaCS Analysis
Skilled manpower
Financial capability
Infrastructure
R&D
networks overseas.
existing infrastructure and facilities.
segments.
Region Percentage of total exports North America European Union
Figure 8: Imports of pharmaceuticals to India
Figure 9: Major demand drivers for exports
Source: IMaCS Analysis
Increasingcertificationfrom WHO,USFDA,
MHRA. etc.
Complexsynthesis
Cost effective drugs,
exports market
Over 50 per cent of pharmaceuticals produced in Indiaare exported.
The exports of drugs and pharmaceuticals were valued atUS$ 14.9 billion in 2013-14, growing at a CAGR of 11.11per cent.
Destinations for exports cover over 200 countries aroundthe globe, the major ones being the US, Russia, the UK,Germany and South Africa.
As per the Department of Pharmaceuticals, imports in2011-12 were valued at around US$ 3.0 billion and havebeen growing at a CAGR of 16.79 per cent.
10,563 pharmaceuticals manufacturing units in the organised sector; 370 USFDA approved plants.
Average R&D expenditure by companies increased by 19.6 per cent in 2011-12.
Sources: Department of Pharmaceuticals Annual Report 2011-12, Pharmexcil
Drugs worth US$ 97 billion will go off-patent in the USbetween 2011 and 2015.
Source: Department of Pharmaceuticals Annual Report 2012-13
67
Association of Southeast AsianNations (ASEAN)Latin AmericaCommonwealth ofIndependent States (CIS)Asia (Excluding MiddleEast)
South Asia
28%
18%16%Africa
7%Middle East
7%
6%
6%
4%
4%
Source: Pharmaceuticals Export Promotion Council (Pharmexcil)
from India (2012-13)
Source: Pharmexcil
CAGR: 16.79%
CAGR: 11.11%
Figure 7: Growth of drugs and pharmaceuticals export
CAGR: 16.79%
CAGR: 11.11%
07

Figure 10: Measures to improve export performance
Sources: Strategy for increasing exports of Pharmaceutical products - Report of the task force, Ministry of Commerce, 2008, IMaCS Analysis
trained professionals
Promoting AYUSHeducationCreating national
Service tax exemptions
Investing in outsourcing Simplifying approvalprocedures
Enhancing
PromotingCRAMS, drugdiscovery andclinical trials
PromotingIndian systemof medicine
such as AYUSH
Acceleratinggrowth ofgenericsindustry
26
09
25070
registered revenue of US$ 1.83 billion in FY2013-14with 48 per cent of exports to the advanced marketsand 27 per cent to emerging markets.
1961.
2014, Sun Pharma has announced to acquire Ranbaxyfor US$ 4 billion from Daiichi Sankyo.
In April
France, Jordan and Sri Lanka.
25
Alendronate Sodium, Budesonide and Carvedilol.
Torrent Pharmaceuticals was established in 1970. It isengaged in the business of branded formulations. In theBrazilian market, the company has 15 products with 4products in the cardiovascular segment, 5 products inthe central nervous system (CNS) segment and 3products in the oral anti-diabetic segment and 3products in other segments.
38 new products. In 2013, the company entered into adefinitive binding agreement with Elder PharmaceuticalsLimited to acquire its branded domestic formulationsbusiness in India and Nepal ("India Business") for aconsideration of about US$ 330.63 million. TorrentPharma exports products to over 50 countries.
11

Figure 11: Pharmaceuticals distribution chain
Retail/Chemist
Customer
Institution
Manufacturer
Central Warehouse
Super Stockist
Hospitals
Stockist
Wholesaler
Source: IMaCS analysis
Table 4: Leading companies and their brands
Company Product Therapeutic Use
Pfizer Corex, Becosule Cough, Multi-Vitamin
GlaxoSmithKline Vicks Action 500, Cough and Cold, Crocin Fever
i-Pill Contraceptive
Ranbaxy Revital Energy and fatigueNovartis Voveran Analgesic
Sources: Express Pharma, IMaCS Analysis
In January 2014, Aurobindo Pharma signed anagreement with Actavis to acquire its personnel,commercial infrastructure, products, marketingauthorisations and dossier licence rights in sevenEuropean countries for €30 million.
Cipla bought Yemen-based drug distributor for US$21 million. The company acquired 51 per cent stakein pharmaceuticals manufacturing and distributionbusiness in Yemen.
Videocon Industries is set to acquire Dr DatsonsLabs Ltd (DTL) at an enterprise value of US$ 57.8million.
Torrent Pharma entered into a definitive bindingagreement with Elder Pharmaceuticals Limited toacquire its branded domestic formulations businessin India and Nepal ("India Business") for aconsideration of about US$ 330.63 millionCadila Pharmaceuticals Ltd signed a joint licensingagreement with the UK-based antibiotics discoverycompany Helperby Therapeutics on antibiotic drugresistance research and development.
Zydus Cadila and Germany-based Pieris AGannounced an alliance for development andcommercialisation of multiple novel Anticalin-basedprotein therapeutics.
Lupin has acquired 100 per cent equity stake inLaboratorios Grin, S.A. De C.V., Mexico, subject tocertain closing conditions, for an unspecifiedamount. The acquisition marks Lupin's entry into thehigh-growth Mexican and the larger Latin Americanpharmaceuticals market.
In April 2014, Sun Pharma announced to acquireRanbaxy for US$ 4 billion from Daiichi Sankyo.
Biocon Ltd and Quark Pharmaceuticals Inc haveentered into a tie-up for the discovery anddevelopment of small interfering RNA (siRNA)-basedmedicines. This collaboration will enable Biocon toco-develop, manufacture and commercialiseQPI-1007, a novel siRNA drug candidate forophthalmic conditions, for India and other markets,according to a company statement.
Cipla acquired a majority stake in Uganda's QualityChemical Industries (QCIL), with the acquisition ofan additional 14.5 per cent stake for US$ 15 millionthrough its subsidiary, Meditab Holdings Ltd (MHL).
Sun Pharmaceutical Industries acquired DUSA, aUS-based dermatology company, in an all-cashtransaction of US$ 230 million.
Lupin acquired Dutch firm Nanomi to enter complexinjectables market. Piramal Enterprises
13
Figure 12: Drug discovery and development process
Sources: Pharmaceutical Research and Manufacturers of America, Pharmaceutical Industry Profile 2011 (Washington, DC: PhRMA, April 2011; IMaCS Analysis)
USFDA Review(Up to 2 years)
Large ScaleManufacturing
Manufacturingand sales
COMPOUNDS: 5VOLUNTEERS:Phase I: 20-100Phase II: 100-500Phase III: 1,000-5,000
USFDA APPROVAL:One drug approved
COMPOUNDS:-Stage I: 5,000-10,000Stage II: 250
Stage I - Drug Discovery+Stage II - Preclinical
(3-6 years)
Stage III - Clinical Trials(6-7years)
Figure 13: ANDA approvals for Indian pharmaceuticals
around US$ 984.38 million in 2012-13, an increase of5.38 per cent over previous year.
Average R&D spending of top Indian pharmaceuticalscompanies in 2012-13 is 7-8 per cent of the total sales, up
370
In 2013, of the total 400 ANDAs and 86 tentativeapprovals, Indian companies received 154 approvals forthe ANDAs and 38 tentative approvals. This gives leadingIndian companies’ dominance in US generic drug market.
Source: Pharmabiz - January 22, 2014
companies (2013)
Global R&D spending in the life sciences industry wasaround US$ 195.3 billion in 2013. The biopharmaceuticalsector accounts for around 85 per cent of all R&Dexpenditures in the life sciences industry.
141
annual handling capacity of 30,000 tonnes.
15
Dr. Reddy’s currently undergoing Phase II study for the treatment and/or prevention of dyslipidemia, atherosclerosis and associated cardiovascular disease.
device with a single device having 120 metered doses.
IPCA LaboratoriesLimited
CIPLA Limited
Torrent Pharma
Elder PharmaceuticalsLtd.
Cadila HealthcareLtd.
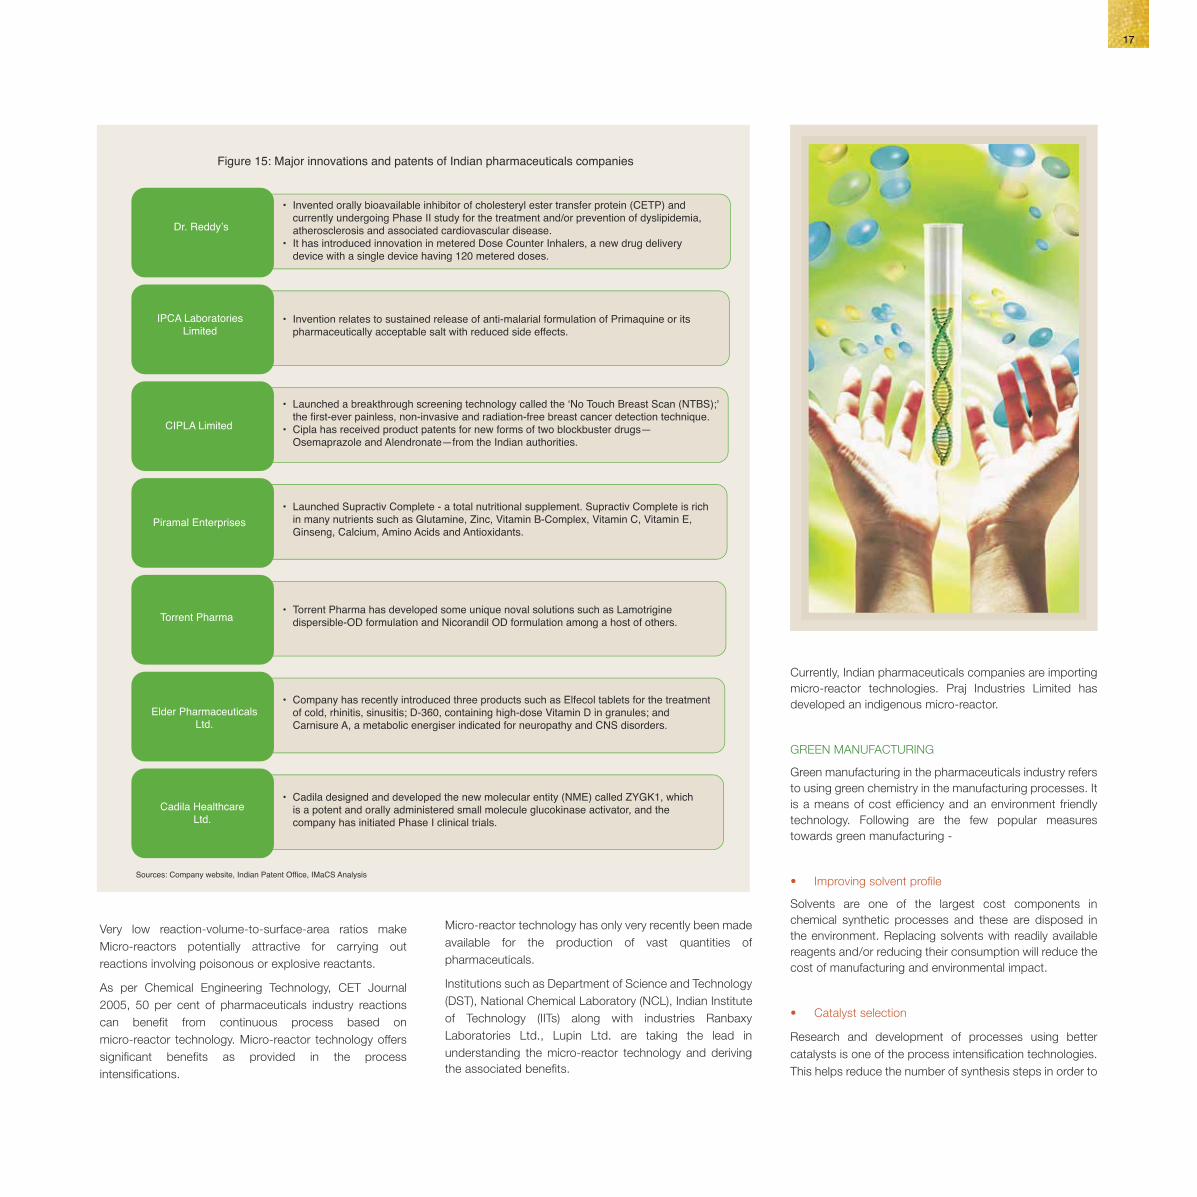
Figure 15: Major innovations and patents of Indian pharmaceuticals companies
pharmaceutically acceptable salt with reduced side effects.
dispersible-OD formulation and Nicorandil OD formulation among a host of others.
of cold, rhinitis, sinusitis; D-360, containing high-dose Vitamin D in granules; and Carnisure A, a metabolic energiser indicated for neuropathy and CNS disorders.
is a potent and orally administered small molecule glucokinase activator, and the company has initiated Phase I clinical trials.
Sources: Company website, Indian Patent Office, IMaCS Analysis
CASE STUDIES – MAJOR INNOVATIONS
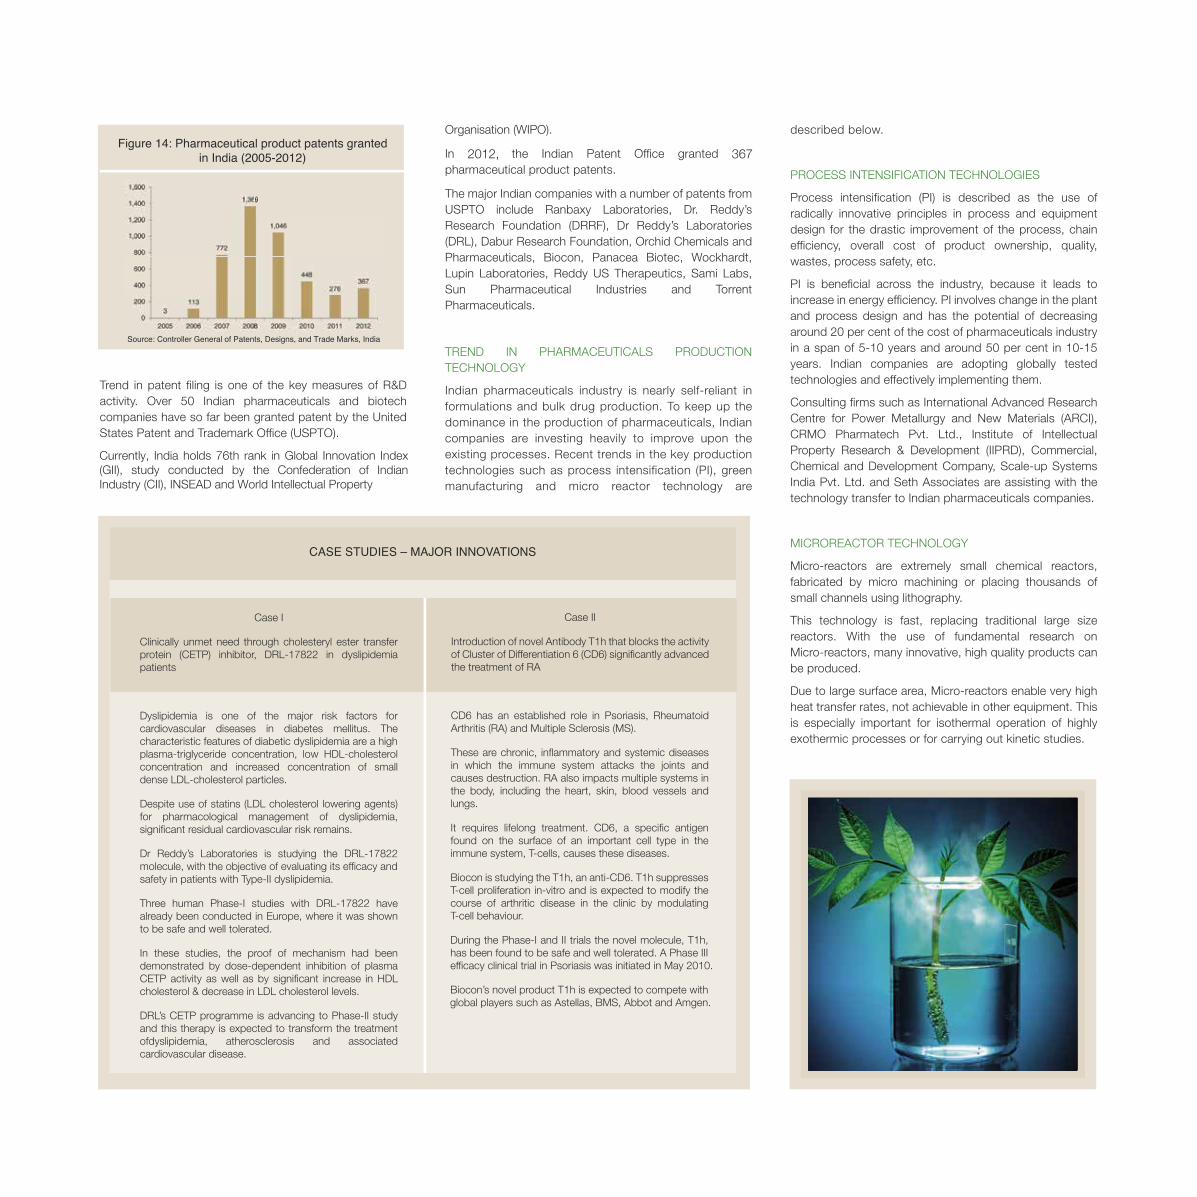
Figure 14: Pharmaceutical product patents granted3672012,in India (2005-2012)
Source: Controller General of Patents, Designs, and Trade Marks, India
Currently, India holds 76th rank in Global Innovation Index(GII), study conducted by the Confederation of IndianIndustry (CII), INSEAD and World Intellectual Property
Organisation (WIPO).
Piramal Enterprises
17
Dr. Reddy’s currently undergoing Phase II study for the treatment and/or prevention of dyslipidemia, atherosclerosis and associated cardiovascular disease.
device with a single device having 120 metered doses.
IPCA LaboratoriesLimited
CIPLA Limited
Torrent Pharma
Elder PharmaceuticalsLtd.
Cadila HealthcareLtd.
Figure 15: Major innovations and patents of Indian pharmaceuticals companies
pharmaceutically acceptable salt with reduced side effects.
dispersible-OD formulation and Nicorandil OD formulation among a host of others.
of cold, rhinitis, sinusitis; D-360, containing high-dose Vitamin D in granules; and Carnisure A, a metabolic energiser indicated for neuropathy and CNS disorders.
is a potent and orally administered small molecule glucokinase activator, and the company has initiated Phase I clinical trials.
Sources: Company website, Indian Patent Office, IMaCS Analysis
CASE STUDIES – MAJOR INNOVATIONS
Figure 14: Pharmaceutical product patents granted3672012,in India (2005-2012)
Source: Controller General of Patents, Designs, and Trade Marks, India
Currently, India holds 76th rank in Global Innovation Index(GII), study conducted by the Confederation of IndianIndustry (CII), INSEAD and World Intellectual Property
Organisation (WIPO).
Piramal Enterprises
17
Figure 16: Process intensification
Process Intensification
Reactors reactive operationsMultifunctional
Reactors Hybrid Separations Alternative EnergySources
Spinning-Disk reactor
reactorMonolithicreactor MicroreactorMembranereactors Ultrasonicreactors
Compact heat
Rotating packed bed Centrifugal adsorber
Reverse-flow reactors Heat-integrated reactors Reactive separations
Fuel cellsChromatographicreactors
Membrane adsorptionMembrane distillationAdsorptive distillation
Centrifugal fieldsUltrasound Solar energy Microwaves Electir & Magneticfields Plasma technology
Other Methods
Supercritical fluids Dynamic (periodic)reactor operationsProcess synthesis
Methods
The global market for nanotechnology in medicalapplications was estimated at approximately US$ 1.7 billionin 2009.
19

Public Expenditure Private Expenditure
Figure 17: Evolution of government policies - Indian healthcare sector
1946, PHC conceptualisation
1952-1977, Integrated health service and medical education
1978, Health for all by 2000 AD
1983, National Health Policy I
2000, National Population Policy (NPP)
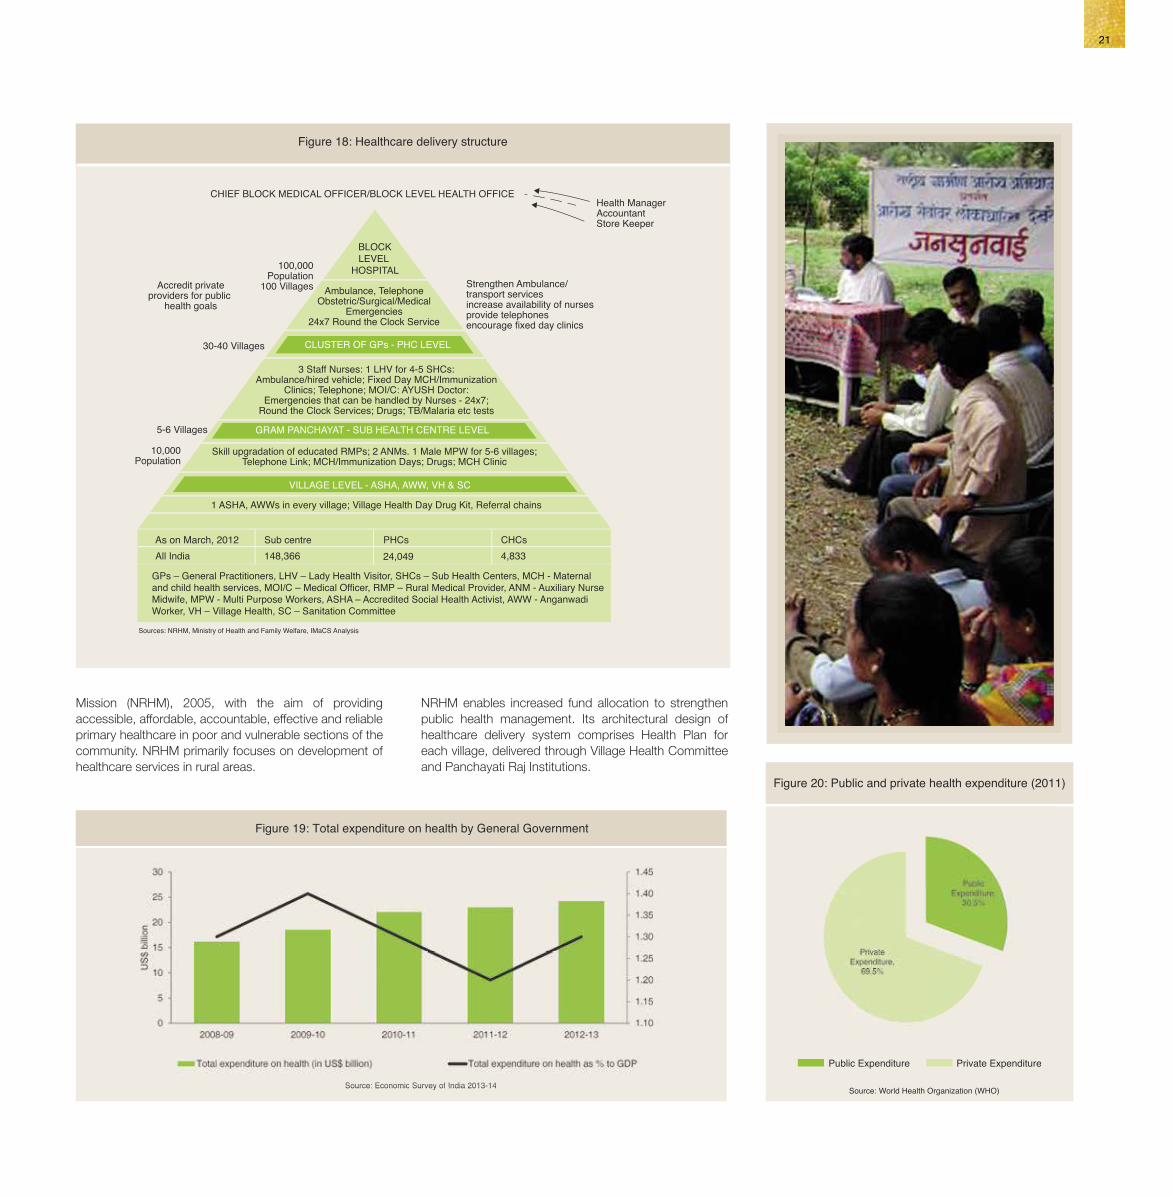
Figure 18: Healthcare delivery structure
Ambulance, TelephoneObstetric/Surgical/Medical
Emergencies24x7 Round the Clock Service
Accredit privateproviders for public
health goals
Strengthen Ambulance/transport servicesincrease availability of nursesprovide telephonesencourage fixed day clinics
100,000Population
100 Villages
30-40 Villages
5-6 Villages
10,000Population
Health ManagerAccountantStore Keeper
3 Staff Nurses: 1 LHV for 4-5 SHCs:Ambulance/hired vehicle; Fixed Day MCH/Immunization
Clinics; Telephone; MOI/C: AYUSH Doctor:Emergencies that can be handled by Nurses - 24x7;
Round the Clock Services; Drugs; TB/Malaria etc tests
Skill upgradation of educated RMPs; 2 ANMs. 1 Male MPW for 5-6 villages;Telephone Link; MCH/Immunization Days; Drugs; MCH Clinic
1 ASHA, AWWs in every village; Village Health Day Drug Kit, Referral chains
BLOCKLEVEL
HOSPITAL
CHIEF BLOCK MEDICAL OFFICER/BLOCK LEVEL HEALTH OFFICE
CLUSTER OF GPs - PHC LEVEL
GRAM PANCHAYAT - SUB HEALTH CENTRE LEVEL
VILLAGE LEVEL - ASHA, AWW, VH & SC
Sources: NRHM, Ministry of Health and Family Welfare, IMaCS Analysis
Sub centre PHCs CHCs All India
GPs – General Practitioners, LHV – Lady Health Visitor, SHCs – Sub Health Centers, MCH - Maternal and child health services, MOI/C – Medical Officer, RMP – Rural Medical Provider, ANM - Auxiliary Nurse Midwife, MPW - Multi Purpose Workers, ASHA – Accredited Social Health Activist, AWW - Anganwadi Worker, VH – Village Health, SC – Sanitation Committee
As on March, 2012148,366 24,049 4,833
Figure 20: Public and private health expenditure (2011)
Source: World Health Organization (WHO)Source: Economic Survey of India 2013-14
Figure 19: Total expenditure on health by General Government
Source: Economic Survey of India 2013-14
2005, National Rural Health Mission (NRHM)
2013, National Health Mission (NHM)Sources: Ministry of Health and Family Welfare,Planning Commission, Government of India
21
Healthcare And Diagnostic Sector In India
Chapter 4
Mission (NRHM), 2005, with the aim of providing accessible, affordable, accountable, effective and reliable primary healthcare in poor and vulnerable sections of the community. NRHM primarily focuses on development of healthcare services in rural areas.
NRHM enables increased fund allocation to strengthen public health management. Its architectural design of healthcare delivery system comprises Health Plan for each village, delivered through Village Health Committee and Panchayati Raj Institutions.
EVOLUTION AND OVERVIEW OF INDIAN HEALTHCARE SECTOR
India is among the first countries to have recognised the importance of primary health care (PHC) approach. Conceptualised in 1946, PHC approach emphasised social orientation of medical practices and high level of public participation.
The period up to the first National Health Policy (NHP) in 1983 was dedicated to a concerted effort towards building programmes covering: health and sanitation through establishment of PHCs and sub-centres, health survey and planning, integrated health services, inclusion of larger population, building medical and support workforce, linking medical colleges and health centres.
Thereafter, policy improvements and evolution of industry have increased private sector participation.
The Government of India’s commitment to health for all led to the formulation of India’s first NHP. The period 1986-1996 was one of substantial growth in the private sector investments and it surpassed the public sector by a wide margin.
Private sector gained significance as the more preferred choice.
The Government of India launched National Rural Health
• Diagnostics industry is highly competitive and fragmented
The Indian diagnostics services industry, including pathological laboratories services, has grown at 20 per cent CAGR for the period 2006-2010.
Pathological laboratories services constitute over 52 per cent of the diagnostic market.With the increasing number of organised players in the segment, diagnostic services industry is likely to expand at more than this growth rate.
GOVERNMENT INITIATIVES - INDIAN HEALTHCARE SECTOR
In the Union Budget 2010-11, the Government increased total allocation for healthcare to US$ 5,240 million, more than an 11 per cent increase over 2009-10.
In the Union Budget 2012-13, the Government increased total allocation for healthcare to US$ 6,400 million, about 14 per cent higher than 2011-12. NRHM has been a successful scheme, launched to make the quality healthcare accessible and affordable.
GOVERNMENT INCENTIVES
The Government is encouraging private sector and investments in the healthcare sector through several
incentives and policy initiatives:
• New hospitals with 100 beds or more will be subject to 100 per cent tax holiday for the initial period of five years of operation.
• To attract investments in the healthcare infrastructure, 100 per cent FDI is permitted for health and medical services under the automatic route.
• Life-saving equipment is exempted from countervailing duty. Custom duty has been reduced to 5 per cent from 25 per cent.
• Multiplicity of customs duty on medical equipment is being done away with and basic customs duty reduced to 5 per cent from 7.5 per cent.
• Hospitals and dispensaries providing health travel facilities and attracting medical tourists are eligible for tax holidays and incentives.
IMPACT OF HEALTHCARE GROWTH ON PHARMACEUTICALS SECTOR
• Expanding overall market
Growth in the healthcare industry is based on the inclusive business model and incorporates a range of activities such as infrastructure development, services penetration, enhancement in training and education.
Consequently, it helps expand the whole healthcare market including pharmaceuticals. Historically, pharmaceuticals sector growth has tracked increase in healthcare expenditure.
• New healthcare players will influence reforms in healthcare industry including pharmaceuticals
Local and international players bring in new ideas and lead to systemic reforms, which in turn foster a streamlined, transparent, and better-regulated healthcare and hospital financing environment for the industry.
This trend will help increase demand for innovative drugs and hence support the long-term sustainable growth of the pharmaceutical sector.
• Industry wide collaboration will help innovate and maximise benefit
The healthcare scenario is ever evolving and the Government is planning to increase the public provisioning of healthcare. As per World Health Organisation (WHO), total expenditure on health increased from US$ 22.42 billion in 2001 to US$ 59.5 billion in 2010.
INDIAN HEALTHCARE SECTOR: MARKET SIZE
Domestic healthcare sector sales recorded a 17 per cent
CAGR during 2005-2010 to reach US$ 59.5 billion a year. The healthcare sector employs about 4.5 million people directly or indirectly and is the largest service sector employer in the country after retail. According to the Investment Commission of India, the healthcare sector is projected to grow at 15 per cent CAGR and reach the market value of US$ 79 billion by 2012 and US$ 280 billion by 2020.
Key segments and growth drivers
Hospital and pharmaceuticals are the largest segments of the sector in India, combined revenue from these segments are estimated to contribute 79 per cent of the total healthcare market by 2012.
• Demand driving healthcare infrastructure investments
For the distribution of healthcare across all demographic segments, 2.8 million additional beds are required by 2025, according to the WHO. Investments of US$ 100 billion are required.
• Flourishing medical tourism attracting growth
Medical tourists in India are expected to increase from
0.8 million in 2010 to 1.6 million by 2015.
India is expected to be a medical tourist hub and likely to contribute 3 per cent of the US$ 100 billion global medical tourism industry by 2013.
• Healthcare information and communication technology (ICT) spend is playing a significant role in healthcare delivery
Information and communication technology (ICT) including electronic medical records requirement of the healthcare industry was around US$ 270 million in 2010.
With the growth in the healthcare infrastructure and telemedicine, it is estimated to grow at 22 per cent CAGR until 2013.
• Pharmaceutical industry is poised for growth on back of affordability, increasing disposable income
The pharmaceuticals industry in India was valued at about US$ 21.73 billion in 2010.
Sustained economic growth, healthcare reforms and patent-related legislation are key drivers for average estimated growth of 12 to 15 per cent CAGR for next 10 years.
• Immense potential in medical equipment and consumables
The medical equipment market is heavily dependent on imports.
Domestic manufacturers such as Anand Medicaids, Carewell Mediproducts, Dental Products of India, Hindustan Syringes and Medical Devices, Lifeline Systems, Relisys Medical Devices Ltd, Surya Surgical Industries, etc., contribute to 25 per cent of the market.
In 2011, the Indian medical equipment market was estimated at US$ 2.64 billion and it is expected to reach US$ 4.95 billion by 2016, according to the Department of Health.
• Health insurance penetration will augment the overall healthcare market
In 2010, 15 per cent of the Indian population were covered through health insurance and 80 per cent of the healthcare expenditure was financed out-of-pocket.
The health insurance market is growing. It was valued at US$ 1.73 billion in 2010, with a 39 per cent CAGR from 2006-2010.
The insurance market is expected to grow to over 4 billion by 2013.
at US$ 345 million in 2010-11, contributing over 70 per cent of the total diagnostics services market and is expected to grow at 15-20 per cent year on year.
The largest segments are blood screening and infectious diseases. The fastest growing segments are genetic diseases, oncology and pharmacogenomics. Tulip Group, Transasia Biomedicals, RFCL (Diagnova), Span Diagnostics and Trivitron are the leading Indian players in this space.
GOVERNMENT INITIATIVES - DIAGNOSTIC INDUSTRY
The Indian diagnostic market is highly regulated for maintaining quality standards and the safety of the patients.
All the diagnostic laboratories need to register and get the license from Central Licensing Approving Authority (CLAA), accreditation from National Accreditation Board for Testing & Calibration of Laboratories (NABL), and imaging centres have to be approved by Bhabha Atomic Research Centre (BARC) or Atomic Energy Regulatory Board (AERB). Central Drugs Standard Control Organization (CDSCO) regulates the manufacture and marketing of drugs, diagnostics, devices, and cosmetics in the Indian market.
In 2010-11, the Indian Government announced fiscal incentives for the diagnostic sector to make it more affordable and accessible.
For the domestic medical device industry, a uniform concessional duty of 5 per cent is levied and assistive devices, rehabilitation aid, etc., are fully exempted.
Import/customs duty on 24 medical equipments including X-ray, goniometer, tele-therapy simulator machines were reduced to 5 per cent. The Government is also promoting domestic device manufacturers by establishing R&D centres and reducing prices of the critical equipment.
TECHNOLOGY TRENDS IN INDIAN DIAGNOSTIC INDUSTRY
Amid government regulations and awareness among physicians and patients, the Indian diagnostic industry is encouraged to provide high quality and technological advanced medical devices, equipments and therapy.
• Technology transfer and outsourcing trend
Due to heavy dependence on imported products, foreign players are attracted to the Indian market for localising high-end products by setting up manufacturing facilities or outsourcing to local players.
• Emerging hub and spoke model
With the development of easy to use and handle devices, corporate players are able to service the tier II and III markets by establishing collection centres and satellite
labs near patients. These centres are networked to the central laboratory.
• Self-diagnosis test market in India
Preference of the patients to conduct self-diagnosis test or tests at home is increasing. Around 10 per cent of the patients opt for the tests at home.
In the last 15 years, several products in the therapeutic devices, monitoring devices, interventional devices, X-rays, ultrasound, electrocardiogram (ECG), pathological tests category have been developed for the self-diagnosis test market
• ICT in healthcare for deep rural penetration
Large ICT players are developing systems for inclusive healthcare services through telemedicine. The industry is
undertaking research programmes to develop affordable technology platforms such as molecular diagnostic, nanotechnology, micro-fluids to make healthcare accessible to rural India.
• Customer relationship management (CRM) resulting in preventive care technology
Database of patients helps in two ways, by offering preventive care to the patients and also transmitting patient’s data to the research firms for developing novel drugs and medical devices. CRM is a key tool for such use.
• Outsourcing laboratory management
Emerging organised players in diagnostic services are building on their expertise and collaborating with hospitals to manage laboratories effectively.
Collaboration within the healthcare industry segments such as – healthcare delivery, pharmaceuticals and medical equipment – can play significant role in making the innovation partnerships successful.
• Government scheme for inclusive healthcare services will benefit affordability
Government schemes encouraging health insurance penetration will bridge the urban-rural gap and make the healthcare services including pharmaceutical market more accessible and affordable.
• Improved margins and profitability
Access to technology and cost efficiency in the healthcare services will lead to higher profit margin for the pharmaceutical industry
DIAGNOSTIC INDUSTRY OVERVIEW
The Indian diagnostic industry comprises of pathological
services and devices. In 2010, total diagnostic market was valued at US$ 1.57 billion.
By 2015, the market is likely to grow to US$ 5.3 billion at 28 per cent CAGR on the back of rising demand from health consciousness and increasing disposable income in the country. In 2010, the diagnostic imaging estimated market was valued at US$ 731 million.
The size of the ultrasound product and services, clinical chemistry, immunology, hematology and molecular diagnostics segments was US$ 120 million, US$ 112 million, US$ 132 million, US$ 47 million and US$ 300 million respectively for the year 2010.
Domestic industry serves 25 per cent of the diagnostic imaging market and the remaining is comprised of imports mainly from the USA, Germany, Japan and China.
Pathological services contribute more than 52 per cent of the total diagnostic market; there are over 40,000 pathology labs in the country servicing around 1-1.25 million patients per day.
Pathological services industry is highly competitive, fragmented and price driven, however it is experiencing increased investments from organised players such as Super Religare Laboratories, Dr. Lal Pathlabs, Metropolis, Thyrocare Quest Diagnostics and Medinova.
In-vitro diagnostics including the analysing body fluids or tissue samples segments account for a significant 25 per cent of total diagnostic services market, remaining is contributed by biochemistry, immunology and haematology, coagulation, molecular diagnostics and critical.
Molecular diagnostic
Molecular diagnostics takes DNA, RNA and genes as
base for diagnostic tests
It plays a crucial role in the early detection of diseases, including identification of predisposition, and comprehensive analysis of pathogens, qualitative, quantitative and detection of resistance mechanisms to pathogens.
The Indian molecular diagnostics market was estimated
Public Expenditure Private Expenditure
Figure 17: Evolution of government policies - Indian healthcare sector
1946, PHC conceptualisation
1952-1977, Integrated health service and medical education
1978, Health for all by 2000 AD
1983, National Health Policy I
2000, National population policy (NPP)
Figure 18: Healthcare delivery structure
Ambulance, TelephoneObstetric/Surgical/Medical
Emergencies24x7 Round the Clock Service
Accredit privateproviders for public
health goals
Strengthen Ambulance/transport servicesincrease availability of nursesprovide telephonesencourage fixed day clinics
100,000Population
100 Villages
30-40 Villages
5-6 Villages
10,000Population
Health ManagerAccountantStore Keeper
3 Staff Nurses: 1 LHV for 4-5 SHCs:Ambulance/hired vehicle; Fixed Day MCH/Immunization
Clinics; Telephone; MOI/C: AYUSH Doctor:Emergencies that can be handled by Nurses - 24x7;
Round the Clock Services; Drugs; TB/Malaria etc tests
Skill upgradation of educated RMPs; 2 ANMs. 1 Male MPW for 5-6 villages;Telephone Link; MCH/Immunization Days; Drugs; MCH Clinic
1 ASHA, AWWs in every village; Village Health Day Drug Kit, Referral chains
BLOCKLEVEL
HOSPITAL
CHIEF BLOCK MEDICAL OFFICER/BLOCK LEVEL HEALTH OFFICE
CLUSTER OF GPs - PHC LEVEL
GRAM PANCHAYAT - SUB HEALTH CENTRE LEVEL
VILLAGE LEVEL - ASHA, AWW, VH & SC
Sources: NRHM, Ministry of Health and Family Welfare, IMaCS Analysis
Sub centre PHCs CHCs All India
GPs – General Practitioners, LHV – Lady Health Visitor, SHCs – Sub Health Centers, MCH - Maternal and child health services, MOI/C – Medical Officer, RMP – Rural Medical Provider, ANM - Auxiliary Nurse Midwife, MPW - Multi Purpose Workers, ASHA – Accredited Social Health Activist, AWW - Anganwadi Worker, VH – Village Health, SC – Sanitation Committee
21
21206529_20_25.pdf 1 25/09/12 7:19 PM
Public Expenditure Private Expenditure
Figure 17: Evolution of government policies - Indian healthcare sector
1946, PHC conceptualisation
1952-1977, Integrated health service and medical education
1978, Health for all by 2000 AD
1983, National Health Policy I
2000, National Population Policy (NPP)
Figure 18: Healthcare delivery structure
Ambulance, TelephoneObstetric/Surgical/Medical
Emergencies24x7 Round the Clock Service
Accredit privateproviders for public
health goals
Strengthen Ambulance/transport servicesincrease availability of nursesprovide telephonesencourage fixed day clinics
100,000Population
100 Villages
30-40 Villages
5-6 Villages
10,000Population
Health ManagerAccountantStore Keeper
3 Staff Nurses: 1 LHV for 4-5 SHCs:Ambulance/hired vehicle; Fixed Day MCH/Immunization
Clinics; Telephone; MOI/C: AYUSH Doctor:Emergencies that can be handled by Nurses - 24x7;
Round the Clock Services; Drugs; TB/Malaria etc tests
Skill upgradation of educated RMPs; 2 ANMs. 1 Male MPW for 5-6 villages;Telephone Link; MCH/Immunization Days; Drugs; MCH Clinic
1 ASHA, AWWs in every village; Village Health Day Drug Kit, Referral chains
BLOCKLEVEL
HOSPITAL
CHIEF BLOCK MEDICAL OFFICER/BLOCK LEVEL HEALTH OFFICE
CLUSTER OF GPs - PHC LEVEL
GRAM PANCHAYAT - SUB HEALTH CENTRE LEVEL
VILLAGE LEVEL - ASHA, AWW, VH & SC
Sources: NRHM, Ministry of Health and Family Welfare, IMaCS Analysis
Sub centre PHCs CHCs All India
GPs – General Practitioners, LHV – Lady Health Visitor, SHCs – Sub Health Centers, MCH - Maternal and child health services, MOI/C – Medical Officer, RMP – Rural Medical Provider, ANM - Auxiliary Nurse Midwife, MPW - Multi Purpose Workers, ASHA – Accredited Social Health Activist, AWW - Anganwadi Worker, VH – Village Health, SC – Sanitation Committee
As on March, 2012148,366 24,049 4,833
Figure 20: Public and private health expenditure (2011)
Source: World Health Organization (WHO)Source: Economic Survey of India 2013-14
Figure 19: Total expenditure on health by General Government
Source: Economic Survey of India 2013-14
2005, National Rural Health Mission (NRHM)
2013, National Health Mission (NHM)Sources: Ministry of Health and Family Welfare,Planning Commission, Government of India
21
Healthcare And Diagnostic Sector In India
Chapter 4
Mission (NRHM), 2005, with the aim of providing accessible, affordable, accountable, effective and reliable primary healthcare in poor and vulnerable sections of the community. NRHM primarily focuses on development of healthcare services in rural areas.
NRHM enables increased fund allocation to strengthen public health management. Its architectural design of healthcare delivery system comprises Health Plan for each village, delivered through Village Health Committee and Panchayati Raj Institutions.
EVOLUTION AND OVERVIEW OF INDIAN HEALTHCARE SECTOR
India is among the first countries to have recognised the importance of primary health care (PHC) approach. Conceptualised in 1946, PHC approach emphasised social orientation of medical practices and high level of public participation.
The period up to the first National Health Policy (NHP) in 1983 was dedicated to a concerted effort towards building programmes covering: health and sanitation through establishment of PHCs and sub-centres, health survey and planning, integrated health services, inclusion of larger population, building medical and support workforce, linking medical colleges and health centres.
Thereafter, policy improvements and evolution of industry have increased private sector participation.
The Government of India’s commitment to health for all led to the formulation of India’s first NHP. The period 1986-1996 was one of substantial growth in the private sector investments and it surpassed the public sector by a wide margin.
Private sector gained significance as the more preferred choice.
The Government of India launched National Rural Health
• Diagnostics industry is highly competitive and fragmented
The Indian diagnostics services industry, including pathological laboratories services, has grown at 20 per cent CAGR for the period 2006-2010.
Pathological laboratories services constitute over 52 per cent of the diagnostic market.With the increasing number of organised players in the segment, diagnostic services industry is likely to expand at more than this growth rate.
GOVERNMENT INITIATIVES - INDIAN HEALTHCARE SECTOR
In the Union Budget 2010-11, the Government increased total allocation for healthcare to US$ 5,240 million, more than an 11 per cent increase over 2009-10.
In the Union Budget 2012-13, the Government increased total allocation for healthcare to US$ 6,400 million, about 14 per cent higher than 2011-12. NRHM has been a successful scheme, launched to make the quality healthcare accessible and affordable.
GOVERNMENT INCENTIVES
The Government is encouraging private sector and investments in the healthcare sector through several
incentives and policy initiatives:
• New hospitals with 100 beds or more will be subject to 100 per cent tax holiday for the initial period of five years of operation.
• To attract investments in the healthcare infrastructure, 100 per cent FDI is permitted for health and medical services under the automatic route.
• Life-saving equipment is exempted from countervailing duty. Custom duty has been reduced to 5 per cent from 25 per cent.
• Multiplicity of customs duty on medical equipment is being done away with and basic customs duty reduced to 5 per cent from 7.5 per cent.
• Hospitals and dispensaries providing health travel facilities and attracting medical tourists are eligible for tax holidays and incentives.
IMPACT OF HEALTHCARE GROWTH ON PHARMACEUTICALS SECTOR
• Expanding overall market
Growth in the healthcare industry is based on the inclusive business model and incorporates a range of activities such as infrastructure development, services penetration, enhancement in training and education.
Consequently, it helps expand the whole healthcare market including pharmaceuticals. Historically, pharmaceuticals sector growth has tracked increase in healthcare expenditure.
• New healthcare players will influence reforms in healthcare industry including pharmaceuticals
Local and international players bring in new ideas and lead to systemic reforms, which in turn foster a streamlined, transparent, and better-regulated healthcare and hospital financing environment for the industry.
This trend will help increase demand for innovative drugs and hence support the long-term sustainable growth of the pharmaceutical sector.
• Industry wide collaboration will help innovate and maximise benefit
The healthcare scenario is ever evolving and the Government is planning to increase the public provisioning of healthcare. As per World Health Organisation (WHO), total expenditure on health increased from US$ 22.42 billion in 2001 to US$ 59.5 billion in 2010.
INDIAN HEALTHCARE SECTOR: MARKET SIZE
Domestic healthcare sector sales recorded a 17 per cent
CAGR during 2005-2010 to reach US$ 59.5 billion a year. The healthcare sector employs about 4.5 million people directly or indirectly and is the largest service sector employer in the country after retail. According to the Investment Commission of India, the healthcare sector is projected to grow at 15 per cent CAGR and reach the market value of US$ 79 billion by 2012 and US$ 280 billion by 2020.
Key segments and growth drivers
Hospital and pharmaceuticals are the largest segments of the sector in India, combined revenue from these segments are estimated to contribute 79 per cent of the total healthcare market by 2012.
• Demand driving healthcare infrastructure investments
For the distribution of healthcare across all demographic segments, 2.8 million additional beds are required by 2025, according to the WHO. Investments of US$ 100 billion are required.
• Flourishing medical tourism attracting growth
Medical tourists in India are expected to increase from
0.8 million in 2010 to 1.6 million by 2015.
India is expected to be a medical tourist hub and likely to contribute 3 per cent of the US$ 100 billion global medical tourism industry by 2013.
• Healthcare information and communication technology (ICT) spend is playing a significant role in healthcare delivery
Information and communication technology (ICT) including electronic medical records requirement of the healthcare industry was around US$ 270 million in 2010.
With the growth in the healthcare infrastructure and telemedicine, it is estimated to grow at 22 per cent CAGR until 2013.
• Pharmaceutical industry is poised for growth on back of affordability, increasing disposable income
The pharmaceuticals industry in India was valued at about US$ 21.73 billion in 2010.
Sustained economic growth, healthcare reforms and patent-related legislation are key drivers for average estimated growth of 12 to 15 per cent CAGR for next 10 years.
• Immense potential in medical equipment and consumables
The medical equipment market is heavily dependent on imports.
Domestic manufacturers such as Anand Medicaids, Carewell Mediproducts, Dental Products of India, Hindustan Syringes and Medical Devices, Lifeline Systems, Relisys Medical Devices Ltd, Surya Surgical Industries, etc., contribute to 25 per cent of the market.
In 2011, the Indian medical equipment market was estimated at US$ 2.64 billion and it is expected to reach US$ 4.95 billion by 2016, according to the Department of Health.
• Health insurance penetration will augment the overall healthcare market
In 2010, 15 per cent of the Indian population were covered through health insurance and 80 per cent of the healthcare expenditure was financed out-of-pocket.
The health insurance market is growing. It was valued at US$ 1.73 billion in 2010, with a 39 per cent CAGR from 2006-2010.
The insurance market is expected to grow to over 4 billion by 2013.
at US$ 345 million in 2010-11, contributing over 70 per cent of the total diagnostics services market and is expected to grow at 15-20 per cent year on year.
The largest segments are blood screening and infectious diseases. The fastest growing segments are genetic diseases, oncology and pharmacogenomics. Tulip Group, Transasia Biomedicals, RFCL (Diagnova), Span Diagnostics and Trivitron are the leading Indian players in this space.
GOVERNMENT INITIATIVES - DIAGNOSTIC INDUSTRY
The Indian diagnostic market is highly regulated for maintaining quality standards and the safety of the patients.
All the diagnostic laboratories need to register and get the license from Central Licensing Approving Authority (CLAA), accreditation from National Accreditation Board for Testing & Calibration of Laboratories (NABL), and imaging centres have to be approved by Bhabha Atomic Research Centre (BARC) or Atomic Energy Regulatory Board (AERB). Central Drugs Standard Control Organization (CDSCO) regulates the manufacture and marketing of drugs, diagnostics, devices, and cosmetics in the Indian market.
In 2010-11, the Indian Government announced fiscal incentives for the diagnostic sector to make it more affordable and accessible.
For the domestic medical device industry, a uniform concessional duty of 5 per cent is levied and assistive devices, rehabilitation aid, etc., are fully exempted.
Import/customs duty on 24 medical equipments including X-ray, goniometer, tele-therapy simulator machines were reduced to 5 per cent. The Government is also promoting domestic device manufacturers by establishing R&D centres and reducing prices of the critical equipment.
TECHNOLOGY TRENDS IN INDIAN DIAGNOSTIC INDUSTRY
Amid government regulations and awareness among physicians and patients, the Indian diagnostic industry is encouraged to provide high quality and technological advanced medical devices, equipments and therapy.
• Technology transfer and outsourcing trend
Due to heavy dependence on imported products, foreign players are attracted to the Indian market for localising high-end products by setting up manufacturing facilities or outsourcing to local players.
• Emerging hub and spoke model
With the development of easy to use and handle devices, corporate players are able to service the tier II and III markets by establishing collection centres and satellite
labs near patients. These centres are networked to the central laboratory.
• Self-diagnosis test market in India
Preference of the patients to conduct self-diagnosis test or tests at home is increasing. Around 10 per cent of the patients opt for the tests at home.
In the last 15 years, several products in the therapeutic devices, monitoring devices, interventional devices, X-rays, ultrasound, electrocardiogram (ECG), pathological tests category have been developed for the self-diagnosis test market
• ICT in healthcare for deep rural penetration
Large ICT players are developing systems for inclusive healthcare services through telemedicine. The industry is
undertaking research programmes to develop affordable technology platforms such as molecular diagnostic, nanotechnology, micro-fluids to make healthcare accessible to rural India.
• Customer relationship management (CRM) resulting in preventive care technology
Database of patients helps in two ways, by offering preventive care to the patients and also transmitting patient’s data to the research firms for developing novel drugs and medical devices. CRM is a key tool for such use.
• Outsourcing laboratory management
Emerging organised players in diagnostic services are building on their expertise and collaborating with hospitals to manage laboratories effectively.
Collaboration within the healthcare industry segments such as – healthcare delivery, pharmaceuticals and medical equipment – can play significant role in making the innovation partnerships successful.
• Government scheme for inclusive healthcare services will benefit affordability
Government schemes encouraging health insurance penetration will bridge the urban-rural gap and make the healthcare services including pharmaceutical market more accessible and affordable.
• Improved margins and profitability
Access to technology and cost efficiency in the healthcare services will lead to higher profit margin for the pharmaceutical industry
DIAGNOSTIC INDUSTRY OVERVIEW
The Indian diagnostic industry comprises of pathological
services and devices. In 2010, total diagnostic market was valued at US$ 1.57 billion.
By 2015, the market is likely to grow to US$ 5.3 billion at 28 per cent CAGR on the back of rising demand from health consciousness and increasing disposable income in the country. In 2010, the diagnostic imaging estimated market was valued at US$ 731 million.
The size of the ultrasound product and services, clinical chemistry, immunology, hematology and molecular diagnostics segments was US$ 120 million, US$ 112 million, US$ 132 million, US$ 47 million and US$ 300 million respectively for the year 2010.
Domestic industry serves 25 per cent of the diagnostic imaging market and the remaining is comprised of imports mainly from the USA, Germany, Japan and China.
Pathological services contribute more than 52 per cent of the total diagnostic market; there are over 40,000 pathology labs in the country servicing around 1-1.25 million patients per day.
Pathological services industry is highly competitive, fragmented and price driven, however it is experiencing increased investments from organised players such as Super Religare Laboratories, Dr. Lal Pathlabs, Metropolis, Thyrocare Quest Diagnostics and Medinova.
In-vitro diagnostics including the analysing body fluids or tissue samples segments account for a significant 25 per cent of total diagnostic services market, remaining is contributed by biochemistry, immunology and haematology, coagulation, molecular diagnostics and critical.
Molecular diagnostic
Molecular diagnostics takes DNA, RNA and genes as
base for diagnostic tests
It plays a crucial role in the early detection of diseases, including identification of predisposition, and comprehensive analysis of pathogens, qualitative, quantitative and detection of resistance mechanisms to pathogens.
The Indian molecular diagnostics market was estimated
Public Expenditure Private Expenditure
Figure 17: Evolution of government policies - Indian healthcare sector
1946, PHC conceptualisation
1952-1977, Integrated health service and medical education
1978, Health for all by 2000 AD
1983, National Health Policy I
2000, National population policy (NPP)
Figure 18: Healthcare delivery structure
Ambulance, TelephoneObstetric/Surgical/Medical
Emergencies24x7 Round the Clock Service
Accredit privateproviders for public
health goals
Strengthen Ambulance/transport servicesincrease availability of nursesprovide telephonesencourage fixed day clinics
100,000Population
100 Villages
30-40 Villages
5-6 Villages
10,000Population
Health ManagerAccountantStore Keeper
3 Staff Nurses: 1 LHV for 4-5 SHCs:Ambulance/hired vehicle; Fixed Day MCH/Immunization
Clinics; Telephone; MOI/C: AYUSH Doctor:Emergencies that can be handled by Nurses - 24x7;
Round the Clock Services; Drugs; TB/Malaria etc tests
Skill upgradation of educated RMPs; 2 ANMs. 1 Male MPW for 5-6 villages;Telephone Link; MCH/Immunization Days; Drugs; MCH Clinic
1 ASHA, AWWs in every village; Village Health Day Drug Kit, Referral chains
BLOCKLEVEL
HOSPITAL
CHIEF BLOCK MEDICAL OFFICER/BLOCK LEVEL HEALTH OFFICE
CLUSTER OF GPs - PHC LEVEL
GRAM PANCHAYAT - SUB HEALTH CENTRE LEVEL
VILLAGE LEVEL - ASHA, AWW, VH & SC
Sources: NRHM, Ministry of Health and Family Welfare, IMaCS Analysis
Sub centre PHCs CHCs All India
GPs – General Practitioners, LHV – Lady Health Visitor, SHCs – Sub Health Centers, MCH - Maternal and child health services, MOI/C – Medical Officer, RMP – Rural Medical Provider, ANM - Auxiliary Nurse Midwife, MPW - Multi Purpose Workers, ASHA – Accredited Social Health Activist, AWW - Anganwadi Worker, VH – Village Health, SC – Sanitation Committee
21
21206529_20_25.pdf 1 25/09/12 7:19 PM
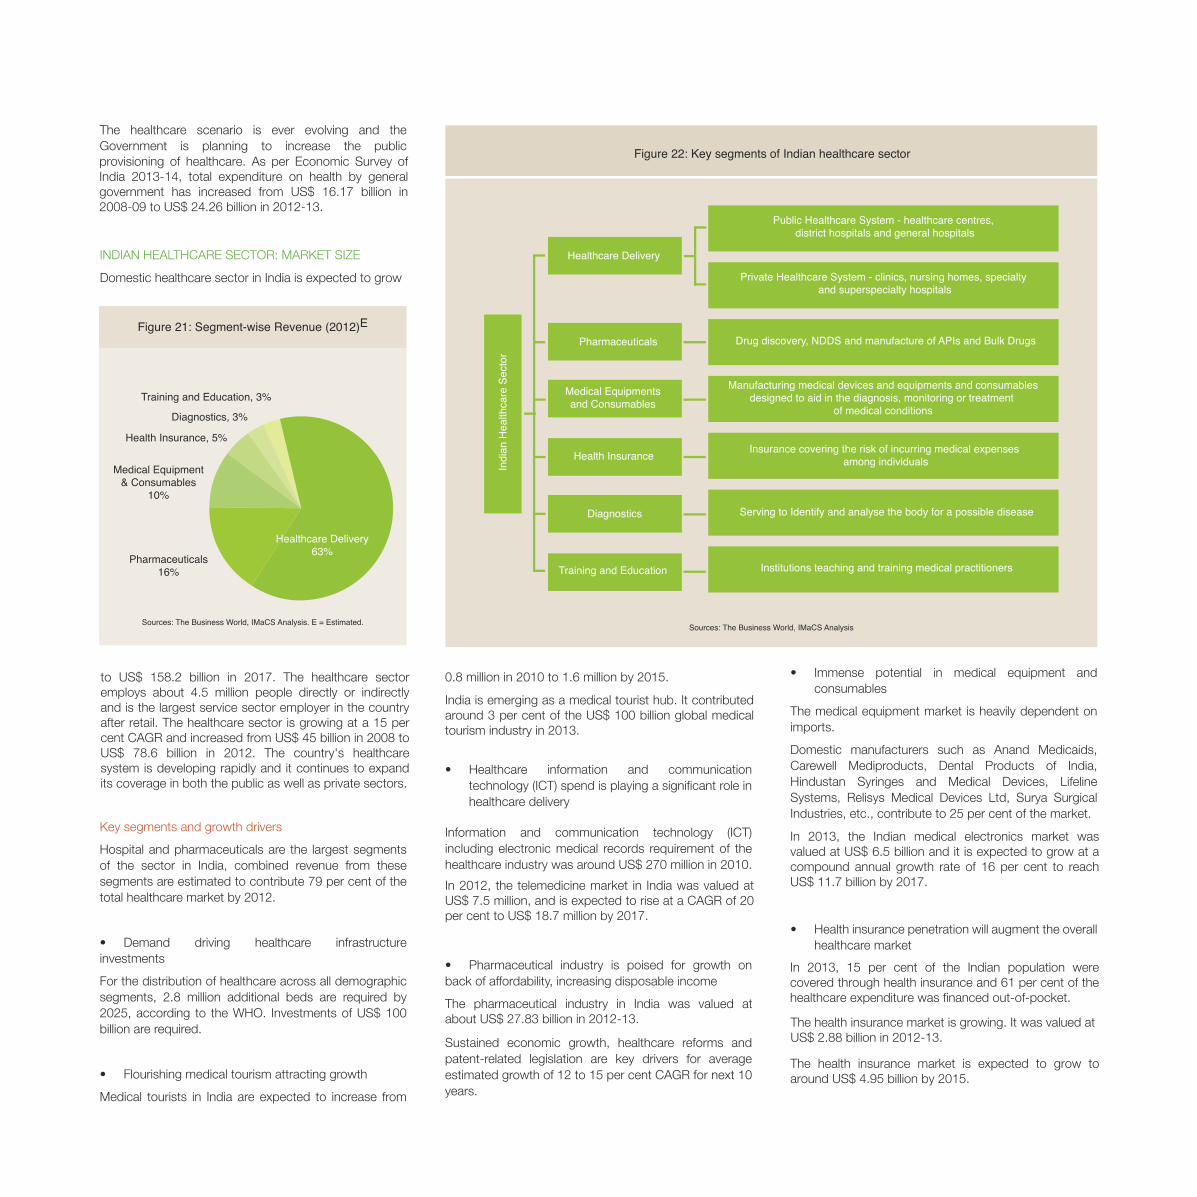
Figure 21: Segment-wise Revenue (2012)E
Sources: The Business World, IMaCS Analysis. E = Estimated.
Health Insurance, 5%
Diagnostics, 3%
Training and Education, 3%
Healthcare Delivery63%
Pharmaceuticals16%
Medical Equipment& Consumables
10%
Figure 22: Key segments of Indian healthcare sector
Indi
an H
ealth
care
Sec
tor
Healthcare Delivery
Public Healthcare System - healthcare centres, district hospitals and general hospitals
Private Healthcare System - clinics, nursing homes, specialty and superspecialty hospitals
Drug discovery, NDDS and manufacture of APIs and Bulk Drugs
Manufacturing medical devices and equipments and consumablesdesigned to aid in the diagnosis, monitoring or treatment
of medical conditions
Insurance covering the risk of incurring medical expenses among individuals
Serving to Identify and analyse the body for a possible disease
Institutions teaching and training medical practitioners
Pharmaceuticals
Medical Equipmentsand Consumables
Health Insurance
Diagnostics
Training and Education
Sources: The Business World, IMaCS Analysis
For the prevention and cure of diseasessuch as cancer , diabetes, heart ailmentsand stroke
to US$ 158.2 billion in 2017. The healthcare sectoremploys about 4.5 million people directly or indirectlyand is the largest service sector employer in the countryafter retail. The healthcare sector is growing at a 15 percent CAGR and increased from US$ 45 billion in 2008 toUS$ 78.6 billion in 2012. The country's healthcaresystem is developing rapidly and it continues to expandits coverage in both the public as well as private sectors.
Domestic healthcare sector in India is expected to grow
India is emerging as a medical tourist hub. It contributedaround 3 per cent of the US$ 100 billion global medicaltourism industry in 2013.
The pharmaceutical industry in India was valued atabout US$ 27.83 billion in 2012-13.
In 2013, the Indian medical electronics market wasvalued at US$ 6.5 billion and it is expected to grow at acompound annual growth rate of 16 per cent to reachUS$ 11.7 billion by 2017.
In 2013, 15 per cent of the Indian population werecovered through health insurance and 61 per cent of thehealthcare expenditure was financed out-of-pocket.
The health insurance market is growing. It was valued atUS$ 2.88 billion in 2012-13.
The health insurance market is expected to grow toaround US$ 4.95 billion by 2015.
The Indian diagnostics services industry, includingpathological laboratories services, is growing at a CAGRof 15 per cent.
In the Union Budget 2012-13, the Governmentincreased total allocation for healthcare to US$ 6,400million, about 14 per cent increase over 2011-12.
In the Union Budget 2014-15, the Government hasallocated US$ 5,813 million for healthcare. NRHM hasbeen a successful scheme, launched to make the qualityhealthcare accessible and affordable.
NHM
provisioning of healthcare. As per Economic Survey ofIndia 2013-14, total expenditure on health by generalgovernment has increased from US$ 16.17 billion in2008-09 to US$ 24.26 billion in 2012-13.
In 2012, the telemedicine market in India was valued atUS$ 7.5 million, and is expected to rise at a CAGR of 20per cent to US$ 18.7 million by 2017.
Figure 23: Government schemes and planned outlay (2013-14)
US$ 3,103million
To enable access to equitable,affordable, and quality health careservices
Medical Education Training& Research
US$ 755million
For medical education training &research, and to establish AIIMS typeSuper Speciality Hospitals
National Program for Preventionand Control of Cancer, Diabetes,
Cardiovascular Diseses and StrokeUS$ 53million
Health Care for the Elderly US$ 14million
Preventive and promotive care,management of illness, health manpowerdevelopment for geriatric services
National Program for Control ofBlindness
US$ 10million
Reduction of prevalence of blindness to0.3 per cent by 2020 by providingcomprehensive eye care services
Sources: Economic Survey of India 2013-14, Ministry of Health & Family Welfare
23

Figure 24: Regulation and fiscal initiatives in diagnostic industry (2010-11)
Government regulatory initiatives indiagnostic industry
Government fiscal initiatives in diagnostic industry
Regulatory, licensing and monitoring authority under Clinical Establishment Act Accreditation
Indian FDA CDSCO CLAANABL,BARC/AERB
Taxes and duties for medicaldevices
Investment
Uniformconcessionon exciseduty of 4%
Full exemption to assistive
devices
Import andcustom dutyreduced to
5%
US$ 69million
Sources: “Excellence in diagnostic care” by KPMG, Expresshealthcare, IMaCS Analysis
CASE STUDY: INTEGRATED HEALTHCARE COMPANIES
APOLLO HOSPITALS ENTERPRISE LTD. (APOLLO)
services and devices. In 2010, total diagnostic marketwas valued at US$ 1.57 billion.
SRL Limited, Dr. Lal Pathlabs, Metropolis, Thyrocare,Quest Diagnostics and Medinova.
51clinics, 1,500 pharmacies and also provides consulting, disease management, insurance and educational services.
30
eightFY2012-13, the company recorded gross revenues of US$ 692.13 million and net profit of US$ 55.90 million.
25
Figure 26: Agencies under Department of Pharmaceuticals
Department of Pharmaceuticals
National Pharmaceutical Pricing Authority (NPPA)
National Institute of Pharmaceuticals Education
Research (NIPER)
Pharma PSUs
Figure 25: Departments of MoHFW
Source: IMaCS Analysis
Ministry of Health & Family Welfare
Department of Health and Family
Welfare
Deals with healthcare and aspects relating to
family welfare.Activities include policy
formulation on issues relating to health and family,
management of hospitals, implementing national
strategies and co-ordinating with Ministries
and Departments
Deals with alternative medicines:
Ayurveda, Yoga &Naturopathy,
Unani, Siddhaand
Homeopathy
Engaged in research in
medicine andhealth
Prevention ofAIDS,
care for HIV+ve patients
Managesmedical
posts underCentral
Government& Union
Territories
Department of Ayush
Department of Health Research
Department ofAids Control
Central HealthService
27
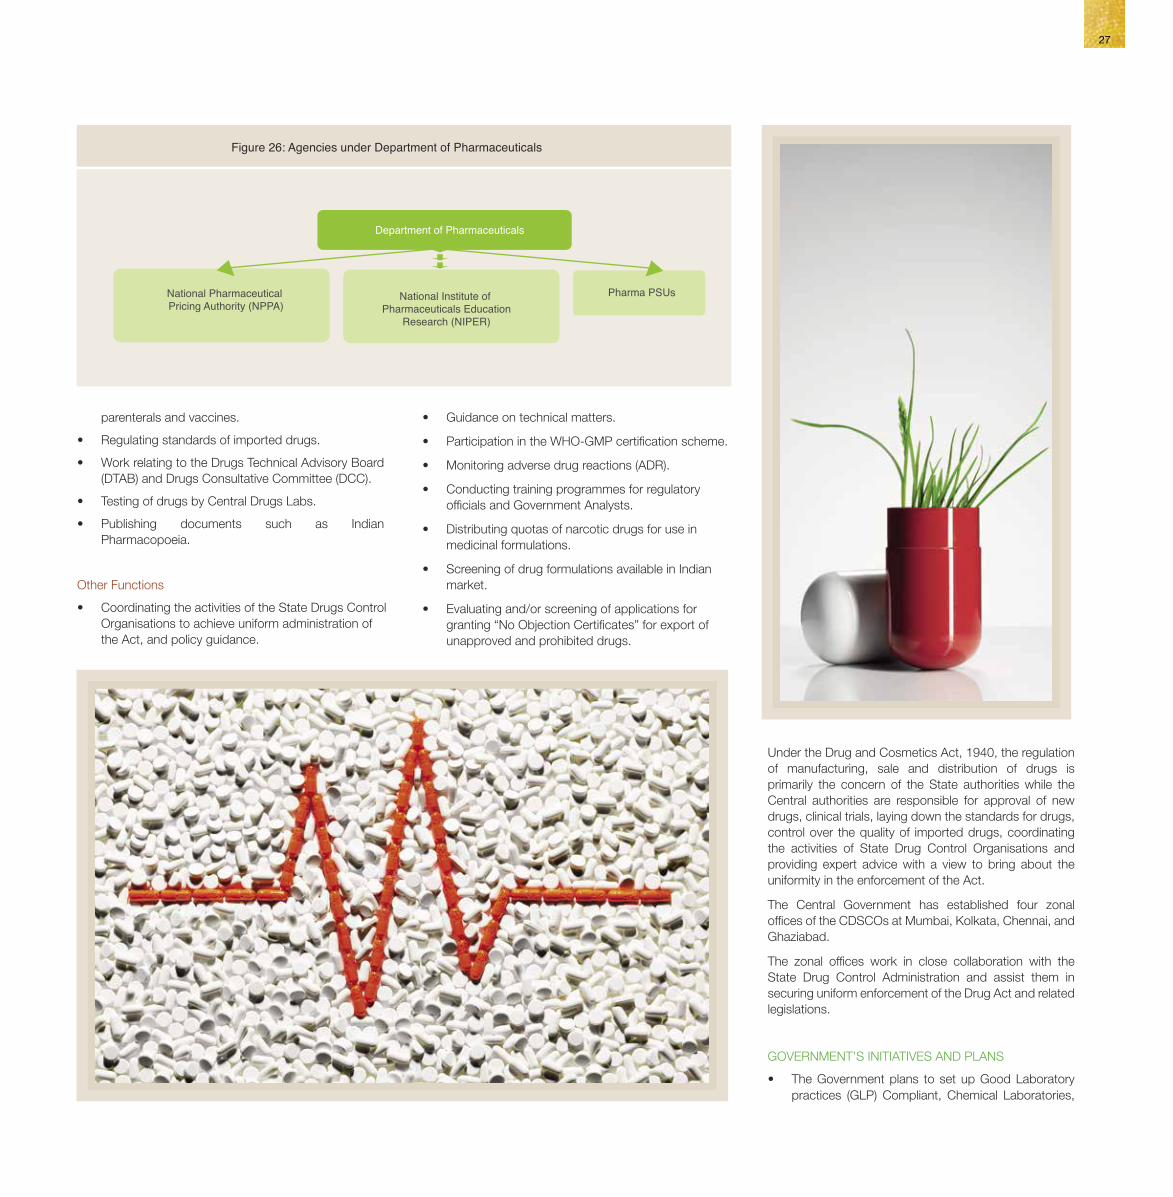
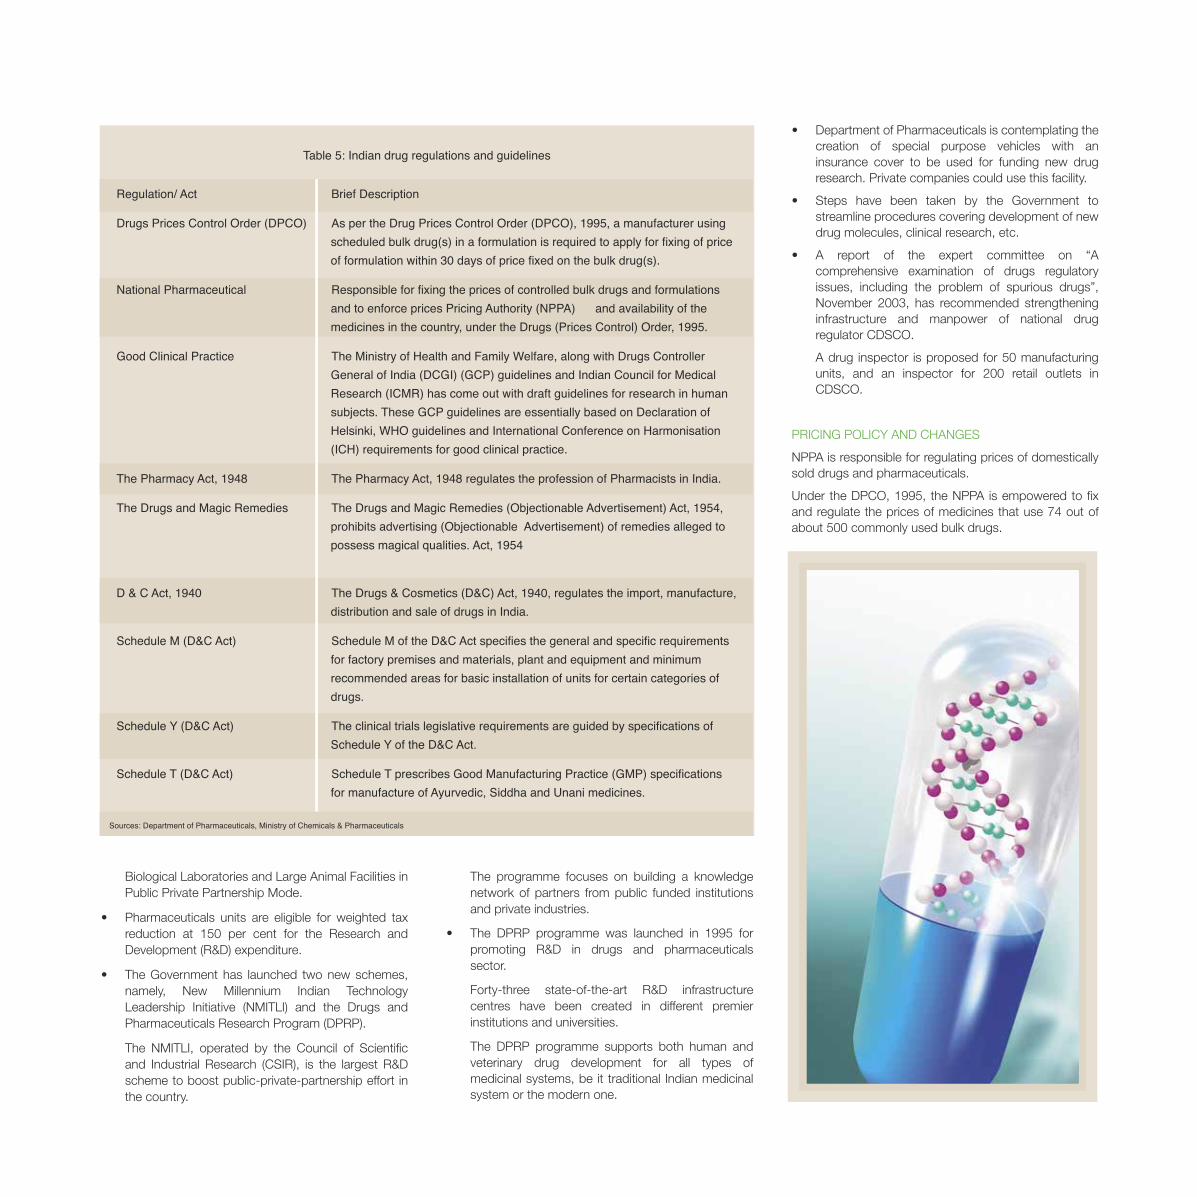
Table 5: Indian drug regulations and guidelines
Regulation/ Act Brief Description
Drugs Prices Control Order (DPCO) As per the Drug Prices Control Order (DPCO), 1995, a manufacturer using scheduled bulk drug(s) in a formulation is required to apply for fixing of price of formulation within 30 days of price fixed on the bulk drug(s).
National Pharmaceutical Responsible for fixing the prices of controlled bulk drugs and formulations and to enforce prices Pricing Authority (NPPA) and availability of the medicines in the country, under the Drugs (Prices Control) Order, 1995.
Good Clinical Practice The Ministry of Health and Family Welfare, along with Drugs Controller General of India (DCGI) (GCP) guidelines and Indian Council for Medical Research (ICMR) has come out with draft guidelines for research in human subjects. These GCP guidelines are essentially based on Declaration of Helsinki, WHO guidelines and International Conference on Harmonisation (ICH) requirements for good clinical practice.
The Pharmacy Act, 1948 The Pharmacy Act, 1948 regulates the profession of Pharmacists in India.
The Drugs and Magic Remedies The Drugs and Magic Remedies (Objectionable Advertisement) Act, 1954, prohibits advertising (Objectionable Advertisement) of remedies alleged to possess magical qualities. Act, 1954
D & C Act, 1940 The Drugs & Cosmetics (D&C) Act, 1940, regulates the import, manufacture, distribution and sale of drugs in India.
Schedule M (D&C Act) Schedule M of the D&C Act specifies the general and specific requirements for factory premises and materials, plant and equipment and minimum recommended areas for basic installation of units for certain categories of drugs.
Schedule Y (D&C Act) The clinical trials legislative requirements are guided by specifications of Schedule Y of the D&C Act.
Schedule T (D&C Act) Schedule T prescribes Good Manufacturing Practice (GMP) specifications for manufacture of Ayurvedic, Siddha and Unani medicines.
Sources: Department of Pharmaceuticals, Ministry of Chemicals & Pharmaceuticals
The Department of Pharmaceuticals, Ministry ofChemicals and Fertilizers has prepared NationalPharmaceuticals Pricing Policy, 2012 (NPPP-2012).
The NPPP-2012 declares that all 348 essentialmedicines under NLEM will fall in the list for priceregulation.The new policy has replaced cost-based pricingmechanism with a market-based pricing approach,wherein a ceiling price would be fixed on the basisof readily monitorable Market Based Data (MBD).
The prices of NLEM-2011 medicines will be allowedan annual increase as per the Wholesale Price Index(WPI).
The regulation of prices of drugs in the NPPP-2012would be on the basis of regulating the prices offormulations only. This is different from the earlierprinciple of regulated price of specified bulk drugsand their formulations.
The prices of medicines which are a part of DPCO1995 but not in NLEM-2011 would be frozen forone year and thereafter a maximum increase of 10per cent per annum, as in case of other non-NLEMmedicines will be allowed.
A manufacturer producing a new drug patentedunder the Indian Patent Act, 1970 (product patent)and not produced elsewhere, if developed throughindigenous R&D, would be eligible for exemptionfrom price control in respect of that drug for aperiod of 5 years from the date of commencementof its commercial production in the country.
A formulation involving a new delivery systemdeveloped through indigenous R&D would beeligible for exemption from price control for a periodof 5 years from the date of its market approval inIndia. The certification of innovation and R&D maybe provided by the office of Drug Controller Generalof India (DCGI).
has been revised several times: during 1981, 2002,2005 and 2013.
29
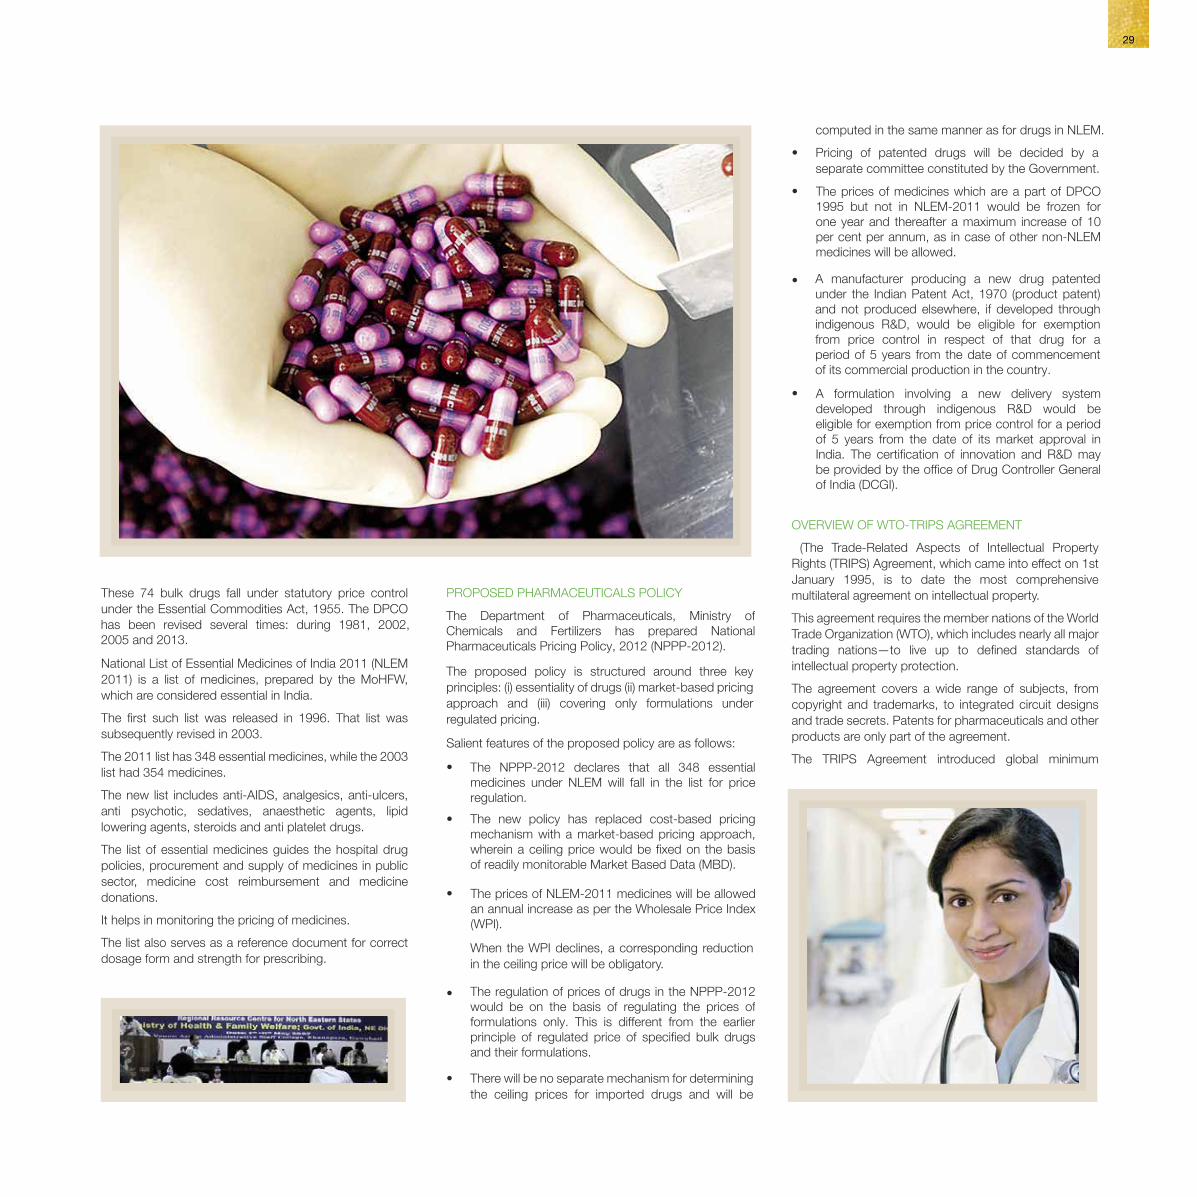

Table 6: Pharmaceuticals patent activity in India
Yearly growth (1995-2004) Yearly growth (2004-2010)
Resident patent applications per year 10 per cent 12 per cent
Resident trademark applications per year 10 per cent 17 per cent
Source: Forbes India
Between 2005-06 and 2011-12, the Indian PatentsOffice has granted 4,394 product patents inpharmaceuticals.
Source: Forbes India
31
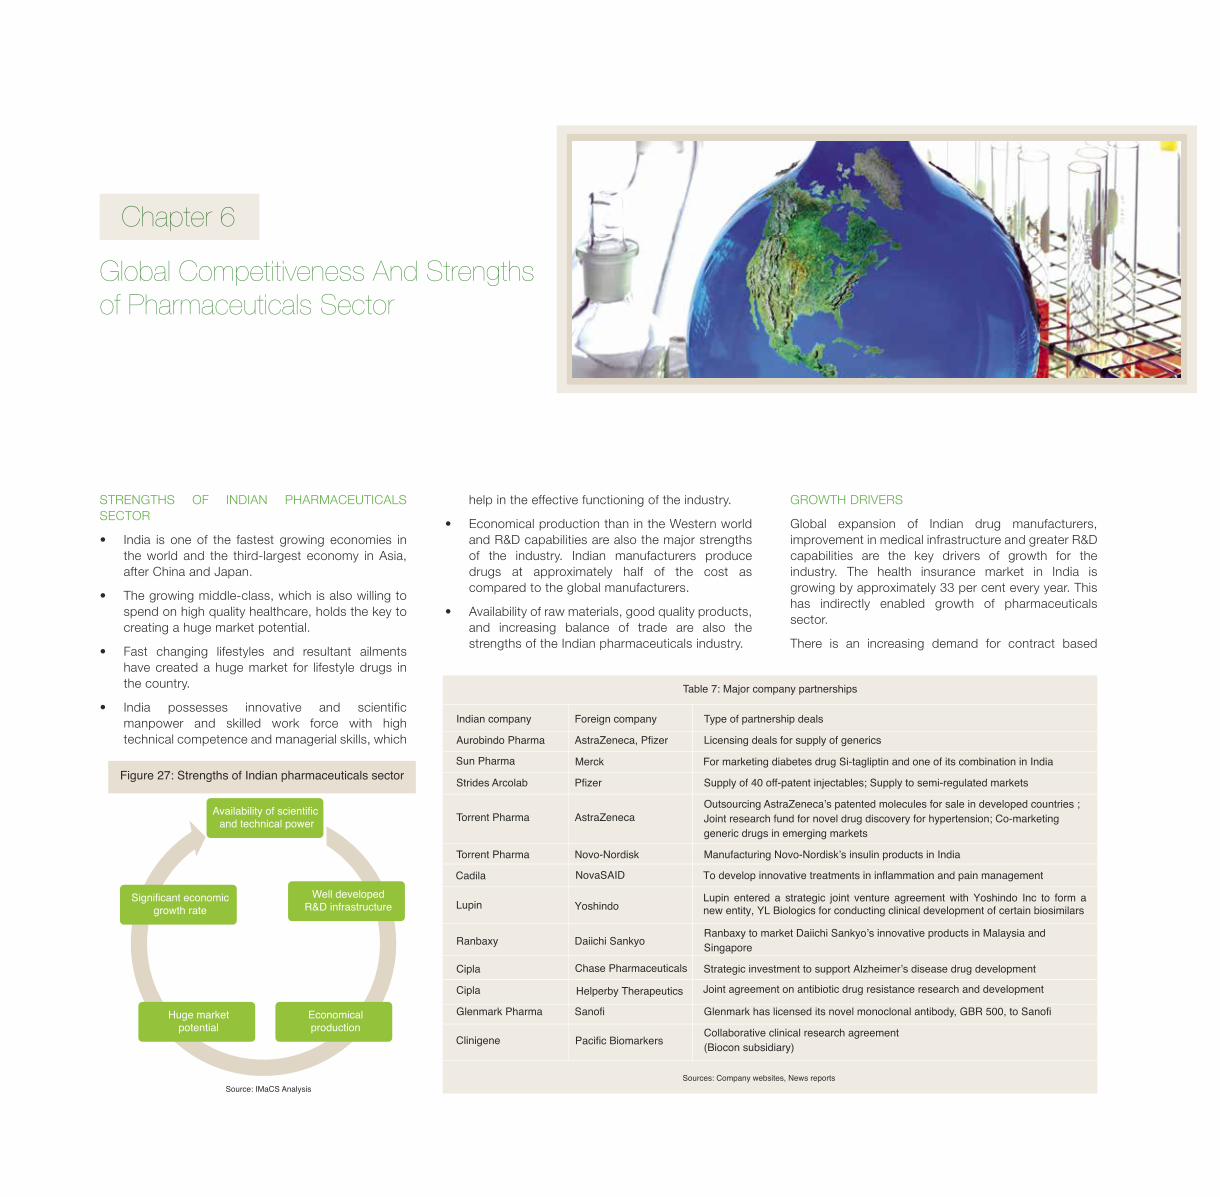
Indian company Foreign company Type of partnership deals
Aurobindo Pharma AstraZeneca, Pfizer Licensing deals for supply of generics
Strides Arcolab Pfizer Supply of 40 off-patent injectables; Supply to semi-regulated markets
Torrent Pharma AstraZeneca Outsourcing AstraZeneca’s patented molecules for sale in developed countries ; Joint research fund for novel drug discovery for hypertension; Co-marketing generic drugs in emerging markets
Torrent Pharma Novo-Nordisk Manufacturing Novo-Nordisk’s insulin products in India
Ranbaxy Daiichi Sankyo Ranbaxy to market Daiichi Sankyo’s innovative products in Malaysia and Singapore
Cipla
Cipla
Glenmark Pharma Sanofi Glenmark has licensed its novel monoclonal antibody, GBR 500, to Sanofi
Collaborative clinical research agreement(Biocon subsidiary)
Table 7: Major company partnerships
Figure 27: Strengths of Indian pharmaceuticals sector
Availability of scientific and technical power
Well developedR&D infrastructure
Significant economicgrowth rate
Huge marketpotential
Economicalproduction
Source: IMaCS Analysis
Figure 28: FDI trend in pharmaceuticals sector
Figure 29: Ranbaxy Laboratories - Sales
First joint venture setup in Nigeria
Figure 30: Ranbaxy Laboratories - Global growth path
Acquisition of a manufacturing facility (Ohm Laboratories Inc.) in USA1995
First product under Ranbaxy name introduced in USA1998
Ranbaxy’s original research product, Ciprofloxin licenced to a company in Germany for exclusive development and worldwide marketing1999
Established a state-of-the-art manufacturing facility in Malaysia2005
Acquired Tarpia and Be-Tabs pharmaceuticals (5th largest generic company in South Africa)2006
Takeover by Daiichi Sankyo completed in 20082008
Year
Sources: Company Annual Reports, Note: *Data is for 15 months
CAGR: 19.54 %
Source: Department of Industrial Policy and Promotion (DIPP)
Source: Company website
Strategic investment to support Alzheimerʼs disease drug developmentChase Pharmaceuticals
Clinigene Pacific Biomarkers
Sun Pharma Merck For marketing diabetes drug Si-tagliptin and one of its combination in India
Cadila NovaSAID To develop innovative treatments in inflammation and pain management
Lupin YoshindoLupin entered a strategic joint venture agreement with Yoshindo Inc to form anew entity, YL Biologics for conducting clinical development of certain biosimilars
Helperby Therapeutics Joint agreement on antibiotic drug resistance research and development
Sources: Company websites, News reports
1977
CAGR: 19.54 %
33
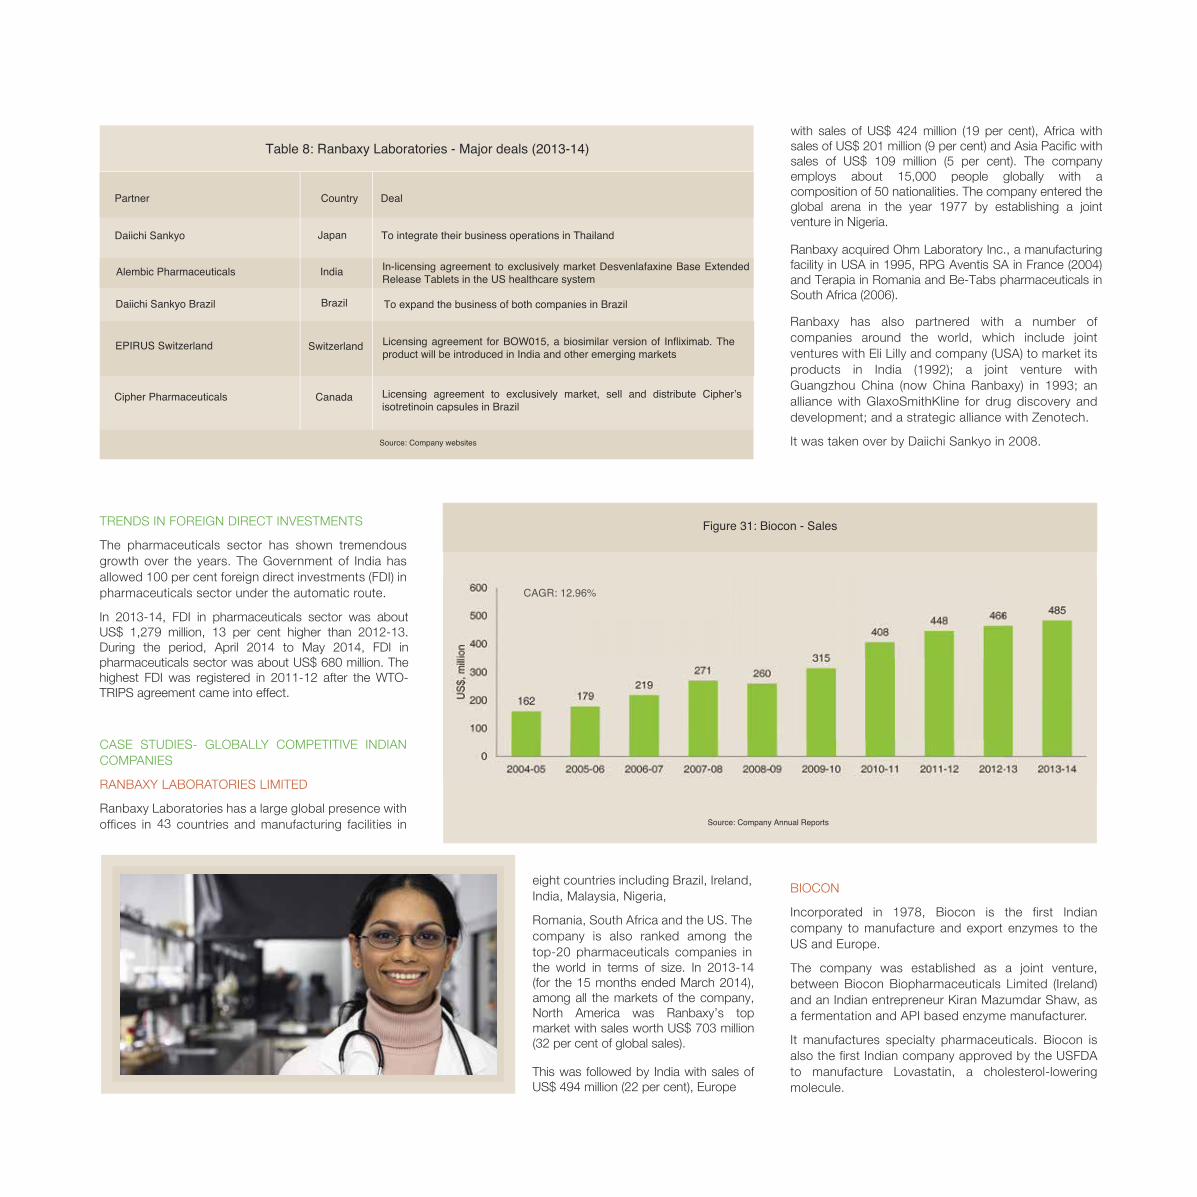
Figure 31: Biocon - Sales
Figure 32: Dr. Reddy’s Laboratories - Sales
Partner Country DealPartner Year Deals
Table 9: Biocon - Alliances
To expand the business of both companies in Brazil
Cipher Pharmaceuticals Canada Licensing agreement to exclusively market, sell and distribute Cipherʼsisotretinoin capsules in Brazil
EPIRUS Switzerland Switzerland Licensing agreement for BOW015, a biosimilar version of Infliximab. Theproduct will be introduced in India and other emerging markets
Daiichi Sankyo Brazil Brazil
Alembic Pharmaceuticals India In-licensing agreement to exclusively market Desvenlafaxine Base ExtendedRelease Tablets in the US healthcare system
Daiichi Sankyo Japan To integrate their business operations in Thailand
Source: Company websites
Table 8: Ranbaxy Laboratories - Major deals (2013-14)
In 2013-14, FDI in pharmaceuticals sector was aboutUS$ 1,279 million, 13 per cent higher than 2012-13.During the period, April 2014 to May 2014, FDI inpharmaceuticals sector was about US$ 680 million. Thehighest FDI was registered in 2011-12 after the WTO-TRIPS agreement came into effect.
43
the world in terms of size. In 2013-14(for the 15 months ended March 2014),among all the markets of the company,North America was Ranbaxy’s topmarket with sales worth US$ 703 million(32 per cent of global sales).
This was followed by India with sales ofUS$ 494 million (22 per cent), Europe
with sales of US$ 424 million (19 per cent), Africa withsales of US$ 201 million (9 per cent) and Asia Pacific withsales of US$ 109 million (5 per cent). The companyemploys about 15,000 people globally with acomposition of 50 nationalities. The company entered theglobal arena in the year 1977 by establishing a jointventure in Nigeria.
Ranbaxy acquired Ohm Laboratory Inc., a manufacturingfacility in USA in 1995, RPG Aventis SA in France (2004)and Terapia in Romania and Be-Tabs pharmaceuticals inSouth Africa (2006).
CAGR: 12.96%
Source: Company Annual Reports
Endo Pharmaceuticals 2010 Syngene (a subsidiary of Biocon) and Endo Pharmaceuticals to jointlydiscover and develop novel biological drug molecules to fight cancer
Optimer Pharmaceuticals 2010Biocon and Optimer Pharmaceuticals announced manufacturing andsupply agreement for a novel API, first-in-class anti-infective (C.difficile)
Malaysian BiotechnologyCorporation 2010 Biocon announced a strategic foreign direct investment in Malaysia
with the Malaysian Biotechnology Corporation SdnBhd (BiotechCorp)
Abbott 2012 Syngene, in collaboration with Abbott, setup a dedicated nutritionresearch and development center at Biocon Park
Bristol-Myers Squibb 2012 Biocon entered into an agreement with Bristol-Myers Squibb for itsIN-105, an oral insulin drug
Mylan 2013 Biocon enhanced partnership with Mylan through strategiccollaboration for insulin products
CytoSorbents 2013 Biocon partnered with CytoSorbents to market CytoSorb® - a 'first-in-class' therapy for sepsis management
Quark Pharmaceuticals 2013 Biocon and Quark Pharmaceuticals collaborated to develop novelsiRNA based therapeutics
Baxter 2014 Syngene, in collaboration with Baxter setup a dedicated research anddevelopment center at Biocon Park
Source: Company websites
CAGR: 19.89%
Source: Company Annual Reports
CAGR: 12.96%
CAGR: 19.89%
35
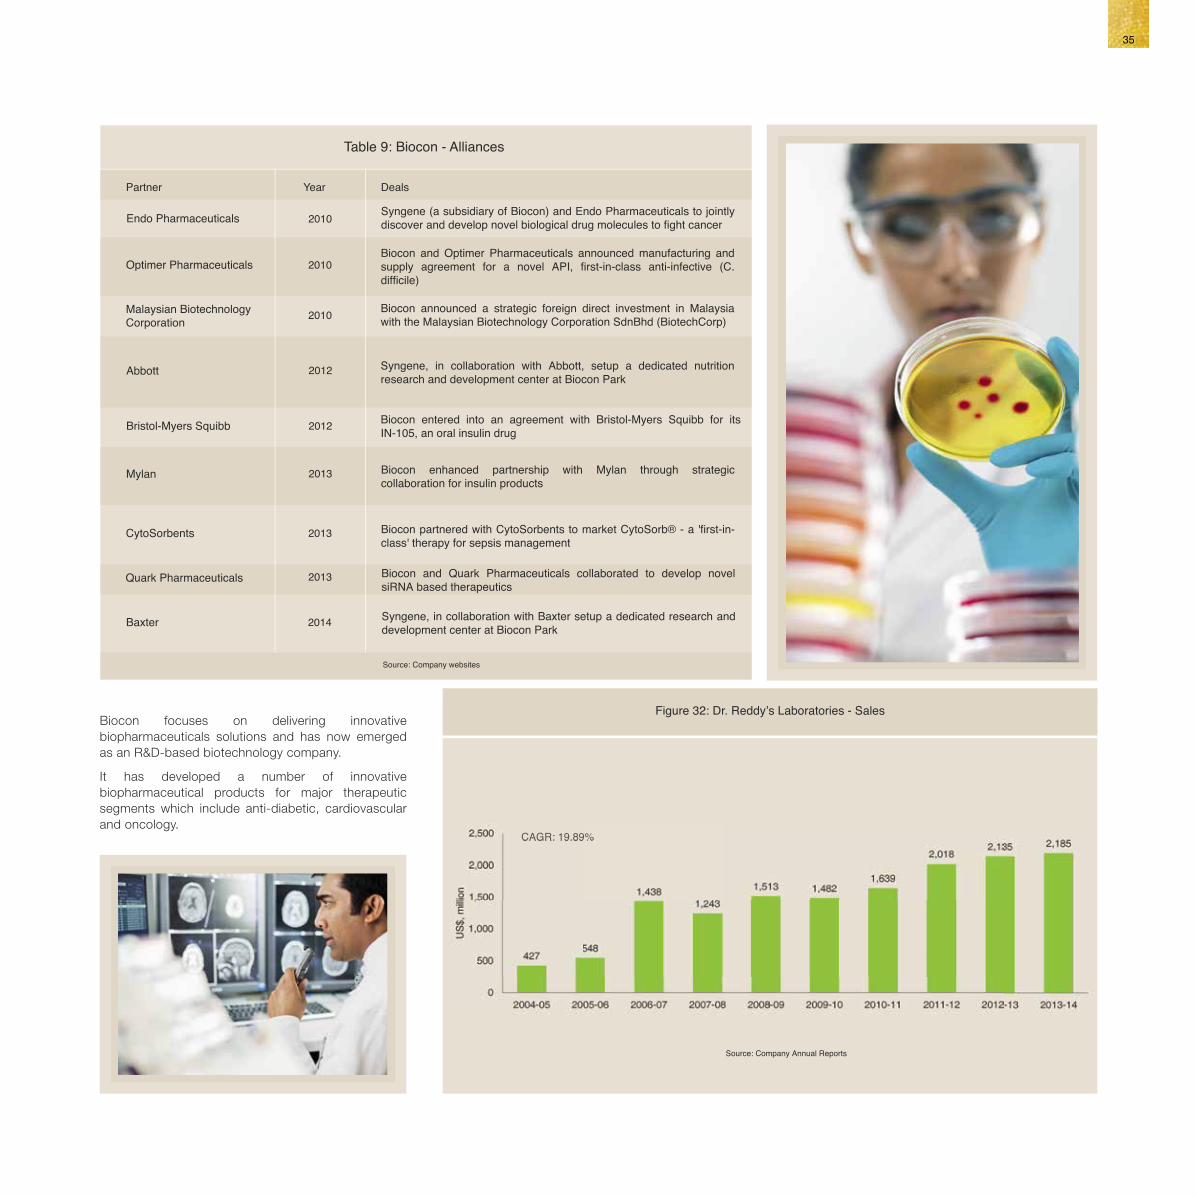
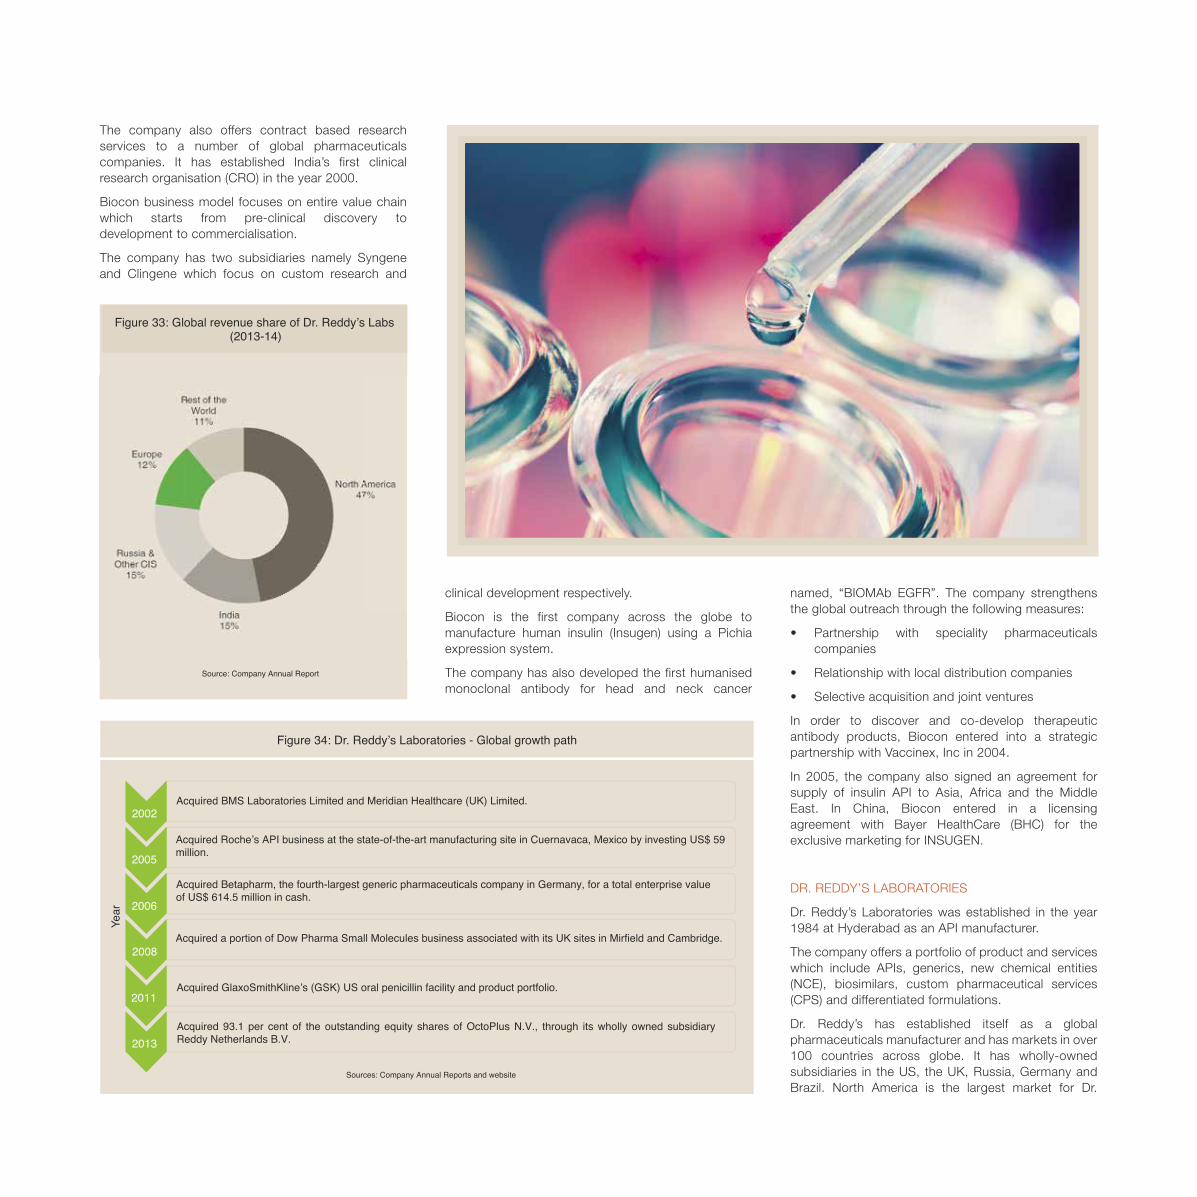
Figure 35: Aurobindo Pharma - Sales
Figure 33: Global revenue share of Dr. Reddy’s Labs
2003
2004
2006
2008
Figure 36: Aurobindo Pharma - Global growth path
Year
Received Certificate of Suitability (CoS) approval from the EDQM for its product in the therapeutic segment of gastroenterology.
Acquired the UK based Milpharm Limited, a company engaged in marketing generic formulationsmainly in the UK market.
Acquisition of intellectual property and marketing authorisations with TAD Italy, a generic company registered in Italy.
Aurobindo Tongling (Datong) Pharmaceuticals Ltd, a joint venture between Aurobindo and Shanxi Tongling Pharmaceuticals Company was formed in China to manufacture and market pharmaceutical products for the Chinese market. Later Aurobindo bought a 100% stake in the company.
Figure 34: Dr. Reddy’s Laboratories - Global growth path
Year
Source: Company Annual Report
(2013-14)
Acquired BMS Laboratories Limited and Meridian Healthcare (UK) Limited.2002
2005Acquired Rocheʼs API business at the state-of-the-art manufacturing site in Cuernavaca, Mexico by investing US$ 59million.
Acquired a portion of Dow Pharma Small Molecules business associated with its UK sites in Mirfield and Cambridge.
Acquired GlaxoSmithKlineʼs (GSK) US oral penicillin facility and product portfolio.
2006
2008
Acquired Betapharm, the fourth-largest generic pharmaceuticals company in Germany, for a total enterprise valueof US$ 614.5 million in cash.
2011
Acquired 93.1 per cent of the outstanding equity shares of OctoPlus N.V., through its wholly owned subsidiaryReddy Netherlands B.V.2013
Sources: Company Annual Reports and website
Reddy’s Laboratories with a share of 47 per cent inannual revenues. This is followed by India, Russia & otherCIS and Europe.
The company has also entered into joint ventures inChina and USA. It has 17 sales & marketing offices andsix manufacturing facilities worldwide. In the year 2000,Dr. Reddys became the third-largest Indianpharmaceuticals company by a merging with CheminorDrugs Limited (CDL). The company expanded its globalfoot print with the acquisition of BMS LaboratoriesLimited and Meridian Healthcare Limited in the UK,ROCHE’s API business in Mexico, Betapharm inGermany and Dow Pharma’s small molecule business inthe UK. The company has filed 631 drug master files(DMF) globally until March 2014.
Aurobindo Pharma manufactures products for majortherapeutic areas such as cardiovascular, neurosciences,anti-retrovirals, anti-diabetics, gastroenterology andcephalosporins, among others.
CAGR: 18.35%
Source: Company Annual Reports
Acquisition of certain commercial operations in Western Europe from Actavis2014
Sources: Company Annual Reports, Company website
37
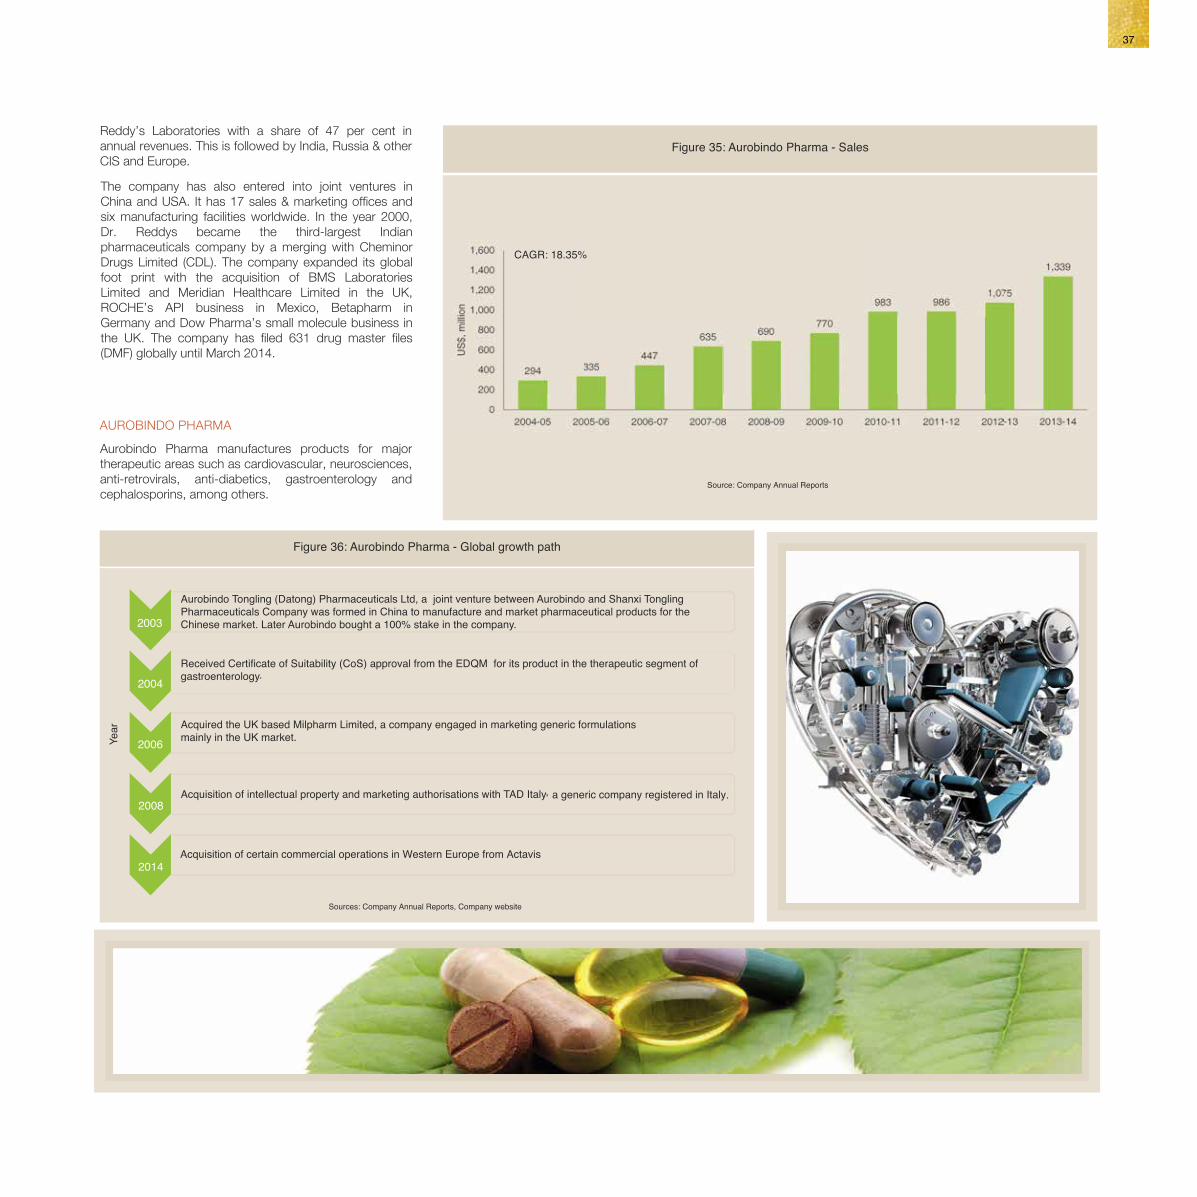

The product portfolio includes 200 APIs and 300finished-dosage formulations. In 2013-14, the companyregistered sales of US$ 1,339 million registering a CAGRof 18.35 per cent from 2004-05 to 2013-14.
Aurobindo Pharma has filed 337 Drug Master Files whichinclude 110 with USFDA, 133 with European Directoratefor Quality Medicines (EDQM) in Europe and 102 in othercounties. The company has also entered into alliancewith a number of companies around the globe includingan alliance with GlaxoSmithKline (India), acquisition ofMilpharm Limited and joint venture with NovagenPharma.
39
Table 10: Blockbuster drugs to lose patent
Patented Drug Therapeutic segment Original Drug Company Year of patent loss
Nexium Gastroesophageal reflux AstraZeneca PLC 2014
Acute lymphocytic leukemia Novartis AG
Crestor Hypertriglyceridemia AstraZeneca PLC
Domestic Pharmaceuticals(US$ 12.9 billion)
Branded Generics (US$ 9.4 billion)
Non-ContractManufacturing (US$ 2.0 billion)
ContractManufacturing (US$ 0.5 billion)
Unbranded Generics & BrandedFormulations (US$ 1.0 billion)
Formulations (US$ 10.4 billion) Bulk Drugs (US$ 2.5 billion)
Figure 37: Indian pharmaceuticals market segmentation - 2011
Figure 38: Generics growth drivers
Patentexpiries
Growthdrivers
GreaterM&A
activity
Risinghealthcareexpenditure
Costadvantage
Table 11: Recent Indian generics launches in the US
Ranbaxy and Dr. Reddy’s Generic Launches
and therefore will open to generic competition.
Benicar High blood pressure Daiichi Sankyo 2016
Gleevec
Abilify Antipsychotic Otsuka Pharmaceutical 2015
2015
2016
Copaxone Multiple sclerosis Teva Pharmaceuticals 2015
Combivent Chronic ObstructivePulmonary Disease Boehringer Ingelheim 2015
Avodart Benign prostatic hyperplasia GlaxoSmithKline 2015
Sources: Evaluate Pharma, IMS Health, Company reports
to go off-patent. Drugs worth US$ 97 billion will go off-patent in the US between 2011 and 2015.
In the next few years, Indian companies will compete fora host of big-ticket drugs losing patent protection,including AstraZeneca's Crestor, antipsychotic drugAbilify of Otsuka Pharmaceutical, and Copaxone of TevaPharmaceuticals.
In June 2014, Indiaʼs leading drug maker Ranbaxy announcedto launch the generic version of Diovan in the US. OhmLaboratories, a wholly-owned subsidiary of the Ranbaxyreceived approval from the USFDA to manufacture and marketgeneric Valsartan tablets with 180 days of marketing exclusivity.
In June 2014, Dr Reddyʼs announced the launch of DuloxetineDelayed-Release Capsules USP in the US.
Source: Company websites
The domestic branded generics market is valued at US$9.4 billion and the unbranded generics and brandedformulations market is valued at US$ 1.0 billion.
In 2013-14, exports of formulations stood at US$ 10.68billion, contributing around 71.43 per cent to the overallIndia's pharmaceutical exports.
Domestic drug companies have combined exposure toover 70 per cent of the products whose patents expireduring the period 2012-16. Around nine popular drugs
41
Table 13: Select USFDA compliant manufacturing units
Company Number of FDA approved units in India
Dr. Reddy’s Laboratories Limited 6
Sun Pharma
Cadila 5
Cipla Limited 5
Torrent Pharma 3
Orchid Chemicals and 1Pharmaceuticals
Source: Company websites
Tentative approvals
Company Drug Name Therapeutic Area Innovator Company Generic Version of Market Size (US$ mn)
Company Drug Name Therapeutic Area Innovator Company Generic Version of Market Size (US$ mn)
Confirmed approvals
Table 12: USFDA approvals for generic drugs
AurobindoPharmaStrides ArcolabSun Pharma
OrchidHealthcareDr. Reddys Labs
Lupin
Sun Pharma
Divalproex Sodium ERtabletsMethoxsalen capsules
Eszopiclone tablets
Risedronate Sodiumtablets (75 mg & 150 mg)
Paricalcitol capsules
PioglitazoneHydrochlorideOxaliplatin injection
CNS
Anti-psoriasisOsteoporosis
Hormonal
Insomnia
Anti-Diabetic
Anti-Cancer
Abbvie
Dow PharmaWarner Chilcott
Sepracor
Abbvie
Takeda
Sanofi
Depakote ER
Oxsoralen-UltraActonel
Lunesta
Zemplar
Actos
Eloxatin
194
13.6180
787
110
3,000
1,400
Sun PharmaGlobal
Oxaliplatin injection(200mg / 40ml)
Anti-Cancer Sanofi Eloxatin 104
Alembic MemantineHydrochloride tablets
CNS Forest Labs Nameda -
Jubilant Life MemantineHydrochloride tablets
CNS Forest Labs Nameda -
Natco Oseltamivir Phosphatecapsules
Anti-Infective Tamiflu Roche 240
Sources: USFDA, ICICI Direct Research
1Ranbaxy
Lupin 3
5
There are about 370 USFDA and nearly 141 UK-MHRAapproved pharmaceuticals manufacturing plants in Indiawhich supply high quality pharmaceutical productsglobally.
are going off-patent in the US in 2014 alone, 12 are likelyto follow during 2015 and 2016.Indian pharmaceuticals companies are expected tolaunch the generic versions of some of the popular drugsthat get off-patent in the US in 2014.
43
Figure 39: Outsourcing market segments in India
Outsourcing Market
Contract Chemistry Biology Research Contract Manufacturing
Clinical Research
Table 14: Business models of CROs
Parameters In-house models Collaborative Models Outsourcing Models
Captive Licensing/ Technology Full Time Joint Venture Third Party Third Party Transfer Equivalent (Single Vendor) (Multiple (FTE) Vendors) Model*
*Preferred for data management services Sources: ValueNotes Research and IMaCS analysis
R&D centres exclusively work for the sponsor
Description
In-house operations of captive centre ensures data security and confidentiality of proprietary technology
Strategic Intent
Licensing the rights of developing or manufacturing a drug by using the partner’s technology for drug development
Licensing the rights for manufacturing or marketing a drug by using the partner's technology for drug development
R&D centres which work full-time and exclusively for the sponsor
A local service provider develops the facility, human resource and offices while the sponsor provides the hardware and the software and also the training on it. It is a project-based model lasting for a few years
R&D centres exclusively work for the sponsor who usually retains management control
Deriving synergies and competitive advantage from partner’s R&D competence, manpower and financial strength
The sponsor pays fixed ‘fees’ for the services out-sourced to a single vendor
Vendor can match buyers’ needs with specific vendor capabilities
Vendor outsources a part of the outsourcing contract to a third party or consortium of vendors
Deriving synergies of multiple vendors for a particular contract on a risk-profit shared basis
Figure 41: Drug discovery value chain
Basic Research Development Regulatory Approval Sales
National Institutes of Health
Venture Capital
Pharmaceutical Companies
Initial Public Offering
Sales
Source: IMaCS Analysis
Figure 40: CRO market in India (2010)
30%
18%
52%
Research - Chemistry & Research-Biology
Research - Chemistry & Research-Biology,
18%
Clinical Trials, 52%
Pre-Clinical Trials, 30%
Clinical TrialsPre-Clinical Trials
Contract Chemistry:- ZCL Chemicals Limited, ShasunPharmaceuticals, Arch Pharmalabs, Dow ChemicalCompany, Piramal Enterprises, Dishman, Jubilant LifeSciences and Ranbaxy.
Contract Manufacturing:- GVK Bio-Sciences, TCG LifeSciences, Dr. Reddy’s Laboratories, Ranbaxy, Alembic,Torrent and Piramal Enterprises.
The Indian pharmaceuticals outsourcing market wasvalued at US$ 4 billion in 2011. It includes contractchemistry, biology research, clinical trials and contractmanufacturing – each valued at around US$ 1 billion,
Clinical Research:- Novartis, LifeCell Corporation, AvraSynthesis, Connexios Life Sciences, MRD Life Sciences,Alkem Labs, Lupin, Aristo, Divis Laboratories, ZydusCadila, Sun Pharmaceuticals and Piramal Enterprises.
45
Cost saving pressureglobally
Price sensitive markets and retailers putting cost pressure on pharmaceutical companiesto look for cost efficient options including contract manufacturing.
World class practices
Skilled manpower
Cost advantage
Complex supplychain network
Compliance of intellectual property
rights
Large productionfacilities
Annually India produces six times more trained chemists than the US, and has an abundantsupply of trained scientists.
Pharmaceutical products traverse a complex global supply chain to reach consumers worldwide. Advance Radio-Frequency Identification (RFID) technology in packagingaids accurate and safer supply chain logistics.
Introduction of product patents in 2005, which increased the confidence and growthof the Indian contract manufacturing industry.
Indian contract manufacturers are upgrading and multiplying manufacturing capacityto match global demand.
Reformulationtechnology
Indian companies’ expertise in NDDS and reformulations of existing products will extendproduct life cycles.
Highly skilled Indian manufacturers offer low cost in producing complex synthesis within a short frame of time.
Figure 42: Growth drivers of contract manufacturing in India
Source: IMaCS Analysis
Table 15: Key contract manufacturing organisations
Patented drugs, custom synthesis and scale-ups
Specialised generics
Old generics and molecules
Company Description CRAMS Products and services
Dishman Pharmaceuticals & Chemicals Ltd.
Divi's Laboratories Ltd.
Ipca Laboratories Ltd.
Jubilant Life Sciences Ltd.
Torrent Pharmaceuticals Ltd.
Morepen Laboratories Ltd.
Shasun Pharmaceuticals Ltd.
Company Description
The firm was founded in 1999. It is a clinical research organisation providing full spectrum of services for clinical drug development activities including clinical trials.
Reliance Life Sciences Pvt. Ltd. The firm was founded in 2001. It offers research, process development, pre-clinical studies, human clinical trials, manufacture and marketing of pharmaceuticals, etc.
Vimta Labs Ltd.
SIRO Clinpharm Pvt. Ltd. The firm was founded in 1996. It provides clinical trial services, clinical resourcing, investigator recruitment, clinical data management and biostatistics.
Synchron Research Services Pvt Ltd. The firm was founded in 1998, is a leading CRO providing clinical research services bioavailability/ bioequivalence, pharmacokinetic and pharmaco-dynamics studies, Phase II-IV studies, Bio-analysis, Statistical analysis.
Jubilant Biosys Ltd.
Table 16: Clinical trials organisations in India
Pharmaceutical companies are expanding theirR&D pipeline and exploiting existing opportunities inthe market via long-term R&D outsourcing and in-licensing. Companies such as Eli Lilly, Sanofi andGlaxoSmithKline (GSK) have endorsed long-termoutsourcing.–
India has the largest number (about 370) of USFDA approved and GMP compliantmanufacturing facilities outside the US.
Piramal Enterprises (Formerly Piramal Healthcare) has astate-of-the-art R&D facility, built at approximately one-fifth of what it would cost in the US or Europe.Secondly, it has set its goal on novel discoveryapproach right from the outset and thus boasts of arobust pipeline of drugs across several therapeuticareas that are at different stages of discovery. Thecompany has capitalised on the advantages India offerswith regard to clinical trials—it has been successful incompleting the duration of clinical trials in lesser timecompared to western countries.
Piramal Enterprises
Founded in 1983. It offers active pharmaceutical ingredients, intermediates,quaternary compounds and fine chemicals. In FY2014, turnover was US$229 million.
Established in 1990. It manufactures and sells active pharmaceuticalingredients and intermediates. FY2014 turnover was US$ 430 million.
Piramal Enterprises Ltd. Firm was established in 1988. It is engaged in manufacturing and sale ofbulk drugs and formulations. In FY2014, turnover was US$ 780 million.
Mylan Laboratories Ltd. Firm was founded as Matrix Laboratories in 2001 and in 2011 became MylanLaboratories Limited. It is engaged in manufacturing active pharmaceuticalingredients and solid oral dosage forms. In FY2011, turnover was US$ 706million. Mylan Laboratories is a subsidiary of Mylan Inc.
Firm was founded in 1976. It is engaged in manufacturing pharmaceuticalingredients, intermediates and enteric coating excipients. In FY2014, turnoverwas US$ 200 million.
Firm was founded in 1949. It is engaged in manufacturing pharmaceuticalingredients and formulations. In FY2014, turnover was US$ 546 million.
Firm was founded in 1978. It is an integrated pharmaceuticals and lifesciences company involved in active pharmaceuticals ingredients andgeneric dosage forms, drug discovery and development, clinical research,custom research and manufacturing services. In FY2014, turnoverwas US$ 962 million.
Firm was founded in 1959. It is engaged in manufacturing and sale ofgeneric pharmaceutical products. In FY2014, turnover was US$ 698 million.
Firm was founded in 1984. It manufactures ampicillin, amoxicillin, cloxacillinand other medicines and also provides home and clinical health careequipment. In FY2013, turnover was US$ 60 million.
Source: Company websites
The firm was founded in 1984. It is engaged in contract research and testingactivities. FY2014, turnover was US$ 20 million.
Firm engages in providing chemo informatics services to pharmaceutical andbiotechnology companies. FY2014, turnover was US$ 16 million.
Source: Company websites
Lambda Therapeutic Research Ltd.
(CRAMS) industry accounted for 8.3 per cent of theglobal CRAMS market in 2012 and is expected to reach21.3 per cent by 2017. CRAMS market in India wasestimated at US$ 7.3 billion in 2013.
US, Germany, France, Canada and UK put togetherpossess around 65 per cent of all trial sites of the world.
Larger Indian pharmaceutical companies haveforayed into innovative research. Genericscompanies such as Dr. Reddy’s Laboratories andRanbaxy are developing novel drugs, while PiramalEnterprises has always been a proponent of noveldrug discovery approach.
47
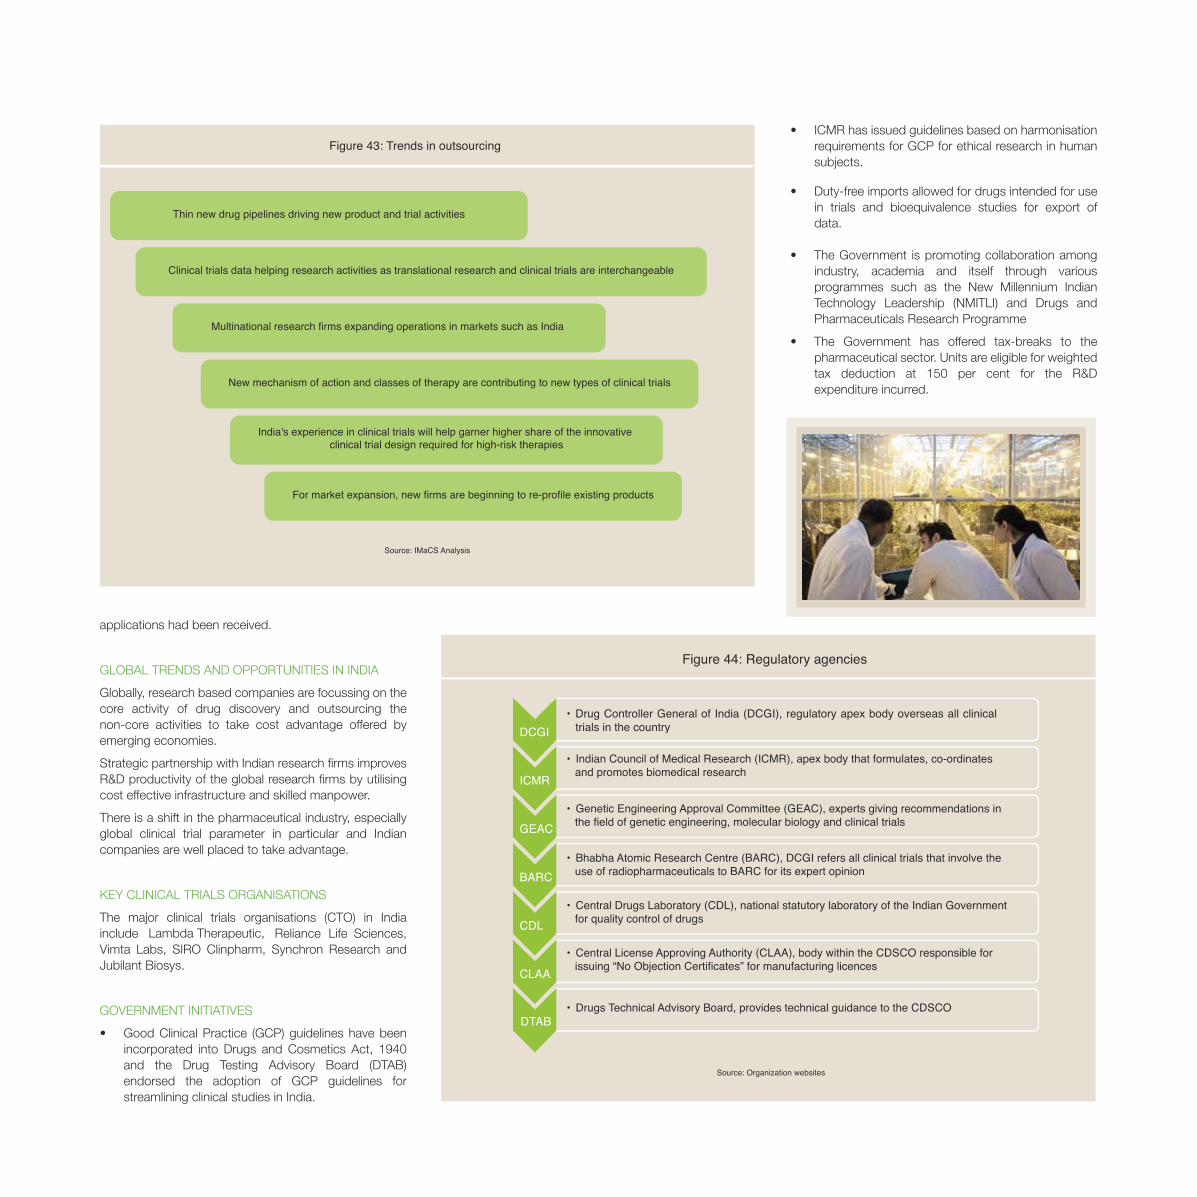
Figure 43: Trends in outsourcing
Thin new drug pipelines driving new product and trial activities
Clinical trials data helping research activities as translational research and clinical trials are interchangeable
New mechanism of action and classes of therapy are contributing to new types of clinical trials
Multinational research firms expanding operations in markets such as India
For market expansion, new firms are beginning to re-profile existing products
India's experience in clinical trials will help garner higher share of the innovative clinical trial design required for high-risk therapies
Source: IMaCS Analysis
DCGI
Indian Council of Medical Research (ICMR), apex body that formulates, co-ordinates and promotes biomedical research
ICMR
Genetic Engineering Approval Committee (GEAC), experts giving recommendations in the field of genetic engineering, molecular biology and clinical trialsGEAC
Bhabha Atomic Research Centre (BARC), DCGI refers all clinical trials that involve the use of radiopharmaceuticals to BARC for its expert opinionBARC
Central Drugs Laboratory (CDL), national statutory laboratory of the Indian Government for quality control of drugsCDL
Central License Approving Authority (CLAA), body within the CDSCO responsible for issuing “No Objection Certificates” for manufacturing licencesCLAA
Drugs Technical Advisory Board, provides technical guidance to the CDSCO
Figure 44: Regulatory agencies
DTAB
Lambda Therapeutic,
Drug Controller General of India (DCGI), regulatory apex body overseas all clinicaltrials in the country
Source: Organization websites
49
Figure 45: OTC sales in India (US$ million)
Dr. Reddy’s Laboratories Darbepoetin alfa (recombinant erythropoietin)
Ranbaxy Laboratories
Table 17: Achievements of Indian firms in biosimilars segment
Figure 46: Segmentation of Indian nutraceuticals market
Sources: Global Nutraceutical Industry:
Dietary Supplements Functional Foods and Beverages
33%
2010
2015
40%
60%
67%
grown at a healthy rate of around 12 per cent per annumsince 2008 to reach around US$ 2.3 billion in 2012.
CAGR : 12%CAGR : 12%
Source: Nicholas Hall's DB6 Global OTC Database
By 2020, approximately US$ 67 billion of biologicproducts will lose patent protection which represents amajor opportunity for Indian manufacturers.
The Indian nutraceuticals market was estimated ataround US$ 3 billion in 2013, representing around 2 percent of global market.
This proves existence of major opportunity for Indiannutraceuticals players to increase their presence inglobal markets. The functional food and functionalbeverages capture a strong 67 per cent market share inIndia.
The global nutraceuticals product market reached US$142.1 billion in 2011 and is expected to reach US$ 204.8billion by 2017. Functional beverages accounting foraround 36 per cent followed by functional food with 33per cent and dietary supplements with 31 per cent.
Several other products are in the pipeline
Source: Company websites
51
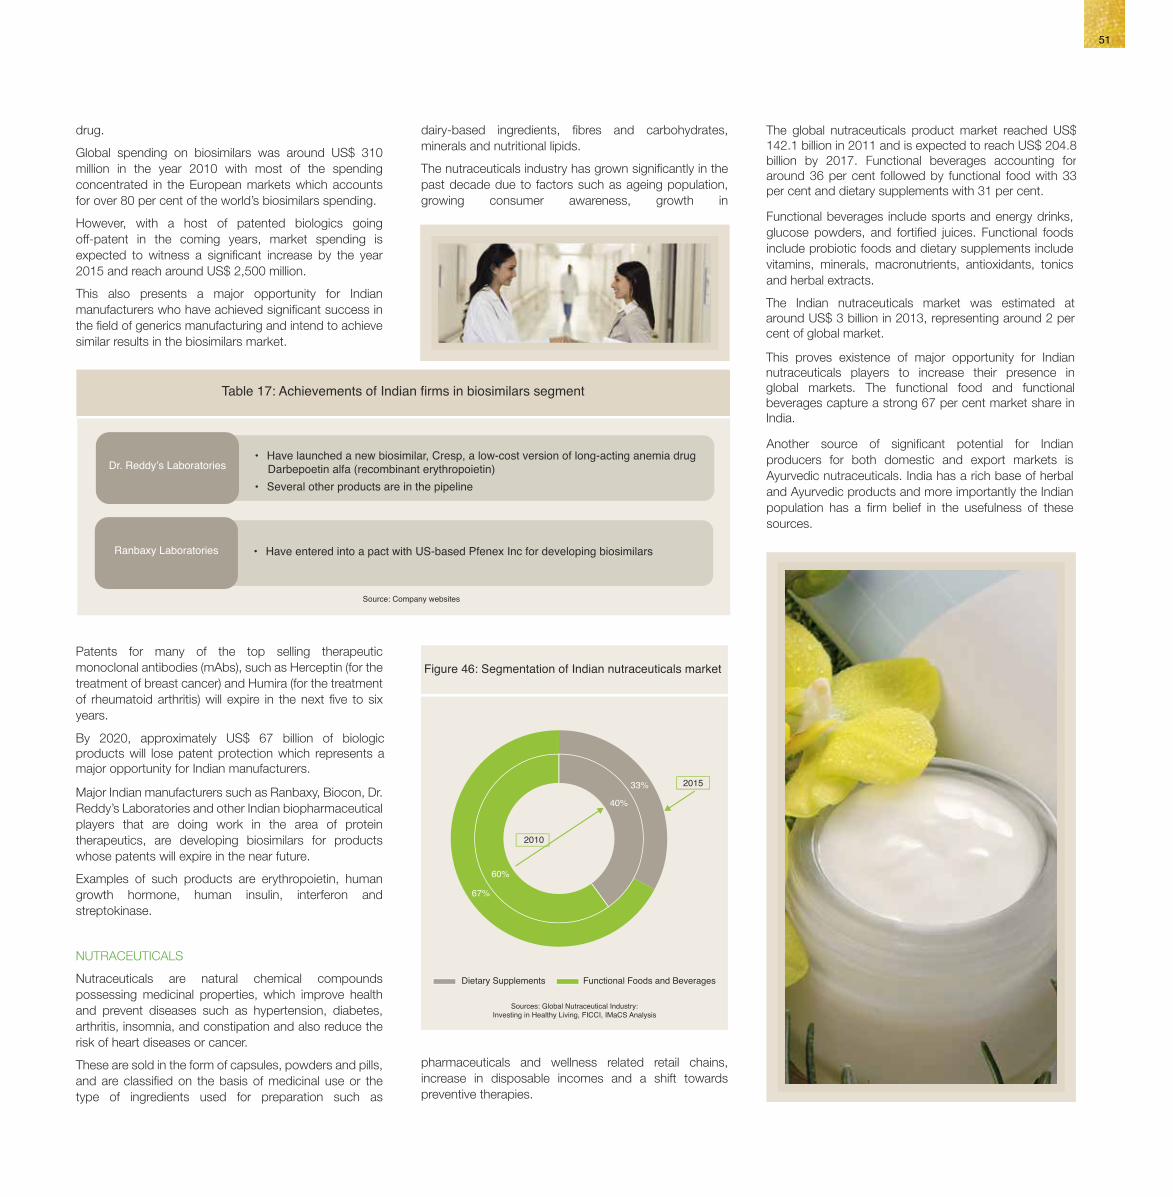
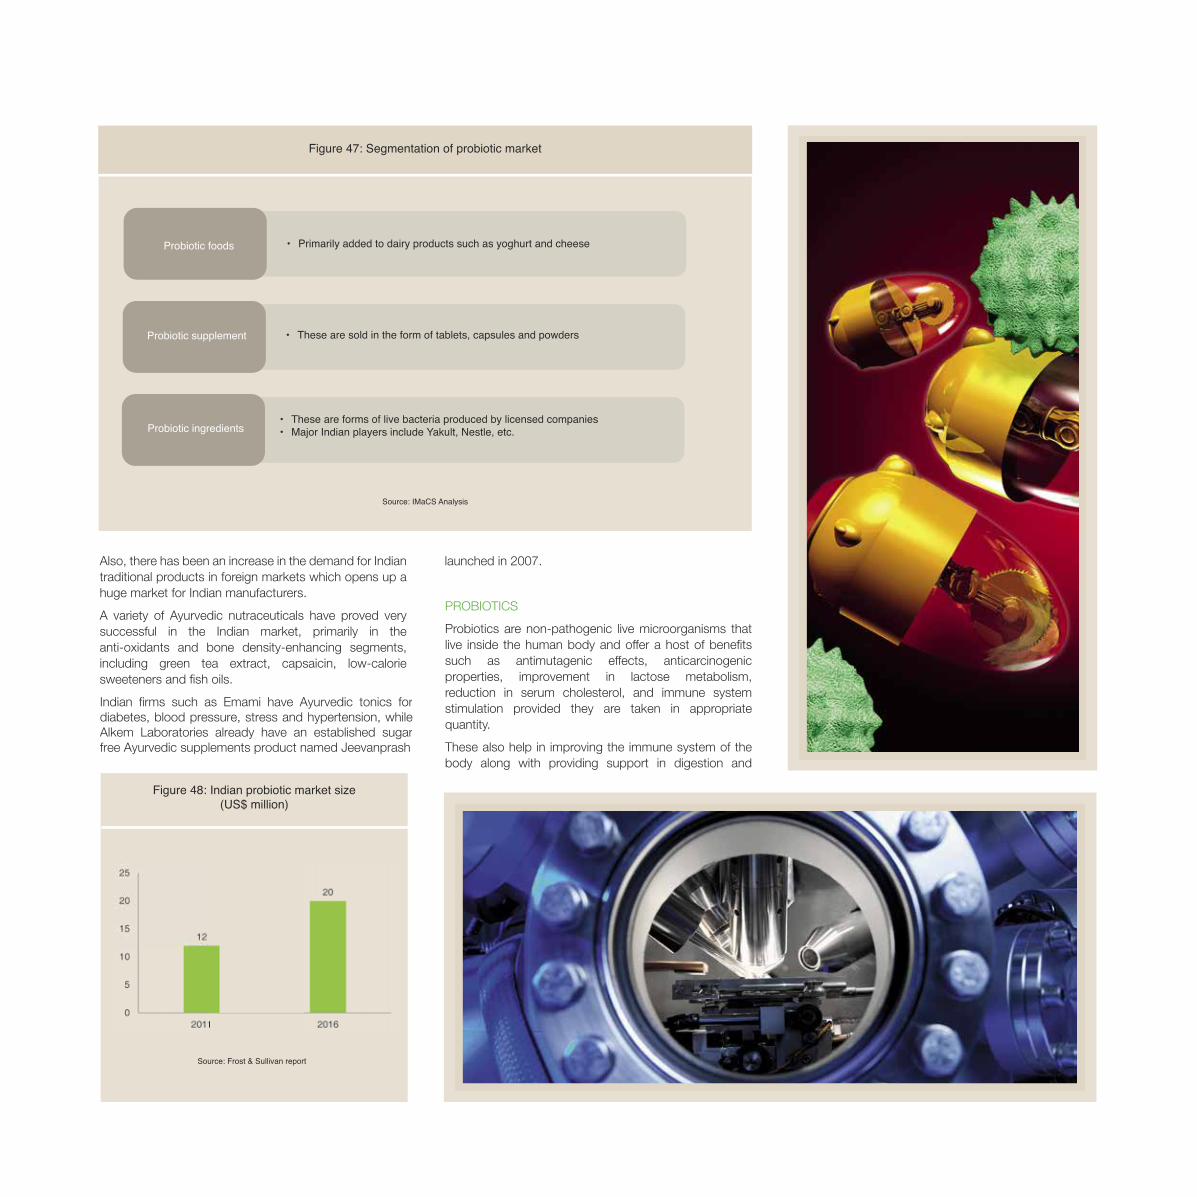
Figure 47: Segmentation of probiotic market
Probiotic foods
Probiotic supplement
Probiotic ingredients
Source: IMaCS Analysis
Indian firms such as Emami have Ayurvedic tonics fordiabetes, blood pressure, stress and hypertension, whileAlkem Laboratories already have an established sugarfree Ayurvedic supplements product named Jeevanprash
launched in 2007.
improving urinary tract health. The global probioticmarket was estimated at around US$ 27.1 billion in 2013and is expected to be worth US$ 36.7 billion by 2018.
The domestic probiotic market on the other hand wasestimated to be around US$ 12 million in 2011 and isexpected to witness a CAGR of 11 per cent by 2016.
The key players in this industry are Yakult, Danone,Nestle, Dr. Reddy's Laboratories, Glenmark, CD PharmaIndia, Aristo Pharmaceuticals, Sanofi India and Ranbaxy.
Source: Frost & Sullivan report
Figure 48: Indian probiotic market size(US$ million)
53
Aerospace, 6%
Figure 49: Global application of nanotechnology (2010)
Chemicalmanufacturing, 9%
Others, 9%
Pharmaceuticals, 17%
28%
Materials, 28%
Sources: National Science Foundation, IMaCS Analysis
individual scientists
locations in the country
Strengthening of characterizationfacilities
across the country
International collaborative programmes
partnership activities public private partnership activities
Figure 51: Activities under Nanoscience and Technology Mission
Sources: Department of Science & Technology- Nanomission, IMaCS Analysis
Source: IMaCS Analysis
Figure 50: Applications of nanotechnology in pharmaceuticals
Nano materials for tissue engineering
Molecular diagnostics
delivery systems, etc.
Drug carrier system
Biosensor and bio-labels carrier system
Source: Department of Biotechnology Annual Report, 2009-2010
Figure 52: Other Government initiatives in pharmaceutical nanotechnology
Department of Biotechnology
Figure 53
Starkey India using sensors
signals and store information
Virtus Innovation to stimulate dormant genes
Technology-Nanocetnanoparticles technology
antimicrobial agents and treatment of pollutants
Velbionanotech stones, and cosmetics generic products using a short fragment of DNA.
Source: “Nanotechnology, the Science of the Future.” Background paper by FICCI and Department of Science and Technology, IMaCS Analysis
Several Indian companies such as Ranbaxy, TorrentPharmaceuticals, Dabur, Dr. Reddy’s Laboratories,Piramal Enterprises and Sun Pharmaceutical Industriesare investing in R&D in the areas of nano-biotechnology.
55
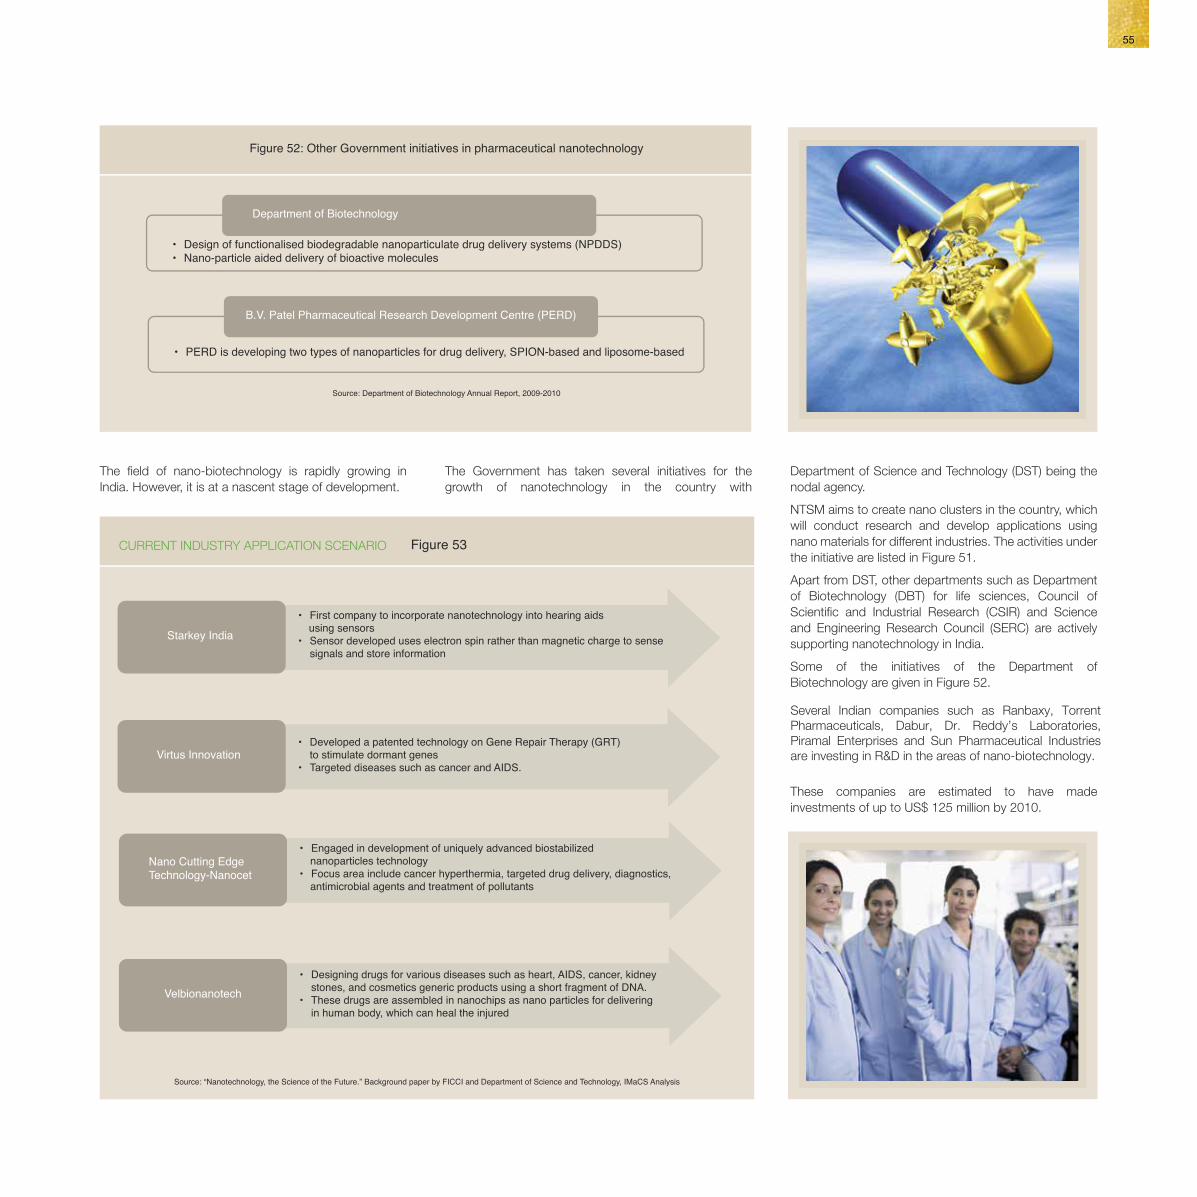

50.0%
45.0%
40.0%
35.0%
30.0%
25.0%
20.0%
15.0%
10.0%
5.0%
0.0%
2006-07 2007-08 2008-09 2009-10 2010-11
Figure 56: Annual growth rate in plan expenditure of Department of AYUSH
22.9%
21.1%
8.8%
44.1%
24.4%
Sources: Department of AYUSH, IMaCS Analysis
Figure 54: Segment-wise share of Indian biopharmaceutical industry (2010)
Vaccines 60%
Diagnostics 25%
Therapeutics15%
Sources: Biospectrum, June 2010, IMaCS Analysis
Source: IMaCS Analysis
Figure 55: Evolution of Indian biotechnology industry
Phase II (1990s)
1991: National Centre for Biological Sciences started R&D in molecular biology1994: Syngene, India's first Contract Research Organisation (CRO) started R&D services
1998: DBT approved the Mahyco-Monsanto 50:50 joint venture to market biotech cotton
Phase III (2000s)
Phase ITrends in early phase
(1970s to 1980s)
for clinical trials
Applied Biotechnology's jointly funded initiative
Source: IMaCS Analysis
Of the broad segments, vaccines account for the largestshare of this industry followed by diagnostics andtherapeutics.
1997: Institute of Genomics and Integrative Biology was created to focus onbioinformatics and genomics
2000: Formation of India's first bioinformatics company, Strand Life Sciences
Indian biopharmaceutical industry was estimated at US$2.5 billion in 2011-12, registering an annual growth of 16per cent over the previous year.
Domestic sales contributed approximately US$ 1.3 billionin 2011-12 accounting for around 51 per cent of totalrevenues, indicating the demand for biopharmaceuticalsin the domestic market. In 2011-12, the export ofbiopharmaceuticals was US$ 1.2 billion, comprisingmainly of statins and vaccines.
57
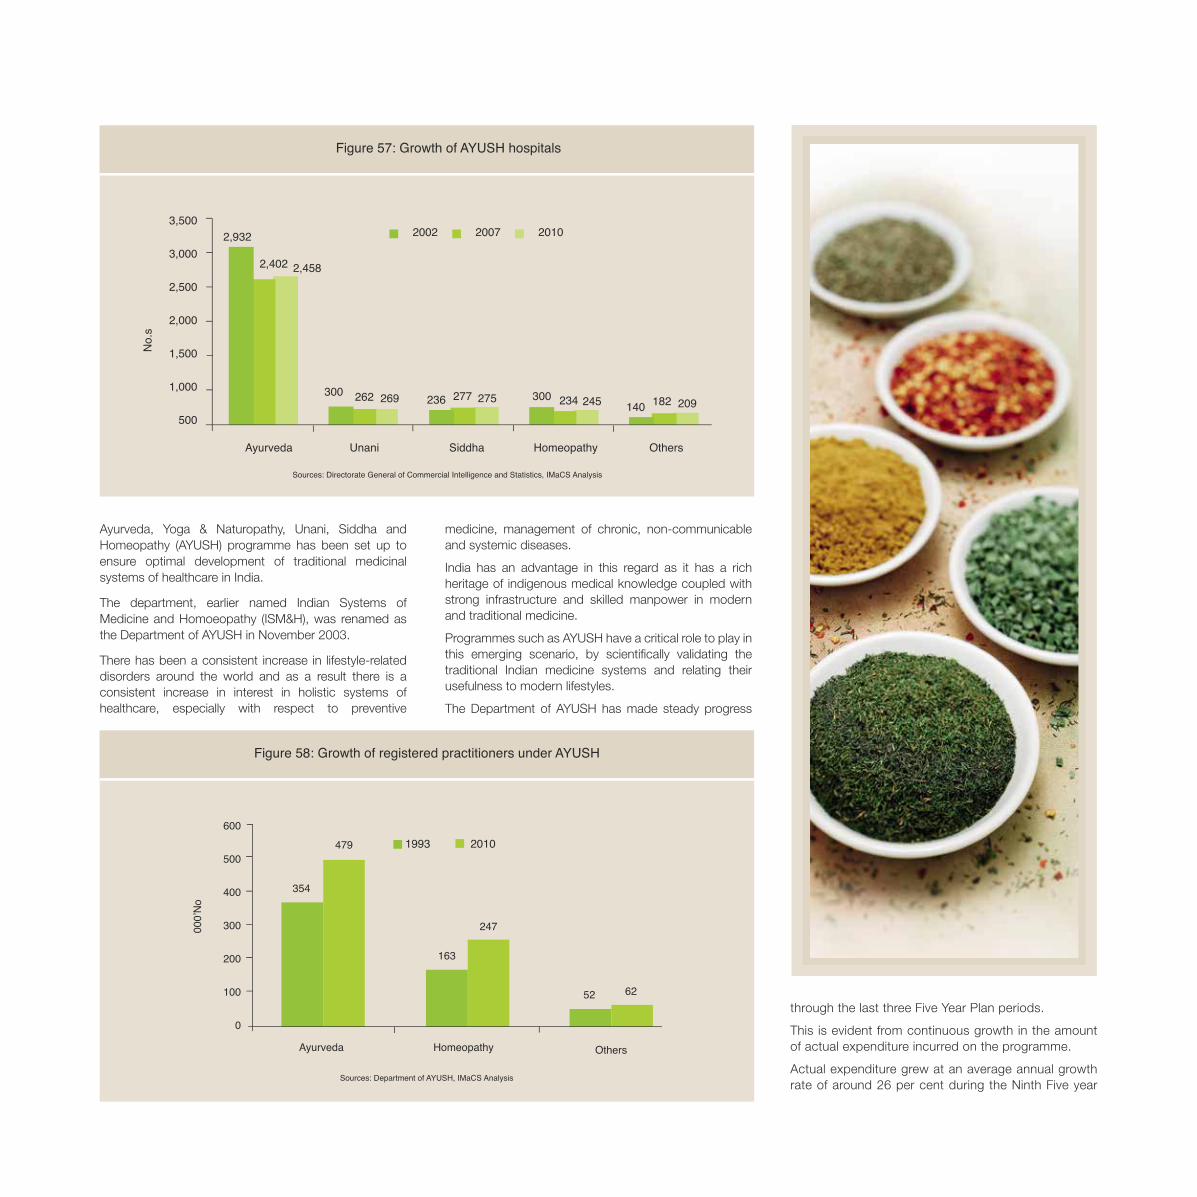
Ayurveda Unani Siddha Homeopathy Others
2,932
2,402 2,458
300
No.
s
262 269 236 277 275
2002 2007 2010
300 234 245 140 182 209
3,500
3,000
2,500
2,000
1,500
1,000
500
Figure 59: AYUSH product categories
Classical Products
practitioners of ASU sciences
Ethically Promoted Products
as well as Ayurvedic Physicians
ASU Foods
supplements, organic teas, etc.
ASU Cosmetics
products such as massage oil, creams etc.
to being used for cosmetic application
Sources: Ayurvedic Drug Manufactures Association (ADMA), IMaCS Analysis
Figure 60: AYUSH product exports (US$, million)
600
500
400
300
200
100
0
354
Ayurveda Homeopathy Others
000’
No
479 1993 2010
163
247
52 62
Sources: Department of AYUSH, IMaCS Analysis
Sources: Department of Commerce, Press Information Bureau, Government of India
59
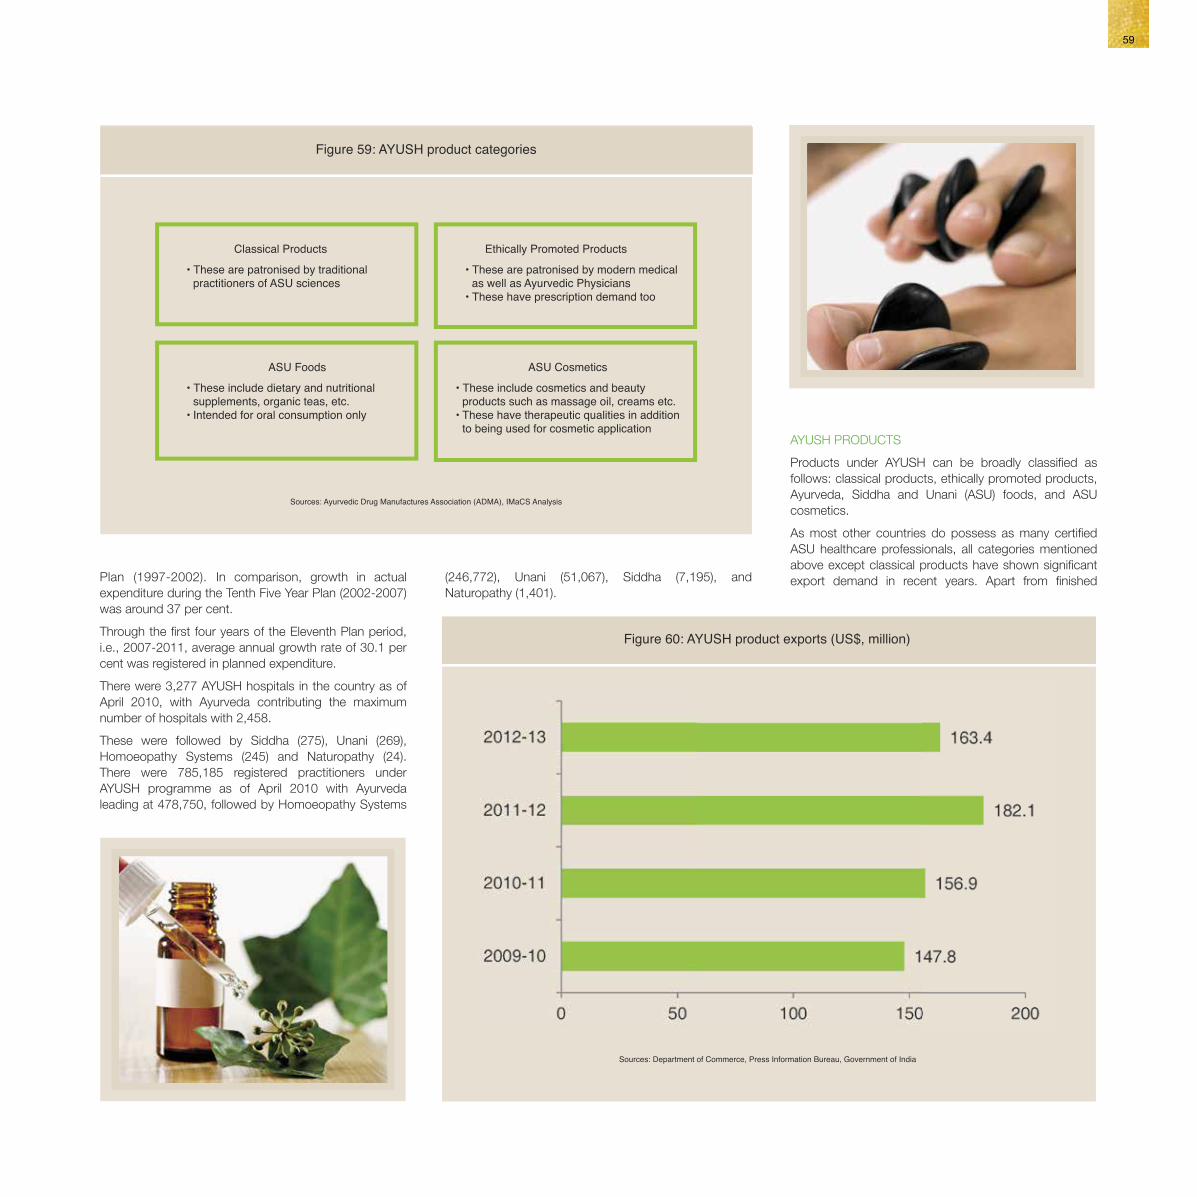
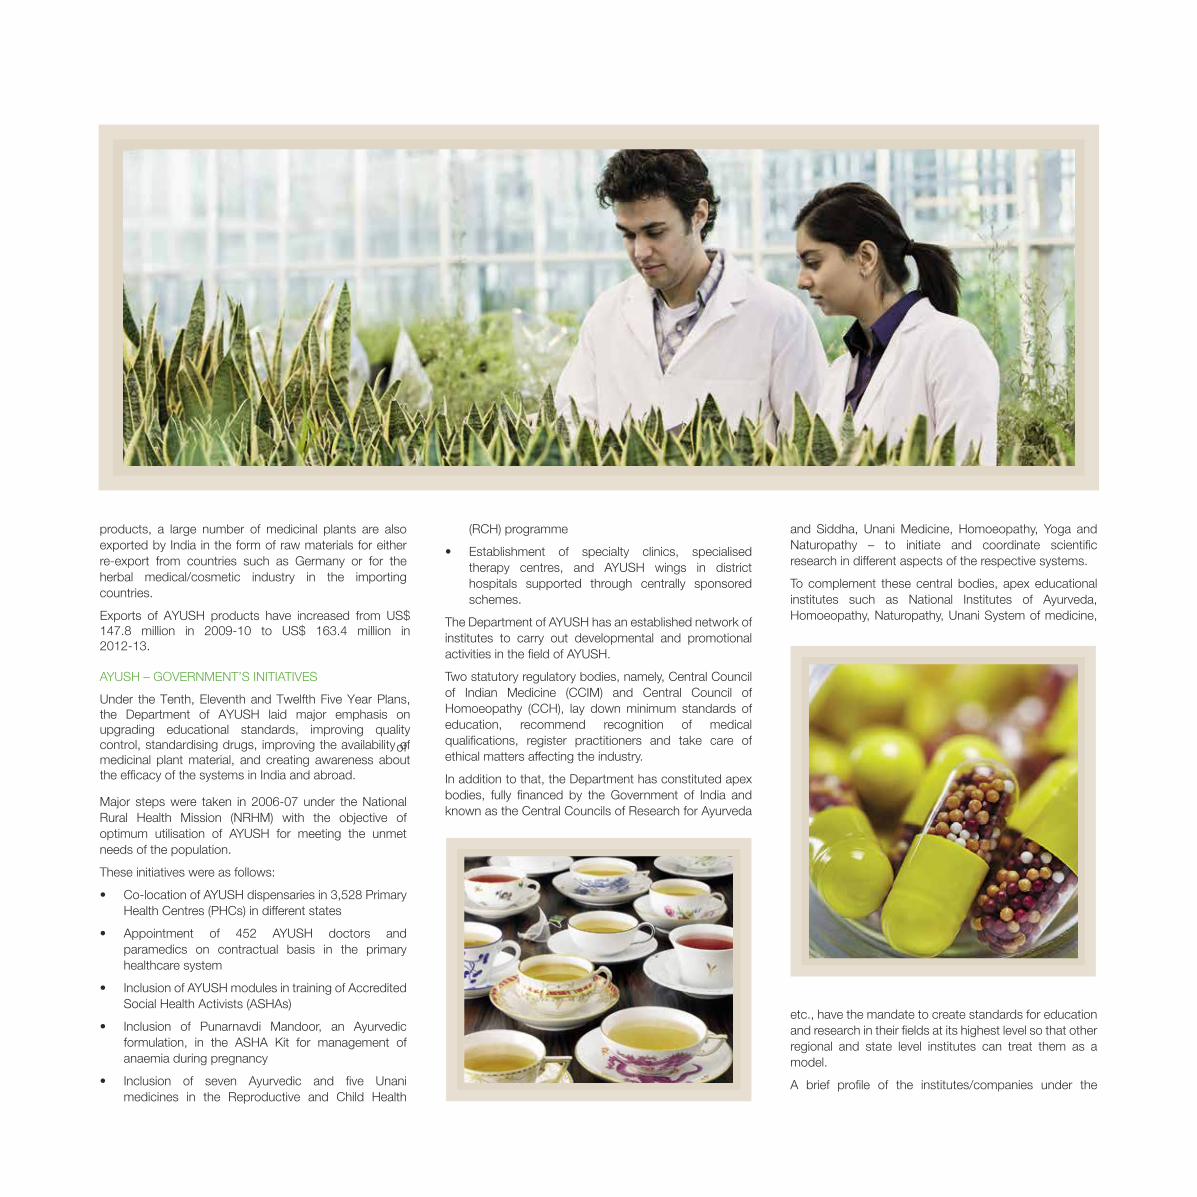
Establishment Incorporated in 1978, IMPCL was setup under the administrative control of the Department of AYUSH
hospitals, dispensaries and by various AYUSH research councils.
Indian Medicines Pharmaceutical Corporation Limited (IMPCL)
facilities for AYUSH industry clusters
conservation and ex-situ cultivation of medicinal plants for a sustainable ASU&H Industry
Initi
ativ
es d
urin
g 11
th P
lan
plant farmers
with focus on global positioning of AYUSH systems and facilitation of cooperation with other countries
Sources: Ministry of Health and Family Welfare, Department of AYUSH, IMaCS Analysis
Exports of AYUSH products have increased from US$147.8 million in 2009-10 to US$ 163.4 million in2012-13.
Under the Tenth, Eleventh and Twelfth Five Year Plans,the Department of AYUSH laid major emphasis onupgrading educational standards, improving qualitycontrol, standardising drugs, improving the availability ofmedicinal plant material, and creating awareness aboutthe efficacy of the systems in India and abroad.
61
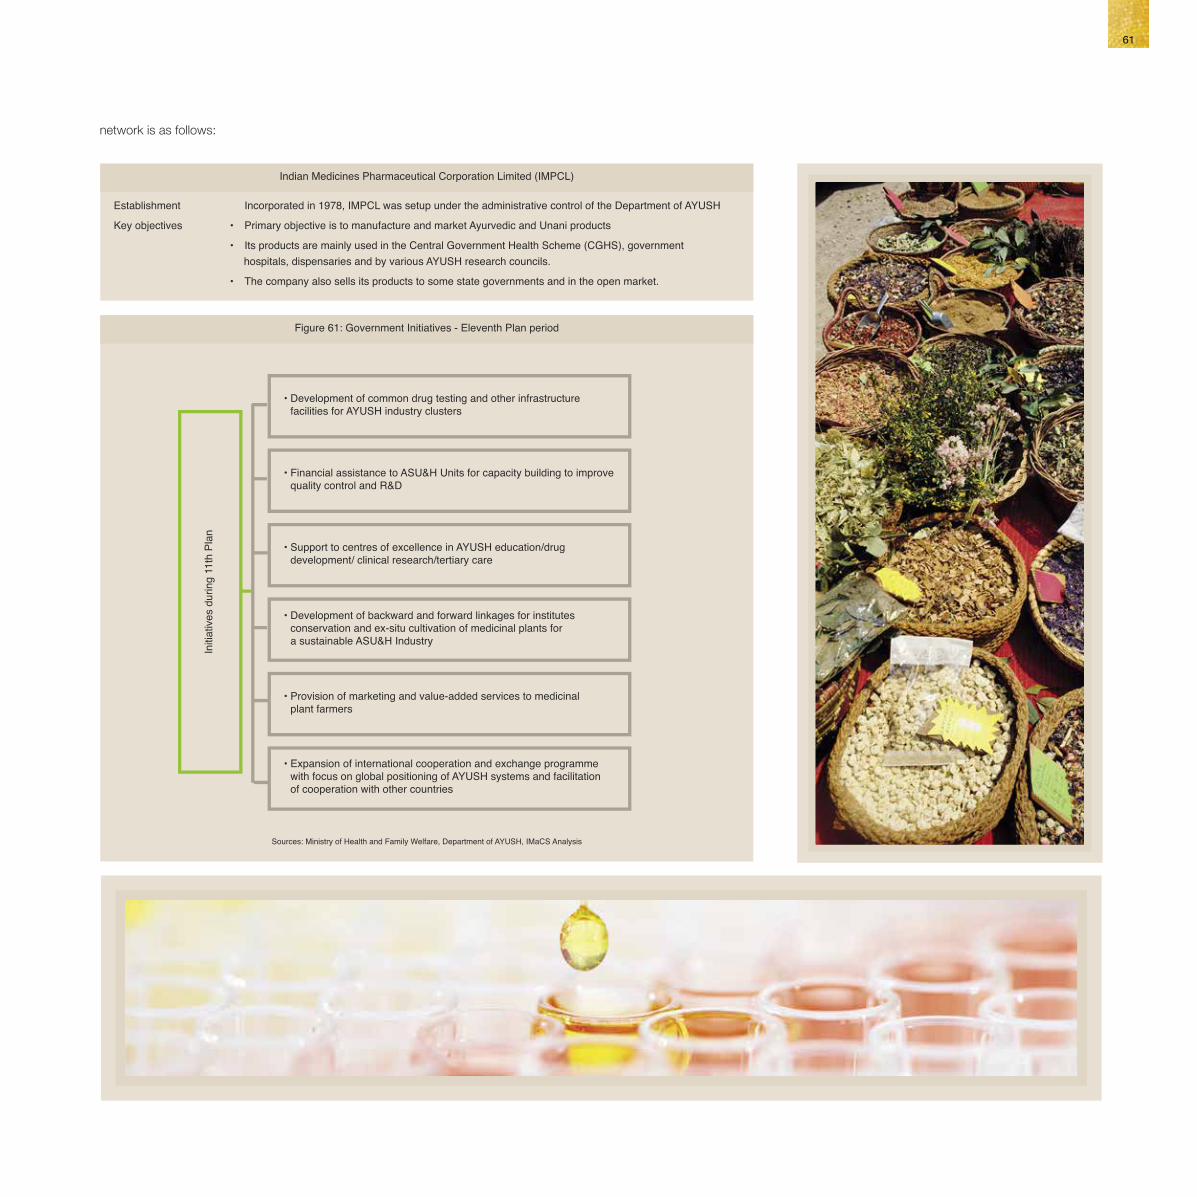
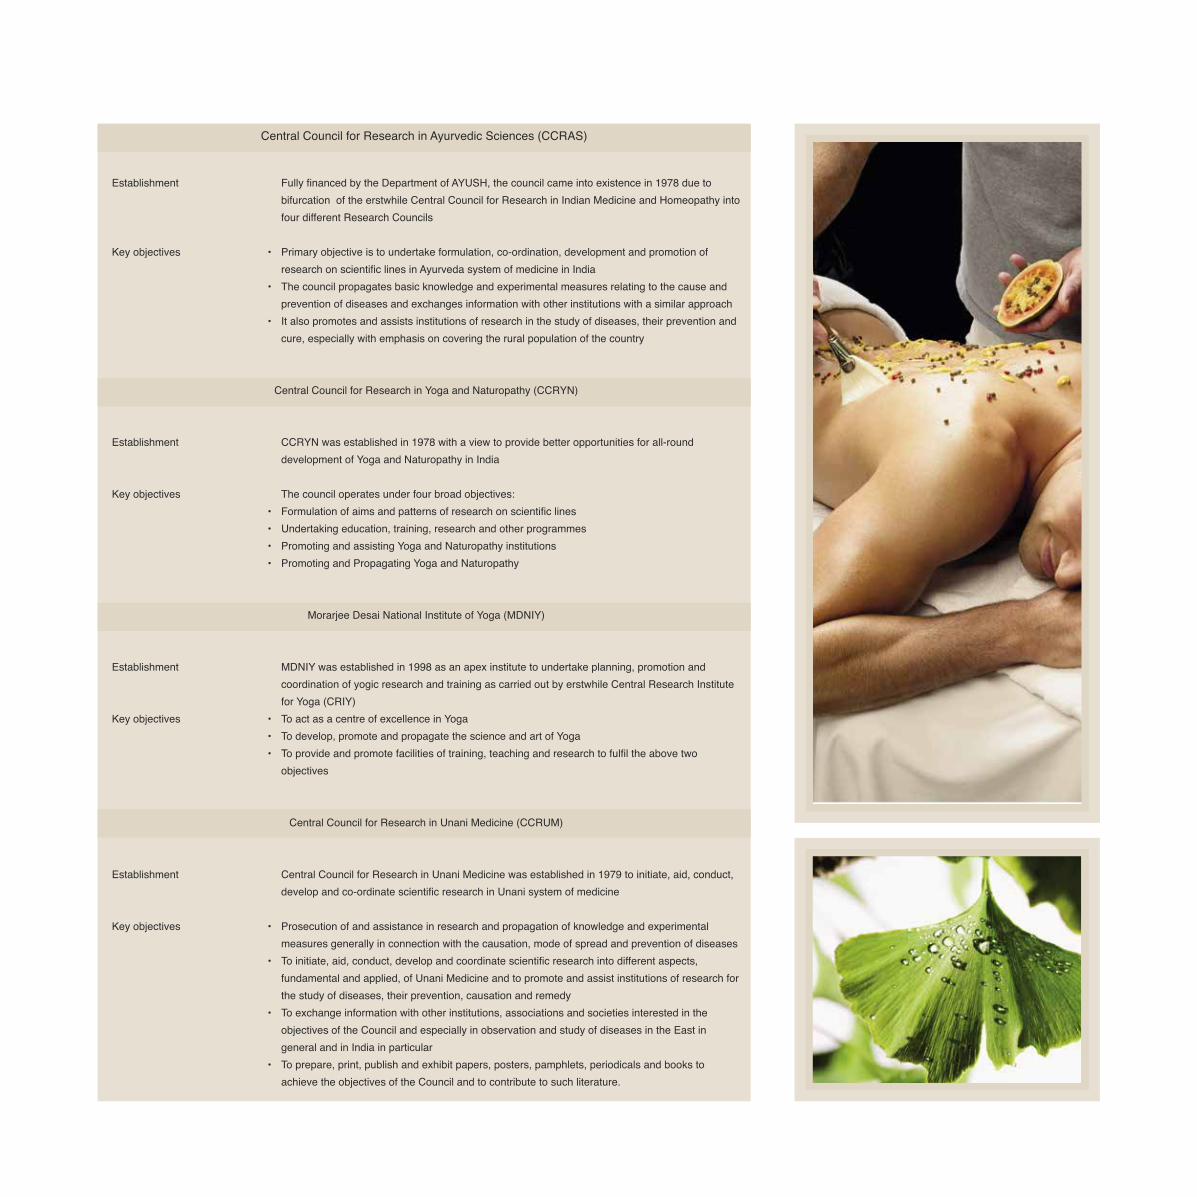
Establishment Fully financed by the Department of AYUSH, the council came into existence in 1978 due to bifurcation of the erstwhile Central Council for Research in Indian Medicine and Homeopathy into four different Research Councils
research on scientific lines in Ayurveda system of medicine in India
objectives
Establishment Central Council for Research in Unani Medicine was established in 1979 to initiate, aid, conduct,
fundamental and applied, of Unani Medicine and to promote and assist institutions of research for the study of diseases, their prevention, causation and remedy
objectives of the Council and especially in observation and study of diseases in the East in
achieve the objectives of the Council and to contribute to such literature.
of Unani medicine
Establishment Central Council for Research in Indian Medicine and Homoeopathy was established in 1969 to streamline research in Homoeopathy
applied aspects of Homoeopathy
Homoeopathy
objects similar to those of the council
63

Collaboration with Russia
Institutes* to promote Ayurveda in Russia
Collaboration with Chinacooperation for promotion of traditional medicine
of ASU medicinal products
Courses on Ayurveda In USmedical schools US to deliver lectures to students at medical schools of
act and rules.
cultivation and introduction of medicinal plants.
The information contained in this publication/report has been taken from trade and statistical services and other sources which we believe are reliable. However, IBEF and its affiliates, partners,research associates, publishers do not guarantee that such information is accurate or complete or reliable and it should not be relied upon as such. Any opinions expressed reflect judgments atthis date and are subject to change without notice.
Readers are solely responsible for assessing the relevance and accuracy of the content (data, graphics, flowcharts etc.) of this publication and any reliance by you (i.e. reader) placed on suchinformation is therefore strictly at your own risk.
IBEF including its affiliates, partners, research associates, publishers shall not be liable (in any manner, whatsoever), whether arising from negligence or otherwise, for any loss, damage, cost orexpense incurred or arising by reason of any person using or relying on information/contents/data (in part or in full) in this publication/report. Nor shall they have any liability (whether arising fromnegligence or otherwise) for any representations (express or implied) made/included in this publication/report.
Products may be identified by proprietary or trade names to help readers identify particular types of products but this is not, and is not intended to be, an endorsement or recommendation of anyproduct or manufacturer referred to. Other products may perform as well or better than those specifically referred to.
For any queries/permissions, please contact: Deepthy Ambooken, [email protected]
Any unauthorized reprint or use of this material is prohibited. No part of this book/report/publication should be reproduced, copied, used, utilised, transmitted or quoted in any form or by anymeans (graphic, electronic or mechanical, including photocopying, recording, taping or information retrieval systems) or reproduced on any disc, tape, perforated media or other informationstorage device, etc., by any person, institution or organisation without a prior written affirmative approval of IBEF. Any intellectual property right including copyright violation would be seriouslydealt with and liable for legal action.
© All Rights Reserved. This book contains material protected under International and Indian Copyright Laws and Treaties; and all intellectual property rights (including copyright) in the contents,data, images, flowcharts etc. as used in this book/publication either belong to IBEF or lawfully licensed to IBEF.
Copyright Disclaimer
Legal Disclaimer
65


India Brand Equity FoundationApparel House, # 519-22, 5th Floor
Sector 44, Gurgaon 122003Haryana, India
Tel: +91 124 449 9601Fax: +91 124 449 9615
Email: [email protected]
Web: www.ibef.orgwww.brandindiapharma.in
India Brand Equity Foundation (IBEF) is a Trust established by the
Ministry of Commerce, Government of India. IBEF’s
primary objective is to promote and create international
awareness of the Made in India label in markets overseas and to
facilitate the dissemination of knowledge of Indian products
and services. Towards this objective, IBEF works closely with stakeholders across government
and industry.