The benefits of quantifying climate model uncertainty in climate change impacts assessment: an...
22
The benefits of quantifying climate model uncertainty in climate change impacts assessment: an example with heat- related mortality change estimates Simon N. Gosling School of Geography, The University of Nottingham, Nottingham, UK. +44(0)115 951 5437 [email protected] Glenn R. McGregor School of Environment, The University of Auckland, Auckland, New Zealand. [email protected] Jason A. Lowe The Met Office Hadley Centre, Exeter, UK. [email protected] Abstract The majority of climate change impacts assessments account for climate change uncertainty by adopting the scenario-based approach. This typically involves assessing the impacts for a small number of emissions scenarios but neglecting the role of climate model physics uncertainty. Perturbed physics ensemble (PPE) climate simulations offer a unique opportunity to explore this uncertainty. Furthermore, PPEs mean it is now possible to make risk-based impacts estimates because they allow for a range of estimates to be presented to decision-makers, which spans the range of climate model physics uncertainty inherent from a given climate model and emissions scenario, due to uncertainty associated with the understanding of physical processes in the climate model. This is generally not possible with the scenario-based approach. Here, we present the first application of a PPE to estimate the impact of climate change on heat-related mortality. By using the estimated impacts of climate change on heat-related mortality in six cities, we demonstrate the benefits of quantifying climate model physics uncertainty in climate change impacts assessment over the more common scenario-based approach. We also show that the impacts are more sensitive to climate model physics uncertainty than they are to emissions scenario uncertainty. For the impact we consider here, whether the climate projections are taken from a global climate model or a regional climate model is shown to have only minor effect. The results demonstrate the importance of presenting model uncertainties in climate change impacts assessments if the impacts are to be placed within a climate risk management framework.
Transcript of The benefits of quantifying climate model uncertainty in climate change impacts assessment: an...

Page 1/22
The benefits of quantifying climate model uncertainty in climate change impacts assessment: an example with heat-related mortality change estimates Simon N. Gosling School of Geography, The University of Nottingham, Nottingham, UK. +44(0)115 951 5437 [email protected]
Glenn R. McGregor School of Environment, The University of Auckland, Auckland, New Zealand. [email protected]
Jason A. Lowe The Met Office Hadley Centre, Exeter, UK. [email protected]
Abstract The majority of climate change impacts assessments account for climate change uncertainty by adopting the scenario-based approach. This typically involves assessing the impacts for a small number of emissions scenarios but neglecting the role of climate model physics uncertainty. Perturbed physics ensemble (PPE) climate simulations offer a unique opportunity to explore this uncertainty. Furthermore, PPEs mean it is now possible to make risk-based impacts estimates because they allow for a range of estimates to be presented to decision-makers, which spans the range of climate model physics uncertainty inherent from a given climate model and emissions scenario, due to uncertainty associated with the understanding of physical processes in the climate model. This is generally not possible with the scenario-based approach. Here, we present the first application of a PPE to estimate the impact of climate change on heat-related mortality. By using the estimated impacts of climate change on heat-related mortality in six cities, we demonstrate the benefits of quantifying climate model physics uncertainty in climate change impacts assessment over the more common scenario-based approach. We also show that the impacts are more sensitive to climate model physics uncertainty than they are to emissions scenario uncertainty. For the impact we consider here, whether the climate projections are taken from a global climate model or a regional climate model is shown to have only minor effect. The results demonstrate the importance of presenting model uncertainties in climate change impacts assessments if the impacts are to be placed within a climate risk management framework.
Page 2/22
Key words Climate model physics uncertainty, Emissions scenario uncertainty, Perturbed physics ensemble, Climate change impacts, Heat-related mortality, Downscaling, Human health, Probabilistic assessment
Introduction Global climate models (GCMs) typically represent the atmosphere, ocean, land surface, biogeochemical processes and increasingly some elements of the cryosphere, and solve the equations governing their evolution on a grid covering the globe (McGuffie and Henderson-Sellers, 2005). Some processes are represented explicitly within GCMs, for instance large-scale atmospheric circulations, while others are represented by simplified parameterisations. The use of parameterisations is necessary to represent sub-grid scale processes or because of the current limited understanding of these processes or the computational expense in representing them. Furthermore, modelling centres will employ different but plausible representations of the climate system, which is why climate projections for a single emissions scenario will differ between modelling centres (Collins et al. 2006). Two main strategies exist to account for this “climate model physics uncertainty” in GCM simulations of future climate. The first of these is the multi-model method which collects GCM output from different modelling centres into a central repository where it can easily be accessed (e.g. Meehl et al. 2007). Typically these models have structural differences, such as a different atmospheric representation, although many also share sub-components. The alternative is to estimate climate model physics uncertainty by generating a “perturbed physics ensemble” (PPE; Lowe et al. 2009; Collins et al. 2006; Murphy et al. 2004; Webb et al. 2006; Stainforth et al. 2005) in which a single model structure is used and perturbations are introduced to the physical parameterisation schemes in the model. This is a relatively new method for considering the complexity of uncertainties inherent with GCMs. An advantage of this method is that variations in model formulation can be made systematically, whereas the multi-model strategy is very much ad hoc and has not been designed to span the complete range of model physics uncertainty. Studies have shown that the PPE approach can explore much of the range seen in a multi-model ensemble for some quantities (Webb et al. 2006). The application of PPEs in climate change impact assessment is in its infancy. To date most impact assessments have adopted the scenario-based approach (Donaldson et al. 2001; McMichael et al. 2003; Mearns et al. 2001). This approach is
Page 3/22
useful for exploring potential climate change impacts and provides an indication of the uncertainty in the impacts due to uncertainty in the magnitude of future greenhouse gas emissions. However, most scenarios have no associated likelihood, which presents difficulties when decision-makers are faced with alternative scenarios. For instance, the entire Intergovernmental Panel on Climate Change (IPCC) Special Report on Emissions Scenarios (SRES) family of scenarios is meant to be treated as being equally likely (Nakićenović and Swart, 2000) despite none of them including any mitigation policy. This lack of an estimate of scenario likelihood means that the relative risk of various alternative scenarios can not be assessed. New et al. (2007) discuss this caveat, commenting that as a result, the tendency for decision-makers may be to choose an adaptation response strategy to a “middle of the road” scenario. Alternatively, they may adopt an adaptation strategy that considers the entire range of scenarios they are presented with, or only consider “worst case” versus “best case” scenarios. Decision-makers are required to act on the best current knowledge in the face of uncertainty. Given this, it is desirable to move to a risk-based-impact framework by considering frequency distributions of climate change impacts. Indeed, a recent review of post-IPCC Fourth Assessment Report (AR4) climate change impacts literature suggests that this is an emerging theme (Gosling et al. 2011a). This preference is because decision-makers have experience of dealing with uncertainty and risk management. For instance, Mastrandrea and Schneider (2004) note that “acceptable risk” thresholds for nuclear power, cancer, vehicular safety, etc., are commonplace, even if controversial. The application of PPEs in climate change impact assessment allows for a range of estimates to be presented to decision-makers, which spans the range of climate model physics uncertainty inherent from a given GCM and emissions scenario, due to uncertainty associated with the understanding of physical processes in the GCM. Here we demonstrate the benefit of applying a PPE with a given emissions scenario, SRES A1B. Given that we present for the first time the application of a PPE to assess climate change impact on human health, we have not considered PPEs for other emissions scenarios. As such, our analysis does not solve the uncertainty coming from the range of possible emissions scenarios in the future and future work should address this. The aims of this paper are twofold. Firstly, to demonstrate the opportunity that PPEs present for risk-based impacts assessment; and secondly, to demonstrate the relative effects of three sources of uncertainty, namely climate model physics uncertainty, emissions scenario uncertainty and downscaling uncertainty on estimates of climate change health impact. As an illustrative example we explore the
Page 4/22
impact associated with a PPE on summer (June, July and August for northern hemisphere) heat-related mortality for the period 2070-2099 for six cities, Boston, Budapest, Dallas, Lisbon, London and Sydney. As such, the impacts presented are indicative of the possible effects of climate change on heat-related mortality and should not be considered as definitive predictions. This is because the major focus of concern is assessing in a relative sense, the resulting effects of three sources of uncertainty on climate change related health impact assessment. We apply the 17-member QUMP (Quantifying Uncertainty in Model Predictions) PPE (Murphy et al. 2009; Collins et al. 2006) which was produced with version three of the UK Met Office Hadley Centre GCM, HadCM3 (Gordon et al. 2000; Pope et al. 1999), with SRES A1B greenhouse gas emissions forcings (Nakićenović and Swart, 2000). These simulations are hereafter referred to as QUMP GCM. We also apply a dynamically downscaled 11-member ensemble regional climate model (RCM), which has a European domain and that was driven by the QUMP GCM, hereafter referred to as QUMP RCM. Heat-related mortality impact was calculated only for London from the QUMP RCM, whereas impacts were calculated for all six cities from the QUMP GCM. To allow a comparison of the QUMP impacts that consider climate model physics uncertainty with the scenario-based approach we also apply single-ensemble simulations from a single tuned version of HadCM3 for the SRES A1B, B2 and A2 scenarios, hereafter referred to as tuned HadCM3 A1B, B2 and A2 respectively. Model tuning involved adjusting parameters to improve model performance based on various climate indices, whereas the QUMP models were not tuned in this sense. A summary of the various climate model runs and the cities for which the climate projections were used to estimate heat-related mortality is provided in Table 1. The tuned HadCM3 parameters were tuned in order to achieve best agreement with observations and this single tuned version of HadCM3 is very similar to the unperturbed ensemble member (member 1) of the QUMP GCM.
Data and Methods Average annual summertime heat-related mortality was simulated using the city-specific temperature-mortality models constructed and validated by Gosling et al. (2007). Briefly, the models estimate daily heat-related mortality from daily maximum temperature, based upon an empirical non-linear relationship between the two. Heat-related mortality rates (per 100,000 of the population) attributable to climate change were calculated by subtracting the heat-related mortality rate for 1961-1990 (calculated from observed temperatures) from the simulated heat-related mortality rate from a climate change scenario for 2070-2099 (e.g. Kovats et al. 2003), for each city. For reference, the average annual summertime heat-related mortality rates for
Page 5/22
1961-1990, for Boston, Budapest, Dallas, Lisbon, London and Sydney were 3.1, 5.4, 1.4, 4.6, 1.8 and 1.6 (all per 100,000 of the population) respectively (Gosling et al. 2009b). For simplicity, it was assumed that population remains unchanged in the future because this allows for the explicit investigation of other uncertainties (Donaldson et al. 2001; Gosling et al. 2009a). The climate change scenarios were calculated using the novel method presented by Gosling et al. (2009b), based on a logistic frequency density function (FDF) fitting and sampling technique to create temperature time series from climate model simulation data that accounts for both climate change related changes in the mean and variability of temperature for use in climate change impact assessment studies. Briefly, this involved the calculation of changes in the location (ξ) and scale (α) parameters between the logistic distributions for the GCM simulated present and future temperature. The changes in each parameter were then added to the respective location and scale parameters estimated from the observed present temperature distribution. The new parameters allowed for the creation of a new artificial temperature distribution, from which a 30-year daily time series was sampled. This technique is an alternative to the delta method (Déqué 2007; Bergot et al. 2004; Dessai 2003), where a mean climate warming calculated from the simulated difference in future and present climate is added to observed present temperatures. Although the delta method is common, it assumes that climate change will result only in a change in the mean temperature, with variability remaining the same as present. To this end, the delta method has been shown to be unrealistic in terms of representing changes in climate statistics (Beniston 2004; Meehl and Tebaldi 2004; Schär et al. 2004) so the technique described by Gosling et al. (2009b) was preferable. A summary of the various climate model runs and the cities for which the climate projections were used to estimate heat-related mortality is provided in Table 1. The physics perturbations performed for the QUMP GCM and RCM ensembles are described by Collins et al. (2009) and descriptions of tuned HadCM3 are provided by Gordon et al. (2000) and Pope et al. (1999). One member of the QUMP GCM ensemble (member 1) used the standard HadCM3 parameter settings, the sixteen additional members using combinations of perturbed settings chosen to sample a wide range of climate sensitivities, while also sampling a wide range of alternative parameter values and providing credible simulations of historical climate (Murphy et al. 2009). Given that all simulations are considered credible, it is not possible to say whether any given member is more likely to be ‘correct’ than any other. The spatial resolution of the QUMP GCM and tuned HadCM3 is 2.5° latitude by 3.75° longitude,
Page 6/22
which is typically around 300km whilst it is around 25km for the QUMP RCM. Heat-related mortality impact was calculated only for London from the QUMP RCM, whereas impacts were calculated for all six cities from the QUMP GCM. There are 17 QUMP GCM ensemble members but 11 QUMP RCM ensemble members. 6 RCM ensemble members were excluded for the reasons outlined by UKCP (Murphy et al. 2009). Briefly, the experimental design the Met Office Hadley Centre applied succeeded in producing RCM simulations of detailed climate variability and change over the UK that were physically plausible. They were also consistent with the QUMP GCM simulations of synoptic scale features that were used to drive the QUMP RCM. However, six QUMP RCM ensemble members were unrealistic in their simulations of storms and precipitation due to a scale dependent issue associated with the diffusive damping scheme. The decision was therefore taken to exclude these 6 RCM ensemble members. Therefore for QUMP GCM-RCM comparisons we only analyse the 11 QUMP GCM ensemble members that include a corresponding QUMP RCM member (see Table 1). Simulated temperatures were extracted for the grid cells located over the six cities of interest. The domain of the QUMP RCM extends such that simulation data could have been extracted for the grid cells located over Budapest and Lisbon. However, these grid cells are located towards the lateral boundaries of the QUMP RCM domain. The Lisbon and Budapest grid cells were considered to be close enough to the lateral boundaries that the simulation of fine scale detail may have been unrealistically constrained by the relaxation to GCM data at the boundaries (Murphy et al. 2009), so QUMP RCM data for these two cities was not extracted.
Results Climate model physics uncertainty and emissions scenario uncertainty Figure 1 shows a histogram of observed (1961-1990) summer daily maximum temperature (Tmax) with a logistic FDF fit overlaid, for each city. In the same way, also shown are logistic FDFs of simulated Tmax for 2070-2099 (adjusted to account for changes in the mean and variability of temperature with climate change for use in climate change impacts studies following the method presented by Gosling et al. (2009b)) for the 17 QUMP GCM ensemble members (histograms are not shown for clarity). The sensitivity of the temperature distributions to perturbations in climate model physics is demonstrated by the large differences in location and scale between various QUMP GCM ensemble FDFs. Importantly, the differences across the QUMP GCM distributions for a single emissions scenario (A1B) are generally greater than the differences across emissions scenarios (tuned HadCM3 A1B, B2 and A2). This is most apparent with Budapest and Dallas.
Page 7/22
Although the uncertainty range across the FDFs in Figure 1 is large, all simulations (QUMP GCM and tuned HadCM3) show an increase in average Tmax relative to present observations. Changes in Tmax variability are not homogenous, however, which is apparent from the scales (i.e. the widths) of the FDFs. This is an important observation, because with previous climate change impacts assessments that tend to use the delta method, or a simple shift in the mean temperature (e.g. Déqué 2007; Bergot et al. 2004; Dessai 2003; see Data and Methods), there would be no scale (i.e. width) differences between the FDFs. As such, the impacts of changes in climate variability would be missed, whereas here, by applying the technique described by Gosling et al. (2009b), they can be accounted for. The importance of changes in climate variability for impacts assessment has previously been demonstrated (Gosling et al. 2009b,c; Ballester et al. 2010). As climate models indicate an increase in the mean and variability of temperatures with climate change (McGregor et al. 2005; Beniston 2004; Meehl and Tebaldi 2004; Schär et al. 2004) it would be preferable if future climate change impact assessments considered the role of temperature variability, as we have done here. Figure 2 displays the mean summer heat-related mortality rates (per 100,000) attributable to climate change for the period 2070-2099 relative to present (1961-1990) when the simulated temperatures presented in Figure 1 are applied to the heat-related mortality models described in Gosling et al. (2007). This allows for a direct comparison of the uncertainty in impact due to climate model physics uncertainty with emissions scenario uncertainty. The green shaded areas highlight the range of mortality impacts from the 17 QUMP GCM A1B ensembles. The blue shaded areas highlight the range of mortality from the 3 tuned HadCM3 emissions scenarios (B2, A1B and A2). Boston and Lisbon present the largest variability in impacts, where the heat-related mortality rate attributable to climate change in 2070-2099 may be up to 1,900/100,000 (QUMP GCM ensemble member 10) and 1,500/100,000 (QUMP GCM ensemble member 5), respectively, or under 50/100,000 for some ensemble members. Sydney presents the lowest impacts, which range between around 1/100,000 and 6/100,000. The most important conclusion to be drawn from Figure 2 is that the range in impact across the 17 QUMP GCM A1B emissions ensembles (green shaded areas) is greater than the range in impact across the three tuned HadCM3 emissions scenarios (blue shaded areas), although the magnitude of impact can be small in some cases, e.g. Sydney. Hence, climate model physics uncertainty is consistently a greater source of uncertainty than greenhouse gas emissions scenario uncertainty

Page 8/22
for heat-related mortality in the case of these cities. To further explore this, the number of the QUMP GCM ensemble member impact estimates that fell outside the range of the three tuned HadCM3 emissions impacts was calculated and expressed as a percentage (Rex). For example, with Boston, 12 of the 17 QUMP GCM ensemble impacts are outside the tuned HadCM3 emissions range (ensemble members 3-6 and 9-16), so Rex = 12/17*100 = 71%. Sydney exhibits the highest Rex, which means climate model physics uncertainty has the greatest affect on mortality impacts here out of the six cities. Usefulness of the ensemble mean By taking the mean of the mortality impacts across the 17 QUMP GCM ensembles we calculated an impact ensemble mean (M) for each city (see Figure 2). These were calculated to be around 750, 50, 12, 350, 15 and 3 (in units of mean summer heat-related mortality rates (per 100,000) attributable to climate change for the period 2070-2099), for Boston, Budapest, Dallas, Lisbon, London and Sydney respectively. Figure 3 presents the shape of the impacts distributions across the 17 QUMP GCM ensembles. Normal FDFs were fitted to the distributions by calculating the maximum likelihood estimates (MLEs) of the location (ξ) and scale (α) parameters of a normal distribution. An “eyeball” test of Figure 3 illustrates that the assumption of normality is not valid because with the exception of Sydney, the mortality distributions are positively skewed and the normal FDFs do not fit the mortality distributions well. This raises the question of the reliability of M as a summary measure of mortality across the 17 ensembles. The mortality distributions presented in Figure 3 are more akin to a Generalized Extreme Value (GEV) distribution. MLEs of the location (ξ), scale (α) and shape (k) parameters of a GEV distribution were calculated, along with the parameters of the 95% confidence intervals. For all cities, the GEV FDFs demonstrate that the mortality rate with highest frequency density is lower than M. Although the ensemble mean is sometimes interpreted as “the most likely outcome”, here we have demonstrated that the most likely outcome is not equal to the ensemble mean. Given that the ensemble mean is often used as a summary indicator of climate change impact for the decision-making process, the results here show that it should be used with caution because it could be misleading. Furthermore, alternative impact distributions should be considered. Benefits of quantifying climate model physics uncertainty for a given climate model over the scenario-based approach to climate change impacts assessment Figure 3 demonstrates the contribution of climate model physics uncertainty to the impact estimates relative to emissions scenario uncertainty. Climate model physics

Page 9/22
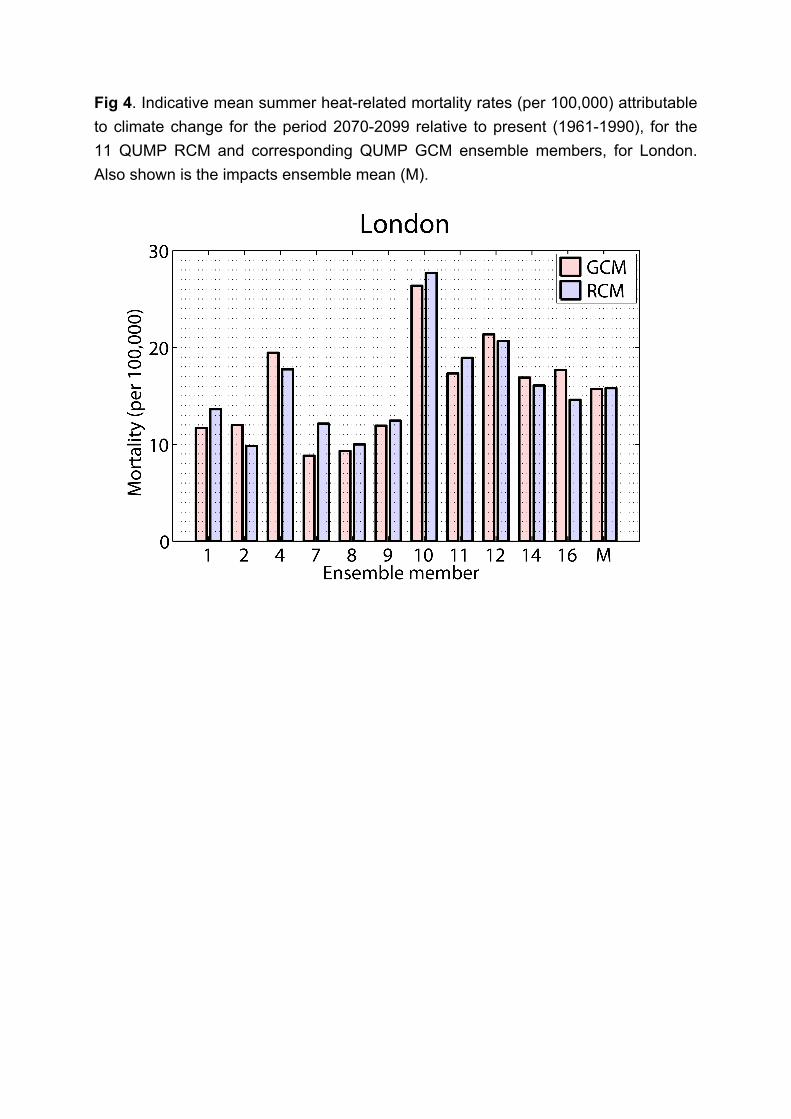
uncertainty has the greatest influence relative to emissions with Sydney because here the three tuned HadCM3 emission projections are clustered around the tails of the FDF distribution. In contrast, with London, there is less clustering of tuned HadCM3 impacts and these are more evenly spread across the FDF distribution; Rex, calculated earlier, is a statistical indicator of this. The benefits of considering an uncertainty range in climate change impacts assessment over a scenario-based approach is also demonstrated by Figure 3. If estimates of SRES A1B scenario-based impacts with an uncertainty range are compared with estimates for the same emissions scenario without an uncertainty range (purple lines) for some cities, it is clear that the tuned HadCM3 A1B estimate is well removed from the peak of the QUMP GCM distribution. The PPE approach to impacts assessment therefore allows several plausible impacts estimates to be made for a single emissions scenario (here, SRES A1B), whereas tuned HadCM3 A1B is a single realisation. Downscaling uncertainty Figure 4 presents heat-related mortality projections for London with QUMP GCM and QUMP RCM forcings respectively, for the QUMP GCM members that have a corresponding QUMP RCM member. There are subtle differences in mortality between the RCM and GCM projections for each ensemble. An important observation is that the differences in mortality between RCM and GCM are smaller than the differences between the PPE members. This is highlighted by examining the degree to which the bars in Figure 4 overlap and demonstrates that the impacts are less sensitive to whether downscaled climate projections are applied than to climate model physics uncertainty. Comparing the relative roles of three sources of uncertainty on impacts By considering London alone we evaluate the relative importance for health impacts of each of three sources of uncertainty: climate model physics, emissions scenario and downscaling. Qualitative assessment of Figure 2 and Figure 4 suggests that health impacts are least sensitive to downscaling uncertainty and most sensitive to climate model physics uncertainty. To quantify these differences and to indicate the sensitivity of impact to each source of uncertainty, the following three statistics were calculated:
i. The maximum percentage difference in impact between 2 QUMP GCM ensemble members (an indication of the sensitivity of impact to climate model physics uncertainty).

Page 10/22
ii. The maximum percentage difference in impact between a QUMP GCM ensemble member and its corresponding QUMP RCM ensemble member (an indication of the sensitivity of mortality impact to downscaling uncertainty).
iii. The maximum percentage difference in impact between two tuned HadCM3 emissions scenarios (an indication of the sensitivity of mortality impact to emissions scenario uncertainty).
The values of the three statistics are 247%, 27% and 214% respectively, indicating that downscaling uncertainty has by far the least affect on impacts. Climate model physics uncertainty has the greatest affect, although the sensitivity of heat-related mortality to emissions scenario uncertainty across the three SRES emissions scenarios is not vastly less.
Discussion and concluding remarks Projections of heat-related mortality impacts for London have been found to be, in decreasing order, most sensitive to:
1. Climate model physics uncertainty 2. Greenhouse gas emissions scenario uncertainty 3. Downscaling uncertainty (GCM versus RCM).
The results demonstrate that the differences in impact between the QUMP GCM and RCM remain small relative to the other sources of uncertainty. The low sensitivity to whether the forcing data came from the GCM or RCM may be, partly, due to the fact that the impacts model requires temperatures from only a single grid cell. It is acknowledged that the GCM-RCM difference in impacts might be different where the impacts are spread over a larger domain that encompasses more than a single grid cell, e.g. crop yield, tree range and hydrological studies (Tsvetsinkskaya et al. 2003; Mearns et al. 2001; Gosling et al. 2011b). However, in one such study Kueppers et al. (2005) demonstrated the range of one species of California endemic oak shrunk by 59% if using RCM projections instead of GCM projections, which is comparable to the difference observed in this study for some ensemble members. The relative roles of climate simulation bias of the RCM and GCM is an additional source of uncertainty that was not explored. To some extent, the differences in health impacts observed between the RCM and GCM here may be due to that. Figure 2 demonstrates that uncertainty in the climate model physics is generally a greater source of uncertainty on impacts than greenhouse gas emissions scenario uncertainty. The systematic analysis of the role of climate model physics uncertainty in climate change impacts assessment is in its infancy. The few studies that have investigated this appear in the hydrological literature, and agree with the findings
Page 11/22
presented here; that impacts are more sensitive to uncertainties in the climate model than to greenhouse gas emissions scenario. For example, Prudhomme et al. (2003) investigated UK river flows for 25,000 climate scenarios randomly generated by a Monte Carlo simulation, for several emissions scenarios. The largest impact uncertainty was attributed to the type of GCM employed, with the magnitude of impacts varying by up to a factor of 9, followed by emissions scenario uncertainty. Another hydrological study by Kay et al. (2009) investigated the uncertainty in the impact of climate change on flood frequency in England, where in order of decreasing uncertainty, hydrological impacts were most sensitive to choice of GCM, emissions scenario, GCM initial conditions, and downscaling - the results suggested that uncertainty in climate model physics was by far the largest source of uncertainty. We did not explore the role of GCM initial conditions but the results of Kay et al. (2009) support the findings we have presented here. This has some important implications for future climate change impact assessments. Great stress is often placed on using high resolution RCM data for climate change impact assessments. Perhaps as a result of this, climate model physics uncertainty is usually overlooked. This is especially the case as far as climate change health impact assessments are concerned. A recommendation for the IPCC in compiling the Fifth Assessment Report is that they continue to consider climate change impacts studies that employ coarse GCMs because it is possible that the results are no less credible than if RCMs were employed. Here it has been demonstrated by using a PPE approach that above all, climate model physics uncertainty has a greater affect on mortality impact estimates than downscaling or emissions scenario uncertainty. Indeed, of the three, downscaling is least important. Therefore it is recommended that future impacts assessments consider adopting an approach that quantifies uncertainty, as demonstrated here. The FDFs presented in Figure 3 provide a useful method for presenting uncertainty in climate change impacts due to climate model physics uncertainty. However, it is important to note that there is an element of uncertainty inherent in the FDF fitting technique. This is why 95% confidence intervals for the GEV FDFs are included in Figure 3. Clearly, the width of the 95% confidence interval will vary by the type of FDF fit (e.g. GEV, Poisson, Normal). The statistical uncertainty could be reduced by estimating mortality for further ensembles, beyond the original 17 but as pointed out by Collins et al. (2006), in order to provide future credible regional frequency distributions for transient climate change, ensembles much larger than the 17 members considered here will be needed. Presently, it remains computationally unfeasible to generate ensembles of the required size (perhaps 100 or more members) using in-house computer resources, but it is anticipated that recent

Page 12/22
developments in pattern-scaling (Mitchell, 2003), grid computing, increased computer power, and projects such as ClimatePrediction.net (Stainforth et al. 2005) will allow for more robust, systematic impacts estimates with uncertainty ranges to be made. The uncertainty in our estimates of heat-related mortality attributable to climate change for 2070-2099 are broadly in line with estimates of uncertainty in global mean temperature change from GCMs presented by the IPCC AR4 (Meehl et al. 2007). For instance, the AR4 showed that at the end of this century, the uncertainty in global mean warming across the 21 GCMs they considered was greater than the range across emissions scenarios for any given model (although the role of emissions becomes increasingly important towards the end of the century; see Figure 10.5 in Meehl et al. 2007). We did not consider impacts earlier in the twenty-first century but projections by the AR4 indicate that the range in global mean temperature change across GCMs is smaller earlier in the century than it is later, which may well be replicated in heat-related mortality impacts. Also, there are differences between global mean temperature and regional temperature. For instance, the AR4 showed that the magnitude of twentieth-century warming for Europe is similar to the change in global mean land surface temperature, whilst changes for Australia have been lower in magnitude than the global change (see Figure SPM.4 in IPCC, 2007). As such, the impacts of climate change on the health sector will occur heterogeneously. An important conclusion from our analysis is that for a given emissions scenario (SRES A1B) and GCM (HadCM3), there can be large differences in the projected impacts of climate change, depending upon whether deterministic (e.g. purple lines in Figure 3) or risk-based projections that consider uncertainty (green FDFs in Figure 3) are provided. This is best illustrated by considering a practical example. Consider a decision-maker who is responsible for managing a city-wide adaptation plan to climate change impacts on heat-related mortality in Budapest. If the decision-maker was presented with only a deterministic projection of heat-related mortality impact under an A1B emissions scenario, then they might (understandably) make decisions that are appropriate for adapting to a future where summer heat-related mortality attributable to climate change is around 88/100,000 (see purple line in Figure 3). However, if the decision-maker is presented with the projections from the PPE (see green FDFs in Figure 3), then it becomes apparent that 88/100,000 is actually an upper extreme projection, when considering the bounds of uncertainty from climate model physics because the purple vertical line (deterministic projection) is well towards the right tail of the green FDF. A heat-related mortality impact around 35/100,000 is more “likely” based upon the FDF derived from the 17 QUMP GCM ensemble members, because this is where the peak density of the FDF is located. If
Page 13/22
we assume that adaptation cost increases with the magnitude of impact to be adapted to, then given that the more “likely” projection from the PPE is more than 50% less than that from the deterministic projection, the resources required for adaptation could be considerably lower, if the decision-maker wished to adapt to the “most likely” projection. On the other hand, the decision-maker may wish to invest lower (higher) resources and instigate adaptation options appropriate to a heat-related mortality impact of around 15/100,000 (90/100,000). Under our assumption that adaptation cost increases with the magnitude of impact to be adapted to, whilst this presents lower (higher) adaptation resources than if the more “likely” projection is considered, the decision-maker is taking a higher (lower) risk because the majority of the impact distribution lies to the right (left) of 15/100,000 (90/100,000) for Budapest in Figure 3. Thus the PPE approach of climate change impacts assessment facilitates this risk-based decision-making process and is advantageous over a determinist approach, which essentially presents a single impact estimate that can not be placed within a risk-management framework. The consideration of uncertainties in the manner we have illustrated here will present more useful information for decision-makers, assuming that they are comfortable with risk-based information over deterministic information. Therefore it is important that risk-based estimates such as those presented here are communicated in a clear and meaningful way to decision-makers. Indeed, now as the PPE approach to quantifying uncertainty in climate change projections becomes more common, the communication of risk-based information in a way that stakeholders can interpret is becoming increasingly recognised (Collins et al. 2006). It should be acknowledged that whilst some sources of uncertainty have here been shown to be more influential than others; these uncertainties have a cascading effect such that there is a cascade of uncertainty in the climate change impact assessment chain (Gosling et al. 2009a). As such, future climate change impacts assessments should seek to consider as many of these uncertainties as is reasonably possible. The analysis we have presented here is the first time a PPE has been applied to estimate the impacts of climate change on heat-related mortality and is one of only a few climate change impact assessments in general to take this approach. To this end, we encourage future climate change impact assessments to apply PPEs in order to better quantify the uncertainty in their projections. Moreover, here we applied a PPE based upon a only a single GCM (HadCM3) but there has been recent progress in combining information from PPEs and multi-model ensemble simulations, which will facilitate an even more complete representation of uncertainty in climate change projections and their impacts (Murphy et al. 2007), as we move towards the
Page 14/22
possibility of ‘super-ensembles’ that sample structural uncertainties (Murphy et al. 2004). The application of such ensembles in climate change impacts assessment is a worthwhile avenue for future research priority.
Acknowledgements This study was supported with PhD funding from the UK Natural Environment Research Council (NERC) and a Cooperative Awards in Sciences of the Environment (CASE) award from the UK Met Office while the lead author was a PhD candidate at King’s College London, Department of Geography. Jason Lowe was supported by the Joint DECC and Defra Integrated Climate Programme - DECC/Defra (GA01101). Three anonymous reviewers are thanked for taking the time to read and comment on an earlier version of the manuscript.
References Ballester J, Giorgi F and Rodo X. (2010) Changes in European temperature extremes can be
predicted from changes in PDF central statistics. Climatic Change 98: 277-284.
Beniston M (2004) The 2003 heat wave in Europe: A shape of things to come? An analysis based on Swiss climatological data and model simulations. Geophysical Research Letters 31:doi 10.1029/2003GL018857.
Bergot M, Cloppet E, Pérarnaud V, Déqué M, Marçais B, Desprez-Loustau ML (2004)
Simulation of potential range expansion of oak disease caused by Phytophthora cinnamomi under climate change, Global Change Biology 10:1539-1552.
Collins M, Booth BBB, Harris GR, Murphy JM, Sexton DMH, Webb MJ (2006) Towards
quantifying uncertainty in transient climate change. Climate Dynamics 27:127-147. Déqué M (2007) Frequency of precipitation and temperature extremes over France in an
anthropogenic scenario: Model results and statistical correction according to observed values. Global and Planetary Change 57:16-26.
Dessai S (2003) Heat stress and mortality in Lisbon Part II. An assessment of the potential
impacts of climate change. International Journal of Biometeorology 48:37-44. Donaldson GC, Kovats RS, Keatinge WR, McMicheal AJ (2001) Heat- and cold related
mortality and morbidity and climate change. In: Maynard RL (Ed) Health Effects of Climate Change in the UK, Department of Health, London, pp 70-80.
Gordon C, Cooper C, Senior CA, Banks H, Gregory JM, Johns TC, Mitchell JFB, Wood RA
(2000) The simulation of SST, sea ice extents and ocean heat transports in a version of the Hadley Centre coupled model without flux adjustments. Climate Dynamics 16: 147-168

Page 15/22
Gosling SN, Lowe JA, McGregor GR, Pelling M, Malamud BD (2009a) Associations between
elevated atmospheric temperature and human mortality: a critical review of the literature. Climatic Change 92:299-341.
Gosling SN, McGregor GR, Lowe JA (2009b) Climate change and heat-related mortality in
six cities Part 2: climate model evaluation and projected impacts from changes in the mean and variability of temperature with climate change. International Journal of Biometeorology 53:31-51.
Gosling SN, Lowe JA, McGregor GR (2009c) Projected impacts on heat-related mortality
from changes in the mean and variability of temperature with climate change. IOP Conference Series: Earth Environmental Science 6:142010 doi:10.1088/1755-1307/6/14/142010
Gosling SN, McGregor GR, Páldy A (2007) Climate change and heat-related mortality in six
cities Part 1: model construction and validation. International Journal of Biometeorology 51:525-540.
Gosling SN, Taylor RG, Arnell NW, Todd MC (2011b) A comparative analysis of projected
impacts of climate change on river runoff from global and catchment-scale hydrological models. Hydrology and Earth System Sciences 15:279-294
Gosling SN, Warren R, Arnell NW, Good P, Caesar J, Bernie D, Lowe JA, van der Linden P,
O’Hanley JR, Smith SM (2011a) A review of recent developments in climate change science. Part II: the global-scale impacts of climate change. Progress in Physical Geography 35:443-464
IPCC (2007) Summary for Policymakers. In: Solomon S, Qin D, Manning M, Chen Z,
Marquis M, Averyt KB, Tignor M, Miller HL (eds) Climate Change 2007: The Physical Science Basis. Contribution of Working Group I to the Fourth Assessment Report of the Intergovernmental Panel on Climate Change. Cambridge University Press, Cambridge, United Kingdom and New York, NY, USA
Kay AL, Davies HN, Bell VA Jones RG (2009) Comparison of uncertainty sources for climate
change impacts: flood frequency in England. Climatic Change 92:41–63. Kovats RS, Ebi K, Menne B (2003) Methods of assessing human health vulnerability and
public health adaptation to climate change. Health and Global Environmental Change Series, No. 1. Copenhagen: World Health Organization, Health Canada, United Nations Environment Programme, World Meteorological Organization.
Kueppers LM, Snyder MA, Sloan LC, Zavaleta ES, Fulfrost B (2005) Modeled regional
climate change and California endemic oak ranges. Proceedings of the National Academy of Sciences of the United States of America 102:16281-16285.
Lowe JA, Howard TP, Pardaens A, Tinker J. Holt J, Wakelin S, Milne G, Leake J, Wolf J,
Horsburgh K, Reeder T, Jenkins G, Ridley J, Dye S, Bradley S (2009) UK Climate Projections science report: Marine and coastal projections. Met Office Hadley Centre, Exeter, UK.
Page 16/22
Mastrandrea MD, Schneider SH (2004) Probabilistic Integrated Assessment of "Dangerous"
Climate Change. Science 304:571-575. McGregor GR, Stephenson D, Ferro C (2005) Projected Changes in Extreme Weather and
Climate Events in Europe. In: Kirch W, Menne B (Eds) Extreme Weather Events & Public Health Responses. Springer, Berlin, pp.13-23.
McGuffie K, Henderson-Sellers, A (2005) A Climate Modelling Primer (Third Edition). Print
ISBN: 9780470857502 Online ISBN: 9780470857618, John Wiley & Sons, Ltd. DOI:10.1002/0470857617
McMichael AJ, Woodruff R, Whetton P, Hennessy K, Nicholls N, Hales S, Woodward A,
Kjellstrom T (2003) Human Health and Climate Change in Oceania: Risk Assessment 2002. Department of Health and Ageing, Canberra, Commonwealth of Australia, pp128.
Mearns LO, Easterling W, Hays C, Marx D (2001) Comparison of Agricultural Impacts of
Climate Change Calculated from High and Low Resolution Climate Change Scenarios: Part I. The Uncertainty Due to Spatial Scale. Climatic Change 51:131-172.
Meehl GA, Covey C, Delworth T, Latif M, McAvney B, Mitchell JFB, Stouffer RJ, Taylor KE
(2007) The WCRP CMIP3 multimodel dataset: A new era in climate change research, Bulletin of the American Meteorological Society 88: 1383–1394.
Meehl GA, Stocker TF, Collins WD, Friedlingstein P, Gaye AT, Gregory JM, Kitoh A, Knutti
R, Murphy JM, Noda A, Raper SCB, Watterson IG, Weaver AJ, Zhao Z-C (2007) Global Climate Projections. In: Solomon S, Qin D, Manning M, Chen Z, Marquis M, Averyt KB, Tignor M, Miller HL (eds) Climate Change 2007: The Physical Science Basis. Contribution of Working Group I to the Fourth Assessment Report of the Intergovernmental Panel on Climate Change. Cambridge University Press, Cambridge, United Kingdom and New York, NY, USA.
Meehl GA, Tebaldi C (2004) More intense, more frequent, and longer lasting heatwaves in
the 21st Century. Science 305:994-997. Mitchell TD (2003) Pattern scaling: an examination of the accuracy of the technique for
describing future climates. Climatic Change 60:217-242. Murphy JM, Booth BBB, Collins M, Harris GR, Sexton DMH, Webb MJ (2007) A methodology
for probabilistic predictions of regional climate change from perturbed physics ensembles. Philosophical Transactions of the Royal Society A 365:1993-2028.
Murphy JM, Sexton DMH, Barnett DN, Jones GS, Webb MJ, Collins M, Stainforth DA (2004)
Quantification of modelling uncertainties in a large ensemble of climate change simulations. Nature 430:768-772.
Murphy JM, Sexton DMH, Jenkins GJ, Boorman PM, Booth BBB, Brown CC, Clark RT,
Collins M, Harris GR, Kendon EJ, Betts RA, Brown SJ, Howard TP, Humphrey KA, McCarthy MP, McDonald RE, Stephens A, Wallace C, Warren R, Wilby R, Wood RA
Page 17/22
(2009) UK Climate Projections Science Report: Climate change projections. Met Office Hadley Centre, Exeter.
Nakićenović N, Swart R (2000) (eds) Special Report on Emission Scenarios. Cambridge
University Press, Cambridge. New M, Lopez A, Dessai S, Wilby R (2007) Challenges in using probabilistic climate change
information for impact assessments: an example from the water sector. Philosophical Transactions of the Royal Society 365: 2117-2131.
Pope VD, Gallani ML, Rowntree PR, Stratton RA (1999) The impact of new physical
parametrizations in the Hadley Centre climate model-HadAM3. Climate Dynamics 16:123-146.
Prudhomme C, Jakob D, Svensson C (2003)Uncertainty and climate change impact on the
flood regime of small UK catchments. Journal of Hydrology, 277: 1-23. Schär C, Vidale PL, Lüthi D, Frei C, Häberli C, Liniger MA, Appenzeller C (2004) The role of
increasing temperature variability in European summer heatwaves. Nature 427:332-336.
Stainforth A, Aina T, Christensen C, Collins M, Faull N, Frame DJ, Kettleborough JA, Knight
S, Martin A, Murphy JM, Piani C, Sexton D, Smith LA, Spicer RA, Thorpe AJ, Allen MR (2005) Uncertainty in predictions of the climate response to rising levels of greenhouse gases. Nature 433:403-406.
Tsvetsinkskaya EA, Mearns LO, Mavromatis T, Gao W, McDaniel L, Downtown MW (2003)
The Effect of Spatial Scale of Climatic Change Scenarios on Simulated Maize, Winter Wheat, and Rice Production in the Southeastern United States. Climatic Change 60:37-71.
Webb MJ, Senior CA, Williams KD, Sexton MDH, Ringer MA, McAvaney BJ, Colman R,
Soden BJ, Andronova NG, Emori S, Tsushima Y, Ogura T, Musat I, Bony S, Taylor K (2006) On uncertainty in feedback mechanisms controlling climate sensitivity in two GCM ensembles. Climate Dynamics 27:17-38.

Page 18/22
Fig 1. Scaled histograms of observed daily summer Tmax (“Point Observations”; 1961-1990). The histogram is scaled so that the summed product of the bar heights and their widths are equal to 1, to make it comparable to the FDFs. A logistic FDF is overlaid (blue). Also shown are the logistic FDFs for the 2070-2099 climate change scenarios for tuned HadCM3 A1B, B2 and A2, and the 17 QUMP GCM ensembles (1-17) and ensemble mean (mean).

Page 19/22
Fig 2. Indicative mean summer heat-related mortality rates (per 100,000) attributable to climate change for the period 2070-2099 relative to present (1961-1990), for tuned HadCM3 A1B, B2, A2, and the 17 QUMP GCM ensemble members. Also shown is the ensemble impacts mean (M). The green shaded areas highlight the range of mortality impact from the 17 QUMP GCM ensemble members. The blue shaded areas highlight the range of mortality from the 3 tuned HadCM3 emissions scenarios. Rex is the percentage of the QUMP GCM ensemble impact members that fall outside the range of tuned HadCM3 emissions scenarios impacts.

Page 20/22
Fig 3. Scaled histograms of indicative mean summer heat-related mortality rates (per 100,000) attributable to climate change for the period 2070-2099 relative to present (1961-1990), for the 17 QUMP GCM ensemble members. Normal FDFs (blue line) are fitted to the distributions. GEV FDFs (green lines) are also fitted to the distributions with the upper bound (UB) and lower bound (LB) of the 95% confidence interval of each statistical fit. Vertical solid lines denote the mortality estimates with tuned HadCM3 B2, A1B and A2.
Page 21/22
Fig 4. Indicative mean summer heat-related mortality rates (per 100,000) attributable to climate change for the period 2070-2099 relative to present (1961-1990), for the 11 QUMP RCM and corresponding QUMP GCM ensemble members, for London. Also shown is the impacts ensemble mean (M).
Page 22/22
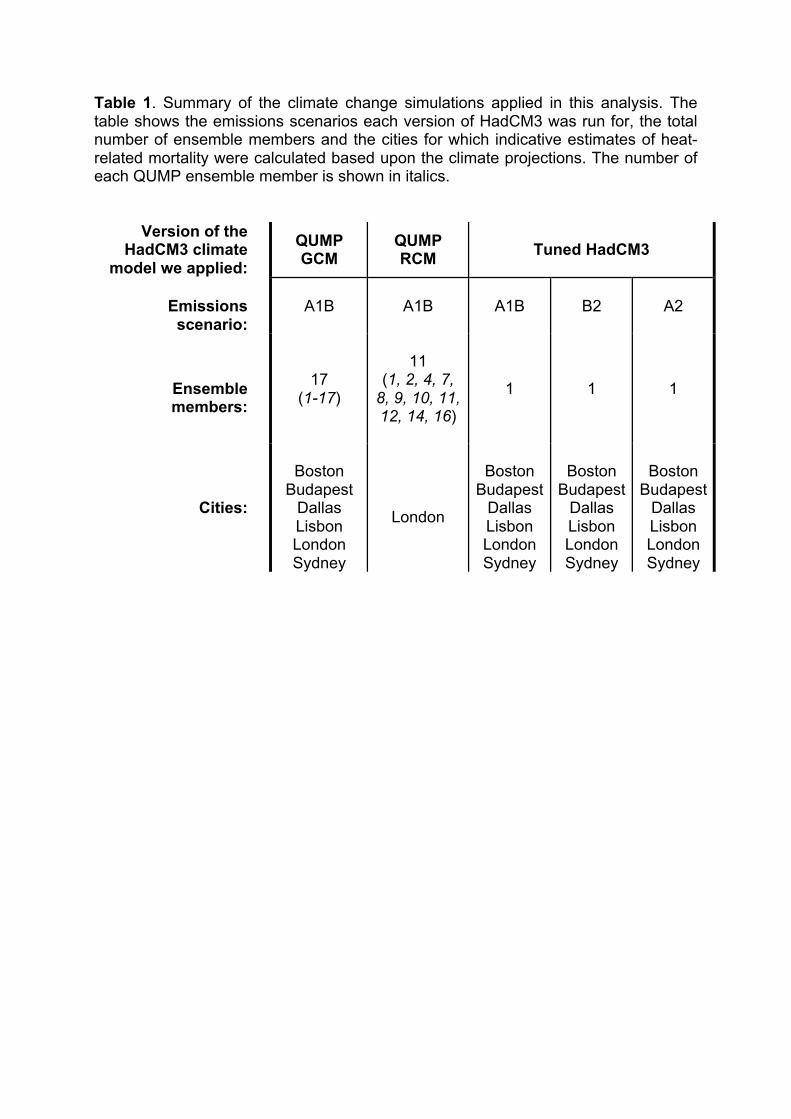
Table 1. Summary of the climate change simulations applied in this analysis. The table shows the emissions scenarios each version of HadCM3 was run for, the total number of ensemble members and the cities for which indicative estimates of heat-related mortality were calculated based upon the climate projections. The number of each QUMP ensemble member is shown in italics.
Version of the HadCM3 climate
model we applied:
QUMP GCM
QUMP RCM Tuned HadCM3
Emissions
scenario: A1B A1B A1B B2 A2
Ensemble members:
17 (1-17)
11
(1, 2, 4, 7, 8, 9, 10, 11, 12, 14, 16)
1 1 1
Cities:
Boston
Budapest Dallas Lisbon London Sydney
London
Boston
Budapest Dallas Lisbon London Sydney
Boston
Budapest Dallas Lisbon London Sydney
Boston
Budapest Dallas Lisbon London Sydney