THE BANK WE'RE BUILDING - BankTrack
268
THE BANK WE’RE BUILDING 2021 ANNUAL REPORT
-
Upload
khangminh22 -
Category
Documents
-
view
4 -
download
0
Transcript of THE BANK WE'RE BUILDING - BankTrack

THE BANKWE’RE BUILDING
2021 ANNUAL REPORT

2017
Established our Ethics and Responsible Business Committee
2018
Implemented our Ethical Decision Making Framework
2019
Committed to fund and facilitate $50 billion by 2025 in sustainable solutions for our customers
2020
Committed to fund and facilitate $10 billion of investment by 2030 to deliver more affordable, accessible and sustainable homes1
2021
Reached more than 67,600 people through our financial wellbeing programs, MoneyMinded and Saver Plus2
1. Refers to homes to buy and rent in Australia and New Zealand. 2. Includes individuals who have participated in more than one program (for example, people who have participated in MoneyMinded as part of Saver Plus are counted twice as they are included in both the MoneyMinded and Saver Plus totals) in the period 1 October 2020 – 30 September 2021.
In 2017 we introduced our purpose...
Shape a world where people and communities thrive

$
$ $
We’re building an ANZ that improves the financial wellbeing and sustainability of customers, focused on:
Helping people start or buy and sustainably grow
their business.
Helping companies move goods and capital around the
region and sustainably grow their business.
Helping people save for, buy and own a sustainable, liveable
and affordable home.
CONTENTS
Overview
Our 2021 reporting suite 22021 performance snapshot 3Chairman’s message 4CEO’s message 6What matters most 9
How we create value
About our business 10Our strategy 11How we create value 12Our operating environment 14Our customers 15Becoming a fairer and more responsible bank 24
Our divisions 26Our people 29Our community 34Improving our approach to human rights 37Our approach to climate change 38Governance 40Risk management 51
Performance overview 56Remuneration report 74Directors’ report 110Financial report 113KPMG assurance 252Shareholder information 254Glossary 263
1ANZ 2021 Annual Report

Our 2021 reporting suite
1. Australia and New Zealand Banking Group Limited (the Company) and the entities it controlled at the year end and from time to time during the financial year (together, the Group). 2. The 2021 Annual Review is comprised of pages 1 to 72, 252 to 253 and 261 to 262 of this Annual Report and a Remuneration Overview.
INTEGRATED REPORTING
This report includes information on Australia and New Zealand Banking Group Limited’s1 financial and non-financial performance. In preparing pages 1 to 72, we have drawn on aspects of the International Integrated Reporting Framework to describe how our business model, strategy, governance and risk management processes help us manage risks and opportunities in our operating environment and deliver value for stakeholders. We outline our response to external social and environmental challenges, including how we are continuing to support our customers, employees and the community through the COVID-19 pandemic and strengthening our approach to climate change and human rights.
ANNUAL REPORT STRUCTURE
The required elements of the Directors’ Report, including the Operating and Financial Review, are covered on pages 1 to 70. Commentary on our performance overview contained on pages 56 to 71 references information reported in the Financial Report pages 113 to 251.
The Remuneration Report pages 74 to 109 and the Financial Report pages 113 to 251 have been audited by KPMG. KPMG also provides limited assurance over Environment, Social and Governance (ESG) content within this Annual Report. A copy of KPMG’s limited assurance report over ESG content is on pages 252–253.
This report covers all ANZ operations worldwide over which, unless otherwise stated, we had control for the financial year 1 October 2020 to 30 September 2021. Monetary amounts in this document are reported in Australian dollars, unless otherwise stated.
ADDITIONAL INFORMATION
We produce a suite of reports to meet the needs and requirements of a wide range of stakeholders.
Our 2021 Corporate Governance Statement discloses how we have complied with the ASX Corporate Governance Council’s ‘Corporate Governance Principles and Recommendations – 4th edition’ and is available at anz.com/corporategovernance. This year is our first reporting against the 4th edition.
Our ESG Supplement provides stakeholders with detailed ESG disclosures, including performance against our ESG targets.
We will release our 2021 Climate-related Financial Disclosures report prior to our Annual General Meeting.
The following documents are available at anz.com/shareholder/centre:
• News Release
• Consolidated Financial Report, Dividend Announcement & Appendix 4E
• Results Presentation and Investor Discussion Pack
• Annual Review2
• Principal Risks and Uncertainties Disclosure
• APS 330 Pillar III Disclosure
We are continually seeking to improve our reporting suite and welcome feedback on this report. Please address any questions, comments or suggestions to [email protected].
DISCLAIMER & IMPORTANT NOTICE:The material in the Annual Report contains general background information about the Bank’s activities current as at 27 October 2021. It is information given in summary form and does not purport to be complete. It is not intended to be and should not be relied upon as advice to investors or potential investors and does not take into account the investment objectives, financial situation or needs of any particular investor. These should be considered, with or without professional advice when deciding if an investment is appropriate. The Annual Report may contain forward-looking statements or opinions including statements regarding our intent, belief or current expectations with respect to ANZ’s business operations, market conditions, results of operations and financial condition, capital adequacy, specific provisions and risk management practices. When used in the Annual Report, the words ‘forecast’, ‘estimate’, ‘project’, ‘intend’, ‘anticipate’, ‘believe’, ‘expect’, ‘may’, ‘probability’, ‘risk’, ‘will’, ‘seek’, ‘would’, ‘could’, ‘should’ and similar expressions, as they relate to ANZ and its management, are intended to identify forward-looking statements or opinions. Those statements: are usually predictive in character; or may be affected by inaccurate assumptions or unknown risks and uncertainties; or may differ materially from results ultimately achieved. As such, these statements should not be relied upon when making investment decisions. These statements only speak as at the date of publication and no representation is made as to their correctness on or after this date. Forward-looking statements constitute ‘forward-looking statements’ for the purposes of the United States Private Securities Litigation Reform Act of 1995. ANZ does not undertake any obligation to publicly release the result of any revisions to these forward-looking statements to reflect events or circumstances after the date hereof to reflect the occurrence of unanticipated events.
2021 Annual Review anz.com/annualreport
2021 ESG Supplement anz.com/annualreport
2021 Climate-related Financial Disclosures anz.com/annualreport
2021 Corporate Governance Statement anz.com/corporategovernance
2
OVERVIEW HOW WE CREATE VALUE
PERFORMANCE OVERVIEW
REMUNERATION REPORT
DIRECTORS’ REPORT
FINANCIAL REPORT
SHAREHOLDER INFORMATION

$6.2B Cash profit1
81%employee engagement
1. On a cash profit (continuing operations) basis. Excludes non-core items included in statutory profit and discontinued operations and is provided to assist readers in understanding the result of the ongoing business activities of the Group. For further information on adjustments between statutory and cash profit refer to page 57 . 2. Figure includes forgone revenue of $106m, the cost of providing low or fee-free accounts to a range of customers such as government benefit recipients, not-for-profit organisations, students and the elderly. International transfer fees were waived for funds sent from Australia and New Zealand to the Pacific to support communities impacted by COVID-19. 3. Equals shareholders’ equity less preference share capital, goodwill, software and other intangible assets divided by the number of ordinary shares. 4. APRA Level 2. 5. Measures representation at the Senior Manager, Executive and Senior Executive levels. Includes all employees regardless of leave status but not contractors (who are included in Full Time Equivalents (FTE)). 6. In Australia and New Zealand.
218.3CCash earnings per share1
35.3%of women in leadership5
12.3%Common equity Tier 1 Capital4 $21.95B
funded and facilitated in sustainable solutions since 2019
$21.09 Net tangible assets per share3
$1.43B funded and facilitated to deliver more affordable, accessible and sustainable homes to buy and rent since 20206
2021 performance snapshot
9.9%Cash return on equity1
142C Dividend for 2021 per share
$
CO2
Supported around
151,600customers to build
a savings habit since 2020
$139.7Min community investment2
3ANZ 2021 Annual Report
OVERVIEW HOW WE CREATE VALUE
PERFORMANCE OVERVIEW
REMUNERATION REPORT
DIRECTORS’ REPORT
FINANCIAL REPORT
SHAREHOLDER INFORMATION

Chairman’s message
The bank has navigated a year of historic health and economic challenges while also supporting our customers and the community.
As we reflect on the events of 2021, I don’t think many of us would have imagined enduring months of further lockdowns this year in Melbourne, Sydney and, most recently, Auckland.
While it has been an incredibly difficult period for many, the future does look much brighter as we adjust to the new phase of living with the virus. Impressive vaccination rates provide hope and if we’ve taken anything from previous lockdowns, it has been the resilience of our people and our customers.
From a bank perspective, we delivered a solid financial outcome. Our full-year statutory profit was up 72% to $6.16 billion. While improving economic conditions meant we were able to release some of the credit reserves we put in place for expected losses, the result also demonstrates the benefits of a diverse portfolio.
Prudent risk management over many years has resulted in much lower than anticipated loss rates, capital buffers remain at an historically high-level with a CET1 of 12.3%, while earnings have returned to near where they were pre-COVID-19 and Total Shareholder Returns have substantially improved.
The overall improved performance of the business has been reflected in our decision to restore dividends close to what they were before the pandemic struck and to lead the industry in returning capital to shareholders.
In fact, on a pro-forma basis we will have approximately $6 billion of capital above ‘unquestionably strong’ and will continue to consider the best use of any surplus capital.
Highlights this year have included New Zealand having a strong year and Institutional providing good returns for shareholders.
However, we did face challenges and although revenue in our Australia Retail & Commercial business in Australia increased, elevated demand for home loans impacted our ability to process applications in a timely manner which resulted in a loss of market share. There was also a delay with one of our key digital transformation products.
4
OVERVIEW HOW WE CREATE VALUE
PERFORMANCE OVERVIEW
REMUNERATION REPORT
DIRECTORS’ REPORT
FINANCIAL REPORT
SHAREHOLDER INFORMATION

The Board has exercised its discretion to reduce the variable remuneration as a percentage of target for relevant executives and we are confident the systematic actions being taken by management will address these issues.
THE BANK WE ARE BUILDING
A joint-venture announced with European-based global payments leader Worldline to provide the most advanced payments technology and merchant services in Australia is the latest example of our simplification program. While we still have some non-core assets, namely our minority investments in Asian banks, the Board and management team are now focused primarily on growing our core franchise.
Rapid change and disruption of traditional banking business models are the new normal. At ANZ we are taking advantage of these changes with the ‘Bank We Are Building’ transformation.
We will continue to focus on driving simplification and efficiency in our core business while also making significant investments in our digital platforms and advanced analytics capability so we can offer compelling products and services to our customers.
Investments will also focus on new pivotal partnerships in the emerging digital ecosystems our customers are increasingly using. Our Chief Executive Officer Shayne Elliott discusses this work in more detail in his update.
We are also acutely aware of the leadership role we play in relation to climate change. While the rapid decarbonisation of the global economy will be a significant business opportunity, there are financial risks associated with lending to customers impacted by climate change. We are committed to play our part in the path to net zero by 2050 and will work with customers to assist them with their transition.
SUPPORTING OUR COMMUNITIES
COVID-19 has reinforced the importance of community and I’m proud of the way ANZ has supported those in need through the pandemic.
The early days rightly prioritised supporting those who had been most impacted by various lockdowns through loan deferrals. These deferrals provided tens of thousands of customers with the critical time required to manage their cashflow through this difficult period.
There was less demand for customer deferrals this year, however equally important has been our support of the Government loan guarantee programs in Australia and New Zealand.
We also utilised our long experience with financial education to set up a program to specifically help Pacific islanders, arriving in Australia to fill labour shortages, better understand how to manage their money.
ANZ of course has large operations in some of the countries hardest hit by COVID-19. India, for example, a country in which we have a deep history, was devastated by its Delta outbreak this year.
While we worked hard to support our staff in India, we also donated $1 million to World Vision’s India COVID-19 appeal as well as setting aside a further $1 million to match customer and staff donations.
We have also taken action to ensure our people across our network are supported. Despite almost two years of remote working, our people remain highly engaged and we were pleased to be awarded the Number 1 position in the Australian Financial Review’s ‘Best Place to Work’ awards within our sector.
BOARD RENEWAL
Firstly, I’d like to acknowledge our former Chairman David Gonski. David retired from the ANZ Board in October last year having made an enormous contribution to our bank during his seven years as Chair. He helped build an organisation with a strong focus on governance, accountability, culture and better customer outcomes. There is no doubt ANZ is in much better shape as a result of his stewardship and on behalf of all shareholders, I thank David for his leadership.
Paula Dwyer will retire from the Board following our Annual General Meeting (AGM) on 16 December 2021. Paula is one of Australia’s most respected non-executive directors and we have been incredibly fortunate to have her serve on our Board for the past nine years, particularly in her role as Chair of the Audit Committee. From a personal perspective, I feel privileged to have been able to serve with her and on behalf of all shareholders thank Paula for her dedicated service to our company and wish her well with her future endeavours.
We are very fortunate to be welcoming Christine O’Reilly to the Board. Christine is an outstanding company director and she will make a significant contribution on behalf of all shareholders. While Christine formally joins the Board on 1 November 2021, she will stand for election as a Director at our AGM .
Finally, as a relatively new Chairman of ANZ, I would like to thank our shareholders for their support through the year. I also acknowledge the hard work and dedication of the 40,000 professionals working at ANZ. The pandemic has meant it has been another challenging year but our team has again stepped up for our customers and shareholders.
Paul D O’Sullivan | Chairman
5ANZ 2021 Annual Report
OVERVIEW HOW WE CREATE VALUE
PERFORMANCE OVERVIEW
REMUNERATION REPORT
DIRECTORS’ REPORT
FINANCIAL REPORT
SHAREHOLDER INFORMATION

CEO’s messageIt has been another significant year in the transformation of ANZ, particularly when considering the impacts COVID-19 is having on our customers and colleagues.
As we approach the final months of the year, I’m sure we all hoped the pandemic would be largely behind us. It isn’t but there are positive signs of a more optimistic 2022.
It was five years ago we outlined our vision for the future. A future that would see traditional banking models under significant pressure from a range of new competitors.
Customers want the same experience in banking they can get from online shopping or travel – convenient, safe, always on. At the same time, society expects more from us. Investors and regulators are rightly more sensitive to banks operating in an ethical, environmentally sustainable and transparent manner. Politicians are also holding the industry to greater account.
The pace of change has been faster than anticipated. Fortunately, we had already made significant progress in readying the organisation for the next phase of our evolution.
We’re now a much simpler and lower risk bank. We focus on the customers for whom we can add value and we’ve delivered on what we said we would. We are clear on who we bank and how we will drive value for customers and shareholders.
As the Chairman mentions in his update, we’ve delivered a solid result this year with highlights being the strong performance in New Zealand and Institutional.
This leads to the next chapter of the bank we are building.
It is our purpose – to shape a world where people and communities thrive – which directly underpins our strategy of improving the financial wellbeing and sustainability of our customers.
For the last couple of years we have been working on a program we’ve internally referred to as ‘ANZx’. This is not just a set of new products, rather it’s improving the digital capability, the digital ‘mindset’ if you like, of our entire organisation.
The first phase of this will be the launch soon of a new proposition we are calling ANZ Plus. Initially focused on savings and deposits, ANZ Plus has been in pilot for a few months and has been specifically designed to help people manage their money better.
But ANZ Plus is just the very first step in what will be a multi-year roll out of what will eventually become the cornerstone of how our retail and small business customers bank with us in the future.
It’s a growth-oriented strategy – taking the best technology and fintech mindset and applying it to our already strong brand and customer base.
Above all, it will be a radically different approach focused on growing the financial wellbeing of our customers and we will continue to update shareholders on our progress through the year.
To help prepare for this new world we also separated our ventures and incubator business, formerly known as ANZi, into a stand-alone entity. This small but important change will accelerate our growth and deliver new digital solutions for our customers.
Now known as 1835i, this independent venture business will operate more like a start-up. We will invest where we see a path to acquire more customers, deepen relationships with existing customers or co-develop new propositions we couldn’t develop on our own. ANZ will, of course, continue to fund 1835i’s investments and oversee its governance.
An example of how digital solutions can rapidly improve our operations was the launch this year of ANZ GoBiz. This allows customers to plug their accounting software straight into our systems so we can understand their financials almost instantly and approve working capital loans much faster. We have also digitised processes in the back-end.
It works with all the major accounting software packages – Xero, MYOB and QuickBooks – covering about 70% of all small businesses in Australia and effectively reduces the time it takes to get the money in the hands of small businesses from 30 to 2 days.
We are also preparing for one of the mega-trends of the global economy – the rapid transformation of how we produce, distribute and consume energy.
This is one of the most exciting opportunities for ANZ and we are well-placed to shape and support the required economic transition. In fact, this is a major business opportunity and one in which we already have made significant gains.
Key areas of interest for us include supporting the electrification of the transport supply chain, commercialisation of hydrogen, financing energy efficient buildings and assisting our customers to establish and develop their own transition plans. As well as being a signatory to the Net-Zero Banking Alliance, these are significant areas of commercial opportunity that will underpin ANZ’s business for many years to come.
As we look to our strengths, one of the highlights this year has been the progress we have made in improving the diversity of our workforce. In fact, this year saw the fastest improvement in the representation of Women in Leadership which increased to 35.3%. This is in addition to my executive team which has 40% women and our Board which has 38%.
6
OVERVIEW HOW WE CREATE VALUE
PERFORMANCE OVERVIEW
REMUNERATION REPORT
DIRECTORS’ REPORT
FINANCIAL REPORT
SHAREHOLDER INFORMATION

Shayne Elliott | Chief Executive Officer
70 years as ANZ This is a milestone year for us as it marks a major anniversary since the start of the ‘modern’ ANZ. It was in October 1951, 70 years ago, The Bank of Australasia joined with Union Bank of Australia and became ANZ Bank. This was a significant incarnation of a bank whose antecedents stretched back to Cornwall Bank, formed in Launceston in then Van Diemen’s Land in 1828.
In 1963 the bank was the first to ‘computerise’ and in 1970 merged with the English, Scottish and Australian Bank (ES&A) to become Australia and New Zealand Banking Group Limited – in what was at the time the largest merger in Australian banking history.
While much has changed during this time, we are still the most international of the Australian banks and I’m proud we’ve retained a culture so focused on our customers, no matter their size or where they are in the world.
TENACIOUS OF PURPOSE
We know there is more to be done which is also why we signed up to Hesta’s 40:40 initiative and I was proud we were the only bank among the first ten signatories.
Our progress in building a talented and diverse team has meant some of our most senior women, in particular our former Deputy CEO Alexis George and former CFO Michelle Jablko, have been selected for high-profile and challenging roles outside of the organisation.
While this could easily be seen as a negative, I’m incredibly proud we are seen as an organisation that provides people with the opportunities they deserve. It also means we are able to broaden the experience of other executives on the team and, in the case of the CFO, appoint Farhan Faruqui to the role.
Farhan is a deeply experienced global banker who played a crucial role in the re-shaping of ANZ’s Institutional and International business and he will make just as important a contribution as our next CFO.
Finally, while this is a period of significant disruption, I’m confident in our ability to continue to deliver for all of our stakeholders. We have never been financially stronger, we are investing for growth and we have the team with the mindset and agility to deliver.
I would like to acknowledge our terrific team across the world who have done an outstanding job for their customers, our shareholders and the community. It has been a difficult year for everyone but I continue to be impressed with their resilience and hard work.
7ANZ 2021 Annual Report
OVERVIEW HOW WE CREATE VALUE
PERFORMANCE OVERVIEW
REMUNERATION REPORT
DIRECTORS’ REPORT
FINANCIAL REPORT
SHAREHOLDER INFORMATION

This year Saver Plus reached a significant milestone.
The program has now enabled more than 50,000 lower income Australians to save around $26 million for their education costs, with ANZ providing matching of $21 million.
1. As at 30 June 2021. 2.2018 Saver Plus: Pathways to Wellbeing Report.
COMMUNITY STORY
50,000 people saving for the future
Program participant Daisy from Greenacre Hill in New South Wales says: “Saver Plus showed me how to save more money. Looking at my needs versus wants when shopping with my kids, I realised I can save so much more by using a list and shopping fortnightly. I’m still using the ANZ account and making deposits every single month.”
Melinda Moore, Acting Director Community Programs at Brotherhood of St Laurence (BSL), says the Saver Plus program has a lasting and sometimes life-changing impact on participants.
“Research shows many participants go on to establish a lasting savings habit that sees them achieve their financial goals and improve their financial wellbeing,” she says.
FINANCIAL WELLBEING AFTER SAVER PLUS2
Average financial wellbeing score before Saver Plus:
36
Average financial wellbeing score after Saver Plus:
64
Australia average financial wellbeing score:
59
Saver Plus is the world’s largest and longest running matched savings and financial education program and was co-developed by BSL and ANZ.
Further information on our financial wellbeing programs is in our 2021 ESG Supplement available at anz.com/annualreport.
50,8401
Total participants since 2003
$26M1
Amount saved
$21M1
Amount received in matching from ANZ
86%Female participants
14%Male participants
75% Saving for
children’s education
17% Saving for own education
8% Saving for both
8
OVERVIEW HOW WE CREATE VALUE
PERFORMANCE OVERVIEW
REMUNERATION REPORT
DIRECTORS’ REPORT
FINANCIAL REPORT
SHAREHOLDER INFORMATION
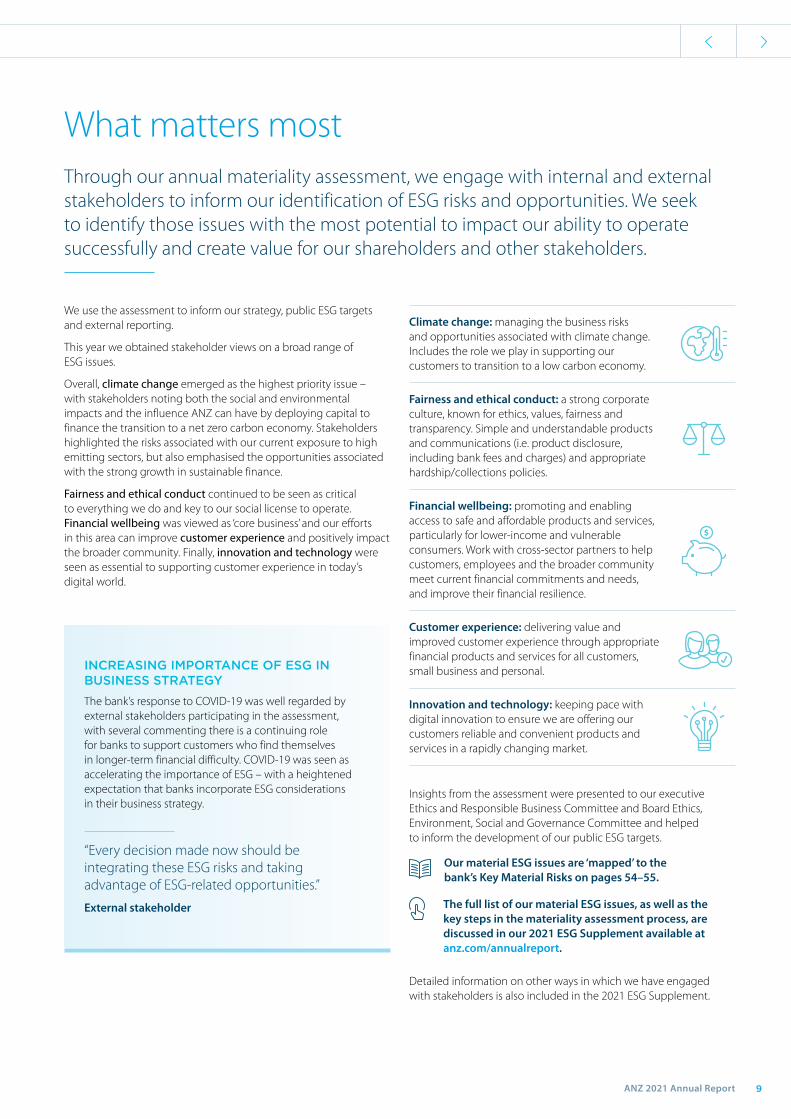
What matters mostThrough our annual materiality assessment, we engage with internal and external stakeholders to inform our identification of ESG risks and opportunities. We seek to identify those issues with the most potential to impact our ability to operate successfully and create value for our shareholders and other stakeholders.
We use the assessment to inform our strategy, public ESG targets and external reporting.
This year we obtained stakeholder views on a broad range of ESG issues.
Overall, climate change emerged as the highest priority issue – with stakeholders noting both the social and environmental impacts and the influence ANZ can have by deploying capital to finance the transition to a net zero carbon economy. Stakeholders highlighted the risks associated with our current exposure to high emitting sectors, but also emphasised the opportunities associated with the strong growth in sustainable finance.
Fairness and ethical conduct continued to be seen as critical to everything we do and key to our social license to operate. Financial wellbeing was viewed as ‘core business’ and our efforts in this area can improve customer experience and positively impact the broader community. Finally, innovation and technology were seen as essential to supporting customer experience in today’s digital world.
Climate change: managing the business risks and opportunities associated with climate change. Includes the role we play in supporting our customers to transition to a low carbon economy.
Fairness and ethical conduct: a strong corporate culture, known for ethics, values, fairness and transparency. Simple and understandable products and communications (i.e. product disclosure, including bank fees and charges) and appropriate hardship/collections policies.
Financial wellbeing: promoting and enabling access to safe and affordable products and services, particularly for lower-income and vulnerable consumers. Work with cross-sector partners to help customers, employees and the broader community meet current financial commitments and needs, and improve their financial resilience.
Customer experience: delivering value and improved customer experience through appropriate financial products and services for all customers, small business and personal.
Innovation and technology: keeping pace with digital innovation to ensure we are offering our customers reliable and convenient products and services in a rapidly changing market.
Insights from the assessment were presented to our executive Ethics and Responsible Business Committee and Board Ethics, Environment, Social and Governance Committee and helped to inform the development of our public ESG targets.
Our material ESG issues are ‘mapped’ to the bank’s Key Material Risks on pages 54–55.
The full list of our material ESG issues, as well as the key steps in the materiality assessment process, are discussed in our 2021 ESG Supplement available at anz.com/annualreport.
Detailed information on other ways in which we have engaged with stakeholders is also included in the 2021 ESG Supplement.
$
INCREASING IMPORTANCE OF ESG IN BUSINESS STRATEGY
The bank’s response to COVID-19 was well regarded by external stakeholders participating in the assessment, with several commenting there is a continuing role for banks to support customers who find themselves in longer-term financial difficulty. COVID-19 was seen as accelerating the importance of ESG – with a heightened expectation that banks incorporate ESG considerations in their business strategy.
“Every decision made now should be integrating these ESG risks and taking advantage of ESG-related opportunities.”
External stakeholder
9ANZ 2021 Annual Report
OVERVIEW HOW WE CREATE VALUE
PERFORMANCE OVERVIEW
REMUNERATION REPORT
DIRECTORS’ REPORT
FINANCIAL REPORT
SHAREHOLDER INFORMATION

About our businessWe provide banking and financial products and services to around 8.7 million retail and business customers, and operate across 32 markets.
Our expertise, products and services make us a bank. Our people, purpose, values and culture make us ANZ.
OUR DIVISIONS
Australia Retail and Commercial – serves retail, commercial and private banking customers through our branch network, business centres, ATMs, and digital and mobile banking applications.
Institutional – serves institutional and business customers across Australia, New Zealand, Asia, Europe and America including Papua New Guinea and the Middle East.
New Zealand – serves retail, commercial and private banking customers in New Zealand and is one of the largest New Zealand companies based on profit and assets.
Pacific – provides products and services to retail and commercial customers located in the Pacific Islands, where our history dates back 138 years.
Technology, Services & Operations and Group Centre – comprised of functions that support our business including Risk, Finance, Communications and Public Affairs, Internal Audit and Talent & Culture.
OUR PURPOSE AND VALUES
Our purpose is to shape a world where people and communities thrive.
Launched five years ago, our purpose explains ‘why’ we exist, guides the decisions we make each day and drives everything we do.
Our values are the foundation of ‘how’ we work – living our values every day enables us to deliver on our strategy and purpose, strengthen stakeholder relationships and earn the community’s trust. All employees and contractors must comply with our Code of Conduct, which sets out the expected standards of professional behaviour and guides us in applying our values.
Supporting sustainable development
We are committed to the United Nations (UN) Sustainable Development Goals (SDGs) and believe that business has an important role to play in their achievement. Our 2022 ESG targets support 12 of the 17 SDGs.
In 2019 we became a founding signatory to the UN Principles for Responsible Banking. Under the Principles we are required to set at least two targets that address our most significant (potential) positive and negative impacts, aligned with the SDGs and the Paris Climate Agreement.
Further information on our progress towards implementing the Principles, including targets we have set, is in our 2021 ESG Supplement available at anz.com/annualreport.
OUR ENVIRONMENT, SOCIAL AND GOVERNANCE (ESG) FOCUS AREAS
We are helping to respond to complex societal issues central to our customers and our business strategy. In particular, we are focusing our efforts on:
Financial wellbeing – improving the financial wellbeing of our people, customers and the community by helping them make the most of their money throughout their lives
Environmental sustainability – supporting household, business and financial practices that improve environmental sustainability
Housing – improving the availability of suitable and affordable housing options for all Australians and New Zealanders
Fundamental to our approach is a commitment to fair and responsible banking – keeping pace with the expectations of our customers, employees and the community, behaving fairly and responsibly and maintaining high standards of conduct.
Integrating ESG and purpose into our strategy has created an opportunity for us to better serve our customers and generate long-term shareholder value.
INTEGRITY COLLABORATION ACCOUNTABILITY RESPECT EXCELLENCE
OUR VALUES ARE
10
OVERVIEW HOW WE CREATE VALUE
PERFORMANCE OVERVIEW
REMUNERATION REPORT
DIRECTORS’ REPORT
FINANCIAL REPORT
SHAREHOLDER INFORMATION

Our strategyTo build a better bank we are bringing our purpose to life, integrating our values and culture into our strategy.
Our strategy is to improve the financial wellbeing and sustainability of our customers. We will do this by providing excellent services, tools and insights that engage and retain customers and positively change their behaviour.
Building the financial wellbeing and sustainability of our customers creates a positive cycle of benefits. It directly benefits customers and also grows shareholder returns; it leads to a strong and positive reputation; it ultimately means it costs less to acquire customers; and it grows loyalty, which in turn generates better returns – delivering more capital so we can invest in building a better bank and continue to improve the lives of our customers.
We will know we have built a better bank when:
• We support a higher share of customers in our target segments
• Our customers have greater financial wellbeing over their lifetimes, and implement more sustainable business practices than others
• Our customers are more engaged, more loyal and avail themselves of more of the right products and services than those banking with peers
• We serve our customers more efficiently than peers and our systems are safer and more reliable
• We attract and retain more of the people with the skills required to reinvent banking, in line with our purpose and culture
• We generate stronger long-term financial results (in terms of sustainable economic profits) than our peers
• Our reputation with customers, community, potential employees and regulators is better, both absolutely and relative to (domestic) competitors (existing and emerging)
• Our practices and services provide more opportunity for the community and we have supported and improved positive economic development and transition.
We will achieve our strategy through…
In particular, we want to help customers:
Propositions our customers love... with easy to use services that evolve to meet their changing needs. Through better use of data we will be able to provide valuable insights about our customers and how they can improve their financial wellbeing and sustainability over their lifetime, enabling us to create superior propositions.
Flexible and resilient digital banking Platforms... powering our customers and made available for others to power the industry. Platforms underpin our own propositions and will increasingly underpin those of our customers, notably other banks or institutional corporations.
Partnerships that unlock new value... with ecosystems that help customers further improve their financial wellbeing and sustainability. We recognise that no one institution can do everything or innovate at the pace necessary to satisfy customers’ needs – strong relationships with partners is therefore vital.
Purpose and values-led people... who drive value by caring about our customers and the outcomes we create. Our people listen, learn and adapt and do the right thing the first time, delivering the outcomes that address financial and sustainability challenges.
Save for, buy and own a sustainable, liveable and affordable home
Start or buy and sustainably grow their business
Move capital and goods around the region and sustainably grow their business
$
$ $
11ANZ 2021 Annual Report
OVERVIEW HOW WE CREATE VALUE
PERFORMANCE OVERVIEW
REMUNERATION REPORT
DIRECTORS’ REPORT
FINANCIAL REPORT
SHAREHOLDER INFORMATION

...ENABLE OUR BUSINESS ACTIVITIES...
Pay dividends to our shareholders
Provide wealth management products and advisory services
Collaborate with partners to
improve financial wellbeing and environmental sustainability
Pay taxes in the countries within which we operate
GO
VE
RN
AN
CE
GO
VE
RN
AN
CE
RIS
KS
& O
UR
OP
PO
RT
UN
ITIE
S OP
ER
AT
ING
EN
VIR
ON
ME
NT
OUR PURPOSE
How we create value
VALUE DRIVERS
Products and services
Loans, transaction banking services, deposits and other financial products developed for our customers.
Finance
Access to capital through customer deposits, debt and equity investors and wholesale markets enables us to run our operations and execute our strategy.
People
Engaged workforce with the skills required to reinvent banking, in line with our purpose and culture.
Technology, data and risk management
Flexible, digital-ready infrastructure to provide great customer experience, with systems and processes that are less complex, less prone to error and more secure.
Social
Trusted relationships with our customers and the community are essential to our brand and reputation.
Environment
Use of natural resources and impact on the environment, resulting from our operations and the products and services we provide our customers.
$¢
$
12
OVERVIEW HOW WE CREATE VALUE
PERFORMANCE OVERVIEW
REMUNERATION REPORT
DIRECTORS’ REPORT
FINANCIAL REPORT
SHAREHOLDER INFORMATION

SHAREHOLDER VALUE
We generate stronger long-term financial results (in terms of sustainable economic profits) enabling shareholders to meet their goals
• 218.3 cents earnings per share2 • 9.9% cash return on equity2 • Proposed final dividend per share of 72 cents and interim
dividend per share of 70 cents • $21.09 net tangible assets per share3 • 70.7% total shareholder return (TSR) in 2021
• 31.8% TSR over the past 5 years
CUSTOMER VALUE
Our customers are financially better off over their lifetime and implement more sustainable business practices than others
• $368 billion home loan portfolio, increase of $12 billion in 2021 (Australia and New Zealand)
• Business loan balance of $91 billion and customer deposits of $105 billion (Australia and New Zealand)
• $12.8 billion funded and facilitated in sustainable solutions
EMPLOYEE VALUE
Our diverse teams are engaged and optimised for success
• 81% employee engagement • 35.3% Women in leadership • $4.9 billion in employee salaries and benefits
• Over 1,275,000 hours of training provided
COMMUNITY VALUE
Our practices and services provide more opportunity for the community and we have supported and improved positive economic development and transition
• Invested $1.29 billion in social and sustainable housing in Australia and NZ$150 million in New Zealand
• $2.4 billion in taxes paid to government4 • More than 67,600 people reached through our financial literacy
programs MoneyMinded and Saver Plus5 • Engaged with 100 of our largest emitting business customers
to support their low carbon transition
...CREATING VALUE FOR OUR STAKEHOLDERS1
Provide transaction banking services
and hold deposits
Lend money to retail, business
and institutional customers
Help customers mitigate and
manage financial risks
Support customers with trade and
capital flows
GO
VE
RN
AN
CE
GO
VE
RN
AN
CE
RIS
KS
& O
UR
OP
PO
RT
UN
ITIE
S OP
ER
AT
ING
EN
VIR
ON
ME
NT
Shape a world where people and communities thrive
Our value creation model outlines how we deliver positive outcomes for our key stakeholders through our business activities, and identifies the value drivers (or capitals) that we rely on to meet our strategic goals and build a better bank. Long-term value creation is dependent on our ability to successfully manage the risks and opportunities in our operating environment.
1. All figures below relate to the period 1 October 2020 - 30 September 2021 unless otherwise stated. 2. On a cash profit (continuing operations) basis. Excludes non-core items included in statutory profit and discontinued operations and is provided to assist readers in understanding the result of the ongoing business activities of the Group. For further information on adjustments between statutory and cash profit refer to page 57 . 3. Equals shareholders’ equity less preference share capital, goodwill, software and other intangible assets divided by the number of ordinary shares. 4. Total taxes borne by the Group, includes unrecovered GST/VAT, employee-related taxes an other taxes. Inclusive of discontinued operations. 5. Includes individuals who have participated in more than one program (for example, people who have participated in MoneyMinded as part of Saver Plus are counted twice as they are included in both the MoneyMinded and Saver Plus totals).
13ANZ 2021 Annual Report
OVERVIEW HOW WE CREATE VALUE
PERFORMANCE OVERVIEW
REMUNERATION REPORT
DIRECTORS’ REPORT
FINANCIAL REPORT
SHAREHOLDER INFORMATION

Our operating environmentThe COVID-19 pandemic has fundamentally changed the external environment across the geographies in which we operate. A summary of the key external challenges currently affecting our business and our response to them is outlined below.
CHALLENGE OUR RESPONSE
Social and economic impacts of COVID-19
• Many customers continue to be financially impacted by the pandemic, and need to adapt to a new environment
• Changed employment proposition due to continued stay-at-home restrictions and employees moving to ‘blended’ models of working where restrictions allow a return to office.
• Responding to customer circumstances, by providing financial support and information
• Working cooperatively with government on policies to see our customers through the COVID-19 pandemic and into a period of growth
• Providing targeted wellbeing and safety support to employees.
Limited growth
• The economic contraction expected as a consequence of prolonged lockdowns in New South Wales and Victoria will impact households and many businesses. It could push unemployment higher and cause more customers to defer loan repayments. Further pandemic-related disruptions are possible over the coming year across our markets of operation.
• Maintaining our focus on core banking services to improve customer outcomes, together with efficient allocation of capital and resources.
Increased public and regulatory scrutiny
• Challenges arising from regulatory expectations and changing community standards and expectations
• Failure to meet our ESG commitments and related social expectations could lead to customer and community impacts and reduced shareholder value.
• Supporting our customers, employees and the community through the pandemic and ensuing recovery period
• Building trust by ‘doing what we say’
• Working cooperatively with regulators, government and NGOs
• Strengthening our ESG policies and processes and ensuring we implement effectively – transparently disclosing our progress.
Increased competition
• Increased competition from digitally enabled competitors. • Deploying new and improved digital services, products and processes to help meet customer needs for efficient and accessible banking.
Cyber security threats
• Increased cyber-attacks, scams and attempted fraud. • Meeting customer needs for safe, secure and reliable banking through investing in our cyber security capabilities.
Climate change
• Increasing regulatory, political and societal focus on the transition risks associated with climate change
• Potential financial risks associated with lending to business and retail customers impacted by climate change.
• Providing sustainable finance products and services, such as green and sustainability-linked loans and bonds, that drive the transition to a low carbon economy
• Strengthening our policies, processes, products and services to manage the risks and opportunities associated with climate change.
Globalisation and geopolitical changes
• The COVID-19 pandemic and changing geopolitical environment has hurt global prosperity and cooperation, threatening flows of trade, investment and people. This may challenge supply chains and productivity across our geographies.
• Developing new markets to leverage business opportunities in Australia and the region as economies recover from the pandemic.
14
OVERVIEW HOW WE CREATE VALUE
PERFORMANCE OVERVIEW
REMUNERATION REPORT
DIRECTORS’ REPORT
FINANCIAL REPORT
SHAREHOLDER INFORMATION

Our customersWe are focused on developing the best propositions, across our platforms and in partnerships, to build the financial wellbeing of our customers. Whether those customers are buying homes, growing small businesses or, in the case of large businesses, trading internationally across our network, we want to help them to succeed.
In partnership with a specialist wellbeing organisation, Benestar, we have introduced a customer support program providing free and confidential counselling to Australian based customers experiencing distress – whether it be as a result of domestic violence, mental health difficulties, bereavement or a range of other factors. The program includes up to five free counselling sessions with clinicians specialising in psychological support. If a customer requires ongoing support they may be referred to relevant community services.
Further information on support available to customers experiencing financial hardship or vulnerability is in our 2021 ESG Supplement available at anz.com/annualreport.
HIGHLIGHT
WE HAVE OFFERED A RANGE OF SUPPORT MEASURES FOR CUSTOMERS IMPACTED BY COVID-19 LOCKDOWNS
Home owners
• Pausing loan repayments (deferrals)
• Reducing repayments to the minimum repayment amount
• Accessing redraw and/or offset balance
• Changing repayments to interest only
• Refinancing and consolidating any other debts
• Applying for financial assistance.
Business loans
• Pausing loan repayments (deferrals)
• Providing access to new loans and government support schemes
• Temporary increases in overdraft facilities for 12 months
• Additional support for Asset Finance, Commercial Cards, Trade and Merchants products.
SUPPORTING CUSTOMERS THROUGH THE COVID-19 PANDEMIC
In Australia, our approach to assisting customers financially impacted by the pandemic has been guided by our ‘Statement of Intent’ (available at anz.com), which we developed with key stakeholders. The Statement outlines the support measures available and our commitment to work with customers on a solution that is respectful, fair and appropriate. It is underpinned by four key principles:
Protect what mattersAdapt to the changing environmentEngage with stakeholdersPrepare for the future
Financial relief measures and ongoing hardship support has been provided for home loan and business customers affected by continuing lockdowns (particularly in New South Wales and Victoria), or those still recovering from earlier lockdowns.
All retail and commercial customer applications for hardship assistance are managed by our Customer Connect team. Relief measures have been offered after assessing each customer’s individual needs and the suitability of hardship assistance.
Since the start of the pandemic, we have significantly increased investment in our hardship capabilities. In 2020 we mobilised employees across our branch network and operational teams to meet demand from customers seeking assistance. This cross-skilling of teams has resulted in greater flexibility across our workforce, meaning we can better match capacity to demand as hardship applications fluctuate in response to lockdowns. We have also established hardship teams in New South Wales, Western Australia and Queensland (in addition to our existing team in Victoria) to enhance local support for our customers and bankers. In addition, we have made it easier for customers to access support, creating a digital hardship portal that allows customers to submit their details (including financial information) online to the Customer Connect team.
In New Zealand, support measures were reintroduced to help business customers through COVID-19 disruptions in late August. Short-term relief measures included waiving fees for contactless debit cards, access to temporary overdrafts and removing fees for loan restructuring.
15ANZ 2021 Annual Report
OVERVIEW HOW WE CREATE VALUE
PERFORMANCE OVERVIEW
REMUNERATION REPORT
DIRECTORS’ REPORT
FINANCIAL REPORT
SHAREHOLDER INFORMATION

IMPROVING FINANCIAL WELLBEING THROUGH SUPERIOR DIGITAL EXPERIENCES
As the COVID-19 pandemic continues, customers are increasingly using digital banking solutions for simple transactions, saving time and reducing unnecessary visits to a branch or calls to the contact centre.
Digital wallet payments have increased by more than 74% in transaction amounts and more than 63% in transaction volumes in 2021, compared to 2020.
In the past 12 months, only 8% of our customers in Australia have relied solely on branches – meaning more than 90% are already using at least one self-service channel.
Over the past two years, we have been developing features within the ANZ App (Australia) and goMoney App (New Zealand) to help our customers do more of their everyday banking via self-service.
In Australia, more than 3.7 million customers are now using the ANZ App, with almost 430,000 new registrations in 2021. More than 2.1 million customers are actively using ANZ Internet Banking and Internet Banking for Business. New registrations for Internet Banking for Business are up 20% compared to last year, and business transactions have increased by 11%, indicating our business customers are also increasingly moving towards digital self-service.
We have added features to the ANZ App to enhance our customers’ financial wellbeing. For example:
• New customers can now join ANZ and open their first savings account through the App. More than 68,000 savings accounts have been opened since the feature was launched in October 2020, representing almost 50% of all new Progress Saver accounts opened.
• We have enhanced the ‘Save for a Goal’ feature, introducing two new ‘nudges’ to kick start customers’ savings goals, informing them when they’re falling behind their goal target and providing ideas for how to get back on track. Customers have now set up over 500,000 savings goals in the App.
• Customers can apply a gambling block to prevent gambling transactions on an eligible credit card.
• Customers with an ANZ Smart Choice Super account can search and consolidate their super by using the updated Australian Taxation Office SuperMatch service in the App.
In New Zealand, almost 1.6 million customers are now using our digital self-service channels, goMoney App and Internet Banking, with over 97,000 new registrations in 2021. This year, more than 72,800 accounts have been opened using Internet Banking or goMoney. In the past three months digital sales represented 49% of all new accounts opened.
New features added to the goMoney App include:
• Eligible new customers can join ANZ via the goMoney App, with the majority also able to complete the identity and credit check process within the App.
• The ability to decrease credit card limits, helping customers take control of their spending and manage their credit card. A total of 12,287 decreases have been completed this year, for a total limit value of NZ$39.2 million.
• Payments requiring more than one authoriser can now be created and authorised in Internet Banking and goMoney, without the need to visit a branch or contact us. Since the feature was enabled, 128,485 payments have been authorised. This was a key part of helping our customers with their banking while we removed cheques as a payment method. We also ran customer education campaigns, focused particularly on supporting vulnerable customers. At the end of May 2021, ANZ became the first major New Zealand bank to remove cheques as a payment method.
Self-service banking sits within the context of a broader societal shift – in the way people shop, interact with services – and even interact with each other.
We want to support customers of all ages and abilities to bank digitally with confidence and will seek to ensure our apps continue to incorporate the latest adaptive and assistive technologies of the major smartphone platforms.
In July 2020, we established a new Retail Customer Care team in Australia to contact all customers older than 65 years, as well as frequent branch users impacted by branch closures. Since then we have contacted 105,000 customers to discuss alternative ways to bank and the self-service options available.
“I’ve banked with ANZ since the 1980s and the method of banking has changed so much. I now use my iPad and iPhone to check my accounts on internet banking regularly.”
Guy “Ted” Salmond | 95 years old
16
OVERVIEW HOW WE CREATE VALUE
PERFORMANCE OVERVIEW
REMUNERATION REPORT
DIRECTORS’ REPORT
FINANCIAL REPORT
SHAREHOLDER INFORMATION

DIGITAL TRANSFORMATION – THE KEY TO BUILDING A BETTER BANK
A key element of our strategy is the delivery of a digital transformation that will help us build a substantially better bank – one that provides tools, support and insights customers need to improve their financial wellbeing.
We are investing heavily in this transformation, prioritising digital products; improved use of data and analytics; innovative strategic partnerships; a refreshed brand proposition; and human-centred design.
Our Australian business
Our transformation goals are focused on the delivery of:
• A small number of purpose-led propositions that people love to use
• A mobile-first human supported distribution model
• A simplified, high integrity, highly automated digital platform
• A customer-centric culture and leading workplace.
Retail customers in Australia will soon see change delivered through our new and different ANZ Plus customer proposition.
One of the first things our customers will see is a new digital banking proposition to help people to manage their money better – by spending less, saving more and creating healthy money habits.
ANZ Plus includes, among other things, an intelligent mobile banking app, two new bank accounts, and access to coaches – all designed to help our customers improve their financial wellbeing over time.
We are simplifying what we do, reducing the number of systems we operate, cutting the length of customer terms and conditions, and using the right tools and technology to build a quality, automated, digital experience.
Our Institutional business
In our Institutional business, the digital transformation is focused on making it simple and easy for our customers to do business with us by providing them with a digitally connected experience.
An example is the work we have done to build a business that allows our customers to integrate their systems with ours to automate payments and reconciliations processes. Receivables data has increased by 37% since 2019, helping more customers auto-reconcile their incoming payments, enabling funds to be deployed as quickly as possible.
Another example is our platform and payments work to help our customers provide payments to their customers and employees. Payments through our digital channels has grown by 30% since 2019, powering transactions for our customers, as well as customers of other banks where we process payments on their behalf.
The digital transformation is focused on making it simple and easy for our customers to do business with us by providing them with a digitally connected experience.
17ANZ 2021 Annual Report
OVERVIEW HOW WE CREATE VALUE
PERFORMANCE OVERVIEW
REMUNERATION REPORT
DIRECTORS’ REPORT
FINANCIAL REPORT
SHAREHOLDER INFORMATION

NEW PLATFORMS AND PARTNERSHIPS TO HELP OUR BUSINESS CUSTOMERS GROW
As the economy recovers from the pandemic we have a role to play in supporting businesses – both large and small – to grow, and we are developing innovative solutions to help make this happen. Earlier this year we launched our new digital lending platform for small businesses, ANZ GoBiz.
Using agile ways of working, we established cross-functional delivery ‘squads’ comprised of frontline bankers, technology architects, experience designers, data engineers, credit risk and assurance experts. Collaborating remotely, the team devised a way to integrate external financial data to provide the instant lending decisions our business customers were seeking. A process that previously took more than 30 days to complete now takes around two days, with loan applications made via a smart phone receiving conditional approval within minutes.
Working with 300 business owners and their accountants and bookkeepers, we created the ANZ GoBiz platform to enable faster lending to our small business customers.
Helping women start, run and grow a small business
The ANZ Business Growth Program, established in 2014, is delivered by The Australian Centre for Business Growth, University of South Australia.
Online courses, seminars and webinars are open to all Australian businesses participating in the program. ANZ business banking customers can also be selected to participate in targeted one-day clinics and an intensive nine-month program.
Results are impressive, with companies going through the program reporting increased revenue, profit, expansion of employees and some also now exporting to new markets.
This year, there was a 27% uptake of women in leadership roles participating in the one-day Business Growth CEO Clinics.
One of these women was Maria Konecsny, who co-founded Gewürzhaus, a specialist Australian spice retailer, with her sister Eva.
Passionate about creating a workplace and a business that challenges “business as usual”, Maria uses care and creativity to responsibly address sustainability at Gewürzhaus.
On her success, Maria says it was about doing things for the right reasons from the start – “no compromise on quality, no compromise on deeply engaging with our customers.”
CASE STUDY
$
18
OVERVIEW HOW WE CREATE VALUE
PERFORMANCE OVERVIEW
REMUNERATION REPORT
DIRECTORS’ REPORT
FINANCIAL REPORT
SHAREHOLDER INFORMATION

We are assisting our Institutional customers through our market-leading New Payments Platform (NPP)1 offering. The platform enables smaller or foreign banks to participate in real time payments within Australia using our systems. Over the last few years, our Institutional business has won 10 mandates from our Financial Institution customers. Four of these are live, with these customers now transacting on the platform.
With respect to our entire agency and clearing offering, Institutional won 37 new mandates this year, and we expect this number to increase as we further develop our platforms strategy.
1. The New Payments Platform is a centralised platform and open infrastructure system that facilitates fast, real-time clearing and settlements of payments between participating Australian financial institutions.
Digitising insurance claims to be real-time, simple and streamlined
Making an insurance claim can sometimes be a difficult and slow process.
In partnership with global Institutional customer Chubb Insurance, we have been working to solve this issue, developing the first real-time Australian claims process to help make the experience for claimants quick and simple.
Using the banking industry’s New Payments Platform (NPP)1 infrastructure and Application Program Interface (API) connectivity – the technology enabling real-time exchange of information between Chubb Insurance’s internal and customer facing web-based applications – ANZ has been able to develop this innovative solution.
Developed as part of Chubb Insurance’s wider global transformation program to streamline its claims payment
experience, the solution improves the claims process by automating near immediate payment once a claim is approved.
“The ability to make faster and simpler claim payments creates a much better customer experience, particularly for people in urgent or emergency situations,” said Gerard Sitaramayya, Chief Financial Officer of Chubb Insurance Australia and New Zealand.
“By using the NPP, it means our customers can submit a claim and have it paid into their nominated bank account in near real-time, 24/7, 365 days a year,” Gerard said.
Depending on the insurance type and/or amount, customers can use either a web-based self-service portal or raise a claim request over the phone with a claim examiner who can approve and process the payment in real-time.
This API solution marks a further shift in the transition from legacy payments infrastructure, such as cheques and direct entry with remittance-based payments, to real time payments, reducing the risk of potential fraud, delays and complications.
CASE STUDY
FINANCING SUSTAINABILITY THROUGH PRODUCT INNOVATION
We continue to innovate our product suite in order to support our customers’ sustainability and transition strategies:
Green, Sustainability, Sustainability-Linked and Transition Loans – lending to deploy capital into green, transition and sustainability initiatives
Green and Sustainable Infrastructure Project Finance – greenfield project financing to support the development of long-term sustainable infrastructure such as renewable energy
Green, Social, Sustainability, Sustainability-Linked and Transition Bonds – distribution of capital into green, transition and sustainability initiatives such as energy efficient buildings
Corporate finance advisory services for renewables – provision of advice in relation to the purchase, sale and raising of capital for renewable energy projects
Green Guarantees and Sustainable Supply Chain – trade facilities supporting green and sustainability initiatives
Sustainability-Linked Derivatives – hedging of interest rate and FX risks on Sustainability-Linked Bond or Sustainability Linked Loan transactions. The same sustainability targets of the underlying Bond or Loan are connected to the derivative, further supporting the customer’s sustainability strategy
ANZ/Clean Energy Finance Corporation Energy Efficiency Asset Finance program – financing to incentivise corporate and retail customers to invest in energy efficient and renewable energy technologies to help reduce their energy costs and carbon emissions
In addition, we are supporting customers through our $50 billion target to help fund and facilitate initiatives that improve environmental sustainability, support disaster resilience, increase access to affordable housing and promote financial wellbeing.
19ANZ 2021 Annual Report
OVERVIEW HOW WE CREATE VALUE
PERFORMANCE OVERVIEW
REMUNERATION REPORT
DIRECTORS’ REPORT
FINANCIAL REPORT
SHAREHOLDER INFORMATION
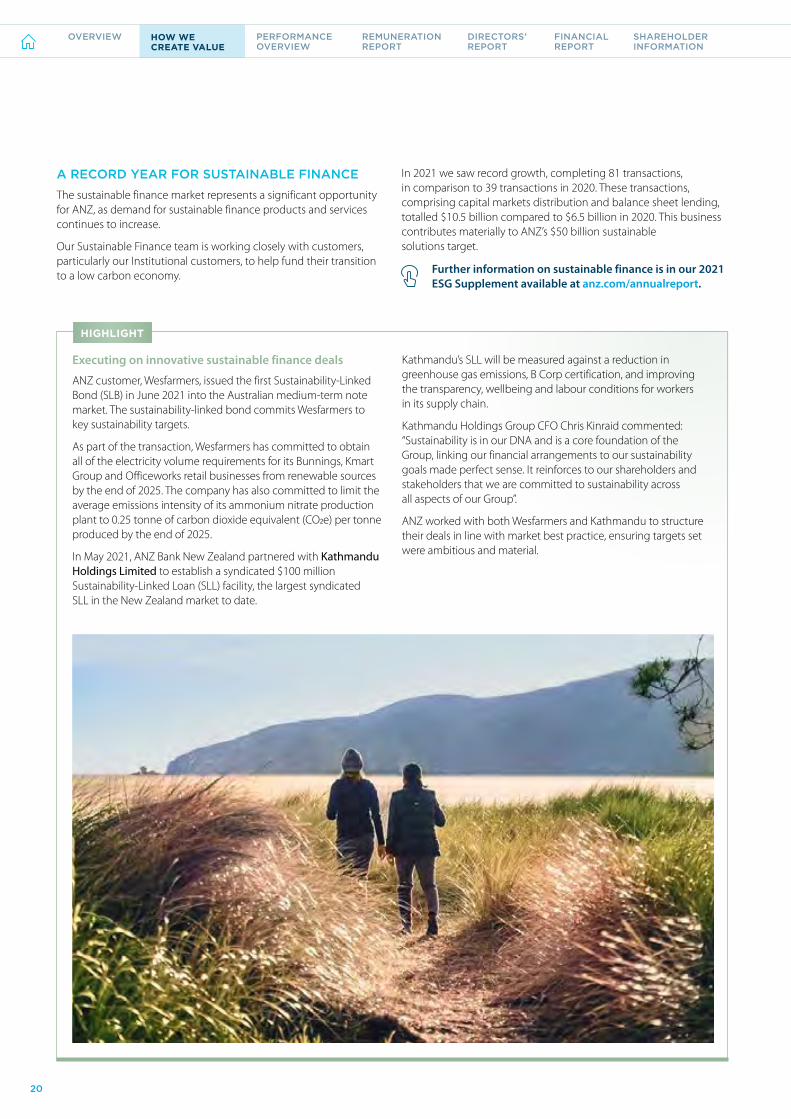
A RECORD YEAR FOR SUSTAINABLE FINANCE
The sustainable finance market represents a significant opportunity for ANZ, as demand for sustainable finance products and services continues to increase.
Our Sustainable Finance team is working closely with customers, particularly our Institutional customers, to help fund their transition to a low carbon economy.
In 2021 we saw record growth, completing 81 transactions, in comparison to 39 transactions in 2020. These transactions, comprising capital markets distribution and balance sheet lending, totalled $10.5 billion compared to $6.5 billion in 2020. This business contributes materially to ANZ’s $50 billion sustainable solutions target.
Further information on sustainable finance is in our 2021 ESG Supplement available at anz.com/annualreport.
Executing on innovative sustainable finance deals
ANZ customer, Wesfarmers, issued the first Sustainability-Linked Bond (SLB) in June 2021 into the Australian medium-term note market. The sustainability-linked bond commits Wesfarmers to key sustainability targets.
As part of the transaction, Wesfarmers has committed to obtain all of the electricity volume requirements for its Bunnings, Kmart Group and Officeworks retail businesses from renewable sources by the end of 2025. The company has also committed to limit the average emissions intensity of its ammonium nitrate production plant to 0.25 tonne of carbon dioxide equivalent (CO2e) per tonne produced by the end of 2025.
In May 2021, ANZ Bank New Zealand partnered with Kathmandu Holdings Limited to establish a syndicated $100 million Sustainability-Linked Loan (SLL) facility, the largest syndicated SLL in the New Zealand market to date.
Kathmandu’s SLL will be measured against a reduction in greenhouse gas emissions, B Corp certification, and improving the transparency, wellbeing and labour conditions for workers in its supply chain.
Kathmandu Holdings Group CFO Chris Kinraid commented: “Sustainability is in our DNA and is a core foundation of the Group, linking our financial arrangements to our sustainability goals made perfect sense. It reinforces to our shareholders and stakeholders that we are committed to sustainability across all aspects of our Group”.
ANZ worked with both Wesfarmers and Kathmandu to structure their deals in line with market best practice, ensuring targets set were ambitious and material.
HIGHLIGHT
20
OVERVIEW HOW WE CREATE VALUE
PERFORMANCE OVERVIEW
REMUNERATION REPORT
DIRECTORS’ REPORT
FINANCIAL REPORT
SHAREHOLDER INFORMATION
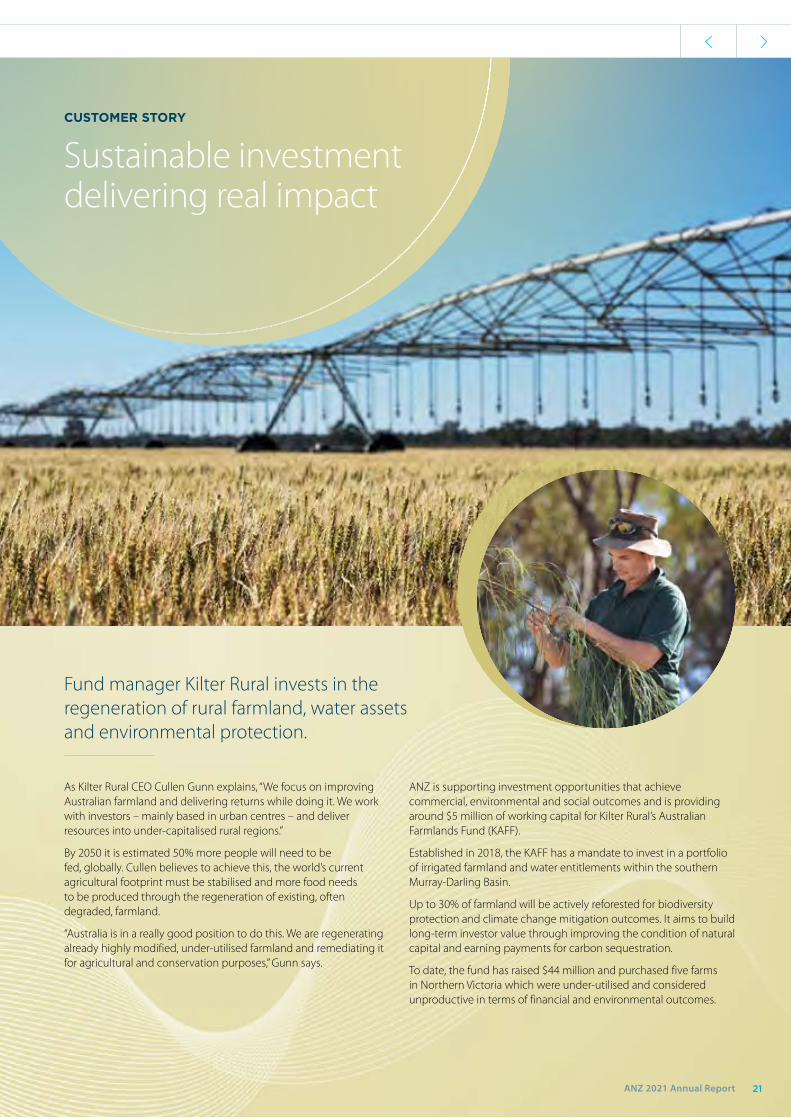
Fund manager Kilter Rural invests in the regeneration of rural farmland, water assets and environmental protection.
As Kilter Rural CEO Cullen Gunn explains, “We focus on improving Australian farmland and delivering returns while doing it. We work with investors – mainly based in urban centres – and deliver resources into under-capitalised rural regions.”
By 2050 it is estimated 50% more people will need to be fed, globally. Cullen believes to achieve this, the world’s current agricultural footprint must be stabilised and more food needs to be produced through the regeneration of existing, often degraded, farmland.
“Australia is in a really good position to do this. We are regenerating already highly modified, under-utilised farmland and remediating it for agricultural and conservation purposes,” Gunn says.
ANZ is supporting investment opportunities that achieve commercial, environmental and social outcomes and is providing around $5 million of working capital for Kilter Rural’s Australian Farmlands Fund (KAFF).
Established in 2018, the KAFF has a mandate to invest in a portfolio of irrigated farmland and water entitlements within the southern Murray-Darling Basin.
Up to 30% of farmland will be actively reforested for biodiversity protection and climate change mitigation outcomes. It aims to build long-term investor value through improving the condition of natural capital and earning payments for carbon sequestration.
To date, the fund has raised $44 million and purchased five farms in Northern Victoria which were under-utilised and considered unproductive in terms of financial and environmental outcomes.
CUSTOMER STORY
Sustainable investment delivering real impact
21ANZ 2021 Annual Report
OVERVIEW HOW WE CREATE VALUE
PERFORMANCE OVERVIEW
REMUNERATION REPORT
DIRECTORS’ REPORT
FINANCIAL REPORT
SHAREHOLDER INFORMATION

IMPROVING THE AVAILABILITY OF AFFORDABLE AND SUSTAINABLE HOUSING
Throughout 2021 we have continued to support our home loan customers experiencing financial difficulty due to the impacts of COVID-19.
While no new COVID-19 home loan deferrals were issued after 31 January 2021, we have assisted customers experiencing ongoing financial hardship through our existing hardship support program. Current deferrals make up only ~1% of the total deferrals provided up to 31 January 2021.
This year in Australia we increased our home loan balance by $3 billion to $278 billion to help our customers buy and own a home.
Our home loan balance in New Zealand grew NZ$10 billion this year to NZ$94 billion to help our customers buy and own a home.
We are committed to improving the availability of suitable and affordable housing options for all Australians and New Zealanders, and have targets to:
• Fund and facilitate $10 billion of investment by 2030 to deliver more affordable, accessible and sustainable homes to buy and rent in Australia and New Zealand
• Support more customers into healthier homes with our Health Home Loan Package and Interest-free insulation loans in New Zealand.
Our work spans many sub-sectors of the market, including affordable housing, specialist disability accommodation, aged care and homelessness. Key initiatives delivered include:
• Joint arranger of all five bond issuances for the Commonwealth’s National Housing Finance and Investment Corporation (NHFIC) over the last three years totaling approximately $2 billion. The capital raised allows NHFIC to provide low cost, long-term loans to registered community housing providers to support the provision of more social and affordable housing.
• Lead commercial financier of over $226 million in committed facilities in the Specialist Disability Accommodation sector.
• Lead financier to the Land Lease Community sector, designed to deliver affordable seniors housing.
• Advocating for institutional investment in long-term rental housing through the backing of a range of ‘build-to-hold’ and ‘build-to-rent’ projects.
Providing affordable accommodation for essential workers
Australia has among the highest levels of home ownership in the world, but is also ranked in the top 10 for the highest levels of unaffordability for home purchase and rental. The availability of suitable and affordable housing is an issue for many in the community, particularly as house prices have risen sharply in the past 12 months.
Many key workers in essential industries such as health, education, emergency services and law enforcement are directly impacted. Due to a lack of affordable housing in Australian metropolitan areas, many key workers are unable to pay market rents close to their place of work, on top of their general living expenses.
The difficulty of finding affordable housing close to their workplaces means that many key workers have to relocate or travel long distances to get to work. A long
commute is expensive and can also impact the ability of these workers to participate in family and community life.
To increase the availability of affordable rental housing for key workers, we have supported both Aware Super and their community housing provider partners. This support includes the provision of a $90 million funding facility to assist in financing Aware Super’s portfolio of key worker affordable housing. We intend to increase our funding in this area as the portfolio grows.
The portfolio currently consists of around 235 units across New South Wales and Victoria - a combination of completed projects and developments still under construction. Once developed, these properties will be rented at a 20% discount off market rent to key workers.
Further information about housing is in our 2021 ESG Supplement available at anz.com/annualreport.
CASE STUDY
22
OVERVIEW HOW WE CREATE VALUE
PERFORMANCE OVERVIEW
REMUNERATION REPORT
DIRECTORS’ REPORT
FINANCIAL REPORT
SHAREHOLDER INFORMATION

Australia suffers from a chronic lack of housing supply for people with disability.
It is estimated there is an immediate need for at least 10,000 new Specialist Disability Accommodation (SDA) places in Australia, with an associated cost of over $10 billion. This investment is necessary to provide suitable alternative accommodation for younger people in aged care and others with unmet needs.
ANZ is committed to growing the pipeline of new purpose-built housing in the SDA sector. We are the largest commercial financer of SDA, investing over $226 million in committed facilities. This investment ensures the development of new SDA homes for approximately 650 Australians - around 6.5% of required SDA places.
In 2021 we provided a $100 million loan to a portfolio of SDA, to support Macquarie Assett Management and Summer Housing. This loan is understood to be the largest SDA deal to date, and will allow for the expansion of homes across New South Wales,
Queensland, Victoria and Western Australia. The transaction is structured to allow for new SDA providers to be added as the pipeline of homes increase.
To further increase the supply of housing for people with disability, we are also working with SDA providers and our existing property clients to facilitate the inclusion of SDA in future property developments.
These initiatives will go some way to easing the acute shortage of Australian purpose-built housing for people with disability needs and will allow residents to achieve as much independence as possible.
Our SDA financing contributes to our target to fund and facilitate $10 billion of investment in affordable, accessible and sustainable housing by 2030.
CUSTOMER STORY
Increasing suitable housing for people with disability
23ANZ 2021 Annual Report
OVERVIEW HOW WE CREATE VALUE
PERFORMANCE OVERVIEW
REMUNERATION REPORT
DIRECTORS’ REPORT
FINANCIAL REPORT
SHAREHOLDER INFORMATION

BECOMING A FAIRER AND MORE RESPONSIBLE BANK
Our response to the Royal Commission
We continue to act in response to the ‘spirit and letter’ of the Royal Commission into Misconduct in the Banking, Superannuation and Financial Services Industry (the Royal Commission).
We provide public updates on our progress to implement the Royal Commission recommendations to the House of Representatives Standing Committee on Economics. Our most recent update (as at 9 September 2021) is available at anz.com.
• 41 of the Royal Commission’s 76 recommendations are assessed as directly applicable to ANZ. Of these, we have completed actions relevant to 11 recommendations, including the four directed at banks for direct implementation. Work relevant to 13 recommendations is underway. The remaining 17 recommendations require actions by government, regulators or the ABA before we take any further steps.
• We also made 16 commitments in February 2019, taking action to respond to a number of Commissioner Hayne’s recommendations and comments. These commitments were made to improve the treatment of retail customers, small businesses and farmers in Australia.
– We have completed 12 of our 16 commitments. This year we completed the requirements of the Financial Sector Reform Act 2021 in relation to ongoing fee arrangements (commitment 16).
– Of the four remaining commitments, three are dependent on reforms to the Banking Executive Accountability Regime that will be effected through the Financial Accountability Regime, and one relates to our ongoing work on culture.
Many of the recommendations in the Royal Commission’s final report require legislative change. We continue to engage constructively with government, regulators and industry as they respond to these.
Our APRA Risk Governance Self-Assessment Plan
Our Risk Governance Oversight Committee (formerly the Royal Commission and Self-Assessment Oversight Group) monitors progress with our Risk Governance Self-Assessment (RGSA) Plan. The Committee is chaired by our Chief Risk Officer and provides regular progress updates to the Executive Committee and the Board.
We have made significant progress across the five focus areas in our RGSA Plan: Culture; Governance and Accountability; Management of Operational Risk; Remediation; and Simplification. For example, we have:
• Built a strong, purpose-led culture (see page 29)
• Ensured accountabilities are clear and applied consequences where there are failings, in line with our strengthened Accountability and Consequence Framework (introduced in 2019)
• Matured our approach to risk culture and risk management (see page 29)
• Remediated customer accounts (see below)
• Simplified our business, products and processes
Our RGSA Plan is well progressed, with clear accountability for and commitment to the remaining actions.
It is important to us that all of these actions deliver better outcomes for our customers, our shareholders and the community, and the changes we have made will endure.
Customer remediation
As discussed above, we are working hard to rebuild trust by identifying our mistakes, fixing them and providing fair, consistent and timely remediation to our customers when we fail to get it right. Across the Group we have close to 830 people focused on the execution of customer remediation1, both within and outside dedicated remediation teams. Since its inception in 2018, our Australian Retail and Commercial Responsible Banking team has increased the number of resources committed to remediating our customers from around 150 to around 390. In addition, 187 people throughout the Australia Retail and Commercial business are also focused on customer remediation activity.
1. In addition, there are ~385 staff working on APRA remediation plans and ~504 staff working on other remediation related initiatives in Australia Retail and Commercial (as at September 2021).
LINKS TO 2021 GROUP PERFORMANCE FRAMEWORK
We have continued to demonstrate our commitment to improve the financial wellbeing of our customers. Sound progress has been made to deliver great outcomes across key segments, however after a strong first half, we experienced material challenges processing home loan application volumes in Australia. This has resulted in our customers experiencing
longer than expected wait times for loan approval decisions and increased volumes in our assessment backlog. While we were able to tactically manage and improve the situation, strengthening our policy and processes in this area remains a high priority focus.
See section 4.5.3 of the Remuneration Report for more details.
24
OVERVIEW HOW WE CREATE VALUE
PERFORMANCE OVERVIEW
REMUNERATION REPORT
DIRECTORS’ REPORT
FINANCIAL REPORT
SHAREHOLDER INFORMATION
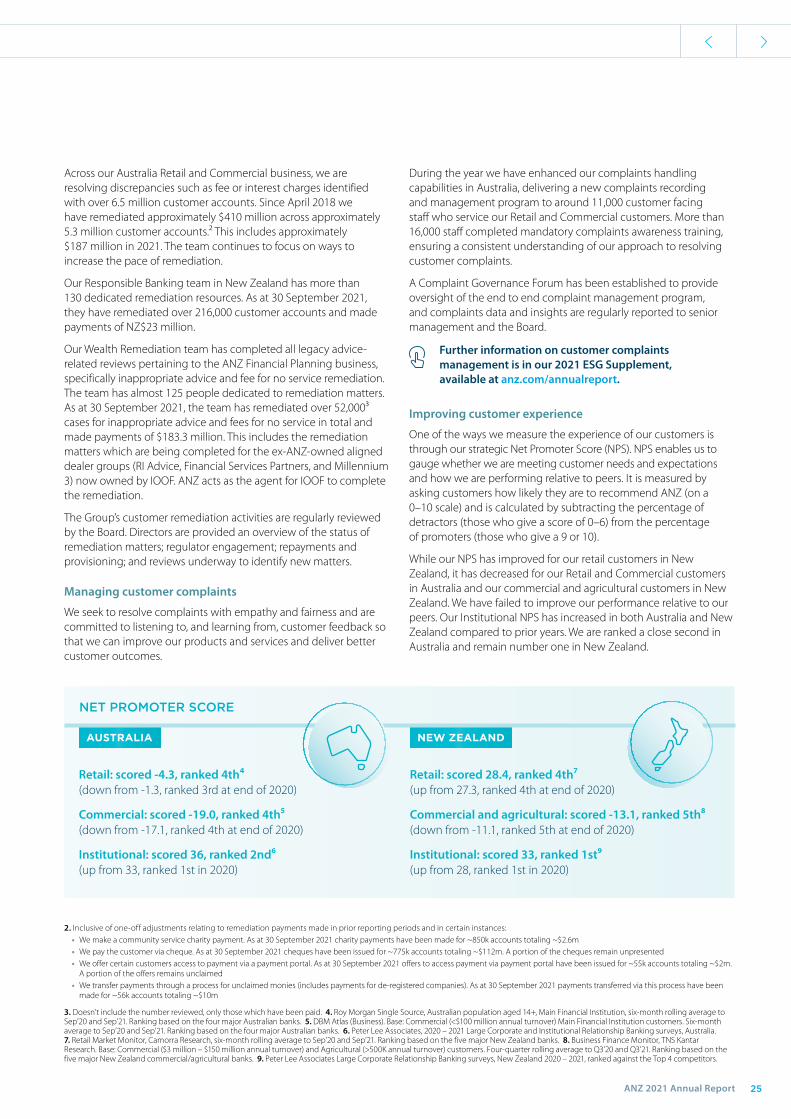
Across our Australia Retail and Commercial business, we are resolving discrepancies such as fee or interest charges identified with over 6.5 million customer accounts. Since April 2018 we have remediated approximately $410 million across approximately 5.3 million customer accounts.2 This includes approximately $187 million in 2021. The team continues to focus on ways to increase the pace of remediation.
Our Responsible Banking team in New Zealand has more than 130 dedicated remediation resources. As at 30 September 2021, they have remediated over 216,000 customer accounts and made payments of NZ$23 million.
Our Wealth Remediation team has completed all legacy advice-related reviews pertaining to the ANZ Financial Planning business, specifically inappropriate advice and fee for no service remediation. The team has almost 125 people dedicated to remediation matters. As at 30 September 2021, the team has remediated over 52,0003 cases for inappropriate advice and fees for no service in total and made payments of $183.3 million. This includes the remediation matters which are being completed for the ex-ANZ-owned aligned dealer groups (RI Advice, Financial Services Partners, and Millennium 3) now owned by IOOF. ANZ acts as the agent for IOOF to complete the remediation.
The Group’s customer remediation activities are regularly reviewed by the Board. Directors are provided an overview of the status of remediation matters; regulator engagement; repayments and provisioning; and reviews underway to identify new matters.
Managing customer complaints
We seek to resolve complaints with empathy and fairness and are committed to listening to, and learning from, customer feedback so that we can improve our products and services and deliver better customer outcomes.
During the year we have enhanced our complaints handling capabilities in Australia, delivering a new complaints recording and management program to around 11,000 customer facing staff who service our Retail and Commercial customers. More than 16,000 staff completed mandatory complaints awareness training, ensuring a consistent understanding of our approach to resolving customer complaints.
A Complaint Governance Forum has been established to provide oversight of the end to end complaint management program, and complaints data and insights are regularly reported to senior management and the Board.
Further information on customer complaints management is in our 2021 ESG Supplement, available at anz.com/annualreport.
Improving customer experience
One of the ways we measure the experience of our customers is through our strategic Net Promoter Score (NPS). NPS enables us to gauge whether we are meeting customer needs and expectations and how we are performing relative to peers. It is measured by asking customers how likely they are to recommend ANZ (on a 0–10 scale) and is calculated by subtracting the percentage of detractors (those who give a score of 0–6) from the percentage of promoters (those who give a 9 or 10).
While our NPS has improved for our retail customers in New Zealand, it has decreased for our Retail and Commercial customers in Australia and our commercial and agricultural customers in New Zealand. We have failed to improve our performance relative to our peers. Our Institutional NPS has increased in both Australia and New Zealand compared to prior years. We are ranked a close second in Australia and remain number one in New Zealand.
2. Inclusive of one-off adjustments relating to remediation payments made in prior reporting periods and in certain instances: • We make a community service charity payment. As at 30 September 2021 charity payments have been made for ~850k accounts totaling ~$2.6m • We pay the customer via cheque. As at 30 September 2021 cheques have been issued for ~775k accounts totaling ~$112m. A portion of the cheques remain unpresented • We offer certain customers access to payment via a payment portal. As at 30 September 2021 offers to access payment via payment portal have been issued for ~55k accounts totaling ~$2m.
A portion of the offers remains unclaimed • We transfer payments through a process for unclaimed monies (includes payments for de-registered companies). As at 30 September 2021 payments transferred via this process have been
made for ~56k accounts totaling ~$10m
3. Doesn’t include the number reviewed, only those which have been paid. 4. Roy Morgan Single Source, Australian population aged 14+, Main Financial Institution, six-month rolling average to Sep’20 and Sep’21. Ranking based on the four major Australian banks. 5. DBM Atlas (Business). Base: Commercial (<$100 million annual turnover) Main Financial Institution customers. Six-month average to Sep’20 and Sep’21. Ranking based on the four major Australian banks. 6. Peter Lee Associates, 2020 – 2021 Large Corporate and Institutional Relationship Banking surveys, Australia. 7. Retail Market Monitor, Camorra Research, six-month rolling average to Sep’20 and Sep’21. Ranking based on the five major New Zealand banks. 8. Business Finance Monitor, TNS Kantar Research. Base: Commercial ($3 million – $150 million annual turnover) and Agricultural (>500K annual turnover) customers. Four-quarter rolling average to Q3’20 and Q3’21. Ranking based on the five major New Zealand commercial/agricultural banks. 9. Peter Lee Associates Large Corporate Relationship Banking surveys, New Zealand 2020 – 2021, ranked against the Top 4 competitors.
AUSTRALIA NEW ZEALAND
Retail: scored -4.3, ranked 4th4 (down from -1.3, ranked 3rd at end of 2020)
Commercial: scored -19.0, ranked 4th5 (down from -17.1, ranked 4th at end of 2020)
Institutional: scored 36, ranked 2nd6 (up from 33, ranked 1st in 2020)
Retail: scored 28.4, ranked 4th7 (up from 27.3, ranked 4th at end of 2020)
Commercial and agricultural: scored -13.1, ranked 5th8 (down from -11.1, ranked 5th at end of 2020)
Institutional: scored 33, ranked 1st9 (up from 28, ranked 1st in 2020)
NET PROMOTER SCORE
25ANZ 2021 Annual Report
OVERVIEW HOW WE CREATE VALUE
PERFORMANCE OVERVIEW
REMUNERATION REPORT
DIRECTORS’ REPORT
FINANCIAL REPORT
SHAREHOLDER INFORMATION

OUR DIVISIONS
Australia Retail and CommercialAs our customers navigate the current uncertainty – and their lives in general – we’re here, ready to help with services and strategies to improve their financial wellbeing.
Mark Hand | Group Executive Australia Retail and Commercial Banking
OPERATING ENVIRONMENT
While COVID-19 lockdowns continue to impact business activity and customer spending, we expect economic activity will bounce back once the vaccine rollout is complete. Until then, we remain flexible to help our customers navigate the uncertainty.
Our Retail customers are increasing their use of digital and mobile banking options. Home loan activity within the economy is particularly strong. Our Retail customers are working on their financial wellbeing by saving more, reducing debt and reviewing their home loans. Our Commercial customers are tackling the uncertainty by innovating, adapting and reviewing their financial commitments. As we head into 2022, we face considerable challenges including a low-growth and interest rate environment and margin pressures.
STRATEGY AND FOCUS
We are delivering on our strategy, in line with our purpose by supporting business owners and home owners in uncertain times, as we prepare for a digitally-enabled future. Since 2019, home loan application volumes have doubled, particularly in the refinance market with customers moving to fixed rates, resulting in pressure on our application turnaround times. We have made progress on improving turnaround times for our customers and are increasing our focus on opportunities to automate and simplify.
For our business owners, we have identified the need to modernise our platforms and processes to meet customer expectations for efficient and digital service. We have commenced building the foundations through delivering new digital propositions, including our Online Business Lending platform, ANZ GoBiz. We continue to explore innovative ways to support our business owners.
In preparation for a digital-enabled future, we have been progressively reshaping our branch network and supporting simpler customer requests digitally. This is a key part of the bank’s transformation agenda.
Our customer remediation work is well-progressed and continues to be well-managed and ensure our customers are treated fairly. We have also invested in staff training and a new complaints management system to ensure we are delivering on customer promises and continuously improving our products and services.
Looking ahead, our vision is to be the partner of choice for home owners and business owners and to improve their financial wellbeing. To do this we will focus on a small number of purpose-led propositions that serve our customers through a digital-first, human-supported model. As we improve efficiency and reliability, disciplined cost and margin management will remain a key focus.
PERFORMANCE HIGHLIGHTS
On balance, we have delivered a solid performance across a diverse business while navigating some strong headwinds.
Cash profit increased 55% year on year, with growth in both lending and customer deposits, a good margin performance and continued cost discipline. While home loan revenue growth was in the low double digits, second half volumes were impacted by a competitive refinancing market, customers paying down their loans faster and processing issues. We have been working on a range of operational and policy changes and those actions are already having a positive impact on processing times.
Customer deposits were up ~$18billion in the year, with Retail, and Commercial and Private Bank deposits growing 6% and 10% respectively. Many customers are moving their money from term deposits to at-call so they have greater flexibility.
Commercial lending remained broadly flat year-on-year in an environment of economic uncertainty and lower levels of business confidence. Despite the weaker demand, lending was up 1% in our business banking segment in the second half.
Applications for ANZ GoBiz have averaged 2,900 per-month since launching in May 2021, providing real-time conditional approval through an online platform, including new-to-bank customers.
1. On a cash profit (continuing operations) basis. Excludes non-core items included in statutory profit and discontinued operations and is provided to assist readers in understanding the result of the ongoing business activities of the Group. For further information on adjustments between statutory and cash profit refer to page 57.
FINANCIAL PERFORMANCE CASH CONTINUING1
Cash profit ($m)
Growth (%)
55%
Growth (%)
1%
Growth (%)
53%
Growth (%)
8%
3,617 341,233
2,337 339,381
FY21 FY21
FY20 FY20
Net Loans & Advances ($b)
Return on Avg. RWAs (%) 2.21% 252,504
1.44% 234,594
FY21 FY21
FY20 FY20
Customer Deposits ($b)
26
OVERVIEW HOW WE CREATE VALUE
PERFORMANCE OVERVIEW
REMUNERATION REPORT
DIRECTORS’ REPORT
FINANCIAL REPORT
SHAREHOLDER INFORMATION

FINANCIAL PERFORMANCE CASH CONTINUING1
Cash profit ($m)
Growth (%)
2%
Growth (%)
0%
Growth (%)
11%
Growth (%)
7%
1,887 158,231
1,854 157,634
FY21 FY21
FY20 FY20
Net Loans & Advances ($b)
Return on Avg. RWAs (%) 2.24% 239,628
1.49% 223,288
FY21 FY21
FY20 FY20
Customer Deposits ($b)
OUR DIVISIONS
InstitutionalThis year our global banking network, insights and expertise supported companies needing to move goods and capital around the region. We continued to deliver for both shareholders and clients, deepening relationships with our high-quality customer base and delivering strong returns, while building and supporting a market-leading team.
Mark Whelan | Group Executive Institutional
1. On a cash profit (continuing operations) basis. Excludes non-core items included in statutory profit and discontinued operations and is provided to assist readers in understanding the result of the ongoing business activities of the Group. For further information on adjustments between statutory and cash profit refer to page 57.
OPERATING ENVIRONMENT
Market conditions normalised in 2021, as companies re-established and re-configured supply chains following periods of significant interruption in the early stages of the COVID-19 pandemic. Customers were initially more focused on repaying facilities, which reduced demand for credit. As customers adapted to changing market conditions they sought opportunities to grow their businesses, including through mergers and acquisitions. This led to in an increase in activity for our Corporate Finance and Corporate Advisory services across the network (particularly in Australia), and a 4% increase in revenue.
As expected, income from our Markets businesses steadied to $2 billion in 2021 as the market volatility experienced in 2020 normalised, and liquidity increased. Record low interest rates continued to constrict margins for our Payments and Cash Management products.
STRATEGY AND FOCUS
Over the past five years the Institutional business has transformed. We have scaled back the number of customers we support, and simplified our business significantly to ensure a better experience for both our people and our customers. These changes positioned the business well for the challenges and opportunities created by the COVID-19 pandemic. We have been able to respond quickly to shifts in customer demand and have proven to be more resilient through the cycle.
We have stronger customer relationships, improved margins and risk management, disciplined growth, focused cost management and a return on equity above the cost of capital. Our network across 32 markets continued to differentiate us from domestic competitors and drove significant activity and volumes in our home markets. It also provided diversification for our customers at times when supply chains faced challenges.
Our ongoing investment in digital platforms helped drive efficiencies and improve customer experience. Payments volumes grew by 24% while in cyber security, we have continued to reduce fraud for our customers, down year-on-year by 17%.
PERFORMANCE HIGHLIGHTS
A focus on execution, responsible growth and risk management saw Institutional again deliver $1.9 billion in profit at returns above the cost of capital despite the challenging environment. The division’s focus on productivity contributed to another year of cost reduction, with costs falling by 4% in 2021. The division has now reduced costs for 11 consecutive half-year periods.
Net loans and advances were flat with improved momentum in the second half of the year (half-on-half growth 7%), while customer deposits grew by 7%. Credit charges were negative for the year reflecting the continued strength in the credit quality of the book.
ANZ maintained its position as the #1 Institutional bank in Australia and New Zealand for relationship quality, as measured by a survey of Corporate and Institutional customers by Peter Lee and Associates, for the sixth year in a row. Customers called out ANZ’s support for customers through the pandemic, rating the bank #1 for COVID-19 support.
Similarly, ANZ Institutional was again named #1 for Relationship Quality in Asia, and a top five Corporate Bank for overall market penetration in Asia by Greenwich.
Peter Lee also ranked ANZ as clear market leader in ESG and Sustainable Finance. Globally, ANZ participated in $119 billion of Sustainable Finance deals, up from $4 billion five years ago. Our bankers are assisting businesses in their transition to a low carbon economy and helping directly link their funding costs to sustainable business goals.
27ANZ 2021 Annual Report
OVERVIEW HOW WE CREATE VALUE
PERFORMANCE OVERVIEW
REMUNERATION REPORT
DIRECTORS’ REPORT
FINANCIAL REPORT
SHAREHOLDER INFORMATION

OUR DIVISIONS
New ZealandAlthough the landscape we operate in has changed for many in the wake of COVID-19, I’m proud that we continue to prioritise what’s best for our customers, our environment, and our people. This stems from our recognition that an organisation’s success is dependent on the success of the communities they are part of.
Antonia Watson | Chief Executive Officer New Zealand
1. On a cash profit (continuing operations) basis. Excludes non-core items included in statutory profit and discontinued operations and is provided to assist readers in understanding the result of the ongoing business activities of the Group. For further information on adjustments between statutory and cash profit refer to page 57.
OPERATING ENVIRONMENT
New Zealand experienced a strong rebound in economic activity following the 2020 COVID-19 lockdowns. Household and business confidence surveys recovered quickly and investment had picked up prior to the August 2021 outbreak. However, the environment remains uncertain.
The Government’s income support measures have kept workers employed and most businesses afloat. Provided that Aotearoa does not see continued outbreaks, the labour market should continue to tighten. Record house price inflation following the 2020 lockdown has caused concern about affordability, especially for first home buyers, although this inflation has now slowed. Consistent with a slowing global recovery, commodity prices may have reached their cyclical peak, which could weigh on export returns.
The Reserve Bank of New Zealand has projected rate increases over the next two years but this outlook could change. Uncertainty will linger as long as the threat of future lockdowns remain.
STRATEGY AND FOCUS
In line with our simplification strategy we have implemented our new customer referral model. This aims to match customers’ personal and business banking needs with the most appropriate banking specialist to meet their needs. We reintroduced targeted support measures to help customers through the COVID-19 lockdowns, including waiving fees for contactless debit cards and access to temporary overdrafts.
To help bring balance to the housing market and help New Zealanders into homes, we voluntarily increased the deposit required from residential property investors to 40%, lowered the deposit required for people to buy small apartments and introduced a discount to the floating rate on new builds.
We commenced the wind up of the Bonus Bonds Scheme by contacting customers to pay out refunds and reserves payments.
We continued to engage industry frameworks to support the transition to net zero, including being a founding sponsor of Toitū Tahua, the Centre for Sustainable Finance, and playing a critical role in developing the Sustainable Agriculture Finance Initiative. On sustainable finance, this year we acted as a lead manager on 13 green, social or sustainable (GSS) bond transactions and one Sustainability Linked Loan totalling over NZ$5 billion.
Our proportion of women in leadership increased to 37% and we appointed our first Te Kaitohu Rautaki Māori (Head of Te Ao Māori Strategy).
PERFORMANCE HIGHLIGHTS
We saw strong revenue momentum and lower credit impairment charges driven by a credit impairment release, reflecting an improved economic outlook. Net loans and advances grew 7% driven by strong home lending growth of 10%, reflecting the market’s historically low interest rates and supply constraints. Unsurprisingly, we have seen subdued customer deposit growth of 4% in this low rate environment.
We have maintained a leading position in core banking products with ~30% share of mortgages, ~33% share of household deposits (August 2021) and ~21% share of KiwiSaver (June 2021).
Our focus on improving customer experiences has seen strong migration to our digital channels, with a reduction in over-the-counter transactions and contact centre calls.
Our Staff Foundation distributed over NZ$1.2 million in donations to 103 charities across New Zealand.
FINANCIAL PERFORMANCE CASH CONTINUING1
Cash profit (NZDm)
Growth (%)
49%
Growth (%)
7%
Growth (%)
50%
Growth (%)
4%
1,607 134,537
1,079 125,981
FY21 FY21
FY20 FY20
Net Loans & Advances (NZDb)
Return on Avg. RWAs (%) 2.24% 102,336
1.49% 98,304
FY21 FY21
FY20 FY20
Customer Deposits (NZDb)
28
OVERVIEW HOW WE CREATE VALUE
PERFORMANCE OVERVIEW
REMUNERATION REPORT
DIRECTORS’ REPORT
FINANCIAL REPORT
SHAREHOLDER INFORMATION

Our peopleCOVID-19 has undoubtedly changed the way we work. In moving to our new ways of working we have been conscious of how we can continue to build and maintain ANZ’s culture while giving our people the opportunity to work flexibly and continue doing their best work.
We now have many flexible working modes: workplace first, where employees perform their work from an ANZ workplace most or all of the time; blended, where employees spend some time in the week in an ANZ workplace; and remote first, where employees perform their work remotely, occasionally visiting an ANZ workplace. The vast majority of our employees’ roles , now and in the future, fit within the blended mode.
Coming together in our ANZ workplaces plays an important role in how we learn and grow and helps employees who are new to ANZ to build their networks and develop an understanding of our culture. Enabling the majority of our people to work in a blended way gives them the best of both worlds: the opportunity to structure their working life in a way that provides greater flexibility to work from home, and to be in the office for the critical, and often intangible, benefits of developing our culture, building social networks and learning from – and mentoring – colleagues.
CULTURE
We continue to develop and embed a culture focused on delivering great customer outcomes, making things simpler and ‘always learning’. This work is underpinned by our purpose and values.
This year, we finalised the design of a new culture and behaviour framework. Developed with input from across the Group, the framework complements our values, building on and respecting our past, while orienting us towards the future. To deliver our purpose and strategy, we need to: create opportunities by bringing in the best ideas from inside and outside ANZ to create long-term value for our customers and the bank; deliver what matters by executing well on the things that matter most; and succeed together by engaging the right people, listening to and challenging each other. As we head into the new financial year, we will start to see this come to life, with a focus on ensuring it is real and relevant to our people and reinforced through our learning programs, people processes and systems.
We have made considerable progress in promoting the importance, understanding and awareness of our risk culture. Our target risk culture is founded on embedding those risk behaviours and practices aligned to the five principles of: living the purpose; risk management accountability; risk management execution; risk management effectiveness; and proactive risk management. Plans and actions are in place to further embed risk culture maturity. These include the insights from our first risk culture survey. Refer to page 51 for further detail on the risk culture survey undertaken this year.
CULTURE REVIEWS AND ASSESSMENTS
Our Talent and Culture team delivers data-led insights – qualitative and quantitative – that are actionable and help drive sustainable cultural change. Multiple listening tools such as surveys, focus groups and interviews enable the business to respond to employee feedback on our culture.
Our Enterprise Steering Culture Group (ESCG), chaired by the CEO and whose membership includes other members of the Executive Committee, comes together twice a year to discuss key cultural themes, strengths and areas for improvement. This year, the ESCG has reinforced our ongoing commitment to employee wellbeing and listening, as well as our learning strategy – prioritising the reskilling and upskilling of employees in critical capabilities required for a digital future, and building an ‘always learning’ culture. They oversaw a significant jump in our speak up culture scores which were a key area of focus.
Our Internal Audit (IA) culture team provides independent assessments of our current organisational culture. The assessments are designed to: inform Board and management by providing insights as to how organisational culture is enabling the bank’s purpose and strategy; support the Board in meeting community and regulatory expectations (e.g. the Australian Prudential Regulation Authority Prudential Standard CPS 220); identify and focus on cultural root causes of issues; and strengthen the bank’s overall approach to strategic delivery and risk management.
Once an assessment is complete, a report on cultural themes, including underlying issues and related impacts, is provided to the business. The business then develops an action plan in response to any identified cultural challenges. The plan is monitored and an actions effectiveness or reassessment is completed to determine how effective it has been in shifting towards the desired culture.
In 2021, IA completed 19 culture reviews, of which nine were reassessments. The reassessments have highlighted leadership accountability as key to building a better bank and creating a culture that will deliver what matters for our customers, employees and shareholders.
In 2018 a culture review identified a business area within the bank experiencing issues with inconsistent leadership, resulting in a reluctance amongst team members to work effectively together, raise issues and challenge constructively.
Following the assessment, the leadership team developed an action plan focused on improving leadership capabilities and engagement through focusing on aligning as a leadership team and initiatives to embed desired leadership behaviours (e.g. using the leadership 180 survey tool that gathers feedback on how well a leader is demonstrating our values and leadership behaviours) supported by development plans; and implementing engagement plans to listen, provide transparency and connect with staff.
Our reassessment of the business revealed a 25% increase in staff’s perception of leadership and a 26% increase in their comfort to raise concerns and challenge constructively.
HIGHLIGHT
29ANZ 2021 Annual Report
OVERVIEW HOW WE CREATE VALUE
PERFORMANCE OVERVIEW
REMUNERATION REPORT
DIRECTORS’ REPORT
FINANCIAL REPORT
SHAREHOLDER INFORMATION

ACCOUNTABILITY AND CONSEQUENCE FRAMEWORK
Throughout 2021, we continued to strengthen ANZ’s Accountability and Consequence Framework (A&CF). The Enterprise Accountability Group (EAG), chaired by the CEO, supports the Board in monitoring the implementation and ongoing effectiveness of ANZ’s A&CF, being cognisant of its impact on the culture of ANZ. The EAG reviews the most material risk, conduct and audit events, accountability and the application of consequences, where appropriate. See section 6 of the Remuneration Report for more details.
CHANGES TO REMUNERATION
The introduction of a new remuneration standard by APRA has driven a review of how we reward our executives. The new regulatory standard does not come into effect until 1 January 2023, however a range of changes are being considered for implementation in 2022, subject to Board approval. These changes are designed not only to meet both the letter and spirit of APRA’s new prudential standard, but also to maintain our strong focus on performance and risk management, and to attract, motivate and retain the best talent.
We have implemented the recommendations from Stephen Sedgwick’s ‘Retail Banking Remuneration Review’ (noting the industry wide recommendations are ongoing). This review was focused on strengthening the alignment of retail bank incentives, sales practices and good customer outcomes. Mr Sedgwick completed his final review of the implementation of the recommendations, with a report submitted to the Australian Banking Association in June 2021. The report determined that significant progress has been made across the industry to align to the 2017 recommendations, with substantial investment in a customer-centric culture, policies and practices evident across the majority of banks. We continue to review our processes to ensure ongoing adherence to the Sedgwick recommendations.
LINKS TO 2021 GROUP PERFORMANCE FRAMEWORK
Our consistently strong management of people and culture was again a highlight and reflects multiple years of purposeful investment in building the right leadership behaviours and enhancing our culture frameworks. Staff engagement survey results remained strong, and following a global trend which saw employer scores spike in 2020, ANZ’s 2021 results expectedly returned to a steady positive trend. The wellbeing of our people continued to be a priority, with all staff supported to complete mental health awareness training. Embedding of our reward and performance framework continued, with a focus on continuous performance management capabilities, employee recognition, and reward arrangements for high performers in critical talent populations.
See section 4.5.3 of the Remuneration Report for more details.
EMPLOYEE ENGAGEMENT
In August, our overall engagement result was 81%. While this result is down five percentage points from April 2020, it remains higher than pre-pandemic levels (77% in 2019).
82% of employees said they felt supported in managing their psychological wellbeing.
WELLBEING
The health and wellbeing of our people remains a priority with the management of COVID-19 and the impacts on our employees, contractors and visitors continuing throughout the year.
Targeted wellbeing and safety support has been provided to employees and local leadership teams in different locations. For example, due to the surge in COVID-19 cases in India, enhanced support was provided to our employees including: access to personal health insurance top-ups; unlimited free tele-consultation medical services for employees and up to four family members; assistance to access medical care; assistance with hospitalisation where required; and provision of specific medical equipment at home or in hospital.
We have formalised a Chief Medical Officer arrangement, providing access to specialist medical advice and ongoing guidance in managing the COVID-19 pandemic and other medical or health challenges as they arise. We have developed a COVID-19 vaccination position statement, supporting the rollout of vaccines as an important step in the global response to COVID-19. We encourage all employees who are medically eligible for COVID-19 vaccines to be vaccinated where it is locally available and approved by regulatory authorities. During the most recent outbreak in New South Wales, we offered a vaccination program to employees and their households located in Local Government Areas with high case numbers. This has since been extended to all of Greater Sydney and Wollongong. We have provided a total of 315 vaccinations as part of the program, 70% of which were family members of employees.
Special paid leave has also been made available to employees who may require time away from work due to COVID-19 impacts. This may include recovery from COVID-19, isolation requirements and caring responsibilities.
We recognise the impact of restricted movement and lockdowns on mental wellbeing and are focused on empowering our employees and leaders to support others and recognise the signs of psychological distress in themselves. To support our employees and leaders in their understanding of and confidence in responding to mental health issues, a digital mental health awareness program has been mandated for all employees. To date over 46,600 individuals have completed this training. We have implemented Mental Health First Aid training for our people in the United Kingdom and have commenced the rollout of this program in New Zealand. We have also piloted a Mental Health First Aid training course in Australia, with planning for further rollout underway.
30
OVERVIEW HOW WE CREATE VALUE
PERFORMANCE OVERVIEW
REMUNERATION REPORT
DIRECTORS’ REPORT
FINANCIAL REPORT
SHAREHOLDER INFORMATION

We continue to provide our employees with access to digital wellbeing resources, developed in partnership with external specialists, including psychologists and physiotherapists, to help them develop strategies to maintain mental, social and physical health.
With many employees working remotely more frequently, we provided funding for ergonomic equipment to enable employees to be set up for optimal safety and productivity. Since the onset of the pandemic, over 14,700 employees have accessed this funding. Further specialist support is provided to employees requiring tailored ergonomic assistance or other workplace adjustments to maintain their wellbeing.
DIVERSITY AND INCLUSION
We believe our diverse workforce and inclusive culture will improve the quality of decision making and drive innovation, making us a better bank for our customers and helping us to shape a world where people and communities thrive.
The representation of Women in Leadership increased this year to 35.3% (up from 33.4% as at September 2020), exceeding our target of 34.4% by the end of 2021. Our progress is monitored monthly by the CEO and the Group Execution and Performance Committee.
We are focused on growing female talent by providing female employees with the critical skills and experiences required to move into senior roles, delivering a number of women in leadership training programs throughout the year.
With the departure of Alexis George and Michelle Jablko, our Key Management Personnel has dropped from 50% to 33.3%, below our target to maintain at least 40% women as Key Management Personnel. Importantly, however, women hold key line roles on our Executive Committee and the portfolio of Kathryn van der Merwe, our Group Executive Talent & Culture, has been expanded to include responsibility for our Service Centres, a critical part of our network and service offering. We are also proud to have a strong alumni of successful executive women in significant roles outside ANZ.
Our numerous employee networks continue to play an important role in building a strong sense of community and belonging by advocating for and supporting the diverse communities they represent. Particularly as the COVID-19 pandemic has evolved, the voice of our networks has ensured we are taking an inclusive approach to supporting our people.
We have continued to develop capability across our recruitment communities to create inclusive and accessible recruitment processes for women, people with disability, Aboriginal and Torres Strait Islander people, Māori and Pasifika people, people from different cultural and religious backgrounds, and people from the LGBTIQ+ community. Our Diversity and Inclusion Policy is available at anz.com/corporategovernance.
This year we finalised our new Diversity and Inclusion Strategy. It was co-created with employees from all levels and geographies, including representatives from our employee networks, and has been endorsed by ANZ’s Executive Committee and the Human Resources Committee of the Board.
We now have a vision for diversity and inclusion that is unique and relevant to ANZ, aligning with our purpose and business strategy, and the expectations of our customers, suppliers and community.
We have established the following five strategic priorities:
1 Create an inclusive culture and improve the experience of our employees who represent all dimensions of diversity
2 Build the confidence and capability of people leaders to lead diverse and inclusive teams
3 Improve the diversity of our leadership population
4 Strengthen and empower our employee networks
5 Improve accountability and governance
There are many dimensions of diversity, and all are important at ANZ. Therefore, the focus on creating an inclusive culture is our most critical strategic priority.
Our strategy will assist us to make decisions about where we will focus our effort and resources to maximise impact.
NEW DIVERSITY AND INCLUSION STRATEGY
The representation of Women in Leadership increased this year to 35.3% (up from 33.4% as at September 2020), exceeding our target of 34.4% by the end of 2021.
31ANZ 2021 Annual Report
OVERVIEW HOW WE CREATE VALUE
PERFORMANCE OVERVIEW
REMUNERATION REPORT
DIRECTORS’ REPORT
FINANCIAL REPORT
SHAREHOLDER INFORMATION

Juggling the final year of high school, two after-school jobs, a Certificate II in Business, a school-based traineeship and a local Aboriginal school-to-work transition program, young Indigenous Australian woman Talia Trimboli is seizing every opportunity that comes her way.
Talia is one of 15 Aboriginal students participating in Ganbina’s Youth Leadership Program in Shepparton, Victoria. ANZ is a financial supporter and corporate partner of Ganbina.
The program, which identifies Aboriginal youth who have the potential to be leaders within their community, helps them unlock their full potential by keeping them engaged in education, training and employment.
Talia is also undertaking a school-based traineeship with ANZ in Shepparton. Her favourite part of the traineeship has been developing her customer service and communications skills, as well as the relationships she has formed with her colleagues at the branch.
“Out of all the skills I’m learning, I enjoy developing my customer service skills the most because I really enjoy talking to the people who come into the bank,” says Tahlia.
CASE STUDY
Empowering Aboriginal youth for a bright future
32
OVERVIEW HOW WE CREATE VALUE
PERFORMANCE OVERVIEW
REMUNERATION REPORT
DIRECTORS’ REPORT
FINANCIAL REPORT
SHAREHOLDER INFORMATION

INVESTING IN STRATEGIC CAPABILITIES
We use people analytics and modelling to understand the current state of our workforce and identify potential skills shortages/gaps. This analysis informs employee development and recruitment programs, ensuring we continue to develop the capabilities aligned to our strategy.
This year we launched our PeopleHub program, designed to replace legacy human resources systems with ‘smarter’, more integrated technology, supporting new functionality and improved processes across the Group.
The program will strengthen our ability to ’future-proof’ our workforce, by providing greater visibility of the current state of our workforce and identifying potential skills shortages and gaps.
Data and engineering continued to be an area of focus in 2021. COVID-19 has exacerbated the scarcity of critical technology talent, with job vacancies at historically high levels creating talent competition across our major geographies.
We have refined our attraction, engagement and recruitment strategies. For each of our key geographies, we have dedicated teams focused on talent marketing and proactive sourcing of top candidates in our strategic demand areas of data and engineering. We are working harder to contact candidates via non-traditional methods, for example approaching a candidate through their blog or other social media. While first engagement is taking longer, our time to offer has only slightly increased. In 2021, we recruited over 5,100 technology candidates, a 92% increase from 2020.
In addition to hiring new talent, we continue to build the engineering capability of our existing workforce by implementing targeted learning initiatives designed to develop both deep technical skills and core ‘soft skills’. Our #TechLearningAcademy and engineering career hubs enable our engineers to identify their strengths and growth opportunities and provide self-guided learning on priority capabilities. Sixteen hours of dedicated learning time has now been scheduled for everyone in Technology.
We rolled out PluralSight, an online education provider, to more than 1,620 people in Technology, providing our people with opportunities to build valuable new technology skills such as cloud computing, software development, cyber security and machine learning.
In India, we have continued the rollout of our Digital Transformation Academy, providing our people with a self-directed learning platform to upskill in the latest digital transformation tools. The program covers topics on emergent technologies like robotic process automation, machine learning, artificial intelligence and blockchain. To date, over 2,100 of our people have completed the program.
Further information on employee learning and development and our approach to diversity and inclusion is in our 2021 ESG Supplement, available at anz.com/annualreport.
Supporting mid-career and mature aged workers
This year, we had the opportunity to support mid-career and mature aged workers to reignite their career, or embark on a new career in ANZ.
In August, we announced a collaboration with the Victorian government to pilot a Digital Jobs Program in ANZ, supporting unemployed and underemployed Victorians to transition into new roles.
The program involves:
• 12 weeks of free training in a high-quality, industry-backed digital course
• 12 weeks in a paid digital role with a Victorian business
• Ongoing support from a mentor throughout the program.
The first placements for the program commenced in October, and are working with leaders and mentors over the 12-week program in our Technology, Australia Business Transformation, Finance and Institutional teams.
“The Digital Jobs Program is giving ANZ an opportunity to support unemployed and underemployed Victorians to move into new roles which we expect to be in high demand both now and in the future”, said Kathryn van der Merwe, Head of Talent &
Culture and Service Centres. “We believe that strong partnerships like this are key to building the capability we need for the future.”
“Employees who come to us from other roles bring professional skills and experiential diversity which can help us think differently about solutions for our customers and staff. They are also more likely to have the skills that position them for a faster career trajectory than people who are just starting out in their careers.”
We also launched an initiative encouraging mature aged workers to email their resumes directly to our Chief Executive Officer, Shayne Elliott, to be considered for roles in ANZ. We received close to 500 applications and have placed successful candidates in our Legal, Talent and Culture and Australia Retail and Commercial teams.
“What we found is that a lot of people, particularly women who were older and for whatever reason had moved out of the workforce, somehow felt they weren’t worthy or capable of coming back”, said Shayne Elliott. “So we’ve got a program to bring people back to the workforce and it has been enormously successful.”
CASE STUDY
33ANZ 2021 Annual Report
OVERVIEW HOW WE CREATE VALUE
PERFORMANCE OVERVIEW
REMUNERATION REPORT
DIRECTORS’ REPORT
FINANCIAL REPORT
SHAREHOLDER INFORMATION

1. Our Volunteer Leave Policy, that applies to permanent, regular and fixed-term employees, provides for at least one day of paid volunteer leave each year. 2. Figure includes forgone revenue of $106m, the cost of providing low or fee-free accounts to a range of customers such as government benefit recipients, not-for-profit organisations, students and the elderly. International transfer fees were waived for funds sent from Australia and New Zealand to the Pacific to support communities impacted by COVID-19.
Our communityWe invest significantly in the communities in which we operate and play a role in supporting their capacity, resilience and financial wellbeing. Strong relationships with our stakeholders and the broader community is one of our key value drivers.
SUPPORTING THE COMMUNITY THROUGH THE COVID-19 PANDEMIC
We have continued to work closely with our community partners to support the communities in which we live and work during the COVID-19 pandemic.
In April 2021, in response to the devastating health crisis in India, we donated $1 million to World Vision Australia’s India COVID-19 Appeal to provide funding for more beds, oxygen machines and hospital medical supplies in some of the worst hit districts.
In addition, we launched an India COVID-19 Appeal encouraging employees and customers to donate, with ANZ matching donations dollar-for-dollar over two months – a total of approximately $1.6 million was raised. FJ$60,000 was also committed to grassroots organisations across Fiji to support communities impacted by COVID-19.
15.5%
Around $2m was distributed to communities through our community grants programs, including our Staff Foundations in Australia, New Zealand and Fiji, and our Seeds of Renewal grants program that provides funding for community groups in rural and regional Australia.
IN 2021
of our employees volunteered1 over 54,645 hours to community organisations
We matched employee donations, collectively contributing $3.2m through our workplace giving programs. Investing a total of $139.7m in the community2
After two years of reflection, development and consultation, we will commence our second Stretch Reconciliation Action Plan (RAP) in October 2021, our fifth RAP as an organisation. Through our RAP we will partner with Aboriginal and Torres Strait Islander organisations to create meaningful opportunities for Aboriginal and Torres Strait Islander peoples and businesses by:
• Improving financial wellbeing
• Providing employment and facilitating career progression
• Building the capacity of Aboriginal and Torres Strait businesses
• Improving understanding of Aboriginal and Torres Strait Islander cultures within our organisation.
We have set a target to achieve the 17 actions set out in our RAP by the end of 2024, elevating accountability for delivery to our Executive Committee. We have also implemented an Aboriginal and Torres Strait Islander employee reference group we will consult with on any matters that impact them as ANZ employees to ensure we are listening to the voices of First Nations employees.
RECONCILIATION ACTION PLAN
Credit: Marcus Lee
34
OVERVIEW HOW WE CREATE VALUE
PERFORMANCE OVERVIEW
REMUNERATION REPORT
DIRECTORS’ REPORT
FINANCIAL REPORT
SHAREHOLDER INFORMATION

3. Includes individuals who have participated in more than one program (for example, people who have participated in MoneyMinded as part of Saver Plus are counted twice as they are included in both the MoneyMinded and Saver Plus totals).
OUR FINANCIAL EDUCATION PROGRAMS
Beyond providing core banking services, we can play a key role in the community by leading thinking about the ‘drivers’ of financial wellbeing and applying insights from our research to our financial education programs, Saver Plus and MoneyMinded. These programs involve close collaboration with partners from the community and government sectors.
More than 841,900 people have been reached through these programs since 20023.
Saver Plus: our matched savings and financial education program, developed in partnership with the Brotherhood of St Laurence. Participants open an ANZ savings account, set a savings goal and make deposits regularly over 10 months while also attending MoneyMinded financial education sessions. On reaching their goal, savings are matched by ANZ dollar for dollar, up to $500, which must be spent on education.
MoneyMinded: supports adults with low levels of financial literacy and those on lower incomes build their financial skills, knowledge and confidence. The program is delivered by community organisations in Australia and New Zealand, and a mix of community organisations and ANZ employees in 15 markets across Asia and the Pacific region.
MoneyBusiness: developed in partnership with the Australian Government in 2005, following our research which showed that financial exclusion was a significant problem for First Nations people, particularly those living in remote communities. Program materials have been developed in consultation with local First Nations communities and community workers, ensuring the information is culturally appropriate.
COMMUNITY STORY
Pacific workers picking financial skills and fresh produce
Our MoneyMinded financial education program – designed to help adults build budgeting, saving and money skills – has been helping Pacific workers during their mandatory two-week quarantine period in Australia.
The Australian agriculture industry, particularly the fresh produce sector, relies on seasonal interstate and overseas labour.
However, the availability of workers has been heavily impacted by COVID-19, with lockdowns and border closures making it difficult for backpacker and overseas work programs to operate.
Many Australian farmers have therefore been left with unharvested crops and wasted produce.
The Australian Government’s ‘Pacific Labour Scheme’ has helped fill regional and rural labour shortages, connecting Australian businesses with workers from nine Pacific Islands and Timor-Leste to help farmers harvest crops.
Arriving from the Pacific, workers are required to complete 14 days of mandatory quarantine when they arrive in Australia, before they can start work assisting farmers to harvest crops.
ANZ has provided MoneyMinded training and resources to Powerpac, an approved provider of the Federal Government’s Pacific Labour Scheme. Powerpac is delivering MoneyMinded to arriving workers during their quarantine period.
Around 240 people have been through the first delivery of MoneyMinded, with hundreds more expected over coming months.
Further information about our community investment and financial education programs is in our 2021 ESG Supplement available at anz.com/annualreport.
35ANZ 2021 Annual Report
OVERVIEW HOW WE CREATE VALUE
PERFORMANCE OVERVIEW
REMUNERATION REPORT
DIRECTORS’ REPORT
FINANCIAL REPORT
SHAREHOLDER INFORMATION
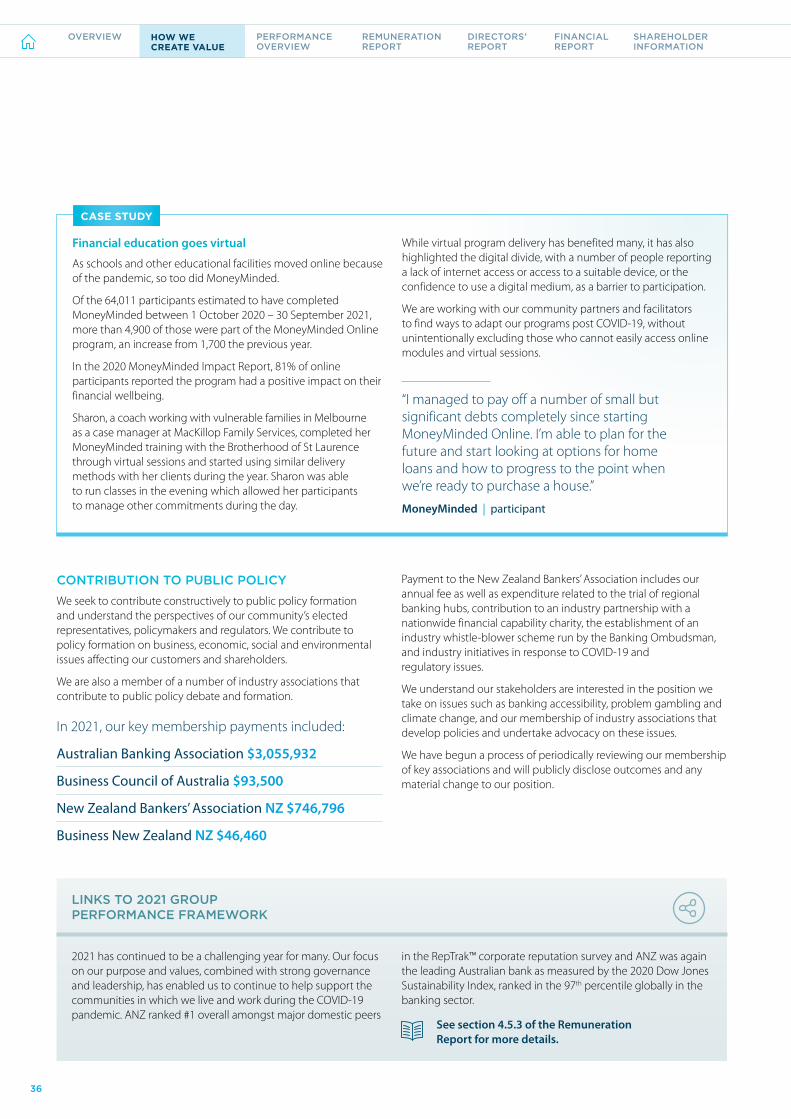
LINKS TO 2021 GROUP PERFORMANCE FRAMEWORK
2021 has continued to be a challenging year for many. Our focus on our purpose and values, combined with strong governance and leadership, has enabled us to continue to help support the communities in which we live and work during the COVID-19 pandemic. ANZ ranked #1 overall amongst major domestic peers
in the RepTrak™ corporate reputation survey and ANZ was again the leading Australian bank as measured by the 2020 Dow Jones Sustainability Index, ranked in the 97th percentile globally in the banking sector.
See section 4.5.3 of the Remuneration Report for more details.
CONTRIBUTION TO PUBLIC POLICY
We seek to contribute constructively to public policy formation and understand the perspectives of our community’s elected representatives, policymakers and regulators. We contribute to policy formation on business, economic, social and environmental issues affecting our customers and shareholders.
We are also a member of a number of industry associations that contribute to public policy debate and formation.
In 2021, our key membership payments included:
Australian Banking Association $3,055,932
Business Council of Australia $93,500
New Zealand Bankers’ Association NZ $746,796
Business New Zealand NZ $46,460
Payment to the New Zealand Bankers’ Association includes our annual fee as well as expenditure related to the trial of regional banking hubs, contribution to an industry partnership with a nationwide financial capability charity, the establishment of an industry whistle-blower scheme run by the Banking Ombudsman, and industry initiatives in response to COVID-19 and regulatory issues.
We understand our stakeholders are interested in the position we take on issues such as banking accessibility, problem gambling and climate change, and our membership of industry associations that develop policies and undertake advocacy on these issues.
We have begun a process of periodically reviewing our membership of key associations and will publicly disclose outcomes and any material change to our position.
Financial education goes virtual
As schools and other educational facilities moved online because of the pandemic, so too did MoneyMinded.
Of the 64,011 participants estimated to have completed MoneyMinded between 1 October 2020 – 30 September 2021, more than 4,900 of those were part of the MoneyMinded Online program, an increase from 1,700 the previous year.
In the 2020 MoneyMinded Impact Report, 81% of online participants reported the program had a positive impact on their financial wellbeing.
Sharon, a coach working with vulnerable families in Melbourne as a case manager at MacKillop Family Services, completed her MoneyMinded training with the Brotherhood of St Laurence through virtual sessions and started using similar delivery methods with her clients during the year. Sharon was able to run classes in the evening which allowed her participants to manage other commitments during the day.
While virtual program delivery has benefited many, it has also highlighted the digital divide, with a number of people reporting a lack of internet access or access to a suitable device, or the confidence to use a digital medium, as a barrier to participation.
We are working with our community partners and facilitators to find ways to adapt our programs post COVID-19, without unintentionally excluding those who cannot easily access online modules and virtual sessions.
“I managed to pay off a number of small but significant debts completely since starting MoneyMinded Online. I’m able to plan for the future and start looking at options for home loans and how to progress to the point when we’re ready to purchase a house.”
MoneyMinded | participant
CASE STUDY
36
OVERVIEW HOW WE CREATE VALUE
PERFORMANCE OVERVIEW
REMUNERATION REPORT
DIRECTORS’ REPORT
FINANCIAL REPORT
SHAREHOLDER INFORMATION

Improving our approach to human rightsThis year we have significantly upgraded our Human Rights Statement (Statement) and developed a new Grievance Mechanism (Mechanism) for people whose human rights may have been impacted by our large business lending customers.
We committed to these two actions in the 2020 Statement of the Parties setting out the resolution of a complaint brought against ANZ by Inclusive Development International and Equitable Cambodia concerning a loan made to Phnom Penh Sugar in 2014. Agreement was reached with the assistance of the Australian National Contact Point.
Our Statement and Mechanism have been informed by an external multi-stakeholder working group including civil society organisations, academics, business representatives and customers. Their involvement did not infer endorsement of the outcomes of this review or other work carried out by ANZ.
The Statement outlines our respect for international human rights standards and includes:
• No tolerance for retaliation against individuals or communities
• Reference to climate change and associated human rights impacts
• Support for an open civic space and human rights defenders
• Scenarios where domestic laws conflict with international human rights standards
• Our process when a customer’s human rights practices are inconsistent with our expectations.
International standards we respect include the International Labour Organisation Declaration on Fundamental Principles and Rights at Work, the International Bill of Human Rights and the UN Guiding Principles on Business and Human Rights (UNGPs).
The UNGPs are the global standard for preventing and addressing the risk of adverse human rights impacts linked to business activities. They incorporate three pillars, including governments’ duty to protect human rights and the responsibility of businesses to respect human rights.
Our Statement is aligned with the UNGP second pillar, including support and respect for human rights of our employees, customers and communities. We expect the same from everyone who works for or with us, including business customers, suppliers and partners.
The UNGP third pillar refers to the need for victims of business-related abuses to have access to remedy. We support access to remedy through our new Grievance Mechanism and participation in the Organisation for Economic Co-Operation and Development (OECD) National Contact Point (NCP) remediation processes.1
Our new Mechanism will help encourage responsible business conduct, including by our large business lending customers. In establishing this Mechanism, we sought to provide a framework through which:
• Efforts can be made to resolve complaints by affected communities about adverse human rights impacts associated with ANZ customers; and
• Feedback and recommendations aimed at strengthening our due diligence processes can be provided.
The Mechanism is designed to be informal and flexible, and we are committed to handling complaints in a way that builds confidence in its effectiveness. As this is new we understand the need to promote its availability, and will use any complaints submitted as an opportunity for learning and reflection.
Implementation of the new Statement and Mechanism will continue in 2022 through our governance, policies, staff training and disclosures.
Engagement will again be sought with external stakeholders in reviews of the Mechanism in 2023 and the Statement in 2024. We will also report on complaints submitted to the Mechanism.
The Statement and the Grievance Mechanism are available at anz.com.
Information on our approach to modern slavery is in our 2021 ESG Supplement available at anz.com/annualreport.
1. NCP is responsible for promoting the OECD Guidelines for Multinational Enterprises (an international standard on responsible business conduct) and providing conciliation services to resolve complaints against multinational enterprises.
37ANZ 2021 Annual Report
OVERVIEW HOW WE CREATE VALUE
PERFORMANCE OVERVIEW
REMUNERATION REPORT
DIRECTORS’ REPORT
FINANCIAL REPORT
SHAREHOLDER INFORMATION

We are committed to playing our part in supporting the transition to net zero emissions by 2050.
The most important role we can play in meeting the Paris Agreement goals is to help our customers reduce emissions and enhance their resilience to a changing climate. We support an orderly transition that recognises and responds to social impacts. This aligns with our purpose to shape a world in which people and communities thrive.
Our climate change statement outlines our approach and commitments in support of a global transition to net zero. We are reviewing our position. Our updated position will be released prior to our Annual General Meeting, together with our 2021 Climate-related Financial Disclosures (our fifth report using the recommendations of the Task Force on Climate-related Financial Disclosures (TCFD)), available at anz.com/annualreport.
CUSTOMER ENGAGEMENT
We have engaged with 100 of our largest emitting business customers, supporting them to establish and, where appropriate, strengthen existing transition plans.
Customers have valued our engagement on this topic, and our perspectives. A number of customers outside of the 100 have sought to engage with us, seeking clarity on our expectations, or requesting suggestions to improve their approach.
Following initial engagement, customer transition plans were grouped into levels of maturity – advanced, developing/intermediate, underdeveloped/starting out, and no public plans.
Within each industry our customers have different starting points. Since this initial assessment, nine customers have sufficiently improved their governance, strategies and targets or disclosures, leading to an improved ranking. Many other customers have also clearly demonstrated improvement since their initial assessment. For example, we observed a rise in the intention to develop ‘Paris aligned’ or ‘science-based’ targets or report under the TCFD framework, and a similar rise in interest in engaging with ANZ on this topic.
While we consider this to be good progress, we understand there is still much to be done. That is why we have committed to continue supporting these larger emitting customers to implement and, where appropriate, strengthen their low carbon transition plans and enhance their efforts to protect biodiversity, by end 2024. As part of this engagement we expect that more customers will improve their plans to a developing/intermediate, or advanced stage over the next three years.
Our approach to climate change
Food, liquor and convenience retailer Coles is one of Australia’s most trusted brands with an average of 20 million customer transactions each week across its network of almost 2,500 stores and its online platforms.
In March 2021, Coles launched its Together to Zero sustainability ambitions. A focus area is Together to zero emissions underpinned by new targets to accelerate climate action and reduce greenhouse gas emissions, as well as its ambition to deliver net zero greenhouse gas emissions by 2050 and its target to have the entire Coles Group powered by 100% renewable electricity by the end of FY25.
Having banked Coles since its demerger from Wesfarmers in 2018, we are supporting the retailer’s ambition to minimise its environmental footprint and mitigate the environmental and social impacts of climate change.
In late August 2021, ANZ worked as a Joint Sustainability Coordinator on Coles’ $1.3bn sustainability-linked loans, the first within the supermarket sector in Australia and the largest in the local market.
Coles replaced $1.3bn of its existing bank debt facilities with sustainability-linked loans to draw a direct link between its sustainability performance and its cost of capital, providing transparency and accountability as it works to achieve its sustainability targets.
Commenting on the deal, Coles Chief Financial Officer, Leah Weckert, said:
“Coles believes that sustainable businesses are better businesses, and our Sustainability-Linked Loans reflect our commitment to working with all our stakeholders to make positive changes.
“The SLL incentive structure is linked to our progress against company-wide sustainability goals, with delivery of those goals delivering improved cost of capital, therefore being an effective tool to drive sustainability throughout our business.”
CASE STUDY
38
OVERVIEW HOW WE CREATE VALUE
PERFORMANCE OVERVIEW
REMUNERATION REPORT
DIRECTORS’ REPORT
FINANCIAL REPORT
SHAREHOLDER INFORMATION

OUR PROGRESS ON THE TASK FORCE ON CLIMATE-RELATED FINANCIAL DISCLOSURES
Our progress to date Focus areas – 2022/23 Beyond 2022 vision
Governance
• Board Risk Committee oversees management of climate-related risks
• Board Ethics, Environment, Social and Governance (EESG) Committee approves climate-related objectives, policy and targets
• Ethics and Responsible Business Committee (executive management) oversees our approach to environment, social and governance (ESG) risks and opportunities, and reviews climate-related risks
• Align with regulatory guidance on climate-related risk governance, including stress-testing of selected portfolios
• An enhanced risk management framework that anticipates potential climate-related impacts, and associated regulatory requirements
Strategy
• ANZ’s Climate Change Statement (available at anz.com) confirms support for the Paris Agreement goals and transition to a net zero carbon economy
• Managing the net zero carbon transition focuses on an orderly transition that recognises and responds to social impacts
• Participated in APRA’s climate vulnerability assessment (CVA) to assess portfolio transition and physical risks
• Low carbon products and services within our Institutional business focused on climate-related opportunities
• Analysis of flood-related risks for our home loan portfolio in a major regional location of Australia and associated test-pilot of socio-economic indicators showing financial resilience of home loan customers with respect to flood risk
• Extending analysis of flood-related risks to incorporate bushfire and other risks relating to retail customers through the CVA
• Include climate risk reference in lending guidance documents for relevant industry sectors used by our front line bankers
• ANZ business strategy to grow in a way that is more closely aligned to a resilient and sustainable economy that supports the Paris Agreement goals and Sustainable Development Goals (SDGs)
Risk managem
ent
• Climate change risk added to Group and Institutional Risk Appetite Statements
• Climate change identified as a Principal Risk and Uncertainty in our UK Disclosure and Transparency Rules (DTR) Submission
• Guidelines and training provided to over 1,000 of our Institutional bankers on customers’ transition plan discussions
• Enhanced financial analysis and stronger credit approval terms applied to agricultural property purchases in regions of low average rainfall or measured variability
• New agribusiness customers assessed for financial resilience and understanding of rainfall and climate trends in their area, and water budgets considered if irrigating
• Encouraging and supporting 100 of our largest emitting business customers to implement and, where appropriate, strengthen their low carbon transition plans and enhance their efforts to protect biodiversity, by end 2024
• Customer engagement to identify customer or sector-specific transition or physical risks, focused on corporate and Institutional customers
• Further develop an enhanced climate risk management framework that strengthens our governance and anticipates potential climate-related impacts and associated regulatory requirements
• Further integrate assessment of climate-related risks into our Group risk management framework
• Standard discussions with business customers include climate-related risks and opportunities
• Assessment of customer transition plans part of standard lending decisions and portfolio analysis
Metrics and targets
• Support 100 of our largest emitting business customers to establish or strengthen low carbon transition plans by 2021, with metrics developed to track progress
• Metrics to enable our progress to be tracked in reducing ‘financed emissions’, beginning with two key sectors: large-scale commercial property and power generation. Metrics are tailored to each sector (e.g. carbon emissions per square metre of net lettable space for commercial property) and disclosed every 12 months
• $50 billion target to fund and facilitate sustainable solutions by 2025
• Target to procure 100% renewable electricity for ANZ’s operations by 2025
• Ongoing emissions reduction targets for ANZ energy use aligned with the Paris Agreement goals
• Complete transition plan engagement with high emitting customers and consider how to integrate into our regular customer assessments
• Implement targets to reduce metrics for ‘financed emissions’ in key sectors by 2030 towards a long-term net zero goal by 2050
• Consider expanding new metrics for measuring impact of our progress on environmental sustainability to other key sectors
• Continue to evolve our reporting with leading practices to measure the alignment of our lending with the Paris Agreement goals
• Reduce ANZ’s operational emissions in line with the decarbonisation trajectory of the Paris Agreement goals
39ANZ 2021 Annual Report
OVERVIEW HOW WE CREATE VALUE
PERFORMANCE OVERVIEW
REMUNERATION REPORT
DIRECTORS’ REPORT
FINANCIAL REPORT
SHAREHOLDER INFORMATION

SHAREHOLDERS
Governance
Digital Business and Technology Committee
Ethics, Environment, Social and Governance Committee
Human Resources Committee
Audit Committee
Nomination and Board Operations Committee
Risk Committee
CORPORATE GOVERNANCE FRAMEWORK
BOARD OF DIRECTORS
ANZ’s strong governance framework provides a solid structure for effective and responsible decision-making within the organisation.
The Board is responsible for the oversight of ANZ and its sound and prudent management, with specific duties as set out in its charter available at anz.com/corporategovernance.
There are six principal Board Committees – the Audit Committee, the Ethics, Environment,
Full biography details can be found on our website at anz.com/directors and on pages 46-50 of this report.
Social and Governance Committee, the Risk Committee, the Human Resources Committee, the Digital Business and Technology Committee and the Nomination and Board Operations Committee.
Each Committee has its own charter setting out its roles and responsibilities. At management level, the Group Executive Committee comprises ANZ’s most senior executives. There is a delegations of authority framework that clearly outlines those matters delegated to the CEO and other members of senior management.
For further detail on ANZ’s governance framework see our 2021 Corporate Governance Statement available at anz.com/corporategovernance.
BOARD OF DIRECTORS
CHIEF EXECUTIVE OFFICER
GROUP EXECUTIVE COMMITTEE
Board reserved powers and delegation of authority
OVERVIEW HOW WE CREATE VALUE
PERFORMANCE OVERVIEW
REMUNERATION REPORT
DIRECTORS’ REPORT
FINANCIAL REPORT
SHAREHOLDER INFORMATION
40
OVERVIEW HOW WE CREATE VALUE
PERFORMANCE OVERVIEW
REMUNERATION REPORT
DIRECTORS’ REPORT
FINANCIAL REPORT
SHAREHOLDER INFORMATION
OVERVIEW HOW WE CREATE VALUE
PERFORMANCE OVERVIEW
REMUNERATION REPORT
DIRECTORS’ REPORT
FINANCIAL REPORT
SHAREHOLDER INFORMATION

Jane Halton, AO PSM
Independent Non-Executive Director
RT Hon Sir John Key, GNZM AC
Independent Non-Executive Director
Paul O’Sullivan
Chairman, Independent Non-Executive Director
Shayne Elliott
Chief Executive Officer, Executive Director
Ilana Atlas, AO
Independent Non-Executive Director
Paula Dwyer
Independent Non-Executive Director
Graeme Liebelt
Independent Non-Executive Director
John Macfarlane
Independent Non-Executive Director
41ANZ 2021 Annual Report
OVERVIEW HOW WE CREATE VALUE
PERFORMANCE OVERVIEW
REMUNERATION REPORT
DIRECTORS’ REPORT
FINANCIAL REPORT
SHAREHOLDER INFORMATION
OVERVIEW HOW WE CREATE VALUE
PERFORMANCE OVERVIEW
REMUNERATION REPORT
DIRECTORS’ REPORT
FINANCIAL REPORT
SHAREHOLDER INFORMATION
OVERVIEW HOW WE CREATE VALUE
PERFORMANCE OVERVIEW
REMUNERATION REPORT
DIRECTORS’ REPORT
FINANCIAL REPORT
SHAREHOLDER INFORMATION

The number of Board, and Board Committee, meetings held during the year and each Directors’ attendance at those meetings are set out below:
BoardRisk
CommitteeAudit
Committee
Human Resources
Committee
Ethics, Environment,
Social and Governance Committee
Digital Business and Technology Committee
Special Committee of the Board
Committee of the Board1
Nominations and Board Operations
Shares Committee1
A B A B A B A B A B A B A B A B A B A B
Paul O’Sullivan 15 15 9 9 8 8 5 5 4 4 6 6 4 4 3 3 2 2
Ilana Atlas, AO 15 15 9 9 5 5 5 5 3 3 1 1
Paula Dwyer 15 15 9 9 9 9 5 5 4 4 2 2 3 3
Shayne Elliott 15 15 4 4 2 2 1 1
David Gonski, AC2 2 2 1 1 1 1 1 1 1 1 1 1
Jane Halton, AO PSM 15 15 5 5 5 5 6 6 3 3
RT Hon Sir John Key, GNZM AC
15 13 9 8 5 5 6 6 3 3
Graeme Liebelt 15 15 9 9 9 9 5 5 4 4 3 3
John Macfarlane 15 15 9 9 9 9 6 6 4 4 3 3
Column A Indicates the number of meetings the Director was eligible to attend as a member. Column B Indicates the number of meetings attended. The Chairman became an ex-officio member of the Risk, Audit, Human Resources, Ethics, Environment, Social and Governance, Digital Business and Technology and Nomination and Board Operations Committees on 28 October 2020, upon David Gonski’s retirement. With respect to Committee meetings, the table above records attendance of Committee members. Any Director is entitled to attend these meetings and from time to time Directors attend meetings of Committees of which they are not a member. 1. The meetings of the Committee of the Board and Shares Committee as referred to in the table above include those conducted by written resolution. 2. David Gonski retired as Chairman and as a Non-Executive Director on 28 October 2020.
Directors’ meetings
“The Board has remained responsive to the continuing disruption brought about by the COVID-19 pandemic, allocating appropriate time throughout the year for open and transparent discussions at Board and Committee meetings in alignment with ANZ’s purpose, and to facilitate greater focus on the achievement of the Bank’s long-term strategy.”
Paul O’Sullivan | Chairman
42
OVERVIEW HOW WE CREATE VALUE
PERFORMANCE OVERVIEW
REMUNERATION REPORT
DIRECTORS’ REPORT
FINANCIAL REPORT
SHAREHOLDER INFORMATION

Executive Committee
*previously known as Management Board.
Full biography details can be found on our website at anz.com/exco.
Shayne Elliott
Chief Executive Officer (appointed CEO on 1 January 2016)
Joined the Executive Committee* on 1 June 2009
Gerard Florian
Group Executive Technology
Joined the Executive Committee on 30 January 2017
Emma Gray
Group Executive Data and Automation
Joined the Executive Committee on 1 May 2020
Kevin Corbally
Group Chief Risk Officer
Joined the Executive Committee on 19 March 2018
Mark Hand
Group Executive Australia Retail and Commercial Banking
Joined the Executive Committee on 15 May 2018
Kathryn van der Merwe
Group Executive Talent & Culture and Service Centres
Joined the Executive Committee on 1 May 2017
Maile Carnegie
Group Executive Digital and Australia Transformation
Joined the Executive Committee on 27 June 2016
Mark Whelan
Group Executive Institutional
Joined the Executive Committee* on 20 October 2014
Farhan Faruqui
Chief Financial Officer (appointed CFO on 11 October 2021)Joined the Executive Committee on 1 February 2016
Antonia Watson
Chief Executive Officer New Zealand
Joined the Executive Committee on 17 June 2019
43ANZ 2021 Annual Report
OVERVIEW HOW WE CREATE VALUE
PERFORMANCE OVERVIEW
REMUNERATION REPORT
DIRECTORS’ REPORT
FINANCIAL REPORT
SHAREHOLDER INFORMATION

The Board and its Committees engage in key strategic, governance and oversight activities each year. The topics below are illustrative to provide stakeholders with an insight into some of the key matters considered by the Board and its Committees during 2021 and are not intended to be a comprehensive list.
Board areas of focus
Strategy and the future The Board and its Committees continued to focus on longer-term strategic matters. During the year, Directors participated in three specific Board strategy sessions, using internal and external experts to provide different points of view. The sessions included assessing the external operating, technological, economic and competitive environment and challenging ANZ’s long-term response and plans.
The Board regularly discussed and revisited ANZ’s strategic and growth priorities, including adjusting the Board agenda to ensure appropriate, distinct and continuous focus on growth matters at each Board meeting.
As a key part of this, the Board regularly discussed and provided oversight with respect to ANZ’s approach to the long-term transformation of its Australian business, including technology and digital-related matters. The Board received ‘deep dives’ into the design of the technology to best meet customer needs, and the Board, utilising the breadth of focus of its Committees received numerous reports overseeing key aspects of the transformation, including testing and implementation.
An additional important focus of the Board during the year was succession planning and development focus in respect of ANZ’s most senior executives, and in respect of its own composition.
COVID-19 pandemic The Board and its Committees continued to play an active role in providing oversight of the impact of, and ANZ’s response to, the COVID-19 pandemic, including:
• The relief measures in place to support our customers, including customer take up, delivery and ongoing communications.
• The impact of COVID-19 on the economy, domestic and international, considering both the immediate and longer-term impacts.
• The impact of the pandemic on our people, and the different geographic responses undertaken in the jurisdictions in which we operate. This included consideration of vaccination trends, the future of the workplace and actions required to protect and support our people operating remotely.
44
OVERVIEW HOW WE CREATE VALUE
PERFORMANCE OVERVIEW
REMUNERATION REPORT
DIRECTORS’ REPORT
FINANCIAL REPORT
SHAREHOLDER INFORMATION

Risk, regulation and reputation The Board and its Committees also continued to oversee the important work carried out by management to progress ANZ’s risk governance roadmap. Management provided regular reports on progress, as well as ANZ’s approach to improving and simplifying organisational and risk culture.
As part of this, the Board approved ANZ’s approach to risk culture and what ANZ’s target risk culture is, with the Risk Committee providing ongoing oversight of work to achieve that, with the Human Resources Committee and Board continuing to focus on and discuss Management’s actions to strengthen and simplify ANZ’s broader organisational culture.
The Board also met with ANZ’s key Australian regulators during the course of the year with the purpose of maintaining constructive and two-way dialogue.
As a key aspect of ensuring the correct focus on ANZ’s strategy and growth, the Board regularly discussed second and third line’s assessment of the risks associated with the implementation of ANZ’s strategic transformation agenda.
The Board and its Committees continued to review ANZ’s approach and performance in relation to compliance as well as reviewing ANZ’s preparedness for regulatory change, including in relation to breach reporting, design and distribution obligations and responsible lending laws. It also received regular education and briefing materials on key areas such as anti-money laundering and counter-terrorism financing, competition law, whistleblowing and cyber security.
The Board also discussed and reviewed the current status of embedding ANZ’s purpose throughout the business, reflecting on progress since its introduction five years ago.
The Board considered and discussed ‘how we bank’ – with an ethical and Environment, Social and Governance (ESG) lens, including ESG focus areas, customers experiencing vulnerability, product suitability, accessibility and diversity and our COVID-19 Statement of Intent. The Board also considered ‘who we bank’, through industry sector and country specific reviews, human rights policy and modern slavery and climate change policy.
Financial/Operational While the Board and its Committees have had a strong focus on the long-term future of the Group, the Board (and its Committees) maintains an equally strong focus on the current performance of the Group, including:
• Reviewing, challenging and ultimately endorsing ANZ’s operating and strategic plans, both annual and longer-term, including in relation to ANZ’s investment and business as usual cost ambitions.
• Regularly discussing merger and acquisitions matters.
• Providing oversight of key capital management matters, including the approval of the issue of Capital Notes 6 and ANZ’s on-market share buyback.
• Developing and implementing standardised Business Performance Templates for discussion at each Board meeting with the Group Executives leading each of ANZ’s major businesses.
45ANZ 2021 Annual Report
OVERVIEW HOW WE CREATE VALUE
PERFORMANCE OVERVIEW
REMUNERATION REPORT
DIRECTORS’ REPORT
FINANCIAL REPORT
SHAREHOLDER INFORMATION

Directors’ qualifications, experience and special responsibilities
As at the date of this report, the Board comprises seven Non-Executive Directors and one Executive Director, the Chief Executive Officer. The names of the current Directors, together with details of their qualifications, experience and special responsibilities are set out below. It was announced in August 2021 that one of Australia’s leading non-executive directors, Christine O’Reilly, will join the Board on 1 November 2021 as a Non-Executive Director. Following her appointment, Christine will stand for election as a Director at ANZ’s AGM on 16 December 2021.
Digital Business and Technology Committee
Ethics, Environment, Social and Governance Committee
Human Resources Committee
Audit Committee
Nomination and Board Operations Committee
Risk Committee
Paul O’Sullivan
Chair
Member
PositionChairman, Independent Non-Executive Director
QualificationsBA (Mod) Economics, Advanced Management Program of Harvard
ResponsibilitiesChairman since October 2020 and a Non-Executive Director since November 2019.
Paul is an ex-officio member of all Board Committees and Chair of the Ethics, Environment, Social and Governance Committee and Nomination and Board Operations Committee.
CareerPaul has experience in the telecommunications and oil and gas sectors, both in Australia and overseas. He has held senior executive roles with Singapore Telecommunications (Singtel) and was previously the CEO of Optus. He has also held management roles with the Colonial Group and the Royal Dutch Shell Group in Canada, the Middle East, Australia and United Kingdom.
Relevant other directorshipsChairman: Singtel Optus Pty Limited (from 2014, Director from 2004) and Western Sydney Airport Corporation (from 2017).
Director: St Vincent’s Health Australia (from 2019) and Australian Tower Network Pty Ltd (from 2021).
Relevant former directorships held in last three years includeFormer Director: Telkomsel Indonesia (2010–2020), Healthscope Limited (2016–2019), National Disability Insurance Agency (2017–2020) and Coca-Cola Amatil (2017–2021).
Age 61 years Residence Sydney, Australia
46
OVERVIEW HOW WE CREATE VALUE
PERFORMANCE OVERVIEW
REMUNERATION REPORT
DIRECTORS’ REPORT
FINANCIAL REPORT
SHAREHOLDER INFORMATION

Ilana Atlas, AOShayne Elliott
Chair
Member
PositionIndependent Non-Executive Director
QualificationsBJuris (Hons), LLB (Hons), LLM
ResponsibilitiesNon-Executive Director since September 2014. Ilana is Chair of the Human Resources Committee and is a member of the Audit Committee, Ethics, Environment, Social and Governance Committee and Nomination and Board Operations Committee.
CareerIlana brings a strong financial services background and legal experience to the Board. Ilana was a partner at law firm Mallesons Stephen Jaques (now King & Wood Mallesons), where in addition to her practice in corporate law, she held a number of management roles in the firm including Executive Partner, People and Information, and Managing Partner. She also worked at Westpac for 10 years, where her roles included Group Secretary and General Counsel and Group Executive, People, where she was responsible for human resources, corporate affairs and sustainability. Ilana has a strong commitment to the community, in particular the arts and education.
Relevant other directorshipsChairman: Jawun (from 2017, Director from 2014).
Director: Paul Ramsay Foundation (from 2017), Scentre Group (from 2021) and Origin Energy Limited (from 2021).
Member: Panel of Adara Partners (from 2015).
Relevant former directorships held in last three years includeFormer Chairman: Coca-Cola Amatil Limited (2017–2021, Director from 2011).
Former Director: Westfield Corporation Limited (2014–2018) and OneMarket Limited (2018–2019).
Former Fellow: Senate of the University of Sydney (2015–2019).
Age 67 years Residence Sydney, Australia
PositionChief Executive Officer and Executive Director
QualificationsBCom
ResponsibilitiesChief Executive Officer and Executive Director since 1 January 2016.
CareerShayne has over 30 years’ experience in banking in Australia and overseas, in all aspects of the industry. Shayne joined ANZ as CEO Institutional in June 2009, and was appointed Chief Financial Officer in 2012.
Prior to joining ANZ, Shayne held senior executive roles at EFG Hermes, the largest investment bank in the Middle East, which included Chief Operating Officer. He started his career with Citibank New Zealand and worked with Citibank/Citigroup for 20 years, holding various senior positions across the UK, USA, Egypt, Australia and Hong Kong.
Shayne is a Director of the Financial Markets Foundation for Children and a member of the Australian Banking Association, the Business Council of Australia and the Australian Customs Advisory Board.
Relevant other directorshipsDirector: ANZ Bank New Zealand Limited (from 2009) and the Financial Markets Foundation for Children (from 2016).
Member: Business Council of Australia (from 2016), the Australian Banking Association (from 2016, Chairman 2017–2019) and the Australian Customs Advisory Board (from 2020).
Age 57 years Residence Melbourne, Australia
47ANZ 2021 Annual Report
OVERVIEW HOW WE CREATE VALUE
PERFORMANCE OVERVIEW
REMUNERATION REPORT
DIRECTORS’ REPORT
FINANCIAL REPORT
SHAREHOLDER INFORMATION

Jane Halton, AO PSM Paula Dwyer
ChairChair
MemberMember
PositionIndependent Non-Executive Director
QualificationsBA (Hons) Psychology, FIPAA, Hon. FAAHMS, Hon. FACHSE, Hon. DLitt, FAIM , FAICD
ResponsibilitiesNon-Executive Director since October 2016. Jane is Chair of the Digital Business and Technology Committee and is a member of the Human Resources Committee, Ethics, Environment, Social and Governance Committee and Nomination and Board Operations Committee.
CareerJane’s 33 year career in the public service includes the positions of Secretary of the Australian Department of Finance, Secretary of the Australian Department of Health, Secretary for the Department of Health and Ageing, and Executive Co-ordinator (Deputy Secretary) of the Department of the Prime Minister and Cabinet. She brings to the Board extensive experience in finance, insurance, risk management, information technology, human resources, health and ageing and public policy. She also has significant international experience.
Jane has contributed extensively to community health through local and international organisations including the World Health Organisation and National Aboriginal and Torres Strait Islander Health Council.
Relevant other directorshipsChairman: Vault Systems (from 2017), Coalition for Epidemic Preparedness Innovations (Norway) (from 2018, Member from 2016) and Council on the Ageing Australia (from 2017).
Director: Clayton Utz (from 2017), Crown Resorts Limited (from 2018) and Naval Group Australia Pty Ltd (from 2021).
Member: Executive Board of the Institute of Health Metrics and Evaluation at the University of Washington (from 2007).
Adjunct Professor: University of Sydney and University of Canberra.
Council Member: Australian Strategic Policy Institute (from 2016).
Relevant former directorships held in last three years includeFormer Member: National COVID-19 Commission Advisory Board (2020–2021).
Age 61 years Residence Canberra, Australia
PositionIndependent Non-Executive Director
QualificationsBCom, FCA, SF Fin, FAICD
ResponsibilitiesNon-Executive Director since April 2012. Paula is Chair of the Audit Committee and is a member of the Risk Committee, Human Resources Committee and Nomination and Board Operations Committee.
CareerPaula has extensive experience in financial markets, corporate finance, risk management and investments, having held senior executive roles at Calibre Asset Management, Ord Minnett (now J P Morgan) and at Price Waterhouse (now PricewaterhouseCoopers). Her career as a company director spans financial services, investment, insurance, healthcare, gambling and entertainment, fast-moving consumer goods, property and construction and retail sectors. Paula has a strong interest in education and medical research, having served as a member of the Geelong Grammar School Council and the Business and Economics Faculty at the University of Melbourne and as Deputy Chairman of Baker IDI.
Relevant other directorshipsChairman: Kin Group Advisory Board (from 2014) and Allianz Australia Limited (from 2020, Director from 2019).
Director: Lion Pty Ltd (from 2012).
Member: Kirin International Advisory Board (from 2012) and Australian Government Takeovers Panel (from 2017).
Relevant former directorships held in last three years includeFormer Chairman: Tabcorp Holdings Limited (2011–2020, Director from 2005) and Healthscope Limited (2014–2019).
Age 61 years Residence Melbourne, Australia
48
OVERVIEW HOW WE CREATE VALUE
PERFORMANCE OVERVIEW
REMUNERATION REPORT
DIRECTORS’ REPORT
FINANCIAL REPORT
SHAREHOLDER INFORMATION

Graeme LiebeltRT Hon Sir John Key, GNZM AC
Chair
MemberMember
PositionIndependent Non-Executive Director
QualificationsBEc (Hons), FAICD, FTSE, FIML
ResponsibilitiesNon-Executive Director since July 2013. Graeme is Chair of the Risk Committee and is a member of the Audit Committee, Human Resources Committee and Nomination and Board Operations Committee.
CareerGraeme brings to the Board his experience of a 23-year executive career with Orica Limited (including a period as Chief Executive Officer), a global mining services company with operations in more than 50 countries. He has extensive international experience and a strong record of achievement as a senior executive, including in strategy development and implementation. Graeme is committed to global trade and cooperation, as well as community education.
Relevant other directorshipsChairman: Amcor Limited (from 2013, Director from 2012).
Director: Australian Foundation Investment Company Limited (from 2012) and Carey Baptist Grammar School (from 2012).
Relevant former directorships held in last three years includeFormer Chairman: DuluxGroup Limited (2018–2019, Director from 2016).
Age 67 years Residence Melbourne, Australia
PositionIndependent Non-Executive Director
QualificationsBCom, DCom (Honoris Causa)
ResponsibilitiesNon-Executive Director since February 2018. Sir John is a member of the Ethics, Environment, Social and Governance Committee, Risk Committee, Digital Business and Technology Committee and Nomination and Board Operations Committee.
CareerSir John was Prime Minister of New Zealand from 2008 to 2016, having commenced his political career in 2002. Sir John had a long career in international finance, primarily for Bankers Trust in New Zealand and Merrill Lynch in Singapore, London and Sydney. He was previously a member of the Foreign Exchange Committee of the Federal Reserve Bank of New York (from 1999 to 2001).
Sir John was made a Knight Grand Companion of the New Zealand Order of Merit in the 2017 Queen’s Birthday Honours. In 2017 Sir John became a Companion of the Order of Australia for advancing the Australia-New Zealand bilateral relationship.
Relevant other directorshipsChairman: ANZ Bank New Zealand Limited (from 2018, Director from 2017).
Director: Palo Alto Networks (from 2019).
Relevant former directorships held in last three years includeFormer Chairman: The International Democratic Union (2014–2018).
Former Director: Air New Zealand Limited (2017–2020).
Age 60 years Residence Auckland, New Zealand
49ANZ 2021 Annual Report
OVERVIEW HOW WE CREATE VALUE
PERFORMANCE OVERVIEW
REMUNERATION REPORT
DIRECTORS’ REPORT
FINANCIAL REPORT
SHAREHOLDER INFORMATION

John Macfarlane
Ken Adams
Simon Pordage
Member
PositionIndependent Non-Executive Director
QualificationsBCom, MCom (Hons)
ResponsibilitiesNon-Executive Director since May 2014. John is a member of the Audit Committee, Risk Committee, Digital Business and Technology Committee and Nomination and Board Operations Committee.
CareerJohn is one of Australia’s most experienced international bankers having previously served as Executive Chairman of Deutsche Bank Australia and New Zealand, and CEO of Deutsche Bank Australia. John has also worked in the USA, Japan and PNG, and brings to the Board a depth of banking experience in ANZ’s key markets in Australia, New Zealand and the Asia Pacific. He is committed to community health, and is a Director of the Aikenhead Centre of Medical Discovery Limited (from 2016).
Relevant other directorshipsDirector: Colmac Group Pty Ltd (from 2014), AGInvest Holdings Limited (MyFarm Limited) (from 2014, Chairman 2014–2016), Balmoral Pastoral Investments (from 2017) and L1 Long Short Fund (from 2018).
Relevant former directorships held in last three years includeFormer Director: St Vincent’s Institute of Medical Research (2008–2018) and Craigs Investment Partners Limited (2013–2020).
Age 61 years Residence Melbourne, Australia
PositionGroup General Counsel
QualificationsBA, LLB, LLM
Ken joined ANZ as Group General Counsel in August 2019, having assisted ANZ with major legal issues for over 10 years. Prior to ANZ, Ken was a Partner of Freehills and later Herbert Smith Freehills for 21 years, and for six years was a member of the Herbert Smith Freehills Global Board. Ken is one of Australia’s leading commercial lawyers with significant experience in class actions and other complex legal issues. He holds a Master of Laws from the University of Melbourne and is a co-author of Class Actions in Australia.
PositionCompany Secretary
QualificationsLLB (Hons), FGIA, FCG (CS, CGP)
Simon joined ANZ in May 2016. He is a Chartered Secretary and Chartered Governance Practitioner and has extensive company secretarial and corporate governance experience. From 2009 to 2016 he was Company Secretary for Australian Foundation Investment Company Limited and a number of other listed investment companies. Other former roles include being Deputy Company Secretary for ANZ and Head of Board Support for Barclays PLC in the United Kingdom.
He is a formal brand ambassador for, and is a former National President and Chairman of, Governance Institute of Australia, and is a member and former Chairman of its National Legislation Review Committee. Simon is committed to the promotion and practice of good corporate governance, and regularly presents on governance issues.
COMPANY SECRETARIES’ QUALIFICATIONS AND EXPERIENCE
Currently there are two people appointed as Company Secretaries of the Company. Details of their roles are contained in the Corporate Governance Statement.
Their qualifications and experience are as follows
50
OVERVIEW HOW WE CREATE VALUE
PERFORMANCE OVERVIEW
REMUNERATION REPORT
DIRECTORS’ REPORT
FINANCIAL REPORT
SHAREHOLDER INFORMATION

Risk managementThe COVID-19 pandemic has continued to impact our operating environment. Our Risk Management Framework has underpinned our response during this challenging time and has enabled us to maintain sound risk management practices.
Over the last year we have continued to invest in our Risk Management Framework, processes and systems, strengthening our ability to respond to changes in existing risks, and to deal with new risks as they arise in our increasingly complex external environment, including those discussed below.
COVID-19
We have maintained a range of support measures to assist employees and customers, and to deliver safe and secure operations throughout the pandemic. The Risk function has helped with the transition of staff to remote working, or conversely, their return to the office. We are continuing to assess the implications of ‘living with COVID’, which is still evolving. The Risk function has also partnered with our divisions to protect the bank through the management of credit risk associated with customer COVID-19 support, as well as industry deep dives and portfolio reviews.
We recognise the mental health and wellbeing risks associated with staff fatigue after almost two years of COVID-induced change. We are working together with our Talent & Culture team to ensure appropriate supports are in place. For further detail on how we have supported our people see page 30.
RISK CULTURE
We strive for a risk culture where our employees demonstrate the right risk behaviours, have clear risk roles and responsibilities and are enabled by effective policies and processes. This year we conducted an internal Risk Culture survey for the first time. The survey gathered the perceptions of target risk behaviours from more than 24,000 employees. We have undertaken a lot of work over the past three years to encourage a strong ‘speak up’ and risk culture and,
pleasingly, responses to the survey confirmed our people believe they can speak up and challenge each other respectfully if they see unethical behaviour, with over 80% of staff expressing a very positive sentiment for ANZ’s risk culture.
Risk culture (as a critical component of our organisational culture) remains an important focus. We have refined our risk culture principles and defined our target risk culture. A framework for assessing each risk culture principle is embedded across the organisation and incorporates desired risk behaviours and business and risk outcomes. Risk culture maturity is assessed at an organisational level, as well as divisional and functional levels, with risk culture plans in place to address identified gaps. Risk culture goals have been set to monitor progress and drive sustainable change towards our aspirational culture.
A priority this year has been transforming behaviours through formal mechanisms (including systems, structures, policies, procedures and processes) as we seek to ensure leaders demonstrate accountability for managing risk within a ‘speak up’ environment, with clear consequence management processes. Guided by our purpose, our behaviours help us to bring our values to life and to execute our strategy. To further strengthen and evolve our risk culture, this year the Enterprise Accountability Group (see page 30) recognised over 40 individuals as role modelling outstanding risk behaviours for their work to manage and mitigate the organisation’s risks and their continuous improvement of our risk culture. The recognition provided included personalised messages from the CEO, the opportunity to meet with the Board and ExCo and having their achievements profiled on our intranet and in internal newsletters .
CONDUCT RISK
Providing our products and services in a manner that delivers fair customer outcomes and promotes market integrity is integral to our strategy. This year Conduct Risk was elevated as a key material risk for the bank, highlighting its importance in our Risk Management Framework. In addition to key initiatives to strengthen our Conduct Risk management approach, our Code of Conduct was enhanced to provide clear guidance to our people. For example, there is guidance relating to some of the ethical considerations employees may encounter in daily decision-making, when dealing with customers and/or undertaking market activities – we expect our people to consider not only whether ‘can we’ do something, but also 'should we'?
LINKS TO 2021 GROUP PERFORMANCE FRAMEWORK
Our already strong risk management framework enabled ANZ to continually manage the evolving risks presented by COVID-19. Clear progress continues to be made on risk culture maturity, evidenced in employee engagement scores including ‘My business leaders demonstrate personal accountability for managing risk and sound risk behaviours’ (87%) and ‘I can raise issues and concerns in ANZ without fear of reprisals or negative consequences’ (80%), exceeding the record highs reached in 2020.
These results are the product of sustained efforts over several years to encourage a speak up and risk culture where people feel they can challenge each other respectfully. Sound progress has been made in addressing the findings of the Risk Governance Self-Assessment and on key regulatory/non-financial risk projects. However, a $500 million APRA capital overlay remains in place pending confirmation of an improvement in operational risk management across the bank.
See section 4.5.3 of the Remuneration Report for more details.
51ANZ 2021 Annual Report
OVERVIEW HOW WE CREATE VALUE
PERFORMANCE OVERVIEW
REMUNERATION REPORT
DIRECTORS’ REPORT
FINANCIAL REPORT
SHAREHOLDER INFORMATION

NON-FINANCIAL RISK
We are improving how we manage our obligations and operational risks by strengthening our non-financial risk, control, governance and compliance focus in line with our Risk Management Framework. This year, to further enhance non-financial risk management, we have adopted a new taxonomy into our Operational and Compliance Risk Framework. Our Compliance and Operational Risk Strategy provides a comprehensive, proactive and well-planned approach to improving our management of non-financial risk by driving transformation across our processes, policies, systems and people, guided by our purpose and contributing to the bank’s strategic priority to improve the financial wellbeing of our customers.
Last year we reviewed our Risk Appetite Statement (RAS) metrics to ensure appropriate coverage of our non-financial risks. The review concluded earlier this year, with the Board Risk Committee approving a collection of over 36 metrics and indicators. This is an increase from 12 prior to the review, and demonstrates the growing importance of non-financial factors in helping inform decisions within our Risk function.
We have developed and launched a new tool that streamlines how we capture and report against the RAS metrics, reducing the time it takes from weeks to days. In addition, we developed a purpose-built dashboard to support the proactive management of our risk appetite using trend analysis technology.
These changes have provided our Board Risk Committee and management with greater visibility and control over our non-financial risk appetite.
FINANCIAL CRIME
We continue to improve our financial crime risk management program. We have invested significantly in enhancing data analytics capability for the bank, creating a central Financial Crime Data Hub and Intelligence ecosystem that uses a range of analytical tools, including:
• Network and link analysis capability – using these tools we can better detect syndicated crimes and demonstrate a ‘big picture’ view of criminal activity
• Dynamic algorithms – using agile monitoring and detection solutions, we can detect changes in customer behaviours, which can assist AUSTRAC and police investigations.
Further information on financial crime is available in our 2021 ESG Supplement at anz.com/annualreport.
EMERGING RISKS
Two risks that continue to evolve and that we are paying particular attention to are:
Cyber security risk: We take the security of our bank, our customers and our customers’ information very seriously. Cyber security threats continue to be significant and our approach to mitigating cyber security risk involves a range of controls relying on people, technology and process. We are continually testing our defences internally and through independent third parties. We have a very sophisticated cyber security protection capability and have invested heavily in a range of recognised industry practices and technologies, processes and defences. In addition, we are cooperating with our counterparts, governments and associated
1. PACT: Pause before sharing your personal information; Activate two layers of security; Call out suspicious messages; Turn on automatic software updates.
entities around the world to protect against cyber security threats, which have increased since COVID-19 and the consequent shift to digital banking and remote working.
We are now blocking around 16 million malicious emails a month – compared to about four million pre-COVID-19 in October 2019.
There has been a significant increase in ‘business email compromise’ (BEC), with cyber scammers targeting transactions and payment systems by intercepting business correspondence.
Many of these compromised emails appear to represent existing suppliers, customers and professional advisors such as accountants or lawyers, and request changes to account or payment details.
A publication released by the Australian Cyber Security Centre (ACSC) shows total losses for the 2020–21 financial year were approximately $81million, an increase of nearly 15% from the previous financial year. Average loss per successful BEC transaction also increased by 54%.
To assist our customers to protect their businesses against these types of scams, we encourage them to take a number of steps including making an organisational PACT1 to protect their virtual valuables. In addition, we are educating our customers on data protection and privacy through focused campaigns, threat intelligence newsletters and cyber security business guide books.
CYBER SCAMMERS ON THE RISE
Climate change risk: The financial risks associated with climate change remain a key focus. We have set a public ESG target to develop an enhanced risk management framework that anticipates potential climate-related impacts, and associated regulatory requirements, by the end of 2022. To help deliver on this target, a number of work streams have been established, including regulatory monitoring and carbon metrics. A new Climate Advisory and Coordination Forum, which is Chaired by the Group Executive, Institutional and includes the Group Chief Risk Officer, has also overseen the development of an updated climate change statement that will be released prior to our Annual General Meeting.
We are continuing to work with our customers to better understand how they are transitioning to a low carbon future. We have now engaged with 100 of our largest emitting business customers to encourage and support them to develop their low carbon transition plans. The majority of the 100 customers recognise climate change risk and have started their transition plan ‘journey’. Some customers have advanced plans towards net zero by 2050. We are using what we learn from this customer engagement to inform how we manage the risks in higher emitting customer portfolios.
We are participating in APRA’s Climate Vulnerability Assessment (CVA), which examines the material exposures and financial risks that banks, the financial system and economy may face due to climate risks. APRA’s CVA comprises two stress tests, counterparty assessment and data assessment. APRA intends to disclose the outcomes of the CVA in 2022, which may also be used to inform future supervisory guidance.
52
OVERVIEW HOW WE CREATE VALUE
PERFORMANCE OVERVIEW
REMUNERATION REPORT
DIRECTORS’ REPORT
FINANCIAL REPORT
SHAREHOLDER INFORMATION

Credit Ratings System Oversight Committee
Capital and Stress Testing Oversight Committee
Regional or Country Risk Management Committee
Country Asset and Liability Committees
Credit and Market Risk Committee
Group Asset and Liability Committee
Operational Risk Executive Committee
Eithics and Responsible Business Committee
Investment Committee
Risk Governance Oversight Committee
EXECUTIVE COMMITTEE
ANZ’s most senior executives meet regularly to discuss performance and review shared initiatives.
ENTERPRISE ACCOUNTABILITY GROUP
GROUP PERFORMANCE EXECUTION COMMITTEE
ANZ’s key Management Committee charged with oversight of the Group’s overall operational performance and position and execution of the operating plan.
Gro
upCo
untr
yD
ivis
ion
BOARD OF DIRECTORS
KEY MANAGEMENT COMMITTEES
Modelling Ratings Working Groups and Usage Forums
Divisional Initiatives Review Committees/Project Advisory Councils
Divisional Risk Management Committees
Various Divisional Specific Management Committees
Divisional/Functional Accountability GroupsOperational
Risk CommitteeProduct Committee
OUR RISK MANAGEMENT FRAMEWORK
The Board is ultimately responsible for establishing and overseeing the Group’s Risk Management Framework (RMF) which is supported by the Group’s underlying systems, structures, policies, procedures, processes and people. The Board has delegated authority to the Board Risk Committee (BRC) to develop and monitor compliance with the Group’s risk management policies. The Committee reports regularly to the Board on its activities. The key pillars of the Group’s RMF include:
• The Risk Management Statement (RMS), which describes the approach for managing risks arising from the Group’s purpose and strategy and the key elements of the RMF that give effect to that strategy. The RMS includes: how the risk function is structured to support the Group’s purpose and strategy, and the execution of the Group Chief Risk Officer’s prescribed responsibilities as an Accountable Person for the Group under the Banking Executive Accountability Regime; the values, attitudes and behaviours required of employees in delivering on strategic priorities; a description of each material risk; and an overview of how the RMF addresses each risk, with reference to the relevant policies, standards and procedures. It also includes information on how the Group identifies, measures, evaluates, monitors, reports and then either controls or mitigates material risks.
• The Risk Appetite Statement (RAS), which sets out the Board’s expectations regarding, for each material risk, the maximum level of risk that the Group is willing to accept in pursuing its strategic objectives and its operating plans considering its stakeholders’, depositors’ and customers’ interests.
• The Risk Culture, an important component of the Group’s organisational culture and an intrinsic part of the Group’s RMF.
The Group operates a Three Lines-of-Defence Model in regard to risk management, helping to embed a culture where risk is everyone’s responsibility.
The business has first line of defence responsibility for day-to-day ownership of risks and controls and accountability for implementation and ongoing maintenance of the RMF.
The Group Risk (including Compliance) teams form the second line of defence, providing independent oversight of the Group’s risk profile and RMF.
Internal Audit is the final line of defence, providing independent evaluation and assurance on the appropriateness, effectiveness and adequacy of the Group’s RMF.
The governance and oversight of risk management, while embedded in day-to-day activities, is also the focus of committees and regular forums across the bank (see diagram below). The committees and forums discuss and monitor known and emerging risks, review management plans and monitor progress to address known issues.
53ANZ 2021 Annual Report
OVERVIEW HOW WE CREATE VALUE
PERFORMANCE OVERVIEW
REMUNERATION REPORT
DIRECTORS’ REPORT
FINANCIAL REPORT
SHAREHOLDER INFORMATION

Key material risksThe material risks facing the Group per the Group’s Risk Management Strategy, and how these risks are managed, are summarised below.
As part of the annual review of our Risk Management Strategy we have classified Conduct Risk as a key material risk to enhance the profile and maturity, comply with better practice and align with the direction of the Compliance and Operational Risk Strategy to identify significant obligations and material risks that matter to the Group.
Risk type Description Managing the riskMaterial ESG issues
Capital Adequacy Risk
The risk of loss arising from the Group failing to maintain the level of capital required by prudential regulators and other key stakeholders (shareholders, debt investors, depositors, rating agencies, etc.) to support the Group’s consolidated operations and risk appetite.
We pursue an active approach to Capital Management, which is designed to protect the interests of depositors, creditors and shareholders through ongoing review, and Board approval, of the level and composition of our capital base against key policy objectives.
Compliance Risk
The risk of failure to act in accordance with laws, regulations, industry standards and codes, internal policies and procedures and principles of good governance as applicable to the Group’s businesses.
Key features of how we manage Compliance Risk as part of our Operational Risk and Compliance Framework include:
• Centralised management of key obligations via a Global Obligations Library, enable our change management capability in relation to new and revised obligations, and emphasis on the identification of changing regulations and the business environment, to enable proactive assessment of emerging compliance risks.
• Recognition of incident management as a separate element to enhance ANZ’s ability to identify, manage and report on incidents/breaches in a timely manner.
Credit Risk
The risk of financial loss resulting from:
• A counterparty failing to fulfil its obligations • A decrease in credit quality of a counterparty
resulting in a financial loss.
Credit Risk incorporates the risks associated with us lending to business and retail customers who could be impacted by climate change or by changes to laws, regulations, or other policies adopted by governments or regulatory authorities, including carbon pricing and climate change adaptation or mitigation policies.
Our Credit Risk framework is top down, being defined by credit principles and policies. Credit policies, requirements and procedures cover all aspects of the credit life cycle from initial approval and risk grading, through ongoing management and problem debt management.
Liquidity and Funding Risk
The risk that the Group is unable to meet its payment obligations as they fall due, including:
• Repaying depositors or maturing wholesale debt; or
• The Group having insufficient capacity to fund increases in assets.
Key principles in managing our Liquidity and Funding Risk include:
• ANZ’s short term liquidity scenario modelling stresses cash flow projections against multiple survival horizons’ over which the Group is required to remain cash flow positive; and
• Longer-term scenarios are in place that measure the structural liquidity position of the balance sheet.
For further information about the principal risks and uncertainties that the Group faces, see our “Principal Risks and Uncertainties” disclosure available at anz.com/shareholder/centre.
Fairness and ethical
conduct
Customer experience
Innovation and
technology
Climate change
Financial wellbeing
$
54
OVERVIEW HOW WE CREATE VALUE
PERFORMANCE OVERVIEW
REMUNERATION REPORT
DIRECTORS’ REPORT
FINANCIAL REPORT
SHAREHOLDER INFORMATION

Risk type Description Managing the riskMaterial ESG issues
Market Risk
The risk to the Group’s earnings arising from:
• Changes in any interest rates, foreign exchange rates, credit spreads, volatility, and correlations; or
• Fluctuations in bond, commodity or equity prices.
We have a detailed market risk management and control framework to support our trading and balance sheet activities, which incorporates an independent risk measurement approach to quantify the magnitude of market risk within the trading and balance sheet portfolios. This approach, along with related analysis, identifies the range of possible outcomes, that can be expected over a given period of time, and establishes the likelihood of those outcomes and allocates an appropriate amount of capital to support these activities.
Operational Risk
The risk of loss and/or non-compliance with laws resulting from inadequate or failed internal processes, people and/or systems, or from external events. This definition includes legal risk, and the risk of reputation loss, or damage arising from inadequate or failed internal processes, people and systems, but excludes strategic risk.
The Group’s foundational operational risk policy is the Operational Risk Approach. The Operational Risk Approach and its supporting requirements includes management and measurement of operational risks and compliance with laws, regulations, industry standards, codes and principles of good governance, and internal policies and procedure. The Group takes a risk-based approach to the management of operational risk and obligations. This enables the Group to be consistent in proactively identifying, assessing, managing, reporting and escalating operational risk-related risk exposures, which respecting the specific obligations of each jurisdiction in which the Group operates.
Strategic Risk
Risks that affect or are created by an organisation’s business strategy and strategic objectives. A possible source of loss might arise from the pursuit of an unsuccessful business plan. For example, Strategic risk might arise from making poor strategic business decisions, from the sub-standard execution of decisions, from inadequate resource allocation, or from a failure to respond well to changes in the business environment.
Strategic risks are discussed and managed through our annual strategic planning process, managed by the Executive Committee and approved by the Board. Where the strategy leads to an increase in other Key Material Risks (e.g. Credit Risk, Market Risk, Operational Risk) the risk management strategies associated with these risks form the primary controls.
Technology Risk
The risk of loss and/or non-compliance with laws from inadequate or failed internal processes, people or systems that deliver Technology assets and services to customers and staff. This risk includes Technology assets and services delivered or managed by third parties, and external events.
The risk specifically includes Information Security and Cyber Security and how information held by the Group needs to be protected from inappropriate modification, loss, disclosure and unavailability.
Approach to manage Technology Risk is to manage our operational risks caused by the use of technology, including risks associated with cyber security and third party providers, in a manner that seeks to ensure customer information is secure and service disruption is within acceptable levels.
Conduct Risk
The risk of loss or damage arising from the failure of the Group, its employees or agents to appropriately consider the interests of customers, the integrity of the financial markets and the expectations of the community in conducting its business activities.
The Risk may arise not only from deliberate or negligent actions of individual employees, but may also be inadvertent and caused by inadequacies in the Group’s systems, processes and procedures.
Approach to manage Conduct Risk is to seek to ensure that risks to customers, community and market integrity are identified, assessed, measured, evaluated, treated, monitored and reported in a structured environment with appropriate governance oversight.
$
$
$
$
55ANZ 2021 Annual Report
OVERVIEW HOW WE CREATE VALUE
PERFORMANCE OVERVIEW
REMUNERATION REPORT
DIRECTORS’ REPORT
FINANCIAL REPORT
SHAREHOLDER INFORMATION

Performance overviewOUR PERFORMANCE (continued)
56 ANZ 2021 ANNUAL REPORT
GROUP PERFORMANCE
The results of the Group’s operations and financial position are set out on pages 56-71. Page 11 outlines the Group’s strategy and pages 10-28 describe in further detail the Group’s prospects in terms of future financial position and performance. Discussion of our approach to risk management, including a summary of our key material risks, is outlined on pages 51-55.
CORONAVIRUS (COVID-19)
The COVID-19 pandemic continues to cause major disruptions to community health and economic activities with wide-ranging impacts across many business sectors in Australia, New Zealand and globally.
During the 2021 financial year, the spread of the Delta variant resulted in new and extended lockdowns in Sydney, Melbourne and Auckland. The Group continues to offer support to our customers to counteract the impact of COVID-19, however loan deferrals at 30 September 2021 were less significant than the previous financial year. Facilities which transitioned to interest-only or took up term extensions offered as a result of COVID-19, are now subsumed within the normal loan population and are managed accordingly.
The ramifications of COVID-19 remain uncertain and it is difficult to predict the ongoing impact or duration of the pandemic and relaxation of restrictions. In preparing the financial statements, we made various accounting estimates for future events based on forecasts of economic conditions which reflect expectations and assumptions as at 30 September 2021 that we believe are reasonable under the circumstances.
While pervasive across the financial statements, the estimation uncertainty is predominantly related to expected credit losses (ECL) where we recognised a credit impairment release of $567 million pre-tax in the 2021 financial year (2020: $2,738 million charge). The credit impairment release in the current period was primarily driven by the release of allowance for collectively assessed ECL largely reflecting the impact of an improved economic outlook relative to the outlook at 30 September 2020, together with improvements in portfolio mix.
GROUP PROFIT RESULTS 2021 2020
Statutory Cash Statutory Cash Income Statement $m $m $m $m
Net interest income 14,161 14,161 14,049 14,049
Other operating income 3,259 3,286 3,588 3,703
Operating income 17,420 17,447 17,637 17,752
Operating expenses (9,051) (9,051) (9,383) (9,383)
Profit before credit impairment and income tax 8,369 8,396 8,254 8,369
Credit impairment (charge)/release 567 567 (2,738) (2,738)
Profit before income tax 8,936 8,963 5,516 5,631
Income tax expense (2,756) (2,764) (1,840) (1,872)
Non-controlling interests (1) (1) (1) (1)
Profit after tax from continuing operations 6,179 6,198 3,675 3,758
Profit/(Loss) after tax from discontinued operations (17) (17) (98) (98)
Profit for the year 6,162 6,181 3,577 3,660 Statutory profit after tax for the year ended 30 September 2021 increased 72% on the prior year to $6,162 million. Statutory return on equity is 9.9% and statutory earnings per share is 217.1 cents, an increase of 72% on prior year.
The Group uses cash profit, a non-IFRS measure, to assess the performance of its business activities. It is an industry-wide measure which enables comparison with our peer group. We calculate cash profit by adjusting statutory profit for non-core items. In general, it represents the financial performance of our core business activities. We use cash profit internally to set targets and incentivise our Senior Executives and leaders through our remuneration plans. Refer to page 57 for adjustments between statutory and cash profit. The adjustments made in arriving at cash profit are included in statutory profit which is subject to audit within the context of the external auditor’s audit of the 2021 Financial Report.
Cash profit is not subject to audit by the external auditor. Our external auditor has informed the Audit Committee that adjustments between statutory and cash profit have been determined on a consistent basis across each of the periods presented.
DISCONTINUED OPERATIONS
We completed the sale of our aligned dealer groups business and our OnePath pensions and investment business to IOOF Holdings Limited, and our life insurance business to Zurich Financial Services Australia across the 2020 and 2019 financial years. The financial results of these businesses are treated as discontinued operations from a financial reporting perspective. The financial results after transaction completion primarily relate to residual operational costs on separation and part recovery based on the respective Transition Service Agreements. There were no material financial impacts from the discontinued operations in the 2021 or 2020 financial years.
OUR PERFORMANCE (continued)
56 ANZ 2021 ANNUAL REPORT
GROUP PERFORMANCE
The results of the Group’s operations and financial position are set out on pages 56-71. Page 11 outlines the Group’s strategy and pages 10-28 describe in further detail the Group’s prospects in terms of future financial position and performance. Discussion of our approach to risk management, including a summary of our key material risks, is outlined on pages 51-55.
CORONAVIRUS (COVID-19)
The COVID-19 pandemic continues to cause major disruptions to community health and economic activities with wide-ranging impacts across many business sectors in Australia, New Zealand and globally.
During the 2021 financial year, the spread of the Delta variant resulted in new and extended lockdowns in Sydney, Melbourne and Auckland. The Group continues to offer support to our customers to counteract the impact of COVID-19, however loan deferrals at 30 September 2021 were less significant than the previous financial year. Facilities which transitioned to interest-only or took up term extensions offered as a result of COVID-19, are now subsumed within the normal loan population and are managed accordingly.
The ramifications of COVID-19 remain uncertain and it is difficult to predict the ongoing impact or duration of the pandemic and relaxation of restrictions. In preparing the financial statements, we made various accounting estimates for future events based on forecasts of economic conditions which reflect expectations and assumptions as at 30 September 2021 that we believe are reasonable under the circumstances.
While pervasive across the financial statements, the estimation uncertainty is predominantly related to expected credit losses (ECL) where we recognised a credit impairment release of $567 million pre-tax in the 2021 financial year (2020: $2,738 million charge). The credit impairment release in the current period was primarily driven by the release of allowance for collectively assessed ECL largely reflecting the impact of an improved economic outlook relative to the outlook at 30 September 2020, together with improvements in portfolio mix.
GROUP PROFIT RESULTS 2021 2020
Statutory Cash Statutory Cash Income Statement $m $m $m $m
Net interest income 14,161 14,161 14,049 14,049
Other operating income 3,259 3,286 3,588 3,703
Operating income 17,420 17,447 17,637 17,752
Operating expenses (9,051) (9,051) (9,383) (9,383)
Profit before credit impairment and income tax 8,369 8,396 8,254 8,369
Credit impairment (charge)/release 567 567 (2,738) (2,738)
Profit before income tax 8,936 8,963 5,516 5,631
Income tax expense (2,756) (2,764) (1,840) (1,872)
Non-controlling interests (1) (1) (1) (1)
Profit after tax from continuing operations 6,179 6,198 3,675 3,758
Profit/(Loss) after tax from discontinued operations (17) (17) (98) (98)
Profit for the year 6,162 6,181 3,577 3,660 Statutory profit after tax for the year ended 30 September 2021 increased 72% on the prior year to $6,162 million. Statutory return on equity is 9.9% and statutory earnings per share is 217.1 cents, an increase of 72% on prior year.
The Group uses cash profit, a non-IFRS measure, to assess the performance of its business activities. It is an industry-wide measure which enables comparison with our peer group. We calculate cash profit by adjusting statutory profit for non-core items. In general, it represents the financial performance of our core business activities. We use cash profit internally to set targets and incentivise our Senior Executives and leaders through our remuneration plans. Refer to page 57 for adjustments between statutory and cash profit. The adjustments made in arriving at cash profit are included in statutory profit which is subject to audit within the context of the external auditor’s audit of the 2021 Financial Report.
Cash profit is not subject to audit by the external auditor. Our external auditor has informed the Audit Committee that adjustments between statutory and cash profit have been determined on a consistent basis across each of the periods presented.
DISCONTINUED OPERATIONS
We completed the sale of our aligned dealer groups business and our OnePath pensions and investment business to IOOF Holdings Limited, and our life insurance business to Zurich Financial Services Australia across the 2020 and 2019 financial years. The financial results of these businesses are treated as discontinued operations from a financial reporting perspective. The financial results after transaction completion primarily relate to residual operational costs on separation and part recovery based on the respective Transition Service Agreements. There were no material financial impacts from the discontinued operations in the 2021 or 2020 financial years.
56
OVERVIEW HOW WE CREATE VALUE
PERFORMANCE OVERVIEW
REMUNERATION REPORT
DIRECTORS’ REPORT
FINANCIAL REPORT
SHAREHOLDER INFORMATION

OUR PERFORMANCE (continued)
ANZ 2021 ANNUAL REPORT 57
CONTINUING OPERATIONS
Key measures of our financial position and performance are set out below.
ADJUSTMENTS BEWEEN STATUTORY PROFIT AND CASH PROFIT ($m)
Adjustments between continuing operations statutory profit and cash profit are summarised below:
Adjustment Reason for the adjustment Economic hedges 2021: ($77) million 2020: $121 million Revenue and expense hedges
2021: $96 million 2020: ($36) million
The Group enters into economic hedges to manage its interest rate and foreign exchange risk which, in accordance with accounting standards, result in fair value gains and losses being recognised within the Income Statement. We remove the fair value adjustments from cash profit since the profit or loss resulting from the hedge transactions will reverse over time to match with the profit or loss from the economically hedged item as part of cash profit. This includes gains and losses arising from derivatives not designated in accounting hedge relationships but which are considered to be economic hedges, including hedges of foreign currency debt issuances and foreign exchange denominated revenue and expense streams, primarily NZD and USD (and USD correlated), as well as ineffectiveness from certain designated accounting hedges.
Structured credit intermediation trades
2021: nil 2020: ($2) million
ANZ entered into a series of structured credit intermediation trades prior to the Global Financial Crisis involving the selling of credit default swaps (CDSs) as protection over specific debt structures and purchasing CDS protection over the same structures. We have subsequently exited our positions with the remaining two CDS deals having matured during the 2021 financial year.
2020
2021 1.64
1.63
NNeett iinntteerreesstt mmaarrggiinn ––ccaasshh11 ((%%))
51.9
52.9
2021
2020
OOppeerraattiinngg eexxppeennsseess ttoo ooppeerraattiinngg iinnccoommee ––ccaasshh11 ((%%))
2021 (810)
2,7382020
CCrreeddiitt iimmppaaiirrmmeenntt cchhaarrggee //((rreelleeaassee)) –– ccaasshh11 (($$mm))
(567) 2021
3,758
6,198
2020
CCaasshh pprrooffiitt11
(($$mm))
9.9
6.2
2021
2020
RReettuurrnn oonn eeqquuiittyy ––ccaasshh11 ((%%))
218.3
132.7
2021
2020
EEaarrnniinnggss ppeerr sshhaarree ––ccaasshh11 ((cceennttss))
12.3
11.32020
2021
CCoommmmoonn eeqquuiittyyttiieerr 11 ((%%))
1422021
602020
DDiivviiddeenndd ppeerr sshhaarree22
((cceennttss))
96
Economichedges
2021 Statutoryprofit -
continuingoperations
Structuredcredit
intermediationtrades
Revenue andexpense hedges
2021 Cash profit -
continuingoperations
6,179
(77)
0 6,198
1. Information has been presented on a cash profit from continuing operations basis. 2. The Directors propose a final dividend of 72 cents fully franked for Australia tax purposes (30% tax rate) and carry New Zealand imputation credits of NZD 8 cents per ordinary share.
Performance overviewOUR PERFORMANCE (continued)
56 ANZ 2021 ANNUAL REPORT
GROUP PERFORMANCE
The results of the Group’s operations and financial position are set out on pages 56-71. Page 11 outlines the Group’s strategy and pages 10-28 describe in further detail the Group’s prospects in terms of future financial position and performance. Discussion of our approach to risk management, including a summary of our key material risks, is outlined on pages 51-55.
CORONAVIRUS (COVID-19)
The COVID-19 pandemic continues to cause major disruptions to community health and economic activities with wide-ranging impacts across many business sectors in Australia, New Zealand and globally.
During the 2021 financial year, the spread of the Delta variant resulted in new and extended lockdowns in Sydney, Melbourne and Auckland. The Group continues to offer support to our customers to counteract the impact of COVID-19, however loan deferrals at 30 September 2021 were less significant than the previous financial year. Facilities which transitioned to interest-only or took up term extensions offered as a result of COVID-19, are now subsumed within the normal loan population and are managed accordingly.
The ramifications of COVID-19 remain uncertain and it is difficult to predict the ongoing impact or duration of the pandemic and relaxation of restrictions. In preparing the financial statements, we made various accounting estimates for future events based on forecasts of economic conditions which reflect expectations and assumptions as at 30 September 2021 that we believe are reasonable under the circumstances.
While pervasive across the financial statements, the estimation uncertainty is predominantly related to expected credit losses (ECL) where we recognised a credit impairment release of $567 million pre-tax in the 2021 financial year (2020: $2,738 million charge). The credit impairment release in the current period was primarily driven by the release of allowance for collectively assessed ECL largely reflecting the impact of an improved economic outlook relative to the outlook at 30 September 2020, together with improvements in portfolio mix.
GROUP PROFIT RESULTS 2021 2020
Statutory Cash Statutory Cash Income Statement $m $m $m $m
Net interest income 14,161 14,161 14,049 14,049
Other operating income 3,259 3,286 3,588 3,703
Operating income 17,420 17,447 17,637 17,752
Operating expenses (9,051) (9,051) (9,383) (9,383)
Profit before credit impairment and income tax 8,369 8,396 8,254 8,369
Credit impairment (charge)/release 567 567 (2,738) (2,738)
Profit before income tax 8,936 8,963 5,516 5,631
Income tax expense (2,756) (2,764) (1,840) (1,872)
Non-controlling interests (1) (1) (1) (1)
Profit after tax from continuing operations 6,179 6,198 3,675 3,758
Profit/(Loss) after tax from discontinued operations (17) (17) (98) (98)
Profit for the year 6,162 6,181 3,577 3,660 Statutory profit after tax for the year ended 30 September 2021 increased 72% on the prior year to $6,162 million. Statutory return on equity is 9.9% and statutory earnings per share is 217.1 cents, an increase of 72% on prior year.
The Group uses cash profit, a non-IFRS measure, to assess the performance of its business activities. It is an industry-wide measure which enables comparison with our peer group. We calculate cash profit by adjusting statutory profit for non-core items. In general, it represents the financial performance of our core business activities. We use cash profit internally to set targets and incentivise our Senior Executives and leaders through our remuneration plans. Refer to page 57 for adjustments between statutory and cash profit. The adjustments made in arriving at cash profit are included in statutory profit which is subject to audit within the context of the external auditor’s audit of the 2021 Financial Report.
Cash profit is not subject to audit by the external auditor. Our external auditor has informed the Audit Committee that adjustments between statutory and cash profit have been determined on a consistent basis across each of the periods presented.
DISCONTINUED OPERATIONS
We completed the sale of our aligned dealer groups business and our OnePath pensions and investment business to IOOF Holdings Limited, and our life insurance business to Zurich Financial Services Australia across the 2020 and 2019 financial years. The financial results of these businesses are treated as discontinued operations from a financial reporting perspective. The financial results after transaction completion primarily relate to residual operational costs on separation and part recovery based on the respective Transition Service Agreements. There were no material financial impacts from the discontinued operations in the 2021 or 2020 financial years.
OUR PERFORMANCE (continued)
56 ANZ 2021 ANNUAL REPORT
GROUP PERFORMANCE
The results of the Group’s operations and financial position are set out on pages 56-71. Page 11 outlines the Group’s strategy and pages 10-28 describe in further detail the Group’s prospects in terms of future financial position and performance. Discussion of our approach to risk management, including a summary of our key material risks, is outlined on pages 51-55.
CORONAVIRUS (COVID-19)
The COVID-19 pandemic continues to cause major disruptions to community health and economic activities with wide-ranging impacts across many business sectors in Australia, New Zealand and globally.
During the 2021 financial year, the spread of the Delta variant resulted in new and extended lockdowns in Sydney, Melbourne and Auckland. The Group continues to offer support to our customers to counteract the impact of COVID-19, however loan deferrals at 30 September 2021 were less significant than the previous financial year. Facilities which transitioned to interest-only or took up term extensions offered as a result of COVID-19, are now subsumed within the normal loan population and are managed accordingly.
The ramifications of COVID-19 remain uncertain and it is difficult to predict the ongoing impact or duration of the pandemic and relaxation of restrictions. In preparing the financial statements, we made various accounting estimates for future events based on forecasts of economic conditions which reflect expectations and assumptions as at 30 September 2021 that we believe are reasonable under the circumstances.
While pervasive across the financial statements, the estimation uncertainty is predominantly related to expected credit losses (ECL) where we recognised a credit impairment release of $567 million pre-tax in the 2021 financial year (2020: $2,738 million charge). The credit impairment release in the current period was primarily driven by the release of allowance for collectively assessed ECL largely reflecting the impact of an improved economic outlook relative to the outlook at 30 September 2020, together with improvements in portfolio mix.
GROUP PROFIT RESULTS 2021 2020
Statutory Cash Statutory Cash Income Statement $m $m $m $m
Net interest income 14,161 14,161 14,049 14,049
Other operating income 3,259 3,286 3,588 3,703
Operating income 17,420 17,447 17,637 17,752
Operating expenses (9,051) (9,051) (9,383) (9,383)
Profit before credit impairment and income tax 8,369 8,396 8,254 8,369
Credit impairment (charge)/release 567 567 (2,738) (2,738)
Profit before income tax 8,936 8,963 5,516 5,631
Income tax expense (2,756) (2,764) (1,840) (1,872)
Non-controlling interests (1) (1) (1) (1)
Profit after tax from continuing operations 6,179 6,198 3,675 3,758
Profit/(Loss) after tax from discontinued operations (17) (17) (98) (98)
Profit for the year 6,162 6,181 3,577 3,660 Statutory profit after tax for the year ended 30 September 2021 increased 72% on the prior year to $6,162 million. Statutory return on equity is 9.9% and statutory earnings per share is 217.1 cents, an increase of 72% on prior year.
The Group uses cash profit, a non-IFRS measure, to assess the performance of its business activities. It is an industry-wide measure which enables comparison with our peer group. We calculate cash profit by adjusting statutory profit for non-core items. In general, it represents the financial performance of our core business activities. We use cash profit internally to set targets and incentivise our Senior Executives and leaders through our remuneration plans. Refer to page 57 for adjustments between statutory and cash profit. The adjustments made in arriving at cash profit are included in statutory profit which is subject to audit within the context of the external auditor’s audit of the 2021 Financial Report.
Cash profit is not subject to audit by the external auditor. Our external auditor has informed the Audit Committee that adjustments between statutory and cash profit have been determined on a consistent basis across each of the periods presented.
DISCONTINUED OPERATIONS
We completed the sale of our aligned dealer groups business and our OnePath pensions and investment business to IOOF Holdings Limited, and our life insurance business to Zurich Financial Services Australia across the 2020 and 2019 financial years. The financial results of these businesses are treated as discontinued operations from a financial reporting perspective. The financial results after transaction completion primarily relate to residual operational costs on separation and part recovery based on the respective Transition Service Agreements. There were no material financial impacts from the discontinued operations in the 2021 or 2020 financial years.
OUR PERFORMANCE (continued)
56 ANZ 2021 ANNUAL REPORT
GROUP PERFORMANCE
The results of the Group’s operations and financial position are set out on pages 56-71. Page 11 outlines the Group’s strategy and pages 10-28 describe in further detail the Group’s prospects in terms of future financial position and performance. Discussion of our approach to risk management, including a summary of our key material risks, is outlined on pages 51-55.
CORONAVIRUS (COVID-19)
The COVID-19 pandemic continues to cause major disruptions to community health and economic activities with wide-ranging impacts across many business sectors in Australia, New Zealand and globally.
During the 2021 financial year, the spread of the Delta variant resulted in new and extended lockdowns in Sydney, Melbourne and Auckland. The Group continues to offer support to our customers to counteract the impact of COVID-19, however loan deferrals at 30 September 2021 were less significant than the previous financial year. Facilities which transitioned to interest-only or took up term extensions offered as a result of COVID-19, are now subsumed within the normal loan population and are managed accordingly.
The ramifications of COVID-19 remain uncertain and it is difficult to predict the ongoing impact or duration of the pandemic and relaxation of restrictions. In preparing the financial statements, we made various accounting estimates for future events based on forecasts of economic conditions which reflect expectations and assumptions as at 30 September 2021 that we believe are reasonable under the circumstances.
While pervasive across the financial statements, the estimation uncertainty is predominantly related to expected credit losses (ECL) where we recognised a credit impairment release of $567 million pre-tax in the 2021 financial year (2020: $2,738 million charge). The credit impairment release in the current period was primarily driven by the release of allowance for collectively assessed ECL largely reflecting the impact of an improved economic outlook relative to the outlook at 30 September 2020, together with improvements in portfolio mix.
GROUP PROFIT RESULTS 2021 2020
Statutory Cash Statutory Cash Income Statement $m $m $m $m
Net interest income 14,161 14,161 14,049 14,049
Other operating income 3,259 3,286 3,588 3,703
Operating income 17,420 17,447 17,637 17,752
Operating expenses (9,051) (9,051) (9,383) (9,383)
Profit before credit impairment and income tax 8,369 8,396 8,254 8,369
Credit impairment (charge)/release 567 567 (2,738) (2,738)
Profit before income tax 8,936 8,963 5,516 5,631
Income tax expense (2,756) (2,764) (1,840) (1,872)
Non-controlling interests (1) (1) (1) (1)
Profit after tax from continuing operations 6,179 6,198 3,675 3,758
Profit/(Loss) after tax from discontinued operations (17) (17) (98) (98)
Profit for the year 6,162 6,181 3,577 3,660 Statutory profit after tax for the year ended 30 September 2021 increased 72% on the prior year to $6,162 million. Statutory return on equity is 9.9% and statutory earnings per share is 217.1 cents, an increase of 72% on prior year.
The Group uses cash profit, a non-IFRS measure, to assess the performance of its business activities. It is an industry-wide measure which enables comparison with our peer group. We calculate cash profit by adjusting statutory profit for non-core items. In general, it represents the financial performance of our core business activities. We use cash profit internally to set targets and incentivise our Senior Executives and leaders through our remuneration plans. Refer to page 57 for adjustments between statutory and cash profit. The adjustments made in arriving at cash profit are included in statutory profit which is subject to audit within the context of the external auditor’s audit of the 2021 Financial Report.
Cash profit is not subject to audit by the external auditor. Our external auditor has informed the Audit Committee that adjustments between statutory and cash profit have been determined on a consistent basis across each of the periods presented.
DISCONTINUED OPERATIONS
We completed the sale of our aligned dealer groups business and our OnePath pensions and investment business to IOOF Holdings Limited, and our life insurance business to Zurich Financial Services Australia across the 2020 and 2019 financial years. The financial results of these businesses are treated as discontinued operations from a financial reporting perspective. The financial results after transaction completion primarily relate to residual operational costs on separation and part recovery based on the respective Transition Service Agreements. There were no material financial impacts from the discontinued operations in the 2021 or 2020 financial years.
OUR PERFORMANCE (continued)
56 ANZ 2021 ANNUAL REPORT
GROUP PERFORMANCE
The results of the Group’s operations and financial position are set out on pages 56-71. Page 11 outlines the Group’s strategy and pages 10-28 describe in further detail the Group’s prospects in terms of future financial position and performance. Discussion of our approach to risk management, including a summary of our key material risks, is outlined on pages 51-55.
CORONAVIRUS (COVID-19)
The COVID-19 pandemic continues to cause major disruptions to community health and economic activities with wide-ranging impacts across many business sectors in Australia, New Zealand and globally.
During the 2021 financial year, the spread of the Delta variant resulted in new and extended lockdowns in Sydney, Melbourne and Auckland. The Group continues to offer support to our customers to counteract the impact of COVID-19, however loan deferrals at 30 September 2021 were less significant than the previous financial year. Facilities which transitioned to interest-only or took up term extensions offered as a result of COVID-19, are now subsumed within the normal loan population and are managed accordingly.
The ramifications of COVID-19 remain uncertain and it is difficult to predict the ongoing impact or duration of the pandemic and relaxation of restrictions. In preparing the financial statements, we made various accounting estimates for future events based on forecasts of economic conditions which reflect expectations and assumptions as at 30 September 2021 that we believe are reasonable under the circumstances.
While pervasive across the financial statements, the estimation uncertainty is predominantly related to expected credit losses (ECL) where we recognised a credit impairment release of $567 million pre-tax in the 2021 financial year (2020: $2,738 million charge). The credit impairment release in the current period was primarily driven by the release of allowance for collectively assessed ECL largely reflecting the impact of an improved economic outlook relative to the outlook at 30 September 2020, together with improvements in portfolio mix.
GROUP PROFIT RESULTS 2021 2020
Statutory Cash Statutory Cash Income Statement $m $m $m $m
Net interest income 14,161 14,161 14,049 14,049
Other operating income 3,259 3,286 3,588 3,703
Operating income 17,420 17,447 17,637 17,752
Operating expenses (9,051) (9,051) (9,383) (9,383)
Profit before credit impairment and income tax 8,369 8,396 8,254 8,369
Credit impairment (charge)/release 567 567 (2,738) (2,738)
Profit before income tax 8,936 8,963 5,516 5,631
Income tax expense (2,756) (2,764) (1,840) (1,872)
Non-controlling interests (1) (1) (1) (1)
Profit after tax from continuing operations 6,179 6,198 3,675 3,758
Profit/(Loss) after tax from discontinued operations (17) (17) (98) (98)
Profit for the year 6,162 6,181 3,577 3,660 Statutory profit after tax for the year ended 30 September 2021 increased 72% on the prior year to $6,162 million. Statutory return on equity is 9.9% and statutory earnings per share is 217.1 cents, an increase of 72% on prior year.
The Group uses cash profit, a non-IFRS measure, to assess the performance of its business activities. It is an industry-wide measure which enables comparison with our peer group. We calculate cash profit by adjusting statutory profit for non-core items. In general, it represents the financial performance of our core business activities. We use cash profit internally to set targets and incentivise our Senior Executives and leaders through our remuneration plans. Refer to page 57 for adjustments between statutory and cash profit. The adjustments made in arriving at cash profit are included in statutory profit which is subject to audit within the context of the external auditor’s audit of the 2021 Financial Report.
Cash profit is not subject to audit by the external auditor. Our external auditor has informed the Audit Committee that adjustments between statutory and cash profit have been determined on a consistent basis across each of the periods presented.
DISCONTINUED OPERATIONS
We completed the sale of our aligned dealer groups business and our OnePath pensions and investment business to IOOF Holdings Limited, and our life insurance business to Zurich Financial Services Australia across the 2020 and 2019 financial years. The financial results of these businesses are treated as discontinued operations from a financial reporting perspective. The financial results after transaction completion primarily relate to residual operational costs on separation and part recovery based on the respective Transition Service Agreements. There were no material financial impacts from the discontinued operations in the 2021 or 2020 financial years.
OUR PERFORMANCE (continued)
56 ANZ 2021 ANNUAL REPORT
GROUP PERFORMANCE
The results of the Group’s operations and financial position are set out on pages 56-71. Page 11 outlines the Group’s strategy and pages 10-28 describe in further detail the Group’s prospects in terms of future financial position and performance. Discussion of our approach to risk management, including a summary of our key material risks, is outlined on pages 51-55.
CORONAVIRUS (COVID-19)
The COVID-19 pandemic continues to cause major disruptions to community health and economic activities with wide-ranging impacts across many business sectors in Australia, New Zealand and globally.
During the 2021 financial year, the spread of the Delta variant resulted in new and extended lockdowns in Sydney, Melbourne and Auckland. The Group continues to offer support to our customers to counteract the impact of COVID-19, however loan deferrals at 30 September 2021 were less significant than the previous financial year. Facilities which transitioned to interest-only or took up term extensions offered as a result of COVID-19, are now subsumed within the normal loan population and are managed accordingly.
The ramifications of COVID-19 remain uncertain and it is difficult to predict the ongoing impact or duration of the pandemic and relaxation of restrictions. In preparing the financial statements, we made various accounting estimates for future events based on forecasts of economic conditions which reflect expectations and assumptions as at 30 September 2021 that we believe are reasonable under the circumstances.
While pervasive across the financial statements, the estimation uncertainty is predominantly related to expected credit losses (ECL) where we recognised a credit impairment release of $567 million pre-tax in the 2021 financial year (2020: $2,738 million charge). The credit impairment release in the current period was primarily driven by the release of allowance for collectively assessed ECL largely reflecting the impact of an improved economic outlook relative to the outlook at 30 September 2020, together with improvements in portfolio mix.
GROUP PROFIT RESULTS 2021 2020
Statutory Cash Statutory Cash Income Statement $m $m $m $m
Net interest income 14,161 14,161 14,049 14,049
Other operating income 3,259 3,286 3,588 3,703
Operating income 17,420 17,447 17,637 17,752
Operating expenses (9,051) (9,051) (9,383) (9,383)
Profit before credit impairment and income tax 8,369 8,396 8,254 8,369
Credit impairment (charge)/release 567 567 (2,738) (2,738)
Profit before income tax 8,936 8,963 5,516 5,631
Income tax expense (2,756) (2,764) (1,840) (1,872)
Non-controlling interests (1) (1) (1) (1)
Profit after tax from continuing operations 6,179 6,198 3,675 3,758
Profit/(Loss) after tax from discontinued operations (17) (17) (98) (98)
Profit for the year 6,162 6,181 3,577 3,660 Statutory profit after tax for the year ended 30 September 2021 increased 72% on the prior year to $6,162 million. Statutory return on equity is 9.9% and statutory earnings per share is 217.1 cents, an increase of 72% on prior year.
The Group uses cash profit, a non-IFRS measure, to assess the performance of its business activities. It is an industry-wide measure which enables comparison with our peer group. We calculate cash profit by adjusting statutory profit for non-core items. In general, it represents the financial performance of our core business activities. We use cash profit internally to set targets and incentivise our Senior Executives and leaders through our remuneration plans. Refer to page 57 for adjustments between statutory and cash profit. The adjustments made in arriving at cash profit are included in statutory profit which is subject to audit within the context of the external auditor’s audit of the 2021 Financial Report.
Cash profit is not subject to audit by the external auditor. Our external auditor has informed the Audit Committee that adjustments between statutory and cash profit have been determined on a consistent basis across each of the periods presented.
DISCONTINUED OPERATIONS
We completed the sale of our aligned dealer groups business and our OnePath pensions and investment business to IOOF Holdings Limited, and our life insurance business to Zurich Financial Services Australia across the 2020 and 2019 financial years. The financial results of these businesses are treated as discontinued operations from a financial reporting perspective. The financial results after transaction completion primarily relate to residual operational costs on separation and part recovery based on the respective Transition Service Agreements. There were no material financial impacts from the discontinued operations in the 2021 or 2020 financial years.
57ANZ 2021 Annual Report
OVERVIEW HOW WE CREATE VALUE
PERFORMANCE OVERVIEW
REMUNERATION REPORT
DIRECTORS’ REPORT
FINANCIAL REPORT
SHAREHOLDER INFORMATION

OUR PERFORMANCE (continued)
58 ANZ 2021 ANNUAL REPORT
GROUP CASH PROFIT PERFORMANCE FROM CONTINUING OPERATIONS
Cash profit performance and the analysis thereof has been presented on a cash profit from continuing operations basis.
CASH PROFIT FROM CONTINUING OPERATIONS ($m)
2021 2020 $m $m Movt
Net interest income 14,161 14,049 1%
Other operating income 3,286 3,703 -11%
Operating income 17,447 17,752 -2%
Operating expenses (9,051) (9,383) -4%
Profit before credit impairment and income tax 8,396 8,369 0%
Credit impairment (charge)/release 567 (2,738) large
Profit before income tax 8,963 5,631 59%
Income tax expense (2,764) (1,872) 48%
Non-controlling interests (1) (1) 0%
Cash profit from continuing operations 6,198 3,758 65% Cash profit from continuing operations increased $2,440 million (65%) compared with the 2020 financial year.
Net interest income increased $112 million (1%) driven by 1 bps increase in net interest margin. The increase of 1 bps was driven by deposit margin management across all divisions, favourable wholesale funding costs, and a reduction in lower margin Markets average interest earning assets as a result of lower reverse repurchase agreements. This was partially offset by growth in lower yielding liquid assets and the impact of low interest rates on earnings on capital and replicating deposits. Average interest earning assets increased $0.8 billion driven by higher central bank balances, higher liquid assets, and home lending growth across the New Zealand and Australia Retail and Commercial divisions. This was partially offset by a decrease in Institutional lending, lower reverse repurchase agreements and the impact of foreign currency translation movements.
Other operating income decreased $417 million (-11%) driven by a decrease of $754 million in Markets other operating income following normalisation of financial market conditions and the impact of surplus system liquidity, a decrease in share of associates’ profit of $331 million, a loss of $251 million associated with the disposal of ANZ Share Investing, and a decrease in net fee and commission income driven by lower volumed related fees due to the impact of COVID-19. This was partially offset by the impairment of Asian associates of $815 million in the prior year and favourable adjustments to loans measured at fair value.
Operating expenses decreased $332 million (-4%) driven by an accelerated software amortisation charges of $197 million, goodwill impairment of $77 million and lease-related items of $50 million all in the prior year, lower restructuring expenses of $34 million and productivity benefits, partially offset by higher investment spend and a litigation settlement of $69 million.
Credit impairment charges decreased $3,305 million driven by a decrease in the collectively assessed credit impairment charges reflecting an improved economic outlook together with improvements in portfolio mix, and a decrease in individually assessed credit impairment charges.
112 332
3,305
6,198
Operatingexpenses
Creditimpairment
2020 Cashprofit -
continuingoperations
Net interestincome
Otheroperating
income
Income taxexpense &
non-controllinginterests
(892)
2021 Cashprofit -
continuingoperations
3,758
(417)
58
OVERVIEW HOW WE CREATE VALUE
PERFORMANCE OVERVIEW
REMUNERATION REPORT
DIRECTORS’ REPORT
FINANCIAL REPORT
SHAREHOLDER INFORMATION

OUR PERFORMANCE (continued)
ANZ 2021 ANNUAL REPORT 59
LARGE/NOTABLE ITEMS INCLUDED IN CASH PROFIT FROM CONTINUING OPERATIONS
Within continuing cash profit, the Group recognised a number of large/notable items. The impact of these items on a post-tax basis is as follows:
2021 2020 Gain/(Loss) on sale from divestments $m $m
UDC Finance (UDC) - (34)
New Zealand legacy insurance portfolio 13 -
ANZ Share Investing (251) -
Divested business results
UDC Finance (UDC) - 57
Other large/notable items
Customer remediation (221) (279)
Litigation settlements (48) -
Accelerated software amortisation - (138)
Asian associate impairments - (815)
Asian associate items (347) (66)
Lease-related items - (34)
Restructuring (92) (115)
Goodwill write-off - (77)
59ANZ 2021 Annual Report
OVERVIEW HOW WE CREATE VALUE
PERFORMANCE OVERVIEW
REMUNERATION REPORT
DIRECTORS’ REPORT
FINANCIAL REPORT
SHAREHOLDER INFORMATION

OUR PERFORMANCE (continued)
60 ANZ 2021 ANNUAL REPORT
Description of large/notable items:
Item Description
Gain/(Loss) on sale from divestments
The 2021 financial year included a loss on disposal of ANZ Share Investing, and a gain on sale of the New Zealand legacy insurance portfolio. The 2020 financial year included a loss on sale of the UDC business.
Divested business results
The 2020 financial year included the divested business results of UDC.
Customer remediation
Customer remediation includes provisions for expected refunds to customers, remediation project costs and related customer and regulatory claims, penalties and litigation outcomes.
Litigation settlements
During the 2021 financial year, the Group reached an agreement to settle a United States class action related to the Bank Bill Swap Rate (BBSW) and the trading of BBSW-based products. The settlement is without admission of liability and remains subject to negotiation and execution of complete settlement terms as well as court approval. The Group recognised a provision in relation to the settlement and related expenses during the year.
Accelerated software amortisation
During the 2020 financial year, the Group recognised an accelerated amortisation charge arising from the revised application of the Group’s software amortisation policy in the 2020 financial year reflecting the shorter useful life of software caused by rapidly changing technology and business requirements.
Asian associate impairments
During the 2020 financial year, the Group recognised an impairment in respect of two of the Group’s investments to adjust their carrying values in line with their value-in-use calculations. No further impairments were recognised in the 2021 financial year (refer to Note 26 Investments in Associates in the Financial Report for further details).
Asian associate items The Group recognised the following adjustments to equity accounted earnings from its Asian associates:
AmBank 1MDB settlement: following AMMB Holdings Berhad’s (AmBank) agreement with the Malaysian Ministry of Finance to resolve potential claims relating to its involvement with 1Malaysia Development Berhad (1MDB), the Group recognised a $212 million reduction in equity accounted earnings after tax reflecting its share of the settlement provision during the 2021 financial year.
AmBank goodwill impairment: during the 2021 financial year, AmBank partially impaired goodwill and the Group recognised a $135 million reduction in equity accounted earnings after tax reflecting its share of the impairment.
PT Panin AASB 9 adjustment: when the Group adopted AASB 9 Financial Instruments on 1 October 2018, an estimate of PT Bank Pan Indonesia (PT Panin)’s transition adjustment was recognised through opening retained earnings to align accounting policies. PT Panin adopted AASB 9 during the 2020 financial year recognising a transition adjustment in retained earnings. The $66 million represents the Group’s equity accounted share of the transition adjustment net of amounts previously adjusted by the Group on 1 October 2018.
Lease-related items Following the adoption of the new lease accounting standard (AASB 16) on 1 October 2019, the Group recognised additional charges which were presented as a large/notable item at the time as the 2019 comparatives were prepared under the previous lease accounting standard (AASB 117). The ongoing AASB 16 impacts for the 2020 financial year are now presented on a consistent basis to the 2021 financial year. The residual lease related item relates to non-recurring items recognised in the 2020 financial year.
Restructuring Restructuring charges largely related to business and property changes in Australia Retail and Commercial division and operational changes in Technology, Services & Operations (TSO) and Group Centre division.
Goodwill write-off The Group recognised the following goodwill write-off during the 2020 financial year:
Pacific division: the impact of COVID-19 on the economies of the Pacific region had been significant and conditions were expected to take some time to recover. Goodwill of $50 million was impaired.
New Zealand division: as a result of changes in the economic environment and outlook, the Group announced its intention to begin winding up the Bonus Bonds business in the New Zealand division by 31 October 2020. As a result, the Group wrote off the associated goodwill of $27 million.
60
OVERVIEW HOW WE CREATE VALUE
PERFORMANCE OVERVIEW
REMUNERATION REPORT
DIRECTORS’ REPORT
FINANCIAL REPORT
SHAREHOLDER INFORMATION

OUR PERFORMANCE (continued)
ANZ 2021 ANNUAL REPORT 61
ANALYSIS OF CASH PROFIT PERFORMANCE
Net interest income
GROUP NET INTEREST MARGIN FROM CONTINUING OPERATIONS (bps)
1. Markets Balance Sheet activities includes the impact of discretionary liquid assets and other Balance Sheet activities.
2021 2020 $m $m Movt
Net interest income1 14,161 14,049 1%
Net interest margin (%) - cash1 1.64 1.63 1 bps
Average interest earning assets 863,691 862,882 0%
Average deposits and other borrowings 712,540 679,336 5% 1. Includes the major bank levy of -$346 million (2020: -$406 million).
Net interest income increased $112 million (1%) driven by 1 bps increase in net interest margin.
Net interest margin increased 1 bps driven by deposit margin management across all divisions, favourable wholesale funding costs, and reduction in lower margin Markets average interest earning assets as a result of lower reverse repurchase agreements. This was partially offset by growth in lower yielding liquid assets and the impact of low interest rate on earnings on capital and replicating deposits.
Average interest earning assets increased $0.8 billion (flat) driven by higher central bank balances, higher liquid assets, and home lending growth across the New Zealand and Australia Retail and Commercial divisions. This was partially offset by a decrease in Institutional lending, lower reverse repurchase agreements and the impact of foreign currency translation movements.
Average deposits and other borrowings increased $33.2 billion (5%) driven by growth in at-call deposits across all divisions and increases in commercial paper and certificates of deposit, partially offset by lower term deposits and the impact of foreign currency translation movements.
1
71
6
Asset andfunding mix
163
Assetpricing
2020 Cashnet interest
margin
Wholesalefunding &depositpricing
0
Impact ofrates net of
repricing
Liquidity 2021 Cashnet interest
margin subtotal
MarketsBalanceSheet
activities
164
Large/notableitems
2021 Cashnet interest
margin
(7)
(5)
159
(1)
61ANZ 2021 Annual Report
OVERVIEW HOW WE CREATE VALUE
PERFORMANCE OVERVIEW
REMUNERATION REPORT
DIRECTORS’ REPORT
FINANCIAL REPORT
SHAREHOLDER INFORMATION

OUR PERFORMANCE (continued)
62 ANZ 2021 ANNUAL REPORT
Other operating income
OTHER OPERATING INCOME ($m)
2021 2020 $m $m Movt
Net fee and commission income1 2,063 2,215 -7%
Markets other operating income 1,130 1,884 -40%
Share of associates' profit/(loss) (176) 155 large
Other1 269 (551) large
Total cash other operating income 3,286 3,703 -11% 1. Excluding the Markets business unit.
Net fee and commission income decreased $152 million (-7%) driven by lower volume related fees due to the impact of COVID-19, higher customer remediation, reduction or removal of fees, and reduced commission income from the wind-up of the Bonus Bonds business.
Markets other operating income decreased $754 million (-40%) driven by lower income across the Rates, Credit and Capital Markets, Foreign Exchange and Commodities businesses following normalisation of financial market conditions and the impact of surplus system liquidity, and a credit valuation adjustment gain in the prior year. This was partially offset by higher Balance Sheet income from net realised gains during the period and customer remediation provision releases.
Share of associates' profit decreased $331 million driven by the Group’s equity accounted share of AmBank 1MDB settlement and goodwill impairment of $347 million, and a decrease in equity accounted share of profits of $52 million. This was partially offset by the Group’s equity accounted share of PT Panin’s transition adjustment on its adoption of AASB 9 of $68 million in the prior year.
Other increased $820 million driven by the impairment of the Asian associates of $815 million in the prior year, higher realised gains on economic hedges against foreign currency denominated revenue streams, favourable adjustments to loans measured at fair value in the Institutional division, higher insurance income and a loss on sale of the UDC business in the prior year. This was partially offset by the loss associated with the disposal of ANZ Share Investing of $251 million.
820
Other
(754)
2020 Cashother
operatingincome
Net fee andcommission
income
Share ofassociates’
profit/(loss)
Marketsother
operatingincome
2021 Cashother
operatingincome
(152)
3,703
(331)
3,286
1
1
62
OVERVIEW HOW WE CREATE VALUE
PERFORMANCE OVERVIEW
REMUNERATION REPORT
DIRECTORS’ REPORT
FINANCIAL REPORT
SHAREHOLDER INFORMATION

OUR PERFORMANCE (continued)
ANZ 2021 ANNUAL REPORT 63
Operating expenses
OPERATING EXPENSES ($m)
2021 2020 $m $m Movt Personnel 4,946 4,878 1% Premises 705 789 -11% Technology 1,588 1,824 -13% Restructuring 127 161 -21% Other 1,685 1,731 -3% Total cash operating expenses from continuing operations 9,051 9,383 -4% Full time equivalent staff (FTE) from continuing operations 39,684 37,506 6% Average full time equivalent staff (FTE) from continuing operations 38,043 37,728 1% Personnel expenses increased $68 million (1%) driven by an uplift in investment in digital capabilities, cloud enabled simplification and meeting regulatory and compliance obligations, as well as additional resourcing for COVID-19 hardship support, regulatory mandated complaints support and Home Loans operations. This was partially offset by the continued benefits enabled by customers embracing digital channels, and favourable foreign currency translation movements.
Premises expenses decreased $84 million (-11%) driven by ongoing optimisation of property footprint across all geographies and lower lease-related costs.
Technology expenses decreased $236 million (-13%) driven by accelerated amortisation of $197 million and lease-related items of $50 million in the prior year, benefits from vendor contract negotiations, lower amortisation and favourable foreign currency translation movements. This was partially offset by increased spend on investment initiatives.
Restructuring expenses decreased $34 million (-21%) driven by lower charges in the Australia Retail and Commercial and New Zealand divisions, partially offset by operational changes in the TSO and Group Centre division.
Other expenses decreased $46 million (-3%) driven by a goodwill write-off of $77 million in the prior year, lower travel expenses and lower freight and cartage. This was partially offset by increased spend on investment initiatives, and a litigation settlement of $69 million.
68
TechnologyPremises
(84)
2020 Cashoperatingexpenses
(236)
RestructuringPersonnel Other 2021 Cashoperatingexpenses
9,383
(34)(46)
9,051
63ANZ 2021 Annual Report
OVERVIEW HOW WE CREATE VALUE
PERFORMANCE OVERVIEW
REMUNERATION REPORT
DIRECTORS’ REPORT
FINANCIAL REPORT
SHAREHOLDER INFORMATION

OUR PERFORMANCE (continued)
64 ANZ 2021 ANNUAL REPORT
Credit impairment 2021 2020 Movt Collectively assessed credit impairment charge/(release) ($m) (823) 1,717 large Individually assessed credit impairment charge ($m) 256 1,021 -75% Credit impairment charge/(release) ($m) (567) 2,738 large Gross impaired assets ($m) 1,965 2,459 -20% Credit risk weighted assets ($b) 342.5 360.0 -5% Total allowance for expected credit losses (ECL) ($m) 4,882 5,899 -17% Individually assessed as % of gross impaired assets 35.0% 36.2% Collectively assessed as % of credit risk weighted assets 1.22% 1.39%
COLLECTIVELY ASSESSED CREDIT IMPAIRMENT CHARGE/(RELEASE) ($m)
The collectively assessed credit impairment charge decreased $2,540 million. Collectively assessed credit impairment provision increased substantially in the prior year driven by the forward-looking impacts of the COVID-19 pandemic. Improvement in the economic outlook together with improvements in portfolio mix resulted in collectively assessed credit impairment provision releases in the current year.
INDIVIDUALLY ASSESSED CREDIT IMPAIRMENT CHARGE ($m)
The individually assessed credit impairment charge decreased by $765 million (-75%). The decrease in the Australia Retail and Commercial division was driven by lower impairments as the underlying flows remained subdued due to the impact of various COVID-19 support initiatives. The decrease in the Institutional division was driven by a number of impairments in the prior year. The decrease in the New Zealand division was driven by lower transitions to impairment and the write-back of a large Agri customer.
1,717
(823)(309) (30)2020 Collectively assessed credit
impairment charge
PacificNew ZealandAustralia Retail and Commercial
Institutional TSO and Group Centre
2021 Collectively assessed credit
impairment release
(532)
(1,672)
3
256
PacificNew Zealand2020 Individually assessed credit
impairment charge
Australia Retail and Commercial
Institutional TSO and Group Centre
2021 Individually assessed credit
impairment charge
(1)
1,021
(401)
(251)
(112)
0
64
OVERVIEW HOW WE CREATE VALUE
PERFORMANCE OVERVIEW
REMUNERATION REPORT
DIRECTORS’ REPORT
FINANCIAL REPORT
SHAREHOLDER INFORMATION

OUR PERFORMANCE (continued)
ANZ 2021 ANNUAL REPORT 65
GROSS IMPAIRED ASSETS BY DIVISION ($m)
Gross impaired assets decreased $494 million (-20%). The decrease in the Australia Retail and Commercial division was driven by the repayment of a single name restructured exposure and decreases in the retail portfolio as underlying delinquency flows remained subdued due to the impact of various COVID-19 support initiatives. The decrease in the New Zealand division was driven by upgrade of a large Agri customer and a number of Agri asset sales. The increase in the Institutional division was driven by impairments of a small number of well secured single name exposures.
TOTAL ALLOWANCE FOR EXPECTED CREDIT LOSSES ($m)
The collectively assessed allowance for expected credit losses decreased $813 million (-16%) driven by a reduction of $448 million from the improving economic outlook partially offset by changes to scenario weightings and an allowance for model uncertainty due to the continuing pandemic and reductions in government support programs, a reduction of $282 million due to lower lending volumes and changes in portfolio composition, and a reduction of $153 million attributable to changes in credit risk. This was partially offset by an increase of $60 million in management adjustments and an increase of $10 million from foreign currency translation movements.
The individually assessed allowance for expected credit losses decreased $204 million (-23%) due to the impact of COVID-19 support initiatives.
270
12
Australia Retail and Commercial
PacificNew ZealandInstitutional2020 Gross impaired assets
TSO and Group Centre
2021 Gross impaired assets
2,459
(593)
(183)
0 1,965
17 3
2020 Totalallowance
for expectedcredit losses
Australia Retail and Commercial
Institutional PacificNew Zealand
4,882
TSO and Group Centre
2021 Totalallowance
for expectedcredit losses
(83)
5,899
(824)(130)
65ANZ 2021 Annual Report
OVERVIEW HOW WE CREATE VALUE
PERFORMANCE OVERVIEW
REMUNERATION REPORT
DIRECTORS’ REPORT
FINANCIAL REPORT
SHAREHOLDER INFORMATION

OUR PERFORMANCE (continued)
66 ANZ 2021 ANNUAL REPORT
DDIIVVIISSIIOONNAALL PPEERRFFOORRMMAANNCCEE
Australia
Retail and New TSO and
Group 2021 Commercial Institutional Zealand Pacific Centre Group
Net interest margin 2.58% 0.81% 2.33% 2.98% n/a 1.64% Operating expenses to operating income 45.3% 49.1% 39.7% 89.4% n/a 51.9%
Cash profit from continuing operations ($m) 3,617 1,887 1,508 (3) (811) 6,198
Net loans and advances ($b) 341.2 158.2 128.5 1.8 - 629.7 Customer deposits ($b) 252.5 239.6 97.7 3.8 - 593.6 Number of FTE 14,480 5,332 7,060 1,089 11,723 39,684
Australia
Retail and New TSO and
Group 2020 Commercial Institutional Zealand Pacific Centre Group
Net interest margin 2.59% 0.76% 2.26% 3.10% n/a 1.63% Operating expenses to operating income 45.1% 43.9% 44.8% 106.2% n/a 52.9%
Cash profit from continuing operations ($m)
2,337 1,854 1,017 (62) (1,388) 3,758
Net loans and advances ($b) 339.4 157.6 116.6 1.9 1.6 617.1 Customer deposits ($b) 234.6 223.3 91.0 3.5 - 552.4 Number of FTE 14,078 5,291 6,679 1,113 10,345 37,506
66
OVERVIEW HOW WE CREATE VALUE
PERFORMANCE OVERVIEW
REMUNERATION REPORT
DIRECTORS’ REPORT
FINANCIAL REPORT
SHAREHOLDER INFORMATION
OUR PERFORMANCE (continued)
ANZ 2021 ANNUAL REPORT 67
DIVISIONAL PERFORMANCE
Australia Retail and Commercial
Lending volumes increased driven by home loan growth, partially offset by lower unsecured lending due to COVID-19 lockdown impacts and a decrease in commercial lending. Net interest margin decreased driven by unfavourable lending mix from stronger growth in lower margin fixed rate home loans, deposit margin compression and lower earnings on capital. This was mostly offset by deposit and asset repricing benefits, favourable funding deposit mix due to strong deposit growth, and lower funding costs. Other operating income decreased driven by the loss associated with the disposal of ANZ Share Investing and lower credit card and international transaction volumes due to COVID-19 impacts. Operating expenses decreased driven by productivity benefits, lower restructuring expenses, and lease-related items and accelerated amortisation in the prior year. This was partially offset by higher investment spend and customer remediation. Credit impairment charges decreased driven by a collectively assessed credit impairment release reflecting an improved economic outlook, and lower individually assessed credit impairment charge as the underlying flows remained subdued due to the impact of various COVID-19 support initiatives.
Institutional
Lending volumes increased in Corporate Finance and Transaction Banking, partially offset by a decrease in Markets. Customer deposits increased in Transaction Banking and Markets. Net interest margin ex-Markets increased driven by improved lending margins. Other operating income decreased driven by lower Markets revenue following normalisation of financial market conditions and the impact of surplus system liquidity, partially offset by lower customer remediation. Other operating expenses decreased driven by productivity benefits and accelerated amortisation in the prior year, partially offset by a litigation settlement and higher restructuring expenses. Credit impairment charges decreased driven by a collectively assessed credit impairment release reflecting an improved economic outlook, and lower individually assessed credit impairment charges in Transaction Banking.
New Zealand
Lending volumes increased driven by home loan growth. Net interest margin increased driven by favourable deposit mix, lower funding costs and deposit repricing benefits, partially offset by headwinds from lower home loan margins due to competition, unfavourable lending mix with growth weighted to fixed rate home loans, and lower income post UDC sale completion in the prior year. Operating expenses decreased driven by lower customer remediation and restructuring expenses, lower expenses post UDC sale completion, realisation of productivity benefits, and goodwill impairment and accelerated software amortisation in the prior year. This was partially offset by higher personnel costs and investment spend. Credit impairment charges decreased driven by collectively assessed credit impairment release reflecting an improved economic outlook, and lower individually assessed credit impairment charge due lower transitions to impairment and the write-back of a large Agri customer.
Pacific
Operating income decreased driven by the full year impact of Commercial portfolio repricing and reduced card fees due to border closures. Operating expenses were lower largely due to a goodwill write-off in the prior year. Credit impairment charges decreased driven by lower collectively assessed credit impairment charges.
TSO and Group Centre
The 2021 financial year included the losses from the Group’s share of AmBank 1MDB settlement and goodwill impairment. The 2020 financial year included the impairment of the Asian associates and a loss on sale of UDC.
67ANZ 2021 Annual Report
OVERVIEW HOW WE CREATE VALUE
PERFORMANCE OVERVIEW
REMUNERATION REPORT
DIRECTORS’ REPORT
FINANCIAL REPORT
SHAREHOLDER INFORMATION

OUR PERFORMANCE (continued)
68 ANZ 2021 ANNUAL REPORT
FINANCIAL POSITION OF THE GROUP – INCLUDING DISCONTINUED OPERATIONS
Condensed balance sheet
As at
2021 2020 $b $b Movt
Assets
Cash / Settlement balances owed to ANZ / Collateral paid 168.0 129.7 30%
Trading and investment securities 127.8 144.3 -11%
Derivative financial instruments 38.7 135.3 -71%
Net loans and advances 629.7 617.1 2%
Other 14.7 15.9 -8%
Total assets 978.9 1,042.3 -6% Liabilities
Settlement balances owed by ANZ / Collateral received 23.1 31.5 -27%
Deposits and other borrowings 743.1 682.3 9%
Derivative financial instruments 36.0 134.7 -73%
Debt issuances 101.1 119.7 -16%
Other 11.9 12.8 -7%
Total liabilities 915.2 981.0 -7%
Total equity 63.7 61.3 4%
Cash / Settlement balances owed to ANZ / Collateral paid increased $38.3 billion (30%) driven by an increase in balances with central banks, partially offset by decreases in reverse repurchase agreements, collateral paid and the impact of foreign currency translation movements.
Trading and investment securities decreased $16.5 billion (-11%) driven by a decrease in liquid assets in Markets.
Derivative financial assets and liabilities decreased $96.6 billion (-71%) and $98.7 billion (-73%) respectively driven by a reduction following a change in legal arrangements for the settlement of derivative transactions with a central clearing counterparty (reduction of $55.1 billion in derivative assets and $55.2 billion in derivative liabilities), and the impact of market rate movements.
Net loans and advances increased $12.6 billion (2%) driven by increases across the New Zealand ($8.2 billion) and Australia Retail and Commercial ($1.9 billion) divisions reflecting home loan growth, and the impact of foreign currency translation movements.
Settlement balances owed by ANZ / Collateral received decreased $8.4 billion (-27%) driven by decreases in collateral received and cash clearing account balances.
Deposits and other borrowings increased $60.8 billion (9%) driven by increases in customer deposits across the Australia Retail and Commercial ($17.9 billion), Institutional ($17.6 billion) and New Zealand ($3.9 billion) divisions, increases in commercial paper ($16.5 billion) and certificates of deposit ($5.2 billion), a further $8.1 billion drawdown of the RBA Term Funding Facility (TFF) and $1.2 billion drawdown of the Reserve Bank of New Zealand’s (RBNZ) Funding for Lending Programme (FLP) and Term Lending Facility (TLF), and the impact of foreign currency translation movements. This was partially offset by decreases in deposits from banks and repurchase agreements ($10.0 billion).
Debt issuances decreased $18.6 billion (-16%) driven by lower senior debt issuances which were partially replaced by the further drawdown of the TFF, classified in Deposits and other borrowings.
68
OVERVIEW HOW WE CREATE VALUE
PERFORMANCE OVERVIEW
REMUNERATION REPORT
DIRECTORS’ REPORT
FINANCIAL REPORT
SHAREHOLDER INFORMATION
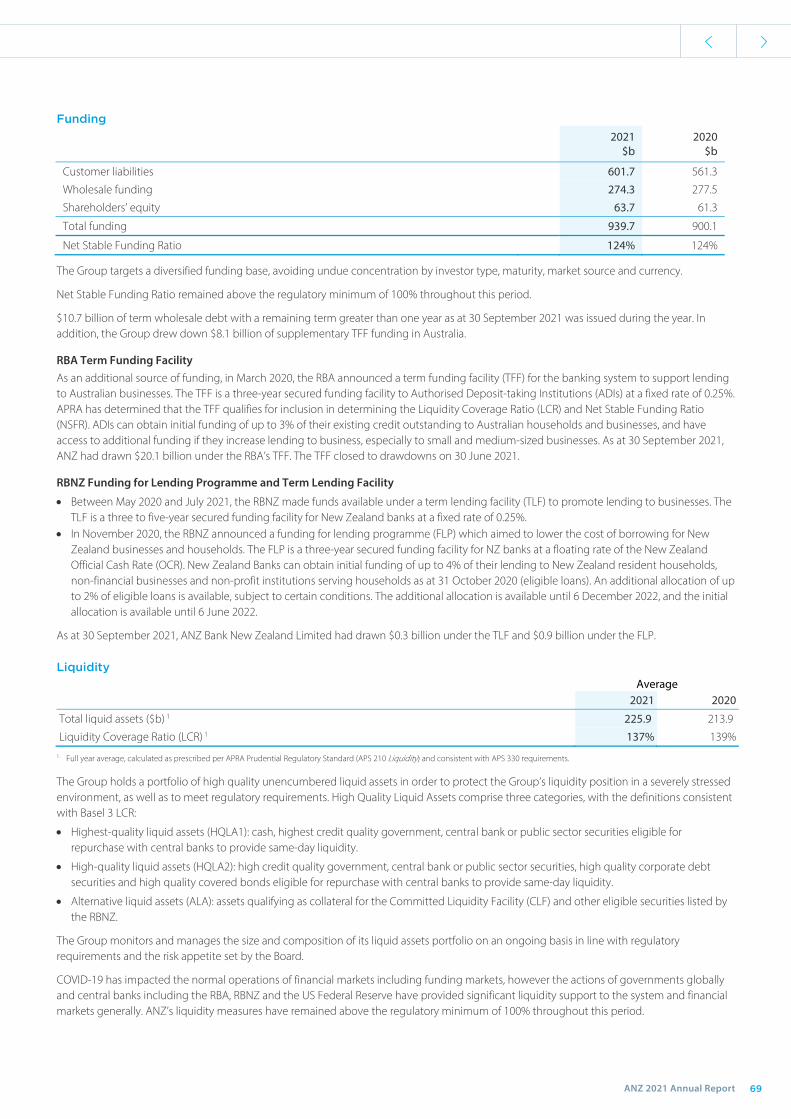
OUR PERFORMANCE (continued)
ANZ 2021 ANNUAL REPORT 69
Funding 2021 2020 $b $b
Customer liabilities 601.7 561.3
Wholesale funding 274.3 277.5
Shareholders’ equity 63.7 61.3
Total funding 939.7 900.1
Net Stable Funding Ratio 124% 124%
The Group targets a diversified funding base, avoiding undue concentration by investor type, maturity, market source and currency.
Net Stable Funding Ratio remained above the regulatory minimum of 100% throughout this period.
$10.7 billion of term wholesale debt with a remaining term greater than one year as at 30 September 2021 was issued during the year. In addition, the Group drew down $8.1 billion of supplementary TFF funding in Australia.
RBA Term Funding Facility As an additional source of funding, in March 2020, the RBA announced a term funding facility (TFF) for the banking system to support lending to Australian businesses. The TFF is a three-year secured funding facility to Authorised Deposit-taking Institutions (ADIs) at a fixed rate of 0.25%. APRA has determined that the TFF qualifies for inclusion in determining the Liquidity Coverage Ratio (LCR) and Net Stable Funding Ratio (NSFR). ADIs can obtain initial funding of up to 3% of their existing credit outstanding to Australian households and businesses, and have access to additional funding if they increase lending to business, especially to small and medium-sized businesses. As at 30 September 2021, ANZ had drawn $20.1 billion under the RBA’s TFF. The TFF closed to drawdowns on 30 June 2021.
RBNZ Funding for Lending Programme and Term Lending Facility
Between May 2020 and July 2021, the RBNZ made funds available under a term lending facility (TLF) to promote lending to businesses. The TLF is a three to five-year secured funding facility for New Zealand banks at a fixed rate of 0.25%.
In November 2020, the RBNZ announced a funding for lending programme (FLP) which aimed to lower the cost of borrowing for New Zealand businesses and households. The FLP is a three-year secured funding facility for NZ banks at a floating rate of the New Zealand Official Cash Rate (OCR). New Zealand Banks can obtain initial funding of up to 4% of their lending to New Zealand resident households, non-financial businesses and non-profit institutions serving households as at 31 October 2020 (eligible loans). An additional allocation of up to 2% of eligible loans is available, subject to certain conditions. The additional allocation is available until 6 December 2022, and the initial allocation is available until 6 June 2022.
As at 30 September 2021, ANZ Bank New Zealand Limited had drawn $0.3 billion under the TLF and $0.9 billion under the FLP.
Liquidity Average 2021 2020
Total liquid assets ($b) 1 225.9 213.9
Liquidity Coverage Ratio (LCR) 1 137% 139% 1. Full year average, calculated as prescribed per APRA Prudential Regulatory Standard (APS 210 Liquidity) and consistent with APS 330 requirements.
The Group holds a portfolio of high quality unencumbered liquid assets in order to protect the Group’s liquidity position in a severely stressed environment, as well as to meet regulatory requirements. High Quality Liquid Assets comprise three categories, with the definitions consistent with Basel 3 LCR:
Highest-quality liquid assets (HQLA1): cash, highest credit quality government, central bank or public sector securities eligible for repurchase with central banks to provide same-day liquidity.
High-quality liquid assets (HQLA2): high credit quality government, central bank or public sector securities, high quality corporate debt securities and high quality covered bonds eligible for repurchase with central banks to provide same-day liquidity.
Alternative liquid assets (ALA): assets qualifying as collateral for the Committed Liquidity Facility (CLF) and other eligible securities listed by the RBNZ.
The Group monitors and manages the size and composition of its liquid assets portfolio on an ongoing basis in line with regulatory requirements and the risk appetite set by the Board.
COVID-19 has impacted the normal operations of financial markets including funding markets, however the actions of governments globally and central banks including the RBA, RBNZ and the US Federal Reserve have provided significant liquidity support to the system and financial markets generally. ANZ’s liquidity measures have remained above the regulatory minimum of 100% throughout this period.
69ANZ 2021 Annual Report
OVERVIEW HOW WE CREATE VALUE
PERFORMANCE OVERVIEW
REMUNERATION REPORT
DIRECTORS’ REPORT
FINANCIAL REPORT
SHAREHOLDER INFORMATION

OUR PERFORMANCE (continued)
70 ANZ 2021 ANNUAL REPORT
Capital management
2021 2020 Movt
Common Equity Tier 1 (Level 2)
- APRA Basel 3 12.3% 11.3%
Credit risk weighted assets ($b) 342.5 360.0 -5%
Total risk weighted assets ($b) 416.1 429.4 -3%
APRA Leverage ratio 5.5% 5.4% APRA, under the authority of the Banking Act 1959, sets minimum regulatory requirements for banks including what is acceptable as regulatory capital and provides methods of measuring the risks incurred by the Bank.
The Group’s Common Equity Tier 1 ratio was 12.3% based on APRA Basel 3 standards, exceeding APRA’s minimum requirements. It increased 100 bps driven by cash earnings, benefits from credit impairment release, partially offset by the impact of dividends during the year.
At 30 September 2021, the Group’s APRA leverage ratio was 5.5% which is above the 3.5% proposed minimum for internal ratings-based approach ADI (IRB ADI), which includes ANZ.
Dividends
Our financial performance allowed us to propose that a final dividend of 72 cents be paid on each eligible fully paid ANZ ordinary share, bringing the total dividend for the year ended 30 September 2021 to 142 cents per share. This represents a dividend payout ratio of 64.9% of cash profit from continuing operations.
The proposed 2021 final dividend of 72 cents per share will be fully franked for Australian taxation purposes, and carry New Zealand imputation credits of NZD 8 cents per ordinary share. It will be paid on 16 December 2021 to owners of ordinary shares at the close of business on 9 November 2021 (record date).
ANZ has a Dividend Reinvestment Plan (DRP) and a Bonus Option Plan (BOP) that will operate in respect of the proposed 2021 final dividend. For the 2021 final dividend, ANZ intends to provide shares under the DRP through an on-market purchase and BOP through the issue of new shares.
Further details on dividends provided for or paid during the year ended 30 September 2021 are set out in Note 6 Dividends in the Financial Report.
Shareholders Returns
1. Information has been presented on a cash profit from continuing operations basis.
218.3
2020
2021
132.7
EEaarrnniinnggss ppeerr sshhaarree ––ccaasshh11 ((cceennttss))
2020 60
1422021
DDiivviiddeenndd ppeerr sshhaarree((cceennttss))
45.3
64.9
2020
2021
DDiivviiddeenndd ppaayyoouuttrraattiioo11 ((%%))
2020
70.7
(36.9)
2021
TToottaall sshhaarreehhoollddeerrrreettuurrnn ((%%))
70
OVERVIEW HOW WE CREATE VALUE
PERFORMANCE OVERVIEW
REMUNERATION REPORT
DIRECTORS’ REPORT
FINANCIAL REPORT
SHAREHOLDER INFORMATION

Five year summaryOUR PERFORMANCE (continued)
ANZ 2021 ANNUAL REPORT 71
FIVE YEAR SUMMARY
2021 2020 2019 2018 2017
$m $m $m $m $m
Financial performance - cash1 Net interest income 14,161 14,049 14,339 14,514 14,875 Other operating income 3,286 3,703 4,690 4,853 4,941 Operating expenses (9,051) (9,383) (9,071) (9,401) (8,967)
Profit before credit impairment and income tax 8,396 8,369 9,958 9,966 10,849 Credit impairment charge 567 (2,738) (795) (688) (1,199) Income tax expense (2,764) (1,872) (2,678) (2,775) (2,826) Non-controlling interests (1) (1) (15) (16) (15)
Cash profit from continuing operations1 6,198 3,758 6,470 6,487 6,809 Cash profit/(loss) from discontinued operations (17) (98) (309) (682) 129
Cash profit 6,181 3,660 6,161 5,805 6,938 Adjustments to arrive at statutory profit1 (19) (83) (208) 595 (532)
Profit attributable to shareholders of the Company 6,162 3,577 5,953 6,400 6,406
Financial position Assets 978,857 1,042,286 981,137 943,182 897,326 Net assets 63,676 61,297 60,794 59,405 59,075 Common Equity Tier 1 12.3% 11.3% 11.4% 11.4% 10.6% Common Equity Tier 1 – Internationally Comparable Basel 32
18.3% 16.7% 16.4% 16.8% 15.8%
Return on average ordinary equity (statutory)3 9.9% 5.9% 10.0% 10.9% 11.0% Return on average assets (statutory) 0.6% 0.3% 0.6% 0.7% 0.7% Cost to income ratio (cash)1 52.2% 53.8% 49.5% 52.0% 46.1%
Shareholder value – ordinary shares
Total return to shareholders (share price movement plus dividends)
70.7% -36.9% 9.2% 0.6% 13.1%
Market capitalisation 79,483 48,839 80,842 80,979 86,948 Dividend (cents) 142 60 160 160 160 Franked portion – interim 100% 100% 100% 100% 100% – final 100% 100% 70% 100% 100% Share price – high (dollars) $29.64 $28.67 $29.30 $30.80 $32.95 – low (dollars) $16.97 $14.10 $22.98 $26.08 $25.78 – closing (dollars) $28.15 $17.22 $28.52 $28.18 $29.60
Share information (per fully paid ordinary share)
Earnings per share (cents) (statutory) 217.1 126.4 210.0 221.6 220.1 Dividend payout ratio (statutory) 65.3% 47.6% 76.2% 72.1% 73.4% Net tangible assets per ordinary share4 $21.09 $20.04 $19.59 $18.47 $17.66 No. of fully paid ordinary shares issued (millions) 2,824 2,840 2,835 2,874 2,937 Dividend reinvestment plan (DRP) issue price
– interim $27.91 $18.06 $27.79 $27.76 $28.80 – final - $22.19 $25.03 $26.03 $29.02
Other information No. of employees (full time equivalents) 40,221 38,579 39,060 39,924 44,896 No. of shareholders 534,166 553,171 506,847 509,238 522,425
1. Cash profit excludes non-core items included in statutory profit and is provided to assist readers in understanding the result of the ongoing business activities of the Group. Cash profit is not
audited; however, the external auditor has informed the Audit Committee that the adjustments have been determined on a consistent basis across each period presented. 2. Internationally Comparable Methodology applied for 2017–2021 aligns with APRA’s information paper entitled ‘International Capital Comparison Study’ (13 July 2015). Basel Internationally
Comparable ratios do not include an estimate of the Basel l capital floor requirement. 3. Average ordinary equity excludes non-controlling interests. 4. Equals shareholders’ equity less total non-controlling interests, goodwill and other intangible assets, divided by the number of ordinary shares.
71ANZ 2021 Annual Report
OVERVIEW HOW WE CREATE VALUE
PERFORMANCE OVERVIEW
REMUNERATION REPORT
DIRECTORS’ REPORT
FINANCIAL REPORT
SHAREHOLDER INFORMATION

2021 2020 2019 2018 2017
Fair and responsible banking
Net Promoter Score Ranking (relative to peers)
Australia Retail1 4 3 4 3 4
Australia Commercial2 4 4 3 3 4
Australia Institutional3 2 1 1 1 2
New Zealand Retail4 4 4 4 4 4
New Zealand Commercial and Agricultural5 5 5 5 5 5
New Zealand Institutional6 1 1 1 1 3
Code of Conduct
Breaches 573 569 784 1,114 1,443
Investigations resulting in termination 114 93 151 226 262
Whistleblower reports 157 157 156 137 121
Financial Wellbeing
People reached by our financial inclusion programs7 >67,600 >61,352 >90,850 >88,224 >80,074
Employees
Employee Engagement (%)8 81 86 77 73 72
Total Women in Leadership (%)9 35.3 33.4 32.5 32.0 31.1
Recruitment of people from under-represented groups10 255 185 224 260 250
Community
Total community investment ($million)11 139.7 139.5 142.2 136.9 131.1
Volunteer hours 54,645 66,402 134,930 124,113 113,127
Employee volunteering participation rate (%)12 15.5 20.5 42.4 34.6 29.4
Sustainable Finance
Total funded or facilitated towards:
Environmentally sustainable solutions (AU$ billion) 9.18 7.57 7.60 4.65 4.51
Housing (AU$ billion)13 1.40 1.45
Other social (AU$ billion)14 2.29 0.06
Environmental Sustainability
Environmental footprint
Total scope 1 & 2 (tCO2e) 111,409 134,093 156,568 171,012 180,993
Total scope 1, 2 & 3 GHG emissions (tCO2e) 153,697 203,700 250,857 266,906 273,216
Project finance portfolio15
Renewables (%) 88 87 83 76 70
Coal (%) 3 5 9 13 16
Gas (%) 9 7 8 10 13
Project finance commitment to renewable energy ($million) 1,425 1,501 1,371 1,076 1,141
1. Roy Morgan Single Source, Australian population aged 14+, Main Financial Institution, six-month rolling average to Sep’17, Sep’18, Sep’19, Sep’20 & Sep’21. Ranking based on the four major Australian banks. 2. DBM Atlas (Business). Base: Commercial (<$100 million annual turnover) Main Financial Institution customers. Six-month average to Sep’17, Sep’18, Sep’19, Sep’20 & Sep’21. Ranking based on the four major Australian banks. 3. Peter Lee Associates, 2017–2020 Large Corporate and Institutional Relationship Banking surveys, Australia. Ranking based on the four major Australian banks. 4. Retail Market Monitor, Camorra Research, six month rolling average to Sep’17, Sep’18, Sep’19, Sep’20 & Sep’21. Ranking based on the five major New Zealand banks. 5. Business Finance Monitor, TNS Kantar Research. Base: Commercial ($3 million–$150 million annual turnover) and Agricultural (>500K annual turnover) customers. Four quarter rolling average to Q3’17, Q3’18, Q3’19, Q3’20 & Q3’21. Ranking based on the five major New Zealand commercial/agricultural banks. 6. Peter Lee Associates Large Corporate Relationship Banking surveys, New Zealand 2017–2021, ranked against the Top 4 competitors. 7. Includes individuals who have participated in more than one program or product (for example, people who have participated in MoneyMinded as part of Saver Plus are counted twice as they are included in both the MoneyMinded and Saver Plus totals). 8. The 2017 engagement survey was run as a pulse survey sent to 10% of the bank’s employees with a 57% response rate. 9. Measures representation at the Senior Manager, Executive and Senior Executive levels. Includes all employees regardless of leave status but not contractors (which are included in FTE). 10. Including Aboriginal and Torres Strait Islander peoples, people with disability and refugees. 11. Figure includes forgone revenue, being the cost of providing low or fee free accounts to a range of customers such as government benefit recipients, not-for-profit organisations, students and the elderly. International transfer fees were waived for funds sent from Australia and New Zealand to the Pacific to support communities impacted by COVID-19. 12. Commenced reporting in 2017. 13. Commenced reporting in 2020. 14. Commenced reporting in 2020. Includes transactions eligible for inclusion in $50 billion target but unable to be allocated to environmentally sustainable solutions, housing or financial wellbeing. 15. Breakdowns for 2020, 2018 and 2017 do not total to 100% due to rounding.
Five year summary (continued)
OVERVIEW HOW WE CREATE VALUE
PERFORMANCE OVERVIEW
REMUNERATION REPORT
DIRECTORS’ REPORT
FINANCIAL REPORT
SHAREHOLDER INFORMATION
72

This page has been intentionally left blank.
ANZ 2021 Annual Report
OVERVIEW HOW WE CREATE VALUE
PERFORMANCE OVERVIEW
REMUNERATION REPORT
DIRECTORS’ REPORT
FINANCIAL REPORT
SHAREHOLDER INFORMATION
73

Remuneration report
CONTENTS
1. Who is covered by this report 76
2. 2021 outcomes at a glance 77
3. Overview of ANZ’s remuneration framework 78
4. 2021 outcomes 79
5. 2021 Executive remuneration structure and delivery 93
6. Accountability and Consequence Framework 97
7. Non-Executive Director (NED) remuneration 98
8. Remuneration governance 100
9. Other information 102
2021 VARIABLE REMUNERATION OUTCOMES
As a Board we believe we have struck the right balance in rewarding our executives for good performance while taking account of shortcomings; balancing this year’s results with the significant work done to prepare the bank for long term success.
Shayne has role modelled ANZ’s values and is a respected leader among staff as well as externally. The Board’s view is that these attributes are very important to the success of ANZ and values them highly.
While Shayne met most of his objectives, the Board determined, with Shayne’s support, that the appropriate 2021 Annual Variable Remuneration (AVR) outcome was 53% of his maximum opportunity.
Long Term Variable Remuneration (LTVR) of $3.5 million is also proposed. This reinforces Shayne’s focus on achieving longer term strategic objectives and creating long-term value for all stakeholders. This allocation remains subject to shareholder approval at the 2021 Annual General Meeting and performance hurdles being met.
For Disclosed Executives, the Board determined their 2021 Variable Remuneration (VR) outcomes at an average outcome of 60% of maximum opportunity. This reflects the assessment of ‘meeting most but not all expectations’ within the Group Performance Framework.
43.3% of the performance rights granted in 2017 to the CEO and Disclosed Executives (excluding the Chief Risk Officer) vested when their performance was tested in November 2020 against their performance hurdles. The remaining 56.7% of rights lapsed and executives received no value from this proportion of the awards.
FIXED REMUNERATION
You may recall the Board decided last year there would be no fixed remuneration increases for our CEO and our Disclosed Executives.
Following the resignation of the Deputy CEO, the role was not replaced, with its BEAR accountabilities transitioned to a number of other executives. This resulted in materially expanded roles for three Disclosed Executives (Gerard Florian, Kathryn van der Merwe, and Mark Whelan) and their fixed remuneration was reviewed and adjusted accordingly.
There were no increases to Non-Executive Director fees for the 2021 year.
2022 REMUNERATION STRUCTURE
The introduction of a new remuneration standard by our regulator APRA has driven a review of how we reward our executives.
The new regulatory standard does not come into effect until 1 January 2023, however a range of changes are being considered for implementation in 2022, subject to Board approval.
These changes are designed not only to meet both the letter and spirit of APRA’s new prudential standard, but also to maintain our strong focus on performance and risk management, and attract, motivate and retain the best talent.
The key structural changes being considered for the CEO and Group Executive Committee (ExCo) include:
• Reduction in variable remuneration opportunity and restructuring long term variable remuneration to deliver greater certainty and value for executives, while ensuring shareholder alignment.
• Longer deferral (up to 6 years) with around 80% of variable remuneration deferred to ensure long term focus.
• The ability to ‘clawback’ vested cash and equity variable remuneration.
• Separate AVR and LTVR for Disclosed Executives, bringing it in-line with the current structure for our Chief Executive.
As part of our design process we have spoken to a range of external stakeholders and will continue to do so. If the changes are approved by the Board, we will ensure they are clearly communicated to our stakeholders including disclosure in the 2022 Remuneration Report.
On behalf of the Board, I invite you to consider our Remuneration Report which will be presented to shareholders at the 2021 Annual General Meeting.
Ilana Atlas, AO | Chair – Human Resources Committee
2021 REMUNERATION REPORT – AUDITED
This year was perhaps even more challenging than last year, given the sustained economic and societal impacts of COVID-19.
While we all would have preferred to have confined the effects of the pandemic to 2020, we find ourselves at the end of 2021, still focused on managing the impacts on our customers, our people, the community and you, our shareholders.
What was pleasing, however, was the way everyone at ANZ, led by our Chief Executive Officer (CEO) Shayne Elliott and the executive team, responded to the continuing crisis.
It has been a very difficult period across our network. In Australia borders have been disrupted, while Sydney and Melbourne have endured lengthy lockdowns. The situation is similar in New Zealand.
We have managed the impacts across our 33 geographies, including our major operations centres in India and the Philippines.
Despite the difficult trading conditions, the bank delivered a solid result for shareholders that reflects the strength of our diversified portfolio.
We led the industry with our productivity and simplification initiatives and we are now in a strong position to take advantage of future opportunities.
We are rapidly building the capabilities we need for the digital world. This year alone we’ve recruited more than 3,000 engineering and data experts, many of whom are from the world’s leading technology companies.
From a risk perspective, our strong frameworks enabled our sound response to COVID-19 and business continuity was maintained through the year with no major operational challenges associated with the pandemic.
We also progressed the delivery of our regulatory commitments, including implementing recommendations arising from the Royal Commission, our APRA self-assessment and the implementation of BS11 in New Zealand.
Despite the 12% increase in home loan revenue, there was a loss of market share in the Australian mortgage business as a result of home loan processing challenges, and a delivery delay with one of our digital transformative products. These issues are being addressed by management.
In assessing ANZ’s performance the Board determined that management had exceeded or met most objectives, while also acknowledging that there have been challenges and performance was below expectations in a few key areas.
All these matters have been taken into account in assessing the Group’s performance, Shayne’s performance and the performance of the executive team for 2021.
7574 ANZ 2021 Annual Report
OVERVIEW HOW WE CREATE VALUE
PERFORMANCE OVERVIEW
REMUNERATION REPORT
DIRECTORS’ REPORT
FINANCIAL REPORT
SHAREHOLDER INFORMATION
OVERVIEW HOW WE CREATE VALUE
PERFORMANCE OVERVIEW
REMUNERATION REPORT
DIRECTORS’ REPORT
FINANCIAL REPORT
SHAREHOLDER INFORMATION
74

Remuneration report
CONTENTS
1. Who is covered by this report 76
2. 2021 outcomes at a glance 77
3. Overview of ANZ’s remuneration framework 78
4. 2021 outcomes 79
5. 2021 Executive remuneration structure and delivery 93
6. Accountability and Consequence Framework 97
7. Non-Executive Director (NED) remuneration 98
8. Remuneration governance 100
9. Other information 102
2021 VARIABLE REMUNERATION OUTCOMES
As a Board we believe we have struck the right balance in rewarding our executives for good performance while taking account of shortcomings; balancing this year’s results with the significant work done to prepare the bank for long term success.
Shayne has role modelled ANZ’s values and is a respected leader among staff as well as externally. The Board’s view is that these attributes are very important to the success of ANZ and values them highly.
While Shayne met most of his objectives, the Board determined, with Shayne’s support, that the appropriate 2021 Annual Variable Remuneration (AVR) outcome was 53% of his maximum opportunity.
Long Term Variable Remuneration (LTVR) of $3.5 million is also proposed. This reinforces Shayne’s focus on achieving longer term strategic objectives and creating long-term value for all stakeholders. This allocation remains subject to shareholder approval at the 2021 Annual General Meeting and performance hurdles being met.
For Disclosed Executives, the Board determined their 2021 Variable Remuneration (VR) outcomes at an average outcome of 60% of maximum opportunity. This reflects the assessment of ‘meeting most but not all expectations’ within the Group Performance Framework.
43.3% of the performance rights granted in 2017 to the CEO and Disclosed Executives (excluding the Chief Risk Officer) vested when their performance was tested in November 2020 against their performance hurdles. The remaining 56.7% of rights lapsed and executives received no value from this proportion of the awards.
FIXED REMUNERATION
You may recall the Board decided last year there would be no fixed remuneration increases for our CEO and our Disclosed Executives.
Following the resignation of the Deputy CEO, the role was not replaced, with its BEAR accountabilities transitioned to a number of other executives. This resulted in materially expanded roles for three Disclosed Executives (Gerard Florian, Kathryn van der Merwe, and Mark Whelan) and their fixed remuneration was reviewed and adjusted accordingly.
There were no increases to Non-Executive Director fees for the 2021 year.
2022 REMUNERATION STRUCTURE
The introduction of a new remuneration standard by our regulator APRA has driven a review of how we reward our executives.
The new regulatory standard does not come into effect until 1 January 2023, however a range of changes are being considered for implementation in 2022, subject to Board approval.
These changes are designed not only to meet both the letter and spirit of APRA’s new prudential standard, but also to maintain our strong focus on performance and risk management, and attract, motivate and retain the best talent.
The key structural changes being considered for the CEO and Group Executive Committee (ExCo) include:
• Reduction in variable remuneration opportunity and restructuring long term variable remuneration to deliver greater certainty and value for executives, while ensuring shareholder alignment.
• Longer deferral (up to 6 years) with around 80% of variable remuneration deferred to ensure long term focus.
• The ability to ‘clawback’ vested cash and equity variable remuneration.
• Separate AVR and LTVR for Disclosed Executives, bringing it in-line with the current structure for our Chief Executive.
As part of our design process we have spoken to a range of external stakeholders and will continue to do so. If the changes are approved by the Board, we will ensure they are clearly communicated to our stakeholders including disclosure in the 2022 Remuneration Report.
On behalf of the Board, I invite you to consider our Remuneration Report which will be presented to shareholders at the 2021 Annual General Meeting.
Ilana Atlas, AO | Chair – Human Resources Committee
2021 REMUNERATION REPORT – AUDITED
This year was perhaps even more challenging than last year, given the sustained economic and societal impacts of COVID-19.
While we all would have preferred to have confined the effects of the pandemic to 2020, we find ourselves at the end of 2021, still focused on managing the impacts on our customers, our people, the community and you, our shareholders.
What was pleasing, however, was the way everyone at ANZ, led by our Chief Executive Officer (CEO) Shayne Elliott and the executive team, responded to the continuing crisis.
It has been a very difficult period across our network. In Australia borders have been disrupted, while Sydney and Melbourne have endured lengthy lockdowns. The situation is similar in New Zealand.
We have managed the impacts across our 33 geographies, including our major operations centres in India and the Philippines.
Despite the difficult trading conditions, the bank delivered a solid result for shareholders that reflects the strength of our diversified portfolio.
We led the industry with our productivity and simplification initiatives and we are now in a strong position to take advantage of future opportunities.
We are rapidly building the capabilities we need for the digital world. This year alone we’ve recruited more than 3,000 engineering and data experts, many of whom are from the world’s leading technology companies.
From a risk perspective, our strong frameworks enabled our sound response to COVID-19 and business continuity was maintained through the year with no major operational challenges associated with the pandemic.
We also progressed the delivery of our regulatory commitments, including implementing recommendations arising from the Royal Commission, our APRA self-assessment and the implementation of BS11 in New Zealand.
Despite the 12% increase in home loan revenue, there was a loss of market share in the Australian mortgage business as a result of home loan processing challenges, and a delivery delay with one of our digital transformative products. These issues are being addressed by management.
In assessing ANZ’s performance the Board determined that management had exceeded or met most objectives, while also acknowledging that there have been challenges and performance was below expectations in a few key areas.
All these matters have been taken into account in assessing the Group’s performance, Shayne’s performance and the performance of the executive team for 2021.
7574 ANZ 2021 Annual Report
OVERVIEW HOW WE CREATE VALUE
PERFORMANCE OVERVIEW
REMUNERATION REPORT
DIRECTORS’ REPORT
FINANCIAL REPORT
SHAREHOLDER INFORMATION
ANZ 2021 Annual Report
OVERVIEW HOW WE CREATE VALUE
PERFORMANCE OVERVIEW
REMUNERATION REPORT
DIRECTORS’ REPORT
FINANCIAL REPORT
SHAREHOLDER INFORMATION
75

2. 2021 OUTCOMES AT A GLANCE
Chief Executive Officer (CEO) remuneration
For 2021, our CEO: • Had no increase to fixed remuneration.
• Was awarded Annual Variable Remuneration (AVR) of 53% of maximum opportunity, having exceeded or met most but not all performance expectations (see section 4).
• Will be awarded Long Term Variable Remuneration (LTVR) of $3.5 million subject to shareholder approval at the 2021 Annual General Meeting (AGM).
• Received total remuneration of $5.75 million in 2021 (i.e. includes the value of prior equity awards which vested in 2021 as per section 4.2).
Disclosed Executive remuneration
For 2021: • There were no increases to fixed remuneration for Disclosed
Executives other than for adjustments to three executives in May 2021 as a result of their roles expanding following the departure of the Deputy CEO.
• Disclosed Executives’ VR outcomes averaged 60% of maximum opportunity, with individual outcomes ranging from 46% to 66% of maximum opportunity.
Performance rights outcomes (CEO and Disclosed Executives)
43.3% of the performance rights granted in late 2017 to the CEO and Disclosed Executives (excluding the CRO) vested and the remaining 56.7% lapsed when tested against the performance hurdles at the end of the performance period in November 2020 (see section 4.4.3).
Non-Executive Director (NED) fees
No increases to NED fees (the Chairman, NED base fee, and Committee fees remained unchanged (see section 7.1)).
The Remuneration Report for the Group outlines our remuneration strategy and framework and the remuneration practices that apply to Key Management Personnel (KMP). This report has been prepared, and audited, as required by the Corporations Act 2001. It forms part of the Directors’ Report.
1. WHO IS COVERED BY THIS REPORT
KMP are Directors of Australia and New Zealand Banking Group Limited (ANZBGL) (whether executive directors or otherwise), and those personnel with a key responsibility for the strategic direction and management of the Group (i.e. members of the Group Executive Committee (ExCo)) who report directly to the Chief Executive Officer (CEO) (referred to as Disclosed Executives).
1.1 DISCLOSED EXECUTIVE AND NED CHANGES
There were several changes to our KMP during the 2021 year:
• Paul O’Sullivan commenced as Chairman on 28 October 2020 (following the retirement of David Gonski on that date).
• Michelle Jablko concluded as ANZ’s Chief Financial Officer (CFO) in February 2021. Shane Buggle has been acting in the role since this time.
• Alexis George concluded as ANZ’s Deputy CEO in May 2021 – the responsibilities of the Deputy CEO were subsequently split across three executives (Gerard Florian, Kathryn van der Merwe, and Mark Whelan).
1.2 KEY MANAGEMENT PERSONNEL (KMP)
The KMP whose remuneration is disclosed in this year’s report are:
2021 Non-Executive Directors (NEDs) – Current
P O’Sullivan Chairman from 28 October 2020 (previously Director)
I Atlas Director
P Dwyer Director
J Halton Director
J Key Director
G Liebelt Director
J Macfarlane Director
2021 Non-Executive Directors (NEDs) – Former
D Gonski Former Chairman – retired 28 October 2020
2021 Chief Executive Officer (CEO) and Disclosed Executives – Current
S Elliott CEO and Executive Director
S Buggle Acting CFO – from 8 February 2021 (concluded in role 10 October 2021)
M Carnegie Group Executive, Digital and Australia Transformation
K Corbally Chief Risk Officer (CRO)
G Florian Group Executive, Technology
M Hand Group Executive, Australia Retail and Commercial Banking
K van der Merwe
Group Executive, Talent & Culture and Service Centres (GE T&C) (title changed effective 17 May 2021 from Group Executive, Talent & Culture)
A Watson Group Executive and CEO, New Zealand (NZ)
M Whelan Group Executive, Institutional
2021 Disclosed Executives – Former
A George Former Deputy CEO – concluded in role 16 May 2021 and ceased employment 30 July 2021
M Jablko Former CFO – concluded in role 7 February 2021 and ceased employment 26 March 2021
Changes to KMP since the end of 2021 up to the date of signing the Directors’ Report, in addition to the one noted above include as previously announced:
• Farhan Faruqui appointed as CFO from 11 October 2021.
• Christine O’Reilly’s appointment to the ANZ Board as a Non-Executive Director, effective 1 November 2021.
77ANZ 2021 Annual Report
OVERVIEW HOW WE CREATE VALUE
PERFORMANCE OVERVIEW
REMUNERATION REPORT
DIRECTORS’ REPORT
FINANCIAL REPORT
SHAREHOLDER INFORMATION
76
OVERVIEW HOW WE CREATE VALUE
PERFORMANCE OVERVIEW
REMUNERATION REPORT
DIRECTORS’ REPORT
FINANCIAL REPORT
SHAREHOLDER INFORMATION
OVERVIEW HOW WE CREATE VALUE
PERFORMANCE OVERVIEW
REMUNERATION REPORT
DIRECTORS’ REPORT
FINANCIAL REPORT
SHAREHOLDER INFORMATION
76
OVERVIEW HOW WE CREATE VALUE
PERFORMANCE OVERVIEW
REMUNERATION REPORT
DIRECTORS’ REPORT
FINANCIAL REPORT
SHAREHOLDER INFORMATION

2. 2021 OUTCOMES AT A GLANCE
Chief Executive Officer (CEO) remuneration
For 2021, our CEO: • Had no increase to fixed remuneration.
• Was awarded Annual Variable Remuneration (AVR) of 53% of maximum opportunity, having exceeded or met most but not all performance expectations (see section 4).
• Will be awarded Long Term Variable Remuneration (LTVR) of $3.5 million subject to shareholder approval at the 2021 Annual General Meeting (AGM).
• Received total remuneration of $5.75 million in 2021 (i.e. includes the value of prior equity awards which vested in 2021 as per section 4.2).
Disclosed Executive remuneration
For 2021: • There were no increases to fixed remuneration for Disclosed
Executives other than for adjustments to three executives in May 2021 as a result of their roles expanding following the departure of the Deputy CEO.
• Disclosed Executives’ VR outcomes averaged 60% of maximum opportunity, with individual outcomes ranging from 46% to 66% of maximum opportunity.
Performance rights outcomes (CEO and Disclosed Executives)
43.3% of the performance rights granted in late 2017 to the CEO and Disclosed Executives (excluding the CRO) vested and the remaining 56.7% lapsed when tested against the performance hurdles at the end of the performance period in November 2020 (see section 4.4.3).
Non-Executive Director (NED) fees
No increases to NED fees (the Chairman, NED base fee, and Committee fees remained unchanged (see section 7.1)).
The Remuneration Report for the Group outlines our remuneration strategy and framework and the remuneration practices that apply to Key Management Personnel (KMP). This report has been prepared, and audited, as required by the Corporations Act 2001. It forms part of the Directors’ Report.
1. WHO IS COVERED BY THIS REPORT
KMP are Directors of Australia and New Zealand Banking Group Limited (ANZBGL) (whether executive directors or otherwise), and those personnel with a key responsibility for the strategic direction and management of the Group (i.e. members of the Group Executive Committee (ExCo)) who report directly to the Chief Executive Officer (CEO) (referred to as Disclosed Executives).
1.1 DISCLOSED EXECUTIVE AND NED CHANGES
There were several changes to our KMP during the 2021 year:
• Paul O’Sullivan commenced as Chairman on 28 October 2020 (following the retirement of David Gonski on that date).
• Michelle Jablko concluded as ANZ’s Chief Financial Officer (CFO) in February 2021. Shane Buggle has been acting in the role since this time.
• Alexis George concluded as ANZ’s Deputy CEO in May 2021 – the responsibilities of the Deputy CEO were subsequently split across three executives (Gerard Florian, Kathryn van der Merwe, and Mark Whelan).
1.2 KEY MANAGEMENT PERSONNEL (KMP)
The KMP whose remuneration is disclosed in this year’s report are:
2021 Non-Executive Directors (NEDs) – Current
P O’Sullivan Chairman from 28 October 2020 (previously Director)
I Atlas Director
P Dwyer Director
J Halton Director
J Key Director
G Liebelt Director
J Macfarlane Director
2021 Non-Executive Directors (NEDs) – Former
D Gonski Former Chairman – retired 28 October 2020
2021 Chief Executive Officer (CEO) and Disclosed Executives – Current
S Elliott CEO and Executive Director
S Buggle Acting CFO – from 8 February 2021 (concluded in role 10 October 2021)
M Carnegie Group Executive, Digital and Australia Transformation
K Corbally Chief Risk Officer (CRO)
G Florian Group Executive, Technology
M Hand Group Executive, Australia Retail and Commercial Banking
K van der Merwe
Group Executive, Talent & Culture and Service Centres (GE T&C) (title changed effective 17 May 2021 from Group Executive, Talent & Culture)
A Watson Group Executive and CEO, New Zealand (NZ)
M Whelan Group Executive, Institutional
2021 Disclosed Executives – Former
A George Former Deputy CEO – concluded in role 16 May 2021 and ceased employment 30 July 2021
M Jablko Former CFO – concluded in role 7 February 2021 and ceased employment 26 March 2021
Changes to KMP since the end of 2021 up to the date of signing the Directors’ Report, in addition to the one noted above include as previously announced:
• Farhan Faruqui appointed as CFO from 11 October 2021.
• Christine O’Reilly’s appointment to the ANZ Board as a Non-Executive Director, effective 1 November 2021.
77ANZ 2021 Annual Report
OVERVIEW HOW WE CREATE VALUE
PERFORMANCE OVERVIEW
REMUNERATION REPORT
DIRECTORS’ REPORT
FINANCIAL REPORT
SHAREHOLDER INFORMATION
76
OVERVIEW HOW WE CREATE VALUE
PERFORMANCE OVERVIEW
REMUNERATION REPORT
DIRECTORS’ REPORT
FINANCIAL REPORT
SHAREHOLDER INFORMATION
77ANZ 2021 Annual Report
OVERVIEW HOW WE CREATE VALUE
PERFORMANCE OVERVIEW
REMUNERATION REPORT
DIRECTORS’ REPORT
FINANCIAL REPORT
SHAREHOLDER INFORMATION
OVERVIEW HOW WE CREATE VALUE
PERFORMANCE OVERVIEW
REMUNERATION REPORT
DIRECTORS’ REPORT
FINANCIAL REPORT
SHAREHOLDER INFORMATION

IS UNDERPINNED BY OUR REMUNERATION POLICY WHICH INCLUDES OUR REWARD PRINCIPLES:
WITH REMUNERATION DELIVERED TO OUR CEO AND DISCLOSED EXECUTIVES THROUGH:
REINFORCED BY ALIGNING REMUNERATION AND RISK:
WHILE SUPPORTING THE ALIGNMENT OF EXECUTIVES AND SHAREHOLDERS THROUGH:
WHILE GOVERNED BY:
ANZ’S PURPOSE AND STRATE-
GY1
ANZ’S PURPOSE AND STRATEGY1
4. 2021 OUTCOMES
Variable remuneration at ANZ is genuinely at risk and can range from zero to maximum opportunity. Annual performance objectives are set at the Group and also at the Divisional/individual level at the start of each year. They are designed to be stretching yet achievable. The HR Committee and the Board make variable remuneration outcome decisions for the CEO and Disclosed Executives following lengthy and detailed discussions and assessment, supported by comprehensive analysis of performance from a number of sources. Where expectations are met, variable remuneration is likely to be awarded around target opportunity. Where performance is below expectations, awards will be less (potentially down to zero), and where above expectations, awards will be more (potentially up to maximum opportunity).
Remuneration outcomes have been presented in the following three ways:
i. Year-on-Year Remuneration Awarded (see section 4.1): Reflects actual remuneration awarded in respect of the relevant financial year. As non-cash components are subject to future vesting outcomes, the awarded value may be higher or lower than the future realised value.
ii. Actual Remuneration Received (see section 4.2): Reflects the actual remuneration received in 2021. Received amounts include cash and the value of prior equity awards which vested in 2021.
iii. Statutory Remuneration (see section 9.1): Reflects remuneration in accordance with Australian Accounting Standards which includes fixed remuneration and the amortised accounting value of variable remuneration (not the actual awarded or received value in respect of the relevant financial year).
4.1 YEAR-ON-YEAR REMUNERATION AWARDED
These tables show a year-on-year comparison of remuneration awarded to the CEO and Disclosed Executives for the 2019, 2020 and 2021 performance periods. Remuneration awarded includes any cash payments (e.g. fixed remuneration and cash variable remuneration) and the value of deferred shares and performance rights awarded for the year but which have not yet vested (i.e. the value was not received during the year).
2021 remuneration outcomes reflect both the overall performance of the Group and the variability in the performance of each individual/Division. In particular, the outcomes for the CEO, the Group Executive, Australia Retail and Commercial Banking, and Group Executive, Digital and Australia Transformation, have been most impacted by the Australian mortgage business loan processing challenges and delivery delays in a key area of our digital transformation agenda.
Variable remuneration outcomes for the CEO and Disclosed Executives are higher in 2021 compared to 2020. In 2020, the Board used its discretion and applied a 50% reduction to the 2020 variable remuneration outcomes (AVR for the CEO), having regard to the impact of COVID-19 on the business, shareholders, as well as the broader community. If we compare 2021 to 2020 without the 50% COVID-19 reduction, the CEO’s total remuneration would be lower.
CEO
The 2021 LTVR shown below has not yet been awarded to the CEO, approval will be sought from shareholders at the 2021 AGM.
YEAR-ON-YEAR REMUNERATION AWARDED IN THE RELEVANT FINANCIAL YEAR – CEO:
The awarded value may be higher or lower than future realised value
Threshold vesting Full vesting AVR as % of
Financial year
Fixed remuneration
$
AVR cash
$
AVR deferred
shares $
Total AVR
$
LTVR performance
rights $
Total remuneration
awarded $
LTVR performance
rights $
Total remuneration
awarded $
Target opport-
unity
Maximum opport-
unity
CEO
S Elliott 2021 2,500,000 1,000,000 1,000,000 2,000,000 1,750,000 6,250,000 3,500,000 8,000,000 80% 53%
2020 2,500,000 625,000 625,000 1,250,000 1,750,000 5,500,000 3,500,000 7,250,000 50% 33%
2019 2,100,000 750,000 750,000 1,500,000 2,100,000 5,700,000 4,200,000 7,800,000 71% 48%
Disclosed Executives
• Fixed remuneration was increased for three Disclosed Executives (Gerard Florian, Kathryn van der Merwe, and Mark Whelan). This was due to their roles expanding in May 2021 as they took on additional BEAR accountabilities, previously held by the Deputy CEO, following the Board’s decision to not replace that role post Alexis George’s resignation.
• The change in Antonia Watson’s fixed remuneration from 2020 to 2021 reflects the impact of exchange rate conversions, noting that her fixed remuneration is paid in NZD and converted to AUD for disclosure purposes.
• The average VR outcome for Disclosed Executives is 90% of target (60% of maximum opportunity), reflecting the overall Group performance assessment of ‘met most but not all expectations’ (see section 4.5.3). Outcomes as a percentage of maximum range from 46% to 66%, with the variability at the lower end of the range largely due to the impact of the home loan processing issues in the Australian mortgage business and the challenges and complexities experienced in progressing some aspects of the digital agenda at pace.
3. OVERVIEW OF ANZ’S REMUNERATION FRAMEWORK
3.1 REMUNERATION FRAMEWORK OVERVIEW
The structure of our remuneration framework is aligned with our Reward Principles and has been designed to support ANZ’s purpose and strategy. No changes have been made to our remuneration framework in 2021.
Are fair and simple to understand
Reward our people for doing the right thing having regard to our customers and shareholders
Focus on how things are achieved as much as what is achieved
Attract, motivate and keep great people
Fixed remuneration Cash salary and superannuation contributions. The Board sets (and reviews annually) the CEO and Disclosed Executives’ fixed remuneration based on financial services market relativities reflecting their responsibilities, performance, qualifications, experience and location.
Variable remuneration (at risk) The CEO and Disclosed Executives are eligible to receive variable remuneration under the ANZ Incentive Plan (ANZIP), our variable remuneration plan.
Board discretion is applied when determining CEO and Disclosed Executive performance and remuneration outcomes, and also before any scheduled release of previously deferred remuneration (see section 5.3). All deferred variable remuneration is subject to malus adjustment.
DISCLOSED EXECUTIVES4
Variable Remuneration (VR) • Rewarded under a single VR framework, with the appropriate
mix of short and long term rewards (including performance hurdles) deferred over the short, medium and longer term
• Determination: ANZ Group Performance Framework, Divisional Performance Frameworks, ANZ values and risk/compliance assessments, and Board discretion
• Maximum opportunity: 402% of fixed remuneration5
• Delivery: 25% cash, 25% as ANZ shares deferred over four years subject to malus, and 50% as performance rights deferred for four years subject to performance hurdles and malus
• Performance hurdles: Relative TSR (75%), absolute TSR (25%)
CEOAnnual Variable Remuneration (AVR) • Rewards the achievement of Group, and individual outcomes
over a 12-month period • Determination: ANZ Group Performance Framework,
individual strategic objectives, ANZ values2 and risk/compliance assessments, and Board discretion
• Maximum opportunity: 150% of fixed remuneration • Delivery: 50% cash and 50% as ANZ shares deferred over
four years, subject to malus3
Long Term Variable Remuneration (LTVR) • Reinforces the CEO’s focus on achieving longer term strategic
objectives and creating long-term value for all stakeholders • Face value at full vesting: 140% of fixed remuneration • Delivery: Performance rights deferred for four years subject
to performance hurdles and malus • Performance hurdles: Relative total shareholder return
(TSR) (75%), absolute TSR (25%)
Determining accountability and applying consequences where appropriate
Prohibiting the hedging of unvested equity
Determining variable remuneration outcomes, with risk as a key input at a pool and individual level
Weighting remuneration toward the longer-term with a significant proportion at risk
Assessing behaviours based on ANZ’s values and risk/compliance standards (including the Banking Executive Accountability Regime (BEAR))
The Human Resources (HR) Committee and the Board determining fixed remuneration and the variable remuneration outcomes for the CEO and each Disclosed Executive. Additionally, the CEO’s LTVR outcome is also subject to shareholder approval at the AGM.
Significant variable remuneration deferral in ANZ equity
Use of relative and absolute TSR hurdles
Substantial shareholding requirements
Consideration of cash profit and economic profit in determining the ANZIP variable remuneration pool
Consideration of the shareholder experience in respect of the share price and dividends
1. See the ‘About our business’ and ‘Our strategy’ sections of the Annual Report. 2. ANZ’s values (Integrity, Collaboration, Accountability, Respect, Excellence (ICARE)) – the foundation of how we work, supported by our Code of Conduct and our Ways of Leading framework. 3. Malus relates to downward adjustment of unvested remuneration. 4. The maximum opportunity and delivery of VR differs for the CRO to that of other Disclosed Executives. See section 5 for further details. 5. Performance rights face value at full vesting.
7978 ANZ 2021 Annual Report
OVERVIEW HOW WE CREATE VALUE
PERFORMANCE OVERVIEW
REMUNERATION REPORT
DIRECTORS’ REPORT
FINANCIAL REPORT
SHAREHOLDER INFORMATION
78
OVERVIEW HOW WE CREATE VALUE
PERFORMANCE OVERVIEW
REMUNERATION REPORT
DIRECTORS’ REPORT
FINANCIAL REPORT
SHAREHOLDER INFORMATION
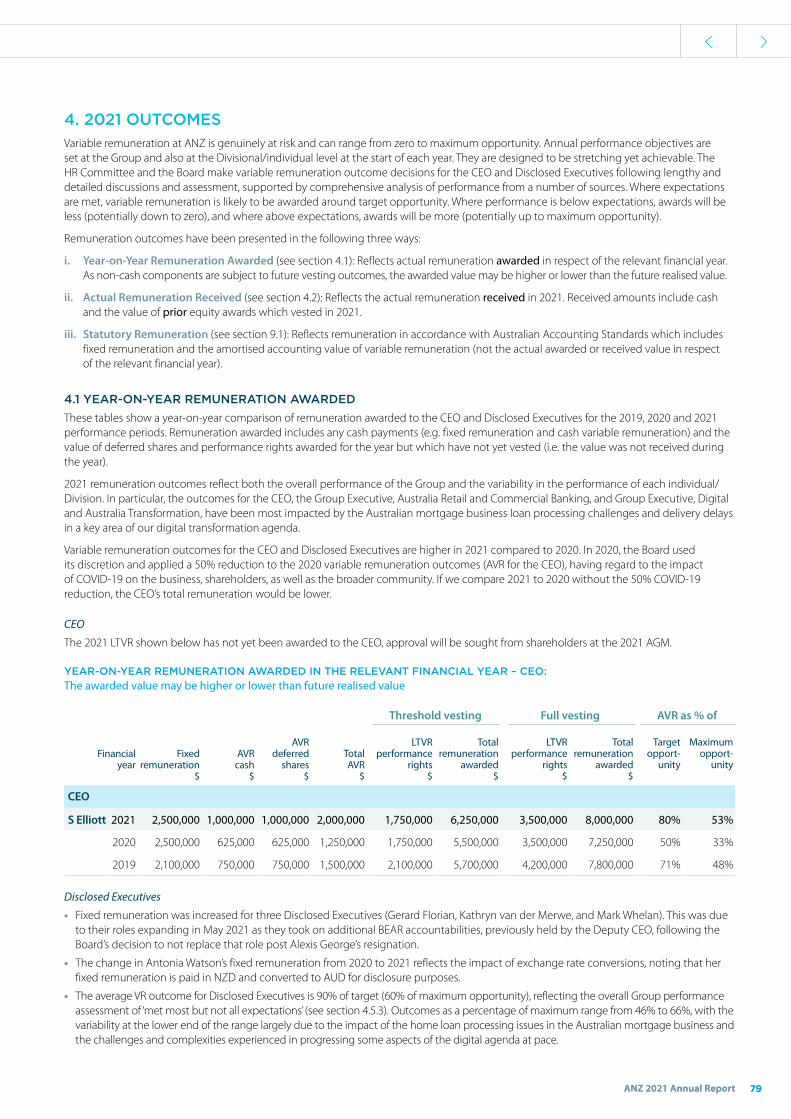
IS UNDERPINNED BY OUR REMUNERATION POLICY WHICH INCLUDES OUR REWARD PRINCIPLES:
WITH REMUNERATION DELIVERED TO OUR CEO AND DISCLOSED EXECUTIVES THROUGH:
REINFORCED BY ALIGNING REMUNERATION AND RISK:
WHILE SUPPORTING THE ALIGNMENT OF EXECUTIVES AND SHAREHOLDERS THROUGH:
WHILE GOVERNED BY:
ANZ’S PURPOSE AND STRATE-
GY1
ANZ’S PURPOSE AND STRATEGY1
4. 2021 OUTCOMES
Variable remuneration at ANZ is genuinely at risk and can range from zero to maximum opportunity. Annual performance objectives are set at the Group and also at the Divisional/individual level at the start of each year. They are designed to be stretching yet achievable. The HR Committee and the Board make variable remuneration outcome decisions for the CEO and Disclosed Executives following lengthy and detailed discussions and assessment, supported by comprehensive analysis of performance from a number of sources. Where expectations are met, variable remuneration is likely to be awarded around target opportunity. Where performance is below expectations, awards will be less (potentially down to zero), and where above expectations, awards will be more (potentially up to maximum opportunity).
Remuneration outcomes have been presented in the following three ways:
i. Year-on-Year Remuneration Awarded (see section 4.1): Reflects actual remuneration awarded in respect of the relevant financial year. As non-cash components are subject to future vesting outcomes, the awarded value may be higher or lower than the future realised value.
ii. Actual Remuneration Received (see section 4.2): Reflects the actual remuneration received in 2021. Received amounts include cash and the value of prior equity awards which vested in 2021.
iii. Statutory Remuneration (see section 9.1): Reflects remuneration in accordance with Australian Accounting Standards which includes fixed remuneration and the amortised accounting value of variable remuneration (not the actual awarded or received value in respect of the relevant financial year).
4.1 YEAR-ON-YEAR REMUNERATION AWARDED
These tables show a year-on-year comparison of remuneration awarded to the CEO and Disclosed Executives for the 2019, 2020 and 2021 performance periods. Remuneration awarded includes any cash payments (e.g. fixed remuneration and cash variable remuneration) and the value of deferred shares and performance rights awarded for the year but which have not yet vested (i.e. the value was not received during the year).
2021 remuneration outcomes reflect both the overall performance of the Group and the variability in the performance of each individual/Division. In particular, the outcomes for the CEO, the Group Executive, Australia Retail and Commercial Banking, and Group Executive, Digital and Australia Transformation, have been most impacted by the Australian mortgage business loan processing challenges and delivery delays in a key area of our digital transformation agenda.
Variable remuneration outcomes for the CEO and Disclosed Executives are higher in 2021 compared to 2020. In 2020, the Board used its discretion and applied a 50% reduction to the 2020 variable remuneration outcomes (AVR for the CEO), having regard to the impact of COVID-19 on the business, shareholders, as well as the broader community. If we compare 2021 to 2020 without the 50% COVID-19 reduction, the CEO’s total remuneration would be lower.
CEO
The 2021 LTVR shown below has not yet been awarded to the CEO, approval will be sought from shareholders at the 2021 AGM.
YEAR-ON-YEAR REMUNERATION AWARDED IN THE RELEVANT FINANCIAL YEAR – CEO:
The awarded value may be higher or lower than future realised value
Threshold vesting Full vesting AVR as % of
Financial year
Fixed remuneration
$
AVR cash
$
AVR deferred
shares $
Total AVR
$
LTVR performance
rights $
Total remuneration
awarded $
LTVR performance
rights $
Total remuneration
awarded $
Target opport-
unity
Maximum opport-
unity
CEO
S Elliott 2021 2,500,000 1,000,000 1,000,000 2,000,000 1,750,000 6,250,000 3,500,000 8,000,000 80% 53%
2020 2,500,000 625,000 625,000 1,250,000 1,750,000 5,500,000 3,500,000 7,250,000 50% 33%
2019 2,100,000 750,000 750,000 1,500,000 2,100,000 5,700,000 4,200,000 7,800,000 71% 48%
Disclosed Executives
• Fixed remuneration was increased for three Disclosed Executives (Gerard Florian, Kathryn van der Merwe, and Mark Whelan). This was due to their roles expanding in May 2021 as they took on additional BEAR accountabilities, previously held by the Deputy CEO, following the Board’s decision to not replace that role post Alexis George’s resignation.
• The change in Antonia Watson’s fixed remuneration from 2020 to 2021 reflects the impact of exchange rate conversions, noting that her fixed remuneration is paid in NZD and converted to AUD for disclosure purposes.
• The average VR outcome for Disclosed Executives is 90% of target (60% of maximum opportunity), reflecting the overall Group performance assessment of ‘met most but not all expectations’ (see section 4.5.3). Outcomes as a percentage of maximum range from 46% to 66%, with the variability at the lower end of the range largely due to the impact of the home loan processing issues in the Australian mortgage business and the challenges and complexities experienced in progressing some aspects of the digital agenda at pace.
3. OVERVIEW OF ANZ’S REMUNERATION FRAMEWORK
3.1 REMUNERATION FRAMEWORK OVERVIEW
The structure of our remuneration framework is aligned with our Reward Principles and has been designed to support ANZ’s purpose and strategy. No changes have been made to our remuneration framework in 2021.
Are fair and simple to understand
Reward our people for doing the right thing having regard to our customers and shareholders
Focus on how things are achieved as much as what is achieved
Attract, motivate and keep great people
Fixed remuneration Cash salary and superannuation contributions. The Board sets (and reviews annually) the CEO and Disclosed Executives’ fixed remuneration based on financial services market relativities reflecting their responsibilities, performance, qualifications, experience and location.
Variable remuneration (at risk) The CEO and Disclosed Executives are eligible to receive variable remuneration under the ANZ Incentive Plan (ANZIP), our variable remuneration plan.
Board discretion is applied when determining CEO and Disclosed Executive performance and remuneration outcomes, and also before any scheduled release of previously deferred remuneration (see section 5.3). All deferred variable remuneration is subject to malus adjustment.
DISCLOSED EXECUTIVES4
Variable Remuneration (VR) • Rewarded under a single VR framework, with the appropriate
mix of short and long term rewards (including performance hurdles) deferred over the short, medium and longer term
• Determination: ANZ Group Performance Framework, Divisional Performance Frameworks, ANZ values and risk/compliance assessments, and Board discretion
• Maximum opportunity: 402% of fixed remuneration5
• Delivery: 25% cash, 25% as ANZ shares deferred over four years subject to malus, and 50% as performance rights deferred for four years subject to performance hurdles and malus
• Performance hurdles: Relative TSR (75%), absolute TSR (25%)
CEOAnnual Variable Remuneration (AVR) • Rewards the achievement of Group, and individual outcomes
over a 12-month period • Determination: ANZ Group Performance Framework,
individual strategic objectives, ANZ values2 and risk/compliance assessments, and Board discretion
• Maximum opportunity: 150% of fixed remuneration • Delivery: 50% cash and 50% as ANZ shares deferred over
four years, subject to malus3
Long Term Variable Remuneration (LTVR) • Reinforces the CEO’s focus on achieving longer term strategic
objectives and creating long-term value for all stakeholders • Face value at full vesting: 140% of fixed remuneration • Delivery: Performance rights deferred for four years subject
to performance hurdles and malus • Performance hurdles: Relative total shareholder return
(TSR) (75%), absolute TSR (25%)
Determining accountability and applying consequences where appropriate
Prohibiting the hedging of unvested equity
Determining variable remuneration outcomes, with risk as a key input at a pool and individual level
Weighting remuneration toward the longer-term with a significant proportion at risk
Assessing behaviours based on ANZ’s values and risk/compliance standards (including the Banking Executive Accountability Regime (BEAR))
The Human Resources (HR) Committee and the Board determining fixed remuneration and the variable remuneration outcomes for the CEO and each Disclosed Executive. Additionally, the CEO’s LTVR outcome is also subject to shareholder approval at the AGM.
Significant variable remuneration deferral in ANZ equity
Use of relative and absolute TSR hurdles
Substantial shareholding requirements
Consideration of cash profit and economic profit in determining the ANZIP variable remuneration pool
Consideration of the shareholder experience in respect of the share price and dividends
1. See the ‘About our business’ and ‘Our strategy’ sections of the Annual Report. 2. ANZ’s values (Integrity, Collaboration, Accountability, Respect, Excellence (ICARE)) – the foundation of how we work, supported by our Code of Conduct and our Ways of Leading framework. 3. Malus relates to downward adjustment of unvested remuneration. 4. The maximum opportunity and delivery of VR differs for the CRO to that of other Disclosed Executives. See section 5 for further details. 5. Performance rights face value at full vesting.
7978 ANZ 2021 Annual Report
OVERVIEW HOW WE CREATE VALUE
PERFORMANCE OVERVIEW
REMUNERATION REPORT
DIRECTORS’ REPORT
FINANCIAL REPORT
SHAREHOLDER INFORMATION
79ANZ 2021 Annual Report
OVERVIEW HOW WE CREATE VALUE
PERFORMANCE OVERVIEW
REMUNERATION REPORT
DIRECTORS’ REPORT
FINANCIAL REPORT
SHAREHOLDER INFORMATION

• For the 2021 Disclosed Executives who were in role for full year 2020 and 2021, year-on-year total remuneration has increased on average by 40%. The year-on-year change primarily reflects the 50% reduction to Disclosed Executives’ VR outcomes in 2020 having regard to the impact of COVID-19. The differential has also been impacted by the increases to fixed remuneration applied to three executives following the transition of Deputy CEO accountabilities.
• For both Mark Hand and Antonia Watson, 2021 and 2020 remuneration awarded is not directly comparable with 2019, as they were Disclosed Executives for only part of the 2019 financial year. Antonia Watson’s 2020 remuneration awarded reflects her permanent appointment to the Group Executive and CEO, NZ role.
• Shane Buggle’s 2021 remuneration awarded reflects the period he acted as the CFO.
• Variable remuneration continues to differ both year-on-year and between different executives demonstrating the at risk nature of this element of remuneration and the variability in Group and individual performance year-on-year. See section 4.4 for details.
YEAR-ON-YEAR REMUNERATION AWARDED IN THE RELEVANT FINANCIAL YEAR – DISCLOSED EXECUTIVES:
The awarded value may be higher or lower than future realised value
Threshold vesting Full vesting VR as % of
Financial year
Fixed remuneration
$
VR cash
$
VR deferred
shares1 $
VR performance
rights2 $
Total remuneration
awarded $
VR performance
rights2 $
Total remuneration
awarded $
Target opport-
unity
Maximum opport-
unity
Current Disclosed Executives
S Buggle 2021 704,000 462,000 462,000 476,000 2,104,000 952,000 2,580,000 99% 66%(8 months Acting in role)
M Carnegie 2021 1,200,000 569,250 569,250 586,500 2,925,000 1,173,000 3,511,500 72% 48%
2020 1,200,000 409,200 409,200 421,600 2,440,000 843,200 2,861,600 52% 34%
2019 1,000,000 495,000 495,000 510,000 2,500,000 1,020,000 3,010,000 75% 50%
K Corbally 2021 1,100,000 613,800 613,800 632,400 2,960,000 632,400 2,960,000 94% 63%
2020 1,100,000 429,000 429,000 442,000 2,400,000 442,000 2,400,000 66% 44%
2019 950,000 478,500 478,500 493,000 2,400,000 493,000 2,400,000 85% 57%
G Florian 2021 1,084,500 676,500 676,500 697,000 3,134,500 1,394,000 3,831,500 95% 63%
2020 1,075,000 371,250 371,250 382,500 2,200,000 765,000 2,582,500 52% 35%
M Hand 2021 1,200,000 544,500 544,500 561,000 2,850,000 1,122,000 3,411,000 69% 46%
2020 1,200,000 462,000 462,000 476,000 2,600,000 952,000 3,076,000 58% 39%
2019 726,000 198,000 198,000 204,000 1,326,000 408,000 1,530,000 41% 28%(9 months as
Disclosed Executive)
K van der Merwe 2021 907,000 594,000 594,000 612,000 2,707,000 1,224,000 3,319,000 99% 66%
2020 850,000 330,000 330,000 340,000 1,850,000 680,000 2,190,000 59% 39%
A Watson3 2021 1,078,682 687,167 687,167 707,991 3,161,008 1,415,981 3,868,998 97% 64%
2020 1,015,599 334,681 334,681 344,822 2,029,783 689,645 2,374,605 50% 33%
2019 219,440 170,255 113,504 – 503,199 – 503,199 65% 43%(3.5 months in role)
M Whelan 2021 1,276,000 810,150 810,150 834,700 3,731,000 1,669,400 4,565,700 96% 64%
2020 1,200,000 363,000 363,000 374,000 2,300,000 748,000 2,674,000 46% 31%
2019 1,200,000 874,500 874,500 901,000 3,850,000 1,802,000 4,751,000 110% 74%
Former Disclosed Executives
A George 2021 913,000 n/a n/a n/a 913,000 n/a 913,000 n/a n/a(10 months to term date)
2020 1,100,000 363,000 363,000 374,000 2,200,000 748,000 2,574,000 50% 33%
2019 1,000,000 528,000 528,000 544,000 2,600,000 1,088,000 3,144,000 80% 53%
M Jablko 2021 528,000 n/a n/a n/a 528,000 n/a 528,000 n/a n/a(6 months to term date)
2020 1,100,000 363,000 363,000 374,000 2,200,000 748,000 2,574,000 50% 33%
2019 1,000,000 544,500 544,500 561,000 2,650,000 1,122,000 3,211,000 83% 55%
1. Deferred share rights for the Acting CFO. 2. Deferred share rights for the CRO. 3. Paid in NZD and converted to AUD. Year to date average exchange rate used to convert NZD to AUD as at 30 September for the relevant year.
4.2 2021 ACTUAL REMUNERATION RECEIVED
Actual remuneration received
This table shows the remuneration the CEO and Disclosed Executives actually received in relation to the 2021 performance year as cash, or in the case of prior equity awards, the value which vested in 2021. The final column also shows the value of prior equity awards which lapsed/were forfeited in 2021. These awards reflect the 2017 performance rights which partially met their performance hurdles when tested in November 2020, and additionally for Alexis George and Michelle Jablko the forfeiture of unvested deferred remuneration on resignation.
ACTUAL REMUNERATION RECEIVED IN 2021 – CEO AND DISCLOSED EXECUTIVES:
Received value includes the value of prior equity awards which vested in that year
Fixed remuneration
$
Cash variable remuneration
$
Total cash
$
Deferred variable remuneration which vested
during the year1$
Other deferred remuneration which vested
during the year1$
Actual remuneration
received$
Deferred variable remuneration which
lapsed/forfeited during the year1, 2
$
CEO and Current Disclosed Executives
S Elliott 2,500,000 1,000,000 3,500,000 2,252,821 – 5,752,821 (1,895,738)
S Buggle 704,000 462,000 1,166,000 – – 1,166,000 -
M Carnegie 1,200,000 569,250 1,769,250 807,983 – 2,577,233 (499,918)
K Corbally 1,100,000 613,800 1,713,800 297,341 – 2,011,141 (39,997)
G Florian 1,084,500 676,500 1,761,000 424,282 – 2,185,282 (257,321)
M Hand 1,200,000 544,500 1,744,500 329,920 – 2,074,420 (59,348)
K van der Merwe 907,000 594,000 1,501,000 378,251 – 1,879,251 (154,402)
A Watson3 1,078,682 687,167 1,765,849 309,419 – 2,075,268 (37,204)
M Whelan 1,276,000 810,150 2,086,150 1,561,716 – 3,647,866 (963,057)
Former Disclosed Executives
A George 913,000 n/a 913,000 582,907 – 1,495,907 (4,344,826)
M Jablko4 528,000 n/a 528,000 991,724 119,239 1,638,963 (5,514,701)
1. The point in time value of previously deferred remuneration granted as shares/share rights and/or performance rights is based on the one day Volume Weighted Average Price (VWAP) of the Company’s shares traded on the ASX on the date of vesting or lapsing/forfeiture multiplied by the number of shares/share rights and/or performance rights. 2. The lapsed/forfeited values relate to 56.7% of the performance rights we awarded in November/December 2017 which lapsed in November/December 2020 due to the performance hurdles not being met, and for A George and M Jablko forfeiture on resignation of unvested deferred remuneration. 3. Paid in NZD and converted to AUD. 4. Other deferred remuneration for M Jablko relates to previously disclosed compensation for deferred remuneration forfeited as a result of joining ANZ.
CEO Comparison of Remuneration Awarded vs Remuneration Received in 2021
• The chart below shows that the remuneration awarded to the CEO in 2021 was less than the maximum opportunity under the current remuneration structure. The future realised value for the CEO may be higher or lower than the awarded value based on the vesting share price for awarded equity (including the percentage of equity that vests or is forfeited).
• Actual remuneration received in 2021 reflects the impact of prior equity awards that vested in 2021. For example, the performance rights awarded value in 2017 was $4.2 million, but the received value that vested to the CEO in 2021 was $1.45 million.
2021 CEO REMUNERATION AWARDED (POTENTIAL VALUE NOT REALISED VALUE) AND ACTUAL REMUNERATION RECEIVED ($m)REMUNERATION MIX – CEO
Fixed remuneration AVR cash AVR deferred shares LTVR performance rights
Maximum opportunity
Actual remunerationreceived
Remuneration awarded
$2$- $4 $6 $8 $10 $12
Deferred AVR/LTVR which vested during the year
$8 million
$5.75 million
$9.75 million
8180 ANZ 2021 Annual Report
OVERVIEW HOW WE CREATE VALUE
PERFORMANCE OVERVIEW
REMUNERATION REPORT
DIRECTORS’ REPORT
FINANCIAL REPORT
SHAREHOLDER INFORMATION
80
OVERVIEW HOW WE CREATE VALUE
PERFORMANCE OVERVIEW
REMUNERATION REPORT
DIRECTORS’ REPORT
FINANCIAL REPORT
SHAREHOLDER INFORMATION

• For the 2021 Disclosed Executives who were in role for full year 2020 and 2021, year-on-year total remuneration has increased on average by 40%. The year-on-year change primarily reflects the 50% reduction to Disclosed Executives’ VR outcomes in 2020 having regard to the impact of COVID-19. The differential has also been impacted by the increases to fixed remuneration applied to three executives following the transition of Deputy CEO accountabilities.
• For both Mark Hand and Antonia Watson, 2021 and 2020 remuneration awarded is not directly comparable with 2019, as they were Disclosed Executives for only part of the 2019 financial year. Antonia Watson’s 2020 remuneration awarded reflects her permanent appointment to the Group Executive and CEO, NZ role.
• Shane Buggle’s 2021 remuneration awarded reflects the period he acted as the CFO.
• Variable remuneration continues to differ both year-on-year and between different executives demonstrating the at risk nature of this element of remuneration and the variability in Group and individual performance year-on-year. See section 4.4 for details.
YEAR-ON-YEAR REMUNERATION AWARDED IN THE RELEVANT FINANCIAL YEAR – DISCLOSED EXECUTIVES:
The awarded value may be higher or lower than future realised value
Threshold vesting Full vesting VR as % of
Financial year
Fixed remuneration
$
VR cash
$
VR deferred
shares1 $
VR performance
rights2 $
Total remuneration
awarded $
VR performance
rights2 $
Total remuneration
awarded $
Target opport-
unity
Maximum opport-
unity
Current Disclosed Executives
S Buggle 2021 704,000 462,000 462,000 476,000 2,104,000 952,000 2,580,000 99% 66%(8 months Acting in role)
M Carnegie 2021 1,200,000 569,250 569,250 586,500 2,925,000 1,173,000 3,511,500 72% 48%
2020 1,200,000 409,200 409,200 421,600 2,440,000 843,200 2,861,600 52% 34%
2019 1,000,000 495,000 495,000 510,000 2,500,000 1,020,000 3,010,000 75% 50%
K Corbally 2021 1,100,000 613,800 613,800 632,400 2,960,000 632,400 2,960,000 94% 63%
2020 1,100,000 429,000 429,000 442,000 2,400,000 442,000 2,400,000 66% 44%
2019 950,000 478,500 478,500 493,000 2,400,000 493,000 2,400,000 85% 57%
G Florian 2021 1,084,500 676,500 676,500 697,000 3,134,500 1,394,000 3,831,500 95% 63%
2020 1,075,000 371,250 371,250 382,500 2,200,000 765,000 2,582,500 52% 35%
M Hand 2021 1,200,000 544,500 544,500 561,000 2,850,000 1,122,000 3,411,000 69% 46%
2020 1,200,000 462,000 462,000 476,000 2,600,000 952,000 3,076,000 58% 39%
2019 726,000 198,000 198,000 204,000 1,326,000 408,000 1,530,000 41% 28%(9 months as
Disclosed Executive)
K van der Merwe 2021 907,000 594,000 594,000 612,000 2,707,000 1,224,000 3,319,000 99% 66%
2020 850,000 330,000 330,000 340,000 1,850,000 680,000 2,190,000 59% 39%
A Watson3 2021 1,078,682 687,167 687,167 707,991 3,161,008 1,415,981 3,868,998 97% 64%
2020 1,015,599 334,681 334,681 344,822 2,029,783 689,645 2,374,605 50% 33%
2019 219,440 170,255 113,504 – 503,199 – 503,199 65% 43%(3.5 months in role)
M Whelan 2021 1,276,000 810,150 810,150 834,700 3,731,000 1,669,400 4,565,700 96% 64%
2020 1,200,000 363,000 363,000 374,000 2,300,000 748,000 2,674,000 46% 31%
2019 1,200,000 874,500 874,500 901,000 3,850,000 1,802,000 4,751,000 110% 74%
Former Disclosed Executives
A George 2021 913,000 n/a n/a n/a 913,000 n/a 913,000 n/a n/a(10 months to term date)
2020 1,100,000 363,000 363,000 374,000 2,200,000 748,000 2,574,000 50% 33%
2019 1,000,000 528,000 528,000 544,000 2,600,000 1,088,000 3,144,000 80% 53%
M Jablko 2021 528,000 n/a n/a n/a 528,000 n/a 528,000 n/a n/a(6 months to term date)
2020 1,100,000 363,000 363,000 374,000 2,200,000 748,000 2,574,000 50% 33%
2019 1,000,000 544,500 544,500 561,000 2,650,000 1,122,000 3,211,000 83% 55%
1. Deferred share rights for the Acting CFO. 2. Deferred share rights for the CRO. 3. Paid in NZD and converted to AUD. Year to date average exchange rate used to convert NZD to AUD as at 30 September for the relevant year.
4.2 2021 ACTUAL REMUNERATION RECEIVED
Actual remuneration received
This table shows the remuneration the CEO and Disclosed Executives actually received in relation to the 2021 performance year as cash, or in the case of prior equity awards, the value which vested in 2021. The final column also shows the value of prior equity awards which lapsed/were forfeited in 2021. These awards reflect the 2017 performance rights which partially met their performance hurdles when tested in November 2020, and additionally for Alexis George and Michelle Jablko the forfeiture of unvested deferred remuneration on resignation.
ACTUAL REMUNERATION RECEIVED IN 2021 – CEO AND DISCLOSED EXECUTIVES:
Received value includes the value of prior equity awards which vested in that year
Fixed remuneration
$
Cash variable remuneration
$
Total cash
$
Deferred variable remuneration which vested
during the year1$
Other deferred remuneration which vested
during the year1$
Actual remuneration
received$
Deferred variable remuneration which
lapsed/forfeited during the year1, 2
$
CEO and Current Disclosed Executives
S Elliott 2,500,000 1,000,000 3,500,000 2,252,821 – 5,752,821 (1,895,738)
S Buggle 704,000 462,000 1,166,000 – – 1,166,000 -
M Carnegie 1,200,000 569,250 1,769,250 807,983 – 2,577,233 (499,918)
K Corbally 1,100,000 613,800 1,713,800 297,341 – 2,011,141 (39,997)
G Florian 1,084,500 676,500 1,761,000 424,282 – 2,185,282 (257,321)
M Hand 1,200,000 544,500 1,744,500 329,920 – 2,074,420 (59,348)
K van der Merwe 907,000 594,000 1,501,000 378,251 – 1,879,251 (154,402)
A Watson3 1,078,682 687,167 1,765,849 309,419 – 2,075,268 (37,204)
M Whelan 1,276,000 810,150 2,086,150 1,561,716 – 3,647,866 (963,057)
Former Disclosed Executives
A George 913,000 n/a 913,000 582,907 – 1,495,907 (4,344,826)
M Jablko4 528,000 n/a 528,000 991,724 119,239 1,638,963 (5,514,701)
1. The point in time value of previously deferred remuneration granted as shares/share rights and/or performance rights is based on the one day Volume Weighted Average Price (VWAP) of the Company’s shares traded on the ASX on the date of vesting or lapsing/forfeiture multiplied by the number of shares/share rights and/or performance rights. 2. The lapsed/forfeited values relate to 56.7% of the performance rights we awarded in November/December 2017 which lapsed in November/December 2020 due to the performance hurdles not being met, and for A George and M Jablko forfeiture on resignation of unvested deferred remuneration. 3. Paid in NZD and converted to AUD. 4. Other deferred remuneration for M Jablko relates to previously disclosed compensation for deferred remuneration forfeited as a result of joining ANZ.
CEO Comparison of Remuneration Awarded vs Remuneration Received in 2021
• The chart below shows that the remuneration awarded to the CEO in 2021 was less than the maximum opportunity under the current remuneration structure. The future realised value for the CEO may be higher or lower than the awarded value based on the vesting share price for awarded equity (including the percentage of equity that vests or is forfeited).
• Actual remuneration received in 2021 reflects the impact of prior equity awards that vested in 2021. For example, the performance rights awarded value in 2017 was $4.2 million, but the received value that vested to the CEO in 2021 was $1.45 million.
2021 CEO REMUNERATION AWARDED (POTENTIAL VALUE NOT REALISED VALUE) AND ACTUAL REMUNERATION RECEIVED ($m)REMUNERATION MIX – CEO
Fixed remuneration AVR cash AVR deferred shares LTVR performance rights
Maximum opportunity
Actual remunerationreceived
Remuneration awarded
$2$- $4 $6 $8 $10 $12
Deferred AVR/LTVR which vested during the year
$8 million
$5.75 million
$9.75 million
8180 ANZ 2021 Annual Report
OVERVIEW HOW WE CREATE VALUE
PERFORMANCE OVERVIEW
REMUNERATION REPORT
DIRECTORS’ REPORT
FINANCIAL REPORT
SHAREHOLDER INFORMATION
81ANZ 2021 Annual Report
OVERVIEW HOW WE CREATE VALUE
PERFORMANCE OVERVIEW
REMUNERATION REPORT
DIRECTORS’ REPORT
FINANCIAL REPORT
SHAREHOLDER INFORMATION

4.3 APPLICATION OF REWARD PRINCIPLES
In considering the 2021 outcomes the HR Committee and Board reflected on the application of ANZ’s Reward Principles:
• Reward our people for doing the right thing having regard to our customers and shareholders: Variable remuneration should be primarily based on ‘outcomes’ rather than ‘effort’ and proportionate relative to performance. It also needs to consider the experience and expectations of a range of stakeholders (including shareholders, customers, employees, community and regulators).
• Attract, motivate and keep great people: In determining remuneration outcomes, the Board acknowledged the importance of balancing performance with being market competitive to ensure retention of key talent – particularly in a tight talent market.
• Focus on how things are achieved as much as what is achieved: The Board has ensured that appropriate consideration and weight was given to performance against a balanced scorecard of objectives (which includes a risk modifier), a risk standards assessment (capturing financial and non-financial risks), and how that performance was achieved (i.e. in accordance with our values and purpose).
• Be fair and simple to understand: Variable remuneration should be fair and consistent through the cycle and have regard to external influences outside of management’s control.
4.4 VARIABLE REMUNERATION – DETAIL
4.4.1 CEO performance, AVR and LTVRPerformance
With regard to AVR, the CEO is assessed 50% on the ANZ Group Performance Framework and 50% on achievement of individual strategic objectives aligned to ANZ’s strategy. Both the Group Performance Framework and individual strategic objectives are agreed by the Board at the start of the financial year and are stretching.
At the end of the financial year, ANZ’s performance is assessed against the Group Performance Framework, and the CEO’s performance is assessed against his individual strategic objectives, the ANZ values (behaviours), delivery of the BEAR obligations and ANZ’s risk and compliance standards. In conducting the CEO’s performance assessment, the HR Committee seeks input from the Chairman, CRO (on risk management), CFO (on financial performance), GE T&C (on talent and culture matters) and Group General Manager Internal Audit (GGM IA) (on internal audit matters). Material risk, audit and conduct events that have either occurred or come to light in the year are also considered together with input from both the Audit Committee and the Risk Committee of the Board.
The Board has assessed the CEO’s 2021 performance as follows:
Group Performance Framework = Met most but not all expectations (see section 4.5.3)
Individual strategic objectives = Met most but not all expectations (see Board assessment below)
ANZ values = Above expectations
Risk/compliance assessment = Met expectations
Overall = Met most but not all expectations
The Board has considered the CEO’s performance in determining the appropriate AVR outcome for 2021. The Board determined, with the CEO’s support, that an AVR outcome of 53% of maximum opportunity was appropriate.
AVR and LTVRAt the end of the financial year, the HR Committee makes a recommendation to the Board for their approval in respect of the CEO’s AVR outcome.
The CEO’s AVR will vary up or down year-on-year, it is not guaranteed, and may range from zero to a maximum opportunity.
The Board exercised their discretion and determined that an AVR outcome of $2 million (53% of maximum opportunity) was appropriate for 2021 having regard to both the performance of the CEO (50% weighting) and also the overall performance of the Group (50% weighting).
The CEO’s proposed LTVR of $3.5 million (performance rights face value at full vesting) ($3.5 million in 2020) is subject to shareholder approval at the 2021 AGM.
2021 AVR Awarded
This table shows the AVR awarded to the CEO for the year ending 30 September 2021.
S Elliott1
LTVR $3,500,000 performance rights face value at full vesting (subject to shareholder approval at the 2021 AGM)
AVR $2,000,000 53% of max
2021 AVR AWARDED – CEO
+
Total variable remuneration $5,500,000=
Maximum opportunityCEO
= +$1,000,000 cash $1,000,000 deferred shares
1. Variable remuneration for the CEO = AVR + LTVR.
BOARD ASSESSMENT OF PERFORMANCE ON INDIVIDUAL STRATEGIC OBJECTIVES:
MET MOST BUT NOT ALL EXPECTATIONS
The CEO publicly outlined in 2021 the bank’s strategy to simplify and strengthen the business through automation and process digitisation. One outcome being a further reduction in run the bank costs, with productivity initiatives allowing for a higher level of investment spend. This was an area of continued out-performance in 2021. Other financial highlights include a strengthened balance sheet, strong capital management, improved ROE, and a declining long run credit loss rate, despite the challenging environment.
Despite the positive outcomes and business momentum as we enter 2022, there was a loss of market share in the Australian mortgage business as a result of home loan processing challenges, and a delay in being ‘market ready’ in respect of one of our transformative digital products (noting that these matters impacted both the assessment of Group Performance as well as the Board’s assessment of the CEO’s performance).
The executive team performed well in a challenging environment, demonstrating a coordinated and effective response to employees, customers and regulators in a timely manner. Executive development continues with expanded portfolios for three executives as a result of the resignation of Alexis George (former Deputy CEO), and the recent appointment of Farhan Faruqui (Group Executive, International) to the position of CFO following Michelle Jablko’s (previous CFO) resignation.
The CEO has successfully led ANZ through a challenging year, progressing our key initiatives whilst also responding to the impacts of the COVID-19 pandemic.
He personally role models the ANZ values and is a respected leader among staff and also externally, as evidenced by the number of senior executives across Australia seeking to interact with the CEO on a range of matters – particularly our culture and purpose. The CEO’s continued focus on culture, building leaders, and supporting leaders through change has resulted in another year of high engagement (despite the challenging environment), and the achievement of the #1 position as employer of choice (relative to peers) in Glassdoor1.
He continues to engage deeply with regulators and government, and proactively manages our external reputation.
The CEO continued to focus on delivering against strategy and our purpose, while ensuring disciplined execution and appropriate risk management. Key outcomes include:
• A refreshed strategy which includes Board support for building out platforms and engaging in digital ecosystems
• An updated climate change strategy, including leading the way on the importance of sustainability to the banking sector
• Strengthening our future as a digital bank by progressing work around our digital agenda
• Further cementing customer financial wellbeing at the heart of our business – including strong support to customers in need
• Managing risk well with an improved control environment, driving reviews of key risk areas and ensuring Board visibility of material risks, and strong progress against all regulatory obligations
• Improving systems and infrastructure performance, resulting in reduced system outages and customer errors
• The finalisation of a four-year Diversity & Inclusion Strategy and action plans to build the foundations for long-term sustainable improvement in gender diversity. Women in leadership in 2021 was also a positive result, increasing 1.9%
• Continued strong overall employee engagement of 81%
While the Australian home loan issue was a key factor impacting the overall assessment of the CEO’s 2021 performance, the bank has ended the 2021 year stronger financially and culturally through the CEO’s leadership, with a refreshed strategy and capability ready for the challenges and opportunities of 2022 and beyond.
1. Glassdoor is a website where employees and former employees anonymously review companies and their management. • Lead and role model the culture and accountability
required to transform ANZ
• Enhance the reputation of ANZ
• Drive the strategic direction of the organisation, focused on building long term sustainable growth and improving ROE relative to industry peers
• Deliver our digital transformation aspiration to materially enhance our customer proposition and build a platform for creating value
• Focus on operational excellence and resilience, including remediation and system stability, to ensure ANZ has a robust and reliable platform to support long-term growth
• Show material progress on productivity initiatives to improve customer and staff experience while driving run the bank operating costs towards a materially reduced run rate
• Continue to build ExCo effectiveness and CEO succession
2021 CEO INDIVIDUAL STRATEGIC OBJECTIVES
AVR
Financial metrics have a 35% weighting in the Group Performance Framework and therefore notionally have a 17.5% weighting in the CEO’s AVR. However, the CEO’s AVR is not formulaic – outcomes are moderated by the Risk element of the Group Performance Framework and the Board’s judgement on the appropriate AVR considering all aspects of performance.
LTVR
100% of the LTVR hurdles are based on TSR (both relative and absolute).
WEIGHTING OF FINANCIAL METRICS
8382 ANZ 2021 Annual Report
OVERVIEW HOW WE CREATE VALUE
PERFORMANCE OVERVIEW
REMUNERATION REPORT
DIRECTORS’ REPORT
FINANCIAL REPORT
SHAREHOLDER INFORMATION
82
OVERVIEW HOW WE CREATE VALUE
PERFORMANCE OVERVIEW
REMUNERATION REPORT
DIRECTORS’ REPORT
FINANCIAL REPORT
SHAREHOLDER INFORMATION
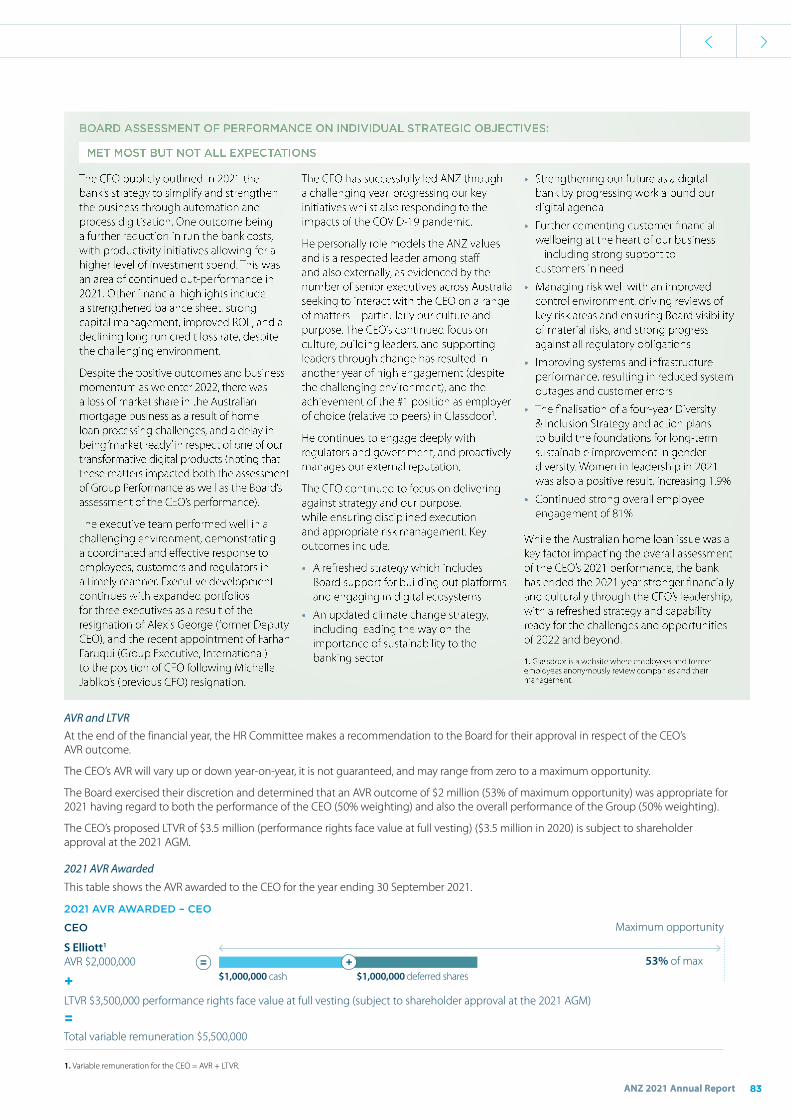
4.3 APPLICATION OF REWARD PRINCIPLES
In considering the 2021 outcomes the HR Committee and Board reflected on the application of ANZ’s Reward Principles:
• Reward our people for doing the right thing having regard to our customers and shareholders: Variable remuneration should be primarily based on ‘outcomes’ rather than ‘effort’ and proportionate relative to performance. It also needs to consider the experience and expectations of a range of stakeholders (including shareholders, customers, employees, community and regulators).
• Attract, motivate and keep great people: In determining remuneration outcomes, the Board acknowledged the importance of balancing performance with being market competitive to ensure retention of key talent – particularly in a tight talent market.
• Focus on how things are achieved as much as what is achieved: The Board has ensured that appropriate consideration and weight was given to performance against a balanced scorecard of objectives (which includes a risk modifier), a risk standards assessment (capturing financial and non-financial risks), and how that performance was achieved (i.e. in accordance with our values and purpose).
• Be fair and simple to understand: Variable remuneration should be fair and consistent through the cycle and have regard to external influences outside of management’s control.
4.4 VARIABLE REMUNERATION – DETAIL
4.4.1 CEO performance, AVR and LTVRPerformance
With regard to AVR, the CEO is assessed 50% on the ANZ Group Performance Framework and 50% on achievement of individual strategic objectives aligned to ANZ’s strategy. Both the Group Performance Framework and individual strategic objectives are agreed by the Board at the start of the financial year and are stretching.
At the end of the financial year, ANZ’s performance is assessed against the Group Performance Framework, and the CEO’s performance is assessed against his individual strategic objectives, the ANZ values (behaviours), delivery of the BEAR obligations and ANZ’s risk and compliance standards. In conducting the CEO’s performance assessment, the HR Committee seeks input from the Chairman, CRO (on risk management), CFO (on financial performance), GE T&C (on talent and culture matters) and Group General Manager Internal Audit (GGM IA) (on internal audit matters). Material risk, audit and conduct events that have either occurred or come to light in the year are also considered together with input from both the Audit Committee and the Risk Committee of the Board.
The Board has assessed the CEO’s 2021 performance as follows:
Group Performance Framework = Met most but not all expectations (see section 4.5.3)
Individual strategic objectives = Met most but not all expectations (see Board assessment below)
ANZ values = Above expectations
Risk/compliance assessment = Met expectations
Overall = Met most but not all expectations
The Board has considered the CEO’s performance in determining the appropriate AVR outcome for 2021. The Board determined, with the CEO’s support, that an AVR outcome of 53% of maximum opportunity was appropriate.
AVR and LTVRAt the end of the financial year, the HR Committee makes a recommendation to the Board for their approval in respect of the CEO’s AVR outcome.
The CEO’s AVR will vary up or down year-on-year, it is not guaranteed, and may range from zero to a maximum opportunity.
The Board exercised their discretion and determined that an AVR outcome of $2 million (53% of maximum opportunity) was appropriate for 2021 having regard to both the performance of the CEO (50% weighting) and also the overall performance of the Group (50% weighting).
The CEO’s proposed LTVR of $3.5 million (performance rights face value at full vesting) ($3.5 million in 2020) is subject to shareholder approval at the 2021 AGM.
2021 AVR Awarded
This table shows the AVR awarded to the CEO for the year ending 30 September 2021.
S Elliott1
LTVR $3,500,000 performance rights face value at full vesting (subject to shareholder approval at the 2021 AGM)
AVR $2,000,000 53% of max
2021 AVR AWARDED – CEO
+
Total variable remuneration $5,500,000=
Maximum opportunityCEO
= +$1,000,000 cash $1,000,000 deferred shares
1. Variable remuneration for the CEO = AVR + LTVR.
BOARD ASSESSMENT OF PERFORMANCE ON INDIVIDUAL STRATEGIC OBJECTIVES:
MET MOST BUT NOT ALL EXPECTATIONS
The CEO publicly outlined in 2021 the bank’s strategy to simplify and strengthen the business through automation and process digitisation. One outcome being a further reduction in run the bank costs, with productivity initiatives allowing for a higher level of investment spend. This was an area of continued out-performance in 2021. Other financial highlights include a strengthened balance sheet, strong capital management, improved ROE, and a declining long run credit loss rate, despite the challenging environment.
Despite the positive outcomes and business momentum as we enter 2022, there was a loss of market share in the Australian mortgage business as a result of home loan processing challenges, and a delay in being ‘market ready’ in respect of one of our transformative digital products (noting that these matters impacted both the assessment of Group Performance as well as the Board’s assessment of the CEO’s performance).
The executive team performed well in a challenging environment, demonstrating a coordinated and effective response to employees, customers and regulators in a timely manner. Executive development continues with expanded portfolios for three executives as a result of the resignation of Alexis George (former Deputy CEO), and the recent appointment of Farhan Faruqui (Group Executive, International) to the position of CFO following Michelle Jablko’s (previous CFO) resignation.
The CEO has successfully led ANZ through a challenging year, progressing our key initiatives whilst also responding to the impacts of the COVID-19 pandemic.
He personally role models the ANZ values and is a respected leader among staff and also externally, as evidenced by the number of senior executives across Australia seeking to interact with the CEO on a range of matters – particularly our culture and purpose. The CEO’s continued focus on culture, building leaders, and supporting leaders through change has resulted in another year of high engagement (despite the challenging environment), and the achievement of the #1 position as employer of choice (relative to peers) in Glassdoor1.
He continues to engage deeply with regulators and government, and proactively manages our external reputation.
The CEO continued to focus on delivering against strategy and our purpose, while ensuring disciplined execution and appropriate risk management. Key outcomes include:
• A refreshed strategy which includes Board support for building out platforms and engaging in digital ecosystems
• An updated climate change strategy, including leading the way on the importance of sustainability to the banking sector
• Strengthening our future as a digital bank by progressing work around our digital agenda
• Further cementing customer financial wellbeing at the heart of our business – including strong support to customers in need
• Managing risk well with an improved control environment, driving reviews of key risk areas and ensuring Board visibility of material risks, and strong progress against all regulatory obligations
• Improving systems and infrastructure performance, resulting in reduced system outages and customer errors
• The finalisation of a four-year Diversity & Inclusion Strategy and action plans to build the foundations for long-term sustainable improvement in gender diversity. Women in leadership in 2021 was also a positive result, increasing 1.9%
• Continued strong overall employee engagement of 81%
While the Australian home loan issue was a key factor impacting the overall assessment of the CEO’s 2021 performance, the bank has ended the 2021 year stronger financially and culturally through the CEO’s leadership, with a refreshed strategy and capability ready for the challenges and opportunities of 2022 and beyond.
1. Glassdoor is a website where employees and former employees anonymously review companies and their management. • Lead and role model the culture and accountability
required to transform ANZ
• Enhance the reputation of ANZ
• Drive the strategic direction of the organisation, focused on building long term sustainable growth and improving ROE relative to industry peers
• Deliver our digital transformation aspiration to materially enhance our customer proposition and build a platform for creating value
• Focus on operational excellence and resilience, including remediation and system stability, to ensure ANZ has a robust and reliable platform to support long-term growth
• Show material progress on productivity initiatives to improve customer and staff experience while driving run the bank operating costs towards a materially reduced run rate
• Continue to build ExCo effectiveness and CEO succession
2021 CEO INDIVIDUAL STRATEGIC OBJECTIVES
AVR
Financial metrics have a 35% weighting in the Group Performance Framework and therefore notionally have a 17.5% weighting in the CEO’s AVR. However, the CEO’s AVR is not formulaic – outcomes are moderated by the Risk element of the Group Performance Framework and the Board’s judgement on the appropriate AVR considering all aspects of performance.
LTVR
100% of the LTVR hurdles are based on TSR (both relative and absolute).
WEIGHTING OF FINANCIAL METRICS
8382 ANZ 2021 Annual Report
OVERVIEW HOW WE CREATE VALUE
PERFORMANCE OVERVIEW
REMUNERATION REPORT
DIRECTORS’ REPORT
FINANCIAL REPORT
SHAREHOLDER INFORMATION
83ANZ 2021 Annual Report
OVERVIEW HOW WE CREATE VALUE
PERFORMANCE OVERVIEW
REMUNERATION REPORT
DIRECTORS’ REPORT
FINANCIAL REPORT
SHAREHOLDER INFORMATION
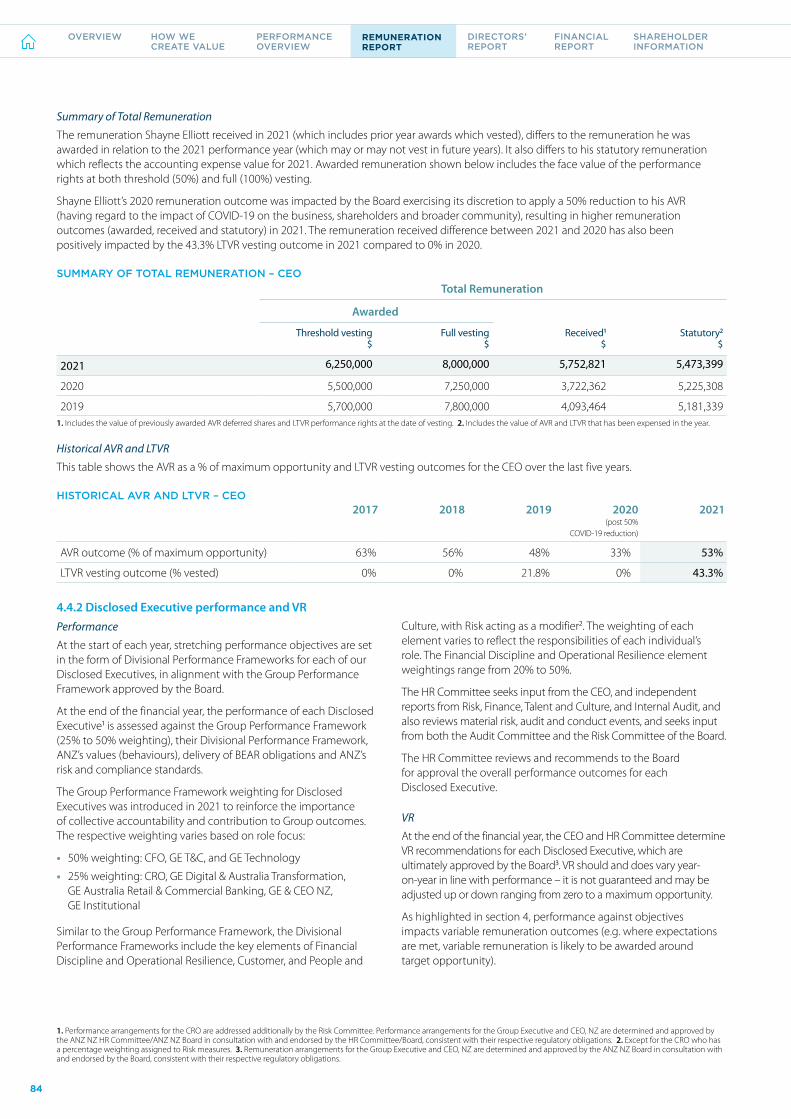
1. Performance arrangements for the CRO are addressed additionally by the Risk Committee. Performance arrangements for the Group Executive and CEO, NZ are determined and approved by the ANZ NZ HR Committee/ANZ NZ Board in consultation with and endorsed by the HR Committee/Board, consistent with their respective regulatory obligations. 2. Except for the CRO who has a percentage weighting assigned to Risk measures. 3. Remuneration arrangements for the Group Executive and CEO, NZ are determined and approved by the ANZ NZ Board in consultation with and endorsed by the Board, consistent with their respective regulatory obligations.
Summary of Total Remuneration
The remuneration Shayne Elliott received in 2021 (which includes prior year awards which vested), differs to the remuneration he was awarded in relation to the 2021 performance year (which may or may not vest in future years). It also differs to his statutory remuneration which reflects the accounting expense value for 2021. Awarded remuneration shown below includes the face value of the performance rights at both threshold (50%) and full (100%) vesting.
Shayne Elliott’s 2020 remuneration outcome was impacted by the Board exercising its discretion to apply a 50% reduction to his AVR (having regard to the impact of COVID-19 on the business, shareholders and broader community), resulting in higher remuneration outcomes (awarded, received and statutory) in 2021. The remuneration received difference between 2021 and 2020 has also been positively impacted by the 43.3% LTVR vesting outcome in 2021 compared to 0% in 2020.
SUMMARY OF TOTAL REMUNERATION – CEO
Total Remuneration
Awarded
Threshold vesting$
Full vesting$
Received1$
Statutory2$
2021 6,250,000 8,000,000 5,752,821 5,473,399
2020 5,500,000 7,250,000 3,722,362 5,225,308
2019 5,700,000 7,800,000 4,093,464 5,181,339 1. Includes the value of previously awarded AVR deferred shares and LTVR performance rights at the date of vesting. 2. Includes the value of AVR and LTVR that has been expensed in the year.
Historical AVR and LTVR
This table shows the AVR as a % of maximum opportunity and LTVR vesting outcomes for the CEO over the last five years.
HISTORICAL AVR AND LTVR – CEO 2017 2018 2019 2020
(post 50% COVID-19 reduction)
2021
AVR outcome (% of maximum opportunity) 63% 56% 48% 33% 53%
LTVR vesting outcome (% vested) 0% 0% 21.8% 0% 43.3%
4.4.2 Disclosed Executive performance and VRPerformance
At the start of each year, stretching performance objectives are set in the form of Divisional Performance Frameworks for each of our Disclosed Executives, in alignment with the Group Performance Framework approved by the Board.
At the end of the financial year, the performance of each Disclosed Executive1 is assessed against the Group Performance Framework (25% to 50% weighting), their Divisional Performance Framework, ANZ’s values (behaviours), delivery of BEAR obligations and ANZ’s risk and compliance standards.
The Group Performance Framework weighting for Disclosed Executives was introduced in 2021 to reinforce the importance of collective accountability and contribution to Group outcomes. The respective weighting varies based on role focus:
• 50% weighting: CFO, GE T&C, and GE Technology
• 25% weighting: CRO, GE Digital & Australia Transformation, GE Australia Retail & Commercial Banking, GE & CEO NZ, GE Institutional
Similar to the Group Performance Framework, the Divisional Performance Frameworks include the key elements of Financial Discipline and Operational Resilience, Customer, and People and
Culture, with Risk acting as a modifier2. The weighting of each element varies to reflect the responsibilities of each individual’s role. The Financial Discipline and Operational Resilience element weightings range from 20% to 50%.
The HR Committee seeks input from the CEO, and independent reports from Risk, Finance, Talent and Culture, and Internal Audit, and also reviews material risk, audit and conduct events, and seeks input from both the Audit Committee and the Risk Committee of the Board.
The HR Committee reviews and recommends to the Board for approval the overall performance outcomes for each Disclosed Executive.
VR
At the end of the financial year, the CEO and HR Committee determine VR recommendations for each Disclosed Executive, which are ultimately approved by the Board3. VR should and does vary year- on-year in line with performance – it is not guaranteed and may be adjusted up or down ranging from zero to a maximum opportunity.
As highlighted in section 4, performance against objectives impacts variable remuneration outcomes (e.g. where expectations are met, variable remuneration is likely to be awarded around target opportunity).
The degree of variance in individual VR outcomes reflect the weighting of the Group component (i.e. roles with 50% Group weighting will generally have less differentiation), and relative performance of the different areas/individuals, ensuring appropriate alignment between performance and reward. The outcomes demonstrate the at risk nature of VR, and that outcomes vary across the Disclosed Executives and also from year to year. The average 2021 VR for Disclosed Executives is 60% of maximum opportunity (ranging from 46% to 66%).
2021 VR Awarded
This table shows the combined VR awarded to Disclosed Executives for the year ending 30 September 2021.
Maximum opportunityCURRENT DISCLOSED EXECUTIVES
2021 VR AWARDED – DISCLOSED EXECUTIVES1
M CarnegieVR $2,311,500
S BuggleVR $1,876,000
=
K Corbally2VR $1,860,000
G FlorianVR $2,747,000
M HandVR $2,211,000
=
=
=
=
=
=
=
=
66% of max
48% of max
63% of max
63% of max
46% of max
66% of max
64% of max
64% of max
+
+ +
+
+ +
+ +
+ +
+ +
+ +
+ +
$569,250
$613,800
$544,500
A WatsonVR $2,790,316
K van der MerweVR $2,412,000
M WhelanVR $3,289,700
$687,167
$810,150
$676,500
$594,000
$462,000
$1,173,000
$632,400
$1,122,000
$1,415,981
$1,669,400
$1,394,000
$1,224,000
$952,000
$569,250
$613,800
$544,500
$687,167
$810,150
$676,500
$594,000
$462,000
Deferred shares or deferred share rights Performance rights face value at full vesting3Cash
1. 2021 VR not awarded to former Disclosed Executives A George and M Jablko. 2. CRO receives deferred share rights instead of performance rights. 3. Divide by two to convert to face value at threshold vesting for performance rights.
Historical Disclosed Executive VR
This table shows the VR as a % of maximum opportunity for the executives who were disclosed over the last five years.
HISTORICAL DISCLOSED EXECUTIVE VR2017 2018 2019 2020
(post 50% COVID-19 reduction)
2021
VR outcome (average % of maximum opportunity) 64% 51% 45% 36% 60%
VR outcome (range % of maximum opportunity) 51% – 91% 40% – 60% 0% – 74% 31% – 44% 46% – 66%
VR performance rights vesting outcome (% vested) 0% 0% 21.8% 0% 43.3%
8584 ANZ 2021 Annual Report
OVERVIEW HOW WE CREATE VALUE
PERFORMANCE OVERVIEW
REMUNERATION REPORT
DIRECTORS’ REPORT
FINANCIAL REPORT
SHAREHOLDER INFORMATION
84
OVERVIEW HOW WE CREATE VALUE
PERFORMANCE OVERVIEW
REMUNERATION REPORT
DIRECTORS’ REPORT
FINANCIAL REPORT
SHAREHOLDER INFORMATION

1. Performance arrangements for the CRO are addressed additionally by the Risk Committee. Performance arrangements for the Group Executive and CEO, NZ are determined and approved by the ANZ NZ HR Committee/ANZ NZ Board in consultation with and endorsed by the HR Committee/Board, consistent with their respective regulatory obligations. 2. Except for the CRO who has a percentage weighting assigned to Risk measures. 3. Remuneration arrangements for the Group Executive and CEO, NZ are determined and approved by the ANZ NZ Board in consultation with and endorsed by the Board, consistent with their respective regulatory obligations.
Summary of Total Remuneration
The remuneration Shayne Elliott received in 2021 (which includes prior year awards which vested), differs to the remuneration he was awarded in relation to the 2021 performance year (which may or may not vest in future years). It also differs to his statutory remuneration which reflects the accounting expense value for 2021. Awarded remuneration shown below includes the face value of the performance rights at both threshold (50%) and full (100%) vesting.
Shayne Elliott’s 2020 remuneration outcome was impacted by the Board exercising its discretion to apply a 50% reduction to his AVR (having regard to the impact of COVID-19 on the business, shareholders and broader community), resulting in higher remuneration outcomes (awarded, received and statutory) in 2021. The remuneration received difference between 2021 and 2020 has also been positively impacted by the 43.3% LTVR vesting outcome in 2021 compared to 0% in 2020.
SUMMARY OF TOTAL REMUNERATION – CEO
Total Remuneration
Awarded
Threshold vesting$
Full vesting$
Received1$
Statutory2$
2021 6,250,000 8,000,000 5,752,821 5,473,399
2020 5,500,000 7,250,000 3,722,362 5,225,308
2019 5,700,000 7,800,000 4,093,464 5,181,339 1. Includes the value of previously awarded AVR deferred shares and LTVR performance rights at the date of vesting. 2. Includes the value of AVR and LTVR that has been expensed in the year.
Historical AVR and LTVR
This table shows the AVR as a % of maximum opportunity and LTVR vesting outcomes for the CEO over the last five years.
HISTORICAL AVR AND LTVR – CEO 2017 2018 2019 2020
(post 50% COVID-19 reduction)
2021
AVR outcome (% of maximum opportunity) 63% 56% 48% 33% 53%
LTVR vesting outcome (% vested) 0% 0% 21.8% 0% 43.3%
4.4.2 Disclosed Executive performance and VRPerformance
At the start of each year, stretching performance objectives are set in the form of Divisional Performance Frameworks for each of our Disclosed Executives, in alignment with the Group Performance Framework approved by the Board.
At the end of the financial year, the performance of each Disclosed Executive1 is assessed against the Group Performance Framework (25% to 50% weighting), their Divisional Performance Framework, ANZ’s values (behaviours), delivery of BEAR obligations and ANZ’s risk and compliance standards.
The Group Performance Framework weighting for Disclosed Executives was introduced in 2021 to reinforce the importance of collective accountability and contribution to Group outcomes. The respective weighting varies based on role focus:
• 50% weighting: CFO, GE T&C, and GE Technology
• 25% weighting: CRO, GE Digital & Australia Transformation, GE Australia Retail & Commercial Banking, GE & CEO NZ, GE Institutional
Similar to the Group Performance Framework, the Divisional Performance Frameworks include the key elements of Financial Discipline and Operational Resilience, Customer, and People and
Culture, with Risk acting as a modifier2. The weighting of each element varies to reflect the responsibilities of each individual’s role. The Financial Discipline and Operational Resilience element weightings range from 20% to 50%.
The HR Committee seeks input from the CEO, and independent reports from Risk, Finance, Talent and Culture, and Internal Audit, and also reviews material risk, audit and conduct events, and seeks input from both the Audit Committee and the Risk Committee of the Board.
The HR Committee reviews and recommends to the Board for approval the overall performance outcomes for each Disclosed Executive.
VR
At the end of the financial year, the CEO and HR Committee determine VR recommendations for each Disclosed Executive, which are ultimately approved by the Board3. VR should and does vary year- on-year in line with performance – it is not guaranteed and may be adjusted up or down ranging from zero to a maximum opportunity.
As highlighted in section 4, performance against objectives impacts variable remuneration outcomes (e.g. where expectations are met, variable remuneration is likely to be awarded around target opportunity).
The degree of variance in individual VR outcomes reflect the weighting of the Group component (i.e. roles with 50% Group weighting will generally have less differentiation), and relative performance of the different areas/individuals, ensuring appropriate alignment between performance and reward. The outcomes demonstrate the at risk nature of VR, and that outcomes vary across the Disclosed Executives and also from year to year. The average 2021 VR for Disclosed Executives is 60% of maximum opportunity (ranging from 46% to 66%).
2021 VR Awarded
This table shows the combined VR awarded to Disclosed Executives for the year ending 30 September 2021.
Maximum opportunityCURRENT DISCLOSED EXECUTIVES
2021 VR AWARDED – DISCLOSED EXECUTIVES1
M CarnegieVR $2,311,500
S BuggleVR $1,876,000
=
K Corbally2VR $1,860,000
G FlorianVR $2,747,000
M HandVR $2,211,000
=
=
=
=
=
=
=
=
66% of max
48% of max
63% of max
63% of max
46% of max
66% of max
64% of max
64% of max
+
+ +
+
+ +
+ +
+ +
+ +
+ +
+ +
$569,250
$613,800
$544,500
A WatsonVR $2,790,316
K van der MerweVR $2,412,000
M WhelanVR $3,289,700
$687,167
$810,150
$676,500
$594,000
$462,000
$1,173,000
$632,400
$1,122,000
$1,415,981
$1,669,400
$1,394,000
$1,224,000
$952,000
$569,250
$613,800
$544,500
$687,167
$810,150
$676,500
$594,000
$462,000
Deferred shares or deferred share rights Performance rights face value at full vesting3Cash
1. 2021 VR not awarded to former Disclosed Executives A George and M Jablko. 2. CRO receives deferred share rights instead of performance rights. 3. Divide by two to convert to face value at threshold vesting for performance rights.
Historical Disclosed Executive VR
This table shows the VR as a % of maximum opportunity for the executives who were disclosed over the last five years.
HISTORICAL DISCLOSED EXECUTIVE VR2017 2018 2019 2020
(post 50% COVID-19 reduction)
2021
VR outcome (average % of maximum opportunity) 64% 51% 45% 36% 60%
VR outcome (range % of maximum opportunity) 51% – 91% 40% – 60% 0% – 74% 31% – 44% 46% – 66%
VR performance rights vesting outcome (% vested) 0% 0% 21.8% 0% 43.3%
8584 ANZ 2021 Annual Report
OVERVIEW HOW WE CREATE VALUE
PERFORMANCE OVERVIEW
REMUNERATION REPORT
DIRECTORS’ REPORT
FINANCIAL REPORT
SHAREHOLDER INFORMATION
85ANZ 2021 Annual Report
OVERVIEW HOW WE CREATE VALUE
PERFORMANCE OVERVIEW
REMUNERATION REPORT
DIRECTORS’ REPORT
FINANCIAL REPORT
SHAREHOLDER INFORMATION

4.4.3 Performance rights outcomes (CEO and Disclosed Executives)Performance rights granted to the CEO in December 2017 and Disclosed Executives (excluding the CRO) in November 2017 reached the end of their performance period in November 2020. Based on performance against hurdles, 43.3% of these rights vested, the remaining 56.7% lapsed and executives received no value for this portion of the award.
PERFORMANCE RIGHTS OUTCOMES
Hurdle Grant date1First date
exercisable1
ANZ TSR over three years/
CAGR2 TSR
Median TSR over three years/ CAGR2 TSR target % vested
Overall performance
rights outcome
75% relative TSRSelect Financial Services (SFS) comparator group3
22-Nov-17 22-Nov-20 (27.28)% (29.18)% 57.7%43.3% vested and
56.7% lapsed
25% absolute CAGR2 TSR 22-Nov-17 22-Nov-20 (10.08)% 9.50% 0%
1. Grant date for the CEO was 19 December 2017, and date first exercisable was 19 December 2020. The CEO’s performance period was the same as the performance period for Disclosed Executives. 2. Compound Annual Growth Rate (CAGR). 3. See section 5.2.3a for details of the SFS comparator group.
4.5 ANZIP VARIABLE REMUNERATION POOL AND GROUP PERFORMANCE
4.5.1 ANZIP variable remunerationThe ANZ Incentive Plan (ANZIP) is the variable remuneration plan operating across ANZ. The variable remuneration award each year, for around 80% of employees, is based on the overall performance of the Group (rather than individual performance) subject to individuals meeting minimum standards of performance and behaviour.
With the exception of the CEO, individual variable remuneration outcomes for all other employees including Disclosed Executives are funded under ANZIP. The Board decides the CEO’s variable remuneration outcomes separately to help mitigate potential conflicts of interest. See section 8.1.3.
At the end of each financial year, the HR Committee makes a recommendation to the Board for their approval on the size of the ANZIP variable remuneration pool for that year. The Board exercise their judgement to determine the appropriate pool size – it is not a formulaic outcome.
An assessment of financial performance, in particular cash profit and economic profit informed the pool range. The Board then considered a range of factors in determining a fair and reasonable ANZIP pool. These included:
• The Group Performance Framework assessment (see 4.5.3).
• The quality of earnings and operating environment.
• The shareholder experience during 2021 (e.g. share price growth and dividend comparison with prior periods).
• Our Reward Principles (e.g. attracting, motivating and keeping great people).
4.5.2 ANZ Group Performance FrameworkThe ANZ Group Performance Framework is approved by the Board at the start of each year. The key objective of our Group Performance Framework is to enable aligned focus across the organisation on delivering the critical outcomes that matter most in delivering on our strategy. It plays a key role to:
• message internally what matters most;
• reinforce the importance of sound management in addition to risk, customer, people and financial outcomes; and
• inform focus of effort, prioritisation and decision-making across ANZ.
The significant economic and social impacts of the COVID-19 pandemic continues to require rapid responses and reprioritisation of resources to ensure we are protecting our people, customers, shareholders and ANZ. In the face of these changes, we have regularly tested our business strategy and Group Performance Framework, and resolved they remain relevant to improving the financial wellbeing of our customers and creating long-term sustainable value for all of our stakeholders.
4.5.3 Assessment against the Group Performance Framework for 2021
As managing risk appropriately is fundamental to the way ANZ operates, Risk forms an integral part of the assessment, directly impacting the overall Group Performance Framework outcome (a modifier ranging from 0% to 110% of the Group Performance assessment).
Overall, ANZ’s performance met or exceeded most expectations when considering the objectives we set ourselves, but missed in a few key areas. In an uncertain and volatile environment, the bank performed well, delivering with purpose against the vast majority of our objectives, while recognising there are areas where continued focus is required to improve. These areas primarily relate to home lending momentum in Australia, the pace of delivery for one of our more complex projects focused on digital innovation, and non-financial risk outcomes.
The below table outlines ANZ’s performance objectives in 2021 and provides a summary of outcomes for each of the key performance categories to inform the overall assessment for 2021. Performance against expectations is evaluated for each category using a holistic assessment of progress and outcomes delivered in line with our Group strategic priorities and annual focus areas. A range of objective indicators and subjective factors are considered including management input on work undertaken, evidence of outcomes realised and lessons learned, and with consideration given to the operating, regulatory and competitive environment.
Board review and approve the ANZIP variable remuneration pool
Business and individual allocations from ANZIP variable remuneration pool
ANZIP variable remuneration pool recommended to the Board for approval based on performance and affordability
RISK
FINANCIAL DISCIPLINE & OPERATIONAL RESILIENCECUSTOMER
PEOPLE & CULTURE OVERALL
Group Performance
AssessmentMet most but not all expectations
35% weight
AssessmentMet expectations
35% weight
AssessmentBelow expectations
30% weight
AssessmentAbove expectations
Overall Adjustment
AssessmentMet most but not all expectations
x + + =
8786 ANZ 2021 Annual Report
OVERVIEW HOW WE CREATE VALUE
PERFORMANCE OVERVIEW
REMUNERATION REPORT
DIRECTORS’ REPORT
FINANCIAL REPORT
SHAREHOLDER INFORMATION
86
OVERVIEW HOW WE CREATE VALUE
PERFORMANCE OVERVIEW
REMUNERATION REPORT
DIRECTORS’ REPORT
FINANCIAL REPORT
SHAREHOLDER INFORMATION

4.4.3 Performance rights outcomes (CEO and Disclosed Executives)Performance rights granted to the CEO in December 2017 and Disclosed Executives (excluding the CRO) in November 2017 reached the end of their performance period in November 2020. Based on performance against hurdles, 43.3% of these rights vested, the remaining 56.7% lapsed and executives received no value for this portion of the award.
PERFORMANCE RIGHTS OUTCOMES
Hurdle Grant date1First date
exercisable1
ANZ TSR over three years/
CAGR2 TSR
Median TSR over three years/ CAGR2 TSR target % vested
Overall performance
rights outcome
75% relative TSRSelect Financial Services (SFS) comparator group3
22-Nov-17 22-Nov-20 (27.28)% (29.18)% 57.7%43.3% vested and
56.7% lapsed
25% absolute CAGR2 TSR 22-Nov-17 22-Nov-20 (10.08)% 9.50% 0%
1. Grant date for the CEO was 19 December 2017, and date first exercisable was 19 December 2020. The CEO’s performance period was the same as the performance period for Disclosed Executives. 2. Compound Annual Growth Rate (CAGR). 3. See section 5.2.3a for details of the SFS comparator group.
4.5 ANZIP VARIABLE REMUNERATION POOL AND GROUP PERFORMANCE
4.5.1 ANZIP variable remunerationThe ANZ Incentive Plan (ANZIP) is the variable remuneration plan operating across ANZ. The variable remuneration award each year, for around 80% of employees, is based on the overall performance of the Group (rather than individual performance) subject to individuals meeting minimum standards of performance and behaviour.
With the exception of the CEO, individual variable remuneration outcomes for all other employees including Disclosed Executives are funded under ANZIP. The Board decides the CEO’s variable remuneration outcomes separately to help mitigate potential conflicts of interest. See section 8.1.3.
At the end of each financial year, the HR Committee makes a recommendation to the Board for their approval on the size of the ANZIP variable remuneration pool for that year. The Board exercise their judgement to determine the appropriate pool size – it is not a formulaic outcome.
An assessment of financial performance, in particular cash profit and economic profit informed the pool range. The Board then considered a range of factors in determining a fair and reasonable ANZIP pool. These included:
• The Group Performance Framework assessment (see 4.5.3).
• The quality of earnings and operating environment.
• The shareholder experience during 2021 (e.g. share price growth and dividend comparison with prior periods).
• Our Reward Principles (e.g. attracting, motivating and keeping great people).
4.5.2 ANZ Group Performance FrameworkThe ANZ Group Performance Framework is approved by the Board at the start of each year. The key objective of our Group Performance Framework is to enable aligned focus across the organisation on delivering the critical outcomes that matter most in delivering on our strategy. It plays a key role to:
• message internally what matters most;
• reinforce the importance of sound management in addition to risk, customer, people and financial outcomes; and
• inform focus of effort, prioritisation and decision-making across ANZ.
The significant economic and social impacts of the COVID-19 pandemic continues to require rapid responses and reprioritisation of resources to ensure we are protecting our people, customers, shareholders and ANZ. In the face of these changes, we have regularly tested our business strategy and Group Performance Framework, and resolved they remain relevant to improving the financial wellbeing of our customers and creating long-term sustainable value for all of our stakeholders.
4.5.3 Assessment against the Group Performance Framework for 2021
As managing risk appropriately is fundamental to the way ANZ operates, Risk forms an integral part of the assessment, directly impacting the overall Group Performance Framework outcome (a modifier ranging from 0% to 110% of the Group Performance assessment).
Overall, ANZ’s performance met or exceeded most expectations when considering the objectives we set ourselves, but missed in a few key areas. In an uncertain and volatile environment, the bank performed well, delivering with purpose against the vast majority of our objectives, while recognising there are areas where continued focus is required to improve. These areas primarily relate to home lending momentum in Australia, the pace of delivery for one of our more complex projects focused on digital innovation, and non-financial risk outcomes.
The below table outlines ANZ’s performance objectives in 2021 and provides a summary of outcomes for each of the key performance categories to inform the overall assessment for 2021. Performance against expectations is evaluated for each category using a holistic assessment of progress and outcomes delivered in line with our Group strategic priorities and annual focus areas. A range of objective indicators and subjective factors are considered including management input on work undertaken, evidence of outcomes realised and lessons learned, and with consideration given to the operating, regulatory and competitive environment.
Board review and approve the ANZIP variable remuneration pool
Business and individual allocations from ANZIP variable remuneration pool
ANZIP variable remuneration pool recommended to the Board for approval based on performance and affordability
RISK
FINANCIAL DISCIPLINE & OPERATIONAL RESILIENCECUSTOMER
PEOPLE & CULTURE OVERALL
Group Performance
AssessmentMet most but not all expectations
35% weight
AssessmentMet expectations
35% weight
AssessmentBelow expectations
30% weight
AssessmentAbove expectations
Overall Adjustment
AssessmentMet most but not all expectations
x + + =
8786 ANZ 2021 Annual Report
OVERVIEW HOW WE CREATE VALUE
PERFORMANCE OVERVIEW
REMUNERATION REPORT
DIRECTORS’ REPORT
FINANCIAL REPORT
SHAREHOLDER INFORMATION
87ANZ 2021 Annual Report
OVERVIEW HOW WE CREATE VALUE
PERFORMANCE OVERVIEW
REMUNERATION REPORT
DIRECTORS’ REPORT
FINANCIAL REPORT
SHAREHOLDER INFORMATION

3. Peter Lee Associates 2021 Large Corporate and Institutional Relationship Banking surveys, Australia and NZ.
RISK (MODIFIER 0% TO 110%) Risk overall: Met most but not all expectations
Performance commentaryPerformance against
expectations
GROUP STRATEGIC PRIORITY: Maintain risk discipline focused on good customer and regulatory outcomes.
Below Met Above
Our already strong risk management framework enabled ANZ to continually manage the evolving risks presented by COVID-19 and support our customers and the community. Business continuity was maintained and improved throughout 2021 with no major operational challenges associated with the pandemic.
No material unexpected credit events were recorded during the year. No material risk appetite statement breaches or overdue regulatory issues were recorded, and significant enhancements were made to streamline data capture and reporting to support the proactive management of the bank’s risk appetite using trend analysis technology.
Clear progress continues to be made on risk culture maturity, evidenced in employee engagement scores including ‘My business leaders demonstrate personal accountability for managing risk and sound risk behaviours’ (87%) and ‘I can raise issues and concerns in ANZ without fear of reprisals or negative consequences’ (80%), exceeding the record highs reached in 2020. These results are the product of sustained efforts over several years to encourage a speak up and risk culture where people feel they can challenge each other respectfully.
Timeframes to report risk events once discovered has reduced year-on-year reflecting the significant work undertaken to uncover historical events and get on top of new issues quickly.
ANZ was again the leading Australian bank as measured by the 2020 Dow Jones Sustainability Index1, ranked in the 97th percentile globally in the banking sector and commended in areas including climate strategy and social and environmental reporting.
ANZ ranked #1 overall amongst major domestic peers in the RepTrak™ 2 corporate reputation survey, while we are also leading peers in key Reputation Driver scores for Governance, Leadership, Products/Services, Citizenship and Workplace.
Sound progress has been made in addressing the findings of the Risk Governance Self-Assessment and on key regulatory/non-financial risk projects. However, we are not as advanced with some Non-Financial Risk projects as we would have liked to be and a $500 million APRA capital overlay remains in place pending confirmation of an improvement in operational risk management across the bank. As a result of not meeting all of the high standards we hold ourselves to, the overall Risk assessment rating is ‘met most but not all expectations’.
2021 focus areas Performance commentaryPerformance against
expectations
Below Met Above
Deliver major regulatory commitments
• Strong progress was made against regulatory obligations and commitments, including clear plans and accountability for fixing issues in a sustainable manner. However, these plans could be more advanced.
• Royal Commission: Implementation of December 2020 legislative reforms are underway. 11 of the 41 applicable recommendations are complete, 13 are underway and 17 require external action in order to progress.
• APRA Self-Assessment: Execution is underway and on track, with comprehensive plans and actions monitored by an internal Oversight Committee and assessed by a third party and ANZ’s internal audit function. To date, the vast majority of actions have been completed and those remaining are tracking well.
• Implementation of BS11 in New Zealand continues to move forward against our challenging, internally imposed delivery timeframes.
CUSTOMER (35% WEIGHT) Customer overall: Below expectations
Performance commentaryPerformance against
expectations
GROUP STRATEGIC PRIORITY: Deliver great customer outcomes, focused on improving the financial wellbeing and experience of priority segments
Below Met Above
We have continued to demonstrate our commitment to improve the financial wellbeing of our customers, which remains central to our business strategy. Sound progress has been made to deliver great outcomes across key segments, however after a strong first half, we experienced material challenges processing home loan application volumes in Australia. This has resulted in our customers experiencing longer than expected wait times for loan approval decisions and increased volumes in our assessment backlog. While we were able to tactically manage and improve the situation, strengthening our policy and processes in this area remains a high priority focus. Given the Australian Home Portfolio is a significant proportion of the group balance sheet, under performance in this area has significantly impacted the performance assessment.
In Australia, our Financial Wellbeing activities achieved 1.34 million visits to our Financial Wellbeing Hub on anz.com.au since launch and a 7% uplift in consideration during the major ‘Financial Wellbeing Challenge’ campaign over the 2021 Australian Open. We also launched a ‘gambling block’ on the ANZ mobile app, a new Cashrewards program for customers to earn cashback payments on everyday spending and additional support for customers with persistent credit card debt.
Saver Plus, established in partnership with The Brotherhood of St Laurence in 2003, remains Australia’s largest and longest-running financial education and matched savings program. During 2021, program participants were supported to save $1.9 million, with a further $1.45 million matched by ANZ.
Our GoBiz product was launched for business owners, creating the ability for customers to apply for loans in 20 minutes, while a new joint venture was established with Worldline for merchant services.
In New Zealand, we launched a new Financial Wellbeing platform ‘We Do How’. Key brand attributes have lifted as a result, including ‘A bank that helps you improve your financial wellbeing’ and ‘A bank that helps you pay off your home loan faster’. In addition, we maintained our #1 ranking for Brand Consideration.
Our Institutional business retained #1 rankings in Peter Lee3 surveys, and continued to support customer-focused sustainability outcomes. We were awarded Sustainability Debt House of the Year and Sustainability Issuer of the Year by KangaNews, Australian Sustainability Issuer of the year by FinanceAsia, and maintained our position as the #1 provider in AUD and NZD Sustainable Bonds.
2021 focus areas Performance commentaryPerformance against
expectations
Below Met Above
Improve time to first decision for home loans in Australia
• Restoring momentum in Australian home lending remains a priority to add scale, efficiency and capacity to deliver faster and more consistent application response times for our customers.
• Median time to first decision for Broker and Mobile Lending applications reduced from 35 days in mid-2020 to 7.4 days and application backlogs have also continued to reduce, however there is still work ahead to meet customer expectations and our own high standards.
Remediate past mistakes in Australia and NZ
• Our Responsible Banking teams in Australia and New Zealand refunded approximately $209 million to around 2.6 million customer accounts during 2021.
• 13 major remediation streams have been completed in Australia, while in New Zealand, 45 remediation events have been closed.
Treat our customers fairly, particularly as COVID-19 loan deferrals are reassessed and managed
• We have proactively ensured that customers undergoing financial stress, including due to the impacts of COVID-19, have access to support options.
• Over the last 12 months, approximately 143k loan deferrals were provided to Australia Retail and Commercial customers. At the completion of deferrals in March 2021, 96% of our home lending customers, and 90% of our commercial and private bank customers had either returned or advised their intention to return to payments. Remaining loans have been either restructured or are in Hardship or Lending Services, with around 1% not suitable for either form of assistance.
• Additional support packages were announced in early July and ANZ has since provided assistance to Home Loan and Commercial customers.
• In New Zealand, communications were sent to 250,000 customers who had not taken assistance during COVID-19 who ANZ felt might need support, with 7,000 customers taking assistance as a result. Home loan deferrals resulted in very few defaults and/or referrals to our financial wellbeing team, with strong oversight and assistance remaining in place.
Deliver new customer service propositions
• Several digital innovation projects are underway to deliver new customer propositions, with early customer satisfaction testing results exceeding expectations. The complexity and scale of this work has resulted in unexpected delays however robust tracking and support remains in place.1. Dow Jones Sustainability Indices (DJSI): Evaluates the sustainability performance of thousands of companies trading publicly, operated under a strategic partnership between S&P Dow Jones
Indices and RobecoSAM (Sustainable Asset Management). 2. RepTrak™ measures the reputation of the 60 largest companies operating nationally every quarter, as determined by the revenue classification of the IBISWorld Top 2000 list.
8988 ANZ 2021 Annual Report
OVERVIEW HOW WE CREATE VALUE
PERFORMANCE OVERVIEW
REMUNERATION REPORT
DIRECTORS’ REPORT
FINANCIAL REPORT
SHAREHOLDER INFORMATION
88
OVERVIEW HOW WE CREATE VALUE
PERFORMANCE OVERVIEW
REMUNERATION REPORT
DIRECTORS’ REPORT
FINANCIAL REPORT
SHAREHOLDER INFORMATION

3. Peter Lee Associates 2021 Large Corporate and Institutional Relationship Banking surveys, Australia and NZ.
RISK (MODIFIER 0% TO 110%) Risk overall: Met most but not all expectations
Performance commentaryPerformance against
expectations
GROUP STRATEGIC PRIORITY: Maintain risk discipline focused on good customer and regulatory outcomes.
Below Met Above
Our already strong risk management framework enabled ANZ to continually manage the evolving risks presented by COVID-19 and support our customers and the community. Business continuity was maintained and improved throughout 2021 with no major operational challenges associated with the pandemic.
No material unexpected credit events were recorded during the year. No material risk appetite statement breaches or overdue regulatory issues were recorded, and significant enhancements were made to streamline data capture and reporting to support the proactive management of the bank’s risk appetite using trend analysis technology.
Clear progress continues to be made on risk culture maturity, evidenced in employee engagement scores including ‘My business leaders demonstrate personal accountability for managing risk and sound risk behaviours’ (87%) and ‘I can raise issues and concerns in ANZ without fear of reprisals or negative consequences’ (80%), exceeding the record highs reached in 2020. These results are the product of sustained efforts over several years to encourage a speak up and risk culture where people feel they can challenge each other respectfully.
Timeframes to report risk events once discovered has reduced year-on-year reflecting the significant work undertaken to uncover historical events and get on top of new issues quickly.
ANZ was again the leading Australian bank as measured by the 2020 Dow Jones Sustainability Index1, ranked in the 97th percentile globally in the banking sector and commended in areas including climate strategy and social and environmental reporting.
ANZ ranked #1 overall amongst major domestic peers in the RepTrak™ 2 corporate reputation survey, while we are also leading peers in key Reputation Driver scores for Governance, Leadership, Products/Services, Citizenship and Workplace.
Sound progress has been made in addressing the findings of the Risk Governance Self-Assessment and on key regulatory/non-financial risk projects. However, we are not as advanced with some Non-Financial Risk projects as we would have liked to be and a $500 million APRA capital overlay remains in place pending confirmation of an improvement in operational risk management across the bank. As a result of not meeting all of the high standards we hold ourselves to, the overall Risk assessment rating is ‘met most but not all expectations’.
2021 focus areas Performance commentaryPerformance against
expectations
Below Met Above
Deliver major regulatory commitments
• Strong progress was made against regulatory obligations and commitments, including clear plans and accountability for fixing issues in a sustainable manner. However, these plans could be more advanced.
• Royal Commission: Implementation of December 2020 legislative reforms are underway. 11 of the 41 applicable recommendations are complete, 13 are underway and 17 require external action in order to progress.
• APRA Self-Assessment: Execution is underway and on track, with comprehensive plans and actions monitored by an internal Oversight Committee and assessed by a third party and ANZ’s internal audit function. To date, the vast majority of actions have been completed and those remaining are tracking well.
• Implementation of BS11 in New Zealand continues to move forward against our challenging, internally imposed delivery timeframes.
CUSTOMER (35% WEIGHT) Customer overall: Below expectations
Performance commentaryPerformance against
expectations
GROUP STRATEGIC PRIORITY: Deliver great customer outcomes, focused on improving the financial wellbeing and experience of priority segments
Below Met Above
We have continued to demonstrate our commitment to improve the financial wellbeing of our customers, which remains central to our business strategy. Sound progress has been made to deliver great outcomes across key segments, however after a strong first half, we experienced material challenges processing home loan application volumes in Australia. This has resulted in our customers experiencing longer than expected wait times for loan approval decisions and increased volumes in our assessment backlog. While we were able to tactically manage and improve the situation, strengthening our policy and processes in this area remains a high priority focus. Given the Australian Home Portfolio is a significant proportion of the group balance sheet, under performance in this area has significantly impacted the performance assessment.
In Australia, our Financial Wellbeing activities achieved 1.34 million visits to our Financial Wellbeing Hub on anz.com.au since launch and a 7% uplift in consideration during the major ‘Financial Wellbeing Challenge’ campaign over the 2021 Australian Open. We also launched a ‘gambling block’ on the ANZ mobile app, a new Cashrewards program for customers to earn cashback payments on everyday spending and additional support for customers with persistent credit card debt.
Saver Plus, established in partnership with The Brotherhood of St Laurence in 2003, remains Australia’s largest and longest-running financial education and matched savings program. During 2021, program participants were supported to save $1.9 million, with a further $1.45 million matched by ANZ.
Our GoBiz product was launched for business owners, creating the ability for customers to apply for loans in 20 minutes, while a new joint venture was established with Worldline for merchant services.
In New Zealand, we launched a new Financial Wellbeing platform ‘We Do How’. Key brand attributes have lifted as a result, including ‘A bank that helps you improve your financial wellbeing’ and ‘A bank that helps you pay off your home loan faster’. In addition, we maintained our #1 ranking for Brand Consideration.
Our Institutional business retained #1 rankings in Peter Lee3 surveys, and continued to support customer-focused sustainability outcomes. We were awarded Sustainability Debt House of the Year and Sustainability Issuer of the Year by KangaNews, Australian Sustainability Issuer of the year by FinanceAsia, and maintained our position as the #1 provider in AUD and NZD Sustainable Bonds.
2021 focus areas Performance commentaryPerformance against
expectations
Below Met Above
Improve time to first decision for home loans in Australia
• Restoring momentum in Australian home lending remains a priority to add scale, efficiency and capacity to deliver faster and more consistent application response times for our customers.
• Median time to first decision for Broker and Mobile Lending applications reduced from 35 days in mid-2020 to 7.4 days and application backlogs have also continued to reduce, however there is still work ahead to meet customer expectations and our own high standards.
Remediate past mistakes in Australia and NZ
• Our Responsible Banking teams in Australia and New Zealand refunded approximately $209 million to around 2.6 million customer accounts during 2021.
• 13 major remediation streams have been completed in Australia, while in New Zealand, 45 remediation events have been closed.
Treat our customers fairly, particularly as COVID-19 loan deferrals are reassessed and managed
• We have proactively ensured that customers undergoing financial stress, including due to the impacts of COVID-19, have access to support options.
• Over the last 12 months, approximately 143k loan deferrals were provided to Australia Retail and Commercial customers. At the completion of deferrals in March 2021, 96% of our home lending customers, and 90% of our commercial and private bank customers had either returned or advised their intention to return to payments. Remaining loans have been either restructured or are in Hardship or Lending Services, with around 1% not suitable for either form of assistance.
• Additional support packages were announced in early July and ANZ has since provided assistance to Home Loan and Commercial customers.
• In New Zealand, communications were sent to 250,000 customers who had not taken assistance during COVID-19 who ANZ felt might need support, with 7,000 customers taking assistance as a result. Home loan deferrals resulted in very few defaults and/or referrals to our financial wellbeing team, with strong oversight and assistance remaining in place.
Deliver new customer service propositions
• Several digital innovation projects are underway to deliver new customer propositions, with early customer satisfaction testing results exceeding expectations. The complexity and scale of this work has resulted in unexpected delays however robust tracking and support remains in place.1. Dow Jones Sustainability Indices (DJSI): Evaluates the sustainability performance of thousands of companies trading publicly, operated under a strategic partnership between S&P Dow Jones
Indices and RobecoSAM (Sustainable Asset Management). 2. RepTrak™ measures the reputation of the 60 largest companies operating nationally every quarter, as determined by the revenue classification of the IBISWorld Top 2000 list.
8988 ANZ 2021 Annual Report
OVERVIEW HOW WE CREATE VALUE
PERFORMANCE OVERVIEW
REMUNERATION REPORT
DIRECTORS’ REPORT
FINANCIAL REPORT
SHAREHOLDER INFORMATION
89ANZ 2021 Annual Report
OVERVIEW HOW WE CREATE VALUE
PERFORMANCE OVERVIEW
REMUNERATION REPORT
DIRECTORS’ REPORT
FINANCIAL REPORT
SHAREHOLDER INFORMATION

PEOPLE & CULTURE (30% WEIGHT) People & Culture overall: Above expectations
Performance commentaryPerformance against
expectations
GROUP STRATEGIC PRIORITY: Build a diverse team who listen, learn and adapt
Below Met Above
Our consistently strong management of people and culture was again a highlight and reflects multiple years of purposeful investment in building the right leadership behaviours and enhancing our culture frameworks. ANZ was awarded the #1 position in the Australian Financial Review’s Best Place to Work Awards (Banking, Superannuation & Financial Services) and we achieved the outright #1 position amongst major bank peers in Glassdoor4 ratings.
Staff engagement survey results remained strong, and following a global trend which saw employer scores spike in 2020, ANZ’s 2021 results expectedly returned to a steady positive trend. Key scores remained within target thresholds and above 2019 levels, with overall engagement at 81% (86% in 2020; 77% in 2019).
The wellbeing of our people continued to be a priority, with all staff supported to complete mental health awareness training. We also have been reshaping how we work by mobilising our employees into three flexible working modes across all geographies where regulatory requirements have permitted.
We made the strongest improvement in gender diversity in several years, with female representation in leadership roles increasing by 1.9% to 35.3%. A new Diversity & Inclusion Strategy was also endorsed to drive further long-term sustainable improvements.
Embedding of our reward and performance framework continued, with a focus on continuous performance management capabilities, employee recognition, and reward arrangements for high performers in critical talent populations.
2021 focus areas Performance commentaryPerformance against
expectations
Below Met Above
Roll out enterprise wide change leadership programs
• We successfully rolled out an enterprise wide program to support all of our people leaders to lead their teams through disruption and change.
• Activities to embed these key leadership behaviours have been developed and introduced into key phases of the employee lifecycle.
• In New Zealand, additional workshops have been delivered to over 80% of people leaders to further educate them on our leadership frameworks and tools.
Strengthen strategic priority capabilities
• To enhance our critical strategic capabilities, we have placed over 3,700 external hires and 700 internal transfers into engineering roles, while more than 400 external hires and over 200 internal moves were completed into data roles.
• We continued to build priority engineering skills, with approximately 7,000 hours of content consumed on our leading edge learning platforms relating to Cloud, DevOps, Coding and Scripting and Data Modelling.
• Critical pipelines for engineering capability were also increased through various programs to improve workforce diversity and participation.
FINANCIAL DISCIPLINE & OPERATIONAL RESILIENCE (35% WEIGHT) Financial Discipline & Operational Resilience overall: Met expectations
Performance commentaryPerformance against
expectations
GROUP STRATEGIC PRIORITY: Run core businesses well, focused on delivering sustainable growth and operational improvements
Below Met Above
In an uncertain and volatile environment, ANZ delivered solid underlying earnings. This reflects the continued execution of our long-term strategy to maintain a strong balance sheet, prudently manage risk and remain focused on cost management. We remained disciplined in our focus on margins and returns, although lending volumes in our Australian home loan business were impacted by challenges in processing application volumes. Costs were again well managed, enabling record levels of investment in both growth initiatives and reducing operational complexity. Our capital strength was again evident enabling us to increase dividends and commence returning capital to shareholders.
2021 focus areas Performance commentaryPerformance against
expectations
Below Met Above
Deliver Group Economic Profit in a high quality and sustainable manner
• On a cash continuing basis, Economic Profit5 of $769 million was generated. This was on target, notwithstanding that NPAT was impacted by $946 million (post-tax) of large/notable items6.
• Excluding large/notable items, revenue was down 3% as the performance of our Markets business normalised reflecting lower market volatility and customer hedging activity. Elsewhere, strong risk-adjusted margin discipline was evident despite environmental and structural headwinds.
• Cost management remained disciplined. Run the bank costs reduced 4% which enabled high levels of investment to grow and simplify the business, and meet our regulatory and compliance obligations.
• The credit quality of our lending portfolio remains strong, with long-run loss rates continuing to decline.
• Capital continued to be well managed. CET1 of 12.3% has enabled increased dividends to be paid to our shareholders and a $1.5 billion share buyback to be commenced, while retaining flexibility to use our balance sheet to support customers as required.
Deliver our Acceleration to Cloud with a focus on our Windows Server Fleet
• We are ahead of schedule in the migration of the Windows Server Fleet to Cloud.
OVERALL Group Performance assessment: Met most but not all expectations
On balance, the Board considered an overall assessment of ‘Met most but not all expectations’ a fair and appropriate rating, reflecting that overall Group performance was slightly below expectations.
The bank performed well, delivering with purpose against the vast majority of our objectives, while recognising there are areas where continued focus is required to improve. These areas primarily relate to home lending momentum in Australia, and the pace at which we are delivering complex projects to achieve digital innovation and non-financial risk outcomes.
5. Economic profit is a risk adjusted profit measure used to evaluate business unit performance and is not subject to audit by the external auditor. Economic profit is calculated via a series of adjustments to cash profit with the economic credit cost adjustment replacing the accounting credit loss charge; the inclusion of the benefit of imputation credits (measured at 70% of Australian tax) and an adjustment to reflect the cost of capital. 6. Large/notable items include the impact of divestments, customer remediation, litigation settlements, restructuring and Asian Associate items.4. Glassdoor is a website where employees and former employees anonymously review companies and their management.
9190 ANZ 2021 Annual Report
OVERVIEW HOW WE CREATE VALUE
PERFORMANCE OVERVIEW
REMUNERATION REPORT
DIRECTORS’ REPORT
FINANCIAL REPORT
SHAREHOLDER INFORMATION
90
OVERVIEW HOW WE CREATE VALUE
PERFORMANCE OVERVIEW
REMUNERATION REPORT
DIRECTORS’ REPORT
FINANCIAL REPORT
SHAREHOLDER INFORMATION
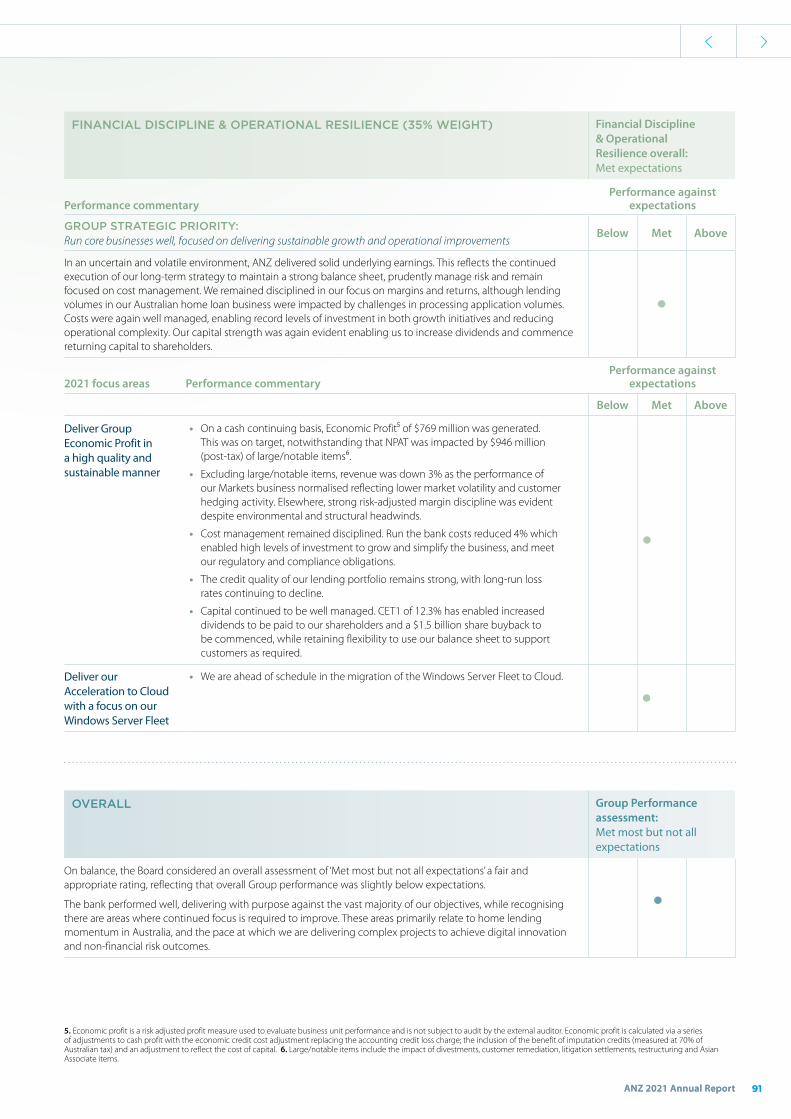
PEOPLE & CULTURE (30% WEIGHT) People & Culture overall: Above expectations
Performance commentaryPerformance against
expectations
GROUP STRATEGIC PRIORITY: Build a diverse team who listen, learn and adapt
Below Met Above
Our consistently strong management of people and culture was again a highlight and reflects multiple years of purposeful investment in building the right leadership behaviours and enhancing our culture frameworks. ANZ was awarded the #1 position in the Australian Financial Review’s Best Place to Work Awards (Banking, Superannuation & Financial Services) and we achieved the outright #1 position amongst major bank peers in Glassdoor4 ratings.
Staff engagement survey results remained strong, and following a global trend which saw employer scores spike in 2020, ANZ’s 2021 results expectedly returned to a steady positive trend. Key scores remained within target thresholds and above 2019 levels, with overall engagement at 81% (86% in 2020; 77% in 2019).
The wellbeing of our people continued to be a priority, with all staff supported to complete mental health awareness training. We also have been reshaping how we work by mobilising our employees into three flexible working modes across all geographies where regulatory requirements have permitted.
We made the strongest improvement in gender diversity in several years, with female representation in leadership roles increasing by 1.9% to 35.3%. A new Diversity & Inclusion Strategy was also endorsed to drive further long-term sustainable improvements.
Embedding of our reward and performance framework continued, with a focus on continuous performance management capabilities, employee recognition, and reward arrangements for high performers in critical talent populations.
2021 focus areas Performance commentaryPerformance against
expectations
Below Met Above
Roll out enterprise wide change leadership programs
• We successfully rolled out an enterprise wide program to support all of our people leaders to lead their teams through disruption and change.
• Activities to embed these key leadership behaviours have been developed and introduced into key phases of the employee lifecycle.
• In New Zealand, additional workshops have been delivered to over 80% of people leaders to further educate them on our leadership frameworks and tools.
Strengthen strategic priority capabilities
• To enhance our critical strategic capabilities, we have placed over 3,700 external hires and 700 internal transfers into engineering roles, while more than 400 external hires and over 200 internal moves were completed into data roles.
• We continued to build priority engineering skills, with approximately 7,000 hours of content consumed on our leading edge learning platforms relating to Cloud, DevOps, Coding and Scripting and Data Modelling.
• Critical pipelines for engineering capability were also increased through various programs to improve workforce diversity and participation.
FINANCIAL DISCIPLINE & OPERATIONAL RESILIENCE (35% WEIGHT) Financial Discipline & Operational Resilience overall: Met expectations
Performance commentaryPerformance against
expectations
GROUP STRATEGIC PRIORITY: Run core businesses well, focused on delivering sustainable growth and operational improvements
Below Met Above
In an uncertain and volatile environment, ANZ delivered solid underlying earnings. This reflects the continued execution of our long-term strategy to maintain a strong balance sheet, prudently manage risk and remain focused on cost management. We remained disciplined in our focus on margins and returns, although lending volumes in our Australian home loan business were impacted by challenges in processing application volumes. Costs were again well managed, enabling record levels of investment in both growth initiatives and reducing operational complexity. Our capital strength was again evident enabling us to increase dividends and commence returning capital to shareholders.
2021 focus areas Performance commentaryPerformance against
expectations
Below Met Above
Deliver Group Economic Profit in a high quality and sustainable manner
• On a cash continuing basis, Economic Profit5 of $769 million was generated. This was on target, notwithstanding that NPAT was impacted by $946 million (post-tax) of large/notable items6.
• Excluding large/notable items, revenue was down 3% as the performance of our Markets business normalised reflecting lower market volatility and customer hedging activity. Elsewhere, strong risk-adjusted margin discipline was evident despite environmental and structural headwinds.
• Cost management remained disciplined. Run the bank costs reduced 4% which enabled high levels of investment to grow and simplify the business, and meet our regulatory and compliance obligations.
• The credit quality of our lending portfolio remains strong, with long-run loss rates continuing to decline.
• Capital continued to be well managed. CET1 of 12.3% has enabled increased dividends to be paid to our shareholders and a $1.5 billion share buyback to be commenced, while retaining flexibility to use our balance sheet to support customers as required.
Deliver our Acceleration to Cloud with a focus on our Windows Server Fleet
• We are ahead of schedule in the migration of the Windows Server Fleet to Cloud.
OVERALL Group Performance assessment: Met most but not all expectations
On balance, the Board considered an overall assessment of ‘Met most but not all expectations’ a fair and appropriate rating, reflecting that overall Group performance was slightly below expectations.
The bank performed well, delivering with purpose against the vast majority of our objectives, while recognising there are areas where continued focus is required to improve. These areas primarily relate to home lending momentum in Australia, and the pace at which we are delivering complex projects to achieve digital innovation and non-financial risk outcomes.
5. Economic profit is a risk adjusted profit measure used to evaluate business unit performance and is not subject to audit by the external auditor. Economic profit is calculated via a series of adjustments to cash profit with the economic credit cost adjustment replacing the accounting credit loss charge; the inclusion of the benefit of imputation credits (measured at 70% of Australian tax) and an adjustment to reflect the cost of capital. 6. Large/notable items include the impact of divestments, customer remediation, litigation settlements, restructuring and Asian Associate items.4. Glassdoor is a website where employees and former employees anonymously review companies and their management.
9190 ANZ 2021 Annual Report
OVERVIEW HOW WE CREATE VALUE
PERFORMANCE OVERVIEW
REMUNERATION REPORT
DIRECTORS’ REPORT
FINANCIAL REPORT
SHAREHOLDER INFORMATION
91ANZ 2021 Annual Report
OVERVIEW HOW WE CREATE VALUE
PERFORMANCE OVERVIEW
REMUNERATION REPORT
DIRECTORS’ REPORT
FINANCIAL REPORT
SHAREHOLDER INFORMATION
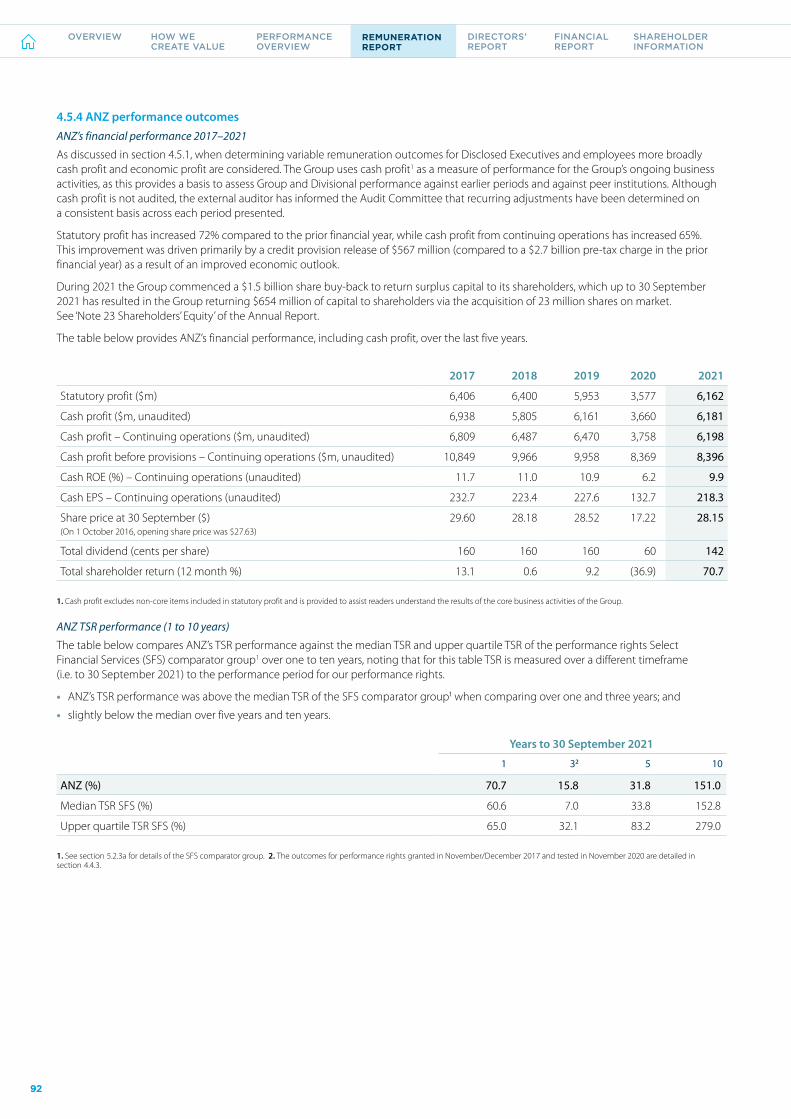
5. 2021 EXECUTIVE REMUNERATION STRUCTURE AND DELIVERY
There are two core components of remuneration at ANZ – fixed remuneration and at risk variable remuneration.
In structuring remuneration, the Board aims to find the right balance between fixed and variable remuneration (at risk), the way it is delivered (cash versus deferred remuneration) and appropriate time frames (the short, medium and long-term).
The Board sets (and reviews annually) the CEO and Disclosed Executives’ fixed remuneration based on financial services market relativities and reflecting their responsibilities, performance, qualifications and experience.
The way variable remuneration operates differs somewhat between the CEO and Disclosed Executives. Namely:
• The CEO’s variable remuneration is comprised of AVR and LTVR (subject to shareholder approval), which provides consistency with external market practice, and LTVR reinforces his focus on achieving longer term strategic objectives and long-term stakeholder value creation.
• Disclosed Executives are subject to one combined VR plan (i.e. a mix of short and also long term rewards with performance hurdles) deferred over the short, medium and longer term.
Variable remuneration seeks to differentiate for performance and is designed to focus our CEO and Disclosed Executives on stretching performance objectives supporting our business strategy, risk management and the delivery of long-term stakeholder value.
By deferring a significant portion of variable remuneration (74% of maximum opportunity for the CEO, 75% for Disclosed Executives and 67% for the CRO), we seek to ensure alignment with shareholder interests to deliver on ANZ’s strategic objectives and ensure a focus on long-term value creation. Deferred variable remuneration has significant retention elements, and most importantly, can be adjusted downwards, including to zero, allowing the Board to hold executives accountable, individually or collectively, for the longer term impacts of their decisions and actions.
Board discretion is applied when determining all CEO and Disclosed Executive variable remuneration outcomes, and also before any scheduled release of previously deferred remuneration (i.e. consider malus or further deferral). See section 5.3.
5.1 REMUNERATION MIX (PERFORMANCE RIGHTS AT FULL VESTING)
We structure the CEO and Disclosed Executives’ remuneration as follows:
REMUNERATION MIX – CEO
Minimum = Fixed remuneration ($2.5 million)
Target = Fixed remuneration + target AVR (100% of �xed remuneration) + LTVR (140% of �xed remuneration)
Maximum = Fixed remuneration + maximum AVR (150% of �xed remuneration) + LTVR (140% of �xed remuneration)
Fixed remuneration AVR cash AVR deferred shares LTVR performance rights
$2.5 million
$9.75 million
$8.5 million
Minimum opportunity
Maximum opportunity
Target opportunity100%
29% 14.5% 14.5% 42%
26% 19% 19% 36%
27% 18% 18% 37%
20% 20% 20% 40%
REMUNERATION MIX – DISCLOSED EXECUTIVES1
Minimum = Fixed remuneration
Target = Fixed remuneration + target VR (268% of �xed remuneration)
Maximum = Fixed remuneration + maximum VR (402% of �xed remuneration (150% of target VR))
Fixed remuneration VR cash VR deferred shares VR performance rights
Minimum opportunity
Maximum opportunity
Target opportunity
100%
1. Excluding CRO.
4.5.4 ANZ performance outcomesANZ’s financial performance 2017–2021
As discussed in section 4.5.1, when determining variable remuneration outcomes for Disclosed Executives and employees more broadly cash profit and economic profit are considered. The Group uses cash profit1 as a measure of performance for the Group’s ongoing business activities, as this provides a basis to assess Group and Divisional performance against earlier periods and against peer institutions. Although cash profit is not audited, the external auditor has informed the Audit Committee that recurring adjustments have been determined on a consistent basis across each period presented.
Statutory profit has increased 72% compared to the prior financial year, while cash profit from continuing operations has increased 65%. This improvement was driven primarily by a credit provision release of $567 million (compared to a $2.7 billion pre-tax charge in the prior financial year) as a result of an improved economic outlook.
During 2021 the Group commenced a $1.5 billion share buy-back to return surplus capital to its shareholders, which up to 30 September 2021 has resulted in the Group returning $654 million of capital to shareholders via the acquisition of 23 million shares on market. See ‘Note 23 Shareholders’ Equity’ of the Annual Report.
The table below provides ANZ’s financial performance, including cash profit, over the last five years.
2017 2018 2019 2020 2021
Statutory profit ($m) 6,406 6,400 5,953 3,577 6,162
Cash profit ($m, unaudited) 6,938 5,805 6,161 3,660 6,181
Cash profit – Continuing operations ($m, unaudited) 6,809 6,487 6,470 3,758 6,198
Cash profit before provisions – Continuing operations ($m, unaudited) 10,849 9,966 9,958 8,369 8,396
Cash ROE (%) – Continuing operations (unaudited) 11.7 11.0 10.9 6.2 9.9
Cash EPS – Continuing operations (unaudited) 232.7 223.4 227.6 132.7 218.3
Share price at 30 September ($)(On 1 October 2016, opening share price was $27.63)
29.60 28.18 28.52 17.22 28.15
Total dividend (cents per share) 160 160 160 60 142
Total shareholder return (12 month %) 13.1 0.6 9.2 (36.9) 70.7
1. Cash profit excludes non-core items included in statutory profit and is provided to assist readers understand the results of the core business activities of the Group.
ANZ TSR performance (1 to 10 years)
The table below compares ANZ’s TSR performance against the median TSR and upper quartile TSR of the performance rights Select Financial Services (SFS) comparator group1 over one to ten years, noting that for this table TSR is measured over a different timeframe (i.e. to 30 September 2021) to the performance period for our performance rights.
• ANZ’s TSR performance was above the median TSR of the SFS comparator group1 when comparing over one and three years; and
• slightly below the median over five years and ten years.
Years to 30 September 2021
1 32 5 10
ANZ (%) 70.7 15.8 31.8 151.0
Median TSR SFS (%) 60.6 7.0 33.8 152.8
Upper quartile TSR SFS (%) 65.0 32.1 83.2 279.0
1. See section 5.2.3a for details of the SFS comparator group. 2. The outcomes for performance rights granted in November/December 2017 and tested in November 2020 are detailed in section 4.4.3.
9392 ANZ 2021 Annual Report
OVERVIEW HOW WE CREATE VALUE
PERFORMANCE OVERVIEW
REMUNERATION REPORT
DIRECTORS’ REPORT
FINANCIAL REPORT
SHAREHOLDER INFORMATION
92
OVERVIEW HOW WE CREATE VALUE
PERFORMANCE OVERVIEW
REMUNERATION REPORT
DIRECTORS’ REPORT
FINANCIAL REPORT
SHAREHOLDER INFORMATION

5. 2021 EXECUTIVE REMUNERATION STRUCTURE AND DELIVERY
There are two core components of remuneration at ANZ – fixed remuneration and at risk variable remuneration.
In structuring remuneration, the Board aims to find the right balance between fixed and variable remuneration (at risk), the way it is delivered (cash versus deferred remuneration) and appropriate time frames (the short, medium and long-term).
The Board sets (and reviews annually) the CEO and Disclosed Executives’ fixed remuneration based on financial services market relativities and reflecting their responsibilities, performance, qualifications and experience.
The way variable remuneration operates differs somewhat between the CEO and Disclosed Executives. Namely:
• The CEO’s variable remuneration is comprised of AVR and LTVR (subject to shareholder approval), which provides consistency with external market practice, and LTVR reinforces his focus on achieving longer term strategic objectives and long-term stakeholder value creation.
• Disclosed Executives are subject to one combined VR plan (i.e. a mix of short and also long term rewards with performance hurdles) deferred over the short, medium and longer term.
Variable remuneration seeks to differentiate for performance and is designed to focus our CEO and Disclosed Executives on stretching performance objectives supporting our business strategy, risk management and the delivery of long-term stakeholder value.
By deferring a significant portion of variable remuneration (74% of maximum opportunity for the CEO, 75% for Disclosed Executives and 67% for the CRO), we seek to ensure alignment with shareholder interests to deliver on ANZ’s strategic objectives and ensure a focus on long-term value creation. Deferred variable remuneration has significant retention elements, and most importantly, can be adjusted downwards, including to zero, allowing the Board to hold executives accountable, individually or collectively, for the longer term impacts of their decisions and actions.
Board discretion is applied when determining all CEO and Disclosed Executive variable remuneration outcomes, and also before any scheduled release of previously deferred remuneration (i.e. consider malus or further deferral). See section 5.3.
5.1 REMUNERATION MIX (PERFORMANCE RIGHTS AT FULL VESTING)
We structure the CEO and Disclosed Executives’ remuneration as follows:
REMUNERATION MIX – CEO
Minimum = Fixed remuneration ($2.5 million)
Target = Fixed remuneration + target AVR (100% of �xed remuneration) + LTVR (140% of �xed remuneration)
Maximum = Fixed remuneration + maximum AVR (150% of �xed remuneration) + LTVR (140% of �xed remuneration)
Fixed remuneration AVR cash AVR deferred shares LTVR performance rights
$2.5 million
$9.75 million
$8.5 million
Minimum opportunity
Maximum opportunity
Target opportunity100%
29% 14.5% 14.5% 42%
26% 19% 19% 36%
27% 18% 18% 37%
20% 20% 20% 40%
REMUNERATION MIX – DISCLOSED EXECUTIVES1
Minimum = Fixed remuneration
Target = Fixed remuneration + target VR (268% of �xed remuneration)
Maximum = Fixed remuneration + maximum VR (402% of �xed remuneration (150% of target VR))
Fixed remuneration VR cash VR deferred shares VR performance rights
Minimum opportunity
Maximum opportunity
Target opportunity
100%
1. Excluding CRO.
4.5.4 ANZ performance outcomesANZ’s financial performance 2017–2021
As discussed in section 4.5.1, when determining variable remuneration outcomes for Disclosed Executives and employees more broadly cash profit and economic profit are considered. The Group uses cash profit1 as a measure of performance for the Group’s ongoing business activities, as this provides a basis to assess Group and Divisional performance against earlier periods and against peer institutions. Although cash profit is not audited, the external auditor has informed the Audit Committee that recurring adjustments have been determined on a consistent basis across each period presented.
Statutory profit has increased 72% compared to the prior financial year, while cash profit from continuing operations has increased 65%. This improvement was driven primarily by a credit provision release of $567 million (compared to a $2.7 billion pre-tax charge in the prior financial year) as a result of an improved economic outlook.
During 2021 the Group commenced a $1.5 billion share buy-back to return surplus capital to its shareholders, which up to 30 September 2021 has resulted in the Group returning $654 million of capital to shareholders via the acquisition of 23 million shares on market. See ‘Note 23 Shareholders’ Equity’ of the Annual Report.
The table below provides ANZ’s financial performance, including cash profit, over the last five years.
2017 2018 2019 2020 2021
Statutory profit ($m) 6,406 6,400 5,953 3,577 6,162
Cash profit ($m, unaudited) 6,938 5,805 6,161 3,660 6,181
Cash profit – Continuing operations ($m, unaudited) 6,809 6,487 6,470 3,758 6,198
Cash profit before provisions – Continuing operations ($m, unaudited) 10,849 9,966 9,958 8,369 8,396
Cash ROE (%) – Continuing operations (unaudited) 11.7 11.0 10.9 6.2 9.9
Cash EPS – Continuing operations (unaudited) 232.7 223.4 227.6 132.7 218.3
Share price at 30 September ($)(On 1 October 2016, opening share price was $27.63)
29.60 28.18 28.52 17.22 28.15
Total dividend (cents per share) 160 160 160 60 142
Total shareholder return (12 month %) 13.1 0.6 9.2 (36.9) 70.7
1. Cash profit excludes non-core items included in statutory profit and is provided to assist readers understand the results of the core business activities of the Group.
ANZ TSR performance (1 to 10 years)
The table below compares ANZ’s TSR performance against the median TSR and upper quartile TSR of the performance rights Select Financial Services (SFS) comparator group1 over one to ten years, noting that for this table TSR is measured over a different timeframe (i.e. to 30 September 2021) to the performance period for our performance rights.
• ANZ’s TSR performance was above the median TSR of the SFS comparator group1 when comparing over one and three years; and
• slightly below the median over five years and ten years.
Years to 30 September 2021
1 32 5 10
ANZ (%) 70.7 15.8 31.8 151.0
Median TSR SFS (%) 60.6 7.0 33.8 152.8
Upper quartile TSR SFS (%) 65.0 32.1 83.2 279.0
1. See section 5.2.3a for details of the SFS comparator group. 2. The outcomes for performance rights granted in November/December 2017 and tested in November 2020 are detailed in section 4.4.3.
9392 ANZ 2021 Annual Report
OVERVIEW HOW WE CREATE VALUE
PERFORMANCE OVERVIEW
REMUNERATION REPORT
DIRECTORS’ REPORT
FINANCIAL REPORT
SHAREHOLDER INFORMATION
93ANZ 2021 Annual Report
OVERVIEW HOW WE CREATE VALUE
PERFORMANCE OVERVIEW
REMUNERATION REPORT
DIRECTORS’ REPORT
FINANCIAL REPORT
SHAREHOLDER INFORMATION

CRO
To preserve the independence of the role and to minimise any conflicts of interest in carrying out the risk control function across the organisation, the CRO’s remuneration arrangements differ to other Disclosed Executives.
The remuneration mix is 27% fixed remuneration and 73% VR at maximum opportunity. The VR target opportunity is 180% of fixed remuneration and VR maximum opportunity is 270% of fixed remuneration. VR is delivered as 33% cash, 33% deferred shares and 34% deferred share rights (instead of performance rights).
5.2 VARIABLE REMUNERATION DELIVERY
Variable remuneration for the CEO and the Disclosed Executives (excluding the CRO) is delivered partly in cash, shares deferred over four years, and performance rights deferred for four years. The performance rights are also subject to performance hurdles which determine whether they vest in four years’ time.
60% of variable remuneration (AVR plus LTVR) for the CEO, 53% of VR for Disclosed Executives (other than the CRO), and 41% of VR for the CRO will be deferred for at least four years (from the date the Board approved the variable remuneration in October (and the date shareholders approve the CEO’s LTVR)), noting that this complies with the BEAR minimum deferral requirement of 60% for the CEO and 40% for Disclosed Executives.
Before any scheduled release of deferred shares/deferred share rights/performance rights, the Board considers whether any malus/downward adjustment of previously deferred remuneration (or further deferral of vesting) should be made for the CEO and Disclosed Executives. See section 5.3.
VARIABLE REMUNERATION DELIVERY – CEO AND DISCLOSED EXECUTIVES
1 O
ct20
20
30 S
ep 2
021
Varia
ble
rem
uner
atio
n pa
id/a
lloca
ted
Nov
202
11
Nov
202
2
Nov
202
3
Nov
202
4
Nov
202
5
Fixed remuneration
ANZ�nancial year
DE
FER
RE
DSH
AR
ES2
(AV
R/V
R)
CA
SH(A
VR
/VR
)
Vesting is subject to meeting TSR performance
hurdles at the end of year 4
40% vesting at the end of year 1 30% vesting at
the end of year 220% vesting at
the end of year 3
PER
FOR
MA
NC
E R
IGH
TS3
(LT
VR
/VR
)
10% vesting at the end of year 4
1. Variable remuneration outcomes were approved by the ANZBGL Board on 15 October 2021, and in addition for A Watson by the ANZ NZ Board on 19 October 2021. The CEO’s performance rights are subject to shareholder approval at the 2021 AGM. 2. Deferred shares for the CRO vest as follows: 30% at the end of years 1 and 2, and 20% at the end of years 3 and 4. 3. Deferred share rights for the CRO.
5.2.1 Cash – CEO (AVR) and Disclosed Executives (VR)The cash component of variable remuneration is paid to executives at the end of the annual Performance and Remuneration Review (December 2021).
5.2.2 Deferred shares – CEO (AVR) and Disclosed Executives (VR)Deferred shares are ordinary shares, deferred over one to four years. By deferring part of an executives’ remuneration over time (and it remaining subject to malus), we enable a substantial amount of their remuneration to be directly linked to delivering long-term shareholder value. We grant deferred shares in respect of performance for the 1 October to 30 September financial year in late November each year.
We calculate the number of deferred shares to be granted based on the VWAP of the shares traded on the ASX in the five trading days leading up to and including the date of grant. For disclosure and expensing purposes, we use the one day VWAP at the date of grant to determine the fair value.
In some cases, we may grant deferred share rights to executives instead of deferred shares. Each deferred share right entitles the holder to one ordinary share.
5.2.3a Performance rights – CEO (LTVR) and Disclosed Executives (VR) excluding the CROA performance right is a right to acquire one ordinary ANZ share at nil cost – as long as time and performance hurdles are met. The future value of performance rights may range from zero to an indeterminate value. The value depends on our performance against the hurdles and on the share price at the time of exercise.
The performance rights have a four-year performance period (and remain subject to malus up to the vesting date). For the 2021 grant, the performance period is from 22 November 2021 to 21 November 2025. A four-year performance period provides sufficient time for longer term performance to be reflected.
More detail relating to the 2021 performance rights is provided below.
Element Detail
Performance rights hurdles
The performance rights have TSR performance hurdles reflecting the importance of focusing on achieving longer term strategic objectives and aligning executives’ and shareholders’ interests. We will apply two TSR performance hurdles for the 2021 grants of performance rights:
• 75% will be measured against a relative TSR hurdle, tranche 1.
• 25% will be measured against an absolute TSR hurdle, tranche 2.
TSR represents the change in value of a share plus the value of reinvested dividends paid. We regard it as the most appropriate long-term measure – it focuses on the delivery of shareholder value and is a well understood and tested mechanism to measure performance. The combination of relative and absolute TSR hurdles provides balance to the plan by:
• Relative: rewarding executives for performance that exceeds that of comparator companies; and
• Absolute: ensuring there is a continued focus on providing positive growth – even when the market is declining.
The two hurdles measure separate aspects of performance:
• the relative TSR hurdle measures our TSR compared to that of the Select Financial Services (SFS) comparator group, made up of core local and global competitors. This comparator group is chosen to broadly reflect the geographies and business segments in which ANZ competes for revenue; and
• the absolute Compound Annual Growth Rate (CAGR) TSR hurdle provides executives with a more direct line of sight to the level of shareholder return to be achieved. It also provides a tighter correlation between the executives’ rewards and the shareholders’ financial outcomes.
We will measure ANZ’s TSR against each hurdle at the end of the four-year performance period to determine whether each tranche of performance rights become exercisable. We measure each tranche independently from the other – for example one tranche may vest fully or partially but the other tranche may not vest.
Relative TSR hurdle for the November/ December 2021 grant
The relative TSR hurdle is an external hurdle that measures our TSR against that of the SFS comparator group over four years. The SFS comparator group (unchanged from prior years) is made up of: Bank of Queensland Limited; Bendigo and Adelaide Bank Limited; Commonwealth Bank of Australia Limited; DBS Bank Limited; Macquarie Group Limited; National Australia Bank Limited; Standard Chartered PLC; Suncorp Group Limited; and Westpac Banking Corporation.
If our TSR when compared to the TSR of the comparator group then the percentage of performance rights that vest
is less than the 50th percentile is nilreaches at least the 50th percentile, but is less than the 75th percentile
is 50% plus 2% for every one percentile increase above the 50th percentile
reaches or exceeds the 75th percentile is 100%
Absolute TSR hurdle for the November/ December 2021 grant
The absolute CAGR TSR hurdle is an internal hurdle as to whether ANZ achieves or exceeds a threshold level of growth the Board sets at the start of the performance period. The Board reviews and approves the absolute TSR targets each year for that year’s award. When reviewing the targets, the Board references ANZ’s assessed Cost of Capital. The Cost of Capital is determined using methodologies including the Capital Asset Pricing Model (CAPM). The Cost of Capital is regularly reviewed and updated to reflect current market conditions. During 2021, a number of inputs in the calculation were updated, such that the Cost of Capital was revised for the second half of 2021. As a result, the Board determined the CAGR TSR targets for 2021 by averaging the Cost of Capital for 1H21 and 2H21.
If the absolute CAGR of our TSR then the percentage of performance rights that vest
is less than 8.1% is nil
is 8.1% is 50%
reaches at least 8.1%, but is less than 12.2% is progressively increased on a pro-rata, straight-line, basis from 50% to 100%
reaches or exceeds 12.2% is 100%
9594 ANZ 2021 Annual Report
OVERVIEW HOW WE CREATE VALUE
PERFORMANCE OVERVIEW
REMUNERATION REPORT
DIRECTORS’ REPORT
FINANCIAL REPORT
SHAREHOLDER INFORMATION
94
OVERVIEW HOW WE CREATE VALUE
PERFORMANCE OVERVIEW
REMUNERATION REPORT
DIRECTORS’ REPORT
FINANCIAL REPORT
SHAREHOLDER INFORMATION

CRO
To preserve the independence of the role and to minimise any conflicts of interest in carrying out the risk control function across the organisation, the CRO’s remuneration arrangements differ to other Disclosed Executives.
The remuneration mix is 27% fixed remuneration and 73% VR at maximum opportunity. The VR target opportunity is 180% of fixed remuneration and VR maximum opportunity is 270% of fixed remuneration. VR is delivered as 33% cash, 33% deferred shares and 34% deferred share rights (instead of performance rights).
5.2 VARIABLE REMUNERATION DELIVERY
Variable remuneration for the CEO and the Disclosed Executives (excluding the CRO) is delivered partly in cash, shares deferred over four years, and performance rights deferred for four years. The performance rights are also subject to performance hurdles which determine whether they vest in four years’ time.
60% of variable remuneration (AVR plus LTVR) for the CEO, 53% of VR for Disclosed Executives (other than the CRO), and 41% of VR for the CRO will be deferred for at least four years (from the date the Board approved the variable remuneration in October (and the date shareholders approve the CEO’s LTVR)), noting that this complies with the BEAR minimum deferral requirement of 60% for the CEO and 40% for Disclosed Executives.
Before any scheduled release of deferred shares/deferred share rights/performance rights, the Board considers whether any malus/downward adjustment of previously deferred remuneration (or further deferral of vesting) should be made for the CEO and Disclosed Executives. See section 5.3.
VARIABLE REMUNERATION DELIVERY – CEO AND DISCLOSED EXECUTIVES
1 O
ct20
20
30 S
ep 2
021
Varia
ble
rem
uner
atio
n pa
id/a
lloca
ted
Nov
202
11
Nov
202
2
Nov
202
3
Nov
202
4
Nov
202
5
Fixed remuneration
ANZ�nancial year
DE
FER
RE
DSH
AR
ES2
(AV
R/V
R)
CA
SH(A
VR
/VR
)
Vesting is subject to meeting TSR performance
hurdles at the end of year 4
40% vesting at the end of year 1 30% vesting at
the end of year 220% vesting at
the end of year 3
PER
FOR
MA
NC
E R
IGH
TS3
(LT
VR
/VR
)
10% vesting at the end of year 4
1. Variable remuneration outcomes were approved by the ANZBGL Board on 15 October 2021, and in addition for A Watson by the ANZ NZ Board on 19 October 2021. The CEO’s performance rights are subject to shareholder approval at the 2021 AGM. 2. Deferred shares for the CRO vest as follows: 30% at the end of years 1 and 2, and 20% at the end of years 3 and 4. 3. Deferred share rights for the CRO.
5.2.1 Cash – CEO (AVR) and Disclosed Executives (VR)The cash component of variable remuneration is paid to executives at the end of the annual Performance and Remuneration Review (December 2021).
5.2.2 Deferred shares – CEO (AVR) and Disclosed Executives (VR)Deferred shares are ordinary shares, deferred over one to four years. By deferring part of an executives’ remuneration over time (and it remaining subject to malus), we enable a substantial amount of their remuneration to be directly linked to delivering long-term shareholder value. We grant deferred shares in respect of performance for the 1 October to 30 September financial year in late November each year.
We calculate the number of deferred shares to be granted based on the VWAP of the shares traded on the ASX in the five trading days leading up to and including the date of grant. For disclosure and expensing purposes, we use the one day VWAP at the date of grant to determine the fair value.
In some cases, we may grant deferred share rights to executives instead of deferred shares. Each deferred share right entitles the holder to one ordinary share.
5.2.3a Performance rights – CEO (LTVR) and Disclosed Executives (VR) excluding the CROA performance right is a right to acquire one ordinary ANZ share at nil cost – as long as time and performance hurdles are met. The future value of performance rights may range from zero to an indeterminate value. The value depends on our performance against the hurdles and on the share price at the time of exercise.
The performance rights have a four-year performance period (and remain subject to malus up to the vesting date). For the 2021 grant, the performance period is from 22 November 2021 to 21 November 2025. A four-year performance period provides sufficient time for longer term performance to be reflected.
More detail relating to the 2021 performance rights is provided below.
Element Detail
Performance rights hurdles
The performance rights have TSR performance hurdles reflecting the importance of focusing on achieving longer term strategic objectives and aligning executives’ and shareholders’ interests. We will apply two TSR performance hurdles for the 2021 grants of performance rights:
• 75% will be measured against a relative TSR hurdle, tranche 1.
• 25% will be measured against an absolute TSR hurdle, tranche 2.
TSR represents the change in value of a share plus the value of reinvested dividends paid. We regard it as the most appropriate long-term measure – it focuses on the delivery of shareholder value and is a well understood and tested mechanism to measure performance. The combination of relative and absolute TSR hurdles provides balance to the plan by:
• Relative: rewarding executives for performance that exceeds that of comparator companies; and
• Absolute: ensuring there is a continued focus on providing positive growth – even when the market is declining.
The two hurdles measure separate aspects of performance:
• the relative TSR hurdle measures our TSR compared to that of the Select Financial Services (SFS) comparator group, made up of core local and global competitors. This comparator group is chosen to broadly reflect the geographies and business segments in which ANZ competes for revenue; and
• the absolute Compound Annual Growth Rate (CAGR) TSR hurdle provides executives with a more direct line of sight to the level of shareholder return to be achieved. It also provides a tighter correlation between the executives’ rewards and the shareholders’ financial outcomes.
We will measure ANZ’s TSR against each hurdle at the end of the four-year performance period to determine whether each tranche of performance rights become exercisable. We measure each tranche independently from the other – for example one tranche may vest fully or partially but the other tranche may not vest.
Relative TSR hurdle for the November/ December 2021 grant
The relative TSR hurdle is an external hurdle that measures our TSR against that of the SFS comparator group over four years. The SFS comparator group (unchanged from prior years) is made up of: Bank of Queensland Limited; Bendigo and Adelaide Bank Limited; Commonwealth Bank of Australia Limited; DBS Bank Limited; Macquarie Group Limited; National Australia Bank Limited; Standard Chartered PLC; Suncorp Group Limited; and Westpac Banking Corporation.
If our TSR when compared to the TSR of the comparator group then the percentage of performance rights that vest
is less than the 50th percentile is nilreaches at least the 50th percentile, but is less than the 75th percentile
is 50% plus 2% for every one percentile increase above the 50th percentile
reaches or exceeds the 75th percentile is 100%
Absolute TSR hurdle for the November/ December 2021 grant
The absolute CAGR TSR hurdle is an internal hurdle as to whether ANZ achieves or exceeds a threshold level of growth the Board sets at the start of the performance period. The Board reviews and approves the absolute TSR targets each year for that year’s award. When reviewing the targets, the Board references ANZ’s assessed Cost of Capital. The Cost of Capital is determined using methodologies including the Capital Asset Pricing Model (CAPM). The Cost of Capital is regularly reviewed and updated to reflect current market conditions. During 2021, a number of inputs in the calculation were updated, such that the Cost of Capital was revised for the second half of 2021. As a result, the Board determined the CAGR TSR targets for 2021 by averaging the Cost of Capital for 1H21 and 2H21.
If the absolute CAGR of our TSR then the percentage of performance rights that vest
is less than 8.1% is nil
is 8.1% is 50%
reaches at least 8.1%, but is less than 12.2% is progressively increased on a pro-rata, straight-line, basis from 50% to 100%
reaches or exceeds 12.2% is 100%
9594 ANZ 2021 Annual Report
OVERVIEW HOW WE CREATE VALUE
PERFORMANCE OVERVIEW
REMUNERATION REPORT
DIRECTORS’ REPORT
FINANCIAL REPORT
SHAREHOLDER INFORMATION
95ANZ 2021 Annual Report
OVERVIEW HOW WE CREATE VALUE
PERFORMANCE OVERVIEW
REMUNERATION REPORT
DIRECTORS’ REPORT
FINANCIAL REPORT
SHAREHOLDER INFORMATION

Calculating TSR performance
When calculating performance against TSR, we:
• reduce the impact of share price volatility – by using an averaging calculation over a 90-trading day period for start and end values;
• ensure an independent measurement – by engaging the services of an external organisation, Mercer Consulting (Australia) Pty Ltd, to calculate ANZ’s performance against the TSR hurdles; and
• test the performance against the relevant hurdle once only at the end of the four-year performance period – the rights lapse if the performance hurdle is not met – there is no retesting.
Calculating the number of performance rights
The number of performance rights we grant is calculated using a face value basis – i.e. the full share price. Face value at full vesting is split into two tranches. Each tranche value is then divided by the market price (five trading day VWAP of ANZ shares at the start of the performance period) to determine the number of performance rights we award in each tranche.
Performance rights are allocated in late November/early December for Disclosed Executives and December for the CEO (subject to shareholder approval).
Expensing performance rights
ANZ engages PricewaterhouseCoopers to independently determine the fair value of performance rights, which is only used for expensing purposes. They consider factors including: the market performance conditions, share price volatility, life of the instrument, dividend yield, and share price at grant date.
5.2.3b Deferred share rights – CRO (VR)The CRO receives deferred share rights instead of performance rights to preserve the independence of the role and to minimise any conflicts of interest in carrying out the risk control function across the organisation.
The CRO’s deferred share rights are subject to a time-based vesting hurdle of four years. The value the Board uses to determine the number of deferred share rights to be allocated to the CRO is the face value of the Company’s shares traded on the ASX at the time of grant (five trading day VWAP).
5.3 MALUS (DOWNWARD ADJUSTMENT OF PREVIOUSLY DEFERRED REMUNERATION) – BOARD DISCRETION
All deferred remuneration we award to an employee is subject to ANZ’s on-going and absolute discretion to adjust this downward (malus) (including to zero) at any time.
ANZ may exercise this discretion, for example, where:
• there is a need to protect the financial soundness of ANZ or to meet regulatory requirements or there has been a material failure of risk management or controls within ANZ;
• the employee has acted fraudulently or dishonestly, failed to act with due care, skill and diligence, or failed to comply with ANZ policies (including the Code of Conduct), processes or directions;
• the employee is responsible or accountable, directly or indirectly, by virtue of their role or seniority for an occurrence/event which has had an adverse impact on ANZ;
• there has been misconduct and the employee was involved directly or indirectly, failed to take adequate steps, could be considered responsible due to their seniority, or the decision to award or grant the deferred remuneration was made on the basis of misinformation.
Further, where the CEO and/or Disclosed Executives of ANZ have failed to comply with their accountability obligations under the BEAR, their deferred remuneration will be reduced by an amount that is proportionate to the failure, as required by the BEAR.
An employee’s deferred remuneration is also subject to ANZ’s on-going and absolute discretion to further defer the vesting. Where ANZ exercises this discretion, the vesting date is postponed and will not vest unless and until ANZ determines it should vest.
Before any scheduled vesting of deferred remuneration, the Board (for the CEO, Disclosed Executives and other specified roles) and/or the Enterprise Accountability Group (EAG) (for other employees) considers whether malus/downward adjustment or further deferral should be applied. See section 6 for details.
1. Employees are listed in all categories which are relevant, meaning one employee may be listed in multiple categories.
6. ACCOUNTABILITY AND CONSEQUENCE FRAMEWORK
Throughout 2021 we continued to strengthen and evolve ANZ’s Accountability and Consequence Framework (A&CF).
The Enterprise Accountability Group (EAG) operates under the delegated authority of the Board HR Committee and:
• supports the Board in monitoring the implementation and ongoing effectiveness of ANZ’s A&CF, being cognisant of its impact on the culture of ANZ.
• is chaired by the CEO and members include the CRO, CFO and GE T&C.
• reviews the most material risk, conduct and audit events (as relevant), accountability and the application of consequences, where appropriate.
• provides guidance to the Divisions and considers initiatives across the Divisions to strengthen risk behaviours and recognise risk role models, whose achievements are profiled across the organisation.
In 2021, 43 individuals were recognised as role modelling outstanding risk behaviours for their work to manage and mitigate the organisation’s risks and their continuous improvement of our risk culture. The recognition provided included personalised messages from the CEO, the opportunity to meet with the Board and ExCo, and having their achievements profiled on our intranet and in internal newsletters.
The EAG has processes in place to ensure that we mitigate the risk of conflicts of interest in reviewing events and determining accountability and consequences. For example, when undertaking accountability reviews, a recommendation regarding the review leader must be sent to the CRO or (in the case of an event involving Group Risk) the CEO, for review and approval to ensure the individual is capable of undertaking an impartial and unbiased review. Further, considerations regarding accountability and consequences for our most senior executives are considered and determined by the HR Committee and Board.
Reports on the most material risk, audit and conduct issues were presented to the HR, Risk and Audit Committees at a concurrent meeting. This information was taken into consideration by the Board when considering the performance of the Group and the 2021 ANZIP variable remuneration pool for all employees, and determining the performance and remuneration outcomes of the CEO and Disclosed Executives.
The HR Committee and Board consider accountability and consequences for the CEO and Disclosed Executives, including the application of malus to previously deferred remuneration. No malus was applied to the previously deferred remuneration of the CEO and Disclosed Executives during 2021.
When determining consequences, consideration is given to the level of accountability, and the severity of the issue, including customer impacts. Consequences may include, for example, one or more of the following: counselling, formal warnings, impacts to in year performance and remuneration outcomes or application of malus to previously deferred remuneration and ultimately termination of employment for the most serious issues.
Our ongoing focus on accountability, consequences and driving a strong risk culture supports our customer commitment that when things go wrong, we fix them quickly and hold executives, current (and former where we can), to account where appropriate. We are also focused on ensuring that we learn from the cause of the event, and mitigate the risk of future recurrences and continuously seek to strengthen our risk culture. We review the effectiveness of the A&CF every year and implement enhancements to further strengthen the framework based on regulatory and internal stakeholder input.
We also continue to raise employee awareness of, and promote the various ways that employees can speak up and raise issues and ideas for improvement including through initiatives such as the Whistleblower Awareness Day, and through monitoring responses in our employee engagement surveys. Key risk and speak-up scores, including ‘Leaders demonstrate accountability for risk’ (87%), ‘I can raise issues without fear of reprisals’ (80%) and ‘When I speak up, my ideas, opinions and concerns are heard’ (81%) held firm at or near the 2020 highs.
In 2021, there were 1,435 matters involving alleged breaches of our Code of Conduct with 573 resulting in a formal consequence or the employee leaving ANZ, marginally up from 569 in 2020. Breaches ranged from compliance/procedural breaches (44%), general unacceptable behaviour (31%) through to email/systems misuse (11%), attendance issues (5%), fraud/theft (4%), conflict of interest (3%) and breaches of our Equal Opportunity, Bullying and Harassment Policy (2%). Outcomes following investigations of breaches this year included 114 terminations, 381 warnings and 78 employees leaving ANZ1. There was no evidence of broader systemic conduct issues.
In relation to the application of consequences to our senior leadership population (senior executives, executives and senior managers), 16 current and former employees (34 in 2020) had a consequence applied as a result of the application of our Code of Conduct policy and/or findings of accountability for a relevant event. Consequences included warnings, impacts on performance and remuneration outcomes and, for former employees, downward adjustment of previously deferred remuneration where relevant. The 16 current and former employees represent 0.6% of our senior leadership population.
9796 ANZ 2021 Annual Report
OVERVIEW HOW WE CREATE VALUE
PERFORMANCE OVERVIEW
REMUNERATION REPORT
DIRECTORS’ REPORT
FINANCIAL REPORT
SHAREHOLDER INFORMATION
96
OVERVIEW HOW WE CREATE VALUE
PERFORMANCE OVERVIEW
REMUNERATION REPORT
DIRECTORS’ REPORT
FINANCIAL REPORT
SHAREHOLDER INFORMATION

Calculating TSR performance
When calculating performance against TSR, we:
• reduce the impact of share price volatility – by using an averaging calculation over a 90-trading day period for start and end values;
• ensure an independent measurement – by engaging the services of an external organisation, Mercer Consulting (Australia) Pty Ltd, to calculate ANZ’s performance against the TSR hurdles; and
• test the performance against the relevant hurdle once only at the end of the four-year performance period – the rights lapse if the performance hurdle is not met – there is no retesting.
Calculating the number of performance rights
The number of performance rights we grant is calculated using a face value basis – i.e. the full share price. Face value at full vesting is split into two tranches. Each tranche value is then divided by the market price (five trading day VWAP of ANZ shares at the start of the performance period) to determine the number of performance rights we award in each tranche.
Performance rights are allocated in late November/early December for Disclosed Executives and December for the CEO (subject to shareholder approval).
Expensing performance rights
ANZ engages PricewaterhouseCoopers to independently determine the fair value of performance rights, which is only used for expensing purposes. They consider factors including: the market performance conditions, share price volatility, life of the instrument, dividend yield, and share price at grant date.
5.2.3b Deferred share rights – CRO (VR)The CRO receives deferred share rights instead of performance rights to preserve the independence of the role and to minimise any conflicts of interest in carrying out the risk control function across the organisation.
The CRO’s deferred share rights are subject to a time-based vesting hurdle of four years. The value the Board uses to determine the number of deferred share rights to be allocated to the CRO is the face value of the Company’s shares traded on the ASX at the time of grant (five trading day VWAP).
5.3 MALUS (DOWNWARD ADJUSTMENT OF PREVIOUSLY DEFERRED REMUNERATION) – BOARD DISCRETION
All deferred remuneration we award to an employee is subject to ANZ’s on-going and absolute discretion to adjust this downward (malus) (including to zero) at any time.
ANZ may exercise this discretion, for example, where:
• there is a need to protect the financial soundness of ANZ or to meet regulatory requirements or there has been a material failure of risk management or controls within ANZ;
• the employee has acted fraudulently or dishonestly, failed to act with due care, skill and diligence, or failed to comply with ANZ policies (including the Code of Conduct), processes or directions;
• the employee is responsible or accountable, directly or indirectly, by virtue of their role or seniority for an occurrence/event which has had an adverse impact on ANZ;
• there has been misconduct and the employee was involved directly or indirectly, failed to take adequate steps, could be considered responsible due to their seniority, or the decision to award or grant the deferred remuneration was made on the basis of misinformation.
Further, where the CEO and/or Disclosed Executives of ANZ have failed to comply with their accountability obligations under the BEAR, their deferred remuneration will be reduced by an amount that is proportionate to the failure, as required by the BEAR.
An employee’s deferred remuneration is also subject to ANZ’s on-going and absolute discretion to further defer the vesting. Where ANZ exercises this discretion, the vesting date is postponed and will not vest unless and until ANZ determines it should vest.
Before any scheduled vesting of deferred remuneration, the Board (for the CEO, Disclosed Executives and other specified roles) and/or the Enterprise Accountability Group (EAG) (for other employees) considers whether malus/downward adjustment or further deferral should be applied. See section 6 for details.
1. Employees are listed in all categories which are relevant, meaning one employee may be listed in multiple categories.
6. ACCOUNTABILITY AND CONSEQUENCE FRAMEWORK
Throughout 2021 we continued to strengthen and evolve ANZ’s Accountability and Consequence Framework (A&CF).
The Enterprise Accountability Group (EAG) operates under the delegated authority of the Board HR Committee and:
• supports the Board in monitoring the implementation and ongoing effectiveness of ANZ’s A&CF, being cognisant of its impact on the culture of ANZ.
• is chaired by the CEO and members include the CRO, CFO and GE T&C.
• reviews the most material risk, conduct and audit events (as relevant), accountability and the application of consequences, where appropriate.
• provides guidance to the Divisions and considers initiatives across the Divisions to strengthen risk behaviours and recognise risk role models, whose achievements are profiled across the organisation.
In 2021, 43 individuals were recognised as role modelling outstanding risk behaviours for their work to manage and mitigate the organisation’s risks and their continuous improvement of our risk culture. The recognition provided included personalised messages from the CEO, the opportunity to meet with the Board and ExCo, and having their achievements profiled on our intranet and in internal newsletters.
The EAG has processes in place to ensure that we mitigate the risk of conflicts of interest in reviewing events and determining accountability and consequences. For example, when undertaking accountability reviews, a recommendation regarding the review leader must be sent to the CRO or (in the case of an event involving Group Risk) the CEO, for review and approval to ensure the individual is capable of undertaking an impartial and unbiased review. Further, considerations regarding accountability and consequences for our most senior executives are considered and determined by the HR Committee and Board.
Reports on the most material risk, audit and conduct issues were presented to the HR, Risk and Audit Committees at a concurrent meeting. This information was taken into consideration by the Board when considering the performance of the Group and the 2021 ANZIP variable remuneration pool for all employees, and determining the performance and remuneration outcomes of the CEO and Disclosed Executives.
The HR Committee and Board consider accountability and consequences for the CEO and Disclosed Executives, including the application of malus to previously deferred remuneration. No malus was applied to the previously deferred remuneration of the CEO and Disclosed Executives during 2021.
When determining consequences, consideration is given to the level of accountability, and the severity of the issue, including customer impacts. Consequences may include, for example, one or more of the following: counselling, formal warnings, impacts to in year performance and remuneration outcomes or application of malus to previously deferred remuneration and ultimately termination of employment for the most serious issues.
Our ongoing focus on accountability, consequences and driving a strong risk culture supports our customer commitment that when things go wrong, we fix them quickly and hold executives, current (and former where we can), to account where appropriate. We are also focused on ensuring that we learn from the cause of the event, and mitigate the risk of future recurrences and continuously seek to strengthen our risk culture. We review the effectiveness of the A&CF every year and implement enhancements to further strengthen the framework based on regulatory and internal stakeholder input.
We also continue to raise employee awareness of, and promote the various ways that employees can speak up and raise issues and ideas for improvement including through initiatives such as the Whistleblower Awareness Day, and through monitoring responses in our employee engagement surveys. Key risk and speak-up scores, including ‘Leaders demonstrate accountability for risk’ (87%), ‘I can raise issues without fear of reprisals’ (80%) and ‘When I speak up, my ideas, opinions and concerns are heard’ (81%) held firm at or near the 2020 highs.
In 2021, there were 1,435 matters involving alleged breaches of our Code of Conduct with 573 resulting in a formal consequence or the employee leaving ANZ, marginally up from 569 in 2020. Breaches ranged from compliance/procedural breaches (44%), general unacceptable behaviour (31%) through to email/systems misuse (11%), attendance issues (5%), fraud/theft (4%), conflict of interest (3%) and breaches of our Equal Opportunity, Bullying and Harassment Policy (2%). Outcomes following investigations of breaches this year included 114 terminations, 381 warnings and 78 employees leaving ANZ1. There was no evidence of broader systemic conduct issues.
In relation to the application of consequences to our senior leadership population (senior executives, executives and senior managers), 16 current and former employees (34 in 2020) had a consequence applied as a result of the application of our Code of Conduct policy and/or findings of accountability for a relevant event. Consequences included warnings, impacts on performance and remuneration outcomes and, for former employees, downward adjustment of previously deferred remuneration where relevant. The 16 current and former employees represent 0.6% of our senior leadership population.
9796 ANZ 2021 Annual Report
OVERVIEW HOW WE CREATE VALUE
PERFORMANCE OVERVIEW
REMUNERATION REPORT
DIRECTORS’ REPORT
FINANCIAL REPORT
SHAREHOLDER INFORMATION
97ANZ 2021 Annual Report
OVERVIEW HOW WE CREATE VALUE
PERFORMANCE OVERVIEW
REMUNERATION REPORT
DIRECTORS’ REPORT
FINANCIAL REPORT
SHAREHOLDER INFORMATION

7. NON-EXECUTIVE DIRECTOR (NED) REMUNERATION
7.1 REMUNERATION STRUCTURE
The HR Committee reviewed NED fees for 2021 and determined not to increase their fees.
NEDs receive a base fee for being a Director of the Board, and additional fees for either chairing, or being a member of a Board Committee. The Chairman of the Board does not receive additional fees for serving on a Board Committee.
In setting Board and Committee fees, the Board considers: general industry practice, ASX Corporate Governance Principles and Recommendations, the responsibilities and risks attached to the NED role, the time commitment expected of NEDs on Group and Company matters, and fees paid to NEDs of comparable companies.
ANZ compares NED fees to a comparator group of Australian listed companies with a similar market capitalisation, with particular focus on the major financial services institutions. This is considered an appropriate group, given similarity in size and complexity, nature of work and time commitment by NEDs.
To maintain NED independence and impartiality:
• NED fees are not linked to the performance of the Group; and
• NEDs are not eligible to participate in any of the Group’s variable remuneration arrangements.
The current aggregate fee pool for NEDs of $4 million was approved by shareholders at the 2012 AGM. The annual total of NEDs’ fees, including superannuation contributions, is within this agreed limit.
This table shows the NED fee policy structure for 2021.
2021 NED FEE POLICY STRUCTURE
Board1, 2Audit
CommitteeRisk
CommitteeHR
Committee
Digital Business & Technology Committee
Ethics, Environment, Social &
Governance Committee
Chair fee $825,000 $65,000 $62,000 $57,000 $45,000 $35,000
Member fee $240,000 $32,500 $31,000 $29,000 $15,000 $15,000
1. Including superannuation. 2. The Chairman of the Board does not receive additional fees for serving on a Board Committee. The Chairman of the Board and NEDs do not receive a fee for serving on the Nomination and Board Operations Committee.
NED shareholding guidelines
We expect our NEDs to hold ANZ shares. NEDs are required:
• to accumulate shares – over a five-year period from their appointment – to the value of 100% (200% for the Chairman) of the NED member fee; and
• to maintain this shareholding while they are a Director of ANZ.
As at 30 September 2021, based on the ANZ share price at that time, all NEDs who have served five years met the holding requirement.
7.2 2021 STATUTORY REMUNERATION – NEDS
The following table outlines the statutory remuneration disclosed in accordance with Australian Accounting Standards for the NEDs.
In addition to the fees shown below, Sir John Key also received NZD 391,000 in each of 2020 and 2021 for his role as Chairman of ANZ Bank New Zealand Limited.
2021 STATUTORY REMUNERATION – NEDS
Short-term NED benefits Post-employmentFinancial
year Fees1 $
Non monetary benefits2
$
Super contributions1
$
Total remuneration3
$
Current Non-Executive Directors
P O'Sullivan4 2021 764,033 19,931 22,163 806,127
2020 243,331 – 19,207 262,538
I Atlas 2021 322,337 – 22,163 344,500
2020 323,324 – 21,176 344,500
P Dwyer 2021 365,000 – – 365,000
2020 354,326 – 10,674 365,000
J Halton 2021 306,837 – 22,163 329,000
2020 307,824 – 21,176 329,000
J Key 2021 278,837 – 22,163 301,000
2020 279,824 – 21,176 301,000
G Liebelt 2021 341,337 – 22,163 363,500
2020 342,324 – 21,176 363,500
J Macfarlane 2021 296,337 – 22,163 318,500
2020 297,324 – 21,176 318,500
Former Non-Executive Directors
D Gonski5 2021 57,348 3,363 5,424 66,135
2020 803,824 – 21,176 825,000
Total of all Non-Executive Directors 2021 2,732,066 23,294 138,402 2,893,762
2020 2,952,101 – 156,937 3,109,038
1. Year-on-year differences in fees relate to changes in Committee memberships and changes to the superannuation Maximum Contribution Base. From 1 January 2020 to 30 September 2021, P Dwyer elected to receive all payments in fees and therefore did not receive superannuation contributions during this period. 2. Non monetary benefits generally consist of company-funded benefits (and the associated Fringe Benefits Tax) such as car parking and gifts provided upon retirement. 3. Long-term benefits and share-based payments do not apply for the NEDs. 4. P O’Sullivan commenced as a NED on 4 November 2019 and as Chairman from 28 October 2020, so 2020 remuneration reflects a partial service year. 5. D Gonski retired as Chairman on 28 October 2020, so 2021 remuneration reflects a partial service year.
9998 ANZ 2021 Annual Report
OVERVIEW HOW WE CREATE VALUE
PERFORMANCE OVERVIEW
REMUNERATION REPORT
DIRECTORS’ REPORT
FINANCIAL REPORT
SHAREHOLDER INFORMATION
98
OVERVIEW HOW WE CREATE VALUE
PERFORMANCE OVERVIEW
REMUNERATION REPORT
DIRECTORS’ REPORT
FINANCIAL REPORT
SHAREHOLDER INFORMATION

7. NON-EXECUTIVE DIRECTOR (NED) REMUNERATION
7.1 REMUNERATION STRUCTURE
The HR Committee reviewed NED fees for 2021 and determined not to increase their fees.
NEDs receive a base fee for being a Director of the Board, and additional fees for either chairing, or being a member of a Board Committee. The Chairman of the Board does not receive additional fees for serving on a Board Committee.
In setting Board and Committee fees, the Board considers: general industry practice, ASX Corporate Governance Principles and Recommendations, the responsibilities and risks attached to the NED role, the time commitment expected of NEDs on Group and Company matters, and fees paid to NEDs of comparable companies.
ANZ compares NED fees to a comparator group of Australian listed companies with a similar market capitalisation, with particular focus on the major financial services institutions. This is considered an appropriate group, given similarity in size and complexity, nature of work and time commitment by NEDs.
To maintain NED independence and impartiality:
• NED fees are not linked to the performance of the Group; and
• NEDs are not eligible to participate in any of the Group’s variable remuneration arrangements.
The current aggregate fee pool for NEDs of $4 million was approved by shareholders at the 2012 AGM. The annual total of NEDs’ fees, including superannuation contributions, is within this agreed limit.
This table shows the NED fee policy structure for 2021.
2021 NED FEE POLICY STRUCTURE
Board1, 2Audit
CommitteeRisk
CommitteeHR
Committee
Digital Business & Technology Committee
Ethics, Environment, Social &
Governance Committee
Chair fee $825,000 $65,000 $62,000 $57,000 $45,000 $35,000
Member fee $240,000 $32,500 $31,000 $29,000 $15,000 $15,000
1. Including superannuation. 2. The Chairman of the Board does not receive additional fees for serving on a Board Committee. The Chairman of the Board and NEDs do not receive a fee for serving on the Nomination and Board Operations Committee.
NED shareholding guidelines
We expect our NEDs to hold ANZ shares. NEDs are required:
• to accumulate shares – over a five-year period from their appointment – to the value of 100% (200% for the Chairman) of the NED member fee; and
• to maintain this shareholding while they are a Director of ANZ.
As at 30 September 2021, based on the ANZ share price at that time, all NEDs who have served five years met the holding requirement.
7.2 2021 STATUTORY REMUNERATION – NEDS
The following table outlines the statutory remuneration disclosed in accordance with Australian Accounting Standards for the NEDs.
In addition to the fees shown below, Sir John Key also received NZD 391,000 in each of 2020 and 2021 for his role as Chairman of ANZ Bank New Zealand Limited.
2021 STATUTORY REMUNERATION – NEDS
Short-term NED benefits Post-employmentFinancial
year Fees1 $
Non monetary benefits2
$
Super contributions1
$
Total remuneration3
$
Current Non-Executive Directors
P O'Sullivan4 2021 764,033 19,931 22,163 806,127
2020 243,331 – 19,207 262,538
I Atlas 2021 322,337 – 22,163 344,500
2020 323,324 – 21,176 344,500
P Dwyer 2021 365,000 – – 365,000
2020 354,326 – 10,674 365,000
J Halton 2021 306,837 – 22,163 329,000
2020 307,824 – 21,176 329,000
J Key 2021 278,837 – 22,163 301,000
2020 279,824 – 21,176 301,000
G Liebelt 2021 341,337 – 22,163 363,500
2020 342,324 – 21,176 363,500
J Macfarlane 2021 296,337 – 22,163 318,500
2020 297,324 – 21,176 318,500
Former Non-Executive Directors
D Gonski5 2021 57,348 3,363 5,424 66,135
2020 803,824 – 21,176 825,000
Total of all Non-Executive Directors 2021 2,732,066 23,294 138,402 2,893,762
2020 2,952,101 – 156,937 3,109,038
1. Year-on-year differences in fees relate to changes in Committee memberships and changes to the superannuation Maximum Contribution Base. From 1 January 2020 to 30 September 2021, P Dwyer elected to receive all payments in fees and therefore did not receive superannuation contributions during this period. 2. Non monetary benefits generally consist of company-funded benefits (and the associated Fringe Benefits Tax) such as car parking and gifts provided upon retirement. 3. Long-term benefits and share-based payments do not apply for the NEDs. 4. P O’Sullivan commenced as a NED on 4 November 2019 and as Chairman from 28 October 2020, so 2020 remuneration reflects a partial service year. 5. D Gonski retired as Chairman on 28 October 2020, so 2021 remuneration reflects a partial service year.
9998 ANZ 2021 Annual Report
OVERVIEW HOW WE CREATE VALUE
PERFORMANCE OVERVIEW
REMUNERATION REPORT
DIRECTORS’ REPORT
FINANCIAL REPORT
SHAREHOLDER INFORMATION
99ANZ 2021 Annual Report
OVERVIEW HOW WE CREATE VALUE
PERFORMANCE OVERVIEW
REMUNERATION REPORT
DIRECTORS’ REPORT
FINANCIAL REPORT
SHAREHOLDER INFORMATION

8.1.4 External advisors provided information but not recommendationsThe HR Committee can engage independent external advisors as needed.
Throughout the year, the HR Committee and management received information from the following external providers: Aon, Ashurst, EY, Mercer Consulting (Australia) Pty Ltd and PricewaterhouseCoopers. This information related to market data, market practices, analysis and modelling, legislative requirements and the interpretation of governance and regulatory requirements.
During the year, ANZ did not receive any remuneration recommendations from external consultants about the remuneration of KMP.
ANZ employs in-house remuneration professionals who provide recommendations to the HR Committee and the Board. The Board made its decisions independently, using the information provided and with careful regard to ANZ’s strategic objectives, purpose and values, risk appetite and the ANZBGL Remuneration Policy and Principles.
8.2 INTERNAL GOVERNANCE
8.2.1 Hedging prohibitionAll deferred equity must remain at risk until it has fully vested. Accordingly, executives and their associated persons must not enter into any schemes that specifically protect the unvested value of equity allocated. If they do so, then they would forfeit the relevant equity.
8.2.2 CEO and Disclosed Executives’ shareholding guidelinesWe expect the CEO and each Disclosed Executive to, over a five-year period:
• accumulate ANZ shares to the value of 200% of their fixed remuneration; and
• maintain this shareholding level while they are an executive of ANZ.
For this purpose, shareholdings include all vested and unvested equity that is not subject to performance hurdles. Based on equity holdings as at 30 September 2021, and the equity to be granted on 22 November 2021 as a result of the 2021 Performance and Remuneration Review outcomes, the CEO and all Disclosed Executives meet or, if less than five years’ tenure, are on track to meet their minimum shareholding guidelines requirements.
8.2.3 CEO and Disclosed Executives’ contract terms and equity treatmentThe details of the contract terms and also the equity treatment on termination (in accordance with the Conditions of Grant) relating to the CEO and Disclosed Executives are below. Although they are similar, they vary in some cases to suit different circumstances.
Type of contract Permanent ongoing employment contract.
Notice on resignation • 12 months by CEO;
• 6 months by Disclosed Executives1.
Notice on termination by ANZ2
• 12 months by ANZ for CEO and Disclosed Executives3.
However, ANZ may immediately terminate an individual’s employment at any time in the case of serious misconduct. In that case, the individual will be entitled only to payment of fixed remuneration up to the date of their termination and their statutory entitlements.
How unvested equity is treated on leaving ANZ
Executives who resign or are terminated will forfeit all their unvested deferred equity – unless the Board determines otherwise.
If an executive is terminated due to redundancy or they are classified as a ‘good leaver’, unless the Board determines otherwise, then:
• their deferred shares/share rights are released at the original vesting date;
• their performance rights4 remain on foot and are released at the original vesting date (to the extent that the performance hurdles are met); and
• their performance rights4 (for grants awarded pre 31 December 2020) are prorated for service to the full notice termination date and released at the original vesting date (to the extent that the performance hurdles are met).
On an executive’s death or total and permanent disablement, their deferred equity vests.
Unvested equity remains subject to malus post termination.
Change of control (applies to the CEO only)
If a change of control or other similar event occurs, then we will test the performance conditions applying to the CEO’s performance rights. They will vest to the extent that the performance conditions are satisfied.
1. 3 months by the Acting CFO. 2. For K Corbally and M Hand, their contracts state that in particular circumstances they may be eligible for a retrenchment benefit in accordance with the relevant ANZ policy, as varied from time to time, and M Hand is also eligible to receive a Retirement Allowance on retirement, retrenchment, death, or resignation for illness, incapacity or domestic reasons (see footnote 5 of section 9.1). For A Watson, notice on retrenchment is 6 weeks and compensation on retrenchment is calculated on a scale up to a maximum of 79 weeks after 25 years’ service. 3. 6 months by ANZ for the Acting CFO. 4. Or deferred share rights granted to the CRO instead of performance rights.
8. REMUNERATION GOVERNANCE
8.1 THE HUMAN RESOURCES (HR) COMMITTEE
8.1.1 Role of the HR CommitteeThe HR Committee supports the Board on remuneration and other HR matters. It reviews the remuneration policies and practices of the Group, and monitors market practice and regulatory and compliance requirements in Australia and overseas.
During the year the HR Committee met on five occasions1 and reviewed and approved, or made recommendations to the Board on matters including:
• remuneration for the CEO and other key executives (broader than those disclosed in the Remuneration Report) covered by the ANZBGL Remuneration Policy, and fees for the NEDs;
• ANZ’s response to the industry-wide Retail Remuneration Review by Stephen Sedgwick AO;
• updates on APRA’s draft Prudential Standard CPS 511 Remuneration, the BEAR Thematic Review, and Treasury’s Financial Accountability Regime (FAR);
• potential changes to the executive reward structure in light of CPS 5112;
• the ANZ Group Performance Framework (annual objectives setting and assessment) and annual variable remuneration spend;
• performance and reward outcomes for key senior executives, including the consideration of material events that have either occurred or came to light in the year;
• the release, further deferral or application of malus/downward adjustment of deferred remuneration;
• key senior executive appointments and terminations;
• the effectiveness of the ANZBGL Remuneration Policy;
• building capabilities required to deliver on our strategy;
• succession plans for key senior executives;
• culture and governance including updates on the strengthened Accountability and Consequence Framework (A&CF); and
• diversity, inclusion, and employee engagement.
More details about the role of the HR Committee, including its Charter, can be found on our website. Go to anz.com > Our company > Strong governance framework > ANZ Human Resources Committee Charter.
1. A subset of the HR Committee also met on a number of occasions during the year to discuss regulatory developments and 2021 outcomes. 2. A HR Committee sub-group was established to review in detail the executive reward structure.
8.1.2 Link between remuneration and riskThe HR Committee has a strong focus on the relationship between business performance, risk management and remuneration, aligned with our business strategy. The chairs of the Risk and Audit Committees are members of the HR Committee and the full Board is in attendance for specific HR Committee meetings. A concurrent meeting of the HR, Risk and Audit Committees was held to review:
• material risk, conduct and audit events that either occurred or came to light in 2021;
• 2021 performance and variable remuneration recommendations at both the Group and Disclosed Executive level.
To further reflect the importance of the link between remuneration and risk:
• the Board had two NEDs (in addition to the Chairman) in 2021 who served on both the HR Committee and the Risk Committee;
• the HR Committee has free and unfettered access to risk and financial control personnel (the CRO and CFO attend HR Committee meetings for specific agenda items);
• the CRO provides an independent report to the HR Committee on the most material risk, conduct and audit events (as relevant) to help inform considerations of performance and remuneration, and accountability and consequences at the Group, Divisional and individual level;
• the CRO also provides an independent report to assist the Board in their assessment of performance and remuneration outcomes for the CEO and Disclosed Executives;
• the chairs of the Audit and Risk Committees are asked to provide input to ensure appropriate consideration of all relevant risk and internal audit issues; and
• the Group Performance Framework and Divisional Performance Frameworks include Risk as a key element acting as a modifier, and it forms an integral part of each framework’s assessment and directly impacts the overall outcomes.
8.1.3 Conflict of interestTo help mitigate potential conflicts of interest:
• management are not in attendance when their own performance or remuneration is being discussed by the HR Committee or Board;
• the CEO’s AVR is funded and determined separately from the ANZIP pool;
• the CRO’s remuneration arrangements differ to other Disclosed Executives to preserve the independence of the role;
• the EAG also has processes in place to help mitigate conflicts of interest as outlined in section 6; and
• the HR Committee seeks input from a number of sources to inform their consideration of performance and remuneration outcomes for the CEO and Disclosed Executives including:
– independent reports from Risk, Finance, Talent and Culture, and Internal Audit;
– material risk, conduct and audit event data provided by the CRO;
– input from both the Audit Committee and the Risk Committee of the Board.
101100 ANZ 2021 Annual Report
OVERVIEW HOW WE CREATE VALUE
PERFORMANCE OVERVIEW
REMUNERATION REPORT
DIRECTORS’ REPORT
FINANCIAL REPORT
SHAREHOLDER INFORMATION
100
OVERVIEW HOW WE CREATE VALUE
PERFORMANCE OVERVIEW
REMUNERATION REPORT
DIRECTORS’ REPORT
FINANCIAL REPORT
SHAREHOLDER INFORMATION

8.1.4 External advisors provided information but not recommendationsThe HR Committee can engage independent external advisors as needed.
Throughout the year, the HR Committee and management received information from the following external providers: Aon, Ashurst, EY, Mercer Consulting (Australia) Pty Ltd and PricewaterhouseCoopers. This information related to market data, market practices, analysis and modelling, legislative requirements and the interpretation of governance and regulatory requirements.
During the year, ANZ did not receive any remuneration recommendations from external consultants about the remuneration of KMP.
ANZ employs in-house remuneration professionals who provide recommendations to the HR Committee and the Board. The Board made its decisions independently, using the information provided and with careful regard to ANZ’s strategic objectives, purpose and values, risk appetite and the ANZBGL Remuneration Policy and Principles.
8.2 INTERNAL GOVERNANCE
8.2.1 Hedging prohibitionAll deferred equity must remain at risk until it has fully vested. Accordingly, executives and their associated persons must not enter into any schemes that specifically protect the unvested value of equity allocated. If they do so, then they would forfeit the relevant equity.
8.2.2 CEO and Disclosed Executives’ shareholding guidelinesWe expect the CEO and each Disclosed Executive to, over a five-year period:
• accumulate ANZ shares to the value of 200% of their fixed remuneration; and
• maintain this shareholding level while they are an executive of ANZ.
For this purpose, shareholdings include all vested and unvested equity that is not subject to performance hurdles. Based on equity holdings as at 30 September 2021, and the equity to be granted on 22 November 2021 as a result of the 2021 Performance and Remuneration Review outcomes, the CEO and all Disclosed Executives meet or, if less than five years’ tenure, are on track to meet their minimum shareholding guidelines requirements.
8.2.3 CEO and Disclosed Executives’ contract terms and equity treatmentThe details of the contract terms and also the equity treatment on termination (in accordance with the Conditions of Grant) relating to the CEO and Disclosed Executives are below. Although they are similar, they vary in some cases to suit different circumstances.
Type of contract Permanent ongoing employment contract.
Notice on resignation • 12 months by CEO;
• 6 months by Disclosed Executives1.
Notice on termination by ANZ2
• 12 months by ANZ for CEO and Disclosed Executives3.
However, ANZ may immediately terminate an individual’s employment at any time in the case of serious misconduct. In that case, the individual will be entitled only to payment of fixed remuneration up to the date of their termination and their statutory entitlements.
How unvested equity is treated on leaving ANZ
Executives who resign or are terminated will forfeit all their unvested deferred equity – unless the Board determines otherwise.
If an executive is terminated due to redundancy or they are classified as a ‘good leaver’, unless the Board determines otherwise, then:
• their deferred shares/share rights are released at the original vesting date;
• their performance rights4 remain on foot and are released at the original vesting date (to the extent that the performance hurdles are met); and
• their performance rights4 (for grants awarded pre 31 December 2020) are prorated for service to the full notice termination date and released at the original vesting date (to the extent that the performance hurdles are met).
On an executive’s death or total and permanent disablement, their deferred equity vests.
Unvested equity remains subject to malus post termination.
Change of control (applies to the CEO only)
If a change of control or other similar event occurs, then we will test the performance conditions applying to the CEO’s performance rights. They will vest to the extent that the performance conditions are satisfied.
1. 3 months by the Acting CFO. 2. For K Corbally and M Hand, their contracts state that in particular circumstances they may be eligible for a retrenchment benefit in accordance with the relevant ANZ policy, as varied from time to time, and M Hand is also eligible to receive a Retirement Allowance on retirement, retrenchment, death, or resignation for illness, incapacity or domestic reasons (see footnote 5 of section 9.1). For A Watson, notice on retrenchment is 6 weeks and compensation on retrenchment is calculated on a scale up to a maximum of 79 weeks after 25 years’ service. 3. 6 months by ANZ for the Acting CFO. 4. Or deferred share rights granted to the CRO instead of performance rights.
8. REMUNERATION GOVERNANCE
8.1 THE HUMAN RESOURCES (HR) COMMITTEE
8.1.1 Role of the HR CommitteeThe HR Committee supports the Board on remuneration and other HR matters. It reviews the remuneration policies and practices of the Group, and monitors market practice and regulatory and compliance requirements in Australia and overseas.
During the year the HR Committee met on five occasions1 and reviewed and approved, or made recommendations to the Board on matters including:
• remuneration for the CEO and other key executives (broader than those disclosed in the Remuneration Report) covered by the ANZBGL Remuneration Policy, and fees for the NEDs;
• ANZ’s response to the industry-wide Retail Remuneration Review by Stephen Sedgwick AO;
• updates on APRA’s draft Prudential Standard CPS 511 Remuneration, the BEAR Thematic Review, and Treasury’s Financial Accountability Regime (FAR);
• potential changes to the executive reward structure in light of CPS 5112;
• the ANZ Group Performance Framework (annual objectives setting and assessment) and annual variable remuneration spend;
• performance and reward outcomes for key senior executives, including the consideration of material events that have either occurred or came to light in the year;
• the release, further deferral or application of malus/downward adjustment of deferred remuneration;
• key senior executive appointments and terminations;
• the effectiveness of the ANZBGL Remuneration Policy;
• building capabilities required to deliver on our strategy;
• succession plans for key senior executives;
• culture and governance including updates on the strengthened Accountability and Consequence Framework (A&CF); and
• diversity, inclusion, and employee engagement.
More details about the role of the HR Committee, including its Charter, can be found on our website. Go to anz.com > Our company > Strong governance framework > ANZ Human Resources Committee Charter.
1. A subset of the HR Committee also met on a number of occasions during the year to discuss regulatory developments and 2021 outcomes. 2. A HR Committee sub-group was established to review in detail the executive reward structure.
8.1.2 Link between remuneration and riskThe HR Committee has a strong focus on the relationship between business performance, risk management and remuneration, aligned with our business strategy. The chairs of the Risk and Audit Committees are members of the HR Committee and the full Board is in attendance for specific HR Committee meetings. A concurrent meeting of the HR, Risk and Audit Committees was held to review:
• material risk, conduct and audit events that either occurred or came to light in 2021;
• 2021 performance and variable remuneration recommendations at both the Group and Disclosed Executive level.
To further reflect the importance of the link between remuneration and risk:
• the Board had two NEDs (in addition to the Chairman) in 2021 who served on both the HR Committee and the Risk Committee;
• the HR Committee has free and unfettered access to risk and financial control personnel (the CRO and CFO attend HR Committee meetings for specific agenda items);
• the CRO provides an independent report to the HR Committee on the most material risk, conduct and audit events (as relevant) to help inform considerations of performance and remuneration, and accountability and consequences at the Group, Divisional and individual level;
• the CRO also provides an independent report to assist the Board in their assessment of performance and remuneration outcomes for the CEO and Disclosed Executives;
• the chairs of the Audit and Risk Committees are asked to provide input to ensure appropriate consideration of all relevant risk and internal audit issues; and
• the Group Performance Framework and Divisional Performance Frameworks include Risk as a key element acting as a modifier, and it forms an integral part of each framework’s assessment and directly impacts the overall outcomes.
8.1.3 Conflict of interestTo help mitigate potential conflicts of interest:
• management are not in attendance when their own performance or remuneration is being discussed by the HR Committee or Board;
• the CEO’s AVR is funded and determined separately from the ANZIP pool;
• the CRO’s remuneration arrangements differ to other Disclosed Executives to preserve the independence of the role;
• the EAG also has processes in place to help mitigate conflicts of interest as outlined in section 6; and
• the HR Committee seeks input from a number of sources to inform their consideration of performance and remuneration outcomes for the CEO and Disclosed Executives including:
– independent reports from Risk, Finance, Talent and Culture, and Internal Audit;
– material risk, conduct and audit event data provided by the CRO;
– input from both the Audit Committee and the Risk Committee of the Board.
101100 ANZ 2021 Annual Report
OVERVIEW HOW WE CREATE VALUE
PERFORMANCE OVERVIEW
REMUNERATION REPORT
DIRECTORS’ REPORT
FINANCIAL REPORT
SHAREHOLDER INFORMATION
101ANZ 2021 Annual Report
OVERVIEW HOW WE CREATE VALUE
PERFORMANCE OVERVIEW
REMUNERATION REPORT
DIRECTORS’ REPORT
FINANCIAL REPORT
SHAREHOLDER INFORMATION

9. OTHER INFORMATION
9.1 2021 STATUTORY REMUNERATION – CEO AND DISCLOSED EXECUTIVES
The following table outlines the statutory remuneration disclosed in accordance with Australian Accounting Standards. While it shows the fixed remuneration awarded (cash and superannuation contributions) and also the cash component of the 2021 variable remuneration award, it does not show the actual variable remuneration awarded or received in 2021 (see sections 4.1 and 4.2), but instead shows the amortised accounting value for this financial year of deferred remuneration (including prior year awards).
2021 STATUTORY REMUNERATION – CEO AND DISCLOSED EXECUTIVES
Short–term employee benefits Post–employmentLong–term employee
benefits Share–based payments7
Total amortisation value of
Variable remuneration
Other equity allocations8
Financial year Cash salary1$
Non monetary benefits2
$
Total cash incentive3
$
Super contributions4
$
Retirement benefit accrued
during year5$
Long service leave accrued during
the year6$
Shares$
Share rights$
Performance rights
$Shares
$
Termination benefits9
$
Total remuneration
$
CEO and Current Disclosed Executives
S Elliott 2021 2,478,132 15,025 1,000,000 21,868 – 37,880 880,970 – 1,039,524 – – 5,473,399
2020 2,478,824 15,089 625,000 21,176 – 100,651 828,507 – 1,156,061 – – 5,225,308
S Buggle10 2021 689,935 – 462,000 14,065 – 52,757 112,974 159,613 71,423 – – 1,562,767
M Carnegie 2021 1,178,047 22,621 569,250 22,453 – 18,182 534,990 – 267,586 – – 2,613,129
2020 1,178,824 20,646 409,200 21,676 – 28,120 502,572 – 196,150 – – 2,357,188
K Corbally 2021 1,078,030 9,525 613,800 21,970 – 16,667 472,538 357,462 1,984 – – 2,571,976
2020 1,078,824 9,589 429,000 21,176 – 32,255 378,884 258,090 16,398 – – 2,224,216
G Florian 2021 1,062,530 21,431 676,500 21,970 – 18,058 478,255 – 312,520 – – 2,591,264
2020 1,053,824 20,646 371,250 21,176 – 24,403 333,927 – 238,329 – – 2,063,555
M Hand 2021 1,178,047 9,525 544,500 21,953 5,218 18,182 451,897 – 266,258 – – 2,495,580
2020 1,178,824 9,589 462,000 21,176 25,177 112,623 367,507 – 203,224 – – 2,380,120
K van der Merwe 2021 885,012 15,620 594,000 22,488 – 22,929 457,267 – 298,076 – – 2,295,392
2020 828,824 15,089 330,000 21,676 – 16,580 358,605 – 229,707 – – 1,800,481
A Watson11 2021 1,042,346 9,786 687,167 36,336 – 4,130 439,710 22,321 200,921 564 – 2,443,281
2020 975,974 11,176 334,681 39,625 – 17,383 237,502 82,845 93,742 711 – 1,793,639
M Whelan 2021 1,254,082 12,275 810,150 21,918 – 69,359 730,123 – 355,857 – – 3,253,764
2020 1,178,824 9,589 363,000 21,176 – 18,232 754,535 – 417,161 – – 2,762,517
Former Disclosed Executives
A George12 2021 891,030 18,837 – 22,470 – – (465,856) – (701,309) – 174,828 (60,000)
2020 1,078,824 26,146 363,000 21,676 – 25,551 430,514 – 219,525 – – 2,165,236
M Jablko13 2021 516,787 7,552 – 11,713 – – (609,753) – (1,081,003) 10,950 74,947 (1,068,807)
2020 1,078,824 9,589 363,000 21,676 – 21,570 535,573 – 307,228 50,316 – 2,387,776
1. Cash salary includes any adjustments required to reflect the use of ANZ’s Lifestyle Leave Policy for the period in the KMP role. 2. Non monetary benefits generally consist of company-funded benefits (and the associated Fringe Benefits Tax) such as car parking, taxation services, costs met by the Company in relation to in-country benefits, and gifts received on leaving ANZ for former Disclosed Executives. 3. The total cash incentive relates to the cash component only. The relevant amortisation of the AVR/VR deferred components is included in share-based payments and has been amortised over the vesting period. The total AVR/VR was approved by the ANZBGL Board on 15 October 2021, and in addition for A Watson by the ANZ NZ Board on 19 October 2021. 100% of the cash component of the AVR/VR awarded for the 2020 and 2021 years vested to the executive in the applicable financial year. 4. For all Australian based executives, the 2020 and 2021 superannuation contributions reflect the Superannuation Guarantee Contribution based on the Maximum Contribution Base. A Watson participates in KiwiSaver where ANZ provides an employer superannuation contribution matching member contributions up to 4% of total gross pay (less employer superannuation contribution tax). 5. Accrual relates to Retirement Allowance. As a result of being employed with ANZ before November 1992, M Hand is eligible to receive a Retirement Allowance on retirement, retrenchment, death, or resignation for illness, incapacity or domestic reasons. The Retirement Allowance is calculated as three months of preserved notional salary (which is 65% of fixed remuneration) plus an additional 3% of notional salary for each year of full-time service above 10 years less the total accrual value of long service leave (including taken and untaken). 6. Long service leave accrued during the year increased year-on-year for K van der Merwe and M Whelan as a result of their fixed remuneration increases. 7. As required by AASB 2 Share-based payments, the amortisation value includes a proportion of the fair value (taking into account market-related vesting conditions) of all equity that had not yet fully vested as at the commencement of the financial year. The fair value is determined at grant date and is allocated on a straight-line basis over the relevant vesting period. The amount included as remuneration neither relates to, nor indicates, the benefit (if any) that the executive may ultimately realise if the equity
becomes exercisable. No terms of share-based payments have been altered or modified during the financial year. There were no cash settled share-based payments or any other form of share-based payment compensation during the financial year for the CEO or Disclosed Executives. 8. Other equity allocations relate to employment arrangements such as compensation for deferred remuneration forfeited, and shares received in relation to the historical Employee Share Offer. 9. Termination benefits reflect payment of accrued annual leave and long service leave in accordance with contract, payable on cessation. 10. S Buggle’s 2021 remuneration reflects a partial service year as he commenced in a Disclosed Executive role on 8 February 2021. 11. A Watson’s fixed remuneration is paid in NZD and converted to AUD. In 2018, 2019 and 2020 A Watson was eligible to receive shares under the historical Employee Share Offer. That offer provided a grant of ANZ shares in each financial year to eligible employees subject to Board approval. See Note 31 Employee Share and Option Plans for further details on the historical Employee Share Offer. 12. A George ceased employment 30 July 2021. Remuneration reflects up to her date of resignation (noting her annual fixed remuneration for 2021 remained unchanged at $1.1 million). Share-based payments include the expensing treatment on resignation for unvested deferred remuneration (including reversals for forfeiture on resignation). Termination benefits reflect payment for accrued annual leave and long service leave in accordance with contract, payable on resignation. 13. M Jablko ceased employment 7 February 2021. Remuneration reflects up to her date of resignation (noting her annual fixed remuneration for 2021 remained unchanged at $1.1 million). Share-based payments include the expensing treatment on resignation for unvested deferred remuneration (including reversals for forfeiture on resignation). Other equity allocations for M Jablko relate to previously disclosed compensation for deferred remuneration forfeited. Termination benefits reflect payment for accrued annual leave in accordance with contract, payable on resignation.
103102 ANZ 2021 Annual Report
OVERVIEW HOW WE CREATE VALUE
PERFORMANCE OVERVIEW
REMUNERATION REPORT
DIRECTORS’ REPORT
FINANCIAL REPORT
SHAREHOLDER INFORMATION
102
OVERVIEW HOW WE CREATE VALUE
PERFORMANCE OVERVIEW
REMUNERATION REPORT
DIRECTORS’ REPORT
FINANCIAL REPORT
SHAREHOLDER INFORMATION

9. OTHER INFORMATION
9.1 2021 STATUTORY REMUNERATION – CEO AND DISCLOSED EXECUTIVES
The following table outlines the statutory remuneration disclosed in accordance with Australian Accounting Standards. While it shows the fixed remuneration awarded (cash and superannuation contributions) and also the cash component of the 2021 variable remuneration award, it does not show the actual variable remuneration awarded or received in 2021 (see sections 4.1 and 4.2), but instead shows the amortised accounting value for this financial year of deferred remuneration (including prior year awards).
2021 STATUTORY REMUNERATION – CEO AND DISCLOSED EXECUTIVES
Short–term employee benefits Post–employmentLong–term employee
benefits Share–based payments7
Total amortisation value of
Variable remuneration
Other equity allocations8
Financial year Cash salary1$
Non monetary benefits2
$
Total cash incentive3
$
Super contributions4
$
Retirement benefit accrued
during year5$
Long service leave accrued during
the year6$
Shares$
Share rights$
Performance rights
$Shares
$
Termination benefits9
$
Total remuneration
$
CEO and Current Disclosed Executives
S Elliott 2021 2,478,132 15,025 1,000,000 21,868 – 37,880 880,970 – 1,039,524 – – 5,473,399
2020 2,478,824 15,089 625,000 21,176 – 100,651 828,507 – 1,156,061 – – 5,225,308
S Buggle10 2021 689,935 – 462,000 14,065 – 52,757 112,974 159,613 71,423 – – 1,562,767
M Carnegie 2021 1,178,047 22,621 569,250 22,453 – 18,182 534,990 – 267,586 – – 2,613,129
2020 1,178,824 20,646 409,200 21,676 – 28,120 502,572 – 196,150 – – 2,357,188
K Corbally 2021 1,078,030 9,525 613,800 21,970 – 16,667 472,538 357,462 1,984 – – 2,571,976
2020 1,078,824 9,589 429,000 21,176 – 32,255 378,884 258,090 16,398 – – 2,224,216
G Florian 2021 1,062,530 21,431 676,500 21,970 – 18,058 478,255 – 312,520 – – 2,591,264
2020 1,053,824 20,646 371,250 21,176 – 24,403 333,927 – 238,329 – – 2,063,555
M Hand 2021 1,178,047 9,525 544,500 21,953 5,218 18,182 451,897 – 266,258 – – 2,495,580
2020 1,178,824 9,589 462,000 21,176 25,177 112,623 367,507 – 203,224 – – 2,380,120
K van der Merwe 2021 885,012 15,620 594,000 22,488 – 22,929 457,267 – 298,076 – – 2,295,392
2020 828,824 15,089 330,000 21,676 – 16,580 358,605 – 229,707 – – 1,800,481
A Watson11 2021 1,042,346 9,786 687,167 36,336 – 4,130 439,710 22,321 200,921 564 – 2,443,281
2020 975,974 11,176 334,681 39,625 – 17,383 237,502 82,845 93,742 711 – 1,793,639
M Whelan 2021 1,254,082 12,275 810,150 21,918 – 69,359 730,123 – 355,857 – – 3,253,764
2020 1,178,824 9,589 363,000 21,176 – 18,232 754,535 – 417,161 – – 2,762,517
Former Disclosed Executives
A George12 2021 891,030 18,837 – 22,470 – – (465,856) – (701,309) – 174,828 (60,000)
2020 1,078,824 26,146 363,000 21,676 – 25,551 430,514 – 219,525 – – 2,165,236
M Jablko13 2021 516,787 7,552 – 11,713 – – (609,753) – (1,081,003) 10,950 74,947 (1,068,807)
2020 1,078,824 9,589 363,000 21,676 – 21,570 535,573 – 307,228 50,316 – 2,387,776
1. Cash salary includes any adjustments required to reflect the use of ANZ’s Lifestyle Leave Policy for the period in the KMP role. 2. Non monetary benefits generally consist of company-funded benefits (and the associated Fringe Benefits Tax) such as car parking, taxation services, costs met by the Company in relation to in-country benefits, and gifts received on leaving ANZ for former Disclosed Executives. 3. The total cash incentive relates to the cash component only. The relevant amortisation of the AVR/VR deferred components is included in share-based payments and has been amortised over the vesting period. The total AVR/VR was approved by the ANZBGL Board on 15 October 2021, and in addition for A Watson by the ANZ NZ Board on 19 October 2021. 100% of the cash component of the AVR/VR awarded for the 2020 and 2021 years vested to the executive in the applicable financial year. 4. For all Australian based executives, the 2020 and 2021 superannuation contributions reflect the Superannuation Guarantee Contribution based on the Maximum Contribution Base. A Watson participates in KiwiSaver where ANZ provides an employer superannuation contribution matching member contributions up to 4% of total gross pay (less employer superannuation contribution tax). 5. Accrual relates to Retirement Allowance. As a result of being employed with ANZ before November 1992, M Hand is eligible to receive a Retirement Allowance on retirement, retrenchment, death, or resignation for illness, incapacity or domestic reasons. The Retirement Allowance is calculated as three months of preserved notional salary (which is 65% of fixed remuneration) plus an additional 3% of notional salary for each year of full-time service above 10 years less the total accrual value of long service leave (including taken and untaken). 6. Long service leave accrued during the year increased year-on-year for K van der Merwe and M Whelan as a result of their fixed remuneration increases. 7. As required by AASB 2 Share-based payments, the amortisation value includes a proportion of the fair value (taking into account market-related vesting conditions) of all equity that had not yet fully vested as at the commencement of the financial year. The fair value is determined at grant date and is allocated on a straight-line basis over the relevant vesting period. The amount included as remuneration neither relates to, nor indicates, the benefit (if any) that the executive may ultimately realise if the equity
becomes exercisable. No terms of share-based payments have been altered or modified during the financial year. There were no cash settled share-based payments or any other form of share-based payment compensation during the financial year for the CEO or Disclosed Executives. 8. Other equity allocations relate to employment arrangements such as compensation for deferred remuneration forfeited, and shares received in relation to the historical Employee Share Offer. 9. Termination benefits reflect payment of accrued annual leave and long service leave in accordance with contract, payable on cessation. 10. S Buggle’s 2021 remuneration reflects a partial service year as he commenced in a Disclosed Executive role on 8 February 2021. 11. A Watson’s fixed remuneration is paid in NZD and converted to AUD. In 2018, 2019 and 2020 A Watson was eligible to receive shares under the historical Employee Share Offer. That offer provided a grant of ANZ shares in each financial year to eligible employees subject to Board approval. See Note 31 Employee Share and Option Plans for further details on the historical Employee Share Offer. 12. A George ceased employment 30 July 2021. Remuneration reflects up to her date of resignation (noting her annual fixed remuneration for 2021 remained unchanged at $1.1 million). Share-based payments include the expensing treatment on resignation for unvested deferred remuneration (including reversals for forfeiture on resignation). Termination benefits reflect payment for accrued annual leave and long service leave in accordance with contract, payable on resignation. 13. M Jablko ceased employment 7 February 2021. Remuneration reflects up to her date of resignation (noting her annual fixed remuneration for 2021 remained unchanged at $1.1 million). Share-based payments include the expensing treatment on resignation for unvested deferred remuneration (including reversals for forfeiture on resignation). Other equity allocations for M Jablko relate to previously disclosed compensation for deferred remuneration forfeited. Termination benefits reflect payment for accrued annual leave in accordance with contract, payable on resignation.
103102 ANZ 2021 Annual Report
OVERVIEW HOW WE CREATE VALUE
PERFORMANCE OVERVIEW
REMUNERATION REPORT
DIRECTORS’ REPORT
FINANCIAL REPORT
SHAREHOLDER INFORMATION
103ANZ 2021 Annual Report
OVERVIEW HOW WE CREATE VALUE
PERFORMANCE OVERVIEW
REMUNERATION REPORT
DIRECTORS’ REPORT
FINANCIAL REPORT
SHAREHOLDER INFORMATION

9.2 EQUITY HOLDINGS
For the equity granted to the CEO and Disclosed Executives in November/December 2020, all deferred shares were purchased on the market. For deferred share rights and performance rights, we will determine our approach to satisfying awards closer to the time of vesting.
9.2.1 CEO and Disclosed Executives equity granted, vested, exercised/sold and lapsed/forfeitedThe table below sets out details of deferred shares and rights that we granted to the CEO and Disclosed Executives:
• during the 2021 year; or
• in prior years and that then vested, were exercised/sold or which lapsed/were forfeited during the 2021 year.
EQUITY GRANTED VESTED, EXERCISED/SOLD AND LAPSED/FORFEITED – CEO AND DISCLOSED EXECUTIVES
Type of equityNumber granted1
Equity fair value at
grant (for 2021
grants only)
$Grant
date
First date
exercisable
Date of
expiry
VestedLapsed/
Forfeited Exercised/SoldVested
and exercis–
able as at 30 Sep
20213
Unexer– cisable
as at 30 Sep
20214Name Number %Value2
$ Number %Value2
$ Number %Value2
$
CEO and Current Disclosed Executives
S Elliott Deferred shares 6,941 22–Nov–16 22–Nov–20 – 6,941 100 155,095 – – – (6,941) 100 161,895 – –
Deferred shares 8,529 22–Nov–17 22–Nov–20 – 8,529 100 190,578 – – – (8,529) 100 198,935 – –
Deferred shares 8,622 22–Nov–18 22–Nov–20 – 8,622 100 192,656 – – – (8,622) 100 201,104 – –
Deferred shares 12,006 22–Nov–19 22–Nov–20 – 12,006 100 268,270 – – – (12,006) 100 280,034 – –
Deferred shares 10,843 23.30 07–Dec–20 22–Nov–21 – – – – – – – – – 10,843
Deferred shares 8,130 23.30 07–Dec–20 22–Nov–22 – – – – – – – – – – – 8,130
Deferred shares 5,420 23.30 07–Dec–20 22–Nov–23 – – – – – – – – – – – 5,420
Deferred shares 2,710 23.30 07–Dec–20 22–Nov–24 – – – – – – – – – 2,710
Performance rights 53,191 17–Dec–15 17–Dec–18 17–Dec–20 – – – – – – (34,733) 65 800,099 – –
Performance rights 107,471 19–Dec–17 19–Dec–20 19–Dec–22 62,010 58 1,446,222 (45,461) 42 (1,060,260) – – – 62,010 –
Performance rights 35,823 19–Dec–17 19–Dec–20 19–Dec–22 – – – (35,823) 100 (835,478) – – – – –
Performance rights 119,481 10.55 16–Dec–20 16–Dec–24 16–Dec–26 – – – – – – – – – – 119,481
Performance rights 39,827 6.67 16–Dec–20 16–Dec–24 16–Dec–26 – – – – – – – – – – 39,827
S Buggle5 Deferred shares 4,703 21–Nov–14 21–Nov–17 – – – – – – – (3,800) 81 100,845 903 –
Deferred shares 2,938 22–Nov–16 22–Nov–19 – – – – – – – (2,938) 100 83,214 – –
Deferred shares 6,277 22–Nov–17 22–Nov–19 – – – – – – – (1,562) 25 44,241 4,715 –
Deferred shares 6,464 22–Nov–18 22–Nov–19 – – – – – – – (3,700) 57 100,212 2,764 –
M Carnegie Deferred shares 1,182 22–Nov–16 22–Nov–20 – 1,182 100 26,411 – – – – – – 1,182 –
Deferred shares 4,785 22–Nov–17 22–Nov–20 – 4,785 100 106,919 – – – – – – 4,785 –
Deferred shares 5,202 22–Nov–18 22–Nov–20 – 5,202 100 116,237 – – – – – – 5,202 –
Deferred shares 7,924 22–Nov–19 22–Nov–20 – 7,924 100 177,059 – – – – – – 7,924 –
Deferred shares 7,099 23.30 07–Dec–20 22–Nov–21 – – – – – – – – – – – 7,099
Deferred shares 5,323 23.30 07–Dec–20 22–Nov–22 – – – – – – – – – – – 5,323
Deferred shares 3,549 23.30 07–Dec–20 22–Nov–23 – – – – – – – – – – – 3,549
Deferred shares 1,774 23.30 07–Dec–20 22–Nov–24 – – – – – – – – – – – 1,774
Performance rights 29,580 22–Nov–17 22–Nov–20 22–Nov–22 17,067 58 381,357 (12,513) 42 (279,599) – – – 17,067 –
Performance rights 9,860 22–Nov–17 22–Nov–20 22–Nov–22 – – – (9,860) 100 (220,319) – – – – –
Performance rights 28,784 10.59 07–Dec–20 22–Nov–24 22–Nov–26 – – – – – – – – – – 28,784
Performance rights 9,594 6.46 07–Dec–20 22–Nov–24 22–Nov–26 – – – – – – – – – – 9,594
Type of equityNumber granted1
Equity fair value at
grant (for 2021
grants only)
$Grant
date
First date
exercisable
Date of
expiry
VestedLapsed/
Forfeited Exercised/SoldVested
and exercis–
able as at 30 Sep
20213
Unexer– cisable
as at 30 Sep
20214Name Number %Value2
$ Number %Value2
$ Number %Value2
$
CEO and Current Disclosed Executives
K Corbally Deferred shares 2,115 22–Nov–17 22–Nov–20 – 2,115 100 47,259 – – – (2,115) 100 48,721 – –
Deferred shares 3,007 22–Nov–18 22–Nov–20 – 3,007 100 67,191 – – – (3,007) 100 69,268 – –
Deferred shares 5,745 22–Nov–19 22–Nov–20 – 5,745 100 128,370 – – – (5,745) 100 132,340 – –
Deferred shares 5,582 23.30 07–Dec–20 22–Nov–21 – – – – – – – – – – – 5,582
Deferred shares 5,581 23.30 07–Dec–20 22–Nov–22 – – – – – – – – – – – 5,581
Deferred shares 3,720 23.30 07–Dec–20 22–Nov–23 – – – – – – – – – – – 3,720
Deferred shares 3,720 23.30 07–Dec–20 22–Nov–24 – – – – – – – – – – – 3,720
Deferred share rights 20,118 19.06 07–Dec–20 22–Nov–24 29–Nov–24 – – – – – – – – – – 20,118
Performance rights 4,230 22–Nov–17 22–Nov–20 22–Nov–22 2,440 58 54,521 (1,790) 42 (39,997) (2,440) 58 56,207 – –
G Florian Deferred shares 2,465 22–Nov–17 22–Nov–18 – – – – – – – (2,465) 100 69,696 – –
Deferred shares 2,462 22–Nov–17 22–Nov–19 – – – – – – – (2,462) 100 69,611 – –
Deferred shares 2,462 22–Nov–17 22–Nov–20 – 2,462 100 55,013 – – – – – – 2,462 –
Deferred shares 3,254 22–Nov–18 22–Nov–19 – – – – – – – (3,254) 100 92,004 – –
Deferred shares 3,251 22–Nov–18 22–Nov–20 – 3,251 100 72,643 – – – – – – 3,251 –
Deferred shares 4,491 22–Nov–19 22–Nov–20 – 4,491 100 100,350 – – – – – – 4,491 –
Deferred shares 6,442 23.30 07–Dec–20 22–Nov–21 – – – – – – – – – – – 6,442
Deferred shares 4,829 23.30 07–Dec–20 22–Nov–22 – – – – – – – – – – – 4,829
Deferred shares 3,219 23.30 07–Dec–20 22–Nov–23 – – – – – – – – – – – 3,219
Deferred shares 1,609 23.30 07–Dec–20 22–Nov–24 – – – – – – – – – – – 1,609
Performance rights 15,225 22–Nov–17 22–Nov–20 22–Nov–22 8,784 58 196,276 (6,441) 42 (143,922) – – – 8,784 –
Performance rights 5,075 22–Nov–17 22–Nov–20 22–Nov–22 – – – (5,075) 100 (113,399) – – – – –
Performance rights 26,115 10.59 07–Dec–20 22–Nov–24 22–Nov–26 – – – – – – – – – – 26,115
Performance rights 8,705 6.46 07–Dec–20 22–Nov–24 22–Nov–26 – – – – – – – – – – 8,705
M Hand Deferred shares 3,138 22–Nov–17 22–Nov–20 – 3,138 100 70,118 – – – (3,138) 100 71,641 – –
Deferred shares 3,251 22–Nov–18 22–Nov–20 – 3,251 100 72,643 – – – (3,251) 100 74,220 – –
Deferred shares 4,755 22–Nov–19 22–Nov–20 – 4,755 100 106,249 – – – (4,755) 100 108,557 – –
Deferred shares 8,015 23.30 07–Dec–20 22–Nov–21 – – – – – – – – – – – 8,015
Deferred shares 6,010 23.30 07–Dec–20 22–Nov–22 – – – – – – – – – – – 6,010
Deferred shares 4,006 23.30 07–Dec–20 22–Nov–23 – – – – – – – – – – – 4,006
Deferred shares 2,003 23.30 07–Dec–20 22–Nov–24 – – – – – – – – – – – 2,003
Performance rights 6,277 22–Nov–17 22–Nov–20 22–Nov–22 3,621 58 80,910 (2,656) 42 (59,348) (3,621) 58 82,667 – –
Performance rights 32,498 10.59 07–Dec–20 22–Nov–24 22–Nov–26 – – – – – – – – – – 32,498
Performance rights 10,832 6.46 07–Dec–20 22–Nov–24 22–Nov–26 – – – – – – – – – – 10,832
K van der Merwe
Deferred shares 1,479 22–Nov–17 22–Nov–18 – – – – – – – (800) 54 21,011 679 –
Deferred shares 1,477 22–Nov–17 22–Nov–20 – 1,477 100 33,003 – – – – – – 1,477 –
Deferred shares 3,577 22–Nov–18 22–Nov–20 – 3,577 100 79,927 – – – – – – 3,577 –
Deferred shares 6,604 22–Nov–19 22–Nov–20 – 6,604 100 147,564 – – – – – – 6,604 –
Deferred shares 5,724 23.30 07–Dec–20 22–Nov–21 – – – – – – – – – – – 5,724
Deferred shares 4,293 23.30 07–Dec–20 22–Nov–22 – – – – – – – – – – – 4,293
Deferred shares 2,862 23.30 07–Dec–20 22–Nov–23 – – – – – – – – – – – 2,862
Deferred shares 1,431 23.30 07–Dec–20 22–Nov–24 – – – – – – – – – – – 1,431
Performance rights 9,135 22–Nov–17 22–Nov–20 22–Nov–22 5,270 58 117,757 (3,865) 42 (86,362) – – – 5,270 –
Performance rights 3,045 22–Nov–17 22–Nov–20 22–Nov–22 – – – (3,045) 100 (68,040) – – – – –
Performance rights 23,213 10.59 07–Dec–20 22–Nov–24 22–Nov–26 – – – – – – – – – – 23,213
Performance rights 7,737 6.46 07–Dec–20 22–Nov–24 22–Nov–26 – – – – – – – – – – 7,737
105104 ANZ 2021 Annual Report
OVERVIEW HOW WE CREATE VALUE
PERFORMANCE OVERVIEW
REMUNERATION REPORT
DIRECTORS’ REPORT
FINANCIAL REPORT
SHAREHOLDER INFORMATION
104
OVERVIEW HOW WE CREATE VALUE
PERFORMANCE OVERVIEW
REMUNERATION REPORT
DIRECTORS’ REPORT
FINANCIAL REPORT
SHAREHOLDER INFORMATION

9.2 EQUITY HOLDINGS
For the equity granted to the CEO and Disclosed Executives in November/December 2020, all deferred shares were purchased on the market. For deferred share rights and performance rights, we will determine our approach to satisfying awards closer to the time of vesting.
9.2.1 CEO and Disclosed Executives equity granted, vested, exercised/sold and lapsed/forfeitedThe table below sets out details of deferred shares and rights that we granted to the CEO and Disclosed Executives:
• during the 2021 year; or
• in prior years and that then vested, were exercised/sold or which lapsed/were forfeited during the 2021 year.
EQUITY GRANTED VESTED, EXERCISED/SOLD AND LAPSED/FORFEITED – CEO AND DISCLOSED EXECUTIVES
Type of equityNumber granted1
Equity fair value at
grant (for 2021
grants only)
$Grant
date
First date
exercisable
Date of
expiry
VestedLapsed/
Forfeited Exercised/SoldVested
and exercis–
able as at 30 Sep
20213
Unexer– cisable
as at 30 Sep
20214Name Number %Value2
$ Number %Value2
$ Number %Value2
$
CEO and Current Disclosed Executives
S Elliott Deferred shares 6,941 22–Nov–16 22–Nov–20 – 6,941 100 155,095 – – – (6,941) 100 161,895 – –
Deferred shares 8,529 22–Nov–17 22–Nov–20 – 8,529 100 190,578 – – – (8,529) 100 198,935 – –
Deferred shares 8,622 22–Nov–18 22–Nov–20 – 8,622 100 192,656 – – – (8,622) 100 201,104 – –
Deferred shares 12,006 22–Nov–19 22–Nov–20 – 12,006 100 268,270 – – – (12,006) 100 280,034 – –
Deferred shares 10,843 23.30 07–Dec–20 22–Nov–21 – – – – – – – – – 10,843
Deferred shares 8,130 23.30 07–Dec–20 22–Nov–22 – – – – – – – – – – – 8,130
Deferred shares 5,420 23.30 07–Dec–20 22–Nov–23 – – – – – – – – – – – 5,420
Deferred shares 2,710 23.30 07–Dec–20 22–Nov–24 – – – – – – – – – 2,710
Performance rights 53,191 17–Dec–15 17–Dec–18 17–Dec–20 – – – – – – (34,733) 65 800,099 – –
Performance rights 107,471 19–Dec–17 19–Dec–20 19–Dec–22 62,010 58 1,446,222 (45,461) 42 (1,060,260) – – – 62,010 –
Performance rights 35,823 19–Dec–17 19–Dec–20 19–Dec–22 – – – (35,823) 100 (835,478) – – – – –
Performance rights 119,481 10.55 16–Dec–20 16–Dec–24 16–Dec–26 – – – – – – – – – – 119,481
Performance rights 39,827 6.67 16–Dec–20 16–Dec–24 16–Dec–26 – – – – – – – – – – 39,827
S Buggle5 Deferred shares 4,703 21–Nov–14 21–Nov–17 – – – – – – – (3,800) 81 100,845 903 –
Deferred shares 2,938 22–Nov–16 22–Nov–19 – – – – – – – (2,938) 100 83,214 – –
Deferred shares 6,277 22–Nov–17 22–Nov–19 – – – – – – – (1,562) 25 44,241 4,715 –
Deferred shares 6,464 22–Nov–18 22–Nov–19 – – – – – – – (3,700) 57 100,212 2,764 –
M Carnegie Deferred shares 1,182 22–Nov–16 22–Nov–20 – 1,182 100 26,411 – – – – – – 1,182 –
Deferred shares 4,785 22–Nov–17 22–Nov–20 – 4,785 100 106,919 – – – – – – 4,785 –
Deferred shares 5,202 22–Nov–18 22–Nov–20 – 5,202 100 116,237 – – – – – – 5,202 –
Deferred shares 7,924 22–Nov–19 22–Nov–20 – 7,924 100 177,059 – – – – – – 7,924 –
Deferred shares 7,099 23.30 07–Dec–20 22–Nov–21 – – – – – – – – – – – 7,099
Deferred shares 5,323 23.30 07–Dec–20 22–Nov–22 – – – – – – – – – – – 5,323
Deferred shares 3,549 23.30 07–Dec–20 22–Nov–23 – – – – – – – – – – – 3,549
Deferred shares 1,774 23.30 07–Dec–20 22–Nov–24 – – – – – – – – – – – 1,774
Performance rights 29,580 22–Nov–17 22–Nov–20 22–Nov–22 17,067 58 381,357 (12,513) 42 (279,599) – – – 17,067 –
Performance rights 9,860 22–Nov–17 22–Nov–20 22–Nov–22 – – – (9,860) 100 (220,319) – – – – –
Performance rights 28,784 10.59 07–Dec–20 22–Nov–24 22–Nov–26 – – – – – – – – – – 28,784
Performance rights 9,594 6.46 07–Dec–20 22–Nov–24 22–Nov–26 – – – – – – – – – – 9,594
Type of equityNumber granted1
Equity fair value at
grant (for 2021
grants only)
$Grant
date
First date
exercisable
Date of
expiry
VestedLapsed/
Forfeited Exercised/SoldVested
and exercis–
able as at 30 Sep
20213
Unexer– cisable
as at 30 Sep
20214Name Number %Value2
$ Number %Value2
$ Number %Value2
$
CEO and Current Disclosed Executives
K Corbally Deferred shares 2,115 22–Nov–17 22–Nov–20 – 2,115 100 47,259 – – – (2,115) 100 48,721 – –
Deferred shares 3,007 22–Nov–18 22–Nov–20 – 3,007 100 67,191 – – – (3,007) 100 69,268 – –
Deferred shares 5,745 22–Nov–19 22–Nov–20 – 5,745 100 128,370 – – – (5,745) 100 132,340 – –
Deferred shares 5,582 23.30 07–Dec–20 22–Nov–21 – – – – – – – – – – – 5,582
Deferred shares 5,581 23.30 07–Dec–20 22–Nov–22 – – – – – – – – – – – 5,581
Deferred shares 3,720 23.30 07–Dec–20 22–Nov–23 – – – – – – – – – – – 3,720
Deferred shares 3,720 23.30 07–Dec–20 22–Nov–24 – – – – – – – – – – – 3,720
Deferred share rights 20,118 19.06 07–Dec–20 22–Nov–24 29–Nov–24 – – – – – – – – – – 20,118
Performance rights 4,230 22–Nov–17 22–Nov–20 22–Nov–22 2,440 58 54,521 (1,790) 42 (39,997) (2,440) 58 56,207 – –
G Florian Deferred shares 2,465 22–Nov–17 22–Nov–18 – – – – – – – (2,465) 100 69,696 – –
Deferred shares 2,462 22–Nov–17 22–Nov–19 – – – – – – – (2,462) 100 69,611 – –
Deferred shares 2,462 22–Nov–17 22–Nov–20 – 2,462 100 55,013 – – – – – – 2,462 –
Deferred shares 3,254 22–Nov–18 22–Nov–19 – – – – – – – (3,254) 100 92,004 – –
Deferred shares 3,251 22–Nov–18 22–Nov–20 – 3,251 100 72,643 – – – – – – 3,251 –
Deferred shares 4,491 22–Nov–19 22–Nov–20 – 4,491 100 100,350 – – – – – – 4,491 –
Deferred shares 6,442 23.30 07–Dec–20 22–Nov–21 – – – – – – – – – – – 6,442
Deferred shares 4,829 23.30 07–Dec–20 22–Nov–22 – – – – – – – – – – – 4,829
Deferred shares 3,219 23.30 07–Dec–20 22–Nov–23 – – – – – – – – – – – 3,219
Deferred shares 1,609 23.30 07–Dec–20 22–Nov–24 – – – – – – – – – – – 1,609
Performance rights 15,225 22–Nov–17 22–Nov–20 22–Nov–22 8,784 58 196,276 (6,441) 42 (143,922) – – – 8,784 –
Performance rights 5,075 22–Nov–17 22–Nov–20 22–Nov–22 – – – (5,075) 100 (113,399) – – – – –
Performance rights 26,115 10.59 07–Dec–20 22–Nov–24 22–Nov–26 – – – – – – – – – – 26,115
Performance rights 8,705 6.46 07–Dec–20 22–Nov–24 22–Nov–26 – – – – – – – – – – 8,705
M Hand Deferred shares 3,138 22–Nov–17 22–Nov–20 – 3,138 100 70,118 – – – (3,138) 100 71,641 – –
Deferred shares 3,251 22–Nov–18 22–Nov–20 – 3,251 100 72,643 – – – (3,251) 100 74,220 – –
Deferred shares 4,755 22–Nov–19 22–Nov–20 – 4,755 100 106,249 – – – (4,755) 100 108,557 – –
Deferred shares 8,015 23.30 07–Dec–20 22–Nov–21 – – – – – – – – – – – 8,015
Deferred shares 6,010 23.30 07–Dec–20 22–Nov–22 – – – – – – – – – – – 6,010
Deferred shares 4,006 23.30 07–Dec–20 22–Nov–23 – – – – – – – – – – – 4,006
Deferred shares 2,003 23.30 07–Dec–20 22–Nov–24 – – – – – – – – – – – 2,003
Performance rights 6,277 22–Nov–17 22–Nov–20 22–Nov–22 3,621 58 80,910 (2,656) 42 (59,348) (3,621) 58 82,667 – –
Performance rights 32,498 10.59 07–Dec–20 22–Nov–24 22–Nov–26 – – – – – – – – – – 32,498
Performance rights 10,832 6.46 07–Dec–20 22–Nov–24 22–Nov–26 – – – – – – – – – – 10,832
K van der Merwe
Deferred shares 1,479 22–Nov–17 22–Nov–18 – – – – – – – (800) 54 21,011 679 –
Deferred shares 1,477 22–Nov–17 22–Nov–20 – 1,477 100 33,003 – – – – – – 1,477 –
Deferred shares 3,577 22–Nov–18 22–Nov–20 – 3,577 100 79,927 – – – – – – 3,577 –
Deferred shares 6,604 22–Nov–19 22–Nov–20 – 6,604 100 147,564 – – – – – – 6,604 –
Deferred shares 5,724 23.30 07–Dec–20 22–Nov–21 – – – – – – – – – – – 5,724
Deferred shares 4,293 23.30 07–Dec–20 22–Nov–22 – – – – – – – – – – – 4,293
Deferred shares 2,862 23.30 07–Dec–20 22–Nov–23 – – – – – – – – – – – 2,862
Deferred shares 1,431 23.30 07–Dec–20 22–Nov–24 – – – – – – – – – – – 1,431
Performance rights 9,135 22–Nov–17 22–Nov–20 22–Nov–22 5,270 58 117,757 (3,865) 42 (86,362) – – – 5,270 –
Performance rights 3,045 22–Nov–17 22–Nov–20 22–Nov–22 – – – (3,045) 100 (68,040) – – – – –
Performance rights 23,213 10.59 07–Dec–20 22–Nov–24 22–Nov–26 – – – – – – – – – – 23,213
Performance rights 7,737 6.46 07–Dec–20 22–Nov–24 22–Nov–26 – – – – – – – – – – 7,737
105104 ANZ 2021 Annual Report
OVERVIEW HOW WE CREATE VALUE
PERFORMANCE OVERVIEW
REMUNERATION REPORT
DIRECTORS’ REPORT
FINANCIAL REPORT
SHAREHOLDER INFORMATION
105ANZ 2021 Annual Report
OVERVIEW HOW WE CREATE VALUE
PERFORMANCE OVERVIEW
REMUNERATION REPORT
DIRECTORS’ REPORT
FINANCIAL REPORT
SHAREHOLDER INFORMATION

Type of equityNumber granted1
Equity fair value at
grant (for 2021
grants only)
$Grant
date
First date
exercisable
Date of
expiry
VestedLapsed/
Forfeited Exercised/SoldVested
and exercis–
able as at 30 Sep
20213
Unexer– cisable
as at 30 Sep
20214Name Number %Value2
$ Number %Value2
$ Number %Value2
$
CEO and Current Disclosed Executives
A Watson Deferred shares 3,904 22–Nov–19 22–Nov–20 – 3,904 100 87,234 – – – – – – 3,904 –
Deferred shares 5,806 23.30 07–Dec–20 22–Nov–21 – – – – – – – – – – – 5,806
Deferred shares 4,354 23.30 07–Dec–20 22–Nov–22 – – – – – – – – – – – 4,354
Deferred shares 2,902 23.30 07–Dec–20 22–Nov–23 – – – – – – – – – – – 2,902
Deferred shares 1,451 23.30 07–Dec–20 22–Nov–24 – – – – – – – – – – – 1,451
Employee Share Offer 23 04–Dec–14 04–Dec–17 – – – – – – – (23) 100 612 – –
Employee Share Offer 26 03–Dec–15 03–Dec–18 – – – – – – – (26) 100 692 – –
Employee Share Offer 24 01–Dec–17 01–Dec–20 – 24 100 548 – – – (24) 100 639 – –
Deferred share rights 2,332 22–Nov–17 22–Nov–20 22–Nov–22 2,332 100 52,108 – – – (2,332) 100 53,013 – –
Deferred share rights 5,318 22–Nov–18 22–Nov–20 22–Nov–22 5,318 100 118,829 – – – (5,318) 100 120,894 – –
Performance rights 3,934 22–Nov–17 22–Nov–20 22–Nov–22 2,269 58 50,700 (1,665) 42 (37,204) (2,269) 58 51,581 – –
Performance rights 23,542 10.59 07–Dec–20 22–Nov–24 22–Nov–26 – – – – – – – – – – 23,542
Performance rights 7,847 6.46 07–Dec–20 22–Nov–24 22–Nov–26 – – – – – – – – – – 7,847
M Whelan Deferred shares 6,724 22–Nov–16 22–Nov–20 - 6,724 100 150,246 – – – (6,724) 100 158,473 – –
Deferred shares 9,218 22–Nov–17 22–Nov–20 – 9,218 100 205,973 – – – (9,218) 100 217,252 – –
Deferred shares 7,072 22–Nov–18 22–Nov–20 – 7,072 100 158,022 – – – (7,072) 100 166,674 – –
Deferred shares 13,998 22–Nov–19 22–Nov–20 – 13,998 100 312,781 – – – (13,998) 100 329,908 – –
Deferred shares 6,297 23.30 07–Dec–20 22–Nov–21 – – – – – – – – – – – 6,297
Deferred shares 4,722 23.30 07–Dec–20 22–Nov–22 – – – – – – – – – – – 4,722
Deferred shares 3,148 23.30 07–Dec–20 22–Nov–23 – – – – – – – – – – – 3,148
Deferred shares 1,574 23.30 07–Dec–20 22–Nov–24 – – – – – – – – – – – 1,574
Performance rights 56,985 22–Nov–17 22–Nov–20 22–Nov–22 32,880 58 734,694 (24,105) 42 (538,619) (32,880) 58 774,922 – –
Performance rights 18,995 22–Nov–17 22–Nov–20 22–Nov–22 – – – (18,995) 100 (424,438) – – – – –
Performance rights 25,534 10.59 07–Dec–20 22–Nov–24 22–Nov–26 – – – – – – – – – – 25,534
Performance rights 8,511 6.46 07–Dec–20 22–Nov–24 22–Nov–26 – – – – – – – – – – 8,511
Former Disclosed Executives
A George6 Deferred shares 3,096 22–Nov–17 22–Nov–20 – 3,096 100 69,179 – – – – – – 3,096 –
Deferred shares 3,096 22–Nov–17 22–Nov–21 – – – – (3,096) 100 (85,924) – – – – –
Deferred shares 3,495 22–Nov–18 22–Nov–20 – 3,495 100 78,095 – – – – – – 3,495 –
Deferred shares 3,495 22–Nov–18 22–Nov–21 – – – – (3,495) 100 (96,997) – – – – –
Deferred shares 3,495 22–Nov–18 22–Nov–22 – – – – (3,495) 100 (96,997) – – – – –
Deferred shares 8,453 22–Nov–19 22–Nov–20 – 8,453 100 188,880 – – – – – – 8,453 –
Deferred shares 6,338 22–Nov–19 22–Nov–21 – – – – (6,338) 100 (175,899) – – – – –
Deferred shares 4,225 22–Nov–19 22–Nov–22 – – – – (4,225) 100 (117,257) – – – – –
Deferred shares 2,112 22–Nov–19 22–Nov–23 – – – – (2,112) 100 (58,615) – – – – –
Deferred shares 6,297 23.30 07–Dec–20 22–Nov–21 – – – – (6,297) 100 (174,761) – – – – –
Deferred shares 4,722 23.30 07–Dec–20 22–Nov–22 – – – – (4,722) 100 (131,050) – – – – –
Deferred shares 3,148 23.30 07–Dec–20 22–Nov–23 – – – – (3,148) 100 (87,367) – – – – –
Deferred shares 1,574 23.30 07–Dec–20 22–Nov–24 – – – – (1,574) 100 (43,683) – – – – –
Performance rights 19,140 22–Nov–17 22–Nov–20 22–Nov–22 11,043 58 246,753 (8,097) 42 (180,925) (11,043) 58 252,112 – –
Performance rights 6,380 22–Nov–17 22–Nov–20 22–Nov–22 – – – (6,380) 100 (142,559) – – – – –
Performance rights 21,610 22–Nov–18 22–Nov–21 22–Nov–23 – – – (21,610) 100 (599,744) – – – – –
Performance rights 7,203 22–Nov–18 22–Nov–21 22–Nov–23 – – – (7,203) 100 (199,906) – – – – –
Performance rights 32,653 22–Nov–19 22–Nov–23 22–Nov–25 – – – (32,653) 100 (906,222) – – – – –
Performance rights 10,884 22–Nov–19 22–Nov–23 22–Nov–25 – – – (10,884) 100 (302,065) – – – – –
Performance rights 25,534 10.59 07–Dec–20 22–Nov–24 22–Nov–26 – – – (25,534) 100 (708,648) – – – – –
Performance rights 8,511 6.46 07–Dec–20 22–Nov–24 22–Nov–26 – – – (8,511) 100 (236,207) – – – – –
Type of equityNumber granted1
Equity fair value at
grant (for 2021
grants only)
$Grant
date
First date
exercisable
Date of
expiry
VestedLapsed/
Forfeited Exercised/SoldVested
and exercis–
able as at 30 Sep
20213
Unexer– cisable
as at 30 Sep
20214Name Number %Value2
$ Number %Value2
$ Number %Value2
$
Former Disclosed Executives
M Jablko6 Deferred shares 11,444 20–Aug–16 27–Feb–19 – – – – – – – (11,444) 100 304,489 – –
Deferred shares 7,617 20–Aug–16 27–Feb–20 – – – – – – – (7,617) 100 202,665 – –
Deferred shares 4,540 20–Aug–16 27–Feb–21 – 4,540 100 119,239 – – – – – – 4,540 –
Deferred shares 1,182 22–Nov–16 22–Nov–19 – – – – – – – (1,182) 100 31,449 – –
Deferred shares 1,182 22–Nov–16 22–Nov–20 – 1,182 100 26,411 – – – (1,182) 100 31,449 – –
Deferred shares 6,305 22–Nov–17 22–Nov–19 – – – – – – – (6,305) 100 167,757 – –
Deferred shares 6,305 22–Nov–17 22–Nov–20 – 6,305 100 140,883 – – – (6,305) 100 167,757 – –
Deferred shares 6,305 22–Nov–17 22–Nov–21 – – – – (6,305) 100 (177,651) – – – – –
Deferred shares 5,693 22–Nov–18 22–Nov–19 – – – – – – – (5,693) 100 151,473 – –
Deferred shares 5,690 22–Nov–18 22–Nov–20 – 5,690 100 127,141 – – – (5,690) 100 151,393 – –
Deferred shares 5,690 22–Nov–18 22–Nov–21 – – – – (5,690) 100 (160,323) – – – – –
Deferred shares 5,690 22–Nov–18 22–Nov–22 – – – – (5,690) 100 (160,323) – – – – –
Deferred shares 8,717 22–Nov–19 22–Nov–20 – 8,717 100 194,779 – – – (8,717) 100 231,932 – –
Deferred shares 6,536 22–Nov–19 22–Nov–21 – – – – (6,536) 100 (184,160) – – – – –
Deferred shares 4,357 22–Nov–19 22–Nov–22 – – – – (4,357) 100 (122,764) – – – – –
Deferred shares 2,178 22–Nov–19 22–Nov–23 – – – – (2,178) 100 (61,368) – – – – –
Deferred shares 6,297 23.30 07–Dec–20 22–Nov–21 – – – – (6,297) 100 (177,426) – – – – –
Deferred shares 4,722 23.30 07–Dec–20 22–Nov–22 – – – – (4,722) 100 (133,048) – – – – –
Deferred shares 3,148 23.30 07–Dec–20 22–Nov–23 – – – – (3,148) 100 (88,699) – – – – –
Deferred shares 1,574 23.30 07–Dec–20 22–Nov–24 – – – – (1,574) 100 (44,349) – – – – –
Performance rights 38,976 22–Nov–17 22–Nov–20 22–Nov–22 22,489 58 502,510 (16,487) 42 (368,397) (22,489) 58 518,050 – –
Performance rights 12,992 22–Nov–17 22–Nov–20 22–Nov–22 – – – (12,992) 100 (290,302) – – – – –
Performance rights 35,179 22–Nov–18 22–Nov–21 22–Nov–23 – – – (35,179) 100 (991,211) – – – – –
Performance rights 11,726 22–Nov–18 22–Nov–21 22–Nov–23 – – – (11,726) 100 (330,394) – – – – –
Performance rights 33,673 22–Nov–19 22–Nov–23 22–Nov–25 – – – (33,673) 100 (948,777) – – – – –
Performance rights 11,224 22–Nov–19 22–Nov–23 22–Nov–25 – – – (11,224) 100 (316,250) – – – – –
Performance rights 25,534 10.59 07–Dec–20 22–Nov–24 22–Nov–26 – – – (25,534) 100 (719,451) – – – – –
Performance rights 8,511 6.46 07–Dec–20 22–Nov–24 22–Nov–26 – – – (8,511) 100 (239,808) – – – – –
1. For the purpose of the five highest paid executive disclosures, Executives are defined as Disclosed Executives or other members of the ExCo. For the 2021 financial year the five highest paid executives include four Disclosed Executives and the Group Executive, International (F Faruqui). Rights granted to Disclosed Executives as remuneration in 2021 are included in the table. Rights granted to F Faruqui as remuneration in 2021 include four tranches of deferred share rights and two tranches of performance rights granted on 07 Dec 2020. (6,459 (tranche 1) deferred share rights first exercisable 22 Nov 2021, expiring 29 Nov 2021; 5,158 (tranche 2) deferred share rights first exercisable 22 Nov 2022, expiring 29 Nov 2022; 3,619 (tranche 3) deferred share rights first exercisable 22 Nov 2023, expiring 29 Nov 2023; 1,904 (tranche 4) deferred share rights first exercisable 22 Nov 2024, expiring 29 Nov 2024; 25,534 (tranche 1) and 8,511 (tranche 2) performance rights first exercisable 22 Nov 2024 subject to meeting performance hurdles, expiring 22 Nov 2026). No rights have been granted to the CEO, Disclosed Executives or the five highest paid executives since the end of 2021 up to the Directors’ Report sign-off date. 2. The point in time value of shares/share rights and/or performance rights is based on the one day VWAP of the Company’s shares traded on the ASX on the date of vesting, lapsing/forfeiture or exercising/sale/transfer out of trust, multiplied by the number of shares/share rights and/or performance rights. The exercise price for all share rights/performance rights is $0.00. No terms or conditions of grant of the share-based payment transactions have been altered or modified during the reporting period. 3. The number vested and exercisable is the number of shares, options and rights that remain vested at the end of the reporting period. No shares, options and rights were vested and unexercisable.
4. Performance rights granted in prior years (by grant date) that remained unexerciseable at 30 Sep 2021 include:
Nov-18 Nov-19 Nov-20S Elliott 110,365 168,066 159,308S Buggle 6,464 – –M Carnegie 42,884 40,816 38,378K Corbally – – –G Florian 26,802 23,128 34,820M Hand 26,802 24,489 43,330K van der Merwe 29,482 34,013 30,950A Watson 4,802 – 31,389M Whelan 58,296 72,108 34,045A George – – –M Jablko – – –
Performance rights granted to S Elliott in 2021 were approved by shareholders at the 2020 AGM in accordance with ASX Listing Rule 10.14.5. Equity transactions disclosed from date commenced as a KMP. 6. Equity transactions disclosed up to date ceased employment.
107106 ANZ 2021 Annual Report
OVERVIEW HOW WE CREATE VALUE
PERFORMANCE OVERVIEW
REMUNERATION REPORT
DIRECTORS’ REPORT
FINANCIAL REPORT
SHAREHOLDER INFORMATION
106
OVERVIEW HOW WE CREATE VALUE
PERFORMANCE OVERVIEW
REMUNERATION REPORT
DIRECTORS’ REPORT
FINANCIAL REPORT
SHAREHOLDER INFORMATION

Type of equityNumber granted1
Equity fair value at
grant (for 2021
grants only)
$Grant
date
First date
exercisable
Date of
expiry
VestedLapsed/
Forfeited Exercised/SoldVested
and exercis–
able as at 30 Sep
20213
Unexer– cisable
as at 30 Sep
20214Name Number %Value2
$ Number %Value2
$ Number %Value2
$
CEO and Current Disclosed Executives
A Watson Deferred shares 3,904 22–Nov–19 22–Nov–20 – 3,904 100 87,234 – – – – – – 3,904 –
Deferred shares 5,806 23.30 07–Dec–20 22–Nov–21 – – – – – – – – – – – 5,806
Deferred shares 4,354 23.30 07–Dec–20 22–Nov–22 – – – – – – – – – – – 4,354
Deferred shares 2,902 23.30 07–Dec–20 22–Nov–23 – – – – – – – – – – – 2,902
Deferred shares 1,451 23.30 07–Dec–20 22–Nov–24 – – – – – – – – – – – 1,451
Employee Share Offer 23 04–Dec–14 04–Dec–17 – – – – – – – (23) 100 612 – –
Employee Share Offer 26 03–Dec–15 03–Dec–18 – – – – – – – (26) 100 692 – –
Employee Share Offer 24 01–Dec–17 01–Dec–20 – 24 100 548 – – – (24) 100 639 – –
Deferred share rights 2,332 22–Nov–17 22–Nov–20 22–Nov–22 2,332 100 52,108 – – – (2,332) 100 53,013 – –
Deferred share rights 5,318 22–Nov–18 22–Nov–20 22–Nov–22 5,318 100 118,829 – – – (5,318) 100 120,894 – –
Performance rights 3,934 22–Nov–17 22–Nov–20 22–Nov–22 2,269 58 50,700 (1,665) 42 (37,204) (2,269) 58 51,581 – –
Performance rights 23,542 10.59 07–Dec–20 22–Nov–24 22–Nov–26 – – – – – – – – – – 23,542
Performance rights 7,847 6.46 07–Dec–20 22–Nov–24 22–Nov–26 – – – – – – – – – – 7,847
M Whelan Deferred shares 6,724 22–Nov–16 22–Nov–20 - 6,724 100 150,246 – – – (6,724) 100 158,473 – –
Deferred shares 9,218 22–Nov–17 22–Nov–20 – 9,218 100 205,973 – – – (9,218) 100 217,252 – –
Deferred shares 7,072 22–Nov–18 22–Nov–20 – 7,072 100 158,022 – – – (7,072) 100 166,674 – –
Deferred shares 13,998 22–Nov–19 22–Nov–20 – 13,998 100 312,781 – – – (13,998) 100 329,908 – –
Deferred shares 6,297 23.30 07–Dec–20 22–Nov–21 – – – – – – – – – – – 6,297
Deferred shares 4,722 23.30 07–Dec–20 22–Nov–22 – – – – – – – – – – – 4,722
Deferred shares 3,148 23.30 07–Dec–20 22–Nov–23 – – – – – – – – – – – 3,148
Deferred shares 1,574 23.30 07–Dec–20 22–Nov–24 – – – – – – – – – – – 1,574
Performance rights 56,985 22–Nov–17 22–Nov–20 22–Nov–22 32,880 58 734,694 (24,105) 42 (538,619) (32,880) 58 774,922 – –
Performance rights 18,995 22–Nov–17 22–Nov–20 22–Nov–22 – – – (18,995) 100 (424,438) – – – – –
Performance rights 25,534 10.59 07–Dec–20 22–Nov–24 22–Nov–26 – – – – – – – – – – 25,534
Performance rights 8,511 6.46 07–Dec–20 22–Nov–24 22–Nov–26 – – – – – – – – – – 8,511
Former Disclosed Executives
A George6 Deferred shares 3,096 22–Nov–17 22–Nov–20 – 3,096 100 69,179 – – – – – – 3,096 –
Deferred shares 3,096 22–Nov–17 22–Nov–21 – – – – (3,096) 100 (85,924) – – – – –
Deferred shares 3,495 22–Nov–18 22–Nov–20 – 3,495 100 78,095 – – – – – – 3,495 –
Deferred shares 3,495 22–Nov–18 22–Nov–21 – – – – (3,495) 100 (96,997) – – – – –
Deferred shares 3,495 22–Nov–18 22–Nov–22 – – – – (3,495) 100 (96,997) – – – – –
Deferred shares 8,453 22–Nov–19 22–Nov–20 – 8,453 100 188,880 – – – – – – 8,453 –
Deferred shares 6,338 22–Nov–19 22–Nov–21 – – – – (6,338) 100 (175,899) – – – – –
Deferred shares 4,225 22–Nov–19 22–Nov–22 – – – – (4,225) 100 (117,257) – – – – –
Deferred shares 2,112 22–Nov–19 22–Nov–23 – – – – (2,112) 100 (58,615) – – – – –
Deferred shares 6,297 23.30 07–Dec–20 22–Nov–21 – – – – (6,297) 100 (174,761) – – – – –
Deferred shares 4,722 23.30 07–Dec–20 22–Nov–22 – – – – (4,722) 100 (131,050) – – – – –
Deferred shares 3,148 23.30 07–Dec–20 22–Nov–23 – – – – (3,148) 100 (87,367) – – – – –
Deferred shares 1,574 23.30 07–Dec–20 22–Nov–24 – – – – (1,574) 100 (43,683) – – – – –
Performance rights 19,140 22–Nov–17 22–Nov–20 22–Nov–22 11,043 58 246,753 (8,097) 42 (180,925) (11,043) 58 252,112 – –
Performance rights 6,380 22–Nov–17 22–Nov–20 22–Nov–22 – – – (6,380) 100 (142,559) – – – – –
Performance rights 21,610 22–Nov–18 22–Nov–21 22–Nov–23 – – – (21,610) 100 (599,744) – – – – –
Performance rights 7,203 22–Nov–18 22–Nov–21 22–Nov–23 – – – (7,203) 100 (199,906) – – – – –
Performance rights 32,653 22–Nov–19 22–Nov–23 22–Nov–25 – – – (32,653) 100 (906,222) – – – – –
Performance rights 10,884 22–Nov–19 22–Nov–23 22–Nov–25 – – – (10,884) 100 (302,065) – – – – –
Performance rights 25,534 10.59 07–Dec–20 22–Nov–24 22–Nov–26 – – – (25,534) 100 (708,648) – – – – –
Performance rights 8,511 6.46 07–Dec–20 22–Nov–24 22–Nov–26 – – – (8,511) 100 (236,207) – – – – –
Type of equityNumber granted1
Equity fair value at
grant (for 2021
grants only)
$Grant
date
First date
exercisable
Date of
expiry
VestedLapsed/
Forfeited Exercised/SoldVested
and exercis–
able as at 30 Sep
20213
Unexer– cisable
as at 30 Sep
20214Name Number %Value2
$ Number %Value2
$ Number %Value2
$
Former Disclosed Executives
M Jablko6 Deferred shares 11,444 20–Aug–16 27–Feb–19 – – – – – – – (11,444) 100 304,489 – –
Deferred shares 7,617 20–Aug–16 27–Feb–20 – – – – – – – (7,617) 100 202,665 – –
Deferred shares 4,540 20–Aug–16 27–Feb–21 – 4,540 100 119,239 – – – – – – 4,540 –
Deferred shares 1,182 22–Nov–16 22–Nov–19 – – – – – – – (1,182) 100 31,449 – –
Deferred shares 1,182 22–Nov–16 22–Nov–20 – 1,182 100 26,411 – – – (1,182) 100 31,449 – –
Deferred shares 6,305 22–Nov–17 22–Nov–19 – – – – – – – (6,305) 100 167,757 – –
Deferred shares 6,305 22–Nov–17 22–Nov–20 – 6,305 100 140,883 – – – (6,305) 100 167,757 – –
Deferred shares 6,305 22–Nov–17 22–Nov–21 – – – – (6,305) 100 (177,651) – – – – –
Deferred shares 5,693 22–Nov–18 22–Nov–19 – – – – – – – (5,693) 100 151,473 – –
Deferred shares 5,690 22–Nov–18 22–Nov–20 – 5,690 100 127,141 – – – (5,690) 100 151,393 – –
Deferred shares 5,690 22–Nov–18 22–Nov–21 – – – – (5,690) 100 (160,323) – – – – –
Deferred shares 5,690 22–Nov–18 22–Nov–22 – – – – (5,690) 100 (160,323) – – – – –
Deferred shares 8,717 22–Nov–19 22–Nov–20 – 8,717 100 194,779 – – – (8,717) 100 231,932 – –
Deferred shares 6,536 22–Nov–19 22–Nov–21 – – – – (6,536) 100 (184,160) – – – – –
Deferred shares 4,357 22–Nov–19 22–Nov–22 – – – – (4,357) 100 (122,764) – – – – –
Deferred shares 2,178 22–Nov–19 22–Nov–23 – – – – (2,178) 100 (61,368) – – – – –
Deferred shares 6,297 23.30 07–Dec–20 22–Nov–21 – – – – (6,297) 100 (177,426) – – – – –
Deferred shares 4,722 23.30 07–Dec–20 22–Nov–22 – – – – (4,722) 100 (133,048) – – – – –
Deferred shares 3,148 23.30 07–Dec–20 22–Nov–23 – – – – (3,148) 100 (88,699) – – – – –
Deferred shares 1,574 23.30 07–Dec–20 22–Nov–24 – – – – (1,574) 100 (44,349) – – – – –
Performance rights 38,976 22–Nov–17 22–Nov–20 22–Nov–22 22,489 58 502,510 (16,487) 42 (368,397) (22,489) 58 518,050 – –
Performance rights 12,992 22–Nov–17 22–Nov–20 22–Nov–22 – – – (12,992) 100 (290,302) – – – – –
Performance rights 35,179 22–Nov–18 22–Nov–21 22–Nov–23 – – – (35,179) 100 (991,211) – – – – –
Performance rights 11,726 22–Nov–18 22–Nov–21 22–Nov–23 – – – (11,726) 100 (330,394) – – – – –
Performance rights 33,673 22–Nov–19 22–Nov–23 22–Nov–25 – – – (33,673) 100 (948,777) – – – – –
Performance rights 11,224 22–Nov–19 22–Nov–23 22–Nov–25 – – – (11,224) 100 (316,250) – – – – –
Performance rights 25,534 10.59 07–Dec–20 22–Nov–24 22–Nov–26 – – – (25,534) 100 (719,451) – – – – –
Performance rights 8,511 6.46 07–Dec–20 22–Nov–24 22–Nov–26 – – – (8,511) 100 (239,808) – – – – –
1. For the purpose of the five highest paid executive disclosures, Executives are defined as Disclosed Executives or other members of the ExCo. For the 2021 financial year the five highest paid executives include four Disclosed Executives and the Group Executive, International (F Faruqui). Rights granted to Disclosed Executives as remuneration in 2021 are included in the table. Rights granted to F Faruqui as remuneration in 2021 include four tranches of deferred share rights and two tranches of performance rights granted on 07 Dec 2020. (6,459 (tranche 1) deferred share rights first exercisable 22 Nov 2021, expiring 29 Nov 2021; 5,158 (tranche 2) deferred share rights first exercisable 22 Nov 2022, expiring 29 Nov 2022; 3,619 (tranche 3) deferred share rights first exercisable 22 Nov 2023, expiring 29 Nov 2023; 1,904 (tranche 4) deferred share rights first exercisable 22 Nov 2024, expiring 29 Nov 2024; 25,534 (tranche 1) and 8,511 (tranche 2) performance rights first exercisable 22 Nov 2024 subject to meeting performance hurdles, expiring 22 Nov 2026). No rights have been granted to the CEO, Disclosed Executives or the five highest paid executives since the end of 2021 up to the Directors’ Report sign-off date. 2. The point in time value of shares/share rights and/or performance rights is based on the one day VWAP of the Company’s shares traded on the ASX on the date of vesting, lapsing/forfeiture or exercising/sale/transfer out of trust, multiplied by the number of shares/share rights and/or performance rights. The exercise price for all share rights/performance rights is $0.00. No terms or conditions of grant of the share-based payment transactions have been altered or modified during the reporting period. 3. The number vested and exercisable is the number of shares, options and rights that remain vested at the end of the reporting period. No shares, options and rights were vested and unexercisable.
4. Performance rights granted in prior years (by grant date) that remained unexerciseable at 30 Sep 2021 include:
Nov-18 Nov-19 Nov-20S Elliott 110,365 168,066 159,308S Buggle 6,464 – –M Carnegie 42,884 40,816 38,378K Corbally – – –G Florian 26,802 23,128 34,820M Hand 26,802 24,489 43,330K van der Merwe 29,482 34,013 30,950A Watson 4,802 – 31,389M Whelan 58,296 72,108 34,045A George – – –M Jablko – – –
Performance rights granted to S Elliott in 2021 were approved by shareholders at the 2020 AGM in accordance with ASX Listing Rule 10.14.5. Equity transactions disclosed from date commenced as a KMP. 6. Equity transactions disclosed up to date ceased employment.
107106 ANZ 2021 Annual Report
OVERVIEW HOW WE CREATE VALUE
PERFORMANCE OVERVIEW
REMUNERATION REPORT
DIRECTORS’ REPORT
FINANCIAL REPORT
SHAREHOLDER INFORMATION
107ANZ 2021 Annual Report
OVERVIEW HOW WE CREATE VALUE
PERFORMANCE OVERVIEW
REMUNERATION REPORT
DIRECTORS’ REPORT
FINANCIAL REPORT
SHAREHOLDER INFORMATION

9.2.2 NED, CEO and Disclosed Executives equity holdingsThe table below sets out details of equity held directly, indirectly or beneficially by each NED, the CEO and each Disclosed Executive, including their related parties.
EQUITY HOLDINGS – NED, CEO AND DISCLOSED EXECUTIVES
Name Type of equity
Opening balance at 1 Oct 2020
Granted during the year as
remuneration1
Received during the year on exercise of
options or rights
Resulting from any other
changes during the year2
Closing balance at
30 Sep 20213, 4Current Non–Executive DirectorsP O’Sullivan Ordinary shares 4,078 – – – 4,078
Capital notes 2 9,250 – – – 9,250 I Atlas Ordinary shares 14,360 – – – 14,360 P Dwyer Ordinary shares 17,500 – – – 17,500 J Halton Ordinary shares 9,049 – – – 9,049 J Key Ordinary shares 3,000 – – – 3,000 G Liebelt Ordinary shares 20,315 – – – 20,315
Capital notes 1 1,500 – – (1,500) – Capital notes 2 2,500 – – – 2,500 Capital notes 6 – – – 2,500 2,500
J Macfarlane Ordinary shares 17,851 – – – 17,851 Capital notes 2 2,000 – – – 2,000 Capital notes 3 5,000 – – – 5,000Capital notes 6 – – – 2,140 2,140
Former Non–Executive Directors D Gonski6 Ordinary shares 31,488 – – – 31,488
CEO and Current Disclosed Executives S Elliott Deferred shares 79,877 27,103 – (36,098) 70,882
Ordinary shares 216,821 – 34,733 39,121 290,675 Performance rights 456,458 159,308 (34,733) (81,284) 499,749
S Buggle5 Deferred shares 98,664 – – (12,000) 86,664 Ordinary shares 19,759 – – 1,415 21,174 Capital notes 2 730 – – (240) 490 Capital notes 6 – – – 590 590 Deferred share rights 24,624 – – – 24,624 Performance rights 6,464 – – – 6,464
M Carnegie Deferred shares 74,539 17,745 – – 92,284 Ordinary shares 5,491 – – 3,179 8,670 Performance rights 123,140 38,378 – (22,373) 139,145
K Corbally Deferred shares 30,283 18,603 – (10,867) 38,019 Ordinary shares 1,095 – 2,440 (2,104) 1,431 Capital notes 6 – – – 1,400 1,400 Deferred share rights 34,273 20,118 – – 54,391 Performance rights 4,230 – (2,440) (1,790) –
G Florian Deferred shares 34,365 16,099 – (8,181) 42,283 Ordinary shares 2,194 – – 9,783 11,977 Performance rights 70,230 34,820 – (11,516) 93,534
M Hand Deferred shares 24,775 20,034 – (11,144) 33,665 Ordinary shares 1,189 – 3,621 (3,575) 1,235 Performance rights 57,568 43,330 (3,621) (2,656) 94,621
K van der Merwe Deferred shares 36,894 14,310 – (800) 50,404 Ordinary shares 1,936 – – (654) 1,282 Performance rights 75,675 30,950 – (6,910) 99,715
A Watson Deferred shares 16,247 14,513 – – 30,760 Employee Share Offer 134 – – (73) 61 Ordinary shares 12,048 – 9,919 1,780 23,747 Deferred share rights 10,467 – (7,650) – 2,817 Performance rights 8,736 31,389 (2,269) (1,665) 36,191
M Whelan Deferred shares 81,369 15,741 – (37,012) 60,098 Ordinary shares 1,126 – 32,880 381 34,387 Performance rights 206,384 34,045 (32,880) (43,100) 164,449
Former Disclosed Executives A George6 Deferred shares 80,090 15,741 – (38,502) 57,329
Ordinary shares 10,289 – 11,043 3,567 24,899 Capital notes 1 802 – – – 802 Performance rights 97,870 34,045 (11,043) (120,872) –
M Jablko6 Deferred shares 89,431 15,741 – (100,632) 4,540 Ordinary shares 5,244 – 22,489 (27,733) – Performance rights 143,770 34,045 (22,489) (155,326) –
9.3 LOANS
9.3.1 OverviewWhen we lend to NEDs, the CEO or Disclosed Executives, we do so in the ordinary course of business and on normal commercial terms and conditions that are no more favourable than those given to other employees or customers – this includes the term of the loan, the security required and the interest rate. Details of the terms and conditions of lending products can be found on anz.com. No amounts have been written off during the period, or individual assessed allowance for expected credit losses raised in respect of these balances.
Total loans to NEDs, the CEO and Disclosed Executives, including their related parties at 30 September 2021 (including those with balances less than $100,000) was $26,866,853 (2020: $32,451,547) with interest paid of $776,791 (2020: $888,019) during the period.
9.3.2 NED, CEO and Disclosed Executives loan transactionsThe table below sets out details of loans outstanding to NEDs, the CEO and Disclosed Executives including their related parties, if – at any time during the year – the individual’s aggregate loan balance exceeded $100,000.
LOAN TRANSACTIONS – NED, CEO AND DISCLOSED EXECUTIVES
Name
Opening balance at 1 October 20201
$
Closing balance at 30 September 2021
$
Interest paid and payable in the reporting period2
$
Highest balance in the reporting period
$
Current Non–Executive Directors
P O'Sullivan 891,715 789,338 110 900,809
I Atlas 1,608,028 – 23,057 1,627,610
J Macfarlane 13,281,199 12,858,040 343,014 15,041,667
CEO and Current Disclosed Executives
S Elliott 2,787,423 2,616,885 54,845 2,820,507
S Buggle3 632,287 504,008 14,147 760,461
G Florian 2,304,601 4,483,293 64,530 4,636,219
M Hand 4,226,595 24,631 123,011 4,942,880
K van der Merwe 3,587,416 2,464,654 83,718 3,745,883
M Whelan 1,575,953 1,628,540 46,073 1,690,773
Former Disclosed Executives
A George4 1,535,414 1,480,152 24,216 1,564,179
Total 32,430,631 26,849,541 776,721 37,730,988
1. Opening balances have been adjusted to take account of minor timing variances. 2. Actual interest paid after considering offset accounts. The loan balance is shown gross, however the interest paid takes into account the impact of offset amounts. 3. Opening balance is as at the date of commencement as a KMP. 4. Closing balance is as at the date ceased in a KMP role.
9.4 OTHER TRANSACTIONS
Other transactions with NEDs, the CEO and Disclosed Executives, and their related parties included deposits.
OTHER TRANSACTIONS – NED, CEO AND DISCLOSED EXECUTIVES
Opening balance at 1 October 20201
$
Closing balance at 30 September 20212, 3
$
Total KMP deposits 48,482,790 45,703,445
1. Opening balance is at 1 October 2020 or the date of commencement as a KMP if part way through the year. 2. Closing balance is at 30 September 2021 or at the date ceased in a KMP role if part way through the year. 3. Interest paid on deposits for 2021 was $88,209 (2020: $498,931).
Other transactions with KMP and their related parties included amounts paid to the Group in respect of investment management service fees, brokerage, bank fees and charges. The Group has reimbursed KMP for the costs incurred for security and secretarial services associated with the performance of their duties. These transactions are conducted on normal commercial terms and conditions are no more favourable than those given to other employees or customers. Gifts in the form of charitable donations amounting to $500 were provided on behalf of the related parties of KMP during the year.
1. Details of options/rights granted as remuneration during 2021 are provided in the previous table. 2. Shares resulting from any other changes during the year include the net result of any shares purchased (including under the ANZ Share Purchase Plan), forfeited, sold or acquired under the Dividend Reinvestment Plan. 3. The following shares (included in the holdings above) were held on behalf of the NEDs, CEO and Disclosed Executives (i.e. indirect beneficially held shares) as at 30 September 2021 (or the date ceased as a KMP): P O’Sullivan - 0, I Atlas - 14,360, P Dwyer - 17,500, J Halton - 0, J Key - 3,000, G Liebelt - 8,158, J Macfarlane - 26,991, D Gonski - 31,488, S Elliott - 358,519, S Buggle - 87,744, M Carnegie - 92,284, K Corbally - 39,419, G Florian - 52,182, M Hand - 33,665, K van der Merwe - 50,404, A Watson - 30,821, M Whelan - 94,485, A George - 60,809 and M Jablko - 4,540. 4. 93,131 rights were vested and exercisable, and zero options/rights were vested and unexerciseable as at 30 September 2021. There was no change in the balance as at the Directors’ Report sign-off date. 5. Commencing balance is based on holdings as at the date of commencement as a KMP. 6. Concluding balance is based on holdings as at the date ceased as a KMP.
109108 ANZ 2021 Annual Report
OVERVIEW HOW WE CREATE VALUE
PERFORMANCE OVERVIEW
REMUNERATION REPORT
DIRECTORS’ REPORT
FINANCIAL REPORT
SHAREHOLDER INFORMATION
108
OVERVIEW HOW WE CREATE VALUE
PERFORMANCE OVERVIEW
REMUNERATION REPORT
DIRECTORS’ REPORT
FINANCIAL REPORT
SHAREHOLDER INFORMATION

9.2.2 NED, CEO and Disclosed Executives equity holdingsThe table below sets out details of equity held directly, indirectly or beneficially by each NED, the CEO and each Disclosed Executive, including their related parties.
EQUITY HOLDINGS – NED, CEO AND DISCLOSED EXECUTIVES
Name Type of equity
Opening balance at 1 Oct 2020
Granted during the year as
remuneration1
Received during the year on exercise of
options or rights
Resulting from any other
changes during the year2
Closing balance at
30 Sep 20213, 4Current Non–Executive DirectorsP O’Sullivan Ordinary shares 4,078 – – – 4,078
Capital notes 2 9,250 – – – 9,250 I Atlas Ordinary shares 14,360 – – – 14,360 P Dwyer Ordinary shares 17,500 – – – 17,500 J Halton Ordinary shares 9,049 – – – 9,049 J Key Ordinary shares 3,000 – – – 3,000 G Liebelt Ordinary shares 20,315 – – – 20,315
Capital notes 1 1,500 – – (1,500) – Capital notes 2 2,500 – – – 2,500 Capital notes 6 – – – 2,500 2,500
J Macfarlane Ordinary shares 17,851 – – – 17,851 Capital notes 2 2,000 – – – 2,000 Capital notes 3 5,000 – – – 5,000Capital notes 6 – – – 2,140 2,140
Former Non–Executive Directors D Gonski6 Ordinary shares 31,488 – – – 31,488
CEO and Current Disclosed Executives S Elliott Deferred shares 79,877 27,103 – (36,098) 70,882
Ordinary shares 216,821 – 34,733 39,121 290,675 Performance rights 456,458 159,308 (34,733) (81,284) 499,749
S Buggle5 Deferred shares 98,664 – – (12,000) 86,664 Ordinary shares 19,759 – – 1,415 21,174 Capital notes 2 730 – – (240) 490 Capital notes 6 – – – 590 590 Deferred share rights 24,624 – – – 24,624 Performance rights 6,464 – – – 6,464
M Carnegie Deferred shares 74,539 17,745 – – 92,284 Ordinary shares 5,491 – – 3,179 8,670 Performance rights 123,140 38,378 – (22,373) 139,145
K Corbally Deferred shares 30,283 18,603 – (10,867) 38,019 Ordinary shares 1,095 – 2,440 (2,104) 1,431 Capital notes 6 – – – 1,400 1,400 Deferred share rights 34,273 20,118 – – 54,391 Performance rights 4,230 – (2,440) (1,790) –
G Florian Deferred shares 34,365 16,099 – (8,181) 42,283 Ordinary shares 2,194 – – 9,783 11,977 Performance rights 70,230 34,820 – (11,516) 93,534
M Hand Deferred shares 24,775 20,034 – (11,144) 33,665 Ordinary shares 1,189 – 3,621 (3,575) 1,235 Performance rights 57,568 43,330 (3,621) (2,656) 94,621
K van der Merwe Deferred shares 36,894 14,310 – (800) 50,404 Ordinary shares 1,936 – – (654) 1,282 Performance rights 75,675 30,950 – (6,910) 99,715
A Watson Deferred shares 16,247 14,513 – – 30,760 Employee Share Offer 134 – – (73) 61 Ordinary shares 12,048 – 9,919 1,780 23,747 Deferred share rights 10,467 – (7,650) – 2,817 Performance rights 8,736 31,389 (2,269) (1,665) 36,191
M Whelan Deferred shares 81,369 15,741 – (37,012) 60,098 Ordinary shares 1,126 – 32,880 381 34,387 Performance rights 206,384 34,045 (32,880) (43,100) 164,449
Former Disclosed Executives A George6 Deferred shares 80,090 15,741 – (38,502) 57,329
Ordinary shares 10,289 – 11,043 3,567 24,899 Capital notes 1 802 – – – 802 Performance rights 97,870 34,045 (11,043) (120,872) –
M Jablko6 Deferred shares 89,431 15,741 – (100,632) 4,540 Ordinary shares 5,244 – 22,489 (27,733) – Performance rights 143,770 34,045 (22,489) (155,326) –
9.3 LOANS
9.3.1 OverviewWhen we lend to NEDs, the CEO or Disclosed Executives, we do so in the ordinary course of business and on normal commercial terms and conditions that are no more favourable than those given to other employees or customers – this includes the term of the loan, the security required and the interest rate. Details of the terms and conditions of lending products can be found on anz.com. No amounts have been written off during the period, or individual assessed allowance for expected credit losses raised in respect of these balances.
Total loans to NEDs, the CEO and Disclosed Executives, including their related parties at 30 September 2021 (including those with balances less than $100,000) was $26,866,853 (2020: $32,451,547) with interest paid of $776,791 (2020: $888,019) during the period.
9.3.2 NED, CEO and Disclosed Executives loan transactionsThe table below sets out details of loans outstanding to NEDs, the CEO and Disclosed Executives including their related parties, if – at any time during the year – the individual’s aggregate loan balance exceeded $100,000.
LOAN TRANSACTIONS – NED, CEO AND DISCLOSED EXECUTIVES
Name
Opening balance at 1 October 20201
$
Closing balance at 30 September 2021
$
Interest paid and payable in the reporting period2
$
Highest balance in the reporting period
$
Current Non–Executive Directors
P O'Sullivan 891,715 789,338 110 900,809
I Atlas 1,608,028 – 23,057 1,627,610
J Macfarlane 13,281,199 12,858,040 343,014 15,041,667
CEO and Current Disclosed Executives
S Elliott 2,787,423 2,616,885 54,845 2,820,507
S Buggle3 632,287 504,008 14,147 760,461
G Florian 2,304,601 4,483,293 64,530 4,636,219
M Hand 4,226,595 24,631 123,011 4,942,880
K van der Merwe 3,587,416 2,464,654 83,718 3,745,883
M Whelan 1,575,953 1,628,540 46,073 1,690,773
Former Disclosed Executives
A George4 1,535,414 1,480,152 24,216 1,564,179
Total 32,430,631 26,849,541 776,721 37,730,988
1. Opening balances have been adjusted to take account of minor timing variances. 2. Actual interest paid after considering offset accounts. The loan balance is shown gross, however the interest paid takes into account the impact of offset amounts. 3. Opening balance is as at the date of commencement as a KMP. 4. Closing balance is as at the date ceased in a KMP role.
9.4 OTHER TRANSACTIONS
Other transactions with NEDs, the CEO and Disclosed Executives, and their related parties included deposits.
OTHER TRANSACTIONS – NED, CEO AND DISCLOSED EXECUTIVES
Opening balance at 1 October 20201
$
Closing balance at 30 September 20212, 3
$
Total KMP deposits 48,482,790 45,703,445
1. Opening balance is at 1 October 2020 or the date of commencement as a KMP if part way through the year. 2. Closing balance is at 30 September 2021 or at the date ceased in a KMP role if part way through the year. 3. Interest paid on deposits for 2021 was $88,209 (2020: $498,931).
Other transactions with KMP and their related parties included amounts paid to the Group in respect of investment management service fees, brokerage, bank fees and charges. The Group has reimbursed KMP for the costs incurred for security and secretarial services associated with the performance of their duties. These transactions are conducted on normal commercial terms and conditions are no more favourable than those given to other employees or customers. Gifts in the form of charitable donations amounting to $500 were provided on behalf of the related parties of KMP during the year.
1. Details of options/rights granted as remuneration during 2021 are provided in the previous table. 2. Shares resulting from any other changes during the year include the net result of any shares purchased (including under the ANZ Share Purchase Plan), forfeited, sold or acquired under the Dividend Reinvestment Plan. 3. The following shares (included in the holdings above) were held on behalf of the NEDs, CEO and Disclosed Executives (i.e. indirect beneficially held shares) as at 30 September 2021 (or the date ceased as a KMP): P O’Sullivan - 0, I Atlas - 14,360, P Dwyer - 17,500, J Halton - 0, J Key - 3,000, G Liebelt - 8,158, J Macfarlane - 26,991, D Gonski - 31,488, S Elliott - 358,519, S Buggle - 87,744, M Carnegie - 92,284, K Corbally - 39,419, G Florian - 52,182, M Hand - 33,665, K van der Merwe - 50,404, A Watson - 30,821, M Whelan - 94,485, A George - 60,809 and M Jablko - 4,540. 4. 93,131 rights were vested and exercisable, and zero options/rights were vested and unexerciseable as at 30 September 2021. There was no change in the balance as at the Directors’ Report sign-off date. 5. Commencing balance is based on holdings as at the date of commencement as a KMP. 6. Concluding balance is based on holdings as at the date ceased as a KMP.
109108 ANZ 2021 Annual Report
OVERVIEW HOW WE CREATE VALUE
PERFORMANCE OVERVIEW
REMUNERATION REPORT
DIRECTORS’ REPORT
FINANCIAL REPORT
SHAREHOLDER INFORMATION
109ANZ 2021 Annual Report
OVERVIEW HOW WE CREATE VALUE
PERFORMANCE OVERVIEW
REMUNERATION REPORT
DIRECTORS’ REPORT
FINANCIAL REPORT
SHAREHOLDER INFORMATION

Directors’ reportThe Directors’ Report for the financial year ended 30 September 2021 has been prepared in accordance with the requirements of the Corporations Act 2001. The information below forms part of this Directors’ Report:
• Principal activities on page 10
• Operating and financial review on pages 56 to 70
• Dividends on page 70
• Information on the Directors, Company Secretaries and Directors’ meetings on pages 40 to 50
• Remuneration report on pages 74 to 109.
SIGNIFICANT CHANGES IN STATE OF AFFAIRS
There have been no significant changes in the Group’s state of affairs.
EVENTS SINCE THE END OF THE FINANCIAL YEAR
On 22 October 2021, a Group fund that owns 19% of the shares in Cashrewards Limited announced it would make an off-market takeover offer to acquire the remaining 81% of the shares, for ~$80 million. The offer is subject to a number of conditions and completion remains uncertain.
Other than the matter above, there have been no significant events from 30 September 2021 to the date of signing this report.
POLITICAL DONATIONS
For the year ending 30 September 2021, our Public Policy Advocacy, Political Donations and Foreign Influence Policy included an annual donation to the two major federal political parties to support Australia’s democratic process. In October 2020, ANZ donated $100,000 to the Liberal Party of Australia and $100,000 to the Australian Labor Party. ANZ also attended paid events including business forums hosted by the major Australian Federal political parties, totalling $47,600. ANZ discloses associated costs and donations through the Australian Electoral Commission’s (AEC) donors annual return process, noting the AEC’s reporting year is a different period to ANZ’s financial year.
ANZ updated its policy on 1 October 2021. It prohibits political donations, but allows attendance at paid events hosted by the major Australian Federal political parties.
ENVIRONMENTAL REGULATION
ANZ recognises the expectations of its stakeholders – customers, shareholders, staff and the community – to operate in a way that mitigates its environmental impact.
In Australia, ANZ meets the requirements of the National Greenhouse and Energy Reporting Act 2007 (Cth), which imposes reporting obligations where energy production, usage or greenhouse gas emissions trigger specified thresholds.
The Group does not believe that its operations are subject to any other particular and significant environmental regulation under a law of the Commonwealth of Australia or of an Australian State or Territory. It may become subject to environmental regulation as a result of its lending activities in the ordinary course of business and has developed policies, which are reviewed on a regular basis to help identify and manage such environmental matters.
Having made due enquiry, and to the best of ANZ’s knowledge, no entity of the Group has incurred any material environmental liability during the year. Further details of ANZ’s environmental performance, including progress against its targets and management of material issues aligned with its commitment to fair and responsible banking and priority areas of financial wellbeing, environmental sustainability and housing, are available in ANZ’s ESG Supplement, at anz.com/annualreport.
CORPORATE GOVERNANCE STATEMENT
ANZ is committed to maintaining a high standard in its governance framework. ANZ confirms it has followed the ASX Corporate Governance Council’s Corporate Governance Principles and Recommendations (4th edition) during the 2021 financial year. ANZ’s Corporate Governance Statement, together with the ASX Appendix 4G which relates to the Corporate Governance Statement, can be viewed at anz.com/corporategovernance and has been lodged with the ASX.
PILLAR 3 INFORMATION
ANZ provides information required by APS 330: Public Disclosure in the Regulatory Disclosures section at anz.com/shareholder/centre/reporting/regulatory-disclosure/.
EXTERNAL AUDITOR
The Group’s external auditor is KPMG. The Group appointed Peat, Marwick, Mitchell & Co (predecessor to KPMG) in 1969.
The Board Audit Committee conducts a formal annual performance assessment of the external auditor, including whether to commence an external tender for the audit. After considering relevant factors including tenure, audit quality, local and international capability and experience, and independence, the Board Audit Committee resolved to reappoint KPMG for the 30 September 2022 financial year audit.
The KPMG Lead Audit Engagement Partner for the Group was appointed for the financial year ended 30 September 2021 replacing the previous Lead Audit Engagement partner who had been in the role since the 30 September 2017 financial year. In addition, KPMG regularly rotates the Engagement Quality Control Review Partner with the most recent rotation being for the financial year ended 30 September 2020.
NON-AUDIT SERVICES
The Group’s Stakeholder Engagement Model for Relationship with the External Auditor (the Policy), which incorporates requirements of the Corporations Act 2001 and industry best practice, prevents the external auditor from providing services that are perceived to be in conflict with the role of the external auditor or breach independence requirements. This includes consulting advice and sub-contracting of operational activities normally undertaken by management, and engagements where the external auditor may ultimately be required to express an opinion on its own work.
110
OVERVIEW HOW WE CREATE VALUE
PERFORMANCE OVERVIEW
REMUNERATION REPORT
DIRECTORS’ REPORT
FINANCIAL REPORT
SHAREHOLDER INFORMATION
110

Specifically the Policy:
• Limits the scope of non-audit services that may be provided;
• Requires that audit, audit-related and permitted non-audit services be considered in light of independence requirements and for any potential conflicts of interest before they are approved by the Audit Committee, or approved by the Chair of the Audit Committee (or delegate) and notified to the Audit Committee; and
• Requires pre-approval before the external auditor can commence any engagement for the Group.
Further details about the Policy can be found in the Corporate Governance Statement.
The external auditor has confirmed to the Audit Committee that it has:
• Implemented procedures to ensure it complies with independence rules in applicable jurisdictions; and
• Complied with applicable policies and regulations in those jurisdictions regarding the provision of non-audit services, and the Policy.
The Audit Committee has reviewed the non-audit services provided by the external auditor during the 2021 financial year, and has confirmed that the provision of these services is consistent with the Policy, compatible with the general standard of independence for auditors imposed by the Corporations Act 2001 and did not compromise the auditor independence requirements of the Corporations Act 2001. This has been formally advised by the Audit Committee to the Board of Directors.
The categories of non-audit services supplied to the Group during the year ended 30 September 2021 by the external auditor, KPMG, or by another person or firm on KPMG’s behalf, and the amounts paid or payable (including GST) by the Group are as follows:
Amount paid/payable $’000’s
Non-audit services 2021 2020
Training and related services – 16
Controls related assessments 90 –
Methodology and procedural reviews 101 107
Total 191 123
Further details on the compensation paid to KPMG is provided in Note 34 Auditor Fees to the financial statements including details of audit-related services provided during the year of $4.43 million (2020: $5.37 million).
For the reasons set out above, the Directors are satisfied that the provision of non-audit services by the external auditor during the year ended 30 September 2021 is compatible with the general standard of independence for external auditors imposed by the Corporations Act 2001 and did not compromise the auditor independence requirements of the Corporations Act 2001.
DIRECTORS’ AND OFFICERS’ INDEMNITY
The Company’s Constitution (Rule 11.1) permits the Company to:
• Indemnify any officer or employee of the Company, or its auditor, against liabilities (so far as may be permitted under applicable law) incurred as such by an officer, employee or auditor, including liabilities incurred as a result of appointment or nomination by the Company as a trustee or as an officer or employee of another corporation; and
• Make payments in respect of legal costs incurred by an officer, employee or auditor in defending an action for a liability incurred as such by an officer, employee or auditor, or in resisting or responding to actions taken by a government agency, a duly constituted Royal Commission or other official inquiry, a liquidator, administrator, trustee in bankruptcy or other authorised official.
It is the Company’s policy that its employees should be protected from any liability they incur as a result of acting in the course of their employment, subject to appropriate conditions.
Under the policy, the Company will indemnify employees and former employees against any liability they incur to any third party as a result of acting in the course of their employment with the Company or a subsidiary of the Company and this extends to liability incurred as a result of their appointment/nomination by or at the request of the Group as an officer or employee of another corporation or body or as trustee.
The indemnity is subject to applicable law and certain exceptions. In accordance with the employee indemnity policy, the Company has during or since the year ended 30 September 2021 paid legal expenses totalling $1,815,847.35 incurred by Mr Richard Moscati in relation to legal proceedings brought against him and the Company by a third party.
The Company has entered into Indemnity Deeds with each of its Directors, with certain secretaries and former Directors of the Company, and with certain employees and other individuals who act as directors or officers of related bodies corporate or of another company, to indemnify them against liabilities and legal costs of the kind mentioned in the Company’s Constitution.
During the financial year, the Company has paid premiums for insurance for the benefit of the Directors and employees of the Company and related bodies corporate of the Company. In accordance with common commercial practice, the insurance prohibits disclosure of the nature of the liability insured against and the amount of the premium.
111ANZ 2021 Annual Report
OVERVIEW HOW WE CREATE VALUE
PERFORMANCE OVERVIEW
REMUNERATION REPORT
DIRECTORS’ REPORT
FINANCIAL REPORT
SHAREHOLDER INFORMATION
111

KEY MANAGEMENT PERSONNEL AND EMPLOYEE SHARE AND OPTION PLANS
The Remuneration Report contains details of Non-Executive Directors, Chief Executive Officer and Disclosed Executives’ equity holdings and options/rights issued during the 2021 financial year and as at the date of this report.
Note 31 Employee Share and Option Plans to the 2021 Financial Report contains details of the 2021 financial year and as at the date of this report:
• Options/rights issued over shares granted to employees;
• Shares issued as a result of the exercise of options/rights granted to employees; and
• Other details about share options/rights issued, including any rights to participate in any share issues of the Company.
The names of all persons who currently hold options/rights are entered in the register kept by the Company pursuant to section 170 of the Corporations Act 2001. This register may be inspected free of charge.
ROUNDING OF AMOUNTS
The Company is a company of the kind referred to in Australian Securities and Investments Commission Corporations (Rounding in Financial/Directors’ Reports) Instrument 2016/191 dated 24 March 2016 and, in accordance with that Instrument, amounts in the consolidated financial statements and this Directors’ Report have been rounded to the nearest million dollars unless specifically stated otherwise.
This report is made in accordance with a resolution of the Board of Directors and is signed for and on behalf of the Directors.
LEAD AUDITOR’S INDEPENDENCE DECLARATION
The Lead Auditors Independence Declaration given under Section 307C of the Corporations Act 2001 is set out below and forms part of the Directors’ Report for the year ended 30 September 2021.
To: the Directors of Australia and New Zealand Banking Group Limited
I declare that, to the best of my knowledge and belief, in relation to the audit of Australia and New Zealand Banking Group Limited for the financial year ended 30 September 2021, there have been:
• No contraventions of the auditor independence requirements as set out in the Corporations Act 2001 in relation to the audit; and
• No contraventions of any applicable code of professional conduct in relation to the audit.
KPMG, an Australian partnership and a member firm of the KPMG global organisation of independent member firms affiliated with KPMG International Limited, a private English company limited by guarantee. All rights reserved. The KPMG name and logo are trademarks used under license by the independent member firms of the KPMG global organisation. Liability limited by a scheme approved under Professional Standards Legislation.
Paul D O’Sullivan | Chairman
27 October 2021
Shayne C Elliott | Managing Director
KPMG Martin McGrath | Partner
27 October 2021
CONTENTS
112
OVERVIEW HOW WE CREATE VALUE
PERFORMANCE OVERVIEW
REMUNERATION REPORT
DIRECTORS’ REPORT
FINANCIAL REPORT
SHAREHOLDER INFORMATION
112

Financial Report
FINANCIAL STATEMENTS
Income Statements 114Statements of Comprehensive Income 115Balance Sheets 116Cash Flow Statements 117Statements of Changes in Equity 118
NOTES TO THE FINANCIAL STATEMENTS
Basis of Preparation
1. About Our Financial Statements 120
Financial Performance
2. Net Interest Income 1263. Non-Interest Income 1274. Operating Expenses 1305. Income Tax 1326. Dividends 1347. Earnings per Ordinary Share 1368. Segment Reporting 137
Financial Assets
9. Cash and Cash Equivalents 14110. Trading Securities 14211. Derivative Financial Instruments 14312. Investment Securities 15613. Net Loans and Advances 15814. Allowance for Expected Credit Losses 159
Financial Liabilities
15. Deposits and Other Borrowings 17016. Debt Issuances 171
Financial Instrument Disclosures
17. Financial Risk Management 17718. Fair Value of Financial Assets and Financial Liabilities 20019. Assets Charged as Security for Liabilities and Collateral Accepted as Security for Assets 20720. Offsetting 208
Non-Financial Assets
21. Goodwill and Other Intangible Assets 210
Non-Financial Liabilities
22. Other Provisions 214
Equity
23. Shareholders’ Equity 21624. Capital Management 218
Consolidation and Presentation
25. Controlled Entities 22026. Investments in Associates 22227. Structured Entities 22428. Transfers of Financial Assets 22629. Discontinued Operations and Assets and Liabilities Held for Sale 228
Employee and Related Party Transactions
30. Superannuation and Post Employment Benefit Obligations 22931. Employee Share and Option Plans 23132. Related Party Disclosures 237
Other Disclosures
33. Commitments, Contingent Liabilities and Contingent Assets 23934. Auditor Fees 24235. Impact of Adoption of New Standards and Other Changes 24336. Events Since the End of the Financial Year 243
Directors’ Declaration 244
Independent Auditor’s Report 245
CONTENTS
113ANZ 2021 Annual Report
OVERVIEW HOW WE CREATE VALUE
PERFORMANCE OVERVIEW
REMUNERATION REPORT
DIRECTORS’ REPORT
FINANCIAL REPORT
SHAREHOLDER INFORMATION
113
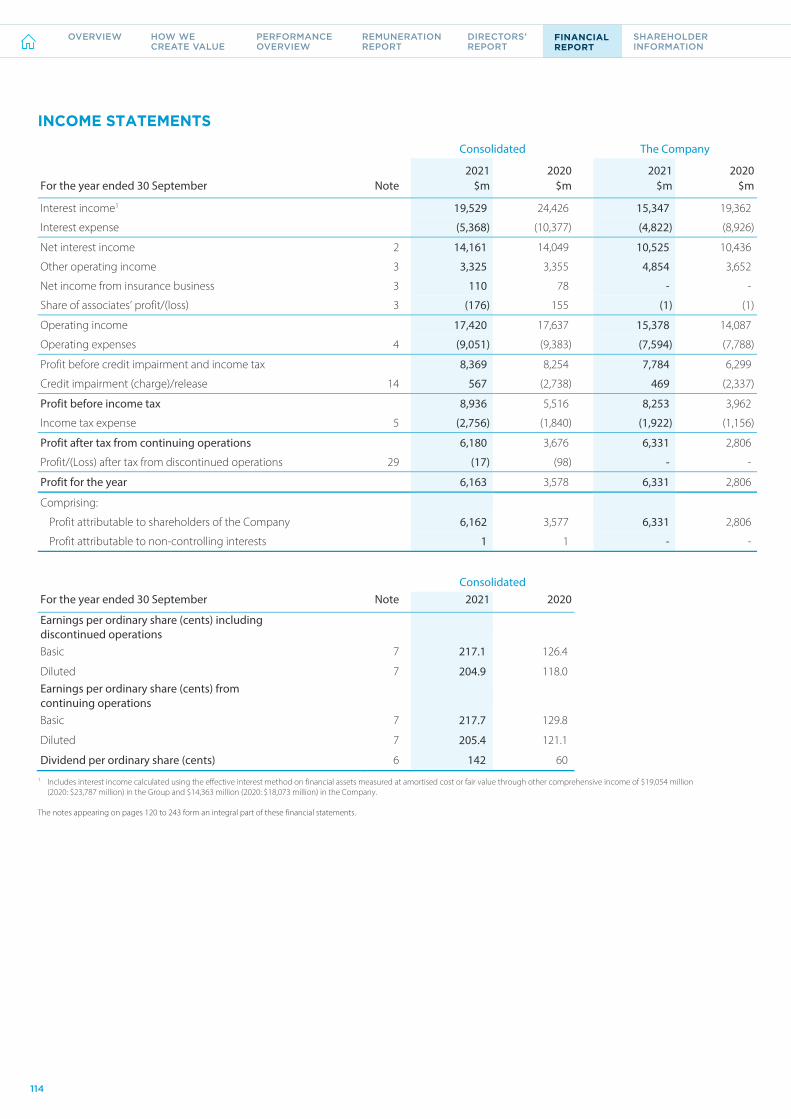
114
FINANCIAL REPORT
INCOME STATEMENTS
Consolidated The Company
2021 2020 2021 2020 For the year ended 30 September Note $m $m $m $m
Interest income1 19,529 24,426 15,347 19,362
Interest expense (5,368) (10,377) (4,822) (8,926)
Net interest income 2 14,161 14,049 10,525 10,436
Other operating income 3 3,325 3,355 4,854 3,652
Net income from insurance business 3 110 78 - -
Share of associates’ profit/(loss) 3 (176) 155 (1) (1)
Operating income 17,420 17,637 15,378 14,087
Operating expenses 4 (9,051) (9,383) (7,594) (7,788)
Profit before credit impairment and income tax 8,369 8,254 7,784 6,299
Credit impairment (charge)/release 14 567 (2,738) 469 (2,337)
Profit before income tax 8,936 5,516 8,253 3,962
Income tax expense 5 (2,756) (1,840) (1,922) (1,156)
Profit after tax from continuing operations 6,180 3,676 6,331 2,806
Profit/(Loss) after tax from discontinued operations 29 (17) (98) - -
Profit for the year 6,163 3,578 6,331 2,806
Comprising:
Profit attributable to shareholders of the Company 6,162 3,577 6,331 2,806
Profit attributable to non-controlling interests 1 1 - -
Consolidated For the year ended 30 September Note 2021 2020
Earnings per ordinary share (cents) including discontinued operations
Basic 7 217.1 126.4
Diluted 7 204.9 118.0 Earnings per ordinary share (cents) from continuing operations
Basic 7 217.7 129.8
Diluted 7 205.4 121.1
Dividend per ordinary share (cents) 6 142 60 1. Includes interest income calculated using the effective interest method on financial assets measured at amortised cost or fair value through other comprehensive income of $19,054 million
(2020: $23,787 million) in the Group and $14,363 million (2020: $18,073 million) in the Company. The notes appearing on pages 120 to 243 form an integral part of these financial statements.
Income statements
114
OVERVIEW HOW WE CREATE VALUE
PERFORMANCE OVERVIEW
REMUNERATION REPORT
DIRECTORS’ REPORT
FINANCIAL REPORT
SHAREHOLDER INFORMATION

115
FINANCIAL REPORT
STATEMENTS OF COMPREHENSIVE INCOME
Consolidated The Company
2021 2020 2021 2020 For the year ended 30 September $m $m $m $m
Profit for the year from continuing operations 6,180 3,676 6,331 2,806 Other comprehensive income
Items that will not be reclassified subsequently to profit or loss
Investment securities - equity securities at FVOCI 80 (157) 67 (151) Other reserve movements (41) 13 (95) 23
Items that may be reclassified subsequently to profit or loss
Foreign currency translation reserve1 456 (550) (14) (109) Other reserve movements (1,052) 712 (1,003) 587
Income tax attributable to the above items 301 (180) 303 (149) Share of associates’ other comprehensive income2 (48) 51 - - Other comprehensive income after tax from continuing operations (304) (111) (742) 201
Profit/(Loss) after tax from discontinued operations (17) (98) - -
Other comprehensive income after tax from discontinued operations - - - - Total comprehensive income for the year 5,859 3,467 5,589 3,007 Comprising total comprehensive income attributable to:
Shareholders of the Company 5,858 3,467 5,589 3,007 Non-controlling interests 1 - - -
1. Includes foreign currency translation differences attributable to non-controlling interests of nil (2020: $1 million loss) in the Group. 2. Share of associates’ other comprehensive income includes a FVOCI reserve loss of $42 million (2020: $48 million gain), defined benefits loss of $5 million (2020: $3 million gain), cash flow hedge reserve gain
of $1 million (2020: $1 million loss) and a foreign currency translation reserve loss of $2 million (2020: $1 million gain) that may be reclassified subsequently to profit or loss in the Group. The notes appearing on pages 120 to 243 form an integral part of these financial statements.
Statements of comprehensive income
115ANZ 2021 Annual Report
OVERVIEW HOW WE CREATE VALUE
PERFORMANCE OVERVIEW
REMUNERATION REPORT
DIRECTORS’ REPORT
FINANCIAL REPORT
SHAREHOLDER INFORMATION

116
FINANCIAL REPORT (continued)
BALANCE SHEETS
Consolidated The Company
2021 2020 2021 2020 As at 30 September Note $m $m $m $m
Assets
Cash and cash equivalents 9 151,260 107,923 141,436 98,083
Settlement balances owed to ANZ 7,530 7,541 7,183 7,116
Collateral paid1 9,166 14,308 8,343 13,012
Trading securities 10 44,688 50,913 34,752 38,423
Derivative financial instruments1 11 38,736 135,331 38,292 130,552
Investment securities 12 83,126 93,391 67,940 80,284
Net loans and advances 13 629,719 617,093 488,487 488,002
Regulatory deposits 671 801 213 199
Due from controlled entities - - 23,530 24,017
Shares in controlled entities 25 - - 15,693 15,022
Investments in associates 26 1,972 2,164 20 20
Current tax assets 57 161 55 155
Deferred tax assets 2,339 2,124 1,887 1,744
Goodwill and other intangible assets 21 4,124 4,379 1,017 1,097
Premises and equipment 2,734 3,013 2,415 2,643
Other assets 2,735 3,144 1,909 2,072
Total assets 978,857 1,042,286 833,172 902,441
Liabilities
Settlement balances owed by ANZ 17,427 22,241 14,922 19,556
Collateral received1 5,657 9,304 5,148 8,074
Deposits and other borrowings 15 743,056 682,333 606,723 558,136
Derivative financial instruments1 11 36,035 134,711 37,005 131,230
Due to controlled entities - - 23,079 24,295
Current tax liabilities 419 349 193 81
Deferred tax liabilities 70 80 70 79
Payables and other liabilities 8,647 9,128 7,244 8,070
Employee entitlements 602 596 447 441
Other provisions 22 2,214 2,579 1,873 2,157
Debt issuances 16 101,054 119,668 81,088 97,050
Total liabilities 915,181 980,989 777,792 849,169
Net assets 63,676 61,297 55,380 53,272
Shareholders' equity
Ordinary share capital 23 25,984 26,531 25,907 26,454
Reserves 23 1,228 1,501 341 1,018
Retained earnings 23 36,453 33,255 29,132 25,800 Share capital and reserves attributable to shareholders of the Company
23 63,665 61,287 55,380 53,272
Non-controlling interests 23 11 10 - -
Total shareholders' equity 23 63,676 61,297 55,380 53,272 1. During 2021, a change was made to the legal arrangements for the settlement of derivative transactions with a central clearing counterparty which resulted in the reduction of derivative financial
instrument assets by $55.1 billion, derivative financial instrument liabilities by $55.2 billion and net collateral paid by $0.1 billion. The notes appearing on pages 120 to 243 form an integral part of these financial statements.
Balance sheets
116
OVERVIEW HOW WE CREATE VALUE
PERFORMANCE OVERVIEW
REMUNERATION REPORT
DIRECTORS’ REPORT
FINANCIAL REPORT
SHAREHOLDER INFORMATION

117
FINANCIAL REPORT
CASH FLOW STATEMENTS Consolidated The Company
2021 2020 2021 2020 For the year ended 30 September $m $m $m $m
Profit after income tax 6,163 3,578 6,331 2,806 Adjustments to reconcile to net cash provided by/(used in) operating activities: Allowance for expected credit losses (567) 2,738 (469) 2,337 Impairment of investment in associates - 815 - - Depreciation and amortisation1 1,087 1,391 959 1,214 Goodwill impairment - 77 - 10 (Profit)/Loss on sale of premises and equipment (11) (8) (11) - Net derivatives/foreign exchange adjustment2 (6,350) (2,678) (4,374) (1,807) (Gain)/Loss on sale from divestments 238 25 (12) 11 Other non-cash movements (237) (80) (456) 64 Net (increase)/decrease in operating assets:
Collateral paid 4,995 283 4,484 33 Trading securities 10 (1,803) (2,778) 1,908 Net loans and advances (8,259) (7,119) (300) (7,526) Net intra-group loans and advances - - (1,212) (393) Other assets 143 (76) 89 (26)
Net increase/(decrease) in operating liabilities: Deposits and other borrowings3 48,896 39,873 41,908 28,660 Settlement balances owed by ANZ (4,928) 11,476 (4,671) 10,286 Collateral received (3,466) 1,739 (2,728) 1,426 Other liabilities2 6,108 (9,949) 5,579 (9,489)
Total adjustments 37,659 36,704 36,008 26,708 Net cash (used in)/provided by operating activities4 43,822 40,282 42,339 29,514 Cash flows from investing activities Investment securities assets:
Purchases (52,639) (40,029) (23,040) (33,731) Proceeds from sale or maturity 63,445 28,642 35,493 25,346
Proceeds from divestments, net of cash disposed 13 1,309 - 688 Repayment of IOOF secured notes - (800) - (800) Net movement in shares in controlled entities - - (175) (75) Net investments in other assets (561) (587) (650) (567) Net cash (used in)/provided by investing activities 10,258 (11,465) 11,628 (9,139) Cash flows from financing activities Deposits and other borrowings drawn down3 9,310 12,002 8,091 12,002 Debt issuances:5
Issue proceeds 12,624 12,260 9,517 10,064 Redemptions (27,709) (21,430) (23,104) (17,179)
Dividends paid6 (2,834) (2,861) (2,834) (2,861) On market purchase of treasury shares (79) (122) (79) (122) Repayment of lease liabilities (330) (281) (288) (267) Share buyback (654) - (654) - Net cash (used in)/provided by financing activities (9,672) (432) (9,351) 1,637 Net (decrease)/increase in cash and cash equivalents 44,408 28,385 44,616 22,012 Cash and cash equivalents at beginning of year 107,923 81,621 98,083 77,949 Effects of exchange rate changes on cash and cash equivalents (1,071) (2,083) (1,263) (1,878) Cash and cash equivalents at end of year 151,260 107,923 141,436 98,083
1. 2020 includes accelerated amortisation of $197 million for the Group and $184 million for the Company following the Group’s change in the application of its software amortisation policy in 2020. 2. Certain non-cash adjustments were reclassified from Other liabilities to Net derivatives/foreign exchange adjustment within Net cash (used in)/ provided by operating activities to better reflect the nature of
the item. Comparatives have been restated (2020 Group and Company reduction to net derivative foreign exchange adjustment: $368 million). 3. Funding in relation to TFF has been reclassified from operating activities to financing activities. Comparatives have been restated (2020 Group: $12,002 million; 2020 Company: $12,002 million). 4. Net cash (used in)/provided by operating activities for the Group includes interest received of $19,649 million (2020: $24,791 million), interest paid of $5,793 million (2020: $11,156 million) and income taxes
paid of $2,427 million (2020: $2,348 million). Net cash (used in)/provided by operating activities for the Company includes interest received of $15,435 million (2020: $19,657 million), interest paid of $5,117 million (2020: $9,577 million) and income taxes paid of $1,541 million (2020: $1,596 million).
5. Non-cash changes in debt issuances includes fair value hedging gain of $1,488 million (2020: $1,127 million loss) and foreign exchange gains of $1,525 million (2020: $1,623 million gain) for the Group, and fair value hedging gain of $1,114 million (2020: $532 million loss) and foreign exchange gains of $1,262 million (2020: $858 million loss) for the Company.
6. Cash outflow for shares purchased to satisfy the dividend reinvestment plan are classified in Dividends paid.
The notes appearing on pages 120 to 243 form an integral part of these financial statements.
Cash flow statements
117ANZ 2021 Annual Report
OVERVIEW HOW WE CREATE VALUE
PERFORMANCE OVERVIEW
REMUNERATION REPORT
DIRECTORS’ REPORT
FINANCIAL REPORT
SHAREHOLDER INFORMATION

118
STATEMENT OF CHANGES IN EQUITY
Ordinary
share capital Reserves Retained earnings
Share capital and reserves
attributable to shareholders
of the Company
Non-controlling
interests
Total shareholders’
equity Consolidated $m $m $m $m $m $m
As at 1 October 2019 26,490 1,629 32,664 60,783 11 60,794
Impact on transition to AASB 16 - - (88) (88) - (88)
Profit or loss from continuing operations - - 3,675 3,675 1 3,676
Profit or loss from discontinued operations - - (98) (98) - (98)
Other comprehensive income for the year from continuing operations - (124) 14 (110) (1) (111)
Other comprehensive income for the year from discontinued operations - - - - - -
Total comprehensive income for the year - (124) 3,591 3,467 - 3,467 Transactions with equity holders in their capacity as equity holders: Dividends paid - - (2,922) (2,922) - (2,922)
Dividend Reinvestment Plan 61 - - 61 - 61
Other equity movements: Group employee share acquisition scheme (20) - - (20) - (20)
Other items - (4) 10 6 (1) 5
As at 30 September 2020 26,531 1,501 33,255 61,287 10 61,297
Profit or loss from continuing operations - - 6,179 6,179 1 6,180 Profit or loss from discontinued operations - - (17) (17) - (17)
Other comprehensive income for the year from continuing operations - (264) (40) (304) - (304)
Other comprehensive income for the year from discontinued operations - - - - - -
Total comprehensive income for the year - (264) 6,122 5,858 1 5,859 Transactions with equity holders in their capacity as equity holders: Dividends paid - - (2,928) (2,928) - (2,928)
Dividend Reinvestment Plan1 94 - - 94 - 94
Group share buy-back2 (654) - - (654) - (654) Other equity movements: Group employee share acquisition scheme 13 - - 13 - 13 Other items - (9) 4 (5) - (5)
As at 30 September 2021 25,984 1,228 36,453 63,665 11 63,676 1 4.2 million shares were issued under the Dividend Reinvestment Plan (DRP) for the 2020 final dividend (3.4 million shares for the 2020 interim dividend); Nil for 2021 interim dividend and 2019 final dividend
as the shares were purchased on-market and provided directly to shareholders participating in the DRP. On-market share purchases for the DRP in 2021 were $199 million (2020: $185 million). 2 The Company commenced a $1.5 billion on-market share buy-back on 4 August 2021. This resulted in 23 million shares ($654 million) being cancelled in the September 2021 half and a further 2 million
shares ($55 million) being cancelled after 30 September 2021 in respect of purchase orders placed but not settled at 30 September 2021.
The notes appearing on pages 120 to 243 form an integral part of these financial statements.
Statement of changes in equity
118
OVERVIEW HOW WE CREATE VALUE
PERFORMANCE OVERVIEW
REMUNERATION REPORT
DIRECTORS’ REPORT
FINANCIAL REPORT
SHAREHOLDER INFORMATION

119
STATEMENT OF CHANGES IN EQUITY
Ordinary
share capital Reserves Retained earnings
Total shareholders’
equity The Company $m $m $m $m
As at 1 October 2019 26,413 840 25,961 53,214
Impact on transition to AASB 16 - - (72) (72)
Profit for the year - - 2,806 2,806
Other comprehensive income for the year - 183 18 201
Total comprehensive income for the year - 183 2,824 3,007 Transactions with equity holders in their capacity as equity holders: Dividends paid - - (2,922) (2,922)
Dividend Reinvestment Plan1 61 - - 61
Other equity movements: -
Group employee share acquisition scheme (20) - - (20)
Other items - (5) 9 4
As at 30 September 2020 26,454 1,018 25,800 53,272
Profit for the year - - 6,331 6,331 Other comprehensive income for the year - (668) (74) (742)
Total comprehensive income for the year - (668) 6,257 5,589 Transactions with equity holders in their capacity as equity holders: Dividends paid - - (2,928) (2,928)
Dividend Reinvestment Plan1 94 - - 94
Group share buy-back2 (654) - - (654)
Other equity movements: Group employee share acquisition scheme 13 - - 13 Other items - (9) 3 (6)
As at 30 September 2021 25,907 341 29,132 55,380 1. 4.2 million shares were issued under the Dividend Reinvestment Plan (DRP) for the 2020 final dividend (3.4 million shares for the 2020 interim dividend); Nil for 2021 interim dividend and 2019 final dividend
as the shares were purchased on-market and provided directly to shareholders participating in the DRP. On-market share purchases for the DRP in 2021 were $199 million (2020: $185 million). 2. The Company commenced a $1.5 billion on-market share buy-back on 4 August 2021. This resulted in 23 million shares ($654 million) being cancelled in the September 2021 half and a further 2 million
shares ($55 million) being cancelled after 30 September 2021 in respect of purchase orders placed but not settled at 30 September 2021. The notes appearing on pages 120 to 243 form an integral part of these financial statements.
119ANZ 2021 Annual Report
OVERVIEW HOW WE CREATE VALUE
PERFORMANCE OVERVIEW
REMUNERATION REPORT
DIRECTORS’ REPORT
FINANCIAL REPORT
SHAREHOLDER INFORMATION

120
NOTES TO THE FINANCIAL STATEMENTS
NOTES TO THE FINANCIAL STATEMENTS (continued)
1. ABOUT OUR FINANCIAL STATEMENTS
These are the financial statements for Australia and New Zealand Banking Group Limited (‘the Company’) and its controlled entities (together, ‘the Group’ or ‘ANZ’) for the year ended 30 September 2021. The Company is incorporated and domiciled in Australia. The address of the Company’s registered office and its principal place of business is ANZ Centre, 833 Collins Street, Docklands, Victoria, Australia 3008. The Group provides banking and financial services to individuals and business customers and operates in and across 32 markets.
On 27 October 2021, the Directors resolved to authorise the issue of these financial statements.
Information in the financial statements is included only to the extent we consider it material and relevant to the understanding of the financial statements. A disclosure is considered material and relevant if, for example:
the amount is significant in size (quantitative factor);
the information is significant by nature (qualitative factor);
the user cannot understand the Group’s results without the specific disclosure (qualitative factor);
the information is critical to a user’s understanding of the impact of significant changes in the Group’s business during the period - for example, business acquisitions or disposals (qualitative factor);
the information relates to an aspect of the Group’s operations that is important to its future performance (qualitative factor); and
the information is required under legislative requirements of the Corporations Act 2001, the Banking Act 1959 (Cth) or by the Group’s principal regulators, including the Australian Securities and Investments Commission (ASIC) and the Australian Prudential Regulation Authority (APRA).
This section of the financial statements:
outlines the basis upon which the Group’s financial statements have been prepared; and
discusses any new accounting standards or regulations that directly impact the financial statements.
BASIS OF PREPARATION This financial report is a general purpose (Tier 1) financial report prepared by a ‘for profit’ entity, in accordance with Australian Accounting Standards (AASs) and other authoritative pronouncements of the Australian Accounting Standards Board (AASB), the Corporations Act 2001, and International Financial Reporting Standards (IFRS) and interpretations published by the International Accounting Standards Board (IASB).
We present the financial statements of the Group in Australian dollars, which is the Company’s functional and presentation currency. We have rounded values to the nearest million dollars ($m), unless otherwise stated, as allowed under the ASIC Corporations (Rounding in Financial/Directors Report) Instrument 2016/191. We measure the financial statements of each entity in the Group using the currency of the primary economic environment in which that entity operates (the functional currency).
BASIS OF MEASUREMENT We have prepared the financial information in accordance with the historical cost basis - except the following assets and liabilities which we have stated at their fair value:
derivative financial instruments and in the case of fair value hedging, a fair value adjustment made to the underlying hedged item;
financial instruments held for trading;
financial assets and financial liabilities designated at fair value through profit or loss;
financial assets at fair value through other comprehensive income; and
assets and liabilities classified as held for sale (except those at carrying value).
In accordance with AASB 119 Employee Benefits (AASB 119) we have measured defined benefit obligations using the Projected Unit Credit Method.
DISCONTINUED OPERATIONS The sale of Wealth Australia business to IOOF Holdings Limited (IOOF) and Zurich Financial Services Australia (Zurich) completed across 2020 and 2019. The financial results of these divested businesses are treated as discontinued operations from a financial reporting perspective.
BASIS OF CONSOLIDATION The consolidated financial statements of the Group comprise the financial statements of the Company and all its subsidiaries. An entity, including a structured entity, is considered a subsidiary of the Group when we determine that the Company has control over the entity. Control exists when the Group is exposed to, or has rights to, variable returns from its involvement with the entity and has the ability to affect those returns through its power over the entity. We assess power by examining existing rights that give the Company the current ability to direct the relevant activities of the entity. We have eliminated, on consolidation, the effect of all transactions between entities in the Group.
Notes to the financial statements
1. About our financial statements
OVERVIEW HOW WE CREATE VALUE
PERFORMANCE OVERVIEW
REMUNERATION REPORT
DIRECTORS’ REPORT
FINANCIAL REPORT
SHAREHOLDER INFORMATION
120
OVERVIEW HOW WE CREATE VALUE
PERFORMANCE OVERVIEW
REMUNERATION REPORT
DIRECTORS’ REPORT
FINANCIAL REPORT
SHAREHOLDER INFORMATION
121
ANZ 2021 ANNUAL REPORT
NOTES TO THE FINANCIAL STATEMENTS (continued)
1. ABOUT OUR FINANCIAL STATEMENTS (continued)
FOREIGN CURRENCY TRANSLATION TRANSACTIONS AND BALANCES Foreign currency transactions are translated into the relevant functional currency at the exchange rate prevailing at the date of the transaction. At the reporting date, monetary assets and liabilities denominated in foreign currencies are translated into the functional currency at the relevant spot rate. Any foreign currency translation gains or losses that arise are included in profit or loss in the period they arise.
We measure translation differences on non-monetary items at fair value through profit or loss and report them as part of the fair value gain or loss on these items. For non-monetary items classified as investment securities measured at fair value through other comprehensive income, translation differences are included in other comprehensive income.
FINANCIAL STATEMENTS OF FOREIGN OPERATIONS THAT HAVE A FUNCTIONAL CURRENCY THAT IS NOT AUSTRALIAN DOLLARS The financial statements of our foreign operations are translated into Australian dollars for consolidation into the Group Financial Statements using the following method:
Foreign currency item Exchange rate used
Assets and liabilities The reporting date rate
Equity The initial investment date rate
Income and expenses The average rate for the period – but if for a significant transaction we believe the average rate is not reasonable, then we use the rate at the date of the transaction
Exchange differences arising from the translation of financial statements of foreign operations are recognised in the foreign currency translation reserve in equity. When we dispose of a foreign operation, the cumulative exchange differences are transferred to profit or loss.
FIDUCIARY ACTIVITIES The Group provides fiduciary services to third parties including custody, nominee and trustee services. This involves the Group holding assets on behalf of third parties and making decisions regarding the purchase and sale of financial instruments. If ANZ is not the beneficial owner or does not control the assets, then we do not recognise these transactions in these financial statements, except when required by accounting standards or another legislative requirement.
KEY JUDGEMENTS AND ESTIMATES
In the process of applying the Group’s accounting policies, management has made a number of judgements and applied estimates and assumptions about past and future events. Further information on the key judgements and estimates that we consider material to the financial statements are contained within each relevant note to the financial statements.
Coronavirus (COVID-19) pandemic The COVID-19 pandemic and its ongoing effects on the global economy has continued to impact our customers, operations and Group performance. Governments have responded at unprecedented levels to protect the health of the population, local economies and livelihoods. The course of the pandemic and vaccination levels has varied across the globe and government responses have differed in their extent and timing. Economies are reopening at different rates whilst the risk of subsequent waves of infection remain. Thus there remains an elevated level of estimation uncertainty involved in the preparation of these financial statements including:
the extent and duration of the disruption to business arising from the actions of governments, businesses and consumers in the ongoing management of the virus;
the impact and expected response of the economy (and forecasts of key economic factors including GDP, employment and house prices). This includes the response of capital markets, and the impacts on credit quality, liquidity, unemployment, consumer spending, as well as specific sector impacts; and
the efficacy of vaccines against variants of the virus, and the effectiveness of government and central bank measures to support businesses and consumers through this disruption.
The Group has made various accounting estimates in this Financial Report based on forecasts of economic conditions which reflect expectations and assumptions as at 30 September 2021 about future events that the Directors believe are reasonable in the circumstances. There is a considerable degree of judgement involved in preparing these estimates. The underlying assumptions are also subject to uncertainties which are outside the control of the Group. Accordingly, actual economic conditions are likely to be different from those forecast since anticipated events frequently do not occur as expected, and the effect of those differences may significantly impact accounting estimates included in these financial statements.
The significant accounting estimates impacted by these forecasts and associated uncertainties are predominantly related to expected credit losses and recoverable amounts of non-financial assets.
The impact of the COVID-19 pandemic on each of these estimates is discussed further in the relevant note of these financial statements. Readers should carefully consider these disclosures in light of the inherent uncertainty described above.
121ANZ 2021 Annual Report
OVERVIEW HOW WE CREATE VALUE
PERFORMANCE OVERVIEW
REMUNERATION REPORT
DIRECTORS’ REPORT
FINANCIAL REPORT
SHAREHOLDER INFORMATION
OVERVIEW HOW WE CREATE VALUE
PERFORMANCE OVERVIEW
REMUNERATION REPORT
DIRECTORS’ REPORT
FINANCIAL REPORT
SHAREHOLDER INFORMATION

ANZ 2021 ANNUAL REPORT
NOTES TO THE FINANCIAL STATEMENTS (continued)
122
1. ABOUT OUR FINANCIAL STATEMENTS (continued)
ACCOUNTING STANDARDS ADOPTED IN THE PERIOD INTEREST RATE BENCHMARK REFORM Interbank offered rates (IBORs), such as the London Interbank Offered Rate (LIBOR) have played a critical role in global financial markets, serving as reference rates for derivatives, loans and securities, and in the valuation of financial instruments. Uncertainty surrounding the integrity of IBOR rates has led to regulators and industry to transition away from IBOR to alternative risk-free benchmark reference rates (RFRs).
As had been anticipated, in March 2021 the UK Financial Conduct Authority (FCA) announced the dates on which IBORs will cease, after which representative IBOR rates will no longer be available. The cessation of the majority of IBOR rates will occur on 31 December 2021, notably for the Pound Sterling (GBP), Euro (EUR), Swiss Franc (CHF) and Japanese Yen (JPY) settings in their entirety, and the US Dollar (USD) 1-week and 2-month LIBOR settings. The Group has ceased issuing new products referencing these rates. Other USD LIBOR settings will cease by 30 June 2023.
The Group has exposure to IBORs through its loan and derivative transactions with customers, issuance of debt and its asset and liability management activities.
Other significant interest rate benchmarks applicable to the Group’s banking activities with customers and our own risk management activities include the Euro Interbank Offered Rate (Euribor), the AUD Bank Bill Swap Rate (BBSW) and the NZ Bank Bill Market (BKBM). These are not impacted by IBOR reform and these benchmark rates are expected to remain for the foreseeable future.
Group approach to interest rate benchmark reform The development of new RFR products and the migration of the Group’s existing contracts that reference IBORs to RFRs exposes the Group to financial, compliance, legal and operational risks. The Group is managing the transition to RFRs and these risks through an enterprise-wide Benchmark Transition Program (the Program), which is overseen by a formal Steering Committee of senior executives. The Program provides regular updates to the Group Executive and Board Audit & Board Risk committees.
The IBOR reforms have a wide-ranging impact for the Group and our customers given the fundamental differences between IBORs and RFRs. RFRs are available both as backward-looking in arrears rates and, for some currencies, as forward-looking term rates. The key difference between IBORs and RFRs is that IBOR rates include a term and bank credit risk premium, whereas RFRs do not. As a result of these differences, adjustments are required to an RFR to ensure contracts referencing an IBOR rate, transition on an economically comparable basis.
The Program includes the identification of impacted IBOR contracts across the Group, actions necessary to develop product capability and transition existing contracts to RFRs. This includes the assessment and mitigation of financial, legal and conduct risks arising from changes to pricing and valuation (largely interest rate risk), compliance risks arising from any potential non-compliance with relevant regulatory requirements, legal risks arising from changes to customer contracts, and operational risks including changes to IT systems, controls and reporting infrastructure. In undertaking these changes, the Group is actively engaging with various regulatory bodies across a number of countries in which the Group operates in respect of our IBOR transition readiness. From an industry perspective, the Group is also actively participating in, and contributing to, different RFR Working Groups, industry associations and business forums focusing on different aspects of interest rate benchmark reform.
To date, the Group has successfully transitioned a significant number of loan transactions that previously referenced an IBOR benchmark, to referencing an RFR benchmark rate. The Group has also commenced transitioning existing IBOR derivative trades to reference RFR benchmark rates. The Group continues to extend and deliver its RFR product suite and pricing options to be able support our customers in line with regulatory best practice guidelines.
The Program also includes the management of the impact on customers. The Group is well-progressed in ensuring all customer transition plans are finalised ahead of IBOR cessation dates, with the significant majority of our derivative counterparties with exposures referencing IBORs agreeing to amend existing contracts by adhering to the industry developed ISDA 2020 IBOR Fallbacks Protocol (ISDA Protocol) to facilitate a standardised and orderly transition to RFRs. The Group has also adhered to the ISDA Protocol.
In relation to our loan and transaction banking customers, the Group has commenced a proactive outreach program to ensure an orderly and well-managed migration to RFRs. Given that USD LIBOR will continue to be published for the most widely used settings until 30 June 2023, the Program is focussing on customer engagement with those customers whose arrangements reference IBORs ceasing on 31 December 2021.
ANZ 2021 ANNUAL REPORT
NOTES TO THE FINANCIAL STATEMENTS (continued)
124
1. ABOUT OUR FINANCIAL STATEMENTS (continued)
ACCOUNTING STANDARDS ADOPTED IN THE PERIOD (continued) iii) Hedge accounting exposures subject to IBOR reform
The Group has hedge-accounted relationships referencing IBORs, with the most significant being USD LIBOR, primarily due to fixed rate investment securities and the Group’s fixed rate debt issuances denominated in USD that are designated in fair value hedge accounting relationships.
The table below details the carrying values of the Group's USD exposures designated in hedge accounting relationships referencing LIBOR that will be impacted by reform. The nominal value of the associated hedging instruments is also included:
As at 30 September 2021
Hedged items $m Investment securities at FVOCI 13,096 Net loans and advances 236 Deposits and other borrowings 577 Debt issuances 24,249
Hedging instruments
Notional designated up to 30 June 2023
$m
Notional designated beyond 30 June 2023
$m Total notional amount
$m Fair value hedges 13,335 23,043 36,379 Cash flow hedges 458 258 716
As at 30 September 2021, the Group also has GBP, CHF and JPY exposures designated in hedge accounting relationships of $1,510 million, $940 million and $1,853 million respectively subject to IBOR reform.
Other hedge accounting relationships referencing the Euro Interbank Offered Rate (Euribor), the AUD Bank Bill Swap Rate (BBSW) and the NZ Bank Bill Market (BKBM) are not impacted by IBOR reform as these benchmark rates are expected to remain for the foreseeable future.
iv) Future Developments
As the most widely referenced USD LIBOR benchmark tenors will continue to be published up to 30 June 2023, the Group’s transition program supporting our customers and the Group’s own risk management activities will continue beyond 2021.
REVISED CONCEPTUAL FRAMEWORK On 1 October 2020, the Group adopted the revised Conceptual Framework for Financial Reporting. The new Framework includes updated definitions and criteria for the recognition and derecognition of assets and liabilities. Additionally, it introduces new concepts on measurement, including factors to consider when selecting a measurement basis. The adoption of the revised conceptual framework did not have a material impact on the Group.
ACCOUNTING STANDARDS NOT EARLY ADOPTED A number of new standards, amendments to standards and interpretations have been published but are not mandatory for the financial statements for the year ended 30 September 2021, and have not been applied by the Group in preparing these financial statements. Further details of these are set out below.
GENERAL HEDGE ACCOUNTING AASB 9 Financial Instruments (AASB 9) introduces new hedge accounting requirements which more closely align accounting with risk management activities undertaken when hedging both financial and non-financial risks. AASB 9 provides the Group with an accounting policy choice to continue to apply the AASB 139 Financial Instruments: Recognition and Measurement (AASB 139) hedge accounting requirements until the International Accounting Standards Board’s ongoing project on macro hedge accounting is completed. The Group continues to apply the hedge accounting requirements of AASB 139.
AASB 17 INSURANCE CONTRACTS (AASB 17) The final version of AASB 17 was issued in July 2017 and is not effective for the Group until 1 October 2023. It will replace AASB 4 Insurance Contracts, AASB 1023 General Insurance Contracts and AASB 1038 Life Insurance Contracts. AASB 17 establishes principles for the recognition, measurement, presentation and disclosure of insurance contracts.
The measurement, presentation and disclosure requirements under AASB 17 are significantly different from current accounting standards. Although the overall profit recognised in respect of insurance contracts will not change, it is expected that the timing of profit recognition will change.
AASB 17 is not expected to have a material impact on the Group.
122
OVERVIEW HOW WE CREATE VALUE
PERFORMANCE OVERVIEW
REMUNERATION REPORT
DIRECTORS’ REPORT
FINANCIAL REPORT
SHAREHOLDER INFORMATION

NOTES TO THE FINANCIAL STATEMENTS
123
Changes to accounting standards In 2018, given the uncertainty with regards to the longer term viability of IBORs, the International Accounting Standards Board (IASB) commenced a review of the financial reporting implications of the reforms, given the significant potential consequences for financial instrument accounting.
In October 2019, the Australian Accounting Standards Board (AASB) issued AASB 2019-3 Amendments to Australian Accounting Standards – Interest Rate Benchmark Reform – Phase 1, which amended certain existing hedge accounting requirements to provide relief from potential effects of the uncertainty caused by the interest rate benchmark reform. The Group elected to early adopt the amendments from 1 October 2019, which have not had a significant impact on the Group.
In September 2020, the AASB issued AASB 2020-8 Amendments to Australian Accounting Standards – Interest Rate Benchmark Reform – Phase 2 (the Standard), which the Group early adopted from 1 April 2021. This Standard addresses issues that may affect the Group at the point of transition from an existing IBOR rate to a RFR, including the effects of changes to contractual cash flows or hedging relationships. The Standard includes amendments in respect of:
Modification of a financial asset or a financial liability measured at amortised cost: IBOR reform is expected to result in a change to the basis for determining contractual cash flows of impacted assets and liabilities of the Group. The Standard provides a practical expedient to account for a change in the basis for determining the contractual cash flows by updating the effective interest rate. As a result, no immediate gain or loss is recognised. This applies only when the change is a direct consequence of IBOR reform, and the new basis for determining the contractual cash flows is economically comparable to the previous basis;
Additional relief for hedging relationships: the Standard also amends a number of existing hedge accounting requirements such that the Group will not have to discontinue any hedge accounting relationships solely because of changes made because of the reform if all other hedge accounting criteria are met; and
Additional disclosure requirements: the Standard amended AASB 7 Financial Instruments: Disclosures which requires additional qualitative and quantitative disclosures in relation to the impact of IBOR reforms on the Group. These disclosures are contained within this note.
Financial Impacts of IBOR reform The following sets out the Group’s impact assessment in relation to IBOR reforms as at 30 September 2021:
i) Impact for the year ended 30 September 2021
For the year ended 30 September 2021, the net impact of the IBOR reforms recognised in the Group’s net profit after tax is not material. The impacts recognised in the current year include: a) changes in the fair values of certain derivative financial instruments for which it is known at balance sheet date – as a result of regulatory
pronouncements confirming IBOR cessation – that the fair valuation will incorporate a change to an RFR at a future date; and
b) revenue from a small number of customers in the Institutional division who have transitioned to loan and derivative contracts referencing an RFR by 30 September.
ii) Exposures subject to benchmark reform as at 30 September 2021
The table below shows the Group’s exposure to interest rate benchmarks subject to IBOR reform. These are financial instruments that contractually reference an IBOR benchmark planned to transition to an RFR, and have a contractual maturity date beyond the planned IBOR cessation date.
Financial Instruments yet to transition to RFRs USD Libor JPY Libor GBP Libor Others1
As at 30 September 2021 $m $m $m $m Loan and advances2 12,744 635 508 465 Non-derivative financial assets2 3,115 - 1,655 78 Non-derivative financial liabilities3 614 - - 55 Derivative asset (notional value)4 515,816 58,264 21,916 16,096 Derivative liability (notional value)4 486,716 83,039 21,524 14,855 Loan commitments2,5 26,982 4 762 3,695
1. Comprises financial instruments referencing other significant benchmark rates subject to cessation yet to transition to alternative benchmarks. 2. Excludes Expected Credit Losses (ECL). 3. Comprises floating rate debt issuances by the Group. 4. For cross-currency swaps, where both the receive and pay legs are in currencies subject to reform, the Group discloses the Australian dollar-equivalent notional amounts for both. Where one leg
of a swap is subject to reform, the Group discloses the notional amount of the receive leg. 5. For multi-currency IBOR referenced facilities, the undrawn balance has been allocated to the base currency of the facility. In the event the base currency interest rate is not subject to cessation,
but can be drawn in a currency subject to cessation, the allocation is based on most likely currency of drawdown.
ANZ 2021 ANNUAL REPORT
NOTES TO THE FINANCIAL STATEMENTS (continued)
124
1. ABOUT OUR FINANCIAL STATEMENTS (continued)
ACCOUNTING STANDARDS ADOPTED IN THE PERIOD (continued) iii) Hedge accounting exposures subject to IBOR reform
The Group has hedge-accounted relationships referencing IBORs, with the most significant being USD LIBOR, primarily due to fixed rate investment securities and the Group’s fixed rate debt issuances denominated in USD that are designated in fair value hedge accounting relationships.
The table below details the carrying values of the Group's USD exposures designated in hedge accounting relationships referencing LIBOR that will be impacted by reform. The nominal value of the associated hedging instruments is also included:
As at 30 September 2021
Hedged items $m Investment securities at FVOCI 13,096 Net loans and advances 236 Deposits and other borrowings 577 Debt issuances 24,249
Hedging instruments
Notional designated up to 30 June 2023
$m
Notional designated beyond 30 June 2023
$m Total notional amount
$m Fair value hedges 13,335 23,043 36,379 Cash flow hedges 458 258 716
As at 30 September 2021, the Group also has GBP, CHF and JPY exposures designated in hedge accounting relationships of $1,510 million, $940 million and $1,853 million respectively subject to IBOR reform.
Other hedge accounting relationships referencing the Euro Interbank Offered Rate (Euribor), the AUD Bank Bill Swap Rate (BBSW) and the NZ Bank Bill Market (BKBM) are not impacted by IBOR reform as these benchmark rates are expected to remain for the foreseeable future.
iv) Future Developments
As the most widely referenced USD LIBOR benchmark tenors will continue to be published up to 30 June 2023, the Group’s transition program supporting our customers and the Group’s own risk management activities will continue beyond 2021.
REVISED CONCEPTUAL FRAMEWORK On 1 October 2020, the Group adopted the revised Conceptual Framework for Financial Reporting. The new Framework includes updated definitions and criteria for the recognition and derecognition of assets and liabilities. Additionally, it introduces new concepts on measurement, including factors to consider when selecting a measurement basis. The adoption of the revised conceptual framework did not have a material impact on the Group.
ACCOUNTING STANDARDS NOT EARLY ADOPTED A number of new standards, amendments to standards and interpretations have been published but are not mandatory for the financial statements for the year ended 30 September 2021, and have not been applied by the Group in preparing these financial statements. Further details of these are set out below.
GENERAL HEDGE ACCOUNTING AASB 9 Financial Instruments (AASB 9) introduces new hedge accounting requirements which more closely align accounting with risk management activities undertaken when hedging both financial and non-financial risks. AASB 9 provides the Group with an accounting policy choice to continue to apply the AASB 139 Financial Instruments: Recognition and Measurement (AASB 139) hedge accounting requirements until the International Accounting Standards Board’s ongoing project on macro hedge accounting is completed. The Group continues to apply the hedge accounting requirements of AASB 139.
AASB 17 INSURANCE CONTRACTS (AASB 17) The final version of AASB 17 was issued in July 2017 and is not effective for the Group until 1 October 2023. It will replace AASB 4 Insurance Contracts, AASB 1023 General Insurance Contracts and AASB 1038 Life Insurance Contracts. AASB 17 establishes principles for the recognition, measurement, presentation and disclosure of insurance contracts.
The measurement, presentation and disclosure requirements under AASB 17 are significantly different from current accounting standards. Although the overall profit recognised in respect of insurance contracts will not change, it is expected that the timing of profit recognition will change.
AASB 17 is not expected to have a material impact on the Group.
123ANZ 2021 Annual Report
OVERVIEW HOW WE CREATE VALUE
PERFORMANCE OVERVIEW
REMUNERATION REPORT
DIRECTORS’ REPORT
FINANCIAL REPORT
SHAREHOLDER INFORMATION Notes to the financial statements (continued)

ANZ 2021 ANNUAL REPORT
NOTES TO THE FINANCIAL STATEMENTS (continued)
124
1. ABOUT OUR FINANCIAL STATEMENTS (continued)
ACCOUNTING STANDARDS ADOPTED IN THE PERIOD (continued) iii) Hedge accounting exposures subject to IBOR reform
The Group has hedge-accounted relationships referencing IBORs, with the most significant being USD LIBOR, primarily due to fixed rate investment securities and the Group’s fixed rate debt issuances denominated in USD that are designated in fair value hedge accounting relationships.
The table below details the carrying values of the Group's USD exposures designated in hedge accounting relationships referencing LIBOR that will be impacted by reform. The nominal value of the associated hedging instruments is also included:
As at 30 September 2021
Hedged items $m Investment securities at FVOCI 13,096 Net loans and advances 236 Deposits and other borrowings 577 Debt issuances 24,249
Hedging instruments
Notional designated up to 30 June 2023
$m
Notional designated beyond 30 June 2023
$m Total notional amount
$m Fair value hedges 13,335 23,043 36,379 Cash flow hedges 458 258 716
As at 30 September 2021, the Group also has GBP, CHF and JPY exposures designated in hedge accounting relationships of $1,510 million, $940 million and $1,853 million respectively subject to IBOR reform.
Other hedge accounting relationships referencing the Euro Interbank Offered Rate (Euribor), the AUD Bank Bill Swap Rate (BBSW) and the NZ Bank Bill Market (BKBM) are not impacted by IBOR reform as these benchmark rates are expected to remain for the foreseeable future.
iv) Future Developments
As the most widely referenced USD LIBOR benchmark tenors will continue to be published up to 30 June 2023, the Group’s transition program supporting our customers and the Group’s own risk management activities will continue beyond 2021.
REVISED CONCEPTUAL FRAMEWORK On 1 October 2020, the Group adopted the revised Conceptual Framework for Financial Reporting. The new Framework includes updated definitions and criteria for the recognition and derecognition of assets and liabilities. Additionally, it introduces new concepts on measurement, including factors to consider when selecting a measurement basis. The adoption of the revised conceptual framework did not have a material impact on the Group.
ACCOUNTING STANDARDS NOT EARLY ADOPTED A number of new standards, amendments to standards and interpretations have been published but are not mandatory for the financial statements for the year ended 30 September 2021, and have not been applied by the Group in preparing these financial statements. Further details of these are set out below.
GENERAL HEDGE ACCOUNTING AASB 9 Financial Instruments (AASB 9) introduces new hedge accounting requirements which more closely align accounting with risk management activities undertaken when hedging both financial and non-financial risks. AASB 9 provides the Group with an accounting policy choice to continue to apply the AASB 139 Financial Instruments: Recognition and Measurement (AASB 139) hedge accounting requirements until the International Accounting Standards Board’s ongoing project on macro hedge accounting is completed. The Group continues to apply the hedge accounting requirements of AASB 139.
AASB 17 INSURANCE CONTRACTS (AASB 17) The final version of AASB 17 was issued in July 2017 and is not effective for the Group until 1 October 2023. It will replace AASB 4 Insurance Contracts, AASB 1023 General Insurance Contracts and AASB 1038 Life Insurance Contracts. AASB 17 establishes principles for the recognition, measurement, presentation and disclosure of insurance contracts.
The measurement, presentation and disclosure requirements under AASB 17 are significantly different from current accounting standards. Although the overall profit recognised in respect of insurance contracts will not change, it is expected that the timing of profit recognition will change.
AASB 17 is not expected to have a material impact on the Group.
124
OVERVIEW HOW WE CREATE VALUE
PERFORMANCE OVERVIEW
REMUNERATION REPORT
DIRECTORS’ REPORT
FINANCIAL REPORT
SHAREHOLDER INFORMATION

NOTES TO THE FINANCIAL STATEMENTS
125
1. ABOUT OUR FINANCIAL STATEMENTS (continued)
ACCOUNTING STANDARDS NOT EARLY ADOPTED (continued)
DEFERRED TAX RELATED TO ASSETS AND LIABILITIES ARISING FROM A SINGLE TRANSACTION AASB 2021-5 Amendments to Australian Accounting Standards – Deferred Tax related to Assets and Liabilities arising from a Single Transaction amends AASB 112 Income Taxes and clarifies that entities are required to recognise deferred tax on transactions for which there is both an asset and a liability and that give rise to equal taxable and deductible temporary differences. This may include transactions such as leases and decommissioning or restoration obligations. This amendment is effective for the Group from 1 October 2023 and is not expected to have a significant impact.
CHANGE IN ACCOUNTING POLICY INTRAGROUP TRANSACTIONS WITH CONSOLIDATED SECURITISATION ENTITIES During the year, the Company changed its accounting policy relating to intragroup transactions with consolidated securitisation structured entities (SEs) in which it holds all the instruments issued by the SE. The Company will no longer separately record a liability to pass the cash flows from the underlying loans to the SE and an asset in the form of notes issued by the SE which entitle the Company to those same cash flows. Rather the transactions will be considered together with the Company recording a net nil position with the SE in order to better reflect the economic substance of the intragroup transactions that are fully offsetting. Comparatives have been restated in the financial statements of the Company. There has been no change to the Group because the relevant securitisation SEs are fully consolidated and the intra-group transactions eliminated. Refer to Note 35 Impact of Adoption of New Standards and Other Changes for further details of this change.
125ANZ 2021 Annual Report
OVERVIEW HOW WE CREATE VALUE
PERFORMANCE OVERVIEW
REMUNERATION REPORT
DIRECTORS’ REPORT
FINANCIAL REPORT
SHAREHOLDER INFORMATION Notes to the financial statements (continued)

ANZ 2021 ANNUAL REPORT
NOTES TO THE FINANCIAL STATEMENTS (continued)
126
2. NET INTEREST INCOME
Consolidated The Company
2021 2020 2021 2020 $m $m $m $m
Net interest income
Interest income by type of financial asset
Financial assets at amortised cost1 18,188 22,625 13,767 17,190
Investment securities at FVOCI 866 1,162 596 883
Trading securities 446 584 325 429
Financial assets designated at FV through profit or loss1 29 55 124 159
External interest income 19,529 24,426 14,812 18,661
Controlled entities income2 - - 535 701
Interest income 19,529 24,426 15,347 19,362
Interest expense by type of financial liability
Financial liabilities at amortised cost1 (4,830) (9,751) (3,681) (7,477)
Securities sold short (91) (95) (82) (91)
Financial liabilities designated at FV through profit or loss1 (101) (125) (158) (190)
External interest expense (5,022) (9,971) (3,921) (7,758)
Controlled entities expense2 - - (555) (762)
Interest expense (5,022) (9,971) (4,476) (8,520)
Major bank levy (346) (406) (346) (406)
Net interest income3 14,161 14,049 10,525 10,436 1. Prior year comparative balances have been restated to align with the classification of the underlying financial asset or liability. The reclassification does not change the reported total interest income or
interest expense in the prior year. Prior period comparatives were restated to reclassify interest income from Financial assets at amortised cost to Financial assets at FV through profit and loss (2020: $50 million for the Group and $159 million for the Company) and interest expense from Financial liabilities at amortised cost to Financial liabilities at FV through profit and loss (2020: $32 million for the Group and $125 million for the Company).
2. From 1 April 2021, the Company changed its accounting policy relating to intragroup transactions with consolidated securitisation structured entities (SEs) in which it holds all of the issued securities of the SE. Transactions with an SE are no longer recorded on a gross basis. Comparatives have been restated, reducing Interest income from Controlled Entities by $2,377 million and Interest expense from Controlled Entities by $2,929 million at 30 September 2020. Refer to Note 35 Impact of Adoption of New Standards and Other Changes for further details.
3. Includes charges for customer remediation of $86 million (2020: $106 million) for the Group and $82 million (2020: $97 million) for the Company.
RECOGNITION AND MEASUREMENT
NET INTEREST INCOME
Interest Income and Expense We recognise interest income and expense in net interest income for all financial instruments, including those classified as held for trading, assets measured at fair value through other comprehensive income or designated at fair value through profit or loss. We use the effective interest rate method to calculate the amortised cost of assets held at amortised cost and to recognise interest income on financial assets measured at fair value through other comprehensive income. The effective interest rate is the rate that discounts the stream of estimated future cash receipts or payments over the expected life of the financial instrument or, when appropriate, a shorter period, to the net carrying amount of the financial asset or liability. For assets subject to prepayment, we determine their expected life on the basis of historical behaviour of the particular asset portfolio - taking into account contractual obligations and prepayment experience.
We recognise fees and costs, which form an integral part of the financial instrument (for example loan origination fees and costs), using the effective interest rate method. These are presented as part of interest income or expense depending on whether the underlying financial instrument is a financial asset or financial liability.
Major Bank Levy The Major Bank Levy Act 2017 (‘Levy’ or ‘Major bank levy’) applies a rate of 0.06% to certain liabilities of the Company. The Group has determined that the levy represents a finance cost for the Group and the Company and it is presented as interest expense in the Income Statement.
2. Net interest income
126
OVERVIEW HOW WE CREATE VALUE
PERFORMANCE OVERVIEW
REMUNERATION REPORT
DIRECTORS’ REPORT
FINANCIAL REPORT
SHAREHOLDER INFORMATION
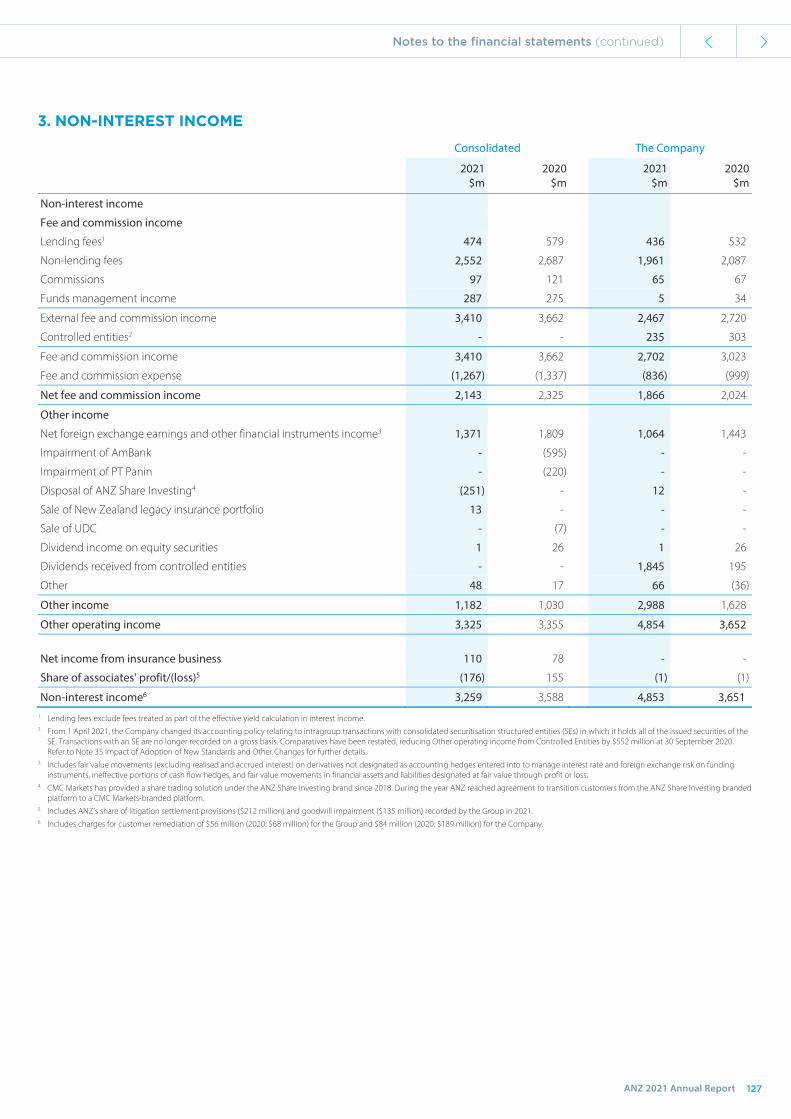
NOTES TO THE FINANCIAL STATEMENTS
127
3. NON-INTEREST INCOME
Consolidated The Company
2021 2020 2021 2020 $m $m $m $m
Non-interest income
Fee and commission income
Lending fees1 474 579 436 532
Non-lending fees 2,552 2,687 1,961 2,087
Commissions 97 121 65 67
Funds management income 287 275 5 34
External fee and commission income 3,410 3,662 2,467 2,720
Controlled entities2 - - 235 303
Fee and commission income 3,410 3,662 2,702 3,023
Fee and commission expense (1,267) (1,337) (836) (999)
Net fee and commission income 2,143 2,325 1,866 2,024
Other income
Net foreign exchange earnings and other financial instruments income3 1,371 1,809 1,064 1,443
Impairment of AmBank - (595) - -
Impairment of PT Panin - (220) - -
Disposal of ANZ Share Investing4 (251) - 12 -
Sale of New Zealand legacy insurance portfolio 13 - - -
Sale of UDC - (7) - -
Dividend income on equity securities 1 26 1 26
Dividends received from controlled entities - - 1,845 195
Other 48 17 66 (36)
Other income 1,182 1,030 2,988 1,628
Other operating income 3,325 3,355 4,854 3,652 Net income from insurance business 110 78 - -
Share of associates' profit/(loss)5 (176) 155 (1) (1)
Non-interest income6 3,259 3,588 4,853 3,651 1. Lending fees exclude fees treated as part of the effective yield calculation in interest income. 2. From 1 April 2021, the Company changed its accounting policy relating to intragroup transactions with consolidated securitisation structured entities (SEs) in which it holds all of the issued securities of the
SE. Transactions with an SE are no longer recorded on a gross basis. Comparatives have been restated, reducing Other operating income from Controlled Entities by $552 million at 30 September 2020. Refer to Note 35 Impact of Adoption of New Standards and Other Changes for further details.
3. Includes fair value movements (excluding realised and accrued interest) on derivatives not designated as accounting hedges entered into to manage interest rate and foreign exchange risk on funding instruments, ineffective portions of cash flow hedges, and fair value movements in financial assets and liabilities designated at fair value through profit or loss.
4. CMC Markets has provided a share trading solution under the ANZ Share Investing brand since 2018. During the year ANZ reached agreement to transition customers from the ANZ Share Investing branded platform to a CMC Markets-branded platform.
5. Includes ANZ’s share of litigation settlement provisions ($212 million) and goodwill impairment ($135 million) recorded by the Group in 2021. 6. Includes charges for customer remediation of $56 million (2020: $68 million) for the Group and $84 million (2020: $189 million) for the Company.
3. Non-interest income
127ANZ 2021 Annual Report
OVERVIEW HOW WE CREATE VALUE
PERFORMANCE OVERVIEW
REMUNERATION REPORT
DIRECTORS’ REPORT
FINANCIAL REPORT
SHAREHOLDER INFORMATION Notes to the financial statements (continued)

ANZ 2021 ANNUAL REPORT
NOTES TO THE FINANCIAL STATEMENTS (continued)
128
3. NON-INTEREST INCOME (continued)
RECOGNITION AND MEASUREMENT
OTHER OPERATING INCOME
Fee and Commission Revenue We recognise fee and commission revenue arising from contracts with customers (a) over time when the performance obligation is satisfied across more than one reporting period or (b) at a point in time when the performance obligation is satisfied immediately or is satisfied within one reporting period.
lending fees exclude fees treated as part of the effective yield calculation of interest income. Lending fees include certain guarantee and commitment fees where the loan or guarantee is not likely to be drawn upon, and other fees charged for providing customers a distinct good or service that are recognised separately from the underlying lending product (including annual package fees that provide benefits on other ANZ products).
non-lending fees includes fees associated with deposit and credit card accounts, interchange fees and fees charged for specific customer transactions such as international money transfers. Where the Group provides multiple goods or services to a customer under the same contract, the Group allocates the transaction price of the contract to distinct performance obligations based on the relative stand-alone selling price of each performance obligation. Revenue is recognised as each performance obligation is satisfied.
commissions represent fees from third parties where we act as an agent by arranging a third party (such as an insurance provider) to provide goods and services to a customer. In such cases, we are not primarily responsible for providing the underlying good or service to the customer. If the Group collects funds on behalf of a third party when acting as an agent, we only recognise the net commission it retains as revenue. When the commission is variable based on factors outside our control (such as a trail commission), revenue is only recognised if it is highly probable that a significant reversal of the variable amount will not be required in future periods.
funds management income represents fees earned from customers for providing financial advice and fees for asset management services and advice provided to investment funds. Revenue is recognised either at the point the financial advice is provided or over the period in which the asset management services are delivered. Performance fees associated with funds management activities are only recognised when it becomes highly probable the performance hurdle will be achieved.
Net Foreign Exchange Earnings and Other Financial Instruments Income We recognise the following as net foreign exchange earnings and other financial instruments income:
exchange rate differences arising on the settlement of monetary items and translation differences on monetary items translated at rates different to those at which they were initially recognised or included in a previous financial report;
fair value movements (excluding realised and accrued interest) on derivatives that we use to manage interest rate and foreign exchange risk on funding instruments not designated as accounting hedges;
the ineffective portions of fair value hedges, cash flow hedges and net investment hedges;
immediately upon sale or repayment of a hedged item, the unamortised fair value adjustments in items designated as fair value hedges and amounts accumulated in equity related to designated cash flow hedges;
fair value movements on financial assets and financial liabilities designated at fair value through profit or loss or held for trading;
amounts released from the fair value through other comprehensive income (FVOCI) reserve when a debt instrument classified as FVOCI is sold; and
the gain or loss on derecognition of financial assets or liabilities measured at amortised cost.
Gain or Loss on Disposal of Non-Financial Assets The gain or loss on the disposal of assets is the difference between the carrying value of the asset and the proceeds of disposal net of costs. This is recognised in Other income in the year in which the significant risks and rewards from the asset transfer to the buyer.
When a non-financial asset or group of assets is classified as held for sale, the difference between the carrying value immediately prior to reclassification and the fair value less costs to sell is recognised in Other operating income to align with the classification of gain or loss on sale that would have applied if the sale had completed during the year.
128
OVERVIEW HOW WE CREATE VALUE
PERFORMANCE OVERVIEW
REMUNERATION REPORT
DIRECTORS’ REPORT
FINANCIAL REPORT
SHAREHOLDER INFORMATION

NOTES TO THE FINANCIAL STATEMENTS
129
3. NON-INTEREST INCOME (continued)
RECOGNITION AND MEASUREMENT
NET INCOME FROM INSURANCE BUSINESS
We recognise:
premiums received (net of reinsurance premiums paid) based on an assessment of the likely pattern in which risk will emerge over the term of the policies written. This assessment is undertaken periodically and updated in accordance with the latest pattern of risk emergence; and
claims incurred net of reinsurance, on an accruals basis once the liability to the policy owner has been established under the terms of the contract and through actuarial assumptions of future claims.
SHARE OF ASSOCIATES’ PROFIT/(LOSS)
The equity method is applied to accounting for associates. Under the equity method, our share of the after tax results of associates is included in the Income Statement and the Statement of Comprehensive Income.
129ANZ 2021 Annual Report
OVERVIEW HOW WE CREATE VALUE
PERFORMANCE OVERVIEW
REMUNERATION REPORT
DIRECTORS’ REPORT
FINANCIAL REPORT
SHAREHOLDER INFORMATION Notes to the financial statements (continued)

ANZ 2021 ANNUAL REPORT
NOTES TO THE FINANCIAL STATEMENTS (continued)
130
4. OPERATING EXPENSES
Consolidated The Company
2021 2020 2021 2020 $m $m $m $m
Personnel Salaries and related costs 4,425 4,310 3,241 3,147
Superannuation costs 337 329 281 277
Other 184 239 110 142
Personnel1 4,946 4,878 3,632 3,566
Premises
Rent 85 84 62 58
Depreciation 446 517 371 427
Other 174 188 131 139
Premises 705 789 564 624
Technology
Depreciation and amortisation2,3 638 858 585 786
Subscription licences and outsourced services 786 780 587 586
Other 164 186 170 189
Technology1 1,588 1,824 1,342 1,561
Restructuring 127 161 77 127
Other
Advertising and public relations 178 177 134 136
Professional fees 769 667 714 614
Freight, stationery, postage and communication 185 205 141 166
Other3 553 682 990 994
Other1 1,685 1,731 1,979 1,910
Operating expenses1 9,051 9,383 7,594 7,788 1. Includes customer remediation expenses of $185 million (2020: $209 million) for the Group and $148 million (2020: $146 million) for the Company allocated across Personnel, Technology and Other
expenses. 2. 2020 includes accelerated amortisation of $197 million for the Group and $184 million for the Company following the Group’s change in the application of its software amortisation policy in 2020. 3. Includes litigation settlement expenses of $69 million in 2021 for the Group and $69 million for the Company in 2021 and goodwill write-off of $77 million for the Group and $10 million for the Company in
2020.
4. Operating expenses
130
OVERVIEW HOW WE CREATE VALUE
PERFORMANCE OVERVIEW
REMUNERATION REPORT
DIRECTORS’ REPORT
FINANCIAL REPORT
SHAREHOLDER INFORMATION

NOTES TO THE FINANCIAL STATEMENTS
131
4. OPERATING EXPENSES (continued)
RECOGNITION AND MEASUREMENT
OPERATING EXPENSES
Operating expenses are recognised as services are provided to the Group, over the period in which an asset is consumed, or once a liability is created.
SALARIES AND RELATED COSTS - ANNUAL LEAVE, LONG SERVICE LEAVE AND OTHER EMPLOYEE BENEFITS
Wages and salaries, annual leave and other employee entitlements expected to be paid or settled within twelve months of employees rendering service are measured at their nominal amounts using remuneration rates that the Group expects to pay when the liabilities are settled.
We accrue employee entitlements relating to long service leave using an actuarial calculation. It includes assumptions regarding staff departures, leave utilisation and future salary increases. The result is then discounted using market yields at the reporting date. The market yields are determined from a blended rate of high quality corporate bonds with terms to maturity that closely match the estimated future cash outflows.
If we expect to pay short term cash bonuses, then a liability is recognised when the Group has a present legal or constructive obligation to pay this amount (as a result of past service provided by the employee) and the obligation can be reliably measured.
Personnel expenses also include share-based payments which may be cash or equity settled. We calculate the fair value of equity settled remuneration at grant date, which is then amortised over the vesting period, with a corresponding increase in share capital or the share option reserve as applicable. When we estimate the fair value, we take into account market vesting conditions, such as share price performance conditions. We take non-market vesting conditions, such as service conditions, into account by adjusting the number of equity instruments included in the expense.
After the grant of an equity-based award, the amount we recognise as an expense is reversed when non-market vesting conditions are not met, for example an employee fails to satisfy the minimum service period specified in the award on resignation, termination or notice of dismissal for serious misconduct. However, we do not reverse the expense if the award does not vest due to the failure to meet a market-based performance condition.
Further information on share-based payment schemes operated by the Group during the current and prior year is included in Note 31 Employee Share and Option Plans.
131ANZ 2021 Annual Report
OVERVIEW HOW WE CREATE VALUE
PERFORMANCE OVERVIEW
REMUNERATION REPORT
DIRECTORS’ REPORT
FINANCIAL REPORT
SHAREHOLDER INFORMATION Notes to the financial statements (continued)

ANZ 2021 ANNUAL REPORT
NOTES TO THE FINANCIAL STATEMENTS (continued)
132
5. INCOME TAX
INCOME TAX EXPENSE Reconciliation of the prima facie income tax expense on pre-tax profit with the income tax expense recognised in profit or loss:
Consolidated The Company
2021 2020 2021 2020
$m $m $m $m
Profit before income tax from continuing operations 8,936 5,516 8,253 3,962
Prima facie income tax expense at 30% 2,681 1,655 2,476 1,189
Tax effect of permanent differences:
Gains or losses on sale from divestments (4) 2 - -
Impairment of investment in AmBank and PT Panin - 245 - -
Share of associates' (profit)/loss 53 (47) - -
Disposal of ANZ Share Investing 75 - (4) -
Interest on convertible instruments 44 52 44 52
Overseas tax rate differential (88) (86) (33) (31)
Provision for foreign tax on dividend repatriation 37 20 33 18
Rebatable and non-assessable dividends - - (554) (58)
Wealth Australia divestment adjustments - - - 8
Other (26) 25 (23) (2)
Subtotal 2,772 1,866 1,939 1,176
Income tax (over)/under provided in previous years (16) (26) (17) (20)
Income tax expense 2,756 1,840 1,922 1,156
Current tax expense 2,616 2,637 1,743 1,689 Adjustments recognised in the current year in relation to the current tax of prior years (16) (26) (17) (20)
Deferred tax expense/(income) relating to the origination and reversal of temporary differences 156 (771) 196 (513)
Income tax expense 2,756 1,840 1,922 1,156
Australia 1,897 1,115 1,806 1,028
Overseas 859 725 116 128
Effective tax rate 30.8% 33.4% 23.3% 29.2%
5. Income tax
132
OVERVIEW HOW WE CREATE VALUE
PERFORMANCE OVERVIEW
REMUNERATION REPORT
DIRECTORS’ REPORT
FINANCIAL REPORT
SHAREHOLDER INFORMATION

NOTES TO THE FINANCIAL STATEMENTS
133
5. INCOME TAX (continued)
TAX CONSOLIDATION The Company and all its wholly owned Australian resident entities are part of a tax-consolidated group under Australian taxation law. The Company is the head entity in the tax-consolidated group. We recognise each of the following in the separate financial statements of members of the tax consolidated group on a ‘group allocation’ basis: tax expense/income, and deferred tax liabilities/assets that arise from temporary differences of the members of the tax-consolidated group. The Company (as head entity in the tax-consolidated group) recognises current tax liabilities and assets of the tax-consolidated group.
Under a tax funding arrangement between the entities in the tax-consolidated group, amounts are recognised as payable to or receivable by the Company and each member of the tax-consolidated group in relation to the tax contribution amounts paid or payable between the Company and the other members of the tax-consolidated group.
Members of the tax-consolidated group have also entered into a tax sharing agreement that provides for the allocation of income tax liabilities between the entities were the head entity to default on its income tax payment obligations.
UNRECOGNISED DEFERRED TAX ASSETS AND LIABILITIES Unrecognised deferred tax assets related to unused realised tax losses (on revenue account) total $6 million (2020: $10 million) for the Group and $2 million (2020: $5 million) for the Company.
Unrecognised deferred tax liabilities related to additional potential foreign tax costs (assuming all retained earnings in offshore branches and subsidiaries are repatriated) total $344 million (2020: $329 million) for the Group and $15 million (2020: $14 million) for the Company.
RECOGNITION AND MEASUREMENT
INCOME TAX EXPENSE
Income tax expense comprises both current and deferred taxes and is based on the accounting profit adjusted for differences in the accounting and tax treatments of income and expenses (that is, taxable income). We recognise tax expense in profit or loss except when the tax relates to items recognised directly in equity and other comprehensive income, in which case we recognise the tax directly in equity or other comprehensive income respectively.
CURRENT TAX EXPENSE
Current tax is the tax we expect to pay on taxable income for the year, based on tax rates (and tax laws) which are enacted at the reporting date. We recognise current tax as a liability (or asset) to the extent that it is unpaid (or refundable).
DEFERRED TAX ASSETS AND LIABILITIES
We account for deferred tax using the balance sheet method. Deferred tax arises because the accounting income is not always the same as the taxable income. This creates temporary differences, which usually reverse over time. Until they reverse, we recognise a deferred tax asset, or liability, on the balance sheet. We measure deferred taxes at the tax rates that we expect will apply to the period(s) when the asset is realised, or the liability settled, based on tax rates (and tax laws) that have been enacted or substantially enacted at the reporting date.
We offset current and deferred tax assets and liabilities only to the extent that:
they relate to income taxes imposed by the same taxation authority;
there is a legal right and intention to settle on a net basis; and
it is allowed under the tax law of the relevant jurisdiction.
KEY JUDGEMENTS AND ESTIMATES
Judgement is required in determining provisions held in respect of uncertain tax positions. The Group estimates its tax liabilities based on its understanding of the relevant law in each of the countries in which it operates and seeks independent advice where appropriate.
133ANZ 2021 Annual Report
OVERVIEW HOW WE CREATE VALUE
PERFORMANCE OVERVIEW
REMUNERATION REPORT
DIRECTORS’ REPORT
FINANCIAL REPORT
SHAREHOLDER INFORMATION Notes to the financial statements (continued)

ANZ 2021 ANNUAL REPORT
NOTES TO THE FINANCIAL STATEMENTS (continued)
134
6. DIVIDENDS
ORDINARY SHARE DIVIDENDS Dividends are provided for in the financial statements once determined, accordingly, the final dividend announced for the current financial year is provided for and paid in the following financial year. Amount Total dividend Dividends % of total per share $m
Financial Year 2020
2019 final dividend paid1,2 80 cents 2,268
2020 interim dividend paid1,3 25 cents 709
Bonus option plan adjustment (55)
Dividends paid during the year ended 30 September 2020 2,922
Cash 91.6% 2,676
Dividend reinvestment plan4 8.4% 246
Dividends paid during the year ended 30 September 2020 2,922
Financial Year 2021
2020 final dividend paid1,3 35 cents 994
2021 interim dividend paid1,3 70 cents 1,992
Bonus option plan adjustment (58)
Dividends paid during the year ended 30 September 2021 2,928
Cash 90.0% 2,635
Dividend reinvestment plan4 10.0% 293
Dividends paid during the year ended 30 September 2021 2,928
Amount Total
dividend Dividends announced and to be paid after year-end Payment date per share $m
2021 final dividend (fully franked for Australian tax, New Zealand imputation credit NZD 8 cents per share) 16 December 2021 72 cents 2,030
1. Carries New Zealand imputation credits of NZD 8 cents for the 2021 interim dividend, NZD 4 cents for the 2020 final dividend, NZD 3 cents for the 2020 interim dividend, and NZD 9 cents for the 2019 final dividend.
2. Partially franked at 70% for Australian tax purposes (30% tax rate). 3. Fully franked for Australian tax purposes (30% tax rate). 4. Includes on-market share purchases for the Dividend Reinvestment Plan of $199 million (2020: $185 million).
DIVIDEND REINVESTMENT PLAN AND BONUS OPTION PLAN Eligible shareholders can elect to reinvest their dividend entitlement into ANZ ordinary shares under the Company’s Dividend Reinvestment Plan (DRP). Eligible shareholders can elect to forgo their dividend entitlement and instead receive ANZ ordinary shares under the Company’s Bonus Option Plan (BOP). For the 2021 final dividend, DRP participation will be satisfied by an on-market purchase, and BOP participation will be satisfied by an issue, of new ANZ ordinary shares. There will be no discount applied to the DRP and BOP price.
See Note 23 Shareholders’ Equity for details of shares the Company purchased or issued in respect of the DRP and BOP.
6. Dividends
134
OVERVIEW HOW WE CREATE VALUE
PERFORMANCE OVERVIEW
REMUNERATION REPORT
DIRECTORS’ REPORT
FINANCIAL REPORT
SHAREHOLDER INFORMATION

NOTES TO THE FINANCIAL STATEMENTS
135
6. DIVIDENDS (continued)
DIVIDEND FRANKING ACCOUNT 2021 2020
Currency $m $m
Australian franking credits available at 30% tax rate AUD 772 477
New Zealand imputation credits available (which can be attached to our Australian dividends but may only be used by New Zealand resident shareholders)
NZD 5,020 4,583
The above amounts represent the balances of the franking accounts as at the end of the financial year, adjusted for:
franking credits that will arise from the payment of income tax payable as at the end of the financial year; and
franking credits/debits from the receipt/payment of dividends that have been recognised as tax receivables/payables as at the end of the financial year.
The proposed final 2021 dividend will utilise the entire balance of $772 million franking credits available at 30 September 2021. Instalment tax payments on account of the 2021 financial year, which will be made after 30 September 2021, will generate sufficient franking credits to enable the final 2021 dividend to be fully franked. The extent to which future dividends will be franked will depend on a number of factors, including the level of profits generated by the Group that will be subject to tax in Australia.
RESTRICTIONS ON THE PAYMENT OF DIVIDENDS APRA’s written approval is required before paying dividends on ANZ ordinary shares if:
the aggregate dividends exceed the Company’s after tax earnings (in calculating those after tax earnings, we take into account any payments we made on senior capital instruments) in the financial year to which they relate; or
the Group’s Common Equity Tier 1 capital ratio falls within capital range buffers specified by APRA.
If the Company fails to pay a dividend or distribution on its ANZ Capital Notes or ANZ Capital Securities on the scheduled payment date, it may (subject to a number of exceptions) be restricted from resolving to pay or paying any dividend on the ANZ ordinary shares.
In response to the uncertain impacts of COVID-19, in July 2020 APRA provided guidance on capital management, including its expectations in relation to limits on the amount of dividends to be paid out of that year’s earnings. The Company’s 2020 interim dividend of 25 cents per share (paid to shareholders on 30 September 2020) and 2020 final dividend of 35 cents per share (paid to shareholders on 16 December 2020) took into account this guidance.
Following an improvement in the economic outlook and stability in financial markets, APRA updated their guidance in December 2020, whereby from the 2021 calendar year, APRA will no longer hold ADIs to a minimum level of earnings retention but emphasised the requirement for ADIs to maintain vigilance and careful planning in capital management, including conducting regular stress testing and assurance on the capacity to continue to lend. APRA also stated that the onus will be on Boards to consider carefully the sustainable rate for dividends, taking into account the outlook for profitability, capital and economic environment.
135ANZ 2021 Annual Report
OVERVIEW HOW WE CREATE VALUE
PERFORMANCE OVERVIEW
REMUNERATION REPORT
DIRECTORS’ REPORT
FINANCIAL REPORT
SHAREHOLDER INFORMATION Notes to the financial statements (continued)

ANZ 2021 ANNUAL REPORT
NOTES TO THE FINANCIAL STATEMENTS (continued)
136
7. EARNINGS PER ORDINARY SHARE
Basic EPS is calculated by dividing the profit or loss attributable to ordinary shareholders by the weighted average number of ordinary shares outstanding during the period (after eliminating ANZ shares held within the Group known as treasury shares). Diluted EPS is calculated by adjusting the profit or loss attributable to ordinary shareholders and the weighted average number of ordinary shares used in the basic EPS calculation for the effect of dilutive potential ordinary shares.
2021 2020 Earnings per ordinary share (EPS) - Basic cents cents
Earnings Per Share 217.1 126.4
Earnings Per Share from continuing operations 217.7 129.8
Earnings Per Share from discontinued operations (0.6) (3.4)
2021 2020 Earnings per ordinary share (EPS) - Diluted cents cents
Earnings Per Share 204.9 118.0
Earnings Per Share from continuing operations 205.4 121.1
Earnings Per Share from discontinued operations (0.5) (3.1)
2021 2020 Reconciliation of earnings used in earnings per share calculations $m $m
Basic:
Profit for the year 6,163 3,578
Less: Profit attributable to non-controlling interests 1 1
Earnings used in calculating basic earnings per share 6,162 3,577
Less: Profit/(Loss) after tax from discontinued operations (17) (98)
Earnings used in calculating basic earnings per share from continuing operations 6,179 3,675
Diluted:
Earnings used in calculating basic earnings per share 6,162 3,577
Add: Interest on convertible subordinated debt 187 201
Earnings used in calculating diluted earnings per share 6,349 3,778
Less: Profit/(Loss) after tax from discontinued operations (17) (98)
Earnings used in calculating diluted earnings per share from continuing operations 6,366 3,876
2021 2020 Reconciliation of weighted average number of ordinary shares (WANOS) used in earnings per share calculations1
millions millions
WANOS used in calculating basic earnings per share 2,838.6 2,830.9
Add: Weighted average dilutive potential ordinary shares
Convertible subordinated debt 250.3 362.2
Share based payments (options, rights and deferred shares) 9.9 8.0
WANOS used in calculating diluted earnings per share 3,098.8 3,201.1 1. Weighted average number of ordinary shares excludes the weighted average number of treasury shares held in ANZEST Pty Ltd of 4.6 million (2020: 5.0 million).
7. Earnings per ordinary share
136
OVERVIEW HOW WE CREATE VALUE
PERFORMANCE OVERVIEW
REMUNERATION REPORT
DIRECTORS’ REPORT
FINANCIAL REPORT
SHAREHOLDER INFORMATION

NOTES TO THE FINANCIAL STATEMENTS
137
8. SEGMENT REPORTING
DESCRIPTION OF SEGMENTS The Group’s five continuing operating segments are presented on a basis that is consistent with the information provided internally to the Chief Executive Officer, who is the chief operating decision maker. This reflects the way the Group’s businesses are managed, rather than the legal structure of the Group.
We measure the performance of these segments on a cash profit basis. To calculate cash profit, we remove certain non-core items from statutory profit. Details of these items are included in the ‘Other Items’ section of this note. Transactions between business units across segments within ANZ are conducted on an arm’s-length basis and disclosed as part of the income and expenses of these segments.
The reportable segments are divisions engaged in providing either different products or services or similar products and services in different geographical areas. They are as follows:
Australia Retail and Commercial The Australia Retail and Commercial division comprises the following business units:
Retail provides products and services to consumer customers in Australia via the branch network, mortgage specialists, contact centres, a variety of self-service channels (digital and internet banking, website, ATMs and phone banking) and third party brokers.
Commercial and Private Bank provides a full range of banking products and financial services, including asset financing, across the following customer segments: medium to large commercial customers, small business owners and high net worth individuals and family groups, in addition to financial planning services provided by salaried financial planners and investment lending secured by approved securities.
Institutional The Institutional division services governments, global institutional and corporate customers across Australia, New Zealand and International via the following business units:
Transaction Banking provides customers with working capital and liquidity solutions including documentary trade, supply chain financing, commodity financing as well as cash management solutions, deposits, payments and clearing.
Corporate Finance provides customers with loan products, loan syndication, specialised loan structuring and execution, project and export finance, debt structuring and acquisition finance and corporate advisory services.
Markets provides customers with risk management services in foreign exchange, interest rates, credit, commodities, and debt capital markets in addition to managing the Group's interest rate exposure and liquidity position.
New Zealand The New Zealand division comprises the following business units:
Personal (previously Retail) provides a full range of banking and wealth management services to consumer and private banking customers. We deliver our services via our internet and app-based digital solutions and network of branches, mortgage specialists, relationship managers and contact centres.
Business (previously Commercial) provides a full range of banking services including small business banking, through our digital, branch and contact centre channels, and traditional relationship banking and sophisticated financial solutions through dedicated managers. These cover privately owned small, medium and large enterprises, the agricultural business segment, government and government related entities.
Pacific The Pacific division provides products and services to retail customers, small to medium-sized enterprises, institutional customers and governments located in the Pacific Islands. Products and services include retail products provided to consumers, traditional relationship banking and sophisticated financial solutions provided to business customers through dedicated managers.
Technology, Services & Operations (TSO) and Group Centre TSO and Group Centre division provides support to the operating divisions, including technology, group operations, shared services, property, risk management, financial management, strategy, marketing, human resources and corporate affairs. The Group Centre includes residual components of Group divestments, Group Treasury, Shareholder Functions and minority investments in Asia.
Refer to Note 29 Discontinued Operations and Assets and Liabilities Held for Sale for further details.
OPERATING SEGMENTS There have been no material structural changes during the year which have impacted the presentation of the Group’s operating segments in 2021. As such, the presentation of the divisional results remains consistent with the prior period.
8. Segment reporting
137ANZ 2021 Annual Report
OVERVIEW HOW WE CREATE VALUE
PERFORMANCE OVERVIEW
REMUNERATION REPORT
DIRECTORS’ REPORT
FINANCIAL REPORT
SHAREHOLDER INFORMATION Notes to the financial statements (continued)
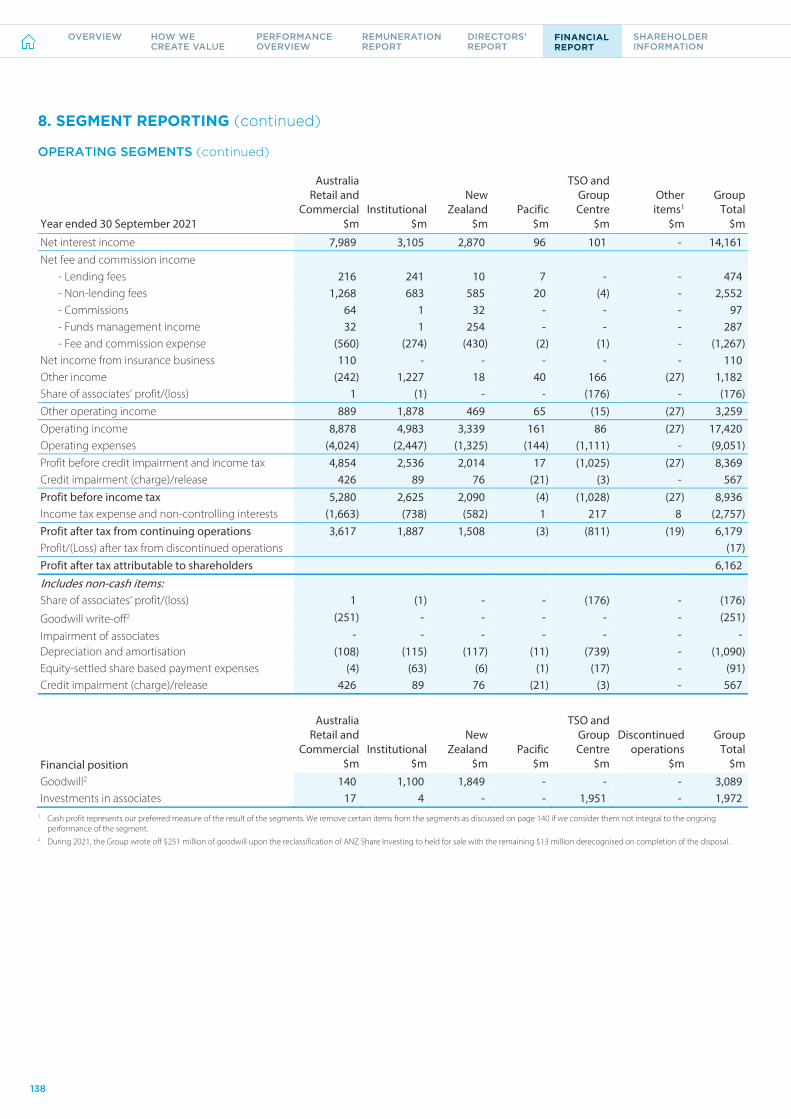
ANZ 2021 ANNUAL REPORT
NOTES TO THE FINANCIAL STATEMENTS (continued)
138
8. SEGMENT REPORTING (continued)
OPERATING SEGMENTS (continued)
Australia
Retail and Commercial Institutional
New Zealand Pacific
TSO and Group Centre
Other items1
Group Total
Year ended 30 September 2021 $m $m $m $m $m $m $m
Net interest income 7,989 3,105 2,870 96 101 - 14,161 Net fee and commission income
- Lending fees 216 241 10 7 - - 474 - Non-lending fees 1,268 683 585 20 (4) - 2,552 - Commissions 64 1 32 - - - 97 - Funds management income 32 1 254 - - - 287 - Fee and commission expense (560) (274) (430) (2) (1) - (1,267)
Net income from insurance business 110 - - - - - 110 Other income (242) 1,227 18 40 166 (27) 1,182 Share of associates’ profit/(loss) 1 (1) - - (176) - (176) Other operating income 889 1,878 469 65 (15) (27) 3,259 Operating income 8,878 4,983 3,339 161 86 (27) 17,420 Operating expenses (4,024) (2,447) (1,325) (144) (1,111) - (9,051) Profit before credit impairment and income tax 4,854 2,536 2,014 17 (1,025) (27) 8,369 Credit impairment (charge)/release 426 89 76 (21) (3) - 567 Profit before income tax 5,280 2,625 2,090 (4) (1,028) (27) 8,936 Income tax expense and non-controlling interests (1,663) (738) (582) 1 217 8 (2,757) Profit after tax from continuing operations 3,617 1,887 1,508 (3) (811) (19) 6,179 Profit/(Loss) after tax from discontinued operations (17) Profit after tax attributable to shareholders 6,162
Includes non-cash items: Share of associates’ profit/(loss) 1 (1) - - (176) - (176)
Goodwill write-off2 (251) - - - - - (251)
Impairment of associates - - - - - - - Depreciation and amortisation (108) (115) (117) (11) (739) - (1,090) Equity-settled share based payment expenses (4) (63) (6) (1) (17) - (91) Credit impairment (charge)/release 426 89 76 (21) (3) - 567
Australia
Retail and Commercial Institutional
New Zealand Pacific
TSO and Group Centre
Discontinued operations
Group Total
Financial position $m $m $m $m $m $m $m Goodwill2 140 1,100 1,849 - - - 3,089 Investments in associates 17 4 - - 1,951 - 1,972
1. Cash profit represents our preferred measure of the result of the segments. We remove certain items from the segments as discussed on page 140 if we consider them not integral to the ongoing performance of the segment.
2. During 2021, the Group wrote off $251 million of goodwill upon the reclassification of ANZ Share Investing to held for sale with the remaining $13 million derecognised on completion of the disposal.
138
OVERVIEW HOW WE CREATE VALUE
PERFORMANCE OVERVIEW
REMUNERATION REPORT
DIRECTORS’ REPORT
FINANCIAL REPORT
SHAREHOLDER INFORMATION

NOTES TO THE FINANCIAL STATEMENTS
139
8. SEGMENT REPORTING (continued)
OPERATING SEGMENTS (continued)
Australia Retail and
Commercial Institutional New
Zealand Pacific
TSO and Group Centre
Other items1
Group Total
Year ended 30 September 2020 $m $m $m $m $m $m $m Net interest income 7,916 3,182 2,731 109 111 - 14,049 Net fee and commission income
- Lending fees 267 288 14 10 - - 579 - Non-lending fees 1,310 776 586 29 (14) - 2,687 - Commissions 67 - 54 - - - 121 - Funds management income 30 2 243 - - - 275 - Fee and commission expense (588) (308) (436) (5) - - (1,337)
Net income from insurance business 77 - - - 1 - 78 Other income (1) 1,891 12 50 (807) (115) 1,030 Share of associates’ profit/(loss) (1) - - - 156 - 155 Other operating income 1,161 2,649 473 84 (664) (115) 3,588 Operating income 9,077 5,831 3,204 193 (553) (115) 17,637 Operating expenses (4,091) (2,558) (1,435) (205) (1,094) - (9,383) Profit before credit impairment and income tax 4,986 3,273 1,769 (12) (1,647) (115) 8,254 Credit impairment (charge)/release (1,647) (694) (345) (52) - - (2,738) Profit before income tax 3,339 2,579 1,424 (64) (1,647) (115) 5,516 Income tax expense and non-controlling interests (1,002) (725) (407) 2 259 32 (1,841) Profit after tax from continuing operations 2,337 1,854 1,017 (62) (1,388) (83) 3,675 Profit/(Loss) after tax from discontinued operations (98) Profit after tax attributable to shareholders 3,577
Includes non-cash items: Share of associates’ profit/(loss) (1) - - - 156 - 155 Goodwill impairment - - (27) (50) - - (77) Impairment of associates2 - - - - (815) - (815) Depreciation and amortisation3 (197) (188) (103) (11) (892) - (1,391) Equity-settled share based payment expenses (7) (70) (7) (1) (25) - (110) Credit impairment (charge)/release (1,647) (694) (345) (52) - - (2,738)
Australia Retail and
Commercial Institutional New
Zealand Pacific
TSO and Group Centre
Discontinued operations
Group Total
Financial position $m $m $m $m $m $m $m Goodwill 403 1,068 1,793 - - - 3,264 Investments in associates2 17 4 - - 2,143 - 2,164
1. Cash profit represents our preferred measure of the result of the segments. We remove certain items from the segments as discussed on page 140 if we consider them not integral to the ongoing performance of the segment.
2. Includes $815 million impairment after tax in respect of two of the Group’s equity accounted investments. AmBank was impaired by $595 million and PT Panin was impaired by $220 million. Refer to Note 26 Investments in Associates for further details.
3. Includes accelerated amortisation of $197 million following the Group’s change in the application of its software amortisation policy in 2020 (Australia Retail and Commercial $31 million, Institutional $38 million, New Zealand $2 million, TSO and Group Centre $126 million). Refer to Note 21 Goodwill and Other Intangible Assets for further details.
139ANZ 2021 Annual Report
OVERVIEW HOW WE CREATE VALUE
PERFORMANCE OVERVIEW
REMUNERATION REPORT
DIRECTORS’ REPORT
FINANCIAL REPORT
SHAREHOLDER INFORMATION Notes to the financial statements (continued)
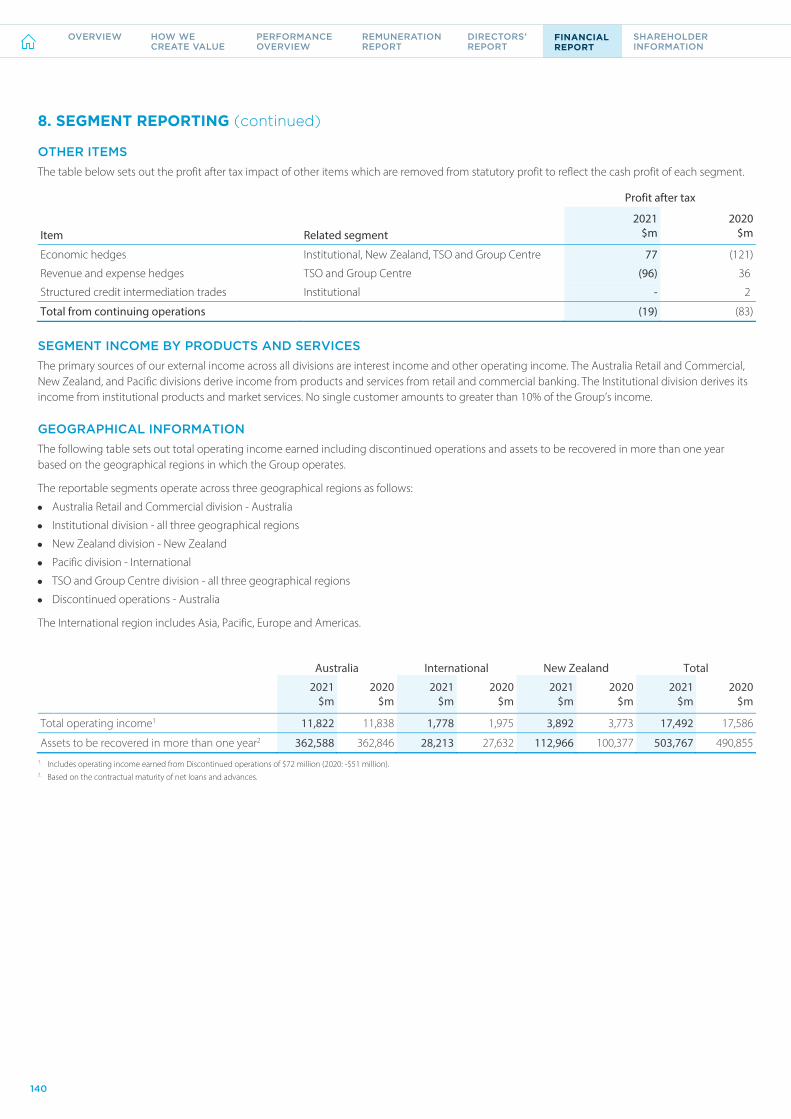
ANZ 2021 ANNUAL REPORT
NOTES TO THE FINANCIAL STATEMENTS (continued)
140
8. SEGMENT REPORTING (continued)
OTHER ITEMS The table below sets out the profit after tax impact of other items which are removed from statutory profit to reflect the cash profit of each segment.
Profit after tax
2021 2020 Item Related segment $m $m
Economic hedges Institutional, New Zealand, TSO and Group Centre 77 (121)
Revenue and expense hedges TSO and Group Centre (96) 36
Structured credit intermediation trades Institutional - 2
Total from continuing operations (19) (83)
SEGMENT INCOME BY PRODUCTS AND SERVICES The primary sources of our external income across all divisions are interest income and other operating income. The Australia Retail and Commercial, New Zealand, and Pacific divisions derive income from products and services from retail and commercial banking. The Institutional division derives its income from institutional products and market services. No single customer amounts to greater than 10% of the Group’s income.
GEOGRAPHICAL INFORMATION The following table sets out total operating income earned including discontinued operations and assets to be recovered in more than one year based on the geographical regions in which the Group operates.
The reportable segments operate across three geographical regions as follows:
Australia Retail and Commercial division - Australia
Institutional division - all three geographical regions
New Zealand division - New Zealand
Pacific division - International
TSO and Group Centre division - all three geographical regions
Discontinued operations - Australia
The International region includes Asia, Pacific, Europe and Americas.
Australia International New Zealand Total 2021 2020 2021 2020 2021 2020 2021 2020
$m $m $m $m $m $m $m $m
Total operating income1 11,822 11,838 1,778 1,975 3,892 3,773 17,492 17,586
Assets to be recovered in more than one year2 362,588 362,846 28,213 27,632 112,966 100,377 503,767 490,855 1. Includes operating income earned from Discontinued operations of $72 million (2020: -$51 million). 2. Based on the contractual maturity of net loans and advances.
140
OVERVIEW HOW WE CREATE VALUE
PERFORMANCE OVERVIEW
REMUNERATION REPORT
DIRECTORS’ REPORT
FINANCIAL REPORT
SHAREHOLDER INFORMATION

NOTES TO THE FINANCIAL STATEMENTS
141
FINANCIAL ASSETS
Outlined below is a description of how we classify and measure financial assets as they apply to subsequent note disclosures.
CLASSIFICATION AND MEASUREMENT
Financial assets - general
There are three measurement classifications for financial assets under AASB 9: amortised cost, fair value through profit or loss (FVTPL) and fair value through other comprehensive income (FVOCI). Financial assets are classified into these measurement classifications on the basis of two criteria:
the business model within which the financial asset is managed; and
the contractual cash flow characteristics of the financial asset (specifically whether the contractual cash flows represent solely payments of principal and interest).
The resultant financial asset classifications are as follows:
Amortised cost: Financial assets with contractual cash flows that comprise solely payments of principal and interest and which are held in a business model whose objective is to collect their cash flows;
FVOCI: Financial assets with contractual cash flows that comprise solely payments of principal and interest and which are held in a business model whose objective is to collect their cash flows or to sell the assets; and
FVTPL: Any other financial assets not falling into the categories above are measured at FVTPL.
Fair value option for financial assets
A financial asset may be irrevocably designated on initial recognition:
at FVTPL when the designation eliminates or significantly reduces an accounting mismatch that would otherwise arise; or
at FVOCI for investments in equity securities, where that instrument is neither held for trading nor contingent consideration recognised by an acquirer in a business combination.
9. CASH AND CASH EQUIVALENTS Consolidated The Company
2021 2020 2021 2020
$m $m $m $m
Coins, notes and cash at bank 1,127 1,514 721 1,084
Securities purchased under agreements to resell in less than 3 months 17,571 35,603 16,465 34,501
Balances with central banks 107,915 46,091 101,400 39,362
Settlement balances owed to ANZ within 3 months 24,647 24,715 22,850 23,136
Cash and cash equivalents 151,260 107,923 141,436 98,083
Financial assets 9. Cash and cash equivalents
141ANZ 2021 Annual Report
OVERVIEW HOW WE CREATE VALUE
PERFORMANCE OVERVIEW
REMUNERATION REPORT
DIRECTORS’ REPORT
FINANCIAL REPORT
SHAREHOLDER INFORMATION Notes to the financial statements (continued)

ANZ 2021 ANNUAL REPORT
NOTES TO THE FINANCIAL STATEMENTS (continued)
142
10. TRADING SECURITIES
Consolidated The Company
2021 2020 2021 2020 $m $m $m $m
Government debt securities and notes 33,880 38,472 26,119 27,917
Corporate and financial institution securities 5,630 6,574 3,493 4,873
Commodities 4,995 5,699 4,957 5,464
Equity and other securities 183 168 183 169
Total 44,688 50,913 34,752 38,423
RECOGNITION AND MEASUREMENT
Trading securities are financial instruments we either:
acquire principally for the purpose of selling in the short-term; or
hold as part of a portfolio we manage for short-term profit making.
We recognise purchases and sales of trading securities on trade date:
initially, we measure them at fair value; and
subsequently, we measure them in the balance sheet at their fair value with any change in fair value recognised in the profit and loss.
KEY JUDGEMENTS AND ESTIMATES
Judgement is required when applying the valuation techniques used to determine the fair value of trading securities not valued using quoted market prices. Refer to Note 18 Fair Value of Financial Assets and Financial Liabilities for further details.
2020202138,472
168
6,574
5,699
Equity and other securities
Commodities
Government debt securities and notes
Corporate and financial institutional securities33,880
183
5,630
4,995
10. Trading securities
142
OVERVIEW HOW WE CREATE VALUE
PERFORMANCE OVERVIEW
REMUNERATION REPORT
DIRECTORS’ REPORT
FINANCIAL REPORT
SHAREHOLDER INFORMATION

NOTES TO THE FINANCIAL STATEMENTS
143
11. DERIVATIVE FINANCIAL INSTRUMENTS
Consolidated
Assets 2021
Liabilities 2021
Assets 2020
Liabilities 2020
Fair Value $m $m $m $m
Derivative financial instruments - held for trading 38,080 (35,833) 130,097 (130,227)
Derivative financial instruments - designated in hedging relationships 656 (202) 5,234 (4,484)
Derivative financial instruments 38,736 (36,035) 135,331 (134,711)
The Company
Assets 2021
Liabilities 2021
Assets 2020
Liabilities 2020
Fair Value $m $m $m $m
Derivative financial instruments - held for trading 37,700 (36,847) 126,561 (128,028)
Derivative financial instruments - designated in hedging relationships 592 (158) 3,991 (3,202)
Derivative financial instruments 38,292 (37,005) 130,552 (131,230)
FEATURES
Derivative financial instruments are contracts:
whose value is derived from an underlying price index (or other variable) defined in the contract - sometimes the value is derived from more than one variable;
that require little or no initial net investment; and
that are settled at a future date.
Movements in the price of the underlying variables, which cause the value of the contract to fluctuate, are reflected in the fair value of the derivative.
PURPOSE
The Group’s derivative financial instruments have been categorised as following:
Trading Derivatives held in order to:
meet customer needs for managing their own risks.
manage risks in the Group that are not in a designated hedge accounting relationship (some elements of balance sheet management).
undertake market making and positioning activities to generate profits from short-term fluctuations in prices or margins.
Designated in Hedging Relationships
Derivatives designated into hedge accounting relationships in order to minimise profit or loss volatility by matching movements in underlying positions relating to:
hedges of the Group’s exposures to interest rate risk and currency risk.
hedges of other exposures relating to non-trading positions.
TYPES The Group offers or uses four different types of derivative financial instruments:
Forwards A contract documenting the rate of interest, or the currency exchange rate, to be paid or received on a notional principal amount at a future date.
Futures An exchange traded contract in which the parties agree to buy or sell an asset in the future for a price agreed on the transaction date, with a net settlement in cash paid on the future date without physical delivery of the asset.
Swaps A contract in which two parties exchange one series of cash flows for another.
Options A contract in which the buyer of the contract has the right - but not the obligation - to buy (known as a ‘call option’) or to sell (known as a ‘put option’) an asset or instrument at a set price on a future date. The seller has the corresponding obligation to fulfil the transaction to sell or buy the asset or instrument if the buyer exercises the option.
11. Derivative financial instruments
143ANZ 2021 Annual Report
OVERVIEW HOW WE CREATE VALUE
PERFORMANCE OVERVIEW
REMUNERATION REPORT
DIRECTORS’ REPORT
FINANCIAL REPORT
SHAREHOLDER INFORMATION Notes to the financial statements (continued)
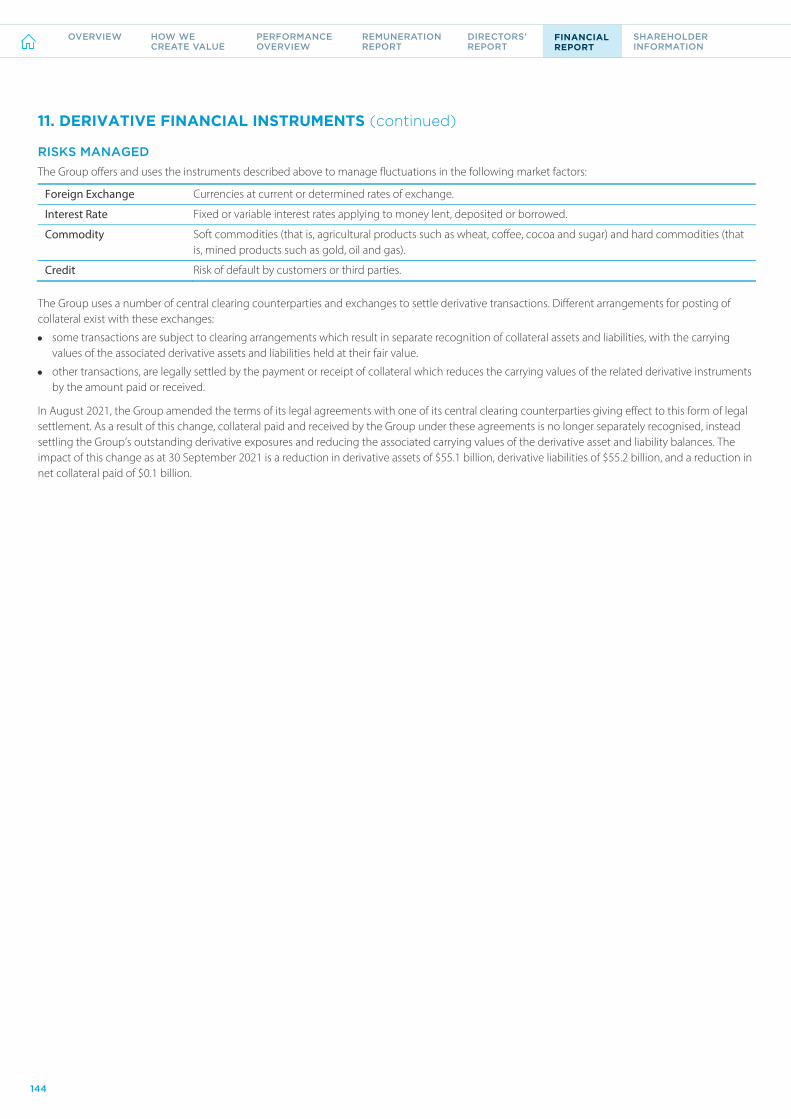
ANZ 2021 ANNUAL REPORT
NOTES TO THE FINANCIAL STATEMENTS (continued)
144
11. DERIVATIVE FINANCIAL INSTRUMENTS (continued)
RISKS MANAGED The Group offers and uses the instruments described above to manage fluctuations in the following market factors:
Foreign Exchange Currencies at current or determined rates of exchange.
Interest Rate Fixed or variable interest rates applying to money lent, deposited or borrowed.
Commodity Soft commodities (that is, agricultural products such as wheat, coffee, cocoa and sugar) and hard commodities (that is, mined products such as gold, oil and gas).
Credit Risk of default by customers or third parties.
The Group uses a number of central clearing counterparties and exchanges to settle derivative transactions. Different arrangements for posting of collateral exist with these exchanges:
some transactions are subject to clearing arrangements which result in separate recognition of collateral assets and liabilities, with the carrying values of the associated derivative assets and liabilities held at their fair value.
other transactions, are legally settled by the payment or receipt of collateral which reduces the carrying values of the related derivative instruments by the amount paid or received.
In August 2021, the Group amended the terms of its legal agreements with one of its central clearing counterparties giving effect to this form of legal settlement. As a result of this change, collateral paid and received by the Group under these agreements is no longer separately recognised, instead settling the Group’s outstanding derivative exposures and reducing the associated carrying values of the derivative asset and liability balances. The impact of this change as at 30 September 2021 is a reduction in derivative assets of $55.1 billion, derivative liabilities of $55.2 billion, and a reduction in net collateral paid of $0.1 billion.
144
OVERVIEW HOW WE CREATE VALUE
PERFORMANCE OVERVIEW
REMUNERATION REPORT
DIRECTORS’ REPORT
FINANCIAL REPORT
SHAREHOLDER INFORMATION

NOTES TO THE FINANCIAL STATEMENTS
145
11. DERIVATIVE FINANCIAL INSTRUMENTS (continued)
DERIVATIVE FINANCIAL INSTRUMENTS – HELD FOR TRADING The majority of the Group’s derivative financial instruments are held for trading. The fair values of derivative financial instruments held for trading are:
Consolidated Assets Liabilities Assets Liabilities 2021 2021 2020 2020 Fair Value $m $m $m $m
Interest rate contracts
Forward rate agreements 2 (23) 86 (86)
Futures contracts 105 (24) 31 (128)
Swap agreements 10,267 (8,065) 104,814 (101,277)
Options purchased 971 - 1,676 -
Options sold - (1,207) - (2,609)
Total 11,345 (9,319) 106,607 (104,100)
Foreign exchange contracts
Spot and forward contracts 13,869 (11,462) 11,815 (11,435)
Swap agreements 11,109 (12,425) 8,703 (12,334)
Options purchased 277 - 372 -
Options sold - (577) - (502)
Total 25,255 (24,464) 20,890 (24,271)
Commodity and other contracts 1,445 (2,017) 2,577 (1,834)
Credit default swaps
Structured credit derivatives purchased - - 18 -
Other credit derivatives purchased - (33) 4 (3)
Credit derivatives purchased - (33) 22 (3)
Structured credit derivatives sold - - - (18)
Other credit derivatives sold 35 - 1 (1)
Credit derivatives sold 35 - 1 (19)
Total 35 (33) 23 (22)
Derivative financial instruments - held for trading1 38,080 (35,833) 130,097 (130,227) 1. Includes derivatives held for balance sheet management which are not designated into accounting hedge relationships.
145ANZ 2021 Annual Report
OVERVIEW HOW WE CREATE VALUE
PERFORMANCE OVERVIEW
REMUNERATION REPORT
DIRECTORS’ REPORT
FINANCIAL REPORT
SHAREHOLDER INFORMATION Notes to the financial statements (continued)

ANZ 2021 ANNUAL REPORT
NOTES TO THE FINANCIAL STATEMENTS (continued)
146
11. DERIVATIVE FINANCIAL INSTRUMENTS (continued)
The Company Assets Liabilities Assets Liabilities 2021 2021 2020 2020 Fair Value $m $m $m $m
Interest rate contracts
Forward rate agreements 3 (24) 92 (91)
Futures contracts 87 (19) 23 (124)
Swap agreements 11,598 (10,538) 102,260 (100,765)
Options purchased 969 - 1,673 -
Options sold - (1,206) - (2,609)
Total 12,657 (11,787) 104,048 (103,589)
Foreign exchange contracts
Spot and forward contracts 11,840 (9,658) 10,525 (10,105)
Swap agreements 11,463 (12,940) 9,008 (12,002)
Options purchased 267 - 378 -
Options sold - (408) - (476)
Total 23,570 (23,006) 19,911 (22,583)
Commodity and other contracts 1,422 (2,015) 2,571 (1,834)
Credit default swaps
Structured credit derivatives purchased - - 18 -
Other credit derivatives purchased - (39) 4 (3)
Credit derivatives purchased - (39) 22 (3)
Structured credit derivatives sold - - - (18)
Other credit derivatives sold 51 - 9 (1)
Credit derivatives sold 51 - 9 (19)
Total 51 (39) 31 (22)
Derivative financial instruments - held for trading1 37,700 (36,847) 126,561 (128,028) 1. Includes derivatives held for balance sheet management which are not designated into accounting hedge relationships.
146
OVERVIEW HOW WE CREATE VALUE
PERFORMANCE OVERVIEW
REMUNERATION REPORT
DIRECTORS’ REPORT
FINANCIAL REPORT
SHAREHOLDER INFORMATION

NOTES TO THE FINANCIAL STATEMENTS
147
11. DERIVATIVE FINANCIAL INSTRUMENTS (continued)
DERIVATIVE FINANCIAL INSTRUMENTS – DESIGNATED IN HEDGING RELATIONSHIPS
There are three types of hedge accounting relationships the Group utilises:
Fair value hedge Cash flow hedge Net investment hedge
Objective of this hedging arrangement
To hedge our exposure to changes to the fair value of a recognised asset or liability or unrecognised firm commitment caused by interest rate or foreign currency movements.
To hedge our exposure to variability in cash flows of a recognised asset or liability, a firm commitment or a highly probable forecast transaction caused by interest rate, foreign currency and other price movements.
To hedge our exposure to exchange rate differences arising from the translation of our foreign operations from their functional currency to Australian dollars.
Recognition of effective hedge portion
The following are recognised in profit or loss at the same time:
all changes in the fair value of the underlying item relating to the hedged risk; and
the change in the fair value of the derivatives.
We recognise the effective portion of changes in the fair value of derivatives designated as a cash flow hedge in the cash flow hedge reserve.
We recognise the effective portion of changes in the fair value of the hedging instrument in the foreign currency translation reserve (FCTR).
Recognition of ineffective hedge portion
Recognised immediately in Other operating income.
If a hedging instrument expires, or is sold, terminated, or exercised; or no longer qualifies for hedge accounting
When we recognise the hedged item in profit or loss, we recognise the related unamortised fair value adjustment in profit or loss. This may occur over time if the hedged item is amortised to profit or loss as part of the effective yield over the period to maturity.
Only when we recognise the hedged item in profit or loss is the amount previously deferred in the cash flow hedge reserve transferred to profit or loss.
The amount we defer in the foreign currency translation reserve remains in equity and is transferred to profit or loss only when we dispose of, or partially dispose of, the foreign operation.
Hedged item sold or repaid
We recognise the unamortised fair value adjustment immediately in profit or loss.
Amounts accumulated in equity are transferred immediately to profit or loss.
The gain or loss, or applicable proportion, we have recognised in equity is transferred to profit or loss on disposal or partial disposal of a foreign operation.
147ANZ 2021 Annual Report
OVERVIEW HOW WE CREATE VALUE
PERFORMANCE OVERVIEW
REMUNERATION REPORT
DIRECTORS’ REPORT
FINANCIAL REPORT
SHAREHOLDER INFORMATION Notes to the financial statements (continued)
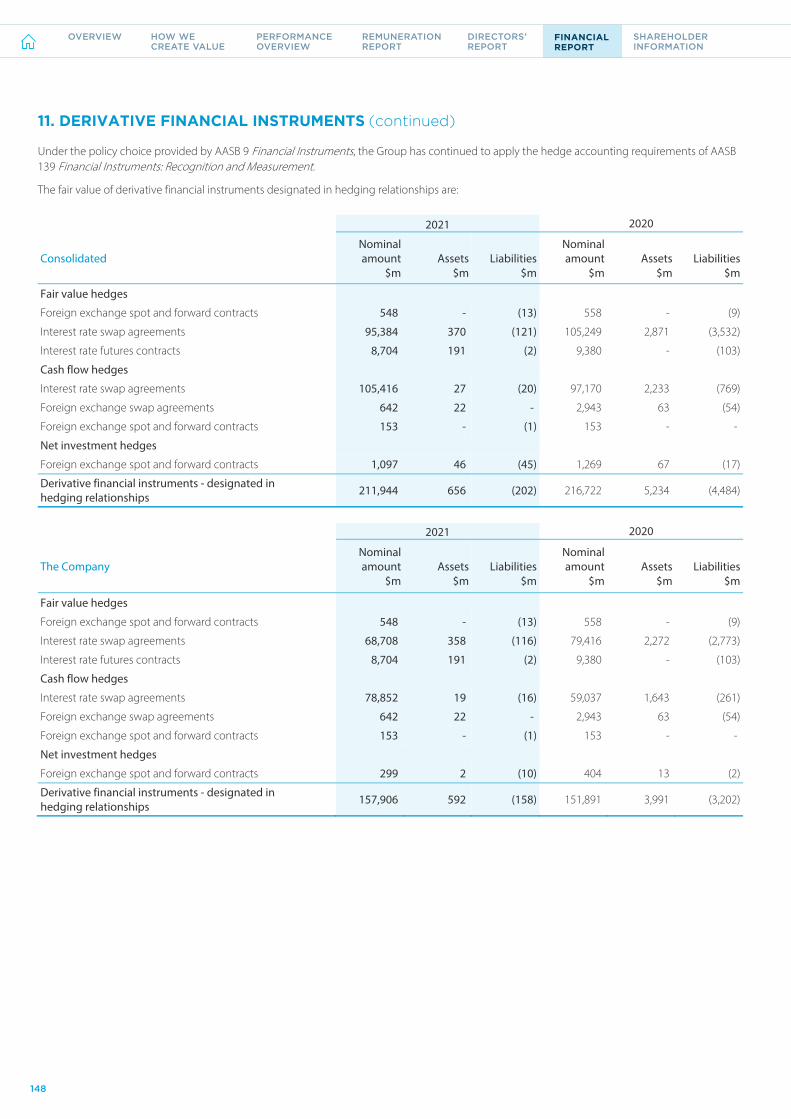
ANZ 2021 ANNUAL REPORT
NOTES TO THE FINANCIAL STATEMENTS (continued)
148
11. DERIVATIVE FINANCIAL INSTRUMENTS (continued)
Under the policy choice provided by AASB 9 Financial Instruments, the Group has continued to apply the hedge accounting requirements of AASB 139 Financial Instruments: Recognition and Measurement.
The fair value of derivative financial instruments designated in hedging relationships are: 2021 2020
Consolidated Nominal amount Assets Liabilities
Nominal amount Assets Liabilities
$m $m $m $m $m $m
Fair value hedges
Foreign exchange spot and forward contracts 548 - (13) 558 - (9)
Interest rate swap agreements 95,384 370 (121) 105,249 2,871 (3,532)
Interest rate futures contracts 8,704 191 (2) 9,380 - (103)
Cash flow hedges
Interest rate swap agreements 105,416 27 (20) 97,170 2,233 (769)
Foreign exchange swap agreements 642 22 - 2,943 63 (54)
Foreign exchange spot and forward contracts 153 - (1) 153 - -
Net investment hedges
Foreign exchange spot and forward contracts 1,097 46 (45) 1,269 67 (17)
Derivative financial instruments - designated in hedging relationships 211,944 656 (202) 216,722 5,234 (4,484)
2021 2020
The Company Nominal amount Assets Liabilities
Nominal amount Assets Liabilities
$m $m $m $m $m $m
Fair value hedges
Foreign exchange spot and forward contracts 548 - (13) 558 - (9)
Interest rate swap agreements 68,708 358 (116) 79,416 2,272 (2,773)
Interest rate futures contracts 8,704 191 (2) 9,380 - (103)
Cash flow hedges
Interest rate swap agreements 78,852 19 (16) 59,037 1,643 (261)
Foreign exchange swap agreements 642 22 - 2,943 63 (54)
Foreign exchange spot and forward contracts 153 - (1) 153 - -
Net investment hedges
Foreign exchange spot and forward contracts 299 2 (10) 404 13 (2)
Derivative financial instruments - designated in hedging relationships 157,906 592 (158) 151,891 3,991 (3,202)
148
OVERVIEW HOW WE CREATE VALUE
PERFORMANCE OVERVIEW
REMUNERATION REPORT
DIRECTORS’ REPORT
FINANCIAL REPORT
SHAREHOLDER INFORMATION

NOTES TO THE FINANCIAL STATEMENTS
149
11. DERIVATIVE FINANCIAL INSTRUMENTS (continued)
The maturity profile of the nominal amounts of our hedging instruments held is:
Consolidated Average
Rate
Less than 3 months
$m
3 to 12 months
$m
1 to 5 years
$m
After 5 years
$m Total
$m Nominal Amount As at 30 September 2021
Fair value hedges
Interest rate Interest Rate 1.26% 2,597 14,328 58,658 28,505 104,088
Foreign exchange HKD/AUD FX Rate 5.74 548 - - - 548
Cash flow hedges
Interest rate Interest Rate 1.17% 4,593 14,180 84,924 1,719 105,416
Foreign exchange1 AUD/USD FX Rate 0.74
38 115 - 642 795 USD/EUR FX Rate 0.91
Net investment hedges
Foreign exchange TWD/AUD FX Rate 20.81
456 641 - - 1,097 THB/AUD FX Rate 24.18
As at 30 September 2020
Fair value hedges
Interest rate Interest Rate 1.47% 3,548 12,736 69,836 28,509 114,629
Foreign exchange HKD/AUD FX Rate 5.59 558 - - - 558
Cash flow hedges
Interest rate Interest Rate 1.72% 9,062 30,364 55,549 2,195 97,170
Foreign exchange1 AUD/USD FX Rate 0.72
38 613 1,157 1,288 3,096 USD/EUR FX Rate 0.91
Net investment hedges
Foreign exchange TWD/AUD FX Rate 20.29
591 678 - - 1,269 THB/AUD FX Rate 21.63
1. Hedges of foreign exchange risk cover multiple currency pairs. The table reflects the larger currency pairs only.
149ANZ 2021 Annual Report
OVERVIEW HOW WE CREATE VALUE
PERFORMANCE OVERVIEW
REMUNERATION REPORT
DIRECTORS’ REPORT
FINANCIAL REPORT
SHAREHOLDER INFORMATION Notes to the financial statements (continued)
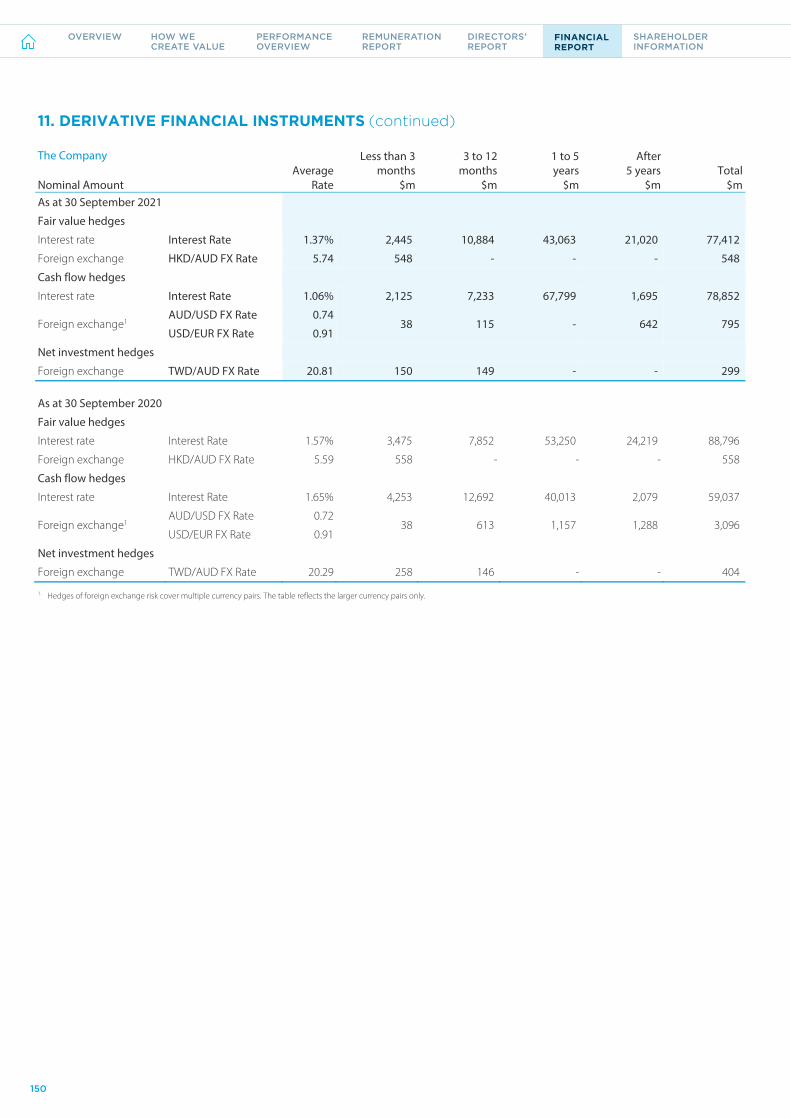
ANZ 2021 ANNUAL REPORT
NOTES TO THE FINANCIAL STATEMENTS (continued)
150
11. DERIVATIVE FINANCIAL INSTRUMENTS (continued)
The Company Average
Rate
Less than 3 months
$m
3 to 12 months
$m
1 to 5 years
$m
After 5 years
$m Total
$m Nominal Amount As at 30 September 2021
Fair value hedges
Interest rate Interest Rate 1.37% 2,445 10,884 43,063 21,020 77,412
Foreign exchange HKD/AUD FX Rate 5.74 548 - - - 548
Cash flow hedges
Interest rate Interest Rate 1.06% 2,125 7,233 67,799 1,695 78,852
Foreign exchange1 AUD/USD FX Rate 0.74
38 115 - 642 795 USD/EUR FX Rate 0.91
Net investment hedges
Foreign exchange TWD/AUD FX Rate 20.81 150 149 - - 299 As at 30 September 2020
Fair value hedges
Interest rate Interest Rate 1.57% 3,475 7,852 53,250 24,219 88,796
Foreign exchange HKD/AUD FX Rate 5.59 558 - - - 558
Cash flow hedges
Interest rate Interest Rate 1.65% 4,253 12,692 40,013 2,079 59,037
Foreign exchange1 AUD/USD FX Rate 0.72
38 613 1,157 1,288 3,096 USD/EUR FX Rate 0.91
Net investment hedges
Foreign exchange TWD/AUD FX Rate 20.29 258 146 - - 404
1. Hedges of foreign exchange risk cover multiple currency pairs. The table reflects the larger currency pairs only.
150
OVERVIEW HOW WE CREATE VALUE
PERFORMANCE OVERVIEW
REMUNERATION REPORT
DIRECTORS’ REPORT
FINANCIAL REPORT
SHAREHOLDER INFORMATION

NOTES TO THE FINANCIAL STATEMENTS
151
11. DERIVATIVE FINANCIAL INSTRUMENTS (continued)
The impacts of ineffectiveness from our designated hedge relationships by type of hedge relationship and type of risk being hedged are:
Ineffectiveness Amount reclassified from the cash flow
hedge reserve or FCTR to profit and loss
Consolidated Change in value
of hedging instrument2
Change in value of hedged item
Hedge ineffectiveness recognised in profit
and loss As at 30 September 2021 $m $m $m $m Fair value hedges1 Interest rate 1,005 (1,006) (1) - Foreign exchange 9 (9) - - Cash flow hedges1 Interest rate (934) 909 (25) 4 Foreign exchange (10) 10 - (1) Net investment hedges1 Foreign exchange 61 (61) - -
As at 30 September 2020 Fair value hedges1 Interest rate 372 (358) 14 - Foreign exchange 23 (23) - - Cash flow hedges1 Interest rate 451 (449) 2 10 Foreign exchange (15) 15 - (2) Net investment hedges1 Foreign exchange 94 (94) - (15)
1. All hedging instruments are classified as derivative financial instruments. 2. Changes in value of hedging instruments is before any adjustments for Settle to Market.
Ineffectiveness Amount reclassified from the cash flow
hedge reserve or FCTR to profit and loss
The Company Change in value
of hedging instrument2
Change in value of hedged item
Hedge ineffectiveness recognised in profit
and loss As at 30 September 2021 $m $m $m $m Fair value hedges1 Interest rate 731 (734) (3) - Foreign exchange 9 (9) - - Cash flow hedges1 Interest rate (797) 772 (25) (6) Foreign exchange (10) 10 - (1) Net investment hedges1 Foreign exchange (6) 6 - -
As at 30 September 2020 Fair value hedges1 Interest rate 166 (154) 12 - Foreign exchange 23 (23) - - Cash flow hedges1 Interest rate 352 (351) 1 (5) Foreign exchange (15) 15 - (2) Net investment hedges1 Foreign exchange 16 (16) - (15)
1. All hedging instruments are classified as derivative financial instruments. 2. Changes in value of hedging instruments is before any adjustments for Settle to Market.
Hedge ineffectiveness recognised is classified within Other operating income. Reclassification adjustments to the Statement of Comprehensive Income are recognised within Net interest income and Other operating income.
151ANZ 2021 Annual Report
OVERVIEW HOW WE CREATE VALUE
PERFORMANCE OVERVIEW
REMUNERATION REPORT
DIRECTORS’ REPORT
FINANCIAL REPORT
SHAREHOLDER INFORMATION Notes to the financial statements (continued)

ANZ 2021 ANNUAL REPORT
NOTES TO THE FINANCIAL STATEMENTS (continued)
152
11. DERIVATIVE FINANCIAL INSTRUMENTS (continued)
The hedged items in relation to the Group’s fair value hedges are:
Carrying amount
Accumulated fair value hedge adjustments on
the hedged item
Consolidated Balance sheet presentation Hedged risk
Assets $m
Liabilities $m
Assets $m
Liabilities $m
As at 30 September 2021 Fixed rate loans and advances Net loans and advances Interest rate 3,416 - 9 -
Fixed rate debt issuance Debt issuances Interest rate - (53,885) - (999)
Fixed rate investment securities (FVOCI)1 Investment securities Interest rate 53,321 - (209) -
Equity securities at FVOCI1 Investment securities Foreign exchange 548 - 20 -
Total 57,285 (53,885) (180) (999) As at 30 September 2020
Fixed rate loans and advances Net loans and advances Interest rate 7,375 - 52 -
Fixed rate debt issuance Debt issuances Interest rate - (61,355) - (2,518)
Fixed rate investment securities (FVOCI)1 Investment securities Interest rate 55,233 - 2,256 -
Equity securities at FVOCI1 Investment securities Foreign exchange 558 - 29 -
Total 63,166 (61,355) 2,337 (2,518) 1. The carrying amount of debt and equity instruments at fair value through other comprehensive income does not include the fair value hedge adjustment since accounting for the hedge relationship results
in the transfer of the hedge adjustment out of other comprehensive income into the Income Statement to match the profit or loss on the hedging instrument.
The cumulative amount of fair value hedge adjustments relating to ceased hedge relationships remaining on the Balance Sheet is $2 million (2020: nil).
The hedged items in relation to the Company’s fair value hedges are:
Carrying amount
Accumulated fair value hedge adjustments on
the hedged item
The Company Balance sheet presentation Hedged risk
Assets $m
Liabilities $m
Assets $m
Liabilities $m
As at 30 September 2021
Fixed rate loans and advances Net loans and advances Interest rate 3,416 - 7 -
Fixed rate debt issuance Debt issuances Interest rate - (38,222) - (769)
Fixed rate investment securities (FVOCI)1 Investment securities Interest rate 41,944 - 129 -
Equity securities at FVOCI1 Investment securities Foreign exchange 548 - 20 -
Total 45,908 (38,222) 156 (769)
As at 30 September 2020
Fixed rate loans and advances Net loans and advances Interest rate 5,946 - 43 -
Fixed rate debt issuance Debt issuances Interest rate - (44,159) - (1,923)
Fixed rate investment securities (FVOCI)1 Investment securities Interest rate 46,747 - 1,958 -
Equity securities at FVOCI1 Investment securities Foreign exchange 558 - 29 -
Total 53,251 (44,159) 2,030 (1,923) 1. The carrying amount of debt and equity instruments at fair value through other comprehensive income does not include the fair value hedge adjustment since accounting for the hedge relationship results
in the transfer of the hedge adjustment out of other comprehensive income into the Income Statement to match the profit or loss on the hedging instrument.
The cumulative amount of fair value hedge adjustments relating to ceased hedge relationships remaining on the Balance Sheet is nil (2020: nil).
152
OVERVIEW HOW WE CREATE VALUE
PERFORMANCE OVERVIEW
REMUNERATION REPORT
DIRECTORS’ REPORT
FINANCIAL REPORT
SHAREHOLDER INFORMATION

NOTES TO THE FINANCIAL STATEMENTS
153
11. DERIVATIVE FINANCIAL INSTRUMENTS (continued)
The hedged items in relation to the Group’s cash flow and net investment hedges are:
Cash flow hedge reserve
Foreign currency translation reserve
Continuing
hedges Discontinued
hedges Continuing hedges
Discontinued hedges
Consolidated Hedged risk $m $m $m $m As at 30 September 2021 Cash flow hedges Floating rate loans and advances Interest rate 546 20 - - Floating rate customer deposits Interest rate 4 (6) - - Foreign currency debt issuance Foreign exchange (4) (1) - - Foreign currency investment securities Foreign exchange - - - - Highly probable forecast transactions Foreign exchange (1) - - - Net investment hedges Foreign operations Foreign exchange - - (19) (149)
As at 30 September 2020 Cash flow hedges Floating rate loans and advances Interest rate 2,013 38 - - Floating rate customer deposits Interest rate (562) (18) - - Foreign currency debt issuance Foreign exchange (2) - - - Foreign currency investment securities Foreign exchange 10 - - - Highly probable forecast transactions Foreign exchange (1) - - - Net investment hedges Foreign operations Foreign exchange - - (80) (149)
Cash flow
hedge reserve Foreign currency
translation reserve
Continuing
hedges Discontinued
hedges Continuing hedges
Discontinued hedges
The Company Hedged risk $m $m $m $m As at 30 September 2021 Cash flow hedges Floating rate loans and advances Interest rate 541 11 - - Floating rate customer deposits Interest rate 8 (6) - - Foreign currency debt issuance Foreign exchange (4) (1) - - Foreign currency investment securities Foreign exchange - - - - Highly probable forecast transactions Foreign exchange (1) - - - Net investment hedges Foreign operations Foreign exchange - - 30 (149)
As at 30 September 2020 Cash flow hedges Floating rate loans and advances Interest rate 1,508 30 - - Floating rate customer deposits Interest rate (193) (15) - - Foreign currency debt issuance Foreign exchange (2) - - - Foreign currency investment securities Foreign exchange 10 - - - Highly probable forecast transactions Foreign exchange (1) - - - Net investment hedges Foreign operations Foreign exchange - - 36 (149)
153ANZ 2021 Annual Report
OVERVIEW HOW WE CREATE VALUE
PERFORMANCE OVERVIEW
REMUNERATION REPORT
DIRECTORS’ REPORT
FINANCIAL REPORT
SHAREHOLDER INFORMATION Notes to the financial statements (continued)
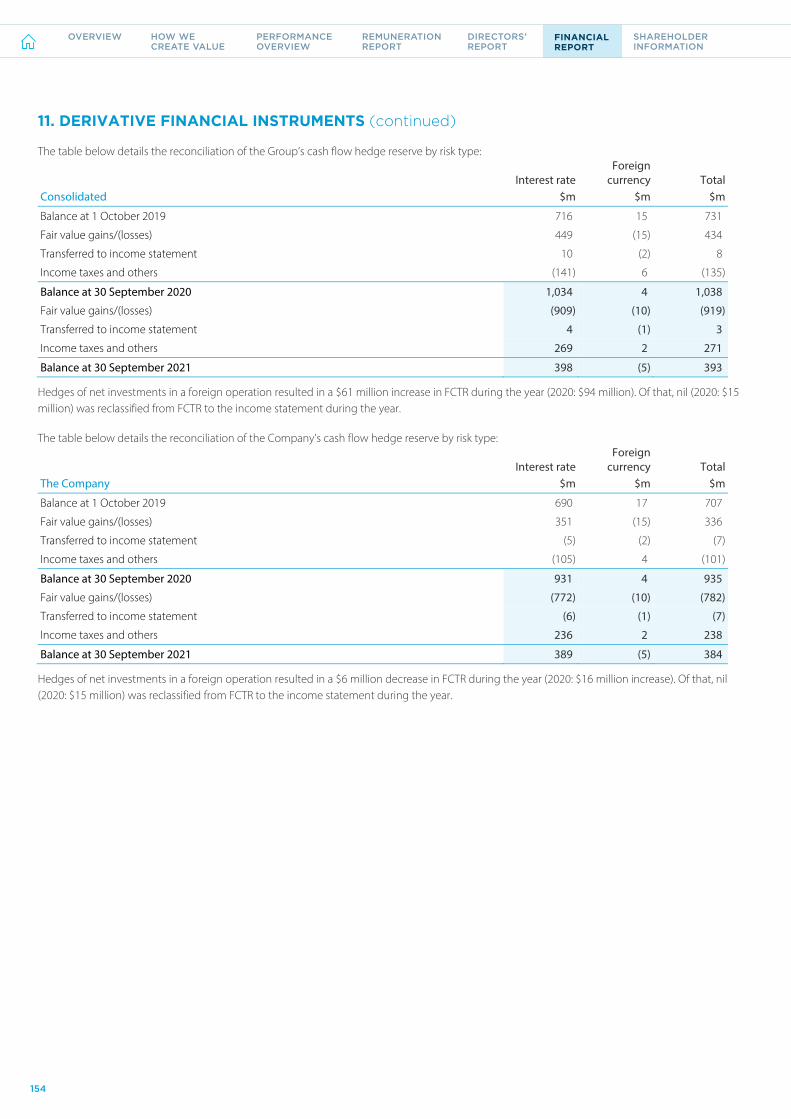
ANZ 2021 ANNUAL REPORT
NOTES TO THE FINANCIAL STATEMENTS (continued)
154
11. DERIVATIVE FINANCIAL INSTRUMENTS (continued)
The table below details the reconciliation of the Group’s cash flow hedge reserve by risk type:
Interest rate Foreign
currency Total Consolidated $m $m $m
Balance at 1 October 2019 716 15 731
Fair value gains/(losses) 449 (15) 434
Transferred to income statement 10 (2) 8
Income taxes and others (141) 6 (135)
Balance at 30 September 2020 1,034 4 1,038
Fair value gains/(losses) (909) (10) (919)
Transferred to income statement 4 (1) 3
Income taxes and others 269 2 271
Balance at 30 September 2021 398 (5) 393
Hedges of net investments in a foreign operation resulted in a $61 million increase in FCTR during the year (2020: $94 million). Of that, nil (2020: $15 million) was reclassified from FCTR to the income statement during the year.
The table below details the reconciliation of the Company’s cash flow hedge reserve by risk type:
Interest rate Foreign
currency Total The Company $m $m $m
Balance at 1 October 2019 690 17 707
Fair value gains/(losses) 351 (15) 336
Transferred to income statement (5) (2) (7)
Income taxes and others (105) 4 (101)
Balance at 30 September 2020 931 4 935
Fair value gains/(losses) (772) (10) (782)
Transferred to income statement (6) (1) (7)
Income taxes and others 236 2 238
Balance at 30 September 2021 389 (5) 384
Hedges of net investments in a foreign operation resulted in a $6 million decrease in FCTR during the year (2020: $16 million increase). Of that, nil (2020: $15 million) was reclassified from FCTR to the income statement during the year.
154
OVERVIEW HOW WE CREATE VALUE
PERFORMANCE OVERVIEW
REMUNERATION REPORT
DIRECTORS’ REPORT
FINANCIAL REPORT
SHAREHOLDER INFORMATION
NOTES TO THE FINANCIAL STATEMENTS
155
11. DERIVATIVE FINANCIAL INSTRUMENTS (continued)
RECOGNITION AND MEASUREMENT
Recognition
Initially and at each reporting date, we recognise all derivatives at fair value. If the fair value of a derivative is positive, then we carry it as an asset, but if its value is negative, then we carry it as a liability.
Valuation adjustments are integral in determining the fair value of derivatives. This includes:
a credit valuation adjustment (CVA) to reflect the counterparty risk and/or event of default; and
a funding valuation adjustment (FVA) to account for funding costs and benefits in the derivatives portfolio.
Derecognition of assets and liabilities
We remove derivative assets from our balance sheet when the contracts expire or we have transferred substantially all the risks and rewards of ownership. We remove derivative liabilities from our balance sheet when the Group’s contractual obligations are discharged, cancelled or expired.
With respect to derivatives cleared through a central clearing counterparty or exchange, derivative assets or liabilities may be derecognised in accordance with the principle above when collateral is settled, depending on the legal arrangements in place for each instrument.
Impact on the Income Statement
The recognition of gains or losses on derivative financial instruments depends on whether the derivative is held for trading or is designated in a hedging relationship. For derivative financial instruments held for trading, gains or losses from changes in the fair value are recognised in profit or loss.
For an instrument designated in a hedging relationship, the recognition of gains or losses depends on the nature of the item being hedged. Refer to the table on page 147 for profit or loss treatment for each hedge type.
Sources of hedge ineffectiveness may arise from differences in the interest rate reference rate, margins, or rate set differences and differences in discounting between the hedged items and the hedging instruments. The hedging instruments are discounted using Overnight Index Swaps discount curves which are not applied to the hedged items.
Hedge effectiveness
To qualify for hedge accounting, a hedge is expected to be highly effective. A hedge is highly effective only if the following conditions are met:
the hedge is expected to be highly effective in achieving offsetting changes in fair value or cash flows attributable to the hedged risk during the period for which the hedge is designated (prospective effectiveness); and
the actual results of the hedge are within the range of 80-125% (retrospective effectiveness).
The Group monitors hedge effectiveness on a regular basis but at a minimum at least at each reporting date.
KEY JUDGEMENTS AND ESTIMATES
Judgement is required when we select the valuation techniques used to determine the fair value of derivatives, particularly the selection of valuation inputs that are not readily observable, and the application of valuation adjustments to certain derivatives. Refer to Note 18 Fair Value of Financial Assets and Financial Liabilities for further details.
155ANZ 2021 Annual Report
OVERVIEW HOW WE CREATE VALUE
PERFORMANCE OVERVIEW
REMUNERATION REPORT
DIRECTORS’ REPORT
FINANCIAL REPORT
SHAREHOLDER INFORMATION Notes to the financial statements (continued)
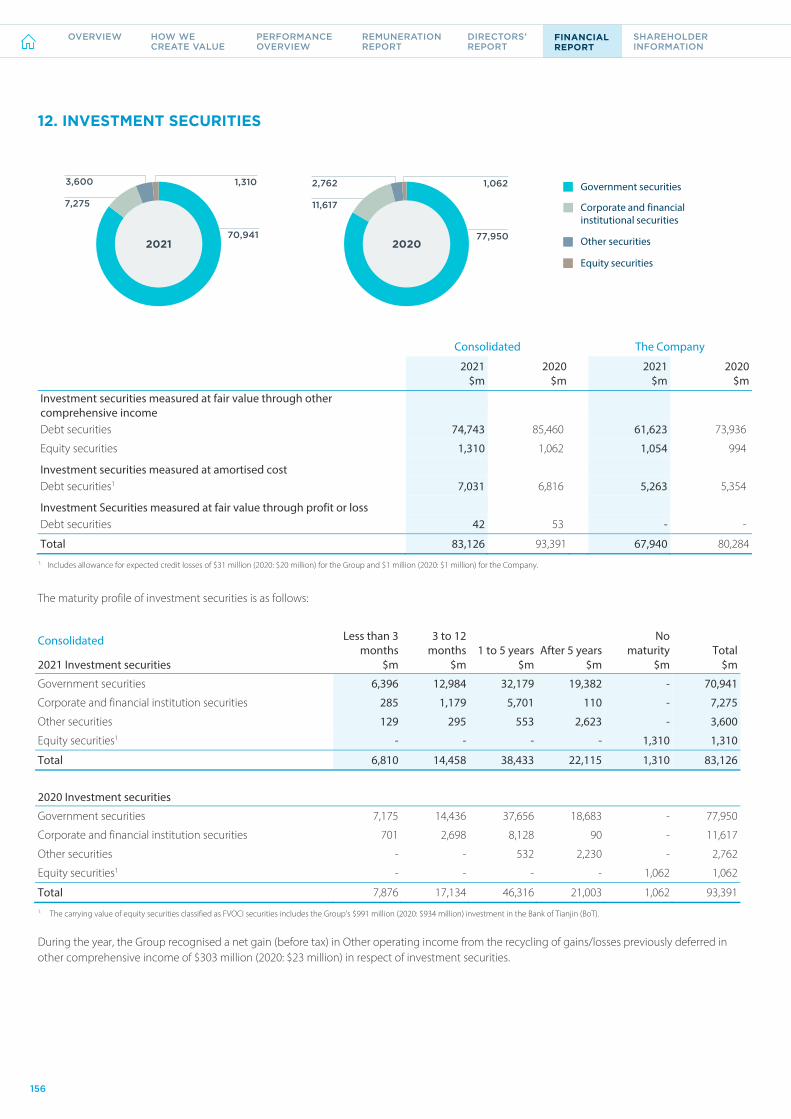
ANZ 2021 ANNUAL REPORT
NOTES TO THE FINANCIAL STATEMENTS (continued)
156
12. INVESTMENT SECURITIES
Consolidated The Company
2021 2020 2021 2020 $m $m $m $m Investment securities measured at fair value through other comprehensive income Debt securities 74,743 85,460 61,623 73,936
Equity securities 1,310 1,062 1,054 994
Investment securities measured at amortised cost Debt securities1 7,031 6,816 5,263 5,354
Investment Securities measured at fair value through profit or loss Debt securities 42 53 - -
Total 83,126 93,391 67,940 80,284 1. Includes allowance for expected credit losses of $31 million (2020: $20 million) for the Group and $1 million (2020: $1 million) for the Company.
The maturity profile of investment securities is as follows:
Consolidated Less than 3
months 3 to 12
months 1 to 5 years After 5 years No
maturity Total 2021 Investment securities $m $m $m $m $m $m
Government securities 6,396 12,984 32,179 19,382 - 70,941
Corporate and financial institution securities 285 1,179 5,701 110 - 7,275
Other securities 129 295 553 2,623 - 3,600
Equity securities1 - - - - 1,310 1,310
Total 6,810 14,458 38,433 22,115 1,310 83,126
2020 Investment securities
Government securities 7,175 14,436 37,656 18,683 - 77,950
Corporate and financial institution securities 701 2,698 8,128 90 - 11,617
Other securities - - 532 2,230 - 2,762
Equity securities1 - - - - 1,062 1,062
Total 7,876 17,134 46,316 21,003 1,062 93,391 1. The carrying value of equity securities classified as FVOCI securities includes the Group’s $991 million (2020: $934 million) investment in the Bank of Tianjin (BoT).
During the year, the Group recognised a net gain (before tax) in Other operating income from the recycling of gains/losses previously deferred in other comprehensive income of $303 million (2020: $23 million) in respect of investment securities.
2020202177,950
1,062
11,617
2,762
Equity securities
Other securities
Government securities
Corporate and financial institutional securities
70,941
1,310
7,275
3,600
12 Investment securities
156
OVERVIEW HOW WE CREATE VALUE
PERFORMANCE OVERVIEW
REMUNERATION REPORT
DIRECTORS’ REPORT
FINANCIAL REPORT
SHAREHOLDER INFORMATION

NOTES TO THE FINANCIAL STATEMENTS
157
12. INVESTMENT SECURITIES (continued)
The Company Less than 3
months 3 to 12
months 1 to 5 years After 5 years No
maturity Total 2021 Investment securities $m $m $m $m $m $m
Government securities 5,453 11,646 24,390 16,350 - 57,839
Corporate and financial institution securities 175 830 4,371 71 - 5,447
Other securities 129 295 553 2,623 - 3,600
Equity securities1 - - - - 1,054 1,054
Total 5,757 12,771 29,314 19,044 1,054 67,940
2020 Investment securities
Government securities 5,770 12,763 30,887 17,600 - 67,020
Corporate and financial institution securities 633 1,700 7,104 71 - 9,508
Other securities - - 532 2,230 - 2,762
Equity securities1 - - - - 994 994
Total 6,403 14,463 38,523 19,901 994 80,284 1. The carrying value of equity securities classified as FVOCI securities includes the Company’s $991 million (2020: $934 million) investment in the Bank of Tianjin (BoT).
During the year, the Company recognised a net gain (before tax) in Other operating income from the recycling of gains/losses previously deferred in other comprehensive income of $301 million (2020: $21 million) in respect of investment securities.
RECOGNITION AND MEASUREMENT
Investment securities are those financial assets in security form (that is, transferable debt or equity instruments) that are not held for trading purposes. By way of exception, bills of exchange (a form of security/transferable instrument) which are used to facilitate the Group’s customer lending activities are classified as Loans and advances (rather than Investment securities) to better reflect the substance of the arrangement.
Non-traded equity investments may be designated at FVOCI on an instrument by instrument basis. If this election is made, gains or losses are not reclassified from other comprehensive income to profit or loss on disposal of the investment. However, gains or losses may be reclassified within equity.
Assets disclosed as Investment securities are subject to the general classification and measurement policy for Financial Assets outlined at the commencement of the Group’s financial asset disclosures on page 141. Additionally, expected credit losses associated with ‘Investment securities - debt securities at amortised cost’ and ‘Investment securities - debt securities at fair value through other comprehensive income’ are recognised and measured in accordance with the accounting policy outlined in Note 14 Allowance for Expected Credit Losses. For ‘Investment securities - debt securities at fair value through other comprehensive income’ the allowance for Expected Credit Loss (ECL) is recognised in the FVOCI reserve in equity with a corresponding charge to profit or loss.
KEY JUDGEMENTS AND ESTIMATES
Judgement is required when we select valuation techniques used to determine the fair value of assets not valued using quoted market prices, particularly the selection of valuation inputs that are not readily observable. Refer to Note 18 Fair Value of Financial Assets and Financial Liabilities for further details.
157ANZ 2021 Annual Report
OVERVIEW HOW WE CREATE VALUE
PERFORMANCE OVERVIEW
REMUNERATION REPORT
DIRECTORS’ REPORT
FINANCIAL REPORT
SHAREHOLDER INFORMATION Notes to the financial statements (continued)

ANZ 2021 ANNUAL REPORT
NOTES TO THE FINANCIAL STATEMENTS (continued)
158
13. NET LOANS AND ADVANCES The following table provides details of net loans and advances for the Group:
Consolidated The Company
2021 2020 2021 2020
$m $m $m $m
Overdrafts 5,360 5,214 4,465 4,466 Credit cards 6,570 7,194 5,494 5,990 Commercial bills 6,000 6,383 6,000 6,383 Term loans – housing 372,572 358,350 278,372 275,579 Term loans – non-housing 239,277 241,725 194,150 197,117 Other 2,985 2,406 2,733 2,133
Subtotal 632,764 621,272 491,214 491,668
Unearned income1 (434) (460) (390) (406) Capitalised brokerage and other origination costs1 1,434 1,262 1,050 959
Gross loans and advances 633,764 622,074 491,874 492,221 Allowance for expected credit losses (refer to Note 14) (4,045) (4,981) (3,387) (4,219)
Net loans and advances 629,719 617,093 488,487 488,002
Residual contractual maturity: Within one year 125,952 126,238 98,214 98,736 More than one year 503,767 490,855 390,273 389,266
Net loans and advances 629,719 617,093 488,487 488,002
Carried on Balance Sheet at: Amortised cost 626,099 613,155 485,015 483,986 Fair value through profit or loss 3,620 3,938 3,472 4,016
Net loans and advances 629,719 617,093 488,487 488,002 1. During 2021, deferred expenses previously netted within Unearned income were reclassified to Capitalised brokerage and other origination costs to better align with the nature of the balances.
Comparatives have been restated accordingly (2020: $394 million for the Group; $387 million for the Company).
RECOGNITION AND MEASUREMENT
Loans and advances are non-derivative financial assets with fixed or determinable payments that are not quoted in an active market and are facilities the Group provides directly to customers or through third party channels.
Loans and advances are initially recognised at fair value plus transaction costs directly attributable to the issue of the loan or advance, which are primarily brokerage and other origination costs which we amortise over the estimated life of the loan. Subsequently, we then measure loans and advances at amortised cost using the effective interest rate method, net of any allowance for expected credit losses, or at fair value when they are specifically designated on initial recognition as fair value through profit or loss or when held for trading.
We classify contracts to lease assets and hire purchase agreements as finance leases if they transfer substantially all the risks and rewards of ownership of the asset to the customer or an unrelated third party. We include these facilities in ‘Other’ in the table above.
The Group enters into transactions in which it transfers financial assets that are recognised on its balance sheet. When the Group retains substantially all of the risks and rewards of the transferred assets, the transferred assets remain on the Group’s balance sheet, however if substantially all the risks and rewards are transferred, the Group derecognises the asset. If the risks and rewards are partially retained and control over the asset is lost, the Group derecognises the asset. If control over the asset is not lost, the Group continues to recognise the asset to the extent of its continuing involvement.
We separately recognise the rights and obligations retained, or created, in the transfer of assets and liabilities as appropriate.
Assets disclosed as net loans and advances are subject to the general classification and measurement policy for financial assets outlined on page 141. Additionally, expected credit losses associated with loans and advances at amortised cost are recognised and measured in accordance with the accounting policy outlined in Note 14 Allowance for Expected Credit Losses.
13. Net loans and advances
158
OVERVIEW HOW WE CREATE VALUE
PERFORMANCE OVERVIEW
REMUNERATION REPORT
DIRECTORS’ REPORT
FINANCIAL REPORT
SHAREHOLDER INFORMATION
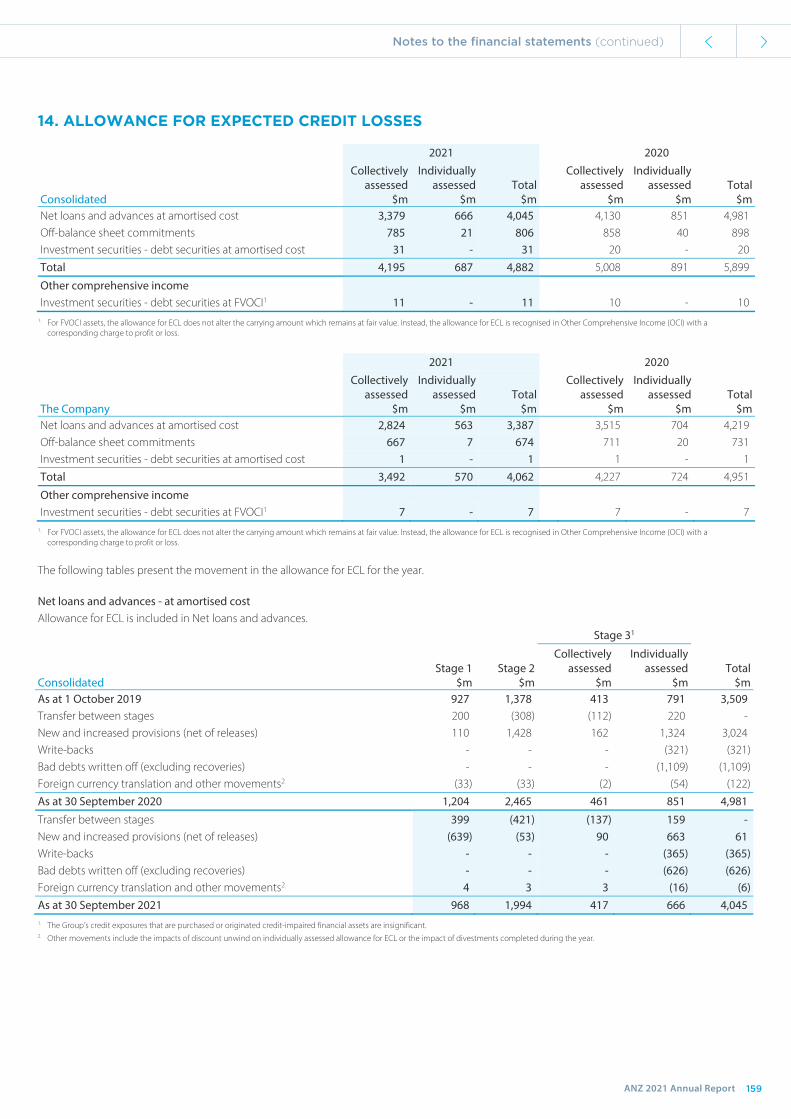
NOTES TO THE FINANCIAL STATEMENTS
159
14. ALLOWANCE FOR EXPECTED CREDIT LOSSES
2021 2020
Consolidated
Collectively assessed
$m
Individually assessed
$m Total
$m
Collectively assessed
$m
Individually assessed
$m Total
$m Net loans and advances at amortised cost 3,379 666 4,045 4,130 851 4,981 Off-balance sheet commitments 785 21 806 858 40 898 Investment securities - debt securities at amortised cost 31 - 31 20 - 20 Total 4,195 687 4,882 5,008 891 5,899
Other comprehensive income Investment securities - debt securities at FVOCI1 11 - 11 10 - 10
1. For FVOCI assets, the allowance for ECL does not alter the carrying amount which remains at fair value. Instead, the allowance for ECL is recognised in Other Comprehensive Income (OCI) with a corresponding charge to profit or loss.
2021 2020
The Company
Collectively assessed
$m
Individually assessed
$m Total
$m
Collectively assessed
$m
Individually assessed
$m Total
$m Net loans and advances at amortised cost 2,824 563 3,387 3,515 704 4,219 Off-balance sheet commitments 667 7 674 711 20 731 Investment securities - debt securities at amortised cost 1 - 1 1 - 1 Total 3,492 570 4,062 4,227 724 4,951
Other comprehensive income Investment securities - debt securities at FVOCI1 7 - 7 7 - 7
1. For FVOCI assets, the allowance for ECL does not alter the carrying amount which remains at fair value. Instead, the allowance for ECL is recognised in Other Comprehensive Income (OCI) with a corresponding charge to profit or loss.
The following tables present the movement in the allowance for ECL for the year.
Net loans and advances - at amortised cost Allowance for ECL is included in Net loans and advances.
Stage 31
Consolidated Stage 1
$m Stage 2
$m
Collectively assessed
$m
Individually assessed
$m Total
$m As at 1 October 2019 927 1,378 413 791 3,509 Transfer between stages 200 (308) (112) 220 - New and increased provisions (net of releases) 110 1,428 162 1,324 3,024 Write-backs - - - (321) (321) Bad debts written off (excluding recoveries) - - - (1,109) (1,109) Foreign currency translation and other movements2 (33) (33) (2) (54) (122) As at 30 September 2020 1,204 2,465 461 851 4,981
Transfer between stages 399 (421) (137) 159 - New and increased provisions (net of releases) (639) (53) 90 663 61 Write-backs - - - (365) (365) Bad debts written off (excluding recoveries) - - - (626) (626) Foreign currency translation and other movements2 4 3 3 (16) (6) As at 30 September 2021 968 1,994 417 666 4,045 1. The Group’s credit exposures that are purchased or originated credit-impaired financial assets are insignificant. 2. Other movements include the impacts of discount unwind on individually assessed allowance for ECL or the impact of divestments completed during the year.
14. Allowance for expected credit losses
159ANZ 2021 Annual Report
OVERVIEW HOW WE CREATE VALUE
PERFORMANCE OVERVIEW
REMUNERATION REPORT
DIRECTORS’ REPORT
FINANCIAL REPORT
SHAREHOLDER INFORMATION Notes to the financial statements (continued)

ANZ 2021 ANNUAL REPORT
NOTES TO THE FINANCIAL STATEMENTS (continued)
160
14. ALLOWANCE FOR EXPECTED CREDIT LOSSES (continued)
Stage 31
The Company Stage 1
$m Stage 2
$m
Collectively assessed
$m
Individually assessed
$m Total
$m As at 1 October 2019 746 1,181 361 633 2,921 Transfer between stages 168 (258) (122) 212 - New and increased provisions (net of releases) 122 1,198 135 1,171 2,626 Write-backs - - - (286) (286) Bad debts written off (excluding recoveries) - - - (1,003) (1,003) Foreign currency translation and other movements2 (8) (7) (1) (23) (39) As at 30 September 2020 1,028 2,114 373 704 4,219
Transfer between stages 392 (382) (130) 120 - New and increased provisions (net of releases) (620) (49) 106 619 56 Write-backs - - - (308) (308) Bad debts written off (excluding recoveries) - - - (556) (556) Foreign currency translation and other movements2 (3) (4) (1) (16) (24) As at 30 September 2021 797 1,679 348 563 3,387
1. The Group’s credit exposures that are purchased or originated credit-impaired financial assets are insignificant. 2. Other movements include the impact of discount unwind on individually assessed allowance for ECL.
Off-balance sheet commitments - undrawn and contingent facilities Allowance for ECL is included in Other provisions. Stage 31
Consolidated Stage 1
$m Stage 2
$m
Collectively assessed
$m
Individually assessed
$m Total
$m As at 1 October 2019 473 151 21 23 668 Transfer between stages 18 (24) (1) 7 - New and increased provisions (net of releases) 115 115 3 24 257 Write-backs - - - (14) (14) Foreign currency translation and other movements2 (10) (3) - - (13) As at 30 September 2020 596 239 23 40 898
Transfer between stages 51 (49) (3) 1 - New and increased provisions (net of releases) (92) 19 - 1 (72) Write-backs - - - (21) (21) Foreign currency translation - 2 (1) - 1 As at 30 September 2021 555 211 19 21 806 1. The Group’s credit exposures that are purchased or originated credit-impaired financial assets are insignificant. 2. Other movements include the impacts of divestments completed during the year.
160
OVERVIEW HOW WE CREATE VALUE
PERFORMANCE OVERVIEW
REMUNERATION REPORT
DIRECTORS’ REPORT
FINANCIAL REPORT
SHAREHOLDER INFORMATION
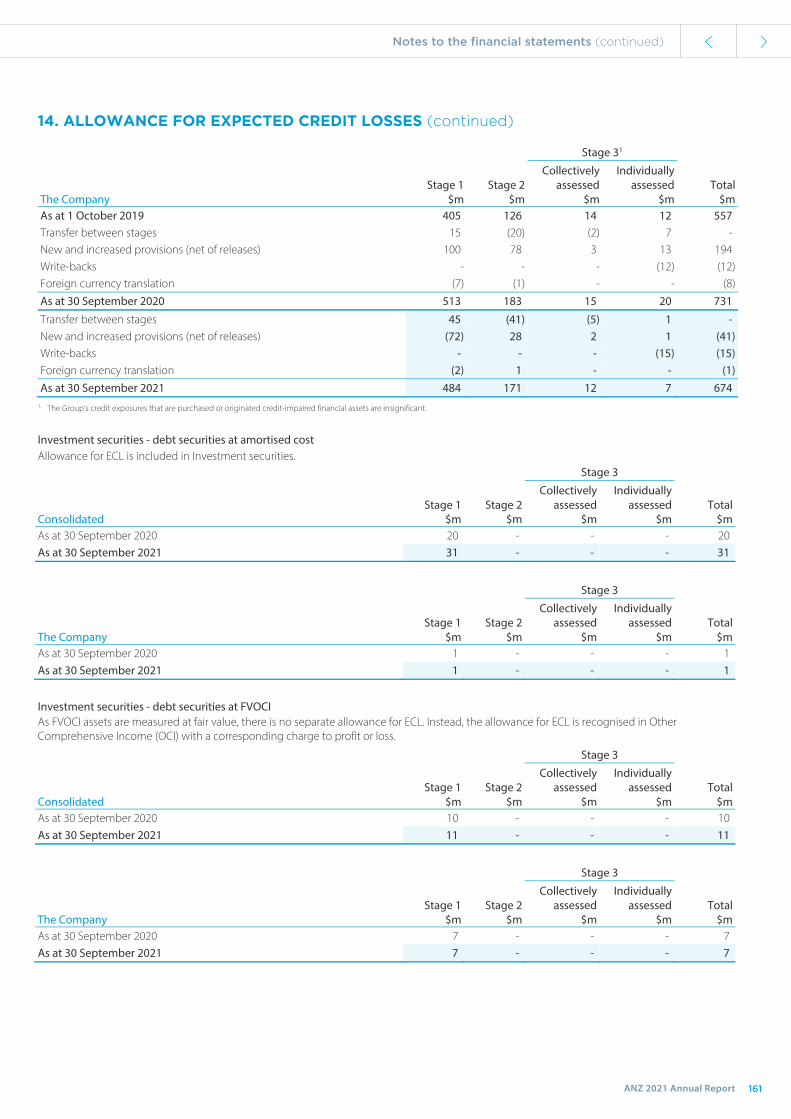
NOTES TO THE FINANCIAL STATEMENTS
161
14. ALLOWANCE FOR EXPECTED CREDIT LOSSES (continued)
Stage 31
The Company Stage 1
$m Stage 2
$m
Collectively assessed
$m
Individually assessed
$m Total
$m As at 1 October 2019 405 126 14 12 557 Transfer between stages 15 (20) (2) 7 - New and increased provisions (net of releases) 100 78 3 13 194 Write-backs - - - (12) (12) Foreign currency translation (7) (1) - - (8) As at 30 September 2020 513 183 15 20 731
Transfer between stages 45 (41) (5) 1 - New and increased provisions (net of releases) (72) 28 2 1 (41) Write-backs - - - (15) (15) Foreign currency translation (2) 1 - - (1) As at 30 September 2021 484 171 12 7 674
1. The Group’s credit exposures that are purchased or originated credit-impaired financial assets are insignificant.
Investment securities - debt securities at amortised cost Allowance for ECL is included in Investment securities.
Stage 3
Consolidated Stage 1
$m Stage 2
$m
Collectively assessed
$m
Individually assessed
$m Total
$m As at 30 September 2020 20 - - - 20 As at 30 September 2021 31 - - - 31
Stage 3
The Company Stage 1
$m Stage 2
$m
Collectively assessed
$m
Individually assessed
$m Total
$m As at 30 September 2020 1 - - - 1 As at 30 September 2021 1 - - - 1
Investment securities - debt securities at FVOCI As FVOCI assets are measured at fair value, there is no separate allowance for ECL. Instead, the allowance for ECL is recognised in Other Comprehensive Income (OCI) with a corresponding charge to profit or loss.
Stage 3
Consolidated Stage 1
$m Stage 2
$m
Collectively assessed
$m
Individually assessed
$m Total
$m As at 30 September 2020 10 - - - 10 As at 30 September 2021 11 - - - 11
Stage 3
The Company Stage 1
$m Stage 2
$m
Collectively assessed
$m
Individually assessed
$m Total
$m As at 30 September 2020 7 - - - 7 As at 30 September 2021 7 - - - 7
161ANZ 2021 Annual Report
OVERVIEW HOW WE CREATE VALUE
PERFORMANCE OVERVIEW
REMUNERATION REPORT
DIRECTORS’ REPORT
FINANCIAL REPORT
SHAREHOLDER INFORMATION Notes to the financial statements (continued)

ANZ 2021 ANNUAL REPORT
NOTES TO THE FINANCIAL STATEMENTS (continued)
162
14. ALLOWANCE FOR EXPECTED CREDIT LOSSES (continued)
CREDIT IMPAIRMENT CHARGE - INCOME STATEMENT
Credit impairment charge/(release) analysis Consolidated The Company 2021 2020 2021 2020 $m $m $m $m
New and increased provisions (net of releases)1,2
- Collectively assessed (823) 1,717 (726) 1,420
- Individually assessed 824 1,575 741 1,403
Write-backs3 (386) (335) (323) (298)
Recoveries of amounts previously written-off (182) (219) (161) (188)
Total credit impairment charge (567) 2,738 (469) 2,337 1. Includes the impact of transfers between collectively assessed and individually assessed. 2. New and increased provisions (net of releases) includes:
Consolidated The Company
2021 2020 2021 2020
Collectively assessed
$m
Individually assessed
$m
Collectively assessed
$m
Individually assessed
$m
Collectively assessed
$m
Individually assessed
$m
Collectively assessed
$m
Individually assessed
$m
Net loans and advances at amortised cost (761) 822 1,479 1,544 (683) 739 1,243 1,383
Off-balance sheet commitments (74) 2 226 31 (43) 2 174 20
Investment securities - debt securities at amortised cost 11 - 9 - - - 1 -
Investment securities - debt securities at FVOCI 1 - 3 - - - 2 -
Total (823) 824 1,717 1,575 (726) 741 1,420 1,403
3. Consists of write-backs in Net loans and advances at amortised cost of $365 million (2020: $321 million) for the Group and $308 million (2020: $286 million) for the Company, and Off-balance sheet commitments of $21 million (2020: $14 million) for the Group and $15 million (2020: $12 million) for the Company.
The contractual amount outstanding on financial assets that were written off during the year and that are still subject to enforcement activity is $168 million (2020: $340 million) for the Group, and $138 million (2020: $321 million) for the Company.
162
OVERVIEW HOW WE CREATE VALUE
PERFORMANCE OVERVIEW
REMUNERATION REPORT
DIRECTORS’ REPORT
FINANCIAL REPORT
SHAREHOLDER INFORMATION
NOTES TO THE FINANCIAL STATEMENTS
163
14. ALLOWANCE FOR EXPECTED CREDIT LOSSES (continued)
RECOGNITION AND MEASUREMENT
EXPECTED CREDIT LOSS MODEL
The measurement of expected credit losses reflects an unbiased, probability weighted prediction which evaluates a range of scenarios and takes into account the time value of money, past events, current conditions and forecasts of future economic conditions.
Expected credit losses are either measured over 12 months or the expected lifetime of the financial asset, depending on credit deterioration since origination, according to the following three-stage approach:
Stage 1: At the origination of a financial asset, and where there has not been a Significant Increase in Credit Risk (SICR) since origination, an allowance equivalent to 12 months ECL is recognised reflecting the expected credit losses resulting from default events that are possible within the next 12 months from the reporting date. For instruments with a remaining maturity of less than 12 months, expected credit losses are estimated based on default events that are possible over the remaining time to maturity.
Stage 2: Where there has been a SICR since origination, an allowance equivalent to lifetime ECL is recognised reflecting expected credit losses resulting from all possible default events over the expected life of a financial instrument. If credit risk were to improve in a subsequent period such that the increase in credit risk since origination is no longer considered significant, the exposure returns to a Stage 1 classification and a 12 month ECL applies.
Stage 3: Where there is objective evidence of impairment, an allowance equivalent to lifetime ECL is recognised.
Expected credit losses are estimated on a collective basis for exposures in Stage 1 and Stage 2, and on either a collective or individual basis when transferred to Stage 3.
MEASUREMENT OF EXPECTED CREDIT LOSS
ECL is calculated as the product of the following credit risk factors at a facility level, discounted to incorporate the time value of money:
Probability of default (PD) - the estimate of the likelihood that a borrower will default over a given period;
Exposure at default (EAD) - the expected balance sheet exposure at default taking into account repayments of principal and interest, expected additional drawdowns and accrued interest; and
Loss given default (LGD) - the expected loss in the event of the borrower defaulting, expressed as a percentage of the facility's EAD, taking into account direct and indirect recovery costs.
These credit risk factors are adjusted for current and forward-looking information through the use of macro-economic variables.
EXPECTED LIFE
When estimating ECL for exposures in Stage 2 and 3, the Group considers the expected lifetime over which it is exposed to credit risk.
For non-retail portfolios, the Group uses the maximum contractual period as the expected lifetime for non-revolving credit facilities. For non-retail revolving credit facilities, such as corporate lines of credit, the expected life reflects the Group’s contractual right to withdraw a facility as part of a contractually agreed annual review, after taking into account the applicable notice period.
For retail portfolios, the expected lifetime is determined using a behavioural term, taking into account expected prepayment behaviour and substantial modifications.
DEFINITION OF DEFAULT, CREDIT IMPAIRED AND WRITE-OFFS
The definition of default used in measuring expected credit losses is aligned to the definition used for internal credit risk management purposes across all portfolios. This definition is also in line with the regulatory definition of default. Default occurs when there are indicators that a debtor is unlikely to fully satisfy contractual credit obligations to the Group, or the exposure is 90 days past due.
Financial assets, including those that are well secured, are considered credit impaired for financial reporting purposes when they default.
When there is no realistic probability of recovery, loans are written off against the related impairment allowance on completion of the Group’s internal processes and when all reasonably expected recoveries have been collected. In subsequent periods, any recoveries of amounts previously written-off are credited to credit impairment charge in the income statement.
163ANZ 2021 Annual Report
OVERVIEW HOW WE CREATE VALUE
PERFORMANCE OVERVIEW
REMUNERATION REPORT
DIRECTORS’ REPORT
FINANCIAL REPORT
SHAREHOLDER INFORMATION Notes to the financial statements (continued)

ANZ 2021 ANNUAL REPORT
NOTES TO THE FINANCIAL STATEMENTS (continued)
164
14. ALLOWANCE FOR EXPECTED CREDIT LOSSES (continued)
RECOGNITION AND MEASUREMENT
MODIFIED FINANCIAL ASSETS
If the terms of a financial asset are modified or an existing financial asset is replaced with a new one for either credit or commercial reasons, an assessment is made to determine if the changes to the terms of the existing financial asset are considered substantial. This assessment considers both changes in cash flows arising from the modified terms as well as changes in the overall instrument risk profile; for example, changes in the principal (credit limit), term, or type of underlying collateral. Where a modification is considered non-substantial, the existing financial asset is not derecognised and its date of origination continues to be used to determine SICR. Where a modification is considered substantial, the existing financial asset is derecognised and a new financial asset is recognised at its fair value on the modification date, which also becomes the date of origination used to determine SICR for this new asset.
SIGNIFICANT INCREASE IN CREDIT RISK (SICR)
Stage 2 assets are those that have experienced a SICR since origination. In determining what constitutes a SICR, the Group considers both qualitative and quantitative information:
i. Internal credit rating grade
For the majority of portfolios, the primary indicator of a SICR is a significant deterioration in the internal credit rating grade of a facility since origination and is measured by application of thresholds.
For non-retail portfolios, a SICR is determined by comparing the Customer Credit Rating (CCR) applicable to a facility at reporting date to the CCR at origination of that facility. A CCR is assigned to each borrower which reflects the probability of default of the borrower and incorporates both borrower and non-borrower specific information, including forward-looking information. CCRs are subject to review at least annually or more frequently when an event occurs which could affect the credit risk of the customer.
For retail portfolios, a SICR is determined, depending on the type of facility, by either comparing the scenario weighted lifetime probability of default at the reporting date to that at origination, or by reference to customer behavioural score thresholds. The scenario weighted lifetime probability of default may increase significantly if:
there has been a deterioration in the economic outlook, or an increase in economic uncertainty; or
there has been a deterioration in the customer’s overall credit position, or ability to manage their credit obligations.
ii. Backstop criteria
The Group uses 30 days past due arrears as a backstop criterion for both non-retail and retail portfolios. For retail portfolios only, facilities are required to demonstrate three to six months of good payment behaviour prior to being allocated back to Stage 1.
iii. COVID-19 initiatives
Facilities previously subject to the COVID-19 repayment deferral arrangements have been subsumed into the normal loan portfolios and SICR applied accordingly.
FORWARD-LOOKING INFORMATION
Forward-looking information is incorporated into both our assessment of whether a financial asset has experienced a SICR since its initial recognition and in our estimate of ECL. In applying forward-looking information for estimating ECL, the Group considers four probability-weighted forecast economic scenarios as follows:
i. Base case scenario
The base case scenario is ANZ’s view of future macro-economic conditions. It reflects management’s assumptions used for strategic planning and budgeting, and also informs the Group Internal Capital Adequacy Assessment Process (ICAAP) which is the process the Group applies in strategic and capital planning over a 3-year time horizon;
ii. Upside and iii. Downside scenarios
The upside and downside scenarios are fixed by reference to average economic cycle conditions (that is, they are not based on the economic conditions prevailing at balance date) and are based on a combination of more optimistic (in the case of the upside) and pessimistic (in the case of the downside) economic events and uncertainty over long term horizons; and
iv. Severe downside scenario
The severe downside scenario is fixed by reference to average economic cycle conditions and accounts for the potentially severe impact of less likely extremely adverse economic conditions. It reflects macro-economic conditions of a downturn economic event with a probability of occurrence once every 25 years.
164
OVERVIEW HOW WE CREATE VALUE
PERFORMANCE OVERVIEW
REMUNERATION REPORT
DIRECTORS’ REPORT
FINANCIAL REPORT
SHAREHOLDER INFORMATION

NOTES TO THE FINANCIAL STATEMENTS
165
14. ALLOWANCE FOR EXPECTED CREDIT LOSSES (continued)
RECOGNITION AND MEASUREMENT (continued)
FORWARD-LOOKING INFORMATION (continued)
The four scenarios are described in terms of macro-economic variables used in the PD, LGD and EAD models (collectively the ECL models) depending on the lending portfolio and country of the borrower. Examples of the variables include unemployment rates, GDP growth rates, house price indices, commercial property price indices and consumer price indices.
Probability weighting of each scenario is determined by management considering the risks and uncertainties surrounding the base case economic scenario, as well as specific portfolio considerations where required. The Group Asset and Liability Committee (GALCO) is responsible for reviewing and approving the base case economic scenario and the Credit and Market Risk Committee (CMRC) approves the probability weights applied to each scenario.
Where applicable, temporary adjustments may be made to account for situations where known or expected risks have not been adequately addressed in the modelling process. CMRC is responsible for approving such adjustments.
KEY JUDGEMENTS AND ESTIMATES
In estimating collectively assessed ECL, the Group makes judgements and assumptions in relation to:
the selection of an estimation technique or modelling methodology; and
the selection of inputs for those models, and the interdependencies between those inputs.
The following table summarises the key judgements and assumptions in relation to the model inputs and the interdependencies between those inputs, and highlights significant changes during the current period.
The judgements and associated assumptions have been made within the context of the impact of COVID-19, and reflect historical experience and other factors that are considered to be relevant, including expectations of future events that are believed to be reasonable under the circumstances. The Group’s ECL estimates are inherently uncertain and, as a result, actual results may differ from these estimates.
Judgement/Assumption Description Considerations for the year ended 30 September 2021
Determining when a Significant Increase in Credit Risk (SICR) has occurred
In the measurement of ECL, judgement is involved in setting the rules and trigger points to determine whether there has been a SICR since initial recognition of a loan, which would result in the financial asset moving from Stage 1 to Stage 2. This is a key area of judgement since transition from Stage 1 to Stage 2 increases the ECL from an allowance based on the probability of default in the next 12 months, to an allowance for lifetime expected credit losses. Subsequent decreases in credit risk resulting in transition from Stage 2 to Stage 1 may similarly result in significant changes in the ECL allowance.
The setting of precise trigger points requires judgement which may have a material impact upon the size of the ECL allowance. The Group monitors the effectiveness of SICR criteria on an ongoing basis.
The support packages offered to customers in response to COVID-19 in 2020 and 2021 have ceased with the majority of customers who took up the support packages having reverted back to their normal loan repayments. Given the recency of cessation of these packages, the Group has provided a component of ECL for expected delinquencies that may have been obscured by the support measures.
165ANZ 2021 Annual Report
OVERVIEW HOW WE CREATE VALUE
PERFORMANCE OVERVIEW
REMUNERATION REPORT
DIRECTORS’ REPORT
FINANCIAL REPORT
SHAREHOLDER INFORMATION Notes to the financial statements (continued)
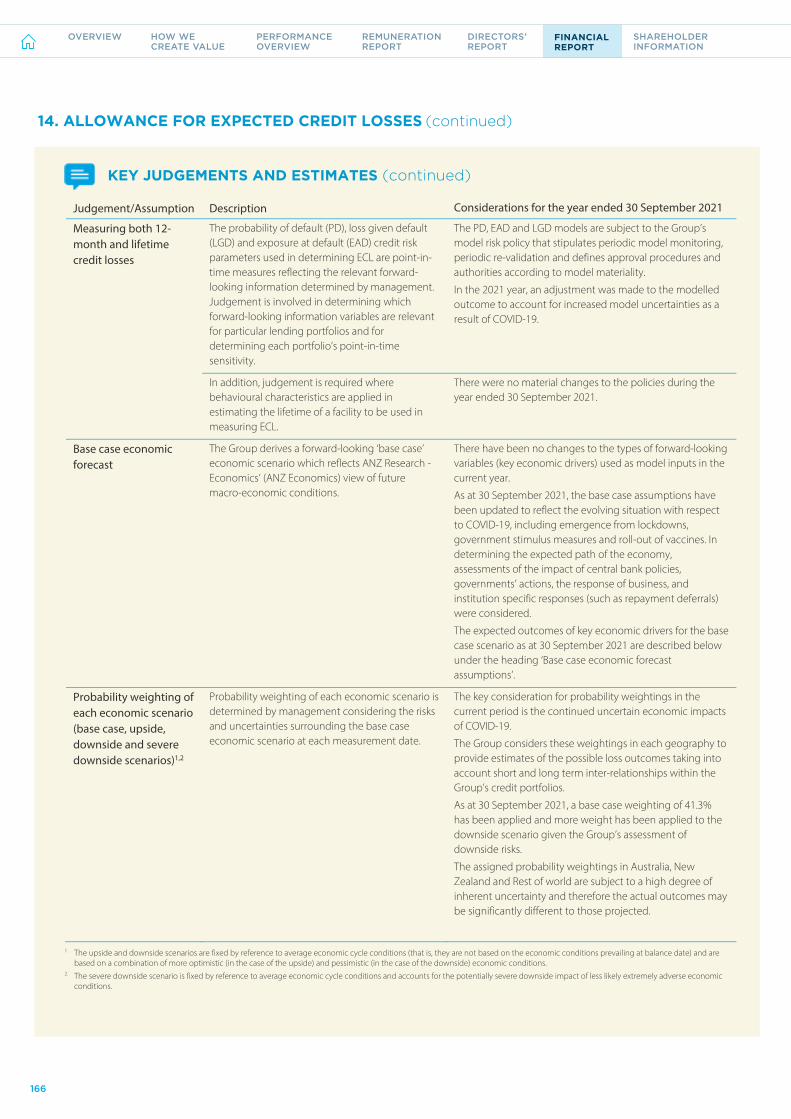
ANZ 2021 ANNUAL REPORT
NOTES TO THE FINANCIAL STATEMENTS (continued)
166
14. ALLOWANCE FOR EXPECTED CREDIT LOSSES (continued)
KEY JUDGEMENTS AND ESTIMATES (continued)
Judgement/Assumption Description Considerations for the year ended 30 September 2021
Measuring both 12-month and lifetime credit losses
The probability of default (PD), loss given default (LGD) and exposure at default (EAD) credit risk parameters used in determining ECL are point-in-time measures reflecting the relevant forward-looking information determined by management. Judgement is involved in determining which forward-looking information variables are relevant for particular lending portfolios and for determining each portfolio’s point-in-time sensitivity.
The PD, EAD and LGD models are subject to the Group’s model risk policy that stipulates periodic model monitoring, periodic re-validation and defines approval procedures and authorities according to model materiality.
In the 2021 year, an adjustment was made to the modelled outcome to account for increased model uncertainties as a result of COVID-19.
In addition, judgement is required where behavioural characteristics are applied in estimating the lifetime of a facility to be used in measuring ECL.
There were no material changes to the policies during the year ended 30 September 2021.
Base case economic forecast
The Group derives a forward-looking ‘base case’ economic scenario which reflects ANZ Research - Economics’ (ANZ Economics) view of future macro-economic conditions.
There have been no changes to the types of forward-looking variables (key economic drivers) used as model inputs in the current year.
As at 30 September 2021, the base case assumptions have been updated to reflect the evolving situation with respect to COVID-19, including emergence from lockdowns, government stimulus measures and roll-out of vaccines. In determining the expected path of the economy, assessments of the impact of central bank policies, governments’ actions, the response of business, and institution specific responses (such as repayment deferrals) were considered.
The expected outcomes of key economic drivers for the base case scenario as at 30 September 2021 are described below under the heading ‘Base case economic forecast assumptions’.
Probability weighting of each economic scenario (base case, upside, downside and severe downside scenarios)1,2
Probability weighting of each economic scenario is determined by management considering the risks and uncertainties surrounding the base case economic scenario at each measurement date.
The key consideration for probability weightings in the current period is the continued uncertain economic impacts of COVID-19.
The Group considers these weightings in each geography to provide estimates of the possible loss outcomes taking into account short and long term inter-relationships within the Group’s credit portfolios.
As at 30 September 2021, a base case weighting of 41.3% has been applied and more weight has been applied to the downside scenario given the Group’s assessment of downside risks.
The assigned probability weightings in Australia, New Zealand and Rest of world are subject to a high degree of inherent uncertainty and therefore the actual outcomes may be significantly different to those projected.
1. The upside and downside scenarios are fixed by reference to average economic cycle conditions (that is, they are not based on the economic conditions prevailing at balance date) and are based on a combination of more optimistic (in the case of the upside) and pessimistic (in the case of the downside) economic conditions.
2. The severe downside scenario is fixed by reference to average economic cycle conditions and accounts for the potentially severe downside impact of less likely extremely adverse economic conditions.
166
OVERVIEW HOW WE CREATE VALUE
PERFORMANCE OVERVIEW
REMUNERATION REPORT
DIRECTORS’ REPORT
FINANCIAL REPORT
SHAREHOLDER INFORMATION

NOTES TO THE FINANCIAL STATEMENTS
167
14. ALLOWANCE FOR EXPECTED CREDIT LOSSES (continued)
KEY JUDGEMENTS AND ESTIMATES (continued)
Judgement/Assumption Description Considerations for the year ended 30 September 2021
Management temporary adjustments
Management temporary adjustments to the ECL allowance are used in circumstances where it is judged that our existing inputs, assumptions and model techniques do not capture all the risk factors relevant to our lending portfolios. Emerging local or global macroeconomic, microeconomic or political events, and natural disasters that are not incorporated into our current parameters, risk ratings, or forward-looking information are examples of such circumstances. The use of management temporary adjustments may impact the amount of ECL recognised.
The uncertainty associated with the COVID-19 pandemic, including the roll-out of vaccines and their efficacy, and the extent to which the actions of governments, businesses and consumers mitigate against potentially adverse credit outcomes are not fully incorporated into existing ECL models which are based on historical underlying data. Accordingly, management overlays have been applied to ensure credit provisions are appropriate.
Management have applied a number of adjustments to the modelled ECL primarily due to the uncertainty associated with continuing COVID-19 impacts.
Management overlays (including COVID-19 overlays) which add to the modelled ECL provision have been made for risks particular to retail including home loans, small business and commercial banking in Australia, for personal and business banking in New Zealand, and for tourism in the Pacific.
Base case economic forecast assumptions
The uncertain evolution of the COVID-19 pandemic and associated government, business and consumer responses, increases the risk of the economic forecast resulting in an understatement or overstatement of the ECL balance due to uncertainties around:
the extent and duration of measures, including the roll-out of vaccines and the relaxation of containment measures, impacting the spread of COVID-19;
the expected impact on the economy, including the timing and speed of the economic response and differences between sectors; and
the effects of progressive reductions in government stimulus measures, in particular their impact on the extent and duration of economic recovery.
The economic drivers of the base case economic forecasts at 30 September 2021 are set out below. These reflect ANZ Economics’ view of future macro-economic conditions at 30 September 2021. For years beyond the near term forecasts below, the ECL models project future year economic conditions including an assumption to eventual reversion to mid-cycle economic conditions.
Forecast calendar year 2021 2022 2023 Australia GDP (annual % change) 3.4% 3.8% 3.4% Unemployment rate 5.3% 4.3% 4.1% Residential property prices (annual % change) 20.5% 6.7% 3.5% Consumer price index 2.4 1.9 2.2 New Zealand GDP (annual % change) 4.3% 4.3% 2.9% Unemployment rate 4.1% 3.9% 3.9% Residential property prices (annual % change) 22.4% 0.4% 5.2% Consumer price index 3.3 2.9 1.9 Rest of world GDP (annual % change) 6.2% 4.2% 2.5% Consumer price index 3.9 2.5 2.2
167ANZ 2021 Annual Report
OVERVIEW HOW WE CREATE VALUE
PERFORMANCE OVERVIEW
REMUNERATION REPORT
DIRECTORS’ REPORT
FINANCIAL REPORT
SHAREHOLDER INFORMATION Notes to the financial statements (continued)

ANZ 2021 ANNUAL REPORT
NOTES TO THE FINANCIAL STATEMENTS (continued)
168
14. ALLOWANCE FOR EXPECTED CREDIT LOSSES (continued)
KEY JUDGEMENTS AND ESTIMATES (continued)
The base case economic forecasts as at 30 September 2021 indicate a significant improvement in current and expected economic conditions from the forecasts as at 30 September 2020 reflecting the ongoing progress and actions in responding to the COVID-19 pandemic.
Probability weightings
Probability weightings for each scenario is determined by management considering the risks and uncertainties surrounding the base case economic scenario. The key consideration for probability weightings in the current period is the effectiveness of actions taken in response to COVID-19 relaxation of containment measures by governments, and the take-up of vaccines limiting the impact of the virus.
The base case scenario represents a significant improvement in the forecasts since September 2020. Given the uncertainties associated with a potential ongoing recovery in the economy, the average base case weighting across geographies has been reduced to 41.3% (Sep 20: 50.0%) and the downside scenario increased to 47.7% (Sep 20: 33.3%).
The assigned probability weightings in Australia, New Zealand and Rest of world are subject to a high degree of inherent uncertainty and therefore the actual outcomes may be significantly different to those projected. The Group considers these weightings in each geography to provide estimates of the possible loss outcomes and taking into account short and long term inter-relationships within the Group’s credit portfolios. The average weightings applied across the Group are set out below:
Consolidated The Company 2021 2020 2021 2020
Base 41.3% 50.0% 40.0% 50.0% Upside 5.2% 10.4% 5.4% 10.9% Downside 47.7% 33.3% 48.8% 33.4% Severe Downside 5.8% 6.3% 5.8% 5.7%
ECL - Sensitivity analysis
Given current economic uncertainties and the judgment applied to factors used in determining the expected default of borrowers in future periods, expected credit losses reported by the Group should be considered as a best estimate within a range of possible estimates.
The table below illustrates the sensitivity of collectively assessed ECL to key factors used in determining it as at 30 September 2021:
Consolidated The Company ECL
$m Impact
$m ECL
$m Impact
$m
If 1% of Stage 1 facilities were included in Stage 2 4,250 55 3,541 49
If 1% of Stage 2 facilities were included in Stage 1 4,188 (7) 3,486 (6)
100% upside scenario 1,774 (2,421) 1,469 (2,024)
100% base scenario 2,337 (1,858) 1,946 (1,547)
100% downside scenario 4,337 142 3,668 175
100% severe downside scenario 5,358 1,163 4,476 983
168
OVERVIEW HOW WE CREATE VALUE
PERFORMANCE OVERVIEW
REMUNERATION REPORT
DIRECTORS’ REPORT
FINANCIAL REPORT
SHAREHOLDER INFORMATION

NOTES TO THE FINANCIAL STATEMENTS
169
FINANCIAL LIABILITIES
Outlined below is a description of how we classify and measure financial liabilities relevant to the subsequent note disclosures.
CLASSIFICATION AND MEASUREMENT
Financial liabilities
Financial liabilities are measured at amortised cost, or fair value through profit or loss (FVTPL) when they are held for trading. Additionally, financial liabilities can be designated at FVTPL where:
the designation eliminates or significantly reduces an accounting mismatch which would otherwise arise;
a group of financial liabilities are managed and their performance is evaluated on a fair value basis, in accordance with a documented risk management strategy; or
the financial liability contains one or more embedded derivatives unless:
a) the embedded derivative does not significantly modify the cash flows that otherwise would be required by the contract; or
b) the embedded derivative is closely related to the host financial liability.
Where financial liabilities are designated as measured at fair value, gains or losses relating to changes in the entity’s own credit risk are included in other comprehensive income, except where doing so would create or enlarge an accounting mismatch in profit or loss.
Financial liabilities
169ANZ 2021 Annual Report
OVERVIEW HOW WE CREATE VALUE
PERFORMANCE OVERVIEW
REMUNERATION REPORT
DIRECTORS’ REPORT
FINANCIAL REPORT
SHAREHOLDER INFORMATION Notes to the financial statements (continued)

ANZ 2021 ANNUAL REPORT
NOTES TO THE FINANCIAL STATEMENTS (continued)
170
15. DEPOSITS AND OTHER BORROWINGS
Consolidated The Company
2021 2020 2021 2020 $m $m $m $m
Certificates of deposit 37,708 32,491 35,696 30,574 Term deposits 177,081 197,273 136,067 148,839 On demand and short term deposits 366,755 315,216 303,381 262,236 Deposits not bearing interest 49,746 39,874 26,836 22,016 Deposits from banks & securities sold under repurchase agreements1 86,082 88,337 83,294 86,947 Commercial paper and other borrowings 25,684 9,142 21,449 7,524 Deposits and other borrowings 743,056 682,333 606,723 558,136 Residual contractual maturity: Within one year 717,889 665,151 584,816 544,324 More than one year 25,167 17,182 21,907 13,812 Deposits and other borrowings 743,056 682,333 606,723 558,136 Carried on Balance Sheet at: Amortised cost 738,772 679,255 606,673 556,676 Fair value through profit or loss 4,284 3,078 50 1,460 Deposits and other borrowings 743,056 682,333 606,723 558,136
1. Includes $20.1 billion (2020: $12.0 billion) of funds drawn under the RBA’s Term Funding Facility (TFF) for the Group and the Company, and $1.2 billion (2020: nil) under the Reserve Bank of New Zealand’s (RBNZ) Funding for Lending Programme (FLP) and Term Lending Facility (TLF) for the Group.
RECOGNITION AND MEASUREMENT
For deposits and other borrowings that:
are not designated at fair value through profit or loss on initial recognition, we measure them at amortised cost and recognise their interest expense using the effective interest rate method; and
are managed on a fair value basis, reduce or eliminate an accounting mismatch or contain an embedded derivative, we designate them as measured at fair value through profit or loss.
Refer to Note 18 Fair Value of Financial Assets and Financial Liabilities for further details.
For deposits and other borrowings designated at fair value we recognise the amount of fair value gain or loss attributable to changes in the Group’s own credit risk in other comprehensive income in retained earnings. Any remaining amount of fair value gain or loss we recognise directly in profit and loss. Once we have recognised an amount in other comprehensive income, we do not later reclassify it to profit and loss.
Securities sold under repurchase agreements represent a liability to repurchase the financial assets that remain on our balance sheet since the risks and rewards of ownership remain with the Group. Over the life of the repurchase agreement, we recognise the difference between the sale price and the repurchase price and charge it to interest expense in the profit and loss.
20202021
Certificates of deposit
Term deposits
On demand and shortterm deposits
Deposits not bearing interest
Deposits from banks & securities sold under repurchase agreements
197,273
315,216
39,874
9,142
88,337
Commercial paper andother borrowings
32,491
366,755
49,746
25,684
86,082
177,081
37,708
15. Deposits and other borrowing
170
OVERVIEW HOW WE CREATE VALUE
PERFORMANCE OVERVIEW
REMUNERATION REPORT
DIRECTORS’ REPORT
FINANCIAL REPORT
SHAREHOLDER INFORMATION

NOTES TO THE FINANCIAL STATEMENTS
171
16. DEBT ISSUANCES
The Group uses a variety of funding programmes to issue senior debt (including covered bonds and securitisations) and subordinated debt. The difference between senior debt and subordinated debt is that holders of senior debt take priority over holders of subordinated debt owed by the relevant issuer. In the winding up of the relevant issuer, the subordinated debt will be repaid by the relevant issuer only after the repayment of claims of depositors, other creditors and the senior debt holders.
Consolidated The Company
2021 2020 2021 2020
$m $m $m $m
Senior debt 58,952 80,835 45,348 64,591 Covered bonds 15,399 15,948 11,342 11,761 Securitisation 1,424 1,824 - -
Total unsubordinated debt 75,775 98,607 56,690 76,352 Subordinated debt - Additional Tier 1 capital 8,506 8,196 8,191 7,833 - Tier 2 capital 16,207 12,865 16,207 12,865 - Other subordinated debt securities 566 - - -
Total subordinated debt 25,279 21,061 24,398 20,698 Total debt issued 101,054 119,668 81,088 97,050 Residual contractual maturity1: Within one year 22,621 25,688 18,512 20,937 More than one year 76,594 92,059 60,605 74,122 No maturity date (instruments in perpetuity) 1,839 1,921 1,971 1,991
Total debt issued 101,054 119,668 81,088 97,050 1. Based on the final maturity date or, in the case of Additional Tier 1 capital securities, the mandatory conversion date (if any).
TOTAL DEBT ISSUED BY CURRENCY The table below shows the Group’s issued debt by currency of issue, which broadly represents the debt holders’ base location.
Consolidated The Company
2021 2020 2021 2020
$m $m $m $m
USD United States dollars 29,788 41,100 22,354 31,836 EUR Euro 22,984 23,038 15,294 15,325 AUD Australian dollars 35,709 43,697 34,299 41,857 NZD New Zealand dollars 3,276 3,682 839 923 JPY Japanese yen 1,854 2,131 1,853 2,131 CHF Swiss francs 940 975 - - GBP Pounds sterling 4,286 2,387 4,287 2,387 HKD Hong Kong dollars 727 1,088 727 1,088
Other Chinese yuan, Norwegian kroner, Singapore dollars and Canadian dollars 1,490 1,570 1,435 1,503
Total debt issued 101,054 119,668 81,088 97,050
SUBORDINATED DEBT At 30 September 2021, all subordinated debt issued by the Company and certain other subordinated debt issued by its subsidiary ANZ Bank New Zealand Limited (ANZ NZ) qualify as regulatory capital for the Group. They are classified as either Additional Tier 1 (AT1) capital, in the case of the ANZ Capital Notes (ANZ CN), ANZ Capital Securities (ANZ CS) or ANZ NZ Capital Notes (ANZ NZ CN), or Tier 2 capital, in the case of perpetual or term subordinated notes, for APRA’s capital adequacy purposes depending on the terms and conditions of the instruments.
Tier 2 capital instruments rank ahead of AT1 capital instruments, and AT1 capital instruments only rank ahead of ordinary shares, in any liquidation event impacting the issuer of the instruments.
16. Debt issuances
171ANZ 2021 Annual Report
OVERVIEW HOW WE CREATE VALUE
PERFORMANCE OVERVIEW
REMUNERATION REPORT
DIRECTORS’ REPORT
FINANCIAL REPORT
SHAREHOLDER INFORMATION Notes to the financial statements (continued)

ANZ 2021 ANNUAL REPORT
NOTES TO THE FINANCIAL STATEMENTS (continued)
172
16. DEBT ISSUANCES (continued)
AT1 CAPITAL
All outstanding AT1 capital instruments are Basel III fully compliant instruments (refer to Note 24 Capital Management for further information about Basel III). Each of the ANZ CN and ANZ CS rank equally with each other.
Distributions on the AT1 capital instruments are non-cumulative and subject to the issuer’s absolute discretion and certain payment conditions (including regulatory requirements). Distributions on ANZ CNs are franked in line with the franking applied to ANZ ordinary shares.
Where specified, the AT1 capital instruments provide the issuer with an early redemption or conversion option on a specified date and in certain other circumstances (such as a tax or regulatory event). This redemption option is subject to APRA’s and, in respect of the ANZ NZ CN, the Reserve Bank of New Zealand’s (RBNZ) prior written approval.
Each of the AT1 capital instruments will immediately convert into a variable number of ANZ ordinary shares (based on the average market price of the shares immediately prior to conversion less a 1% discount, subject to a maximum conversion number of ANZ ordinary shares) if:
ANZ’s or, in the case of the ANZ NZ CN, ANZ Bank New Zealand Limited’s (ANZ NZ) Common Equity Tier 1 capital ratio is equal to or less than 5.125% - known as a Common Equity Capital Trigger Event; or
APRA notifies the Company that, without the conversion or write-off of certain securities or a public sector injection of capital (or equivalent support), it considers that the Company would become non-viable or, in the case of the ANZ NZ CN, the RBNZ directs ANZ NZ to convert or write-off the notes, or a statutory manager is appointed to ANZ NZ and decides that ANZ NZ must convert or write-off the notes – known as a Non-Viability Trigger Event.
Where specified, AT1 capital instruments mandatorily convert into a variable number of ANZ ordinary shares (based on the average market price of the shares immediately prior to conversion less a 1% discount):
on a specified mandatory conversion date; or
on an earlier date under certain circumstances as set out in the terms.
However, the mandatory conversion is deferred for a specified period if certain conversion tests are not met.
The tables below show the key details of the Group’s AT1 capital instruments on issue at 30 September in both the current and prior years:
Consolidated The Company 2021 2020 2021 2020 $m $m $m $m
Additional Tier 1 capital (perpetual subordinated securities)1 ANZ Capital Notes (ANZ CN) AUD 1,120m ANZ CN12 - 1,119 - 1,119 AUD 1,610m ANZ CN2 1,609 1,608 1,609 1,608
AUD 970m ANZ CN3 968 967 998 997 AUD 1,622m ANZ CN4 1,617 1,614 1,617 1,614
AUD 931m ANZ CN5 927 926 927 926 AUD 1,500m ANZ CN6 1,486 - 1,486 -
ANZ Capital Securities (ANZ CS) USD 1,000m ANZ Capital Securities 1,422 1,499 1,554 1,569
ANZ NZ Capital Notes (ANZ NZ CN) NZD 500m ANZ NZ Capital Notes 477 463 - -
Total Additional Tier 1 capital3 8,506 8,196 8,191 7,833 1. Carrying values are net of issuance costs, and where appropriate include fair value hedge accounting adjustments. 2. Approximately $750 million of ANZ Capital Notes 1 were reinvested into ANZ Capital Notes 6 on 8 July 2021 with the remaining $370m being redeemed on 1 September 2021. 3. This forms part of qualifying Additional Tier 1 capital. Refer to Note 24 Capital Management for further details.
172
OVERVIEW HOW WE CREATE VALUE
PERFORMANCE OVERVIEW
REMUNERATION REPORT
DIRECTORS’ REPORT
FINANCIAL REPORT
SHAREHOLDER INFORMATION

NOTES TO THE FINANCIAL STATEMENTS
173
16. DEBT ISSUANCES (continued)
ANZ Capital Notes (ANZ CN) CN1 CN2 CN3 Issuer
ANZ
ANZ
ANZ, acting through its New Zealand branch
Issue date 7 August 2013 31 March 2014 5 March 2015
Issue amount $1,120 million $1,610 million $970 million
Face value $100 $100 $100
Distribution frequency Semi-annually in arrears Semi-annually in arrears Semi-annually in arrears
Distribution rate
Floating rate: (180 day Bank Bill rate +3.4%)x(1-Australian corporate tax rate)
Floating rate: (180 day Bank Bill rate +3.25%)x(1-Australian corporate tax rate)
Floating rate: (180 day Bank Bill rate +3.6%)x(1-Australian corporate tax rate)
Issuer’s early redemption or conversion option 1 September 20211 24 March 2022 24 March 2023
Mandatory conversion date 1 September 20232 24 March 2024 24 March 2025
Common equity capital trigger event Yes Yes Yes
Non-viability trigger event Yes Yes Yes Carrying value (net of issue costs)
$nil (2020: $1,119 million)
$1,609 million (2020: $1,608 million)
$968 million (2020: $967 million)
CN4 CN5 CN6
Issuer ANZ ANZ ANZ
Issue date 27 September 2016 28 September 2017 8 July 2021
Issue amount $1,622 million $931 million $1,500 million
Face value $100 $100 $100
Distribution frequency Quarterly in arrears Quarterly in arrears Quarterly in arrears
Distribution rate
Floating rate: (90 day Bank Bill rate +4.7%)x(1-Australian corporate tax rate)
Floating rate: (90 day Bank Bill rate +3.8%)x(1-Australian corporate tax rate)
Floating rate: (90 day Bank Bill rate +3.0%)x(1-Australian corporate tax rate)
Issuer’s early redemption or conversion option 20 March 2024 20 March 2025 20 March 2028
Mandatory conversion date 20 March 2026 20 March 2027 20 September 2030
Common equity capital trigger event Yes Yes Yes
Non-viability trigger event Yes Yes Yes Carrying value (net of issue costs)
$1,617 million (2020: $1,614 million)
$927 million (2020: $926 million)
$1,486 million (2020: $nil)
1. Approximately $750 million of ANZ Capital Notes 1 were reinvested into ANZ Capital Notes 6 on 8 July 2021 with the remaining $370m being redeemed on 1 September 2021. 2. The mandatory conversion date is no longer applicable as all of CN1 has been redeemed.
173ANZ 2021 Annual Report
OVERVIEW HOW WE CREATE VALUE
PERFORMANCE OVERVIEW
REMUNERATION REPORT
DIRECTORS’ REPORT
FINANCIAL REPORT
SHAREHOLDER INFORMATION Notes to the financial statements (continued)

ANZ 2021 ANNUAL REPORT
NOTES TO THE FINANCIAL STATEMENTS (continued)
174
16. DEBT ISSUANCES (continued)
ANZ Capital Securities (ANZ CS)
Issuer ANZ, acting through its London branch
Issue date 15 June 2016
Issue amount USD 1,000 million
Face value Minimum denomination of USD 200,000 and an integral multiple of USD 1,000 above that
Interest frequency Semi-annually in arrears
Interest rate
Fixed at 6.75% p.a. until 15 June 2026. Reset on 15 June 2026 and each 5 year anniversary to a floating rate: 5 year USD mid-market swap rate + 5.168%
Issuer’s early redemption option 15 June 2026 and each 5 year anniversary
Common equity capital trigger event Yes
Non-viability trigger event Yes
Carrying value (net of issue costs) $1,422 million (2020: $1,499 million)
ANZ NZ Capital Notes (ANZ NZ CN)
Issuer ANZ Bank New Zealand Limited (ANZ NZ)
Issue date 31 March 2015
Issue amount NZD 500 million
Face value NZD 1
Interest frequency Quarterly in arrears
Interest rate
Fixed at 7.2% p.a. until 25 May 2020. The rate reset in May 2020 to a floating rate: New Zealand 3 month bank bill rate + 3.5% Interest payments are subject to ANZ NZ’s absolute discretion and certain payment conditions (including APRA and RBNZ requirements)
Issuer’s early redemption option The option was not exercised on 25 May 2020 and has expired
Mandatory conversion date 25 May 2022
Common equity capital trigger event Yes
Non-viability trigger event Yes
Carrying value (net of issue costs) $477 million (2020: $463 million)
In April 2020, the RBNZ informed New Zealand-incorporated registered banks (including ANZ NZ) that they should not redeem capital instruments. In March 2021, the RBNZ announced that it would remove these restrictions on the redemption of non-CET1 capital instruments. However, as the restriction was in place in May 2020, ANZ NZ was not able to redeem its ANZ NZ CNs and decided not to exercise its option to convert at the optional exchange date in May 2020. As ANZ NZ did not exercise its option to convert in May 2020, the terms of the ANZ NZ CNs provide for their conversion into a variable number of shares of the Company in May 2022 subject to certain conditions.
The RBNZ has released new capital adequacy requirements for New Zealand banks, which are being implemented from October 2021 to July 2028. Under these changes, from 1 January 2022, the ANZ NZ CNs are subject to a reduction in their regulatory capital recognition, and as a result, ANZ NZ has determined that a Regulatory Event (as defined in the ANZ NZ CN Deed Poll) has occurred in respect of these notes. The occurrence of a Regulatory Event means that ANZ NZ may choose to redeem the ANZ NZ CNs at its discretion. A redemption of the ANZ NZ CNs is subject to certain conditions, including approval from the RBNZ and APRA. At the date of this financial report, no decision had been made on whether ANZ NZ will redeem the ANZ NZ CNs (subject to regulatory approvals).
174
OVERVIEW HOW WE CREATE VALUE
PERFORMANCE OVERVIEW
REMUNERATION REPORT
DIRECTORS’ REPORT
FINANCIAL REPORT
SHAREHOLDER INFORMATION

NOTES TO THE FINANCIAL STATEMENTS
175
16. DEBT ISSUANCES (continued)
TIER 2 CAPITAL
Convertible term subordinated notes issued by the Company are Basel III fully compliant instruments. If a Non-Viability Trigger Event occurs, each of the convertible term subordinated notes will immediately convert into ANZ ordinary shares (based on the average market price of the shares immediately prior to conversion less a 1% discount, subject to a maximum conversion number).
APRA has granted transitional Basel III capital treatment for the USD 300 million perpetual subordinated notes until the end of the transitional period (December 2021). These subordinated notes do not contain a Non-Viability Trigger Event.
The table below shows the Tier 2 capital subordinated notes the Group holds at 30 September in both the current and prior year:
Consolidated The Company
Next optional call date – Interest 2021 2020 2021 2020 Currency Face value Maturity subject to APRA’s prior approval rate $m $m $m $m
Basel III transitional subordinated notes (perpetual)
USD 300m Perpetual Each semi-annual interest payment date
Floating 417 422 417 422
Total Basel III transitional subordinated notes 417 422 417 422
Basel III fully compliant convertible subordinated notes (term)
USD 800m 2024 N/A Fixed 1,173 1,225 1,173 1,225
SGD 500m 2027 2022 Fixed 515 529 515 529
AUD 200m 2027 2022 Fixed 200 200 200 200
JPY 20,000m 2026 N/A Fixed 250 270 250 270
AUD 700m 2026 2021 Floating - 700 - 700
USD 1,500m 2026 N/A Fixed 2,137 2,253 2,137 2,253
JPY 10,000m 2026 2021 Fixed - 133 - 133
JPY 10,000m 2028 2023 Fixed 124 133 124 133
AUD 225m 2032 2027 Fixed 225 225 225 225
AUD 1,750m 2029 2024 Floating 1,740 1,750 1,740 1,750
EUR 1,000m 2029 2024 Fixed 1,608 1,657 1,608 1,657
AUD 265m 2039 N/A Fixed 253 265 253 265
USD 1,250m 2030 2025 Fixed 1,782 1,859 1,782 1,859
AUD 1,250m 2031 2026 Floating 1,235 1,244 1,235 1,244
USD 1,500m 2035 2030 Fixed 1,955 - 1,955 -
AUD 330m 2040 N/A Fixed 304 - 304 -
AUD 195m 2040 N/A Fixed 178 - 178 -
EUR 750m 2031 2026 Fixed 1,193 - 1,193 -
GBP 500m 2031 2026 Fixed 918 - 918 -
Total Basel III fully compliant subordinated notes 15,790 12,443 15,790 12,443
Total Tier 2 capital1,2 16,207 12,865 16,207 12,865 1. Carrying value are net of issuance costs, and where applicable include fair value hedge accounting adjustments. 2. This forms part of qualifying Tier 2 capital. Refer to Note 24 Capital Management for further details.
OTHER SUBORDINATED DEBT SECURITIES
A subsidiary of the Group, ANZ Bank New Zealand Limited, issued NZ$600 million of unsecured subordinated notes in September 2021. Whilst these notes constitute Tier 2 capital under RBNZ requirements, the notes do not contain a Non-Viability Trigger Event and therefore do not meet APRA’s requirements for Tier 2 capital instruments in order to qualify as regulatory capital for the Group.
175ANZ 2021 Annual Report
OVERVIEW HOW WE CREATE VALUE
PERFORMANCE OVERVIEW
REMUNERATION REPORT
DIRECTORS’ REPORT
FINANCIAL REPORT
SHAREHOLDER INFORMATION Notes to the financial statements (continued)

ANZ 2021 ANNUAL REPORT
NOTES TO THE FINANCIAL STATEMENTS (continued)
176
16. DEBT ISSUANCES (continued)
RECOGNITION AND MEASUREMENT
Debt issuances are measured at amortised cost, except where designated at fair value through profit or loss. Where the Group enters into a fair value hedge accounting relationship, the fair value attributable to the hedge risk is reflected in adjustments to the carrying value of the debt. Interest expense is recognised using the effective interest rate method.
Subordinated debt with capital-based conversion features (i.e. Common Equity Capital Trigger Events or Non-Viability Trigger Events) are considered to contain embedded derivatives that we account for separately at fair value through profit and loss. The embedded derivatives arise because the amount of shares issued on conversion following any of those trigger events is subject to the maximum conversion number, however they have no significant value as of the reporting date given the remote nature of those trigger events.
176
OVERVIEW HOW WE CREATE VALUE
PERFORMANCE OVERVIEW
REMUNERATION REPORT
DIRECTORS’ REPORT
FINANCIAL REPORT
SHAREHOLDER INFORMATION

NOTES TO THE FINANCIAL STATEMENTS
177
17. FINANCIAL RISK MANAGEMENT
RISK MANAGEMENT FRAMEWORK AND MODEL INTRODUCTION The use of financial instruments is fundamental to the Group’s businesses of providing banking and other financial services to our customers. The associated financial risks (primarily credit, market, and liquidity risks) are a significant portion of the Group’s key material risks.
We disclose details of all key material risks impacting the Group, and further information on the Group’s risk management activities, in the Governance and Risk Management sections of this Annual Report.
This note details the Group’s financial risk management policies, processes and quantitative disclosures in relation to the key financial risks.
Key material financial risks Key sections applicable to this risk Credit risk The risk of financial loss resulting from:
a counterparty failing to fulfil its obligations; or
a decrease in credit quality of a counterparty resulting in a financial loss.
Credit risk incorporates the risks associated with us lending to customers who could be impacted by climate change or by changes to laws, regulations, or other policies adopted by governments or regulatory authorities, including carbon pricing and climate change adaptation or mitigation policies.
Credit risk overview, management and control responsibilities
Maximum exposure to credit risk
Credit quality
Concentrations of credit risk
Collateral management
Market risk The risk to the Group’s earnings arising from:
changes in interest rates, foreign exchange rates, credit spreads, volatility and correlations; or
fluctuations in bond, commodity or equity prices.
Market risk overview, management and control responsibilities
Measurement of market risk
Traded and non-traded market risk
Equity securities designated at FVOCI
Foreign currency risk – structural exposure
Liquidity and funding risk The risk that the Group is unable to meet payment obligations as they fall due, including:
repaying depositors or maturing wholesale debt; or
the Group having insufficient capacity to fund increases in assets.
Liquidity risk overview, management and control responsibilities
Key areas of measurement for liquidity risk
Liquidity risk outcomes
Residual contractual maturity analysis of the Group’s liabilities
17 Financial risk management
177ANZ 2021 Annual Report
OVERVIEW HOW WE CREATE VALUE
PERFORMANCE OVERVIEW
REMUNERATION REPORT
DIRECTORS’ REPORT
FINANCIAL REPORT
SHAREHOLDER INFORMATION Notes to the financial statements (continued)

ANZ 2021 ANNUAL REPORT
NOTES TO THE FINANCIAL STATEMENTS (continued)
178
17. FINANCIAL RISK MANAGEMENT (continued)
OVERVIEW AN OVERVIEW OF OUR RISK MANAGEMENT FRAMEWORK This overview is provided to aid the users of the financial statements in understanding the context of the financial disclosures required under AASB 7 Financial Instruments: Disclosures (AASB 7). It should be read in conjunction with the Governance and Risk Management sections of this Annual Report.
The Board is responsible for establishing and overseeing the Group’s Risk Management Framework (RMF). The Board has delegated authority to the Board Risk Committee (BRC) to develop and monitor compliance with the Group’s risk management policies. The BRC reports regularly to the Board on its activities.
The Board approves the strategic objectives of the Group including:
the Risk Appetite Statement (RAS), which sets out the Board’s expectations regarding the degree of risk that ANZ is prepared to accept in pursuit of its strategic objectives and business plan; and
the Risk Management Strategy (RMS), which describes ANZ’s strategy for managing risks and the key elements of the RMF that give effect to this strategy. This includes a description of each material risk, and an overview of how the RMF addresses each risk, with reference to the relevant policies, standards and procedures. It also includes information on how ANZ identifies, measures, evaluates, monitors, reports and controls or mitigates material risks.
The Group, through its training and management standards and procedures, aims to maintain a disciplined and robust control environment in which all employees understand their roles and obligations. At ANZ, risk is everyone’s responsibility.
The Group has an independent risk management function, headed by the Chief Risk Officer who:
is responsible for overseeing the risk profile and the risk management framework;
can effectively challenge activities and decisions that materially affect ANZ’s risk profile; and
has an independent reporting line to the BRC to enable the appropriate escalation of issues of concern.
The Internal Audit Function reports directly to the Board Audit Committee (BAC). Internal Audit provides:
an independent evaluation of the Group’s RMF annually that seeks to ensure compliance with, and the effectiveness of, the risk management framework;
facilitation of a comprehensive review every three years that seeks to ensure the appropriateness, effectiveness and adequacy of the risk management framework; and
recommendations to improve the framework and/or work practices to strengthen the effectiveness of day to day operations.
178
OVERVIEW HOW WE CREATE VALUE
PERFORMANCE OVERVIEW
REMUNERATION REPORT
DIRECTORS’ REPORT
FINANCIAL REPORT
SHAREHOLDER INFORMATION

NOTES TO THE FINANCIAL STATEMENTS
179
17. FINANCIAL RISK MANAGEMENT (continued)
CREDIT RISK CREDIT RISK OVERVIEW, MANAGEMENT AND CONTROL RESPONSIBILITIES Granting credit facilities to customers is one of the Group’s major sources of income. As this activity is also a principal risk, the Group dedicates considerable resources to its management. The Group assumes credit risk in a wide range of lending and other activities in diverse markets and in many jurisdictions. Credit risks arise from traditional lending to customers as well as from interbank, treasury, trade finance and capital markets activities around the world.
Our credit risk management framework ensures we apply a consistent approach across the Group when we measure, monitor and manage the credit risk appetite set by the Board. The Board is assisted and advised by the BRC in discharging its duty to oversee credit risk. The BRC:
sets the credit risk appetite and credit strategies; and
approves credit transactions beyond the discretion of executive management.
We quantify credit risk through an internal credit rating system (masterscales) to ensure consistency across exposure types and to provide a consistent framework for reporting and analysis. The system uses models and other tools to measure the following for customer exposures:
Probability of Default (PD) Expressed by a Customer Credit Rating (CCR), reflecting the Group’s assessment of a customer’s ability to service and repay debt.
Exposure at Default (EAD) The expected balance sheet exposure at default taking into account repayments of principal and interest, expected additional drawdowns and accrued interest at the time of default.
Loss Given Default (LGD) Expressed by a Security Indicator (SI) ranging from A to G. The SI is calculated by reference to the percentage of loan covered by security which the Group can realise if a customer defaults. The A-G scale is supplemented by a range of other SIs which cover factors such as cash cover and sovereign backing. For retail and some small business lending, we group exposures into large homogenous pools – and the LGD is assigned at the pool level.
Our specialist credit risk teams develop and validate the Group’s PD and LGD rating models. The outputs from these models drive our day-to-day credit risk management decisions including origination, pricing, approval levels, regulatory capital adequacy, economic capital allocation, and credit provisioning.
All customers with whom ANZ has a credit relationship are assigned a CCR at origination via either of the following assessment approaches:
Large and more complex lending Retail and some small business lending
Rating models provide a consistent and structured assessment, with judgement required around the use of out-of-model factors. We handle credit approval on a dual approval basis, jointly with the business writer and an independent credit officer.
Automated assessment of credit applications using a combination of scoring (application and behavioural), policy rules and external credit reporting information. If the application does not meet the automated assessment criteria, then it is subject to manual assessment.
We use the Group’s internal CCRs to manage the credit quality of financial assets. To enable wider comparisons, the Group’s CCRs are mapped to external rating agency scales as follows:
Credit Quality Description Internal CCR ANZ Customer Requirements
Moody’s Rating
Standard & Poor’s Rating
Strong CCR 0+ to 4- Demonstrated superior stability in their operating and financial performance over the long-term, and whose earnings capacity is not significantly vulnerable to foreseeable events.
Aaa – Baa3 AAA – BBB-
Satisfactory CCR 5+ to 6- Demonstrated sound operational and financial stability over the medium to long-term, even though some may be susceptible to cyclical trends or variability in earnings.
Ba1 – B1 BB+ – B+
Weak CCR 7+ to 8= Demonstrated some operational and financial instability, with variability and uncertainty in profitability and liquidity projected to continue over the short and possibly medium term.
B2 - Caa B - CCC
Defaulted CCR 8- to 10 When doubt arises as to the collectability of a credit facility, the financial instrument (or ‘the facility’) is classified as defaulted.
N/A N/A
179ANZ 2021 Annual Report
OVERVIEW HOW WE CREATE VALUE
PERFORMANCE OVERVIEW
REMUNERATION REPORT
DIRECTORS’ REPORT
FINANCIAL REPORT
SHAREHOLDER INFORMATION Notes to the financial statements (continued)
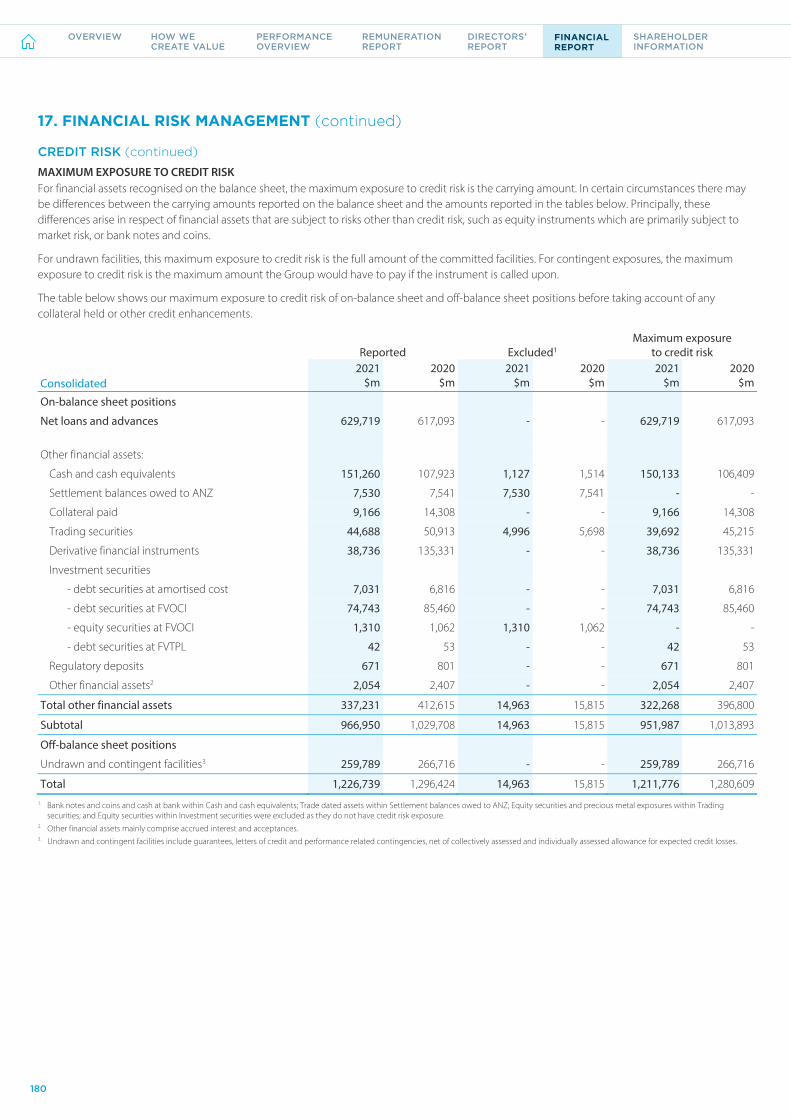
ANZ 2021 ANNUAL REPORT
NOTES TO THE FINANCIAL STATEMENTS (continued)
180
17. FINANCIAL RISK MANAGEMENT (continued)
CREDIT RISK (continued) MAXIMUM EXPOSURE TO CREDIT RISK For financial assets recognised on the balance sheet, the maximum exposure to credit risk is the carrying amount. In certain circumstances there may be differences between the carrying amounts reported on the balance sheet and the amounts reported in the tables below. Principally, these differences arise in respect of financial assets that are subject to risks other than credit risk, such as equity instruments which are primarily subject to market risk, or bank notes and coins.
For undrawn facilities, this maximum exposure to credit risk is the full amount of the committed facilities. For contingent exposures, the maximum exposure to credit risk is the maximum amount the Group would have to pay if the instrument is called upon.
The table below shows our maximum exposure to credit risk of on-balance sheet and off-balance sheet positions before taking account of any collateral held or other credit enhancements.
Reported Excluded1
Maximum exposure to credit risk
2021 2020 2021 2020 2021 2020 Consolidated $m $m $m $m $m $m
On-balance sheet positions
Net loans and advances 629,719 617,093 - - 629,719 617,093 Other financial assets:
Cash and cash equivalents 151,260 107,923 1,127 1,514 150,133 106,409
Settlement balances owed to ANZ 7,530 7,541 7,530 7,541 - -
Collateral paid 9,166 14,308 - - 9,166 14,308
Trading securities 44,688 50,913 4,996 5,698 39,692 45,215
Derivative financial instruments 38,736 135,331 - - 38,736 135,331
Investment securities
- debt securities at amortised cost 7,031 6,816 - - 7,031 6,816
- debt securities at FVOCI 74,743 85,460 - - 74,743 85,460
- equity securities at FVOCI 1,310 1,062 1,310 1,062 - -
- debt securities at FVTPL 42 53 - - 42 53
Regulatory deposits 671 801 - - 671 801
Other financial assets2 2,054 2,407 - - 2,054 2,407
Total other financial assets 337,231 412,615 14,963 15,815 322,268 396,800
Subtotal 966,950 1,029,708 14,963 15,815 951,987 1,013,893
Off-balance sheet positions
Undrawn and contingent facilities3 259,789 266,716 - - 259,789 266,716
Total 1,226,739 1,296,424 14,963 15,815 1,211,776 1,280,609 1. Bank notes and coins and cash at bank within Cash and cash equivalents; Trade dated assets within Settlement balances owed to ANZ; Equity securities and precious metal exposures within Trading
securities; and Equity securities within Investment securities were excluded as they do not have credit risk exposure. 2. Other financial assets mainly comprise accrued interest and acceptances. 3. Undrawn and contingent facilities include guarantees, letters of credit and performance related contingencies, net of collectively assessed and individually assessed allowance for expected credit losses.
180
OVERVIEW HOW WE CREATE VALUE
PERFORMANCE OVERVIEW
REMUNERATION REPORT
DIRECTORS’ REPORT
FINANCIAL REPORT
SHAREHOLDER INFORMATION

NOTES TO THE FINANCIAL STATEMENTS
181
17. FINANCIAL RISK MANAGEMENT (continued)
CREDIT RISK (continued)
Reported Excluded1
Maximum exposure to credit risk
2021 2020 2021 2020 2021 2020 The Company $m $m $m $m $m $m
On-balance sheet positions
Net loans and advances 488,487 488,002 - - 488,487 488,002 Other financial assets:
Cash and cash equivalents 141,436 98,083 721 1,084 140,715 96,999
Settlement balances owed to ANZ 7,183 7,116 7,183 7,116 - -
Collateral paid 8,343 13,012 - - 8,343 13,012
Trading securities 34,752 38,423 4,957 5,465 29,795 32,958
Derivative financial instruments 38,292 130,552 - - 38,292 130,552
Investment securities
- debt securities at amortised cost 5,263 5,354 - - 5,263 5,354
- debt securities at FVOCI 61,623 73,936 - - 61,623 73,936
- equity securities at FVOCI 1,054 994 1,054 994 - -
- debt securities at FVTPL - - - - - -
Regulatory deposits 213 199 - - 213 199 Due from controlled entities2 23,530 24,017 - - 23,530 24,017 Other financial assets3 1,371 1,460 - - 1,371 1,460
Total other financial assets 323,060 393,146 13,915 14,659 309,145 378,487
Subtotal 811,547 881,148 13,915 14,659 797,632 866,489
Off-balance sheet positions
Undrawn and contingent facilities4 220,445 226,714 - - 220,445 226,714
Total 1,031,992 1,107,862 13,915 14,659 1,018,077 1,093,203 1. Bank notes and coins and cash at bank within Cash and cash equivalents; Trade dated assets within Settlement balances owed to ANZ; Equity securities and precious metal exposures within Trading
securities; and Equity securities within Investment securities were excluded as they do not have credit risk exposure. 2. From 1 April 2021, the Company changed its accounting policy relating to intragroup transactions with consolidated securitisation structured entities (SEs) in which it holds all of the issued securities of the
SE. Transactions with an SE are no longer recorded on a gross basis. Comparatives have been restated, reducing Due from controlled entities by $76,637 million at 30 September 2020. Refer to Note 35 Impact of Adoption of New Standards and Other Changes for further details.
3. Other financial assets mainly comprise accrued interest and acceptances. 4. Undrawn and contingent facilities include guarantees, letters of credit and performance related contingencies, net of collectively assessed and individually assessed allowance for expected credit losses.
181ANZ 2021 Annual Report
OVERVIEW HOW WE CREATE VALUE
PERFORMANCE OVERVIEW
REMUNERATION REPORT
DIRECTORS’ REPORT
FINANCIAL REPORT
SHAREHOLDER INFORMATION Notes to the financial statements (continued)

ANZ 2021 ANNUAL REPORT
NOTES TO THE FINANCIAL STATEMENTS (continued)
182
17. FINANCIAL RISK MANAGEMENT (continued)
CREDIT RISK (continued) CREDIT QUALITY An analysis of the Group’s credit risk exposure is presented in the following tables based on the Group’s internal credit quality rating by stage without taking account of the effects of any collateral or other credit enhancements:
Net loans and advances
Stage 3
Stage 1 Stage 2 Collectively
assessed Individually
assessed Total Consolidated $m $m $m $m $m
As at 30 September 2021
Strong 412,821 12,596 - - 425,417
Satisfactory 146,368 31,228 - - 177,596
Weak 7,921 12,907 - - 20,828
Defaulted - - 3,754 1,549 5,303
Gross loans and advances at amortised cost 567,110 56,731 3,754 1,549 629,144
Allowance for ECL (968) (1,994) (417) (666) (4,045)
Net loans and advances at amortised cost 566,142 54,737 3,337 883 625,099
Coverage ratio 0.17% 3.51% 11.11% 43.00% 0.64%
Loans and advances at fair value through profit or loss 3,620
Unearned income1 (434)
Capitalised brokerage and other origination costs1 1,434
Net carrying amount 629,719
As at 30 September 2020
Strong 395,608 18,262 - - 413,870
Satisfactory 133,558 37,577 - - 171,135
Weak 8,461 16,850 - - 25,311
Defaulted - - 4,762 2,256 7,018
Gross loans and advances at amortised cost 537,627 72,689 4,762 2,256 617,334
Allowance for ECL (1,204) (2,465) (461) (851) (4,981)
Net loans and advances at amortised cost 536,423 70,224 4,301 1,405 612,353
Coverage ratio 0.22% 3.39% 9.68% 37.72% 0.81%
Loans and advances at fair value through profit or loss 3,938
Unearned income1 (460)
Capitalised brokerage and other origination costs1 1,262
Net carrying amount 617,093 1. During 2021, deferred expenses previously netted within Unearned income were reclassified to Capitalised brokerage and other origination costs to better align with the nature of the balances.
Comparatives have been restated accordingly (2020: $394 million).
182
OVERVIEW HOW WE CREATE VALUE
PERFORMANCE OVERVIEW
REMUNERATION REPORT
DIRECTORS’ REPORT
FINANCIAL REPORT
SHAREHOLDER INFORMATION
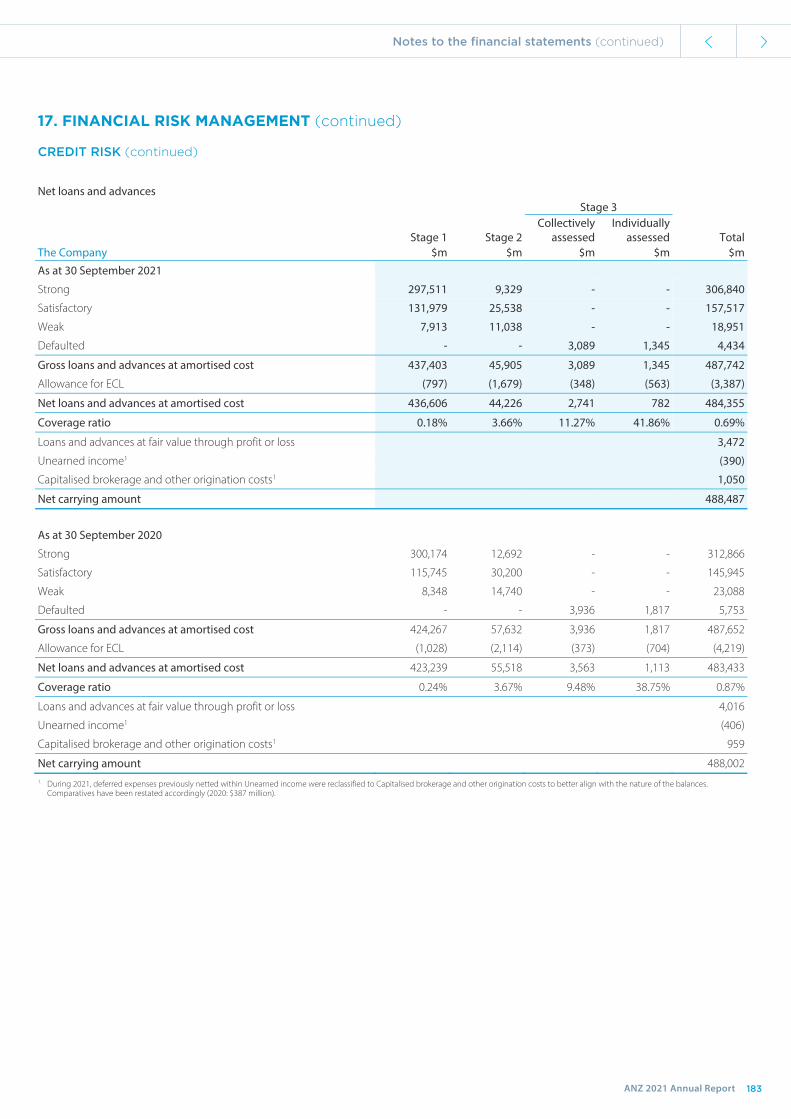
NOTES TO THE FINANCIAL STATEMENTS
183
17. FINANCIAL RISK MANAGEMENT (continued)
CREDIT RISK (continued)
Net loans and advances
Stage 3
Stage 1 Stage 2 Collectively
assessed Individually
assessed Total The Company $m $m $m $m $m
As at 30 September 2021
Strong 297,511 9,329 - - 306,840
Satisfactory 131,979 25,538 - - 157,517
Weak 7,913 11,038 - - 18,951
Defaulted - - 3,089 1,345 4,434
Gross loans and advances at amortised cost 437,403 45,905 3,089 1,345 487,742
Allowance for ECL (797) (1,679) (348) (563) (3,387)
Net loans and advances at amortised cost 436,606 44,226 2,741 782 484,355
Coverage ratio 0.18% 3.66% 11.27% 41.86% 0.69%
Loans and advances at fair value through profit or loss 3,472
Unearned income1 (390)
Capitalised brokerage and other origination costs1 1,050
Net carrying amount 488,487
As at 30 September 2020
Strong 300,174 12,692 - - 312,866
Satisfactory 115,745 30,200 - - 145,945
Weak 8,348 14,740 - - 23,088
Defaulted - - 3,936 1,817 5,753
Gross loans and advances at amortised cost 424,267 57,632 3,936 1,817 487,652
Allowance for ECL (1,028) (2,114) (373) (704) (4,219)
Net loans and advances at amortised cost 423,239 55,518 3,563 1,113 483,433
Coverage ratio 0.24% 3.67% 9.48% 38.75% 0.87%
Loans and advances at fair value through profit or loss 4,016
Unearned income1 (406)
Capitalised brokerage and other origination costs1 959
Net carrying amount 488,002 1. During 2021, deferred expenses previously netted within Unearned income were reclassified to Capitalised brokerage and other origination costs to better align with the nature of the balances.
Comparatives have been restated accordingly (2020: $387 million).
183ANZ 2021 Annual Report
OVERVIEW HOW WE CREATE VALUE
PERFORMANCE OVERVIEW
REMUNERATION REPORT
DIRECTORS’ REPORT
FINANCIAL REPORT
SHAREHOLDER INFORMATION Notes to the financial statements (continued)

ANZ 2021 ANNUAL REPORT
NOTES TO THE FINANCIAL STATEMENTS (continued)
184
17. FINANCIAL RISK MANAGEMENT (continued)
CREDIT RISK (continued)
Off-balance sheet commitments - undrawn and contingent facilities
Stage 3
Stage 1 Stage 2 Collectively
assessed Individually
assessed Total Consolidated $m $m $m $m $m
As at 30 September 2021
Strong 174,808 1,754 - - 176,562
Satisfactory 23,799 3,564 - - 27,363
Weak 1,030 1,185 - - 2,215
Defaulted - - 138 50 188
Gross undrawn and contingent facilities subject to ECL 199,637 6,503 138 50 206,328
Allowance for ECL included in Other provisions (refer to Note 22) (555) (211) (19) (21) (806)
Net undrawn and contingent facilities subject to ECL 199,082 6,292 119 29 205,522
Coverage ratio 0.28% 3.24% 13.77% 42.00% 0.39%
Undrawn and contingent facilities not subject to ECL1 54,267
Net undrawn and contingent facilities 259,789
As at 30 September 2020
Strong 171,979 3,045 - - 175,024
Satisfactory 22,983 3,972 - - 26,955
Weak 1,123 1,132 - - 2,255
Defaulted - - 144 203 347
Gross undrawn and contingent facilities subject to ECL 196,085 8,149 144 203 204,581
Allowance for ECL included in Other provisions (refer to Note 22) (596) (239) (23) (40) (898)
Net undrawn and contingent facilities subject to ECL 195,489 7,910 121 163 203,683
Coverage ratio 0.30% 2.93% 15.97% 19.70% 0.44%
Undrawn and contingent facilities not subject to ECL1 63,033
Net undrawn and contingent facilities 266,716 1. Commitments that can be unconditionally cancelled at any time without notice.
184
OVERVIEW HOW WE CREATE VALUE
PERFORMANCE OVERVIEW
REMUNERATION REPORT
DIRECTORS’ REPORT
FINANCIAL REPORT
SHAREHOLDER INFORMATION
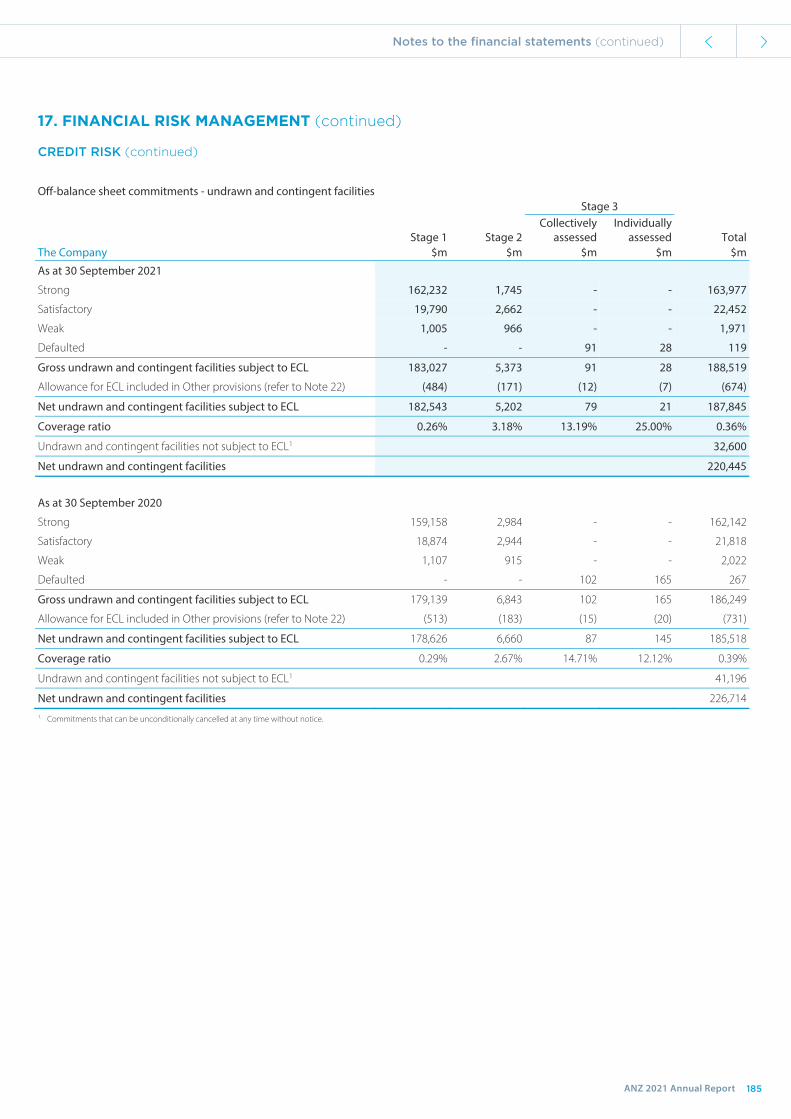
NOTES TO THE FINANCIAL STATEMENTS
185
17. FINANCIAL RISK MANAGEMENT (continued)
CREDIT RISK (continued)
Off-balance sheet commitments - undrawn and contingent facilities
Stage 3
Stage 1 Stage 2 Collectively
assessed Individually
assessed Total The Company $m $m $m $m $m
As at 30 September 2021
Strong 162,232 1,745 - - 163,977
Satisfactory 19,790 2,662 - - 22,452
Weak 1,005 966 - - 1,971
Defaulted - - 91 28 119
Gross undrawn and contingent facilities subject to ECL 183,027 5,373 91 28 188,519
Allowance for ECL included in Other provisions (refer to Note 22) (484) (171) (12) (7) (674)
Net undrawn and contingent facilities subject to ECL 182,543 5,202 79 21 187,845
Coverage ratio 0.26% 3.18% 13.19% 25.00% 0.36%
Undrawn and contingent facilities not subject to ECL1 32,600
Net undrawn and contingent facilities 220,445
As at 30 September 2020
Strong 159,158 2,984 - - 162,142
Satisfactory 18,874 2,944 - - 21,818
Weak 1,107 915 - - 2,022
Defaulted - - 102 165 267
Gross undrawn and contingent facilities subject to ECL 179,139 6,843 102 165 186,249
Allowance for ECL included in Other provisions (refer to Note 22) (513) (183) (15) (20) (731)
Net undrawn and contingent facilities subject to ECL 178,626 6,660 87 145 185,518
Coverage ratio 0.29% 2.67% 14.71% 12.12% 0.39%
Undrawn and contingent facilities not subject to ECL1 41,196
Net undrawn and contingent facilities 226,714 1. Commitments that can be unconditionally cancelled at any time without notice.
185ANZ 2021 Annual Report
OVERVIEW HOW WE CREATE VALUE
PERFORMANCE OVERVIEW
REMUNERATION REPORT
DIRECTORS’ REPORT
FINANCIAL REPORT
SHAREHOLDER INFORMATION Notes to the financial statements (continued)

ANZ 2021 ANNUAL REPORT
NOTES TO THE FINANCIAL STATEMENTS (continued)
186
17. FINANCIAL RISK MANAGEMENT (continued)
CREDIT RISK (continued)
Investment securities - debt securities at amortised cost
Stage 3
Stage 1 Stage 2 Collectively
assessed Individually
assessed Total Consolidated $m $m $m $m $m
As at 30 September 2021
Strong 5,574 - - - 5,574
Satisfactory 121 - - - 121
Weak 1,367 - - - 1,367
Gross investment securities - debt securities at amortised cost 7,062 - - - 7,062
Allowance for ECL (31) - - - (31)
Net investment securities - debt securities at amortised cost 7,031 - - - 7,031
Coverage ratio 0.44% - - - 0.44%
As at 30 September 2020
Strong 5,594 - - - 5,594
Satisfactory 1,067 175 - - 1,242
Gross investment securities - debt securities at amortised cost 6,661 175 - - 6,836
Allowance for ECL (20) - - - (20)
Net investment securities - debt securities at amortised cost 6,641 175 - - 6,816
Coverage ratio 0.30% 0.00% - - 0.29%
Stage 3
Stage 1 Stage 2 Collectively
assessed Individually
assessed Total The Company $m $m $m $m $m As at 30 September 2021
Strong 5,162 - - - 5,162
Satisfactory 102 - - - 102
Gross investment securities - debt securities at amortised cost 5,264 - - - 5,264
Allowance for ECL (1) - - - (1)
Net investment securities - debt securities at amortised cost 5,263 - - - 5,263
Coverage ratio 0.02% - - - 0.02%
As at 30 September 2020
Strong 5,271 - - - 5,271
Satisfactory 84 - - - 84
Gross investment securities - debt securities at amortised cost 5,355 - - - 5,355
Allowance for ECL (1) - - - (1)
Net investment securities - debt securities at amortised cost 5,354 - - - 5,354
Coverage ratio 0.02% - - - 0.02%
186
OVERVIEW HOW WE CREATE VALUE
PERFORMANCE OVERVIEW
REMUNERATION REPORT
DIRECTORS’ REPORT
FINANCIAL REPORT
SHAREHOLDER INFORMATION

NOTES TO THE FINANCIAL STATEMENTS
187
17. FINANCIAL RISK MANAGEMENT (continued)
CREDIT RISK (continued)
Investment securities - debt securities at FVOCI
Stage 3
Stage 1 Stage 2 Collectively
assessed Individually
assessed Total Consolidated $m $m $m $m $m As at 30 September 2021
Strong 74,541 - - - 74,541
Satisfactory 202 - - 202
Investment securities - debt securities at FVOCI 74,743 - - - 74,743
Allowance for ECL recognised in other comprehensive income (11) - - - (11)
Coverage ratio 0.01% - - - 0.01%
As at 30 September 2020
Strong 85,287 - - - 85,287
Satisfactory 173 - - - 173
Investment securities - debt securities at FVOCI 85,460 - - - 85,460
Allowance for ECL recognised in other comprehensive income (10) - - - (10)
Coverage ratio 0.01% - - - 0.01%
Stage 3
Stage 1 Stage 2 Collectively
assessed Individually
assessed Total The Company $m $m $m $m $m As at 30 September 2021
Strong 61,623 - - - 61,623
Satisfactory - - - - -
Investment securities - debt securities at FVOCI 61,623 - - - 61,623
Allowance for ECL recognised in other comprehensive income (7) - - - (7)
Coverage ratio 0.01% - - - 0.01%
As at 30 September 2020
Strong 73,936 - - - 73,936
Satisfactory - - - - -
Investment securities - debt securities at FVOCI 73,936 - - - 73,936
Allowance for ECL recognised in other comprehensive income (7) - - - (7)
Coverage ratio 0.01% - - - 0.01%
187ANZ 2021 Annual Report
OVERVIEW HOW WE CREATE VALUE
PERFORMANCE OVERVIEW
REMUNERATION REPORT
DIRECTORS’ REPORT
FINANCIAL REPORT
SHAREHOLDER INFORMATION Notes to the financial statements (continued)

ANZ 2021 ANNUAL REPORT
NOTES TO THE FINANCIAL STATEMENTS (continued)
188
17. FINANCIAL RISK MANAGEMENT (continued)
CREDIT RISK (continued)
Investment securities - debt securities at FVTPL
Stage 3
Stage 1 Stage 2 Collectively
assessed Individually
assessed Total Consolidated $m $m $m $m $m As at 30 September 2021
Strong 42 - - - 42
Investment securities - debt securities at FVTPL 42 - - - 42
Allowance for ECL - - - - -
Coverage ratio - - - - -
As at 30 September 2020
Strong 53 - - - 53
Investment securities - debt securities at FVTPL 53 - - - 53
Allowance for ECL - - - - -
Coverage ratio - - - - -
Other financial assets
Consolidated The Company 2021 2020 2021 2020 $m $m $m $m
Strong 235,847 293,171 238,452 365,532
Satisfactory 3,471 10,671 3,026 9,724
Weak 1,122 628 769 577
Defaulted 12 1 12 1
Total carrying amount 240,452 304,471 242,259 375,834
188
OVERVIEW HOW WE CREATE VALUE
PERFORMANCE OVERVIEW
REMUNERATION REPORT
DIRECTORS’ REPORT
FINANCIAL REPORT
SHAREHOLDER INFORMATION

NOTES TO THE FINANCIAL STATEMENTS
189
17. FINANCIAL RISK MANAGEMENT (continued)
CREDIT RISK (continued)
CONCENTRATIONS OF CREDIT RISK Credit risk becomes concentrated when a number of customers are engaged in similar activities, have similar economic characteristics, or have similar activities within the same geographic region – therefore, they may be similarly affected by changes in economic or other conditions. The Group monitors its credit portfolio to manage risk concentration and rebalance the portfolio. The Group also applies single customer counterparty limits to protect against unacceptably large exposures to one single customer.
Composition of financial instruments that give rise to credit risk by industry group are presented below:
Loans Other financial Off-balance sheet
credit related and advances assets commitments Total
Consolidated 2021 2020 2021 2020 2021 2020 2021 2020
$m $m $m $m $m $m $m $m
Agriculture, forestry, fishing and mining 34,862 36,458 335 1,092 16,034 17,188 51,231 54,738
Business services 9,161 8,642 119 172 6,429 6,506 15,709 15,320
Construction 5,886 5,807 46 44 6,458 6,679 12,390 12,530
Electricity, gas and water supply 6,513 5,881 807 2,386 9,053 8,663 16,373 16,930
Entertainment, leisure and tourism 12,710 13,179 157 600 3,862 4,114 16,729 17,893
Financial, investment and insurance 56,107 51,857 229,273 279,468 50,568 48,537 335,948 379,862
Government and official institutions 4,651 4,645 83,741 98,017 1,798 1,968 90,190 104,630
Manufacturing 23,752 25,163 741 2,306 37,696 41,114 62,189 68,583
Personal lending 361,814 361,459 664 1,170 57,410 50,433 419,888 413,062
Property services 50,396 50,406 489 2,044 16,673 27,992 67,558 80,442
Retail trade 9,967 10,739 104 231 8,444 9,602 18,515 20,572
Transport and storage 11,710 12,657 437 1,280 8,257 8,587 20,404 22,524
Wholesale trade 12,434 11,816 583 2,649 20,899 19,494 33,916 33,959
Other 32,801 22,563 4,803 5,361 17,014 16,737 54,618 44,661
Gross total 632,764 621,272 322,299 396,820 260,595 267,614 1,215,658 1,285,706
Allowance for ECL (4,045) (4,981) (31) (20) (806) (898) (4,882) (5,899)
Subtotal 628,719 616,291 322,268 396,800 259,789 266,716 1,210,776 1,279,807
Unearned income1 (434) (460) - - - - (434) (460) Capitalised brokerage and other origination costs1 1,434 1,262 - - - - 1,434 1,262
Maximum exposure to credit risk 629,719 617,093 322,268 396,800 259,789 266,716 1,211,776 1,280,609 1. During 2021, deferred expenses previously netted within Unearned income were reclassified to Capitalised brokerage and other origination costs to better align with the nature of the balances.
Comparatives have been restated accordingly (2020: $394 million).
189ANZ 2021 Annual Report
OVERVIEW HOW WE CREATE VALUE
PERFORMANCE OVERVIEW
REMUNERATION REPORT
DIRECTORS’ REPORT
FINANCIAL REPORT
SHAREHOLDER INFORMATION Notes to the financial statements (continued)

ANZ 2021 ANNUAL REPORT
NOTES TO THE FINANCIAL STATEMENTS (continued)
190
17. FINANCIAL RISK MANAGEMENT (continued)
CREDIT RISK (continued) Composition of financial instruments that give rise to credit risk by industry group are presented below:
Loans Other financial Off-balance sheet
credit related and advances assets commitments Total
The Company 2021 2020 2021 2020 2021 2020 2021 2020
$m $m $m $m $m $m $m $m
Agriculture, forestry, fishing and mining 18,283 19,555 297 946 14,305 15,837 32,885 36,338
Business services 8,096 7,544 73 105 5,618 5,747 13,787 13,396
Construction 4,710 4,649 30 19 5,241 5,331 9,981 9,999
Electricity, gas and water supply 5,523 4,842 580 1,843 7,356 6,841 13,459 13,526
Entertainment, leisure and tourism 10,934 11,477 138 560 3,404 3,522 14,476 15,559
Financial, investment and insurance 52,230 49,254 236,430 364,478 46,971 44,678 335,631 458,410
Government and official institutions 4,621 3,347 65,429 75,554 1,113 1,224 71,163 80,125
Manufacturing 20,143 21,452 369 1,661 30,794 33,716 51,306 56,829
Personal lending 278,526 279,899 638 697 45,886 49,421 325,050 330,017
Property services 37,580 37,605 379 1,024 14,424 14,526 52,383 53,155
Retail trade 8,273 9,023 82 164 7,298 7,279 15,653 16,466
Transport and storage 10,564 11,599 339 1,016 7,229 7,412 18,132 20,027
Wholesale trade 10,345 9,973 380 2,237 17,462 17,151 28,187 29,361
Other 21,386 21,449 3,982 4,821 14,018 14,760 39,386 41,030
Gross total 491,214 491,668 309,146 455,125 221,119 227,445 1,021,479 1,174,238
Allowance for ECL (3,387) (4,219) (1) (1) (674) (731) (4,062) (4,951)
Subtotal 487,827 487,449 309,145 455,124 220,445 226,714 1,017,417 1,169,287
Unearned income1 (390) (406) - - - - (390) (406) Capitalised brokerage and other origination costs1 1,050 959 - - - - 1,050 959
Maximum exposure to credit risk 488,487 488,002 309,145 455,124 220,445 226,714 1,018,077 1,169,840 1. During 2021, deferred expenses previously netted within Unearned income were reclassified to Capitalised brokerage and other origination costs to better align with the nature of the balances.
Comparatives have been restated accordingly (2020: $387 million).
COLLATERAL MANAGEMENT We use collateral for on and off-balance sheet exposures to mitigate credit risk if a counterparty cannot meet its repayment obligations. Where there is sufficient collateral, an expected credit loss is not recognised. This is largely the case for certain lending products that are secured by corresponding investment for which the margin loans are utilised and for reverse repurchase agreements. For some products, the collateral provided by customers is fundamental to the product’s structuring, so it is not strictly the secondary source of repayment - for example, lending secured by trade receivables is typically repaid by the collection of those receivables. During the period there was no change in our collateral policies.
190
OVERVIEW HOW WE CREATE VALUE
PERFORMANCE OVERVIEW
REMUNERATION REPORT
DIRECTORS’ REPORT
FINANCIAL REPORT
SHAREHOLDER INFORMATION

NOTES TO THE FINANCIAL STATEMENTS
191
17. FINANCIAL RISK MANAGEMENT (continued)
CREDIT RISK (continued)
The nature of collateral or security held for the relevant classes of financial assets is as follows:
Net loans and advances
Loans - housing and personal
Housing loans are secured by mortgage(s) over property and additional security may take the form of guarantees and deposits.
Personal lending (including credit cards and overdrafts) is predominantly unsecured. If we take security, then it is restricted to eligible vehicles, motor homes and other assets.
Loans - business Business loans may be secured, partially secured or unsecured. Typically, we take security by way of a mortgage over property and/or a charge over the business or other assets.
If appropriate, we may take other security to mitigate the credit risk, such as guarantees, standby letters of credit or derivative protection.
Other financial assets
Trading securities, Investment securities, Derivatives and Other financial assets
For trading securities, we do not seek collateral directly from the issuer or counterparty. However, the collateral may be implicit in the terms of the instrument (for example, with an asset-backed security). The terms of debt securities may include collateralisation.
For derivatives, we typically terminate all contracts with the counterparty and settle on a net basis at market levels current at the time of a counterparty default under International Swaps and Derivatives Association (ISDA) Master Agreements.
Our preferred practice is to use a Credit Support Annex (CSA) to the ISDA so that open derivative positions with the counterparty are aggregated and cash collateral (or other forms of eligible collateral) is exchanged daily. The collateral is provided by the counterparty when their position is out of the money (or provided to the counterparty by ANZ when our position is out of the money).
Off-balance sheet positions
Undrawn and contingent facilities
Collateral for off-balance sheet positions is mainly held against undrawn facilities, and they are typically performance bonds or guarantees. Undrawn facilities that are secured include housing loans secured by mortgages over residential property and business lending secured by commercial real estate and/or charges over business assets.
The table below shows the estimated value of collateral we hold and the net unsecured portion of credit exposures:
Credit exposure Total value of collateral
Unsecured portion of credit exposure
2021 2020 2021 2020 2021 2020 Consolidated $m $m $m $m $m $m
Net loans and advances 629,719 617,093 515,866 510,995 113,853 106,098
Other financial assets 322,268 396,800 24,410 45,246 297,858 351,554
Off-balance sheet positions 259,789 266,716 52,512 51,361 207,277 215,355
Total 1,211,776 1,280,609 592,788 607,602 618,988 673,007
Credit exposure Total value of collateral
Unsecured portion of credit exposure
2021 2020 2021 2020 2021 2020 The Company $m $m $m $m $m $m
Net loans and advances 488,487 488,002 387,273 393,548 101,214 94,454
Other financial assets1 309,145 378,487 22,027 42,000 287,118 336,487
Off-balance sheet positions 220,445 226,714 36,676 36,372 183,769 190,342
Total 1,018,077 1,093,203 445,976 471,920 572,101 621,283 1. From 1 April 2021, the Company changed its accounting policy relating to intragroup transactions with consolidated securitisation structured entities (SEs) in which it holds all of the issued securities of the
SE. Transactions with an SE are no longer recorded on a gross basis. Comparatives have been restated, reducing Other financial assets by $76,637 million at 30 September 2020. Refer to Note 35 Impact of Adoption of New Standards and Other Changes for further details.
191ANZ 2021 Annual Report
OVERVIEW HOW WE CREATE VALUE
PERFORMANCE OVERVIEW
REMUNERATION REPORT
DIRECTORS’ REPORT
FINANCIAL REPORT
SHAREHOLDER INFORMATION Notes to the financial statements (continued)

ANZ 2021 ANNUAL REPORT
NOTES TO THE FINANCIAL STATEMENTS (continued)
192
17. FINANCIAL RISK MANAGEMENT (continued)
MARKET RISK MARKET RISK OVERVIEW, MANAGEMENT AND CONTROL RESPONSIBILITIES Market risk stems from the Group’s trading and balance sheet management activities and the impact of changes and correlations between interest rates, foreign exchange rates, credit spreads and volatility in bond, commodity or equity prices.
The BRC delegates responsibility for day-to-day management of both market risks and compliance with market risk policies to the Credit & Market Risk Committee (CMRC) and the Group Asset & Liability Committee (GALCO).
Within overall strategies and policies established by the BRC, business units and risk management have joint responsibility for the control of market risk at the Group level. The Market Risk team (a specialist risk management unit independent of the business) allocates market risk limits at various levels and monitors and reports on them daily. This detailed framework allocates individual limits to manage and control exposures using risk factors and profit and loss limits.
Management, measurement and reporting of market risk is undertaken in two broad categories:
Traded Market Risk Non-Traded Market Risk
Risk of loss from changes in the value of financial instruments due to movements in price factors for both physical and derivative trading positions. Principal risk categories monitored are:
1. Currency risk – potential loss arising from changes in foreign exchange rates or their implied volatilities.
2. Interest rate risk – potential loss from changes in market interest rates or their implied volatilities.
3. Credit spread risk – potential loss arising from a movement in margin or spread relative to a benchmark.
4. Commodity risk – potential loss arising from changes in commodity prices or their implied volatilities.
5. Equity risk – potential loss arising from changes in equity prices.
Risk of loss associated with the management of non-traded interest rate risk, liquidity risk and foreign exchange exposures. This includes interest rate risk in the banking book. This risk of loss arises from adverse changes in the overall and relative level of interest rates for different tenors, differences in the actual versus expected net interest margin, and the potential valuation risk associated with embedded options in financial instruments and bank products.
MEASUREMENT OF MARKET RISK We primarily manage and control market risk using Value at Risk (VaR), sensitivity analysis and stress testing.
VaR measures the Group’s possible daily loss based on historical market movements.
The Group’s VaR approach for both traded and non-traded risk is historical simulation. We use historical changes in market rates, prices and volatilities over:
the previous 500 business days, to calculate standard VaR; and a 1-year stressed period, to calculate stressed VaR.
We calculate traded and non-traded VaR using one-day and ten-day holding periods. For stressed VaR, we use a ten-day period. Back testing is used to ensure our VaR models remain accurate.
ANZ measures VaR at a 99% confidence interval which means there is a 99% chance that a loss will not exceed the VaR for the relevant holding period.
192
OVERVIEW HOW WE CREATE VALUE
PERFORMANCE OVERVIEW
REMUNERATION REPORT
DIRECTORS’ REPORT
FINANCIAL REPORT
SHAREHOLDER INFORMATION

NOTES TO THE FINANCIAL STATEMENTS
193
17. FINANCIAL RISK MANAGEMENT (continued)
MARKET RISK (continued) TRADED AND NON-TRADED MARKET RISK Traded market risk The table below shows the traded market risk VaR on a diversified basis by risk categories:
2021 2020
Consolidated As at
High for year
Low for year
Average for year As at
High for year
Low for year
Average for year
$m $m $m $m $m $m $m $m
Traded value at risk 99% confidence
Foreign exchange 3.8 10.0 1.3 3.9 2.0 6.1 1.2 3.1
Interest rate 9.6 19.6 4.3 8.8 9.6 13.8 3.3 7.2
Credit 6.3 22.2 5.3 13.7 13.9 17.1 1.8 8.6
Commodity 3.1 5.0 1.3 2.8 3.0 4.7 1.3 2.6
Equity - - - - - - - -
Diversification benefit1 (9.4) n/a n/a (9.7) (10.9) n/a n/a (8.0)
Total VaR 13.4 30.0 8.7 19.5 17.6 31.9 5.7 13.5 2021 2020
The Company As at
High for year
Low for year
Average for year As at
High for year
Low for year
Average for year
$m $m $m $m $m $m $m $m
Traded value at risk 99% confidence
Foreign exchange 3.4 7.6 1.5 3.5 2.0 5.6 1.0 2.8
Interest rate 9.0 16.4 4.1 7.5 7.2 10.6 2.9 5.8
Credit 5.8 22.1 5.3 13.3 13.6 16.9 1.6 8.2
Commodity 2.3 5.4 1.4 2.7 2.7 4.3 1.3 2.2
Equity - - - - - - - -
Diversification benefit1 (6.0) n/a n/a (10.1) (10.5) n/a n/a (7.9)
Total VaR 14.5 26.0 9.6 16.9 15.0 24.5 5.3 11.1 1. The diversification benefit reflects risks that offset across categories. The high and low VaR figures reported for each factor did not necessarily occur on the same day as the high and low VaR reported for the
Group as a whole. Consequently, a diversification benefit for high and low would not be meaningful and is therefore omitted from the table.
193ANZ 2021 Annual Report
OVERVIEW HOW WE CREATE VALUE
PERFORMANCE OVERVIEW
REMUNERATION REPORT
DIRECTORS’ REPORT
FINANCIAL REPORT
SHAREHOLDER INFORMATION Notes to the financial statements (continued)

ANZ 2021 ANNUAL REPORT
NOTES TO THE FINANCIAL STATEMENTS (continued)
194
17. FINANCIAL RISK MANAGEMENT (continued)
MARKET RISK (continued)
Non-traded market risk Balance sheet risk management The principal objectives of balance sheet risk management are to maintain acceptable levels of interest rate and liquidity risk to mitigate the negative impact of movements in interest rates on the earnings and market value of the Group’s banking book, while ensuring the Group maintains sufficient liquidity to meet its obligations as they fall due.
Interest rate risk management Non-traded interest rate risk relates to the potential adverse impact of changes in market interest rates on the Group’s future net interest income. This risk arises from two principal sources, namely mismatches between the repricing dates of interest bearing assets and liabilities; and the investment of capital and other non-interest bearing liabilities and assets. Interest rate risk is reported using VaR and scenario analysis (based on the impact of a 1% rate shock). The table below shows VaR figures for non-traded interest rate risk for the combined Group as well as Australia, New Zealand and Asia Pacific, Europe and Americas (APEA) geographies which are calculated separately.
2021 2020
Consolidated As at
High for year
Low for year
Average for year As at
High for year
Low for year
Average for year
$m $m $m $m $m $m $m $m
Non-traded value at risk 99% confidence
Australia 67.0 81.8 61.9 69.8 60.8 60.8 18.8 33.4
New Zealand 21.6 32.8 21.6 26.7 26.3 26.3 9.4 15.2
Asia Pacific, Europe & America 31.5 34.9 29.0 32.0 29.4 30.2 17.8 24.2
Diversification benefit1 (32.9) n/a n/a (53.7) (61.4) n/a n/a (29.5)
Total VaR 87.2 87.2 59.3 74.8 55.1 58.3 31.5 43.3 2021 2020
The Company As at
High for year
Low for year
Average for year As at
High for year
Low for year
Average for year
$m $m $m $m $m $m $m $m
Non-traded value at risk 99% confidence
Australia 67.0 81.8 61.9 69.8 60.8 60.8 18.8 33.4
New Zealand 0.0 0.0 0.0 0.0 0.0 0.1 0.0 0.0
Asia Pacific, Europe & America 30.8 35.2 27.5 31.2 28.5 30.9 17.7 24.1
Diversification benefit1 (31.9) n/a n/a (36.2) (43.3) n/a n/a (21.4)
Total VaR 65.9 69.9 55.0 64.8 46.0 47.6 25.5 36.1 1. The diversification benefit reflects the historical correlation between the regions. The high and low VaR figures reported for the region did not necessarily occur on the same day as the high and low VaR
reported for the Group as a whole. Consequently, a diversification benefit for high and low would not be meaningful and is therefore omitted from the table.
194
OVERVIEW HOW WE CREATE VALUE
PERFORMANCE OVERVIEW
REMUNERATION REPORT
DIRECTORS’ REPORT
FINANCIAL REPORT
SHAREHOLDER INFORMATION

NOTES TO THE FINANCIAL STATEMENTS
195
17. FINANCIAL RISK MANAGEMENT (continued)
MARKET RISK (continued) We undertake scenario analysis to stress test the impact of extreme events on the Group’s market risk exposures. We model a 1% overnight parallel positive shift in the yield curve to determine the potential impact on our net interest income over the next 12 months. This is a standard risk measure which assumes the parallel shift is reflected in all wholesale and customer rates.
The table below shows the outcome of this risk measure for the current and previous financial years, expressed as a percentage of reported net interest income.
Consolidated The Company
2021 2020 2021 2020
Impact of 1% rate shock
As at period end 2.43% 1.25% 2.02% 0.78%
Maximum exposure 2.43% 1.61% 2.02% 1.78%
Minimum exposure 0.98% 0.52% 0.54% 0.06%
Average exposure (in absolute terms) 1.55% 1.01% 1.08% 0.78%
EQUITY SECURITIES DESIGNATED AT FVOCI Our investment securities contain equity investment holdings which predominantly comprise investments we hold for longer-term strategic reasons. The market risk impact on these equity investments is not captured by the Group’s VaR processes for traded and non-traded market risks. Therefore, the Group regularly reviews the valuations of the investments within the portfolio and assesses whether the investments are appropriately measured based on the recognition and measurement policies set out in Note 12 Investment Securities.
FOREIGN CURRENCY RISK – STRUCTURAL EXPOSURES Our investment of capital in foreign operations - for example, branches, subsidiaries or associates with functional currencies other than the Australian Dollar - exposes the Group to the risk of changes in foreign exchange rates. Variations in the value of these foreign operations arising as a result of exchange differences are reflected in the foreign currency translation reserve in equity.
Where it is considered appropriate, the Group takes out economic hedges against larger foreign exchange denominated revenue streams (primarily New Zealand Dollar, US Dollar and US Dollar correlated). The primary objective of hedging is to ensure that, if practical, the effect of changes in foreign exchange rates on the consolidated capital ratios are minimised.
195ANZ 2021 Annual Report
OVERVIEW HOW WE CREATE VALUE
PERFORMANCE OVERVIEW
REMUNERATION REPORT
DIRECTORS’ REPORT
FINANCIAL REPORT
SHAREHOLDER INFORMATION Notes to the financial statements (continued)

ANZ 2021 ANNUAL REPORT
NOTES TO THE FINANCIAL STATEMENTS (continued)
196
17. FINANCIAL RISK MANAGEMENT (continued)
LIQUIDITY AND FUNDING RISK LIQUIDITY RISK OVERVIEW, MANAGEMENT AND CONTROL RESPONSIBILITIES Liquidity risk is the risk that the Group is either:
unable to meet its payment obligations (including repaying depositors or maturing wholesale debt) when they fall due; or
does not have the appropriate amount, tenor and composition of funding and liquidity to fund increases in its assets.
Management of liquidity and funding risks are overseen by GALCO. The Group’s liquidity and funding risks are governed by a set of principles approved by the BRC and include:
maintaining the ability to meet all payment obligations in the immediate term;
ensuring that the Group has the ability to meet ‘survival horizons’ under a range of ANZ specific, and general market, liquidity stress scenarios, at the site and Group-wide level, to meet cash flow obligations over the short to medium term;
maintaining strength in the Group’s balance sheet structure to ensure long term resilience in the liquidity and funding risk profile;
ensuring the liquidity management framework is compatible with local regulatory requirements;
preparing daily liquidity reports and scenario analysis to quantify the Group’s positions;
targeting a diversified funding base to avoid undue concentrations by investor type, maturity, market source and currency;
holding a portfolio of high quality liquid assets to protect against adverse funding conditions and to support day-to-day operations; and
establishing detailed contingency plans to cover different liquidity crisis events.
KEY AREAS OF MEASUREMENT FOR LIQUIDITY RISK Scenario modelling of funding sources ANZ’s liquidity risk appetite is defined by a range of regulatory and internal liquidity metrics mandated by the Board. The metrics cover a range of scenarios of varying duration and level of severity.
A key component of this framework is the Liquidity Coverage Ratio (LCR), which is a severe short term liquidity stress scenario mandated by banking regulators including APRA. As part of meeting LCR requirements, the Group has a Committed Liquidity Facility (CLF) with the Reserve Bank of Australia (RBA). The CLF was established to offset the shortage of available High Quality Liquid Assets (HQLA) in Australia and provides an alternative form of contingent liquidity. The CLF is collateralised by assets, including internal residential mortgage backed securities, that are eligible to be pledged as security with the RBA. The total amount of the CLF available to a qualifying Authorised Deposit-taking Institution (ADI) is set annually by APRA. The total amount of the CLF available to a qualifying Australian Deposit-taking Institution is set annually by APRA. In September 2021, APRA wrote to ADI’s to advise that APRA and the RBA consider there to be sufficient HQLA for ADI’s to meet their LCR requirements, and therefore the use of the CLF should no longer be required beyond 2022.
From 1 January 2021, ANZ’s CLF is $10.7 billion (2020 calendar year end: $35.7 billion). Consistent with APRA’s requirement, ANZ’s CLF will decrease to zero through equal reductions on 1 January, 30 April, 31 August and 31 December 2022. This reduction will be managed as part of ANZ’s funding plans over this period.
Liquid assets The Group holds a portfolio of high quality (unencumbered) liquid assets to protect the Group’s liquidity position in a severely stressed environment and to meet regulatory requirements. HQLA comprise three categories consistent with Basel III LCR requirements:
HQLA1- Cash and highest credit quality government, central bank or public sector securities eligible for repurchase with central banks to provide same-day liquidity.
HQLA2 - High credit quality government, central bank or public sector securities, high quality corporate debt securities and high quality covered bonds eligible for repurchase with central banks to provide same-day liquidity.
Alternative liquid assets (ALA) - Assets qualifying as collateral for the CLF and eligible securities that the Reserve Bank of New Zealand (RBNZ) will accept in its domestic market operations.
LIQUIDITY RISK OUTCOMES1 Liquidity Coverage Ratio ANZ’s Liquidity Coverage Ratio (LCR) averaged 136% for 2021, a decrease from the 2020 average of 139%, and above the regulatory minimum of 100%.
Net Stable Funding Ratio ANZ’s Net Stable Funding Ratio (NSFR) as at 30 September 2021 was 124% (2020: 124%), above the regulatory minimum of 100%.
1. This information is not within the scope of the external audit of the Group Financial Report by the Group’s external auditor, KPMG. The Liquidity Coverage Ratio and Net Stable Funding Ratio are non-IFRS
disclosures and are disclosed as part of the Group's APS 330 Public Disclosure which is subject to specific review procedures in accordance with the Australian Standard on Related Services (ASRS) 4400 Agreed upon Procedures Engagements to Report Factual Findings.
196
OVERVIEW HOW WE CREATE VALUE
PERFORMANCE OVERVIEW
REMUNERATION REPORT
DIRECTORS’ REPORT
FINANCIAL REPORT
SHAREHOLDER INFORMATION

NOTES TO THE FINANCIAL STATEMENTS
197
17. FINANCIAL RISK MANAGEMENT (continued)
LIQUIDITY AND FUNDING RISK (continued) Liquidity crisis contingency planning The Group maintains APRA-endorsed liquidity crisis contingency plans for analysing and responding to a liquidity threatening event at a country and Group-wide level. Key liquidity contingency crisis planning requirements and guidelines include:
Ongoing business management Early signs/ mild stress Severe stress
establish crisis/severity levels
liquidity limits
early warning indicators
monitoring and review
management actions not requiring business rationalisation
activate contingency funding plans
management actions for altering asset and liability behaviour
Assigned responsibility for internal and external communications and the appropriate timing to communicate
Since the precise nature of any stress event cannot be known in advance, we design the plans to be flexible to the nature and severity of the stress event with multiple variables able to be accommodated in any plan.
Group funding The Group monitors the composition and stability of its funding so that it remains within the Group’s funding risk appetite. This approach ensures that an appropriate proportion of the Group’s assets are funded by stable funding sources, including customer deposits; longer-dated wholesale funding (with a remaining term exceeding one year); and equity.
Funding plans prepared Considerations in preparing funding plans
3 year strategic plan prepared annually
annual funding plan as part of budgeting process
forecasting in light of actual results as a calibration to the annual plan
customer balance sheet growth
changes in wholesale funding including: targeted funding volumes; markets; investors; tenors; and currencies for senior, secured, subordinated, hybrid transactions and market conditions
RBA Term Funding Facility As an additional source of funding, in March 2020, the RBA announced a term funding facility (TFF) for the banking system to support lending to Australian businesses. The TFF is a three-year secured funding facility to ADIs at a fixed rate of 0.25%. APRA has determined that the TFF qualifies for inclusion in determining the Liquidity Coverage Ratio (LCR) and Net Stable Funding Ratio (NSFR). ADIs can obtain initial funding of up to 3% of their existing credit outstanding to Australian households and businesses, and have access to additional funding if they increase lending to business, especially to small and medium-sized businesses. The TFF closed to drawdowns on 30 June 2021.
As at 30 September 2021, ANZ had drawn $20.1 billion under the RBA’s TFF.
RBNZ Funding for Lending Programme and Term Lending Facility
Between May 2020 and July 2021, the RBNZ made funds available under a term lending facility (TLF) to promote lending to businesses. The TLF is a three to five-year secured funding facility for New Zealand banks at a fixed rate of 0.25%.
In November 2020, the RBNZ announced a funding for lending programme (FLP) which aimed to lower the cost of borrowing for New Zealand businesses and households. The FLP is a three-year secured funding facility for New Zealand banks at a floating rate of the New Zealand Official Cash Rate (OCR). New Zealand banks can obtain initial funding of up to 4% of their lending to New Zealand resident households, non-financial businesses and non-profit institutions serving households as at 31 October 2020 (eligible loans). An additional allocation of up to 2% of eligible loans is available, subject to certain conditions. The additional allocation is available until 6 December 2022, and the initial allocation is available until 6 June 2022.
As at 30 September 2021, ANZ NZ had drawn $0.3 billion under the TLF and $0.9 billion under the FLP.
197ANZ 2021 Annual Report
OVERVIEW HOW WE CREATE VALUE
PERFORMANCE OVERVIEW
REMUNERATION REPORT
DIRECTORS’ REPORT
FINANCIAL REPORT
SHAREHOLDER INFORMATION Notes to the financial statements (continued)
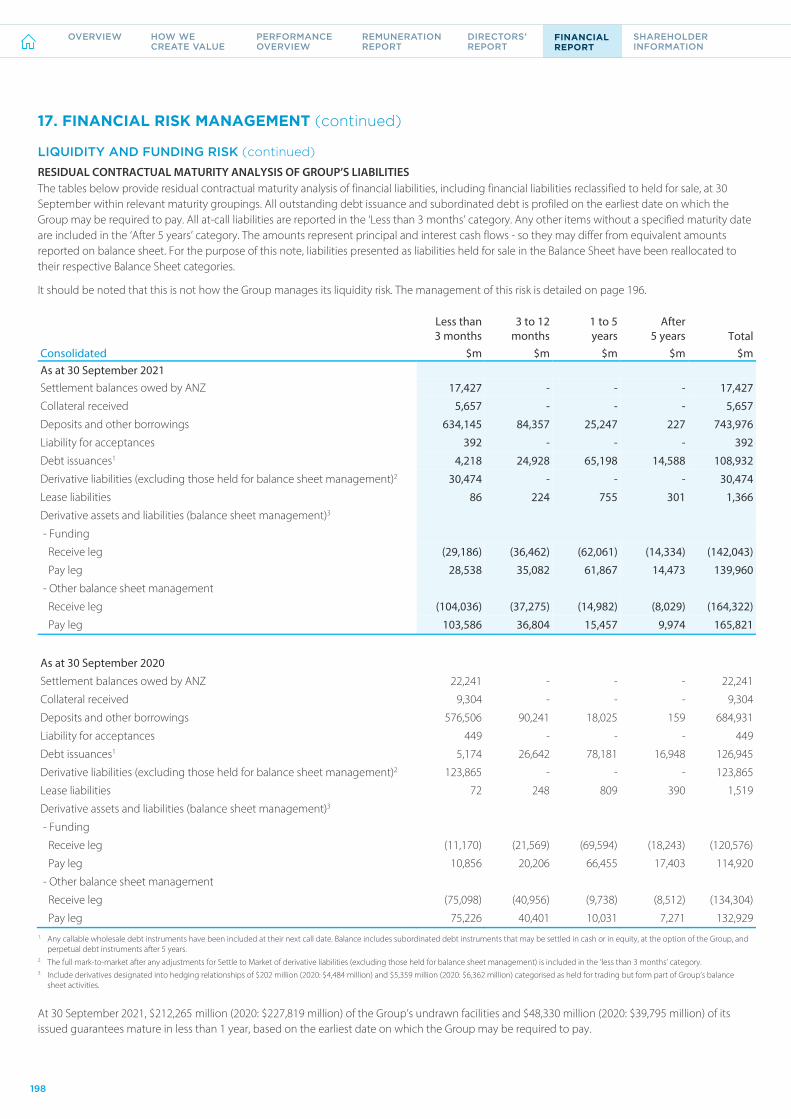
ANZ 2021 ANNUAL REPORT
NOTES TO THE FINANCIAL STATEMENTS (continued)
198
17. FINANCIAL RISK MANAGEMENT (continued)
LIQUIDITY AND FUNDING RISK (continued) RESIDUAL CONTRACTUAL MATURITY ANALYSIS OF GROUP’S LIABILITIES The tables below provide residual contractual maturity analysis of financial liabilities, including financial liabilities reclassified to held for sale, at 30 September within relevant maturity groupings. All outstanding debt issuance and subordinated debt is profiled on the earliest date on which the Group may be required to pay. All at-call liabilities are reported in the ‘Less than 3 months’ category. Any other items without a specified maturity date are included in the ‘After 5 years’ category. The amounts represent principal and interest cash flows - so they may differ from equivalent amounts reported on balance sheet. For the purpose of this note, liabilities presented as liabilities held for sale in the Balance Sheet have been reallocated to their respective Balance Sheet categories.
It should be noted that this is not how the Group manages its liquidity risk. The management of this risk is detailed on page 196.
Less than 3 months
3 to 12 months
1 to 5 years
After 5 years Total
Consolidated $m $m $m $m $m As at 30 September 2021 Settlement balances owed by ANZ 17,427 - - - 17,427
Collateral received 5,657 - - - 5,657
Deposits and other borrowings 634,145 84,357 25,247 227 743,976
Liability for acceptances 392 - - - 392
Debt issuances1 4,218 24,928 65,198 14,588 108,932
Derivative liabilities (excluding those held for balance sheet management)2 30,474 - - - 30,474
Lease liabilities 86 224 755 301 1,366
Derivative assets and liabilities (balance sheet management)3
- Funding
Receive leg (29,186) (36,462) (62,061) (14,334) (142,043)
Pay leg 28,538 35,082 61,867 14,473 139,960
- Other balance sheet management
Receive leg (104,036) (37,275) (14,982) (8,029) (164,322)
Pay leg 103,586 36,804 15,457 9,974 165,821
As at 30 September 2020
Settlement balances owed by ANZ 22,241 - - - 22,241
Collateral received 9,304 - - - 9,304
Deposits and other borrowings 576,506 90,241 18,025 159 684,931
Liability for acceptances 449 - - - 449
Debt issuances1 5,174 26,642 78,181 16,948 126,945
Derivative liabilities (excluding those held for balance sheet management)2 123,865 - - - 123,865
Lease liabilities 72 248 809 390 1,519
Derivative assets and liabilities (balance sheet management)3
- Funding
Receive leg (11,170) (21,569) (69,594) (18,243) (120,576)
Pay leg 10,856 20,206 66,455 17,403 114,920
- Other balance sheet management
Receive leg (75,098) (40,956) (9,738) (8,512) (134,304)
Pay leg 75,226 40,401 10,031 7,271 132,929 1. Any callable wholesale debt instruments have been included at their next call date. Balance includes subordinated debt instruments that may be settled in cash or in equity, at the option of the Group, and
perpetual debt instruments after 5 years. 2. The full mark-to-market after any adjustments for Settle to Market of derivative liabilities (excluding those held for balance sheet management) is included in the ‘less than 3 months’ category. 3. Include derivatives designated into hedging relationships of $202 million (2020: $4,484 million) and $5,359 million (2020: $6,362 million) categorised as held for trading but form part of Group’s balance
sheet activities.
At 30 September 2021, $212,265 million (2020: $227,819 million) of the Group’s undrawn facilities and $48,330 million (2020: $39,795 million) of its issued guarantees mature in less than 1 year, based on the earliest date on which the Group may be required to pay.
198
OVERVIEW HOW WE CREATE VALUE
PERFORMANCE OVERVIEW
REMUNERATION REPORT
DIRECTORS’ REPORT
FINANCIAL REPORT
SHAREHOLDER INFORMATION

NOTES TO THE FINANCIAL STATEMENTS
199
17. FINANCIAL RISK MANAGEMENT (continued)
LIQUIDITY AND FUNDING RISK (continued)
Less than 3 months
3 to 12 months
1 to 5 years
After 5 years Total
The Company $m $m $m $m $m
As at 30 September 2021 Settlement balances owed by ANZ 14,922 - - - 14,922
Collateral received 5,148 - - - 5,148
Deposits and other borrowings 524,654 60,427 21,844 227 607,152
Liability for acceptances 223 - - - 223
Debt issuances1 4,108 20,244 54,465 8,965 87,782
Derivative liabilities (excluding those held for balance sheet management)2 34,240 - - - 34,240
Lease liabilities 81 208 814 989 2,092
Derivative assets and liabilities (balance sheet management)3
- Funding
Receive leg (25,170) (26,362) (48,026) (7,364) (106,922)
Pay leg 24,523 25,344 47,467 7,318 104,652
- Other balance sheet management
Receive leg (102,921) (35,426) (11,063) (7,633) (157,043)
Pay leg 102,346 34,908 11,501 9,587 158,342
As at 30 September 2020
Settlement balances owed by ANZ 19,556 - - - 19,556
Collateral received 8,074 - - - 8,074
Deposits and other borrowings 479,498 65,779 14,419 158 559,854
Liability for acceptances 224 - - - 224
Debt issuances1 4,627 21,483 64,102 12,775 102,987
Derivative liabilities (excluding those held for balance sheet management)2 124,027 - - - 124,027
Lease liabilities 66 234 855 1,114 2,269
Derivative assets and liabilities (balance sheet management)3
- Funding
Receive leg (8,430) (14,025) (51,487) (13,620) (87,562)
Pay leg 8,038 12,930 49,365 12,942 83,275
- Other balance sheet management
Receive leg (74,219) (40,186) (8,321) (8,343) (131,069)
Pay leg 74,097 39,327 8,048 7,029 128,501 1. Any callable wholesale debt instruments have been included at their next call date. Balance includes subordinated debt instruments that may be settled in cash or in equity, at the option of the Company,
and perpetual debt instruments after 5 years. 2. The full mark-to-market after any adjustments for Settle to Market of derivative liabilities (excluding those held for balance sheet management) is included in the ‘less than 3 months’ category. 3. Include derivatives designated into hedging relationships of $158 million (2020: $3,202 million) and $2,607 million (2020: $4,001 million) categorised as held for trading but form part of Company’s balance
sheet activities.
At 30 September 2021, $176,077 million (2020: $191,300 million) of the Company’s undrawn facilities and $45,042 million (2020: $36,146 million) of its issued guarantees mature in less than 1 year, based on the earliest date on which the Company may be required to pay.
199ANZ 2021 Annual Report
OVERVIEW HOW WE CREATE VALUE
PERFORMANCE OVERVIEW
REMUNERATION REPORT
DIRECTORS’ REPORT
FINANCIAL REPORT
SHAREHOLDER INFORMATION Notes to the financial statements (continued)
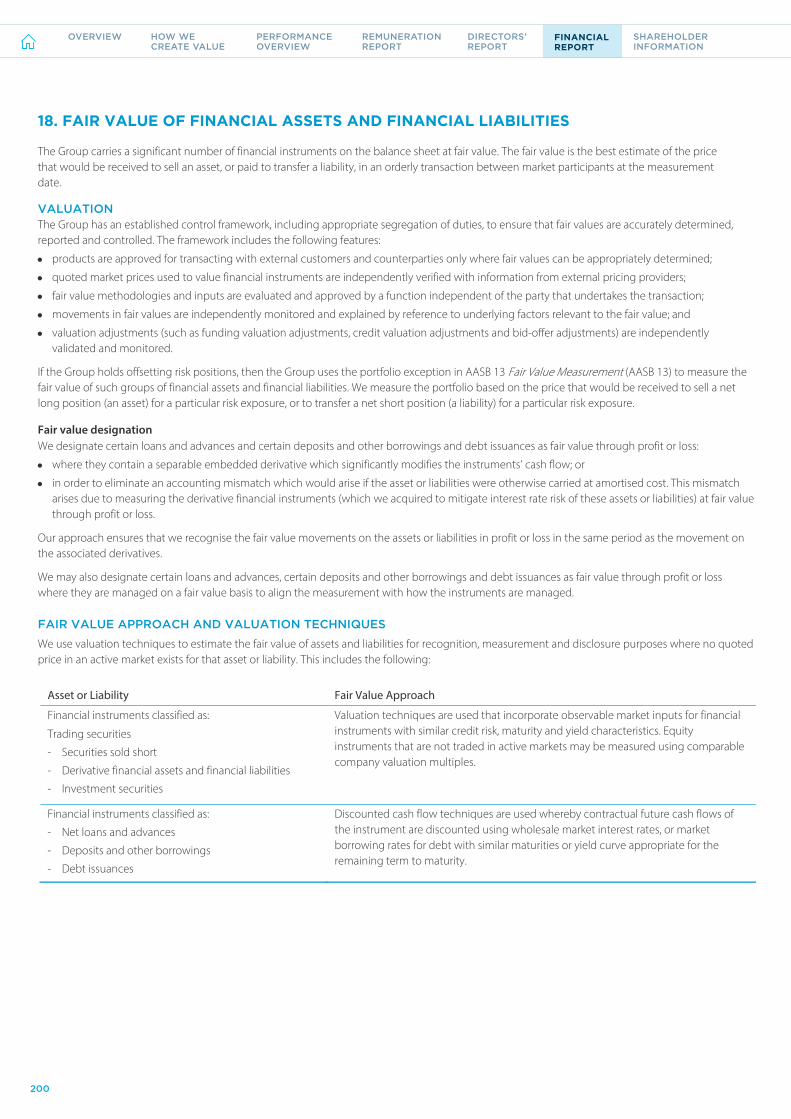
ANZ 2021 ANNUAL REPORT
NOTES TO THE FINANCIAL STATEMENTS (continued)
200
18. FAIR VALUE OF FINANCIAL ASSETS AND FINANCIAL LIABILITIES
The Group carries a significant number of financial instruments on the balance sheet at fair value. The fair value is the best estimate of the price that would be received to sell an asset, or paid to transfer a liability, in an orderly transaction between market participants at the measurement date.
VALUATION The Group has an established control framework, including appropriate segregation of duties, to ensure that fair values are accurately determined, reported and controlled. The framework includes the following features:
products are approved for transacting with external customers and counterparties only where fair values can be appropriately determined;
quoted market prices used to value financial instruments are independently verified with information from external pricing providers;
fair value methodologies and inputs are evaluated and approved by a function independent of the party that undertakes the transaction;
movements in fair values are independently monitored and explained by reference to underlying factors relevant to the fair value; and
valuation adjustments (such as funding valuation adjustments, credit valuation adjustments and bid-offer adjustments) are independently validated and monitored.
If the Group holds offsetting risk positions, then the Group uses the portfolio exception in AASB 13 Fair Value Measurement (AASB 13) to measure the fair value of such groups of financial assets and financial liabilities. We measure the portfolio based on the price that would be received to sell a net long position (an asset) for a particular risk exposure, or to transfer a net short position (a liability) for a particular risk exposure.
Fair value designation We designate certain loans and advances and certain deposits and other borrowings and debt issuances as fair value through profit or loss:
where they contain a separable embedded derivative which significantly modifies the instruments’ cash flow; or
in order to eliminate an accounting mismatch which would arise if the asset or liabilities were otherwise carried at amortised cost. This mismatch arises due to measuring the derivative financial instruments (which we acquired to mitigate interest rate risk of these assets or liabilities) at fair value through profit or loss.
Our approach ensures that we recognise the fair value movements on the assets or liabilities in profit or loss in the same period as the movement on the associated derivatives.
We may also designate certain loans and advances, certain deposits and other borrowings and debt issuances as fair value through profit or loss where they are managed on a fair value basis to align the measurement with how the instruments are managed.
FAIR VALUE APPROACH AND VALUATION TECHNIQUES
We use valuation techniques to estimate the fair value of assets and liabilities for recognition, measurement and disclosure purposes where no quoted price in an active market exists for that asset or liability. This includes the following:
Asset or Liability Fair Value Approach
Financial instruments classified as:
Trading securities
- Securities sold short
- Derivative financial assets and financial liabilities
- Investment securities
Valuation techniques are used that incorporate observable market inputs for financial instruments with similar credit risk, maturity and yield characteristics. Equity instruments that are not traded in active markets may be measured using comparable company valuation multiples.
Financial instruments classified as:
- Net loans and advances
- Deposits and other borrowings
- Debt issuances
Discounted cash flow techniques are used whereby contractual future cash flows of the instrument are discounted using wholesale market interest rates, or market borrowing rates for debt with similar maturities or yield curve appropriate for the remaining term to maturity.
18. Fair value of financial assets and financial liabilities
200
OVERVIEW HOW WE CREATE VALUE
PERFORMANCE OVERVIEW
REMUNERATION REPORT
DIRECTORS’ REPORT
FINANCIAL REPORT
SHAREHOLDER INFORMATION

NOTES TO THE FINANCIAL STATEMENTS
201
18. FAIR VALUE OF FINANCIAL ASSETS AND FINANCIAL LIABILITIES (continued)
CLASSIFICATION OF FINANCIAL ASSETS AND FINANCIAL LIABILITIES
The following tables set out the classification of financial asset and liability categories according to measurement bases together with their carrying amounts as recognised on the balance sheet.
2021 2020
At amortised
cost
At fair
value Total
At amortised
cost
At fair
value Total Consolidated Note $m $m $m $m $m $m Financial assets
Cash and cash equivalents 9 151,260 - 151,260 107,923 - 107,923
Settlement balances owed to ANZ 7,530 - 7,530 7,541 - 7,541
Collateral paid 9,166 - 9,166 14,308 - 14,308
Trading securities 10 - 44,688 44,688 - 50,913 50,913
Derivative financial instruments 11 - 38,736 38,736 - 135,331 135,331
Investment securities 12 7,031 76,095 83,126 6,816 86,575 93,391
Net loans and advances 13 626,099 3,620 629,719 613,155 3,938 617,093
Regulatory deposits 671 - 671 801 - 801
Other financial assets 2,054 - 2,054 2,407 - 2,407
Total 803,811 163,139 966,950 752,951 276,757 1,029,708
Financial liabilities
Settlement balances owed by ANZ 17,427 - 17,427 22,241 - 22,241
Collateral received 5,657 - 5,657 9,304 - 9,304
Deposits and other borrowings 15 738,772 4,284 743,056 679,255 3,078 682,333
Derivative financial instruments 11 - 36,035 36,035 - 134,711 134,711
Payables and other liabilities 4,734 3,913 8,647 5,285 3,843 9,128
Debt issuances 16 99,092 1,962 101,054 117,509 2,159 119,668
Total 865,682 46,194 911,876 833,594 143,791 977,385
201ANZ 2021 Annual Report
OVERVIEW HOW WE CREATE VALUE
PERFORMANCE OVERVIEW
REMUNERATION REPORT
DIRECTORS’ REPORT
FINANCIAL REPORT
SHAREHOLDER INFORMATION Notes to the financial statements (continued)

ANZ 2021 ANNUAL REPORT
NOTES TO THE FINANCIAL STATEMENTS (continued)
202
18. FAIR VALUE OF FINANCIAL ASSETS AND FINANCIAL LIABILITIES (continued)
CLASSIFICATION OF FINANCIAL ASSETS AND FINANCIAL LIABILITIES (continued) 2021 2020
At amortised
cost
At fair
value Total
At amortised
cost
At fair
value Total The Company Note $m $m $m $m $m $m Financial assets
Cash and cash equivalents 9 141,436 - 141,436 98,083 - 98,083
Settlement balances owed to ANZ 7,183 - 7,183 7,116 - 7,116
Collateral paid 8,343 - 8,343 13,012 - 13,012
Trading securities 10 - 34,752 34,752 - 38,423 38,423
Derivative financial instruments 11 - 38,292 38,292 - 130,552 130,552
Investment securities 12 5,262 62,678 67,940 5,354 74,930 80,284
Net loans and advances 13 485,015 3,472 488,487 483,986 4,016 488,002
Regulatory deposits 213 - 213 199 - 199
Due from controlled entities1 21,489 2,041 23,530 22,089 1,928 24,017
Other financial assets 1,371 - 1,371 1,460 - 1,460
Total 670,312 141,235 811,547 631,299 249,849 881,148
Financial liabilities
Settlement balances owed by ANZ 14,922 - 14,922 19,556 - 19,556
Collateral received 5,148 - 5,148 8,074 - 8,074
Deposits and other borrowings 15 606,673 50 606,723 556,676 1,460 558,136
Derivative financial instruments 11 - 37,005 37,005 - 131,230 131,230
Due to controlled entities1 23,079 - 23,079 24,295 - 24,295
Payables and other liabilities 3,999 3,245 7,244 4,377 3,693 8,070
Debt issuances 16 77,053 4,035 81,088 92,832 4,218 97,050
Total 730,874 44,335 775,209 705,810 140,601 846,411 1. From 1 April 2021, the Company changed its accounting policy relating to intragroup transactions with consolidated securitisation structured entities (SEs) in which it holds all of the issued securities of the
SE. Transactions with an SE are no longer recorded on a gross basis. Comparatives have been restated, reducing Due from controlled entities and Due to controlled entities by $76,637 million at 30 September 2020. Refer to Note 35 Impact of Adoption of New Standards and Other Changes for further details.
202
OVERVIEW HOW WE CREATE VALUE
PERFORMANCE OVERVIEW
REMUNERATION REPORT
DIRECTORS’ REPORT
FINANCIAL REPORT
SHAREHOLDER INFORMATION

NOTES TO THE FINANCIAL STATEMENTS
203
18. FAIR VALUE OF FINANCIAL ASSETS AND FINANCIAL LIABILITIES (continued)
FAIR VALUE HIERARCHY
The Group categorises assets and liabilities carried at fair value into a fair value hierarchy as required by AASB 13 Fair Value Measurement based on the observability of inputs used to measure the fair value:
Level 1 - valuations based on quoted prices (unadjusted) in active markets for identical assets or liabilities;
Level 2 - valuations using inputs other than quoted prices included within Level 1 that are observable for a similar asset or liability, either directly or indirectly; and
Level 3 - valuations where significant unobservable inputs are used to measure the fair value of the asset or liability.
The following table presents assets and liabilities carried at fair value in accordance with the fair value hierarchy:
Fair value measurements
Quoted price in active markets
(Level 1)
Using observable inputs (Level 2)
Using unobservable inputs (Level 3)
Total 2021 2020 2021 2020 2021 2020 2021 2020 Consolidated $m $m $m $m $m $m $m $m
Assets
Trading securities1 36,025 44,004 8,663 6,909 - - 44,688 50,913
Derivative financial instruments 494 681 38,187 134,588 55 62 38,736 135,331
Investment securities1 68,007 85,330 6,756 137 1,332 1,108 76,095 86,575
Net loans and advances - - 3,510 3,925 110 13 3,620 3,938
Total 104,526 130,015 57,116 145,559 1,497 1,183 163,139 276,757
Liabilities
Deposits and other borrowings - - 4,284 3,078 - - 4,284 3,078
Derivative financial instruments 1,131 1,120 34,874 133,536 30 55 36,035 134,711
Payables and other liabilities2 3,690 3,830 223 13 - - 3,913 3,843
Debt issuances (designated at fair value) - - 1,962 2,159 - - 1,962 2,159
Total 4,821 4,950 41,343 138,786 30 55 46,194 143,791
Fair value measurements
Quoted price in active markets
(Level 1)
Using observable inputs (Level 2)
Using unobservable inputs (Level 3)
Total
2021 2020 2021 2020 2021 2020 2021 2020 The Company $m $m $m $m $m $m $m $m
Assets
Trading securities1 27,764 35,170 6,988 3,253 - - 34,752 38,423
Derivative financial instruments 470 662 37,788 129,832 34 58 38,292 130,552
Investment securities1 56,277 73,838 5,354 105 1,046 987 62,677 74,930
Net loans and advances - - 3,362 4,016 110 - 3,472 4,016
Due from controlled entities - - 2,041 1,928 - - 2,041 1,928
Total 84,511 109,670 55,533 139,134 1,190 1,045 141,234 249,849
Liabilities
Deposits and other borrowings - - 50 1,460 - - 50 1,460
Derivative financial instruments 1,121 1,109 35,854 130,066 30 55 37,005 131,230
Payables and other liabilities2 3,040 3,680 205 13 - - 3,245 3,693
Debt issuances (designated at fair value) 998 996 3,037 3,222 - - 4,035 4,218
Total 5,159 5,785 39,146 134,761 30 55 44,335 140,601 1. During the year, $3,845 million of assets were transferred from Level 1 to Level 2 (2020: $127 million transferred from Level 2 to Level 1) for the Group and the Company due to a change of the observability
of inputs. There were no other material transfers during the year. Transfers into and out of levels are measured at the beginning of the reporting period in which the transfer occurred. 2. Payables and other liabilities relates to securities sold short, which we classify as held for trading and measured at fair value through profit or loss.
203ANZ 2021 Annual Report
OVERVIEW HOW WE CREATE VALUE
PERFORMANCE OVERVIEW
REMUNERATION REPORT
DIRECTORS’ REPORT
FINANCIAL REPORT
SHAREHOLDER INFORMATION Notes to the financial statements (continued)

ANZ 2021 ANNUAL REPORT
NOTES TO THE FINANCIAL STATEMENTS (continued)
204
18. FAIR VALUE OF FINANCIAL ASSETS AND FINANCIAL LIABILITIES (continued)
FAIR VALUE MEASUREMENT INCORPORATING UNOBSERVABLE MARKET DATA
Level 3 fair value measurements The net balance of Level 3 financial instruments is an asset of $1,467 million (2020: $1,128 million) for the Group and $1,160 million (2020: $1,003 million) for the Company.
The assets and liabilities which incorporate significant unobservable inputs primarily include:
equities for which there is no active market or traded prices cannot be observed;
net loans and advances that are required to be measured at fair value for which there is no observable market data; and
derivatives referencing market rates that cannot be observed primarily due to lack of market activity.
The increase in the net balance of Level 3 financial instruments is Investment Securities, due to the revaluation of the investment in Bank of Tianjin (Group and Company), and an increase in unlisted equity investments (Group).
During the year, the Group and Company transferred $5 million of derivative liabilities from Level 3 to Level 2, where valuation parameters for these financial instruments became observable during the year, and $105 million of Loan and advances measured at fair value from Level 2 to Level 3, where valuation parameters for these loans became unobservable during the year. There were no other transfers in or out of Level 3 in the current or prior year.
Bank of Tianjin (BoT) The investment is valued based on comparator bank price-to-book (P/B) multiples (a P/B multiple is the ratio of the market value of equity to the book value of equity). The extent of judgement applied in determining the appropriate multiple and comparator group from which the multiple is derived are non-observable inputs which have resulted in the Level 3 classification.
Sensitivity to Level 3 data inputs When we make assumptions due to significant inputs not being directly observable in the market place (Level 3 inputs), then changing these assumptions changes the Group’s estimate of the instrument’s fair value. Favourable and unfavourable changes are determined by changing the primary unobservable parameter used to derive the valuation.
Bank of Tianjin (BoT) The valuation of the BoT investment is sensitive to the selected unobservable input, being the P/B multiple. If the P/B multiple was increased or decreased by 10% it would result in a $99 million (2020: $93 million) increase or decrease to the fair value of the investment, which would be recognised in shareholders’ equity.
Other The remaining Level 3 balance is immaterial and changes in inputs have a minimal impact on net profit and net assets of the Group.
Deferred fair value gains and losses Where fair values are determined using unobservable inputs significant to the fair value of a financial instrument, the Group does not immediately recognise the difference between the transaction price and the amount we determine based on the valuation technique (day one gain or loss) in profit or loss. After initial recognition, we recognise the deferred amount in profit or loss on a straight line basis over the life of the transaction or until all inputs become observable.
Day one gains and losses which have been deferred are not material.
204
OVERVIEW HOW WE CREATE VALUE
PERFORMANCE OVERVIEW
REMUNERATION REPORT
DIRECTORS’ REPORT
FINANCIAL REPORT
SHAREHOLDER INFORMATION

NOTES TO THE FINANCIAL STATEMENTS
205
18. FAIR VALUE OF FINANCIAL ASSETS AND FINANCIAL LIABILITIES (continued)
FINANCIAL ASSETS AND FINANCIAL LIABILITIES NOT MEASURED AT FAIR VALUE
The following table sets out the Group’s basis of estimating the fair values of financial assets and liabilities carried at amortised cost where the carrying value is not typically a reasonable approximation of fair value.
Financial Asset and Liability Fair Value Approach
Investment securities - debt securities at amortised cost Calculated based on quoted market prices or observable inputs as applicable. If quoted market prices are not available, we use a discounted cash flow model using a yield curve appropriate for the remaining term to maturity of the debt instrument. The fair value reflects adjustments to credit spreads applicable for that instrument.
Net loans and advances to banks Discounted cash flows using prevailing market rates for loans with similar credit quality.
Net loans and advances to customers Present value of future cash flows, discounted using a curve that incorporates changes in wholesale market rates, the Group’s cost of wholesale funding and the customer margin, as appropriate.
Deposit liability without a specified maturity or at call The amount payable on demand at the reporting date. We do not adjust the fair value for any value we expect the Group to derive from retaining the deposit for a future period.
Interest bearing fixed maturity deposits and other borrowings and acceptances with quoted market rates
Market borrowing rates of interest for debt with a similar maturity are used to discount contractual cash flows to derive the fair value.
Debt issuances Calculated based on quoted market prices or observable inputs as applicable. If quoted market prices are not available, we use a discounted cash flow model using a yield curve appropriate for the remaining term to maturity of the debt instrument. The fair value reflects adjustments to credit spreads applicable to ANZ for that instrument.
The financial assets and financial liabilities listed in the table below are carried at amortised cost on the Group’s Balance Sheet. While this is the value at which we expect the assets will be realised and the liabilities settled, the Group provides an estimate of the fair value of the financial assets and financial liabilities at balance date in the table below.
Categorised into fair value hierarchy
Quoted price active markets Using observable
With significant non-observable inputs
At amortised cost (Level 1) inputs (Level 2) (Level 3) Total fair value 2021 2020 2021 2020 2021 2020 2021 2020 2021 2020 Consolidated $m $m $m $m $m $m $m $m $m $m Financial assets
Net loans and advances 626,099 613,155 - - 16,906 22,862 609,541 591,296 626,447 614,158
Investment securities 7,031 6,816 - - 7,043 6,816 - - 7,043 6,816
Total 633,130 619,971 - - 23,949 29,678 609,541 591,296 633,490 620,974
Financial liabilities
Deposits and other borrowings 738,772 679,255 - - 738,840 679,544 - - 738,840 679,544
Debt issuances 99,092 117,509 27,785 26,107 73,332 93,187 - - 101,117 119,294
Total 837,864 796,764 27,785 26,107 812,172 772,731 - - 839,957 798,838
205ANZ 2021 Annual Report
OVERVIEW HOW WE CREATE VALUE
PERFORMANCE OVERVIEW
REMUNERATION REPORT
DIRECTORS’ REPORT
FINANCIAL REPORT
SHAREHOLDER INFORMATION Notes to the financial statements (continued)

ANZ 2021 ANNUAL REPORT
NOTES TO THE FINANCIAL STATEMENTS (continued)
206
18. FAIR VALUE OF FINANCIAL ASSETS AND FINANCIAL LIABILITIES (continued) FINANCIAL ASSETS AND FINANCIAL LIABILITIES NOT MEASURED AT FAIR VALUE (continued) Categorised into fair value hierarchy
Quoted price active markets Using observable
With significant non-observable inputs
At amortised cost (Level 1) inputs (Level 2) (Level 3) Total fair value 2021 2020 2021 2020 2021 2020 2021 2020 2021 2020 The Company $m $m $m $m $m $m $m $m $m $m Financial assets
Net loans and advances 485,015 483,986 - - 16,050 22,350 469,363 462,073 485,413 484,423
Investment securities 5,263 5,354 - - 5,275 5,352 - - 5,275 5,352
Due from controlled entities1 21,489 22,089 - - - - 21,489 22,089 21,489 22,089
Total 511,767 511,429 - - 21,325 27,702 490,852 484,162 512,177 511,864
Financial liabilities
Deposits and other borrowings 606,673 556,676 - - 606,723 556,805 - - 606,723 556,805
Debt issuances 77,053 92,832 24,280 23,214 54,421 71,133 - - 78,701 94,347
Due to controlled entities1 23,079 24,295 - - - - 23,079 24,295 23,079 24,295
Total 706,805 673,803 24,280 23,214 661,144 627,938 23,079 24,295 708,503 675,447 1. From 1 April 2021, the Company changed its accounting policy relating to intragroup transactions with consolidated securitisation structured entities (SEs) in which it holds all of the issued securities of the
SE. Transactions with an SE are no longer recorded on a gross basis. Comparatives have been restated, reducing Due from controlled entities and Due to controlled entities by $76,637 million at 30 September 2020. Refer to Note 35 Impact of Adoption of New Standards and Other Changes for further details.
KEY JUDGEMENTS AND ESTIMATES
The Group evaluates the material accuracy of the valuations incorporated in the financial statements as they can involve a high degree of judgement and estimation in determining the carrying values of financial assets and financial liabilities at the balance sheet date.
The majority of valuation models the Group uses employ only observable market data as inputs. This has not changed as a result of COVID-19, however the Group has considered the impact of related economic and market disruptions on fair value measurement assumptions and the appropriateness of valuation inputs, notably valuation adjustments, as well as the impact of COVID-19 on the classification of exposures in the fair value hierarchy.
For certain financial instruments, we may use data that is not readily observable in current markets. If we use unobservable market data, then we need to exercise more judgement to determine fair value depending on the significance of the unobservable input to the overall valuation. Generally, we derive unobservable inputs from other relevant market data and compare them to observed transaction prices where available.
When establishing the fair value of a financial instrument using a valuation technique, the Group considers valuation adjustments in determining the fair value. We may apply adjustments (such as bid/offer spreads, credit valuation adjustments and funding valuation adjustments – refer Note 11 Derivative Financial Instruments) to reflect the Group’s assessment of factors that market participants would consider in determining fair value.
19. Assets charged as security for all liabilities and collateral accepted as security for assets
206
OVERVIEW HOW WE CREATE VALUE
PERFORMANCE OVERVIEW
REMUNERATION REPORT
DIRECTORS’ REPORT
FINANCIAL REPORT
SHAREHOLDER INFORMATION

NOTES TO THE FINANCIAL STATEMENTS
207
19. ASSETS CHARGED AS SECURITY FOR LIABILITIES AND COLLATERAL ACCEPTED AS SECURITY FOR ASSETS
The following disclosure excludes the amounts presented as collateral paid and received in the Balance Sheet that relate to derivative liabilities and derivative assets respectively. The terms and conditions of those collateral agreements are included in the standard Credit Support Annex that forms part of the International Swaps and Derivatives Association Master Agreement under which most of our derivatives are executed.
ASSETS CHARGED AS SECURITY FOR LIABILITIES
Assets charged as security for liabilities include the following types of instruments:
securities provided as collateral for repurchase transactions. These transactions are governed by standard industry agreements;
specified residential mortgages provided as security for notes and bonds issued to investors as part of ANZ’s covered bond programs;
collateral provided to central banks; and
collateral provided to clearing houses.
The carrying amount of assets pledged as security are as follows:
Consolidated The Company
2021 2020 2021 2020 $m $m $m $m
Securities sold under arrangements to repurchase1 51,208 61,415 48,663 60,612
Residential mortgages provided as security for covered bonds 28,816 28,559 17,925 17,937
Other 4,039 4,990 3,963 4,921 1. The amounts disclosed as securities sold under arrangements to repurchase include both:
assets pledged as security which continue to be recognised on the Group's balance sheet; and assets repledged, which are included in the disclosure below.
COLLATERAL ACCEPTED AS SECURITY FOR ASSETS
ANZ has received collateral associated with various financial transactions. Under certain arrangements ANZ has the right to sell, or to repledge, the collateral received. These arrangements are governed by standard industry agreements.
The fair value of collateral we have received and that which we have sold or repledged is as follows:
Consolidated The Company
2021 2020 2021 2020 $m $m $m $m
Fair value of assets which can be sold or repledged 26,814 54,242 25,679 53,118
Fair value of assets sold or repledged 18,741 32,578 18,189 32,308
19. Assets charged as security for all liabilities and collateral accepted as security for assets
207ANZ 2021 Annual Report
OVERVIEW HOW WE CREATE VALUE
PERFORMANCE OVERVIEW
REMUNERATION REPORT
DIRECTORS’ REPORT
FINANCIAL REPORT
SHAREHOLDER INFORMATION Notes to the financial statements (continued)

ANZ 2021 ANNUAL REPORT
NOTES TO THE FINANCIAL STATEMENTS (continued)
208
20. OFFSETTING
We offset financial assets and financial liabilities on the balance sheet (in accordance with AASB 132 Financial Instruments: Presentation) when there is:
a current legally enforceable right to set off the recognised amounts in all circumstances; and
an intention to settle the asset and liability on a net basis, or to realise the asset and settle the liability simultaneously.
The following table identifies financial assets and financial liabilities which have not been offset but are subject to enforceable master netting agreements (or similar arrangements) and the related amounts not offset in the balance sheet. We have not taken into account the effect of over-collateralisation.
Amount subject to master netting agreement or similar
Total amounts recognised
in the Balance Sheet
Amounts not subject to
master netting agreement or
similar Total Financial
instruments
Financial collateral
(received)/ pledged Net amount
Consolidated $m $m $m $m $m $m
As at 30 September 2021
Derivative financial assets1 38,736 (3,078) 35,658 (24,186) (5,750) 5,722
Reverse repurchase, securities borrowing and similar agreements2 26,082 (3,166) 22,916 (1,052) (21,864) -
Total financial assets 64,818 (6,244) 58,574 (25,238) (27,614) 5,722
Derivative financial liabilities1 (36,035) 2,822 (33,213) 24,186 5,530 (3,497)
Repurchase, securities lending and similar agreements3 (46,147) 11,461 (34,686) 1,052 33,634 -
Total financial liabilities (82,182) 14,283 (67,899) 25,238 39,164 (3,497)
As at 30 September 2020
Derivative financial assets 135,331 (3,862) 131,469 (117,982) (6,397) 7,090
Reverse repurchase, securities borrowing and similar agreements2
53,434 (5,922) 47,512 (1,566) (45,946) -
Total financial assets 188,765 (9,784) 178,981 (119,548) (52,343) 7,090
Derivative financial liabilities (134,711) 2,824 (131,887) 117,982 10,059 (3,846)
Repurchase, securities lending and similar agreements3
(55,716) 14,354 (41,362) 1,566 39,796 -
Total financial liabilities (190,427) 17,178 (173,249) 119,548 49,855 (3,846)
1. In August 2021, the Group amended the terms of its legal agreements with one of its central clearing counterparties whereby the payment or receipt of collateral results in a legal settlement of associated derivative assets and liabilities, and an associated reduction in the carrying values of the related derivative instruments. These derivative remain subject to a master netting agreement. The impact of this change as at 30 September 2021 is a decrease in the derivative assets of $55.1 billion and a decrease in derivative liabilities of $55.2 billion and reduction in net collateral paid of $0.1 billion. Refer to Note 11 Derivative Financial Instruments for further information.
2. Reverse repurchase agreements: with less than 90 days to maturity are presented in the Balance Sheet within cash and cash equivalents; or with 90 days or more to maturity are presented in the Balance Sheet within net loans and advances.
3. Repurchase agreements are presented on the Balance Sheet within deposits and other borrowings.
20. Offsetting
208
OVERVIEW HOW WE CREATE VALUE
PERFORMANCE OVERVIEW
REMUNERATION REPORT
DIRECTORS’ REPORT
FINANCIAL REPORT
SHAREHOLDER INFORMATION

NOTES TO THE FINANCIAL STATEMENTS
209
20. OFFSETTING (continued)
Amount subject to master netting agreement or similar
Total amounts
recognised in the
Balance Sheet
Amounts not subject to
master netting agreement or
similar Total Financial
instruments
Financial collateral
(received)/ pledged Net amount
The Company $m $m $m $m $m $m
As at 30 September 2021
Derivative financial assets1 38,292 (1,539) 36,753 (27,288) (5,189) 4,276
Reverse repurchase, securities borrowing and similar agreements2 24,958 (2,042) 22,916 (1,052) (21,864) -
Total financial assets 63,250 (3,581) 59,669 (28,340) (27,053) 4,276
Derivative financial liabilities1 (37,005) 1,343 (35,662) 27,288 5,425 (2,949)
Repurchase, securities lending and similar agreements3 (43,925) 10,480 (33,445) 1,052 32,393 -
Total financial liabilities (80,930) 11,823 (69,107) 28,340 37,818 (2,949)
As at 30 September 2020
Derivative financial assets 130,552 (2,531) 128,021 (117,039) (5,625) 5,357
Reverse repurchase, securities borrowing and similar agreements2
52,322 (4,810) 47,512 (1,566) (45,946) -
Total financial assets 182,874 (7,341) 175,533 (118,605) (51,571) 5,357
Derivative financial liabilities (131,230) 1,567 (129,663) 117,039 9,402 (3,222)
Repurchase, securities lending and similar agreements3 (54,951) 13,589 (41,362) 1,566 39,796 -
Total financial liabilities (186,181) 15,156 (171,025) 118,605 49,198 (3,222)
1. In August 2021, the Company amended the terms of its legal agreements with one of its central clearing counterparties whereby the payment or receipt of collateral results in a legal settlement of associated derivative assets and liabilities, and an associated reduction in the carrying values of the related derivative instruments. These derivative remain subject to a master netting agreement. The impact of this change as at 30 September 2021 is a decrease in the derivative assets of $51.4 billion and a decrease in derivative liabilities of $51.3 billion and reduction in net collateral paid of $0.1 billion. Refer to Note 11 Derivative Financial Instruments for further information.
2. Reverse repurchase agreements: with less than 90 days to maturity are presented in the Balance Sheet within cash and cash equivalents; or with 90 days or more to maturity are presented in the Balance Sheet within net loans and advances.
3. Repurchase agreements are presented on the Balance Sheet within deposits and other borrowings.
209ANZ 2021 Annual Report
OVERVIEW HOW WE CREATE VALUE
PERFORMANCE OVERVIEW
REMUNERATION REPORT
DIRECTORS’ REPORT
FINANCIAL REPORT
SHAREHOLDER INFORMATION Notes to the financial statements (continued)

ANZ 2021 ANNUAL REPORT
NOTES TO THE FINANCIAL STATEMENTS (continued)
210
21. GOODWILL AND OTHER INTANGIBLE ASSETS
Goodwill1 Software Other Intangibles Total
Consolidated
2021 2020 2021 2020 2021 2020 2021 2020
$m $m $m $m $m $m $m $m
Balance at start of year 3,264 3,467 1,039 1,323 76 71 4,379 4,861
Additions - - 356 375 - 6 356 381
Amortisation expense2 - - (434) (657) (2) (1) (436) (658)
Impairment expense3 (251) (77) (1) (2) - - (252) (79)
Written off on disposal (13) (124) - - - - (13) (124)
Foreign currency exchange difference 89 (2) - - 1 - 90 (2)
Balance at end of year 3,089 3,264 960 1,039 75 76 4,124 4,379
Cost4 3,089 3,264 7,639 7,300 78 77 10,806 10,641
Accumulated amortisation n/a n/a (6,679) (6,261) (3) (1) (6,682) (6,262)
Carrying amount 3,089 3,264 960 1,039 75 76 4,124 4,379 Goodwill1 Software Other Intangibles Total
The Company
2021 2020 2021 2020 2021 2020 2021 2020
$m $m $m $m $m $m $m $m
Balance at start of year 62 82 1,030 1,285 5 - 1,097 1,367
Additions - - 345 372 - 6 345 378
Amortisation expense2 - - (422) (625) (2) (1) (424) (626)
Impairment expense - (10) (1) (2) - - (1) (12)
Written off on disposal - (10) - - - - - (10)
Foreign currency exchange difference - - - - - - - -
Balance at end of year 62 62 952 1,030 3 5 1,017 1,097
Cost4 62 62 7,342 7,006 6 6 7,410 7,074
Accumulated amortisation n/a n/a (6,390) (5,976) (3) (1) (6,393) (5,977)
Carrying amount 62 62 952 1,030 3 5 1,017 1,097 1. Goodwill excludes notional goodwill in equity accounted investments. 2. During 2020, the Group amended the application of its software amortisation policy and recognised an accelerated amortisation of $197 million for the Group and $184 million for the Company in 2020. 3. 2021 goodwill impairment expense relates to the write-off on reclassification of ANZ Share Investing to held for sale. This is recognised in Other income to align with the classification on completion of the
disposal in 2021. 4. Includes impact of foreign currency translation differences.
IMPAIRMENT TESTING FOR CASH GENERATING UNITS (CGUs) CONTAINING GOODWILL An assessment as to whether the current carrying value of goodwill is impaired is undertaken annually or where there are indicators of potential impairment. For the purpose of impairment testing, goodwill acquired in a business combination is allocated at the date of acquisition to the cash generating units (CGUs) that are expected to benefit from the synergies of the related business combination. These CGUs are ANZ’s reportable segments. Goodwill is considered to be impaired if the carrying amount of the relevant CGU exceeds its recoverable amount.
We estimate the recoverable amount of each CGU to which goodwill is allocated using a fair value less costs of disposal (FVLCOD) approach, with a value-in-use (VIU) assessment performed where the FVLCOD is less than the carrying amount.
During the year ended 30 September 2021, $251 million of goodwill was written off upon reclassification of ANZ Share Investing to held for sale in the Group (Company: nil) with a remaining $13 million of goodwill derecognised upon completion of the disposal.
During the year ended 30 September 2020, the Group wrote off $124 million of goodwill in relation to completed divestments (Company: $10 million). In addition, the Group announced its intention to begin winding up the Bonus Bonds business, a managed investment product in New Zealand and the Group wrote off the associated goodwill of $27 million (Company: nil). The Group wrote off $50 million of goodwill in the Pacific division (Company: $10 million) as a result of changes in economic outlook.
21. Goodwill and other intangible assets
210
OVERVIEW HOW WE CREATE VALUE
PERFORMANCE OVERVIEW
REMUNERATION REPORT
DIRECTORS’ REPORT
FINANCIAL REPORT
SHAREHOLDER INFORMATION

NOTES TO THE FINANCIAL STATEMENTS
211
21. GOODWILL AND OTHER INTANGIBLE ASSETS (continued)
Fair Value Less Cost of Disposal The recoverable amount of each CGU to which goodwill is allocated is estimated on a FVLCOD basis, calculated using a market multiple approach. Under this approach, we determine the estimated fair value of each CGU by applying observable price earnings multiples of appropriate comparator companies to the estimated future maintainable earnings of each CGU. A deduction is then made for estimated costs of disposal. The valuation is considered to be level 3 in the fair value hierarchy due to unobservable inputs used in the valuation.
Management’s approach and the key assumptions used to determine FVLCOD, for those CGUs where recoverable amount was determined on the basis of FVLCOD were as follows:
Key assumption Approach to determining the value (or values) for each key assumption
Future maintainable earnings Future maintainable earnings for each CGU have been estimated as the sum of:
The Group’s 2022 financial plan for each CGU; plus An allocation of the central costs recorded outside of the CGU’s to which goodwill is allocated.
Where relevant, adjustments are made to the Group’s financial plan to reflect the long term expectations for items such as expected credit losses and investment spend.
Price/Earnings (P/E) multiple applied
The P/E multiples used have been derived from valuations of comparable publicly traded companies relevant to the respective CGU.
In the case of the New Zealand and Institutional CGUs, management has made downwards adjustments to comparator group multiples to address specific factors relevant to those CGUs.
The median P/E multiples applied (including a 30% control premium discussed below) were as follows:
Division 2021 2020 Australia Retail and Commercial 18.9 16.0 New Zealand 16.4 12.7 Institutional 15.5 13.4
Control premium:
A control premium has been applied which recognises the increased consideration a potential acquirer would be willing to pay in order to gain sufficient ownership to achieve control over the relevant activities of the CGU. For each CGU, the control premium has been estimated as 30% of the comparator group P/E multiple based on historical transactions.
Costs of disposal Costs of disposal have been estimated as 2% of the fair value of the CGU based on input from historical and recent transactions.
As noted above, our impairment testing did not result in any material impairment of goodwill being identified as at 30 September 2021.
FVLCOD assessment outcomes For each CGU, the surplus of the recoverable amount over the carrying amount determined on the basis of FVLCOD was as follows:
Surplus 2021
Cash generating unit: $m Australia Retail and Commercial 12,168 New Zealand 6,332 Institutional 4,249
Sensitivity analysis The surpluses disclosed above are sensitive to judgements and estimates however the FVLCOD estimates for the respective CGUs would continue to show a surplus in recoverable amount over carrying amount even where reasonably possible alternative estimates were used.
211ANZ 2021 Annual Report
OVERVIEW HOW WE CREATE VALUE
PERFORMANCE OVERVIEW
REMUNERATION REPORT
DIRECTORS’ REPORT
FINANCIAL REPORT
SHAREHOLDER INFORMATION Notes to the financial statements (continued)

ANZ 2021 ANNUAL REPORT
NOTES TO THE FINANCIAL STATEMENTS (continued)
212
21. GOODWILL AND OTHER INTANGIBLE ASSETS (continued)
RECOGNITION AND MEASUREMENT
The table below details how we recognise and measure different intangible assets:
Goodwill Software Other Intangible Assets
Definition
Excess amount the Group has paid in acquiring a business over the fair value of the identifiable assets and liabilities acquired.
Purchased software owned by the Group is capitalised.
Internal and external costs incurred in building software and computer systems costing greater than $20 million are capitalised as assets. Those less than $20 million are expensed in the year in which the costs are incurred.
Management fee rights arising from acquisition of funds management business and an intangible asset arising from contractual rights.
Carrying value
Cost less any accumulated impairment losses.
Allocated to the cash generating unit to which the acquisition relates.
Initially, measured at cost.
Subsequently, carried at cost less accumulated amortisation and impairment losses.
Costs incurred in planning or evaluating software proposals or in maintaining systems after implementation are not capitalised.
Initially, measured at fair value at acquisition.
Subsequently, carried at cost less amortisation and impairment losses.
Useful life
Indefinite.
Goodwill is reviewed for impairment at least annually or when there is an indication of impairment.
Except for major core infrastructure, amortised over periods between 2-5 years; however major core infrastructure may be amortised up to 7 years subject to approval by the Audit Committee.
Purchased software is amortised over 2 years unless it is considered integral to other assets with a longer useful life.
Management fee rights with an indefinite life are reviewed for impairment at least annually or when there is an indication of impairment. The contractual rights intangible asset is amortised over 3 years.
Depreciation method
Not applicable. Straight-line method. Not applicable to indefinite life intangible assets. Straight line for those with a limited life.
212
OVERVIEW HOW WE CREATE VALUE
PERFORMANCE OVERVIEW
REMUNERATION REPORT
DIRECTORS’ REPORT
FINANCIAL REPORT
SHAREHOLDER INFORMATION

NOTES TO THE FINANCIAL STATEMENTS
213
21. GOODWILL AND OTHER INTANGIBLE ASSETS (continued)
KEY JUDGEMENTS AND ESTIMATES
Management judgement is used to assess the recoverable value of goodwill and other intangible assets, and the useful economic life of an asset, or whether an asset has an indefinite life. We reassess the recoverability of the carrying value at each reporting date.
Goodwill
A number of key judgements are required in the determination of whether or not a goodwill balance is impaired including:
the level at which goodwill is allocated – consistent with prior periods the CGUs to which goodwill is allocated are the Group’s revenue generating segments that benefit from relevant historical business combinations generating goodwill.
determination of the carrying amount of each CGU which includes an allocation, on a reasonable and consistent basis, of corporate assets and liabilities that are not directly attributable to the CGUs to which goodwill is allocated.
assessment of the recoverable amount of each CGU including:
o selection of the model used to determine the fair value – the Group has used the market multiple approach to estimate the fair value; and
o selection of the key assumptions in respect of future maintainable earnings, the P/E multiple applied, including selection of an appropriate comparator group and determination of an appropriate control premium, and costs of disposal as described above.
Software and other intangible assets
At each reporting date, software and other intangible assets are assessed for indicators of impairment and, where such indicators are identified, an impairment assessment is performed. In the event that an asset’s carrying amount is determined to be greater than its recoverable amount, the carrying amount of the asset is written down immediately. Those assets not yet ready for use are tested for impairment annually.
In addition, the expected useful lives of intangible assets are assessed at each reporting date. The assessment requires management judgement, and in relation to our software assets, a number of factors can influence the expected useful lives. These factors include changes to business strategy, significant divestments and the increasing pace of technological change.
213ANZ 2021 Annual Report
OVERVIEW HOW WE CREATE VALUE
PERFORMANCE OVERVIEW
REMUNERATION REPORT
DIRECTORS’ REPORT
FINANCIAL REPORT
SHAREHOLDER INFORMATION Notes to the financial statements (continued)

ANZ 2021 ANNUAL REPORT
NOTES TO THE FINANCIAL STATEMENTS (continued)
214
22. OTHER PROVISIONS
Consolidated The Company
2021 2020 2021 2020 $m $m $m $m
ECL allowance on undrawn and contingent facilities1 806 898 674 731
Customer remediation 886 1,109 791 969
Restructuring costs 99 105 44 70
Non-lending losses, frauds and forgeries 61 79 54 57
Other 362 388 310 330
Total other provisions 2,214 2,579 1,873 2,157 1. Refer to Note 14 Allowance for Expected Credit Losses for movement analysis.
Customer remediation
Restructuring costs
Non-lending losses, frauds and forgeries Other
Consolidated $m $m $m $m
Balance at 1 October 2020 1,109 105 79 388
New and increased provisions made during the year 379 89 41 121
Provisions used during the year (449) (84) (56) (127)
Unused amounts reversed during the year1 (153) (11) (3) (20)
Balance at 30 September 2021 886 99 61 362 1. Customer remediation includes a $52 million transfer to the purchaser on completion of divestment of part of Wealth Australia discontinued operations.
Customer remediation
Restructuring costs
Non-lending losses, frauds and forgeries Other
The Company $m $m $m $m
Balance at 1 October 2020 969 70 57 330
New and increased provisions made during the year 360 37 - 116
Provisions used during the year (390) (55) (1) (118)
Unused amounts reversed during the year1 (148) (8) (2) (18)
Balance at 30 September 2021 791 44 54 310 1. Customer remediation includes a $52 million transfer to the purchaser on completion of divestment of part of Wealth Australia discontinued operations.
22. Other provisions
214
OVERVIEW HOW WE CREATE VALUE
PERFORMANCE OVERVIEW
REMUNERATION REPORT
DIRECTORS’ REPORT
FINANCIAL REPORT
SHAREHOLDER INFORMATION

NOTES TO THE FINANCIAL STATEMENTS
215
22. OTHER PROVISIONS (continued)
Customer remediation Customer remediation includes provisions for expected refunds to customers, remediation project costs and related customer and regulatory claims, penalties and litigation outcomes.
Restructuring costs Provisions for restructuring costs arise from activities related to material changes in the scope of business undertaken by the Group or the manner in which that business is undertaken and include employee termination benefits. Costs relating to on-going activities are not provided for and are expensed as incurred.
Non-lending losses, frauds and forgeries Non-lending losses include losses arising from certain legal actions not directly related to amounts of principal outstanding for loans and advances and losses arising from forgeries, frauds and the correction of operational issues. The amounts recognised are the best estimate of the consideration required to settle the present obligation at the reporting date, taking into account the risks and uncertainties that surround the events and circumstances that affect the provision.
Other Other provisions comprise various other provisions including workers compensation, make-good provisions associated with leased premises, warranties and indemnities provided in connection with various disposals of businesses and assets, and contingent liabilities recognised as part of a business combination.
RECOGNITION AND MEASUREMENT
The Group recognises provisions when there is a present obligation arising from a past event, an outflow of economic resources is probable, and the amount of the provision can be measured reliably.
The amount recognised is the best estimate of the consideration required to settle the present obligation at the reporting date, taking into account the risks and uncertainties surrounding the timing and amount of the obligation. Where a provision is measured using the estimated cash flows required to settle the present obligation, its carrying amount is the present value of those cash flows.
KEY JUDGEMENTS AND ESTIMATES
The Group holds provisions for various obligations including customer remediation, restructuring costs, non-lending losses, fraud and forgeries and litigation related claims. These provisions involve judgements regarding the timing and outcome of future events, including estimates of expenditure required to satisfy such obligations. Where relevant, expert legal advice has been obtained and, in light of such advice, provisions and/or disclosures as deemed appropriate have been made.
In relation to customer remediation, determining the amount of the provisions, which represent management’s best estimate of the cost of settling the identified matters, requires the exercise of significant judgement. It will often be necessary to form a view on a number of different assumptions, including, the number of impacted customers, the average refund per customer, the associated remediation project costs, and the implications of regulatory exposures and customer claims having regard to their specific facts and circumstances. Consequently, the appropriateness of the underlying assumptions is reviewed on a regular basis against actual experience and other relevant evidence including expert legal advices and adjustments are made to the provisions where appropriate.
215ANZ 2021 Annual Report
OVERVIEW HOW WE CREATE VALUE
PERFORMANCE OVERVIEW
REMUNERATION REPORT
DIRECTORS’ REPORT
FINANCIAL REPORT
SHAREHOLDER INFORMATION Notes to the financial statements (continued)
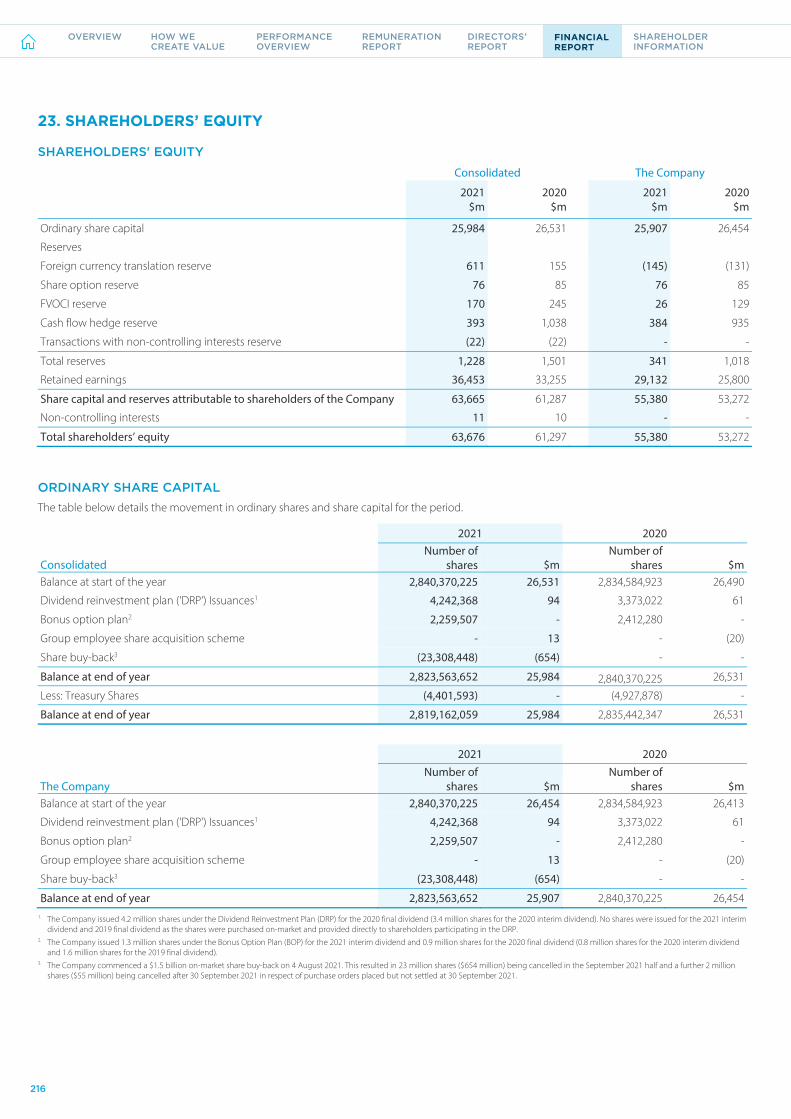
ANZ 2021 ANNUAL REPORT
NOTES TO THE FINANCIAL STATEMENTS (continued)
216
23. SHAREHOLDERS’ EQUITY
SHAREHOLDERS' EQUITY
Consolidated The Company
2021 2020 2021 2020 $m $m $m $m
Ordinary share capital 25,984 26,531 25,907 26,454
Reserves
Foreign currency translation reserve 611 155 (145) (131)
Share option reserve 76 85 76 85
FVOCI reserve 170 245 26 129
Cash flow hedge reserve 393 1,038 384 935
Transactions with non-controlling interests reserve (22) (22) - -
Total reserves 1,228 1,501 341 1,018
Retained earnings 36,453 33,255 29,132 25,800
Share capital and reserves attributable to shareholders of the Company 63,665 61,287 55,380 53,272
Non-controlling interests 11 10 - -
Total shareholders’ equity 63,676 61,297 55,380 53,272
ORDINARY SHARE CAPITAL The table below details the movement in ordinary shares and share capital for the period.
2021 2020 Number of
shares Number of
shares Consolidated $m $m Balance at start of the year 2,840,370,225 26,531 2,834,584,923 26,490
Dividend reinvestment plan ('DRP') Issuances1 4,242,368 94 3,373,022 61
Bonus option plan2 2,259,507 - 2,412,280 -
Group employee share acquisition scheme - 13 - (20)
Share buy-back3 (23,308,448) (654) - -
Balance at end of year 2,823,563,652 25,984 2,840,370,225 26,531
Less: Treasury Shares (4,401,593) - (4,927,878) -
Balance at end of year 2,819,162,059 25,984 2,835,442,347 26,531
2021 2020
Number of shares
Number of shares The Company $m $m
Balance at start of the year 2,840,370,225 26,454 2,834,584,923 26,413
Dividend reinvestment plan ('DRP') Issuances1 4,242,368 94 3,373,022 61
Bonus option plan2 2,259,507 - 2,412,280 -
Group employee share acquisition scheme - 13 - (20)
Share buy-back3 (23,308,448) (654) - -
Balance at end of year 2,823,563,652 25,907 2,840,370,225 26,454 1. The Company issued 4.2 million shares under the Dividend Reinvestment Plan (DRP) for the 2020 final dividend (3.4 million shares for the 2020 interim dividend). No shares were issued for the 2021 interim
dividend and 2019 final dividend as the shares were purchased on-market and provided directly to shareholders participating in the DRP. 2. The Company issued 1.3 million shares under the Bonus Option Plan (BOP) for the 2021 interim dividend and 0.9 million shares for the 2020 final dividend (0.8 million shares for the 2020 interim dividend
and 1.6 million shares for the 2019 final dividend). 3. The Company commenced a $1.5 billion on-market share buy-back on 4 August 2021. This resulted in 23 million shares ($654 million) being cancelled in the September 2021 half and a further 2 million
shares ($55 million) being cancelled after 30 September 2021 in respect of purchase orders placed but not settled at 30 September 2021.
23. Shareholders' Equity
216
OVERVIEW HOW WE CREATE VALUE
PERFORMANCE OVERVIEW
REMUNERATION REPORT
DIRECTORS’ REPORT
FINANCIAL REPORT
SHAREHOLDER INFORMATION

NOTES TO THE FINANCIAL STATEMENTS
217
23. SHAREHOLDERS’ EQUITY (continued)
RECOGNITION AND MEASUREMENT
Ordinary shares
Ordinary shares have no par value. They entitle holders to receive dividends, or proceeds available on winding up of the Company, in proportion to the number of fully paid ordinary shares held. They are recognised at the amount paid per ordinary share net of directly attributable costs. Every holder of fully paid ordinary shares present at a meeting in person, or by proxy, is entitled to:
on a show of hands, one vote; and
on a poll, one vote, for each share held.
Treasury shares
Treasury shares are shares in the Company which:
the ANZ Employee Share Acquisition Plan purchases on market and have not yet distributed, or
the Company issues to the ANZ Employee Share Acquisition Plan and have not yet been distributed.
Treasury shares are deducted from share capital and excluded from the weighted average number of ordinary shares used in the earnings per share calculations.
Reserves:
Foreign currency translation reserve
Includes differences arising on translation of assets and liabilities into Australian dollars when the functional currency of a foreign operation (including subsidiaries and branches) is not Australian dollars. In this reserve, we reflect any offsetting gains or losses on hedging these exposures, together with any tax effect.
Cash flow hedge reserve Includes fair value gains and losses associated with the effective portion of designated cash flow hedging instruments together with any tax effect.
FVOCI reserve Includes changes in the fair value of certain debt securities and equity securities included within Investment Securities together with any tax effect.
In respect of debt securities classified as measured at FVOCI, the FVOCI reserve records accumulated changes in fair value arising subsequent to initial recognition, except for those relating to allowance for expected credit losses, interest income and foreign currency exchange gains and losses which are recognised in profit or loss. As debt securities at FVOCI are recorded at fair value, the balance of the FVOCI reserve is net of the ECL allowance associated with such assets. When a debt security measured at FVOCI is derecognised, the cumulative gain or loss recognised in the FVOCI reserve in respect of that security is reclassified to profit or loss and presented in Other operating income.
In respect of the equity securities classified as measured at FVOCI, the FVOCI reserve records accumulated changes in fair value arising subsequent to initial recognition (including any related foreign exchange gains or losses). When an equity security measured at FVOCI is derecognised, the cumulative gain or loss recognised in the FVOCI reserve in respect of that security is not recycled to profit or loss.
Share option reserve Includes amounts which arise on the recognition of share-based compensation expense.
Transactions with non-controlling interests reserve
Includes the impact of transactions with non-controlling shareholders in their capacity as shareholders.
Non-controlling interests Share in the net assets of controlled entities attributable to equity interests which the Company does not own directly or indirectly.
217ANZ 2021 Annual Report
OVERVIEW HOW WE CREATE VALUE
PERFORMANCE OVERVIEW
REMUNERATION REPORT
DIRECTORS’ REPORT
FINANCIAL REPORT
SHAREHOLDER INFORMATION Notes to the financial statements (continued)
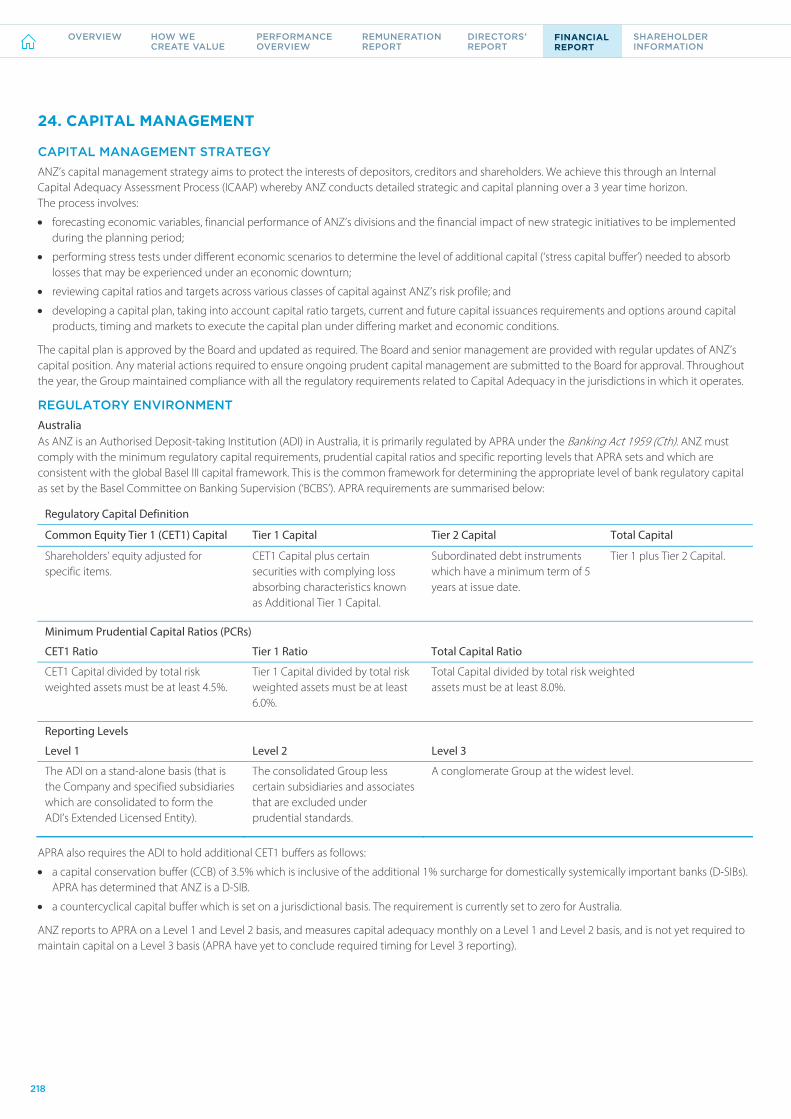
ANZ 2021 ANNUAL REPORT
NOTES TO THE FINANCIAL STATEMENTS (continued)
218
24. CAPITAL MANAGEMENT
CAPITAL MANAGEMENT STRATEGY ANZ’s capital management strategy aims to protect the interests of depositors, creditors and shareholders. We achieve this through an Internal Capital Adequacy Assessment Process (ICAAP) whereby ANZ conducts detailed strategic and capital planning over a 3 year time horizon. The process involves:
forecasting economic variables, financial performance of ANZ’s divisions and the financial impact of new strategic initiatives to be implemented during the planning period;
performing stress tests under different economic scenarios to determine the level of additional capital (‘stress capital buffer’) needed to absorb losses that may be experienced under an economic downturn;
reviewing capital ratios and targets across various classes of capital against ANZ’s risk profile; and
developing a capital plan, taking into account capital ratio targets, current and future capital issuances requirements and options around capital products, timing and markets to execute the capital plan under differing market and economic conditions.
The capital plan is approved by the Board and updated as required. The Board and senior management are provided with regular updates of ANZ’s capital position. Any material actions required to ensure ongoing prudent capital management are submitted to the Board for approval. Throughout the year, the Group maintained compliance with all the regulatory requirements related to Capital Adequacy in the jurisdictions in which it operates.
REGULATORY ENVIRONMENT Australia As ANZ is an Authorised Deposit-taking Institution (ADI) in Australia, it is primarily regulated by APRA under the Banking Act 1959 (Cth). ANZ must comply with the minimum regulatory capital requirements, prudential capital ratios and specific reporting levels that APRA sets and which are consistent with the global Basel III capital framework. This is the common framework for determining the appropriate level of bank regulatory capital as set by the Basel Committee on Banking Supervision (‘BCBS’). APRA requirements are summarised below:
Regulatory Capital Definition
Common Equity Tier 1 (CET1) Capital Tier 1 Capital Tier 2 Capital Total Capital
Shareholders’ equity adjusted for specific items.
CET1 Capital plus certain securities with complying loss absorbing characteristics known as Additional Tier 1 Capital.
Subordinated debt instruments which have a minimum term of 5 years at issue date.
Tier 1 plus Tier 2 Capital.
Minimum Prudential Capital Ratios (PCRs)
CET1 Ratio Tier 1 Ratio Total Capital Ratio
CET1 Capital divided by total risk weighted assets must be at least 4.5%.
Tier 1 Capital divided by total risk weighted assets must be at least 6.0%.
Total Capital divided by total risk weighted assets must be at least 8.0%.
Reporting Levels
Level 1 Level 2 Level 3
The ADI on a stand-alone basis (that is the Company and specified subsidiaries which are consolidated to form the ADI’s Extended Licensed Entity).
The consolidated Group less certain subsidiaries and associates that are excluded under prudential standards.
A conglomerate Group at the widest level.
APRA also requires the ADI to hold additional CET1 buffers as follows:
a capital conservation buffer (CCB) of 3.5% which is inclusive of the additional 1% surcharge for domestically systemically important banks (D-SIBs). APRA has determined that ANZ is a D-SIB.
a countercyclical capital buffer which is set on a jurisdictional basis. The requirement is currently set to zero for Australia.
ANZ reports to APRA on a Level 1 and Level 2 basis, and measures capital adequacy monthly on a Level 1 and Level 2 basis, and is not yet required to maintain capital on a Level 3 basis (APRA have yet to conclude required timing for Level 3 reporting).
24. Capital Management
218
OVERVIEW HOW WE CREATE VALUE
PERFORMANCE OVERVIEW
REMUNERATION REPORT
DIRECTORS’ REPORT
FINANCIAL REPORT
SHAREHOLDER INFORMATION
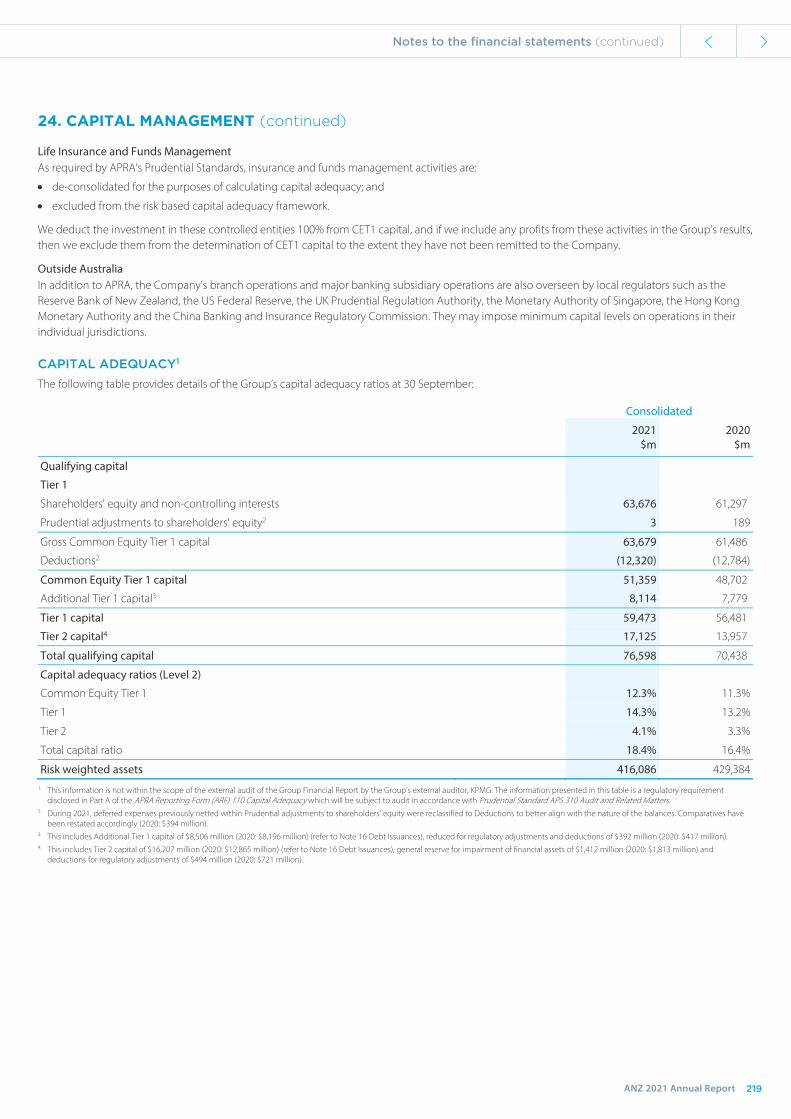
NOTES TO THE FINANCIAL STATEMENTS
219
24. CAPITAL MANAGEMENT (continued)
Life Insurance and Funds Management As required by APRA’s Prudential Standards, insurance and funds management activities are:
de-consolidated for the purposes of calculating capital adequacy; and
excluded from the risk based capital adequacy framework.
We deduct the investment in these controlled entities 100% from CET1 capital, and if we include any profits from these activities in the Group’s results, then we exclude them from the determination of CET1 capital to the extent they have not been remitted to the Company.
Outside Australia In addition to APRA, the Company’s branch operations and major banking subsidiary operations are also overseen by local regulators such as the Reserve Bank of New Zealand, the US Federal Reserve, the UK Prudential Regulation Authority, the Monetary Authority of Singapore, the Hong Kong Monetary Authority and the China Banking and Insurance Regulatory Commission. They may impose minimum capital levels on operations in their individual jurisdictions.
CAPITAL ADEQUACY1 The following table provides details of the Group’s capital adequacy ratios at 30 September:
Consolidated
2021 2020 $m $m
Qualifying capital
Tier 1
Shareholders' equity and non-controlling interests 63,676 61,297
Prudential adjustments to shareholders' equity2 3 189
Gross Common Equity Tier 1 capital 63,679 61,486
Deductions2 (12,320) (12,784)
Common Equity Tier 1 capital 51,359 48,702
Additional Tier 1 capital3 8,114 7,779
Tier 1 capital 59,473 56,481
Tier 2 capital4 17,125 13,957
Total qualifying capital 76,598 70,438
Capital adequacy ratios (Level 2)
Common Equity Tier 1 12.3% 11.3%
Tier 1 14.3% 13.2%
Tier 2 4.1% 3.3%
Total capital ratio 18.4% 16.4%
Risk weighted assets 416,086 429,384 1. This information is not within the scope of the external audit of the Group Financial Report by the Group’s external auditor, KPMG. The information presented in this table is a regulatory requirement
disclosed in Part A of the APRA Reporting Form (ARF) 110 Capital Adequacy which will be subject to audit in accordance with Prudential Standard APS 310 Audit and Related Matters. 2. During 2021, deferred expenses previously netted within Prudential adjustments to shareholders’ equity were reclassified to Deductions to better align with the nature of the balances. Comparatives have
been restated accordingly (2020: $394 million). 3. This includes Additional Tier 1 capital of $8,506 million (2020: $8,196 million) (refer to Note 16 Debt Issuances), reduced for regulatory adjustments and deductions of $392 million (2020: $417 million). 4. This includes Tier 2 capital of $16,207 million (2020: $12,865 million) (refer to Note 16 Debt Issuances), general reserve for impairment of financial assets of $1,412 million (2020: $1,813 million) and
deductions for regulatory adjustments of $494 million (2020: $721 million).
219ANZ 2021 Annual Report
OVERVIEW HOW WE CREATE VALUE
PERFORMANCE OVERVIEW
REMUNERATION REPORT
DIRECTORS’ REPORT
FINANCIAL REPORT
SHAREHOLDER INFORMATION Notes to the financial statements (continued)

ANZ 2021 ANNUAL REPORT
NOTES TO THE FINANCIAL STATEMENTS (continued)
220
25. CONTROLLED ENTITIES
The ultimate parent of the Group is Australia and New Zealand Banking Group Limited Incorporated in
Australia Nature of Business
Banking
All controlled entities are 100% owned, unless otherwise noted.
The material controlled entities of the Group are:
ANZ Bank (Vietnam) Limited1 Vietnam Banking
ANZ Capel Court Limited Australia Securitisation Manager
ANZ Funds Pty. Ltd. Australia Holding Company
ANZ Bank (Kiribati) Limited1 (75% ownership) Kiribati Banking
ANZ Bank (Samoa) Limited1 Samoa Banking
ANZ Bank (Thai) Public Company Limited1 Thailand Banking
ANZ Holdings (New Zealand) Limited1 New Zealand Holding Company
ANZ Bank New Zealand Limited1 New Zealand Banking
ANZ Investment Services (New Zealand) Limited1 New Zealand Funds Management
ANZ New Zealand (Int’l) Limited1 New Zealand Finance
ANZ Wealth New Zealand Limited1 New Zealand Holding Company
ANZ New Zealand Investments Limited1 New Zealand Funds Management
ANZNZ Covered Bond Trust1,4 New Zealand Finance
ANZ International Private Limited1 Singapore Holding Company
ANZ Singapore Limited1 Singapore Merchant Banking
ANZ International (Hong Kong) Limited1 Hong Kong Holding Company
ANZ Asia Limited1 Hong Kong Banking
ANZ Bank (Vanuatu) Limited2 Vanuatu Banking
ANZcover Insurance Private Ltd1 Singapore Captive-Insurance
ANZ Lenders Mortgage Insurance Pty. Limited Australia Mortgage Insurance
ANZ Residential Covered Bond Trust4 Australia Finance
Australia and New Zealand Bank (China) Company Limited1 China Banking
Australia and New Zealand Banking Group (PNG) Limited1 Papua New Guinea Banking
Chongqing Liangping ANZ Rural Bank Company Limited1 China Banking
Citizens Bancorp3 Guam Holding Company
ANZ Guam Inc3 Guam Banking
PT Bank ANZ Indonesia1 (99% ownership) Indonesia Banking
1. Audited by overseas KPMG firms — either as part of the Group audit, or for standalone financial statements as required. 2. Audited by Law Partners. 3. Audited by Deloitte Guam. 4. Not owned by the Group. Control exists as the Group retains substantially all the risks and rewards of the operations.
25. Controlled Entities
220
OVERVIEW HOW WE CREATE VALUE
PERFORMANCE OVERVIEW
REMUNERATION REPORT
DIRECTORS’ REPORT
FINANCIAL REPORT
SHAREHOLDER INFORMATION

NOTES TO THE FINANCIAL STATEMENTS
221
25. CONTROLLED ENTITIES (continued)
RECOGNITION AND MEASUREMENT
The Group’s subsidiaries are those entities it controls through:
being exposed to, or having rights to, variable returns from the entity; and
being able to affect those returns through its power over the entity.
The Group assesses whether it has power over those entities by examining the Group’s existing rights to direct the relevant activities of the entity.
If the Group sells or acquires subsidiaries during the year, it includes their operating results in the Group results to the date of disposal or from the date of acquisition. When the Group’s control ceases, it derecognises the assets and liabilities of the subsidiary, any related non-controlling interest and other components of equity.
When the Group ceases to control a subsidiary, it:
measures any retained interest in the entity at fair value; and
recognises any resulting gain or loss in profit or loss.
If the Group’s ownership interest in a subsidiary changes in a way that does not result in a loss of control, then the Group accounts for that as a transaction with equity holders in their capacity as equity holders.
All transactions between Group entities are eliminated on consolidation.
221ANZ 2021 Annual Report
OVERVIEW HOW WE CREATE VALUE
PERFORMANCE OVERVIEW
REMUNERATION REPORT
DIRECTORS’ REPORT
FINANCIAL REPORT
SHAREHOLDER INFORMATION Notes to the financial statements (continued)

ANZ 2021 ANNUAL REPORT
NOTES TO THE FINANCIAL STATEMENTS (continued)
222
26. INVESTMENTS IN ASSOCIATES
Significant associates of the Group are:
Ordinary share
interest Carrying amount
$m
Name of entity Principal activity 2021 2020 2021 2020
AMMB Holdings Berhad ('AmBank') Banking and insurance 22% 24% 719 1,056
PT Bank Pan Indonesia ('PT Panin') Consumer and business bank 39% 39% 1,210 1,084
Aggregate other individually immaterial associates n/a n/a 43 24
Total carrying value of associates1 1,972 2,164 1. Includes the impact of foreign currency translation recognised in the foreign currency translation reserve.
FINANCIAL INFORMATION ON SIGNIFICANT ASSOCIATES
Set out below is the summarised financial information of each associate that is significant to the Group. The summarised financial information is based on the associates’ IFRS financial information and may require the use of unaudited financial information as both associates have different financial years to the Group (PT Panin 31 December, AmBank 31 March).
AMMB Holdings Berhad PT Bank Pan Indonesia Principal place of business and country of incorporation Malaysia Indonesia
2021 2020 2021 2020 $m $m $m $m
Summarised results
Operating income 2,663 3,156 1,222 1,105
Profit/(Loss) for the year (1,192) 456 298 319
Other comprehensive income/(loss) (39) 105 (56) 72
Total comprehensive income/(loss) (1,231) 561 242 391
Less: Total comprehensive (income)/loss attributable to non–controlling interests (25) (26) 1 (11)
Total comprehensive income/(loss) attributable to owners of associate (1,256) 535 243 380
Summarised financial position
Total assets1 55,711 53,301 18,323 19,669
Total liabilities1 49,773 48,530 15,377 16,599
Total net assets1 5,938 4,771 2,946 3,070
Less: Non–controlling interests of associate (327) (343) (304) (294)
Net assets attributable to owners of associate 5,611 4,428 2,642 2,776
Reconciliation to carrying amount of Group's interest in associate Carrying amount at the beginning of the year 1,056 1,586 1,084 1,350
Group's share of total comprehensive income/(loss)2 (313) 126 90 150
Dividends received from associate - (32) - -
Group's share of other reserve movements of associate and foreign currency translation reserve adjustments (24) (29) 36 (128)
Group's equity accounted share of AASB 9 transition adjustment3 - - - (68)
Impairment charges4 - (595) - (220)
Carrying amount at the end of the year 719 1,056 1,210 1,084
Market value of Group's investment in associate 756 727 675 653 1. Includes market value adjustments (including goodwill) the Group made at the time of acquisition (and adjustments for any differences in accounting policies). 2. Includes the Group’s share of settlement provision expenses ($212 million) recorded by AmBank in relation to an agreement with the Malaysian Ministry of Finance to resolve potential claims to its
involvement with 1Malaysia Development Berhad and the Group’s share of impairments ($135 million) recognised by AmBank during 2021. 3. In 2020, the Group recognised an adjustment of $68 million to the equity accounted earnings of PT Panin. When the Group adopted AASB 9 Financial Instruments on 1 October 2018, an estimate of PT
Panin’s transition adjustment was recognised through opening retained earnings to align accounting policies. PT Panin adopted AASB 9 during the current financial year recognising a transition adjustment in retained earnings.
4. The Group recorded an impairment charge of $815 million in other operating income based on impairment assessments performed in 2020 with AmBank impaired by $595 million and PT Panin impaired by $220 million. No impairment charges were recorded in 2021.
23. Investements in associates
222
OVERVIEW HOW WE CREATE VALUE
PERFORMANCE OVERVIEW
REMUNERATION REPORT
DIRECTORS’ REPORT
FINANCIAL REPORT
SHAREHOLDER INFORMATION

NOTES TO THE FINANCIAL STATEMENTS
223
26. INVESTMENTS IN ASSOCIATES (continued)
IMPAIRMENT ASSESSMENT The Group assesses the carrying value of its associate investments for impairment indicators.
At 30 September 2021, the impairment assessment of non-lending assets identified that two of the Group’s associate investments AmBank and PT Panin had indicators of impairment. No impairment was recognised as their carrying values are supported by their value-in-use (VIU) calculations.
RECOGNITION AND MEASUREMENT
An associate is an entity over which the Group has significant influence over its operating and financial policies but does not control. The Group accounts for associates using the equity method. Its investments in associates are carried at cost plus the post-acquisition share of changes in the associate’s net assets less accumulated impairments. Dividends the Group receives from associates are recognised as a reduction in the carrying amount of the investment. The Group includes goodwill recognised by the associate in the carrying amount of the investment. It does not individually test the goodwill incorporated in the associates carrying amount for impairment.
At least at each reporting date, the Group reviews investments in associates for any indication of impairment. If an indication of impairment exists, then the Group determines the recoverable amount of the associate using the higher of:
the associate’s fair value less cost of disposal; and its value-in-use.
We use a discounted cash flow methodology, and when applicable, other methodologies (such as capitalisation of earnings methodology), to determine the recoverable amount.
KEY JUDGEMENTS AND ESTIMATES
The ongoing impact of COVID-19 on the valuation of AmBank and PT Panin remains uncertain. Significant management judgment is required in determining the key assumptions underpinning the VIU calculations. Factors may change in subsequent periods and lead to potential future impairments or reversals of prior period impairments. These include forecast earnings levels in the near term and/or changes in the long term growth forecasts, required levels of regulatory capital and post-tax discount rate.
The key assumptions used in the value-in-use calculations are outlined below:
As at 30 September 2021 AmBank PT Panin
Post-tax discount rate 10.6% 14.4%
Terminal growth rate 5.0% 5.1%
Expected earnings growth (compound annual growth rate – 5 years) 4.2% 6.4%
Common Equity Tier 1 ratio (5 year average) 13.4% 12.8%
The VIU calculations are sensitive to changes in the underlying assumptions with reasonably possible changes in key assumptions having a positive or negative impact on the VIU outcome, and as such the recoverable amount of the investment.
A change in the September 2021 post-tax discount rate by +/- 50 bps would impact the VIU outcome for PT Panin by ($55 million)/ $60 million, and ($84 million)/$106 million for AmBank.
A change in the September 2021 terminal growth rate by +/- 25 bps would impact the VIU outcome for PT Panin by $9 million/ ($10 million), and $49 million/($45 million) for AmBank.
Neither investment would be impaired if the discount rate were increased or the terminal growth rate reduced by the reasonably possible changes above.
223ANZ 2021 Annual Report
OVERVIEW HOW WE CREATE VALUE
PERFORMANCE OVERVIEW
REMUNERATION REPORT
DIRECTORS’ REPORT
FINANCIAL REPORT
SHAREHOLDER INFORMATION Notes to the financial statements (continued)

ANZ 2021 ANNUAL REPORT
NOTES TO THE FINANCIAL STATEMENTS (continued)
224
27. STRUCTURED ENTITIES
A Structured Entity (SE) is an entity that has been designed such that voting or similar rights are not the dominant factor in determining who controls the entity. SEs are generally established with restrictions on their ongoing activities in order to achieve narrow and well defined objectives.
SEs are classified as subsidiaries and consolidated when control exists. If the Group does not control a SE, then it is not consolidated. This note provides information on both consolidated and unconsolidated SEs.
The Group’s involvement with SEs is as follows:
Type Details
Securitisation The Group establishes SEs to securitise customer loans and advances that it has originated, in order to diversify sources of funding for liquidity management. Securitisation programs include customer loans and advances assigned to bankruptcy remote SEs to provide either security for obligations payable on notes issued by the SEs to external investors or create assets held by the Group eligible for repurchase agreements with applicable central banks.
The Group retains control over these SEs and therefore they are consolidated. Refer to Note 28 Transfers of Financial Assets for further details.
The Group also establishes SEs on behalf of customers to securitise their loans or receivables. The Group may manage these securitisation vehicles or provide liquidity or other support. Additionally, the Group may acquire interests in securitisation vehicles set up by third parties through holding securities issued by such entities. In limited circumstances where control exists, the Group consolidates the SE.
Covered bond issuances Certain loans and advances have been assigned to bankruptcy remote SEs to provide security for issuances of debt securities by the Group. The Group retains control over these SEs and therefore they are consolidated. Refer to Note 28 Transfers of Financial Assets for further details.
Structured finance arrangements
The Group is involved with SEs established:
in connection with structured lending transactions to facilitate debt syndication and/or to ring-fence collateral; and
to own assets that are leased to customers in structured leasing transactions.
The Group may manage the SE, hold minor amounts of the SE’s capital, or provide risk management products (derivatives) to the SE. In most instances, the Group does not control these SEs. In limited circumstances where control exists, the Group consolidates the SE.
Funds management activities The Group is the scheme manager for a number of Managed Investment Schemes (MIS) in New Zealand. These MIS are financed through the issue of units to investors and the Group considers them to be SEs. The Group’s interests in these MIS are limited to receiving fees for services or providing risk management products (derivatives). These interests do not create significant exposures that would allow the Group to control the funds. Therefore, these MIS are not consolidated.
CONSOLIDATED STRUCTURED ENTITIES FINANCIAL OR OTHER SUPPORT PROVIDED TO CONSOLIDATED STRUCTURED ENTITIES The Group provides financial support to consolidated SEs as outlined below.
Securitisation and covered bond issuances
The Group provides lending facilities, derivatives and commitments to these SEs and/or holds debt instruments that they have issued.
Structured finance arrangements
The assets held by these SEs are normally pledged as collateral for financing provided. Certain consolidated SEs are financed entirely by the Group while others are financed by syndicated loan facilities in which the Group is a participant. The financing provided by the Group includes lending facilities where the Group’s exposure is limited to the amount of the loan and any undrawn amount. Additionally, the Group has provided Letters of Support to these consolidated SEs confirming that the Group will not demand repayment of the financing provided for the ensuing 12 month period.
The Group did not provide any non-contractual support to consolidated SEs during the year (2020: nil). Other than as disclosed above, the Group does not have any current intention to provide financial or other support to consolidated SEs.
27. Structured entities
224
OVERVIEW HOW WE CREATE VALUE
PERFORMANCE OVERVIEW
REMUNERATION REPORT
DIRECTORS’ REPORT
FINANCIAL REPORT
SHAREHOLDER INFORMATION

NOTES TO THE FINANCIAL STATEMENTS
225
27. STRUCTURED ENTITIES (continued)
UNCONSOLIDATED STRUCTURED ENTITIES GROUP’S INTEREST IN UNCONSOLIDATED STRUCTURED ENTITIES An ‘interest’ in an unconsolidated SE is any form of contractual or non-contractual involvement with a SE that exposes the Group to variability of returns from the performance of that SE. These interests include, but are not limited to: holdings of debt or equity securities; derivatives that pass-on risks specific to the performance of the SE; lending; loan commitments; financial guarantees; and fees from funds management activities.
For the purpose of disclosing interests in unconsolidated SEs:
no disclosure is made if the Group’s involvement is not more than a passive interest - for example: when the Group’s involvement constitutes a typical customer-supplier relationship. On this basis, exposures to unconsolidated SEs that arise from lending, trading and investing activities are not considered disclosable interests - unless the design of the structured entity allows the Group to participate in decisions about the relevant activities (being those that significantly affect the entity’s returns).
‘interests’ do not include derivatives intended to expose the Group to market-risk (rather than performance risk specific to the SE) or derivatives through which the Group creates, rather than absorbs, variability of the unconsolidated SE (such as purchase of credit protection under a credit default swap).
The table below sets out the Group’s interests in unconsolidated SEs together with the maximum exposure to loss that could arise from those interests:
Securitisation Structured finance Total
2021 2020 2021 2020 2021 2020 $m $m $m $m $m $m
On-balance sheet interests
Investment securities 2,624 2,280 - - 2,624 2,280
Gross loans and advances 7,697 8,479 53 74 7,750 8,553
Total on-balance sheet 10,321 10,759 53 74 10,374 10,833
Off-balance sheet interests
Commitments (facilities undrawn) 2,034 2,072 - 22 2,034 2,094
Guarantees 50 40 - - 50 40
Total off-balance sheet 2,084 2,112 - 22 2,084 2,134
Maximum exposure to loss 12,405 12,871 53 96 12,458 12,967
In addition to the interests above, the Group earned funds management fees from unconsolidated investment funds of $192 million (2020: $285 million) during the year.
The Group’s maximum exposure to loss represents the maximum amount of loss that the Group could incur as a result of its involvement with unconsolidated SEs if loss events were to take place - regardless of the probability of occurrence. This does not in any way represent the actual losses expected to be incurred. Furthermore, the maximum exposure to loss is stated gross of the effects of hedging and collateral arrangements entered into to mitigate ANZ’s exposure to loss.
The maximum exposure to loss has been determined as:
the carrying amount of Investment securities measured at amortised cost; and
the carrying amount plus the undrawn amount of any committed loans and advances.
The size of unconsolidated SEs is indicated by total assets which vary by SE with a maximum value of approximately $4.3 billion.
The Group did not provide any non-contractual support to unconsolidated SEs during the year (2020: nil) nor does it have any current intention to provide financial or other support to unconsolidated SEs.
225ANZ 2021 Annual Report
OVERVIEW HOW WE CREATE VALUE
PERFORMANCE OVERVIEW
REMUNERATION REPORT
DIRECTORS’ REPORT
FINANCIAL REPORT
SHAREHOLDER INFORMATION Notes to the financial statements (continued)

ANZ 2021 ANNUAL REPORT
NOTES TO THE FINANCIAL STATEMENTS (continued)
226
27. STRUCTURED ENTITIES (continued)
SPONSORED UNCONSOLIDATED STRUCTURED ENTITIES The Group may also sponsor unconsolidated SEs in which it has no disclosable interest.
For the purposes of this disclosure, the Group considers itself the ‘sponsor’ of an unconsolidated SE if it is the primary party involved in the design and establishment of that SE and:
the Group is the major user of that SE; or
the Group’s name appears in the name of that SE, or on its products; or
the Group provides implicit or explicit guarantees of that SE’s performance.
The Group has sponsored the ANZ PIE Fund in New Zealand, which invests only in deposits with ANZ Bank New Zealand Limited. The Group does not provide any implicit or explicit guarantees of the capital value or performance of investments in the ANZ PIE Fund. There was no income received from, nor assets transferred to, this entity during the year.
KEY JUDGEMENTS AND ESTIMATES
Significant judgement is required in assessing whether the Group has control over Structured Entities. Judgement is required to determine the existence of:
power over the relevant activities (being those that significantly affect the entity’s returns);
exposure to variable returns of the entity; and
the ability to use its power over the entity to affect the Group’s returns.
28. TRANSFERS OF FINANCIAL ASSETS
In the normal course of business the Group enters into transactions where it transfers financial assets directly to third parties or to SEs. These transfers may give rise to the Group fully, or partially, derecognising those financial assets - depending on the Group’s exposure to the risks and rewards or control over the transferred assets. If the Group retains substantially all of the risk and rewards of a transferred asset, the transfer does not qualify for derecognition and the asset remains on the Group’s balance sheet in its entirety.
SECURITISATIONS Net loans and advances include residential mortgages securitised under the Group’s securitisation programs which are assigned to bankruptcy remote SEs to provide security for obligations payable on the notes issued by the SEs. The holders of the issued notes have full recourse to the pool of residential mortgages which have been securitised and the Group cannot otherwise pledge or dispose of the transferred assets.
In some instances, the Group is also the holder of the securitised notes issued by the SEs. In addition, the Group is entitled to any residual income of the SEs and sometimes enters into derivatives with the SEs. The Group retains the risks and rewards of the residential mortgages and continues to recognise the mortgages as financial assets.
The Group is exposed to variable returns from its involvement with these securitisation SEs and has the ability to affect those returns through its power over the SEs activities. The SEs are therefore consolidated by the Group.
During the 2021 financial year, the Company changed its accounting policy regarding intragroup positions with consolidated securitisation SEs in which it holds all of the issued securities of the SE. The Company records a net nil position with the securitisation SE to reflect the economic substance of these fully offsetting intercompany transactions. Refer to Note 35 Impacts of Adoption of New Standards and Other Changes for further details of the change in accounting policy.
226
OVERVIEW HOW WE CREATE VALUE
PERFORMANCE OVERVIEW
REMUNERATION REPORT
DIRECTORS’ REPORT
FINANCIAL REPORT
SHAREHOLDER INFORMATION

NOTES TO THE FINANCIAL STATEMENTS
227
28. TRANSFERS OF FINANCIAL ASSETS (continued)
COVERED BONDS The Group operates various global covered bond programs to raise funding in its primary markets. Net loans and advances include residential mortgages assigned to bankruptcy remote SEs associated with these covered bond programs. The mortgages provide security for the obligations payable on the issued covered bonds.
The covered bond holders have dual recourse to the issuer and the cover pool of assets. The issuer cannot otherwise pledge or dispose of the transferred assets, however, subject to legal arrangements it may repurchase and substitute assets as long as the required cover is maintained.
The Group is required to maintain the cover pool at a level sufficient to cover the bond obligations. In addition, the Group is entitled to any residual income of the covered bond SEs and enters into derivatives with the SEs. The Group retains the majority of the risks and rewards of the residential mortgages and continues to recognise the mortgages as financial assets. The obligation to pay this amount to the SEs is recognised as a financial liability of the Group.
The Group is exposed to variable returns from its involvement with the covered bond SEs and has the ability to affect those returns through its power over the SEs activities. The SEs are therefore consolidated by the Group. The covered bonds issued externally are included within debt issuances.
REPURCHASE AGREEMENTS When the Group sells securities subject to repurchase agreements under which we retain substantially all the risks and rewards of ownership, then those assets do not qualify for derecognition. An associated liability is recognised for the consideration received from the counterparty.
STRUCTURED FINANCE ARRANGEMENTS The Group arranges funding for certain customer transactions through structured leasing and commodity prepayment arrangements. These transactions are recognised on Group’s balance sheet as lease receivables or loans. At times, other financial institutions participate in the funding of these arrangements. This participation involves a proportionate transfer of the rights to the assets recognised by the Group. The participating banks have limited recourse to the leased assets or financed commodity and related proceeds. Where the Group continues to be exposed to some of the risks of the transferred assets through a derivative or other continuing involvement, the Group does not derecognise the lease receivable or loan. Instead, the Group recognises an associated liability representing its obligations to the participating financial institutions.
The tables below set out the balance of assets transferred that do not qualify for derecognition, along with the associated liabilities.
Securitisations1,2 Covered bonds Repurchase agreements
Structured finance arrangements
2021 2020 2021 2020 2021 2020 2021 2020
Consolidated $m $m $m $m $m $m $m $m
Current carrying amount of assets transferred 1,430 1,831 28,816 28,559 51,208 61,415 55 67
Carrying amount of associated liabilities 1,424 1,824 15,399 15,948 46,147 55,716 55 67
Securitisations1,2 Covered bonds Repurchase agreements
Structured finance arrangements
2021 2020 2021 2020 2021 2020 2021 2020
The Company $m $m $m $m $m $m $m $m
Current carrying amount of assets transferred 1,430 1,831 17,925 17,937 48,663 60,612 - -
Carrying amount of associated liabilities 1,430 1,831 17,925 17,937 43,925 54,951 - - 1. Does not include transfers to internal structured entities where there are no external investors. 2. The securitisation noteholders have recourse only to the pool of residential mortgages which have been securitised. The carrying value of securitised assets and the associated liabilities approximates their
fair value.
28. Transfers of financial assets
227ANZ 2021 Annual Report
OVERVIEW HOW WE CREATE VALUE
PERFORMANCE OVERVIEW
REMUNERATION REPORT
DIRECTORS’ REPORT
FINANCIAL REPORT
SHAREHOLDER INFORMATION Notes to the financial statements (continued)

ANZ 2021 ANNUAL REPORT
NOTES TO THE FINANCIAL STATEMENTS (continued)
228
29. DISCONTINUED OPERATIONS AND ASSETS AND LIABILITIES HELD FOR SALE
DISCONTINUED OPERATIONS
The Group completed the sale of its Aligned Dealer Groups business to IOOF Holdings Limited (IOOF) on 1 October 2018, its life insurance business to Zurich Financial Services Australia (Zurich) on 31 May 2019 and its OnePath pensions and investments business to IOOF on 31 January 2020.
The financial results of these divested businesses are treated as discontinued operations from a financial reporting perspective. The financial results after transaction completion primarily relate to residual operational costs on separation and part recovery based on the respective Transition Service Agreements. The loss after tax from discontinued operations for the year was $17 million (2020: $98 million loss).
INCOME STATEMENT IMPACT RELATING TO DISCONTINUED OPERATIONS AND ASSETS AND LIABILITIES HELD FOR SALE
During the 2021 financial year, the Group recognised the following impacts in relation to discontinued operations:
$17 million loss after tax attributable to customer remediation charges of $3 million and an associated $1 million tax benefit, and ongoing sale completion costs net of recoveries.
During the 2020 financial year, the Group recognised the following impacts in relation to discontinued operations:
$13 million loss after tax recorded in operating income attributable to sale completion costs. $126 million of customer remediation charges and an associated $30 million tax benefit. $101 million charge recognised in operating income offset by a $101 million tax benefit within income tax expense relating to the finalisation of
the policyholder tax position associated with the sale of the life insurance business to Zurich.
KEY JUDGEMENTS AND ESTIMATES
A significant level of judgement is used by the Group to determine:
whether an asset or group of assets is classified and presented as held for sale or as a discontinued operation; and
the fair value of the assets and liabilities classified as being held for sale.
Management is required to exercise significant judgement when assessing the fair value less costs to sell for assets and liabilities held for sale. The judgemental factors include determining: costs to sell, allocation of goodwill, indemnities provided under the sale contract and consideration received - particularly where elements of consideration are contingent in nature. Any impairment we record is based on the best available evidence of fair value compared to the carrying value before the impairment. The final sale price may be different to the fair value we estimate when recording the impairment. Management regularly assess the appropriateness of the underlying assumptions against actual outcomes and other relevant evidence and adjustments are made to fair value where appropriate. We expect that sales will complete within 12 months after balance date, subject to the relevant regulatory approvals and customary terms of sale for such assets.
29. Discontinued operations and assets and liabilities held for sale
228
OVERVIEW HOW WE CREATE VALUE
PERFORMANCE OVERVIEW
REMUNERATION REPORT
DIRECTORS’ REPORT
FINANCIAL REPORT
SHAREHOLDER INFORMATION
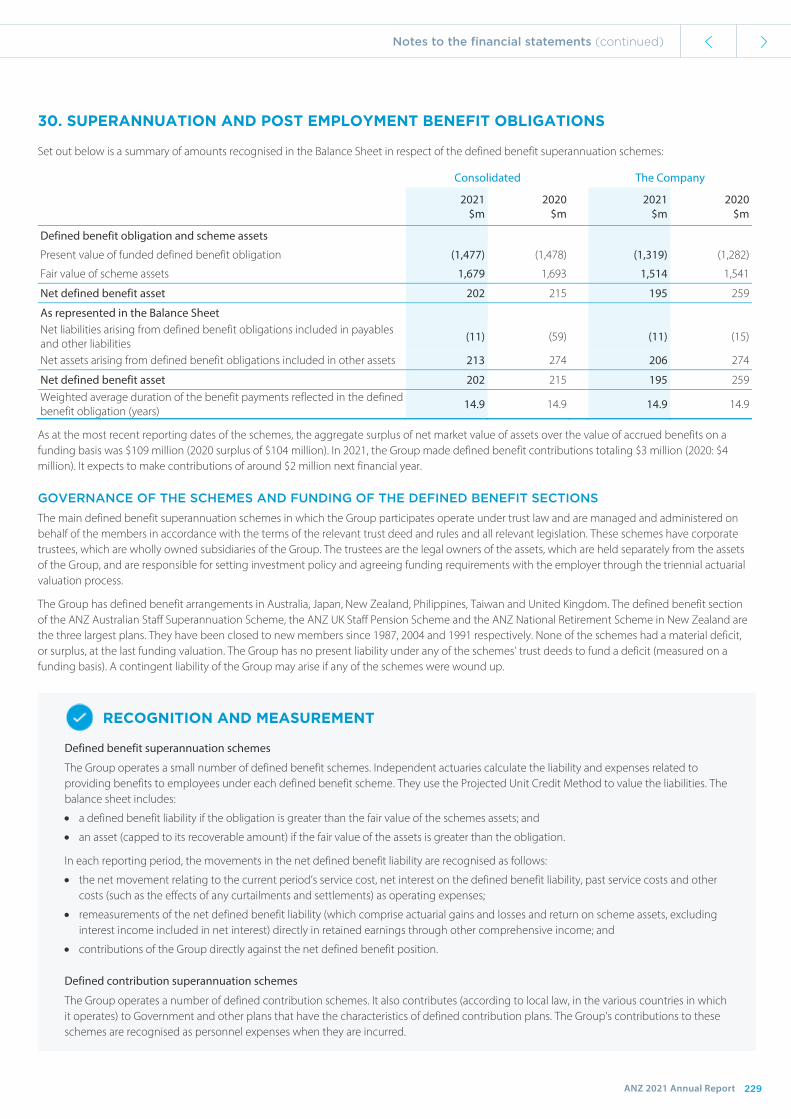
NOTES TO THE FINANCIAL STATEMENTS
229
30. SUPERANNUATION AND POST EMPLOYMENT BENEFIT OBLIGATIONS
Set out below is a summary of amounts recognised in the Balance Sheet in respect of the defined benefit superannuation schemes:
Consolidated The Company
2021 2020 2021 2020 $m $m $m $m
Defined benefit obligation and scheme assets
Present value of funded defined benefit obligation (1,477) (1,478) (1,319) (1,282)
Fair value of scheme assets 1,679 1,693 1,514 1,541
Net defined benefit asset 202 215 195 259
As represented in the Balance Sheet Net liabilities arising from defined benefit obligations included in payables and other liabilities (11) (59) (11) (15)
Net assets arising from defined benefit obligations included in other assets 213 274 206 274
Net defined benefit asset 202 215 195 259 Weighted average duration of the benefit payments reflected in the defined benefit obligation (years) 14.9 14.9 14.9 14.9
As at the most recent reporting dates of the schemes, the aggregate surplus of net market value of assets over the value of accrued benefits on a funding basis was $109 million (2020 surplus of $104 million). In 2021, the Group made defined benefit contributions totaling $3 million (2020: $4 million). It expects to make contributions of around $2 million next financial year.
GOVERNANCE OF THE SCHEMES AND FUNDING OF THE DEFINED BENEFIT SECTIONS The main defined benefit superannuation schemes in which the Group participates operate under trust law and are managed and administered on behalf of the members in accordance with the terms of the relevant trust deed and rules and all relevant legislation. These schemes have corporate trustees, which are wholly owned subsidiaries of the Group. The trustees are the legal owners of the assets, which are held separately from the assets of the Group, and are responsible for setting investment policy and agreeing funding requirements with the employer through the triennial actuarial valuation process.
The Group has defined benefit arrangements in Australia, Japan, New Zealand, Philippines, Taiwan and United Kingdom. The defined benefit section of the ANZ Australian Staff Superannuation Scheme, the ANZ UK Staff Pension Scheme and the ANZ National Retirement Scheme in New Zealand are the three largest plans. They have been closed to new members since 1987, 2004 and 1991 respectively. None of the schemes had a material deficit, or surplus, at the last funding valuation. The Group has no present liability under any of the schemes’ trust deeds to fund a deficit (measured on a funding basis). A contingent liability of the Group may arise if any of the schemes were wound up.
RECOGNITION AND MEASUREMENT
Defined benefit superannuation schemes
The Group operates a small number of defined benefit schemes. Independent actuaries calculate the liability and expenses related to providing benefits to employees under each defined benefit scheme. They use the Projected Unit Credit Method to value the liabilities. The balance sheet includes:
a defined benefit liability if the obligation is greater than the fair value of the schemes assets; and
an asset (capped to its recoverable amount) if the fair value of the assets is greater than the obligation.
In each reporting period, the movements in the net defined benefit liability are recognised as follows:
the net movement relating to the current period’s service cost, net interest on the defined benefit liability, past service costs and other costs (such as the effects of any curtailments and settlements) as operating expenses;
remeasurements of the net defined benefit liability (which comprise actuarial gains and losses and return on scheme assets, excluding interest income included in net interest) directly in retained earnings through other comprehensive income; and
contributions of the Group directly against the net defined benefit position.
Defined contribution superannuation schemes
The Group operates a number of defined contribution schemes. It also contributes (according to local law, in the various countries in which it operates) to Government and other plans that have the characteristics of defined contribution plans. The Group’s contributions to these schemes are recognised as personnel expenses when they are incurred.
30. Superannuation and post employment benefit obligations
229ANZ 2021 Annual Report
OVERVIEW HOW WE CREATE VALUE
PERFORMANCE OVERVIEW
REMUNERATION REPORT
DIRECTORS’ REPORT
FINANCIAL REPORT
SHAREHOLDER INFORMATION Notes to the financial statements (continued)

ANZ 2021 ANNUAL REPORT
NOTES TO THE FINANCIAL STATEMENTS (continued)
230
30. SUPERANNUATION AND POST EMPLOYMENT BENEFIT OBLIGATIONS (continued)
KEY JUDGEMENTS AND ESTIMATES
The main assumptions we use in valuing defined benefit obligations are listed in the table below. A change to any assumptions, or applying different assumptions, could have an effect on the Statement of Other Comprehensive Income and Balance Sheet.
Sensitivity analysis change in significant
assumptions
Increase/(decrease) in defined benefit
obligation 2021
$m 2020
$m Consolidated 2021 2020
Discount rate (% p.a.) 0.4 - 2.15 0.5 - 1.7 0.5% increase (103) (103)
Future salary increases (% p.a.) 1.9 - 3.5 1.6 - 3.0
Future pension indexation
In payment (% p.a.)/In deferment (% p.a.) 1.05 - 3.35/2.7 1.1 - 2.8/2.2 0.5% increase 84 85
Life expectancy at age 60 for current pensioners 1 year increase 74 73
– Males (years) 26.1 - 28.8 26.0 - 28.7
– Females (years) 29.0 - 30.5 28.9 - 30.4
Sensitivity analysis change in significant
assumptions
Increase/(decrease) in defined benefit
obligation 2021
$m 2020
$m The Company 2021 2020
Discount rate (% p.a.) 1.95 - 2.15 1.55 - 1.7 0.5% increase (94) (91)
Future salary increases (% p.a.) 3.5 2.95
Future pension indexation
In payment (% p.a.)/In deferment (% p.a.) 2.0 - 3.35/2.7 1.5 - 2.8/2.15 0.5% increase 75 73
Life expectancy at age 60 for current pensioners 1 year increase 67 65
– Males (years) 26.1 - 28.8 26.0 - 28.7
– Females (years) 29.0 - 30.5 28.9 - 30.4
230
OVERVIEW HOW WE CREATE VALUE
PERFORMANCE OVERVIEW
REMUNERATION REPORT
DIRECTORS’ REPORT
FINANCIAL REPORT
SHAREHOLDER INFORMATION

NOTES TO THE FINANCIAL STATEMENTS
231
31. EMPLOYEE SHARE AND OPTION PLANS
ANZ operates a number of employee share and option schemes under the ANZ Employee Share Acquisition Plan and the ANZ Share Option Plan.
ANZ EMPLOYEE SHARE ACQUISITION PLAN ANZ Employee Share Acquisition Plan schemes that operated during the 2021 and 2020 years were the Employee Share Offer (2020 only) and the Deferred Share Plan.
Employee Share Offer The details below relate to the grant of the Employee Share Offer in December 2019.
Eligibility Most permanent employees employed in either Australia or New Zealand with three years continuous service.
Grant The Board approved AUD 1,000 in Australia (and AUD 800 in New Zealand) of ANZ shares.
Allocation value One week Volume Weighted Average Price (VWAP) of ANZ shares traded on the ASX in the week leading up to and including the date of grant.
Australia ANZ ordinary shares were granted to eligible employees for nil consideration. The shares vested on grant and are being held in trust for three years from grant date, after which time they may remain in trust, be transferred to the employee’s name or sold. Dividends are automatically reinvested in the Dividend Reinvestment Plan.
New Zealand Shares were granted to eligible employees on payment of NZD one cent per share. Shares vest subject to satisfaction of a three-year service period, after which they may remain in trust, be transferred to the employee’s name or sold. Unvested shares are forfeited if the employee resigns or is dismissed for serious misconduct. Dividends are either paid in cash or reinvested into the Dividend Reinvestment Plan.
Expensing value (fair value)
In Australia, the fair value of the shares is expensed in the year shares are granted, as they are not subject to forfeiture.
In New Zealand, the fair value is expensed on a straight-line basis over the three year vesting period.
The expense is recognised as a share-based compensation expense with a corresponding increase in equity.
2020 grants 698,862 shares were granted on 2 December 2019 at an issue price of $24.96.
Deferred Share Plan i) ANZ Incentive Plan (ANZIP) - Chief Executive Officer (CEO), Group Executive Committee (ExCo) and other Banking Executive Accountability Regime (BEAR) Accountable Executives
Eligibility Group CEO, ExCo and Group General Manager Internal Audit (GGM IA).
Grant 50% of the CEO’s Annual Variable Remuneration (AVR), 25% of ExCo’s Variable Remuneration (VR) (except for the Chief Risk Officer (CRO)), and 33% of the CRO and GGM IA’s VR, is received as deferred shares.
Conditions Deferred over at least one to four years from the date the Board approved the variable remuneration award.
ii) ANZIP: Based on the 2020 Performance and Remuneration Review
Eligibility All employees excluding the CEO, ExCo and GGM IA (i.e. other BEAR Accountable Executive), and select roles in the United Kingdom (UK)/China1.
Grant If VR is at or exceeds AUD 100,000, then 60% of total VR amount is deferred as shares.
Conditions Deferred over three years from grant date.
iii) ANZIP: Based on the 2019 Performance and Remuneration Review (granted in the 2020 financial year)
Eligibility All employees excluding the CEO, ExCo and GGM IA (i.e. other BEAR Accountable Executive), and select roles in the UK/China1.
Grant If VR is at or exceeds AUD 150,000, then 60% of VR amounts exceeding AUD 80,000 (subject to a minimum deferral amount of AUD 42,000) is deferred as shares.
Conditions Deferred over three years from grant date.
iv) Long Term Incentives (LTIs): Based on the 2019 Performance and Remuneration Review (granted in the 2020 financial year)
Eligibility Selected employees (excludes the CEO, ExCo and GGM IA (i.e. other BEAR Accountable Executive)).
Grant 100% deferred shares.
Conditions Vest three years from grant date.
1. Specific deferral arrangements also exist under ANZIP for roles defined as United Kingdom Material Risk Takers and China Material Risk Takers, in line with local regulatory requirements.
31. Employee share and option plans
231ANZ 2021 Annual Report
OVERVIEW HOW WE CREATE VALUE
PERFORMANCE OVERVIEW
REMUNERATION REPORT
DIRECTORS’ REPORT
FINANCIAL REPORT
SHAREHOLDER INFORMATION Notes to the financial statements (continued)

ANZ 2021 ANNUAL REPORT
NOTES TO THE FINANCIAL STATEMENTS (continued)
232
31. EMPLOYEE SHARE AND OPTION PLANS (continued)
v) Exceptional circumstances
Remuneration foregone
In exceptional circumstances, we grant deferred shares to certain employees when they start with ANZ to compensate them for remuneration they have foregone from their previous employer. The vesting period generally aligns with the remaining vesting period of the remuneration they have foregone, and therefore varies between grants.
Retention We may grant deferred shares to high performing employees who are regarded as a significant retention risk to ANZ.
vi) Further information
Cessation Unless the Board decides otherwise, employees forfeit their unvested deferred shares if they resign, are terminated on notice, or are dismissed for serious misconduct. The deferred shares may be held in trust beyond the deferral period.
Dividends Dividends are reinvested in the Dividend Reinvestment Plan.
Instrument Deferred share rights may be granted instead of deferred shares in some countries as locally appropriate (see deferred share rights section).
Allocation value All deferred shares are issued based on the VWAP of ANZ shares traded on the ASX in the week leading up to and including the date of grant.
Expensing value (fair value)
We expense the fair value of deferred shares on a straight-line basis over the relevant vesting period and we recognise the expense as a share-based compensation expense with a corresponding increase in equity.
2021 and 2020 grants During the 2021 year, we granted 1,653,585 deferred shares (2020: 2,259,897) with a weighted average grant price of $23.31 (2020: $24.94).
Malus (downward adjustment)
Deferred shares remain at risk and the Board has the discretion to adjust the number of deferred shares downwards, including to zero at any time before the vesting date. ANZ’s malus (downward adjustment) provisions are detailed in section 5.3 of the 2021 Remuneration Report.
Board discretion was not exercised to adjust downward any deferred shares in 2021 (2020: nil).
Expensing of the ANZ Employee Share Acquisition Plan
Expensing value (fair value)
The fair value of shares we granted during 2021 under the Deferred Share Plan (in 2020 under the Employee Share Offer and the Deferred Share Plan), measured as at the date of grant of the shares, is $38.9 million (2020: $73.4 million) based on 1,653,585 shares (2020: 2,958,759) at VWAP of $23.53 (2020: $24.81).
232
OVERVIEW HOW WE CREATE VALUE
PERFORMANCE OVERVIEW
REMUNERATION REPORT
DIRECTORS’ REPORT
FINANCIAL REPORT
SHAREHOLDER INFORMATION

NOTES TO THE FINANCIAL STATEMENTS
233
31. EMPLOYEE SHARE AND OPTION PLANS (continued)
ANZ SHARE OPTION PLAN Allocation We may grant selected employees options/rights which entitle them to acquire fully paid ordinary ANZ shares at a
fixed price at the time the options/rights vest. Voting and dividend rights will be attached to the ordinary shares allocated on exercise of the options/rights.
Each option/right entitles the holder to one ordinary share subject to the terms and conditions imposed on grant. Exercise price of options, determined in accordance with the rules of the plan, is generally based on the VWAP of the shares traded on the ASX in the week leading up to and including the date of grant. For rights, the exercise price is nil.
Rules Prior to the exercise of the option/right if ANZ changes its share capital due to a bonus share issue, pro-rata new share issue or reorganisation the following adjustments are required:
Issue of bonus shares - When the holder exercises their option, they are also entitled to be issued the number of bonus shares they would have been entitled to had they held the underlying shares at the time of the bonus issue;
Pro-rata share offer - We will adjust the exercise price of the option in the manner set out in the ASX Listing Rules; and
Reorganisation - In respect of rights, if there is a bonus issue or reorganisation of ANZ’s share capital, then the Board may adjust the number of rights or the number of underlying shares so that there is no advantage or disadvantage to the holder.
Holders otherwise have no other entitlements to participate:
in any new issue of ANZ securities before they exercise their options/rights; or
in a share issue of a body corporate other than ANZ (such as a subsidiary).
Any portion of the award which vests may, at the Board’s discretion, be satisfied by a cash equivalent payment rather than shares.
Expensing We expense the fair value of options/rights on a straight-line basis over the relevant vesting period and we recognise the expense as a share-based compensation expense with a corresponding increase in equity.
Cessation The provisions that apply if the employee’s employment ends are in section 8.2.3 of the 2021 Remuneration Report.
Malus (downward adjustment)
ANZ’s malus (downward adjustment) provisions are detailed in section 5.3 of the 2021 Remuneration Report.
233ANZ 2021 Annual Report
OVERVIEW HOW WE CREATE VALUE
PERFORMANCE OVERVIEW
REMUNERATION REPORT
DIRECTORS’ REPORT
FINANCIAL REPORT
SHAREHOLDER INFORMATION Notes to the financial statements (continued)

ANZ 2021 ANNUAL REPORT
NOTES TO THE FINANCIAL STATEMENTS (continued)
234
31. EMPLOYEE SHARE AND OPTION PLANS (continued)
Option Plans that operated during 2021 and 2020
i) Performance Rights
Allocation We grant performance rights to the CEO and ExCo as part of ANZ’s variable remuneration plans. Performance rights provide the holder with the right to acquire ANZ shares at nil cost, subject to a four-year vesting period and Total Shareholder Return (TSR) performance hurdles. Further details on the performance hurdles are in section 5.2.3a of the 2021 Remuneration Report.
Satisfying vesting Any portion of the award of performance rights (that have met the performance hurdles) may be satisfied by a cash equivalent payment rather than shares at the Board’s discretion. In 2021, the performance rights that vested (previously granted in November/December 2017) were satisfied through a share allocation, other than 36,103 performance rights for which a cash payment was made. In 2020, all performance rights (previously granted in November/December 2016) lapsed due to not meeting the performance hurdles.
2021 and 2020 grants During the 2021 year, we granted 485,032 performance rights (2020: 520,172).
Malus (downward adjustment) Board discretion was not exercised to adjust downward any performance rights in 2021 (2020: nil).
ii) Deferred Share Rights (no performance hurdles)
Allocation Deferred share rights provide the holder with the right to acquire ANZ shares at nil cost after a specified vesting period. We adjust the fair value of rights for the absence of dividends during the restriction period. Also, see section 5.2.3b of the 2021 Remuneration Report.
Satisfying vesting Any portion of the award of share rights may be satisfied by a cash equivalent payment rather than shares at the Board’s discretion. All share rights were satisfied through a share allocation, other than 89,296 deferred share rights (2020: 99,891) for which a cash payment was made.
2021 and 2020 grants During the 2021 year, 2,258,774 deferred share rights (no performance hurdles) were granted (2020: 2,393,424).
Malus (downward adjustment) Board discretion was exercised to adjust downward 8,414 deferred share rights to zero in 2021 (2020: nil).
234
OVERVIEW HOW WE CREATE VALUE
PERFORMANCE OVERVIEW
REMUNERATION REPORT
DIRECTORS’ REPORT
FINANCIAL REPORT
SHAREHOLDER INFORMATION

NOTES TO THE FINANCIAL STATEMENTS
235
31. EMPLOYEE SHARE AND OPTION PLANS (continued)
Options, Deferred Share Rights and Performance Rights on Issue
As at 27 October 2021, there were 442 holders of 4,537,088 deferred share rights on issue and 97 holders of 1,709,028 performance rights on issue.
Options/Rights Movements
This table shows the options/rights over unissued ANZ shares and their related weighted average (WA) exercise prices as at the beginning and end of 2021 and the movements during 2021:
Opening balance
1 Oct 2020
Options/ rights
granted
Options/ rights
forfeited1
Options/ rights
expired
Options/ rights
exercised
Closing balance
30 Sep 2021
Number of options/rights 6,724,557 2,743,806 (918,589) 0 (2,241,996) 6,307,778
WA exercise price $0.00 $0.00 $0.00 $0.00 $0.00 $0.00
WA closing share price $25.34
WA remaining contractual life 1.8 years
WA exercise price of all exercisable options/rights outstanding
$0.00
Outstanding exercisable options/rights 227,412
This table shows the options/rights over unissued ANZ shares and their related weighted average exercise prices as at the beginning and end of 2020 and the movements during 2020:
Opening balance
1 Oct 2019
Options/ rights
granted
Options/ rights
forfeited1
Options/ rights
expired
Options/ rights
exercised
Closing balance
30 Sep 2020
Number of options/rights 6,688,538 2,913,596 (976,468) 0 (1,901,109) 6,724,557
WA exercise price $0.00 $0.00 $0.00 $0.00 $0.00 $0.00
WA closing share price $19.94
WA remaining contractual life 1.9 years
WA exercise price of all exercisable options/rights outstanding $0.00
Outstanding exercisable options/rights 151,829
1. Refers to any circumstance where equity can be forfeited (for example on cessation, downward adjustment or performance conditions not met).
All of the shares issued as a result of the exercise of options/rights during 2021 and 2020, were issued at a nil exercise price.
As at the date of the signing of the Directors’ Report on 27 October 2021:
no options/rights over ordinary shares have been granted since the end of 2021; and
no shares issued as a result of the exercise of options/rights since the end of 2021.
235ANZ 2021 Annual Report
OVERVIEW HOW WE CREATE VALUE
PERFORMANCE OVERVIEW
REMUNERATION REPORT
DIRECTORS’ REPORT
FINANCIAL REPORT
SHAREHOLDER INFORMATION Notes to the financial statements (continued)

ANZ 2021 ANNUAL REPORT
NOTES TO THE FINANCIAL STATEMENTS (continued)
236
31. EMPLOYEE SHARE AND OPTION PLANS (continued)
Fair Value Assumptions
When determining the fair value, we apply the standard market techniques for valuation, including Monte Carlo and/or Black Scholes pricing models. We do so in accordance with the requirements of AASB 2 Share-based Payments. The models take into account early exercise of vested equity, non-transferability and internal/external performance hurdles (if any).
The table below shows the significant assumptions we used as inputs into our fair value calculation of instruments granted during the period. We present the values as weighted averages, but the specific values we use for each allocation are the ones we use for the fair value calculation.
2021 2020
Deferred share rights
Performance rights
Deferred share rights
Performance rights1
Exercise price ($) 0.00 0.00 0.00 0.00
Share closing price at grant date ($) 23.37 23.32 24.78 24.93
Expected volatility of ANZ share price (%)2 26.5 25.0 20.0 20.0
Equity term (years) 2.3 6.0 2.5 6.0
Vesting period (years) 2.0 4.0 2.1 4.0
Expected life (years) 2.0 4.0 2.1 4.0
Expected dividend yield (%) 4.85 5.25 6.0 6.0
Risk free interest rate (%) 0.10 0.21 0.77 0.74
Fair value ($) 21.15 9.56 21.95 9.07 1. Relates to grants made in November 2019. 2. Expected volatility represents a measure of the amount by which ANZ’s share price is expected to fluctuate over the life of the rights. The measure of volatility used in the model is the annualised standard
deviation of the continuously compounded rates of return on the historical share price over a defined period of time preceding the date of grant. This historical average annualised volatility is then used to estimate a reasonable expected volatility over the expected life of the rights.
SATISFYING EQUITY AWARDS All shares underpinning equity awards may be purchased on market, reallocated or be newly issued shares, or a combination.
The equity we purchased on market during the 2021 financial year (either under the ANZ Employee Share Acquisition Plan and the ANZ Share Option Plan, or to satisfy options or rights) for all employees amounted to 3,593,574 shares at an average price of $22.03 per share (2020: 4,882,936 shares at an average price of $25.06 per share).
236
OVERVIEW HOW WE CREATE VALUE
PERFORMANCE OVERVIEW
REMUNERATION REPORT
DIRECTORS’ REPORT
FINANCIAL REPORT
SHAREHOLDER INFORMATION
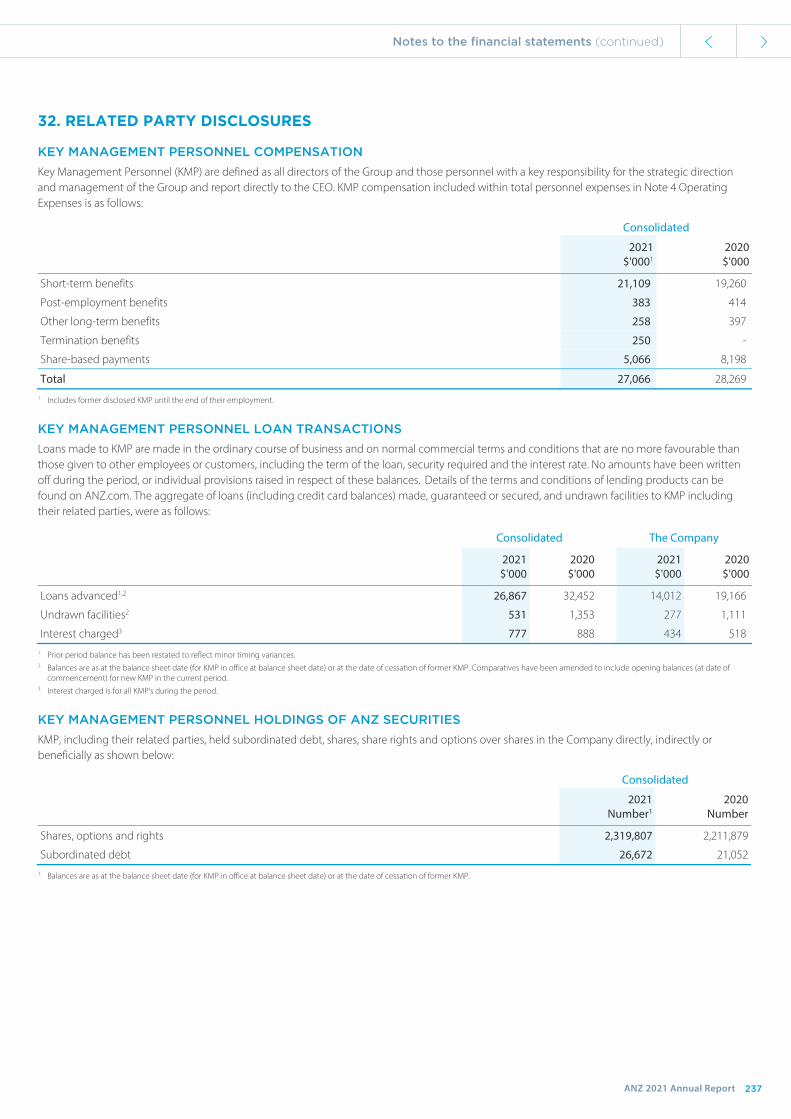
NOTES TO THE FINANCIAL STATEMENTS
237
32. RELATED PARTY DISCLOSURES
KEY MANAGEMENT PERSONNEL COMPENSATION Key Management Personnel (KMP) are defined as all directors of the Group and those personnel with a key responsibility for the strategic direction and management of the Group and report directly to the CEO. KMP compensation included within total personnel expenses in Note 4 Operating Expenses is as follows:
Consolidated 2021 2020 $'0001 $'000
Short-term benefits 21,109 19,260
Post-employment benefits 383 414
Other long-term benefits 258 397
Termination benefits 250 -
Share-based payments 5,066 8,198
Total 27,066 28,269 1. Includes former disclosed KMP until the end of their employment.
KEY MANAGEMENT PERSONNEL LOAN TRANSACTIONS Loans made to KMP are made in the ordinary course of business and on normal commercial terms and conditions that are no more favourable than those given to other employees or customers, including the term of the loan, security required and the interest rate. No amounts have been written off during the period, or individual provisions raised in respect of these balances. Details of the terms and conditions of lending products can be found on ANZ.com. The aggregate of loans (including credit card balances) made, guaranteed or secured, and undrawn facilities to KMP including their related parties, were as follows:
Consolidated The Company
2021 2020 2021 2020 $'000 $'000 $'000 $'000
Loans advanced1,2 26,867 32,452 14,012 19,166
Undrawn facilities2 531 1,353 277 1,111
Interest charged3 777 888 434 518 1. Prior period balance has been restated to reflect minor timing variances. 2. Balances are as at the balance sheet date (for KMP in office at balance sheet date) or at the date of cessation of former KMP. Comparatives have been amended to include opening balances (at date of
commencement) for new KMP in the current period. 3. Interest charged is for all KMP’s during the period.
KEY MANAGEMENT PERSONNEL HOLDINGS OF ANZ SECURITIES KMP, including their related parties, held subordinated debt, shares, share rights and options over shares in the Company directly, indirectly or beneficially as shown below:
Consolidated 2021 2020 Number1 Number
Shares, options and rights 2,319,807 2,211,879
Subordinated debt 26,672 21,052 1. Balances are as at the balance sheet date (for KMP in office at balance sheet date) or at the date of cessation of former KMP.
32. Related party disclosures
237ANZ 2021 Annual Report
OVERVIEW HOW WE CREATE VALUE
PERFORMANCE OVERVIEW
REMUNERATION REPORT
DIRECTORS’ REPORT
FINANCIAL REPORT
SHAREHOLDER INFORMATION Notes to the financial statements (continued)

ANZ 2021 ANNUAL REPORT
NOTES TO THE FINANCIAL STATEMENTS (continued)
238
32. RELATED PARTY DISCLOSURES (continued)
OTHER TRANSACTIONS OF KEY MANAGEMENT PERSONNEL AND THEIR RELATED PARTIES The aggregate of deposits of KMP and their related parties with the Group were $46 million (2020: $48 million) and with the Company were $38 million (2020: $37 million).
During the year, in recognition of the contribution of David Gonski as Group Chairman over the period from 2014-2020 the Group donated a painting (valued at approximately $325,000) from its collection to the Art Gallery of New South Wales, where he is the president on the Board of Trustees. ANZ has enjoyed an association with the Art Gallery of NSW since 2010, through its sponsorship of various annually awarded art prizes and it has been a Leadership Partner since 2017. The transaction between the Group and the Art Gallery New South Wales is not a related party transaction for accounting purposes.
Other transactions with KMP and their related parties included amounts paid to the Group in respect of investment management service fees, brokerage and bank fees and charges. The Group has reimbursed KMP for the costs incurred for security and secretarial services associated with the performance of their duties. These transactions are conducted on normal commercial terms and conditions no more favourable than those given to other employees or customers. Gifts in the form of charitable donation amounting to $500 were provided on behalf of the related parties of KMP during the year.
ASSOCIATES We disclose significant associates in Note 26 Investments in Associates. During the course of the financial year, transactions conducted with all associates were on terms equivalent to those made on an arm’s length basis.
Consolidated The Company
2021 2020 2021 2020 $'000 $'000 $'000 $'000
Amounts receivable from associates 7 354 - -
Amounts payable to associates 1,739 1,354 716 746
Interest expense to associates 2 10 - -
Other revenue from associates - 500 - -
Other expenses paid to associates 9,988 9,018 8,063 7,706
Guarantees given to associates 28 - 28 -
Dividend income from associates - 32,465 - - There have been no material guarantees given or received. No amounts receivable from the associates have been written-off during the period, or individual provisions raised in respect of these balances.
SUBSIDIARIES We disclose material controlled entities in Note 25 Controlled Entities. During the financial year, subsidiaries conducted transactions with each other and with associates on terms equivalent to those on an arm’s length basis. As of 30 September 2021, we consider all outstanding amounts on these transactions to be fully collectible.
Transactions between the Company and its subsidiaries include providing a wide range of banking and other financial facilities. Details of amounts paid to, or received from, related parties, in the form of dividends or interest, are set out in Note 2 Net Interest Income and Note 3 Non-Interest Income.
Other intragroup transactions include providing management and administrative services, staff training, data processing facilities, transfer of tax losses, and the leasing of Premises and equipment.
238
OVERVIEW HOW WE CREATE VALUE
PERFORMANCE OVERVIEW
REMUNERATION REPORT
DIRECTORS’ REPORT
FINANCIAL REPORT
SHAREHOLDER INFORMATION
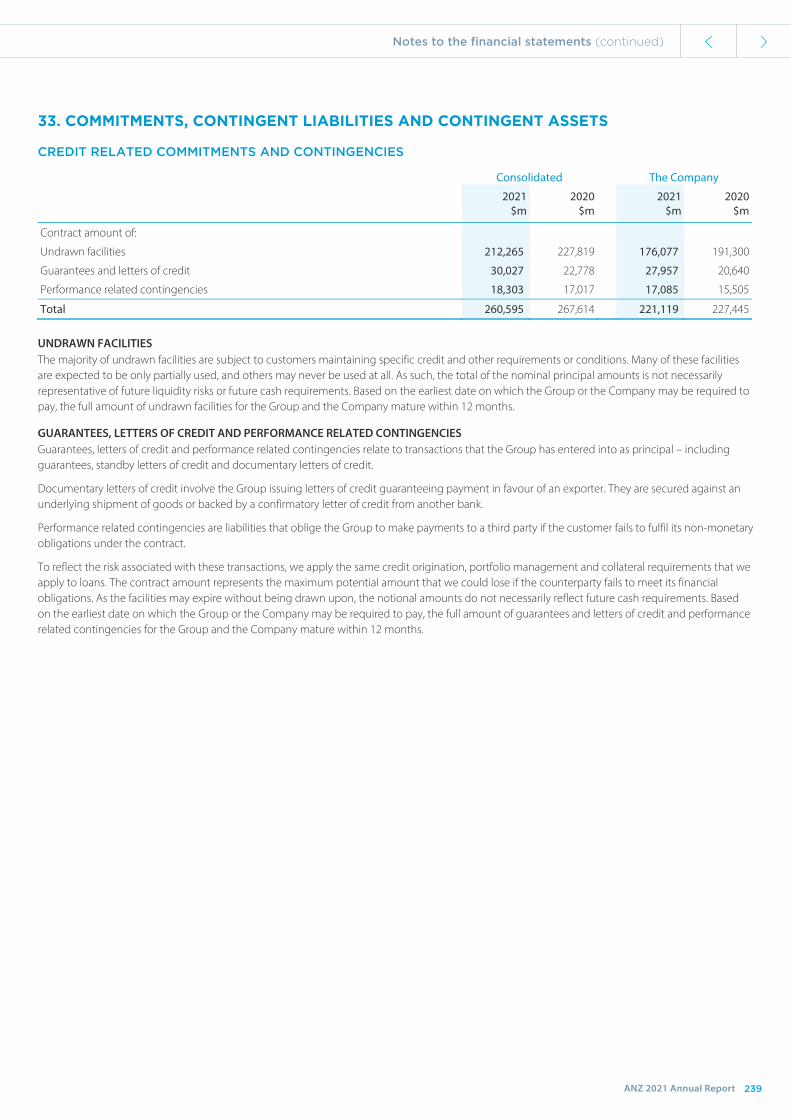
NOTES TO THE FINANCIAL STATEMENTS
239
33. COMMITMENTS, CONTINGENT LIABILITIES AND CONTINGENT ASSETS
CREDIT RELATED COMMITMENTS AND CONTINGENCIES
Consolidated The Company
2021 2020 2021 2020 $m $m $m $m
Contract amount of:
Undrawn facilities 212,265 227,819 176,077 191,300
Guarantees and letters of credit 30,027 22,778 27,957 20,640
Performance related contingencies 18,303 17,017 17,085 15,505
Total 260,595 267,614 221,119 227,445
UNDRAWN FACILITIES The majority of undrawn facilities are subject to customers maintaining specific credit and other requirements or conditions. Many of these facilities are expected to be only partially used, and others may never be used at all. As such, the total of the nominal principal amounts is not necessarily representative of future liquidity risks or future cash requirements. Based on the earliest date on which the Group or the Company may be required to pay, the full amount of undrawn facilities for the Group and the Company mature within 12 months.
GUARANTEES, LETTERS OF CREDIT AND PERFORMANCE RELATED CONTINGENCIES Guarantees, letters of credit and performance related contingencies relate to transactions that the Group has entered into as principal – including guarantees, standby letters of credit and documentary letters of credit.
Documentary letters of credit involve the Group issuing letters of credit guaranteeing payment in favour of an exporter. They are secured against an underlying shipment of goods or backed by a confirmatory letter of credit from another bank.
Performance related contingencies are liabilities that oblige the Group to make payments to a third party if the customer fails to fulfil its non-monetary obligations under the contract.
To reflect the risk associated with these transactions, we apply the same credit origination, portfolio management and collateral requirements that we apply to loans. The contract amount represents the maximum potential amount that we could lose if the counterparty fails to meet its financial obligations. As the facilities may expire without being drawn upon, the notional amounts do not necessarily reflect future cash requirements. Based on the earliest date on which the Group or the Company may be required to pay, the full amount of guarantees and letters of credit and performance related contingencies for the Group and the Company mature within 12 months.
33. Commitments, contingent liabilities and contingent assets
239ANZ 2021 Annual Report
OVERVIEW HOW WE CREATE VALUE
PERFORMANCE OVERVIEW
REMUNERATION REPORT
DIRECTORS’ REPORT
FINANCIAL REPORT
SHAREHOLDER INFORMATION Notes to the financial statements (continued)
ANZ 2021 ANNUAL REPORT
NOTES TO THE FINANCIAL STATEMENTS (continued)
240
33. COMMITMENTS, CONTINGENT LIABILITIES AND CONTINGENT ASSETS (continued)
OTHER CONTINGENT LIABILITIES As at 30 September 2021, the Group had contingent liabilities in respect of the matters outlined below. Where relevant, expert legal advice has been obtained and, in the light of such advice, provisions (refer to Note 22 Other Provisions) and/or disclosures as deemed appropriate have been made. In some instances we have not disclosed the estimated financial impact of the individual items either because it is not practicable to do so or because such disclosure may prejudice the interests of the Group.
REGULATORY AND CUSTOMER EXPOSURES In recent years there has been an increase in the number of matters on which the Group engages with its regulators. There have also been significant increases in the nature and scale of regulatory investigations, surveillance and reviews, civil and criminal enforcement actions (whether by court action or otherwise), formal and informal inquiries, regulatory supervisory activities and the quantum of fines issued by regulators, particularly against financial institutions both in Australia and globally. The Group has received various notices and requests for information from its regulators as part of both industry-wide and Group-specific reviews and has also made disclosures to its regulators at its own instigation. The nature of these interactions can be wide ranging and, for example, include or have included a range of matters including responsible lending practices, regulated lending requirements, product suitability and distribution, interest and fees and the entitlement to charge them, customer remediation, wealth advice, insurance distribution, pricing, competition, conduct in financial markets and financial transactions, capital market transactions, anti-money laundering and counter-terrorism financing obligations, reporting and disclosure obligations and product disclosure documentation. There may be exposures to customers which are additional to any regulatory exposures. These could include class actions, individual claims or customer remediation or compensation activities. The outcomes and total costs associated with such reviews and possible exposures remain uncertain.
BENCHMARK/RATE ACTIONS In July and August 2016, class action complaints were brought in the United States District Court against local and international banks, including the Company – one action relating to the bank bill swap rate (BBSW), and one action relating to the Singapore Interbank Offered Rate (SIBOR) and the Singapore Swap Offer Rate (SOR). The class actions are expressed to apply to persons and entities that engaged in US-based transactions in financial instruments that were priced, benchmarked, and/or settled based on BBSW or SIBOR. The claimants seek damages or compensation in amounts not specified, and allege that the defendant banks, including the Company, violated US anti-trust laws and (in the BBSW case only) antiracketeering laws, the Commodity Exchange Act, and unjust enrichment principles. In March 2021, the Company reached an agreement to settle the BBSW class action. The settlement is without admission of liability and remains subject to negotiation and execution of complete settlement terms as well as court approval. The financial impact of the settlement is not material and has been fully provided at 31 March 2021. The separate class action in relation to SIBOR is ongoing and is being defended.
In February 2017, the South African Competition Commission commenced proceedings against local and international banks including the Company alleging breaches of the cartel provisions of the South African Competition Act in respect of trading in the South African rand. The potential civil penalty or other financial impact is uncertain.
CAPITAL RAISING ACTIONS In June 2018, the Commonwealth Director of Public Prosecutions commenced criminal proceedings against a number of companies and individuals, including the Company and a senior employee. It is alleged that the joint lead managers of the Company’s August 2015 underwritten institutional equity placement engaged in cartel conduct and that the Company and its senior employee were involved in one of those joint lead managers giving effect to a cartel. The Company and its senior employee are defending the allegations. The trial is currently scheduled to start in April 2022.
In September 2018, the Australian Securities and Investments Commission (ASIC) commenced civil penalty proceedings against the Company alleging failure to comply with continuous disclosure obligations in connection with the Company’s August 2015 underwritten institutional equity placement. ASIC alleges the Company should have advised the market that the joint lead managers took up approximately 25.5 million ordinary shares of the placement. The Company is defending the allegations.
CONSUMER CREDIT INSURANCE LITIGATION In February 2020, a class action was brought against the Company alleging breaches of financial advice obligations, misleading or deceptive conduct and unconscionable conduct in relation to the distribution of consumer credit insurance products. The issuers of the insurance products, QBE and OnePath Life, are also defendants to the claim. The Company is defending the allegations.
ESANDA DEALER CAR LOAN LITIGATION In August 2020, a class action was brought against the Company alleging unfair conduct, misleading or deceptive conduct and equitable mistake in relation to the use of flex commissions in dealer arranged Esanda car loans. The Company is defending the allegations.
ONEPATH SUPERANNUATION LITIGATION In December 2020, a class action was brought against OnePath Custodians, OnePath Life and the Company alleging that OnePath Custodians breached its obligations under superannuation legislation, and its duties as trustee, in respect of superannuation investments and fees. The claim also alleges that the Company was involved in some of OnePath Custodians’ investment breaches. The Company is defending the allegations.
240
OVERVIEW HOW WE CREATE VALUE
PERFORMANCE OVERVIEW
REMUNERATION REPORT
DIRECTORS’ REPORT
FINANCIAL REPORT
SHAREHOLDER INFORMATION

NOTES TO THE FINANCIAL STATEMENTS
241
33. COMMITMENTS, CONTINGENT LIABILITIES AND CONTINGENT ASSETS (continued)
OTHER CONTINGENT LIABILITIES (continued)
NEW ZEALAND LOAN INFORMATION LITIGATION In September 2021, a representative proceeding was brought against ANZ Bank New Zealand Limited, alleging breaches of disclosure requirements under consumer credit legislation in respect of variation letters sent to certain loan customers. ANZ Bank New Zealand Limited is defending the allegations.
ROYAL COMMISSION The Royal Commission into Misconduct in the Banking, Superannuation and Financial Services Industry released its final report on 4 February 2019. Following the Royal Commission there have been, and continue to be, additional costs and further exposures, including exposures associated with further regulator activity or potential customer exposures such as class actions, individual claims or customer remediation or compensation activities. The outcomes and total costs associated with these possible exposures remain uncertain.
SECURITY RECOVERY ACTIONS Various claims have been made or are anticipated, arising from security recovery actions taken to resolve impaired assets. These claims will be defended.
WARRANTIES AND INDEMNITIES The Group has provided warranties, indemnities and other commitments in favour of the purchaser and other persons in connection with various disposals of businesses and assets and other transactions, covering a range of matters and risks. It is exposed to claims under those warranties, indemnities and commitments.
CLEARING AND SETTLEMENT OBLIGATIONS Certain group companies have a commitment to comply with rules governing various clearing and settlement arrangements which could result in a credit risk exposure and loss if another member institution fails to settle its payment clearing activities. The Group’s potential exposure arising from these arrangements is unquantifiable in advance.
Certain group companies hold memberships of central clearing houses, including ASX Clear (Futures), London Clearing House (LCH) SwapClear and RepoClear, Korea Exchange (KRX), Hong Kong Exchange (HKEX), Clearing Corporation of India and the Shanghai Clearing House. These memberships allow the relevant group company to centrally clear derivative instruments in line with cross-border regulatory requirements. Common to all of these memberships is the requirement for the relevant group company to make default fund contributions. In the event of a default by another member, the relevant group company could potentially be required to commit additional default fund contributions which are unquantifiable in advance.
PARENT ENTITY GUARANTEES The Company has issued letters of comfort and guarantees in respect of certain subsidiaries in the normal course of business. Under these letters and guarantees, the Company undertakes to ensure that those subsidiaries continue to meet their financial obligations, subject to certain conditions including that the entity remains a controlled entity of the Company.
SALE OF GRINDLAYS BUSINESSES On 31 July 2000, the Company completed the sale to Standard Chartered Bank (SCB) of ANZ Grindlays Bank Limited (Grindlays) and certain other businesses. The Company provided warranties and indemnities relating to those businesses.
The indemnified matters include civil penalty proceedings and criminal prosecutions brought by Indian authorities against Grindlays and certain of its officers, in relation to certain transactions conducted in 1991 that are alleged to have breached the Foreign Exchange Regulation Act, 1973.
Civil penalties were imposed in 2007 which are the subject of appeals. The criminal prosecutions are being defended.
CONTINGENT ASSETS NATIONAL HOUSING BANK The Company is pursuing recovery of the proceeds of certain disputed cheques which were credited to the account of a former Grindlays customer in the early 1990s.
The disputed cheques were drawn on the National Housing Bank (NHB) in India. Proceedings between Grindlays and NHB concerning the proceeds of the cheques were resolved in early 2002.
Recovery is now being pursued from the estate of the Grindlays customer who received the cheque proceeds. Any amounts recovered are to be shared between the Company and NHB.
241ANZ 2021 Annual Report
OVERVIEW HOW WE CREATE VALUE
PERFORMANCE OVERVIEW
REMUNERATION REPORT
DIRECTORS’ REPORT
FINANCIAL REPORT
SHAREHOLDER INFORMATION Notes to the financial statements (continued)

ANZ 2021 ANNUAL REPORT
NOTES TO THE FINANCIAL STATEMENTS (continued)
242
34. AUDITOR FEES
Consolidated The Company
2021 2020 2021 2020 $’000 $’000 $’000 $’000
KPMG Australia
Audit or review of financial reports 7,434 8,059 7,021 7,262 Audit-related services1 2,772 3,693 2,696 3,540 Non-audit services2 106 25 106 25 Total3 10,312 11,777 9,823 10,827
Overseas related practices of KPMG Australia
Audit or review of financial reports 5,511 6,049 1,965 2,107
Audit-related services1 1,657 1,677 917 1,008
Non-audit services2 85 98 85 44
Total 7,253 7,824 2,967 3,159
Total auditor fees 17,565 19,601 12,790 13,986 1. Group audit-related services comprise prudential and regulatory services of $3.27 million (2020: $3.61 million), comfort letters $0.49 million (2020: $0.75 million) and other services $0.67 million (2020: $1.01
million). Company audit-related services comprise prudential and regulatory services of $2.78 million (2020: $3.07 million), comfort letters $0.45 million (2020: $0.72 million) and other services $0.38 million (2020: $0.76 million).
2. The nature of non-audit services for Group and Company include controls related assessments and methodology and procedural reviews. Further details are provided in the Directors’ Report. 3. Inclusive of goods and services tax.
The Group and Company’s Policy allows KPMG Australia or any of its related practices to provide assurance and other audit-related services that, while outside the scope of the statutory audit, are consistent with the role of an external auditor. These include regulatory and prudential reviews requested by regulators such as APRA. Any other services that are not audit or audit-related services are non-audit services. The Policy allows certain non-audit services to be provided where the service would not contravene auditor independence requirements. KPMG Australia or any of its related practices may not provide services that are perceived to be in conflict with the role of the external auditor or breach auditor independence. These include consulting advice and subcontracting of operational activities normally undertaken by management, and engagements where the external auditor may ultimately be required to express an opinion on its own work.
34. Auditor fees
242
OVERVIEW HOW WE CREATE VALUE
PERFORMANCE OVERVIEW
REMUNERATION REPORT
DIRECTORS’ REPORT
FINANCIAL REPORT
SHAREHOLDER INFORMATION

NOTES TO THE FINANCIAL STATEMENTS
243
35. IMPACT OF ADOPTION OF NEW STANDARDS AND OTHER CHANGES
INTEREST RATE BENCHMARK REFORM
There was no material impact from the early adoption of AASB 2020-8 Amendments to Australian Accounting Standards - Interest Rate Benchmark Reform – Phase 2. Refer to Note 1 About Our Financial Statements for further details.
INTRAGROUP TRANSACTIONS WITH CONSOLIDATED SECURITISATION STRUCTURED ENTITIES
During the 2021 financial year, the Company changed its accounting policy relating to intragroup transactions with consolidated securitisation SEs in which it holds all of the issued securities of the SE. These internal securitisation transactions provide an additional source of liquidity for the Group by creating residential mortgage-backed securities (RMBS) which can be sold under repurchase agreements with relevant central banks. A distinguishing feature of these transactions is that all of the RMBS issued by the SE are held by the Company, rather than purchased by third parties. By holding all of the RMBS issued by the SE, the Company retains all of the risk and rewards of the mortgages transferred to the SE which cannot be derecognised for accounting purposes. Furthermore, because the intragroup transactions with the SE fully offset each other, they do not alter the cash position, assets or future cash flows of the Company. Accordingly, under this policy change, these transactions will no longer be recorded on a gross basis. Rather, the Company will recognise a net nil position with the SE in order to better reflect the economic substance of the intragroup transactions.
This accounting policy change has no impact on the Group’s consolidated financial statements given the previously recorded intercompany balances were eliminated in consolidation. Comparatives have been restated in the financial statements of the Company as follows:
2020 The Company $m
Income Statement
Interest income (2,377)
Interest expense 2,929
Net interest income 552
Other operating income (552)
Net profit after tax -
Balance Sheet
Due from controlled entities (76,637)
Total assets (76,637)
Due to controlled entities (76,637)
Total liabilities (76,637)
Net assets -
36. EVENTS SINCE THE END OF THE FINANCIAL YEAR
On 22 October 2021, a Group fund that owns 19% of the shares in Cashrewards Limited announced it would make an off-market takeover offer to acquire the remaining 81% of the shares, for ~$80 million. The offer is subject to a number of conditions and completion remains uncertain.
Other than the matter above, there have been no significant events from 30 September 2021 to the date of signing this report.
35. Impact of adoption of new standards and other changes
36. Events since the end of the financial year
243ANZ 2021 Annual Report
OVERVIEW HOW WE CREATE VALUE
PERFORMANCE OVERVIEW
REMUNERATION REPORT
DIRECTORS’ REPORT
FINANCIAL REPORT
SHAREHOLDER INFORMATION Notes to the financial statements (continued)
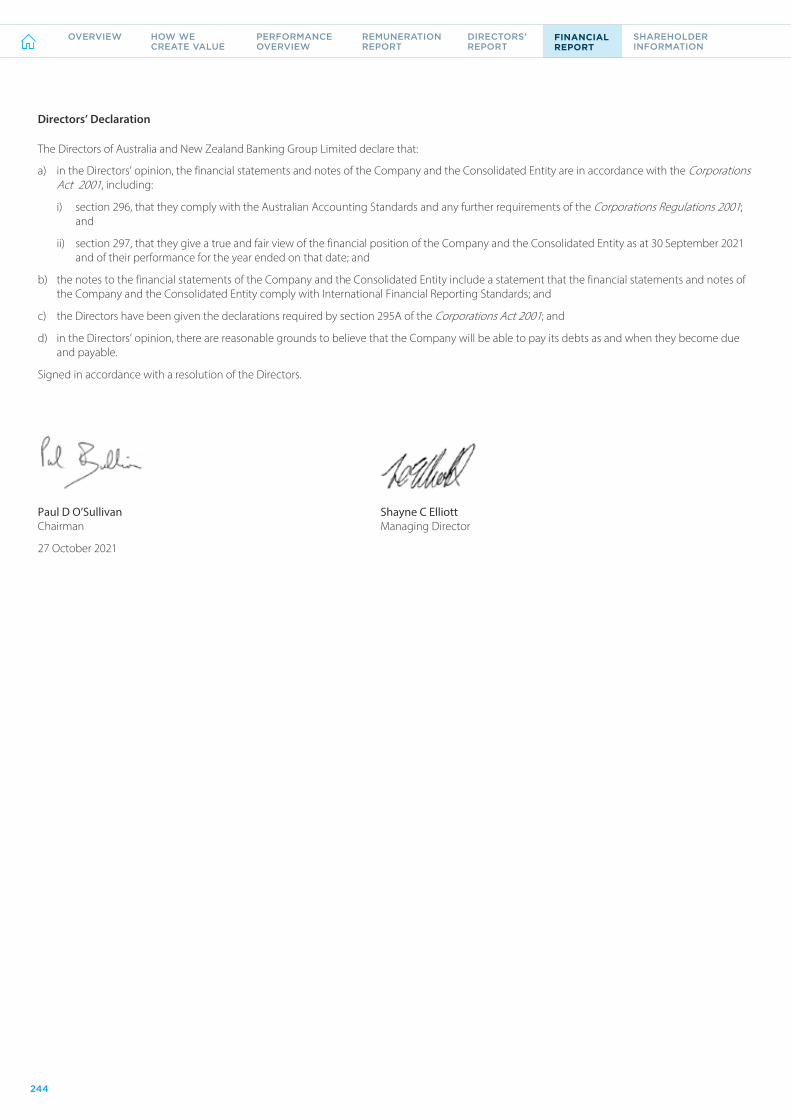
CONSOLIDATED GROUP DIRECTORS’ DECLARATION
244
Directors’ Declaration
The Directors of Australia and New Zealand Banking Group Limited declare that:
a) in the Directors’ opinion, the financial statements and notes of the Company and the Consolidated Entity are in accordance with the Corporations Act 2001, including:
i) section 296, that they comply with the Australian Accounting Standards and any further requirements of the Corporations Regulations 2001; and
ii) section 297, that they give a true and fair view of the financial position of the Company and the Consolidated Entity as at 30 September 2021 and of their performance for the year ended on that date; and
b) the notes to the financial statements of the Company and the Consolidated Entity include a statement that the financial statements and notes of the Company and the Consolidated Entity comply with International Financial Reporting Standards; and
c) the Directors have been given the declarations required by section 295A of the Corporations Act 2001; and
d) in the Directors’ opinion, there are reasonable grounds to believe that the Company will be able to pay its debts as and when they become due and payable.
Signed in accordance with a resolution of the Directors.
Paul D O’Sullivan Chairman
27 October 2021
Shayne C Elliott Managing Director
Directors' Declaration
OVERVIEW HOW WE CREATE VALUE
PERFORMANCE OVERVIEW
REMUNERATION REPORT
DIRECTORS’ REPORT
FINANCIAL REPORT
SHAREHOLDER INFORMATION
244
OVERVIEW HOW WE CREATE VALUE
PERFORMANCE OVERVIEW
REMUNERATION REPORT
DIRECTORS’ REPORT
FINANCIAL REPORT
SHAREHOLDER INFORMATION

INDEPENDENT AUDITOR’S REPORT
NOTES TO THE FINANCIAL STATEMENTS
245
TO THE SHAREHOLDERS OF AUSTRALIA AND NEW ZEALAND BANKING GROUP LIMITED
REPORT ON THE AUDIT OF THE FINANCIAL REPORT OPINION We have audited the Financial Report of Australia and New Zealand Banking Group Limited (the Company) and the entities it controlled at the year end and from time to time during the financial year (together, the Group).
In our opinion, the accompanying Financial Report is in accordance with the Corporations Act 2001, including:
giving a true and fair view of the Company and Group’s financial positions as at 30 September 2021 and of their financial performance for the year ended on that date; and
complying with Australian Accounting Standards and the Corporations Regulations 2001.
The Financial Report comprises the:
balance sheets as at 30 September 2021;
income statements, statements of comprehensive income, statements of changes in equity, and cash flow statements for the year then ended;
notes 1 to 36 including a summary of significant accounting policies; and
Directors’ Declaration.
BASIS FOR OPINION We conducted our audit in accordance with Australian Auditing Standards. We believe that the audit evidence we have obtained is sufficient and appropriate to provide a basis for our opinion.
Our responsibilities under those standards are further described in the Auditor’s responsibilities for the audit of the Financial Report section of our report.
We are independent of the Group in accordance with the Corporations Act 2001 and the ethical requirements of the Accounting Professional and Ethical Standards Board’s APES 110 Code of Ethics for Professional Accountants (the Code) that are relevant to our audit of the Financial Report in Australia. We have fulfilled our other ethical responsibilities in accordance with the Code.
KEY AUDIT MATTERS The Key Audit Matters we identified are:
Allowance for expected credit losses;
Subjective and complex valuation of financial instruments held at fair value;
Carrying value of investment in Asian associates;
Provisions for customer remediation; and
IT systems and controls.
Key Audit Matters are those matters that, in our professional judgement, were of most significance in our audit of the Financial Report of the current period.
These matters were addressed in the context of our audit of the Financial Report as a whole, and in forming our opinion thereon, and we do not provide a separate opinion on these matters.
KPMG, an Australian partnership and a member firm of the KPMG global organisation of independent member firms affiliated with KPMG International Limited, a private English company limited by guarantee. All rights reserved. The KPMG name and logo are trademarks used under license by the independent member firms of the KPMG global organisation. Liability limited by a scheme approved under Professional Standards Legislation.
External Audit
245ANZ 2021 Annual Report
OVERVIEW HOW WE CREATE VALUE
PERFORMANCE OVERVIEW
REMUNERATION REPORT
DIRECTORS’ REPORT
FINANCIAL REPORT
SHAREHOLDER INFORMATION
OVERVIEW HOW WE CREATE VALUE
PERFORMANCE OVERVIEW
REMUNERATION REPORT
DIRECTORS’ REPORT
FINANCIAL REPORT
SHAREHOLDER INFORMATION

ANZ 2021 ANNUAL REPORT
INDEPENDENT AUDITOR’S REPORT (continued)
246
KEY AUDIT MATTERS (continued) ALLOWANCE FOR EXPECTED CREDIT LOSSES (Group $4,882m; Company $4,062m)
Refer to the critical accounting estimates and judgements disclosures in relation to the allowance for expected credit losses in Note 14 to the Financial Report.
The Key Audit Matter Allowance for expected credit losses is a key audit matter due to the significance of the loans and advances balance to the financial statements and the inherent complexity of the Company and Group’s Expected Credit Loss models (ECL models) used to measure ECL allowances. These models are reliant on data and a number of estimates including the impact of multiple economic scenarios and other assumptions such as defining a significant increase in credit risk (SICR).
AASB 9 Financial Instruments requires the Company and Group to measure ECLs on a forward-looking basis reflecting a range of economic conditions, of which gross domestic product (GDP) and unemployment levels are considered key assumptions. Post-model adjustments are made by the Company and Group to address known ECL model limitations or emerging trends in the loan portfolios. We exercise significant judgement in challenging the economic scenarios used and the judgmental post model adjustments the Company and Group applies to the ECL results.
The Company and Group’s criteria selected to identify a SICR, such as a decrease in customer credit rating (CCR), are key areas of judgement within the Company and Group’s ECL methodology as these criteria determine if a forward-looking 12 month or lifetime allowance is recorded.
The COVID-19 pandemic has meant that assumptions regarding the economic outlook are more uncertain which, combined with varying government responses, increases the level of judgement required by the Company and Group in calculating the ECL, and the associated audit risk.
Additionally, allowances for individually assessed wholesale loans exceeding specific thresholds are individually assessed by the Company and Group. We exercise significant judgement in challenging the assessment of specific allowances based on the expected future cash repayments and estimated proceeds from the value of the collateral held by the Company and Group in respect of the loans.
How the matter was addressed in our audit Our audit procedures for the allowance for ECL and disclosures included assessing the Company and Group’s significant accounting policies against the requirements of the accounting standard. Additionally, our procedures included:
Testing key controls of the Company and Group in relation to:
The ECL model governance and validation processes which involved assessment of model performance;
The assessment and approval of the forward-looking macroeconomic assumptions and scenario weightings through challenge applied by the Company and Group’s internal governance processes;
Reconciliation of the data used in the ECL calculation process to gross balances recorded within the general ledger as well as source systems;
Customer credit rating (CCR) for wholesale loans (larger customer exposures are monitored individually). This covered elements such as: approval of new lending facilities against the Company and Group’s lending policies, monitoring of counterparty credit quality against the Company and Group’s exposure criteria for internal factors specific to the counterparty or external macroeconomic factors, and accuracy and timeliness of CCR and security indicator (SI) assessments against the requirements of the Company and Group’s lending policies and regulatory requirements; and
IT system controls which record retail loans lending arrears, group exposures into delinquency buckets, and re-calculate individual allowances. We tested automated calculation and change management controls and evaluated the Company and Group’s oversight of the portfolios, with a focus on controls over delinquency monitoring.
We tested relevant General Information Technology Controls (GITCs) in relation to the key IT applications used by the Company and Group in measuring ECL allowances as detailed in the IT Systems and Controls key audit matter below.
In addition to controls testing, our procedures included:
Re-performing credit assessments of a sample of wholesale loans controlled by the Company and Group’s specialist workout and recovery team assessed as higher risk or impaired, and a sample of other loans, focusing on larger exposures assessed by the Company and Group as showing signs of deterioration, or in areas of emerging risk (assessed against external market conditions and in particular considering the impacts of COVID-19 and climate change). For each loan sampled, we challenged management’s assessment of CCR and SI, taking into account our assessment of the customer’s financial position and, where relevant, the risk of stranded assets, and our overall assessment of loan recoverability, the valuation of security, and the impact on the credit allowance. To do this, we used the information on the Company’s and Group’s loan file, discussed the facts and circumstances of the case with the loan officer, and performed our own assessment of recoverability. Exercising our judgement, our procedures included using our understanding of relevant industries and the macroeconomic environment and comparing data and assumptions used by the Company and Group in recoverability assessments to externally sourced evidence, such as commodity prices, publicly available audited financial statements and comparable external valuations of collateral held. Where relevant we assessed the forecast timing of future cash flows in the context of underlying valuations and approved business plans and challenged key assumptions in the valuations;
Obtaining an understanding of the Company and Group’s processes to determine ECL allowances, evaluating the Company and Group’s ECL model methodologies against established market practices and criteria in the accounting standards;
246
OVERVIEW HOW WE CREATE VALUE
PERFORMANCE OVERVIEW
REMUNERATION REPORT
DIRECTORS’ REPORT
FINANCIAL REPORT
SHAREHOLDER INFORMATION

NOTES TO THE FINANCIAL STATEMENTS
247
KEY AUDIT MATTERS (continued)
Working with our risk consulting specialists, we assessed the accuracy of the Company and Group’s ECL model estimates by re-performing, for a sample of loans, the ECL allowance using our independently derived calculation tools and comparing this to the amount recorded by the Company and Group;
Working with our economic specialists, we challenged the Company and Group’s forward-looking macroeconomic assumptions and scenarios incorporated in the Company and Group’s ECL models. We compared the Company and Group’s forecast GDP, unemployment rates, CPI and property price indices to relevant publicly available macro-economic information, and considered other known variables and information obtained through our other audit procedures to identify contradictory indicators;
Testing the implementation of the Company and Group’s SICR methodology by re-performing the staging calculation for a sample of loans taking into consideration movements in the CCR from loan origination CCR and comparing our expectation to actual staging applied on an individual account level in the Company and Group’s ECL model; and
Assessing the accuracy of the data used in the ECL models by confirming a sample of data fields such as account balance and CCR to relevant source systems.
We challenged key assumptions in the components of the Company and Group’s post-model adjustments to the ECL allowance balance. This included:
Assessing the requirement for additional allowances considering the Company and Group’s ECL model and data deficiencies identified by the Company and Group’s ECL model validation processes, particularly in light of the extreme volatility in economic scenarios caused by the current COVID-19 pandemic and government responses;
Evaluating underlying data used in concentration risk and economic cycle allowances by comparing underlying loan portfolio characteristics to recent loss experience, current market conditions and specific risks in the Group’s loan portfolios;
Assessing the impacts on the modelled ECL and the requirement for out of model adjustments to account for the expected increase in delinquencies. We also assessed assumptions used to determine whether a SICR event has occurred; and
Assessing the completeness of additional allowance overlays by checking the consistency of risks we identified in the loan portfolios against the Company and Group’s assessment.
SUBJECTIVE AND COMPLEX VALUATION OF FINANCIAL INSTRUMENTS HELD AT FAIR VALUE:
GROUP - FAIR VALUE OF LEVEL 3 ASSET POSITIONS $1,497m - FAIR VALUE OF LEVEL 2 ASSET POSITIONS $57,116m - FAIR VALUE OF LEVEL 3 LIABILITY POSITIONS $30m - FAIR VALUE OF LEVEL 2 LIABILITY POSITIONS $41,343m
COMPANY - FAIR VALUE OF LEVEL 3 ASSET POSITIONS $1,190m - FAIR VALUE OF LEVEL 2 ASSET POSITIONS $55,533m - FAIR VALUE OF LEVEL 3 LIABILITY POSITIONS $30m - FAIR VALUE OF LEVEL 2 LIABILITY POSITIONS $39,146m
Refer to the critical accounting estimates, judgements and disclosures of fair values in Note 18 to the Financial Report.
The Key Audit Matter The fair value of the Company and Group’s Level 3 and 2 financial instruments is determined by the application of valuation techniques which often involve the exercise of judgement and the use of assumptions and estimates.
The valuation of Level 3 and level 2 financial instruments held at fair value is considered a Key Audit Matter due to:
The high degree of estimation uncertainty and potentially significant range of reasonable outcomes associated with the valuation of financial instruments classified as Level 3 where significant pricing inputs used in the valuation methodology and models are not observable. Level 3 financial instruments represented 0.8% and 0.9% respectively of the Company and Group’s financial assets and 0.07% and 0.06% of the Company and Group’s financial liabilities carried at fair value; and
The complexity associated with the valuation methodology and models of certain more complex Level 2 financial instruments leading to an increase in subjectivity and estimation uncertainty. Level 2 financial instruments represented 39% and 35% respectively of the Company and Group’s financial assets and 88% and 89% of the Company and Group’s financial liabilities carried at fair value.
247ANZ 2021 Annual Report
OVERVIEW HOW WE CREATE VALUE
PERFORMANCE OVERVIEW
REMUNERATION REPORT
DIRECTORS’ REPORT
FINANCIAL REPORT
SHAREHOLDER INFORMATION Independent auditor's report (continued)

ANZ 2021 ANNUAL REPORT
INDEPENDENT AUDITOR’S REPORT (continued)
248
KEY AUDIT MATTERS (continued)
How the matter was addressed in our audit Our audit procedures for the valuation of financial instruments held at fair value included:
Performing an assessment of the population of financial instruments held at fair value to identify portfolios that have a higher risk of misstatement arising from significant judgements over valuation either due to unobservable inputs or complex models.
Testing the design and operating effectiveness of key controls relating specifically to these financial instruments, including:
Controls in relation to Independent Price Verification (IPV), including completeness of portfolios and valuation inputs subject to IPV;
Controls in relation to model validation at inception and periodically, including assessment of model limitation and assumptions;
Controls in relation to the review and challenge of daily profit and loss by a control function;
Controls over the collateral management process, including review of margin reconciliations with clearing houses; and
Controls over fair value adjustments (FVAs), including exit price and portfolio level adjustments.
With the assistance of our valuation specialists, independently re-valuing a selection of financial instruments and FVAs. This involved sourcing independent inputs from market data providers or external sources and using our own valuation models.
In relation to the subjective valuation of Level 3 financial instruments, where appropriate, with our valuation specialists:
Assessing the reasonableness of key inputs and assumptions using comparable data in the market and available alternatives; and
Comparing the Company and Group’s valuation methodology to industry practice and the criteria in the accounting standards.
Assessing the financial statements disclosures, including key judgements and assumptions using our understanding obtained from our testing and against the relevant accounting standard requirements.
CARRYING VALUE OF INVESTMENT IN ASIAN ASSOCIATES (Group $1,929m; Company $Nil) Refer to the critical accounting estimates, judgements and disclosures in Notes 26 to the Financial Report.
The Key Audit Matter Carrying value of investment in Asian associates (PT Panin and AmBank) is a key audit matter as:
The Group’s impairment assessment of non-lending assets identified that two of the Group’s associate investments (PT Panin and AmBank) had indicators of impairment.
Significant judgement was required by the Group as a result of the business disruption and economic impacts of the COVID-19 pandemic, raising estimation uncertainty. These conditions and the uncertainty of their continuation increases the possibility of the investments in the associates being impaired, and the risk of inaccurate forecasts or a significantly wider range of possible outcomes in the cash flow models.
Our evaluation of potential impairment involves critically evaluating the Group’s judgement in relation to key forward-looking assumptions for the Group’s Asian associates. Instances where the Group’s judgement is evaluated include:
Forecast earnings and terminal growth rates – The Group’s models are highly sensitive to small changes in these assumptions, reducing available headroom or indicating possible impairment. This drives additional audit effort specific to their feasibility and consistency of application; and
Discount rates – These are complicated in nature and vary according to the conditions and environment the specific associate investments operate in.
We involved our valuation specialists to supplement our senior team members in assessing this key audit matter.
How the matter was addressed in our audit Working with our valuation specialists, our procedures included:
Considering the appropriateness of the value in use valuation method applied by the Group to perform their annual test for impairment against the requirements of the accounting standards;
Assessing the integrity of the models used, including the accuracy of the underlying calculation formulas;
Assessing the Group’s key assumptions used in the discounted cash flow model, such as, discount rates, growth rates, forecast earnings and terminal growth rate by comparing to external observable metrics, historical experience, our knowledge of the markets and current market practice;
Independently developing a discount rate estimate or range considered comparable using publicly available market data for comparable entities, adjusted for factors specific to the Asian associates and the market and industry they operate in;
Comparing the forecast cash flows contained in the models to recent broker consensus reports, reflecting the COVID-19 impacts;
Considering and challenging the Group’s assessment of the impact of COVID-19 on cash flows and assumptions as well as its assessment of the likely recovery period;
Considering the sensitivity of the models by varying key assumptions, such as, forecast growth rates, terminal growth rates and discount rates, within a reasonable possible range, including specific analysis of reasonable possible impacts of COVID-19;
248
OVERVIEW HOW WE CREATE VALUE
PERFORMANCE OVERVIEW
REMUNERATION REPORT
DIRECTORS’ REPORT
FINANCIAL REPORT
SHAREHOLDER INFORMATION

NOTES TO THE FINANCIAL STATEMENTS
249
KEY AUDIT MATTERS (continued)
Assessing the recoverable amount at the reporting date against the recoverable amount of each investment when it was last impaired to assess if any reversal of previous impairment loss was required; and
Assessing the disclosures in the financial report using our understanding obtained from our testing and against the requirements of the accounting standards.
PROVISIONS FOR CUSTOMER REMEDIATION (Group $886m; Company $791m) Refer to the critical accounting estimates, judgements and disclosures in Notes 22 and 33 to the Financial Report.
The Key Audit Matter The Company and Group have assessed the need to recognise provisions in relation to certain customer remediation activities arising from both internal and external investigations and reviews.
The provision for customer remediation activities is a key audit matter due to the judgements required by us in assessing the Company and Group’s determination of:
The completeness of the population of matters requiring remediation;
The existence of a present legal or constructive obligation arising from a past event using the conditions of the event against the criteria in the accounting standards;
Reliable estimates of the amounts which may be paid arising from investigations, including estimates of related costs; and
The potential for legal proceedings, further investigations, and reviews from its regulators leading to a wider range of estimation outcomes for us to consider.
How the matter was addressed in our audit Our audit procedures for customer remediation provisions included:
Obtaining an understanding of the Company and Group’s processes and controls for identifying and assessing the potential impact of the investigations into customer remediation activities;
Enquiring with the Company and Group regarding ongoing legal, regulatory and other investigation into remediation activities;
Conducting independent discussions on significant matters with external legal counsel;
Reading the minutes and other relevant documentation of the Company’s Board of Directors, Board Committees, various management committees, and attending the Company’s Audit and Risk Committee meetings;
Inspecting correspondence with relevant regulatory bodies;
For a sample of individual customer remediation matters, we evaluate the basis for recognition of a provision and associated costs against the requirements of the accounting standards. We did this by obtaining an understanding of the matter, its status and independently assessing these against the recognition requirements of the accounting standard;
For a sample of individual customer remediation matters, testing the valuation and accuracy of the provision by:
Assessing and challenging the method, data and assumptions;
Sample checking data accuracy to underlying systems; and
Performing model integrity checks
Testing completeness by evaluating where exposures may have arisen based upon our knowledge and experience of broader industry matters, the Group's documentation and the current regulatory environment. We also checked the features of these exposures against the criteria defining a provision or a contingency in the accounting standards;
Assessing the appropriateness of the Company and Group’s conclusions against the requirements of Australian Accounting Standards where estimates were unable to be reliably made for a provision to be recognised; and
Evaluating the related disclosures using our understanding obtained from our testing and against the requirements of Australian Accounting Standards.
249ANZ 2021 Annual Report
OVERVIEW HOW WE CREATE VALUE
PERFORMANCE OVERVIEW
REMUNERATION REPORT
DIRECTORS’ REPORT
FINANCIAL REPORT
SHAREHOLDER INFORMATION Independent auditor's report (continued)
ANZ 2021 ANNUAL REPORT
INDEPENDENT AUDITOR’S REPORT (continued)
250
KEY AUDIT MATTERS (continued)
IT SYSTEMS AND CONTROLS The Key Audit Matter As a major Australian bank, the Company and Group’s businesses utilise many complex, interdependent Information Technology (IT) systems to process and record a high volume of transactions. Controls over access and changes to IT systems are critical to the recording of financial information and the preparation of a financial report which provides a true and fair view of the Company and Group’s financial position and performance.
The IT systems and controls, as they impact the financial recording and reporting of transactions, is a key audit matter as our audit approach could significantly differ depending on the effective operation of the Company and Group’s IT controls. We work with our IT specialists as a core part of our audit team.
How the matter was addressed in our audit Testing the technology control environment for key IT applications (systems) used in processing significant transactions and recording balances in the general ledger, and testing the automated controls embedded within these systems which link the technology-enabled business processes. Our audit procedures included:
Assessing the governance and higher-level controls across the IT Environment, including those regarding policy design, review and awareness, and IT Risk Management practices;
Design and operating effectiveness testing of controls across the User Access Management Lifecycle, including how users are on-boarded, reviewed, and removed on a timely basis from critical IT applications and supporting infrastructure. We also examined how privileged roles and functions are managed across each IT Application and the supporting infrastructure;
Design and operating effectiveness testing of controls to enable Change Management including how changes are initiated, documented, approved, tested and authorised prior to migration into the production environment of critical IT Applications. We assessed the appropriateness of users with access to release changes to IT application production environments across the Company and Group;
Design and operating effectiveness testing of controls used by the Company and Group’s technology teams to schedule system jobs and monitor system integrity;
Design and operating effectiveness testing of controls related to significant IT application programs delivered per the ANZ Delivery Framework;
Design and operating effectiveness testing of automated business process controls including those relating to enforcing segregation of duties to avoid conflicts from inappropriate role combinations within IT applications. Testing:
Configurations in place to perform calculations, mappings and flagging of financial transactions, and automated reconciliation controls (both between systems and intra-system); and
Data integrity of critical system reporting used by us in our audit to select samples and analyse data used by management to generate financial reporting.
OTHER INFORMATION
Other Information is both financial and non-financial information in Australia and New Zealand Banking Group Limited’s annual reporting which is provided in addition to the Financial Report and the Auditor's Report. The Directors are responsible for the Other Information.
Our opinion on the Financial Report does not cover the Other Information and, accordingly, we do not express an audit opinion or any form of assurance conclusion thereon, with the exception of the Remuneration Report and our related assurance opinion.
In connection with our audit of the Financial Report, our responsibility is to read the Other Information. In doing so, we consider whether the Other Information is materially inconsistent with the Financial Report or our knowledge obtained in the audit, or otherwise appears to be materially misstated.
We are required to report if we conclude that there is a material misstatement of this Other Information, and based on the work we have performed on the Other Information that we obtained prior to the date of this Auditor’s Report, we have nothing to report.
RESPONSIBILITIES OF DIRECTORS FOR THE FINANCIAL REPORT The Directors are responsible for:
preparing a Financial Report that gives a true and fair view in accordance with Australian Accounting Standards and the Corporations Act 2001
implementing necessary internal control to enable the preparation of a Financial Report that gives a true and fair view and is free from material misstatement, whether due to fraud or error
assessing the Group and Company’s ability to continue as a going concern and whether the use of the going concern basis of accounting is appropriate. This includes disclosing, as applicable, matters related to going concern and using the going concern basis of accounting unless they either intend to liquidate the Group and Company or to cease operations or have no realistic alternative but to do so.
250
OVERVIEW HOW WE CREATE VALUE
PERFORMANCE OVERVIEW
REMUNERATION REPORT
DIRECTORS’ REPORT
FINANCIAL REPORT
SHAREHOLDER INFORMATION
NOTES TO THE FINANCIAL STATEMENTS
251
KEY AUDIT MATTERS (continued)
AUDITOR’S RESPONSIBILITIES FOR THE AUDIT OF THE FINANCIAL REPORT Our objective is:
to obtain reasonable assurance about whether the Financial Report as a whole is free from material misstatement, whether due to fraud or error; and
to issue an Auditor’s Report that includes our opinion.
Reasonable assurance is a high level of assurance but is not a guarantee that an audit conducted in accordance with Australian Auditing Standards will always detect a material misstatement when it exists. Misstatements can arise from fraud or error. They are considered material if, individually or in the aggregate, they could reasonably be expected to influence the economic decisions of users taken on the basis of the Financial Report.
A further description of our responsibilities for the audit of the Financial Report is located at the Auditing and Assurance Standards Board website at: https://www.auasb.gov.au/admin/file/content102/c3/ar1_2020.pdf. This description forms part of our Auditor’s Report.
REPORT ON THE REMUNERATION REPORT In our opinion, the Remuneration Report of Australia and New Zealand Banking Group Limited for the year ended 30 September 2021, complies with Section 300A of the Corporations Act 2001.
DIRECTORS’ RESPONSIBILITIES The Directors of the Company are responsible for the preparation and presentation of the Remuneration Report in accordance with Section 300A of the Corporations Act 2001.
OUR RESPONSIBILITIES
We have audited the Remuneration Report included in the Directors’ report for the year ended 30 September 2021.
Our responsibility is to express an opinion on the Remuneration Report, based on our audit conducted in accordance with Australian Auditing Standards.
KPMG Martin McGrath Partner
Melbourne 27 October 2021
251ANZ 2021 Annual Report
OVERVIEW HOW WE CREATE VALUE
PERFORMANCE OVERVIEW
REMUNERATION REPORT
DIRECTORS’ REPORT
FINANCIAL REPORT
SHAREHOLDER INFORMATION Independent auditor's report (continued)

Independent Limited Assurance Report to the Directors of Australia and New Zealand Banking Group Limited
Based on the evidence we obtained from the procedures performed, we are not aware of any material misstatements of the specified ESG Information in the ANZ 2021 Annual Report and ANZ 2021 Annual Review which has been prepared by ANZ in accordance with ANZ’s Basis of Reporting for the year ended 30 September 2021.
CONCLUSION
WHAT DID KPMG’S WORK INVOLVE – SCOPE OF WORK
Australia and New Zealand Banking Group Limited (ANZ) engaged KPMG to perform a limited assurance engagement in relation to the ESG Information in the ANZ 2021 Annual Report and ANZ 2021 Annual Review. The scope of work comprised limited assurance over the material text and data claims as specified in the table below.
ESG information Page
2021 performance snapshot 3
What matters most 9
Our customers 15 - 23
Becoming a fairer and more responsible bank 24 - 25
Our people 29 - 33
Our community 8, 34 - 36
Improving our approach to Human Rights 37
Our approach to climate change 38 - 39
Five year summary 72
The ANZ 2021 Annual Report and ANZ 2021 Annual Review covers ANZ’s global operations for the year ended 30 September 2021 unless otherwise indicated.
WHAT WAS THE REPORTING CRITERIA USED?
The ESG Information was prepared in accordance with the Management’s Basis of Reporting, which draws upon the Integrated Reporting Framework published by the International Integrated Reporting Council (“the criteria”).
WHAT WAS THE BASIS FOR KPMG’S CONCLUSION?
We conducted our work in accordance with International Standard on Assurance Engagements ISAE 3000 (Standard). In accordance with the Standard we have:
• Used our professional judgement to plan and perform the engagement to obtain limited assurance that we are not aware of any material misstatements in the ESG Information, whether due to fraud or error;
• Considered relevant internal controls when designing our assurance procedures, however we do not express a conclusion on their effectiveness; and
• Ensured that the engagement team possess the appropriate knowledge, skills and professional competencies.
WHAT DID KPMG DO TO SUPPORT THE SCOPE OF WORK – OUR PROCEDURES
Our limited assurance conclusion is based on the evidence obtained from performing the following procedures:
• Enquiries of relevant management to understand ANZ’s process for determining material ESG issues;
• Interviews with relevant management concerning ANZ’s ESG framework and policies for material ESG issues, and the implementation of these across the business;
• Interviews with relevant staff responsible for developing the content (text and data) within the ESG Information to understand the approach for management, monitoring, collation and reporting of such information and the accuracy, completeness and existence of reported text and data;
• Undertaking analytical review procedures to support the reasonableness of the data;
• Identifying and testing assumptions supporting the calculations;
• Comparing text and data (on a sample basis) presented to underlying sources;
• Reviewing the ANZ 2021 Annual Report and ANZ 2021 Annual Review in their entirety for consistency with the ESG Information; and
• Reviewing other ANZ reporting including the ESG Supplement in its entirety to ensure it is consistent with our knowledge obtained through our assurance engagement.
OVERVIEW HOW WE CREATE VALUE
PERFORMANCE OVERVIEW
REMUNERATION REPORT
DIRECTORS’ REPORT
FINANCIAL REPORT
SHAREHOLDER INFORMATION
252

WHAT IS LIMITED ASSURANCE AND MATERIAL MISSTATEMENT?
A limited assurance engagement is restricted primarily to enquiries and analytical procedures. The procedures performed in a limited assurance engagement vary in nature and timing from, and are less in extent than for, a reasonable assurance engagement. Consequently, the level of assurance obtained in a limited assurance engagement is substantially lower than the assurance that would have been obtained had a reasonable assurance engagement been performed. The Standard requires our report to be worded around what we have not found, rather than what we have found.
Misstatements, including omissions, are considered material if, individually or in the aggregate, they could reasonably be expected to influence relevant decisions of the Directors of ANZ.
USE OF THIS ASSURANCE REPORT
This report has been prepared for the Directors of ANZ for the purpose of providing an assurance conclusion on the ESG Information within the ANZ 2021 Annual Report and ANZ 2021 Annual Review and may not be suitable for another purpose. We disclaim any assumption of responsibility for any reliance on this report, to any person other than the Directors of ANZ, or for any other purpose than that for which it was prepared.
KPMG, an Australian partnership and a member firm of the KPMG global organisation of independent member firms affiliated with KPMG International Limited, a private English company limited by guarantee. All rights reserved. The KPMG name and logo are trademarks used under license by the independent member firms of the KPMG global organisation. Liability limited by a scheme approved under Professional Standards Legislation.
ANZ is responsible for:
• Determining that the criteria is appropriate to meet their needs;
• Preparing and presenting the ESG Information in accordance with the criteria; and
• Establishing internal controls that enable the preparation and presentation of the ESG Information that is free from material misstatement, whether due to fraud or error.
KPMG is responsible for:
Our responsibility is to perform a limited assurance engagement in relation to the ESG Information for the year ended 30 September 2021, and to issue an assurance report that includes our conclusion.
KPMG Independence and Quality Control
We have complied with our independence and other relevant ethical requirements of the Code of Ethics for Professional Accountants issued by the Australian Professional and Ethical Standards Board and complied with the applicable requirements of Australian Standard on Quality Control 1 to maintain a comprehensive system of quality control. We have also complied with ANZ’s Stakeholder Engagement Model for Relationship with External Auditor (available at anz.com).
KPMG
27 October 2021
Adrian King | Partner
Melbourne27 October 2021
ANZ 2021 Annual Report
OVERVIEW HOW WE CREATE VALUE
PERFORMANCE OVERVIEW
REMUNERATION REPORT
DIRECTORS’ REPORT
FINANCIAL REPORT
SHAREHOLDER INFORMATION
253

Shareholder information – unauditedORDINARY SHARES
At 1 October 2021, the 20 largest holders of ANZ ordinary shares held 1,643,583,398 ordinary shares, equal to 58.23% of the total issued ordinary capital. At 1 October 2021 the issued ordinary capital was 2,822,579,294 ordinary shares.
DISTRIBUTION OF SHAREHOLDINGS
Name Number of shares % of shares
1 HSBC CUSTODY NOMINEES (AUSTRALIA) LIMITED 732,183,388 25.94
2 J P MORGAN NOMINEES AUSTRALIA PTY LIMITED 437,803,033 15.51
3 CITICORP NOMINEES PTY LIMITED 210,892,503 7.47
4 NATIONAL NOMINEES LIMITED 85,004,301 3.01
5 BNP PARIBAS NOMINEES PTY LTD <AGENCY LENDING DRP A/C> 42,765,637 1.51
6 BNP PARIBAS NOMS PTY LTD <DRP> 33,504,153 1.19
7 CITICORP NOMINEES PTY LIMITED <COLONIAL FIRST STATE INV A/C> 18,827,855 0.67
8 HSBC CUSTODY NOMINEES (AUSTRALIA) LIMITED <NT-COMNWLTH SUPER CORP A/C> 16,161,125 0.57
9 NETWEALTH INVESTMENTS LIMITED <WRAP SERVICES A/C> 8,715,336 0.31
10 AUSTRALIAN FOUNDATION INVESTMENT COMPANY LIMITED 8,487,710 0.30
11 ARGO INVESTMENTS LIMITED 8,265,275 0.29
12 BNP PARIBAS NOMINEES PTY LTD SIX SIS LTD <DRP A/C> 6,999,902 0.25
13 BNP PARIBAS NOMINEES PTY LTD HUB24 CUSTODIAL SERV LTD <DRP A/C> 6,915,514 0.24
14 ANZEST PTY LTD <DEA CONTROL A/C> 5,056,931 0.18
15 CUSTODIAL SERVICES LIMITED <BENEFICIARIES HOLDING A/C> 4,171,866 0.15
16 BNP PARIBAS NOMS PTY LTD BP2S PROPLEND ASSETS <DRP A/C> 3,999,898 0.14
17 AMP LIFE LIMITED 3,831,603 0.14
18 NAVIGATOR AUSTRALIA LTD <MLC INVESTMENT SETT A/C> 3,428,865 0.12
19 NULIS NOMINEES (AUSTRALIA) LIMITED <NAVIGATOR MAST PLAN SETT A/C> 3,291,064 0.12
20 BNP PARIBAS NOMS (NZ) LTD <DRP> 3,277,439 0.12
Total 1,643,583,398 58.23
At 1 October 2021 – Range of shares Number of holders % of holders Number of shares % of shares
1 to 1,000 311,856 58.42 113,411,704 4.02
1,001 to 5,000 175,901 32.95 403,960,874 14.31
5,001 to 10,000 29,648 5.55 207,021,342 7.33
10,001 to 100,000 16,013 3.00 320,381,359 11.35
Over 100,000 420 0.08 1,777,804,015 62.99
Total 533,838 100.00 2,822,579,294 100.00
At 1 October 2021:
• the average size of holdings of ordinary shares was 5,287 (2020: 5,134) shares; and
• there were 19,915 holdings (2020: 27,189 holdings) of less than a marketable parcel (less than $500 in value or 19 shares based on the market price of $27.44 per share), which is less than 3.73% of the total holdings of ordinary shares.
On 12 May 2017 ANZ was notified by BlackRock Group that it held a substantial shareholding of 148,984,864 ordinary shares in ANZ (5.07%) and on 2 December 2019, BlackRock Group’s interest increased to 172,225,527 ordinary shares in ANZ (6.07%). As at 1 October 2021 ANZ has received no further update in relation to this substantial holding.
On 3 July 2018 ANZ was notified by The Vanguard Group, Inc that it held a substantial shareholding of 144,730,016 ordinary shares in ANZ (5.001%) and on 17 March 2020 The Vanguard Group, Inc’s interest increased to 170,502,797 ordinary shares in ANZ (6.012%). As at 1 October 2021 ANZ has received no further update in relation to this substantial shareholding. As announced on 19 July 2021, there is currently an on-market buy-back in relation to ANZ’s ordinary shares.
Voting rights of ordinary shares
The Constitution provides for votes to be cast as follows:i) on show of hands, one vote for each shareholder; andii) on a poll, one vote for every fully paid ordinary share. A register of holders of ordinary shares is held at: 452 Johnston Street, Abbotsford, Victoria, Australia Telephone: +61 3 9415 4010
254
OVERVIEW HOW WE CREATE VALUE
PERFORMANCE OVERVIEW
REMUNERATION REPORT
DIRECTORS’ REPORT
FINANCIAL REPORT
SHAREHOLDER INFORMATION

ANZ CAPITAL NOTES
ANZ CN2
On 31 March 2014 the Company issued convertible subordinated perpetual notes (ANZ CN2) which were offered pursuant to a prospectus dated 19 February 2014.
At 1 October 2021 the 20 largest holders of ANZ CN2 held 5,246,090 securities, equal to 32.58% of the total issued securities. At 1 October 2021 the total number of ANZ CN2 on issue was 16,100,000.
DISTRIBUTION OF ANZ CN2 HOLDINGS
Name Number of securities % of securities
1 HSBC CUSTODY NOMINEES (AUSTRALIA) LIMITED 1,067,710 6.63
2 CITICORP NOMINEES PTY LIMITED 895,442 5.56
3 J P MORGAN NOMINEES AUSTRALIA PTY LIMITED 683,695 4.25
4 BNP PARIBAS NOMINEES PTY LTD <AGENCY LENDING DRP A/C> 441,906 2.74
5 NETWEALTH INVESTMENTS LIMITED <WRAP SERVICES A/C> 293,661 1.82
6 BNP PARIBAS NOMINEES PTY LTD HUB24 CUSTODIAL SERV LTD <DRP A/C> 256,590 1.59
7 BNP PARIBAS NOMS PTY LTD <DRP> 228,142 1.42
8 NETWEALTH INVESTMENTS LIMITED <SUPER SERVICES A/C> 221,774 1.38
9 JOHN E GILL TRADING PTY LTD 165,026 1.03
10 NAVIGATOR AUSTRALIA LTD <MLC INVESTMENT SETT A/C> 141,288 0.88
11 HSBC CUSTODY NOMINEES (AUSTRALIA) LIMITED – A/C 2 123,046 0.76
12 AUSTRALIAN EXECUTOR TRUSTEES LIMITED <IPS SUPER A/C> 117,620 0.73
13 MUTUAL TRUST PTY LTD 113,588 0.71
14 NULIS NOMINEES (AUSTRALIA) LIMITED <NAVIGATOR MAST PLAN SETT A/C> 111,257 0.69
15 BNP PARIBAS NOMINEES PTY LTD <PITCHER PARTNERS DRP> 91,933 0.57
16 NAVIGATOR AUSTRALIA LTD <JB WERE LIST FIX INT SMA A/C> 88,591 0.55
17 CITICORP NOMINEES PTY LIMITED <DPSL> 56,931 0.35
18 BERNE NO 132 NOMINEES PTY LTD <684168 A/C> 53,115 0.33
19 KOLL PTY LTD <NO 1 ACCOUNT> 50,000 0.31
20 AUSTRALIAN EXECUTOR TRUSTEES LIMITED <NO 1 ACCOUNT> 44,775 0.28
Total 5,246,090 32.58
At 1 October 2021 – Range of securities Number of holders % of holders Number of securities % of securities
1 to 1,000 16,726 89.98 5,536,677 34.39
1,001 to 5,000 1,670 8.98 3,324,343 20.65
5,001 to 10,000 109 0.59 789,223 4.90
10,001 to 100,000 69 0.37 1,589,012 9.87
Over 100,000 14 0.08 4,860,745 30.19
Total 18,588 100.00 16,100,000 100.00
At 1 October 2021 there were 10 holdings (2020: 6 holdings) of less than a marketable parcel (less than $500 in value or 5 securities based on the market price of $100.76 per security), which is less than 0.05% of the total holdings of ANZ CN2.
Voting rights of ANZ CN2
ANZ CN2 do not confer on holders a right to vote at any meeting of members of the Company.A register of holders of ANZ CN2 is held at:452 Johnston Street, Abbotsford, Victoria, Australia Telephone: +61 3 9415 4010
255ANZ 2021 Annual Report
OVERVIEW HOW WE CREATE VALUE
PERFORMANCE OVERVIEW
REMUNERATION REPORT
DIRECTORS’ REPORT
FINANCIAL REPORT
SHAREHOLDER INFORMATION
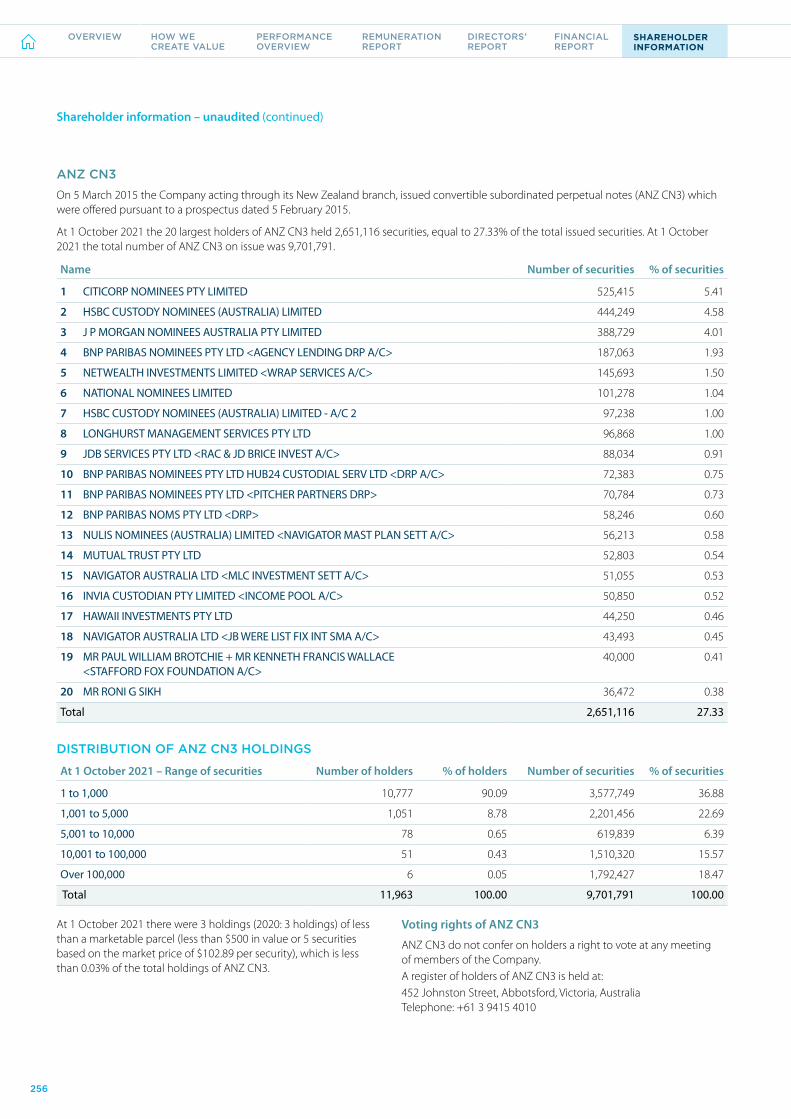
Shareholder information – unaudited (continued)
ANZ CN3
On 5 March 2015 the Company acting through its New Zealand branch, issued convertible subordinated perpetual notes (ANZ CN3) which were offered pursuant to a prospectus dated 5 February 2015.
At 1 October 2021 the 20 largest holders of ANZ CN3 held 2,651,116 securities, equal to 27.33% of the total issued securities. At 1 October 2021 the total number of ANZ CN3 on issue was 9,701,791.
DISTRIBUTION OF ANZ CN3 HOLDINGS
Name Number of securities % of securities
1 CITICORP NOMINEES PTY LIMITED 525,415 5.41
2 HSBC CUSTODY NOMINEES (AUSTRALIA) LIMITED 444,249 4.58
3 J P MORGAN NOMINEES AUSTRALIA PTY LIMITED 388,729 4.01
4 BNP PARIBAS NOMINEES PTY LTD <AGENCY LENDING DRP A/C> 187,063 1.93
5 NETWEALTH INVESTMENTS LIMITED <WRAP SERVICES A/C> 145,693 1.50
6 NATIONAL NOMINEES LIMITED 101,278 1.04
7 HSBC CUSTODY NOMINEES (AUSTRALIA) LIMITED - A/C 2 97,238 1.00
8 LONGHURST MANAGEMENT SERVICES PTY LTD 96,868 1.00
9 JDB SERVICES PTY LTD <RAC & JD BRICE INVEST A/C> 88,034 0.91
10 BNP PARIBAS NOMINEES PTY LTD HUB24 CUSTODIAL SERV LTD <DRP A/C> 72,383 0.75
11 BNP PARIBAS NOMINEES PTY LTD <PITCHER PARTNERS DRP> 70,784 0.73
12 BNP PARIBAS NOMS PTY LTD <DRP> 58,246 0.60
13 NULIS NOMINEES (AUSTRALIA) LIMITED <NAVIGATOR MAST PLAN SETT A/C> 56,213 0.58
14 MUTUAL TRUST PTY LTD 52,803 0.54
15 NAVIGATOR AUSTRALIA LTD <MLC INVESTMENT SETT A/C> 51,055 0.53
16 INVIA CUSTODIAN PTY LIMITED <INCOME POOL A/C> 50,850 0.52
17 HAWAII INVESTMENTS PTY LTD 44,250 0.46
18 NAVIGATOR AUSTRALIA LTD <JB WERE LIST FIX INT SMA A/C> 43,493 0.45
19 MR PAUL WILLIAM BROTCHIE + MR KENNETH FRANCIS WALLACE <STAFFORD FOX FOUNDATION A/C>
40,000 0.41
20 MR RONI G SIKH 36,472 0.38
Total 2,651,116 27.33
At 1 October 2021 – Range of securities Number of holders % of holders Number of securities % of securities
1 to 1,000 10,777 90.09 3,577,749 36.88
1,001 to 5,000 1,051 8.78 2,201,456 22.69
5,001 to 10,000 78 0.65 619,839 6.39
10,001 to 100,000 51 0.43 1,510,320 15.57
Over 100,000 6 0.05 1,792,427 18.47
Total 11,963 100.00 9,701,791 100.00
At 1 October 2021 there were 3 holdings (2020: 3 holdings) of less than a marketable parcel (less than $500 in value or 5 securities based on the market price of $102.89 per security), which is less than 0.03% of the total holdings of ANZ CN3.
Voting rights of ANZ CN3
ANZ CN3 do not confer on holders a right to vote at any meeting of members of the Company.A register of holders of ANZ CN3 is held at:452 Johnston Street, Abbotsford, Victoria, Australia Telephone: +61 3 9415 4010
256
OVERVIEW HOW WE CREATE VALUE
PERFORMANCE OVERVIEW
REMUNERATION REPORT
DIRECTORS’ REPORT
FINANCIAL REPORT
SHAREHOLDER INFORMATION

ANZ CN4
On 27 September 2016 the Company issued convertible subordinated perpetual notes (ANZ CN4) which were offered pursuant to a prospectus dated 24 August 2016.
At 1 October 2021 the 20 largest holders of ANZ CN4 held 5,266,551 securities, equal to 32.47% of the total issued securities. At 1 October 2021 the total number of ANZ CN4 on issue was 16,220,000.
Name Number of securities % of securities
1 HSBC CUSTODY NOMINEES (AUSTRALIA) LIMITED 1,269,718 7.83
2 CITICORP NOMINEES PTY LIMITED 993,896 6.13
3 J P MORGAN NOMINEES AUSTRALIA PTY LIMITED 744,741 4.59
4 NETWEALTH INVESTMENTS LIMITED <WRAP SERVICES A/C> 267,251 1.65
5 NATIONAL NOMINEES LIMITED 207,985 1.28
6 BNP PARIBAS NOMINEES PTY LTD HUB24 CUSTODIAL SERV LTD <DRP A/C> 198,938 1.23
7 BNP PARIBAS NOMS PTY LTD <DRP> 192,777 1.19
8 BNP PARIBAS NOMINEES PTY LTD <AGENCY LENDING DRP A/C> 176,178 1.09
9 MUTUAL TRUST PTY LTD 158,380 0.98
10 AUSTRALIAN EXECUTOR TRUSTEES LIMITED <IPS SUPER A/C> 152,963 0.94
11 NULIS NOMINEES (AUSTRALIA) LIMITED <NAVIGATOR MAST PLAN SETT A/C> 145,231 0.90
12 HSBC CUSTODY NOMINEES (AUSTRALIA) LIMITED – A/C 2 144,641 0.89
13 NAVIGATOR AUSTRALIA LTD <MLC INVESTMENT SETT A/C> 125,672 0.77
14 PAMDALE INVESTMENTS PTY LTD 96,498 0.59
15 AUSTRALIAN EXECUTOR TRUSTEES LIMITED <NO 1 ACCOUNT> 81,226 0.50
16 MARROSAN INVESTMENTS PTY LTD 78,500 0.48
17 BNP PARIBAS NOMINEES PTY LTD <PITCHER PARTNERS DRP> 71,227 0.44
18 NETWEALTH INVESTMENTS LIMITED <SUPER SERVICES A/C> 60,129 0.37
19 JMB PTY LIMITED 50,300 0.31
20 RETFORD PTY LTD 50,300 0.31
Total 5,266,551 32.47
DISTRIBUTION OF ANZ CN4 HOLDINGS
At 1 October 2021 – Range of securities Number of holders % of holders Number of securities % of securities
1 to 1,000 16,403 89.60 5,423,896 33.44
1,001 to 5,000 1,694 9.25 3,522,968 21.72
5,001 to 10,000 131 0.72 978,482 6.03
10,001 to 100,000 66 0.36 1,516,283 9.35
Over 100,000 13 0.07 4,778,371 29.46
Total 18,307 100.00 16,220,000 100.00
At 1 October 2021 there were 8 holdings (2020: 5 holdings) of less than a marketable parcel (less than $500 in value or 5 securities based on the market price of $107.25 per security), which is less than 0.04% of the total holdings of ANZ CN4.
Voting rights of ANZ CN4
ANZ CN4 do not confer on holders a right to vote at any meeting of members of the Company.A register of holders of ANZ CN4 is held at:452 Johnston Street, Abbotsford, Victoria, Australia Telephone: +61 3 9415 4010
257ANZ 2021 Annual Report
OVERVIEW HOW WE CREATE VALUE
PERFORMANCE OVERVIEW
REMUNERATION REPORT
DIRECTORS’ REPORT
FINANCIAL REPORT
SHAREHOLDER INFORMATION

Shareholder information – unaudited (continued)
ANZ CN5
On 28 September 2017 the Company issued convertible subordinated perpetual notes (ANZ CN5) which were offered pursuant to a prospectus dated 24 August 2017.
At 1 October 2021 the 20 largest holders of ANZ CN5 held 2,580,897 securities, equal to 27.72% of the total issued securities. At 1 October 2021 the total number of ANZ CN5 on issue was 9,310,782.
DISTRIBUTION OF ANZ CN5 HOLDINGS
Name Number of securities % of securities
1 HSBC CUSTODY NOMINEES (AUSTRALIA) LIMITED 806,651 8.66
2 CITICORP NOMINEES PTY LIMITED 373,501 4.01
3 J P MORGAN NOMINEES AUSTRALIA PTY LIMITED 151,189 1.62
4 NETWEALTH INVESTMENTS LIMITED <WRAP SERVICES A/C> 126,556 1.36
5 BNP PARIBAS NOMINEES PTY LTD HUB24 CUSTODIAL SERV LTD <DRP A/C> 116,452 1.25
6 HSBC CUSTODY NOMINEES (AUSTRALIA) LIMITED – A/C 2 100,303 1.08
7 AUSTRALIAN EXECUTOR TRUSTEES LIMITED <IPS SUPER A/C> 85,725 0.92
8 NULIS NOMINEES (AUSTRALIA) LIMITED <NAVIGATOR MAST PLAN SETT A/C> 85,422 0.92
9 DIMBULU PTY LTD 85,000 0.91
10 LONGHURST MANAGEMENT SERVICES PTY LTD 78,246 0.84
11 NETWEALTH INVESTMENTS LIMITED <SUPER SERVICES A/C> 76,547 0.82
12 NAVIGATOR AUSTRALIA LTD <MLC INVESTMENT SETT A/C> 71,090 0.76
13 BNP PARIBAS NOMINEES PTY LTD <PITCHER PARTNERS DRP> 70,612 0.76
14 BNP PARIBAS NOMINEES PTY LTD <AGENCY LENDING DRP A/C> 68,113 0.73
15 BNP PARIBAS NOMS PTY LTD <DRP> 50,679 0.55
16 EASTCOTE PTY LTD <VAN LIESHOUT FAMILY A/C> 50,000 0.54
17 FEDERATION UNIVERSITY AUSTRALIA 50,000 0.54
18 MARROSAN INVESTMENTS PTY LTD 50,000 0.54
19 G C F INVESTMENTS PTY LTD 44,811 0.48
20 MR RONALD MAURICE BUNKER 40,000 0.43
Total 2,580,897 27.72
At 1 October 2021 – Range of securities Number of holders % of holders Number of securities % of securities
1 to 1,000 10,045 90.51 3,542,687 38.05
1,001 to 5,000 934 8.42 2,013,604 21.63
5,001 to 10,000 64 0.58 506,604 5.44
10,001 to 100,000 49 0.44 1,573,235 16.90
Over 100,000 6 0.05 1,674,652 17.98
Total 11,098 100.00 9,310,782 100.00
At 1 October 2021 there were 6 holdings (2020: 4 holdings) of less than a marketable parcel (less than $500 in value or 5 securities based on the market price of $105.79 per security), which is less than 0.05% of the total holdings of ANZ CN5.
Voting rights of ANZ CN5
ANZ CN5 do not confer on holders a right to vote at any meeting of members of the Company.A register of holders of ANZ CN5 is held at:452 Johnston Street, Abbotsford, Victoria, Australia Telephone: +61 3 9415 4010
258
OVERVIEW HOW WE CREATE VALUE
PERFORMANCE OVERVIEW
REMUNERATION REPORT
DIRECTORS’ REPORT
FINANCIAL REPORT
SHAREHOLDER INFORMATION

ANZ CN6
On 8 July 2021 the Company issued convertible subordinated perpetual notes (ANZ CN6) which were offered pursuant to a prospectus dated 9 June 2021.
At 1 October 2021 the 20 largest holders of ANZ CN6 held 4,669,313 securities, equal to 31.13% of the total issued securities. At 1 October 2021 the total number of ANZ CN6 on issue was 15,000,000.
Name Number of securities % of securities
1 HSBC CUSTODY NOMINEES (AUSTRALIA) LIMITED 1,220,439 8.14
2 CITICORP NOMINEES PTY LIMITED 728,439 4.86
3 J P MORGAN NOMINEES AUSTRALIA PTY LIMITED 383,985 2.56
4 BNP PARIBAS NOMS PTY LTD <DRP> 335,422 2.24
5 NETWEALTH INVESTMENTS LIMITED <WRAP SERVICES A/C> 310,970 2.07
6 BNP PARIBAS NOMINEES PTY LTD HUB24 CUSTODIAL SERV LTD <DRP A/C> 257,641 1.72
7 NATIONAL NOMINEES LIMITED 231,079 1.54
8 HSBC CUSTODY NOMINEES (AUSTRALIA) LIMITED – A/C 2 221,643 1.48
9 BNP PARIBAS NOMINEES PTY LTD <AGENCY LENDING DRP A/C> 174,451 1.16
10 DIMBULU PTY LTD 140,000 0.93
11 NETWEALTH INVESTMENTS LIMITED <SUPER SERVICES A/C> 121,970 0.81
12 MUTUAL TRUST PTY LTD 91,698 0.61
13 DIOCESE DEVELOPMENT FUND -CATHOLIC DIOCESE OF PARRAMATTA 88,440 0.59
14 BNP PARIBAS NOMINEES PTY LTD <PITCHER PARTNERS DRP> 73,333 0.49
15 LEDA HOLDINGS PTY LTD 57,760 0.38
16 NAVIGATOR AUSTRALIA LTD <MLC INVESTMENT SETT A/C> 51,879 0.35
17 MARROSAN INVESTMENTS PTY LTD 50,000 0.33
18 NULIS NOMINEES (AUSTRALIA) LIMITED <NAVIGATOR MAST PLAN SETT A/C> 47,704 0.32
19 ALWOOD PTY LTD 44,600 0.30
20 MCCUSKER FOUNDATION LTD <THE MCCUSKER CHARITABLE A/C> 37,860 0.25
Total 4,669,313 31.13
DISTRIBUTION OF ANZ CN6 HOLDINGS
At 1 October 2021 – Range of securities Number of holders % of holders Number of securities % of securities
1 to 1,000 17,628 90.42 5,441,194 36.27
1,001 to 5,000 1,699 8.71 3,374,125 22.49
5,001 to 10,000 107 0.55 774,890 5.17
10,001 to 100,000 50 0.26 1,283,752 8.56
Over 100,000 11 0.06 4,126,039 27.51
Total 19,495 100.00 15,000,000 100.00
At 1 October 2021 there were 4 holdings of less than a marketable parcel (less than $500 in value or 5 securities based on the market price of $102.60 per security), which is less than 0.02% of the total holdings of ANZ CN6.
Voting rights of ANZ CN6
ANZ CN6 do not confer on holders a right to vote at any meeting of members of the Company.A register of holders of ANZ CN6 is held at:452 Johnston Street, Abbotsford, Victoria, Australia Telephone: +61 3 9415 4010
259ANZ 2021 Annual Report
OVERVIEW HOW WE CREATE VALUE
PERFORMANCE OVERVIEW
REMUNERATION REPORT
DIRECTORS’ REPORT
FINANCIAL REPORT
SHAREHOLDER INFORMATION

Shareholder information – unaudited (continued)
EMPLOYEE SHAREHOLDER INFORMATION
In order to comply with the requirements of the ANZ Employee Share Acquisition Plan Rules and the ANZ Share Option Plan Rules, shares or options must not be issued under these plans if the aggregate number of shares and options that remain subject to the rules of either plan exceed 7% of the total number of ANZ shares of all classes on issue (including preference shares). At 30 September 2021 participants under the following plans/schemes held 0.65% (2020: 0.71%) of the total number of ANZ shares of all classes on issue:
• ANZ Employee Share Acquisition Plan;
• ANZ Employee Share Save Scheme;
• ANZ Share Option Plan; and
• ANZ Directors’ Share Plan
STOCK EXCHANGE LISTINGS
Australia and New Zealand Banking Group Limited’s ordinary shares are listed on the Australian Securities Exchange and New Zealand’s Exchange (NZX).
The Group’s other stock exchange listings include:
• Australian Securities Exchange – ANZ Capital Notes (CN2, CN3, CN4, CN5 and CN6), ANZ Capital Securities, senior debt and subordinated debt [Australia and New Zealand Banking Group Limited], and residential mortgage backed securities;
• London Stock Exchange – Senior (including covered bonds) debt and subordinated debt [Australia and New Zealand Banking Group Limited] and senior (including covered bonds) debt [ANZ New Zealand (Int’l) Limited];
• NZX – ANZ NZ Capital Notes, senior debt and subordinated debt [ANZ Bank New Zealand Limited];
• SIX Swiss Exchange – Senior debt [ANZ New Zealand (Int’l) Limited]; and
• Taipei Exchange – Senior debt [Australia and New Zealand Banking Group Limited].
For more information on the ANZ Capital Notes, ANZ Capital Securities and ANZ NZ Capital Notes please refer to Note 16 to the Financial Report.
AMERICAN DEPOSITARY RECEIPTS
The Company has American Depositary Receipts (ADRs) representing American Depositary Shares (ADSs) that are traded on the over-the-counter securities market ‘OTC Pink’ electronic platform operated by OTC Markets Group Inc. in the United States under the ticker symbol: ANZBY and the CUSIP number: 052528304.
With effect from 23 July 2008, the ADR ratio changed from one ADS representing five ANZ ordinary shares to one ADS representing one ANZ ordinary share.
The Bank of New York Mellon (BNY Mellon) is the Depositary for the Company’s ADR program in the United States. For further information about ADRs, please call BNY Mellon at 1-888-269-2377 if you are calling from within the United States. If you are calling from outside the United States, please call 1-201-680-6825. You may also visit BNY Mellon’s website at www.adrbnymellon.com.
260
OVERVIEW HOW WE CREATE VALUE
PERFORMANCE OVERVIEW
REMUNERATION REPORT
DIRECTORS’ REPORT
FINANCIAL REPORT
SHAREHOLDER INFORMATION

Important dates for shareholders1
OUR INTERNATIONAL PRESENCE AND EARNING COMPOSITION BY GEOGRAPHY2
1. If there are any changes to these dates, the Australian Securities Exchange will be notified accordingly. 2. On a Cash profit (continuing operations) basis. Excludes non-core items included in statutory profit and discontinued operations included in cash profit. It is provided to assist readers in understanding the result of the ongoing business activitives of the Group. For further information on adjustments between statutory and cash profit refer to page 57.
MAY 2022
4 May Half Year Results Announcement
9 May Interim Dividend Ex-Date
10 May Interim Dividend Record Date
11 May DRP/BOP/Foreign Currency Election Date
NOVEMBER 2022
7 November Final Dividend Ex-Date
8 November Final Dividend Record Date
9 November DRP/BOP/Foreign Currency Election Date
DECEMBER 2022
15 December Final Dividend Payment Date
15 December Annual General Meeting
OCTOBER 2022
13 October Closing date for receipt of Director Nominations
27 October Annual Results Announcement
JULY 2022
1 July Interim Dividend Payment Date
New Zealand$1,788 million
Australia$4,184 million
International$209 million
AsiaChina Hong Kong India IndonesiaJapan Laos Malaysia
Myanmar The Philippines Singapore South Korea TaiwanThailandVietnam
PacificAmerican SamoaCook Islands FijiGuamKiribatiPapua New Guinea
SamoaSolomon IslandsTimor-LesteTonga Vanuatu
EuropeFranceGermanyUnited Kingdom
Middle EastUnited Arab Emirates (Dubai)
United States of America
INTERNATIONAL
261ANZ 2021 Annual Report
OVERVIEW HOW WE CREATE VALUE
PERFORMANCE OVERVIEW
REMUNERATION REPORT
DIRECTORS’ REPORT
FINANCIAL REPORT
SHAREHOLDER INFORMATION

ContactsREGISTERED OFFICE
ANZ Centre Melbourne Level 9, 833 Collins Street Docklands VIC 3008 Australia
Telephone: +61 3 9273 5555Facsimile: +61 3 8542 5252
Company Secretary: Simon Pordage
INVESTOR RELATIONS
Level 10, 833 Collins Street Docklands VIC 3008 Australia
Telephone: +61 3 8654 7682Facsimile: +61 3 8654 8886 Email: [email protected] Web: shareholder.anz.com
Group General Manager Investor Relations: Jill Campbell
COMMUNICATIONS AND PUBLIC AFFAIRS
Level 10, 833 Collins Street Docklands VIC 3008 Australia
Telephone: +61 2 6198 5001Email: [email protected]
Group General Manager Communications and Public Affairs: Tony Warren
SHARE AND SECURITIES REGISTRAR AUSTRALIA
AustraliaComputershare Investor Services Pty LtdGPO Box 2975Melbourne VIC 3001Australia
Telephone within Australia: 1800 11 33 99International Callers: +61 3 9415 4010Facsimile: +61 3 9473 2500Email: [email protected]
Austraclear Services Limited20 Bridge StreetSydney NSW 2000 Australia
Telephone:1300 362 257
JapanJapan Securities Depository Center, Incorporated1-1, Nihombashi Kayabacho 2-chome, Chuo-ku, Tokyo 103-0025 Japan
Telephone: +81-3-3661-0139
LuxembourgDeutsche Bank Luxembourg S.A.2, Boulevard Konrad AdenauerL-1115 Luxembourg, Luxembourg
Telephone: +352 4 21 22 1
New ZealandComputershare Investor Services LimitedPrivate Bag 92119Auckland 1142 New Zealand
Telephone: 0800 174 007Facsimile: +64 9 488 8787
United KingdomComputershare Investor Services PLCThe Pavilions Bridgwater Road Bristol BS99 6ZZ UK
Telephone: +44 870 702 0000Facsimile: +44 870 703 6101
United StatesThe Bank of New York Mellon 240 Greenwich St, Floor 7E New York, NY 10286 USA
Telephone: +1 212 495 1784
BNY Mellon Shareowner ServicesPO Box 505000Louisville, KY 40233-5000 USA
USA Toll Free Telephone: 1888 269 2377Telephone for International Callers: 1201 680 6825Web: www-us.computershare.com/investorEmail: [email protected]
Deutsche Bank Trust Company Americas60 Wall Street New York, NY 10005 USATelephone: +1 212 250 2500
GermanyDeutsche Bank AG Taunusanlage 1260262 Frankfurt am Main Germany
Telephone: +49 69 910 00
MORE INFORMATION
General Information on ANZ can be obtained from our website at anz.com. Shareholders can visit our Shareholder Centre at anz.com/shareholder/centre. ANZ Corporate Governance: For information about ANZ’s approach to Corporate Governance and to obtain copies of ANZ’s Constitution, Board/Board Committee Charters, Code of Conduct and summaries of other ANZ policies of interest to shareholders and stakeholders, visit anz.com/corporategovernance.
Australia and New Zealand Banking Group Limited ABN 11 005 357 522.
This Annual Report has been prepared for Australia and New Zealand Banking Group Limited (“the Company”) together with its subsidiaries which are variously described as: “ANZ”, “Group”, “ANZ Group”, “the Bank”, “us”, “we” or“our”. DISCLOSURE INSIGHT ACTION
Founding Signatory of:
262
OVERVIEW HOW WE CREATE VALUE
PERFORMANCE OVERVIEW
REMUNERATION REPORT
DIRECTORS’ REPORT
FINANCIAL REPORT
SHAREHOLDER INFORMATION

GlossaryAASs Australian Accounting Standards.
AASB Australian Accounting Standards Board. The term ‘AASB’ is commonly used when identifying AASs issued by the AASB. In doing so, the term is used together with the AAS number.
ADI Authorised Deposit-taking Institution.
APRA Australian Prudential Regulation Authority.
APS ADI Prudential Standard.
BCBS Basel Committee on Banking Supervision.
Cash and cash equivalents comprise coins, notes, money at call, balances held with central banks, liquid settlement balances (readily convertible to known amounts of cash which are subject to insignificant risk of changes in value) and securities purchased under agreements to resell (reverse repurchase agreements) in less than three months.
Cash profit is an additional measure of profit which is prepared on a basis other than in accordance with accounting standards. Cash profit represents ANZ’s preferred measure of the result of the core business activities of the Group, enabling readers to assess Group and Divisional performance against prior periods and against peer institutions. To calculate cash profit, the Group excludes non-core items from statutory profit as noted below. These items are calculated consistently period on period so as not to discriminate between positive and negative adjustments.
Gains and losses are adjusted where they are significant, or have the potential to be significant in any one period, and fall into one of three categories:
1. gains or losses included in earnings arising from changes in tax, legal or accounting legislation or other non-core items not associated with the core operations of the Group;
2. economic hedging impacts and similar accounting items that represent timing differences that will reverse through earnings in the future; and
3. accounting reclassifications between individual line items that do not impact reported results, such as credit risk on impaired derivatives.
Cash profit is not a measure of cash flow or profit determined on a cash accounting basis.
Collectively assessed allowance for expected credit loss represents the Expected Credit Loss (ECL), which incorporates forward-looking information and does not require an actual loss event to have occurred for a credit loss provision to be recognised.
Coronavirus (COVID-19) is a respiratory illness which was declared a Public Health Emergency of International Concern. COVID-19 was characterised as a pandemic by the World Health Organisation on 11 March 2020.
Covered bonds are bonds issued by an ADI to external investors secured against a pool of the ADI’s assets (the cover pool) assigned to a bankruptcy remote special purpose entity. The primary assets forming the cover pool are mortgage loans. The mortgages remain
on the issuer’s balance sheet. The covered bond holders have dual recourse to the issuer and the cover pool assets. The mortgages included in the cover pool cannot be otherwise pledged or disposed of but may be repurchased and substituted in order to maintain the credit quality of the pool. The Group issues covered bonds as part of its funding activities.
Credit risk is the risk of financial loss resulting from the failure of ANZ’s customers and counterparties to honour or perform fully the terms of a loan or contract.
Credit risk weighted assets (CRWA) represent assets which are weighted for credit risk according to a set formula as prescribed in APS 112/113.
Customer deposits represent term deposits, other deposits bearing interest, deposits not bearing interest and borrowing corporations’ debt excluding securitisation deposits.
Customer remediation includes provisions for expected refunds to customers, remediation project costs and related customer and regulatory claims, penalties and litigation outcomes.
Derivative credit valuation adjustment (CVA) Over the life of a derivative instrument, ANZ uses a model to adjust fair value to take into account the impact of counterparty credit quality. The methodology calculates the present value of expected losses over the life of the financial instrument as a function of probability of default, loss given default, expected credit risk exposure and an asset correlation factor. Impaired derivatives are also subject to a CVA.
Dividend payout ratio is the total ordinary dividend payment divided by profit attributable to shareholders of the Company.
Fair value is an amount at which an asset or liability could be exchanged between knowledgeable and willing parties in an arm’s length transaction.
Funding for Lending Programme (FLP) refers to three-year funding announced by the RBNZ in November 2020 and offered to New Zealand banks, which aimed to lower the cost of borrowing for New Zealand businesses and households.
Gross loans and advances (GLA) is made up of loans and advances, capitalised brokerage and other origination costs less unearned income.
Group is Australia and New Zealand Banking Group Limited (the Company) and the entities it controlled at the year end and from time to time during the financial year (together, the Group).
IFRS International Financial Reporting Standards.
Impaired assets are those financial assets where doubt exists as to whether the full contractual amount will be received in a timely manner, or where concessional terms have been provided because of the financial difficulties of the customer. Financial assets are impaired if there is objective evidence of impairment as a result of a loss event that occurred prior to the reporting date, and that loss event has had an impact, which can be reliably estimated, on the expected future cash flows of the individual asset or portfolio of assets.
263ANZ 2021 Annual Report
OVERVIEW HOW WE CREATE VALUE
PERFORMANCE OVERVIEW
REMUNERATION REPORT
DIRECTORS’ REPORT
FINANCIAL REPORT
SHAREHOLDER INFORMATION
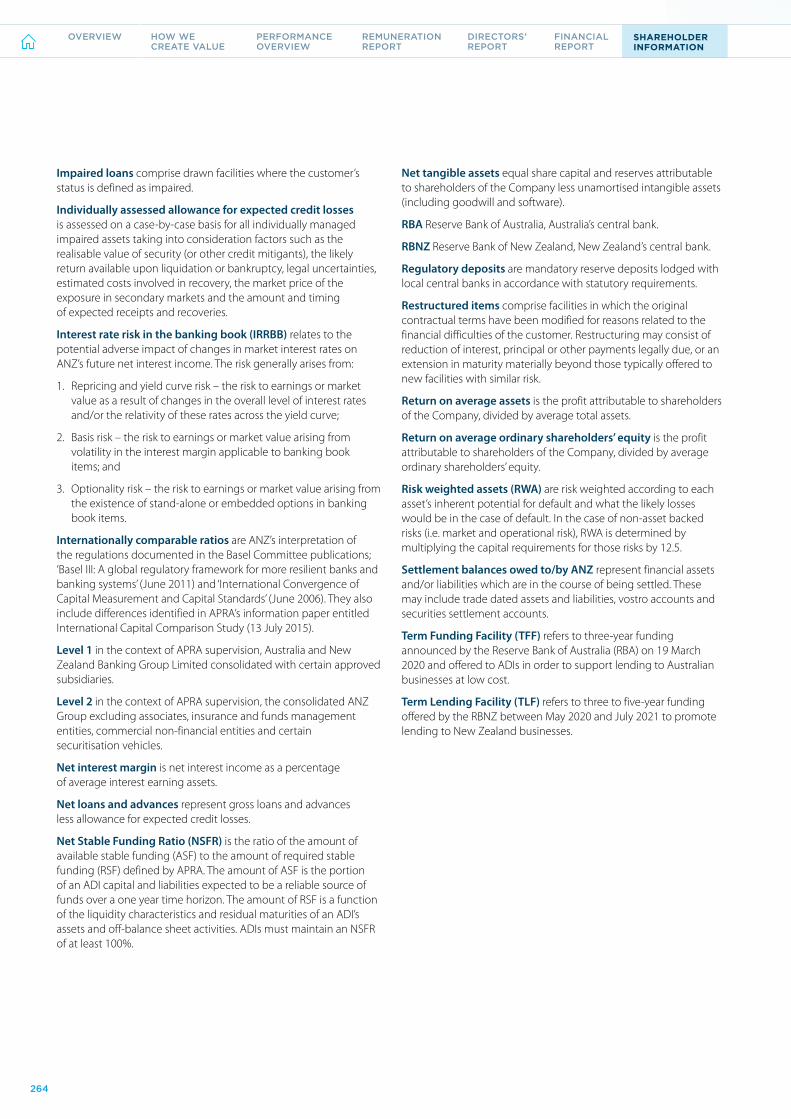
Impaired loans comprise drawn facilities where the customer’s status is defined as impaired.
Individually assessed allowance for expected credit losses is assessed on a case-by-case basis for all individually managed impaired assets taking into consideration factors such as the realisable value of security (or other credit mitigants), the likely return available upon liquidation or bankruptcy, legal uncertainties, estimated costs involved in recovery, the market price of the exposure in secondary markets and the amount and timing of expected receipts and recoveries.
Interest rate risk in the banking book (IRRBB) relates to the potential adverse impact of changes in market interest rates on ANZ’s future net interest income. The risk generally arises from:
1. Repricing and yield curve risk – the risk to earnings or market value as a result of changes in the overall level of interest rates and/or the relativity of these rates across the yield curve;
2. Basis risk – the risk to earnings or market value arising from volatility in the interest margin applicable to banking book items; and
3. Optionality risk – the risk to earnings or market value arising from the existence of stand-alone or embedded options in banking book items.
Internationally comparable ratios are ANZ’s interpretation of the regulations documented in the Basel Committee publications; ‘Basel III: A global regulatory framework for more resilient banks and banking systems’ (June 2011) and ‘International Convergence of Capital Measurement and Capital Standards’ (June 2006). They also include differences identified in APRA’s information paper entitled International Capital Comparison Study (13 July 2015).
Level 1 in the context of APRA supervision, Australia and New Zealand Banking Group Limited consolidated with certain approved subsidiaries.
Level 2 in the context of APRA supervision, the consolidated ANZ Group excluding associates, insurance and funds management entities, commercial non-financial entities and certain securitisation vehicles.
Net interest margin is net interest income as a percentage of average interest earning assets.
Net loans and advances represent gross loans and advances less allowance for expected credit losses.
Net Stable Funding Ratio (NSFR) is the ratio of the amount of available stable funding (ASF) to the amount of required stable funding (RSF) defined by APRA. The amount of ASF is the portion of an ADI capital and liabilities expected to be a reliable source of funds over a one year time horizon. The amount of RSF is a function of the liquidity characteristics and residual maturities of an ADI’s assets and off-balance sheet activities. ADIs must maintain an NSFR of at least 100%.
Net tangible assets equal share capital and reserves attributable to shareholders of the Company less unamortised intangible assets (including goodwill and software).
RBA Reserve Bank of Australia, Australia’s central bank.
RBNZ Reserve Bank of New Zealand, New Zealand’s central bank.
Regulatory deposits are mandatory reserve deposits lodged with local central banks in accordance with statutory requirements.
Restructured items comprise facilities in which the original contractual terms have been modified for reasons related to the financial difficulties of the customer. Restructuring may consist of reduction of interest, principal or other payments legally due, or an extension in maturity materially beyond those typically offered to new facilities with similar risk.
Return on average assets is the profit attributable to shareholders of the Company, divided by average total assets.
Return on average ordinary shareholders’ equity is the profit attributable to shareholders of the Company, divided by average ordinary shareholders’ equity.
Risk weighted assets (RWA) are risk weighted according to each asset’s inherent potential for default and what the likely losses would be in the case of default. In the case of non-asset backed risks (i.e. market and operational risk), RWA is determined by multiplying the capital requirements for those risks by 12.5.
Settlement balances owed to/by ANZ represent financial assets and/or liabilities which are in the course of being settled. These may include trade dated assets and liabilities, vostro accounts and securities settlement accounts.
Term Funding Facility (TFF) refers to three-year funding announced by the Reserve Bank of Australia (RBA) on 19 March 2020 and offered to ADIs in order to support lending to Australian businesses at low cost.
Term Lending Facility (TLF) refers to three to five-year funding offered by the RBNZ between May 2020 and July 2021 to promote lending to New Zealand businesses.
264
OVERVIEW HOW WE CREATE VALUE
PERFORMANCE OVERVIEW
REMUNERATION REPORT
DIRECTORS’ REPORT
FINANCIAL REPORT
SHAREHOLDER INFORMATION

2007 ANZ Reconciliation Action Plan launched – Australian-first.
1982 ANZ launches Night and Day Bank (ATM).
1983 ANZ appoints Australia’s first female bank Director – Dame Leonie Kramer DBE.1997
Asian language phone banking launched, a first among major
Australian banks.
1973 Miss Enid O’Toole appointed at Rockhampton North branch as the first female ANZ branch accountant.
1970 In what was then the largest merger
in Australian banking history, ANZ Ltd merged with the English, Scottish and Australian Bank
Limited to form Australia and New Zealand Banking Group Limited – the modern ANZ.
1958 ANZ adopted a new electronic bookkeeping machine that revolutionised ledger-posting procedures.
1961Mobile branches in vans
visited factories and workplaces bringing banking to staff. 1965
ANZ’s first computer – EMANZA (Electronic Method of ANZ Accounting) – was installed at 177 Toorak Road, South Yarra.
2010ANZ launched a free mobile banking application
for the iPhone called ANZ goMoney. ANZ was the first bank in Australia to offer customers a
mobile-to mobile payment application.
1951The Union Bank of Australia
merged with the Bank of Australasia to form the Australia
and New Zealand Bank Ltd (ANZ).
1835Bank of Australasia was an Australian Bank in operation from 1835-1951. Headquartered in London and incorporated by Royal Charter in March 1834.
1837The Union Bank of Australia was an Australian Bank in operation from 1837-1851. Was established in London in October 1837.
TENACIOUS OF PURPOSE
“The values forged in this merger 70 years ago are still part of the fabric
of who we are today. We are still a bank that wants to back people
with a vision for a better life.”
Shayne Elliott | Chief Executive Officer
70 years of ANZ
186 years old and 70 years as ANZ
OVERVIEW HOW WE CREATE VALUE
PERFORMANCE OVERVIEW
REMUNERATION REPORT
DIRECTORS’ REPORT
FINANCIAL REPORT
SHAREHOLDER INFORMATION

shareholder.anz.com
Australia and New Zealand Banking Group Limited (ANZ) ABN 11 005 357 522.
ANZ’s colour blue is a trade mark of ANZ.