The Balance of the Balance: small arms, light weapons (SALW) its parts and ammunition exports and...
37
En la Mira: the Latin American Small Arms Watch, nº 29, year 4, January of 2010 The Balance of the Balance: small arms, light weapons (SALW) its parts and ammunition exports and imports to Africa, Latin America, and the Caribbean from 2000 to 2007. Júlio Cesar Purcena e Natasha Leite* 1. Background All countries are supposed to declare their SALW transfers and this information is available in several databases, however to paint a realistic picture of SALW, its parts and ammunition transfers is not the simplest task. 1 Fortunetely there are global initiatives that excel in overcoming these challenges, among them, the Small Arms Survey Yearbook known to be an important source of information, mainly, concerning SALW production and transfers. Another pioneer initiative is NISAT, Norwegian Initiative on Small Arms Transfers that since 1962 has kept a database of all transfers records. In spite of all these very important initiatives, there is a lack of information about regional markets such as the Latin American one, the Caribbean or the African. In order to cover that gap, since 2007, “En La Mira” devotes a whole issue in SALW transfers, its parts and ammunition in those regions (Purcena e Dreyfus, 2007; Purcena e Dreyfus, 2008). In this issue, we included a region which has similar problems to those of Latin America and the Caribbean concerning armed violence: Africa. Africa presents answers to many of very basic questionings about armed violence: what creates armed violence? Is it related to poverty, inequality? Africa and Latin America have indeed very different and specific contexts, however we have identified in Africa a window of opportunity to prevent levels of armed violence that we see in Latin America today. We hope that through this exercise and our findings alongside with the work of many others specific policies of armed violence reduction can be implemented in an African context. * Researchers at the SALW Control Project of Viva Rio. 1 In this report, we chose to use the Acronym SALW (Small Arms and Light Weapons) to refer to firearms, its parts, accessories and ammunition. For further detail about this definition, please check: Small Arms Survey. Small Arms Survey 2001: Profiling the Problem. Oxford: Oxford University Press. p.8.
-
Upload
independent -
Category
Documents
-
view
1 -
download
0
Transcript of The Balance of the Balance: small arms, light weapons (SALW) its parts and ammunition exports and...
En la Mira: the Latin American Small Arms Watch, nº 29, year 4, January of 2010
The Balance of the Balance: small arms, light weapo ns (SALW)
its parts and ammunition exports and imports to Afr ica, Latin
America, and the Caribbean from 2000 to 2007.
Júlio Cesar Purcena e Natasha Leite*
1. Background
All countries are supposed to declare their SALW transfers and this information
is available in several databases, however to paint a realistic picture of SALW, its parts
and ammunition transfers is not the simplest task.1 Fortunetely there are global
initiatives that excel in overcoming these challenges, among them, the Small Arms
Survey Yearbook known to be an important source of information, mainly, concerning
SALW production and transfers. Another pioneer initiative is NISAT, Norwegian
Initiative on Small Arms Transfers that since 1962 has kept a database of all transfers
records.
In spite of all these very important initiatives, there is a lack of information
about regional markets such as the Latin American one, the Caribbean or the African. In
order to cover that gap, since 2007, “En La Mira” devotes a whole issue in SALW
transfers, its parts and ammunition in those regions (Purcena e Dreyfus, 2007; Purcena e
Dreyfus, 2008). In this issue, we included a region which has similar problems to those
of Latin America and the Caribbean concerning armed violence: Africa. Africa presents
answers to many of very basic questionings about armed violence: what creates armed
violence? Is it related to poverty, inequality? Africa and Latin America have indeed
very different and specific contexts, however we have identified in Africa a window of
opportunity to prevent levels of armed violence that we see in Latin America today. We
hope that through this exercise and our findings alongside with the work of many others
specific policies of armed violence reduction can be implemented in an African context.
* Researchers at the SALW Control Project of Viva Rio. 1 In this report, we chose to use the Acronym SALW (Small Arms and Light Weapons) to refer to firearms, its parts, accessories and ammunition. For further detail about this definition, please check: Small Arms Survey. Small Arms Survey 2001: Profiling the Problem. Oxford: Oxford University Press. p.8.
En la Mira: the Latin American Small Arms Watch, nº 29, year 4, January of 2010
Therefore, according to the analyzed data in this report provided by NISAT
which gather information of the United Nations Commodity Trade Statistics Database
(UN-Comtrade or Comtrade) USD 19,5 billion were exported between 2000 and 2007,
and USD 19,3 billion were imported. African, Latin American and Caribbean countries
represented 6.3% of the exports and 5.5% of imports of the world. On the other hand,
62% of homicides caused by firearms were commited in those regions (Small Arms
Survey, 2004). This discrepancy between the volume of transfers and the levels of
armed violence is alarming because of its both tragic and very expressive number of
homicides.2
Our goal here is not to level volume of transfers with homicide rate, but rather
clarify the main legal channels of SALW and ammunition entrance and exit, and follow
up their developments. The result of this exercise is this report in which we inform,
through a Customs perspective, the SALW, its parts and ammunition legal flux of
Africa, Latin America and the Caribbean during this last decade. Based on this data we
can answer the following questions: Who exported/imported? From whom? What? And
when?
We also would like to point out that is not up to this report to provide the
answers to causes of SALW exports and imports by those countries. Besides informing,
we hope that through this research, we can foment other researches and initiatives by
other fellow researchers, activists or government employees so countries can work
better on transparency and better answer who is using those weapons and how.
2 When we refer to Africa, Latin America and the Caribbean we consider the following countries and territories: South Africa, Angola, Algeria, Benin, Botswana, Burkina Faso, Burundi, Cape Verde, Cameroon, Chad, Comoros, Congo, Cote D’Ivoire, Djibouti, Egypt, Eritrea, Ethiopia, Gabon, Gambia, Ghana, Guinea, Equatorial Guinea, Guinea-Bissau, Lesotho, Liberia, Libya, Madagascar, Malawi, Morocco, Mauritius, Mauritania, Mozambique, Namibia, Niger, Nigeria, Kenya, Central African Republic, Rwanda, Senegal, Sierra Leone, Seychelles, Somalia, Swaziland, Sudan, Tanzania, Togo, Tunisia, Uganda, Zambia e Zimbabwe are African countries; Antigua and Barbuda, Argentina, Bahamas, Barbados, Belize, Bolivia, Brazil, Chile, Colombia, Costa Rica, Cuba, Dominica, Dominican Republic, Ecuador, El Salvador, Granada, Guatemala, Guiana, Haiti, Honduras, Jamaica, Mexico, Nicaragua, Panama, Paraguay, Peru, Saint Kitts and Nevis, Saint Lucia, Suriname, Trinidad and Tobago, Uruguay and Venezuela are Latin American countries. Autonomous region of Spain: Ceuta, Ilhas Canárias e Melila. Estado Livre Associado aos EUA: Porto Rico; dependências dos EUA; Ilhas Virgens Americanas; territórios ultramarinos da França: Guiana Francesa, Guadalupe, Maiote, Martinica e Reunião; territórios autônomos holandeses: Aruba e Antilhas Holandesas; e colônias britânicas: Anguilla, Ascensão, Bermuda, Ilhas Caimãs, Ilha Gough, Ilha de Tristão da Cunha, British Virgin Islands, Montserrat, Santa Helena, São Vicente e Grenadines e Turks e Caicos. There are 82 countries and 23 territories under foreign administration, totalling 105 different entities.

En la Mira: the Latin American Small Arms Watch, nº 29, year 4, January of 2010
2. Methodology
By authorized international transfers of SALW, we refer to the movement of
SALW, its parts; accessories and ammunition through national borders that got the
necessary authorization or license by acknowledge governments. Those weapons are
sent to countries with awareness and consent of importing, exporting or intermediating
countries. Sending those weapons requires, at least, a licence or export authorization
(although there are exceptions to the rule) besides extra paperwork.
We consider authorized intenational transfers to be: Sales by private or State
industries; liasons to private and State buyers seeking profit; arms sales negociated by
States; arms sales of one State to other State institutions for National Defense or law
enforcement purposes; SALW sent for testing and showcasing in other countries to
facilitate a possible business transaction; SALW sent from one State to the other to
support the Armed Forces or Law Enforcement of the recipient country, with no
sales/commercial transactions involved; SALW sent to allied countries as part of a
trainning programme or joint-military exercises; SALW sent by a State to its
peacekeeping forces outer State; SALW sent overseas to repairment; resending excess
armament (no sales involved) to the original exporting industry or country3; returning
rent or borrowed itens to the owner country; SALW sent by a government institution to
its overseas agents with purposes different from peacekeeping, such as training.
(SMALL ARMS SURVEY, 2001).
The data used in this report were colected from NISAT database, which gathers
over 880 thousand records of worldwide transfers of SALW, its parts, ammunition and
other types of armament that makes up the 93 chapter of the Harmonized System (HS).
The HS exists since 1992, in 2007, it launched its fourth edition – the previous were in
1996 and in 2002. We work with the data up until 2007 because it was the last year
available in NISAT. This database works with different sources of data, among them,
Comtrade. Therefore, in this report, it is only used this source because all countries
should declare their transfers to the United Nations.
About the data from NISAT, most countries agree to declare transfers in values
and/or tonnage of goods, although very few countries declare the number of units
transferred. Thus, in this study the main unit for analysis is the U.S. dollar, USD.
3 For instance, an industry can get old weapons as part of an agreement for the supply of new ones.
En la Mira: the Latin American Small Arms Watch, nº 29, year 4, January of 2010
Moreover, because of analysed timeframe and the fact that there was an inclusion of
another region, as well as other comparisons in this work, it was decided to update the
values analyzed. Therefore, these values were corrected by the implicit US GDP
deflator.4
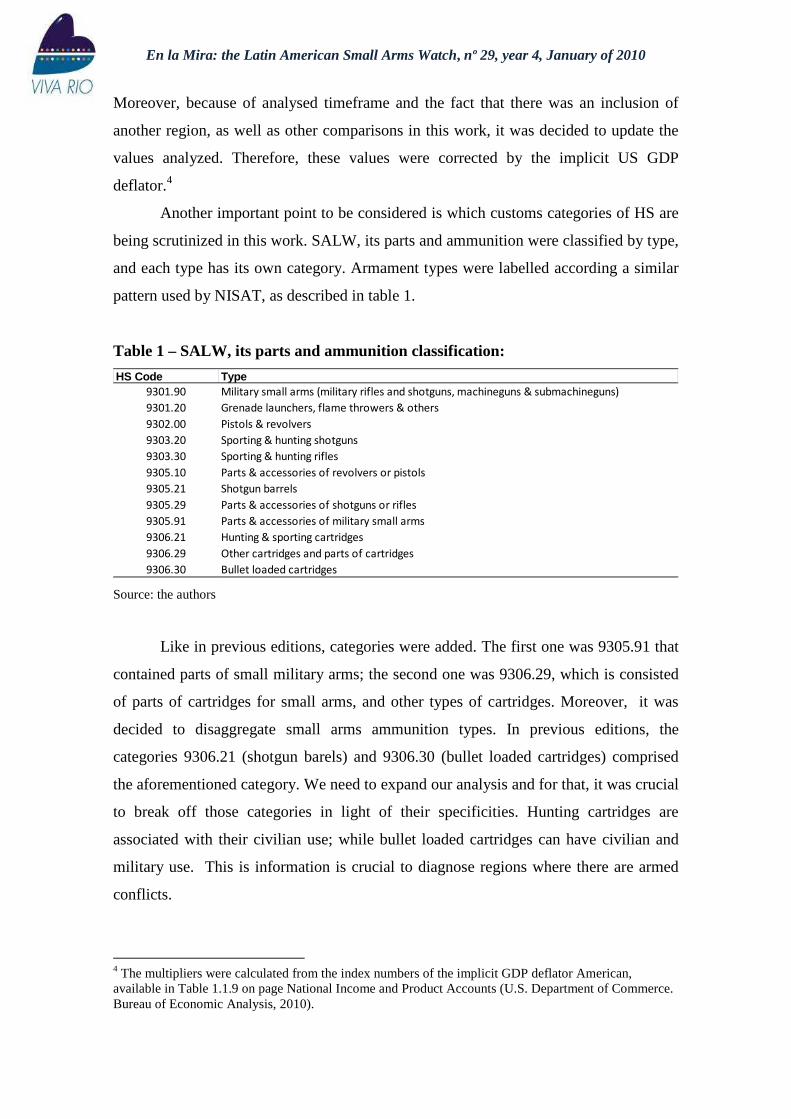
Another important point to be considered is which customs categories of HS are
being scrutinized in this work. SALW, its parts and ammunition were classified by type,
and each type has its own category. Armament types were labelled according a similar
pattern used by NISAT, as described in table 1.
Table 1 – SALW, its parts and ammunition classification:
HS Code Type9301.90 Military small arms (military rifles and shotguns, machineguns & submachineguns)
9301.20 Grenade launchers, flame throwers & others
9302.00 Pistols & revolvers
9303.20 Sporting & hunting shotguns
9303.30 Sporting & hunting rifles
9305.10 Parts & accessories of revolvers or pistols
9305.21 Shotgun barrels
9305.29 Parts & accessories of shotguns or rifles
9305.91 Parts & accessories of military small arms
9306.21 Hunting & sporting cartridges
9306.29 Other cartridges and parts of cartridges
9306.30 Bullet loaded cartridges
Source: the authors
Like in previous editions, categories were added. The first one was 9305.91 that
contained parts of small military arms; the second one was 9306.29, which is consisted
of parts of cartridges for small arms, and other types of cartridges. Moreover, it was
decided to disaggregate small arms ammunition types. In previous editions, the
categories 9306.21 (shotgun barels) and 9306.30 (bullet loaded cartridges) comprised
the aforementioned category. We need to expand our analysis and for that, it was crucial
to break off those categories in light of their specificities. Hunting cartridges are
associated with their civilian use; while bullet loaded cartridges can have civilian and
military use. This is information is crucial to diagnose regions where there are armed
conflicts.
4 The multipliers were calculated from the index numbers of the implicit GDP deflator American, available in Table 1.1.9 on page National Income and Product Accounts (U.S. Department of Commerce. Bureau of Economic Analysis, 2010).
En la Mira: the Latin American Small Arms Watch, nº 29, year 4, January of 2010
Data limitation is not restricted to unnotified quantities, Comtrade data has also
limitations derivated from HS versions that were not dully disagregated, or even wrong
subnotes and notes of some categories by some countries. In relation to incossistencies
found in notes or subnotes, the ones that stand out are the allegations of “matter of
National Security” as pretext to not report to Comtrade (BRASIL. CÂMARA DOS
DEPUTADOS, 2006, pp. 439-440).
The limitations regarding older versions happened because some of the main
categories for the current analysis of SALW tranfers situation were not detailed, among
them, 9301.00 (military weapons). The difficulty here lies on the fact that military
weapons, before 2002, included heavy armory, such as artillery pieces. Since 2002, the
harmonized system stablish the categories: 9301.90, including small arms, for overall
military use, such as machine guns, submachine guns, assault rifles and millitary
shotguns; anda 9301.20, which includes light weapons such as grenade lauchers inclui
armamento leve, como por exemplo, lançadores de granada, portable anti-tank weapons,
flame throwers and others.
In previous editions of this report, we have analyzed the category 9301.00 and
took the necessary procedures to mitigate the identified problems in the data
inconsistencies (Purcena and Dreyfus, 2007; Purcena and Dreyfus, 2008). However, in
the current edition it was decided to revise such procedures and, for that, not include
this particular category in our analysis. With a wider scope of work, such
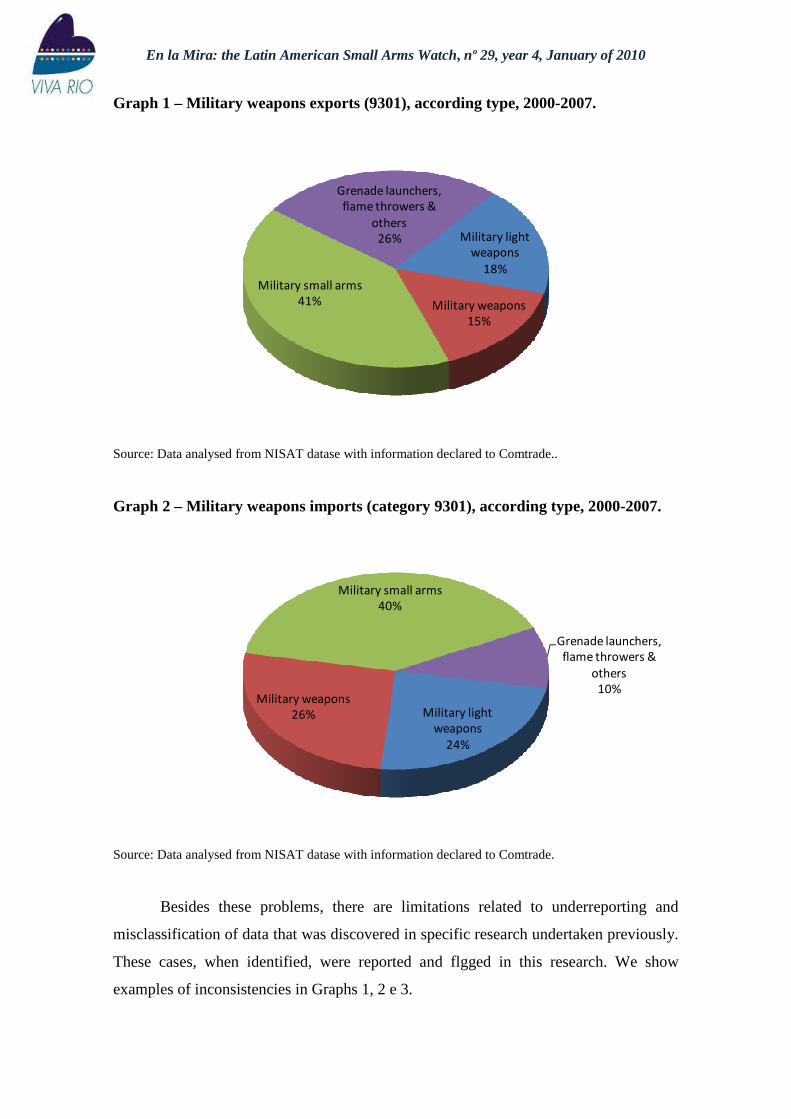
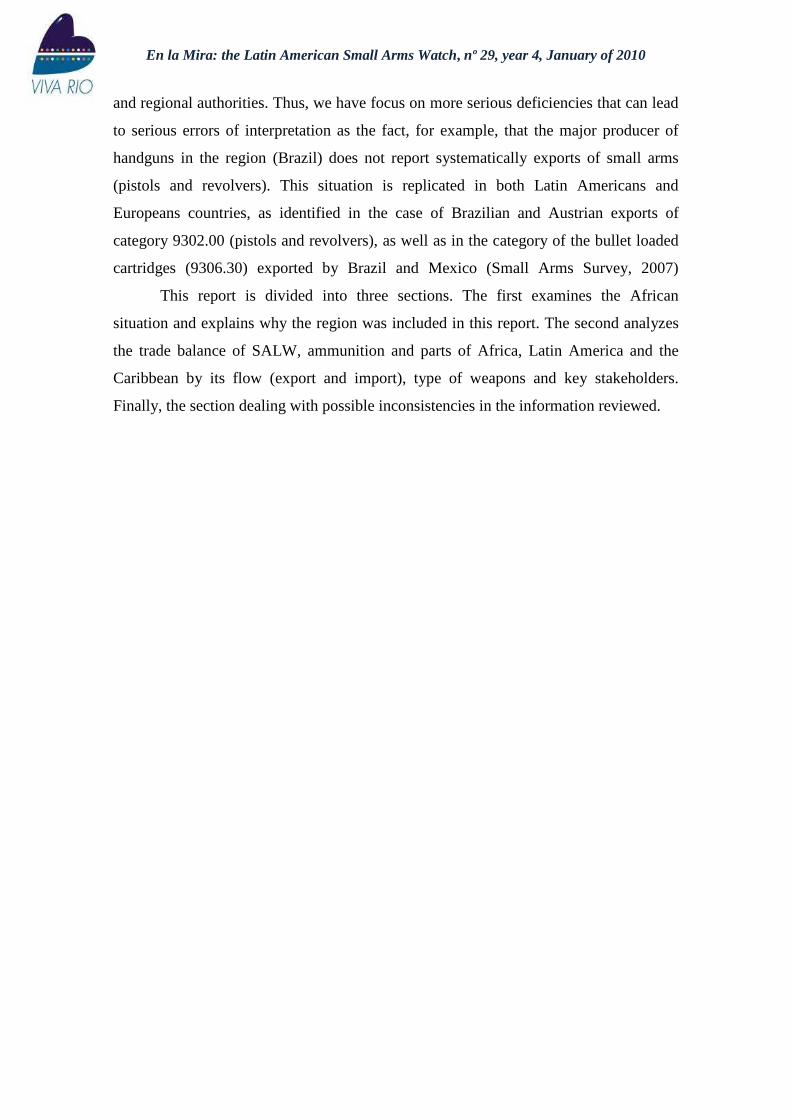
inconsistencies could not be afforded to be made. As it may be seen in Graphs 1 and 2,
SALW transfer for military use (categories 9301.90 and 9301.20) represented 50% of
the total of category 9301 between 2000 and 2007. It is also worth of note that although
newer versions (from 2002 fowarded) of the HS have more details, it is still possible to
analyse specific positions of military weapons by considering their first four digits
9301.
En la Mira: the Latin American Small Arms Watch, nº 29, year 4, January of 2010
Graph 1 – Military weapons exports (9301), according type, 2000-2007.
Military light
weapons
18%
Military weapons
15%
Military small arms
41%
Grenade launchers,
flame throwers &
others
26%
Source: Data analysed from NISAT datase with information declared to Comtrade..
Graph 2 – Military weapons imports (category 9301), according type, 2000-2007.
Military light
weapons
24%
Military weapons
26%
Military small arms
40%
Grenade launchers,
flame throwers &
others
10%
Source: Data analysed from NISAT datase with information declared to Comtrade.
Besides these problems, there are limitations related to underreporting and
misclassification of data that was discovered in specific research undertaken previously.
These cases, when identified, were reported and flgged in this research. We show
examples of inconsistencies in Graphs 1, 2 e 3.

En la Mira: the Latin American Small Arms Watch, nº 29, year 4, January of 2010
Graph 3 - Brazil exports of hunting and sporting rifles (9303.30) comparing to the
imports of United States of America (USA) of pistols and revolvers (9302.00), in
millions of USD current, 1992 - 2007.
-
10
20
30
40
50
60
70
80
90
1992 1993 1994 1995 1996 1997 1998 1999 2000 2001 2002 2003 2004 2005 2006 2007
9303.30 - Exports by Brazil 9302.00 - Imports by USA
Source: Data analysed from NISAT datase with information declared to Comtrade..
Graph 4 - Brazil exports of cartridges for shotguns (9306.21) compared to USA
imports of other firearms cartridges (9306.30), in million of USD current, 1992 -
2007.
-
5
10
15
20
25
1992 1993 1994 1995 1996 1997 1998 1999 2000 2001 2002 2003 2004 2005 2006 2007
9306.21 - Exports by Brazil 9306.30 - Imports by USA
Source: Data analysed from NISAT datase with information declared to Comtrade..

En la Mira: the Latin American Small Arms Watch, nº 29, year 4, January of 2010
Graph 5 – Mexico exports of shotgun cartridges (9306.21) compared to USA
imports of bullet loaded cartridges (9306.30), in million of USD current, 1992 -
2007.
0,0
0,5
1,0
1,5
2,0
2,5
3,0
3,5
4,0
1992 1993 1994 1995 1996 1997 1998 1999 2000 2001 2002 2003 2004 2005 2006 2007
9306.21 - Exports by Mexico 9306.30 - Imports by USA
Source: Data analysed from NISAT datase with information declared to Comtrade..
The graphs above (1 e 2) aim to show how Brazilian expots curves of rifles
(9303.30) and hunting cartridges (9306.21) are extremely similar to the imports curves
of revolvers (9302.00) as well as the curves of bullet loaded cartridges (9306.30) of the
United States, which in the end of the day demonstrates the same flow that is Brazilian
transfers to the US. It is worth of note that the main products exports (short arms and
bullet loaded cartridges) of the Brazilian industry of SALW do not appear at the exports
listings (Dreyfus, Lessing e Purcena, 2005; Dreyfus e Purcena, 2007). For that reason, it
was decided to compare informations declared by the main buyer of Brazilian SALW
and ammunition, the United States, which is pretty transparent when it comes to SALW
imports (Purcena, 2006; Small Arms Survey, 2007; Dreyfus e Purcena, 2009).
As the case of cartridge transfers between Brazil and United States, the same
pattern can be seen in Mexico as Graph 3 demonstrates, with a slitest difference
because, since 2002, Mexican exports of Hunting cartridges drops while American
import remain high when compare to the mentioned exports.
Finally, it is clear that although the purpose of this report is not only analyze
discrepancies (which do exist and are quite common) between the declared by importers
and exporters. As already mentioned the goal is to show data as it is declared to the UN
En la Mira: the Latin American Small Arms Watch, nº 29, year 4, January of 2010
and regional authorities. Thus, we have focus on more serious deficiencies that can lead
to serious errors of interpretation as the fact, for example, that the major producer of
handguns in the region (Brazil) does not report systematically exports of small arms
(pistols and revolvers). This situation is replicated in both Latin Americans and
Europeans countries, as identified in the case of Brazilian and Austrian exports of
category 9302.00 (pistols and revolvers), as well as in the category of the bullet loaded
cartridges (9306.30) exported by Brazil and Mexico (Small Arms Survey, 2007)
This report is divided into three sections. The first examines the African
situation and explains why the region was included in this report. The second analyzes
the trade balance of SALW, ammunition and parts of Africa, Latin America and the
Caribbean by its flow (export and import), type of weapons and key stakeholders.
Finally, the section dealing with possible inconsistencies in the information reviewed.

En la Mira: the Latin American Small Arms Watch, nº 29, year 4, January of 2010
3. African Context
3.1 Why expand the balance analysis to Africa?
The Balance is an effort to map legal transactions in African, Latin American
and Caribbean countries and pointing out inconsistencies and trends when we see fit.
Armed violence is a huge problem in Latin America, where we are based, therefore to
focus our attention to that region in our first reports appeared to be only natural.
Nevertheless, with the development of this report, our researches and even our work in
Africa, turn our eyes to this region seemed to be the next logical step.
Although African SALW transfers do not have a very high volume of
transactions or armed violence rates as high as Latin America; African countries have to
deal with the many diverse direct and indirect consequencies of arms proliferation.
SALW proliferation changed African society and their relations to territory through
massive amounts of internally displaced people and refugees conflicts produce.
Moreover, SALW proliferation hinders development, prevents humanitarian aid to
reach the ones that need it the most and facilitates the conscription of Child Soldies..The
Coalition to Stop the Use of Child Soldiers reports that Children are still being
“recruited” in five countries: Chad, Congo (DRC), Somalia, Sudan and Uganda. While
in counries where SALW supply is limited, guns are commodities that can not be
wasted in lesser experient warriores. On top of that, the damage to civilian population is
incredibly desproporcional; the number of civilians afected by conflicts in Africa is over
60 times higher than the number of civilians afected in na European conflict scenario
(IDMC, 2008).
Africa has several countries under arms embargoes; however, those very same
countries have the most arms transactions among African countries. We wonder if the
States that agree to those embargoes (which coincidentely are the main partners outside
Africa) are really willing to drop their arms sales. At the same time, the attention given
to arms control in Africa gives us hope that efective policies would be made before an
escalation of armed violence rates.
En la Mira: the Latin American Small Arms Watch, nº 29, year 4, January of 2010
3.2 – Mapping the issue of Firearms in Africa (Africa: the arms)
The 2003 Small Arms Survey Yearbook estimates that there are, at least, 30
million firearms in Subsaarian Africa onlu, and 38 companies produce firearms in the
subcontinent, located mainly in South Africa (Small Arms Survey, 2003). Even so, the
domestic production does not cover the demand, which leads to imports. Although there
is illicit traffic, through individual sellers also known as brokers that became famous by
books, movies and newscovers, it is clear that the major suppliers of SALW to Africa
are the States. Selling the weapons themselves or the parts and licences that allow those
weapons to be made.
To reduce supply and use of SALW in post-conflict sites has been very
important to the region in the last decade. The indiscriminate use of SALW diverge
State resources to public security and undermines the confidence in African enterprises.
Millions of small arms and light weapons were sent to Africa during Cold War so the
proxy wars could be fought and those stockpiles are still being kept. In 2001, the United
States government estimates that SALW were catalyst elements of conflicts in 22
African countries, which robbed the lives of 8 million people. As the former Secretary
General of the United Nations, Kofi Annan has already stated, in África, small arms are
not only weapons of choice, they are weapons of mass destruction. (SMALL ARMS
SURVEY, 2003: 80).
To stop this situation, the African countries have to develop stricter legislation
on SALW control and strengthen internal and external arms flow control. National
Plans of Action must approach supply and demand aspects of arms transaction, to tackle
arms proliferation in all its aspects. Demobilization, Disarmament and Reintegration
(DDR) programs are important, as well as campaigns for voluntary handover of
firearms to curb demand. However, regional cooperation is essential to halt the offer.
The ECOWAS Moratorium, the Protocol on Firearms, Ammunition and Explosive
Materials and the Nairobi Protocol are important steps in that direction.

En la Mira: the Latin American Small Arms Watch, nº 29, year 4, January of 2010
4. Data Analysis
In order to measure the size of trade of SALW in global terms, it is needed to
compare the values of transfers within Chapter 93 of the HS. This chapter considers all
conventional weapons from handguns to guided missiles. However, it do not take into
account aircraft, tanks and frigates, that is, weapons systems that are not restricted to
bellicose activity bellicose.
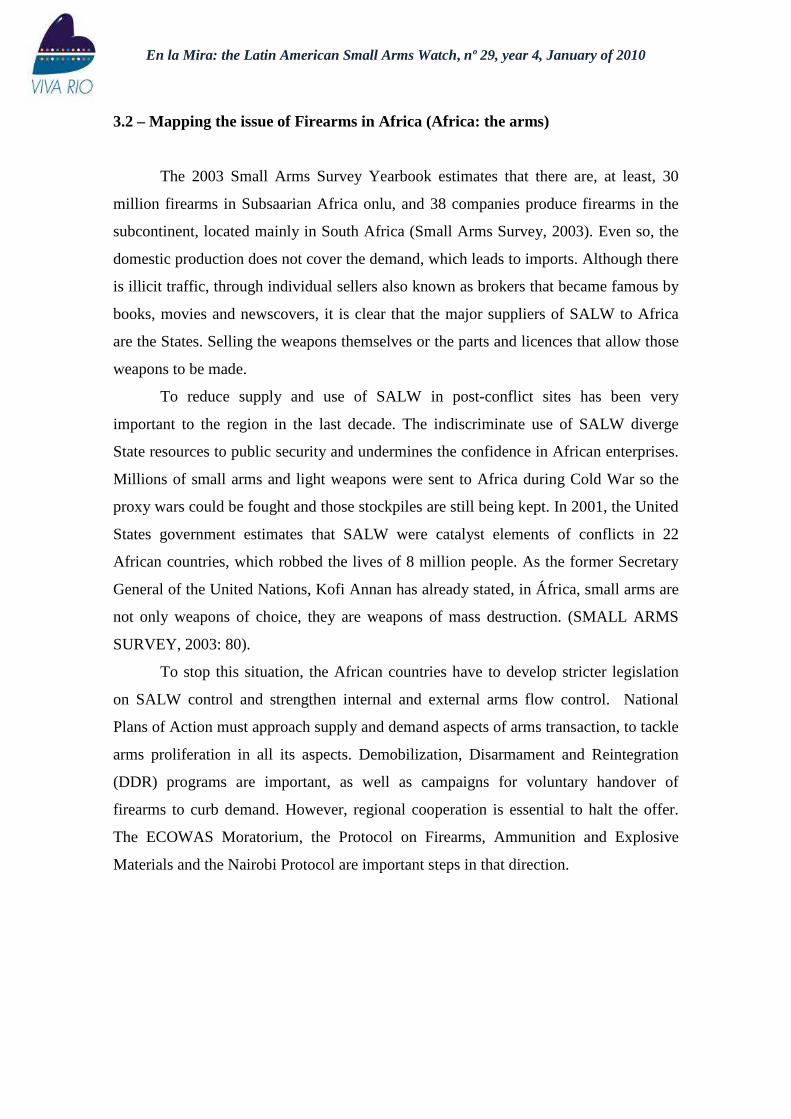
Thus, in Graph 6, we considered only the 10 most important positions that
chapter. Ammunition of war represents 42% of the total circulating worldwide, which,
during the period 2000 to 2007, was USD 41.5 billion. An important point of
ammunitions of war is that this category includes products of higher added value (such
as missiles or mines) than bullet loaded cartridges. The second most traded item is also
a type ammunition: bullet loaded cartridges. The main difference between these two
types of ammunition is that the first is used only for military purposes, while the second
has both civilian and military use. However, this alone does not explain why such high
values for that category, it would be necessary to expand this analysis. However, our
goal here is to deal with small arms which is not the case of ammunitions of war,
therefore, it is noted that small arms have concentrated 44% of world exports between
2000 and 2007. What is very relevant, especially since they are products of lesser value
when compared to military weapons.
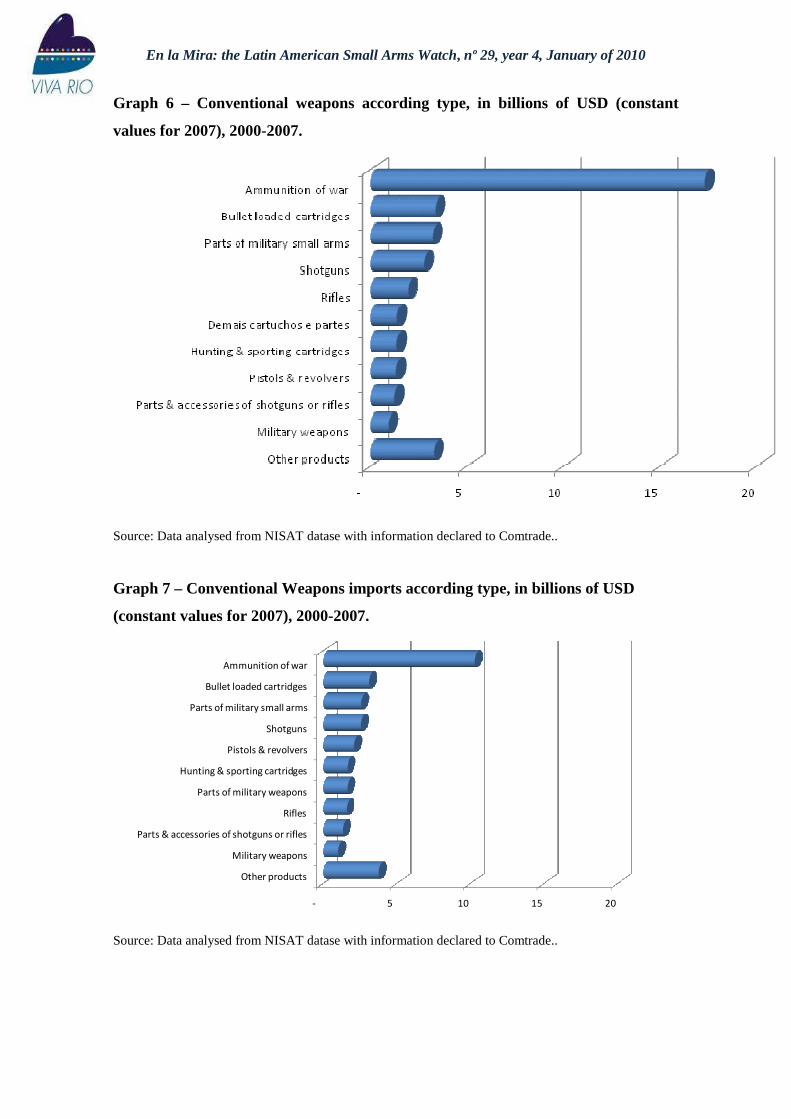
In Graph 7, which deals with the categories discussed above through the
consumers, that is, importers, declarations, ammunitions of war are still in first place in
the ranking of conventional arms transfers. However, in this graph, the category
represents 31% of imports. As pointed out above, the declaration of weapons for
military use is not always transparent and it may be one reason for lower percentage
than that observed in exports
Among the small arms, the main changes are the participation and position of
the category of revolvers and pistols. The category accounted for 5.7% of world imports
and it has moved from 8th place in exports to 4th position in imports. On small arms
alone, they represented 54% of world imports between 2000 and 2007.
En la Mira: the Latin American Small Arms Watch, nº 29, year 4, January of 2010
Graph 6 – Conventional weapons according type, in billions of USD (constant
values for 2007), 2000-2007.
Source: Data analysed from NISAT datase with information declared to Comtrade..
Graph 7 – Conventional Weapons imports according type, in billions of USD
(constant values for 2007), 2000-2007.
- 5 10 15 20
Other products
Military weapons
Parts & accessories of shotguns or rifles
Rifles
Parts of military weapons
Hunting & sporting cartridges
Pistols & revolvers
Shotguns
Parts of military small arms
Bullet loaded cartridges
Ammunition of war
Source: Data analysed from NISAT datase with information declared to Comtrade..
En la Mira: the Latin American Small Arms Watch, nº 29, year 4, January of 2010
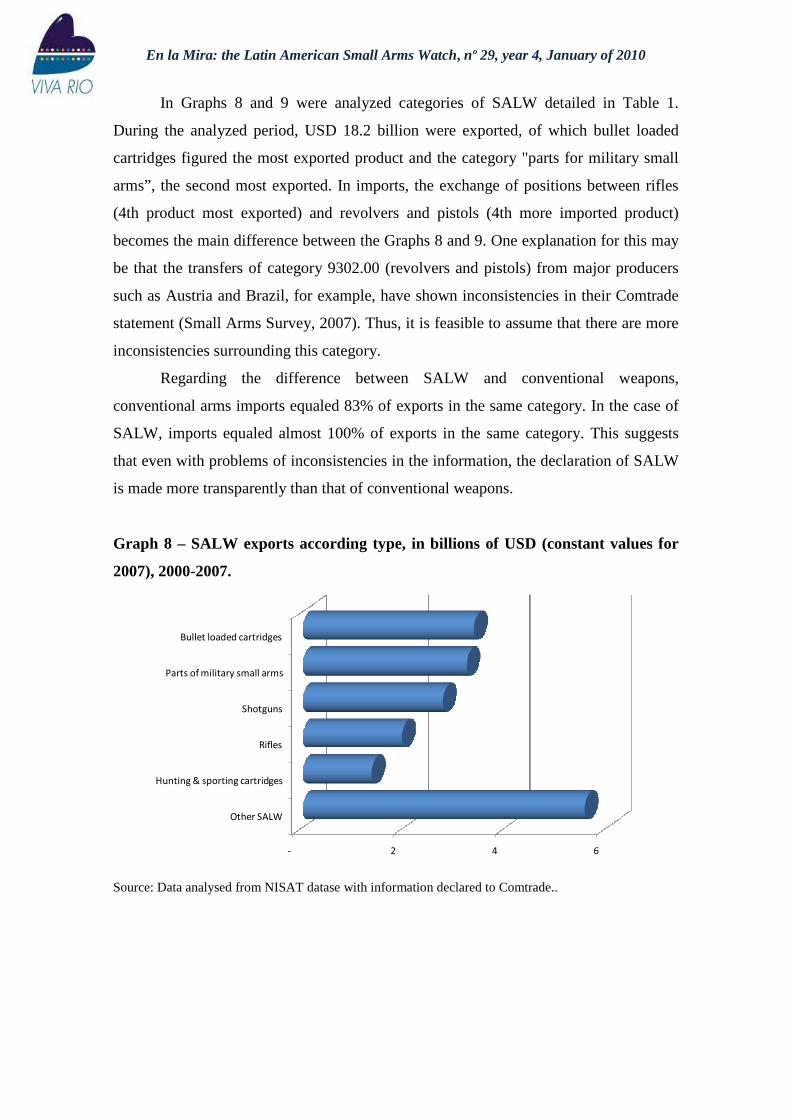
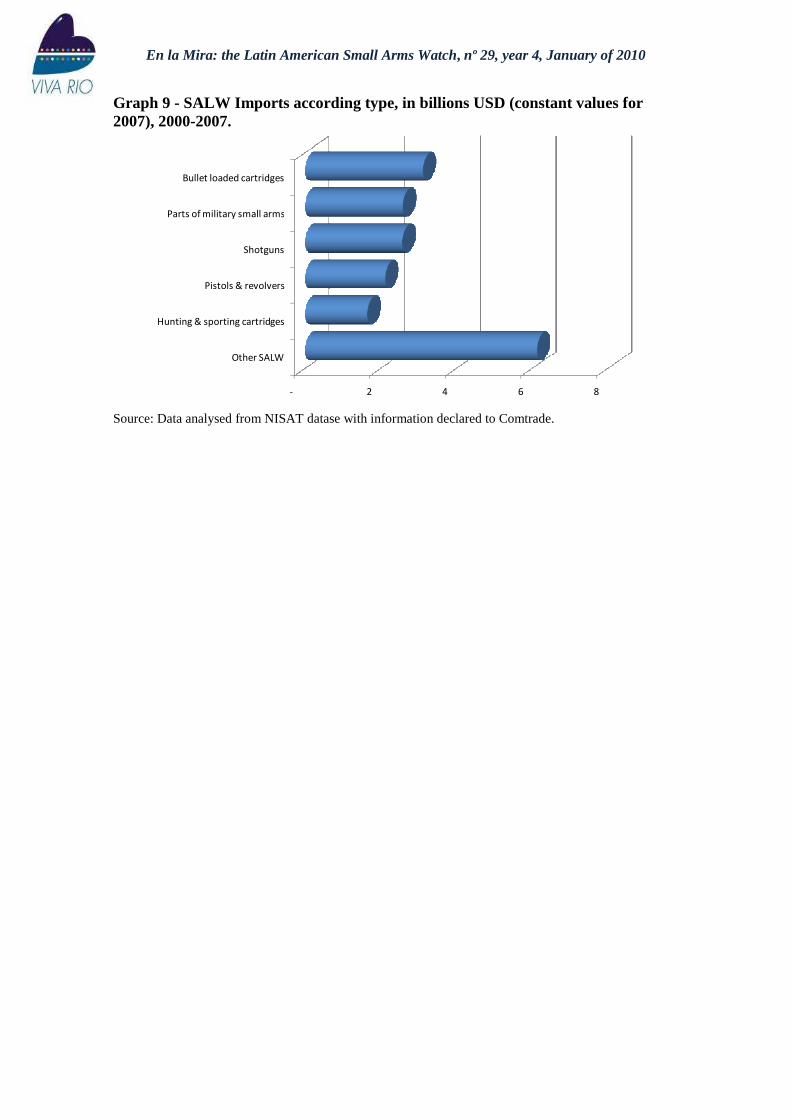
In Graphs 8 and 9 were analyzed categories of SALW detailed in Table 1.
During the analyzed period, USD 18.2 billion were exported, of which bullet loaded
cartridges figured the most exported product and the category "parts for military small
arms”, the second most exported. In imports, the exchange of positions between rifles
(4th product most exported) and revolvers and pistols (4th more imported product)
becomes the main difference between the Graphs 8 and 9. One explanation for this may
be that the transfers of category 9302.00 (revolvers and pistols) from major producers
such as Austria and Brazil, for example, have shown inconsistencies in their Comtrade
statement (Small Arms Survey, 2007). Thus, it is feasible to assume that there are more
inconsistencies surrounding this category.
Regarding the difference between SALW and conventional weapons,
conventional arms imports equaled 83% of exports in the same category. In the case of
SALW, imports equaled almost 100% of exports in the same category. This suggests
that even with problems of inconsistencies in the information, the declaration of SALW
is made more transparently than that of conventional weapons.
Graph 8 – SALW exports according type, in billions of USD (constant values for
2007), 2000-2007.
- 2 4 6
Other SALW
Hunting & sporting cartridges
Rifles
Shotguns
Parts of military small arms
Bullet loaded cartridges
Source: Data analysed from NISAT datase with information declared to Comtrade..
En la Mira: the Latin American Small Arms Watch, nº 29, year 4, January of 2010
Graph 9 - SALW Imports according type, in billions USD (constant values for 2007), 2000-2007.
- 2 4 6 8
Other SALW
Hunting & sporting cartridges
Pistols & revolvers
Shotguns
Parts of military small arms
Bullet loaded cartridges
Source: Data analysed from NISAT datase with information declared to Comtrade.
En la Mira: the Latin American Small Arms Watch, nº 29, year 4, January of 2010
4.1. SALW in Latin America and the Caribbean
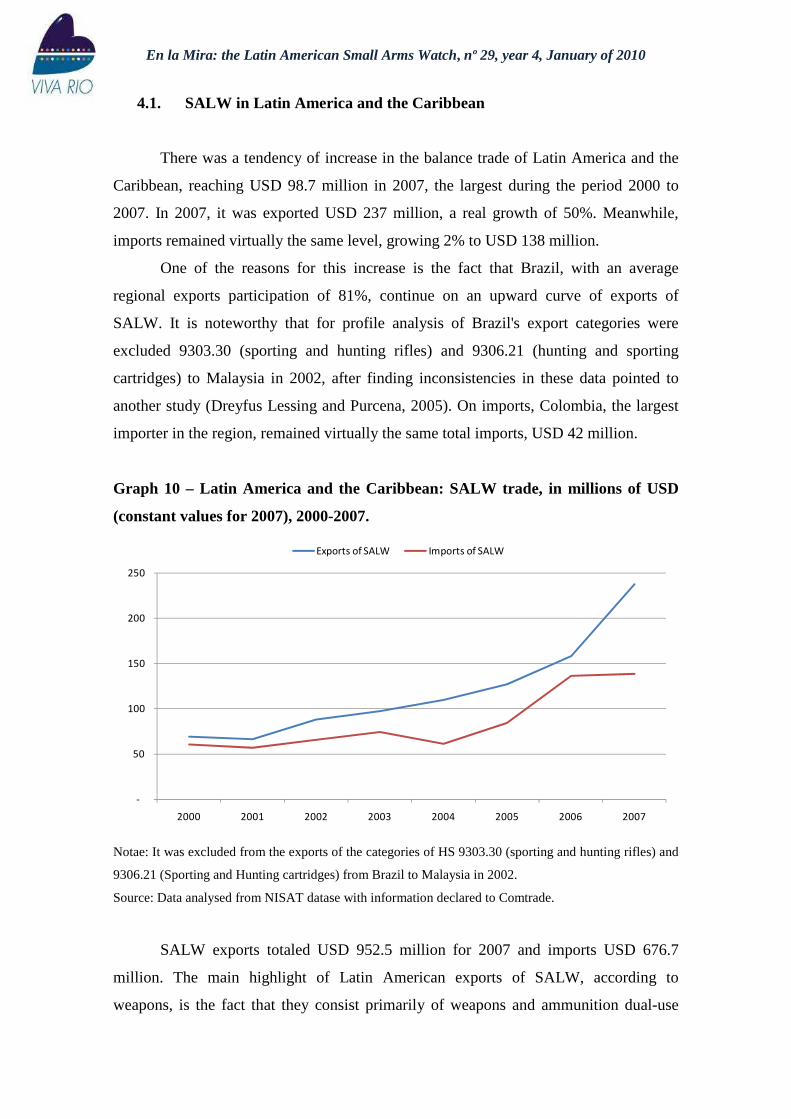
There was a tendency of increase in the balance trade of Latin America and the
Caribbean, reaching USD 98.7 million in 2007, the largest during the period 2000 to
2007. In 2007, it was exported USD 237 million, a real growth of 50%. Meanwhile,
imports remained virtually the same level, growing 2% to USD 138 million.
One of the reasons for this increase is the fact that Brazil, with an average
regional exports participation of 81%, continue on an upward curve of exports of
SALW. It is noteworthy that for profile analysis of Brazil's export categories were
excluded 9303.30 (sporting and hunting rifles) and 9306.21 (hunting and sporting
cartridges) to Malaysia in 2002, after finding inconsistencies in these data pointed to
another study (Dreyfus Lessing and Purcena, 2005). On imports, Colombia, the largest
importer in the region, remained virtually the same total imports, USD 42 million.
Graph 10 – Latin America and the Caribbean: SALW trade, in millions of USD
(constant values for 2007), 2000-2007.
-
50
100
150
200
250
2000 2001 2002 2003 2004 2005 2006 2007
Exports of SALW Imports of SALW
Notae: It was excluded from the exports of the categories of HS 9303.30 (sporting and hunting rifles) and
9306.21 (Sporting and Hunting cartridges) from Brazil to Malaysia in 2002.
Source: Data analysed from NISAT datase with information declared to Comtrade.
SALW exports totaled USD 952.5 million for 2007 and imports USD 676.7
million. The main highlight of Latin American exports of SALW, according to
weapons, is the fact that they consist primarily of weapons and ammunition dual-use
En la Mira: the Latin American Small Arms Watch, nº 29, year 4, January of 2010
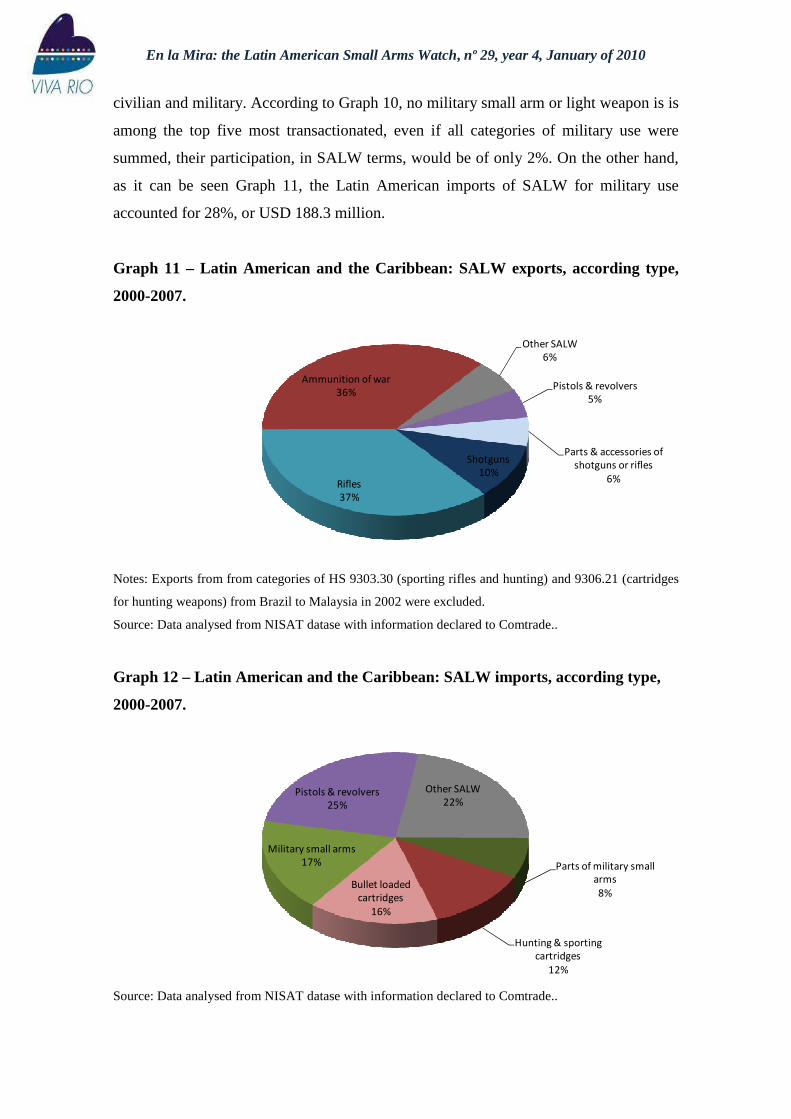
civilian and military. According to Graph 10, no military small arm or light weapon is is
among the top five most transactionated, even if all categories of military use were
summed, their participation, in SALW terms, would be of only 2%. On the other hand,
as it can be seen Graph 11, the Latin American imports of SALW for military use
accounted for 28%, or USD 188.3 million.
Graph 11 – Latin American and the Caribbean: SALW exports, according type,
2000-2007.
Other SALW
6%
Pistols & revolvers
5%
Parts & accessories of
shotguns or rifles
6%
Shotguns
10%Rifles
37%
Ammunition of war
36%
Notes: Exports from from categories of HS 9303.30 (sporting rifles and hunting) and 9306.21 (cartridges
for hunting weapons) from Brazil to Malaysia in 2002 were excluded.
Source: Data analysed from NISAT datase with information declared to Comtrade..
Graph 12 – Latin American and the Caribbean: SALW imports, according type,
2000-2007.
Other SALW
22%
Parts of military small
arms
8%
Hunting & sporting
cartridges
12%
Bullet loaded
cartridges
16%
Military small arms
17%
Pistols & revolvers
25%
Source: Data analysed from NISAT datase with information declared to Comtrade..
En la Mira: the Latin American Small Arms Watch, nº 29, year 4, January of 2010
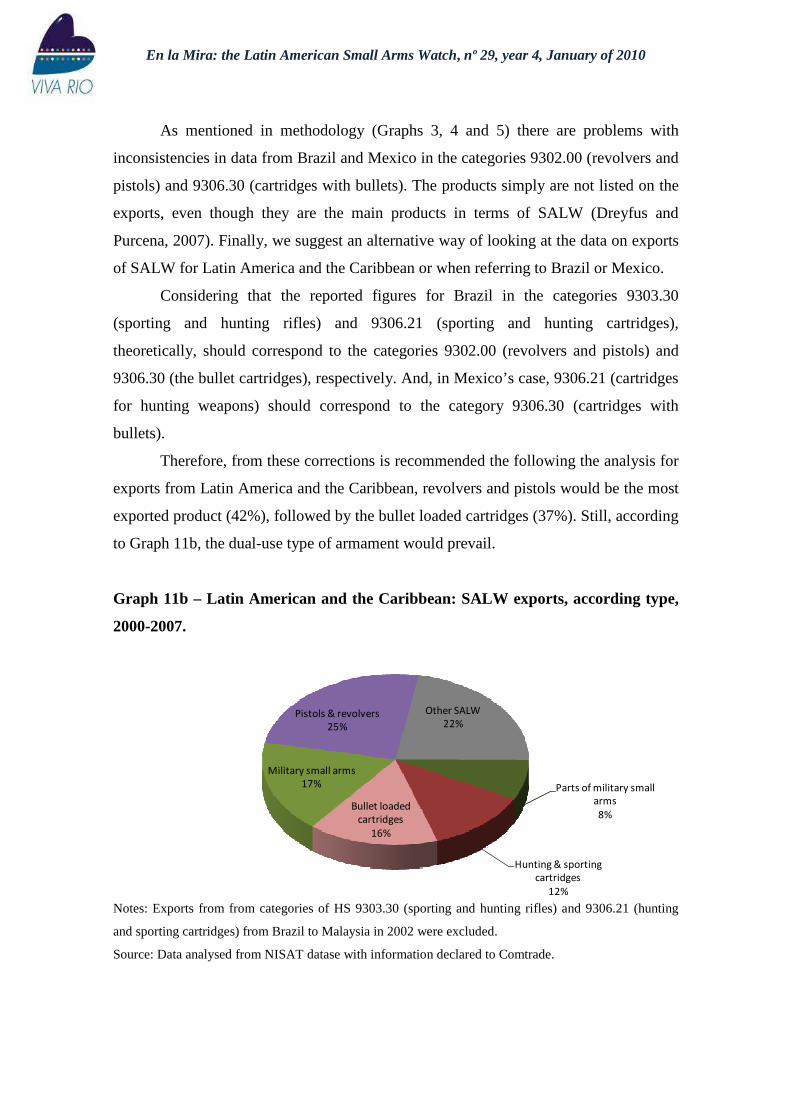
As mentioned in methodology (Graphs 3, 4 and 5) there are problems with
inconsistencies in data from Brazil and Mexico in the categories 9302.00 (revolvers and
pistols) and 9306.30 (cartridges with bullets). The products simply are not listed on the
exports, even though they are the main products in terms of SALW (Dreyfus and
Purcena, 2007). Finally, we suggest an alternative way of looking at the data on exports
of SALW for Latin America and the Caribbean or when referring to Brazil or Mexico.
Considering that the reported figures for Brazil in the categories 9303.30
(sporting and hunting rifles) and 9306.21 (sporting and hunting cartridges),
theoretically, should correspond to the categories 9302.00 (revolvers and pistols) and
9306.30 (the bullet cartridges), respectively. And, in Mexico’s case, 9306.21 (cartridges
for hunting weapons) should correspond to the category 9306.30 (cartridges with
bullets).
Therefore, from these corrections is recommended the following the analysis for
exports from Latin America and the Caribbean, revolvers and pistols would be the most
exported product (42%), followed by the bullet loaded cartridges (37%). Still, according
to Graph 11b, the dual-use type of armament would prevail.
Graph 11b – Latin American and the Caribbean: SALW exports, according type,
2000-2007.
Other SALW
22%
Parts of military small
arms
8%
Hunting & sporting
cartridges
12%
Bullet loaded
cartridges
16%
Military small arms
17%
Pistols & revolvers
25%
Notes: Exports from from categories of HS 9303.30 (sporting and hunting rifles) and 9306.21 (hunting
and sporting cartridges) from Brazil to Malaysia in 2002 were excluded.
Source: Data analysed from NISAT datase with information declared to Comtrade.
En la Mira: the Latin American Small Arms Watch, nº 29, year 4, January of 2010
When considering the exports of countries from Latin America and the
Caribbean, Brazil is responsible for much of the exports from the region to the world,
81%, in constant values that would summed USD 776.5 million. The second largest
exporter in the region, Mexico, has 11% of Brazilian exports, which equals USD 83.1
million. In Graph 13 we considered the 10 largest exporters in the region. When
analyzing exports by region: South America has 91%, Central America, plus Mexico
are 8.86% and 0.04% Caribbean has.
In Graph 14 was analyzed other countries divided by region, disregarding the 10
largest exporters. Thus, the Central American countries totaled USD 273 thousand in
constant values, or 76% of the total. Caribbean was 23% and South America with 1% of
total exports.
Ao analisar as exportações da América Latina e Caribe por países, nota-se como
o Brasil é responsável por grande parte das transferências da região para o mundo, 81%
nas exportações, o que em valores constantes é representado por USD 776,5 milhões. O
segundo maior exportador da região, México, tem 11% das exportações brasileiras, o
que equivale USD 83,1 milhões. No Graph 13 foram considerados os 10 maiores
exportadores da região. Ao analisar as exportações por região: América do Sul tem
91%, América Central, mais o México têm 8,86% e Caribe tem 0,04%.
In Graph 14 was analyzed other countries divided by region, disregarding the 10
largest exporters. Thus, the Central American countries totaled USD 273 thousand in
constant values, or 76% of the total. Caribbean was 23% and South America with 1% of
total exports.
No Graph 14 foi analisado os demais países divididos por região,
desconsiderando os 10 maiores exportadores. Assim, os países da América Central
totalizaram USD 273 mil, em valores constantes, ou 76% do total. Caribe ficou 23% e
América do Sul com 1% do total exportado.

En la Mira: the Latin American Small Arms Watch, nº 29, year 4, January of 2010
Graph 13 – Latin America and the Caribbean: SALW exports, according to
country, in millions USD (constant values for 2007), 2000-2007.
- 200 400 600 800
Guatemala
Barbados
Venezuela
El Salvador
Colombia
Chile
Peru
Argentina
Mexico
Brazil
Notes: Exports from from categories of HS 9303.30 (sporting and hunting rifles) and 9306.21 (hunting
and sporting cartridges) from Brazil to Malaysia in 2002 were excluded.
Source: Data analysed from NISAT datase with information declared to Comtrade..
Graph 14 – Latin America and the Caribbean: SALW exports, according to
region, in millionsof USD (constant values for 2007), 2000-2007.¹
Central America
76%South America
1%
Caribbean
23%
¹ The ten top exporters of SALW in Latin American and the Caribbean were excluded.
Source: Data analysed from NISAT datase with information declared to Comtrade.
On the import side, the main consumer of SALW in Latin America and the
Caribbean is Colombia. During 2000 and 2007, as seen in Graph 15, USD 173.7 million
in weapons were transferred to Colombia, which represented 26% of total regional
imports. In second and third place we found Mexico and Venezuela who imported USD
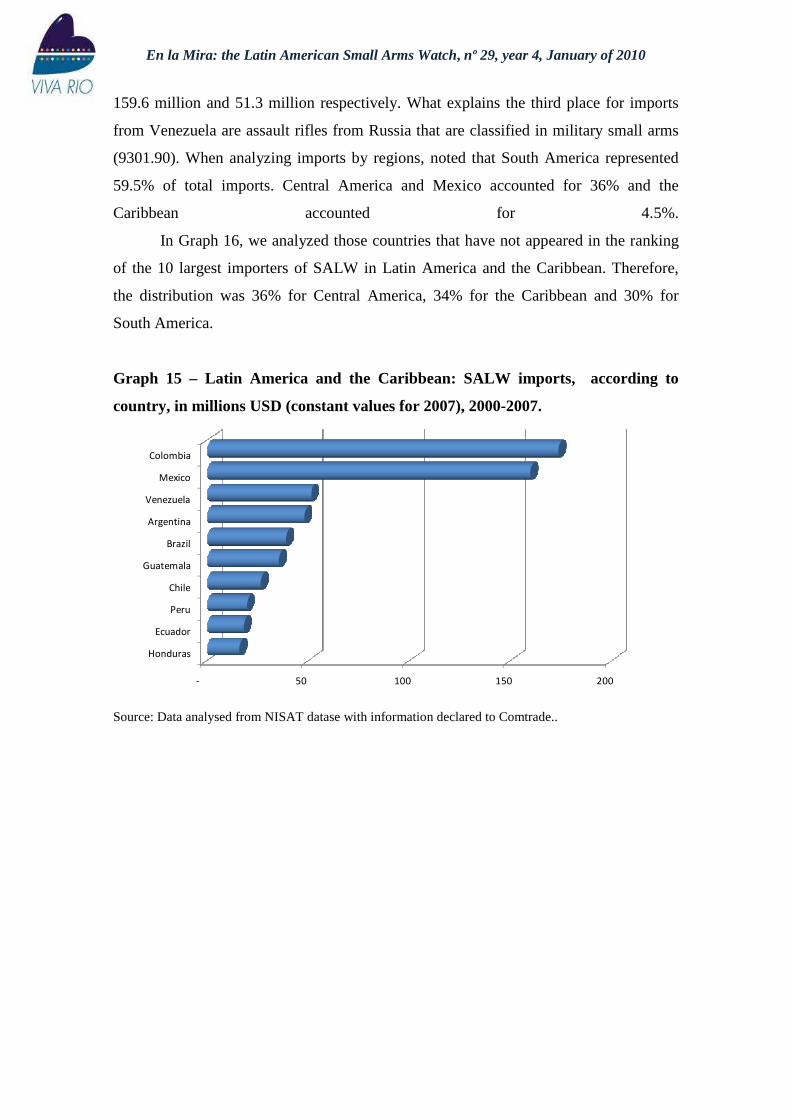
En la Mira: the Latin American Small Arms Watch, nº 29, year 4, January of 2010
159.6 million and 51.3 million respectively. What explains the third place for imports
from Venezuela are assault rifles from Russia that are classified in military small arms
(9301.90). When analyzing imports by regions, noted that South America represented
59.5% of total imports. Central America and Mexico accounted for 36% and the
Caribbean accounted for 4.5%.
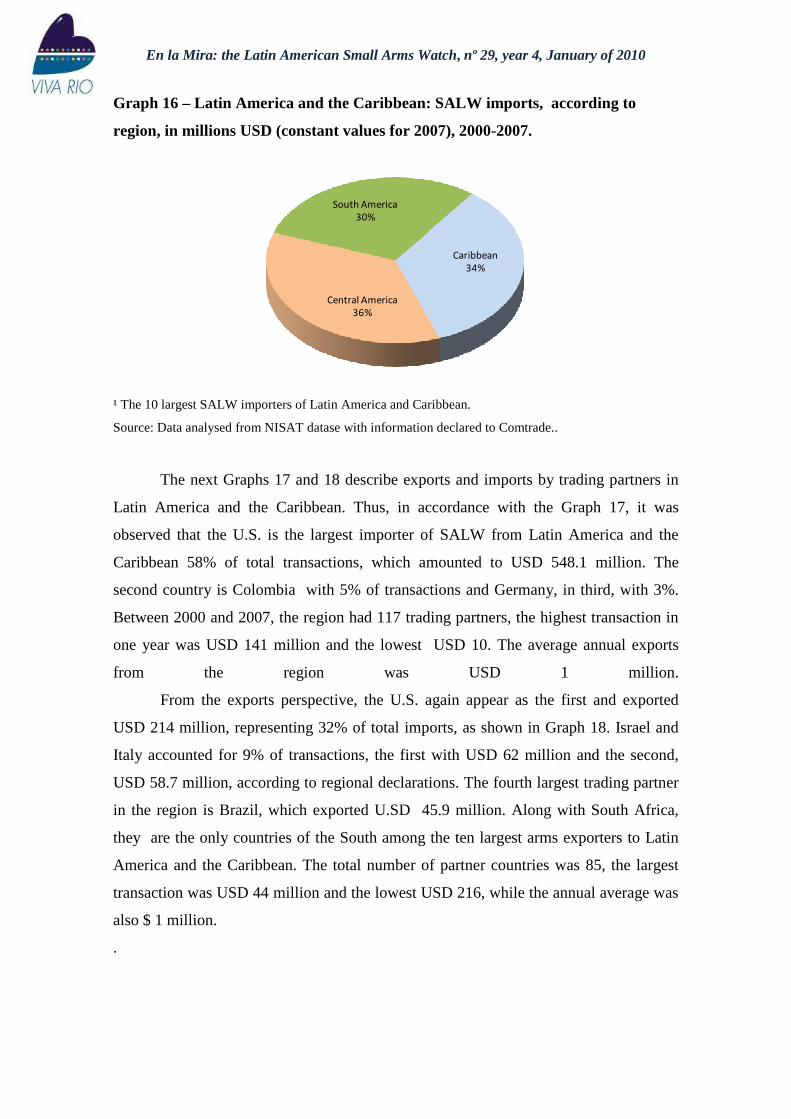
In Graph 16, we analyzed those countries that have not appeared in the ranking
of the 10 largest importers of SALW in Latin America and the Caribbean. Therefore,
the distribution was 36% for Central America, 34% for the Caribbean and 30% for
South America.
Graph 15 – Latin America and the Caribbean: SALW imports, according to
country, in millions USD (constant values for 2007), 2000-2007.
- 50 100 150 200
Honduras
Ecuador
Peru
Chile
Guatemala
Brazil
Argentina
Venezuela
Mexico
Colombia
Source: Data analysed from NISAT datase with information declared to Comtrade..
En la Mira: the Latin American Small Arms Watch, nº 29, year 4, January of 2010
Graph 16 – Latin America and the Caribbean: SALW imports, according to
region, in millions USD (constant values for 2007), 2000-2007.
Central America
36%
South America
30%
Caribbean
34%
¹ The 10 largest SALW importers of Latin America and Caribbean.
Source: Data analysed from NISAT datase with information declared to Comtrade..
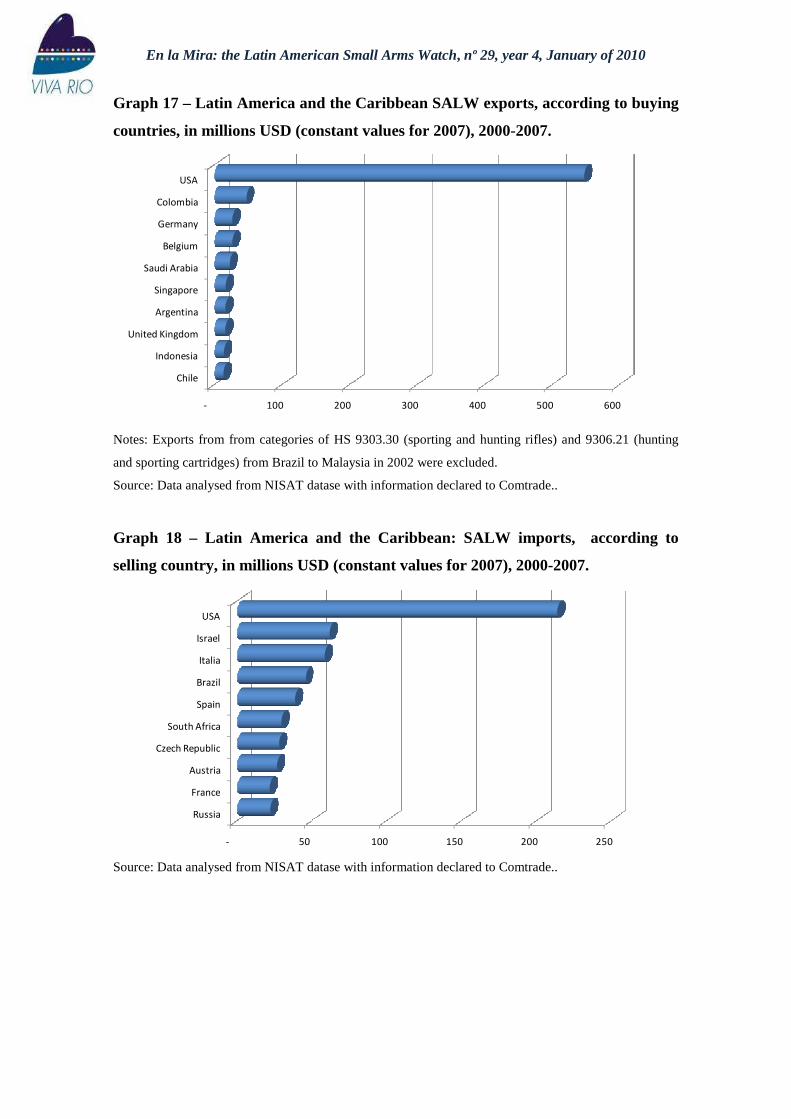
The next Graphs 17 and 18 describe exports and imports by trading partners in
Latin America and the Caribbean. Thus, in accordance with the Graph 17, it was
observed that the U.S. is the largest importer of SALW from Latin America and the
Caribbean 58% of total transactions, which amounted to USD 548.1 million. The
second country is Colombia with 5% of transactions and Germany, in third, with 3%.
Between 2000 and 2007, the region had 117 trading partners, the highest transaction in
one year was USD 141 million and the lowest USD 10. The average annual exports
from the region was USD 1 million.
From the exports perspective, the U.S. again appear as the first and exported
USD 214 million, representing 32% of total imports, as shown in Graph 18. Israel and
Italy accounted for 9% of transactions, the first with USD 62 million and the second,
USD 58.7 million, according to regional declarations. The fourth largest trading partner
in the region is Brazil, which exported U.SD 45.9 million. Along with South Africa,
they are the only countries of the South among the ten largest arms exporters to Latin
America and the Caribbean. The total number of partner countries was 85, the largest
transaction was USD 44 million and the lowest USD 216, while the annual average was
also $ 1 million.
.
En la Mira: the Latin American Small Arms Watch, nº 29, year 4, January of 2010
Graph 17 – Latin America and the Caribbean SALW exports, according to buying
countries, in millions USD (constant values for 2007), 2000-2007.
- 100 200 300 400 500 600
Chile
Indonesia
United Kingdom
Argentina
Singapore
Saudi Arabia
Belgium
Germany
Colombia
USA
Notes: Exports from from categories of HS 9303.30 (sporting and hunting rifles) and 9306.21 (hunting
and sporting cartridges) from Brazil to Malaysia in 2002 were excluded.
Source: Data analysed from NISAT datase with information declared to Comtrade..
Graph 18 – Latin America and the Caribbean: SALW imports, according to
selling country, in millions USD (constant values for 2007), 2000-2007.
- 50 100 150 200 250
Russia
France
Austria
Czech Republic
South Africa
Spain
Brazil
Italia
Israel
USA
Source: Data analysed from NISAT datase with information declared to Comtrade..
En la Mira: the Latin American Small Arms Watch, nº 29, year 4, January of 2010
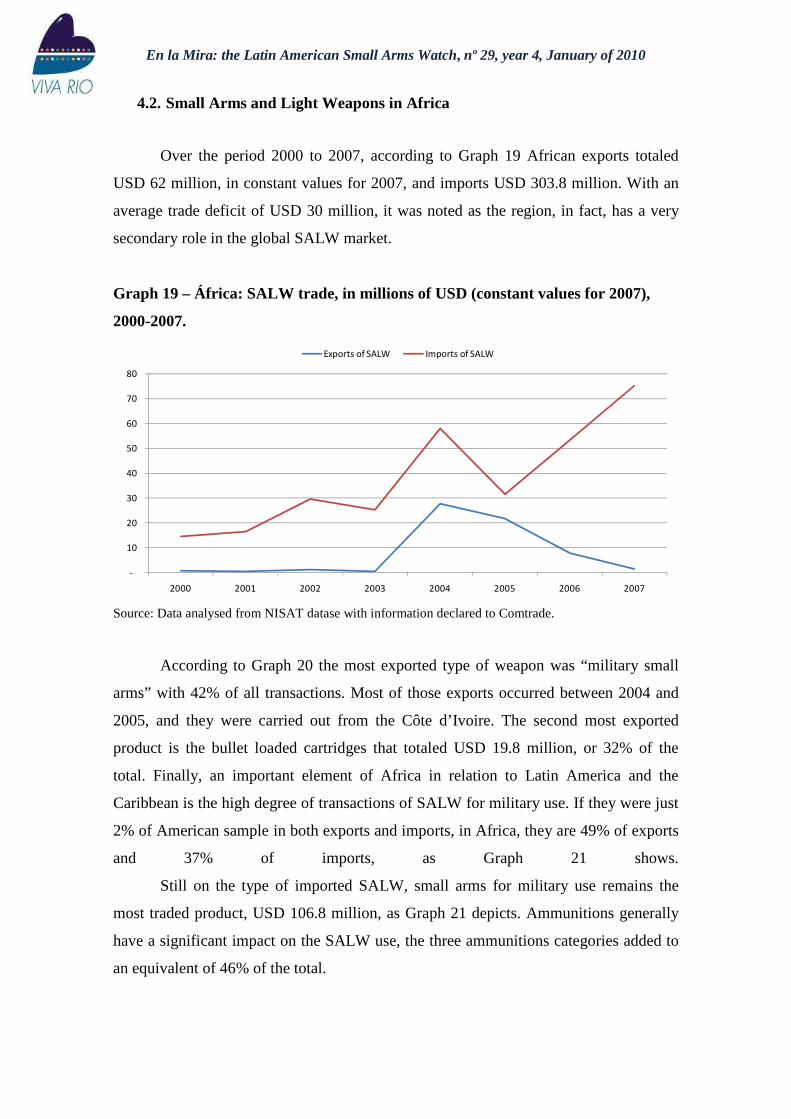
4.2. Small Arms and Light Weapons in Africa
Over the period 2000 to 2007, according to Graph 19 African exports totaled
USD 62 million, in constant values for 2007, and imports USD 303.8 million. With an
average trade deficit of USD 30 million, it was noted as the region, in fact, has a very
secondary role in the global SALW market.
Graph 19 – África: SALW trade, in millions of USD (constant values for 2007),
2000-2007.
-
10
20
30
40
50
60
70
80
2000 2001 2002 2003 2004 2005 2006 2007
Exports of SALW Imports of SALW
Source: Data analysed from NISAT datase with information declared to Comtrade.
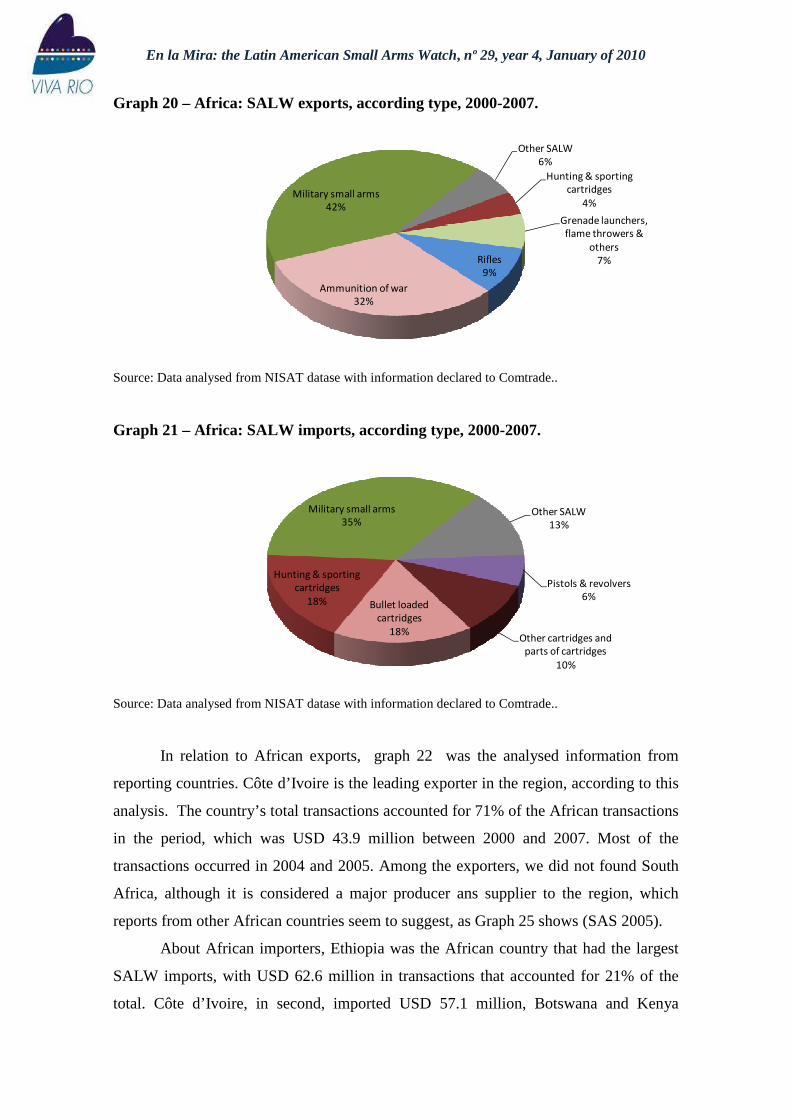
According to Graph 20 the most exported type of weapon was “military small
arms” with 42% of all transactions. Most of those exports occurred between 2004 and
2005, and they were carried out from the Côte d’Ivoire. The second most exported
product is the bullet loaded cartridges that totaled USD 19.8 million, or 32% of the
total. Finally, an important element of Africa in relation to Latin America and the
Caribbean is the high degree of transactions of SALW for military use. If they were just
2% of American sample in both exports and imports, in Africa, they are 49% of exports
and 37% of imports, as Graph 21 shows.
Still on the type of imported SALW, small arms for military use remains the
most traded product, USD 106.8 million, as Graph 21 depicts. Ammunitions generally
have a significant impact on the SALW use, the three ammunitions categories added to
an equivalent of 46% of the total.
En la Mira: the Latin American Small Arms Watch, nº 29, year 4, January of 2010
Graph 20 – Africa: SALW exports, according type, 2000-2007.
Other SALW
6%
Hunting & sporting
cartridges
4%
Grenade launchers,
flame throwers &
others
7%Rifles
9%
Ammunition of war
32%
Military small arms
42%
Source: Data analysed from NISAT datase with information declared to Comtrade..
Graph 21 – Africa: SALW imports, according type, 2000-2007.
Other SALW
13%
Pistols & revolvers
6%
Other cartridges and
parts of cartridges
10%
Bullet loaded
cartridges
18%
Hunting & sporting
cartridges
18%
Military small arms
35%
Source: Data analysed from NISAT datase with information declared to Comtrade..
In relation to African exports, graph 22 was the analysed information from
reporting countries. Côte d’Ivoire is the leading exporter in the region, according to this
analysis. The country’s total transactions accounted for 71% of the African transactions
in the period, which was USD 43.9 million between 2000 and 2007. Most of the
transactions occurred in 2004 and 2005. Among the exporters, we did not found South
Africa, although it is considered a major producer ans supplier to the region, which
reports from other African countries seem to suggest, as Graph 25 shows (SAS 2005).
About African importers, Ethiopia was the African country that had the largest
SALW imports, with USD 62.6 million in transactions that accounted for 21% of the
total. Côte d’Ivoire, in second, imported USD 57.1 million, Botswana and Kenya
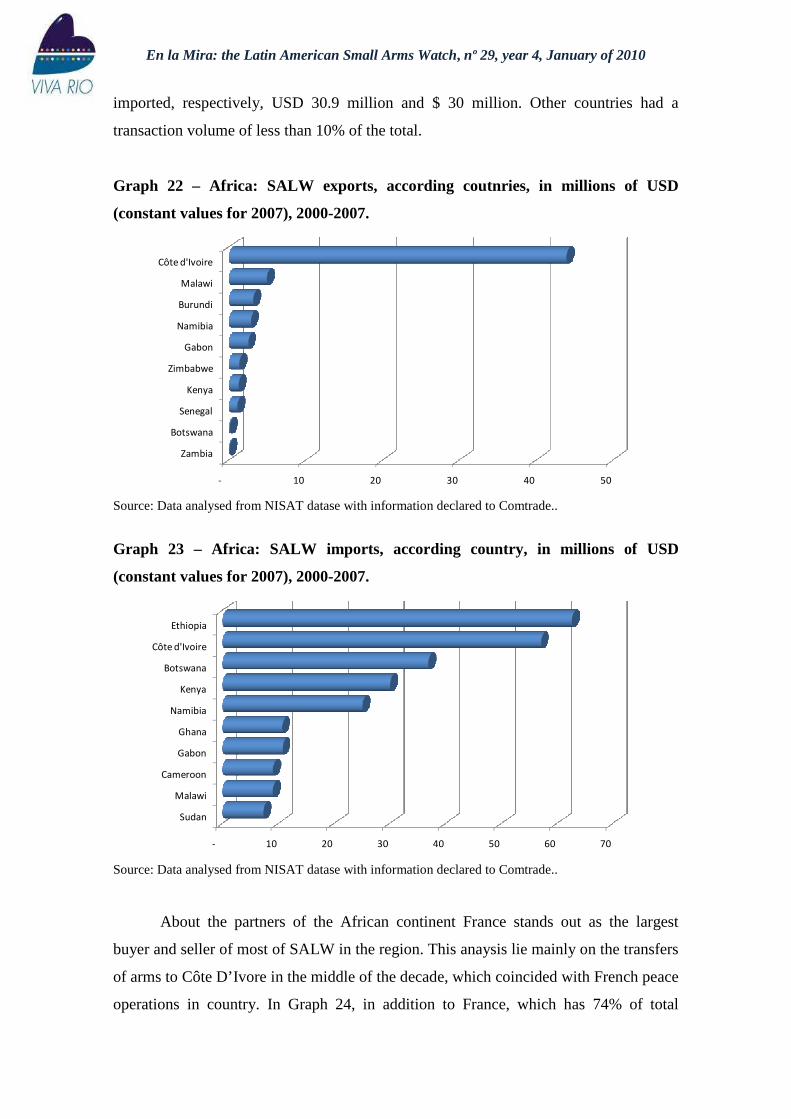
En la Mira: the Latin American Small Arms Watch, nº 29, year 4, January of 2010
imported, respectively, USD 30.9 million and $ 30 million. Other countries had a
transaction volume of less than 10% of the total.
Graph 22 – Africa: SALW exports, according coutnries, in millions of USD
(constant values for 2007), 2000-2007.
- 10 20 30 40 50
Zambia
Botswana
Senegal
Kenya
Zimbabwe
Gabon
Namibia
Burundi
Malawi
Côte d'Ivoire
Source: Data analysed from NISAT datase with information declared to Comtrade..
Graph 23 – Africa: SALW imports, according country, in millions of USD
(constant values for 2007), 2000-2007.
- 10 20 30 40 50 60 70
Sudan
Malawi
Cameroon
Gabon
Ghana
Namibia
Kenya
Botswana
Côte d'Ivoire
Ethiopia
Source: Data analysed from NISAT datase with information declared to Comtrade..
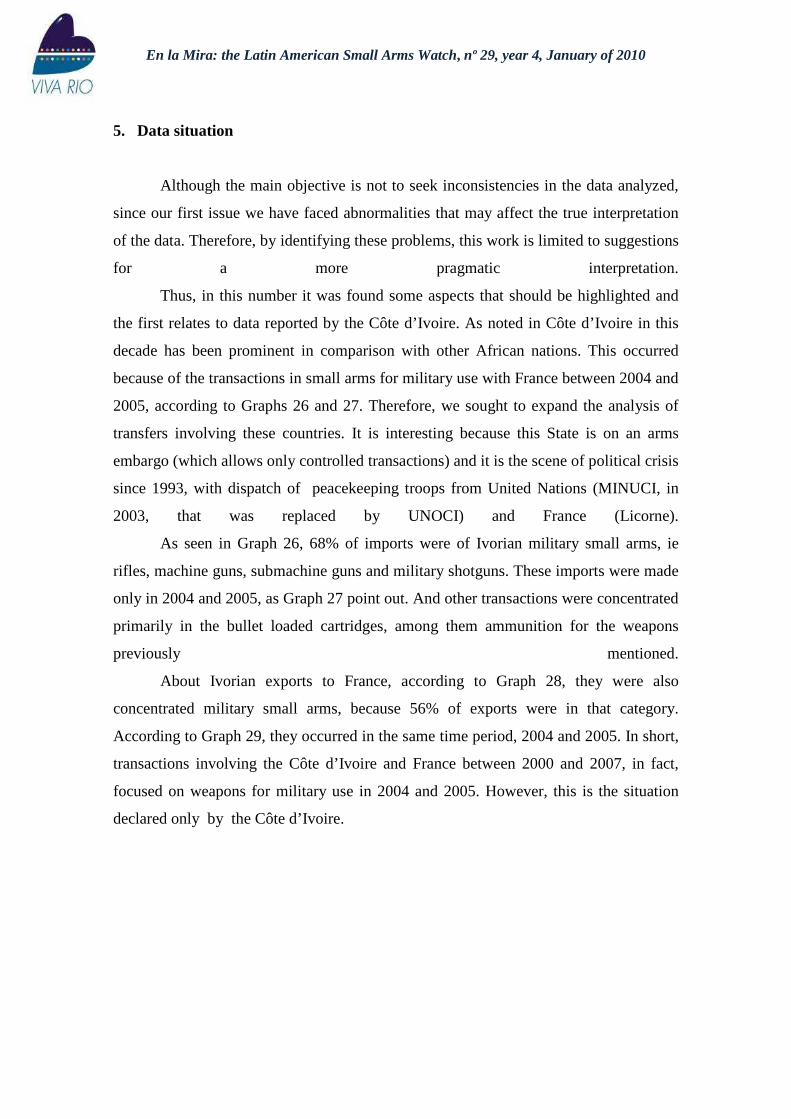
About the partners of the African continent France stands out as the largest
buyer and seller of most of SALW in the region. This anaysis lie mainly on the transfers
of arms to Côte D’Ivore in the middle of the decade, which coincided with French peace
operations in country. In Graph 24, in addition to France, which has 74% of total
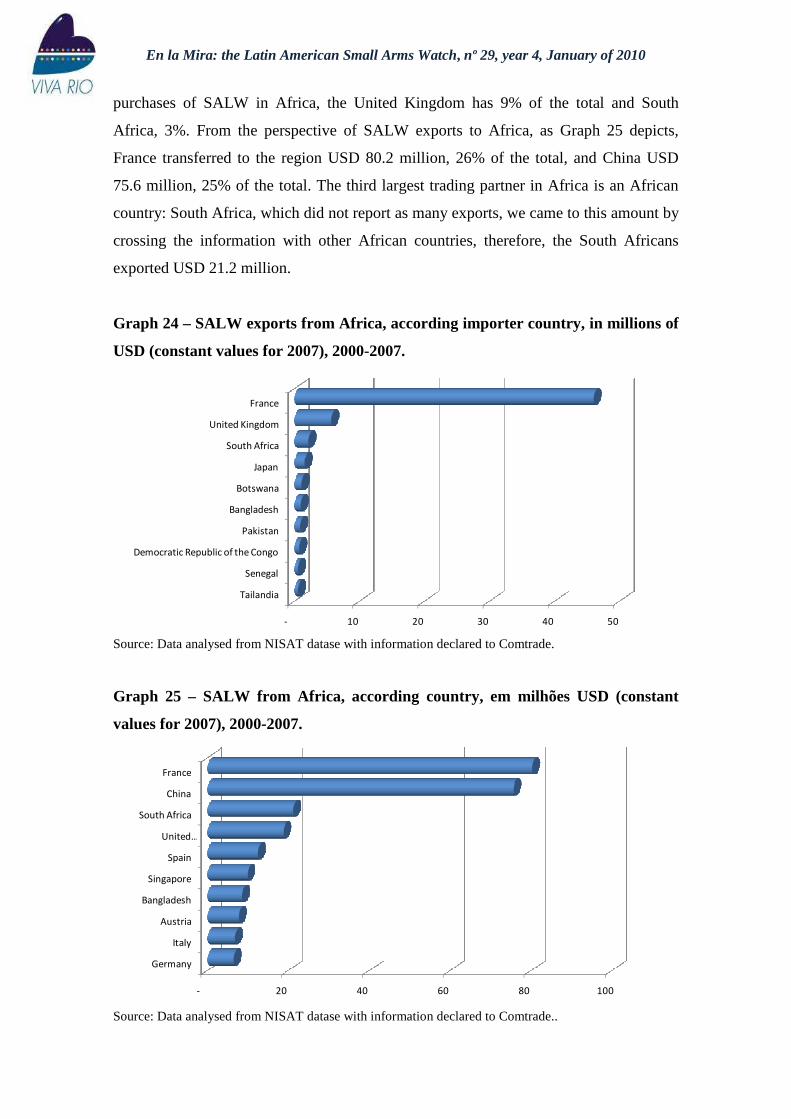
En la Mira: the Latin American Small Arms Watch, nº 29, year 4, January of 2010
purchases of SALW in Africa, the United Kingdom has 9% of the total and South
Africa, 3%. From the perspective of SALW exports to Africa, as Graph 25 depicts,
France transferred to the region USD 80.2 million, 26% of the total, and China USD
75.6 million, 25% of the total. The third largest trading partner in Africa is an African
country: South Africa, which did not report as many exports, we came to this amount by
crossing the information with other African countries, therefore, the South Africans
exported USD 21.2 million.
Graph 24 – SALW exports from Africa, according importer country, in millions of
USD (constant values for 2007), 2000-2007.
- 10 20 30 40 50
Tailandia
Senegal
Democratic Republic of the Congo
Pakistan
Bangladesh
Botswana
Japan
South Africa
United Kingdom
France
Source: Data analysed from NISAT datase with information declared to Comtrade.
Graph 25 – SALW from Africa, according country, em milhões USD (constant
values for 2007), 2000-2007.
- 20 40 60 80 100
Germany
Italy
Austria
Bangladesh
Singapore
Spain
United …
South Africa
China
France
Source: Data analysed from NISAT datase with information declared to Comtrade..
En la Mira: the Latin American Small Arms Watch, nº 29, year 4, January of 2010
5. Data situation
Although the main objective is not to seek inconsistencies in the data analyzed,
since our first issue we have faced abnormalities that may affect the true interpretation
of the data. Therefore, by identifying these problems, this work is limited to suggestions
for a more pragmatic interpretation.
Thus, in this number it was found some aspects that should be highlighted and
the first relates to data reported by the Côte d’Ivoire. As noted in Côte d’Ivoire in this
decade has been prominent in comparison with other African nations. This occurred
because of the transactions in small arms for military use with France between 2004 and
2005, according to Graphs 26 and 27. Therefore, we sought to expand the analysis of
transfers involving these countries. It is interesting because this State is on an arms
embargo (which allows only controlled transactions) and it is the scene of political crisis
since 1993, with dispatch of peacekeeping troops from United Nations (MINUCI, in
2003, that was replaced by UNOCI) and France (Licorne).
As seen in Graph 26, 68% of imports were of Ivorian military small arms, ie
rifles, machine guns, submachine guns and military shotguns. These imports were made
only in 2004 and 2005, as Graph 27 point out. And other transactions were concentrated
primarily in the bullet loaded cartridges, among them ammunition for the weapons
previously mentioned.
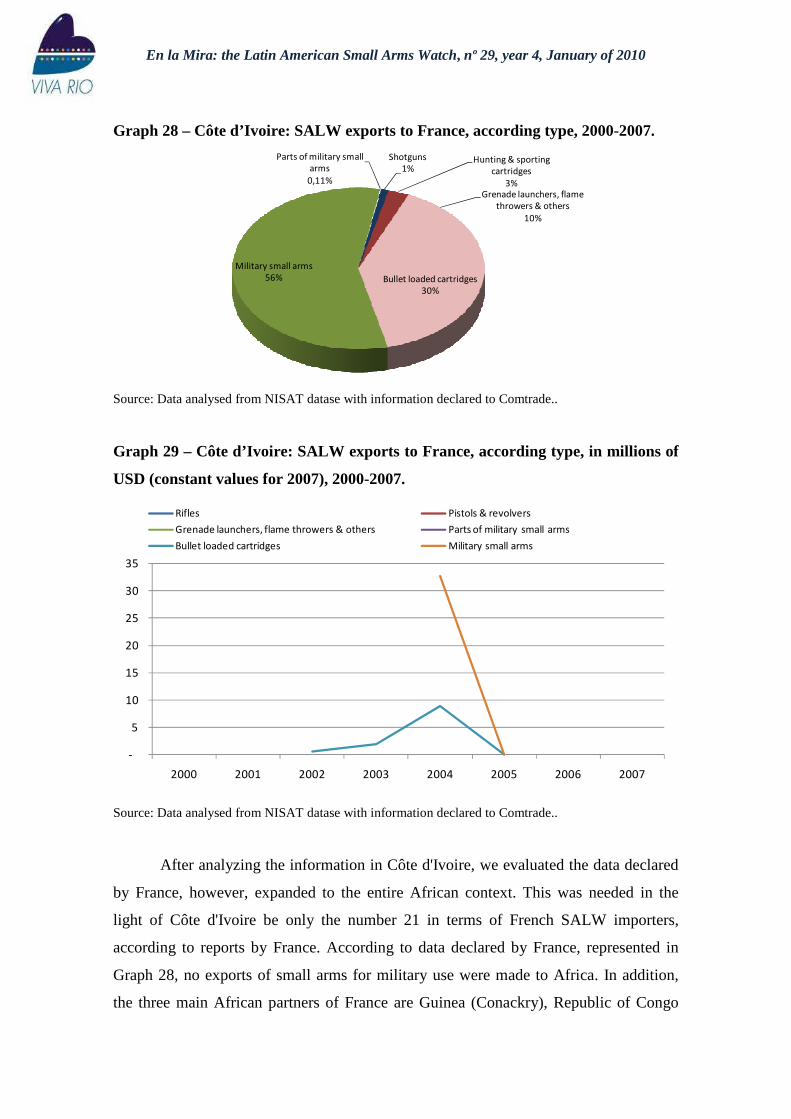
About Ivorian exports to France, according to Graph 28, they were also
concentrated military small arms, because 56% of exports were in that category.
According to Graph 29, they occurred in the same time period, 2004 and 2005. In short,
transactions involving the Côte d’Ivoire and France between 2000 and 2007, in fact,
focused on weapons for military use in 2004 and 2005. However, this is the situation
declared only by the Côte d’Ivoire.

En la Mira: the Latin American Small Arms Watch, nº 29, year 4, January of 2010
Graph 26 – Côte d’Ivoire: SALW imports from France, according type, 2000-2007.
Rifles
0,08%
Pistols & revolvers
0,17% Grenade launchers, flame
throwers & others
1%
Parts of military small
arms
7%
Bullet loaded cartridges
24%Military small arms
68%
Source: Data analysed from NISAT datase with information declared to Comtrade..
Graph 27 – Côte d’Ivoire: SALW imports from França, according type, in millions
USD (constant values for 2007), 2000-2007.
0
2
4
6
8
10
12
14
16
18
2000 2001 2002 2003 2004 2005 2006 2007
Parts of military small arms Shotguns
Hunting & sporting cartridges Grenade launchers, flame throwers & others
Bullet loaded cartridges Military small arms
Source: Data analysed from NISAT datase with information declared to Comtrade..
En la Mira: the Latin American Small Arms Watch, nº 29, year 4, January of 2010
Graph 28 – Côte d’Ivoire: SALW exports to France, according type, 2000-2007.
Parts of military small
arms
0,11%
Shotguns
1%Hunting & sporting
cartridges
3%
Grenade launchers, flame
throwers & others
10%
Bullet loaded cartridges
30%
Military small arms
56%
Source: Data analysed from NISAT datase with information declared to Comtrade..
Graph 29 – Côte d’Ivoire: SALW exports to France, according type, in millions of
USD (constant values for 2007), 2000-2007.
-
5
10
15
20
25
30
35
2000 2001 2002 2003 2004 2005 2006 2007
Rifles Pistols & revolvers
Grenade launchers, flame throwers & others Parts of military small arms
Bullet loaded cartridges Military small arms
Source: Data analysed from NISAT datase with information declared to Comtrade..
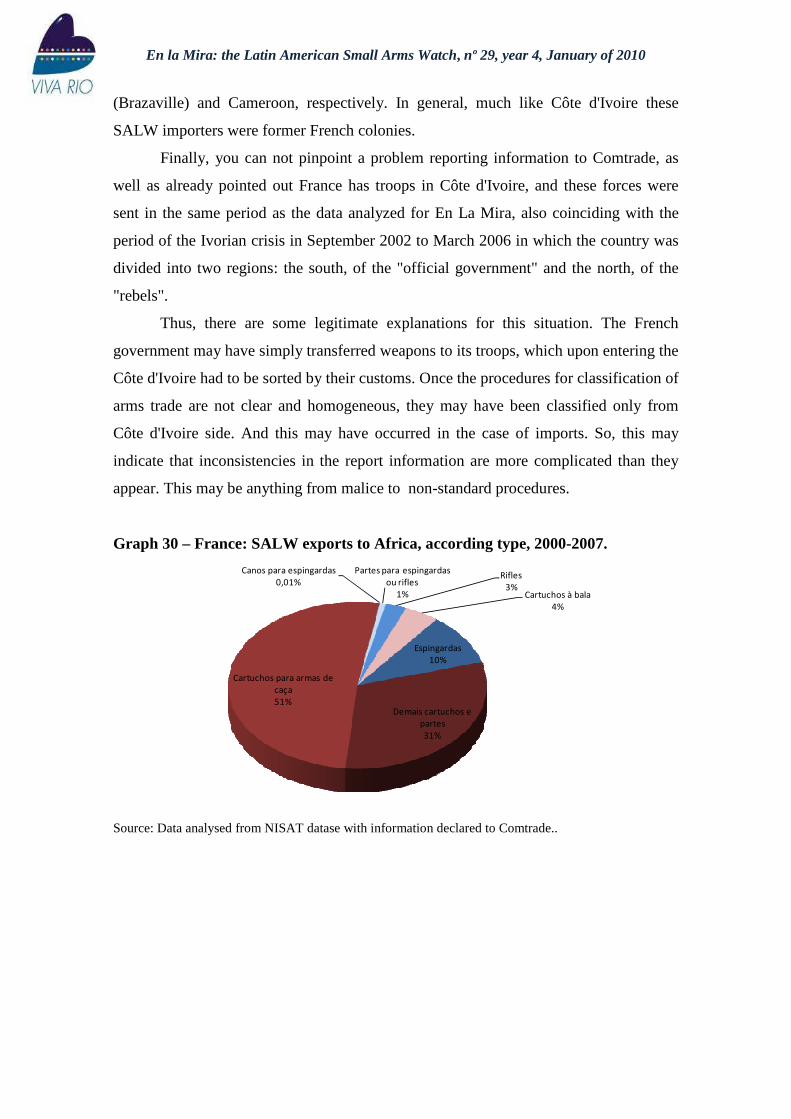
After analyzing the information in Côte d'Ivoire, we evaluated the data declared
by France, however, expanded to the entire African context. This was needed in the
light of Côte d'Ivoire be only the number 21 in terms of French SALW importers,
according to reports by France. According to data declared by France, represented in
Graph 28, no exports of small arms for military use were made to Africa. In addition,
the three main African partners of France are Guinea (Conackry), Republic of Congo
En la Mira: the Latin American Small Arms Watch, nº 29, year 4, January of 2010
(Brazaville) and Cameroon, respectively. In general, much like Côte d'Ivoire these
SALW importers were former French colonies.
Finally, you can not pinpoint a problem reporting information to Comtrade, as
well as already pointed out France has troops in Côte d'Ivoire, and these forces were
sent in the same period as the data analyzed for En La Mira, also coinciding with the
period of the Ivorian crisis in September 2002 to March 2006 in which the country was
divided into two regions: the south, of the "official government" and the north, of the
"rebels".
Thus, there are some legitimate explanations for this situation. The French
government may have simply transferred weapons to its troops, which upon entering the
Côte d'Ivoire had to be sorted by their customs. Once the procedures for classification of
arms trade are not clear and homogeneous, they may have been classified only from
Côte d'Ivoire side. And this may have occurred in the case of imports. So, this may
indicate that inconsistencies in the report information are more complicated than they
appear. This may be anything from malice to non-standard procedures.
Graph 30 – France: SALW exports to Africa, according type, 2000-2007.
Canos para espingardas
0,01%
Partes para espingardas
ou rifles
1%
Rifles
3%Cartuchos à bala
4%
Espingardas
10%
Demais cartuchos e
partes
31%
Cartuchos para armas de
caça
51%
Source: Data analysed from NISAT datase with information declared to Comtrade..
En la Mira: the Latin American Small Arms Watch, nº 29, year 4, January of 2010
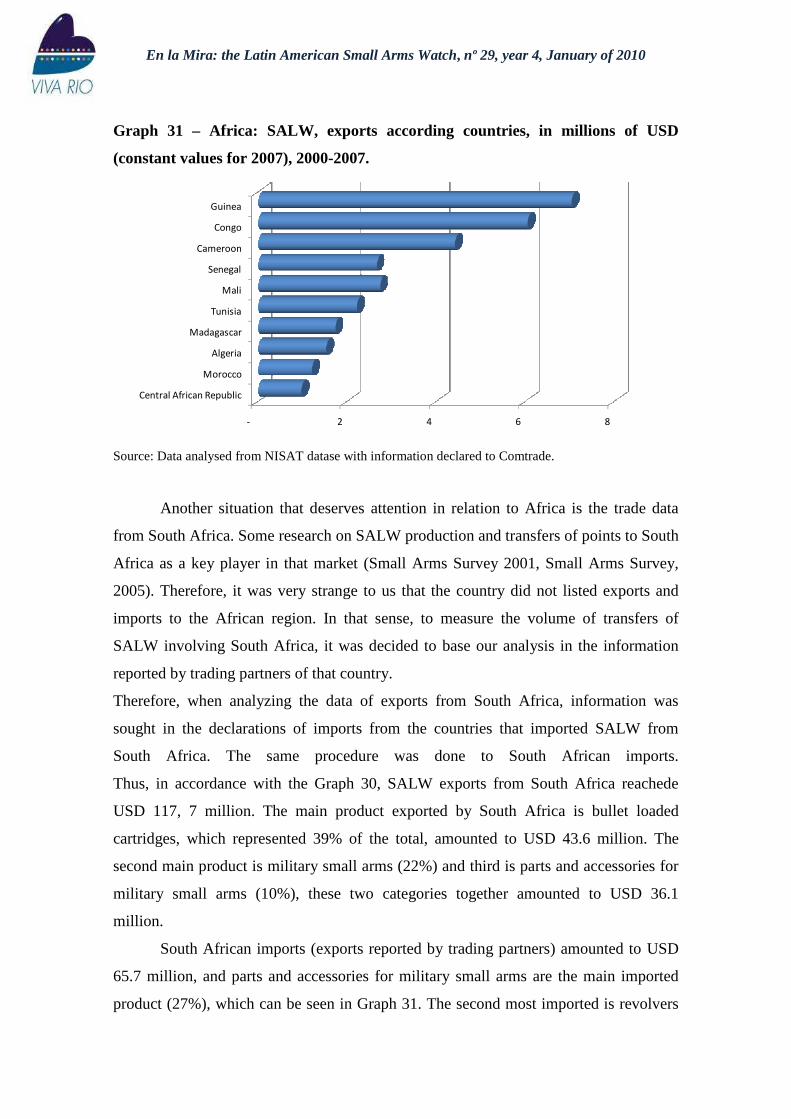
Graph 31 – Africa: SALW, exports according countries, in millions of USD
(constant values for 2007), 2000-2007.
- 2 4 6 8
Central African Republic
Morocco
Algeria
Madagascar
Tunisia
Mali
Senegal
Cameroon
Congo
Guinea
Source: Data analysed from NISAT datase with information declared to Comtrade.
Another situation that deserves attention in relation to Africa is the trade data
from South Africa. Some research on SALW production and transfers of points to South
Africa as a key player in that market (Small Arms Survey 2001, Small Arms Survey,
2005). Therefore, it was very strange to us that the country did not listed exports and
imports to the African region. In that sense, to measure the volume of transfers of
SALW involving South Africa, it was decided to base our analysis in the information
reported by trading partners of that country.
Therefore, when analyzing the data of exports from South Africa, information was
sought in the declarations of imports from the countries that imported SALW from
South Africa. The same procedure was done to South African imports.
Thus, in accordance with the Graph 30, SALW exports from South Africa reachede
USD 117, 7 million. The main product exported by South Africa is bullet loaded
cartridges, which represented 39% of the total, amounted to USD 43.6 million. The
second main product is military small arms (22%) and third is parts and accessories for
military small arms (10%), these two categories together amounted to USD 36.1
million.
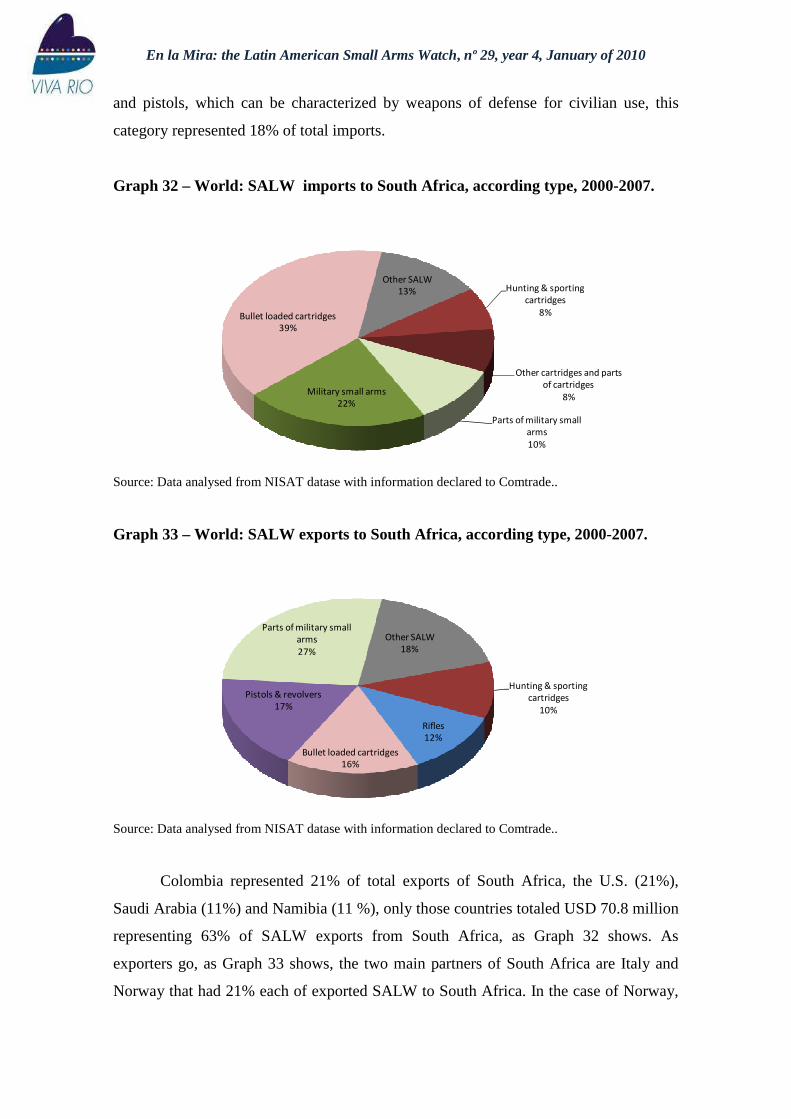
South African imports (exports reported by trading partners) amounted to USD
65.7 million, and parts and accessories for military small arms are the main imported
product (27%), which can be seen in Graph 31. The second most imported is revolvers
En la Mira: the Latin American Small Arms Watch, nº 29, year 4, January of 2010
and pistols, which can be characterized by weapons of defense for civilian use, this
category represented 18% of total imports.
Graph 32 – World: SALW imports to South Africa, according type, 2000-2007.
Other SALW
13% Hunting & sporting
cartridges
8%
Other cartridges and parts
of cartridges
8%
Parts of military small
arms
10%
Military small arms
22%
Bullet loaded cartridges
39%
Source: Data analysed from NISAT datase with information declared to Comtrade..
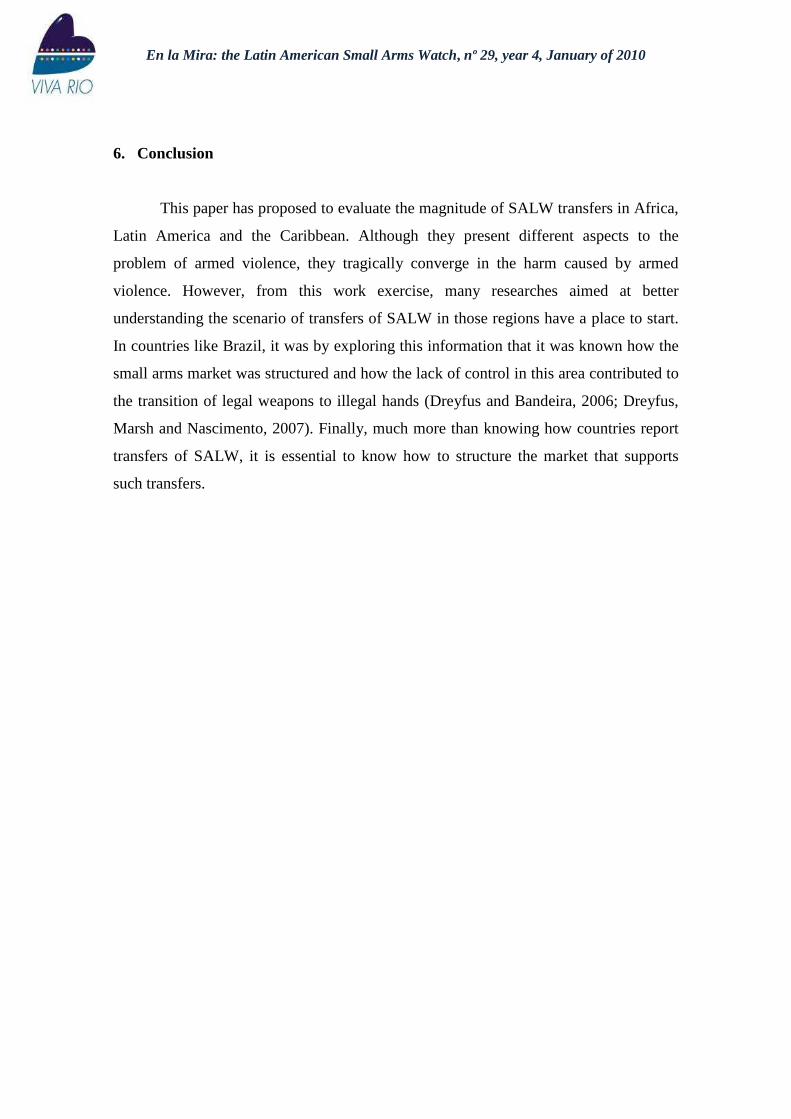
Graph 33 – World: SALW exports to South Africa, according type, 2000-2007.
Other SALW
18%
Hunting & sporting
cartridges
10%
Rifles
12%
Bullet loaded cartridges
16%
Pistols & revolvers
17%
Parts of military small
arms
27%
Source: Data analysed from NISAT datase with information declared to Comtrade..
Colombia represented 21% of total exports of South Africa, the U.S. (21%),
Saudi Arabia (11%) and Namibia (11 %), only those countries totaled USD 70.8 million
representing 63% of SALW exports from South Africa, as Graph 32 shows. As
exporters go, as Graph 33 shows, the two main partners of South Africa are Italy and
Norway that had 21% each of exported SALW to South Africa. In the case of Norway,

En la Mira: the Latin American Small Arms Watch, nº 29, year 4, January of 2010
the main product transferred to South Africa were parts of military small arms. It is
worth noting that this information was provided by trading partners.
Graph 34 – SALW imports importação de SALW da África do Sul, segundo país,
em milhões USD (constant values for 2007), 2000-2007.
- 5 10 15 20 25
Brazil
India
Botswana
United Arab Emirates
Mexico
Germany
Namibia
Saudi Arabia
USA
Colombia
Source: Data analysed from NISAT datase with information declared to Comtrade..
Graph 35 – World: SALW exports to South Africa, according country, in millions
of USD (constant values for 2007), 2000-2007.
- 2 4 6 8 10 12 14
Namibia
Switzerland
Germany
Spain
Australia
Czech Republic
United Kingdom
USA
Norway
Italy
Source: Data analysed from NISAT datase with information declared to Comtrade..
En la Mira: the Latin American Small Arms Watch, nº 29, year 4, January of 2010
6. Conclusion
This paper has proposed to evaluate the magnitude of SALW transfers in Africa,
Latin America and the Caribbean. Although they present different aspects to the
problem of armed violence, they tragically converge in the harm caused by armed
violence. However, from this work exercise, many researches aimed at better
understanding the scenario of transfers of SALW in those regions have a place to start.
In countries like Brazil, it was by exploring this information that it was known how the
small arms market was structured and how the lack of control in this area contributed to
the transition of legal weapons to illegal hands (Dreyfus and Bandeira, 2006; Dreyfus,
Marsh and Nascimento, 2007). Finally, much more than knowing how countries report
transfers of SALW, it is essential to know how to structure the market that supports
such transfers.
En la Mira: the Latin American Small Arms Watch, nº 29, year 4, January of 2010
7. Bibliography
BRASIL. CÂMARA DOS DEPUTADOS. Relatório da Comissão Parlamentar de Inquérito destinada a investigar as organizações do criminosas do tráfico de armas. Câmara dos Deputados. Brasília, p. 480. 2006. Available at: <http://www.comunidadesegura.org/files/active/0/relatorio_final_CPI_armas.pdf>
DREYFUS, P.; BANDEIRA, A. R. Vecindario Bajo Observación: Un estudio sobre las “Transferencias Grises” de armas de fuego y municiones en las fronteras de Brasil con Paraguay, Bolivia, Uruguay y Argentina. Viva Rio. Rio de Janeiro. 2006. (Documento de Trabajo Nº 2 del Proyecto de Control de Armas de Fuego de Viva Rio). Available at: <http://www.comunidadesegura.org/files/vecindariobajoobservacion.pdf>
DREYFUS, P.; LESSING, B.; PURCENA, J. C. A Indústria Brasileira de Armas Leves e Pequeno Porte: Produção Legal e Comércio. In: FERNANDES, R. C. Brasil: as armas e as vítimas. Rio de Janeiro: 7 Letras, 2005. p. 64-125. Available at: <http://www.comunidadesegura.org/files/active/0/vitimas_armas_producao_comercio.pdf>
DREYFUS, P.; MARSH, N.; NASCIMENTO, M. S. Tracking the Guns: international diversion of small arms to illicit markets in Rio de Janeiro. Viva Rio, PRIO e ISER. Rio de Janeiro e Oslo. 2007. Available at: <http://www.comunidadesegura.org/pt-br/node/31128?q=en/node/32137>
DREYFUS, P.; PURCENA, J. C. Brasil e México, onde estão as balas? En la mira – Observador Latino-americano de Armas de Fogo., Rio de Janeiro, v. Ano 2, n. 14/ 15, Outubro/ Novembro 2007. Available at: <http://www.comunidadesegura.org/node/37585>
DREYFUS, P.; PURCENA, J. C. Pegando o Touro pelos Chifres. Asteriskos - Revista de Estudos Internacional e da Paz, Corunha, nº. 7/8, 2009. 55-87.
INTERNAL DISPLACED MONITORING CENTER (IDMC). Activity Report 2007. April, 2008. Available at: <http://www.internal-displacement.org/8025708F004BE3B1/(httpInfoFiles)/5D16689E77E469D0C125742E00335B4B/$file/Activity_Report_2007.pdf>
PURCENA, J. C. Uma saída para a indústria nacional de armas? Breve análise dos investimentos da Forjas Taurus em produtos não-letais. En la mira – Observador Latino-americano de Armas de Fogo, Rio de Janeiro, v. Ano 1, n. 3, Outubro 2006. Available at: <http://www.comunidadesegura.org/node/30775>
En la Mira: the Latin American Small Arms Watch, nº 29, year 4, January of 2010
PURCENA, J. C. A indústria brasileira armas pequenas: apesar dos pesares, tudo vai bem. En la mira – Observador Latino-americano de Armas de Fogo, Rio de Janeiro, v. Ano 3, n. 18, Março 2008. Available at: <http://www.comunidadesegura.org/node/38775>
PURCENA, J. C.; DREYFUS, P. O balanço da balança: exportações e importações de armas pequenas e leves, suas partes e munição na América Latina e no Caribe 2000-2005. En la mira – Observador Latino-americano de Armas de Fogo., Rio de Janeiro, v. Ano 2, n. 12, Agosto 2007. Available at: <http://www.comunidadesegura.org/node/36051>
PURCENA, J. C.; DREYFUS, P. O balanço da balança: exportações e importações de armas pequenas e leves, suas partes e munição na América Latina e no Caribe 2000-2006. En la mira – Observador Latino-americano de Armas de Fogo., Rio de Janeiro, v. Ano 3, n. 23, Agosto 2008. Available at: <http://www.comunidadesegura.org/node/40380>
SMALL ARMS SURVEY. Small Arms Survey 2001: Profiling the Problem. Oxford: Oxford University Press, 2001.
SMALL ARMS SURVEY. Small Arms Survey 2003: Development Denied. New York: Oxford University Press, 2003.
SMALL ARMS SURVEY. Small Arms Survey 2004: Rights at risk. Oxford: Oxford University Press, 2004.
SMALL ARMS SURVEY. Small Arms Survey 2005: Weapons at War. New York: Oxford University Press, 2005.
SMALL ARMS SURVEY. Small Arms Survey 2006: Unfinished Business. Oxford: Oxford University Press, 2006.
SMALL ARMS SURVEY. Small Arms Survey 2007: Guns and The City. Cambridge: Cambridge University Press, 2007.
U.S. DEPARTMENT OF COMMERCE. BUREAU OF ECONOMIC ANALYSIS. National Economic Accounts. Bureau of Economic Analysis. Available at: <http://www.bea.gov/national/nipaweb/TableView.asp?SelectedTable=13&Freq=Qtr&FirstYear=2007&LastYear=2009>. Acessed in: 26 Janeiro 2010.