Review of High Performance Structure in Australian Women's ...
The Australian Economy and
PerformanceDecember 2014
The Australian Economy and Performance
Participants
Md. Ashrafuzzaman (ID: 11427049)
Faculty
Md. Shafayat Hossain
Assistant Professor , AIS
University of Dhaka
Australia is a Unique and Diverse country in every way- in culture, population,
climate, geography, history and economy as well. Australian culture is as broad and
varied as the county’s landscape. Australia is an island continent and the world’s sixth
largest country with an area of 7,682,300 sq km, with roughly 25.8 million people. As
of 2014 Index of Economic Freedom, Australia’s economic freedom score is 82, making
its economy the 3rd freest.
About Australian
Nominal & Real GDP- Australian
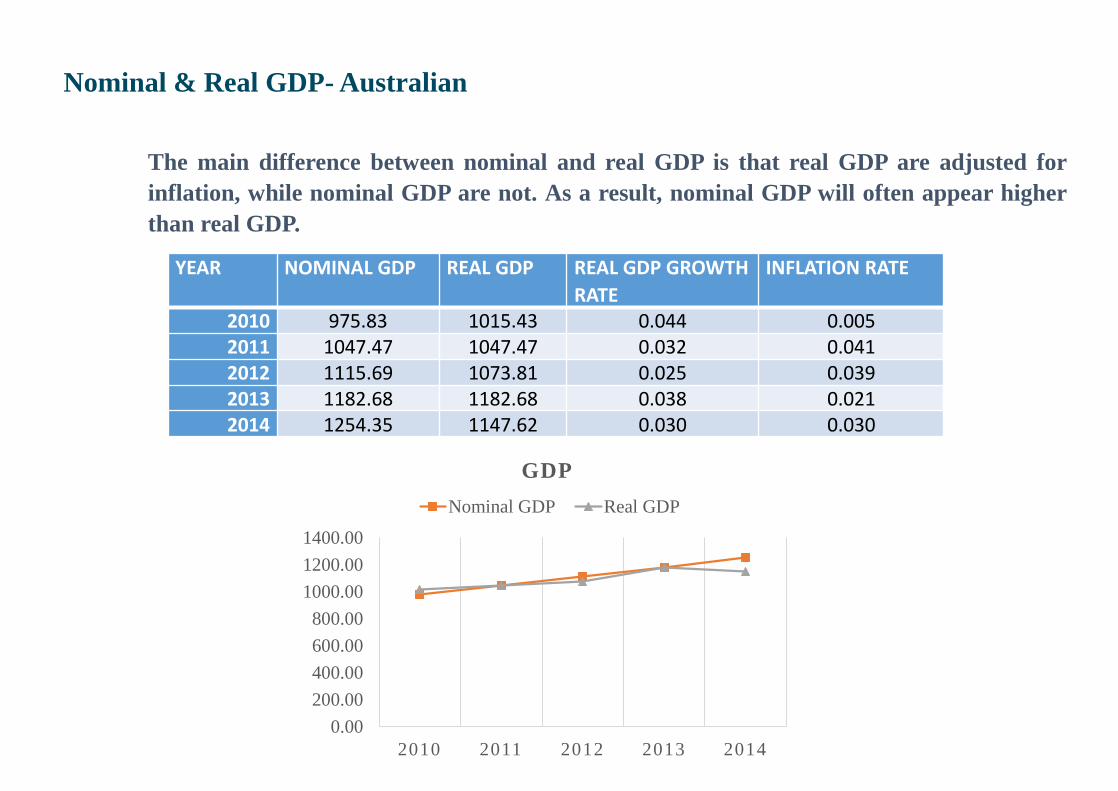
The main difference between nominal and real GDP is that real GDP are adjusted for
inflation, while nominal GDP are not. As a result, nominal GDP will often appear higher
than real GDP.
YEAR NOMINAL GDP REAL GDP REAL GDP GROWTH
RATE
INFLATION RATE
2010 975.83 1015.43 0.044 0.0052011 1047.47 1047.47 0.032 0.0412012 1115.69 1073.81 0.025 0.0392013 1182.68 1182.68 0.038 0.0212014 1254.35 1147.62 0.030 0.030
0.00
200.00
400.00
600.00
800.00
1000.00
1200.00
1400.00
2010 2011 2012 2013 2014
GDP
Nominal GDP Real GDP
Australian Economy
%
6
4
2
0
-2
-4 2002
GDP Growth - World Year-ended
Major trading partners*
World**
2006 2010
%
6
4
2
0
-2
-4
2014
Weighted using Australian export shares
** PPP-weighted; accounts for 87 per cent of world GDP
1994 1998
GDP Growth- Australia
Year-ended
Quarterly
2002 2006 2010
%
4
2
0
-2 2014
%
5
4
3
2
1
0
-1 1994
Consumer Price Inflation- Australia
Year-ended
Quarterly (seasonally adjusted)
1998 2002 2006 2010
%
5
4
3
2
1
0
-1 2014
Excluding interest charges prior to the September quarter 1998 and adjusted for the tax changes of 1999-2000
Inflation - East Asia Year-ended
% %
Middle-income*
8 8
4 4
0 High-income**
0
-4
2002 2005 2008
2011 2014
Indonesia, Malaysia, Philippines and Thailand; PPP-weighted Hong
Kong, Singapore, South Korea and Taiwan; PPP-weighted
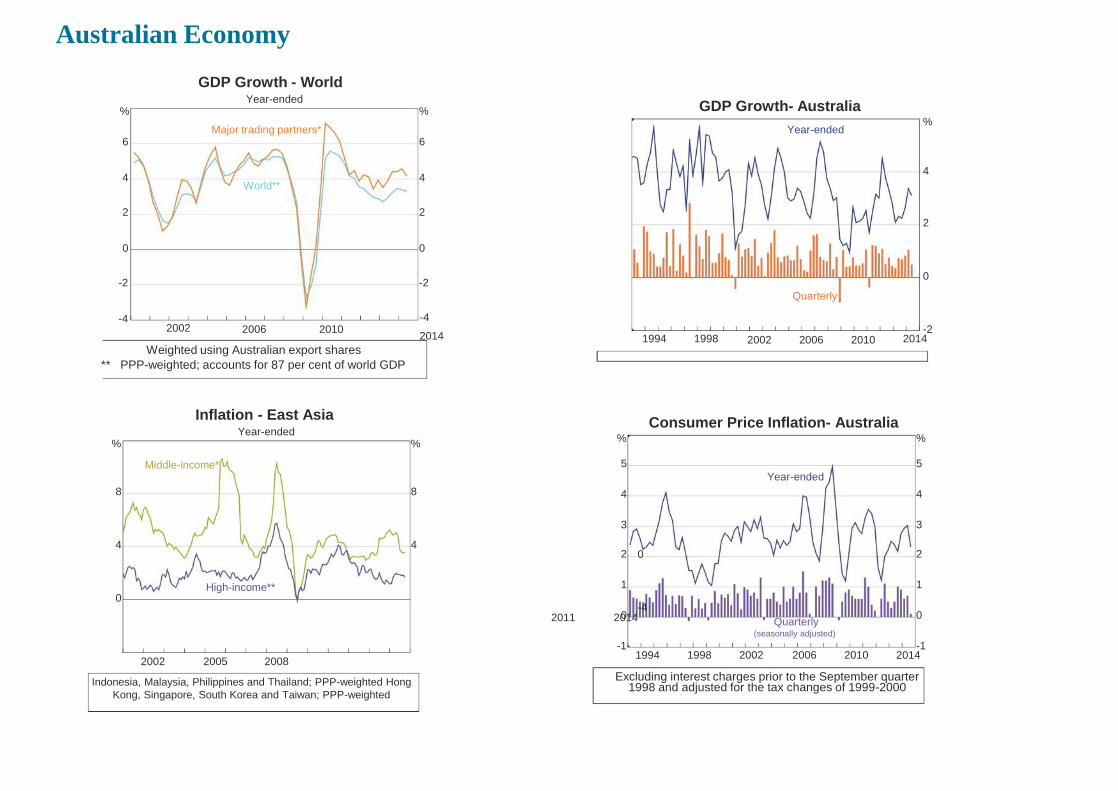
The Australian economy grew at 0.8% in Q4 despite a decline of 0.4% in hours
worked, largely in line with our expectations. Annual GDP growth of 2.8% is still
below the rate needed to prevent rising unemployment. The broad-based
inflation measures in the national accounts remain moderate: annual chain price
index inflation was 2.8% for private consumption and 2.2% for GDP.
Australian Economy

Sectorial Contribution (Household Sector)
Household Finances* Per cent of household disposable income
% Debt Interest paid %
150 14
125 12
100 10
75 8
50 6
25 4 1994 2004 2014 1994 2004 2014
Household sector excludes unincorporated enterprises; disposable income is after tax and before the deduction of
interest payments
Housing Prices $’000 $’000
750 750
Sydney 650 650
Canberra
Household Wealth and Liabilities* Per cent of annual household disposable income
% %
Net worth
600 600
Dwellings 450 450
300 300
Financial assets
150 150 Liabilities
0 0 1998 2002 2006 2010 2014
Household liabilities exclude the liabilities of unincorporated enterprises; disposable income is after tax and before the
deduction of interest payments
Housing Loan Approvals $b $b
Total 20 20
15 15 Perth
550
450
350
250 2006
Melbourne Australia
Brisbane Adelaide
Regional*
2010 2014 2010 2014
550
450
350
250
Owner-occupiers
10 10
5 5 Investors
0 0 2002 2005 2008 2011 2014
Excludes apartments; measured as areas outside of capital cities
Private consumer spending grew by 0.8% in Q4 yielding moderate through-the-year
growth of 2.6%. Spending volumes have generally grown more strongly on goods than
services, other than insurance, with particularly large increases in clothing & footwear,
furnishings & household equipment, cigarettes & tobacco and food.
Residential building approvals numbers have risen sharply since early 2013, from
around 30,000 units in Q1 to almost 50,000 in the final quarter of 2014 and grew particularly
strongly for medium density dwellings. In fact, approval numbers for medium density
dwellings exceeded those of houses in September 2013 for the first time in Australian
history. The growth in approvals has been concentrated in other
dwellings particularly in larger apartment buildings.
Sectorial Contribution (Household Sector)
Sectorial Contribution (Business Sector)
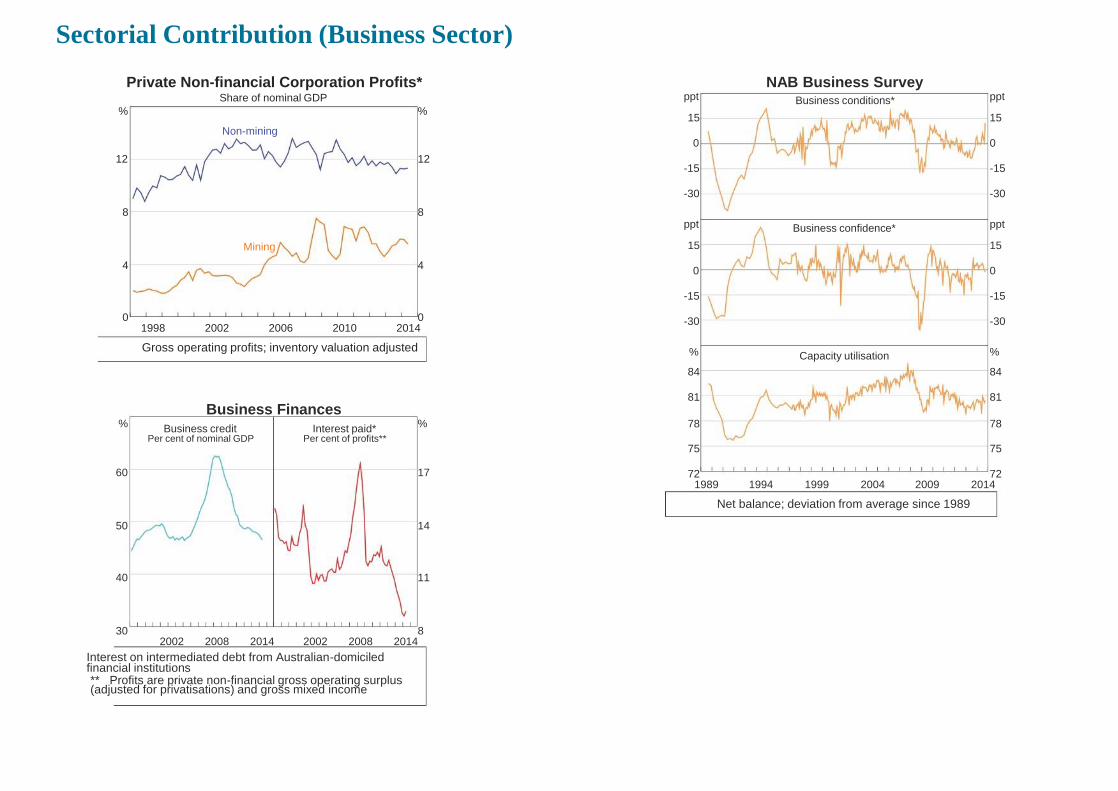
Private Non-financial Corporation Profits* Share of nominal GDP
% %
Non-mining
12 12
8 8
Mining
4 4
0 0 1998 2002 2006 2010 2014
Gross operating profits; inventory valuation adjusted
Business Finances % %
ppt
15
0
-15
-30
ppt
15
0
-15
-30
%
84
81
78
NAB Business Survey Business conditions*
Business confidence*
Capacity utilisation
ppt
15
0
-15
-30
ppt
15
0
-15
-30
%
84
81
78 Business credit Interest paid*Per cent of nominal GDP Per cent of profits**
75 75
60 17 72 721989 1994 1999 2004 2009 2014
Net balance; deviation from average since 1989
50 14
40 11
30 82002 2008 2014 2002 2008 2014
Interest on intermediated debt from Australian-domiciled financial institutions ** Profits are private non-financial gross operating surplus (adjusted for privatisations) and gross mixed income
Sectorial Contribution (Business Sector)
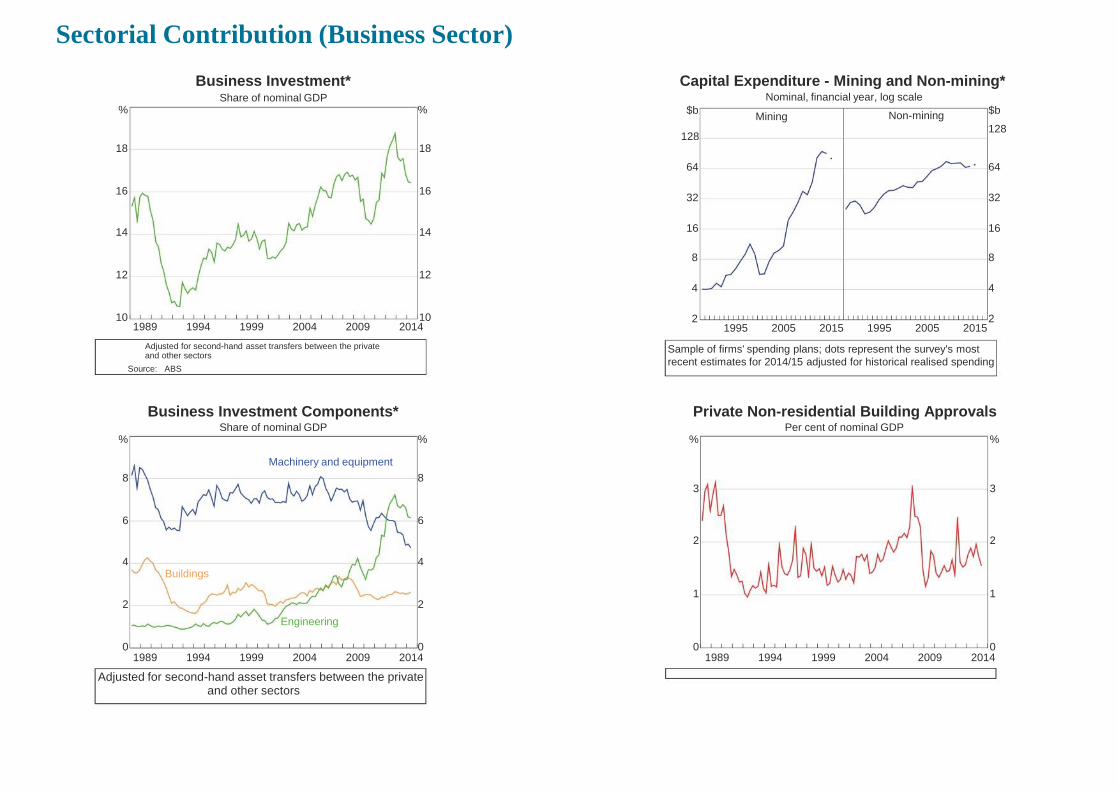
Business Investment* Share of nominal GDP
% %
Capital Expenditure - Mining and Non-mining* Nominal, financial year, log scale
$b $b
18
16
14
12
10 1989 1994 1999
18
16
14
12
10 2004 2009 2014
Mining
128
64
32
16
8
4
2 1995 2005 2015
Non-mining
128
64
32
16
8
4
2 1995 2005 2015
Adjusted for second-hand asset transfers between the private Sample of firms' spending plans; dots represent the survey's most
recent estimates for 2014/15 adjusted for historical realised spendingand other sectors
Source: ABS
Business Investment Components* Private Non-residential Building ApprovalsShare of nominal GDP Per cent of nominal GDP
% % % %
Machinery and equipment
8 83 3
6 6
2 2
4 4Buildings
1 12 2
Engineering
0 0 0 01989 1994 1999 2004 2009 2014 1989 1994 1999 2004 2009 2014
Adjusted for second-hand asset transfers between the privateand other sectors
Sectorial Contribution (Credit and Money)
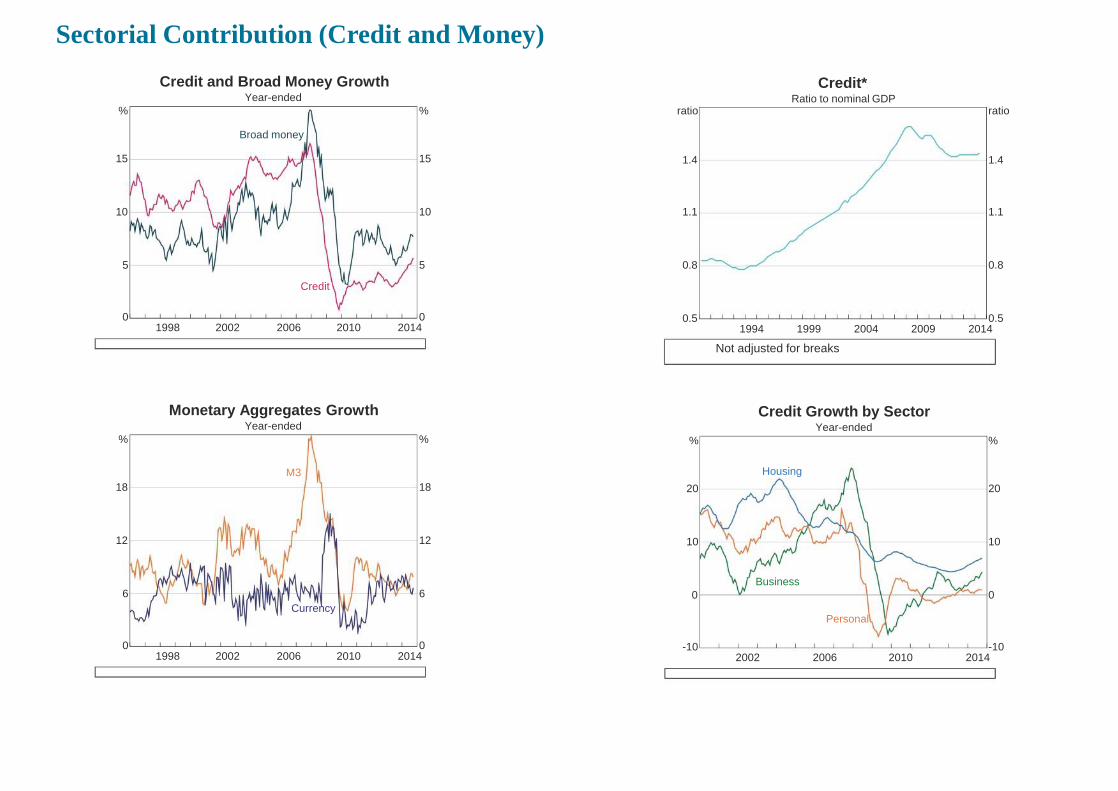
Credit and Broad Money Growth Credit*Year-ended Ratio to nominal GDP
% % ratio ratio
Broad money
15 15 1.4 1.4
10 10 1.1 1.1
5 5 0.8 0.8
Credit
0 0 0.5 0.51998 2002 2006 2010 2014 1994 1999 2004 2009 2014
Not adjusted for breaks
Monetary Aggregates Growth Credit Growth by SectorYear-ended Year-ended
% % % %
M3 Housing
18 18 20 20
12 12 10 10
Business6 6 0 0
CurrencyPersonal
0 0 -10 -101998 2002 2006 2010 2014 2002 2006 2010 2014
Unemployment and Labor Market
Employment and Participation Rates % %
Participation rate
64 64
61 61
58 58
Employment to working-age population
55 55 1994 1998 2002 2006 2010 2014
index
110
105
100
95
Employment and Hours Worked* 2007 average = 100
Employment
Total hours worked
Average hours worked
index
110
105
100
95 2008 2010 2012 2014
Smoothed lines are 13-period Henderson trends
Unemployment Rate % %
10 10
8 8
6 6
4 4
2 2 1994 1998 2002 2006 2010 2014
Job Vacancies and Advertisements Per cent of labour force
% %
Advertisements (ANZ survey)
2.0 2.0
1.5 1.5 Vacancies* (ABS survey)
1.0 1.0
0.5 0.5 2002 2006 2010 2014
This survey was suspended between May and November 2009
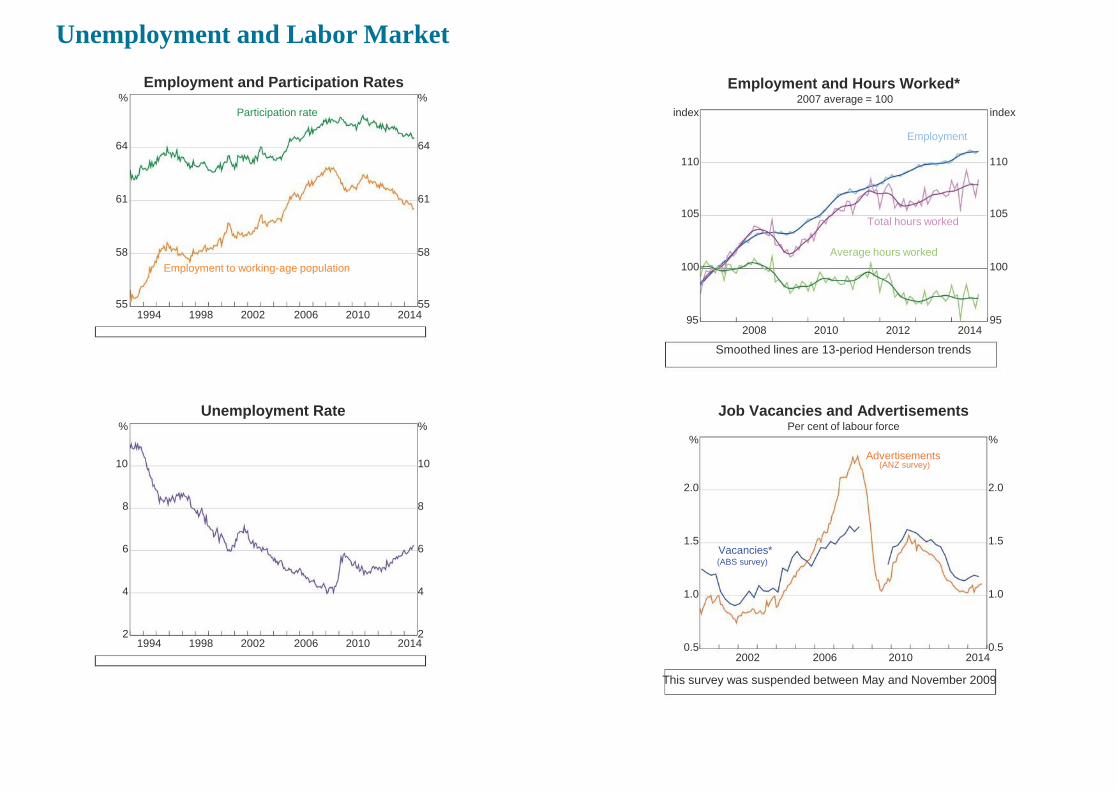
There have been mixed signals for the labor market since late 2013. Several key
indicators have pointed to improving conditions, or at least a slowing in the rate of
deterioration, including ANZ job ads, DEEWR internet vacancies and aggregate hours
worked (up 5.1%, 7.6% and1.3% respectively in January).
The labor adjustment task from the mining sector appears to have been magnified
by recent announcements of the end of automotive manufacturing and several
other high-profile operations as well as labor-shedding in aviation over the forecast
horizon. Our forecast profile for the unemployment rate is broadly unchanged until
2015, when we have slowed the rate of improvement marginally to be 6.1% by end-
2015(was 5.8%).
Unemployment and Labor Market
Government Budget
Australian Government Budget Balance* Per cent of nominal GDP
% %
2 2
1 1
0 0
-1 -1
-2 -2
-3 -3
-4 -4
-5 -5 81/82 87/88 93/94 99/00 05/06 11/12 17/18
Underlying cash balance
Source: Australian Treasury
Public Construction Work Done Per cent of nominal GDP
% %
Total
3 3
2 2
Engineering
1 1
Building
0 0 1989 1994 1999 2004 2009 2014
Source: ABS
State Budget Balances* Per cent of nominal GDP
% %
1.0 1.0
0.5 0.5
0.0 0.0
-0.5 -0.5
-1.0 -1.0
-1.5 -1.5 82/83 87/88 92/93 97/98 02/03 07/08 12/13
Underlying cash balance
Source: ABS
Non-financial Public Sector Net Debt* Per cent of nominal GDP
% %
Non-financial public sector
30 30
20 20
Australian Government
10 10
0 0
State and local general governments
-10 -10 93/94 98/99 03/04 08/09 13/14
Estimates as at the 2014/15 Budget
Source: Australian Treasury
Commodity Prices
RBA Index of Commodity Prices SDR, 2012/13 average = 100
index
120
index index
120 220
Base Metals, Rural and Oil Prices Weekly
US$/b
Base metals*
150
100
80
60
40
20 1989 1994 1999
100
80
60
40
20 2004 2009 2014
Rural*
190
160
130
100
70 2006 2010 2014
Brent oil
125
100
75
50
25 2006 2010 2014
US$/t
170
130
90
50
Source: RBA
Bulk Commodity Prices Free on board basis
Iron ore Thermal coal Coking coal (LHS) (LHS) (RHS)
Average Australian Spot price*
export price
US$/t index
100 350
80
250
60
150 40
50 20
RBA Index of Commodity Prices sub-indices; SDR terms; 2005
average = 100
Sources: Bloomberg; RBA
Terms of Trade* 2011/12 average = 100
index
100
80
60
40
20 2010 2012 2014 2012 2014 2012 2014 1954 1969 1984 1999 2014
Iron ore fines, Newcastle thermal coal and premium hard coking coal Annual data are used prior to 1960
Sources: ABS; AFR; Bloomberg; Citigroup; IHS Energy Publishing; Macquarie Sources: ABS; RBABank; RBA; Thomson Reuters

Import Export Position
Export Volumes Quarterly, 2011/12 prices, log scale
$b $b
Resources Services
40 12
Rural
20 6
Manufacturing
10 3 2000 2007 2014 2000 2007 2014
Mt
170
150
130
110
90
70
50
30 2004
Bulk Commodity Exports Quarterly
Iron ore Coal
2009 2014 2004 2009
Mt
110
100
90
80
70
60
50
40 2014
Sources: ABS; RBA
Import Volumes Quarterly, 2011/12 prices, log scale
$b
Intermediate
$b %
30
Sources: ABS; RBA
Exports by Destination Annual, share of total values
%
30 Consumption
16
8
Services
4
2 2000 2007 2014
16
8
Capital
4
2 2000 2007 2014
China
25 25
20 20 Japan
15 15
EU - 27
10 10 South Korea
5 5
India US
0 0 2001 2005 2009 2013
Source: ABS Source: ABS
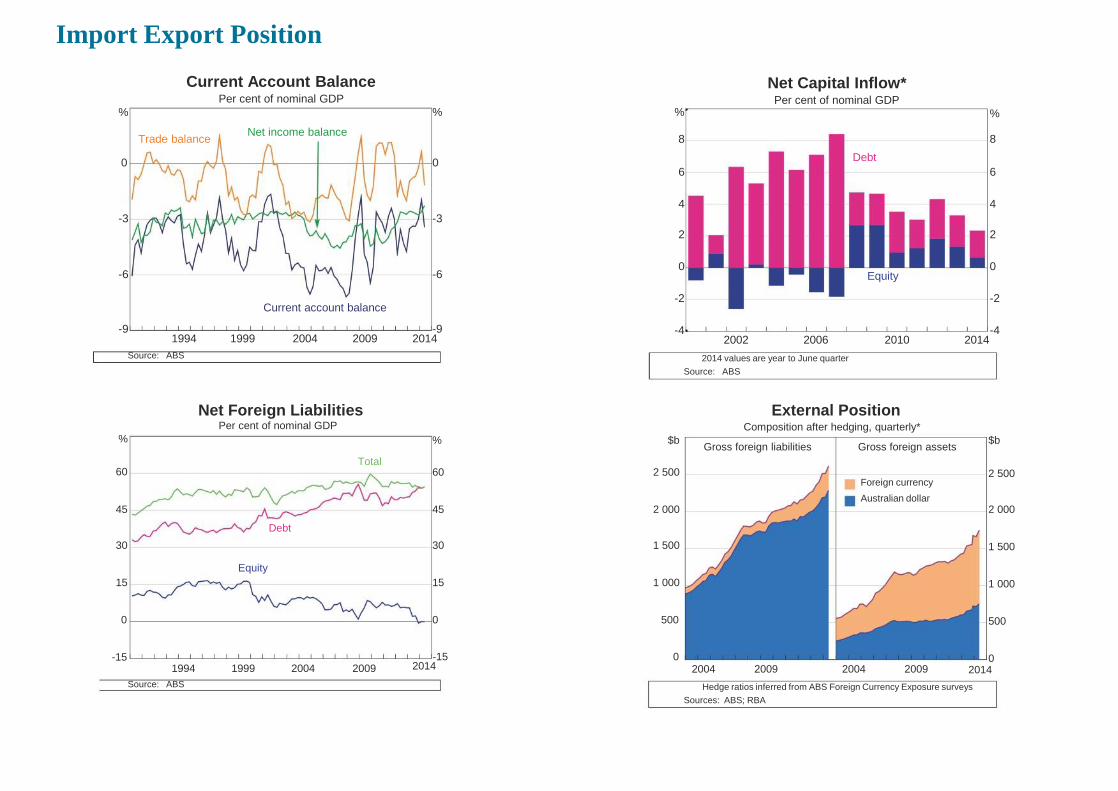
Current Account Balance Per cent of nominal GDP
%
Net income balance
% %
Net Capital Inflow* Per cent of nominal GDP
%
Trade balance
0
-3
-6
-9 1994 1999
0
-3
-6
Current account balance
-9 2004 2009 2014
8
6
4
2
0
-2
-4 2002 2006
8
Debt
6
4
2
0 Equity
-2
-4 2010 2014
Source: ABS
Net Foreign Liabilities Per cent of nominal GDP
%
Total 60
45
Debt
30
Equity
15
0
-15 1994 1999 2004 2009
% $b
60 2 500
45 2 000
30 1 500
15 1 000
0 500
-15 0 2014
2014 values are year to June quarter
Source: ABS
External Position Composition after hedging, quarterly*
Gross foreign liabilities Gross foreign assets
Foreign currency
Australian dollar
2004 2009 2004 2009
$b
2 500
2 000
1 500
1 000
500
0 2014
Source: ABS Hedge ratios inferred from ABS Foreign Currency Exposure surveys
Sources: ABS; RBA
Import Export Position
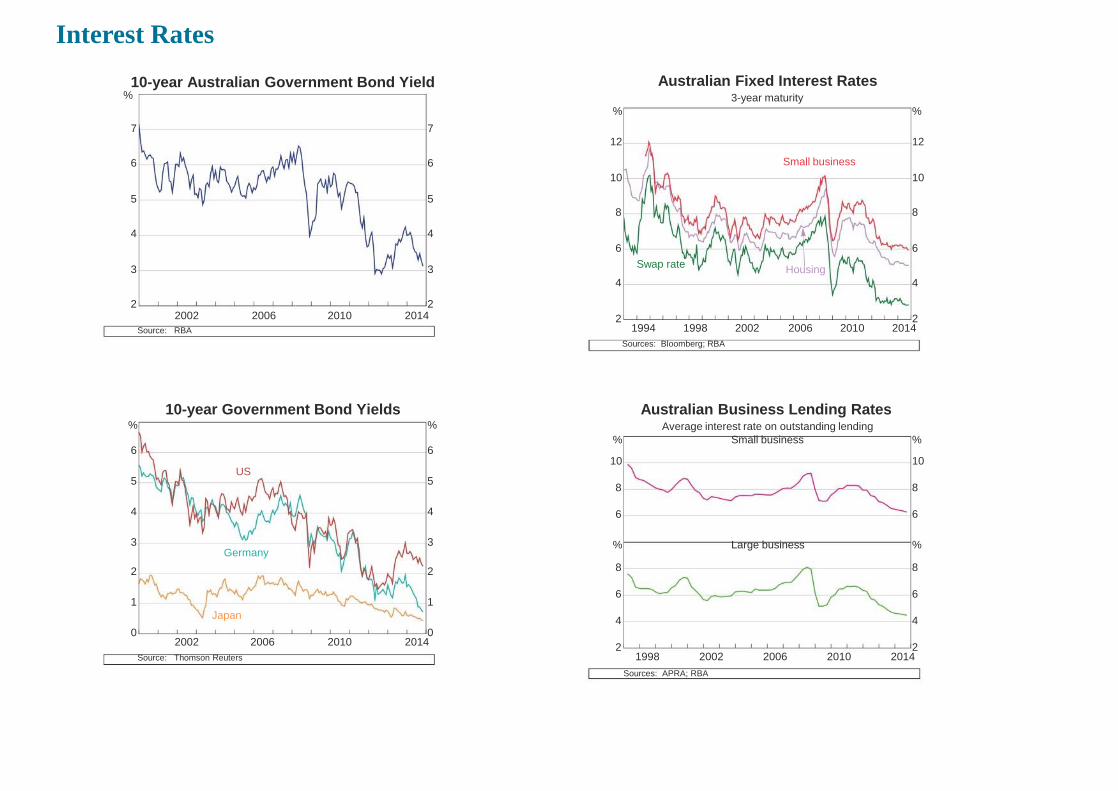
Interest Rates
10-year Australian Government Bond Yield %
7 7
6 6
5 5
4 4
3 3
2 2 2002 2006 2010 2014
Source: RBA
10-year Government Bond Yields %
6
%
6
US 5 5
4 4
3 3 Germany
2 2
1 1
Japan
0 0 2002 2006 2010 2014
Source: Thomson Reuters
Australian Fixed Interest Rates 3-year maturity
% %
12 12
Small business
10 10
8 8
6 6
Swap rate
4
2 1994 1998 2002
Housing
4
2 2006 2010 2014
Sources: Bloomberg; RBA
Australian Business Lending Rates Average interest rate on outstanding lending
% Small business %
10 10
8 8
6 6
% Large business %
8 8
6 6
4 4
2 2 1998 2002 2006 2010 2014
Sources: APRA; RBA
The Australia continues to maintain a watching brief on he flow of economic data,
having left the cash rate unchanged at 2.5% since July 2013. In our view, there are
three conditions that all need to be satisfied before another rate cut becomes likely:
rising unemployment, stabilization of asset prices and low inflation (well into the
bottom half of the target range). The first of these is in place, there are increasing signs
that the second is occurring and we expect that weak cost growth should bring about
the third by the end of the year.
Interest Rates
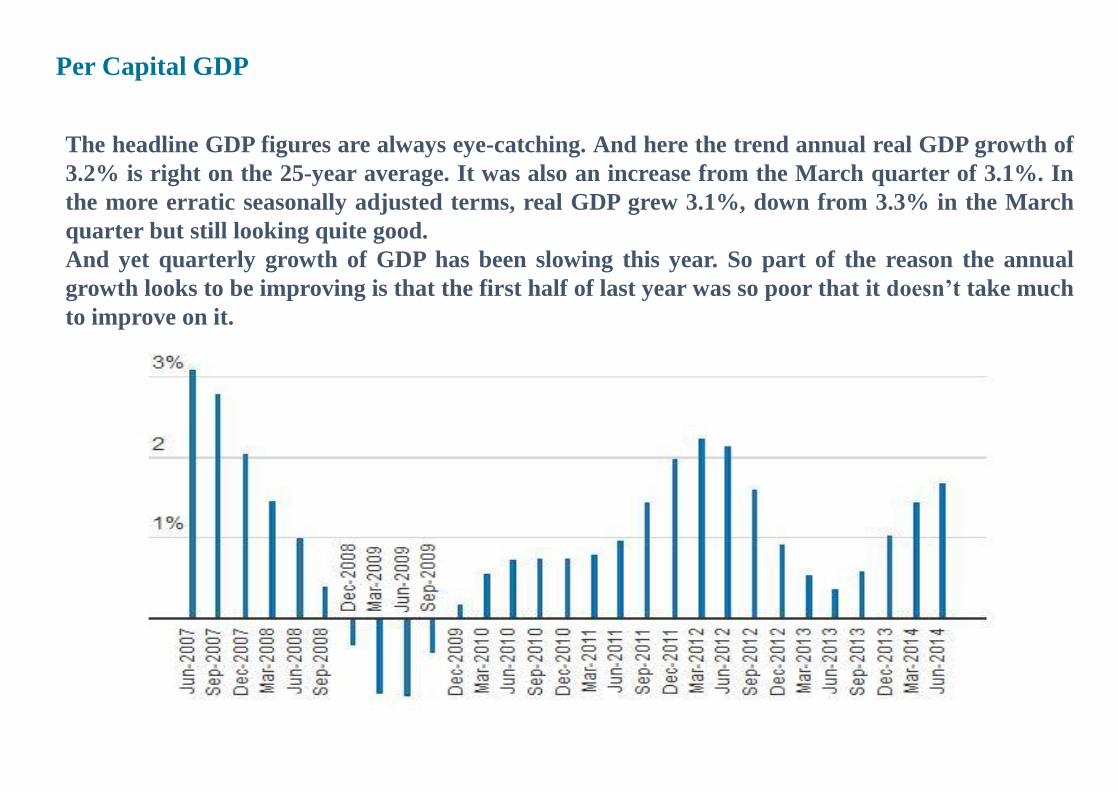
Per Capital GDP
The headline GDP figures are always eye-catching. And here the trend annual real GDP growth of
3.2% is right on the 25-year average. It was also an increase from the March quarter of 3.1%. In
the more erratic seasonally adjusted terms, real GDP grew 3.1%, down from 3.3% in the March
quarter but still looking quite good.
And yet quarterly growth of GDP has been slowing this year. So part of the reason the annual
growth looks to be improving is that the first half of last year was so poor that it doesn’t take much
to improve on it.

THANK YOU
Copyright © 2022 FDOKUMEN