The augmented RIC model of the human respiratory system
10
ORIGINAL ARTICLE The augmented RIC model of the human respiratory system Bill Diong A. Rajagiri M. Goldman H. Nazeran Received: 9 January 2008 / Accepted: 12 January 2009 / Published online: 31 January 2009 Ó International Federation for Medical and Biological Engineering 2009 Abstract This paper describes the augmented RIC model of respiratory impedance and analyzes its parameter values estimated—by a modified Newton method with least squares criterion—from impulse oscillometry data. The data were from asthmatic children, tested pre- and post- bronchodilator, and from healthy adults and a second group of adults with COPD. Our analyses show that the aug- mented RIC model was 13.7–66.6% more accurate than the extended RIC model at fitting these data, while its parameter estimates were within previously reported ran- ges, unlike the Mead1969, DuBois and Mead models, which typically yielded compliance estimates exceeding 200 l/kPa. Additionally, the augmented RIC model’s C p parameter, representing peripheral airway compliance, is a statistically significant discriminator between unconstricted and constricted conditions (with p \ 0.001) occurring in asthma and COPD. This corresponds well with current medical understanding, so the augmented RIC model is potentially useful for detection and treatment of airflow obstruction. Keywords Respiratory system impedance Model parameter estimation Impulse oscillometry Asthma COPD 1 Introduction At the present time, lung function is most commonly assessed by spirometry, which requires maximal coordi- nated inspiratory and expiratory efforts by the subject, making this test inappropriate for preschool children and for older adults. However, early detection of childhood asthma is crucial since, if left untreated, it can lead to permanent damage of the airways leading to chronic respiratory disability. As for older adults, asthma and chronic obstructive pulmonary disease (COPD) can greatly compromise their quality of life, and COPD is in fact the fourth leading cause of death in the United States, recently claiming about 119,000 lives each year. In contrast to spirometry, respiratory function assessment by the forced oscillation technique (FOT) [4, 13] requires minimal, passive patient cooperation. Hence even preschool children and older adults can provide valid measurements of respiratory function for use in reliable detection or optimally effective disease management, of obstructive respiratory disease. One implementation of FOT for measuring respi- ratory impedance is the impulse oscillometry system (IOS) [13, 24, 28], which is a commercially available instrument that applies 60–70 ms pulses of pressure at the subject’s mouth as the respiratory system stimulus. The airflow responses then lead to (after signal processing) frequency- dependent impedance curves, that provide the most reliable, reproducible, and appropriate method for demonstrating reversible airflow obstruction in preschool (aged 2–5 years) asthmatics [18]. These pressure-to-flow impedance curves can also be correlated with the voltage-to-current imped- ance of models containing electrical components that are analogous to the mechanical resistances, inertances and compliances in the respiratory system. Consequently, parameter estimates for such respiratory system models B. Diong (&) A. Rajagiri Department of Engineering, Texas Christian University, Fort Worth, TX 76129, USA e-mail: [email protected] M. Goldman H. Nazeran Department of Electrical and Computer Engineering, University of Texas at El Paso, El Paso, TX 79968, USA 123 Med Biol Eng Comput (2009) 47:395–404 DOI 10.1007/s11517-009-0443-2
Transcript of The augmented RIC model of the human respiratory system

ORIGINAL ARTICLE
The augmented RIC model of the human respiratory system
Bill Diong Æ A. Rajagiri Æ M. Goldman ÆH. Nazeran
Received: 9 January 2008 / Accepted: 12 January 2009 / Published online: 31 January 2009
� International Federation for Medical and Biological Engineering 2009
Abstract This paper describes the augmented RIC model
of respiratory impedance and analyzes its parameter values
estimated—by a modified Newton method with least
squares criterion—from impulse oscillometry data. The
data were from asthmatic children, tested pre- and post-
bronchodilator, and from healthy adults and a second group
of adults with COPD. Our analyses show that the aug-
mented RIC model was 13.7–66.6% more accurate than the
extended RIC model at fitting these data, while its
parameter estimates were within previously reported ran-
ges, unlike the Mead1969, DuBois and Mead models,
which typically yielded compliance estimates exceeding
200 l/kPa. Additionally, the augmented RIC model’s Cp
parameter, representing peripheral airway compliance, is a
statistically significant discriminator between unconstricted
and constricted conditions (with p \ 0.001) occurring in
asthma and COPD. This corresponds well with current
medical understanding, so the augmented RIC model is
potentially useful for detection and treatment of airflow
obstruction.
Keywords Respiratory system impedance �Model parameter estimation � Impulse oscillometry �Asthma � COPD
1 Introduction
At the present time, lung function is most commonly
assessed by spirometry, which requires maximal coordi-
nated inspiratory and expiratory efforts by the subject,
making this test inappropriate for preschool children and
for older adults. However, early detection of childhood
asthma is crucial since, if left untreated, it can lead to
permanent damage of the airways leading to chronic
respiratory disability. As for older adults, asthma and
chronic obstructive pulmonary disease (COPD) can greatly
compromise their quality of life, and COPD is in fact the
fourth leading cause of death in the United States, recently
claiming about 119,000 lives each year.
In contrast to spirometry, respiratory function assessment
by the forced oscillation technique (FOT) [4, 13] requires
minimal, passive patient cooperation. Hence even preschool
children and older adults can provide valid measurements of
respiratory function for use in reliable detection or optimally
effective disease management, of obstructive respiratory
disease. One implementation of FOT for measuring respi-
ratory impedance is the impulse oscillometry system (IOS)
[13, 24, 28], which is a commercially available instrument
that applies 60–70 ms pulses of pressure at the subject’s
mouth as the respiratory system stimulus. The airflow
responses then lead to (after signal processing) frequency-
dependent impedance curves, that provide the most reliable,
reproducible, and appropriate method for demonstrating
reversible airflow obstruction in preschool (aged 2–5 years)
asthmatics [18]. These pressure-to-flow impedance curves
can also be correlated with the voltage-to-current imped-
ance of models containing electrical components that are
analogous to the mechanical resistances, inertances and
compliances in the respiratory system. Consequently,
parameter estimates for such respiratory system models
B. Diong (&) � A. Rajagiri
Department of Engineering, Texas Christian University,
Fort Worth, TX 76129, USA
e-mail: [email protected]
M. Goldman � H. Nazeran
Department of Electrical and Computer Engineering,
University of Texas at El Paso, El Paso, TX 79968, USA
123
Med Biol Eng Comput (2009) 47:395–404
DOI 10.1007/s11517-009-0443-2

[3–6, 12, 16, 19–22, 27] can then possibly serve as a com-
plementary quantitative means to detect, diagnose and treat
various respiratory diseases, including asthma and COPD.
In this paper, we expand on the initial results presented
in [20, 21], and also describe additional work. Specifically,
we examine the impedance-fitting performance of six
respiratory models, including the recently introduced aug-
mented RIC (aRIC) model, by estimating their parameters
from collected IOS data and then comparing the corre-
sponding estimation errors. We also present an analysis of
the estimated parameter values for the aRIC model aimed
at determining whether the model’s parameters are sensi-
tive to the presence of COPD in adults and/or to
bronchodilator intervention in asthmatic children.
2 Methods
2.1 Respiratory impedance models
Various electric circuit models with lumped parameter
components representing the respiratory system’s resis-
tances (R—typically in units of cmH2O/l/s or kPa/l/s),
inertances (I—units of cmH2O/l/s2 or kPa/l/s2) and com-
pliances (C—units of l/cmH2O or l/kPa), have been studied
over the years. The simplest are the well-known series RC
and RIC (see Fig. 1a) models, while some work has also
been done on the DuBois model (Fig. 1e) [4, 12]. In [22],
the RC and RIC models together with a 7-element Mead
model (Fig. 1f) were studied with respect to newborn
infants’ respiratory impedance as measured by FOT. In [5,
6], a 5-element respiratory system model (Fig. 1d—based
upon a simplified lung model proposed by Mead [16] and
designated in this paper as the Mead1969 model) was
compared to the RIC and DuBois models using impedance
data obtained with pseudorandom noise forced oscillation
from normal subjects and COPD patients. Note that these
models of impedance are all based upon a time-corre-
spondence between an imposed pressure (at the mouth) and
the resulting response of air flow, which satisfies a linear
ordinary differential equation. This is in contrast to respi-
ratory system models of the pressure–flow relationship
with respect to time that satisfy nonlinear ordinary differ-
ential equations, such as [10] and [29]. Moreover, these
stimulus-response models are also fundamentally different
from the structural types modeling air (and particle) flow
through the respiratory system, e.g., using computational
fluid dynamics [2].
The extended RIC (eRIC) model (Fig. 1b) was recently
introduced in [27] and then analyzed in [3] to reveal its
advantages as well as its shortcomings. The drawbacks of
this model then prompted the proposal of the aRIC model
(Fig. 1c) in [20]. Since the aRIC model is a relatively new
model and the focus of this paper, it will be the only one of
the above-mentioned models described in detail here.
The aRIC model was proposed as an augmentation of
the eRIC model, which has components representing large
airway resistance R, large airway inertance I, peripheral
airway resistance Rp and peripheral airway compliance Cp
[3, 27] (see Fig. 1b). The additional element Ce in the aRIC
model (see Fig. 1c), represents extrathoracic compliance
due mainly to upper airways shunt effects. Alternatively,
the aRIC model can be regarded as a simplification of the
7-element Mead model (with its lung compliance Cl and
chest wall compliance Cw parts ignored): justification for
doing so is provided in a later section. Although previously
given in [20], for completeness, we show the aRIC model’s
input impedance, as a function of frequency f (in Hz) as
IR C IcRc
R2 C2
C1
(a) RIC model (d) Mead1969 model
IR
Rp
C R
Rt Ct
CI
I t
(b) Extended RIC model (e) DuBois model
IR
Ce
Rp
Cp
Rp C l
Cb
Ce
CwIRc
(c) Augmented RIC model (f) Mead model
Fig. 1 Electric circuit models of respiratory system impedance
Z fð Þ ¼A RAþ Rp
� �
A 1� x2ICeð Þ þ x2R2pCpCe
� �h i2
þ xCe RAþ Rp
� �� �2
þ jx IA� R2
pCp
� �A 1� x2ICeð Þ þ x2R2
pCpCe
h i� xCe RAþ Rp
� �2
A 1� x2ICeð Þ þ x2R2pCpCe
h i2
þ xCe RAþ Rp
� �� �2
ð1Þ
396 Med Biol Eng Comput (2009) 47:395–404
123
where A = 1 ? (xRpCp)2 is used to simplify the
impedance expression, radian frequency x = 2pf and
j =ffiffiffiffiffiffiffi�1p
: Note that the real part of this complex func-
tion is known as the resistive impedance ZR whereas the
imaginary part (multiplying j) is known as the reactive
impedance ZX.
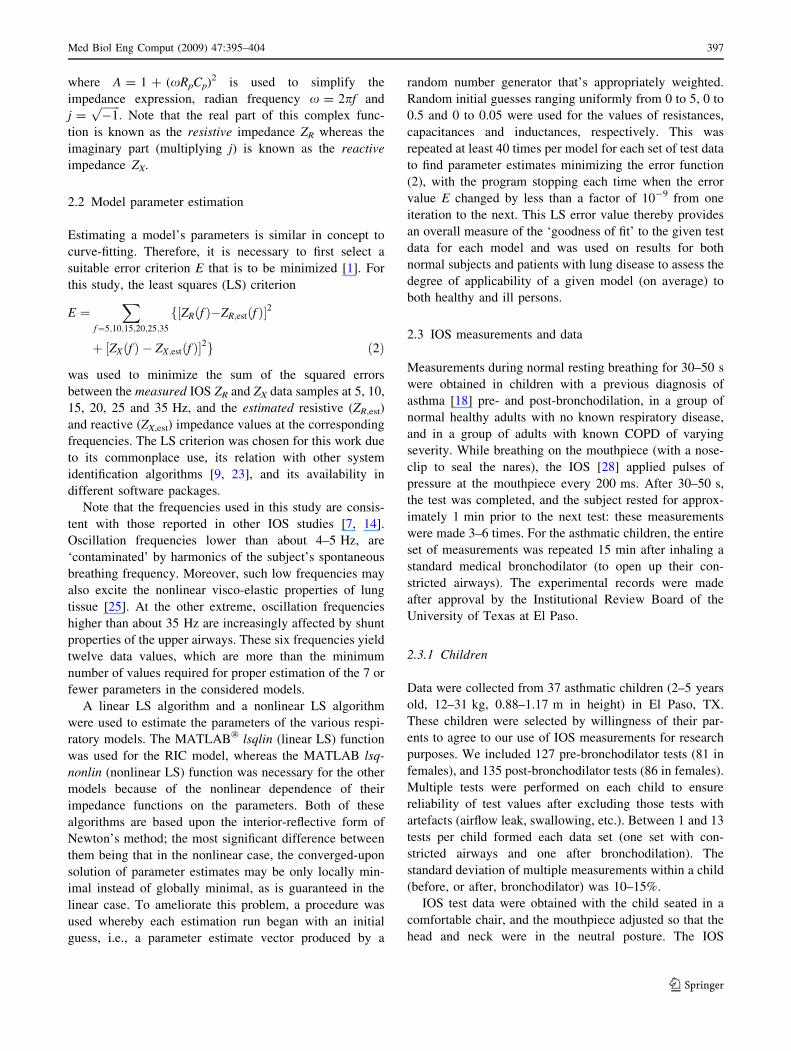
2.2 Model parameter estimation
Estimating a model’s parameters is similar in concept to
curve-fitting. Therefore, it is necessary to first select a
suitable error criterion E that is to be minimized [1]. For
this study, the least squares (LS) criterion
E ¼X
f¼5;10;15;20;25;35
f½ZRðf Þ�ZR;estðf Þ�2
þ ½ZXðf Þ � ZX;estðf Þ�2g ð2Þ
was used to minimize the sum of the squared errors
between the measured IOS ZR and ZX data samples at 5, 10,
15, 20, 25 and 35 Hz, and the estimated resistive (ZR,est)
and reactive (ZX,est) impedance values at the corresponding
frequencies. The LS criterion was chosen for this work due
to its commonplace use, its relation with other system
identification algorithms [9, 23], and its availability in
different software packages.
Note that the frequencies used in this study are consis-
tent with those reported in other IOS studies [7, 14].
Oscillation frequencies lower than about 4–5 Hz, are
‘contaminated’ by harmonics of the subject’s spontaneous
breathing frequency. Moreover, such low frequencies may
also excite the nonlinear visco-elastic properties of lung
tissue [25]. At the other extreme, oscillation frequencies
higher than about 35 Hz are increasingly affected by shunt
properties of the upper airways. These six frequencies yield
twelve data values, which are more than the minimum
number of values required for proper estimation of the 7 or
fewer parameters in the considered models.
A linear LS algorithm and a nonlinear LS algorithm
were used to estimate the parameters of the various respi-
ratory models. The MATLAB� lsqlin (linear LS) function
was used for the RIC model, whereas the MATLAB lsq-
nonlin (nonlinear LS) function was necessary for the other
models because of the nonlinear dependence of their
impedance functions on the parameters. Both of these
algorithms are based upon the interior-reflective form of
Newton’s method; the most significant difference between
them being that in the nonlinear case, the converged-upon
solution of parameter estimates may be only locally min-
imal instead of globally minimal, as is guaranteed in the
linear case. To ameliorate this problem, a procedure was
used whereby each estimation run began with an initial
guess, i.e., a parameter estimate vector produced by a
random number generator that’s appropriately weighted.
Random initial guesses ranging uniformly from 0 to 5, 0 to
0.5 and 0 to 0.05 were used for the values of resistances,
capacitances and inductances, respectively. This was
repeated at least 40 times per model for each set of test data
to find parameter estimates minimizing the error function
(2), with the program stopping each time when the error
value E changed by less than a factor of 10-9 from one
iteration to the next. This LS error value thereby provides
an overall measure of the ‘goodness of fit’ to the given test
data for each model and was used on results for both
normal subjects and patients with lung disease to assess the
degree of applicability of a given model (on average) to
both healthy and ill persons.
2.3 IOS measurements and data
Measurements during normal resting breathing for 30–50 s
were obtained in children with a previous diagnosis of
asthma [18] pre- and post-bronchodilation, in a group of
normal healthy adults with no known respiratory disease,
and in a group of adults with known COPD of varying
severity. While breathing on the mouthpiece (with a nose-
clip to seal the nares), the IOS [28] applied pulses of
pressure at the mouthpiece every 200 ms. After 30–50 s,
the test was completed, and the subject rested for approx-
imately 1 min prior to the next test: these measurements
were made 3–6 times. For the asthmatic children, the entire
set of measurements was repeated 15 min after inhaling a
standard medical bronchodilator (to open up their con-
stricted airways). The experimental records were made
after approval by the Institutional Review Board of the
University of Texas at El Paso.
2.3.1 Children
Data were collected from 37 asthmatic children (2–5 years
old, 12–31 kg, 0.88–1.17 m in height) in El Paso, TX.
These children were selected by willingness of their par-
ents to agree to our use of IOS measurements for research
purposes. We included 127 pre-bronchodilator tests (81 in
females), and 135 post-bronchodilator tests (86 in females).
Multiple tests were performed on each child to ensure
reliability of test values after excluding those tests with
artefacts (airflow leak, swallowing, etc.). Between 1 and 13
tests per child formed each data set (one set with con-
stricted airways and one after bronchodilation). The
standard deviation of multiple measurements within a child
(before, or after, bronchodilator) was 10–15%.
IOS test data were obtained with the child seated in a
comfortable chair, and the mouthpiece adjusted so that the
head and neck were in the neutral posture. The IOS
Med Biol Eng Comput (2009) 47:395–404 397
123

deadspace (mouthpiece, filter, and three-way chamber to
direct airflow) was approximately 60 ml. IOS data from
each test consisted of ZR and ZX values at 5, 10, 15, 20, 25
and 35 Hz, a total of 12 values per test.
2.3.2 Adults
The first set of 25 IOS measurements was obtained from
ten adults with COPD who agreed to their test results being
used for research purposes. All ten adults had a known
history of COPD for several years, and were on various
medications, including different kinds of bronchodilators.
They were 54–79 years of age (mean 66, SD 7.4), 1.60–
1.80 m in height (mean 1.74 m, SD 5.6 cm), 54.5–95.9 kg
in weight (mean 79.0 kg, SD 11.5 kg). Four test results
were from 1 female and 21 were from 9 males with 2–3 test
results per male adult. The second IOS dataset of 33 test
results was obtained from ten adults with no identifiable
respiratory disease, who had previously agreed to undergo
IOS testing for purely research purposes and were paid a
nominal sum to reimburse transportation/parking expenses.
Nine test results were from 3 females and 24 were from
7 males, 24–67 years of age (mean 43.6, SD 14), 1.73–
1.83 m in height (mean 1.77 m, SD 3.6 cm), weighing
50.0–100.9 kg (mean 77.7 kg, SD 14.9 kg) with 1–6 test
results per adult after excluding results with artefacts.
Again, IOS data consisted of ZR and ZX values at 5, 10, 15,
20, 25 and 35 Hz.
3 Results
There was convergence of the various model parameter
estimation programs from all initial values, although the
converged-on solution of the nonlinear LS algorithm
depended on the specific set of initial values. Also as
expected, the larger the number of model parameters being
estimated, the greater the proportion of non-globally min-
imum solutions and the longer the computing time to
convergence. The set of parameter estimates corresponding
to the smallest LS error was selected as the best fit to the
measured impedance data.
Table 1 shows the least square errors in ZR and ZX of all
models for a representative pre-bronchodilator test result
from one child, and the corresponding total LS errors. For
this test (illustrative of all results), estimation error of the
Table 1 Estimation errors for one pre-bronchodilator test result from
one asthmatic child
Model ZR LS error ZX LS error Z LS error
RIC 0.1329 0.0352 0.1681
eRIC 0.0223 0.0057 0.0280
aRIC 0.0125 0.0026 0.0151
Mead1969 0.0202 0.0026 0.0228
DuBois 0.0127 0.0019 0.0146
Mead 0.0074 0.0036 0.0110
5 15 25 350.5
0.6
0.7
0.8
0.9
1
ZR (
kPa/
l/s)
IOS dataRICExt RICAug RIC
5 15 25 35-0.6
-0.4
-0.2
0
0.2
0.4
ZX (
kPa/
l/s)
Frequency (Hz)
IOS dataRICExt RICAug RIC
5 15 25 350.5
0.6
0.7
0.8
0.9
1
ZR (
kPa/
l/s)
IOS dataMead1969DuBoisMead
5 15 25 35-0.6
-0.4
-0.2
0
0.2
0.4
ZX (
kPa/
l/s)
Frequency (Hz)
IOS dataMead1969DuBoisMead
(a) (b)
Fig. 2 Impedance plots of IOS
data and model estimates for the
same patient as Table 1 (a) RIC,
extended RIC and augmented
RIC models (b) Mead1969,
DuBois and Mead models
398 Med Biol Eng Comput (2009) 47:395–404
123
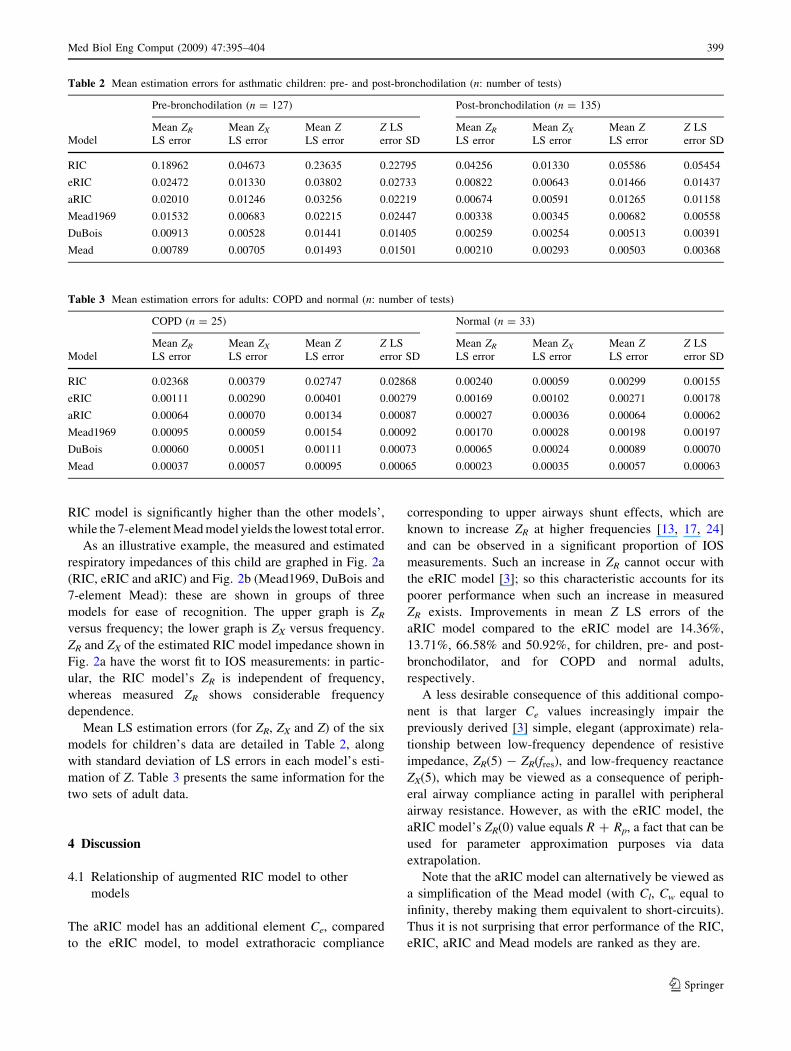
RIC model is significantly higher than the other models’,
while the 7-element Mead model yields the lowest total error.
As an illustrative example, the measured and estimated
respiratory impedances of this child are graphed in Fig. 2a
(RIC, eRIC and aRIC) and Fig. 2b (Mead1969, DuBois and
7-element Mead): these are shown in groups of three
models for ease of recognition. The upper graph is ZR
versus frequency; the lower graph is ZX versus frequency.
ZR and ZX of the estimated RIC model impedance shown in
Fig. 2a have the worst fit to IOS measurements: in partic-
ular, the RIC model’s ZR is independent of frequency,
whereas measured ZR shows considerable frequency
dependence.
Mean LS estimation errors (for ZR, ZX and Z) of the six
models for children’s data are detailed in Table 2, along
with standard deviation of LS errors in each model’s esti-
mation of Z. Table 3 presents the same information for the
two sets of adult data.
4 Discussion
4.1 Relationship of augmented RIC model to other
models
The aRIC model has an additional element Ce, compared
to the eRIC model, to model extrathoracic compliance
corresponding to upper airways shunt effects, which are
known to increase ZR at higher frequencies [13, 17, 24]
and can be observed in a significant proportion of IOS
measurements. Such an increase in ZR cannot occur with
the eRIC model [3]; so this characteristic accounts for its
poorer performance when such an increase in measured
ZR exists. Improvements in mean Z LS errors of the
aRIC model compared to the eRIC model are 14.36%,
13.71%, 66.58% and 50.92%, for children, pre- and post-
bronchodilator, and for COPD and normal adults,
respectively.
A less desirable consequence of this additional compo-
nent is that larger Ce values increasingly impair the
previously derived [3] simple, elegant (approximate) rela-
tionship between low-frequency dependence of resistive
impedance, ZR(5) - ZR(fres), and low-frequency reactance
ZX(5), which may be viewed as a consequence of periph-
eral airway compliance acting in parallel with peripheral
airway resistance. However, as with the eRIC model, the
aRIC model’s ZR(0) value equals R ? Rp, a fact that can be
used for parameter approximation purposes via data
extrapolation.
Note that the aRIC model can alternatively be viewed as
a simplification of the Mead model (with Cl, Cw equal to
infinity, thereby making them equivalent to short-circuits).
Thus it is not surprising that error performance of the RIC,
eRIC, aRIC and Mead models are ranked as they are.
Table 2 Mean estimation errors for asthmatic children: pre- and post-bronchodilation (n: number of tests)
Model
Pre-bronchodilation (n = 127) Post-bronchodilation (n = 135)
Mean ZR
LS error
Mean ZX
LS error
Mean ZLS error
Z LS
error SD
Mean ZR
LS error
Mean ZX
LS error
Mean ZLS error
Z LS
error SD
RIC 0.18962 0.04673 0.23635 0.22795 0.04256 0.01330 0.05586 0.05454
eRIC 0.02472 0.01330 0.03802 0.02733 0.00822 0.00643 0.01466 0.01437
aRIC 0.02010 0.01246 0.03256 0.02219 0.00674 0.00591 0.01265 0.01158
Mead1969 0.01532 0.00683 0.02215 0.02447 0.00338 0.00345 0.00682 0.00558
DuBois 0.00913 0.00528 0.01441 0.01405 0.00259 0.00254 0.00513 0.00391
Mead 0.00789 0.00705 0.01493 0.01501 0.00210 0.00293 0.00503 0.00368
Table 3 Mean estimation errors for adults: COPD and normal (n: number of tests)
Model
COPD (n = 25) Normal (n = 33)
Mean ZR
LS error
Mean ZX
LS error
Mean ZLS error
Z LS
error SD
Mean ZR
LS error
Mean ZX
LS error
Mean ZLS error
Z LS
error SD
RIC 0.02368 0.00379 0.02747 0.02868 0.00240 0.00059 0.00299 0.00155
eRIC 0.00111 0.00290 0.00401 0.00279 0.00169 0.00102 0.00271 0.00178
aRIC 0.00064 0.00070 0.00134 0.00087 0.00027 0.00036 0.00064 0.00062
Mead1969 0.00095 0.00059 0.00154 0.00092 0.00170 0.00028 0.00198 0.00197
DuBois 0.00060 0.00051 0.00111 0.00073 0.00065 0.00024 0.00089 0.00070
Mead 0.00037 0.00057 0.00095 0.00065 0.00023 0.00035 0.00057 0.00063
Med Biol Eng Comput (2009) 47:395–404 399
123

4.2 Comparing the models
4.2.1 Children
4.2.1.1 Pre-bronchodilation The mean LS estimation
modeling errors in Table 2 shows that the DuBois model
yielded the best fit (on average) followed closely by the
Mead model and the Mead1969 model. The proposed aRIC
model performed slightly worse than the Mead1969 model
but slightly better than the eRIC model, while the RIC
model provided the worst fit.
Since many different initial guesses were used in esti-
mating the parameters of these models and the ‘optimal’
results were consistent, the LS errors obtained are very
likely to be the global minima. Hence, it is significant to
note that the Mead model typically yielded unphysiologic
values of Cl and Cw, corresponding to lung compliance and
chest wall compliance, respectively, (although values for
other components were physiologic)—many being several
orders of magnitude larger than previously published and
widely-accepted value of 2 l/kPa for Cl and also for Cw
[26]. Similarly, the DuBois model also yielded unphysio-
logic values of tissue compliance Ct (values for other
components were physiologic)—many being several orders
of magnitude larger than 1.0 l/kPa for Ct (combination of
lung tissue and chest wall values) [4]. The Mead1969
model also yielded unphysiologic values of C2 (corre-
sponding to aggregated lung and chest wall compliance)
much larger than 1.0 l/kPa [4]. While these published
values are for normal adults, it is reasonable to expect the
values for normal children to be of the same order of
magnitude and actually lower. Using two orders of mag-
nitude larger than published, accepted values as the
arbitrary threshold between physiologic and unphysiologic,
Table 4 shows the percentage of compliance estimates
obtained that were unphysiologically large.
In contrast, all of the parameter estimates obtained for
the aRIC model were within the expected ranges of phys-
iological values for the subjects studied. The tendencies of
the Mead and DuBois models to overestimate compliances
from IOS data was previously established in [3, 20, 21], but
this is the first documentation that the Mead1969 model
also may yield unphysiologic values (of C2, from IOS
data).
4.2.1.2 Post-bronchodilation Table 2 reveals that the
Mead model yielded the best overall fit followed closely by
the DuBois model and the Mead1969 model. The perfor-
mance of the aRIC model and the other models remained in
the same order as for pre-bronchodilator data. Again, some
estimated values for C2 (Mead1969), Cl and Cw (Mead),
and Ct (DuBois) were unphysiologic (see Table 4), while
the aRIC model yielded physiological estimates.
We believe the Mead1969, DuBois and 7-element Mead
models produced grossly unphysiologic values for certain
compliances because of the small volume displacements
(less than 10 ml) produced by the IOS as compared to
volume displacements at least an order of magnitude larger
under which the Mead1969, DuBois and Mead models had
usually been studied. We suggest that there is an insuffi-
cient stimulus from IOS to provoke a measureable response
typically from the lung and/or chest wall.
It is also worth noting again that the DuBois model
yielded a better fit (on average) than the Mead model for
the set of pre-bronchodilation test data. While the DuBois
model is not a simplification (by short-circuiting or open-
circuiting of components) of the Mead model, which would
require its modeling error to be worse than the Mead
model, it does have less components than the Mead. This
implies that the DuBois model contains a component—not
found in the Mead model—which is significant in model-
ing the pre-bronchodilation data for asthmatic children;
that component may be It, lung tissue inertance.
4.2.2 Adults
4.2.2.1 COPD Table 3 shows that the RIC model had the
largest error in estimating Z while the smallest error was
achieved by the Mead model, followed by the DuBois
model. The aRIC model had slightly smaller error than the
Mead1969 model. However, the Mead1969 and the Mead
models again yielded unphysiologic values for the com-
pliances C2, and Cl and Cw, respectively, for some subjects
(see Table 4).
Table 4 Percentage of compliance estimates that were unphysiologically large
Mead1969
C2 [ 100 l/kPa (%)
DuBois
Ct [ 100 l/kPa (%)
Mead
Cl [ 200 l/kPa (%)
Mead
Cw [ 200 l/kPa (%)
Children (pre-BD) 17.32 13.39 66.93 27.56
Children (post-BD) 15.56 12.59 50.37 32.59
Adults (COPD) 28.00 0 96 36
Adults (normal) 39.39 3.03 96.97 57.58
400 Med Biol Eng Comput (2009) 47:395–404
123

4.2.2.2 Normal Table 3 also shows that the mean LS
errors of Z for normal adults are in the same order as for
the COPD patients except that the aRIC model and the
DuBois model have switched places, and the aRIC model
has the second lowest error. Notably, the percentage
difference between the RIC model and the other models is
significantly reduced due to a huge drop in this model’s
mean estimation error from its value for the group of
COPD patients. This observation correlates with the
widely-accepted notion that the ZR for healthy humans is
essentially independent of frequency; but diseases that
cause ZR to become frequency-dependent are poorly-
modeled by the RIC model, as illustrated by Fig. 2a.
Again, unphysiologic values were obtained in the
Mead1969, DuBois and Mead models for compliances C2,
Ct, and Cl and Cw, respectively, for some subjects (see
Table 4).
In contrast to the results in children, the DuBois model
has only one unreasonable value for Ct out of 58 adult test
results, so that the choice of the aRIC model as ‘best’ for
adult IOS data is less clear cut.
4.3 Reference values and statistical differences
of augmented RIC model parameters
4.3.1 Children
Parameter estimates of the aRIC model were analyzed
further to determine if they could discriminate between
asthmatic children’s pre- and post-bronchodilation states.
Since previous studies have established that reference
values for normal respiratory impedance in children are
strongly correlated to subject height [17], Fig. 3 shows
scatter plots of the aRIC model’s parameters (for pre- and
post-bronchodilation) versus height. Trend lines—based on
linear regression using a least squares error criterion—for
those estimates corresponding to the post-bronchodilation
data (to be used as a rough approximation of ‘normal
children’ data) are also superimposed on these plots. Trend
line equations are displayed for each of these parameters as
functions of height (H).
In [17], clinical values of ZR (denoted Rrs in that paper)
for most of the reviewed studies on healthy children start at
about 1.2 kPa/l/s (for various frequencies between 4 and
8 Hz) for height = 90 cm and decrease to about 0.35 kPa/
l/s for height = 175 cm. In comparison, linear regression
values from Fig. 3 for children’s post-bronchodilation
R = 0.79 kPa/l/s and Rp = 1.4 kPa/l/s, which are the main
components of ZR, for height = 90 cm, and decrease to
R = 0.42 kPa/L/s and Rp = 0.8 kPa/L/s for height =
115 cm. Hence the aRIC model’s estimates of R and Rp
correspond reasonably well to the clinical reference values
of Rrs for normal children given in [17].
Fig. 3 Estimated value of augmented RIC model parameter versus
child’s height
Med Biol Eng Comput (2009) 47:395–404 401
123
To assess the aRIC model’s ability to discriminate
between pre-and post-bronchodilation states, we applied
the Student’s t test to each of the five parameters. Pre-
bronchodilation Cp (peripheral airway compliance) is sta-
tistically significantly different from post-bronchodilation
Cp (p = 6 9 10-24). For R, Rp, I and Ce, p = 9 9 10-5,
8 9 10-5, 3 9 10-5 and 2 9 10-2, respectively. This
association of the asthmatic state (pre-bronchodilation)
with reduced peripheral airway capacitance is consistent
with current medical interpretation of the significance of
inflamed small peripheral airways, and concomitant
implied increase in their resistance and decrease in their
compliance, in the pathology of asthma [15].
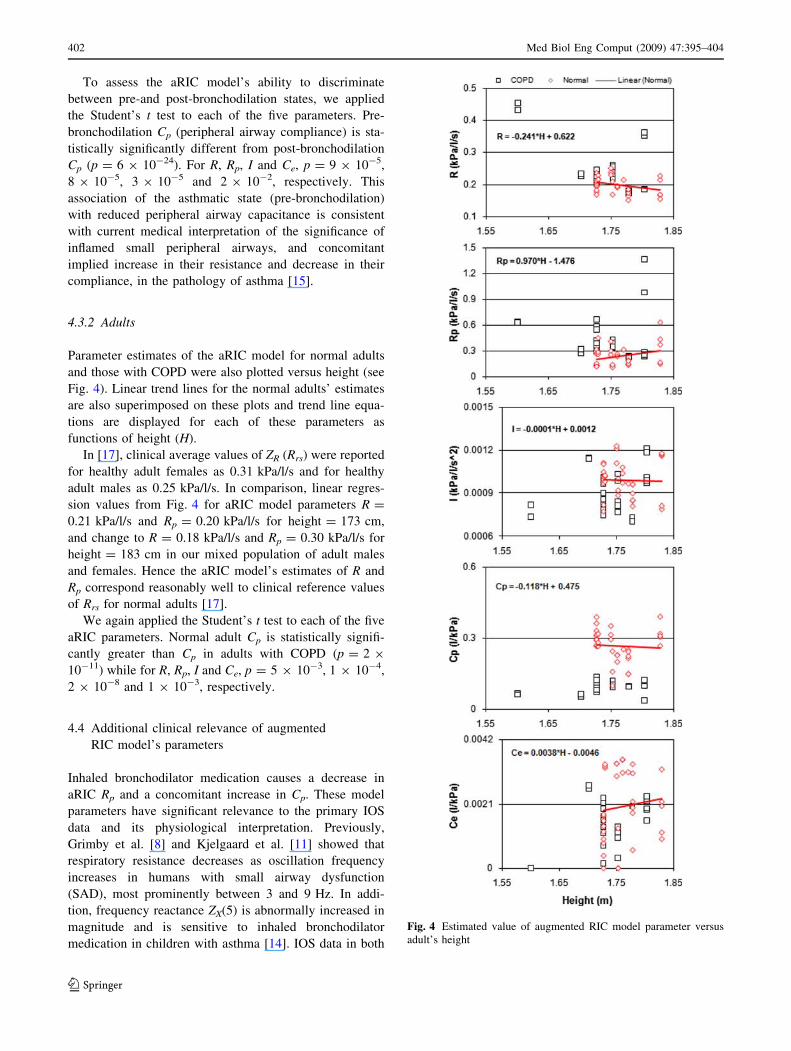
4.3.2 Adults
Parameter estimates of the aRIC model for normal adults
and those with COPD were also plotted versus height (see
Fig. 4). Linear trend lines for the normal adults’ estimates
are also superimposed on these plots and trend line equa-
tions are displayed for each of these parameters as
functions of height (H).
In [17], clinical average values of ZR (Rrs) were reported
for healthy adult females as 0.31 kPa/l/s and for healthy
adult males as 0.25 kPa/l/s. In comparison, linear regres-
sion values from Fig. 4 for aRIC model parameters R =
0.21 kPa/l/s and Rp = 0.20 kPa/l/s for height = 173 cm,
and change to R = 0.18 kPa/l/s and Rp = 0.30 kPa/l/s for
height = 183 cm in our mixed population of adult males
and females. Hence the aRIC model’s estimates of R and
Rp correspond reasonably well to clinical reference values
of Rrs for normal adults [17].
We again applied the Student’s t test to each of the five
aRIC parameters. Normal adult Cp is statistically signifi-
cantly greater than Cp in adults with COPD (p = 2 9
10-11) while for R, Rp, I and Ce, p = 5 9 10-3, 1 9 10-4,
2 9 10-8 and 1 9 10-3, respectively.
4.4 Additional clinical relevance of augmented
RIC model’s parameters
Inhaled bronchodilator medication causes a decrease in
aRIC Rp and a concomitant increase in Cp. These model
parameters have significant relevance to the primary IOS
data and its physiological interpretation. Previously,
Grimby et al. [8] and Kjelgaard et al. [11] showed that
respiratory resistance decreases as oscillation frequency
increases in humans with small airway dysfunction
(SAD), most prominently between 3 and 9 Hz. In addi-
tion, frequency reactance ZX(5) is abnormally increased in
magnitude and is sensitive to inhaled bronchodilator
medication in children with asthma [14]. IOS data in both
Fig. 4 Estimated value of augmented RIC model parameter versus
adult’s height
402 Med Biol Eng Comput (2009) 47:395–404
123

children and adults manifest a very close association
between low-frequency dependence of resistive imped-
ance, ZR(5) - ZR(15), and ZX(5). Thus, IOS data with
increased frequency dependence of resistance and
increased magnitude of ZX(5) are commonly interpreted as
indicating SAD. In the subjects studied for this paper,
aRIC Rp and Cp are increased and decreased, respectively,
in both adults and children (pre-bronchodilation) with
SAD. Changes in Rp and Cp after bronchodilator in
children (and differences in Rp and Cp between COPD
and normal adults) are consistent with decreased SAD
after bronchodilation (and the difference between SAD
and health in adults). Thus, while we recognize that the
aRIC model must represent an oversimplified ‘respiratory
system structure’, nevertheless its parameters as calcu-
lated from IOS data reflect changes consistent with known
physiological changes resulting from obstructive airway
disease and with their modification by appropriate
treatment.
5 Conclusions
This paper has described the estimation of component
parameter values for the recently introduced aRIC model,
from IOS measurements of ill and healthy children and
adults. The ability of this model’s impedance to fit mea-
sured IOS data was compared to that of 5 other well-known
models using a LS criterion. While 3 of these other models
yielded less error (on average) than the aRIC model, the
same 3 models also typically yielded unphysiologic values
of greater than 200 l/kPa for at least one of their compli-
ance components. Hence, the aRIC model, with the next
lowest estimation error and its consistently physiologic
parameter estimates, appears to be the most useful model at
present for IOS-based computer-aided detection and treat-
ment of airflow obstruction as commonly occurs in asthma
and COPD.
Furthermore, the aRIC model’s parameter Cp, repre-
senting peripheral airway compliance, provides statistically
significant discrimination between abnormal airway func-
tion and less abnormal (or normal) airway function in
children and adults. This finding corresponds well with
current medical understanding of the pathologies of asthma
and COPD, and will be of use in the detection and/or
treatment of these disorders.
Acknowledgments This project was supported by grant number
S11 ES013339 from the US National Institute of Environmental
Health Sciences (NIEHS), NIH. Its contents are solely the responsi-
bility of the authors and do not necessarily represent the official views
of the NIEHS, NIH. The help of Dr. Roger Menendez, Allergy &
Asthma Center of El Paso, TX, with the children’s IOS data is also
gratefully acknowledged.
References
1. Adby PR, Dempster MAH (1974) Introduction to optimization
methods. Chapman and Hall, London, UK
2. Collins TP, Tabor GR, Young PG (2007) A computational fluid
dynamics study of inspiratory flow in orotracheal geometries.
Med Biol Eng Comput 45(9):829–836. doi:10.1007/s11517-
007-0238-2
3. Diong B, Nazeran H, Nava P, Goldman M (2007) Modeling
human respiratory impedance. IEEE Eng Med Biol Soc Mag
Spec Issue Respir Sound Anal 26:48–55
4. DuBois AB, Brody AW, Lewis DH, Burgess BF (1956) Oscil-
lation mechanics of lungs and chest in man. J Appl Physiol
8:587–594
5. Eyles JG, Pimmel RL (1981) Estimating respiratory mechanical
parameters in parallel compartment models. IEEE Trans Biomed
Eng BME 28(4):313–317. doi:10.1109/TBME.1981.324798
6. Eyles JG, Pimmel RL, Fullton JM, Bromberg PA (1982)
Parameter estimates in a five-element respiratory mechanical
model. IEEE Trans Biomed Eng BME 29(6):460–463. doi:
10.1109/TBME.1982.324974
7. Frei J, Jutla J, Kramer G, Hatzakis GE, Ducharme FM, Davis GM
(2005) Impulse oscillometry—reference values in children 100–
150 cm in height and 3–10 years of age. Chest 128(3):1266–
1273. doi:10.1378/chest.128.3.1266
8. Grimby G, Takishima T, Graham W, Macklem P, Mead J (1968)
Frequency dependence of flow resistance in patients with
obstructive lung disease. J Clin Invest 47:1455–1465
9. Hsia TC (1977) System identification. Lexington Books,
Lexington, MA
10. Jandre FC, Modesto FC, Carvalho AR, Giannella-Neto A (2008)
The endotracheal tube biases the estimates of pulmonary
recruitment and overdistension. Med Biol Eng Comput
46(1):69–73. doi:10.1007/s11517-007-0227-5
11. Kjeldgaard J, Hyde R, Speers D, Reichert W (1976) Frequency
dependence of total respiratory resistance in early airway disease.
Am Rev Respir Dis 144:501–508
12. Lutchen KR, Costa KD (1990) Physiological interpretations
based on lumped element models fit to respiratory impedance
data: use of forward–inverse modeling. IEEE Trans Biomed Eng
37(11):1076–1086. doi:10.1109/10.61033
13. MacLeod D, Birch M (2001) Respiratory input impedance mea-
surements: forced oscillation methods. Med Biol Eng Comput
39(5):505–516. doi:10.1007/BF02345140
14. Marotta A, Klinnert M, Price M, Larsen G, Liu A (2003) Impulse
oscillometry provides an effective measure of lung dysfunction in
4-year-old children at risk for persistent asthma. J Allergy Clin
Immunol 112:317–322. doi:10.1067/mai.2003.1627
15. Martin RJ (2002) Therapeutic significance of distal airway
inflammation in asthma. J Allergy Clin Immunol 109(2):S447–
S460. doi:10.1067/mai.2002.121409
16. Mead J (1969) Contribution of compliance of airways to fre-
quency-dependent behavior of lungs. J Appl Physiol 26(5):670–
673
17. Oostveen E, MacLeod D, Lorino H, Farre R, Hantos Z et al
(2003) The forced oscillation technique in clinical practice:
methodology, recommendations and future developments. Eur
Respir J 22:1026–1041. doi:10.1183/09031936.03.00089403
18. Ortiz G, Menendez R (2002) The effects of inhaled albuterol and
salmeterol in 2- to 5- year-old asthmatic children as measured by
Impulse Oscillometry. J Asthma 39(6):531–536. doi:10.1081/
JAS-120004923
19. Otis A, McKerrow C, Bartlett R, Mead J, McIlroy M et al (1956)
Mechanical factors in distribution of pulmonary ventilation. J
Appl Physiol 8:427–443
Med Biol Eng Comput (2009) 47:395–404 403
123

20. Rajagiri A, Diong B, Nazeran H, Goldman M (2005) Evaluation
of augmented RIC model of adult respiratory impedance based
on parameter estimates from Impulse Oscillometry data. In:
Proceedings of 12th international conference on biomedical
engineering
21. Rajagiri A, Diong B, Goldman M, Nazeran H (2006) Can the
estimated parameter values of the augmented RIC model be used
to detect asthma in children? In: Proceedings of IEEE engineer-
ing in medicine and biology society conference, pp. 5595–5598
22. Schmidt M, Foitzik B, Hochmuth O, Schmalisch G (1998)
Computer simulation of the measured respiratory impedance in
newborn infants and the effect of the measurement equipment.
Med Eng Phys 20:220–228. doi:10.1016/S1350-4533(98)
00006-X
23. Sinha NK, Kuszta B (1983) Modeling and identification of
dynamic systems. Van Nostrand Reinhold Co, New York
24. Smith HJ, Reinhold P, Goldman MD (2005) Forced oscillation
technique and impulse oscillometry. Eur Respir Mon 31:72–105
25. Suki B, Bates JH (1991) A nonlinear viscoelastic model of lung
tissue mechanics. J Appl Physiol 71(3):826–833
26. Vogel J, Smidt U (1994) Impulse oscillometry. pmi Ver-
lagsgruppe GmbH. Frankfurt am Main, Germany
27. Woo T, Diong B, Mansfield L, Goldman M, Nava P, Nazeran H
(2004) A comparison of various respiratory system models based
on parameter estimates from Impulse Oscillometry data. In:
Proceedings of IEEE engineering in medicine and biology society
conference, pp 3828–3831
28. VIASYS MasterScreen IOS. VIASYS/Jaeger, Yorba Linda CA,
USA
29. Yamashiro SM (2007) Non-linear dynamics of human periodic
breathing and implications for sleep apnea therapy. Med Biol Eng
Comput 45(4):345–356. doi:10.1007/s11517-006-0153-y
404 Med Biol Eng Comput (2009) 47:395–404
123