CONTINUOUS VERIFICATION USING BIOMETRICS (2-FACTOR AUTHENTICATION)
International Journal of Advanced Engineering Research and Science (IJAERS) [Vol-1, Issue-7, Dec.- 2014]
ISSN: 2349-6495
Page | 14
The Application of Hierarchical Clustering
Algorithms for Recognition Using Biometrics of
the Hand Lúcia Sousa
1, João Gama
2
1Department of Mathematics, School of Technology and Management of Polytechnic Institute of Viseu, Portugal
2Faculty of Economic, Porto University, Portugal
Abstract— In data analysis, the hierarchical clustering
algorithms are powerful tools allowing to identify natural
clusters, often without any priori information of the data
structure, and are quite often used because provide a
graphical representation of the resulting partitions, a
hierarchy or dendrogram, revealing more information
than non-hierarchical algorithms that returns a unique
partition. Moreover, it is not necessary specify the
number of clusters à priori. Cutting the dendrogram in
different levels on the hierarchy produces different
partitions and also, the use of different clusters
aggregation methods for the same data set can produces
different hierarchies and hence different partitions. So,
several studies have been concerned with validate the
resulting partitions comparing them, for instance, by the
analysis of cohesion and separation of their clusters.
The work presented here focuses on the problem of
choosing the best partition in hierarchical clusterings.
The procedure to search for the best partition is made in
the nested set of partitions, defined by the hierarchy. In
traditional approaches each partition is defined by
horizontal lines cutting the dendrogram at a determined
level. Was proposed an improved method, SEP/COP, to
obtain the best partition, based on a wide set of
partitions. In this paper we discuss these two types of
approaches and we do a comparative study using a set of
experiments using two-dimensional synthetics and real-
world data sets, based on the biometrics of the hands.
This database is provided from Bosphorus Hand
Database, in the context of recognition of the identity of a
person by using the features of her hand/biometrics. In
the results of the experiments, the SEP/COP showed to be
a better partition algorithm in some situations namely
regarding to real data, leading to a contribution to
identification systems based on the biometrics of the
hands shape.
Keywords— Hand biometrics, Hierarchical clustering,
Partition, Post-processing, Validation.
I. INTRODUCTION
The clustering methods, in particular the hierarchical, are
a powerful tool on multivariate data analysis, for the
identification of natural clusters in the set to be clustered.
A hierarchical clustering algorithm applied to a data set
produces a series of nested partitions, usually designated
by hierarchy. A hierarchy is a complex and difficult
structure to interpret, so that, it is usual to post-process a
hierarchy to find the best partition in it. The pos-
processing consist in “cut off” the dendrogram through horizontal lines at determined levels. In general, the
procedure is to evaluate some partitions in the hierarchy
based on validity indexes, to choice a single partition,
which is intended to translate the all structure underlying
the data. The usual post-processing of the hierarchy in
some cases doesn’t achieve the correct partition, so, several approaches to produce the correct partition, have
another view of the usual pos-processing of the traditional
hierarchical algorithms. As, in [3,19] is implemented a
method, which is a combination of the traditional
hierarchical algorithms and the SEP/COP method,
capable to identify more partitions than the traditional
hierarchy algorithms considering an extension of the
partitions set and a validity index applied on search of the
correct partition among all the possible partitions set. To
improve the efficiency of the method, in [3] the authors
performed a set of experiments with some known real
data sets and with some syntactic ones, considering at this
case structures in ten clusters varying the number of
elements and the covariance matrix of each cluster.
Besides it, they allow overlapped clusters and include
different levels of data noise. Other work, apply the same
methodology to build a system to identify preferences for
the users of the website information and make the access
to those web pages easier [19]. They use SEP/COP
algorithm to obtain the best partition from a hierarchy to
International Journal of Advanced Engineering Research and Science (IJAERS) [Vol-1, Issue-7, Dec.- 2014]
ISSN: 2349-6495
Page | 15
cluster users with similar interests on navigation of web
site.
In this work we compare these two different approaches
for choosing the best partition, the known traditional, and
associated with a new method which is based on the
concept of extended set of partitions, SEP/COP. This
approach includes a proposed index of validity of
partition adapted to this new situation.
For that, we evaluated these approaches with an empirical
study using synthetic and real-world data sets and in this
case we use a multidimensional data set available in
Bosphorus Hand Database [36] to obtain truth
information on hand biometrics.
This paper is organized as follows: Section II is devoted
to basic concepts of hierarchical clustering and partition
validation indices. Is explained in Section III the SEP
method and the COP index. Section IV addresses real-
world biometric applications, namely, hand geometry
biometrics. It follows the work methodology developed in
Section V. Results and conclusions are drawn in Section
VI and VII, respectively.
II. HIERARCHICAL PARTITIONING AND
VALIDATING
In the following will be considered the application of
hierarchical clustering method ascending to data set, that
is, a set of n individuals (or elements or objects) described
by P variables, where the aim is to identify individuals
into clusters. Thus, it is intended to define on the set of
individuals, a hierarchy of partitions into clusters based
on the choice of proximity measure between individuals
and a method of aggregation of clusters. The objective of
clustering consists of grouping in clusters elements of a
data set such that elements of the same cluster have a high
degree of natural association with each other and
elements of different clusters are distinct.
The hierarchical clustering constitute a methodology of
sequentially aggregate, pairs of clusters, also can join two
individuals forming a new cluster, or still, add an
individual to an existing cluster. Initially, each individual
forms a cluster and the process is carried out by ordered
steps of aggregation where the order of each step
corresponds to the level of the hierarchy. These
aggregations are based on proximities or similarities
matrix, which represent the distance between individuals
or clusters. The idea is to observe the proximity matrix (or
a representation in graph), and in accordance with the
shortest distance, joins the individuals in a cluster and or
join the corresponding clusters, thus building a new
cluster. With the appearance of a new cluster, distances
are recalculated and thus, one gets a new proximity
matrix. The process ends when all individuals are at the
same cluster. The final result is a hierarchy of partitions
represented in a dendrogram. Analyzing the dendrogram,
one can cut the dendrogram in different levels yielding
different partitions or partitions with different number of
clusters. At our studies, we fixed the cut level,
corresponding to the number of clusters according the
data sets and their known structure.
The various aggregation methods differ in how they
define the distance between clusters, i.e., differ in the
entries of proximity matrix. Different definitions of the
distances may result in different hierarchy [12].
The distance between two clusters, X and Y, are stated
by distance between objects, and . There are several
ways to calculate the distance between two objects, for
instance, we can mention the following metrics:
• Euclidian- ,
• Manhattan- ,
• Maximum- ,
• Mahalanobis-
, where is the covariance matrix [13].
In this work, the obtaining of hierarchies by the
hierarchical clustering approach, is considering as
measure of proximity the Euclidean distance and three
aggregation methods, namely, Single-Linkage (SL),
Complete-Linkage (CL), Average-Linkage (AL). We
chose the Euclidian distance because, corresponds to the
trivial sense of distance and is the most known and used
than others metrics [12].
The different aggregation methods have different ways to
define :
- In SL, is the distance between the pair of individuals
(one in each cluster), which are the closest among all
possible pairs, .
- In CL, is the distance between the pair of individuals
(one in each cluster), which are most distant from all
possible pairs, .
- In AL, is the average distance between all pairs of
individuals (one in each cluster),
.
In the case of large data sets, a review of all of the
hierarchy becomes a difficult process, so it is desirable to
interpret only one partition, for this reason it is intended
International Journal of Advanced Engineering Research and Science (IJAERS) [Vol-1, Issue-7, Dec.- 2014]
ISSN: 2349-6495
Page | 16
to find a partition in clusters of the hierarchy which best
represents the data structure inherent.
Due to the way these aggregation methods characterize
the similarity between pairs of clusters, they often provide
different hierarchies and therefore, different partitions, for
the same data set. Some characteristics of these
aggregation methods are summarized in Table 1.
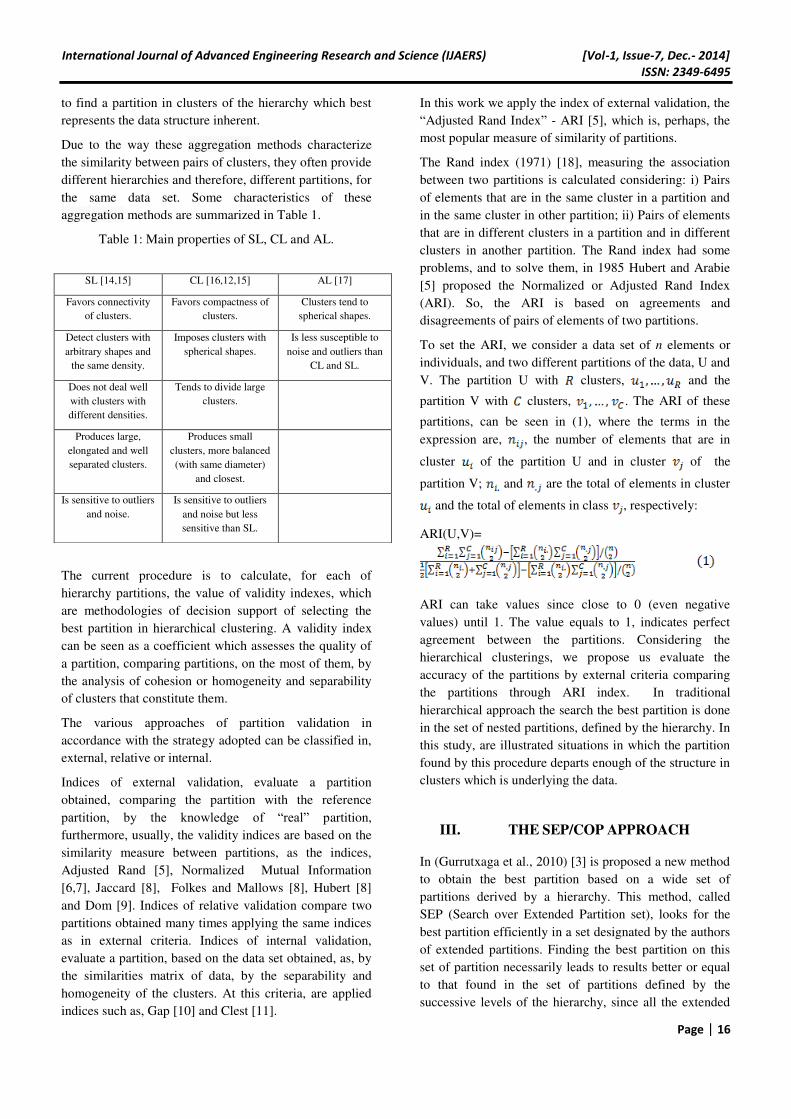
Table 1: Main properties of SL, CL and AL.
The current procedure is to calculate, for each of
hierarchy partitions, the value of validity indexes, which
are methodologies of decision support of selecting the
best partition in hierarchical clustering. A validity index
can be seen as a coefficient which assesses the quality of
a partition, comparing partitions, on the most of them, by
the analysis of cohesion or homogeneity and separability
of clusters that constitute them.
The various approaches of partition validation in
accordance with the strategy adopted can be classified in,
external, relative or internal.
Indices of external validation, evaluate a partition
obtained, comparing the partition with the reference
partition, by the knowledge of “real” partition,
furthermore, usually, the validity indices are based on the
similarity measure between partitions, as the indices,
Adjusted Rand [5], Normalized Mutual Information
[6,7], Jaccard [8], Folkes and Mallows [8], Hubert [8]
and Dom [9]. Indices of relative validation compare two
partitions obtained many times applying the same indices
as in external criteria. Indices of internal validation,
evaluate a partition, based on the data set obtained, as, by
the similarities matrix of data, by the separability and
homogeneity of the clusters. At this criteria, are applied
indices such as, Gap [10] and Clest [11].
In this work we apply the index of external validation, the
“Adjusted Rand Index” - ARI [5], which is, perhaps, the
most popular measure of similarity of partitions.
The Rand index (1971) [18], measuring the association
between two partitions is calculated considering: i) Pairs
of elements that are in the same cluster in a partition and
in the same cluster in other partition; ii) Pairs of elements
that are in different clusters in a partition and in different
clusters in another partition. The Rand index had some
problems, and to solve them, in 1985 Hubert and Arabie
[5] proposed the Normalized or Adjusted Rand Index
(ARI). So, the ARI is based on agreements and
disagreements of pairs of elements of two partitions.
To set the ARI, we consider a data set of n elements or
individuals, and two different partitions of the data, U and
V. The partition U with clusters, and the
partition V with clusters, . The ARI of these
partitions, can be seen in (1), where the terms in the
expression are, , the number of elements that are in
cluster of the partition U and in cluster of the
partition V; and are the total of elements in cluster
and the total of elements in class , respectively:
ARI(U,V)=
ARI can take values since close to 0 (even negative
values) until 1. The value equals to 1, indicates perfect
agreement between the partitions. Considering the
hierarchical clusterings, we propose us evaluate the
accuracy of the partitions by external criteria comparing
the partitions through ARI index. In traditional
hierarchical approach the search the best partition is done
in the set of nested partitions, defined by the hierarchy. In
this study, are illustrated situations in which the partition
found by this procedure departs enough of the structure in
clusters which is underlying the data.
III. THE SEP/COP APPROACH
In (Gurrutxaga et al., 2010) [3] is proposed a new method
to obtain the best partition based on a wide set of
partitions derived by a hierarchy. This method, called
SEP (Search over Extended Partition set), looks for the
best partition efficiently in a set designated by the authors
of extended partitions. Finding the best partition on this
set of partition necessarily leads to results better or equal
to that found in the set of partitions defined by the
successive levels of the hierarchy, since all the extended
SL [14,15] CL [16,12,15] AL [17]
Favors connectivity
of clusters.
Favors compactness of
clusters.
Clusters tend to
spherical shapes.
Detect clusters with
arbitrary shapes and
the same density.
Imposes clusters with
spherical shapes.
Is less susceptible to
noise and outliers than
CL and SL.
Does not deal well
with clusters with
different densities.
Tends to divide large
clusters.
Produces large,
elongated and well
separated clusters.
Produces small
clusters, more balanced
(with same diameter)
and closest.
Is sensitive to outliers
and noise.
Is sensitive to outliers
and noise but less
sensitive than SL.
International Journal of Advanced Engineering Research and Science (IJAERS) [Vol-1, Issue-7, Dec.- 2014]
ISSN: 2349-6495
Page | 17
partition includes the set of partitions provided by the
hierarchy [3].
The particularities of the algorithm SEP constrain the use
of validity indexes, i.e., most of the available indexes in
the literature cannot be used for extended partitions. In
the same paper is proposed a new index of validity of
clusters, called COP (whose acronym derives from the
fact that checks the properties of "Context-independent
Optimality" and "partiality").
The SEP/COP method is combined with the traditional
methods and deviates from those methods in which the
partition is defined by a horizontal line cutting the
dendrogram. The formally description of the SEP/CP is as
follows.
Let: X the individuals set to classify; a partial partition
of X (as in (2)); a hierarchy of partitions
of X, verifying (3); the set of extended partitions of
the hierarchy where is the set of partitions built with
combinations of clusters found in the hierarchy (see (4)):
Staring the dendrogram as a binary tree, the SEP method
analyzes each sub tree of the dendrogram independently
and decides on each node, which one is the best partial
partition to the data set. The usual indices of validation of
partitions cannot be applied to extended partitions, so, it
is proposed the index of validation COP which is able to
assess the partial partitions, identifying the best partial
partitions after adding them together by successive
aggregations and is calculated by a weighted ratio of the
intra-cluster variance and inter-cluster variance, as, in (5).
(6) calculates the COP index of the union of two
partitions. The lowest index value indicates the better
partition, corresponding to the partition in which the
clusters are more homogeneous and more separated
between them.
Where,
Description of the algorithm:
The idea of the algorithm is first of all, view the hierarchy
as a tree with subtrees and inner nodes, as “left nodes” and “right nodes”, assuming without loss of generality, that the trees are binary. Analyzing each subtree, at each
node decides which is the best partition between two
partitions, the one corresponding at the current node and
the other which corresponding to the union of the best
partition in each child node of the current node. The
comparison is by the COP values and hence deciding for
the best partition at each subtree.
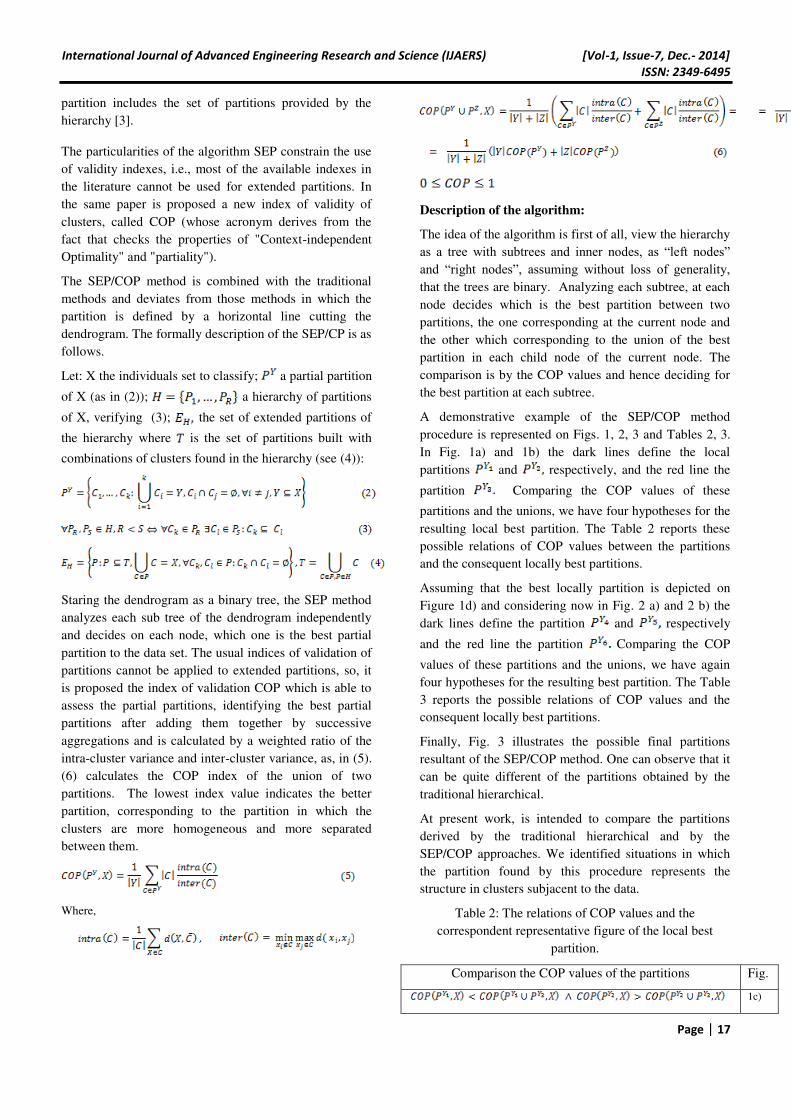
A demonstrative example of the SEP/COP method
procedure is represented on Figs. 1, 2, 3 and Tables 2, 3.
In Fig. 1a) and 1b) the dark lines define the local
partitions and respectively, and the red line the
partition Comparing the COP values of these
partitions and the unions, we have four hypotheses for the
resulting local best partition. The Table 2 reports these
possible relations of COP values between the partitions
and the consequent locally best partitions.
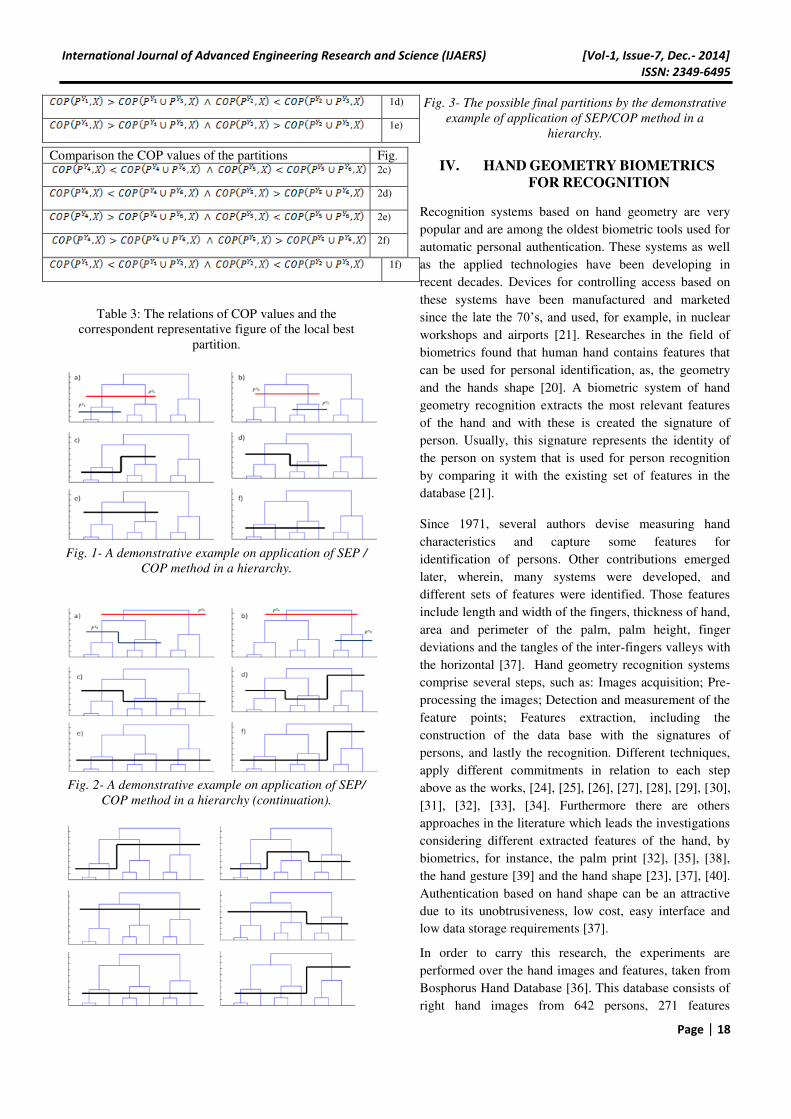
Assuming that the best locally partition is depicted on
Figure 1d) and considering now in Fig. 2 a) and 2 b) the
dark lines define the partition and respectively
and the red line the partition Comparing the COP
values of these partitions and the unions, we have again
four hypotheses for the resulting best partition. The Table
3 reports the possible relations of COP values and the
consequent locally best partitions.
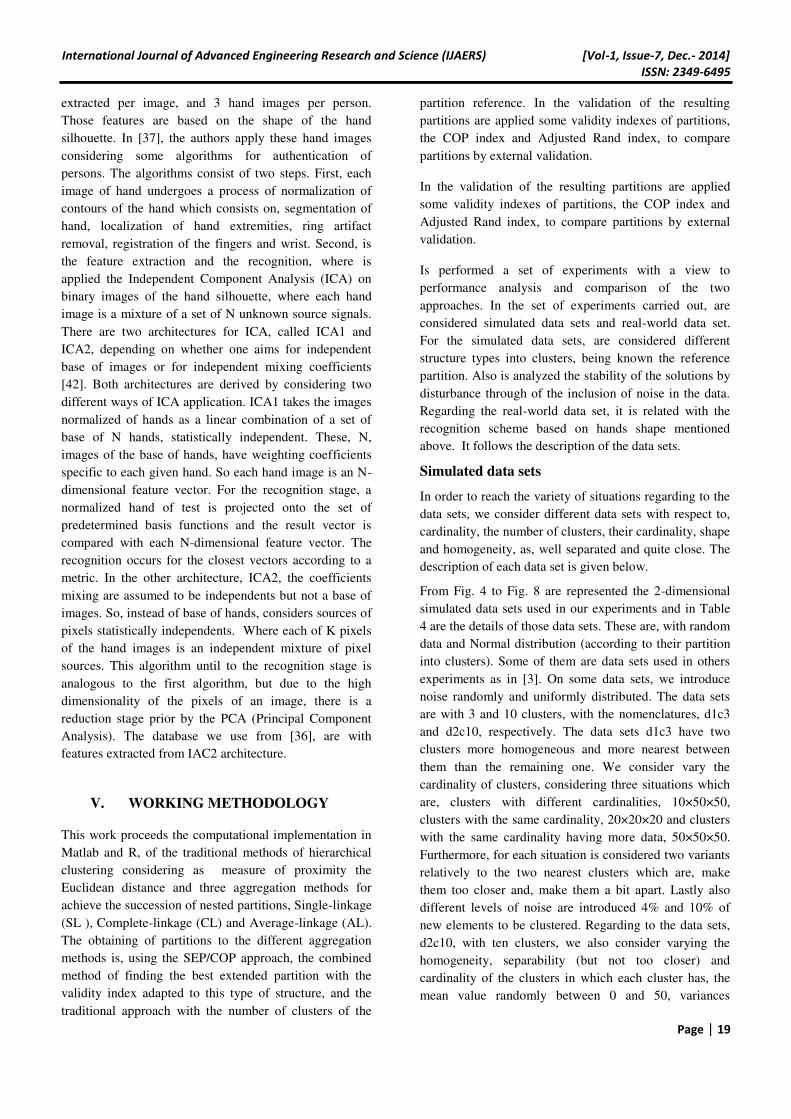
Finally, Fig. 3 illustrates the possible final partitions
resultant of the SEP/COP method. One can observe that it
can be quite different of the partitions obtained by the
traditional hierarchical.
At present work, is intended to compare the partitions
derived by the traditional hierarchical and by the
SEP/COP approaches. We identified situations in which
the partition found by this procedure represents the
structure in clusters subjacent to the data.
Table 2: The relations of COP values and the
correspondent representative figure of the local best
partition.
Comparison the COP values of the partitions Fig.
1c)
International Journal of Advanced Engineering Research and Science (IJAERS) [Vol-1, Issue-7, Dec.- 2014]
ISSN: 2349-6495
Page | 18
1d)
1e)
1f)
Table 3: The relations of COP values and the
correspondent representative figure of the local best
partition.
Fig. 1- A demonstrative example on application of SEP /
COP method in a hierarchy.
Fig. 2- A demonstrative example on application of SEP/
COP method in a hierarchy (continuation).
Fig. 3- The possible final partitions by the demonstrative
example of application of SEP/COP method in a
hierarchy.
IV. HAND GEOMETRY BIOMETRICS
FOR RECOGNITION
Recognition systems based on hand geometry are very
popular and are among the oldest biometric tools used for
automatic personal authentication. These systems as well
as the applied technologies have been developing in
recent decades. Devices for controlling access based on
these systems have been manufactured and marketed
since the late the 70’s, and used, for example, in nuclear workshops and airports [21]. Researches in the field of
biometrics found that human hand contains features that
can be used for personal identification, as, the geometry
and the hands shape [20]. A biometric system of hand
geometry recognition extracts the most relevant features
of the hand and with these is created the signature of
person. Usually, this signature represents the identity of
the person on system that is used for person recognition
by comparing it with the existing set of features in the
database [21].
Since 1971, several authors devise measuring hand
characteristics and capture some features for
identification of persons. Other contributions emerged
later, wherein, many systems were developed, and
different sets of features were identified. Those features
include length and width of the fingers, thickness of hand,
area and perimeter of the palm, palm height, finger
deviations and the tangles of the inter-fingers valleys with
the horizontal [37]. Hand geometry recognition systems
comprise several steps, such as: Images acquisition; Pre-
processing the images; Detection and measurement of the
feature points; Features extraction, including the
construction of the data base with the signatures of
persons, and lastly the recognition. Different techniques,
apply different commitments in relation to each step
above as the works, [24], [25], [26], [27], [28], [29], [30],
[31], [32], [33], [34]. Furthermore there are others
approaches in the literature which leads the investigations
considering different extracted features of the hand, by
biometrics, for instance, the palm print [32], [35], [38],
the hand gesture [39] and the hand shape [23], [37], [40].
Authentication based on hand shape can be an attractive
due to its unobtrusiveness, low cost, easy interface and
low data storage requirements [37].
In order to carry this research, the experiments are
performed over the hand images and features, taken from
Bosphorus Hand Database [36]. This database consists of
right hand images from 642 persons, 271 features
Comparison the COP values of the partitions Fig.
2c)
2d)
2e)
2f)
International Journal of Advanced Engineering Research and Science (IJAERS) [Vol-1, Issue-7, Dec.- 2014]
ISSN: 2349-6495
Page | 19
extracted per image, and 3 hand images per person.
Those features are based on the shape of the hand
silhouette. In [37], the authors apply these hand images
considering some algorithms for authentication of
persons. The algorithms consist of two steps. First, each
image of hand undergoes a process of normalization of
contours of the hand which consists on, segmentation of
hand, localization of hand extremities, ring artifact
removal, registration of the fingers and wrist. Second, is
the feature extraction and the recognition, where is
applied the Independent Component Analysis (ICA) on
binary images of the hand silhouette, where each hand
image is a mixture of a set of N unknown source signals.
There are two architectures for ICA, called ICA1 and
ICA2, depending on whether one aims for independent
base of images or for independent mixing coefficients
[42]. Both architectures are derived by considering two
different ways of ICA application. ICA1 takes the images
normalized of hands as a linear combination of a set of
base of N hands, statistically independent. These, N,
images of the base of hands, have weighting coefficients
specific to each given hand. So each hand image is an N-
dimensional feature vector. For the recognition stage, a
normalized hand of test is projected onto the set of
predetermined basis functions and the result vector is
compared with each N-dimensional feature vector. The
recognition occurs for the closest vectors according to a
metric. In the other architecture, ICA2, the coefficients
mixing are assumed to be independents but not a base of
images. So, instead of base of hands, considers sources of
pixels statistically independents. Where each of K pixels
of the hand images is an independent mixture of pixel
sources. This algorithm until to the recognition stage is
analogous to the first algorithm, but due to the high
dimensionality of the pixels of an image, there is a
reduction stage prior by the PCA (Principal Component
Analysis). The database we use from [36], are with
features extracted from IAC2 architecture.
V. WORKING METHODOLOGY
This work proceeds the computational implementation in
Matlab and R, of the traditional methods of hierarchical
clustering considering as measure of proximity the
Euclidean distance and three aggregation methods for
achieve the succession of nested partitions, Single-linkage
(SL ), Complete-linkage (CL) and Average-linkage (AL).
The obtaining of partitions to the different aggregation
methods is, using the SEP/COP approach, the combined
method of finding the best extended partition with the
validity index adapted to this type of structure, and the
traditional approach with the number of clusters of the
partition reference. In the validation of the resulting
partitions are applied some validity indexes of partitions,
the COP index and Adjusted Rand index, to compare
partitions by external validation.
In the validation of the resulting partitions are applied
some validity indexes of partitions, the COP index and
Adjusted Rand index, to compare partitions by external
validation.
Is performed a set of experiments with a view to
performance analysis and comparison of the two
approaches. In the set of experiments carried out, are
considered simulated data sets and real-world data set.
For the simulated data sets, are considered different
structure types into clusters, being known the reference
partition. Also is analyzed the stability of the solutions by
disturbance through of the inclusion of noise in the data.
Regarding the real-world data set, it is related with the
recognition scheme based on hands shape mentioned
above. It follows the description of the data sets.
Simulated data sets
In order to reach the variety of situations regarding to the
data sets, we consider different data sets with respect to,
cardinality, the number of clusters, their cardinality, shape
and homogeneity, as, well separated and quite close. The
description of each data set is given below.
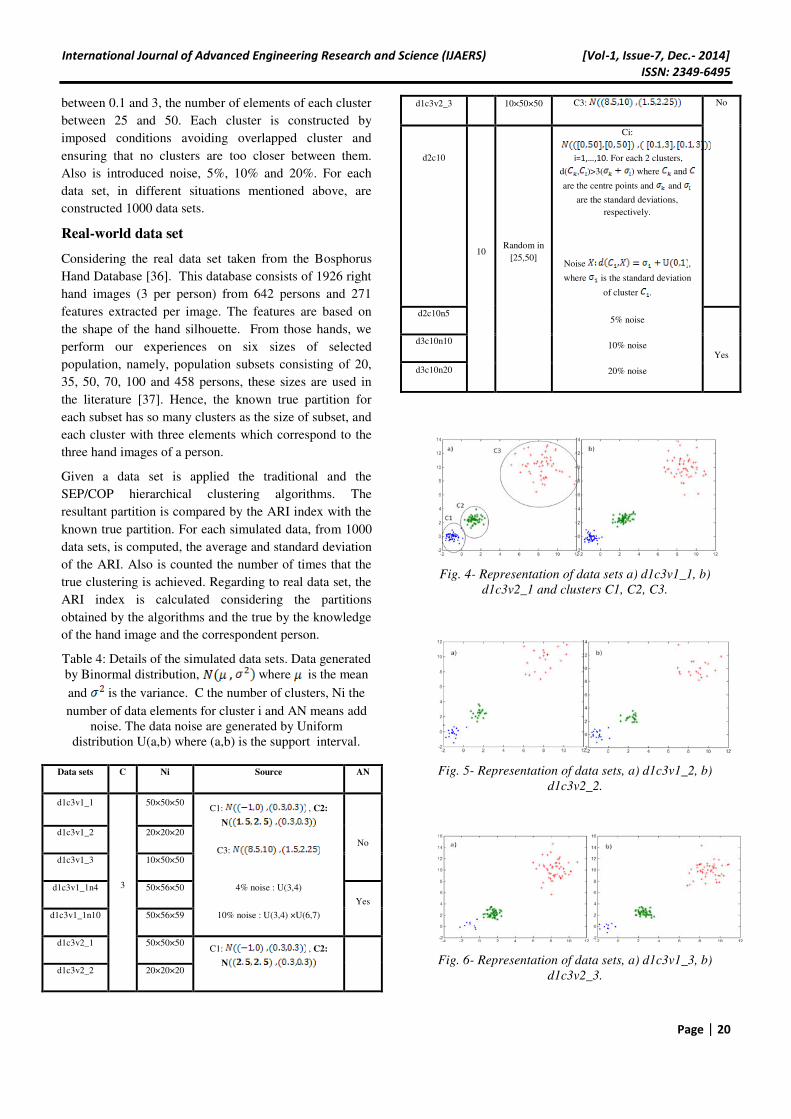
From Fig. 4 to Fig. 8 are represented the 2-dimensional
simulated data sets used in our experiments and in Table
4 are the details of those data sets. These are, with random
data and Normal distribution (according to their partition
into clusters). Some of them are data sets used in others
experiments as in [3]. On some data sets, we introduce
noise randomly and uniformly distributed. The data sets
are with 3 and 10 clusters, with the nomenclatures, d1c3
and d2c10, respectively. The data sets d1c3 have two
clusters more homogeneous and more nearest between
them than the remaining one. We consider vary the
cardinality of clusters, considering three situations which
are, clusters with different cardinalities, 10×50×50,
clusters with the same cardinality, 20×20×20 and clusters
with the same cardinality having more data, 50×50×50.
Furthermore, for each situation is considered two variants
relatively to the two nearest clusters which are, make
them too closer and, make them a bit apart. Lastly also
different levels of noise are introduced 4% and 10% of
new elements to be clustered. Regarding to the data sets,
d2c10, with ten clusters, we also consider varying the
homogeneity, separability (but not too closer) and
cardinality of the clusters in which each cluster has, the
mean value randomly between 0 and 50, variances
International Journal of Advanced Engineering Research and Science (IJAERS) [Vol-1, Issue-7, Dec.- 2014]
ISSN: 2349-6495
Page | 20
between 0.1 and 3, the number of elements of each cluster
between 25 and 50. Each cluster is constructed by
imposed conditions avoiding overlapped cluster and
ensuring that no clusters are too closer between them.
Also is introduced noise, 5%, 10% and 20%. For each
data set, in different situations mentioned above, are
constructed 1000 data sets.
Real-world data set
Considering the real data set taken from the Bosphorus
Hand Database [36]. This database consists of 1926 right
hand images (3 per person) from 642 persons and 271
features extracted per image. The features are based on
the shape of the hand silhouette. From those hands, we
perform our experiences on six sizes of selected
population, namely, population subsets consisting of 20,
35, 50, 70, 100 and 458 persons, these sizes are used in
the literature [37]. Hence, the known true partition for
each subset has so many clusters as the size of subset, and
each cluster with three elements which correspond to the
three hand images of a person.
Given a data set is applied the traditional and the
SEP/COP hierarchical clustering algorithms. The
resultant partition is compared by the ARI index with the
known true partition. For each simulated data, from 1000
data sets, is computed, the average and standard deviation
of the ARI. Also is counted the number of times that the
true clustering is achieved. Regarding to real data set, the
ARI index is calculated considering the partitions
obtained by the algorithms and the true by the knowledge
of the hand image and the correspondent person.
Table 4: Details of the simulated data sets. Data generated
by Binormal distribution, where is the mean
and is the variance. C the number of clusters, Ni the
number of data elements for cluster i and AN means add
noise. The data noise are generated by Uniform
distribution U(a,b) where (a,b) is the support interval.
Data sets C Ni Source AN
d1c3v1_1
3
50×50×50 C1: , C2:
N
C3:
No
d1c3v1_2 20×20×20
d1c3v1_3 10×50×50
d1c3v1_1n4 50×56×50 4% noise : U(3,4)
Yes
d1c3v1_1n10 50×56×59 10% noise : U(3,4) ×U(6,7)
d1c3v2_1 50×50×50 C1: , C2:
N
d1c3v2_2 20×20×20
d1c3v2_3 10×50×50 C3: No
d2c10
10 Random in
[25,50]
Ci:
i= ,…, . For each 2 clusters,
d( , )>3( ) where and
are the centre points and and
are the standard deviations,
respectively.
Noise ,
where is the standard deviation
of cluster .
5% noise
10% noise
20% noise
d2c10n5
Yes
d3c10n10
d3c10n20
Fig. 4- Representation of data sets a) d1c3v1_1, b)
d1c3v2_1 and clusters C1, C2, C3.
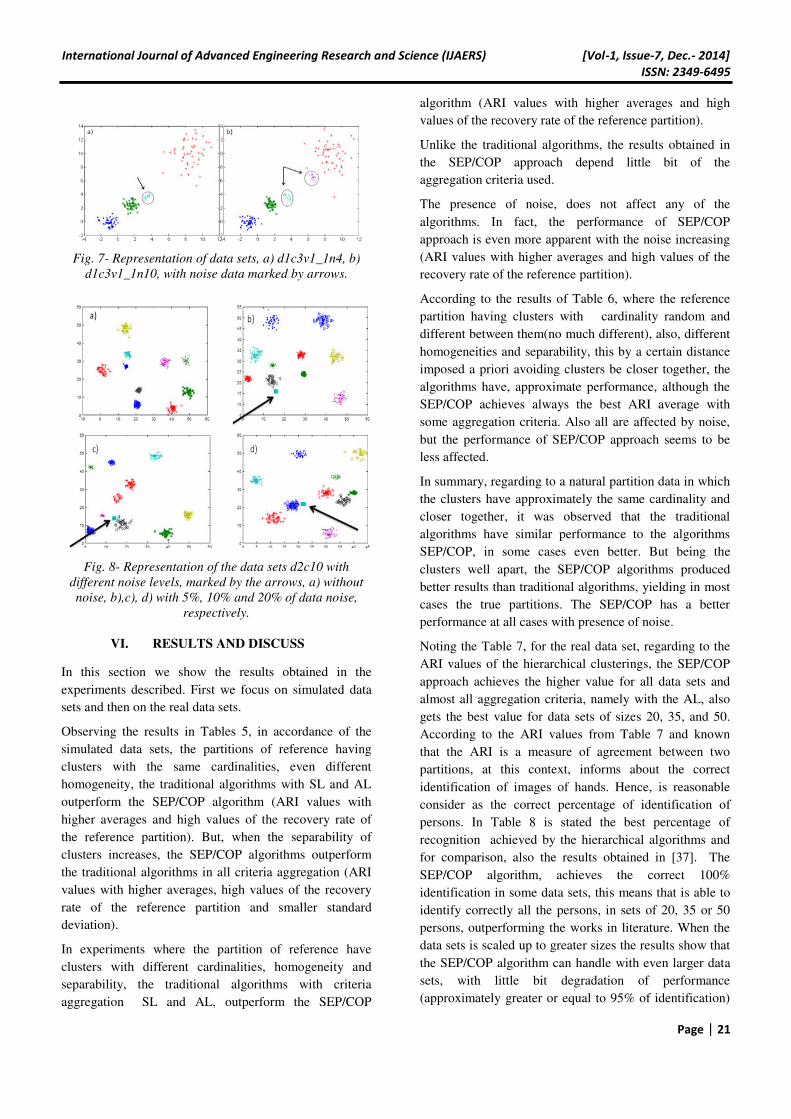
Fig. 5- Representation of data sets, a) d1c3v1_2, b)
d1c3v2_2.
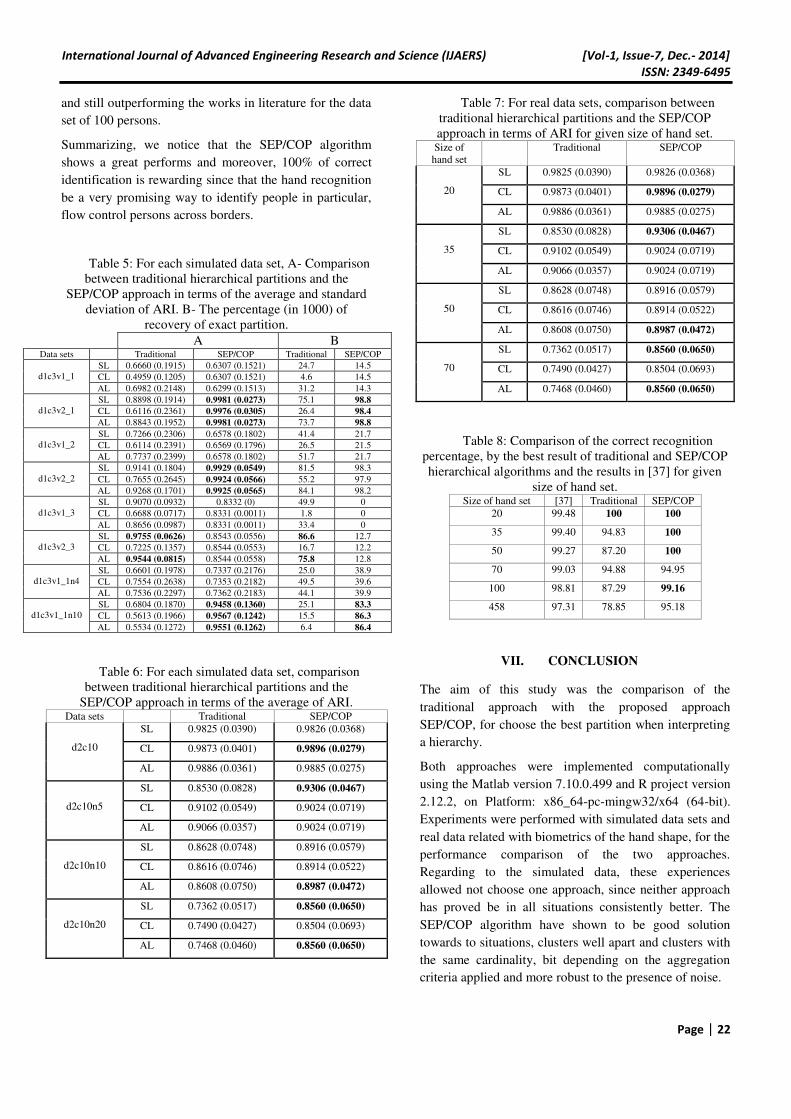
Fig. 6- Representation of data sets, a) d1c3v1_3, b)
d1c3v2_3.
International Journal of Advanced Engineering Research and Science (IJAERS) [Vol-1, Issue-7, Dec.- 2014]
ISSN: 2349-6495
Page | 21
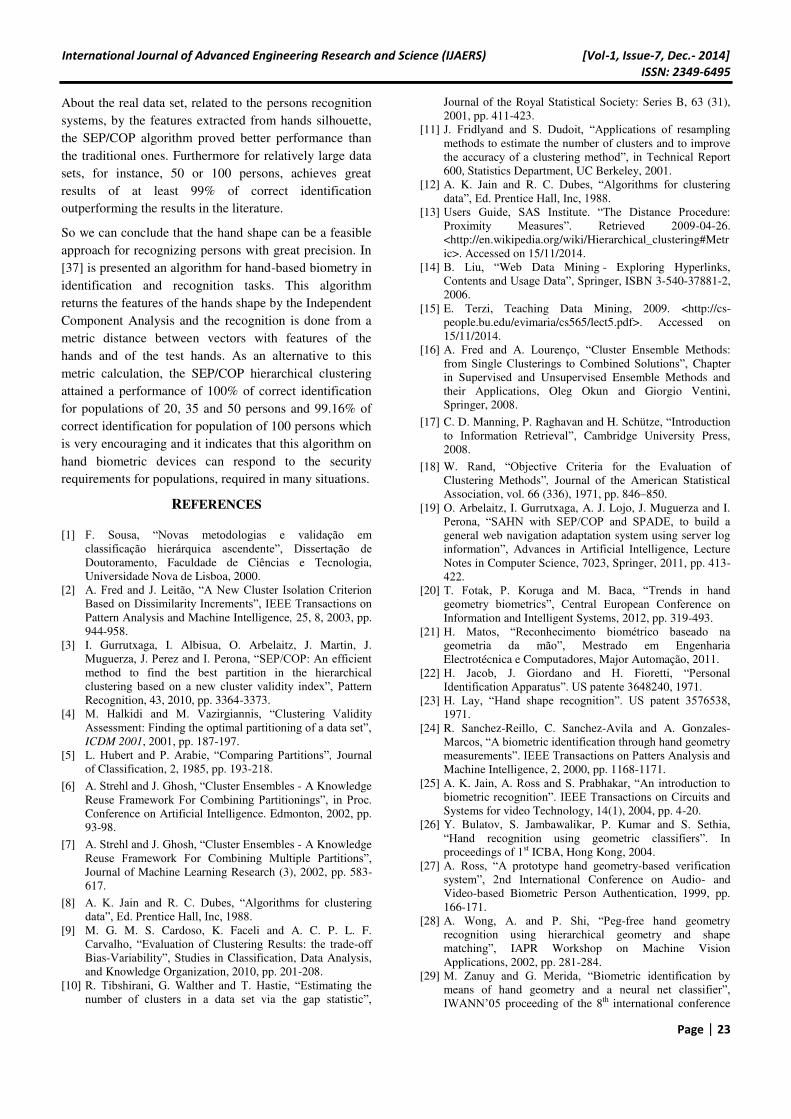
Fig. 7- Representation of data sets, a) d1c3v1_1n4, b)
d1c3v1_1n10, with noise data marked by arrows.
Fig. 8- Representation of the data sets d2c10 with
different noise levels, marked by the arrows, a) without
noise, b),c), d) with 5%, 10% and 20% of data noise,
respectively.
VI. RESULTS AND DISCUSS
In this section we show the results obtained in the
experiments described. First we focus on simulated data
sets and then on the real data sets.
Observing the results in Tables 5, in accordance of the
simulated data sets, the partitions of reference having
clusters with the same cardinalities, even different
homogeneity, the traditional algorithms with SL and AL
outperform the SEP/COP algorithm (ARI values with
higher averages and high values of the recovery rate of
the reference partition). But, when the separability of
clusters increases, the SEP/COP algorithms outperform
the traditional algorithms in all criteria aggregation (ARI
values with higher averages, high values of the recovery
rate of the reference partition and smaller standard
deviation).
In experiments where the partition of reference have
clusters with different cardinalities, homogeneity and
separability, the traditional algorithms with criteria
aggregation SL and AL, outperform the SEP/COP
algorithm (ARI values with higher averages and high
values of the recovery rate of the reference partition).
Unlike the traditional algorithms, the results obtained in
the SEP/COP approach depend little bit of the
aggregation criteria used.
The presence of noise, does not affect any of the
algorithms. In fact, the performance of SEP/COP
approach is even more apparent with the noise increasing
(ARI values with higher averages and high values of the
recovery rate of the reference partition).
According to the results of Table 6, where the reference
partition having clusters with cardinality random and
different between them(no much different), also, different
homogeneities and separability, this by a certain distance
imposed a priori avoiding clusters be closer together, the
algorithms have, approximate performance, although the
SEP/COP achieves always the best ARI average with
some aggregation criteria. Also all are affected by noise,
but the performance of SEP/COP approach seems to be
less affected.
In summary, regarding to a natural partition data in which
the clusters have approximately the same cardinality and
closer together, it was observed that the traditional
algorithms have similar performance to the algorithms
SEP/COP, in some cases even better. But being the
clusters well apart, the SEP/COP algorithms produced
better results than traditional algorithms, yielding in most
cases the true partitions. The SEP/COP has a better
performance at all cases with presence of noise.
Noting the Table 7, for the real data set, regarding to the
ARI values of the hierarchical clusterings, the SEP/COP
approach achieves the higher value for all data sets and
almost all aggregation criteria, namely with the AL, also
gets the best value for data sets of sizes 20, 35, and 50.
According to the ARI values from Table 7 and known
that the ARI is a measure of agreement between two
partitions, at this context, informs about the correct
identification of images of hands. Hence, is reasonable
consider as the correct percentage of identification of
persons. In Table 8 is stated the best percentage of
recognition achieved by the hierarchical algorithms and
for comparison, also the results obtained in [37]. The
SEP/COP algorithm, achieves the correct 100%
identification in some data sets, this means that is able to
identify correctly all the persons, in sets of 20, 35 or 50
persons, outperforming the works in literature. When the
data sets is scaled up to greater sizes the results show that
the SEP/COP algorithm can handle with even larger data
sets, with little bit degradation of performance
(approximately greater or equal to 95% of identification)
International Journal of Advanced Engineering Research and Science (IJAERS) [Vol-1, Issue-7, Dec.- 2014]
ISSN: 2349-6495
Page | 22
and still outperforming the works in literature for the data
set of 100 persons.
Summarizing, we notice that the SEP/COP algorithm
shows a great performs and moreover, 100% of correct
identification is rewarding since that the hand recognition
be a very promising way to identify people in particular,
flow control persons across borders.
Table 5: For each simulated data set, A- Comparison
between traditional hierarchical partitions and the
SEP/COP approach in terms of the average and standard
deviation of ARI. B- The percentage (in 1000) of
recovery of exact partition. A B
Data sets Traditional SEP/COP Traditional SEP/COP
d1c3v1_1
SL 0.6660 (0.1915) 0.6307 (0.1521) 24.7 14.5
CL 0.4959 (0.1205) 0.6307 (0.1521) 4.6 14.5
AL 0.6982 (0.2148) 0.6299 (0.1513) 31.2 14.3
d1c3v2_1
SL 0.8898 (0.1914) 0.9981 (0.0273) 75.1 98.8
CL 0.6116 (0.2361) 0.9976 (0.0305) 26.4 98.4
AL 0.8843 (0.1952) 0.9981 (0.0273) 73.7 98.8
d1c3v1_2
SL 0.7266 (0.2306) 0.6578 (0.1802) 41.4 21.7
CL 0.6114 (0.2391) 0.6569 (0.1796) 26.5 21.5
AL 0.7737 (0.2399) 0.6578 (0.1802) 51.7 21.7
d1c3v2_2
SL 0.9141 (0.1804) 0.9929 (0.0549) 81.5 98.3
CL 0.7655 (0.2645) 0.9924 (0.0566) 55.2 97.9
AL 0.9268 (0.1701) 0.9925 (0.0565) 84.1 98.2
d1c3v1_3
SL 0.9070 (0.0932) 0.8332 (0) 49.9 0
CL 0.6688 (0.0717) 0.8331 (0.0011) 1.8 0
AL 0.8656 (0.0987) 0.8331 (0.0011) 33.4 0
d1c3v2_3
SL 0.9755 (0.0626) 0.8543 (0.0556) 86.6 12.7
CL 0.7225 (0.1357) 0.8544 (0.0553) 16.7 12.2
AL 0.9544 (0.0815) 0.8544 (0.0558) 75.8 12.8
d1c3v1_1n4
SL 0.6601 (0.1978) 0.7337 (0.2176) 25.0 38.9
CL 0.7554 (0.2638) 0.7353 (0.2182) 49.5 39.6
AL 0.7536 (0.2297) 0.7362 (0.2183) 44.1 39.9
d1c3v1_1n10
SL 0.6804 (0.1870) 0.9458 (0.1360) 25.1 83.3
CL 0.5613 (0.1966) 0.9567 (0.1242) 15.5 86.3
AL 0.5534 (0.1272) 0.9551 (0.1262) 6.4 86.4
Table 6: For each simulated data set, comparison
between traditional hierarchical partitions and the
SEP/COP approach in terms of the average of ARI. Data sets Traditional SEP/COP
d2c10
SL 0.9825 (0.0390) 0.9826 (0.0368)
CL 0.9873 (0.0401) 0.9896 (0.0279)
AL 0.9886 (0.0361) 0.9885 (0.0275)
d2c10n5
SL 0.8530 (0.0828) 0.9306 (0.0467)
CL 0.9102 (0.0549) 0.9024 (0.0719)
AL 0.9066 (0.0357) 0.9024 (0.0719)
d2c10n10
SL 0.8628 (0.0748) 0.8916 (0.0579)
CL 0.8616 (0.0746) 0.8914 (0.0522)
AL 0.8608 (0.0750) 0.8987 (0.0472)
d2c10n20
SL 0.7362 (0.0517) 0.8560 (0.0650)
CL 0.7490 (0.0427) 0.8504 (0.0693)
AL 0.7468 (0.0460) 0.8560 (0.0650)
Table 7: For real data sets, comparison between
traditional hierarchical partitions and the SEP/COP
approach in terms of ARI for given size of hand set. Size of
hand set
Traditional SEP/COP
20
SL 0.9825 (0.0390) 0.9826 (0.0368)
CL 0.9873 (0.0401) 0.9896 (0.0279)
AL 0.9886 (0.0361) 0.9885 (0.0275)
35
SL 0.8530 (0.0828) 0.9306 (0.0467)
CL 0.9102 (0.0549) 0.9024 (0.0719)
AL 0.9066 (0.0357) 0.9024 (0.0719)
50
SL 0.8628 (0.0748) 0.8916 (0.0579)
CL 0.8616 (0.0746) 0.8914 (0.0522)
AL 0.8608 (0.0750) 0.8987 (0.0472)
70
SL 0.7362 (0.0517) 0.8560 (0.0650)
CL 0.7490 (0.0427) 0.8504 (0.0693)
AL 0.7468 (0.0460) 0.8560 (0.0650)
Table 8: Comparison of the correct recognition
percentage, by the best result of traditional and SEP/COP
hierarchical algorithms and the results in [37] for given
size of hand set. Size of hand set [37] Traditional SEP/COP
20 99.48 100 100
35 99.40 94.83 100
50 99.27 87.20 100
70 99.03 94.88 94.95
100 98.81 87.29 99.16
458 97.31 78.85 95.18
VII. CONCLUSION
The aim of this study was the comparison of the
traditional approach with the proposed approach
SEP/COP, for choose the best partition when interpreting
a hierarchy.
Both approaches were implemented computationally
using the Matlab version 7.10.0.499 and R project version
2.12.2, on Platform: x86_64-pc-mingw32/x64 (64-bit).
Experiments were performed with simulated data sets and
real data related with biometrics of the hand shape, for the
performance comparison of the two approaches.
Regarding to the simulated data, these experiences
allowed not choose one approach, since neither approach
has proved be in all situations consistently better. The
SEP/COP algorithm have shown to be good solution
towards to situations, clusters well apart and clusters with
the same cardinality, bit depending on the aggregation
criteria applied and more robust to the presence of noise.
International Journal of Advanced Engineering Research and Science (IJAERS) [Vol-1, Issue-7, Dec.- 2014]
ISSN: 2349-6495
Page | 23
About the real data set, related to the persons recognition
systems, by the features extracted from hands silhouette,
the SEP/COP algorithm proved better performance than
the traditional ones. Furthermore for relatively large data
sets, for instance, 50 or 100 persons, achieves great
results of at least 99% of correct identification
outperforming the results in the literature.
So we can conclude that the hand shape can be a feasible
approach for recognizing persons with great precision. In
[37] is presented an algorithm for hand-based biometry in
identification and recognition tasks. This algorithm
returns the features of the hands shape by the Independent
Component Analysis and the recognition is done from a
metric distance between vectors with features of the
hands and of the test hands. As an alternative to this
metric calculation, the SEP/COP hierarchical clustering
attained a performance of 100% of correct identification
for populations of 20, 35 and 50 persons and 99.16% of
correct identification for population of 100 persons which
is very encouraging and it indicates that this algorithm on
hand biometric devices can respond to the security
requirements for populations, required in many situations.
REFERENCES
[1] F. Sousa, “Novas metodologias e validação em classificação hierárquica ascendente”, Dissertação de Doutoramento, Faculdade de Ciências e Tecnologia,
Universidade Nova de Lisboa, 2000.
[2] A. Fred and J. Leitão, “A New Cluster Isolation Criterion Based on Dissimilarity Increments”, IEEE Transactions on Pattern Analysis and Machine Intelligence, 25, 8, 2003, pp.
944-958.
[3] I. Gurrutxaga, I. Albisua, O. Arbelaitz, J. Martin, J.
Muguerza, J. Perez and I. Perona, “SEP/COP: An efficient method to find the best partition in the hierarchical
clustering based on a new cluster validity index”, Pattern Recognition, 43, 2010, pp. 3364-3373.
[4] M. Halkidi and M. Vazirgiannis, “Clustering Validity
Assessment: Finding the optimal partitioning of a data set”, ICDM 2001, 2001, pp. 187-197.
[5] L. Hubert and P. Arabie, “Comparing Partitions”, Journal
of Classification, 2, 1985, pp. 193-218.
[6] A. Strehl and J. Ghosh, “Cluster Ensembles - A Knowledge
Reuse Framework For Combining Partitionings”, in Proc. Conference on Artificial Intelligence. Edmonton, 2002, pp.
93-98.
[7] A. Strehl and J. Ghosh, “Cluster Ensembles - A Knowledge
Reuse Framework For Combining Multiple Partitions”, Journal of Machine Learning Research (3), 2002, pp. 583-
617.
[8] A. K. Jain and R. C. Dubes, “Algorithms for clustering data”, Ed. Prentice Hall, Inc, 1988.
[9] M. G. M. S. Cardoso, K. Faceli and A. C. P. L. F.
Carvalho, “Evaluation of Clustering Results: the trade-off
Bias-Variability”, Studies in Classification, Data Analysis,
and Knowledge Organization, 2010, pp. 201-208.
[10] R. Tibshirani, G. Walther and T. Hastie, “Estimating the number of clusters in a data set via the gap statistic”,
Journal of the Royal Statistical Society: Series B, 63 (31),
2001, pp. 411-423.
[11] J. Fridlyand and S. Dudoit, “Applications of resampling methods to estimate the number of clusters and to improve
the accuracy of a clustering method”, in Technical Report 600, Statistics Department, UC Berkeley, 2001.
[12] A. K. Jain and R. C. Dubes, “Algorithms for clustering data”, Ed. Prentice Hall, Inc, 1988.
[13] Users Guide, SAS Institute. “The Distance Procedure: Proximity Measures”. Retrieved 2009-04-26.
<http://en.wikipedia.org/wiki/Hierarchical_clustering#Metr
ic>. Accessed on 15/11/2014.
[14] B. Liu, “Web Data Mining - Exploring Hyperlinks,
Contents and Usage Data”, Springer, ISBN 3-540-37881-2,
2006.
[15] E. Terzi, Teaching Data Mining, 2009. <http://cs-
people.bu.edu/evimaria/cs565/lect5.pdf>. Accessed on
15/11/2014.
[16] A. Fred and A. Lourenço, “Cluster Ensemble Methods:
from Single Clusterings to Combined Solutions”, Chapter
in Supervised and Unsupervised Ensemble Methods and
their Applications, Oleg Okun and Giorgio Ventini,
Springer, 2008.
[17] C. D. Manning, P. Raghavan and H. Schütze, “Introduction
to Information Retrieval”, Cambridge University Press,
2008.
[18] W. Rand, “Objective Criteria for the Evaluation of Clustering Methods”, Journal of the American Statistical
Association, vol. 66 (336), 1971, pp. 846–850.
[19] O. Arbelaitz, I. Gurrutxaga, A. J. Lojo, J. Muguerza and I.
Perona, “SAHN with SEP/COP and SPADE, to build a general web navigation adaptation system using server log
information”, Advances in Artificial Intelligence, Lecture Notes in Computer Science, 7023, Springer, 2011, pp. 413-
422.
[20] T. Fotak, P. Koruga and M. Baca, “Trends in hand geometry biometrics”, Central European Conference on Information and Intelligent Systems, 2012, pp. 319-493.
[21] H. Matos, “Reconhecimento biométrico baseado na geometria da mão”, Mestrado em Engenharia Electrotécnica e Computadores, Major Automação, 2011.
[22] H. Jacob, J. Giordano and H. Fioretti, “Personal Identification Apparatus”. US patente 3648240, 1971.
[23] H. Lay, “Hand shape recognition”. US patent 3576538, 1971.
[24] R. Sanchez-Reillo, C. Sanchez-Avila and A. Gonzales-
Marcos, “A biometric identification through hand geometry measurements”. IEEE Transactions on Patters Analysis and Machine Intelligence, 2, 2000, pp. 1168-1171.
[25] A. K. Jain, A. Ross and S. Prabhakar, “An introduction to biometric recognition”. IEEE Transactions on Circuits and Systems for video Technology, 14(1), 2004, pp. 4-20.
[26] Y. Bulatov, S. Jambawalikar, P. Kumar and S. Sethia,
“Hand recognition using geometric classifiers”. In proceedings of 1st ICBA, Hong Kong, 2004.
[27] A. Ross, “A prototype hand geometry-based verification
system”, 2nd International Conference on Audio- and
Video-based Biometric Person Authentication, 1999, pp.
166-171.
[28] A. Wong, A. and P. Shi, “Peg-free hand geometry
recognition using hierarchical geometry and shape
matching”, IAPR Workshop on Machine Vision
Applications, 2002, pp. 281-284.
[29] M. Zanuy and G. Merida, “Biometric identification by means of hand geometry and a neural net classifier”, IWANN’05 proceeding of the 8th international conference
International Journal of Advanced Engineering Research and Science (IJAERS) [Vol-1, Issue-7, Dec.- 2014]
ISSN: 2349-6495
Page | 24
on Artificial Neural Networks: Computational Intelligence
and Bioinspired Systems, Springer, 2005, pp. 1172-1179.
[30] M. Adan, A. Adan, A. Vasquez and R. Torres, “Biometric verification/identification based on hands natural layout”, Image and Vision Computing, 26(4), 2008, pp. 451-465.
[31] J. Montalvão, L. Molina and J. Canuto, “Robust hand image processing for biometric application”, Pattern Analysis and Application, 13(4), 2010, pp. 397-407.
[32] A. Kumar, D. Wong, H. Shen and A. Jain, “Personal verification using palmprint and hand geometry biometric”, Lecture Notes in Computer Science, 2688, 2003, pp. 668-
678.
[33] F. Magalhães, H. Oliveira and A. Campilho, “A new
method for the detection of singular points in fingerprint
images”, Proccedings of the IEEE Workshop on
Applications of Computer Vision, 2009, pp. 157-162.
[34] M. Zanuy, D. Elisondo, M. Ballester and C. Gonzalez,
“Authentication of individuals using hand geometry
biometrics: A neural network approach”. Neural Process
Lett, 26, 2007, pp. 201-216.
[35] D. Liliana and E. Utaminingsih, “The combination of palm print and hand geometry for biometrics palm recognition”, International Journal of Video & Image Processing and
Network Security, 12(1), 2012, pp. 1-5.
[36] Bosphorus Hand Database.
<http://bosphorus.ee.boun.edu.tr/hand/home.aspx>,
accessed on 28/11/2014.
[37] E. Konukoglu, E. Yoruk, J. Darbon and B. Sankur, “Shape-
based hand recognition”, IEEE Trans. on Image
Processing, 15(7), 2006, pp. 1803-1815.
[38] S. Raut and V. Humbe, “Biometric palm prints feature matching for person identification”, I.J. Modern Education and Computer Science, 11, 2012, pp. 61-69.
[39] K. Hasija and R. Mehna, “Analysis of various methodology
of hand gesture recognition system using Matlab”, International Journal of Advanced Engineering Research
and Science, Issue 5, vol. 1, 2014, pp. 28-32.
[40] A. Jain and N. Duta, “Deformable matching of hand shapes for verification”, Proc. Of Int. Conf. on Image Processing,
1999.
[41] H. Dutagaci, B. Sankur and E. Yoruk, “A comparative
analysis of global hand appearance-based person
recognition”, J. Electronic Imaging, 17(1), 011018/1-
011018/19, Jan-March, 2008.
[42] H. Dutagaci and E. Yoruk, “Hand Biometry”, Image And
Vision Computing, 24(5), 2006, pp.483-497.
Copyright © 2022 FDOKUMEN