The antisaccade task in a sample of 2,006 young males
11
Exp Brain Res (2002) 147:53–63 DOI 10.1007/s00221-002-1207-5 RESEARCH ARTICLE N. Smyrnis · I. Evdokimidis · N. C. Stefanis · T. S. Constantinidis · D. Avramopoulos · C. Theleritis · C. Paximadis · C. Efstratiadis · G. Kastrinakis · C. N. Stefanis The antisaccade task in a sample of 2,006 young males II. Effects of task parameters Received: 30 January 2002 / Accepted: 14 June 2002 / Published online: 13 September 2002 # Springer-Verlag 2002 Abstract Antisaccade performance was investigated in a sample of 2,006 young males as part of a large epidemiological study investigating psychosis proneness. This report summarizes the effects of task parameters on performance using a sample of 55,678 antisaccade trials collected from a subpopulation of 947 individuals. Neither the amplitude nor the latency of an error prosaccade in the antisaccade task was correlated with the latency of the ensuing corrective antisaccade that almost always followed an error. However, the latency of the corrective antisaccade decreased with increasing stimulus distance. Concerning the effects of specific task parameters, trials with stimuli closer to the central fixation point and trials preceded by shorter fixation intervals resulted in more errors and longer latencies for the antisaccades. Finally, there were learning and fatigue effects reflected mainly in the error rate, which was greater at the beginning and at the end of the 5-min task. We used a model to predict whether an error or a correct antisaccade would follow a particular trial. All task parameters were significant predictors of the trial out- come but their power was negligible. However, when modeled alone, response latency of the first movement predicted 40% of errors. In particular, the smaller this latency was, the higher the probability of an error. These findings are discussed in light of current hypotheses on antisaccade production mechanisms involving mainly the superior colliculus. Keywords Antisaccade · Saccade · Volitional saccade · Reflex saccade · Attention · Inhibition · Saccade programming · Saccadic latency · Frontal lobe · Superior colliculus Introduction The antisaccade task has been widely used in the study of neurological and psychiatric diseases as an indicator of frontal lobe dysfunction (Everling and Fischer 1998). Functional imaging studies investigating the anatomical substrate of antisaccade movements showed that, in fact, a complex network of cortical and subcortical areas are activated when humans perform this task (O’Driscoll et al. 1995; Sweeney et al. 1996). Studies with primates have identified that increased neuronal activity in the lateral intraparietal area (LIP) (Zhang and Barash 2000), supplementary eye field (SEF) (Schlag-Rey et al. 1997), frontal eye field (FEF) (Everling and Munoz 2000), dorsolateral prefrontal cortex (DLPC) (Funahashi et al. 1993) and superior colliculus (Everling et al. 1999) are related to the direction of an impending volitional antisaccade eye movement. Thus, neurophysiological data support the hypothesis that the volitional antisaccade is indeed programmed and executed by a complex circuit involving both cortical and subcortical areas. In part I of this work (Evdokimidis et al. 2002), we reported the results from the analysis of antisaccade task performance indices in a sample of 2,006 young males recruited from the Greek Air Force. The analyses focused on indices of performance for each subject and the correlation of these indices with other data about the individual such as IQ. In this second part, we pooled together a large set of individual trials from a randomly chosen subpopulation of 947 subjects to study the specific effects of task parameters on performance. Thus, we categorized individual trials according to stimulus direc- tion and distance, according to the preceding fixation interval, and according to the presence or absence of a sequence of trials that often precedes a perseveration N. Smyrnis · I. Evdokimidis ( ) ) · T.S. Constantinidis · C. Theleritis · C. Paximadis · C. Efstratiadis · G. Kastrinakis Cognition and Action Group, National University of Athens, Neurology Clinic, Aeginition Hospital, 72 Vas. Sofias Ave., Athens 11528, Greece e-mail: [email protected] Tel.: +30-1-7293244 Fax: +30-1-7216424 N. Smyrnis · N.C. Stefanis · T.S. Constantinidis · D. Avramopoulos · C.N. Stefanis University Mental Health Research Institute, National University of Athens, Athens, Greece
-
Upload
independent -
Category
Documents
-
view
4 -
download
0
Transcript of The antisaccade task in a sample of 2,006 young males
Exp Brain Res (2002) 147:53–63DOI 10.1007/s00221-002-1207-5
R E S E A R C H A R T I C L E
N. Smyrnis · I. Evdokimidis · N. C. Stefanis ·T. S. Constantinidis · D. Avramopoulos · C. Theleritis ·C. Paximadis · C. Efstratiadis · G. Kastrinakis ·C. N. Stefanis
The antisaccade task in a sample of 2,006 young malesII. Effects of task parametersReceived: 30 January 2002 / Accepted: 14 June 2002 / Published online: 13 September 2002� Springer-Verlag 2002
Abstract Antisaccade performance was investigated in asample of 2,006 young males as part of a largeepidemiological study investigating psychosis proneness.This report summarizes the effects of task parameters onperformance using a sample of 55,678 antisaccade trialscollected from a subpopulation of 947 individuals.Neither the amplitude nor the latency of an errorprosaccade in the antisaccade task was correlated withthe latency of the ensuing corrective antisaccade thatalmost always followed an error. However, the latency ofthe corrective antisaccade decreased with increasingstimulus distance. Concerning the effects of specific taskparameters, trials with stimuli closer to the centralfixation point and trials preceded by shorter fixationintervals resulted in more errors and longer latencies forthe antisaccades. Finally, there were learning and fatigueeffects reflected mainly in the error rate, which wasgreater at the beginning and at the end of the 5-min task.We used a model to predict whether an error or a correctantisaccade would follow a particular trial. All taskparameters were significant predictors of the trial out-come but their power was negligible. However, whenmodeled alone, response latency of the first movementpredicted 40% of errors. In particular, the smaller thislatency was, the higher the probability of an error. Thesefindings are discussed in light of current hypotheses onantisaccade production mechanisms involving mainly thesuperior colliculus.
Keywords Antisaccade · Saccade · Volitional saccade ·Reflex saccade · Attention · Inhibition · Saccadeprogramming · Saccadic latency · Frontal lobe · Superiorcolliculus
Introduction
The antisaccade task has been widely used in the study ofneurological and psychiatric diseases as an indicator offrontal lobe dysfunction (Everling and Fischer 1998).Functional imaging studies investigating the anatomicalsubstrate of antisaccade movements showed that, in fact, acomplex network of cortical and subcortical areas areactivated when humans perform this task (O’Driscoll etal. 1995; Sweeney et al. 1996). Studies with primateshave identified that increased neuronal activity in thelateral intraparietal area (LIP) (Zhang and Barash 2000),supplementary eye field (SEF) (Schlag-Rey et al. 1997),frontal eye field (FEF) (Everling and Munoz 2000),dorsolateral prefrontal cortex (DLPC) (Funahashi et al.1993) and superior colliculus (Everling et al. 1999) arerelated to the direction of an impending volitionalantisaccade eye movement. Thus, neurophysiologicaldata support the hypothesis that the volitional antisaccadeis indeed programmed and executed by a complex circuitinvolving both cortical and subcortical areas.
In part I of this work (Evdokimidis et al. 2002), wereported the results from the analysis of antisaccade taskperformance indices in a sample of 2,006 young malesrecruited from the Greek Air Force. The analyses focusedon indices of performance for each subject and thecorrelation of these indices with other data about theindividual such as IQ. In this second part, we pooledtogether a large set of individual trials from a randomlychosen subpopulation of 947 subjects to study the specificeffects of task parameters on performance. Thus, wecategorized individual trials according to stimulus direc-tion and distance, according to the preceding fixationinterval, and according to the presence or absence of asequence of trials that often precedes a perseveration
N. Smyrnis · I. Evdokimidis ()) · T.S. Constantinidis ·C. Theleritis · C. Paximadis · C. Efstratiadis · G. KastrinakisCognition and Action Group, National University of Athens,Neurology Clinic, Aeginition Hospital, 72 Vas. Sofias Ave.,Athens 11528, Greecee-mail: [email protected].: +30-1-7293244Fax: +30-1-7216424
N. Smyrnis · N.C. Stefanis · T.S. Constantinidis · D. Avramopoulos ·C.N. StefanisUniversity Mental Health Research Institute,National University of Athens, Athens, Greece
error. We also investigated the effect of the trial positionwithin the trial sequence to test for the existence oflearning and fatigue effects. We then included suchstimulus parameters in regression models in an effort topredict a specific trial outcome (error or correct, latencyof first eye movement, latency of corrective eye-move-ment after an error). This analysis provided some insightsinto the possible mechanisms of antisaccade generationthat are discussed in conjunction with published neuro-physiological data concerning the performance of anti-saccades in primates.
Materials and methods
The subject population, the experimental setup for the antisaccadetask and the recording procedures have been described in detail inpart I of this report (Evdokimidis et al. 2002).
In the present analysis, we investigated the effects of taskparameters on performance. We selected a random subset of 947subjects (47% of the total population of 2,006 subjects) whose trialsincluded all parameters of interest, thus forming a set of 55,678individual trials. The reason for including a randomly selectedsubset of individuals was that of forming a smaller data set of singletrial data. Using the whole population would result in over 100,000individual trials and the statistical processing of such a huge dataset presented technical problems. From a statistical point of viewwe did not expect an increase of n from 55,678 to 100,000 to affectthe resulting inferences, as both numbers were already extremelylarge. The same criteria for validity of a trial were used as describedin part I (Evdokimidis et al. 2002), namely that there where noartifacts occurring for 100 ms before the appearance of the stimulusfor the antisaccade movement and that the response latency wasmore than 80 ms and less than 600 ms. All 947 subjects performedat least 40 valid trials. For each trial we evaluated:
1. The trial outcome (ER), which was either an error prosaccade(code =1) or correct antisaccade (code =0).
2. The latency of the first response (first eye movement) (L),irrespective of whether this response was a correct antisaccadeor an error prosaccade.
3. The latency of the first eye movement if the trial was a correctantisaccade (LA).
4. The latency of the first eye movement if the trial was an error(LE).
5. The latency of correction (LC), which was the time intervalbetween the end of the error prosaccade and the beginning ofthe corrective antisaccade in an error trial.
6. The latency to the corrective antisaccade from the appearance ofthe peripheral stimulus in error trials (LEC). For each error trialLEC = LE + duration of error prosaccade + LC.
7. The amplitude of the error prosaccade in degrees (EA).
We evaluated the above measures in relation to the followingtask parameters:
1. The stimulus direction, (DIR; right =1, left =0).2. The stimulus distance (DIS) in degrees (2–10�). We also
defined two categorical variables related to stimulus distance:the variable NEAR was set to 1 if the distance of the stimuluswas 2� and 0 for all other distances; the variable FAR was set to1 for distances of 8–10� and 0 for all other distances.
3. The time interval of fixation (FIX) before the appearance of theperipheral stimulus, which varied randomly from 1 to 2 s. Thistime interval reflected the inter-trial interval. We also binnedthe fixation time interval into ten categories of 100 ms intervals.
4. The running time in the task, measured in numbers of trials.Specifically, we divided the sequence of 90 trials into nine time
intervals of ten trials each. We further defined two variables inour regression models related to the time in the task. The first,termed LEARN, was set to 1 if the trial was one of the first tentrials performed and was set to 0 for all subsequent trials. Thesecond, termed FATIGUE, was set to 1 if the trial was one ofthe last 20 trials performed and was set to 0 for all other trials inthe task.
5. Whether or not the trial was perseveration prone (PERS =1 or 0,respectively). A perseveration prone trial was defined asfollows:
a. A sequence of two correct antisaccades was executed to theright or to the left and the instruction in the current trial was abreak of the sequence direction (sequence RR current trial L,sequence LL current trial R).
b. A sequence of two alternations of right, left or left, right wasperformed and the current instruction was a break from thealternation pattern (sequence RLRL current trial L, sequenceLRLR current trial R).
We used a logistic regression analysis to predict ER from thetask variables. We included L in a separate analysis as a predictor.We used linear regression analysis to predict L, LA, LE, LC andLEC from the task variables as previously defined. For theprediction of LC, we also included LE and EA as predictors in aseparate analysis. These analyses were implemented using Statsticav. 5.5 (Statsoft Co., Tulsa, Okla., USA) and SPSS 10.0 forWindows. In the results section SD refers to standard deviation andSEM to standard error of the mean.
Results
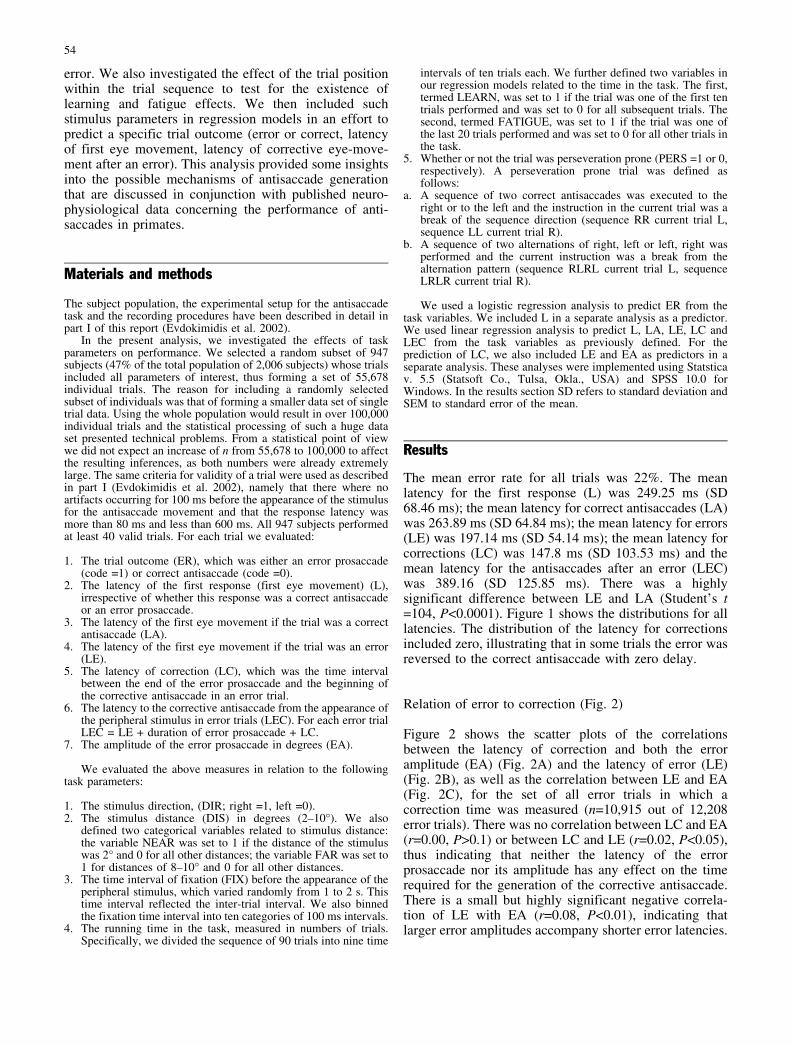
The mean error rate for all trials was 22%. The meanlatency for the first response (L) was 249.25 ms (SD68.46 ms); the mean latency for correct antisaccades (LA)was 263.89 ms (SD 64.84 ms); the mean latency for errors(LE) was 197.14 ms (SD 54.14 ms); the mean latency forcorrections (LC) was 147.8 ms (SD 103.53 ms) and themean latency for the antisaccades after an error (LEC)was 389.16 (SD 125.85 ms). There was a highlysignificant difference between LE and LA (Student’s t=104, P<0.0001). Figure 1 shows the distributions for alllatencies. The distribution of the latency for correctionsincluded zero, illustrating that in some trials the error wasreversed to the correct antisaccade with zero delay.
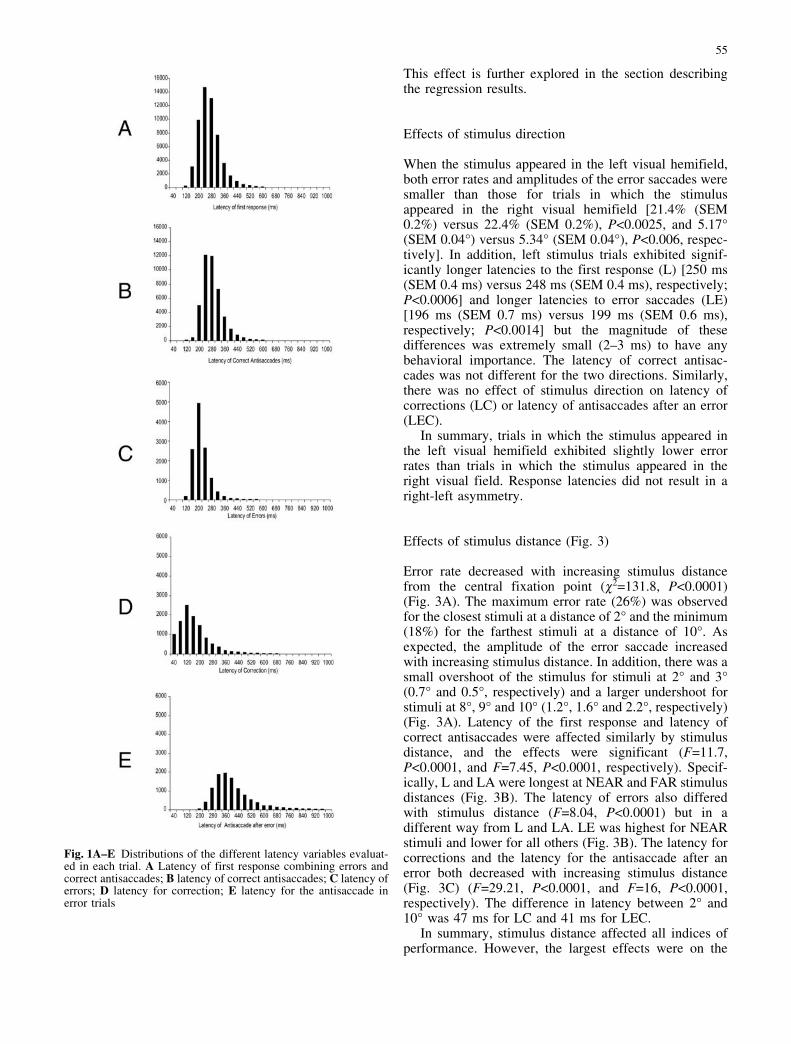
Relation of error to correction (Fig. 2)
Figure 2 shows the scatter plots of the correlationsbetween the latency of correction and both the erroramplitude (EA) (Fig. 2A) and the latency of error (LE)(Fig. 2B), as well as the correlation between LE and EA(Fig. 2C), for the set of all error trials in which acorrection time was measured (n=10,915 out of 12,208error trials). There was no correlation between LC and EA(r=0.00, P>0.1) or between LC and LE (r=0.02, P<0.05),thus indicating that neither the latency of the errorprosaccade nor its amplitude has any effect on the timerequired for the generation of the corrective antisaccade.There is a small but highly significant negative correla-tion of LE with EA (r=0.08, P<0.01), indicating thatlarger error amplitudes accompany shorter error latencies.
54
This effect is further explored in the section describingthe regression results.
Effects of stimulus direction
When the stimulus appeared in the left visual hemifield,both error rates and amplitudes of the error saccades weresmaller than those for trials in which the stimulusappeared in the right visual hemifield [21.4% (SEM0.2%) versus 22.4% (SEM 0.2%), P<0.0025, and 5.17�(SEM 0.04�) versus 5.34� (SEM 0.04�), P<0.006, respec-tively]. In addition, left stimulus trials exhibited signif-icantly longer latencies to the first response (L) [250 ms(SEM 0.4 ms) versus 248 ms (SEM 0.4 ms), respectively;P<0.0006] and longer latencies to error saccades (LE)[196 ms (SEM 0.7 ms) versus 199 ms (SEM 0.6 ms),respectively; P<0.0014] but the magnitude of thesedifferences was extremely small (2–3 ms) to have anybehavioral importance. The latency of correct antisac-cades was not different for the two directions. Similarly,there was no effect of stimulus direction on latency ofcorrections (LC) or latency of antisaccades after an error(LEC).
In summary, trials in which the stimulus appeared inthe left visual hemifield exhibited slightly lower errorrates than trials in which the stimulus appeared in theright visual field. Response latencies did not result in aright-left asymmetry.
Effects of stimulus distance (Fig. 3)
Error rate decreased with increasing stimulus distancefrom the central fixation point (c2=131.8, P<0.0001)(Fig. 3A). The maximum error rate (26%) was observedfor the closest stimuli at a distance of 2� and the minimum(18%) for the farthest stimuli at a distance of 10�. Asexpected, the amplitude of the error saccade increasedwith increasing stimulus distance. In addition, there was asmall overshoot of the stimulus for stimuli at 2� and 3�(0.7� and 0.5�, respectively) and a larger undershoot forstimuli at 8�, 9� and 10� (1.2�, 1.6� and 2.2�, respectively)(Fig. 3A). Latency of the first response and latency ofcorrect antisaccades were affected similarly by stimulusdistance, and the effects were significant (F=11.7,P<0.0001, and F=7.45, P<0.0001, respectively). Specif-ically, L and LA were longest at NEAR and FAR stimulusdistances (Fig. 3B). The latency of errors also differedwith stimulus distance (F=8.04, P<0.0001) but in adifferent way from L and LA. LE was highest for NEARstimuli and lower for all others (Fig. 3B). The latency forcorrections and the latency for the antisaccade after anerror both decreased with increasing stimulus distance(Fig. 3C) (F=29.21, P<0.0001, and F=16, P<0.0001,respectively). The difference in latency between 2� and10� was 47 ms for LC and 41 ms for LEC.
In summary, stimulus distance affected all indices ofperformance. However, the largest effects were on the
Fig. 1A–E Distributions of the different latency variables evaluat-ed in each trial. A Latency of first response combining errors andcorrect antisaccades; B latency of correct antisaccades; C latency oferrors; D latency for correction; E latency for the antisaccade inerror trials
55
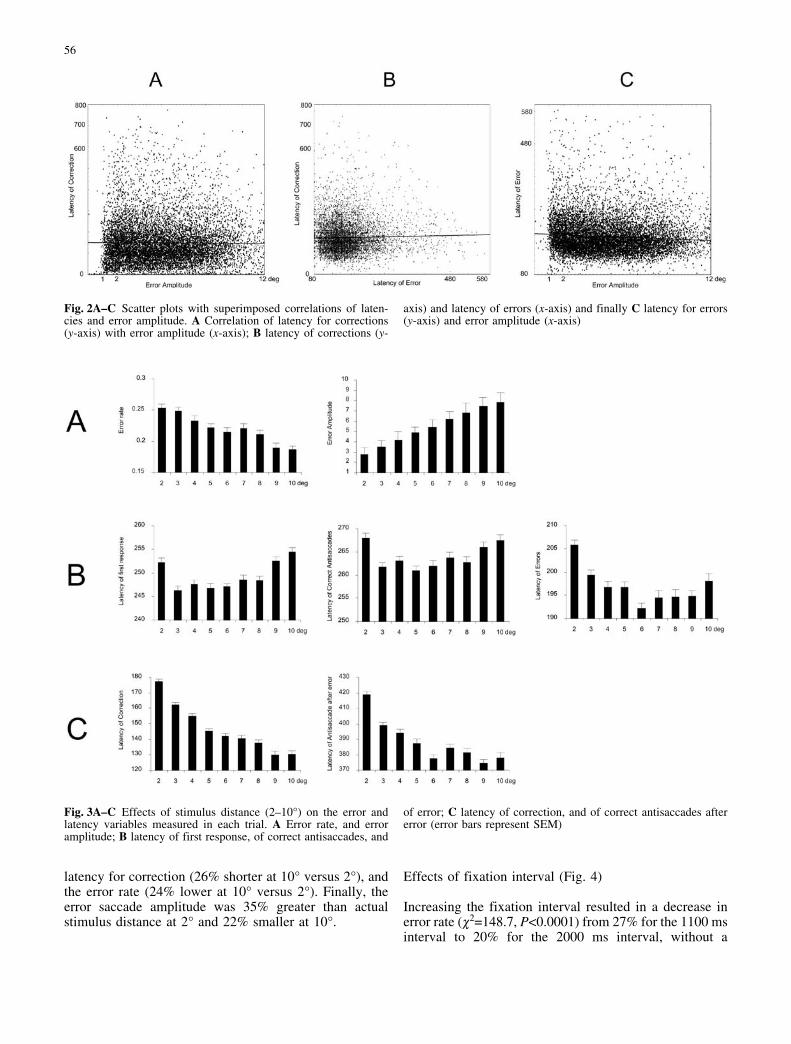
latency for correction (26% shorter at 10� versus 2�), andthe error rate (24% lower at 10� versus 2�). Finally, theerror saccade amplitude was 35% greater than actualstimulus distance at 2� and 22% smaller at 10�.
Effects of fixation interval (Fig. 4)
Increasing the fixation interval resulted in a decrease inerror rate (c2=148.7, P<0.0001) from 27% for the 1100 msinterval to 20% for the 2000 ms interval, without a
Fig. 3A–C Effects of stimulus distance (2–10�) on the error andlatency variables measured in each trial. A Error rate, and erroramplitude; B latency of first response, of correct antisaccades, and
of error; C latency of correction, and of correct antisaccades aftererror (error bars represent SEM)
Fig. 2A–C Scatter plots with superimposed correlations of laten-cies and error amplitude. A Correlation of latency for corrections(y-axis) with error amplitude (x-axis); B latency of corrections (y-
axis) and latency of errors (x-axis) and finally C latency for errors(y-axis) and error amplitude (x-axis)
56
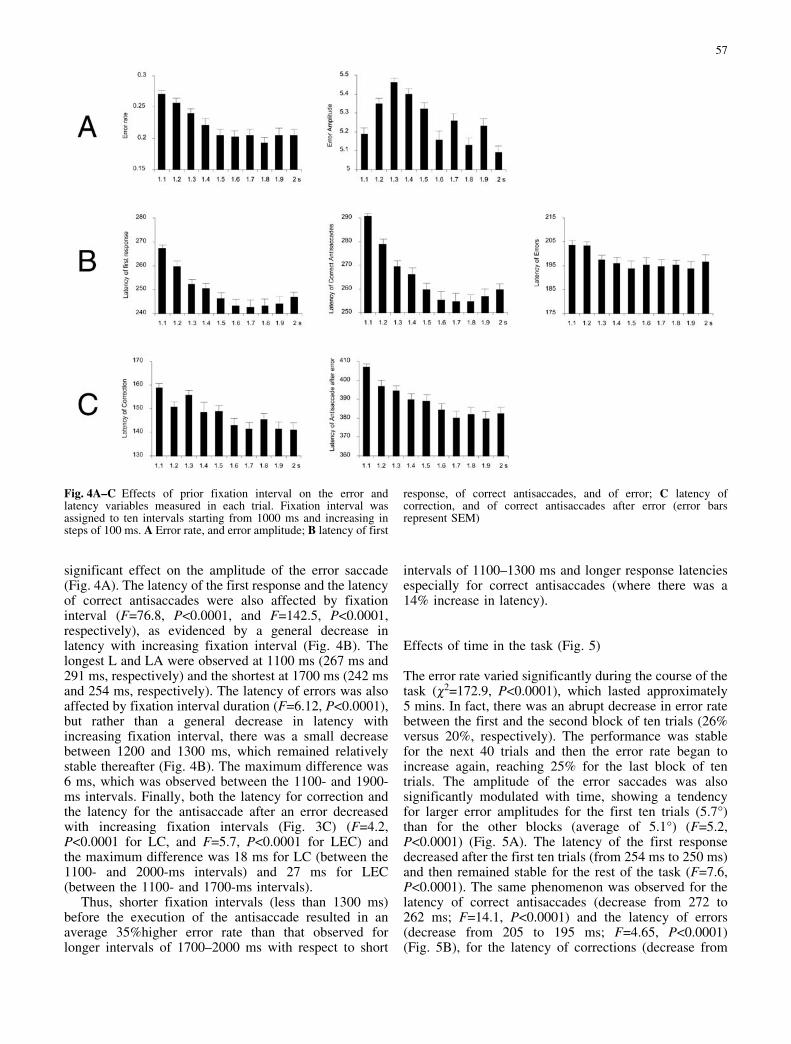
significant effect on the amplitude of the error saccade(Fig. 4A). The latency of the first response and the latencyof correct antisaccades were also affected by fixationinterval (F=76.8, P<0.0001, and F=142.5, P<0.0001,respectively), as evidenced by a general decrease inlatency with increasing fixation interval (Fig. 4B). Thelongest L and LA were observed at 1100 ms (267 ms and291 ms, respectively) and the shortest at 1700 ms (242 msand 254 ms, respectively). The latency of errors was alsoaffected by fixation interval duration (F=6.12, P<0.0001),but rather than a general decrease in latency withincreasing fixation interval, there was a small decreasebetween 1200 and 1300 ms, which remained relativelystable thereafter (Fig. 4B). The maximum difference was6 ms, which was observed between the 1100- and 1900-ms intervals. Finally, both the latency for correction andthe latency for the antisaccade after an error decreasedwith increasing fixation intervals (Fig. 3C) (F=4.2,P<0.0001 for LC, and F=5.7, P<0.0001 for LEC) andthe maximum difference was 18 ms for LC (between the1100- and 2000-ms intervals) and 27 ms for LEC(between the 1100- and 1700-ms intervals).
Thus, shorter fixation intervals (less than 1300 ms)before the execution of the antisaccade resulted in anaverage 35%higher error rate than that observed forlonger intervals of 1700–2000 ms with respect to short
intervals of 1100–1300 ms and longer response latenciesespecially for correct antisaccades (where there was a14% increase in latency).
Effects of time in the task (Fig. 5)
The error rate varied significantly during the course of thetask (c2=172.9, P<0.0001), which lasted approximately5 mins. In fact, there was an abrupt decrease in error ratebetween the first and the second block of ten trials (26%versus 20%, respectively). The performance was stablefor the next 40 trials and then the error rate began toincrease again, reaching 25% for the last block of tentrials. The amplitude of the error saccades was alsosignificantly modulated with time, showing a tendencyfor larger error amplitudes for the first ten trials (5.7�)than for the other blocks (average of 5.1�) (F=5.2,P<0.0001) (Fig. 5A). The latency of the first responsedecreased after the first ten trials (from 254 ms to 250 ms)and then remained stable for the rest of the task (F=7.6,P<0.0001). The same phenomenon was observed for thelatency of correct antisaccades (decrease from 272 to262 ms; F=14.1, P<0.0001) and the latency of errors(decrease from 205 to 195 ms; F=4.65, P<0.0001)(Fig. 5B), for the latency of corrections (decrease from
Fig. 4A–C Effects of prior fixation interval on the error andlatency variables measured in each trial. Fixation interval wasassigned to ten intervals starting from 1000 ms and increasing insteps of 100 ms. A Error rate, and error amplitude; B latency of first
response, of correct antisaccades, and of error; C latency ofcorrection, and of correct antisaccades after error (error barsrepresent SEM)
57
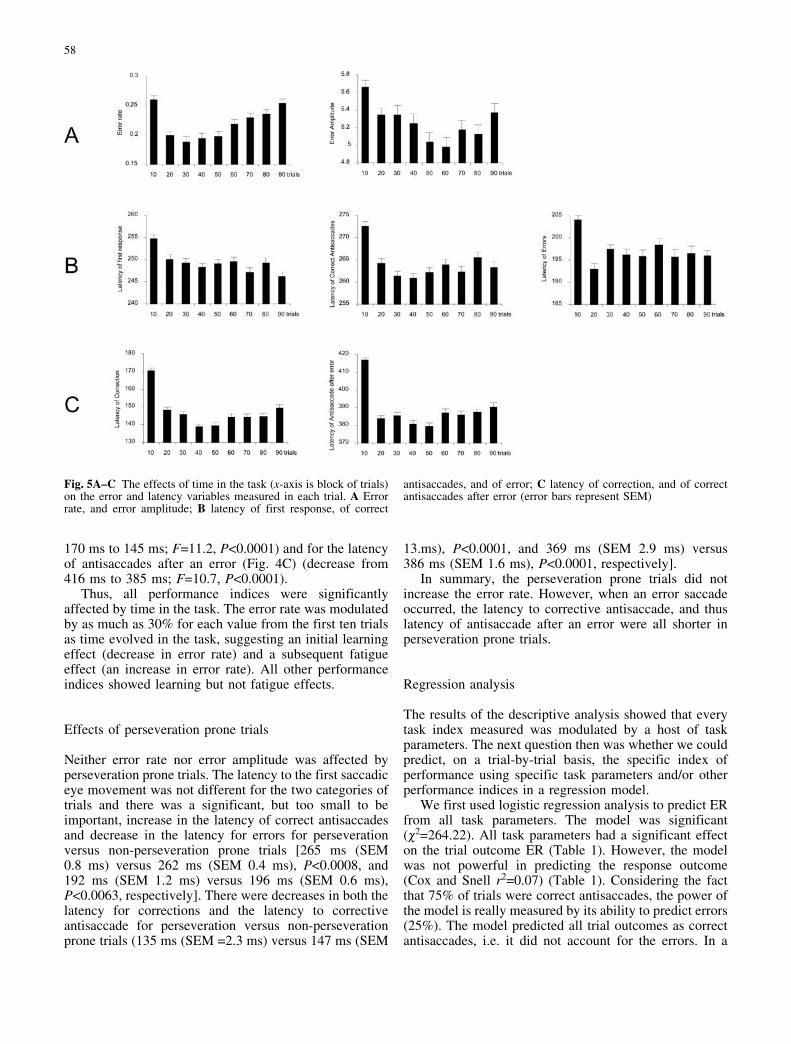
170 ms to 145 ms; F=11.2, P<0.0001) and for the latencyof antisaccades after an error (Fig. 4C) (decrease from416 ms to 385 ms; F=10.7, P<0.0001).
Thus, all performance indices were significantlyaffected by time in the task. The error rate was modulatedby as much as 30% for each value from the first ten trialsas time evolved in the task, suggesting an initial learningeffect (decrease in error rate) and a subsequent fatigueeffect (an increase in error rate). All other performanceindices showed learning but not fatigue effects.
Effects of perseveration prone trials
Neither error rate nor error amplitude was affected byperseveration prone trials. The latency to the first saccadiceye movement was not different for the two categories oftrials and there was a significant, but too small to beimportant, increase in the latency of correct antisaccadesand decrease in the latency for errors for perseverationversus non-perseveration prone trials [265 ms (SEM0.8 ms) versus 262 ms (SEM 0.4 ms), P<0.0008, and192 ms (SEM 1.2 ms) versus 196 ms (SEM 0.6 ms),P<0.0063, respectively]. There were decreases in both thelatency for corrections and the latency to correctiveantisaccade for perseveration versus non-perseverationprone trials (135 ms (SEM =2.3 ms) versus 147 ms (SEM
13.ms), P<0.0001, and 369 ms (SEM 2.9 ms) versus386 ms (SEM 1.6 ms), P<0.0001, respectively].
In summary, the perseveration prone trials did notincrease the error rate. However, when an error saccadeoccurred, the latency to corrective antisaccade, and thuslatency of antisaccade after an error were all shorter inperseveration prone trials.
Regression analysis
The results of the descriptive analysis showed that everytask index measured was modulated by a host of taskparameters. The next question then was whether we couldpredict, on a trial-by-trial basis, the specific index ofperformance using specific task parameters and/or otherperformance indices in a regression model.
We first used logistic regression analysis to predict ERfrom all task parameters. The model was significant(c2=264.22). All task parameters had a significant effecton the trial outcome ER (Table 1). However, the modelwas not powerful in predicting the response outcome(Cox and Snell r2=0.07) (Table 1). Considering the factthat 75% of trials were correct antisaccades, the power ofthe model is really measured by its ability to predict errors(25%). The model predicted all trial outcomes as correctantisaccades, i.e. it did not account for the errors. In a
Fig. 5A–C The effects of time in the task (x-axis is block of trials)on the error and latency variables measured in each trial. A Errorrate, and error amplitude; B latency of first response, of correct
antisaccades, and of error; C latency of correction, and of correctantisaccades after error (error bars represent SEM)
58
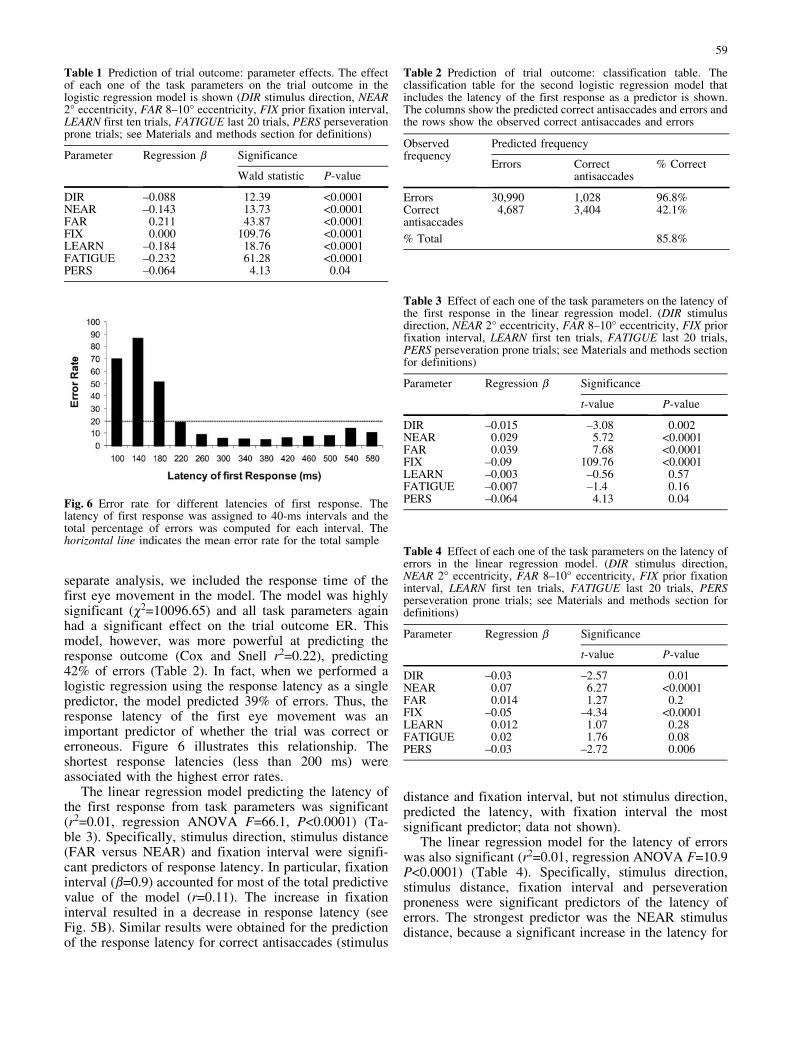
separate analysis, we included the response time of thefirst eye movement in the model. The model was highlysignificant (c2=10096.65) and all task parameters againhad a significant effect on the trial outcome ER. Thismodel, however, was more powerful at predicting theresponse outcome (Cox and Snell r2=0.22), predicting42% of errors (Table 2). In fact, when we performed alogistic regression using the response latency as a singlepredictor, the model predicted 39% of errors. Thus, theresponse latency of the first eye movement was animportant predictor of whether the trial was correct orerroneous. Figure 6 illustrates this relationship. Theshortest response latencies (less than 200 ms) wereassociated with the highest error rates.
The linear regression model predicting the latency ofthe first response from task parameters was significant(r2=0.01, regression ANOVA F=66.1, P<0.0001) (Ta-ble 3). Specifically, stimulus direction, stimulus distance(FAR versus NEAR) and fixation interval were signifi-cant predictors of response latency. In particular, fixationinterval (b=0.9) accounted for most of the total predictivevalue of the model (r=0.11). The increase in fixationinterval resulted in a decrease in response latency (seeFig. 5B). Similar results were obtained for the predictionof the response latency for correct antisaccades (stimulus
distance and fixation interval, but not stimulus direction,predicted the latency, with fixation interval the mostsignificant predictor; data not shown).
The linear regression model for the latency of errorswas also significant (r2=0.01, regression ANOVA F=10.9P<0.0001) (Table 4). Specifically, stimulus direction,stimulus distance, fixation interval and perseverationproneness were significant predictors of the latency oferrors. The strongest predictor was the NEAR stimulusdistance, because a significant increase in the latency for
Table 2 Prediction of trial outcome: classification table. Theclassification table for the second logistic regression model thatincludes the latency of the first response as a predictor is shown.The columns show the predicted correct antisaccades and errors andthe rows show the observed correct antisaccades and errors
Observedfrequency
Predicted frequency
Errors Correctantisaccades
% Correct
Errors 30,990 1,028 96.8%Correctantisaccades
4,687 3,404 42.1%
% Total 85.8%
Fig. 6 Error rate for different latencies of first response. Thelatency of first response was assigned to 40-ms intervals and thetotal percentage of errors was computed for each interval. Thehorizontal line indicates the mean error rate for the total sample
Table 3 Effect of each one of the task parameters on the latency ofthe first response in the linear regression model. (DIR stimulusdirection, NEAR 2� eccentricity, FAR 8–10� eccentricity, FIX priorfixation interval, LEARN first ten trials, FATIGUE last 20 trials,PERS perseveration prone trials; see Materials and methods sectionfor definitions)
Parameter Regression b Significance
t-value P-value
DIR –0.015 –3.08 0.002NEAR 0.029 5.72 <0.0001FAR 0.039 7.68 <0.0001FIX –0.09 109.76 <0.0001LEARN –0.003 –0.56 0.57FATIGUE –0.007 –1.4 0.16PERS –0.064 4.13 0.04
Table 4 Effect of each one of the task parameters on the latency oferrors in the linear regression model. (DIR stimulus direction,NEAR 2� eccentricity, FAR 8–10� eccentricity, FIX prior fixationinterval, LEARN first ten trials, FATIGUE last 20 trials, PERSperseveration prone trials; see Materials and methods section fordefinitions)
Parameter Regression b Significance
t-value P-value
DIR –0.03 –2.57 0.01NEAR 0.07 6.27 <0.0001FAR 0.014 1.27 0.2FIX –0.05 –4.34 <0.0001LEARN 0.012 1.07 0.28FATIGUE 0.02 1.76 0.08PERS –0.03 –2.72 0.006
Table 1 Prediction of trial outcome: parameter effects. The effectof each one of the task parameters on the trial outcome in thelogistic regression model is shown (DIR stimulus direction, NEAR2� eccentricity, FAR 8–10� eccentricity, FIX prior fixation interval,LEARN first ten trials, FATIGUE last 20 trials, PERS perseverationprone trials; see Materials and methods section for definitions)
Parameter Regression b Significance
Wald statistic P-value
DIR –0.088 12.39 <0.0001NEAR –0.143 13.73 <0.0001FAR 0.211 43.87 <0.0001FIX 0.000 109.76 <0.0001LEARN –0.184 18.76 <0.0001FATIGUE –0.232 61.28 <0.0001PERS –0.064 4.13 0.04
59
errors was observed for stimuli appearing at 2� from thecentral fixation point.
The linear regression model for the latency of correc-tions was significant (r2=0.02, regression ANOVAF=25.3, P<0.0001), and all task parameters exceptstimulus direction were significant predictors. The mostpowerful predictors were stimulus distance (FAR andNEAR variables) and fixation interval. Given that theeffect of increasing stimulus distance was a monotonicdecrease in correction time (see Fig. 4), we performed theanalysis using stimulus distance (DIS) as a continuousvariable (Table 5). DIS was the strongest predictor ofcorrection latency. We repeated the analysis using theamplitude of the error saccade instead of the stimulusdistance. Although the amplitude of the error saccade wasa significant predictor of the latency for correction, it wasmuch weaker than the stimulus distance (b-value –0.02versus –0.12, respectively), although the correlationbetween error amplitude and stimulus distance was, asexpected, very high (r=0.68, P<0.0001). Finally, weincluded the latency for the error saccade in our modeland observed that this factor was not a significantpredictor of the latency for correction, as expected fromour original correlation analysis.
The latency of the antisaccade after an error showedvery similar results in the regression analysis to those forthe latency for correction (data not shown) and again thestimulus distance was the most significant predictor ofthis latency.
Discussion
In this study, we investigated the effects of severalparameters related to stimulus presentation in the anti-saccade task on the latency of the response and on theresponse outcome (error prosaccade or correct antisac-cade). We also formulated models for the prediction ofthe response outcome and the latencies of the first and thecorrective eye-movements.
Correlation of error and correction
A robust finding of this analysis was the lack ofcorrelation between latency and amplitude of errorprosaccades and the ensuing time for their correction bythe antisaccade. Furthermore, in many cases the correc-tion latency was extremely small and in some cases theerror prosaccade was reversed with zero delay. Thisphenomenon has been reported previously for the correc-tion of erroneous prosaccades in the antisaccade task(Fischer and Weber 1997). Thus, the correction processseemed to be unrelated to the previous programming andexecution of the error prosaccade and it could actuallyinterrupt the execution of this movement in some cases.
Effects of stimulus location
A higher error rate was observed for stimuli presented inthe right versus left visual field. Similar results have beenreported previously (Fischer and Weber 1997; Fischer etal. 1997). Fischer and Weber (1997) found this differencespecifically for stimuli at small eccentricities but notthose at larger eccentricities. In the present study, theamplitude of error saccades was also larger for stimuli inthe right visual hemifield. The absence of differences inlatency for antisaccades to the right or to the lefthemifield is in agreement with the results of the studyof Fischer and Weber (1997).
Error rate decreased with increasing stimulus eccen-tricity. Fischer and Weber (1997) reported an increase inerror rate with increasing stimulus eccentricity (from 2� to12�). Although there are minor differences in theexperimental paradigm used in that study (a gap betweencentral fixation offset and stimulus onset varied from 0 to600 ms, and the subjects were instructed to saccade to themirror location of the peripheral stimulus as opposed toour subjects being instructed to saccade in the otherdirection), they do not seem able to account for oppositeeffects on error rate. In support of the current findings, ina recent study, monkeys performing the antisaccade taskmade more errors when stimuli were presented close tothe central fixation point and the error rate declined withincreasing eccentricity (Bell et al. 2001). The authorsreported a preferred distance range of 8–10�. The authorssuggested that small stimulus distances induce bothfixation and saccade signals (considered as opposingsignals) at the level of superior colliculus and this signalambiguity leads to longer latencies and a higher proba-bility of errors for small amplitude saccades.
Fischer and Weber (1997) observed an increase inlatency with small distance stimuli. We also observed anincrease in latencies when stimuli were presented at aclose distance compared with those presented at largerdistances. More interestingly, this increase in latency wasvery pronounced for the latency of corrections and thelatency for the antisaccade after an error. Actually, thebest predictor of both these latencies in a regressionmodel was the distance of the stimulus. This effect of
Table 5 Effect of each one of the task parameters on the latency ofthe correction in the linear regression model. (DIR stimulusdirection, DIS stimulus distance, FIX prior fixation interval,LEARN first ten trials, FATIGUE last 20 trials, PERS perseverationprone trials; see Materials and methods section for definitions)
Parameter Regression b Significance
t-value P-value
DIR 0.014 1.22 0.22DIS –0.126 –10.94 <0.0001FIX –0.067 –5.84 <0.0001LEARN 0.025 2.22 0.025FATIGUE 0.034 2.96 0.003PERS –0.046 –3.90 <0.0001
60

stimulus distance on correction latency was not observedwhen we substituted the actual error amplitude forstimulus distance in our regression model, confirmingour initial observation of a lack of correlation betweenerror amplitude and correction latency. Nevertheless, theerror amplitude increased with increasing stimulus dis-tance. Perhaps the presence of a stimulus at a closedistance interferes with the programming of the correctantisaccade (Bell et al. 2001). This interference wasmaximal in the cases where an actual error did occurresulting in a prolongation of the initiation of theantisaccade movement, irrespective of the actual ampli-tude of the error that was finally observed.
Fixation interval
The fixation interval preceding a response is as an indexof the rate of stimulus presentation. Relatively highpresentation rates (short fixation intervals) resulted inhigher error rates and longer latencies, especially forcorrect antisaccades. The single most significant predictorof the latency for correct antisaccades in a regressionmodel was the fixation interval. Manipulation of the stateof fixation before the execution of the antisaccade leads toa difference in performance (Fischer and Weber 1992,1996, 1997). For example, introducing a gap betweenfixation and stimulus presentation results in an increase ofantisaccade errors (Fischer and Weber 1997). Similarly, asmaller fixation interval could result in a less stablefixation before stimulus appearance leading to an increasein error rate. Perhaps in an effort to compensate for a shortfixation interval, response latency increases.
Learning and fatigue effects
Performance changed during the course of the task (taskduration approximately 5 min, 90 trials) the. Time-dependent changes were observed for the percentage oferrors, amplitude of errors and for the latencies. Error ratefollowed a U-shaped curve (Fig. 6), suggesting two well-known effects of time on performance: an initial “learningeffect” reflected by higher error rates in early trials, and a“fatigue effect” reflected by similarly high error rates infinal trials. In fact, many subjects reported at the end ofthe task that they were tired from the effort. A differenteffect of time in the task was observed for error amplitudeand latencies, all of which decreased abruptly after thefirst ten trials and then remained lower throughout thetask. Thus, fatigue was not reflected in error amplitude orresponse latencies.
Perseveration effects
Perseverative behavior has been reported in patients withfrontal lobe lesions and consists of an inappropriaterepetition or maintenance of a previous response when a
new one is needed (Lezack 1995). In this study, weconsidered two types of perseveration prone trials, thetrial after a repetition of two identical responses and thetrial after an alternation of left-right or right-left respons-es. Surprisingly, the error rate was not different forperseveration prone trials versus non-perseveration pronetrials. Only the latency corrections decreased in persev-eration prone trials.
Predicting the response outcome
The final outcome for each trial of the antisaccade taskwas a choice between moving in the direction of thestimulus (error prosaccade) and moving in the oppositedirection (correct antisaccade). We have discussed howstimulus parameters affected this outcome. We attemptedto predict the trial outcomes based on the stimulusparameters. Although all the stimulus parameters weresignificant predictors of the trial outcome, their value forpredicting error trials was negligible. As we have alreadymentioned, the power of such a model is really tested inthe prediction of errors in performance due to the overallsmall percentage of errors (25% of trials). Thus, stimulusdistance and direction, perseveration prone sequences,fixation interval (reflecting rate of trial transition) andtask duration are of minimal significance in determiningwhether a particular trial will result in an error prosac-cade. In contrast, response latency predicted 40% oferrors. An increase in probability of error with decreasingresponse latency has been found in previous studies ofperformance in the antisaccade task (Fischer and Weber1992, 1997). Nevertheless, given that less than half oferrors are predicted by response latency, further experi-ments are required to determine which other variablesmay better predict performance. These variables could berelated to the large variability of error rate amongdifferent subjects in our population (see part I of thisstudy; Evdokimidis et al. 2002).
A combining hypothesis for antisaccade generation
In this study, we investigated the effects on antisaccadeperformance of several stimulus-related parameters. Oneimportant finding was that an error correction was alwaysevident in the sample of trials we investigated (n=947)and it was observed in more than 99% of the total trialsfor all subjects in the study n=2,006). Fischer et al. (2000)have proposed that corrected errors in the antisaccade taskhave characteristically short latencies (in the range ofexpress saccades) and result from a fixation instability,meaning a difficulty in maintaining fixation while thevolitional antisaccade movement is still in preparation. Incontrast, errors that are not corrected reflect a deficit inthe volitional component of the antisaccade movement.These errors have larger latencies than the corrected onesand they might be related to pathology of the frontal lobes(Guitton et al. 1985).
61
A recent model of collicular neuronal activity actuallyproposes the activation of the superior colliculus (SC) bytwo competing signals in the antisaccade task, anendogenous signal based on the antisaccade instructionthat comes from cortical processing of that instruction andan exogenous signal coming directly from visual areas(Trappenberg et al. 2001). Both these signals activate theSC buildup neurons but at the same time one signalinhibits the other. The result of the interplay betweenthese competing signals could be an error prosaccade or acorrect antisaccade. Neurons in the SC are indeedactivated prior to the execution of antisaccades in themonkey (Everling et al. 1999). Moreover, an increasedactivity of fixation neurons in the SC has been observedin the preparatory period before the execution of anantisaccade (Everling et al. 1999). In yet another study ofSC neurons, the increased activity of buildup neuronsrelated to the error prosaccade stimulus location predictedwell the occurrence of an error in the antisaccade task(Everling et al. 1998). Furthermore, activation of fixationneurons in the ipsilateral SC can inhibit saccade neuronsin the contralateral SC via intercollicular inhibition(Munoz and Istvan 1998). Finally, SC saccade neuronsare tonically inhibited by the basal ganglia (substantianigra pars reticulata; Hikosaka and Wurtz 1983). The lossof striatal cholinergic neurons in Huntington’s diseaseresults in a high rate error-prosaccades in the antisaccadetask (Lasker et al. 1987).
The neurophysiological data, combined with thepsychophysical evidence from this and previous studies,suggest the existence of two parallel signals that mayinteract at the level of the SC: a volitional antisaccade(endogenous signal) and a reflex prosaccade (exogenoussignal). The inhibition of the reflex prosaccade might relyboth on the prior level of fixation activity, the intra- andinter-collicular inhibition, and on inhibitory signals to theSC coming from other brain areas such as the basalganglia. Our data suggest a dissociation in programmingbetween the erroneous prosaccade and the correctiveantisaccade that follows. A very striking dissociation wasthat the latency of the ensuing antisaccade after an errorwas dependent on the distance of the stimulus and not onthe actual error amplitude, indicating that the program-ming of the antisaccade in this case was affected by theoriginal stimulus information and not on the erroramplitude.
The dependence of the inhibition on the level offixation activity prior to the onset of the antisaccade(fixation instability hypothesis) could explain the effectsof the fixation interval. Thus, when the fixation intervalpreceding the antisaccade onset is short, the neuronalactivity of fixation neurons could be less leading to ahigher probability of error. A compensatory strategywould be to increase the level of activity of fixationneurons leading to an increase in response latency for thecorrect antisaccades.
In conclusion, our data could be viewed under ageneral hypothesis that antisaccade performance dependson the parallel processing of two distinct signals, one
volitional involving cortical and subcortical structures andone reflexive involving mostly the SC. The successfulinhibition of the reflexive signal could be mediated by theinter-play of fixation- and saccade-related activity at thelevel of SC, and the increase in error rate could be theresult of a deficit in this mechanism, an effect named“fixation instability” (Fischer et al. 2000). We believe thatthe term “corrective antisaccade” is misleading for theantisaccade after the occurrence of an error because itsupposes a serial process of error detection and asubsequent programming of a corrective antisaccade,whereas our data point to a parallel processing of twoseparate commands. It would be interesting to investigateat the behavioral level the error and correction parametersin neurological and psychiatric conditions, where anti-saccade error rate was found to be increased (Everlingand Fischer 1998).
Acknowledgements This work was supported by the grantEKBAN 97 to Professor C.N. Stefanis from the General Secretariatof Research and Technology of the Greek Ministry of Develop-ment. Intrasoft Co. provided the technical support for this project.
References
Bell AH, Everling S, Munoz DP (2001) Influence of stimuluseccentricity and direction on characteristics of pro- andantisaccades in non-human primates. J Neurophysiol84:2595–2604
Evdokimidis I, Smyrnis N, Constantinidis TS, Stefanis NC,Avramopoulos D, Paximadis C, Thelcritis C, Efstratiadis C,Kastrinakis G, Stefanis CN (2002) The antisaccade TASK in asample of 2006 young males. I. Normal population character-istics. Exp Brain Res DOI 10.1007/s00221-002-1208-4
Everling S, Fischer B (1998) The antisaccade: a review of basicresearch and clinical studies. Neuropsychologia 36:885–899
Everling S, Munoz DP (2000) Neuronal correlates for preparatoryset associated with prosaccades and antisaccades in the primatefrontal eye field. J Neurosci 20:387–400
Everling S, Dorris MC, Munoz DP (1998) Reflex suppression in theantisaccade task is dependent on prestimulus neural processes.J Neurophysiol 80:1584–1589
Everling S, Dorris MC, Klein RM, Munoz DP (1999) Role ofprimate superior colliculus in preparation and execution ofantisaccades and prosaccades. J Neurosci 19:2740–2754
Fischer B, Weber H (1992) Characteristics of “anti” saccades inman. Exp Brain Res 89:415–424
Fischer B, Weber H (1996) Effects of procues on error rate andreaction times of antisaccades in human subjects. Exp BrainRes 109:507–512
Fischer B, Weber H (1997) Effects of stimulus conditions on theperformance of antisaccades in man. Exp Brain Res 116:191–200
Fischer B, Biscaldi M, Gezeck S (1997) On the development ofvoluntary and reflexive components in human saccade gener-ation. Brain Res 754:285–297
Fischer B, Gezeck S, Hartnegg K (2000) On the production ancorrection of involuntary prosaccades in a gap antisaccade task.Vision Res 40:2211–2217
Funahashi S, Chafee MV, Goldman-Rakic PS (1993) Prefrontalneuronal activity in rhesus monkeys performing a delayedantisaccade task. Nature 365:753–756
Guitton D, Buchtel HA, Douglas RM (1985) Frontal lobe lesions inman cause difficulties in suppressing reflexive glances and ingenerating goal-directed saccades. Exp Brain Res 58:455–472
62

Hikosaka O, Wurtz RH (1983) Visual and oculomotor functions ofthe monkey substantia nigra pars reticulata. IV. Relation ofsubstantia nigra to superior colliculus. J Neurophysiol 49:1285-1301
Lasker AG, Zee DS, Hain TC, Folstein SE, Singer HS (1987)Saccades in Huntington’s disease: initiation defects anddistractibility. Neurology 37:364–370
Lezak MD (1995) Neuropsychological assessment, 3rd edn. OxfordUniversity Press, New York
Munoz DP, Istvan PJ (1998) Lateral inhibitory interactions in theintermediate layers of the monkey superior colliculus. J Neuro-physiol 79:1193–1209
O’Driscoll GA, Alpert NM, Matthysse SW, Levy DL, Rauch SL,Holzman PS (1995) Functional neuroanatomy of antisaccadeeye movements invastigated with positron emission tomogra-phy. Proc Nat Acad Sci 92:925–929
Schlag-Rey M, Amador N, Sanchez H, Schlag J (1997) Antisaccadeperformance predicted by neuronal activity in the supplemen-tary eye field. Nature 390:398–401
Sweeney JA, Mintun MA, Kwee S, Wiseman MB, Brown DL,Rosenberg DR, Carl JR (1996) Positron emission tomographystudy of voluntary saccadic eye movements and spatial workingmemory. J Neurophysiol 75:454–468
Trappendberg TP, Dorris MC, Munoz DP, Klein RM (2001) Amodel of saccade initiation based on the competitive integrationof exogenous and endogenous signals in the superior colliculus.J Cogn Neurosci 13:256–271
Zhang M, Barash S (2000) Neuronal switching of sensorimotortransformations for antisaccades. Nature 408:971–975
63