The Annual Report of Jan, Brit Wenche, Magne, Jens Børge ...
92
2003 The Annual Report of Jan, Brit Wenche, Magne, Jens Børge, Geir, Dag Magne, Inger, Elisabeth, Anne, Geir Inge, Gerhard and SpareBank 1 SR-Bank.
-
Upload
khangminh22 -
Category
Documents
-
view
0 -
download
0
Transcript of The Annual Report of Jan, Brit Wenche, Magne, Jens Børge ...

2003
The Annual Report ofJan, Brit Wenche,Magne, Jens Børge, Geir, Dag Magne, Inger, Elisabeth, Anne, Geir Inge, Gerhard andSpareBank 1 SR-Bank.


Value is created by our customers.
SpareBank 1 SR-Bankhas over 180 000 retailcustomers and 13 500corporate and agri-cultural customers. Ourcustomers are the oneswho create the value.That is why we haveincluded some of themin our annual report.

4
ElisabethPage 65
AnnePage 11
GerhardPage 64
MagnePage 10
Jens BørgePage 16
Brit WenchePage 17
5
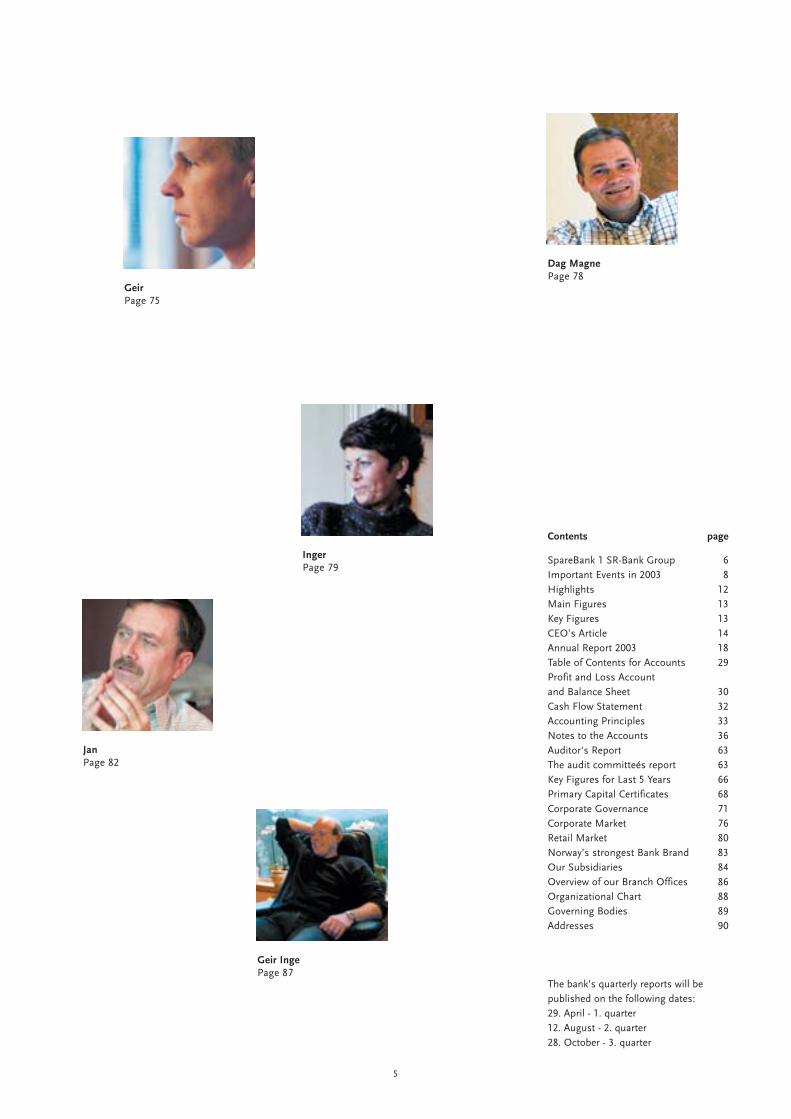
GeirPage 75
Geir IngePage 87
IngerPage 79
JanPage 82
Dag MagnePage 78
Contents page
SpareBank 1 SR-Bank Group 6Important Events in 2003 8Highlights 12Main Figures 13Key Figures 13 CEO’s Article 14Annual Report 2003 18Table of Contents for Accounts 29 Profit and Loss Account and Balance Sheet 30Cash Flow Statement 32Accounting Principles 33 Notes to the Accounts 36 Auditor's Report 63The audit committeés report 63Key Figures for Last 5 Years 66Primary Capital Certificates 68 Corporate Governance 71Corporate Market 76Retail Market 80Norway’s strongest Bank Brand 83Our Subsidiaries 84Overview of our Branch Offices 86Organizational Chart 88Governing Bodies 89Addresses 90
The bank’s quarterly reports will bepublished on the following dates:29. April - 1. quarter12. August - 2. quarter28. October - 3. quarter

HISTORY
Sparebanken Rogaland was established on 1 October 1976as the first regional savings bank in Norway through themerger of 22 savings banks. After 27 years of business andthe merger of 39 savings banks in total, SpareBank 1 SR-Bank has emerged as Rogaland’s leading bank. InNovember 1996, Sparebanken Rogaland helped establishthe SpareBank 1 Alliance, which is a Scandinavian bankingand product alliance.
GROUP
In addition to the bank, the group consists of the financecompany Westbroker Finans AS, real estate brokerageEiendomsMegler 1 Rogaland AS and the bank's investmentmanagement company SR-Forvaltning ASA. The group has894 employees and total assets of NOK 52.6 billion.
BANK
SpareBank 1 SR-Bank is the largest savings bank in Norway.The bank’s market area is Rogaland and Agder, and thebank currently has 52 local branch offices in its market area.The head office is located in Stavanger. The customer-oriented operations are organized in a retail market andcorporate market division.
Retail market division:
SpareBank 1 SR-Bank is the leading retail bank in Rogalandwith 181 000 customers. In addition to retail customers, theretail market division serves more than 8 500 smallbusiness and agricultural customers. The bank offersproducts and services in the area of financing, investments,payment services and pension insurance, as well as generaland life insurance. SpareBank 1 SR-Bank had over 77 000Internet bank customers at the end of 2003.
Corporate market division:
SpareBank 1 SR-Bank has a solid position in the corporatemarket. Over 40 percent of all the businesses in the bank’straditional market list SpareBank 1 SR-Bank as their mainbank. The bank has recently established corporate marketoperations in the Agder counties, and they are also showinga positive development. Overall the bank’s corporatemarket division serves just under 5 000 customers in the
private and public sector. In addition, there are 8 500 smallbusiness and agricultural customers who are served by theretail market division.
EIENDOMSMEGLER 1 ROGALAND AS
The EiendomsMegler 1 chain is the market leader in theNorwegian market. EiendomsMegler 1 Rogaland AS is thelargest firm in the chain and the market leader in thisregion. It sold around 4 300 homes in 2003, divided among17 brokerage offices in Rogaland and Agder. In addition toreal estate brokerage, the firm has a special department forcommercial and project brokerage, and a specialdepartment for the sale of new homes in Spain. The com-pany has 100 employees.
WESTBROKER FINANS AS
Westbroker Finans AS is the leading leasing company inRogaland with over NOK 1.6 billion in total assets and 21employees. The company shares offices with the bank’scorporate market department for Stavanger and Jæren atForus outside Stavanger, and it provides special financingand funding services, in addition to leasing.
SR-FORVALTNING ASA
SR-Forvaltning ASA manages portfolios for over 1 000external customers, as well as SpareBank 1 SR-Bank andSpareBank 1 SR-Bank's pension fund. SR-Forvaltning's goalis to be a local alternative with a high level of competence inthe financial management area. The company has totalassets of NOK 2.3 billion and 6 employees.
SPAREBANK 1 ALLIANCE
The paramount goal of the SpareBank 1 Alliance is to securethe individual bank's independence and regional tiesthrough robust competitiveness, profitability and solidity.The Norwegian banks in the alliance cooperate through thejointly-owned holding company SpareBank 1 Gruppen AS.In addition to Sparebanken Rogaland, the other banks in thealliance include SpareBanken Nord-Norge, SpareBankenMidt-Norge and Samarbeidende Sparebanker A/S (15 localsavings banks in eastern and northwestern Norway). Theother owners and partners through the SpareBank 1Gruppen AS are FöreningsSparbanken AB (publ) in Sweden
6
SPAREBANK 1 SR-BANK GROUP

and the Norwegian Federation of Trade Unions (LO).SpareBank 1 Gruppen AS owns the following companies:Bank 1 Oslo AS, SpareBank 1 Livsforsikring AS, SpareBank1 Fondsforsikring AS, SpareBank 1 Skadeforsikring AS,Odin Forvaltning AS, SpareBank 1 Bilplan AS (67.2 percent)and First Securities ASA (33.3 percent).
VISION
“SpareBank 1 SR-Bank – the recommended bank”
STRATEGIC DIRECTION
SpareBank 1 SR-Bank has a goal to distinguish itself on thebasis of the following six statements:
• A profitable and solid bank that is attractive to the capital markets, owners, customers and employees.
• A savings bank philosophy with a strong brand. Value is created locally and plowed back into the local communities.
• Clear prioritization based on customer needs and profitability.
• Our market area is primarily Rogaland, Agder and Sunnhordland.
• Clear position in the savings/pension market and the “digitalized world”.
• Capable employees who are proud to work for SpareBank 1 SR-Bank.
7

614 CLUBS AND ASSOCIATIONS SUPPORTED
In 2003, 614 clubs and associations received financialsupport from SpareBank 1 SR-Bank. Of a total sponsorshipbudget of NOK 20 million, the bank spends NOK 5 millionon sponsoring sports, primarily on small clubs. The rest isdonated to charitable causes. “We sponsor no one, wesupport local values”, is SpareBank 1 SR-Bank’s motto.
NEW COOPERATION AGREEMENT SIGNED
FöreningsSparbanken (FSPA) and SpareBank 1 signed a newcooperation agreement. The new Nordic cooperationagreement will entail closer commercial cooperation inseveral areas. Our cooperation with respect to cards andpayment services will be expanded and provide a goodfoundation for building closer cooperation with Förenings-Sparbanken.
NOK 50 BILLION IN TOTAL ASSETS PASSED
A new milestone was passed in the first quarter whenSpareBank 1 SR-Bank’s total assets grew to over NOK 50billion.
CORE CAPITAL STRENGTHENED
SpareBank 1 SR-Bank issued perpetual capital securities inthe US market valued at USD 75 million. This issuestrengthened our core capital and capital adequacy ratio.
SPAREBANK 1 SR-BANK’S RATINGS UPGRADED
Moody’s Investor Service upgraded SpareBank 1 SR-Bank’srating (Long Term Bank Deposit) from A3 to A2. Accordingto Moody’s, the upgrade reflects the bank’s continuingearnings improvement in combination with its good creditrisk management. Moody’s points out the following in itsevaluation:
• Success in cross sales and improvement in other operating income make the bank less dependent on the interest margin.
• Better risk pricing of the corporate portfolio.• The bank is distinguished by a good risk profile. Its risk
management has been conservative, and its routines and systems have strengthened over time.
• The quality of its credit portfolio is solid with moderate exposure to vulnerable industries.
According to Moody’s, the bank’s membership in theSpareBank 1 Alliance has had a positive effect on the bank,especially with regard to cost synergies and the exchange ofcompetence.
OWN ART FOUNDATION ESTABLISHED
SpareBank 1 SR-Bank has established its own artfoundation, the object of which is to acquire art originatingfrom Rogaland, so that it can benefit the general public inRogaland. The foundation purchased two paintings of LarsHertervig for a total value of NOK 2.5 million. The paintingsare on loan to the Rogaland Art Museum to make thecollection available to the local population.
8
IMPORTANT EVENTS IN 2003

NEW ARTICLES OF ASSOCIATION ADOPTED
In October the bank's supervisory board adopted new articlesof association for the bank. The new articles of associationwill reduce the number of members of the supervisoryboard from 104 to 56. The primary capital certificate ownerswill have 22 representatives, the depositors and municipali-ties will each have 10 representatives, and the employeeswill have 14 representatives. The current supervisory boardwill be dissolved and hold its last meeting in March 2004.The new supervisory board will be functional from the sametime.
THREE NOK 100 000 WINNERS
Christian Ihle Hadland and Andrea Lumb from Stavanger,and Camilla Sjo Fasting from Time, each won NOK 100 000when the prizes from SpareBank 1 SR-Bank’s G9alt talentfund were awarded. The winners were a pianist, artphotographer and architect, respectively. A total of 28 othertalents were awarded NOK 25 000 each. This is the fourthyear in a row that the bank awards money to young talentsin Rogaland and Agder.
GROWTH ON THE INTERNET
SpareBank 1 SR-Bank had over 77 000 Internet bankcustomers at the end of 2003. This represents an increaseof 15 percent over 2002. At present 54 percent of our wageaccount customers over the age of 18 use our Internet bank.
COOPERATION AGREEMENT ON BANK IDS SIGNEDWITH STAVANGER MUNICIPALITY
Bank IDs are issued by banks in Norway and can be used forelectronic identification and signatures on the Internet.SpareBank 1 SR-Bank is one of the banks that have comethe furthest with Bank IDs in Norway. StavangerMunicipality and SpareBank 1 SR-Bank will cooperate ontesting a secure method of accomplishing this. Initially, day-care center applications will be converted from paper to aweb solution.
REQUIREMENTS FOR CERTIFICATION OF CUSTOMERCONSULTANTS INTRODUCED
As part of the preparations for the public authorities’ futurecertification requirements for financial consultants, thebank introduced certification requirements with respect topayment services, insurance, financing and investments forcustomer consultants in the retail market division. Thecertification requirements are defined in relation to basic,in-depth and specialist competence.
PRIMARY CAPITAL CERTIFICATES SOLD TO EMPLOYEES
As an alternative to an employee issue, the bank sold 49 754primary capital certificates at a discount to employees.SpareBank 1 SR-Bank views employee ownership as a goodtool for stimulating its employees to take a greater interestin the bank’s profitability and future. This is the fourth yearin a row that an employee issue or sale has been carried out,and 561 employees now own primary capital certificates inthe bank.
9

- Last year we sold 190 new homes and had sales ofNOK 215 million, says Magne. - It was a good year forus, especially the fall. Some of this can be attributed tothe low interest rates and the fact that people seem tohave more faith in the future.
- Badedammen Vest was decidedly our largest project in2003, he explains. This project has shifted the centre ofStavanger to the east and has created an urban,maritime and environmentally friendly city district justfive minutes from the cathedral. The first occupantsmoved in in June. At that time a total of 103 units werecompleted. Badedammen is scheduled for completionin 2006 and will house about a thousand people. Inaddition, we had great success with our homes foryoung people at Sunde near Hafrsfjord last year.
- SpareBank 1 SR-Bank is an important partner for us inseveral areas. The bank participates by financing thebuilding during the construction period. Being themarket leader also plays an important role for our
customers, who are home buyers. In addition, we sellthe homes through the bank's subsidiary company,EiendomsMegler 1.
- We cooperate with the bank with regard to youngpeople and provide new home solutions that areadapted to the needs and requirements of young people.
- The Stavanger area will grow rapidly, Magne claims.This is a trend that is seen in all the regional centers.The new university and the arrangement of attractivecultural experiences will attract people to the area. Thismeans that there will be a need for more homes. Butpeople have become more discerning. For Skanska,quality is the only way to go.
- It is a bit sad that we lost the Selmer name last year.Magne looks at an old advertising poster in his office.After all, the Selmer name has been part of Norwegiancontractor activities for almost a hundred years.
10
CONTROLLED GROWTH BUILT ON QUALITYSKANSKA BUILT BETTER HOMES
Badedammen Vest was Magne's largest project in 2003.
Maybe you live in one of the homes that he has built?Magne Svendsen manages Skanska Bolig AS in ourregion. The company is one of the country's leadingplayers in the property market. Their products includeapartment buildings, small houses and individualhomes in housing developments.

Actually she likes her old car more. It is a 31 year oldMG. But it doesn't quite thrive in the Norwegianwinters, even when it is as mild as in Haugesund.
Anne is Haugesund's only physiotherapist that hasspecialized in manual therapy. She moved to the towntwo years ago and works at the Haugesund MedicalCentre. She also shares her knowledge with thewomen's national soccer team.
- I can't remember the first time I was in SpareBank 1SR-Bank, but I must have been very small, she says. Soin a manner of speaking, I have always been a customer.
- Of course I am concerned about the terms offered. I'mnot married to the bank and try to follow what offers areavailable in the market. But as long as SpareBank 1 SR-Bank gives me good offers, I would like to stay with thebank. The ability to drop by the bank and receivepersonal service means a lot to me, she admits.
- I bought the MG in England when I worked over there.It is a lovely car but a bit impractical, she laughs. So Ineeded to borrow some money for a "winter car". SinceI had just bought a new apartment in Haugesund, thesolution was a loan with the car as collateral. SpareBank1 SR-Bank gave me good terms with repayment overthree years.
11
PERSONAL SERVICE MEANS A LOTANNE BOUGHT A NEW CAR
Anne Torkelsen got a Golf, an almost new carshe bought from some friends who movedabroad.
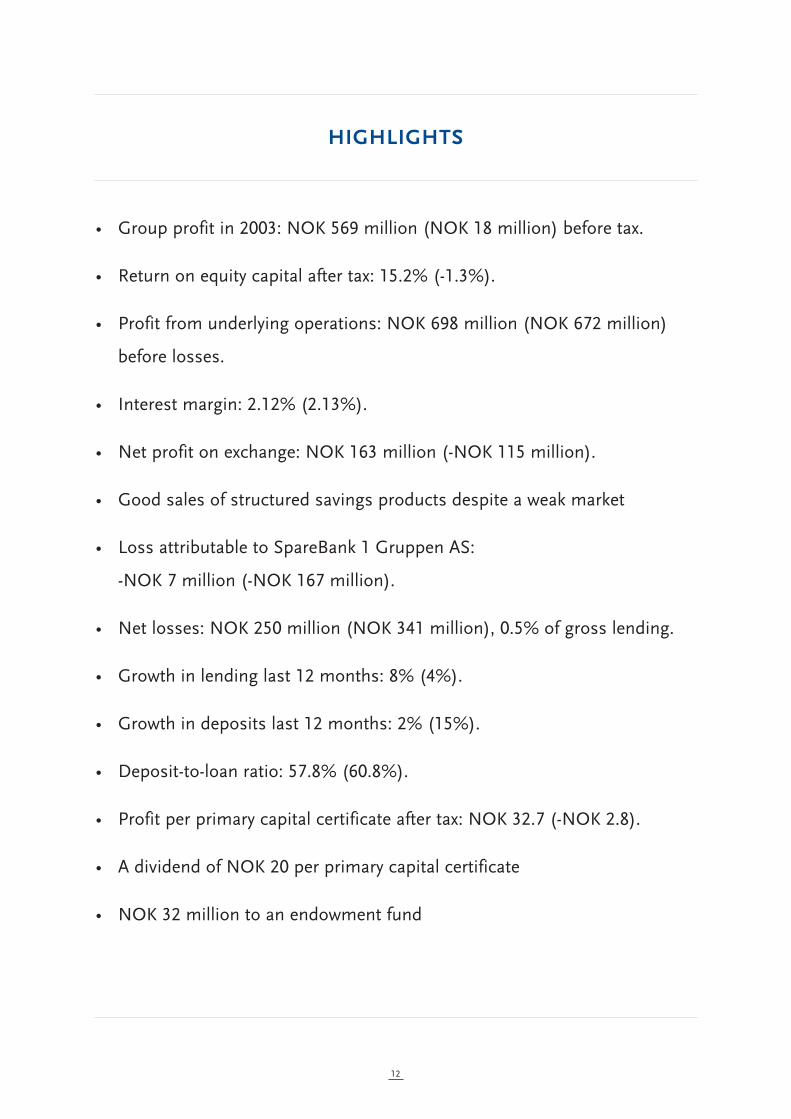
• Group profit in 2003: NOK 569 million (NOK 18 million) before tax.
• Return on equity capital after tax: 15.2% (-1.3%).
• Profit from underlying operations: NOK 698 million (NOK 672 million)
before losses.
• Interest margin: 2.12% (2.13%).
• Net profit on exchange: NOK 163 million (-NOK 115 million).
• Good sales of structured savings products despite a weak market
• Loss attributable to SpareBank 1 Gruppen AS:
-NOK 7 million (-NOK 167 million).
• Net losses: NOK 250 million (NOK 341 million), 0.5% of gross lending.
• Growth in lending last 12 months: 8% (4%).
• Growth in deposits last 12 months: 2% (15%).
• Deposit-to-loan ratio: 57.8% (60.8%).
• Profit per primary capital certificate after tax: NOK 32.7 (-NOK 2.8).
• A dividend of NOK 20 per primary capital certificate
• NOK 32 million to an endowment fund
12
HIGHLIGHTS

SpareBank 1 SR-Bank Group (NOK mill) 2003 2002 2001 2000 1999
Net interest income 1 095 1 050 979 934 895
Net other operating income 601 137 397 332 381
Total operating costs 891 812 785 705 622
Result before losses and write-downs 805 375 591 561 654
Losses and write-downs 236 357 169 -72 56
Result of ordinary activities 569 18 422 633 598
13
MAIN FIGURES
SpareBank 1 SR-Bank Group 2003 2002 2001 2000 1999
Total assets 52 642 49 538 48 471 43 624 36 397
Net loans to customers 48 183 44 674 43 120 38 789 32 378
Deposits from customers 28 266 27 634 24 011 22 120 19 211
Growth in loans 8 % 4 % 11 % 20 % 15 %
Growth in deposits 2 % 15 % 9 % 15 % 10 %
Capital adequacy ratio 12,39 10,81 12,69 11,65 12,12
Core capital ratio 9,11 7,24 7,92 8,15 8,63
Net equity and subordinated loan capital 4 238 3 519 4 059 3 444 3 037
Return on equity 15,2 -1,3 11,2 19,5 21,8
Cost percentage 56,1 61,0 56,9 56,2 52,7
Number of man-years 829 818 807 711 677
Number of offices 52 53 53 50 57
Market price at the close of the year 323 180 247 247 253
Profit per primary capital certificate 32,7 -2,8 24,7 40,4 40,4
Dividend per primary capital certificate 20 10 19 21,0 19,0
Effective return on the primary capital certificate 85,0 -19,3 8,1 5,3 41,0
RISK-amount as of 1. january 12,9 -2,9 9,5 18,5 28,4
Referring to page 66 - 70 for a complete list of key figures and definitions.
KEY FIGURES
SpareBank 1 SR-Bank can look back on 2003 as a good year.The bank has strengthened its position in the market with anet increase of 2 100 customers for the year. Our financialresults place the bank in the top echelon of the Norwegianfinancial services industry.
In the SpareBank 1 SR-Bank Group, we have set ambitiousgoals for ourselves. We want to be the recommended bankfor our customers. We want to improve the profitability ofour customers through good advice, and good financialproducts and solutions. Essentially it is all about trust,because good advice requires mutual trust and understandingbetween the customers and the bank.
The merger of DnB and Gjensidige Nor illustrates thestrong forces contributing to large-scale operations in thefinancial services industry. DnB/Nor is 15 times larger thanSpareBank 1 SR-Bank, which is currently the largest savingsbank in Norway.
Can a regional savings bank survive in such competition?That will depend on whether the bank can deliver theproducts and solutions that the customers want at compe-titive terms, and whether we can manage to maintain pro-fitability on par with the best in the industry.
The development of technology, good products and astrong brand is costly and represents the important forcesthat explain the mergers and concentration in the financialservices industry. Cooperation within the SpareBank 1Alliance meets these challenges by generating economies ofscale through the joint development of such products. Eventhough the economies of scale from this cooperationcannot fully compare with the economies of scale of themajor national and international financial concerns, asavings bank with regional roots can still achieve advantagesin the market by exploiting a local bank’s proximity to thecustomer and local perspective.
We focus on being able to offer good savings and insuranceproducts, and provide good advice to individual customers,so that the financial solutions are adapted as well aspossible to each individual customer’s needs. The import-ance of savings to individual customers has grown. ThePension Commission’s proposed new national insurancescheme also illustrates the importance of private savings asa supplement to the national insurance pension benefits.
Therefore SpareBank 1 SR-Bank wants to emerge as a bankthat is different from the major national and international
14
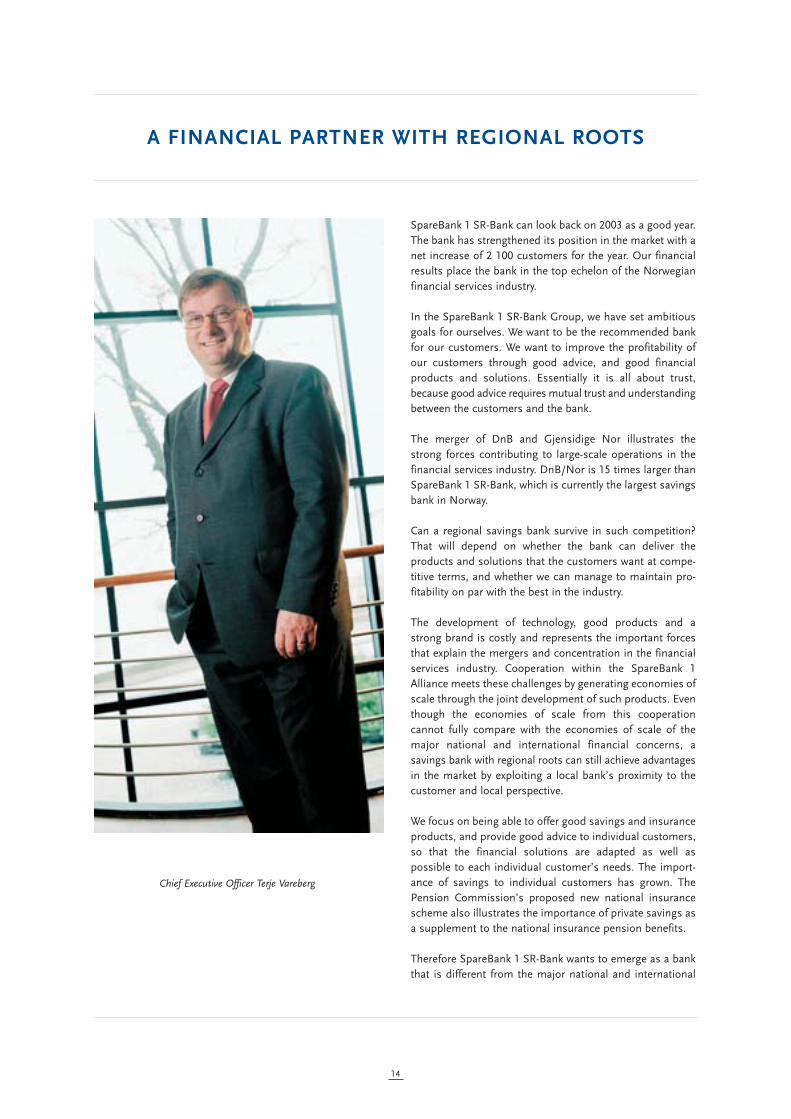
A FINANCIAL PARTNER WITH REGIONAL ROOTS
Chief Executive Officer Terje Vareberg

financial concerns, where we build in particular on personalcontact, nearness, trust and a local presence for ourservices where people live and work.
We believe that the key basic values of the savings bankconcept will provide a good foundation for our operations inthe years to come. As a regional savings bank, we are linkedto a common destiny with the region we operate in. If thebusiness community and job market does poorly in ourregion, then the bank will also do poorly. We cannot just pullour operations out of the region, because this is where wedo business.
Future-oriented companies will do best in communities thatare a good place for old and young people alike to live, andwhere capable people want to live and work.
This explains the background for the bank's interest inregional business development. The formulation of aregulatory framework that allows the establishment ofprofitable businesses and the creation of new jobs incompetitive industries is important to our region.
The welfare of the country is dependent on the creation ofvalue in the business community. The Storting will make adecision soon on the scheme for our future nationalinsurance benefits. Profitable jobs in profitable companiesand an efficient organization of the social infrastructurerepresent the foundation for this reform.
As the region's leading bank, SpareBank 1 SR-Bank wants tobe a recommended financial partner that can contribute togood solutions for customers and the community. Inaccordance with the savings bank concept, we support localvalues and plow part of the value created by the bank backinto the local community through the bank's endowmentfund for charitable causes.
By making ourselves worthy of our customers’ trust throughproviding advice and offering solutions that make ourcustomers more profitable, we believe that SpareBank 1 SR-Bank has a good foundation for success in the years tocome.
15
Stavanger, March 2004
Terje Vareberg Chief Executive Officer

Every third tomato sold in Norway comes from Finnøy,which is also the country's largest poultry municipality.On Finnøy you can dare to dream.
Jens Børge comes from a family that has been involvedin farming on this island in Ryfylke for many gener-ations. In 2003 he was forced to make a decision. Whatwas he going to produce on the farm? The new regu-latory framework for agriculture meant that a milk quotaof 95 000 liters and providing transportation for otherfarmers was not enough. Should he find an extra job?
- My choice was to become a full-time farmer, says JensBørge. In January 2003 I contacted Agro and receivedgood advice. With my spreading land, piglets were themost suitable and profitable solution. But it was alsothe choice that was the most work intensive.
- The next step was to visit large piggeries in Jæren inorder to learn, he says. I soon found out that automationand a really professional solution was the way to go.
- This was then followed up by two rounds with the
bank. It wasn't surprising that my contact person in thebank was at times a bit skeptical, Jens Børge admits. Iwas continuously coming up with newer and higherfigures.
- Agriculture today is how the manufacturing industryused to be, he explains. The bank must believe in theproject you are planning. For me the final cost for a 1 200 square meter piggery was NOK 4.7 million.
Jens Børge proudly shows us one of the country's mostmodern facilities with a very efficient installation,computer controlled feeding and ventilation, and watercarried heat for the pigs. Nothing was lacking when thefirst animals came in February 2004.
- It is important to me that the pigs thrive, the newlyestablished pig farmer smiles.
- When it comes to financing, it is important to me thatthe bank's employees know about pigs as a product andwhat market I belong to as a pig farmer. SpareBank 1SR-Bank's employees have this knowledge.
16
TALKING PIG ON FINNØYJENS BØRGE’S PROFESSIONAL SOLUTION
Jens Børge Flesjå is a farmer onthe island of Finnøy in Ryfylke.His farm has been in the familyfor generations. But in 2003something new happened.

The Solland Group's head office is located in Stavanger.The group encompasses three companies with around100 employees in nine Norwegian cities. The companiesreported sales of NOK 160 million and a profit of NOK4 million last year.
- The year 2003 was a very eventful year for us, says LeifWilhelm. We completed the college in Lillestrøm, thelargest contract ever in our history with a total budget ofNOK 70 million.
- Throughout 2003 we focused strongly on efficientproject management, he explains. It is of decisiveimportance to our profitability that we have goodproject management for the contracts we enter into.Cooperation with other companies is also decisive. Wewant everyone to earn money on our projects.
- Internally, an important event in 2003 was the fact thatwe changed to a new pension plan for our employees,
says Brit Wenche. The company has had a definedbenefit plan since 1977. In the end this plan becameboth costly and complex. In addition, the plan made itdifficult to hire older employees with the pensionobligations this entailed.
- In consultation with SpareBank 1 SR-Bank, we decidedon a defined contribution plan just before Christmas,she explains. Now we know exactly what our obligationsare from month to month. It also makes it a lot easierto show individuals what the company contributes.
- For us it is important to use a bank with a localconnection, Leif Wilhelm admits. We have used otherbanks. But being able to knock on a door and have apersonal chat with the bank's consultants is both usefuland profitable.
17
A NEW AND BETTER PENSION PLANSOLLAND’S INNOVATIVE IDEA
The Solland group is a nationwide group that wasestablished in 1965. The company carries out all typesof technical contracting work, as well as the manage-ment, operation and maintenance of technicalinstallations. The head office is in Stavanger, and thegroup has local offices in most major cities in Norway.
Brit Wenche and Leif Wilhelm Solland are thefinancial manager and managing director of the familyfirm L.S. Solland AS, one of the leading technicalcontractors in the country. Both are the founder LeifSolland's children.

SpareBank 1 SR-Bank achieved good results in 2003.
The group reported profit before tax of NOK 569 millioncompared with NOK 18 million in 2002. Profit after tax wasNOK 408 million, up from minus NOK 34 million in 2002.
The return on equity capital after tax was 15.2 percent,compared with minus 1.3 percent in 2002.
The good results are due to solid underlying bankingoperations and a high return on securities. The board is verysatisfied with the results for 2003.
The lending volume increased by 8 percent in 2003, whilethe deposit volume increased by 2 percent. The deposit-to-loan ratio was 57.8 percent at the end of the year.
The interest margin in 2003 was 2.12 percent, nearly un-changed from 2.13 percent in 2002. Other income amountedto 35 percent of total income and increased by 339 percent.Costs have increased by 10 percent in 2003.
Net losses amounted to NOK 250 million. This is areduction of NOK 91 million from 2002.
The board proposes a dividend of NOK 20 per primarycapital certificate.
The board proposes allocating NOK 32 million to anendowment fund.
THE GROUP'S DEVELOPMENT
The contribution from underlying operations in 2003 hasbeen good and amounted to NOK 698 million in profitbefore losses, an increase of NOK 26 million over 2002.
The group has consolidated its position as the marketleader in the course of 2003.
In 2003 the bank segmented its operations into a privatecustomer division and a corporate market division. Thisdivision has strengthened the group's expertise and led toincreased specialization in order to offer the customersbetter financial advice and financial solutions. Together withincreased interaction between the bank's departments andsubsidiaries, this has contributed to a good developmentfor the group in 2003. The group has had good access tonew customers and increased product coverage percustomer.
The private customer market is financially robust and withthe current low interest rate level, improved business cycleprospects and assumed lower level of unemployment, this
business area is expected to continue to develop well in2004.
The corporate market is expected to have increased activitiesin 2004 due to the low interest rate level and improvedbusiness cycle prospects.
In 2003 the bank has seen the results of the improvementprogram that was implemented in the last six months of2002. The goal of a 15 percent return on equity capital wasattained, while the goal of costs in relation to income of 50percent in the parent bank was not fully attained.Highlighting best practice both within the income side andthe cost side using the bank's system for balanced goalmanagement, has contributed to increased income percustomer and more cost-effective operations.
In November SpareBank 1 SR-Bank was upgraded by therating agency Moody’s from A3 to A2. This has had apositive effect on the bank's access to liquidity both asregards availability and price.
The bank's subsidiaries have also consolidated their marketpositions in 2003. EiendomsMegler 1 Rogaland AS and SR-Forvaltning ASA have made good contributions to thegroup's results, while Westbroker Finans AS made a negativecontribution in 2003 due to losses on a few majorcommitments.
DEVELOPMENT IN THE GROUP'S MARKET AREA
The Norwegian economy has passed the recession andentered into a business upswing at the end of 2003. Thelabor market is showing signs of improving and productiongrowth is increasing. The most important driving forcesbehind the shift in the Norwegian economy has been thestrong growth in oil investments and the substantialdecrease in the interest rate together with a weakenedkroner rate throughout 2003. The business upswing isexpected to continue in 2004, but will probably be moderatedthroughout 2005 and 2006. Unemployment is expected todecline gradually in the next few years. Onflation will nevert-heless most likely remain at a low level in the future.
Despite substantial growth in the oil investments(estimated increase of 22% from 2002 to 2003), oil-relatedemployment was reduced both on a national basis and inRogaland. The reduction in Rogaland in 2003 was about2000 persons, corresponding to about 5% of employmentin and related to the oil and gas industry. However, it seemsthe situation will be stabilized in the short term. The oilinvestments are expected to increase by a further 11.5% in2004 before they fall considerably in the subsequent years.
18
ANNUAL REPORT 2003

At the end of December the number of unemployed personsin Rogaland was about 8,000. This accounts for 3.9% of theworkforce and is an increase of about 1,100 persons (+0.5percentage points) compared with the end of 2002. InDecember 2003 unemployment in Rogaland was equal tothe national average. The Confederation of NorwegianBusiness and Industry's (NHO's) company survey showsthat major parts of business and industry in Rogalandexpect increased turnover and increased investments in2004, but this will only have a marginal effect on employ-ment. It is only within commercial and private services thatthe companies in the survey expected an overall increase inemployment.
Rogaland had a population of 388,000 at the end of the thirdquarter of 2003, and had the highest percentage increase inpopulation growth following Akershus County. Rogaland'spopulation increased by 3,000 persons (0.8%) in the firstthree quarters of 2003. The municipalities in Jæren, includingStavanger and Sandnes, had the highest percentage growth.
In the Agder Counties there were about 7,000 personsregistered as completely unemployed at the end of 2003.This accounts for 4.6 percent of the workforce. Comparedwith the end of 2002 the number of completely unemployedpersons increased by about 500 in the course of 2003. Thenumber of inhabitants in the Agder Counties at the end ofthe third quarter of 2003 was 263,400. In the course of thefirst three quarters of the year the population increased byabout 1,000 persons (0.4%).
PROFIT PERFORMANCE
The interest rate on sight deposits in the Bank of Norwaywas reduced from 6.50 percent on 31 December 2002 to2.25 percent on 31 December 2003, and is now at the lowestlevel since just after the Second World War.
Solid underlying banking operations together with a goodsecurities market had a positive effect on the group's resultsfor 2003.
Fewer losses and a substantial profit improvement inSpareBank 1 Gruppen AS also contribute to the profitimprovement from 2002.
NET INTEREST INCOME AND INTEREST MARGIN
Net interest and credit commission income was NOK 1,095million, NOK 45 million more than in 2002.
The interest margin has been stable compared with 2002and amounted to 2.12 percent. Compared with 2002 thelending margins increased by 35 points, while the depositmargin was reduced by 38 points.
The interest margin has, however, shown a decline towardsthe end of the year, mainly due to a lower lending marginand lower interest margin on equity capital due to the lowinterest rate level.
The bank has paid the full guarantee fund charge in 2003,which has been charged to net interest income in theamount of NOK 40 million.
19
3
2.5
2
1.5
1
0.5
0
NO
K m
illio
n
Perc
ent
Net interest income, NOK million
Interest margin
Net interest income and interest margin
0
200
400
600
800
1000
1200
20031999 2000 2001 2002
NO
K m
illio
n
20031999 2000 2001 2002
Profit before tax, NOK million
Return on equity
Profit before tax and return on equity
0
100
200
300
400
500
600
700
800 25
20
15
10
5
0
-5
Perc
ent

OTHER INCOME
The group's net commission income increased by 8 percentin 2003, from NOK 289 million to NOK 313 million.
The commission income from money transfer services,which was net NOK 144 million, still contributes the mostto the total commission income and increased by 7 percentin 2003. Insurance income also showed a good develop-ment in 2003 with a growth of 17 percent and amounted toNOK 68 million.
Income from the sale of securities and structured productshad a weak development at the beginning of the year, butincreased well throughout the year and wound up at NOK60 million with an annual growth of 8 percent.
Dividend and income from ownership interests improvedby NOK 142 million compared with 2002 and amounted toNOK 7 million. The improvement is mainly due to the lossattributable to SpareBank 1 Gruppen AS being reducedfrom -NOK 167 million in 2002 to -NOK 7 million in 2003.The negative result of NOK 7 million is based on theaccounts for November and the forecast for December. Thefinal figures are expected to be somewhat better than thepreliminary forecast. The final figures for SpareBank 1Gruppen AS will be available at the end of February and willbe included in the bank's accounts for the first quarter of2004.
SpareBank 1 SR-Bank's investment in Odin Pengemarkeds-fond did not yield a dividend in 2003 and also contributedto a loss on exchange of NOK 8 million. At the end of 2003the bank sold all its interests in Odin Pengemarkedsfond.
Profit on exchange from the bank's portfolio of shares andprimary capital certificates amounted to NOK 93 million in2003, compared with a loss of NOK 93 million in 2002. Thebank's holdings of shares and primary capital certificatesamounted to NOK 259 at the end of the year, compared withNOK 216 million in 2002. The portfolio of bonds and certi-ficates provided a profit on exchange of NOK 22 million in2003, compared with a loss of NOK 25 million the yearbefore. Of the total commission income, interest andcurrency trading contributed NOK 55 million in 2003,compared with NOK 28 million in 2002.
OPERATING COSTS
The group's operating costs amounted to NOK 891 millionin 2003 compared with NOK 812 million in 2002, anincrease of 10 percent. Personnel costs in 2003 were NOK483 million in the group, an increase of NOK 52 million, 12percent from 2002. The increase is due to NOK 10 million
in increased pension costs inter alia due to a lower returnon the pension funds, NOK 10 million for internal measuresand an increase in bonus allocations of NOK 18 million dueto good results. The underlying growth in personnel costs is3 percent. Of other costs the IT costs have the greatestgrowth. This growth is mainly due to high costs fromSparebankutvikling AS (development collaboration betweenthe SpareBank 1 banks), plus higher costs from EDBFellesdata AS than in 2002.
The operating costs accounted for 1.72 percent of theaverage total assets (1.65). The cost percentage (costs/income excluding capital gains on securities) was 53.5percent in the parent bank, an improvement from 58percent in 2002. The bank's target is to have a cost per-centage of 50 in the parent bank.
LOSSES AND DEFAULT
Defaults in the group as of 31 December 2003 were NOK110 million higher than on 31 December 2002. The group'sgross defaults as a percentage of gross lending was 0.9percent as of 31 December 2003, up from 0.7 percent at theend of 2002. The increase in defaults must be seen incontext with loss-allocated non-defaulted commitmentsbeing reduced from NOK 751 million to NOK 419 million in2003. Some of these commitments are part of the defaultvolume at the end of 2003.
20
2.0
1.5
Perc
ent
NO
K m
illio
n
Operating costs, NOK million
Percentage of average total assets
Operating costs
0
200
400
600
800
1000
20031999 2000 2001 2002

21
The group had net losses on lending of NOK 250 million(NOK 341 million). Losses in the corporate marketamounted to NOK 221 million, while losses in the privatemarket amounted to NOK 29 million.
Losses in percentage of gross lending were 0.51 percentcompared with 0.75 percent in 2002.
In connection with the losses charged to the accounts in2002 related to Finance Credit, an action has been broughtagainst the company's auditor, KPMG. A claim under theinsurance has been brought against the bank's insurancecompany.
Specified loss provisions as of 31 December 2003amounted to NOK 316 million. Unspecified loss provisionsat the end of the year amounted to NOK 375 million or 0.77percent of total lending.
BALANCE SHEET
The group's total assets as of 31 December 2003 were NOK52.6 billion. This is an increase of NOK 3.1 billion over 2002.
Lending growth was higher than in 2002 and amounted to 8percent. Lending to the private customer market increasedby NOK 3.5 billion, an increase of 12 percent over 2002.Lending to the corporate market and public sector wasreduced by NOK 0.1 billion, a reduction of 1 percent.
Lending to the private customer market accounted for 68%of total lending.
Total deposits amounted to NOK 28.3 billion, an increase of2 percent as of 31 December 2003. The growth in the privatecustomer market was 4 percent and 1 percent in thecorporate market and private sector.
The low interest rate level and keen competition for depositfunds was a substantial contributor to the low growth indeposits.
The deposit-to-loan ratio was reduced to 57.8 percent as of31 December 2003.
Perc
ent
Retail market
Corporate market
Gross lending, percentage growth,retail and corporate market
-5
0
5
10
15
20
25
20031999 2000 2001 2002
NO
K m
illio
n
Retail market
Corporate market
Gross lending, retail and corporate market
0
5000
10000
15000
20000
25000
30000
35000
20031999 2000 2001 2002
Perc
ent
Deposit to loan ratio
20031999 2000 2001 2002

SUBSIDIARIES
The subsidiaries' expertise, services and products comple-ment the bank's product range and contribute to giving thegroup a broader range of products and services to offer thecustomers.
EiendomsMegler1 Rogaland AS has consolidated itsposition as the leading real estate company in Rogaland. Inrecent years the company has also acquired considerablemarket shares in Lyngdal, Mandal and Kristiansand. Thecompany deals in real estate, business/industry and projectbrokering, and sold 4,300 properties in 2003 at a total valueof NOK 5.8 billion. Total sales in 2003 amounted to NOK150 million and yielded a pre-tax profit of NOK 17 million.
Westbroker Finans AS offers expertise and products withinleasing and had total assets of NOK 1.62 billion at the endof the year, which corresponds to a growth of 6.4 percent.The growth in net lending was 9.3 percent. Pre-tax loss wasNOK 10 million as a result of losses on a few majorcommitments.
The business area of active finance management is organizedin the company SR-Forvaltning ASA. The company has sixemployees and manages securities for the bank, the bank'spension fund and external customers, companies and pri-vate individuals in the region. Following a cautious start-up,the company has increased managed capital by 46 percentto NOK 2.3 billion in the course of the year. Pre-tax profitamounted to NOK 6 million.
CAPITAL ADEQUACY
The capital adequacy ratio for the group was 12.4 percent atthe end of 2003, of which 9.1 percent was core capital. Forthe parent bank the corresponding figures were 12.8percent and 9.4 percent respectively. In April 2003SpareBank 1 SR-Bank issued a perpetual capital securitiesof USD 75 million. Up to 15 percent of the core capital canconsist of perpetual capital securities and the excessamount of the securities bond loan is part of thesubordinated loan capital in the capital adequacy. As of 31December 2003 the securities bonds contributed 1.4% and1.5% respectively to the group's core capital and capitaladequacy. The group's objective is a core capital ratio of 8percent and a capital adequacy ratio of 12 percent.
CORPORATE GOVERNANCE
Corporate governance in SpareBank1 SR-Bank encompassesthe objectives and general principles by which the bank isdirected and controlled to secure the interests of primarycapital certificate owners, depositors and other stake-holders in the bank. The bank's corporate governance shallensure prudent administration of assets, and provideadditional assurance that the bank's communicatedobjectives and strategies are achieved and realized. As a result of this, the bank has set up the following mainprinciples for good corporate governance based on threemain pillars: openness, predictability and transparency:• a structure that ensures focused and independent
management and control• systems that ensure measurement and accountability• effective risk management • complete information and effective communication to
support the relationship of trust between the supervisory board, the board of directors and the management
• equal treatment of primary capital certificate owners and balanced relations with other stakeholders
• compliance with statutes, rules and ethical standards
A more detailed description of the bank's corporategovernance can be found in a separate chapter on this in theannual report.
22
Perc
ent
Core capital
Capital adequacy ratio
Core capital and capital adequacy ratio
0
3
6
9
12
15
20031999 2000 2001 2002

RISK MANAGEMENT
The group places great emphasis on ongoing managementand follow-up of risks as an effective tool for achieving itsstrategic objectives. SpareBank1 SR-Bank maintained amoderate risk profile in 2003 and its objective is to imple-ment extensive risk follow-up to ensure that no individualevents can seriously affect the bank's financial standing.
SpareBank1 SR-Bank is well underway in reaching itsobjective of establishing effective risk management systemsequal to the best small and medium-sized internationalbanks. In 2003 the bank continued the process of adaptingto the new framework for risk management and new capitaladequacy requirements in accordance with the internationalregulatory requirements, Basel II. Basel II is expected toenter into force on 1 January 2007.
Credit risksCredit risks are defined as the risk of loss as a result ofcustomers or counterparties not having the ability orwillingness to meet their obligations to the bank. The bank'sstrategy for credit risks is derived from the bank's principalstrategy and contains objectives for the bank's risk profile.
The risk profile is measured through the probability ofdefaults and losses, concentration of risk related togeographical areas, the size of individual commitments,participation in loan syndicates and profitability and growth.
A risk classification system has been developed in order tomeasure the bank's lending portfolio in line with the bank'scredit strategy, credit policy and licensing rules.
Corporate marketThe bank's risk classification system for corporate marketcustomers is based on a score model that calculates theprobability of defaults. The risk matrix is divided into fivegroups: Lowest, Low, Medium, High and Highest riskrespectively.
The quality of the credit portfolio is solid with normalexposure in vulnerable lines of business. The bank has arestrictive practice related to granting new high-riskcommitments, and has implemented measures to improvethe risk profile in the portfolio. This has led to a reductionin the share of high-risk commitments in the bank'sportfolio.
Private customer marketThe bank's classification system for the private customermarket is based on the customer's financial ability to servicenew loans in relation to the standard SIFO (NationalInstitute for Consumer Research) norm for living costs forvarious family sizes.
For the private customer market the loss risk is calculatedand assessed in a combination of quantitative andqualitative information on the portfolio. This loss risk isconsiderably lower than for the corporate market.
Market risksMarket risks affect the results through fluctuations in thevalue of currency, interest rate and securities portfolios. Themanagement of market risks is carried out through detailedlimits for investments in shares, bonds and positions in theinterest rate and currency markets, etc. which are reportedmonthly to the board. These limits are reviewed at leastonce a year and adopted by the board. The bank hasconservative limits for market risks that are well within themaximum limits stipulated by the authorities.
Liquidity risksBriefly, liquidity risks can be said to be the risk of the banknot being able to fulfil its obligations when due.
Management of the bank's funding structure is based on aprincipal liquidity strategy, which is reviewed and adoptedby the board at least once a year. The bank's objective is tohave reserves that enable the bank to survive for one monthin terms of liquidity without access to external funding andwithout other extraordinary measures.
The liquidity risks are reduced by distribution of fundingamong various markets, funding sources, instruments andloan periods.
Deposits from customers are the bank's most importantfunding source. Low interest levels and a good return onsecurities in 2003 have led to a change in the customers'savings pattern and less bank savings, among other things.The deposit-to-loan ratio has been reduced from 60.8% asof 31 December 2002 to 57.8% as of 31 December 2003.
The bank's liquidity situation as of 31 December 2003 isgood. The bank has an undrawn revolving credit facility inthe amount of EURO 270 million. Of the bank's total netrefinancing requirements, only 26% is to be refinanced in2004. There is an even distribution between internationaland national funding sources.
Operational risksOperational risks can be defined as the risk of loss due to:• human errors• failure in internal systems and processes• external events
Effective management of the operational risks is conditionalon systems and processes for continuous identification,analysis and quantification of the risk. In 2003 the bank
23

therefore prioritized the development of processes andsystems for this.
THE SPAREBANK 1 ALLIANCE
The SpareBank 1 alliance is a Scandinavian banking andproduct alliance in which the SpareBank 1 banks in Norwaycooperate through the jointly-owned SpareBank 1 GruppenAS. The other owners and partners through the SpareBank 1Gruppen AS are FöreningsSparbanken AB (publ) in Swedenand the Norwegian Confederation of Trade Unions (LO).SpareBank 1 Gruppen AS owns the following companies:Bank 1 Oslo AS, SpareBank 1 Livsforsikring AS, SpareBank1 Fondsforsikring AS, SpareBank 1 Skadeforsikring AS,SpareBank 1 Odin Forvaltning AS, SpareBank 1 Bilplan AS(67.2%) and First Securities ASA (33.3%).
The paramount goal of the SpareBank 1 Alliance is to securethe individual bank's independence and regional tiesthrough robust competitiveness, profitability and solidity. Atthe same time, the SpareBank 1 Alliance represents acomplete competitive alternative at the national andScandinavian levels. In 2003 the strategy for the bankingalliance and SpareBank 1 Gruppen was further reinforced.Sparebanken Vest chose to withdraw from the alliance as of31 December 2003, but will continue to distributeSpareBank 1's products.
The ownership interest in SpareBank 1 Gruppen AS isregarded as participation in a joint venture and is accountedfor in accordance with the equity method in the bank'saccounts. This means that the bank has included a 14.08%share of the results of SpareBank 1 Gruppen AS in itsaccounts for 2003.
The efficiency improvement program that was implementedat the beginning of the fourth quarter of 2002 provides anannual efficiency gain of NOK 244 million with full effectfrom 2004. The program also required a workforcereduction of 125 man-years or just over 10% of the totalnumber of employees. The process required redundancy of50 employees in the fall of 2003. The goal for demanningwas reached as of 31 December 2003.
In 2003 the bank's share of the results was -NOK 7 millionbased on a preliminary forecast, an improvement of NOK160 million. The ownership interest is listed under "Sharesand ownership interests" with an amount corresponding to14.8% of SpareBank 1 Gruppen AS’ equity capital.
FöreningsSparbanken is the largest owner in SpareBank 1Gruppen AS with 25%. In February 2003 SpareBank 1 andFöreningsSparbanken renewed the cooperation agreement.The new agreement entails closer commercial cooperation
in several areas. In particular, cooperation with respect tocard and payment services will be expanded. Another jointambition is to extend the commercial cooperation within IT,customer-related services and basic banking services.
At the end of 2003 the SpareBank 1 alliance in Norway hadabout 295 offices and branches located all over the country.SpareBank 1 Gruppen's products are distributed throughabout 350 offices.
In 2003 SpareBank 1 Gruppen sold its share of 65% inEnterCard AS.
MEASURES TO IMPROVE EARNINGS AND REDUCE RISK
The board is interested in measures that can secure goodand stable earnings in the group.
In 2003 the board focused on the following areas amongothers:
• continuation of measures already implemented related to the bank's cost and income enhancement program
• the bank's funding strategy and framework for capital acquisition and capital application
• reinforcement of the controller organization and control systems for credit, currency/finance, including a system for uniform risk management
• credit strategy and paramount credit policy guidelines• strengthening of the portfolio monitoring area and
commitment follow-up• measures to develop expertise for further development
of the corporate market and the savings and insurance markets
It is the board's opinion that the measures implementedhave contributed to improved operational effectiveness,greater robustness in the group's operations and betterquality in the credit portfolio at the end of the year.
AUDITOR
The bank's external auditor is PricewaterhouseCoopers.
An agreement has been signed with Ernst & Young fordelivery of internal auditing services. Internal auditingreports to the bank's board from 2003. In 2003 the boardappointed the head of the bank's internal auditing.
EMPLOYEES AND WORKING ENVIRONMENT
At the end of 2003 the group had 894 employees,
24
corresponding to 829 man-years. In the course of the yearthe bank's staffing was reduced by 8 man-years to 708 man-years, including temporary help.
The bank has conducted organizational and workingenvironment surveys in 2003 as well, which show that theemployees have a good relationship with the bank as anemployer. The bank has employees who are motivated forsales, able and willing to adapt, and desire to acquire newskills. The group's employees have a great deal of job satis-faction and enjoy their working environment. Absence dueto illness is still low compared with other financialinstitutions, but there has been an increase from 4% to4.1% in 2003. In order to further strengthen the bank's HSEwork, the bank became an IA company (inclusive workinglife company) on 1 December 2003. This entails betteropportunities for follow-up of and measures directedtowards personnel.
The bank works proactively with health, safety and theenvironment, and it continuously seeks to improve thebank's security system. In 2003 the bank suffered a robberyin the bank's branch at Hinna in the Stavanger region.
The bank does not use any input materials or productionmethods that have any significant environmental impact.The group's direct impact on the external environmental islimited to the materials and energy that are required so thatthe group can carry out its activities. We are workingcontinuously on a transition to electronic communicationinternally and externally that will also contribute to reducedpaper consumption.
In the opinion of the board, the bank's activities do notpollute the external environment.
Equal opportunitiesOf the bank's 829 man-years, the share of women is 55percent. In recent years this share has been approximatelystable.
Gender distribution in the group's management groups:Group management:7 persons: 6 men and 1 womanExtended management group:40 persons: 30 men and10 women
Average pay for bank employees is NOK 320,000. Averagepay for women and men is NOK 297,000 and NOK 350,000respectively.In 2003 the group recruited 28 new employees, of which 14were women and 14 were men.
The number of employees with reduced working hours is
214, which amounts to 136 man-years. Of this there are 14men with six man-years and 200 women corresponding to130 man-years.
For several years the group has worked on increasing theshare of women in leading positions and the followingmeasures have been implemented to promote equalopportunities:• Special pay review with a view towards uncovering
difference in pay between the genders. This pay review shows that the group has equal pay for equal work. The difference in the average pay is due to a relatively larger share of men in leading positions.
• An objective has been adopted to increase the share of women in leading positions. The share has increased from 14 percent to 32 percent in the past four years.
• A dedicated talent development program to develop our own specialists and managers in-house. Nineteen persons have been selected for last year, of which 13 are women
• Dedicated manager program for all group managers has been established
• There is a great deal of job flexibility with regard to home computers and the opportunity to work flexible hours
• There is good adaptation of working conditions with regard to the employees' needs and life phases
BANK ADVISORY COUNCILS
Bank advisory councils have been established in themunicipalities where the bank is represented. The bankadvisory councils have actively contributed to the work onpromoting the bank's position in 2003 as well. The bankadvisory councils are to be a supplement to the marketexpertise possessed by the bank. They are to look atopportunities in the local market and represent a broadercorrective to the bank, and thus function as advisers to thelocal offices. The bank advisory councils also play animportant role in connection with allocation of grants.
PRIMARY CAPITAL
At the end of the year there were 7,065 registered owners ofthe bank's primary capital certificates, about 10% morethan in December 2002 (6,412). The percentage of primarycapital certificates owned by foreigners was 17.1 percent(16.5), while 47.1 percent (46.0) was linked to Rogaland.The 20 largest owners controlled 34.6 percent (38.5) of theprimary capital at the end of the year.
In 2003 the number of primary capital certificates soldcorresponded to 31 percent of the number of certificates
25

issued. This is an increase from 27 percent in 2002. Theprimary capital certificates have had a substantial pricegrowth in the course of 2003, from NOK 180 at the beginningof the year to NOK 323 at the end of 2003. Including paiddividend this provided an effective return of 85 percent in2003.
In the course of 2003 the bank sold net 30,228 of its ownprimary capital certificates and the holding as of 31December 2003 was 38,662 primary capital certificates.
In 2003 the bank also exercised its authorization from thesupervisory board to sell its own primary capital certificatesto employees instead of increasing the primary capital inconnection with an employee issue.
In a board meeting on in December 2003, SparebankenRogaland considered a proposal for a bonus issue of NOK150 million by means of a transfer from the equalizationreserve to the primary capital. The matter was consideredbefore in a meeting of the supervisory board on 27 March2003. On the basis of unfavorable RISK (adjustment oforiginal cost of shares by taxed profits) rules related tobonus issues in primary capital certificate banks, the bankhas awaited implementing the bonus issue. The Storting(Norwegian Parliament) approved the changes in the RISKrules for the savings banks in December 2003, and a bonusissue will now not cause a negative RISK adjustment for theprimary capital certificate owners. In its two meetings on 25March 2004, the supervisory board will adopt conditionsrelated to the bonus issue. The board proposes that NOK150.8 million be transferred from the equalization reserveand that 1,507,640 new primary capital certificates (freecertificates) be issued at issue price and nominal value percertificate of NOK 100. Five old certificates will thus equalone new primary capital certificate. The number of primarycapital certificates the owners have when the supervisoryboard makes its final decision will be the basis for allotment.
The result per primary capital certificate for 2003 was NOK32.7. Based on the bank's dividend policy and other assess-ments, the board proposes that a dividend of NOK 20 perprimary capital certificate be paid for 2003. The RISKamount as of 1 January 2004 is estimated at NOK 12.9 perprimary capital certificate.
In accordance with the (Norwegian) Savings Banks Act amaximum of 25 percent of the savings bank's reserve'sshare of the profit may be allocated to an endowment fund.The maximum allocation was previously 10 percent. Theboard proposes allocating about 20 percent or NOK 32million to the endowment fund in 2003.
GOING CONCERN
The profit outlook for 2004 and the long-term budget for theyears to come, together with the measures that have beenimplemented and planned, provide good prospects for con-tinued prosperity for the group. The group has good solidityand the core capital and capital adequacy ratio are wellabove the authorities' requirements. The annual accountshave been prepared on the basis of the going concernassumption.
ALLOCATION OF PROFIT FOR THE YEAR/DIVIDEND
The board proposes the following allocations for the 2003financial year.
NOK millionProfit for the year 408From reserve for valuation variances 0For allocation 408
Dividend (NOK 20 per primary capital certificate) 151Equalization reserve 95The savings bank's reserve 130Endowment fund 32Total 408
26
NO
K
Perc
ent
Dividend per certificate, NOK
Direct return, percent
Dividend per certificate and direct return
0
5
10
15
20
25
20031999 2000 2001 2002
0
2
4
6
8
10
OUTLOOK FOR THE FUTURE
The interest rate level has declined throughout 2003 and isnow at a historical low.
The low interest rate level together with a weaker krone ratecontribute to a considerable improvement in the businesscycle prospects and framework condition for business andindustry at the beginning of 2004.
The low interest rate level is also positive for the householdsector, with lower interest costs and the prospects of lowunemployment.
The lending growth is expected to increase somewhat in theprivate customer and corporate markets in 2004.
Growth in deposits is expected to be low in 2004 as well.The low interest rate level which is expected to continue in2004 will to a greater degree than in 2003 lead to bankdeposits having to compete with other investmentalternatives.
In the board's opinion there is a need for a regionally based,profitable savings bank. In order to secure the bank'sposition, the bank must have the confidence of its customers.It is the board's opinion that these goals can best be attainedthrough activities where proximity to the customers can becombined with efficient operations.
The board emphasizes the significance of being in the fore-front with regard to profitability and the scope of service vis-à-vis customers. Another goal is that the group is to be per-ceived as an attractive workplace for competent employees.
The bank will therefore continue to work actively to developthe collaboration in the SpareBank 1 alliance. Through thiscollaboration the bank benefits from economies of scale,
inter alia in brand building, technology and access to com-petitive products.
The dynamics in the finance industry are considerable. Thetransition needs for the individual players are extensive andof a continuous nature, not least as a result of more stringentcustomer requirements and expectations and technologicalchanges.
In the board's opinion the bank has succeeded in high-lighting the savings bank concept as a good and modernplatform for business operations. As a savings bank withregional ties, SpareBank 1 SR-Bank's development is greatlyinfluenced by regional developments, as this is where ouroperations take place. The bank therefore works to promotea good business and industry policy that can contribute tothe best possible basis for a competitive business andindustry sector. This is also the reason why part of the assetscreated by the bank are plowed back into the localcommunity. An example is the bank's endowment fund.
A low interest rate level will put even more pressure on theinterest margin, and the significance of increasing otherincome together with cost-effective operations will becrucial to the bank's ability to deliver good results in 2004.In the board's opinion SpareBank 1 SR-Bank is well-equipped to meet this challenge.
The board expects satisfactory profit performance for thegroup in 2004.
The board would like to thank the bank's employees fortheir efforts in the year behind us and their contribution tothe bank's results.
The board would also like to thank the bank's customersand elected representatives for their support in 2003.
27
Stavanger, 26 February 2004The Board of Directors of Sparebanken Rogaland
Geir WorumChairman
Ole Gladhaug Anne Elisabeth Kroken
Kristian EidesvikVice Chairman
Gunn-Jane Håland John P. Hernes
Magne Vathne Torstein Plener Terje VarebergChief Executive Officer

Geir WorumYear of birth: 1947 Board chairmanOriginally elected: 1999 Elected for this term until: 2006 HaugesundBoard Chairman of: Woco AS, Helse Fonna HF, Oma Båtbyggeri A/S, Solve IT-Stavanger AS, Rasmussen Elektro AS, Helifuel AS Board member of: Data Design System ASA, Carbontech AS
Kristian Eidesvik Year of birth: 1945 Deputy chairmanOriginally elected: 1997 Elected for this term until: 2005 Shipowner, BømloBoard chairman of: Wilson AS, Green Reefers ASA, Caiano AS
Ole GladhaugYear of birth: 1954 Originally elected: 1998 Elected for this term until: 2005 Financial Director, Kristian Gerhard Jebsen Group, London
Anne Elisabeth Kroken Year of birth: 1962 Originally elected: 2003 Elected for this term until: 2005 Attorney, Stavanger
Gunn-Jane HålandYear of birth: 1963 Originally elected: 2003 Elected for this term until: 2005 Senior consultant, Petoro AS,Stavanger
John Peter HernesYear of birth: 1959 Originally elected: 2001 Elected for this term until: 2005 General manager, SåkornInVest,Forus Board chairman of: Kino 1 Stavanger/Sandnes AS Board member of: Rogaland Theatre,Stavanger Concert Hall FoundationNovel Diagnostics ASA
Magne VathneYear of birth: 1944 Originally elected: 1998 Elected for this term until: 2006 Managing Director, Coop Økonom BA, StavangerBoard member of: OBS AS, Coop Økonom BA, Marieroparken AS
Terje VarebergYear of birth: 1948 CEO, SpareBank 1 SR-BankBoard chairman of: Statkraft SFDeputy chairman of: RogalandTheatreBoard member of: SpareBank 1 Gruppen AS, Sparebankenes Hus AS
Torstein PlenerYear of birth: 1961 Originally elected: 2000 Elected for this term until: 2004 Corporate employee representative of:SpareBank 1 SR-Bank Board member of: SpareBank 1 Gruppen AS
28
Board of SpareBank 1 SR-Bank. From the left: Kristian Eidesvik, Torstein Plener, Gunn-Jane Håland, Magne Vathne, Geir Worum, Terje Vareberg, John Peter Hernes, Anne Elisabeth Kroken and Ole Gladhaug.
CONTENTS PAGE
Profit and loss account 30Balance sheet 31Cash flow statement 32Accounting principles 33
NOTESNote 1 Interest income and interst costs 36Note 2 Net other operating income 36Note 3 Wages and gen. adm. costs 37Note 4 Other operating costs 38Note 5 Loss on loans and guarantees 38Note 6 Loss/gain on long-term financial assets 38Note 7 Taxes 39Note 8 Claims on credit institutions 39Note 9 Gross loans to customers 40Note 10 Loss provisions 40Note 11 Non-performing, problem and non-accrual loans 40Note 12 Risk classification of loans 41Note 13 Loss on loans and guarantees in 2003 by industry 45Note 14 Certificates and bonds 45Note 15 Shares and ownership stakes 45Note 16 Fixed assets 50Note 17 Other assets 51Note 18 Prepayments and accrued income 51Note 19 Debt to credit institutions 51Note 20 Deposits from customers 51Note 21 Bond debt and other long-term loans 52Note 22 Alloc. to commitments and costs 52Note 23 Pension schemes 52Note 24 Subordinated loan capital 54Note 25 Primary capital certificate capital, ownership structure and movement in equity 55Note 26 Guarantee liabilities/Secured debt 56Note 27 Forex position and exchange and interest agreements 56Note 28 Contingent liabilties 57Note 29 Distribution of loans, guarantees and deposits by industry and geographical areas 57Note 30 Transactions with subsidiaries 58Note 31 Capital adequacy ratio 59Note 32 Remaining – and fixed – interest periods 60Note 33 Summary of accounts for subsidiaries 62Note 34 IAS/IFRS implementation 62
Auditor’s report/The audit committeés report 63Key figures last 5 years 66Primary capital certificates 68
29
ANNUAL REPORT

30
PROFIT AND LOSS ACCOUNT
SpareBank 1 SR-Bank SpareBank 1 SR-Bank group
2001 2002 2003 NOTE 2003 2002 2001
3 410 3 593 2 921 Interest income 1 3 009 3 696 3 559
2 488 2 588 1 871 Interest costs 1 1 914 2 646 2 580
922 1 005 1 050 Net interest income 1 095 1 050 979
20 -115 14 Dividends 2 7 -135 -14
331 345 360 Commission income 2 379 362 356
-80 -74 -67 Commission costs 2 -66 -73 -74
32 -115 163 Net change in fair market value of securities 2 163 -115 32
11 8 8 Other operating income 2 118 98 97
314 49 478 Net other operating income 601 137 397
1 236 1 054 1 528 Total operating income 1 696 1 187 1 376
531 571 622 Wages and general administration costs 3 727 666 622
55 54 55 Depreciation and write-downs 16 63 61 61
82 69 83 Other operating costs 4 101 85 102
668 694 760 Total operating costs 891 812 785
568 360 768 Profit before losses and write-downs 805 375 591
151 335 218 Loss on loans and guarantees 5, 13 250 341 159
10 16 -14 Loss/gain on long-term financial assets 6 -14 16 10
407 9 564 Result of ordinary activities 569 18 422
113 43 156 Taxes 7 160 51 127
294 -34 408 Profit/loss for the year 409 -33 295
Including minority interests 1 1 1
-143 -75 -151 Dividend -151 -75 -143
56 124 0 Transferred from reserve for valuation variances 0 124 56
-78 20 -95 Transferred to/from equalization reserve -95 20 -78
-117 -35 -130 Transferred to savings bank’s reserve -130 -35 -117
-12 0 -32 Transferred to endowment fund -32 0 -12
-294 34 -408 Total allocation of profit/coverage of loss for the year -408 34 -294
24.7 -2.8 32.7 Profit/loss per primary capital certificate 32.7 -2.8 24.7
Geir WorumChairman
Ole Gladhaug Anne Elisabeth Kroken
Kristian EidesvikVice Chairman
Gunn-Jane Håland John P. Hernes
Magne Vathne Torstein Plener Terje VarebergChief Executive Officer

31
BALANCE SHEET
SpareBank 1 SR-Bank SpareBank 1 SR-Bank group
2001 2002 2003 NOTE 2003 2002 2001
Assets
667 631 545 Cash and claims on central banks 545 631 667
477 333 668 Claims on credit institutions 8 149 144 352
42 631 44 078 47 379 Gross loans to customers 9,11,12,29 48 874 45 445 43 766
-282 -383 -299 Specified loss provisions 10 -316 -396 -290
-341 -360 -360 Unspecified loss provisions 10 -375 -375 -356
42 008 43 335 46 720 Net loans to customers 48 183 44 674 43 120
3 1 0 Repossessed assets 17 32 2 6
1 916 2 268 2 375 Certificates and bonds 14 2 375 2 268 1 916
1 557 1 094 769 Shares and ownership stakes 15 617 940 1 351
75 104 34 Intangible assets 16 65 151 118
310 322 309 Tangible fixed assets 16 321 332 321
302 61 69 Other assets 17 48 95 338
279 300 300 Prepayments and accrued income 18 307 301 282
47 594 48 449 51 789 Total assets 52 642 49 538 48 471
Liabilities and equity
6 380 5 066 4 928 Debt to credit institutions 19 4 912 4 959 5 875
22 900 26 716 27 548 Deposits from customers 20, 29 28 266 27 634 24 011
29 280 31 782 32 476 Total deposits 33 178 32 593 29 886
4 345 4 535 2 248 Certificates and other short-term borrowings 2 248 4 535 4 345
8 592 7 316 11 412 Bond and other long-term dept 21 11 412 7 316 8 592
12 937 11 851 13 660 Debt established by issuance of securities 13 660 11 851 12 937
386 423 497 Other debt 546 556 520
254 278 362 Accrued costs and income paid in advance 415 376 346
132 139 150 Cost accruals and other provisions 22, 23 157 144 135
1 919 1 420 1 835 Subordinated loan capital 24 1 875 1 460 1 959
748 747 750 Primary capital certificate capital 750 747 748
15 16 18 Premium reserve 18 16 15
132 0 0 Reserve for valuation variances 0 0 132
967 1 002 1 132 Savings bank’s reserve 1 132 1 002 967
28 16 37 Endowment fund 37 16 28
796 775 872 Dividend equalization reserve 872 775 796
0 0 0 Minority interests 2 2 2
2 686 2 556 2 809 Total equity 25 2 811 2 558 2 688
47 594 48 449 51 789 Total liabilities and equity 52 642 49 538 48 471
See Notes 26 and 27 for off-balance sheet items.

32
CASH FLOW STATEMENT
SpareBank 1 SR-Bank SpareBank 1 SR-Bank group
2001 2002 2003 2003 2002 2001
294 -34 408 Profit for the year 408 -34 294
56 124 0 Retained earnings in subsidiaries and joint ventures 0 0 0
-143 -75 -151 Dividend to owners of primary capital certificates -151 -75 -143
34 20 7 Dividends from subsidiaries 0 0 0
-1 1 1 Gain/loss on long-term financial assets 1 1 -1
11 15 -15 Revaluations/write-downs on long-term financial assets -15 15 11
55 54 55 Depreciation and write-downs 63 61 61
151 335 218 Loss on loans 250 341 159
457 440 523 Transferred from the year’s activity 556 309 381
-5 932 -1 781 -3 520 Change in gross loans to customers -3 680 -2 020 -4 543
9 2 1 Change in repossessed assets -30 4 14
759 92 -239 Change in claims on credit institutions 91 157 -84
1 878 3 817 831 Change in deposits from customers 632 3 623 1 891
1 147 -1 265 -138 Change in debt to credit institutions -47 -866 649
-178 -352 -107 Change in certificates and bonds -107 -352 -178
-67 303 -29 Change in other claims 42 302 -83
-70 108 159 Change in other short-term liabilities 25 218 -81
-1 997 1 364 -2 519 A Net cash flow from the activity -2 518 1 375 -2 034
-41 -60 -37 Change in fixed assets -43 -63 -53
-18 448 340 Change in shares and ownership stakes 337 396 -15
-59 388 303 B Net cash flow, investments 294 333 -68
50 -50 0 Change in deposits from Norges Bank 0 -50 50
1 813 -1 086 1 808 Change in debt established by issuance of securities 1 808 -1 086 1 795
329 -703 417 Change in other long-term liabilities 425 -659 393
2 192 -1 839 2 225 C Net cash flow, financing 2 233 -1 795 2 238
136 -87 9 A+B+C Net cash flow during the year 9 -87 136
635 771 684 Cash and cash equivalents January 1st 684 771 635
771 684 693 Cash and cash equivalents December 31st 693 684 771
136 -87 9 Net cash flow during the year 9 -87 136
The cash and cash equivalents includes cash and claims on central banks, plus the share of the total of claims on credit istitutions that
pertains to placements solely in credit institutions. The cash flow statement shows cash provided and used by SpareBank 1 SR-Bank
and SpareBank 1 SR-Bank Group.
Altogether, the cash and cash equivalents of the Sparebank 1 SR-Bank Group increased by NOK 9 million. The underlying banking
operations in 2003 are characterised by an increase in the growth of loans and a reduction in the growth of customer deposits. There
has been an increase in debt established by issuance of securities and other long-term debt.
GENERALThe annual accounts for 2003 have been prepared inaccordance with the applicable statutes, regulations andgene-rally accepted accounting principles. All figures arestated in millions of NOK unless otherwise indicated. Thesame accounting principles are applied to the parent bank'sand the group's accounts.
CONSOLIDATION OF SUBSIDIARIESThe group accounts include SpareBank 1 SR-Bank andcompanies in which SpareBank 1 SR-Bank directly orindirectly owns more than 50 percent of the shares or has acontrolling influence over the company's operations. Theinvestments in subsidiaries have been consolidatedaccording to the acquisition method in the group accountsand the equity method in the company's accounts.
AFFILIATED COMPANIESAffiliated companies are defined as companies in which thebank has a long-term investment with an ownership interestof 20 to 50 percent and significant influence. Suchinvestments are valued according to the equity method bothin the company's accounts and the group accounts.
JOINT VENTURESJoint ventures are financial operations governed by an agre-ement between the bank and one or more participants, sothat the bank and the participants have joint control of theoperations. No participants have controlling influencealone. The bank owns SpareBank 1 Gruppen AS incollaboration with SpareBank 1 Nord-Norge, SpareBank 1Midt-Norge, SpareBank 1 Vest and SamarbeidendeSparebanker AS. Each of the parties owns 14.08 percent ofthe shares in the company, with the exception of Sparebank1 Vest, which owns 8.67 percent. In addition, SwedishFöreningsSparbanken AB owns 25 percent of the shares inthe company, and the Norwegian Confede-ration of TradeUnions (LO) and trade unions associated with LO own 10percent of the shares. The management structure for theSpareBank 1 collaboration is governed by an agreementbetween the owners. In the accounts for SpareBank 1 SR-Bank the shares in SpareBank 1 Gruppen AS have beenvalued according to the equity method, both in the com-pany's accounts and the group accounts, as the operationsof SpareBank 1 Gruppen are considerably different than thebank's other operations, where use of the proportionateconsolidation method would provide accountinginformation that is not easily accessible.
RECOGNITION OF INCOME AND COSTSInterest and commission fees are recognized in the profitand loss account as they are earned as income or accruedas costs. Fees that are a direct payment for servicesrendered are taken to income when they are earned. Loanarrangement fees are taken to income in accordance withthe costs that accrue for arranging loans. The accrualsprinciple is applied to prepaid income and accrued unpaidcosts at the end of the year, which are entered as debt in thebalance sheet. Accrued income is taken to income andentered as receivables in the balance sheet. Share dividendsand dividends from money market funds are taken toincome in the year they are received. The payment andincome years coincide for the Odin money market fund.Share dividends and group contributions from subsidiaries,affiliated companies and joint ventures, less deferred tax,are entered directly against the book ownership interest inthe associated business. Gains/Losses on the sale ofsecurities are calculated on the basis of the average costprice of the papers sold. The purchase and sale of securitiesare recognized on the settlement date.
SECURITIES AND SHARESShares, primary capital certificates and interests in equityfunds that are traded on the stock exchange or in aregulated market and have good ownership diversificationand liquidity are included in the trading portfolio and valuedat market value on the balance sheet date. If there is nocontinuous market, then the value will be calculated basedon the company's best understanding of the market.Securities that are not listed on the stock exchange arevalued at the lower of original cost or estimated marketvalue. Long-term shareholdings are valued at original cost.If the fair value is considerably lower than the original cost,and the decline in value is not deemed to be of a temporarynature, then the share is written down to the fair value. Thewrite-down is reversed when there no longer is a basis forthe write-down.
CERTIFICATES AND BONDSCertificates and bonds are classified as a trading portfolioand valued at market value on the balance sheet date.
FOREIGN CURRENCYThe bank's assets and liabilities in foreign currency areconverted to middle rates as of 31 December. Income andcosts in foreign currency are converted to NOK at the ratesin effect at the time of the transaction. The currency itemsare mainly hedged against corresponding items on theopposite side of the balance sheet or by hedging -transactions off the balance sheet.
33
ACCOUNTING PRINCIPLES

FINANCIAL INSTRUMENTSFinancial instruments include negotiable financial asset andliability items plus financial derivatives. Financial instrumentsin the balance sheet include shares, primary capitalcertificates, bonds, certificates and interests in moneymarket instruments as well as financial derivatives.Financial derivatives are agreements that are entered intowith financial institutions or customers to set financialvalues in the form of interest terms, foreign exchange ratesand the value of equity instruments for specific periods oftime. These agreements include forward exchangecontracts, interest rate swaps (currency swaps), currencyand interest rate options, and agreements to set futureinterest terms (FRAs).
A distinction is made between agreements that are a stagein own-account transactions in order to achieve earningsthrough price differences and price changes (the tradingportfolio) and agreements that are entered into in thecourse of ordinary business. Interest rate and foreigncurrency agreements are classified at the time they areentered into as part of the trading portfolio or bankingbusiness depending on the individual agreement. Thetrading portfolio consists of certificates and bonds, sharesand primary capital certificates in the bank's balance sheet,plus currency, interest and equity instruments not includedin the balance sheet.
The off-balance sheet portfolios are valued according to themarket value method, and changes in market values areentered in the profit and loss account under the net changein fair market value of securities. Agreements that are ente-red into to reduce the bank's exposure to fluctuations ininterest and/or exchange rates for items in the balancesheet are defined as hedging transactions.
In order for foreign currency or interest rate agreements tobe defined as hedging transactions, the expected trend inthe value of the hedging transactions must be closelyassociated with the balance sheet item that is hedged.Income and expenses related to the hedging agreementsand their respective balance sheet items are entered in theaccounts as accruals and classified in the same way.
LOSSES ON LOANSLoans are valued at their nominal value with the exceptionof problem, non-performing and renegotiated loans.
NON-PERFORMING/PROBLEM LOANSThe aggregate loans to a customer are regarded as non-performing and included in the bank's summaries of non-performing loans when the installment or interest due hasnot been paid within 90 days after the due date or when theline of credit has been overdrawn for 90 days or more. Loansand other commitments that are not non-performing, but
where the customer's financial situation makes it likely thatthe bank will incur a loss, are classified as problem loans.
SPECIFIED LOSS PROVISIONSWhen loans have been non-performing for more than 60days or are classified as problem loans, unpaid interest isreversed and further recognition of income is halted unlessthe loan is covered by underlying collateral. The differencebetween the value of the loan and value of the collateral isadjusted based on the customer's assumed servicingcapacity and charged as an expense under losses on loansand guarantees. The valuation of collateral is based onobjective valuation rules for the maximum value andobjective downward adjustment rules. There is, however, acertain degree of uncertainty associated with the actualrealization value of the individual items of collateral and thecustomer's financial servicing capacity.
UNSPECIFIED LOSS PROVISIONSUnspecified loss provisions are to cover losses that, on thebasis of conditions that prevail on the balance sheet date,are expected to come in addition to losses that have beenidentified and estimated for individual customers. Suchprovisions are estimated on the basis of the valuation ofportfolios, experience and general development trends.Changes in the size of the lending portfolio are taken intoconsideration.
ACTUAL LOAN LOSSESWhen it is highly likely that the losses are final, the lossesare classified as actual loan losses. Actual loan losses thatare covered by specified loss provisions that have previouslybeen made are charged against these provisions. Actualloan losses that are not covered by loan loss provisions, aswell as excess or insufficient coverage in relation to previousloss provisions, are entered in the profit and loss account.
ACQUIRED ASSETSAs part of the handling of non-performing loans andguarantees, the bank acquires in some cases assets thathave been furnished as security for these commitments. Atthe time of acquisition, the assets are valued at theirassumed realization value. Acquired assets that are to berealized are classified as current assets. Any losses and/orgains at the time of disposal or revaluation of the value ofthese assets are entered as a loss or reduction in the loss onthe loan.
LEASINGThe leasing portfolio is classified for accounting purposesas leasing agreements under the main category of loans toand receivables from customers. Leasing income is enteredas leasing income under interest income and theexpenditures as interest costs.
34
TANGIBLE FIXED ASSETSTangible fixed assets are entered in the accounts at costwith the addition of previous revaluation, and the deductionof write-downs and ordinary accumulated depreciation.Ordinary depreciation is based on the cost price and thedepreciation is distributed linearly over the useful life of theassets. If the fair value of a tangible fixed asset isconsiderably less than the book value, and the decrease invalue cannot be expected to be temporary, the asset iswritten down to the fair value. The write-down is reversedwhen there no longer is a basis for the write-down.
ISSUED BONDS AND OTHER LOANSIssued bonds are entered in the balance sheet at theirnominal value with premiums added and discountsdeducted. Premiums are taken to income and discounts arecharged against income according to a schedule as anadjustment of the current interest costs until the bondmatures or until the first time the interest rate is adjusted.Capital discounts when raising other long-term loans arehandled in a similar manner. Direct costs related to raisingbonds loans and other loans are charged against incomeaccording to a schedule as an adjustment to the currentinterest costs until the bond or loan matures.
SUBORDINATED LOAN CAPITAL/PERPETUAL CAPITAL SECURITIESSubordinated loan capital is subordinated to bond debt andtherefore has a higher price. Fixed maturity subordinatedloan capital is eligible for inclusion in the core capital by anamount not exceeding 50 percent of the capital adequacyratio, while perpetual subordinated loan capital mayaccount for up to 100 percent of the core capital.
In April 2003 Sparebank 1 SR-Bank issued a USD 75 millionperpetual subordinated loan capital security. A perpetualsubordinated loan capital security is a so-called “hybrid”that ranks somewhere between equity and subordinatedloan capital, for instance in terms of priority. A Perpetualsubordinated loan capital security is an interest-bearingsecurity, though the banks are not obligated to pay interestsin a period where no dividends are being paid. Investors arenot at a later point of time entitled to retained interests, thatis, the interests are not accumulated. Perpetualsubordinated loan capital securities are eligible forinclusion in the core capital by an amount not exceeding 15percent of total core capital. Issuing perpetualsubordinated loan capital securities does not affect thebank’s equity . The transaction costs are capitalised andaccrued over the security’s life span.
PENSION LIABILITIESPension costs and liabilities are calculated according tolinear earnings based on assumptions regarding thediscount rate, future wage adjustments, pensions and
benefits from the National Insurance Scheme, future returnon pension assets as well as actuarial assumptions relatedto mortality, attrition, etc. In the balance sheet net pensionfunds in the group plan are treated as fixed assets, where-asnet unfunded pension liabilities are classified as long-termdebt. The employer's National Insurance contributions thatwill accrue at the current rates are also included in theamount of the unfunded pension liabilities. Net pensioncosts are classified in their entirety under wage costs in theprofit and loss account, and include the earned pensionbenefits for the period and interest costs on the liabilitiesminus the estimated return on the pension funds. Theeconomic effects of changes in pension plans are amortizedover the average remaining contribution period. Otherchanges and differences are evaluated in total against thehighest value of the total pension liabilities and totalpension funds. If total changes and estimated differencesrepresent more than 10 percent of this basis at the end ofthe fiscal year, the surplus will be amortized over theremaining contribution period in the profit and lossaccount.
TAXESThe annual tax expenditures in the profit and loss accountconsist of taxes payable on the income for the year adjustedfor surplus or deficit allocations from previous years pluschanges in deferred taxes. Deferred taxes are calculated onthe basis of temporary differences between accounting andtax values at the close of the accounting year. The nominaltax rate is employed in the calculation. Positive and negativedifferences are valued against each other and shown as thenet value in the balance sheet. Deferred tax benefits arise ifthere are temporary differences that give rise to taxdeductions in the future.
LIABILITIESLiabilities are entered at original cost. Interest is recognizedas an expense in the profit and loss account on acontinuous basis.
BUSINESS AREASSpareBank 1 SR-Bank considers business in the bank to bean aggregate business area.
35

36
NOTES
SpareBank 1 SR-Bank SpareBank 1 SR-Bank group
2001 2002 2003 NOTE 1 INTEREST INCOME AND INTEREST COSTS 2003 2002 2001
96 79 40 Interest on claims on credit institutions 30 73 45
3 164 3 360 2 753 Interest on loans to customers 2 851 3 469 3 362
150 154 128 Interest on certificates and bonds 128 154 152
3 410 3 593 2 921 Interest income 3 009 3 696 3 559
380 365 194 Interest on debt to credit institutions 193 347 376
1 256 1 441 961 Interest on deposits from customers 1 003 1 514 1 346
701 673 617 Interest on issued securities 617 673 701
120 73 59 Interest on subordinated loan capital 61 76 126
31 36 40 Other interest costs 40 36 31
2 488 2 588 1 871 Interest costs 1 914 2 646 2 580
2001 2002 2003 NOTE 2 NET OTHER OPERATING INCOME 2003 2002 2001
42 33 14 Income on shares 14 33 42
-56 -168 -7 Income on ownership stakes in affiliated companies -7 -168 -56
34 20 7 Income on ownership stakes in Group companies 0 0 0
20 -115 14 Dividends 7 -135 -14
22 29 25 Interbank commissions 25 29 22
14 21 21 Underwriting commission 21 21 15
163 171 178 Payment facilities/payment terminals 178 171 163
63 47 48 Securities trading and management 60 56 73
47 58 68 Insurance products 68 58 47
22 19 20 Other commissions and fees 27 27 36
331 345 360 Commission income 379 362 356
16 20 18 Interbank commissions 18 20 16
41 46 41 Payment facilities 41 46 41
23 8 8 Other commissions 7 7 17
80 74 67 Commission costs 66 73 74
1 -25 22 Net profit/loss on certificates and bonds 22 -25 1
-5 -118 86 Net profit/loss on shares and primary capital certificates 86 -118 -5
36 28 55 Net profit/loss on exchange and financial derivates 55 28 36
32 -115 163 Net change in fair market value of securities 163 -115 32
5 6 5 Operating income, real estate 4 5 4
6 2 3 Other operating income 3 2 6
0 0 0 Real estate sales 111 91 87
11 8 8 Other operating income 118 98 97
314 49 478 Net other operating income 601 137 397
The item Other operating income, is profit on the sale of buildings.

37
SpareBank 1 SR-Bank SpareBank 1 SR-Bank group
2001 2002 2003 NOTE 3 WAGES AND GEN. ADM. COSTS 2003 2002 2001
246 262 293 Wages 358 320 304
32 34 46 Pensions 51 38 35
35 37 38 Social costs 47 46 43
23 23 23 Other personnel costs 27 27 25
336 356 400 Personnel costs 483 431 407
93 111 123 IT-costs 127 114 94
32 33 27 Marketing 37 41 41
31 36 38 Postage/Telephone 40 38 34
23 21 19 Travel/meetings/accessories 23 25 28
16 14 15 Other administrative costs 17 17 18
195 215 222 General administrative costs 244 235 215
531 571 622 Wages and general administrative costs 727 666 622
Staff
715 700 708 Number of man-years as of 31 December 829 818 807
792 763 767 Number of employees as of 31 December 894 891 915
739 771 760 Average number of employees 888 892 856
(Amount in NOK 1000)
Remuneration to the Board of Directors 1 028
Remuneration to the Audit Committee 360
Remuneration to the Supervisory Board 540
Managing Director compensation has been fixed at NOK 1 929 thousand. Upon reaching the age of 62 the managing director may
retire with a pension corresponding to 70 % of his salary at the time of retirement. There is no contractual bonus scheme, option
scheme or compensation upon termination of the employment relationship for the managing director, the chairman of the board, the
individual directors or employees in management positions.
Loans and security furnished to employees in management positions
Loan balance in NOK 1000
Managing Director 4 266
Chairman of the Board 0
Chairman of the Audit Committee 184
Chairman of the Supervisory Board 0
Board members with loans in the bank
John Peter Hernes 194
Anne Kroken 2 895
Kristian Eidesvik 10 652
Torstein Plener 1 430
Employees in management positions
Deputy Managing Dir. 2 388
Financial Manager 1 233
Project Manager 721
General Manager, Corporate Market 1 300
General Manager, Private Market 2 621
General Manager Human resources 572
Audit Committee 1 435
The Supervisory Board 65 452
No security has been furnished. Loan conditions do not differ from the general conditions for employees.
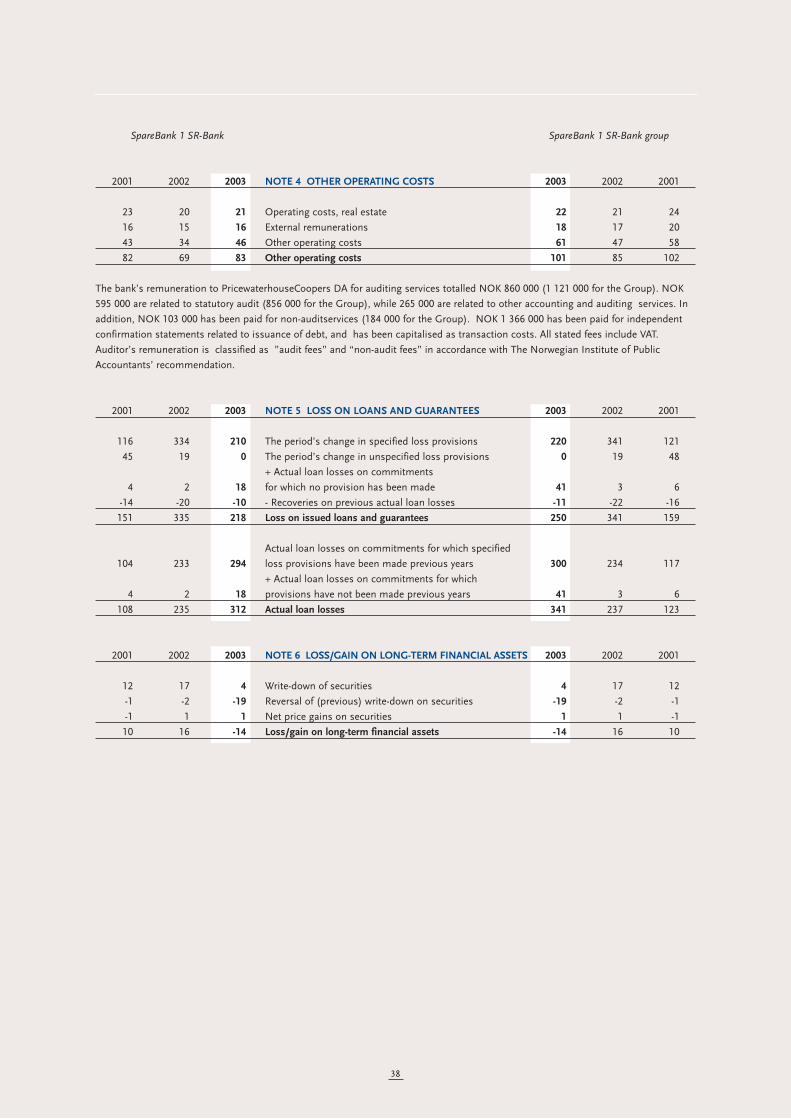
38
SpareBank 1 SR-Bank SpareBank 1 SR-Bank group
2001 2002 2003 NOTE 4 OTHER OPERATING COSTS 2003 2002 2001
23 20 21 Operating costs, real estate 22 21 24
16 15 16 External remunerations 18 17 20
43 34 46 Other operating costs 61 47 58
82 69 83 Other operating costs 101 85 102
The bank’s remuneration to PricewaterhouseCoopers DA for auditing services totalled NOK 860 000 (1 121 000 for the Group). NOK
595 000 are related to statutory audit (856 000 for the Group), while 265 000 are related to other accounting and auditing services. In
addition, NOK 103 000 has been paid for non-auditservices (184 000 for the Group). NOK 1 366 000 has been paid for independent
confirmation statements related to issuance of debt, and has been capitalised as transaction costs. All stated fees include VAT.
Auditor’s remuneration is classified as ”audit fees” and “non-audit fees” in accordance with The Norwegian Institute of Public
Accountants’ recommendation.
2001 2002 2003 NOTE 5 LOSS ON LOANS AND GUARANTEES 2003 2002 2001
116 334 210 The period’s change in specified loss provisions 220 341 121
45 19 0 The period’s change in unspecified loss provisions 0 19 48
+ Actual loan losses on commitments
4 2 18 for which no provision has been made 41 3 6
-14 -20 -10 - Recoveries on previous actual loan losses -11 -22 -16
151 335 218 Loss on issued loans and guarantees 250 341 159
Actual loan losses on commitments for which specified
104 233 294 loss provisions have been made previous years 300 234 117
+ Actual loan losses on commitments for which
4 2 18 provisions have not been made previous years 41 3 6
108 235 312 Actual loan losses 341 237 123
2001 2002 2003 NOTE 6 LOSS/GAIN ON LONG-TERM FINANCIAL ASSETS 2003 2002 2001
12 17 4 Write-down of securities 4 17 12
-1 -2 -19 Reversal of (previous) write-down on securities -19 -2 -1
-1 1 1 Net price gains on securities 1 1 -1
10 16 -14 Loss/gain on long-term financial assets -14 16 10

39
SpareBank 1 SR-Bank SpareBank 1 SR-Bank group
2001 2002 2003 NOTE 7 TAXES 2003 2002 2001
Taxable profit
407 9 564 Profit before taxes 569 18 422
1 129 -20 Permanent differences -12 151 35
-1 -1 -58 Group contribution 0 0 0
22 126 -228 Change in temporary differences -277 152 76
429 263 258 Taxable profit for the year 280 321 533
120 74 72 Tax payable for the year (Taxes payable) 78 90 149
Tax expense
120 74 72 Tax payable 78 90 149
0 0 16 Tax effect of group contribution 0 0 0
3 3 4 Wealth tax 4 3 3
-6 -35 64 Change in deferred tax 78 -43 -21
-4 1 0 Insufficient/excess tax expense in previous year 0 1 -4
113 43 156 Tax expense 160 51 127
Temporary differences
-72 -70 -65 Accelerated depreciation of fixed assets -153 -203 -184
32 31 29 Revaluation of fixed assets 29 31 32
45 65 127 Pension funds 133 67 47
-51 -190 0 Securities 0 -190 -51
-126 -138 -149 Pension liabilities -156 -143 -130
-23 -18 -35 Other negative differences -41 -27 -26
-195 -320 -93 Net temporary differences -188 -465 -312
-55 -90 -26 Deferred tax/(benefit) -53 -130 -88
Explanation as to why taxes for the year do
not amount to 28 % of the profit before tax
113 3 157 28 % tax on profit before tax 161 11 127
0 36 -5 28 % on permanent differences * -5 36 0
-3 1 0 Insufficient/excess tax expense in previous year 0 1 -3
3 3 4 Wealth tax 4 3 3
113 43 156 Estimated taxes 160 51 127
* includes dividends, non-deductible costs, regulation of taxable input value (Risk-regulation) on securities sold and deduction for
share of profit related to affiliated companies (the share of profit is taken out as it has already been taxed in the individual companies).
Risk-regulation
The Risk-regulation amount as of 1 January 2003 for the bank's primary capital certificates has been stipulated at NOK -2.91. It is
expected that the Risk-regulation amount will be stipulated at about plus NOK 12.93 per primary capital certificate as of 1 January 2004.
2001 2002 2003 NOTE 8 CLAIMS ON CREDIT INSTITUTIONS 2003 2002 2001
104 52 149 Claims w/o stipulated loan per. or notice of withdrawal 149 52 104
373 281 519 Claims with stipulated loan per. and notice of withdrawal 0 92 248
477 333 668 Claims on credit institutions 149 144 352

40
SpareBank 1 SR-Bank SpareBank 1 SR-Bank group
2001 2002 2003 NOTE 9 GROSS LOANS TO CUSTOMERS 2003 2002 2001
2 492 2 427 2 906 Overdrafts 2 906 2 427 2 492
922 1 127 948 Building loans 962 1 127 922
39 217 40 524 43 525 Amortised loans 43 672 40 694 39 265
0 0 0 Leasing agreements 1 334 1 197 1 087
42 631 44 078 47 379 Gross loans to customers 48 874 45 445 43 766
Hereby subordinated loan capital
0 60 60 Subordinated loan capital in credit institutions 0 0 0
17 43 43 Subordinated loan capital in other financial institutions 43 43 17
33 33 33 Other subordinated loan capital 33 33 33
50 136 136 Subordinated loan capital posted under loans 76 76 50
Loans to employees
523 625 702 Loans to employees 839 736 618
15 16 18 Interest subsidies 21 19 18
There are no special terms for these loans beyond ordinary terms for employees.
2001 2002 2003 NOTE 10 LOSS PROVISIONS 2003 2002 2001
Specified loss provisions:
270 282 383 Specified loss provisions, January 1 396 290 286
-104 -233 -294 - Actual loan losses during the period for which -300 -234 -117
specified loss provisions have been made previously
116 334 210 +/- The period’s specified loss provisions 220 340 121
282 383 299 Specified loss provisions, December 31 316 396 290
Unspecified loss provisions:
296 341 360 Unspecified loss provisions, January 1 375 356 308
45 19 0 +/- The period’s changes in unspecified loss provisions 0 19 48
341 360 360 Unspecified loss provisions, December 31 375 375 356
NOTE 11 NON-PERFORMING, PROBLEM
1999 2000 2001 2002 2003 AND NON-ACCRUAL LOANS 2003 2002 2001 2000 1999
Non-performing loans for which loss provisions have been made
Retail market:
118 147 164 166 163 Gross non-performing loans 163 167 166 157 136
60 59 71 72 78 Specified loss provisions 78 72 72 59 61
58 88 93 94 85 Net non-perf. retail market loans 85 95 94 98 75
51 % 40 % 43 % 43 % 48 % Loan loss prov. ratio, retail market 48 % 43 % 43 % 38 % 45 %
Corporate:
134 140 132 127 229 Gross non-performing loans 263 149 141 163 148
57 61 57 35 53 Specified loss provisions 60 41 59 73 60
77 79 75 92 176 Net non-perf. loans, corporate 203 108 82 90 88
43 % 44 % 43 % 28 % 23 % Loan loss prov. ratio, corporate 23 % 28 % 42 % 45 % 41 %

41
SpareBank 1 SR-Bank SpareBank 1 SR-Bank group
Cont. NOTE 11
Total:
252 287 296 293 392 Gross non-performing loans 426 316 307 320 284
117 120 128 107 131 Specified loss provisions 138 113 131 132 121
135 167 168 186 261 Net non-performing loans 288 203 176 188 163
46 % 42 % 43 % 37 % 33 % Loan loss provision ratio 32 % 36 % 43 % 41 % 43 %
Of which gross non-accrual loans:
78 76 97 104 124 Retail customers 124 105 99 84 89
61 67 35 31 120 Corporate customers 142 38 40 88 70
139 143 132 135 244 Total 266 143 139 172 159
Performing loans for which loss provisions have been made
Retail market:
69 71 99 119 157 Perf. loans for which loss prov. have been made 157 119 99 72 69
35 34 37 46 48 Specified loss provisions 48 46 37 35 35
Net retail-market loans for which
34 37 62 73 109 loss provisions have been made 109 73 62 37 34
51 % 48 % 37 % 39 % 31 % Loan loss prov. ratio, retail market 31 % 39 % 37 % 49 % 51 %
Corporate:
300 393 306 578 242 Perf. loans for which loss prov. have been made 262 632 322 400 306
104 116 117 230 120 Specified loss provisions 130 237 122 119 106
Net corporate loans for which
196 277 189 348 122 loss provisions have been made 132 395 200 281 200
35 % 30 % 38 % 40 % 50 % Loan loss prov. ratio, corporate 50 % 38 % 38 % 30 % 35 %
Total:
369 464 405 697 399 Perf. loans for which loss prov. have been made 419 751 421 472 375
139 150 154 276 168 Specified loss provisions 178 283 159 154 141
Net loans for which loss
230 314 251 421 231 provisions have been made 241 468 262 318 234
38 % 32 % 38 % 40 % 42 % Loan loss provision ratio 42 % 38 % 38 % 33 % 38 %
The total loans for a customer are regarded as non-performing and included in the bank’s overviews of non-performing loans when
due instalments or interest payments have not been paid within 90 days after the due date or a line of credit is overdrawn for 90 days
or more. Loss assessments are made of loans that are non-performing for more than 60 days.
Changes in interest on loans not recorded in income in the course of the year: 2000 2001 2002 2003
Earned, not recorded interest on loans entered in the balance sheet as of 1 January 40 44 40 36
-this period´s recording of previous period´s earned interest on loans -9 -14 -21 -28
-earned, not recorded interest on loans that have been removed from the balance sheet -3 -6 -7 -8
+the period´s earned, not recorded interest on problem loans 16 16 24 37
Earned, not recorded interest on loans entered in the balance sheet as of 31 December 44 40 36 37
NOTE 12 RISK CLASSIFICATION OF LOANS
The bank's risk classification systems have been developed to manage the bank's lending portfolio in accordance with the bank's credit
strategy, credit policy and license regulations. The risk classification system and credit processing routines stipulate clear requirements
for the credit handling and risk assessment processes to be applied when working with corporate and retail customer commitments.
The bank's credit strategy and credit policy are derived from the bank's principal strategy and the strategies for equity, funding, pro-
fitability and growth.
CORPORATE MARKETThe bank's classification system for corporate market customers has been changed significantly and improved through a new scoringand classification model that was implemented in the autumn of 2001. The scoring model estimates the risk of default based onhistorical data series for eight financial key figures, four of which are related to earning capacity, and the other four are related toconsumption capacity, in addition to four non-financial criteria for behavior.

Cont. NOTE 12
All the criteria are objective and based on publicly available information such as the last year's audited accounts, credit information
and information from the bank's own registers. Adjustment of accounting data, and thus adjustment of the classification, is performed
in accordance with specially-defined standard adjustment rules. A thorough analysis of the future development as grounds for an
adjusted classification is performed for certain specific groups according to size and risk. The adjusted classification forms the basis
for further processing in accordance with the credit strategy, credit policy and license regulations.
Downgrading is performed in accordance with the adjustment rules for accounts, or if the accounts show a negative developmentduring the year. There are more stringent follow-up routines and quarterly reviews for high-risk commitments.
The selection and weighting of criteria is performed under the supervision of SpareBank 1 with professional assistance from prominentexperts in the field of statistical models at the university level.
The number of risk classes has been expanded from 5 to 11 (A-K), and they express the various intervals of default risk. The limits forthe intervals have been selected arbitrarily based on the prerequisite of an approximately normal distribution of the portfolio in thevarious classes. The collatereal values are classified in 5 groups (code 1-5) with mandatory objective assessment rules for themaximum value of each item of collateral.
Risk matrix
The risk matrix is divided into 5 groups – the lowest, low, normal, high and highest risk. Commitments include all types of capital
services that are provided to the customer through loans, credit, guarantees including letters of credit, accrued unpaid interest and
commissions, and forward currency and interest-rate contracts.
2002 2003 2002 2003
Risk group % %
Lowest and low risk 10 778 11 050 50.7 52.5
Normal risk 7 471 7 733 35.1 36.7
Highest and high risk 3 029 2 273 14.2 10.8
TOTAL 21 278 21 056 100 100
The bank has a restrictive practice with regard to granting new high-risk commitments. In combination with the measures
implemented to improve the portfolio's risk profile, this has contributed to a reduction of the high-risk share.
Pricing
The bank endeavors to price its commitments according to risk exposure, so that the commitments with the highest risk are priced the
highest. A new price model was implemented in 2002. This model is based on the bank's required rate of return on risk-adjusted
capital. The basic principle is to achieve the same risk-adjusted return by the price covering the funding costs, administrative costs,
operational costs and the individual expected loss risk for each commitment in relation to the risk-adjusted capital the bank must have
to cover unexpected losses.
Specification by risk group:
2002 2003 2002 2003 2002 2003 2002 2003
Loan Loan
Loan Loan Credit Credit Guarantees Guarantees loss prov. loss prov.
Lowest and low risk 6 341 6 965 3 452 3 523 985 562 0 0
Normal risk 3 667 3 787 2 916 2 696 886 1 250 21 0
Highest and high risk 1 557 1 387 1 088 821 386 65 244 173
TOTAL 11 565 12 139 7 456 7 040 2 257 1 877 265 173
42
Security >
0 – 1 %1 – 2 %2 – 3 %3 – 4 %4 – 5 %5 – 7 %7 – 9 %9 – 16 %16 – 25 %25 – 50 %50 – 100 %
ClassABCDEFGHIJK
1> 100 %
275 – 100 %
350 – 75 %
425 – 50 %
50 – 25 %

Cont. NOTE 12
Specification by industry
The corporate customer commitments are divided into 19 industries. There are special market committees for most of the industries
to follow up market-related and structural developments, etc. The industry committees are also an instrument for the development of
experience in the SpareBank 1 collaboration.
Distribution of corporate customer commitments by industry:
2002 2003 2002 2003 2002 2003 2002 2003
Loan Loan Credit Credit Guarantees Guarantees Total Total
Farming 1 211 1 391 484 558 5 5 1 700 1 954
Fishing 281 223 79 13 0 12 359 248
Fish farming 529 220 394 259 29 20 951 499
Oil/gas extraction 611 642 487 87 254 49 1 352 778
Food production 138 96 263 407 125 77 526 580
Printing/publishing 135 614 48 26 12 9 196 649
Industry 985 454 368 293 33 130 1 385 877
Shipbuilding 48 49 583 300 715 290 1 345 639
Power and water supply 131 71 299 378 144 148 574 597
Building and construction 456 452 590 606 432 433 1 478 1 491
Commodity trade 845 952 556 407 98 104 1 499 1 463
Hotel and restaurant 210 217 31 28 6 6 247 251
Shipping 1 216 1 595 207 46 8 2 1 431 1 643
Transportation 264 133 51 70 31 162 346 365
Real estate 3 268 3 632 782 715 263 225 4 314 4 572
Commercial service industry 597 673 452 415 30 143 1 080 1 231
Social/private service industry 412 462 234 309 19 12 666 783
Finance 101 170 272 163 53 50 426 383
Public sector 127 93 1 276 1 960 0 0 1 403 2 053
Total 11 565 12 139 7 456 7 040 2 257 1 877 21 278 21 056
Distribution of non-performing loans, problem loans and loan loss provisions by industry:
2002 2003 2002 2003 2002 2003
Non- Non-
performing performing Problem Problem Loan Loan
loans loans loans loans loss prov. loss prov.
Farming 9 3 1 4 3 2
Fishing 6 64 113 2 34 3
Fish farming 0 13 0 16 0 4
Oil/gas extraction 0 0 100 0 25 0
Food production 9 0 0 0 3 0
Printing/publishing 0 0 1 1 1 1
Industry 6 6 26 27 24 13
Shipbuilding 0 0 0 0 0 0
Power and water supply 0 0 0 2 0 1
Building and construction 13 2 31 13 13 4
Commodity trade 6 4 27 8 20 8
Hotel and restaurant 4 2 32 24 14 13
Shipping 0 54 141 36 66 50
Transportation 2 0 10 14 7 11
Real estate 45 54 32 14 17 16
Commercial service industry 25 25 62 75 34 43
Social/private service industry 2 2 2 6 4 4
Finance 0 0 0 0 0 0
Public sector 0 0 0 0 0 0
Total 127 229 578 242 265 173
43

Cont. NOTE 12
RETAIL MARKET
The bank's classification system for the retail customer market is based on the customer's financial capacity to service new loans in
relation to the SIFO cost of living standard for various family sizes. If the disposable income after the estimated expenses according to
the family size and official cost of living standard is 150% of the SIFO standard, then the customer is classified as an A customer.
After adjustments for consumption capacity (wealth) and behavior according to objective criteria from publicly available information
and information from the bank's own registers, financial capacity is synthesized and expressed as A - D.
Risk matrix:
2002 2003 2002 2003
Risk group % %
Low 23 848 28 090 80.0 84.3
Normal 3 154 3 112 10.6 9.3
High 2 801 2 143 9.4 6.4
TOTAL 29 803 33 345 100 100
Pricing
The pricing is differentiated based on the position in the matrix, where importance is attached to the financial capacity and security, as
well as the profitability targets for the retail customer market.
LEVEL OF LOSS IN THE PORTFOLIO
Average annual expected loss level
The loss risk in the corporate market is measured by the probability of default and the probability of bankruptcy/liquidation for
non-performing commitments after adjustment for the level of security for the individual commitments/portfolio. The loss risk of the
individual commitment is included in the price model. Quarterly statistical calculations show that the risk of loss is stable around 0.45
percent for commitments where no loss provisions have been made. The loss risk is estimated and assessed in the retail market based
on a combination of quantitative and qualitative information on the portfolio.
Unexpected losses - risk-adjusted capital
Unexpected losses are to be covered by risk-adjusted capital. The risk-adjusted capital is calculated statistically for a specific economic
cycle based on the bank's strategic choices with regard to the confidence level. The confidence level expresses how long the economic
cycle shall apply. In addition to selection of the confidence level, and thus the size of the capital requirements, it is the changes from
year to year and the causes of these changes that are the most interesting.
The calculated need for risk-adjusted capital to cover credit risk shows a small increase as compared to previous years, at approximately
NOK 2 billion. The increase is related to the increased volume of loans and a somewhat higher concentration of risk through a higher
ratio of large commitments.
Losses in 2003
The net losses on loans, credit and guarantees recorded in 2003 were higher than the estimated normalized losses for the portfolio.
44
Servicing capacity in relation to the SIFO standard
Security
1 - within 60 %2 - within 80 %3 - within 90 %4 - over 90 %5 - unsecured
A(over 150 %)
B(115 % – 150 %)
C(90 % – 115 %)
D(under 90 %)

45
NOTE 13 LOSS ON LOANS AND GUARANTEES IN 2003 BY INDUSTRY
Loans and Gross Recoveries Net Loss
SpareBank 1 SR-Bank group guarantees losses losses percentage
Agriculture/forestry 1 787 1 0 1 0.06 %
Fishing/fish farming 604 100 16 84 13.91 %
Mining/extraction 766 0 0 0 0.00 %
Industry 2 229 15 7 8 0.36 %
Power and water supply/building and construction 1 557 16 4 12 0.77 %
Commodity trade, hotel and restaurant business 1 520 29 17 12 0.79 %
Foreign trade shipping, pipeline transport and other transport activities 1 983 93 23 70 3.53 %
Real estate business 4 321 25 3 22 0.51 %
Service industry 2 032 21 9 12 0.59 %
Public sector and financial services 676 0 0 0 0.00 %
Total corporate sector 17 475 300 79 221 1.26 %
Retail customers 33 384 58 29 29 0.09 %
Total 50 859 358 108 250 0.49 %
SpareBank 1 SR-Bank SpareBank 1 SR-Bank group
2001 2002 2003 NOTE 14 CERTIFICATES AND BONDS 2003 2002 2001
350 211 278 Certificates and bonds issued by the government 278 211 350
1 566 2 057 2 097 Certificates and bonds issued by others 2 097 2 057 1 566
1 916 2 268 2 375 Certificates and bonds 2 375 2 268 1 916
1 916 2 268 2 375 Trade portfolio 2 375 2 268 1 916
1 915 2 294 2 378 Original cost 2 378 2 294 1 915
71 % 75 % 70 % Portion listed on stock exchange 70 % 75 % 71 %
1 916 2 268 2 375 NOK 2 375 2 268 1 916
7.3 % 7.0 % 5.1 % Average effective interest rate 5.1 % 7.0 % 7.3 %
352 211 278 Public sector 278 211 352
1 288 1 304 1 260 Financial businesses 1 260 1 304 1 288
276 753 837 Non-financial businesses 837 753 276
1 916 2 268 2 375 Certificates and bonds 2 375 2 268 1 916
2001 2002 2003 NOTE 15 SHARES AND OWNERSHIP STAKES 2003 2002 2001
343 216 259 Short-term investment in shares and primary capital certificates 259 216 343
599 382 1 Short-term investment in fund 2 383 599
82 79 100 Long-term investment in shares and primary capital certificates 103 80 83
326 261 253 Ownership interests in associated companies 253 261 326
181 131 131 Ownership interests in credit institutions 0 0 0
26 25 25 Ownership interests in other Group companies 0 0 0
1 557 1 094 769 Shares and ownership stakes 617 940 1 351

Cont. NOTE 15
Investment in shares, equity interests
and primary capital certificates
Ownership
The company’s interest Number Acquisition Book value/
(Amounts in NOK thousand ) share capital in percent of shares cost market value
Short-term investment in shares, equity interests and primary capital certificates:
Listed companies
Storebrand 1 390 353 0.2 567 848 18 079 24 701
DNB NOR 13 090 272 0.0 304 100 11 260 13 654
Kongsberg Gruppen 150 000 0.6 179 123 17 208 18 808
Veidekke 69 022 0.5 128 000 7 745 7 520
Prosafe 339 579 0.3 106 540 13 592 14 276
Telenor 10 824 128 0.0 441 173 13 117 19 147
DOF 153 536 1.4 1 053 370 9 290 15 485
Kverneland 124 006 1.0 122 313 10 697 9 999
Norsk Hydro 5 331 933 0.0 60 240 21 050 25 000
Statoil 5 473 964 0.0 306 210 19 876 22 966
Norske Skogindustrier 1 331 371 0.1 129 920 16 814 16 825
Lerøy Seafood 34 441 1.2 413 320 10 413 14 756
Vmetro 11 491 1.0 219 302 6 637 6 952
Golar LNG USD 55 284 0.1 60 000 4 989 5 760
Elektrolux SEK 1 620 500 0.0 40 000 5 771 5 869
Sparebanken Nord-Norge 659 702 0.2 14 567 2 490 2 673
Sparebanken Møre 552 615 0.7 37 290 7 405 9 173
Sparebanken Midt-Norge 614 806 0.0 1 562 289 371
Sandsvær Sparebank 101 545 0.6 6 000 690 1 026
Sparebanken Vestfold 125 000 0.6 7 901 967 1 205
Sparebanken Pluss 125 000 0.6 7 276 1 278 1 455
Melhus Sparebank 80 000 0.1 420 57 59
Other listed companies 14 508 11 361
Total listed companies 214 222 249 041
Unlisted companies 21 862 9 190
Total short-term investment in shares, equity interest and primary capital certificates 236 084 258 231
Shares in fund 917 1 159
Total SpareBank 1 SR-Bank’s investment in fund 917 1 159
Carnegie moneymarket fund 71 1 000 1 047
Total SpareBank 1 SR-Bank Group’s investment in fund 1 917 2 206
46

Cont. NOTE 15
Ownership
The company’s interest Number Acquisition Book value/
(Amounts in NOK thousand ) share capital in percent of shares cost market value
Long-term investment in shares, equity interests and primary capital certificates:
Listed companies
Sparebanken Nord-Norge 659 702 1.1 70 000 8 400
Sparebanken Midt-Norge 614 806 1.1 70 000 8 400
FöreningsSparbanken SEK 10 556 177 0.1 345 000 45 337
Kverneland 124 006 0.8 98 600 8 061
Total listed companies 70 198
Unlisted companies
BBS/Bank-Axept Holding 165 000 4.3 283 830 4 940
NOS 15 983 1.4 223 950 616
Energivekst (15 % av kommitert kapital) 1 035 7.2 75 000 7 500
Marin Vekst 108 200 2.3 25 000 2 500
Viking Fotball 8 216 7.3 600 000 5 000
Other 9 331
Total unlisted companies 29 887
Total SpareBank 1 SR-Bank shares, equity interest and primary capital certificates 100 085
EiendomsMegler 1 Sunnhordaland 200 50.0 100 100 411
Solheimsveien 3 100 49.0 49 49 49
SpareBank 1 Bilplan 6 098 10.9 1 332 2 000 2 000
Havanna Senteret 500 50.0 50 255 255
Havanna Badeland 100 50.0 50 55 0
Prosjektsalg 300 10.0 300 400 0
Total SpareBank 1 SR-Bank Group shares, equity interest and primary capital certificates 102 800
Change in long-term investment in shares, equity interest and primary capital certificates
Book value 01.01.2003 79 370
Additions/disposals 5 757
Reversal of previous write-downs 14 958
Book value 31.12.2003 100 085
Ownership interest in affiliated and joint ventures Book value
Admi-Senteret 0
SpareBank 1 Gruppen 253 308
Total ownership in other affiliated and joint ventures 253 308
Ownership
Shares in subsidiaries The company’s interest Number Face Book value/
SpareBank 1 SR-Bank share capital in percent of shares value market value
Westbroker Finans 67 000 100 134 000 67 000 130 913
Total ownership in credit institutions 67 000 130 913
EiendomsMegler 1 Rogaland 1 500 100 150 1 500 12 736
Bjergsted Boliger 100 100 100 100 8 165
SR-Forvaltning 6 000 66.7 6 000 4 000 4 136
Vilist 100 100 100 100 0
Total ownership in other Group companies 5 700 25 037
Voting interest and ownership interest are the same for all companies.
47

Cont. NOTE 15
Subsidiaries, affiliated and jointly controlled companies
Year of Registered Ownership
Company acquisition office interest in %
Westbroker Finans 1987 Stavanger 100.00
EiendomsMegler 1 Rogaland 1990 Stavanger 100.00
Bjergsted Boliger 1990 Stavanger 100.00
SpareBank 1 Gruppen 1996 Oslo 14.08
Admi-senteret 1984 Jørpeland 50.00
EiendomsMegler 1 Sunnhordaland 2000 Stord 50.00
SR-Forvaltning 2001 Stavanger 66.67
Investment in all companies are assessed according to the equity method.
Eiendoms-
Investment in subsidiaries Westbroker Eiendoms- Bjergsted SR- Megler 1
Excess value analysis Finans Megler 1 Boliger Forvaltning Sunnhordaland
Equity entered in balance sheet at time of purchase 53 400 8 000 50 4 000 100
Goodwill 40 000 0 0 18 0
Acquisition cost 93 400 8 000 50 4 018 100
Calculation of book value as of 31 Dec. 2003
Opening balance as of 1 Jan. 2003 130 913 12 736 8 243 4 136 237
Profit for the year -7 248 11 856 168 2 610 174
Transferred to company (group contribution) 41 190 0 633 0 0
Transferred from companies (dividends) -33 942 -11 856 -879 -2 610 0
Closing balance as of 31 Dec. 2003 130 913 12 736 8 165 4 136 411
Investments in affiliated and jointly controlled businesses
SpareBank 1 Admi-
Excess value analysis Gruppen Senteret
Equity entered in balance sheet at time of purchase 145 900 1 000
Goodwill
Acquisition cost 145 900 1 000
Calculation of value capitalized as of 31 Dec. 2003
Opening balance as of 1 January 2003 260 082 0
Share of profit for the year -7 633 0
Correction to last years result 381 0
Profit due to dilution 478 0
Closing balance as of 31 Dec. 2003 253 308 0
SpareBank 1 Gruppen
The bank owns SpareBank 1 Gruppen AS i collaboration with SpareBank 1 Nord-Norge, SpareBank 1 Midt-Norge and Samarbeidende
Sparebanker AS. Each of the parties owns 14.08 % of the shares in the company. SpareBank 1 Vest owns 8.67 %. In addition, the
Swedish FöreningsSparbanken AB owns 25 % af the shares, and the Norwegian Confederation of Trade Unions (LO) and trade unions
associated with LO own 10 %. The management structure for the SpareBank 1 collaboration is governed by an agreement between the
owners. The holding is regarded as participation in joint ventures.
48

Cont. NOTE 15
Company’s Ownership Number of
Company name share capital votes
SpareBank 1 Gruppen AS 1 562.4 14.08 % 14.08 %
The joint ventures consist of the parent company SpareBank 1 Gruppen AS, SpareBank 1 Livsforsikring AS, SpareBank 1
Skadeforsikring AS, SpareBank 1 Fondsforsikring AS, Bank 1 Oslo AS, Sparebankutvikling AS, ODIN Forvaltning AS, SpareBank 1 Aktiv
Forvaltning ASA, SpareBank 1 Finans AS, IDA A/S, Enter Card AS (65 %). The subsidiaries are engaged in business within banking,
insurance, brokering and securities management activities. All transactions between the bank and the subsidiaries in the SpareBank 1
Gruppen AS have been based on business-like terms. Internal compensation between the bank and SpareBank 1 Gruppen AS that is
not related to sales and portfolio counseling, is based on the full cost principle.
2003 2002
Profit and loss 100 % 14.08 % 100 % 13 %
Profit after tax 108.7 -563.9
Goodwill- and value added write-downs -133.7 -755.7
Other eliminations -9.6 30.8
Minority share -0.4 -1.4
Loss for the year -35.0 -4.9 -1 290.2 -167.7
In the annual accounts for 2003 our share of the results of SpareBank 1 Gruppen has been posted at minus NOK 7.6 million.
This was based on a preliminary estimate in mid-January 2004. In February we received preliminary results where our share was
minus NOK 4.9 million. Due to insignificances in the size of the amount and the fact that the final accounts have not been received
from SpareBank 1 Gruppen, we have chosen to retain the preliminary figure in our accounts and will post the final results in the first
quarter of 2004.
49

NOTE 16 FIXED ASSETS
SpareBank 1 SR-Bank Machines, Bank buildings
fixtures and and other
transport vehicles real prop. Total
Acquisition cost 1 January 2003 377 357 734
Additions this year 40 0 40
Disposals 2003 1 3 4
Total depreciation and write-downs 31 December 2003 314 147 461
Book value 31 December 2003 102 207 309
Ordinary depreciation and write-downs this year 42 7 49
Of this written-off on revaluated assets 0 1 1
Gain on realization 1 3 4
Percentage used on ordinary depreciation and write-downs 14 - 33 % 2 %
Of the total book value of bank buildings, NOK 197 million is for use in the banking business.
Sparebank 1 SR-Bank group Machines, Bank buildings
fixtures and and other
transport vehicles real prop. Total
Acquisition cost 1 January 2003 405 358 763
Additions this year 47 0 47
Disposals 2003 2 3 5
Total depreciation and write-downs 31 December 2003 337 147 484
Book value 31 December 2003 113 208 321
Ordinary depreciation and write-downs this year 47 7 54
Of this written-off on revaluated assets 0 1 1
Gain on realization 1 3 4
Percentage used on ordinary depreciation and write-downs 14 - 33 % 2 %
Real property of importance for the bank:
Total Rental portion
Geographical location Type sq. meters sq. meters
Centre of Stavanger Bank building 3 085 930
Stavanger Bjergsted Bank building 9 200 704
Centre of Sola Bank building 3 783 1 850
Centre of Randaberg Bank building 1 903 1 088
Centre of Haugesund Bank building 3 536 363
Centre of Aksdal, Tysvær Bank building 2 288 811
Intangible fixed assets SpareBank 1 SpareBank 1
SR-Bank SR-Bank Group
Acquisition cost Goodwill January 1, 2003 32 45
Total depreciation and write-downs December 31, 2003 24 33
Book value December 31, 2003 8 12
Deferred tax asset 26 53
Total 34 65
The years ordinary depreciation and write-downs on goodwill 6 9
Goodwill depreciates on a straight line basis over 5 years.
50
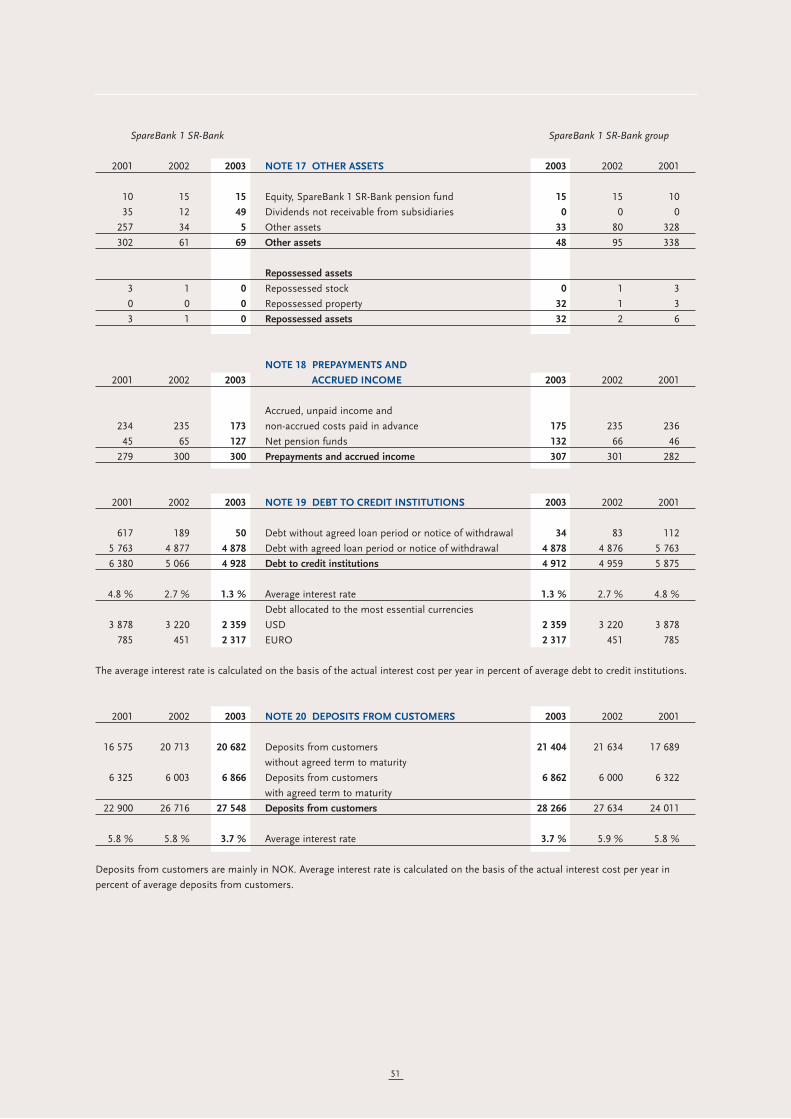
51
SpareBank 1 SR-Bank SpareBank 1 SR-Bank group
2001 2002 2003 NOTE 17 OTHER ASSETS 2003 2002 2001
10 15 15 Equity, SpareBank 1 SR-Bank pension fund 15 15 10
35 12 49 Dividends not receivable from subsidiaries 0 0 0
257 34 5 Other assets 33 80 328
302 61 69 Other assets 48 95 338
Repossessed assets
3 1 0 Repossessed stock 0 1 3
0 0 0 Repossessed property 32 1 3
3 1 0 Repossessed assets 32 2 6
NOTE 18 PREPAYMENTS AND
2001 2002 2003 ACCRUED INCOME 2003 2002 2001
Accrued, unpaid income and
234 235 173 non-accrued costs paid in advance 175 235 236
45 65 127 Net pension funds 132 66 46
279 300 300 Prepayments and accrued income 307 301 282
2001 2002 2003 NOTE 19 DEBT TO CREDIT INSTITUTIONS 2003 2002 2001
617 189 50 Debt without agreed loan period or notice of withdrawal 34 83 112
5 763 4 877 4 878 Debt with agreed loan period or notice of withdrawal 4 878 4 876 5 763
6 380 5 066 4 928 Debt to credit institutions 4 912 4 959 5 875
4.8 % 2.7 % 1.3 % Average interest rate 1.3 % 2.7 % 4.8 %
Debt allocated to the most essential currencies
3 878 3 220 2 359 USD 2 359 3 220 3 878
785 451 2 317 EURO 2 317 451 785
The average interest rate is calculated on the basis of the actual interest cost per year in percent of average debt to credit institutions.
2001 2002 2003 NOTE 20 DEPOSITS FROM CUSTOMERS 2003 2002 2001
16 575 20 713 20 682 Deposits from customers 21 404 21 634 17 689
without agreed term to maturity
6 325 6 003 6 866 Deposits from customers 6 862 6 000 6 322
with agreed term to maturity
22 900 26 716 27 548 Deposits from customers 28 266 27 634 24 011
5.8 % 5.8 % 3.7 % Average interest rate 3.7 % 5.9 % 5.8 %
Deposits from customers are mainly in NOK. Average interest rate is calculated on the basis of the actual interest cost per year in
percent of average deposits from customers.

52
SpareBank 1 SR-Bank SpareBank 1 SR-Bank group
NOTE 21 BOND DEBT AND OTHER
2001 2002 2003 LONG-TERM LOANS 2003 2002 2001
Maturity dates
1 475 0 0 2002 0 0 1 475
2 050 2 050 0 2003 0 2 050 2 050
1 750 1 907 3 596 2004 3 596 1 907 1 750
2 495 2 340 3 785 2005 3 785 2 340 2 495
303 297 526 2006 526 297 303
214 214 1 967 2007 1 967 214 214
0 0 1 169 2008 1 169 0 0
0 0 600 2009 600 0 0
340 560 560 2011 560 560 340
1 0 2 Premium 2 0 1
-26 -46 -790 Holdings of own bonds -790 -46 -26
-10 -6 -3 Capitalized costs in connection with bond loans -3 -6 -10
8 592 7 316 11 412 Bond debt and other long-term loans 11 412 7 316 8 592
7.4 % 7.2 % 4.3 % Average interest rate 4.3 % 7.2 % 7.4 %
Debt divided among significant foreign currencies
5 070 4 098 5 800 NOK 5 800 4 098 5 070
3 522 3 218 3 898 EURO 3 898 3 218 3 522
Premium on borrowing is taken to income over the term of the loan. All loans mature without installments.
Average interest rate is calculated on the basis of the actual interest cost per year in percent of average bond holding.
NOTE 22 ALLOC. TO COMMITMENTS
2001 2002 2003 AND COSTS 2003 2002 2001
132 138 149 Uncovered pension liabilities 156 143 135
0 1 1 Other allocations to commitments and costs 1 1 0
132 139 150 Allocations to commitments and costs 157 144 135
NOTE 23 PENSION SCHEMES
The SpareBank 1 SR-Bank Group has group occupational pension schemes for its employees. The pension schemes for SpareBank 1
SR-Bank, SR-Forvaltning ASA and for EiendomsMegler 1 Rogaland AS are secured by the bank’s pension fund, while Westbroker Finans
AS has its scheme secured in Storebrand.
SpareBank 1 SR-Bank, SR-Forvaltning ASA and EiendomsMegler 1 Rogaland AS have uniform schemes whereby the main terms are 30
years’ service-period, 70 percent pension with respect to the pensionable income as of January 1 of the year of reaching 67 years of age
as well as disablement, spouse’s and children’s pension. All pension benefits are coordinated with expected benefits from social
security. If social security amendments are made entailing reduced benefits, said reductions will not be compensated from the pension
schemes. As of December 31, 2003, the pension schemes had 973 active members (SR-Bank 718) and 208 pensioners (SR-Bank 199).
The pension scheme at Westbroker Finans AS has the same service-period, but a somewhat lower coverage than the schemes secured
by the pension fund. In all, the scheme at Westbroker Finans AS includes 22 active members and 9 pensioneers.

53
Cont. NOTE 23
In addition to the defined benefit plans secured through the insurance schemes, the Group has defined benefit plans that cannot be
secured by the funds in the group schemes. The benefit obligation concern persons not enrolled in the insurance schemes, additional
pensions beyond 12G (base), ordinary early-retirement pensions and early-retirement pensions according to the AFP arrangement
(Contractual early-retirement pension).
Estimates are used for valuating the fair value of plan assests and the benefit obligation. Estimates are corrected each year according
to the actual value of the plan assets in the pension fund, statements of the pension funds’ transfer value from the insurance company,
and actuary calculation of the size of the benefit obligation. In calculating future pensions, the following assumptions are applied:
31.12.2003 31.12.2002 31.12.2001
Discount rate 6.00 % 6.75 % 6.75 %
Expected return on plan assets 7.00 % 7.50 % 7.50 %
Expected rate of compensation increas 3.50 % 3.50 % 3.50 %
G (base) adjustment/inflation 2.50 % 2.50 % 2.50 %
Annual adjustments to pensions in percent 2.50 % 2.50 % 2.50 %
The calculations are based on standardised requisites regarding trends in fatality and disablement rates and other demographic factors
calculated by the Association of Norwegian Insurance Companies. Also stipulated is a resignation/retirement rate on 2 percent until 45
years and 0 percent for age group 45 years and older. For calculating the AFP (contractual early-retirement pension) liability, it is
stipulated that 30 percent of those entitled to the scheme will use it upon reaching 62 years of age, and the remaining 70 percent will
use it upon reaching 64 years of age.
SpareBank 1 SR-Bank SpareBank 1 SR-Bank group
The annual pension costs are derived as follows:
2001 2002 2003 2003 2002 2001
19 20 23 Service cost 27 23 21
31 32 35 Interest costs of accrued pension liabilities 37 34 33
-24 -23 -25 Expected return on plan assets -27 -25 -21
0 0 0 Effects of pension plan changes taken to profits 1 1 1
Estimate changes and deviations between
4 3 6 actual and expected return taken to profits 6 3 4
0 0 4 Number of early retirements this year 4 0 0
2 2 3 Social security tax 3 2 2
32 34 46 Pension costs 51 38 40
Plan assets and pension obligation in group schemes:
-339 -357 -468 Accumulated benefit obligation incl. social security tax -500 -380 -358
310 351 397 Estimated value of plan assets 422 372 328
-29 -6 -71 Projected benefit obligation -78 -8 -30
68 64 184 Unrecognized effect of change in estimates 196 69 72
1 0 0 Unrecognized effect of change in pension plans 0 0 1
5 6 14 Social security tax 14 6 5
45 64 127 Net pension assets 132 67 48
Pension liabilities in non-secured schemes:
-163 -164 -173 Accumulated benefit obligation incl. social security tax -184 -173 -172
27 22 21 Unrecognized effect of change in estimates 24 25 31
4 4 3 Unrecognized effect of change in pension plans 4 5 5
-132 -138 -149 Net benefit obligation including social security tax -156 -143 -136
The pension funds are managed according to guidelines laid down by the board of the pension fund. The pension funds consist mainly
of bearer bonds and stock funds.

54
SpareBank 1 SR-Bank SpareBank 1 SR-Bank group
2001 2002 2003 NOTE 24 SUBORDINATED LOAN CAPITAL 2003 2002 2001
Time of maturity/interest rate
Fixed maturity:
0 0 0 2012 - 3 months Nibor + margin 40 40 40
803 619 557 2009 - USD 83.7 mill 3 months Libor + margin 557 619 803
300 300 300 2010 - 3 months Nibor + margin 300 300 300
15 8 1 Premium 1 8 15
1 118 927 858 Total fixed maturity 898 967 1 158
Perpetual:
250 0 0 3 months Nibor + margin 0 0 250
-84 0 0 -Own perpetual subordinated loans 0 0 -84
676 521 501 USD 75 mill 3 months Libor + margin 501 521 676
-41 -28 -23 Capitalized costs in connection with subordinated loans -23 -28 -41
801 493 478 Total perpetual 478 493 801
Perpetual subordinated loan capital securities:
0 0 501 USD 75 mill 3 months Libor + margin 501 0 0
Capitalised transaction costs on perpetual
0 0 -2 subordinated loan capital securities -2 0 0
0 0 499 Total perpetual subordinated loan capital securities 499 0 0
1 919 1 420 1 835 Subordinated loan capital 1 875 1 460 1 959
Foreign currency denominated subordinated loan capital and perpetual subordinated loan capital securities (USD 233.7 million as of
31 December 2003) are included in the bank’s total currency position, such that there is no currency risk associated with the loans, ref.
note 27. USD 83.7 may be redeemed in 2004. The NOK 300 mill subordinated loan capital maturing in 2010 may be redeemed in
2005. The NOK 40 mill subordinated loan capital in the Group, maturing in 2012, may be redeemed in 2007. Out of the total
subordinated loan capital all is eligible for inclusion as supplementary capital as of 31 December 2003. Any values above/below face
value upon the issuance of debt is taken to income over the term of the loan.
Perpetual subordinated loan capital securities are eligible for inclusion in the core capital by an amount not exceeding 15 percent of
total core capital. Any amount in excess count as perpetual subordinated loan capital.
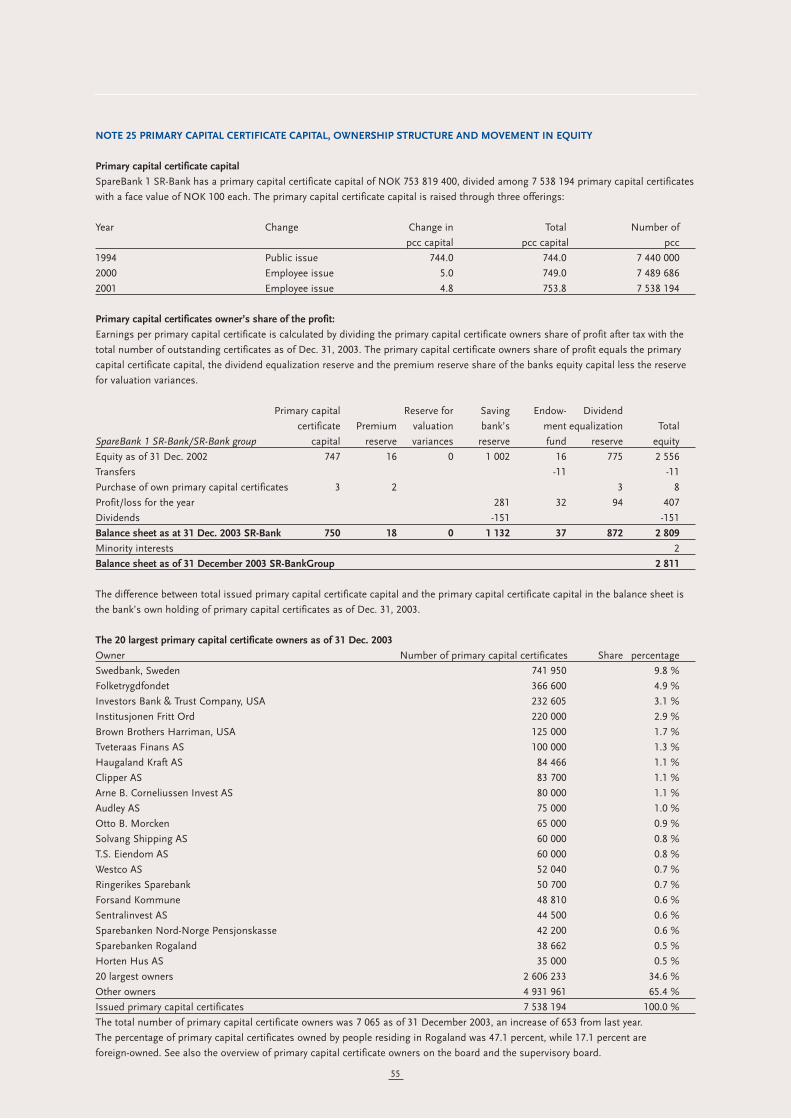
NOTE 25 PRIMARY CAPITAL CERTIFICATE CAPITAL, OWNERSHIP STRUCTURE AND MOVEMENT IN EQUITY
Primary capital certificate capital
SpareBank 1 SR-Bank has a primary capital certificate capital of NOK 753 819 400, divided among 7 538 194 primary capital certificates
with a face value of NOK 100 each. The primary capital certificate capital is raised through three offerings:
Year Change Change in Total Number of
pcc capital pcc capital pcc
1994 Public issue 744.0 744.0 7 440 000
2000 Employee issue 5.0 749.0 7 489 686
2001 Employee issue 4.8 753.8 7 538 194
Primary capital certificates owner’s share of the profit:
Earnings per primary capital certificate is calculated by dividing the primary capital certificate owners share of profit after tax with the
total number of outstanding certificates as of Dec. 31, 2003. The primary capital certificate owners share of profit equals the primary
capital certificate capital, the dividend equalization reserve and the premium reserve share of the banks equity capital less the reserve
for valuation variances.
Primary capital Reserve for Saving Endow- Dividend
certificate Premium valuation bank’s ment equalization Total
SpareBank 1 SR-Bank/SR-Bank group capital reserve variances reserve fund reserve equity
Equity as of 31 Dec. 2002 747 16 0 1 002 16 775 2 556
Transfers -11 -11
Purchase of own primary capital certificates 3 2 3 8
Profit/loss for the year 281 32 94 407
Dividends -151 -151
Balance sheet as at 31 Dec. 2003 SR-Bank 750 18 0 1 132 37 872 2 809
Minority interests 2
Balance sheet as of 31 December 2003 SR-BankGroup 2 811
The difference between total issued primary capital certificate capital and the primary capital certificate capital in the balance sheet is
the bank’s own holding of primary capital certificates as of Dec. 31, 2003.
The 20 largest primary capital certificate owners as of 31 Dec. 2003
Owner Number of primary capital certificates Share percentage
Swedbank, Sweden 741 950 9.8 %
Folketrygdfondet 366 600 4.9 %
Investors Bank & Trust Company, USA 232 605 3.1 %
Institusjonen Fritt Ord 220 000 2.9 %
Brown Brothers Harriman, USA 125 000 1.7 %
Tveteraas Finans AS 100 000 1.3 %
Haugaland Kraft AS 84 466 1.1 %
Clipper AS 83 700 1.1 %
Arne B. Corneliussen Invest AS 80 000 1.1 %
Audley AS 75 000 1.0 %
Otto B. Morcken 65 000 0.9 %
Solvang Shipping AS 60 000 0.8 %
T.S. Eiendom AS 60 000 0.8 %
Westco AS 52 040 0.7 %
Ringerikes Sparebank 50 700 0.7 %
Forsand Kommune 48 810 0.6 %
Sentralinvest AS 44 500 0.6 %
Sparebanken Nord-Norge Pensjonskasse 42 200 0.6 %
Sparebanken Rogaland 38 662 0.5 %
Horten Hus AS 35 000 0.5 %
20 largest owners 2 606 233 34.6 %
Other owners 4 931 961 65.4 %
Issued primary capital certificates 7 538 194 100.0 %
The total number of primary capital certificate owners was 7 065 as of 31 December 2003, an increase of 653 from last year.
The percentage of primary capital certificates owned by people residing in Rogaland was 47.1 percent, while 17.1 percent are
foreign-owned. See also the overview of primary capital certificate owners on the board and the supervisory board.
55
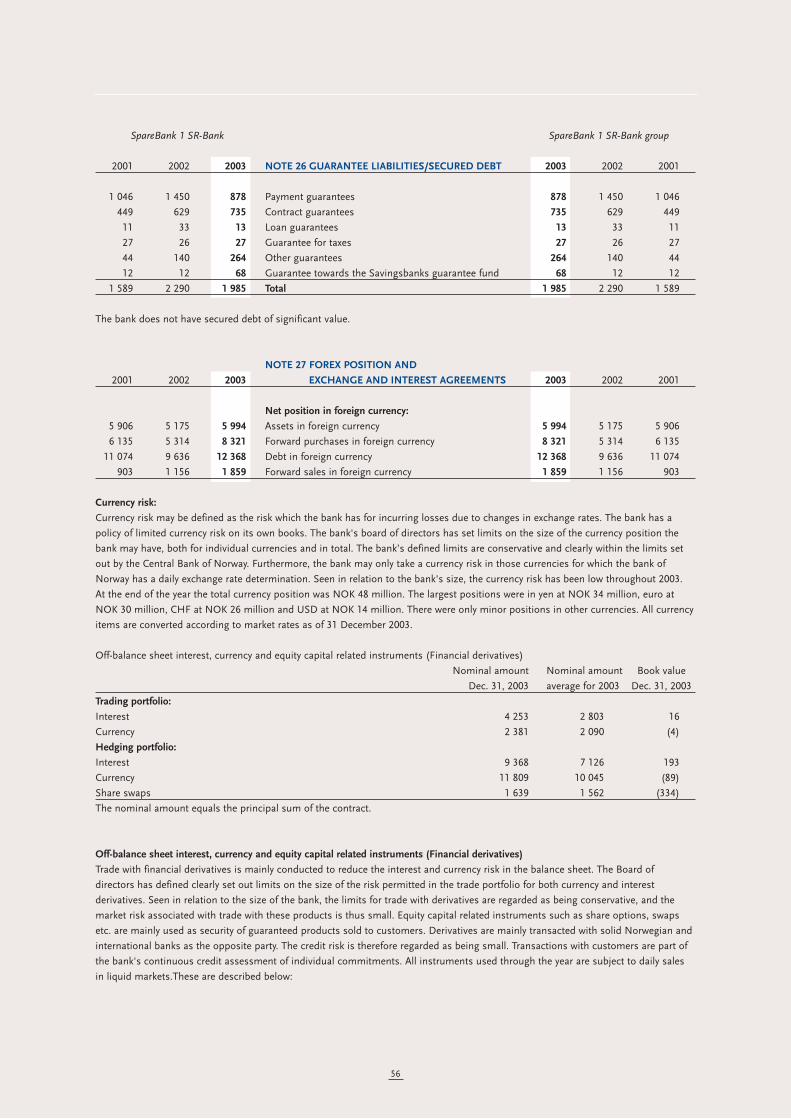
56
SpareBank 1 SR-Bank SpareBank 1 SR-Bank group
2001 2002 2003 NOTE 26 GUARANTEE LIABILITIES/SECURED DEBT 2003 2002 2001
1 046 1 450 878 Payment guarantees 878 1 450 1 046
449 629 735 Contract guarantees 735 629 449
11 33 13 Loan guarantees 13 33 11
27 26 27 Guarantee for taxes 27 26 27
44 140 264 Other guarantees 264 140 44
12 12 68 Guarantee towards the Savingsbanks guarantee fund 68 12 12
1 589 2 290 1 985 Total 1 985 2 290 1 589
The bank does not have secured debt of significant value.
NOTE 27 FOREX POSITION AND
2001 2002 2003 EXCHANGE AND INTEREST AGREEMENTS 2003 2002 2001
Net position in foreign currency:
5 906 5 175 5 994 Assets in foreign currency 5 994 5 175 5 906
6 135 5 314 8 321 Forward purchases in foreign currency 8 321 5 314 6 135
11 074 9 636 12 368 Debt in foreign currency 12 368 9 636 11 074
903 1 156 1 859 Forward sales in foreign currency 1 859 1 156 903
Currency risk:
Currency risk may be defined as the risk which the bank has for incurring losses due to changes in exchange rates. The bank has a
policy of limited currency risk on its own books. The bank's board of directors has set limits on the size of the currency position the
bank may have, both for individual currencies and in total. The bank’s defined limits are conservative and clearly within the limits set
out by the Central Bank of Norway. Furthermore, the bank may only take a currency risk in those currencies for which the bank of
Norway has a daily exchange rate determination. Seen in relation to the bank's size, the currency risk has been low throughout 2003.
At the end of the year the total currency position was NOK 48 million. The largest positions were in yen at NOK 34 million, euro at
NOK 30 million, CHF at NOK 26 million and USD at NOK 14 million. There were only minor positions in other currencies. All currency
items are converted according to market rates as of 31 December 2003.
Off-balance sheet interest, currency and equity capital related instruments (Financial derivatives)
Nominal amount Nominal amount Book value
Dec. 31, 2003 average for 2003 Dec. 31, 2003
Trading portfolio:
Interest 4 253 2 803 16
Currency 2 381 2 090 (4)
Hedging portfolio:
Interest 9 368 7 126 193
Currency 11 809 10 045 (89)
Share swaps 1 639 1 562 (334)
The nominal amount equals the principal sum of the contract.
Off-balance sheet interest, currency and equity capital related instruments (Financial derivatives)
Trade with financial derivatives is mainly conducted to reduce the interest and currency risk in the balance sheet. The Board of
directors has defined clearly set out limits on the size of the risk permitted in the trade portfolio for both currency and interest
derivatives. Seen in relation to the size of the bank, the limits for trade with derivatives are regarded as being conservative, and the
market risk associated with trade with these products is thus small. Equity capital related instruments such as share options, swaps
etc. are mainly used as security of guaranteed products sold to customers. Derivatives are mainly transacted with solid Norwegian and
international banks as the opposite party. The credit risk is therefore regarded as being small. Transactions with customers are part of
the bank's continuous credit assessment of individual commitments. All instruments used through the year are subject to daily sales
in liquid markets.These are described below:
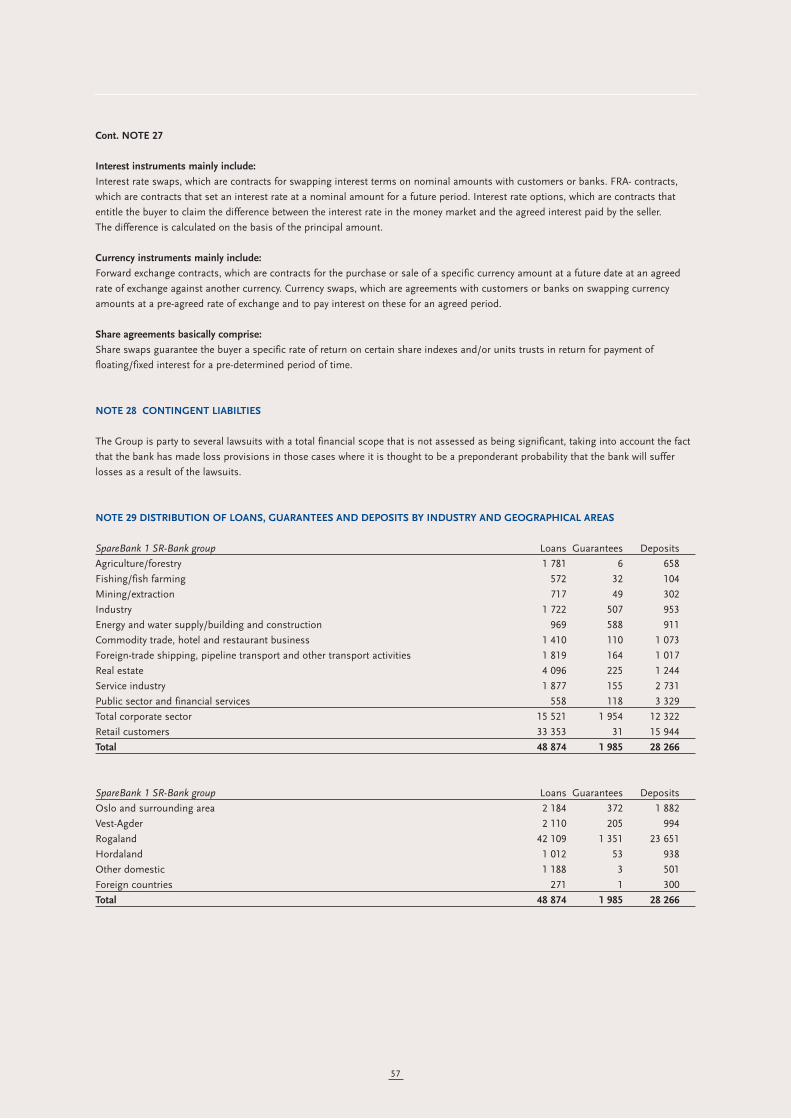
Cont. NOTE 27
Interest instruments mainly include:
Interest rate swaps, which are contracts for swapping interest terms on nominal amounts with customers or banks. FRA- contracts,
which are contracts that set an interest rate at a nominal amount for a future period. Interest rate options, which are contracts that
entitle the buyer to claim the difference between the interest rate in the money market and the agreed interest paid by the seller.
The difference is calculated on the basis of the principal amount.
Currency instruments mainly include:
Forward exchange contracts, which are contracts for the purchase or sale of a specific currency amount at a future date at an agreed
rate of exchange against another currency. Currency swaps, which are agreements with customers or banks on swapping currency
amounts at a pre-agreed rate of exchange and to pay interest on these for an agreed period.
Share agreements basically comprise:
Share swaps guarantee the buyer a specific rate of return on certain share indexes and/or units trusts in return for payment of
floating/fixed interest for a pre-determined period of time.
NOTE 28 CONTINGENT LIABILTIES
The Group is party to several lawsuits with a total financial scope that is not assessed as being significant, taking into account the fact
that the bank has made loss provisions in those cases where it is thought to be a preponderant probability that the bank will suffer
losses as a result of the lawsuits.
NOTE 29 DISTRIBUTION OF LOANS, GUARANTEES AND DEPOSITS BY INDUSTRY AND GEOGRAPHICAL AREAS
SpareBank 1 SR-Bank group Loans Guarantees Deposits
Agriculture/forestry 1 781 6 658
Fishing/fish farming 572 32 104
Mining/extraction 717 49 302
Industry 1 722 507 953
Energy and water supply/building and construction 969 588 911
Commodity trade, hotel and restaurant business 1 410 110 1 073
Foreign-trade shipping, pipeline transport and other transport activities 1 819 164 1 017
Real estate 4 096 225 1 244
Service industry 1 877 155 2 731
Public sector and financial services 558 118 3 329
Total corporate sector 15 521 1 954 12 322
Retail customers 33 353 31 15 944
Total 48 874 1 985 28 266
SpareBank 1 SR-Bank group Loans Guarantees Deposits
Oslo and surrounding area 2 184 372 1 882
Vest-Agder 2 110 205 994
Rogaland 42 109 1 351 23 651
Hordaland 1 012 53 938
Other domestic 1 188 3 501
Foreign countries 271 1 300
Total 48 874 1 985 28 266
57

58
NOTE 30 TRANSACTIONS WITH SUBSIDIARIES
Income and expenses: 2003 2002 2001
Interest income from subsidiaries 12 9 52
Interest costs to subsidiaries 5 23 8
Commission income from subsidiaries 3 2 0
Commission costs from subsidiaries 2 1 6
Other income from subsidiaries 1 1 1
Other costs to subsidiaries 0 0 1
Claims on subsidiaries:
Overdraft 1 0 11
Other loans 518 189 113
Other claims 50 12 34
Total claims 569 201 158
Debt to subsidiaries:
Deposits from subsidiaries 155 258 633
Other liabilities 59 0 0
Total liabilities 214 258 633
On-demand and loans to affiliated companies Subordinated
Loan Deposits Loans
Admi-senteret 21 1 0
SpareBank 1 Gruppen 66 35 43
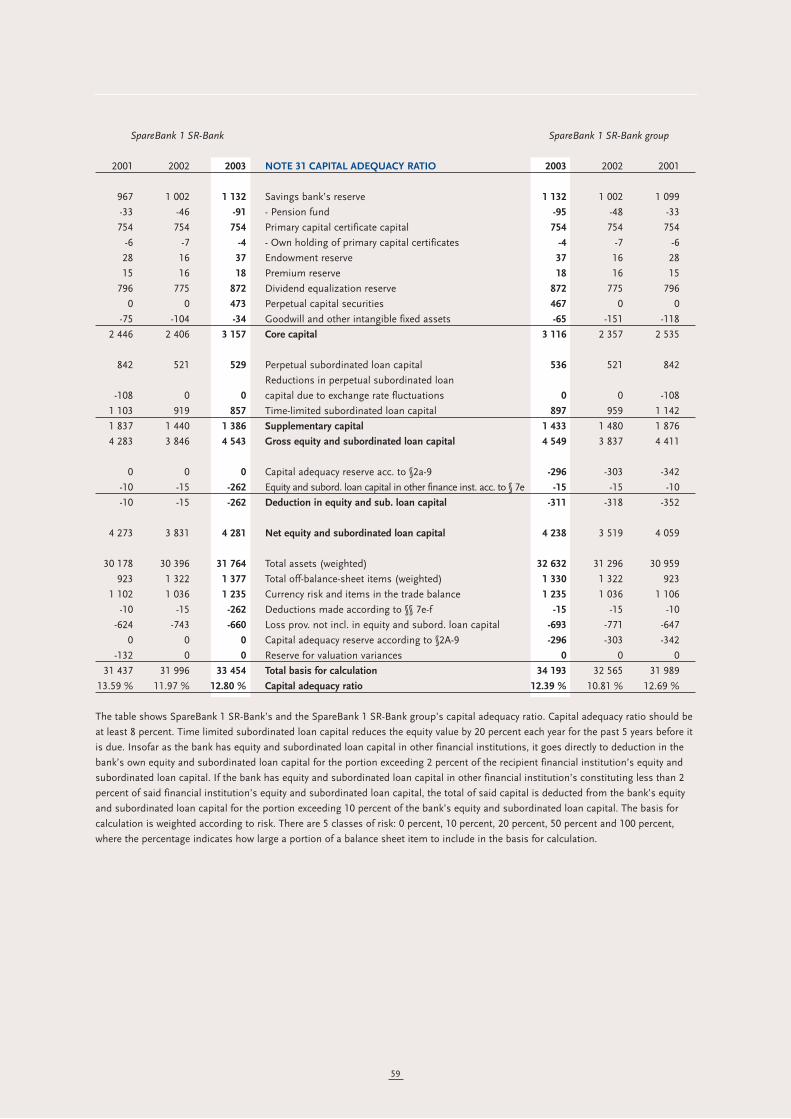
59
SpareBank 1 SR-Bank SpareBank 1 SR-Bank group
2001 2002 2003 NOTE 31 CAPITAL ADEQUACY RATIO 2003 2002 2001
967 1 002 1 132 Savings bank’s reserve 1 132 1 002 1 099
-33 -46 -91 - Pension fund -95 -48 -33
754 754 754 Primary capital certificate capital 754 754 754
-6 -7 -4 - Own holding of primary capital certificates -4 -7 -6
28 16 37 Endowment reserve 37 16 28
15 16 18 Premium reserve 18 16 15
796 775 872 Dividend equalization reserve 872 775 796
0 0 473 Perpetual capital securities 467 0 0
-75 -104 -34 Goodwill and other intangible fixed assets -65 -151 -118
2 446 2 406 3 157 Core capital 3 116 2 357 2 535
842 521 529 Perpetual subordinated loan capital 536 521 842
Reductions in perpetual subordinated loan
-108 0 0 capital due to exchange rate fluctuations 0 0 -108
1 103 919 857 Time-limited subordinated loan capital 897 959 1 142
1 837 1 440 1 386 Supplementary capital 1 433 1 480 1 876
4 283 3 846 4 543 Gross equity and subordinated loan capital 4 549 3 837 4 411
0 0 0 Capital adequacy reserve acc. to §2a-9 -296 -303 -342
-10 -15 -262 Equity and subord. loan capital in other finance inst. acc. to § 7e -15 -15 -10
-10 -15 -262 Deduction in equity and sub. loan capital -311 -318 -352
4 273 3 831 4 281 Net equity and subordinated loan capital 4 238 3 519 4 059
30 178 30 396 31 764 Total assets (weighted) 32 632 31 296 30 959
923 1 322 1 377 Total off-balance-sheet items (weighted) 1 330 1 322 923
1 102 1 036 1 235 Currency risk and items in the trade balance 1 235 1 036 1 106
-10 -15 -262 Deductions made according to §§ 7e-f -15 -15 -10
-624 -743 -660 Loss prov. not incl. in equity and subord. loan capital -693 -771 -647
0 0 0 Capital adequacy reserve according to §2A-9 -296 -303 -342
-132 0 0 Reserve for valuation variances 0 0 0
31 437 31 996 33 454 Total basis for calculation 34 193 32 565 31 989
13.59 % 11.97 % 12.80 % Capital adequacy ratio 12.39 % 10.81 % 12.69 %
The table shows SpareBank 1 SR-Bank’s and the SpareBank 1 SR-Bank group’s capital adequacy ratio. Capital adequacy ratio should be
at least 8 percent. Time limited subordinated loan capital reduces the equity value by 20 percent each year for the past 5 years before it
is due. Insofar as the bank has equity and subordinated loan capital in other financial institutions, it goes directly to deduction in the
bank’s own equity and subordinated loan capital for the portion exceeding 2 percent of the recipient financial institution’s equity and
subordinated loan capital. If the bank has equity and subordinated loan capital in other financial institution’s constituting less than 2
percent of said financial institution’s equity and subordinated loan capital, the total of said capital is deducted from the bank’s equity
and subordinated loan capital for the portion exceeding 10 percent of the bank’s equity and subordinated loan capital. The basis for
calculation is weighted according to risk. There are 5 classes of risk: 0 percent, 10 percent, 20 percent, 50 percent and 100 percent,
where the percentage indicates how large a portion of a balance sheet item to include in the basis for calculation.
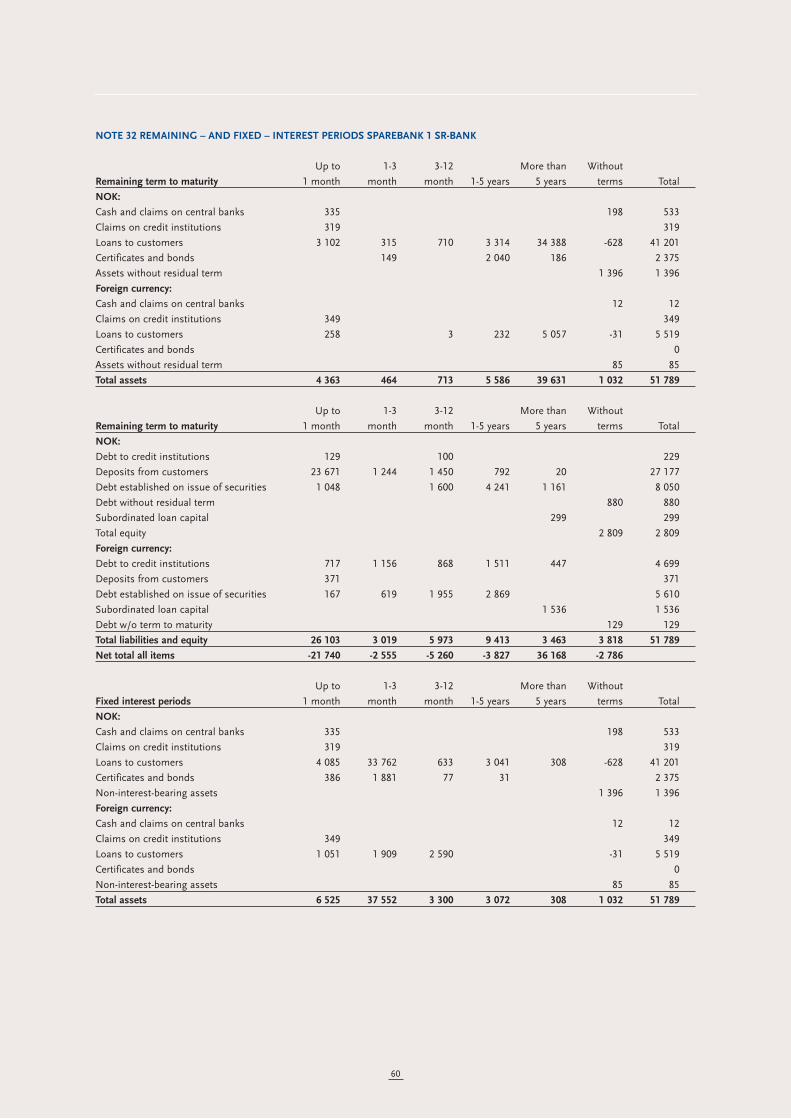
NOTE 32 REMAINING – AND FIXED – INTEREST PERIODS SPAREBANK 1 SR-BANK
Up to 1-3 3-12 More than Without
Remaining term to maturity 1 month month month 1-5 years 5 years terms Total
NOK:
Cash and claims on central banks 335 198 533
Claims on credit institutions 319 319
Loans to customers 3 102 315 710 3 314 34 388 -628 41 201
Certificates and bonds 149 2 040 186 2 375
Assets without residual term 1 396 1 396
Foreign currency:
Cash and claims on central banks 12 12
Claims on credit institutions 349 349
Loans to customers 258 3 232 5 057 -31 5 519
Certificates and bonds 0
Assets without residual term 85 85
Total assets 4 363 464 713 5 586 39 631 1 032 51 789
Up to 1-3 3-12 More than Without
Remaining term to maturity 1 month month month 1-5 years 5 years terms Total
NOK:
Debt to credit institutions 129 100 229
Deposits from customers 23 671 1 244 1 450 792 20 27 177
Debt established on issue of securities 1 048 1 600 4 241 1 161 8 050
Debt without residual term 880 880
Subordinated loan capital 299 299
Total equity 2 809 2 809
Foreign currency:
Debt to credit institutions 717 1 156 868 1 511 447 4 699
Deposits from customers 371 371
Debt established on issue of securities 167 619 1 955 2 869 5 610
Subordinated loan capital 1 536 1 536
Debt w/o term to maturity 129 129
Total liabilities and equity 26 103 3 019 5 973 9 413 3 463 3 818 51 789
Net total all items -21 740 -2 555 -5 260 -3 827 36 168 -2 786
Up to 1-3 3-12 More than Without
Fixed interest periods 1 month month month 1-5 years 5 years terms Total
NOK:
Cash and claims on central banks 335 198 533
Claims on credit institutions 319 319
Loans to customers 4 085 33 762 633 3 041 308 -628 41 201
Certificates and bonds 386 1 881 77 31 2 375
Non-interest-bearing assets 1 396 1 396
Foreign currency:
Cash and claims on central banks 12 12
Claims on credit institutions 349 349
Loans to customers 1 051 1 909 2 590 -31 5 519
Certificates and bonds 0
Non-interest-bearing assets 85 85
Total assets 6 525 37 552 3 300 3 072 308 1 032 51 789
60

Cont. NOTE 32
Up to 1-3 3-12 More than Without
Fixed interest periods 1 month month month 1-5 years 5 years terms Total
NOK:
Debt to credit institutions 129 100 229
Deposits from customers 24 810 1 244 1 055 68 27 177
Debt established on issue of securities 2 343 913 1 300 2 333 1 161 8 050
Non-interest-bearing debt 880 880
Subordinated loan capital 299 299
Total equity 2 809 2 809
Foreign currency:
Debt to credit institutions 2 060 1 561 1 078 4 699
Deposits from customers 371 371
Debt established on issue of securities 2 908 2 702 5 610
Subordinated loan capital 977 559 1 536
Non-interest-bearing debt 129 129
Total liabilities and equity 33 598 6 719 4 092 2 401 1 161 3 818 51 789
Net interest exposure on the balance sheet -27 073 30 833 -792 671 -853 -2 786
Off balance finance deriv. affecting
the interest exposure -756 729 -193 -666 886
Net int. exp. incl. off balance finance deriv. -27 829 31 562 -985 5 33 -2 786
In percent of total assets -54 % 61 % -2 % 0 % 0 % -5 %
Bank overdraft has been included under the inverval 0-1 months. The statement shows the remaining term of various balance sheet
items. The Statement of fixed interest periods shows how long the bank is bound to the applicable interest of various balance sheet
items. The bank’s interest risk has been low throughout the year compared with the bank’s balance sheet. At the end of the year total
interest sensitivity was such that a change in the interest rate of 1 percent would have yielded approximately NOK 25 million in the
profit and loss account. All items in the balance sheet, and off-balance sheet items such as interest swaps, etc., are included in this cal-
culation.The trade portfolio, which mainly consists of bonds and certificates, has had a low duration throughout the year. At the end of
the year this portfolio had a duration of 0.2 and a change in the interest rate of 1 percent would have yielded nearly NOK 15 million in
the profit and loss account.
61

NOTE 33 SUMMARY OF ACCOUNTS FOR SUBSIDIARIES
Profit and loss account – subsidiaries Westbroker Eiendoms- Bjergsted SR- Total
(Amounts in NOK thousand) Finans Megler 1 Boliger Forvaltning subsidiaries
Interest income 101 695 2 886 190 763 105 534
Interest costs 58 522 743 0 0 59 265
Net interest income 43 173 2 143 190 763 46 269
Dividend 0 174 50 0 224
Commission income 46 10 476 0 13 159 23 681
Commission costs -3 123 0 0 -100 -3 223
Net change in fair market value of securities 12 0 0 47 59
Other operating income 0 111 542 102 0 111 644
Net other operating income -3 065 122 192 152 13 106 132 385
Total operating income 40 108 124 335 342 13 869 178 654
Wages and general administration costs 14 026 86 184 0 6 596 106 806
Depreciation and write-downs 1 283 5 747 19 505 7 554
Other operating costs 2 977 15 909 108 1 231 20 225
Total operating costs 18 286 107 840 127 8 332 134 585
Profit before losses and write-downs 21 822 16 495 215 5 537 44 069
Loss/gain long-term financial assets 55 0 0 0 55
Loss on loans and guarantees 31 765 0 0 0 31 765
Profit from ordinary activities -9 998 16 495 215 5 537 12 249
Balance sheet – subsidiaries
Assets
Cash and claims on central banks 0 10 0 0 10
Claims on credit institutions 15 519 126 278 5 421 7 838 155 056
Gross loans to customers 1 495 660 0 0 0 1 495 660
Specified loss provisions -17 348 0 0 0 -17 348
Unspecified loss provisions -15 600 0 0 0 -15 600
Net loans to customers 1 462 712 0 0 0 1 462 712
Repossessed assets 31 349 0 0 0 31 349
Securities 2 304 411 0 1 047 3 762
Fixed assets 27 940 12 658 2 759 802 44 159
Prepayments and accrued income 84 165 5 934 0 4 572 94 671
Total assets 1 623 989 145 291 8 180 14 259 1 791 719
Liabilities and equity
Debt to credit institutions 459 435 0 0 0 459 435
Deposits from customers 857 625 0 0 0 857 625
Debt established on issue of securities 72 911 128 330 15 8 082 209 338
Cost accruals and other provisions 3 105 4 225 0 0 7 330
Subordinated loan capital 100 000 0 0 0 100 000
Total equity 130 913 12 736 8 165 6 177 157 991
Total liabilities and equity 1 623 989 145 291 8 180 14 259 1 791 719
NOTE 34 IAS/IFRS IMPLEMENTATION
The annual report will be subject to substantial changes in the near future with the implementation of international accounting
standards (IAS/IFRS). The new standards are intended to bring a greater degree of harmonisation and make financial statements
comparable across national borders. The European Parliament has imposed on the member states, and thus indirectly Norway as a
member of the EEA, to abide these standards for all stock-listed companies’ group accounts by 2005 at the latest. This ruling will also
apply to the group accounts of Sparebank 1 SR-Bank. In the autumn of 2002 we started working on an impact assessment together
with the other large banks in the Sparebank 1 network. The assessment pointed to the following main areas that would be affected by
the new accounting standards; evaluation of financial instruments including lending/losses and pensions. Within the Sparebank 1
network and on a local level workgroups have been appointed to identify and resolve issues concerned with implementing the new
standards. Although the interim reports in 2004 will be published in accordance with current standards and regulations, separate
reports will be prepared internally that are in accordance with IFRS in order to have comparable figures for 2005. The same applies to
the 2004 annual report.
62
We have audited the annual financial statements of SparebankenRogaland as of December 31, 2003, showing a profit of NOK 408million for the parent company and a profit of NOK 409 millionfor the group. We have also audited the information in thedirectors' report concerning the financial statements, the goingconcern assumption, and the proposal for the allocation of theprofit. The financial statements comprise the balance sheet, thestatements of income and cash flows, the accompanying notesand the group accounts. These financial statements are theresponsibility of the Company’s Board of Directors andManaging Director. Our responsibility is to express an opinion onthese financial statements and on other information according tothe requirements of the Norwegian Act on Auditing and Auditors.
We conducted our audit in accordance with the Norwegian Acton Auditing and Auditors and auditing standards and practicesgenerally accepted in Norway. Those standards and practicesrequire that we plan and perform the audit to obtain reasonableassurance about whether the financial statements are free ofmaterial misstatement. An audit includes examining, on a testbasis, evidence supporting the amounts and disclosures in thefinancial statements. An audit also includes assessing theaccounting principles used and significant estimates made bymanagement, as well as evaluating the overall financial
statement presentation. To the extent required by law and auditingstandards an audit also comprises a review of the managementof the Company's financial affairs and its accounting and internalcontrol systems. We believe that our audit provides a reasonablebasis for our opinion.
In our opinion,• the financial statements have been prepared in accordance
with the law and regulations and present the financial position of the Company and of the Group as of December 31, 2003, and the results of its operations and its cash flows for the year then ended, in accordance with accounting standards, principles and practices generally accepted in Norway
• the company's management has fulfilled its duty to produce a proper and clearly set out registration and documentation of accounting information as required by law and accounting standards, principles and practices generally accepted in Norway
• the information given in the directors' report concerning the financial statements, the going concern assumption, and the proposal for the allocation of the profit are consistent with the financial statements and comply with the law and regulations.
The audit committee has carried out its assignment inaccordance with the Savings Banks Act and the committee’sinstructions.
The bank’s activities in 2003 have complied with the SavingsBanks Act, the bank’s articles of association and other rules thatthe bank is required to comply with.
The annual report and accounts have been submitted inaccordance with the provisions of the Savings Banks Act and theBanking Insurance and Securities Commission. The supervisoryBoard can approve the profit and loss account and the balancesheet as the bank’s accounts for 2003.
Stavanger, February 27, 2004
Forus, February 26, 2004PricewaterhouseCoopers DA
Torbjørn LarsenState Authorised Public Accountant (Norway)
63
AUDITOR’S REPORT FOR 2003
Harald Ribland, Chairman Odd Rune Torstrup Odd Broshaug
Svein Hodnefjell Berit Skjæveland
THE AUDIT COMMITTEÉS REPORT FOR 2003
Note: This translationfrom Norwegian has beenprepared for informationpurposes only.

- 2003 was a bit of a slump for us, Gerhard admits. Oursales were approximately NOK 220 million. Ourbusiness sector is marked by an uneven level of activity.The activity offshore dictates our workdays. We there-fore strengthened our long-term focus last year byobtaining a foothold outside Norwegian waters.
- Last year we got a breakthrough in the seismic sector,Gerhard explains. We entered into cooperation withSeaBed, an exciting geophysical company in Trondheim.We also participate on the ownership side. This co-operation means that we now can reach larger marketsin the value chain. Our philosophy is to cooperate withpartner companies and actively develop good relation-ships with our clients. This provided us with contractsin Mexico, for example. The activities in Mexico arecarried out when it is winter in Norway, and in this waywe manage to even out our capacity throughout the year.
- Another important step was the establishment of asubsidiary in Great Britain in 2003. This provides uswith a bridgehead for the English sector in the NorthSea and also gives us a presence in the EU and new
opportunities for the future. During the year we alsorenewed our framework agreement with Statoil foranother two years. When we entered into thisagreement around four years ago, we received the wor-ld's largest contract for subsea exploration, saysSkåleskog and smiles. With this contract Statoil provesthat they take responsibility for industrial policies andlet the local industry get a chance.
Gerhard explains that the equipment they use are ultra-modern ROVs costing approximately NOK 20 million apiece. These are leased through SpareBank 1 SR-Bank'ssubsidiary Westbroker Finans.
- When we started out we used a bank based in Osloand found that it is further from Oslo to Haugesundthan vice versa. In SpareBank 1 SR-Bank we met peoplewho were willing to focus on offshore activity. We seethat decisions are made quickly and without any un-necessary bureaucracy. Besides, there aren't manybanks that have better offshore knowledge thanSpareBank 1 SR-Bank.
64
THEY ARE BEST ON THE BOTTOMDEEPOCEAN WENT TO MEXICO
With unmanned submarines, the so-calledROVs, DeepOcean performs services on theocean floor. This business is managed from thebase in Haugesund and is an internationalleader in its niche.
Gerhard Skåleskog is the financial director ofDeepOcean. Up until 1998 he and a smallgroup of others worked for Stolt-Nilsen. Whenthe shipowning company moved out of town,they decided to start up their own companydoing what they were good at.

In March 2002 the young couple moved into theirmodern town house in Sunde. Little Mari was born thatfall. When 2003 arrived everything seemed to be perfect.And it was, almost.
The summer holidays in 2003 were spent nearFlekkefjord together with Rune's parents. It was theirdaughter's very first summer. For Elisabeth this wassomething very special.
- I have always been very preoccupied by children. In away you can say that being a mother is my hobby, shesays and laughs. In her spare time she is the conductorof the Hafrsfjord Children's Gospel Choir. She looks upat the wall and a large picture of her daughter wrappedin a white bath robe.
- It happened completely unexpectedly of course. It wasa Friday night in August last year, says Elisabethseriously. Rune had just come home from work. I was inthe kitchen when I noticed the smell, I thought it wasRune's socks and sent him down to the basement tochange, she says jokingly.
- Suddenly I heard a roar from Rune. The whole base-ment was filled with pure sewage! The sight wasabsolutely indescribable down there. We had stored alot of clothes and things in the basement that we hadn't
unpacked yet. Everything was floating around in thesewage, what were we to do?
Elisabeth has been a customer of SpareBank 1 SR-Banksince she was a child. The couple are now total custom-ers and also have their home insurance in the bank.
- We started by emptying the basement as best wecould, Elisabeth recollects. At the same time we phonedour contact person in the bank, who we knew very well.The help we received is almost impossible to praise anyhigher. Our contact person came over right away andeven helped us throw things into plastic bags and imm-ediately started to assess the damages.
- We received settlement for our claim just a few dayslater. They had even added the value of our own workefforts. Two of our neighbors also had problems withsewage in their basements. Their insurance companiesdidn't contact them for several weeks, Elisabeth explains.
- We didn't lose a penny and everything reverted back toits original state. Insurance is something you neverthink about until something goes wrong. Only then doyou find out if you've made the right choice. The bankuses the slogan “Know that we are there”. We have first-hand knowledge that this is not just advertising.
65
WHEN INSURANCE IS NEEDED THE MOSTELISABETH EXPERIENCED THE SHOCK OF A LIFETIME
Elisabeth Sønneland is a social worker at Madlavoll School inStavanger. Her domestic partner Rune Joa is employed in acontractor firm. Last year they experienced something they willnever forget.
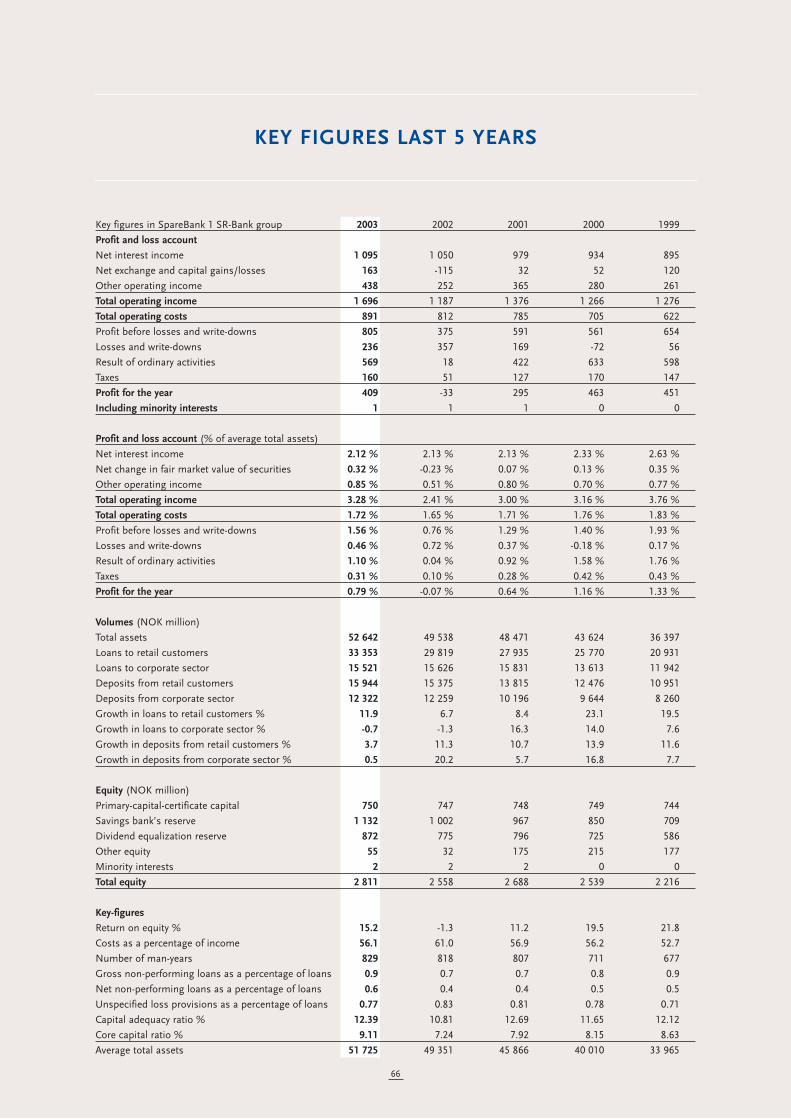
66
KEY FIGURES LAST 5 YEARS
Key figures in SpareBank 1 SR-Bank group 2003 2002 2001 2000 1999
Profit and loss account
Net interest income 1 095 1 050 979 934 895
Net exchange and capital gains/losses 163 -115 32 52 120
Other operating income 438 252 365 280 261
Total operating income 1 696 1 187 1 376 1 266 1 276
Total operating costs 891 812 785 705 622
Profit before losses and write-downs 805 375 591 561 654
Losses and write-downs 236 357 169 -72 56
Result of ordinary activities 569 18 422 633 598
Taxes 160 51 127 170 147
Profit for the year 409 -33 295 463 451
Including minority interests 1 1 1 0 0
Profit and loss account (% of average total assets)
Net interest income 2.12 % 2.13 % 2.13 % 2.33 % 2.63 %
Net change in fair market value of securities 0.32 % -0.23 % 0.07 % 0.13 % 0.35 %
Other operating income 0.85 % 0.51 % 0.80 % 0.70 % 0.77 %
Total operating income 3.28 % 2.41 % 3.00 % 3.16 % 3.76 %
Total operating costs 1.72 % 1.65 % 1.71 % 1.76 % 1.83 %
Profit before losses and write-downs 1.56 % 0.76 % 1.29 % 1.40 % 1.93 %
Losses and write-downs 0.46 % 0.72 % 0.37 % -0.18 % 0.17 %
Result of ordinary activities 1.10 % 0.04 % 0.92 % 1.58 % 1.76 %
Taxes 0.31 % 0.10 % 0.28 % 0.42 % 0.43 %
Profit for the year 0.79 % -0.07 % 0.64 % 1.16 % 1.33 %
Volumes (NOK million)
Total assets 52 642 49 538 48 471 43 624 36 397
Loans to retail customers 33 353 29 819 27 935 25 770 20 931
Loans to corporate sector 15 521 15 626 15 831 13 613 11 942
Deposits from retail customers 15 944 15 375 13 815 12 476 10 951
Deposits from corporate sector 12 322 12 259 10 196 9 644 8 260
Growth in loans to retail customers % 11.9 6.7 8.4 23.1 19.5
Growth in loans to corporate sector % -0.7 -1.3 16.3 14.0 7.6
Growth in deposits from retail customers % 3.7 11.3 10.7 13.9 11.6
Growth in deposits from corporate sector % 0.5 20.2 5.7 16.8 7.7
Equity (NOK million)
Primary-capital-certificate capital 750 747 748 749 744
Savings bank’s reserve 1 132 1 002 967 850 709
Dividend equalization reserve 872 775 796 725 586
Other equity 55 32 175 215 177
Minority interests 2 2 2 0 0
Total equity 2 811 2 558 2 688 2 539 2 216
Key-figures
Return on equity % 15.2 -1.3 11.2 19.5 21.8
Costs as a percentage of income 56.1 61.0 56.9 56.2 52.7
Number of man-years 829 818 807 711 677
Gross non-performing loans as a percentage of loans 0.9 0.7 0.7 0.8 0.9
Net non-performing loans as a percentage of loans 0.6 0.4 0.4 0.5 0.5
Unspecified loss provisions as a percentage of loans 0.77 0.83 0.81 0.78 0.71
Capital adequacy ratio % 12.39 10.81 12.69 11.65 12.12
Core capital ratio % 9.11 7.24 7.92 8.15 8.63
Average total assets 51 725 49 351 45 866 40 010 33 965

67
KEY FIGURES LAST 5 YEARS
Result of ordinary activities
Losses and write-downs
Profit and loss (NOK million)
0
100
200
300
400
500
600
700
800
-100
1999 2000 2001 2002 2003
NO
K m
illio
n
Gross loans Deposits
Deposit and loans (NOK million)
10000
20000
30000
40000
50000
1999 2000 2001 2002 2003
Perc
ent
Return on equity (%)
-5
0
5
10
15
20
25
1999 2000 2001 2002 2003
Perc
ent
Total operating costs (% of average total assets)
0.0
0.5
1.0
1.5
2.0
1999 2000 2001 2002 2003
Subordinated loan
Other funds
Dividend equalization reserve
Primary capital certificate capital
Savings bank reserve
NO
K m
illio
n
Equity and subordinated loan (NOK million)
0
1000
2000
3000
4000
5000
1999 2000 2001 2002 2003
Man years, group
0
200
400
600
800
1000
1999 2000 2001 2002 2003

PRIMARY CAPITALAt the end of 2003 SpareBank 1 SR-Bank had primary capitalof NOK 750 million, divided into 7 499 532 outstandingprimary capital certificates, each with a nominal value ofNOK 100. The number of certificates issued is 7 538 194. Inaddition, the primary capital certificate owners' capitalincludes an equalization reserve of NOK 872 million and apremium reserve of NOK 18 million.
The board of directors are set to propose the final terms forthe stock dividend transaction at the supervisory board’smeeting on the 25 March 2004. The proposal implies thatNOK 150.8 million is transferred from the Dividendequalization reserve to the Primary capital certificate capital.1 507 640 new primary capital certificates will be issued withan issue price and face value of NOK 100 per certificate.Thus 5 old certificates give the right to one new primarycapital certificate. Allotment of the new certificates will bebased on the number of certificates held by each primarycapital certificate holder on the date the supervisory boardfinalise the decision.
DIVIDEND POLICYIt is the aim of the bank to divide its profits between theprimary capital certificate holders and the savings bank’sreserves according to their share of the bank’s equity. Theaim is to divide the profit between the primary capitalcertificate owners and the savings bank's reserves inaccordance with their share of the bank's equity. SpareBank1 SR-Bank places emphasis on paying a competitive cashdividend. Variations may exist in the proportional distri-bution between cash dividends and the equalization
reserve when consideration must be given to the developmentof the bank's equity.
In the annual accounts for 2003 the primary capitalcertificate owners' share of the profit is NOK 32.7 per out-standing primary capital certificate. A cash dividend ofNOK 20 per certificate is proposed for 2003.
INVESTOR POLICYThe bank attaches importance to the fact that correct,relevant and timely information on the bank's developmentand results will inspire the confidence of the investor market.Information to the market will be distributed throughquarterly investor presentations, websites on the Internet,press releases and accounting reports. Regular presentationsare given to international partners, lenders and investors,primarily in London.
INFORMATION ADDRESSESSpareBank 1 SR-Bank is also accessible via the Internet forinformation of interest to investors, the media and brokers.
• SpareBank 1 SR-Bank's website on the Internet: www.sr-bank.no
• Other links to financial information: www.huginonline.no
FINANCIAL CALENDAR FOR 2004• Ex-dividend date: 26 March 2004• 1st quarter 29 April 2004• 2nd quarter 12 August 2004• 3rd quarter 28 October 2004• The preliminary 2004 financial statements will be made
public in February 2005.
68
PRIMARY CAPITAL CERTIFICATES
50
100
150
200
feb mar apr may junjan
OSEBX ROGG
aug sep oct nov decjul
Inde
xed/
Reb
ased
Price performance for 2003Distribution of primary capital certificates as of 31 December 2003
Foreign investors
Investors from Rogaland
Other Norwegian investors
17 %
47 %
36 %
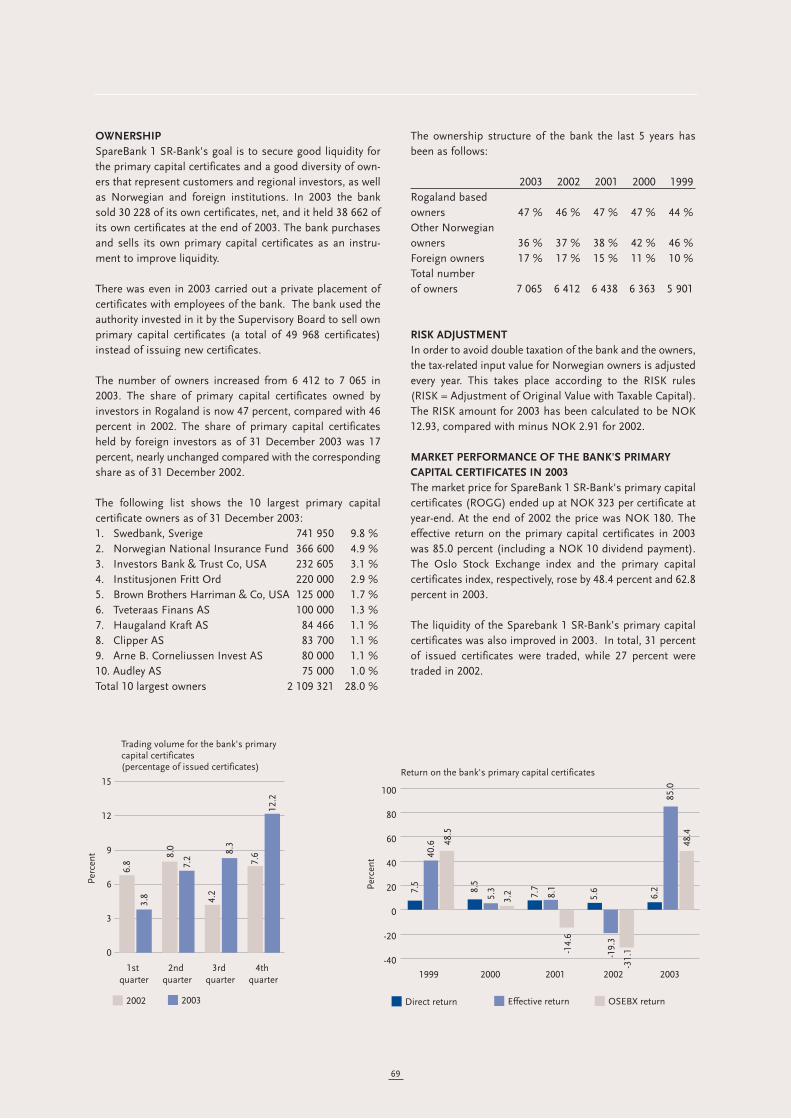
OWNERSHIPSpareBank 1 SR-Bank's goal is to secure good liquidity forthe primary capital certificates and a good diversity of own-ers that represent customers and regional investors, as wellas Norwegian and foreign institutions. In 2003 the banksold 30 228 of its own certificates, net, and it held 38 662 ofits own certificates at the end of 2003. The bank purchasesand sells its own primary capital certificates as an instru-ment to improve liquidity.
There was even in 2003 carried out a private placement ofcertificates with employees of the bank. The bank used theauthority invested in it by the Supervisory Board to sell ownprimary capital certificates (a total of 49 968 certificates)instead of issuing new certificates.
The number of owners increased from 6 412 to 7 065 in2003. The share of primary capital certificates owned byinvestors in Rogaland is now 47 percent, compared with 46percent in 2002. The share of primary capital certificatesheld by foreign investors as of 31 December 2003 was 17percent, nearly unchanged compared with the correspondingshare as of 31 December 2002.
The following list shows the 10 largest primary capitalcertificate owners as of 31 December 2003:1. Swedbank, Sverige 741 950 9.8 %2. Norwegian National Insurance Fund 366 600 4.9 %3. Investors Bank & Trust Co, USA 232 605 3.1 % 4. Institusjonen Fritt Ord 220 000 2.9 %5. Brown Brothers Harriman & Co, USA 125 000 1.7 %6. Tveteraas Finans AS 100 000 1.3 %7. Haugaland Kraft AS 84 466 1.1 %8. Clipper AS 83 700 1.1 %9. Arne B. Corneliussen Invest AS 80 000 1.1 %10. Audley AS 75 000 1.0 %Total 10 largest owners 2 109 321 28.0 %
The ownership structure of the bank the last 5 years hasbeen as follows:
2003 2002 2001 2000 1999Rogaland based owners 47 % 46 % 47 % 47 % 44 %Other Norwegian owners 36 % 37 % 38 % 42 % 46 %Foreign owners 17 % 17 % 15 % 11 % 10 %Total number of owners 7 065 6 412 6 438 6 363 5 901
RISK ADJUSTMENTIn order to avoid double taxation of the bank and the owners,the tax-related input value for Norwegian owners is adjustedevery year. This takes place according to the RISK rules(RISK = Adjustment of Original Value with Taxable Capital).The RISK amount for 2003 has been calculated to be NOK12.93, compared with minus NOK 2.91 for 2002.
MARKET PERFORMANCE OF THE BANK'S PRIMARYCAPITAL CERTIFICATES IN 2003The market price for SpareBank 1 SR-Bank's primary capitalcertificates (ROGG) ended up at NOK 323 per certificate atyear-end. At the end of 2002 the price was NOK 180. Theeffective return on the primary capital certificates in 2003was 85.0 percent (including a NOK 10 dividend payment).The Oslo Stock Exchange index and the primary capitalcertificates index, respectively, rose by 48.4 percent and 62.8percent in 2003.
The liquidity of the Sparebank 1 SR-Bank’s primary capitalcertificates was also improved in 2003. In total, 31 percentof issued certificates were traded, while 27 percent weretraded in 2002.
69
-40
-20
0
20
40
60
80
100
Direct return Effective return OSEBX return
1999 2000 2001 2002 2003
Perc
ent
Return on the bank's primary capital certificates
7.5
40.6 48
.5
8.5
5.3
3.2 7.7
8.1
-14.
6
5.6
-19.
3
-31.
1
6.2
85.0
48.4
0
3
6
9
12
15
2002 2003
1st quarter
2nd quarter
3rd quarter
4th quarter
6.8
8.0
4.2
7.6
3.8
7.2
8.3
12.2
Perc
ent
Trading volume for the bank's primary capital certificates (percentage of issued certificates)

1) Dividend in percentage of market price at year-end.2) Price increase during the year plus dividend paid as a
percentage of the market price at the beginning of the year.
3) Book equity multiplied by the primary capital certificate percentage divided by the number of outstanding certificates.
CREDIT RATINGMoody’s Investor Services’ rating of Sparebanken Rogaland(Long term deposit) was upgraded from A3 to A2 inNovember 2003. The Short Term Deposit was upgradedfrom Prime 2 to Prime 1 and the bank’s overall financialstrength was upgraded from C to C + at the same time.According to Moody’s, the upgrade was a result of the bank-’s continuous improvement on profitability in conjunctionwith good credit risk management. Fitsch IBCA’s grading ofSparebanken Rogaland’s debt was maintained at A- (long-term) and F2 (short-term).
4) Primary capital certificates' share of profit after tax.5) Dividend per certificate as a percentage of profit per
certificate.6) The primary capital, equalization reserve and premium
reserve as a percentage of the parent bank's equity at year-end (excluding valuation difference fund).
70
KEY FIGURES2003 2002 2001 2000 1999
Market price 31 December, NOK 323.0 180.0 246.5 247.5 253.0Taxable price as of 1 January following year, NOK 208.98 179.00 244.50 247.00 250.00Dividend per certificate, NOK 20 10 19 21 19Direct return 1) 6.2 % 5.6 % 7.7 % 8.5 % 7.5 %Effective return 2) 85.0 % -19.3 % 8.1 % 5.3 % 40.6 %Book value per certificate, NOK 3) 219 206 219 214 193Earnings per certificate, NOK 4) 32.7 -2.8 24.7 40.4 40.4Allocated to equalization reserve per certificate, NOK 12.6 -2.7 10.4 18.5 21.4Payout ratio, net 5) 61 % -357 % 77 % 52 % 47 %Primary capital certificate percentage 6) 58.4 % 60.2 % 61.2 % 63.0 % 64.8 %RISK amount as of 1 January following year, NOK 12.93 -2.91 9.46 18.47 28.44Number of issued primary capital certificates 31 December 7 538 194 7 538 194 7 538 194 7 489 686 7 440 000Own primary capital certificates 31 December 38 662 68 890 56 000 0 0Number of primary capital certificates outstanding 31 December 7 499 532 7 469 304 7 482 194 7 489 686 7 440 000Primary capital certificates traded per year (in of issued certificates) 31 % 27 % 20 % 19 % 39 %

Good corporate governance in SpareBank 1 SR-Bankencompasses the goals and overall principles that the bankis managed and controlled by to safeguard the interests ofthe primary capital certificate owners, depositors, lendersand other groups in the bank. The bank’s corporategovernance shall secure proper asset management and pro-vide greater assurance that the goals and strategies com-municated are achieved and realized.
The bank has accordingly adopted the following funda-mental principles for good corporate governance based onthe three pillars of openness, predictability and transparency:
• A structure that ensures goal-oriented and independent management and control
• Systems that ensure measurement and accountability• Effective risk management• Full disclosure and effective communication to
promote trust between the supervisory board, board and management
• Equal treatment of primary capital certificate owners and a balanced relationship to other interest groups
• Compliance with laws, regulations and ethical standards
A STRUCTURE THAT ENSURES GOAL-ORIENTED ANDINDEPENDENT MANAGEMENT AND CONTROL
The bank’s management structure is based on the bank’svision, goals, strategies and basic values.
Management and control encompasses all the processesand control measures that are implemented by the bank’smanagement to secure efficient business operations andexecution of the bank’s strategies.
To provide greater assurance that the primary capitalcertificate owners and other interest groups receive correctinformation on business and financial matters, the bank hasseveral independent auditing bodies.
The bank’s management and control bodies each have theirown duties and objectives, and the roles and responsibilitiesof the various bodies are defined at the highest level bylegislation, regulations and statutes.
GOVERNING BODIES
Supervisory boardThe supervisory board is the bank’s highest administrativebody, and the board’s primary duties include:• Supervision of the board’s management of the company• Adoption of the accounts• Election of members to the bank’s board, audit
committee and nomination committee• Election of an external auditor
The supervisory board makes the following resolutions in ajoint meeting with the board:• Appointment of the managing director• Opening and closing of branches in municipalities
where the bank does not have its head office, other branches and local offices
• Distribution of the amount that shall be donated to charitable purposes pursuant to Section 32 of the Savings Banks Act
• Raising subordinated loan capital
The bank shall ensure that all the members receive a lettergiving at least eight days’ notice of any supervisory boardmeetings to be arranged. The supervisory board cannotmake resolutions on matters other than those listed in thenotice.
The supervisory board has 56 members and 56 alternatemembers, and it normally holds three meetings a year.
71
CORPORATE GOVERNANCE
GOVERNING BODIESINDEPENDENT
CONTROL BODIES
Supervisory Board
NominationCommittee
Board
Managing Director
OverallRisk Management
Audit Committee
External Auditor
Internal Auditor

Nomination committeeThe nomination committee prepares:• Election of the chairman and deputy chairman of the
supervisory board• Primary capital certificate owners’ and depositors’
election of members and alternate members to the supervisory board
• Election of members and alternate members to the board, except for the employee representatives
• Election of members and alternate members to the audit committee
• Election of members and alternate members to the nomination committee
The work of the nomination committee shall ensure that thesupervisory board, audit committee, nomination committeeand board have the necessary qualifications. In addition, thenomination committee shall seek a balanced regionaldistribution and representation by both sexes.
The supervisory board shall elect the nomination committeefrom among the members of the supervisory board. Thenomination committee consists of five members.
BoardThe board supervises the bank's operations in accordancewith the applicable legislation, statutes, and the detailedinstructions of the supervisory board. The board is alsoresponsible for ensuring that the funds controlled by thebank are managed in a secure and proper manner. It followsfrom this that the board also has a duty to ensure that thebank’s accounting and asset management are subjected toproper scrutiny. The board members shall exercise due carein executing their responsibilities and duties.
The duties of the board also include the following:• Adoption of instructions for the day-to-day
management of the saving bank• Adoption of the bank’s strategy and budget, and
marketing and organizational goals• Appointment and dismissal of the internal auditing
manager
The board normally meets 11 times a year.
The board is elected by the supervisory board and consistsof nine members, one of whom is elected by the employees.The managing director is a member of the board. All electedboard members are elected for a term of two years, andalternate members are elected for a term of one year.Members and alternate members can be reelected. Toensure continuity half of the board's members are electedevery other year.
The board members shall be independent, and they shalldisqualify themselves and leave the meeting if any commit-ment in which they hold an interest or have duties isdiscussed. The board members are defined as primary
insiders, and they must follow the bank's regulationsconcerning the acquisition of primary capital certificates inthe bank and SpareBank 1 alliance banks. This applies alsoto the acquisition of shares in companies that are customersof the bank. These matters are regulated in greater detail inthe Savings Banks Act and Financial Institutions Act.
The board performs an annual self-assessment of its workwith a view to its form of work, administrative procedures,meeting structure and prioritization of tasks.
The board’s remuneration is a fixed amount per year that isadopted by the bank’s supervisory board. No remunerationis paid in addition to this.
The board has not appointed any permanent subcommittees.
Managing directorThe managing director is responsible for the day-to-daymanagement of the bank’s operations in accordance withthe applicable legislation, statutes, authorities andinstructions. The managing director shall brief the board onthe operations, position and performance of the bank atleast once a month.
Matters that are of an unusual nature or of great importanceto the bank shall be submitted to the board.
The managing director’s overall performance is assessedannually by the board.
CONTROL BODIES
Unit for overall risk managementThis unit is independent of the customer units andresponsible for:• Development of the bank's framework for
comprehensive risk management• Overall risk management and followup
Separate controller functions have been established forcredit risk, operational risk and currency/finance.
Audit committeeThe audit committee shall monitor that the bank operatesin an appropriate and satisfactory manner in accordancewith the applicable legislation, regulations, statutes, andguidelines adopted by the supervisory board, in addition todirectives from the Banking, Insurance and SecuritiesCommission. The audit committee shall also ensure thatthe operations of the entire bank are managed in anappropriate and satisfactory manner.
The audit committee is elected by the supervisory board andconsists of five members, who elect their own chairman.The members are elected for a term of two years.The audit committee normally meets 11 times a year.
72

External auditorThe external auditor’s primary task is to assess whether thebank’s annual financial statements are prepared inaccordance with the applicable laws and regulations.Moreover, the external auditor shall assess whether thebank’s asset management is handled properly andsubjected to proper scrutiny. The external auditor is electedby the supervisory board.
The external auditor submits a report to the supervisoryboard and audit committee on these matters.
Internal auditorThe internal auditing function is a tool that is used by theboard and management to monitor whether the riskmanagement process is goal-oriented, effective andfunctions as intended. The bank’s internal auditing functionhas been outsourced, and this ensures that the function hasthe required independence, qualifications and capacity. Theinternal auditing function reports organizationally to theboard. The internal auditing function's reports andrecommendations for risk management improvements arereviewed and implemented in the bank on an ongoingbasis.
SYSTEMS THAT ENSURE MEASUREMENT ANDACCOUNTABILITY
Effective goal-oriented management is a prerequisite for thebank’s ability to measure whether it is achieving its strategicgoals. The bank has established guidelines and effectivemeasurement variables for the measurement and manage-ment of the business units. In addition, strategic planning,and forecast and budget management are used as effectivemanagement tools.
Accountability is provided through clear communication ofbusiness plans and the adopted goals to the employees.This is operationalized through clearly defined roles,responsibilities and expectations, where the managers areheld accountable for the achievement of goals within theindividual areas of responsibility. Compensation schemeshave been established based on how well the managementand employees perform in relation to these measurementvariables.
EFFECTIVE RISK MANAGEMENT
Effective risk management is an essential element in theachievement of the bank’s strategic goals. Risk manage-ment is an integral part of the management's decision-making processes and a key element with regard toorganization, routines and systems.
Significant risks are analyzed, managed and followed upthrough the continuous risk management process in the
bank to ensure that the bank operates in accordance withthe approved risk profile and adopted strategies. The boardand management review the bank’s risk profile at least oncea year in relation to strategic, operational and transactionalmatters. The development of the risk picture is reportedperiodically to the managing director and board.
FULL DISCLOSURE AND EFFECTIVE COMMUNICATION
Full disclosure and effective communication promote trustbetween the owners, board and management, and provideother interest groups with an ongoing opportunity to evalu-ate and relate to the bank. The bank’s information policythus places emphasis on an active dialog with the bank’svarious interest groups, in which there is focus onopenness, predictability and transparency.
The bank also attaches importance to the fact that correct,relevant and timely information on the bank's performanceand results will inspire the confidence of the investormarket. Information is distributed to the market throughthe bank’s quarterly investor presentations, website andpress releases. Regular presentations are also given tointernational partners, lenders and investors.
EQUAL TREATMENT OF PRIMARY CAPITAL CERTIFICATEOWNERS AND A BALANCED RELATIONSHIP TO OTHERINTEREST GROUPS
GeneralThe bank’s relationship to its interest groups, including theprimary capital certificate owners, depositors, lenders,customers, employees and the society around it shall bebased on the bank’s vision, goals, strategies and basicvalues. These basic values shall be achieved through a long-term perspective, openness and honesty, and throughshowing responsibility, respect, and a willingness and abilityto change.
Primary capital certificate ownersThe board’s most important objective is to safeguard thebank’s and, thus, the primary capital certificate owners’long-term interests at all times and under any circumstances.
The bank shall ensure that all the primary capital certificateowners have an opportunity to express their opinions on thebank’s operations and development through an on-goingdialog. The bank shall have a profile that ensures credibilityand predictability on the market. A long-term competitivereturn shall be sought. The bank shall provide the marketwith relevant and complementary information as basis for abalanced and correct valuation of the primary capitalcertificate.
The bank’s financial goal for its operations is to achieveresults that provide a good and stable return on the bank's
73

total equity. The bank's required return on equity capitalafter tax is the long-term government bond rate plus a riskpremium of 6 percentage points. In addition, the bank hasa goal to be among the best third of the Norwegian banksthat are naturally comparable with regard to its return onequity capital. The bank’s basic foundation is the division ofprofit between the primary capital certificate owners and thesavings bank's reserves in accordance with their share ofthe bank's equity capital. The bank will place emphasis onpaying a competitive cash dividend. Variations may exist inthe proportional distribution between cash dividends andthe equalization reserve when consideration must be givento the development of the bank's equity.
DepositorsOne of the primary tasks of the board is to secure thedepositors’ funds by ensuring that the bank's financialperformance provides satisfactory asset management, andthat the bank does not assume any unwarranted risk basedon the bank’s earnings and capital adequacy.
LendersThe bank’s liquidity management strategy safeguards thebank’s and, thus, the lenders’ interests, through theprincipal goal of ensuring sound and healthy bankingoperations, so that the bank can meet any futureobligations. Moreover, this strategy shall contribute to areduction in the probability that the bank's financialstrength will be questioned or debated.
CustomersTo create the best possible foundation for the developmentof the bank, the bank shall engage in an active dialog withits customers, through ordinary contact with customers,user surveys and customer panels. All contact with customersshall be based on commercial principles, the bank’s basicvalues, ethical guidelines and vision “The recommendedbank”.
The bank promotes cooperation between the variousemployees and units, always with the aim to give thecustomers the best solutions and high quality service,through giving its basic values practical and tangiblecontent in everyday life.
It is the responsibility of the board to ensure that the bankdevelops and maintains effective, appropriate and ethicallyresponsible products and advice to ensure the best possiblerelationship with its customers.
Employees
The bank shall have a corporate culture that supports anddevelops employees in the organization like a dynamicwinning team. The bank focuses on a corporate culture thatpromotes well-being, job satisfaction and a good workingenvironment. This is measured by quarterly surveys.
The bank’s employees shall act in a predictable manner,have high ethical standards and show respect for the bank’stradition as a regional savings bank with local roots.
Leadership and employeeship are rooted in the bank’s basicvalues, routines, guidelines and work rules. All the bank’semployees have a responsibility and obligation to fam-iliarize themselves with and comply with these values,routines, guidelines, and rules. In order to succeed, allemployees must be qualified and conform to high qualitystandards.
Provisions have been established to secure the safety of thebank’s employees and customers with a view to protectingthem against physical or mental injury, as well as safe-guarding the assets that have been entrusted to the bank.
The bank’s basic values specify how the bank’s employeesshould act with a view to their ethics and conduct.Management in the bank means that the individual managersshould set a good example and familiarize themselves withthe bank’s ethical guidelines. Violations of the guidelinesand routines are not acceptable, and serious cases will bereported automatically to the police.
Social responsibilityThe bank is an integral part of the local community with itsregional roots and branch network. It contributes a netsupply of capital to the region through profitableoperations. This is a prerequisite for business developmentand settlement.
SpareBank 1 SR-Bank works for the common good and isconcerned about strengthening voluntary organizations,and it helps promote local activities through gifts andsponsorship agreements. Gifts and sponsoring shall bebased on the bank’s vision and business concept, and thedistribution of such shall promote diversity and breadth.
COMPLIANCE WITH LAWS, REGULATIONS ANDETHICAL STANDARDS
Compliance with laws, regulations and ethical standards isa prerequisite for healthy banking operations. The bank hasestablished clear basic values and ethical guidelines that areappropriate to these values. The ethical guidelines arecommunicated clearly throughout the organization anddefine what is desirable and undesirable conduct in theorganization.
74
Bank’s Basic Values
Courage to speak out, the strength
to create
Long-sighted
Open and honest
Responsibility and respect
Willingness and ability to improve
and by showing
by being
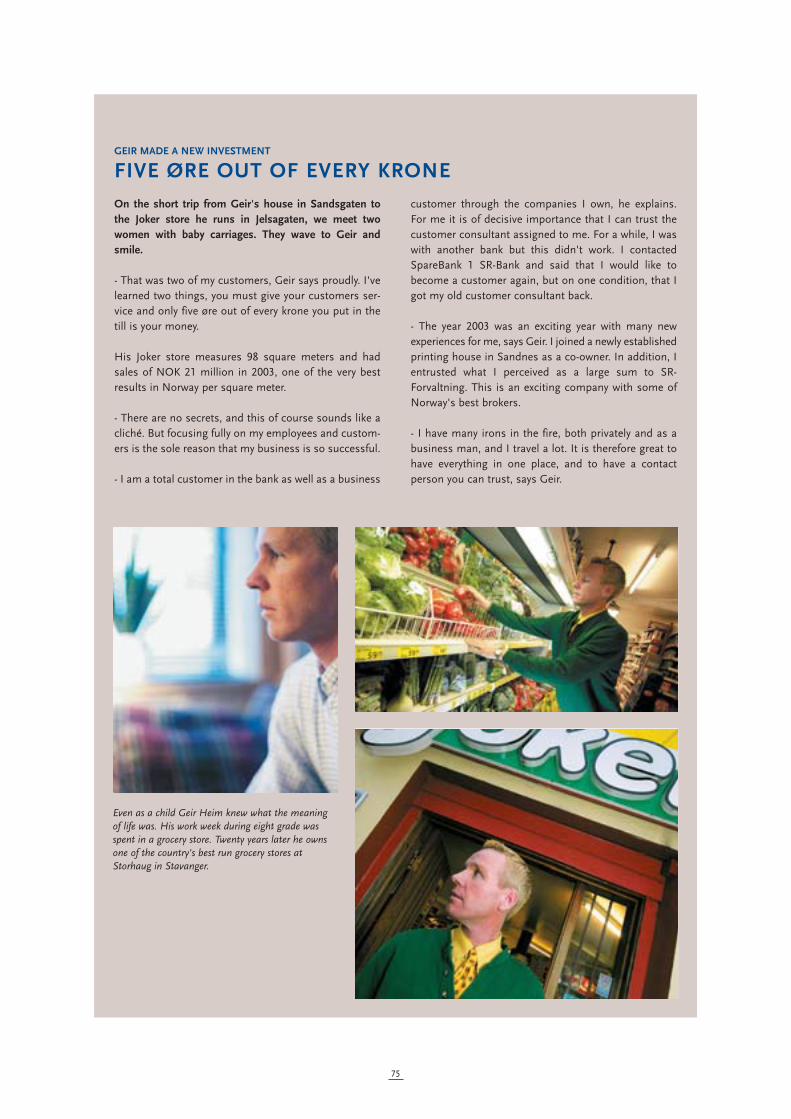
On the short trip from Geir's house in Sandsgaten tothe Joker store he runs in Jelsagaten, we meet twowomen with baby carriages. They wave to Geir andsmile.
- That was two of my customers, Geir says proudly. I'velearned two things, you must give your customers ser-vice and only five øre out of every krone you put in thetill is your money.
His Joker store measures 98 square meters and hadsales of NOK 21 million in 2003, one of the very bestresults in Norway per square meter.
- There are no secrets, and this of course sounds like acliché. But focusing fully on my employees and custom-ers is the sole reason that my business is so successful.
- I am a total customer in the bank as well as a business
customer through the companies I own, he explains.For me it is of decisive importance that I can trust thecustomer consultant assigned to me. For a while, I waswith another bank but this didn't work. I contactedSpareBank 1 SR-Bank and said that I would like tobecome a customer again, but on one condition, that Igot my old customer consultant back.
- The year 2003 was an exciting year with many newexperiences for me, says Geir. I joined a newly establishedprinting house in Sandnes as a co-owner. In addition, Ientrusted what I perceived as a large sum to SR-Forvaltning. This is an exciting company with some ofNorway's best brokers.
- I have many irons in the fire, both privately and as abusiness man, and I travel a lot. It is therefore great tohave everything in one place, and to have a contactperson you can trust, says Geir.
75
FIVE ØRE OUT OF EVERY KRONEGEIR MADE A NEW INVESTMENT
Even as a child Geir Heim knew what the meaningof life was. His work week during eight grade wasspent in a grocery store. Twenty years later he ownsone of the country's best run grocery stores atStorhaug in Stavanger.

Facts:Number of customers: Around 5 000Growth in lending: 1%Growth in deposits: 3%Gross lending: NOK 11.8 billion.Deposits: NOK 8.2 billion
The corporate market division serves the private and publicsector from Haugalandet to Arendal. Based on our localaffiliation, it is our goal is to contribute to the creation ofvalue for our customers.
Lending up in the last half yearThe lending volume in the corporate market did not changemuch in 2003. At the end of the first half year the lendinggrowth was negative. The market improved somewhat inthe fall, and the full year shows lending growth of 1 percent(adjusted for losses and foreign currency loan fluctuations).Total lending volume to the corporate market is NOK 11.8billion.
Fine growth in depositsThe deposit volume from the corporate market has shownfine growth in 2003 and totaled NOK 8.2 billion. The bankhas consolidated its position in the market for largedeposits. Total deposit volume increased by NOK 0.2 billion,which corresponds to an increase of 3 percent in 2003.
Other operating incomeIn recent years the bank has strengthened its efforts tocreate other operating income. In 2003 we have seen amarked increase in commission income related to the saleof insurance and currency/interest rate products. Inaddition, income from payment services is showing a steadyincrease. These areas will be focus areas in 2004 as well.
Improved portfolioThe bank recorded significant losses in the corporate mark-et in 2003 as well. The majority of these losses are attributedto a few major commitments entered into in the middle ofthe 1990s, related primarily to fishery and shipping custom-ers. In recent years, a major cleanup operation has beenperformed on the bank’s corporate market portfolio, andthe quality of the portfolio was significantly better at thestart of 2004.
Overall the corporate market division achieved a return onequity of 24 percent before losses and tax and 3 percent
after losses and tax. An improvement in the results isexpected on the whole in 2004.
Stable market positionSpareBank 1 SR-Bank has a solid position in the corporatemarket. Over 40 percent of all the businesses in the bank’straditional market list SpareBank 1 SR-Bank as their mainbank. In the new areas, such as the Agder counties, the bankhas a weaker position, but the operations are showing apositive development here as well. We serve a total of justunder 5 000 customers. Moreover, the bank has developeda key role in relation the public sector in recent years, and17 out of 27 municipalities in Rogaland, including thecounty administration, are customers of the bank.
Satisfied customersThe bank conducts annual customer surveys with a view toidentifying areas where we can make improvements. Thegeneral feedback from customers is good. In recent yearsthe bank’s CSI (customer satisfaction index) has beenaround 70. Among our strategic partners the score is evenhigher. We continuously strive to improve all facets of ouroperations to increase customer satisfaction, and in 2003the bank decided in particular to establish a special customersatisfaction unit for corporate customers to improve ouravailability and service further. This unit will be operativefrom the middle of February 2004.
Lending broken down by industries as a percentage of all lending
76
CORPORATE MARKET DIVISION
0 2 4 6 8 10
31.12.200331.12.2002
Percent
Public sector/finance
Fishing/aquaculture
Mining/oil and gas
Power and water supply/building and construction
Distributive trades/hotel
Service sector
Industrial sector
Agriculture/forestry
Shipping/transport
Property management

Customer comprehension as a competitive factorOur strategy for the corporate market was reviewed andrevised in 2003. The fundamental principle of our strategy isstill to serve businesses with clear local roots. We will builda unique customer comprehension through our localnetwork and proximity to our customers. This comprehens-ion will be a key competition parameter. We will continue tofocus on the development of local forums and the intro-duction of our customers to our values through theseforums. Our employees shall present themselves as future-oriented and capable in their work with customers.
New contact channelsIn 2003 we launched our new regional business and industrymagazine “Tett på næringslivet”. Our goal here is toillustrate the colorful trade and industry we have in ourregion and place development on the agenda. We have alsoentered into broad cooperation with key actors. Oureconomic barometer is published three times a year andillustrates development trends and forecasts in the varioussectors with a focus on Rogaland. In November 2003 webrought 500 business managers together for an analysisand discussion of the outlook for 2004. We also establishedlocal forums at several locations in the region in 2003. Thisgives us opportunities for networking and the exchange ofexperience between our customers. We desire at the sametime to make a professional contribution that is closely link-ed to our customers' business.
Strengthened organizationThe corporate market organization workforce consists ofjust under 100 man-years. We have personnel located inHaugalandet, Ryfylke, Dalane, Kristiansand and Nord-Jæren. In 2003 we have strengthened our focus on sectorspecialization with the aim of becoming a good discussionpartner for our customers. We have also strengthened ourfocus on competence development through new recruit-ment and the development of our own employees.
We have established a special sales support unit in thedivision in 2003 to strengthen other operating incomefurther. A number of resource persons have been gatheredtogether here to provide adequate competence to servecustomers in all segments.
Outlook for business and industry in 2004Business and industry in the region are dependent onstability and a predictable framework from the publicauthorities and the market. This is of decisive important inorder to attract new capital to businesses. The region needs
innovation, and this means that there must be a willingnessto invest for the future.
77
91 bedrifter i Rogaland drives av elever på videregående skoler.De kan bli morgendagens bedriftsledere. Side 14
Unge, men ikke lenger grønne
TETT PÅNÆRINGSLIVET
Et magasin fra SpareBank 1 SR-Bank • Nr. 4, januar 2004
Sola kommune114 år gammelt kundeforhold erfremdeles like levende.Side 4
NordialogEr telefon ikke lenger et dekkende ord?Side 6
ARENAHvordan hente mot og viljestyrke til åtørre å nå dine mål? Årets ARENA-program begynner å ta form. Side 18

- For us 2003 was a year of good growth, says DagMagne, general manager of Nordialog. While theNorwegian mobile market increased by 20 percent, wemanaged to increase by 30 percent.
In other words, this means that the mobile chain withheadquarters in Hillevåg gained market shares.Nordialog increased their number of retail outlets byfour Tele-kiosks and two Nordialog shops.
Dag Magne claims that the reason for the overallgrowth is the increased competition between the sup-pliers with heavy subsidies, for example.
- We sold 216 000 phones last year, he says. Theenormous development of technology means thatpeople want new phones. Previously, it was sufficient ifthe phone worked when you were at your cabin. Nowpeople want MMS, pictures, Bluetooth, and synchro-nization with their computer. Everything is supposed tofunction perfectly.
- It's been seven years since the then 29 year old boyfrom Stavanger established the Nordialog chain. Today
he manages 83 outlets all over Norway, from Vadsø inthe north to Mandal in the south, 37 Nordialog shopsand 46 Tele-kiosks. The chain had sales of approximatelyNOK 700 million last year.
- When we started out, we used a large Oslo-basedbank. We had zero profit and a lot of money tied up in alarge inventory. We increased our sales turnover fromNOK 11 million to NOK 290 million in one year. We feltnevertheless like a small customer in a large bank, headmits. Everything was distant and impersonal.
- We contacted SpareBank 1 SR-Bank and they believedin us, says Dag Magne. He doesn't try to hide the factthat Nordialog is very satisfied with the bank.
- It gave us much more direct contact and greaterlatitude financially. We think it is important that we arewell taken care of and that the bank's employees delivergood solutions. They aren't only interested in how muchmoney we have in our account at any given time. Thebank takes us along on courses and invites us forregular talks on how we can do things better.
78
THEY SOLD EVERY 7TH MOBILE PHONE IN NORWAYNORDIALOG CONTINUED TO GROW
New technology, such as being able totake pictures and send e-mail, meansthat the phones people bought just twoyears ago no longer are up to standard.On the average mobile phones last lessthan two and a half years before they areexchanged for a new device.
Nine out of ten Norwegians now have amobile subscription. The Stavanger basedNordialog chain is among the winners inthe Norwegian mobile market. In 2003 atotal of 1 550 000 phones were sold inNorway, and 216 000 of these were soldby Nordialog. The chain is managed byDag Magne Søyland.

Inger had worked in the ophthalmology department atSørlandet Hospital for many years. The department wasreorganized in 2003 and Inger decided to start workingfor a private clinic in the center of Kristiansand.
- I wanted to live in the center of town, says Inger,smiling as she sits in her “brand new” apartment from1898, centrally located on Dronningens gate in thecenter of town, near the old Norges Bank. The ceiling isat least three meters high and the whole apartmentmeasures 123 square meters. She hasn't lived here forvery long. The next room is filled with boxes and bagswith items that have yet to find their place.
- I've only been in my new job for three days, she says.It is very exciting and hectic, so for the time beingunpacking will just have to wait a while.
- I found the apartment on the Internet, she explains.First I contacted EiendomsMegler 1 and then I became acustomer in the bank. I got my own customer consultant
in the bank and received good financial advice and goodterms. I've only been with the bank for a short while, butso far I must say that I've been treated very positively.
- Here in Kristiansand the bank also has customerconsultants available in the evening twice a week, andthis is very handy for me, she adds.
79
AN APARTMENT ON THE INTERNETINGER MOVED INTO A “NEW” APARTMENT
Inger Tveida is a nurse and lives in Kristiansand. She hasrecently moved into a large apartment in the center of town.

Facts: Number of retail customers withSR-Bank as their main bank: 181 100 Number of agricultural customers: 3 200 Number of small and medium-sized businesses: 5 300 Number of clubs and associations: 13 900 Number of customers with savings agreements: 13 280 Number of customers with investments in ODIN funds: 40 850 Number of customers with general insurance: 71 180 Lending: NOK 34.6 billionDeposits: NOK 18.4 billionOff-balance sheet savings investments: NOK 5.8 billion
In the fall of 2002 customer service for retail customers,agricultural customers, associations/clubs and parts andthe SMB (small and medium-sized business) market wasjoined together in a single business area. This has given usa sharper commercial focus and contributed to greaterefficiency and professionalism at the distribution level.
A good yearThe division delivered strong results in 2003 as well. Theresults were marked by higher volumes, better risk pricing,good cross sales, low losses and low cost growth. Thedivision achieved a return on equity of 31 percent beforelosses and tax and 21 percent after losses and tax in 2003.
Historically low interest rate levelThe year 2003 was marked primarily by six interest ratereductions by Norges Bank. This resulted in a historicallylow interest rate level at the start of 2004. The householdloan demand shot up in the last quarter and the growth forthe year was 12 percent (+ NOK 3.6 billion), around 1 percentover the market growth. The pressure on lending marginswas less than the previous year, which is attributed to thedifficult funding situation for certain actors for majorportions of the year. There has, however, been a great dealof pressure on the deposit margins due to the samesituation. There is reason to assume that this has resulted ina permanent weakening of the deposit margins in the retailmarket. With the low interest rate level and a strongly risingstock market during the last three quarters, bank savingshave become less attractive. As a result of this, the growthin deposits was a modest 2.6 percent (+ NOK 0.7 billion).
Non-performing loans and lossesUnemployment in our market areas has been relatively highand higher than the national average for the year. In spite ofthis, the net non-performing loans have shown a decliningtrend and totaled NOK 138 million or 0.4 percent of thelending portfolio at the end of the year. The main reason forthis very positive development is the close followup throughthe use of the special work process “From default to legaldebt recovery” and the focus on this in the balanced score-cards at the departmental level.
Net losses totaled NOK 29 million or 0.09 percent of theaverage lending volume. Additional measures were imple-mented during the year to ensure high quality credit work ingeneral, in order to keep the non-performing loans and losseslow in the division.
Multichannel banking – the customer’s choiceSpareBank 1 SR-Bank had 52 branch offices at the end of theyear. Our branch offices are still the primary channel in ourdistribution strategy. The number of telephone inquiries tothe branch offices is declining as the customers start to usethe customer center’s common number 02002 more (seethe next section). In combination with the continued growthin the number of Internet bank users, this has resulted in adecline in the number of in-person inquiries. The resourcesat the branch offices can thus be channeled in the directionof consulting with the associated ongoing need for newcompetence. In 2003 SpareBank 1 SR-Bank focused a greatdeal on increasing its consulting competence through theintroduction of a new consulting tool developed throughcooperation between the banks in the SpareBank 1 Alliance.
80
RETAIL MARKET DIVISION
Customer center – good job in the market and internallyThe customer center 02002 plays a very key role in ourmultichannel strategy. In 2003 the center started to use newtechnology that integrates customer data and telephony.The service level measured as the wait times for incomingcalls and e-mail to the bank has stabilized at the desiredlevel during the year. As a result of this, the general customersatisfaction index (CSI) for customers who contact thecenter is 75 out of 100, and this must be regarded as verysatisfactory. Interaction between the customer center andthe consultants in the branch office network is defined as acritical factor for success, and the employees’ satisfactionwith the solution is also very high.
55 percent of our wage account customers now use ourInternet bankThe number of active Internet bank users has shown steadygrowth throughout the year, and the utilization level isconsidered to be one of the highest in the bank market. Theoperational regularity of the Internet bank has been good,and new services were introduced in 2003. The new Internetbank services include Internet insurance, where thecustomers can calculate offers, change their existinginsurance coverage, submit claims and buy new insurance.Electronic message distribution is another service thatmakes it possible for customers to receive messages,account statements, payments, etc., from the bank directlyin the Internet bank.
Telephone bankOur telephone bank is still a popular channel. Around74,000 customers used the telephone bank in 2003, and theaverage daily traffic volume was 14 000 payments. This doesnot include balance inquiries. Our customers alternatemostly between the use of our telephone bank and Internetbank to meet their day-to-day banking needs.
Card use rising – ATM use leveling offCard use shows a steady, strong increase, especially for theuse of payment terminals. The bank’s card transactionsthrough the Norwegian Banks' Central Clearing House(BBS) increased by 13 percent during the year. In 2003, 4.8million withdrawals totaling NOK 5.3 million were madefrom our 60 ATMs. Of these withdrawals, 55 percent weremade by our own customers. The transaction volumegrowth over 2002 was 8.2 percent and the monetary valuegrowth was 11 percent. In 2003, 62 000 prepaid mobilephone service transactions were carried out through ourATMs. This is an increase of 130 percent over the previousyear.
SUMMARY OF THE DIVISION’S SUBAREAS
Retail customersWe had a net increase of 2 100 customers. Our customersatisfaction index is stable. Good cross sales show that ouroverall offerings are competitive. The market’s acceptanceof our relatively new market area, Agder, shows that ourconcept is future-oriented and robust. No strategic changeshave been made during the year, and our main focus is onoptimizing our current primary strategy. Consulting andsales visits with a special focus on long-term savings hasbeen given priority.
AgricultureThe needs of agriculture to reorganize and adapt theindividual operations to the new regulatory framework havebeen great, and they will continue to be so in the future.Larger units, specialization and new farming systemschallenge the bank as a partner. Feedback from the marketand the organizations that cooperate with agricultureindicates that the bank is perceived as a competent andactive partner. The growth in business volume and the rolethe bank has as the clear market leader entails obligations,and we will focus even more on this sector in the future.
Small and medium-sized businessesA total of 5 300 small and medium-sized businesses have arelationship with the retail market division through theindividual branch offices. These commitments aredistinguished by the fact that the businesses are organizedas a sole proprietorship, and have a low level of complexityand risk. If the nature of the businesses changes, they willbe transferred to the corporate market division. Thedevelopment in this market has been very good in 2003.
81

It is very evident that they have their sights on foreignmarkets and exports. Their website isn't even inNorwegian. Here they only deal in foreign currency.
Since their start-up 12 years ago, Egersund-based Janexhas grown to become one of Great Britain's leadingsuppliers of high-quality Scandinavian doors andwindows. Their choice of a small niche has beensuccessful, and the Janex brand is enjoying greatsuccess. The business that employs a total of 28 peoplehad sales of NOK 140 million last year, and everythingis managed from the offices on the harbor in Egersund.
Jan Skaara, founder and managing director of the JanexGroup, realized early on that the British needed properdoors and windows with good woodwork. He unitedseven Norwegian producers and created a newNorwegian brand.
- Janex is a brand that makes clear promises to itscustomers, Scandinavian quality and smart functionality.But the windows and doors are produced at sevendifferent factories. We are, for example, responsible forabout 20 percent of Gilje's production capacity. Janex'srole is to define the standard, sell it to the market and
make arrangements for an efficient distribution of theproducts, Jan explains.
- However, 2003 started out quite poorly, Jan admits.The reason for this was the fact that we sell ourproducts on the basis of annual contracts in Britishpounds. Last year's foreign currency situation meantthat we lost approximately NOK 4 million during thefirst four months.
- We had to quickly reconsider our earlier ambitiousplans and increase our capital. We are rather proud ofthe fact that we managed to break even in 2003.
- The foreign currency tools that we can use throughSpareBank 1 SR-Bank and the expertise the bank has inthis area have been of great help, Jan says. We can, forexample, lock in a large portion of our budget. Thismeans that we can operate with less risk and withouthaving to worry about the foreign currency situation. Wehave to be predictable in the market. We cannot adjustthe prices month to month, otherwise we would be outof the running in a flash.
82
TURNAROUND AT THE LAST MINUTEJANEX USED FOREIGN CURRENCY TOOLS
It's difficult being a small player in an international market. Butif many small players join forces the sum total is much greater.This was the business concept of Jan Skaara in Egersund.

In 2003 TNS Gallup conducted a comprehensive positionsurvey of the various brands in the bank market. The surveywas made on the basis of 7 165 telephone interviews withindividuals over the age of 18 who were randomly drawnfrom sample areas that were defined by the banks’ marketareas. Of these telephone interviews, 1 002 were conductedin SpareBank 1 SR-Bank’s market area.
The survey illustrates the banks’ position in the form ofawareness, preference, differentiation and market share. Abrand strength index was prepared on the basis of theseindicators. The survey also measured the banks’ CSI(customer satisfaction index) and what the banks areknown for. For respondents with SpareBank 1 as their mainbank, they were asked whether and where they had variousbank products.
The results were very uplifting for us. They show that we arecontinuing the important job of creating trust between usand our customers. SpareBank 1 SR-Bank clearly has thestrongest brand in its market area. Brand strength is
measured by means of the following dimensions, which arecombined to form an overall brand strength score:
• Awareness (Top of Mind shares)• Preference/relevance (preference shares)• Unique relevant qualities (differentiation shares)• Market power (main bank shares)
We interpret this as an indication that we are giving ourcustomers what they want, and that we are headed in thedirection of our vision of being the recommended bank. Wereceived another indication of good marketing work whenSpareBank 1 SR-Bank was selected as the Marketer of theYear for 2003 by the Marketing Association in Stavanger.The jury stated that the reason for their decision was the factthat the bank has solid local roots and has built its positionstone by stone. In addition, they pointed out that the bank’ssuccess was not only rooted in its long-term strategy, butalso in the employees’ good execution ability.
83
NORWAY’S STRONGEST BANK BRAND
Terje Vareberg (center) and Bjørnar Jacobsen received the coveted“Mortepumpen” award as proof that the bank was the Marketer ofthe Year for 2003. The award was presented by Arild Slettebø,President of the Marketing Association in Stavanger.
The survey shows thatSpareBank 1 SR-Bankclearly has the strongestbrand in its market area.
0 30 60 90 120 150
Main bank
Differentiation
Preference
Top of Mind
Storebrand
Gjensidige NOR
Handelsbanken
Nordea
Postbanken
SkandiaBanken
Fokus
DnB
Local savings banks
SpareBank 1 SR-Bank
Banks’ brand strength in SpareBank 1 SR-Bank’s market area
Brand index

EIENDOMSMEGLER 1 ROGALAND AS
The EiendomsMegler 1 real estate brokerage chain has beenthe market leader in the Norwegian market and sold closeto 15 000 homes with an overall value of NOK 18 billion in2003.
With income of around NOK 150 million and the sale of 4 295 properties divided among 17 brokerage offices inRogaland and Agder, EiendomsMegler 1 Rogaland AS is thelargest company in the chain and the market leader in ourregion. This represents an increase of 18 percent comparedwith 2002.
In May 2003 EiendomsMegler 1 took over the real estatebrokerage operations of Stavanger Boligbyggelag. This hasstrengthened the market position of EiendomsMegler 1.
The operations in Rogaland and Agder are based on thebrokerage of homes, commercial property and the sale ofnew planned homes, as well as a separate department for thebrokerage of housing cooperative units. EiendomsMegler 1also has a special department for the sale of new homes inSpain, primarily in the Torrevieja area. In addition, the com-pany brokers a significant number of cabins and vacationproperties along the coast of southern Norway, inSirdalsheiene and in Ryfylke.
EiendomsMegler 1’s communication with the market plac-es emphasis on "a transaction you can live with". This isdone based on acknowledgement of the fact that thepurchase of a home is perhaps the most importanttransaction made in one's life.
EiendomsMegler 1’s task is to take this seriously, and to bejust as thorough and committed every time. The best pricecan be achieved when both the buyer and seller trust ourrecommendations. The experience and competence of thecompany’s 100 employees is therefore of decisive importanceto the continuation of the company’s success.
WESTBROKER FINANS AS
Westbroker Finans is the leading finance company inRogaland with total assets of around NOK 1.6 billion. Thecompany has 21 employees, and its main products areleasing, car leasing, special financing and funding services.The company's largest customer groups are in the serviceand transport sectors, and the company has a broadcommitment in other sectors.
Westbroker Finans is distinguished by its proximity to thelocal business community. Knowledge of the people andlocal conditions give the company the best opportunities forproviding the best advice and making the right decisions.Every decision is based on local knowledge and specialistcompetence.
84
OUR SUBSIDIARIES
0
1
2
3
4
5
6
200320022001
Value of homes sold 2001-2003 in NOK billion
0
1000
2000
3000
4000
5000
200320022001
Number of homes sold 2001-2003

The management and administration share offices withSpareBank 1 SR-Bank’s corporate market department atForus near Stavanger. The company’s employees have solidexperience from finance and industry/business in general.Local knowledge has given the company an opportunity tocontribute to financing solutions for a broad range of valuecreating actors in the local business community.
SR-FORVALTNING ASA
SR-Forvaltning ASA has a license for active investmentmanagement. SR-Forvaltning's goal is to be a localalternative with a high level of competence in the financialmanagement area.
The company’s six employees manage portfolios forSpareBank 1 SR-Bank and SpareBank 1 SR-Bank's pensionfund, in addition to portfolios for around 1 000 externalcustomers. These customers are primarily pension funds,public institutions, corporate customers and privateinvestors.
The assets under management totaled around NOK 2.3 billion at the end of 2003. This represents an increase ofalmost 50 percent compared with 2002.
SR-Forvaltning's operations are based on conservativeprinciples and a long-term perspective. Different portfoliomodels form the basis for the structure and adaptation ofthe individual investor's solutions. The managementconcept is based on the application of various investmentalternatives in combinations that contribute to a good risk-adjusted return.
85
Service sector22 %
Transport21 %
Industry13 %
Building and construction
12 %
Primary industry10 %
Public sector10 %
Oil6 %
Retail trade6 %
Westbroker’s portfolio broken down by sectorTotal portfolio is NOK 1.5 billion
0.0
0.5
1.0
1.5
2.0
2.5
200320022001
Assets in NOK billion
SR-Forvaltning ASA, change in assets under management
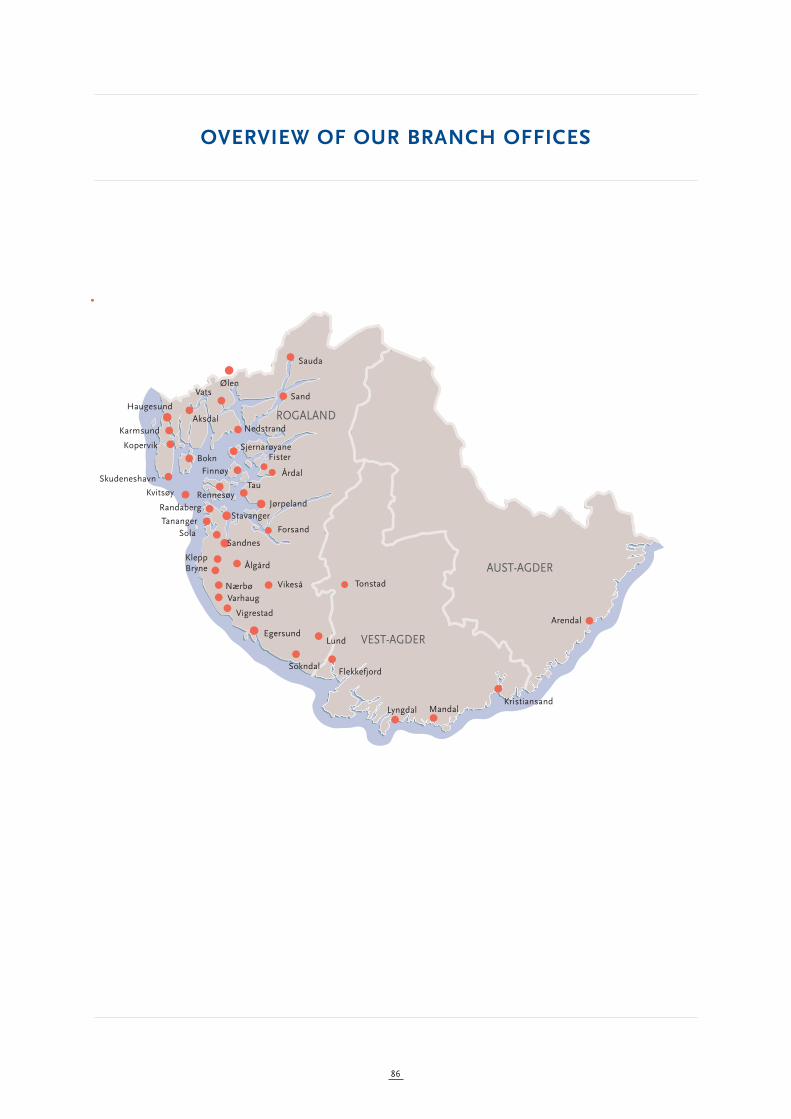
86
OVERVIEW OF OUR BRANCH OFFICES
ROGALAND
VEST-AGDER
AUST-AGDER
Sauda
Sand
ØlenVats
Fister
Årdal
Jørpeland
Tau
Forsand
Vikeså Tonstad
Ålgård
Sandnes
AksdalHaugesund
Karmsund
Kopervik
Bokn
Nedstrand
Sjernarøyane
Rennesøy
Finnøy
Kvitsøy
SolaTananger
RandabergStavanger
KleppBryne
NærbøVarhaug
Vigrestad
EgersundLund
SokndalFlekkefjord
Lyngdal MandalKristiansand
Arendal
Skudeneshavn

Geir Inge knows better than most people that thingscan change quickly. In 1995 he was gathering sheep inthe mountains. He lost his footing and plummeteddown a 200 meter rock face. He was 34 years old. Hehad three children who had not yet started school. Justbefore this incident he had cycled from Trondheim toOslo. Now he is dependent on his wheelchair.
The view is spectacular from his home just underDalsnuten. Here he can follow his share prices fall andrise. It pays to keep a close watch. Geir Inge has a fairsum of money with SR-Forvaltning.
- In 2003 I thought I had started on the bottom, he says.Almost every day newspapers and the TV reported thatthose of us who had decided to save in shares wereidiots. Tandberg Data was, for example, down to NOK1.80 in January. And it was going to get worse. BetweenFebruary and March the market hit bottom.
- And when something reaches the bottom there is onlyone direction it can go, he smiles. By May Tandberg was
up 500 percent, Geir Inge says enthusiastically. Idecided to sell and made good money on the sale.
Why SR-Forvaltning?
- When you go to a bank and ask for a loan you areevaluated by the bank, Geir Inge explains. It is not just aquestion of security, it is just as much a question oftrust. Can they trust you? People should evaluate thebank in the same way when they choose who shouldmanage their money.
- I compared the various suppliers up against eachother. My initial sum was NOK 1 million. What did themanagement of my money cost? What would they dowith my money? What reporting routines did they have?I wanted to do this in a thorough manner. This concernsmy own future and my family's future.
- I ended up choosing SR-Forvaltning. What is goodenough for SpareBank 1 SR-Bank's pension fund isgood enough for me.
87
IT IS MY FUTURE THEY ARE MANAGINGGEIR INGE MADE GOOD MONEY
Geir Inge Sivertsen lives in Gramstad in Sandnes.Over the past years he has gained a lot of knowledgeabout shares and savings.
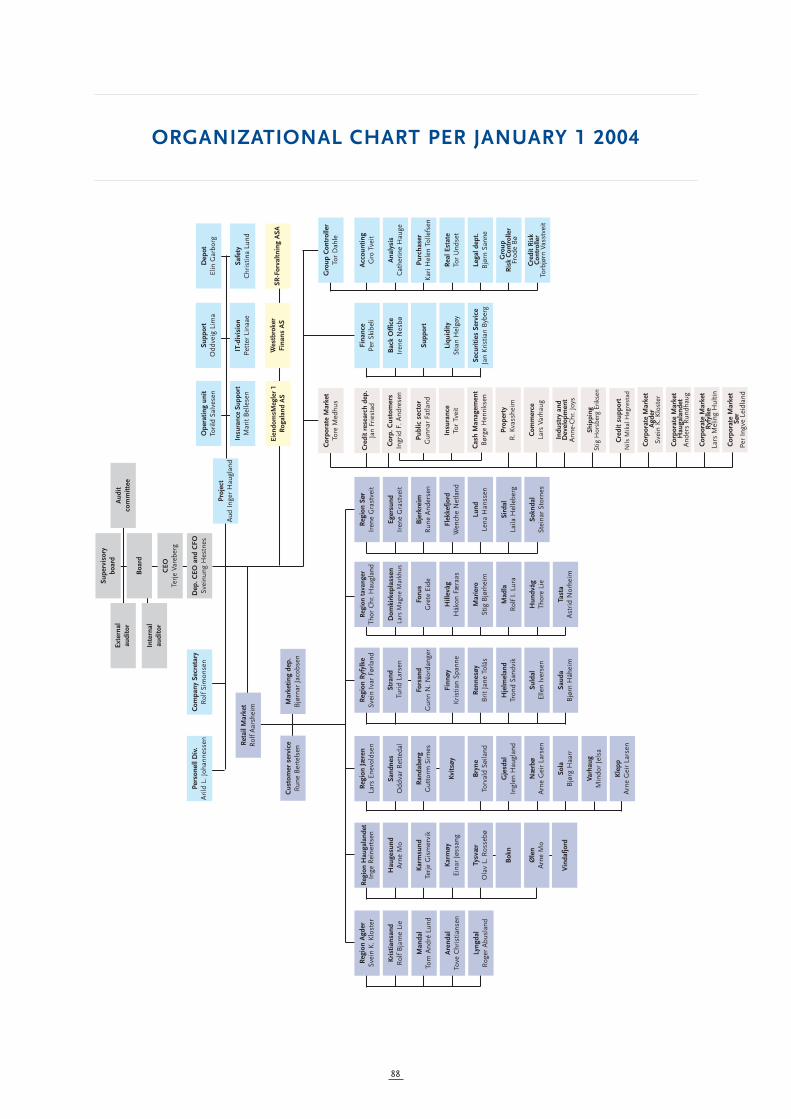
88
ORGANIZATIONAL CHART PER JANUARY 1 2004C
EOTe
rje
Vare
berg
Boa
rd
Supe
rvis
ory
boar
dA
udit
com
mitt
eeEx
tern
alau
dito
r
Inte
rnal
audi
tor
Dep
. CEO
and
CFO
Svei
nung
Hes
tnes
Com
pany
Sec
reta
ryR
olf S
imon
sen
Pers
onel
l Div
.A
rild
L. J
ohan
ness
en
Reg
ion
Jære
nLa
rs E
nevo
ldse
n
Sand
nes
Odd
var
Ret
teda
l
Ran
dabe
rgG
utto
rm S
irne
s
Kvits
øy
Bry
neTo
rval
d Sø
iland
Gje
sdal
Ingl
en H
augl
and
Næ
rbø
Arn
e G
eir
Lars
en
Sola
Bjø
rg H
aarr
Varh
aug
Min
dor
Jels
a
Kle
ppA
rne
Gei
r La
rsen
Reg
ion
Hau
gala
ndet
Inge
Rei
nert
sen
Hau
gesu
ndA
rne
Mo
Kar
msu
ndTe
rje
Gis
mer
vik
Kar
møy
Eina
r Jø
ssan
g
Tysv
ær
Ola
v L.
Ros
sebø
Bok
n
Øle
nA
rne
Mo
Vin
dafjo
rd
Dep
otEl
in G
arbo
rgPr
ojec
tA
ud I
nger
Hau
glan
d
Supp
ort
Odd
veig
Lim
aO
pera
ting
unit
Tori
ld S
alve
sen
Reg
ion
Sør
Iren
e G
rast
veit
Eger
sund
Iren
e G
rast
veit
Bje
rkre
imR
une
And
erse
n
Flek
kefjo
rdW
ench
e N
etla
nd
Lund
Lena
Han
ssen
Sird
alLa
ila H
elle
berg
Sokn
dal
Stei
nar
Stor
nes
Reg
ion
Agd
erSv
ein
K. K
lost
er
Kri
stia
nsan
d R
olf B
jarn
e Li
e
Man
dal
Tom
And
ré L
und
Are
ndal
Tove
Chr
istia
nsen
Lyng
dal
Rog
er A
busl
and
Reg
ion
Ryf
ylke
Svei
n Iv
ar F
ørla
nd
Stra
ndTu
rid
Lars
en
Fors
and
Gun
n N
. Nor
dang
er
Finn
øyK
rist
ian
Span
ne
Ren
nesø
yB
rit
Jane
Tol
ås
Hje
lmel
and
Tron
d Sa
ndvi
k
Suld
alEl
len
Iver
sen
Saud
aB
jørn
Håh
eim
Reg
ion
tava
nger
Thor
Chr
. Hau
glan
d
Dom
kirk
epla
ssen
Lars
Mag
ne M
arkh
us
Foru
sG
rete
Eid
e
Hill
evåg
Håk
on F
æra
as
Mar
iero
Stig
Bjø
rhei
m
Mad
laR
olf I
. Lur
a
Hun
dvåg
Thor
e Li
e
Tast
aA
stri
d N
orhe
im
Cus
tom
er s
ervi
ceR
une
Ber
tels
enM
arke
ting
dep.
Bjø
rnar
Jac
obse
n
Cre
dit
rese
arch
dep
.Ja
n Fr
iest
ad
Publ
ic s
ecto
rG
unna
r Fa
tland
Cor
p. C
usto
mer
sIn
grid
F. A
ndre
sen
Insu
ranc
eTo
r Tv
eit
Cre
dit
supp
ort
Nils
Mik
al H
egre
stad
Cor
pora
te M
arke
t A
gder
Svei
n K
. Klo
ster
Cor
pora
te M
arke
t H
auga
land
etA
nder
s R
undh
aug
Cor
pora
te M
arke
t R
yfyl
keLa
rs M
elin
g H
ultin
Cor
pora
te M
arke
t Sø
rPe
r In
gve
Leid
land
Fina
nce
Per
Skib
eli
Bac
k O
ffic
eIr
ene
Nes
bø
Supp
ort
Liqu
idity
Stia
n H
elgø
y
Secu
ritie
s Se
rvic
eJa
n K
rist
ian
Byb
erg
Acc
ount
ing
Gro
Tve
it
Ana
lysi
sC
athe
rine
Hau
ge
Purc
hase
rK
ari H
elen
Tol
lefs
en
Rea
l Est
ate
Tor
Und
set
Lega
l dep
t.B
jørn
San
ne
Gro
upR
isk
Con
trol
ler
Frod
e B
ø
Safe
tyC
hris
tina
Lund
IT-d
ivis
ion
Pett
er L
inaa
eIn
sura
nce
Supp
ort
Mar
it B
elle
sen
SR-F
orva
ltnin
g A
SAW
estb
roke
r Fi
nans
AS
Eien
dom
sMeg
ler
1R
ogal
and
AS
Cor
pora
te M
arke
tTo
re M
edhu
sG
roup
Con
trol
ler
Tor
Dah
le
Cre
dit
Ris
kC
ontr
olle
r To
rbjø
rn V
asst
veit
Cas
h M
anag
emen
tB
ørge
Hen
riks
en
Prop
erty
R
. Kva
sshe
im
Com
mer
ce
Lars
Var
haug
Indu
stry
and
Dev
elop
men
tA
nne-
Chr
. Joy
s
Ship
ping
Stig
Hor
sber
g Er
ikse
n
Ret
ail M
arke
tR
olf A
arsh
eim
The numbers indicate how many primarycapital certificates the person in questionowned in Sparebanken Rogaland as per31 December 2003. Also included areprimary capital certificates belonging tothe nearest kin and well-known companiesin which the person in question hasdecisive influence, cf. the CompaniesAct’s § 1-5. Primary capital certificatesbelonging to the institution that theemployee representative in question waschosen on behalf of are also included.
Elected by the primary capital certificate ownersAlf Erevik, Hønefoss (50 770)Anne Elise Hystad, Karmøy (1 700)Birte Næsheim, Stavanger, nestleder (3 600)Bjarne Andersson, Oslo (366 600)Bjarne Risa, Nærbø (1 700)Bjørn M. Stangeland, Sandnes (2 450)Einar Risa, Stavanger, leder (2 750)Eivinn A. Enoksen, Stavanger (3 070)Erik Sture Larre, Oslo (16 500)Finn Haugan, Trondheim (13 624)Gunnar Hagen, Stavanger (9 000)Harald Sig. Pedersen, Stavanger (30 000)Harald V. Hanssen, Stavanger (1 400)Ivar Kolnes, Stavanger (17 100)Jan S. Aske, Stavanger (5 000)Knut Næss, Jørpeland (60 100)Marit Borgen, Stavanger (600)Martha Gudmestad, Stavanger (4 350)Martin Ølberg, Stavanger (2 850)Ole Gabrielsen, Sandnes (836)Ove Tveteraas, Stavanger (100 000)Per Hedberg, Stavanger (15 633)Terje Mjelde, Bergen Terje Ruud, Stavanger (11 150)Trygve Jacobsen, Stavanger (56 590)Trygve Stangeland, Sola (101 100)
Elected by the depositorsArve Edland, Time Anbjørn Vaage, Suldal Arne Joa jr., Sola (134)Bjørg Vestbø, Rennesøy Helene Haaland, Kvitsøy (250)Egil Svela, Bjerkreim Finn Nesvold, Sokndal (60)Gunvald Surdal, Lund (680)Hallvard Ween, Stavanger Inger Rossebø Knudsen, Haugesund
Helge M. Todnem, Randaberg (100)Hogne Fjellanger, Hjelmeland Ingeborg Søyland, Forsand Jørgen Risdal, Hå Kåre Hansen, Egersund Karin Vik, Finnøy (200)Koll Kyllingstad, Sandnes Lindy Haram, Bokn Mandrup Hovland, Aksdal Odd Broshaug, Karmøy Oddlaug Rødne, Ølen Rolf Ersdal, Strand (600)Sølvi Lysen Nordtveit, Vats Stein Petter Tagholdt, Flekkefjord Tore Hansen, Sirdal Torgeir Undheim, Gjesdal (400)
Elected by the municipalitiesArne Borgemyr, Ølen Arne Hosaas, Bokn Berit Skjæveland, Sandnes Borghild Yrkje, Tysvær Dagny Matland, Karmøy (1 050)Einar Simonsen, Randaberg Haldor Skare, Vats Hans Greger Aarenes, Flekkefjord Håkon Rege, Sola Inger Johanne Bergslien, Stavanger Jostein Havnerås, Haugesund Kai Kvilstad, Kvitsøy Kjell H. Fredriksen, Egersund Kjell Hognestad, Bryne Magnhild Harboe Kleppa, Hjelmeland Peder Eikeland, Bjerkreim Randulf Skretting, Sokndal (1 742)Reidun Byberg Haughom, Sirdal Rune Vidar Olsen, Forsand Svein Hodnefjell, RennesøySvein Kj. Søyland, Gjesdal Svein Kåre Eggebø, Finnøy Svein Lode, Hå (856)Tor Egil Fjelde, Strand (770)Tormod Skeie, Suldal (4 497)Øystein Hognestad, Lund
Elected by the employeesAnlaug Stormo, Sokndal (239)Arne Kjærstad, Stavanger (200)Arnt Eivind Roth Halvorsen (423)Arvid Ek, Haugalandet Astrid Saurdal, Egersund (220)Atle Øvestad, Stavanger (137)Berit Helene Bjerga, Stavanger (350)Berit Mihle Laugaland, Stavanger (293)
Gunnar Førland (20)Bjørn Berland, Stavanger (446)Erling Trædal, Haugalandet (228)Gaute Jacobsen, Sandnes Geir Gundersen, Stavanger (237)Gyrid Bakka, Ryfylke (373)Harald Utvik Hamre, Stavanger (501)Helen Hellesvik, Skudesneshavn (270)Jan Michael Nilsen, Stavanger Lars Magne Markhus, Stavanger (1100)Lars Sletten, Jæren Linn Vetrhus Lode, Bjergsted Magnus Bjorland, Klepp Margot O. Kristoffersen, Stavanger (440)Morten Erga, Jæren Morten Lange, Bjergsted Roar Haualand, Ryfylke (239)Rune Andersen, Bjerkreim (340)
The BoardManager Geir Worum, Chairman Shipowner Kristian Eidesvik, Vice Chairman Man. Dir. John Peter Hernes Chief Fin. Officer Ole Gladhaug (800)Man. Dir. Magne Vathne Attorney at Law Anne Elisabeth KrokenSenior Consultant Gunn Jane HålandCEO Terje Vareberg (4 528) Main employee repr. Torstein Plener (380)Regulary attending dep. board memberfor the employees Birte Wereide (578)
Audit CommitteeLocal Tax Officer Harald Ribland, Chairman (800)Attorney at Law Odd Rune Torstrup, Vice Chairman Manager Svein Hodnefjell Farmer Berit Skjæveland Office Manager Odd Broshaug
Group ManagementCEO Terje Vareberg (4 528)Dep. CEO and CFO Sveinung Hestnes (510)Group Controller Tor Dahle (1 990)Dir. Aud Inger Haugland (1 340)Dir. Rolf Aarsheim (1 020)Dir. Tore Medhus (440)Personell mngr. Arild L. Johannesen (640)
AuditorPricewaterhouseCoopers DA State Authorized Public AccountantTorbjørn Larsen
89
GOVERNING BODIES

90
ADDRESSES
MAIN SWITCHBOARD+47 02002
MAIN OFFICE:Bjergsted Terrasse 1P.O. Box 218,4001 StavangerTelefax +47 51 53 18 64Telex 33 016 SRBK Ne-mail: [email protected] addr.: www.sr.bank.no
MANAGEMENT:CEO Terje VarebergDep. CEO and CFO Sveinung HestnesGroup Controller Tor DahleCompany secr. Rolf Simonsen
PROJECT DIR.:Dir. Aud Inger Haugland
CORPORATE MARKET:Dir. Tore Medhus
Property:Banksjef Rasmus KvassheimCommerce:Gen. Man. Lars VarhaugIndustry and Development:Gen. Man. Anne-Chr. JoysPetroleumsveien 6,4033 Stavanger
Corporate Customers:Gen. Man. Ingrid F. AndresenShipping:Gen. Man. Stig H. EriksenBjergsted Terrasse 14001 Stavanger
SERVICE CENTERLangflåtveien 5, 4017 Stavangere-mail:[email protected] Rune BertelsenBranch:Stavanger Lufthavn, Sola
RETAIL MARKET:Dir. Rolf Aarsheim
REGION HAUGALANDETReg. Gen. Man. Inge ReinertsenCorporate Market HaugalandetGen. man. Anders Rundhaug
HAUGESUNDSørhauggata 150,P.O. Box 473, 5501 HaugesundGen. man. Arne Mo
KARMSUNDOasen Storsenter, P.O. Box 1270, 5508 KarmsundGen. Man. Terje Gismervik
KARMØYKarmsundgt. 9. P.O. Box 68,4251 KopervikGen. Man. Einar JøssangBranches: Skudeneshavn
TYSVÆR/BOKNAksdal, P.O. Box 44,5570 GrindafjordGen. Man. Olav Lande RossebøBranches : Nedstrand, Bokn
ØLEN/VINDAFJORDP.O. Box 33, 5580 ØlenGen. Man. Arne MoBranches: Vindafjord
REGION SØRReg. Gen. Man. Irene GrastveitCorporate Market SørPer Ingve Leidland
EGERSUNDNesgården. P.O. Box 190,4371 EgersundGen. Man. Irene Grastveit
BJERKREIMP.O. Box 10, 4389 VikesåGen. Man. Rune Andersen
FLEKKEFJORDElvegt. 14. P.O. Box 98,4401 FlekkefjordGen. Man. Wenche Netland
LUNDStasjonsveienP.O. Box 94, 4460 MoiGen. Man. Lena Hanssen
SIRDALP.O. Box 25, 4440 TonstadGen. Man. Laila Helleberg
SOKNDALP.O. Box 10,4380 Hauge i DalaneGen. Man. Steinar Stornes
REGION STAVANGERRetail MarketReg. Gen. Man. ThorChristian Haugland
STAVANGER SENTRUMDomkirkeplassen 1,P.O. Box 218. 4001 StavangerGen. Man. Lars Magne Markhus
FORUSPetroleumsvn. 6, 4033 StavangerGen. Man. Grete Eide
HUNDVÅGHundvågvn. 50 P.O. Box 26,4085 HundvågGen. Man. Thore Lie
MADLAMadlamarkveien 2P.O. Box 525, 4040 HafrsfjordGen. Man. Rolf Inge Lura
TASTARandabergveien 45P.O. Box 4052, 4004 StavangerGen. Man. Astrid Norheim
MARIEROBreidablikkvn. 3a,4017 StavangerGen. Man. Stig Bjørheim
HILLEVÅGKilden, Gartnerveien 164016 StavangerGen. Man. Håkon FæraasBranches : Østre Bydel
REGION RYFYLKEReg. Gen. Man. Svein I. FørlandCorporate MarketLars M. Hultin
STRANDP.O. Box 8, 4100 JørpelandGen. Man. Turid Larsen Branches: Tau, Forsand
FINNØYP.O. Box 25, 4160 JudabergGen. Man. Kristian SpanneBranches: Sjernarøy
HJELMELANDP.O. Box 55,4137 Årdal i RyfylkeGen. Man. Trond SandvikBranches : Fister
SULDAL4230 SANDGen. Man. Ellen Iversen
SAUDA4200 SaudaGen. Man. Bjørn Håheim
RENNESØYVikevågP.O. Box 10, 4150 RennesøyGen. Man. Brit Jane Tolås
REGION JÆRENReg. Gen. Man. Lars Enevoldsen
SANDNESHaakon VII’sgt. 8P.O. Box 33, 4301 SandnesGen. Man. Oddvar RettedalBranches: Ganddal, Kvadrat
RANDABERGRandabergveien 378P.O. Box 90, 4070 RandabergGen. Man. Guttorm SirnesBranches: Kvitsøy
BRYNEStorgt. 15P.O. Box 413, 4341 BryneGen. Man. Torvald Søiland
KLEPPJærveien 537P.O. Box 234, 4352 KleppeGen. Man. Arne Geir Larsen
GJESDALOle Nielsensvei 28P.O. Box 55, 4330 ÅlgårdGen. Man. Inglen Haugland
NÆRBØTorggt. 9 P.O. Box 205,4350 NærbøGen. Man. Arne Geir Larsen
SOLASolakrossenP.O. Box 39, 4051 SolaGen. Man. Bjørg HaarrBranches : Tananger,
VARHAUGStasjonsveien 20P.O. Box 94, 4460 VarhaugGen. Man. Mindor JelsaBranches : Vigrestad
REGION AGDERReg. Gen. Man. and Corporate Market Agder Svein K. Kloster
KRISTIANSANDRådhusgaten 12P.O. Box 5904665 KristiansandGen. Man. Retail Market Rolf Bjarne Lie
LYNGDALSentrumsgården,4580 LyngdalGen. Man. Roger Abusland
MANDALMarnaveien 2P.O. Box 156,4502 MandalGen. Man. Tom Lund
ARENDALInsurance officeLangbrygga 9, 4800 ArendalGen. Man. Tove Christiansen
SUBSIDIARIESEiendomsMegler 1 Rogaland ASDomkirkeplassen 2P.O. Box 167, 4001 StavangerMan. Dir. Johannes Vold
BRANCHES:Madla - Mariero - Hundvåg -Forus - Sandnes - Haugesund - Sola- Bryne - Klepp - Egersund- Flekkefjord - Lyngdal- Mandal - Kristiansand
Westbroker Finans ASTel. 51 95 65 00Petroleumsveien 64033 StavangerMan. Dir. Knut Sirevåg
SR-Forvaltning ASABjergsted Terrasse 14009 StavangerGen. Man. Dag Sønsterud

Photo: Tom Haga page 7, 10, 11, 14, 17, 28, 64, 65, 75, 78, 79, 82, 87. Sigbjørn Sigbjørnsen page 8. Dag Svihus page 16. Emile Ashley page 80.

Bjergsted Terrasse 1. P.O. Box 218, 4001 Stavanger. Telephone +47 02002. Telefax +47 51 53 18 64
www.sr-bank.no
Our customers create the values.
Melvæ
r&L
ien Th
e Idea En
trepreneu
r Prin
t: Bryn
e Offset