The Agro-Economic Feasibility of Growing the Medicinal Plant ...
20
Citation: Bafort, F.; Kohnen, S.; Maron, E.; Bouhadada, A.; Ancion, N.; Crutzen, N.; Jijakli, M.H. The Agro-Economic Feasibility of Growing the Medicinal Plant Euphorbia peplus in a Modified Vertical Hydroponic Shipping Container. Horticulturae 2022, 8, 256. https://doi.org/10.3390/ horticulturae8030256 Academic Editor: Christian Fischer Received: 1 February 2022 Accepted: 14 March 2022 Published: 17 March 2022 Publisher’s Note: MDPI stays neutral with regard to jurisdictional claims in published maps and institutional affil- iations. Copyright: © 2022 by the authors. Licensee MDPI, Basel, Switzerland. This article is an open access article distributed under the terms and conditions of the Creative Commons Attribution (CC BY) license (https:// creativecommons.org/licenses/by/ 4.0/). horticulturae Article The Agro-Economic Feasibility of Growing the Medicinal Plant Euphorbia peplus in a Modified Vertical Hydroponic Shipping Container Françoise Bafort 1, * , Stephan Kohnen 2 , Etienne Maron 2 , Ayoub Bouhadada 1 , Nicolas Ancion 1,3 , Nathalie Crutzen 3 and M. Haïssam Jijakli 1 1 Integrated and Urban Plant Pathology Laboratory, Liège University, Gembloux Agro-Bio Tech, Passage des Déportés 2, 5030 Gembloux, Belgium; [email protected] (A.B.); [email protected] (N.A.); [email protected] (M.H.J.) 2 Biomass Valorisation Platform, Celabor scrl, Avenue du Parc 38, 4650 Herve, Belgium; [email protected] (S.K.); [email protected] (E.M.) 3 Smart City Institute, HEC Liège, Rue Saint-Gilles 35, 4000 Liège, Belgium; [email protected] * Correspondence: [email protected] Abstract: Vertical farming is considered as a potential solution to increase yield while decreasing resource use and pesticide impacts compared to conventional agriculture. However, the profitability of cultivating ordinary leafy green crops with low market prices in vertical farming is debated. We studied the agronomic feasibility and viability of growing a medicinal plant—Euphorbia peplus—for its ingenol-mebutate content in a modified shipping container farm as an alternative crop cultivation system. The impacts of three hydroponic substrates, three light intensities, three plant localizations and two surface areas on E. peplus yield and cost were tested in several scenarios. The optimization of biomass yield and area surface decreased the cultivation cost, with fresh crop cost per kg ranging from €185 to €59. Three ingenol-mebutate extraction methods were tested. The best extraction yields and cheapest method can both be attributed to ethyl acetate at 120 ◦ C, with a yield of 43.8 mg/kg at a cost of €38 per mg. Modeling of the profitability of a pharmaceutical gel based on ingenol-mebutate showed that economic feasibility was difficult to reach, but some factors could rapidly increase the profitability of this production. Keywords: vertical farming; hydroponics; profitability; biomass yield; ingenol-mebutate; Euphorbia peplus 1. Introduction In recent years the phenomenon of urbanization has rapidly increased, and more than half of the world’s people are now living in cities [1]. The rapid expansion of cities and the increasing population are putting a lot of pressure on food systems. The land area available for agricultural production is predicted to be restrained by urbanization, primarily due to decreased soil fertility as a result of overexploitation and climate change, the deployment of industrial activities and the expansion of cities [2,3]. Indoor farming represents a means of cultivation less dependent on arable land avail- ability and external climate conditions. As pointed out by Agrilyst, “indoor farms” is a generic name encompassing a large range of cultivation systems, including greenhouses, indoor vertical farms, and container farms [4]. Plants suitable for vertical farming are leafy greens, herbs, transplants, and medicinal plants no taller than 30 cm, allowing the maximizing of the indoor space [5]. Vertical farming is seen as a potential solution to in- crease yield while decreasing resource use and pesticide impacts compared to conventional agriculture [6]. Several authors have indeed reported that vertical farming improves yields as compared to traditional farming, whereas greenhouse farming yields are intermedi- ate [7–10]. Nevertheless, several difficulties have been pointed out for vertical farming, such Horticulturae 2022, 8, 256. https://doi.org/10.3390/horticulturae8030256 https://www.mdpi.com/journal/horticulturae
-
Upload
khangminh22 -
Category
Documents
-
view
1 -
download
0
Transcript of The Agro-Economic Feasibility of Growing the Medicinal Plant ...
�����������������
Citation: Bafort, F.; Kohnen, S.;
Maron, E.; Bouhadada, A.; Ancion,
N.; Crutzen, N.; Jijakli, M.H. The
Agro-Economic Feasibility of
Growing the Medicinal Plant
Euphorbia peplus in a Modified
Vertical Hydroponic Shipping
Container. Horticulturae 2022, 8, 256.
https://doi.org/10.3390/
horticulturae8030256
Academic Editor: Christian Fischer
Received: 1 February 2022
Accepted: 14 March 2022
Published: 17 March 2022
Publisher’s Note: MDPI stays neutral
with regard to jurisdictional claims in
published maps and institutional affil-
iations.
Copyright: © 2022 by the authors.
Licensee MDPI, Basel, Switzerland.
This article is an open access article
distributed under the terms and
conditions of the Creative Commons
Attribution (CC BY) license (https://
creativecommons.org/licenses/by/
4.0/).
horticulturae
Article
The Agro-Economic Feasibility of Growing the Medicinal PlantEuphorbia peplus in a Modified Vertical HydroponicShipping ContainerFrançoise Bafort 1,* , Stephan Kohnen 2, Etienne Maron 2, Ayoub Bouhadada 1, Nicolas Ancion 1,3,Nathalie Crutzen 3 and M. Haïssam Jijakli 1
1 Integrated and Urban Plant Pathology Laboratory, Liège University, Gembloux Agro-Bio Tech,Passage des Déportés 2, 5030 Gembloux, Belgium; [email protected] (A.B.);[email protected] (N.A.); [email protected] (M.H.J.)
2 Biomass Valorisation Platform, Celabor scrl, Avenue du Parc 38, 4650 Herve, Belgium;[email protected] (S.K.); [email protected] (E.M.)
3 Smart City Institute, HEC Liège, Rue Saint-Gilles 35, 4000 Liège, Belgium; [email protected]* Correspondence: [email protected]
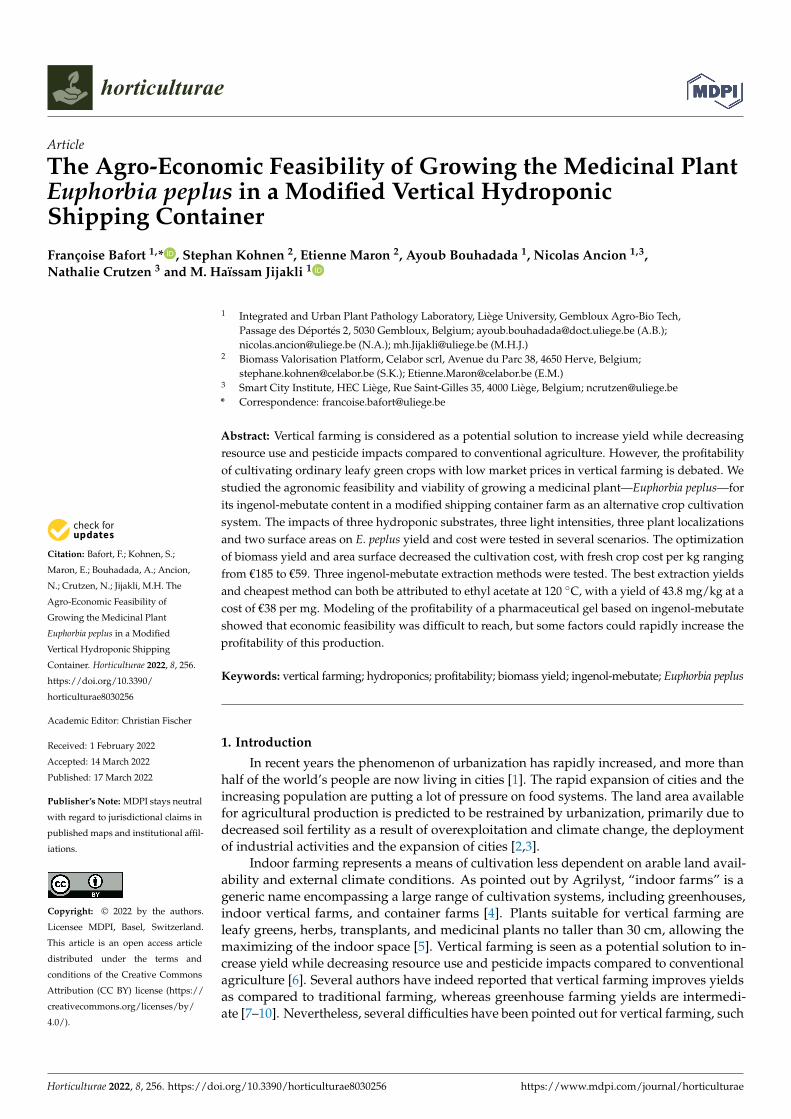
Abstract: Vertical farming is considered as a potential solution to increase yield while decreasingresource use and pesticide impacts compared to conventional agriculture. However, the profitabilityof cultivating ordinary leafy green crops with low market prices in vertical farming is debated. Westudied the agronomic feasibility and viability of growing a medicinal plant—Euphorbia peplus—forits ingenol-mebutate content in a modified shipping container farm as an alternative crop cultivationsystem. The impacts of three hydroponic substrates, three light intensities, three plant localizationsand two surface areas on E. peplus yield and cost were tested in several scenarios. The optimizationof biomass yield and area surface decreased the cultivation cost, with fresh crop cost per kg rangingfrom €185 to €59. Three ingenol-mebutate extraction methods were tested. The best extraction yieldsand cheapest method can both be attributed to ethyl acetate at 120 ◦C, with a yield of 43.8 mg/kg at acost of €38 per mg. Modeling of the profitability of a pharmaceutical gel based on ingenol-mebutateshowed that economic feasibility was difficult to reach, but some factors could rapidly increase theprofitability of this production.
Keywords: vertical farming; hydroponics; profitability; biomass yield; ingenol-mebutate; Euphorbia peplus
1. Introduction
In recent years the phenomenon of urbanization has rapidly increased, and more thanhalf of the world’s people are now living in cities [1]. The rapid expansion of cities and theincreasing population are putting a lot of pressure on food systems. The land area availablefor agricultural production is predicted to be restrained by urbanization, primarily due todecreased soil fertility as a result of overexploitation and climate change, the deploymentof industrial activities and the expansion of cities [2,3].
Indoor farming represents a means of cultivation less dependent on arable land avail-ability and external climate conditions. As pointed out by Agrilyst, “indoor farms” is ageneric name encompassing a large range of cultivation systems, including greenhouses,indoor vertical farms, and container farms [4]. Plants suitable for vertical farming areleafy greens, herbs, transplants, and medicinal plants no taller than 30 cm, allowing themaximizing of the indoor space [5]. Vertical farming is seen as a potential solution to in-crease yield while decreasing resource use and pesticide impacts compared to conventionalagriculture [6]. Several authors have indeed reported that vertical farming improves yieldsas compared to traditional farming, whereas greenhouse farming yields are intermedi-ate [7–10]. Nevertheless, several difficulties have been pointed out for vertical farming, such
Horticulturae 2022, 8, 256. https://doi.org/10.3390/horticulturae8030256 https://www.mdpi.com/journal/horticulturae
Horticulturae 2022, 8, 256 2 of 20
as a limited number of cultivable varieties, high energy use, high technical requirementsfor employees, consumer complaints, low market prices for cultivable varieties, start-upcosts, property costs in urban areas, and subsequently the profitability of such farmingsystems [7,11–16].
The profitability of vertical farming is debated. Agrylist reported that only 51% ofindoor farming reported operating profitability after 7 years of existence—only 50% ofcontainer farms and 27% of indoor vertical farms—and the main crops were leafy greens [4].The highest reported costs were labor costs, followed by rent, packaging, and energy [4].In an adapted shipping container, the efficiency of lettuce crop production, measured inseveral scenarios, was too low to be viable, although improvements in energy consumptionand yield efficiency could allow viable crop production [17]. The cultivation of Romainelettuce and Genovese basil in a modified insulated freight container could not compete withRomaine lettuce and basil in the European market, but improvements in terms of space andplant density in the plant design factory could decrease the production cost for basil from€19/kg to €10/kg [18]. A vertical farm in The Netherlands recently went bankrupt becauseit was not possible to market their vertically grown vegetables in a financially attractiveway [19]. Calculating the profitability of urban farms is challenging, and few studies havebeen conducted to quantitatively evaluate their viability [15]. On the other hand, verticalfarming could be a viable farming solution according to certain models [20,21]. Profitabilitywas linked to the cultivation area, the plant design (using renewable energy and wastevalorization), the high unit production yield, and the selling price of the crop [21].
Diversification by cultivating high-added-value plants could be economically lesschallenging. One-third of the current top 20 drugs on the market are plant derived [22,23].According the World Health Organization, the percentage of the population which has usedplant-based medicine at least once is 48% in Australia, 31% in Belgium, 42% in the UnitedStates of America, and 70% in Canada [24]. Among medicinal plants, the Euphorbiaceaefamily includes more than 2000 species, generally characterized by the production of anirritating latex in the stems and leaves [25]. Euphorbia peplus, more commonly known asmilkweed or petty spurge, is an annual herbaceous weed that develops in temperate or hotclimates, and is an interesting candidate for vertical cultivation due to its small size andrapid growth [24]. E. peplus is found in gardens, ornamental groves or fields, and its latexis rich in alkaloids, terpenoids, and cardenolides, which gives it a defensive role againstattacks by pathogens or herbivorous insects, since those compounds are toxic [26]. E. peplusis a long-day plant with a C3 photosynthetic mechanism [27]. Its scientific interest soaredin the early 2000s, when ingenol mebutate, a diterpene ester present in the sap of E. peplus,was discovered to be efficient against actinic keratosis, a precancerous skin disease [25,28].
Indoor farming in a controlled environment allows the user to control importantfactors in terms of biomass and secondary metabolite yield. Light intensity, the photoperiod,and the light spectrum regulate plant photosynthesis, growth, and secondary metaboliteaccumulation [29–32]. For optimal light quality and intensity, there is not a single answer:it is specific to the plant species, the plant growth stage, the specific secondary metabolites,and the environmental practices [31].
In soilless cultivation, substrate cultures employs substrate media to provide supportto plants and provide for plant root and shoot growth [33]. The main role of the substrateis to supply the plant with water and oxygen, for its growth through the root system.Common soilless plant growth substrates include rockwool, vermiculite, perlite, clay beads,and coconut fiber. They have specific water and oxygen retention capacities [34,35]. Soillessplant substrates can affect nutrient availability, physiological processes, plant growth, yieldquantity, and quality [36–39].
The goal of this work was to investigate the agronomic feasibility and economic viabil-ity of growing a medicinal plant in a modified shipping container farm as an alternativecrop cultivation system by analyzing the cost requirements and the resulting crop yield.

Horticulturae 2022, 8, 256 3 of 20
2. Materials and Methods2.1. Chemicals and Reagents
Potassium hydroxide and sulfuric acid were purchased from VWR International(Leuven, Belgium). Rockwool cubes (25 × 25 × 40 mm) for the germination of seeds werepurchased from Grodan (Roermond, The Netherlands). Cultivation substrates were GrodanDelta Rockwool® blocks (75 mm × 75 mm), coconut fiber, and GROROX® clay beadsfrom Terra Aquatica (Fleurance, France). Nutrient solutions were ready-to-use solutionsdesigned for hydroponic culture from Mills Nutrients (Aalsmeer, The Netherlands) andfrom Plagron (Weert, The Netherlands). Plagron Hydro A has an NPK of (3-0-1) with 4.2%Ca, and Hydro B has an NPK of (1-3-6) with 1.4% MgO. Mills Nutrient Basis A has an NPKof (3-0-1) with 4% Ca and Mills Nutrient Basis B has an NPK of (0-4-3) with 1% Mg. MillsNutrient Basis A/B was used in the trial 2 of the substrate experiment. Plagron Hydro A/Bwas used in all others experiments.
2.2. Vertical Hydroponic Container
The experiments took place in a 30 m2 vertical environment-controlled horticulturalready-to-use production unit from Urban Crop Solutions (Waregem, Belgium) (Figure 1).
Horticulturae 2022, 8, x FOR PEER REVIEW 3 of 21
The goal of this work was to investigate the agronomic feasibility and economic via-bility of growing a medicinal plant in a modified shipping container farm as an alternative crop cultivation system by analyzing the cost requirements and the resulting crop yield.
2. Materials and Methods 2.1. Chemicals and Reagents
Potassium hydroxide and sulfuric acid were purchased from VWR International (Leuven, Belgium). Rockwool cubes (25 × 25 × 40 mm) for the germination of seeds were purchased from Grodan (Roermond, The Netherlands). Cultivation substrates were Grodan Delta Rockwool® blocks (75 mm × 75 mm), coconut fiber, and GROROX® clay beads from Terra Aquatica (Fleurance, France). Nutrient solutions were ready-to-use so-lutions designed for hydroponic culture from Mills Nutrients (Aalsmeer, The Nether-lands) and from Plagron (Weert, The Netherlands). Plagron Hydro A has an NPK of (3-0-1) with 4.2% Ca, and Hydro B has an NPK of (1-3-6) with 1.4% MgO. Mills Nutrient Basis A has an NPK of (3-0-1) with 4% Ca and Mills Nutrient Basis B has an NPK of (0-4-3) with 1% Mg. Mills Nutrient Basis A/B was used in the trial 2 of the substrate experiment. Plagron Hydro A/B was used in all others experiments.
2.2. Vertical Hydroponic Container The experiments took place in a 30 m2 vertical environment-controlled horticultural
ready-to-use production unit from Urban Crop Solutions (Waregem, Belgium) (Figure 1).
Figure 1. Modified vertical hydroponic shipping container.
The container had the following characteristics: - Dimensions: 12,192 mm × 2438 mm × 2896 mm - Germination area: Eight PE food-grade plastic trays (1220 mm × 560 mm) at 4 levels
equipped with separate manual irrigation valves and LED lights adjustable in inten-sity allowing a maximum of 2400 seeds to germinate.
- Cultivation area: Thirty-six food-grade plastic trays (1220 mm × 560 mm) with 2 irri-gation systems and at 3 levels, each 600 mm high, equipped with automatic irrigation valves and LED lights adjustable in intensity. Each cultivation tray had a capacity of 24 plants (Figure 2).
- Irrigation system: A deep-water irrigation system supplied irrigation for 1 min every 5 min, with water recirculation to the water reserve. The irrigation system included a water reserve (800 L), a connection to the reserve of concentrated nutrient solutions, peristaltic pumps, the piping assembly sized according to the required flow rates, the flow control valve, filters (UV and physical filters) for water recirculation, and a con-trol station connected to the LED control circuit and to various measuring instru-ments—including a pH-meter, an EC-meter, a kWh meter, and a CO2 concentration sensor.
Figure 1. Modified vertical hydroponic shipping container.
The container had the following characteristics:
- Dimensions: 12,192 mm × 2438 mm × 2896 mm- Germination area: Eight PE food-grade plastic trays (1220 mm × 560 mm) at 4 levels
equipped with separate manual irrigation valves and LED lights adjustable in intensityallowing a maximum of 2400 seeds to germinate.
- Cultivation area: Thirty-six food-grade plastic trays (1220 mm × 560 mm) with2 irrigation systems and at 3 levels, each 600 mm high, equipped with automaticirrigation valves and LED lights adjustable in intensity. Each cultivation tray had acapacity of 24 plants (Figure 2).
- Irrigation system: A deep-water irrigation system supplied irrigation for 1 min every5 min, with water recirculation to the water reserve. The irrigation system included awater reserve (800 L), a connection to the reserve of concentrated nutrient solutions,peristaltic pumps, the piping assembly sized according to the required flow rates, theflow control valve, filters (UV and physical filters) for water recirculation, and a controlstation connected to the LED control circuit and to various measuring instruments—including a pH-meter, an EC-meter, a kWh meter, and a CO2 concentration sensor.
- LED lighting: For the substrate experiment (see Section 2.4), LEDs with an irradiance of150 µmol m−2 s−1 at a distance of 30 cm were used. The LED spectrum was composedof 35% blue (450 nm) and 65% red (660 nm). For the light intensity experiment (seeSection 2.5), LEDs adjustable up to 500 µmol m−2 s−1 were used. The spectrum wascomposed of 20.8% blue, 22.7% green, 52.5% red, and 4% far red.
Horticulturae 2022, 8, 256 4 of 20
Horticulturae 2022, 8, x FOR PEER REVIEW 4 of 21
- LED lighting: For the substrate experiment (see Section 2.4), LEDs with an irradiance of 150 μmolm−2s−1 at a distance of 30 cm were used. The LED spectrum was composed of 35% blue (450 nm) and 65% red (660 nm). For the light intensity experiment (see Section 2.5), LEDs adjustable up to 500 μmol m−2s−1 were used. The spectrum was composed of 20.8% blue, 22.7% green, 52.5% red, and 4% far red. The container was controlled using a remote monitoring application that allowed the
user to program culture conditions and to have an overview of the environmental param-eters. Apart from the air conditioning unit, all the components were located inside the container.
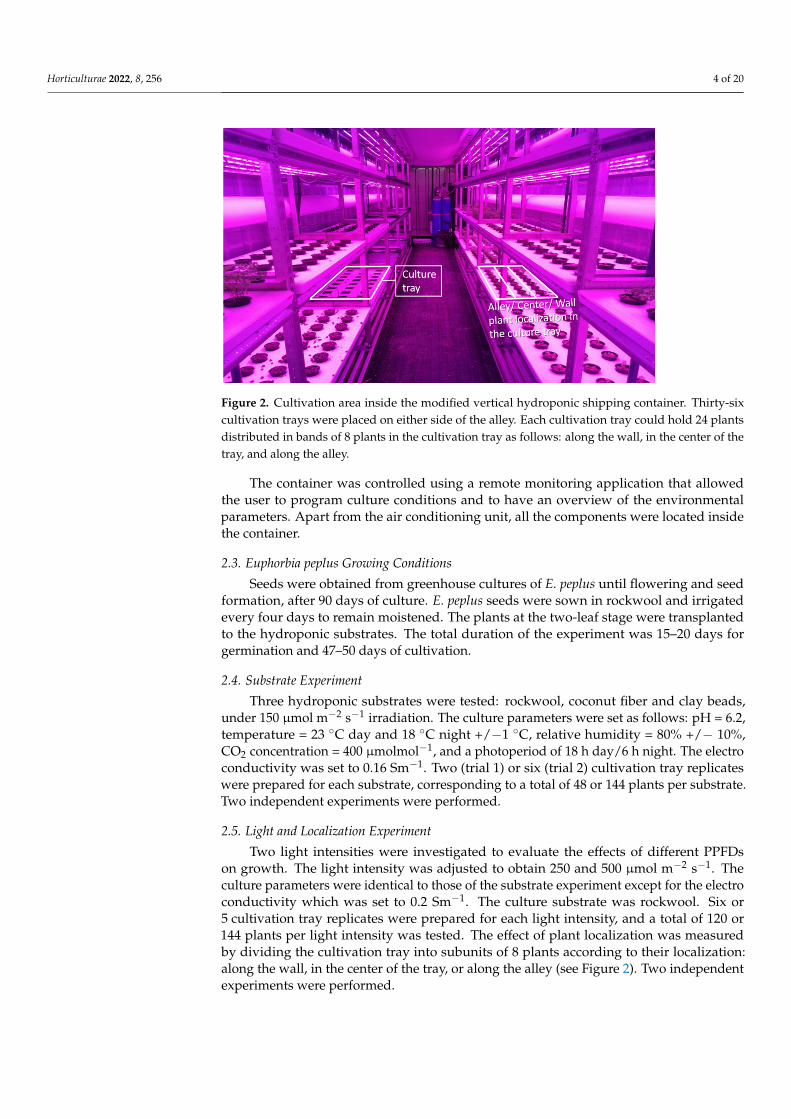
Figure 2. Cultivation area inside the modified vertical hydroponic shipping container. Thirty-six cultivation trays were placed on either side of the alley. Each cultivation tray could hold 24 plants distributed in bands of 8 plants in the cultivation tray as follows: along the wall, in the center of the tray, and along the alley.
2.3. Euphorbia peplus Growing Conditions Seeds were obtained from greenhouse cultures of E. peplus until flowering and seed
formation, after 90 days of culture. E. peplus seeds were sown in rockwool and irrigated every four days to remain moistened. The plants at the two-leaf stage were transplanted to the hydroponic substrates. The total duration of the experiment was 15–20 days for germination and 47–50 days of cultivation.
2.4. Substrate Experiment Three hydroponic substrates were tested: rockwool, coconut fiber and clay beads,
under 150 μmolm−2s−1 irradiation. The culture parameters were set as follows: pH = 6.2, temperature = 23 °C day and 18 °C night +/−1 °C, relative humidity = 80% +/− 10%, CO2 concentration = 400 μmolmol−1, and a photoperiod of 18 h day/6 h night. The electro con-ductivity was set to 0.16 Sm−1. Two (trial 1) or six (trial 2) cultivation tray replicates were prepared for each substrate, corresponding to a total of 48 or 144 plants per substrate. Two independent experiments were performed.
2.5. Light and Localization Experiment Two light intensities were investigated to evaluate the effects of different PPFDs on
growth. The light intensity was adjusted to obtain 250 and 500 μmol m−2 s−1. The culture parameters were identical to those of the substrate experiment except for the electro con-ductivity which was set to 0.2 Sm−1. The culture substrate was rockwool. Six or 5 cultiva-tion tray replicates were prepared for each light intensity, and a total of 120 or 144 plants per light intensity was tested. The effect of plant localization was measured by dividing
Figure 2. Cultivation area inside the modified vertical hydroponic shipping container. Thirty-sixcultivation trays were placed on either side of the alley. Each cultivation tray could hold 24 plantsdistributed in bands of 8 plants in the cultivation tray as follows: along the wall, in the center of thetray, and along the alley.
The container was controlled using a remote monitoring application that allowedthe user to program culture conditions and to have an overview of the environmentalparameters. Apart from the air conditioning unit, all the components were located insidethe container.
2.3. Euphorbia peplus Growing Conditions
Seeds were obtained from greenhouse cultures of E. peplus until flowering and seedformation, after 90 days of culture. E. peplus seeds were sown in rockwool and irrigatedevery four days to remain moistened. The plants at the two-leaf stage were transplantedto the hydroponic substrates. The total duration of the experiment was 15–20 days forgermination and 47–50 days of cultivation.
2.4. Substrate Experiment
Three hydroponic substrates were tested: rockwool, coconut fiber and clay beads,under 150 µmol m−2 s−1 irradiation. The culture parameters were set as follows: pH = 6.2,temperature = 23 ◦C day and 18 ◦C night +/−1 ◦C, relative humidity = 80% +/− 10%,CO2 concentration = 400 µmolmol−1, and a photoperiod of 18 h day/6 h night. The electroconductivity was set to 0.16 Sm−1. Two (trial 1) or six (trial 2) cultivation tray replicateswere prepared for each substrate, corresponding to a total of 48 or 144 plants per substrate.Two independent experiments were performed.
2.5. Light and Localization Experiment
Two light intensities were investigated to evaluate the effects of different PPFDson growth. The light intensity was adjusted to obtain 250 and 500 µmol m−2 s−1. Theculture parameters were identical to those of the substrate experiment except for the electroconductivity which was set to 0.2 Sm−1. The culture substrate was rockwool. Six or5 cultivation tray replicates were prepared for each light intensity, and a total of 120 or144 plants per light intensity was tested. The effect of plant localization was measuredby dividing the cultivation tray into subunits of 8 plants according to their localization:along the wall, in the center of the tray, or along the alley (see Figure 2). Two independentexperiments were performed.
Horticulturae 2022, 8, 256 5 of 20
2.6. Biomass Accumulation Measurements
Fresh and dried biomass measurements were performed using an electronic scale(precision = 0.01 g). The drying of the vegetative system was realized in an oven at 40 ◦Cfor 5 days.
2.7. Apical Growth Measurements
The height of the fresh harvested plants was measured using a graduated slat fromthe base of their stem to their apex.
2.8. Total Ingenol Measurements
To evaluate the impacts of the culture parameters (substrate, light, localization) on theproduction of ingenol by the plants, a total ingenol quantification method was internallydeveloped by Celabor (Herve, Belgium) based on the protocol reported by [40], excludingthe methanolysis step to be able to specifically identify ingenol mebutate and ingenol.Other ingenol esters were not quantified, as they were found in insignificant amounts incomparison of the 2 main compounds.
A specific extraction protocol to obtained UPLC-quality grade samples was developed.After grinding the dried plants with a 250 µm sieve, 100 mg of accurately weighed samplewas placed in a 2.0 mL volumetric flask, 1.5 mL of methanol was added, and the flask wasplaced in an ultrasound bath for 3 cycles of 5 min each, with vortexing in-between. Then,the flask was completed to 2 mL with methanol and filtrated with PTFE 0.22 µm (Millipore)into a UPLC vial and injected for analysis.
A UPLC-DAD-MS/MS system (Waters SA) was employed, equipped with an AcquityUPLC device including a quaternary pump, autosample and column thermostats, anAcquity PDA UV/Visible Detector, and a Xevo mass spectrometer. UPLC separationwas performed by injecting 2 µL via the autosampler on Waters Acquity UPLC BEH C18(100 × 2.1 mm i.d. and 1.7 µm particle size) at a flow rate of 0.5 mL min−1. The mobilephase was composed by (0.6% formic acid + 2 mM ammonium formate) aqueous buffer atpH 2.4 (A) and acetonitrile (B) with the following gradient: from 80% to 20% of A for 6 min,then from 20% to 0% of A for 0.5 min, an isocratic mode at 0% of A for 2.5 min, and finallya linear gradient to 80% of A for 2 min, reconditioning for 3 min (total time of 14 min). Thetemperature of the oven column was programmed at 40 ◦C.
Stock solutions of ingenol (1.0 mg/2 mL) and ingenol mebutate (1.0 mg/2 mL) fromBio-Connect (Huissen, The Netherlands) were prepared in methanol, and were dilutedwith methanol to prepare a series of standard working solutions.
2.9. Extraction Procedures
Three extraction procedures were carried on the base of a selection work done dur-ing “Tropical Plant Factory” research program, focusing on the environmental impact ofthe solvents used. Ethyl acetate is usually reported to have lower environmental risksthan methanol [41] and is also reported to be purification solvent for isolation of ingenolmebutate [42]. Moreover, ethyl acetate extracts of euphorbiacea are reported to have strongantiviral and antitumoral activities [43,44]. In addition, in order to reduce the use of organicsolvent, supercritical CO2 was also considered as cosolvent, as it is already reported toefficiently extract diterpenes from coffee [45].
The aerial parts of the E. peplus biomass produced during the experiments describedabove were collected and dried at 40 ◦C. The resulting dry material was milled usinga 4-mm sieve with a SM200 Retsch cutting mill. In order to have enough material forthe extraction processes trials on the same sample, the biomasses obtained from everyexperiment were pooled and homogenized. The global dry content was estimated to be11% of the fresh biomass.
Supercritical CO2 extraction was done on a 100 mL SFE lab-scale device: 15 g of driedbiomass were exposed to a mixture of CO2 + 5% ethyl acetate (w/w) at 60 ◦C under 350 bar
Horticulturae 2022, 8, 256 6 of 20
for 15 min, at a flow rate of 50 g/min. The remaining ethyl acetate was evaporated underreduced pressure.
Hot ethyl acetate extraction was done on a Thermo-Dionex ASE350 device: 5 g ofdried biomass were transferred into an 11-mL extraction cell. The material was extractedby ethyl acetate at 120 ◦C under 100 bar by applying 2 cycles of 15 min. Then, ethyl acetatewas evaporated under reduced pressure.
As a comparison, dried biomass was also extracted by ethyl acetate at room tem-perature. In brief, 10 g of dried material were suspended in 100 mL of ethyl acetate in a250-mL Erlenmeyer flask. The resulting solution was mixed using a magnetic stirrer atroom temperature (25 ◦C) for 60 min. After filtration, ethyl acetate was evaporated underreduced pressure.
Mass yields of the extraction processes were determined gravimetrically after solventevaporation and ingenol mebutate was quantified in the dry extracts after solubilization inmethanol according to the protocol described in Section 2.8.
2.10. Economical Evaluation of E. peplus Production
Cultivation and extraction were monitored from an operational point of view, andintegrated into a budget to assess profitability. All the investments and actions related tothe culture were listed to monitor them and assess profitability by assessing the price of thefinal product.
2.11. Data Analysis
For the substrate experiment, a one-way analysis of variance (ANOVA) was performedto test the significance of differences caused by “substrate” in measured values (height,fresh biomass, dried biomass, and total ingenol content). In the light and localizationexperiment, a two-way analysis of variance (ANOVA) was performed to test the significanceof differences in the factors “light” and “localization” and their interactions with measuredvalues. Prior to this analysis, the homogeneity of variance was tested using the Levenetest, and the normality of data was tested using Anderson–Darling and Ryan–Joiner tests.ANOVA results with p under 0.05 were considered as significant.
To identify the means or medians that contributed to the ANOVA effect, a Studentt-test or Wilcoxon test on data not normally distributed was performed. An adjustment formultiple comparison was applied with Holm corrections for multiple testing. Differencesat p < 0.05 were considered significant.
All of these calculations were conducted using R version 4.0.2. and Minitab® 19.2020.1(64-bit) software.
3. Results and Discussion3.1. Substrate Experiment
Three hydroponic substrates were tested, and fresh biomass, dried biomass, height,and total ingenol were measured. Results are showed in Figure 3 and Table 1.
Table 1. Mean and standard deviation of total ingenol (mg/kg) measured in aliquots of 24 plants intwo independent hydroponic cultivations of E. peplus in three substrates (rockwool, coco fiber, andclay beads). Student’s comparison of means was applied with 95% confidence; means that do notshare a letter are significantly different.
Trial 1 Trial 2
Substrate Number ofAliquots Total Ingenol Number of
Aliquots Total Ingenol
Clay beads 2 61.8 ± 1.57 a 6 60.0 ± 12 a
Coco Fiber 2 59.9 ± 3.84 a 6 63.5 ± 8.84 a
Rockwool 2 61.7 ± 1.41 a 6 61.8 ± 5.17 a

Horticulturae 2022, 8, 256 7 of 20Horticulturae 2022, 8, x FOR PEER REVIEW 7 of 21
Figure 3. Boxplot of Euphorbia peplus height (A), fresh biomass (B), and dried biomass (C) according to the substrate (RW: rockwool; CB: clay beads; CF: coco fiber) in two independent experiments. Student or Wilcoxon’s comparison test was applied with 95% confidence; means or medians that do not share a letter are significantly different. Trial 1: N = 48 plants. Trial 2: N = 144 plants.
Table 1. Mean and standard deviation of total ingenol (mg/kg) measured in aliquots of 24 plants in two independent hydroponic cultivations of E. peplus in three substrates (rockwool, coco fiber, and clay beads). Student’s comparison of means was applied with 95% confidence; means that do not share a letter are significantly different.
Trial 1 Trial 2 Substrate Number of Aliquots Total Ingenol Number of Aliquots Total Ingenol
Clay beads 2 61.8 ± 1.57 a 6 60.0 ± 12 a Coco Fiber 2 59.9 ± 3.84 a 6 63.5 ± 8.84 a Rockwool 2 61.7 ± 1.41 a 6 61.8 ± 5.17 a
The fresh and dried biomass increased when E. peplus was grown on rockwool, was intermediate on coco fiber, and decreased on expanded clay beads. Rockwool has very
Figure 3. Boxplot of Euphorbia peplus height (A), fresh biomass (B), and dried biomass (C) accordingto the substrate (RW: rockwool; CB: clay beads; CF: coco fiber) in two independent experiments.Student or Wilcoxon’s comparison test was applied with 95% confidence; means or medians that donot share a letter are significantly different. Trial 1: N = 48 plants. Trial 2: N = 144 plants.
The fresh and dried biomass increased when E. peplus was grown on rockwool, wasintermediate on coco fiber, and decreased on expanded clay beads. Rockwool has veryfavorable aeration properties, but a low water buffering capacity and hydraulic conduc-tivity characteristics that may lead to insufficient water and nutrient uptake, with thedevelopment of water stress symptoms in case of insufficient irrigation [46,47]. In ourexperimental conditions, the limited water buffering capacity of rockwool was bypassedby constant water availability.
Although coconut fiber is described as having a high water-holding capacity, andgood drainage and aeration properties [48], the biomass was lower than or similar to thatof rockwool, with a variability between the two trials, which could be linked to the changeof nutritive solution and high degradation of coco fiber. Coconut fiber posed a filteringproblem due to greater degradation of the substrate, and hence more labor was needed toclean the filtering system very regularly.
Horticulturae 2022, 8, 256 8 of 20
While clay beads have good aeration characteristics and can be reused, they havea low water-holding capacity [46]. The yield was lower and the crop had lower aerialpart development, and exhibited fresh biomass decreases of 18% and of 13% compared torockwool in trials 1 and 2, respectively.
The total ingenol content was not influenced by the hydroponic substrate in ourexperimental conditions. Rockwool was the most appropriate hydroponic substrate forgrowing E. peplus under deep-water irrigation with enhanced yield, which is an importantfactor for reaching economic viability.
3.2. Lighting and Localization Experiment
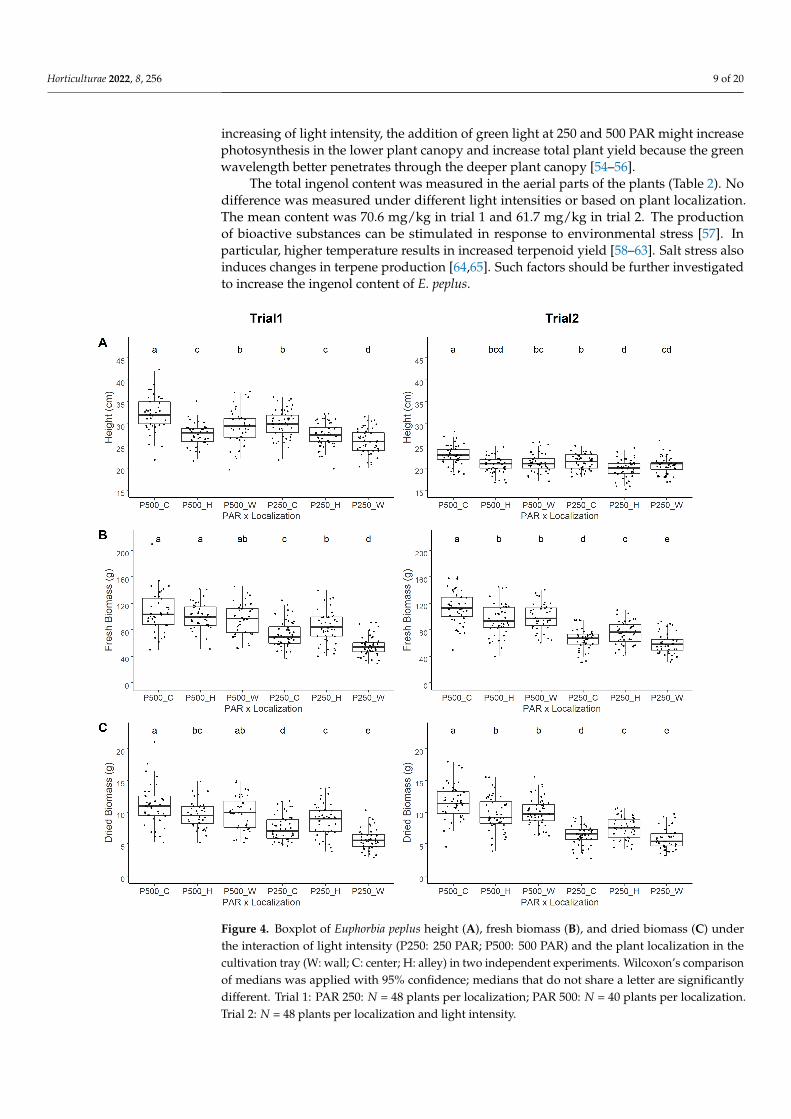
The effects of light intensity and plant localization on plant height, fresh biomass,and dried biomass were tested in two independent trials. Both factors were statisticallysignificant (p < 0.001). The interaction between the two factors was also statistically signifi-cant, showing that each factor cannot be interpreted independently. Results are shown inFigure 4.
In the field, plant localization has been showed to have an impact on yield. Comparedto mild-field yields, winter wheat yields in various edges decreased from 7.5% to 17.5%depending on the type of edges [49]. The lower yields at the field borders are explained byseveral factors, such as limited fertilizer inputs, soil compaction, reduced chemical inputs,or competition for water and nutrients by forest borders and hedgerows, but the mainfactor is lower solar irradiance in those edge regions due to shading [49,50].
In container cultivation, air conditioning provides continuous homogenous ventila-tion, and nutrient and temperature levels are homogenous across the surface area. How-ever, shifts in PAR intensity may occur depending on the plant localization inside a tray.Moreover, the plants close to the alley have more space to develop, and shading fromsurrounding plants is reduced.
In cultivation under 500 PAR, better growth was observed in the middle of the trays,and reduced growth at the edges. The mean decrease in fresh biomass at the edges was 8.2%in trial 1 and 14.6% in trial 2. A mean PAR loss of 12.5% was observed in the alley-localizedplants, and it was 9.2% in the wall-localized plants, as compared to the center-localizedplants. The wall acted as a light reflector that reduced the decrease in PAR.
Under 250 PAR, the pattern was different. Growth was better along the alley, followedby a 35% yield reduction along the wall and 14% in the centers of the trays in the firsttrial, and a 21% yield reduction along the wall and 13% in the centers of the trays in thesecond trial. A loss of PAR was also observed at the edges, but to a lesser extent (3.3%along the wall and 7.3% along the alley). Increased space availability reduces interplantshading, allows better red/far-red light ratios within the canopy, and decreases competitionfrom other plants, so that more energy is allocated to developing biomass [51,52]. Theplants along the alley benefited from a spectrum likely to slightly differ from the spectrumreceived by the plants located at the centers of the trays and along the wall, which mayhave favored better growth at lower PPFD [53].
In less favorable locations compared to favorable ones (center or alley), a decreasedPAR had a greater impact on fresh biomass yield losses, with a mean loss of 21% under250 PAR compared to 11.4% under 500 PAR: higher light intensity allowed the plantslocated in less favorable locations to better catch up with their growth delays. The plantscombining 250 PAR and a localization near the wall had more difficulties in growing thanthe plants in all other combinations. Distinct apical growth was observed between bothtrials. Part of the variability linked to the nutritive solution cannot be excluded, as thesolely nutritive parameter measured continuously was electroconductivity.
In the substrate trial with an intensity of 150 PAR, the mean fresh weight of euphorbiacultivated in rockwool was 32.7 g. With an extended spectrum and light intensity, the meanfresh weights reached 69.1 g (250 PAR) and 102 g (500 PAR), which represent increasesin mean shoot fresh weight by 111% and 212%, respectively, compared to the 150 PARexperiment. The same trend was observed for dry biomass. In addition to the effect of
Horticulturae 2022, 8, 256 9 of 20
increasing of light intensity, the addition of green light at 250 and 500 PAR might increasephotosynthesis in the lower plant canopy and increase total plant yield because the greenwavelength better penetrates through the deeper plant canopy [54–56].
The total ingenol content was measured in the aerial parts of the plants (Table 2). Nodifference was measured under different light intensities or based on plant localization.The mean content was 70.6 mg/kg in trial 1 and 61.7 mg/kg in trial 2. The productionof bioactive substances can be stimulated in response to environmental stress [57]. Inparticular, higher temperature results in increased terpenoid yield [58–63]. Salt stress alsoinduces changes in terpene production [64,65]. Such factors should be further investigatedto increase the ingenol content of E. peplus.
Horticulturae 2022, 8, x FOR PEER REVIEW 9 of 21
Figure 4. Boxplot of Euphorbia peplus height (A), fresh biomass (B), and dried biomass (C) under the interaction of light intensity (P250: 250 PAR; P500: 500 PAR) and the plant localization in the culti-vation tray (W: wall; C: center; H: alley) in two independent experiments. Wilcoxon’s comparison of medians was applied with 95% confidence; medians that do not share a letter are significantly different. Trial 1: PAR 250: N = 48 plants per localization; PAR 500: N = 40 plants per localization. Trial 2: N = 48 plants per localization and light intensity.
In less favorable locations compared to favorable ones (center or alley), a decreased PAR had a greater impact on fresh biomass yield losses, with a mean loss of 21% under 250 PAR compared to 11.4% under 500 PAR: higher light intensity allowed the plants lo-cated in less favorable locations to better catch up with their growth delays. The plants combining 250 PAR and a localization near the wall had more difficulties in growing than the plants in all other combinations. Distinct apical growth was observed between both trials. Part of the variability linked to the nutritive solution cannot be excluded, as the solely nutritive parameter measured continuously was electroconductivity.
In the substrate trial with an intensity of 150 PAR, the mean fresh weight of euphor-bia cultivated in rockwool was 32.7 g. With an extended spectrum and light intensity, the mean fresh weights reached 69.1 g (250 PAR) and 102 g (500 PAR), which represent in-creases in mean shoot fresh weight by 111% and 212%, respectively, compared to the 150
Figure 4. Boxplot of Euphorbia peplus height (A), fresh biomass (B), and dried biomass (C) underthe interaction of light intensity (P250: 250 PAR; P500: 500 PAR) and the plant localization in thecultivation tray (W: wall; C: center; H: alley) in two independent experiments. Wilcoxon’s comparisonof medians was applied with 95% confidence; medians that do not share a letter are significantlydifferent. Trial 1: PAR 250: N = 48 plants per localization; PAR 500: N = 40 plants per localization.Trial 2: N = 48 plants per localization and light intensity.

Horticulturae 2022, 8, 256 10 of 20
Table 2. Total ingenol mean content and standard deviation in the aerial parts of E. peplus as a functionof light intensity or plant localization in two independent experiments. Total ingenol was measuredin aliquots of 8 plants. Student’s comparison of means was applied with 95% confidence; meansthat do not share a letter are significantly different. Light intensity: Trial 1: PAR 250: N = 18 aliquots;PAR 500: N = 15 aliquots; trial 2: N = 18 aliquots. Localization: Trial 1: N = 11 aliquots; trial 2:N= 12 aliquots.
Trial 1 Trial 2
LightIntensity (µmolm−2 s−1) 250 500 250 500
Total Ingenol (mg/kg) 74.7 ± 25.4 a 65.7 ± 19.6 a 60.9 ± 2.61 a 62.4 ± 3.08 a
Localization Center Alley Wall Center Alley Wall
Total Ingenol (mg/kg) 71.5 ± 24.6 a 72.4 ± 24.1 a 68.0 ± 22.3 a 62.8 ± 1.81 a 61.3 ± 3.63 a 60.9 ± 2.88 a
3.3. Economic Evaluation of E. peplus Production
The cost price is an economic term that refers to all the costs supported by a companyto produce a goods/a service. It includes direct costs and indirect costs. Indirect costsare expenses not directly linked to the production of the product/service (advertising,rental of premises, salaries, etc.). Different calculation approaches exist: variable costprice, direct cost price, coefficient method, and activity-based costing [66]. Therefore, acompany supplying different products and services has to choose the right analysis in orderto understand how much a service or a product costs.
In this study, all the costs are directly related to the production activity.The study will be useful to forecast an economical evaluation of (i) raw chemical
production, and (ii) pharmaceutical production based on ingenol-mebutate. The forecastcalculation for the pharmaceutical market is based on assumptions and general costs. Theobjective is to verify the economic viability of this type of model.
3.3.1. Economic Comparison of E. peplus and Romaine Lettuce Production
We compared the cultivation cost prices of E. peplus and Romaine lettuce in a modifiedshipping container. Results are showed in Table 3.
The economic feasibility of medicinal E. peplus production was calculated based on (i)the substrate test under light conditions of 150 PAR and (ii) the light trial under 500 PAR.The results are expressed in Table 3 in the “R&D Container” columns. Those results werealso projected on a 10-sqm larger “R&D+ Container” with one more shelf above the top one.The romaine lettuce results are projected according to the technical possibilities offered by acommercial container optimized for smaller plant production with an extra space of 10 m2
from the same supplier, similarly to the R&D containers in terms of layout (a germinationcorner, a cultivation corner, and a central alley). The output represents the fresh biomassproduced in one year per container, including 5% quality loss.
Capital expenditure (capex) represents major long-term expenses. The “R&D con-tainer” capex is the price of a research container with an LED light of 150 PAR, or adaptedwith the cost of replacing initial lighting by modular lighting up to 500 PAR. The capex ofthe commercial container was obtained from Urban Crop Solutions.
Operating expenses (opex) represent the day-to-day expenses to keep a companyrunning. They include staff costs and daily costs necessary to generate outputs such aselectricity, water, substrates, and fertilizers. The opex range per year for E. peplus cultivationvaried from €28,597 for the 150-PAR R&D container to €36,505 for the 500 PAR-R&D+container: the opex increased by 27% when the size of the cultivation area was increased. Inparallel, E. peplus production yield varied from 192 to 776 kg per year, i.e., a 304% increase.This highlights that optimizing the cultivation area and growing conditions is significantfor the output of a crop and the calculation of its economic feasibility.

Horticulturae 2022, 8, 256 11 of 20
Table 3. Cultivation costs of Euphorbia peplus and Romaine lettuce in several scenarios accordingto the light intensity and growing surface, generating fresh biomass, output, capex, and opex. Thecost per kg of fresh biomass includes capex and opex; the contribution of each particular cost tothe total cost was calculated as a percentage. The values mentioned under the “R&D” containerare experimental results, and the values mentioned under the “R&D+” container and “Commercialcontainer” are projected results.
Crop Euphorbia peplus RomaineLettuce
Light (µmolm−2 s−1) 150 500 150Fresh Biomass per crop g 32.7 102 102
R&Dcontainer
R&D+container
R&Dcontainer
R&D+container
Commercialcontainer
Total Growing surface(sqm) sqm 30 40 30 40 50
Fresh Biomass (incl. 5%quality loss) (kg/yr/sqm) 6.4 6.34 19.97 19.39 34.04
OUTPUT (kg/yr) 192 254 599 776 1702
CAPEX (EUR/sqm) 3500 3000 3833.33 3375 3100CAPEX (15-yrdepreciation) (EUR/yr) 7000 8000 7667 9000 10,333
OPEXTechnical Staff at
€210/day (EUR/yr) 12,023 13,395 12,023 13,395 19,467
Engineer staff at€310/day (EUR/yr) 4437 4394 4437 4394 1465
Director staff at€600/day (EUR/yr) 2147 2126 2147 2126 709
Electricity at €0.2/kW (EUR/yr) 6650 8845 9177 12,206 10,964Water at €4.94/m3 (EUR/yr) 33 45 34 45 50
Seeds (EUR/yr) 0 0 0 0 75Fertilizer (EUR/yr) 1001 1319 1001 1319 810
Substrates (rockwool) (EUR/yr) 1255 1657 1255 1657 934pH adjustors (EUR/yr) 47 62 47 62 76
Container maintenance (EUR/yr) 1001 1301 1001 1301 1626TOTAL (EUR/yr) 28,597 33,144 31,124 36,505 36,176
COST per kg of freshbiomass
CAPEX (15-yrdepreciation) (EUR/kg) 36.44 20% 31.54 19% 12.80 20% 11.60 20% 6.07 22%
Labor Technical staff (EUR/kg) 62.59 34% 52.81 34% 20.07 31% 17.27 29% 11.44 42%Labor Eng. staff (EUR/kg) 23.10 12% 17.32 11% 7.41 11% 5.67 10% 0.86 3%
Labor Director staff (EUR/kg) 11.18 6% 8.38 5% 3.58 6% 2.74 5% 0.42 2%Electricity (EUR/kg) 34.62 19% 34.87 21% 15.32 24% 15.74 27% 6.44 24%
Water (EUR/kg) 0.18 0% 0.18 0% 0.06 0% 0.06 0% 0.03 0%Seeds (EUR/kg) - 0% - 0% - 0% - 0% 0.04 0%
Fertilizer (EUR/kg) 5.21 3% 5.20 3% 1.67 3% 1.70 3% 0.48 2%Substrates (rockwool) (EUR/kg) 6.53 4% 6.53 4% 2.09 3% 2.14 4% 0.55 2%
pH adjustors (EUR/kg) 0.24 0% 0.24 0% 0.08 0% 0.08 0% 0.04 0%Container maintenance (EUR/kg) 5.21 3% 5.13 3% 1.67 3% 1.68 3% 0.96 3%
TOTAL (EUR/kg) 185.31 162.22 64.74 58.67 27.33
When calculating the cost per kg of produced E. peplus, the most expensive scenariowas the R&D container with low-power LEDs because productivity was lowest. Thecontainer can be used 7.1 times a year, accounting for container cleaning and harvest. Ahigher capacity requires more labor and electricity. The cultivation of a plant for producinga pharmaceutical drug requires regular quality monitoring by qualified labor. Labor
Horticulturae 2022, 8, 256 12 of 20
contributed from 52% to 44% of the total crop cost, followed by capex (19–20%) andelectricity (19–27%). The enhanced productivity in the 500-PAR R&D and R&D+ containersdrastically decreased the crop cost per kg by 65% and 68%, respectively. As a consequence,the total production cost per kg of fresh E. peplus ranged from €59 to €185.
We simulated the cultivation of a common vegetable in the container to compare theproduction cost of a medicinal crop with that of a traditional leafy-green crop in verticalcontainer farming. Romaine lettuce was grown in short hydroponic culture, and harvestedafter 25–30 days of cultivation, at a mean biomass of 102 gr. The container can be used11.6 times per year, accounting for container shutoff for harvest, cleaning, and re-planting.Projections showed that productivity could reach almost 2 tons per year due to a shortercultivation time and greater utilization of space with an enhanced surface area of 50 m2.Therefore, the biomass per crop, the surface area, and the culture cycle are important factorswhen considering productivity. Labor needs were greater owing to a quick turnover andpre- or post-cultivation work such as seeding, harvesting, and packaging. On the otherhand, the need for qualified labor was lower. The total production cost of 1 kg of romainelettuce in the commercial container was estimated to be €27.33, including 47% for labor,followed by capex (22%) and electricity (24%). Table 4 shows the retail sales and purchaseprices of Romaine lettuce in several cities. The retail price of Romaine lettuce in Belgium isabout five times lower than in Singapore or New York, which makes the Belgian marketdifficult to access. The purchase price per kg at 50% gross margin in Singapore is stillabout two times lower than the production cost. Those actual production costs make itvery difficult to compete against traditional growing methods and confirm that profitabilityof vertically grown traditional leafy greens is difficult to reach with the actual design ofthe modified shipping container. The next steps for leafy-green vertical farming would becontinuing improvements in the factory engineering and design, to reduce capex and opexand reach affordable food costs [18].
Table 4. Retail sales prices and retail purchase prices at 50% gross margin for Romaine lettuce [18].
Retail Sales Prices Retail Purchase Prices (at50% Gross Margin)
Europe-Belgium (EUR/kg) 5.00 2.50USA-New York (EUR/kg) 22.00 11.00Asia-Singapore (EUR/kg) 26.00 13.0
3.3.2. Economic Evaluation of the Production of Ingenol-Mebutate as a Raw Material
The cost of ingenol-mebutate extraction from E. peplus was evaluated following threemethods: ethyl acetate at 120 ◦C, ethyl acetate at room temperature, and supercritical CO2.The costs were estimated based on the biomass generated during the cultivation process,the extraction yields, and the capex and opex costs. Results are showed in Table 5.
Extraction started with the drying of the plant. Eleven percent of residual biomass wasobtained from fresh biomass after drying, corresponding to 66 to 85 kg per year under the500 PAR scenario. Those outputs represent a very low load for industrial drying, grinding,extraction, and purification devices, which can handle much more biomass. To take thelow level of occupation of the devices into account, the occupation rate of the deviceswas set to 10% for the 500 PAR scenario. The best extraction yields were obtained withethyl acetate at 120 ◦C, followed by supercritical CO2 and then ethyl acetate, both at roomtemperature. In the CAPEX, the extraction and purification devices represented the highestcosts. Opex were higher with extraction at 120 ◦C due to higher needs in operators andelectricity, followed by extraction with supercritical CO2, which also induced high costsin operators and electricity. Extraction yield with ethyl acetate at room temperature andwith supercritical CO2 were decreased by 45.31% and 26.3% compared to ethyl acetate at120 ◦C, respectively.

Horticulturae 2022, 8, 256 13 of 20
Table 5. Extraction costs of ingenol-mebutate from Euphorbia peplus following three extractionmethods (ethyl acetate at 120 ◦C, ethyl acetate at room temperature, supercritical CO2), and accordingto the biomass generated in the container R&D and R&D+ under 500 PAR. Extraction yields areexperimental results.
EXTRACTION COSTS
Extraction Method
Ethyl Acetate120 ◦C
Ethyl AcetateRoom Temp.
SupercriticalCO2
OUTPUTDried biomass R&D+ container (kg/yr) 85 85 85Dried biomass R&D container (kg/yr) 66 66 66Ingenol-mebutate per dried kg (mg/kg) 43.76 23.94 32.17
CAPEXDrying equipment (EUR) 15,000 15,000 15,000
Grinding equipment (EUR) 20,000 20,000 20,000Extraction pilot (EUR) 500,000 100,000 800,000
Evaporation equipment (EUR) 30,000 30,000 30,000Purification equipment (EUR) 500,000 500,000 500,000
Occupation Rate (%) 10 10 10TOTAL CAPEX (20-yr depreciation) (EUR/yr) 5325 3325 6835
OPEXTechnical Staff at €210/day (EUR/batch) 840 840 840Engineer staff at €310/day (EUR/batch) 620 310 620Director staff at €600/day (EUR/batch) 600 300 600
Electricity at €0.2/kW (EUR/batch) 4000 800 4000Water at €4.94/m3 (EUR/batch) 49.4 49.4 0
Solvent (CO2, EtOAc) (EUR/batch) 228.10 228.10 199.3Filtration/Evaporation/Concentration (EUR/batch) 2500 3500 500
Purification consumables (EUR/batch) 1500 1500 1500Purification solvents (EUR/batch) 1500 1500 1500
Equipment maintenance (EUR/batch) 200 200 500Total OPEX costs/batch (EUR/batch) 12,037.5 9,227.5 10,259.30Total OPEX costs/year (EUR/yr) 90,281.25 69,206.22 76,944.75
CAPEX + OPEX (EUR/yr) 95,606.25 72,531.22 83,769.75
The cost of 1 mg of ingenol-mebutate was calculated (Table 6). The low extractionyield of ethyl acetate at room temperature was not compensated by its reduced cost: theproduction cost per mg was the highest. The cheapest method was extraction using ethylacetate at 120 ◦C: the production cost per mg was €37.80. The cost price was calculatedby adding flat fees to the production cost. The flat fees, including commercial works,administrative works, and bottling were evaluated at 2 to 3 euros per mg, hence the costprice ranging from 40 to 73 euros per mg.
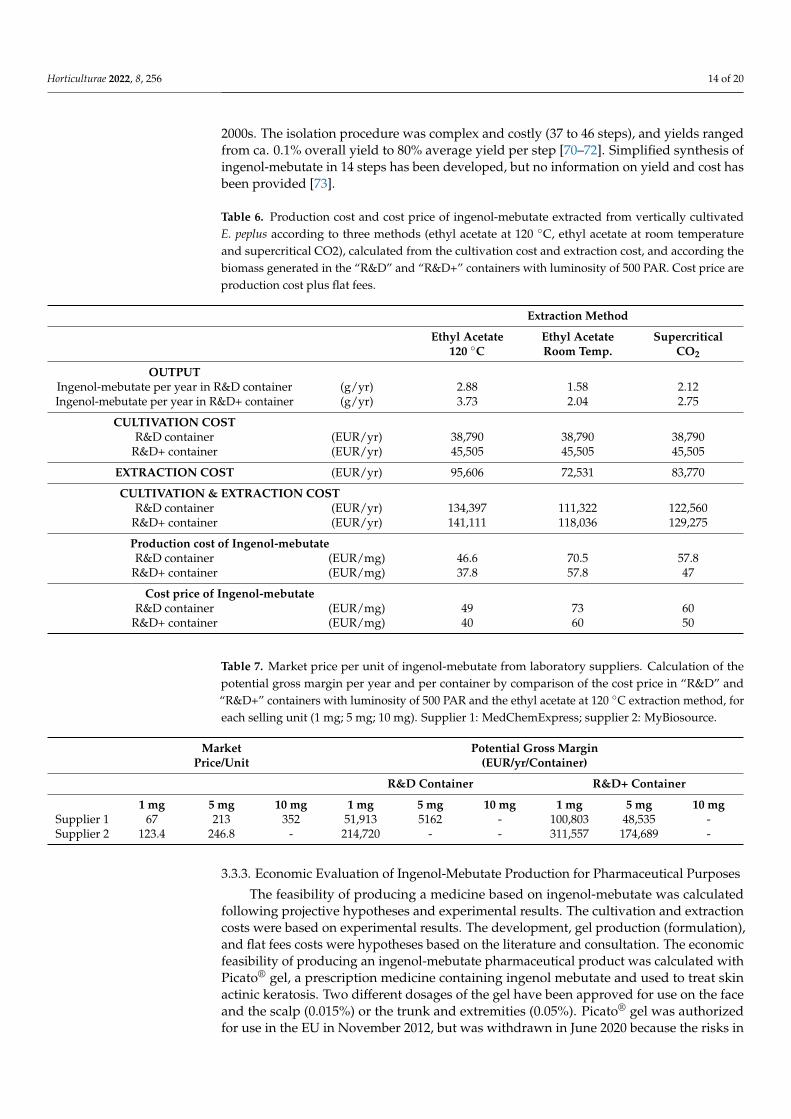
When comparing cost price obtained with the ethyl acetate at 120 ◦C extraction method,with the market price of ingenol-mebutate as a raw chemical product (Table 7), we shouldnote that the price of units of ingenol-mebutate from suppliers of laboratory productsvaries greatly. As a consequence, the potential gross margin per year and per R&D or R&D+container showed a wide range from 5162 to 311,557 EUR for the 1 and 5 mg units, themarket price for 10 mg being too low to generate a gross margin.
The selection of the appropriate extraction method allowed us to increase the extractionyield. However, the plant content in ingenol-mebutate was low, so that the extraction yieldremained low too. Previous extraction works on E. peplus showed a low yield of about1.1 mg/kg [67]. Other ways of generating ingenol-mebutate have been explored. Semi-chemical synthesis of ingenol mebutate from ingenol has also been developed, at a greateryield of ~250 mg/kg [68,69]. Total chemical synthesis of ingenol was proposed in the early
Horticulturae 2022, 8, 256 14 of 20
2000s. The isolation procedure was complex and costly (37 to 46 steps), and yields rangedfrom ca. 0.1% overall yield to 80% average yield per step [70–72]. Simplified synthesis ofingenol-mebutate in 14 steps has been developed, but no information on yield and cost hasbeen provided [73].
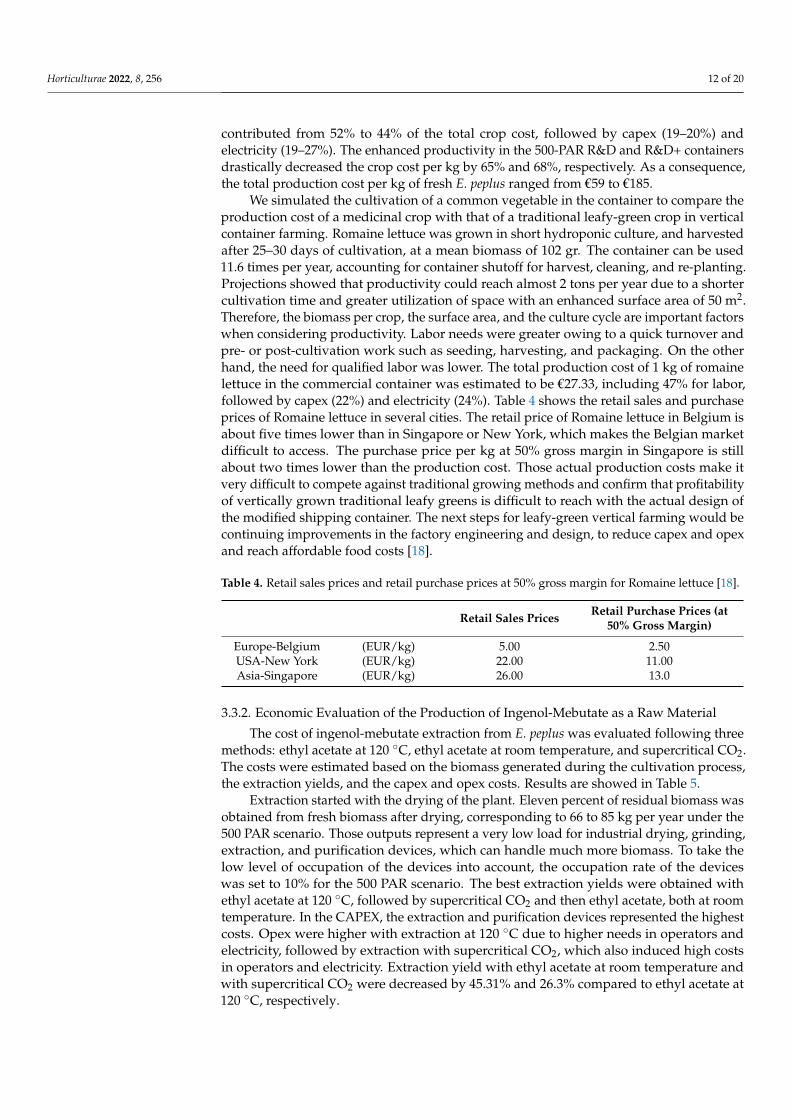
Table 6. Production cost and cost price of ingenol-mebutate extracted from vertically cultivatedE. peplus according to three methods (ethyl acetate at 120 ◦C, ethyl acetate at room temperatureand supercritical CO2), calculated from the cultivation cost and extraction cost, and according thebiomass generated in the “R&D” and “R&D+” containers with luminosity of 500 PAR. Cost price areproduction cost plus flat fees.
Extraction Method
Ethyl Acetate120 ◦C
Ethyl AcetateRoom Temp.
SupercriticalCO2
OUTPUTIngenol-mebutate per year in R&D container (g/yr) 2.88 1.58 2.12Ingenol-mebutate per year in R&D+ container (g/yr) 3.73 2.04 2.75
CULTIVATION COSTR&D container (EUR/yr) 38,790 38,790 38,790
R&D+ container (EUR/yr) 45,505 45,505 45,505
EXTRACTION COST (EUR/yr) 95,606 72,531 83,770
CULTIVATION & EXTRACTION COSTR&D container (EUR/yr) 134,397 111,322 122,560
R&D+ container (EUR/yr) 141,111 118,036 129,275
Production cost of Ingenol-mebutateR&D container (EUR/mg) 46.6 70.5 57.8
R&D+ container (EUR/mg) 37.8 57.8 47
Cost price of Ingenol-mebutateR&D container (EUR/mg) 49 73 60
R&D+ container (EUR/mg) 40 60 50
Table 7. Market price per unit of ingenol-mebutate from laboratory suppliers. Calculation of thepotential gross margin per year and per container by comparison of the cost price in “R&D” and“R&D+” containers with luminosity of 500 PAR and the ethyl acetate at 120 ◦C extraction method, foreach selling unit (1 mg; 5 mg; 10 mg). Supplier 1: MedChemExpress; supplier 2: MyBiosource.
MarketPrice/Unit
Potential Gross Margin(EUR/yr/Container)
R&D Container R&D+ Container
1 mg 5 mg 10 mg 1 mg 5 mg 10 mg 1 mg 5 mg 10 mgSupplier 1 67 213 352 51,913 5162 - 100,803 48,535 -Supplier 2 123.4 246.8 - 214,720 - - 311,557 174,689 -
3.3.3. Economic Evaluation of Ingenol-Mebutate Production for Pharmaceutical Purposes
The feasibility of producing a medicine based on ingenol-mebutate was calculatedfollowing projective hypotheses and experimental results. The cultivation and extractioncosts were based on experimental results. The development, gel production (formulation),and flat fees costs were hypotheses based on the literature and consultation. The economicfeasibility of producing an ingenol-mebutate pharmaceutical product was calculated withPicato® gel, a prescription medicine containing ingenol mebutate and used to treat skinactinic keratosis. Two different dosages of the gel have been approved for use on the faceand the scalp (0.015%) or the trunk and extremities (0.05%). Picato® gel was authorizedfor use in the EU in November 2012, but was withdrawn in June 2020 because the risks in

Horticulturae 2022, 8, 256 15 of 20
actinic keratosis might outweigh the benefits. Further research should be led to developnew products based on metabolites of interest present in the latex of E. peplus. Moreover, al-though the medicine is not produced anymore, the present study showed the methodologyand key elements for calculating the economic feasibility of producing a medicinal plantand could be transposed to other cases.
The economic evaluation of pharmaceutical production based on ingenol-mebutatePicato® gel is shown in Table 8.
Table 8. Production cost of pharmaceutical ingenol-mebutate from Euphorbia peplus according to themarket characteristics of Picato® gel and the cultivation yields. The cultivation and extraction yieldsgenerated output, capex, and opex. Three scenarios according to the type of Picato® gel produced(0.015%, 0.05%, and a mix of the two items) were simulated. The return on investment was calculatedaccording to the scenarios and to the annual biomass generated by cultivation in the R&D and R&D+containers under two light intensities. A simulation with the best annual biomass multiplied by 10(meaning running 10 shipping containers) is also presented. IngMeb: ingenol-mebutate.
Characteristics of Picato® gel
A: Distributor Price/unit (EUR/3 gel) 36.9B: Distributor Price/unit (EUR/2 gel) 36.9
Volume per gel tube (g) 0.47A: 0.015% IngMeb (µg IngMeb/gel) 70.4B: 0.05% IngMeb (µg IngMeb/gel) 235
Production cost of Picato® gel R&Dcontainer
R&D+container
R&Dcontainer
R&D+container
(R&D+container):
10 units
Cultivation yield (fresh biomass) (kg/yr) 192 254 599 776 7756.4Extraction yield at 0.0043758% (g IngMeb/yr) 0.92 1.22 2.88 3.73 37.3
OUTPUTA: 0.015% IngMeb (gel/yr) 13,064 17,336 40,954 53,015 530,152B: 0.05% IngMeb (gel/yr) 3934 5195 12,273 15,887 158,871
100% A- 3 gels/unit (EUR/yr) 161,492 213,232 503,737 652,087 6,520,870100% B- 2 gels/unit (EUR/yr) 72,592 95,849 226,432 293,117 2,931,166
75% A-25%B (EUR/yr) 139,267 183,887 434,411 562,344 5,623,444
CAPEXGMP gel production (EUR) 200,000 200,000 200,000 200,000 400,000
Capex (30 yr depreciation) (EUR/yr) 6667 6667 6667 6667 13,333
OPEXDevelopment costs (EUR) 300,000,000 300,000,000 300,000,000 300,000,000 300,000,000
Development cost (20-yr depreciation) (EUR/yr) 15,000,000 15,000,000 15,000,000 15,000,000 15,000,000Cultivation cot (EUR/yr) 35,597 41,144 38,790 45,505 455,050
Extraction cost—EtOAc 120 ◦C (EUR/yr) 92,944 92,944 95,606 95,606 143,531Gel production cost (75% A-25%B) (EUR/yr) 8123 10,725 25,338 32,800 327,999
Flat fees (EUR/yr) 45,000 45,000 90,000 90,000 300,000
CAPEX + OPEX (EUR/yr) 15,188,330 15,196,480 15,256,401 15,270,577 16,239,914
Return on investment—100% A (yr) 94 71 30 23 3Return on investment—100% B (yr) 209 158 67 52 5
Return on investment—75%A-25%B (yr) 109 83 35 27 3
The economic feasibility of producing a medicinal molecule is calculated from annualbiomass production and the ingenol-mebutate extraction yield from the plant. These twovalues will fix the quantity of gel tubes that can be produced and the output. The priceof Picato® gel in drugstores was €71.96 per packet-unit of three tubes at 0.015% or twotubes at 0.05%. Taking into account the gross margin of distributors and drugstores at 1.3and 1.5, respectively, the sales price by the manufacturer can be estimated as €36.90. Theoutput is linked to the productivity of cultivation and the efficacy of ingenol-mebutateextraction. It will generate from €161,492 to €652,087 per year if the sales are 100% of thegel at 0.015%. The enhanced productivity in the 40 sqm container at 500 PAR increasedthe output by 304%. If we consider that the sales are represented by 100% of the gel at0.05%, the output depletes to the range of €72,592 to €293,117 per year. The constant priceof the more concentrated gel is not compensated for by the lower number of tubes. In fact,the increase in ingenol-mebutate content causes a sharp decrease in the quantity of tubesproduced and generates a lower turnover due to too low a price compared to the gel at
Horticulturae 2022, 8, 256 16 of 20
0.015%. This projection is not the most profitable one for the manufacturer. Supposingmixed production composed of 75% of gel at 0.015% and 25% of gel at 0.05%, the turnoverwould range from €139,267 to €562,344 per year.
The capex of the pharmaceutical company is represented by the tube productionfacilities. It can be estimated at a relatively low price due to the low number of tubesproduced annually (53,000 maximum), taking into account that a pharma-GMP labelis required.
The opex can be estimated based on the research and development, cultivation, ex-traction, gel production costs, and flat fees. The extraction costs for the research containersunder 150 PAR and 500 PAR were estimated at occupation rates of 5% and 10%, respectively.The extraction cost with 10 units of R&D+ container under 500 PAR was estimated at anoccupation rate of 100%. The gel production cost was estimated at a unit price of 0.75 EURper tube. Flat fees include operational costs, such as renting a building, electricity andheating costs, and staff costs (administrative and commercial teams). They were estimatedto be 300,000 EUR in the 10 R&D+/500 PAR scenario, in which the number of annuallyproduced tubes reached 437,000 (75%A–25%B). In the other scenarios, the volume of annu-ally produced tubes ranged from 11,000 to 43,700 (75%A–25%B); these are small quantitiesthat do not require a 100% occupation rate for flat fees. We converted this low volumeinto an occupational rate of 15% for the R&D and R&D+ containers under 150 PAR, versus30% under 500 PAR. The development costs of a drug include pre-clinical and clinicalstudies. The estimation of the average cost of drug development is difficult. It largelyvaries according to the studies that have to be carried out, from USD 92.0 million to USD884 million, or even to USD 1395 million [74–76]. Moreover, the clinical costs of drugdevelopment vary depending on the treatment category. They range from USD 312 millionfor analgesics/anesthetics to USD 448 million for anti-infective drugs [74]. As Picato®
is a topical product, an intermediate value was hypothesized for the development cost.Although we hypothesized a relatively optimistic development cost and allocated its costover the term of a patent, this item represented the main cost, and all the other costsappeared as a very low load. Due to very high development costs, the return on investmentwould be about 100 years at the lowest productivity level, compared to around 30 yearsat the best productivity level. It would be necessary to multiply production by 10—forexample, by having 10 highly productive containers, to reach a return on investment withinless than 5 years, while hypothesizing that the market is sufficiently developed to absorbthe number of tubes produced each year—about 152,000 units of 3 (75%) and 2 (25%) tubes.
Although the simulation of the profitability of Picato® gel showed that economicfeasibility would be difficult to reach, certain factors could rapidly increase the profitabilityof ingenol production. The improvement in the ingenol content in the plant by a morespecific and adapted cultivation process would increase the extraction yield rapidly. Thedoubling of the extraction yield by increasing the ingenol content through abiotic factorswould reduce the return on investment time to 14 years. Furthermore, upcoming new plantfactory designs with increased growing surfaces and planting densities will reduce thecapex and the cost per mg of vegetable, and profitability will be less challenging [18].
4. Conclusions
The economic feasibility of producing a metabolite for pharmaceutical purposes isclosely linked to the biomass yield, the concentration of the metabolite in the plant, and theextraction yield. A low biomass yield, a low phytomolecule content, and a low extractionyield complicate the economic feasibility of the process and should carefully be checked toassess profitability. Considering all vertical plant production, the biomass yield dependson the cultivation surface area, the length of growing cycle, the growing density of theplant, its biomass, and abiotic cultivation factors, such as light, temperature, substrate,and CO2 content. Considering E. peplus production in the R&D+ container with enhancedlight, we succeeded in increasing fresh shoot biomass by 200% by choosing the appropriatesubstrate and the appropriate light, and by increasing the surface area. The content in

Horticulturae 2022, 8, 256 17 of 20
a specific metabolite is also an important factor for reaching economic viability. A lowcontent in a specific metabolite negatively impacts the extraction yield and the final outputof a medicinal product. In the specific case of ingenol-mebutate in E. peplus, its contentis low. Therefore, testing abiotic factors to maximize the metabolite content is importantfor profitability, such as temperature and salt stresses in the particular case of ingenol-mebutate. The size of the cultivation plant is also an important factor, as we have showedthat increasing the surface area by the use of several containers allows access to significantreturn on investment. Finally, the therapeutic dose of the phytomolecule in the drug andthe selling price of the drug directly influence the potential turnover of the pharmaceuticalcompany and return on investment. In our particular case, it was established that acomplete return on investment might be reached between 3 and 5 years in case of highinvestments funds enable to acquire 10 containers.
Author Contributions: Conceptualization, F.B. and M.H.J.; methodology, F.B., S.K., E.M., A.B., N.A.,N.C. and M.H.J.; validation, F.B., S.K., E.M., A.B., N.A. and N.C.; formal analysis, F.B., S.K., E.M., andN.A.; investigation, F.B., S.K., E.M., A.B., N.A. and N.C.; writing—original draft preparation, F.B.;writing—review and editing, F.B., S.K., E.M., A.B., N.A., N.C. and M.H.J.; visualization, F.B., S.K.,N.A. and M.H.J.; supervision M.H.J.; project administration, F.B. and M.H.J.; funding acquisition, F.B.and M.H.J. All authors have read and agreed to the published version of the manuscript.
Funding: This research work was funded by the European Union and the Walloon Region withthe European Funds for Regional Development 2014–2020 within the framework of the VERDIRTropical Plant Factory program (Optibiomasse and ExtraTech projects) (form number: 814687-481490).Economic analysis support was funded by the Interreg North-West Europe Groof project (formnumber: NWE 474).
Institutional Review Board Statement: Not applicable.
Informed Consent Statement: Not applicable.
Conflicts of Interest: The authors declare no conflict of interest.
References1. Food and Agriculture Organization of the United Nations (FAO). Feeding the Cities of the Future. Available online: https:
//www.fao.org/news/story/en/item/446763/icode/ (accessed on 31 January 2022).2. Lotze-Campen, H.; Müller, C.; Bondeau, A.; Rost, S.; Popp, A.; Lucht, W. Global food demand, productivity growth, and the
scarcity of land and water resources: A spatially explicit mathematical programming approach. Agric. Econ. 2008, 39, 325–338.[CrossRef]
3. Davis, K. The origin and growth of urbanization in the world. Am. J. Sociol. 1955, 60, 429–437. [CrossRef]4. Agrilyst State of Indoor Farming. Available online: https://artemisag.com/wp-content/uploads/06/stateofindoorfarming-
report-2017.pdf (accessed on 7 June 2021).5. Kozai, T.; Niu, G. Chapter 1—Introduction. In Plant Factory, 2nd ed.; Kozai, T., Niu, G., Takagaki, M., Eds.; Academic Press:
Cambridge, MA, USA, 2020; pp. 3–6. ISBN 978-0-12-816691-8.6. Despommier, D. The rise of vertical farms. Sci. Am. 2009, 301, 80–87. [CrossRef] [PubMed]7. Avgoustaki, D.D.; Xydis, G. How energy innovation in indoor vertical farming can improve food security, sustainability, and food
safety? Adv. Food Secur. Sustain. 2020, 5, 1–51. [CrossRef]8. Avgoustaki, D.D.; Xydis, G. Indoor vertical farming in the urban nexus context: Business growth and resource savings.
Sustainability 2020, 12, 1965. [CrossRef]9. Barbosa, G.L.; Gadelha, F.D.A.; Kublik, N.; Proctor, A.; Reichelm, L.; Weissinger, E.; Wohlleb, G.M.; Halden, R.U. Comparison of
land, water, and energy requirements of lettuce grown using hydroponic vs. conventional agricultural methods. Int. J. Environ.Res. Public Health 2015, 12, 6879–6891. [CrossRef]
10. Banerjee, C.; Adenaeuer, L. Up, up and away! The economics of vertical farming. J. Agric. Stud. 2014, 2, 40–60. [CrossRef]11. Benke, K.; Tomkins, B. Future food-production systems: Vertical farming and controlled-environment agriculture. Sustain. Sci.
Pract. Policy 2017, 13, 13–26. [CrossRef]12. Beacham, A.M.; Vickers, L.H.; Monaghan, J.M. Vertical farming: A summary of approaches to growing skywards. J. Hortic. Sci.
Biotechnol. 2019, 94, 277–283. [CrossRef]13. Coyle, B.D.; Ellison, B. Will consumers find vertically farmed produce “out of reach”? Choices 2017, 32, 1–8.14. Cox, S.; Van Tassel, D. Vertical farming doesn’t stack up. Synth. Regen. 2010, 52.15. Benis, K.; Ferrao, P. Commercial farming within the urban built environment—Taking stock of an evolving field in northern
countries. Glob. Food Secur. 2018, 17, 30–37. [CrossRef]

Horticulturae 2022, 8, 256 18 of 20
16. Graamans, L.; Baeza, E.; van den Dobbelsteen, A.; Tsafaras, I.; Stanghellini, C. Plant factories versus greenhouses: Comparison ofresource use efficiency. Agric. Syst. 2018, 160, 31–43. [CrossRef]
17. Sparks, R.E.; Stwalley, R.M., III. Design and testing of a modified hydroponic shipping container system for urban food production.Int. J. Appl. Agric. Sci. 2018, 4, 93–102.
18. Debusschere, T.; Boekhout, R. When Will Vertical Farming Become Profitable? Available online: https://www.verticalfarmdaily.com/article/9321424/when-will-vertical-farming-become-profitable/ (accessed on 6 August 2021).
19. VerticalFarmDaily Not Possible to Market Our Vertically Grown Vegetables in a Financially Attractive Way. Availableonline: https://www.verticalfarmdaily.com/article/9349889/not-possible-to-market-our-vertically-grown-vegetables-in-a-financially-attractive-way/ (accessed on 31 August 2021).
20. Eaves, J.; Eaves, S. Comparing the profitability of a greenhouse to a vertical farm in Quebec. Can. J. Agric. Econ. Can.. 2018, 66,43–54. [CrossRef]
21. Li, L.; Li, X.; Chong, C.; Wang, C.-H.; Wang, X. A decision support framework for the design and operation of sustainable urbanfarming systems. J. Clean. Prod. 2020, 268, 121928. [CrossRef]
22. Howitz, K.T.; Sinclair, D.A. Xenohormesis: Sensing the chemical cues of other species. Cell 2008, 133, 387–391. [CrossRef][PubMed]
23. Newman, D.J.; Cragg, G.M. Natural products as sources of new drugs over the last 25 years. J. Nat. Prod. 2007, 70, 461–477.[CrossRef] [PubMed]
24. World Health Organization. Traditional medicine: Report by the secretariat. In Proceedings of the 56th World Health Assembly,Geneva, Switzerland, 19–28 May 2003.
25. Ernst, M.; Grace, O.M.; Saslis-Lagoudakis, H.; Nilsson, N.; Simonsen, H.T.; Rønsted, N. Global medicinal uses of Euphorbia L.(Euphorbiaceae). J. Ethnopharmacol. 2015, 176, 90–101. [CrossRef] [PubMed]
26. Frezza, C.; Venditti, A.; Sciubba, F.; Tomai, P.; Antonetti, M.; Franceschin, M.; Di Cocco, M.E.; Gentili, A.; Delfini, M.; Serafini, M.;et al. Phytochemical profile of Euphorbia peplus L. collected in Central Italy and NMR semi-quantitative analysis of the diterpenoidfraction. J. Pharm. Biomed. Anal. 2018, 160, 152–159. [CrossRef] [PubMed]
27. Batanouny, K.H.; Stichler, W.; Ziegler, H. Photosynthetic pathways and ecological distribution of Euphorbia species in Egypt.Oecologia 1991, 87, 565–569. [CrossRef] [PubMed]
28. Berman, B. New developments in the treatment of actinic keratosis: Focus on ingenol mebutate gel. Clin. Cosmet. Investig.Dermatol. 2012, 5, 111–122. [CrossRef] [PubMed]
29. Verma, N.; Shukla, S. Impact of various factors responsible for fluctuation in plant secondary metabolites. J. Appl. Res. Med.Aromat. Plants 2015, 2, 105–113. [CrossRef]
30. Akula, R.; Ravishankar, G.A. Influence of abiotic stress signals on secondary metabolites in plants. Plant Signal. Behav. 2011, 6,1720–1731. [CrossRef] [PubMed]
31. Dou, H.; Niu, G. Chapter 9—Plant responses to light. In Plant Factory, 2nd ed.; Kozai, T., Niu, G., Takagaki, M., Eds.; AcademicPress: Cambridge, MA, USA, 2020; pp. 153–166. ISBN 978-0-12-816691-8.
32. Dou, H.; Niu, G.; Gu, M.; Masabni, J. Morphological and physiological responses in basil and brassica species to differentproportions of red, blue, and green wavelengths in indoor vertical farming. J. Am. Soc. Hortic. Sci. 2020, 145, 267–278. [CrossRef]
33. Raviv, M.; Wallach, R.; Silber, A.; Bar-Tal, A. Substrates and their analysis. In Hydroponic Production of Vegetables and Ornamentals;Sawas, D., Passam, H., Eds.; Embrio Publications: Athens, Greece, 2002; pp. 25–105.
34. Deepagoda, T.C.; Lopez, J.C.C.; Møldrup, P.; De Jonge, L.W.; Tuller, M. Integral parameters for characterizing water, energy, andaeration properties of soilless plant growth media. J. Hydrol. 2013, 502, 120–127. [CrossRef]
35. Sonneveld, C.; Voogt, W. Plant nutrition in future greenhouse production. In Plant Nutrition of Greenhouse Crops; Springer:Dordrecht, The Netherlands, 2009; pp. 393–403. ISBN 978-90-481-2532-6.
36. Othman, Y.; Bataineh, K.; Al-Ajlouni, M.; Alsmairat, N.; Ayad, J.; Shiyab, S.; Al-Qarallah, B.; St Hilaire, R. Soilless culture:Management of growing substrate, water, nutrient, salinity, microorganism and product quality. Fresenius Environ. Bull. 2019, 28,3249–3260.
37. Alsmairat, N.G.; Al-Ajlouni, M.G.; Ayad, J.Y.; Othman, Y.A.; Hilaire, R.S. Composition of soilless substrates affect the physiologyand fruit quality of two strawberry (Fragaria × ananassa Duch.) cultivars. J. Plant Nutr. 2018, 41, 2356–2364. [CrossRef]
38. Al-Ajmi, A.; Al-Karaki, G.; Othman, Y. Effect of different substrates on fruit yield and quality of cherry tomato grown in a closedsoilless system. In Proceedings of the Acta Horticulturae; International Society for Horticultural Science (ISHS): Leuven, Belgium,2009; pp. 491–494.
39. Maloupa, E.; Gerasopoulos, D. Quality production of four cut gerberas in a hydroponic system of four substrates. In Proceedingsof the Acta Horticulturae; International Society for Horticultural Science (ISHS): Leuven, Belgium, 1999; pp. 433–438.
40. Béres, T.; Dragull, K.; Pospíšil, J.; Tarkowská, D.; Dancák, M.; Bíba, O.; Tarkowski, P.; Doležal, K.; Strnad, M. Quantitative analysisof ingenol in Euphorbia species via validated isotope dilution ultra-high performance liquid chromatography tandem massspectrometry. Phytochem. Anal. 2018, 29, 23–29. [CrossRef] [PubMed]
41. Tobiszewski, M.; Namiesnik, J.; Pena-Pereira, F. Environmental risk-based ranking of solvents using the combination of amultimedia model and multi-criteria decision analysis. Green Chem. 2017, 19, 1034–1042. [CrossRef]
42. Appendino, G. Ingenane diterpenoids. Prog. Chem. Org. Nat. Prod. 2016, 102, 1–90. [CrossRef] [PubMed]
Horticulturae 2022, 8, 256 19 of 20
43. Nothias-Scaglia, L.-F.; Dumontet, V.; Neyts, J.; Roussi, F.; Costa, J.; Leyssen, P.; Litaudon, M.; Paolini, J. LC-MS2-Based dereplicationof Euphorbia extracts with anti-Chikungunya virus activity. Fitoterapia 2015, 105, 202–209. [CrossRef] [PubMed]
44. Cheng, J.; Han, W.; Wang, Z.; Shao, Y.; Wang, Y.; Zhang, Y.; Li, Z.; Xu, X.; Zhang, Y. Hepatocellular carcinoma growth is inhibitedby Euphorbia helioscopia L. extract in nude mice xenografts. BioMed Res. Int. 2015, 2015, 601015. [CrossRef] [PubMed]
45. Araújo, J.M.; Sandi, D. Extraction of coffee diterpenes and coffee oil using supercritical carbon dioxide. Food Chem. 2007, 101,1087–1094. [CrossRef]
46. Bar-Tal, A.; Saha, U.K.; Raviv, M.; Tuller, M. Chapter 7—Inorganic and synthetic organic components of soilless culture andpotting mixtures. In Soilless Culture, 2nd ed.; Raviv, M., Lieth, J.H., Bar-Tal, A., Eds.; Elsevier: Boston, MA, USA, 2019; pp. 259–301.ISBN 978-0-444-63696-6.
47. De Swaef, T.; Verbist, K.; Cornelis, W.; Steppe, K. Tomato sap flow, stem and fruit growth in relation to water availability inrockwool growing medium. Plant Soil 2012, 350, 237–252. [CrossRef]
48. Deepagoda, T.C.; Moldrup, P.; Tuller, M.; Pedersen, M.; Lopez, J.C.C.; de Jonge, L.W.; Kawamoto, K.; Komatsu, T. Gas diffusivity-based design and characterization of greenhouse growth substrates. Vadose Zone J. 2013, 12, 1–13. [CrossRef]
49. Raatz, L.; Bacchi, N.; Pirhofer Walzl, K.; Glemnitz, M.; Müller, M.E.H.; Joshi, J.; Scherber, C. How much do we really lose?—Yieldlosses in the proximity of natural landscape elements in agricultural landscapes. Ecol. Evol. 2019, 9, 7838–7848. [CrossRef][PubMed]
50. Schmidt, M.; Nendel, C.; Funk, R.; Mitchell, M.G.E.; Lischeid, G. Modeling yields response to shading in the field-to-foresttransition zones in heterogeneous landscapes. Agriculture 2019, 9, 6. [CrossRef]
51. Board, J. Light interception efficiency and light quality affect yield compensation of soybean at low plant populations. Crop Sci.2000, 40, 1285–1294. [CrossRef]
52. Kasperbauer, M.J. Far-red light reflection from green leaves and effects on phytochrome-mediated assimilate partitioning underfield conditions. Plant Physiol. 1987, 85, 350–354. [CrossRef] [PubMed]
53. Dou, H.; Niu, G.; Gu, M.; Masabni, J.G. Responses of sweet basil to different daily light integrals in photosynthesis, morphology,yield, and nutritional quality. HortScience horts 2018, 53, 496–503. [CrossRef]
54. Wang, Y.; Folta, K.M. Contributions of green light to plant growth and development. Am. J. Bot. 2013, 100, 70–78. [CrossRef][PubMed]
55. Terashima, I.; Fujita, T.; Inoue, T.; Chow, W.S.; Oguchi, R. Green light drives leaf photosynthesis more efficiently than red light instrong white light: Revisiting the enigmatic question of why leaves are green. Plant Cell Physiol. 2009, 50, 684–697. [CrossRef][PubMed]
56. Dou, H.; Niu, G.; Gu, M. Photosynthesis, morphology, yield, and phytochemical accumulation in basil plants influenced bysubstituting green light for partial red and/or blue light. HortScience 2019, 54, 1769–1776. [CrossRef]
57. Yang, L.; Wen, K.-S.; Ruan, X.; Zhao, Y.-X.; Wei, F.; Wang, Q. Response of plant secondary metabolites to environmental factors.Molecules 2018, 23, 762. [CrossRef] [PubMed]
58. Hanson, D.T.; Sharkey, T.D. Effect of growth conditions on isoprene emission and other thermotolerance-enhancing compounds.Plant Cell Environ. 2001, 24, 929–936. [CrossRef]
59. Rosenfeld, H.J.; Aaby, K.; Lea, P. Influence of temperature and plant density on sensory quality and volatile terpenoids of carrot(Daucus carota L.) root. J. Sci. Food Agric. 2002, 82, 1384–1390. [CrossRef]
60. Helmig, D.; Ortega, J.; Duhl, T.; Tanner, D.; Guenther, A.; Harley, P.; Wiedinmyer, C.; Milford, J.; Sakulyanontvittaya, T.Sesquiterpene emissions from pine trees—Identifications, emission rates and flux estimates for the contiguous United States.Environ. Sci. Technol. 2007, 41, 1545–1553. [CrossRef] [PubMed]
61. Ibrahim, M.A.; Mäenpää, M.; Hassinen, V.; Kontunen-Soppela, S.; Malec, L.; Rousi, M.; Pietikäinen, L.; Tervahauta, A.; Kärenlampi,S.; Holopainen, J.; et al. Elevation of night-time temperature increases terpenoid emissions from Betula pendula and Populustremula. J. Exp. Bot. 2010, 61, 1583–1595. [CrossRef] [PubMed]
62. Filella, I.; Wilkinson, M.J.; Llusià, J.; Hewitt, C.N.; Peñuelas, J. Volatile organic compounds emissions in Norway spruce (Picea abies)in response to temperature changes. Physiol. Plant. 2007, 130, 58–66. [CrossRef]
63. Kivimäenpää, M.; Riikonen, J.; Ahonen, V.; Tervahauta, A.; Holopainen, T. Sensitivity of Norway spruce physiology and terpenoidemission dynamics to elevated ozone and elevated temperature under open-field exposure. Environ. Exp. Bot. 2013, 90, 32–42.[CrossRef]
64. Petridis, A.; Therios, I.; Samouris, G.; Tananaki, C. Salinity-induced changes in phenolic compounds in leaves and roots of fourolive cultivars (Olea europaea L.) and their relationship to antioxidant activity. Environ. Exp. Bot. 2012, 79, 37–43. [CrossRef]
65. Tounekti, T.; Vadel, A.M.; Ennajeh, M.; Khemira, H.; Munné-Bosch, S. Ionic interactions and salinity affect monoterpene andphenolic diterpene composition in rosemary (Rosmarinus officinalis). J. Plant Nutr. Soil Sci. 2011, 174, 504–514. [CrossRef]
66. Niessen, W.; Chanteux, A. Les Tableaux de Bord et Business Plan; Editions des Chambres de Commerce et d’Industrie de Wallonie,Ed.; Edipro: Seraing, Belgium, 2005.
67. Hohmann, J.; Evanics, F.; Berta, L.; Bartók, T. Diterpenoids from Euphorbia peplus. Planta Med. 2000, 66, 291–294. [CrossRef][PubMed]
68. Liang, X.; Grue-Sørensen, G.; Petersen, A.K.; Högberg, T. Semisynthesis of ingenol 3-angelate (PEP005): Efficient stereoconserva-tive angeloylation of alcohols. Synlett 2012, 23, 2647–2652. [CrossRef]

Horticulturae 2022, 8, 256 20 of 20
69. Appendino, G.; Tron, G.C.; Cravotto, G.; Palmisano, G.; Annunziata, R.; Baj, G.; Surico, N. Synthesis of modified ingenol esters.Eur. J. Org. Chem. 1999, 1999, 3413–3420. [CrossRef]
70. Winkler, J.D.; Rouse, M.B.; Greaney, M.F.; Harrison, S.J.; Jeon, Y.T. The first total synthesis of (±)-ingenol. J. Am. Chem. Soc. 2002,124, 9726–9728. [CrossRef] [PubMed]
71. Tanino, K.; Onuki, K.; Asano, K.; Miyashita, M.; Nakamura, T.; Takahashi, A.Y.; Kuwajima, I. Total synthesis of ingenol. J. Am.Chem. Soc. 2003, 125, 1498–1500. [CrossRef] [PubMed]
72. Nickel, A.; Maruyama, T.; Tang, H.; Murphy, P.D.; Greene, B.; Yusuff, A.N.; Wood, J.L. Total synthesis of ingenol. J. Am. Chem. Soc.2004, 126, 16300–16301. [CrossRef] [PubMed]
73. McKerrall, S.J.; Jørgensen, L.; Kuttruff, C.A.; Ungeheuer, F.; Baran, P.S. Development of a concise synthesis of (+)-ingenol. J. Am.Chem. Soc. 2014, 136, 5799–5810. [CrossRef] [PubMed]
74. Morgan, S.; Grootendorst, P.; Lexchin, J.; Cunningham, C.; Greyson, D. The cost of drug development: A systematic review.Health Policy 2011, 100, 4–17. [CrossRef] [PubMed]
75. DiMasi, J.A.; Grabowski, H.G.; Hansen, R.W. Innovation in the pharmaceutical industry: New estimates of R&D costs. J. HealthEcon. 2016, 47, 20–33. [CrossRef] [PubMed]
76. Le Galès, C. Pourquoi les nouveaux médicaments sont-ils si chers? Med. Sci. 2018, 34, 354–361. [CrossRef] [PubMed]