The Advanced Host-Level Surveillance (AHLS) DND/NSERC ...
125
The Advanced Host-Level Surveillance (AHLS) DND/NSERC project Final report Mario Couture DRDC – Valcartier Research Centre Defence Research and Development Canada Scientific Report DRDC-RDDC-2017-R003 January 2017
-
Upload
khangminh22 -
Category
Documents
-
view
0 -
download
0
Transcript of The Advanced Host-Level Surveillance (AHLS) DND/NSERC ...
The Advanced Host-Level Surveillance (AHLS) DND/NSERC project Final report
Mario Couture DRDC – Valcartier Research Centre
Defence Research and Development Canada Scientific Report DRDC-RDDC-2017-R003 January 2017

Template in use: (2010) SR Advanced Template_EN (051115).dotm
© Her Majesty the Queen in Right of Canada, as represented by the Minister of National Defence, 2017
© Sa Majesté la Reine (en droit du Canada), telle que représentée par le ministre de la Défense nationale, 2017

DRDC-RDDC-2017-R003 i
Abstract
The detection of anomalies in deployed software systems (during their operation) is an important challenge that must be addressed on a continuing basis. These systems are complex and imperfect, and will always suffer from unknown vulnerabilities that could be exploited by malicious software, using methods that become ever more complex as time goes by.
Another aspect of the problem concerns the commercial security systems that provide anomaly and undesirable behaviour detection. Often, the detection surface of these systems is incomplete. Further, certain types of detectors, despite contributing to the completion of said detection surface, suffer from sometimes very high false positive rates, which makes them impractical.
DRDC, an agency of DND, sets up research and development projects that aim to develop new technologies that could improve the anomaly detection capabilities of defence software systems. The DND/NSERC programme is often used to define and initiate such projects. One of these is the four-year “Advanced Host-Level Surveillance (AHLS)” project. Researchers from the academic, industrial and DRDC communities joined together to form a research team that sought to improve the following aspects of online software system surveillance: a) the online capture and management of data representative of the systems’ behaviours and states, and b) the analysis of these data in order to detect software anomalies with as low/high false/true positive rates as possible. These two axes define the application domain of AHLS; the online cyber surveillance of software systems.
This scientific report provides a high-level description of the concepts and technologies that were developed within AHLS. Using the elements composing the vision put forward by DRDC, the project’s experts pursued the goal of bridging the detection gaps of commercial anomaly detection systems. The experts were strongly encouraged to make their technologies interoperable and evolutive.
This applied research and development work yielded a series of interoperable and evolutive prototypes that solved the problems described earlier. Data acquisition can now manage the vast majority of data types generated by software systems. An adapted work environment allows the online execution and control of advanced stochastic and machine learning techniques.
Significance to defence and security
This scientific report is a PASS (Platform-to-Assembly Secured Systems) deliverable. All the technologies described in this document result from collaborative R&D efforts which involved the participation of NSERC, Ericsson Canada, DRDC – Valcartier Research Centre, and the following Canadian universities: Montreal Polytechnique, Concordia University, Toronto University and École de technologie supérieure. The sponsors of the PASS project are: Directorate of Naval Combat Systems (DNCS), Director General Maritime Equipment Program Management (DGMEPM) and DG Cyber.

ii DRDC-RDDC-2017-R003
These technologies open the door for the implementation of new advanced leading-edge anomaly detection algorithms in DND’s critical software systems. They will contribute to improve significantly online detection of malicious activities that may take place in running computing systems.
DRDC-RDDC-2017-R003 iii
Résumé
La détection d’anomalies dans les systèmes logiciels de production (pendant qu’ils sont en opération) représente un défi important qu’il faut relever sur une base continue. Ces systèmes sont complexes et imparfaits; ils vont toujours contenir des vulnérabilités cachées qui peuvent être exploitées par du logiciel malicieux, lequel devient de plus en plus complexe avec le temps.
Une autre facette du problème est celle des systèmes de sécurité que l’on trouve sur le marché pour la détection en ligne d’anomalies et de comportements logiciels indésirables. Bien souvent, la surface de détection définie par ces systèmes ne couvre pas tous les types d’anomalies et de patrons comportementaux indésirables que l’on peut retrouver sur ces systèmes. De plus, certains types de détecteurs, qui pourraient contribuer à régler ce problème, produisent des taux de faux positifs qui sont souvent très élevés, les rendant inutilisables.
L’agence RDDC du MDN met en place des projets de recherche et développement dans le but de développer de nouvelles technologies pour améliorer les capacités de détection d’anomalies des systèmes logiciels de la défense. Le programme MDN/CRSNG est souvent utilisé pour définir et lancer ces projets. Un de ceux-ci est le projet de 4 ans « Advanced Host-Level Surveillance (AHLS) ». Des chercheurs provenant des milieux académique, industriel et de RDDC ont donc formé une équipe de recherche collaborative dans le but d’améliorer les aspects suivants de la surveillance en ligne : a) l’acquisition en ligne et la gestion de données représentant les comportements et états logiciels courants, et b) l’analyse de ces données dans le but de détecter les anomalies logicielles avec des taux de vrais/faux positifs aussi hauts/bas que possible. Ces deux catégories définissent le champ d'application de AHLS; la cyber surveillance en ligne des systèmes logiciels.
Ce rapport scientifique fournit une description de haut niveau des concepts et des technologies qui ont été développés dans AHLS. Utilisant les éléments d’une vision prédéfinie par RDDC, les experts du projet avaient pour but de combler les défauts de détection des systèmes de sécurité qui sont publiquement disponibles. Ces experts ont été fortement encouragés à rendre leurs technologies interfonctionnelles et évolutives.
Ce travail de recherche et de développement appliqué a produit une suite de prototypes interfonctionnels et évolutifs qui apportent des solutions aux problèmes décrits plus haut. L’acquisition de données peut maintenant gérer la plupart des types de données que l’on retrouve sur les systèmes informatiques. Un environnement de travail adapté permet également l’exécution de techniques stochastiques et d’apprentissage machine avancées ainsi que leur contrôle en ligne.
Importance pour la défense et la sécurité
Ce rapport scientifique est un livrable du projet PASS (Platform-to-Assembly Secured Systems). Toutes les technologies qui sont décrites dans ce document résultent de travaux collaboratifs de R et D qui ont impliqué la participation de CRSNG, Ericsson Canada, RDDC Valcartier ainsi que les universités suivantes : la Polytechnique de Montréal, l’Université Concordia, l’Université de

iv DRDC-RDDC-2017-R003
Toronto, et l’École de technologie supérieure. Les commanditaires du projet PASS sont les suivants : Direction des systèmes de combat naval (DSCN), Direction générale de gestion des programmes et de l’équipement maritime (DGGPEM), Direction générale (DG) Cyber.
Ces technologies ouvrent la porte à l’implémentation de nouveaux algorithmes avancés de détection d’anomalies des systèmes logiciels critiques du MDN. Elles vont contribuer à améliorer de façon significative la détection en ligne d’activités malicieuses qui peuvent se produire dans les systèmes informatiques pendant leur exécution.
DRDC-RDDC-2017-R003 v
Table of contents
Abstract . . . . . . . . . . . . . . . . . . . . . . . . . . . . . . . . . i Significance to defence and security . . . . . . . . . . . . . . . . . . . . . . i Résumé . . . . . . . . . . . . . . . . . . . . . . . . . . . . . . . . iii Importance pour la défense et la sécurité . . . . . . . . . . . . . . . . . . . . iii Table of contents . . . . . . . . . . . . . . . . . . . . . . . . . . . . v
List of figures . . . . . . . . . . . . . . . . . . . . . . . . . . . . . . vii List of tables . . . . . . . . . . . . . . . . . . . . . . . . . . . . . . viii 1 Introduction . . . . . . . . . . . . . . . . . . . . . . . . . . . . . 1
1.1 Context and purpose of this work . . . . . . . . . . . . . . . . . . . 2
1.2 Methodology . . . . . . . . . . . . . . . . . . . . . . . . . . 3
1.3 How to read this document . . . . . . . . . . . . . . . . . . . . . 3
1.4 Important terms used in this report . . . . . . . . . . . . . . . . . . 3
2 Online Cyber-Surveillance of Software Systems (OCS3)—The proposed vision and works . . . . . . . . . . . . . . . . . . . . . . . . . . . . . . . 4
2.1 OCS3 for the computer—Overview . . . . . . . . . . . . . . . . . . 4
2.2 Possible new research ideas that could improve OCS3 . . . . . . . . . . . 6
2.3 The five tracks of the AHLS project—Overview . . . . . . . . . . . . . 12
2.4 Poly-Tracing technologies for AHLS . . . . . . . . . . . . . . . . . 14
3 Online data capture for OCS3 (AHLS Tracks 1 and 2) . . . . . . . . . . . . . 16
3.1 The use of multiple data sources to improve OCS3 . . . . . . . . . . . . 16
3.2 The open source Trace Compass integrating framework . . . . . . . . . . 18
3.3 The Centralized Data Store (CDS) . . . . . . . . . . . . . . . . . . 18
3.4 AHLS—Multi-level trace abstraction; linking and display . . . . . . . . . 24
3.5 Modelling technologies for trace analysis . . . . . . . . . . . . . . . . 27
3.6 First analyses—Google Chrome . . . . . . . . . . . . . . . . . . . 29
3.7 Extension to Track 2 . . . . . . . . . . . . . . . . . . . . . . . 29
4 OCS3 at the system calls interface (AHLS Track 3) . . . . . . . . . . . . . . 31
4.1 Intrusion detection systems (IDS)—Definitions . . . . . . . . . . . . . 32
4.2 Limits of the available supporting technology . . . . . . . . . . . . . . 32
4.3 Overview of the research in advanced anomaly detection . . . . . . . . . . 33
4.4 The TotalADS integrating framework . . . . . . . . . . . . . . . . . 35
4.5 Detection technique 1—Sequence Modelling (SQM) . . . . . . . . . . . 40
4.6 Detection technique 2—Improved Hidden Markov Model (IHMM) . . . . . . 43
4.7 Detection technique 3—Kernel Space Modelling (KSM) . . . . . . . . . . 46
4.8 Detection technique 4—One-Class Support Vector Machines (OCSVM) . . . . 49
4.9 Optimization techniques—Iterative Boolean Combination (IBC) and Pruning Boolean Combination (PBC) . . . . . . . . . . . . . . . . . . . . 51
vi DRDC-RDDC-2017-R003
5 OCS3 within the operating system kernel (AHLS Track 4) . . . . . . . . . . . 53
5.1 Granary; a framework for kernel-level dynamic binary translation . . . . . . . 54
5.2 An event-based language for dynamic binary translation frameworks . . . . . 57
5.3 Behavioural watchpoints; A kernel-level software-based watchpoint framework . 59
6 OCS3 and small-scale computers (AHLS Track 5). . . . . . . . . . . . . . . 62
6.1 OCS3 on Small-Scale Computers (SSCs) . . . . . . . . . . . . . . . . 62
6.2 The use of SSC’s GPU for OCS3 . . . . . . . . . . . . . . . . . . . 67
6.3 The use of small-scale Beowulf clusters for remote OCS3 . . . . . . . . . . 69
7 Concluding remarks . . . . . . . . . . . . . . . . . . . . . . . . . . 74
7.1 Recommendations . . . . . . . . . . . . . . . . . . . . . . . . 78
References . . . . . . . . . . . . . . . . . . . . . . . . . . . . . . . 79
Overview of the LTTng software tracer . . . . . . . . . . . . . . . . 85 Annex A On evasion and adversarial cyber-attacks . . . . . . . . . . . . . . . 91 Annex B A comprehensive analysis of kernel exploits for the Linux operating system . . 95 Annex C
List of symbols/abbreviations/acronyms/initialisms . . . . . . . . . . . . . . . 107
DRDC-RDDC-2017-R003 vii
List of figures
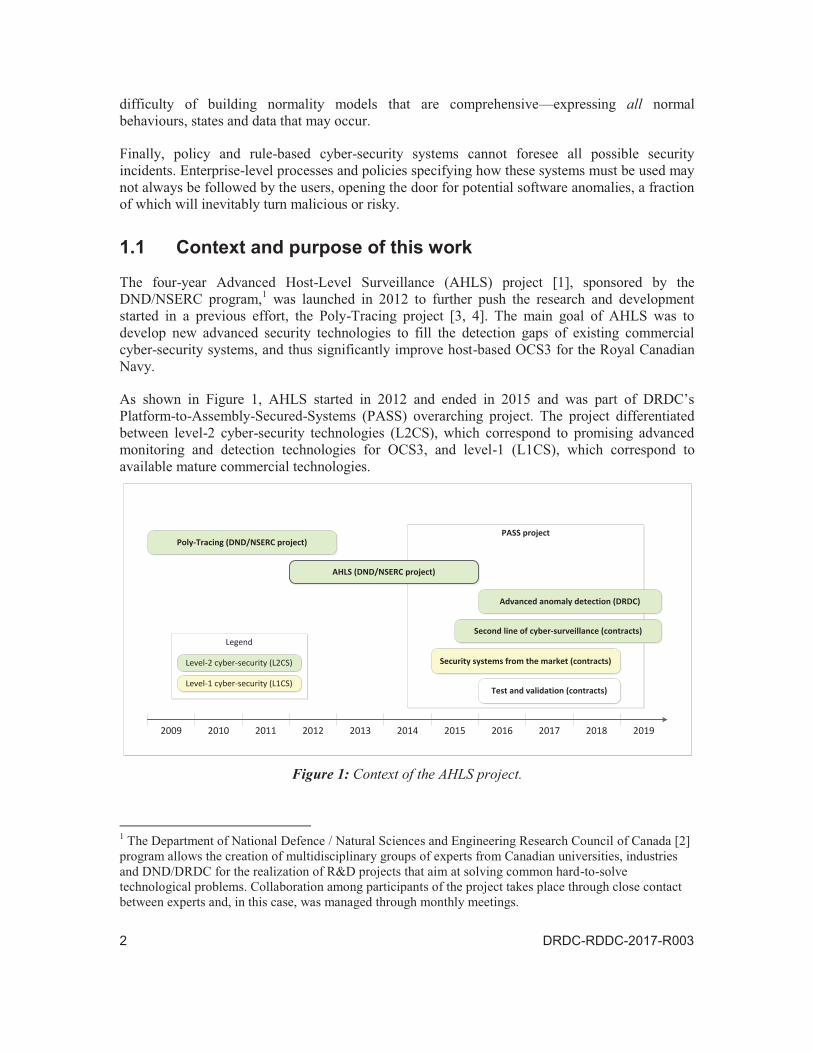
Figure 1: Context of the AHLS project. . . . . . . . . . . . . . . . . . . . . 2
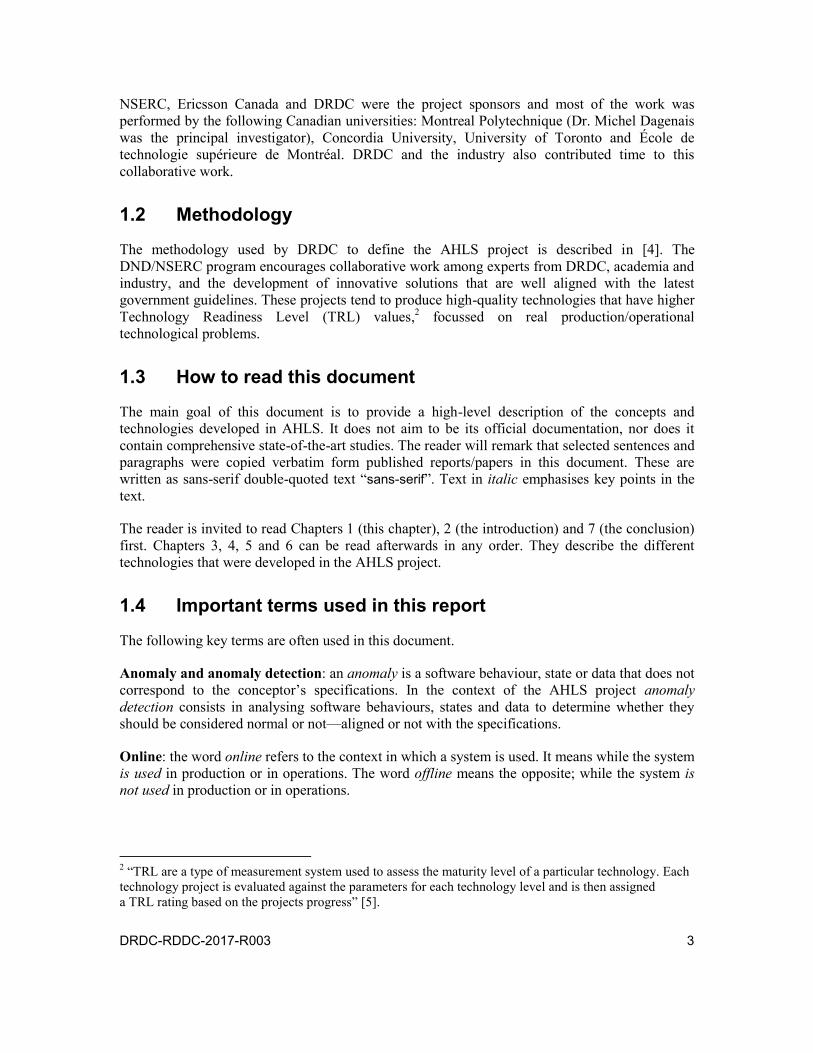
Figure 2: Components of host-based OCS3. . . . . . . . . . . . . . . . . . . 5
Figure 3: Hypothetical collaborative military computing infrastructure. . . . . . . . 7
Figure 4: The state system and its attributes. . . . . . . . . . . . . . . . . . . 21
Figure 5: Attribute tree (reproduced from [20]). . . . . . . . . . . . . . . . . . 21
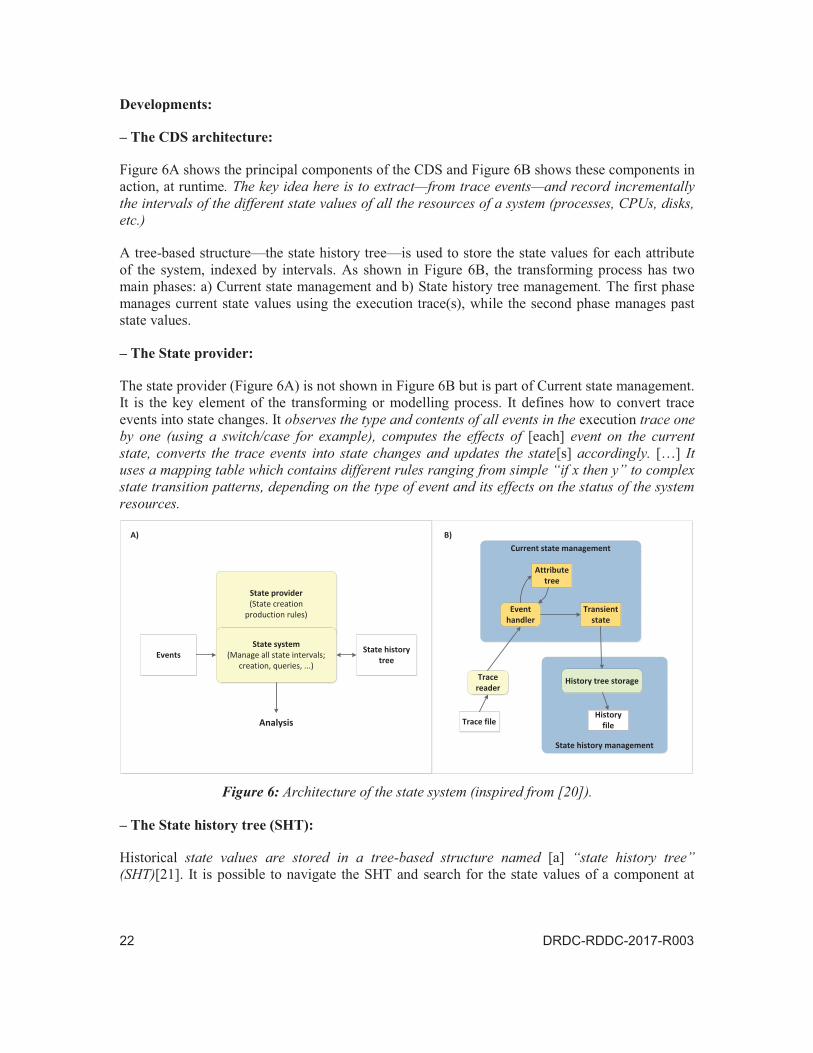
Figure 6: Architecture of the state system (inspired from [20]). . . . . . . . . . . . 22
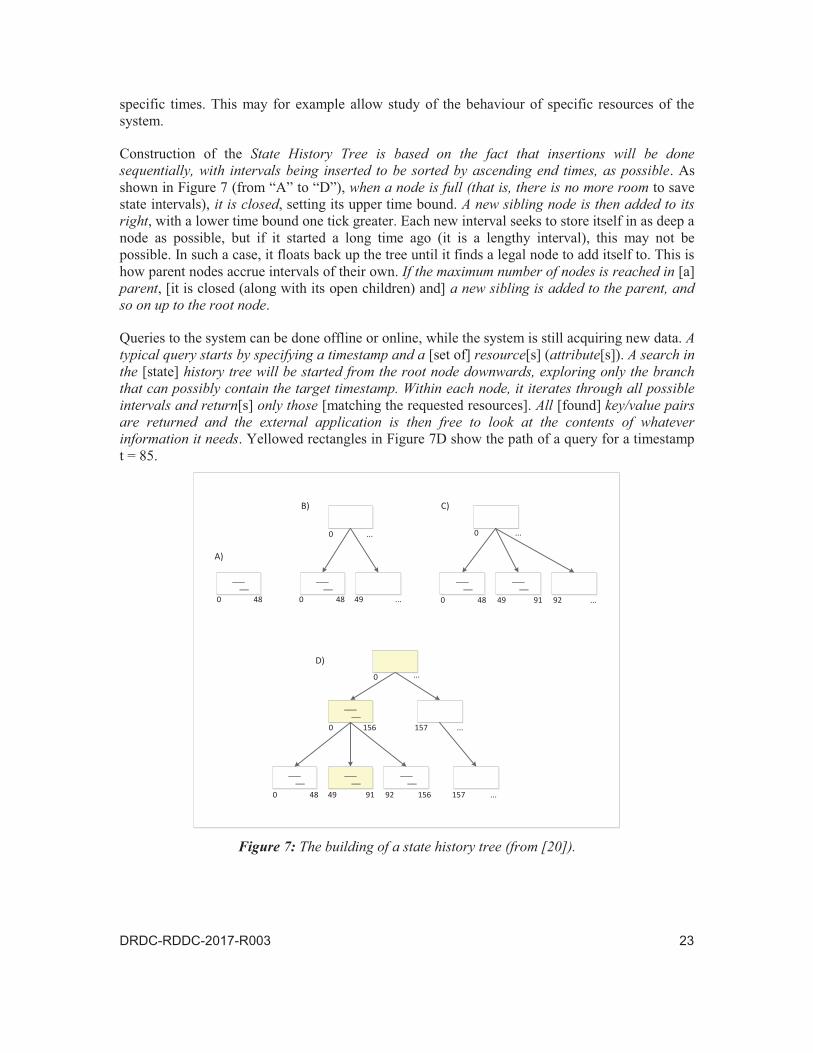
Figure 7: The building of a state history tree (from [20]). . . . . . . . . . . . . . 23
Figure 8: Architectural view of the developed technology (from [23]). . . . . . . . . 25
Figure 9: The TotalADS framework architecture (reproduced from [33]). . . . . . . 35
Figure 10: TotalADS live training and testing (reproduced from [33]). . . . . . . . . 38
Figure 11: TotalADS view (reproduced from [33]). . . . . . . . . . . . . . . . . 39
Figure 12: TotalADS view (reproduced from [33]). . . . . . . . . . . . . . . . . 39
Figure 13: The SQM detection technique. . . . . . . . . . . . . . . . . . . . . 41
Figure 14: Hidden Markov model (HMM). A) States and observations, B) state transitions. . . . . . . . . . . . . . . . . . . . . . . . . . . . . 44
Figure 15: The KSM detection technique—data preparation. . . . . . . . . . . . . 48
Figure 16: Kernel state density diagrams; A) normal and B) abnormal (reproduced from [32]). . . . . . . . . . . . . . . . . . . . . . . . . . . . . . . 49
Figure 17: Granary architecture (reproduced from [46]). . . . . . . . . . . . . . . 55
Figure 18: The watchpoint supporting mechanism (reproduced from [50]). . . . . . . 60
Figure 19: The framework built to study cyber-security on SSC systems (reproduced from [53]). . . . . . . . . . . . . . . . . . . . . . . . . . . . . . . 64
Figure 20: OCS3 using mobile GPU—Architecture of the experimental framework (reproduced from [61]). . . . . . . . . . . . . . . . . . . . . . . 68
Figure 21: Different types of hypervisor. . . . . . . . . . . . . . . . . . . . . 71
Figure 22: Different types of hypervisors and supporting technologies (reproduced from [63]). . . . . . . . . . . . . . . . . . . . . . . . . . . . . . . 72
Figure A.1: Main components of the LTTng software tracer (reproduced from [4]). . . . 85
Figure A.2: High-level functional view of an instance of the LTTng tracer and tools (reproduced from [4]). . . . . . . . . . . . . . . . . . . . . . . . 86

viii DRDC-RDDC-2017-R003
List of tables
Table 1: Relative importance of data types for the AHLS project. . . . . . . . . . 10
Table 2: Number of system calls per kernel module of the Linux operating system (reproduced from [38]). . . . . . . . . . . . . . . . . . . . . . . 42
Table 3: Technical specifications of selected SSCs for this study (reproduced from [63]). . . . . . . . . . . . . . . . . . . . . . . . . . . . . . . 73
Table A.1: List of actual LTTng characteristics (reproduced from [4]). . . . . . . . . 88
Table C.1: Linux rootkits that modify code, registers or function pointers. This table is adapted from Petroni and Hicks [17]. . . . . . . . . . . . . . . . . 104
Table C.2: Linux rootkits that modify non-control data. This table is adapted from Baliga et al. [11, 10]. . . . . . . . . . . . . . . . . . . . . . . . . . 105
DRDC-RDDC-2017-R003 1
1 Introduction
The criticality and vulnerability of current military computing systems require that additional efforts be made to improve the detection of software anomalies during military operations. This document describes the work performed in a four-year R&D project to address this issue. The main goals were to: a) raise true alarm rates, b) lower false alarm rates, and c) appropriately report these alerts to officers on duty. In this document, this domain is called Online Cyber-Surveillance of Software Systems (OCS3)—online meaning at runtime or during military operations. As shown in Chapter 2 OCS3 includes: a) the online monitoring of the software systems and b) the online analysis of the monitoring data to detect anomalies.
Networked software systems supporting military platforms like the post-FELEX Combat Management System (the CMS330 installed on the twelve Canadian frigates) have reached unprecedented degrees of technological complexity that make their full certification impossible. Unfortunately, such systems will always contain software flaws that can manifest as errors and service failures at runtime. Some of these may yield vulnerabilities, which can be exploited by hackers or malware to conduct various types of cyber-attacks.
Software anomalies can be defined as software behaviours and states that diverge from the design specifications. They can be caused by the manifestation of design flaws, the incorrect utilization of the system, or cyber-attacks. They may take place both at the level of software applications in user space as well as deep within the operating system itself, in kernel space. From an operational perspective, the failure of a software system to deliver trusted services in a timely manner may take forms ranging from a sudden service interruption at a very critical moment to the theft of classified operational data over extended periods of time.
The numerous sources of software anomalies, combined with the high degree of complexity of current software systems and cyber-attacks, make their detection very difficult at runtime. Current commercial and open source cyber-security systems cannot detect all types of software anomalies for many reasons. First, telling abnormal behaviour from the huge amount of legitimate software activities that takes place within the operating system and within users’ applications is hard to achieve.
Second, signature-based security systems—such as antivirus (AV) software, host-based intrusion detection systems (HIDS) and network-based intrusion detection systems (NIDS)—have severe detection limitations. Signatures are pre-defined static sequences of bytes in the system’s persistent storage, network transmission packets, or active memory. Worldwide, the number of new signatures that can be identified every day is very small compared to the massive daily malware production. The main characteristic of signature-based security systems is that they can only detect malware or malicious activities for which signatures are pre-defined. There are heuristic-based detection that help, but they are often turned off because of their massive impact on system performance.
Third, anomaly-based detection techniques—using normality models to detect software behaviours that deviate from normality—are able to detect unforeseen anomalies in software systems, but they often generate many false alerts that render them nearly useless. They quickly get turned off or simply ignored by the security analyst. The problem with these lies in the
Legend
PASS project
Security systems from the market (contracts)
2014
Poly-Tracing (DND/NSERC project)
2015 2016 2017 2018 2019
AHLS (DND/NSERC project)
20132012
Test and validation (contracts)
Second line of cyber-surveillance (contracts)
Advanced anomaly detection (DRDC)
201120102009
Level-2 cyber-security (L2CS)
Level-1 cyber-security (L1CS)
DRDC-RDDC-2017-R003 3
NSERC, Ericsson Canada and DRDC were the project sponsors and most of the work was performed by the following Canadian universities: Montreal Polytechnique (Dr. Michel Dagenais was the principal investigator), Concordia University, University of Toronto and École de technologie supérieure de Montréal. DRDC and the industry also contributed time to this collaborative work.
1.2 Methodology
The methodology used by DRDC to define the AHLS project is described in [4]. The DND/NSERC program encourages collaborative work among experts from DRDC, academia and industry, and the development of innovative solutions that are well aligned with the latest government guidelines. These projects tend to produce high-quality technologies that have higher Technology Readiness Level (TRL) values,2 focussed on real production/operational technological problems.
1.3 How to read this document
The main goal of this document is to provide a high-level description of the concepts and technologies developed in AHLS. It does not aim to be its official documentation, nor does it contain comprehensive state-of-the-art studies. The reader will remark that selected sentences and paragraphs were copied verbatim form published reports/papers in this document. These are written as sans-serif double-quoted text “sans-serif”. Text in italic emphasises key points in the text.
The reader is invited to read Chapters 1 (this chapter), 2 (the introduction) and 7 (the conclusion) first. Chapters 3, 4, 5 and 6 can be read afterwards in any order. They describe the different technologies that were developed in the AHLS project.
1.4 Important terms used in this report
The following key terms are often used in this document.
Anomaly and anomaly detection: an anomaly is a software behaviour, state or data that does not correspond to the conceptor’s specifications. In the context of the AHLS project anomaly detection consists in analysing software behaviours, states and data to determine whether they should be considered normal or not—aligned or not with the specifications.
Online: the word online refers to the context in which a system is used. It means while the system is used in production or in operations. The word offline means the opposite; while the system is not used in production or in operations.
2 “TRL are a type of measurement system used to assess the maturity level of a particular technology. Each technology project is evaluated against the parameters for each technology level and is then assigned a TRL rating based on the projects progress” [5].

4 DRDC-RDDC-2017-R003
2 Online Cyber-Surveillance of Software Systems (OCS3)—The proposed vision and works
This chapter presents an overview of: a) OCS3, b) the possible options for its improvement and c) the five tracks of the AHLS project. OCS3 at the level of the computer (as opposed to at thenetwork level) is briefly described in Section 2.1. Possible options for improving some of its aspects are then described in Section 2.2. Based on this information, the five tracks of the AHLS project aiming at improving OCS3 are described in Section 2.3. Finally, the technologies from a similar previous project that were helpful for AHLS are listed in Section 2.4.
2.1 OCS3 for the computer—Overview
An overview of an ideal OCS3 as applied to a computer or host—as opposed to a network of computers—is presented in this section (advanced network-based OCS3 builds on the work that was made in AHLS on host-based OCS3). Figure 2 shows a simplified view of the main components of host-based OCS3 (herein called OCS3):
Online data capture (ODC);
Level-1 cyber-security (L1CS);
Level-2 cyber-security (L2CS); and
Online alarm management and controls (OAMC).
As mentioned in Section 1 (Figure 1), level-1 technologies are mature security systems that are distributed commercially while level-2 technologies correspond to promising advanced monitoring and detection techniques. A difference is made between L1CS, L2CS, OAMC and ODC in Figure 2 because AHLS focuses more on L2CS and ODC and, to a lesser degree, on L1CS and OAMC. As shown in Figure 1, the work aiming to improve L1CS technologies is made in another sibling effort of the PASS project [6].
During military operations, the ODC, L1CS, L2CS and OAMC components are run (locally on each computer and/or remotely) to conduct OCS3 on each computer of the infrastructure. Each component produces data and information that can be used by the next component(s), flowing along the purple arrows (called Online data). For example, an hypothetical computer’s ODC would produce the data for L2CS and possibly L1CS, which would generate alerts when anomalies are detected. These alerts and the corresponding information would be transferred to OAMC, which in turn would produce the information describing the health state of this computer.
The OAMC components also help officers on duty update their situational awareness of the computers’ health, and allows manual and/or automatic control of the ODC, L2CS and possibly L1CS components (Control arrows in Figure 2). All components are manually/automatically managed/synchronized by the Integrating framework (IF).

Integrating framework (IF)
Online data capture(ODC)
On-disk data saving (DS)
On-disk data saving (DS)
On-disk data saving (DS)
Model building
(MB; in-lab)
Level-1 cyber-security(L1CS)
Level-2 cyber-security
(L2CS)
Online alarm management and controls
(OAMC)
LegendControls
Online data
Models
Hist. data
6 DRDC-RDDC-2017-R003
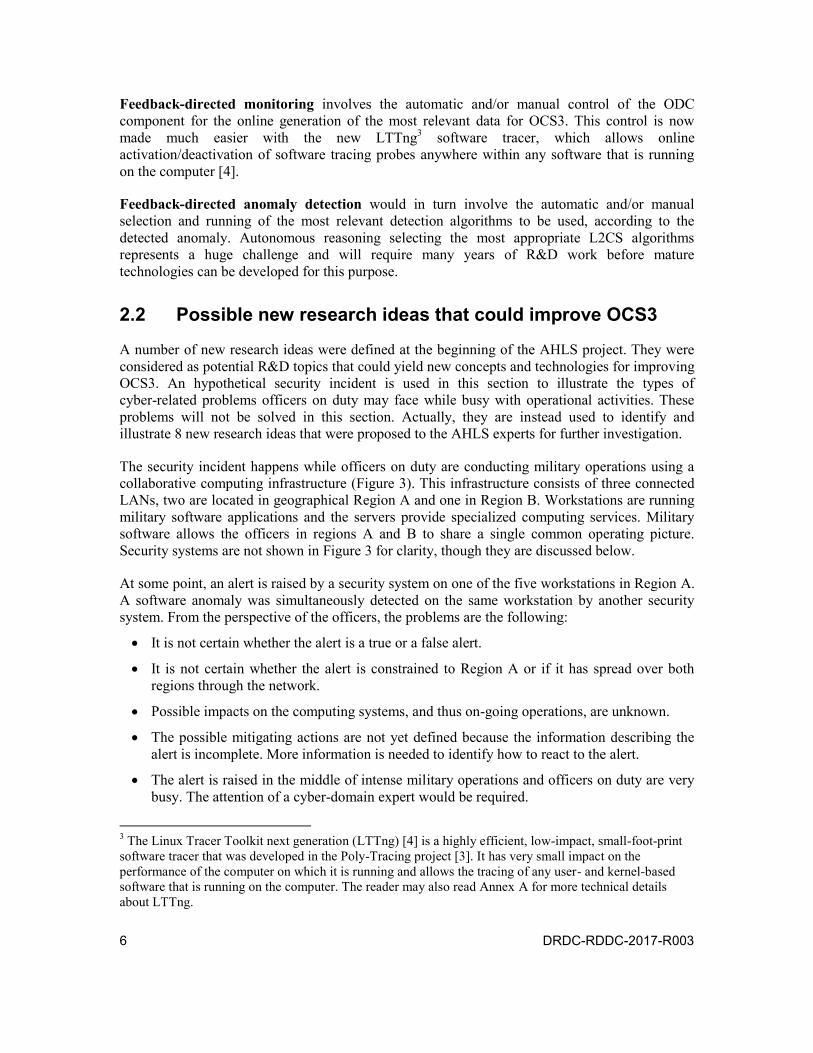
Feedback-directed monitoring involves the automatic and/or manual control of the ODC component for the online generation of the most relevant data for OCS3. This control is now made much easier with the new LTTng3 software tracer, which allows online activation/deactivation of software tracing probes anywhere within any software that is running on the computer [4].
Feedback-directed anomaly detection would in turn involve the automatic and/or manual selection and running of the most relevant detection algorithms to be used, according to the detected anomaly. Autonomous reasoning selecting the most appropriate L2CS algorithms represents a huge challenge and will require many years of R&D work before mature technologies can be developed for this purpose.
2.2 Possible new research ideas that could improve OCS3
A number of new research ideas were defined at the beginning of the AHLS project. They were considered as potential R&D topics that could yield new concepts and technologies for improving OCS3. An hypothetical security incident is used in this section to illustrate the types of cyber-related problems officers on duty may face while busy with operational activities. These problems will not be solved in this section. Actually, they are instead used to identify and illustrate 8 new research ideas that were proposed to the AHLS experts for further investigation.
The security incident happens while officers on duty are conducting military operations using a collaborative computing infrastructure (Figure 3). This infrastructure consists of three connected LANs, two are located in geographical Region A and one in Region B. Workstations are running military software applications and the servers provide specialized computing services. Military software allows the officers in regions A and B to share a single common operating picture. Security systems are not shown in Figure 3 for clarity, though they are discussed below.
At some point, an alert is raised by a security system on one of the five workstations in Region A. A software anomaly was simultaneously detected on the same workstation by another security system. From the perspective of the officers, the problems are the following:
It is not certain whether the alert is a true or a false alert.
It is not certain whether the alert is constrained to Region A or if it has spread over both regions through the network.
Possible impacts on the computing systems, and thus on-going operations, are unknown.
The possible mitigating actions are not yet defined because the information describing the alert is incomplete. More information is needed to identify how to react to the alert.
The alert is raised in the middle of intense military operations and officers on duty are very busy. The attention of a cyber-domain expert would be required.
3 The Linux Tracer Toolkit next generation (LTTng) [4] is a highly efficient, low-impact, small-foot-print software tracer that was developed in the Poly-Tracing project [3]. It has very small impact on the performance of the computer on which it is running and allows the tracing of any user- and kernel-based software that is running on the computer. The reader may also read Annex A for more technical details about LTTng.
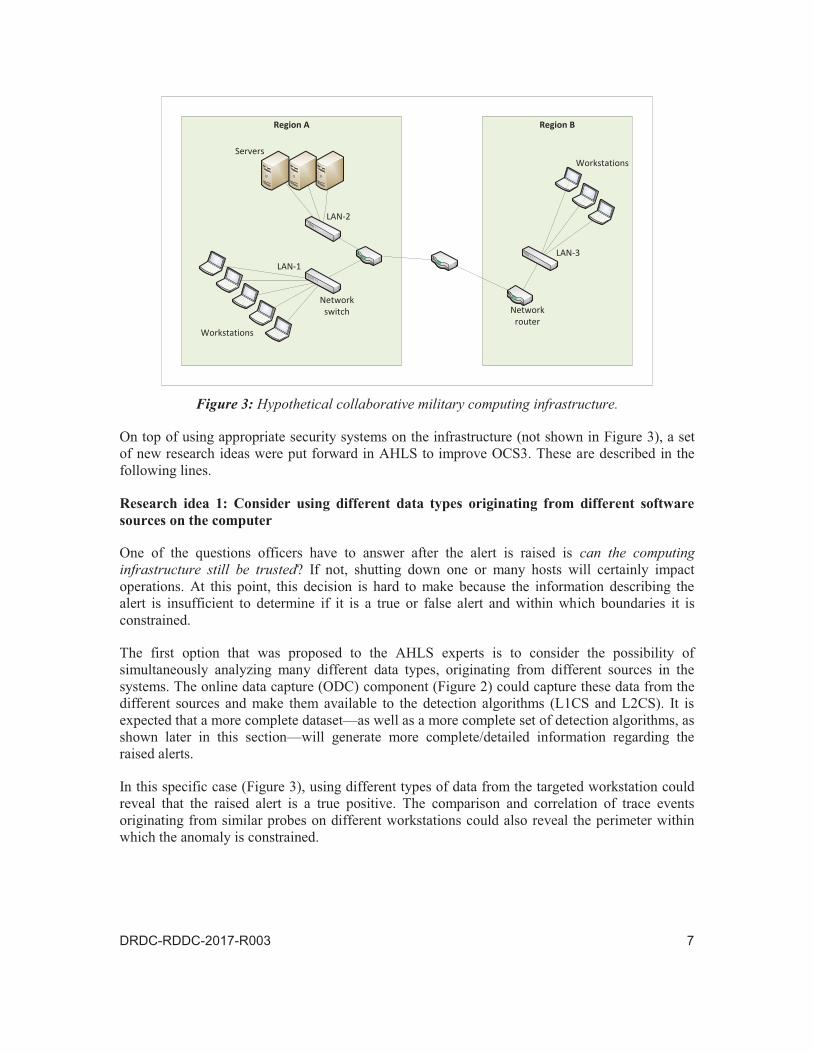
Region A Region B
Workstations
WorkstationsServers
Network switch Network
router
LAN-1
LAN-2
LAN-3

8 DRDC-RDDC-2017-R003
It was not clear at the beginning of AHLS what data types should be considered. Experts were thus asked to make the ODC component scalable enough so that any type of data source could be added in the future.
Research idea 2: Consider pre-treating the captured data
Pre-treating captured data before it is analyzed to improve its quality and thus improve the results of later analyses. For example, a fusion algorithm could continually fuse generated data from two sources into a unified value-added data stream, which would then be fed into specialized L2CS detection algorithms. The merging of network-related trace events originating from two connected remote workstations could, for example, help the detection of anomalies in IP communications.
It was not clear at the beginning of AHLS what types of pre-treatment could be implemented. Experts were thus asked to make the ODC component scalable enough so that new pre-treatment algorithms could be added in the future.
Research idea 3: Consider using detection systems that complement each other
Security systems that can successfully detect and report “any” type of anomaly at runtime do not exist, and still won’t in the near future, the reason being that software systems and malware are too complex and their evolution is too rapid. The development of new L2CS detection algorithms and their execution along with L1CS detection systems are expected to compensate for this lack.
Different strategies can be put in place to improve L2CS algorithms. Some of them are relatively easy to implement, others will need more time because of their complexity. The AHLS experts were presented with the following points:
1. The ability to continually maximize the detection surface and precision by starting and running the most relevant detection algorithms at any time. Chances are that humans will have to be involved in this coordination process because autonomous systems that have reasoning capabilities for this task do not yet exist, or are not mature enough. This centralized supervision of detection algorithms could be assigned to the OAMC component. Option 5 provides more details on feedback-directed anomaly detection.
2. The security systems that are running at any given moment should be selected based on constraints that are determined by the computing infrastructure and military operations. Running multiple security systems could for example impact the performance of the military systems and ultimately the pace of operations. Option 6 proposes a solution to this problem.
3. The different types of security systems—AV, HIDS, NIDS, policy-based, etc.—should be strategically located within the computing infrastructure in order to maximize both the surface and precision of the detection, again without impacting the performance of the military systems.
4. Merging or fusing in one way or another the results that are generated by multiple detection algorithms may produce value-added results. This could contribute for example to raising/lowering true/false positive rates. A simple example would be the fusion of alerts generated by antiviruses (AV) and a Host-based intrusion detection system (HIDS) installed on a workstation.
DRDC-RDDC-2017-R003 9
5. The possibility of making security systems exchange important data and results at runtime. Most security systems work in silos; they do not exchange critical data between them. This could improve the detection process. The types of collaboration among different security systems that could be implemented remain to be identified and studied. Again, this idea probably involves a centralized system like the OAMC that could supervise this collaboration according to a pre-defined protocol. The confidentiality, integrity and availability of the data that are exchanged between security systems—resulting from this collaboration—must also be studied in depth.
6. L2CS systems should be scalable. It should be possible to transparently integrate new custom detection algorithms as they become available in the future. The main reason is that cyber-war is an arms race: the detection capability of L2CS must keep pace with new increasingly complex malware and attacks. Scalability was requested of the experts of the AHLS project.
It was not clear at the beginning of the project how these points—1. to 6.—could be implemented and when. The experts of the AHLS project were thus asked to keep these in mind (keep room in their software applications for their eventual implementation) while developing their technologies.
Research idea 4: Consider implementing feedback-directed monitoring
Different types of data are used as input to detection algorithms. Table 1 lists the relative importance of the data types that were considered in AHLS: high importance (P-1), medium importance (P-2) and low importance (P-3). For example, cyber-security alerts, system logs and trace events are considered highly important because they are actually the best data for detecting anomalies in software systems.
More specifically, execution traces originating from the LTTng software tracer are particularly important. The reason is related to the fact that LTTng allows deep tracing of any Linux-based software component by activating/deactivating probes at runtime. These probes can be located anywhere within the software, including deep in the kernel of the operating system. Recall that an activated probe in software will generate an event in the execution trace every time it is executed by one of the CPUs [4]. Controlling which probes are active at runtime—based on detection needs—allows what can be called feedback-directed monitoring.
An expert—or an intelligent security system—can control both the focus and the resolution of the data that is generated by LTTng at runtime by activating appropriate probes in the system. Results of subsequent analyses of these data will be more precise because algorithms will have access to all the data that they really need, while keeping the performance impact to negligible levels under normal circumstances.
As soon as the anomaly is detected in the example above (Figure 3), appropriate software probes for this type of alert could be activated on all the workstations of LAN-1. This way, more relevant data could be subsequently generated and further analyses of these data would probably reveal more precise details regarding the nature of the alert and its spread in the local network.
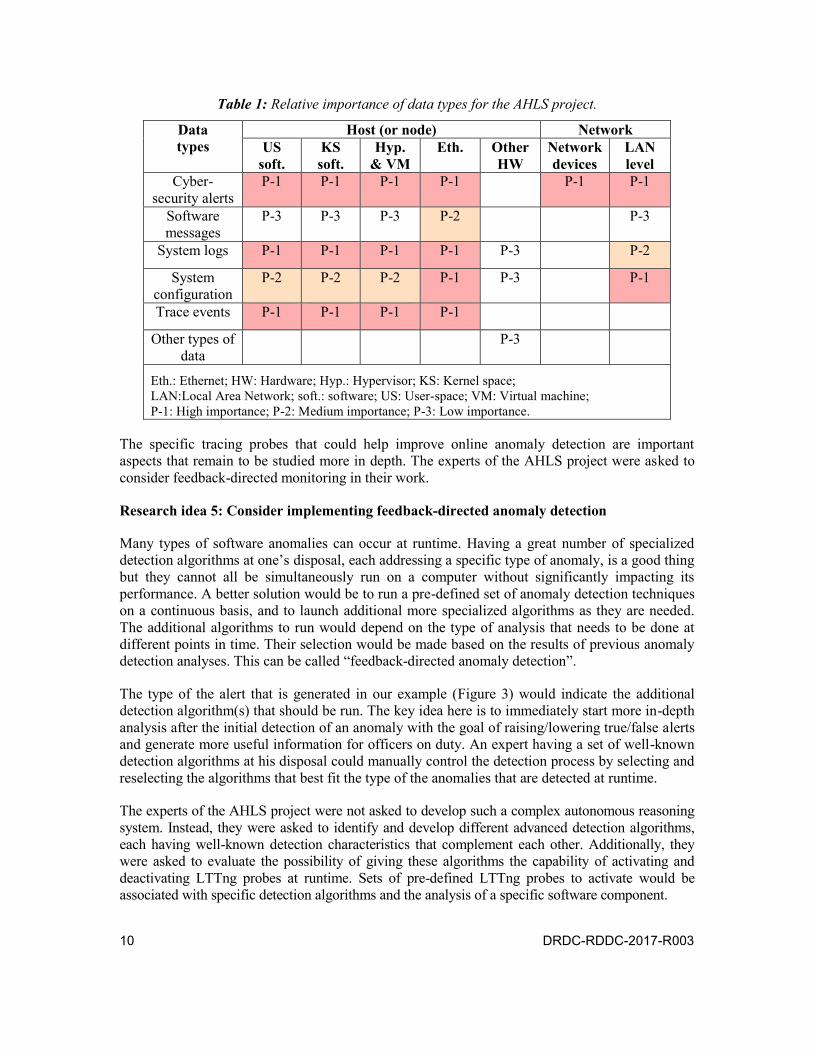
10 DRDC-RDDC-2017-R003
Table 1: Relative importance of data types for the AHLS project.
Data types
Host (or node) Network US
soft. KS soft.
Hyp. & VM
Eth. Other HW
Network devices
LAN level
Cyber-security alerts
P-1 P-1 P-1 P-1 P-1 P-1
Software messages
P-3 P-3 P-3 P-2 P-3
System logs P-1 P-1 P-1 P-1 P-3 P-2
System configuration
P-2 P-2 P-2 P-1 P-3 P-1
Trace events P-1 P-1 P-1 P-1
Other types of data
P-3
Eth.: Ethernet; HW: Hardware; Hyp.: Hypervisor; KS: Kernel space; LAN:Local Area Network; soft.: software; US: User-space; VM: Virtual machine; P-1: High importance; P-2: Medium importance; P-3: Low importance.
The specific tracing probes that could help improve online anomaly detection are important aspects that remain to be studied more in depth. The experts of the AHLS project were asked to consider feedback-directed monitoring in their work.
Research idea 5: Consider implementing feedback-directed anomaly detection
Many types of software anomalies can occur at runtime. Having a great number of specialized detection algorithms at one’s disposal, each addressing a specific type of anomaly, is a good thing but they cannot all be simultaneously run on a computer without significantly impacting its performance. A better solution would be to run a pre-defined set of anomaly detection techniques on a continuous basis, and to launch additional more specialized algorithms as they are needed. The additional algorithms to run would depend on the type of analysis that needs to be done at different points in time. Their selection would be made based on the results of previous anomaly detection analyses. This can be called “feedback-directed anomaly detection”.
The type of the alert that is generated in our example (Figure 3) would indicate the additional detection algorithm(s) that should be run. The key idea here is to immediately start more in-depth analysis after the initial detection of an anomaly with the goal of raising/lowering true/false alerts and generate more useful information for officers on duty. An expert having a set of well-known detection algorithms at his disposal could manually control the detection process by selecting and reselecting the algorithms that best fit the type of the anomalies that are detected at runtime.
The experts of the AHLS project were not asked to develop such a complex autonomous reasoning system. Instead, they were asked to identify and develop different advanced detection algorithms, each having well-known detection characteristics that complement each other. Additionally, they were asked to evaluate the possibility of giving these algorithms the capability of activating and deactivating LTTng probes at runtime. Sets of pre-defined LTTng probes to activate would be associated with specific detection algorithms and the analysis of a specific software component.

DRDC-RDDC-2017-R003 11
Research idea 6: Consider using clusters of computers for “hidden” L2CS
As mentioned previously, the simultaneous running of too many detection algorithms on the computers of a military infrastructure may not be suitable because they may require too much CPU power, which may then impact operations. Also, an expert hacker that has successfully compromised some of the components of this infrastructure would probably have no problem compromising the security systems themselves.
There is a need for a “second line of OCS3”, which would be run on a hidden network that is separate from the operational infrastructure. Computers running on this network could be configured as clusters, and these could take a high percentage of the CPU-load that is associated with intense OCS3. More CPU-demanding detection algorithms running on this second line could complement the ones running on the infrastructure. A hacker that would have compromised most of the components of the military infrastructure—including the security systems—would need more time to compromise the second hidden line of OCS3. During this time, these hidden detection algorithms could reveal the presence of the malicious activities ongoing within the operational infrastructure.
This option involves the development of two main components: a) an advanced technique for the efficient stealthy extraction of data from the computing infrastructure and b) one or many clusters of computers—not directly connected to the LANs in Figure 3—that can simultaneously run different advanced detection algorithms.
The option that was proposed to the members of the AHLS project consists of studying the second component; the isolated clusters of computers. The first component was given to DRDC contractors.
Research idea 7: Consider saving captured data and results from analyses to disk
Different types of data and results from analyses can be saved to disk during operations. If the alert is a true positive, it is important to save to disk all the data that will help online and offline forensic analyses. A good solution would be to use a circular buffer (analogous to an aircraft’s flight data recorder) to continually save all these data.
AHLS experts were asked to identify the details that must be captured in the buffer.
Research idea 8: Consider using scalable framework to integrate, synchronize and manage OCS3 activities
Advanced security systems capable of autonomous reasoning and decision making won’t be available in the mid-term. A framework is needed to help humans accomplish OCS3-related tasks. Experts need to have an easy to understand centralized display of continuously updated information that will help them build and maintain a complete situational awareness of the health state and trustiness of their software systems. They also need to have the tools allowing the full control of the different components of OCS3 at any time.
The experts of the AHLS project were asked to start defining such a framework.
12 DRDC-RDDC-2017-R003
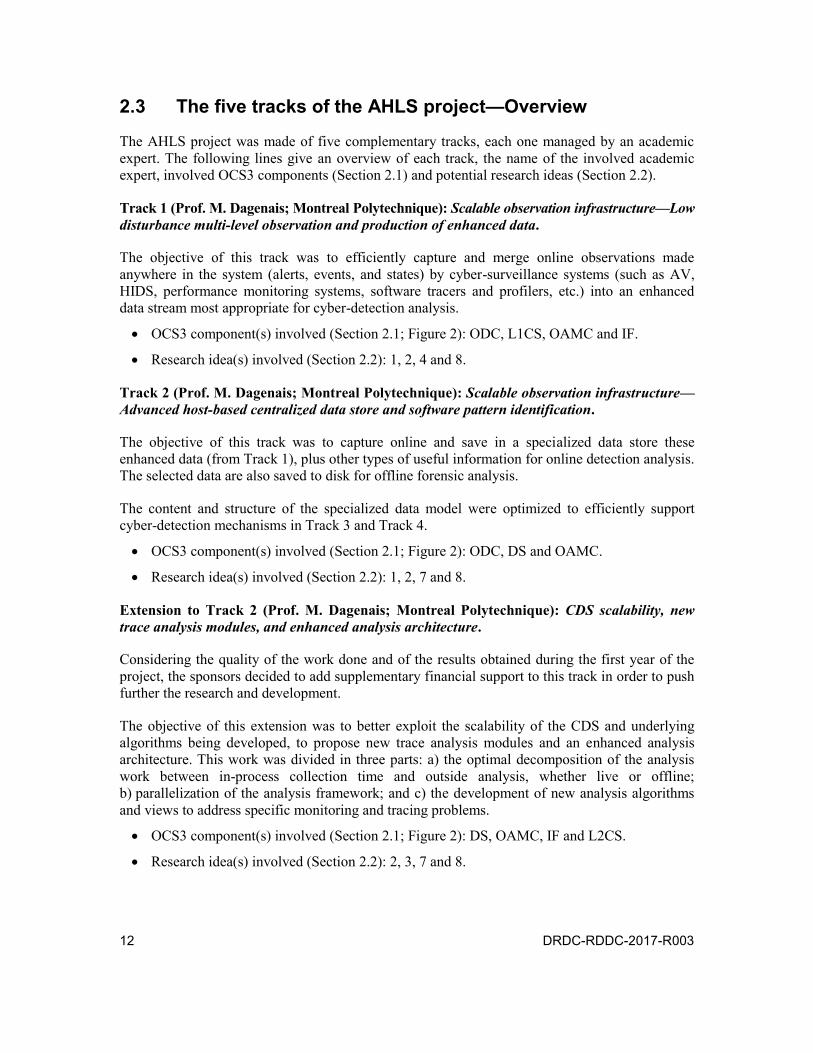
2.3 The five tracks of the AHLS project—Overview
The AHLS project was made of five complementary tracks, each one managed by an academic expert. The following lines give an overview of each track, the name of the involved academic expert, involved OCS3 components (Section 2.1) and potential research ideas (Section 2.2).
Track 1 (Prof. M. Dagenais; Montreal Polytechnique): Scalable observation infrastructure—Low disturbance multi-level observation and production of enhanced data.
The objective of this track was to efficiently capture and merge online observations made anywhere in the system (alerts, events, and states) by cyber-surveillance systems (such as AV, HIDS, performance monitoring systems, software tracers and profilers, etc.) into an enhanced data stream most appropriate for cyber-detection analysis.
OCS3 component(s) involved (Section 2.1; Figure 2): ODC, L1CS, OAMC and IF.
Research idea(s) involved (Section 2.2): 1, 2, 4 and 8.
Track 2 (Prof. M. Dagenais; Montreal Polytechnique): Scalable observation infrastructure—Advanced host-based centralized data store and software pattern identification.
The objective of this track was to capture online and save in a specialized data store these enhanced data (from Track 1), plus other types of useful information for online detection analysis. The selected data are also saved to disk for offline forensic analysis.
The content and structure of the specialized data model were optimized to efficiently support cyber-detection mechanisms in Track 3 and Track 4.
OCS3 component(s) involved (Section 2.1; Figure 2): ODC, DS and OAMC.
Research idea(s) involved (Section 2.2): 1, 2, 7 and 8.
Extension to Track 2 (Prof. M. Dagenais; Montreal Polytechnique): CDS scalability, new trace analysis modules, and enhanced analysis architecture.
Considering the quality of the work done and of the results obtained during the first year of the project, the sponsors decided to add supplementary financial support to this track in order to push further the research and development.
The objective of this extension was to better exploit the scalability of the CDS and underlying algorithms being developed, to propose new trace analysis modules and an enhanced analysis architecture. This work was divided in three parts: a) the optimal decomposition of the analysis work between in-process collection time and outside analysis, whether live or offline; b) parallelization of the analysis framework; and c) the development of new analysis algorithms and views to address specific monitoring and tracing problems.
OCS3 component(s) involved (Section 2.1; Figure 2): DS, OAMC, IF and L2CS.
Research idea(s) involved (Section 2.2): 2, 3, 7 and 8.
DRDC-RDDC-2017-R003 13
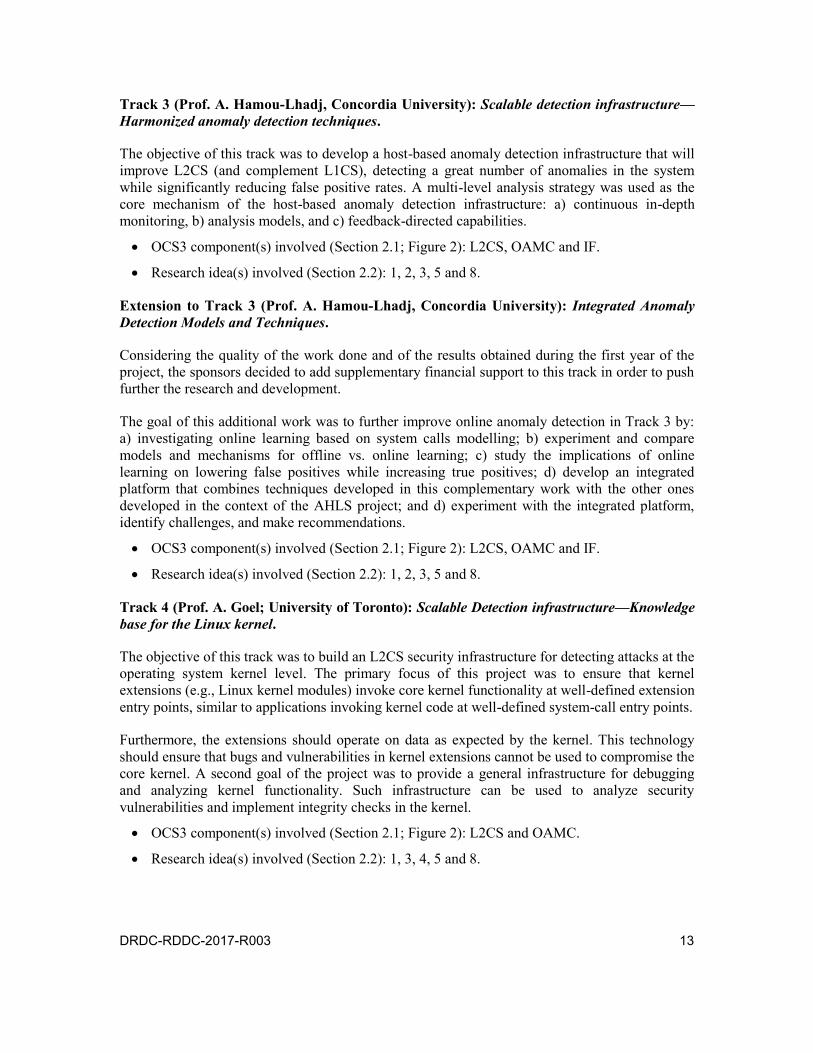
Track 3 (Prof. A. Hamou-Lhadj, Concordia University): Scalable detection infrastructure—Harmonized anomaly detection techniques.
The objective of this track was to develop a host-based anomaly detection infrastructure that will improve L2CS (and complement L1CS), detecting a great number of anomalies in the system while significantly reducing false positive rates. A multi-level analysis strategy was used as the core mechanism of the host-based anomaly detection infrastructure: a) continuous in-depth monitoring, b) analysis models, and c) feedback-directed capabilities.
OCS3 component(s) involved (Section 2.1; Figure 2): L2CS, OAMC and IF.
Research idea(s) involved (Section 2.2): 1, 2, 3, 5 and 8.
Extension to Track 3 (Prof. A. Hamou-Lhadj, Concordia University): Integrated Anomaly Detection Models and Techniques.
Considering the quality of the work done and of the results obtained during the first year of the project, the sponsors decided to add supplementary financial support to this track in order to push further the research and development.
The goal of this additional work was to further improve online anomaly detection in Track 3 by: a) investigating online learning based on system calls modelling; b) experiment and compare models and mechanisms for offline vs. online learning; c) study the implications of online learning on lowering false positives while increasing true positives; d) develop an integrated platform that combines techniques developed in this complementary work with the other ones developed in the context of the AHLS project; and d) experiment with the integrated platform, identify challenges, and make recommendations.
OCS3 component(s) involved (Section 2.1; Figure 2): L2CS, OAMC and IF.
Research idea(s) involved (Section 2.2): 1, 2, 3, 5 and 8.
Track 4 (Prof. A. Goel; University of Toronto): Scalable Detection infrastructure—Knowledge base for the Linux kernel.
The objective of this track was to build an L2CS security infrastructure for detecting attacks at the operating system kernel level. The primary focus of this project was to ensure that kernel extensions (e.g., Linux kernel modules) invoke core kernel functionality at well-defined extension entry points, similar to applications invoking kernel code at well-defined system-call entry points.
Furthermore, the extensions should operate on data as expected by the kernel. This technology should ensure that bugs and vulnerabilities in kernel extensions cannot be used to compromise the core kernel. A second goal of the project was to provide a general infrastructure for debugging and analyzing kernel functionality. Such infrastructure can be used to analyze security vulnerabilities and implement integrity checks in the kernel.
OCS3 component(s) involved (Section 2.1; Figure 2): L2CS and OAMC.
Research idea(s) involved (Section 2.2): 1, 3, 4, 5 and 8.

14 DRDC-RDDC-2017-R003
Track 5 (Prof. C. Talhi; École de technologie supérieure de Montréal): Small-scale computers and cyber-security.
The main objective of this track was to study how small-scale computing systems can be used to achieve efficient cyber-surveillance operations. Two sub-goals were defined: a) identify how small-scale computing systems can be efficiently monitored during military operations, and b) identify how clusters made of small-scale computing systems could achieve cyber-surveillance of larger servers during military operations.
OCS3 component(s) involved (Section 2.1; Figure 2): ODC, L1CS, L2CS and OAMC.
Research idea(s) involved (Section 2.2): 1, 2, 3, 6 and 7.
2.4 Poly-Tracing technologies for AHLS
A number of advanced technologies that were developed in the Poly-Tracing project [3, 4] represented a lot of potential for the success of the AHLS project. The advanced LTTng software tracer is one of these. These technologies are briefly listed and described in this section.
Advanced software tracing—LTTng:
There exist many software tracers for Linux systems on the market. Examples include: SystemTap [7], ftrace [8], and DTrace [9]. Unfortunately, these cannot be considered in OCS3 because of their limited capabilities, low performance and their impact on the performance of the monitored system. The LTTng tracer—and related supporting technologies—were developed for this purpose in the Poly-Tracing project [4]. LTTng is the only tracer offering all the necessary functionality and performance for online deep software tracing, including a very low impact on system performance (the LTTng specifications are provided in Annex A).
LTTng allows the online tracing of any software components that run in either the user or kernel spaces of the Linux operating system. The tracer gives users full control over the focus and granularity of the tracing process as well as of the content of the execution traces. These can be recorded locally on the hard drive of the traced computer, or remotely on another computer through standard network links and synchronization mechanisms.
Software instrumentation—Umple:
Software instrumentation inserts LTTng probes at pre-defined locations within software source code. These probes can be switched on/off at runtime. An activated probe will generate an event in the execution trace every time it is executed by one of the CPUs. The Umple framework [4] allows the instrumentation of legacy software applications that are written in C, C++, Java and Erlang.
Adapted data storage—The Centralized Data Store:
The capture and storage on disk of execution traces represented a problem for long LTTng tracing sessions, which produces huge volumes of data. A new storage mechanism was developed [4] to solve this problem. Instead of saving trace events directly, a mechanism transforms trace events into state changes of the system’s resources. Resources states are saved instead of trace events.
DRDC-RDDC-2017-R003 15
Using the content of this database, it is possible to reconstitute and replay the evolution of the state of any computing resource over time.
A framework for tracing and monitoring—Trace Compass:
The Eclipse-based Tracing and Monitoring Framework (TMF; now called Trace Compass [10]), embeds LTTng and other supporting tools for deep online software analysis. Already in the Poly-Tracing project, the framework showed interesting new possibilities that could be successfully used at runtime for anomaly detection. Trace Compass exploits the LTTng API (Application Programming Interface) to provide users with full control over tracing sessions. It includes a visualizer that can zoom in and out of huge execution traces as they are generated. The selection of one or many trace events in the viewer automatically brings up all the relevant information regarding the selected events such as process IDs, start/end times, states, etc.
Trace Compass also offers the possibility of simultaneously executing many different algorithms in its plug-in environment. Examples are: trace analysis, anomaly detection, scenario detection, trace event synchronization, specialized visualization, etc.
Trace Compass opens the door for the development of a future cyber-dashboard that could provide system administrators and cyber experts all the graphical tools and controls they need for efficient decision-making during military operations.
Expert system for pattern detection:
A new descriptive programming language [4] was developed allowing user-defined complex software behaviour scenarios. A specialized search engine was also developed to scan LTTng execution trace files, searching for the presence of these pre-defined scenarios. An expert system was then developed for the logical analysis of execution traces, providing the state of the monitored software system at any time.
Improved techniques for anomaly detection:
Anomaly-based detection techniques using the content of LTTng execution traces were also studied [4]. Some improvements were made for the training of Hidden Markov Models (HMMs), which are known to give good results in such classification problems. As anomaly-based detection algorithms often generate a lot of false positives, new ways to reduce these using HMM models were also studied. These preliminary studies gave promising results, showing that they should be pushed further.
Tabular representation of the low-level information contained in execution traces:
The ease of utilization of LTTng by software developers and system administrators was also addressed. A new Linux-like tool called lttngtop [11] was developed to allow the capture and dynamic tabular representation of the low-level information contained in execution traces. This tool complements other traditional Linux tools such as top, ftrace, systemtap and other specialized debugging tools. The new information that is generated by LTTng allows the discovery of complex bugs, which was not possible with traditional tools.

16 DRDC-RDDC-2017-R003
3 Online data capture for OCS3 (AHLS Tracks 1 and 2)
As shown in Section 2.1, OCS3 starts with the selection/production/capture of the most appropriate data expressing ongoing software behaviours and states, and its transfer as input to detection algorithms for online analysis. This process represents an important challenge because many sources of data can be exploited on most computer systems and huge volumes of data can be produced in short periods of time. Tracks 1 and 2 of AHLS aimed at improving different aspects of ODC (Figure 2).
The utilization of multiple data sources to improve OCS3 is first discussed in Section 3.1. An Eclipse-based framework integrating all the AHLS technologies into one efficient working environment is then described in Section 3.2. This working environment aims to facilitate data capture, model building, data analysis and advanced anomaly detection through the sharing of these data between running algorithms. It also eases and accelerates the development of new specialized techniques, which take the form of plug-ins.
A Centralized Data Store allowing the storing of this data on disks is described in Section 3.3. This technology aims to solve the problem of saving huge volumes of data over long periods of time—such as execution traces. States are saved and retrieved in a very efficient way, allowing the replaying at will of any portion of the execution of the system. It is expected that this new technology will contribute to improving significantly both the online detection of anomalies in the system and offline forensic analysis.
A number of specialized tools facilitating user-defined analysis, the identification of hard-to-find anomalies and modelling technologies for advanced trace analysis are described in Sections 3.4 and 3.5. Section 3.6 briefly describes collaborative work between AHLS and Google using these tools and Section 3.7 describes the work that could be added to AHLS during the project thanks to additional financial resources.
This chapter describes the work that was done in Tracks 1 and 2 of the AHLS project under the supervision of Professor Michel Dagenais from Montreal Polytechnique. The text included in this section is largely taken from scientific presentations, papers, reports and theses as well as emails sent by Professor Dagenais. The text that is copied verbatim from other documents is written as sans-serif double-quoted text “sans-serif”. Text in italic emphasises key points in the text.
3.1 The use of multiple data sources to improve OCS3
Context:
AHLS experts investigated the possibility of simultaneously using different types of data as input to OCS3 algorithms—for Tracks 3, 4 and 5—with the goal of raising/lowering true/false positive rates. This section describes the work that was done to allow the use of different sources of data.

DRDC-RDDC-2017-R003 17
Concepts:
The quality of results obtained from running anomaly detection algorithms can be improved by simultaneously analyzing many types of data, each reflecting different aspects of the same software component. An effort was made in Track 1 of AHLS to give the ODC component (Section 2.1; Figure 2) the extensibility necessary to allow the capture of any types of data for further online detection analysis.
Examples of data types that can now be considered are: local and remote LTTng execution traces, alerts from L1CS cyber-security systems (Snort, ClamAV, etc.), output data from standard Linux-based monitoring systems (OProfile, htop, collect, etc.), and output data from L2CS advanced anomaly detection systems such as the ones described in Sections 3.2 and 3.3.
Developments:
– Online tracing with LTTng:
Through collaboration with the EfficiOS company, the last developments and tests were made on LTTng to allow both local and remote online software tracing and data streaming. Trace synchronization algorithms [4] were also adapted for online synchronization and capture of trace events originating from different remote computers.
Trace Compass was also adapted for online tracing and streaming by adding new visualization plug-ins.
– Data sources for online anomaly detection:
A large number of potential data sources were studied in Track 1 including LTTng/UST [4], GDB tracepoints [12], KProbes [13], ClamAV [14], NetFilter, AppArmor [15], Snort [16], JVMTI [17], Oprofile [18], and tracing hardware.
A bridge connecting messages sent by selected security tools—AppArmor and Snort—to LTTng through the syslog interface was developed and successfully tested. Using this mechanism, alerts that are generated by these tools are made available within the set of LTTng technologies, and connect to the new Trace Compass visualizer [10]. This new mechanism allows for the integration of any similar security tool output and makes possible the prototyping of new more powerful detection algorithms in Track 3.
– Data integration:
The development of a flexible mechanism for the integration of multiple sources of information into the Centralized Data Store (CDS) was developed in AHLS. Through a collaboration with Montreal Google Research and Development, this mechanism was extended to capture events originating from the Microsoft Event Tracing software tracer. These events can now be captured in the CDS and made available in the Trace Compass framework for advanced online software analysis and anomaly detection for both Linux and Microsoft Windows operating systems.

18 DRDC-RDDC-2017-R003
3.2 The open source Trace Compass integrating framework
Context:
AHLS experts investigated the possibility of developing an integrative framework that would allow using all AHLS technologies in the same software environment. They have pushed further the development of the existing Trace Compass framework [3, 4] for this purpose. This section describes the work that was done in this direction.
Concepts:
The development of Trace Compass was initiated in the Poly-Tracing project [3, 4]—the Tracing and Monitoring Framework (TMF)—and pushed further in the AHLS project. It turned out to be very useful for advanced online and offline trace analysis and anomaly detection. It integrates all the concepts and technologies that were developed in both Poly-Tracing and AHLS projects.
Developments:
The framework was adapted through refactorization in order to integrate heterogeneous sources of tracing data, the new Centralized Data Store and the new Common Trace Format (CTF) standard [19] used by LTTng since version 2.0 (released in May 2012). A flexible interface was developed to compute system state intervals—from trace events—and integrate them in the CDS history tree (Section 3.1.4), which is run in Trace Compass.
The detailed lists, control flows, histograms and other specialized views of the Trace Compass visualization component were also adapted for the new CDS. Expected performance gains by this new approach based on the new CDS were confirmed, even for the panning or zooming of sizeable fractions of huge execution traces. Computation cost grows very slowly with the trace size (O(log n)), and remains constant irrespective of the fraction of the trace to be viewed, which enables quasi-instant navigation through huge traces.
Statistic computation algorithms in Trace Compass were also refactored in such a way that they can now be computed in batches and stored for intervals of data into the CDS. This new capability enables experimenting with multiple data stores associated with traces, each using a more optimal strategy for the type of data stored within. A new algorithm was also developed to accumulate running statistics for live traces. In addition, a new algorithm and new data structures were developed to store links between raw low level trace events and higher level abstracted events. Excellent performance was also obtained with these new components.
3.3 The Centralized Data Store (CDS) The text written in sans-serif double-quoted text “sans-serif” and italic in this section was copied
verbatim from [20].
DRDC-RDDC-2017-R003 19
Context:
As mentioned in Section 2.1, different types of data—generated by ODC, L1CS and L2CS algorithms (Figure 2)—need to be saved on disk for further online and offline purposes. Considering the diversity of this data, a specialized database able to store and restore this huge and complex data in very short periods of time had to be developed in AHLS. The first version of such a database was developed during the Poly-Tracing project: the Centralized Data Store (CDS) [20, 21, 22]. Its development was pushed further in AHLS and fully implemented in Trace Compass [10].
The CDS has now become the main repository to which all data sources and analysis algorithms connect. As described in the following paragraphs, state intervals derived from trace events are stored in the database instead of trace events. Their storage is optimized for block devices such as hard disks [20]. This section describes the concepts and components behind the CDS.
“The CDS is made of new generic methods and corresponding data structures to model and manage the system state values, and allow efficient storage and access. The proposed state organization mechanism generates state intervals from trace events and stores them in a tree-based state history database. The state history database can then be used to extract the state of any system resources (i. e. CPU, process, memory, file, etc.) at any time stamp. The extracted state values can be used to track system problems (e. g. performance degradation, cyber-attacks). The proposed system is usable in both the offline tracing mode, when there is a set of trace files, and online tracing mode, when there is a stream of trace events. The proposed system has been implemented and used to display and analyze interactively various information extracted from very large traces [of the] order of 1 TB.” [20]
Concepts:
A number of basic concepts need to be defined before describing the CDS.
Event: an event corresponds to the execution of an LTTng probe by a CPU, which generates a trace event in the execution trace. An event is a punctual record in a trace that has no duration. Each record of a trace is characterized by its capture time, type, and other information that depends on the type of the event.
Execution trace: an execution trace can be defined as a time-ordered sequence of records corresponding to trace events that were generated when LTTng probes were executed by a CPU. “Each trace event or record has the following information attached: a timestamp ti that indicates the time when the event occurred, the CPU number that generated the event, the channel name (or the group to which the event belongs: kernel, file system, memory management, disk block, etc.), the event name, and finally the event parameters including file name, network IP and port, etc.” [23].
State: a state characterizes a system—or one of its components—during a limited time duration. It is determined by the events that are triggered at runtime; the state of a component may for example change when a specific trace event is generated. The state of a component is characterized by a time duration—the interval—which has a start and an end, and its value. A complex system such as a multicore computer simultaneously running many software applications will have many states evolving over time.
20 DRDC-RDDC-2017-R003
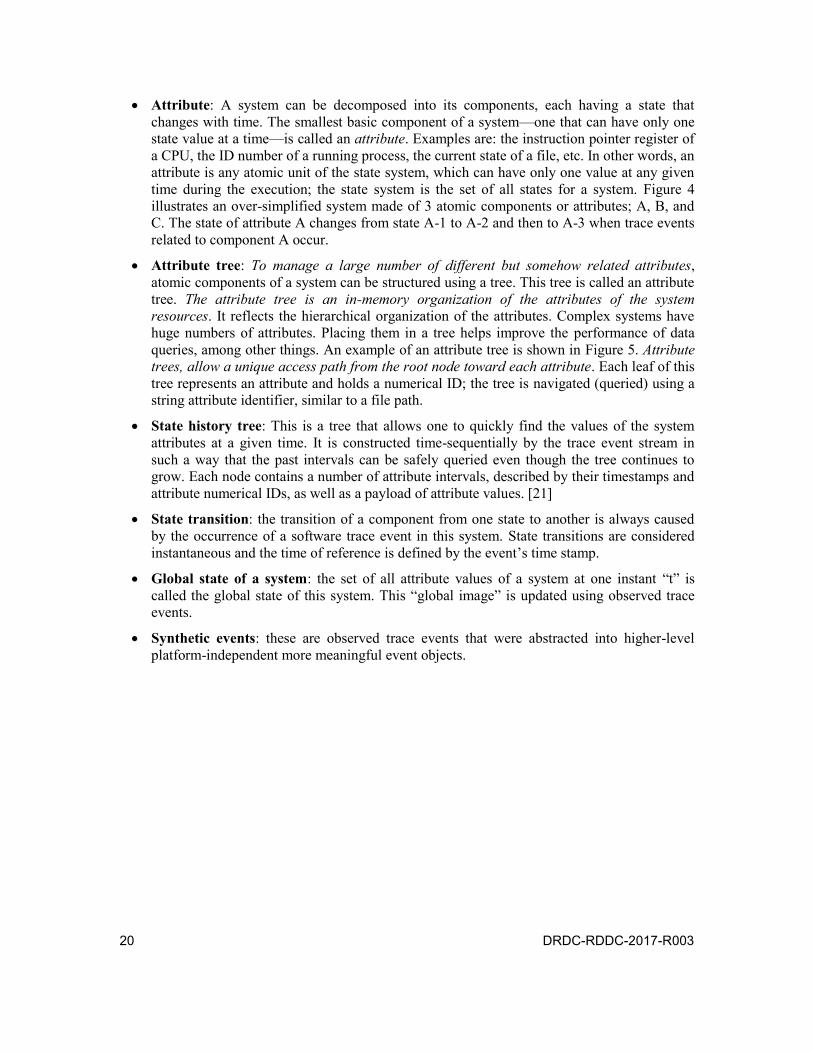
Attribute: A system can be decomposed into its components, each having a state that changes with time. The smallest basic component of a system—one that can have only one state value at a time—is called an attribute. Examples are: the instruction pointer register of a CPU, the ID number of a running process, the current state of a file, etc. In other words, an attribute is any atomic unit of the state system, which can have only one value at any given time during the execution; the state system is the set of all states for a system. Figure 4 illustrates an over-simplified system made of 3 atomic components or attributes; A, B, and C. The state of attribute A changes from state A-1 to A-2 and then to A-3 when trace events related to component A occur.
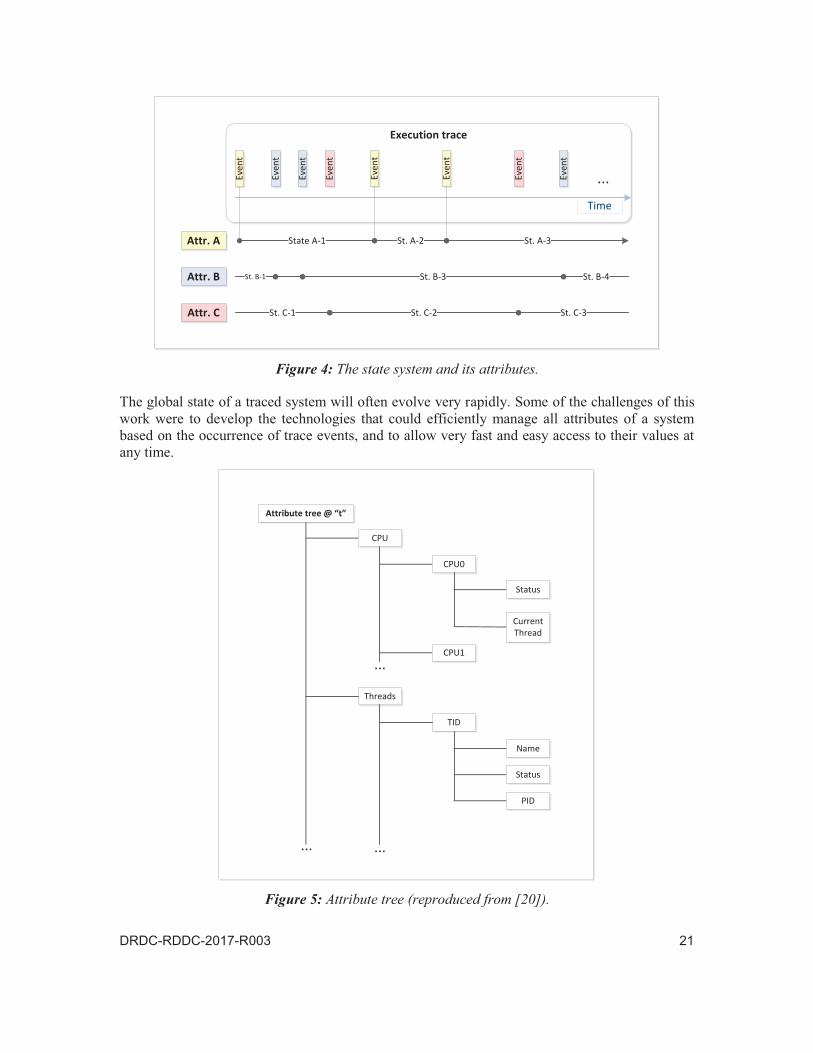
Attribute tree: To manage a large number of different but somehow related attributes, atomic components of a system can be structured using a tree. This tree is called an attribute tree. The attribute tree is an in-memory organization of the attributes of the system resources. It reflects the hierarchical organization of the attributes. Complex systems have huge numbers of attributes. Placing them in a tree helps improve the performance of data queries, among other things. An example of an attribute tree is shown in Figure 5. Attribute trees, allow a unique access path from the root node toward each attribute. Each leaf of this tree represents an attribute and holds a numerical ID; the tree is navigated (queried) using a string attribute identifier, similar to a file path.
State history tree: This is a tree that allows one to quickly find the values of the system attributes at a given time. It is constructed time-sequentially by the trace event stream in such a way that the past intervals can be safely queried even though the tree continues to grow. Each node contains a number of attribute intervals, described by their timestamps and attribute numerical IDs, as well as a payload of attribute values. [21]
State transition: the transition of a component from one state to another is always caused by the occurrence of a software trace event in this system. State transitions are considered instantaneous and the time of reference is defined by the event’s time stamp.
Global state of a system: the set of all attribute values of a system at one instant “t” is called the global state of this system. This “global image” is updated using observed trace events.
Synthetic events: these are observed trace events that were abstracted into higher-level platform-independent more meaningful event objects.
Execution trace
Time
State A-1 St. A-2 St. A-3
St. B-1 St. B-3 St. B-4
St. C-1 St. C-2 St. C-3
Attr. A
Attr. B
Attr. C
...Even
t
Even
t
Even
t
Even
t
Even
t
Even
t
Even
t
Even
t
Attribute tree @ “t”
CPU
Threads
CPU0
CPU1
TID
...
...
Status
Current Thread
Name
Status
PID
...
State history management
Trace file
Current state management
Trace reader
History file
Event handler
Attribute tree
Transient state
History tree storage
State provider(State creation
production rules)
State system(Manage all state intervals;
creation, queries, ...)
State history treeEvents
Analysis
A) B)
____ ___
____ ___
____ ___
____ ___
A)
____ ___
____ ___
____ ___
____ ___
B) C)
D)
...
...
...
...
...
...
...
0 48 0 48 0 48
0 48
0 0
0
0
49 49
49
91
91
92
92
156 157
156 157

24 DRDC-RDDC-2017-R003
3.4 AHLS—Multi-level trace abstraction; linking and display
The work presented in this section was done in a doctoral context for Tracks 1 and 2. It resulted in six different papers. As it is not possible to include all the technical details of these studies, only a brief overview is presented for each paper. The reader may refer to the PhD thesis for more details [23]. Parts of the thesis abstract are copied verbatim from [23] in the following lines.
The text written in sans-serif double-quoted text “sans-serif” in this section was copied verbatim from [23].
Context:
A number of additional tools were developed and integrated in the Trace Compass framework to facilitate the analysis of complex execution traces and enhance the comprehension of the execution of software applications. The central tool is a scalable multi-level trace abstraction and visualization framework. It uses various algorithms to manage the size of execution traces, reduce complexity and visualize the content of traces at different logical levels.
Developments:
“The proposed framework is studied in two major parts: multi-level trace abstraction, and multi-level trace organization and visualization. The first part discusses the techniques used to abstract out trace data using either the trace events content, a predefined set of metrics and measures, or structure-based abstraction to extract the resources involved in the system execution. The second part determines the hierarchical organization of the generated abstract events, establishes links between the related events, and finally visualizes events using a zoomable timeline view. This view displays the events at different granularity levels, and enables a hierarchical navigation through different layers of trace events by supporting the semantic zooming. Using this tool, users can first see an overview of the execution, and then can pan around the view, and focus and zoom on any area of interest for more details and insight.”
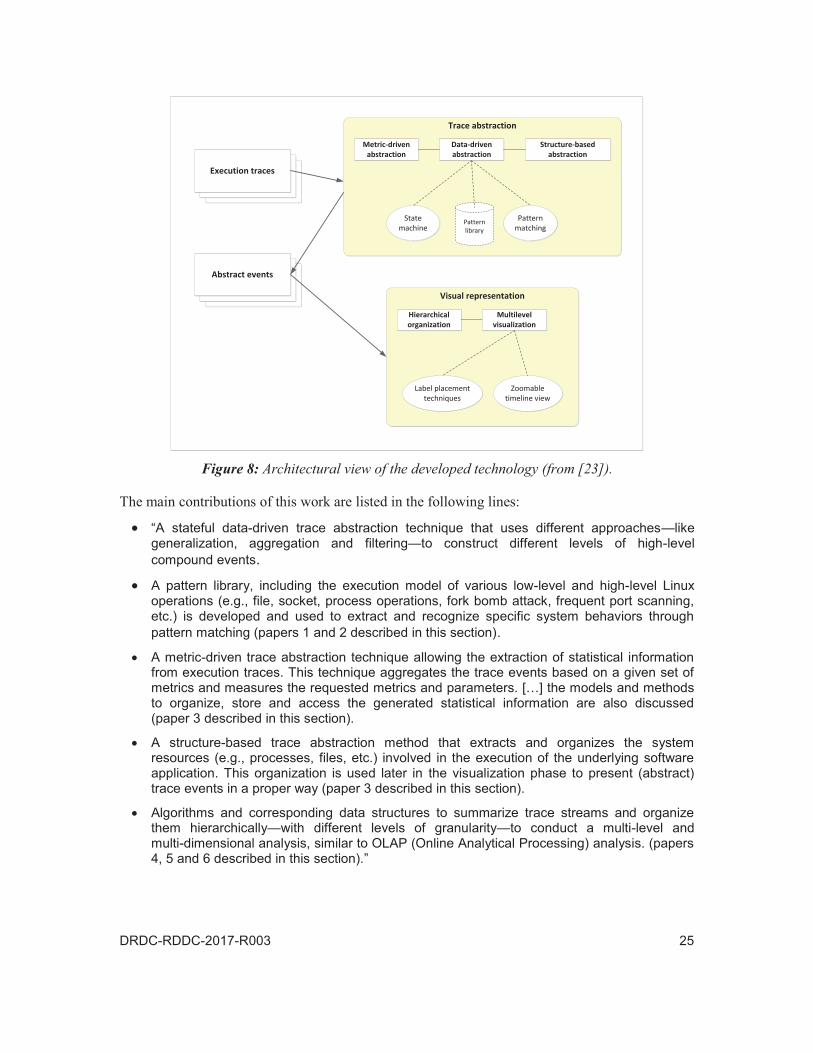
The global architectural view of the work described in this thesis is shown in Figure 8. Here, “abstract events are defined as events generated by applying abstraction techniques over the original execution trace” [(they match the “synthetic events” of 3.3)]. “Each abstract event [has] a name, [a] key (a running process or a combination of processes), boundary information (start ts and end te), and [possibly] event parameters.”
Trace abstraction
Metric-driven abstraction
Data-driven abstraction
Structure-based abstraction
State machine
Pattern matching
Pattern library
Visual representation
Hierarchical organization
Multilevel visualization
Label placement techniques
Zoomable timeline view
Execution traces
Abstract events
26 DRDC-RDDC-2017-R003
The following text presents a brief overview of the six papers, which are included in the thesis [23].
– Paper 1: Multilevel Abstraction and Visualization of Large Trace Data: A Survey.
“Dynamic analysis through execution traces is frequently used to analyze the runtime behaviour of software systems. However, the large size of traces makes the analysis and understanding of systems difficult and complex. […] Multi-scale (multi-level) visualization with support for zoom and focus operations is an effective way to enable this kind of analysis. […] Considerable research and several surveys are proposed in the literature in the field of trace visualization. However, multi-scale visualization has yet received little attention. In this paper, we provide a survey of techniques aiming at multi-scale visualization of trace data, and discuss the requirements and challenges.”
– Paper 2: A Stateful Approach to Generate Synthetic Events From Kernel Traces.
“In this paper we propose a generic synthetic event generator—a mechanism for abstracting trace events. The proposed method makes use of the system states patterns and environment-independent semantic events rather than platform-specific raw trace events […] to generate synthetic events. […] The state model [see Section 3.1.4] is used to store intermediate states and events. This stateful method supports partial trace abstraction and enables users to seek and navigate through the trace events and to abstract out selected portions of the trace.”
– Paper 3: A Framework to Compute Statistics of System Parameters from Very Large Trace Files.
This paper describes the technology that was developed to “compute, store and retrieve the statistics of various system metrics for large execution traces in an efficient way. One of the challenges was to create a compact data structure that has reduced overhead and a reasonable access and query time while utilizing less disk space. […] A parameter named “granularity degree” (GD) is defined to determine how often—in event counts or in time units—should the pre-computed statistics be saved to disk. The solution supports the hierarchy of system resources and different granularities of time ranges.”
– Paper 4: Cube Data Model for Multilevel Statistics Computation of Live Execution Traces.
Compared with finite length execution traces, continuous streams of trace events represent a challenge for trace analysis. Algorithms must deal with events that are continually generated and captured, the trace having no end. “This paper describes the technologies that were developed to: a) process such streams of events, b) generate detailed summaries based on an appropriate length of time, and c) organize this data so that multilevel and multidimensional OLAP-like analysis can be achieved. Reasonable memory usage, efficient response time and support of different query types (single point, range queries, drill-down and roll-up, sliding window queries) were the main constraints or requirements that were considered in this work.
The proposed solution can be used for any type of streaming data. It arranges the data in a compact manner using cubes as storage of intervals instead of storing the single values, and it enables the range queries for any arbitrary time durations. […] Testing results show that the memory usage and speed of the proposed method is reasonable and efficient.”
DRDC-RDDC-2017-R003 27
– Paper 5: Fast Label Placement Technique for Multilevel Visualizations of Execution Trace.
Appropriate placement of a balanced number of labels on graphical views represents a problem that may impact the quality of trace analysis in Trace Compass. “This paper describes a label placement technique that aims to efficiently maximize the number of labelled items and to increase the quality of the labels. The speed of the algorithm was also an important factor because the former will be used in an interactive multi-level visualization tool involving lots of possible interactions, zoom and panning operations. […] The algorithm takes into account both the topological and semantic relationships between the trace items to achieve both quantitative and qualitative placements. It uses a dynamic preference method to increase the quality and readability of the assigned labels.”
– Paper 6: Multilevel Visualization of Large Execution Traces.
“This paper presents a zoomable timeline view and a set of techniques to interactively visualize the content of large execution traced at multiple software layers. Each layer contains an increasing number of details from higher to lower layers. A single graphical interface displays the content of the execution trace according to the layer. Using this display, users can navigate hierarchically up and down through the entire trace data and conduct multi-level visualization and analysis of trace events.” Top-down exploration and analysis of trace content “—using different granularity levels for different portions of the trace—” is thus made possible by this new Trace Compass tool.
“The display first shows an overview—the coarsest layer—and different exploration operators enable exploring and navigating through the different layers. The view supports both the semantic (content-driven) zooming and standard (structural or visual) zooming. […] Structural links maintain relations between the data at different levels. When zooming in/out, the tool retrieves data from lower or higher levels and displays the result. This approach facilitates the comprehension of execution trace content and contributes to improving root cause analysis. It provides an “event location” feature, specifying where to look within the trace events for any selected high-level behaviour (e.g., an alert, a system problem, a network attack, etc.). The proposed method is generic enough to be applicable to many areas and any types of trace data.”
3.5 Modelling technologies for trace analysis
Context:
The analysis of a specific software problem using trace events generated by the LTTng software tracer requires the utilization of powerful tools for the selection and analysis of the most relevant events in the execution trace. This section describes some of the tools that were developed to reduce the cognitive load associated with trace analysis, and to provide meaningful representations of trace content.
Developments:
Advanced filtering of execution traces [24, 25]:

28 DRDC-RDDC-2017-R003
The text written in sans-serif double-quoted text “sans-serif” in this section was copied verbatim from [24, 25].
To detect complex patterns in execution traces, a declarative automata-based pattern description language and supporting software components were developed and integrated in: a) Trace Compass, b) its specialized interactive trace viewer and c) the CDS. “The proposed language is designed declaratively in XML and uses state machines to describe complex patterns.” The state system (see Section 3.1.4) “was used to model the system and the state history tree was used as a container to store the data in the CDS. This offers interesting capabilities such as the forward/backward replaying of patterns and data sharing.”
Patterns defined using this language “are passed to an analyzer designed to efficiently verify and detect their presence within the execution trace. A mechanism able to follow the execution of the patterns has also been implemented. Synthetic events” [abstract events] “can be generated and are used to locate the patterns in the analysis. They can also provide details about the matched patterns. Moreover, timeouts and maximum duration conditions can be described and processed.”
“The language can represent any type of pattern found in the literature; security attack patterns, testing patterns, system performance patterns, events aggregation patterns, etc. Large execution traces—more than 1 GB—can be processed by this technology with very good performance. The proposed solution can write the data directly to disk so it does not accumulate information in memory, which optimizes memory utilization. This technology was successfully used to find the root cause of a web request defect and to detect the presence of an attack on a system.”
Access to the CDS content [26, 27]:
The text written in sans-serif double-quoted text “sans-serif” in this section was copied verbatim from [26, 27].
Trace Compass contains a specialized interactive trace visualization—the time-view—that allows the visualization of simultaneous processes and their states at any time during execution. It extracts the relevant information according to different perspectives and displays it in an intuitive and compact manner. The development of this kind of view in Trace Compass involves the coding of an Eclipse plugin in Java, which is time-consuming.
A new XML-formatted declarative language and a new declarative mechanism were developed in order to simplify the creation of Trace Compass views. This simplifies the way custom trace analysis and visualization are made. XML files define how software-specific trace events must be mapped to state changes, and how the timeline should be displayed. As this “declarative analysis” is written in XML files, no Eclipse plugin coding is required, reducing the burden of creating new state-based analyses.
“The proposed solution enables users to first define their different analysis models based on their application and requirements, then visualize these models in many alternate representations (Gantt chart, XY chart, etc.), and finally filter the data to get some highlights or detect potential malicious patterns.” Several sample applications with different operating systems were successfully tested using trace events gathered from both Linux and Windows operating systems, at the kernel and user-space levels.
DRDC-RDDC-2017-R003 29
UML for trace analysis [28]:
Declarative analysis involving the creation of XML files may be difficult. It may also lead to mistakes because the user must learn the set of XML tags and create mental representations of the state machine textual descriptions. An effort was made to add a graphical editor that would represent state machine analysis directly in Trace Compass, without XML editing. The new Eclipse-based modelling tool simplifies the design of new state-based analyses. It allows the user to define custom views and provides the ability to specify the mapping between trace events and state changes.
The modelling tool was used to realize complex analyses, and it was verified that they produce the same results as their XML counterparts. It offers practical benefits over a generic XML editor in terms of ease of use, safety and functionality.
3.6 First analyses—Google Chrome
The first utilization of this technology—the Trace Compass framework and its toolchain—was made through a collaboration with Google. The Google Chrome browser was chosen as the target software application for deep dynamic analysis. The appropriate instrumentation of this web browser combined with both AHLS and Google development tools helped solve many hard to find software problems.
In order to allow the study of Microsoft versions of Chrome in Trace Compass, a new converter was also developed. It is now possible to read trace events directly from the Microsoft Windows Event Tracing framework and to write them in the CDS according to the Common Trace Format (CTF) standard. Chrome-specific filters and patterns were defined and implemented for this analysis.
3.7 Extension to Track 2
Additional financial resources were granted to Track 2 during the project, allowing the extension of this work [29, 30]. The objective was to better exploit the scalability of the CDS and underlying algorithms being developed, to propose new trace analysis modules and an enhanced analysis architecture. This work was divided in three parts: a) the optimal decomposition of the analysis work between in-process collection time and outside analysis, whether live or offline; b) parallelization of the analysis framework; and c) the development of new analysis algorithms and views to address specific monitoring and tracing problems.
The optimal decomposition of the analysis work between in-process collection time and outside analysis involved an in-depth analysis of Google Chrome performance using Trace Compass and new ways to combine trace events. For example, hooks were added in system call entries and exits in order to detect undue latency at runtime. In case of undue latency, additional data, including call stacks and performance counters, were collected upon coming back from the culprit system call. These data were then combined with regular trace data and the complete performance analysis was performed a posteriori. By combining minimal runtime analysis and regular tracing data, it was possible to greatly enhance the accuracy of the latency root cause detection, while adding minimal additional overhead.

30 DRDC-RDDC-2017-R003
The parallelization of the analysis framework consisted in evaluating the various bottlenecks in trace analysis, including the I/O limitations for regular and solid state hard drives. Then, portions that could be more easily parallelized were identified and managed accordingly. Different techniques were proposed to divide the work among multiple cores: a) either each core looking at the trace stream of a single node or single core, or b) each core looking at all streams but at different time periods within the trace. In the first case, the interactions are minimal but the number of parallel tasks may be smaller. In the second case, the task is easier to divide into many parallel tasks, but more complex algorithms need to be devised in order to break and later fix up the dependencies in state values from one interval to earlier time intervals. Good acceleration factors were obtained on multi-core machines of 8 or more cores.
The development of new analysis algorithms and views for specific monitoring and tracing problems involved the in-depth study of Linux Containers and KVM virtual machines, and the prototyping of new Trace Compass views showing interactions between the physical and virtual resources including machines and cores. Different operating system facilities such as Linux cgroups were also studied in order to assign quotas to Virtual Machines. Different mitigation measures were proposed to diminish the impact of Denial of Service (DoS) attacks based on the information obtained through monitoring.
New Trace Compass views were then proposed to integrate the tracing information from user-space OpenCL programs with kernel-level GPU drivers in order to analyze the performance of GPU-accelerated applications. Finally, the I/O behaviour of requests to block devices in the Linux kernel were studied in detail. New instrumentation points were then proposed to efficiently monitor all the I/O requests throughout the system, new algorithms were proposed to properly track the requests through the different layers, and new Trace Compass views were proposed to better understand the I/O behaviour either from the viewpoint of a process and its requests, or from the viewpoint of global resource contention and latency in the system.
DRDC-RDDC-2017-R003 31
4 OCS3 at the system calls interface (AHLS Track 3)
The technologies developed in Track 3 aim at improving L2CS detection techniques (Section 2.1; Figure 2). A preliminary study [31] was made to compare user space and kernel space execution traces using different types of classification algorithms. Results show that kernel space tracing can be used to identify software anomalies with better accuracy than user space tracing. In fact, the majority of software anomalies (~90%) in a software application can best be identified by using a classification algorithm on kernel space traces. The tracing of system calls is considered a very good source of data in the scientific literature for anomaly detection. Anomaly detection techniques studied in this Track consider execution traces of system call events as input to detect abnormal software behaviour in the system at runtime. The LTTng software tracer is used to capture system call events, which are then fed to detection algorithms.
A number of improved anomaly detection techniques were proposed in this work—instead of one huge model that could resolve all anomalies. It is expected that a set of well-selected detection algorithms that have different detection capabilities—and the associated LTTng software probes at the system call level—will contribute to improving OCS3. When an alert is raised at one point, for example, related information will help the subsequent selection and execution of the best detection algorithms/LTTng probes.
First, a brief introduction to intrusion detection systems (Section 4.1), a discussion on the limits of available supporting technologies (Section 4.2), and an overview of the research in advanced anomaly detection (Section 4.3) are presented. A new scalable framework that is specialized for advanced anomaly detection is then described in Section 4.4; TotalADS. This Eclipse-based software component can be integrated in Trace Compass, which allows for the simultaneous execution of many detection algorithms. Apart from its expandable visualization capabilities, it offers full control over the detection process as well as full access to other AHLS tools at runtime.
Four complementary detection algorithms are then described in Sections 4.5, 4.6, 4.7 and 4.8. These four detection algorithms and the corresponding models define a set of many detectors that will contribute to enlarge the detection surface. Some models may focus on specific more-vulnerable software applications or services while others can be started only when they are needed, when specific alarms are raised, for example. The ability to control which detection algorithms are run at any time—and thus the models and associated probes—gives TotalADS very high flexibility for improving OCS3. This technology represents the first step toward feedback-directed anomaly detection in which the result of previous anomaly detections can be used to appropriately adjust OCS3 on a continual basis. Finally, Section 4.9 describes the technologies that were developed to optimize the detection process.
This chapter describes the work that was done in Track 3 of the AHLS project under the supervision of Professor Abdelwahab Hamou-Lhadj from Concordia University. The text included in this section is largely taken from scientific presentations, papers, reports and theses as well as emails sent by Professor Hamou-Lhadj. The text that is copied verbatim from other documents is written as sans-serif double-quoted text “sans-serif”. Text in italic emphasises key points in the text.
32 DRDC-RDDC-2017-R003
4.1 Intrusion detection systems (IDS)—Definitions
Context:
This section defines a number of terms that are intensively used in this Chapter.
Important note: the text in this section was copied verbatim from [32]. The reader is invited to refer to this paper for the referenced documents.
“Traditional Intrusion Detection Systems compare software behaviour with a database of known attributes extracted from known attacks. When a pattern of attack is found, the behaviour is considered as anomalous, otherwise, it is considered legitimate. These IDS are called misuse or (signature-based) detection systems. Another type of intrusion detection system works by building a robust baseline of the normal behaviour of a system and then monitors for deviations from this baseline during system operations […]. These systems are called anomaly detection systems.”
“Anomaly detection systems can be classified into Host-based Intrusion Detection Systems (HIDS) or Network-based Intrusion Detection Systems (NIDS). NIDS examine network traffic to detect anomalies; e.g., the use of Bayesian networks on network traffic records to detect anomalies […] and the extraction of rules by mining tcp-dump data to detect anomalies […].”
“HIDS focus on using metrics present in a host to detect anomalies. A type of HIDS uses different algorithms on normal audit records (logs) of a host (e.g., CPU usage, process id, user id, etc.) These systems measure an anomaly threshold and raise alerts when particular attribute values of a new record are above the threshold. For example, using multivariate statistical analysis on audit records to identify anomalies […], and using frequency distribution based anomaly detection on shell command logs […].”
“Another type of HIDS trains different algorithms on system call [traces] of normal software behaviour. These systems raise alerts when [a] deviation from normal system calls is observed in unknown software behaviour (e.g., a trace).”
4.2 Limits of the available supporting technology
Available COTS and Open Source technologies that could be used to detect anomalies in software systems have limitations. This section briefly describes some of these.
Important note: the text in this section was copied verbatim from [33]. The reader is invited to refer to this paper for referenced documents.
“A number of existing specialized technologies were evaluated before starting the development of new detection systems. Weka […], R […] and MOA […] are examples of these, allowing the parameterization and utilization of machine learning and stochastic algorithms. These software applications were built to work as general purpose frameworks for the “offline” deep analysis of different types of datasets, which must always be converted into a precise format. Unfortunately, they are not well adapted for OCS3. They would also hardly support online host-based detection algorithms such as sequence matching, kernel state modelling or hidden Markov models—described in this chapter.”

DRDC-RDDC-2017-R003 33
“Other tools aiming at detecting undesired software activities at the host level—like OSSEC […] and Samhain […]—use predefined rules to monitor logs, opened ports, the integrity of the running kernel, etc. Like signature-based detectors, the detection capabilities of these technologies are limited by the completeness of the pre-defined conditions they require—signatures/rules. Considering the huge number of new malware that is produced every day, it is practically impossible to define—and implement every day—a set of signatures/rules that would address all types of malicious software activities.”
“Current tools for the inspection of execution traces also present limitations that make them impractical for the online identification of cyber-related anomalies in execution traces. For example, Babeltrace can be used to convert binary LTTng traces into a text format […], and later the grep utility can be used to find patterns in it offline. The Strace analyzer can provide offline statistics about a trace in a textual format […]. Similarly, tools for users space trace analysis, such as Bugsense […] and Crittercism […] provide only summaries in the form of charts, trends of a trace.”
4.3 Overview of the research in advanced anomaly detection
Research and development in the domain of advanced anomaly detection have yielded a number of different techniques that still need to be improved. This is particularly true for the algorithms requiring normality models, which rarely address all normal software behaviours and states of a system. This section briefly reviews the latest important work that was done in this domain.
Important note: the text in this section was copied verbatim from [32]. The reader is invited to refer to this paper for referenced documents.
The use of system call traces as input data to L2CS anomaly detectors:
“Forrest et al. were the first to suggest that the temporal order of system calls could be used to represent the normal behaviour of a privileged process […]. The authors have then confirmed that short sequences of system calls can describe the normal process operation, while unusual bursts will occur during an attack […].”
“Forrest et al. […] propose to build a database of normal sequences by sliding a window of length ‘n’ on normal traces. Sequences of similar length ‘n’ are also extracted from traces of unknown behaviour and compared with the database. If an unknown sequence is found in a trace then it is considered as anomalous.”
“Hofmeyr et al. […] improve the Sliding Window algorithm by computing the Hamming distance between two sequences to determine how much one sequence differs from another. Warrender et al. […] use a locality frame count (i.e., the number of mismatches during the last ‘n’ calls) instead of the Hamming distance for the Sliding Window algorithm. Warrender et al. […] actually compare the Sliding Window algorithm, Hidden Markov Model (HMM) and Association Rules (called RIPPER) on system call traces. They identify that HMM and Sliding Window are better than the Association Rules, but they did not find any conclusive difference between HMM and Sliding Window.”

34 DRDC-RDDC-2017-R003
Hidden Markov model (HMM) as L2CS anomaly detector:
“When Warrender et al. […] train HMM on system call sequences, they raise alerts as the probability of a system call in a sequence goes below a certain threshold. On the other hand, Wang et al. […] train HMM on normal system call sequences and raise alerts when the probability of a whole sequence of system calls is below a threshold rather than individual calls in a sequence […]. Similarly, Yeung and Ding […] also employ HMM on system call sequences, and call it dynamic modelling. Yeung and Ding […] also measure frequency distributions for shell command logs and call it static modelling. They show that dynamic modelling performs better than static modelling.”
“Other researchers, Cho and Park […], use HMM to model, using system calls, the execution of only normal root privilege acquisitions. This allows them to detect 90% of the illegal privilege flow attack. Hoang et al. […] move a step ahead and propose a multiple layer detection approach in which one layer trains the Sliding Window algorithm on system calls and another layer trains HMM on system calls. They combine the output of both to detect anomalies. Hoang et al. […] also improve their earlier work […] by combining HMM and the Sliding Window algorithm using a fuzzy inference engine. Though HMM has been found useful, one of the main hurdles for HMM is its high training time. Researchers like Hu et al. […] propose an incremental HMM training technique to reduces its training time by 50%.”
Other Machine learning techniques for L2CS anomaly detection:
“To detect anomalous system calls, researchers have employed standard multilayer perceptrons […], Elman recurrent neural networks […], self-organizing maps neural networks […]and radial basis functions based neural networks […]. SVM, decision tree and K-means clustering have also been used on system calls extracted from static analysis […]. The researchers in […] and […] employed training on both normal and anomalous traces to detect anomalies.”
“Jiang et al. […] extract varied length n-grams from [system] call traces of normal behaviour, and build an automaton that represents the generalized state of the normal behaviour: they use this automaton to detect anomalous behaviour in traces. Tandon […] proposes different variations of LERAD, a conditional rule learning algorithm […], to learn rules with sequences of system calls and their arguments. They also propose to generate new rules for the rules pruned due to false alarms on validation data. They argue that new rule generation increases the detection rate and coverage on a limited training set. Several other researchers also consider the use of system calls and arguments to strengthen HIDS against the control flow, data flow and mimicry attacks […]. However, these techniques remain constrained by selecting key system calls and arguments due to the multitude of argument values.”
“Recently, Creech and Hu […] proposed to generate seen and unseen patterns of system calls from normal traces by using production rules of Context-Free Grammar (CFG). They also proposed a semantic rule that occurrences of patterns in normal traces are greater than anomalous traces and train ELM neural network on occurrences of patterns. They claim that the approach is applicable on multiple processes simultaneously but recognize that the accuracy will be higher on individual processes. This is because the false alarm rate reached 20% (out of 4373 normal traces) in one dataset. They also claim portability across versions of different operating systems but the results show up to 100% false positive rate for 80% of the attacks.”
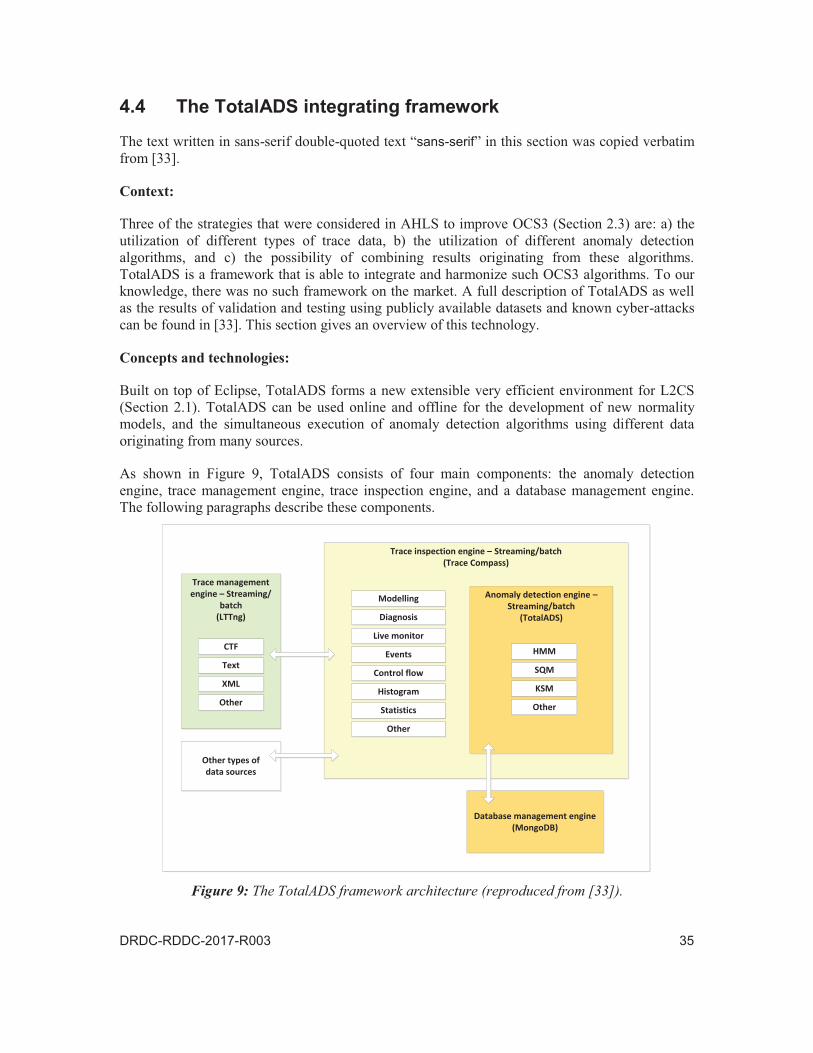
Trace inspection engine – Streaming/batch(Trace Compass)
Trace management engine – Streaming/
batch(LTTng)
Anomaly detection engine – Streaming/batch
(TotalADS)
Database management engine(MongoDB)
Other types of data sources
CTF
Text
XML
Other
HMM
SQM
KSM
Other
Modelling
Diagnosis
Live monitor
Events
Control flow
Histogram
Statistics
Other
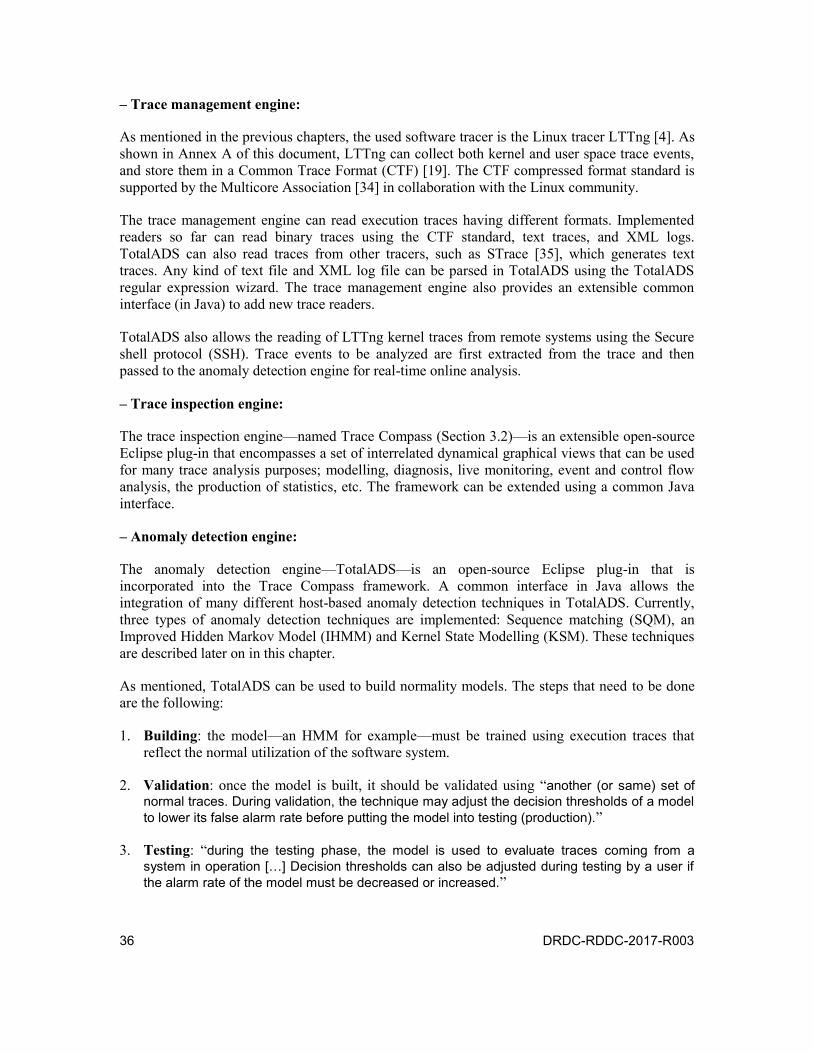
36 DRDC-RDDC-2017-R003
– Trace management engine:
As mentioned in the previous chapters, the used software tracer is the Linux tracer LTTng [4]. As shown in Annex A of this document, LTTng can collect both kernel and user space trace events, and store them in a Common Trace Format (CTF) [19]. The CTF compressed format standard is supported by the Multicore Association [34] in collaboration with the Linux community.
The trace management engine can read execution traces having different formats. Implemented readers so far can read binary traces using the CTF standard, text traces, and XML logs. TotalADS can also read traces from other tracers, such as STrace [35], which generates text traces. Any kind of text file and XML log file can be parsed in TotalADS using the TotalADS regular expression wizard. The trace management engine also provides an extensible common interface (in Java) to add new trace readers.
TotalADS also allows the reading of LTTng kernel traces from remote systems using the Secure shell protocol (SSH). Trace events to be analyzed are first extracted from the trace and then passed to the anomaly detection engine for real-time online analysis.
– Trace inspection engine:
The trace inspection engine—named Trace Compass (Section 3.2)—is an extensible open-source Eclipse plug-in that encompasses a set of interrelated dynamical graphical views that can be used for many trace analysis purposes; modelling, diagnosis, live monitoring, event and control flow analysis, the production of statistics, etc. The framework can be extended using a common Java interface.
– Anomaly detection engine:
The anomaly detection engine—TotalADS—is an open-source Eclipse plug-in that is incorporated into the Trace Compass framework. A common interface in Java allows the integration of many different host-based anomaly detection techniques in TotalADS. Currently, three types of anomaly detection techniques are implemented: Sequence matching (SQM), an Improved Hidden Markov Model (IHMM) and Kernel State Modelling (KSM). These techniques are described later on in this chapter.
As mentioned, TotalADS can be used to build normality models. The steps that need to be done are the following:
1. Building: the model—an HMM for example—must be trained using execution traces that reflect the normal utilization of the software system.
2. Validation: once the model is built, it should be validated using “another (or same) set of normal traces. During validation, the technique may adjust the decision thresholds of a model to lower its false alarm rate before putting the model into testing (production).”
3. Testing: “during the testing phase, the model is used to evaluate traces coming from a system in operation […] Decision thresholds can also be adjusted during testing by a user if the alarm rate of the model must be decreased or increased.”
DRDC-RDDC-2017-R003 37
– Example of utilization of TotalADS:
The following example of utilization of TotalADS is partially reproduced from [33]. It shows how TotalADS can automatically train and test models on live trace streams and automatically diagnose anomalies and facilitate the identification of their origin. In this text, live means online and live tracing corresponds to the continued generation of trace events at runtime.
Operators can use TotalADS to build normality models from execution traces originating from either pre-recorded traces or through live system call tracing. The collection of trace events can be achieved through the Live monitoring view of TotalADS. The process is divided into two modes: a) live training and testing, and b) live testing.
In the first mode, live training and testing, the KSM, SQM, and IHMM models—described later on in this section—are first initialized using appropriate parameters. This example involves the “Ubuntu 12.04 kernel for KSM, and a window length of 6 for SQM. For HMM, 10 states, 200 observable events, and 10 iterations of the Baum-Welch technique were selected”.
The models are then built through live training and testing; the live tracing over SSH of the monitored software system while it is normally used (without cyber-attacks). “In this phase, TotalADS first tests a new trace against an existing model in a system, shows the results, and then trains the model on the same trace.” [33]
Results of the live training and testing are shown in Figure 10. “TotalADS started by testing the new traces on the models of the KSM technique, the HMM technique, and the SQM technique. If a trace is found to be anomalous then TotalADS plots it as an anomaly (one) on a chart. It then trains the three models on the trace.”
“Initially, each of the three models considered every incoming trace as an anomaly. TotalADS at this point shows higher false alarm rates because the models built for each technique did not have sufficient (or rather they had zero) information to predict anomalies [Figure 10a]. The three series in the chart represent three different models. When there is only one line visible on the chart, it means that the three models predict the same results. All initial traces are shown as anomalies on the chart [in Figure 10a], except at the 8th and 11th minutes.”
“As time passed, regular binary signals started to appear on the chart, showing that several newer traces have started to be considered as normal traces [Figure 10b]. At this point, we also slightly increased the decision thresholds of the models. In machine learning, decision thresholds are usually adjusted during validation of a model before testing. The decision thresholds for SQM, HMM, and KSM were Hamming distance, alpha, and probability values, respectively. This process of training kept on continuing until we reached a point in time where all the new upcoming traces started to appear as normal. [This is shown in Figure 10c.] We stopped the live training and testing mode at this point.”
These results show that TotalADS can be used to train and test anomaly detection techniques on live traces (streams of traces) originating from real systems, with minimal human intervention.
In the second mode—live testing—”the idea is to simulate both normal and abnormal behaviour of the system (under attack). If an attack is detected by one of the three detection algorithms, the effects of the attack in the execution trace can further be investigated in the trace analysis views.”

38 DRDC-RDDC-2017-R003
Results of experiments in this mode, using Metasploit [36] to bypass the MySQL authentication mechanism with a wrong password, are shown in Figure 11. Initially when the monitored system was normally used, “the predictions of anomalous alarms remained zero for all three models. But as the remote hacker (Metasploit) tried to penetrate the system, the models raised anomalies in a span of 2 (between 9 and 11) minutes. The models did not raise anomalies on exactly the same traces but the anomalies were raised on the traces collected in close proximity.”
Figure 10: TotalADS live training and testing (reproduced from [33]).
“For example, the SQM technique flagged 1 out of 10 traces as anomalous and the anomalous sequence in the trace contained 4 occurrences of the “sys_recvfrom” system call in a sequence of 6 system calls (67%). The anomalous sequence was “sys_rt_sigtimedwait, sys_recvfrom, sys_recvfrom, sys_recvfrom, sys_poll, sys_recvfrom”.”
“The “sys_recvfrom” system call is used to receive a message from a socket. This seems suspicious enough to explore it further. We therefore loaded this trace into the trace inspection views. The trace inspection views are shown in [Figure 12]. The three trace inspection views shown in [Figure 12] are Control Flow view, Events view, and Resource view.”
“In the Events view, we searched for the event “recvfrom” and found all the occurrences of “sys_recvfrom” emphasized […] by the Events view. Detailed attributes, in this case arguments of the system call, are also shown in the Events view. When we clicked on the “sys_recvfrom” at the time stamp “02:09:23.588.581 765”, the Control Flow view got synchronized and immediately showed the process corresponding to the time stamp and the event. The yellowish-green bar represents the wait-blocked state of the process, brown bar represents the CPU-wait, the green bar represents the user mode, and the blue bar represents the system call mode of a process.”
“When the mouse hovers over the bar, the details are also shown as a tool tip [Figure 12]. In this case, this is a process “unity-2d-shell” running at CPU 0 (see resource view) and it switched a few times from user mode to system call mode in a short span of time. These few system calls are “sys_recvfrom” system calls occurring consecutively as shown in the Events view. The Unity-2d-shell2 process is a component of Unity Desktop in Ubuntu that provides a shell interface to the system and “sys_recvfrom” is a system call that provides a common entry point for hackers to open a socket.”

DRDC-RDDC-2017-R003 39
“Thus, this shows that a malicious hacker was trying to log into the system at this point in time. In a similar manner to the sequence matching technique, the KSM model [results not shown in these figures] also showed an anomaly.”
“The HMM model did not point out a suspicious trace. HMM is a complicated but powerful algorithm and sometimes it converges to a local minimum rather than the global minimum. It therefore requires additional tuning. However, SQM and KSM both pointed out the suspicious activity and it can be ascertained the trace was anomalous.”
Figure 11: TotalADS view (reproduced from [33]).
In addition to the attack on MySQL, other exploits were launched against TikiWiki, Apache, and brute-force attacks were launched against SSH and FTP. “The brute-force attacks remained unsuccessful; however, the attempts were detected as suspicious. In summary, all the attacks were detected correctly and the false alarm rate remained less than 10%.”
Figure 12: TotalADS view (reproduced from [33]).
40 DRDC-RDDC-2017-R003
To our knowledge, “such automated descriptive and visual analysis for software traces does not exist in [current] tools”. Apart from anomaly-based detection techniques, TotalADS could also integrate many other types of efficient detection algorithms, enlarging the detection surface.
– Database management engine (TotalADS):
The database management engine provides TotalADS online saving/retrieving services for different types of data that are useful for online anomaly detection. It involves the utilization of the MongoDB NoSQL database [37], which stores data using JSON (JavaScript Object Notation). “The advantage of JSON is that models can be serialized directly from their class representation in memory to a database without any conversion into a relational schema like structure.”
4.5 Detection technique 1—Sequence Modelling (SQM)
The text written in sans-serif double-quoted text “sans-serif” in this section was copied verbatim from [38].
Context:
High false alarm rates and long training and execution times of detection techniques are among the key issues in L2CS (Section 2.1). A new abstraction technique aiming at reducing the execution time of detection algorithms while keeping the same accuracy was studied. The key idea is to represent system call traces as “traces of kernel module interactions” and use the resulting abstract traces as input to known anomaly detection techniques.
A full description of the SQM algorithm as well as results of validation and testing using publicly available datasets and known cyber-attacks can be found in [38]. This section gives a high-level description of this technology.
Concepts and technologies:
The SQM detection algorithm works by extracting sequences of length ‘n’ trace events—called Window Length (WL)—from an execution trace by sliding a window one event at a time. The building of the model consists in capturing all the different sequences of the same WL value that appear in the trace. Figure 13a shows for example that the building of a model—the central reddish rectangle with WL = 3—from a normal execution trace involves the capture of all possible unique sequences of 3 consecutive events. An empty space has been intentionally left in the model to show that the “ABA” sequence can be captured only once in the model.
The detection of anomalies in an unknown execution trace (Figure 13b) consists of comparing observed sequences of WL = 3 in an unknown trace with the sequences that were captured in the model. If a new sequence is found in the unknown trace (the sequence AAA for example), then it is considered anomalous.
Sequence comparisons involving higher values for the WL parameter may generate higher numbers of false positives. The Hamming distance may be used to adjust a decision threshold determining a degree of tolerance based on the total number of mismatches that can be tolerated during event-by-event comparison of two sequences. For example, a Hamming distance of 1 with
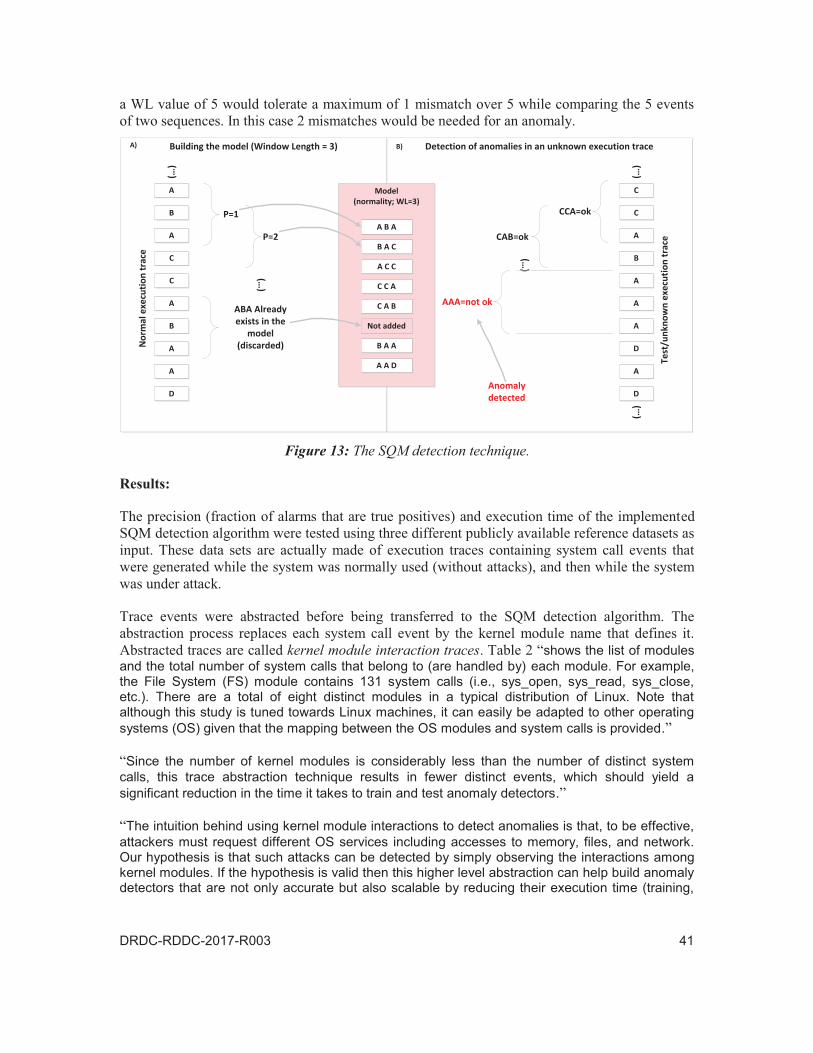
P=1
A
C
C
A
B
A
A
D
B
A Model(normality; WL=3)
P=2
(…)
A B A
B A C
A C C
C C A
C A B
B A A
A A D
Building the model (Window Length = 3)N
orm
al e
xecu
tion
trac
e
A
B
A
A
A
D
A
D
C
C
(…)
(…)
Test
/unk
now
n ex
ecut
ion
trac
e
CCA=ok
CAB=ok
(…)
AAA=not ok
(…)
Detection of anomalies in an unknown execution trace
Anomaly detected
ABA Already exists in the
model(discarded)
A) B)
Not added
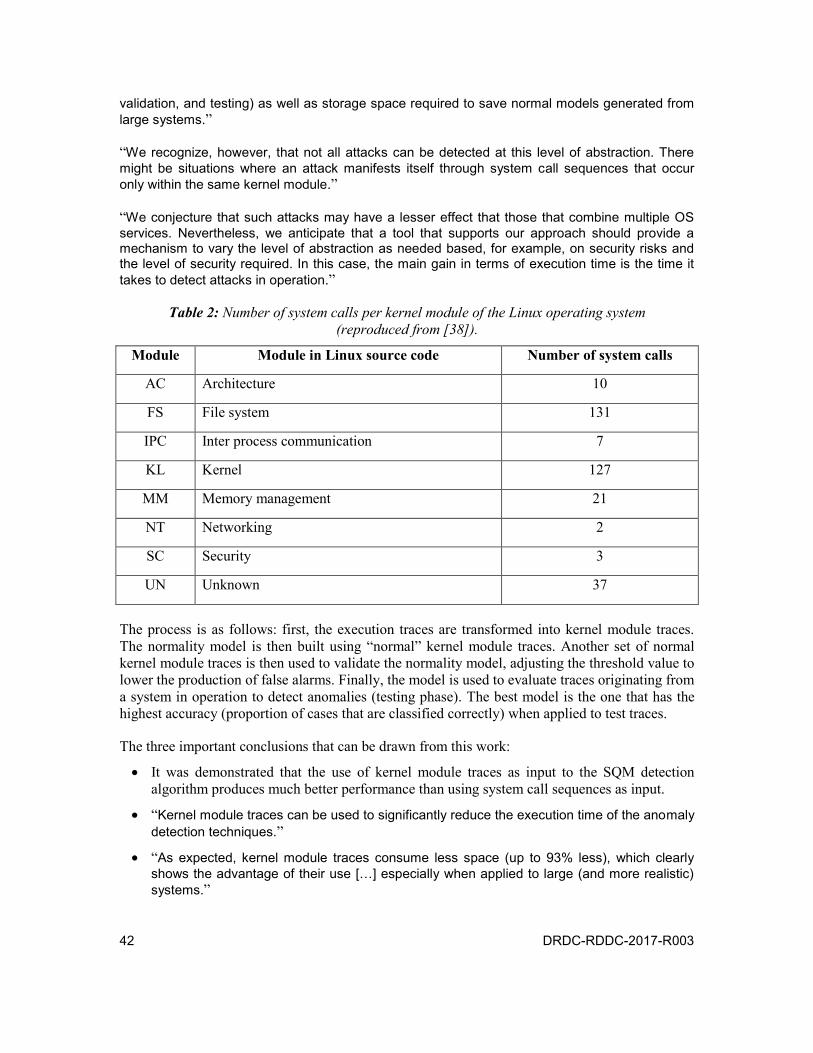
42 DRDC-RDDC-2017-R003
validation, and testing) as well as storage space required to save normal models generated from large systems.”
“We recognize, however, that not all attacks can be detected at this level of abstraction. There might be situations where an attack manifests itself through system call sequences that occur only within the same kernel module.”
“We conjecture that such attacks may have a lesser effect that those that combine multiple OS services. Nevertheless, we anticipate that a tool that supports our approach should provide a mechanism to vary the level of abstraction as needed based, for example, on security risks and the level of security required. In this case, the main gain in terms of execution time is the time it takes to detect attacks in operation.”
Table 2: Number of system calls per kernel module of the Linux operating system (reproduced from [38]).
Module Module in Linux source code Number of system calls
AC Architecture 10
FS File system 131
IPC Inter process communication 7
KL Kernel 127
MM Memory management 21
NT Networking 2
SC Security 3
UN Unknown 37
The process is as follows: first, the execution traces are transformed into kernel module traces. The normality model is then built using “normal” kernel module traces. Another set of normal kernel module traces is then used to validate the normality model, adjusting the threshold value to lower the production of false alarms. Finally, the model is used to evaluate traces originating from a system in operation to detect anomalies (testing phase). The best model is the one that has the highest accuracy (proportion of cases that are classified correctly) when applied to test traces.
The three important conclusions that can be drawn from this work:
It was demonstrated that the use of kernel module traces as input to the SQM detection algorithm produces much better performance than using system call sequences as input.
“Kernel module traces can be used to significantly reduce the execution time of the anomaly detection techniques.”
“As expected, kernel module traces consume less space (up to 93% less), which clearly shows the advantage of their use […] especially when applied to large (and more realistic) systems.”

DRDC-RDDC-2017-R003 43
Implementation in TotalADS:
The SQM detection algorithm was implemented in the TotalADS framework. It can be used to build normality models from normal execution traces, using different values of WL. Using such models, the algorithm can then be used to detect abnormal sequences of events in execution traces.
4.6 Detection technique 2—Improved Hidden Markov Model (IHMM)
The text written in sans-serif double-quoted text “sans-serif” in this section was copied verbatim from [38, 39].
Context:
A Hidden Markov Model (HMM) is a stochastic model that is adapted for sequential data and hence, it is naturally suitable for modelling the temporal order of system call sequences. A full description of the Improved HMM (IHMM) algorithm as well as results of validation and testing using publicly available datasets and known cyber-attacks can be found in [38, 39]. This section gives a high-level description of this technology.
Concepts and technologies:
Figure 14A presents a system that behaves as a Markov process; it can be in different states and only the last previous state is needed to compute the next. The HMM is a doubly embedded stochastic process. The first process determines the probabilistic evolution of the state of the system with respect to time (q1 to q8) according to the control/input imposed on the system. The process is “hidden” because the state is not directly observable: the second stochastic process determines the observable that is emitted when the system is in one of any of its possible states (O1 to O8).
Figure 14B represents the possible states and observations of a 4-state hypothetical ergotic—that is, fully connected—Markov system. It is used as an example to illustrate how the system may evolve over time. The system is in state S1 at time t1 and some control and input are imposed on the system in such a way that it transits from state S1 to state S3, according to the probability factor a13 of the transition probability matrix (the first stochastic process). Once in state S3, the system emits an observation, let’s say O5, according to the probability factor b5 of the second stochastic process.
Since it is not possible to observe directly the state of the system, these states can only be deduced from the analysis of the sequences of observations that are emitted by the system.

1 2 3 4 5 6 7 Time(t)
Output(Observations)
8
System(state q)
Control(Ctrl)
Input(In)
States
Observations
q1 q2 q3 q4 q5 q6 q7 q8
O1 O2 O3 O4 O5 O6 O7 O8
S2S1
S3 S4
a12
a21
a13
a11
b1 b2 b5
O1 O2 O5(…) (…)
A) B)
DRDC-RDDC-2017-R003 45
– The utilization of HMM and input data within TotalADS:
When λ—(A, B, π)—is well defined, the HMM represents how the system behaves when controls and input are imposed on the system. It reflects the evolution of the state of the system and the corresponding observations.
In the case of online anomaly detection, λ is not known in advance. It is obtained through appropriate training of the HMM, as shown later on. Controls and input imposed on the system are determined by the user and the operating system that are executing software applications and functions. These executions change the state of the system and generate corresponding system call events, which are actually the observations shown in Figure 14A.
“Observed” trace events are first abstracted and then sent to the HMM. The abstraction process replaces each event by the kernel module in which it is defined. Table 2 shows the list of modules and the total number of system calls that belong to each module.
– The training of an HMM:
The HMM has to be trained with normal observations—abstracted execution traces—in order to identify the values of the λ parameters that will best represent the system behaviour. The Baum-Welch iterative procedure is used for that purpose. Such relatively complex algorithms must be used because there is no optimal way of estimating the model parameters of the HMM.
– Validation:
Having determined the values of the parameters of λ, it is then possible to adjust the value of a threshold parameter that will determine if the content of any abstracted execution trace submitted to the HMM contains anomalies or not. The HMM adjusts the decision threshold of anomaly detection on sequences from abstracted execution traces that are not the same as the ones that were used to train the HMM.
– Anomaly detection:
Anomaly detection in execution traces consists of abstracting the sequence of trace events using the same abstraction process that was used in the training and validation process. This abstracted sequence is then submitted to the HMM using λ as parameters in order to evaluate the probability of this sequence. If the probability value is below the threshold value, then it is considered as anomalous, otherwise it is considered as normal.
Results:
Experiments involved three publicly available datasets of execution traces to test the HMM. These traces were abstracted into kernel module interactions and then transferred as input to the HMM. Different numbers of HMM states were studied—𝑁={5, 10, 15, 20}—in order to understand how true/false positive rates can be raised/lowered.
“Each trace was segmented into contiguous sequences of length 100 events, using a sliding window shifted by one event. In previous work on system call anomaly detection […], it was
46 DRDC-RDDC-2017-R003
empirically found that HMMs trained on sequences of length 100 provide a high level of detection accuracy.”
“To improve the execution time of the HMM, duplicate sequences were removed from all the traces of the training, validation and testing set. This reduced the number of sequences by approximately 90%. The HMM was then applied to the adjusted traces by implementing it in R […]. This tuning of the HMM during training is needed for the HMM to be effective in operation.”
The results show that the utilization of the abstracted kernel module interaction traces instead of raw system calls can lead to a similar or lower number of false alarms with considerably shorter execution times.
“For the ADFA dataset, HMM using kernel modules did not perform as well as with system calls. The authors think that this is due to the nature of the ADFA dataset itself. The dataset was collected by exercising various scenarios on multiple Linux systems. The number of normal traces used for training the HMM is too small (833), which resulted in many unseen cases during the operation, hence a higher positive rate for both representations (system call and kernel module traces) than in other datasets. The authors are still not sure as to why kernel module traces resulted in more false positives than system calls. They think that the HMM is sensitive to the size of the alphabets in the dataset (eight in the case of kernel module traces and 57 for the system calls used in the ADFA dataset).”
“Despite the results we obtained using the HMM on the ADFA dataset, the authors have demonstrated that kernel module traces perform better than system call sequences. The execution time of the HMM using the datasets includes training, validation and testing time. The authors observed that the kernel module representation achieves an execution-time gain of up to 96%. Moreover, kernel module traces consume less space (up to 93% less), which clearly shows the advantage of using kernel module interaction traces, especially when applied to large (and more realistic) systems. They concluded that kernel module interaction traces can be used to significantly reduce the execution time of the anomaly detection techniques.”
“When put together, kernel module interaction traces hold real promise in allowing existing anomaly detection such as SQM and HMM to scale up to large datasets without compromising accuracy. To build on this work, the authors need to continue experimenting with other datasets. They also need to study malware and understand situations where attacks do not manifest themselves at the level of kernel module interactions.”
Implementation in TotalADS:
The Apache Mahout HMM algorithm [40] was used to implement HMM in TotalADS.
4.7 Detection technique 3—Kernel Space Modelling (KSM)
The text written in sans-serif double-quoted text “sans-serif” in this section was copied verbatim from [32].
Context:
This section “introduces a completely novel way of interpreting the raw system call traces by employing a semantic interpretation of system call interactions at the level of kernel modules

DRDC-RDDC-2017-R003 47
(states). Though system call sequence analysis has higher sensitivity, the state sequence analysis allows better system understanding and lower false alarm rates.”
A full description of the KSM algorithm as well as the results of validation and testing using publicly available datasets and known cyber-attacks can be found in [32]. This section gives a high-level description of this technology.
Concepts and technologies:
The KSM algorithm uses sequences of kernel states instead of system call events to detect anomalies in execution traces. Anomalies are identified by comparing the “probabilities of occurrence of states in normal and anomalous traces.”
The technique used to transform Firefox system call traces into sequences of kernel states is illustrated in Figure 15. For example, the three consecutive system calls to the kernel memory manager that were made by Firefox—probably through libc—result in three distinct trace events “e” in the execution trace.
The system call trace is abstracted by replacing all events in the execution trace by the name of the kernel module they belong to (Table 2 lists these names) and collapsing repetitions of each kernel module. As an example, Figure 15 shows that the three consecutive events “e” corresponding to three memory management system calls are replaced by only one kernel state, memory management (MM). The abstraction process lowers the number of elements to be analyzed during the anomaly detection process.
System call events occur at specific points in time, have no duration and represent state transitions. “In the state sequence, a state occurs for a specific time duration, and a transition takes place from one state to another […]. For example, an application can be performing file system operations, memory management operations, network operations, kernel operations, and so on. The two concepts of events and states are integrated because state transitions are triggered by events but they differ in their representation and analysis.”
“State sequences are particularly useful in the visualization of system call events in traces. For example, if we were to visualize Linux-based system call traces by representing every system call with a colour then a chart would have resulted with more than 300 (the number of distinct system calls in a typical Linux kernel) colours and become incomprehensible. However, if the system call events are grouped to form valid states then the behaviour of an application can be illustrated on a chart.”
As shown in Figure 15, consecutive kernel states are grouped into state sequences having a length of ten intervals. A difference of more than “ten units” creates a new sequence. In other words, the trace is transformed into a sequence of states, and the sequence is then cut up into sub-sequences of ten states. The value of ten was chosen “because it can accommodate traces of small to large sizes. Each state sequence shows that an application spends a certain amount of time in one state and then moves to another state.”

Execution trace (events are system calls)
1 2 3 4 5 6 7
e e e
MM
(…)(…)
Kernel states (events are now kernel states)
MM (…)(…)
8 9 10
User space(Firefox is running)
System calls
Kernel space
libc
Mapping processSystem call->kernel module
3 consecutive calls to the memory manager kernel
module
Abstraction process
Sequencing process
Sequences of kernel states of
length 10
LTTng
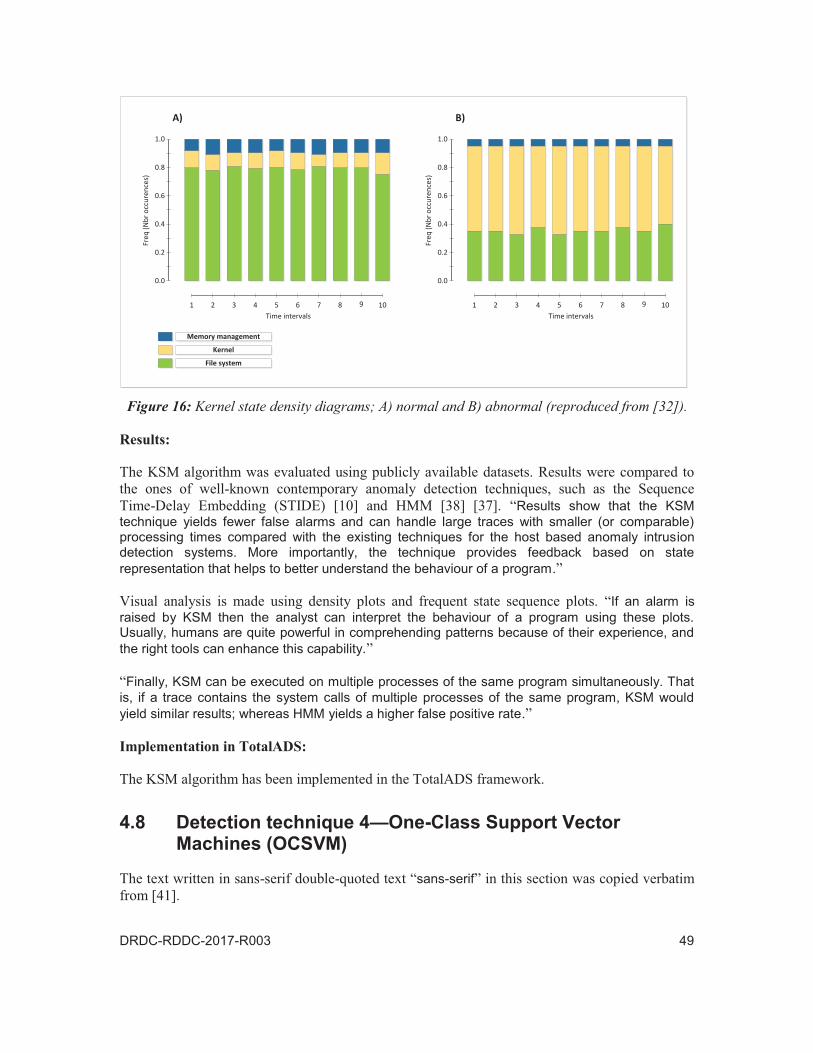
1 2 3 4 5 6 7 8 9 10
0.0
0.2
0.4
0.6
0.8
1.0
Time intervals
Freq
(Nbr
occ
uren
ces)
1 2 3 4 5 6 7 8 9 10
0.0
0.2
0.4
0.6
0.8
1.0
Time intervals
Freq
(Nbr
occ
uren
ces)
A) B)
Memory management
Kernel
File system
50 DRDC-RDDC-2017-R003
Context:
Previous sections showed that the SQM, IHMM and KSM algorithms are well adapted for the analysis of chronological data representing software activities at the interface between the user and kernel spaces of the Linux operating system. These can learn directly from data streams—system call events. Another type of machine learning technique was studied; the One-class support vector machine (OCSVM).
Support vector machines (SVM) are supervised learning models and algorithms—or more precisely non-probabilistic binary linear classifiers—that analyze data for classification and regression analysis. A two-class model can be trained with a dataset {xi, yi} where the variable X represents the data and the variable Y specifies the classes they belong to. Once the model is trained, the SVM can be seen as a spatial representation containing categories of data—according to feature vectors—that are separated by gaps, which are as wide as possible. New data {zj} can be mapped into this space to identify the category to which it belongs—by examining the side of the gap it falls on.
It is also possible to perform non-linear classification when the linear classification does not succeed in resolving the categories. This is done by mapping the data into high-dimensional feature spaces using the kernel trick [42]. The method is similar to the linear one but it uses a specific kernel function (a mathematical term, unrelated to the computer science meaning) to fit the gap between categories in the feature space.
The SVM algorithm is not well suited if the available data have only one class, such as the data we use in our detection algorithms—system calls events. Moreover, chronological series of system calls cannot be directly used by SVM because it requires fixed-length numeric feature vectors as inputs. The One-class support vector machine (OCSVM) algorithm is much more adapted for anomaly detection. It is used to build normality models based on normal system calls that were transformed into fixed-length feature vectors using a new mapping technique. Further data are tested against the model to determine if they can be considered similar to or different from the normality. “Essentially, the OCSVM algorithm maps the input data into a high-dimensional feature space using non-linear kernel functions and then attempts to find the maximal margin hyperplane that separates the training data points from the origin.” It treats the origin as the only member of the other class.
A full description of the OCSVM algorithm as well as the results of validation and testing using publicly available datasets and known cyber-attacks can be found in [41].
Results:
The OCSVM detectors were trained with two sets of feature vectors that were extracted from the normal training traces of the ADFA-LD dataset using the LIBSVM library [43]. The training and performance comparison of OCSVMs were made using two common kernel functions: linear and Gaussian kernel functions.
“Results show that […] our anomaly detection using OCSVM trained on our feature vector achieves higher detection accuracy and lower rates of false alarms than that of STIDE, HMM and the ADS proposed by the creators of the ADFA-LD dataset.”
DRDC-RDDC-2017-R003 51
Implementation in TotalADS:
The OCSVM algorithm is not yet implemented in the TotalADS framework.
4.9 Optimization techniques—Iterative Boolean Combination (IBC) and Pruning Boolean Combination (PBC)
The text written in sans-serif double-quoted text “sans-serif” in this section was copied verbatim from [44, 45].
Context:
Anomaly Detection Systems (ADSs) monitor for significant deviations from normal software behaviour. Different techniques have been investigated in AHLS for detecting anomalies in system call sequences. Among these, Sequence modelling (SQM), Hidden Markov models (HMMs), and One-class support vector machines (OCSVMs) have shown high degrees of anomaly detection accuracy.
Although ADSs can detect novel attacks, they may generate many false alarms due to the difficulty in building comprehensive normality models. For example, “a single HMM may not provide an adequate approximation of the underlying data distribution of a complex host system behaviour due to the “many local maxima” of the likelihood function.”
“Ensemble methods have been used to improve the overall system accuracy by combining the outputs of several accurate and diverse models […]. In particular, combining the outputs from multiple HMMs—each trained with a different number of states—in the Receiver Operating Characteristic (ROC) space according to the Iterative Boolean Combination (IBC) has been shown to provide a significant improvement in the detection accuracy of system call anomalies.”
The work described in this section focuses on the combination of detectors with the goal of raising/lowering true/false positive rates. It is expected that “combining diverse and accurate detection algorithms—which commit different errors—will provide complementary information that can be exploited by the combiner to reduce the number of false alarms.” The use of complementary detectors may also contribute to making the set of detection algorithms more resilient to evasion attacks than a single-detector system; the combination of multiple heterogeneous detectors will further improves ADSs resilience to adversarial attacks. Annex B provides a discussion on evasion and adversarial cyber-attacks.
Two studies were conducted in AHLS in order to allow the simultaneous utilization of different detectors. The first one used the Iterative binary combination (IBC) technique to combine results from SQM, HMM and OCSVM models. A new mechanism was developed for the mapping of system calls into fixed-sized feature vectors (Section 3.2.9), which represents the standard input for most machine learning techniques.
The second study pushed further this work by proposing an efficient mechanism allowing the aggressive pruning of redundant and trivial detectors, reducing the time needed to identify the best detectors—the Pruning Boolean Combination (PBC).
52 DRDC-RDDC-2017-R003
A full description of both techniques (IBC and PBC) as well as the results of validation and testing using publicly available datasets and known cyber-attacks can be found in [44, 45].
Results:
– IBC:
“The combination of responses from heterogeneous detectors using IBC can reduce the number of false alarms while increasing the detection accuracy (without a significant performance overhead) compared to the use of homogeneous detectors. Results on two modern and large system call datasets generated from Linux and Windows operating systems show that the proposed ADS consistently outperforms an ADS based on a single best detector and on an ensemble of homogeneous detectors. At an operating point of zero percent false alarm rate, the proposed multiple-detector ADS increased the true positive rate by 75% on the Linux dataset and by 20% on Window dataset. Furthermore, the combinations of decisions from multiple heterogeneous detectors make the ADS more reliable and resilient against evasion and adversarial attacks.”
– PBC:
The PBC algorithm was evaluated using “publicly available datasets. The performance of the PBC using both pruning techniques is compared to that of IBC (and other techniques) in terms of ROC analysis and time complexity.”
“The results show that PBC with both pruning techniques is capable of maintaining similar overall accuracy as measured by the ROC curves to that of IBC. However, the time required for searching and selecting (or pruning) the subset of detectors from the same ensemble of detectors is on average much lower for PBC with MinMax-Kappa pruning. Furthermore, the experimental results show that PBC with both pruning techniques always provides only two crisp detectors for combination (during the operations), while IBC provided an average of 11 detectors to achieve the same operating point.”
The important result from this study is that the “proposed PBC-based ADS is able to prune and combine a large number of detectors without suffering from the exponential explosion in the number of combinations provided with the pairwise brute force Boolean combination techniques. This has been shown analytically (in the time complexity analysis) and confirmed in the experimental results. The proposed PBC approach is also general and can be applied to combine any soft or crisp detectors or two-class classifiers in a wide range of applications that require a combination of decisions.”
Implementation in TotalADS:
The IBC and PBC algorithms are not yet implemented in the TotalADS framework.
DRDC-RDDC-2017-R003 53
5 OCS3 within the operating system kernel (AHLS Track 4)
The kernel of an operating system is typically the most trusted software component of a computer because it runs with the highest privileges. The presence of vulnerabilities in the kernel therefore poses dangerous threats to system security. For example, buffer overflow exploits can be used to tamper with kernel functionality to launch various attacks such as escalating the privilege of malicious programs, opening backdoors, stealing information and disabling OS-level defences. The reader may refer to Annex C of this document for a comprehensive analysis of kernel exploits for the Linux operating system.
The cyber-security of the operating system is compounded by kernel extensions such as device drivers (under the form of kernel modules) that run with the same privileges as the core kernel. Kernel modules that are dedicated to specific hardware devices on a computer are often developed by third-party organizations, which may not always respect the golden rules of kernel development and thus produce buggy modules. On the other hand, malicious organizations may introduce very-hard-to-find malicious code such as rootkits in their modules, which will silently compromise the kernel at runtime. They cannot be trusted like other Linux kernel modules because they may contain vulnerabilities or even malicious code. For example, a kernel-level vulnerability within a kernel extension can be used to install kernel rootkit software. Such a rootkit poses a serious risk because it is specifically designed to hide its presence, making it hard to detect. A rootkit may for example subvert the security software that aims to detect it.
L2CS technologies (Figure 2) for OCS3 within the kernel of the operating system are described in this chapter. The Granary framework was developed to protect the kernel against compromised or buggy kernel modules (like third-party device drivers). As shown in Section 5.1, any kernel module is taken in charge by Granary, which makes sure the kernel cannot be impacted in any way by compromised or buggy device drivers.
A new event-based language is also described in Section 5.2. It helps developers work on kernel modules without having to deal with the assembly code, which is difficult, error-prone, and time-consuming. Using this language, it becomes much easier to modify “unknown” kernel modules.
Finally, a new framework for kernel memory monitoring is described in Section 5.3. It simplifies kernel module analysis and debugging. This framework can provide context-specific information on memory accesses and adds more versatility. For example, access to a monitored memory location—or a range of memory locations—at one point will instantaneously generate events and corresponding information, like the LTTng software tracer that generates an event when one of its probes is executed by a CPU. This information can be used to identify legal and illegal kernel memory accesses at runtime. This is particularly interesting because it can detect malicious activities within the kernel, which cannot be done by traditional security systems with that much versatility.
This chapter describes the work that was done in Track 4 of the AHLS projects under the supervision of Professor Ashvin Goel from the University of Toronto. The text included in this
54 DRDC-RDDC-2017-R003
section is taken from scientific presentations, papers, reports and theses as well as emails sent by Professor Goel. The text that is copied verbatim from other documents is written as sans-serif double-quoted text “sans-serif”. Text in italic emphasises key points in the text.
5.1 Granary; a framework for kernel-level dynamic binary translation
The text written in sans-serif double-quoted text “sans-serif” in this section was copied verbatim from [46, 47, 48].
Context:
“Over the years, researchers have attempted to address the problem of kernel extensions misbehaving and potentially compromising the kernel. This problem has been approached using compile time and run-time checking/annotations […], hardware protection domains […], by moving extensions into user space […], and by extending virtual machines (VMs) and hypervisors with the ability to introspect and monitor a running kernel and its extensions […]. While these approaches have already achieved many of the goals of this research, all suffer from at least one of the following issues: i) they depend on VMs/hypervisors, and thus limit the breadth of extensions which can be monitored, or; ii) they require a custom compilation toolchain and/or kernel modifications, and so limit the likelihood of their integration within existing OS build processes.”
Also, signature-based detection systems will not work well for attacks on the operating system kernel because kernel rootkits can be very sophisticated. It is hardly possible to define a signature representing a rootkit because they function similarly to benign kernel code. On the other hand, modern intrusion detection systems such as anomaly detection algorithms, which typically analyze system calls, are also insufficient to detect these rootkits because they can execute entirely in the kernel context without issuing any system calls.
“A high level of security against misbehaving kernel extensions can be achieved and is desirable. AHLS experts think that the best way to encourage the adoption of secured kernel extensions by existing commodity kernels is by showing that arbitrary extensions can be securely executed. As shown in this section, the approach uses dynamic binary instrumentation (DBI) to achieve this goal […]. The authors have implemented a proof-of-concept that enforces control-flow integrity (CFI) constraints […] in the Linux kernel using the DynamoRIO Kernel (DRK) DBI framework […].
The choice of DRK as a host platform was motivated by its ability to provide fine-grained control over instrumentation. The prototype is loaded as a kernel module, which transparently monitors all control-flow transfers while the kernel is running. The system is able to detect and report unauthorized control transfers by potentially malicious kernel modules. Building on this, a security system—Granary—was developed to protect the kernel from multiple types of malicious activity by untrusted extensions.”
A full description of Granary can be found in [47, 48]. This section gives a high-level description of this technology.

(1) The module is just-in-time compiled into a private DRK code cache
Application Application
Kernel
Wrapper
Wrapper
Instrumented module
Shadow memory
DRK
1
2 2
3
ddd
(2) Control flow transfers are mediated by kernel-to-module and module-to-kernel wrappers
(3) Instrumentation code enforces read and write permissions stored in shadow memory
The DynamoRIO Kernel (DRK) secures modules by modifying their binary code at runtime
DRK
User space
Kernel space

56 DRDC-RDDC-2017-R003
A high level of security is achieved in the kernel by “isolating instrumented modules into code caches, monitoring all their interactions with the kernel”. This approach represents an important challenge because the “OS kernel & its extensions reside in the same address space and DRK, despite having complete control over all kernel execution, has no clue about when these extensions start executing”. The problem is “tackled by dynamically inserting impassable barriers between the kernel and its extensions using hardware page protection in a similar fashion to Nooks […] and Gateway […]. Any transition from kernel page table to extension page table will generate a page fault which will start the instrumentation system” (Figure 17).
The first time a kernel module is required, it is (just-in-time) compiled into a private DRK code cache (1 in Figure 17), which uses dedicated shadow memory (3). The execution of the instrumented module is guaranteed by a “wrapper” that manages the control flow between the kernel and the modules (2). Granary wraps module functions even if the module source code is not available.
The interface layer “mediates communication between kernel and instrumented extensions and guarantees control flow integrity (CFI) by enforcing the following conditions: kernel code integrity must be maintained; all call and jump instructions between extensions and the kernel must target trusted entry points; and all return instructions must target the instruction following the call.”
“Direct and indirect branches that transition from the code cache to the kernel “detach” the instrumentation system by branching to the desired address if that address is a trusted entry point. Once loaded into the Linux kernel, the system replaces Linux’s exception and interrupt handlers and the system call table, and any future modifications to these subsystems is disallowed” [46]. Kernel code can thus be executed in two modes: a) executions under the control of Granary (the execution of instrumented code in the Granary code cache using the shadow memory) and b) native executions (the non-module kernel code).
The main characteristics of Granary are described in the following lines [49]:
1. It allows the comprehensive analysis of any kernel modules. “Granary is comprehensive because it controls and instruments the execution of all module code. It maintains control by ensuring that normal module code is never executed. Instead, only decoded and translated module code is executed. Translated module code contains instrumentation and always yields control back to Granary. All modules can be instrumented in this way because dynamic binary translation operates on binaries and does not depend on any hardware features.”
2. It imposes no performance overhead on non-module kernel code. “Kernel code runs without overhead because Granary relinquishes its control whenever an instrumented module executes kernel code. Granary implements a novel technique for regaining control when kernel code attempts to execute module code. Each time some instrumented module code invokes a kernel function, each of that function’s arguments is wrapped. Argument wrappers are type- and function-specific, and ensure that potential module entry points (e.g. module function pointers) are replaced with behaviourally equivalent values that first yield control to Granary.”
3. It requires no changes to modules and minimal changes to the kernel. “Less than 100 LOC were changed in the Linux kernel in order to support Granary.”

DRDC-RDDC-2017-R003 57
4. It is easily portable between different hardware and kernel versions. “Granary’s wrapping mechanism is portable across different kernel versions because the majority of wrappers are automatically generated by a GCC plugin and several meta-programs.”
Results:
Detailed analysis of kernel module binary code can be achieved by Granary. This framework enables the monitoring through code instrumentation and the manipulation of any instruction in existing kernel binary code before it is executed by a CPU. Subtle errors as well as malicious code can be detected just-in-time and reported. The main advantages of Granary are that: a) it operates at the level of instructions, b) it operates on binaries, no recompilation is necessary, and c) it allows the instrumentation of all the binary code, providing comprehensive coverage.
“Considering the complexity of this technology, Granary is still a work in progress. It works on multi-core processors with pre-emptive kernels, and incurs a modest decrease in throughput of 10% to 50% for network device drivers. Granary was used to isolate and comprehensively instrument several network device drivers (e1000, e1000e, ixgbe, tg3) and file system modules (ext2, ext3). It was also used to develop an application which enforces partial control-flow integrity policies. These policies disallow modules from executing dangerous control-flow transfers” [49].
5.2 An event-based language for dynamic binary translation frameworks
The text written in sans-serif double-quoted text “sans-serif” in this section was copied verbatim from [48].
Context:
DBT frameworks such as the one implemented in Granary are a powerful approach allowing comprehensive analysis of kernel binary code, but they require developers to work at the assembly-code level, which is difficult and time-consuming. A new event-based language for DBT (EBT) was thus developed to help instrumenting binary codes. The new EBT is inspired by the event-based model of the SystemTap and DTrace languages. A script using the EBT language contains the information that will determine how the binary code will be instrumented. The running of a probe in the instrumented binary code will generate an event and corresponding handler code will be executed in response to this event.
“The EBT is implemented as a translator program that converts a script program to source code for a DBT client. The translator can also automatically compile and run the resulting client against a specified target program. […] Events are specified using a general model consisting of a small set of primitives combined with a mechanism to compute additional predicates over data available from the context of the event. The EBT language translator resolves these high-level events to an exact description of how to instrument each location in the target program, producing C source code for an analysis tool based on the DynamoRIO DBT framework” [48].
A full description of the new EBT language can be found in [48]. This section gives a high-level description of this technology.
58 DRDC-RDDC-2017-R003
Concepts and technologies:
“An EBT user writes their analysis tool in the form of a script program, which can include declarations specifying probes, global data, and functions. Probes describe instrumentation that is to be inserted into the target program. Global data is used to store information collected by the probes, either in the script’s local memory or as shadow memory values associated with specific address locations in the target program’s memory, managed by a framework such as Umbra […].”
“Functions can be called from elsewhere in the script as in any high-level scripting language. […] The instrumentation performed by an EBT script is described as a series of probes. Each probe consists of an event expression along with an associated handler code block. This follows a clear separation of concerns: the handler code is used to describe what additional code to insert into the target program, while the event expression identifies when that code should run. The answer to the question of ‘when?’ may be as simple as ‘a specific point in the target program’s code’, or it may require computing a complex series of predicates to satisfy a query such as ‘every instruction matching a certain predicate’ or ‘every access to a certain memory object’. As a secondary concern, the event expression also describes what data from the target program are available when the handler code runs. Data which can be obtained from within the target program at the point where the event occurs are called context data.”
“This separation is also a good reflection of the internal logic of a DBT client. A client for a DBT framework must include code to identify where to instrument the target program as well as code that will actually be injected into the target program. Computations relating to the former task can be described as running during ‘instrumentation-time’, while computations occurring in injected code can be described as happening during the target program’s ‘run-time’. Event expressions in EBT correspond to instrumentation-time code, while handler blocks execute at run-time. The language used inside the handler blocks is a simple scripting language inspired by the SystemTap language […]. It supports control-flow, function calls, and allows access to global data structures such as associative arrays.”
“The event description language in EBT pertains entirely to instrumentation-time computation. Event expressions are composed using combinators out of basic events and context specifiers, each of which may include predicates.”
“Basic Events. Each basic event provided by EBT refers to a category of events occurring in the target program. […] Each basic event defines a corresponding set of context values which provide further information about the event occurrence to the subsequent handler block as well as to any predicates in the event expression.”
“Context Specifiers. When the context value provided by a basic event does not include necessary data, additional context can be obtained using specifiers. For example, the function specifier imports context information about the current function. By itself, a specifier does not suggest a location to instrument; in order to form a valid event expression, it must be combined with a basic event. […] Through the use of specifiers, the script makes explicit which context data are being made available to each handler.”
“Predicates. Predicate expressions are placed in parentheses ‘()’ after an event expression, and cause the DBT framework to only place instrumentation at locations for which the expression inside the predicate evaluates to ‘true’. Predicate expressions are capable of performing arbitrarily complex computation on these values by invoking functions
DRDC-RDDC-2017-R003 59
elsewhere in the script. Judicious use of predicates is important to ensure that the DBT framework only inserts instrumentation relevant to the desired analysis.”
“Combinators. Event expressions can be combined using ‘and’ and ‘or’. Whereas ‘and’ can be used to combine a basic event with an arbitrary number of specifiers, ‘or’ is used to combine two alternate events: the corresponding handler block is run whenever either one of the alternate events occurs.”
“The current prototype version of EBT targets the DynamoRIO framework.”
Results:
“The current version of the translator provides a proof-of-concept showing that a language structured around the ideas of events and context data is significantly more effective to work with than the APIs directly provided by a dynamic binary translation framework. As a rule of thumb, what takes hundreds of lines of boilerplate to implement in DynamoRIO takes only ten lines or so of scripting using EBT to accomplish.”
“This reduction in complexity has a particularly significant impact when the user wants to study their program in an exploratory fashion, changing their analysis repeatedly until they find the information they were looking for. […] Additional work is needed for EBT to become a mature and practically useful language.”
5.3 Behavioural watchpoints; A kernel-level software-based watchpoint framework
The text written in sans-serif double-quoted text “sans-serif” in this section was copied verbatim from [50, 51].
Context:
Traditionally, the analysis and debugging of kernel modules are challenging tasks. Static analysis of module source code is difficult because of the tight interaction between modules and the kernel. Furthermore, some modules are only distributed in a binary format, which makes static analysis intractable. Existing dynamic analysis tools capable of instrumenting modules are not suited for module analysis. They either impose unnecessary performance overhead, lack flexibility, or are too coarse-grained.
Dynamic Binary Ttranslation (DBT) systems such as Granary provide a powerful facility for building program analysis and debugging tools but they are low-level and provide limited contextual information for instrumentation tools. A new software-based watchpoint framework that simplifies the implementation of DBT-based program analysis and debugging tools was developed—the behavioural watchpoint framework. This framework simplifies the utilization of Granary by providing context-specific information at the instruction level and specializing instrumentation to individual data structures.
A full description of the behavioural watchpoint framework can be found in [50, 51]. This section gives a high-level description of this technology.
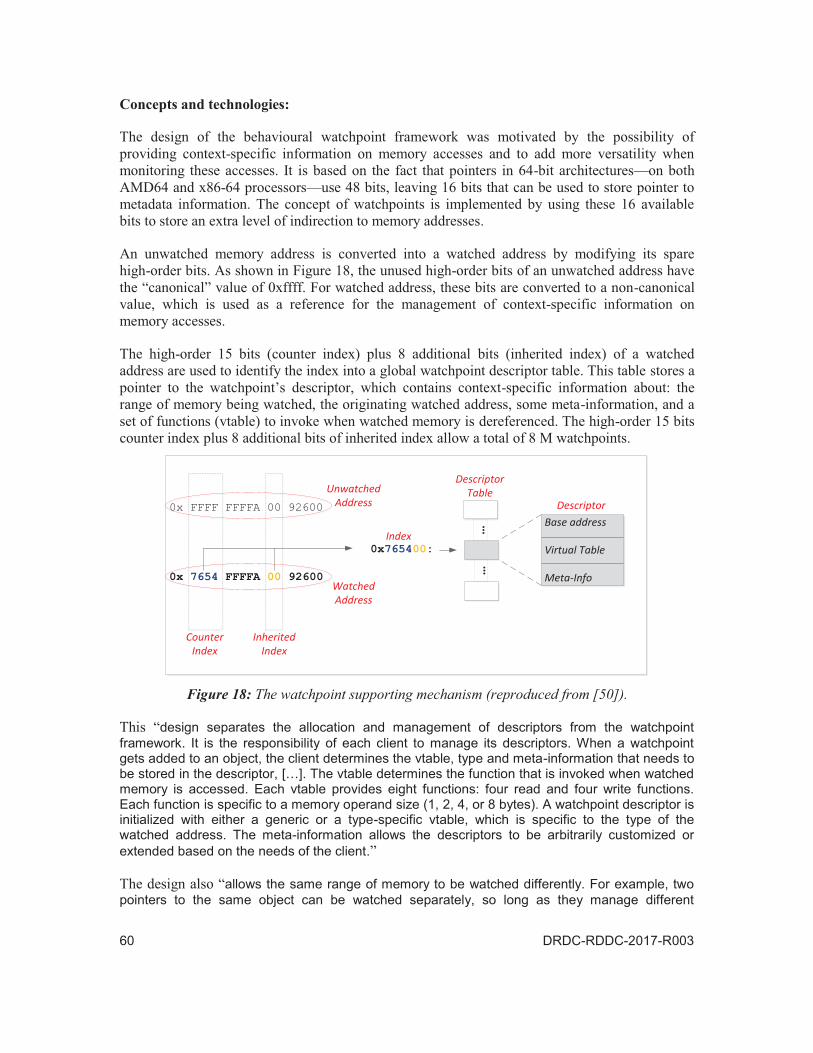
0x FFFF FFFFA 00 92600
0x765400:0x 7654 FFFFA 00 92600 …
Base address
Virtual Table
Meta-Info
…
FFFF 00
Counter Index
Inherited Index
Index
Descriptor Table
Descriptor
0
0Unwatched
Address
Watched Address

DRDC-RDDC-2017-R003 61
descriptors. This feature is useful for distinguishing logically different objects that occupy the same memory. For example, this feature enables efficient detection of use-after-free bugs without preventing deallocated memory from being immediately reallocated for use. Having one watchpoint for the freed memory, and another watchpoint for newly allocated memory occupying the same space is critical for this application” [50].
Finally, “behavioral watchpoints can be used virally. If an address A is watched, then every address derived from A (e.g., through copying or offsetting) is also watched.”
Results:
Four different types of memory error and protection applications were made using behavioural watchpoints. They were successfully used to detect buffer overflows, read-before-write bugs, memory freeing bugs, memory leaks in the Linux kernel, and to enforce fine-grained memory access policies for Linux kernel modules.
The concept of behavioural watchpoints offers the possibility of isolating and enforcing control-flow integrity policies on Linux kernel modules, which could represent an important improvement to the cyber-security of the kernel of the Linux operating system.
62 DRDC-RDDC-2017-R003
6 OCS3 and small-scale computers (AHLS Track 5)
The last decade has seen huge developments in the domain of Small-Scale Computers (SSCs), yielding miniaturized Linux-based computing electronic boards essentially made of a multicore CPU, memory, and GPU arrays with added wireless capabilities. These provide more computing power per unit of electrical power and their small size makes them easily embedded in many types of military systems.
Like any computers, SSCs have software vulnerabilities within, which can be exploited by hackers at runtime. The running of cyber-security systems on these SSCs may represent a challenge for many reasons. First, if their CPUs offer more computing power per unit of electrical power, their computing capabilities are not as great as those of general-purpose computer CPUs. The same is true for memory. Moreover, when SSCs are embedded in portable devices, battery limitations may also represent another challenge that needs to be addressed. These factors limit the number and types of cyber-security systems that can be run on these devices. L1CS and L2CS detection technologies must be appropriately adapted for these devices.
Different options were studied in AHLS in order to find appropriate ways to adapt OCS3 for SSCs, according to their constraints (Section 6.1). Other solutions such as the utilization of the SSC GPU are also studied (Section 6.2). In addition, the possibility of connecting and running many SSCs in clusters, forming a portable low-power flexible computing unit that can be used as an independent detector system, is studied (Section 6.3).
This section describes the work that was done in Track 5 of the AHLS project under the supervision of Professor Chamseddine Talhi from École de technologie supérieure (ÉTS). The text included in this section is taken from scientific presentations, papers, reports and theses as well as emails sent by Professor Talhi. The text that is copied verbatim from other documents is written as sans-serif double-quoted text “sans-serif”. Text in italic emphasises key points in the text.
6.1 OCS3 on Small-Scale Computers (SSCs)
The text written in sans-serif double-quoted text “sans-serif” in this section was copied verbatim from [52, 53, 54].
Context:
With nearly 2000 malware discovered every day, the Linux-modified Android platform is one of the most popular targets for malware. The running of OCS3 algorithms on these devices represents a hard challenge due to the limited resources of these devices. The popular Overo FE COM and APC 8750, for example, have restricted resources with at most 512 MiB of RAM and 800 MHz of CPU. Even the brand new Samsung Galaxy S5 with 16 GiB of on-board storage has less than 8 GiB of usable storage.
Most of the existing embedded anti-malware solutions do not make an economical utilization of the devices’ physical resources. Examples are AntiMalDroid and DroidAPIMiner [52, 53, 54].
DRDC-RDDC-2017-R003 63
Other solutions use machine learning that requires high-speed calculations or Data Mining that involves huge data management. Examples of anomaly detection algorithms are Hidden Markov Models, Support Vector Machines, Neural Networks and statistical profiling. Forrest et al. [55] built a model of normal behaviour based on fixed-length sequences of system calls. Hubballi et al. [56] created a set of bins for different lengths of n-gram, and Kymie et al. [57] tried to find the optimal size of n-gram which offers the best detection rate.
Although these approaches maintain high detection rates, they must be adapted to small-scale devices. The implementation of these algorithms in small-scale systems requires efficient online management. There has been a lot of work done in this field. Amontamavut et al. [58] suggest sending traces to a server via the network and performing remote monitoring. This approach requires continuous availability of the server, which is not guaranteed. Wang et al. [59] used a detection algorithm based on compression in order to prevent huge sizes of log data, Amontamavut et al. [58] used a compressor in order to decrease log data collection/size overhead.
A detection framework is first proposed to study OCS3 on Android-based devices. Normality models for mobile applications and online analysis can be built locally and/or remotely, using a lossless compression technique for storing and transferring traces and models. Storage area and the transfer cost of data over the network are minimized.
Then, new filtering and abstraction processes are presented to further improve OCS3 on Android devices. The studied techniques can reduce the time and space complexities associated with the running of anomaly detection algorithms, which take as input system calls that are triggered by 200 of the most popular free Android applications.
A full description of this work can be found in [52, 53, 54]. This section gives a high-level description of this technology.
The following research questions drove this work:
What is the best trade-off between security and usability?
How should security mechanisms be adapted to system resources availability?
Can more than one detection algorithm be run when resources are available?
Concepts:
– The experimental framework:
An experimental framework was built to study the different aspects of the research questions. The framework was built to study different configurations of security-systems on Android-based devices. It makes possible the local/remote building of trace-based normality models for software applications as well as the local/remote execution of anomaly detection algorithms for OCS3. Traces and models are stored in compressed format using a lossless compression technique. This increases the storage area and reduces the costs of data transfer over networks. Traces are serialized before being exported to a remote server.
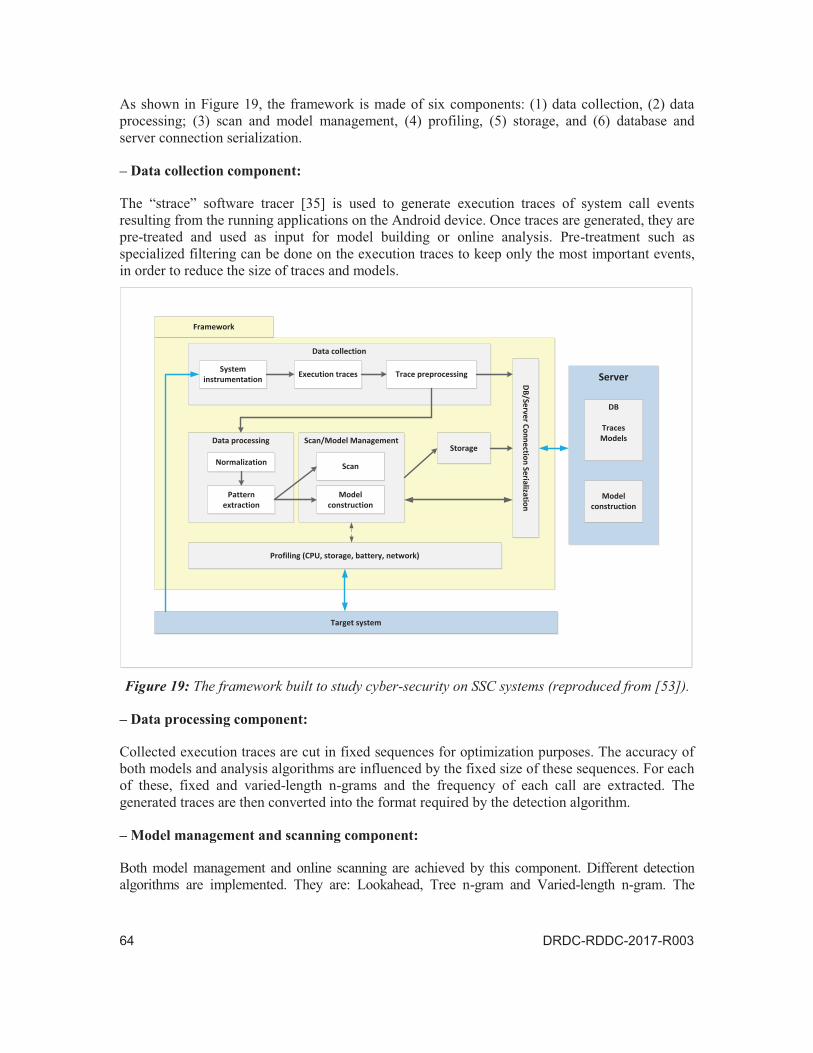
Data collection
Target system
System instrumentation Execution traces Trace preprocessing
DB/Server Connection Serialization
StorageData processing Scan/Model Management
Profiling (CPU, storage, battery, network)
Server
DB
Traces Models
Model construction
Normalization
Pattern extraction
Scan
Model construction
Framework
DRDC-RDDC-2017-R003 65
Lookahead algorithm is similar to the SQM algorithm (Section 3.2.6). The normality model is built using a sliding window across the training normal traces. For example, for a window of size k=3 and the following trace {a, t, f, o}, the following normal records will be kept: {a, t, f}, {t, f, o}. These represent the normal subsequences of length 3 that are expected in the trace. Online detection consists in searching observed subsequences of the same length in the set of normal records. Different measures such as the Hamming distance can be used to determine if an observed subsequence should be considered normal or abnormal.
The Tree n-gram model uses the same sliding window approach (called sequence in the text), “but instead of regrouping them by position, this algorithm generates a tree where each node represents a system call in the form of a tuple < ai; frequency >, where ai denotes the system call in position i of a n-gram and frequency denotes the number of times the system call appeared in this position while sliding over the whole sequence in the normality model. Therefore, a branch of a tree contains an n-gram with the frequency of appearance for each system call” […]. Online detection consists of building a tree using the same method and observations and comparing computed tuples with the ones of the normality model.
The Varied-length n-gram algorithm reduces the model size while maintaining detection efficiency. It extracts only frequent patterns made of n-grams of various lengths.
– Storage component:
Storage is also a limited resource on mobile devices. The open source higher compression Zopfli tool—released by Google in 2013 [60]—was used in this research to optimize the memory budget consumed when saving the generated normal models, while allowing perfect reconstruction of the original data from the compressed data. It compresses around 3.7% better than any zlib-compatible compressor.
– Data filtering and abstraction [54]:
Anomaly detection algorithms implemented on general purpose computers and servers—such as the ones studied in Section 3.2—usually produce accurate normality models, which yield low false positive rates. Unfortunately, accurate detection comes at the price of expensive computation and memory usage, which represents a problem for resource-limited mobile devices.
The second study principally focusses on mechanisms that can reduce and simplify Android system call datasets. It aims to reduce time and space complexities associated with specific detection algorithms, without decreasing accuracy. Filtering and abstraction processes were developed to build a database describing a canonical normal behaviour model of Android applications. Essentially, these techniques “remove irrelevant system calls to describe the main behaviour of an Android application and they unify system calls having the same functionality but different names.”
Malware detection systems using system call traces as input mainly suffer from the following limitations:
“Easy evasion (the reader will find more details in Annex B): malware detection techniques based on system call traces can be evaded easily by inserting noops or nullified system
66 DRDC-RDDC-2017-R003
calls, or replacing system calls with other system calls having the same functionality but different names […].”
“Inaccurate normal behaviour: Unfortunately, execution traces contain several system calls that are irrelevant for the description of the main behaviour of an application. Examples are: system calls for saving and maintaining process information, system calls for checking resources availability and managing resources, IPC, and memory management. These produce large and complex traces, which may lead to inaccurate models of the application behaviour.”
“Time and space complexities: Anomaly-based malware detection techniques are usually based on machine learning and statistical approaches, such as SVM, HMM, Bayes model, and k-means to build accurate behaviour models. However, these approaches have limitations:”
“Their computational costs are generally high. In some cases, the algorithms require multiple passes over the entire datasets, thus failing the real-time requirement of a malware detection system;”
“Most statistical approaches assume the normal behaviour does not change while the system is being trained and tested. This latter limitation violates the adaptability principle […].”
“Finally, the number of system calls increases from an OS kernel version to another, and this impacts the adaptability and complexity of the approach.”
The new filtering and abstraction processes were developed to overcome these limitations. They are based on the fact that many system calls are irrelevant for the description of the main behaviours of a software application. “For example, a simple application to display Hello World on the screen generates 200 system calls. Among which only 10 are really significant.” Classes of system calls were thus studied in depth in order to identify the most relevant system calls for anomaly detection. Irrelevant system calls are filtered out by the process. This filtering produces simpler and smaller traces, which require less computing and memory resources when analyzed by detection algorithms.
In order to further simplify execution traces, system calls that are similar and that have overlapping functionalities are considered equivalent by the abstraction process. This abstraction does not prevent the detection of attacks that replace specific system calls with equivalent ones, such as readv(int fd, const struct iovec, int iovcnt) and read(int fd, void buf, size_t count).
Results:
– The experimental framework:
“The proposed adaptive host-based anomaly detection framework allows studying lightweight protection for limited-resource devices. The authors have investigated Lookahead, Tree N-gram, and Varied-length N-gram algorithms. They further tested the framework using publicly available Android applications and their malicious versions.”
“Experimental results show that based on the size of the n-gram, the value of the threshold and the number of traces used, good detection rates can be reached with low false positive rates while consuming a reasonable amount of resources.”
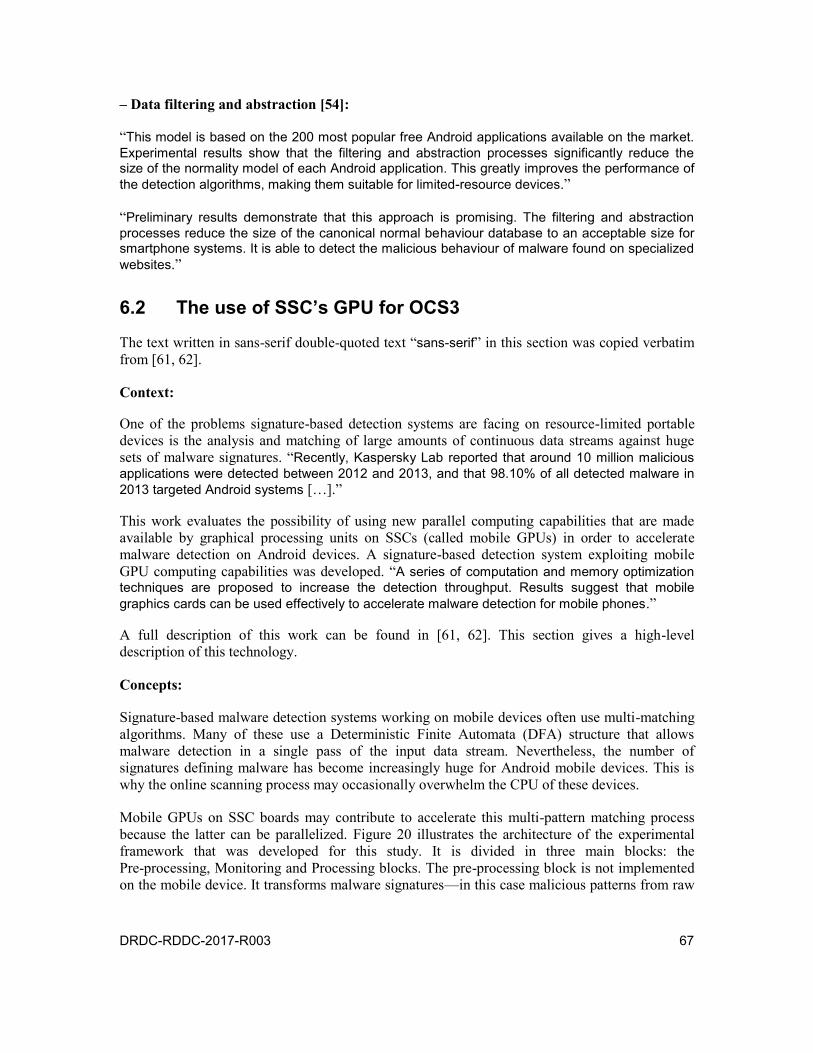
DRDC-RDDC-2017-R003 67
– Data filtering and abstraction [54]:
“This model is based on the 200 most popular free Android applications available on the market. Experimental results show that the filtering and abstraction processes significantly reduce the size of the normality model of each Android application. This greatly improves the performance of the detection algorithms, making them suitable for limited-resource devices.”
“Preliminary results demonstrate that this approach is promising. The filtering and abstraction processes reduce the size of the canonical normal behaviour database to an acceptable size for smartphone systems. It is able to detect the malicious behaviour of malware found on specialized websites.”
6.2 The use of SSC’s GPU for OCS3
The text written in sans-serif double-quoted text “sans-serif” in this section was copied verbatim from [61, 62].
Context:
One of the problems signature-based detection systems are facing on resource-limited portable devices is the analysis and matching of large amounts of continuous data streams against huge sets of malware signatures. “Recently, Kaspersky Lab reported that around 10 million malicious applications were detected between 2012 and 2013, and that 98.10% of all detected malware in 2013 targeted Android systems […].”
This work evaluates the possibility of using new parallel computing capabilities that are made available by graphical processing units on SSCs (called mobile GPUs) in order to accelerate malware detection on Android devices. A signature-based detection system exploiting mobile GPU computing capabilities was developed. “A series of computation and memory optimization techniques are proposed to increase the detection throughput. Results suggest that mobile graphics cards can be used effectively to accelerate malware detection for mobile phones.”
A full description of this work can be found in [61, 62]. This section gives a high-level description of this technology.
Concepts:
Signature-based malware detection systems working on mobile devices often use multi-matching algorithms. Many of these use a Deterministic Finite Automata (DFA) structure that allows malware detection in a single pass of the input data stream. Nevertheless, the number of signatures defining malware has become increasingly huge for Android mobile devices. This is why the online scanning process may occasionally overwhelm the CPU of these devices.
Mobile GPUs on SSC boards may contribute to accelerate this multi-pattern matching process because the latter can be parallelized. Figure 20 illustrates the architecture of the experimental framework that was developed for this study. It is divided in three main blocks: the Pre-processing, Monitoring and Processing blocks. The pre-processing block is not implemented on the mobile device. It transforms malware signatures—in this case malicious patterns from raw
Mobile device
Monitoring CPU GPU
Preprocessing
Trace bufferApplication
Trace
Trace
Trace
(…)
GPU Threads
A
B
C D
E
F
Malwaresignatures
DFA structure
Processing
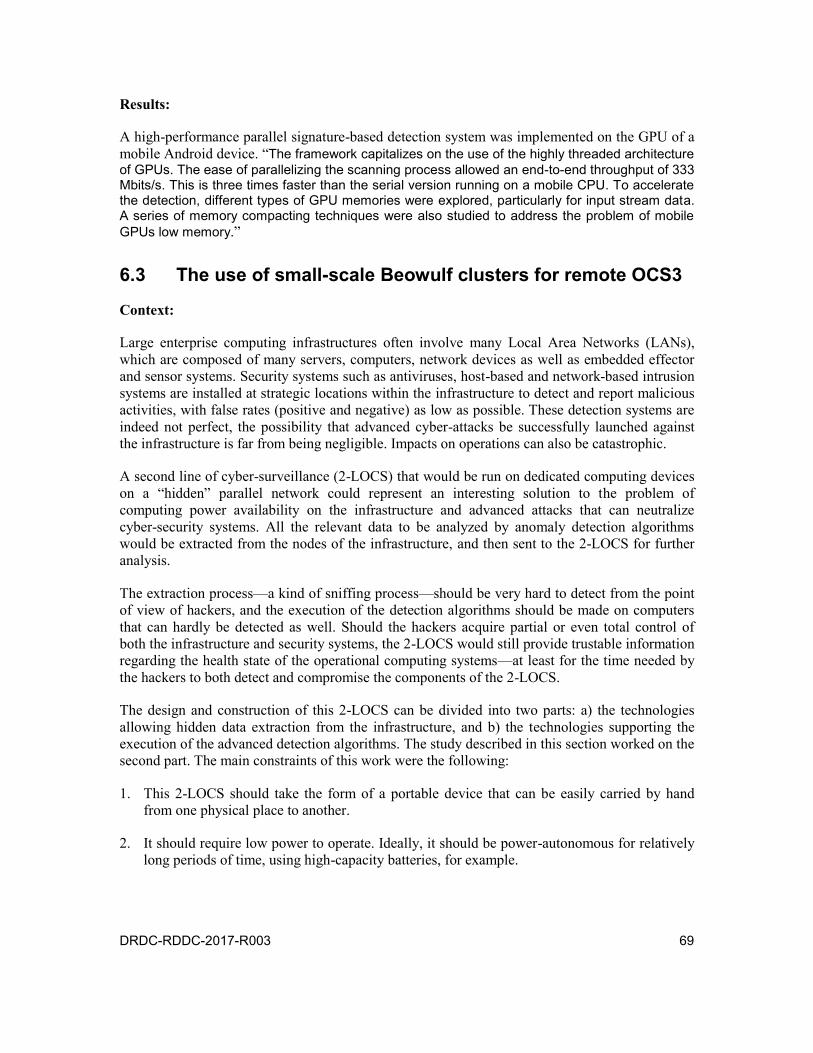
DRDC-RDDC-2017-R003 69
Results:
A high-performance parallel signature-based detection system was implemented on the GPU of a mobile Android device. “The framework capitalizes on the use of the highly threaded architecture of GPUs. The ease of parallelizing the scanning process allowed an end-to-end throughput of 333 Mbits/s. This is three times faster than the serial version running on a mobile CPU. To accelerate the detection, different types of GPU memories were explored, particularly for input stream data. A series of memory compacting techniques were also studied to address the problem of mobile GPUs low memory.”
6.3 The use of small-scale Beowulf clusters for remote OCS3
Context:
Large enterprise computing infrastructures often involve many Local Area Networks (LANs), which are composed of many servers, computers, network devices as well as embedded effector and sensor systems. Security systems such as antiviruses, host-based and network-based intrusion systems are installed at strategic locations within the infrastructure to detect and report malicious activities, with false rates (positive and negative) as low as possible. These detection systems are indeed not perfect, the possibility that advanced cyber-attacks be successfully launched against the infrastructure is far from being negligible. Impacts on operations can also be catastrophic.
A second line of cyber-surveillance (2-LOCS) that would be run on dedicated computing devices on a “hidden” parallel network could represent an interesting solution to the problem of computing power availability on the infrastructure and advanced attacks that can neutralize cyber-security systems. All the relevant data to be analyzed by anomaly detection algorithms would be extracted from the nodes of the infrastructure, and then sent to the 2-LOCS for further analysis.
The extraction process—a kind of sniffing process—should be very hard to detect from the point of view of hackers, and the execution of the detection algorithms should be made on computers that can hardly be detected as well. Should the hackers acquire partial or even total control of both the infrastructure and security systems, the 2-LOCS would still provide trustable information regarding the health state of the operational computing systems—at least for the time needed by the hackers to both detect and compromise the components of the 2-LOCS.
The design and construction of this 2-LOCS can be divided into two parts: a) the technologies allowing hidden data extraction from the infrastructure, and b) the technologies supporting the execution of the advanced detection algorithms. The study described in this section worked on the second part. The main constraints of this work were the following:
1. This 2-LOCS should take the form of a portable device that can be easily carried by hand from one physical place to another.
2. It should require low power to operate. Ideally, it should be power-autonomous for relatively long periods of time, using high-capacity batteries, for example.

70 DRDC-RDDC-2017-R003
3. This device should efficiently run and manage different specialized detection algorithms in parallel and report the results of the analyses to the system administrator.
The work described in this section involves the study of high-performance computing (HPC) and the development of the prototype of a Beowulf cluster of ARM small-scale computers (SSCs). The following goals were defined:
1. Study the execution of advanced malware detection algorithms on SSCs involving ARM processors.
2. Study the parallel execution of detection algorithms on clusters of SSCs.
3. Study the possibility of improving the online distribution of CPU loads among the components of these clusters.
4. Study the possibility of deploying virtualization on these SSCs.
A full description of this work can be found in [63]. This section gives a high-level description of this technology.
Concepts and technologies:
– Advanced RISC Machines (ARM) processors:
ARM processors were first created in 1985 with the goal of offering efficient CPU power combined with low power consumption. Nowadays, their immense popularity is mainly due to their efficiency at delivering high-computing power for low electrical power—as compared with the powerful Intel x86, among others. To give an idea, some 10 billion ARM units were produced in 2013 and 98% of the mobile devices embed an ARM processor within.
The first processors made available were 32-bit (Cortex A15). Then, 64-bit processors were made available (Cortex A53 and Cortex A57), which can execute both 32-bit and 64-bit software applications and do not necessarily require more power than Cortex A15 processors.
– High-performance computing (HPC) and Beowulf clusters:
HPC consists of simultaneously using the CPU/memory resources of many SSCs with the goal of creating a single computing unit, which is more appropriate for the solving of parallelizable engineering problems that require high computing power.
Beowulf clusters gather many computers into a single entity—the cluster—on which HPC technologies can be used. HPC is made possible on clusters by implementing one of the two following parallel computing technologies; Message Passing Interface (MPI) or Parallel Virtual Machine (PVM). Very briefly, MPI is made of a master node and many slave nodes. Task management on the cluster is achieved through exchanges of messages between the master and the slaves. For PVM, the cluster takes the form of a virtual machine that gathers and abstracts all the resources of the physical nodes of the cluster. Different load balancing algorithms can be used to distribute the tasks between the nodes, which may have different computing capabilities.
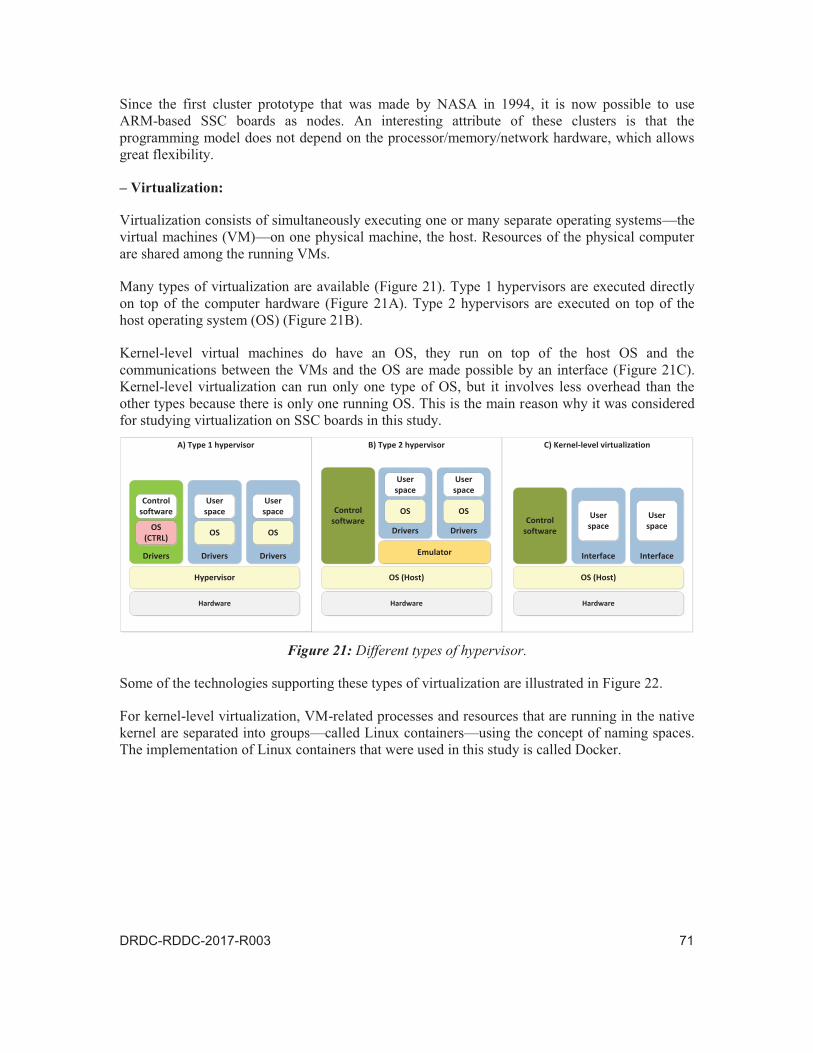
C) Kernel-level virtualizationB) Type 2 hypervisorA) Type 1 hypervisor
Hypervisor
Hardware
Drivers
OS (CTRL)
Control software
Drivers
OS
User space
Drivers
OS
User space
OS (Host)
Hardware
Control software
Drivers
OS
User space
Drivers
OS
User space
Emulator
OS (Host)
Hardware
Interface
User space
Interface
User space
Control software
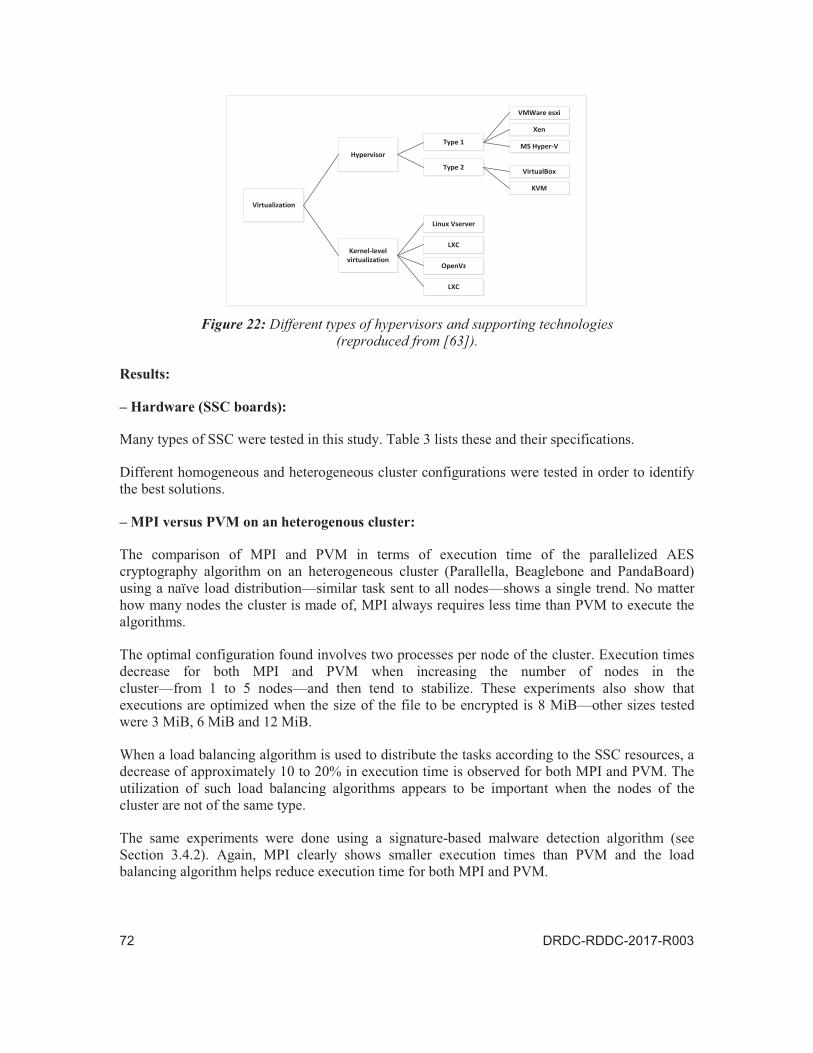
Hypervisor
Kernel-level virtualization
Type 1
Type 2
VMWare esxi
Xen
MS Hyper-V
VirtualBox
KVM
Linux Vserver
LXC
OpenVz
LXC
Virtualization
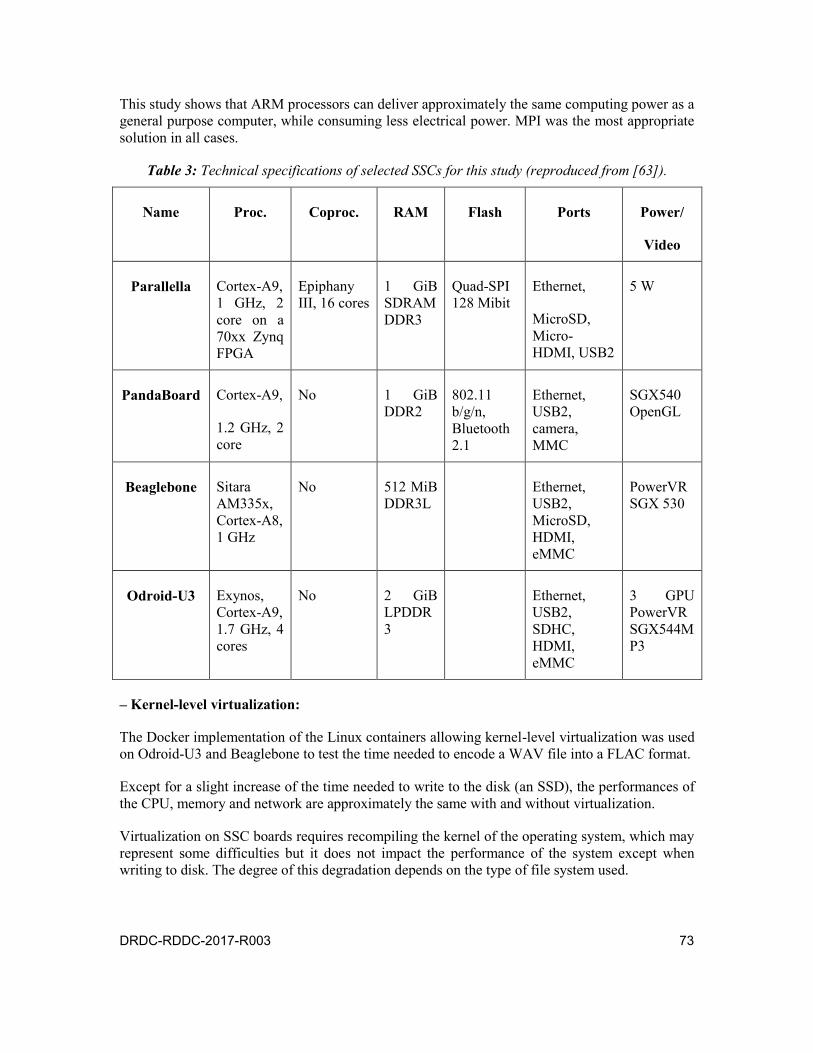
DRDC-RDDC-2017-R003 73
This study shows that ARM processors can deliver approximately the same computing power as a general purpose computer, while consuming less electrical power. MPI was the most appropriate solution in all cases.
Table 3: Technical specifications of selected SSCs for this study (reproduced from [63]).
Name Proc. Coproc. RAM Flash Ports Power/
Video
Parallella Cortex-A9, 1 GHz, 2 core on a 70xx Zynq FPGA
Epiphany III, 16 cores
1 GiB SDRAM DDR3
Quad-SPI 128 Mibit
Ethernet,
MicroSD, Micro-HDMI, USB2
5 W
PandaBoard Cortex-A9,
1.2 GHz, 2 core
No 1 GiB DDR2
802.11 b/g/n, Bluetooth 2.1
Ethernet, USB2, camera, MMC
SGX540 OpenGL
Beaglebone Sitara AM335x, Cortex-A8, 1 GHz
No 512 MiB DDR3L
Ethernet, USB2, MicroSD, HDMI, eMMC
PowerVR SGX 530
Odroid-U3 Exynos, Cortex-A9, 1.7 GHz, 4 cores
No 2 GiB LPDDR3
Ethernet, USB2, SDHC, HDMI, eMMC
3 GPU PowerVR SGX544MP3
– Kernel-level virtualization:
The Docker implementation of the Linux containers allowing kernel-level virtualization was used on Odroid-U3 and Beaglebone to test the time needed to encode a WAV file into a FLAC format.
Except for a slight increase of the time needed to write to the disk (an SSD), the performances of the CPU, memory and network are approximately the same with and without virtualization.
Virtualization on SSC boards requires recompiling the kernel of the operating system, which may represent some difficulties but it does not impact the performance of the system except when writing to disk. The degree of this degradation depends on the type of file system used.

74 DRDC-RDDC-2017-R003
7 Concluding remarks
This scientific report summarizes the work conducted in the AHLS project, as part of the overarching DRDC PASS project. This project and the previous one—Poly-Tracing—have produced both theoretical concepts and applied technologies that can interoperate to solve real cyber-related problems in the domain of Online Cyber-Surveillance of Software Systems (OCS3). New research ideas were proposed to improve aspects of OCS3 in the 5 tracks of AHLS.
The main goal of AHLS was to develop and push further level-2 cyber-surveillance technologies (L2CS; Section 2.1) to improve OCS3. The detection capabilities of these technologies should complement those of the L1CS detection systems that are available commercially or from the open source community. This work was mainly divided into four parts; 1) online data capture (Tracks 1 and 2), 2) advanced anomaly detection at the system call level (Track 3), 3) advanced anomaly detection within the operating system (Track 4), and 4) OCS3 on small-scale computers (Track 5). The following give an overview of the work done and the results obtained in each part.
Part 1 (Tracks 1 and 2; Chapter 3): Online data capture
Efficient online system data capture is important for the detection of anomalies at runtime. The selection and capture on disk of the most appropriate data—among huge volumes of data—represents an important challenge. This part of AHLS aimed at improving different aspects of online data capture.
An Eclipse-based framework was first developed to integrate all the AHLS technologies into one efficient working environment. It aims to facilitate data capture, model building, data analysis and advanced anomaly detection through the sharing of these data between running algorithms. It also eases and accelerates the development of new specialized techniques, which take the form of easy-to-develop plug-ins.
It is now possible to capture and use—online and/or offline—many types of data originating from many sources within local and remote software systems. It is expected that this new capability will contribute to enlarging the detection surface and raising/lowering the production of true/false positives. Moreover, the possibility of activating/deactivating LTTng probes at runtime makes possible online adjustment of the monitoring process in response to the raised alarms. This can be called feedback-directed monitoring.
The problem of saving huge volumes of data over long periods of time—such as LTTng execution traces—was solved by the Centralized Data Store and its specialized data structure. This technology was integrated in Trace Compass and allows the capture of the evolution of the states of all the components of a system, down to the atomic level.
States are saved and retrieved in a very efficient way, allowing the replaying at will of any portion of the execution of software systems. It is expected that this new technology will contribute to improving significantly both the online detection of anomalies in the system and offline forensic analysis. Moreover, it directly supports the utilization of the recent deep learning recurrent neural networks, which may be very advantageous for OCS3.

DRDC-RDDC-2017-R003 75
A number of specialized tools were developed to help the multi-level abstraction, modelling and visualization of this data. Some facilitate user-defined analysis while others help the identification of hard-to-find anomalies through advanced data visualization.
A collaboration between the AHLS project and Google Research Montreal yielded a new specialized interface to integrate tracing data originating from MS Windows software systems in the Trace Compass framework. These tools combined with Google’s development tools contributed to solve some of the problems encountered with the Windows versions of the Chrome browser.
Part 2 (Track 3; Chapter 4): OCS3 at the system call interface
OCS3 can be made using data that originate from the following logical software levels; the user space, the kernel space, and the interface between these. This work focuses on the interface between both areas of the operating system. It considers system call events as input data to advanced anomaly detection algorithms. It aims at improving the online detection of anomalies in software systems.
A number of complementary models and associated algorithms were proposed in this work—instead of one huge model that could resolve all anomalies. It is expected that a set of well-selected detection algorithms that have different detection capabilities—and pre-identified LTTng software probes—will contribute to improving OCS3. When an alert is raised at one point for example, in-so-far collected system data will help the subsequent selection and execution of the best detection algorithms/LTTng probes.
AHLS has made an important contribution in this domain. A new scalable framework that is specialized for advanced anomaly detection was developed; TotalADS. The Eclipse-based framework was recognized as a new important contribution by scientific peers. It can be integrated in Trace Compass, which allows the integration and simultaneous execution of many detection algorithms. It takes many types of data as input, among them LTTng trace events corresponding to system calls. Apart from its expandable visualization capabilities, it offers full online control over the detection process as well as full access to other AHLS tools at runtime.
Four complementary detection algorithms were then developed, integrated and tested in TotalADS using well-known datasets from the scientific literature. These algorithms are: Sequence modelling (SQM), Improved Hidden Markov model (IHMM), Kernel space modelling (KSM) and One-class support vector machine (OCSVM). The utilization of different detection algorithms such as these enlarge the detection surface and contribute to raising/lowering true/false alarm rates. Moreover, the model of each algorithm can be trained differently in different contexts and using different parameters—producing different specialized models. These models thus represent different detectors.
These four detection algorithms and the corresponding models define a set of many detectors that enlarges the detection surface because many can be simultaneously used at runtime. Some models may focus on specific more-vulnerable software applications or services while others can be started only when they are needed, when specific alarms are raised, for example. The ability to control which detection algorithms are run at any time—and thus the models and associated probes—gives TotalADS very high flexibility for improving OCS3. This technology represents
76 DRDC-RDDC-2017-R003
the first step toward feedback-directed anomaly detection in which the result of previous anomaly detections can be used to appropriately adjust/select OCS3 algorithms on a continual basis. The net result of this is the generation of more precise/relevant information describing the health states of the monitored systems.
Despite the very good results obtained using the four detection algorithms using internationally recognized datasets, a supplementary effort was made in this track to further lower the rate of production of false positives. A new algorithm that can merge the results of many detection algorithms—such as the HMM—was developed and studied in depth. The utilization of this algorithm involves little CPU computing and is able to significantly raise/reduce true/false positive rates.
Part 3 (Track 4; Chapter 5): OCS3 within the operating system kernel
Kernel modules that are dedicated to specific hardware devices on a computer are often developed by third-party organizations, which may not always respect the golden-rules of kernel development and thus produce buggy modules. On the other hand, malicious organizations may introduce very-hard-to-find malicious code such as rootkits in their modules, which will silently compromise the kernel at runtime.
L2CS technologies were developed to allow conducting OCS3 within the kernel of the operating system. One of the goals behind this effort was to develop a system that could protect the kernel against compromised or buggy kernel modules (like third-party device drivers). The Granary framework was developed for this purpose. In the case where an unknown kernel module—a module that may contain malware, for example—has to be executed on a computer, Granary takes charge of its execution within an isolated environment. This environment protects the kernel from bugs or malware by capturing and isolating any binary code that does not respect pre-defined rules. Granary allows the comprehensive analysis of any kernel module, imposes no performance overhead on non-module kernel code, requires no changes to modules and minimal changes to the kernel (approximately 100 lines of code), and is easily portable between different hardware and kernel versions.
A new event-based language was then developed to help developers work on kernel modules without having to deal with the assembly code, which is difficult, error-prone, and time-consuming. Using this language, it is now much easier to modify unknown kernel modules. This reduction in complexity has a particularly significant impact when the user wants to conduct in-depth studies of their device drivers, adapting their analysis until they find the information they are looking for.
A new framework for kernel memory monitoring was finally developed to simplify kernel module analysis and debugging. This framework can provide context-specific information on memory accesses and adds more versatility. For example, access to a monitored memory location in the kernel—or a range of memory locations—at one point will instantaneously generate events and corresponding information. This information can be used to identify legal and illegal kernel memory accesses at runtime. This technology can detect malicious activities within the kernel, which cannot be done by traditional security systems with that much versatility.
DRDC-RDDC-2017-R003 77
Part 4 (Track 5; Chapter 6): OCS3 and small-scale computers (SSCs)
The last decade has seen huge developments in the domain of SSCs, yielding miniaturized Linux-based computing electronic boards essentially made of a multicore CPU, memory, and GPU arrays with added wired/wireless capabilities. These provide more computing power per unit of electrical power and their small size make them easily embedded in many types of military systems.
Like any computers, SSCs have software vulnerabilities within, which can be exploited by hackers at runtime. L1CS and L2CS detection technologies adapted to these devices must be developed in order to protect them from cyber-threats. Nevertheless, the running of cyber-security systems on these SSCs may represent a challenge for many reasons. First, if their CPUs offer more computing power per unit of electrical power, their computing capabilities are not as great as those of general-purpose computer CPUs. The same is true for memory. Moreover, when SSCs are embedded in portable devices, battery limitations may also represent another challenge that needs to be addressed. These factors limit the number and types of cyber-security systems that can be run on these devices.
A testing environment was developed to study how OCS3 technologies can be adapted to portable devices according to their constraints; Linux-like Android devices were used as a test-bed. Different detection algorithms were successfully tested using a number of publicly available Android software applications. Experimental results show that, based on the value of specific parameters, good detection rates can be reached with low false positive rates while consuming a reasonable amount of device resources.
Filtering and abstraction techniques were also developed in order to reduce the CPU loads associated with the huge amount of data to be analyzed. Using 200 of the most popular free Android software applications available on the market, experimental results show that the filtering and abstraction significantly reduce the size of the normality model of each application. This greatly improves the performance of the detection algorithms, making them suitable for such limited-resource devices.
The utilization of GPU computing power available on portable devices was also studied using a high-performance parallel signature-based detection system on an Android device. The ease of parallelizing the scanning process allowed an end-to-end throughput of 333 Mbits/s. This is three times faster than the serial version running on a mobile CPU. To accelerate the detection, different types of GPU memories were explored, particularly for input stream data. A series of memory compacting techniques were also studied to address the problem of mobile GPUs low memory.
Finally, the possibility of combining many SSCs into a Beowulf cluster was studied using different SSC boards and two technologies—MPI and PVM—allowing the parallelization of programs. Experimental results show that from the point of view of time execution, MPI is more interesting than PVM. ARM processors can deliver approximately the same computing power as a general-purpose computer, for less electrical consumption.
78 DRDC-RDDC-2017-R003
7.1 Recommendations
Research and development work done in this four-year DND/NSERC project (AHLS) produced new advanced technologies that open the door for significant improvements in the domain of OCS3. These technologies complement currently available security systems by enlarging the detection surface and increasing the precision of OCS3 reports to officers on duty. All the developed prototypes were successfully tested and validated using well-known datasets from the scientific literature. Any operating system (servers, workstations, laptops, as well as small-scale computing devices) can now be analyzed online in its entirety.
Given the R&D nature of AHLS and the available resources, these prototypes have reached a limited degree of maturity. They would require additional testing and validation work using extended datasets before they could be implemented on military infrastructure. The first group of key components that needs to be pushed forward are the ones that allow the capture of the most relevant data at runtime for improved online anomaly detection, offline forensic investigation, online adapted reporting, and online system health assessment. In this sense, the Trace Compass framework and the Central Data Store as well as their related technologies, including technologies for small-scale computers, represent a breakthrough that must be considered in future work.
The second group of key components that needs to be pushed forward are the ones that allow the analysis of the captured data for the detection of hard-to-find anomalies at runtime with high/low true/false positive rates. This R&D work represented a hard challenge. The different anomaly detection mechanisms and related frameworks using data from the system call interface—TotalADS—and from within the kernel of the operating system—Granary—are breakthroughs that must be pushed forward in future work.
The third group of key components contains technologies allowing: a) adapted OCS3 for small-scale computers such as portable devices and other types of embedded systems, and b) the utilization of clusters made of small-scale computers for stealth OCS3—a second line of OCS3. As a second line of cyber-surveillance, stealth OCS3 will continue to produce trustable reports after hackers have compromised whole software systems in the infrastructure, including the cyber-security systems. These components must be pushed forward as well in future work.
DRDC-RDDC-2017-R003 79
References
[1] The Advanced Host-Level Surveillance (AHLS) project. Official web site (last accessed September 2016): http://ahls.dorsal.polymtl.ca/.
[2] The Natural Sciences and Engineering Research Council of Canada (NSERC) (last accessed November 2016): http://www.nserc-crsng.gc.ca/index_eng.asp.
[3] The Poly-Tracing project. Official web site (last accessed September 2016): http://dmct.dorsal.polymtl.ca/.
[4] M. Couture. “Advanced Linux tracing technologies for Online Surveillance of Software Systems”. DRDC – Valcartier Research Centre, Scientific Report, DRDC-RDDC-2015-R211, October 2015.
[5] TRL as defined by Nasa (Nasa Web site last accessed November 2016): https://www.nasa.gov/pdf/458490main_TRL_Definitions.pdf.
[6] Platform-to-Assembly Secured Systems (PASS). Project charter, DRDC Valcartier, M.-J. Marcoux Project Manager, Version 2.2, 24 pages, November 2015.
[7] SystemTap. Wikipedia web site (last accessed September 2016): https://en.wikipedia.org/wiki/SystemTap.
[8] ftrace. Wikipedia web site (last accessed September 2016): https://en.wikipedia.org/wiki/Ftrace.
[9] DTrace. Wikipedia web site (last accessed September 2016): https://en.wikipedia.org/wiki/DTrace.
[10] Trace compass. Official web site (last accessed September 2016): http://tracecompass.org/.
[11] J. Desfossez. “Résolution de problèmes par suivi de métriques dans les systèmes virtualisés.” Master thesis, École Polytechnique de Montréal, December 2011.
[12] GDB Tracepoints. Web site (last accessed September 2016): https://sourceware.org/gdb/onlinedocs/gdb/Tracepoints.html.
[13] Kprobe. Web site (last accessed September 2016): https://lwn.net/Articles/132196/.
[14] ClamAV. Web site (last accessed September 2016): https://www.clamav.net/.
[15] AppArmor. Web site (last accessed September 2016): http://wiki.apparmor.net/index.php/Main_Page.
[16] Snort. Web site (last accessed September 2016): https://www.snort.org/.

80 DRDC-RDDC-2017-R003
[17] JVMTI. Web site (last accessed September 2016): https://en.wikipedia.org/wiki/Java_Virtual_Machine_Tools_Interface.
[18] OProfile. Web site (last accessed September 2016): http://oprofile.sourceforge.net/news/.
[19] Common Trace Format (CTF). Web site (last accessed September 2016): http://www.efficios.com/ctf.
[20] A. Montplaisir, N. Ezzati-Jivan, F. Wininger, and M. Dagenais. “Efficient Model to Query and Visualize the System States Extracted from Trace Data”. In the Proceedings of the 4th International Conference, RV 2013, Rennes, France, September 24–27, 2013.
[21] A. Montplaisir-Gonçalves, N. Ezzati-Jivan, F. Wininger, and M. R. Dagenais. “State History Tree : an Incremental Disk – based Data Structure for Very Large Interval Data.” In the Proceedings of the ASE/IEEE International Conference on Big Data, Washington DC, August 2013.
[22] A. Montplaisir-Gonçalves. “Stockage sur disque pour accès rapide d’attributs avec intervalles de temps.” Master thesis, École Polytechnique de Montréal, December 2011.
[23] N. Ezzati Jivan. “Multi-level trace abstraction, linking and display.” PhD thesis, École Polytechnique de Montréal, April 2014.
[24] K. Gwandy Kouamé. “Language dédié et analyse automatisée pour la detection de patrons au sein de traces d’exécution.” Master thesis, École Polytechnique de Montréal, August 2015.
[25] K. Kouame, N. Ezzati-Jivan and M. R. Dagenais. “A Flexible Data-Driven Approach for Execution Trace Filtering.” 2015 IEEE International Congress on Big Data, New York, NY, 2015, pp. 698–703.
[26] F. Wininger. “Conception flexible d’analyses issues d’une trace système.” Master thesis, École Polytechnique de Montréal, April 2014.
[27] F. Wininger, N. Ezzati-Jivan and M. R. Dagenais. ”A declarative framework for stateful analysis of execution traces.” Software Quality Journal, Springer, pp. 1–29, 2016.
[28] S. Deslisle. “Conception d’un outil de modélisation intégré pour l’indexation et l’analyse de trace.” Master thesis, École Polytechnique de Montréal, December 2015.
[29] F. Doray. “Analyse de variation de performance par comparaison de traces d’exécution.” Master thesis, École Polytechnique de Montréal, June 2015.
[30] F. Reumont-Locke. “Méthodes efficaces de parallélisation de l’analyse de traces noyau.” Master thesis, École Polytechnique de Montréal, August 2015.
DRDC-RDDC-2017-R003 81
[31] S. S. Murtaza, A. Sultana, A. Hamou-Lhadj, M. Couture. “On the Comparison of User Space and Kernel Space Traces in Identification of Software Anomalies.” In the Proceedings of the 16th European Conference on Software Maintenance and Reengineering (CSMR’12), pp.127–136, 2012.
[32] S. S. Murtaza, W. Khreich, A. Hamou-Lhadj, and M. Couture. “A Host-based Anomaly Detection Approach by Representing System Calls as States of Kernel Modules.” In the Proceedings of the 24th IEEE International Symposium on Software Reliability Engineering (ISSRE’13), IEEE, Pasadena, CA, USA, pp. 431–440, 2013.
[33] S. S. Murtaza, A. Hamou-Lhadj, W. Khreich, and M. Couture. “TotalADS: Automated Software Anomaly Detection System.” In the Proceedings of the 14th IEEE International Working Conference on Source Code Analysis and Manipulation (SCAM’14), IEEE, Victoria, British Columbia, Canada, pp. 83–88, 2014.
[34] Multicore association. Web site (last accessed September 2016): https://multicore-association.org/.
[35] strace. Web site (last accessed September 2016): https://en.wikipedia.org/wiki/Strace.
[36] Metasploit. Web site (last accessed September 2016): https://www.metasploit.com/.
[37] MongoDB NoSQL database. Web site (last accessed September 2016): https://www.mongodb.com/.
[38] S. S. Murtaza, W. Khreich, A. Hamou-Lhadj, and S. Gagnon. “A Trace Abstraction Approach for Host-based Anomaly Detection.” In the Proceedings of the 8th IEEE Symposium on Computational Intelligence for Security and Defense Applications (CISDA’15), pp. 1–8, 2015.
[39] A. Sultana, A. Hamou-Lhadj, and M. Couture. “An Improved Hidden Markov Model for Anomaly Detection Using Frequent Common Patterns.” In the Proceedings of the IEEE International Conference on Communications (ICC’12), The Communication and Information Systems Security Symposium, IEEE, Ottawa, ON, Canada, pp. 1113–1117, 2012.
[40] Apache Mahout. Web site (last accessed September 2016): http://mahout.apache.org/.
[41] W. Khreich, B. Khosravifar, A. Hamou-Lhadj, and C. Talhi. “An Anomaly Detection System based on One-Class SVM and Varying N-gram Feature Vectors.” Elsevier Journal on Computers and Security, 2016, (in press).
[42] SVM kernel trick. Web site (last accessed September 2016): https://en.wikipedia.org/wiki/Kernel_method.
[43] LIBSVM library. Web site (last accessed September 2016): https://www.csie.ntu.edu.tw/~cjlin/libsvm/.
82 DRDC-RDDC-2017-R003
[44] A. Soudi, W. Khreich, A. Hamou-Lhadj. “An Anomaly Detection System based on Ensemble of Detectors with Effective Pruning Techniques.” In the Proceedings of the 2015 IEEE International Conference on Software Quality, Reliability & Security (QRS, a merger of SERE and QSIC), pp. 109–118, 2015.
[45] W. Khreich, S. S. Murtaza, A. Hamou-Lhadj, and C. Talhi. “Combining Heterogeneous Anomaly Detectors for Improved Software Security.” Submitted to Elsevier Journal of Systems and Software (JSS), Special Issue on Software Reliability Engineering, 2016.
[46] P. Goodman, A. Kumar, A. Demke Brown, and A. Goel. “Protecting Kernels from Untrusted Modules using Dynamic Binary Instrumentation.” In Proceedings of the Seventeenth International Conference on Architectural Support for Programming Languages and Operating Systems (ASPLOS 2012).
[47] P. Feiner, A. Demke Brown, and A. Goel. “Comprehensive Kernel Instrumentation via Dynamic Binary Translation.” In Architectural Support for Programming Languages and Operating Systems (ASPLOS), February 2012.
[48] S. Makarov, A. Demke Brown, and A. Goel. “An Event-Based Language for Dynamic Binary Translation Frameworks.” In Proceedings of the 23rd International Conference on Parallel Architectures and Compilation Techniques (PACT), August 2014.
[49] P. Goodman, A. Kumar, A. Demke Brown, and A. Goel. “Granary: Comprehensive Kernel Module Instrumentation.” In the 10th USENIX Symposium on Operating Systems Design and Implementation, (OSDI 2012).
[50] A. Kumar, P. Goodman, A. Goel, and A. Demke Brown. “Behave or be watched: Debugging with behavioral watchpoints.” In Proceedings of the Workshop on Hot Topics in System Dependability (HotDep), November 2013.
[51] A. Kumar. “Debugging With Behavioral [sic] Watchpoints”. Master thesis, University of Toronto, February 18, 2014.
[52] M. Ben Attia. “Détection d’anomalies basée sur l’hôte, pour les systèmes à ressources limitées.” Master thesis, École de Technologie Supppérieure, Université du Québec, July 23, 2015.
[53] M. Ben Attia, C. Talhi, A. Hamou-Lhadj, B. Khosravifar, V. Turpaud, and M. Couture. “On-device Anomaly Detection for Resource-limited Systems.” In the Proceedings of the 30th ACM/SIGAPP Symposium On Applied Computing Salamanca, Spain, April 13–17, 2015.
[54] A. Amamra, J-M. Robert, and C. Talhi, 2014. “Enhancing Malware Detection for Android Systems Using a System-call Filtering & Abstraction Process.” Security and Communication Networks, Volume 8, issue 7, 2014, pp 1179–1192.
[55] S. Forrest, S.-A. Hofmeyr, A. Somayaji, and T. A. Longstaff. “A sense of self for unix processes.” in Proceedings of IEEE Symposium on Security and Privacy, Oakland, CA, 1996; 120–128.
DRDC-RDDC-2017-R003 83
[56] N. Hubballi, S. Biswas, and S. Nandi. (2010). “Layered Higher Order N-grams for hardening Payload Based Anomaly Intrusion Detection”. In International Conference on Availability, Reliability, and Security, ARES ‘10, 321–326, 2010.
[57] M. C. T. Kymie and A. M Roy. “Defining the Operational Limits of Stide, an Anomaly-Based Intrusion Detector.” In Proceedings of the 2002 IEEE Symposium on Security and Privacy (SP ‘02). IEEE Computer Society, Washington, DC, USA, 188-. 2002.
[58] P. Amontamavut, Y. Nakagawa, and E. Hayakawa. “Separated Linux Process Logging Mechanism for Embedded Systems.” In 2012 IEEE 18th International Conference on Embedded and Real-Time Computing Systems and Applications (RTCSA), 411–414, August 2012.
[59] N. Wang, J. Han, and J. Fang. “Anomaly Sequences Detection from Logs Based on Compression.” 7 pages, arXiv:1109.1729, 2011. Web site (last accessed September 2016): https://arxiv.org/abs/1109.1729.
[60] Zopfli. Web site (last accessed September 2016): https://en.wikipedia.org/wiki/Zopfli.
[61] M. Abdellatif, C. Talhi, A. Hamou-Lhadj, and M. Dagenais. “On the Use of Mobile GPU for Accelerating Malware Detection Using Trace Analysis.” In the Proceedings of the Reliable Distributed Systems Workshop (SRDSW), 2015 IEEE 34th Symposium, September 2015.
[62] M. Abdellatif. “Accélération des traitements de la sécurité mobile avec calcul parallèle.” Master thesis, École de Technologie Supppérieure, Université du Québec, February 2016.
[63] G. Zagdene. “Mise en place d’un cluster de systèmes ARM pour solutions de sécurité.” Master thesis, École de Technologie Supppérieure, Université du Québec, April 2016.
[64] D. U. Thibault. “LTTng: Quick Start Guide (for version 2.3).” Valcartier Research Centre, Defence Research and Development Canada DRDC-RDDC-2016-N012, 2016.
[65] D. U. Thibault. “LTTng: The Linux Trace Toolkit Next Generation: A Comprehensive User’s Guide (version 2.3 edition)”. Valcartier Research Centre, Defence Research and Development Canada, 2016, (in press).
[66] A. Goel. “A comprehensive Analysis of Kernel Exploits for the Linux Operating System”. DRDC contract number W7701-125171, final report, June 2012.

84 DRDC-RDDC-2017-R003
This page intentionally left blank.

ComComCommonmonmon TrTrTraceaceace FoFoFormarmarmat (t (t ((CTFCTFCTF) o) o) o) ververver TCTCTCP/UP/UP/UDP/DP/DP/SSHSSHSSHCommon Trace Format (CTF) over TCP/UDP/SSH
Traced system
C/C++ application- Tracepoints
Java/Erlang application- Tracepoints
Linux kernel- Tracepoints- Dynamic probes
(kprobes, kretprobes)- System calls (syscalls)liburcu
liblttng-ustLTTng VM Adaptor
- Tracepoints
liblttng-ustliburcu LTTng Modules
- Tracepoints
LTTng consumer daemon (lttng-consumerd)- Zero-copy data transport or aggregator- Export raw trace data- Snapshots from in-memory flight recorder mode- Store all trace data, discard on overrun
liburculiblttng-ust-ctl
liblttng-consumer
POSIX shared memory and pipe Memory-mapped buffers or splice,
poll, ioctl
LTTng command line interface
LTTng session dAemon(lttng-sessiond)
- Control multiple tracing sessions- Centralized tracing status
management
Custom control software- Interface with proprietary cluster
management infrastructures
liblttngctl
liburculiblttngctl
liblttng-ust-ctl
liblttngctl
Local storage(CTF)
Observer system
Babeltrace- Trace converter- Trace pretty printer- Allows open source and proprietary
plugins
LTTV- Trace display and analysis- Trace control- Allows open source plugins
Eclipse Tracing and Monitoring Framework (TMF)
- Trace display and analysis- Trace control- Allows open source and proprietary
plugins
libbabeltrace libbabeltrace
Control
Instrumentation
Libraries
Control
Data flow
LTTng relay daemon
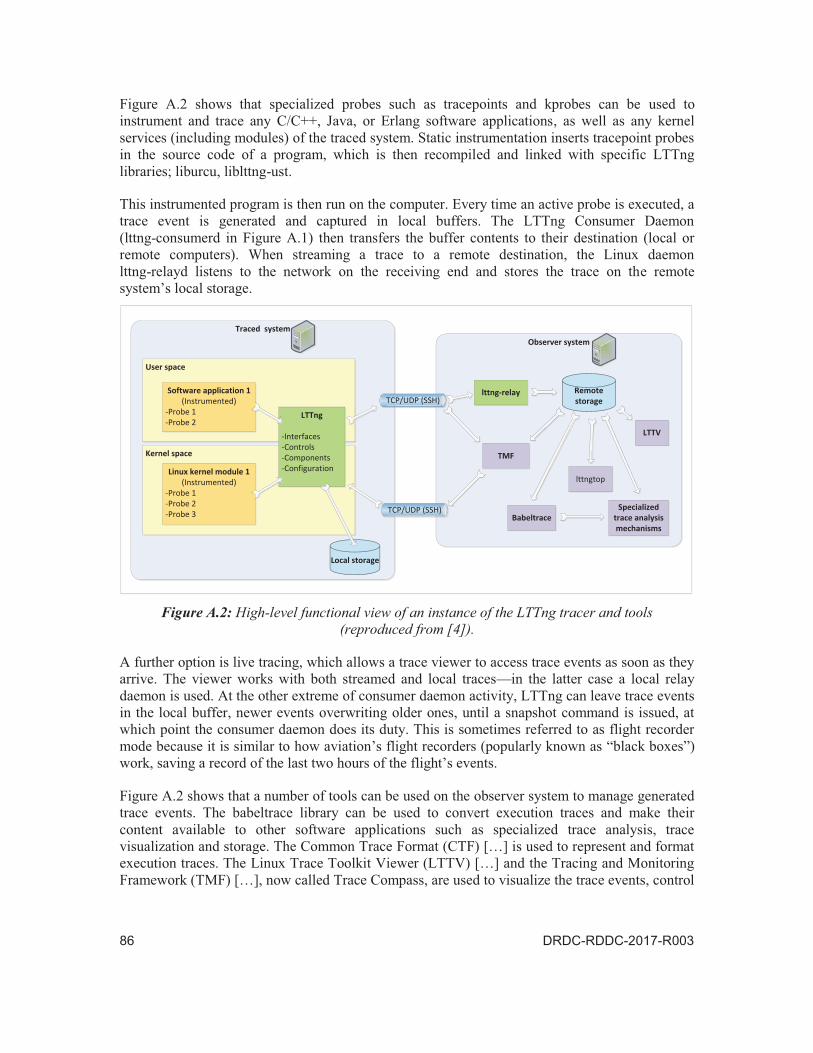
Traced systemObserver system
TCPTCPTCP/UD/UD/UDP (P (P ((SSHSSHSSH))))TCP/UDP (SSH)Babeltrace
LTTV
User space
Kernel space
Software application 1(Instrumented)
-Probe 1-Probe 2
Linux kernel module 1(Instrumented)
-Probe 1-Probe 2-Probe 3
LTTng
-Interfaces-Controls-Components-Configuration
Local storage
Remote storage
Specialized trace analysis mechanisms
TMF
TCPTCPTCP/UD/UD/UDP (P (P ((SSHSSHSSH))))TCP/UDP (SSH)lttng-relay
lttngtop
DRDC-RDDC-2017-R003 87
the tracing process, and analyse execution traces. TMF/Trace Compass allows the addition of new algorithms for trace management and analysis through plug-ins.
The control of the tracing process is achieved through the LTTng session daemon (lttng-sessiond; the central green rectangle in Figure A.1). This centralized management allows the control of one or many simultaneously tracing sessions on the traced system. The command line interface or custom control software (such as TMF/Trace Compass) can be used to achieve this control (locally or remotely).
Some of the most important commands are listed in the following lines.
lttng: allows interaction with the tracer and tracing sessions to control both kernel and user-space tracing. Available functionalities are:
add context to one or many channels;
evaluate overhead and calibrate;
create, destroy, start, or stop (suspend) tracing sessions;
view the trace of a tracing session;
list the information related to a tracing session;
switch between tracing sessions;
enable or disable one or many channels;
enable or disable one or many events; and
grab the contents of the tracing buffers in order to export them to a destination specified by the user.
lttng-gen-tp: is a python script that simplifies the generation of user space tracepoint source code files.
lttngtop: is an ncurses-based interface for reading and browsing execution traces and find software bugs. It is similar to the top programs on Linux systems. It provides a number of statistics that are related to tracing sessions.
babeltrace-log: is a tool to convert a text log (read from standard input) to the Common Trace Format (CTF) and to write it out as a trace file.
LTTng controls the flow of events into a trace at several levels. At the highest level, an entire trace session can be suspended, temporarily stopping any events from being traced. Within the session, events are organized in channels, and each of these channels can be activated and deactivated separately. Within a channel, each individual event can also be activated and deactivated separately. Lastly, a filter (dynamically evaluated Boolean expression) can be applied to each event.
Table A.1 lists the characteristics of the LTTng software tracer as of the end of the Project […]. Not mentioned in this table is the fact that LTTng provides the users with a simplified integrated control interface to manage tracing processes. Simultaneous capture and recording of multiple traces is supported through multiple tracing sessions. These are created and can be concurrently

88 DRDC-RDDC-2017-R003
active, each with its own instrumentation set. Non-root users that are registered to a predefined tracing group are given the permission to perform both kernel and user space tracing.
The LTTng interface API library allows any software application to embed LTTng and have full control over the tracing process. The Tracing and Monitoring Framework (TMF) […] (now Trace Compass) is an example of an environment in which LTTng can be embedded.
Table A.1: List of actual LTTng characteristics (reproduced from [4]).
Required characteristics LTTng software tracer characteristics at the end of the Poly-Tracing Project
Online tracing of software systems that are running on computing systems ranging from small-scale embedded systems to complex multi-core systems.
Supported architectures (as of Dec. 2013) are: x86, x64, PowerPC 32/64, ARM (ARMv7 OMAP3 in particular), MIPS, sh, sparc64, s390. Other supported architectures are added every year.
Local and remote control of both the focus and granularity of the generated execution traces at all times during the tracing process.
Control of the monitoring process can be local or remote. Live controlled monitoring supports the activation or deactivation of any static or dynamic probe at runtime, making possible the online selection of both the focus of the tracing process (what is traced within the system), and the granularity of the content of the execution trace (the number of probes and their specific locations).
Ability to send execution traces to both local and remote computers.
The choice of execution trace destination (local or remote disk) can be made.
Optimization of the tracing mechanisms so that they do not impose significant overhead performance penalties on the traced system; the system and traced processes should be perturbed as little as possible by the tracing process itself.
The tracepoints (LTTng main static probes) involve no trap mechanisms nor any kernel system calls, yielding very low performance impacts on the system. Probes that are not activated at runtime have almost zero performance impact. LTTng also imposes a very low overhead because it uses the Read-Copy-Update synchronization mechanism (a wait-free alternative to the reader-writer lock mechanism), it also uses efficient per-CPU buffers to capture the trace events and uses non-blocking atomic operations.
Use of the same tracer for both complex debugging and online system monitoring.
LTTng provides full support of both complex debugging and OCS3. For example, it can be used on systems to solve very hard to find bugs such as race conditions in multi-core hardware environments, where current debuggers are too intrusive.
Ability to run on most Linux distributions.
LTTng can be implemented and run on many types of computing platforms and most Linux distributions. An experimental version of LTTng is also available for CYGWIN under MS Windows.
Ability to scale to a high number of CPU cores and to support real-time computing.
LTTng scales to a high number of CPU cores and supports strong real-time.
Ability to trace both the user and kernel spaces of the operating system.
Both the user space and the kernel space domains of the Linux operating system can be traced by LTTng. Probes

DRDC-RDDC-2017-R003 89
Required characteristics LTTng software tracer characteristics at the end of the Poly-Tracing Project
can be inserted anywhere in both spaces, including in interruption contexts.
Use of many types of tracing probes that could be installed within the system.
LTTng allows the concurrent utilization of both static probes (tracepoints) and dynamic probes (kprobes).
Precise common timing of trace events, the event that is generated when a trace probe is executed by a CPU.
The timestamp of a trace event accurately tracks individual processor cycles, and the event specifies on which processor it occurred in multi-core systems. Timestamps allow event ordering across cores/CPUs (except if hardware makes it impossible). The timestamp ordering of trace events originating from the user and kernel spaces is also made using the same base, allowing correlations of trace events originating from both domains.
Standardization of the output of the software tracer.
Execution traces are formatted according to the Common Trace Format (CTF). CTF is a versatile self-described binary formatting standard that is highly optimized for compactness.

90 DRDC-RDDC-2017-R003
This page intentionally left blank.
DRDC-RDDC-2017-R003 91
On evasion and adversarial cyber-attacks Annex B
This section reproduces verbatim a text from [45] describing additional research works that were made in AHLS on evasion and adversarial attacks against system call ADSs. All references can be found in [45].
Mimicry attacks and anomaly detection based on system calls:
Mimicry attacks were among the earliest attempts toward defeating host-based ADSs that only monitor the temporal order of system calls. Wagner et al. proposed that it is possible to craft sequences of system calls which appear normal to the ADS (hence they will not be detected) while exploiting some vulnerabilities in the monitored process […]. The authors proposed replacing the foreign system calls, which do not belong to the normal process behaviour (and can be easily detected), with one or multiple nullified system calls that belong to the normal system behaviour. Nullified system calls are legitimate calls but have no effect (similar to no operation “no-op” system call) since their return values and the parameters are ignored.
This form of mimicry attacks allow an attacker to embed the malicious sequence of system calls (necessary to run the exploit) within the sequences that belong to the normal process behaviour, by careful substitution and padding of nullified calls. The authors formulate the generation of a mimicry attack sequence as a finite-state automata intersection and showed that an initial detectable exploit of eight system calls can be transformed into a mimicry attack of length 100 system calls.
In our opinion, the presence of mimicry attacks does not diminish the need for anomaly detection systems based on system call sequences. In fact, it is quite the opposite. It encourages researchers to combine models of system call sequences with other models built from additional system artifacts such as system call arguments […], memory and call stack information […], and function calls and other user-space information […]. The long-term goal is to work towards an anomaly detection infrastructure with multiple layers of security, as further detailed below. With this in mind, system call based techniques that can reduce false alarms while keeping a decent level of accuracy […], should contribute to building such a holistic solution.
Weaknesses in the detection coverage of the sequence matching anomaly detectors based on a sliding window:
Another form of evasion attack relies on crafting attack sequences that exploit specific weaknesses in the detection coverage of the sequence-matching anomaly detectors that are based on a sliding window, such as STIDE […]. An example of such blind regions is provided in […] showing that the detector window size (W) of STIDE must be at least equal to the smallest anomalous sequence of the attack for the latter to be visible to the detector. Otherwise, the window of the STIDE detector will slide on the subsequences of the anomalous sequence (which are all normal), without discovering that the whole sequence is anomalous. This blind region issue only affects binary or crisp window-based detectors that produce a class label (normal or anomalous) for a given sequence.
92 DRDC-RDDC-2017-R003
In contrast, probabilistic and sequential detectors have no blind regions and will be able to detect the anomalous sequence even if its length is greater than the detector window size […]. The multiple-detector ADS is resilient to such evasion attacks, because the attacker must now simultaneously predict two (or more) thresholds as well as the applied Boolean functions (which are difficult to guess) to remain undetected. An attacker could also attempt to predict the threshold that raises the alarm in order to make his attack go undetected (under the radar) […]. […] Any ADS provides a trade-off between true and false positives.
The reduction of false positive rates:
In order to reduce the number false positives (i.e., smoothen the false alarms), several researchers used another temporal threshold on a recent history of events. Instead of raising an alarm when one subsequence is detected as anomalous, the test sequence is only signaled as an attack if the number of anomalous subsequences within a recent time window exceeded a given threshold. This has been called a locality frame in […], since the anomaly signal is computed from the number of mismatches occurring in a temporally local region. However, this second threshold is typically set to arbitrary values and opens the possibility of crafting attacks that remain under the threshold value, by spreading the anomalous sequences over a period of time longer than the locality frame. Our approach does not rely on smoothing thresholds to reduce false alarms, but on the Boolean combination of detectors, and hence this kind of attack is not applicable.
Exploiting the system call arguments to evade the detection of ADSs monitoring system call sequences:
An alternative type of evasive attack against the control-flow relies on exploiting the system call arguments to evade the detection of ADSs monitoring system call sequences. If an attacker is able to launch the attack by exploiting the arguments of system calls without tampering with the normal order of system calls, then it may go undetected by the ADS since the arguments are not monitored […]. Recent work included additional information about the system call arguments to defend against such attacks […]. However, these approaches have difficulties in deciding which legitimate argument value is really benign, when multiple legitimate values appear in the training phase […].
Our approach allows the inclusion of additional detectors (specialized for examining different features such as system call arguments, return values and other information flow features) in a modular way. This is achieved by only recomputing and automatically selecting the Boolean combinations and decision thresholds that reduce the overall false alarm rate while increasing the true positive rate.
The gray-box anomaly detector:
The anomaly detection techniques described above, which try to defend against control-flow attacks using both the system call sequences (temporal order) and the system call arguments, have been called black-box detectors […]. In contrast, the white-box detectors examine the program being monitored by statically analyzing the source code or binary files […]. Gaoo et al. coined the term gray-box for the anomaly detector that does not utilize static analysis of the program source code, but does extract additional runtime information from the monitored process when a system call is invoked, by looking for instance into the memory allocated for that process […].
DRDC-RDDC-2017-R003 93
Sekar et al. proposed the first gray-box anomaly detector by including the program counter of the process with the system call number […], while Feng et al. further incorporated the return addresses on the call stack of the process when each system call is invoked […]. Tandon and Chan coupled the system call arguments with their return values […]. Gao et al. proposed an execution graph model that accepts sequences of system calls as well as the active function calls when each system call is invoked […]. The previous approach has been further extended using the call stack information to provide more context for system call arguments, and introduced a metric that quantifies the degree to which system call arguments are unique to particular execution contexts […].
These gray-box approaches make evasion and mimicry attacks harder, because the attack code will not be able to resume control after the execution of a system call. In fact, if the attacker attempts to regain execution control by providing a return address on the stack, the ADS monitoring the return values would detect the presence of the attack. However, Kruegel et al. devised an approach that relies on corrupting the data in register contents or local variables to regain control of the program execution flow after a system call is completed […]. The authors focused on demonstrating the ability of their symbolic execution technique to generate configurations that return control to the attack code. However, several issues that need to be addressed before constructing such attacks against real-world applications were left open.
Attacks exploiting non-control data-flow:
The main focus of the above approaches was mainly against code-injection attacks to compromise the host system. Chen et al. demonstrated other kinds of attacks that do not modify the control flow of a program; instead, they exploit the (non-control) data-flow to take full control of the system […]. The authors also demonstrated exploits against data-flow vulnerabilities by, for instance, using normal system calls to overwrite the password file and then elevate privileges […]. Similar kinds of attacks have also been applied to common web servers by targeting security-critical data, such as variables that store the user identification numbers corresponding to an FTP client and the directory that contains all allowable CGI scripts for a web server […].
Some non-control data-flow attacks require no invocation of system calls, therefore the attacks will most likely evade detection by system-call based monitoring mechanisms. For instance, the persistent interposition attacks proposed by Parampalli et al. are based on injecting code that interposes on input/output operations, by modifying the data read or written by the victim, but leaving the control-flow and other system-call arguments unmodified. Although these persistent interposition attacks do not aim at compromising the system (e.g., by obtaining a root shell), they are powerful enough to steal credit card numbers and passwords or a server’s private key, or alter emails […].
These attacks do not manifest at the system call level, and hence are outside the scope of system call based ADS. In practice, however, it may be difficult to launch an evasion or a mimicry attack without disrupting the order of the system calls. As shown in […], the actions taken by the attacker before and while launching his attack (within the preamble phase), may produce deviations from the normal behaviour of the monitored system that could be detected at the system call level, before the attacker proceeds to take full control of the system or perform other stealthy actions.
94 DRDC-RDDC-2017-R003
The main problem of anomaly detection:
In summary, we think that the key problem of anomaly detection systems is the high rate of false alarms. An anomaly detector that generates an excessive number of false alarms is not useful, especially if an expensive and time consuming investigation is required to confirm or refute each alarm. Therefore, an ADS monitoring the temporal order of system calls that generates a small number of false alarms provides an important first line of defense. Attacks that have no manifestations at the system call sequence level could be detected with ADSs that rely on additional information about the system call arguments, return values, call stack, function calls, or other runtime and memory information, as described above.
A layered defense architecture:
We strongly believe in a layered defense architecture that employs several independent defense strategies to provide more robust overall protection. An adversary is then forced to craft attacks that must conform to the normal behaviour of the system from various points of view, depending on several detection techniques and features. The modularity of the proposed multiple-detectors ADS provides an efficient and easy to apply solution because it operates at the decision level. It allows the inclusion of any additional detector (specialized to detect specific features) by only recomputing the Boolean combinations and decision thresholds (which is very efficient).
Our multiple-detector ADS is resilient to evasion attacks, because the attacker must now simultaneously predict two (or more) thresholds and the applied Boolean functions. Furthermore, the operating point could be changed during system runtime, which activates different detectors, decision thresholds and Boolean functions. More importantly, the combination of two or more detectors compensates for the weaknesses of each individual detector. Exploiting the diversity of detectors that commit different errors is at the heart of multiple detector (or classifier) systems.
DRDC-RDDC-2017-R003 95
A comprehensive analysis of kernel exploits Annex Cfor the Linux operating system
The following text was copied verbatim from [66] to provide information on additional research that were made in AHLS on Linux exploits. The reader will find all references in [66].
Abstract
The goal of this work is to perform a comprehensive analysis of known Linux-based kernel exploits, the types of attack vectors they utilize, their hiding strategies, and current countermeasures and their limitations. Based on this study, the second goal of this work is to start identifying critical elements of a Knowledge Base (to be developed in a further project) that will help detect attacks that target the Linux kernel.
1 Introduction
An operating system kernel is typically the most trusted software component of a computer system because it runs with the highest privileges. A kernel vulnerability therefore poses a serious threat to system security. Furthermore, modern kernels allow third-party, untrusted extensions, such as drivers, to be loaded on demand and executed with the same privileges as the core kernel. Today, a malicious extension poses serious risk because it can easily hide its presence (e.g., a kernel rootkitg, open backdoors, steal information or disable kernel-based defenses.
Current security technologies such as firewalls, virus and worm scanners, and host-based intrusion detection systems primarily focus on detecting attacks on application code or system files. However, kernel exploits can easily bypass these technologies. For example, sophisticated detection systems may detect exploits by monitoring sensitive system calls made by applications, but kernel exploits can execute entirely in the kernel context without issuing any system calls or modifying any files. Furthermore, these exploits may actively subvert the detection software, thus making detection a real challenge.
Given the severity of the threat posed by kernel exploits, and the lack of easily deployable tools for detecting them, there has recently been significant research on protecting systems against kernel exploits. In this work, we summarize these results by describing the types of kernel exploits available for the Linux operating system, the kernel vulnerabilities utilized by these exploits, and proposed defenses against them. A key objective is to identify the types of integrity constraints that need to hold in the Linux kernel. This knowledge base of constraints will help detect attacks that target the Linux kernel. Our hope is that this study will form the basis for the future development of state-of-the art defenses against kernel exploits.
2 Analysis of Known Linux-based Kernel Exploits
An attack strategy typically consists of one or more of the following steps: 1) gain limited access to the system, 2) escalate privileges to gain elevated access, and 3) take steps that enable continued access to the system. A kernel exploit compromises the integrity of the operating

96 DRDC-RDDC-2017-R003
system, and it is dangerous because it allows the attacker to “own the box”, or it provides the attacker with complete access to the system.
A kernel exploit that is designed to hide its existence from normal detection methods is called a kernel rootkit or simply a rootkit. Rootkits are hard to detect because they can actively subvert any user or kernel-level detection mechanisms. Thus rootkits are a severe threat because they provide the attacker with complete control and continued access to the system.
Below, we first describe the common methods used to compromise the operating system. Next, we discuss the challenges associated with detecting rootkits and common techniques used by rootkits to hide their presence. Then, we discuss the basic types of vulnerabilities that are targeted by kernel exploits. Each type of vulnerability can be defined as a violation of a corresponding integrity property. Understanding the nature of these vulnerabilities and the corresponding integrity properties is beneficial in two ways: 1) it helps design defenses against the vulnerabilities rather than for specific exploits, and 2) it helps clarify the limitations of existing defenses. Then we describe several examples of exploits available for the Linux kernel and categorize them by how they target the vulnerabilities. Finally, we summarize the proposed defenses against kernel vulnerabilities and their limitations.
2.1 Attack Vectors
An attacker gains access to a system either by exploiting a known software vulnerability (e.g., cracking weak passwords, buffer overflow, etc.) or by social engineering. Below, we describe common targets that lead to a kernel compromise.
2.1.1 Local kernel exploits
A local exploit is a program (or user input) that is run on the same machine as the program with the vulnerability. It requires prior access to the vulnerable system and then uses privilege escalation to compromise the kernel. A privilege escalation attack exploits a bug or a configuration error in software running with elevated privileges to gain unauthorized access to the system. For example, traditionally many Linux server applications ran with root privileges. A vulnerability in these applications, such as a buffer or integer overflow, may allow an attacker to gain a root shell on the system. The typical root or administrator account in most operating systems allows powerful capabilities for managing the system, such as modifying any file in the system, loading kernel modules to update a running kernel and even modifying the kernel memory directly. As a result, access to a root account allows complete control over the kernel.
A local exploit may also be able to target a vulnerability in the kernel directly. For example, a flaw in the implementation of the kernel module loader in certain versions of the Linux kernel allowed local users to gain root privileges by using the ptrace system call to attach to a privileged child process that is spawned by the kernel [8, 2].
2.1.2 Remote kernel exploits
A remote exploit allows the attacker to exploit a vulnerable program on a remote machine. Remote exploits work over a network and exploit the security vulnerability without any prior access to the vulnerable system. Remote exploits may allow initial access to the system, e.g., by
DRDC-RDDC-2017-R003 97
cracking regular user passwords, after which a local root or kernel exploit might be tried. Alternatively, a remote exploit can target a privileged root program to obtain a remote root shell and then compromise the system.
A remote exploit may also target a bug in the core kernel or in a device driver module code, such as a buffer overflow vulnerability, with carefully crafted remote messages. For example, a bug in Linux SCTP subsystem could cause a crash (denial of service) when a remote attacker sent certain packets with invalid parameters [4]. Similarly, a buffer overflow bug in the ndiswrapper module for the Linux kernel could allow remote attackers to execute arbitrary code [3].
2.1.3 Malicious drivers and modules
A Linux kernel module is code that can be loaded in a running kernel. Kernel modules are used to support drivers for devices, file systems, networks, etc. We distinguish a module from the core kernel because it may be provided by third parties, and unlike the core kernel, a module is only loaded in the kernel when it is needed. For example, a camera driver can be loaded in the kernel after a USB camera is hooked up to a laptop.
A kernel module runs with the same privileges as the kernel and thus a malicious module can easily compromise the kernel. While Linux modules can certainly be buggy, the risk that a malicious module is provided by a Linux distribution is relatively low because the sources of most module code are available for scrutiny by third parties. However, some proprietary, binary-only modules exist for Linux systems and there is a slight risk that they may be malicious. OnWindows, this threat is not imaginary. In 2005, Sony provided a music player on Windows that installed a kernel rootkit, which limited the user’s ability to access the CD. Unfortunately, other malware then took advantage of this rootkit, and when Sony attempted to uninstall its rootkit, it exposed users to an even more serious vulnerability.
The easiest method for an attacker to install a malicious driver on a target system is by using a Trojan horse, or by deceiving a user into trusting the rootkit installation program as a benign program (a social engineering attack), such as Sony providing the rootkit with a music player. The user needs root/administrator privileges to install the music player in a system directory. These same privileges allow installing the rootkit module in the kernel. Unfortunately, current operating systems do not provide an easy way to install programs, while limiting modifications to critical kernel components such as kernel configuration files, module binaries, and the kernel binary itself.
2.1.4 Offline attacks
A large number of attacks are possible with offline access to the system. The simplest and most common offline attack involves booting an alternate operating system from a CD or USB drive, and then this operating system is used by the attacker to modify the target system. These attacks may modify sensitive kernel configuration files or kernel modules on disk. Another target of a compromise is subverting operating system initialization. For example, a bootkit replaces the legitimate boot loader with one controlled by an attacker [5, 1]. Similarly, a firmware rootkit creates a persistent malware image in hardware, such as a network card, or a hard drive, or the system BIOS. The rootkit can hide unless the integrity of the firmware code is inspected when it is loaded and run.

98 DRDC-RDDC-2017-R003
These attacks can be avoided by preventing physical access to the system (which is hard to do with laptops and smartphones) or by using a Trusted Platform Module that is configured for secure boot to protect the integrity of the boot path [24]. The Linux integrity measurement architecture helps protect against offline attacks by providing trusted computing facilities for checking the integrity and authenticity of files, directories, and their metadata, such as file names. We do not discuss these attacks any further.
2.2 Challenges in Detecting Rootkits
After a kernel rootkit is installed, it will take active measures to obscure its presence within the host system by subverting standard operating system security tools and APIs used for diagnosis, scanning, and monitoring. Rootkits hide themselves by modifying the behaviour of core parts of an operating system, such as by loading code into other processes, installing or modifying module code, concealing running processes from system-monitoring mechanisms and hiding system and other configuration files. Rootkits may also disable or tamper with the event logging facility in an operating system in an attempt to hide any evidence of an attack. In theory, rootkits can subvert any operating system activities because they run with the privileges of the operating system code. The “perfect rootkit” can be thought of as similar to a “perfect crime”: one that nobody realizes has taken place [6].
Rootkits are a binary payload that may modify kernel data structures to hide their presence from system administrators. Injecting the payload requires an initial compromise as described in the previous section. The rootkit payload then takes control of some kernel component such as system call handlers, interrupt handlers, kernel internal functions, etc. An example will clarify the challenges in defending against these kernel compromises.
A common target of a rootkit is a system call, for two reasons: a system call is relatively easy to compromise, and it provides powerful control over the data visible to the user. For example, system calls allows viewing all the processes and files in the system. A rootkit could filter out malicious processes it has started or files it has created in the relevant system calls and thus hide its presence. The system call handlers, e.g., sys open, sys read, are functions in the kernel that implement the system call semantics. The addresses of these functions are stored in an array called the system call table that is maintained by the kernel. When a system call is issued, the system call table is indexed by the system call number and the corresponding handler function is invoked, with the arguments passed in from the application invoking the system call. A rootkit can simply replace a handler function, such as sys read, with a function of its choice, e.g., my read, by first loading the my read function at some memory address, and then using an instruction to overwrite the appropriate entry in the system call table with the address of the my read function. After the overwrite, the my read rootkit function will get control when the read system call is issued. The my read function may invoke the original sys read function to ensure that the file is read from disk, but it could modify the file data before returning the data to the user.
It may appear that protecting the system call table from overwrites would avoid this problem. One way to protect kernel memory is by using page protection, but if the kernel is implementing the page protection, then the rootkit can simply disable the page protection before overwriting the system call table. Furthermore, a rootkit can invoke the my read function without overwriting the system call table. To do so, it can overwrite the first few instructions of the original sys read function with the binary representation of the call or jmp machine instruction to jump to the

DRDC-RDDC-2017-R003 99
replacement function, such as the my read function. In this case, the function definition rather than the system call table data has been modified. To avoid to need to modify the system call table as well as the definition of the sys read handler, the rootkit could modify the address to which sys read will return when it is done. This return address is stored on the stack and modifying it to be the address of the my read function will enable the rootkit to get control of the read system call before it returns to the user mode. While it is conceivable that the system call table and the sys read code pages are write protected, the stack is modifiable and hence write protection cannot be used to protect against this attack.
2.3 Vulnerabilities and Integrity Properties
The example above shows some of the challenges in defending against rootkits. Unfortunately, we show later in Section 2.4, much more sophisticated rootkit attacks are possible and hence defending against them is non-trivial. As a result, it is important to understand the fundamental types of vulnerabilities that can be exploited by a rootkit.
All rootkit attacks subvert the intended execution of the kernel by writing data to unintended locations. These writes may occur as a result of exploiting kernel vulnerabilities, such as a buffer overflow, or by using other attack vectors, such as installing malicious modules, as described in Section 2.1. The unintended writes give rise to three types of vulnerabilities:
1. Arbitrary code execution: An attack may inject and execute an arbitrary piece of code that is supplied by the attacker. In the example above, the my read function is supplied by the attacker.
2. Arbitrary execution control: An attack redirects execution to an arbitrary piece of code that already exists in the address space (i.e., memory) of the vulnerable program. In this case, the attacker supplies or controls the address of the target code. In the example above, suppose the return address of sys read was modified to be the address of an existing kernel target function, then the attacker does not need to inject code (e.g., my read) in the kernel. Instead, it simply specifies the target address and updates the return address with this target address. When sys read finishes executing, it will return to the attacker-specified target function rather the the caller of the sys read function.
3. Arbitrary data overwrite: An attack overwrites security critical data without subverting the intended control flow of the program. This data injection vulnerability may allow changing the value of arguments to critical functions or changing security-sensitive variables. In this case, the attacker controls the critical data value rather than an arbitrary piece of code or the address of some existing code in the kernel. For example, say a buffer overflow allows an attacker to modify the user ID of a regular process to the value 0, which is the id of the root process. In this case, the regular process would operate with full privileges and may then be tricked into performing unintended activities.
Each of the three vulnerabilities described above results from the violation of a corresponding integrity property described below:
1. Code integrity: The code that is executing was received from a trusted source and has not been modified by the attacker [26]. With the arbitrary code execution vulnerability, the code
100 DRDC-RDDC-2017-R003
is received from the attacker and hence violates this integrity property. Code integrity is the foundation for the following more stringent integrity properties.
2. Control-flow integrity: The code execution only follows paths determined by the static control-flow graph (CFG) of the kernel [7]. Merely protecting code integrity is insufficient to guarantee correct kernel operation, as shown by return-to-libc [13] and return-oriented programming [16] attacks that make use of unmodified, existing code to accomplish malicious goals. With the arbitrary execution control vulnerability, the attacker specifies a jump target, altering the target program’s control data (data that is loaded into the program counter, e.g., return address and function pointer), thereby controlling program execution. Hence the program does not follow the static control-flow graph of the kernel, violating this constraint.
3. Non-control data integrity: All kernel data is modified by program instructions that were intended by the original programmer. Protecting control-flow integrity is not sufficient for guaranteeing correct kernel operation, as shown by non-control data attacks [12] that exploit a program by overwriting security critical data without subverting the intended control-flow in the program. With arbitrary data overwrite attacks, the attacker could use a buffer overflow to modify security critical data such as a user ID and alter the behaviour of the program (e.g., give the corresponding process higher privileges than normally allowed by the kernel), while still following the static control-flow graph (CFG) of the kernel. Various types of such attacks have been reported by researchers [12, 11], including configuration change (e.g., changing a file path), changing the user input after it has been validated, decision making data (e.g., modifying a variable that indicates whether a user is logged in), wasting resources, contaminating the entropy generator in the kernel, etc.
2.4 Description of Kernel Rootkits
In this section, we discuss various examples of Linux kernel rootkits. Table C.1 shows several Linux rootkits and violate code or control-flow integrity. This table has been adapted from a paper by Petroni and Hicks [17]. A rootkit may overwrite values either transiently, persistently or both. Generally, rootkits modify values persistently so that they can continue to exist in the kernel. Certain rootkits modify kernel code directly. For example, enyelkm hides files and processes by modifying code that dispatches to the system call table. The system call code is patched to redirect system calls to modified versions of these calls.
Most of the rootkits do not modify kernel code. Instead they violate control-flow integrity by modifying register values or function pointers. For example, the adore-ng rootkit modifies structures that contain a function pointer table used by the Linux’s Virtual File System (VFS) layer. The function pointer table allows supporting different filesystems using generic file system functions. adore-ng also modifies function pointers in the /proc file system code.
There are only a few available Linux rootkits that do not modify control flow but violate noncontrol data integrity. The most well-known is a process hiding rootkit that directly manipulates the relationship among kernel data structures to hide a process from the /proc directory. When the user lists the contents of the /proc directory, the kernel enumerates all processes using a PID hash table, and then creates a directory for each PID. This rootkit removes the target process from the PID hash table, hiding it from the PID enumeration.
DRDC-RDDC-2017-R003 101
Table C.2 shows some stealthy rootkits that were implemented by Baliga et al. [11, 10]. These rootkits exploit data overwrite vulnerabilities and thus violate non-control data integrity. The table shows the various data structures in the kernel that each attack modifies to perform the exploit.
2.5 Defense Methods and Limitations
In this section, we provide a brief survey of existing work on defending against kernel rootkits. The main problem with rootkit detection is that if the operating system has been subverted by a kernel rootkit then it cannot be trusted to find unauthorized modifications to itself or its components.
Actions such as requesting a list of running processes, or a list of files in a directory, cannot be trusted to behave as expected. As a result, rootkit detection must be performed by code that is securely isolated from the kernel, and this code should lie below the kernel so that its operations cannot be intercepted by a compromised kernel. A kernel rootkit detector is typically implemented in a hypervisor because a hypervisor satisfies these requirements. Below, we describe methods for protecting code integrity, control-flow integrity and non-control data integrity. By protecting specific integrity properties, these methods allow defending against entire classes of attacks rather than just the known attacks.
2.5.1 Code integrity
Code integrity can be enforced by protecting code segments and by ensuring that code only executes from these segments. For example, all data segments must be marked non-executable, but this limits the use of self-modifying code, such as is used in just-in-time compilers. SecVisor [25] protects kernel code from modification thus defeating code execution attacks. It restricts what code can be executed by a modified Linux kernel with a custom, tiny hypervisor, showing that kernel control integrity can be achieved with a small trusted computing base (TCB). Patagonix [21] provides hypervisor support to detect covertly executing user-level binaries without making assumptions about the OS kernel. Instead, Patagonix depends only on the processor hardware to detect code execution and on the binary format specifications of executables to identify code and verify kernel and executable code modifications. However, these systems do not protect the kernel from control-flow or data overwrite attacks.
2.5.2 Control-flow integrity
Program shepherding [19] and control-flow integrity [7] are general mechanisms to ensure that a program does not deviate from its control-flow graph. These techniques analyze the source code of programs to compute a control-flow graph and use binary rewriting to enforce integrity of control flow at runtime. Kernel-level binary rewriting tools have not existed until recently [14], and hence these techniques have not been applied using binary writing to the kernel. Instead, control-flow integrity has been enforced in kernels using hypervisors.
Petroni and Hicks [17] describe a hypervisor-based approach for maintaining kernel control-flow integrity. They perform periodic scans of kernel memory for detecting persistent changes to the statically determined control-flow graph of the kernel, a technique they call state-based controlflow integrity. They compute a type graph from kernel sources and use this graph to

102 DRDC-RDDC-2017-R003
determine a set of global roots for kernel data, the fields of kernel data structures that are function pointers, and the fields that point to other structures. Periodically, their integrity checking monitor executes and traverses the kernel’s object graph starting from the set of global roots, successively following pointers to examine all allocated kernel data structures. For each object, the system verifies that all function pointers have desired properties, for example, that they point to a specific set of allowed functions. This work does not handle control-flow integrity of function return statements, or track pointers from the stack or from registers. Also, type-unsafe function pointer assignments are ignored.
HookSafe [28] protects kernel function pointers (often called hooks) by moving them to a write-protected area. The key idea is that a function pointer, once initialized, is frequently readaccessed, but rarely write-accessed, and thus can be moved to a protected area. Instructions that access these pointers within the kernel are detected with a profiling run, and then rewritten via binary translation to access the new hook locations. However, any accesses to function pointers not present in the profiling run are not correctly translated during runtime.
2.5.3 Non-control data integrity
Non-control data integrity requires that all program data be modified by intended instructions. Since the intent of the programmer is not necessarily clear from either static code analysis or by using runtime techniques, it is hard to ensure this integrity property. Instead, various techniques discussed below aim to approximate this integrity property.
KernelGuard [18] protects kernel data structures by selectively interposing on memory writes in the QEMU system emulator. It uses the source code to determine the set of functions are normally access a given kernel data structure. Then it detects an attack when a data structure, represented by a guarded memory region, is modified by an unauthorized function. This approach does not prevent attacks when an authorized function updates data with function pointers. For example, the netfilter filter registration functions install new filters for the iptables firewall tool. A rootkit could use the registration functions to install malicious filters KernelGuard would not detect such an attack. OSck [15] ensures that all function pointers must point to safe functions (functions in kernel text and of the same signature as the caller), and thus would detect that unsafe filters were installed. OSck enforces type safety at the hypervisor level, similar to the state-based control-flow integrity approach described in Section 2.5.2. However, OSck also provides support for writing kernel integrity checks to ensure data integrity. It runs these checks concurrently with a running operating system, while ensuring that the checks are performed when the kernel memory is in a consistent state.
Gibralter [10, 11] also enforces state-based control-flow integrity. In addition, it shows that a large number of data structure invariants can be automatically inferred by observing the execution of an uninfected kernel. Such inference is performed during a controlled training phase, when a clean OS executes several benign workloads. A rootkit detection phase uses these invariants as specifications of data structure integrity.
WIT [9] uses points-to analysis at compile time to compute the control-flow graph and the set of objects that can be written by each instruction in the program. Then it generates code instrumented to prevent instructions from modifying objects that are not in the set computed by the static analysis and to ensure that indirect control transfers are allowed by the control-flow

DRDC-RDDC-2017-R003 103
graph. WIT detects all control-flow integrity violations with low overhead because it does not need to check function returns. By ensuring that instructions only write to the objects that were computed by the static analysis, this approach provides a much stronger guarantee of data integrity. However, the approach has only been implemented for user-level programs and not for the kernel.
Several systems have proposed broad coverage attack detectors based on dynamic taint analysis [27, 22, 30]. These mechanisms can detect both control-flow and non-control-data attacks. Compared to the control-flow and data-flow integrity approaches discussed above, they have the advantage of not requiring source code because they work on binaries and do not even require symbol information. However, they can have false positives and the implementations have high overhead in software or require hardware support.
2.5.4 Kernel Rootkit Analysis
There also exist a number of recent efforts on analyzing and profiling kernel rootkits. The goal of these efforts is to enrich our understanding of rootkit behaviour, including their hooking behaviour and targeted kernel objects. Specifically, Panorama [32] performs system-wide information flow tracking to understand how sensitive data (e.g., user keystrokes) are stolen or manipulated by kernel malware. HookFinder [31] applies dynamic tainting techniques to identify and analyze the hooking behaviour of rootkits. HookMap [29] monitors normal kernel execution to identify potential kernel hooks that rootkits may hijack for hiding purposes. K-Tracer [20] takes a step further to systematically discover system data manipulation behaviour by rootkits. PoKeR [23] defines four key aspects of kernel rootkit behaviours and uses them to efficiently characterize and profile them.
3 Conclusion
This report performs a comprehensive analysis of known Linux-based kernel exploits. It describes the types of attack vectors utilized by these rootkits. Then, it provides a classification of the the kernel vulnerabilities that the rootkits exploit and the basic integrity properties that are violated by these vulnerabilities. We describe some examples of Linux rootkits and then provide a brief survey of existing defenses for Linux rootkits. Our plan is to use this report as a basis for the future development of state-of-the art defenses against kernel exploits.
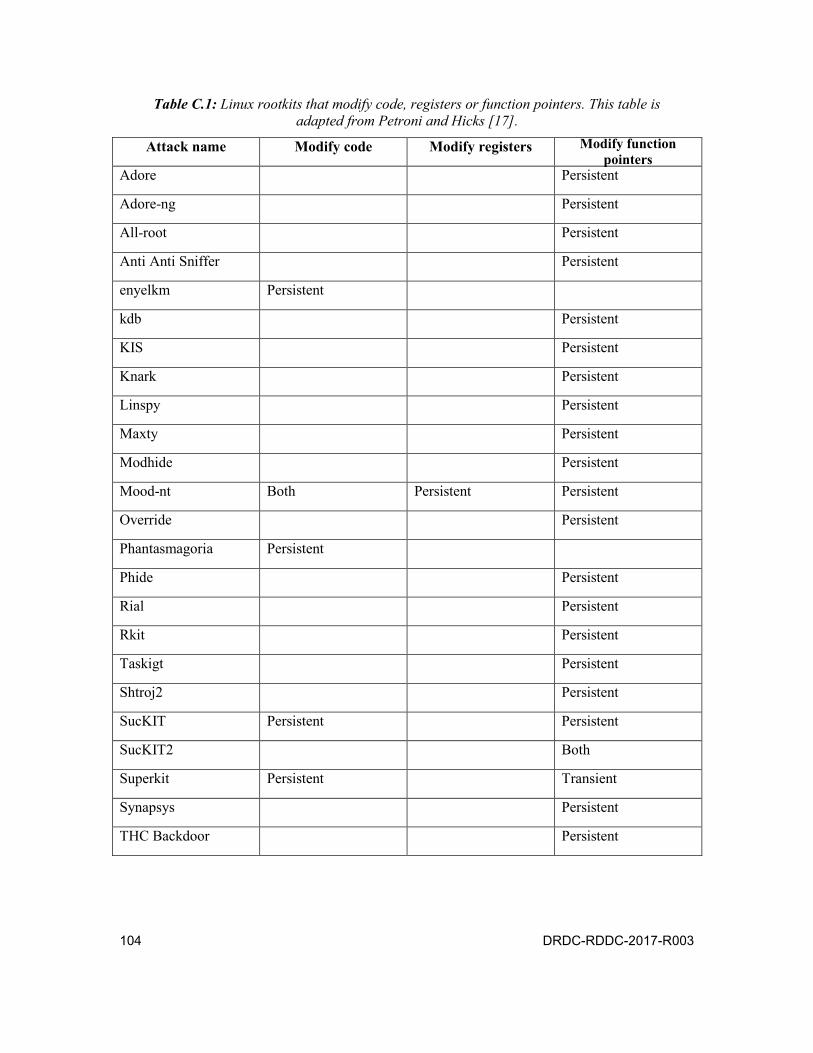
104 DRDC-RDDC-2017-R003
Table C.1: Linux rootkits that modify code, registers or function pointers. This table is adapted from Petroni and Hicks [17].
Attack name Modify code Modify registers Modify function pointers
Adore Persistent
Adore-ng Persistent
All-root Persistent
Anti Anti Sniffer Persistent
enyelkm Persistent
kdb Persistent
KIS Persistent
Knark Persistent
Linspy Persistent
Maxty Persistent
Modhide Persistent
Mood-nt Both Persistent Persistent
Override Persistent
Phantasmagoria Persistent
Phide Persistent
Rial Persistent
Rkit Persistent
Taskigt Persistent
Shtroj2 Persistent
SucKIT Persistent Persistent
SucKIT2 Both
Superkit Persistent Transient
Synapsys Persistent
THC Backdoor Persistent
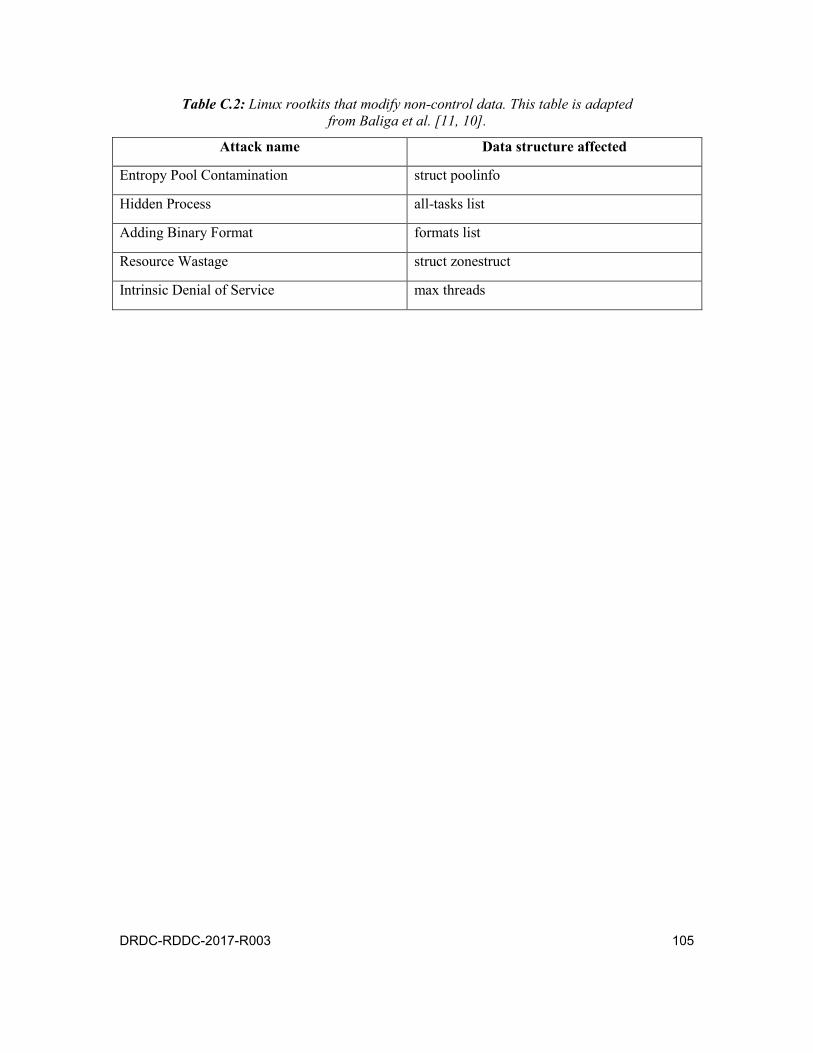
DRDC-RDDC-2017-R003 105
Table C.2: Linux rootkits that modify non-control data. This table is adapted from Baliga et al. [11, 10].
Attack name Data structure affected
Entropy Pool Contamination struct poolinfo
Hidden Process all-tasks list
Adding Binary Format formats list
Resource Wastage struct zonestruct
Intrinsic Denial of Service max threads

106 DRDC-RDDC-2017-R003
This page intentionally left blank.

DRDC-RDDC-2017-R003 107
List of symbols/abbreviations/acronyms/initialisms
2-LOCS Second line of Cyber-Surveillance
AC Architecture [kernel module]
ADFA Australian Defence Force Academy
ADFA-LD ADFA Linux Dataset
ADM Assistant Deputy Minister
ADS Anomaly Detection System
AES Advanced Encryption Standard
AFI Advanced Fault Identification
AHLS Advanced Host-Level Surveillance
AMD Advanced Micro Devices
ANN Artificial Neural Network
APC Android Personal Computer
API Application Programming Interface
ARM originally Advanced RISC Machine
AST Abstract Syntax Tree
AUC Area Under the [ROC] Curve
AV Antivirus
BIOS Basic Input/Output System
CD Compact Disk
CDF Chef du Développement des forces
CDS Centralized Data Store
CEM Chef d’état-major
CFD Chief Force Development
CFG Context-Free Grammar or Control-Flow Graph
CFI Control-Flow Integrity
CGI Common Gateway Interface
CMS Combat Management System
COM Computer On Module
COS Chief of Staff
COTS Commercial Off-the-Shelf

108 DRDC-RDDC-2017-R003
CPU Central Processing Unit
CRSNG Conseil de recherches en sciences naturelles et en génie (du Canada)
CSeSS Cyber surveillance en ligne des systèmes logiciels
CTF Common Trace Format
DBI Dynamic Binary Instrumentation
DBT Dynamic Binary Translation
DDRn Double Data Rate type n
DDRnL Double Data Rate type n Low Voltage
DFA Deterministic Finite Automata
DG Director General / Directeur-général
DGGPEM Directeur-général – Gestion du programme d’équipement maritime
DGMEPM Director General Maritime Equipment Program Management
DMRS Director Maritime Requirements Sea. This title was replaced by “Director Naval Requirements” (DNR) on March 28, 2013.
DNCS Directorate of Naval Combat Systems
DND Department of National Defence
DNR Director Naval Requirements
DoS Denial of Service
DRDC Defence Research and Development Canada
DRK DynamoRIO Kernel [where RIO is Runtime Introspection and Optimization]
DSCN Direction – Systèmes de combat naval
EBT Event-directed dynamic Binary Translation
ELM Extreme Learning Machine
EMF Eclipse Modeling Framework
eMMC Embedded MultiMediaCard
ÉTS École de technologie supérieure
FDCS Feedback-Directed Cyber-Surveillance
FELEX Frigate Life Extension
FLAC Free Lossless Audio Codec
FPGA Field-Programmable Gate Array
FS File System [kernel module]
FTP File Transfer Protocol
GCC GNU C Compiler

DRDC-RDDC-2017-R003 109
GD Granularity Degree
GDB GNU Debugger
GHz gigahertz
GI Gestion de l’information
GiB gibibyte (1024×1024×1024 bytes)
GNU GNU’s Not Unix
GPU Graphics Processing Unit
HDMI High-Definition Multimedia Interface
HIDS Host-based Intrusion Detection System
HMM Hidden Markov Model
HPC High-Performance Computing
IBC Iterative Boolean Combination
ID Identifier
IDF Inverse Document Frequency
IDS Intrusion Detection System
IHMM Improved Hidden Markov Model
IM Information Management
I/O Input/Output
IP Internet Protocol
IPC Inter Process Communication [kernel module]
JSON JavaScript Object Notation
JVMTI Java Virtual Machine Tools Interface
KL Kernel [kernel module]
KSM Kernel State Modelling
KVM Kernel-based Virtual Machine
LnCS Level-n Cyber-Security
LAN Local Area Network
LERAD LEarning Rules for Anomaly Detection
LOC Line of Code
LPDDR Low Power Double Data Rate
LR Logistic Regression
LTT Linux Trace Toolkit
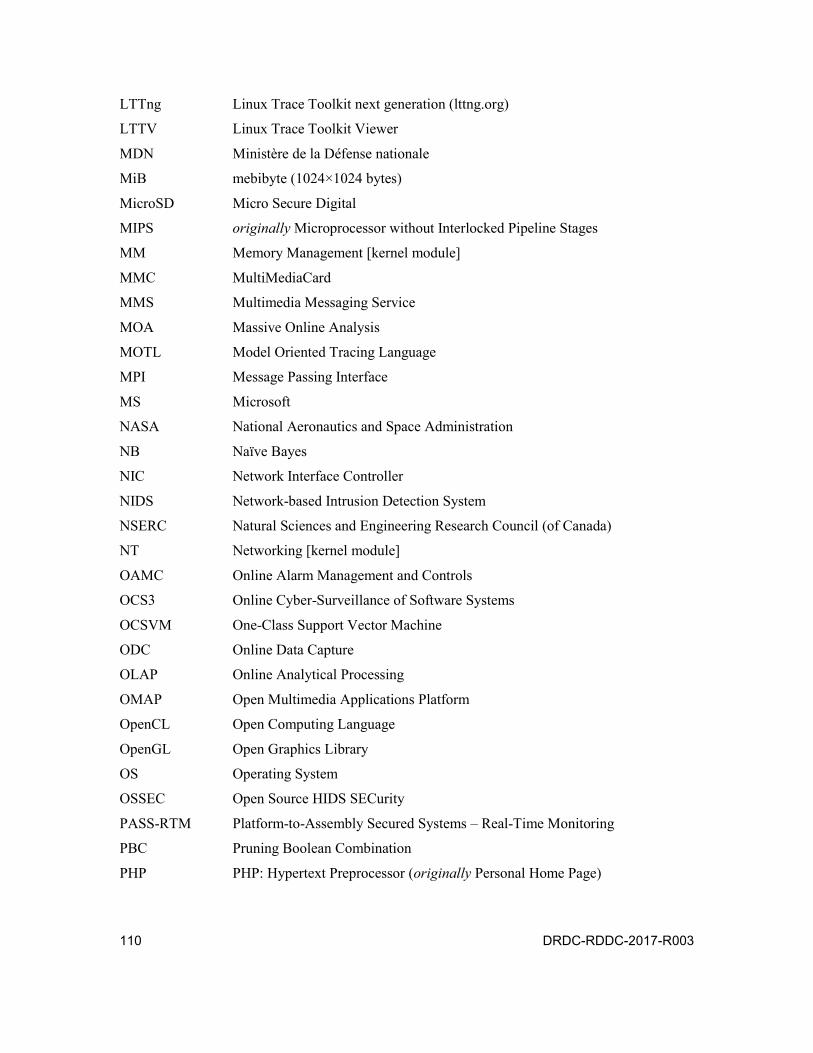
110 DRDC-RDDC-2017-R003
LTTng Linux Trace Toolkit next generation (lttng.org)
LTTV Linux Trace Toolkit Viewer
MDN Ministère de la Défense nationale
MiB mebibyte (1024×1024 bytes)
MicroSD Micro Secure Digital
MIPS originally Microprocessor without Interlocked Pipeline Stages
MM Memory Management [kernel module]
MMC MultiMediaCard
MMS Multimedia Messaging Service
MOA Massive Online Analysis
MOTL Model Oriented Tracing Language
MPI Message Passing Interface
MS Microsoft
NASA National Aeronautics and Space Administration
NB Naïve Bayes
NIC Network Interface Controller
NIDS Network-based Intrusion Detection System
NSERC Natural Sciences and Engineering Research Council (of Canada)
NT Networking [kernel module]
OAMC Online Alarm Management and Controls
OCS3 Online Cyber-Surveillance of Software Systems
OCSVM One-Class Support Vector Machine
ODC Online Data Capture
OLAP Online Analytical Processing
OMAP Open Multimedia Applications Platform
OpenCL Open Computing Language
OpenGL Open Graphics Library
OS Operating System
OSSEC Open Source HIDS SECurity
PASS-RTM Platform-to-Assembly Secured Systems – Real-Time Monitoring
PBC Pruning Boolean Combination PHP PHP: Hypertext Preprocessor (originally Personal Home Page)
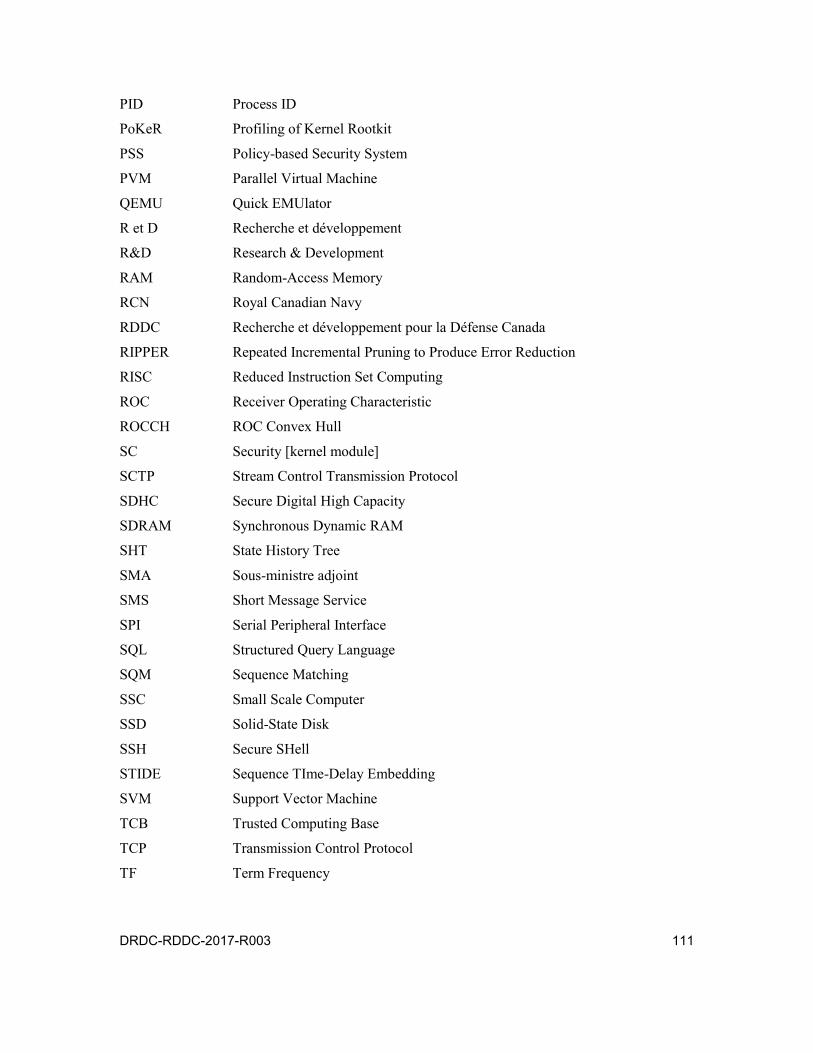
DRDC-RDDC-2017-R003 111
PID Process ID
PoKeR Profiling of Kernel Rootkit
PSS Policy-based Security System
PVM Parallel Virtual Machine
QEMU Quick EMUlator
R et D Recherche et développement R&D Research & Development
RAM Random-Access Memory
RCN Royal Canadian Navy
RDDC Recherche et développement pour la Défense Canada
RIPPER Repeated Incremental Pruning to Produce Error Reduction
RISC Reduced Instruction Set Computing
ROC Receiver Operating Characteristic
ROCCH ROC Convex Hull
SC Security [kernel module]
SCTP Stream Control Transmission Protocol
SDHC Secure Digital High Capacity
SDRAM Synchronous Dynamic RAM
SHT State History Tree
SMA Sous-ministre adjoint
SMS Short Message Service
SPI Serial Peripheral Interface
SQL Structured Query Language
SQM Sequence Matching
SSC Small Scale Computer
SSD Solid-State Disk
SSH Secure SHell
STIDE Sequence TIme-Delay Embedding SVM Support Vector Machine
TCB Trusted Computing Base
TCP Transmission Control Protocol
TF Term Frequency
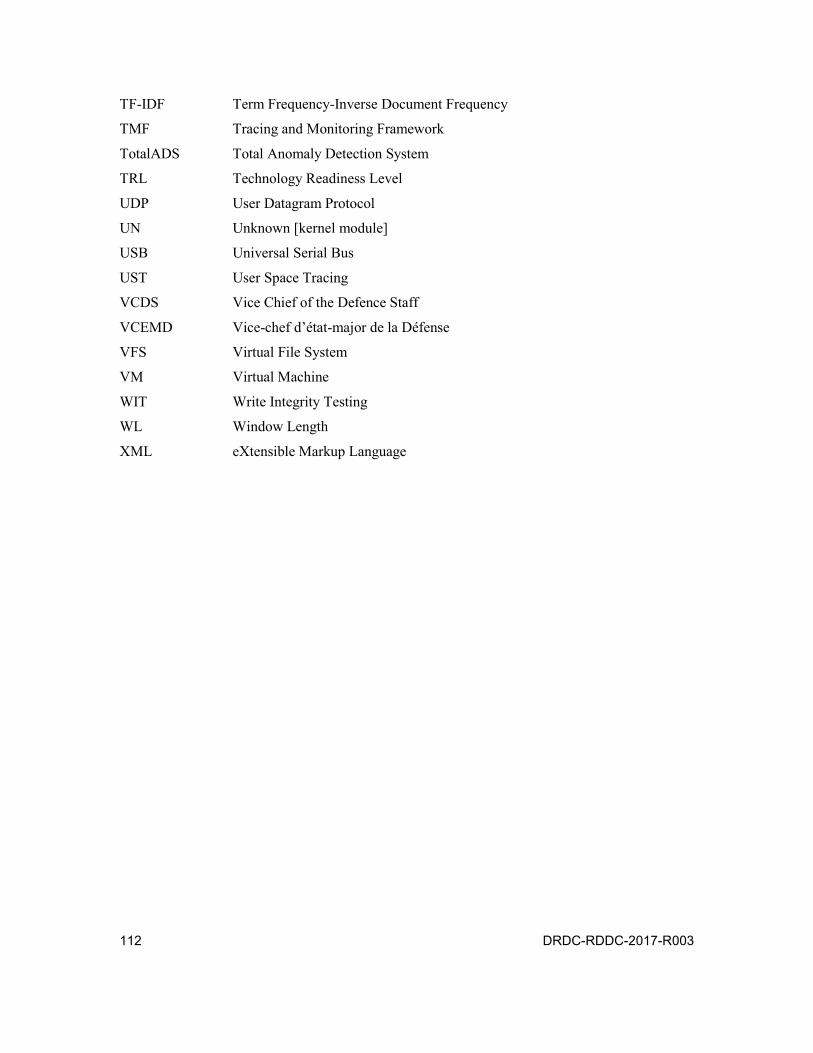
112 DRDC-RDDC-2017-R003
TF-IDF Term Frequency-Inverse Document Frequency
TMF Tracing and Monitoring Framework
TotalADS Total Anomaly Detection System
TRL Technology Readiness Level
UDP User Datagram Protocol
UN Unknown [kernel module]
USB Universal Serial Bus
UST User Space Tracing
VCDS Vice Chief of the Defence Staff
VCEMD Vice-chef d’état-major de la Défense
VFS Virtual File System
VM Virtual Machine
WIT Write Integrity Testing
WL Window Length
XML eXtensible Markup Language

DOCUMENT CONTROL DATA (Security markings for the title, abstract and indexing annotation must be entered when the document is Classified or Designated)
1. ORIGINATOR (The name and address of the organization preparing the document.Organizations for whom the document was prepared, e.g., Centre sponsoring a contractor's report, or tasking agency, are entered in Section 8.)
DRDC – Valcartier Research CentreDefence Research and Development Canada2459 route de la BravoureQuebec (Quebec) G3J 1X5Canada
2a. SECURITY MARKING (Overall security marking of the document including special supplemental markings if applicable.)
UNCLASSIFIED
2b. CONTROLLED GOODS
(NON-CONTROLLED GOODS) DMC A REVIEW: GCEC DECEMBER 2013
3. TITLE (The complete document title as indicated on the title page. Its classification should be indicated by the appropriate abbreviation (S, C or U) in parentheses after the title.)
The Advanced Host-Level Surveillance (AHLS) DND/NSERC project : Final report
4. AUTHORS (last name, followed by initials – ranks, titles, etc., not to be used)
Couture, M.
5. DATE OF PUBLICATION (Month and year of publication of document.)
January 2017
6a. NO. OF PAGES (Total containing information, including Annexes, Appendices, etc.)
125
6b. NO. OF REFS (Total cited in document.)
66 7. DESCRIPTIVE NOTES (The category of the document, e.g., technical report, technical note or memorandum. If appropriate, enter the type of report,
e.g., interim, progress, summary, annual or final. Give the inclusive dates when a specific reporting period is covered.)
Scientific Report
8. SPONSORING ACTIVITY (The name of the department project office or laboratory sponsoring the research and development – include address.)
DRDC – Valcartier Research CentreDefence Research and Development Canada2459 route de la BravoureQuebec (Quebec) G3J 1X5Canada
9a. PROJECT OR GRANT NO. (If appropriate, the applicable research and development project or grant number under which the document was written. Please specify whether project or grant.)
9b. CONTRACT NO. (If appropriate, the applicable number under which the document was written.)
10a. ORIGINATOR’S DOCUMENT NUMBER (The official document number by which the document is identified by the originating activity. This number must be unique to this document.)
DRDC-RDDC-2017-R003
10b. OTHER DOCUMENT NO(s). (Any other numbers which may be assigned this document either by the originator or by the sponsor.)
11. DOCUMENT AVAILABILITY (Any limitations on further dissemination of the document, other than those imposed by security classification.)
Unlimited
12. DOCUMENT ANNOUNCEMENT (Any limitation to the bibliographic announcement of this document. This will normally correspond to theDocument Availability (11). However, where further distribution (beyond the audience specified in (11) is possible, a wider announcement audience may be selected.))
Unlimited
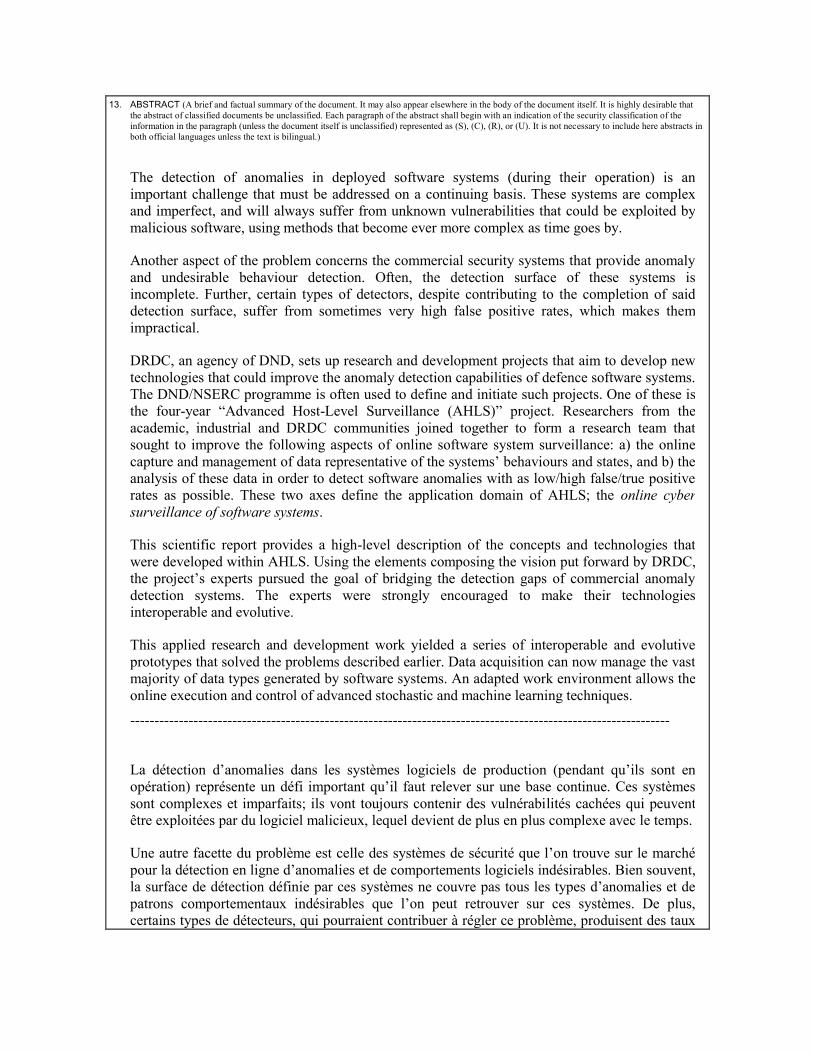
13. ABSTRACT (A brief and factual summary of the document. It may also appear elsewhere in the body of the document itself. It is highly desirable that the abstract of classified documents be unclassified. Each paragraph of the abstract shall begin with an indication of the security classification of the information in the paragraph (unless the document itself is unclassified) represented as (S), (C), (R), or (U). It is not necessary to include here abstracts in both official languages unless the text is bilingual.)
The detection of anomalies in deployed software systems (during their operation) is an important challenge that must be addressed on a continuing basis. These systems are complex and imperfect, and will always suffer from unknown vulnerabilities that could be exploited by malicious software, using methods that become ever more complex as time goes by.
Another aspect of the problem concerns the commercial security systems that provide anomaly and undesirable behaviour detection. Often, the detection surface of these systems is incomplete. Further, certain types of detectors, despite contributing to the completion of said detection surface, suffer from sometimes very high false positive rates, which makes them impractical.
DRDC, an agency of DND, sets up research and development projects that aim to develop new technologies that could improve the anomaly detection capabilities of defence software systems. The DND/NSERC programme is often used to define and initiate such projects. One of these is the four-year “Advanced Host-Level Surveillance (AHLS)” project. Researchers from the academic, industrial and DRDC communities joined together to form a research team that sought to improve the following aspects of online software system surveillance: a) the online capture and management of data representative of the systems’ behaviours and states, and b) the analysis of these data in order to detect software anomalies with as low/high false/true positive rates as possible. These two axes define the application domain of AHLS; the online cyber surveillance of software systems.
This scientific report provides a high-level description of the concepts and technologies that were developed within AHLS. Using the elements composing the vision put forward by DRDC, the project’s experts pursued the goal of bridging the detection gaps of commercial anomaly detection systems. The experts were strongly encouraged to make their technologies interoperable and evolutive.
This applied research and development work yielded a series of interoperable and evolutive prototypes that solved the problems described earlier. Data acquisition can now manage the vast majority of data types generated by software systems. An adapted work environment allows the online execution and control of advanced stochastic and machine learning techniques.
---------------------------------------------------------------------------------------------------------------
La détection d’anomalies dans les systèmes logiciels de production (pendant qu’ils sont en opération) représente un défi important qu’il faut relever sur une base continue. Ces systèmes sont complexes et imparfaits; ils vont toujours contenir des vulnérabilités cachées qui peuvent être exploitées par du logiciel malicieux, lequel devient de plus en plus complexe avec le temps.
Une autre facette du problème est celle des systèmes de sécurité que l’on trouve sur le marché pour la détection en ligne d’anomalies et de comportements logiciels indésirables. Bien souvent, la surface de détection définie par ces systèmes ne couvre pas tous les types d’anomalies et de patrons comportementaux indésirables que l’on peut retrouver sur ces systèmes. De plus, certains types de détecteurs, qui pourraient contribuer à régler ce problème, produisent des taux

de faux positifs qui sont souvent très élevés, les rendant inutilisables.
L’agence RDDC du MDN met en place des projets de recherche et développement dans le but de développer de nouvelles technologies pour améliorer les capacités de détection d’anomalies des systèmes logiciels de la défense. Le programme MDN/CRSNG est souvent utilisé pour définir et lancer ces projets. Un de ceux-ci est le projet de 4 ans « Advanced Host-Level Surveillance (AHLS) ». Des chercheurs provenant des milieux académique, industriel et de RDDC ont donc formé une équipe de recherche collaborative dans le but d’améliorer les aspects suivants de la surveillance en ligne : a) l’acquisition en ligne et la gestion de données représentant les comportements et états logiciels courants, et b) l’analyse de ces données dans le but de détecter les anomalies logicielles avec des taux de vrais/faux positifs aussi hauts/bas que possible. Ces deux catégories définissent le champ d'application de AHLS; la cyber surveillance en ligne des systèmes logiciels.
Ce rapport scientifique fournit une description de haut niveau des concepts et des technologies qui ont été développés dans AHLS. Utilisant les éléments d’une vision prédéfinie par RDDC, les experts du projet avaient pour but de combler les défauts de détection des systèmes de sécurité qui sont publiquement disponibles. Ces experts ont été fortement encouragés à rendre leurs technologies interfonctionnelles et évolutives.
Ce travail de recherche et de développement appliqué a produit une suite de prototypes interfonctionnels et évolutifs qui apportent des solutions aux problèmes décrits plus haut. L’acquisition de données peut maintenant gérer la plupart des types de données que l’on retrouve sur les systèmes informatiques. Un environnement de travail adapté permet également l’exécution de techniques stochastiques et d’apprentissage machine avancées ainsi que leur contrôle en ligne.
14. KEYWORDS, DESCRIPTORS or IDENTIFIERS (Technically meaningful terms or short phrases that characterize a document and could be helpful in cataloguing the document. They should be selected so that no security classification is required. Identifiers, such as equipment model designation, trade name, military project code name, geographic location may also be included. If possible keywords should be selected from a published thesaurus, e.g., Thesaurus of Engineering and Scientific Terms (TEST) and that thesaurus identified. If it is not possible to select indexing terms which are Unclassified, the classification of each should be indicated as with the title.) Cyber-threat; Online cyber-surveillance; software system