JMIR Public Health and Surveillance
189
JMIR Public Health and Surveillance A multidisciplinary journal that focuses on public health and technology, public health informatics, mass media campaigns, surveillance, participatory epidemiology, and innovation in public health practice and research Volume 1 (2015), Issue 2 ISSN: 2369-2960 Editor in Chief: Travis Sanchez, PhD, MPH Contents Original Papers The US National Tuberculosis Surveillance System: A Descriptive Assessment of the Completeness and Consistency of Data Reported from 2008 to 2012 (e15) Rachel Yelk Woodruff, Robert Pratt, Lori Armstrong. . . . . . . . . . . . . . . . . . . . . . . . . . . . . . . . . . . . . . . . . . . . . . . . . . . . . . . . . . . . . . . . . . . . . . . . . . . . . . 3 Implementation of a Multimodal Mobile System for Point-of-Sale Surveillance: Lessons Learned From Case Studies in Washington, DC, and New York City (e20) Jennifer Cantrell, Ollie Ganz, Vinu Ilakkuvan, Michael Tacelosky, Jennifer Kreslake, Joyce Moon-Howard, Angela Aidala, Donna Vallone, Andrew Anesetti-Rothermel, Thomas Kirchner. . . . . . . . . . . . . . . . . . . . . . . . . . . . . . . . . . . . . . . . . . . . . . . . . . . . . . . . . . . . . . . . . . . . . . . . . . . . . . . . . . . . . . . 12 Agenda Setting for Health Promotion: Exploring an Adapted Model for the Social Media Era (e21) Yousef Albalawi, Jane Sixsmith. . . . . . . . . . . . . . . . . . . . . . . . . . . . . . . . . . . . . . . . . . . . . . . . . . . . . . . . . . . . . . . . . . . . . . . . . . . . . . . . . . . . . . . . . . . . 25 Identifying Adverse Effects of HIV Drug Treatment and Associated Sentiments Using Twitter (e7) Cosme Adrover, Todd Bodnar, Zhuojie Huang, Amalio Telenti, Marcel Salathé. . . . . . . . . . . . . . . . . . . . . . . . . . . . . . . . . . . . . . . . . . . . . . . . . . . . . . . . 42 Electronic Cigarette Marketing Online: a Multi-Site, Multi-Product Comparison (e11) Kar-Hai Chu, Anupreet Sidhu, Thomas Valente. . . . . . . . . . . . . . . . . . . . . . . . . . . . . . . . . . . . . . . . . . . . . . . . . . . . . . . . . . . . . . . . . . . . . . . . . . . . . . . . 52 The Effect of Commuting Patterns on HIV Care Attendance Among Men Who Have Sex With Men (MSM) in Atlanta, Georgia (e10) Sharoda Dasgupta, Michael Kramer, Eli Rosenberg, Travis Sanchez, Landon Reed, Patrick Sullivan. . . . . . . . . . . . . . . . . . . . . . . . . . . . . . . . . . . . . . 62 An Integrated Service Delivery Model to Identify Persons Living with HIV and to Provide Linkage to HIV Treatment and Care in Prioritized Neighborhoods: A Geotargeted, Program Outcome Study (e16) Paula Frew, Matthew Archibald, Jay Schamel, Diane Saint-Victor, Elizabeth Fox, Neena Smith-Bankhead, Dazon Diallo, Marcia Holstad, Carlos del Rio. . . . . . . . . . . . . . . . . . . . . . . . . . . . . . . . . . . . . . . . . . . . . . . . . . . . . . . . . . . . . . . . . . . . . . . . . . . . . . . . . . . . . . . . . . . . . . . . . . . . . . . . . . . . . . . . 73 Building a Mobile HIV Prevention App for Men Who Have Sex With Men: An Iterative and Community-Driven Process (e18) Tamar Goldenberg, Sarah McDougal, Patrick Sullivan, Joanne Stekler, Rob Stephenson. . . . . . . . . . . . . . . . . . . . . . . . . . . . . . . . . . . . . . . . . . . . . . . 92 A Qualitative Examination of Respondent-Driven Sampling (RDS) Peer Referral Challenges Among Young Transwomen in the San Francisco Bay Area (e9) Sean Arayasirikul, Xiang Cai, Erin Wilson. . . . . . . . . . . . . . . . . . . . . . . . . . . . . . . . . . . . . . . . . . . . . . . . . . . . . . . . . . . . . . . . . . . . . . . . . . . . . . . . . . . 119 JMIR Public Health and Surveillance 2015 | vol. 1 | iss. 2 | p.1 XSL • FO RenderX
-
Upload
khangminh22 -
Category
Documents
-
view
0 -
download
0
Transcript of JMIR Public Health and Surveillance
JMIR Public Health and Surveillance
A multidisciplinary journal that focuses on public health and technology, public health informatics, massmedia campaigns, surveillance, participatory epidemiology, and innovation in public health practice and
researchVolume 1 (2015), Issue 2 ISSN: 2369-2960 Editor in Chief: Travis Sanchez, PhD, MPH
Contents
Original Papers
The US National Tuberculosis Surveillance System: A Descriptive Assessment of the Completeness andConsistency of Data Reported from 2008 to 2012 (e15)Rachel Yelk Woodruff, Robert Pratt, Lori Armstrong. . . . . . . . . . . . . . . . . . . . . . . . . . . . . . . . . . . . . . . . . . . . . . . . . . . . . . . . . . . . . . . . . . . . . . . . . . . . . . 3
Implementation of a Multimodal Mobile System for Point-of-Sale Surveillance: Lessons Learned From CaseStudies in Washington, DC, and New York City (e20)Jennifer Cantrell, Ollie Ganz, Vinu Ilakkuvan, Michael Tacelosky, Jennifer Kreslake, Joyce Moon-Howard, Angela Aidala, Donna Vallone, AndrewAnesetti-Rothermel, Thomas Kirchner. . . . . . . . . . . . . . . . . . . . . . . . . . . . . . . . . . . . . . . . . . . . . . . . . . . . . . . . . . . . . . . . . . . . . . . . . . . . . . . . . . . . . . . 12
Agenda Setting for Health Promotion: Exploring an Adapted Model for the Social Media Era (e21)Yousef Albalawi, Jane Sixsmith. . . . . . . . . . . . . . . . . . . . . . . . . . . . . . . . . . . . . . . . . . . . . . . . . . . . . . . . . . . . . . . . . . . . . . . . . . . . . . . . . . . . . . . . . . . . 25
Identifying Adverse Effects of HIV Drug Treatment and Associated Sentiments Using Twitter (e7)Cosme Adrover, Todd Bodnar, Zhuojie Huang, Amalio Telenti, Marcel Salathé. . . . . . . . . . . . . . . . . . . . . . . . . . . . . . . . . . . . . . . . . . . . . . . . . . . . . . . . 42
Electronic Cigarette Marketing Online: a Multi-Site, Multi-Product Comparison (e11)Kar-Hai Chu, Anupreet Sidhu, Thomas Valente. . . . . . . . . . . . . . . . . . . . . . . . . . . . . . . . . . . . . . . . . . . . . . . . . . . . . . . . . . . . . . . . . . . . . . . . . . . . . . . . 52
The Effect of Commuting Patterns on HIV Care Attendance Among Men Who Have Sex With Men (MSM)in Atlanta, Georgia (e10)Sharoda Dasgupta, Michael Kramer, Eli Rosenberg, Travis Sanchez, Landon Reed, Patrick Sullivan. . . . . . . . . . . . . . . . . . . . . . . . . . . . . . . . . . . . . . 62
An Integrated Service Delivery Model to Identify Persons Living with HIV and to Provide Linkage to HIVTreatment and Care in Prioritized Neighborhoods: A Geotargeted, Program Outcome Study (e16)Paula Frew, Matthew Archibald, Jay Schamel, Diane Saint-Victor, Elizabeth Fox, Neena Smith-Bankhead, Dazon Diallo, Marcia Holstad, Carlosdel Rio. . . . . . . . . . . . . . . . . . . . . . . . . . . . . . . . . . . . . . . . . . . . . . . . . . . . . . . . . . . . . . . . . . . . . . . . . . . . . . . . . . . . . . . . . . . . . . . . . . . . . . . . . . . . . . . . 73
Building a Mobile HIV Prevention App for Men Who Have Sex With Men: An Iterative and Community-DrivenProcess (e18)Tamar Goldenberg, Sarah McDougal, Patrick Sullivan, Joanne Stekler, Rob Stephenson. . . . . . . . . . . . . . . . . . . . . . . . . . . . . . . . . . . . . . . . . . . . . . . 92
A Qualitative Examination of Respondent-Driven Sampling (RDS) Peer Referral Challenges Among YoungTranswomen in the San Francisco Bay Area (e9)Sean Arayasirikul, Xiang Cai, Erin Wilson. . . . . . . . . . . . . . . . . . . . . . . . . . . . . . . . . . . . . . . . . . . . . . . . . . . . . . . . . . . . . . . . . . . . . . . . . . . . . . . . . . . 119
JMIR Public Health and Surveillance 2015 | vol. 1 | iss. 2 | p.1
XSL•FORenderX

Texting-Based Reporting of Adverse Drug Reactions to Ensure Patient Safety: A Feasibility Study (e12)Godofreda Vergeire-Dalmacion, Nina Castillo-Carandang, Noel Juban, Maria Amarillo, Maria Tagle, Emmanuel Baja. . . . . . . . . . . . . . . . . . . . . . . . . 127
Direct-to-Patient Research: Piloting a New Approach to Understanding Drug Safety During Pregnancy(e22)Nancy Dreyer, Stella Blackburn, Shahrul Mt-Isa, Jonathan Richardson, Simon Thomas, Maja Laursen, Priscilla Zetstra-van der Woude, AnnaJamry-Dziurla, Valerie Hliva, Alison Bourke, Lolkje de Jong-van den Berg. . . . . . . . . . . . . . . . . . . . . . . . . . . . . . . . . . . . . . . . . . . . . . . . . . . . . . . . . . 135
Tracking Hookah Bars in New York: Utilizing Yelp as a Powerful Public Health Tool (e19)Philip Cawkwell, Lily Lee, Michael Weitzman, Scott Sherman. . . . . . . . . . . . . . . . . . . . . . . . . . . . . . . . . . . . . . . . . . . . . . . . . . . . . . . . . . . . . . . . . . . . 147
Patient-Reported Outcomes and Total Health Care Expenditure in Prediction of Patient Satisfaction: ResultsFrom a National Study (e13)Man Hung, Weiping Zhang, Wei Chen, Jerry Bounsanga, Christine Cheng, Jeremy Franklin, Anthony Crum, Maren Voss, Shirley Hon. . . . . . . . . . . 156
A Comparison of Self-Reported and Objective Physical Activity Measures in Young Australian Women(e14)Stefanie Hartley, Suzanne Garland, Elisa Young, Kim Bennell, Ilona Tay, Alexandra Gorelik, John Wark. . . . . . . . . . . . . . . . . . . . . . . . . . . . . . . . . . . 166
Machine Translation of Public Health Materials From English to Chinese: A Feasibility Study (e17)Anne Turner, Kristin Dew, Loma Desai, Nathalie Martin, Katrin Kirchhoff. . . . . . . . . . . . . . . . . . . . . . . . . . . . . . . . . . . . . . . . . . . . . . . . . . . . . . . . . . . 179
Protocol
The Tobacco Pack Surveillance System: A Protocol for Assessing Health Warning Compliance, DesignFeatures, and Appeals of Tobacco Packs Sold in Low- and Middle-Income Countries (e8)Katherine Smith, Carmen Washington, Jennifer Brown, Alison Vadnais, Laura Kroart, Jacqueline Ferguson, Joanna Cohen. . . . . . . . . . . . . . . . . . . 105
JMIR Public Health and Surveillance 2015 | vol. 1 | iss. 2 | p.2
XSL•FORenderX
Original Paper
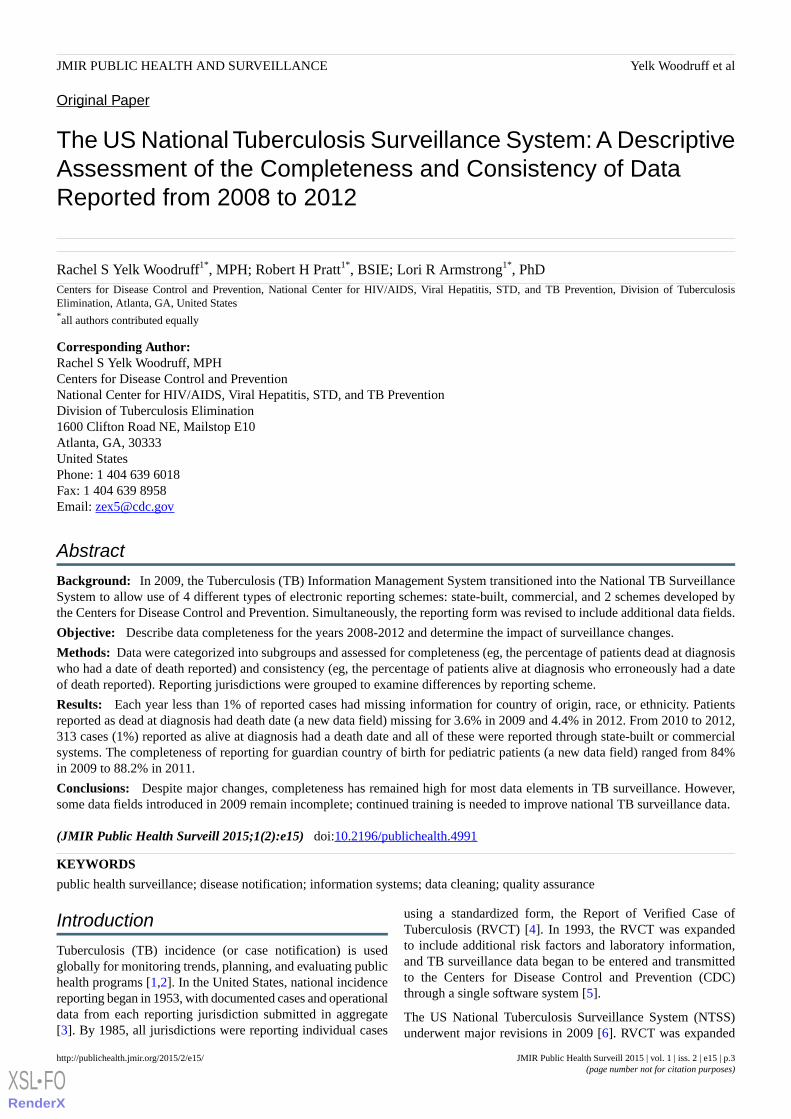
The US National Tuberculosis Surveillance System: A DescriptiveAssessment of the Completeness and Consistency of DataReported from 2008 to 2012
Rachel S Yelk Woodruff1*, MPH; Robert H Pratt1*, BSIE; Lori R Armstrong1*, PhDCenters for Disease Control and Prevention, National Center for HIV/AIDS, Viral Hepatitis, STD, and TB Prevention, Division of TuberculosisElimination, Atlanta, GA, United States*all authors contributed equally
Corresponding Author:Rachel S Yelk Woodruff, MPHCenters for Disease Control and PreventionNational Center for HIV/AIDS, Viral Hepatitis, STD, and TB PreventionDivision of Tuberculosis Elimination1600 Clifton Road NE, Mailstop E10Atlanta, GA, 30333United StatesPhone: 1 404 639 6018Fax: 1 404 639 8958Email: [email protected]
Abstract
Background: In 2009, the Tuberculosis (TB) Information Management System transitioned into the National TB SurveillanceSystem to allow use of 4 different types of electronic reporting schemes: state-built, commercial, and 2 schemes developed bythe Centers for Disease Control and Prevention. Simultaneously, the reporting form was revised to include additional data fields.
Objective: Describe data completeness for the years 2008-2012 and determine the impact of surveillance changes.
Methods: Data were categorized into subgroups and assessed for completeness (eg, the percentage of patients dead at diagnosiswho had a date of death reported) and consistency (eg, the percentage of patients alive at diagnosis who erroneously had a dateof death reported). Reporting jurisdictions were grouped to examine differences by reporting scheme.
Results: Each year less than 1% of reported cases had missing information for country of origin, race, or ethnicity. Patientsreported as dead at diagnosis had death date (a new data field) missing for 3.6% in 2009 and 4.4% in 2012. From 2010 to 2012,313 cases (1%) reported as alive at diagnosis had a death date and all of these were reported through state-built or commercialsystems. The completeness of reporting for guardian country of birth for pediatric patients (a new data field) ranged from 84%in 2009 to 88.2% in 2011.
Conclusions: Despite major changes, completeness has remained high for most data elements in TB surveillance. However,some data fields introduced in 2009 remain incomplete; continued training is needed to improve national TB surveillance data.
(JMIR Public Health Surveill 2015;1(2):e15) doi:10.2196/publichealth.4991
KEYWORDS
public health surveillance; disease notification; information systems; data cleaning; quality assurance
Introduction
Tuberculosis (TB) incidence (or case notification) is usedglobally for monitoring trends, planning, and evaluating publichealth programs [1,2]. In the United States, national incidencereporting began in 1953, with documented cases and operationaldata from each reporting jurisdiction submitted in aggregate[3]. By 1985, all jurisdictions were reporting individual cases
using a standardized form, the Report of Verified Case ofTuberculosis (RVCT) [4]. In 1993, the RVCT was expandedto include additional risk factors and laboratory information,and TB surveillance data began to be entered and transmittedto the Centers for Disease Control and Prevention (CDC)through a single software system [5].
The US National Tuberculosis Surveillance System (NTSS)underwent major revisions in 2009 [6]. RVCT was expanded
JMIR Public Health Surveill 2015 | vol. 1 | iss. 2 | e15 | p.3http://publichealth.jmir.org/2015/2/e15/(page number not for citation purposes)
Yelk Woodruff et alJMIR PUBLIC HEALTH AND SURVEILLANCE
XSL•FORenderX

to include 11 new data fields, and 25 of 38 existing fields weremodified. Concurrently, state and local reporting areastransitioned from reporting TB case data through theTuberculosis Information Management System (TIMS), astand-alone, modem-based system developed at the CDC, totheir choice of 4 reporting schemes: (1) the National ElectronicDisease Surveillance System (NEDSS)-base system, aCDC-developed infrastructure; (2) the electronic RVCT(eRVCT), also developed by the CDC; (3) state-developedcustom software systems; or (4) commercial software developedby private companies. All reporting schemes were required toconform to specific Public Health Information Network andNEDSS data standards [7,8].
The transition from a single reporting scheme to a choice ofdifferent types of schemes allowed state and local TB programsmore control over the structure of their surveillance systemsand gave them responsibility for their own data validation [9].Prior to 2009, surveillance data came to the CDC via TIMS,which had a built-in data validation system for alerting logicerrors to help ensure accurate data entry and reporting. Thesevalidation standards were retired with TIMS in 2010, althoughthe CDC-developed eRVCT and NEDSS-base system retainedvalidation rules similar to those in TIMS. Validation rules forstate-developed and commercial schemes vary by jurisdiction.Furthermore, routine maintenance, updates, changes, andenhancements of state-developed and commercial reportingschemes are now at the expense of state and local TB programs;information technology (IT) expertise is necessary at the stateand local level to maintain and update these types of systems[9]. Modifications of state and commercial reporting schemes,such as changes in RVCT data fields, have to be done at thelevel of the individual reporting jurisdiction; therefore,modifications to NTSS are more complicated than they wereprior to 2009, when the CDC was able to update a single systemand provide all reporting jurisdictions with updated softwarethat incorporated the revisions.
The objectives of this report are to describe the completenessand consistency of TB case data reported to the CDC from 2008to 2012, to determine the extent to which the 2009 changes inRVCT and reporting schemes affected the data, and to find waysto improve data quality. Although the surveillance report andthe reporting schemes described here are specific to TB, theanalytical methods and results may be useful to managers ofother public health programs who are contemplating similarchanges in surveillance systems or reporting schemes.
Methods
Data sourcesNTSS receives TB surveillance data electronically from the 50states and the District of Columbia [6]. The reporting officialsin TB programs collect laboratory and clinical TB data from avariety of sources and store them in electronic reporting systems.From 1998 to 2009, those officials submitted TB surveillancedata through TIMS by using file-transfer protocol andcontrolled-access Internet and modem transfer [10]. Starting in2009, TB surveillance data have been transmitted using Public
Health Information Network Messaging Service software inHL7 messaging format.
The CDC provides preliminary TB surveillance datasets weeklyfor reporting program officials to verify reported data. The CDCcreates final TB surveillance datasets annually for reporting,research, and publications. Since 2009, TB data reported to theCDC have been subjected to a data-cleaning routine before afinalized dataset is created. The data cleaning routine is appliedto selected data fields using a hierarchical strategy as determinedby CDC staff (eg, a dependent field, such as the year of previousTB episode, is deleted if the independent field, such as historyof previous TB, is not present) that creates a dataset that hasfewer inconsistencies but not necessarily more accuracy. Ouranalysis included only clean, finalized annual datasets.
AnalysisWe examined responses from NTSS data elements from 2008to 2012 (the most recent year of data at the time of analysis)and new elements from 2009 to 2012. Although NTSS includesdata from 1993 to 2012, the purpose of this study was toexamine how the changes in data elements and reportingschemes affected the data; therefore, the study period beginsthe year before the changes occurred. New data elements fromAlaska, California, Connecticut, Illinois, Missouri, Mississippi,North Carolina, North Dakota, New York City, and Ohio werenot included for 2009 because these jurisdictions used TIMSthat year and the new elements were not supported. In addition,we excluded California and Vermont from analyses that includedHIV test results for 2008-2012 because HIV reporting practiceswere different for these jurisdictions.
Reporting jurisdictions were categorized according to the typeof reporting scheme (TIMS, commercial, eRVCT, NEDSS-base,or state-developed) used in 2009 and 2010-2012. Because ofthe changes in both reporting schemes and RVCT in 2009, datafrom that year were examined separately from latter years’data.
Data were categorized into subgroups and data elementsassociated with subgroups were assessed for completeness (eg,the percentage of patients dead at diagnosis who had a date ofdeath reported) and consistency (eg, the percentage of patientsalive at diagnosis who erroneously had a date of death reported).The results are presented for a subset of data elements that areclinically or demographically important or exhibitedinconsistency or incompleteness in reporting. Furthermore, foreach TB case we selected key data elements from 3 differentcategories: risk factors, clinical aspects of TB disease, andmolecular aspects of TB disease.
Results
From 2008 to 2012, 56,040 cases were reported to NTSS [6].Each year, fewer than 1% of reported cases had missing orunknown information for origin of birth (nativity; 59/56,040),or race/ethnicity (197/56,040). One data element thatdemonstrated inconsistency in completeness was correctionalfacility status (residence in correctional facility at time ofdiagnosis), for which 6.5% of cases (746/11,520) had unknownor missing information in 2009, compared with approximately1% or less of cases (265/44,529) in other years (Table 1). When
JMIR Public Health Surveill 2015 | vol. 1 | iss. 2 | e15 | p.4http://publichealth.jmir.org/2015/2/e15/(page number not for citation purposes)
Yelk Woodruff et alJMIR PUBLIC HEALTH AND SURVEILLANCE
XSL•FORenderX

correctional facility status was examined by reporting system(Table 2), information was missing for 17.1% (729/4266) ofthe cases reported by jurisdictions using TIMS in 2009, whilethe other reporting systems had less than 1% of cases (17/6871)missing for this element. Among cases reported as residents incorrectional facilities at the time of diagnosis, information on
the type of correctional facility was missing for 9% (10/110)of cases reported through state-developed reporting systems in2009 and 2010-2012 (25/267), compared to less than 3%(17/1386) through TIMS, commercial, NEDSS-based, andeRVCT reporting systems for those same years (Tables 2 and3).
Table 1. Completeness of trend data elements reported to the National Tuberculosis Surveillance System, United States, 2008-2012.
20122011201020092008
%N%N%N%N%N
100.09945100.010,517100.011,163100.011,520100.012,904Total reported TB cases
Resident in correctional fa-cility
3.93864.04234.44894.04653.9499Yes
95.6950995.410,03694.410,53689.510,30996.012,386No
0.5500.6581.21386.57460.119Unknown/
Missing
99.038297.241196.347197.045198.6492Type of correctional facility
indicateda
4.84814.95114.65104.34924.4572History of TB
96.046297.349796.749392.545598.6564Year of TB reportedb
4.0192.7143.3177.5371.48Year of TB missingb
96.3731598.5796698.4831698.2872598.49604Initial DST donec
99.2725899.5792399.6827999.5868497.79385Isoniazid resultsc
99.3726099.4791999.6827999.5867897.69377Rifampin resultsc
aAmong patients who were residents of correctional facilities at the time of diagnosis.bAmong cases that reported history of previous TB.cDrug susceptibility test. Among patients who had positive culture; includes resistant and susceptible test results.
JMIR Public Health Surveill 2015 | vol. 1 | iss. 2 | e15 | p.5http://publichealth.jmir.org/2015/2/e15/(page number not for citation purposes)
Yelk Woodruff et alJMIR PUBLIC HEALTH AND SURVEILLANCE
XSL•FORenderX
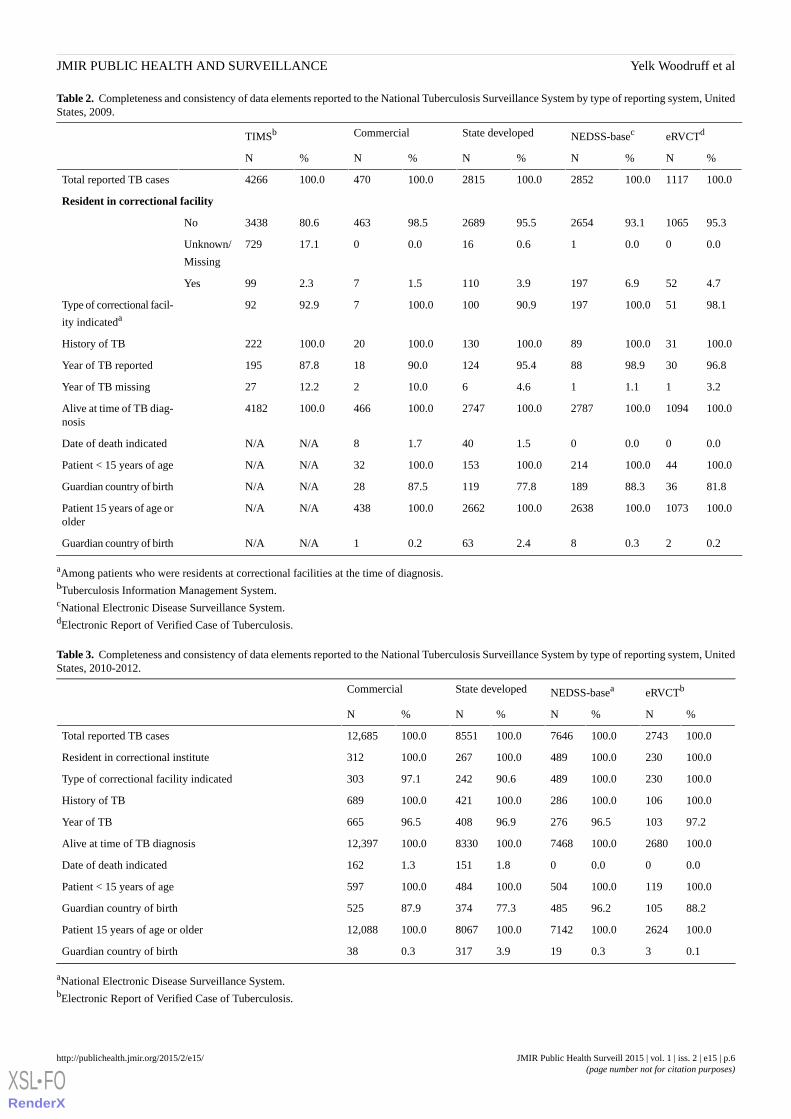
Table 2. Completeness and consistency of data elements reported to the National Tuberculosis Surveillance System by type of reporting system, UnitedStates, 2009.
eRVCTdNEDSS-basecState developedCommercialTIMSb
%N%N%N%N%N
100.01117100.02852100.02815100.0470100.04266Total reported TB cases
Resident in correctional facility
95.3106593.1265495.5268998.546380.63438No
0.000.010.6160.0017.1729Unknown/
Missing
4.7526.91973.91101.572.399Yes
98.151100.019790.9100100.0792.992Type of correctional facil-
ity indicateda
100.031100.089100.0130100.020100.0222History of TB
96.83098.98895.412490.01887.8195Year of TB reported
3.211.114.6610.0212.227Year of TB missing
100.01094100.02787100.02747100.0466100.04182Alive at time of TB diag-nosis
0.000.001.5401.78N/AN/ADate of death indicated
100.044100.0214100.0153100.032N/AN/APatient < 15 years of age
81.83688.318977.811987.528N/AN/AGuardian country of birth
100.01073100.02638100.02662100.0438N/AN/APatient 15 years of age orolder
0.220.382.4630.21N/AN/AGuardian country of birth
aAmong patients who were residents at correctional facilities at the time of diagnosis.bTuberculosis Information Management System.cNational Electronic Disease Surveillance System.dElectronic Report of Verified Case of Tuberculosis.
Table 3. Completeness and consistency of data elements reported to the National Tuberculosis Surveillance System by type of reporting system, UnitedStates, 2010-2012.
eRVCTbNEDSS-baseaState developedCommercial
%N%N%N%N
100.02743100.07646100.08551100.012,685Total reported TB cases
100.0230100.0489100.0267100.0312Resident in correctional institute
100.0230100.048990.624297.1303Type of correctional facility indicated
100.0106100.0286100.0421100.0689History of TB
97.210396.527696.940896.5665Year of TB
100.02680100.07468100.08330100.012,397Alive at time of TB diagnosis
0.000.001.81511.3162Date of death indicated
100.0119100.0504100.0484100.0597Patient < 15 years of age
88.210596.248577.337487.9525Guardian country of birth
100.02624100.07142100.08067100.012,088Patient 15 years of age or older
0.130.3193.93170.338Guardian country of birth
aNational Electronic Disease Surveillance System.bElectronic Report of Verified Case of Tuberculosis.
JMIR Public Health Surveill 2015 | vol. 1 | iss. 2 | e15 | p.6http://publichealth.jmir.org/2015/2/e15/(page number not for citation purposes)
Yelk Woodruff et alJMIR PUBLIC HEALTH AND SURVEILLANCE
XSL•FORenderX
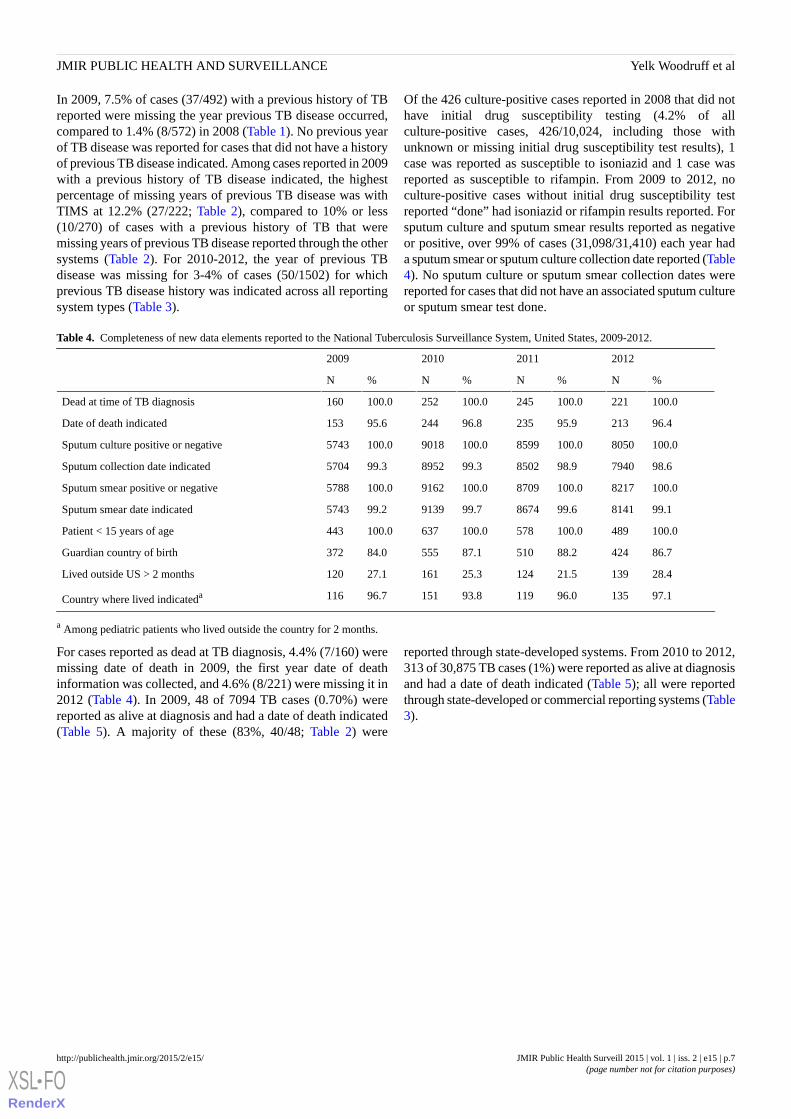
In 2009, 7.5% of cases (37/492) with a previous history of TBreported were missing the year previous TB disease occurred,compared to 1.4% (8/572) in 2008 (Table 1). No previous yearof TB disease was reported for cases that did not have a historyof previous TB disease indicated. Among cases reported in 2009with a previous history of TB disease indicated, the highestpercentage of missing years of previous TB disease was withTIMS at 12.2% (27/222; Table 2), compared to 10% or less(10/270) of cases with a previous history of TB that weremissing years of previous TB disease reported through the othersystems (Table 2). For 2010-2012, the year of previous TBdisease was missing for 3-4% of cases (50/1502) for whichprevious TB disease history was indicated across all reportingsystem types (Table 3).
Of the 426 culture-positive cases reported in 2008 that did nothave initial drug susceptibility testing (4.2% of allculture-positive cases, 426/10,024, including those withunknown or missing initial drug susceptibility test results), 1case was reported as susceptible to isoniazid and 1 case wasreported as susceptible to rifampin. From 2009 to 2012, noculture-positive cases without initial drug susceptibility testreported “done” had isoniazid or rifampin results reported. Forsputum culture and sputum smear results reported as negativeor positive, over 99% of cases (31,098/31,410) each year hada sputum smear or sputum culture collection date reported (Table4). No sputum culture or sputum smear collection dates werereported for cases that did not have an associated sputum cultureor sputum smear test done.
Table 4. Completeness of new data elements reported to the National Tuberculosis Surveillance System, United States, 2009-2012.
2012201120102009
%N%N%N%N
100.0221100.0245100.0252100.0160Dead at time of TB diagnosis
96.421395.923596.824495.6153Date of death indicated
100.08050100.08599100.09018100.05743Sputum culture positive or negative
98.6794098.9850299.3895299.35704Sputum collection date indicated
100.08217100.08709100.09162100.05788Sputum smear positive or negative
99.1814199.6867499.7913999.25743Sputum smear date indicated
100.0489100.0578100.0637100.0443Patient < 15 years of age
86.742488.251087.155584.0372Guardian country of birth
28.413921.512425.316127.1120Lived outside US > 2 months
97.113596.011993.815196.7116Country where lived indicateda
a Among pediatric patients who lived outside the country for 2 months.
For cases reported as dead at TB diagnosis, 4.4% (7/160) weremissing date of death in 2009, the first year date of deathinformation was collected, and 4.6% (8/221) were missing it in2012 (Table 4). In 2009, 48 of 7094 TB cases (0.70%) werereported as alive at diagnosis and had a date of death indicated(Table 5). A majority of these (83%, 40/48; Table 2) were
reported through state-developed systems. From 2010 to 2012,313 of 30,875 TB cases (1%) were reported as alive at diagnosisand had a date of death indicated (Table 5); all were reportedthrough state-developed or commercial reporting systems (Table3).
JMIR Public Health Surveill 2015 | vol. 1 | iss. 2 | e15 | p.7http://publichealth.jmir.org/2015/2/e15/(page number not for citation purposes)
Yelk Woodruff et alJMIR PUBLIC HEALTH AND SURVEILLANCE
XSL•FORenderX
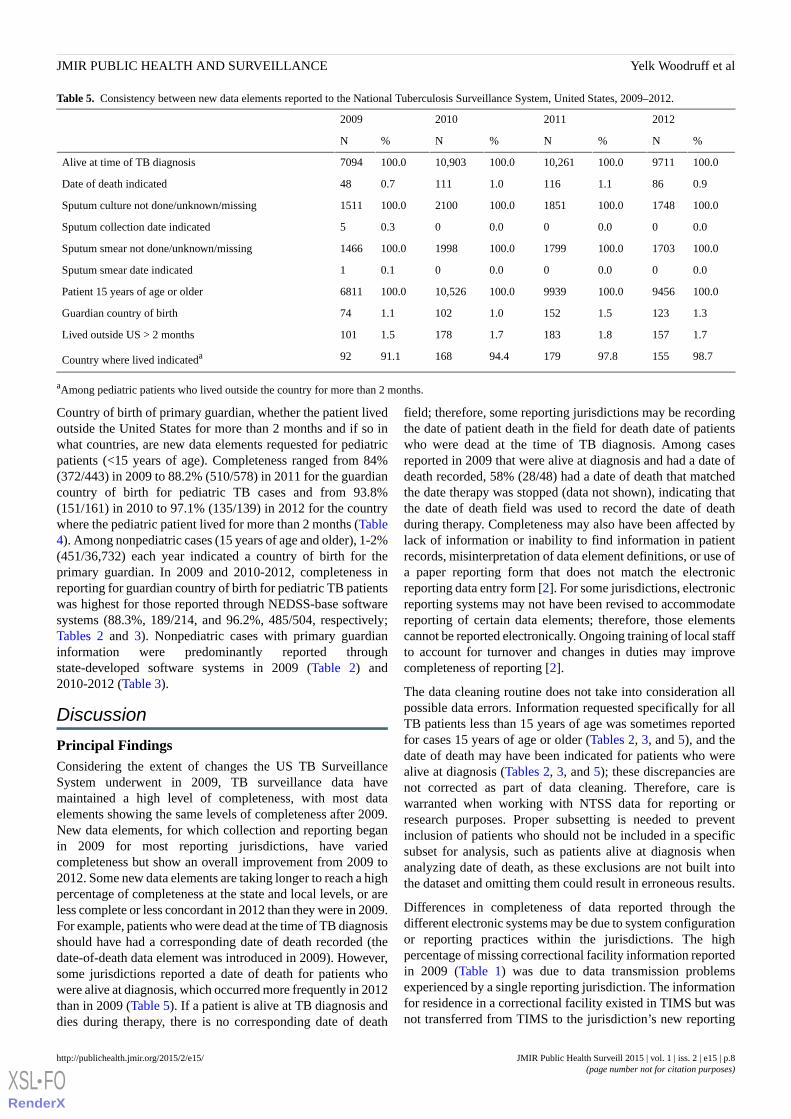
Table 5. Consistency between new data elements reported to the National Tuberculosis Surveillance System, United States, 2009–2012.
2012201120102009
%N%N%N%N
100.09711100.010,261100.010,903100.07094Alive at time of TB diagnosis
0.9861.11161.01110.748Date of death indicated
100.01748100.01851100.02100100.01511Sputum culture not done/unknown/missing
0.000.000.000.35Sputum collection date indicated
100.01703100.01799100.01998100.01466Sputum smear not done/unknown/missing
0.000.000.000.11Sputum smear date indicated
100.09456100.09939100.010,526100.06811Patient 15 years of age or older
1.31231.51521.01021.174Guardian country of birth
1.71571.81831.71781.5101Lived outside US > 2 months
98.715597.817994.416891.192Country where lived indicateda
aAmong pediatric patients who lived outside the country for more than 2 months.
Country of birth of primary guardian, whether the patient livedoutside the United States for more than 2 months and if so inwhat countries, are new data elements requested for pediatricpatients (<15 years of age). Completeness ranged from 84%(372/443) in 2009 to 88.2% (510/578) in 2011 for the guardiancountry of birth for pediatric TB cases and from 93.8%(151/161) in 2010 to 97.1% (135/139) in 2012 for the countrywhere the pediatric patient lived for more than 2 months (Table4). Among nonpediatric cases (15 years of age and older), 1-2%(451/36,732) each year indicated a country of birth for theprimary guardian. In 2009 and 2010-2012, completeness inreporting for guardian country of birth for pediatric TB patientswas highest for those reported through NEDSS-base softwaresystems (88.3%, 189/214, and 96.2%, 485/504, respectively;Tables 2 and 3). Nonpediatric cases with primary guardianinformation were predominantly reported throughstate-developed software systems in 2009 (Table 2) and2010-2012 (Table 3).
Discussion
Principal FindingsConsidering the extent of changes the US TB SurveillanceSystem underwent in 2009, TB surveillance data havemaintained a high level of completeness, with most dataelements showing the same levels of completeness after 2009.New data elements, for which collection and reporting beganin 2009 for most reporting jurisdictions, have variedcompleteness but show an overall improvement from 2009 to2012. Some new data elements are taking longer to reach a highpercentage of completeness at the state and local levels, or areless complete or less concordant in 2012 than they were in 2009.For example, patients who were dead at the time of TB diagnosisshould have had a corresponding date of death recorded (thedate-of-death data element was introduced in 2009). However,some jurisdictions reported a date of death for patients whowere alive at diagnosis, which occurred more frequently in 2012than in 2009 (Table 5). If a patient is alive at TB diagnosis anddies during therapy, there is no corresponding date of death
field; therefore, some reporting jurisdictions may be recordingthe date of patient death in the field for death date of patientswho were dead at the time of TB diagnosis. Among casesreported in 2009 that were alive at diagnosis and had a date ofdeath recorded, 58% (28/48) had a date of death that matchedthe date therapy was stopped (data not shown), indicating thatthe date of death field was used to record the date of deathduring therapy. Completeness may also have been affected bylack of information or inability to find information in patientrecords, misinterpretation of data element definitions, or use ofa paper reporting form that does not match the electronicreporting data entry form [2]. For some jurisdictions, electronicreporting systems may not have been revised to accommodatereporting of certain data elements; therefore, those elementscannot be reported electronically. Ongoing training of local staffto account for turnover and changes in duties may improvecompleteness of reporting [2].
The data cleaning routine does not take into consideration allpossible data errors. Information requested specifically for allTB patients less than 15 years of age was sometimes reportedfor cases 15 years of age or older (Tables 2, 3, and 5), and thedate of death may have been indicated for patients who werealive at diagnosis (Tables 2, 3, and 5); these discrepancies arenot corrected as part of data cleaning. Therefore, care iswarranted when working with NTSS data for reporting orresearch purposes. Proper subsetting is needed to preventinclusion of patients who should not be included in a specificsubset for analysis, such as patients alive at diagnosis whenanalyzing date of death, as these exclusions are not built intothe dataset and omitting them could result in erroneous results.
Differences in completeness of data reported through thedifferent electronic systems may be due to system configurationor reporting practices within the jurisdictions. The highpercentage of missing correctional facility information reportedin 2009 (Table 1) was due to data transmission problemsexperienced by a single reporting jurisdiction. The informationfor residence in a correctional facility existed in TIMS but wasnot transferred from TIMS to the jurisdiction’s new reporting
JMIR Public Health Surveill 2015 | vol. 1 | iss. 2 | e15 | p.8http://publichealth.jmir.org/2015/2/e15/(page number not for citation purposes)
Yelk Woodruff et alJMIR PUBLIC HEALTH AND SURVEILLANCE
XSL•FORenderX

system. Furthermore, commercial and state-developed reportingsystems are responsible for their own validation, which couldaccount for some higher percentages of missing or inaccuratedata. TB case surveillance data do not allow for assessment ofsystems or reporting practices at the state and local level, so itwas not possible to distinguish between factors related tosystems or reporting practices in this analysis.
In 2009 there was an unexpected and significant decline in thenumbers of TB cases reported to NTSS compared to previousyears [11]. Changes to electronic reporting systems were notdeemed to be a causal factor. Rather, we concluded that thedecline in TB cases was a result of decreased TB diagnoses inthe United States. Therefore, we did not consider the unexpecteddecline in TB cases in 2009 to be a factor in our study.
LimitationsThis study has several limitations. Limited resources preventedus from conducting a validation study at the local level tocompare patient data from medical charts to the data reportedto NTSS. This would have been especially valuable to assessdata elements that exhibited inconsistency. The data-cleaningroutine replaced some validation rules that existed in TIMS butmay not have improved the quality of data reported to the CDC.For example, from 2009 to 2012, 2 cases reported as not havinginitial susceptibility testing done were also reported assusceptible to both isoniazid and rifampin (data not shown),indicating that initial drug susceptibility testing may actuallyhave been done. Because the cases were reported as notundergoing susceptibility testing, the susceptibility results weredeleted for these cases during data cleaning and therefore arenot reflected in the clean, finalized dataset. Isoniazid andrifampin are important drugs for treating TB and resistance toboth defines multidrug-resistant TB. If susceptibility testingwas indeed done for isoniazid and rifampin, then drugsusceptibility testing should be reported as “done” on RVCT.
ConclusionSeveral ongoing efforts have been implemented to improve thequality of surveillance reporting. The CDC initiated a series oftrainings in 2010 with the goal of familiarizing state and localreporting jurisdictions with the updated RVCT and reportingrequirements [12]. Additionally, in 2011, the CDC conducteda series of trainings on quality assurance of TB data [13]. Thetrainings culminated in a published manual that is available to
reporting jurisdictions and others interested in attaininghigh-quality surveillance data [14]. A collection of reportsshowing various aspects of TB data reported to the CDC isavailable through NTSS to authorized state and local TBprogram staff. Information provided through NTSS reportsincludes the numbers of missing and unknown values associatedwith reported data elements, the frequency of reporting for selectelements, when data were last transmitted to the CDC, and alist of elements with no information ever reported for a particularreporting area. State and local TB program staff can use thesereports to identify and correct gaps in reported data or to reportdata errors to the CDC. The National Tuberculosis IndicatorsProject (NTIP) can also be used to verify and check TBsurveillance data reported to the CDC [13]. Reportingjurisdictions can compare their records with NTIP data and usethe NTIP to identify discrepancies. The RVCT has anaccompanying manual that provides comprehensive reportingguidance for each data element [15]. Furthermore, the RVCTworkgroup, composed of CDC and state and local TB programstaff, actively pursues clarification and provides guidance onimproving RVCT reporting. As state and local TB controlprograms are often challenged with declining resources andstaff turnover, the CDC should periodically provide updatedquality assurance and RVCT training webinars and materialsto ensure that TB control program staff remain aware of dataproblem areas and new and existing quality assurance tools andtechniques. These efforts, as well as ongoing discussionsregarding data quality assurance, will improve the completenessand accuracy of TB surveillance data.
State and local communicable disease surveillance systems varyfrom disease-specific systems to systems used for reporting anarray of diseases and conditions [9]. However, from 2007 to2010, interoperability and integration of state and local publichealth disease surveillance systems increased substantially [9].As public health programs begin to utilize current advances inelectronic reporting and embrace new national guidelines relatedto health information exchange and meaningful use, moreelectronic surveillance systems will be modified to increasecapacity and meet national standards [9,16]. The results of theNTSS transition from a single, stand-alone surveillance systemto a variety of different reporting schemes illustrate that majormodifications of disease surveillance systems can be donewithout substantial impact on the completeness of surveillancedata.
Conflicts of InterestNone declared.
References1. World Health Organization. Global Tuberculosis Report. Geneva, Switzerland: World Health Organization; 2013. URL:
http://apps.who.int/iris/bitstream/10665/91355/1/9789241564656_eng.pdf [accessed 2015-09-16] [WebCite Cache ID6basTNaiX]
2. Sprinson JE, Lawton ES, Porco TC, Flood JM, Westenhouse JL. Assessing the validity of tuberculosis surveillance datain California. BMC Public Health 2006;6:217 [FREE Full text] [doi: 10.1186/1471-2458-6-217] [Medline: 16930492]
3. Public Health Service (US). Reported tuberculosis morbidity and other data. In: Reported Tuberculosis Data 1953-69.Washington, DC: US Department of Health, Education, and Welfare; 1953.
JMIR Public Health Surveill 2015 | vol. 1 | iss. 2 | e15 | p.9http://publichealth.jmir.org/2015/2/e15/(page number not for citation purposes)
Yelk Woodruff et alJMIR PUBLIC HEALTH AND SURVEILLANCE
XSL•FORenderX

4. Centers for Disease Control and Prevention (US). 1985 Tuberculosis statistics, states and cities. In: Tuberculosis Statisticsin the United States, 1985, 1985-1986, 1987, 1988. Atlanta, GA: US Department of Health and Human Services; 1986:1-89.
5. Centers for Disease Control and Prevention (US). Reported Tuberculosis in the United States. Atlanta, GA: US Departmentof Health and Human Services; 1993.
6. Centers for Disease Control and Prevention (US). Reported Tuberculosis in the United States, 2012. Atlanta, GA: USDepartment of Health and Human Services; 2012. URL: http://www.cdc.gov/tb/statistics/reports/2012/ [accessed 2015-09-16][WebCite Cache ID 6batJhFHd]
7. Centers for Disease Control and Prevention (US). Public Health Information Network. URL: http://www.cdc.gov/phin/about/index.html [accessed 2015-07-28] [WebCite Cache ID 6aMgdFfL5]
8. Centers for Disease Control and Prevention (US). National Notifiable Diseases Surveillance System (NNDSS). Atlanta,GA: Centers for Disease Control and Prevention URL: http://wwwn.cdc.gov/nndss/nedss.html [accessed 2015-07-28][WebCite Cache ID 6aMqfHNf4]
9. Centers for Disease Control and Prevention (US). State electronic disease surveillance systems—United States, 2007 and2010. MMWR Morb Mortal Wkly Rep 2011 Oct 21;60(41):1421-1423 [FREE Full text] [Medline: 22012115]
10. National Public Health Service and Biosurveillance Registry for Human Health (US). Tuberculosis Information ManagementSystem (TIMS). Atlanta, GA: US Department of Health and Human Services; 2011.
11. Winston CA, Navin TR, Becerra JE, Chen MP, Armstrong LR, Jeffries C, et al. Unexpected decline in tuberculosis casescoincident with economic recession—United States, 2009. BMC Public Health 2011;11:846 [FREE Full text] [doi:10.1186/1471-2458-11-846] [Medline: 22059421]
12. Magee E, Tryon C, Forbes A, Heath B, Manangan L. The National Tuberculosis Surveillance System training program toensure accuracy of tuberculosis data. J Public Health Manag Pract 2011;17(5):427-430. [doi:10.1097/PHH.0b013e31820f8e43] [Medline: 21788780]
13. Manangan LP, Tryon C, Magee E, Miramontes R. Innovative quality-assurance strategies for tuberculosis surveillance inthe United States. Tuberc Res Treat 2012;2012:481230 [FREE Full text] [doi: 10.1155/2012/481230] [Medline: 22685648]
14. Centers for Disease Control and Prevention (US). Quality assurance for tuberculosis surveillance data: A guide and toolkit.2009. URL: ftp://ftp.cdc.gov/pub/Software/TIMS/2009%20RVCT%20Documentation/RVCT%20Training%20Materials/Quality%20Assurance%20Materials/QA%20Manual/ [accessed 2015-03-13] [WebCite Cache ID 6bcRhinAR]
15. Centers for Disease Control and Prevention (US). CDC tuberculosis surveillance data training: Report of Verified Case ofTuberculosis (RVCT) instruction manual. Atlanta, GA: Centers for Disease Control and Prevention (US) URL: http://www.cdc.gov/tb/programs/rvct/instructionmanual.pdf [accessed 2015-07-28] [WebCite Cache ID 6aMshVik5]
16. Shapiro JS, Mostashari F, Hripcsak G, Soulakis N, Kuperman G. Using health information exchange to improve publichealth. Am J Public Health 2011 Apr;101(4):616-623. [doi: 10.2105/AJPH.2008.158980] [Medline: 21330598]
AbbreviationsCDC: Centers for Disease Control and PreventioneRVCT: electronic Report of Verified Case of TuberculosisNEDSS: National Electronic Diseases Surveillance SystemNTIP: National Tuberculosis Indicators ProjectNTSS: National Tuberculosis Surveillance SystemRVCT: Report of Verified Case of TuberculosisTB: tuberculosisTIMS: Tuberculosis Information Management System
Edited by T Sanchez; submitted 30.07.15; peer-reviewed by N Baruch, N Nordin; comments to author 22.08.15; revised versionreceived 07.09.15; accepted 11.09.15; published 15.10.15.
Please cite as:Yelk Woodruff RS, Pratt RH, Armstrong LRThe US National Tuberculosis Surveillance System: A Descriptive Assessment of the Completeness and Consistency of Data Reportedfrom 2008 to 2012JMIR Public Health Surveill 2015;1(2):e15URL: http://publichealth.jmir.org/2015/2/e15/ doi:10.2196/publichealth.4991PMID:27227133
JMIR Public Health Surveill 2015 | vol. 1 | iss. 2 | e15 | p.10http://publichealth.jmir.org/2015/2/e15/(page number not for citation purposes)
Yelk Woodruff et alJMIR PUBLIC HEALTH AND SURVEILLANCE
XSL•FORenderX

©Rachel S Yelk Woodruff, Robert H Pratt, Lori R Armstrong. Originally published in JMIR Public Health and Surveillance(http://publichealth.jmir.org), 15.10.2015. This is an open-access article distributed under the terms of the Creative CommonsAttribution License (http://creativecommons.org/licenses/by/2.0/), which permits unrestricted use, distribution, and reproductionin any medium, provided the original work, first published in JMIR Public Health and Surveillance, is properly cited. The completebibliographic information, a link to the original publication on http://publichealth.jmir.org, as well as this copyright and licenseinformation must be included.
JMIR Public Health Surveill 2015 | vol. 1 | iss. 2 | e15 | p.11http://publichealth.jmir.org/2015/2/e15/(page number not for citation purposes)
Yelk Woodruff et alJMIR PUBLIC HEALTH AND SURVEILLANCE
XSL•FORenderX
Original Paper
Implementation of a Multimodal Mobile System for Point-of-SaleSurveillance: Lessons Learned From Case Studies in Washington,DC, and New York City
Jennifer Cantrell1,2, MPA, DrPH; Ollie Ganz1,3, MSPH; Vinu Ilakkuvan1,3, MSPH; Michael Tacelosky4; Jennifer
Kreslake2, MPH, PhD; Joyce Moon-Howard5, MPH, DrPH; Angela Aidala6, PhD; Donna Vallone1,5, MPH, PhD;
Andrew Anesetti-Rothermel7, PhD; Thomas R Kirchner2,5,8, PhD1Truth Initiative, Evaluation Science and Research, Washington, DC, United States2Department of Health, Behavior, and Society, Johns Hopkins Bloomberg School of Public Health, Baltimore, MD, United States3Department of Prevention and Community Health, George Washington University Milken Institute School of Public Health, Washington, DC, UnitedStates4Survos LLC, Washington, DC, United States5College of Global Public Health, New York University, New York, NY, United States6Department of Sociomedical Sciences, Columbia University Mailman School of Public Health, New York, NY, United States7Steven A Schroeder Institute for Tobacco Research and Policy Studies, Truth Initiative, Washington, DC, United States8Department of Oncology, Lombardi Comprehensive Cancer Center, Georgetown University Medical Center, Washington, NY, United States
Corresponding Author:Jennifer Cantrell, MPA, DrPHTruth InitiativeEvaluation Science and Research900 G Street, NW, Fourth FloorWashington, DC, 20001United StatesPhone: 1 202 436 2118Fax: 1 202 454 5798Email: [email protected]
Abstract
Background: In tobacco control and other fields, point-of-sale surveillance of the retail environment is critical for understandingindustry marketing of products and informing public health practice. Innovations in mobile technology can improve existing,paper-based surveillance methods, yet few studies describe in detail how to operationalize the use of technology in public healthsurveillance.
Objective: The aims of this paper are to share implementation strategies and lessons learned from 2 tobacco, point-of-salesurveillance projects to inform and prepare public health researchers and practitioners to implement new mobile technologies inretail point-of-sale surveillance systems.
Methods: From 2011 to 2013, 2 point-of-sale surveillance pilot projects were conducted in Washington, DC, and New York,New York, to capture information about the tobacco retail environment and test the feasibility of a multimodal mobile datacollection system, which included capabilities for audio or video recording data, electronic photographs, electronic location data,and a centralized back-end server and dashboard. We established a preimplementation field testing process for both projects,which involved a series of rapid and iterative tests to inform decisions and establish protocols around key components of theproject.
Results: Important components of field testing included choosing a mobile phone that met project criteria, establishing anefficient workflow and accessible user interfaces for each component of the system, training and providing technical support tofieldworkers, and developing processes to integrate data from multiple sources into back-end systems that can be utilized inreal-time.
Conclusions: A well-planned implementation process is critical for successful use and performance of multimodal mobilesurveillance systems. Guidelines for implementation include (1) the need to establish and allow time for an iterative testing
JMIR Public Health Surveill 2015 | vol. 1 | iss. 2 | e20 | p.12http://publichealth.jmir.org/2015/2/e20/(page number not for citation purposes)
Cantrell et alJMIR PUBLIC HEALTH AND SURVEILLANCE
XSL•FORenderX
framework for resolving technical and logistical challenges; (2) developing a streamlined workflow and user-friendly interfacesfor data collection; (3) allowing for ongoing communication, feedback, and technology-related skill-building among all staff;and (4) supporting infrastructure for back-end data systems. Although mobile technologies are evolving rapidly, lessons learnedfrom these case studies are essential for ensuring that the many benefits of new mobile systems for rapid point-of-sale surveillanceare fully realized.
(JMIR Public Health Surveill 2015;1(2):e20) doi:10.2196/publichealth.4191
KEYWORDS
mobile technology; public health surveillance; tobacco; point-of-sale; implementation; tobacco industry advertising; marketing
Introduction
Public health surveillance is necessary for collecting health dataand for planning and evaluating programs and policies [1]. Intobacco control and other fields, point-of-sale surveillance ofthe retail environment is critical for understanding industrymarketing of products and informing public health practice [2].Innovations in mobile technologies provide opportunities toimprove existing surveillance methods. Recent studiescomparing mobile versus paper-based data collection forsurveillance have identified several benefits of mobiletechnologies, including reduced data loss [3], real-time qualitycontrol [3], rapid use of data [3,4], and reduced costs [4]. Mobilephones have the added benefit of being less conspicuous thanpaper surveys [4]—an important consideration in retailsurveillance.
Previous retail assessments of tobacco marketing and relatedpublic health topics such as alcohol marketing and foodavailability have traditionally involved paper surveys completedby trained data collectors within a sample of representativestores [5-9]. More recent studies mention other modes of datacollection for tobacco point-of-sale assessment [10-13], but fewreport their methodology with any detail [6] and none havedescribed the challenges and potential solutions forimplementing multimodal mobile systems that incorporate datafrom different sources. A detailed and well-plannedimplementation process is critical to ensuring surveillancesystems gather up-to-date, accurate information quickly andefficiently, which is especially critical for low-resourceenvironments.
This paper aims to address this gap in the literature by sharingimplementation lessons from 2 point-of-sale surveillanceprojects, with the objective of preparing public healthpractitioners for the process of implementing multimodalsystems using mobile technologies for point-of-sale marketingassessments. First, we describe the background of each projectand the mobile systems and tools used. We then describe thepreimplementation field testing process, providing examples ofchallenges and solutions to issues confronted during testing.We summarize by providing lessons learned for implementingmobile technologies for point-of-sale surveillance.
Project DescriptionsFrom August 2011 to May 2013, our research group conducted2 point-of-sale surveillance projects in Washington, DC, andNew York City. The goals of these projects were (1) to capturepoint-of-sale marketing information to educate communities
about tobacco marketing in their neighborhoods and informpolicy and (2) to assess the feasibility of multimodal mobiledata collection tools for point-of-sale surveillance.
Washington, DC, Point-of-Sale Surveillance ProjectThe Washington, DC, project was funded by the District ofColumbia (DC) Department of Health and Truth Initiative(known as the “American Legacy Foundation” at the time ofthis project) and ran from August 2011 to March 2012. Thisproject was a traditional research study, in which researchershired and trained paid professional fieldworkers to collect dataon tobacco advertising in all outlets licensed to sell tobacco(n=1061) in DC, a midsized urban city of approximately 650,000people, with a large African-American population. More detailson the study can be found elsewhere [14-17].
New York City Point-of-Sale Surveillance ProjectThe New York City (NYC) study was funded by Truth Initiativeand was conducted from February to May 2013. This study wasa community-based participatory research project and involveda comprehensive survey of all outlets within selected censustracts in Central Harlem, a predominantly low- tomoderate-income, African-American community with a totalof approximately 156 outlets that serve a local population of
165,000 people over a 2.1-mi2 area [18-20]. The study includedthe formation of an academic-community partnership betweenresearchers from Truth Initiative, Columbia University’sMailman School of Public Health, and communityrepresentatives with experience in tobacco control work inHarlem. Local students recruited through a nonprofit Boys &Girls Club were paid a small stipend for conducting datacollection. More details on this study can be found elsewhere[21].
Both projects were designed to include some or all of thefollowing components:
1. Audio or voice recording data: Responses to surveyquestions (by selecting or typing a response or by voicerecording) on tobacco advertising on the exterior and/orinterior of outlets;
2. Electronic photographs: Images of tobacco advertisementsin outlets;
3. Electronic location data: Information about the outlet, suchas the store name, address, and/or GPS coordinates.
Surveillance SystemPrior to the commencement of the DC and NYC projects, theauthors worked with an information technology service provider
JMIR Public Health Surveill 2015 | vol. 1 | iss. 2 | e20 | p.13http://publichealth.jmir.org/2015/2/e20/(page number not for citation purposes)
Cantrell et alJMIR PUBLIC HEALTH AND SURVEILLANCE
XSL•FORenderX
to develop a flexible multimodal surveillance system to collectdata through digital, or nonpaper-based, methods. The systemwas based on a server-client model in which data could beentered via a mobile device or computer (ie, acting as the“client”) and communicate directly and in real-time with theremote server. Data were transmitted via a wireless local areanetwork or via a mobile phone network.
SoftwareSoftware allowed for data collection via mobile technologiesutilizing text messaging, email, GPS technologies, andphone-based interactive voice response (IVR), a technologythat allows a computer to interact with humans through the useof voice and touchtone input via keypad. The IVR software waswritten in PHP (a Web-based programming language) andintegrated with a telephone provider (Voxeo), communicatingvia the VoiceXML protocol, which is designed specifically toenable IVR and remote computer systems to exchange data. Inaddition, a test version of a custom mobile application functionalfor both iOS and Android operating systems was developedprior to the NYC project. This app was not available for the DCproject.
Server and DashboardAll data from the field were automatically sent to and stored ina secure server. The server provided authorized users with accessto a Web interface that contained tools for visualizing andmanaging data.
Methods
Data Collection ModesFor each project, we chose tools from the multimodal systemand software based on project needs, software availability atthe time, fieldworker expertise, and the environment in whichthe project was implemented. For the DC study, primary datacollection modes included an IVR-programmed survey takenusing any mobile phone and photographs taken with a mobilephone with a built-in camera and emailing capabilities. ForNYC, tools included an IVR-programmed survey accessed viamobile phone and the aforementioned mobile app on a smartphone used to take photographs.
A preimplementation field period involved conducting a seriesof iterative tests to inform decisions and establish protocolsaround the components of the project, described below. TheDC field testing period lasted 7 weeks and included field testing,survey instrument development, and reliability testing. Applyinglessons learned in DC, our field testing period for NYC wasapproximately 2 weeks.
Mobile Phone SelectionField tests involved photographic or survey data collection ata limited number of stores using a specific mobile phone, withfieldworkers reporting on problems encountered in the fieldwith the device, using that feedback to inform the next seriesof tests, and repeating the process until final mobile phonecriteria were established.
Workflow and User InterfaceFor both projects, the workflow involved unobtrusively takingphotographs and collecting survey data on tobacco advertisingfor each store exterior and interior. The user interface in thisstudy referred to the fieldworker interaction with the IVRsurvey, phone cameras, phone email, and mobile app. Differentworkflows were tested along with varying aspects of the userinterface until the most efficient process was established.
For fieldworker training and technical support, we allotted timefor initial training on the specifics of tobacco advertising datacollection as well as practicing with the technologies, testingthe workflow and interface in the field, and establishing afeedback loop between fieldworkers and researchers.
For the back-end data system, researchers and fieldworkerstested different strategies for linking survey, photo, and locationdata collected from various modes to an individual store, withdifferent solutions developed for each project. As part of thelinking and geocoding process, we obtained lists of allbusinesses licensed to sell tobacco in the area from the citygovernments, which included business names and addresses.We geocoded addresses for each study utilizing the MasterRepository Geocoder from the DC Office of the ChiefTechnology Officer [22], a free tool available for addresseswithin the District. For NYC, we utilized ArcGIS Onlinegeocoding services [23], which were free at the time. Theresearch team also worked with the technologist to develop acustom-made, secure online website that allowed for real-timeposting and monitoring of data.
To come to decisions on key issues, the full interdisciplinaryteam—including researchers, project managers, technologists,and field staff—met formally 1-2 times per week to discussrelevant components of the project, identify the specificchallenges and decisions to be addressed, and work througheach issue utilizing a group consensus-based approach. Relevantmaterials were provided before or during the meeting. Duringthe user interface and website development phases, thetechnologist team provided versions of the survey via IVR orupdates to the website to be tested by team members andsubsequently discussed during meetings to resolve major issuesand decide on next steps. Additional discussions were held ona Web forum established during the pilot process to resolvefield testing issues (described below) and over email. Smalleror more urgent decisions were often made on a daily basis usingthese electronic channels or daily debriefs with fieldworkers.Preliminary lessons learned were decided upon by the team andbased on the first DC project; they were then further refinedafter the NYC project for the purposes of this paper.
Results
Below we discuss the main challenges and solutions that resultedfrom the field testing process, including examples to illustratehow technical and other challenges were resolved for projectimplementation.
Choosing a Mobile PhoneThe choice of a mobile phone will facilitate or hinder usability,visibility, and quality of data collection, thus criteria for phone
JMIR Public Health Surveill 2015 | vol. 1 | iss. 2 | e20 | p.14http://publichealth.jmir.org/2015/2/e20/(page number not for citation purposes)
Cantrell et alJMIR PUBLIC HEALTH AND SURVEILLANCE
XSL•FORenderX

selection should be established based on the type of data to becollected and following a series of field tests. For both projects,most mobile phones with cellular service could be used for IVRsurvey data collection. However, the collection of multiplehigh-quality photographs and linking photos with survey andstore identification data required further criteria for mobilephone selection. Criteria established included the following:
1. Wireless technologies: A minimum of 3G cellularconnectivity was required. For the NYC project, phonesalso required Wi-Fi connectivity so fieldworkers couldquickly upload photos to the server from the mobile appvia a wireless connection as it was often too slow to uploadphotos over the cellular network.
2. Operating system: Either an Android or iOS operatingsystem was required for compatibility with apps that werein development or in use during the projects.
3. Camera: A rear-facing camera with a minimum of 5-8megapixels was required. A higher number of megapixelsindicates higher quality photographs. Camera featuresshould allow for the ability to disable the flash and shutternoise, which is essential for being unobtrusive while takingphotos in the retail environment. The camera must alsoallow for geotagging of photos when GPS is turned on.
4. Display: The display technology of the phone had to allowfor high resolution visibility outdoors and in direct sunlight,preferably with a Super AMOLED touchscreen.
5. Battery life: Phone battery life for talk time had to extendthrough the length of at least one field shift, which wasusually 4-6 hours long.
6. Global positioning system (GPS): The phone requiredGPS-enabled receiving capability.
7. Other features: Phone had to have a headphone jack forlistening to the IVR survey and reducing background noise.
Based on the aforementioned criteria, we chose the SamsungFocus in 2011 for the DC project and the Samsung Galaxy S II4G in 2012 for the NYC project.
Workflow and Front-End User InterfaceThe field testing process demonstrated that utilizing fieldworkerpairs to survey stores was needed for safety purposes and tooptimize workflow. Streamlining the field data collectionnecessitated that the fieldworkers share tasks at each store andrequired allowing for time and flexibility during data collectionto respond to delays or unexpected events. Figure 1 outlines theworkflow used in DC and NYC. Based on lessons learned inDC, we added questions to the survey for NYC that allowedfieldworkers time to pause the IVR survey when needed to movearound naturally (ie, from the exterior of the store to theinterior).
Figure 1. Final optimized workflow for DC and NYC.
JMIR Public Health Surveill 2015 | vol. 1 | iss. 2 | e20 | p.15http://publichealth.jmir.org/2015/2/e20/(page number not for citation purposes)
Cantrell et alJMIR PUBLIC HEALTH AND SURVEILLANCE
XSL•FORenderX
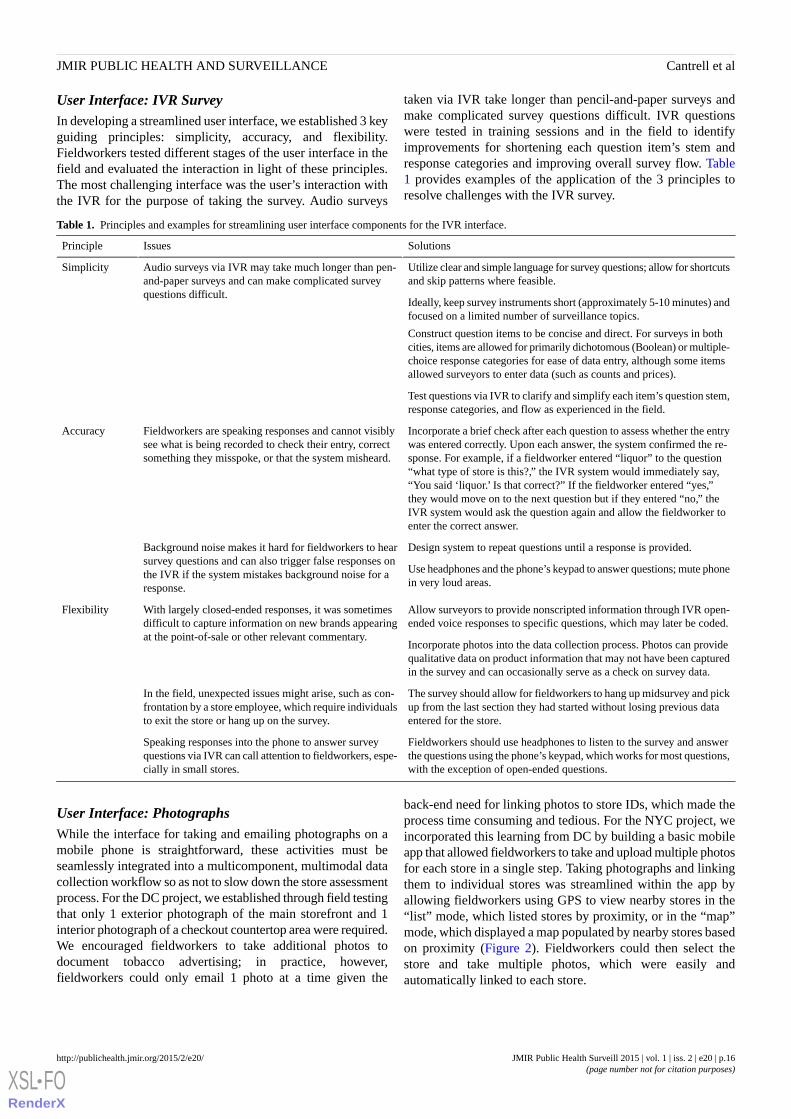
User Interface: IVR SurveyIn developing a streamlined user interface, we established 3 keyguiding principles: simplicity, accuracy, and flexibility.Fieldworkers tested different stages of the user interface in thefield and evaluated the interaction in light of these principles.The most challenging interface was the user’s interaction withthe IVR for the purpose of taking the survey. Audio surveys
taken via IVR take longer than pencil-and-paper surveys andmake complicated survey questions difficult. IVR questionswere tested in training sessions and in the field to identifyimprovements for shortening each question item’s stem andresponse categories and improving overall survey flow. Table1 provides examples of the application of the 3 principles toresolve challenges with the IVR survey.
Table 1. Principles and examples for streamlining user interface components for the IVR interface.
SolutionsIssuesPrinciple
Utilize clear and simple language for survey questions; allow for shortcutsand skip patterns where feasible.
Audio surveys via IVR may take much longer than pen-and-paper surveys and can make complicated surveyquestions difficult.
Simplicity
Ideally, keep survey instruments short (approximately 5-10 minutes) andfocused on a limited number of surveillance topics.
Construct question items to be concise and direct. For surveys in bothcities, items are allowed for primarily dichotomous (Boolean) or multiple-choice response categories for ease of data entry, although some itemsallowed surveyors to enter data (such as counts and prices).
Test questions via IVR to clarify and simplify each item’s question stem,response categories, and flow as experienced in the field.
Incorporate a brief check after each question to assess whether the entrywas entered correctly. Upon each answer, the system confirmed the re-sponse. For example, if a fieldworker entered “liquor” to the question“what type of store is this?,” the IVR system would immediately say,“You said ‘liquor.’ Is that correct?” If the fieldworker entered “yes,”they would move on to the next question but if they entered “no,” theIVR system would ask the question again and allow the fieldworker toenter the correct answer.
Fieldworkers are speaking responses and cannot visiblysee what is being recorded to check their entry, correctsomething they misspoke, or that the system misheard.
Accuracy
Design system to repeat questions until a response is provided.Background noise makes it hard for fieldworkers to hearsurvey questions and can also trigger false responses onthe IVR if the system mistakes background noise for aresponse.
Use headphones and the phone’s keypad to answer questions; mute phonein very loud areas.
Allow surveyors to provide nonscripted information through IVR open-ended voice responses to specific questions, which may later be coded.
With largely closed-ended responses, it was sometimesdifficult to capture information on new brands appearingat the point-of-sale or other relevant commentary.
Flexibility
Incorporate photos into the data collection process. Photos can providequalitative data on product information that may not have been capturedin the survey and can occasionally serve as a check on survey data.
The survey should allow for fieldworkers to hang up midsurvey and pickup from the last section they had started without losing previous dataentered for the store.
In the field, unexpected issues might arise, such as con-frontation by a store employee, which require individualsto exit the store or hang up on the survey.
Fieldworkers should use headphones to listen to the survey and answerthe questions using the phone’s keypad, which works for most questions,with the exception of open-ended questions.
Speaking responses into the phone to answer surveyquestions via IVR can call attention to fieldworkers, espe-cially in small stores.
User Interface: PhotographsWhile the interface for taking and emailing photographs on amobile phone is straightforward, these activities must beseamlessly integrated into a multicomponent, multimodal datacollection workflow so as not to slow down the store assessmentprocess. For the DC project, we established through field testingthat only 1 exterior photograph of the main storefront and 1interior photograph of a checkout countertop area were required.We encouraged fieldworkers to take additional photos todocument tobacco advertising; in practice, however,fieldworkers could only email 1 photo at a time given the
back-end need for linking photos to store IDs, which made theprocess time consuming and tedious. For the NYC project, weincorporated this learning from DC by building a basic mobileapp that allowed fieldworkers to take and upload multiple photosfor each store in a single step. Taking photographs and linkingthem to individual stores was streamlined within the app byallowing fieldworkers using GPS to view nearby stores in the“list” mode, which listed stores by proximity, or in the “map”mode, which displayed a map populated by nearby stores basedon proximity (Figure 2). Fieldworkers could then select thestore and take multiple photos, which were easily andautomatically linked to each store.
JMIR Public Health Surveill 2015 | vol. 1 | iss. 2 | e20 | p.16http://publichealth.jmir.org/2015/2/e20/(page number not for citation purposes)
Cantrell et alJMIR PUBLIC HEALTH AND SURVEILLANCE
XSL•FORenderX
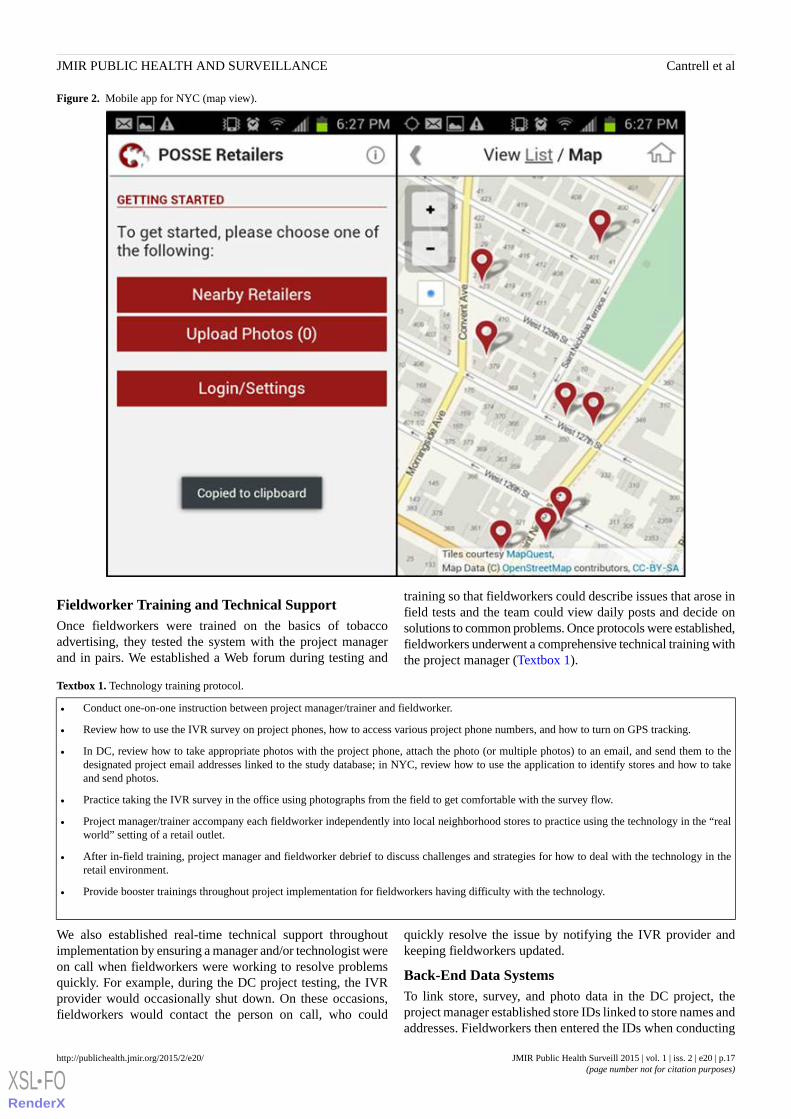
Figure 2. Mobile app for NYC (map view).
Fieldworker Training and Technical SupportOnce fieldworkers were trained on the basics of tobaccoadvertising, they tested the system with the project managerand in pairs. We established a Web forum during testing and
training so that fieldworkers could describe issues that arose infield tests and the team could view daily posts and decide onsolutions to common problems. Once protocols were established,fieldworkers underwent a comprehensive technical training withthe project manager (Textbox 1).
Textbox 1. Technology training protocol.
• Conduct one-on-one instruction between project manager/trainer and fieldworker.
• Review how to use the IVR survey on project phones, how to access various project phone numbers, and how to turn on GPS tracking.
• In DC, review how to take appropriate photos with the project phone, attach the photo (or multiple photos) to an email, and send them to thedesignated project email addresses linked to the study database; in NYC, review how to use the application to identify stores and how to takeand send photos.
• Practice taking the IVR survey in the office using photographs from the field to get comfortable with the survey flow.
• Project manager/trainer accompany each fieldworker independently into local neighborhood stores to practice using the technology in the “realworld” setting of a retail outlet.
• After in-field training, project manager and fieldworker debrief to discuss challenges and strategies for how to deal with the technology in theretail environment.
• Provide booster trainings throughout project implementation for fieldworkers having difficulty with the technology.
We also established real-time technical support throughoutimplementation by ensuring a manager and/or technologist wereon call when fieldworkers were working to resolve problemsquickly. For example, during the DC project testing, the IVRprovider would occasionally shut down. On these occasions,fieldworkers would contact the person on call, who could
quickly resolve the issue by notifying the IVR provider andkeeping fieldworkers updated.
Back-End Data SystemsTo link store, survey, and photo data in the DC project, theproject manager established store IDs linked to store names andaddresses. Fieldworkers then entered the IDs when conducting
JMIR Public Health Surveill 2015 | vol. 1 | iss. 2 | e20 | p.17http://publichealth.jmir.org/2015/2/e20/(page number not for citation purposes)
Cantrell et alJMIR PUBLIC HEALTH AND SURVEILLANCE
XSL•FORenderX
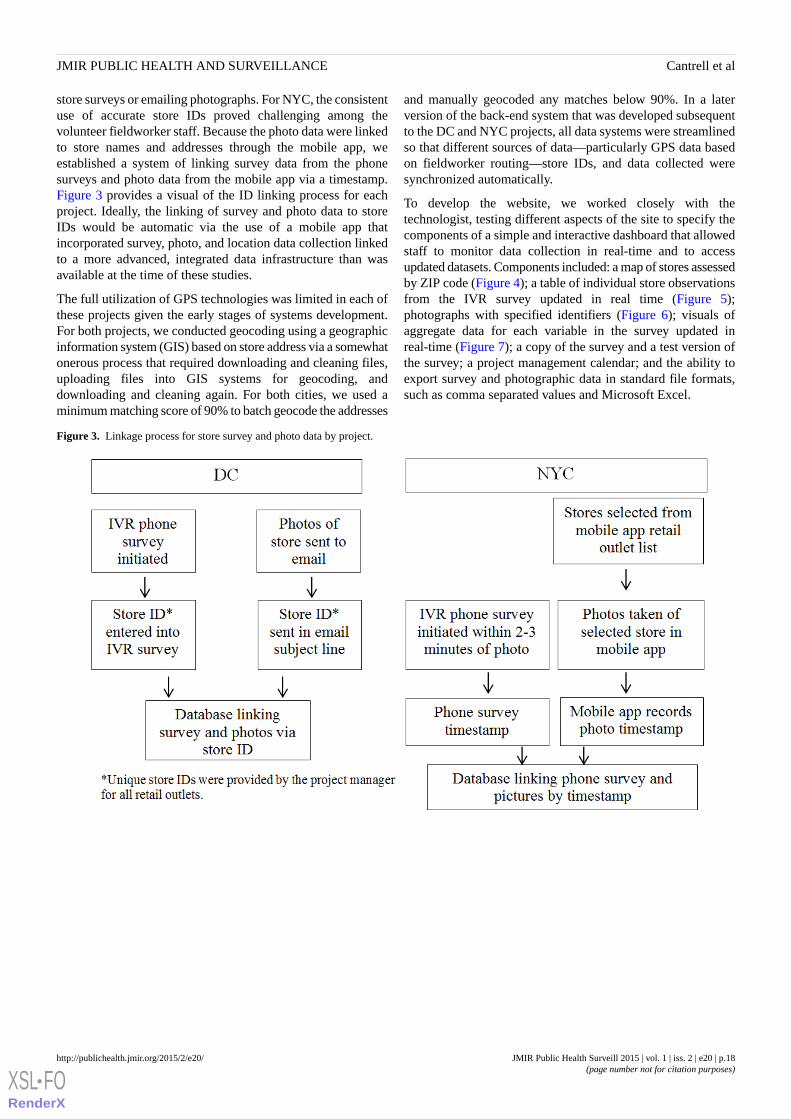
store surveys or emailing photographs. For NYC, the consistentuse of accurate store IDs proved challenging among thevolunteer fieldworker staff. Because the photo data were linkedto store names and addresses through the mobile app, weestablished a system of linking survey data from the phonesurveys and photo data from the mobile app via a timestamp.Figure 3 provides a visual of the ID linking process for eachproject. Ideally, the linking of survey and photo data to storeIDs would be automatic via the use of a mobile app thatincorporated survey, photo, and location data collection linkedto a more advanced, integrated data infrastructure than wasavailable at the time of these studies.
The full utilization of GPS technologies was limited in each ofthese projects given the early stages of systems development.For both projects, we conducted geocoding using a geographicinformation system (GIS) based on store address via a somewhatonerous process that required downloading and cleaning files,uploading files into GIS systems for geocoding, anddownloading and cleaning again. For both cities, we used aminimum matching score of 90% to batch geocode the addresses
and manually geocoded any matches below 90%. In a laterversion of the back-end system that was developed subsequentto the DC and NYC projects, all data systems were streamlinedso that different sources of data—particularly GPS data basedon fieldworker routing—store IDs, and data collected weresynchronized automatically.
To develop the website, we worked closely with thetechnologist, testing different aspects of the site to specify thecomponents of a simple and interactive dashboard that allowedstaff to monitor data collection in real-time and to accessupdated datasets. Components included: a map of stores assessedby ZIP code (Figure 4); a table of individual store observationsfrom the IVR survey updated in real time (Figure 5);photographs with specified identifiers (Figure 6); visuals ofaggregate data for each variable in the survey updated inreal-time (Figure 7); a copy of the survey and a test version ofthe survey; a project management calendar; and the ability toexport survey and photographic data in standard file formats,such as comma separated values and Microsoft Excel.
Figure 3. Linkage process for store survey and photo data by project.
JMIR Public Health Surveill 2015 | vol. 1 | iss. 2 | e20 | p.18http://publichealth.jmir.org/2015/2/e20/(page number not for citation purposes)
Cantrell et alJMIR PUBLIC HEALTH AND SURVEILLANCE
XSL•FORenderX
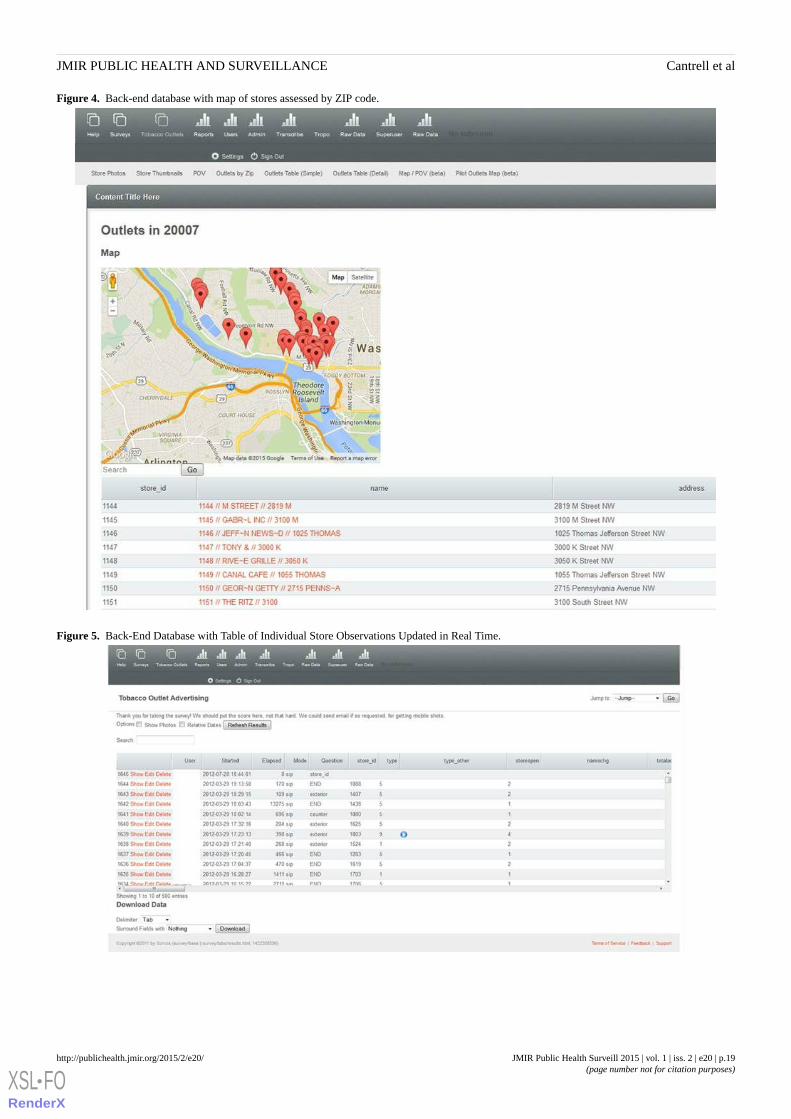
Figure 4. Back-end database with map of stores assessed by ZIP code.
Figure 5. Back-End Database with Table of Individual Store Observations Updated in Real Time.
JMIR Public Health Surveill 2015 | vol. 1 | iss. 2 | e20 | p.19http://publichealth.jmir.org/2015/2/e20/(page number not for citation purposes)
Cantrell et alJMIR PUBLIC HEALTH AND SURVEILLANCE
XSL•FORenderX
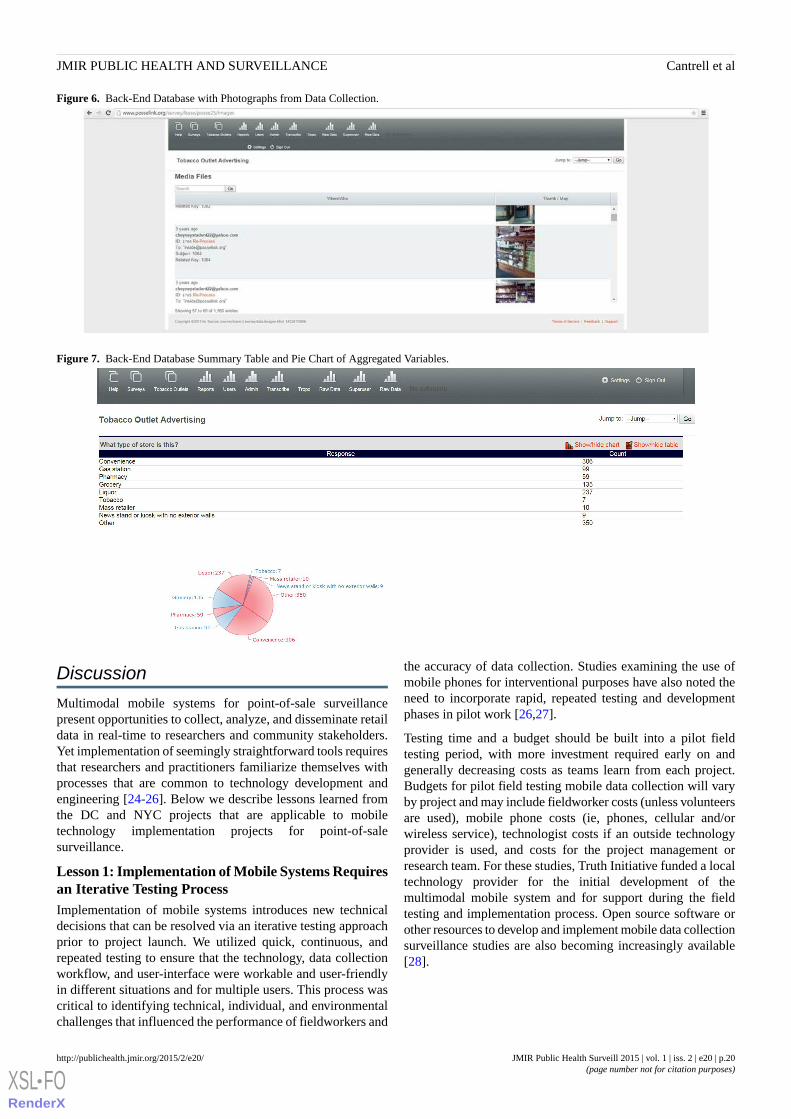
Figure 6. Back-End Database with Photographs from Data Collection.
Figure 7. Back-End Database Summary Table and Pie Chart of Aggregated Variables.
Discussion
Multimodal mobile systems for point-of-sale surveillancepresent opportunities to collect, analyze, and disseminate retaildata in real-time to researchers and community stakeholders.Yet implementation of seemingly straightforward tools requiresthat researchers and practitioners familiarize themselves withprocesses that are common to technology development andengineering [24-26]. Below we describe lessons learned fromthe DC and NYC projects that are applicable to mobiletechnology implementation projects for point-of-salesurveillance.
Lesson 1: Implementation of Mobile Systems Requiresan Iterative Testing ProcessImplementation of mobile systems introduces new technicaldecisions that can be resolved via an iterative testing approachprior to project launch. We utilized quick, continuous, andrepeated testing to ensure that the technology, data collectionworkflow, and user-interface were workable and user-friendlyin different situations and for multiple users. This process wascritical to identifying technical, individual, and environmentalchallenges that influenced the performance of fieldworkers and
the accuracy of data collection. Studies examining the use ofmobile phones for interventional purposes have also noted theneed to incorporate rapid, repeated testing and developmentphases in pilot work [26,27].
Testing time and a budget should be built into a pilot fieldtesting period, with more investment required early on andgenerally decreasing costs as teams learn from each project.Budgets for pilot field testing mobile data collection will varyby project and may include fieldworker costs (unless volunteersare used), mobile phone costs (ie, phones, cellular and/orwireless service), technologist costs if an outside technologyprovider is used, and costs for the project management orresearch team. For these studies, Truth Initiative funded a localtechnology provider for the initial development of themultimodal mobile system and for support during the fieldtesting and implementation process. Open source software orother resources to develop and implement mobile data collectionsurveillance studies are also becoming increasingly available[28].
JMIR Public Health Surveill 2015 | vol. 1 | iss. 2 | e20 | p.20http://publichealth.jmir.org/2015/2/e20/(page number not for citation purposes)
Cantrell et alJMIR PUBLIC HEALTH AND SURVEILLANCE
XSL•FORenderX
Lesson 2: Workflow and User Interface DecisionsRequire Attention and TestingData collection workflow and the user interface take onincreased importance with the use of new technologies forsurveillance. Ease of use and usefulness to the end user is closelylinked to the performance of a technology [29,30] and toeffective implementation of mobile surveillance projects [31-34],thus it is critical to consider the experience of the primary usersof the system. Therefore, as the main user of the system, we putthe fieldworker at the center of the process for establishing theworkflow protocol and streamlining the interface. This helpedframe questions about what data to collect from a user-centeredperspective of how the information could best be collected usingthe technology to ensure simplicity, accuracy, and flexibility.
Lesson 3: Training and Implementation Require CloseCommunication, Feedback, and Ongoing TechnicalAssistanceDeveloping feedback loops for consistent communicationbetween fieldworkers, researchers, and the technologist—alongwith rapid ongoing technical assistance—is critical duringtesting and deployment to quickly resolve problems and keepfield staff committed to using the technology correctly [34-36].This also assures researchers that data collection and qualitywill not be undermined by technical glitches. During the iterativetesting process, the Web forum and daily debriefs withfieldworkers kept all staff up to date with technical, workflow,or other field problems and allowed for immediate problemsolving. This process served as a training ground forfieldworkers who were involved in the early stages of the projectand, importantly, allowed for the development of knowledgeand skills among all staff for quickly resolving technical glitchesand moving the project forward.
Lesson 4: Back-End Data Infrastructure andAutomated Systems Require Development andIntegrationAutomatic collection of data from the field to a back-end serverprovides many potential benefits, including allowing managersto utilize real-time quality control while data is being collectedto improve data accuracy and quickly resolve logisticaldifficulties. However, these tools require that systems areintegrated and, ideally, automatically link different sources ofdata from the field together for real-time monitoring, integrationwith GIS systems, and analyses. This process takes time andplanning to identify the key issues for each project forintegrating data sources, linking data from multimodal mobilesources to store identifiers, ensuring GPS can be collected andused efficiently in GIS systems, and ensuring skilled staff oroutside consultants are available to develop and maintain thisautomated back-end infrastructure. Careful planning forback-end systems can ensure that a key benefit of multimodalmobile surveillance—rapid, automated, and visualized datacollection—can be fully utilized.
LimitationsOur findings should be considered with the followinglimitations:
1. This study was not designed to examine the validity orreliability of mobile phone data collection for surveillancecompared with more traditional paper-based methods, soit cannot be assumed these methods lead to improved dataquality compared with paper surveys. We have, however,clarified some of the benefits of mobile data collection incomparison with paper surveys.
2. Fieldworkers and staff used their own phones in the earlystages of testing until phone criteria were developed andphones were purchased. In projects where staff cannot usepersonal phones, field testing to establish mobile phonecriteria would likely require additional funding or rely moreon online research. Given that mobile technology isadvancing at a rapid pace, projects that last more than 6months to 1 year may need to update mobile phonehardware to take advantage of new mobile phonetechnologies as well as developments in software andautomatic data integration, all of which will impact multiplecomponents of a project.
3. Lists of licensed tobacco retail outlets in the geographicareas surveyed were available for these projects. Not allcities or states require or provide such lists, thus fieldsurveying of stores may be necessary in some areas andmay require additional strategies for identifying retail outletsand linking data from different sources to specific storesthrough mobile systems.
These projects were conducted in the United States, thusdifferent or additional lessons may be applicable in internationalsettings. Further, as technology continues to evolve, new lessonsmay apply.
ConclusionsMobile technologies may improve surveillance efforts andfacilitate rapid policy responses to emerging tobacco productsand industry marketing practices. Information on technologyimplementation in health care and health research is sparse,which may be one factor in the limited number of large-scaleimplementation efforts despite a growing literature indicatingpromising findings from technology and health pilot studies[37]. Implementing new technologies with an iterative testingframework that (1) ensures a smooth workflow and user-friendlyinterfaces; (2) allows for training, ongoing communication, andfeedback among all staff; and (3) supports infrastructure forback-end data integration is critical for successful systemperformance.
This is the first study to examine implementation needs forconducting multimodal mobile tobacco retail surveillance.Although mobile technologies are evolving rapidly, theseimplementation lessons are relevant for those who want toharness the strengths of any new mobile system for point-of-salesurveillance or collection of other types of neighborhoodobservational data. Findings suggest the need for further researchexamining mobile surveillance implementation challenges, aswell as funding for developing and implementing systems thatallow public health practitioners and researchers to improvesurveillance by taking advantage of the communications toolsof the twenty-first century.
JMIR Public Health Surveill 2015 | vol. 1 | iss. 2 | e20 | p.21http://publichealth.jmir.org/2015/2/e20/(page number not for citation purposes)
Cantrell et alJMIR PUBLIC HEALTH AND SURVEILLANCE
XSL•FORenderX
AcknowledgmentsThis research was supported by the Centers for Disease Control and Prevention, Communities Putting Prevention to Work fromthe District of Columbia Department of Health (contract PO358719 to TRK), and Truth Initiative (known as the American LegacyFoundation at the time of this study) We thank Denise Grant and Bonita McGee from the DC Department of Health.
Conflicts of InterestOne of the authors, Michael Tacelosky, is the owner of the local information technology service provider, Survos Observe, usedto develop and support the multimodal surveillance system.
References1. World Health Organization. Immunization Surveillance, Assessment and Monitoring. Geneva, Switzerland: World Health
Organization; 2014. URL: http://www.who.int/immunization/monitoring_surveillance/en/ [accessed 2014-12-29] [WebCiteCache ID 6VBu8AiEb]
2. Cohen JE, Planinac LC, O'Connor SC, Lavack AM, Robinson DJ, Thompson FE. Keeping the point-of-sale environmentat the forefront. Am J Public Health 2008 Jan;98(1):5-6. [doi: 10.2105/AJPH.2007.124321] [Medline: 18048773]
3. Tomlinson M, Solomon W, Singh Y, Doherty T, Chopra M, Ijumba P, et al. The use of mobile phones as a data collectiontool: A report from a household survey in South Africa. BMC Med Inform Decis Mak 2009;9(1):51 [FREE Full text] [doi:10.1186/1472-6947-9-51] [Medline: 20030813]
4. Kanter R, Alvey J, Fuentes D. A novel mobile phone application to assess nutrition environment measures in low- andmiddle-income countries. Food Nutr Bull 2014 Sep;35(3):296-300. [Medline: 25902589]
5. Cohen DA, Schoeff D, Farley TA, Bluthenthal R, Scribner R, Overton A. Reliability of a store observation tool in measuringavailability of alcohol and selected foods. J Urban Health 2007 Nov;84(6):807-813 [FREE Full text] [doi:10.1007/s11524-007-9219-x] [Medline: 17763963]
6. Lee Joseph GL, Henriksen L, Myers AE, Dauphinee AL, Ribisl KM. A systematic review of store audit methods forassessing tobacco marketing and products at the point of sale. Tob Control 2014 Mar;23(2):98-106 [FREE Full text] [doi:10.1136/tobaccocontrol-2012-050807] [Medline: 23322313]
7. Morland K, Wing S, Diez RA, Poole C. Neighborhood characteristics associated with the location of food stores and foodservice places. Am J Prev Med 2002 Jan;22(1):23-29. [Medline: 11777675]
8. Campaign for Tobacco-Free Kids. Store Alert: Retail Store Survey URL: http://www.storealert.org/default_flash.asp[accessed 2014-12-29] [WebCite Cache ID 6VBqzSJ61]
9. Glanz K, Sutton NM, Jacob AKR. Operation storefront Hawaii: Tobacco advertising and promotion in Hawaii stores. JHealth Commun 2006;11(7):699-707. [doi: 10.1080/10810730600941471] [Medline: 17074736]
10. Gong T, Lv J, Liu Q, Ren Y, Li L, Kawachi I, Community Interventions for Health (CIH) Collaboration. Audit of tobaccoretail outlets in Hangzhou, China. Tob Control 2013 Jul;22(4):245-249. [doi: 10.1136/tobaccocontrol-2011-050038][Medline: 22180327]
11. Rose SW, Myers AE, D'Angelo H, Ribisl KM. Retailer adherence to Family Smoking Prevention and Tobacco ControlAct, North Carolina, 2011. Prev Chronic Dis 2013;10:E47 [FREE Full text] [doi: 10.5888/pcd10.120184] [Medline:23557638]
12. Salloum RG, Nakkash RT, Myers AE, Wood KA, Ribisl KM. Point-of-sale tobacco advertising in Beirut, Lebanon followinga national advertising ban. BMC Public Health 2013;13:534 [FREE Full text] [doi: 10.1186/1471-2458-13-534] [Medline:23731766]
13. Spanopoulos D, Ratschen E, McNeill A, Britton J. Retail price and point of sale display of tobacco in the UK: A descriptivestudy of small retailers. PLoS One 2012;7(1):e29871 [FREE Full text] [doi: 10.1371/journal.pone.0029871] [Medline:22242183]
14. Cantrell J, Kreslake JM, Ganz O, Pearson JL, Vallone D, Anesetti-Rothermel A, et al. Marketing little cigars and cigarillos:Advertising, price, and associations with neighborhood demographics. Am J Public Health 2013 Oct;103(10):1902-1909.[doi: 10.2105/AJPH.2013.301362] [Medline: 23948008]
15. Kirchner T, Cantrell J, Anesetti-Rothermel A, Pearson J, Cha S, Kreslake J, et al. Individual mobility patterns and real-timegeo-spatial exposure to point-of-sale tobacco marketing. New York: ACM; 2012 Presented at: ACM Wireless Health'12;Oct 23-25, 2012; San Diego, CA. [doi: 10.1145/2448096.2448104]
16. Kirchner TR, Cantrell J, Anesetti-Rothermel A, Ganz O, Vallone DM, Abrams DB. Geospatial exposure to point-of-saletobacco: Real-time craving and smoking-cessation outcomes. Am J Prev Med 2013 Oct;45(4):379-385 [FREE Full text][doi: 10.1016/j.amepre.2013.05.016] [Medline: 24050412]
17. Cantrell J, Ganz O, Anesetti-Rothermel A, Harrell P, Kreslake JM, Xiao H, et al. Cigarette price variation around highschools: Evidence from Washington DC. Health Place 2015 Jan;31:193-198. [doi: 10.1016/j.healthplace.2014.12.002][Medline: 25560754]
JMIR Public Health Surveill 2015 | vol. 1 | iss. 2 | e20 | p.22http://publichealth.jmir.org/2015/2/e20/(page number not for citation purposes)
Cantrell et alJMIR PUBLIC HEALTH AND SURVEILLANCE
XSL•FORenderX

18. U.S. Census Bureau. American Community Survey URL: http://www.census.gov/acs/www/ [accessed 2014-12-29] [WebCiteCache ID 6VBtnuJcI]
19. New York City Department of City Planning. Manhattan Community District 10. New York: New York City Departmentof City Planning; 2010. URL: http://www.nyc.gov/html/dcp/pdf/lucds/mn10profile.pdf [accessed 2014-12-29] [WebCiteCache ID 6YoncKJ11]
20. New York City Department of City Planning. Census Demographic Maps. New York: New York City Department of CityPlanning; 2013. URL: http://www.nyc.gov/html/dcp/html/census/demo_maps_2010.shtml [accessed 2015-05-26] [WebCiteCache ID 6YonfK6sW]
21. Ganz O, Cantrell J, Moon-Howard J, Aidala A, Kirchner TR, Vallone D. Electronic cigarette advertising at the point-of-sale:A gap in tobacco control research. Tob Control 2015 Mar;24(e1):e110-e112. [doi: 10.1136/tobaccocontrol-2013-051337][Medline: 24619455]
22. Office of the Chief Technology Officer, District of Columbia. District of Columbia: Data Catalog. 2012. URL: http://opendata.dc.gov/ [accessed 2015-07-31] [WebCite Cache ID 6aQAOo2e5]
23. Environmental Systems Research Institute. ArcGIS Desktop: Advanced 10.1 ed. Redlands, CA: Envrionmental SystemsResearch Institute; 2012.
24. Boehm BW. A spiral model of software development and enhancement. Computer 1988 May;21(5):61-72. [doi: 10.1109/2.59]25. Hartson H, Hix D. Toward empirically derived methodologies and tools for human-computer interface development. Int J
Man-Mach Stud 1989 Oct;31(4):477-494. [doi: 10.1016/0020-7373(89)90005-9]26. Ben-Zeev D, Schueller SM, Begale M, Duffecy J, Kane JM, Mohr DC. Strategies for mHealth research: Lessons from 3
mobile intervention studies. Adm Policy Ment Health 2015 Mar;42(2):157-167. [doi: 10.1007/s10488-014-0556-2] [Medline:24824311]
27. Bergstrom RJ. Web Survey and Forms Usability Design and Testing. 2014. URL: http://www.slideshare.net/JenniferRomanoBergstrom/web-survey-and-forms-usability-design-testing [accessed 2015-05-26] [WebCite Cache ID6YomWXrNA]
28. CommCare. URL: https://www.commcarehq.org/home/ [accessed 2015-05-26] [WebCite Cache ID 6YonUZYEr]29. Karsh B. Beyond usability: Designing effective technology implementation systems to promote patient safety. Qual Saf
Health Care 2004 Oct;13(5):388-394 [FREE Full text] [doi: 10.1136/qhc.13.5.388] [Medline: 15465944]30. Constantine LL, Lockwood LA. Software for Use: A Practical Guide to the Models and Methods of Usage-Centered Design.
Boston, MA: Pearson Education; 1999.31. Berg M, Wariero J, Modi V. Every Child Counts: The Use of SMS in Kenya to Support the Community Based Management
of Acute Malnutrition and Malaria in Children Under Five. 2009. URL: http://www.cmamforum.org/resource/305 [accessed2015-05-26] [WebCite Cache ID 6Yom9OapF]
32. World Health Organization. mHealth: New Horizons for Health Through Mobile Technologies. Geneva, Switzerland: WHOPress; 2011. URL: http://apps.who.int/iris/bitstream/10665/44607/1/9789241564250_eng.pdf [accessed 2015-11-17][WebCite Cache ID 6d6jPkwmp]
33. Rajatonirina S, Heraud JM, Randrianasolo L, Orelle A, Razanajatovo NH, Raoelina YN, et al. Short message service sentinelsurveillance of influenza-like illness in Madagascar, 2008-2012. Bull World Health Organ 2012 May 1;90(5):385-389[FREE Full text] [doi: 10.2471/BLT.11.097816] [Medline: 22589573]
34. Brinkel J, Krämer A, Krumkamp R, May J, Fobil J. Mobile phone-based mHealth approaches for public health surveillancein sub-Saharan Africa: A systematic review. Int J Environ Res Public Health 2014 Nov;11(11):11559-11582 [FREE Fulltext] [doi: 10.3390/ijerph111111559] [Medline: 25396767]
35. Pascoe L, Lungo J, Kaasbøll J, Koleleni I. Collecting integrated disease surveillance and response data through mobilephones. In: Proceedings of the IST-Africa 2012 Conference and Exhibition. 2012 Presented at: IST-Africa 2012 Conferenceand Exhibition; 2012; Dar es Salaam, Tanzania.
36. Kamanga A, Moono P, Stresman G, Mharakurwa S, Shiff C. Rural health centres, communities and malaria case detectionin Zambia using mobile telephones: A means to detect potential reservoirs of infection in unstable transmission conditions.Malar J 2010;9:96 [FREE Full text] [doi: 10.1186/1475-2875-9-96] [Medline: 20398318]
37. Nhavoto JA, Grönlund A. Mobile technologies and geographic information systems to improve health care systems: Aliterature review. JMIR Mhealth Uhealth 2014;2(2):e21 [FREE Full text] [doi: 10.2196/mhealth.3216] [Medline: 25099368]
AbbreviationsDC: District of ColumbiaGIS: geographic information systemGPS: global positioning systemIVR: interactive voice responseNYC: New York City
JMIR Public Health Surveill 2015 | vol. 1 | iss. 2 | e20 | p.23http://publichealth.jmir.org/2015/2/e20/(page number not for citation purposes)
Cantrell et alJMIR PUBLIC HEALTH AND SURVEILLANCE
XSL•FORenderX
Edited by G Eysenbach; submitted 31.12.14; peer-reviewed by A Chan, S Regan; comments to author 21.04.15; revised versionreceived 29.05.15; accepted 07.10.15; published 26.11.15.
Please cite as:Cantrell J, Ganz O, Ilakkuvan V, Tacelosky M, Kreslake J, Moon-Howard J, Aidala A, Vallone D, Anesetti-Rothermel A, KirchnerTRImplementation of a Multimodal Mobile System for Point-of-Sale Surveillance: Lessons Learned From Case Studies in Washington,DC, and New York CityJMIR Public Health Surveill 2015;1(2):e20URL: http://publichealth.jmir.org/2015/2/e20/ doi:10.2196/publichealth.4191PMID:27227138
©Jennifer Cantrell, Ollie Ganz, Vinu Ilakkuvan, Michael Tacelosky, Jennifer Kreslake, Joyce Moon-Howard, Angela Aidala,Donna Vallone, Andrew Anesetti-Rothermel, Thomas R. Kirchner. Originally published in JMIR Public Health and Surveillance(http://publichealth.jmir.org), 26.11.2015. This is an open-access article distributed under the terms of the Creative CommonsAttribution License (http://creativecommons.org/licenses/by/2.0/), which permits unrestricted use, distribution, and reproductionin any medium, provided the original work, first published in JMIR Public Health and Surveillance, is properly cited. The completebibliographic information, a link to the original publication on http://publichealth.jmir.org, as well as this copyright and licenseinformation must be included.
JMIR Public Health Surveill 2015 | vol. 1 | iss. 2 | e20 | p.24http://publichealth.jmir.org/2015/2/e20/(page number not for citation purposes)
Cantrell et alJMIR PUBLIC HEALTH AND SURVEILLANCE
XSL•FORenderX

Original Paper
Agenda Setting for Health Promotion: Exploring an Adapted Modelfor the Social Media Era
Yousef Albalawi1,2*, MBBS, MSc Public Health; Jane Sixsmith1*, RN, HV, BSc, MA, PhD1Health Promotion Research Centre, National University of Ireland Galway, Galway, Ireland2Public Health Administration, Ministry of Health, Medina, Saudi Arabia*all authors contributed equally
Corresponding Author:Yousef Albalawi, MBBS, MSc Public HealthHealth Promotion Research CentreNational University of Ireland GalwayUniversity RoadGalway,IrelandPhone: 353 83 1232203Fax: 353 91 494577Email: [email protected]
Abstract
Background: The foundation of best practice in health promotion is a robust theoretical base that informs design, implementation,and evaluation of interventions that promote the public’s health. This study provides a novel contribution to health promotionthrough the adaptation of the agenda-setting approach in response to the contribution of social media. This exploration andproposed adaptation is derived from a study that examined the effectiveness of Twitter in influencing agenda setting among usersin relation to road traffic accidents in Saudi Arabia.
Objective: The proposed adaptations to the agenda-setting model to be explored reflect two levels of engagement: agendasetting within the social media sphere and the position of social media within classic agenda setting. This exploratory researchaims to assess the veracity of the proposed adaptations on the basis of the hypotheses developed to test these two levels ofengagement.
Methods: To validate the hypotheses, we collected and analyzed data from two primary sources: Twitter activities and Saudinational newspapers. Keyword mentions served as indicators of agenda promotion; for Twitter, interactions were used to measurethe process of agenda setting within the platform. The Twitter final dataset comprised 59,046 tweets and 38,066 users whocontributed by tweeting, replying, or retweeting. Variables were collected for each tweet and user. In addition, 518 keywordmentions were recorded from six popular Saudi national newspapers.
Results: The results showed significant ratification of the study hypotheses at both levels of engagement that framed the proposedadaptions. The results indicate that social media facilitates the contribution of individuals in influencing agendas (individual usersaccounted for 76.29%, 67.79%, and 96.16% of retweet impressions, total impressions, and amplification multipliers, respectively),a component missing from traditional constructions of agenda-setting models. The influence of organizations on agenda settingis also highlighted (in the data of user interactions, organizational accounts registered 17% and 14.74% as source and target ofinteractions, respectively). In addition, 13 striking similarities showed the relationship between newspapers and Twitter on thementions trends line.
Conclusions: The effective use of social media platforms in health promotion intervention programs requires new strategiesthat consider the limitations of traditional communication channels. Conducting research is vital to establishing a strong basisfor modifying, designing, and developing new health promotion strategies and approaches.
(JMIR Public Health Surveill 2015;1(2):e21) doi:10.2196/publichealth.5014
KEYWORDS
agenda setting, health promotion, social media, Twitter, health communication, Saudi Arabia, road traffic accidents
JMIR Public Health Surveill 2015 | vol. 1 | iss. 2 | e21 | p.25http://publichealth.jmir.org/2015/2/e21/(page number not for citation purposes)
Albalawi & SixsmithJMIR PUBLIC HEALTH AND SURVEILLANCE
XSL•FORenderX

Introduction
BackgroundCommunication is a core component of many effective healthpromotion interventions and change processes at individual andcommunity levels [1]. In the social media age, the emergenceof eHealth communication is expected to significantly enhancethe efficacy of health promotion programs. The evolution ofsocial media stimulated a shift of the communication equationfrom a top-down, expert-to-consumer approach to anonhierarchical, dialog-based strategy. Consequently,communication has become an individual and communityenabler in terms of achieving development goals, includinghealth development [2]. Korda [3] indicated that an importantcharacteristic of Web-based interventions is the sense ofempowerment that it endows people and groups as they makedecisions related to health; this feature is a positive influenceon communities and individuals who are actively aiming forhealthy behaviors and lifestyle changes. With theseconsiderations in mind, we investigated the use of theagenda-setting function of health promotion interventions inthe social media era. Specifically, we examined the effectivenessof Twitter as a social media platform in influencing agendasetting among users in relation to road traffic accidents in SaudiArabia.
Road Traffic AccidentsGlobally, road traffic accidents result in 1.24 million deaths and20 to 50 million injuries per year, many of which causepermanent disabilities [4]. In Saudi Arabia, the 544,000 yearlyaccidents cause 7153 fatalities and more than 39,000 injuries[5]. Eighty-one percent of deaths in Ministry of Health hospitalsare the result of road traffic accidents [6]. The World HealthOrganization recommendations emphasize the consideration ofroad safety as a public health issue [7], with a focus onpersuading policy and decision makers to place road trafficaccidents on their agendas as a major problem and implementmeasures for improving related interventions.
Maximizing the effectiveness of social media for the promotionand protection of health necessitates intervention programsbased on a thorough scientific understanding of howcommunication and media action theories and models areprioritized [8,9]. Agenda-setting theory has been examinedwithin the sphere of social media and shows promise for thepromotion of effective health practices [10,11,12].
According to Kaplan and Haenlein, social media is “a group ofInternet-based applications that build on the ideological andtechnological foundations of Web 2.0, and that allow thecreation and exchange of User Generated Content” [13]. Thisdefinition covers many types of social media including Twitter,Facebook, and Instagram. These platforms have powerfulcharacteristics which make them effective channels forcommunication-based activities. An interesting developmentin recent years is the significant increase in the availability ofsocial media; this growth is expected to continue [14].
The development of social media has been recognized as anopportunity for the promotion of the public’s health
demonstrated through the concept of infodemiology, a termcoined by Eysenbach [15]. Infodemiology is the melding ofhealth informatics and epidemiology and has been defined as“the science of distribution and determinants of information inan electronic medium, specifically the Internet, or in apopulation, with the ultimate aim to inform public health andpublic policy” [16,17].
Infodemiology is based on the idea that the vast quantities ofcommunication data generated by social media can be used forpublic health [16]. We live in a digital world where peoplecommunicate using Internet channels supported by highlyadvanced technologies. These communication channels arecharacterized by an ability to track activities and collectinformation and data about them. For example, social mediaplatforms generate data that reflect people’s behaviors andrecord, in real time, large parts of their daily life, including theirhealth status [16,18]. When suitable metrics and measures areapplied, these data can provide valuable information that caninform policies, strategies, and decisions for public health atthe level of policy makers and of the population [17].
These data provide a new level of information that was notmeasurable before this era [17]. Currently, only a smallproportion will be analyzed (in 2013, only 5% of these datawere analyzed [19]) due to a lack of methods and measures forcollecting, analyzing, and interpreting such data [16,17,20].Nevertheless, infodemiology advances our understanding andprovides methods that can move public health to a new level ofpractice and research [16,17]. Applications of infodemiologycan harmonize the research and practice of public health throughthe analysis of so-called “big data” in the era of social media[16,17]. Examples of infodemiology applications includetracking user activities on microblogging platforms such asTwitter [16]. This study explores user activities on Twitter inrelation to public health and as such can be positioned in thecontext of infodemiology.
TwitterTwitter is “an information network made up of 140-charactermessages called Tweets” [21]. It is a social and microbloggingservice that enables participants to post messages and followothers’ posts. Outside China, 53% of the Internet populationhas Twitter accounts, and 69% of online adults browse Twitter[22]. The 2015 statistics for Saudi Arabia show that in apopulation of 28 million, more than 18 million are Internet users[23], 60% of whom have Twitter accounts and 33% of Internetusers are active Twitter users [22]. Apart from being among thetop-ranked countries in terms of registered users, Saudi Arabiais number one globally in terms of visitation rates (logged-outusers) [22].
Agenda-Setting TheoryLippman [24] first expressed the idea of agenda setting, whichwas subsequently developed by Lasswell [25] and Cohen [26],culminating in agenda-setting theory through the work ofMcCombs and Shaw [27]. The core concept of agenda settingassumes that media stimulates the awareness of people regardingcertain issues. This assumption is grounded on two mainprinciples: (1) media shapes and filters reality before presenting
JMIR Public Health Surveill 2015 | vol. 1 | iss. 2 | e21 | p.26http://publichealth.jmir.org/2015/2/e21/(page number not for citation purposes)
Albalawi & SixsmithJMIR PUBLIC HEALTH AND SURVEILLANCE
XSL•FORenderX
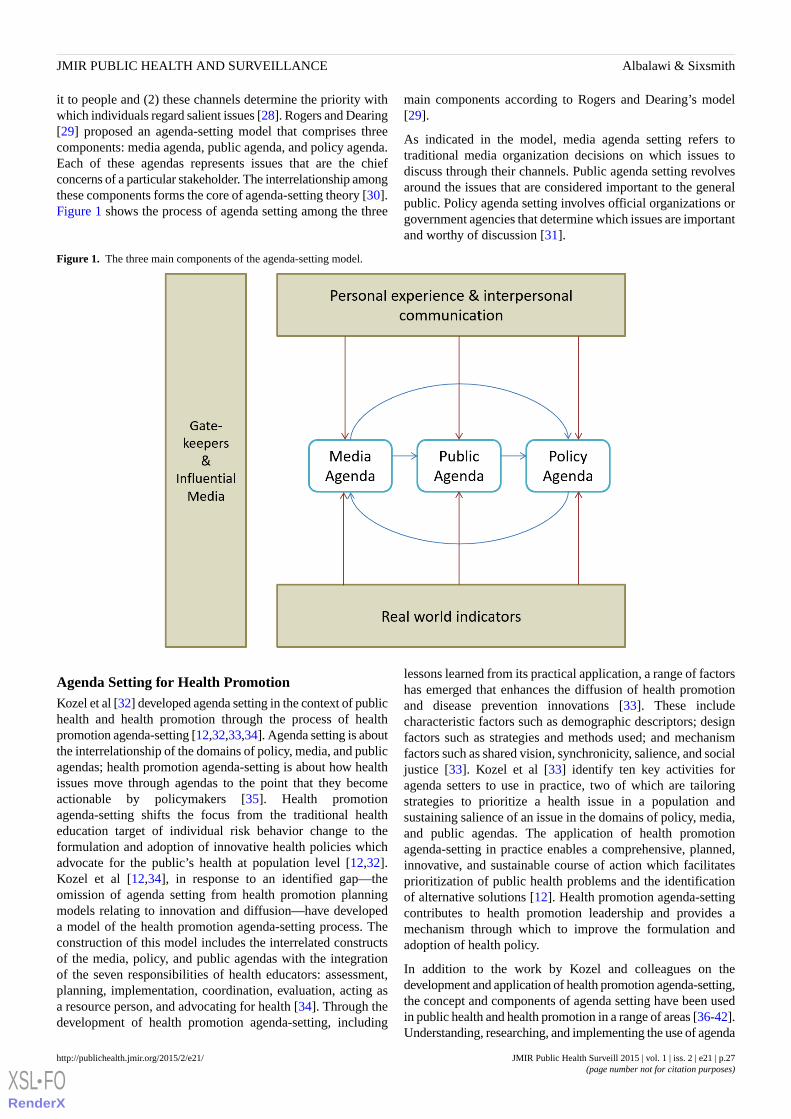
it to people and (2) these channels determine the priority withwhich individuals regard salient issues [28]. Rogers and Dearing[29] proposed an agenda-setting model that comprises threecomponents: media agenda, public agenda, and policy agenda.Each of these agendas represents issues that are the chiefconcerns of a particular stakeholder. The interrelationship amongthese components forms the core of agenda-setting theory [30].Figure 1 shows the process of agenda setting among the three
main components according to Rogers and Dearing’s model[29].
As indicated in the model, media agenda setting refers totraditional media organization decisions on which issues todiscuss through their channels. Public agenda setting revolvesaround the issues that are considered important to the generalpublic. Policy agenda setting involves official organizations orgovernment agencies that determine which issues are importantand worthy of discussion [31].
Figure 1. The three main components of the agenda-setting model.
Agenda Setting for Health PromotionKozel et al [32] developed agenda setting in the context of publichealth and health promotion through the process of healthpromotion agenda-setting [12,32,33,34]. Agenda setting is aboutthe interrelationship of the domains of policy, media, and publicagendas; health promotion agenda-setting is about how healthissues move through agendas to the point that they becomeactionable by policymakers [35]. Health promotionagenda-setting shifts the focus from the traditional healtheducation target of individual risk behavior change to theformulation and adoption of innovative health policies whichadvocate for the public’s health at population level [12,32].Kozel et al [12,34], in response to an identified gap—theomission of agenda setting from health promotion planningmodels relating to innovation and diffusion—have developeda model of the health promotion agenda-setting process. Theconstruction of this model includes the interrelated constructsof the media, policy, and public agendas with the integrationof the seven responsibilities of health educators: assessment,planning, implementation, coordination, evaluation, acting asa resource person, and advocating for health [34]. Through thedevelopment of health promotion agenda-setting, including
lessons learned from its practical application, a range of factorshas emerged that enhances the diffusion of health promotionand disease prevention innovations [33]. These includecharacteristic factors such as demographic descriptors; designfactors such as strategies and methods used; and mechanismfactors such as shared vision, synchronicity, salience, and socialjustice [33]. Kozel et al [33] identify ten key activities foragenda setters to use in practice, two of which are tailoringstrategies to prioritize a health issue in a population andsustaining salience of an issue in the domains of policy, media,and public agendas. The application of health promotionagenda-setting in practice enables a comprehensive, planned,innovative, and sustainable course of action which facilitatesprioritization of public health problems and the identificationof alternative solutions [12]. Health promotion agenda-settingcontributes to health promotion leadership and provides amechanism through which to improve the formulation andadoption of health policy.
In addition to the work by Kozel and colleagues on thedevelopment and application of health promotion agenda-setting,the concept and components of agenda setting have been usedin public health and health promotion in a range of areas [36-42].Understanding, researching, and implementing the use of agenda
JMIR Public Health Surveill 2015 | vol. 1 | iss. 2 | e21 | p.27http://publichealth.jmir.org/2015/2/e21/(page number not for citation purposes)
Albalawi & SixsmithJMIR PUBLIC HEALTH AND SURVEILLANCE
XSL•FORenderX
setting for health promotion practice will improve itsperformance and boost intervention outcomes [12]. This isparticularly important in the era of social media, a relativelynew addition to the media landscape that warrants furtherexploration in the context of agenda setting.
Agenda Setting in the Social Media EraAgenda-setting initiatives have been extensively studied anddeveloped by researchers and practitioners. New frames andmodels have been proposed with emphasis placed on the idealmatch between changes people and societies are undergoing inthe social media era and agenda setting for public health [43].Given that social media was nonexistent during the introductionand early development of agenda-setting theory, this has notbeen comprehensively investigated in previous research [44].
Simple application of agenda setting in the era of social mediadoes not reflect the complex process of communication resultingfrom the use of social media platforms [44]. We argue thatunderstanding agenda-setting theory in the social media erashould cover two levels of engagement: the first centers onagenda setting within the social media sphere and the secondis related to the position of social media within the classicagenda-setting process implemented in the real world. Here wepropose social media in the agenda-setting context as anindependent body governed by its own agenda..
Social Media Agenda SettingAs proposed by Dearing and Rogers [45], agenda setting is bestunderstood as a process of interaction; it therefore revolvesaround the flow of agendas from one component to another.Within the agenda-setting process, an important task is toidentify who owns specific agendas and who interacts with otherstakeholders.
Individual AgendaSocial media offers numerous platforms where people cancommunicate and interact. One of the most important changesin agenda setting within the social media realm is the shift inpower towards the public in terms of control overcommunication; this shift was triggered by the fact that withsocial media technologies, individuals become active producersinstead of functioning merely as receivers of information.Bekkers et al [46] argue that Web 2.0 has shifted politicalmobilization from a traditional mass-oriented movement to onedriven by individuals and small groups of people.
Furthermore, individuals differ significantly in how they respondto the media agenda [47]. The power that individuals havegained in the social media era enables them to directlycommunicate their arguments, opinions, and agendas to theworld. Supported by highly interactive features anduser-generated content, social media platforms allow individualsto control what they receive, from whom, and how muchaccording to their interests [48]. Tran and Johnson [49] claimthat one of the opportunities provided by social media toagenda-setting research is the empowerment of individuals indeveloping their personal agendas [49]. We argue that suchopportunity extends not only to development but also toinfluence over agendas. In real communities, an individual is a
member of the public and thus can adopt and influence a givenagenda advocated by a specific community. Similarly, anindividual can hold membership in any organization and assistthis organization by adopting and influencing its agenda. Inclassic agenda setting, individuals are always regarded asmembers of the public because influence is acquired through aprocess called “agenda melding” [39]. Although the emergenceof social media does not cancel the role of agenda melding, itmay extend the role of individuals by assigning them effectivepositions within the social process. This perspective is supportedby the findings of Althaus and Tewksbury [50] and Conwayand Patterson [51], who illustrated the differences in the powerof individuals to control communication between traditionaland social media.
Organizational AgendaSocial media has also redistributed the power to controlcommunication at the organizational level. The nature of socialmedia has allowed many types of organizations—not only mediaand policy institutions—to contribute to agenda setting. Similarto the shift in power at the public and individual level, changesat the organizational level have translated to organizationalinfluence over and interaction with various agendas.
The effect of the presence of health organizations on theseplatforms has been explored in recent studies [52,53]. Thesestudies include the examination of factors such as thoseassociated with the organizations’ ability to engage andmeasures that directly affect the organizations’ influence [53].
The organizational agenda is not a new concept. Berger [31]pointed out that organizations are effective agenda-setting actorsthat can establish agenda through funding, lobbying, andadvertising, thereby influencing the specific issues that arediscussed in societies.
The authors propose to regard organizations as essentialstakeholders in agenda setting because they can interact withdifferent community actors, including the public, media, andpolicy makers.
A New Contributor to the Agenda-Setting ProcessAs previously stated, the nature of social media with its two-waycommunication platforms and channels differs completely fromthat of traditional one-way mass communication channels. Thesocial media age has driven changes in the manner by whichinformation is disseminated. This era has decentralizedtraditional communication, thereby diminishing its power inshaping the issues that people think about [49]. Researchershave examined the relationship between traditional media (eg,newspapers and television) and social media (eg, Twitter andYouTube, a video-sharing website) [48,54]. The findings suggestthat the social media realm is an independent arena that canaffect and be affected by traditional media [54]. Researchconfirms traditional media’s influence over the social mediaagenda and vice versa [45,46,55].
McCombs [47] and Meraz [56], among others, have highlightedthe manner by which social media influences agenda settingwithin the traditional media realm. An interesting finding is thatthe influence of social media not only covers the traditional
JMIR Public Health Surveill 2015 | vol. 1 | iss. 2 | e21 | p.28http://publichealth.jmir.org/2015/2/e21/(page number not for citation purposes)
Albalawi & SixsmithJMIR PUBLIC HEALTH AND SURVEILLANCE
XSL•FORenderX
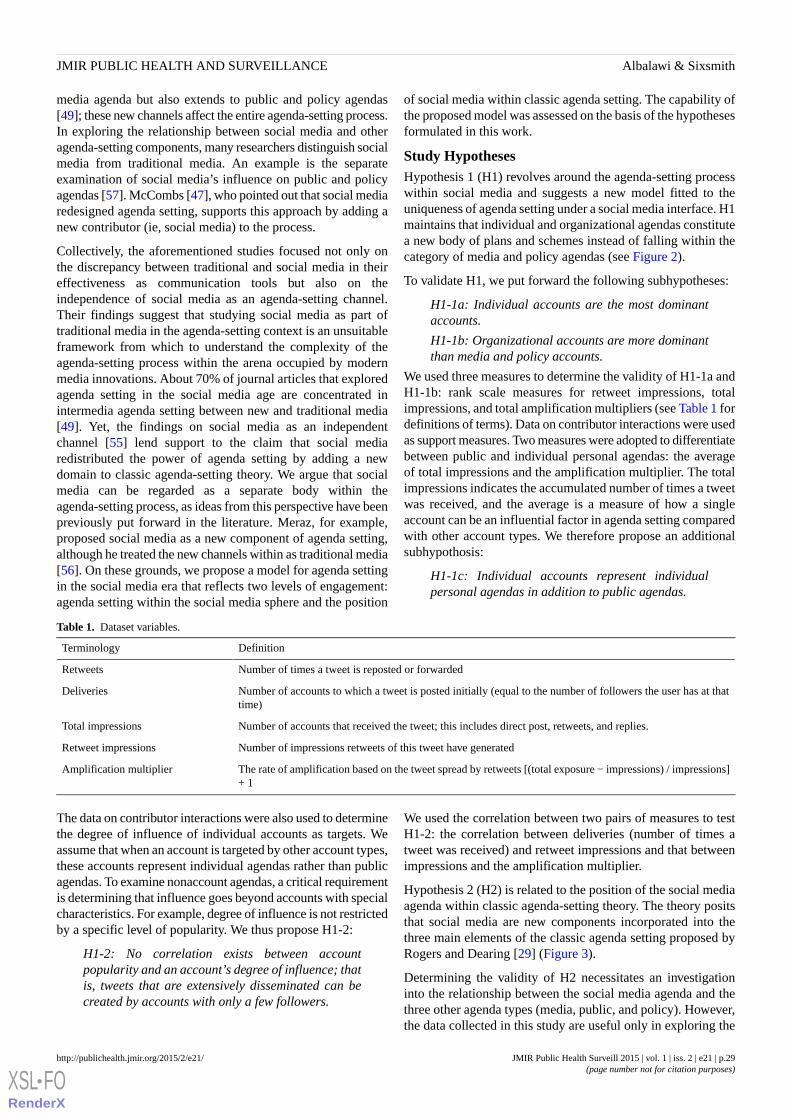
media agenda but also extends to public and policy agendas[49]; these new channels affect the entire agenda-setting process.In exploring the relationship between social media and otheragenda-setting components, many researchers distinguish socialmedia from traditional media. An example is the separateexamination of social media’s influence on public and policyagendas [57]. McCombs [47], who pointed out that social mediaredesigned agenda setting, supports this approach by adding anew contributor (ie, social media) to the process.
Collectively, the aforementioned studies focused not only onthe discrepancy between traditional and social media in theireffectiveness as communication tools but also on theindependence of social media as an agenda-setting channel.Their findings suggest that studying social media as part oftraditional media in the agenda-setting context is an unsuitableframework from which to understand the complexity of theagenda-setting process within the arena occupied by modernmedia innovations. About 70% of journal articles that exploredagenda setting in the social media age are concentrated inintermedia agenda setting between new and traditional media[49]. Yet, the findings on social media as an independentchannel [55] lend support to the claim that social mediaredistributed the power of agenda setting by adding a newdomain to classic agenda-setting theory. We argue that socialmedia can be regarded as a separate body within theagenda-setting process, as ideas from this perspective have beenpreviously put forward in the literature. Meraz, for example,proposed social media as a new component of agenda setting,although he treated the new channels within as traditional media[56]. On these grounds, we propose a model for agenda settingin the social media era that reflects two levels of engagement:agenda setting within the social media sphere and the position
of social media within classic agenda setting. The capability ofthe proposed model was assessed on the basis of the hypothesesformulated in this work.
Study HypothesesHypothesis 1 (H1) revolves around the agenda-setting processwithin social media and suggests a new model fitted to theuniqueness of agenda setting under a social media interface. H1maintains that individual and organizational agendas constitutea new body of plans and schemes instead of falling within thecategory of media and policy agendas (see Figure 2).
To validate H1, we put forward the following subhypotheses:
H1-1a: Individual accounts are the most dominantaccounts.
H1-1b: Organizational accounts are more dominantthan media and policy accounts.
We used three measures to determine the validity of H1-1a andH1-1b: rank scale measures for retweet impressions, totalimpressions, and total amplification multipliers (see Table 1 fordefinitions of terms). Data on contributor interactions were usedas support measures. Two measures were adopted to differentiatebetween public and individual personal agendas: the averageof total impressions and the amplification multiplier. The totalimpressions indicates the accumulated number of times a tweetwas received, and the average is a measure of how a singleaccount can be an influential factor in agenda setting comparedwith other account types. We therefore propose an additionalsubhypothosis:
H1-1c: Individual accounts represent individualpersonal agendas in addition to public agendas.
Table 1. Dataset variables.
DefinitionTerminology
Number of times a tweet is reposted or forwardedRetweets
Number of accounts to which a tweet is posted initially (equal to the number of followers the user has at thattime)
Deliveries
Number of accounts that received the tweet; this includes direct post, retweets, and replies.Total impressions
Number of impressions retweets of this tweet have generatedRetweet impressions
The rate of amplification based on the tweet spread by retweets [(total exposure − impressions) / impressions]+ 1
Amplification multiplier
The data on contributor interactions were also used to determinethe degree of influence of individual accounts as targets. Weassume that when an account is targeted by other account types,these accounts represent individual agendas rather than publicagendas. To examine nonaccount agendas, a critical requirementis determining that influence goes beyond accounts with specialcharacteristics. For example, degree of influence is not restrictedby a specific level of popularity. We thus propose H1-2:
H1-2: No correlation exists between accountpopularity and an account’s degree of influence; thatis, tweets that are extensively disseminated can becreated by accounts with only a few followers.
We used the correlation between two pairs of measures to testH1-2: the correlation between deliveries (number of times atweet was received) and retweet impressions and that betweenimpressions and the amplification multiplier.
Hypothesis 2 (H2) is related to the position of the social mediaagenda within classic agenda-setting theory. The theory positsthat social media are new components incorporated into thethree main elements of the classic agenda setting proposed byRogers and Dearing [29] (Figure 3).
Determining the validity of H2 necessitates an investigationinto the relationship between the social media agenda and thethree other agenda types (media, public, and policy). However,the data collected in this study are useful only in exploring the
JMIR Public Health Surveill 2015 | vol. 1 | iss. 2 | e21 | p.29http://publichealth.jmir.org/2015/2/e21/(page number not for citation purposes)
Albalawi & SixsmithJMIR PUBLIC HEALTH AND SURVEILLANCE
XSL•FORenderX
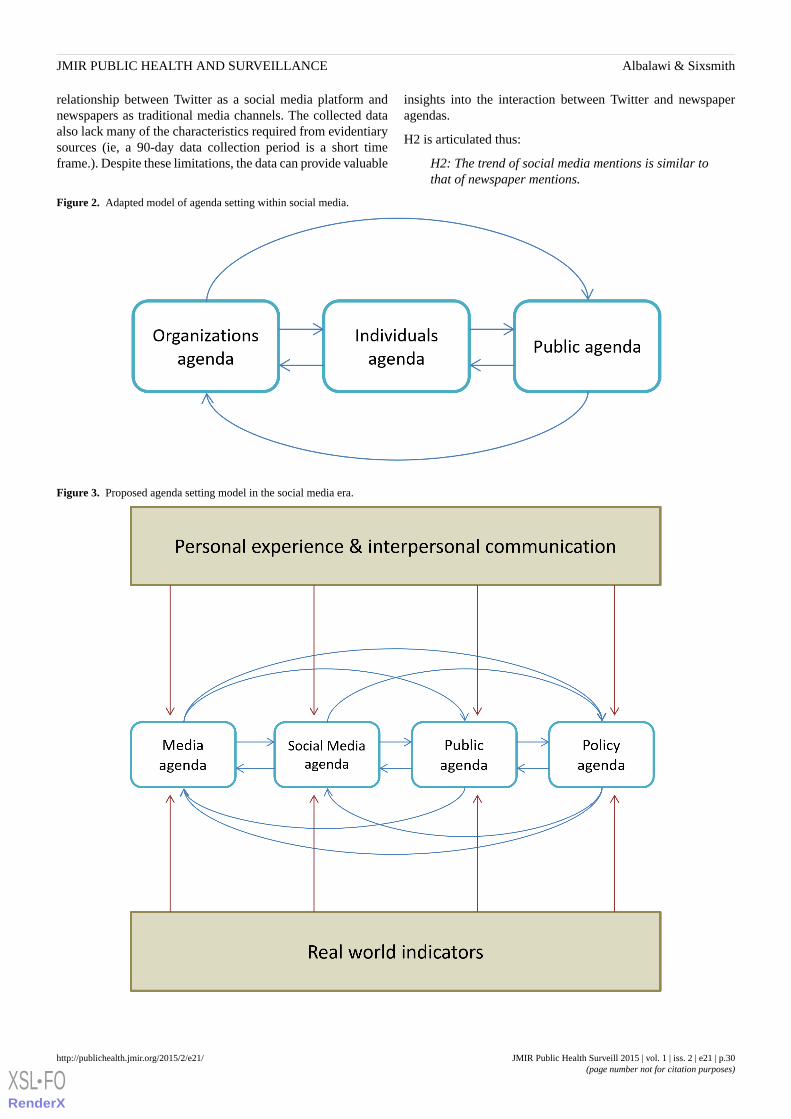
relationship between Twitter as a social media platform andnewspapers as traditional media channels. The collected dataalso lack many of the characteristics required from evidentiarysources (ie, a 90-day data collection period is a short timeframe.). Despite these limitations, the data can provide valuable
insights into the interaction between Twitter and newspaperagendas.
H2 is articulated thus:
H2: The trend of social media mentions is similar tothat of newspaper mentions.
Figure 2. Adapted model of agenda setting within social media.
Figure 3. Proposed agenda setting model in the social media era.
JMIR Public Health Surveill 2015 | vol. 1 | iss. 2 | e21 | p.30http://publichealth.jmir.org/2015/2/e21/(page number not for citation purposes)
Albalawi & SixsmithJMIR PUBLIC HEALTH AND SURVEILLANCE
XSL•FORenderX
Methods
DesignThis study is part of exploratory research aimed at testing thecapability of traditional communication theories inunderstanding social media platforms related to health promotionpractice.
Exploratory research is preliminary research that contributes tothe formulation and identification of hypotheses that show somemerit in being followed up by confirmatory research [58,59].The formulation of this hypothesis is not usually restricted, anda more flexible approach is used [59,60]. This study suggestsappropriate hypotheses that fit with the aim of the study overall.In addition, the statistical tests used to examine these hypotheses,the analysis procedures employed, and the intervention thatdeveloped as part of the study harmonize the spirit ofexploratory research [59,60].
The study used an important concern of public health, that ofroad traffic accidents. Based on the conceptual frames [61,62]and the selected message design [63,64], tweets about roadtraffic accidents were developed, pilot tested, and approved bya university research ethics committee. The study disseminatedthe tweets through the Saudi Ministry of Health Twitter account.
Immediately after completion of this Twitter intervention, anational campaign on road safety was run through varioustraditional and social media channels. The campaign enhancedthe dynamics of mentioning the keywords of the study. Suchenhancement does not bias the study as it reflects the normaldynamic of interactions targeted by the study to be examined.Furthermore, the collected data covered the periods before andafter the campaign. Textbox 1 presents examples of interventiontweets as well as other users’ tweets (see Multimedia Appendix1 for the original Arabic texts).
Textbox 1. Examples of intervention tweets and tweets by other users that mention the keywords road traffic accident.
Intervention tweets:
• Good health is a major resource for social, economic, and personal development and an important dimension of quality of life.
• 81% of all deaths in Ministry of Health hospitals are due to road traffic accidents.
• Road safety is a public health issue which involves health as well as other sectors that have the responsibility to be engaged in road traffic accidentprevention.
Tweets by other users:
• Your life is a candle; do not extinguish it. Stats: it is estimated that the number of traffic accidents will reach 1 million in the next 8 years.
• Traffic accidents cost SR 1.9 trillion (US $518 billion) globally each year.
• Did you know that in Saudi Arabia one person every hour is killed in a traffic accident?!!
Data CollectionTwitter data can be accessed directly from service profiles.Many third-party providers also offer Twitter statistics andanalysis services. For instance, Tweetreach offers licensedaccess to the full Twitter “firehose” through Gnip, a licenseddata reseller [65]. Increasing numbers of researchers are usingthese tools [66-72]. Account type was used as a variable fordetermining the most effective contributors to promoting roadtraffic accident agendas. Mentions of specific keywords as wellas related variables (who tweeted messages, when messageswere tweeted, to whom tweets were addressed, and howmessages were tweeted) were the indicators used to measurecontribution.
To validate the hypotheses, we collected data from two primarysources: Twitter activities and Saudi newspapers. As previouslystated, keyword mentions served as indicators of agendapromotion; for Twitter, interactions were used to measure theprocess of agenda setting within the platform. Data from bothsources were collected in a 90-day period from January 1 toMarch 31, 2014. Three Arabic keywords that are highlyassociated with road traffic accidents were considered in theanalysis. The English translations of these keywords are “trafficaccidents,” “the traffic accidents,” and “road accidents.”Tracking mentions of predefined keywords have been used in
previous studies although for different research purposes[71,73,74].
In collecting the Twitter data, we used the Tweetreach serviceto collect all tweets that contained the keywords. Manyresearchers have used this tool. For example, it has beenemployed in examining the use of Twitter as a platform forsharing information about medical events [75,76] and as atracker and analysis tool in evaluating the effect of public healthcampaigns such as tobacco control social media advocacy [77].
In this study, we set up operators to filter tweets: only thoseexpressed in the Arabic language were included, and tweets toand from Arab states other than Saudi Arabia were excluded.The final dataset comprised 59,046 tweets (16,071 regulartweets, 2783 replies, and 40,193 retweets) and 38,066contributors. For each tweet and contributor, variables werecollected. A total of three datasets were obtained from Twittertrackers: tweet data, retweet data, and contributor data.
In collecting the newspaper data, we used Google AdvancedSearch to gather information on six popular Saudi nationalnewspapers: Al-riyadh, Okaz, Al-Madina, Al-Yaum, Al-Watan,and Al-Jazirah. Across these newspapers, 518 keyword mentionswere recorded. All the datasets were extracted and preparedusing Excel spreadsheets (Microsoft Corp).
JMIR Public Health Surveill 2015 | vol. 1 | iss. 2 | e21 | p.31http://publichealth.jmir.org/2015/2/e21/(page number not for citation purposes)
Albalawi & SixsmithJMIR PUBLIC HEALTH AND SURVEILLANCE
XSL•FORenderX
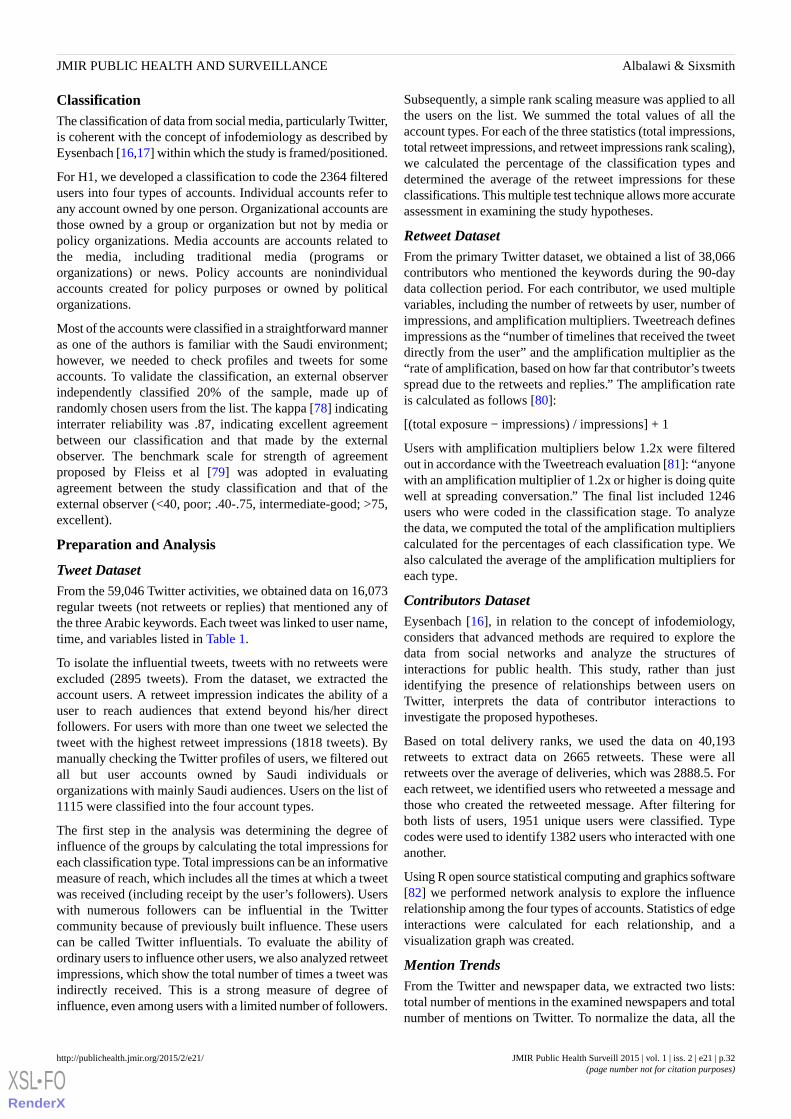
ClassificationThe classification of data from social media, particularly Twitter,is coherent with the concept of infodemiology as described byEysenbach [16,17] within which the study is framed/positioned.
For H1, we developed a classification to code the 2364 filteredusers into four types of accounts. Individual accounts refer toany account owned by one person. Organizational accounts arethose owned by a group or organization but not by media orpolicy organizations. Media accounts are accounts related tothe media, including traditional media (programs ororganizations) or news. Policy accounts are nonindividualaccounts created for policy purposes or owned by politicalorganizations.
Most of the accounts were classified in a straightforward manneras one of the authors is familiar with the Saudi environment;however, we needed to check profiles and tweets for someaccounts. To validate the classification, an external observerindependently classified 20% of the sample, made up ofrandomly chosen users from the list. The kappa [78] indicatinginterrater reliability was .87, indicating excellent agreementbetween our classification and that made by the externalobserver. The benchmark scale for strength of agreementproposed by Fleiss et al [79] was adopted in evaluatingagreement between the study classification and that of theexternal observer (<40, poor; .40-.75, intermediate-good; >75,excellent).
Preparation and Analysis
Tweet DatasetFrom the 59,046 Twitter activities, we obtained data on 16,073regular tweets (not retweets or replies) that mentioned any ofthe three Arabic keywords. Each tweet was linked to user name,time, and variables listed in Table 1.
To isolate the influential tweets, tweets with no retweets wereexcluded (2895 tweets). From the dataset, we extracted theaccount users. A retweet impression indicates the ability of auser to reach audiences that extend beyond his/her directfollowers. For users with more than one tweet we selected thetweet with the highest retweet impressions (1818 tweets). Bymanually checking the Twitter profiles of users, we filtered outall but user accounts owned by Saudi individuals ororganizations with mainly Saudi audiences. Users on the list of1115 were classified into the four account types.
The first step in the analysis was determining the degree ofinfluence of the groups by calculating the total impressions foreach classification type. Total impressions can be an informativemeasure of reach, which includes all the times at which a tweetwas received (including receipt by the user’s followers). Userswith numerous followers can be influential in the Twittercommunity because of previously built influence. These userscan be called Twitter influentials. To evaluate the ability ofordinary users to influence other users, we also analyzed retweetimpressions, which show the total number of times a tweet wasindirectly received. This is a strong measure of degree ofinfluence, even among users with a limited number of followers.
Subsequently, a simple rank scaling measure was applied to allthe users on the list. We summed the total values of all theaccount types. For each of the three statistics (total impressions,total retweet impressions, and retweet impressions rank scaling),we calculated the percentage of the classification types anddetermined the average of the retweet impressions for theseclassifications. This multiple test technique allows more accurateassessment in examining the study hypotheses.
Retweet DatasetFrom the primary Twitter dataset, we obtained a list of 38,066contributors who mentioned the keywords during the 90-daydata collection period. For each contributor, we used multiplevariables, including the number of retweets by user, number ofimpressions, and amplification multipliers. Tweetreach definesimpressions as the “number of timelines that received the tweetdirectly from the user” and the amplification multiplier as the“rate of amplification, based on how far that contributor’s tweetsspread due to the retweets and replies.” The amplification rateis calculated as follows [80]:
[(total exposure − impressions) / impressions] + 1
Users with amplification multipliers below 1.2x were filteredout in accordance with the Tweetreach evaluation [81]: “anyonewith an amplification multiplier of 1.2x or higher is doing quitewell at spreading conversation.” The final list included 1246users who were coded in the classification stage. To analyzethe data, we computed the total of the amplification multiplierscalculated for the percentages of each classification type. Wealso calculated the average of the amplification multipliers foreach type.
Contributors DatasetEysenbach [16], in relation to the concept of infodemiology,considers that advanced methods are required to explore thedata from social networks and analyze the structures ofinteractions for public health. This study, rather than justidentifying the presence of relationships between users onTwitter, interprets the data of contributor interactions toinvestigate the proposed hypotheses.
Based on total delivery ranks, we used the data on 40,193retweets to extract data on 2665 retweets. These were allretweets over the average of deliveries, which was 2888.5. Foreach retweet, we identified users who retweeted a message andthose who created the retweeted message. After filtering forboth lists of users, 1951 unique users were classified. Typecodes were used to identify 1382 users who interacted with oneanother.
Using R open source statistical computing and graphics software[82] we performed network analysis to explore the influencerelationship among the four types of accounts. Statistics of edgeinteractions were calculated for each relationship, and avisualization graph was created.
Mention TrendsFrom the Twitter and newspaper data, we extracted two lists:total number of mentions in the examined newspapers and totalnumber of mentions on Twitter. To normalize the data, all the
JMIR Public Health Surveill 2015 | vol. 1 | iss. 2 | e21 | p.32http://publichealth.jmir.org/2015/2/e21/(page number not for citation purposes)
Albalawi & SixsmithJMIR PUBLIC HEALTH AND SURVEILLANCE
XSL•FORenderX
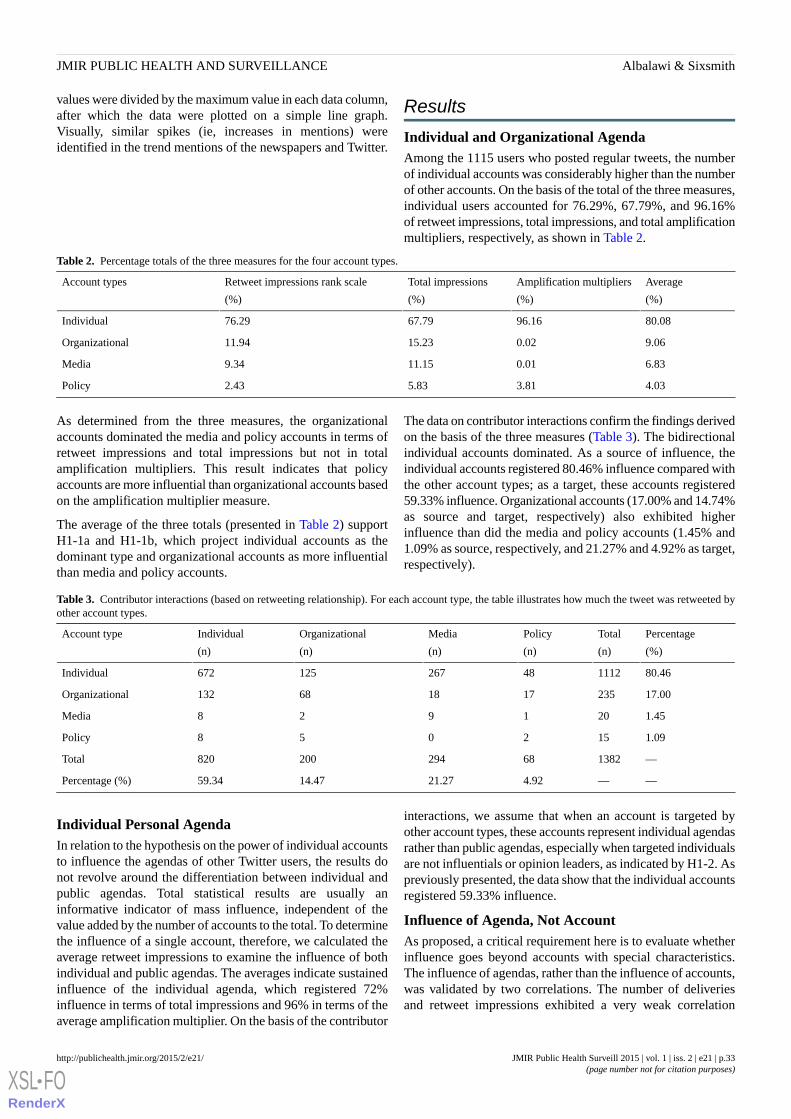
values were divided by the maximum value in each data column,after which the data were plotted on a simple line graph.Visually, similar spikes (ie, increases in mentions) wereidentified in the trend mentions of the newspapers and Twitter.
Results
Individual and Organizational AgendaAmong the 1115 users who posted regular tweets, the numberof individual accounts was considerably higher than the numberof other accounts. On the basis of the total of the three measures,individual users accounted for 76.29%, 67.79%, and 96.16%of retweet impressions, total impressions, and total amplificationmultipliers, respectively, as shown in Table 2.
Table 2. Percentage totals of the three measures for the four account types.
Average
(%)
Amplification multipliers
(%)
Total impressions
(%)
Retweet impressions rank scale
(%)
Account types
80.0896.1667.7976.29Individual
9.060.0215.2311.94Organizational
6.830.0111.159.34Media
4.033.815.832.43Policy
As determined from the three measures, the organizationalaccounts dominated the media and policy accounts in terms ofretweet impressions and total impressions but not in totalamplification multipliers. This result indicates that policyaccounts are more influential than organizational accounts basedon the amplification multiplier measure.
The average of the three totals (presented in Table 2) supportH1-1a and H1-1b, which project individual accounts as thedominant type and organizational accounts as more influentialthan media and policy accounts.
The data on contributor interactions confirm the findings derivedon the basis of the three measures (Table 3). The bidirectionalindividual accounts dominated. As a source of influence, theindividual accounts registered 80.46% influence compared withthe other account types; as a target, these accounts registered59.33% influence. Organizational accounts (17.00% and 14.74%as source and target, respectively) also exhibited higherinfluence than did the media and policy accounts (1.45% and1.09% as source, respectively, and 21.27% and 4.92% as target,respectively).
Table 3. Contributor interactions (based on retweeting relationship). For each account type, the table illustrates how much the tweet was retweeted byother account types.
Percentage
(%)
Total
(n)
Policy
(n)
Media
(n)
Organizational
(n)
Individual
(n)
Account type
80.46111248267125672Individual
17.00235171868132Organizational
1.45201928Media
1.09152058Policy
—138268294200820Total
——4.9221.2714.4759.34Percentage (%)
Individual Personal AgendaIn relation to the hypothesis on the power of individual accountsto influence the agendas of other Twitter users, the results donot revolve around the differentiation between individual andpublic agendas. Total statistical results are usually aninformative indicator of mass influence, independent of thevalue added by the number of accounts to the total. To determinethe influence of a single account, therefore, we calculated theaverage retweet impressions to examine the influence of bothindividual and public agendas. The averages indicate sustainedinfluence of the individual agenda, which registered 72%influence in terms of total impressions and 96% in terms of theaverage amplification multiplier. On the basis of the contributor
interactions, we assume that when an account is targeted byother account types, these accounts represent individual agendasrather than public agendas, especially when targeted individualsare not influentials or opinion leaders, as indicated by H1-2. Aspreviously presented, the data show that the individual accountsregistered 59.33% influence.
Influence of Agenda, Not AccountAs proposed, a critical requirement here is to evaluate whetherinfluence goes beyond accounts with special characteristics.The influence of agendas, rather than the influence of accounts,was validated by two correlations. The number of deliveriesand retweet impressions exhibited a very weak correlation
JMIR Public Health Surveill 2015 | vol. 1 | iss. 2 | e21 | p.33http://publichealth.jmir.org/2015/2/e21/(page number not for citation purposes)
Albalawi & SixsmithJMIR PUBLIC HEALTH AND SURVEILLANCE
XSL•FORenderX

(r=.08); the impressions and amplification multipliers showeda strong correlation (r=.01).
Twitter and Newspaper AgendaThe line graph that represents the mention trends in Twitter andnewspapers (Figure 4) shows the relationship between thesetwo time series datasets. Broadly, we identified 13 strikingsimilarities between the two trends.
Figure 4. Line graph of the mention trends of Twitter and newspapers.
Discussion
OverviewAvailable evidence reflects the importance of communicationtechnologies and the Internet in daily life and social interaction[43,46]. The characteristics and features of social mediafacilitate the powerful effects of such platforms in terms ofdisseminating information, framing opinions, and mobilizingaction [43,46,83].
Among the many effective features of social media,user-generated content is critical to the positioning of newchannels within the agenda-setting process. Other social mediafunctions that influence agenda-setting dynamics are the sharingof content and the selection of the type of information that userswant to receive [3].
Based on a simple classification scheme, Twitter accounts canbe either personal or organizational.. This study suggests thatin many cases, the emergence of agenda setting among socialmedia users (eg, Twitter users) occurs through the advocacy ofindividual personal agendas. On social media platforms,individuals can influence the public and organizations throughtheir own agenda. In other words, individuals can function asindependent actors in agenda setting. In a similar vein, socialmedia platforms enable organizations and the public to influenceindividual perceptions and behaviors through their agendas.
From the viewpoint of health promotion, agenda setting is aneffective approach to achieving best practice aims and objectives[10,11,12]. Agenda setting can hold more potential thanbehavioral change strategies, as confirmed by road safetyresearch and interventions [33,84,85]. This is demonstratedthrough the impact of influencing social policies [84,86],persuading policy and decision makers [7], orienting mediacoverage [11], enhancing the advocacy process, and maximizingthe diffusion of innovations [12]. In addition to influencinghealth policy actions, the outcomes can result in positive changesin the behaviors of individuals [87]. This indirect approach isbased on the view that human behaviors are not isolated fromsocial and community contexts [38]. The evolution of the socialmedia age encourages health promotion practitioners andorganizations to maximize the benefits of innovations arisingfrom such developments.
This exploratory study centers on the importance of acomprehensive understanding of best practices for healthpromotion. It does so by suggesting a novel contribution tohealth promotion through the development of an adaptedagenda-setting approach in the social media era and within itsplatforms.
Agenda Setting in the Social Media EraHealth promotion needs a more creative approach to researchand practice in using the agenda-setting function [33]. This ismore challenging in the social media era where understanding
JMIR Public Health Surveill 2015 | vol. 1 | iss. 2 | e21 | p.34http://publichealth.jmir.org/2015/2/e21/(page number not for citation purposes)
Albalawi & SixsmithJMIR PUBLIC HEALTH AND SURVEILLANCE
XSL•FORenderX
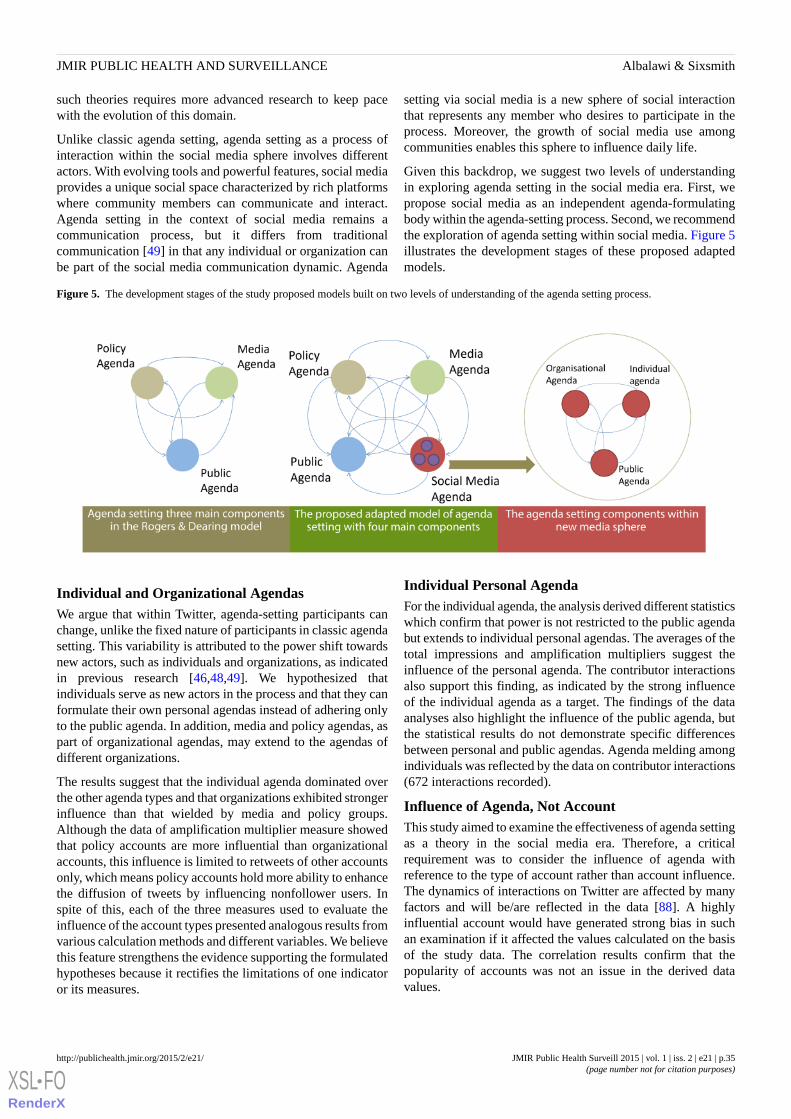
such theories requires more advanced research to keep pacewith the evolution of this domain.
Unlike classic agenda setting, agenda setting as a process ofinteraction within the social media sphere involves differentactors. With evolving tools and powerful features, social mediaprovides a unique social space characterized by rich platformswhere community members can communicate and interact.Agenda setting in the context of social media remains acommunication process, but it differs from traditionalcommunication [49] in that any individual or organization canbe part of the social media communication dynamic. Agenda
setting via social media is a new sphere of social interactionthat represents any member who desires to participate in theprocess. Moreover, the growth of social media use amongcommunities enables this sphere to influence daily life.
Given this backdrop, we suggest two levels of understandingin exploring agenda setting in the social media era. First, wepropose social media as an independent agenda-formulatingbody within the agenda-setting process. Second, we recommendthe exploration of agenda setting within social media. Figure 5illustrates the development stages of these proposed adaptedmodels.
Figure 5. The development stages of the study proposed models built on two levels of understanding of the agenda setting process.
Individual and Organizational AgendasWe argue that within Twitter, agenda-setting participants canchange, unlike the fixed nature of participants in classic agendasetting. This variability is attributed to the power shift towardsnew actors, such as individuals and organizations, as indicatedin previous research [46,48,49]. We hypothesized thatindividuals serve as new actors in the process and that they canformulate their own personal agendas instead of adhering onlyto the public agenda. In addition, media and policy agendas, aspart of organizational agendas, may extend to the agendas ofdifferent organizations.
The results suggest that the individual agenda dominated overthe other agenda types and that organizations exhibited strongerinfluence than that wielded by media and policy groups.Although the data of amplification multiplier measure showedthat policy accounts are more influential than organizationalaccounts, this influence is limited to retweets of other accountsonly, which means policy accounts hold more ability to enhancethe diffusion of tweets by influencing nonfollower users. Inspite of this, each of the three measures used to evaluate theinfluence of the account types presented analogous results fromvarious calculation methods and different variables. We believethis feature strengthens the evidence supporting the formulatedhypotheses because it rectifies the limitations of one indicatoror its measures.
Individual Personal AgendaFor the individual agenda, the analysis derived different statisticswhich confirm that power is not restricted to the public agendabut extends to individual personal agendas. The averages of thetotal impressions and amplification multipliers suggest theinfluence of the personal agenda. The contributor interactionsalso support this finding, as indicated by the strong influenceof the individual agenda as a target. The findings of the dataanalyses also highlight the influence of the public agenda, butthe statistical results do not demonstrate specific differencesbetween personal and public agendas. Agenda melding amongindividuals was reflected by the data on contributor interactions(672 interactions recorded).
Influence of Agenda, Not AccountThis study aimed to examine the effectiveness of agenda settingas a theory in the social media era. Therefore, a criticalrequirement was to consider the influence of agenda withreference to the type of account rather than account influence.The dynamics of interactions on Twitter are affected by manyfactors and will be/are reflected in the data [88]. A highlyinfluential account would have generated strong bias in suchan examination if it affected the values calculated on the basisof the study data. The correlation results confirm that thepopularity of accounts was not an issue in the derived datavalues.
JMIR Public Health Surveill 2015 | vol. 1 | iss. 2 | e21 | p.35http://publichealth.jmir.org/2015/2/e21/(page number not for citation purposes)
Albalawi & SixsmithJMIR PUBLIC HEALTH AND SURVEILLANCE
XSL•FORenderX

Influentials Significance in Agenda-Setting ProcessAlthough influentials or opinion leaders are beyond the scopeof this work, they remain essential participants in any socialcommunication process, including agenda setting [89]. In earlytheories such as the two-step flow [90] and diffusion ofinnovations [89], influentials have a significant impact oninfluencing the agenda and enhancing its diffusion. It issuggested by Kozel et al [33] that it is crucial for healthpromotion agenda-setting practices to develop strategies thatenhance the diffusion of health promotion agendas through allagenda-setting process components. In addition to amplifyingthe diffusion of influence, these influentials can play a key rolein sustaining the salience of specific issues, which contributesto effective agenda-setting processes [33]. The data yielded bythe measures used in this study show the high impact ofinfluentials on the agenda among users, which will increase theinterrelation dynamics of influencing the agenda among differentaccount types. Thus, using influentials is one of the strategiesthat can be efficient in health promotion agenda-setting practiceson social media platforms. The role of influentials requiresfurther research which is beyond the scope of the current study.
Twitter and Newspaper AgendaWe hypothesized a relationship between newspapers and Twitterand illustrated this association via a line graph of mention trendsover the platform. Nevertheless, the collected data cannotilluminate a clear direction for this relationship and do notexclude external factors that can affect the trends. Thishypothesis was intended as a starting point in exploring theincorporation of the social media agenda in the classicagenda-setting process. This relationship has been studied andvalidated through various analysis techniques and methodologies[44,45,48,49,55,91]. Furthermore, examining causality is acrucial component of determining the direction of therelationship between new and traditional media in agenda setting[48,92].
Nonetheless, this relationship is only part of the model proposedin this work and therefore requires further examination [44,83].Particularly interesting focal issues in this regard are theagenda-setting interaction between social media and the publicagenda and that between social media and the policy agenda[44].
LimitationsWe have proposed an alternative perspective from which tounderstand agenda setting in the social media age. Supportedby the data collected, we adopted well-defined measures thatreflected a positive evaluation of the study’s hypotheses. Wehave applied multiple hypothesis testing methods which cansupport authenticity of the study as is recommended for anyexploratory research [59]. Nonetheless, it is crucial in scientific
research that any exploratory research must be carefullyexamined by confirmatory research [59].
The nature of data on social media results in limitations whichcan affect any infodemiology study. These include, for example,the lack of strong representation of the population and the lackof accuracy of some information provided on such platforms[17].
Furthermore, the statistical procedures and measures usedrequire replication and/or repetition to establish a solidfoundation for the implications of the results. As indicated byMcCombs [45], such studies are limited by variables related totime, place, and the selection of measurement and analysis tools;a repeated examination of a model and the replication of ideasare thus critical requirements in the validation of results.Utilizing agenda setting in the field of health promotion willencounter many challenges in research and practice [93].
Many factors and variables must be considered, guided by amore in-depth understanding of the process of agenda settingin relation to its possible applications [93]. This will providevaluable strategies and themes for the successful application ofagenda setting in promoting the public’s health [93].
For the public health and health promotion domain, furtherresearch may include different health topics with larger datasamples and modified methods. At the organizational level, thefindings suggest more dominance for health organizations inthe agenda-setting process within social media. Further researchrelated to strategies and best practices is required for suchorganizations to close the gap that has already been identified[53]. Moreover, such research may consider extending theinfodemiology framework to development efforts addressingmore topics, languages, and platforms.
ConclusionThe results indicate that media platforms are a promising avenuethat can enhance the efficacy of intervention programs.However, the effective use of such platforms will necessitatenew strategies that address the limitations of traditionalcommunication channels. More efforts towards modifying healthpromotion strategies and developing new approaches should beinitiated. For such development, conducting research is vital toestablishing a strong basis for the design, formulation, andimplementation of agendas. Social media augments theeffectiveness of this approach by shifting power towardsreachable individual participants. In turn, agendas become moreaccessible and more easily used as tools or targets of influence.Finally, organizations that promote the public’s health willbenefit considerably from actively participating in theagenda-setting process through the formulation of theorganizational agenda.
AcknowledgmentsWe would like to acknowledge Yahya Albalawi's advice and guidance in relation to the statistical analysis.
JMIR Public Health Surveill 2015 | vol. 1 | iss. 2 | e21 | p.36http://publichealth.jmir.org/2015/2/e21/(page number not for citation purposes)
Albalawi & SixsmithJMIR PUBLIC HEALTH AND SURVEILLANCE
XSL•FORenderX

Conflicts of InterestNone declared.
Multimedia Appendix 1Examples of intervention tweets and tweets by other users that mention the keywords road traffic accident (Arabic texts).
[PDF File (Adobe PDF File), 295KB - publichealth_v1i2e21_app1.pdf ]
References1. Frati A, Luzi A, Colucci A. Communication for health promotion: history and identification of effective methods. Ann Ist
Super Sanità 2010;46(4):422-426 [FREE Full text] [doi: 10.4415/ANN_10_04_10]2. Suresh K. Evidence based communication for health promotion: Indian lessons of last decade. Indian J Public Health
2011;55(4):276-285 [FREE Full text] [doi: 10.4103/0019-557X.92405] [Medline: 22298137]3. Korda H, Itani Z. Harnessing social media for health promotion and behavior change. Health Promot Pract 2013
Jan;14(1):15-23. [doi: 10.1177/1524839911405850] [Medline: 21558472]4. World Health Organization. Geneva: World Health Organization (WHO); 2013. Global status report on road safety Internet
URL: http://www.who.int/iris/bitstream/10665/78256/1/9789241564564_eng.pdf?ua=1 [WebCite Cache ID 6acr0b6Be]5. Ageli M, Zaidan A. Road Traffic Accidents in Saudi Arabia: An ADRL Approach and Multivariate Granger Causality.
International Journal of Economics and Finance 2013;5(7). [doi: 10.5539/ijef.v5n7p26]6. Ansari S, Akhdar F, Mandoorah M, Moutaery K. Causes and effects of road traffic accidents in Saudi Arabia. Public Health
2000 Jan;114(1):37-39. [doi: 10.1038/sj.ph.1900610] [Medline: 10787024]7. Peden M., Scurfield R., Sleet D., Mohan D., Hyder A., Jarawan E., Mathers C.. World Health Organization. Geneva: World
Health Organization; 2004. World report on road traffic injury prevention Internet URL: http://whqlibdoc.who.int/publications/2004/9241562609.pdf [WebCite Cache ID 6bfTSuJZy]
8. Balatsoukas P, Kennedy C, Buchan I, Powell J, Ainsworth J. J Med Internet Res(6). 2015. The Role of Social NetworkTechnologies in Online Health Promotion: A Narrative Review of Theoretical and Empirical Factors Influencing InterventionEffectiveness URL: http://www.jmir.org/2015/6/e141/ [WebCite Cache ID 6bfSoz9Lv]
9. Narayanaswami P, Gronseth G, Dubinsky R, Penfold-Murray R, Cox J, Bever JC, et al. J Med Internet Res(8). 2015. TheImpact of Social Media on Dissemination and Implementation of Clinical Practice Guidelines: A Longitudinal ObservationalStudy URL: http://www.jmir.org/2015/8/e193/ [WebCite Cache ID 6bfTwU9ze]
10. Leask J, Hooker C, King C. Media coverage of health issues and how to work more effectively with journalists: a qualitativestudy. BMC Public Health 2010;10:535 [FREE Full text] [doi: 10.1186/1471-2458-10-535] [Medline: 20822552]
11. Cohen L, Chavez V, Chehimi S. Prevention is primary: strategies for community well being. San Francisco, CA: Jossey-Bass;2010.
12. Kozel CT, Kane WM, Rogers EM, Brandon JE, Hatcher MT, Hammes MJ, et al. Exploring health promotion agenda-settingin New Mexico: reshaping health promotion leadership. Promot Educ 2003;10(4):171-7, 198, 209. [Medline: 15071972]
13. Kaplan A, Haenlein M. Users of the world, unite! The challenges and opportunities of Social Media. Business Horizons2010 Jan;53(1):59-68. [doi: 10.1016/j.bushor.2009.09.003]
14. Internet World Stats. World Internet Users Statistics and 2014 World Population Stats URL: http://www.internetworldstats.com/stats.htm [WebCite Cache ID 6aOgE6a6n]
15. Eysenbach G. Infodemiology: The epidemiology of (mis)information. Am J Med 2002 Dec 15;113(9):763-765. [Medline:12517369]
16. Eysenbach G. Infodemiology and infoveillance: framework for an emerging set of public health informatics methods toanalyze search, communication and publication behavior on the Internet. J Med Internet Res 2009;11(1):e11 [FREE Fulltext] [doi: 10.2196/jmir.1157] [Medline: 19329408]
17. Eysenbach G. Infodemiology and Infoveillance. American Journal of Preventive Medicine 2011;40(5):S154-S158. [doi:10.1016/j.amepre.2011.02.006]
18. Eysenbach G. Infodemiology: Tracking Flu-Related Searches on the Web for Syndromic Surveillance. AMIA Annu SympProc 2006:244-248.
19. Zwolenski M, Weatherill L. The Digital Universe Rich Data and the Increasing Value of the Internet of Things. ajTDE2014 Oct 20;2(3) [FREE Full text] [doi: 10.7790/ajtde.v2n3.47]
20. Bail C. The cultural environment: measuring culture with big data. Theor Soc 2014 Mar 27;43(3-4):465-482. [doi:10.1007/s11186-014-9216-5]
21. Twitter Help Center. Getting started with Twitter URL: https://support.twitter.com/groups/50-welcome-to-twitter/topics/204-the-basics/articles/215585-getting-started-with-twitter [WebCite Cache ID 6aOlw1c4l]
22. Jason M. Global Web Index. London: Global Web Index; 2015. Twitter Users - Q1 2015 Internet URL: https://app.globalwebindex.net/products/report/twitter-users-q1-2015 [WebCite Cache ID 6aOm8d8vX]
JMIR Public Health Surveill 2015 | vol. 1 | iss. 2 | e21 | p.37http://publichealth.jmir.org/2015/2/e21/(page number not for citation purposes)
Albalawi & SixsmithJMIR PUBLIC HEALTH AND SURVEILLANCE
XSL•FORenderX
23. Internet world stats.: Internet world stats Middle East Internet Usage Statistics, Population, Facebook and TelecommunicationsReports Internet URL: http://www.internetworldstats.com/stats5.htm [WebCite Cache ID 6aOmX7iuT]
24. Lippmann W. Public opinion. New York: Macmillan; 1922.25. Lasswell H. The structure and function of communication in society. In: Bryson L, editor. The communication of ideas: a
series of addresses. New York: Institute for Religious and Social Studies; 1948:215-228.26. Cohen B. Press and Foreign Policy. New Jersey: Princeton University Press; 1963.27. McCombs M, Shaw D. The Agenda-Setting Function of Mass Media. Public Opinion Quarterly 1972;36(2):176-187. [doi:
10.1086/267990]28. University of Utwente. 2015. Agenda Setting Theory URL: http://www.utwente.nl/cw/theorieenoverzicht/Theory%20clusters/
Mass%20Media/Agenda-Setting_Theory/ [WebCite Cache ID 6aOnUb56H]29. Rogers E, Dearing J. Agenda-setting research: Where has it been? Where is it going? In: Anderson J, editor. Communication
yearbook. 11th ed. Newbury Park, CA: Sage; 1988:555-594.30. Kosicki G. Problems and Opportunities in Agenda-Setting Research. J Communication 1993 Jun;43(2):100-127. [doi:
10.1111/j.1460-2466.1993.tb01265.x]31. Berger B. Private Issues and Public Policy: Locating the Corporate Agenda in Agenda-Setting Theory. Journal of Public
Relations Research 2009 Nov 19;13(2):91-126. [doi: 10.1207/s1532754xjprr1302_1]32. Kozel C, Kane W, Rogers E, Hammes M. Exploring health promotion agenda-setting design: A study of the factors associated
with health promotion agenda-setting design in New Mexico. Unpublished doctoral dissertation 1995 University of NewMexico, Albuquerque.
33. Kozel C, Kane W, Hatcher M, Hubbell A, Dearing J, Forster-Cox S. Introducing health promotion agenda-setting for healtheducation practitioners. California Journal of Health Promotion 2006;4(1):32-40.
34. Kozel C, Hubbell A, Dearing J, Kane W, Thompson S, Perez F. Exploring agenda-setting for Healthy Border 2010: Researchdirections and methods. Californian Journal of Health Promotion 2006;4(1):141-161.
35. Farmer J, Kozel C. Agenda Setting and the Albuquerque Clean Indoor Air Ordinance. Journal of Health Education2005;36(5):313-315.
36. Pratt C, Ha L, Pratt C. Setting the Public Health Agenda on Major Diseases in Sub-Saharan Africa: African PopularMagazines and Medical Journals, 1981--1997. Journal of communication. - 2002;52(4):889-904. [doi: 10.1093/joc/52.4.889]
37. Grover L, Horent E. Public health agenda setting in Louisiana: an applied index and implications for community developmentpolicy. Community Development 2011 Apr;42(2):268-285. [doi: 10.1080/15575330.2011.558207]
38. Terris M. A social policy for health. American Journal of Public Health and the Nations Health 1968;58(1):5-12.39. Hao-yu F. An Interpretation of Agenda-Setting of the Health Communication on the Internet. Journal of Fujian Normal
University (Philosophy and Social Sciences Edition) 2013;1:031.40. Flora JA, Maibach EW, Maccoby N. The role of media across four levels of health promotion intervention. Annu Rev
Public Health 1989;10:181-201. [doi: 10.1146/annurev.pu.10.050189.001145] [Medline: 2655630]41. Molleman Gerard R M, Bouwens Jan G M. Building the evidence base: from tool development to agenda-setting and
defining a joint programme for health promotion in Europe. Promot Educ 2005;Suppl 1:8-9, 43. [Medline: 15952272]42. Pacheco J, Boushey G. Public health and agenda setting: determinants of state attention to tobacco and vaccines. J Health
Polit Policy Law 2014 Jun;39(3):565-589. [doi: 10.1215/03616878-2682612] [Medline: 24603088]43. Liang B, Scammon D. Incidence of Online Health Information Search: A Useful Proxy for Public Health Risk Perception.
J Med Internet Res 2013;15(6):e114 [FREE Full text] [doi: 10.2196/jmir.2401]44. Zheluk A, Gillespie J, Quinn C. Searching for Truth: Internet Search Patterns as a Method of Investigating Online Responses
to a Russian Illicit Drug Policy Debate. J Med Internet Res 2012;14(6):e165 [FREE Full text] [doi: 10.2196/jmir.2270]45. Dearing J, Rogers E. Agenda-setting. Thousand Oaks, Calif: Sage; 1996.46. Bekkers V, Beunders H, Edwards A, Moody R. New Media, Micromobilization, and Political Agenda Setting: Crossover
Effects in Political Mobilization and Media Usage. The Information Society 2011 Jul;27(4):209-219. [doi:10.1080/01972243.2011.583812]
47. McCombs M. A Look at Agenda-setting: past, present and future. Journalism Studies 2005 Nov;6(4):543-557. [doi:10.1080/14616700500250438]
48. Sayre B, Bode L, Shah D, Wilcox D, Shah C. Agenda Setting in a Digital Age: Tracking Attention to California Proposition8 in Social Media, Online News and Conventional News. Policy & Internet 2010;2(2):7-32. [doi: 10.2202/1944-2866.1040]
49. Tran H. Online agenda setting: A new frontier for theory development. In: Thomas J. J, editor. Agenda Setting in a 2.0World: New Agendas in Communication: A Tribute to Maxwell McCombs;-. Oxon: Routledge; 2014:205-229.
50. Althaus S, Tewksbury D. Agenda Setting and the "New" News: Patterns of Issue Importance Among Readers of the Paperand Online Versions of the New York Times. Communication Research 2002 Apr 01;29(2):180-207. [doi:10.1177/0093650202029002004]
51. Conway M, Patterson J. Today's Top Story? An Agenda-Setting and Recall Experiment Involving Television and InternetNews. Southwestern Mass Communication Journal 2008;24(1):31-48.
JMIR Public Health Surveill 2015 | vol. 1 | iss. 2 | e21 | p.38http://publichealth.jmir.org/2015/2/e21/(page number not for citation purposes)
Albalawi & SixsmithJMIR PUBLIC HEALTH AND SURVEILLANCE
XSL•FORenderX
52. Neiger BL, Thackeray R, Burton SH, Giraud-Carrier CG, Fagen MC. Evaluating social media's capacity to develop engagedaudiences in health promotion settings: use of Twitter metrics as a case study. Health Promot Pract 2013 Mar;14(2):157-162.[doi: 10.1177/1524839912469378] [Medline: 23271716]
53. Bhattacharya S, Srinivasan P, Polgreen P. Engagement with Health Agencies on Twitter. PLoS ONE 2014;9(11):e112235[FREE Full text] [doi: 10.1371/journal.pone.0112235]
54. Gulyas A. THE INFLUENCE OF PROFESSIONAL VARIABLES ON JOURNALISTS’USES AND VIEWS OF SOCIALMEDIA: A comparative study of Finland, Germany, Sweden and the United Kingdom. Digital Journalism 2013Jun;1(2):270-285. [doi: 10.1080/21670811.2012.744559]
55. Jones R, Rogers R, Roberts J, Callaghan L, Lindsey L, Campbell J, et al. What Is eHealth (5): A Research Agenda foreHealth Through Stakeholder Consultation and Policy Context Review. J Med Internet Res 2005;7(5):e54 [FREE Full text][doi: 10.2196/jmir.7.5.e54]
56. Meraz S. Is There an Elite Hold? Traditional Media to Social Media Agenda Setting Influence in Blog Networks. Journalof Computer-Mediated Communication 2009;14(3):682-707. [doi: 10.1111/j.1083-6101.2009.01458.x]
57. Zhu J, Watt J, Snyder L, Yan J, Jiang Y. Public Issue Priority Formation: Media Agenda-Setting and Social Interaction. JCommunication 1993 Mar;43(1):8-29. [doi: 10.1111/j.1460-2466.1993.tb01246.x]
58. Tukey J. We Need Both Exploratory and Confirmatory. The American Statistician 1980 Feb;34(1):23-25. [doi:10.2307/2682991]
59. Goeman J, Solari A. Multiple Testing for Exploratory Research. Statist. Sci 2011 Nov;26(4):584-597. [doi: 10.1214/11-sts356]60. Koestler Parapsychology Unit Study Registry. Edinburgh: University of Edinburgh; 2015. Exploratory and Confirmatory
Analyses Internet URL: http://www.koestler-parapsychology.psy.ed.ac.uk/Documents/explore_confirm.pdf [accessed2015-09-20] [WebCite Cache ID 6bgqIZdXw]
61. Lakoff G, Morgan P. Framing social issues: Does “the working poor” work? In: Report to the Ford Foundation; RockridgeStrategic Analysis Paper 2001-01. Cambridge, MA: Kennedy School of Government, Harvard University; 2001 Presentedat: Public obligations: Giving kids a chance; June 1, 2001; Cambridge p. 16-38.
62. Dorfman L, Wallack L, Woodruff K. More than a message: framing public health advocacy to change corporate practices.Health Educ Behav 2005 Jun;32(3):320-36; discussion 355. [doi: 10.1177/1090198105275046] [Medline: 15851542]
63. O’Flahavan L, Goulet A. Centers for Disease Control and Prevention. 2012. CDC’s Guide to Writing for Social MediaURL: http://www.cdc.gov/socialmedia/Tools/guidelines/pdf/GuidetoWritingforSocialMedia.pdf [WebCite Cache ID6bgrZUNIE]
64. Public Health Ontario; Dalla Lana School of Public Health. Toronto, ON: Queen’s Printer for Ontario; 2012. Healthcommunication message review criteria URL: http://www.publichealthontario.ca/en/eRepository/Health_communication_message_review_criteria_2012.pdf [accessed 2015-09-20] [WebCite Cache ID 6bgrhTGZB]
65. Union Metrics.: Union Metrics; 2014. TweetReach: Where our Twitter data comes from - TweetReach Blog Internet URL:https://blog.tweetreach.com/2014/01/tweetreach-where-our-twitter-data-comes-from/ [accessed 2015-07-30] [WebCiteCache ID 6aOnHlUVd]
66. Anger I, Kittl C. Measuring influence on Twitter. New York: ACM; 2011 Presented at: the 11th International Conferenceon Knowledge Management and Knowledge Technologies (i-KNOW '11); September 07 - 09, 2011; Graz, Austria p.31:1-31:4. [doi: 10.1145/2024288.2024326]
67. Bakshy E, Hofman J, Mason W, Watts D. Everyone's an influencer: quantifying influence on twitter. New York, NY: ACM;2011 Presented at: Fourth ACM International Conference on Web Search and Data Mining (WSDM '11); February 9-12,2011; Hong Kong, China p. 65-74. [doi: 10.1145/1935826.1935845]
68. Kwak H, Lee C, Park H, Moon S. What is Twitter, a social network or a news media? New York: ACM; 2010 Presentedat: The 19th international conference on World wide web (WWW '10); 26-30 April 2010; Raleigh, North Carolina, USAp. 591-600. [doi: 10.1145/1772690.1772751]
69. Cha M, Haddadi H, Benevenuto F, Gummadi P. Measuring User Influence in Twitter: The Million Follower Fallacy. 2010Presented at: ICWSM. (10-17); 23-26 May 2010; Washington, DC p. 30.
70. Wu S, Hofman J, Mason W, Watts D. Who says what to whom on twitter. New York: ACM; 2011 Presented at: The 20thinternational conference on World wide web (WWW '11); 28 March- 1 April 2011; Hyderabad, India p. 705-714. [doi:10.1145/1963405.1963504]
71. Mollema L, Harmsen I, Broekhuizen E, Clijnk R, De MH, Paulussen T, et al. Disease Detection or Public Opinion Reflection?Content Analysis of Tweets, Other Social Media, and Online Newspapers During the Measles Outbreak in the Netherlandsin 2013. J Med Internet Res 2015;17(5):e128 [FREE Full text] [doi: 10.2196/jmir.3863]
72. Kendra R, Karki S, Eickholt J, Gandy L. Characterizing the Discussion of Antibiotics in the Twittersphere: What is theBigger Picture? J Med Internet Res 2015;17(6):e154 [FREE Full text] [doi: 10.2196/jmir.4220]
73. McIver D, Hawkins J, Chunara R, Chatterjee A, Bhandari A, Fitzgerald T, et al. Characterizing Sleep Issues Using Twitter.J Med Internet Res 2015;17(6):e140 [FREE Full text] [doi: 10.2196/jmir.4476]
74. Weeg C, Schwartz H, Hill S, Merchant R, Arango C, Ungar L. Using Twitter to Measure Public Discussion of Diseases:A Case Study. JMIR Public Health Surveill 2015 Jun 26;1(1):e6 [FREE Full text] [doi: 10.2196/publichealth.3953]
JMIR Public Health Surveill 2015 | vol. 1 | iss. 2 | e21 | p.39http://publichealth.jmir.org/2015/2/e21/(page number not for citation purposes)
Albalawi & SixsmithJMIR PUBLIC HEALTH AND SURVEILLANCE
XSL•FORenderX
75. Cochran A, Kao L, Gusani N, Suliburk J, Nwomeh B. Use of Twitter to document the 2013 Academic Surgical Congress.Journal of Surgical Research 2014;190(1):36-40. [doi: 10.1016/j.jss.2014.02.029]
76. Udovicich C, Barberi A, Perera K. Tweeting the meeting: a comparative analysis of an Australian emergency medicineconference over four years. J Emerg Trauma Shock 2015 [FREE Full text] [doi: 10.4103/0974-2700.161655]
77. Hefler M, Freeman B, Chapman S. Tobacco control advocacy in the age of social media: using Facebook, Twitter andchange. Tob Control 2013 May;22(3):210-214. [doi: 10.1136/tobaccocontrol-2012-050721] [Medline: 23047890]
78. Cohen J. A Coefficient of Agreement for Nominal Scales. Educational and Psychological Measurement 1960 Apr01;20(1):37-46. [doi: 10.1177/001316446002000104]
79. Fleiss L, Bruce L, Myunghee C. The measurement of interrater agreement. In: Statistical Methods for Rates and Proportions.3rd ed. Hoboken, NJ, USA: John Wiley & Sons Inc; 1981:212-236.
80. Betsy Rowden. Union Metrics Help Desk.: Union Metrics; 2015. Understanding The Tracker CSV Export Internet URL:http://help.tweetreach.com/hc/en-us/articles/202899469-Understanding-The-Tracker-CSV-Export [accessed 2015-07-30][WebCite Cache ID 6aOoB3GTu]
81. Union Metrics, TweetReach Blog Internet.: Union Metrics Measuring participant influence through amplification on TwitterURL: https://blog.tweetreach.com/2011/11/measuring-participant-influence-through-amplification-on-twitter/ [accessed2015-07-30] [WebCite Cache ID 6aOpOi61Z]
82. The R Project for Statistical Computing. 2015. URL: http://www.r-project.org/ [WebCite Cache ID 6aOpK5Aso]83. Roberts M, Wanta W, Dzwo T. Agenda Setting and Issue Salience Online. Communication Research 2002 Aug
01;29(4):452-465 [FREE Full text] [doi: 10.1177/0093650202029004004]84. Elder RW, Shults RA, Sleet DA, Nichols JL, Thompson RS, Rajab W, Task Force on Community Preventive Services.
Effectiveness of mass media campaigns for reducing drinking and driving and alcohol-involved crashes: a systematicreview. Am J Prev Med 2004 Jul;27(1):57-65. [doi: 10.1016/j.amepre.2004.03.002] [Medline: 15212776]
85. Heng Kenneth W J, Vasu A. Newspaper media reporting of motor vehicle crashes in Singapore: an opportunity lost forinjury prevention education? Eur J Emerg Med 2010 Jun;17(3):173-176. [doi: 10.1097/MEJ.0b013e328330b40a] [Medline:19704376]
86. Farmer J, Kozel C. Agenda Setting and the Albuquerque Clean Indoor Air Ordinance. American Journal of Health Education2005 Oct;36(5):313-315. [doi: 10.1080/19325037.2005.10608202]
87. Moon S. Attention, Attitude, and Behavior: Second-Level Agenda-Setting Effects as a Mediator of Media Use and PoliticalParticipation. Communication Research 2011 Oct 17;40(5):698-719. [doi: 10.1177/0093650211423021]
88. Mustafaraj E, Finn S, Whitlock C, Metaxas P. Vocal minority versus silent majority: Discovering the opionions of the longtail. : IEEE; 2011 Presented at: In: Privacy, Security, Risk and Trust (PASSAT) and IEEE Third International Conferenceon Social Computing (SocialCom); 9-11 Oct. 2011; Athens, Greece p. 103-110. [doi: 10.1109/PASSAT/SocialCom.2011.188]
89. Rogers E. Diffusion of innovations. New York: Free Press; 1983.90. Lazarsfeld P, Berelson B, Gaudet H. The peoples choice: how the voter makes up his mind in a presidential campaign. In:
Psychological Bulletin. New York: Columbia University Press; 1948.91. Broersma M, Graham T. TWITTER AS A NEWS SOURCE: How Dutch and British newspapers used tweets in their news
coverage, 2007–2011. Journalism Practice 2013 Aug;7(4):446-464. [doi: 10.1080/17512786.2013.802481]92. Tan Y, Weaver D. Agenda-Setting Effects among the Media, the Public, and Congress, 1946-2004. Journalism & Mass
Communication Quarterly 2007 Dec 01;84(4):729-744. [doi: 10.1177/107769900708400405]93. Moran C, Kozel C, Hubbell A. Turning Research into Practice: Key Strategies for Developing a Shared Vision Approach
for Health Education Advocacy. Californian Journal of Health Promotion 2011;9(2):77-84.
Edited by G Eysenbach; submitted 10.08.15; peer-reviewed by C Kozel, S Bhattacharya; comments to author 02.09.15; revised versionreceived 20.09.15; accepted 17.10.15; published 25.11.15.
Please cite as:Albalawi Y, Sixsmith JAgenda Setting for Health Promotion: Exploring an Adapted Model for the Social Media EraJMIR Public Health Surveill 2015;1(2):e21URL: http://publichealth.jmir.org/2015/2/e21/ doi:10.2196/publichealth.5014PMID:27227139
©Yousef Albalawi, Jane Sixsmith. Originally published in JMIR Public Health and Surveillance (http://publichealth.jmir.org),25.11.2015. This is an open-access article distributed under the terms of the Creative Commons Attribution License(http://creativecommons.org/licenses/by/2.0/), which permits unrestricted use, distribution, and reproduction in any medium,provided the original work, first published in JMIR Public Health and Surveillance, is properly cited. The complete bibliographic
JMIR Public Health Surveill 2015 | vol. 1 | iss. 2 | e21 | p.40http://publichealth.jmir.org/2015/2/e21/(page number not for citation purposes)
Albalawi & SixsmithJMIR PUBLIC HEALTH AND SURVEILLANCE
XSL•FORenderX

information, a link to the original publication on http://publichealth.jmir.org, as well as this copyright and license informationmust be included.
JMIR Public Health Surveill 2015 | vol. 1 | iss. 2 | e21 | p.41http://publichealth.jmir.org/2015/2/e21/(page number not for citation purposes)
Albalawi & SixsmithJMIR PUBLIC HEALTH AND SURVEILLANCE
XSL•FORenderX

Original Paper
Identifying Adverse Effects of HIV Drug Treatment and AssociatedSentiments Using Twitter
Cosme Adrover1, PhD; Todd Bodnar1, BSc; Zhuojie Huang1, PhD; Amalio Telenti2*, MD, PhD; Marcel Salathé1*,PhD1Center for Infectious Disease Dynamics, Department of Biology, Penn State University, University Park, PA, United States2J. Craig Venter Institute, La Jolla, CA, United States*these authors contributed equally
Corresponding Author:Marcel Salathé, PhDCenter for Infectious Disease DynamicsDepartment of BiologyPenn State UniversityMSC W-251University Park, PA, 16803United StatesPhone: 1 4083868916Fax: 1 814 863 7590Email: [email protected]
Abstract
Background: Social media platforms are increasingly seen as a source of data on a wide range of health issues. Twitter is ofparticular interest for public health surveillance because of its public nature. However, the very public nature of social mediaplatforms such as Twitter may act as a barrier to public health surveillance, as people may be reluctant to publicly discloseinformation about their health. This is of particular concern in the context of diseases that are associated with a certain degree ofstigma, such as HIV/AIDS.
Objective: The objective of the study is to assess whether adverse effects of HIV drug treatment and associated sentiments canbe determined using publicly available data from social media.
Methods: We describe a combined approach of machine learning and crowdsourced human assessment to identify adverseeffects of HIV drug treatment solely on individual reports posted publicly on Twitter. Starting from a large dataset of 40 milliontweets collected over three years, we identify a very small subset (1642; 0.004%) of individual reports describing personalexperiences with HIV drug treatment.
Results: Despite the small size of the extracted final dataset, the summary representation of adverse effects attributed to specificdrugs, or drug combinations, accurately captures well-recognized toxicities. In addition, the data allowed us to discriminate acrossspecific drug compounds, to identify preferred drugs over time, and to capture novel events such as the availability of preexposureprophylaxis.
Conclusions: The effect of limited data sharing due to the public nature of the data can be partially offset by the large numberof people sharing data in the first place, an observation that may play a key role in digital epidemiology in general.
(JMIR Public Health Surveill 2015;1(2):e7) doi:10.2196/publichealth.4488
KEYWORDS
Twitter; HIV; AIDS; pharmacovigilance; mTurk; mechanical Turk
Introduction
The Sharing of Health Information on TwitterTwitter is a popular microblogging platform where userspublicly share information, including personal thoughts and
emotions. Everyday, hundreds of millions of tweets are postedon Twitter. This offers a large potential source of informationfor public health purposes. The sharing of information aboutpersonal health is now widely recognized to be a broadphenomenon that occurs in almost any field imaginable [1].
JMIR Public Health Surveill 2015 | vol. 1 | iss. 2 | e7 | p.42http://publichealth.jmir.org/2015/2/e7/(page number not for citation purposes)
Adrover et alJMIR PUBLIC HEALTH AND SURVEILLANCE
XSL•FORenderX
Examples include the sharing of vaccination behavior [2], thesharing of marijuana consumption [3], the sharing of weightloss attempts [4], or the sharing of suicidal thoughts [5].Moreover, this large pool of available data can be used toestimate the most common side effects of certain pharmaceuticalproducts [6,7]. In this study, we will focus on identifying humanimmunodeficiency virus (HIV)-infected individuals currentlyundergoing drug treatment, and on their personal experiences,specifically, with regard to drug toxicities.
We chose a specific question that a priori seemed difficult: toidentify infected individuals that would communicate abouttheir HIV status, and more specifically, about their treatment.Drug adverse effects have been a source of concern, both forthe medical establishment, and for HIV-infected individuals,due to their prevalence [8,9], and because treatments have tobe taken for life. There is a general agreement that toxicity canalso affect treatment adherence. Newer agents are increasinglyassociated with lesser rates and severity of adverse drug effects;however, the user community remains highly sensitive to thiscentral aspect of treatment that influences the quality of life.Information and beliefs can spread rapidly, and influential voicesand vehicles of opinion may alter the perception of thecommunity on treatment adequacy.
Filtering Tweets for the StudyThe study that we present is based upon tweets filtered byspecific keywords related to HIV and HIV treatments. Our workbuilds on a growing body of literature that uses combined humanand computational approaches to assess health and diseasedynamics from digital media [2,10]. Our goal was to determineif there are common adverse effects related to a particular HIVtreatment, and to establish overall user sentiment (a positive,neutral, or negative perception) associated with the content ofthe tweet. Through our study, we defined methods to identifypopulations of interest. We used crowdsourcing (AmazonMechanical Turk) to rate tweets to create training samples forour machine learning algorithms. On the analytical side, thesealgorithms were used to identify most of the tweets posted byour identified community (hereafter, referred to as “signal”):users with HIV whose tweets included references to treatments,symptomatic descriptions, opinions, and feelings. The finalfiltering of identified tweets was again obtained throughcrowdsourcing. Despite the limited number of tweets andindividuals that may communicate publicly about HIV treatmentexperiences, we found a surprisingly large proportion of reportsof drug toxicity, a high level of precision on drug-specificeffects, and a general negative perception of treatment. Webelieve that monitoring of social media will be informative forthe field, and broadly applicable to the surveillance of othertherapies with long duration of use, even for those targeted atdiseases that are associated with considerable stigma.
Methods
DatasetFor this study, we purchased 39,988,306 tweets posted betweenSeptember 2010 and August 2013. We purchased the data fromGnip Inc, an official Twitter data reseller, which has recentlybeen acquired by Twitter Inc. These tweets represent the fulland unbiased stream of data during that period of time. A tweetwas included in the dataset if at least one of the followingkeywords was contained within the tweet: Sustiva, Stocrin,Viread, FTC, Ziagen, 3TC, Epivir, Retrovir, Viramune, Edurant,Prezista, Reyataz, Norvir, Kaletra, Isentress, Tivicay, Atripla,Trizivir, Truvada, Combivir, Kivexa, Epzicom, Complera,Stribild, HIV treatment, HIV drug, anti-HIV, triple therapy HIV,or anti HIV. These keywords were chosen in line with the listingof main antiretroviral agents in use [11]. AZT was droppedbecause of its extreme noise to signal ratio (as azt is one of themost used words in Hungarian). For technical reasons, the searchquery had to be limited in the numbers of search terms used.
Processing of TweetsFor each collected tweet, we created a list of all the distincttokens that the tweet contained. If at least one keyword matchedat least one item in the list, we kept that tweet. This step reducedour data sample to about 1.8 million tweets, mainly due to thepresence of compound words such as giftcard, triggered by thekeyword FTC, which represented a large source of noise.Moreover, a subsample of tweets containing the keyword FTCpresented a large bias toward information related to the FederalTrade Commission. We decided to discard this subsample fromthe data.
Hereafter, “signal” denotes our identified tweets posted bypatients, and “noise” denotes tweets about unrelated topics,such as objective sentences concerning new discoveries or recentinformation about HIV in general.
Our statistical sampling analysis (Figure 1 shows this) startedwith loose criteria to reduce the noise in our sample. We usedcomputational algorithms to randomly select different sets oftweets that contained words from potential noisy sources andsets of tweets that did not contain these “noisy” words. Thesesets of tweets were manually annotated by two of the authors(CA and TB) as either noise or signal. In the case of a slightindication of subjectivity, the tweet was annotated as signal. Ifthe differences between the two types of sets (ie, containing ornot containing specific noisy words) were significant in termsof signal content, we discarded tweets from our dataset thatcontained those noisy words (for more details, see below underthe subheading “Identification of Signal Through ConsecutiveFilters”). Although we expected to discard some signal tweetsthrough this cleaning process, it provided robustness to ourprocedure, as it allowed us to increase the percentage of signaltweets in the remaining sample. This higher purity of signalallowed a higher number of crowdsourced signal tweets to definetraining samples.
JMIR Public Health Surveill 2015 | vol. 1 | iss. 2 | e7 | p.43http://publichealth.jmir.org/2015/2/e7/(page number not for citation purposes)
Adrover et alJMIR PUBLIC HEALTH AND SURVEILLANCE
XSL•FORenderX
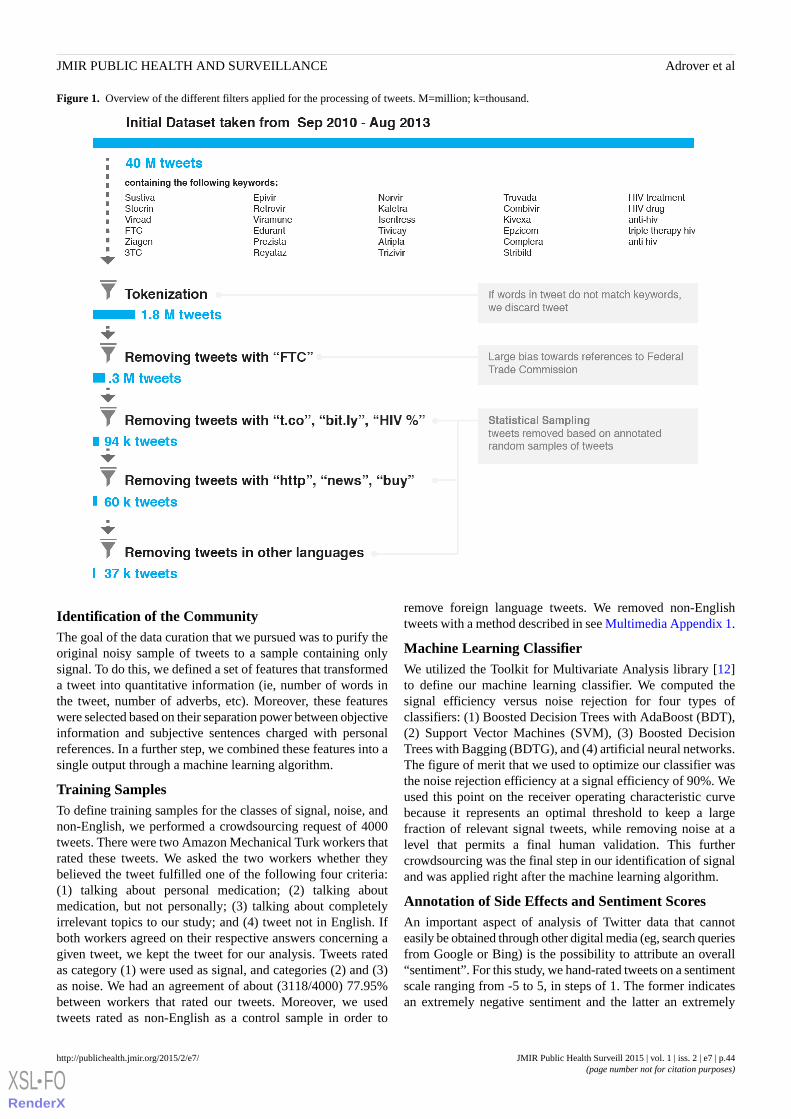
Figure 1. Overview of the different filters applied for the processing of tweets. M=million; k=thousand.
Identification of the CommunityThe goal of the data curation that we pursued was to purify theoriginal noisy sample of tweets to a sample containing onlysignal. To do this, we defined a set of features that transformeda tweet into quantitative information (ie, number of words inthe tweet, number of adverbs, etc). Moreover, these featureswere selected based on their separation power between objectiveinformation and subjective sentences charged with personalreferences. In a further step, we combined these features into asingle output through a machine learning algorithm.
Training SamplesTo define training samples for the classes of signal, noise, andnon-English, we performed a crowdsourcing request of 4000tweets. There were two Amazon Mechanical Turk workers thatrated these tweets. We asked the two workers whether theybelieved the tweet fulfilled one of the following four criteria:(1) talking about personal medication; (2) talking aboutmedication, but not personally; (3) talking about completelyirrelevant topics to our study; and (4) tweet not in English. Ifboth workers agreed on their respective answers concerning agiven tweet, we kept the tweet for our analysis. Tweets ratedas category (1) were used as signal, and categories (2) and (3)as noise. We had an agreement of about (3118/4000) 77.95%between workers that rated our tweets. Moreover, we usedtweets rated as non-English as a control sample in order to
remove foreign language tweets. We removed non-Englishtweets with a method described in see Multimedia Appendix 1.
Machine Learning ClassifierWe utilized the Toolkit for Multivariate Analysis library [12]to define our machine learning classifier. We computed thesignal efficiency versus noise rejection for four types ofclassifiers: (1) Boosted Decision Trees with AdaBoost (BDT),(2) Support Vector Machines (SVM), (3) Boosted DecisionTrees with Bagging (BDTG), and (4) artificial neural networks.The figure of merit that we used to optimize our classifier wasthe noise rejection efficiency at a signal efficiency of 90%. Weused this point on the receiver operating characteristic curvebecause it represents an optimal threshold to keep a largefraction of relevant signal tweets, while removing noise at alevel that permits a final human validation. This furthercrowdsourcing was the final step in our identification of signaland was applied right after the machine learning algorithm.
Annotation of Side Effects and Sentiment ScoresAn important aspect of analysis of Twitter data that cannoteasily be obtained through other digital media (eg, search queriesfrom Google or Bing) is the possibility to attribute an overall“sentiment”. For this study, we hand-rated tweets on a sentimentscale ranging from -5 to 5, in steps of 1. The former indicatesan extremely negative sentiment and the latter an extremely
JMIR Public Health Surveill 2015 | vol. 1 | iss. 2 | e7 | p.44http://publichealth.jmir.org/2015/2/e7/(page number not for citation purposes)
Adrover et alJMIR PUBLIC HEALTH AND SURVEILLANCE
XSL•FORenderX

positive sentiment. The following tweets are examples from thefinal dataset.
5: Hey guys I m officially undetectable!!!! Take that#hiv! CD4 went up bout 150 pts also! yaya!! #atripla
4: Whoever invented Atripla (and it s component parts- it s three drugs in one) are geniuses. I love you.
3: and more exciting and totally separate from thisweekend, I am moving drug combinations fromAtripla.
2: I hear Truvada makes you fat like a Tellytubby. Iam soooooo excited to finally be able to look like myhero, Tinky Winky!
1: @TheBodyDotCom Taking Good food #nutritionas part of myother side effects.
0: So,you better all get started taking Truvada (likeI already do). It s OK, coz the FDA say so. hmmmm
-1: #Atripla vs #HIV These meds seem to be gettingshort andwas still flying.
-2: Atripla is a B**CH when you have to be up earlyin thefor 6 hours!
-3: Oh boy here goes that feeling I hate.... #Atripla
-4: I think I ll pass on the Atripla again today though.I feel weak but my future is so bleak I just want towaste away.
(There were no tweets that we felt met out criteria of anextremely negative -5 rating.) Our measure of sentiment, Ψ, isthe average of the sentiments of all tweets in a given timewindow, after having assigned a systematic uncertainty of 1 toeach rating, which lead to a total uncertainty in the average of1 / √ N. The sample of pure signal tweets was annotated by oneof the authors (CA). Side effects were transcribed with noprevious knowledge of drug toxicities.
Identification of Signal Through Consecutive FiltersAfter we applied the cleaning process described above, ourdataset contained a larger fraction of possible signal tweets. Inthis section, we detail the steps taken to reach a sample thatcontained only signal tweets (Figure 1).
In a first step, we selected three random samples of 500 tweetscontaining tokens t.co, bit.ly, and starting with the term HIV.In Twitter, the tokens t.co and bit.ly are used as part ofhyperlinks. We selected also one random sample of 500 tweetsnot containing these words. For the three filters, we found 0, 1,and 1 possible signal tweets in the first samples, respectively.There were 24 possible signal tweets that were found in the lastsample where the tokens t.co, bit.ly, and starting with HIV wereexcluded. From this, we derived that 7.4 ± 2.7 possible signaltweets were expected to be found in 500 tweets taken from theoriginal 316,081. The subsample with t.co, bit.ly, and startingwith HIV contained a very low fraction of possible signal tweets,and was discarded from the dataset. Our findings indicate thatthese tokens appear within tweets addressing an objective idea.
In a second step, we checked tweets containing http, news, orbuy. We selected three random samples of 140 tweets and foundzero tweets in each of the three cases. As we found 24 possible
signal tweets in a total of 500 tweets, we expected 6.7 ± 2.6possible signal tweets in 140 tweets, assuming a Poissondistribution. We computed the probability to discard a possiblesignal tweet if we removed tweets containing http, news, or buy
to be 4 × 10⁻⁶. After we discarded tweets containing http, news,or buy, our dataset was reduced substantially.
In the final step, we separated two samples of 150 tweetscontaining free, buy, de, e, za, que, en, lek, la, obat, da, majka,molim, hitno, mil, or africa. These tokens were selected on thebasis of forming part of foreign dictionaries, belonging toretailing companies selling their products, or seemingly formingpart of news. We found zero possible signal tweets in both cases.Then, we estimated that the probability of losing possible signal
tweets was less than 5 × 10⁻⁶, if we removed tweets containingat least one of this large set of words. Following theaforementioned processing of tweets, the sample was furtherreduced to 37,337 tweets, or about 0.933% of the original samplesize of 40 million tweets. Figure 1 presents a visualization ofthe various filters applied to our dataset in the cleaning process.
To identify tweets posted by our community of interest, wecontinued to filter the sample of 37,337 tweets. An SVMclassifier, trained using the variables (see Multimedia Appendix1) personalcount, tagnoun, sis noise, sis signal, bigrams noise,is english, common noise, common signal, and ncharacters,allowed to reduce the noise of the aforementioned sample by(481/603) 79.8%, while keeping (26/30) 87% of the signaltweets (see Multimedia Appendix 1, Figure S1). We wereconfident with the performances of our classifier, as the resultsobtained using a different testing (cross-check) sample agreewithin the statistical uncertainties. The classifier used wastrained using 603 noise and 49 signal tweets, respectively. Theperformances of this classifier were tested and then validatedusing two different sample sets that contained each 603 noiseand 30 signal tweets, respectively.
The output of our classifier is a real number between 0 and 1.Higher values indicate higher probability of being signal. Inorder to estimate the threshold to apply to our sample, we usedthe annotated signal tweets and computed the 90% signalefficiency threshold to be 0.45. Therefore, we parsed our entiresample of tweets through our classifier and kept only thosetweets with classifier outputs larger than 0.45. As a result ofthis filtering, our remaining sample was reduced to 5443 tweetsthat we sent for crowdsourcing rating. Finally, aftercrowdsourcing, our pure sample of signal contained 1642annotated tweets.
Results
Analysis of the Identified CommunityThe selection described above allowed the identification of usersthat tweet about their daily lives in the context of HIV. Therewere 512 unique users that posted the tweets identified as signal.We identified 247/512 (48.2%) male users, 83/512 (16.2%)female, and 182/512 (35.5%) that were unidentified gender.Gender was annotated manually either by first name (ifconclusive) or by self-reported identification (if available).About half of users also identified their location. Half of these
JMIR Public Health Surveill 2015 | vol. 1 | iss. 2 | e7 | p.45http://publichealth.jmir.org/2015/2/e7/(page number not for citation purposes)
Adrover et alJMIR PUBLIC HEALTH AND SURVEILLANCE
XSL•FORenderX
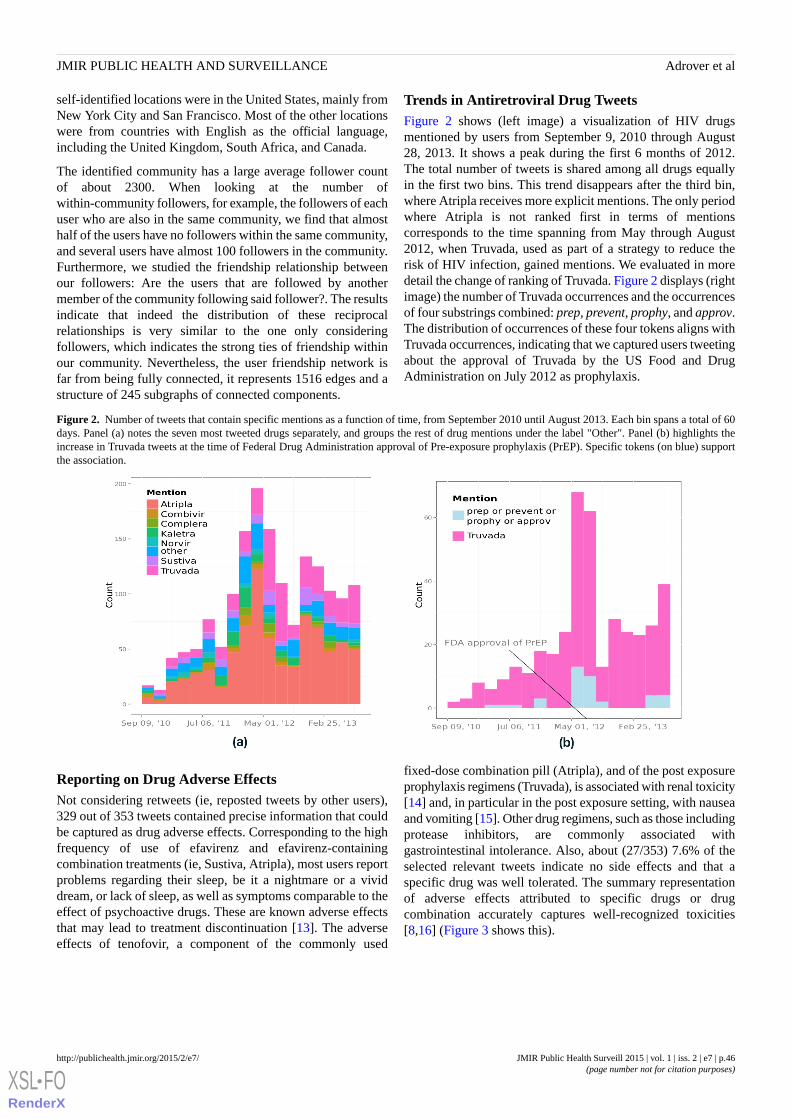
self-identified locations were in the United States, mainly fromNew York City and San Francisco. Most of the other locationswere from countries with English as the official language,including the United Kingdom, South Africa, and Canada.
The identified community has a large average follower countof about 2300. When looking at the number ofwithin-community followers, for example, the followers of eachuser who are also in the same community, we find that almosthalf of the users have no followers within the same community,and several users have almost 100 followers in the community.Furthermore, we studied the friendship relationship betweenour followers: Are the users that are followed by anothermember of the community following said follower?. The resultsindicate that indeed the distribution of these reciprocalrelationships is very similar to the one only consideringfollowers, which indicates the strong ties of friendship withinour community. Nevertheless, the user friendship network isfar from being fully connected, it represents 1516 edges and astructure of 245 subgraphs of connected components.
Trends in Antiretroviral Drug TweetsFigure 2 shows (left image) a visualization of HIV drugsmentioned by users from September 9, 2010 through August28, 2013. It shows a peak during the first 6 months of 2012.The total number of tweets is shared among all drugs equallyin the first two bins. This trend disappears after the third bin,where Atripla receives more explicit mentions. The only periodwhere Atripla is not ranked first in terms of mentionscorresponds to the time spanning from May through August2012, when Truvada, used as part of a strategy to reduce therisk of HIV infection, gained mentions. We evaluated in moredetail the change of ranking of Truvada. Figure 2 displays (rightimage) the number of Truvada occurrences and the occurrencesof four substrings combined: prep, prevent, prophy, and approv.The distribution of occurrences of these four tokens aligns withTruvada occurrences, indicating that we captured users tweetingabout the approval of Truvada by the US Food and DrugAdministration on July 2012 as prophylaxis.
Figure 2. Number of tweets that contain specific mentions as a function of time, from September 2010 until August 2013. Each bin spans a total of 60days. Panel (a) notes the seven most tweeted drugs separately, and groups the rest of drug mentions under the label "Other". Panel (b) highlights theincrease in Truvada tweets at the time of Federal Drug Administration approval of Pre-exposure prophylaxis (PrEP). Specific tokens (on blue) supportthe association.
Reporting on Drug Adverse EffectsNot considering retweets (ie, reposted tweets by other users),329 out of 353 tweets contained precise information that couldbe captured as drug adverse effects. Corresponding to the highfrequency of use of efavirenz and efavirenz-containingcombination treatments (ie, Sustiva, Atripla), most users reportproblems regarding their sleep, be it a nightmare or a vividdream, or lack of sleep, as well as symptoms comparable to theeffect of psychoactive drugs. These are known adverse effectsthat may lead to treatment discontinuation [13]. The adverseeffects of tenofovir, a component of the commonly used
fixed-dose combination pill (Atripla), and of the post exposureprophylaxis regimens (Truvada), is associated with renal toxicity[14] and, in particular in the post exposure setting, with nauseaand vomiting [15]. Other drug regimens, such as those includingprotease inhibitors, are commonly associated withgastrointestinal intolerance. Also, about (27/353) 7.6% of theselected relevant tweets indicate no side effects and that aspecific drug was well tolerated. The summary representationof adverse effects attributed to specific drugs or drugcombination accurately captures well-recognized toxicities[8,16] (Figure 3 shows this).
JMIR Public Health Surveill 2015 | vol. 1 | iss. 2 | e7 | p.46http://publichealth.jmir.org/2015/2/e7/(page number not for citation purposes)
Adrover et alJMIR PUBLIC HEALTH AND SURVEILLANCE
XSL•FORenderX
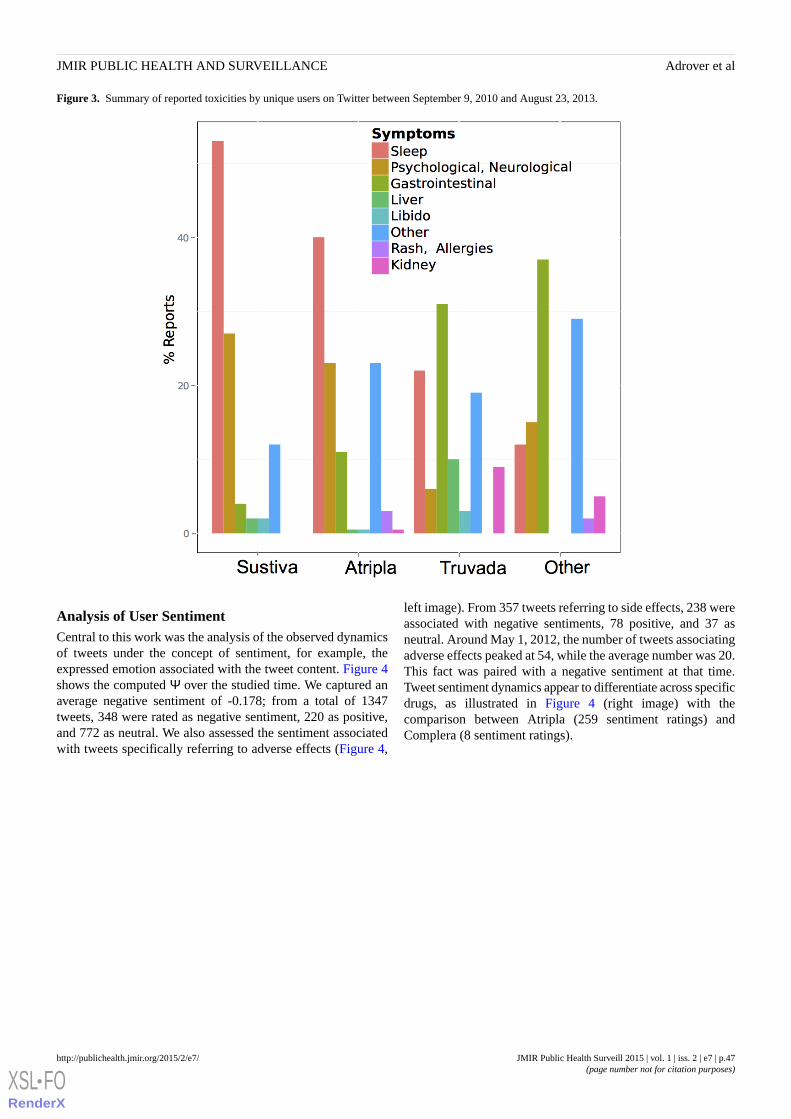
Figure 3. Summary of reported toxicities by unique users on Twitter between September 9, 2010 and August 23, 2013.
Analysis of User SentimentCentral to this work was the analysis of the observed dynamicsof tweets under the concept of sentiment, for example, theexpressed emotion associated with the tweet content. Figure 4shows the computed Ψ over the studied time. We captured anaverage negative sentiment of -0.178; from a total of 1347tweets, 348 were rated as negative sentiment, 220 as positive,and 772 as neutral. We also assessed the sentiment associatedwith tweets specifically referring to adverse effects (Figure 4,
left image). From 357 tweets referring to side effects, 238 wereassociated with negative sentiments, 78 positive, and 37 asneutral. Around May 1, 2012, the number of tweets associatingadverse effects peaked at 54, while the average number was 20.This fact was paired with a negative sentiment at that time.Tweet sentiment dynamics appear to differentiate across specificdrugs, as illustrated in Figure 4 (right image) with thecomparison between Atripla (259 sentiment ratings) andComplera (8 sentiment ratings).
JMIR Public Health Surveill 2015 | vol. 1 | iss. 2 | e7 | p.47http://publichealth.jmir.org/2015/2/e7/(page number not for citation purposes)
Adrover et alJMIR PUBLIC HEALTH AND SURVEILLANCE
XSL•FORenderX

Figure 4. Sentiment score Ψ as a function of time. Panel (a) shows sentiment distributions obtained by considering all tweets and tweets with referencesto side effects, respectively. Panel (b) depicts sentiment distributions for tweets referring to Atripla and Complera, respectively. The uncertainties areestimated as referred in the Methods section.
Discussion
Using Social Media Data for Public HealthThere has been increasing interest on the use of social mediadata for public health and medicine. Digital epidemiology [1,17]utilizes data from sources such as search engines (Google, Bing,etc), public Internet resources such as Wikipedia [18], and socialonline networks to track the dynamics of health and disease.Specifically, data from Twitter has been used for the analysisof influenza epidemics [19,20] and influenza vaccine sentiments.More recently, there has been increasing attention to thepotential of Internet-based analytics for post marketingassessment of drug toxicity [2,6]. Analysis data from searchengines can reconstruct known toxicities based on users queries.Importantly, pharmacovigilance using search query data canexpand the spectrum of adverse effects for a given drug or druginteraction on the basis of “guilt by association” [21].
There is little scientific experience in the analysis and use ofsocial media data for HIV. This contrasts with the clear interestthat this approach could have for the understanding of globalor local epidemiology, for social behavioral studies, and forresearch on prevention. A study by Young et al [22] served toexplore social media for identification of HIV risk throughtweets. From more than 550 million tweets, they extracted 9800geolocated tweets that mapped to areas of high HIV prevalence.On the basis of their study, it has been suggested that an earlywarning indicator for HIV incidence could emerge by combiningHIV prevalence and Twitter data [23].
We aimed here to conduct a first study, to our knowledge, onthe possibility that HIV-infected individuals would tweet abouttheir disease, and more specifically, about their experience withdrug treatment. It is probable that the specific analysis of drugtoxicity, and in particular the possible identification of expandedspectrum of adverse effects, could have been more efficient andsuccessful through the study of queries in search engines suchas Google or Bing. However, exploring these questions via
analysis of Twitter data offered two unique features: (1) thepossibility to capture the emotional context of the tweet, and(2) the estimate of the number of individuals (followers onTwitter) that could be influenced by the content of those tweets.
Extracting Information From TweetsExtracting information from tweets requires a significantinvestment in filtering strategies to separate signal from noise.We placed particular attention on removing tweets that werenot written by the identified population (ie, the community ofinfected individuals). We also went through a number ofvalidation steps that included crowdsourcing and humanintervention to assure the validity of filters and supportidentification of toxicities and hand-rating of sentiments. Afterapplying data cleaning, machine learning, and human rating toan initial dataset of 40 million tweets, we identified 1642 tweetsand 512 unique users disclosing personal information in thecontext of HIV. Although these numbers are not large,individuals that do tweet about their HIV drugs are heavilyfollowed on Twitter, with an average number of followers ofalmost 2300. Analysis of the target community also revealedstrong ties of friendship. This sizable landscape of contacts andpossible influence becomes particularly relevant when weexamined the sentiment associated with their treatment, as thoseperceptions can spread broadly to influence the community. Asexpected, relevant hubs were cities like New York and SanFrancisco.
The interest of Twitter and of social online networks rests onthe fact that information has a personal character that can becaptured as “sentiment”. Tweets can be tagged as expressing apositive, negative, or neutral sentiment. About (137/531) 25.8%of tweets on drugs were scored as “negative”. Up to (424/1491)28.43% of the tweets concerned adverse drug effects, and(281/424) 66.2% of those were scored as negative. It was clearfrom the data that the concerns expressed in those tweets wereaccurate as to the nature of the toxicities associated withdifferent components of the anti-HIV combination treatment.
JMIR Public Health Surveill 2015 | vol. 1 | iss. 2 | e7 | p.48http://publichealth.jmir.org/2015/2/e7/(page number not for citation purposes)
Adrover et alJMIR PUBLIC HEALTH AND SURVEILLANCE
XSL•FORenderX

For example, the description of adverse effects ofefavirenz-containing drugs (Sustiva, Atripla) reconstructswell-established patterns of the neuropsychological toxicity ofthis compound [8]. The analysis also allowed capturing the ratesof reporting, and the associated sentiment in time among thosethat described side effects. These analyses discriminated acrossdrugs in terms of general acceptance (negative vsneutral-positive sentiments) over time.
The analysis also identified the response of the community tounique events. In Spring 2012, we observed a peak of tweetingabout Truvada, at the time that this drug was approved by theFederal Drug Administration for use as post exposureprophylaxis. Although increased media attention would resultin increased Twitter communication, we observed thatincreasingly negative sentiment scores accompanied the increasein tweets, including for tweets referring to adverse effects. Thisunderscores the interest for public health stakeholders promotingnew preventive measurements to track these potentiallyinfluential signals from online social networks.
The limits of the study are derived from the low numbers ofindividuals actually reporting on HIV drugs through Twitter.However, as discussed above, the reporting of toxicities isaccurate in regards of what is known about those drugs.Different also from search engines, where individuals areactively searching for information possibly related to newadverse events, the content of tweets may simply reflect the
awareness of symptoms and signs that have already beenannounced by health care professionals or in Web resources.The reporting may also reflect preconceived notions of sharedbeliefs from the community. This observation is in line withthe work of Freifeld et al [6] that analyzed 4401 tweets ofpotential adverse events to 23 medical products and found ar=0.75 correlation with consumer-reported Federal DrugAdministration Adverse Event Reporting System reports at theSystem Organ Class level. However, whatever is reported, itindeed reflects on contemporary sentiments among users andtheir followers. Moreover, previous studies using Twitter werelimited by only accessing a small fraction of the tweets. Incontrast, we acquired from a specialist service all tweetscontaining the keywords for the study interval, and we thereforehave a full representation of the data for the period of the study.There is also increasing skepticism regarding the use of onlinesocial media data as the sole source of information. There hasbeen considerable debate on the recent failure of Google Flu toaccurately match influenza trends as compared with the sentineldata from the US Center for Disease Control and Prevention[24]. We believe that our approach that combines automatedfilters, crowdsourcing, machine learning, and extensive manualvalidation and scoring may bring more reliable results, even ifat the cost of lesser automation. The approach would apply andbe a useful addition to real time surveillance of other therapeuticinterventions at the population level.
AcknowledgmentsMS gratefully acknowledges the National Institutes of Health Research and Policy for Infectious Disease Dynamics support. ATreceived support from the Santos Suarez Foundation for this work.
Conflicts of InterestNone declared.
Multimedia Appendix 1Method used to remove non-English tweets.
[PDF File (Adobe PDF File), 176KB - publichealth_v1i2e7_app1.pdf ]
References1. Salathé M, Bengtsson L, Bodnar TJ, Brewer DD, Brownstein JS, Buckee C, et al. Digital epidemiology. PLoS Comput
Biol 2012;8(7):e1002616 [FREE Full text] [doi: 10.1371/journal.pcbi.1002616] [Medline: 22844241]2. Salathé M, Khandelwal S. Assessing vaccination sentiments with online social media: Implications for infectious disease
dynamics and control. PLoS Comput Biol 2011 Oct;7(10):e1002199 [FREE Full text] [doi: 10.1371/journal.pcbi.1002199][Medline: 22022249]
3. Cavazos-Rehg P, Krauss M, Grucza R, Bierut L. Characterizing the followers and tweets of a marijuana-focused Twitterhandle. J Med Internet Res 2014;16(6):e157 [FREE Full text] [doi: 10.2196/jmir.3247] [Medline: 24974893]
4. Pagoto S, Schneider KL, Evans M, Waring ME, Appelhans B, Busch AM, et al. Tweeting it off: Characteristics of adultswho tweet about a weight loss attempt. J Am Med Inform Assoc 2014;21(6):1032-1037. [doi: 10.1136/amiajnl-2014-002652][Medline: 24928175]
5. Jashinsky J, Burton SH, Hanson CL, West J, Giraud-Carrier C, Barnes MD, et al. Tracking suicide risk factors throughTwitter in the US. Crisis 2014;35(1):51-59. [doi: 10.1027/0227-5910/a000234] [Medline: 24121153]
6. Freifeld C, Brownstein J, Menone C, Bao W, Filice R, Kass-Hout T, et al. Digital drug safety surveillance: Monitoringpharmaceutical products in twitter. Drug Saf 2014 May;37(5):343-350 [FREE Full text] [doi: 10.1007/s40264-014-0155-x][Medline: 24777653]
JMIR Public Health Surveill 2015 | vol. 1 | iss. 2 | e7 | p.49http://publichealth.jmir.org/2015/2/e7/(page number not for citation purposes)
Adrover et alJMIR PUBLIC HEALTH AND SURVEILLANCE
XSL•FORenderX

7. Sarker A, Ginn R, Nikfarjam A, O'Connor K, Smith K, Jayaraman S, et al. Utilizing social media data for pharmacovigilance:A review. J Biomed Inform 2015 Apr;54:202-212 [FREE Full text] [doi: 10.1016/j.jbi.2015.02.004] [Medline: 25720841]
8. Fellay J, Boubaker K, Ledergerber B, Bernasconi E, Furrer H, Battegay M, Swiss HIV Cohort Study. Prevalence of adverseevents associated with potent antiretroviral treatment: Swiss HIV Cohort Study. Lancet 2001 Oct 20;358(9290):1322-1327.[Medline: 11684213]
9. Keiser O, Fellay J, Opravil M, Hirsch H, Hirschel B, Bernasconi E, Swiss HIV Cohort Study. Adverse events to antiretroviralsin the Swiss HIV Cohort Study: Effect on mortality and treatment modification. Antivir Ther 2007;12(8):1157-1164.[Medline: 18240856]
10. Sadilek A, Brennan S, Kautz H, Silenzio V. nEmesis: Which restaurants should you avoid today?. Palm Springs, California;2013. URL: http://www.cs.rochester.edu/u/kautz/papers/Sadilek-Brennan-Kautz-Silenzio_nEmesis_HCOMP-13.pdf[accessed 2015-07-14] [WebCite Cache ID 6a1tfZoUa]
11. Günthard HF, Aberg JA, Eron JJ, Hoy JF, Telenti A, Benson CA, International Antiviral Society-USA Panel. Antiretroviraltreatment of adult HIV infection: 2014 recommendations of the International Antiviral Society-USA Panel. JAMA2014;312(4):410-425. [doi: 10.1001/jama.2014.8722] [Medline: 25038359]
12. Hoecker A, Speckmayer P, Stelzer J, Therhaag J, Toerne VE. TMVA - Toolkit for Multivariate Data Analysis. 2007. TMVA- Toolkit for multivariate data analysis URL: http://arxiv.org/abs/physics/0703039 [accessed 2015-07-01] [WebCite CacheID 6ZhC3T3yO]
13. Ford N, Shubber Z, Pozniak A, Vitoria M, Doherty M, Kirby C, et al. Comparative safety and neuropsychiatric adverseevents associated with efavirenz use in first-line antiretroviral therapy: A systematic review and meta-analysis of randomizedtrials. J Acquir Immune Defic Syndr 2015 Aug 1;69(4):422-429. [doi: 10.1097/QAI.0000000000000606] [Medline:25850607]
14. Ryom L, Mocroft A, Lundgren JD. Antiretroviral therapy, immune suppression and renal impairment in HIV-positivepersons. Curr Opin HIV AIDS 2014 Jan;9(1):41-47. [doi: 10.1097/COH.0000000000000023] [Medline: 24225381]
15. Coutinho B, Prasad R. Emtricitabine/tenofovir (Truvada) for HIV prophylaxis. Am Fam Physician 2013 Oct 15;88(8):535-540[FREE Full text] [Medline: 24364575]
16. Fagard C, Le BM, Günthard H, Hirsch HH, Egger M, Vernazza P, Swiss HIV Cohort Study. A controlled trial of granulocytemacrophage-colony stimulating factor during interruption of HAART. AIDS 2003 Jul 4;17(10):1487-1492. [doi:10.1097/01.aids.0000060396.18106.5b] [Medline: 12824786]
17. Salathé M, Freifeld CC, Mekaru SR, Tomasulo AF, Brownstein JS. Influenza A (H7N9) and the importance of digitalepidemiology. N Engl J Med 2013 Aug 1;369(5):401-404. [doi: 10.1056/NEJMp1307752] [Medline: 23822655]
18. McIver DJ, Brownstein JS. Wikipedia usage estimates prevalence of influenza-like illness in the United States in nearreal-time. PLoS Comput Biol 2014 Apr;10(4):e1003581 [FREE Full text] [doi: 10.1371/journal.pcbi.1003581] [Medline:24743682]
19. Chew C, Eysenbach G. Pandemics in the age of Twitter: Content analysis of Tweets during the 2009 H1N1 outbreak. PLoSOne 2010;5(11):e14118 [FREE Full text] [doi: 10.1371/journal.pone.0014118] [Medline: 21124761]
20. Kim E, Seok JH, Oh JS, Lee HW, Kim KH. Use of hangeul twitter to track and predict human influenza infection. PLoSOne 2013;8(7):e69305 [FREE Full text] [doi: 10.1371/journal.pone.0069305] [Medline: 23894447]
21. White R, Tatonetti N, Shah N, Altman R, Horvitz E. Web-scale pharmacovigilance: Listening to signals from the crowd.J Am Med Inform Assoc 2013 May 1;20(3):404-408 [FREE Full text] [doi: 10.1136/amiajnl-2012-001482] [Medline:23467469]
22. Young SD, Rivers C, Lewis B. Methods of using real-time social media technologies for detection and remote monitoringof HIV outcomes. Prev Med 2014 Jun;63:112-115 [FREE Full text] [doi: 10.1016/j.ypmed.2014.01.024] [Medline: 24513169]
23. Stoové MA, Pedrana AE. Making the most of a brave new world: Opportunities and considerations for using Twitter as apublic health monitoring tool. Prev Med 2014 Jun;63:109-111. [doi: 10.1016/j.ypmed.2014.03.008] [Medline: 24632229]
24. Lazer D, Kennedy R, King G, Vespignani A. Big data. The parable of Google Flu: Traps in big data analysis. Science 2014Mar 14;343(6176):1203-1205. [doi: 10.1126/science.1248506] [Medline: 24626916]
AbbreviationsBDT: Boosted Decision Trees with AdaBoostHIV: human immunodeficiency virusSVM: Support Vector Machines
JMIR Public Health Surveill 2015 | vol. 1 | iss. 2 | e7 | p.50http://publichealth.jmir.org/2015/2/e7/(page number not for citation purposes)
Adrover et alJMIR PUBLIC HEALTH AND SURVEILLANCE
XSL•FORenderX

Edited by G Eysenbach; submitted 31.03.15; peer-reviewed by C Freifeld, N Zhang; comments to author 17.04.15; revised versionreceived 29.04.15; accepted 30.05.15; published 27.07.15.
Please cite as:Adrover C, Bodnar T, Huang Z, Telenti A, Salathé MIdentifying Adverse Effects of HIV Drug Treatment and Associated Sentiments Using TwitterJMIR Public Health Surveill 2015;1(2):e7URL: http://publichealth.jmir.org/2015/2/e7/ doi:10.2196/publichealth.4488PMID:27227141
©Cosme Adrover, Todd Bodnar, Zhuojie Huang, Amalio Telenti, Marcel Salathé. Originally published in JMIR Public Healthand Surveillance (http://publichealth.jmir.org), 27.07.2015. This is an open-access article distributed under the terms of theCreative Commons Attribution License (http://creativecommons.org/licenses/by/2.0/), which permits unrestricted use, distribution,and reproduction in any medium, provided the original work, first published in JMIR Public Health and Surveillance, is properlycited. The complete bibliographic information, a link to the original publication on http://publichealth.jmir.org, as well as thiscopyright and license information must be included.
JMIR Public Health Surveill 2015 | vol. 1 | iss. 2 | e7 | p.51http://publichealth.jmir.org/2015/2/e7/(page number not for citation purposes)
Adrover et alJMIR PUBLIC HEALTH AND SURVEILLANCE
XSL•FORenderX
Original Paper
Electronic Cigarette Marketing Online: a Multi-Site, Multi-ProductComparison
Kar-Hai Chu1, PhD; Anupreet K Sidhu1, MA; Thomas W Valente1, PhDUniversity of Southern California, Department of Preventive Medicine, Los Angeles, CA, United States
Corresponding Author:Kar-Hai Chu, PhDUniversity of Southern CaliforniaDepartment of Preventive Medicine2001 North Soto Street, 3rd FloorLos Angeles, CA, 90032United StatesPhone: 1 323 442 7244Fax: 1 323 442 8201Email: [email protected]
Abstract
Background: Electronic cigarette awareness and use has been increasing rapidly. E-cigarette brands have utilized socialnetworking sites to promote their products, as the growth of the e-cigarette industry has paralleled that of Web 2.0. These onlineplatforms are cost-effective and have unique technological features and user demographics that can be attractive for selectivemarketing. The popularity of multiple sites also poses a risk of exposure to social networks where e-cigarette brands might nothave a presence.
Objective: To examine the marketing strategies of leading e-cigarette brands on multiple social networking sites, and to identifyhow affordances of the digital media are used to their advantage. Secondary analyses include determining if any brands arebenefitting from site demographics, and exploring cross-site diffusion of marketing content through multi-site users.
Methods: We collected data from two e-cigarette brands from four social networking sites over approximately 2.5 years. Contentanalysis is used to search for themes, population targeting, marketing strategies, and cross-site spread of messages.
Results: Twitter appeared to be the most frequently used social networking site for interacting directly with product users.Facebook supported informational broadcasts, such as announcements regarding political legislation. E-cigarette brands alsodiffered in their approaches to their users, from informal conversations to direct product marketing.
Conclusions: E-cigarette makers use different strategies to market their product and engage their users. There was no evidenceof direct targeting of vulnerable populations, but the affordances of the different sites are exploited to best broadcast context-specificmessages. We developed a viable method to study cross-site diffusion, although additional refinement is needed to account forhow different types of digital media are used.
(JMIR Public Health Surveill 2015;1(2):e11) doi:10.2196/publichealth.4777
KEYWORDS
electronic cigarettes; content analysis; social networking sites; marketing
Introduction
Electronic cigarettes, also known as e-cigs or e-cigarettes, arebattery-operated products that deliver nicotine by turning it intoan aerosol that is inhaled by the user [1]. Today, awareness ofe-cigarettes is high [2], and their use continues to grow [3,4].With declining cigarette sales and the potential for increasingFood and Drug Administration (FDA) regulation, there is a risein noncombustible tobacco products, with e-cigarette advertising
being the most extensively circulated [5]. E-cigarette brandshave been using widespread advertising campaigns, spending$541.7 million in 2011 [6].
The Internet represents a medium that offers an opportunity fore-cigarette brands to expand their audience reach. However,this unregulated domain can also be a cause for concern. Severalstudies have suggested that e-cigarettes can be a viable methodto quit smoking [7,8], although Grana and Ling [9] found thathealth claims and smoking-cessation messages on many
JMIR Public Health Surveill 2015 | vol. 1 | iss. 2 | e11 | p.52http://publichealth.jmir.org/2015/2/e11/(page number not for citation purposes)
Chu et alJMIR PUBLIC HEALTH AND SURVEILLANCE
XSL•FORenderX
websites, aided by images of doctors or celebrities, areunsupported by scientific evidence. Misinformation can beeasily spread in many arenas online, and social networkingprovides a convenient and cost-effective venue for e-cigarettepromotions of non-scientifically supported claims.
There are countless social networking sites with uniquetechnological features and user demographics that can beattractive for selective marketing. The growth of e-cigarettesoccurred as social media and other Web 2.0 sites became animportant platform for commercial advertising. It is no surprisethat e-cigarette brands, especially smaller ones that have noaffiliation with larger tobacco companies and no sizableadvertising budgets, took to social media to market theirproducts. Recent e-cigarette studies have typically examinedproduct health effects (eg, [10,11]). Few studies, however, haveexamined e-cigarette marketing within social media. In oneexample, Huang et al [12] found that e-cigarette tweets weremostly commercial (90%), and were posted by a small groupof active accounts. They concluded that Twitter served as animportant platform for e-cigarette marketing.
Social networking sites such as Facebook or Twitter areinherently built to support social networks. Whether postingmessages to a Facebook wall or sending updates on Twitter,interactions between users are the foundation of all activity onthese sites. The distinction in how users of different sites interactdepends on the digital media affordances the sites focus on.Affordances are the actionable relationships between an actorand an aspect of the environment that offer the actor the potentialfor action [13]. This concept has been extended tohuman-computer interactions and applied to product designs,such as graphical user interfaces [14]. The concept ofaffordances is especially important as new technologies continueto be developed.
Web 2.0 tools provide an abundance of ways to interact, andsocial networking sites use these tools to great advantage.Kietzmann and colleagues’well-cited work [15] describes sevenfunctional blocks of social networking sites: identity,conversations, sharing (of content), presence, relationships,reputation, and groups. Each site varies in the degree to whichthey use or promote these functions. For example, everyInstagram post has a picture, and sharing is at the core of thesite. Twitter, on the other hand, allows users to micro-blog byproducing 140 character tweets that promote sharing andconversations. Facebook and Google+ combine various digitalmedia, wrapped together to create a general social networkingplatform, focusing on relationships and identity. Indeed,Facebook friends are not the same as Instagram friends, andspreading messages on Twitter is different than doing the sameon Google+. These differences in digital media afford uniqueways by which users on these sites interact, and can result indifferent kinds of relationships being developed [16].
Social networking sites also have varying user demographics.A Pew 2013 report on social media [17] revealed that Facebookhas an increasingly older population (users 65+), Twitter hashigh adoption by African Americans, women are 4 times morelikely than men to be Pinterest users, Instagram is also popularamong women, and LinkedIn is popular for higher-income
households. Research using different methods of collectingdemographic data, such as connecting self-reported user nameswith ethnicity based on US Census data, report similar resultsfor Twitter [18] and Facebook [19]. There are other demographictrends, but it is clear that each social networking site hasdifferent levels of usage and appeal for certain demographics.These variations in social networking site demographics allowmarketing companies to customize their advertisements andpossibly target sub-populations based on their social networkingtendencies.
The unique affordances and demographics of each socialnetworking site, especially how they are used by onlinemarketers, is the focus of this paper. In this study, we explorethe possibility of e-cigarette brands potentially taking advantageof social networking site demographics and targeting vulnerablesub-populations, such as underage youth. We will also see ifand how e-cigarette brands utilize different digital media intheir marketing strategies. As such, we ask two primary researchquestions: (1) Are e-cigarette brands exploiting the affordancesof each site in their marketing? And (2) Are e-cigarette brandstargeting sub-populations (eg, women, teenagers) by takingadvantage of the demographic differences of different socialnetworking sites?
We also study how different social networking sites potentiallyinteract with one another, for example when posting a tweet toone’s Facebook wall. To our knowledge, no studies haveexamined the diffusion of information across multiple socialnetworking sites. However, Pew’s latest (2014) survey indicatesthat 52% of online adults use two or more social media sites,rising from 42% in 2013 [20]. Given our plans to collectinformation across multiple social networking sites, we are alsointerested in determining if viable methods can be developedto identify how users and information might cross the boundariesbetween different platforms. There are many implications inthis line of study, including diffusion of messages, how differenttechnologies can change message content, and roles that peoplemight serve in bridging social networks from different sites, toname a few. This leads to our final exploratory researchquestion: Are there identifiable instances of users andinformation crossing different social networking sites?
Methods
DataThis study examined four social networking sites and twoe-cigarette brands that maintain a presence in each site formarketing and advertising. Data from each of the four sites werecollected from October 20, 2012 through April 14, 2015. Thesites were chosen based on popularity (from currenteBizMBA.com rankings), differences in the affordances of theplatform’s technologies, accessibility of data, and userdemographics [20,21]. The final set of sites included Facebook(general purpose, with increase usage among seniors), Twitter(text micro-blog, with high adoption by African Americans),Google+ (general purpose), and Instagram (picture based, withhigh adoption by women). E-cigarette brands were chosen basedon activity in multiple social networking sites and general onlinepresence. The two choices were Blu (owned by Lorillard, then
JMIR Public Health Surveill 2015 | vol. 1 | iss. 2 | e11 | p.53http://publichealth.jmir.org/2015/2/e11/(page number not for citation purposes)
Chu et alJMIR PUBLIC HEALTH AND SURVEILLANCE
XSL•FORenderX
by Reynolds Tobacco, and finally by Imperial Tobacco in 2014)and V2 (owned by VMR). Currently, Blu and V2 are two of thetop three e-cigarette brand websites based on activity, accordingto traffic tracker Compete.com, with similarly high social mediaactivity. Blu also has the highest advertising expenditures,comprising more than 75% of all e-cigarette advertisingexpenditures in 2012 [22]. These two choices also allow us tosee potential differences between a tobacco industry-ownedbrand (Blu) and a privately owned brand (V2).
Data were collected by establishing connections to each socialnetworking site via the platform’s Application ProgrammingInterface (API). An API allows external software to makerequests for data and post information and to perform tasks thatare made allowable by the service. Custom software was writtento communicate with the API of each of the four socialnetworking sites. The 3 main objectives were to:
1. Gather any available long-term historical data, primarilyany content posted by Blu or V2 and related information,such as users who shared or commented on such posts. Thisprocess was conducted a single time.
2. Gather recent data as it was being posted. This task was thesame as objective 1 but only collected recent data (about3-4 days old), as many social networking sites limit theamount of data that can be requested. This process wasexecuted every 3-4 days.
3. Gather related data unique to each site, as their methods ofonline interactions are different. For example, the datacollection included retweets on Twitter, comments onFacebook, shares on Google+, likes on Instagram, and soon. Users who performed these actions were also recorded,along with any available demographic information. Thisprocess was executed every 3-4 days, in parallel to objective2.
All data collected were publicly available since any person withan Internet connection is able to view data that has beenretrieved through this mining software. The primary data beingcollected were content posted on the social networking sites.Demographic information came from users’ self-reported datain the site and was only collected if the user had made it public.Personal information such as emails, phone numbers, oraddresses was not collected. This study was reviewed by theUniversity of Southern California Health Sciences InstitutionalReview Board, which found that it does not qualify as HumanSubjects Research and thus is not subject to the requirementsof 45 CFR 46.102.
AnalysisWe analyzed the content posted on each of the social networkingsites and parsed data according to e-cigarette brand and social
networking site. Our primary method of analysis was TermFrequency-Inverse Document Frequency (TF-IDF) weightinga commonly used statistical method in information retrieval tocalculate word relevance for a document across a large corpus[23]. TF-IDF classifies documents by examining each word andcalculating its occurrence frequency. TF is the measure ofimportance of a single term in one document, as determined byits frequency (usually normalized by the total number of wordsin the document). The TF score is balanced by the IDF, whichcounts the number of documents a term appears in across theentire corpus, and takes the inverse. Thus, IDF measures thediscriminating power of a term. In short, TF-IDF classifies anysingle document by terms that frequently appear in it but do notappear in many other documents. More advanced techniquescan also build from this foundation, although they were not usedin this study. We used the Simstat 2.6.2 software package andits associated content analysis component, WordStat 6.1.23, tosupport the analyses.
We conducted an exploratory network analysis of users whohad posted content or interacted with one of the e-cigarettebrands in one of the four social networking sites. To examinethe possibility of cross-platform diffusion of e-cigarettemessages, we ran the test in two steps. First, we identifiedusernames from each site that had an identical matchingusername in another site. While this tactic did not guaranteecertainty that the different users are the same, it provided astarting approximation. We then analyzed content posted bythe identified users in the different sites. Using the names thatwere found in multiple sites, we confirmed it was in fact thesame person via identical profile pictures or personaldescriptions, and then examined whether their activity on onesite (eg, liking a Blu post on Facebook) resulted in sharing thecontent on another site (eg, posting the same message onTwitter).
Results
Table 1 describes the data, including total counts of postedcontent on each of the four social networking sites. Table 2 isa list of the top 20 terms used based on TF-IDF score. Theseare the top terms based on frequency and number of cases theyappear in (representing how unique they are for each possiblebrand/site combination). The terms help contextualize the cases.As we are studying four social networking sites and twoe-cigarette brands, there are 8 possible brand/site scenarios, orcases, that any given term can appear in. For example, the termecig is used by both companies in all four sites, and thus has acount of 8 for number of cases, also called an 8-case scenario.In another example, the term RT is used by both companies butonly on Twitter, and thus has a count of 2 for number of cases.
JMIR Public Health Surveill 2015 | vol. 1 | iss. 2 | e11 | p.54http://publichealth.jmir.org/2015/2/e11/(page number not for citation purposes)
Chu et alJMIR PUBLIC HEALTH AND SURVEILLANCE
XSL•FORenderX

Table 1. Summary of posted data collected.
%Twitter%Instagram%Google+%Facebook
78616383719915Total
60%475354%34290%33564% (61%)6313 (2106) aBlu
40%310846%29610%3636% (39%)3602 (1343) av2
aFacebook data includes posts by other users to be displayed on the e-cigarette brand page. Number in parenthesis represents posts made by the e-cigarettebrands, ie, Blu and V2.
Table 2. Top terms based on TF-IDF scores.
TF-IDF% casesNo. cases% TotalFrequency
722.525.00%20.50%1200RT
55050.00%40.80%1827BLUCIGS
513.675.00%61.80%4111CO
336.625.00%20.20%559HREF
265.862.50%50.60%1302BLU
246.225.00%20.20%409NOFOLLOW
246.225.00%20.20%409REL
245.612.50%10.10%272BLUCRM
195.725.00%20.10%325DM
174.637.50%30.20%410OT
167.450.00%40.20%556BLUNATION
140.350.00%40.20%466CLASS
102.762.50%50.20%503SAVE
99.312.50%10.00%110PWD
98.125.00%20.10%163WARD
87.737.50%30.10%206VAPORIZER
8637.50%30.10%202SXSW
84.162.50%50.20%412HASHTAG
82.850.00%40.10%275BLUFREEDOM
73.675.00%60.30%589HTTPS
In contrast, a 1-case scenario shows words that are only foundin a single brand/site case (eg, BLUCRM or PWD in Table 2).In other words, those terms were only used by a single companyon a single site. These terms are helpful in explaining why onlyone brand might be applying a specific marketing strategy ona single site. Applied to only a single case out of eightpossibilities, it is the most conservative classification of thecase by the terms found. These terms are unique, based on eitherthe brand’s usage or how the technology supports certainfeatures. We found 163 terms that fit the 1-case scenario andclassified each according to 15 possible categories. Thecategories were developed through an exploratory examinationof the data, and the terms were coded by two of the authors.The authors agreed on the categories of 121 of the terms (74%).The remaining disagreements in classifications were discusseduntil a mutual agreement had been reached for all 163 terms.The most frequent categories found in the data were: 68% ofBlu’s terms on Twitter were for user interactions; 84% of Blu’s
terms on Facebook were for political information; and 73% ofV2’s terms on Twitter were links to their homepage. No strongcontent data were found to help classify either brand’s activitieson Google+ or Instagram, or for V2 on Facebook.
The results showed that Blu and V2 had contrasting strategiesin their social networking site presence. In the 1-case data, V2focused primarily on Twitter (94% of all of V2’s 1-case terms),with the majority of interactions aimed at connecting followersto their home website. V2 did not have any notable 1-casediscriminating content on Facebook, Google+, or Instagram.On Twitter, V2’s content remained focused on websiteadvertisement, although interactions with users were alsoincluded. Blu had unique content in both Twitter (66%) andFacebook (28%). Unlike V2, Blu’s use of Twitter focused oninteracting with users on a wide range of topics, from productsupport to general conversation. On Facebook, Blu’s postscentered on political activities (eg, suggestions to email staterepresentatives or city council members, information on rallies,
JMIR Public Health Surveill 2015 | vol. 1 | iss. 2 | e11 | p.55http://publichealth.jmir.org/2015/2/e11/(page number not for citation purposes)
Chu et alJMIR PUBLIC HEALTH AND SURVEILLANCE
XSL•FORenderX
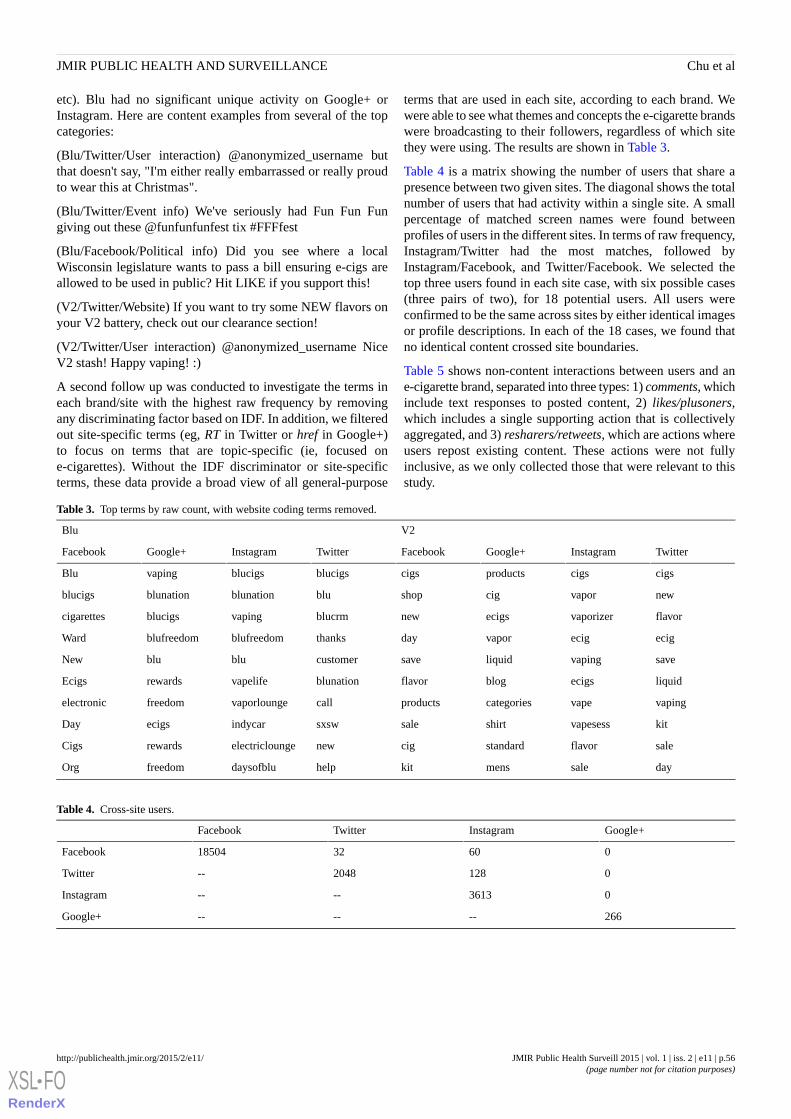
etc). Blu had no significant unique activity on Google+ orInstagram. Here are content examples from several of the topcategories:
(Blu/Twitter/User interaction) @anonymized_username butthat doesn't say, "I'm either really embarrassed or really proudto wear this at Christmas".
(Blu/Twitter/Event info) We've seriously had Fun Fun Fungiving out these @funfunfunfest tix #FFFfest
(Blu/Facebook/Political info) Did you see where a localWisconsin legislature wants to pass a bill ensuring e-cigs areallowed to be used in public? Hit LIKE if you support this!
(V2/Twitter/Website) If you want to try some NEW flavors onyour V2 battery, check out our clearance section!
(V2/Twitter/User interaction) @anonymized_username NiceV2 stash! Happy vaping! :)
A second follow up was conducted to investigate the terms ineach brand/site with the highest raw frequency by removingany discriminating factor based on IDF. In addition, we filteredout site-specific terms (eg, RT in Twitter or href in Google+)to focus on terms that are topic-specific (ie, focused one-cigarettes). Without the IDF discriminator or site-specificterms, these data provide a broad view of all general-purpose
terms that are used in each site, according to each brand. Wewere able to see what themes and concepts the e-cigarette brandswere broadcasting to their followers, regardless of which sitethey were using. The results are shown in Table 3.
Table 4 is a matrix showing the number of users that share apresence between two given sites. The diagonal shows the totalnumber of users that had activity within a single site. A smallpercentage of matched screen names were found betweenprofiles of users in the different sites. In terms of raw frequency,Instagram/Twitter had the most matches, followed byInstagram/Facebook, and Twitter/Facebook. We selected thetop three users found in each site case, with six possible cases(three pairs of two), for 18 potential users. All users wereconfirmed to be the same across sites by either identical imagesor profile descriptions. In each of the 18 cases, we found thatno identical content crossed site boundaries.
Table 5 shows non-content interactions between users and ane-cigarette brand, separated into three types: 1) comments, whichinclude text responses to posted content, 2) likes/plusoners,which includes a single supporting action that is collectivelyaggregated, and 3) resharers/retweets, which are actions whereusers repost existing content. These actions were not fullyinclusive, as we only collected those that were relevant to thisstudy.
Table 3. Top terms by raw count, with website coding terms removed.
V2Blu
TwitterInstagramGoogle+FacebookTwitterInstagramGoogle+Facebook
cigscigsproductscigsblucigsblucigsvapingBlu
newvaporcigshopblublunationblunationblucigs
flavorvaporizerecigsnewblucrmvapingblucigscigarettes
ecigecigvapordaythanksblufreedomblufreedomWard
savevapingliquidsavecustomerblubluNew
liquidecigsblogflavorblunationvapeliferewardsEcigs
vapingvapecategoriesproductscallvaporloungefreedomelectronic
kitvapesessshirtsalesxswindycarecigsDay
saleflavorstandardcignewelectricloungerewardsCigs
daysalemenskithelpdaysofblufreedomOrg
Table 4. Cross-site users.
Google+InstagramTwitterFacebook
0603218504Facebook
01282048--Twitter
03613----Instagram
266------Google+
JMIR Public Health Surveill 2015 | vol. 1 | iss. 2 | e11 | p.56http://publichealth.jmir.org/2015/2/e11/(page number not for citation purposes)
Chu et alJMIR PUBLIC HEALTH AND SURVEILLANCE
XSL•FORenderX

Table 5. Non-content interactions between users and e-cigarette brands. The numbers in parentheses represent the ratio of comments to original postson Facebook and Instagram.
CountTwitterCountInstagramCountGoogle+CountFacebook
2127comments26612comments
1838 (5.37)Blu18582 (2.94)Blu
289 (0.98)V28030 (2.23)V2
17034likes754plusoners54029Likes
11214Blu740Blu37231Blu
5820V214v216798V2
14781retweets80resharers
13879Blu80Blu
902V20V2
Discussion
Exploring the ResultsThe 1-case data provides valuable information in determiningsome of the most discriminating terms used by each e-cigarettebrand, for the different social networking sites. It also revealsearly evidence of how the two e-cigarette brands differ in theirsocial media marketing strategies, with V2 focusing onmarketing products on their website and Blu using Twitter foruser interactions and Facebook for political activity information.The 163 terms were able to show that specific combinations,specifically Blu/Twitter, Blu/Facebook, and V2/Twitter, werebeing utilized by each brand for a particular type of marketing.However, the limited data—only 163 terms—does not provideenough information for deeper investigations. Therefore, weviewed the data through several other lenses. First, we examinedthe n-case data to include all possible terms (Table 2). In manyof these cases, there were technologically driven explanationsfor the high discriminating power of some of the terms. Forexample, RT has the highest TF-IDF score and is found in onlytwo case scenarios (Blu/Twitter and V2/Twitter). However, thisis not unexpected, as it is only used in Twitter as shorthand for“retweet”. Similarly, terms such as href or nofollow arewebpage-coding syntax used only in Google+ to create links toexternal sites, usually to images or videos. Interestingly,Instagram is the only site where coding terms are not used,another artifact of the available technology. As an image-basedplatform, there would be no need for text to contain anyadditional image links for each Instagram post. Other types oflinks seen in Facebook or Google+ were not seen in Instagramcaptions. Overall, the n-case results suggest that propertiesinherent to specific platforms can dictate the types ofdiscriminating content found.
We continued to broaden our view by removing thediscriminating IDF and also filtering out technology-specificterms (Table 3). These results help provide additional evidenceof the marketing strategies of each e-cigarette brand on thedifferent sites. When looking at the terms for V2, we found asimilar theme as in the 1-case results: V2’s focus is on brandmarketing, different products, and directing users to theirwebsite. In the case of Blu, we again confirmed some of the
findings from the 1-case view. Terms such as thanks, customer,and help in Twitter were indicative of interactions with theirfollowers. The only political term, ward (in context ofgeopolitical boundaries), was found only in Facebook.Interestingly, we saw a theme across Blu’s social networkingsite presence, containing the terms blunation and blufreedomin Google+, Instagram, and Twitter. Blu’s social media strategyappears to focus more on community and lifestyle, contrastingsharply with V2’s efforts to market products and direct usersto their website. Blu’s efforts are more engaging than V2,possibly leading to more conversations and additional activitiesacross the sites. Table 5 shows evidence of user engagement;user comments represent actions when users are responding inconversation to an original post, as compared to likes orredirects, which typically only require a single mouse click. Inboth sites where comments were recorded (Facebook andInstagram), Blu followers commented at higher rates than V2.
The cross-platform network analysis found several meaningfulresults (Table 4). First, the users on Google+ appeared to shareno connection with any of the other sites. One possible reasonfor this is that Google+ does not explicitly require a traditionalscreen name that serves as an alias, but instead concatenateswhat the user inputs for a first and last name. Because extrasteps are needed to create a pseudonym, users are more likelyto retain Google+’s universal naming scheme, resulting indifferent aliases used than on other sites. Second, the highestnumber of overlapping screen names was between Instagramand Twitter. We had expected Facebook to be one of theoverlapping pairs based on the high number of collectedFacebook users and Pew’s survey of users with multiple socialmedia accounts [20], leading to a much greater potential formatches. However, as Instagram and Twitter have a moredistinct focus on their media usage—short text for Twitter,images for Instagram—it is possible that users would overlapin their usage of these two sites rather than the more generalsocial networking tools of Facebook. Overall, we expect thatthat our results are likely to represent the minimum amount ofoverlapping users, as it is likely that users might maintaindifferent online identities and change their screen names indifferent sites.
The content analysis of cross-platform posts yielded no resultswhere activity from a user on one site led to sharing that
JMIR Public Health Surveill 2015 | vol. 1 | iss. 2 | e11 | p.57http://publichealth.jmir.org/2015/2/e11/(page number not for citation purposes)
Chu et alJMIR PUBLIC HEALTH AND SURVEILLANCE
XSL•FORenderX
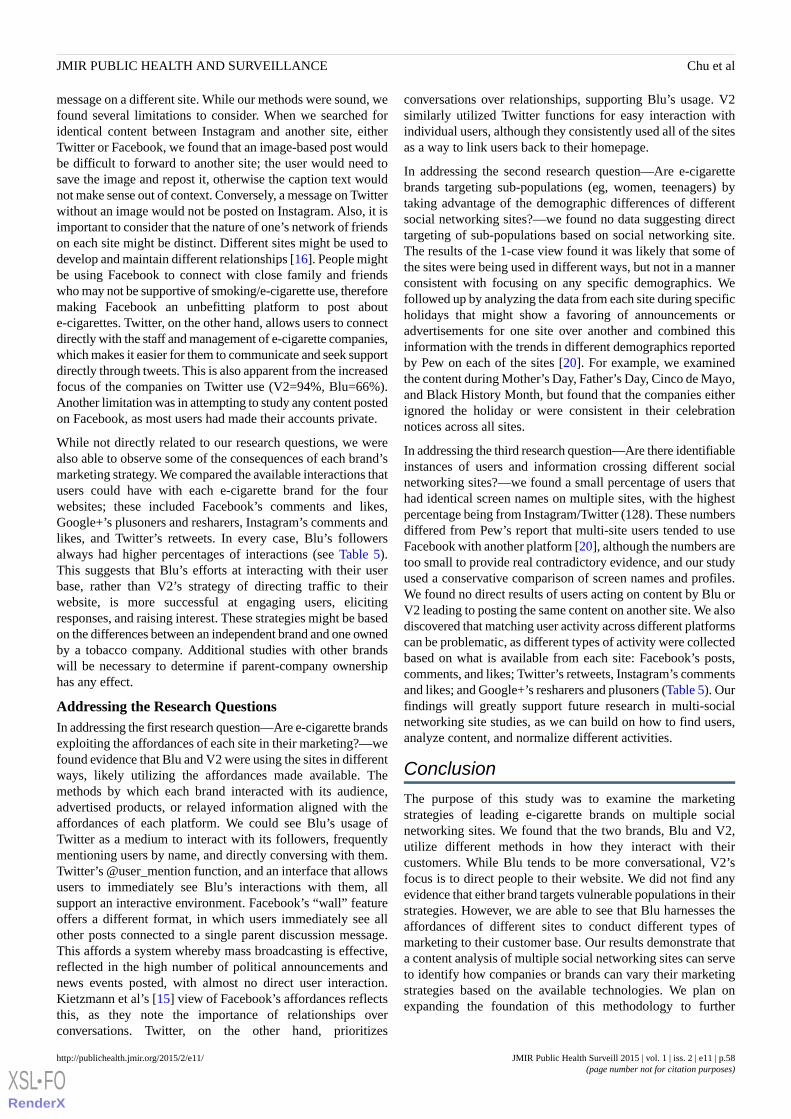
message on a different site. While our methods were sound, wefound several limitations to consider. When we searched foridentical content between Instagram and another site, eitherTwitter or Facebook, we found that an image-based post wouldbe difficult to forward to another site; the user would need tosave the image and repost it, otherwise the caption text wouldnot make sense out of context. Conversely, a message on Twitterwithout an image would not be posted on Instagram. Also, it isimportant to consider that the nature of one’s network of friendson each site might be distinct. Different sites might be used todevelop and maintain different relationships [16]. People mightbe using Facebook to connect with close family and friendswho may not be supportive of smoking/e-cigarette use, thereforemaking Facebook an unbefitting platform to post aboute-cigarettes. Twitter, on the other hand, allows users to connectdirectly with the staff and management of e-cigarette companies,which makes it easier for them to communicate and seek supportdirectly through tweets. This is also apparent from the increasedfocus of the companies on Twitter use (V2=94%, Blu=66%).Another limitation was in attempting to study any content postedon Facebook, as most users had made their accounts private.
While not directly related to our research questions, we werealso able to observe some of the consequences of each brand’smarketing strategy. We compared the available interactions thatusers could have with each e-cigarette brand for the fourwebsites; these included Facebook’s comments and likes,Google+’s plusoners and resharers, Instagram’s comments andlikes, and Twitter’s retweets. In every case, Blu’s followersalways had higher percentages of interactions (see Table 5).This suggests that Blu’s efforts at interacting with their userbase, rather than V2’s strategy of directing traffic to theirwebsite, is more successful at engaging users, elicitingresponses, and raising interest. These strategies might be basedon the differences between an independent brand and one ownedby a tobacco company. Additional studies with other brandswill be necessary to determine if parent-company ownershiphas any effect.
Addressing the Research QuestionsIn addressing the first research question—Are e-cigarette brandsexploiting the affordances of each site in their marketing?—wefound evidence that Blu and V2 were using the sites in differentways, likely utilizing the affordances made available. Themethods by which each brand interacted with its audience,advertised products, or relayed information aligned with theaffordances of each platform. We could see Blu’s usage ofTwitter as a medium to interact with its followers, frequentlymentioning users by name, and directly conversing with them.Twitter’s @user_mention function, and an interface that allowsusers to immediately see Blu’s interactions with them, allsupport an interactive environment. Facebook’s “wall” featureoffers a different format, in which users immediately see allother posts connected to a single parent discussion message.This affords a system whereby mass broadcasting is effective,reflected in the high number of political announcements andnews events posted, with almost no direct user interaction.Kietzmann et al’s [15] view of Facebook’s affordances reflectsthis, as they note the importance of relationships overconversations. Twitter, on the other hand, prioritizes
conversations over relationships, supporting Blu’s usage. V2similarly utilized Twitter functions for easy interaction withindividual users, although they consistently used all of the sitesas a way to link users back to their homepage.
In addressing the second research question—Are e-cigarettebrands targeting sub-populations (eg, women, teenagers) bytaking advantage of the demographic differences of differentsocial networking sites?—we found no data suggesting directtargeting of sub-populations based on social networking site.The results of the 1-case view found it was likely that some ofthe sites were being used in different ways, but not in a mannerconsistent with focusing on any specific demographics. Wefollowed up by analyzing the data from each site during specificholidays that might show a favoring of announcements oradvertisements for one site over another and combined thisinformation with the trends in different demographics reportedby Pew on each of the sites [20]. For example, we examinedthe content during Mother’s Day, Father’s Day, Cinco de Mayo,and Black History Month, but found that the companies eitherignored the holiday or were consistent in their celebrationnotices across all sites.
In addressing the third research question—Are there identifiableinstances of users and information crossing different socialnetworking sites?—we found a small percentage of users thathad identical screen names on multiple sites, with the highestpercentage being from Instagram/Twitter (128). These numbersdiffered from Pew’s report that multi-site users tended to useFacebook with another platform [20], although the numbers aretoo small to provide real contradictory evidence, and our studyused a conservative comparison of screen names and profiles.We found no direct results of users acting on content by Blu orV2 leading to posting the same content on another site. We alsodiscovered that matching user activity across different platformscan be problematic, as different types of activity were collectedbased on what is available from each site: Facebook’s posts,comments, and likes; Twitter’s retweets, Instagram’s commentsand likes; and Google+’s resharers and plusoners (Table 5). Ourfindings will greatly support future research in multi-socialnetworking site studies, as we can build on how to find users,analyze content, and normalize different activities.
Conclusion
The purpose of this study was to examine the marketingstrategies of leading e-cigarette brands on multiple socialnetworking sites. We found that the two brands, Blu and V2,utilize different methods in how they interact with theircustomers. While Blu tends to be more conversational, V2’sfocus is to direct people to their website. We did not find anyevidence that either brand targets vulnerable populations in theirstrategies. However, we are able to see that Blu harnesses theaffordances of different sites to conduct different types ofmarketing to their customer base. Our results demonstrate thata content analysis of multiple social networking sites can serveto identify how companies or brands can vary their marketingstrategies based on the available technologies. We plan onexpanding the foundation of this methodology to further
JMIR Public Health Surveill 2015 | vol. 1 | iss. 2 | e11 | p.58http://publichealth.jmir.org/2015/2/e11/(page number not for citation purposes)
Chu et alJMIR PUBLIC HEALTH AND SURVEILLANCE
XSL•FORenderX
understand potential diffusion of information across multiplesites.
There are several limitations in this study. Primarily, we focusedon only two e-cigarette brands. While their dominant onlinepresence made them attractive candidates, we are also interestedin following up with additional brands. Similarly, we only chosefour social networking sites. Other social networking sites suchas Pinterest, Tumblr, and LinkedIn were considered but werenot included due to various limitations. We also did notinterview any of the users in the study for specific reactions toor comments on the messages by the e-cigarette brands.Presenting the user side and experience would help provideadditional context to the media messages. However, two of theauthors are involved in a parallel project that, informed by someof the results of this pilot, will involve such interviews.Relatedly, we limited our content to publicly available data.While this affords easy access since all of the text or imagesposted can be viewed by anyone online, we do not know theimpact on the larger online audience, which includes users thatrestrict access to their accounts. Therefore, the ability togeneralize the results should be limited to public user accounts.Lastly, our content analysis focused on individual terms andwe did not develop a synonym set of conceptually equivalentthemes prior to the analysis. While this allows for a cleaneranalysis, it risks over-representation of certain concepts.
We strongly believe cross-platform studies will be a vital areaof research in the future. There are apps available that allow
users to streamline their post activity by broadcasting content,whether text, image, or other media, to multiple socialnetworking sites at once (eg, Everypost, HootSuite). New socialnetworking sites are also continuing to be developed, especiallyas technology provides new opportunities in other hardware,such as mobile phones or wearable devices. A fast-paced arenamakes single-platform studies very narrow and difficult togeneralize, as more of the population continues using multiplesocial networking sites [20]. Additionally, public healthcampaigns have begun utilizing social networking sites as aplatform for their causes, although not always with the desiredoutcomes [24]. As researchers, we must be able to adapt to thechanging landscape of social media tools. In particular, publichealth researchers should be made aware what sites might besusceptible to potentially dangerous marketing strategies. Ourresearch in multi-social networking site marketing should onlybe considered a first step in understanding this type of analysis.New tools in social media will require constant vigilance bythose in public health to not only understand new arenas, butalso to quickly develop strategies for prevention andintervention. Researchers need to understand what tools areavailable to establish counter-measures, whether againstdemographic targeting or misinformation. Public healthcampaigns should be carried out across the social networkingsites that will best reach influential users able to spread anddiffuse messages across many sites. Researchers must knowwhat affordances need to be focused on and how users areaffected, rather than blindly choose their platforms and audience.
AcknowledgmentsResearch reported in this publication was supported by grant number P50CA180905 from the National Cancer Institute and FDACenter for Tobacco Products.
Authors' ContributionsKC was the primary author and contributed to the planning, study design, analyses, and manuscript. AS and TV contributed tothe analyses and manuscript.
Conflicts of InterestNone declared.
References1. FDA, ” 2. Available Online. “Public Health Focus - Electronic Cigarettes (e-Cigarettes)" URL: http://www.fda.gov/
newsevents/publichealthfocus/ucm172906.htm [accessed 2015-09-04] [WebCite Cache ID 6bJ5uDIVx]2. Pearson JL, Richardson A, Niaura RS, Vallone DM, Abrams DB. e-Cigarette awareness, use, and harm perceptions in US
adults. Am J Public Health 2012 Sep;102(9):1758-1766 [FREE Full text] [doi: 10.2105/AJPH.2011.300526] [Medline:22813087]
3. King BA, Alam S, Promoff G, Arrazola R, Dube SR. Awareness and ever-use of electronic cigarettes among U.S. adults,2010-2011. Nicotine Tob Res 2013 Sep;15(9):1623-1627. [doi: 10.1093/ntr/ntt013] [Medline: 23449421]
4. Regan AK, Promoff G, Dube SR, Arrazola R. Electronic nicotine delivery systems: adult use and awareness of the 'e-cigarette'in the USA. Tob Control 2013 Jan;22(1):19-23. [doi: 10.1136/tobaccocontrol-2011-050044] [Medline: 22034071]
5. Richardson A, Ganz O, Stalgaitis C, Abrams D, Vallone D. Noncombustible tobacco product advertising: how companiesare selling the new face of tobacco. Nicotine Tob Res 2014 May;16(5):606-614. [doi: 10.1093/ntr/ntt200] [Medline:24379146]
6. Federal Trade Commission. Federal Trade Commission Cigarette Report for 2011. Washington: Federal Trade Commission;2013 May. Cigarette Report for 2011 URL: https://www.ftc.gov/sites/default/files/documents/reports/
JMIR Public Health Surveill 2015 | vol. 1 | iss. 2 | e11 | p.59http://publichealth.jmir.org/2015/2/e11/(page number not for citation purposes)
Chu et alJMIR PUBLIC HEALTH AND SURVEILLANCE
XSL•FORenderX
federal-trade-commission-cigarette-report-2011/130521cigarettereport.pdf [accessed 2015-09-06] [WebCite Cache ID6bM82BcbL]
7. Bullen C, Howe C, Laugesen M, McRobbie H, Parag V, Williman J, et al. Electronic cigarettes for smoking cessation: arandomised controlled trial. Lancet 2013 Nov 16;382(9905):1629-1637. [doi: 10.1016/S0140-6736(13)61842-5] [Medline:24029165]
8. Caponnetto P, Campagna D, Cibella F, Morjaria JB, Caruso M, Russo C, “EffiCiencySafety of an eLectronic cigAreTte(ECLAT) as Tobacco Cigarettes Substitute: A Prospective 12-Month Randomized Control Design Study, et al. vol. 8, no.6,, Jun 2013:e66317. [doi: 10.1371/journal.pone.0066317]
9. Grana RA, Ling PM. "Smoking revolution": a content analysis of electronic cigarette retail websites. Am J Prev Med 2014Apr;46(4):395-403 [FREE Full text] [doi: 10.1016/j.amepre.2013.12.010] [Medline: 24650842]
10. Etter JF, Bullen C. A longitudinal study of electronic cigarette users. Addict Behav 2014 Feb;39(2):491-494. [doi:10.1016/j.addbeh.2013.10.028] [Medline: 24229843]
11. Dawkins L, Turner J, Hasna S, Soar K. The electronic-cigarette: effects on desire to smoke, withdrawal symptoms andcognition. Addict Behav 2012 Aug;37(8):970-973. [doi: 10.1016/j.addbeh.2012.03.004] [Medline: 22503574]
12. Huang J, Kornfield R, Szczypka G, Emery SL. A cross-sectional examination of marketing of electronic cigarettes onTwitter. Tob Control 2014 Jul;23 Suppl 3:iii26-iii30 [FREE Full text] [doi: 10.1136/tobaccocontrol-2014-051551] [Medline:24935894]
13. Gibson J, ” IP, Acting, Knowing R. “The theory of affordances". S. & J. Bransford, Ed. Hillsdale, NJ: Lawrence ErlbaumAssociations 1977.
14. Norman D. The psychology of everyday things. New York: Doubleday. ISBN: 0465067107 1988.15. Kietzmann JH, Hermkens K, McCarthy IP, Silvestre BS. “Social media? Get serious! Understanding the functional building
blocks of social media,” Bus. Horiz., vol. 54, no. 3, pp. 241-251, May :2011. [doi: 10.1016/j.bushor.2011.01.005]16. Chu KH, Suthers DD. Technology-Mediated Relationships in a Socio-technical System. In: Proceedings of the 46th Hawaii
International Conference on System Sciences.: IEEE; 2013 Presented at: 2013 46th Hawaii International Conference onSystem Sciences (HICSS); January 7-10, 2013; Wailea, Maui, HI URL: http://ieeexplore.ieee.org/xpl/articleDetails.jsp?arnumber=6479926 [doi: 10.1109/HICSS.2013.511]
17. Duggan M, Smith A. Social Media Update 2013.: Pew Internet and American Life Project; 2013 Dec 30. Social MediaUpdate 2013 URL: http://www.pewinternet.org/2013/12/30/social-media-update-2013/ [accessed 2015-09-06] [WebCiteCache ID 6bM8XFWnG]
18. Mislove A, Lehmann S, Ahn YY, Onnela JP, Rosenquist JN. Understanding the Demographics of Twitter Users. In:Proceedings of the Fifth Int. AAAI Conf. Weblogs Soc. Media.: AAAI; 2011 Presented at: Fifth Int. AAAI Conf. WeblogsSoc. Media; July 17-21, 2011; Barcelona, Spain URL: http://dougleschan.com/the-recruitment-guru/wp-content/uploads/2014/01/Understanding-the-Demographics-of-Twitter-Users-Jukka-Pekka-....pdf
19. Chang J, Rosenn I, Backstrom L, Marlow C. ePluribus: Ethnicity on Social Networks. In: Proceedings of the Fourth Int.AAAI Conf. Weblogs Soc. Media.: AAAI Press; 2010 Presented at: Fourth Int. AAAI Conf. Weblogs Soc. Media; May23-26, 2010; Washington, DC URL: http://www.aaai.org/ocs/index.php/ICWSM/ICWSM10/paper/viewFile/1534/1828
20. Duggan M, Ellison N, Lampe C, Lenhart A, Madden M. “Social Media Update 2014,” Pew Research Center’s Internet &American Life Project. 2014. URL: http://www.pewinternet.org/2015/01/09/social-media-update-2014/ [accessed 2015-01-15][WebCite Cache ID 6VbRMf5n5]
21. Madden M, Lenhart A, Cortesi S, Gasser U, Duggan M, Smith A. “Teens, Social Media, and Privacy,”. 2013. URL: http://www.pewinternet.org/2013/05/21/teens-social-media-and-privacy/ [accessed 2014-03-15] [WebCite Cache ID 6O5psgdAN]
22. Kim AE, Arnold KY, Makarenko O. E-cigarette advertising expenditures in the U.S., 2011-2012. Am J Prev Med 2014Apr;46(4):409-412. [doi: 10.1016/j.amepre.2013.11.003] [Medline: 24650844]
23. Salton G, Fox EA, Wu H, “Extended Boolean Information Retrieval, ” CACM. vol. 26, no. 11, pp. 1022-1036, Nov 1983.[doi: 10.1145/182.358466]
24. Harris J, Moreland-Russell S, Choucair B, Mansour R, Staub M, Simmons K. Tweeting for and Against Public HealthPolicy: Response to the Chicago Department of Public Health's Electronic Cigarette Twitter Campaign. J Med Internet Res2014;16(10):e238 [FREE Full text] [doi: 10.2196/jmir.3622]
Edited by G Eysenbach; submitted 29.05.15; peer-reviewed by A Richardson, A Sanders-Jackson, S Leischow, B Liang; comments toauthor 09.07.15; revised version received 07.08.15; accepted 17.08.15; published 11.09.15.
Please cite as:Chu KH, Sidhu AK, Valente TWElectronic Cigarette Marketing Online: a Multi-Site, Multi-Product ComparisonJMIR Public Health Surveill 2015;1(2):e11URL: http://publichealth.jmir.org/2015/2/e11/ doi:10.2196/publichealth.4777PMID:27227129
JMIR Public Health Surveill 2015 | vol. 1 | iss. 2 | e11 | p.60http://publichealth.jmir.org/2015/2/e11/(page number not for citation purposes)
Chu et alJMIR PUBLIC HEALTH AND SURVEILLANCE
XSL•FORenderX

©Kar-Hai Chu, Anupreet K Sidhu, Thomas W Valente. Originally published in JMIR Public Health and Surveillance(http://publichealth.jmir.org), 11.09.2015. This is an open-access article distributed under the terms of the Creative CommonsAttribution License (http://creativecommons.org/licenses/by/2.0/), which permits unrestricted use, distribution, and reproductionin any medium, provided the original work, first published in JMIR Public Health and Surveillance, is properly cited. The completebibliographic information, a link to the original publication on http://publichealth.jmir.org, as well as this copyright and licenseinformation must be included.
JMIR Public Health Surveill 2015 | vol. 1 | iss. 2 | e11 | p.61http://publichealth.jmir.org/2015/2/e11/(page number not for citation purposes)
Chu et alJMIR PUBLIC HEALTH AND SURVEILLANCE
XSL•FORenderX
Original Paper
The Effect of Commuting Patterns on HIV Care Attendance AmongMen Who Have Sex With Men (MSM) in Atlanta, Georgia
Sharoda Dasgupta1, PhD, MPH; Michael R Kramer1, PhD; Eli S Rosenberg1, PhD; Travis H Sanchez1, DVM, MPH;
Landon Reed2, MCRP, MS; Patrick S Sullivan1, DVM, PhD1Emory University, Atlanta, GA, United States2Atlanta Regional Commission, Atlanta, GA, United States
Corresponding Author:Sharoda Dasgupta, PhD, MPHEmory University1518 Clifton Road NEAtlanta, GA, 30322United StatesPhone: 1 5124841667Fax: 1 8663118234Email: [email protected]
Abstract
Background: Travel-related barriers to human immunodeficiency virus (HIV) care, such as commute time and mode oftransportation, have been reported in the United States.
Objective: The objective of the study was to investigate the association between public transportation use and HIV care attendanceamong a convenience sample of Atlanta-based, HIV-positive men who have sex with men (MSM), evaluate differences acrossregions of residence, and estimate the relationship between travel distance and time by mode of transportation taken to attendappointments.
Methods: We used Poisson regression to estimate the association between use of public transportation to attend HIV-relatedmedical visits and frequency of care attendance over the previous 12 months. The relationship between travel distance andcommute time was estimated using linear regression. Kriging was used to interpolate commute time to visually examine geographicdifferences in commuting patterns in relation to access to public transportation and population-based estimates of householdvehicle ownership.
Results: Using public transportation was associated with lower rates of HIV care attendance compared to using privatetransportation, but only in south Atlanta (south: aRR: 0.75, 95% CI 0.56, 1.0, north: aRR: 0.90, 95% CI 0.71, 1.1). Participantsliving in south Atlanta were more likely to have longer commute times associated with attending HIV visits, have greater accessto public transportation, and may live in areas with low vehicle ownership. A majority of attended HIV providers were locatedin north and central Atlanta, despite there being participants living all across the city. Estimated commute times per mile traveledwere three times as high among public transit users compared to private transportation users.
Conclusions: Improving local public transit and implementing use of mobile clinics could help address travel-related barriersto HIV care.
(JMIR Public Health Surveill 2015;1(2):e10) doi:10.2196/publichealth.4525
KEYWORDS
men who have sex with men; HIV care; commuting patterns; public transportation
JMIR Public Health Surveill 2015 | vol. 1 | iss. 2 | e10 | p.62http://publichealth.jmir.org/2015/2/e10/(page number not for citation purposes)
Dasgupta et alJMIR PUBLIC HEALTH AND SURVEILLANCE
XSL•FORenderX
Introduction
Importance of Regular Human ImmunodeficiencyVirus Care EngagementMen who have sex with men (MSM) accounted for 67% of allnew human immunodeficiency virus (HIV) infections in theUnited States in 2012, despite accounting for only 3% of thepopulation [1,2]. Regular medical care utilization among HIVpatients is important in maintaining viral load suppression,reducing transmission to others [3-5], and improving survivalover time [5,6]. Among newly diagnosed cases in Georgia in2011, an estimated 46% were regularly engaged in HIV careand 45% had achieved viral suppression within 15 months ofdiagnosis [7]. Similar estimates in HIV care engagement wereobserved among a large cohort of MSM in Atlanta [6].
Transportation Factors as Barriers to HumanImmunodeficiency Virus CareTransportation-related factors, such as travel distance andcommute time, have been reported as substantial barriers togeneral medical care and attending HIV appointments [8-15].Transportation assistance was reported as an unmet need among16% of those who needed it in a cross-sectional, nationallyrepresentative study of HIV-positive individuals engaged incare [16]. Travel distance and mode are both importantpredictors of commute time [17] and can influence travel timesdifferentially by neighborhood, depending on availability ofpublic transportation, household vehicle ownership, and trafficcongestion patterns [18,19].
Compared to traveling by car, using public transportation isoften associated with longer commute times and reducedconvenience and flexibility in travel [17,20]. This is especiallyimportant in cities like Atlanta with limited public transportationand a strong dependence on travel by car [21]. Longer commutetimes can be a deterrent to attending care visits, especially withcompeting household and job responsibilities [8]. In Atlanta,the Metropolitan Atlanta Rapid Transit Authority (MARTA)has been the primary source of public transportationinfrastructure for both bus and rail since the 1970s. MARTA,as well as other transit systems in the metro area, serves mostlyurban areas in the city [22,23].
Atlanta has historically been a highly segregated city withrespect to race and income [24], with differential access to publictransportation. A general north-south pattern exists; withpredominantly lower income, black neighborhoods in southAtlanta and mostly white neighborhoods in north Atlanta.Neighborhood contextual factors, such as availability ofresources and socioeconomic deprivation, have been shown tobe associated with negative physical and mental health outcomes[25-27]. Our study objectives were two-fold. First, weinvestigated whether public transportation use is associated withHIV care attendance and whether the association varies byregion of residence (north vs south) in Atlanta. Second, becausetaking public transportation can strongly affect commute times,we also estimated the relationship between travel distance andcommute time by mode of transportation. Identifying areaswhere travel-related factors might be barriers to HIV care can
be beneficial in planning targeted structural interventions toimprove health care utilization.
Methods
Study Methodology
RecruitmentThe Engage Study, a cross-sectional study of self-identifyingHIV-positive MSM, was designed to investigate structural andpsychosocial barriers to HIV care among MSM living in theAtlanta area. A convenience sample of men was recruited fromOctober 2012 to June 2013 from two sources: (1) based onparticipation in previously conducted Atlanta-based studies onHIV, and (2) from Facebook. Men who previously participatedin the Atlanta-based studies and had a known positive HIV testwere contacted by phone and email for recruitment. Individualsinterested in participation were then sent a Web link to theInternet eligibility screener by email. Participants from Facebookwere recruited based on banner advertisements targeting menwho were interested in other men and lived within 50 miles ofAtlanta. Those who clicked on the banner advertisements weredirected to the Internet eligibility screener.
Individuals were eligible for participation if they reported being18 years of age or older, being told they were HIV-positive bya health care provider, having sex with at least one other manin their lifetime, and living in the Atlanta area. All consentingparticipants were directed from the Internet eligibility screenerto the questionnaire administered using a Health InsurancePortability and Accountability Act (HIPAA)-compliant Internetsurvey software platform, SurveyGizmo (Boulder, CO) [28].The Emory University Institutional Review Board approvedthe study protocol (approval number: IRB00060430). Moredetails on study methodology have been previously described[29].
MeasuresThe Web-based questionnaire collected information ondemographic characteristics, potential structural (eg, publictransportation use, health insurance status) and psychosocialbarriers (eg, perceived HIV-related stigma, disclosure of HIVstatus, self-perceived community perceptions of HIV) to HIVcare engagement, and characteristics related to HIV careexperiences (eg, number of attended care appointments withthe most recently attended HIV provider). We also collectedinformation about home address at the time of the interviewand location of the last HIV care provider, which was used toestimate travel distance and commute time to attend care visits.We geocoded all addresses using ArcGIS 10.2 (Redlands, CA).Participants were also asked about mode of transportation usedto regularly attend care. Those reporting normally traveling bytrain, bus, or foot were considered to be public transportationusers; otherwise, they were considered private transportationusers.
To estimate travel distance and commute time betweenparticipant residence and last attended HIV provider, we usedthe Google Maps Directions application programming interface.Distance and commute time were calculated for each pair of
JMIR Public Health Surveill 2015 | vol. 1 | iss. 2 | e10 | p.63http://publichealth.jmir.org/2015/2/e10/(page number not for citation purposes)
Dasgupta et alJMIR PUBLIC HEALTH AND SURVEILLANCE
XSL•FORenderX
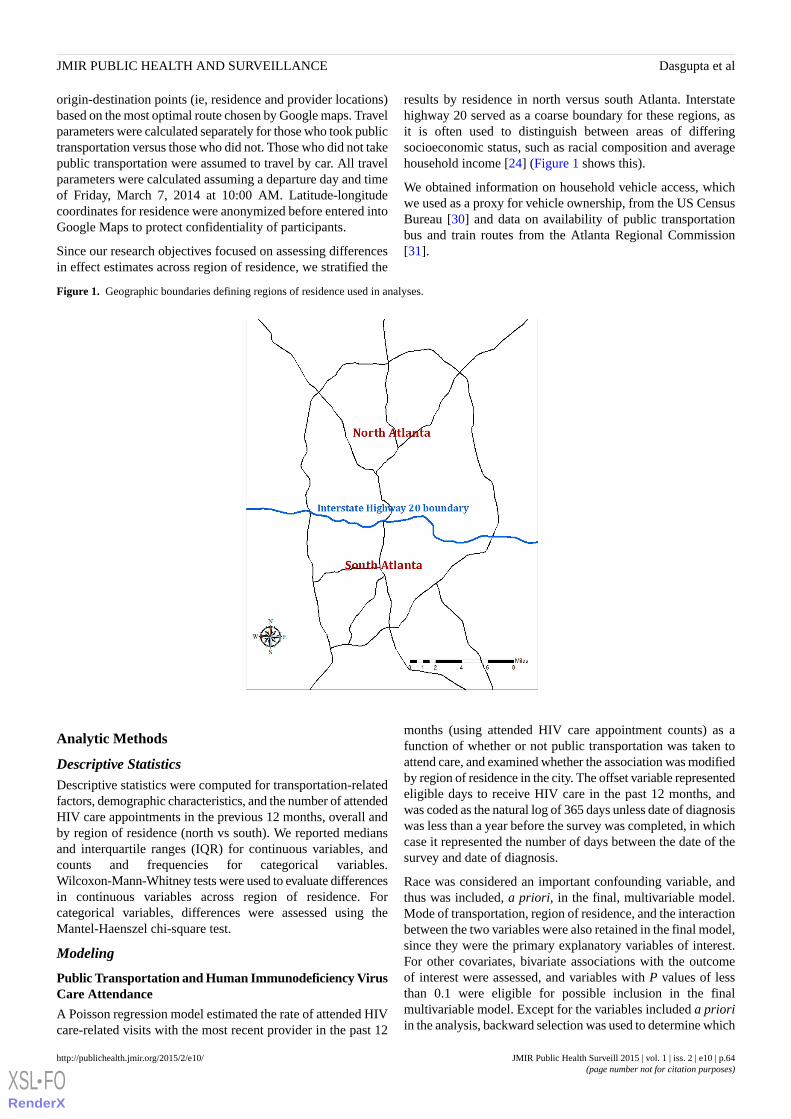
origin-destination points (ie, residence and provider locations)based on the most optimal route chosen by Google maps. Travelparameters were calculated separately for those who took publictransportation versus those who did not. Those who did not takepublic transportation were assumed to travel by car. All travelparameters were calculated assuming a departure day and timeof Friday, March 7, 2014 at 10:00 AM. Latitude-longitudecoordinates for residence were anonymized before entered intoGoogle Maps to protect confidentiality of participants.
Since our research objectives focused on assessing differencesin effect estimates across region of residence, we stratified the
results by residence in north versus south Atlanta. Interstatehighway 20 served as a coarse boundary for these regions, asit is often used to distinguish between areas of differingsocioeconomic status, such as racial composition and averagehousehold income [24] (Figure 1 shows this).
We obtained information on household vehicle access, whichwe used as a proxy for vehicle ownership, from the US CensusBureau [30] and data on availability of public transportationbus and train routes from the Atlanta Regional Commission[31].
Figure 1. Geographic boundaries defining regions of residence used in analyses.
Analytic Methods
Descriptive StatisticsDescriptive statistics were computed for transportation-relatedfactors, demographic characteristics, and the number of attendedHIV care appointments in the previous 12 months, overall andby region of residence (north vs south). We reported mediansand interquartile ranges (IQR) for continuous variables, andcounts and frequencies for categorical variables.Wilcoxon-Mann-Whitney tests were used to evaluate differencesin continuous variables across region of residence. Forcategorical variables, differences were assessed using theMantel-Haenszel chi-square test.
Modeling
Public Transportation and Human Immunodeficiency VirusCare Attendance
A Poisson regression model estimated the rate of attended HIVcare-related visits with the most recent provider in the past 12
months (using attended HIV care appointment counts) as afunction of whether or not public transportation was taken toattend care, and examined whether the association was modifiedby region of residence in the city. The offset variable representedeligible days to receive HIV care in the past 12 months, andwas coded as the natural log of 365 days unless date of diagnosiswas less than a year before the survey was completed, in whichcase it represented the number of days between the date of thesurvey and date of diagnosis.
Race was considered an important confounding variable, andthus was included, a priori, in the final, multivariable model.Mode of transportation, region of residence, and the interactionbetween the two variables were also retained in the final model,since they were the primary explanatory variables of interest.For other covariates, bivariate associations with the outcomeof interest were assessed, and variables with P values of lessthan 0.1 were eligible for possible inclusion in the finalmultivariable model. Except for the variables included a prioriin the analysis, backward selection was used to determine which
JMIR Public Health Surveill 2015 | vol. 1 | iss. 2 | e10 | p.64http://publichealth.jmir.org/2015/2/e10/(page number not for citation purposes)
Dasgupta et alJMIR PUBLIC HEALTH AND SURVEILLANCE
XSL•FORenderX
variables should be retained in the final model, using a cutoffof P<.05. The multivariable Poisson model was built using SAS9.3 (Cary, NC).
In a post-hoc analysis, we examined spatial relationshipsbetween estimated commute time, the network of availablepublic transportation routes in Atlanta, and areas with lowhousehold vehicle ownership. Using ArcGIS 10.2, we utilizedkriging to interpolate commute time associated with travelingto the last attended HIV provider. Because we did not askparticipants directly about individual household vehicleownership, we used US Census data as a marker for study areaswith poor access to a vehicle. We defined vehicle ownership ashaving access to one or more vehicles in the household (a proxyfor ownership); census tracts with < 87% household vehicleaccess were considered areas of low ownership. We based thiscutoff on results from the 2009 National Household TravelSurvey, which estimated that approximately 13% of UShouseholds were without access to a vehicle in large urban areas[32]. Using GeoDa (Tempe, AZ), local Moran’s I statistics withsignificance testing (alpha = .05) evaluated local spatialautocorrelation to identify clusters of low vehicle ownershipgeographically.
Travel Distance and Commute Time
We used a linear regression model to describe the relationshipbetween travel distance and commute time, stratified by modeof transportation used to attend appointments. For each modeof travel, the intercept represented initial investment in time;the slope provided information on the increase in commute timefor each mile traveled. No other covariates were of interest, andtherefore, were not included in the final model.
Results
Descriptive StatisticsA total of 213 eligible MSM participated; 205/213 (96.2%)participants reported ever receiving HIV care, among which184/205 (89.7%) reported valid location data on home addressand last HIV provider to enable calculation of road distance andcommute time between the two. A total of 178/184 (96.7%)respondents who traveled less than 100 miles and lived within50 miles from the center of Atlanta were used in the finalanalysis dataset.
The median age of participants was 34 years old, over half ofparticipants reported an annual household income of less thanUS $20,000, and about two-thirds identified as black/AfricanAmerican race (Table 1). Participants attended a median of 3appointments with their most recent HIV care provider in theprevious 12 months, and about a third of participants reportedmissing at least one appointment. Overall, (72/178) 40%reported using some form of public transportation to attend care;median commute time was 22 minutes and median traveldistance was about 9 miles.
Participants living in south Atlanta were significantly morelikely to report black race (P<.001), have lower annualhousehold income (P=.04), and not have health insurance at thetime of the survey (P=.03). Greater reported use of publictransportation (P=.002), travel distance (P=.003), and commutetimes (P<.001) associated with attending HIV care visits wereobserved in south Atlanta, compared to north Atlanta.Participants in south Atlanta were also more likely to live incensus tracts with low vehicle ownership, but this differencewas not statistically significant (P=.05).
JMIR Public Health Surveill 2015 | vol. 1 | iss. 2 | e10 | p.65http://publichealth.jmir.org/2015/2/e10/(page number not for citation purposes)
Dasgupta et alJMIR PUBLIC HEALTH AND SURVEILLANCE
XSL•FORenderX

Table 1. Demographic characteristics reported among a convenience sample of HIV-positive MSM linked to care in Atlanta, Georgia, 2012-2013.
South AtlantaaNorth AtlantaaOveralla
Meanvisits
%nMeanvisits
%nMean visits%nDemographic characteristics
People living in tracts with low household vehicle ownership
3.344233.533413.53664< 87%
3.656293.167853.264114> 87%
Taking public transit (bus, train, foot) to attend care visits b
3.358303.433423.44072Yes
3.842223.167843.360106No
Age in years
2.750263.052652.95191< 35 years
4.350263.448613.74987> 35 years
Race b
4.51583.141523.33460White
3.379413.452663.460107Black/African American
Education
3.623122.916203.21832High school or less
3.577403.3831043.481144At least some college
Annual household income b (US)
3.662323.248613.35293< $20,000
3.633173.149623.24479> $20,000
Current health insurance status b
3.646243.262783.357102Yes
3.454283.237463.34274No
a Numbers may not sum to total because of missing values. Percentages may not add up to 100 due to rounding.b Statistically significant differences observed across region of residence, alpha =.05.
Modeling
Public Transportation and Human ImmunodeficiencyVirus Care AttendanceOf those living south Atlanta, the adjusted rate of HIV careattendance was 25% lower among those who took publictransportation to attend care visits, compared to those who tookprivate transportation (aRR: 0.75, 95% CI 0.56, 1.0; Figure 2shows this). No significant association was observed amongthose living in north Atlanta (aRR: 0.90, 95% CI 0.71, 1.1). Themultivariable model adjusted for race, annual household income,and health insurance status reported at the time of the interview.Although the interaction between region of residence and useof public transportation was not significant, stratified resultsare presented because we hypothesize that factors related tosocioeconomic status (SES), such as reasons for taking publictransportation to attend visits, might vary depending on regionof residence
To explore this hypothesis, we examined interpolated commutetimes across urban areas of Atlanta with respect to census tractswith low car ownership and the network of available publictransportation in the city (Figure 3 shows this). Interpolatedcommute times greater than the overall mean (34 minutes) wereobserved in much of south Atlanta. A majority of attended HIVproviders were also located in north or central Atlanta, whichmay have driven longer commute times observed for participantsliving in south Atlanta.
Further, positive spatial autocorrelation was observed in a clusterof census tracts with low car ownership in south Atlanta. Withinthe auxiliary interstate highway 285 (often used as a boundaryfor urban vs suburban/rural areas of Atlanta), there are 6.6 milesof available public transportation per 1000 population in southAtlanta and 4.4 miles of available transit per 1000 populationin north Atlanta.
JMIR Public Health Surveill 2015 | vol. 1 | iss. 2 | e10 | p.66http://publichealth.jmir.org/2015/2/e10/(page number not for citation purposes)
Dasgupta et alJMIR PUBLIC HEALTH AND SURVEILLANCE
XSL•FORenderX

Figure 2. Adjusted association between public transportation use and rates of HIV care attendance in the past 12 months, by region of residence, amonga convenience sample of HIV-positive MSM linked to care, Atlanta, Georgia, 2012-2013. Final multivariable model controls for race, annual householdincome, and health insurance status reported at the time of interview.
Figure 3. Relationships between interpolated commute time and network of public transportation routes (left), and interpolated commute time and lowcar ownership (right), among a convenience sample of HIV-positive MSM linked to care, Atlanta, Georgia, 2012-2013. Locations of HIV providersattended by participants are denoted in pink triangles, and locations of participant residences, which have been anonymized, are represented by darkblue dots.
Travel Distance and Commute TimeThe modeled estimates showed that the relationship betweentravel distance and commute time varied by mode of
transportation taken to attend HIV care visits (Table 2 andFigure 4 show this). The model explained 93% of the varianceof the data around the estimated regression equation. Theestimated initial time investment associated with commuting
JMIR Public Health Surveill 2015 | vol. 1 | iss. 2 | e10 | p.67http://publichealth.jmir.org/2015/2/e10/(page number not for citation purposes)
Dasgupta et alJMIR PUBLIC HEALTH AND SURVEILLANCE
XSL•FORenderX
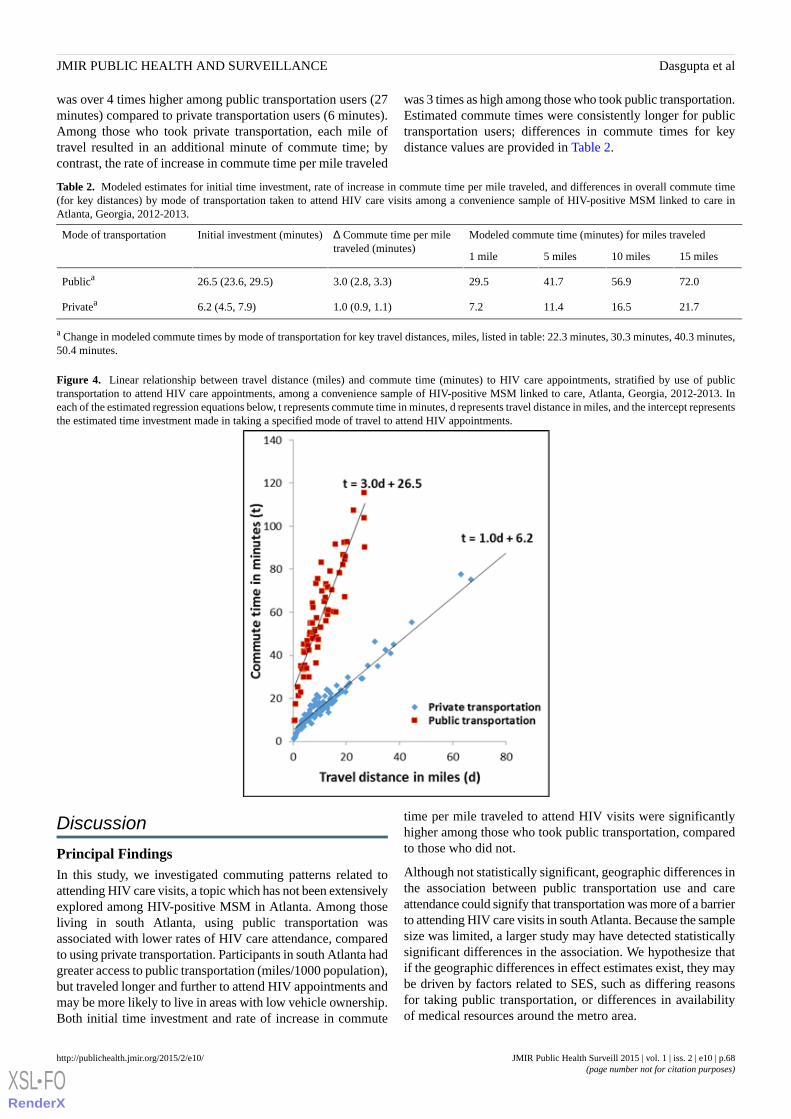
was over 4 times higher among public transportation users (27minutes) compared to private transportation users (6 minutes).Among those who took private transportation, each mile oftravel resulted in an additional minute of commute time; bycontrast, the rate of increase in commute time per mile traveled
was 3 times as high among those who took public transportation.Estimated commute times were consistently longer for publictransportation users; differences in commute times for keydistance values are provided in Table 2.
Table 2. Modeled estimates for initial time investment, rate of increase in commute time per mile traveled, and differences in overall commute time(for key distances) by mode of transportation taken to attend HIV care visits among a convenience sample of HIV-positive MSM linked to care inAtlanta, Georgia, 2012-2013.
Modeled commute time (minutes) for miles traveled∆ Commute time per miletraveled (minutes)
Initial investment (minutes)Mode of transportation
15 miles10 miles5 miles1 mile
72.056.941.729.53.0 (2.8, 3.3)26.5 (23.6, 29.5)Publica
21.716.511.47.21.0 (0.9, 1.1)6.2 (4.5, 7.9)Privatea
a Change in modeled commute times by mode of transportation for key travel distances, miles, listed in table: 22.3 minutes, 30.3 minutes, 40.3 minutes,50.4 minutes.
Figure 4. Linear relationship between travel distance (miles) and commute time (minutes) to HIV care appointments, stratified by use of publictransportation to attend HIV care appointments, among a convenience sample of HIV-positive MSM linked to care, Atlanta, Georgia, 2012-2013. Ineach of the estimated regression equations below, t represents commute time in minutes, d represents travel distance in miles, and the intercept representsthe estimated time investment made in taking a specified mode of travel to attend HIV appointments.
Discussion
Principal FindingsIn this study, we investigated commuting patterns related toattending HIV care visits, a topic which has not been extensivelyexplored among HIV-positive MSM in Atlanta. Among thoseliving in south Atlanta, using public transportation wasassociated with lower rates of HIV care attendance, comparedto using private transportation. Participants in south Atlanta hadgreater access to public transportation (miles/1000 population),but traveled longer and further to attend HIV appointments andmay be more likely to live in areas with low vehicle ownership.Both initial time investment and rate of increase in commute
time per mile traveled to attend HIV visits were significantlyhigher among those who took public transportation, comparedto those who did not.
Although not statistically significant, geographic differences inthe association between public transportation use and careattendance could signify that transportation was more of a barrierto attending HIV care visits in south Atlanta. Because the samplesize was limited, a larger study may have detected statisticallysignificant differences in the association. We hypothesize thatif the geographic differences in effect estimates exist, they maybe driven by factors related to SES, such as differing reasonsfor taking public transportation, or differences in availabilityof medical resources around the metro area.
JMIR Public Health Surveill 2015 | vol. 1 | iss. 2 | e10 | p.68http://publichealth.jmir.org/2015/2/e10/(page number not for citation purposes)
Dasgupta et alJMIR PUBLIC HEALTH AND SURVEILLANCE
XSL•FORenderX
Although using public transportation is often associated withlonger and more variable commute times and reduced flexibilityin travel, there may be many reasons why public transportationis preferred, including: (1) concerns related to traffic congestionand pollution, (2) cost reductions associated with traveling bycar, (3) convenience, if residence is in an urban area with accessto public transit and limited space for private vehicle parking,and (4) not having another means of travel [17,20,33,34]. Outof these four reasons, the first three are related to convenience,or choice to take public transportation, while the fourth isassociated with necessity because of lack of vehicle ownership.Because levels of household vehicle ownership may be higherin north versus south Atlanta, we hypothesize that those livingin south Atlanta might be more likely to take publictransportation out of necessity, and people living in north Atlantamight choose to take public transportation out of convenience.Although we did not directly measure reasons for taking certainmodes of transit in the present study, exploring differences inreasons for taking public transportation in the future may behelpful in understanding complex patterns and dynamicsbetween travel and medical care utilization.
When we examined a combination of population-basedtransportation-related factors with the Engage Study data to geta clearer picture of reasons for taking public transportationacross Atlanta, we found that south Atlanta had overlappinggeographic areas of longer estimated commute times to attendHIV care visits, low car ownership, and greater access to publictransportation. Historically, south Atlanta also has a majorityblack population and greater levels of poverty compared to otherareas of Atlanta [24], and along with downtown Atlanta, alsohas a greater burden of HIV compared to other areas of the city[35]. National data also show disproportionately greater use ofpublic transportation among minorities and individuals fromlow-income households, suggesting socioeconomic differencesin travel behaviors [36]. Therefore, transportation-relatedbarriers to HIV care may be more prevalent in economicallydisadvantaged communities in south Atlanta where there is agreater need for HIV medical care utilization.
Although reasons for taking public transportation are highlycorrelated with SES, controlling for census tract-level carownership and individual-level race and income in this analysisdid not explain the observed association between publictransportation use and HIV care attendance in south Atlanta.Individual-level household vehicle ownership could haveexplained the association if the participants are notrepresentative of their census tract of residence. However,information on individual-level vehicle ownership was notavailable. Alternatively, there may have been one or moreunmeasured factors associated with neighborhood economicdisadvantage and deprivation, which explain the differentialresults between north and south Atlanta, and this should befurther explored.
Differences in the density of available medical resources mayhave also helped drive the geographic differences in effectestimates. In particular, there were very few attended HIVproviders located in south Atlanta, compared to north Atlanta.This is consistent with another study, which found poorer spatialaccessibility to HIV providers in south Atlanta, where HIV
prevalence is high [37]. Having fewer available providers in anarea where residents are potentially more reliant on public transitas a sole means of travel might amplify travel-related barriers.Exploring this idea further in future studies through focus groupsmay help elucidate important drivers of travel-related barriersto HIV care.
Although this is a hypothesis-generating study with exploratoryobjectives, the results justify exploring in the future whethertravel-related barriers affect medical care attendancedifferentially by region of residence among Atlanta-based,HIV-positive MSM. Larger studies which collect informationon individual car ownership and any unmeasured factors whichcould potentially explain the differential effect estimates wouldhelp inform whether interventions related to improving spatialaccess might be beneficial. For instance, if transportation didindeed differentially affect HIV care attendance, the use ofmobile clinics, as well as expansion of public transportationnetworks and more frequently operating bus and train routes,could be helpful in mitigating travel-related barriers.
Mobile vehicles used for HIV testing have been accepted bypatients both in and out of the United States [38-40], but haverarely been used to administer HIV care, despite such an optionbeing suggested to reduce transportation and socioeconomicbarriers to medical care [41]. Mobile clinics have been used toprovide other types of medical care previously, and have beenassociated with improved health care utilization [42], andpotentially, fewer visits to the emergency department [43], afterimplementation.
Improving public transportation connectivity to other parts ofthe city, where preferred HIV clinics may operate, is key toincreasing mobility of lower income communities that may beless likely to own a vehicle. Increasing frequency of existingpublic bus and train routes may also cut down on commutetimes and improve the level of convenience associated withtaking public transportation. However, expansion of publictransit in Atlanta has continually been a contentious issue amongthe public [23,44]. The original plan for a public transit systemwas published in a 1961 report by the Atlanta RegionMetropolitan Planning Commission, and included an expansive,66 mile rail network and covered five counties in the metro area[21,22]. Unfortunately, the plan was not approved by votersand eventually resulted in the 48 mile rail and 91 route bussystem that it is today [22]. Despite limited availability of fundsto expand the current public transportation network,incorporating discussions about public health during transitplanning would be helpful in serving communities, which maybenefit from greater access to medical resources they may need.
LimitationsThere are several limitations to this study. First, thecross-sectional study design does not lend itself to makinginferences on temporality or causality. Second, because a largeproportion of participants were recruited on the Internet, HIVstatus was self-reported and could not be verified. However,we suspect little to no misclassification of HIV status becausethe study survey contained extensive questions about providerlocation and HIV care engagement. The primary outcome,number of attended HIV care visits in the past 12 months, was
JMIR Public Health Surveill 2015 | vol. 1 | iss. 2 | e10 | p.69http://publichealth.jmir.org/2015/2/e10/(page number not for citation purposes)
Dasgupta et alJMIR PUBLIC HEALTH AND SURVEILLANCE
XSL•FORenderX

self-reported, and therefore, is subject to information bias. Wehypothesize that the number of attended appointments mightbe overreported, but do not suspect that misclassification wasdifferential with respect to travel parameters.
The relationship between travel-related factors and HIV careattendance may be confounded by level of disease progression,which should be incorporated in future analyses. Results weregenerated from a convenience sample, which may not berepresentative of all HIV-positive MSM living in Atlanta,limiting generalizability of results. Obtaining more informationon mode of transportation used to attend visits, includingwhether the patient carpooled with someone or received a rideand reasons for taking certain modes of transit, would haveadded to the results. In addition, using population-basedestimates of vehicle access as a proxy for household vehicleownership for participants may not have been appropriate dueto convenience sampling. Finally, home and provider locationsare based on self-report and are subject to information bias.
ConclusionsUsing public transportation, compared to private transportation,may have been a barrier to HIV care among a sample ofAtlanta-based, HIV-positive MSM living in south Atlanta. Wehypothesize that reasons for taking public transportation andavailability of HIV providers may differ across regions ofresidence in Atlanta, and, thus, could help explain thedifferences in the observed association by region. However,this hypothesis should be further explored in future studies.
The results from this analysis add to the current knowledgeabout travel and transportation-related barriers to HIV care,may inform the design of larger population-based studies whichfurther explore potential neighborhood-level characteristicsdriving differences in travel-related barriers, and could provideguidance on potentially beneficial interventions which addressgaps in care among Atlanta-based, HIV-positive MSM.
AcknowledgmentsThe National Institute of Mental Health (grant number R01MH085600), Eunice Kennedy Shriver National Institute for ChildHealth and Human Development (grant number R01HD067111), Emory University Center for AIDS Research (grant numberP30AI050409), and Professional Development Support Funds provided by Laney Graduate School, Emory University financiallysupported the Engage Study.
Conflicts of InterestNone declared.
References1. Centers for Disease Control and Prevention. Centers for Disease Control and Prevention. 2015. HIV surveillance report,
2012; Published 2014 URL: http://www.cdc.gov/hiv/library/reports/surveillance [accessed 2015-04-13] [WebCite CacheID 6XlezndHa]
2. Purcell DW, Johnson CH, Lansky A, Prejean J, Stein R, Denning P, et al. Estimating the population size of men who havesex with men in the United States to obtain HIV and syphilis rates. Open AIDS J 2012;6:98-107 [FREE Full text] [doi:10.2174/1874613601206010098] [Medline: 23049658]
3. Horstmann E, Brown J, Islam F, Buck J, Agins BD. Retaining HIV-infected patients in care: Where are we? Where do wego from here? Clin Infect Dis 2010 Mar 1;50(5):752-761 [FREE Full text] [doi: 10.1086/649933] [Medline: 20121413]
4. Mugavero MJ, Norton WE, Saag MS. Health care system and policy factors influencing engagement in HIV medical care:Piecing together the fragments of a fractured health care delivery system. Clin Infect Dis 2011 Jan 15;52 Suppl 2:S238-S246[FREE Full text] [doi: 10.1093/cid/ciq048] [Medline: 21342913]
5. Das M, Chu PL, Santos G, Scheer S, Vittinghoff E, McFarland W, et al. Decreases in community viral load are accompaniedby reductions in new HIV infections in San Francisco. PLoS One 2010;5(6):e11068 [FREE Full text] [doi:10.1371/journal.pone.0011068] [Medline: 20548786]
6. Sullivan PS, Peterson J, Rosenberg ES, Kelley CF, Cooper H, Vaughan A, et al. Understanding racial HIV/STI disparitiesin black and white men who have sex with men: A multilevel approach. PLoS One 2014;9(3):e90514 [FREE Full text][doi: 10.1371/journal.pone.0090514] [Medline: 24608176]
7. HIV care continuum surveillance report, adults and adolescents, Georgia, 2012; Published 2014. on April 13, 2015 URL:https://dph.georgia.gov/sites/dph.georgia.gov/files/HIV%20Care%20Continuum%20Report_2012_web%20view_spreads.pdf [accessed 2015-04-13] [WebCite Cache ID 6Xlg7V4jg]
8. Cunningham WE, Andersen RM, Katz MH, Stein MD, Turner BJ, Crystal S, et al. The impact of competing subsistenceneeds and barriers on access to medical care for persons with human immunodeficiency virus receiving care in the UnitedStates. Med Care 1999 Dec;37(12):1270-1281. [Medline: 10599608]
9. Conviser R, Pounds MB. The role of ancillary services in client-centred systems of care. AIDS Care 2002 Aug;14 Suppl1:S119-S131. [doi: 10.1080/09540120220150018] [Medline: 12204146]
JMIR Public Health Surveill 2015 | vol. 1 | iss. 2 | e10 | p.70http://publichealth.jmir.org/2015/2/e10/(page number not for citation purposes)
Dasgupta et alJMIR PUBLIC HEALTH AND SURVEILLANCE
XSL•FORenderX
10. Moneyham L, McLeod J, Boehme A, Wright L, Mugavero M, Seal P, et al. Perceived barriers to HIV care amongHIV-infected women in the Deep South. J Assoc Nurses AIDS Care 2010;21(6):467-477. [doi: 10.1016/j.jana.2010.03.003][Medline: 20430653]
11. Wohl AR, Carlos J, Tejero J, Dierst-Davies R, Daar ES, Khanlou H, et al. Barriers and unmet need for supportive servicesfor HIV patients in care in Los Angeles County, California. AIDS Patient Care STDS 2011 Sep;25(9):525-532. [doi:10.1089/apc.2011.0149] [Medline: 21774689]
12. Sagrestano LM, Clay J, Finerman R, Gooch J, Rapino M. Transportation vulnerability as a barrier to service utilization forHIV-positive individuals. AIDS Care 2014;26(3):314-319. [doi: 10.1080/09540121.2013.819403] [Medline: 23876086]
13. Buzza C, Ono SS, Turvey C, Wittrock S, Noble M, Reddy G, et al. Distance is relative: Unpacking a principal barrier inrural healthcare. J Gen Intern Med 2011 Nov;26 Suppl 2:648-654 [FREE Full text] [doi: 10.1007/s11606-011-1762-1][Medline: 21989617]
14. Heckman TG, Somlai AM, Peters J, Walker J, Otto-Salaj L, Galdabini CA, et al. Barriers to care among persons livingwith HIV/AIDS in urban and rural areas. AIDS Care 1998 Jun;10(3):365-375. [doi: 10.1080/713612410] [Medline: 9828979]
15. Reif S, Golin CE, Smith SR. Barriers to accessing HIV/AIDS care in North Carolina: Rural and urban differences. AIDSCare 2005 Jul;17(5):558-565. [doi: 10.1080/09540120412331319750] [Medline: 16036242]
16. Blair JM, McNaghten AD, Frazier EL, Skarbinski J, Huang P, Heffelfinger JD. Clinical and behavioral characteristics ofadults receiving medical care for HIV infection --- Medical Monitoring Project, United States, 2007. MMWR SurveillSumm 2011 Sep 2;60(11):1-20 [FREE Full text] [Medline: 21881551]
17. Beirão G, Sarsfield Cabral J. Understanding attitudes towards public transport and private car: A qualitative study. TransportPolicy 2007 Nov;14(6):478-489. [doi: 10.1016/j.tranpol.2007.04.009]
18. Levinson D. Network structure and city size. PLoS One 2012;7(1):e29721 [FREE Full text] [doi:10.1371/journal.pone.0029721] [Medline: 22253764]
19. Nurul Habib KM. Modeling commuting mode choice jointly with work start time and work duration. Transportation researchpart A: Policy and practice 2012 Jan;46(1):33-47. [doi: 10.1016/j.tra.2011.09.012]
20. Van Vugt M, Van Lange P, Meertens R. Commuting by car or public transportation? A social dilemma analysis of travelmode judgements. Eur. J. Soc. Psychol 1996 May;26(3):373-395. [doi:10.1002/(SICI)1099-0992(199605)26:3<373::AID-EJSP760>3.0.CO;2-1]
21. University LB. ScholarWorks. Snow Jam 2014: Georgia State University,; 2014. Planning Atlanta, ryan gravel, and acar-dependent region URL: http://webapps.library.gsu.edu/blogs/library/2014/02/06/snow-jam-2014-planning-atlanta-ryan-gravel-and-a-car-dependent-region/ [accessed 2015-04-13] [WebCite Cache ID6Xli6bjH0]
22. Metropolitan Atlanta Rapid Transportation Authority. Metropolitan Atlanta Rapid Transportation Authority. USA: MARTA;2013. FY 2013 annual report: July 1, 2012-June 30, 2013 URL: http://jkheneghan.com/city/meetings/2013/Sep/FY2013_MARTOC_Report_Marta.pdf [accessed 2015-08-18] [WebCite Cache ID 6asao0Cuo]
23. Monroe D. Atlanta. Where it all went wrong: If only we could undo the MARTA Compromise of 1971; 2012. URL: http://www.atlantamagazine.com/great-reads/marta-tsplost-transportation/ [accessed 2015-04-12] [WebCite Cache ID 6XlpDrNbx]
24. Bayor RH. Roads to racial segregation: Atlanta in the twentieth century. Journal of Urban History 1988 Nov 01;15(1):3-21.[doi: 10.1177/009614428801500101]
25. Doubeni CA, Schootman M, Major JM, Stone Rosalie A Torres, Laiyemo AO, Park Y, et al. Health status, neighborhoodsocioeconomic context, and premature mortality in the United States: The National Institutes of Health-AARP Diet andHealth Study. Am J Public Health 2012 Apr;102(4):680-688 [FREE Full text] [doi: 10.2105/AJPH.2011.300158] [Medline:21852636]
26. Sampson RJ, Morenoff JD, Gannon-Rowley T. Assessing “neighborhood effects”: Social processes and new directions inresearch. Annu. Rev. Sociol 2002 Aug;28(1):443-478. [doi: 10.1146/annurev.soc.28.110601.141114]
27. Kramer MR, Hogue CR. Is segregation bad for your health? Epidemiol Rev 2009;31:178-194 [FREE Full text] [doi:10.1093/epirev/mxp001] [Medline: 19465747]
28. SurveyGizmo. URL: http://www.surveygizmo.com/ [accessed 2015-04-13] [WebCite Cache ID 6Xlpwqfpq]29. Dasgupta S, Vaughan AS, Kramer MR, Sanchez TH, Sullivan PS. Use of a Google Map tool embedded in an internet survey
instrument: Is it a valid and reliable alternative to geocoded address data? JMIR Res Protoc 2014;3(2):e24 [FREE Full text][doi: 10.2196/resprot.2946] [Medline: 24726954]
30. United States Census Bureau. American fact finder URL: http://factfinder.census.gov/faces/nav/jsf/pages/index.xhtml[accessed 2015-04-13] [WebCite Cache ID 6XlqIax0P]
31. Atlanta Regional Commission. GIS data and maps: Regional transportation URL: http://www.atlantaregional.com/info-center/gis-data-maps/gis-data [accessed 2015-04-13] [WebCite Cache ID 6XlqWnPq9]
32. Summary of travel trends. 2009 National household travel survey: US Department of Transportation, Federal HighwayAdministration; 2011 URL: http://nhts.ornl.gov/2009/pub/stt.pdf [accessed 2015-04-12] [WebCite Cache ID 6Xlqxl1Hq]
33. Hagman O. Mobilizing meanings of mobility: Car users’ constructions of the goods and bads of car use. TransportationResearch Part D: Transport and Environment 2003 Jan;8(1):1-9. [doi: 10.1016/S1361-9209(02)00014-7]
JMIR Public Health Surveill 2015 | vol. 1 | iss. 2 | e10 | p.71http://publichealth.jmir.org/2015/2/e10/(page number not for citation purposes)
Dasgupta et alJMIR PUBLIC HEALTH AND SURVEILLANCE
XSL•FORenderX
34. Paulley N, Balcombe R, Mackett R, Titheridge H, Preston J, Wardman M, et al. The demand for public transport: Theeffects of fares, quality of service, income and car ownership. Transport Policy 2006 Jul;13(4):295-306. [doi:10.1016/j.tranpol.2005.12.004]
35. Hixson BA, Omer SB, del RC, Frew PM. Spatial clustering of HIV prevalence in Atlanta, Georgia and populationcharacteristics associated with case concentrations. J Urban Health 2011 Feb;88(1):129-141 [FREE Full text] [doi:10.1007/s11524-010-9510-0] [Medline: 21249526]
36. Pucher J, Renne JL. Rural mobility and mode choice: Evidence from the 2001 National Household Travel Survey.Transportation 2005 Mar;32(2):165-186. [doi: 10.1007/s11116-004-5508-3]
37. Dasgupta S, Kramer MR, Rosenberg ES, Sanchez TH, Sullivan PS. Spatial accessibility to HIV providers in Atlanta,Georgia. AIDS Res Hum Retroviruses 2015 May;31(5):473-474. [doi: 10.1089/aid.2014.0365]
38. Liang TS, Erbelding E, Jacob CA, Wicker H, Christmyer C, Brunson S, et al. Rapid HIV testing of clients of a mobileSTD/HIV clinic. AIDS Patient Care STDS 2005 Apr;19(4):253-257. [doi: 10.1089/apc.2005.19.253] [Medline: 15857197]
39. Morin SF, Khumalo-Sakutukwa G, Charlebois ED, Routh J, Fritz K, Lane T, et al. Removing barriers to knowing HIVstatus: Same-day mobile HIV testing in Zimbabwe. J Acquir Immune Defic Syndr 2006 Feb 1;41(2):218-224. [Medline:16394855]
40. Larson BA, Schnippel K, Ndibongo B, Xulu T, Brennan A, Long L, et al. Rapid point-of-care CD4 testing at mobile HIVtesting sites to increase linkage to care: An evaluation of a pilot program in South Africa. J Acquir Immune Defic Syndr2012 Oct 1;61(2):e13-e17 [FREE Full text] [doi: 10.1097/QAI.0b013e31825eec60] [Medline: 22659650]
41. Sarnquist CC, Soni S, Hwang H, Topol BB, Mutima S, Maldonado YA. Rural HIV-infected women's access to medicalcare: Ongoing needs in California. AIDS Care 2011 Jul;23(7):792-796. [doi: 10.1080/09540121.2010.516345] [Medline:21287418]
42. Edgerley LP, El-Sayed YY, Druzin ML, Kiernan M, Daniels KI. Use of a community mobile health van to increase earlyaccess to prenatal care. Matern Child Health J 2007 May;11(3):235-239. [doi: 10.1007/s10995-006-0174-z] [Medline:17243022]
43. Song Z, Hill C, Bennet J, Vavasis A, Oriol NE. Mobile clinic in Massachusetts associated with cost savings from loweringblood pressure and emergency department use. Health Aff (Millwood) 2013 Jan;32(1):36-44 [FREE Full text] [doi:10.1377/hlthaff.2011.1392] [Medline: 23297269]
44. Sampson R. Rail Magazine. 2011. Carpe Diem: Georgia prepares to seize its mobility future URL: http://web1.ctaa.org/webmodules/webarticles/articlefiles/Fall-Winter11_Georgia.pdf [accessed 2015-04-13] [WebCite Cache ID 6Xls1si35]
AbbreviationsHIV: human immunodeficiency virusIQR: interquartile rangesMARTA: Metropolitan Atlanta Rapid Transit AuthorityMSM: men who have sex with menSES: socioeconomic status
Edited by G Eysenbach; submitted 14.04.15; peer-reviewed by C George, S Stahlman, B Linas; comments to author 26.06.15; revisedversion received 19.07.15; accepted 27.07.15; published 24.08.15.
Please cite as:Dasgupta S, Kramer MR, Rosenberg ES, Sanchez TH, Reed L, Sullivan PSThe Effect of Commuting Patterns on HIV Care Attendance Among Men Who Have Sex With Men (MSM) in Atlanta, GeorgiaJMIR Public Health Surveill 2015;1(2):e10URL: http://publichealth.jmir.org/2015/2/e10/ doi:10.2196/publichealth.4525PMID:27227128
©Sharoda Dasgupta, Michael R Kramer, Eli S Rosenberg, Travis H Sanchez, Landon Reed, Patrick S Sullivan. Originallypublished in JMIR Public Health and Surveillance (http://publichealth.jmir.org), 24.08.2015. This is an open-access articledistributed under the terms of the Creative Commons Attribution License (http://creativecommons.org/licenses/by/2.0/), whichpermits unrestricted use, distribution, and reproduction in any medium, provided the original work, first published in JMIR PublicHealth and Surveillance, is properly cited. The complete bibliographic information, a link to the original publication onhttp://publichealth.jmir.org, as well as this copyright and license information must be included.
JMIR Public Health Surveill 2015 | vol. 1 | iss. 2 | e10 | p.72http://publichealth.jmir.org/2015/2/e10/(page number not for citation purposes)
Dasgupta et alJMIR PUBLIC HEALTH AND SURVEILLANCE
XSL•FORenderX
Original Paper
An Integrated Service Delivery Model to Identify Persons Livingwith HIV and to Provide Linkage to HIV Treatment and Care inPrioritized Neighborhoods: A Geotargeted, Program OutcomeStudy
Paula M Frew1,2, MA, MPH, PhD; Matthew Archibald3, PhD; Jay Schamel1, BS; Diane Saint-Victor1, MPH; Elizabeth
Fox1; Neena Smith-Bankhead4, MS; Dazon Dixon Diallo5, MPH; Marcia M Holstad6, PhD, FNP-BC, FAAN, FAANP;
Carlos del Rio1,2, MD1Division of Infectious Diseases, Department of Medicine, Emory University School of Medicine, Atlanta, GA, United States2Hubert Department of Global Health, Rollins School of Public Health, Emory University, Atlanta, GA, United States3Department of Sociology, Colby College, Waterville, ME, United States4AID Atlanta, Atlanta, GA, United States5SisterLove, Inc., Atlanta, GA, United States6Emory University School of Nursing, Atlanta, GA, United States
Corresponding Author:Paula M Frew, MA, MPH, PhDDivision of Infectious DiseasesDepartment of MedicineEmory University School of Medicine1760 Haygood Drive, Suite W327Atlanta, GA, 30322United StatesPhone: 1 404 712 8546Fax: 1 404 370 6142Email: [email protected]
Abstract
Background: Recent studies have demonstrated that high human immunodeficiency virus (HIV) prevalence (2.1%) rates existin “high-risk areas” of US cities that are comparable to rates in developing nations. Community-based interventions (CBIs) havedemonstrated potential for improving HIV testing in these areas, thereby facilitating early entry and engagement in the HIVcontinuum of care. By encouraging neighborhood-based community participation through an organized community coalition,Project LINK sought to demonstrate the potential of the CBI concept to improve widespread HIV testing and referral in an areacharacterized by high poverty and HIV prevalence with few existing HIV-related services.
Objective: This study examines the influence of Project LINK to improve linkage-to-care and HIV engagement among residentsof its target neighborhoods.
Methods: Using a venue-based sampling strategy, survey participants were selected from among all adult participants aged 18years or more at Project LINK community events (n=547). We explored multilevel factors influencing continuum-of-care outcomes(linkage to HIV testing and CBI network referral) through combined geospatial-survey analyses utilizing hierarchical linear modelmethodologies and random-intercept models that adjusted for baseline effect differences among zip codes. The study specificallyexamined participant CBI utilization and engagement in relation to individual and psychosocial factors, as well as neighborhoodcharacteristics including the availability of HIV testing services, and the extent of local prevention, education, and clinical supportservices.
Results: Study participants indicated strong mean intention to test for HIV using CBI agencies (mean 8.66 on 10-point scale[SD 2.51]) and to facilitate referrals to the program (mean 8.81 on 10-point scale [SD 1.86]). Individual-level effects wereconsistent across simple multiple regression and random-effects models, as well as multilevel models. Participants with lowerincome expressed greater intentions to obtain HIV tests through LINK (P<.01 across models). HIV testing and CBI referralintention were associated with neighborhood-level factors, including reduced availability of support services (testing P<.001),
JMIR Public Health Surveill 2015 | vol. 1 | iss. 2 | e16 | p.73http://publichealth.jmir.org/2015/2/e16/(page number not for citation purposes)
Frew et alJMIR PUBLIC HEALTH AND SURVEILLANCE
XSL•FORenderX
greater proportion of black/African Americans (testing and referral P<.001), and reduced socioeconomic capital (testing P=.017and referral P<.001). Across models, participants expressing positive attitudes toward the CBI exhibited greater likelihood ofengaging in routine HIV testing (P<.01) and referring others to HIV care (P<.01). Transgender individuals indicated greaterintent to refer others to the CBI (P<.05). These outcomes were broadly influenced by distal community-level factors includingavailability of neighborhood HIV support organizations, population composition socioeconomic status, and high HIV prevalence.
Conclusions: Project LINK demonstrated its potential as a geotargeted CBI by evidencing greater individual intention to engagein HIV testing, care, and personal referrals to its coalition partner organizations. This study highlights important socioecologicaleffects of US-based CBIs to improve HIV testing and initiate acceptable mechanisms for prompt referral to care among a vulnerablepopulation.
(JMIR Public Health Surveill 2015;1(2):e16) doi:10.2196/publichealth.4675
KEYWORDS
human immunodeficiency virus; human immunodeficiency virus prevention; human immunodeficiency virus testing; racial/ethnicminorities; community-based organizations; High-Impact Prevention
Introduction
BackgroundCommunity-based interventions (CBIs) are a feasible,sustainable approach to increase widespread humanimmunodeficiency virus (HIV) testing and improve entry andengagement in the HIV continuum of care [1,2]. Ideally,engagement in care is a seamless, coordinated processcommencing with individual testing, diagnosis, and treatmentinitiation. Yet those at highest risk of HIV infection are the mostchallenging to engage and susceptible to delays across the carecontinuum. HIV testing delay is frequent in USmen-who-have-sex-with-men (MSM) populations, with anestimated 19-26% of MSM unaware of their status [3]. Delayedtesting is associated with a lack of awareness or denial ofperceived risk for infection, age, and race/ethnicity [3,4]. Racialand ethnic minorities are at increased risk of delayed referralto HIV care and treatment following diagnosis [5,6]. Rates ofdelayed testing rates remain high; in 2013, 23.6% of newlydiagnosed HIV patients in the United States were classified asStage 3 (acquired immune deficiency syndrome, AIDS) atdiagnosis [7]. Treatment delay is more common amongblack/African Americans, immigrants, and uninsured individuals[8]. Between 20% and 40% do not link to HIV care within ayear of diagnosis, a delay which is associated with higher ratesof virologic failure, increased morbidity and mortality, andimmune system damage resulting from delayed receipt ofantiretrovirals [9].
Recent studies have demonstrated that high HIV prevalence(2.1%), comparable with HIV rates in developing nations, arepresent in “high-risk areas” of US cities, particularly inneighborhoods characterized by high poverty and HIVprevalence [10]. These “hot spot” areas are experiencing local,yet generalized, HIV microepidemics. Notably, many of theseareas are located within 12 major metropolitan areas that accountfor approximately 44% of all estimated AIDS cases, signifyingthe challenges facing continuum of care access and delivery[11]. Thus, it is important to look at health care service deliveryin these areas and examine the extent to which these optionsare culturally compatible and socially sensitive to the needs ofthose who could most benefit from geographically targeted HIVprevention and care. Previous studies have identified the
importance of recognizing the spatial distribution of HIV burden[11,12], HIV service provision and continuum of care objectives[13-15], and also of the spatial and ecosocial dimensions of thedevelopment and delivery of CBIs targeting HIV transmission[1,16,17].
Project LINKProject LINK was an initiative supported by the Atlanta AIDSPartnership Fund and the Community Foundation of GreaterAtlanta to increase HIV testing in an area of Atlanta, Georgia,characterized by high poverty and HIV prevalence. LINK’sgoals were to identify residents living with HIV and directlyconnect those living with HIV to appropriate medical care andtreatment programs. In addition, LINK created a model forbuilding lasting partnerships between community and HIV/AIDSoutreach agencies. The project was initiated as a result ofnumerous meetings with community partners and local residentsconcerned about the high HIV prevalence rate in theirneighborhood. Collectively, all parties reviewed HIV/AIDSdata, held discussions on community needs and assets, andworked to identify specific strengths and potential contributionsof the selected agency partners to the delivery of HIV preventionand care in the selected neighborhoods.
Development of the intervention thus occurred through a processof community-based participatory research [18]. Communitymembers and leaders were invited to attend a series of meetingswith the funder, technical advisors, and evaluative team todiscuss factors that may be influencing high HIV prevalencerates in the target neighborhoods for the intervention, a processthat has proven to be effective in eliciting critical interventionpoints [19]. These conversations led to an inventory of structural,social, and individual-level factors that aligned well with thesocioecological model [20]. Thus, the intervention was informedby this theoretical framework based on community consensusand resulting activities that focused on addressing such factorsacross levels. As a result of these planning activities, 5community partner agencies were selected to collaborate withthe selected community to increase the capacity of localresidents and agencies to conduct HIV prevention andlinkage-to-care activities: the Center for Black Women’sWellness, Inc (CBWW), the Atlanta Harm Reduction Coalition(AHRC), AID Atlanta, Positive Impact, and SisterLove, Inc.
JMIR Public Health Surveill 2015 | vol. 1 | iss. 2 | e16 | p.74http://publichealth.jmir.org/2015/2/e16/(page number not for citation purposes)
Frew et alJMIR PUBLIC HEALTH AND SURVEILLANCE
XSL•FORenderX
High-Impact Prevention [21], an intervention approach adoptedby the Centers for Disease Control and Prevention (CDC) in2013 to improve the effectiveness of HIV prevention efforts,maximizes the relevance of proposed interventions throughconsideration of the cost effectiveness and feasibility offull-scale implementation, as well as assessment of coverage,interactions, and combinations. Project LINK utilized this samestrategy in bringing together various types of service providerswhile supporting partnership development and linkage systemsto ensure that those in need of HIV services had access to acomprehensive range of resources appropriate for their needs,accessible to those at greatest risk. Each of the participatingagencies had a long history of providing culturally competentprograms and integrative service delivery for HIV/AIDSprevention, testing, counseling, and linkage to HIV casemanagers and mental health services. Each agency had a specificrole related to HIV testing and subsequent coordinated referraland linkage to in-house clinical care. In addition, supportiveprograms such as the evidence-based “HealthyLove” HIVprevention party (SisterLove) [22,23]; needle exchange (AHRC)[24,25]; women’s support groups (CBWW, SisterLove, andAID Atlanta) [26]; and mental health counseling and domesticviolence prevention and response training (Positive Impact)[27] were components of the agencies’service delivery package.These were offered to residents at neighborhood schools,churches, housing complexes, and community meeting locations,in addition to street outreach conducted by the agencies’mobileunits.
The community partners developed Project LINK to normalizeroutine HIV testing and to provide coordinated linkage to HIVcare among the participating partner entities serving residentsin the target neighborhoods. LINK focused on engagingresidents living in an area comprising 2 target zip codes withina generalized HIV high-prevalence cluster (≥1.0% HIV caseprevalence) and few established HIV continuum-of-careresources [12]. For this study, we also identified a secondarycatchment area of 5 adjacent zip codes within the cluster,directly abutting the 2 target zip codes. The initiative sought toreach about 5000 residents over a 1-year period.
Methods
Study Design and SampleThe purpose of this study is to assess the influence of the ProjectLINK CBI to improve linkage-to-care and HIV engagement ina selected area of Atlanta that demonstrated a high HIVprevalence burden and limited health care services in its censustracts. Individuals enrolled in this study were selected fromsurvey sessions that were randomly scheduled over a 10-monthdemonstration period. This resulted in questionnaire collectionat 31 unique LINK-organized community activities andprograms during this period. Outcomes related to intention toutilize CBI HIV testing resources and to refer other CBIs wereincluded in surveys administered at 23 of thesepostimplementation activities within the process evaluationphase of the CBI. Eligibility criteria specified inclusion of menand women aged 18 and over who had the ability to read andwrite English. Respondents selected a gift card, t-shirt, transit
card, or some other health-promotion item for their participation.The Emory University Institutional Review Board approvedthe protocol (00005278) prior to study inception.
Study MeasuresThe questionnaire included items on HIV testing and referralto the CBI, in addition to sociodemographics, perceptions, andattitudinal factors. Our primary outcome of interest wasparticipants’ willingness to engage in routine HIV testingthrough the CBI, measured by the item, "On a scale from 0(definitely not) to 10 (definitely so), rank your likelihood ofgetting your next HIV test with a LINK agency in the next 6months." To assess the potential of the CBI to motivateparticipants to refer others to its services, we included the item,"On a scale from 0 (definitely not) to 10 (definitely so), rankyour likelihood of getting others involved in Project LINK."
Individual-Level FactorsWe estimated the impact of multiple, nested influential factorson the CBI’s key outcomes of interest, HIV testing, and LINKservice referral. Demographic factors from survey responsesincluded race, income, gender, and age. For the purposes of thisstudy, race was coded as "white" and "nonwhite." Householdincome responses included 6 categories in US $20,000increments from “less than US $20K per year” to “over US$100K per year,” and were treated as a continuous variable forour analyses. Gender was included in our models as a three-levelcategorical variable with levels "male," "female," and"transgender." Age was measured in years, and was incorporatedinto our models as a continuous covariate.
Exploratory Factor AnalysisPsychometric items were drawn from previous HIV behavioralresearch demonstrating excellent internal consistency andvalidity of items [20,28]. The questionnaire included measuresassessing attitudes about the LINK initiative, HIV/AIDS, socialnorms, and community involvement [1,29,30]. Subscaledevelopment utilized principal component analyses with varimaxrotation, followed by assessment of components’ internalconsistency. Because some item responses were missing (3.6%),we conducted Little’s Missing Completely at Random (MCAR)test to analyze the overall pattern on surveys and subsequentlyperformed mean imputation.
Neighborhood-Level FactorsTo assess the CBI’s success in promoting linkage to HIV supportin underserved communities, we explored the relationshipbetween LINK service utilization and the availability of HIVservices, support, and educational organizations. Previousresearch provided a comprehensive catalog of HIV serviceofferings in both the 2 CBI target area zip codes and thesurrounding neighborhoods [12]. Using their reported residentialzip code, each participant was connected to the total number ofdiscrete, permanent HIV-related services available in theircommunity [13]. Discrete services included HIV casemanagement, HIV medical treatment/services, HIV testing andcounseling, community education and outreach, mentoring andsupport services, etc. and separate services from the sameprovider were counted separately. Only services provided priorto the initiation of Project LINK were included in this count.
JMIR Public Health Surveill 2015 | vol. 1 | iss. 2 | e16 | p.75http://publichealth.jmir.org/2015/2/e16/(page number not for citation purposes)
Frew et alJMIR PUBLIC HEALTH AND SURVEILLANCE
XSL•FORenderX

HIV prevalence was estimated for each zip code usingcensus-tract-level HIV diagnosis counts from 2005 to 2007.These census-tract-level HIV counts were aggregated tozip-code-level counts using Esri ArcGIS version 10.2 [31].Counts from census tracts overlapping more than 1 zip codewere split by area. HIV prevalence was computed by dividingthe aggregate HIV diagnosis count by the zip code population,as measured in the US Census 2000 [32].
Other neighborhood-level factors were included to reflect thesocioeconomic composition of the community. These variablesincluded the proportion of black/African American residents,the proportion of residents aged 25 years or more, the proportionof male residents over 18 who have graduated high school,median income, male employment rate, and the proportion ofvacant households. These community characteristics wereobtained at the zip code level from the US Census Bureau'sCensus 2000 [32].
Statistical AnalysesWe first computed descriptive statistics for characteristics ofour sample of CBI participants and for questions elicitingparticipant impressions of the CBI. We then computeddescriptive statistics for our 2 outcome measures, willingnessto engage in routine HIV testing through the CBI, and intentionto refer others to the CBI. To compare these outcomes betweenparticipants living in the 2 primary target zip codes, those livingin the 5 secondary catchment zip codes, and those living outsidethe target areas, we utilized analysis of variance (ANOVA) posthoc pairwise analysis with Tamhane adjustment.
Next, we employed random-intercept linear mixed models toexamine the effect of individual- and neighborhood-levelcovariates on CBI utilization and referral outcomes. Baselinedifferences among participants from different zip codes wereadjusted for through the incorporation of random intercepts foreach zip code. To focus analysis on effects relating to individualswithin the CBI area, only participants from the 2 target and 5secondary catchment zip codes were included in the multilevel
analysis. Because 7 zip codes did not admit multipleneighborhood effects in a single model, separate models werefit for each neighborhood-level covariate, each regressing asingle neighborhood-level covariate and all individual-levelcovariates on a CBI outcome. To assess the stability ofindividual-level effects, multiple linear and random-intercept(by zip code) models were also fit using only the individual andpsychosocial variables, excluding neighborhood-level variables.Random-intercept models used the xtreg procedure withmaximum likelihood estimation in Stata version 13 [33].Participants with missing outcome responses were excluded bylistwise deletion. Variance inflation factors were used to assessall models for multicollinearity; no issues were discovered. Forall hypothesis tests, results were considered statisticallysignificant if P<0.05.
Results
Sample CharacteristicsOf the 597 respondents selected at the 23 postimplementationactivities, 414 (69%) lived within the 2 primary LINK targetzip codes, 37 (6.2%) within the 5 secondary catchment zipcodes, 101 (17%) lived outside the targeted area, and 45 (7.5%)did not list a home zip code. Table 1 describes thesociodemographic characteristics of the sampled participants,together with the characteristics of the participants living withinthe 2 target zip codes and the 5 secondary catchment zip codes(Table 1). The CBI participants included a majority ofblack/African American (88.8%, n=530) participants in the agerange of 40-59 years (63.7%, n=380; Table 1). Respondentswere evenly split between male and female participants (47.6%,n=284 versus 45.2%, n=270). In addition, the sample included27 transgender persons (the majority male-to-female). Mostrespondents obtained high-school diplomas or generaleducational developments (56.8%, n=339), yet many were alsounemployed (54.6%, n=326) and had annual household incomeless than US $20,000 per year (78.2%, n=467).
JMIR Public Health Surveill 2015 | vol. 1 | iss. 2 | e16 | p.76http://publichealth.jmir.org/2015/2/e16/(page number not for citation purposes)
Frew et alJMIR PUBLIC HEALTH AND SURVEILLANCE
XSL•FORenderX
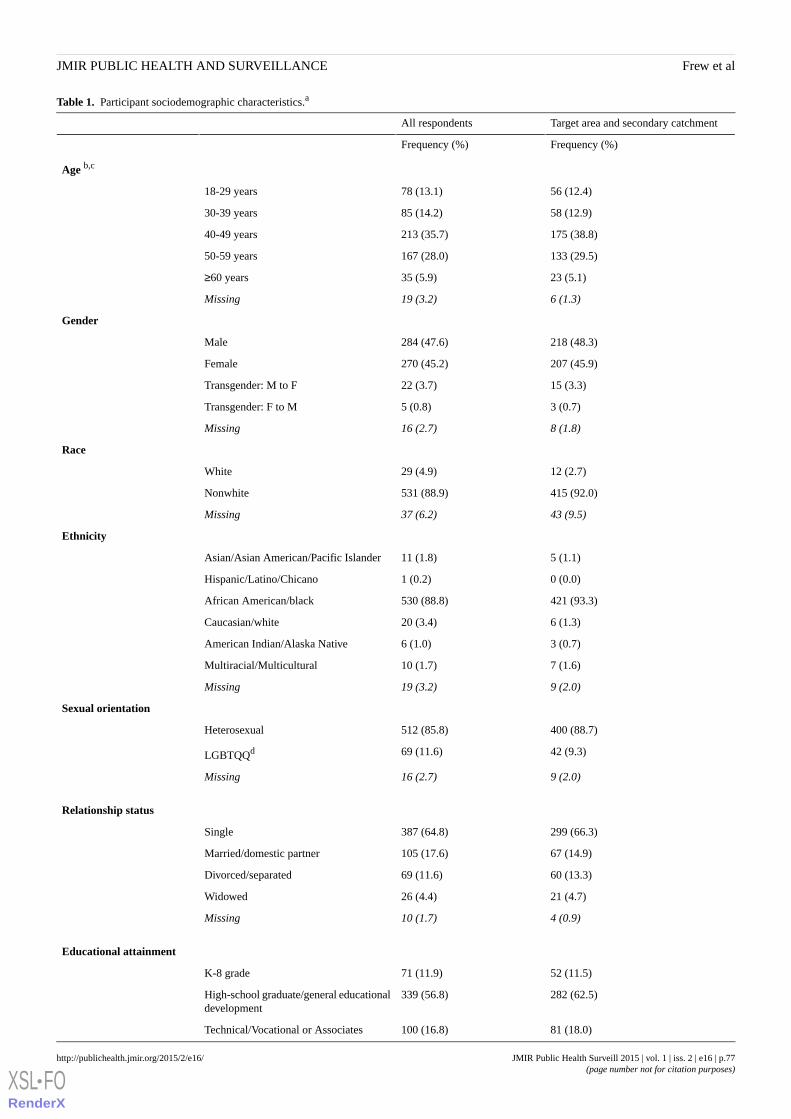
Table 1. Participant sociodemographic characteristics.a
Target area and secondary catchmentAll respondents
Frequency (%)Frequency (%)
Age b,c
56 (12.4)78 (13.1)18-29 years
58 (12.9)85 (14.2)30-39 years
175 (38.8)213 (35.7)40-49 years
133 (29.5)167 (28.0)50-59 years
23 (5.1)35 (5.9)≥60 years
6 (1.3)19 (3.2)Missing
Gender
218 (48.3)284 (47.6)Male
207 (45.9)270 (45.2)Female
15 (3.3)22 (3.7)Transgender: M to F
3 (0.7)5 (0.8)Transgender: F to M
8 (1.8)16 (2.7)Missing
Race
12 (2.7)29 (4.9)White
415 (92.0)531 (88.9)Nonwhite
43 (9.5)37 (6.2)Missing
Ethnicity
5 (1.1)11 (1.8)Asian/Asian American/Pacific Islander
0 (0.0)1 (0.2)Hispanic/Latino/Chicano
421 (93.3)530 (88.8)African American/black
6 (1.3)20 (3.4)Caucasian/white
3 (0.7)6 (1.0)American Indian/Alaska Native
7 (1.6)10 (1.7)Multiracial/Multicultural
9 (2.0)19 (3.2)Missing
Sexual orientation
400 (88.7)512 (85.8)Heterosexual
42 (9.3)69 (11.6)LGBTQQd
9 (2.0)16 (2.7)Missing
Relationship status
299 (66.3)387 (64.8)Single
67 (14.9)105 (17.6)Married/domestic partner
60 (13.3)69 (11.6)Divorced/separated
21 (4.7)26 (4.4)Widowed
4 (0.9)10 (1.7)Missing
Educational attainment
52 (11.5)71 (11.9)K-8 grade
282 (62.5)339 (56.8)High-school graduate/general educationaldevelopment
81 (18.0)100 (16.8)Technical/Vocational or Associates
JMIR Public Health Surveill 2015 | vol. 1 | iss. 2 | e16 | p.77http://publichealth.jmir.org/2015/2/e16/(page number not for citation purposes)
Frew et alJMIR PUBLIC HEALTH AND SURVEILLANCE
XSL•FORenderX
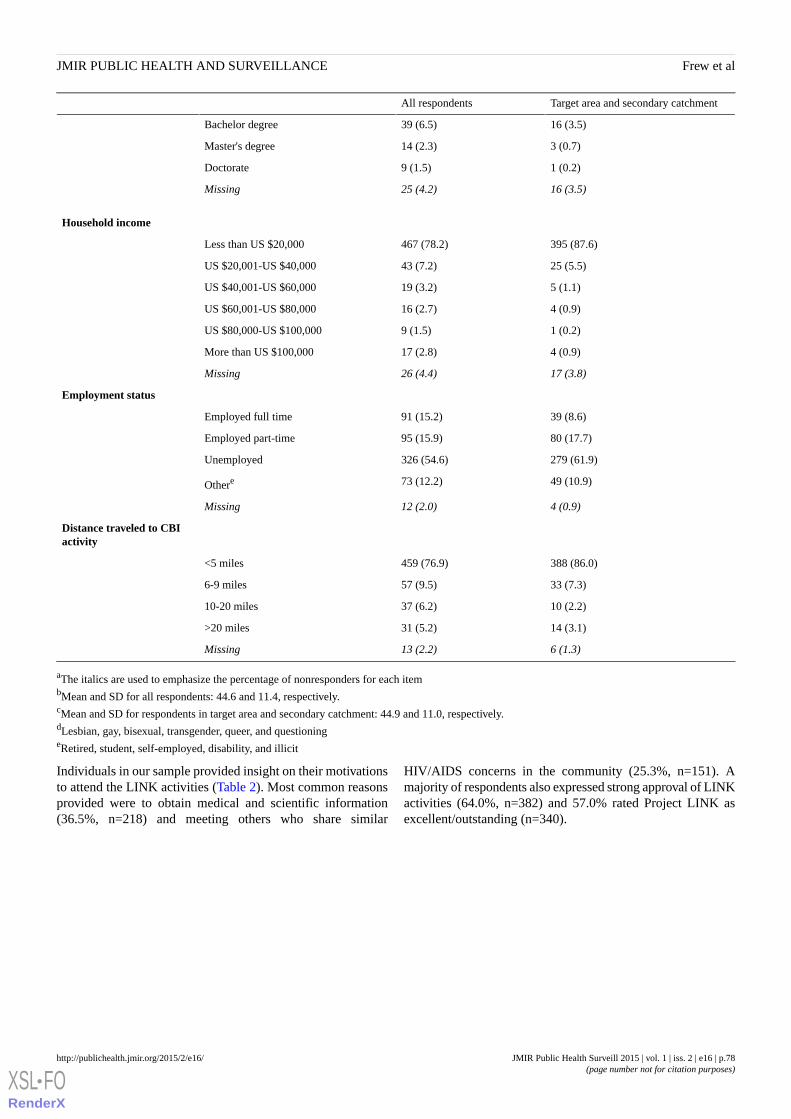
Target area and secondary catchmentAll respondents
16 (3.5)39 (6.5)Bachelor degree
3 (0.7)14 (2.3)Master's degree
1 (0.2)9 (1.5)Doctorate
16 (3.5)25 (4.2)Missing
Household income
395 (87.6)467 (78.2)Less than US $20,000
25 (5.5)43 (7.2)US $20,001-US $40,000
5 (1.1)19 (3.2)US $40,001-US $60,000
4 (0.9)16 (2.7)US $60,001-US $80,000
1 (0.2)9 (1.5)US $80,000-US $100,000
4 (0.9)17 (2.8)More than US $100,000
17 (3.8)26 (4.4)Missing
Employment status
39 (8.6)91 (15.2)Employed full time
80 (17.7)95 (15.9)Employed part-time
279 (61.9)326 (54.6)Unemployed
49 (10.9)73 (12.2)Othere
4 (0.9)12 (2.0)Missing
Distance traveled to CBIactivity
388 (86.0)459 (76.9)<5 miles
33 (7.3)57 (9.5)6-9 miles
10 (2.2)37 (6.2)10-20 miles
14 (3.1)31 (5.2)>20 miles
6 (1.3)13 (2.2)Missing
aThe italics are used to emphasize the percentage of nonresponders for each itembMean and SD for all respondents: 44.6 and 11.4, respectively.cMean and SD for respondents in target area and secondary catchment: 44.9 and 11.0, respectively.dLesbian, gay, bisexual, transgender, queer, and questioningeRetired, student, self-employed, disability, and illicit
Individuals in our sample provided insight on their motivationsto attend the LINK activities (Table 2). Most common reasonsprovided were to obtain medical and scientific information(36.5%, n=218) and meeting others who share similar
HIV/AIDS concerns in the community (25.3%, n=151). Amajority of respondents also expressed strong approval of LINKactivities (64.0%, n=382) and 57.0% rated Project LINK asexcellent/outstanding (n=340).
JMIR Public Health Surveill 2015 | vol. 1 | iss. 2 | e16 | p.78http://publichealth.jmir.org/2015/2/e16/(page number not for citation purposes)
Frew et alJMIR PUBLIC HEALTH AND SURVEILLANCE
XSL•FORenderX

Table 2. Participant CBI impressions.a
Target area and secondarycatchment (n=451)
All respondents (n=597)
Frequency (%)Frequency (%)
Motivation to attend CBI activity
168 (37.3)218 (36.5)Get the latest scientific/medical information
119 (26.4)151 (25.3)Meet others who share my concerns
58 (12.9)88 (14.7)Sense of obligation to my community
46 (10.2)58 (9.7)Learn about volunteer opportunities
42 (9.3)52 (8.7)Otherb
18 (4.0)30 (5.0)Missing
Rating of this event/activity
302 (67.0)382 (64.0)Excellent/outstanding
131 (29.0)179 (30.0)Good/very good
6 (1.3)8 (1.3)Fair/poor
4 (0.9)10 (1.7)No opinion
8 (1.8)18 (3.0)Missing
Overall impression of Project LINK
268 (59.4)340 (57.0)Excellent/outstanding
167 (37.0)226 (37.9)Good/very good
5 (1.1)6 (1.0)Fair/poor
8 (1.8)15 (2.5)No opinion
3 (0.7)10 (1.7)Missing
aThe italics are used to emphasize the percentage of nonresponders for each item.bMultiple responses given included write-in comments such as accompanying friend/relative, treatment/testing, compensation, life change, and communityservice.
The 2 primary CBI target zip codes and 5 secondary catchmentzip codes differed in the availability of HIV continuum-of-careservices. Within 1 primary target zip code, there were no HIVservices available to residents. The other primary zip code had10 HIV services located within the area (eg, testing, support).The number of available HIV services identified within the 5secondary target zip codes ranged from only 3 or 4 in 3 of thezip code areas to 49 in 1 zip code area.
Psychosocial FactorsPsychosocial subscale items and results of the exploratory factoranalysis are detailed in Table 3. Chosen subscales include LINK
Attitudes about the risks of HIV and benefits of LINKinvolvement, degree of psychological LINK Engagement,Negative Participatory Norms associated with HIV testing andthe CBI, Perceived LINK Social Support, and Identificationwith LINK Brand (Table 3). The scales exhibited excellentpsychometric properties including strong internal consistenciesacross domains (alpha=.733-.940). Responses to the items wererated on a 5-point scale and subscale scores were summed;higher scores indicated higher levels of the attribute.
JMIR Public Health Surveill 2015 | vol. 1 | iss. 2 | e16 | p.79http://publichealth.jmir.org/2015/2/e16/(page number not for citation purposes)
Frew et alJMIR PUBLIC HEALTH AND SURVEILLANCE
XSL•FORenderX

Table 3. Factor subscales for psychosocial domains.
LoadingFactor characteristics and questionsFactor
LINK attitudesa
.77I benefit from Project LINK services.
.76I like getting involved with Project LINK.
.73My community will really benefit from Project LINK.
.73My involvement will improve my community's trust in Project LINK.
.73My involvement in Project LINK will improve my health.
.72My participation in Project LINK would be very good.
.72I would participate in Project LINK activities because it would help to prevent AIDS.
.70I feel that my involvement in Project LINK is making an important difference.
.68HIV testing is a benefit of getting involved.
.68HIV is a serious concern in my immediate community.
LINK engagementb
.77Getting involved in the Project LINK effort is liberating.
.74Project LINK is a social justice effort.
.70Project LINK will reduce health disparities.
.69I feel a sense of purpose in this cause.
.68It is fun to be involved with the Project LINK.
.67I feel a sense of belonging through my participation in this effort.
.67My involvement is helping to protect the rights of others.
.65I am advancing the public's health and well-being through my support of this cause.
.62I am as source of HIV/AIDS information in my community.
.59Being involved with the Project LINK helps me to feel empowered.
.59I experience a sense of community in this cause.
.42I would be very concerned about the outcome of any effort of which I am affiliated.
.40It is extremely important to make the right choice in selecting a volunteer organization.
.40The Project LINK effort is very different from others.
Negative participatory
normsc
.84I think my friends would negatively judge me if I sought HIV testing.
.79I tend to be worried about what people think of me, even if I do not know them.
.75Participating in Project LINK seems risky.
.72I think some of my family members would be upset if I participated in Project LINK.
.70People negatively judge those who participate in Project LINK.
.69Even if I wanted to participate in Project LINK, I just do not have the time.
.58I generally do what my family expects of me.
.57If people heard of my participation with the Project LINK, they would form an opinion of me.
.55In general, I am among the last of my circle of friends to try new things.
LINK social supportd
.61If I decided to participate in Project LINK, I probably would tell my partner.
.56I would do something even if members of my social group disagreed with my actions.
.54I think my work colleagues would approve of my involvement.
JMIR Public Health Surveill 2015 | vol. 1 | iss. 2 | e16 | p.80http://publichealth.jmir.org/2015/2/e16/(page number not for citation purposes)
Frew et alJMIR PUBLIC HEALTH AND SURVEILLANCE
XSL•FORenderX

LoadingFactor characteristics and questionsFactor
.50Most people important to me think my involvement in Project LINK is good.
.49I think my doctor would approve of my involvement in Project LINK.
.48My immediate family is supportive of my involvement in Project LINK.
.42If my pastor supported Project LINK, I would be inclined to get involved.
LINK brand percep-
tione
.64Prior to joining any organization, I prefer to consult a friend who has experience with that group.
.58Hearing that somebody else is involved with the Project LINK tells me a lot about that person.
.56When it comes to deciding whether to join a new organization, I rely on experienced friends or family membersfor advice.
.47Being active with the Project LINK would help me to express who I am.
.37You can tell a lot about a person by their community affiliations.
aAlpha=0.940; 10 itemsbAlpha=0.935; 14 itemscAlpha=0.880; 9 itemsdAlpha=0.830; 7 itemseAlpha=0.733; 5 items
Linkage to HIV TestingMost participants felt comfortable obtaining an HIV test withdesignated LINK providers, as indicated by high mean intentionto test for HIV using a LINK agency (mean 8.66 on 10-pointscale [SD 2.51]). One-way ANOVA by residence within CBItarget areas (primary, secondary, outside of target area) foundstatistically significant differences among persons living in theLINK target area, those living adjacent to the primaryintervention zone, and those coming from outside the designatedzip codes with desire to use CBI HIV testing resources(F2,447=11.6, P<.001). Tamhane post hoc analyses indicatedthat respondents living in the 2 CBI target zip codes expressedgreater intention to engage in routine HIV testing through theCBI compared with those living outside the target and secondarycatchment zip codes (difference=1.6, P=.004).
The results of the multiple regression and random-interceptmodels with individual-level covariates are presented in Table4 and model parameters in Table 5. Figure 1 shows theindividual predictors of HIV testing. The multiple regressionmodel incorporates all individual and psychosocial independentvariables (race, income, gender, age, and the 5 psychosocialscales), but no neighborhood-level factors. The individual-levelrandom-intercept model adds a random intercept for zip codeto the previous model. Results from the multilevel models
containing all individual-level covariates and a singleneighborhood-level covariate are detailed in Table 6. Figure 2shows the adjusted neighborhoods predictors of HIV testing.Full results for individual and psychosocial effects in themultilevel models are given in Multimedia Appendix 1. Thecoefficient estimates for individual and psychosocial covariatesare very similar across multivariable models (Tables 4 and 6).Among the demographic covariates, lower income is associatedwith greater willingness to test in all models (P<.01 acrossmodels). Older individuals have increased testing intention inthe multiple linear model (P=.02). Among the psychosocialfactors, favorable “LINK attitudes” (P<.01 across models),“LINK engagement” (P<.05 across models), and “Identificationwith LINK brand” (P<.05 across model) were all associatedwith increased desire to obtain routine HIV testing throughLINK.
Within the target area and secondary catchment, participantsliving in zip codes with fewer available HIV services (P<.001),lower HIV prevalence (P=.01), greater proportion ofblack/African Americans (P<.001), smaller proportion of those24 years or older living in the community (P<.001), and reducedmedian household income (P=.02) were associated withincreased desire to obtain HIV testing through LINK, afteradjustment for individual factors (Table 5).
JMIR Public Health Surveill 2015 | vol. 1 | iss. 2 | e16 | p.81http://publichealth.jmir.org/2015/2/e16/(page number not for citation purposes)
Frew et alJMIR PUBLIC HEALTH AND SURVEILLANCE
XSL•FORenderX
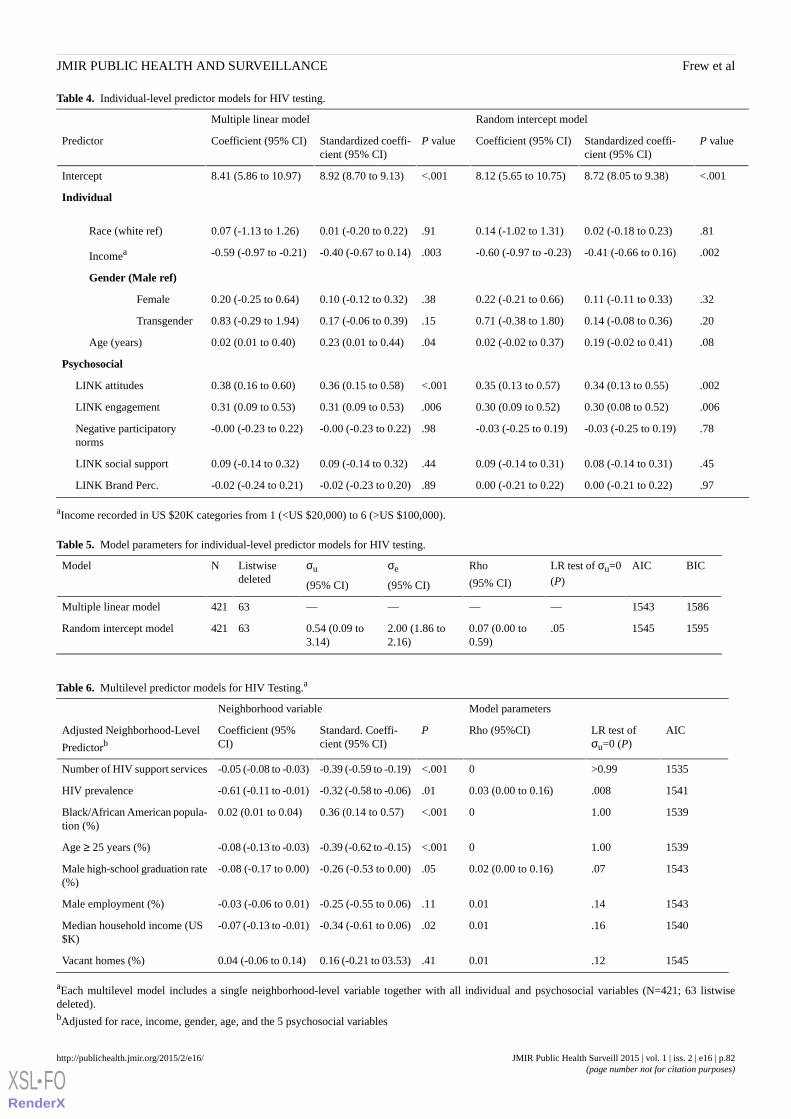
Table 4. Individual-level predictor models for HIV testing.
Random intercept modelMultiple linear model
P valueStandardized coeffi-cient (95% CI)
Coefficient (95% CI)P valueStandardized coeffi-cient (95% CI)
Coefficient (95% CI)Predictor
<.0018.72 (8.05 to 9.38)8.12 (5.65 to 10.75)<.0018.92 (8.70 to 9.13)8.41 (5.86 to 10.97)Intercept
Individual
.810.02 (-0.18 to 0.23)0.14 (-1.02 to 1.31).910.01 (-0.20 to 0.22)0.07 (-1.13 to 1.26)Race (white ref)
.002-0.41 (-0.66 to 0.16)-0.60 (-0.97 to -0.23).003-0.40 (-0.67 to 0.14)-0.59 (-0.97 to -0.21)Incomea
Gender (Male ref)
.320.11 (-0.11 to 0.33)0.22 (-0.21 to 0.66).380.10 (-0.12 to 0.32)0.20 (-0.25 to 0.64)Female
.200.14 (-0.08 to 0.36)0.71 (-0.38 to 1.80).150.17 (-0.06 to 0.39)0.83 (-0.29 to 1.94)Transgender
.080.19 (-0.02 to 0.41)0.02 (-0.02 to 0.37).040.23 (0.01 to 0.44)0.02 (0.01 to 0.40)Age (years)
Psychosocial
.0020.34 (0.13 to 0.55)0.35 (0.13 to 0.57)<.0010.36 (0.15 to 0.58)0.38 (0.16 to 0.60)LINK attitudes
.0060.30 (0.08 to 0.52)0.30 (0.09 to 0.52).0060.31 (0.09 to 0.53)0.31 (0.09 to 0.53)LINK engagement
.78-0.03 (-0.25 to 0.19)-0.03 (-0.25 to 0.19).98-0.00 (-0.23 to 0.22)-0.00 (-0.23 to 0.22)Negative participatorynorms
.450.08 (-0.14 to 0.31)0.09 (-0.14 to 0.31).440.09 (-0.14 to 0.32)0.09 (-0.14 to 0.32)LINK social support
.970.00 (-0.21 to 0.22)0.00 (-0.21 to 0.22).89-0.02 (-0.23 to 0.20)-0.02 (-0.24 to 0.21)LINK Brand Perc.
aIncome recorded in US $20K categories from 1 (<US $20,000) to 6 (>US $100,000).
Table 5. Model parameters for individual-level predictor models for HIV testing.
BICAICLR test of σu=0(P)
Rho
(95% CI)
σe
(95% CI)
σu
(95% CI)
Listwisedeleted
NModel
15861543————63421Multiple linear model
15951545.050.07 (0.00 to0.59)
2.00 (1.86 to2.16)
0.54 (0.09 to3.14)
63421Random intercept model
Table 6. Multilevel predictor models for HIV Testing.a
Model parametersNeighborhood variable
AICLR test ofσu=0 (P)
Rho (95%CI)PStandard. Coeffi-cient (95% CI)
Coefficient (95%CI)
Adjusted Neighborhood-Level
Predictorb
1535>0.990<.001-0.39 (-0.59 to -0.19)-0.05 (-0.08 to -0.03)Number of HIV support services
1541.0080.03 (0.00 to 0.16).01-0.32 (-0.58 to -0.06)-0.61 (-0.11 to -0.01)HIV prevalence
15391.000<.0010.36 (0.14 to 0.57)0.02 (0.01 to 0.04)Black/African American popula-tion (%)
15391.000<.001-0.39 (-0.62 to -0.15)-0.08 (-0.13 to -0.03)Age ≥ 25 years (%)
1543.070.02 (0.00 to 0.16).05-0.26 (-0.53 to 0.00)-0.08 (-0.17 to 0.00)Male high-school graduation rate(%)
1543.140.01.11-0.25 (-0.55 to 0.06)-0.03 (-0.06 to 0.01)Male employment (%)
1540.160.01.02-0.34 (-0.61 to 0.06)-0.07 (-0.13 to -0.01)Median household income (US$K)
1545.120.01.410.16 (-0.21 to 03.53)0.04 (-0.06 to 0.14)Vacant homes (%)
aEach multilevel model includes a single neighborhood-level variable together with all individual and psychosocial variables (N=421; 63 listwisedeleted).bAdjusted for race, income, gender, age, and the 5 psychosocial variables
JMIR Public Health Surveill 2015 | vol. 1 | iss. 2 | e16 | p.82http://publichealth.jmir.org/2015/2/e16/(page number not for citation purposes)
Frew et alJMIR PUBLIC HEALTH AND SURVEILLANCE
XSL•FORenderX
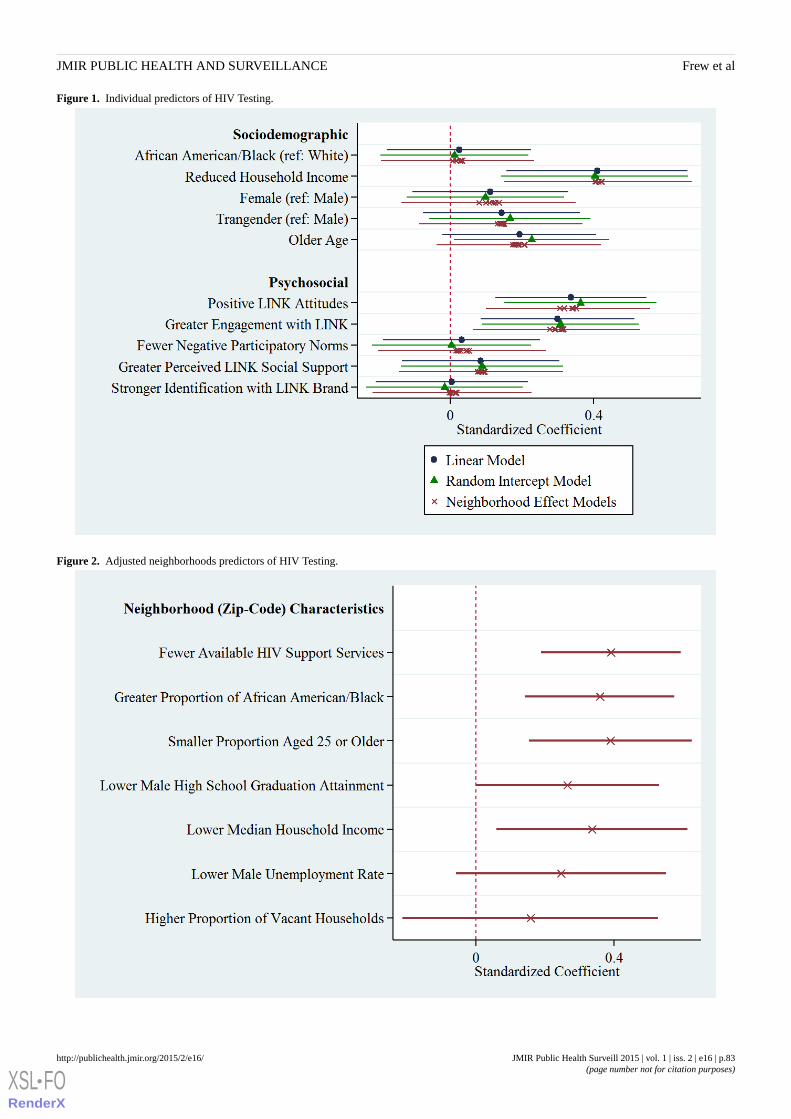
Figure 1. Individual predictors of HIV Testing.
Figure 2. Adjusted neighborhoods predictors of HIV Testing.
JMIR Public Health Surveill 2015 | vol. 1 | iss. 2 | e16 | p.83http://publichealth.jmir.org/2015/2/e16/(page number not for citation purposes)
Frew et alJMIR PUBLIC HEALTH AND SURVEILLANCE
XSL•FORenderX
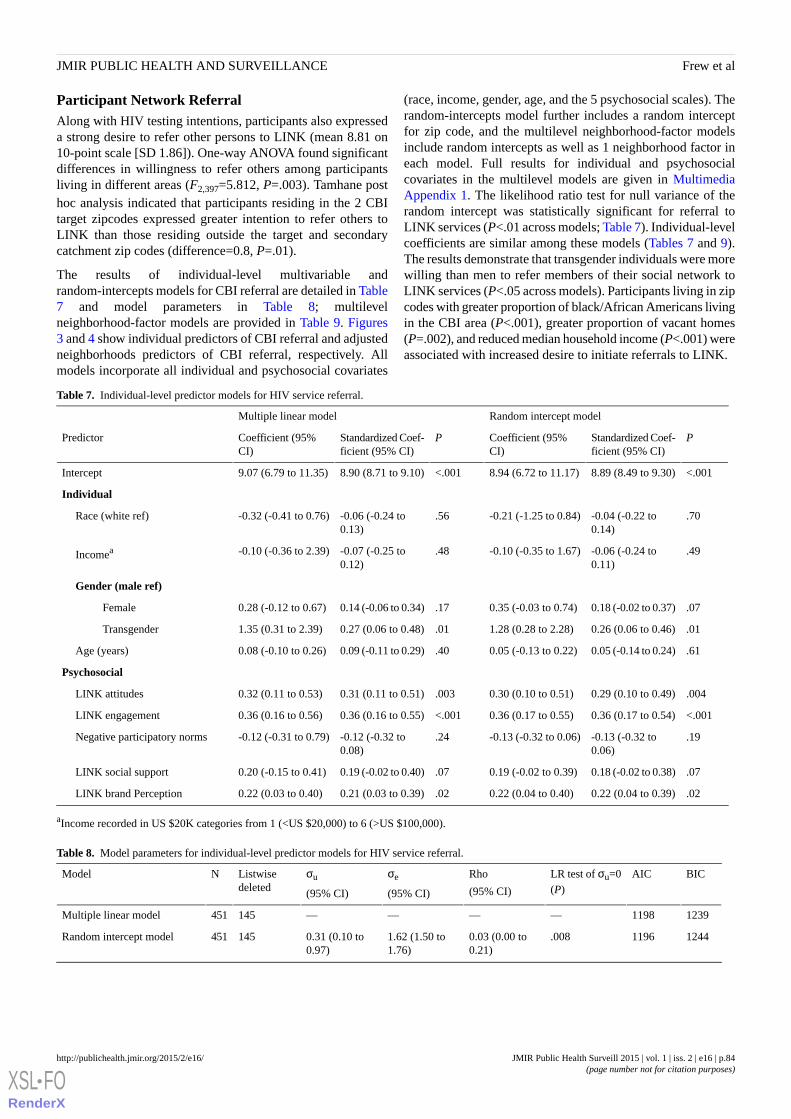
Participant Network ReferralAlong with HIV testing intentions, participants also expresseda strong desire to refer other persons to LINK (mean 8.81 on10-point scale [SD 1.86]). One-way ANOVA found significantdifferences in willingness to refer others among participantsliving in different areas (F2,397=5.812, P=.003). Tamhane posthoc analysis indicated that participants residing in the 2 CBItarget zipcodes expressed greater intention to refer others toLINK than those residing outside the target and secondarycatchment zip codes (difference=0.8, P=.01).
The results of individual-level multivariable andrandom-intercepts models for CBI referral are detailed in Table7 and model parameters in Table 8; multilevelneighborhood-factor models are provided in Table 9. Figures3 and 4 show individual predictors of CBI referral and adjustedneighborhoods predictors of CBI referral, respectively. Allmodels incorporate all individual and psychosocial covariates
(race, income, gender, age, and the 5 psychosocial scales). Therandom-intercepts model further includes a random interceptfor zip code, and the multilevel neighborhood-factor modelsinclude random intercepts as well as 1 neighborhood factor ineach model. Full results for individual and psychosocialcovariates in the multilevel models are given in MultimediaAppendix 1. The likelihood ratio test for null variance of therandom intercept was statistically significant for referral toLINK services (P<.01 across models; Table 7). Individual-levelcoefficients are similar among these models (Tables 7 and 9).The results demonstrate that transgender individuals were morewilling than men to refer members of their social network toLINK services (P<.05 across models). Participants living in zipcodes with greater proportion of black/African Americans livingin the CBI area (P<.001), greater proportion of vacant homes(P=.002), and reduced median household income (P<.001) wereassociated with increased desire to initiate referrals to LINK.
Table 7. Individual-level predictor models for HIV service referral.
Random intercept modelMultiple linear model
PStandardized Coef-ficient (95% CI)
Coefficient (95%CI)
PStandardized Coef-ficient (95% CI)
Coefficient (95%CI)
Predictor
<.0018.89 (8.49 to 9.30)8.94 (6.72 to 11.17)<.0018.90 (8.71 to 9.10)9.07 (6.79 to 11.35)Intercept
Individual
.70-0.04 (-0.22 to0.14)
-0.21 (-1.25 to 0.84).56-0.06 (-0.24 to0.13)
-0.32 (-0.41 to 0.76)Race (white ref)
.49-0.06 (-0.24 to0.11)
-0.10 (-0.35 to 1.67).48-0.07 (-0.25 to0.12)
-0.10 (-0.36 to 2.39)Incomea
Gender (male ref)
.070.18 (-0.02 to 0.37)0.35 (-0.03 to 0.74).170.14 (-0.06 to 0.34)0.28 (-0.12 to 0.67)Female
.010.26 (0.06 to 0.46)1.28 (0.28 to 2.28).010.27 (0.06 to 0.48)1.35 (0.31 to 2.39)Transgender
.610.05 (-0.14 to 0.24)0.05 (-0.13 to 0.22).400.09 (-0.11 to 0.29)0.08 (-0.10 to 0.26)Age (years)
Psychosocial
.0040.29 (0.10 to 0.49)0.30 (0.10 to 0.51).0030.31 (0.11 to 0.51)0.32 (0.11 to 0.53)LINK attitudes
<.0010.36 (0.17 to 0.54)0.36 (0.17 to 0.55)<.0010.36 (0.16 to 0.55)0.36 (0.16 to 0.56)LINK engagement
.19-0.13 (-0.32 to0.06)
-0.13 (-0.32 to 0.06).24-0.12 (-0.32 to0.08)
-0.12 (-0.31 to 0.79)Negative participatory norms
.070.18 (-0.02 to 0.38)0.19 (-0.02 to 0.39).070.19 (-0.02 to 0.40)0.20 (-0.15 to 0.41)LINK social support
.020.22 (0.04 to 0.39)0.22 (0.04 to 0.40).020.21 (0.03 to 0.39)0.22 (0.03 to 0.40)LINK brand Perception
aIncome recorded in US $20K categories from 1 (<US $20,000) to 6 (>US $100,000).
Table 8. Model parameters for individual-level predictor models for HIV service referral.
BICAICLR test of σu=0(P)
Rho
(95% CI)
σe
(95% CI)
σu
(95% CI)
Listwisedeleted
NModel
12391198————145451Multiple linear model
12441196.0080.03 (0.00 to0.21)
1.62 (1.50 to1.76)
0.31 (0.10 to0.97)
145451Random intercept model
JMIR Public Health Surveill 2015 | vol. 1 | iss. 2 | e16 | p.84http://publichealth.jmir.org/2015/2/e16/(page number not for citation purposes)
Frew et alJMIR PUBLIC HEALTH AND SURVEILLANCE
XSL•FORenderX
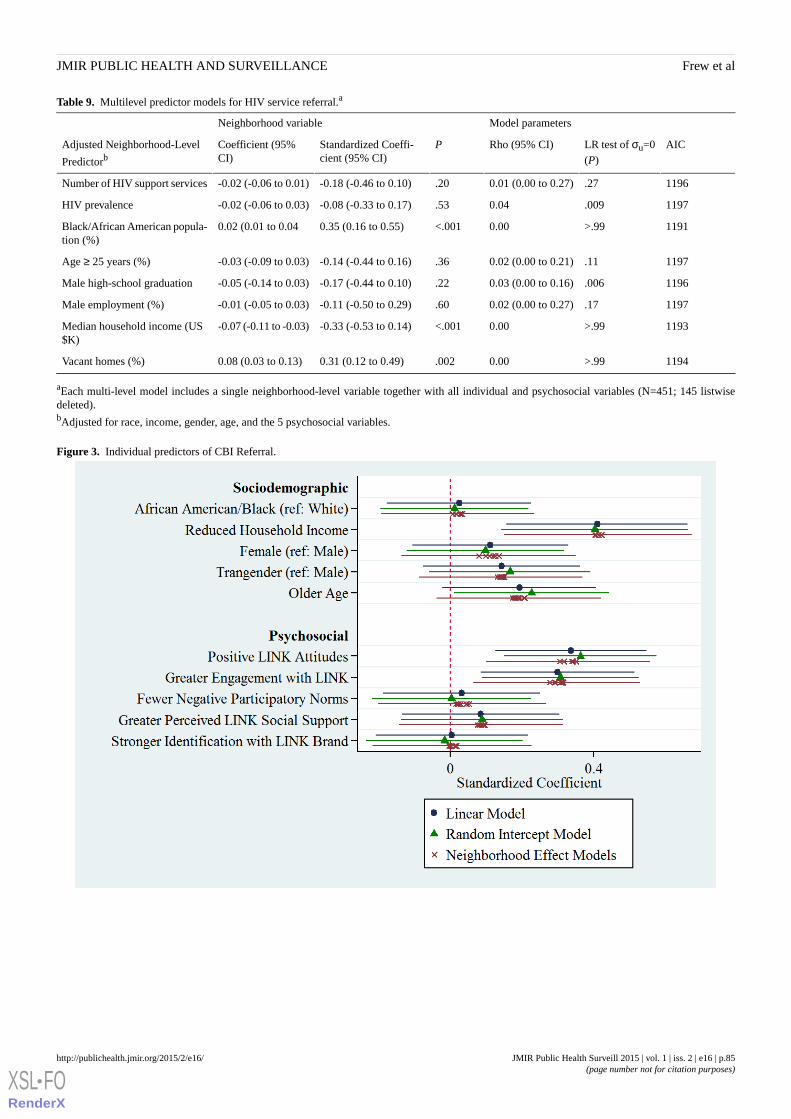
Table 9. Multilevel predictor models for HIV service referral.a
Model parametersNeighborhood variable
AICLR test of σu=0(P)
Rho (95% CI)PStandardized Coeffi-cient (95% CI)
Coefficient (95%CI)
Adjusted Neighborhood-Level
Predictorb
1196.270.01 (0.00 to 0.27).20-0.18 (-0.46 to 0.10)-0.02 (-0.06 to 0.01)Number of HIV support services
1197.0090.04.53-0.08 (-0.33 to 0.17)-0.02 (-0.06 to 0.03)HIV prevalence
1191>.990.00<.0010.35 (0.16 to 0.55)0.02 (0.01 to 0.04Black/African American popula-tion (%)
1197.110.02 (0.00 to 0.21).36-0.14 (-0.44 to 0.16)-0.03 (-0.09 to 0.03)Age ≥ 25 years (%)
1196.0060.03 (0.00 to 0.16).22-0.17 (-0.44 to 0.10)-0.05 (-0.14 to 0.03)Male high-school graduation
1197.170.02 (0.00 to 0.27).60-0.11 (-0.50 to 0.29)-0.01 (-0.05 to 0.03)Male employment (%)
1193>.990.00<.001-0.33 (-0.53 to 0.14)-0.07 (-0.11 to -0.03)Median household income (US$K)
1194>.990.00.0020.31 (0.12 to 0.49)0.08 (0.03 to 0.13)Vacant homes (%)
aEach multi-level model includes a single neighborhood-level variable together with all individual and psychosocial variables (N=451; 145 listwisedeleted).bAdjusted for race, income, gender, age, and the 5 psychosocial variables.
Figure 3. Individual predictors of CBI Referral.
JMIR Public Health Surveill 2015 | vol. 1 | iss. 2 | e16 | p.85http://publichealth.jmir.org/2015/2/e16/(page number not for citation purposes)
Frew et alJMIR PUBLIC HEALTH AND SURVEILLANCE
XSL•FORenderX
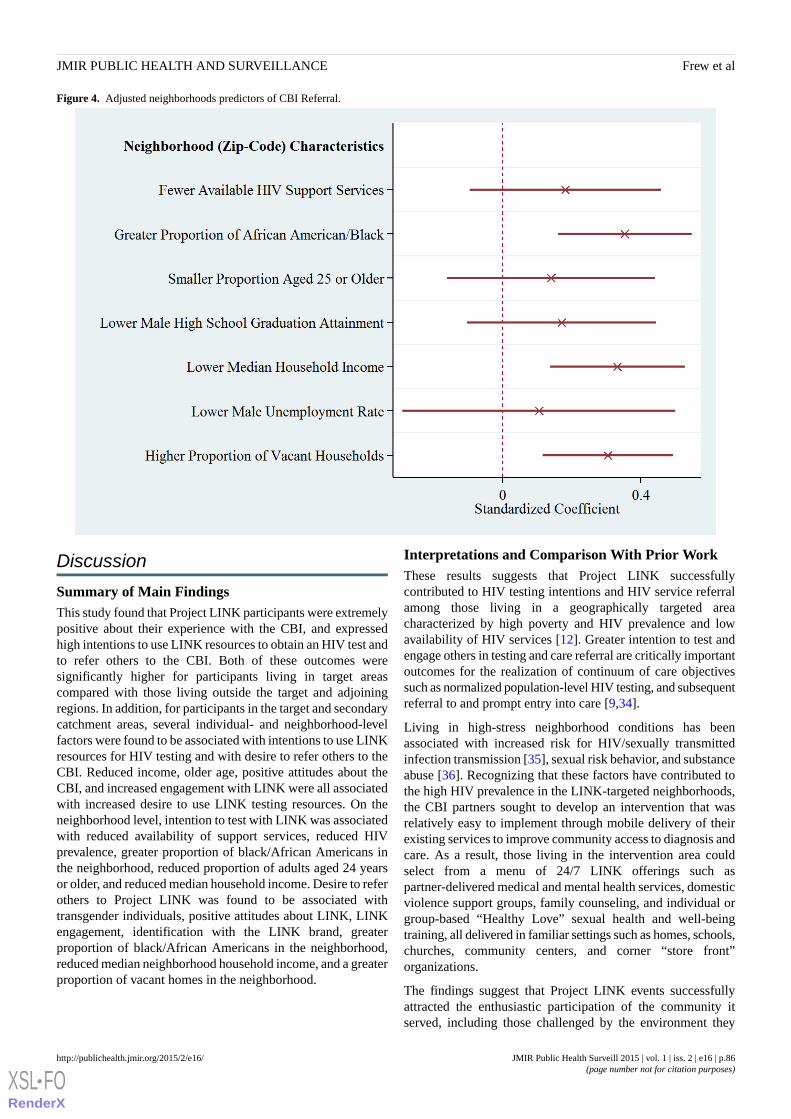
Figure 4. Adjusted neighborhoods predictors of CBI Referral.
Discussion
Summary of Main FindingsThis study found that Project LINK participants were extremelypositive about their experience with the CBI, and expressedhigh intentions to use LINK resources to obtain an HIV test andto refer others to the CBI. Both of these outcomes weresignificantly higher for participants living in target areascompared with those living outside the target and adjoiningregions. In addition, for participants in the target and secondarycatchment areas, several individual- and neighborhood-levelfactors were found to be associated with intentions to use LINKresources for HIV testing and with desire to refer others to theCBI. Reduced income, older age, positive attitudes about theCBI, and increased engagement with LINK were all associatedwith increased desire to use LINK testing resources. On theneighborhood level, intention to test with LINK was associatedwith reduced availability of support services, reduced HIVprevalence, greater proportion of black/African Americans inthe neighborhood, reduced proportion of adults aged 24 yearsor older, and reduced median household income. Desire to referothers to Project LINK was found to be associated withtransgender individuals, positive attitudes about LINK, LINKengagement, identification with the LINK brand, greaterproportion of black/African Americans in the neighborhood,reduced median neighborhood household income, and a greaterproportion of vacant homes in the neighborhood.
Interpretations and Comparison With Prior WorkThese results suggests that Project LINK successfullycontributed to HIV testing intentions and HIV service referralamong those living in a geographically targeted areacharacterized by high poverty and HIV prevalence and lowavailability of HIV services [12]. Greater intention to test andengage others in testing and care referral are critically importantoutcomes for the realization of continuum of care objectivessuch as normalized population-level HIV testing, and subsequentreferral to and prompt entry into care [9,34].
Living in high-stress neighborhood conditions has beenassociated with increased risk for HIV/sexually transmittedinfection transmission [35], sexual risk behavior, and substanceabuse [36]. Recognizing that these factors have contributed tothe high HIV prevalence in the LINK-targeted neighborhoods,the CBI partners sought to develop an intervention that wasrelatively easy to implement through mobile delivery of theirexisting services to improve community access to diagnosis andcare. As a result, those living in the intervention area couldselect from a menu of 24/7 LINK offerings such aspartner-delivered medical and mental health services, domesticviolence support groups, family counseling, and individual orgroup-based “Healthy Love” sexual health and well-beingtraining, all delivered in familiar settings such as homes, schools,churches, community centers, and corner “store front”organizations.
The findings suggest that Project LINK events successfullyattracted the enthusiastic participation of the community itserved, including those challenged by the environment they
JMIR Public Health Surveill 2015 | vol. 1 | iss. 2 | e16 | p.86http://publichealth.jmir.org/2015/2/e16/(page number not for citation purposes)
Frew et alJMIR PUBLIC HEALTH AND SURVEILLANCE
XSL•FORenderX
lived in that was characterized by poverty, transportationlimitations, and high unemployment. Among the psychosocialfactors assessed, we found that positive attitudes about HIVtesting and the CBI are critically important for facilitatinglinkage to testing and referrals to the CBI services.
Notably, LINK drew the participation of black/AfricanAmerican transgender women (transwomen) who represent ahighly vulnerable group for HIV transmission [37]. With anestimated 60% of annual HIV infections diagnosed among MSMand transwomen, LINK’s culturally sensitive service deliveryapproach appeared to resonate with the transgender population[38]. The data indicate that transgender individuals showedsignificantly higher intention to refer others to LINK, even afteradjustment for other individual-, psychosocial-, andneighborhood-level covariates. The sample of transgenderindividuals was small (n=27), so we are cautious of generalizingthis result, but we feel that it indicates this CBI model's successin providing a safe and comfortable service environment forthose who are marginalized and/or disenfranchised with existinghealth care options.
Distal neighborhood-level factors played a role in promotingHIV testing intentions and referral to the CBI services [39].Stronger outcomes were observed among those living inpredominately black/African American tracts. We believe thesefactors can be linked to the messages delivered by LINKpartners and others that black/African Americans aredisproportionately affected by HIV/AIDS and account for ahigher proportion of people living with HIV at every stage fromnew infection to death [40]. Thus, living in an area with a highcase rate among black/African Americans alters individuals’perceptions of their perceived vulnerability to HIV andmotivates testing and referral to care and treatment services[41].
We also observed a strong indicator that neighborhood disorder,as evidenced by the density of nearby vacant households, isassociated with HIV testing and referral [42]. We assert thatthis may be indicative of the presence of drug activity includinginjection drug use and extent of “crack houses” in theneighborhood, both associated with greater concentration ofHIV risk behavior and prevalent cases [43-45]. Our studycorresponds with previous evidence that intravenous drug usersliving in lower income areas may be more likely to utilizeneighborhood prevention programs than those living in moreaffluent areas [46]. Thus, our findings evidence the need fortargeted community interventions such as LINK in similarhigh-stress neighborhoods, and reflect the efficacy of LINK inreaching these neighborhoods.
On the individual level, those persons facing the extreme povertywere more likely to intend to obtain HIV testing. There was nodifference in testing intentions between men and women, orbetween white and black/African American participants.Because intention to utilize LINK resources for testing was highon average, especially in the primary target area, this reflectsthe successful targeting of individuals with the highest need forlinkage to care, regardless of race or gender. Although the smallnumber of zip codes in our sample does not allow for effectiveseparation of the neighborhood-level effect across heterogeneous
neighborhoods, the large number of significantneighborhood-level factors suggests that community structureplays an important role in the success of targeted HIV carelinkage interventions. Among those participants residing in thetarget area, the reduced availability of local HIV support servicesresulted in much greater willingness to use LINK for HIVtesting. In this respect, we argue that LINK offers a model forreaching historically marginalized populations through itsgeographically focused, socially compatible service deliveryapproach [2]. The results also reflect the reality of effectivelypromoting HIV prevention in communities with considerablechallenges; our theoretical orientation was validated by thefindings that suggested direct and indirect effects of multiplelevels of influence on HIV testing intentions and referralpatterns.
The results of this project indicate the importance of includingCBIs as options for HIV prevention planning that seeks toincrease access to HIV testing and delay the time for linkage tocare. Timely linkage to and retention in care is key to ensuringthat patients living with HIV reach an undetectable status, whichin turns helps to decrease the transmission of new infections.Furthermore, decreasing the waiting time for accessing carealso increases the likelihood of people actually beginningtherapy, and increasing their chances for improved health whileliving with HIV. Finally, the outcomes of the project supportensuring that communities and their members are not onlyengaged when it comes to accessing HIV testing, but are alsoengaged in the planning, site selection, and coordination of bothHIV testing events and activities, as well as strategic planningto ensure linkage to care for any services that will take placewithin their communities [47]. Thus, CBIs should continue tobe used for prevention work in communities, especially whentargeting improvements in HIV testing and linkage to care.Linkage strategies should consider incorporatingcommunity-level engagement to support timely linkage andretention in care. Bringing services into communities andenabling easy access to neighborhood-based services closermay help reach the immediate linkage-to-care goals of theNational AID Strategy and the CDC’s High-Impact Preventionprogrammatic policy.
LimitationsWe recognize the limitations associated with self-report, whichis susceptible to social desirability bias. In addition, our randomsampling approach within venues hosting LINK activities andevents is effective for describing associations within thepopulation of attendees [48]. However, this sampling techniquetogether with the locality of the study restricts the ability togeneralize results to other neighborhoods, cities, or tononattendees. Furthermore, privacy concerns limited availableaddress information to only zip-code-level data. While censustracts are generally considered the gold standard forneighborhood-level analysis, zip codes have been successfullyused to characterize neighborhood factors in many recent studiesin which census-tract-level data are unavailable [49-52].Although this pilot initiative demonstrated feasibility andacceptability of the concept utilizing attitudinal and intentiondata, no behavioral data on actual testing were collected. This
JMIR Public Health Surveill 2015 | vol. 1 | iss. 2 | e16 | p.87http://publichealth.jmir.org/2015/2/e16/(page number not for citation purposes)
Frew et alJMIR PUBLIC HEALTH AND SURVEILLANCE
XSL•FORenderX
is an important next step in examining the efficacy of thisproject.
ConclusionsProject LINK used a targeted approach to reach marginalizedpopulations that prompted greater intention to engage in HIVtesting, care, and referral to community partner organizationsserving those in the selected neighborhoods. Our study findingsindicate that community/neighborhood and psychosocial factors
are critical to future efforts to increase routine HIV testingintentions in underserved areas and enhance efforts forsubsequent referral to care. Yet, this project also highlights theneed for additional, long-term assessment to evidence the impactof CBIs on care continuum outcomes. The results from thisstudy demonstrate the promise of CBIs to reach individualswithin a 1st year of diagnosis for subsequent improvements inHIV-related health outcomes.
AcknowledgmentsThe authors wish to thank Jamey Rousey and Tene Traylor for their support of this project. Special thanks to the staff of AIDAtlanta, the Atlanta Harm Reduction Coalition (Mona Bennett), the Center for Black Women’s Wellness (Jamea Dorsey), PositiveImpact (Paul Plate), and SisterLove, Inc and all of the community residents and community leaders, Don Speaks and MakedaJohnson.
Conflicts of InterestNone declared.
Multimedia Appendix 1Results of multilevel models for HIV testing and CBI referral.
[DOCX File, 69KB - publichealth_v1i2e16_app1.docx ]
References1. Salam RA, Haroon S, Ahmed HH, Das JK, Bhutta ZA. Impact of community-based interventions on HIV knowledge,
attitudes, and transmission. Infect Dis Poverty 2014;3:26 [FREE Full text] [doi: 10.1186/2049-9957-3-26] [Medline:25126420]
2. Nunn A, Yolken A, Cutler B, Trooskin S, Wilson P, Little S, et al. Geography should not be destiny: Focusing HIV/AIDSimplementation research and programs on microepidemics in US neighborhoods. Am J Public Health 2014May;104(5):775-780 [FREE Full text] [doi: 10.2105/AJPH.2013.301864] [Medline: 24716570]
3. Chen NE, Gallant JE, Page KR. A systematic review of HIV/AIDS survival and delayed diagnosis among Hispanics in theUnited States. J Immigr Minor Health 2012 Feb;14(1):65-81 [FREE Full text] [doi: 10.1007/s10903-011-9497-y] [Medline:21773882]
4. MacKellar DA, Valleroy LA, Secura GM, Behel S, Bingham T, Celentano DD, Young Men's Survey Study Group.Unrecognized HIV infection, risk behaviors, and perceptions of risk among young men who have sex with men: Opportunitiesfor advancing HIV prevention in the third decade of HIV/AIDS. J Acquir Immune Defic Syndr 2005 Apr 15;38(5):603-614.[Medline: 15793373]
5. Torian LV, Wiewel EW, Liu K, Sackoff JE, Frieden TR. Risk factors for delayed initiation of medical care after diagnosisof human immunodeficiency virus. Arch Intern Med 2008 Jun 9;168(11):1181-1187. [doi: 10.1001/archinte.168.11.1181][Medline: 18541826]
6. Tripathi A, Gardner LI, Ogbuanu I, Youmans E, Stephens T, Gibson JJ, et al. Predictors of time to enter medical care aftera new HIV diagnosis: A statewide population-based study. AIDS Care 2011 Nov;23(11):1366-1373. [doi:10.1080/09540121.2011.565032] [Medline: 22022847]
7. Centers for Disease Control and Prevention. HIV Surveillance Supplemental Report. 2015. Monitoring selected nationalHIV prevention and care objectives by using HIV surveillance data—United States and 6 dependent areas—2013 URL:http://www.cdc.gov/hiv/pdf/library/reports/surveillance/cdc-hiv-surveillancereport_vol20_no2.pdf [accessed 2015-07-14][WebCite Cache ID 6a0mJZcYo]
8. Anthony MN, Gardner L, Marks G, Anderson-Mahoney P, Metsch LR, Valverde EE, Antiretroviral TreatmentAccess Study(ARTAS) Study Group. Factors associated with use of HIV primary care among persons recently diagnosed with HIV:Examination of variables from the behavioural model of health-care utilization. AIDS Care 2007 Feb;19(2):195-202. [doi:10.1080/09540120600966182] [Medline: 17364398]
9. Gardner EM, McLees MP, Steiner JF, Del RC, Burman WJ. The spectrum of engagement in HIV care and its relevance totest-and-treat strategies for prevention of HIV infection. Clin Infect Dis 2011 Mar 15;52(6):793-800 [FREE Full text] [doi:10.1093/cid/ciq243] [Medline: 21367734]
JMIR Public Health Surveill 2015 | vol. 1 | iss. 2 | e16 | p.88http://publichealth.jmir.org/2015/2/e16/(page number not for citation purposes)
Frew et alJMIR PUBLIC HEALTH AND SURVEILLANCE
XSL•FORenderX
10. Denning P, DiNenno E. Communities in Crisis: Is There a Generalized HIV Epidemic in Impoverished Urban Areas of theUnited States? Who's At Risk for HIV. Atlanta, GA: Centers for Disease Control and Prevention; 2013. URL: http://www.cdc.gov/hiv/pdf/statistics_poverty_poster.pdf [accessed 2015-05-06] [WebCite Cache ID 6YKAFz0Sh]
11. Shepard CW, Gortakowski HW, Nasrallah H, Cutler BH, Begier EM. Using GIS-based density maps of HIV surveillancedata to identify previously unrecognized geographic foci of HIV burden in an urban epidemic. Public Health Rep2011;126(5):741-749 [FREE Full text] [Medline: 21886335]
12. Hixson BA, Omer SB, del RC, Frew PM. Spatial clustering of HIV prevalence in Atlanta, Georgia and populationcharacteristics associated with case concentrations. J Urban Health 2011 Feb;88(1):129-141 [FREE Full text] [doi:10.1007/s11524-010-9510-0] [Medline: 21249526]
13. Fulcher C, Kaukinen C. Mapping and visualizing the location HIV service providers: An exploratory spatial analysis ofToronto neighborhoods. AIDS Care 2005 Apr;17(3):386-396. [doi: 10.1080/09540120512331314312] [Medline: 15832887]
14. Oppong JR, Tiwari C, Ruckthongsook W, Huddleston J, Arbona S. Mapping late testers for HIV in Texas. Health Place2012 May;18(3):568-575. [doi: 10.1016/j.healthplace.2012.01.008] [Medline: 22356835]
15. Eberhart MG, Yehia BR, Hillier A, Voytek CD, Blank MB, Frank I, et al. Behind the cascade: Analyzing spatial patternsalong the HIV care continuum. J Acquir Immune Defic Syndr 2013 Nov 1;64 Suppl 1:S42-S51 [FREE Full text] [doi:10.1097/QAI.0b013e3182a90112] [Medline: 24126447]
16. Philbin MM, Tanner AE, DuVal A, Ellen JM, Xu J, Kapogiannis B, Adolescent Trials Network for HIV/AIDS Interventions.Factors affecting linkage to care and engagement in care for newly diagnosed HIV-positive adolescents within fifteenadolescent medicine clinics in the United States. AIDS Behav 2014 Aug;18(8):1501-1510 [FREE Full text] [doi:10.1007/s10461-013-0650-6] [Medline: 24682848]
17. Krieger N. Theories for social epidemiology in the 21st century: An ecosocial perspective. Int J Epidemiol 2001Aug;30(4):668-677 [FREE Full text] [Medline: 11511581]
18. Parker EA, Chung LK, Israel BA, Reyes A, Wilkins D. Community organizing network for environmental health: Usinga community health development approach to increase community capacity around reduction of environmental triggers. JPrim Prev 2010 Apr;31(1-2):41-58 [FREE Full text] [doi: 10.1007/s10935-010-0207-7] [Medline: 20306137]
19. Schultz Annette SH, Temple B, Gibbons C, Preston J, Ronson G. Listening to those who are living with HIV and tobaccodependence and exploring their health care context. J Assoc Nurses AIDS Care 2014;25(1):46-59. [doi:10.1016/j.jana.2013.01.003] [Medline: 23582577]
20. Frew PM, Archibald M, Hixson B, del RC. Socioecological influences on community involvement in HIV vaccine research.Vaccine 2011 Aug 18;29(36):6136-6143 [FREE Full text] [doi: 10.1016/j.vaccine.2011.06.082] [Medline: 21722689]
21. High-Impact HIV Prevention: CDC's Approach to Reducing HIV Infections in the United States. Atlanta, GA: Centers forDisease Control and Prevention; 2011. URL: http://www.cdc.gov/hiv/pdf/policies_NHPC_Booklet.pdf [accessed 2015-05-06][WebCite Cache ID 6YKBnaTh0]
22. Painter TM, Herbst JH, Diallo DD, White LD, Centers for Disease Control and Prevention (CDC). Community-basedprogram to prevent HIV/STD infection among heterosexual black women. MMWR Surveill Summ 2014 Apr 18;63 Suppl1:15-20 [FREE Full text] [Medline: 24743662]
23. Diallo DD, Moore TW, Ngalame PM, White LD, Herbst JH, Painter TM. Efficacy of a single-session HIV preventionintervention for black women: A group randomized controlled trial. AIDS Behav 2010 Jun;14(3):518-529. [doi:10.1007/s10461-010-9672-5] [Medline: 20135214]
24. Maher L, Iversen J, Kaldor J. Measuring effectiveness of needle and syringe exchange programs for prevention of HIVamong injecting drug users: Response to Amundsen. Addiction 2006 Dec;101(12):1834-1836. [doi:10.1111/j.1360-0443.2006.01666.x] [Medline: 17156184]
25. Amundsen EJ. Measuring effectiveness of needle and syringe exchange programmes for prevention of HIV among injectingdrug users. Addiction 2006 Jul;101(7):911-912. [doi: 10.1111/j.1360-0443.2006.01519.x] [Medline: 16771880]
26. Holstad MM, Essien JE, Ekong E, Higgins M, Teplinskiy I, Adewuyi MF. Motivational groups support adherence toantiretroviral therapy and use of risk reduction behaviors in HIV positive Nigerian women: A pilot study. Afr J ReprodHealth 2012 Sep;16(3):14-27 [FREE Full text] [Medline: 23437496]
27. Rothenberg KH, Paskey SJ, Reuland MM, Zimmerman SI, North RL. Domestic violence and partner notification: Implicationsfor treatment and counseling of women with HIV. J Am Med Womens Assoc 1995;50(3-4):87-93. [Medline: 7657955]
28. Frew PM, Hou SI, Davis M, Chan K, Horton T, Shuster J, et al. The likelihood of participation in clinical trials can bemeasured: The Clinical Research Involvement Scales. J Clin Epidemiol 2010 Oct;63(10):1110-1117 [FREE Full text] [doi:10.1016/j.jclinepi.2009.12.002] [Medline: 20303711]
29. Pawinski R. Community attitudes to HIV/AIDS. S Afr Med J 2001 Jun;91(6):448. [Medline: 11455701]30. Miner MH, Peterson JL, Welles SL, Jacoby SM, Rosser BR. How do social norms impact HIV sexual risk behavior in
HIV-positive men who have sex with men?: Multiple mediator effects. J Health Psychol 2009 Sep;14(6):761-770 [FREEFull text] [doi: 10.1177/1359105309338976] [Medline: 19687113]
31. Kumar S, Liu M, Hwang S. A multifaceted comparison of ArcGIS and MapMarker for automated geocoding. GeospatHealth 2012 Nov;7(1):145-151. [doi: 10.4081/gh.2012.113] [Medline: 23242688]
JMIR Public Health Surveill 2015 | vol. 1 | iss. 2 | e16 | p.89http://publichealth.jmir.org/2015/2/e16/(page number not for citation purposes)
Frew et alJMIR PUBLIC HEALTH AND SURVEILLANCE
XSL•FORenderX
32. Census 2000. Washington, DC: United States Census Bureau; 2000. URL: http://factfinder.census.gov/faces/nav/jsf/pages/index.xhtml [accessed 2015-05-06] [WebCite Cache ID 6YKCQzdFd]
33. Boston RC, Sumner AE. STATA: A statistical analysis system for examining biomedical data. Adv Exp Med Biol2003;537:353-369. [Medline: 14995047]
34. Gardner EM, Daniloff E, Thrun MW, Reirden DH, Davidson AJ, Johnson SC, et al. Initial linkage and subsequent retentionin HIV care for a newly diagnosed HIV-infected cohort in Denver, Colorado. J Int Assoc Provid AIDS Care2013;12(6):384-390. [doi: 10.1177/2325957413500532] [Medline: 23962912]
35. Kerr JC, Valois RF, Siddiqi A, Vanable P, Carey MP, DiClemente RJ, et al. Neighborhood condition and geographic localein assessing HIV/STI risk among African American adolescents. AIDS Behav 2015 Jun;19(6):1005-1013. [doi:10.1007/s10461-014-0868-y] [Medline: 25108404]
36. Bowleg L, Neilands TB, Tabb LP, Burkholder GJ, Malebranche DJ, Tschann JM. Neighborhood context and Blackheterosexual men's sexual HIV risk behaviors. AIDS Behav 2014 Nov;18(11):2207-2218. [doi: 10.1007/s10461-014-0803-2][Medline: 24906531]
37. Garofalo R, Deleon J, Osmer E, Doll M, Harper GW. Overlooked, misunderstood and at-risk: Exploring the lives and HIVrisk of ethnic minority male-to-female transgender youth. J Adolesc Health 2006 Mar;38(3):230-236. [doi:10.1016/j.jadohealth.2005.03.023] [Medline: 16488820]
38. Centers for Disease Control and Prevention. Centers for Disease Control and Prevention. Atlanta, GA: Centers for DiseaseControl and Prevention; 2013. HIV in the US: At a Glance URL: http://www.cdc.gov/hiv/pdf/statistics_basics_factsheet.pdf [accessed 2015-09-08] [WebCite Cache ID 6bOWjkyqK]
39. Raymond HF, Chen Y, Syme SL, Catalano R, Hutson MA, McFarland W. The role of individual and neighborhood factors:HIV acquisition risk among high-risk populations in San Francisco. AIDS Behav 2014 Feb;18(2):346-356. [doi:10.1007/s10461-013-0508-y] [Medline: 23760633]
40. Centers for Disease Control and Prevention. HIV among African-Americans. Atlanta, GA: Centers for Disease Controland Prevention; 2013. URL: http://www.cdc.gov/hiv/pdf/risk_HIV_AAA.pdf [accessed 2015-09-08] [WebCite Cache ID6bOWmVAn3]
41. Axelrad JE, Mimiaga MJ, Grasso C, Mayer KH. Trends in the spectrum of engagement in HIV care and subsequent clinicaloutcomes among men who have sex with men (MSM) at a Boston community health center. AIDS Patient Care STDS 2013May;27(5):287-296 [FREE Full text] [doi: 10.1089/apc.2012.0471] [Medline: 23651106]
42. McCurdy SA, Ross MW, Kilonzo GP, Leshabari MT, Williams ML. HIV/AIDS and injection drug use in the neighborhoodsof Dar es Salaam, Tanzania. Drug Alcohol Depend 2006 Apr;82 Suppl 1:S23-S27. [Medline: 16769441]
43. Latkin CA, Curry AD, Hua W, Davey MA. Direct and indirect associations of neighborhood disorder with drug use andhigh-risk sexual partners. Am J Prev Med 2007 Jun;32(6 Suppl):S234-S241 [FREE Full text] [doi:10.1016/j.amepre.2007.02.023] [Medline: 17543716]
44. Latkin CA, German D, Hua W, Curry AD. Individual-level influences on perceptions of neighborhood disorder: A multilevelanalysis. J Community Psychol 2009 Jan 1;37(1):122-133 [FREE Full text] [doi: 10.1002/jcop.20284] [Medline: 20027234]
45. Latkin CA, Williams CT, Wang J, Curry AD. Neighborhood social disorder as a determinant of drug injection behaviors:A structural equation modeling approach. Health Psychol 2005 Jan;24(1):96-100. [doi: 10.1037/0278-6133.24.1.96][Medline: 15631567]
46. Buchanan D, Shaw S, Teng W, Hiser P, Singer M. Neighborhood differences in patterns of syringe access, use, and discardamong injection drug users: Implications for HIV outreach and prevention education. J Urban Health 2003 Sep;80(3):438-454[FREE Full text] [doi: 10.1093/jurban/jtg050] [Medline: 12930882]
47. Centers for Disease Control and Prevention. High-Impact HIV Prevention: CDC's Approach to Reducing HIV Infectionsin the United States. Atlanta, GA: Centers for Disease Control and Prevention; 2011. URL: http://www.cdc.gov/hiv/pdf/policies_NHPC_Booklet.pdf [accessed 2015-05-06] [WebCite Cache ID 6YKBnaTh0]
48. Muhib FB, Lin LS, Stueve A, Miller RL, Ford WL, Johnson WD, Community Intervention Trial for Youth Study Team.A venue-based method for sampling hard-to-reach populations. Public Health Rep 2001;116 Suppl 1:216-222 [FREE Fulltext] [Medline: 11889287]
49. Brumback BA, Zheng HW, Dailey AB. Adjusting for confounding by neighborhood using generalized linear mixed modelsand complex survey data. Stat Med 2013 Apr 15;32(8):1313-1324. [doi: 10.1002/sim.5624] [Medline: 22975990]
50. Lim J, Ashing-Giwa KT. Examining the effect of minority status and neighborhood characteristics on cervical cancersurvival outcomes. Gynecol Oncol 2011 Apr;121(1):87-93. [doi: 10.1016/j.ygyno.2010.11.041] [Medline: 21183210]
51. Sathyanarayanan S, Brooks AJ, Hagen SE, Edington DW. Multilevel analysis of the physical health perception of employees:Community and individual factors. Am J Health Promot 2012;26(5):e126-e136. [doi: 10.4278/ajhp.110316-QUAL-120][Medline: 22548431]
52. Walker DR, Inglese GW, Sloand JA, Just PM. Dialysis facility and patient characteristics associated with utilization ofhome dialysis. Clin J Am Soc Nephrol 2010 Sep;5(9):1649-1654 [FREE Full text] [doi: 10.2215/CJN.00080110] [Medline:20634324]
JMIR Public Health Surveill 2015 | vol. 1 | iss. 2 | e16 | p.90http://publichealth.jmir.org/2015/2/e16/(page number not for citation purposes)
Frew et alJMIR PUBLIC HEALTH AND SURVEILLANCE
XSL•FORenderX

AbbreviationsAHRC: Atlanta Harm Reduction CoalitionAIDS: acquired immune deficiency syndromeANOVA: analysis of varianceCBI: Community-based interventionCBWW: The Center for Black Women's WellnessCDC: Centers for Disease Control and PreventionHIV: human immunodeficiency virusMCAR: Missing Completely at RandomMSM: men who have sex with men
Edited by G Eysenbach; submitted 31.05.15; peer-reviewed by J Weiner, D Cordova; comments to author 02.07.15; revised versionreceived 14.07.15; accepted 29.07.15; published 08.10.15.
Please cite as:Frew PM, Archibald M, Schamel J, Saint-Victor D, Fox E, Smith-Bankhead N, Diallo DD, Holstad MM, del Rio CAn Integrated Service Delivery Model to Identify Persons Living with HIV and to Provide Linkage to HIV Treatment and Care inPrioritized Neighborhoods: A Geotargeted, Program Outcome StudyJMIR Public Health Surveill 2015;1(2):e16URL: http://publichealth.jmir.org/2015/2/e16/ doi:10.2196/publichealth.4675PMID:27227134
©Paula M. Frew, Matthew Archibald, Jay Schamel, Diane Saint-Victor, Elizabeth Fox, Neena Smith-Bankhead, Dazon DixonDiallo, Marcia M. Holstad, Carlos del Rio. Originally published in JMIR Public Health and Surveillance(http://publichealth.jmir.org), 08.10.2015. This is an open-access article distributed under the terms of the Creative CommonsAttribution License (http://creativecommons.org/licenses/by/2.0/), which permits unrestricted use, distribution, and reproductionin any medium, provided the original work, first published in JMIR Public Health and Surveillance, is properly cited. The completebibliographic information, a link to the original publication on http://publichealth.jmir.org, as well as this copyright and licenseinformation must be included.
JMIR Public Health Surveill 2015 | vol. 1 | iss. 2 | e16 | p.91http://publichealth.jmir.org/2015/2/e16/(page number not for citation purposes)
Frew et alJMIR PUBLIC HEALTH AND SURVEILLANCE
XSL•FORenderX

Original Paper
Building a Mobile HIV Prevention App for Men Who Have SexWith Men: An Iterative and Community-Driven Process
Tamar Goldenberg1, MPH; Sarah J McDougal2, MPH; Patrick S Sullivan3, DVM, PhD; Joanne D Stekler2, PhD; Rob
Stephenson1, PhD1School of Nursing, Department of Health Behavior and Biological Sciences and the Center for Sexuality and Health Disparities, University of Michigan,Ann Arbor, MI, United States2Department of Medicine, Division of Allergy and Infectious Diseases, University of Washington, Seattle, WA, United States3Rollins School of Public Health, Department of Epidemiology, Emory University, Atlanta, GA, United States
Corresponding Author:Tamar Goldenberg, MPHSchool of NursingDepartment of Health Behavior and Biological Sciences and the Center for Sexuality and Health DisparitiesUniversity of Michigan400 North Ingalls BuildingAnn Arbor, MI,United StatesPhone: 1 734 647 8826Fax: 1 734 763 7259Email: [email protected]
Abstract
Background: Gay, bisexual, and other men who have sex with men (MSM) account for a disproportionate burden of new HIVinfections in the United States. Mobile technology presents an opportunity for innovative interventions for HIV prevention. SomeHIV prevention apps currently exist; however, it is challenging to encourage users to download these apps and use them regularly.An iterative research process that centers on the community’s needs and preferences may increase the uptake, adherence, andultimate effectiveness of mobile apps for HIV prevention.
Objective: The aim of this paper is to provide a case study to illustrate how an iterative community approach to a mobile HIVprevention app can lead to changes in app content to appropriately address the needs and the desires of the target community.
Methods: In this three-phase study, we conducted focus group discussions (FGDs) with MSM and HIV testing counselors inAtlanta, Seattle, and US rural regions to learn preferences for building a mobile HIV prevention app. We used data from thesegroups to build a beta version of the app and theater tested it in additional FGDs. A thematic data analysis examined how thisapproach addressed preferences and concerns expressed by the participants.
Results: There was an increased willingness to use the app during theater testing than during the first phase of FGDs. Manyconcerns that were identified in phase one (eg, disagreements about reminders for HIV testing, concerns about app privacy) wereconsidered in building the beta version. Participants perceived these features as strengths during theater testing. However, somedisagreements were still present, especially regarding the tone and language of the app.
Conclusions: These findings highlight the benefits of using an interactive and community-driven process to collect data on apppreferences when building a mobile HIV prevention app. Through this process, we learned how to be inclusive of the larger MSMpopulation without marginalizing some app users. Though some issues in phase one were able to be addressed, disagreementsstill occurred in theater testing. If the app is going to address a large and diverse risk group, we cannot include niche functionalitythat may offend some of the target population.
(JMIR Public Health Surveill 2015;1(2):e18) doi:10.2196/publichealth.4449
KEYWORDS
HIV; AIDS; MSM; mobile app; prevention; community
JMIR Public Health Surveill 2015 | vol. 1 | iss. 2 | e18 | p.92http://publichealth.jmir.org/2015/2/e18/(page number not for citation purposes)
Goldenberg et alJMIR PUBLIC HEALTH AND SURVEILLANCE
XSL•FORenderX

Introduction
In 2011, gay, bisexual, and other men who have sex with men(MSM) accounted for 62% of new HIV infections in the UnitedStates, despite comprising only 2% of the population [1]. Toincrease identification of new HIV infections and linkage toHIV treatment among MSM, it is recommended that MSM testfor HIV at least three to four times per year [2]. However,despite current HIV prevention efforts, most MSM do not testthat frequently, with only 20% of MSM testing at least threetimes per year [3]. This gap identifies a need for new andinnovative HIV testing and HIV prevention solutions.
One possible opportunity for innovative HIV prevention is theuse of Internet-based interventions and mHealth (the use ofmobile phones for medical and public health-supportedinterventions) [4-9]. mHealth HIV interventions are becomingincreasingly popular and include interventions that use mobiletext messaging and mobile phone apps [4,10-24]. A study byMuessig et al identified 55 unique mobile apps that address HIVprevention or HIV care, but these apps were not frequentlydownloaded or highly rated by their users [21]. Even thoughmobile apps for HIV intervention are a popular platform fordevelopers, it is challenging to encourage app users to downloadthese apps and use them regularly. In order to address this,Muessig et al suggest that prior to building an app, developersshould use an iterative data collection process to obtain inputfrom the target audience about app preferences and appevaluation [21].
When disseminating research-based HIV preventioninterventions to communities, a disconnect between the researchenvironment and the community can reduce the effectivenessof the intervention and lead to underutilization [25].Community-based and community-centered approaches towardsbuilding research-based interventions can help address the gapbetween science and practice by ensuring that the interventionsare appropriate and driven by the community’s needs and desires[26]. When building mHealth interventions, this meansinterventions should be developed from community-identifiedneeds [4]. An iterative research process that centers on thecommunity’s needs and preferences (as suggested by Muessiget al) [21] may increase the uptake, adherence, and ultimateeffectiveness of mobile apps for HIV prevention. In this study,we outline the use of a community-driven approach to gatherdata from MSM in order to build an HIV prevention mobileapp. This paper describes how the community-driven approachwas used to develop an app that was reflective of the reportedneeds and desires of the community. We outline an iterativeapp development process in which multiple rounds of interactionwith the target community are used to inform and refine the appcontent and look. We previously published a report of findingsfrom one round of data collection from focus group discussions(FGDs) with MSM addressing men’s preferences for using amobile HIV prevention app [27]. In the current paper, we buildon our previously published work to focus specifically on howmultiple rounds of data collection and interaction that constitutedthe community-driven process allowed us to build a mobileHIV prevention app for MSM that was reflective of their statedneeds and desires. The current paper focuses on data from two
rounds of data collection, focusing more on the second roundof FGDs to illustrate how participant perceptions of the appintervention shifted (or did not shift) after the intervention wentthrough the additional round of app content building. The overallpurpose of this paper is to provide a case study to illustrate howan iterative approach to a mobile HIV prevention app can leadto changes in content to appropriately address the preferencesof the target community. To achieve this, we present themesthat emerged from the data and examine how discussions ofthese themes shifted at different phases of the study process andhow this ultimately lead to the creation of an app that was morelikely to be used by the target audience.
Methods
EthicsThis study was approved by Emory University’s InstitutionalReview Board. In this three-phase study, we used FGDs tocollect formative data and theater test the app.
Study Population and RecruitmentMethods for recruitment and a description of the FGDs withMSM during phase one have been previously described [27].We conducted research with three populations: (1) MSM inAtlanta, Seattle, and rural US regions; (2) HIV testing counselorsin Atlanta and Seattle; and (3) key informants including primarycare providers as well as key stakeholders at community-basedorganizations, health departments, and other governmentagencies at local, county, state, and federal levels. From Augustto December 2013, we recruited MSM using flyers andFacebook advertisements. Flyers were posted in a variety ofvenues in Atlanta and Seattle (eg, restaurants, bars, coffee shops,gyms) that MSM are known to frequent. Facebookadvertisements targeted men living in Atlanta, Seattle, and ruralUS regions who reported being interested in men in theirprofiles. In Atlanta, men recruited through Facebook have beenreported to be behaviorally comparable to men recruited throughother venues [28]. Rural locations were determined by zip codesand defined as geographical areas with population densities ofless than 1000 people per square mile using data from the USCensus Bureau [29]. The flyers and advertisements provided alink to an online screening survey through SurveyGizmo(Widgix LLC) to determine eligibility for the study. Participantsmeeting eligibility criteria for MSM in all three geographicalregions were self-identified gay or bisexual men aged 18 yearsor older who owned or had ever owned a smartphone and hadnever had a positive HIV test. HIV testing counselors wererecruited through flyers sent to organizations, clinics, and healthdepartments in Atlanta and Seattle where HIV testing isperformed. HIV testing counselors met eligibility criteria if theywere aged 18 years or older, provided HIV testing andcounseling services to MSM in Atlanta or Seattle, and ownedor had ever owned a smartphone. All participants who completedthe online survey and were eligible and interested providedemail addresses and phone numbers and were later contactedto participate in an FGD. Some MSM were asked to participatein only one FGD (either in phase one or phase three), and otherswere asked to participate in both; these participants wererandomly selected. Key informants were strategically chosen
JMIR Public Health Surveill 2015 | vol. 1 | iss. 2 | e18 | p.93http://publichealth.jmir.org/2015/2/e18/(page number not for citation purposes)
Goldenberg et alJMIR PUBLIC HEALTH AND SURVEILLANCE
XSL•FORenderX
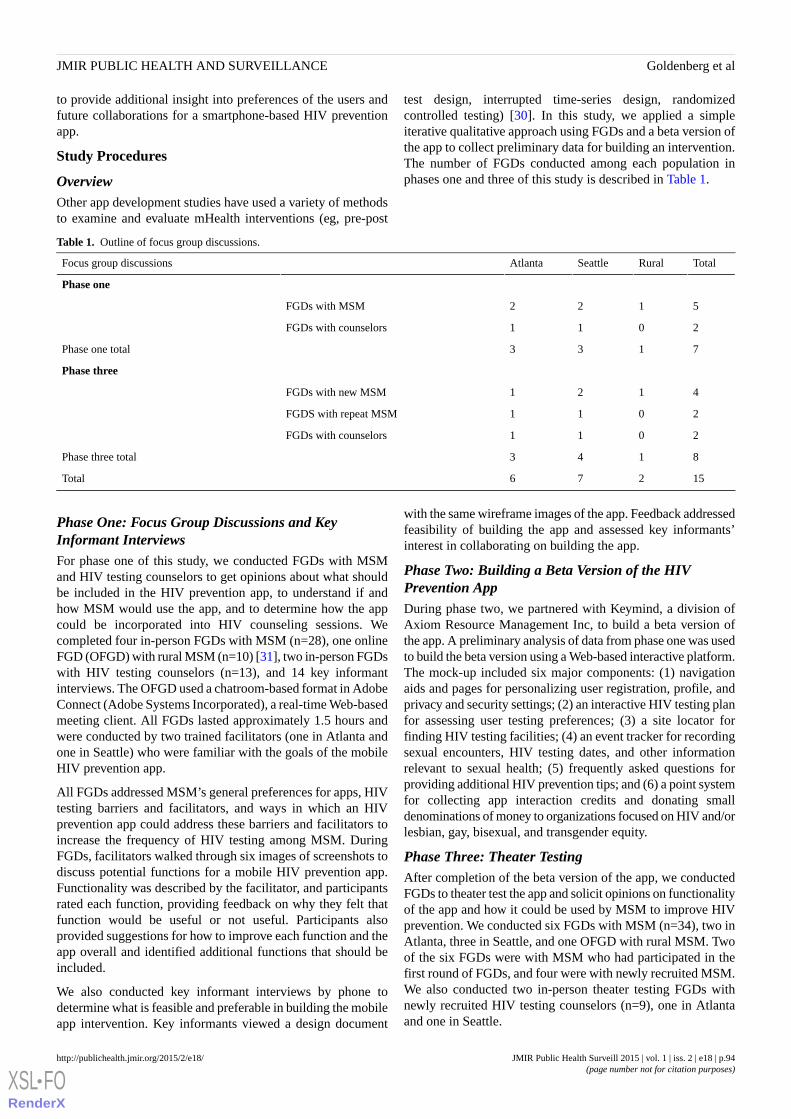
to provide additional insight into preferences of the users andfuture collaborations for a smartphone-based HIV preventionapp.
Study Procedures
OverviewOther app development studies have used a variety of methodsto examine and evaluate mHealth interventions (eg, pre-post
test design, interrupted time-series design, randomizedcontrolled testing) [30]. In this study, we applied a simpleiterative qualitative approach using FGDs and a beta version ofthe app to collect preliminary data for building an intervention.The number of FGDs conducted among each population inphases one and three of this study is described in Table 1.
Table 1. Outline of focus group discussions.
TotalRuralSeattleAtlantaFocus group discussions
Phase one
5122FGDs with MSM
2011FGDs with counselors
7133Phase one total
Phase three
4121FGDs with new MSM
2011FGDS with repeat MSM
2011FGDs with counselors
8143Phase three total
15276Total
Phase One: Focus Group Discussions and KeyInformant InterviewsFor phase one of this study, we conducted FGDs with MSMand HIV testing counselors to get opinions about what shouldbe included in the HIV prevention app, to understand if andhow MSM would use the app, and to determine how the appcould be incorporated into HIV counseling sessions. Wecompleted four in-person FGDs with MSM (n=28), one onlineFGD (OFGD) with rural MSM (n=10) [31], two in-person FGDswith HIV testing counselors (n=13), and 14 key informantinterviews. The OFGD used a chatroom-based format in AdobeConnect (Adobe Systems Incorporated), a real-time Web-basedmeeting client. All FGDs lasted approximately 1.5 hours andwere conducted by two trained facilitators (one in Atlanta andone in Seattle) who were familiar with the goals of the mobileHIV prevention app.
All FGDs addressed MSM’s general preferences for apps, HIVtesting barriers and facilitators, and ways in which an HIVprevention app could address these barriers and facilitators toincrease the frequency of HIV testing among MSM. DuringFGDs, facilitators walked through six images of screenshots todiscuss potential functions for a mobile HIV prevention app.Functionality was described by the facilitator, and participantsrated each function, providing feedback on why they felt thatfunction would be useful or not useful. Participants alsoprovided suggestions for how to improve each function and theapp overall and identified additional functions that should beincluded.
We also conducted key informant interviews by phone todetermine what is feasible and preferable in building the mobileapp intervention. Key informants viewed a design document
with the same wireframe images of the app. Feedback addressedfeasibility of building the app and assessed key informants’interest in collaborating on building the app.
Phase Two: Building a Beta Version of the HIVPrevention AppDuring phase two, we partnered with Keymind, a division ofAxiom Resource Management Inc, to build a beta version ofthe app. A preliminary analysis of data from phase one was usedto build the beta version using a Web-based interactive platform.The mock-up included six major components: (1) navigationaids and pages for personalizing user registration, profile, andprivacy and security settings; (2) an interactive HIV testing planfor assessing user testing preferences; (3) a site locator forfinding HIV testing facilities; (4) an event tracker for recordingsexual encounters, HIV testing dates, and other informationrelevant to sexual health; (5) frequently asked questions forproviding additional HIV prevention tips; and (6) a point systemfor collecting app interaction credits and donating smalldenominations of money to organizations focused on HIV and/orlesbian, gay, bisexual, and transgender equity.
Phase Three: Theater TestingAfter completion of the beta version of the app, we conductedFGDs to theater test the app and solicit opinions on functionalityof the app and how it could be used by MSM to improve HIVprevention. We conducted six FGDs with MSM (n=34), two inAtlanta, three in Seattle, and one OFGD with rural MSM. Twoof the six FGDs were with MSM who had participated in thefirst round of FGDs, and four were with newly recruited MSM.We also conducted two in-person theater testing FGDs withnewly recruited HIV testing counselors (n=9), one in Atlantaand one in Seattle.
JMIR Public Health Surveill 2015 | vol. 1 | iss. 2 | e18 | p.94http://publichealth.jmir.org/2015/2/e18/(page number not for citation purposes)
Goldenberg et alJMIR PUBLIC HEALTH AND SURVEILLANCE
XSL•FORenderX

Theater testing was conducted by the same facilitators whoconducted the first round of FGDs. For these groups, thefacilitator went through the interactive Web-based beta versionof the app piece by piece and asked participants to providefeedback on what they liked and did not like about each feature.Facilitators used scenarios to present possibilities for how MSMcould use the app. Participants provided feedback on how eachfunction could be used, their willingness to use it, andsuggestions for improvement. The purpose of theater testingwas to refine the content of the app, determine the best way topresent content, and better understand participant attitudes andwillingness to use the app.
Data AnalysisAll in-person FGDs were audio-recorded and transcribedverbatim. OFGDs were automatically downloaded to a readabletext file. Key informant interviews were not recorded ortranscribed, but detailed notes were used to inform the analysisof transcripts from FGDs. Analysis was conducted usingMAXQDA version 10 qualitative data analysis software (VerbiGmbH). We conducted a thematic analysis, examining bothinductive and deductive themes within the transcripts. Aftermultiple close readings, we created a preliminary codebook ofall salient themes. Provisional definitions were given to eachcode, and four analysts applied each code to a single transcript.The coded transcripts were merged for comparison, and codedefinitions were revised based on coding disagreements. Thisprocess was repeated until a final codebook was created and allfour analysts applied codes consistently. Once the finaldefinitions of the codebook were established, analystsconsistently applied the codes to all of the fifteen transcriptsfrom both sets of FGDs. Seven of the fifteen transcripts weredouble-coded with two analysts each coding the same transcript.Eight of the transcripts were coded by one analyst.Double-coded transcripts were merged and codes werereconciled; differences among coders were resolved byconsensus. Data were also coded by functionality, with aseparate set of inductive codes being applied to all transcriptsfrom phase one and from theater testing. After multiplepurposeful and focused readings of coded text, thick descriptionswere created for each theme. The descriptions identifiedcommon concepts, patterns, and unique ideas expressed in theFGDs. Themes were analyzed separately based on the FGDphase, participant group (MSM or counselors), and location(Atlanta, Seattle, or rural) and were compared and contrastedbetween groups.
Results
Descriptive StatisticsWe conducted 15 FGDs with 70 MSM and 22 HIV testingcounselors. Nine of the 70 MSM participated in both phases ofFGDs. Participant demographics are described in Tables 2 and3.
Building on Phase One ResultsThis three-phase process produced results that enabledresearchers and developers to build a detailed design documentoutlining the functionality of an HIV prevention smartphoneapp for MSM. Detailed results from FGDs with MSM fromphase one have been previously described [27]; however, otherdata from phase one have not been previously reported. In thefirst phase of FGDs, MSM described three categories offunctions that the app should include: education, interactiveengagement, and social networking. MSM also discussed theimportance of the tone and privacy of the app. Counselors statedthat the app could be a resource during HIV counseling sessionsbecause it could provide educational information, details forrisk behavior assessments, previous test dates, etc. Keyinformants identified potential benefits of the app includingbenefits for MSM and HIV prevention organizations. Keyinformants liked that the app could help promote testing andeducate MSM about testing, but they also felt that the app shouldinclude information about pre-exposure prophylaxis andnonoccupational postexposure prophylaxis and offer more helpcreating risk reduction plans. Informants also talked about thebenefits the app could have for promoting organizations usinga locator and potentially allowing MSM to provide feedbackon their testing experiences. These informants also identifiedwhich functions would be feasible and which would not. Forexample, we included a wireframe of a function that wouldvalidate test results, but community-based organizations andhealth departments said they do not have the capacity to validatetest results on a mobile app. Key informants expressed interestin collaborating and promoting the app.
We used these data from phase one to inform the beta versionof the app, resulting in an increased willingness of MSM to usethe app during theater testing. Some concerns that werediscussed in phase one were addressed in the beta version (eg,disagreements about HIV testing reminders, concerns about appprivacy), while others still existed (eg, over functionality, usingfriendly versus clinical language). We use examples of threeapp functions (HIV testing reminders, privacy settings, and sexdiaries) to explain how the feedback changed throughout thestudy process. We then examine participant desires forpersonalizing the app and their willingness to use it.
JMIR Public Health Surveill 2015 | vol. 1 | iss. 2 | e18 | p.95http://publichealth.jmir.org/2015/2/e18/(page number not for citation purposes)
Goldenberg et alJMIR PUBLIC HEALTH AND SURVEILLANCE
XSL•FORenderX
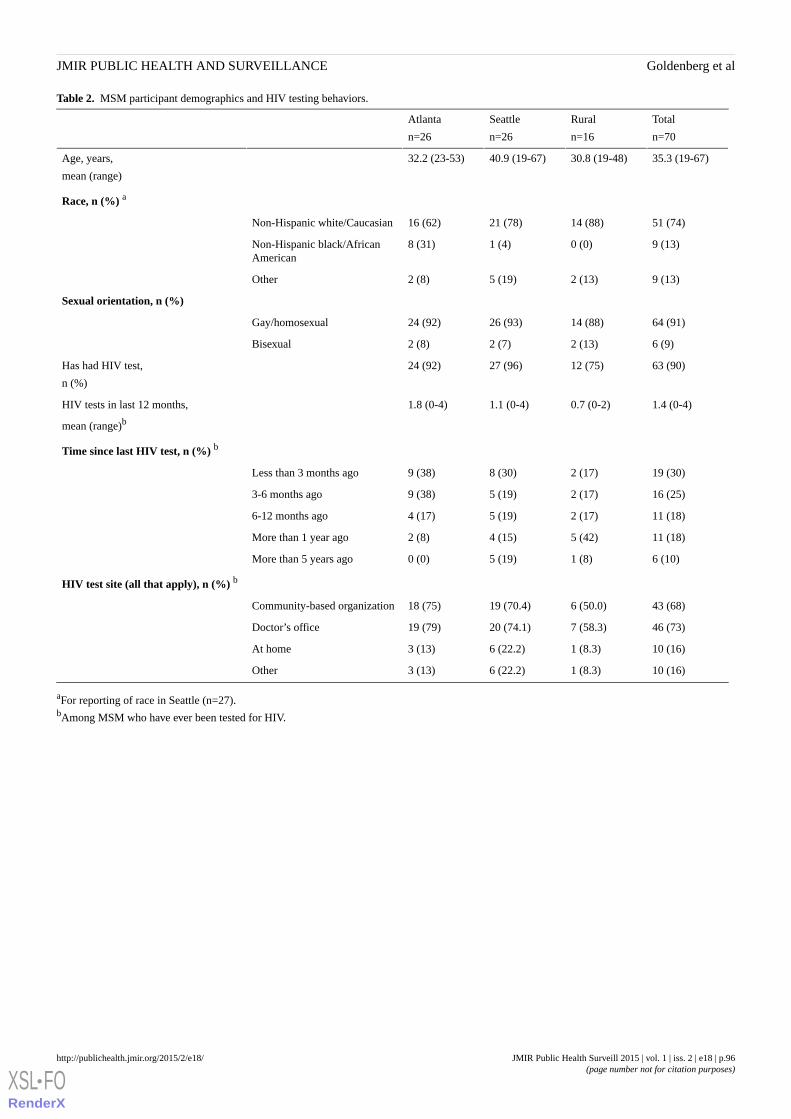
Table 2. MSM participant demographics and HIV testing behaviors.
Total
n=70
Rural
n=16
Seattle
n=26
Atlanta
n=26
35.3 (19-67)30.8 (19-48)40.9 (19-67)32.2 (23-53)Age, years,
mean (range)
Race, n (%) a
51 (74)14 (88)21 (78)16 (62)Non-Hispanic white/Caucasian
9 (13)0 (0)1 (4)8 (31)Non-Hispanic black/AfricanAmerican
9 (13)2 (13)5 (19)2 (8)Other
Sexual orientation, n (%)
64 (91)14 (88)26 (93)24 (92)Gay/homosexual
6 (9)2 (13)2 (7)2 (8)Bisexual
63 (90)12 (75)27 (96)24 (92)Has had HIV test,
n (%)
1.4 (0-4)0.7 (0-2)1.1 (0-4)1.8 (0-4)HIV tests in last 12 months,
mean (range)b
Time since last HIV test, n (%) b
19 (30)2 (17)8 (30)9 (38)Less than 3 months ago
16 (25)2 (17)5 (19)9 (38)3-6 months ago
11 (18)2 (17)5 (19)4 (17)6-12 months ago
11 (18)5 (42)4 (15)2 (8)More than 1 year ago
6 (10)1 (8)5 (19)0 (0)More than 5 years ago
HIV test site (all that apply), n (%) b
43 (68)6 (50.0)19 (70.4)18 (75)Community-based organization
46 (73)7 (58.3)20 (74.1)19 (79)Doctor’s office
10 (16)1 (8.3)6 (22.2)3 (13)At home
10 (16)1 (8.3)6 (22.2)3 (13)Other
aFor reporting of race in Seattle (n=27).bAmong MSM who have ever been tested for HIV.
JMIR Public Health Surveill 2015 | vol. 1 | iss. 2 | e18 | p.96http://publichealth.jmir.org/2015/2/e18/(page number not for citation purposes)
Goldenberg et alJMIR PUBLIC HEALTH AND SURVEILLANCE
XSL•FORenderX
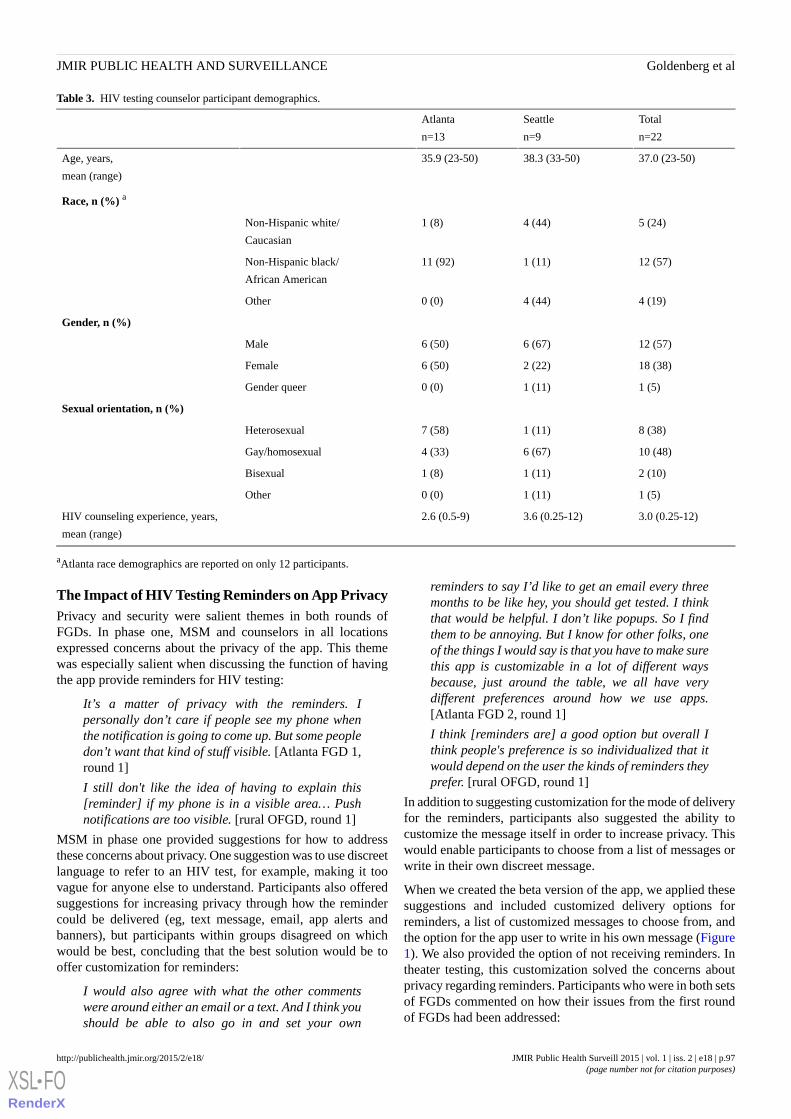
Table 3. HIV testing counselor participant demographics.
Total
n=22
Seattle
n=9
Atlanta
n=13
37.0 (23-50)38.3 (33-50)35.9 (23-50)Age, years,
mean (range)
Race, n (%) a
5 (24)4 (44)1 (8)Non-Hispanic white/
Caucasian
12 (57)1 (11)11 (92)Non-Hispanic black/
African American
4 (19)4 (44)0 (0)Other
Gender, n (%)
12 (57)6 (67)6 (50)Male
18 (38)2 (22)6 (50)Female
1 (5)1 (11)0 (0)Gender queer
Sexual orientation, n (%)
8 (38)1 (11)7 (58)Heterosexual
10 (48)6 (67)4 (33)Gay/homosexual
2 (10)1 (11)1 (8)Bisexual
1 (5)1 (11)0 (0)Other
3.0 (0.25-12)3.6 (0.25-12)2.6 (0.5-9)HIV counseling experience, years,
mean (range)
aAtlanta race demographics are reported on only 12 participants.
The Impact of HIV Testing Reminders on App PrivacyPrivacy and security were salient themes in both rounds ofFGDs. In phase one, MSM and counselors in all locationsexpressed concerns about the privacy of the app. This themewas especially salient when discussing the function of havingthe app provide reminders for HIV testing:
It’s a matter of privacy with the reminders. Ipersonally don’t care if people see my phone whenthe notification is going to come up. But some peopledon’t want that kind of stuff visible. [Atlanta FGD 1,round 1]
I still don't like the idea of having to explain this[reminder] if my phone is in a visible area… Pushnotifications are too visible. [rural OFGD, round 1]
MSM in phase one provided suggestions for how to addressthese concerns about privacy. One suggestion was to use discreetlanguage to refer to an HIV test, for example, making it toovague for anyone else to understand. Participants also offeredsuggestions for increasing privacy through how the remindercould be delivered (eg, text message, email, app alerts andbanners), but participants within groups disagreed on whichwould be best, concluding that the best solution would be tooffer customization for reminders:
I would also agree with what the other commentswere around either an email or a text. And I think youshould be able to also go in and set your own
reminders to say I’d like to get an email every threemonths to be like hey, you should get tested. I thinkthat would be helpful. I don’t like popups. So I findthem to be annoying. But I know for other folks, oneof the things I would say is that you have to make surethis app is customizable in a lot of different waysbecause, just around the table, we all have verydifferent preferences around how we use apps.[Atlanta FGD 2, round 1]
I think [reminders are] a good option but overall Ithink people's preference is so individualized that itwould depend on the user the kinds of reminders theyprefer. [rural OFGD, round 1]
In addition to suggesting customization for the mode of deliveryfor the reminders, participants also suggested the ability tocustomize the message itself in order to increase privacy. Thiswould enable participants to choose from a list of messages orwrite in their own discreet message.
When we created the beta version of the app, we applied thesesuggestions and included customized delivery options forreminders, a list of customized messages to choose from, andthe option for the app user to write in his own message (Figure1). We also provided the option of not receiving reminders. Intheater testing, this customization solved the concerns aboutprivacy regarding reminders. Participants who were in both setsof FGDs commented on how their issues from the first roundof FGDs had been addressed:
JMIR Public Health Surveill 2015 | vol. 1 | iss. 2 | e18 | p.97http://publichealth.jmir.org/2015/2/e18/(page number not for citation purposes)
Goldenberg et alJMIR PUBLIC HEALTH AND SURVEILLANCE
XSL•FORenderX
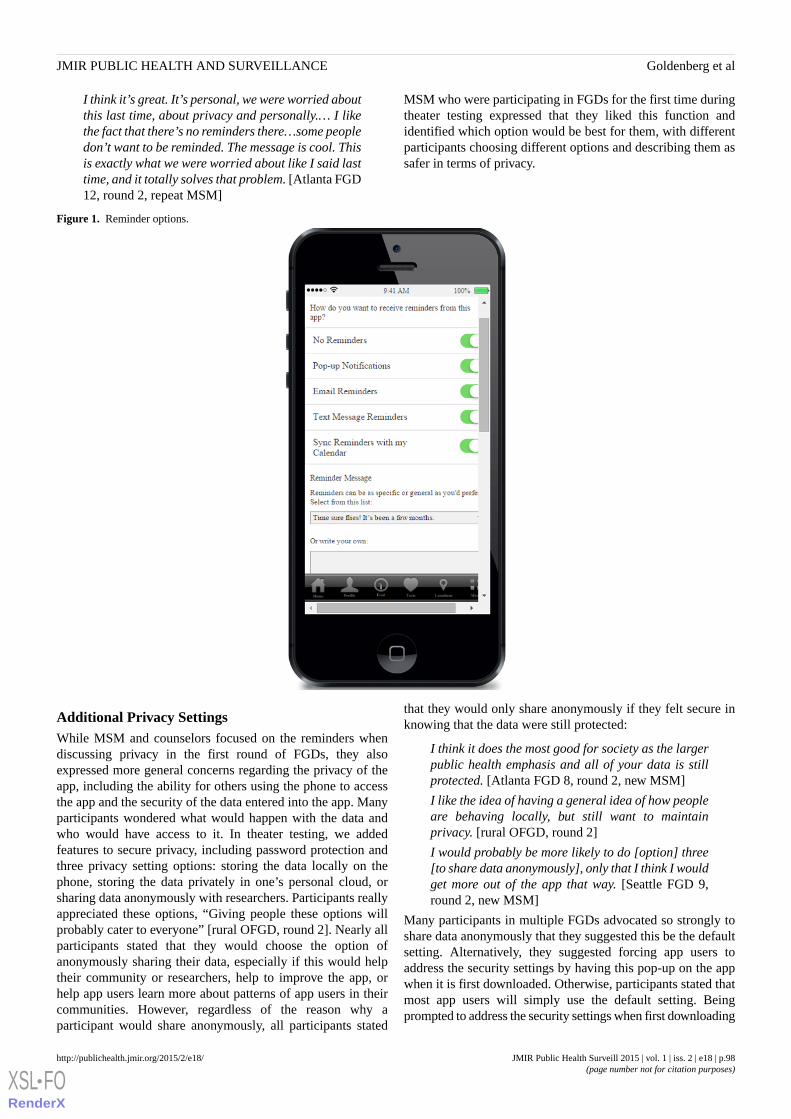
I think it’s great. It’s personal, we were worried aboutthis last time, about privacy and personally.… I likethe fact that there’s no reminders there…some peopledon’t want to be reminded. The message is cool. Thisis exactly what we were worried about like I said lasttime, and it totally solves that problem. [Atlanta FGD12, round 2, repeat MSM]
MSM who were participating in FGDs for the first time duringtheater testing expressed that they liked this function andidentified which option would be best for them, with differentparticipants choosing different options and describing them assafer in terms of privacy.
Figure 1. Reminder options.
Additional Privacy SettingsWhile MSM and counselors focused on the reminders whendiscussing privacy in the first round of FGDs, they alsoexpressed more general concerns regarding the privacy of theapp, including the ability for others using the phone to accessthe app and the security of the data entered into the app. Manyparticipants wondered what would happen with the data andwho would have access to it. In theater testing, we addedfeatures to secure privacy, including password protection andthree privacy setting options: storing the data locally on thephone, storing the data privately in one’s personal cloud, orsharing data anonymously with researchers. Participants reallyappreciated these options, “Giving people these options willprobably cater to everyone” [rural OFGD, round 2]. Nearly allparticipants stated that they would choose the option ofanonymously sharing their data, especially if this would helptheir community or researchers, help to improve the app, orhelp app users learn more about patterns of app users in theircommunities. However, regardless of the reason why aparticipant would share anonymously, all participants stated
that they would only share anonymously if they felt secure inknowing that the data were still protected:
I think it does the most good for society as the largerpublic health emphasis and all of your data is stillprotected. [Atlanta FGD 8, round 2, new MSM]
I like the idea of having a general idea of how peopleare behaving locally, but still want to maintainprivacy. [rural OFGD, round 2]
I would probably be more likely to do [option] three[to share data anonymously], only that I think I wouldget more out of the app that way. [Seattle FGD 9,round 2, new MSM]
Many participants in multiple FGDs advocated so strongly toshare data anonymously that they suggested this be the defaultsetting. Alternatively, they suggested forcing app users toaddress the security settings by having this pop-up on the appwhen it is first downloaded. Otherwise, participants stated thatmost app users will simply use the default setting. Beingprompted to address the security settings when first downloading
JMIR Public Health Surveill 2015 | vol. 1 | iss. 2 | e18 | p.98http://publichealth.jmir.org/2015/2/e18/(page number not for citation purposes)
Goldenberg et alJMIR PUBLIC HEALTH AND SURVEILLANCE
XSL•FORenderX

the app was also perceived as increasing the overall feeling ofsecurity of the app:
If security is the concern it also indicates to them thatyou thought about security and that this is beingaddressed upfront rather than like I had to find thesecurity settings [Seattle FGD 13, round 2, repeatMSM]
Sex Diaries and App ToneIn phase one and phase three of this study, MSM disagreed onthe tone of the app. This difference occurred between groupsand geographical locations, but also within groups. In the firstround of FGDs, some participants wanted more fun and friendlylanguage and functionality, identifying that this would makethe app more user-friendly and less judgmental. Otherparticipants identified wanting more clinical language andlanguage and functionality that was more authoritative. Thiswas perceived as increasing the credibility and trustworthinessof the app.
When creating the beta version of the app, we tried to havecontent and language that addressed both of these needs. Somefunctionalities (like descriptions of HIV tests) werestraightforward, and while we attempted to use simple,easy-to-understand language for this section, it was not writtenusing sexy language. However, other functionality, like sexdiaries in the feed (Figure 2), used more fun and sexy language.The sex diaries were meant to help app users track sex partnersand experiences to identify risk behaviors, including condomuse and substance use during sex. Some MSM in all threelocations strongly expressed support for this feature. Participantsliked this function because they felt it was fun and mightencourage users to be more engaged with the app, possiblyencouraging users to try other pieces of the app:
It does sound like a certain degree of fun, this appoverall, like maybe because you’re using this featureof the app, you’ll be more likely to use the otherfeatures of the app. [Seattle FGD 9, round 2, newMSM]
Participants also found value in this function because they feltit added accountability by being able to keep track of sexualbehavior patterns:
I like the idea of tracking your behavior.…I think thatthat’s important when you’re creating a testing planto know when and what did you do and when do Ineed to go get tested. And then, even after I get tested,have I passed the window period or not, so I’ll knowif I get tested, do I need to get tested in another coupleof weeks, another month or whatever. [Atlanta FGD12, round 2, repeat MSM]
I like it a lot. It makes it feel more like a personal app.Keeping track of things simply adds to the ownershipof the whole thing.…People keep a food diary tobecome healthier. Maybe a sex diary would lead tohealthier choices.…And keep one accountable tothemselves. [rural OFGD, round 2]
Many participants in multiple FGDs liked this feature so muchthey felt we should center the entire app on this function, usethe sex diary for marketing, and call it “My Little Black Book.”
P14: I love the black book idea. I'd market the hellout of this aspect, and use it as tool for HIV testingas the secondary.
Moderator: How do others feel about that?
P18: But, P14, the whole POINT is HIV testing.
P14: I know, but use the fun part of it to get peoplerecording and thinking about their activities and thenuse that history to encourage testing. …more of acover on the testing things.
P22: That's true. A Black Book app would be a goodangle on it. Maybe Black Book could be incorporatedinto the title?
P14: Take the clinical aspect out of it.
P19: I feel this is getting a little off-track.
P18: Then again, point. See the list of stuff you'vedone, and be like, "I should get tested."
P14: Yea… I’m not suggesting dropping the testing,but the diary aspect puts your history in your face,makes you think about it more. [rural OFGD, round2]
Despite the overall positive reaction to this feature in many ofthe FGDs, not all participants liked this feature. Some, like P19stated in the OFGD, felt that it took away from the main pointof the app.
Even when participants found value in the sex diary function,some participants felt that this function asked for too much fromapp users and they did not want to put that type of informationinto their phone:
Are you really going to go to the effort of putting inthe dirty details? [rural OFGD, round 2]
Sometimes these concerns were related to app user motivation,but participants also identified privacy as a concern regardingthis type of sensitive information:
I was the one advocating for blunt use of languagebut at the same time no one would write that tothemselves on the off chance that their mother pickedup the phone, but still it’s useful information…evenfor your own personal diary or your own personaluse. [Atlanta FGD 8, round 2, new MSM]
It’s just very personal. It’s up to the individual, Imean, I certainly wouldn’t put anything like that onmy phone, but somebody that wants to get thatdetailed and it’s their own personalization, I guess.[Atlanta FGD 12, round 2, repeat MSM]
Some participants (especially those in Atlanta) disagreed withthis function even further and did not find value in its use. Someof these participants stated that they would delete the app if thiswere a function on it, even if this function were optional. Theseparticipants felt that this function took away from the main pointof the app and would encourage MSM to brag to their friendsabout the number of sex partners they had had:
JMIR Public Health Surveill 2015 | vol. 1 | iss. 2 | e18 | p.99http://publichealth.jmir.org/2015/2/e18/(page number not for citation purposes)
Goldenberg et alJMIR PUBLIC HEALTH AND SURVEILLANCE
XSL•FORenderX

P1: I’m just kind of uncomfortable now so I don’tthink I would put that on my phone…
P2: I would not take this app seriously after seeingthis.
P1: I would completely walk away, be done… I don’tsee the purpose of writing [about] the sex…Unlessyou wanted to take this app…
P2: Unless you wanted to make it a game orsomething.
P3: Well then does it start to defeat its own purposeonce you start turning this into like a super fun, howmany things can I list out.
P1: Yeah, you start to look at the game and then it’slike…the HIV part becomes, ‘Oh by the way go gettested’ after I’ve done all this.
P2: Knowing that, you know, [Name] blah, blah, blah,has his sex diary on his phone who wants to see hissex diary then he passes his phone around the bar.[Atlanta FGD 8, round 2, new MSM]
Some participants who disagreed with this function felt that itwould have been improved by a more professional tone:
And this may be just a personal preference for me butI would keep the language… extremely clinical… ifI were going to use it I’d want it to be somethingwhere I could just put the facts down so that I couldhave a reminder if I needed it. [Atlanta FGD 8, round2, new MSM]
This disagreement about the sex diary is an example of thetension between making the language and tone of the app overlyclinical and over-sexing the language and functionality of theapp so that it offends people and deters them from using theapp. There was no expressed solution to solve this disagreement,but participants recognized that this tension is a sensitive issuethat can make or break an app:
I think there is a fine line between keeping it real andbeing accessible and trivializing. [Atlanta FGD 8,round 2, new MSM]
Figure 2. Sex diary.
Personalization of the AppParticipants discussed the importance of personalizing the app.This was evident in the appreciation of customized features likethe reminders and the privacy settings. Participants whoapproved of the sex diaries also stated that they felt it made theapp more personal and added to the ownership of the whole
thing. In addition to functionality that personalized the app,participants also stated that the language that the app used waspersonal:
The personal pronouns lend the user towards a senseof ownership of the whole thing. [rural OFGD, round2]
JMIR Public Health Surveill 2015 | vol. 1 | iss. 2 | e18 | p.100http://publichealth.jmir.org/2015/2/e18/(page number not for citation purposes)
Goldenberg et alJMIR PUBLIC HEALTH AND SURVEILLANCE
XSL•FORenderX
Something that sort of personalizes, like you’ve gotMY feed, MY test plan using the word my. [AtlantaFGD 8, round 2, new MSM]
Using titles for functions such as “My Test Plan” helpedparticipants to take ownership over these functions and identifiedthat these were functions that could be customized andpersonalized to fit each app user’s individual needs. Participantsliked this type of language so much that they suggested that thetitle of the app include a personal pronoun to stress theimportance of ownership. According to participants, ownershipapplied to the ability to customize and personalize app functions,but it also contributed to the ownership of one’s sexual healthand HIV risk through increased self-responsibility.
Willingness to Use the AppOverall, participants felt that the app seemed easy to use andthe information was easy to digest. Participants appreciated thesimple, straightforward language as well as infographics andsuggested including more of these. Participants recognized thatmen most likely to use or need the app are men who are moresexually active, who have concerns about their HIV risk, or whodo not already have a HIV testing plan established.
One of the biggest challenges identified by participants in gettingmen to use the app is maintaining interest and motivation to usethe app:
It seems like one of those apps that you download andyou play it for about ten minutes after youdownloaded it and then just kind of sat there on yourphone until you get the notification. [Atlanta FGD 8,round 2, new MSM]
Even though some participants expressed that this might not bean app that they would use constantly, participants did see theimportance for having this app available when they really neededit:
But I think too if you do have an accident or you haveengaged in high risk behavior…and you’re scaredand you don’t have a plan in place you might turn tothis out of curiosity to help build a plan. It would bea good anonymous way to…create a plan and findout as much as you want to find out too. But…Iwouldn’t play on it every day but again we’ve all had.[Atlanta FGD 8, round 2, new MSM]
Participants also offered suggestions for what could helpmotivate MSM to use the app more regularly. One idea was toincentivize app use. In the beta version, we included incentivesin the form of reward points that would contribute to donationsfor organizations, but participants stated that there should alsobe incentives that benefit the app user directly:
I was trying to think of what would get me or get somepeople I know to do it, and it might be like, I waswondering if you could do, you know, fifty points andwe’ll send you a pack of condoms, or a hundred pointsand you get no cover charge at this club.…I think [thereward points are a] great thing, I don’t know if it’sgoing to motivate as many people as something that’s
actually for them. [Seattle FGD 10, round 2, newMSM]
In addition to incentivizing, many participants in multiple FGDsdiscussed app promotion and advertising as an important wayto get users to download the app.
Discussion
Principal FindingsThese findings highlight how using an interactive andcommunity-centered process to collect data on app preferencesis fundamental when building a mobile HIV prevention app.Many of the concerns and problems that were voiced in the firstround of FGDs were addressed in the beta version of the appwith increased acceptability noted in phase three, especiallyregarding concerns about privacy. Through this process, welearned about the needs and desires that MSM have for a mobileHIV prevention app and gained insight on what would motivatemen to download and use the app.
Through the testing, we learned that if this app-basedintervention is going to address a large and diverse risk group,we cannot include niche functionality that may offend some ofthe target population. Even though some participants loved thesex diaries, others said that they would not use the app at all ifit was included, even as an optional function. This app is meantto cater to the larger MSM population, so it needs to includemore general functionality that everyone agrees is useful whilealso being customizable so that each app user can have apersonalized experience. In the process of building this app, welearned that personalization and customization can improvemany components of the app, especially when there arepersonalized settings to address different user security needs.This personalization along with interactive functionality allowsfor the app user to take ownership over the app, making HIVtesting plans and other features more catered to the app users’specific needs. According to participants, this act of takingownership over one’s sexual health within the app may alsoassist men to take ownership of their HIV risk management inother aspects of their lives.
This concept of personalization and ownership is aligned withBandura’s social cognitive theory of self-regulation, whichstates that self-regulation occurs through self-monitoring,judging one’s behaviors in relation to personal and societalstandards, and reacting to these judgments [32]. Participantswho appreciated the sex diaries expressed the benefits ofself-regulation and increased accountability. Participants alsorecognized other areas of the app that encouraged this type ofaccountability, such as the use of personal pronouns (eg, MyTest Plan). These findings support current recommendationsthat mHealth interventions should be guided by existing theoriesof behavior change [33]. HIV prevention apps may benefit fromapplying this cognitive theory of self-regulation throughincreased personalization, accountability, and ownership of appfunctionality.
LimitationsAlthough recruitment by race is reflective of the largergeographical demographics [34] with more black MSM
JMIR Public Health Surveill 2015 | vol. 1 | iss. 2 | e18 | p.101http://publichealth.jmir.org/2015/2/e18/(page number not for citation purposes)
Goldenberg et alJMIR PUBLIC HEALTH AND SURVEILLANCE
XSL•FORenderX

participating in Atlanta, we do not have enough racial variationto make any conclusions based on race. Participants representedan older population of MSM with an overall mean age of 35.We do not know how the results would have differed if theywere more reflective of the attitudes of younger MSM, andgiven the increase in HIV among young MSM, this representsa knowledge gap in the current study. Participants in Seattlealso had a higher mean age than participants in Atlanta and wedo not know if this contributed to any differences betweengeographical groups. In addition, recruitment of men whoidentify as gay or bisexual and who identify as seeking othermen on Facebook may not represent MSM in general. Includingonly MSM who own smartphones may also not be representativeof MSM in general; however, targeting MSM who ownedsmartphones allowed us to include participants who would bemost likely to use the app. Since these are qualitative findings,we are not trying to generalize study results or quantifydifferences between groups. However, we were able tounderstand app preferences using populations in two differentUS cities as well as rural regions, where populationdemographics, culture, and HIV prevention efforts vary. OFGDswith rural men were limited to the online environment. Allparticipants needed to have access to a computer with Internet.Furthermore, the facilitator did not have nonverbal cues to assistwith probing questions. Still, the OFGDs were useful incapturing insight from a population that we would have
otherwise not been able to include in this study. Overall, thisstudy addressed perspectives and attitudes on willingness to usean HIV prevention app and to determine the best approach forfunctionality and content of the app; however, this study didnot address usability testing. While usability testing is importantto ensure that the target population will use the app, since thispaper describes an early stage of app development, the aim ofthe FGDs was to determine preferences for content andfunctionality rather than design and interface. Future testing ofthe app will address other factors that influence app usability.
ConclusionsDespite these limitations, this study reflects the need for acommunity-driven approach that includes multiple rounds ofdata collection and theater testing when developing apps orother mHealth interventions for HIV prevention. Building anHIV prevention app is expensive and requires time andresources. To maximize app uptake and usage, it makes senseto build the best app possible, and the definition of best appshould be defined by the community it aims to serve. Throughthis process, we learned how to be inclusive of the larger MSMpopulation without marginalizing some app users. We alsolearned how to personalize the app so users take ownership andfeel comfortable with its security. This community-drivenprocess increased an overall willingness to use the app andprovided important insight into how to build an HIV preventionapp that MSM want to use.
AcknowledgmentsThis research was supported by MAC AIDS Fund and the Emory Center for AIDS Research (P30 AI050409).
Conflicts of InterestNone declared.
References1. Estimated HIV Incidence in the United States, 2007-2010. Atlanta GA: Centers for Disease Control & Prevention; 2012.
HIV Surveillance Supplemental Report URL: http://www.cdc.gov/hiv/pdf/statistics_hssr_vol_17_no_4.pdf [accessed2015-10-30] [WebCite Cache ID 6cfjrJUcQ]
2. Oster AM, Johnson CH, Le BC. Trends in HIV prevalence and HIV testing among young MSM: five United States Cities,1994-2011. AIDS Behav 2014;18(3):237-247. [doi: 10.1007/s10461-013-0566-1]
3. Khosropour CM, Sullivan PS. At-home HIV testing of MSM enrolled in an online HIV behavioral risk study. 2011 Presentedat: National HIV Prevention Conference; August 14-17 2011; Atlanta.
4. Arya M, Kumar D, Patel S, Street RL, Giordano TP, Viswanath K. Mitigating HIV health disparities: the promise of mobilehealth for a patient-initiated solution. Am J Public Health 2014 Dec;104(12):2251-2255. [doi: 10.2105/AJPH.2014.302120][Medline: 25322292]
5. Boulos Maged N Kamel, Wheeler S, Tavares C, Jones R. How smartphones are changing the face of mobile and participatoryhealthcare: an overview, with example from eCAALYX. Biomed Eng Online 2011;10:24 [FREE Full text] [doi:10.1186/1475-925X-10-24] [Medline: 21466669]
6. Mobile Health 2012: Half of smartphone owners use their devices to get health information and one-fifth of smartphoneowners have health apps. Washington DC: Pew Internet & American Life Project URL: http://www.pewinternet.org/files/old-media/Files/Reports/2012/PIP_MobileHealth2012_FINAL.pdf [accessed 2015-10-30] [WebCite Cache ID 6cfkTL8pF]
7. Terry M. Medical Apps for Smartphones. Telemed J E Health 2010;16(1):17-22. [doi: 10.1089/tmj.2010.9999] [Medline:20070172]
8. Ybarra ML, Bull SS. Current trends in Internet- and cell phone-based HIV prevention and intervention programs. CurrHIV/AIDS Rep 2007 Dec;4(4):201-207. [Medline: 18366952]
JMIR Public Health Surveill 2015 | vol. 1 | iss. 2 | e18 | p.102http://publichealth.jmir.org/2015/2/e18/(page number not for citation purposes)
Goldenberg et alJMIR PUBLIC HEALTH AND SURVEILLANCE
XSL•FORenderX

9. Sullivan PS, Grey JA, Simon Rosser BR. Emerging technologies for HIV prevention for MSM: what we have learned, andways forward. J Acquir Immune Defic Syndr 2013 Jun 1;63 Suppl 1:S102-S107 [FREE Full text] [doi:10.1097/QAI.0b013e3182949e85] [Medline: 23673879]
10. Catalani C, Philbrick W, Fraser H, Mechael P, Israelski DM. mHealth for HIV Treatment & Prevention: A SystematicReview of the Literature. Open AIDS J 2013;7:17-41 [FREE Full text] [doi: 10.2174/1874613620130812003] [Medline:24133558]
11. Cornelius JB, Cato M, Lawrence JS, Boyer CB, Lightfoot M. Development and pretesting multimedia HIV-prevention textmessages for mobile cell phone delivery. J Assoc Nurses AIDS Care 2011;22(5):407-413 [FREE Full text] [doi:10.1016/j.jana.2010.11.007] [Medline: 21256053]
12. Cornelius JB, Cato MG, Toth JL, Bard PM, Moore MW, White A. Following the trail of an HIV-prevention Web siteenhanced for mobile cell phone text messaging delivery. J Assoc Nurses AIDS Care 2012;23(3):255-259 [FREE Full text][doi: 10.1016/j.jana.2011.03.002] [Medline: 21550826]
13. Cornelius JB, St Lawrence JS, Howard JC, Shah D, Poka A, McDonald D, et al. Adolescents' perceptions of a mobile cellphone text messaging-enhanced intervention and development of a mobile cell phone-based HIV prevention intervention.J Spec Pediatr Nurs 2012 Jan;17(1):61-69 [FREE Full text] [doi: 10.1111/j.1744-6155.2011.00308.x] [Medline: 22188273]
14. da Costa TM, Barbosa BJ, Gomes e Costa DA, Sigulem D, de Fátima Marin H, Filho AC, et al. Results of a randomizedcontrolled trial to assess the effects of a mobile SMS-based intervention on treatment adherence in HIV/AIDS-infectedBrazilian women and impressions and satisfaction with respect to incoming messages. Int J Med Inform 2012Apr;81(4):257-269 [FREE Full text] [doi: 10.1016/j.ijmedinf.2011.10.002] [Medline: 22296762]
15. Dowshen N, Kuhns LM, Johnson A, Holoyda BJ, Garofalo R. Improving adherence to antiretroviral therapy for youthliving with HIV/AIDS: a pilot study using personalized, interactive, daily text message reminders. J Med Internet Res2012;14(2):e51 [FREE Full text] [doi: 10.2196/jmir.2015] [Medline: 22481246]
16. Hardy H, Kumar V, Doros G, Farmer E, Drainoni M, Rybin D, et al. Randomized controlled trial of a personalized cellularphone reminder system to enhance adherence to antiretroviral therapy. AIDS Patient Care STDS 2011 Mar;25(3):153-161[FREE Full text] [doi: 10.1089/apc.2010.0006] [Medline: 21323532]
17. Horvath T, Azman H, Kennedy GE, Rutherford GW. Mobile phone text messaging for promoting adherence to antiretroviraltherapy in patients with HIV infection. Cochrane Database Syst Rev 2012;3. [Medline: 22419345]
18. Juzang I, Fortune T, Black S, Wright E, Bull S. A pilot programme using mobile phones for HIV prevention. J TelemedTelecare 2011;17(3):150-153. [doi: 10.1258/jtt.2010.091107] [Medline: 21270049]
19. Krishnan A, Ferro EG, Weikum D, Vagenas P, Lama JR, Sanchez J, et al. Communication technology use and mHealthacceptance among HIV-infected men who have sex with men in Peru: implications for HIV prevention and treatment. AIDSCare 2015;27(3):273-282. [doi: 10.1080/09540121.2014.963014] [Medline: 25285464]
20. Lester RT, Ritvo P, Mills EJ, Kariri A, Karanja S, Chung MH, et al. Effects of a mobile phone short message service onantiretroviral treatment adherence in Kenya (WelTel Kenya1): a randomised trial. Lancet 2010 Nov 27;376(9755):1838-1845.[doi: 10.1016/S0140-6736(10)61997-6] [Medline: 21071074]
21. Muessig KE, Pike EC, Legrand S, Hightow-Weidman LB. Mobile phone applications for the care and prevention of HIVand other sexually transmitted diseases: a review. J Med Internet Res 2013;15(1):e1 [FREE Full text] [doi: 10.2196/jmir.2301][Medline: 23291245]
22. Pop-Eleches C, Thirumurthy H, Habyarimana JP, Zivin JG, Goldstein MP, de WD, et al. Mobile phone technologies improveadherence to antiretroviral treatment in a resource-limited setting: a randomized controlled trial of text message reminders.AIDS 2011 Mar 27;25(6):825-834 [FREE Full text] [doi: 10.1097/QAD.0b013e32834380c1] [Medline: 21252632]
23. Schnall R, Travers J, Rojas M, Carballo-Diéguez A. eHealth interventions for HIV prevention in high-risk men who havesex with men: a systematic review. J Med Internet Res 2014;16(5):e134 [FREE Full text] [doi: 10.2196/jmir.3393] [Medline:24862459]
24. Tufts KA, Johnson KF, Shepherd JG, Lee JY, Bait Ajzoon MS, Mahan LB, et al. Novel interventions for HIVself-management in African American women: a systematic review of mHealth interventions. J Assoc Nurses AIDS Care2015;26(2):139-150. [doi: 10.1016/j.jana.2014.08.002] [Medline: 25283352]
25. Kelly JA, Somlai AM, DiFranceisco WJ, Otto-Salaj LL, McAuliffe TL, Hackl KL, et al. Bridging the gap between thescience and service of HIV prevention: transferring effective research-based HIV prevention interventions to communityAIDS service providers. Am J Public Health 2000 Jul;90(7):1082-1088. [Medline: 10897186]
26. Wandersman A, Florin P. Community interventions and effective prevention. Am Psychol 2003;58(6-7):441-448. [Medline:12971190]
27. Goldenberg T, McDougal SJ, Sullivan PS, Stekler JD, Stephenson R. Preferences for a mobile HIV prevention app for menwho have sex with men. JMIR Mhealth Uhealth 2014;2(4):e47.
28. Hernandez-Romieu AC, Sullivan PS, Sanchez TH, Kelley CF, Peterson JL, Del Rio C, et al. The comparability of menwho have sex with men recruited from venue-time-space sampling and facebook: a cohort study. JMIR Res Protoc2014;3(3):e37 [FREE Full text] [doi: 10.2196/resprot.3342] [Medline: 25048694]
JMIR Public Health Surveill 2015 | vol. 1 | iss. 2 | e18 | p.103http://publichealth.jmir.org/2015/2/e18/(page number not for citation purposes)
Goldenberg et alJMIR PUBLIC HEALTH AND SURVEILLANCE
XSL•FORenderX
29. Womach J. Congressional Research Service Report for Congress. 2005. Agriculture: A Glossary of Terms, Programs, andLaws, 2005 Edition URL: http://digital.library.unt.edu/ark:/67531/metacrs7246/ [accessed 2015-10-30] [WebCite CacheID 6cfm1CFRu]
30. Kumar S, Nilsen WJ, Abernethy A, Atienza A, Patrick K, Pavel M, et al. Mobile health technology evaluation: the mHealthevidence workshop. Am J Prev Med 2013 Aug;45(2):228-236 [FREE Full text] [doi: 10.1016/j.amepre.2013.03.017][Medline: 23867031]
31. Stewart K, Williams M. Researching online populations: the use of online focus groups for social research. QualitativeResearch 2005 Nov 01;5(4):395-416. [doi: 10.1177/1468794105056916]
32. Bandura A. Social cognitive theory of self-regulation. Organ Behav Hum Decis Process 1991;50(2):248-287.33. Tomlinson M, Rotheram-Borus MJ, Swartz L, Tsai AC. Scaling up mHealth: where is the evidence? PLoS Med
2013;10(2):e1001382 [FREE Full text] [doi: 10.1371/journal.pmed.1001382] [Medline: 23424286]34. QuickFacts. Washington DC: United States Census Bureau; 2010. URL: http://quickfacts.census.gov/ [accessed 2015-10-30]
[WebCite Cache ID 6cfmUd9H3]
AbbreviationsFGD: focus group discussionMSM: men who have sex with menOFGD: online focus group discussion
Edited by G Eysenbach; submitted 20.03.15; peer-reviewed by K Horvath, R Schnall; comments to author 16.04.15; revised versionreceived 22.05.15; accepted 22.09.15; published 16.11.15.
Please cite as:Goldenberg T, McDougal SJ, Sullivan PS, Stekler JD, Stephenson RBuilding a Mobile HIV Prevention App for Men Who Have Sex With Men: An Iterative and Community-Driven ProcessJMIR Public Health Surveill 2015;1(2):e18URL: http://publichealth.jmir.org/2015/2/e18/ doi:10.2196/publichealth.4449PMID:27227136
©Tamar Goldenberg, Sarah J McDougal, Patrick S Sullivan, Joanne D Stekler, Rob Stephenson. Originally published in JMIRPublic Health and Surveillance (http://publichealth.jmir.org), 16.11.2015. This is an open-access article distributed under theterms of the Creative Commons Attribution License (http://creativecommons.org/licenses/by/2.0/), which permits unrestricteduse, distribution, and reproduction in any medium, provided the original work, first published in JMIR Public Health andSurveillance, is properly cited. The complete bibliographic information, a link to the original publication onhttp://publichealth.jmir.org, as well as this copyright and license information must be included.
JMIR Public Health Surveill 2015 | vol. 1 | iss. 2 | e18 | p.104http://publichealth.jmir.org/2015/2/e18/(page number not for citation purposes)
Goldenberg et alJMIR PUBLIC HEALTH AND SURVEILLANCE
XSL•FORenderX
Protocol
The Tobacco Pack Surveillance System: A Protocol for AssessingHealth Warning Compliance, Design Features, and Appeals ofTobacco Packs Sold in Low- and Middle-Income Countries
Katherine Smith1, PhD; Carmen Washington1, MPH, MSW; Jennifer Brown1, MPH; Alison Vadnais1, MHS; Laura
Kroart1, BA; Jacqueline Ferguson1, MHS; Joanna Cohen1, PhDInstitute for Global Tobacco Control, Department of Health, Behavior and Society, Johns Hopkins Bloomberg School of Public Health, Baltimore, MD,United States
Corresponding Author:Katherine Smith, PhDInstitute for Global Tobacco ControlDepartment of Health, Behavior and SocietyJohns Hopkins Bloomberg School of Public HealthRm 726624 N. BroadwayBaltimore, MD, 21215United StatesPhone: 1 4105020025Fax: 1 4109557241Email: [email protected]
Abstract
Background: Tobacco remains the world’s leading preventable cause of death, with the majority of tobacco-caused deathsoccurring in low- and middle-income countries. The first global health treaty, the Framework Convention on Tobacco Control(FCTC), outlines a set of policy initiatives that have been demonstrated as effective in reducing tobacco use. Article 11 of theFCTC focuses on using the tobacco package to communicate tobacco-caused harms; it also seeks to restrict the delivery ofmisleading information about the product on the pack.
Objective: The objective of this study was to establish a surveillance system for tobacco packs in the 14 low- and middle-incomecountries with the greatest number of smokers. The Tobacco Pack Surveillance System (TPackSS) monitors whether requiredhealth warnings on tobacco packages are being implemented as intended, and identifies pack designs and appeals that mightviolate or detract from the communication of harm-related information and undermine the impact of a country’s tobacco packaginglaws. The protocol outlined is intended to be applicable or adaptable for surveillance efforts in other countries.
Methods: Tobacco packs were collected in 14 countries during 2013. The intention was, to the extent possible, to construct acensus of “unique” pack presentations available for purchase in each country. The TPackSS team partnered with in-country fieldstaff to implement a standardized protocol for acquiring packs from 36 diverse neighborhoods across three cities in each country.At the time of purchase, data on price and place of acquisition of each pack was recorded. The field staff, according to a standardizedprotocol, then photographed packs before they were shipped to the United States for coding and archiving.
Results: Each pack was coded for compliance with the country-specific health warning label laws, as well as for key designfeatures of the pack and appeals of the branding elements. The coding protocols were developed based upon prior research, expertopinion, and communication theories. Each pack was coded by two independent coders, with consistency of personnel across theproject. We routinely measured intercoder reliability, and only retained variables for which a good level of reliability was achieved.Variables where reliability was too low were not included in final analyses, and any inconsistencies in coding were resolved ona daily basis.
Conclusions: Across the 14 countries, the TPackSS team collected 3307 tobacco packs. We have established a publicly accessible,Internet archive of these packs that is intended for use by the tobacco control policy advocacy and research community.
(JMIR Public Health Surveill 2015;1(2):e8) doi:10.2196/publichealth.4616
JMIR Public Health Surveill 2015 | vol. 1 | iss. 2 | e8 | p.105http://publichealth.jmir.org/2015/2/e8/(page number not for citation purposes)
Smith et alJMIR PUBLIC HEALTH AND SURVEILLANCE
XSL•FORenderX
KEYWORDS
tobacco products; cigarettes; public health surveillance; health communication; national health policy; marketing; developingcountries
Introduction
Policy Approaches to Tackling the Global TobaccoEpidemicTobacco use kills six million people each year and remains theleading preventable cause of death around the globe [1]. Almost80% of tobacco-related deaths occur in low- and middle-incomecountries [2]. The World Health Organization’s FrameworkConvention on Tobacco Control (FCTC), the first global healthtreaty, outlines the evidence-based policies that countries shouldadopt in order to eliminate tobacco use [3]. The surveillancesystem outlined in this paper pertains to Article 11 of the FCTC,which requires that parties to the FCTC implement effectivepackaging and labeling measures to increase public awarenessof the negative health impacts of tobacco products.
The Cigarette Pack as a Powerful CommunicationPlatformThe cigarette pack is on display not only when cigarettes arepurchased, but also each time a smoker retrieves a cigarettefrom the pack [4]. A person who smokes a pack of cigarettesper day might look at a pack over 7000 times a year [5].Moreover, it is not only smokers who are exposed to cigarettepacks. Packs are in public view much of the time, either in thehands of smokers, left out at a social gathering, or prominentlydisplayed in retail settings [5]. The cigarette pack has long beena key marketing method to attract new smokers and retaincurrent ones [6-8]. As restrictions on tobacco marketing andadvertising tighten, so tobacco packs have become an ever moreimportant channel for brand advertising [6].
In addition to promoting smoking and prompting purchase ofa specific brand, cigarette packs can also be used to provideimportant health information to smokers and the wider public.A growing number of countries are implementing health warninglabels (HWLs) on cigarette packs, consistent with Article 11 ofthe FCTC [9]. As of September 2014, 77 countries orjurisdictions had adopted and finalized graphic HWLrequirements [10]. HWLs have been associated with increasedawareness of smoking risks; reduced appeal of smoking andsmoking initiation among youth; increased motivation andintention to quit among smokers; increased cessation behaviors;increased use of cessation resources; increased likelihood thatex-smokers will remain abstinent; and reduced consumptionlevels among smokers [11-15]. Moreover, HWLs have beenfound to be a prominent and trusted source of health informationfor both smokers and nonsmokers [5,16]. Not all health warningsare, however, equally effective. Exposure to health warningsthat are larger, placed on the front upper face of the tobaccopackage, and that contain pictures, are more effective thansmaller text-only warnings [5,8,17,18]. While the impact of allwarnings has been shown to lessen over time, pictorial warnings
are less impacted by the “wear-out” effect [16,17]. Largerwarnings allow for more information, such as cessationresources, to be provided to the consumer [15]. Graphicwarnings that elicit a strong emotional response have beenshown to be better remembered and reduce the urge to smoke[19].
In addition to adding warnings to packs, a number of countriesnow prohibit descriptors such as “light”, “mild”, and “low tar”on tobacco packaging on the basis that such terms candeceptively imply that these products are less harmful than otherproducts. In the place of these descriptors, tobacco companiesare using proxy terms (such as “smooth”), colors, and designelements to convey (falsely) that some products are less harmfulthan others [6,9,20-22].
Study OverviewThe Institute for Global Tobacco Control (IGTC) at the JohnsHopkins Bloomberg School of Public Health has developed theTobacco Pack Surveillance System (TPackSS), to monitorwhether required health warnings on tobacco packages are beingimplemented as intended, and to identify pack design featuresand appeals that might violate or detract from HWLs.
TPackSS was designed to be implemented in the 14 low- andmiddle-income countries with the greatest number of smokers[1]. The overall goal of the project is to collect one of everyunique pack available for sale in each country. The initiativewas developed with funding from Bloomberg Philanthropiesthrough the Bloomberg Initiative to Reduce Tobacco Use [23].
Methods
Development of the Tobacco Pack Surveillance SystemProtocolThe development of the TPackSS protocol began with anexploratory and planning phase in 2012 to identify strategicgoals and systematic protocols for establishing a surveillancesystem for cigarette packs. Based on discussions with 11 keytobacco control informants, a protocol was developed to collectpacks as well as to train data collectors, photograph packs, codepacks, and construct a searchable, Internet archive. Each expertconsulted is affiliated with a leading academic institution or apublic sector research or advocacy organization focusing ontobacco control issues. None of the consultants for this projecthave ties to the tobacco industry.
Partnering With In-Country Data Collection TeamsIn each country, IGTC collaborated with an in-country agency(market research firm; academic research group;nongovernmental organization, NGO; government-relatedagency; or independent consultant) to conduct field activities(see Table 1).
JMIR Public Health Surveill 2015 | vol. 1 | iss. 2 | e8 | p.106http://publichealth.jmir.org/2015/2/e8/(page number not for citation purposes)
Smith et alJMIR PUBLIC HEALTH AND SURVEILLANCE
XSL•FORenderX
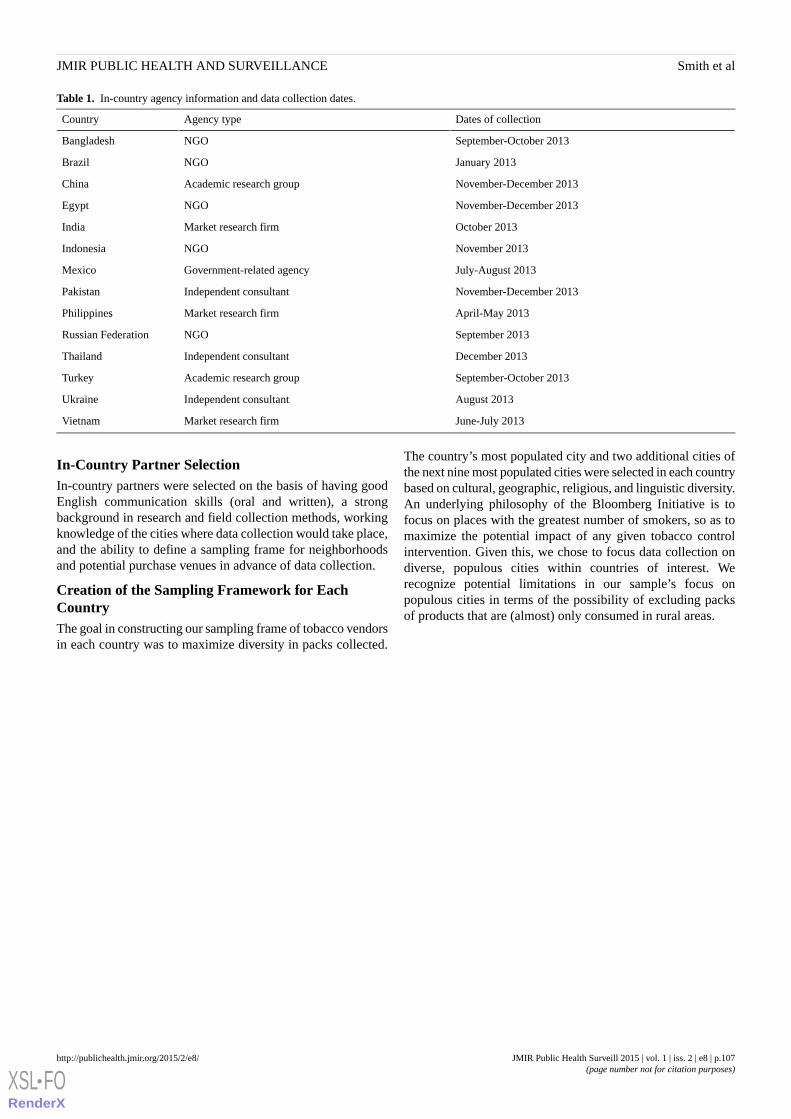
Table 1. In-country agency information and data collection dates.
Dates of collectionAgency typeCountry
September-October 2013NGOBangladesh
January 2013NGOBrazil
November-December 2013Academic research groupChina
November-December 2013NGOEgypt
October 2013Market research firmIndia
November 2013NGOIndonesia
July-August 2013Government-related agencyMexico
November-December 2013Independent consultantPakistan
April-May 2013Market research firmPhilippines
September 2013NGORussian Federation
December 2013Independent consultantThailand
September-October 2013Academic research groupTurkey
August 2013Independent consultantUkraine
June-July 2013Market research firmVietnam
In-Country Partner SelectionIn-country partners were selected on the basis of having goodEnglish communication skills (oral and written), a strongbackground in research and field collection methods, workingknowledge of the cities where data collection would take place,and the ability to define a sampling frame for neighborhoodsand potential purchase venues in advance of data collection.
Creation of the Sampling Framework for EachCountryThe goal in constructing our sampling frame of tobacco vendorsin each country was to maximize diversity in packs collected.
The country’s most populated city and two additional cities ofthe next nine most populated cities were selected in each countrybased on cultural, geographic, religious, and linguistic diversity.An underlying philosophy of the Bloomberg Initiative is tofocus on places with the greatest number of smokers, so as tomaximize the potential impact of any given tobacco controlintervention. Given this, we chose to focus data collection ondiverse, populous cities within countries of interest. Werecognize potential limitations in our sample’s focus onpopulous cities in terms of the possibility of excluding packsof products that are (almost) only consumed in rural areas.
JMIR Public Health Surveill 2015 | vol. 1 | iss. 2 | e8 | p.107http://publichealth.jmir.org/2015/2/e8/(page number not for citation purposes)
Smith et alJMIR PUBLIC HEALTH AND SURVEILLANCE
XSL•FORenderX

Table 2. Data collection cities per country.
City 3City 2City 1Country
ChittagongSylhetDhakaBangladesh
ManausSalvadorSão PauloBrazil
ShanghaiGuangzhouBeijingChinaa
MansouraAlexandriaCairoEgypt
ChennaiDelhiMumbaiIndia
SurabayaSemarangJakartaIndonesia
MeridaGuadalajaraMexico CityMexico
KarachiLahoreIslamabadPakistan
DavaoCebuManilaPhilippines
KarachiLahoreMoscowRussian Federation
Hat YaiBangkokChiang MaiThailand
KonyaDiyarbakirIstanbulTurkey
DonetskLvivKyivUkraine
Da NangHanoiHo Chi Minh CityVietnam
aIn China, data collection was undertaken in 5 cities at the recommendation of tobacco control expert advisors. Additional cities were Kunming andChengdu.
Training In-Country Field StaffOne of two TPackSS staff traveled traveled to each country totrain in-country field staff. Training was delivered in the initialcity in which data collection took place in each country. ForEgypt and Pakistan, social and political conditions at the timemade travel from the United States inadvisable, and, therefore,in-country staff were trained in Dubai, United Arab Emirates.In each country, training took place over five days and includedan overview of the project and its goals, hands-on instruction,and supervision with how to carry out data collectionprocedures, create a data inventory, and take standardizedphotographs of the tobacco packs collected. TPackSS staffaccompanied in-country field staff for purchases in at least fourneighborhoods in the initial city. In-country staff were alsoprovided with detailed training reference documents (seeMultimedia Appendix/ces 1-4) and remote access to staff forquestions throughout the process of data collection, cataloging,and image creation.
Pack CollectionOur aim in this project was to maximize breadth and collectone of every different/unique brand presentation available forsale in the tobacco vendors visited across 36 differentneighborhoods in each country.
Within each city, 12 distinct neighborhoods were identified fortobacco vendor sampling. In-country field staff used a varietyof local and national resources, including census and propertyvalue data, to create a sampling frame of low, moderate, andhigh socioeconomic areas within the metropolitan boundariesof each city. In each of three socioeconomic strata per city (high,medium, low), we selected four neighborhoods that were diversein terms of geographic locale and residential composition. Thus,
tobacco packs were acquired through purchases made at vendorsfrom a total of 36 different neighborhoods in each country.
Unique packs were defined as tobacco packs that had at leastone difference in an exterior feature of the pack. Any pack witha different design or feature, including packs differing in stickcount, size, brand name presentation, colors, cellophane, andinclusion of a promotional item was considered to be “unique”.Packs that were exactly the same except for different iterationsof the country’s warning labels were not considered to bedistinct. Although the majority of packs were easily identifiedas unique (ie, Marlboro Red was identified as distinct fromMarlboro Blue), some packs had minor differences that weremore difficult to discern, such as differences in cellophanewrapping around the pack or variations in smaller pack featureslike brand logo.
In addition to cigarette packs, we also collected cigarros depalha (straw cigarettes from Brazil) and packs sold withpromotional items, where these were sold alongside cigarettes.Promotional items were defined to be products that containeda tobacco pack and an additional item such as a lighter, ashtray,or hard tobacco pack carrying case. In countries where bidis orkreteks were sold, these were also purchased.
The initial (index) purchase was always made from a largetobacco vendor in the first sample city, where a broad array oftobacco products was available. We expected the index storepurchase to be the largest purchase in each country. In-countrystaff identified the initial/index vendor in advance of the firstday of data collection.
At the initial purchase, every distinct pack available for purchasewas acquired, and the price was recorded for each itempurchased. The purchase of packs required two field staff. Onefield staff member worked systematically to review and selectevery unique cigarette pack on display. The other staff member
JMIR Public Health Surveill 2015 | vol. 1 | iss. 2 | e8 | p.108http://publichealth.jmir.org/2015/2/e8/(page number not for citation purposes)
Smith et alJMIR PUBLIC HEALTH AND SURVEILLANCE
XSL•FORenderX
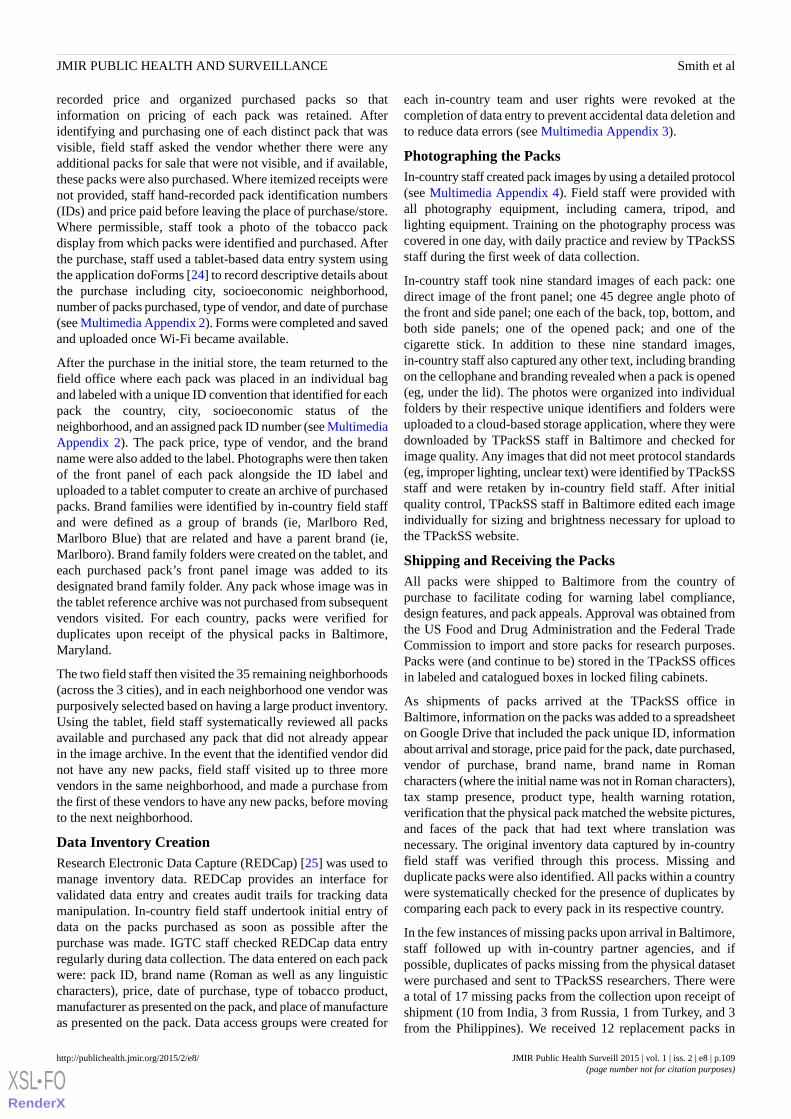
recorded price and organized purchased packs so thatinformation on pricing of each pack was retained. Afteridentifying and purchasing one of each distinct pack that wasvisible, field staff asked the vendor whether there were anyadditional packs for sale that were not visible, and if available,these packs were also purchased. Where itemized receipts werenot provided, staff hand-recorded pack identification numbers(IDs) and price paid before leaving the place of purchase/store.Where permissible, staff took a photo of the tobacco packdisplay from which packs were identified and purchased. Afterthe purchase, staff used a tablet-based data entry system usingthe application doForms [24] to record descriptive details aboutthe purchase including city, socioeconomic neighborhood,number of packs purchased, type of vendor, and date of purchase(see Multimedia Appendix 2). Forms were completed and savedand uploaded once Wi-Fi became available.
After the purchase in the initial store, the team returned to thefield office where each pack was placed in an individual bagand labeled with a unique ID convention that identified for eachpack the country, city, socioeconomic status of theneighborhood, and an assigned pack ID number (see MultimediaAppendix 2). The pack price, type of vendor, and the brandname were also added to the label. Photographs were then takenof the front panel of each pack alongside the ID label anduploaded to a tablet computer to create an archive of purchasedpacks. Brand families were identified by in-country field staffand were defined as a group of brands (ie, Marlboro Red,Marlboro Blue) that are related and have a parent brand (ie,Marlboro). Brand family folders were created on the tablet, andeach purchased pack’s front panel image was added to itsdesignated brand family folder. Any pack whose image was inthe tablet reference archive was not purchased from subsequentvendors visited. For each country, packs were verified forduplicates upon receipt of the physical packs in Baltimore,Maryland.
The two field staff then visited the 35 remaining neighborhoods(across the 3 cities), and in each neighborhood one vendor waspurposively selected based on having a large product inventory.Using the tablet, field staff systematically reviewed all packsavailable and purchased any pack that did not already appearin the image archive. In the event that the identified vendor didnot have any new packs, field staff visited up to three morevendors in the same neighborhood, and made a purchase fromthe first of these vendors to have any new packs, before movingto the next neighborhood.
Data Inventory CreationResearch Electronic Data Capture (REDCap) [25] was used tomanage inventory data. REDCap provides an interface forvalidated data entry and creates audit trails for tracking datamanipulation. In-country field staff undertook initial entry ofdata on the packs purchased as soon as possible after thepurchase was made. IGTC staff checked REDCap data entryregularly during data collection. The data entered on each packwere: pack ID, brand name (Roman as well as any linguisticcharacters), price, date of purchase, type of tobacco product,manufacturer as presented on the pack, and place of manufactureas presented on the pack. Data access groups were created for
each in-country team and user rights were revoked at thecompletion of data entry to prevent accidental data deletion andto reduce data errors (see Multimedia Appendix 3).
Photographing the PacksIn-country staff created pack images by using a detailed protocol(see Multimedia Appendix 4). Field staff were provided withall photography equipment, including camera, tripod, andlighting equipment. Training on the photography process wascovered in one day, with daily practice and review by TPackSSstaff during the first week of data collection.
In-country staff took nine standard images of each pack: onedirect image of the front panel; one 45 degree angle photo ofthe front and side panel; one each of the back, top, bottom, andboth side panels; one of the opened pack; and one of thecigarette stick. In addition to these nine standard images,in-country staff also captured any other text, including brandingon the cellophane and branding revealed when a pack is opened(eg, under the lid). The photos were organized into individualfolders by their respective unique identifiers and folders wereuploaded to a cloud-based storage application, where they weredownloaded by TPackSS staff in Baltimore and checked forimage quality. Any images that did not meet protocol standards(eg, improper lighting, unclear text) were identified by TPackSSstaff and were retaken by in-country field staff. After initialquality control, TPackSS staff in Baltimore edited each imageindividually for sizing and brightness necessary for upload tothe TPackSS website.
Shipping and Receiving the PacksAll packs were shipped to Baltimore from the country ofpurchase to facilitate coding for warning label compliance,design features, and pack appeals. Approval was obtained fromthe US Food and Drug Administration and the Federal TradeCommission to import and store packs for research purposes.Packs were (and continue to be) stored in the TPackSS officesin labeled and catalogued boxes in locked filing cabinets.
As shipments of packs arrived at the TPackSS office inBaltimore, information on the packs was added to a spreadsheeton Google Drive that included the pack unique ID, informationabout arrival and storage, price paid for the pack, date purchased,vendor of purchase, brand name, brand name in Romancharacters (where the initial name was not in Roman characters),tax stamp presence, product type, health warning rotation,verification that the physical pack matched the website pictures,and faces of the pack that had text where translation wasnecessary. The original inventory data captured by in-countryfield staff was verified through this process. Missing andduplicate packs were also identified. All packs within a countrywere systematically checked for the presence of duplicates bycomparing each pack to every pack in its respective country.
In the few instances of missing packs upon arrival in Baltimore,staff followed up with in-country partner agencies, and ifpossible, duplicates of packs missing from the physical datasetwere purchased and sent to TPackSS researchers. There werea total of 17 missing packs from the collection upon receipt ofshipment (10 from India, 3 from Russia, 1 from Turkey, and 3from the Philippines). We received 12 replacement packs in
JMIR Public Health Surveill 2015 | vol. 1 | iss. 2 | e8 | p.109http://publichealth.jmir.org/2015/2/e8/(page number not for citation purposes)
Smith et alJMIR PUBLIC HEALTH AND SURVEILLANCE
XSL•FORenderX
total (8 from India, 3 from the Philippines, and 1 from Turkey),with 5 packs remaining missing (2 from India and 3 fromRussia). Of the 5 remaining missing packs, US Customs held2 because they were manufactured in Cuba.
Using Google Drive allowed for data entry by multiple peoplesimultaneously, and saving a copy of the spreadsheet at the endof each day new data were entered ensured quality. Packs weresorted and stored alphanumerically and by presence of specifichealth warnings; all packs with a given health warning werestored together for the ease of coding health warningcompliance. Packs were resorted by brand name once healthwarning compliance coding was completed.
TranslationWe employed a professional translation service to translatenon-English text on the packs. In most cases, it was notnecessary to translate warning label text because warning labeltext on packs could be directly compared with copies ofapproved warning labels from each country. The translationservice was provided with the number of the image as foundon the TPackSS website for each pack panel where anytranslation was required. All translation was entered into adatabase with rows for each pack and columns ordered by panel.The translation service provided transcription of the text, literaltranslation, and adaptive translation for cultural meaning whenapplicable. The translation database was used during coding forcompliance with HWL laws and features and appeals (seebelow).
Creating Codebooks for Pack Compliance With HealthWarning Labels LawsWe created a codebook for each country based on the tobaccopackaging and labeling laws in effect in each country at the timeof data collection. All laws were acquired from the TobaccoControl Laws website [26], a public resource maintained by theCampaign for Tobacco-Free Kids. For countries whose lawswere not written in English, we utilized the unofficial Englishtranslation of the law, provided on the Tobacco Control Lawswebsite. Only those requirements concerning labeling andpackaging were incorporated into the codebooks. Whereapplicable, the codebooks included measures of inclusion ofinformation on HWLs, emissions and content levels, indicationsof less harm such as misleading descriptors, and messagesprohibiting the sale of cigarettes to minors (see MultimediaAppendix 5).
Any aspect of a law that was considered too nonspecific to becoded consistently was excluded from the codebook. Legal andcountry experts were consulted when interpretation of the lawwas in question. Each codebook went through multiple iterationsto improve the validity and the reliability of the coding process.During the codebook development process, two members of
the research team coded packs in order to assess the reliabilityof the variables at each stage. Where differences in codinginterpretation were identified, codebook questions were clarified.The research team also considered the codebook variables inlight of available packs from each country to anticipate codingchallenges not obvious from laws alone. Challenges wererecorded, discussed, and resolved by the research team.
Creating a Codebook for Features and AppealsIn addition to compliance with tobacco packaging and labelinglaws, we also coded each pack for its physical, textual, andvisual aspects (features and appeals). Unlike country-specificcodebooks to assess compliance with HWL laws, there is onecommon “Features and Appeals” (F&A) codebook used for allcountries (see Multimedia Appendix 6). In order to develop thecodebook for F&A, we reviewed the tobacco control literatureon packaging and marketing [6,7,27-29]. We also consultedexisting coding systems for tobacco packaging F&A, such asthe Chatterbox website [30]. We sought to integrate relevantconcepts from the published literature on brand appeal, marketdevelopment, and audience segmentation into our F&Acodebook.
Each pack was coded for “features”, which pertain to designelements of the pack including the shape and size of the pack,color, size descriptors, Web presence, the type of opening, andany wrapping or container. The outside and the inside of thepack were both considered, as was the product (stick) itself. Wealso coded for any evidence of various common “appeals”associated with the tobacco products. Product “appeals” areconnections and connotations created in marketing efforts inorder to create reasons for a person to purchase (or desire topurchase) a given item (Figure 1 shows this). The TPackSS“appeals” codes are assessments of sociocultural connotationsmade via various visual elements of branding on the pack tocreate positive sentiments about the product among a targetaudience [30]. Product “appeals” can appear both on and insidethe pack, on any wrapping or additional packaging, as well ason the stick. We looked for both lexical (words) and imagesthat convey specific appeals. Our appeals codes included (butwere not limited to): technology, luxury, femininity, masculinity,youth, nationalism, and United States.
An initial draft of the codebook was developed and then refinedto improve objectivity and reliability of coding categories. Thecoding development and refinement involved test coding samplepacks from all 14 countries and a wide variety of pack shapesand opening styles. In addition, we consulted in-countryprofessionals with expertise in tobacco control, communications,and marketing, on the interpretation of culturally significantimagery, and how to objectively code for elements ofnationalism and cultural appeal.
JMIR Public Health Surveill 2015 | vol. 1 | iss. 2 | e8 | p.110http://publichealth.jmir.org/2015/2/e8/(page number not for citation purposes)
Smith et alJMIR PUBLIC HEALTH AND SURVEILLANCE
XSL•FORenderX

Figure 1. Illustrative photo of collection packs.
Coding the Packs OverviewPacks were first coded for compliance with HWL requirements.Only packs displaying a HWL that had been issued by thecountry in which the pack was purchased and that was in rotationat the time that packs were collected were coded for HWLcompliance.
A subsequent and separate process was undertaken for codingpacks for F&A. All packs collected (regardless of existence ofappropriate HWL) were coded for F&A. In each instance, twoindependent coders coded every pack. The coders all wentthrough extensive training in tobacco control policy andpackaging features, and to the extent possible, the coders wereinvolved in the development of the various codebooks.
TPackSS staff completed all coding using the physical packsrather than the images. To retain a high level of coding quality,coding was limited to approximately 4 hours per day. At thebeginning of coding for any country, a team meeting was heldto present and discuss the HWL compliance codebook withcoders. When necessary, codebooks were revised for clarityand coding issues were resolved.
Over time, one pair of coders specialized in HWL compliancecoding, and two sets of coders specialized in F&A coding. Alldifferences or discrepancies within the coding pairs werediscussed in regularly held review meetings so as to resolvedifferences and refine and improve the coding processes. Allcoding discrepancies and subsequent resolutions were recordedand stored in a central repository. REDCap was used for dataentry [25].
In addition to individual pack coding, we also undertooksummative and comparative consideration of groups of packs.For HWL compliance, we compared all packs to be coded withineach country by warning label and looked for differences insize, color, warning image distortion (such as being stretchedor only showing part of the image), placement on the pack, andinitial consideration of content. For F&A, we gathered brandsacross countries and considered all elements of brandconsistency and the impact of health warning placement onbrand display. In each instance, this was undertaken as a groupprocess with notes taken about notable elements and possiblepatterns throughout the sets of packs being considered.
Data Management and Quality ControlDatabase management began with raw data imported fromdoForms and REDCap and ended with a frozen analytic filewith a corresponding codebook. All data were stored in Stata13 in 2013 to 2014 [31] and then Stata 14 [32] in 2015. Datawere accessible only to the database administrator and thedatabase administrator was accountable for all corrections,addition, deletions, and merging of data. Data were routinelybacked up on an encrypted external hard drive.
Data audit trails were produced for every addition, deletion, andchange of the original data. Multiple data validation checks (eg,extraneous values, outliers, and abnormalities), data verificationwithin a dataset (eg, simple range and constraint validation),and cross-dataset checks (eg, data redundancy and consistencychecks) were performed.
For each country, there are five initial datasets that were mergedafter data cleaning to form a master relational dataset. In orderof their generation, the datasets are: (1) Field data; (2) Intakedata; (3) HWL compliance; (4) Brand Names and Owners; and(5) F&A. Each pack’s unique identifier enabled the merging ofdifferent datasets into one master relational database. Field datawere verified and cross checked against Intake data. Intake datawere verified and cross checked against HWL compliancecoding, and so forth. Consulting tobacco brand and tobaccobrand owner websites validated brand names. ConsultingEuromonitor International [33], a market intelligence reportbased upon tobacco market research, also validated brand names.For the purpose of this study, "Owner of the Brand" is definedas the entity that holds an active trademark registration of thebrand in the particular country and/or would be responsible forthe pack in instances of any legal or business related challenges,absent other information. A consultant who utilized portfoliosof brands and trademark registry databases validated brandowners.
Because the F&A and HWL compliance data were both enteredby independent coding pairs, any discrepancies were reconciledthrough a process of review by a third trained reviewer. Allreconciliations were performed within 24 hours of entering thedata for F&A coding and every other day for HWL compliancecoding.
Pack measurements (ie, pack height and warning label height)in the HWL compliance codebook required special attention.
JMIR Public Health Surveill 2015 | vol. 1 | iss. 2 | e8 | p.111http://publichealth.jmir.org/2015/2/e8/(page number not for citation purposes)
Smith et alJMIR PUBLIC HEALTH AND SURVEILLANCE
XSL•FORenderX
Coders measured packs with standardized rules and roundedmeasurements to the closest millimeter (mm). Given that it wasinfrequent, although not rare, to get exactly the samemeasurement between coders, a difference of 1 mm wasaveraged, while a difference greater than 1 mm requiredmeasurement by a third reviewer. Bland-Altman plots werecreated to assess random error and systematic error in thecoder’s measurements [34]. Quality checks were also performedon the HWL compliance data to ensure impossible data werenot being entered (eg, width of the warning label greater thanthe width of the pack).
To assess data reliability in the F&A and HWL compliancecodebook, Cohen’s kappa, prevalence adjusted kappa (PABAK),and interclass correlation coefficient were calculated asappropriate for each country [35-39]. Each coder’s entry for arecord was compared against the final merged record to assesshow frequently coders were agreeing with the final record. ThePABAK statistic takes into account low-prevalence bias thatskews the Cohen’s kappa. By evaluating both of these statistics,we identified variables with low agreement (< 80% agreement).A 2-sided alpha of < .05 was considered statistically significant.Variables with low agreement were flagged and coders wereroutinely provided feedback on variables for which there waslow agreement. This feedback was used to clarify instructions
for the codebook. Follow-up was performed to ensure agreementof these variables improved as coding progressed.
Developing a Health Warning Label Compliance ScoreArticle 11 of the FCTC outlines mechanisms by which partiesto the treaty can increase the effectiveness of their tobaccopackaging and labeling. Key elements include location; size;use of pictorials; color; rotation; message content; language;source attribution; and information on constituents andemissions.
We operationalized HWL compliance through four overarchingcategories that related to requirements across the study countries:(1) Warning location; (2) Warning size; (3) Text size in thewarning; and (4) Warning label elements (such as color orcontent of warning). All four key requirements were assessedfor 10 countries. For the four remaining countries, only 3 of the4 categories pertained to the country’s law, and so only theseelements were included in the compliance measure (Table 3).The compliance score was calculated as number of compliantpacks divided by number of packs with a warning label inrotation at the time of collection. In addition, a compositecompliance score was determined by dividing the number ofpacks compliant on all four key requirements by the totalnumber of packs coded for each country. The compliance resultsare outside of the scope of this protocol paper.
JMIR Public Health Surveill 2015 | vol. 1 | iss. 2 | e8 | p.112http://publichealth.jmir.org/2015/2/e8/(page number not for citation purposes)
Smith et alJMIR PUBLIC HEALTH AND SURVEILLANCE
XSL•FORenderX

Table 3. HWL compliance measures as related to elements of countries’ laws.
Warning label elementsWarning text sizeWarning sizeWarning type & locationCountry
Black text on white background orwhite text on black background
18 point font30% of the frontand back
Text warnings on front andback of the pack
Bangladesh
White text on black rectangularbackground
Proportion and graphic parame-ters of images provided by theBrazilian Health SurveillanceAgency must be unchanged
100% of the backPicture-based warning onback of the pack
Brazil
Color contrast between the text andbackground
4 mm tall text30% of the frontand back
Text warnings on front andback of the pack
China
Text printed on black background;quit line and standard warning printedon yellow background
Not applicable50% of the frontand back
Picture-based warning onfront and back of the pack
Egypt
Red and white text on black back-ground
Warning must be 0.75 to 1 ratioof its vertical to horizontallength
40% of the frontPicture-based warning onfront of the pack
India
Black text on background that is ashade of white with black border
3 mm tall textNot applicableText warnings on a “part ofthe package that is easilyread”
Indonesia
Yellow text on front and back; blackbackground on back
10 point font on front; 9-11point font on back
30% of the frontand 100% of theback
Picture-based warning onfront and text warning onback of the pack
Mexico
Black text on white background2 mm tall text40% of the frontand back
Picture-based warnings onfront and back of the pack
Pakistan
Black text on white background withblack border
Text must comprise at least50% of the warning
30% of the frontText warnings on front ofthe pack
Philippines
Black border on front and back; blacktext on white background on back
Not applicable30% of the frontand 50% of theback
Text warning on front andpicture-based warning onback of the pack
Russian Federation
Content must appear as it does in ex-amples provided by the Ministry ofHealth
Size and positioning of textmust appear as it does in exam-ples provided by the Ministryof Health
55% of the frontand back
Picture-based warnings onfront and back of the pack
Thailand
Black border on front and back; blacktext on back
Not applicable65% of the frontand back
Picture-based warning onfront and picture-basedwarning on back of the pack
Turkey
Black text on white background withblack border
Must occupy no less than 40%of the area within the blackborder of the health warning
50% of the frontand back
Text warning on front andpicture-based warning onback of the pack
Ukraine
Black text on white background2 mm tall text30% of the frontand back
Text warnings on front andback of the pack
Vietnam
Results
Packs CollectedAcross the 14 countries, we collected 3307 tobacco packs. Wecollected 3006 cigarette packs, 55 bidi packs, 234 kretek packs,3 cigarros de palha (straw cigarettes), and 9 promotional items.
Product type was determined by labeling on the pack. Wecollected the most packs from the Russian Federation (n=505)and the fewest packs from Egypt (n=58). We will be analyzingdata on compliance with HWL requirements, pack F&A, andpricing of products in separate analyses to be published at alater date.
JMIR Public Health Surveill 2015 | vol. 1 | iss. 2 | e8 | p.113http://publichealth.jmir.org/2015/2/e8/(page number not for citation purposes)
Smith et alJMIR PUBLIC HEALTH AND SURVEILLANCE
XSL•FORenderX

Table 4. Packs collected in each country and each city.
Number of packs collectedCountry
City 3City 2City 1Total
4611143200Bangladesh
1610104130Brazil
5570227453Chinaa
--5858Egypt
3229108169India
6535115215Indonesia
819107134Mexico
4058296394Pakistan
125379144Philippines
3861406505Russian Federation
165357126Thailand
3072206308Turkey
3448242324Ukraine
324120147Vietnam
39554322683307aTotal
aTotal includes packs from China city 4=50 & city 5=51 packs
Creating a WebsiteThe TPackSS searchable Internet archive is now publiclyavailable [40] (Figure 2 shows this). This dynamic archivehouses images of all the tobacco packs purchased in the 14countries. The intention is for this archive to be used by thetobacco control community to monitor compliance with existingHWL laws, understand innovation in pack design and brandpromotion, and advocate for policy change that can preventfuture harm from tobacco use.
A Web development company was contracted to create a sitethat can be searched and filtered by country, brand family, brandowner, and tobacco product type. Pack specific data such asbrand family, product type, price, purchase date, purchase city,and purchase country were paired with each pack and are alsoavailable on the site. The site includes information aboutpackaging and labeling regulations in each country.
Future plans for the website include uploading the keycompliance, design, and F&A variables for each pack, andincorporating the capacity to view the site in multiple languages.
JMIR Public Health Surveill 2015 | vol. 1 | iss. 2 | e8 | p.114http://publichealth.jmir.org/2015/2/e8/(page number not for citation purposes)
Smith et alJMIR PUBLIC HEALTH AND SURVEILLANCE
XSL•FORenderX

Figure 2. Screenshot of Internet archive.
Discussion
TPackSS data collection will be repeated at a minimum of twoyears following the previous data collection, for those countrieswhere the warning label or packaging requirements havechanged. This will facilitate comparisons of packaging pre andpost policy implementation.
In addition to creating the Internet archive, we are compilingcountry-specific fact sheets on HWL compliance to supportpolicy advocacy. We are also creating resources (countryspecific and comparative) related to various aspects of the F&A.The fact sheets will be downloadable from the TPackSS website[40]. We have made our field protocol documents, healthwarning compliance codebooks, and F&A codebook availableon the project website.
AcknowledgmentsThis study would not be possible without the entire TPackSS team, including our coders Ashley Conroy, Cerise Kleb, andAdamove Osho. We would also like to thank all of our in-country field partners for their assistance in this study, as well as thenumerous tobacco control experts from various countries for input on cultural references being made on the tobacco packs. Wealso acknowledge the work of Dr Hana Ross who provided data on brand ownership. Finally, we acknowledge all of the expertconsultants who assisted us in our initial planning of the study.
This work was supported by a grant from the Bloomberg Initiative to Reduce Tobacco Use to the Johns Hopkins BloombergSchool of Public Health.
Conflicts of InterestNone declared.
Multimedia Appendix 1Training manual.
[PDF File (Adobe PDF File), 1MB - publichealth_v1i2e8_app1.pdf ]
Multimedia Appendix 2In-field data collection form for vendor and neighborhood.
[PDF File (Adobe PDF File), 329KB - publichealth_v1i2e8_app2.pdf ]
JMIR Public Health Surveill 2015 | vol. 1 | iss. 2 | e8 | p.115http://publichealth.jmir.org/2015/2/e8/(page number not for citation purposes)
Smith et alJMIR PUBLIC HEALTH AND SURVEILLANCE
XSL•FORenderX
Multimedia Appendix 3REDCap in-country inventory form.
[PDF File (Adobe PDF File), 865KB - publichealth_v1i2e8_app3.pdf ]
Multimedia Appendix 4Photography protocol.
[PDF File (Adobe PDF File), 1MB - publichealth_v1i2e8_app4.pdf ]
Multimedia Appendix 5Example of one country health warning compliance codebook.
[PDF File (Adobe PDF File), 1MB - publichealth_v1i2e8_app5.pdf ]
Multimedia Appendix 6Features and appeals codebook.
[PDF File (Adobe PDF File), 3MB - publichealth_v1i2e8_app6.pdf ]
References1. World Health Organization. WHO report on the global tobacco epidemic, 2013: enforcing bans on tobacco advertising,
promotion and sponsorship URL: http://apps.who.int/iris/bitstream/10665/85380/1/9789241505871_eng.pdf?ua=1 [accessed2015-08-04] [WebCite Cache ID 6aXRufYiV]
2. Wipfli H. American Journal of Epidemiology. Atlanta, GA: American Cancer Society; New York, NY: World LungFoundation; 2012 Nov 06. The tobacco atlas, fourth edition URL: http://aje.oxfordjournals.org/content/early/2012/11/05/aje.kws389.full [accessed 2015-08-04] [WebCite Cache ID 6aXSPYdzO]
3. World Health Organization. The WHO framework convention on tobacco control: An overview URL: http://www.who.int/fctc/about/WHO_FCTC_summary_January2015.pdf [accessed 2015-04-15] [WebCite Cache ID 6XoBW3iqb]
4. Wakefield M, Germain D, Durkin S, Hammond D, Goldberg M, Borland R. Do larger pictorial health warnings diminishthe need for plain packaging of cigarettes? Addiction 2012 Jun;107(6):1159-1167. [doi: 10.1111/j.1360-0443.2012.03774.x][Medline: 22372966]
5. Hammond D. Health warning messages on tobacco products: A review. Tob Control 2011 Sep;20(5):327-337. [doi:10.1136/tc.2010.037630] [Medline: 21606180]
6. Hammond D, Dockrell M, Arnott D, Lee A, McNeill A. Cigarette pack design and perceptions of risk among UK adultsand youth. Eur J Public Health 2009 Dec;19(6):631-637 [FREE Full text] [doi: 10.1093/eurpub/ckp122] [Medline: 19726589]
7. Wakefield M, Morley C, Horan JK, Cummings KM. The cigarette pack as image: New evidence from tobacco industrydocuments. Tob Control 2002 Mar;11 Suppl 1:I73-I80 [FREE Full text] [Medline: 11893817]
8. Institute for Global Tobacco Control. State of evidence review: Health warning labels on tobacco products URL: http://globaltobaccocontrol.org/sites/default/files/HealthWarnings_state_of_evidence_final_11_18_2013_web_0.pdf [accessed2015-04-15] [WebCite Cache ID 6XoSFe0a1]
9. Bansal-Travers M, Hammond D, Smith P, Cummings KM. The impact of cigarette pack design, descriptors, and warninglabels on risk perception in the U.S. Am J Prev Med 2011 Jun;40(6):674-682 [FREE Full text] [doi:10.1016/j.amepre.2011.01.021] [Medline: 21565661]
10. Cancer society. Canadian: Cancer society, Cigarette package health warnings: International status report, fourth edition,September 2014 URL: http://www.tobaccolabels.ca/wp/wp-content/uploads/2014/10/Cigarette-Package-Health-Warnings-International-Status-Report-English-CCS-Sept-2014.pdf [accessed 2015-04-15][WebCite Cache ID 6XoApX6RD]
11. Partos TR, Borland R, Yong H, Thrasher J, Hammond D. Cigarette packet warning labels can prevent relapse: Findingsfrom the International Tobacco Control 4-Country policy evaluation cohort study. Tob Control 2013 May;22(e1):e43-e50[FREE Full text] [doi: 10.1136/tobaccocontrol-2011-050254] [Medline: 22535363]
12. Hammond D, Fong GT, McNeill A, Borland R, Cummings KM. Effectiveness of cigarette warning labels in informingsmokers about the risks of smoking: Findings from the International Tobacco Control (ITC) Four Country Survey. TobControl 2006 Jun;15 Suppl 3:iii19-iii25 [FREE Full text] [doi: 10.1136/tc.2005.012294] [Medline: 16754942]
13. Fathelrahman AI, Omar M, Awang R, Borland R, Fong GT, Hammond D, et al. Smokers' responses toward cigarette packwarning labels in predicting quit intention, stage of change, and self-efficacy. Nicotine Tob Res 2009 Mar;11(3):248-253[FREE Full text] [doi: 10.1093/ntr/ntn029] [Medline: 19246625]
JMIR Public Health Surveill 2015 | vol. 1 | iss. 2 | e8 | p.116http://publichealth.jmir.org/2015/2/e8/(page number not for citation purposes)
Smith et alJMIR PUBLIC HEALTH AND SURVEILLANCE
XSL•FORenderX

14. Borland R, Yong HH, Wilson N, Fong GT, Hammond D, Cummings KM, et al. How reactions to cigarette packet healthwarnings influence quitting: Findings from the ITC Four-Country survey. Addiction 2009 Apr;104(4):669-675 [FREE Fulltext] [doi: 10.1111/j.1360-0443.2009.02508.x] [Medline: 19215595]
15. Hammond D, Wakefield M, Durkin S, Brennan E. Tobacco packaging and mass media campaigns: Research needs forArticles 11 and 12 of the WHO Framework Convention on Tobacco Control. Nicotine Tob Res 2013 Apr;15(4):817-831[FREE Full text] [doi: 10.1093/ntr/nts202] [Medline: 23042986]
16. Fong GT, Hammond D, Hitchman SC. The impact of pictures on the effectiveness of tobacco warnings. Bull World HealthOrgan 2009 Aug;87(8):640-643 [FREE Full text] [Medline: 19705020]
17. Borland R, Wilson N, Fong GT, Hammond D, Cummings KM, Yong H, et al. Impact of graphic and text warnings oncigarette packs: Findings from four countries over five years. Tob Control 2009 Oct;18(5):358-364. [doi:10.1136/tc.2008.028043] [Medline: 19561362]
18. Hammond D, Fong GT, Borland R, Cummings KM, McNeill A, Driezen P. Text and graphic warnings on cigarette packages:Findings from the international tobacco control four country study. Am J Prev Med 2007 Mar;32(3):202-209 [FREE Fulltext] [doi: 10.1016/j.amepre.2006.11.011] [Medline: 17296472]
19. Wang A, Lowen SB, Romer D, Giorno M, Langleben DD. Emotional reaction facilitates the brain and behavioural impactof graphic cigarette warning labels in smokers. Tob Control 2015 May;24(3):225-232. [doi:10.1136/tobaccocontrol-2014-051993] [Medline: 25564288]
20. Shiffman S, Pillitteri JL, Burton SL, Rohay JM, Gitchell JG. Smokers' beliefs about "Light" and "Ultra Light" cigarettes.Tob Control 2001;10 Suppl 1:i17-i23 [FREE Full text] [Medline: 11740040]
21. Hamilton WL, Norton GD, Ouellette TK, Rhodes WM, Kling R, Connolly GN. Smokers' responses to advertisements forregular and light cigarettes and potential reduced-exposure tobacco products. Nicotine Tob Res 2004 Dec;6 Suppl3:S353-S362. [Medline: 15799598]
22. Cohen JE, Yang J, Donaldson EA. Impact of the removal of light and mild descriptors from cigarette packages in Ontario,Canada: Switching to "light replacement" brand variants. Prev Med 2014 Dec;69:120-125 [FREE Full text] [doi:10.1016/j.ypmed.2014.08.037] [Medline: 25224153]
23. World HO. Bloomberg initiative components. Tobacco free initiative URL: http://www.who.int/tobacco/about/partners/bloomberg/initiative_components/en/ [accessed 2015-04-15] [WebCite Cache ID 6XoRyZ9XX]
24. doForms. 2015-04-15 URL: http://www.doforms.com/product-overview [accessed 2015-04-15] [WebCite Cache ID6XoS9Vtmv]
25. Harris PA, Taylor R, Thielke R, Payne J, Gonzalez N, Conde JG. Research electronic data capture (REDCap)--ametadata-driven methodology and workflow process for providing translational research informatics support. J BiomedInform 2009 Apr;42(2):377-381 [FREE Full text] [doi: 10.1016/j.jbi.2008.08.010] [Medline: 18929686]
26. Campaign for Tobacco Free Kids. Tobacco control laws URL: http://www.tobaccocontrollaws.org/ [accessed 2015-04-15][WebCite Cache ID 6XoHMSLr8]
27. Ford A, Moodie C, Hastings G. The role of packaging for consumer products: Understanding the move towards ‘plain’tobacco packaging. Addict Res Theory 2012 Aug;20(4):339-347. [doi: 10.3109/16066359.2011.632700]
28. Hammond D, Doxey J, Daniel S, Bansal-Travers M. Impact of female-oriented cigarette packaging in the United States.Nicotine Tob Res 2011 Jul;13(7):579-588 [FREE Full text] [doi: 10.1093/ntr/ntr045] [Medline: 21486994]
29. Dewhirst T, Lee WB. Cigarette advertising in the Republic of Korea: A case illustration of The One. Tob Control 2012Nov;21(6):584-588. [doi: 10.1136/tobaccocontrol-2011-050315] [Medline: 22517803]
30. Health Canada. Chatter Box. URL: http://chatterbox.otru.org/ [accessed 2015-04-15] [WebCite Cache ID 6XoNEpcTK]31. StataCorp. StataCorp. College Station, TX: Release 13. : StataCorp LP; 2013.32. StataCorp. StataCorp. College Station, TX: Release 14. : StataCorp LP; 2015. URL: http://www.stata.com/manuals14/u.
pdf [accessed 2015-08-04] [WebCite Cache ID 6aXWIuvUm]33. Euromonitor. Retrieved from Euromonitor Passport Database. 2013. Tobacco statistics by country URL: http://www.
euromonitor.com/tobacco [WebCite Cache ID 6aXXH7xWB]34. Altman D, Bland J. Statistician. Measurement in medicine: the analysis of method comparison studies. Statistician ;
1983:307-317.35. Byrt T, Bishop J, Carlin JB. Bias, prevalence and kappa. J Clin Epidemiol 1993 May;46(5):423-429. [Medline: 8501467]36. Gwet KL. Computing inter-rater reliability and its variance in the presence of high agreement. Br J Math Stat Psychol 2008
May;61(Pt 1):29-48. [doi: 10.1348/000711006X126600] [Medline: 18482474]37. Viera AJ, Garrett JM. Understanding interobserver agreement: The kappa statistic. Fam Med 2005 May;37(5):360-363
[FREE Full text] [Medline: 15883903]38. Hallgren KA. Computing inter-rater reliability for observational data: An overview and tutorial. Tutor Quant Methods
Psychol 2012;8(1):23-34 [FREE Full text] [Medline: 22833776]39. Cunningham M. SAS global forum. More than just the kappa coefficient: A program to fully characterize inter-rater
reliability between two raters URL: http://support.sas.com/resources/papers/proceedings09/242-2009.pdf [accessed2015-04-15] [WebCite Cache ID 6XoRrA7qH]
JMIR Public Health Surveill 2015 | vol. 1 | iss. 2 | e8 | p.117http://publichealth.jmir.org/2015/2/e8/(page number not for citation purposes)
Smith et alJMIR PUBLIC HEALTH AND SURVEILLANCE
XSL•FORenderX

40. Institute for Global Tobacco Control. Tobacco pack surveillance system:TPackSS URL: http://globaltobaccocontrol.org/tpackss/ [accessed 2015-04-15] [WebCite Cache ID 6XoNUkHUm]
AbbreviationsF&A: features and appealsFCTC: Framework Convention on Tobacco ControlIGTC: Global Tobacco ControlHWLs: health warning labelsIDs: identification numbersmm: millimeterNGO: nongovernmental organizationPABAK: prevalence adjusted kappaREDCap: Research Electronic Data CaptureTPackSS: Tobacco Pack Surveillance System
Edited by G Eysenbach; submitted 13.05.15; peer-reviewed by J Kimmerle, MP Wang; comments to author 19.06.15; revised versionreceived 02.07.15; accepted 03.07.15; published 12.08.15.
Please cite as:Smith K, Washington C, Brown J, Vadnais A, Kroart L, Ferguson J, Cohen JThe Tobacco Pack Surveillance System: A Protocol for Assessing Health Warning Compliance, Design Features, and Appeals ofTobacco Packs Sold in Low- and Middle-Income CountriesJMIR Public Health Surveill 2015;1(2):e8URL: http://publichealth.jmir.org/2015/2/e8/ doi:10.2196/publichealth.4616PMID:27227142
©Katherine Smith, Carmen Washington, Jennifer Brown, Alison Vadnais, Laura Kroart, Jacqueline Ferguson, Joanna Cohen.Originally published in JMIR Public Health and Surveillance (http://publichealth.jmir.org), 12.08.2015. This is an open-accessarticle distributed under the terms of the Creative Commons Attribution License (http://creativecommons.org/licenses/by/2.0/),which permits unrestricted use, distribution, and reproduction in any medium, provided the original work, first published in JMIRPublic Health and Surveillance, is properly cited. The complete bibliographic information, a link to the original publication onhttp://publichealth.jmir.org, as well as this copyright and license information must be included.
JMIR Public Health Surveill 2015 | vol. 1 | iss. 2 | e8 | p.118http://publichealth.jmir.org/2015/2/e8/(page number not for citation purposes)
Smith et alJMIR PUBLIC HEALTH AND SURVEILLANCE
XSL•FORenderX

Original Paper
A Qualitative Examination of Respondent-Driven Sampling (RDS)Peer Referral Challenges Among Young Transwomen in the SanFrancisco Bay Area
Sean Arayasirikul1,2; Xiang Cai3, BA; Erin C Wilson1,4, DrPH1Center for Public Health, Population Health Division, San Francisco Department of Public Health, San Francisco, CA, United States2Medical Sociology, Department of Social and Behavioral Sciences, University of California San Francisco, San Francisco, CA, United States3Yale University, New Haven, CT, United States4Department of Epidemiology and Biostatistics, University of California San Francisco, San Francisco, CA, United States
Corresponding Author:Sean ArayasirikulCenter for Public HealthPopulation Health DivisionSan Francisco Department of Public Health25 Van Ness Ave 5th FloorSan Francisco, CA, 94102United StatesPhone: 1 4155549036Fax: 1 4155549000Email: [email protected]
Abstract
Background: Efforts have focused on developing innovative recruitment strategies to engage the most marginalized of populationsin public health research. Respondent-driven sampling (RDS) has been found to be an effective sampling strategy for hard-to-reach,hidden populations. Though studies have documented RDS peer referral as challenging, literature contextualizing these challengesis scant and rarely do they discuss the role of Internet technologies.
Objective: The objective of the study was to explore reasons for peer referral challenges in a human immunodeficiency virus(HIV) risk and resilience study among a hidden population of youth, specifically, young transwomen. These findings amplifythe unique opportunities Internet technologies bring to public health research and methodology.
Methods: We conducted focused, semistructured, qualitative interviews with 16 young transwomen to investigate the reasonswhy youth did or did not refer peers to an RDS study for transwomen ages 16-24 in the San Francisco Bay Area. Qualitativeinterview data were coded and analyzed using grounded theory.
Results: Participants discussed specific barriers and facilitators related to four factors that include study design, studyimplementation, community characteristics, and individual characteristics, which contributed to RDS peer referral challenges.
Conclusions: Our grounded theory analysis identifies important considerations for future RDS studies with hidden youthpopulations. Exploring research participants’ experiences is integral in strengthening future epidemiologic research efforts thatplan to use RDS to sample and estimate the hidden epidemics among at-risk youth and transgender women. Additionally, Internettechnologies and Web-based adaptations offer solutions to traditional RDS peer referral challenges, having the potential to increaseaccessibility and use among hidden youth populations.
(JMIR Public Health Surveill 2015;1(2):e9) doi:10.2196/publichealth.4573
KEYWORDS
transgenders; young adults; qualitative research; epidemiology; methodology
JMIR Public Health Surveill 2015 | vol. 1 | iss. 2 | e9 | p.119http://publichealth.jmir.org/2015/2/e9/(page number not for citation purposes)
Arayasirikul et alJMIR PUBLIC HEALTH AND SURVEILLANCE
XSL•FORenderX
Introduction
Accessing Transgender WomenAccess to hard-to-reach, hidden populations is often limited,but necessary to characterize epidemics among key populationsat risk for human immunodeficiency virus (HIV) [1,2]. However,such populations are often difficult to sample [3].Respondent-driven sampling (RDS), an adaptation ofchain-referral sampling [4], has been used to sample diversehard-to-reach, hidden populations. Transgender women are apopulation disproportionately impacted by HIV around theworld [5] and are considered a hidden population due togender-based stigma toward this group. RDS studies have beenquite successful in reaching transwomen, individuals who notidentify with the gender associated with their assigned male sexat birth, for HIV research [6-9], but gaps in specificsubpopulations remain.
Research has emerged finding that younger transwomen arealso at high risk for HIV [10], but there have been calls for morerigorous population-based studies to assess local epidemics anddetermine current risk. Younger people in general are a groupparticularly difficult to recruit using RDS [11-15]. ARDS-evaluation study comparing field data to population datafound that being younger was one of only four factors associatedwith being underrepresented in the RDS data [15]. RDS forfinding hidden youth populations has been even moreproblematic. For example, it took 12 waves of recruitment toachieve a sample size of 259 young women with multiple sexpartners in a South African study [12]. It took over three yearsto recruit a sample of 450 young men who have sex with men(YMSM) using respondent driven sampling in a recent U.S.study [13]. The only factor significantly related to recruitmentsuccess in the YMSM study was having a large network size.Some research has been done to identify ways to overcomethese issues and to determine what demographic factors areassociated, which may give some insight into what populationsmay be most challenging [13]. No studies were found in theliterature that qualitatively investigated reasons for challengesassociated with RDS referral among a hidden youth population.
Purpose of the AnalysisThe purpose of this analysis was to fill a gap in the literatureby examining the referral experiences of youth participants inan RDS study. Specifically, we sought to address the followingresearch question, “What barriers and facilitators did youngtranswomen encounter in RDS peer referral?” We discuss howthese findings amplify the unique opportunities Internettechnologies bring to public health research and methodologyand considerations for future applications of RDS peer referralamong hidden youth populations.
Methods
The SHINE StudyThe SHINE study is the first longitudinal study, to ourknowledge, of HIV risk and resilience among youngtranswomen, ages 16-24 [16], in the San Francisco Bay Area.We conducted six focus groups with participants and confirmed
feasibility and acceptability of RDS in this hidden, hard-to-reachpopulation. After nine months of RDS implementation, seedswere not propagating, leading to few peer referrals. In order toboost recruitment, we later incorporated direct referrals fromcommunity-based organizations, outreach at events, and onlineoutreach through social networks to identify new seeds until acohort of 300 individuals were enrolled. Participants werecompensated for their participation at each data collection timepoint (baseline, 6-month, and 12-month) in the amounts of US$50, $70, and $100, respectively. At the end of participants’baseline visit, study staff explained RDS peer referralprocedures. Participants were provided with three referralcoupons and earned US $20 for each successful referral.
Participant Recruitment, Procedures, and AnalysisWe conducted focused, semistructured, qualitative interviewswith a subsample of 16 participants of the parent study viatelephone. Participants were purposively sampled in order toobtain diversity in ability/willingness to provide study referralsto peers in age, race/ethnicity, and socioeconomic status.Participants were not paid. Interviews lasted 10-15 minutes andtook place during a time that was most convenient for theparticipant. The interview guide was iterated in order tomaximize coverage of participant experiences throughtheoretical sampling to reach theoretical saturation [17] and toaddress the following research question, “What barriers andfacilitators did young transwomen encounter in RDS peerreferral?” The interview guide assessed the following constructs:friendship networks, social isolation; knowledge, attitudes,motivation, and behavior related to peer referral; and peerreferral successes, challenges, and improvements.
Interviews were audio-recorded and transcribed verbatim bythe second author. Transcriptions were randomly checked forquality and accuracy against original recordings by the firstauthor. Qualitative interview data were coded and analyzedusing grounded theory [17]. The first and second authorsindependently coded qualitative data, line by line, and together,organized codes into categories to identify specific factors thatinfluenced RDS referrals among participants. The last authoroversaw all research procedures and is an expert in qualitativeresearch. The Institutional Review Board (IRB) at the Universityof California, San Francisco, approved all study procedures.All participants provided written consent (or written assent forthose younger than 18 years of age in accordance with a reviewboard waiver of parental consent) to participate in thelongitudinal parent study. We obtained IRB approval six monthslater to approach consented participants in the longitudinalparent study to recruit for this substudy in which verbal consentwas approved for and obtained.
Results
The ParticipantsThe age range of the 16 participants was 17 to 24 years old,with a mean age of 21.25 years. The majority, (10/16) of thesubsample, were young transwomen of color, with 12% (2/16)identifying as African American, 25% (4/16) as Asian/PacificIslander, 19% (3/16) as Latina, and 6% (1/16) as mixed race.There were (50%) 8/16 participants that reported having
JMIR Public Health Surveill 2015 | vol. 1 | iss. 2 | e9 | p.120http://publichealth.jmir.org/2015/2/e9/(page number not for citation purposes)
Arayasirikul et alJMIR PUBLIC HEALTH AND SURVEILLANCE
XSL•FORenderX
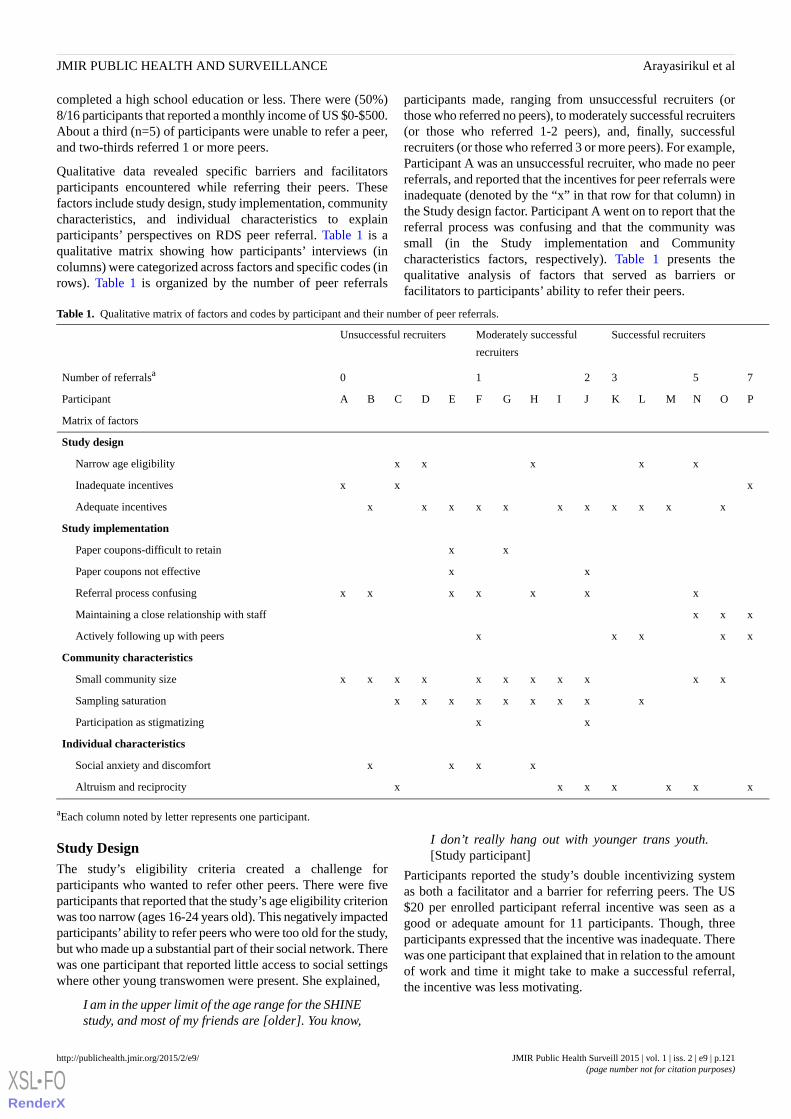
completed a high school education or less. There were (50%)8/16 participants that reported a monthly income of US $0-$500.About a third (n=5) of participants were unable to refer a peer,and two-thirds referred 1 or more peers.
Qualitative data revealed specific barriers and facilitatorsparticipants encountered while referring their peers. Thesefactors include study design, study implementation, communitycharacteristics, and individual characteristics to explainparticipants’ perspectives on RDS peer referral. Table 1 is aqualitative matrix showing how participants’ interviews (incolumns) were categorized across factors and specific codes (inrows). Table 1 is organized by the number of peer referrals
participants made, ranging from unsuccessful recruiters (orthose who referred no peers), to moderately successful recruiters(or those who referred 1-2 peers), and, finally, successfulrecruiters (or those who referred 3 or more peers). For example,Participant A was an unsuccessful recruiter, who made no peerreferrals, and reported that the incentives for peer referrals wereinadequate (denoted by the “x” in that row for that column) inthe Study design factor. Participant A went on to report that thereferral process was confusing and that the community wassmall (in the Study implementation and Communitycharacteristics factors, respectively). Table 1 presents thequalitative analysis of factors that served as barriers orfacilitators to participants’ ability to refer their peers.
Table 1. Qualitative matrix of factors and codes by participant and their number of peer referrals.
Successful recruitersModerately successful
recruiters
Unsuccessful recruiters
753210Number of referralsa
PONMLKJIHGFEDCBAParticipant
Matrix of factors
Study design
x x x xx Narrow age eligibility
x x xInadequate incentives
x xxxxx xxxx x Adequate incentives
Study implementation
x x Paper coupons-difficult to retain
x x Paper coupons not effective
x x x xx xxReferral process confusing
xxx Maintaining a close relationship with staff
xx xx x Actively following up with peers
Community characteristics
xx xxxxx xxxxSmall community size
x xxxxxxxx Sampling saturation
x x Participation as stigmatizing
Individual characteristics
x xx x Social anxiety and discomfort
x xx xxx x Altruism and reciprocity
aEach column noted by letter represents one participant.
Study DesignThe study’s eligibility criteria created a challenge forparticipants who wanted to refer other peers. There were fiveparticipants that reported that the study’s age eligibility criterionwas too narrow (ages 16-24 years old). This negatively impactedparticipants’ability to refer peers who were too old for the study,but who made up a substantial part of their social network. Therewas one participant that reported little access to social settingswhere other young transwomen were present. She explained,
I am in the upper limit of the age range for the SHINEstudy, and most of my friends are [older]. You know,
I don’t really hang out with younger trans youth.[Study participant]
Participants reported the study’s double incentivizing systemas both a facilitator and a barrier for referring peers. The US$20 per enrolled participant referral incentive was seen as agood or adequate amount for 11 participants. Though, threeparticipants expressed that the incentive was inadequate. Therewas one participant that explained that in relation to the amountof work and time it might take to make a successful referral,the incentive was less motivating.
JMIR Public Health Surveill 2015 | vol. 1 | iss. 2 | e9 | p.121http://publichealth.jmir.org/2015/2/e9/(page number not for citation purposes)
Arayasirikul et alJMIR PUBLIC HEALTH AND SURVEILLANCE
XSL•FORenderX
Study ImplementationParticipants identified the study’s referral coupons, referraltraining, and the relationship with study staff as important totheir ability to recruit their peers. For example, three participantswho had referred 5 or more peers noted that maintaining a closerelationship with research staff supported their referral efforts.There was one participant that even shared that the rapport shedeveloped with research staff over time motivated her to activelyseek out potential participants in their network. This participantsaid that as a result of rapport with study staff, she sought “tobe the best possible referral person ever”. Additionally, goodrapport with participants helped participants form a betterunderstanding of the study, its objectives, and eligibility criteria.There was one participant that said,
I definitely felt more comfortable when I wascompletely brought on board with what was going onand what was it about as well as what to say and howto get people in. [Study participant]
Additionally, five participants who successfully referred peerswere more likely to report practicing active follow-up with peersthey gave coupons to. Types of active follow-up theseparticipants implemented included telephone calls, shortmessage service texts, and accompanying referrals to their studyvisits. Some took the initiative to schedule appointments withstudy staff for their peers to ensure their follow through.
For two participants, paper coupons were difficult to retainbecause they were struggling with residential instability; thus,holding onto paper coupons was challenging. There were twoparticipants that reported that the paper coupon was not aneffective referral tool. There was one participant that said,
People disregard most of the coupons nowadays. Justlike okay, I will just put it somewhere and forget aboutit. [Study participant]
Additionally, seven participants reported that they were confusedabout how to refer peers or how important it was to refer; as aresult, participants often felt little responsibility to refer peers.There was one participant that said,
I am not going to go to somebody and like ‘Hey, howis it going?’and just hand them out coupons. It is justa little weird, I think. [Study participant]
Another participant said that she “was not particularly sure howmuch information [she] could give out”. Whereas anotherparticipant said,
It wasn’t in mind that I needed to tell them. I feel likeI was not so informed about the SHINE Study, and Ididn’t think I needed to recruit. [Study participant]
Community CharacteristicsParticipants identified a number of importantcommunity/population-specific factors that impacted their abilityto refer peers. Specifically, the size of the community, samplingsaturation, and participation in research as stigmatizing, emergedas barriers to successful referrals.
There were 11 participants that reported that the youngtranswomen population overall was very small, which made it
very difficult to refer peers. For those who lived outside themetropolitan areas of San Francisco and Oakland, referrals wereparticularly difficult because the population was even smaller.There was one participant that explained,
I think a lot of girls who also participated in this studylive in different areas of the Bay Area. So if you don’tlive in San Francisco or you don’t live in Oakland,your network of girls would be a lot smaller. [Studyparticipant]
There were 9 participants that reported that the study hadreached a point of sampling saturation, saying that most or allof their friends were already enrolled. There was one participantthat commented, “I know a lot of people, but a lot of the peopleI reached out to have already contacted the SHINE study”.Another participant shared, “the challenge [with referring peers]is finding someone who hasn’t already done the SHINE Study”.
Additionally, two participants expressed the belief thatparticipation in research can be stigmatizing. There was oneparticipant that elaborated,
I think [young transwomen] are vulnerable [because]like the study is like a medical experience, like amental health experience. I think a lot of trans peoplehave a negative impression toward the medicalprofession. Or like just a general anxiety about it.Like I don’t know, it might feel like going to the doctorwithout really meaning to, I guess. [Study participant]
These participants were influenced by negative experienceswith medical and mental health institutions in the past and adeep concern around protection of one’s privacy.
Individual CharacteristicsAt the individual level, a number of participants reportedexperiencing social discomfort around RDS referrals, whileothers reported altruism as a motivator for peer referral. Therewere four participants that expressed that they had feelings ofsocial anxiety and discomfort associated with referring peers.There was one participant that explained,
People stress me out, and I don’t like to talk to people.I don’t get social cues. I don’t know; I am just bad atit. I just like to go home and watch Netflix. It’s justnot my personality to try to get people to do things.That is why I am not in sales. That is why I sit in frontof a computer and program all day, where I don’thave to talk to people. [Study participant]
Participants also reported altruism and reciprocity, which helpedto motivate their own participation in the study, andsubsequently helped motivate some youth to make peer referrals.There was one participant that said,
[The study] is pretty fascinating. In like since it isspecifically for [young] transwomen, I was prettyimpressed. So like I think, it was an honor to be a partof it...I would be willing to do it without receivinganything. I don’t really care for it. Because, I like, Ifeel like the purpose and the goal is more important.[Study participant]
JMIR Public Health Surveill 2015 | vol. 1 | iss. 2 | e9 | p.122http://publichealth.jmir.org/2015/2/e9/(page number not for citation purposes)
Arayasirikul et alJMIR PUBLIC HEALTH AND SURVEILLANCE
XSL•FORenderX
There were seven participants that reported that their ownparticipation in this study was motivated by helping thecommunity of young transwomen and they, in turn, wouldbenefit from the impact of the study’s findings.
Discussion
Principal FindingsThese data identify specific factors that serve as barriers andfacilitators to RDS peer referral among young transwomen andsuggest important considerations for future RDS studies withhidden youth populations. Contrary to adult RDS studies thatfound low monetary incentives to be inadequate for generatingpeer referrals, data in this study found that the majority ofparticipants reported the US $20 incentive as adequate. PreviousRDS studies conducted in adult populations have experiencedchallenges in successfully incentivizing peer referrals [18,19].An RDS study of HIV risk among international MSM travelersoffered a secondary incentive for peer referrals in the amountof US $10 [18]. Participants in this study did not respond to thatlevel of monetary incentivization, which prompted studyinvestigators to instead offer participants a raffle entry for prizesof US $500. Another study found that even at that level ofincentivization, raffling large monetary sums was not effectiveamong an adult sample of cannabis users [19]. Finding that thislevel of incentivization was effective for youth supports futureRDS studies with youth populations.
With regard to RDS implementation, participants identifiedchallenges around the use of paper coupons and confusionaround the referral process. Methodological developments inRDS studies have expanded to include the use of Webadaptations of RDS, referred to as webRDS, which may helpto address these challenges [11,20]. WebRDS uses an Internetportal to assign unique identifiers to participants and enablethem to generate electronic coupons and linked email messages,which can be sent to peer referrals [20]. Because few publichealth studies have utilized webRDS [11,18,21-23], a rigorousexploration of webRDS among hidden youth populations mayameliorate challenges we found associated with the use of papercoupons. There was one study that observed that when presentedwith the choice, study participants strongly preferred electroniccoupons to paper coupons [18]. The success of electroniccoupons in this study has even suggested that electronic referralsmay enhance random selection of peers if participants were notlimited to in-person meetings to transfer paper coupons [18].
Broadly, our data found that youth participants were influencedby research-related, relationship, and interactional factors ratherthan the adequacy of monetary incentives. For example, wefound that participants who maintained close workingrelationships with research staff were more motivated and, asa result, able to successfully refer peers. There was one studythat found that though youth often want the potential benefitsof research, they vary in their cognitive ability to understandimportant research details and procedures [24]. Our findingsunderscore the importance of providing a supportiveenvironment with multiple engagement opportunities for youthparticipating in research, similar to other published work callingfor increased engagement with youth and adolescent
communities to address perceived barriers to participation[25,26].
Related to research participation in general, we found that youthparticipating in research can be stigmatizing and is importantfor understanding the use of RDS among hidden populations.This is especially true for research studies with vulnerable andmarginalized youth that rely on the assumption that participantsbe “out” as trans, at the very least to themselves and theresearchers [27]. Literature has identified many barriers toresearch participation among socially disadvantaged groups,such as medical mistrust, fear of authority, stigma, mistreatment,or exploitation; these reasons were especially salient for racial,gender, and sexual minorities [3,28-30]. Moreover, HIV researchstudies have struggled to sample adolescents due to HIV-relatedperceived stigma and negative social consequences [27].WebRDS may create opportunities to address these largerresearch-related issues, making research more accessible andyouth-friendly [11]. WebRDS has been found to address someof these challenges around communicating with potential peerreferrals by affording youth the ability to recruit peers throughpassive or active strategies, using the approach that they prefermost [11]. WebRDS may alleviate the social anxiety anddiscomfort participants reported related to recruiting peers andpossibly aid in protecting their anonymity or the confidentialityof their gender identity [11].
LimitationsThere are a number of limitations to this study. The small sizeof this subsample limits the generalizability of these results toboth the large cohort of the parent study as well as thepopulation. Though purposive sampling was used to generatea range of experiences in recruitment, it is subject to selectionbias. The extent to which social desirability bias influencedparticipants’ discussion with researchers about the quality ofthe research experience is a possibility. Additionally, these dataare constrained by brief one-time interviews centered on aspecific topic, RDS peer referral. Despite these limitations, thesefindings highlight the import in examining the experiences ofresearch participants themselves. Most importantly, these dataseek to inform and bolster future epidemiologic research effortsthat use RDS to sample and estimate the burgeoning HIVepidemic among at-risk youth and transgender women.
ConclusionsOur findings identified important considerations for theimplementation of RDS in communities of young transwomen.Qualitative data identified specific factors related to study designand implementation and community and individualcharacteristics that impacted participants’ implementation ofRDS peer referrals. Specifically, these findings identifystrategies that may strengthen future RDS peer referrals andepidemiologic surveillance methods for sampling youngtranswomen.
Future research building on the methodology and best practicesof RDS implementation is necessary to understand and improvethe sampling of vulnerable and hard-to-reach minority youth inpublic health research. More qualitative studies examining thechallenges of RDS peer referral may help to build a larger
JMIR Public Health Surveill 2015 | vol. 1 | iss. 2 | e9 | p.123http://publichealth.jmir.org/2015/2/e9/(page number not for citation purposes)
Arayasirikul et alJMIR PUBLIC HEALTH AND SURVEILLANCE
XSL•FORenderX
literature base of RDS best practices. Public health practitionersand researchers can then refer and reflect on these studies tohelp overcome RDS peer referral challenges they may encounter.Additionally, future studies assessing webRDS in comparison
with traditional in-person RDS could reveal important findingsabout when and for which population Internet technologies playa critical role in reaching.
AcknowledgmentsThe authors would like to thank all participants in the SHINE study. Award Number R01MH095598 from the National Instituteof Mental Health funded this study. The lead author was supported by Award Number T32AA007240, Graduate Research Trainingon Alcohol Problems, from the National Institute on Alcohol Abuse and Alcoholism. Award Number R25MH097591 from theNational Institute of Mental Health supported the second author. The content is solely the responsibility of the authors and doesnot necessarily represent the official view of the National Institute on Alcohol Abuse and Alcoholism, the National Institute ofMental Health, or the National Institutes of Health.
Conflicts of InterestNone declared.
References1. Magnani R, Sabin K, Saidel T, Heckathorn D. Review of sampling hard-to-reach and hidden populations for HIV surveillance.
AIDS 2005 May;19 Suppl 2:S67-S72. [Medline: 15930843]2. Faugier J, Sargeant M. Sampling hard to reach populations. J Adv Nurs 1997 Oct;26(4):790-797. [Medline: 9354993]3. Bonevski B, Randell M, Paul C, Chapman K, Twyman L, Bryant J, et al. Reaching the hard-to-reach: A systematic review
of strategies for improving health and medical research with socially disadvantaged groups. BMC Med Res Methodol2014;14:42 [FREE Full text] [doi: 10.1186/1471-2288-14-42] [Medline: 24669751]
4. Heckathorn D. Respondent-driven sampling: A new approach to the study of hidden populations. Social Problems 1997May;44(2):174-199. [doi: 10.2307/3096941]
5. Baral SD, Poteat T, Strömdahl S, Wirtz AL, Guadamuz TE, Beyrer C. Worldwide burden of HIV in transgender women:A systematic review and meta-analysis. Lancet Infect Dis 2013 Mar;13(3):214-222. [doi: 10.1016/S1473-3099(12)70315-8][Medline: 23260128]
6. Clements-Nolle K, Marx R, Guzman R, Katz M. HIV prevalence, risk behaviors, health care use, and mental health statusof transgender persons: Implications for public health intervention. Am J Public Health 2001 Jun;91(6):915-921. [Medline:11392934]
7. Silva-Santisteban A, Raymond HF, Salazar X, Villayzan J, Leon S, McFarland W, et al. Understanding the HIV/AIDSepidemic in transgender women of Lima, Peru: Results from a sero-epidemiologic study using respondent driven sampling.AIDS Behav 2012 May;16(4):872-881. [doi: 10.1007/s10461-011-0053-5] [Medline: 21983694]
8. Rotondi NK, Bauer GR, Scanlon K, Kaay M, Travers R, Travers A. Nonprescribed hormone use and self-performedsurgeries: "Do-it-yourself" transitions in transgender communities in Ontario, Canada. Am J Public Health 2013Oct;103(10):1830-1836. [doi: 10.2105/AJPH.2013.301348] [Medline: 23948009]
9. Rapues J, Wilson EC, Packer T, Colfax GN, Raymond HF. Correlates of HIV infection among transfemales, San Francisco,2010: Results from a respondent-driven sampling study. Am J Public Health 2013 Aug;103(8):1485-1492. [doi:10.2105/AJPH.2012.301109] [Medline: 23763398]
10. Wilson EC, Garofalo R, Harris RD, Herrick A, Martinez M, Martinez J, Transgender Advisory Committeethe AdolescentMedicine Trials Network for HIV/AIDS Interventions. Transgender female youth and sex work: HIV risk and a comparisonof life factors related to engagement in sex work. AIDS Behav 2009 Oct;13(5):902-913 [FREE Full text] [doi:10.1007/s10461-008-9508-8] [Medline: 19199022]
11. Bauermeister JA, Zimmerman MA, Johns MM, Glowacki P, Stoddard S, Volz E. Innovative recruitment using onlinenetworks: Lessons learned from an online study of alcohol and other drug use utilizing a web-based, respondent-drivensampling (webRDS) strategy. J Stud Alcohol Drugs 2012 Sep;73(5):834-838. [Medline: 22846248]
12. Zembe YZ, Townsend L, Thorson A, Ekström AM. Predictors of inconsistent condom use among a hard to reach populationof young women with multiple sexual partners in peri-urban South Africa. PLoS One 2012;7(12):e51998 [FREE Full text][doi: 10.1371/journal.pone.0051998] [Medline: 23284847]
13. Kuhns LM, Kwon S, Ryan DT, Garofalo R, Phillips G, Mustanski BS. Evaluation of respondent-driven sampling in a studyof urban young men who have sex with men. J Urban Health 2015 Feb;92(1):151-167. [doi: 10.1007/s11524-014-9897-0][Medline: 25128301]
14. Phillips G, Kuhns LM, Garofalo R, Mustanski B. Do recruitment patterns of young men who have sex with men (YMSM)recruited through respondent-driven sampling (RDS) violate assumptions? J Epidemiol Community Health 2014Dec;68(12):1207-1212 [FREE Full text] [doi: 10.1136/jech-2014-204206] [Medline: 25086159]
JMIR Public Health Surveill 2015 | vol. 1 | iss. 2 | e9 | p.124http://publichealth.jmir.org/2015/2/e9/(page number not for citation purposes)
Arayasirikul et alJMIR PUBLIC HEALTH AND SURVEILLANCE
XSL•FORenderX
15. McCreesh N, Frost Simon D W, Seeley J, Katongole J, Tarsh MN, Ndunguse R, et al. Evaluation of respondent-drivensampling. Epidemiology 2012 Jan;23(1):138-147 [FREE Full text] [doi: 10.1097/EDE.0b013e31823ac17c] [Medline:22157309]
16. United NE. United Nations Educational, S.a.C.O. What do we mean by "youth"? URL: http://www.unesco.org/new/en/social-and-human-sciences/themes/youth/youth-definition/ [accessed 2015-08-14] [WebCite Cache ID 6ambxNvQu]
17. Corbin J, Strauss A. Basics of qualitative research: Techniques and procedures for developing grounded theory. USA: SagePublications, Inc; 2008.
18. Truong HM, Grasso M, Chen Y, Kellogg TA, Robertson T, Curotto A, et al. Balancing theory and practice inrespondent-driven sampling: A case study of innovations developed to overcome recruitment challenges. PLoS One2013;8(8):e70344 [FREE Full text] [doi: 10.1371/journal.pone.0070344] [Medline: 23990901]
19. Hathaway AD, Hyshka E, Erickson PG, Asbridge M, Brochu S, Cousineau M, et al. Whither RDS? An investigation ofrespondent driven sampling as a method of recruiting mainstream marijuana users. Harm Reduct J 2010;7:15 [FREE Fulltext] [doi: 10.1186/1477-7517-7-15] [Medline: 20618944]
20. No authors listed. Erratum for PMID 21180585. Therap Adv Gastroenterol 2012 Sep;5(5):371 [FREE Full text] [doi:10.1177/1756283X10363751] [Medline: 22973420]
21. Sadasivam RS, Volz EM, Kinney RL, Rao SR, Houston TK. Share2Quit: Web-based peer-driven referrals for smokingcessation. JMIR Res Protoc 2013;2(2):e37 [FREE Full text] [doi: 10.2196/resprot.2786] [Medline: 24067329]
22. Bengtsson L, Lu X, Nguyen QC, Camitz M, Hoang NL, Nguyen TA, et al. Implementation of web-based respondent-drivensampling among men who have sex with men in Vietnam. PLoS One 2012;7(11):e49417 [FREE Full text] [doi:10.1371/journal.pone.0049417] [Medline: 23152902]
23. Stein ML, van Steenbergen Jim E, Chanyasanha C, Tipayamongkholgul M, Buskens V, van der Heijden Peter G M,Kretzschmar Mirjam E E. Online respondent-driven sampling for studying contact patterns relevant for the spread ofclose-contact pathogens: A pilot study in Thailand. PLoS One 2014;9(1):e85256 [FREE Full text] [doi:10.1371/journal.pone.0085256] [Medline: 24416371]
24. Wendler DS. Assent in paediatric research: Theoretical and practical considerations. J Med Ethics 2006 Apr;32(4):229-234[FREE Full text] [doi: 10.1136/jme.2004.011114] [Medline: 16574878]
25. Morrison-Beedy D, Carey MP, Aronowitz T, Mkandawire L, Dyne J. Adolescents' input on the development of an HIVrisk reduction intervention. J Assoc Nurses AIDS Care 2002;13(1):21-27. [Medline: 11828857]
26. Ziff MA, Willard N, Harper GW, Bangi AK, Johnson J, Ellen JM. Connect to protect researcher-community partnerships:Assessing change in successful collaboration factors over time. Glob J Community Psychol Pract 2010 Jan;1(1):32-39[FREE Full text] [Medline: 21152354]
27. DiClemente RJ, Ruiz MS, Sales JM. Barriers to adolescents' participation in HIV biomedical prevention research. J AcquirImmune Defic Syndr 2010 Jul;54 Suppl 1:S12-S17 [FREE Full text] [doi: 10.1097/QAI.0b013e3181e1e2c0] [Medline:20571418]
28. Brawner BM, Volpe EM, Stewart JM, Gomes MM. Attitudes and beliefs toward biobehavioural research participation:Voices and concerns of urban adolescent females receiving outpatient mental health treatment. Ann Hum Biol2013;40(6):485-495. [doi: 10.3109/03014460.2013.806590] [Medline: 23822716]
29. Valaitis R. "They don't trust us; we're just kids": Views about community from predominantly female inner city youth.Health Care Women Int 2002;23(3):248-266. [doi: 10.1080/073993302317346325] [Medline: 12003503]
30. Miller MK, Wickliffe J, Jahnke S, Linebarger JS, Dowd D. Accessing general and sexual healthcare: Experiences of urbanyouth. Vulnerable Child Youth Stud 2014 Jul 1;9(3):279-290 [FREE Full text] [doi: 10.1080/17450128.2014.925170][Medline: 25101138]
AbbreviationsHIV: human immunodeficiency virusIRB: Institutional Review BoardRDS: respondent-driven samplingwebRDS: Web adaptations of RDSYMSM: young men who have sex with men
JMIR Public Health Surveill 2015 | vol. 1 | iss. 2 | e9 | p.125http://publichealth.jmir.org/2015/2/e9/(page number not for citation purposes)
Arayasirikul et alJMIR PUBLIC HEALTH AND SURVEILLANCE
XSL•FORenderX
Edited by T Sanchez, G Eysenbach; submitted 23.04.15; peer-reviewed by T Finlayson, R Britt; comments to author 29.06.15; revisedversion received 13.07.15; accepted 21.07.15; published 25.08.15.
Please cite as:Arayasirikul S, Cai X, Wilson ECA Qualitative Examination of Respondent-Driven Sampling (RDS) Peer Referral Challenges Among Young Transwomen in the SanFrancisco Bay AreaJMIR Public Health Surveill 2015;1(2):e9URL: http://publichealth.jmir.org/2015/2/e9/ doi:10.2196/publichealth.4573PMID:27227143
©Sean Arayasirikul, Xiang Cai, Erin C Wilson. Originally published in JMIR Public Health and Surveillance(http://publichealth.jmir.org), 25.08.2015. This is an open-access article distributed under the terms of the Creative CommonsAttribution License (http://creativecommons.org/licenses/by/2.0/), which permits unrestricted use, distribution, and reproductionin any medium, provided the original work, first published in JMIR Public Health and Surveillance, is properly cited. The completebibliographic information, a link to the original publication on http://publichealth.jmir.org, as well as this copyright and licenseinformation must be included.
JMIR Public Health Surveill 2015 | vol. 1 | iss. 2 | e9 | p.126http://publichealth.jmir.org/2015/2/e9/(page number not for citation purposes)
Arayasirikul et alJMIR PUBLIC HEALTH AND SURVEILLANCE
XSL•FORenderX
Original Paper
Texting-Based Reporting of Adverse Drug Reactions to EnsurePatient Safety: A Feasibility Study
Godofreda Vergeire-Dalmacion1,2,3, MSc, MD, MHPEd; Nina T Castillo-Carandang2,3, MSc; Noel R Juban2,3, MSc,
MD; Maria Lourdes Amarillo2,3, MPH; Maria Pamela Tagle2,3, BSc; Emmanuel S Baja2,3, MSc, ScD1College of Medicine, Department of Pharmacology and Toxicology, University of the Philippines-Manila, Manila, Philippines2College of Medicine, Department of Clinical Epidemiology, University of the Philippines-Manila, Manila, Philippines3National Institutes of Health, Institute of Clinical Epidemiology, University of the Philippines-Manila, Manila, Philippines
Corresponding Author:Godofreda Vergeire-Dalmacion, MSc, MD, MHPEdCollege of MedicineDepartment of Pharmacology and ToxicologyUniversity of the Philippines-ManilaDepartment of Clinical Epidemiology Room 103Paz Mendoza Building, Pedro Gil Street, ErmitaManila, 1000PhilippinesPhone: 63 2 525 4098Fax: 63 2 525 4098Email: [email protected]
Abstract
Background: Paper-based adverse drug reaction (ADR) reporting has been in practice for more than 6 decades. Healthprofessionals remain the primary source of reports, while the value of patients’ reporting is yet unclear. With the increasingpopularity of using electronic gadgets in health, it is expected that the electronic transmission of reports will become the normwithin a few years.
Objective: The aims of this study are to investigate whether short messaging service or texting can provide an alternative orsupplemental method for ADR reporting given the increasing role of mobile phones in health care monitoring; to determine theusefulness of texting in addition to paper-based reporting of ADRs by resident physicians; and to describe the barriers to ADRreporting and estimate the cost for setting up and maintaining a texting-computer reporting system.
Methods: This was a pre-post cross-sectional study that measured the number of ADRs texted by 51 resident physicians for 12months from the Department of Obstetrics and Gynecology and the Department of Adult Medicine of a tertiary governmenthospital in Manila, Philippines, with 1350-bed capacity. Reports were captured by a texting-computer reporting system. Prior toits implementation, key informant interview and focus group discussion were conducted. Baseline information and practice onthe existing paper-based reporting system were culled from the records of the hospital’s Pharmacy and Therapeutics Committee.A postintervention survey questionnaire was administered at the end of 12 months.
Results: Only 3 ADRs were texted by 51 resident physicians in 12 months (reporting rate 3/51 or 6%). By contrast, 240 ADRsfrom the paper-based reporting system from 848 resident physicians of the study hospital were collected and tabulated (reportingrate 240/848 or 28.3%). Texting ADRs was not efficient because of power interruption, competition with the existing paper-basedreporting system, and unforeseen expiration of prepaid text loads/credits. The 3 ADRs texted were a report of vivid dreams andnightmares, a report of disturbing dreams and memory lapses, both of which were due to montelukast use, and a report of hepatitisfrom an isoniazid/rifampicin fixed-dose combination. Nineteen of 51 resident physicians (37%) registered in the reporting systemresponded to the postintervention survey. The most common reasons for not reporting ADRs were no adverse reaction identified11/19 (58%) and restrictive reporting syntax 4/19 (21%). All doctors preferred a free form of reporting. The direct cost of thetexting-based reporting system was calculated to be US $5581.40 and the indirect cost was US $9989.40. The total cost fortexting-based ADR reporting system for 12 months was US $15,570.79.
JMIR Public Health Surveill 2015 | vol. 1 | iss. 2 | e12 | p.127http://publichealth.jmir.org/2015/2/e12/(page number not for citation purposes)
Vergeire-Dalmacion et alJMIR PUBLIC HEALTH AND SURVEILLANCE
XSL•FORenderX
Conclusions: Reporting of ADRs via texting could be lower compared with an existing ADR paper-based system. Problemsof Internet connectivity, reporting syntax, and expiration and reliability of text loads/credits should be addressed while implementinga text-based ADR reporting system in a developing country.
(JMIR Public Health Surveill 2015;1(2):e12) doi:10.2196/publichealth.4605
KEYWORDS
adverse drug reactions; pharmacovigilance; postmarketing; spontaneous reporting; texting
Introduction
Toward the early 1970s, pharmacovigilance evolved as a criticalfield in drug development and regulation after the drugthalidomide showed serious adverse reactions in humans butnot in animals. As an offshoot of this disastrous incident, in1968, the World Health Organization (WHO) established theProgram for International Drug Monitoring in Uppsala, Sweden[1]. The program created an adverse drug reaction (ADR)monitoring system based on spontaneous reporting by healthcare professionals. In the early 1980s, regulators, pharmaceuticalmanufacturers, and physicians realized that prolonging theapproval of new drugs is as harmful as allowing marketing ofdrugs without postmarketing surveillance. Regulators alsorealized that rare ADRs, effects from drug-drug interactions,drug-disease interaction, and self-medication toxicities can onlybe elucidated in the real world of drug treatment rather than inclinical trials. This paved the way to the science ofpharmacoepidemiology and the practice of pharmacovigilance.
To promote and encourage postmarketing surveillance, variousstrategies, regulatory policies, and even laws were created tofacilitate the reporting of suspected ADRs. The major task forassuring drug safety was given to the pharmaceutical companies.However, this resulted in a conflict of interest and a restrainedwillingness to pass judgment on a drug’s culpability. A case inpoint is cerivastatin. After the release of cerivastatin on February18, 1998, the dataset of ADRs grew, but important analyses ofthese data remained internal to Bayer Corporation [2]. Bayermodified the label of cerivastatin 5 times during the 3 years thedrug was available to try to improve its safety before ultimatelywithdrawing it from the market. Reports of ADRs are ofteninadequately recorded or defined. This was proven by Loke andDerry in 2001 in their systematic review of the reporting andrecording of ADRs in 185 randomized clinical trials. They foundthat 25 of the 185 trials (13.5%) did not mention anything aboutADRs [3]. When ADRs such as clinical events or patientsymptoms were mentioned in the reports, details on how theyhad been recorded were given in only 14 of 95 (15%) and 18of 104 (17%) trials, respectively [3].
After 4 decades, postmarketing surveillance of newly marketeddrugs has become a vital step in drug development, demandingthe same attention and rigors as the other steps. It has also ledto the science of pharmacovigilance, which is defined as“activities relating to the detection, assessment, understandingand prevention of adverse effects or any other drug-relatedproblem.” Together with the WHO Collaborating Centre forInternational Drug Monitoring, Uppsala, WHO promotespharmacovigilance at the country level. At the end of 2010, 134countries have become part of the WHO pharmacovigilance
program. Recently, pharmacovigilance has become synonymouswith patient safety and care in relation to the use of medicines[1]. Although spontaneous ADR reporting is the mainstay ofsafety evaluation in the postapproval phase, a high level ofunquantifiable underreporting by doctors remains aninsurmountable problem of the system [4].
Another systematic review involving 37 studies across 12countries was carried out in 2006 to numerically estimate theunderreporting of ADRs using spontaneous reporting. Themedian underreporting rate was 94% (interquartile range82-98%) [5]. There was no significant difference in the medianunderreporting rates calculated for general practice andhospital-based studies [5]. Despite more than 5 decades ofspontaneous reporting, underreporting still remains a majordrawback. Health professionals remain the primary source ofreports, while the value of patients’ reporting is yet unclear.With the increasing popularity of using electronic gadgets inhealth, it is expected that the electronic transmission of reportswill become the norm within a few years [6]. Ines in 1986 [7]published the earliest body of evidence on ADR reporting inthe Philippines. This aforementioned study revealed that ADRreporting established in 1967 by the Philippine MedicalAssociation has not been successful in gathering informationon ADRs for the last 20 years of its existence. The authorproposed in her study a change in the attitudes of patients anddoctors toward ADRs and the adoption of newer strategy ofreporting. Furthermore, a confidential and reliable mechanismof review and assessing the reports was recommended.
In the era of computers, cyberspace, and rapid connectivity, itis reasonable to explore the potential use of short messagingservice, more commonly known as “texting,” in reporting ADRs.The use of mobile phones in health delivery services and careis not new. In 2008, mobile phone texting for pharmaceuticalcare in a hospital was implemented in China [8]. The systemwas called the “Mobile Pharmacy Service System.” The textmessages sent by the system to patients consisted of thefollowing: (1) reminders about medication from the dayfollowing discharge, (2) practical information about medicines,and (3) information about ADRs. Baron et al [9] published in2013 a pilot study on the use of mobile phone-based tools foradverse event notifications after a vaccination program inCambodia. A total of 184 patients from the study were textedfor their clinical status 48 hours after their vaccinations.Fifty-two (28.3%) did not reply but 101 (54.9%) sent animmediate text response, and 31 (16.8%) sent a text reply afteradditional prompting. The study concluded that texting can alsobe a useful tool for notification by patients or health users inCambodia, especially in an urban setting [9]. Local informationon the texting activity of the Philippines in 2007 revealed that
JMIR Public Health Surveill 2015 | vol. 1 | iss. 2 | e12 | p.128http://publichealth.jmir.org/2015/2/e12/(page number not for citation purposes)
Vergeire-Dalmacion et alJMIR PUBLIC HEALTH AND SURVEILLANCE
XSL•FORenderX
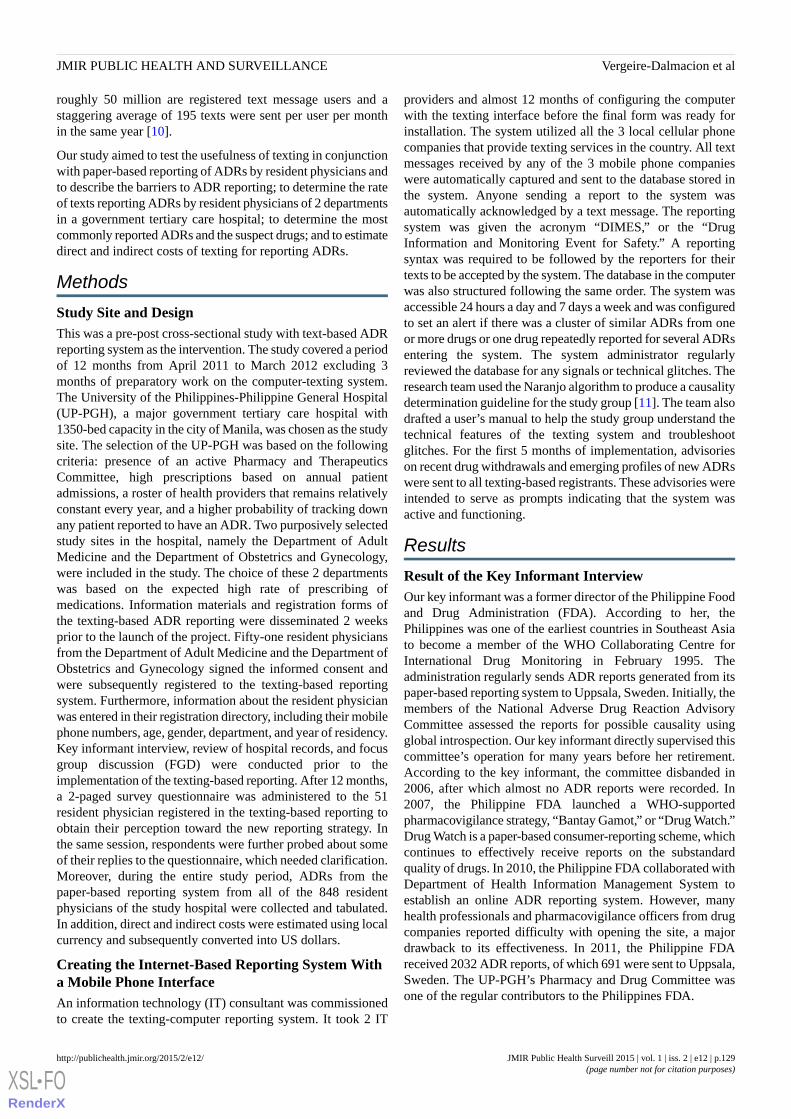
roughly 50 million are registered text message users and astaggering average of 195 texts were sent per user per monthin the same year [10].
Our study aimed to test the usefulness of texting in conjunctionwith paper-based reporting of ADRs by resident physicians andto describe the barriers to ADR reporting; to determine the rateof texts reporting ADRs by resident physicians of 2 departmentsin a government tertiary care hospital; to determine the mostcommonly reported ADRs and the suspect drugs; and to estimatedirect and indirect costs of texting for reporting ADRs.
Methods
Study Site and DesignThis was a pre-post cross-sectional study with text-based ADRreporting system as the intervention. The study covered a periodof 12 months from April 2011 to March 2012 excluding 3months of preparatory work on the computer-texting system.The University of the Philippines-Philippine General Hospital(UP-PGH), a major government tertiary care hospital with1350-bed capacity in the city of Manila, was chosen as the studysite. The selection of the UP-PGH was based on the followingcriteria: presence of an active Pharmacy and TherapeuticsCommittee, high prescriptions based on annual patientadmissions, a roster of health providers that remains relativelyconstant every year, and a higher probability of tracking downany patient reported to have an ADR. Two purposively selectedstudy sites in the hospital, namely the Department of AdultMedicine and the Department of Obstetrics and Gynecology,were included in the study. The choice of these 2 departmentswas based on the expected high rate of prescribing ofmedications. Information materials and registration forms ofthe texting-based ADR reporting were disseminated 2 weeksprior to the launch of the project. Fifty-one resident physiciansfrom the Department of Adult Medicine and the Department ofObstetrics and Gynecology signed the informed consent andwere subsequently registered to the texting-based reportingsystem. Furthermore, information about the resident physicianwas entered in their registration directory, including their mobilephone numbers, age, gender, department, and year of residency.Key informant interview, review of hospital records, and focusgroup discussion (FGD) were conducted prior to theimplementation of the texting-based reporting. After 12 months,a 2-paged survey questionnaire was administered to the 51resident physician registered in the texting-based reporting toobtain their perception toward the new reporting strategy. Inthe same session, respondents were further probed about someof their replies to the questionnaire, which needed clarification.Moreover, during the entire study period, ADRs from thepaper-based reporting system from all of the 848 residentphysicians of the study hospital were collected and tabulated.In addition, direct and indirect costs were estimated using localcurrency and subsequently converted into US dollars.
Creating the Internet-Based Reporting System Witha Mobile Phone InterfaceAn information technology (IT) consultant was commissionedto create the texting-computer reporting system. It took 2 IT
providers and almost 12 months of configuring the computerwith the texting interface before the final form was ready forinstallation. The system utilized all the 3 local cellular phonecompanies that provide texting services in the country. All textmessages received by any of the 3 mobile phone companieswere automatically captured and sent to the database stored inthe system. Anyone sending a report to the system wasautomatically acknowledged by a text message. The reportingsystem was given the acronym “DIMES,” or the “DrugInformation and Monitoring Event for Safety.” A reportingsyntax was required to be followed by the reporters for theirtexts to be accepted by the system. The database in the computerwas also structured following the same order. The system wasaccessible 24 hours a day and 7 days a week and was configuredto set an alert if there was a cluster of similar ADRs from oneor more drugs or one drug repeatedly reported for several ADRsentering the system. The system administrator regularlyreviewed the database for any signals or technical glitches. Theresearch team used the Naranjo algorithm to produce a causalitydetermination guideline for the study group [11]. The team alsodrafted a user’s manual to help the study group understand thetechnical features of the texting system and troubleshootglitches. For the first 5 months of implementation, advisorieson recent drug withdrawals and emerging profiles of new ADRswere sent to all texting-based registrants. These advisories wereintended to serve as prompts indicating that the system wasactive and functioning.
Results
Result of the Key Informant InterviewOur key informant was a former director of the Philippine Foodand Drug Administration (FDA). According to her, thePhilippines was one of the earliest countries in Southeast Asiato become a member of the WHO Collaborating Centre forInternational Drug Monitoring in February 1995. Theadministration regularly sends ADR reports generated from itspaper-based reporting system to Uppsala, Sweden. Initially, themembers of the National Adverse Drug Reaction AdvisoryCommittee assessed the reports for possible causality usingglobal introspection. Our key informant directly supervised thiscommittee’s operation for many years before her retirement.According to the key informant, the committee disbanded in2006, after which almost no ADR reports were recorded. In2007, the Philippine FDA launched a WHO-supportedpharmacovigilance strategy, “Bantay Gamot,” or “Drug Watch.”Drug Watch is a paper-based consumer-reporting scheme, whichcontinues to effectively receive reports on the substandardquality of drugs. In 2010, the Philippine FDA collaborated withDepartment of Health Information Management System toestablish an online ADR reporting system. However, manyhealth professionals and pharmacovigilance officers from drugcompanies reported difficulty with opening the site, a majordrawback to its effectiveness. In 2011, the Philippine FDAreceived 2032 ADR reports, of which 691 were sent to Uppsala,Sweden. The UP-PGH’s Pharmacy and Drug Committee wasone of the regular contributors to the Philippines FDA.
JMIR Public Health Surveill 2015 | vol. 1 | iss. 2 | e12 | p.129http://publichealth.jmir.org/2015/2/e12/(page number not for citation purposes)
Vergeire-Dalmacion et alJMIR PUBLIC HEALTH AND SURVEILLANCE
XSL•FORenderX
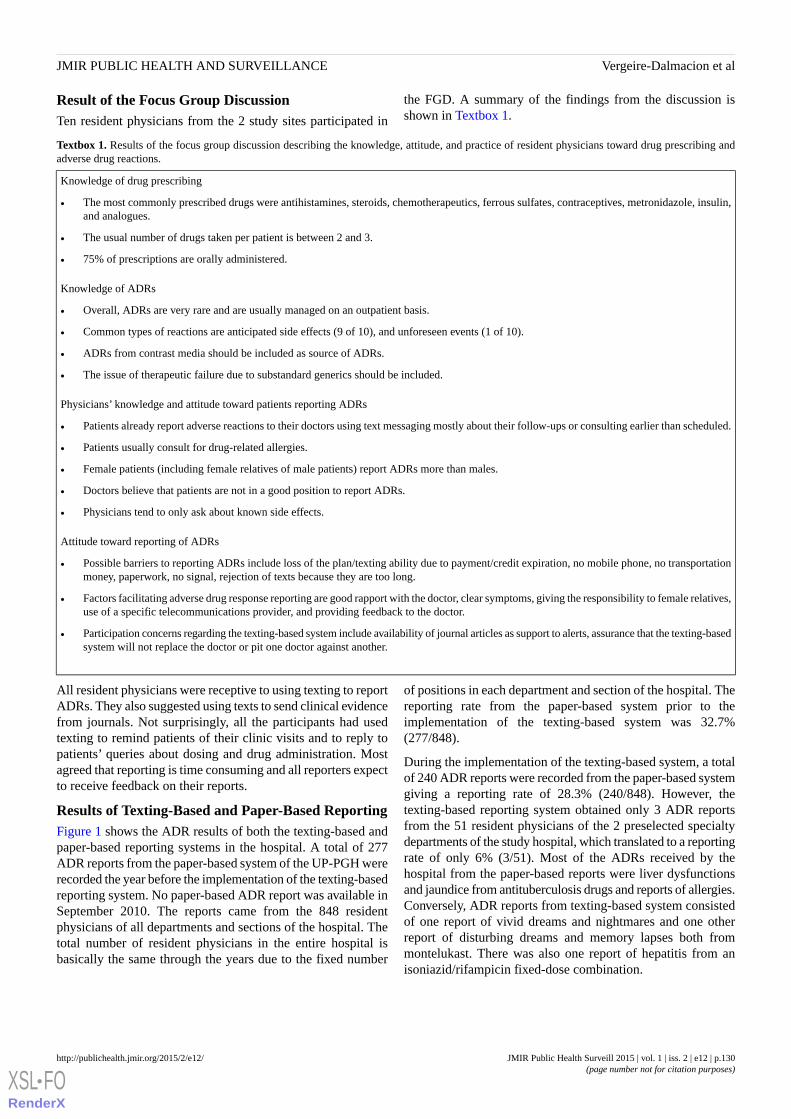
Result of the Focus Group DiscussionTen resident physicians from the 2 study sites participated in
the FGD. A summary of the findings from the discussion isshown in Textbox 1.
Textbox 1. Results of the focus group discussion describing the knowledge, attitude, and practice of resident physicians toward drug prescribing andadverse drug reactions.
Knowledge of drug prescribing
• The most commonly prescribed drugs were antihistamines, steroids, chemotherapeutics, ferrous sulfates, contraceptives, metronidazole, insulin,and analogues.
• The usual number of drugs taken per patient is between 2 and 3.
• 75% of prescriptions are orally administered.
Knowledge of ADRs
• Overall, ADRs are very rare and are usually managed on an outpatient basis.
• Common types of reactions are anticipated side effects (9 of 10), and unforeseen events (1 of 10).
• ADRs from contrast media should be included as source of ADRs.
• The issue of therapeutic failure due to substandard generics should be included.
Physicians’ knowledge and attitude toward patients reporting ADRs
• Patients already report adverse reactions to their doctors using text messaging mostly about their follow-ups or consulting earlier than scheduled.
• Patients usually consult for drug-related allergies.
• Female patients (including female relatives of male patients) report ADRs more than males.
• Doctors believe that patients are not in a good position to report ADRs.
• Physicians tend to only ask about known side effects.
Attitude toward reporting of ADRs
• Possible barriers to reporting ADRs include loss of the plan/texting ability due to payment/credit expiration, no mobile phone, no transportationmoney, paperwork, no signal, rejection of texts because they are too long.
• Factors facilitating adverse drug response reporting are good rapport with the doctor, clear symptoms, giving the responsibility to female relatives,use of a specific telecommunications provider, and providing feedback to the doctor.
• Participation concerns regarding the texting-based system include availability of journal articles as support to alerts, assurance that the texting-basedsystem will not replace the doctor or pit one doctor against another.
All resident physicians were receptive to using texting to reportADRs. They also suggested using texts to send clinical evidencefrom journals. Not surprisingly, all the participants had usedtexting to remind patients of their clinic visits and to reply topatients’ queries about dosing and drug administration. Mostagreed that reporting is time consuming and all reporters expectto receive feedback on their reports.
Results of Texting-Based and Paper-Based ReportingFigure 1 shows the ADR results of both the texting-based andpaper-based reporting systems in the hospital. A total of 277ADR reports from the paper-based system of the UP-PGH wererecorded the year before the implementation of the texting-basedreporting system. No paper-based ADR report was available inSeptember 2010. The reports came from the 848 residentphysicians of all departments and sections of the hospital. Thetotal number of resident physicians in the entire hospital isbasically the same through the years due to the fixed number
of positions in each department and section of the hospital. Thereporting rate from the paper-based system prior to theimplementation of the texting-based system was 32.7%(277/848).
During the implementation of the texting-based system, a totalof 240 ADR reports were recorded from the paper-based systemgiving a reporting rate of 28.3% (240/848). However, thetexting-based reporting system obtained only 3 ADR reportsfrom the 51 resident physicians of the 2 preselected specialtydepartments of the study hospital, which translated to a reportingrate of only 6% (3/51). Most of the ADRs received by thehospital from the paper-based reports were liver dysfunctionsand jaundice from antituberculosis drugs and reports of allergies.Conversely, ADR reports from texting-based system consistedof one report of vivid dreams and nightmares and one otherreport of disturbing dreams and memory lapses both frommontelukast. There was also one report of hepatitis from anisoniazid/rifampicin fixed-dose combination.
JMIR Public Health Surveill 2015 | vol. 1 | iss. 2 | e12 | p.130http://publichealth.jmir.org/2015/2/e12/(page number not for citation purposes)
Vergeire-Dalmacion et alJMIR PUBLIC HEALTH AND SURVEILLANCE
XSL•FORenderX
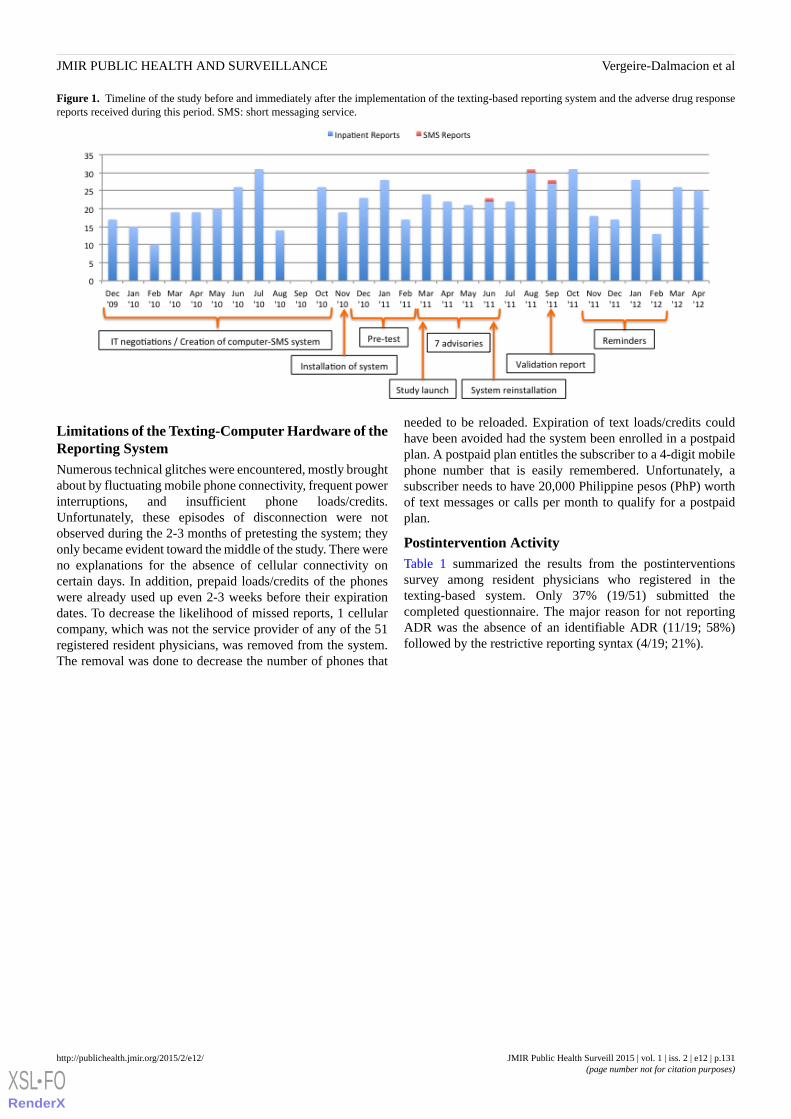
Figure 1. Timeline of the study before and immediately after the implementation of the texting-based reporting system and the adverse drug responsereports received during this period. SMS: short messaging service.
Limitations of the Texting-Computer Hardware of theReporting SystemNumerous technical glitches were encountered, mostly broughtabout by fluctuating mobile phone connectivity, frequent powerinterruptions, and insufficient phone loads/credits.Unfortunately, these episodes of disconnection were notobserved during the 2-3 months of pretesting the system; theyonly became evident toward the middle of the study. There wereno explanations for the absence of cellular connectivity oncertain days. In addition, prepaid loads/credits of the phoneswere already used up even 2-3 weeks before their expirationdates. To decrease the likelihood of missed reports, 1 cellularcompany, which was not the service provider of any of the 51registered resident physicians, was removed from the system.The removal was done to decrease the number of phones that
needed to be reloaded. Expiration of text loads/credits couldhave been avoided had the system been enrolled in a postpaidplan. A postpaid plan entitles the subscriber to a 4-digit mobilephone number that is easily remembered. Unfortunately, asubscriber needs to have 20,000 Philippine pesos (PhP) worthof text messages or calls per month to qualify for a postpaidplan.
Postintervention ActivityTable 1 summarized the results from the postinterventionssurvey among resident physicians who registered in thetexting-based system. Only 37% (19/51) submitted thecompleted questionnaire. The major reason for not reportingADR was the absence of an identifiable ADR (11/19; 58%)followed by the restrictive reporting syntax (4/19; 21%).
JMIR Public Health Surveill 2015 | vol. 1 | iss. 2 | e12 | p.131http://publichealth.jmir.org/2015/2/e12/(page number not for citation purposes)
Vergeire-Dalmacion et alJMIR PUBLIC HEALTH AND SURVEILLANCE
XSL•FORenderX
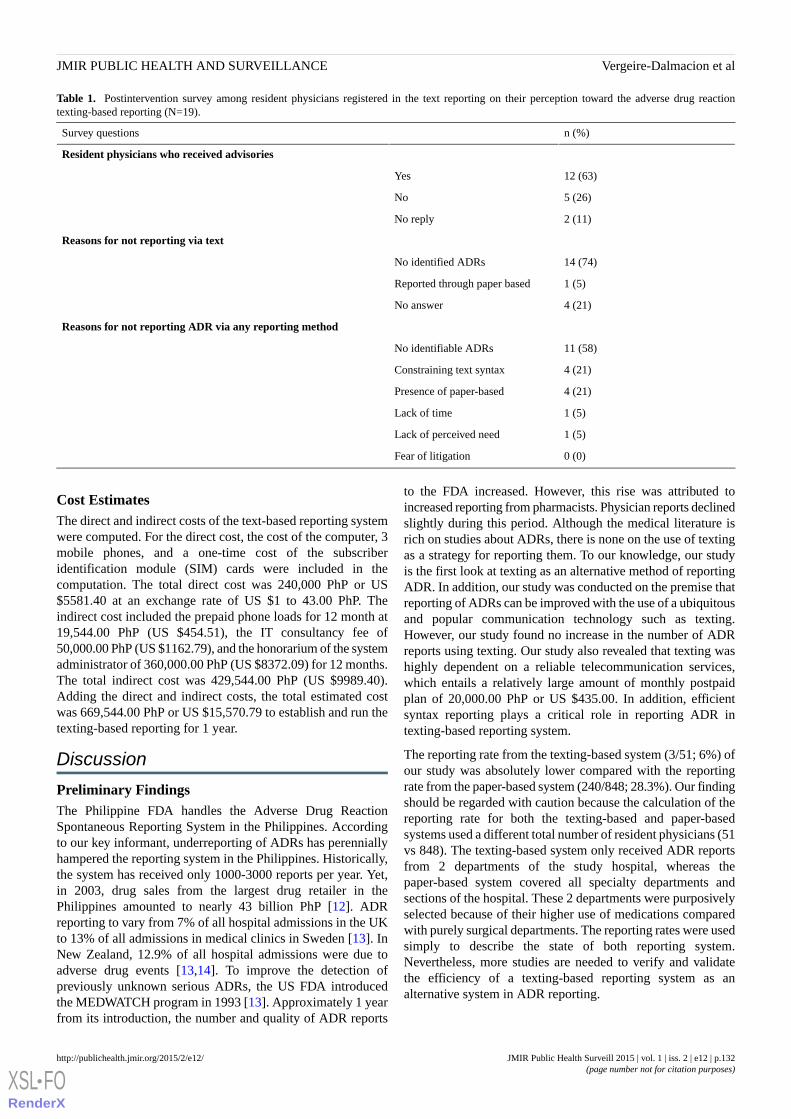
Table 1. Postintervention survey among resident physicians registered in the text reporting on their perception toward the adverse drug reactiontexting-based reporting (N=19).
n (%)Survey questions
Resident physicians who received advisories
12 (63)Yes
5 (26)No
2 (11)No reply
Reasons for not reporting via text
14 (74)No identified ADRs
1 (5)Reported through paper based
4 (21)No answer
Reasons for not reporting ADR via any reporting method
11 (58)No identifiable ADRs
4 (21)Constraining text syntax
4 (21)Presence of paper-based
1 (5)Lack of time
1 (5)Lack of perceived need
0 (0)Fear of litigation
Cost EstimatesThe direct and indirect costs of the text-based reporting systemwere computed. For the direct cost, the cost of the computer, 3mobile phones, and a one-time cost of the subscriberidentification module (SIM) cards were included in thecomputation. The total direct cost was 240,000 PhP or US$5581.40 at an exchange rate of US $1 to 43.00 PhP. Theindirect cost included the prepaid phone loads for 12 month at19,544.00 PhP (US $454.51), the IT consultancy fee of50,000.00 PhP (US $1162.79), and the honorarium of the systemadministrator of 360,000.00 PhP (US $8372.09) for 12 months.The total indirect cost was 429,544.00 PhP (US $9989.40).Adding the direct and indirect costs, the total estimated costwas 669,544.00 PhP or US $15,570.79 to establish and run thetexting-based reporting for 1 year.
Discussion
Preliminary FindingsThe Philippine FDA handles the Adverse Drug ReactionSpontaneous Reporting System in the Philippines. Accordingto our key informant, underreporting of ADRs has perenniallyhampered the reporting system in the Philippines. Historically,the system has received only 1000-3000 reports per year. Yet,in 2003, drug sales from the largest drug retailer in thePhilippines amounted to nearly 43 billion PhP [12]. ADRreporting to vary from 7% of all hospital admissions in the UKto 13% of all admissions in medical clinics in Sweden [13]. InNew Zealand, 12.9% of all hospital admissions were due toadverse drug events [13,14]. To improve the detection ofpreviously unknown serious ADRs, the US FDA introducedthe MEDWATCH program in 1993 [13]. Approximately 1 yearfrom its introduction, the number and quality of ADR reports
to the FDA increased. However, this rise was attributed toincreased reporting from pharmacists. Physician reports declinedslightly during this period. Although the medical literature isrich on studies about ADRs, there is none on the use of textingas a strategy for reporting them. To our knowledge, our studyis the first look at texting as an alternative method of reportingADR. In addition, our study was conducted on the premise thatreporting of ADRs can be improved with the use of a ubiquitousand popular communication technology such as texting.However, our study found no increase in the number of ADRreports using texting. Our study also revealed that texting washighly dependent on a reliable telecommunication services,which entails a relatively large amount of monthly postpaidplan of 20,000.00 PhP or US $435.00. In addition, efficientsyntax reporting plays a critical role in reporting ADR intexting-based reporting system.
The reporting rate from the texting-based system (3/51; 6%) ofour study was absolutely lower compared with the reportingrate from the paper-based system (240/848; 28.3%). Our findingshould be regarded with caution because the calculation of thereporting rate for both the texting-based and paper-basedsystems used a different total number of resident physicians (51vs 848). The texting-based system only received ADR reportsfrom 2 departments of the study hospital, whereas thepaper-based system covered all specialty departments andsections of the hospital. These 2 departments were purposivelyselected because of their higher use of medications comparedwith purely surgical departments. The reporting rates were usedsimply to describe the state of both reporting system.Nevertheless, more studies are needed to verify and validatethe efficiency of a texting-based reporting system as analternative system in ADR reporting.
JMIR Public Health Surveill 2015 | vol. 1 | iss. 2 | e12 | p.132http://publichealth.jmir.org/2015/2/e12/(page number not for citation purposes)
Vergeire-Dalmacion et alJMIR PUBLIC HEALTH AND SURVEILLANCE
XSL•FORenderX
Brewer and Colditz in 1999 [15] observed that spontaneousreporting systems could be effective in revealing unusual andrare events that occur with the use of medications. However,they showed that spontaneous reporting systems were notreliable for detecting ADRs occurring far from the time of intakeor in a population not commonly exposed to the drug. Brewerand Colditz [15] recommended the use of other methods, suchas clinical trial data, medical records, and computerizeddatabases of medication users and nonusers to complementspontaneous reporting. Huang et al [16] reviewed in 2014 thepostmarketing drug surveillance for adverse drug eventsworldwide. It showed 2 systems of surveillance in the UK usingadministrative claims or electronic medical records and mostpharmacovigilance being conducted on behalf of a regulatoryagency. To access existing data, either a common data modelor a centralized model could be used. Aside from studyingexisting databases as data sources for detecting ADRs, methodsfor reporting ADR such as texting were explored by our study.However, results from our study showed that texting could beunreliable due to consumable phone loads/credits and anunpredictable power supply. Nonetheless, these obstacles maybe less common in more economically developed countries.
Resident physicians were probed about their reply of “noidentified ADR” as a reason for not reporting. About a third ofthe respondents did not find it necessary to report known andaccepted adverse reactions to a suspect drug. The rest reallyadmitted to not identifying any ADR during the 12-month studyperiod. The observation that few ADR reports were due to“unrecognized adverse events” was likewise reported in a studyby Hartigan-Go in 2002 [17]. Hartigan-Go [17] reported that
sometimes the adverse event is misconstrued as part of thehealing action. This suggests that physicians and other healthprofessional prescribing medications should be regularlyeducated on the principles and rationale of pharmacovigilanceand be reminded on how important it is to quantify even knownADRs to drugs in their local clinical setting. Contrary to ourexpectations, fear of litigation was never considered a deterrentto reporting.
However, there is still room for studying the use of texting forreporting ADR by other health professionals, such as nursesand clinical pharmacists, provided the observed obstacles andproblems are resolved. More people reporting will help generatethe 20,000.00 PhP required for the postpaid plan that will ensureuninterrupted Internet service. Lastly, texting might be bestsuited for timely dissemination of drug information bulletins,drug advisories, or as a tool for reminding patients on theirfollow-up visits. A study by Kew in 2010 [18] found that textingvia mobile phone was an effective method for collecting weeklysymptom reports during a clinical trial, reminding trial patientsto attend face-to-face visits and completing more complexpaper-based evaluation.
ConclusionsIn summary, the reporting rate of ADRs using texting-basedADR reporting system may be lower compared with thepaper-based ADR reporting system. Unreliabletelecommunication services, frequent electrical interruptions,reporting syntax, and expiring prepaid loads/credits should beaddressed when setting up a texting-based ADR reportingsystem in a developing country.
Conflicts of InterestNone declared.
References1. World Health Organization-Uppsala Monitoring Center. Uppsala Monitoring Center: Home. Uppsala, Sweden: Uppsala
Monitoring Center URL: http://www.who-umc.org/ [accessed 2015-11-15] [WebCite Cache ID 6bVx7sfge]2. Psaty BM, Furberg CD, Ray WA, Weiss NS. Potential for conflict of interest in the evaluation of suspected adverse drug
reactions: Use of cerivastatin and risk of rhabdomyolysis. JAMA 2004 Dec 1;292(21):2622-2631. [doi:10.1001/jama.292.21.2622] [Medline: 15572720]
3. Loke YK, Derry S. Reporting of adverse drug reactions in randomised controlled trials: A systematic survey. BMC ClinPharmacol 2001;1:3 [FREE Full text] [Medline: 11591227]
4. Fanelli R, Di GM, Di MM, Loperfido F, De MD. Interference of unstable intraventricular conduction disorders in therecognition of anterior necrosis. Boll Soc Ital Cardiol 1979;24(10):1149-1155. [Medline: 261900]
5. Hazell L, Shakir SA. Under-reporting of adverse drug reactions : A systematic review. Drug Saf 2006;29(5):385-396.[Medline: 16689555]
6. Coulter DM. The New Zealand Intensive Medicines Monitoring Programme. Pharmacoepidemiol Drug Saf 1998Mar;7(2):79-90. [doi: 10.1002/(SICI)1099-1557(199803/04)7:2<79::AID-PDS330>3.0.CO;2-1] [Medline: 15073731]
7. Ines CE. Adverse drug reaction reporting. Philippine experience. Med Toxicol 1986;1 Suppl 1:99-104. [Medline: 3821435]8. Mao Y, Zhang Y, Zhai S. Mobile phone text messaging for pharmaceutical care in a hospital in China. J Telemed Telecare
2008;14(8):410-414. [doi: 10.1258/jtt.2008.080406] [Medline: 19047450]9. Baron S, Goutard F, Nguon K, Tarantola A. Use of a text message-based pharmacovigilance tool in Cambodia: Pilot study.
J Med Internet Res 2013;15(4):e68 [FREE Full text] [doi: 10.2196/jmir.2477] [Medline: 23591700]10. J@ps [Hubpages]. The Philippines Is Still the Undisputed Text Capital of the World. 2011 Aug 9. URL: http://hubpages.
com/travel/The-Philippines-is-Still-the-Undisputed-Text-Capital-of-the-World [accessed 2015-11-16] [WebCite Cache ID6d4q1qVnr]
JMIR Public Health Surveill 2015 | vol. 1 | iss. 2 | e12 | p.133http://publichealth.jmir.org/2015/2/e12/(page number not for citation purposes)
Vergeire-Dalmacion et alJMIR PUBLIC HEALTH AND SURVEILLANCE
XSL•FORenderX
11. Naranjo CA, Busto U, Sellers EM, Sandor P, Ruiz I, Roberts EA, et al. A method for estimating the probability of adversedrug reactions. Clin Pharmacol Ther 1981 Aug;30(2):239-245. [Medline: 7249508]
12. Reyes CM, Lavado R, Tabuga AD, Asis RD, Datu MBG. A Profile of the Philippine Pharmaceutical Sector. 2011 May.URL: http://dirp4.pids.gov.ph/webportal/CDN/PUBLICATIONS/pidsdps1111_rev.pdf [accessed 2015-11-16] [WebCiteCache ID 6d4qsGSSO]
13. Gony M, Badie K, Sommet A, Jacquot J, Baudrin D, Gauthier P, et al. Improving adverse drug reaction reporting in hospitals:Results of the French Pharmacovigilance in Midi-Pyrénées region (PharmacoMIP) network 2-year pilot study. Drug Saf2010 May 1;33(5):409-416. [doi: 10.2165/11319170-000000000-00000] [Medline: 20397740]
14. Piazza-Hepp TD, Kennedy DL. Reporting of adverse events to MedWatch. Am J Health Syst Pharm 1995 Jul1;52(13):1436-1439. [Medline: 7671043]
15. Brewer T, Colditz GA. Postmarketing surveillance and adverse drug reactions: Current perspectives and future needs.JAMA 1999 Mar 3;281(9):824-829. [Medline: 10071004]
16. Huang YL, Moon J, Segal JB. A comparison of active adverse event surveillance systems worldwide. Drug Saf 2014Aug;37(8):581-596 [FREE Full text] [doi: 10.1007/s40264-014-0194-3] [Medline: 25022829]
17. Hartigan-Go K. Developing a pharmacovigilance system in the Philippines, a country of diverse culture and strong traditionalmedicine background. Toxicology 2002 Dec 27;181-182:103-107. [Medline: 12505293]
18. Kew S. Text messaging: An innovative method of data collection in medical research. BMC Res Notes 2010;3:342 [FREEFull text] [doi: 10.1186/1756-0500-3-342] [Medline: 21172018]
AbbreviationsADR: adverse drug reactionFDA: Food and Drug AdministrationFGD: focus group discussionIT: information technologySIM: subscriber identification moduleUP-PGH: University of the Philippines-Philippine General HospitalWHO: World Health Organization
Edited by T Sanchez; submitted 03.05.15; peer-reviewed by C Jimeno; comments to author 07.07.15; revised version received 06.08.15;accepted 19.08.15; published 19.11.15.
Please cite as:Vergeire-Dalmacion G, Castillo-Carandang NT, Juban NR, Amarillo ML, Tagle MP, Baja ESTexting-Based Reporting of Adverse Drug Reactions to Ensure Patient Safety: A Feasibility StudyJMIR Public Health Surveill 2015;1(2):e12URL: http://publichealth.jmir.org/2015/2/e12/ doi:10.2196/publichealth.4605PMID:27227130
©Godofreda Vergeire-Dalmacion, Nina T Castillo-Carandang, Noel R Juban, Maria Lourdes Amarillo, Maria Pamela Tagle,Emmanuel S Baja. Originally published in JMIR Public Health and Surveillance (http://publichealth.jmir.org), 19.11.2015. Thisis an open-access article distributed under the terms of the Creative Commons Attribution License(http://creativecommons.org/licenses/by/2.0/), which permits unrestricted use, distribution, and reproduction in any medium,provided the original work, first published in JMIR Public Health and Surveillance, is properly cited. The complete bibliographicinformation, a link to the original publication on http://publichealth.jmir.org, as well as this copyright and license informationmust be included.
JMIR Public Health Surveill 2015 | vol. 1 | iss. 2 | e12 | p.134http://publichealth.jmir.org/2015/2/e12/(page number not for citation purposes)
Vergeire-Dalmacion et alJMIR PUBLIC HEALTH AND SURVEILLANCE
XSL•FORenderX
http://www.ncbi.nlm.nih.gov/entrez/query.fcgi?cmd=Retrieve&db=PubMed&list_uids=7249508&dopt=Abstract
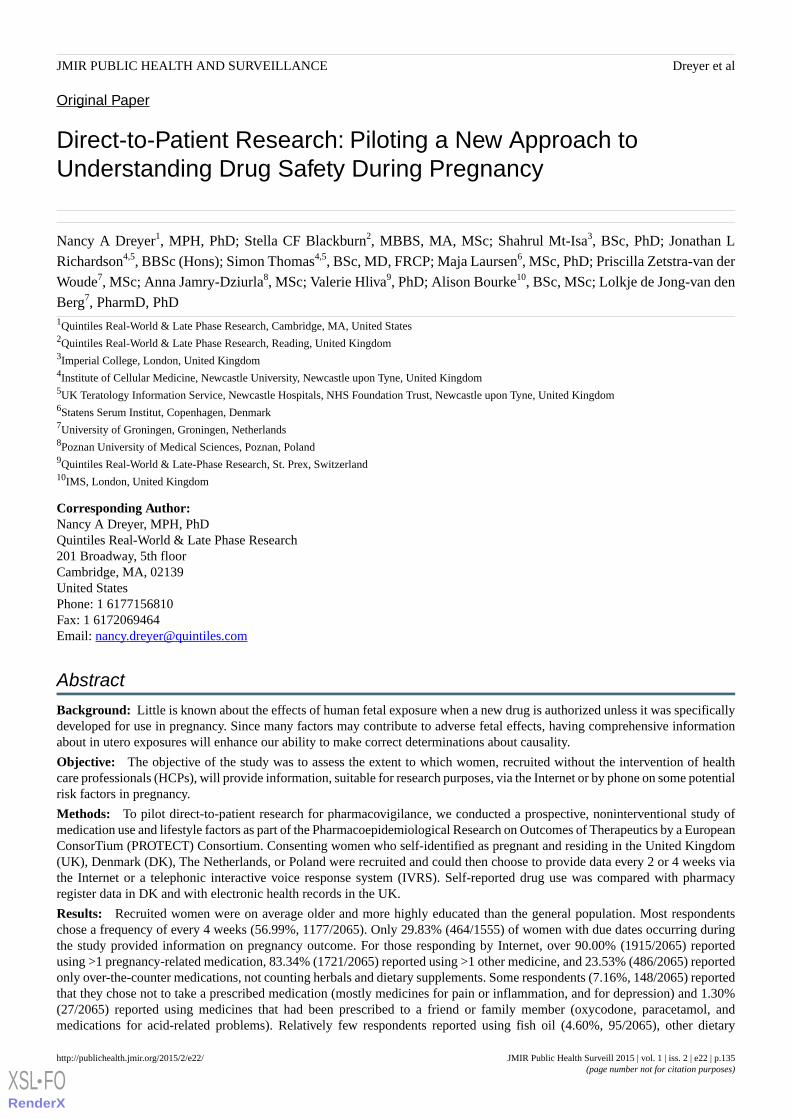
Original Paper
Direct-to-Patient Research: Piloting a New Approach toUnderstanding Drug Safety During Pregnancy
Nancy A Dreyer1, MPH, PhD; Stella CF Blackburn2, MBBS, MA, MSc; Shahrul Mt-Isa3, BSc, PhD; Jonathan L
Richardson4,5, BBSc (Hons); Simon Thomas4,5, BSc, MD, FRCP; Maja Laursen6, MSc, PhD; Priscilla Zetstra-van der
Woude7, MSc; Anna Jamry-Dziurla8, MSc; Valerie Hliva9, PhD; Alison Bourke10, BSc, MSc; Lolkje de Jong-van den
Berg7, PharmD, PhD1Quintiles Real-World & Late Phase Research, Cambridge, MA, United States2Quintiles Real-World & Late Phase Research, Reading, United Kingdom3Imperial College, London, United Kingdom4Institute of Cellular Medicine, Newcastle University, Newcastle upon Tyne, United Kingdom5UK Teratology Information Service, Newcastle Hospitals, NHS Foundation Trust, Newcastle upon Tyne, United Kingdom6Statens Serum Institut, Copenhagen, Denmark7University of Groningen, Groningen, Netherlands8Poznan University of Medical Sciences, Poznan, Poland9Quintiles Real-World & Late-Phase Research, St. Prex, Switzerland10IMS, London, United Kingdom
Corresponding Author:Nancy A Dreyer, MPH, PhDQuintiles Real-World & Late Phase Research201 Broadway, 5th floorCambridge, MA, 02139United StatesPhone: 1 6177156810Fax: 1 6172069464Email: [email protected]
Abstract
Background: Little is known about the effects of human fetal exposure when a new drug is authorized unless it was specificallydeveloped for use in pregnancy. Since many factors may contribute to adverse fetal effects, having comprehensive informationabout in utero exposures will enhance our ability to make correct determinations about causality.
Objective: The objective of the study was to assess the extent to which women, recruited without the intervention of healthcare professionals (HCPs), will provide information, suitable for research purposes, via the Internet or by phone on some potentialrisk factors in pregnancy.
Methods: To pilot direct-to-patient research for pharmacovigilance, we conducted a prospective, noninterventional study ofmedication use and lifestyle factors as part of the Pharmacoepidemiological Research on Outcomes of Therapeutics by a EuropeanConsorTium (PROTECT) Consortium. Consenting women who self-identified as pregnant and residing in the United Kingdom(UK), Denmark (DK), The Netherlands, or Poland were recruited and could then choose to provide data every 2 or 4 weeks viathe Internet or a telephonic interactive voice response system (IVRS). Self-reported drug use was compared with pharmacyregister data in DK and with electronic health records in the UK.
Results: Recruited women were on average older and more highly educated than the general population. Most respondentschose a frequency of every 4 weeks (56.99%, 1177/2065). Only 29.83% (464/1555) of women with due dates occurring duringthe study provided information on pregnancy outcome. For those responding by Internet, over 90.00% (1915/2065) reportedusing >1 pregnancy-related medication, 83.34% (1721/2065) reported using >1 other medicine, and 23.53% (486/2065) reportedonly over-the-counter medications, not counting herbals and dietary supplements. Some respondents (7.16%, 148/2065) reportedthat they chose not to take a prescribed medication (mostly medicines for pain or inflammation, and for depression) and 1.30%(27/2065) reported using medicines that had been prescribed to a friend or family member (oxycodone, paracetamol, andmedications for acid-related problems). Relatively few respondents reported using fish oil (4.60%, 95/2065), other dietary
JMIR Public Health Surveill 2015 | vol. 1 | iss. 2 | e22 | p.135http://publichealth.jmir.org/2015/2/e22/(page number not for citation purposes)
Dreyer et alJMIR PUBLIC HEALTH AND SURVEILLANCE
XSL•FORenderX
supplements (1.88%, 39/2065), herbal products (7.07%, 146/2065), or homeopathic products (1.16%, 24/2065). Most medicationsfor chronic conditions that were listed in the Danish prescription registry were also self-reported (83.3%, 145/174 agreement),with larger discrepancies for medications indicated for short-term use (54.0%, 153/283 agreement) and pregnancy-relatedmedications (66.1%, 78/118).
Conclusions: Self-reported information on medication use as well as other potential teratogenic factors can be collected via theInternet, although recruitment costs are not insubstantial and maintaining follow-up is challenging. Direct data collection fromconsumers adds detail, but clinical input may be needed to fully understand patients’medical histories and capture birth outcomes.
(JMIR Public Health Surveill 2015;1(2):e22) doi:10.2196/publichealth.4939
KEYWORDS
pharmacovigilance; direct-to-patient; drug safety; validation
Introduction
Prenatal Exposure to Harmful MedicationsThe use of medication during pregnancy may be essential forthe health of the mother, but some have the potential to causeharm to the fetus, which can be delayed in presentation. Prenatalexposure to harmful medications can be related to a variety ofadverse outcomes, including congenital malformations, pretermbirth, intrauterine growth restriction, spontaneous abortion, latefetal death, neonatal death, or developmental disabilities(behavioral, neurological, motor, intellectual, or sensory) thatonly become apparent in later infancy or childhood, or evenlater like the rare vaginal adenocarcinomas that were detectedamong young women who had prenatal exposure todiethylstilbestrol [1].
Unless the medicine is intended to treat pregnancy-specificconditions, at the time of initial authorization, information withrespect to reproductive toxicity is usually only available fromanimal studies. Pregnant women are often excluded ordiscontinued from premarketing clinical trials in humans, sothe safety of many drugs in pregnant women has not beenestablished at the time of drug licensing [2]. Consequently,some important drugs are contraindicated or have specialwarnings because their safety during pregnancy has not beenstudied sufficiently. In addition, women who are concernedabout conventional drug use in pregnancy may turn to alternativetherapies, such as homeopathic or herbal medicines, which theyperceive as being “natural” and somehow safer. Many of thesealternative drugs are not regulated and information about safetyin pregnancy is often lacking. Many pregnancies are unplannedand inadvertent exposure of the fetus to prescription ornonprescription medications may have already occurred by thetime the woman realizes she is pregnant. Because organogenesisoccurs early in pregnancy, first-trimester exposures are ofparticular interest as detrimental effects on the fetus may havealready occurred before a pregnancy is confirmed [3,4].Therefore, good postmarketing information on drug use andother possible risk factors and pregnancy outcome is needed,not only to provide information on which drugs may be unsafe,but very importantly on which drugs are probably safe.
The majority of data available on medications used duringpregnancy and lifestyle factors are usually collected either fromhealth care professionals, through direct patient questioning byan interviewer (frequently a midwife), or making use of
prescription or dispensing records. In most situations, womentend to present for medical attention once it appears thepregnancy is viable, making it difficult to get accurateinformation about all medication exposures that occur early inpregnancy [5]. Using researchers to collect information is timeconsuming and expensive, and can only be performed atrelatively infrequent times during the pregnancy, which maylead to lost information [6]. In addition, women may be reluctantto report accurate information about lifestyle behaviors alreadyidentified as being potentially harmful to a fetus, or which arein themselves illegal, in a face-to-face interaction. There is someevidence that using the Internet may overcome these issuesrelated to collection of potentially sensitive information, forexample, a study on sexually transmitted diseases using ananonymous Internet questionnaire successfully collected dataon the number of sexual partners and cocaine use [7].
Purpose of Pilot StudyThis pilot study was designed to explore (1) whether womenwould be willing to volunteer for Internet-based research withoutany encouragement or direct involvement of their health careproviders, (2) if they would provide information prospectivelyon exposure to medications and other factors that may affectbirth outcome, and (3) if so, to assess whether this informationwas complete and accurate enough to be useful forpharmacovigilance.
Methods
Study Eligibility RequirementsTo be eligible for study entry, women had to be pregnant;resident in 1 of 4 countries in the European Union (Denmark,DK; The Netherlands, NL; Poland, PL; or the United Kingdom,UK); to be proficient in the predominant language of theircountry of residence; to have access to the Internet or atelephone; and to be of an age to provide legal consent (16 yearsof age in the UK, 18 years elsewhere). Ethical review and reviewof data protection plans were reviewed as necessary in allcountries, and the data protection plan was also reviewed bythe European Medicines Agency and the European DataProtection Supervisor [8]. The study was promoted using avariety of methods including Internet announcements, email tomembers of pregnancy clubs, flyers placed in pharmacies, andradio and television interviews.
JMIR Public Health Surveill 2015 | vol. 1 | iss. 2 | e22 | p.136http://publichealth.jmir.org/2015/2/e22/(page number not for citation purposes)
Dreyer et alJMIR PUBLIC HEALTH AND SURVEILLANCE
XSL•FORenderX

Study ParticipantsWomen were invited to respond by Internet or interactive voiceresponse system (IVRS), using the predominant natural languagein each of the 4 study countries. The IVRS system wasdeveloped in addition to Internet-based systems to facilitateparticipation regardless of Internet access, thus making the studyavailable to women without access to computers, or the requisitecomputer skills. In NL and the UK, women could use eithermethod for enrollment and informed consent, but in DK,informed consent by Internet was required even for subsequentparticipation by IVRS. In PL, the IVRS system was not offeredbecause women were required to print, sign, and return theinformed consent to the university coordinators, necessitatingusing the Internet system. Those who chose to participate byInternet were also offered the choice of responding toquestionnaires every 2 or 4 weeks. Following study entry,women provided contact information, chose a personalidentification number, and reminder method (text and/or email).Women could enroll at any time during their pregnancy, as longas it was prior to delivery, recognizing that not all women wouldbe able to be followed throughout their entire pregnancies. Studydata were collected using a study number and were maintainedon a server that was separate from where contact details werestored.
Participants were recruited between October 1, 2012(recruitment week 1) and January 31, 2014 (recruitment week70) in DK, NL, and the UK; follow-up ended on March 28,2014. Because of difficulties in arranging ethical approvals, thestart date in PL was delayed until May 20, 2013 (recruitmentweek 34). Data were collected on medications used to treatillnesses including prescription and nonprescription medications,vaccines, x-rays, and various lifestyle factors, recreational druguse, and herbal products during current pregnancy or in themonth preceding it; additionally, we collected basicdemographics, education and ethnicity, and current and previouspregnancy history. Participants were also asked if they had usedany medications that were not prescribed for them (borrowedmedications) or had decided not to use medications that wereprescribed. Follow-up questionnaires, provided at 2- or 4-weekintervals as decided by the participant, asked about any changesto use of medications, and a final outcome questionnaire soughtinformation about the birth outcome, including the presence ofany birth defects. Participants were asked to tell us aboutmedication use through a series of checkboxes of top 10 listsof medications that are commonly used during pregnancyspecific to each country, as agreed by the study team. Theselists were organized into medical conditions as a memory aid.Participants were also able to report other medication use asfree texts.
In the UK, study participants were asked to provide their consentfor linkage with primary care electronic health records (EHRs)
in an effort to provide some validation of self-reported data,and in DK, consent for linkage with the national registries wasmandatory for participation. Medications were classifiedaccording to their over-the-counter (OTC) or prescription statusin DK, and applied to all other countries. Thus, medicationswere classified as available by prescription only (Rx only),available OTC, but may also be available by prescription insome countries depending on dose and various prescribingpractices for pregnant women (OTC and Rx, or OTC or Rx),and OTC products not available by prescription (OTC only.)Those medications that were reported as being used duringpregnancy and which can be obtained OTC and by prescriptionincluded acetylcysteine, acetylsalicylic acid, acyclovir,benzydamine, budesonide, fexofenedine, fluticasone, ibuprofen,lansoprazole, loperamide, pantoprazole, and paracetamol.
Results
Study ParticipantsOverall, 2521 women were enrolled in this study. Figure 1shows a flowchart showing recruitment and retention throughstudy close. There were 14 women (0.55%, 14/2521) who choseto provide information via IVRS and only 1 actually completedthe baseline questionnaire, but did not provide information onbirth outcome. Hence, results reported here are for those whoparticipated via the Internet.
Internet ResultsOf 43,068 people who clicked on the website, 23,536 (54.64%,23,536/43,068) stayed for at least 30 seconds, and 2507(10.65%) of 23,536 women enrolled and provided informedconsent (DK 770; NL 568; PL 316; the UK 853). Some womendiscontinued participation before completing the baselinequestionnaire, leaving 2065 who completed at least baselinedata (DK 639; NL 476; PL 241; the UK 709). There were43.00% (888/2065) of those who completed the baselinequestionnaire that chose to respond every 2 weeks and 56.99%(1177/2065) every 4 weeks. The age distribution of participantsin comparison to the general population of each country isshown in Table 1. Most participants reported themselves to bewhite (95.93%, 1981/2065 in all 4 countries). The educationalstatus of participants, shown in Table 2, reveals that participantsreported being highly educated, with 38.74% (800/2065) havingcompleted some university or postgraduate education, and aparticularly high rate of postgraduate education in PL. Mostwomen had at least one previous pregnancy that resulted in alive birth, but 42.95% (887/2065) of participants were reportingtheir first pregnancies (38.3%, 245/639 in DK; 47.3%, 225/476in NL; 50.6%, 122/241 in PL; and 41.6%, 295/709 in the UK);23.00% (475/2065) of women enrolled were in their firsttrimester of pregnancy, 52.34% (1081/2065) in their secondtrimester, and 24.65% (509/2065) in their third trimester.
JMIR Public Health Surveill 2015 | vol. 1 | iss. 2 | e22 | p.137http://publichealth.jmir.org/2015/2/e22/(page number not for citation purposes)
Dreyer et alJMIR PUBLIC HEALTH AND SURVEILLANCE
XSL•FORenderX

Figure 1. Recruitment and retention. WEB (Web, World Wide Web) is a method of accessing information over the medium of the Internet; IVRS:interactive voice response system; EDD: expected date of delivery.
Table 1. Age of participants and referent population in each country.
Age in years at end of pregnancy
n (%)
>4035-3930-3425-2920-24<20nMean (SD)
Denmark a
26 (4.1)118 (18.5)237 (37.1)214 (33.5)43 (6.7)1 (0.2)63931.5 (4.6)PROTECTf
2083 (3.77)9769 (17.68)19,319 (34.98)17,112 (30.98)6192 (11.21)750 (1.35)55,22530.9 (5.1)National
The Netherlands b
13 (2.7)74 (15.5)206 (43.3)153 (32.1)29 (6.1)1 (0.2)47631.3 (4.3)PROTECTf
5860 (3.38)29,562 (17.07)64,498 (37.26)53,181 (30.72)17,727(10.24)
2257 (1.30)173,08530.9 (4.9)National 2012
Poland c
3 (1.2)22 (9.1)77 (32.0)109 (45.2)29 (12.0)1 (0.4)24129.8 (4.2)PROTECTf
8133 (2.19)43,554 (11.74)110,192 (29.70)131,373(35.41)
63,158(17.02)
14,522(3.91)370,93229.2 (NAa)National
United Kingdom d
29 (4.1)159 (22.4)266 (37.5)183 (25.8)67 (9.4)5 (0.7)70931.7 (5.1)PROTECTf
29,158(4.17)
111,500(15.96)212,306 (30.39)
196,693(28.15)
119,719(17.13)
29,136(4.17)698,51230.0 (NAe)
England & Wales2013
aThe Birth Register at Statens Serum Institut; also see website [9].bStichting Perinatale Registratie Nederland: Perinatale Zorg in Nederland 2012. Utrecht: Stichting Perinatale Registratie Nederland 2013cCentral Statistical Office of Poland [10,11]dUK Office for National Statistics, Age England & Wales 2013eNA: not availablefPROTECT: Pharmacoepidemiological Research on Outcomes of Therapeutics by a European ConsorTium
JMIR Public Health Surveill 2015 | vol. 1 | iss. 2 | e22 | p.138http://publichealth.jmir.org/2015/2/e22/(page number not for citation purposes)
Dreyer et alJMIR PUBLIC HEALTH AND SURVEILLANCE
XSL•FORenderX
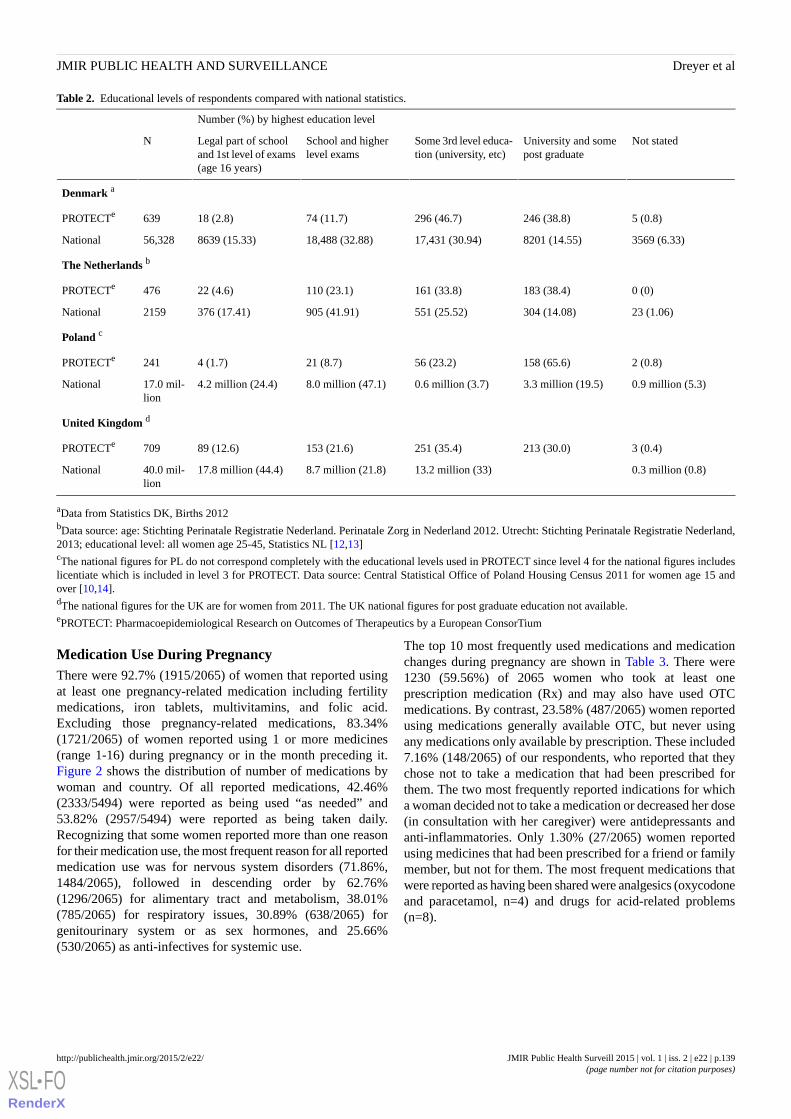
Table 2. Educational levels of respondents compared with national statistics.
Number (%) by highest education level
Not statedUniversity and somepost graduate
Some 3rd level educa-tion (university, etc)
School and higherlevel exams
Legal part of schooland 1st level of exams(age 16 years)
N
Denmark a
5 (0.8)246 (38.8)296 (46.7)74 (11.7)18 (2.8)639PROTECTe
3569 (6.33)8201 (14.55)17,431 (30.94)18,488 (32.88)8639 (15.33)56,328National
The Netherlands b
0 (0)183 (38.4)161 (33.8)110 (23.1)22 (4.6)476PROTECTe
23 (1.06)304 (14.08)551 (25.52)905 (41.91)376 (17.41)2159National
Poland c
2 (0.8)158 (65.6)56 (23.2)21 (8.7)4 (1.7)241PROTECTe
0.9 million (5.3)3.3 million (19.5)0.6 million (3.7)8.0 million (47.1)4.2 million (24.4)17.0 mil-lion
National
United Kingdom d
3 (0.4)213 (30.0)251 (35.4)153 (21.6)89 (12.6)709PROTECTe
0.3 million (0.8)13.2 million (33)8.7 million (21.8)17.8 million (44.4)40.0 mil-lion
National
aData from Statistics DK, Births 2012bData source: age: Stichting Perinatale Registratie Nederland. Perinatale Zorg in Nederland 2012. Utrecht: Stichting Perinatale Registratie Nederland,2013; educational level: all women age 25-45, Statistics NL [12,13]cThe national figures for PL do not correspond completely with the educational levels used in PROTECT since level 4 for the national figures includeslicentiate which is included in level 3 for PROTECT. Data source: Central Statistical Office of Poland Housing Census 2011 for women age 15 andover [10,14].dThe national figures for the UK are for women from 2011. The UK national figures for post graduate education not available.ePROTECT: Pharmacoepidemiological Research on Outcomes of Therapeutics by a European ConsorTium
Medication Use During PregnancyThere were 92.7% (1915/2065) of women that reported usingat least one pregnancy-related medication including fertilitymedications, iron tablets, multivitamins, and folic acid.Excluding those pregnancy-related medications, 83.34%(1721/2065) of women reported using 1 or more medicines(range 1-16) during pregnancy or in the month preceding it.Figure 2 shows the distribution of number of medications bywoman and country. Of all reported medications, 42.46%(2333/5494) were reported as being used “as needed” and53.82% (2957/5494) were reported as being taken daily.Recognizing that some women reported more than one reasonfor their medication use, the most frequent reason for all reportedmedication use was for nervous system disorders (71.86%,1484/2065), followed in descending order by 62.76%(1296/2065) for alimentary tract and metabolism, 38.01%(785/2065) for respiratory issues, 30.89% (638/2065) forgenitourinary system or as sex hormones, and 25.66%(530/2065) as anti-infectives for systemic use.
The top 10 most frequently used medications and medicationchanges during pregnancy are shown in Table 3. There were1230 (59.56%) of 2065 women who took at least oneprescription medication (Rx) and may also have used OTCmedications. By contrast, 23.58% (487/2065) women reportedusing medications generally available OTC, but never usingany medications only available by prescription. These included7.16% (148/2065) of our respondents, who reported that theychose not to take a medication that had been prescribed forthem. The two most frequently reported indications for whicha woman decided not to take a medication or decreased her dose(in consultation with her caregiver) were antidepressants andanti-inflammatories. Only 1.30% (27/2065) women reportedusing medicines that had been prescribed for a friend or familymember, but not for them. The most frequent medications thatwere reported as having been shared were analgesics (oxycodoneand paracetamol, n=4) and drugs for acid-related problems(n=8).
JMIR Public Health Surveill 2015 | vol. 1 | iss. 2 | e22 | p.139http://publichealth.jmir.org/2015/2/e22/(page number not for citation purposes)
Dreyer et alJMIR PUBLIC HEALTH AND SURVEILLANCE
XSL•FORenderX
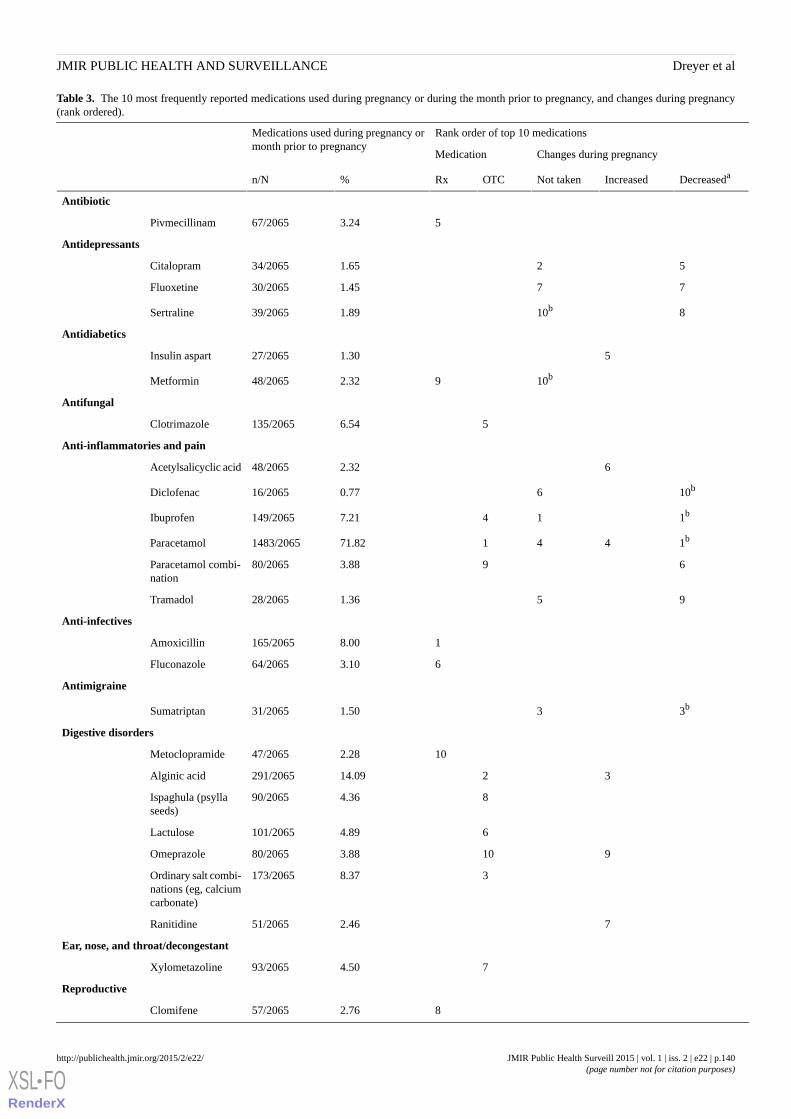
Table 3. The 10 most frequently reported medications used during pregnancy or during the month prior to pregnancy, and changes during pregnancy(rank ordered).
Rank order of top 10 medicationsMedications used during pregnancy ormonth prior to pregnancy
Changes during pregnancyMedication
DecreasedaIncreasedNot takenOTCRx%n/N
Antibiotic
53.2467/2065Pivmecillinam
Antidepressants
521.6534/2065Citalopram
771.4530/2065Fluoxetine
810b1.8939/2065Sertraline
Antidiabetics
51.3027/2065Insulin aspart
10b92.3248/2065Metformin
Antifungal
56.54135/2065Clotrimazole
Anti-inflammatories and pain
62.3248/2065Acetylsalicyclic acid
10b60.7716/2065Diclofenac
1b147.21149/2065Ibuprofen
1b44171.821483/2065Paracetamol
693.8880/2065Paracetamol combi-nation
951.3628/2065Tramadol
Anti-infectives
18.00165/2065Amoxicillin
63.1064/2065Fluconazole
Antimigraine
3b31.5031/2065Sumatriptan
Digestive disorders
102.2847/2065Metoclopramide
3214.09291/2065Alginic acid
84.3690/2065Ispaghula (psyllaseeds)
64.89101/2065Lactulose
9103.8880/2065Omeprazole
38.37173/2065Ordinary salt combi-nations (eg, calciumcarbonate)
72.4651/2065Ranitidine
Ear, nose, and throat/decongestant
74.5093/2065Xylometazoline
Reproductive
82.7657/2065Clomifene
JMIR Public Health Surveill 2015 | vol. 1 | iss. 2 | e22 | p.140http://publichealth.jmir.org/2015/2/e22/(page number not for citation purposes)
Dreyer et alJMIR PUBLIC HEALTH AND SURVEILLANCE
XSL•FORenderX

Rank order of top 10 medicationsMedications used during pregnancy ormonth prior to pregnancy
Changes during pregnancyMedication
DecreasedaIncreasedNot takenOTCRx%n/N
90.245/2065Ethinyl estradiol
84c3.5473/2065
Hormonal contracep-tives for systemicuse
7c2.8659/2065Progesterone
Respiratory
81.4530/2065Beclomethasone
3b224.6496/2065Salbutamol
10b101.5532/2065Terbutaline
Thyroid
134.0283/2065Levothyroxine sodi-um
aDecreased, but not stoppedbTied for placecProbably represents use in the month before pregnancy
Figure 2. The number of different medications taken per woman by percentage in each country. Includes prescription and nonprescription medications;excludes herbals, fish oil, homeopathic, multivitamins, iron, vaccinations, and antimalarials. Denmark: DK, The Netherlands: NL, Poland: PL, UnitedKingdom: UK.
Use of Anesthetics, Cosmetic Surgery, and AlternativeMedicines During PregnancyIn addition to prescription medications, 7.31% (151/2065) ofwomen reported using an anesthetic during pregnancy, withmost (n=128) having received local anesthetics. Very few
women (0.44%, 9/2065) reported having undergone a cosmeticprocedure during pregnancy. Relatively few women usedalternative medicines and dietary supplements during pregnancy(Table 4). The most frequently cited products were herbal(7.07%, 146/2065), followed by fish oil (4.60%, 95/2065).
JMIR Public Health Surveill 2015 | vol. 1 | iss. 2 | e22 | p.141http://publichealth.jmir.org/2015/2/e22/(page number not for citation purposes)
Dreyer et alJMIR PUBLIC HEALTH AND SURVEILLANCE
XSL•FORenderX
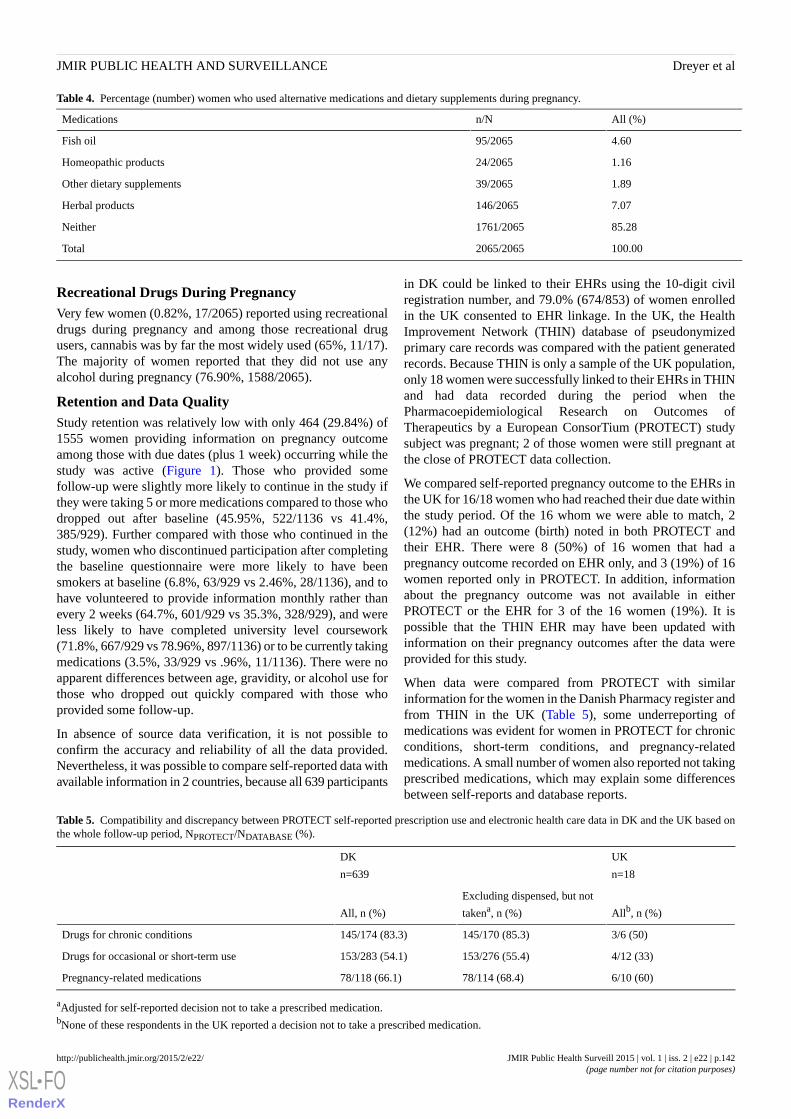
Table 4. Percentage (number) women who used alternative medications and dietary supplements during pregnancy.
All (%)n/NMedications
4.6095/2065Fish oil
1.1624/2065Homeopathic products
1.8939/2065Other dietary supplements
7.07146/2065Herbal products
85.281761/2065Neither
100.002065/2065Total
Recreational Drugs During PregnancyVery few women (0.82%, 17/2065) reported using recreationaldrugs during pregnancy and among those recreational drugusers, cannabis was by far the most widely used (65%, 11/17).The majority of women reported that they did not use anyalcohol during pregnancy (76.90%, 1588/2065).
Retention and Data QualityStudy retention was relatively low with only 464 (29.84%) of1555 women providing information on pregnancy outcomeamong those with due dates (plus 1 week) occurring while thestudy was active (Figure 1). Those who provided somefollow-up were slightly more likely to continue in the study ifthey were taking 5 or more medications compared to those whodropped out after baseline (45.95%, 522/1136 vs 41.4%,385/929). Further compared with those who continued in thestudy, women who discontinued participation after completingthe baseline questionnaire were more likely to have beensmokers at baseline (6.8%, 63/929 vs 2.46%, 28/1136), and tohave volunteered to provide information monthly rather thanevery 2 weeks (64.7%, 601/929 vs 35.3%, 328/929), and wereless likely to have completed university level coursework(71.8%, 667/929 vs 78.96%, 897/1136) or to be currently takingmedications (3.5%, 33/929 vs .96%, 11/1136). There were noapparent differences between age, gravidity, or alcohol use forthose who dropped out quickly compared with those whoprovided some follow-up.
In absence of source data verification, it is not possible toconfirm the accuracy and reliability of all the data provided.Nevertheless, it was possible to compare self-reported data withavailable information in 2 countries, because all 639 participants
in DK could be linked to their EHRs using the 10-digit civilregistration number, and 79.0% (674/853) of women enrolledin the UK consented to EHR linkage. In the UK, the HealthImprovement Network (THIN) database of pseudonymizedprimary care records was compared with the patient generatedrecords. Because THIN is only a sample of the UK population,only 18 women were successfully linked to their EHRs in THINand had data recorded during the period when thePharmacoepidemiological Research on Outcomes ofTherapeutics by a European ConsorTium (PROTECT) studysubject was pregnant; 2 of those women were still pregnant atthe close of PROTECT data collection.
We compared self-reported pregnancy outcome to the EHRs inthe UK for 16/18 women who had reached their due date withinthe study period. Of the 16 whom we were able to match, 2(12%) had an outcome (birth) noted in both PROTECT andtheir EHR. There were 8 (50%) of 16 women that had apregnancy outcome recorded on EHR only, and 3 (19%) of 16women reported only in PROTECT. In addition, informationabout the pregnancy outcome was not available in eitherPROTECT or the EHR for 3 of the 16 women (19%). It ispossible that the THIN EHR may have been updated withinformation on their pregnancy outcomes after the data wereprovided for this study.
When data were compared from PROTECT with similarinformation for the women in the Danish Pharmacy register andfrom THIN in the UK (Table 5), some underreporting ofmedications was evident for women in PROTECT for chronicconditions, short-term conditions, and pregnancy-relatedmedications. A small number of women also reported not takingprescribed medications, which may explain some differencesbetween self-reports and database reports.
Table 5. Compatibility and discrepancy between PROTECT self-reported prescription use and electronic health care data in DK and the UK based onthe whole follow-up period, NPROTECT/NDATABASE (%).
UK
n=18
DK
n=639
Allb, n (%)
Excluding dispensed, but not
takena, n (%)All, n (%)
3/6 (50)145/170 (85.3)145/174 (83.3)Drugs for chronic conditions
4/12 (33)153/276 (55.4)153/283 (54.1)Drugs for occasional or short-term use
6/10 (60)78/114 (68.4)78/118 (66.1)Pregnancy-related medications
aAdjusted for self-reported decision not to take a prescribed medication.bNone of these respondents in the UK reported a decision not to take a prescribed medication.
JMIR Public Health Surveill 2015 | vol. 1 | iss. 2 | e22 | p.142http://publichealth.jmir.org/2015/2/e22/(page number not for citation purposes)
Dreyer et alJMIR PUBLIC HEALTH AND SURVEILLANCE
XSL•FORenderX

Discussion
Principal FindingsThere is incomplete information about the efficacy and safetyof treatments used by the broad array of patients seen ineveryday clinical practice [15]. Could direct-to-patient researchhelp fill that gap for pregnant women with information thatcould be used to investigate possible risk factors for negativebirth outcomes in order to guide expectant mothers and theirclinicians to make healthy pregnancy choices? Coulddirect-to-patient data also be used to understand treatmentbenefits and risks to inform decisions about personalizedmedicine [16]? This study shows that some pregnant womenwill volunteer to participate in pharmacovigilance-type studiesand will report medications used in pregnancy, including bothprescription and nonprescription medications, as well as otherlife style factors, like alcohol and drug use. A comparison ofour respondents with demographics from each of their countriesshows that our volunteers were broadly representative of thepopulation density in each country, as well as age and parity,although they were more educated than their peers, and in somecountries, were not as ethnically diverse as the underlyingpopulation (eg, 94.5%, 670/709 white in this study vs 86%, 48.2million/56.1 million in the UK) [17]. To the extent that biologicresponses to medication are not heavily dependent on educationand ethnicity, these data would support the use ofdirect-to-patient research, as it may have benefits forunderstanding both safety and effectiveness. Further, it appearsthat interactive voice response is not a popular method forconsumer responses. In this study, the IVRS was only chosenby 14 patients and of those, only 1 provided any usable data.
Recruitment and RetentionLoss to follow-up was high in this study, which withoutsubstantial improvement would lessen the value ofdirect-to-patient research for pharmacovigilance. This study,however, employed very minimal patient reminders, onlyunvarying reminder emails and/or text messages a few daysbefore, and once after, a follow-up form was expected. Nopatient incentives were used and the Web study portal onlyprovided study-related information and no other information toattract or maintain the interest of study participants. Using onlythese straight forward methods for retention, only 55.01%(1136/2065) of the subjects who enrolled in this study providedany follow-up, which may reflect, in part, the difficulty of fillingout a detailed questionnaire and perhaps the unwanted focus onlifestyle factors that may negatively affect birth outcome. Only29.83% (464/1555) of the women provided information aboutbirth outcome. Among those who provided some follow-up, theloss-to-follow-up rates were more than doubled among womenwho enrolled in the second and third trimesters when comparedto those who enrolled in the first trimester.
To further explore reasons that would affect recruitment andretention, we convened a small focus group of 45 first-timemothers in their first pregnancy from the DK, NL, PL, and theUK to assess their willingness and interest in participating in astudy like PROTECT. Although most women reported that theywould participate in a study like this purely for altruistic reasons,
one of the most frequent comments was that some form ofmodest compensation would enhance the appeal of participation.
Prescription ReportingGetting detailed, interpretable reports about medication use waschallenging. We asked about medication use according to theindication for which it was being used, did not ask about dosageor route of administration, and did not distinguish betweenprescription and nonprescription medication because that variedfrom country to country and could change at any time duringthe study. Instead, we used a list of nonprescription medicationfor DK (the only country that was able to provide such a list)and applied that assumption to the other 3 countries, recognizingthat in some countries, pregnant women receive prescriptionsfor medications that are available OTC in order to have thosemedications paid for by their insurance. We providedmachine-prompts on the questionnaires for the top 10medications in each country for each indication to guide dataentry for medications, which was challenging to compile in 4countries as proprietary names of the same products varied bycountry and by whether a prescription was required for aparticular medication and dose. Nearly 25% (3136/12,699) ofthe medications used were reported as free text, rather thanusing the drop-down list available on the questionnaire for thispurpose, which required substantial manual review and recoding.More consumer-friendly computerized methods of acquiringdata about medication use would be helpful for future research.
Strengths of Direct-to-Patient ResearchDespite the challenges we encountered in distinguishingmedications that were obtained by prescription and those thatwere not, the extensive reporting of medication use here is astrong advantage for understanding the causal relations of drugsand adverse events. About 4 of 5 women (80%) reported usingat least one medication during or immediately before pregnancy,a figure that is in line with some other estimates [18-22] andhigher than others (eg, 50%) [23]. Our estimates may be higherthan some other studies because our recruitment materials andinformed consent documents described our interest inunderstanding medication use during pregnancy. Nonetheless,the information that our respondents provided corresponds fairlywell with other reports. For example, a recent study ofmedications used by Medicaid recipients during pregnancyshowed the most commonly dispensed medications duringpregnancy were antibiotics and anti-infectives (nitrofurantoin,21.6%; metronidazole, 19.4%; amoxicillin, 18.0%; azithromycin,16.9%) and an antihistamine (promethazine, 13.5%) [23],whereas another US study showed the most commonly usedprescription medication components during the first trimesterof pregnancy were progestins from oral contraceptives,amoxicillin, progesterone, albuterol, promethazine, andestrogenic compounds [18]. In our study, the most commonprescription medications were anti-infectives (amoxicillin) andantibiotics (pivmecillinam), as well as respiratory medication(salbutamol), thyroid medication (levothyroxine sodium), andhormonal medication (contraceptives). Interestingly, we notedthat respondents might not always understand the indication forwhich they are taking prescribed medications. For example, inour validation study in the UK, physicians reported prescribing
JMIR Public Health Surveill 2015 | vol. 1 | iss. 2 | e22 | p.143http://publichealth.jmir.org/2015/2/e22/(page number not for citation purposes)
Dreyer et alJMIR PUBLIC HEALTH AND SURVEILLANCE
XSL•FORenderX
no antidiabetic medications for the 18 women whose recordswere matched with PROTECT, yet 1 woman self-reported takingan antidiabetic medication.
Our estimate that 40.73% (841/2065) of pregnant women usednonprescription medicine is not much different from the limitedpublished literature [19], even though the reference estimatemay not include the identical nonprescription medications thatwere used in this study. In the US study of medications usedduring the first trimester of pregnancy, the most commonly usedOTC medications included anti-inflammatories and painmedications (acetaminophen and ibuprofen) and medication fordigestive disorders (docusate) [18], as did our study(paracetemol and ibuprofen; alginic acid and ordinary saltcombinations like calcium carbonate). Of note, the methodologyused here provided rich information about intermittent use ofmedication as well as nonprescription and complementarymedication use, the details of which are rarely available fromother sources. This pilot study gives some indication that womenare willing to report their use of herbal medications, althoughthe estimates from these 4 study countries (7.07%, 146/2065 ofour respondents self-identified as using herbals during apregnancy) are lower than the 6% and 11% reported in 2 USstudies [20,21], and the 55% reported in Italy in 2009 [22].
ConclusionsTaken as a whole, it appears that direct to consumer (or patient)is a useful method for learning about use of prescription andnonprescription medication use, including medications that maybe administered in hospitals, emergency rooms, or as outpatients,and in some cases, these patient-reported data are more completethan reliance on existing data like prescription registers andEHR [23]. Further, using the Internet to collect data directlyfrom patients/consumers makes it easier to collect data regularlyduring a study. This steady data collection may reduce recall
bias, which is particularly useful when investigating potentialeffects of medication use during pregnancy on birth outcomes,since such effects are largely dependent on gestational age atthe time of exposure. In addition, because women could enterthe study as soon as they became pregnant, it provides valuableinformation on exposure during the early weeks of pregnancy,which might not be available, or complete, using moretraditional interview methods.
Could patient-reported information be a complete substitute forother types of pharmacovigilance? Although there appears tobe some underreporting about medication use and perhapsherbals, self-reporting of prenatal exposures provides a morecomplete picture of factors which may contribute to an adverseoutcome than does reliance purely on existing traditionalmethods of collecting data. The value of having information onmedication use as well as other exposures that may not bereadily available is appealing, for example, anesthesia, travelvaccinations, as well as other behaviors that patients may bereluctant to report directly to their physicians, such as use ofrecreational products like cocaine and marijuana. Such a richdata source would enhance our ability to evaluate individualteratogens as well as to look at various exposures, which maybe risky when used in combination during pregnancy.Nonetheless, there are shortcomings to sole reliance onpatient-reported data that make it difficult to use in the absenceof supplementary data, including (1) accurate and completeproduct reporting of molecular entity, dose, and manufacturer;and (2) clinician-reported assessment of birth outcomes. Lookingtoward the future, perhaps the most effective method to assemblemeaningful information about potential teratogens would be tocombine patient-reported data with information on prescriptionand/or clinical validation from physicians or health care registersfor major events and exposures of special interest.
AcknowledgmentsThe research leading to these results was conducted as part of the PROTECT consortium [24], which is a public-private partnershipcoordinated by the European Medicines Agency. The PROTECT project has received support from the Innovative MedicinesInitiative Joint Undertaking under Grant Agreement No 115004, resources of which are composed of financial contribution fromthe European Union's Seventh Framework Programme (FP7/2007-2013) and EFPIA companies’ in kind contribution. The viewsexpressed are those of the authors only. In PL, the scientific work was cofinanced from the 2011-2014 allocation of funds forinternational projects from the Ministry of Science and Higher Education. Quintiles provided funding for one senior scientist(NAD). The authors gratefully acknowledge the help of A Latos-Bieleńska, Department of Medical Genetics, Poznan Universityof Medical Sciences; J-P Balling, Lundbeck; L Comisky, Genzyme; Rebecca Groves, International Alliance of Patients’Organizations; O de Mol, Genzyme; B Patel, Amgen; S Stevens, Institute of Cellular Medicine, Newcastle University.
Conflicts of InterestNone declared.
References1. Herbst AL, Ulfelder H, Poskanzer D. Adenocarcinoma of the vagina. Association of maternal stilbestrol therapy with tumor
appearance in young women. N Engl J Med 1971 Apr 15;284(15):878-881. [doi: 10.1056/NEJM197104222841604][Medline: 5549830]
2. Clemow DB, Nolan M, Michaels D, Kogelnik A, Cantrell SA, Dewulf L. Medicines in pregnancy forum: Proceedings onethical and legal considerations. Therapeutic Innovation & Regulatory Science 2015 Feb 27;49(3):326-332. [doi:10.1177/2168479015572373]
JMIR Public Health Surveill 2015 | vol. 1 | iss. 2 | e22 | p.144http://publichealth.jmir.org/2015/2/e22/(page number not for citation purposes)
Dreyer et alJMIR PUBLIC HEALTH AND SURVEILLANCE
XSL•FORenderX
3. Brody T, Larner J, Minneman K. Perinatal/neonatal pharmacology. In: Human pharmacology: Molecular to clinical. St.Louis: Mosby; 1998.
4. Mitchell AA. Systematic identification of drugs that cause birth defects--a new opportunity. N Engl J Med 2003 Dec25;349(26):2556-2559. [doi: 10.1056/NEJMsb031395] [Medline: 14695418]
5. Margulis AV, Mittleman MA, Glynn RJ, Holmes LB, Hernández-Díaz S. Effects of gestational age at enrollment inpregnancy exposure registries. Pharmacoepidemiol Drug Saf 2015 Apr;24(4):343-352. [doi: 10.1002/pds.3731] [Medline:25702683]
6. Jick H. Recall "error" in interview studies of past drug use [Letter]. Am J Public Health 1982 Apr;72:405 [FREE Full text]7. Rhodes SD, Diclemente R, Yee LJ, Hergenrather K. Factors associated with testing for hepatitis C in an internet-recruited
sample of men who have sex with men. Sex Transm Dis 2001 Sep;28(9):515-520. [Medline: 11518868]8. Dreyer NA, Blackburn S, Hliva V, Mt-Isa S, Richardson J, Jamry-Dziurla A, et al. Balancing the interests of patient data
protection and medication safety monitoring in a public-private partnership. JMIR Med Inform 2015;3(2):e18 [FREE Fulltext] [doi: 10.2196/medinform.3937] [Medline: 25881627]
9. Sundhud. URL: http://www.esundhed.dk/sundhedsregistre/MFR/Sider/MFR01.aspx [accessed 2015-11-22] [WebCiteCache ID 6dETM2KVO]
10. GUS. URL: http://stat.gov.pl/ [accessed 2015-11-22] [WebCite Cache ID 6dETpmMj3]11. Demographfia. URL: http://demografia.stat.gov.pl/bazademografia [accessed 2015-11-21] [WebCite Cache ID 6dEU6JTyw]12. CBS. URL: http://www.cbs.nl/nl-NL/menu/home/default.htm [WebCite Cache ID 6dEUMa4fA]13. statline. URL: http://statline.cbs.nl/Statweb/publication/
?DM=SLNL&PA=71822NED&D1=0&D2=0,l&D3=2-3&D4=0-4&D5=a&D6=0&D7=l&HDR=T,G2,G1,G5,G6&STB=G4,G3&VW=T[WebCite Cache ID 6dEUZTsIn]
14. BAZA Demografia. URL: http://demografia.stat.gov.pl/bazademografia/Tables.aspx [accessed 2015-11-22] [WebCiteCache ID 6dEUqTAAc]
15. Chandra A, Khullar D, Lee T. Addressing the challenge of gray-zone medicine. N Engl J Med 2015 Jan 15;372(3):203-205.[doi: 10.1056/NEJMp1409696] [Medline: 25587945]
16. Jameson JL, Longo D. Precision medicine--personalized, problematic, and promising. N Engl J Med 2015 Jun4;372(23):2229-2234. [doi: 10.1056/NEJMsb1503104] [Medline: 26014593]
17. Office for National Statistics. Ethnicity and national identity in England and Wales 2011. London, UK: Office for NationalStatistics; 2012 Dec 11. URL: http://www.ons.gov.uk/ons/rel/census/2011-census/key-statistics-for-local-authorities-in-england-and-wales/rpt-ethnicity.html [accessed 2015-07-14] [WebCite Cache ID6a1SgjWAj]
18. Thorpe PG, Gilboa S, Hernandez-Diaz S, Lind J, Cragan J, Briggs G, National Birth Defects Prevention Study. Medicationsin the first trimester of pregnancy: Most common exposures and critical gaps in understanding fetal risk. PharmacoepidemiolDrug Saf 2013 Sep;22(9):1013-1018 [FREE Full text] [doi: 10.1002/pds.3495] [Medline: 23893932]
19. Werler M, Mitchell A, Hernandez-Diaz S, Honein M. Use of over-the-counter medications during pregnancy. Am J ObstetGynecol 2005 Sep;193(3 Pt 1):771-777. [doi: 10.1016/j.ajog.2005.02.100] [Medline: 16150273]
20. Louik C, Gardiner P, Kelley K, Mitchell A. Use of herbal treatments in pregnancy. Am J Obstet Gynecol 2010May;202(5):439.e1-439.e10 [FREE Full text] [doi: 10.1016/j.ajog.2010.01.055] [Medline: 20452484]
21. Broussard C, Louik C, Honein M, Mitchell A, National Birth Defects Prevention Study. Herbal use before and duringpregnancy. Am J Obstet Gynecol 2010 May;202(5):443.e1-443.e6. [doi: 10.1016/j.ajog.2009.10.865] [Medline: 20035911]
22. Cuzzolin L, Francini-Pesenti F, Verlato G, Joppi M, Baldelli P, Benoni G. Use of herbal products among 392 Italian pregnantwomen: Focus on pregnancy outcome. Pharmacoepidemiol Drug Saf 2010 Nov;19(11):1151-1158. [doi: 10.1002/pds.2040][Medline: 20872924]
23. Haerskjold A, Henriksen L, Way S, Malham M, Hallas J, Pedersen L, et al. The Danish National Prescription Registry instudies of a biological pharmaceutical: Palivizumab - validation against two external data sources. Clin Epidemiol2015;7:305-312 [FREE Full text] [doi: 10.2147/CLEP.S73355] [Medline: 26056490]
24. Protect. URL: http://www.imi-protect.eu/ [accessed 2015-11-22] [WebCite Cache ID 6dEhc77cy]
AbbreviationsDK: DenmarkEHRs: electronic health recordsIVRS: interactive voice response systemNL: the NetherlandsOTC: over-the-counterPL: PolandPROTECT: Pharmacoepidemiological Research on Outcomes of Therapeutics by a European ConsorTiumUK: United Kingdom
JMIR Public Health Surveill 2015 | vol. 1 | iss. 2 | e22 | p.145http://publichealth.jmir.org/2015/2/e22/(page number not for citation purposes)
Dreyer et alJMIR PUBLIC HEALTH AND SURVEILLANCE
XSL•FORenderX
Edited by G Eysenbach; submitted 14.07.15; peer-reviewed by C Broussard; comments to author 05.08.15; revised version received21.08.15; accepted 20.09.15; published 22.12.15.
Please cite as:Dreyer NA, Blackburn SCF, Mt-Isa S, Richardson JL, Thomas S, Laursen M, Zetstra-van der Woude P, Jamry-Dziurla A, Hliva V,Bourke A, de Jong-van den Berg LDirect-to-Patient Research: Piloting a New Approach to Understanding Drug Safety During PregnancyJMIR Public Health Surveill 2015;1(2):e22URL: http://publichealth.jmir.org/2015/2/e22/ doi:10.2196/publichealth.4939PMID:27227140
©Nancy A Dreyer, Stella CF Blackburn, Shahrul Mt-Isa, Jonathan L Richardson, Simon Thomas, Maja Laursen, PriscillaZetstra-van der Woude, Anna Jamry-Dziurla, Valerie Hliva, Alison Bourke, Lolkje de Jong-van den Berg. Originally publishedin JMIR Public Health and Surveillance (http://publichealth.jmir.org), 22.12.2015. This is an open-access article distributed underthe terms of the Creative Commons Attribution License (http://creativecommons.org/licenses/by/2.0/), which permits unrestricteduse, distribution, and reproduction in any medium, provided the original work, first published in JMIR Public Health andSurveillance, is properly cited. The complete bibliographic information, a link to the original publication onhttp://publichealth.jmir.org, as well as this copyright and license information must be included.
JMIR Public Health Surveill 2015 | vol. 1 | iss. 2 | e22 | p.146http://publichealth.jmir.org/2015/2/e22/(page number not for citation purposes)
Dreyer et alJMIR PUBLIC HEALTH AND SURVEILLANCE
XSL•FORenderX
Original Paper
Tracking Hookah Bars in New York: Utilizing Yelp as a PowerfulPublic Health Tool
Philip B Cawkwell1, BA; Lily Lee1,2; Michael Weitzman1,3,4,5, MD; Scott E Sherman3,5,6,7, MD, MPH1Department of Pediatrics, New York University School of Medicine, New York, NY, United States2Brooklyn College, Brooklyn, NY, United States3College of Global Public Health, New York University, New York, NY, United States4Department of Environmental Health, New York University School of Medicine, New York, NY, United States5NYU/Abu Dhabi Public Health Research Center, Abu Dhabi, United Arab Emirates6Department of Population Health, New York University School of Medicine, New York, NY, United States7Department of Medicine, VA New York Harbor Healthcare System, New York, NY, United States
Corresponding Author:Philip B Cawkwell, BADepartment of PediatricsNew York University School of Medicine550 1st AvenueNew York, NY 10016United StatesPhone: 1 212 263 7300Fax: 1 212 263 7300Email: [email protected]
Abstract
Background: While cigarette use has seen a steady decline in recent years, hookah (water pipe) use has rapidly increased inpopularity. While anecdotal reports have noted a rise in hookah bars, methodological difficulties have prevented researchers fromdrawing definitive conclusions about the number of hookah bars in any given location. There is no publicly available databasethat has been shown to reliably provide this information. It is now possible to analyze Internet trends as a measure of populationbehavior and health-related phenomena.
Objective: The objective of the study was to investigate whether Yelp can be used to accurately identify the number of hookahbars in New York State, assess the distribution and characteristics of hookah bars, and monitor temporal trends in their presence.
Methods: Data were obtained from Yelp that captures a variety of parameters for every business listed in their database as ofOctober 28, 2014, that was tagged as a “hookah bar” and operating in New York State. Two algebraic models were created: oneestimated the date of opening of a hookah bar based on the first Yelp review received and the other estimated whether the barwas open or closed based on the date of the most recent Yelp review. These findings were then compared with empirical dataobtained by Internet searches.
Results: From 2014 onward, the date of the first Yelp review predicts the opening date of new hookah bars to within 1 month.Yelp data allow the estimate of such venues and demonstrate that new bars are not randomly distributed, but instead are clusterednear colleges and in specific racial/ethnic neighborhoods. New York has seen substantially more new hookah bars in 2012-2014compared with the number that existed prior to 2009.
Conclusions: Yelp is a powerful public health tool that allows for the investigation of various trends and characteristics ofhookah bars. New York is experiencing tremendous growth in hookah bars, a worrying phenomenon that necessitates furtherinvestigation.
(JMIR Public Health Surveill 2015;1(2):e19) doi:10.2196/publichealth.4809
KEYWORDS
hookah; hookah bar; Internet; public health; Yelp
JMIR Public Health Surveill 2015 | vol. 1 | iss. 2 | e19 | p.147http://publichealth.jmir.org/2015/2/e19/(page number not for citation purposes)
Cawkwell et alJMIR PUBLIC HEALTH AND SURVEILLANCE
XSL•FORenderX

Introduction
Hookah Smoking Perceived Less Dangerous ThanCigarettesIn recent years, cigarette use has had a dramatic steady decline[1-3], whereas hookah (water pipe) use has rapidly becomemore popular. National Adult Tobacco Survey data show that9.8% of adults in the United States report having ever usedhookah and 1.5% currently use this alternative tobacco product[4]. Among US high-school seniors, 18% report having usedhookah in the past year [5]. There is growing evidence thathookah smoking may be at least as harmful as cigarette smoking[6-8]. Research has shown that the tobacco specifically usedfor hookah—shisha—delivers tar, nicotine, and carbonmonoxide in higher doses than cigarette use [9-11]. Hookah usehas also been linked to lung cancer [12], decreased pulmonaryand cardiovascular function [13,14], infertility [15], and lowbirth weight [12]. Furthermore, secondhand hookah smokecontains the same constituents resulting from tobaccocombustion, as well as additional chemicals and carcinogensfrom the charcoal used to heat the product [16,17], thus posingserious health risks not only to the user, but also to hookah baremployees and nonsmoking patrons [7,17,18]. Unfortunately,numerous studies worldwide consistently report that hookahsmoking is perceived to be safer and less addictive thancigarettes by both public and health care providers [8,9,19-23].
In the last decade, Internet use in the United States has expandedrapidly as millions of consumers have new ways to access theInternet, from laptops to mobile phone to tablets and otherdevices [24]. The Internet is used by as many as 93% ofhigh-school students and young adults [25]. The Internet alsohas emerged as a new resource for tracking public health trends[26]. It is now possible to analyze Internet trends as a measureof population behavior and health-related phenomena. The socialmedia platform Twitter has been analyzed to show how usersperceive and respond to emerging tobacco products [27,28].One database, Google Trends, a publicly available resource,allows users to compare Internet search frequency over time invarious regions of the world [29,30]. Researchers have useddata drawn from this source to create models that accuratelypredict chronic disease risk factors such as alcohol consumptionby measuring Web search activity [31]. This mechanism hasalso been used to demonstrate the increasing popularity ofhookah smoking in the United States as measured by increasedsearch volume for hookah and related terms [32].
Social Media and YelpIn recent years, new forms of social media and networking havealso risen. Yelp is one such site in which patrons review andshare information about businesses and their services, therebyallowing local businesses to publicize themselves to the public[33,34]. Based out of San Francisco, the company has set uponline communities in almost every major city in the UnitedStates and worldwide. In 2014, it received an average of 135million visitors per month and more than 67 million totalreviews [35]. Yelp is ranked in the top 40 in the United Statesand top 150 worldwide in number of daily visitors to the website[36].
To date, no study has examined the number, distribution, andpotential proliferation of hookah bars. There is no publicallyavailable database of hookah bars at either a state or federallevel. Yelp has an unharnessed, but immense, potential forproviding critical public health data. In this paper, we reportwhether data from Yelp can be used to accurately answer thefollowing three questions: (1) What is the number of hookahbars throughout a specific geographic region and how accuratelycan Yelp identify the hookah bars?; (2) What are the distributionand characteristics of hookah bars (such as whether they servealcohol or have live music)?; and (3) What are the temporaltrends in hookah bars?
Methods
DataData were provided by Yelp in the form of a spreadsheet filethat captured a variety of parameters for every business listedin their database as of October 28, 2014 that was tagged as a“hookah bar” and operating in the state of New York. We alsoobtained similar data for “wine bar” to serve as acontemporaneous control. These parameters included thebusiness address, categorization within the Yelp database (eg,“bars,” “hookah bars,” “lounges”), business hours, and attributessuch as whether alcohol is served, the ambiance, whether Wi-Fiis available, etc. In addition, every review written for each ofthese businesses was provided in a separate file with thereviewer’s username removed. According to Yelp’s policy,business listings are not removed after the location is determinedto be closed. These businesses may feature less prominently insearch results, but this did not affect the database file that wereceived.
AnalysesTwo simple algebraic models were created from the dataprovided by Yelp. The first was created to estimate the date ofopening of a hookah bar based on the date of its first Yelpreview. To do this, we attempted to determine the actual dateof opening for each hookah bar via Internet searches. A preciseopening date could be established for 46 hookah bars. Then,the actual date of opening was compared with the date of thefirst published Yelp review for each hookah bar. The algebraicmodel compared these differences on a yearly basis and usedthe average difference between verified date of opening andfirst Yelp review as the predicted date of opening for eachhookah bar. Because of low review frequency in the early yearsof Yelp, it was not practical or accurate to use the date of thefirst published review as a predictor of true opening date priorto 2010.
A second algebraic model was created that predicted whetheror not a hookah bar had shut down based on the date of its latestYelp review. The Yelp website allows its users to mark locationsas closed, and this information is contained within the Yelpdatabase. We verified that all 24 of these locations were indeedclosed with phone calls to the location and Internet searches.We then combed the remaining database to find whether therewere other closed locations that had not been marked as such,and 7 were identified with further phone calls and Internetsearches. Of the 24 that were marked closed on Yelp, 17 had
JMIR Public Health Surveill 2015 | vol. 1 | iss. 2 | e19 | p.148http://publichealth.jmir.org/2015/2/e19/(page number not for citation purposes)
Cawkwell et alJMIR PUBLIC HEALTH AND SURVEILLANCE
XSL•FORenderX
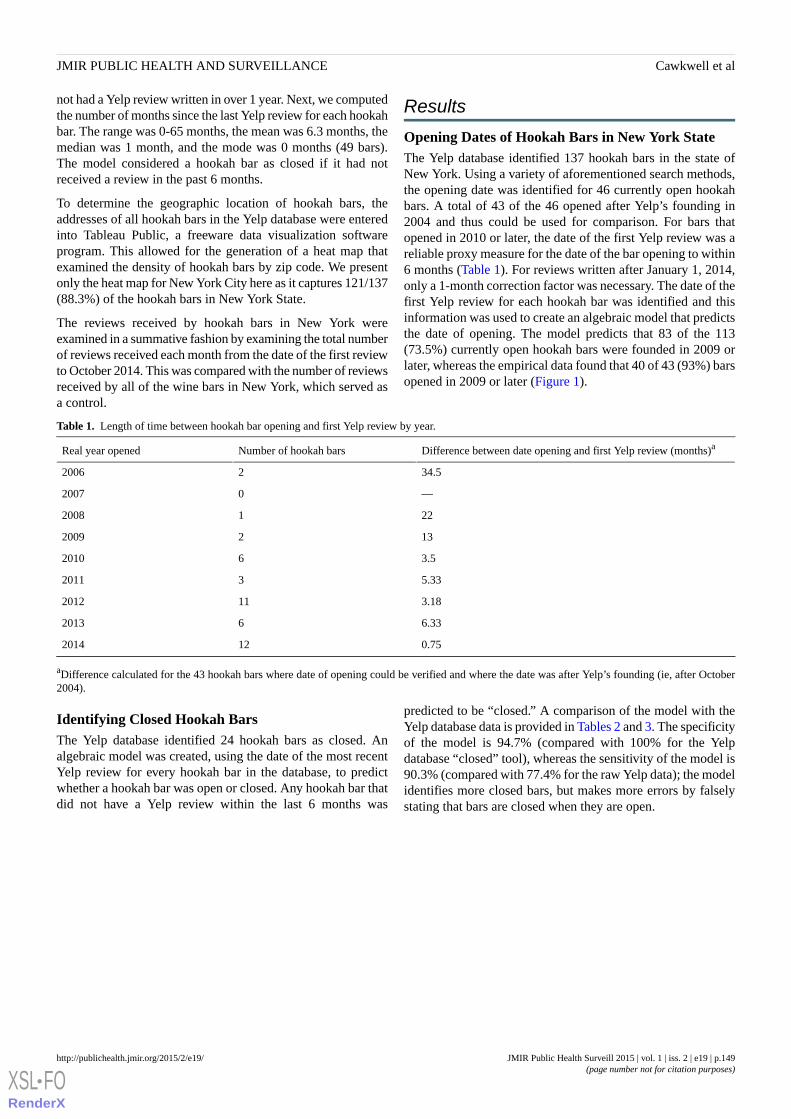
not had a Yelp review written in over 1 year. Next, we computedthe number of months since the last Yelp review for each hookahbar. The range was 0-65 months, the mean was 6.3 months, themedian was 1 month, and the mode was 0 months (49 bars).The model considered a hookah bar as closed if it had notreceived a review in the past 6 months.
To determine the geographic location of hookah bars, theaddresses of all hookah bars in the Yelp database were enteredinto Tableau Public, a freeware data visualization softwareprogram. This allowed for the generation of a heat map thatexamined the density of hookah bars by zip code. We presentonly the heat map for New York City here as it captures 121/137(88.3%) of the hookah bars in New York State.
The reviews received by hookah bars in New York wereexamined in a summative fashion by examining the total numberof reviews received each month from the date of the first reviewto October 2014. This was compared with the number of reviewsreceived by all of the wine bars in New York, which served asa control.
Results
Opening Dates of Hookah Bars in New York StateThe Yelp database identified 137 hookah bars in the state ofNew York. Using a variety of aforementioned search methods,the opening date was identified for 46 currently open hookahbars. A total of 43 of the 46 opened after Yelp’s founding in2004 and thus could be used for comparison. For bars thatopened in 2010 or later, the date of the first Yelp review was areliable proxy measure for the date of the bar opening to within6 months (Table 1). For reviews written after January 1, 2014,only a 1-month correction factor was necessary. The date of thefirst Yelp review for each hookah bar was identified and thisinformation was used to create an algebraic model that predictsthe date of opening. The model predicts that 83 of the 113(73.5%) currently open hookah bars were founded in 2009 orlater, whereas the empirical data found that 40 of 43 (93%) barsopened in 2009 or later (Figure 1).
Table 1. Length of time between hookah bar opening and first Yelp review by year.
Difference between date opening and first Yelp review (months)aNumber of hookah barsReal year opened
34.522006
—02007
2212008
1322009
3.562010
5.3332011
3.18112012
6.3362013
0.75122014
aDifference calculated for the 43 hookah bars where date of opening could be verified and where the date was after Yelp’s founding (ie, after October2004).
Identifying Closed Hookah BarsThe Yelp database identified 24 hookah bars as closed. Analgebraic model was created, using the date of the most recentYelp review for every hookah bar in the database, to predictwhether a hookah bar was open or closed. Any hookah bar thatdid not have a Yelp review within the last 6 months was
predicted to be “closed.” A comparison of the model with theYelp database data is provided in Tables 2 and 3. The specificityof the model is 94.7% (compared with 100% for the Yelpdatabase “closed” tool), whereas the sensitivity of the model is90.3% (compared with 77.4% for the raw Yelp data); the modelidentifies more closed bars, but makes more errors by falselystating that bars are closed when they are open.
JMIR Public Health Surveill 2015 | vol. 1 | iss. 2 | e19 | p.149http://publichealth.jmir.org/2015/2/e19/(page number not for citation purposes)
Cawkwell et alJMIR PUBLIC HEALTH AND SURVEILLANCE
XSL•FORenderX
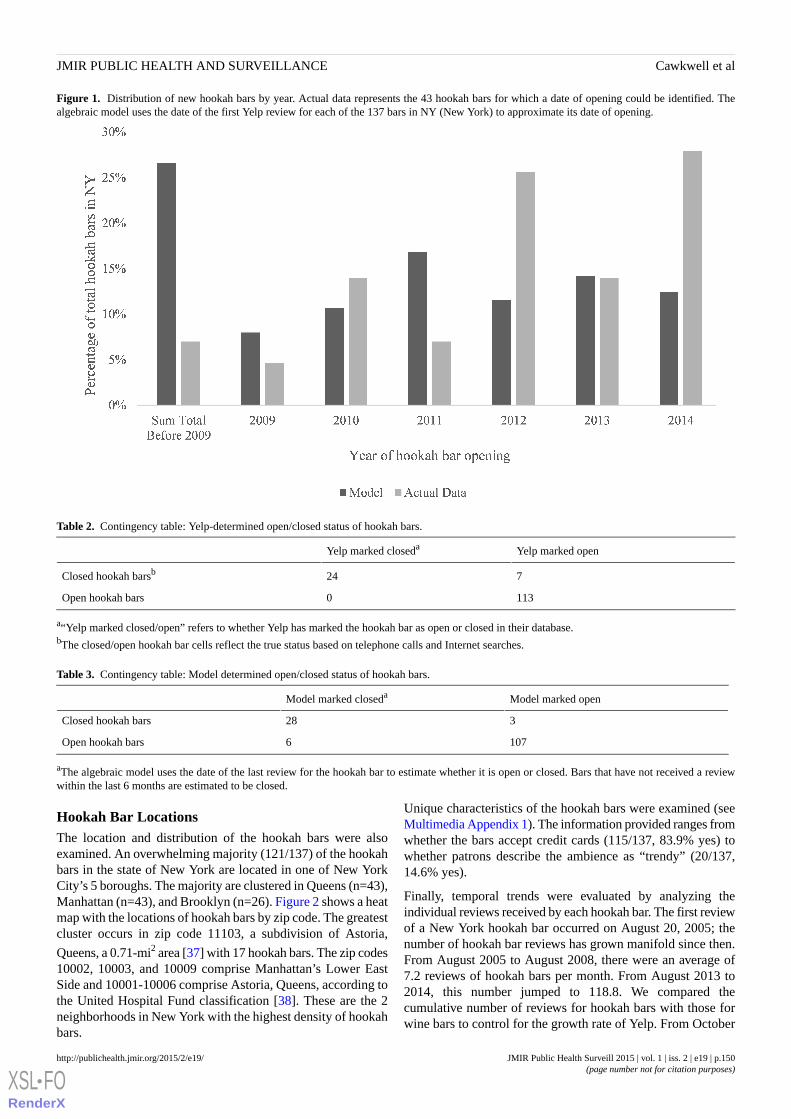
Figure 1. Distribution of new hookah bars by year. Actual data represents the 43 hookah bars for which a date of opening could be identified. Thealgebraic model uses the date of the first Yelp review for each of the 137 bars in NY (New York) to approximate its date of opening.
Table 2. Contingency table: Yelp-determined open/closed status of hookah bars.
Yelp marked openYelp marked closeda
724Closed hookah barsb
1130Open hookah bars
a“Yelp marked closed/open” refers to whether Yelp has marked the hookah bar as open or closed in their database.bThe closed/open hookah bar cells reflect the true status based on telephone calls and Internet searches.
Table 3. Contingency table: Model determined open/closed status of hookah bars.
Model marked openModel marked closeda
328Closed hookah bars
1076Open hookah bars
aThe algebraic model uses the date of the last review for the hookah bar to estimate whether it is open or closed. Bars that have not received a reviewwithin the last 6 months are estimated to be closed.
Hookah Bar LocationsThe location and distribution of the hookah bars were alsoexamined. An overwhelming majority (121/137) of the hookahbars in the state of New York are located in one of New YorkCity’s 5 boroughs. The majority are clustered in Queens (n=43),Manhattan (n=43), and Brooklyn (n=26). Figure 2 shows a heatmap with the locations of hookah bars by zip code. The greatestcluster occurs in zip code 11103, a subdivision of Astoria,
Queens, a 0.71-mi2 area [37] with 17 hookah bars. The zip codes10002, 10003, and 10009 comprise Manhattan’s Lower EastSide and 10001-10006 comprise Astoria, Queens, according tothe United Hospital Fund classification [38]. These are the 2neighborhoods in New York with the highest density of hookahbars.
Unique characteristics of the hookah bars were examined (seeMultimedia Appendix 1). The information provided ranges fromwhether the bars accept credit cards (115/137, 83.9% yes) towhether patrons describe the ambience as “trendy” (20/137,14.6% yes).
Finally, temporal trends were evaluated by analyzing theindividual reviews received by each hookah bar. The first reviewof a New York hookah bar occurred on August 20, 2005; thenumber of hookah bar reviews has grown manifold since then.From August 2005 to August 2008, there were an average of7.2 reviews of hookah bars per month. From August 2013 to2014, this number jumped to 118.8. We compared thecumulative number of reviews for hookah bars with those forwine bars to control for the growth rate of Yelp. From October
JMIR Public Health Surveill 2015 | vol. 1 | iss. 2 | e19 | p.150http://publichealth.jmir.org/2015/2/e19/(page number not for citation purposes)
Cawkwell et alJMIR PUBLIC HEALTH AND SURVEILLANCE
XSL•FORenderX
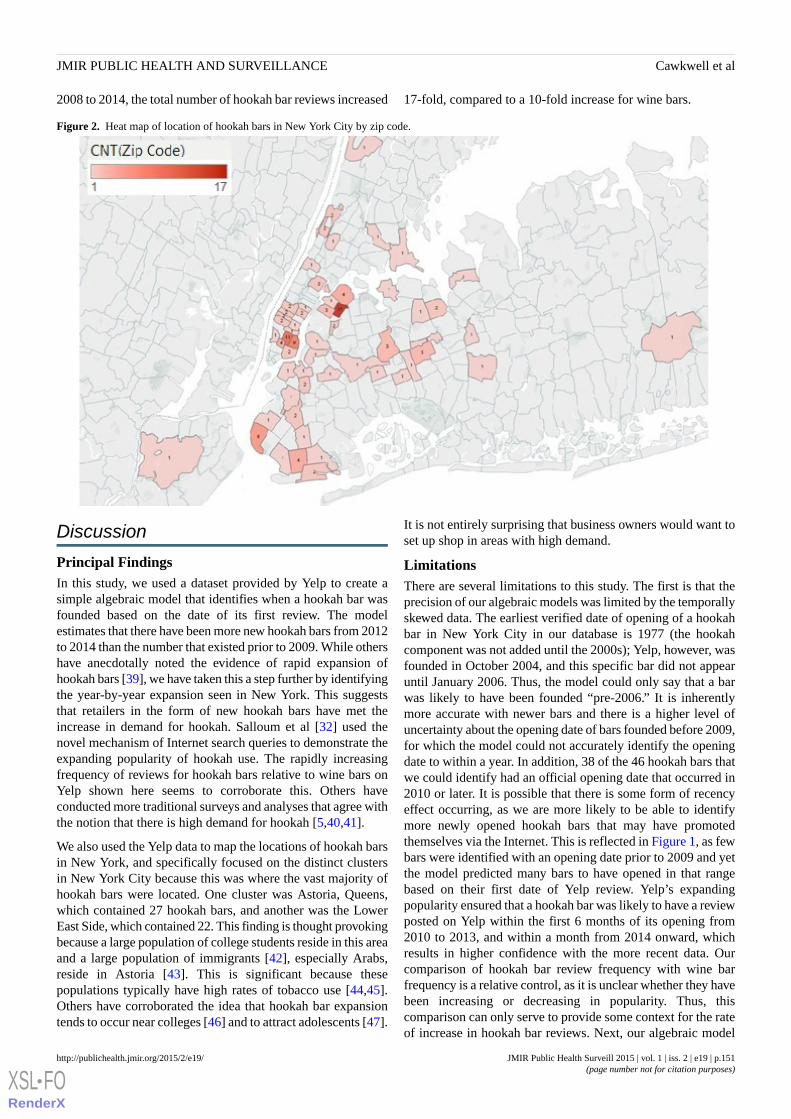
2008 to 2014, the total number of hookah bar reviews increased 17-fold, compared to a 10-fold increase for wine bars.
Figure 2. Heat map of location of hookah bars in New York City by zip code.
Discussion
Principal FindingsIn this study, we used a dataset provided by Yelp to create asimple algebraic model that identifies when a hookah bar wasfounded based on the date of its first review. The modelestimates that there have been more new hookah bars from 2012to 2014 than the number that existed prior to 2009. While othershave anecdotally noted the evidence of rapid expansion ofhookah bars [39], we have taken this a step further by identifyingthe year-by-year expansion seen in New York. This suggeststhat retailers in the form of new hookah bars have met theincrease in demand for hookah. Salloum et al [32] used thenovel mechanism of Internet search queries to demonstrate theexpanding popularity of hookah use. The rapidly increasingfrequency of reviews for hookah bars relative to wine bars onYelp shown here seems to corroborate this. Others haveconducted more traditional surveys and analyses that agree withthe notion that there is high demand for hookah [5,40,41].
We also used the Yelp data to map the locations of hookah barsin New York, and specifically focused on the distinct clustersin New York City because this was where the vast majority ofhookah bars were located. One cluster was Astoria, Queens,which contained 27 hookah bars, and another was the LowerEast Side, which contained 22. This finding is thought provokingbecause a large population of college students reside in this areaand a large population of immigrants [42], especially Arabs,reside in Astoria [43]. This is significant because thesepopulations typically have high rates of tobacco use [44,45].Others have corroborated the idea that hookah bar expansiontends to occur near colleges [46] and to attract adolescents [47].
It is not entirely surprising that business owners would want toset up shop in areas with high demand.
LimitationsThere are several limitations to this study. The first is that theprecision of our algebraic models was limited by the temporallyskewed data. The earliest verified date of opening of a hookahbar in New York City in our database is 1977 (the hookahcomponent was not added until the 2000s); Yelp, however, wasfounded in October 2004, and this specific bar did not appearuntil January 2006. Thus, the model could only say that a barwas likely to have been founded “pre-2006.” It is inherentlymore accurate with newer bars and there is a higher level ofuncertainty about the opening date of bars founded before 2009,for which the model could not accurately identify the openingdate to within a year. In addition, 38 of the 46 hookah bars thatwe could identify had an official opening date that occurred in2010 or later. It is possible that there is some form of recencyeffect occurring, as we are more likely to be able to identifymore newly opened hookah bars that may have promotedthemselves via the Internet. This is reflected in Figure 1, as fewbars were identified with an opening date prior to 2009 and yetthe model predicted many bars to have opened in that rangebased on their first date of Yelp review. Yelp’s expandingpopularity ensured that a hookah bar was likely to have a reviewposted on Yelp within the first 6 months of its opening from2010 to 2013, and within a month from 2014 onward, whichresults in higher confidence with the more recent data. Ourcomparison of hookah bar review frequency with wine barfrequency is a relative control, as it is unclear whether they havebeen increasing or decreasing in popularity. Thus, thiscomparison can only serve to provide some context for the rateof increase in hookah bar reviews. Next, our algebraic model
JMIR Public Health Surveill 2015 | vol. 1 | iss. 2 | e19 | p.151http://publichealth.jmir.org/2015/2/e19/(page number not for citation purposes)
Cawkwell et alJMIR PUBLIC HEALTH AND SURVEILLANCE
XSL•FORenderX
was intentionally designed to be simplistic. This allows for arobust and rapid estimation of whether a hookah bar is open orclosed and when it was founded based simply on the date of itsfirst and most recent reviews. As a drawback, however, it is notas precise as could potentially be achieved with morecomprehensive measures.
Yelp is a powerful tool and is getting still more popular; wenoted a 20-fold increase in monthly reviews for hookah barsbetween January 2007 and 2014. In spite of this, there havebeen very few public health studies that utilize its vast database,and only one that used it in the context of hookah. Primack etal [48] utilized Yelp to locate hookah bars in municipalitieswith clean air laws. Sussman et al [34] coded Yelp reviews inLos Angeles, California, for Vape shops to analyze consumerbeliefs and behaviors. Other medical studies that use Yelp datafocus on analyzing reviews of physicians who are listed on Yelp[49-51] and on food safety [52,53].
Yelp offers both public health researchers and potentially localhealth departments the ability to quickly and accurately spottrends. We found that on average, beginning in 2014, a newhookah bar will appear on Yelp within 1 month of its opening.This allows for rapid identification of an expanding market.This could be particularly useful for local health departments.In New York City, for example, the health department is veryactive in enforcing health standards; they recently undertookan operation to identify which hookah bars were serving
shisha-containing tobacco, which is a violation of the 2002Smoke-Free Air Act [54]. Utilization of Yelp data would bebeneficial because it would allow health departments to rapidlyidentify new bars. The same would apply to researchers seekingto measure the effects on working in a hookah bar or track theirexpanding popularity.
Some data contained within the Yelp database are moreimmediately useful than others are. It is readily apparent howknowledge of location of the hookah bars could be useful toresearchers, health departments, and policy makers. However,there is a trove of other data collected for every hookah barwhich includes whether they have parking, television, livemusic, offer outdoor seating, accept credit cards, or if they servealcohol. Whether there are important findings or implicationscontained in these data remain to be seen, but it is clear thatYelp is an important, but underutilized, public health tool.
ConclusionsIn summary, the findings presented in this paper corroboratethat data from Yelp do in fact accurately identify the supply ofhookah bars and their distribution and characteristics, as wellas allowing for monitoring changes in their presence over time.In the state of New York, these data demonstrate both anincreasing number of such venues and substantial geographicclustering. As emerging health epidemics like hookah use grow,public health officials and researchers would be well served toconsider innovative sources such as Yelp for data analysis.
AcknowledgmentsThis work was supported in part by the NYU/Abu Dhabi Public Health Research Center (Drs Sherman and Weitzman). DrSherman is also supported by a grant from the National Institute on Drug Abuse (Grant No 1K24DA038345) and Dr Weitzmanalso is supported by a grant from the National Institute of Environmental Health (Grant No NIH/NCI 3 P30 CA016087-33S1).The content of this work is solely the responsibility of the authors and does not necessarily represent the official views of theNational Institutes of Health or the US Government.
Conflicts of InterestNone declared.
Multimedia Appendix 1Attributes of the 137 hookah bars in New York, as described by Yelp.
[PDF File (Adobe PDF File), 29KB - publichealth_v1i2e19_app1.pdf ]
References1. Centers for Disease Control and Prevention (CDC). Tobacco product use among middle and high school students—United
States, 2011 and 2012. MMWR Morb Mortal Wkly Rep 2013 Nov 15;62(45):893-897 [FREE Full text] [Medline: 24226625]2. Johnston LD, O'Malley PM, Miech RA, Bachman JG, Schulenberg JE. Monitoring the Future National Results on Drug
Use: 1975-2013: Overview, Key Findings on Adolescent Drug Use. Ann Arbor, MI: The University of Michigan; 2014.URL: http://www.monitoringthefuture.org/pubs/monographs/mtf-overview2013.pdf [accessed 2015-06-09] [WebCiteCache ID 6ZA9VWdLi]
3. Substance Abuse and Mental Health Services Administration. Results from the 2012 National Survey on Drug Use andHealth: Summary of National Findings, NSDUH Series H-46, HHS Publication No (SMA) 13-4795. Rockville, MD:Substance Abuse and Mental Health Services Administration; 2013. URL: http://www.samhsa.gov/data/sites/default/files/NSDUHresults2012/NSDUHresults2012.pdf [accessed 2015-11-17] [WebCite Cache ID 6ZA9c1qs6]
4. Salloum RG, Thrasher JF, Kates FR, Maziak W. Water pipe tobacco smoking in the United States: Findings from theNational Adult Tobacco Survey. Prev Med 2015 Feb;71:88-93. [doi: 10.1016/j.ypmed.2014.12.012] [Medline: 25535678]
JMIR Public Health Surveill 2015 | vol. 1 | iss. 2 | e19 | p.152http://publichealth.jmir.org/2015/2/e19/(page number not for citation purposes)
Cawkwell et alJMIR PUBLIC HEALTH AND SURVEILLANCE
XSL•FORenderX
5. Palamar JJ, Zhou S, Sherman S, Weitzman M. Hookah use among U.S. high school seniors. Pediatrics 2014Aug;134(2):227-234 [FREE Full text] [doi: 10.1542/peds.2014-0538] [Medline: 25002664]
6. Cobb C, Ward KD, Maziak W, Shihadeh AL, Eissenberg T. Waterpipe tobacco smoking: An emerging health crisis in theUnited States. Am J Health Behav 2010;34(3):275-285 [FREE Full text] [Medline: 20001185]
7. Daher N, Saleh R, Jaroudi E, Sheheitli H, Badr T, Sepetdjian E, et al. Comparison of carcinogen, carbon monoxide, andultrafine particle emissions from narghile waterpipe and cigarette smoking: Sidestream smoke measurements and assessmentof second-hand smoke emission factors. Atmos Environ (1994) 2010 Jan 1;44(1):8-14 [FREE Full text] [doi:10.1016/j.atmosenv.2009.10.004] [Medline: 20161525]
8. Noonan D, Kulbok PA. New tobacco trends: Waterpipe (hookah) smoking and implications for healthcare providers. J AmAcad Nurse Pract 2009 May;21(5):258-260. [doi: 10.1111/j.1745-7599.2009.00402.x] [Medline: 19432909]
9. Eissenberg T, Shihadeh A. Waterpipe tobacco and cigarette smoking: Direct comparison of toxicant exposure. Am J PrevMed 2009 Dec;37(6):518-523 [FREE Full text] [doi: 10.1016/j.amepre.2009.07.014] [Medline: 19944918]
10. Knishkowy B, Amitai Y. Water-pipe (narghile) smoking: An emerging health risk behavior. Pediatrics 2005Jul;116(1):e113-e119. [doi: 10.1542/peds.2004-2173] [Medline: 15995011]
11. Shihadeh A. Investigation of mainstream smoke aerosol of the argileh water pipe. Food Chem Toxicol 2003Jan;41(1):143-152. [Medline: 12453738]
12. Akl EA, Gaddam S, Gunukula SK, Honeine R, Jaoude PA, Irani J. The effects of waterpipe tobacco smoking on healthoutcomes: A systematic review. Int J Epidemiol 2010 Jun;39(3):834-857 [FREE Full text] [doi: 10.1093/ije/dyq002][Medline: 20207606]
13. Al Mutairi Sana S, Shihab-Eldeen AA, Mojiminiyi OA, Anwar AA. Comparative analysis of the effects of hubble-bubble(Sheesha) and cigarette smoking on respiratory and metabolic parameters in hubble-bubble and cigarette smokers. Respirology2006 Jul;11(4):449-455. [doi: 10.1111/j.1440-1843.2006.00873.x] [Medline: 16771915]
14. Kiter G, Uçan ES, Ceylan E, Kilinç O. Water-pipe smoking and pulmonary functions. Respir Med 2000 Sep;94(9):891-894[FREE Full text] [doi: 10.1053/rmed.2000.0859] [Medline: 11001082]
15. Inhorn MC, Buss KA. Ethnography, epidemiology and infertility in Egypt. Soc Sci Med 1994 Sep;39(5):671-686. [Medline:7973866]
16. Monzer B, Sepetdjian E, Saliba N, Shihadeh A. Charcoal emissions as a source of CO and carcinogenic PAH in mainstreamnarghile waterpipe smoke. Food Chem Toxicol 2008 Sep;46(9):2991-2995. [doi: 10.1016/j.fct.2008.05.031] [Medline:18573302]
17. WHO Study Group on Tobacco Product Regulation. Waterpipe Tobacco Smoking: Health Effects, Research Needs andRecommended Actions by Regulators. Geneva, Switzerland; 2005. URL: http://www.who.int/tobacco/global_interaction/tobreg/Waterpipe%20recommendation_Final.pdf [accessed 2015-06-09] [WebCite Cache ID 6ZA9RDzy4]
18. Fromme H, Dietrich S, Heitmann D, Dressel H, Diemer J, Schulz T, et al. Indoor air contamination during a waterpipe(narghile) smoking session. Food Chem Toxicol 2009 Jul;47(7):1636-1641. [doi: 10.1016/j.fct.2009.04.017] [Medline:19394392]
19. Grekin ER, Ayna D. Waterpipe smoking among college students in the United States: A review of the literature. J Am CollHealth 2012;60(3):244-249. [doi: 10.1080/07448481.2011.589419] [Medline: 22420702]
20. Heinz AJ, Giedgowd GE, Crane NA, Veilleux JC, Conrad M, Braun AR, et al. A comprehensive examination of hookahsmoking in college students: Use patterns and contexts, social norms and attitudes, harm perception, psychological correlatesand co-occurring substance use. Addict Behav 2013 Nov;38(11):2751-2760. [doi: 10.1016/j.addbeh.2013.07.009] [Medline:23934006]
21. Primack BA, Sidani J, Agarwal AA, Shadel WG, Donny EC, Eissenberg TE. Prevalence of and associations with waterpipetobacco smoking among U.S. university students. Ann Behav Med 2008 Aug;36(1):81-86 [FREE Full text] [doi:10.1007/s12160-008-9047-6] [Medline: 18719977]
22. Roskin J, Aveyard P. Canadian and English students' beliefs about waterpipe smoking: A qualitative study. BMC PublicHealth 2009;9:10 [FREE Full text] [doi: 10.1186/1471-2458-9-10] [Medline: 19134220]
23. Smith SY, Curbow B, Stillman FA. Harm perception of nicotine products in college freshmen. Nicotine Tob Res 2007Sep;9(9):977-982. [doi: 10.1080/14622200701540796] [Medline: 17763115]
24. File T, Ryan C. Computer and Internet use in the United States: 2013. American Community Survey Reports (ACS-28).Washington, DC: US Census Bureau URL: http://www.census.gov/history/pdf/2013computeruse.pdf [accessed 2015-06-09][WebCite Cache ID 6ZA9OIpAg]
25. Lenhart A, Purcell K, Smith A, Zickuhr K. Social Media and Mobile Internet Use Among Teens and Young Adults.Washington, DC: Pew Internet and American Life Project; 2010. URL: http://www.pewinternet.org/files/old-media/Files/Reports/2010/PIP_Social_Media_and_Young_Adults_Report_Final_with_toplines.pdf [accessed 2015-06-09] [WebCiteCache ID 6ZA9LQOLw]
26. Gross E. Adolescent Internet use: What we expect, what teens report. J Appl Dev Psychol 2004 Nov;25(6):633-649. [doi:10.1016/j.appdev.2004.09.005]
27. Myslín M, Zhu S, Chapman W, Conway M. Using twitter to examine smoking behavior and perceptions of emergingtobacco products. J Med Internet Res 2013;15(8):e174 [FREE Full text] [doi: 10.2196/jmir.2534] [Medline: 23989137]
JMIR Public Health Surveill 2015 | vol. 1 | iss. 2 | e19 | p.153http://publichealth.jmir.org/2015/2/e19/(page number not for citation purposes)
Cawkwell et alJMIR PUBLIC HEALTH AND SURVEILLANCE
XSL•FORenderX

28. Cavazos-Rehg P, Krauss M, Grucza R, Bierut L. Characterizing the followers and tweets of a marijuana-focused Twitterhandle. J Med Internet Res 2014;16(6):e157 [FREE Full text] [doi: 10.2196/jmir.3247] [Medline: 24974893]
29. Whitsitt J, Karimkhani C, Boyers LN, Lott JP, Dellavalle RP. Comparing burden of dermatologic disease to search intereston google trends. Dermatol Online J 2015 Jan;21(1). [Medline: 25612125]
30. Nuti SV, Wayda B, Ranasinghe I, Wang S, Dreyer RP, Chen SI, et al. The use of google trends in health care research: Asystematic review. PLoS One 2014;9(10):e109583 [FREE Full text] [doi: 10.1371/journal.pone.0109583] [Medline:25337815]
31. Nguyen T, Tran T, Luo W, Gupta S, Rana S, Phung D, et al. Web search activity data accurately predict population chronicdisease risk in the USA. J Epidemiol Community Health 2015 Jul;69(7):693-699. [doi: 10.1136/jech-2014-204523] [Medline:25805603]
32. Salloum RG, Osman A, Maziak W, Thrasher JF. How popular is waterpipe tobacco smoking? Findings from internet searchqueries. Tob Control 2015 Sep;24(5):509-513. [doi: 10.1136/tobaccocontrol-2014-051675] [Medline: 25052859]
33. Hicks A, Comp S, Horovitz J, Hovarter M, Miki M, Bevan J. Why people use Yelp.com: An exploration of uses andgratifications. Comput Hum Behav 2012 Nov;28(6):2274-2279. [doi: 10.1016/j.chb.2012.06.034]
34. Sussman S, Garcia R, Cruz TB, Baezconde-Garbanati L, Pentz MA, Unger JB. Consumers' perceptions of vape shops inSouthern California: An analysis of online Yelp reviews. Tob Induc Dis 2014;12(1):22 [FREE Full text] [doi:10.1186/s12971-014-0022-7] [Medline: 25484852]
35. 10 Things You Should Know About Yelp. URL: http://www.yelp.com/about [accessed 2015-06-09] [WebCite Cache ID6ZA8HmAqJ]
36. Competitive Intelligence. Yelp.com Site Overview. URL: http://www.alexa.com/siteinfo/yelp.com [accessed 2015-06-09][WebCite Cache ID 6ZA9Hpdel]
37. United States Census Bureau. 2014 U.S. Gazetteer files. [Data set]. 2014. URL: https://www.census.gov/geo/maps-data/data/gazetteer2014.html [accessed 2015-06-09] [WebCite Cache ID 6ZA9EvslA]
38. Buchholz N, Resnick S, Konty K. The New York City Community Health Survey Atlas, 2010. New York: The New YorkCity Department of Health and Mental Hygeine; 2012. URL: http://www.nyc.gov/html/doh/downloads/pdf/epi/nyc_comhealth_atlas10.pdf [accessed 2015-03-30] [WebCite Cache ID 6ZA8BLQgr]
39. Noonan D. Exemptions for hookah bars in clean indoor air legislation: A public health concern. Public Health Nurs2010;27(1):49-53. [doi: 10.1111/j.1525-1446.2009.00826.x] [Medline: 20055968]
40. Maziak W, Taleb ZB, Bahelah R, Islam F, Jaber R, Auf R, et al. The global epidemiology of waterpipe smoking. TobControl 2015 Mar;24 Suppl 1:i3-i12 [FREE Full text] [doi: 10.1136/tobaccocontrol-2014-051903] [Medline: 25298368]
41. Barnett TE, Smith T, He Y, Soule EK, Curbow BA, Tomar SL, et al. Evidence of emerging hookah use among universitystudents: A cross-sectional comparison between hookah and cigarette use. BMC Public Health 2013;13:302 [FREE Fulltext] [doi: 10.1186/1471-2458-13-302] [Medline: 23560649]
42. New York City Department of City Planning. Population Growth and Race/Hispanic Composition. New York: New YorkCity Department of City Planning URL: http://www.nyc.gov/html/dcp/pdf/census/nyc20001.pdf [accessed 2015-06-09][WebCite Cache ID 6ZA85aca7]
43. Museum N, Kayal P, York M, Benson K. A Community of Many Worlds: Arab Americans in New York City. New York:Museum of the City of New York; 2002.
44. Rice VH, Weglicki LS, Templin T, Hammad A, Jamil H, Kulwicki A. Predictors of Arab American adolescent tobaccouse. Merrill Palmer Q (Wayne State Univ Press) 2006 Apr;52(2):327-342 [FREE Full text] [Medline: 16909165]
45. Lauterstein D, Hoshino R, Gordon T, Watkins B, Weitzman M, Zelikoff J. The changing face of tobacco use among UnitedStates youth. Curr Drug Abuse Rev 2014;7(1):29-43 [FREE Full text] [Medline: 25323124]
46. Primack BA, Aronson JD, Agarwal AA. An old custom, a new threat to tobacco control. Am J Public Health 2006Aug;96(8):1339. [doi: 10.2105/AJPH.2006.090381] [Medline: 16809578]
47. Sterling KL, Mermelstein R. Examining hookah smoking among a cohort of adolescent ever smokers. Nicotine Tob Res2011 Dec;13(12):1202-1209 [FREE Full text] [doi: 10.1093/ntr/ntr146] [Medline: 21896886]
48. Primack BA, Hopkins M, Hallett C, Carroll MV, Zeller M, Dachille K, et al. US health policy related to hookah tobaccosmoking. Am J Public Health 2012 Sep;102(9):e47-e51 [FREE Full text] [doi: 10.2105/AJPH.2012.300838] [Medline:22827447]
49. Kadry B, Chu LF, Kadry B, Gammas D, Macario A. Analysis of 4999 online physician ratings indicates that most patientsgive physicians a favorable rating. J Med Internet Res 2011;13(4):e95 [FREE Full text] [doi: 10.2196/jmir.1960] [Medline:22088924]
50. Ellimoottil C, Kadlec AO, Farooq A, Quek ML. Choosing a physician in the Yelp era. Bull Am Coll Surg 2013Nov;98(11):20-21. [Medline: 24313135]
51. Bakhsh W, Mesfin A. Online ratings of orthopedic surgeons: Analysis of 2185 reviews. Am J Orthop (Belle Mead NJ)2014 Aug;43(8):359-363. [Medline: 25136868]
52. Booth D. Yelp partners with health departments to improve food safety. J Environ Health 2014 Apr;76(8):52-55. [Medline:24749227]
JMIR Public Health Surveill 2015 | vol. 1 | iss. 2 | e19 | p.154http://publichealth.jmir.org/2015/2/e19/(page number not for citation purposes)
Cawkwell et alJMIR PUBLIC HEALTH AND SURVEILLANCE
XSL•FORenderX
53. Nsoesie EO, Kluberg SA, Brownstein JS. Online reports of foodborne illness capture foods implicated in official foodborneoutbreak reports. Prev Med 2014 Oct;67:264-269 [FREE Full text] [doi: 10.1016/j.ypmed.2014.08.003] [Medline: 25124281]
54. The New York City Department of Health and Mental Hygiene. Undercover Health Department Investigation Found 13Hookah Bars in Violation of the Smoke-Free Air Act. New York: The New York City Department of Health and MentalHygiene; 2015 Jan 7. URL: http://www.nyc.gov/html/doh/html/pr2015/pr001-15.shtml [accessed 2015-06-09] [WebCiteCache ID 6ZA7xMpvV]
Edited by G Eysenbach; submitted 09.06.15; peer-reviewed by Y Wang, W Luo; comments to author 29.07.15; revised version received09.08.15; accepted 22.09.15; published 20.11.15.
Please cite as:Cawkwell PB, Lee L, Weitzman M, Sherman SETracking Hookah Bars in New York: Utilizing Yelp as a Powerful Public Health ToolJMIR Public Health Surveill 2015;1(2):e19URL: http://publichealth.jmir.org/2015/2/e19/ doi:10.2196/publichealth.4809PMID:27227137
©Philip B Cawkwell, Lily Lee, Michael Weitzman, Scott E Sherman. Originally published in JMIR Public Health and Surveillance(http://publichealth.jmir.org), 20.11.2015. This is an open-access article distributed under the terms of the Creative CommonsAttribution License (http://creativecommons.org/licenses/by/2.0/), which permits unrestricted use, distribution, and reproductionin any medium, provided the original work, first published in JMIR Public Health and Surveillance, is properly cited. The completebibliographic information, a link to the original publication on http://publichealth.jmir.org, as well as this copyright and licenseinformation must be included.
JMIR Public Health Surveill 2015 | vol. 1 | iss. 2 | e19 | p.155http://publichealth.jmir.org/2015/2/e19/(page number not for citation purposes)
Cawkwell et alJMIR PUBLIC HEALTH AND SURVEILLANCE
XSL•FORenderX

Original Paper
Patient-Reported Outcomes and Total Health Care Expenditurein Prediction of Patient Satisfaction: Results From a National Study
Man Hung1,2,3,4,5,6, PhD; Weiping Zhang4, PhD; Wei Chen5, PhD; Jerry Bounsanga1; Christine Cheng1; Jeremy D
Franklin6, PhD; Anthony B Crum1, BS; Maren W Voss1, MS; Shirley D Hon1
1Department of Orthopaedics, University of Utah, Salt Lake City, UT, United States2Division of Public Health, University of Utah, Salt Lake City, UT, United States3School of Business, University of Utah, Salt Lake City, UT, United States4School of Medicine, University of Utah, Salt Lake City, UT, United States5Division of Epidemiology, University of Utah, Salt Lake City, UT, United States6College of Education, University of Utah, Salt Lake City, UT, United States
Corresponding Author:Man Hung, PhDDepartment of OrthopaedicsUniversity of Utah590 Wakara WaySalt Lake City, UT, 84108United StatesPhone: 1 801 587 5372Fax: 1 801 587 5411Email: [email protected]
Abstract
Background: Health care quality is often linked to patient satisfaction. Yet, there is a lack of national studies examining therelationship between patient satisfaction, patient-reported outcomes, and medical expenditure.
Objective: The aim of this study is to examine the contribution of physical health, mental health, general health, and total healthcare expenditures to patient satisfaction using a longitudinal, nationally representative sample.
Methods: Using data from the 2010-2011 Medical Expenditure Panel Survey, analyses were conducted to predict patientsatisfaction from patient-reported outcomes and total health care expenditures. The study sample consisted of adult participants(N=10,157), with sampling weights representative of 233.26 million people in the United States.
Results: The results indicated that patient-reported outcomes and total health care expenditure were associated with patientsatisfaction such that higher physical and mental function, higher general health status, and higher total health care expenditurewere associated with higher patient satisfaction.
Conclusions: We found that patient-reported outcomes and total health care expenditure had a significant relationship withpatient satisfaction. As more emphasis is placed on health care value and quality, this area of research will become increasinglyneeded and critical questions should be asked about what we value in health care and whether we can find a balance betweenpatient satisfaction, outcomes, and expenditures. Future research should apply big data analytics to investigate whether there isa differential effect of patient-reported outcomes and medical expenditures on patient satisfaction across different medicalspecialties.
(JMIR Public Health Surveill 2015;1(2):e13) doi:10.2196/publichealth.4360
KEYWORDS
health care quality; value; expenditure; cost; medical outcomes; patient satisfaction; Medical Expenditure Panel Survey;patient-reported outcomes; Affordable Care Act; big data analytics
JMIR Public Health Surveill 2015 | vol. 1 | iss. 2 | e13 | p.156http://publichealth.jmir.org/2015/2/e13/(page number not for citation purposes)
Hung et alJMIR PUBLIC HEALTH AND SURVEILLANCE
XSL•FORenderX
Introduction
Value-based health care has become a buzzword for health carereforms across the globe. In the United States, the AffordableCare Act has placed huge emphasis on health care value andquality [1]. Although it has yet to be clearly defined, health carequality is often linked to patient satisfaction [2-4]. Beginningon October 1, 2012, the Center for Medicare & MedicaidServices (CMS) has tied Medicare reimbursements with patientsatisfaction, as measured by the Hospital Consumer Assessmentof Healthcare Providers and Systems (CAHPS) survey. TheCAHPS survey measures the following 5 aspects of patientsatisfaction or perception of health care experiences: (1) accessto care, (2) provider communication, (3) coordination of care,(4) shared decision-making, and (5) the office staff.Additionally, it contains a global rating item on patientsatisfaction. The results of the patient satisfaction survey areestimated to put a hospital at risk of US $500,000 to US$850,000 on average for Medicare reimbursement [5]. Thestakes are high with patient satisfaction, but how can we improvepatient satisfaction and what are the predictors of patientsatisfaction?
One question is "what constitutes value in health care?" Porterposited that health care value is linked to patient-reportedoutcomes (PROs) and expenditures [6]. PROs are patients’self-reported health status based on their perceptions of theirhealth conditions. PROs, in addition to information from clinicalassessments, have become a critical component of medicalassessment by directly receiving information from the patient’sperspective [7]. Some argue that understanding PROs is criticalto understanding patient satisfaction [8]. PRO instruments, suchas SF-12 v2, can measure various outcomes including physicalhealth, mental health, and general health.
While PROs have become increasingly important in assessinghealth care value, the second part of the value equation is costor expenditures in health care. Prior research has showed mixedfindings between expenditures and patient satisfaction [9-12].Fenton et al [11] found that higher inpatient utilization, loweremergency department utilization, higher total medicalexpenditures, higher prescription drug expenditures, and feweremergency visits are associated with higher patient satisfaction.However, a review of the literature found no consistentrelationship and the majority of studies only found a smallassociation between expenditures and satisfaction [10].
Research has suggested that a number of sociodemographiccharacteristics correlate with patient satisfaction, but there isnot a strong consensus [13]. Several studies demonstrated thatolder patients, patients with better functional status, and clearercommunication from doctors are related to greater patientsatisfaction [9,11,14-16]. Rahmqvist and Bara [17] also foundthat older patients were more satisfied than younger patients[17], yet critiques suggested that the magnitude of age as apredictor of satisfaction is small [18]. Additionally, greaterpatient satisfaction has been associated with lower levels ofeducation and income [17-19]. However, Hall and Dornan [18]found no relationship among income, ethnicity, sex, or familysize with patient satisfaction.
Although sociodemographics and other nonmodifiablecharacteristics may influence patient satisfaction, they are notvery useful for implementing changes in health care. Modifiablecharacteristics such as patient outcomes and health careexpenditures are more useful for attaining actionable changesand reform in health care, yet there is a shortage of research inthis area. There is also a lack of longitudinal, national studiesexamining the relationship between PROs, medical expenditures,and patient satisfaction. This study aims to fill this gap byinvestigating this relationship using a longitudinal, nationallyrepresentative sample, adjusting for various sociodemographicsand health-related characteristics.
Methods
Study Design
OverviewData from the longitudinal study of adult respondents to the2010-2011 longitudinal panel Medical Expenditures PanelSurvey (MEPS) [20] served as a basis for the comprehensiveassessment of health care value and health care quality in thisstudy. The MEPS is a nationally representative survey,sponsored by the Agency for Healthcare Research and Quality,which measures access, use, and cost of health care services.The survey consists of 3 major components, namely, (1) thehousehold, (2) the medical provider, and (3) insurance. Thehousehold component samples were drawn from the respondentsto the National Health Interview Survey by the National Centerfor Health Statistics. This study utilized data from the householdcomponent and included respondents aged 18 years or older. Alist of all the variables used in this study is shown in MultimediaAppendix 1, and Multimedia Appendix 2 contains all of thecovariates included in the analyses. Capitalizing on MEPS’slongitudinal panel survey design, we sought to predict patientsatisfaction from PROs and total health care expenditures,controlling for demographics, prior health status, and clinicalcharacteristics.
Medical ExpendituresThe MEPS collects data on various categories of medicalexpenditures such as prescription drugs, emergency patientvisits, and inpatient hospital stays. The variable total expenditureis an aggregate of medical expenditures in various categories.In this study, we used total health care expenditures (EXP) fromYear 1 (2010) as an independent variable.
Patient-Reported OutcomesThe MEPS also contains PROs data. Specifically, it containsdata from the SF-12v2, which measures patients’ self-reportedfunctional health status and well-being. The SF-12v2’s physicalhealth component score (PCS), the mental health componentscore (MCS), and the general health perceptions (GH) scorefrom Year 1 were also included as independent variables in thisstudy. The PCS and MCS possible scores range from 0 (worsthealth) to 100 (best health). To put GH in the same direction asthe PCS and MCS scoring, we reverse coded the original GHsuch that the possible scores range from 1 (worst health) to 5(best health).
JMIR Public Health Surveill 2015 | vol. 1 | iss. 2 | e13 | p.157http://publichealth.jmir.org/2015/2/e13/(page number not for citation purposes)
Hung et alJMIR PUBLIC HEALTH AND SURVEILLANCE
XSL•FORenderX

Patient SatisfactionWe used the CAHPS’s single-item global rating of satisfactionin Year 2 (2011) as a dependent variable. This global patientsatisfaction item (SAT) reflects patients’ rating of their healthcare from all physicians and health care providers in the last 12months when the patients were taking the survey. It is not arecall of a certain visit at a specific time (eg, at 3 month or 5months ago), rather it represents a patient's average experienceof all health care encounters within the last 12 months. Thepossible scores range from 0 (worst health care possible) to 10(best health care possible). The survey was administered usingcomputer-assisted personal interviewing technology.
CovariatesBased on a literature review, we identified a list of potentialconfounders from the MEPS data to be the covariates andadjusted for them when investigating the contribution of PROsand total health care expenditure to patient satisfaction. The listof potential confounders is included in Multimedia Appendix2, which contains patients’ age, sex, education, race, ethnicity,income, insurance coverage, provider characteristics, prior healthstatus, and different clinical conditions. The covariates selectedfor the regression analyses were confounders that showedsignificant associations with patient satisfaction.
Data AnalysisThe MEPS utilized a multistage, probability clustering sampledesign that enabled comprehensive examination of the USpopulation. The sampling weight, stratification, clustering,multiple stages of selection, and disproportionate sampling fromthe MEPS were taken into account in the analyses so that thefindings reported represented the entire US population. Samplingweight took into account the differential probability of sample
selection and adjusted for nonresponses and missing data.Descriptive statistics were conducted to examine SAT, PCS,MCS, GH scores, EXP, and different service categories ofmedical expenditures across clinical conditions. We alsoperformed descriptive statistics on all potential confoundersand flagged those that had significant associations with patientsatisfaction to be included as covariates in subsequent regressionanalyses.
To investigate the contribution of PCS, MCS, GH, and EXP onpatient satisfaction, we conducted logistic regressions withadjustment of covariates and reported the odds ratio withassociated 95% CI. We recoded the PROs, satisfaction, andexpenditure variables into low/high SAT, PCS, MCS, GH, andEXP prior to running the logistic regressions. All statistical testswere two sided, were set at an alpha level of .05, and wereconducted using SAS 9.3. Institutional review board (IRB)and/or ethics committee approval was not required as the MEPSdata are freely available to the general public online.
Results
DemographicsThe entire study sample consisted of adult participants(N=10,157), which represented 233.26 million adults (aged ≥18 years) in the United States. The mean age was 47 years (SE0.28, range 18-85). Approximately 52% (121 million/233.26million) were female and the majority were white (81%, 188million/233.26 million) and black (12%, 27 million/233.26million). About 15% (34 million/233.26 million) were Hispanic,approximately 34% (79 million/233.26 million) wereunemployed, and nearly 12% (27 million/233.26 million) spokenon-English at home (Table 1).
JMIR Public Health Surveill 2015 | vol. 1 | iss. 2 | e13 | p.158http://publichealth.jmir.org/2015/2/e13/(page number not for citation purposes)
Hung et alJMIR PUBLIC HEALTH AND SURVEILLANCE
XSL•FORenderX

Table 1. Demographics of the sample from MEPS (weighted N=233.26 million; unweighted N=10,157).
UnweightedWeighted
%n (millions)%n (millions)Variable
Sex
72.3238548.3113Male
27.791651.7121Female
Race
69.5706080.7188White
19.6199211.727Black
0.8840.72American Indian/Alaskan native
7.98055.112Asian
0.7720.72Native Hawaiian/Pacific Islander
1.41441.13Multiple races
Ethnicity
24.4247514.534Hispanic
19.2195011.427Black (not Hispanic or another race)
7.87945.012Asian (not Hispanic or another race)
48.6493869.1161Other race (not Hispanic or anotherrace)
Hispanic
24.4247514.534Hispanic
75.6768285.5200Not Hispanic
Employment status
63.9646566.2154Employed
36.1365333.879Not employed
Marital status
50.9517253.4124Married
6.06126.315Widowed
11.5117311.326Divorced
3.13122.35Separated
28.4288826.862Never married
Currently smoke
18.5173218.339Yes
81.5760681.7176No
Language spoken athome
79.2800988.3205English
15.415558.119Spanish
5.45423.68Another language
Highest level of educa-tion
20.0198613.431High school or less with no degree
32.5323929.969High-school graduate or GED
23.7235926.962Associates degree, beyond college,but no degree
JMIR Public Health Surveill 2015 | vol. 1 | iss. 2 | e13 | p.159http://publichealth.jmir.org/2015/2/e13/(page number not for citation purposes)
Hung et alJMIR PUBLIC HEALTH AND SURVEILLANCE
XSL•FORenderX

UnweightedWeighted
%n (millions)%n (millions)Variable
16.0159619.445Bachelor's degree
7.877710.424Master's, PhD, or professional degree
This nationally representative adult population had a numberof health conditions. About 32% (74.97 million/233.09 million)had high blood pressure and 5% (12.31 million/233.11 million)had coronary heart disease. Approximately 4% (8.52million/233.20 million) had previously experienced a stroke.Almost 30% (70.59 million/233.07 million) had high cholesteroland 24% (56.34 million/233.18 million) had arthritis. Therewere 10% (23.48 million/233.20 million) diagnosed with cancer.
The sample population visited a variety of providers; however,most visited a general/family practice physician (71%, 60.69million/86.00 million) and internal medicine physicians (20%,17.10 million/86.00 million) within the last 12 months. About68% (101.57 million/150.09 million) stated that their providersalways showed respect for their treatment, whereas 3% (3.89million/150.09 million) stated that their providers never showedrespect. Almost 96% (161.35 million/168.25 million) indicatedthat their providers explained treatment options but 4% (6.90million/168.25 million) did not. Approximately 67% (156.18
million/233.26 million) had private insurance, 18% (41.31million/233.26 million) had public health insurance, whereasover 15% (35.77 million/233.26 million) were uninsured. Adetailed breakdown of the number of responses for each variableis not provided here but can be obtained by contacting theauthors.
Medical ExpendituresThe 2010 annual total health care expenditure in the US wasover US $1.11 trillion and the average total health careexpenditure per adult was US $4752.39 (Table 2). The totalmedical expenditures for emergency visits, hospital stay, dentalcare, and prescription drugs were US $7.17 billion, US $41.21billion, US $62.87 billion, and US $252.45 billion, respectively.The US medical expenditures, by major service categories, bydisease conditions are displayed in Table 2. Table 3 presentsthe descriptive statistics for medical expenditure, outcomes,and patient satisfaction.
JMIR Public Health Surveill 2015 | vol. 1 | iss. 2 | e13 | p.160http://publichealth.jmir.org/2015/2/e13/(page number not for citation purposes)
Hung et alJMIR PUBLIC HEALTH AND SURVEILLANCE
XSL•FORenderX
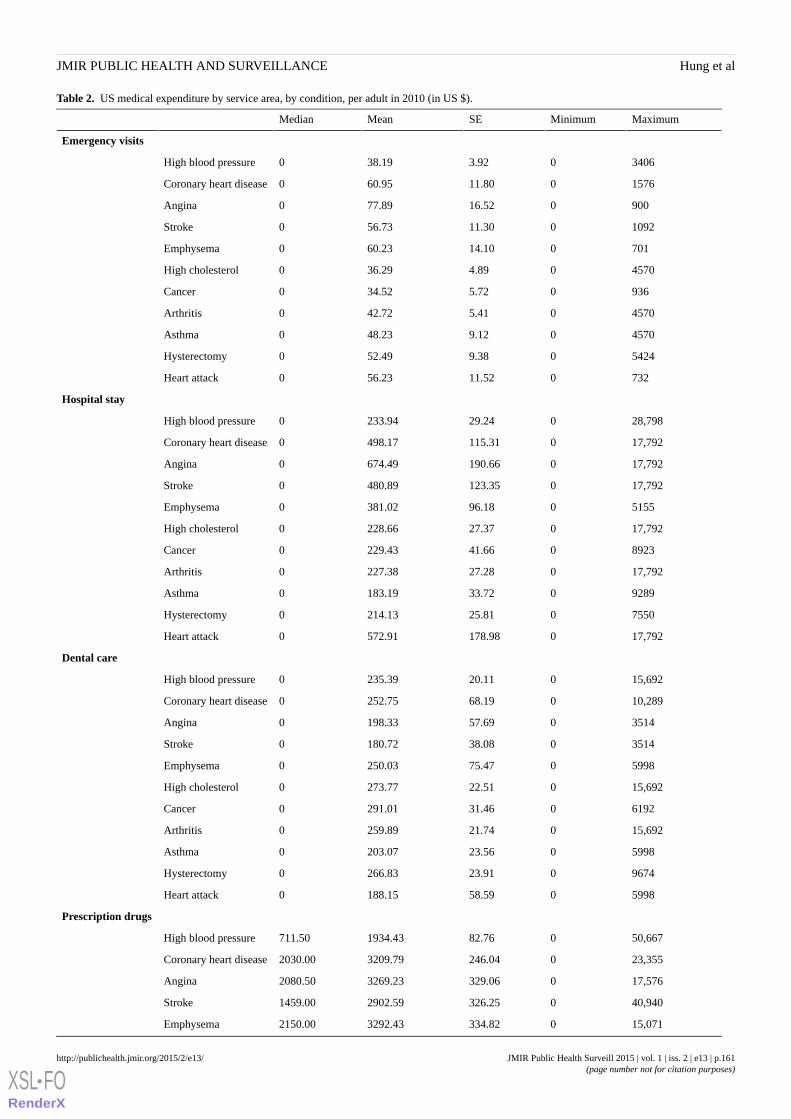
Table 2. US medical expenditure by service area, by condition, per adult in 2010 (in US $).
MaximumMinimumSEMeanMedian
Emergency visits
340603.9238.190High blood pressure
1576011.8060.950Coronary heart disease
900016.5277.890Angina
1092011.3056.730Stroke
701014.1060.230Emphysema
457004.8936.290High cholesterol
93605.7234.520Cancer
457005.4142.720Arthritis
457009.1248.230Asthma
542409.3852.490Hysterectomy
732011.5256.230Heart attack
Hospital stay
28,798029.24233.940High blood pressure
17,7920115.31498.170Coronary heart disease
17,7920190.66674.490Angina
17,7920123.35480.890Stroke
5155096.18381.020Emphysema
17,792027.37228.660High cholesterol
8923041.66229.430Cancer
17,792027.28227.380Arthritis
9289033.72183.190Asthma
7550025.81214.130Hysterectomy
17,7920178.98572.910Heart attack
Dental care
15,692020.11235.390High blood pressure
10,289068.19252.750Coronary heart disease
3514057.69198.330Angina
3514038.08180.720Stroke
5998075.47250.030Emphysema
15,692022.51273.770High cholesterol
6192031.46291.010Cancer
15,692021.74259.890Arthritis
5998023.56203.070Asthma
9674023.91266.830Hysterectomy
5998058.59188.150Heart attack
Prescription drugs
50,667082.761934.43711.50High blood pressure
23,3550246.043209.792030.00Coronary heart disease
17,5760329.063269.232080.50Angina
40,9400326.252902.591459.00Stroke
15,0710334.823292.432150.00Emphysema
JMIR Public Health Surveill 2015 | vol. 1 | iss. 2 | e13 | p.161http://publichealth.jmir.org/2015/2/e13/(page number not for citation purposes)
Hung et alJMIR PUBLIC HEALTH AND SURVEILLANCE
XSL•FORenderX
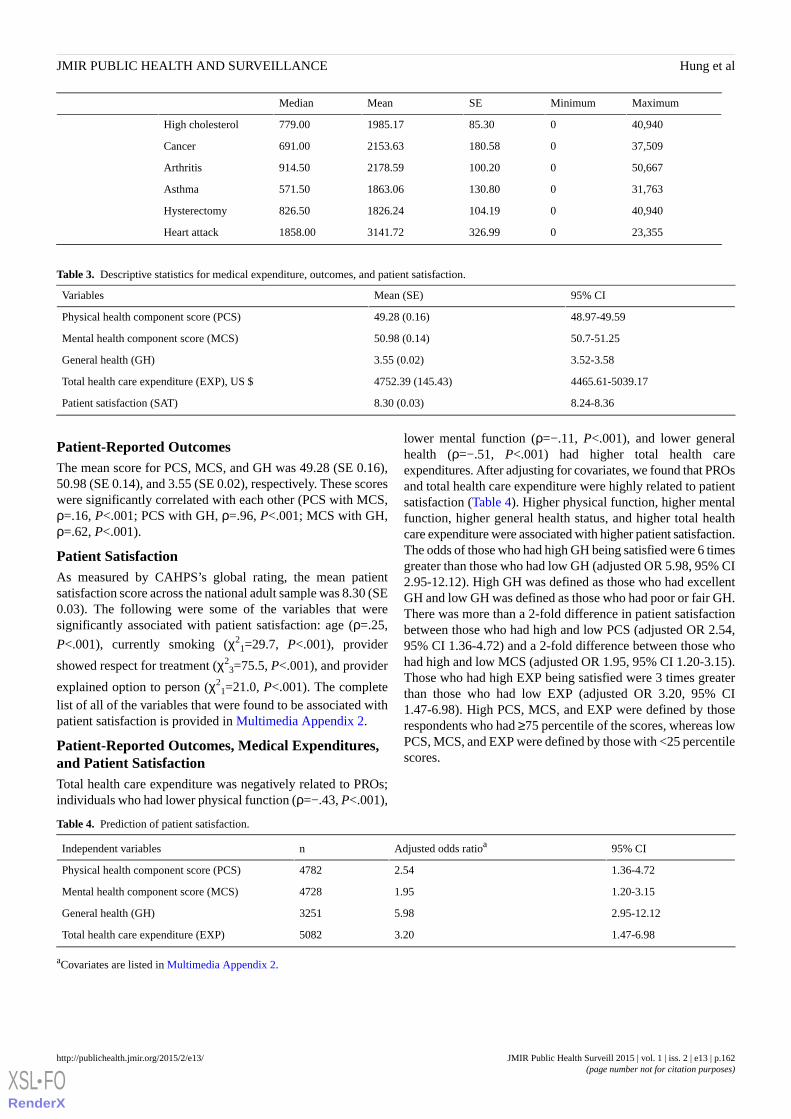
MaximumMinimumSEMeanMedian
40,940085.301985.17779.00High cholesterol
37,5090180.582153.63691.00Cancer
50,6670100.202178.59914.50Arthritis
31,7630130.801863.06571.50Asthma
40,9400104.191826.24826.50Hysterectomy
23,3550326.993141.721858.00Heart attack
Table 3. Descriptive statistics for medical expenditure, outcomes, and patient satisfaction.
95% CIMean (SE)Variables
48.97-49.5949.28 (0.16)Physical health component score (PCS)
50.7-51.2550.98 (0.14)Mental health component score (MCS)
3.52-3.583.55 (0.02)General health (GH)
4465.61-5039.174752.39 (145.43)Total health care expenditure (EXP), US $
8.24-8.368.30 (0.03)Patient satisfaction (SAT)
Patient-Reported OutcomesThe mean score for PCS, MCS, and GH was 49.28 (SE 0.16),50.98 (SE 0.14), and 3.55 (SE 0.02), respectively. These scoreswere significantly correlated with each other (PCS with MCS,ρ=.16, P<.001; PCS with GH, ρ=.96, P<.001; MCS with GH,ρ=.62, P<.001).
Patient SatisfactionAs measured by CAHPS’s global rating, the mean patientsatisfaction score across the national adult sample was 8.30 (SE0.03). The following were some of the variables that weresignificantly associated with patient satisfaction: age (ρ=.25,
P<.001), currently smoking (χ21=29.7, P<.001), provider
showed respect for treatment (χ23=75.5, P<.001), and provider
explained option to person (χ21=21.0, P<.001). The complete
list of all of the variables that were found to be associated withpatient satisfaction is provided in Multimedia Appendix 2.
Patient-Reported Outcomes, Medical Expenditures,and Patient SatisfactionTotal health care expenditure was negatively related to PROs;individuals who had lower physical function (ρ=−.43, P<.001),
lower mental function (ρ=−.11, P<.001), and lower generalhealth (ρ=−.51, P<.001) had higher total health careexpenditures. After adjusting for covariates, we found that PROsand total health care expenditure were highly related to patientsatisfaction (Table 4). Higher physical function, higher mentalfunction, higher general health status, and higher total healthcare expenditure were associated with higher patient satisfaction.The odds of those who had high GH being satisfied were 6 timesgreater than those who had low GH (adjusted OR 5.98, 95% CI2.95-12.12). High GH was defined as those who had excellentGH and low GH was defined as those who had poor or fair GH.There was more than a 2-fold difference in patient satisfactionbetween those who had high and low PCS (adjusted OR 2.54,95% CI 1.36-4.72) and a 2-fold difference between those whohad high and low MCS (adjusted OR 1.95, 95% CI 1.20-3.15).Those who had high EXP being satisfied were 3 times greaterthan those who had low EXP (adjusted OR 3.20, 95% CI1.47-6.98). High PCS, MCS, and EXP were defined by thoserespondents who had ≥75 percentile of the scores, whereas lowPCS, MCS, and EXP were defined by those with <25 percentilescores.
Table 4. Prediction of patient satisfaction.
95% CIAdjusted odds ratioanIndependent variables
1.36-4.722.544782Physical health component score (PCS)
1.20-3.151.954728Mental health component score (MCS)
2.95-12.125.983251General health (GH)
1.47-6.983.205082Total health care expenditure (EXP)
aCovariates are listed in Multimedia Appendix 2.
JMIR Public Health Surveill 2015 | vol. 1 | iss. 2 | e13 | p.162http://publichealth.jmir.org/2015/2/e13/(page number not for citation purposes)
Hung et alJMIR PUBLIC HEALTH AND SURVEILLANCE
XSL•FORenderX
Discussion
Principal FindingsThe purpose of this study was to investigate the contribution ofphysical health, mental health, general health, and total healthcare expenditures to patient satisfaction. We found that higherscores of physical health, mental health, and general health wererelated to higher scores of patient satisfaction. Consistent withprevious research, we found that some factors such as age andprovider interactions could impact patient satisfaction.Additionally, total health care expenditure was associated withpatient satisfaction. Taken together, findings from this studycan help providers, payers, policy makers, and the general publicbetter understand the relationship between PROs, health careexpenditures, and satisfaction.
General health demonstrated the strongest relationship withpatient satisfaction. After accounting for demographics andvarious factors, we see that greater patient satisfaction is directlyrelated to greater physical and mental health, although therelationship is stronger with physical health. The argument thatthe relation between higher patient satisfaction and better healthis an artifact of the tendency of healthy patients to be satisfiedis not new [21]. This stresses the importance of controlling forprior health status as we did in this study and with the inclusionof prior clinical conditions into the model. Previous researchfound that a functional measure of health predicted greatersatisfaction levels immediately following the medical treatment[9]. Differing research results regarding the impact of patientsatisfaction on health have been partially attributed todifferences in how risk or health have been assessed as well asthe time frame as to when the satisfaction scores were gathered[22]. It may be that individuals who are in poor health have tovisit a physician more often, increasing the likelihood of a bador unsatisfactory visit. Prior experience with health care, alongwith age and mental status variables had been shown to impactpatient expectations [23]. Our study emphasizes the importanceof controlling for prior health status, prior health careexperience, nonmodifiable characteristics, and patientexpectations when assessing the effect of patient satisfaction.
Mental health often goes unnoticed or it is dismissed as someonehaving a bad day. Both identifying mental health issues andaddressing problems require training that goes beyond that ofa general physician. As a result, a patient or a provider oftenneeds to raise a concern about mental health. A stigma stillexists about discussing and treating mental health issues, whichmay lead patients to be less willing to discuss mental healthconditions. Seeing a mental health specialist adds an additionalcost for patients that they may want to avoid. Finally, patientsmight not even notice that they have mental health issues. Thesemay be reasons why mental health is a weaker predictor ofpatient satisfaction than physical health.
A surprising finding was that total health care expenditures alsohad a significant relation to patient satisfaction. In a recentreview of health care quality, only one third of the 61 studiesreviewed found a positive association between higher spendingand better health care quality [10], but did not address patientsatisfaction directly as a measure of quality. While our findings
add to the body of research that suggests an association betweenspending and patient satisfaction [11], it contradicts otherresearch that states there is no association [9,24]. It is possiblethat initiatives that improve PROs and control cost at the sametime contribute to patient satisfaction. Instead of raising healthcare expenditures, health policy makers and providers shouldattend to modifiable characteristics that are within their controlsuch as providers showing respect and providers explainingtreatment options to enhance PROs and thus, patient satisfaction.
LimitationsWe were limited by the measurement tools in the MEPS, thuslimiting the data we could use to measure physical, mental, andgeneral health. Newer instruments have been developed usingadvanced techniques and these instruments may have betterpsychometric properties than instruments included in MEPS.The MEPS was administered using computer-assisted personalinterviewing technology and the results obtained from this modeof survey administration may be different from those obtainedfrom other modes. Care needs to be taken when doingcross-comparisons of results from different modes in differentstudies. Furthermore, the definition of health care expendituresreflects the CMS’s definition but might not represent a completeassessment of medical expenditures. We were not able to lookat diseases that were not included in MEPS. Even though wehad adjusted for nonresponses and missing data in the sample,such adjustment could only be made to a certain degree. Theadjustment might not be adequate in the event thatnonrespondents differed from respondents. It is well-knownthat there could be a larger share of nonrespondents havingsevere illness, impairment, and dealing with poor socialeconomic conditions on a daily basis. Additionally, the majorityof the population is white, but within the past few years, theUnited States has seen a growth of racial and ethnic diversity.Therefore, our findings might not represent underrepresentedminorities at this moment in time.
Finally, the concept of patient satisfaction lacks a clearconnotation and definition in the literature. It has sometimesbeen considered as a component of consumer marketing [6] thatmeasures important customer service qualities within the realmof health care. These qualities include effective providercommunication, support from physicians, waiting time,fulfillment of patient requests, staff integrity, and shareddecision making, and represent multiple dimensions of patientsatisfaction. Together, these dimensions of patient satisfactionconstitute a patient’s overall health care experience. It is thisoverall patient health care experience that this study used todefine patient satisfaction. It is likely that we were notaccounting for everything that comprises patient satisfaction.In the future it would be beneficial to collect different aspectsof patient satisfaction data and examine them under a differentlens.
Future Research DirectionsFuture research should consider other modifiable characteristicsthat may influence patient satisfaction so that changes can beenacted. Often, underrepresented minorities have differentexperiences with health care than European Americans.Therefore, investigating their perspectives may illuminate group
JMIR Public Health Surveill 2015 | vol. 1 | iss. 2 | e13 | p.163http://publichealth.jmir.org/2015/2/e13/(page number not for citation purposes)
Hung et alJMIR PUBLIC HEALTH AND SURVEILLANCE
XSL•FORenderX
differences. Finally, future research should apply businessintelligence or big data analytics to investigate whether thereis a differential effect of PROs and medical expenditures onpatient satisfaction across different medical areas.
ConclusionsWe found that PROs and total health care expenditure had astrong relationship with patient satisfaction. As more emphasis
is placed on health care value and quality, this area of researchwill become increasingly needed. Critical questions should beasked about what we value in health care and whether we canfind a balance between patient satisfaction, outcomes, andexpenditures. These questions need to be asked to policy makers,physicians, patients, insurers, and the general public.
Conflicts of InterestNone declared.
Multimedia Appendix 1List of all MEPS variables examined in this study.
[PDF File (Adobe PDF File), 144KB - publichealth_v1i2e13_app1.pdf ]
Multimedia Appendix 2Association between patient satisfaction and potential confounders. Variables are rank listed with the strongest relations to patientsatisfaction at the top and the lowest relations at the bottom.
[PDF File (Adobe PDF File), 313KB - publichealth_v1i2e13_app2.pdf ]
References1. Reineck LA, Kahn JM. Quality measurement in the Affordable Care Act: a reaffirmed commitment to value in health care.
Am J Respir Crit Care Med 2013 May 15;187(10):1038-1039. [doi: 10.1164/rccm.201302-0404ED] [Medline: 23675709]2. Sequist TD, Schneider EC, Anastario M, Odigie EG, Marshall R, Rogers WH, et al. Quality monitoring of physicians:
linking patients' experiences of care to clinical quality and outcomes. J Gen Intern Med 2008 Nov;23(11):1784-1790 [FREEFull text] [doi: 10.1007/s11606-008-0760-4] [Medline: 18752026]
3. Kupfer JM, Bond EU. Patient satisfaction and patient-centered care: necessary but not equal. JAMA 2012 Jul11;308(2):139-140. [doi: 10.1001/jama.2012.7381] [Medline: 22782413]
4. Glickman SW, Boulding W, Manary M, Staelin R, Roe MT, Wolosin RJ, et al. Patient satisfaction and its relationship withclinical quality and inpatient mortality in acute myocardial infarction. Circ Cardiovasc Qual Outcomes 2010 Mar;3(2):188-195[FREE Full text] [doi: 10.1161/CIRCOUTCOMES.109.900597] [Medline: 20179265]
5. Buhlman N, Matthes N. White Papers. South Bend, IN: Press Ganey; 2011 May 01. The time to prepare for value-basedpurchasing is now URL: http://pressganey.com/Documents_secure/White%20Papers/VBP_TimeToPrepareIsNow.pdf[accessed 2015-09-16] [WebCite Cache ID 6bZg5Noz3]
6. Porter ME. What is value in health care? N Engl J Med 2010 Dec 23;363(26):2477-2481. [doi: 10.1056/NEJMp1011024][Medline: 21142528]
7. Deshpande PR, Rajan S, Sudeepthi BL, Abdul Nazir CP. Patient-reported outcomes: a new era in clinical research. PerspectClin Res 2011 Oct;2(4):137-144 [FREE Full text] [doi: 10.4103/2229-3485.86879] [Medline: 22145124]
8. Manary MP, Boulding W, Staelin R, Glickman SW. The patient experience and health outcomes. N Engl J Med 2013 Jan17;368(3):201-203. [doi: 10.1056/NEJMp1211775] [Medline: 23268647]
9. Jackson JL, Chamberlin J, Kroenke K. Predictors of patient satisfaction. Soc Sci Med 2001 Feb;52(4):609-620. [Medline:11206657]
10. Hussey PS, Wertheimer S, Mehrotra A. The association between health care quality and cost: a systematic review. AnnIntern Med 2013 Jan 1;158(1):27-34. [doi: 10.7326/0003-4819-158-1-201301010-00006] [Medline: 23277898]
11. Fenton JJ, Jerant AF, Bertakis KD, Franks P. The cost of satisfaction: a national study of patient satisfaction, health careutilization, expenditures, and mortality. Arch Intern Med 2012 Mar 12;172(5):405-411. [doi:10.1001/archinternmed.2011.1662] [Medline: 22331982]
12. Cohen JW, Monheit AC, Beauregard KM, Cohen SB, Lefkowitz DC, Potter DE, et al. The Medical Expenditure PanelSurvey: a national health information resource. Inquiry 1996;33(4):373-389. [Medline: 9031653]
13. Sitzia J, Wood N. Patient satisfaction: a review of issues and concepts. Soc Sci Med 1997 Dec;45(12):1829-1843. [Medline:9447632]
14. Hekkert KD, Cihangir S, Kleefstra SM, van den Berg B, Kool RB. Patient satisfaction revisited: a multilevel approach.Soc Sci Med 2009 Jul;69(1):68-75. [doi: 10.1016/j.socscimed.2009.04.016] [Medline: 19446942]
JMIR Public Health Surveill 2015 | vol. 1 | iss. 2 | e13 | p.164http://publichealth.jmir.org/2015/2/e13/(page number not for citation purposes)
Hung et alJMIR PUBLIC HEALTH AND SURVEILLANCE
XSL•FORenderX
http://www.ncbi.nlm.nih.gov/entrez/query.fcgi?cmd=Retrieve&db=PubMed&list_uids=9031653&dopt=Abstract
15. Sitzia J, Wood N. Patient satisfaction: a review of issues and concepts. Soc Sci Med 1997 Dec;45(12):1829-1843. [Medline:9447632]
16. Stewart M, Brown JB, Donner A, McWhinney IR, Oates J, Weston WW, et al. The impact of patient-centered care onoutcomes. J Fam Pract 2000 Sep;49(9):796-804. [Medline: 11032203]
17. Rahmqvist M, Bara A. Patient characteristics and quality dimensions related to patient satisfaction. Int J Qual Health Care2010 Apr;22(2):86-92 [FREE Full text] [doi: 10.1093/intqhc/mzq009] [Medline: 20133477]
18. Hall JA, Dornan MC. Patient sociodemographic characteristics as predictors of satisfaction with medical care: a meta-analysis.Soc Sci Med 1990;30(7):811-818. [Medline: 2138357]
19. Young GJ, Meterko M, Desai KR. Patient satisfaction with hospital care: effects of demographic and institutionalcharacteristics. Med Care 2000 Mar;38(3):325-334. [Medline: 10718357]
20. Medical Expenditure Panel Survey. Road Rockville, MD: Agency for Healthcare Research and Quality; 2011. NationalHealth Care Expenses in the U.S. Civilian Noninstitutionalized Population URL: http://meps.ahrq.gov/mepsweb/data_stats/Pub_ProdResults_Details.jsp?pt=Statistical%20Brief&opt=2&id=1125 [WebCite Cache ID 6bcjfpUpI]
21. Covinsky KE, Rosenthal GE, Chren MM, Justice AC, Fortinsky RH, Palmer RM, et al. The relation between health statuschanges and patient satisfaction in older hospitalized medical patients. J Gen Intern Med 1998 Apr;13(4):223-229 [FREEFull text] [Medline: 9565384]
22. Manary MP, Boulding W, Staelin R, Glickman SW. The patient experience and health outcomes. N Engl J Med 2013 Jan17;368(3):201-203. [doi: 10.1056/NEJMp1211775] [Medline: 23268647]
23. Bowling A, Rowe G, Lambert N, Waddington M, Mahtani K, Kenten C, et al. The measurement of patients' expectationsfor health care: a review and psychometric testing of a measure of patients' expectations. Health Technol Assess 2012Jul;16(30):i-xii, 1 [FREE Full text] [doi: 10.3310/hta16300] [Medline: 22747798]
24. Fu AZ, Wang N. Healthcare expenditures and patient satisfaction: cost and quality from the consumer's perspective in theUS. Curr Med Res Opin 2008 May;24(5):1385-1394. [doi: 10.1185/030079908X291994] [Medline: 18387219]
AbbreviationsCAHPS: Consumer Assessment of Healthcare Providers and SystemsCMS: Center for Medicare & Medicaid ServicesEXP: total health care expenditureGH: general healthMCS: mental health component scoreMEPS: Medical Expenditures Panel SurveyPCS: physical health component scorePRO: patient-reported outcomesSAT: patient satisfaction
Edited by G Eysenbach; submitted 19.02.15; peer-reviewed by E Papastavrou, M Rahmqvist; comments to author 07.04.15; revisedversion received 12.07.15; accepted 17.08.15; published 23.09.15.
Please cite as:Hung M, Zhang W, Chen W, Bounsanga J, Cheng C, Franklin JD, Crum AB, Voss MW, Hon SDPatient-Reported Outcomes and Total Health Care Expenditure in Prediction of Patient Satisfaction: Results From a National StudyJMIR Public Health Surveill 2015;1(2):e13URL: http://publichealth.jmir.org/2015/2/e13/ doi:10.2196/publichealth.4360PMID:27227131
©Man Hung, Weiping Zhang, Wei Chen, Jerry Bounsanga, Christine Cheng, Jeremy D Franklin, Anthony B Crum, Maren WVoss, Shirley D Hon. Originally published in JMIR Public Health and Surveillance (http://publichealth.jmir.org), 23.09.2015.This is an open-access article distributed under the terms of the Creative Commons Attribution License(http://creativecommons.org/licenses/by/2.0/), which permits unrestricted use, distribution, and reproduction in any medium,provided the original work, first published in JMIR Public Health and Surveillance, is properly cited. The complete bibliographicinformation, a link to the original publication on http://publichealth.jmir.org, as well as this copyright and license informationmust be included.
JMIR Public Health Surveill 2015 | vol. 1 | iss. 2 | e13 | p.165http://publichealth.jmir.org/2015/2/e13/(page number not for citation purposes)
Hung et alJMIR PUBLIC HEALTH AND SURVEILLANCE
XSL•FORenderX
http://www.ncbi.nlm.nih.gov/entrez/query.fcgi?cmd=Retrieve&db=PubMed&list_uids=9447632&dopt=Abstract
http://www.ncbi.nlm.nih.gov/entrez/query.fcgi?cmd=Retrieve&db=PubMed&list_uids=2138357&dopt=Abstract

Original Paper
A Comparison of Self-Reported and Objective Physical ActivityMeasures in Young Australian Women
Stefanie Hartley1, BA, BSc, MPH; Suzanne Garland1,2,3, MBBS, MD, FRCPA, FRANZCOG, FAChSHM; Elisa
Young1, BSc (Hons), MSc, PhD; Kim Louise Bennell3, BAppSci, PhD; Ilona Tay3, BSc, MSc; Alexandra Gorelik3,4,
BA, MSc; John Dennis Wark3,4, MBBS, PhD, FRACP1Murdoch Childrens Research Institute, Parkville, Australia2The Royal Women's Hospital, Department of Molecular Microbiology & Infectious Diseases, Parkville, Australia3University of Melbourne, Parkville, Australia4Melbourne Health, Royal Melbourne Hospital, Parkville, Australia
Corresponding Author:Suzanne Garland, MBBS, MD, FRCPA, FRANZCOG, FAChSHMThe Royal Women's HospitalDepartment of Molecular Microbiology & Infectious DiseasesLocked Bag 3000Parkville, 3052AustraliaPhone: 61 3 8345 3670Fax: 61 3 9347 8235Email: [email protected]
Abstract
Background: The evidence for beneficial effects of recommended levels of physical activity is overwhelming. However, 70%of Australians fail to meet these levels. In particular, physical activity participation by women falls sharply between ages 16 to25 years. Further information about physical activity measures in young women is needed. Self-administered questionnaires areoften used to measure physical activity given their ease of application, but known limitations, including recall bias, compromisethe accuracy of data. Alternatives such as objective measures are commonly used to overcome this problem, but are more costlyand time consuming.
Objective: To compare the output between the Modified Active Australia Survey (MAAS), the International Physical ActivityQuestionnaire (IPAQ), and an objective physical activity measure—the SenseWear Armband (SWA)—to evaluate the test-retestreliability of the MAAS and to determine the acceptability of the SWA among young women.
Methods: Young women from Victoria, Australia, aged 18 to 25 years who had participated in previous studies via Facebookadvertising were recruited. Participants completed the two physical activity questionnaires online, immediately before and afterwearing the armband for 7 consecutive days. Data from the SWA was blocked into 10-minute activity times. Follow-up IPAQ,MAAS, and SWA data were analyzed by comparing the total continuous and categorical activity scores, while concurrent validityof IPAQ and MAAS were analyzed by comparing follow-up scores. Test-retest reliability of MAAS was analyzed by comparingMAAS total physical activity scores at baseline and follow-up. Participants provided feedback in the follow-up questionnaireabout their experience of wearing the armband to determine acceptability of the SWA. Data analyses included graphical (ie,Bland-Altman plot, scatterplot) and analytical (ie, canonical correlation, kappa statistic) methods to determine agreement betweenMAAS, IPAQ, and SWA data.
Results: A total of 58 participants returned complete data. Comparisons between the MAAS and IPAQ questionnaires (n=52)showed moderate agreement for both categorical (kappa=.48, P<.001) and continuous data (r=.69, P<.001). Overall, the IPAQtended to give higher scores. No significant correlation was observed between SWA and IPAQ or MAAS continuous data, forboth minute-by-minute and blocked SWA data. The SWA tended to record lower scores than the questionnaires, suggestingparticipants tended to overreport their amount of physical activity. The test-retest analysis of MAAS showed moderate agreementfor continuous outcomes (r=.44, P=.001). However, poor agreement was seen for categorical outcomes. The acceptability of theSWA to participants was high.
JMIR Public Health Surveill 2015 | vol. 1 | iss. 2 | e14 | p.166http://publichealth.jmir.org/2015/2/e14/(page number not for citation purposes)
Hartley et alJMIR PUBLIC HEALTH AND SURVEILLANCE
XSL•FORenderX
Conclusions: Moderate agreement between the MAAS and IPAQ and moderate reliability of the MAAS indicates that theMAAS may be a suitable alternative to the IPAQ to assess total physical activity in young women, due to its shorter length andconsequently lower participant burden. The SWA, and likely other monitoring devices, have the advantage over questionnairesof avoiding overreporting of self-reported physical activity, while being highly acceptable to participants.
(JMIR Public Health Surveill 2015;1(2):e14) doi:10.2196/publichealth.4259
KEYWORDS
physical activity; exercise; women’s health; questionnaires
Introduction
There is overwhelming evidence of the health, social, andeconomic benefits of engaging in recommended levels ofphysical activity [1,2]. Physical activity guidelines forAustralians are to accumulate 150-300 minutes ofmoderate-intensity physical activity, 75-150 minutes ofvigorous-intensity physical activity, or an equivalentcombination of both moderate and vigorous activities each week[3]. However, close to three-quarters of the Australianpopulation aged 18-65 years fail to meet these levels [4], afinding common to other developed countries [5]. Research intointerventions to increase physical activity levels in thecommunity is therefore warranted. In particular, young womenshould be targeted for interventions, as women play a large rolein influencing household activity levels and the amount ofphysical activity women engage in falls sharply during the agesof 16-25 years [6].
Physical activity is defined as "any bodily movement producedby skeletal muscles that requires energy expenditure" [7]. It canoccur in various forms and contexts, such as actions performedduring recreation, sports, work, household chores, andgardening. The health benefits of physical activity includeprevention and management of chronic diseases as well asoverall reduced mortality and improved mental health [1,2].
Given the importance of physical activity, valid and preciseassessment of activity levels are needed to determine activitytrends, explore associations between health and physical activity,predict population health outcomes, and evaluate theeffectiveness of physical activity interventions [8,9]. However,it is a methodological challenge to accurately measure physicalactivity in individuals, due to the complexities of daily life [10]and the technical requirements to make meaningfulmeasurements. The burden and inadequate precision ofquantifying physical activity levels has created a market for thedevelopment of better measuring methods. Various methods tocapture levels of physical activity in free-living individuals areavailable and are categorized under (1) subjective (self-reported)and (2) objective measures. For research purposes, it is importantto select reliable and valid measures that can be feasiblyadministered to individuals.
Self-reported questionnaires, while low cost and simple toadminister, can vary in accuracy due to recall bias, socialdesirability bias, and misinterpretation [11]. A systematic reviewof physical activity questionnaires recommended 23questionnaires, identified as having good content validity [8].One of these was the International Physical Activity
Questionnaire (IPAQ), which is considered to be the mostextensively validated questionnaire across 12 countries [12].The Modified Active Australia Survey (MAAS) is a lesscommonly used questionnaire to measure physical activity [13],although it has been employed in large Australian national andstate surveys [13,14]. The MAAS was developed by shorteningthe Active Australia Survey, and has been shown to havecomparable reliability and validity to the Active AustraliaSurvey [13]. Both the IPAQ and MAAS ask the respondentabout the duration, frequency, and intensity of activity in thepreceding 7 days, and include activities such as walking, sports,yard and housework, and bicycling. MAAS has the advantageof being considerably shorter than the long-form IPAQ and isrelevant to the Australian context. When tested in middle-agedAustralian women, it has also been found to have comparablereliability and validity to that reported for the full version ofthe Active Australia Survey [13]. However, neither the test-retestreliability of the MAAS nor its concurrent validity comparedto other questionnaires, such as the widely accepted IPAQ, hasbeen established in younger women.
A variety of noninvasive objective measures is commerciallyavailable to assess physical activity levels. One of these is theSenseWear Armband (SWA) activity monitor (Model: MF-SW)(BodyMedia, Inc, Pittsburgh, PA, USA), which is a small,lightweight, multisensor activity monitor worn on the upperarm. It integrates body motion and step count from a three-axisaccelerometer while other sensors such as heat flux, galvanicskin responses, and skin surface temperature can provide otherdata. The SWA has been extensively validated in numerouspeer-reviewed publications [15]. However, the SWA is costlyand not waterproof, meaning that it cannot record water-basedphysical activity. To date, a comparison of measures from theSWA and the IPAQ and MAAS has not been conducted inyoung Australian women. It is also not known whether the SWAis an acceptable method of collecting physical activity measuresin this population.
The primary aims of the study in young Australian women wereto (1) compare the output from the SWA with self-reportedmeasures of physical activity by IPAQ and MAAS and (2)determine the acceptability of using the SWA to assess levelsof physical activity. The secondary aims were to evaluate (1)the concurrent validity of MAAS by comparing IPAQ andMAAS and (2) the test-retest reliability of MAAS.
JMIR Public Health Surveill 2015 | vol. 1 | iss. 2 | e14 | p.167http://publichealth.jmir.org/2015/2/e14/(page number not for citation purposes)
Hartley et alJMIR PUBLIC HEALTH AND SURVEILLANCE
XSL•FORenderX
Methods
ParticipantsThis project was a substudy of the Young Female HealthInitiative (YFHI), a comprehensive study of lifestyle, health,and well-being in young women aged 16-25 years living in thestate of Victoria, Australia. This study received ethical approvalfrom the Human Research and Ethics Committees of the RoyalWomen’s Hospital, Victoria, Australia.
Cross-recruitment of participants from previous studies, namelythe YFHI pilot [16] and the Vaccine Against Cervical CancerImpact aNd Effectiveness (VACCINE) studies [17], was themain recruitment method employed. The majority of womenin these 2 studies had previously volunteered by responding toadvertisements on Facebook. Women were approached for thisstudy if they met the inclusion criteria and had consented to becontacted for future studies. Individuals who expressed aninterest in the study from the YFHI website [18] and fulfilledthe inclusion criteria also were recruited. The recruitment of 70participants for this substudy took place from June to September2012. All participants gave verbal and written informed consentfor the study, after the nature and possible consequences wereexplained.
To be eligible for the substudy, participants needed to be YFHIstudy participants and to satisfy the following criteria: (1)female, (2) aged 16-25 years, (3) living in Victoria, Australia,(4) provide verbal and written consent, and (5) willing tocomplete 2 questionnaires and to wear an SWA for 7consecutive days. Participants were excluded if they were livingoutside Victoria, were unable to give consent due to a languagebarrier, had a physical impairment, or if there were any otherreasons that would affect the completion of the study.
ProcedureParticipants were emailed a link to the online baselinequestionnaire containing the MAAS (16 items) and IPAQ(self-administered long-form version; 49 items), and a set ofquestions on acceptability of the SWA. Questionnaires wereadministered using the online survey tool, SurveyMonkey [19].
Participants were sent a study package by post containing aninformation and consent form, an SWA with instructions on itsuse, and an armband usage log. Participants were instructed towear the armband on the back of the upper left arm (over thetriceps muscle) for 7 consecutive days, removing it only forwater-based activities, such as showering or swimming. Theywere also asked to record on the monitor log provided whenthe SWA was removed, entering details including the time thearmband was removed, the time it was replaced, activitiesundertaken during that time, and the intensity level of anyphysical activity (low, moderate, or vigorous). Participants wereasked to return the package via registered post, or deliver itdirectly to the study office.
Participants were emailed a link to the follow-up physicalactivity questionnaires as completion of the 7-day periodwearing the SWA approached. These were identical to thebaseline questionnaires, with the addition of feedback questionsabout the participant’s experience of wearing the SWA.
Participants who completed the study were given AUD $10 inthe form of a gift voucher to a retail store as minor compensationfor their time.
Analysis of QuestionnairesMAAS asks the respondent the duration, frequency, andintensity of activity in leisure time, household or garden chores,and sedentary behavior in the last 7 days. The MAASquestionnaires were analyzed and scored according to themethod described in Brown et al [13]. Participants who scored"none" in the total physical activity were grouped in the lowcategory, to enable comparisons with IPAQ. The IPAQ scoringprotocol was used for the IPAQ [20]. In brief, for bothquestionnaires, participants are classified into low, medium,and high levels of activity based on specified rules for occasionsand minutes of various-intensity exercise. As well as thiscategorical outcome, a continuous outcome can be calculatedbased on metabolic equivalent of task (MET) minutes per week.Both MAAS and IPAQ give scores for different domains andintensities of physical activity. These are then combined to givea total score. For this study, only the total scores of the MAASand IPAQ were used in the analysis.
Analysis of SenseWear OutputReturned devices were connected to a computer andminute-by-minute data were downloaded from the device usingSenseWear Professional Software 7.0 (BodyMedia Inc,Pittsburgh, PA, USA). The data were used to estimate thefrequency and duration of each activity as well as METs thatare based on the participant’s gender, age, height, and bodymass. The MET data were analyzed twice as follows: (1) usingminute-by-minute data, and (2) using blocked data. Blockeddata were generated to allow comparisons between the SWAdata and the 2 questionnaires. The IPAQ and MAAS ask onlyabout physical activity performed for 10 minutes or more,whereas the SWA collects minute-by-minute data. To enablemore meaningful comparisons between the SWA and thequestionnaires, SWA data were blocked into activity of 10minutes or more. A similar method of blocking was used byBrown et al [13].
The following conditions were applied to generate blocked data:(1) the time between the first and last reading must be 10minutes or longer, (2) the first and last times must show an MET≥ 3.3, (3) for blocks of 15 minutes or less, 80% of MET valuesmust be ≥ 3.3, (4) for blocks of over 15 minutes, 75% of METvalues must be ≥ 3.3, (5) for blocks of 15 minutes or less, “rests”must be no longer than 2 minutes, (6) for blocks of over 15minutes, “rests” must be no longer than 3 minutes, (7) for blocksof 30-60 minutes, there can be one 4-minute “rest," (8) forblocks over 60 minutes, there can be two 4-minute “rests,” and(9) rest was defined as an MET value of less than 3.3.
For our analyses, participants who had at least 4 monitoringdays, including 2 weekend days, were included. A valid daywas defined as having at least 1296 on-body minutes, afterinclusion of known activities from the monitor log. Thiscorresponds to 90% of a 24-hour period. Participants who fellshort of the criteria were excluded from analysis.
JMIR Public Health Surveill 2015 | vol. 1 | iss. 2 | e14 | p.168http://publichealth.jmir.org/2015/2/e14/(page number not for citation purposes)
Hartley et alJMIR PUBLIC HEALTH AND SURVEILLANCE
XSL•FORenderX
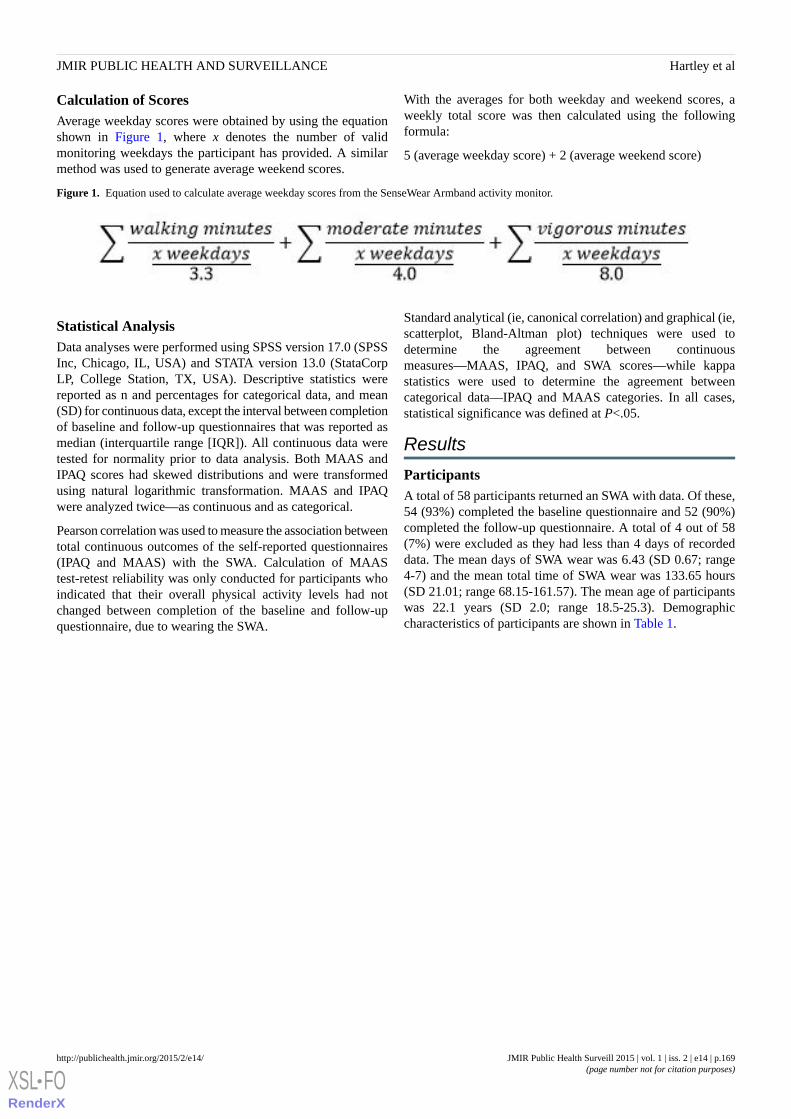
Calculation of ScoresAverage weekday scores were obtained by using the equationshown in Figure 1, where x denotes the number of validmonitoring weekdays the participant has provided. A similarmethod was used to generate average weekend scores.
With the averages for both weekday and weekend scores, aweekly total score was then calculated using the followingformula:
5 (average weekday score) + 2 (average weekend score)
Figure 1. Equation used to calculate average weekday scores from the SenseWear Armband activity monitor.
Statistical AnalysisData analyses were performed using SPSS version 17.0 (SPSSInc, Chicago, IL, USA) and STATA version 13.0 (StataCorpLP, College Station, TX, USA). Descriptive statistics werereported as n and percentages for categorical data, and mean(SD) for continuous data, except the interval between completionof baseline and follow-up questionnaires that was reported asmedian (interquartile range [IQR]). All continuous data weretested for normality prior to data analysis. Both MAAS andIPAQ scores had skewed distributions and were transformedusing natural logarithmic transformation. MAAS and IPAQwere analyzed twice—as continuous and as categorical.
Pearson correlation was used to measure the association betweentotal continuous outcomes of the self-reported questionnaires(IPAQ and MAAS) with the SWA. Calculation of MAAStest-retest reliability was only conducted for participants whoindicated that their overall physical activity levels had notchanged between completion of the baseline and follow-upquestionnaire, due to wearing the SWA.
Standard analytical (ie, canonical correlation) and graphical (ie,scatterplot, Bland-Altman plot) techniques were used todetermine the agreement between continuousmeasures—MAAS, IPAQ, and SWA scores—while kappastatistics were used to determine the agreement betweencategorical data—IPAQ and MAAS categories. In all cases,statistical significance was defined at P<.05.
Results
ParticipantsA total of 58 participants returned an SWA with data. Of these,54 (93%) completed the baseline questionnaire and 52 (90%)completed the follow-up questionnaire. A total of 4 out of 58(7%) were excluded as they had less than 4 days of recordeddata. The mean days of SWA wear was 6.43 (SD 0.67; range4-7) and the mean total time of SWA wear was 133.65 hours(SD 21.01; range 68.15-161.57). The mean age of participantswas 22.1 years (SD 2.0; range 18.5-25.3). Demographiccharacteristics of participants are shown in Table 1.
JMIR Public Health Surveill 2015 | vol. 1 | iss. 2 | e14 | p.169http://publichealth.jmir.org/2015/2/e14/(page number not for citation purposes)
Hartley et alJMIR PUBLIC HEALTH AND SURVEILLANCE
XSL•FORenderX

Table 1. Demographic characteristics of participants (n=54).
n (%)aCategoriesCharacteristic
Age (years)
26 (48)18-21
28 (52)22-25
Country of birth
52 (96)Australia
2 (4)Other
Geographic region of residence
45 (83)Major city
9 (17)Inner regional
0 (0)Outer regional/remote
Body mass index (kg/m 2 ) (using self-report-ed height and weight)
6 (11)Underweight
32 (59)Normal
13 (24)Overweight
3 (6)Obese
0 (0)Extremely obese
Education level b
4 (7)<Year 12
19 (35)Year 12
31 (57)>Year 12
Socioeconomic level (SEIFA c percentile) d
2 (4)≤25 (most disadvantaged)
52 (96)26-100
aPercentages may not add to exactly 100 due to rounding.bYear 12 is the final year of high school in the Australian education system.cSocio-Economic Indexes For Areas (SEIFA).dBased on postal/zip code. Percentiles are the rankings within Victoria, with a percentile of ≤25 being the most disadvantaged quartile.
Criterion Validity of the International Physical ActivityQuestionnaire and Modified Active Australia SurveyThere was no significant correlation observed between follow-upIPAQ scores and SWA minute-by-minute continuous data(r=.10, P=.48) and follow-up IPAQ scores and SWA blockedcontinuous data (r=.07, P=.63). Both distributions are scattered
and no linearity is observed. The negative slope of the band inthe Bland-Altman plot reveals a tendency for IPAQ to givehigher scores than the SWA (see Figure 2).
No significant correlations were observed between follow-upMAAS scores and SWA minute-by-minute continuous data andSWA blocked continuous data (r=.02, P=.88; r=.05, P=.72,respectively; Figure 3).
JMIR Public Health Surveill 2015 | vol. 1 | iss. 2 | e14 | p.170http://publichealth.jmir.org/2015/2/e14/(page number not for citation purposes)
Hartley et alJMIR PUBLIC HEALTH AND SURVEILLANCE
XSL•FORenderX

Figure 2. Bland-Altman plot of natural log transformed score showing the difference between IPAQ and SWA, plotted against the mean. Note: thelines represent the limits of agreement (95%) and average difference between the two variables.
JMIR Public Health Surveill 2015 | vol. 1 | iss. 2 | e14 | p.171http://publichealth.jmir.org/2015/2/e14/(page number not for citation purposes)
Hartley et alJMIR PUBLIC HEALTH AND SURVEILLANCE
XSL•FORenderX
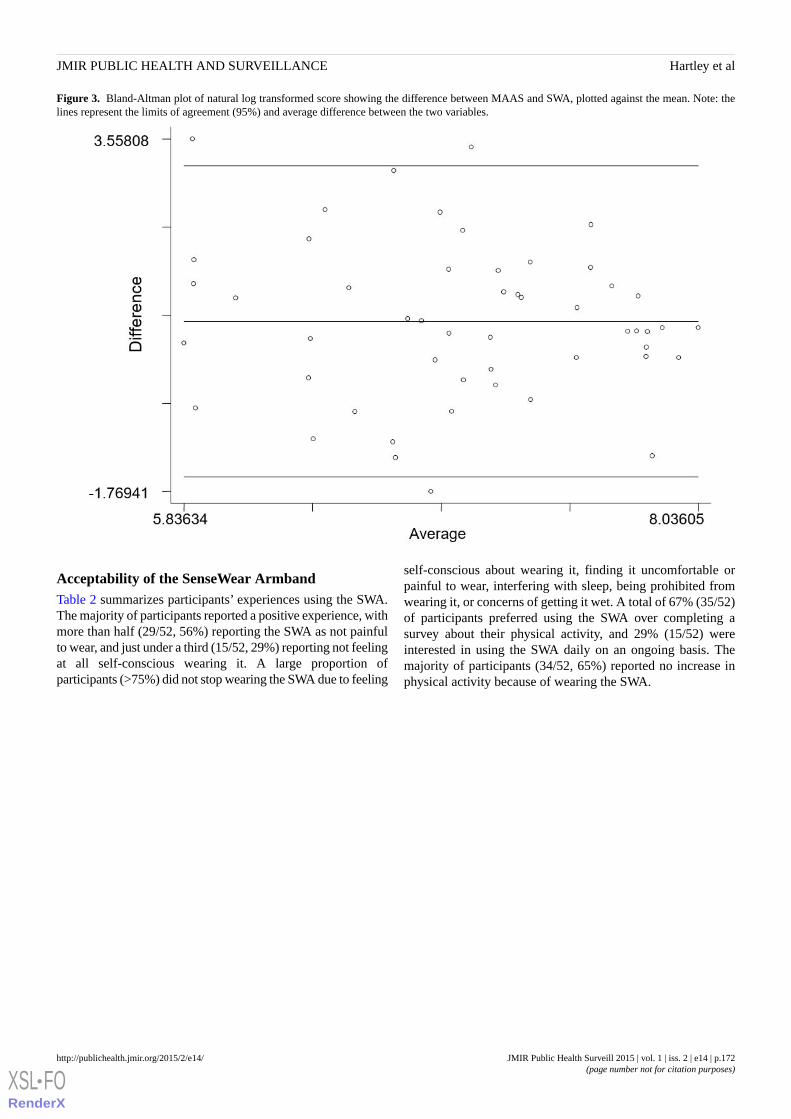
Figure 3. Bland-Altman plot of natural log transformed score showing the difference between MAAS and SWA, plotted against the mean. Note: thelines represent the limits of agreement (95%) and average difference between the two variables.
Acceptability of the SenseWear ArmbandTable 2 summarizes participants’ experiences using the SWA.The majority of participants reported a positive experience, withmore than half (29/52, 56%) reporting the SWA as not painfulto wear, and just under a third (15/52, 29%) reporting not feelingat all self-conscious wearing it. A large proportion ofparticipants (>75%) did not stop wearing the SWA due to feeling
self-conscious about wearing it, finding it uncomfortable orpainful to wear, interfering with sleep, being prohibited fromwearing it, or concerns of getting it wet. A total of 67% (35/52)of participants preferred using the SWA over completing asurvey about their physical activity, and 29% (15/52) wereinterested in using the SWA daily on an ongoing basis. Themajority of participants (34/52, 65%) reported no increase inphysical activity because of wearing the SWA.
JMIR Public Health Surveill 2015 | vol. 1 | iss. 2 | e14 | p.172http://publichealth.jmir.org/2015/2/e14/(page number not for citation purposes)
Hartley et alJMIR PUBLIC HEALTH AND SURVEILLANCE
XSL•FORenderX

Table 2. Participants’ experiences of using the SenseWear Armband (n=52)a.
Median
(IQRb)Agreement scale (1=completely false to 5=completely true),n (%)Statements from the questionnaire
54321
2.5 (1.0-3.3)2 (4)11 (21)13 (25)11 (21)15 (29)I often felt self-conscious wearing the activity monitor.
2 (2-3)4 (8)7 (13)14 (27)17 (33)10 (19)I often found the activity monitor uncomfortable to wear.
1 (1-2)1 (2)2 (4)7 (13)13 (25)29 (56)I often found the activity monitor painful to wear.
3 (2-3)1 (2)9 (17)18 (35)17 (33)7 (13)I often felt proud to be seen wearing the activity monitor.
1 (1-1)0 (0)1 (2)1 (2)7 (13)43 (83)I often did not wear the activity monitor because I felt self-conscious aboutbeing seen wearing it.
1 (1-1)0 (0)0 (0)3 (6)7 (13)42 (81)I often did not wear the activity monitor because it was uncomfortable orpainful.
1 (1-1)1 (2)2 (4)4 (8)5 (10)40 (77)I often did not wear the activity monitor overnight because it interferedwith my sleep.
1 (1-2)3 (6)3 (6)2 (4)7 (13)37 (71)I often did not wear the activity monitor during exercise because it wouldhave got wet (eg, while swimming, or because I was walking in the rain).
1 (1-1)1 (2)2 (4)0 (0)3 (6)46 (88)I often did not wear the activity monitor because it was prohibited (eg,not allowed to wear it during netball, or in my workplace).
1 (1-2)1 (2)1 (2)3 (6)13 (25)34 (65)I exercised more than I otherwise would have, because of wearing the ac-tivity monitor.
1 (1-2)1 (2)2 (4)7 (13)7 (13)35 (67)I would prefer to record my physical activity for the last 7 days by com-pleting a survey rather than wearing the activity monitor for 7 days.
4 (3-5)15 (29)15 (29)13 (25)4 (8)5 (10)I would like to wear the activity monitor everyday if I could get real-timefeedback of my physical activity and calories burned.
aThere were 52 respondents due to missing data on these items for 2 participants.bInterquartile range (IQR).
Concurrent Validity of the Modified Active AustraliaSurveyBoth categorical and continuous measures of the follow-upMAAS and IPAQ showed moderate agreement. Based on
categorical data, 65% of cases (34/52) were in agreement, whichcorresponds to moderate agreement between 2 measures(kappa=.48, P<.001) (see Table 3).
Table 3. Categorical outcomes from MAASaand IPAQbfollow-up questionnaires.
IPAQ, n (%)
Total (n=52)High (n=19)Moderate (n=16)Low (n=17)
MAAS, n (%)
17 (33)1 (5)3 (19)13 (76)Low
17 (33)5 (26)8 (50)4 (24)Moderate
18 (35)13 (68)5 (31)0 (0)High
52 (100)19 (100)16 (100)17 (100)Total
aModified Active Australia Survey (MAAS).bInternational Physical Activity Questionnaire (IPAQ).
The results are similar when analyzed using continuous datawith a canonical correlation of .69 (P<.001) and are in
agreement with no visible consistent bias between 2 scores(limits of agreement are between -0.78 and 2.45; Figure 4).
JMIR Public Health Surveill 2015 | vol. 1 | iss. 2 | e14 | p.173http://publichealth.jmir.org/2015/2/e14/(page number not for citation purposes)
Hartley et alJMIR PUBLIC HEALTH AND SURVEILLANCE
XSL•FORenderX

Figure 4. Bland-Altman plot of natural log transformed score showing the difference between follow-up IPAQ and MAAS, plotted against the mean.Note: the lines represent the limits of agreement (95%) and average difference between the two variables.
Test-Retest Analysis of the Modified Active AustraliaSurveyThe median interval between completion of baseline andfollow-up questionnaires was 11.5 days (IQR 9.0-14.5). In
analysis of test-retest reliability of the MAAS, 2 participantswere excluded as they reported increasing their activity levelsas a result of using the SWA. There was poor agreementbetween baseline and follow-up MAAS categorical scores(kappa=.193, P=.03; Table 4).
JMIR Public Health Surveill 2015 | vol. 1 | iss. 2 | e14 | p.174http://publichealth.jmir.org/2015/2/e14/(page number not for citation purposes)
Hartley et alJMIR PUBLIC HEALTH AND SURVEILLANCE
XSL•FORenderX
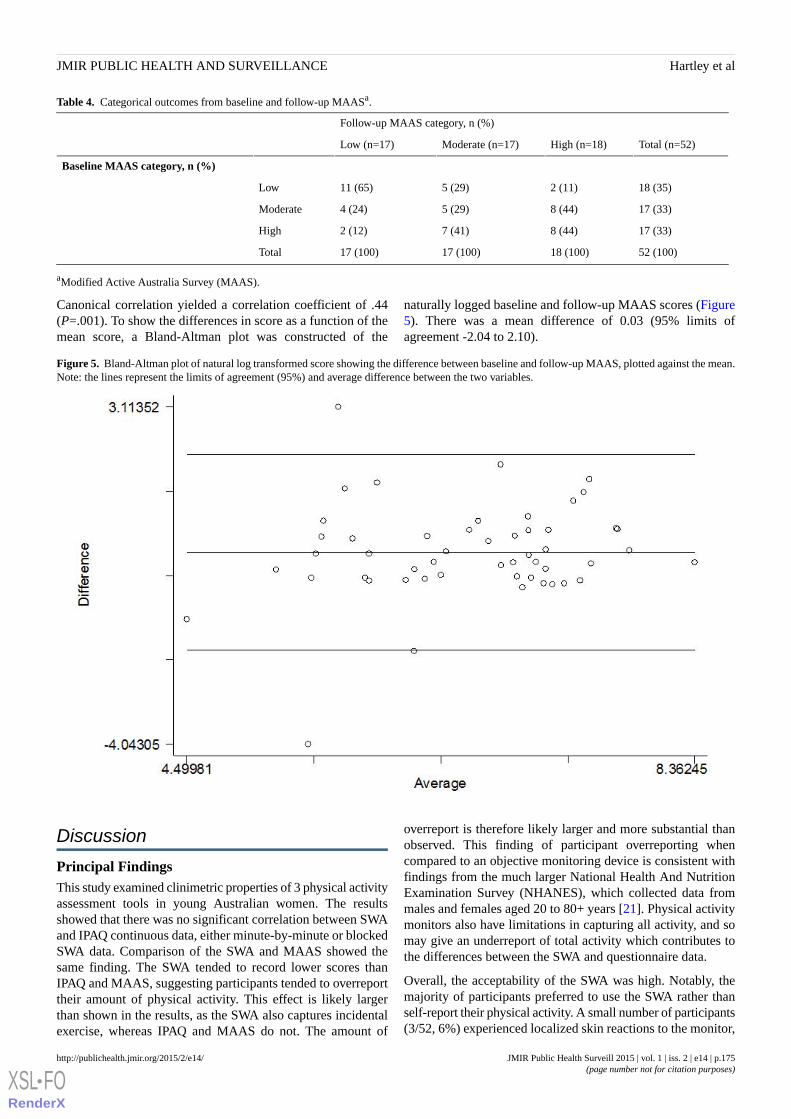
Table 4. Categorical outcomes from baseline and follow-up MAASa.
Follow-up MAAS category, n (%)
Total (n=52)High (n=18)Moderate (n=17)Low (n=17)
Baseline MAAS category, n (%)
18 (35)2 (11)5 (29)11 (65)Low
17 (33)8 (44)5 (29)4 (24)Moderate
17 (33)8 (44)7 (41)2 (12)High
52 (100)18 (100)17 (100)17 (100)Total
aModified Active Australia Survey (MAAS).
Canonical correlation yielded a correlation coefficient of .44(P=.001). To show the differences in score as a function of themean score, a Bland-Altman plot was constructed of the
naturally logged baseline and follow-up MAAS scores (Figure5). There was a mean difference of 0.03 (95% limits ofagreement -2.04 to 2.10).
Figure 5. Bland-Altman plot of natural log transformed score showing the difference between baseline and follow-up MAAS, plotted against the mean.Note: the lines represent the limits of agreement (95%) and average difference between the two variables.
Discussion
Principal FindingsThis study examined clinimetric properties of 3 physical activityassessment tools in young Australian women. The resultsshowed that there was no significant correlation between SWAand IPAQ continuous data, either minute-by-minute or blockedSWA data. Comparison of the SWA and MAAS showed thesame finding. The SWA tended to record lower scores thanIPAQ and MAAS, suggesting participants tended to overreporttheir amount of physical activity. This effect is likely largerthan shown in the results, as the SWA also captures incidentalexercise, whereas IPAQ and MAAS do not. The amount of
overreport is therefore likely larger and more substantial thanobserved. This finding of participant overreporting whencompared to an objective monitoring device is consistent withfindings from the much larger National Health And NutritionExamination Survey (NHANES), which collected data frommales and females aged 20 to 80+ years [21]. Physical activitymonitors also have limitations in capturing all activity, and somay give an underreport of total activity which contributes tothe differences between the SWA and questionnaire data.
Overall, the acceptability of the SWA was high. Notably, themajority of participants preferred to use the SWA rather thanself-report their physical activity. A small number of participants(3/52, 6%) experienced localized skin reactions to the monitor,
JMIR Public Health Surveill 2015 | vol. 1 | iss. 2 | e14 | p.175http://publichealth.jmir.org/2015/2/e14/(page number not for citation purposes)
Hartley et alJMIR PUBLIC HEALTH AND SURVEILLANCE
XSL•FORenderX
a known rare complication due to metal allergy. Despite this,adherence to SWA use was high and participant responses tothe feedback questions indicated that the SWA is both acceptableand favored by young Australian women. While adherence tothe SWA was high, it is not known whether repeated use wouldgive similar adherence levels. It may be that the young womenfound the SWA to be a novelty initially and so were pleased towear it for 7 days, but that enthusiasm may wane with repeateduse. Given that studies often require participants to collectphysical activity data more than once over an extended period,it would be important to ascertain young women’s preferencefor the SWA or questionnaires with repeated use.
According to Scheers et al [11], participants ideally should haveat least 5 monitoring days, including 2 weekend days. However,for our analyses participants who had at least 4 monitoring days,including 2 weekend days, were included. This decision wasmade due to participant numbers. A larger cohort size wouldhave allowed the conditions of Scheers et al to be applied,without losing too many participants from analysis. This is alimitation of this study which needs to be considered ininterpreting the findings. It is possible that the days theparticipants wore the SWA were their most or least active daysof the week, which would give an overestimation orunderestimation of their total weekly activity, respectively.However, the agreement of our findings with the NHANESstudy [21], as discussed above, gives us greater confidence inthem, despite this limitation.
Since this study was conducted, there has been a large increasein the availability and range of devices available for objectivelymonitoring physical activity and other body parameters, suchas sleep and calorie intake. Many of these have the advantageof being considerably less costly and more lightweight than theSWA, and future studies would need to consider the advantagesof using the SWA compared with these newer devices. However,our finding that a monitoring device tends to record lower levelsof physical activity than self-reported questionnaires is likelyapplicable to other devices. We would expect that these deviceswould also share the acceptability to young women found forthe SWA in this study, and that they may indeed be moreacceptable due to their smaller and more lightweight design.
The test-retest reliability of the MAAS was moderate whenusing continuous outcomes. This is consistent with data froma study using MAAS in 159 middle-aged Australian women[13]. However, test-retest reliability was poor when usingcategorical outcomes. A possible explanation for lack of strongagreement is that participants were not excluded from this
analysis if they indicated their activity levels had changed dueto factors other than wearing the SWA. In order to be excludedfrom this analysis, participants had to indicate that their levelof activity had increased due to wearing the SWA. Participantswere not asked about increased or decreased physical activitydue to factors other than the SWA—such as illness, holidays,or work commitments—so participants who experienced thiswere not excluded from this analysis.
Comparisons between the MAAS and IPAQ questionnairesshowed moderate agreement for both categorical and continuousdata. There was an overall tendency for the IPAQ to give ahigher score, which may be due to the more detailed questionson different domains of activity contained in the IPAQ. Giventhe moderate level of agreement between MAAS and IPAQ andthe moderate test-retest reliability when using continuousoutcomes, MAAS may be a suitable alternative to IPAQ toassess total physical activity score, due to its shorter length andconsequent reduction in participant burden. The analysesperformed in this study were only for the total physical activityscores obtained using each instrument. Further analyses of thecorrelation between domains of physical activity would be usefulin assessing comparison of the instruments.
A limitation of this study is the relatively small sample size andthis needs to be considered in interpreting the results. A largerstudy would allow our findings to be further tested. Therecruitment method used in this study has been shown to recruita representative sample of young women, therefore we areconfident our sample was not overly selective [16].
ConclusionsPhysical activity is an important contributor to health and theprevention of disease, and its study requires reliable and validmeasures which can be administered to individuals. This studyshowed that the MAAS has moderate agreement with the IPAQ,and as such may be a suitable alternative in some situations.Test-retest analysis of the MAAS did not give strong results;however, this is potentially explained by a limitation of thestudy in the omission of a question on changes in activity levels.This study showed that young women tended to overreport theirphysical activity when compared to the SWA monitor,suggesting the SWA may be a more accurate tool whichovercomes some of the limitations of self-report instruments.This finding, combined with the high acceptability of the deviceto young women, suggests the SWA, and perhaps other suchmonitors, may be a better option for measuring physical activityfor both researchers and research participants.
AcknowledgmentsThe researchers acknowledge Avelyn Yuan Hui Sim, whose Bachelor of Biomedicine (Honors) thesis contributed to the workin this manuscript. We would like to thank all the young women who participated in this study and joined us in our commitmentto improving women’s health. We would also like to acknowledge the wider YFHI study group for their support and contributions.
Conflicts of InterestProfessor Suzanne Garland has received grant support to her institution from CSL Bio, Merck, and GlaxoSmithKline (GSK) aswell as receiving funding through her institution to conduct human papillomavirus (HPV) vaccine studies for the Merck Sharp
JMIR Public Health Surveill 2015 | vol. 1 | iss. 2 | e14 | p.176http://publichealth.jmir.org/2015/2/e14/(page number not for citation purposes)
Hartley et alJMIR PUBLIC HEALTH AND SURVEILLANCE
XSL•FORenderX
& Dohme (MSD) GSK Human PapillomaVIrus Vaccine Immunogenicity ANd Efficacy (VIVIANE) trial. Professor Garland isa member of the Merck Global Advisory Board as well as the Merck Scientific Advisory Committee for HPV (unpaid position).
References1. Warburton DE, Nicol CW, Bredin SS. Health benefits of physical activity: the evidence. CMAJ 2006 Mar 14;174(6):801-809
[FREE Full text] [doi: 10.1503/cmaj.051351] [Medline: 16534088]2. Fox KR. The influence of physical activity on mental well-being. Public Health Nutr 1999 Sep;2(3A):411-418. [Medline:
10610081]3. Brown WJ, Bauman AE, Bull FC, Burton NW. Development of Evidence-Based Physical Activity Recommendations for
Adults (18-64 Years). Canberra, Australia: Australian Government Department of Health; 2012 Aug 01. URL: http://www.health.gov.au/internet/main/publishing.nsf/Content/health-pubhlth-strateg-phys-act-guidelines/$File/DEB-PAR-Adults-18-64years.pdf [accessed 2015-09-29] [WebCite Cache ID 6buH1j5kK]
4. Brown H, Roberts J. Exercising choice: the economic determinants of physical activity behaviour of an employed population.Soc Sci Med 2011 Aug;73(3):383-390 [FREE Full text] [doi: 10.1016/j.socscimed.2011.06.001] [Medline: 21757272]
5. Hallal PC, Andersen LB, Bull FC, Guthold R, Haskell W, Ekelund U, Lancet Physical Activity Series Working Group.Global physical activity levels: surveillance progress, pitfalls, and prospects. Lancet 2012 Jul 21;380(9838):247-257. [doi:10.1016/S0140-6736(12)60646-1] [Medline: 22818937]
6. Christie J, Nowson C, Garland S, Wark J. Emerging nutritional and lifestyle risk factors for bone health in young women:a mixed longitudinal twin study. In: Burckhardt P, Dawson-Hughes B, Weaver CM, editors. Nutritional Influences on BoneHealth: 8th International Symposium. London, UK: Springer-Verlag; 2013:61-69.
7. Caspersen CJ, Powell KE, Christenson GM. Physical activity, exercise, and physical fitness: definitions and distinctionsfor health-related research. Public Health Rep 1985 Apr;100(2):126-131 [FREE Full text] [Medline: 3920711]
8. van Poppel MN, Chinapaw MJ, Mokkink LB, van Mechelen W, Terwee CB. Physical activity questionnaires for adults: asystematic review of measurement properties. Sports Med 2010 Jul 1;40(7):565-600. [doi:10.2165/11531930-000000000-00000] [Medline: 20545381]
9. Chinapaw MJ, Mokkink LB, van Poppel MN, van Mechelen W, Terwee CB. Physical activity questionnaires for youth: asystematic review of measurement properties. Sports Med 2010 Jul 1;40(7):539-563. [doi:10.2165/11530770-000000000-00000] [Medline: 20545380]
10. Zhang K, Pi-Sunyer FX, Boozer CN. Improving energy expenditure estimation for physical activity. Med Sci Sports Exerc2004 May;36(5):883-889. [Medline: 15126725]
11. Scheers T, Philippaerts R, Lefevre J. Variability in physical activity patterns as measured by the SenseWear Armband: howmany days are needed? Eur J Appl Physiol 2012 May;112(5):1653-1662. [doi: 10.1007/s00421-011-2131-9] [Medline:21874552]
12. Craig CL, Marshall AL, Sjöström M, Bauman AE, Booth ML, Ainsworth BE, et al. International physical activityquestionnaire: 12-country reliability and validity. Med Sci Sports Exerc 2003 Aug;35(8):1381-1395. [doi:10.1249/01.MSS.0000078924.61453.FB] [Medline: 12900694]
13. Brown WJ, Burton NW, Marshall AL, Miller YD. Reliability and validity of a modified self-administered version of theActive Australia physical activity survey in a sample of mid-age women. Aust N Z J Public Health 2008 Dec;32(6):535-541.[doi: 10.1111/j.1753-6405.2008.00305.x] [Medline: 19076744]
14. Armstrong T, Bauman A, Davies J. Physical Activity Patterns of Australian Adults: Results of the 1999 National PhysicalActivity Survey. Canberra, Australia: Australian Institute of Health and Welfare; 2000. URL: http://www.aihw.gov.au/WorkArea/DownloadAsset.aspx?id=6442454841 [accessed 2015-09-29] [WebCite Cache ID 6buHpw4qn]
15. Liden CB, Wolowicz M, Stivoric J, Teller A, Vishnubhatla S, Pelletier R, et al. Integrated Fitness Systems. Benefits of theSenseWear Armband over other physical activity and energy expenditure measurement techniques URL: http://www.integratedfitnesssystems.com/wp-content/uploads/2012/10/Benefits.pdf [accessed 2015-01-20] [WebCite Cache ID6VihQiQZo]
16. Fenner Y, Garland SM, Moore EE, Jayasinghe Y, Fletcher A, Tabrizi SN, et al. Web-based recruiting for health researchusing a social networking site: an exploratory study. J Med Internet Res 2012;14(1):e20 [FREE Full text] [doi:10.2196/jmir.1978] [Medline: 22297093]
17. Young EJ, Tabrizi SN, Brotherton JM, Wark JD, Pyman J, Saville M, et al. Measuring effectiveness of the cervical cancervaccine in an Australian setting (the VACCINE study). BMC Cancer 2013;13:296 [FREE Full text] [doi:10.1186/1471-2407-13-296] [Medline: 23777549]
18. Young Female Health Initiative. URL: https://www.yfhi.org/ [accessed 2015-09-16] [WebCite Cache ID 6baf35N3p]19. SurveyMonkey. URL: https://www.surveymonkey.com/ [accessed 2015-09-16] [WebCite Cache ID 6bafnhYwj]20. Guidelines for Data Processing and Analysis of the International Physical Activity Questionnaire (IPAQ): Short and Long
Forms.: International Physical Activity Questionnaire; 2005 Nov. URL: http://www.ipaq.ki.se/scoring.pdf [accessed2015-01-20] [WebCite Cache ID 6Vihh9xAX]
JMIR Public Health Surveill 2015 | vol. 1 | iss. 2 | e14 | p.177http://publichealth.jmir.org/2015/2/e14/(page number not for citation purposes)
Hartley et alJMIR PUBLIC HEALTH AND SURVEILLANCE
XSL•FORenderX
21. Schuna JM, Johnson WD, Tudor-Locke C. Adult self-reported and objectively monitored physical activity and sedentarybehavior: NHANES 2005-2006. Int J Behav Nutr Phys Act 2013;10:126 [FREE Full text] [doi: 10.1186/1479-5868-10-126][Medline: 24215625]
AbbreviationsGSK: GlaxoSmithKlineHPV: human papillomavirusIPAQ: International Physical Activity QuestionnaireIQR: interquartile rangeMAAS: Modified Active Australia SurveyMET: metabolic equivalent of taskMSD: Merck Sharp & DohmeNHANES: National Health And Nutrition Examination SurveySEIFA: Socio-Economic Indexes For AreasSWA: SenseWear ArmbandVACCINE: Vaccine Against Cervical Cancer Impact aNd EffectivenessVIVIANE: Human PapillomaVIrus Vaccine Immunogenicity ANd EfficacyYFHI: Young Female Health Initiative
Edited by G Eysenbach; submitted 19.01.15; peer-reviewed by A Reimers, M van Poppel, R Joseph, D Pekmezi; comments to author25.05.15; revised version received 13.07.15; accepted 15.08.15; published 05.10.15.
Please cite as:Hartley S, Garland S, Young E, Bennell KL, Tay I, Gorelik A, Wark JDA Comparison of Self-Reported and Objective Physical Activity Measures in Young Australian WomenJMIR Public Health Surveill 2015;1(2):e14URL: http://publichealth.jmir.org/2015/2/e14/ doi:10.2196/publichealth.4259PMID:27227132
©Stefanie Hartley, Suzanne Garland, Elisa Young, Kim Louise Bennell, Ilona Tay, Alexandra Gorelik, John Dennis Wark.Originally published in JMIR Public Health and Surveillance (http://publichealth.jmir.org), 05.10.2015. This is an open-accessarticle distributed under the terms of the Creative Commons Attribution License (http://creativecommons.org/licenses/by/2.0/),which permits unrestricted use, distribution, and reproduction in any medium, provided the original work, first published in JMIRPublic Health and Surveillance, is properly cited. The complete bibliographic information, a link to the original publication onhttp://publichealth.jmir.org, as well as this copyright and license information must be included.
JMIR Public Health Surveill 2015 | vol. 1 | iss. 2 | e14 | p.178http://publichealth.jmir.org/2015/2/e14/(page number not for citation purposes)
Hartley et alJMIR PUBLIC HEALTH AND SURVEILLANCE
XSL•FORenderX

Original Paper
Machine Translation of Public Health Materials From English toChinese: A Feasibility Study
Anne M Turner1*, MD, MLIS, MPH; Kristin N Dew2*, MS; Loma Desai3, MS, MBA; Nathalie Martin4*, BA; Katrin
Kirchhoff5*, PhD1Northwest Center for Public Health Practice, Department of Health Services, University of Washington, Seattle, WA, United States2Northwest Center for Public Health Practice, Human Centered Design & Engineering, University of Washington, Seattle, WA, United States3Northwest Center for Public Health Practice, Information School, University of Washington, Seattle, WA, United States4Northwest Center for Public Health Practice, Department of Biomedical Informatics and Medical Education, University of Washington, Seattle, WA,United States5Speech, Signal and Language Interpretation (SSLI) Lab, Department of Electrical Engineering, University of Washington, Seattle, WA, United States*these authors contributed equally
Corresponding Author:Anne M Turner, MD, MLIS, MPHNorthwest Center for Public Health PracticeDepartment of Health ServicesUniversity of WashingtonSuite 4001107 NE 45th StreetSeattle, WA, 98105United StatesPhone: 1 206 491 1489Fax: 1 206 616 5249Email: [email protected]
Abstract
Background: Chinese is the second most common language spoken by limited English proficiency individuals in the UnitedStates, yet there are few public health materials available in Chinese. Previous studies have indicated that use of machine translationplus postediting by bilingual translators generated quality translations in a lower time and at a lower cost than human translations.
Objective: The purpose of this study was to investigate the feasibility of using machine translation (MT) tools (eg, GoogleTranslate) followed by human postediting (PE) to produce quality Chinese translations of public health materials.
Methods: From state and national public health websites, we collected 60 health promotion documents that had been translatedfrom English to Chinese through human translation. The English version of the documents were then translated to Chinese usingGoogle Translate. The MTs were analyzed for translation errors. A subset of the MT documents was postedited by native Chinesespeakers with health backgrounds. Postediting time was measured. Postedited versions were then blindly compared against humantranslations by bilingual native Chinese quality raters.
Results: The most common machine translation errors were errors of word sense (40%) and word order (22%). Posteditorscorrected the MTs at a rate of approximately 41 characters per minute. Raters, blinded to the source of translation, consistentlyselected the human translation over the MT+PE. Initial investigation to determine the reasons for the lower quality of MT+PEindicate that poor MT quality, lack of posteditor expertise, and insufficient posteditor instructions can be barriers to producingquality Chinese translations.
Conclusions: Our results revealed problems with using MT tools plus human postediting for translating public health materialsfrom English to Chinese. Additional work is needed to improve MT and to carefully design postediting processes before theMT+PE approach can be used routinely in public health practice for a variety of language pairs.
(JMIR Public Health Surveill 2015;1(2):e17) doi:10.2196/publichealth.4779
JMIR Public Health Surveill 2015 | vol. 1 | iss. 2 | e17 | p.179http://publichealth.jmir.org/2015/2/e17/(page number not for citation purposes)
Turner et alJMIR PUBLIC HEALTH AND SURVEILLANCE
XSL•FORenderX
KEYWORDS
public health informatics; public health; natural language processing; machine translation; Chinese language; health promotion;public health departments; consumer health; limited English proficiency; health literacy
Introduction
A key role of public health departments is to inform and educatethe public on issues of public health importance. Healthdepartments produce health promotion materials on a range oftopics, such as environmental health, communicable diseases,immunizations, and maternal-child health, and the Internet hasbecome a key mechanism by which they distribute anddisseminate this information. Although federal and stateregulations require that health materials be made available inthe languages of patients, due to the time and costs required tomanually produce quality translations, very few of thesematerials are available in languages other than English [1].Therefore, individuals with limited English proficiency (LEP)have limited access to this health information. This is ofparticular significance given that LEP status is associated withpoor health literacy and negative health consequences, includingdocumented health disparities such as poorer health outcomesand poorer access to health care and preventive servicescompared to English-speaking minorities [2-4].
Machine translation (MT)—the automatic translation of textfrom one human language into another by a computerprogram—has been an area of study within natural languageprocessing for several decades. State-of-the-art MT tools use astatistical machine translation (SMT) framework. This approachuses large amounts of parallel text for the desired language pairto train SMT models. During testing, an SMT engine thenproduces the most likely translation under the statistical model.While MT tools have improved greatly over the last 5 years,and MT is now routinely used by many language serviceproviders, the quality of raw MT output generally falls short ofhuman-generated translations (HT).
In order to produce quality translations, MT errors need to becorrected by human readers who have domain expertise and arefluent in the source and target languages. This correction, calledpostediting (PE), can range from light to heavy editing. It hasbeen shown that MT+PE increases productivity (ie, it can becompleted more quickly than producing an entirely new HT)both for translators and for lay users [5]. However, comparedwith translating, postediting is a cognitively different process,and postediting results are strongly dependent on posteditorskill, attitudes towards machine translation, difficulty of thesource document, and quality of the initial machine translationoutput [5,6].
Our previous research indicates that freely available MT tools,such as Google Translate and Microsoft Translator, can be usedin conjunction with human PE to produce quality translationsefficiently and at low cost [7,8]. We compared the time and costof HT versus MT+PE for Spanish public health documents,
using health professionals as posteditors [7]. Posteditorscorrected 25 machine-translated public health documents. Pairsof HT and MT+PE were blindly presented to 2 bilingual publichealth professionals, who were asked to rate which of thetranslations they preferred. In this blinded rating, the HT andMT+PE were found to be overall equivalent (33% HT preferred,33% MT+PE preferred, 33% both translations consideredequivalent).
These previous studies were conducted on a single languagepair of English-Spanish. SMT generally works best when thesource and target languages have similar sentence structures,as in the case of English-Spanish. In order to assess the broaderusefulness of MT technology in public health departments, itis necessary to determine whether these results generalize to awider set of language pairs, specifically those pairs with verydivergent linguistic structures. One such pair, English-Chinese,is of particular interest since Chinese is the second mostcommon language spoken by LEP individuals in the UnitedStates, representing 6.1% of the LEP population [9].
We conducted postediting experiments, similar to thoseconducted for the English-Spanish pair, in order to determinethe feasibility (accuracy and efficiency) of using MT+PE fortranslating public health documents from English to TraditionalChinese. We investigated the types of MT errors occurring inChinese, the PE time needed to correct them, and the quality ofMT+PE compared to HTs, as rated by raters fluent in bothEnglish and Traditional Chinese. In this paper, we discuss theresults of these investigations and compare them to our previousexperiences with the English-Spanish pair. This work contributesto our understanding of the challenges involved in applying theMT+PE approach in a public health setting.
Methods
Initial StepsWe collected 60 health promotion documents from differentpublic health agencies in the United States that had beentranslated manually (HT) from English to Chinese. Translationswere created using the Traditional Chinese character set, asopposed to Simplified Chinese, because this is the form knownto most Chinese LEP individuals in the Pacific Northwestregion. We identified the types of linguistic errors present inMT from English to Chinese and then conducted the posteditingof the translated materials with participants fluent in bothlanguages. Next, we had bilingual public health professionalsand laypersons rate the quality of the human versus the MT pluspostedited documents. A diagram of the study design is shownin Figure 1. A more detailed description of the specific methodsfor the linguistic error analysis, postediting and rating studies,and follow-up evaluation is provided below.
JMIR Public Health Surveill 2015 | vol. 1 | iss. 2 | e17 | p.180http://publichealth.jmir.org/2015/2/e17/(page number not for citation purposes)
Turner et alJMIR PUBLIC HEALTH AND SURVEILLANCE
XSL•FORenderX
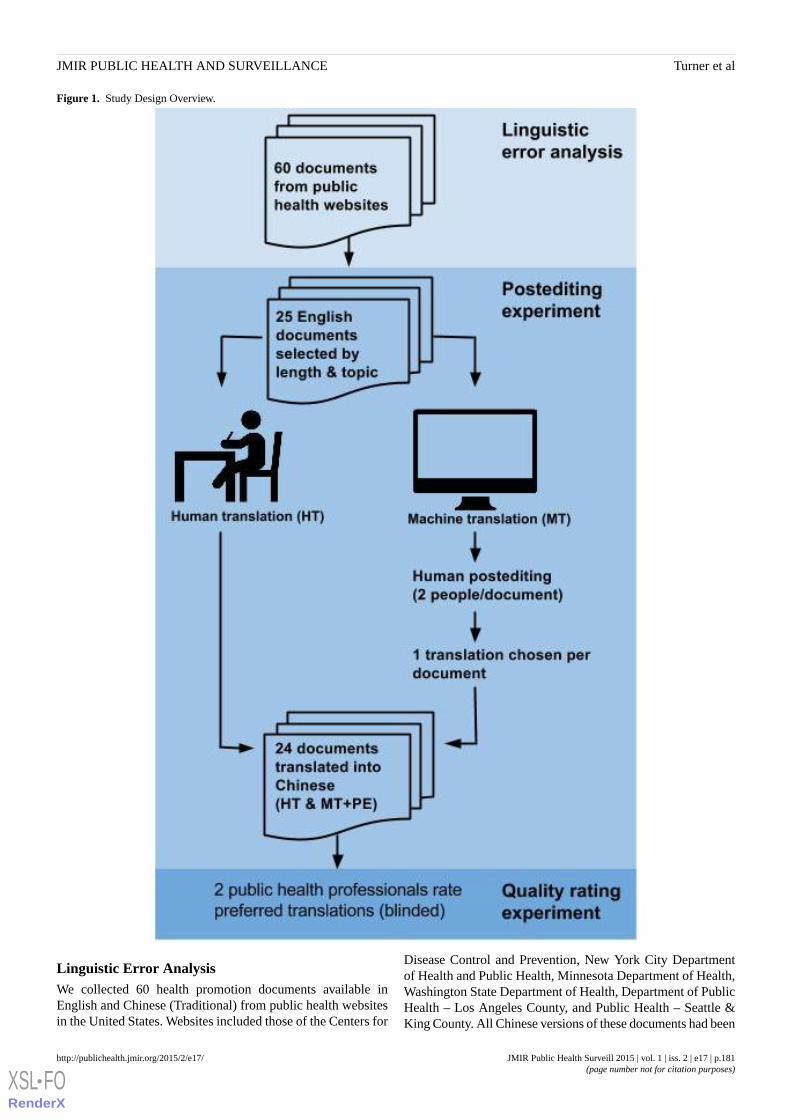
Figure 1. Study Design Overview.
Linguistic Error AnalysisWe collected 60 health promotion documents available inEnglish and Chinese (Traditional) from public health websitesin the United States. Websites included those of the Centers for
Disease Control and Prevention, New York City Departmentof Health and Public Health, Minnesota Department of Health,Washington State Department of Health, Department of PublicHealth – Los Angeles County, and Public Health – Seattle &King County. All Chinese versions of these documents had been
JMIR Public Health Surveill 2015 | vol. 1 | iss. 2 | e17 | p.181http://publichealth.jmir.org/2015/2/e17/(page number not for citation purposes)
Turner et alJMIR PUBLIC HEALTH AND SURVEILLANCE
XSL•FORenderX

translated manually (HT) by health department translators orprofessional translation vendors. The English versions of thedocuments were then translated into Traditional Chinese usingGoogle Translate. We developed a categorization scheme forMT errors, and all MTs were annotated based on this schemeby a native Chinese speaker with formal training in linguistics.Subsequently, aggregate error statistics were computed to gaininsights into the most frequent error categories: word sense,word order, missing word, superfluous word,orthography/punctuation, particle error, untranslated word,pragmatic error, and other grammar error.
Postediting ExperimentsFor the postediting studies, we selected 25 of the 60 healthdocuments that had been machine translated from English toChinese using Google Translate. To ensure a wide representationof topics, we selected the documents based on the length of theEnglish version (340-914 words) and topic area. From thememberships of local Chinese cultural organizations, 6 Chinesetranslators were recruited for postediting and screened forlanguage ability and health experience. Posteditors, all nativeChinese speakers, were fluent in oral and written TraditionalChinese and English, had varying levels of translationexperience, and had prior experience in a health-related field(Table 1).
The 25 machine-translated documents were each corrected byat least 2 posteditors in order to permit consistency checks acrossposteditors and computation of average time, adequacy, andfluency ratings per document. Posteditors used a proprietaryMT and postediting tool built for the purpose of this study, asdescribed previously [7]. Each posteditor corrected betweenfour and 21 documents representing common types of publichealth materials, including informational webpages, agencyletters, fact sheets, and brochures. Posteditors were allowed tochoose their preferred character input method. One posteditorused a pinyin keyboard called Q9, while the rest used thestandard Windows OS pinyin input. The postediting tooldisplays three versions of the text from left to right in onewindow: the original English text, the MT, and the editable MT,respectively. When a posteditor clicks the editable MT field tobegin editing, a timer starts. The tool saves the total editing time(minus pauses), keystrokes, and a copy of the posteditedmachine translation. Time and keystroke data were collectedfor all postedited documents. Due to a posteditor saving error,only 24 of the 25 postedited documents were put out in areadable format and therefore available for rating.
Posteditors were given written and verbal instructions to“perform all corrections necessary to ensure that the text (1) isconsistent with the grammar rules of Chinese, (2) adequatelyrepresents the meaning of the English text, (3) is culturallyappropriate (ie, not unintentionally funny or offensive), and (4)preserves the linguistic style of the source document.”Posteditors were asked not to alter a correct, appropriatetranslation simply because it may not correspond to their firstchoice of translation. In short, they were instructed to correctonly as much as necessary and to not rewrite the text. Thesewere the same instructions used in the previous Spanish study.
After completing postediting, participants were asked to fill outa questionnaire to rate the adequacy and fluency of each MT+PEon a scale of 1-5. These rating scales are common in humanevaluations of machine translation quality [10]. An adequacyof 1 indicated that none of the original meaning of the Englishsource text was retained in the MT, while an adequacy of 5indicated that all of the meaning was retained. A fluency ratingof 1 indicated that the MT was incomprehensible, while a ratingof 5 indicated flawless Chinese. The questionnaire also askedparticipants to describe the common translation errors theyfound, identify which errors were most difficult to correct, andexplain which errors took the longest time to correct.
Quality RatingTwo public health professionals, blinded to the method oftranslation, compared the quality of the postedited documentsto the quality of the HT documents from the health departmentwebsites. The quality raters were asked to rate the MT+PEagainst HT versions. One rater was a professional public healthtranslator and a Department of Social and Health ServicesCertified Medical Interpreter at a local clinic; the other was ahealth researcher (Table 1). They were presented with 20 setsof documents selected from the 24 available, with each setcontaining an original English text, an HT version of that text,and an MT+PE version of the text. Even though one raterparticipated in the initial postediting study as well, she did notrate documents that she had encountered while postediting. Thedocuments were not labeled as human- or machine-translated,and the order in which they were presented in each set wasrandomized. Using a questionnaire, we asked the quality ratersto read each set carefully, indicate which of the translatedversions they preferred, and describe why they chose thatversion, based on five dimensions: grammar, adequacy, wordchoice, cultural appropriateness, and reading level.
JMIR Public Health Surveill 2015 | vol. 1 | iss. 2 | e17 | p.182http://publichealth.jmir.org/2015/2/e17/(page number not for citation purposes)
Turner et alJMIR PUBLIC HEALTH AND SURVEILLANCE
XSL•FORenderX

Table 1. Initial postediting and quality rating participants, health, and translation experience.
Translation experienceHealth backgroundRoleParticipant number
Limited—translating at health fairsPharmacy studentPosteditorP1
Teaching English as a second language &translating research
Social work for Chinese population,including health care support
PosteditorP2
10 years of various translation experiencePublic health researcherPosteditor and quality raterP3
Translating agency and government publicationsfor distribution to clients
Social work for Chinese population,including health care support
PosteditorP4
NonePublic health studentPosteditorP5
DSHS Certified Medical InterpreterPublic health translatorQuality rater (posteditor for follow-up evaluation only)
P6
Follow-Up EvaluationAfter analyzing the results of the quality rating study, weperformed follow-up evaluations of the effects of posteditorexpertise, engagement, and instructions on the quality ofpostedited translations. To assess whether posteditors’ publichealth and translation expertise negatively impacted the qualityrating outcome, we asked P6, a highly trained and experiencedhealth translator, to postedit four documents. We then repeatedthe quality rating procedure with those documents, asking fivenative Chinese speakers to review them.
To test posteditor engagement and whether the instructions toedit only as necessary were problematic, we asked 3 posteditors(P2, P4, and P5) to return to edit a total of 10 more documents,this time with instructions to make as many corrections asneeded to ensure the quality of the translation. We again
repeated the quality rating procedure with one native Chinesespeaker who has public health experience to see whetherposteditors given the revised instructions would produce textequivalent to the HTs.
Results
Linguistic Error AnalysisResults from the linguistic error analysis are summarized inTable 2. The left-hand column shows the error type; theright-hand column shows the corresponding frequency of theerror type, computed as the percentage of all errors annotatedin the total set of 60 documents. For example, word sense errors(errors where the word meaning was translated incorrectly)constituted 40% of all annotated errors. The next most commonerror types involved word order (22%) and missing words(16%).
Table 2. Error categories and their distributions.
Frequency (%)Error categories
40Word sense
22Word order
16Missing word
14Superfluous word
3Other grammar error
3Orthography/punctuation
1Particle error
0.03Untranslated word
0.01Pragmatic error
Postediting ExperimentsThe proprietary postediting tool recorded the time taken topostedit each machine-translated document. We analyzed thetime taken, by document and by posteditor, and examinedposteditors’ quality ratings of the initial MT output. A list withdescriptions of the source documents is provided in MultimediaAppendix 1.
To determine and analyze the amount of time required forpostediting, we calculated the number of characters per minute(CPM) for each document and then computed means and
standard deviations (SDs) in CPM for each document, usingposteditors’ recorded times. In addition, we computed meansand SDs in CPM for each posteditor (Table 3). This helped usgain insights into potential correlations between posteditingtime and document topic, length, etc, as well as differencesbetween posteditors (though not all posteditors edited the samenumber of documents).
The mean CPM per document varied greatly, from 18.5-79.6CPM (SD 0.03-38.7). The total mean CPM across all documentswas 37.8 (SD 10.2). Thus, on average a posteditor correctedapproximately 38 CPM, with a variation of around 10 CPMs.
JMIR Public Health Surveill 2015 | vol. 1 | iss. 2 | e17 | p.183http://publichealth.jmir.org/2015/2/e17/(page number not for citation purposes)
Turner et alJMIR PUBLIC HEALTH AND SURVEILLANCE
XSL•FORenderX
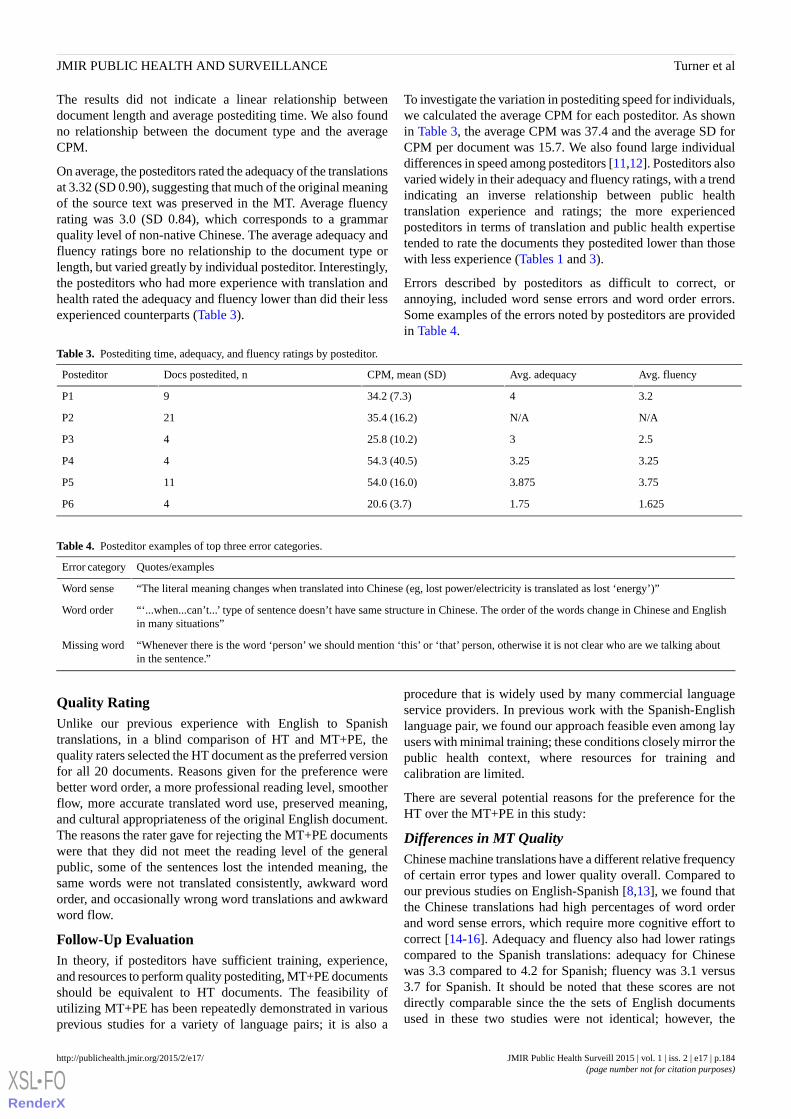
The results did not indicate a linear relationship betweendocument length and average postediting time. We also foundno relationship between the document type and the averageCPM.
On average, the posteditors rated the adequacy of the translationsat 3.32 (SD 0.90), suggesting that much of the original meaningof the source text was preserved in the MT. Average fluencyrating was 3.0 (SD 0.84), which corresponds to a grammarquality level of non-native Chinese. The average adequacy andfluency ratings bore no relationship to the document type orlength, but varied greatly by individual posteditor. Interestingly,the posteditors who had more experience with translation andhealth rated the adequacy and fluency lower than did their lessexperienced counterparts (Table 3).
To investigate the variation in postediting speed for individuals,we calculated the average CPM for each posteditor. As shownin Table 3, the average CPM was 37.4 and the average SD forCPM per document was 15.7. We also found large individualdifferences in speed among posteditors [11,12]. Posteditors alsovaried widely in their adequacy and fluency ratings, with a trendindicating an inverse relationship between public healthtranslation experience and ratings; the more experiencedposteditors in terms of translation and public health expertisetended to rate the documents they postedited lower than thosewith less experience (Tables 1 and 3).
Errors described by posteditors as difficult to correct, orannoying, included word sense errors and word order errors.Some examples of the errors noted by posteditors are providedin Table 4.
Table 3. Postediting time, adequacy, and fluency ratings by posteditor.
Avg. fluencyAvg. adequacyCPM, mean (SD)Docs postedited, nPosteditor
3.2434.2 (7.3)9P1
N/AN/A35.4 (16.2)21P2
2.5325.8 (10.2)4P3
3.253.2554.3 (40.5)4P4
3.753.87554.0 (16.0)11P5
1.6251.7520.6 (3.7)4P6
Table 4. Posteditor examples of top three error categories.
Quotes/examplesError category
“The literal meaning changes when translated into Chinese (eg, lost power/electricity is translated as lost ‘energy’)”Word sense
“‘...when...can’t...’ type of sentence doesn’t have same structure in Chinese. The order of the words change in Chinese and Englishin many situations”
Word order
“Whenever there is the word ‘person’ we should mention ‘this’ or ‘that’ person, otherwise it is not clear who are we talking aboutin the sentence.”
Missing word
Quality RatingUnlike our previous experience with English to Spanishtranslations, in a blind comparison of HT and MT+PE, thequality raters selected the HT document as the preferred versionfor all 20 documents. Reasons given for the preference werebetter word order, a more professional reading level, smootherflow, more accurate translated word use, preserved meaning,and cultural appropriateness of the original English document.The reasons the rater gave for rejecting the MT+PE documentswere that they did not meet the reading level of the generalpublic, some of the sentences lost the intended meaning, thesame words were not translated consistently, awkward wordorder, and occasionally wrong word translations and awkwardword flow.
Follow-Up EvaluationIn theory, if posteditors have sufficient training, experience,and resources to perform quality postediting, MT+PE documentsshould be equivalent to HT documents. The feasibility ofutilizing MT+PE has been repeatedly demonstrated in variousprevious studies for a variety of language pairs; it is also a
procedure that is widely used by many commercial languageservice providers. In previous work with the Spanish-Englishlanguage pair, we found our approach feasible even among layusers with minimal training; these conditions closely mirror thepublic health context, where resources for training andcalibration are limited.
There are several potential reasons for the preference for theHT over the MT+PE in this study:
Differences in MT QualityChinese machine translations have a different relative frequencyof certain error types and lower quality overall. Compared toour previous studies on English-Spanish [8,13], we found thatthe Chinese translations had high percentages of word orderand word sense errors, which require more cognitive effort tocorrect [14-16]. Adequacy and fluency also had lower ratingscompared to the Spanish translations: adequacy for Chinesewas 3.3 compared to 4.2 for Spanish; fluency was 3.1 versus3.7 for Spanish. It should be noted that these scores are notdirectly comparable since the the sets of English documentsused in these two studies were not identical; however, the
JMIR Public Health Surveill 2015 | vol. 1 | iss. 2 | e17 | p.184http://publichealth.jmir.org/2015/2/e17/(page number not for citation purposes)
Turner et alJMIR PUBLIC HEALTH AND SURVEILLANCE
XSL•FORenderX

differences in scores confirm the common observation in theMT community that MT for English-Chinese is less effectivethan for English-Spanish.
Instructions Provided to PosteditorsPosteditors might have misinterpreted the posteditinginstructions. Specifically, the instruction to “postedit only wherenecessary” and to not “rewrite” might have led them to producefewer edits than they would under real-life circumstances.Quality raters observed that the postedited documents oftencontained very literal word-by-word translations that wereperceived as unacceptable. In other language pairs with similarlinguistic structures (like English and Spanish), more literaltranslations may still yield acceptable translation outputs,whereas fluent Chinese requires the translator to depart morestrongly from a literal translation. Due to time and resourceconstraints for this study, as with prior studies, there also wasno extensive training and calibration phase for the studyparticipants. Combined with the lower quality of initial MTChinese versions, the postediting instructions might help explainthe lesser quality of the postedited Chinese translations ascompared to the Spanish translations.
Linguistic Expertise of PosteditorsAlthough posteditors were selected for bilingual competenceand familiarity with the domain of public health, they did nothave to undergo initial language or translation tests to verifytheir editing abilities.
Engagement of PosteditorsPosteditors may not have been sufficiently engaged in the task,or they may have optimized for time rather than quality.
Different Levels of Quality ControlIn the postediting, only one round of postediting was performed,followed by the quality rating task. We do not know how manyiterations of editing and quality control were applied to thehuman-generated translations, since they were collected fromdifferent sources where the translation processes were nottransparent. Our prior investigations into health departmenttranslation processes revealed that most of the public health HTdocuments had been translated in-house or by language serviceproviders who conduct several rounds of postediting and reviewprior to making them public [7].
Additional Follow-UpIn order to ascertain the contribution of these factors to theoverall results, we conducted additional follow-up studiesinvestigating the role of posteditor expertise, instruction, andengagement.
ExpertiseTo assess whether posteditor expertise played a role in thetranslation quality, we engaged the services of a public healthprofessional who performed translation for a large metropolitanhealth department in Washington State (P6). She was given theoriginal set of instructions to correct only as much as neededand to not rewrite the text extensively. She postedited fourdocuments, which were then given as a set and blindly ratedagainst their original human translations by five native Chinese
speakers so that each rater reviewed all four documents. Threeof the 5 raters selected the human translation over the MT+PEfor all four documents; 2 raters rated one of the HT and MT+PEdocuments as equivalent.
Instructions and EngagementTo test whether our instructions to postedit only where necessaryplayed a role in the MT+PE ratings, we modified the instructionsto emphasize quality and recruited 3 posteditors to come backfor another postediting session with the new instructions. Theoriginal instructions—as adapted from the Spanishstudy—directed posteditors to not alter a correct translation,even if it was not their first choice; to not engage in extensiverewriting of the text; and to not spend an extended period oftime looking up grammar, punctuation, or unfamiliarterminology online. The updated instructions directed posteditorsto use as much time and effort as necessary to ensure ahigh-quality translation. The 3 returning posteditors correcteda total of 10 documents, which were then blindly rated by aquality rater with language and public health expertise. Asanticipated, posteditors took longer to produce the MT+PEtranslations with the updated instructions: P2’s average speeddropped from 35.38 CPM to 23.43 CPM, P4’s fell from 54.33to 17.46 CPM, and P5’s decreased from 53.96 to 19.69 CPM.The rater chose the manual human translations for 6/10documents, while rating four as equivalent—a notableimprovement over the original instructions.
Discussion
Principal FindingsAlthough our prior research on English to Spanish translationindicated that MT+PE could produce translations equivalent inquality for less time and cost, our current study on theEnglish-Chinese language pair showed that maintaining qualitythrough postediting was more problematic. Translation betweenEnglish and Chinese presents a challenge due to very divergentsyntactic structures (eg, topic-comment structure in Chinese vssubject-verb-object structure in English), frequent dropping ofpronouns in Chinese, higher degree of morphology in English,and other linguistic differences. Compared to a language pairlike English and Spanish, SMT for English and Chinesegenerally tends to produce lower-quality results (eg, the resultsobtained in benchmark evaluations for different language pairsconducted by the US National Institute of Standards andTechnology [17].
Strengths and LimitationsAlthough, theoretically, professional translators with sufficienttraining and time should be able to produce an equivalentproduct through postediting MTs, even with instructions to takethe time to provide the best quality translation, the finalpostedited translations still contained obvious errors that ledthe quality raters to prefer HTs in most cases. Experiencedtranslators who performed the translations rated the adequacyand fluency of MT+PE lower in general than their lessexperienced counterparts and commented that for manymachine-translated sentences it would be easier to start withthe English version than to correct the MT version. However,
JMIR Public Health Surveill 2015 | vol. 1 | iss. 2 | e17 | p.185http://publichealth.jmir.org/2015/2/e17/(page number not for citation purposes)
Turner et alJMIR PUBLIC HEALTH AND SURVEILLANCE
XSL•FORenderX
it should be noted that our prior evaluation of health departmenttranslation processes found that HT documents undergo multipleediting cycles to ensure translation quality and culturalappropriateness. In the studies reported on here, themachine-translated documents underwent only one round ofpostediting. It is likely that with additional rounds of editingthe MT+PE product would be further improved.
Another possible limitation of our study is the use of a singletranslation engine, Google Translate. However, most SMTsystems are based on the same set of underlying statisticalmodels, suggesting that the types and relative frequencies oftranslation errors would not have been significantly differenthad a different SMT system been used.
Additional work is needed to improve the quality of MT fromEnglish to Chinese. Word sense and word order errors requirethe most attention for improvement. Our team is currentlyworking to improve these errors. In addition, particular caremust be taken in selecting posteditors, documents, and machinetranslation engines, and in designing postediting instructionsand quality control processes.
ConclusionIn the United States, Chinese is the second most commonlanguage spoken by LEP individuals and the single mostcommon character language used. However, due to the resourcesand time involved in human translation, health departmentscurrently offer few health promotion materials in Chinese. Ourinvestigation into the use of MT+PE to produce translationsindicates that using the methods that worked for English toSpanish translations was not as effective with translation fromEnglish to Chinese. Multiple factors, including quality of MTand expertise of posteditors, may have contributed to theseresults. Our preliminary follow-up studies suggest that reducingword sense errors and word order errors would improve Englishto Chinese MTs, while additional training and expertise ofbilingual posteditors may be needed in order to successfullyapply online MT technology to public health practice. We areperforming additional studies to determine how best to improvetranslation from English to Chinese in order to ensure qualitytranslation at a low cost.
AcknowledgmentsThe research reported here was supported by the National Library of Medicine of the National Institutes of Health (NIH) underaward number R0110432704. The content is solely the responsibility of the authors and does not necessarily represent the officialviews of the NIH. The images used in Figure 1 were created by Hadi Davodpour, Edward Boatman, and Lauren Manninen forthe Noun Project. We would also like to thank Beryl Schulman and Julie Loughran for reviewing this manuscript.
Conflicts of InterestNone declared.
Multimedia Appendix 1Study source documents and postediting times.
[PDF File (Adobe PDF File), 41KB - publichealth_v1i2e17_app1.pdf ]
References1. Turner A, Capurro D, Kirchhoff K. 3rd Annual Health Literacy Research Conference. Chicago, IL: Health Literacy Research
Conference; 2011. The availability of translated public health materials for limited English proficiency populations inWashington State URL: http://www.bumc.bu.edu/healthliteracyconference/files/2011/07/Poster-Abstracts-Packet.pdf[accessed 2015-05-19] [WebCite Cache ID 6Ye9EvBZk]
2. Raynor EM. Factors Affecting Care in Non-English-Speaking Patients and Families. Clin Pediatr (Phila) 2015 May 11.[doi: 10.1177/0009922815586052] [Medline: 25963177]
3. Ponce NA, Hays RD, Cunningham WE. Linguistic disparities in health care access and health status among older adults.J Gen Intern Med 2006 Jul;21(7):786-791 [FREE Full text] [doi: 10.1111/j.1525-1497.2006.00491.x] [Medline: 16808783]
4. Sentell TL, Tsoh JY, Davis T, Davis J, Braun KL. Low health literacy and cancer screening among Chinese Americans inCalifornia: a cross sectional analysis. BMJ Open 2015;5:1-9.
5. Aranberri N, Labaka G, Diaz de Ilarraza A, Sarasola K. Comparison of Post-Editing Productivity between ProfessionalTranslators and Lay Users. In: Third Workshop on Post-editing Technology and Practice. 2014 Oct Presented at: ThirdWorkshop on Post-editing Technology and Practice; October 2014; Vancouver (BC), Canada p. 20-33 URL: http://www.amtaweb.org/AMTA2014Proceedings/AMTA2014Proceedings_PEWorkshop_final.pdf
6. Koehn P, Germann U. The impact of machine translation quality on human post-editing. In: Workshop on Humans andComputer-Assisted Translation. 2014 Presented at: Workshop on Humans and Computer-assisted Translation; 2014;Gothenburg, Sweden p. 38-46 URL: http://www.aclweb.org/anthology/W14-0307.pdf
JMIR Public Health Surveill 2015 | vol. 1 | iss. 2 | e17 | p.186http://publichealth.jmir.org/2015/2/e17/(page number not for citation purposes)
Turner et alJMIR PUBLIC HEALTH AND SURVEILLANCE
XSL•FORenderX
7. Turner AM, Bergman M, Brownstein M, Cole K, Kirchhoff K. A comparison of human and machine translation of healthpromotion materials for public health practice: time, costs, and quality. J Public Health Manag Pract 2014;20(5):523-529.[doi: 10.1097/PHH.0b013e3182a95c87] [Medline: 24084391]
8. Kirchhoff K, Turner AM, Axelrod A, Saavedra F. Application of statistical machine translation to public health information:a feasibility study. J Am Med Inform Assoc 2011;18(4):473-478 [FREE Full text] [doi: 10.1136/amiajnl-2011-000176][Medline: 21498805]
9. Pandya C, Batalova J, McHugh M. Limited English Proficient Individuals in the United States: Number, Share, Growth,Linguistic Diversity.: Migration Policy Institute; 2011. URL: http://www.immigrationresearch-info.org/report/migration-policy-institute/limited-english-proficient-individuals-united-states-number-share- [accessed 2015-05-17][WebCite Cache ID 6Ye8R4lAY]
10. Linguistic Data Consortium. Linguistic Data Annotation Specification: Assessment of Fluency and Adequacy in TranslationsRevision 1.5. 2005 Jan 25. URL: https://www.ldc.upenn.edu/collaborations/past-projects [accessed 2015-05-18] [WebCiteCache ID 6Ye9VQH0J]
11. Guerberof A. Machine Translation Summit XII. 2009 Aug. Productivity and quality in MT post-editing URL: http://www.mt-archive.info/MTS-2009-Guerberof.pdf [accessed 2015-05-18] [WebCite Cache ID 6Ye9wRXwj]
12. Guerberof A. Correlations between productivity and quality when post-editing in a professional context. Machine Translation2014 Nov 20;28(3-4):165-186. [doi: 10.1007/s10590-014-9155-y]
13. Kirchhoff K, Capurro D, Turner AM. A Conjoint Analysis Framework for Evaluating User Preferences in MachineTranslation. Mach Transl 2014 Mar 1;28(1):1-17 [FREE Full text] [doi: 10.1007/s10590-013-9140-x] [Medline: 24683295]
14. Temnikova I. Cognitive Evaluation Approach for a Controlled Language Post-Editing Experiment. In: Proceedings of theSeventh International Conference on Language Resources and Evaluation. 2010 May Presented at: Seventh InternationalConference on Language Resources and Evaluation; May 2010; Valletta, Malta p. 3485-3490 URL: http://www.lrec-conf.org/proceedings/lrec2010/pdf/437_Paper.pdf
15. Lacruz I, Denkowski M, Lavie A. Cognitive Demand and Cognitive Effort in Post-Editing. In: Third Workshop onPost-Editing Technology and Practice. 2014 Oct Presented at: The Third Workshop on Post-Editing Technology andPractice; October 2014; Vancouver (BC), Canada p. 73-84 URL: http://www.amtaweb.org/AMTA2014Proceedings/AMTA2014Proceedings_PEWorkshop_final.pdf
16. Koponen M, Aziz W, Ramos L, Specia L. Post-Editing Time as a Measure of Cognitive Effort. In: Workshop on Post-EditingTechnology and Practice. 2012 Oct Presented at: Tenth Biennial Conference of the Association for Machine Translationof the Americas; October 2012; San Diego, California URL: http://amta2012.amtaweb.org/AMTA2012Files/html/13/13_paper.pdf
17. Koehn P. Options, Human Language Technologies: The 2010 Annual Conference of the North American Chapter of theACL. 2010 Jun Presented at: 2010 Annual Conference of the North American Chapter of the ACL; June 2010; Los Angeles,CA p. 537-545 URL: http://www.aclweb.org/anthology/N10-1078
AbbreviationsCPM: characters per minuteHT: human translationLEP: limited English proficiencyMT: machine translationNIH: National Institutes of HealthPE: posteditingSMT: statistical machine translation
Edited by G Eysenbach; submitted 29.05.15; peer-reviewed by D Capurro, Y Kim, B Massoudi; comments to author 08.07.15; revisedversion received 18.08.15; accepted 07.10.15; published 17.11.15.
Please cite as:Turner AM, Dew KN, Desai L, Martin N, Kirchhoff KMachine Translation of Public Health Materials From English to Chinese: A Feasibility StudyJMIR Public Health Surveill 2015;1(2):e17URL: http://publichealth.jmir.org/2015/2/e17/ doi:10.2196/publichealth.4779PMID:27227135
JMIR Public Health Surveill 2015 | vol. 1 | iss. 2 | e17 | p.187http://publichealth.jmir.org/2015/2/e17/(page number not for citation purposes)
Turner et alJMIR PUBLIC HEALTH AND SURVEILLANCE
XSL•FORenderX

©Anne M Turner, Kristin N Dew, Loma Desai, Nathalie Martin, Katrin Kirchhoff. Originally published in JMIR Public Healthand Surveillance (http://publichealth.jmir.org), 17.11.2015. This is an open-access article distributed under the terms of theCreative Commons Attribution License (http://creativecommons.org/licenses/by/2.0/), which permits unrestricted use, distribution,and reproduction in any medium, provided the original work, first published in JMIR Public Health and Surveillance, is properlycited. The complete bibliographic information, a link to the original publication on http://publichealth.jmir.org, as well as thiscopyright and license information must be included.
JMIR Public Health Surveill 2015 | vol. 1 | iss. 2 | e17 | p.188http://publichealth.jmir.org/2015/2/e17/(page number not for citation purposes)
Turner et alJMIR PUBLIC HEALTH AND SURVEILLANCE
XSL•FORenderX

Publisher:JMIR Publications130 Queens Quay East.Toronto, ON, M5A 3Y5Phone: (+1) 416-583-2040Email: [email protected]
https://www.jmirpublications.com/
XSL•FORenderX