Physics and applications of superhydrophobic and superhydrophilic surfaces and coatings
Upload
khangminh22Category
view
5download
0
JMIR mHealth and uHealth
Mobile and tablet apps, ubiquitous and pervasive computing, wearable computing and domotics for healthVolume 10 (2022), Issue 7 ISSN: 2291-5222
Contents
Reviews
The Association Between Smartphone App–Based Self-monitoring of Hypertension-Related Behaviorsand Reductions in High Blood Pressure: Systematic Review and Meta-analysis (e34767)Aikaterini Kassavou, Michael Wang, Venus Mirzaei, Sonia Shpendi, Rana Hasan. . . . . . . . . . . . . . . . . . . . . . . . . . . . . . . . . . . . . . . . . . . . . . . . . . . . . . 2
Wearing the Future—Wearables to Empower Users to Take Greater Responsibility for Their Health andCare: Scoping Review (e35684)Harjeevan Kang, Mark Exworthy. . . . . . . . . . . . . . . . . . . . . . . . . . . . . . . . . . . . . . . . . . . . . . . . . . . . . . . . . . . . . . . . . . . . . . . . . . . . . . . . . . . . . . . . . . . 13
Original Papers
Impact of a Mobile Application for Tracking Nausea and Vomiting During Pregnancy (NVP) on NVPSymptoms, Quality of Life, and Decisional Conflict Regarding NVP Treatments: MinSafeStart RandomizedControlled Trial (e36226)Elin Ngo, Maria Truong, Hedvig Nordeng, David Wright. . . . . . . . . . . . . . . . . . . . . . . . . . . . . . . . . . . . . . . . . . . . . . . . . . . . . . . . . . . . . . . . . . . . . . . . . . 28
The Efficacy of “Foundations,” a Digital Mental Health App to Improve Mental Well-being During COVID-19:Proof-of-Principle Randomized Controlled Trial (e30976)Silvina Catuara-Solarz, Bartlomiej Skorulski, Iñaki Estella-Aguerri, Claudia Avella-Garcia, Sarah Shepherd, Emily Stott, Nicola Hemmings, AleixRuiz de Villa, Laura Schulze, Sophie Dix. . . . . . . . . . . . . . . . . . . . . . . . . . . . . . . . . . . . . . . . . . . . . . . . . . . . . . . . . . . . . . . . . . . . . . . . . . . . . . . . . . . . . 42
Awareness, Acceptability, and Perceived Effectiveness of Text-Based Therapy Among Graduate Students:Cross-sectional Study (e34102)Samari Blair, Andrea Brockmann, Kelsey Arroyo, Chelsea Carpenter, Kathryn Ross. . . . . . . . . . . . . . . . . . . . . . . . . . . . . . . . . . . . . . . . . . . . . . . . . . . 59
Comparison of Accelerometry-Based Measures of Physical Activity: Retrospective Observational DataAnalysis Study (e38077)Marta Karas, John Muschelli, Andrew Leroux, Jacek Urbanek, Amal Wanigatunga, Jiawei Bai, Ciprian Crainiceanu, Jennifer Schrack. . . . . . . . . . . . 71
Data Management and Privacy Policy of COVID-19 Contact-Tracing Apps: Systematic Review and ContentAnalysis (e35195)Marco Bardus, Melodie Al Daccache, Noel Maalouf, Rayan Al Sarih, Imad Elhajj. . . . . . . . . . . . . . . . . . . . . . . . . . . . . . . . . . . . . . . . . . . . . . . . . . . . . . 83
JMIR mHealth and uHealth 2022 | vol. 10 | iss. 7 | p.1
XSL•FORenderX

Review
The Association Between Smartphone App–Based Self-monitoringof Hypertension-Related Behaviors and Reductions in High BloodPressure: Systematic Review and Meta-analysis
Aikaterini Kassavou1, BSc, MSc, PhD; Michael Wang1, BSc, MPhil; Venus Mirzaei1, BSc, MSc; Sonia Shpendi1,
BSc, MSc, PhD; Rana Hasan1, BScThe Primary Care Unit, Department of Public Health and Primary Care, The University of Cambridge, Cambridge, United Kingdom
Corresponding Author:Aikaterini Kassavou, BSc, MSc, PhDThe Primary Care UnitDepartment of Public Health and Primary CareThe University of CambridgeEast Forvie BuildingCambridge, CB2 0SRUnited KingdomPhone: 44 1223330456Email: [email protected]
Abstract
Background: Self-monitoring of behavior can support lifestyle modifications; however, we do not know whether suchinterventions are effective in supporting positive changes in hypertension-related health behaviors and thus in reducing bloodpressure in patients treated for hypertension.
Objective: This systematic literature review evaluates the extent to which smartphone app–based self-monitoring of healthbehavior supports reductions in blood pressure and changes in hypertension-related behaviors. It also explores the behavioralcomponents that might explain intervention effectiveness.
Methods: A systematic search of 7 databases was conducted in August 2021. Article screening, study and intervention coding,and data extraction were completed independently by reviewers. The search strategy was developed using keywords from previousreviews and relevant literature. Trials involving adults, published after the year 2000, and in the English language were consideredfor inclusion. The random-effects meta-analysis method was used to account for the distribution of the effect across the studies.
Results: We identified 4638 articles, of which 227 were included for full-text screening. A total of 15 randomized controlledtrials were included in the review. In total, 7415 patients with hypertension were included in the meta-analysis. The results indicatethat app-based behavioral self-monitoring interventions had a small but significant effect in reducing systolic blood pressure(SBP), on average, by 1.64 mmHg (95% CI 2.73-0.55, n=7301; odds ratio [OR] 1.60, 95% CI 0.74-3.42, n=114) and in improvingchanges in medication adherence behavior (standardized mean difference [SMD] 0.78, 95% CI 0.22-1.34) compared to usualcare or minimal intervention. The review found the intervention had a small effect on supporting improvements in healthy dietby changing habits related to high sodium food (SMD –0.44, 95% CI –0.79 to –0.08) and a trend, although insignificant, towardsupporting smoking cessation, low alcohol consumption, and better physical activity behaviors. A subgroup analysis found thatbehavioral self-monitoring interventions combined with tailored advice resulted in higher and significant changes in both SBPand diastolic blood pressure (DBP) in comparison to those not providing tailored advice (SBP: –2.92 mmHg, 95% CI –3.94 to
–1.90, n=3102 vs –0.72 mmHg, 95% CI –1.67 to 0.23, n=4199, χ2=9.65, P=.002; DBP: –2.05 mmHg, 95% CI –3.10 to –1.01,
n=968 vs 1.54 mmHg, 95% CI –0.53 to 3.61, n=400, χ2=9.19, P=.002).
Conclusions: Self-monitoring of hypertension-related behaviors via smartphone apps combined with tailored advice has amodest but potentially clinically significant effect on blood pressure reduction. Future studies could use rigorous methods toexplore its effects on supporting changes in both blood pressure and hypertension-related health behaviors to informrecommendations for policy making and service provision.
Trial Registration: PROSPERO CRD42019136158; https://www.crd.york.ac.uk/prospero/display_record.php?RecordID=136158
JMIR Mhealth Uhealth 2022 | vol. 10 | iss. 7 | e34767 | p.2https://mhealth.jmir.org/2022/7/e34767(page number not for citation purposes)
Kassavou et alJMIR MHEALTH AND UHEALTH
XSL•FORenderX

(JMIR Mhealth Uhealth 2022;10(7):e34767) doi:10.2196/34767
KEYWORDS
self-monitoring; smartphone apps; behavior change; hypertension; blood pressure; mobile health; mHealth; mobile app;self-management; lifestyle
Introduction
Hypertension, or high blood pressure, affects over 1 billionadults globally and is a leading risk factor for prematuremorbidity and mortality [1,2]. However, only about half ofadults with hypertension achieve adequate blood pressurecontrol, increasing both health care resources and the costrequired for treatment [3]. In England, hypertension is estimatedto cost the National Health Service an excess of £2 billion (US$2.4 billion) per year [4]. Although various risk factorscontribute to poorly controlled blood pressure, nonadherenceto prescribed health behaviors, like compliance to prescribedmedications [5], improvements in physical activity [6,7], lowsalt intake [8,9], consumption of fruits and vegetables [10], lowalcohol consumption [11], and smoking cessation [12],independently account for most of these uncontrolled cases.
Modifying health-related behaviors to address the underlyingrisk factors of hypertension could result in clinically significanthealth improvements and reduce morbidity, mortality, andtreatment cost. Practitioners have an important role inprescribing lifestyle modifications; however, the time they canspend providing advice about and supporting adherence to healthbehavior change recommendations is limited and expensive[13], and there is currently limited evidence on effectiveinterventions to support health behavior change in patientstreated for hypertension [14-16].
There is growing interest in the potential of digital innovationsas an inexpensive and scalable method to deliver personalizedadvice to people with long-term health conditions, enablingthem to improve adherence to their recommended healthbehavior modifications and achieve health improvements[17-19]. Mobile apps, facilitated via digital technologies suchas computers, smartphones, tablets, and other mobile devicesare accessible to large numbers of people and in differentsettings [20]. Smartphone apps appear to be promising due totheir potential to complement physician efforts and engagepatients in decision-making processes regarding their healthcare [21,22]. Users of app-based interventions can receivereal-time advice about patterns of health behaviors that impacttheir long-term health condition [23], with the potential toeliminate barriers that rely on memory and are prone toinaccuracies and recall bias, and to better inform shareddecision-making during usual care consultations.
Moreover, reporting and monitoring health behaviors usingapps could act as a behavior change strategy to support theindividual in self-regulating health behaviors and thus lead tosustained improvements in clinical health indicators [23,24].Self-monitoring of behavior could underpin individual behaviorchange by modifying self-regulation processes, for example,by enabling patients to reflect on and change their healthbehaviors informed by behavioral performance [24-26].
Interventions providing advice to support patients’self-regulatory processes might be more effective at improvinglong-term treatment adherence and thus might be a cost-effectivesolution for sustained health care.
While smartphone app–based self-monitoring of healthbehaviors has the potential to have a direct, positive effect onpatients’ health and an indirect effect on service provision, todate there is a lack of evidence on the clinical effectiveness ofapp-based behavioral self-monitoring to support patients treatedfor hypertension.
Previous systematic reviews have evaluated the impact ofapp-based interventions to support changes in behavioral orclinical outcomes, suggesting some promising evidence of theirpotential effectiveness [18,27-30]. Furthermore, content analysisof publicly available apps suggests that such interventions arecomplex and often consist of one or a combination of thefollowing components: generic education about the healthcondition, provision of social support, reminders and feedbackabout the behavior, feedback on blood pressure measurements,or provision of clinical advice about medicine adjustments.However, previous reviews have neither investigated the impactof behavioral self-monitoring via smartphone apps on bothclinical and behavioral effectiveness nor disentangled thecomponents that account for clinical effectiveness in patientstreated for hypertension.
This review investigates whether app-based self-monitoring ofhealth behavior reduces blood pressure and improves healthbehaviors in patients treated for hypertension. The review alsoexplores the intervention components combined with thebehavioral self-monitoring interventions and estimates whetherand to what extent they explain intervention clinicaleffectiveness.
Methods
Systematic Searches, Study Eligibility and Selection,and Data CodingThis systematic literature review involved searching theelectronic databases MEDLINE via Ovid, Embase via Ovid,Web of Science, PsycINFO, Scopus, CINAHL, and theCochrane Central Register of Controlled Trials (CENTRAL) inAugust 2021 to identify eligible studies. References foradditional trials involved searches in 1 additional database:JMIR Publications [31].
The search strategy was developed using keywords fromprevious reviews and relevant literature (see an example of thesearch strategy in Multimedia Appendix 1). The review includedrandomized controlled trials testing intervention effects onbehavior change and clinical effectiveness in people treated forhypertension. Studies on trials involving adults, published afterthe year 2000, and in the English language were considered for
JMIR Mhealth Uhealth 2022 | vol. 10 | iss. 7 | e34767 | p.3https://mhealth.jmir.org/2022/7/e34767(page number not for citation purposes)
Kassavou et alJMIR MHEALTH AND UHEALTH
XSL•FORenderX
inclusion. The review was preregistered on PROSPERO(CRD42019136158).
Screening of the title, abstract, and full text was conductedindependently by 4 reviewers (MW, VM, SS, and RH), anddisagreements were discussed by another reviewer (AK).Articles had to meet all of the following criteria to be eligiblefor full-text screening: (1) the population comprised adultindividuals treated for hypertension; (2) the interventionconsisted of self-monitoring of hypertension-related healthbehaviors via a mobile app; (3) the intervention aimed to supportchanges in both blood pressure and related health behaviors;(4) the comparator was usual care, enhanced usual care, or aminimal behavioral intervention; (5) the study includedmeasurements of both blood pressure and health behaviors; and(6) the study design was a randomized controlled trial.
Outcome data were extracted for measurements of systolic anddiastolic blood pressure (SBP and DSP, respectively), as wellas health behaviors for medication adherence, physical activity,healthy diet, alcohol consumption, and smoking cessation.Outcome data for blood pressure and health behaviors wereextracted for baseline and follow-up values for most of thestudies; otherwise, only the follow-up values were extracted.When follow-up values were missing (eg, SD), the baselinevalues were selected to estimate intervention effects.
The Taxonomy of Behavior Change Techniques [32] wasselected to conceptualize and guide the coding for theself-monitoring interventions. We also coded the interventioncomponent “tailoring” for those interventions that delivereddifferent messages to different participants based on informationobtained about them [17,18], as well as the hypothesizedmechanism of behavior change when these were reported.Authors of primary studies were contacted by email for missinginformation. Risk of bias was assessed using the Cochrane Riskof Bias tool, version 2, evaluating the risk introduced in theprimary outcome of blood pressure [33,34]. Two reviewersindependently coded study design and intervention componentsand extracted outcome data. Disagreement was discussed andresolved by a third reviewer.
AnalysisA random-effects meta-analysis was conducted to estimate theweighted, pooled effect for each of the blood pressure andbehavioral outcomes to account for the true effect that may varyacross the individual studies [35]. Effect sizes for continuousoutcomes were calculated using the mean difference for bloodpressure and the standardized mean difference (SMD) forbehavioral outcome measurements. Mean difference wasselected for blood pressure because measurements used similarunits, whereas SMD was selected for behavioral outcomesbecause measurements were obtained using diverse methods,scales, units, or a composite of these. For example, for physicalactivity, these were minutes of physical activity per day andnumber of exercise sessions per week; for medication adherence,
these were days of adherence per week, summary scoreresponses to a 5-point scale, 8-item questionnaire. Effect sizesfor dichotomous outcomes were calculated using the odds ratio(OR) for both blood pressure and behavioral outcomes [35,36].In most cases, blood pressure outcomes were grouped based onan SBP threshold of 140 mmHg and a DBP threshold of 90mmHg (exceeding the threshold indicates poorly controlledblood pressure whereas values below the threshold indicatecontrolled blood pressure) unless stratification variables wereapplied and reported (eg, age or gender-specific thresholds,clinic vs remote measurements thresholds, multimorbiditythresholds). Behavioral outcomes were grouped based on thecorresponding guidelines for health behavior change adoptedby individual studies.
Change-from-baseline outcomes were calculated unless baselinedata were missing, in which case changes at follow-up wereincluded in the analysis. The random-effects meta-analysismethod was used to account for the distribution of the effectacross studies [37].
The I2 statistic was used to estimate the percentage of thevariability in the effect estimates that is due to heterogeneityrather than chance [35]. Heterogeneity was explored further viasubgroup analyses to investigate whether study-level variablescould explain the observed heterogeneity.
Frequencies were used to summarize the behavioral strategiescoded for each of the intervention and comparator groups [38].Intervention strategies coded more than 3 times (frequencyabove 3) were considered for inclusion in the analysis. Subgroupanalyses were performed to test for quantitative interactions,that is, whether intervention behavioral strategies could explainvariation in the effect size.
Publication bias was examined by visual inspection of funnelplots and the Egger test. The meta-analysis was conducted usingRevMan (version 5.4; The Cochrane Collaboration) [39].
Results
OverviewThe systematic search of the 7 databases identified 4638 articles,of which 227 were included for full-text screening. Oneadditional trial was identified from another source. A total of15 randomized controlled trials with 7415 participants met allthe eligibility criteria and were included in the analysis (Figure1).
The majority of the included trials were conducted in the UnitedStates [40-45], whereas 2 studies were conducted in Australia[46,47], and 1 study in each of the following countries: Canada[48], China [49], New Zealand [50], Ghana [51], India [52],China and India [53], and Norway [54]. Participants (adultsaged >18 years) were recruited from primary and secondaryhealth care settings (Multimedia Appendix 2).
JMIR Mhealth Uhealth 2022 | vol. 10 | iss. 7 | e34767 | p.4https://mhealth.jmir.org/2022/7/e34767(page number not for citation purposes)
Kassavou et alJMIR MHEALTH AND UHEALTH
XSL•FORenderX

Figure 1. The PRISMA flowchart.
Meta-analysis
Blood PressureThe meta-analysis suggested that behavioral self-monitoringinterventions via smartphone apps have a small but significanteffect on reducing SPB by an average of 1.64 mmHg (95% CI2.73-0.55, n=7301; Figure 2) across the studies among those inthe intervention group compared to those in the control group.A similar but insignificant effect was found among studiesmeasuring changes in SBP based on recommended thresholds;participants receiving the intervention were, on average, 60%more likely to achieve recommended levels of SBP (eg, SBPbelow 140 mmHg for measurements obtained in clinic)compared to those in the control group (OR 1.60, 95% CI0.74-3.42, n=114; Figure 3).
A similar direction of effect, though not significant, was foundfor the impact of the app-based behavioral self-monitoring
interventions in changing DBP. The interventions had a smalleffect in changing DBP by an average of 0.39 mmHg (95% CI–2.01 to 1.23, n=1368; Multimedia Appendix 3) compared tothe control. The effect of the intervention in supportingreductions in DBP (eg, DBP below 90 mmHg) was, on average,41% more likely in the intervention than in the control (OR1.41, 95% CI 0.66-3.01, n=114; Multimedia Appendix 4),though the changes were not different between the 2 groups.
Heterogeneity between studies was low for most blood pressure
outcome measurements (SBP, continuous: I2=29%, Τ2=0.87,
P=.15; SBP, dichotomous: I2=0%, Τ2=0, P=.58; DBP,
continuous: I2=53%, Τ2=2.56, P=.04; DBP, dichotomous:
I2=0%, Τ2=0, P=.54), suggesting that there is potentially small,unimportant variation in the effect beyond chance between the2 studies that operationalized the blood pressure outcome usingcategorical thresholds.
Figure 2. Meta-analysis of continuous outcome measurements for systolic blood pressure.
JMIR Mhealth Uhealth 2022 | vol. 10 | iss. 7 | e34767 | p.5https://mhealth.jmir.org/2022/7/e34767(page number not for citation purposes)
Kassavou et alJMIR MHEALTH AND UHEALTH
XSL•FORenderX

Figure 3. Meta-analysis of dichotomous outcome measurements for systolic blood pressure.
Medication AdherenceThe SMD between the intervention and control groups wasmedium to large (SMD 0.78, 95% CI 0.22-1.34, n=688;Multimedia Appendix 5), suggesting that app-based behavioralself-monitoring is significantly more effective at supportingimprovements in medication adherence behavior compared tothe control. A similar direction of effect was found for thesubsample of studies that used categorical operationalizationfor the intervention effect and suggested those receiving theapp-based behavioral self-monitoring intervention are, onaverage, 3.8 times more likely to achieve clinically meaningfulmedication adherence than those not receiving the intervention(OR 3.83, 95% CI 1.25-11.76, n=6428; Multimedia Appendix6).
Physical ActivityThe review found a moderate but insignificant effect of theapp-based behavioral self-monitoring interventions in improvingphysical activity (SMD 1.63, 95% CI –0.35 to 0.87, n=501;Multimedia Appendix 7) although only 4 studies provided datafor this, with one of the included studies suggesting thatintervention group patients were 1.6 times more likely to adhereto the lifestyle change.
DietThe meta-analysis included 4 studies on healthy diet andsuggested a moderate effect of behavioral self-monitoring onchanging dietary habits by reducing the consumption of highsodium food by an SMD of 0.44 (95% CI 0.08-0.79, n=382;Multimedia Appendix 8). Objective measures of urinalysissuggested a positive but insignificant trend of the behavioralintervention in reducing salt intake. Although promising, theseresults should be interpreted with caution due to the smallnumber of studies and sample size contributing to themeta-analyses.
Smoking and AlcoholOne study found, on average, a 53% improvement in smokingcessation among those receiving an app-based self-monitoringintervention compared to those in the control group (OR 1.53,95% CI 0.76-3.09, n=3698) [52]. Effects on alcoholconsumption were very small and not significant.
Subgroup AnalysesThe most frequent behavior change technique coded inapp-based behavioral self-monitoring interventions was feedbackon behavior (n=13). Many app-based interventions (n=8)prompted participants to obtain advice from a health careprovider following the behavioral measurements, and some(n=6) provided tailored advice to address the underlying
mechanisms of behavior change. Goal setting of behavior,information about health consequences, and generic informationabout hypertension were strategies each coded in a small numberof interventions (n=4). The most frequent strategy coded acrossboth the intervention and control groups was reporting bloodpressure and feedback on blood pressure (Multimedia Appendix9).
Subgroup analysis found that tailored interventions resulted inhigher and significant changes in both SBP and DBP incomparison to nontailored interventions (SBP: –2.92 mmHg,95% CI –3.94 to –1.90, n=3102 vs –0.72 mmHg, 95% CI –1.67
to 0.23, n=4199, χ2=9.65, P=.002; DBP: –2.05 mmHg, 95% CI–3.10 to –1.01, n=968 vs 1.54 mmHg, 95% CI –0.53 to 3.61,
n=400, χ2=9.19, P=.002). The differences between the 2conditions were statistically significant and clinically meaningful(Multimedia Appendices 10 and 11).
Further investigation of the data revealed no effect of preselectedvariables that could influence blood pressure outcome (eg,sample size, time of follow-up, blood pressure outcomemeasurement obtained at clinic or remotely) on the observedeffect.
Risk of BiasThe risk-of-bias analyses suggested that studies were of lowrisk of bias. Inspection of funnel plots and the Egger testsuggested a low risk of publication bias (Multimedia Appendix12).
Discussion
Principal FindingsThis systematic literature review and meta-analysis included15 randomized controlled trials with 7415 participants and foundthat patients treated for hypertension receiving an app-basedbehavioral self-monitoring intervention reduced SBP by anaverage of 1.64 mmHg (95% CI 2.73-0.55) and were, onaverage, 60% more likely to reduce SBP to <140 mmHg andDBP to <90 mmHg compared to those in the control group.Further subgroup analysis suggested that behavioralself-monitoring interventions combined with tailored advicehad a higher and potentially clinically meaningful effect onreducing both SBP (mean reduction of 2.92 mmHg) and DBP(mean reduction of 2.05 mmHg) [55,56].
This study found that app-based self-monitoring of behaviorinterventions increased the odds of achieving medicationadherence by 3 folds in the intervention group compared to thecontrol. The significant effect of the app-based behavioralself-monitoring interventions in supporting improvements in
JMIR Mhealth Uhealth 2022 | vol. 10 | iss. 7 | e34767 | p.6https://mhealth.jmir.org/2022/7/e34767(page number not for citation purposes)
Kassavou et alJMIR MHEALTH AND UHEALTH
XSL•FORenderX

both blood pressure and medication adherence provides us withconfidence that such interventions could be effective solutionsto support health behavior change and thus reduce bloodpressure in patients treated for hypertension during bloodpressure checks or similar clinical consultations.
The behavioral interventions indicated positive effects forsupporting improvements in healthy diet by reducing theconsumption of high sodium food, as well as positive trends insupporting physical activity, smoking cessation, and alcoholconsumption. Although promising, a small number of studiescontributed to these meta-analyses, and thus the results shouldbe treated with caution.
Strengths and LimitationsThis review has several strengths and limitations. It did notinclude gray literature or unpublished studies and was limitedto searching a few publicly accessible databases only.Nevertheless, this review summarizes the currently availableevidence and suggests that behavioral tailored self-monitoringinterventions are effective in changing SBP and DBP by –2.92mmHg and –2.05 mmHg on average, respectively, comparedto usual care, enhanced usual care, or a minimal behavioralintervention.
A limitation of the included studies is the use of self-reportedmeasurements for the behavioral outcomes, which are inherentto bias. This might have diminished the validity of the observedintervention effect on health behaviors. Future trials shouldemploy valid methods of measurement to assess behavioraloutcomes and thus inform recommendations for policy makingand practice.
This review has evaluated randomized controlled trials thatcompared behavioral self-monitoring interventions with usualcare, enhanced usual care, or minimal behavioral interventions.We have used an extensive search strategy and identified allpublicly available evidence. We have adopted a rigorousapproach to data extraction and intervention coding to generatethe results and form recommendations for best practices andfuture intervention development.
Implications for Practice and InterventionDevelopmentThe included trials had a duration of 1 to 12 months; thus, theevidence for the sustained effects of the intervention remainsuncertain. However, a limited number of studies with long-termmeasurements had positive trends toward blood pressurereduction. Considering the wide reach and low-cost use ofmobile technologies, this evidence indicates the potential impactof behavioral interventions on overall hypertension-relatedmorbidity and mortality.
The comparator group included usual care (eg, clinic bloodpressure checks), enhanced usual care (eg, regular blood pressurechecks and medication adjustments), or minimal generic lifestyleinterventions (eg, lifestyle tips and advice), suggesting thattailored behavioral self-monitoring is an acceptable addition tousual care and has a small, though clinically meaningful, effect
on reducing blood pressure beyond and above usual care clinicalpractice.
Many studies involved clinicians in signposting participants tothe app-based behavioral intervention, which might haveinfluenced participants’ engagement with the intervention andtheir health care. Moreover, the most frequent strategies reportedbeing used with the behavioral self-monitoring interventionswere feedback on health behaviors and prompts to obtain advicefrom a health care provider following behavioral measurementsthat require further support and monitoring. Although none ofthese strategies individually explained clinical effectiveness,they could have a synergistic effect in supporting patients’engagement with self-monitoring processes and thus ingenerating the observed improvements in health behaviors andreductions in blood pressure.
However, due to the limited information reported by primarystudies, this review could not provide comprehensive,theory-based evidence on the mechanism by which theself-monitoring intervention achieved the observed clinicaleffectiveness [23-26]. Only a small number of studies explicitlyreported on the theoretical concepts that informed the healthbehavior change intervention. For example, Chandler et al [40]and Dorsch et al [42] reported that the intervention aimed tomodify beliefs and attitudes to support self-regulation processesand bring about changes in health behaviors. However, there isno evidence on the effects of the interventions with regard tomodifying these theoretical influences to achieve changes inhealth behaviors and blood pressure. It would be useful if futurestudies report on the theoretical underpinnings and use validmeasurements of engagement with the intervention strategies,as well as the underpinnings of health behaviors, to facilitatethe generation of rigorous and replicable evidence on themechanisms by which self-monitoring of behavior via the useof digital interventions support health behavior change andclinical effectiveness [57].
ConclusionThis systematic literature review suggested that tailoredbehavioral self-monitoring of hypertension-related behaviorsfacilitated via smartphone apps is effective in reducing bloodpressure by an average of 2 mmHg above and beyond usualcare, enhanced usual care, or minimal behavioral interventions.Thus, clinical practice should recommend behavioralself-monitoring combined with tailored behavioral advice toachieve clinical effectiveness. Considering the wide use ofsmartphone apps and their potential to reach large numbers ofpeople, app-based behavioral self-monitoring interventionscombined with tailored behavioral advice could potentially bea cost-effective addition to usual care blood pressureconsultations. However, due to the limited quality of the trialsincluded in this review, future research with rigorous methodsis required to determine the direct impact of such interventionson both health behavior change and blood pressure, as well astheir indirect effects on service provision andhypertension-related morbidity and mortality.
JMIR Mhealth Uhealth 2022 | vol. 10 | iss. 7 | e34767 | p.7https://mhealth.jmir.org/2022/7/e34767(page number not for citation purposes)
Kassavou et alJMIR MHEALTH AND UHEALTH
XSL•FORenderX
AcknowledgmentsThis paper presents independent research. AK, SS, and VM were funded by the National Institute for Health and Care Research(NIHR) under the Programme Grants for Applied Research (grant PR-PG-0615-20013). MW and RH were funded by studentships.The views expressed are those of the authors and are not necessarily those of the NIHR or the Department of Health and SocialCare.
Data AvailabilityAll data included in this review are reported in the multimedia appendices.
Conflicts of InterestNone declared.
Multimedia Appendix 1Search strategy for MEDLINE.[DOCX File , 18 KB - mhealth_v10i7e34767_app1.docx ]
Multimedia Appendix 2Study characteristics.[DOCX File , 23 KB - mhealth_v10i7e34767_app2.docx ]
Multimedia Appendix 3Meta-analysis of continuous outcome measurements for diastolic blood pressure.[DOCX File , 904 KB - mhealth_v10i7e34767_app3.docx ]
Multimedia Appendix 4Meta-analysis of dichotomous outcome measurements for diastolic blood pressure.[DOCX File , 602 KB - mhealth_v10i7e34767_app4.docx ]
Multimedia Appendix 5Meta-analysis of continuous outcome measurements for medication adherence.[DOCX File , 660 KB - mhealth_v10i7e34767_app5.docx ]
Multimedia Appendix 6Meta-analysis of dichotomous outcome measurements for medication adherence.[DOCX File , 725 KB - mhealth_v10i7e34767_app6.docx ]
Multimedia Appendix 7Meta-analysis of continuous outcome measurements for physical activity.[DOCX File , 660 KB - mhealth_v10i7e34767_app7.docx ]
Multimedia Appendix 8Meta-analysis of continuous outcome measurements for healthy diet (consumption of low sodium food).[DOCX File , 669 KB - mhealth_v10i7e34767_app8.docx ]
Multimedia Appendix 9Intervention coding of experimental and comparator groups.[DOCX File , 33 KB - mhealth_v10i7e34767_app9.docx ]
Multimedia Appendix 10Subgroup analysis for the systolic blood pressure continuous outcome.[DOCX File , 2091 KB - mhealth_v10i7e34767_app10.docx ]
Multimedia Appendix 11Subgroup analysis for the diastolic blood pressure dichotomous outcome.
JMIR Mhealth Uhealth 2022 | vol. 10 | iss. 7 | e34767 | p.8https://mhealth.jmir.org/2022/7/e34767(page number not for citation purposes)
Kassavou et alJMIR MHEALTH AND UHEALTH
XSL•FORenderX

[DOCX File , 1457 KB - mhealth_v10i7e34767_app11.docx ]
Multimedia Appendix 12Funnel plot of the systolic blood pressure continuous outcome.[DOCX File , 957 KB - mhealth_v10i7e34767_app12.docx ]
Multimedia Appendix 13The PRISMA (Preferred Reporting Items for Systematic Reviews and Meta-Analyses) checklist.[PDF File (Adobe PDF File), 110 KB - mhealth_v10i7e34767_app13.pdf ]
References1. Zhou B, Carrillo-Larco RM, Danaei G, Riley LM, Paciorek CJ, Stevens GA, et al. . [doi: 10.1016/S0140-6736(21)01330-1]2. Hypertension. World Health Organization. 2021. URL: https://www.who.int/health-topics/hypertension#tab=tab_1 [accessed
2021-08-23]3. Mazzaglia G, Ambrosioni E, Alacqua M, Filippi A, Sessa E, Immordino V, et al. Adherence to antihypertensive medications
and cardiovascular morbidity among newly diagnosed hypertensive patients. Circulation 2009 Oct 20;120(16):1598-1605.[doi: 10.1161/CIRCULATIONAHA.108.830299] [Medline: 19805653]
4. York Health Economics Consortium, School of Pharmacy, University of London. Evaluation of the Scale, Causes and Costsof Waste Medicines: Final Report. 2010 Nov. URL: https://discovery.ucl.ac.uk/id/eprint/1350234/1/Evaluation_of_NHS_Medicines_Waste__web_publication_version.pdf [accessed 2022-06-07]
5. Schroeder K, Fahey T, Ebrahim S. Interventions for improving adherence to treatment in patients with high blood pressurein ambulatory settings. Cochrane Database Syst Rev 2004(3). [doi: 10.1002/14651858.cd004804]
6. Diaz KM, Shimbo D. Physical activity and the prevention of hypertension. Curr Hypertens Rep 2013 Dec 20;15(6):659-668[FREE Full text] [doi: 10.1007/s11906-013-0386-8] [Medline: 24052212]
7. Huai P, Xun H, Reilly KH, Wang Y, Ma W, Xi B. Physical Activity and Risk of Hypertension. Hypertension 2013Dec;62(6):1021-1026. [doi: 10.1161/hypertensionaha.113.01965]
8. He FJ, Li J, Macgregor GA. Effect of longer term modest salt reduction on blood pressure: Cochrane systematic reviewand meta-analysis of randomised trials. BMJ 2013 Apr 03;346:f1325-f1325 [FREE Full text] [doi: 10.1136/bmj.f1325][Medline: 23558162]
9. Strazzullo P, D'Elia L, Kandala N, Cappuccio FP. Salt intake, stroke, and cardiovascular disease: meta-analysis of prospectivestudies. BMJ 2009 Nov 24;339(nov24 1):b4567-b4567 [FREE Full text] [doi: 10.1136/bmj.b4567] [Medline: 19934192]
10. John J, Ziebland S, Yudkin P, Roe L, Neil H. Effects of fruit and vegetable consumption on plasma antioxidant concentrationsand blood pressure: a randomised controlled trial. The Lancet 2002 Jun;359(9322):1969-1974. [doi:10.1016/s0140-6736(02)98858-6]
11. Roerecke M, Kaczorowski J, Tobe SW, Gmel G, Hasan OSM, Rehm J. The effect of a reduction in alcohol consumptionon blood pressure: a systematic review and meta-analysis. The Lancet Public Health 2017 Feb;2(2):e108-e120. [doi:10.1016/s2468-2667(17)30003-8]
12. Huxley RR, Woodward M. Cigarette smoking as a risk factor for coronary heart disease in women compared with men: asystematic review and meta-analysis of prospective cohort studies. The Lancet 2011 Oct;378(9799):1297-1305. [doi:10.1016/s0140-6736(11)60781-2]
13. Quality and Outcomes Framework, 2020-21. NHS Digital. 2021 Sep 30. URL: https://digital.nhs.uk/data-and-information/publications/statistical/quality-and-outcomes-framework-achievement-prevalence-and-exceptions-data/2020-21 [accessed2022-06-07]
14. Nieuwlaat R, Wilczynski N, Navarro T, Hobson N, Jeffery R, Keepanasseril A, et al. Interventions for enhancing medicationadherence. Cochrane Database Syst Rev 2014 Nov 20(11):CD000011 [FREE Full text] [doi:10.1002/14651858.CD000011.pub4] [Medline: 25412402]
15. Acin M, Rueda J, Saiz L, Parent MV, Alzueta N, Solà I, et al. Alcohol intake reduction for controlling hypertension.Cochrane Database Syst Rev 2020(9). [doi: 10.1002/14651858.cd010022.pub2]
16. Lee L, Mulvaney C, Wong Y, Chan E, Watson M, Lin H. Walking for hypertension. Cochrane Database Syst Rev 2021(2).[doi: 10.1002/14651858.cd008823.pub2]
17. Kassavou A, Sutton S. Automated telecommunication interventions to promote adherence to cardio-metabolic medications:meta-analysis of effectiveness and meta-regression of behaviour change techniques. Health Psychol Rev 2018 Mar12;12(1):25-42. [doi: 10.1080/17437199.2017.1365617] [Medline: 28805162]
18. Armitage LC, Kassavou A, Sutton S. Do mobile device apps designed to support medication adherence demonstrate efficacy?A systematic review of randomised controlled trials, with meta-analysis. BMJ Open 2020 Jan 30;10(1):e032045 [FREEFull text] [doi: 10.1136/bmjopen-2019-032045] [Medline: 32005778]
JMIR Mhealth Uhealth 2022 | vol. 10 | iss. 7 | e34767 | p.9https://mhealth.jmir.org/2022/7/e34767(page number not for citation purposes)
Kassavou et alJMIR MHEALTH AND UHEALTH
XSL•FORenderX

19. Berry R, Kassavou A, Sutton S. Does self-monitoring diet and physical activity behaviors using digital technology supportadults with obesity or overweight to lose weight? A systematic literature review with meta-analysis. Obes Rev 2021 Oct30;22(10):e13306. [doi: 10.1111/obr.13306] [Medline: 34192411]
20. The text message is 20 years old today. Ofcom. 2012 Dec 03. URL: https://www.ofcom.org.uk/about-ofcom/latest/media/media-releases/2012/the-text-message-is-20-years-old-today [accessed 2021-08-22]
21. Medicines adherence: involving patients in decisions about prescribed medicines and supporting adherence. NationalInstitute for Health and Care Excellence. 2009 Jan 28. URL: https://www.nice.org.uk/guidance/cg76 [accessed 2022-06-06]
22. Global strategy on digital health 2020-2025. World Health Organization. 2021. URL: https://apps.who.int/iris/bitstream/handle/10665/344249/9789240020924-eng.pdf [accessed 2021-08-23]
23. Spaulding EM, Marvel FA, Piasecki RJ, Martin SS, Allen JK. User Engagement With Smartphone Apps and CardiovascularDisease Risk Factor Outcomes: Systematic Review. JMIR Cardio 2021 Feb 03;5(1):e18834 [FREE Full text] [doi:10.2196/18834] [Medline: 33533730]
24. French D, Sutton S. Reactivity of measurement in health psychology: how much of a problem is it? What can be done aboutit? Br J Health Psy. 2010 2010 Dec 24:15-468. [doi: 10.1348/135910710x492341]
25. McCambridge J, Kypri K. Can simply answering research questions change behaviour? Systematic review and meta analysesof brief alcohol intervention trials. PLoS One 2011 Oct 5;6(10):e23748 [FREE Full text] [doi: 10.1371/journal.pone.0023748][Medline: 21998626]
26. McCambridge J, Witton J, Elbourne DR. Systematic review of the Hawthorne effect: new concepts are needed to studyresearch participation effects. J Clin Epidemiol 2014 Mar;67(3):267-277 [FREE Full text] [doi: 10.1016/j.jclinepi.2013.08.015][Medline: 24275499]
27. Haase J, Farris KB, Dorsch MP. Mobile Applications to Improve Medication Adherence. Telemed J E Health 2017Feb;23(2):75-79. [doi: 10.1089/tmj.2015.0227] [Medline: 27248315]
28. Park JYE, Li J, Howren A, Tsao NW, De Vera M. Mobile Phone Apps Targeting Medication Adherence: Quality Assessmentand Content Analysis of User Reviews. JMIR Mhealth Uhealth 2019 Jan 31;7(1):e11919 [FREE Full text] [doi:10.2196/11919] [Medline: 30702435]
29. Alessa T, Hawley MS, Hock ES, de Witte L. Smartphone Apps to Support Self-Management of Hypertension: Review andContent Analysis. JMIR Mhealth Uhealth 2019 May 28;7(5):e13645 [FREE Full text] [doi: 10.2196/13645] [Medline:31140434]
30. Xu H, Long H. The Effect of Smartphone App-Based Interventions for Patients With Hypertension: Systematic Reviewand Meta-Analysis. JMIR Mhealth Uhealth 2020 Oct 19;8(10):e21759 [FREE Full text] [doi: 10.2196/21759] [Medline:33074161]
31. JMIR Publications. URL: http://www.jmir.org/search [accessed 2022-06-07]32. Michie S, Richardson M, Johnston M, Abraham C, Francis J, Hardeman W, et al. The behavior change technique taxonomy
(v1) of 93 hierarchically clustered techniques: building an international consensus for the reporting of behavior changeinterventions. Ann Behav Med 2013 Aug;46(1):81-95. [doi: 10.1007/s12160-013-9486-6] [Medline: 23512568]
33. Higgins J, Savović J, Page M, Elbers R, Sterne J. Chapter 8: Assessing risk of bias in a randomized trial. Cochrane Handbookfor Systematic Reviews of Interventions, version 6.3 (updated February 2022). 2022. URL: https://training.cochrane.org/handbook/current/chapter-08 [accessed 2020-06-22]
34. RoB 2: A revised Cochrane risk-of-bias tool for randomized trials. Cochrane Methods Bias. URL: https://methods.cochrane.org/bias/resources/rob-2-revised-cochrane-risk-bias-tool-randomized-trials [accessed 2020-06-16]
35. Higgins JPT, Thompson SG, Deeks JJ, Altman DG. Measuring inconsistency in meta-analyses. BMJ 2003 Sep06;327(7414):557-560 [FREE Full text] [doi: 10.1136/bmj.327.7414.557] [Medline: 12958120]
36. Higgins J, Li T, Deeks J. Chapter 6: Choosing effect measures and computing estimates of effect. Cochrane Handbook forSystematic Reviews of Interventions, version 6.3 (updated February 2022). 2022. URL: https://training.cochrane.org/handbook/current/chapter-06 [accessed 2020-06-14]
37. Deeks J, Higgins J, Douglas A. Chapter 10: Analysing data and undertaking meta-analyses. Cochrane Handbook forSystematic Reviews of Interventions, version 6.3 (updated February 2022). 2022. URL: https://training.cochrane.org/handbook/current/chapter-10 [accessed 2022-06-07]
38. Michie S, Prestwich A, de Bruin M. Importance of the nature of comparison conditions for testing theory-based interventions:reply. Health Psychol 2010 Sep;29(5):468-470. [doi: 10.1037/a0020844] [Medline: 20836600]
39. Cochrane RevMan. Cochrane Training. URL: https://training.cochrane.org/online-learning/core-software-cochrane-reviews/revman [accessed 2021-11-14]
40. Chandler J, Sox L, Kellam K, Feder L, Nemeth L, Treiber F. Impact of a Culturally Tailored mHealth Medication RegimenSelf-Management Program upon Blood Pressure among Hypertensive Hispanic Adults. Int J Environ Res Public Health2019 Apr 06;16(7) [FREE Full text] [doi: 10.3390/ijerph16071226] [Medline: 30959858]
41. Choi BG, Dhawan T, Metzger K, Marshall L, Akbar A, Jain T, et al. Image-Based Mobile System for Dietary Managementin an American Cardiology Population: Pilot Randomized Controlled Trial to Assess the Efficacy of Dietary CoachingDelivered via a Smartphone App Versus Traditional Counseling. JMIR Mhealth Uhealth 2019 Apr 23;7(4):e10755 [FREEFull text] [doi: 10.2196/10755] [Medline: 31012860]
JMIR Mhealth Uhealth 2022 | vol. 10 | iss. 7 | e34767 | p.10https://mhealth.jmir.org/2022/7/e34767(page number not for citation purposes)
Kassavou et alJMIR MHEALTH AND UHEALTH
XSL•FORenderX

42. Dorsch MP, Cornellier ML, Poggi AD, Bilgen F, Chen P, Wu C, et al. Effects of a Novel Contextual Just-In-Time MobileApp Intervention (LowSalt4Life) on Sodium Intake in Adults With Hypertension: Pilot Randomized Controlled Trial. JMIRMhealth Uhealth 2020 Aug 10;8(8):e16696 [FREE Full text] [doi: 10.2196/16696] [Medline: 32663139]
43. Morawski K, Ghazinouri R, Krumme A, Lauffenburger JC, Lu Z, Durfee E, et al. Association of a Smartphone ApplicationWith Medication Adherence and Blood Pressure Control: The MedISAFE-BP Randomized Clinical Trial. JAMA InternMed 2018 Jun 01;178(6):802-809 [FREE Full text] [doi: 10.1001/jamainternmed.2018.0447] [Medline: 29710289]
44. Persell SD, Peprah YA, Lipiszko D, Lee JY, Li JJ, Ciolino JD, et al. Effect of Home Blood Pressure Monitoring via aSmartphone Hypertension Coaching Application or Tracking Application on Adults With Uncontrolled Hypertension: ARandomized Clinical Trial. JAMA Netw Open 2020 Mar 02;3(3):e200255 [FREE Full text] [doi:10.1001/jamanetworkopen.2020.0255] [Medline: 32119093]
45. Widmer RJ, Allison TG, Lennon R, Lopez-Jimenez F, Lerman LO, Lerman A. Digital health intervention during cardiacrehabilitation: A randomized controlled trial. Am Heart J 2017 Jun;188:65-72. [doi: 10.1016/j.ahj.2017.02.016] [Medline:28577682]
46. Del Rosario MB, Lovell NH, Fildes J, Holgate K, Yu J, Ferry C, et al. Evaluation of an mHealth-Based Adjunct to OutpatientCardiac Rehabilitation. IEEE J Biomed Health Inform 2018 Nov;22(6):1938-1948. [doi: 10.1109/jbhi.2017.2782209]
47. Santo K, Singleton A, Rogers K, Thiagalingam A, Chalmers J, Chow CK, et al. Medication reminder applications to improveadherence in coronary heart disease: a randomised clinical trial. Heart 2019 Feb 27;105(4):323-329. [doi:10.1136/heartjnl-2018-313479] [Medline: 30150326]
48. Petrella RJ, Stuckey MI, Shapiro S, Gill DP. Mobile health, exercise and metabolic risk: a randomized controlled trial.BMC Public Health 2014 Oct 18;14:1082 [FREE Full text] [doi: 10.1186/1471-2458-14-1082] [Medline: 25326074]
49. Gong K, Yan Y, Li Y, Du J, Wang J, Han Y, et al. Mobile health applications for the management of primary hypertension:A multicenter, randomized, controlled trial. Medicine (Baltimore) 2020 Apr;99(16):e19715 [FREE Full text] [doi:10.1097/MD.0000000000019715] [Medline: 32311957]
50. Eyles H, McLean R, Neal B, Jiang Y, Doughty RN, McLean R, et al. A salt-reduction smartphone app supports lower-saltfood purchases for people with cardiovascular disease: Findings from the SaltSwitch randomised controlled trial. Eur JPrev Cardiol 2017 Sep;24(13):1435-1444. [doi: 10.1177/2047487317715713] [Medline: 28631933]
51. Sarfo FS, Treiber F, Gebregziabher M, Adamu S, Nichols M, Singh A, PINGS Team. Phone-based intervention for bloodpressure control among Ghanaian stroke survivors: A pilot randomized controlled trial. Int J Stroke 2019 Aug22;14(6):630-638. [doi: 10.1177/1747493018816423] [Medline: 30465630]
52. Prabhakaran D, Jha D, Prieto-Merino D, Roy A, Singh K, Ajay VS, Members of the Research Steering Committee‚Investigators‚ Members of the Data SafetyMonitoring Board. Effectiveness of an mHealth-Based Electronic DecisionSupport System for Integrated Management of Chronic Conditions in Primary Care: The mWellcare Cluster-RandomizedControlled Trial. Circulation 2019 Jan 15;139(3):380-391 [FREE Full text] [doi: 10.1161/CIRCULATIONAHA.118.038192][Medline: 30586732]
53. Tian M, Ajay VS, Dunzhu D, Hameed SS, Li X, Liu Z, et al. A Cluster-Randomized, Controlled Trial of a SimplifiedMultifaceted Management Program for Individuals at High Cardiovascular Risk (SimCard Trial) in Rural Tibet, China,and Haryana, India. Circulation 2015 Sep 01;132(9):815-824 [FREE Full text] [doi:10.1161/CIRCULATIONAHA.115.015373] [Medline: 26187183]
54. Lunde P, Bye A, Bergland A, Grimsmo J, Jarstad E, Nilsson BB. Long-term follow-up with a smartphone applicationimproves exercise capacity post cardiac rehabilitation: A randomized controlled trial. Eur J Prev Cardiol 2020 Nov28;27(16):1782-1792 [FREE Full text] [doi: 10.1177/2047487320905717] [Medline: 32106713]
55. Lawes CM, Hoorn SV, Rodgers A. Global burden of blood-pressure-related disease, 2001. The Lancet 2008May;371(9623):1513-1518. [doi: 10.1016/s0140-6736(08)60655-8]
56. Prospective Studies Collaboration. Age-specific relevance of usual blood pressure to vascular mortality: a meta-analysisof individual data for one million adults in 61 prospective studies. The Lancet 2002 Dec;360(9349):1903-1913. [doi:10.1016/s0140-6736(02)11911-8]
57. Kassavou A, Court CA, Mirzaei V, Brimicombe J, Edwards S, Sutton S. Process Evaluation of MAPS: A Highly TailoredDigital Intervention to Support Medication Adherence in Primary Care Setting. Front Public Health 2021 Dec 20;9:806168[FREE Full text] [doi: 10.3389/fpubh.2021.806168] [Medline: 34988058]
AbbreviationsCENTRAL: Cochrane Central Register of Controlled TrialsDBP: diastolic blood pressureNIHR: National Institute for Health and Care ResearchOR: odds ratioSBP: systolic blood pressureSMD: standardized mean difference
JMIR Mhealth Uhealth 2022 | vol. 10 | iss. 7 | e34767 | p.11https://mhealth.jmir.org/2022/7/e34767(page number not for citation purposes)
Kassavou et alJMIR MHEALTH AND UHEALTH
XSL•FORenderX

Edited by L Buis; submitted 08.11.21; peer-reviewed by C Basavarajappa, H Ayatollahi, A Joseph; comments to author 29.12.21;revised version received 05.02.22; accepted 02.05.22; published 12.07.22.
Please cite as:Kassavou A, Wang M, Mirzaei V, Shpendi S, Hasan RThe Association Between Smartphone App–Based Self-monitoring of Hypertension-Related Behaviors and Reductions in High BloodPressure: Systematic Review and Meta-analysisJMIR Mhealth Uhealth 2022;10(7):e34767URL: https://mhealth.jmir.org/2022/7/e34767 doi:10.2196/34767PMID:35819830
©Aikaterini Kassavou, Michael Wang, Venus Mirzaei, Sonia Shpendi, Rana Hasan. Originally published in JMIR mHealth anduHealth (https://mhealth.jmir.org), 12.07.2022. This is an open-access article distributed under the terms of the Creative CommonsAttribution License (https://creativecommons.org/licenses/by/4.0/), which permits unrestricted use, distribution, and reproductionin any medium, provided the original work, first published in JMIR mHealth and uHealth, is properly cited. The completebibliographic information, a link to the original publication on https://mhealth.jmir.org/, as well as this copyright and licenseinformation must be included.
JMIR Mhealth Uhealth 2022 | vol. 10 | iss. 7 | e34767 | p.12https://mhealth.jmir.org/2022/7/e34767(page number not for citation purposes)
Kassavou et alJMIR MHEALTH AND UHEALTH
XSL•FORenderX
Review
Wearing the Future—Wearables to Empower Users to TakeGreater Responsibility for Their Health and Care: Scoping Review
Harjeevan Singh Kang1,2, MD; Mark Exworthy2, PhD1College of Medical and Dental Sciences, University of Birmingham, Birmingham, United Kingdom2Health Services Management Centre, University of Birmingham, Birmingham, United Kingdom
Corresponding Author:Harjeevan Singh Kang, MDCollege of Medical and Dental SciencesUniversity of BirminghamEdgbastonBirmingham, B15 2TTUnited KingdomPhone: 44 121 414 3344Email: [email protected]
Abstract
Background: Wearables refer to devices that are worn by individuals. In the health care field, wearables may assist withindividual monitoring and diagnosis. In fact, the potential for wearable technology to assist with health care has received recognitionfrom health systems around the world, including a place in the strategic Long Term Plan shared by the National Health Servicein England. However, wearables are not limited to specialist medical devices used by patients. Leading technology companies,including Apple, have been exploring the capabilities of wearable health technology for health-conscious consumers. Despiteadvancements in wearable health technology, research is yet to be conducted on wearables and empowerment.
Objective: This study aimed to identify, summarize, and synthesize knowledge on how wearable health technology can empowerindividuals to take greater responsibility for their health and care.
Methods: This study was a scoping review with thematic analysis and narrative synthesis. Relevant guidance, such as the Arkseyand O’Malley framework, was followed. In addition to searching gray literature, we searched MEDLINE, EMBASE, PsycINFO,HMIC, and Cochrane Library. Studies were included based on the following selection criteria: publication in English, publicationin Europe or the United States, focus on wearables, relevance to the research, and the availability of the full text.
Results: After identifying 1585 unique records and excluding papers based on the selection criteria, 20 studies were includedin the review. On analysis of these 20 studies, 3 main themes emerged: the potential barriers to using wearables, the role ofproviders and the benefits to providers from promoting the use of wearables, and how wearables can drive behavior change.
Conclusions: Considerable literature findings suggest that wearables can empower individuals by assisting with diagnosis,behavior change, and self-monitoring. However, greater adoption of wearables and engagement with wearable devices dependon various factors, including promotion and support from providers to encourage uptake; increased short-term investment toupskill staff, especially in the area of data analysis; and overcoming the barriers to use, particularly by improving device accuracy.Acting on these suggestions will require investment and constructive input from key stakeholders, namely users, health careprofessionals, and designers of the technology. As advancements in technology to make wearables viable health care deviceshave only come about recently, further studies will be important for measuring the effectiveness of wearables in empoweringindividuals. The investigation of user outcomes through large-scale studies would also be beneficial. Nevertheless, a significantchallenge will be in the publication of research to keep pace with rapid developments related to wearable health technology.
(JMIR Mhealth Uhealth 2022;10(7):e35684) doi:10.2196/35684
KEYWORDS
wearable; device; tracker; activity tracker; fitness tracker; technology; MedTech; HealthTech; sensor; monitor; gadget; smartwatch;empowerment; self-care; management; behavior; responsibility; attitude; personalization; mobile phone; self-management;smartphone; wearable electronic devices; health promotion; health behavior; mHealth; digital health; health care wearables;scoping review
JMIR Mhealth Uhealth 2022 | vol. 10 | iss. 7 | e35684 | p.13https://mhealth.jmir.org/2022/7/e35684(page number not for citation purposes)
Kang & ExworthyJMIR MHEALTH AND UHEALTH
XSL•FORenderX

Introduction
Background
Wearable Health TechnologyWearables are “seamlessly embedded portable computers...wornon the body” [1]. Examples include consumer products marketedas wellness gadgets, such as smartwatches produced by Apple[2] or activity trackers from Fitbit [3], and more specializedmedical devices, such as those that can detect electrolyte levels[4] or screen blood for cancer cells [5].
Wearable devices can be used in the medical field to monitorindividuals and assist with diagnosis, thereby enablingindividuals to contribute to their health [6] and gain greatercontrol of their lives [7]. For example, certain wearables havebeen developed to recognize the symptoms of COVID-19infection by measuring individuals’ vital signs [8].
As technology advances, it may be expected that wearables willbecome more advanced in their health care capabilities. A futurevision for wearables has been discussed [9], concerning thepotential application of on-teeth sensors, smart contact lenses,electronic epidermal tattoos, smart patches, and smart textiles.Any data from wearables may be integrated with health systemsand potentially inform care plans.
EmpowermentPatient empowerment has been well discussed in the literature,but the complexity of the concept is thought to be responsiblefor the “lack of a consensus definition” [10]. The mostcommonly cited definitions [11,12] indicate that “Patientempowerment starts from the principle of one’s inherentcapacity to be responsible for one’s own life, and can bedescribed as a complex experience of personal change, possiblyfacilitated by health care providers” [10]. Other researchershave proposed that patient empowerment encompasses activitiesthat foster self-management [13].
Participatory health informatics (PHI) considers the role oftechnology in assisting individuals with self-management anddecision-making by also improving health literacy and thephysician-patient relationship so that individuals can becomemore involved in the aspects of their health and care [14].Historically, research in the PHI field has predominantly beenbased on social media and internet-based applications, withpatient empowerment having been identified as the mostcommon theme in this body of research [14]. However,wearables are just beginning to be considered as part of PHIgiven recent technological advancements [14]. Therefore, similarresearch is now required to examine whether wearables canempower individuals in ways similar to those mentioned earlierregarding domains such as self-management, decision-making,and the physician-patient relationship.
There are several ways in which wearables may assist inempowering patients. First, wearables may minimize the impactof health care on the daily routine of patients. Wearables mayoffer greater convenience [15] if they reduce the need forpatients to invest time in booking appointments with health careprofessionals, plan their schedule around such appointments,
or commit time and money for appointment-related travel.Wearables have already been shown to reduce the need forcertain in-person appointments [16].
Next, wearables collecting data throughout the day may providea richer data set [17] than snapshot reading records obtainedduring visits to a health care facility. Such data may be collectedmore readily around individuals’normal daily activities, whetherat rest or on exertion [18], which may be useful for heart ratereadings, for example.
Furthermore, patients can take an electrocardiogram (ECG) andother readings multiple times each day over the course ofmonths. This would add to the richness of the data set andpotentially better inform diagnosis and treatment while alsoproving valuable in screening for COVID-19 infection, as AppleWatch could regularly monitor blood oxygen levels [19].Attending appointments for taking such readings would neitherallow the degree of frequency nor convenience of doing so athome and while on the move as with wearables.
Moreover, wearables may help preserve patient dignity whenoffering an alternative to more privacy-intrusive procedures.For example, an ECG taken by Apple Watch [19] may bepreferred over a traditional ECG in a medical setting, whichwould require the removal of clothing to expose the patient’schest. Data from wearables may also flag early warning signs[2], prompting individuals to arrange appropriate medicalconsultations.
In addition, wearables may facilitate behavior change andpotentially motivate patients to exercise, whether through dailystep challenges, goal setting, or otherwise [20]. This coulddeliver associated health benefits [21] and help combat theobesity epidemic that faces health systems [22] and has beenworsened by the COVID-19 pandemic [23].
Benefits for the Health SystemThe COVID-19 pandemic has exacerbated the pressure on theNational Health Service (NHS) in England, as disruption toservices has contributed to a backlog of care that is estimatedto cost the NHS £2 billion (US $2.44 billion) to clear [24]. TheNHS has been persistently overstretched, such that theseadditional pressures compound pre-existing problems ofinadequate funding and understaffing [25]. As the NHScontinues to face challenges, owing to resource constraints, caremust be delivered more efficiently.
Innovative solutions are known to secure growth [26] byredefining care pathways [27] to improve patient satisfaction,teamwork, the provision of care, and clinical outcomes. In thisway, wearables [28] can shift the burden of care from the NHSto the individual. Such a shift would represent greaterconvenience and independence for patients (as outlined earlier),while reducing costs and staff workloads. In fact, the NHS LongTerm Plan has welcomed wearables from an efficiencystandpoint [29], as the technology has the potential torevolutionize health care [28].
Remote patient monitoring, in the context of reducing thedemand for health systems, has been of particular importanceduring the pandemic [30]. However, it should continue to retain
JMIR Mhealth Uhealth 2022 | vol. 10 | iss. 7 | e35684 | p.14https://mhealth.jmir.org/2022/7/e35684(page number not for citation purposes)
Kang & ExworthyJMIR MHEALTH AND UHEALTH
XSL•FORenderX
its relevance [31] by reducing patient consultations [32] becauseof the health care sector’s focus on patient care and theversatility of wearables in catering to a wide spectrum of needs,from acting as a preventive tool in promoting fitness tomanaging chronic conditions [33].
Challenges Relating to WearablesAlthough it has been stated that wearables can empower andemancipate patients [34] to manage their own care, the efficacyof these devices has attracted skepticism from some physicians[35], especially because the technology is emerging. However,change should be welcome, as patients are an “untappedresource” [7]. If patients were to take a more proactive role intheir care, then the effects on the “quality and sustainability ofhealth systems” could be transformative [7].
However, the accuracy of wearables is a concern that may detertheir use, especially if they fail to produce reliable data.Therefore, regulatory oversight may be beneficial in ensuringthat only accurate, tested devices are in circulation. Medicaldevices are regulated in the United Kingdom by the Medicinesand Healthcare Products Regulatory Agency (MHRA) [36].Nonetheless, certain wearables may not be regulated by theMHRA, as devices such as the Fitbit explicitly state that theyare neither medical devices nor are “intended to diagnose, treat,cure or prevent any disease” [37]. Therefore, this may underminethe perceived efficacy of such devices and thereby fuel theskepticism of health care professionals. However, as wearablesbecome more accurate, this is likely to change; someconsumer-targeted wearables, such as Apple Watch, havealready received Food and Drug Administration approval in theUnited States [38]. Consequently, it seems to be only a matterof time before approval is sought under the MHRA.
Furthermore, Accenture [39] advised that physicians shouldpromote digital engagement and awareness of such devicesamong patients. This recommendation followed the findingsthat more than half of those surveyed [39] would take moreresponsibility for their care if their health care providerencouraged them to. However, only one-tenth of the respondents[39] reported having been recommended any digital tools tomanage their care. It has been argued that despite initialreservations from patients, typically arising from a lack ofconfidence or knowledge, “it is incumbent on providers to foster[patients’] self-reliance” [7]. Clearly, with “self-managementgaining ascendancy as a concept” [40,41], there is more to bedone, including possibly reshaping the perceptions of providersand patients [7].
ObjectivesThis study aims to identify, summarize, and synthesizeknowledge to answer the following research question: “Howcan wearable health technology empower individuals to takegreater responsibility for their health and care?” To theresearcher’s knowledge, a review has yet to be conducted inthis area; other reviews did not specifically focus their researchon the concept of empowerment. Hence, research is needed tofill this gap and convey the importance of wearables to healthcare professionals.
Methods
DesignA scoping review design was chosen for its exploratory nature[42], which is useful when the international evidence base isheterogeneous [43]. In addition, this design enables theresearcher to determine the range of available evidence andidentify research gaps to guide future research [44].
Furthermore, the need to integrate research from a wide varietyof sources and perspectives [43] across a broad area lends itselfto a scoping review over alternative designs. A systematicreview was found to be too restrictive and limited the materialsconsidered [45,46], whereas research in the wearable field didnot seem to place the same emphasis on theory as would berequired for a realist review [47].
The 22-item PRISMA-ScR (Preferred Reporting Items forSystematic Reviews and Meta-Analyses extension for ScopingReviews) [48] checklist was used, as it indicates what shouldbe included in a scoping review. Background reading wasconducted to ensure adherence to the latest guidelines. Forexample, there have been numerous additions [49-53] followingthe publication of a seminal paper by Arksey and O’Malley[44], which initially proposed a methodological framework forundertaking scoping reviews. The guidance document publishedby the Joanna Briggs Institute (JBI) [54] was also followed.
Selection CriteriaSelection criteria were set to ensure the coverage of evidence,while excluding irrelevant papers. Hence, the inclusion criteriawere as follows: English-language articles, a focus on wearablesrather than other digital health technologies, and relevance tothe research objective (by offering information that may relateto empowerment, such as barriers to use or discussions of theefficacy of certain wearables, even if such information had notbeen explicitly linked to empowerment). The researcher wasselective in only including sources where there was a substantivefocus on wearables rather than those that only mentionedwearables in passing. Regarding the inclusion of literaturereviews, the individual studies of the review were screened. Ifmany of these met the inclusion criteria, the review was includedinstead of the individual studies.
Despite wearable technology being a fast-moving area, no limitswere imposed on the publication year of articles. Studies wereexcluded if the full text was unavailable or the studies werepublished outside of Europe or the United States. The latter wasdetermined after preliminary searches indicated the presenceof sufficient evidence. At this point, it was necessary to refinethe selection criteria during the literature search phase becauseof practical constraints. In fact, Arksey and O’Malley [44]encouraged an iterative approach to research by using broadsearches to first gain a sense of the field and thereafter settingany search parameters more strictly to meet the researchrequirements. Such an approach is further supported by the factthat “reading is central to reviewing literature” [55] andinforming literature searches.
JMIR Mhealth Uhealth 2022 | vol. 10 | iss. 7 | e35684 | p.15https://mhealth.jmir.org/2022/7/e35684(page number not for citation purposes)
Kang & ExworthyJMIR MHEALTH AND UHEALTH
XSL•FORenderX

Search StrategyDatabase searches included MEDLINE, EMBASE, PsycINFO,HMIC, and Cochrane Library. Gray literature was alsoconsidered by searching OpenGrey, Google Scholar, andindependent think tanks. The literature search was completedin early February 2021. A further search was conducted in May2021 to account for any articles that may have been subsequentlypublished.
The literature search involved relevant subject heading indexterms, and subject headings were exploded as required. Thesearch strategy (Multimedia Appendix 1) was adjusted to reflectvariations in subject headings and syntax across the databases.For the breadth of coverage, a multipurpose search was used tosearch for keywords across numerous fields. A librarian wasconsulted to identify additional keywords.
Various strategies have been used to mitigate the risk of missingrelevant evidence, including the use of synonymous terms,wildcard symbols, and truncation symbols. Boolean operatorswere used to combine the keywords and exclude others.Parentheses were used to group keywords joined by differentBoolean operators, which yielded more relevant results than ifa nesting approach had not been followed. In cases wherequotation marks for phrase searching would potentially omitrelevant results, proximity operators were used instead. Theabove-mentioned publication limits for language and locationwere also applied to the results. Furthermore, there was forwardcitation searching, and reference lists were snowballed forrelevance to find studies that had not been identified in the initialliterature search.
Duplicate records were identified using EndNote (Clarivate).The software-generated list of duplicates was manually reviewedto mitigate the risk of any records being incorrectly categorizedas duplicates. The researcher then screened the remaining resultsand manually removed duplicates that had not beenautomatically flagged.
Data CollectionThe single researcher screened the literature by using a 2-stepprocess, with a review of the title and abstract before the fulltext. If neither the title nor the abstract seemed relevant to theresearch, the article was excluded. If the title and abstractappeared relevant, the full-text article was read. Papers that didnot meet the inclusion criteria were excluded, and the mainreasons for exclusion were noted.
Scoping reviews do not typically address the appraisal of sources[44]. However, this would have resulted in a much larger samplesize of evidence of questionable quality. Therefore, the JBI
critical appraisal tool was used because of its relatively greatersensitivity to validity [56] to help ensure that any emergentfindings would be based on high-quality evidence. This involvedconsidering the limitations of the evidence, while assessing thecongruity between the research aims, methodology, and findings[57].
Data ChartingKey details were extracted to assess the relevance of a study[58], including publication details and study details relating tothe objectives, findings, and type of wearable device. A datacharting form (Multimedia Appendix 2) was adapted from theJBI [59] to incorporate other relevant details described elsewhere[60]. This form was piloted and updated with additional datathat the researcher wished to chart.
Data AnalysisOftentimes, reviews fail to go beyond a summary of theevidence. Hence, this research followed the 6-step process ofthematic analysis by Braun and Clarke [61], which involvedfamiliarization with the data, coding of the data, generation ofthemes based on the codes, refinement of the themes, namingand defining the themes, and final write-up.
NVivo (QSR International) was used for a more structuredanalysis, as each source was individually uploaded and coded,which enabled the identification of themes from a wide evidencebase. Themes were refined, with the findings being presentedin the style of a narrative synthesis and related to the researchquestion.
Such an approach to analysis and synthesis accords withguidance from Arksey and O’Malley [44], which stated the needfor a scoping review to potentially use a “thematic constructionin order to present a narrative account of existing literature.”This has been reflected in the PRISMA-ScR [48] and guidanceon advancing the methodology of scoping reviews [49]. Thereare also examples of scoping reviews incorporating such anapproach to analysis [62-64].
Results
Literature SearchThe search (Figure 1) identified 1887 records. Followingscreening, 20 studies were included in the final data set, assummarized in Multimedia Appendix 3 [65-84]. Some of thesestudies were identified for inclusion in gray literature searches[77,78,83] or snowballing the reference lists of the includedstudies [76,80].
JMIR Mhealth Uhealth 2022 | vol. 10 | iss. 7 | e35684 | p.16https://mhealth.jmir.org/2022/7/e35684(page number not for citation purposes)
Kang & ExworthyJMIR MHEALTH AND UHEALTH
XSL•FORenderX

Figure 1. PRISMA (Preferred Reporting Items for Systematic Reviews and Meta-Analyses) flow diagram to illustrate the literature search.
Study CharacteristicsThe 20 included sources represent a significant body ofliterature, collectively accounting for >7000 participants. Thestudies were published between 2015 and 2021, with the numberof studies appearing to have generally increased year-on-year.Most studies were published in the United States (12/20, 60%).The studies used quantitative (10/20, 50%), qualitative (8/20,40%), and mixed methods (2/20, 10%; Multimedia Appendix4). Funding details were provided by 65% (13/20) of the studies(Multimedia Appendix 5). Although Fitbit was the mostcommon brand of wearable used (10/20, 50%), several studies(9/20, 45%) included multiple brands or discussed wearablesin general.
Discussion
A total of 3 main themes, relevant to user empowerment,emerged from the literature, namely, Health CareProviders—Benefits and Involvement, Behavior Change, andBarriers to Use. Multimedia Appendix 6 [65-84] lists thecontributions of the included studies to each theme.
Theme: Health Care Providers—Benefits andInvolvement
Collaboration Between Providers and PatientsHealth care providers are an important part of health caresystems [85]. Therefore, it may be expected that providers wouldbe considered as part of the literature on how wearables canempower patients.
Collaboration between research management and health carestaff is imperative, especially during the study design process,as such a partnership may benefit patient compliance,particularly for those with cognitive impairments [65]. However,the role of clinicians may extend further. Outside of the researchcontext, patients may rely on the clinicians’ acceptance of theirdecision to use a wearable device for other purposes, includingas part of rehabilitation; hence, it would be incorrect to limitthe role of health care professionals to simply prescribingmedication without considering their role in educating patients[66]. The significance of such support and backing fromclinicians may be easily overlooked.
Users seem to appreciate that consumer wearables are notmedically accurate devices and that clinicians would not solelyrely on data from such devices to make clinical decisions [84].An open-minded, supportive approach may encourage patients
JMIR Mhealth Uhealth 2022 | vol. 10 | iss. 7 | e35684 | p.17https://mhealth.jmir.org/2022/7/e35684(page number not for citation purposes)
Kang & ExworthyJMIR MHEALTH AND UHEALTH
XSL•FORenderX

to share data with their clinicians [84]. However, clinicians whoare unwilling to engage with wearables and support theirempowered patients, on the grounds of potential inaccuraciesregarding data [84], may risk foregoing the benefits attributableto wearables.
Benefits to Providers and PatientsWearables may offer several benefits to clinicians. First,wearables may offer objective, real-time patient data [66,76].This would allow clinicians to remotely supervise progress[72,76] and provide comfort to patients who may otherwise feelthat they are just communicating their subjective experiencesand perceptions [76]. In such cases, it would be possible to usesuch data to inform clinicians of a patient’s history, therebyenabling a more personalized approach to treatment tailored toindividual needs that can be adjusted according to themanagement plan [66,76]. This should enable more timelyfeedback so that clinicians can be more responsive to situationalchanges [80]. Access to data such as nutrition andactivity-related information over an extended period may offera solution to the issues of conventional health measurementsand tests, as clinicians would benefit from a more completepicture of a patient’s health status [80]. In addition, data fromwearables may eventually be used for risk stratification andearly intervention [83], which should prevent furtherdeterioration.
Furthermore, the accessibility of wearable data to patients mayfacilitate communication and assist with patient education [66].Better-informed patients can offer more worthwhilecontributions to any discussion, thereby promoting shareddecision-making [66] and assisting with adherence to what isagreed [76,83]. In fact, a higher quality of life was associatedwith patients taking a more proactive role in their health [66].There is the important caveat that to maximize these benefits,health care professionals should first identify patients with thewillingness and ability to self-manage, especially becausesustaining engagement can be challenging [83].
It is not difficult to imagine the potential for a large-scale rolloutof wearables, which may help reduce the contact time and offera more cost-effective approach to providers [75,76]. Suchimprovements in efficiency would likely free up resources,thereby alleviating the burden on health systems. Theachievement of this is realistic, as supported by the NuffieldTrust [83], which has reported that “professional monitoringinterventions for chronic conditions, whereby data is sent to thehealth care team, have had very positive results on healthoutcomes and resource use.”
Data from wearables can also be integrated into medical recordsto facilitate care [70,80], which can help overcome currentbarriers to reporting and retrieving data for inpatients and remotemonitoring [80]. Patients living with chronic conditions oftenfeel undersupported in managing their conditions [83]; therefore,wearables may offer this support. This is largely why wearablesand other patient-facing technologies have been praised as a“bright hope” in the health care sector horizon [83].
Challenges to Wearables Advocation in the Health CareSectorCertain health care services do not have the best track recordfor the uptake of technology. For example, in the UnitedKingdom, the NHS has been portrayed as “one of the mostbackward industries in responding to digital technology” [83].The Nuffield Trust has captured the fact that the NHS has thepotential to capitalize on consumer wearables [83]. However,consumer wearables may not be suitable for use, in their currentstate, by health care professionals. In fact, poorly calibrateddevices can work counterproductively by worsening healthoutcomes and increasing staff workload [83]. Nevertheless, careshould be taken not to be overly critical about the lack ofaccuracy of certain wearables because of benefits associatedwith aspects such as the provision of insights over extendedperiods [17].
Staff may require further upskilling to encourage engagementwith wearables and facilitate behavior change [83]. This maydemand professional monitoring and the provision of feedbackon an ongoing basis [83]. In the short term, this may imposegreater pressure on staff as it will add to workers’responsibilities and may therefore appear unfeasible given theexisting strain on staff. However, the short-term increase inworkload may result in an overall reduction in workers’commitments over the long term because of benefits associatedwith self-measurement of readings and the consequentialreduction in appointments for such purposes [86].
Ultimately, providers have much to gain from patients takingsteps to monitor their own health. To realize these benefits,health care professionals should encourage patients by adoptinga supportive attitude, recognizing that wearables offer a meansfor patients to take a more proactive role in managing theirhealth rather than viewing the devices too critically. In fact,diffusion of innovations theory [87] classifies adopters intocategories, ranging from those who easily embrace change tolaggards who are more skeptical about the innovation. Applyingthis theory [87] to the adoption of wearables, providers can playan important role in seeking to convince laggards about thebenefits of wearables.
Theme: Behavior Change
OverviewBreaking bad habits and establishing good ones, as part of asustainable change to one’s lifestyle, requires positive actionswhereby attitudes or behaviors may need to shift. The potentialfor wearables to draw on various behavior change techniquesto prompt positive behavior change [20] holds promise forindividuals willing to take greater responsibility for their healthand care. Behavior change through wearables can take manyforms, from reminders and positive reinforcement associatedwith progress tracking and reporting to social group support formotivational purposes. However, such aspects, among others,can also give rise to negative outcomes if not carefully cateredfor, as discussed in the following sections.
JMIR Mhealth Uhealth 2022 | vol. 10 | iss. 7 | e35684 | p.18https://mhealth.jmir.org/2022/7/e35684(page number not for citation purposes)
Kang & ExworthyJMIR MHEALTH AND UHEALTH
XSL•FORenderX

Behavior Change Techniques and SupportContinually providing information to users through wearablesmay be useful for consolidating patients’understanding of theirconditions and prompting behavior changes [66]. Furthermore,the ability of wearables to track progress and achievementscould bolster adherence to exercise, which aligns with thebehavior change theory [66]. It has also been suggested thatintroducing behavioral counseling based on feedback fromwearables may lead to better results [70]. Another study hassuggested the potential for activity trackers to complementbehavioral counseling because of the behavior change techniquesembedded in wearables, including those related to goal settingand social support [74]. These behavior change techniques havebeen leveraged by certain wearables [73,80] to help achievepositive changes, such as by promoting an active lifestyle [83].Wearables seem to support behavior change, as another studyhas concluded that wearables further benefit patients inachieving their outcomes, as opposed to counseling alone [75].
Contrary to the position that has been taken in these studies,which have suggested that wearables can be effective, and theresults for patients can be enhanced through the additional useof behavioral counseling, wearables’value as a positive behaviorchange strategy may be context dependent. This is supportedby a study that found that activity tracking was insufficient forimproving pain-related outcomes or daily activity withoutbehavior change support [72]. Despite not tracking changes invariables linked to behavior change theories, it has been arguedthat wearables may not be effective from a behavior changestandpoint when promoting physical activity in college students[73].
In one study, only a few participants recognized specificbehavior changes arising from the use of wearables [71]. Theseparticipants were more disciplined and conscious about activitylevels and which exercises were more effective [71]. Althoughonly a few commented on any behavior changes, the subjectivenature of these changes may mean that others made similarprogress but did not recognize such progress. Another studystated that their effect size for behavioral outcomes rangedbetween small and medium but could not identify which aspectsof the devices resulted in this finding; instead, they speculatedthat this was because of greater intrinsic motivation for exercise[74].
An analysis of behavior change techniques used by activitytrackers suggested that wearables commonly have morecontrolling features than those that promote autonomy [69]. Forsome users, this focus on rewards or social comparison mayonly appear detrimental to their physical activity in the longterm [69] and may not be reflected in the findings of relativelyshort studies.
Moreover, physical activity levels seem to affect users’perceptions of wearables, as those who are more active generallyfound the devices to have a higher number of motivationalaffordances, which refer to the features of technology thatmotivate and support users to meet their goals [79]. It has beensuggested that this is because of greater familiarity with themotivational features of wearables, whereas novice exercisersmay not understand or notice these features, such as the symbol
denoting calorie burn [79]. Therefore, guided studies may notgeneralize to first-time, real-world use [79,80].
Self-efficacySelf-efficacy refers to an individual’s belief that they canperform a task [88]. The strength of self-efficacy is importantin influencing behavior change and how the individual respondsto adversity [88].
Wearables appeared to draw on 3 sources of self-efficacyproposed by Bandura [88]; these have been credited withincreasing user compliance and positive behavior change [77].The first source relates to personal accomplishments [88], whichare encompassed by the various features of wearable devices,including awards, progress toward activity goals, andperformance over time [77,82]. The use of activity remindersforms part of the second source of self-efficacy, related to verbalpersuasion [88], as motivational notifications can encourageusers to progress and meet their goals [77,84]. The third sourceis termed “vicarious experience” [88] and links to the socialaspects of wearables, whereby seeing users of a similar abilitycomplete activities motivate certain users to believe that theycan execute the same tasks [77].
However, it may be detrimental to self-efficacy when usersbelieve that they are significantly underachieving relative totheir peers [77]. Therefore, individuals should be matched tofellow users with whom they identify and who are successfullyachieving their goals, as otherwise they may be discouraged[84]. Of course, this must be balanced with the privacyimplications associated with personal data use, as individualsmust be provided with transparent information about how theirdata will be used, coupled with data minimization techniquesto ensure that only data required for the particular objective arebeing used and shared [89]. Nevertheless, designers shouldcontinue to consider sources of self-efficacy when developingfeatures for wearables [77].
Contextual FactorsImportantly, users’ perceptions of self-efficacy seem contextdependent [77]. The internal context comprises cognitive,behavioral, and emotional factors [77], whereas the externalcontext considers factors outside the user’s control, such as theweather or time of the day [77]. The internal context isparticularly important for self-efficacy, as it can either neutralizeor compound a negative external context, meaning that userswill either persevere in the face of adversity or stop using thewearable device [77]. In the interest of long-term behaviorchange and compliance, users should be supported to developpositive internal processes. For example, it would be valuablefor wearables to be capable of adjusting their feedback basedon the momentary state of the user [84] to reinforce theirsuccesses while supporting them through any difficulties inmeeting targets.
Wearables offer a safe environment, as users can try to meettheir goals even after repeatedly falling short; this establishesthe intrinsic motivation to stay committed [84]. However, thesupport offered by wearables may need to be individualized toreflect the uniqueness of users’ personalities and priorities,which can factor into the affordances of wearables [80], as better
JMIR Mhealth Uhealth 2022 | vol. 10 | iss. 7 | e35684 | p.19https://mhealth.jmir.org/2022/7/e35684(page number not for citation purposes)
Kang & ExworthyJMIR MHEALTH AND UHEALTH
XSL•FORenderX

engagement may convert to positive steps for behavior change.In addition, it is believed to foster self-efficacy, therebysupporting self-management [84]. For example, lessconscientious individuals may require additional motivationalsupport to assist with goal setting [79]. In addition, becauseself-set targets may not aid motivation, it may be beneficial forwearables to suggest feasible goals after monitoring the user[84]. Less agreeable users may respond better to increasedsupport for their autonomy or greater transparency to build trustin the technology [79]. Introverts may prefer greater privacy,whereas extroverts may be more receptive to social aspects,such as comparing activities with others [79].
Users comparing their own data against expected standards mayprompt positive behavior change [82], as not meeting suchstandards may lead to discomfort, referred to as cognitivedissonance [80]. The companion app plays an important role inenabling users to process information, as it visualizes andcontextualizes their data [82]; this positively affects self-reportedhealth metrics [82]. Of course, the privacy implications, asdiscussed earlier, of identifying peer comparators with respectto expected standards must still be observed.
IncentivizationEconomic incentives, such as offering discounts on insurancepremiums or wellness products, also appear to increase thewillingness of individuals to use wearables [81]. Such anapproach, in terms of offering discounts, has been undertakenby health and life insurance providers who are motivated tominimize claims on their issued policies. For example, Vitalityoffers a discount on Apple Watch [90] and encourages membersto track their activities via the app.
Consequently, incentivizing uptake may facilitate behaviorchange through regular use, but this would seem to be contingenton users’ satisfaction with the data privacy and technicalprovisions of the wearable device. Therefore, it is important toaddress any barriers so that they do not hinder the use ofwearables and prevent users from beginning the process ofpositive behavior change.
Motivational ProfileThe subsequent discussion on barriers to use centers primarilyon the design of the wearable, among other factors. However,there may be a case for considering the motivational profile(degree of autonomy and motivation) of users [69] and themotivational affordances of devices [79] when using wearablesas a tool for empowerment, as is evident that there may becontextual factors that affect the ability of wearables to inspirebehavior change.
For wearables to empower individuals, it would be worthundertaking a preliminary assessment of individuals who mayrequire additional support in the form of behavioral counseling.This will help ensure that patients receive appropriate support,as individuals whose motivational profiles are not matched tothe wearable device may become demotivated and experiencenegative emotions from persistently failing to meet goals [69].
Theme: Barriers to UseBarriers to the adoption and use of wearables could havesignificant ramifications for empowerment.
Although individuals expressed willingness to use wearables,use seemed to be inconsistent; a study reported that >90% ofthe participants suspended use [65]. As this is not an isolatedcase, with the issue of compliance mentioned elsewhere [68],it is worth considering factors that may have contributed to this.
The barriers to use that were identified [65] include forgettingto apply, hospitalization, loss of interest, and temporary loss ofthe wearable device. Aside from the concerns of wearability,accuracy, and price, feelings of fatigue stemming from the useof technology highlight the need for wearables to constantlyengage users, as loss of interest is a key reason for disuse [73].It is perhaps surprising that losing wearables does not seem tobe uncommon; this is evidenced by other studies [68,72,73],some of which have also reported malfunctioning devices thatrequire replacement by the manufacturer [68].
Design-Related AspectsIn addition, although certain design aspects, such as color andsize, may influence use [65], an aesthetically pleasingappearance may be a more important consideration for youngerindividuals [76].
Concerns regarding stigma arising from the use of certainwearables have also been raised. For instance, children who areoverweight that wear the badge of an activity tracker may bebullied [91]. Similarly, this seems to factor into the decisionsof patients who would prefer a sleek, discreet device rather thanone that is overtly medical [76].
Technical AspectsThe technology itself may deter use. A study [67] has addedthe following to the list of potential barriers: health difficulties,technical difficulties, a lack of personalized advice, and aninability to track other types of physical activity such as strengthexercises. These clearly represent barriers, as reported elsewhere[76]. Such concerns may also discourage regular use over aprolonged period [76], especially if individuals come to perceivethat these issues are associated with all wearables.
Annoyances may also prevent users from engaging with thetechnology [71]. For example, users may be frustrated by theperceived inaccuracies of sleep or pulse monitors [71], as somehave stopped using wearables for being unreliable [84]. Deviceinaccuracies have been cited elsewhere together with issuesrelated to battery life [72].
Barriers That Are More Common for Older UsersIn addition, a lack of familiarity [71] or not being tech-savvy[84] may mean that some individuals are put off by wearablesthat appear too complicated at first use. Such difficulties maybe more common among the older generation [79], in the contextof connecting wearables to smartphones and accessing metrics[71]. In fact, not owning a smartphone, through which manywearables tend to display such metrics, seemed to limit interestin tracking activities altogether [71].
JMIR Mhealth Uhealth 2022 | vol. 10 | iss. 7 | e35684 | p.20https://mhealth.jmir.org/2022/7/e35684(page number not for citation purposes)
Kang & ExworthyJMIR MHEALTH AND UHEALTH
XSL•FORenderX

Certain other barriers seem to apply to an older user base.Devices that require a high level of manual dexterity to operateproved unsuitable for older individuals to easily use [72,79].Another complaint was that the displayed text was too small toread easily [79]. Furthermore, many users were frustrated bythe lack of availability of instructions and guides for theexecution of basic tasks. This may be more of an issue inresearch studies, as users typically have access to any devicemanual when they make a purchase themselves. However,technical issues are common and tend to be resolved by the staffleading the research study [72].
CostCost may be another barrier, as even relatively low-cost trackersmay be inaccessible to older adults [72]. For others, the cost isa nonissue, as it was suggested that if the device is beneficial,then it is a matter of answering the question, “What’s my healthworth to me?” [76]. This highlights the possible need forindividuals to weigh the advantages offered by a wearable deviceagainst its shortcomings to ascertain whether the device is ofvalue and justifies the investment in one’s health.
Importantly, wearables should not seek to widen the healthinequalities that have worsened during the COVID-19 pandemic[92], especially for the poorest in society who tend to be in thegreatest need of care but least likely to receive such care [93].Therefore, wearables should serve as an additional option forindividuals to proactively manage their health care rather thanacting as a replacement for any traditional mode of delivery.
Barriers Arising From Long-term UseThe nature of wearables, as a newly emerging technology thathas gained traction in recent years, warrants further researchand development [78] to allay concerns surrounding durability,comfort, power consumption, standardization, interoperability,accuracy, privacy, and confidentiality. These potential issuesare more likely to arise from regular, long-term use of wearables;however, they are often missed in shorter clinical studies [78].If the barriers and concerns that have been raised are deemedby users to outweigh the benefits offered by the wearable, thenthis may discourage individuals from using such devices tomonitor their health, thereby potentially interfering with theirability to follow an active lifestyle [80].
PrivacyMoreover, privacy concerns have often been raised [84]. Thisis illustrated by the recent acquisition of Fitbit by Google [94],which gave rise to concerns about how personal and health datawere going to be used by a tech giant that is active in theAdTech and data commercialization fields [95]. Consequently,it is necessary to balance privacy and security concerns withpotential benefits to users and the health system [80].
Another high-profile example of significant privacy concernsfrom the use of portable technology in the context of health carehas arisen from the development and use of COVID Track andTrace apps around the world [96-98]. Although this does notfall within the strict definition of a wearable, the privacyconcerns raised [99] with respect to the apps with regard tolocation tracking of individuals and the sharing and aggregation
of personal data are equally applicable to the use of wearablesthat capture and process such types of user data.
Technology-Specific or General BarriersIt must be acknowledged that some of the criticisms ofwearables that seem to hinder use could be specific to the brandof wearables used in a study. Therefore, although theaforementioned concerns should be considered, it is importantto distinguish the specific nature of some barriers rather thanapplying them to wearables in general. For example, the inabilityto measure strength exercises appears to be specific to thewearable used in a study as part of a review [67]. In reality, theavailability of a range of wearables, some of which are designedto track strength exercises, may present less of a barrier to use.
However, the fact that the aforementioned barriers have beendescribed in the literature seems to suggest that such issues areprevalent rather than being restricted to a single brand ofwearable technology, as Multimedia Appendix 3 shows thediversity of wearables included in this review. In addition, thebarriers are significant and clearly need to be overcome to avertany further negative effects on user perceptions, which mayotherwise discourage the use of wearables. Failure to takeappropriate steps for damage control may erode public trust inwearables, thereby limiting the potential to empower new usersto manage their health more proactively. Therefore, althoughall technologies seem to have their own shortcomings or barriers,issues relating to wearable health technology may be viewedmore critically, as such wearables can inform decisions relatedto one’s health and care.
Principal FindingsA summary of the principal findings with respect to these themesis provided in the following sections.
Health Care Providers—Benefits and InvolvementProviders play an important role in empowering patients to usewearables. Therefore, providers require support because of theshort-term resource constraints that they are likely to face.However, data from wearables may help create a more holisticunderstanding of a patient’s health status, thereby acceleratingthe delivery of personalized advice. Better-informed patientsshould aid in communication and improve their adherence toadvice.
Behavior ChangeWearables may lead to positive behavior changes. This mayarise from the ability to set goals, receive motivationalreminders, track progress, and contextualize user data via acompanion app to facilitate understanding. Furthermore, peercomparison of activity data may benefit some in meeting theirgoals but may be detrimental to those who become discouragedfrom feeling that they are underperforming relative to theirpeers. Ultimately, wearables may better empower individualsby offering tailored support with positive reinforcement of users’successes while encouraging users when they fail to meet theirtargets.
JMIR Mhealth Uhealth 2022 | vol. 10 | iss. 7 | e35684 | p.21https://mhealth.jmir.org/2022/7/e35684(page number not for citation purposes)
Kang & ExworthyJMIR MHEALTH AND UHEALTH
XSL•FORenderX

Barriers to UseBarriers to user empowerment include a perceived lack ofaccuracy and overly complex devices. However, lack ofaccessibility may be a greater issue, with concerns about pricingand how not owning a smartphone may mean that individualsmiss out on the interpretation of data facilitated by thecompanion app. Another major concern relates to privacy, inwhich wearables collect sensitive health data. Consequently,strategies are required to mitigate the associated risks.
Strengths and LimitationsThis review has its limitations. The nature of this research andits focus on wearable technology as a broad area may mean thatrelevant studies have been inadvertently missed. For example,although gray literature may reduce publication bias, it maygive rise to selection bias because there is no gold standardmethod for retrieval [100]. Another potential source of bias maybe the use of judgment when selecting studies for inclusion.Furthermore, the selection criteria may have excludedpopulations from low- and middle-income countries, wherewearables can also be of benefit.
In certain circumstances, literature reviews have been includedwithout including individual studies for review. It is importantto note the reliance on the analysis undertaken as part of thesereviews and that those reviews should be read alongside thisreview to see the full picture. Although this approach has itsshortcomings from an analytic perspective, it was more practicalas the individual studies that were screened met the inclusioncriteria. It is also worth noting that although some studies thatformed part of the literature review were identified from theinitial literature searches for this scoping review, others werenot. Although this only became apparent when the referencelists of the literature reviews were cross-checked against therecords collated in the EndNote library, it gives rise to thequestion of how many other potential studies may have beenmissed and why?
The researcher took steps to minimize any bias and its effecton the research findings. The researcher consulted with senioracademics throughout the research. A librarian guided the searchstrategy. Moreover, the researcher adhered to best practicerecommendations from the PRISMA-ScR checklist andappraised the literature (which is not a requirement of scopingreviews) to further strengthen the rigor of this research. In fact,the very act of acknowledging these limitations has enabled thereader to contextualize the findings of the research within itslimitations while demonstrating compliance with therecommended practice documented by the PRISMA-ScR [50].
The main consideration for this review was to balance thepracticalities of research as a single researcher with the need toreview representative, relevant evidence. This is where feedbackon the research protocol and the availability of published scopingreviews (particularly those cited in the PRISMA-ScR “Tip
Sheets” [48] as examples to illustrate good practice) have helpeddevelop the methodology. Consequently, this review has beensuccessful in meeting its aims and answering the researchquestion; therefore, it should serve as a meaningful contributionto the literature in a dynamic, emerging area.
ConclusionsAlthough this scoping review has its limitations, its value isunderscored by the fact that it fills a gap in the literature byaddressing the research question and aims.
Considerable literature findings support the proposition thatwearable health technology can empower users and, in turn,benefit providers and patients. Even if patients are unable toentirely self-manage their conditions, wearables have thepotential to empower users to take more responsibility for theirhealth and inspire positive behavior changes.
However, the ability of wearables to empower users may belimited by several factors. To maximize the potential forconsumer wearables to integrate with the health system, supportfrom health care professionals is critical. In addition, userfeedback should be considered with respect to common barriersto use, such as technical issues and privacy concerns. As partof this process, designers of wearables should seek toincorporate more personalized support by way of positivereinforcement of any successes alongside encouragement forusers who fail to meet their targets.
Future research may report whether there has been any progressin overcoming the barriers to use, including those mentionedearlier and others raised as part of this review. Furtherinvestigation of the long-term effects of wearables onindividuals’ outcomes through larger studies is warranted, asmuch of the literature revolves around small-scale studies.Moreover, despite the abundance of literature on wearables,what seems to be missing is the focus on the people who wearthem. This may be because wearables, as viable instruments toassist with health care, have only been introduced in recentyears. Specifically, future research may focus more closely onwearables and empowerment, especially as technology continuesto evolve and advance over time. However, the challenge is forthe publication of research to keep pace with rapid developmentsrelated to wearable health technology.
The adoption of wearables in the health sector may be gradualand fraught with challenges [101], but strategic change iscertainly possible. In particular, any communication to relevantparties should emphasize the fact that although it may not beimmediately apparent, each party has much to gain in the longrun. Patients and users are expected to exercise greater controlover their health and care decisions. Designers of the devicesshould benefit from having a more engaged user base. Similarly,individuals taking a more proactive role in their care shouldlessen the burden on clinicians and ease the pressure on thewider health system.
AcknowledgmentsThis study was supported by the University of Birmingham.
JMIR Mhealth Uhealth 2022 | vol. 10 | iss. 7 | e35684 | p.22https://mhealth.jmir.org/2022/7/e35684(page number not for citation purposes)
Kang & ExworthyJMIR MHEALTH AND UHEALTH
XSL•FORenderX

Conflicts of InterestNone declared.
Multimedia Appendix 1Search strategies for databases and gray literature.[PDF File (Adobe PDF File), 121 KB - mhealth_v10i7e35684_app1.pdf ]
Multimedia Appendix 2Data charting form.[PDF File (Adobe PDF File), 75 KB - mhealth_v10i7e35684_app2.pdf ]
Multimedia Appendix 3Summary of the included studies.[PDF File (Adobe PDF File), 115 KB - mhealth_v10i7e35684_app3.pdf ]
Multimedia Appendix 4Characteristics of the included studies.[PDF File (Adobe PDF File), 77 KB - mhealth_v10i7e35684_app4.pdf ]
Multimedia Appendix 5Funding details of the relevant included studies.[PDF File (Adobe PDF File), 94 KB - mhealth_v10i7e35684_app5.pdf ]
Multimedia Appendix 6Contribution of the included studies to each of the themes.[PDF File (Adobe PDF File), 82 KB - mhealth_v10i7e35684_app6.pdf ]
References1. Dehghani M, Kim K, Dangelico R. Will smartwatches last? factors contributing to intention to keep using smart wearable
technology. Telematics Informatics 2018 May;35(2):480-490 [FREE Full text] [doi: 10.1016/j.tele.2018.01.007]2. Apple Watch. Helping your patients identify early warning signs. Apple. URL: https://www.apple.com/uk/healthcare/
apple-watch/ [accessed 2020-11-20]3. Fitbit homepage. Fitbit. URL: https://www.fitbit.com/global/ie/home [accessed 2020-11-20]4. Wearable sweat-sensor informs athletes of water and electrolyte loss. Doc Wire News. URL: https://www.docwirenews.com/
docwire-pick/future-of-medicine-picks/wearable-sweat-sensor-informs-athletes-of-water-and-electrolyte-loss/ [accessed2020-11-25]
5. Kim T, Wang Y, Oliver C, Thamm D, Cooling L, Paoletti C, et al. A temporary indwelling intravascular aphaeretic systemfor in vivo enrichment of circulating tumor cells. Nat Commun 2019 Apr 01;10(1):1478-1478 [FREE Full text] [doi:10.1038/s41467-019-09439-9] [Medline: 30932020]
6. Coulter A. Engaging Patients in Health Care. Maidenhead, Berkshire, United Kingdom: Open University Press; 2011.7. Walshe K, Smith J. Healthcare Management, 3rd Edition. London: Open University Press; 2016.8. Steger A. Weighing the pros and cons of wearable health technology. HealthTech. URL: https://healthtechmagazine.net/
article/2020/04/weighing-pros-and-cons-wearable-health-technology-perfcon [accessed 2020-11-27]9. Ates H, Yetisen A, Güder F, Dincer C. Wearable devices for the detection of COVID-19. Nat Electron 2021 Jan 25;4(1):13-14
[FREE Full text] [doi: 10.1038/s41928-020-00533-1]10. Werbrouck A, Swinnen E, Kerckhofs E, Buyl R, Beckwée D, De Wit L. How to empower patients? A systematic review
and meta-analysis. Transl Behav Med 2018 Sep 08;8(5):660-674 [FREE Full text] [doi: 10.1093/tbm/iby064] [Medline:29982675]
11. Aujoulat I, d'Hoore W, Deccache A. Patient empowerment in theory and practice: polysemy or cacophony? Patient EducCouns 2007 Apr;66(1):13-20 [FREE Full text] [doi: 10.1016/j.pec.2006.09.008] [Medline: 17084059]
12. Funnell M. Patient empowerment. Crit Care Nurs Q 2004;27(2):201-204 [FREE Full text] [doi:10.1097/00002727-200404000-00012] [Medline: 15137362]
13. Bravo P, Edwards A, Barr P, Scholl I, Elwyn G, McAllister M, Cochrane Healthcare Quality Research Group‚ CardiffUniversity. Conceptualising patient empowerment: a mixed methods study. BMC Health Serv Res 2015 Jul 01;15:252[FREE Full text] [doi: 10.1186/s12913-015-0907-z] [Medline: 26126998]
14. Denecke K, Gabarron E, Petersen C, Merolli M. Defining participatory health informatics - a scoping review. Inform HealthSoc Care 2021 Sep 02;46(3):234-243. [doi: 10.1080/17538157.2021.1883028] [Medline: 33622168]
JMIR Mhealth Uhealth 2022 | vol. 10 | iss. 7 | e35684 | p.23https://mhealth.jmir.org/2022/7/e35684(page number not for citation purposes)
Kang & ExworthyJMIR MHEALTH AND UHEALTH
XSL•FORenderX

15. Awotunde J, Jimoh R, AbdulRaheem M, Oladipo I, Folorunso S, Ajamu G. IoT-based wearable body sensor network forCOVID-19 pandemic. In: Advances in Data Science and Intelligent Data Communication Technologies for COVID-19.Cham: Springer; 2022.
16. Cooper D, Bhuskute N, Walsh G. Exploring the impact and acceptance of wearable sensor technology for pre- andpostoperative rehabilitation in knee replacement patients: a U.K.-based pilot study. JB JS Open Access 2022;7(2):e21.00154[FREE Full text] [doi: 10.2106/JBJS.OA.21.00154] [Medline: 35506018]
17. Hasan A, Klintworth K, Hajat C. Wearable technology and health improvement. Occup Med (Lond) 2021 Apr 09;71(2):53-55[FREE Full text] [doi: 10.1093/occmed/kqaa178] [Medline: 33836090]
18. Taffoni F, Rivera D, La Camera A, Nicolò A, Velasco J, Massaroni C. A wearable system for real-time continuous monitoringof physical activity. J Healthc Eng 2018;2018:1878354-1878316 [FREE Full text] [doi: 10.1155/2018/1878354] [Medline:29849993]
19. Apple Watch Series 6. Apple. URL: https://www.apple.com/uk/apple-watch-series-6/ [accessed 2021-05-01]20. Michie S, Richardson M, Johnston M, Abraham C, Francis J, Hardeman W, et al. The behavior change technique taxonomy
(v1) of 93 hierarchically clustered techniques: building an international consensus for the reporting of behavior changeinterventions. Ann Behav Med 2013 Aug;46(1):81-95 [FREE Full text] [doi: 10.1007/s12160-013-9486-6] [Medline:23512568]
21. Benefits of exercise. National Health Service England. URL: https://www.nhs.uk/live-well/exercise/exercise-health-benefits/[accessed 2021-04-02]
22. Obesity and overweight. World Health Organization. URL: https://www.who.int/news-room/fact-sheets/detail/obesity-and-overweight [accessed 2021-04-30]
23. Senthilingam M. Covid-19 has made the obesity epidemic worse, but failed to ignite enough action. BMJ 2021 Mar04;372:n411 [FREE Full text] [doi: 10.1136/bmj.n411] [Medline: 33664084]
24. Oussedik S, MacIntyre S, Gray J, McMeekin P, Clement ND, Deehan DJ. Elective orthopaedic cancellations due to theCOVID-19 pandemic: where are we now, and where are we heading? Bone Joint Open 2021 Feb 01;2(2):103-110. [doi:10.1302/2633-1462.22.bjo-2020-0161.r1]
25. Pressure points in the NHS. British Medical Association. URL: https://www.bma.org.uk/advice-and-support/nhs-delivery-and-workforce/pressures/pressure-points-in-the-nhs [accessed 2020-12-02]
26. Innovation and growth: rationale for an innovation strategy. Organisation for Economic Co-operation and Development.URL: https://www.oecd.org/science/inno/39374789.pdf [accessed 2020-12-06]
27. Re-imagining care pathways: innovative solutions to improve clinical workloads. The Kings's Fund. URL: https://www.kingsfund.org.uk/events/re-imagining-care-pathways [accessed 2020-12-01]
28. Loncar-Turukalo T, Zdravevski E, Machado da Silva J, Chouvarda I, Trajkovik V. Literature on wearable technology forconnected health: scoping review of research trends, advances, and barriers. J Med Internet Res 2019 Sep 05;21(9):e14017[FREE Full text] [doi: 10.2196/14017] [Medline: 31489843]
29. NHS Long Term Plan. National Health Service England. URL: https://www.england.nhs.uk/long-term-plan/ [accessed2020-11-28]
30. Liu N, Huang R, Baldacchino T, Sud A, Sud K, Khadra M, et al. Telehealth for noncritical patients with chronic diseasesduring the COVID-19 pandemic. J Med Internet Res 2020 Aug 07;22(8):e19493 [FREE Full text] [doi: 10.2196/19493][Medline: 32721925]
31. Greiwe J, Nyenhuis SM. Wearable technology and how this can be implemented into clinical practice. Curr Allergy AsthmaRep 2020 Jun 06;20(8):36 [FREE Full text] [doi: 10.1007/s11882-020-00927-3] [Medline: 32506184]
32. Remote patient monitoring 2018. KLAS Research. URL: https://klasresearch.com/report/remote-patient-monitoring-2018/1273 [accessed 2020-12-05]
33. Scheid J, West S. Opportunities of wearable technology to increase physical activity in individuals with chronic disease:an editorial. Int J Environ Res Public Health 2019 Aug 28;16(17):1-6 [FREE Full text] [doi: 10.3390/ijerph16173124][Medline: 31466226]
34. Bove L. Increasing patient engagement through the use of wearable technology. J Nurse Practitioners 2019 Sep;15(8):535-539[FREE Full text] [doi: 10.1016/j.nurpra.2019.03.018]
35. Azodo I, Williams R, Sheikh A, Cresswell K. Opportunities and challenges surrounding the use of data from wearablesensor devices in health care: qualitative interview study. J Med Internet Res 2020 Oct 22;22(10):e19542 [FREE Full text][doi: 10.2196/19542] [Medline: 33090107]
36. Guidance regulating medical devices in the UK. GOV.UK. URL: https://www.gov.uk/guidance/regulating-medical-devices-in-the-uk#overview [accessed 2021-04-27]
37. Important safety and product and services information. Fitbit. URL: https://tinyurl.com/277av7cb [accessed 2021-04-25]38. Apple Watch 4 is now an FDA Class 2 medical device: detects falls, irregular heart rhythm. Forbes. URL: https://tinyurl.
com/25t65jtz [accessed 2021-02-10]39. How can leaders make recent digital health gains last? Accenture. URL: https://www.accenture.com/us-en/insights/health/
leaders-make-recent-digital-health-gains-last [accessed 2020-11-28]40. Exworthy M, Mannion R. Dismantling the NHS? Evaluating the Impact of Health Reforms. Bristol: Policy Press; 2016.
JMIR Mhealth Uhealth 2022 | vol. 10 | iss. 7 | e35684 | p.24https://mhealth.jmir.org/2022/7/e35684(page number not for citation purposes)
Kang & ExworthyJMIR MHEALTH AND UHEALTH
XSL•FORenderX

41. Dineen-Griffin S, Garcia-Cardenas V, Williams K, Benrimoj SI. Helping patients help themselves: a systematic review ofself-management support strategies in primary health care practice. PLoS One 2019 Aug 1;14(8):e0220116 [FREE Fulltext] [doi: 10.1371/journal.pone.0220116] [Medline: 31369582]
42. Scoping reviews: what they are and how you can do them. Cochrane Training. URL: https://training.cochrane.org/resource/scoping-reviews-what-they-are-and-how-you-can-do-them [accessed 2020-12-07]
43. Peters M, Godfrey C, Khalil H, McInerney P, Parker D, Soares C. Guidance for conducting systematic scoping reviews.Int J Evid Based Healthc 2015 Sep;13(3):141-146 [FREE Full text] [doi: 10.1097/XEB.0000000000000050] [Medline:26134548]
44. Arksey H, O'Malley L. Scoping studies: towards a methodological framework. Int J Social Res Methodol 2005 Feb;8(1):19-32[FREE Full text] [doi: 10.1080/1364557032000119616]
45. Munn Z, Peters M, Stern C, Tufanaru C, McArthur A, Aromataris E. Systematic review or scoping review? Guidance forauthors when choosing between a systematic or scoping review approach. BMC Med Res Methodol 2018 Nov19;18(1):143-147 [FREE Full text] [doi: 10.1186/s12874-018-0611-x] [Medline: 30453902]
46. Munn Z, Stern C, Aromataris E, Lockwood C, Jordan Z. What kind of systematic review should I conduct? A proposedtypology and guidance for systematic reviewers in the medical and health sciences. BMC Med Res Methodol 2018 Jan10;18(1):5 [FREE Full text] [doi: 10.1186/s12874-017-0468-4] [Medline: 29316881]
47. Pawson R, Greenhalgh T, Harvey G, Walshe K. Realist review--a new method of systematic review designed for complexpolicy interventions. J Health Serv Res Policy 2005 Jul;10 Suppl 1:21-34 [FREE Full text] [doi: 10.1258/1355819054308530][Medline: 16053581]
48. PRISMA for scoping reviews. Preferred Reporting Items for Systematic Reviews and Meta-Analyses. URL: http://www.prisma-statement.org/Extensions/ScopingReviews [accessed 2021-02-12]
49. Levac D, Colquhoun H, O'Brien K. Scoping studies: advancing the methodology. Implement Sci 2010 Sep 20;5:69 [FREEFull text] [doi: 10.1186/1748-5908-5-69] [Medline: 20854677]
50. Tricco A, Lillie E, Zarin W, O'Brien K, Colquhoun H, Levac D. PRISMA extension for scoping reviews (PRISMA-ScR):checklist and explanation. Ann Intern Med 2018:467-473 [FREE Full text] [doi: 10.7326/m18-0850]
51. Sucharew H, Macaluso M. Progress notes: methods for research evidence synthesis: the scoping review approach. J HospMed 2019 Jul 01;14(7):416-418 [FREE Full text] [doi: 10.12788/jhm.3248] [Medline: 31251164]
52. Pham M, Rajić A, Greig J, Sargeant J, Papadopoulos A, McEwen S. A scoping review of scoping reviews: advancing theapproach and enhancing the consistency. Res Synth Methods 2014 Dec;5(4):371-385 [FREE Full text] [doi:10.1002/jrsm.1123] [Medline: 26052958]
53. Peters M, Marnie C, Tricco A, Pollock D, Munn Z, Alexander L, et al. Updated methodological guidance for the conductof scoping reviews. JBI Evid Synth 2020 Oct;18(10):2119-2126 [FREE Full text] [doi: 10.11124/JBIES-20-00167] [Medline:33038124]
54. Resources. JBI. URL: https://jbi.global/scoping-review-network/resources [accessed 2020-11-28]55. Robson C, McCartan K. Real World Research, 4th Edition. Chichester: John Wiley & Sons; 2016.56. Long H, French D, Brooks J. Optimising the value of the critical appraisal skills programme (CASP) tool for quality
appraisal in qualitative evidence synthesis. Res Method Med Health Sci 2020 Aug 06;1(1):31-42 [FREE Full text] [doi:10.1177/2632084320947559]
57. Critical Appraisal Tools. JBI. URL: https://jbi.global/critical-appraisal-tools [accessed 2021-03-03]58. Scott P, Nakkas H, Roderick P. Protocol for a scoping review to understand how interorganisational electronic health
records affect hospital physician and pharmacist decisions. BMJ Open 2019 Jan 15;9(1):e023712 [FREE Full text] [doi:10.1136/bmjopen-2018-023712] [Medline: 30647036]
59. JBI Manual for evidence synthesis. JBI. URL: https://wiki.jbi.global/display/MANUAL/11.2.7+Data+extraction [accessed2020-12-04]
60. Booth A, Sutton A, Papaioannou D. Systematic Approaches to a Successful Literature Review 2nd Edition. Thousand Oaks,California: SAGE Publications Ltd; 2016.
61. Braun V, Clarke V. Successful Qualitative Research A Practical Guide for Beginners. Thousand Oaks, California: SAGEPublications; 2013.
62. Jesus TS, Bright F, Kayes N, Cott CA. Person-centred rehabilitation: what exactly does it mean? Protocol for a scopingreview with thematic analysis towards framing the concept and practice of person-centred rehabilitation. BMJ Open 2016Jul 19;6(7):e011959 [FREE Full text] [doi: 10.1136/bmjopen-2016-011959] [Medline: 27436670]
63. Safarpour H, Khorasani-Zavareh D, Mohammadi R. The common road safety approaches: a scoping review and thematicanalysis. Chin J Traumatol 2020 Apr;23(2):113-121 [FREE Full text] [doi: 10.1016/j.cjtee.2020.02.005] [Medline: 32178997]
64. Finkelstein S, Sharma U, Furlonger B. The inclusive practices of classroom teachers: a scoping review and thematic analysis.Int J Inclusive Educ 2019 Jan 30;25(6):735-762 [FREE Full text] [doi: 10.1080/13603116.2019.1572232]
65. Auerswald T, Meyer J, von Holdt K, Voelcker-Rehage C. Application of activity trackers among nursing home residents-apilot and feasibility study on physical activity behavior, usage behavior, acceptance, usability and motivational impact. IntJ Environ Res Public Health 2020 Sep 14;17(18):1-21 [FREE Full text] [doi: 10.3390/ijerph17186683] [Medline: 32937840]
JMIR Mhealth Uhealth 2022 | vol. 10 | iss. 7 | e35684 | p.25https://mhealth.jmir.org/2022/7/e35684(page number not for citation purposes)
Kang & ExworthyJMIR MHEALTH AND UHEALTH
XSL•FORenderX

66. Belsi A, Papi E, McGregor AH. Impact of wearable technology on psychosocial factors of osteoarthritis management: aqualitative study. BMJ Open 2016 Feb 03;6(2):e010064 [FREE Full text] [doi: 10.1136/bmjopen-2015-010064] [Medline:26842273]
67. Coughlin S, Caplan L, Stone R. Use of consumer wearable devices to promote physical activity among breast, prostate,and colorectal cancer survivors: a review of health intervention studies. J Cancer Surviv 2020 Jun;14(3):386-392 [FREEFull text] [doi: 10.1007/s11764-020-00855-1] [Medline: 31933148]
68. DiFrancisco-Donoghue J, Jung M, Stangle A, Werner W, Zwibel H, Happel P, et al. Utilizing wearable technology toincrease physical activity in future physicians: a randomized trial. Prev Med Rep 2018 Dec;12:122-127 [FREE Full text][doi: 10.1016/j.pmedr.2018.09.004] [Medline: 30234000]
69. Friel C, Garber C. An examination of the relationship between motivation, physical activity, and wearable activity monitoruse. J Sport Exerc Psychol 2020 Mar 09:1-8 [FREE Full text] [doi: 10.1123/jsep.2019-0170] [Medline: 32150727]
70. Goode A, Hall K, Batch B, Huffman K, Hastings S, Allen K, et al. The impact of interventions that integrate accelerometerson physical activity and weight loss: a systematic review. Ann Behav Med 2017 Feb;51(1):79-93 [FREE Full text] [doi:10.1007/s12160-016-9829-1] [Medline: 27565168]
71. Henriksen A, Sand A, Deraas T, Grimsgaard S, Hartvigsen G, Hopstock L. Succeeding with prolonged usage ofconsumer-based activity trackers in clinical studies: a mixed methods approach. BMC Public Health 2020 Aug 27;20(1):1300[FREE Full text] [doi: 10.1186/s12889-020-09406-w] [Medline: 32854671]
72. Janevic M, Shute V, Murphy S, Piette J. Acceptability and effects of commercially available activity trackers for chronicpain management among older African American adults. Pain Med 2020 Feb 01;21(2):e68-e78 [FREE Full text] [doi:10.1093/pm/pnz215] [Medline: 31509196]
73. Kim Y, Lumpkin A, Lochbaum M, Stegemeier S, Kitten K. Promoting physical activity using a wearable activity trackerin college students: a cluster randomized controlled trial. J Sports Sci 2018 Aug;36(16):1889-1896 [FREE Full text] [doi:10.1080/02640414.2018.1423886] [Medline: 29318916]
74. Lewis Z, Ottenbacher K, Fisher S, Jennings K, Brown A, Swartz M, et al. Effect of electronic activity monitors andpedometers on health: results from the TAME health pilot randomized pragmatic trial. Int J Environ Res Public Health2020 Sep 18;17(18):1-11 [FREE Full text] [doi: 10.3390/ijerph17186800] [Medline: 32961834]
75. Lugones-Sanchez C, Sanchez-Calavera M, Repiso-Gento I, Adalia E, Ramirez-Manent J, Agudo-Conde C, EVIDENT 3Investigators. Effectiveness of an mHealth intervention combining a smartphone app and smart band on body compositionin an overweight and obese population: randomized controlled trial (EVIDENT 3 study). JMIR Mhealth Uhealth 2020 Nov26;8(11):e21771 [FREE Full text] [doi: 10.2196/21771] [Medline: 33242020]
76. Papi E, Belsi A, McGregor AH. A knee monitoring device and the preferences of patients living with osteoarthritis: aqualitative study. BMJ Open 2015 Sep 07;5(9):e007980 [FREE Full text] [doi: 10.1136/bmjopen-2015-007980] [Medline:26346873]
77. Rieder A, Eseryel U, Lehrer C, Jung R. Why users comply with wearables: the role of contextual self-efficacy in behavioralchange. Int J Human Comput Interact 2020 Sep 30;37(3):281-294 [FREE Full text] [doi: 10.1080/10447318.2020.1819669]
78. Rodgers M, Alon G, Pai V, Conroy R. Wearable technologies for active living and rehabilitation: current research challengesand future opportunities. J Rehabil Assist Technol Eng 2019;6:2055668319839607-2055668319839609 [FREE Full text][doi: 10.1177/2055668319839607] [Medline: 31245033]
79. Rupp M, Michaelis J, McConnell D, Smither J. The role of individual differences on perceptions of wearable fitness devicetrust, usability, and motivational impact. Appl Ergon 2018 Jul;70:77-87 [FREE Full text] [doi: 10.1016/j.apergo.2018.02.005][Medline: 29866329]
80. Shin G, Jarrahi M, Fei Y, Karami A, Gafinowitz N, Byun A, et al. Wearable activity trackers, accuracy, adoption, acceptanceand health impact: a systematic literature review. J Biomed Inform 2019 May;93:103153 [FREE Full text] [doi:10.1016/j.jbi.2019.103153] [Medline: 30910623]
81. Soliño-Fernandez D, Ding A, Bayro-Kaiser E, Ding E. Willingness to adopt wearable devices with behavioral and economicincentives by health insurance wellness programs: results of a US cross-sectional survey with multiple consumer healthvignettes. BMC Public Health 2019 Dec 16;19(1):1649 [FREE Full text] [doi: 10.1186/s12889-019-7920-9] [Medline:31839006]
82. Stiglbauer B, Weber S, Batinic B. Does your health really benefit from using a self-tracking device? Evidence from alongitudinal randomized control trial. Comput Human Behav 2019 May;94:131-139 [FREE Full text] [doi:10.1016/j.chb.2019.01.018]
83. The digital patient: transforming primary care? The Nuffield Trust. 2016. URL: https://www.nuffieldtrust.org.uk/research/the-digital-patient-transforming-primary-care [accessed 2021-02-04]
84. Wulfovich S, Fiordelli M, Rivas H, Concepcion W, Wac K. " I must try harder": design implications for mobile apps andwearables contributing to self-efficacy of patients with chronic conditions. Front Psychol 2019;10:2388 [FREE Full text][doi: 10.3389/fpsyg.2019.02388] [Medline: 31749733]
85. Frenk J. Dimensions of health system reform. Health Policy 1994 Jan;27(1):19-34 [FREE Full text] [doi:10.1016/0168-8510(94)90155-4]
JMIR Mhealth Uhealth 2022 | vol. 10 | iss. 7 | e35684 | p.26https://mhealth.jmir.org/2022/7/e35684(page number not for citation purposes)
Kang & ExworthyJMIR MHEALTH AND UHEALTH
XSL•FORenderX

86. Smuck M, Odonkor C, Wilt J, Schmidt N, Swiernik M. The emerging clinical role of wearables: factors for successfulimplementation in healthcare. NPJ Digit Med 2021 Mar 10;4(1):45-48 [FREE Full text] [doi: 10.1038/s41746-021-00418-3][Medline: 33692479]
87. Rogers E. Diffusion of innovations. London: Collier-Macmillan; 1962.88. Bandura A. Self-efficacy: toward a unifying theory of behavioral change. Psychol Rev 1977;84(2):191-215 [FREE Full
text] [doi: 10.1037/0033-295x.84.2.191]89. The principles. Information Commissioner's Office. URL: https://ico.org.uk/for-organisations/guide-to-data-protection/
guide-to-the-general-data-protection-regulation-gdpr/principles/ [accessed 2021-05-02]90. Get the Apple Watch deal. Vitality. URL: https://www.vitality.co.uk/rewards/partners/active-rewards/apple-watch/ [accessed
2021-05-02]91. Jamruk K. The weight game: fighting childhood obesity with childhood video technology. J Leg Med 2017;37(1-2):175-194
[FREE Full text] [doi: 10.1080/01947648.2017.1303409] [Medline: 28910218]92. Bambra C, Riordan R, Ford J, Matthews F. The COVID-19 pandemic and health inequalities. J Epidemiol Community
Health 2020 Nov 13;74(11):964-968 [FREE Full text] [doi: 10.1136/jech-2020-214401] [Medline: 32535550]93. Tudor Hart J. The inverse care law. Lancet 1971 Feb;297(7696):405-412 [FREE Full text] [doi:
10.1016/s0140-6736(71)92410-x]94. Osterloh R. Google completes Fitbit acquisition. Google. URL: https://blog.google/products/devices-services/fitbit-acquisition/
[accessed 2021-05-02]95. Google tries to allay Fitbit-deal privacy fears. BBC News. URL: https://www.bbc.co.uk/news/technology-55662659
[accessed 2021-05-02]96. COVID-19 app support. National Health Service England. URL: https://www.covid19.nhs.uk/ [accessed 2021-05-02]97. Privacy-preserving contact tracing. Apple. URL: https://covid19.apple.com/contacttracing [accessed 2021-05-02]98. Criddle C, Kelion L. Coronavirus contact-tracing: world split between two types of app. BBC News. URL: https://www.
bbc.co.uk/news/technology-52355028 [accessed 2021-05-02]99. Lehmann C. Privacy concerns hindering digital contact tracing. WebMD. URL: https://www.webmd.com/lung/news/
20200928/privacy-concerns-hindering-digital-contact-tracing [accessed 2021-05-02]100. Paez A. Gray literature: an important resource in systematic reviews. J Evid Based Med 2017 Aug;10(3):233-240 [FREE
Full text] [doi: 10.1111/jebm.12266] [Medline: 28857505]101. Kotter J. Force For Change How Leadership Differs from Management. London: Free Press; 1990.
AbbreviationsECG: electrocardiogramJBI: Joanna Briggs InstituteMHRA: Medicines and Healthcare Products Regulatory AgencyNHS: National Health ServicePHI: participatory health informaticsPRISMA-ScR: Preferred Reporting Items for Systematic Reviews and Meta-Analyses extension for ScopingReviews
Edited by L Buis; submitted 13.12.21; peer-reviewed by S Mantalvanos, S Subramaniam; comments to author 06.01.22; revised versionreceived 20.01.22; accepted 08.06.22; published 13.07.22.
Please cite as:Kang HS, Exworthy MWearing the Future—Wearables to Empower Users to Take Greater Responsibility for Their Health and Care: Scoping ReviewJMIR Mhealth Uhealth 2022;10(7):e35684URL: https://mhealth.jmir.org/2022/7/e35684 doi:10.2196/35684PMID:35830222
©Harjeevan Singh Kang, Mark Exworthy. Originally published in JMIR mHealth and uHealth (https://mhealth.jmir.org),13.07.2022. This is an open-access article distributed under the terms of the Creative Commons Attribution License(https://creativecommons.org/licenses/by/4.0/), which permits unrestricted use, distribution, and reproduction in any medium,provided the original work, first published in JMIR mHealth and uHealth, is properly cited. The complete bibliographic information,a link to the original publication on https://mhealth.jmir.org/, as well as this copyright and license information must be included.
JMIR Mhealth Uhealth 2022 | vol. 10 | iss. 7 | e35684 | p.27https://mhealth.jmir.org/2022/7/e35684(page number not for citation purposes)
Kang & ExworthyJMIR MHEALTH AND UHEALTH
XSL•FORenderX

Original Paper
Impact of a Mobile Application for Tracking Nausea and VomitingDuring Pregnancy (NVP) on NVP Symptoms, Quality of Life, andDecisional Conflict Regarding NVP Treatments: MinSafeStartRandomized Controlled Trial
Elin Ngo1, MSc; Maria Bich-Thuy Truong1, PhD; Hedvig Nordeng1,2, PhD; David Wright3,4, PhD1PharmacoEpidemiology and Drug Safety Research Group, Department of Pharmacy, University of Oslo, Oslo, Norway2Department of Child Health and Development, National Institute of Public Health, Oslo, Norway3School of Allied Health Professions, University of Leicester, England, United Kingdom4Centre for Pharmacy, University of Bergen, Bergen, Norway
Corresponding Author:Elin Ngo, MScPharmacoEpidemiology and Drug Safety Research GroupDepartment of PharmacyUniversity of OsloPostbox 1068 BlindernOslo, 0316NorwayPhone: 47 93849866Email: [email protected]
Abstract
Background: Pregnant women are active users of mobile apps for health purposes. These apps may improve self-managementof health-related conditions. Up to 70% of pregnant women experience nausea and vomiting (NVP). Even mild NVP cansignificantly reduce quality of life (QoL), and it can become an economic burden for both the woman and society. NVP oftenoccurs before the first maternal care visit; therefore, apps can potentially play an important role in empowering pregnant womento recognize, manage, and seek appropriate treatment for NVP, when required.
Objective: This study investigated whether the MinSafeStart (MSS) mobile app could impact NVP-related symptoms, QoL,and decisional conflict regarding NVP treatment.
Methods: This randomized controlled trial enrolled 268 pregnant women with NVP in Norway from 2019 to 2020. Theintervention group had access to the MSS app, which could be used to track NVP symptoms and access tailored advice. NVPseverity was rated with the Pregnancy Unique Quantification of Emesis (PUQE) score. The control group followed standardmaternal care. We collected data on maternal baseline characteristics, NVP severity, QoL, and decisional conflict using 2 sets ofonline questionnaires. One set of questionnaires was completed at enrollment, and the other was completed after 2 weeks. Weperformed linear regression analyses to explore whether the use of the MSS app was associated with NVP severity, QoL, ordecisional conflict.
Results: Among the 268 women enrolled in the study, 192 (86.5%) completed the baseline questionnaires and were randomizedto either the intervention (n=89) or control group (n=103). In the intervention group, 88 women downloaded the app, and 468logs were recorded. In both groups, women were enrolled at a median of 8 gestational weeks. At baseline, the average PUQEscores were 4.9 and 4.7; the average QoL scores were 146 and 149; and the average DCS scores were 40 and 43 in the interventionand control groups, respectively. The app had no impact on NVP severity (aβ 0.6, 95% Cl −0.1 to 1.2), QoL (aβ −5.3, 95% Cl−12.5 to 1.9), or decisional conflict regarding NVP treatment (aβ −1.1, 95% Cl −6.2 to 4.2), compared with standard care.
Conclusions: Tracking NVP symptoms with the MSS app was not associated with improvements in NVP symptoms, QoL, ordecisional conflict after 2 weeks, compared with standard care. Future studies should include a process evaluation to improveour understanding of how pregnant women use the app and how to optimize its utility within maternity care. Specifically, studiesshould focus on how digital tools might facilitate counseling and communication between pregnant women and health careproviders regarding NVP management during pregnancy.
JMIR Mhealth Uhealth 2022 | vol. 10 | iss. 7 | e36226 | p.28https://mhealth.jmir.org/2022/7/e36226(page number not for citation purposes)
Ngo et alJMIR MHEALTH AND UHEALTH
XSL•FORenderX

Trial Registration: ClinicalTrails.gov (NCT04719286): https://www.clinicaltrials.gov/ct2/show/NCT04719286
(JMIR Mhealth Uhealth 2022;10(7):e36226) doi:10.2196/36226
KEYWORDS
eHealth; mHealth; decision support tool; nausea and vomiting; pregnancy; RCT
Introduction
BackgroundPregnant women and women of reproductive age are activeusers of mobile apps for health purposes [1]. Available apps aredesigned for promoting self-management of chronic diseases,such as migraine and diabetes; tracking gestational weeks,weight, and belly measurements during pregnancy; and keepingtrack of pregnancy development in general [1,2]. These appsare often used to supplement routine care, because women tendto search for health-related information early in pregnancy,before and after health consultations, and when making decisions[1,3-5]. Often, the primary motivation for using apps is the needfor easily accessible health information [6]. Our recentsystematic review on decision support tools in pregnancyrevealed that few studies had investigated the effect of digitaltools on the course of pregnancy and pregnancy-related ailments.However, available studies have shown that apps could have apositive impact on the knowledge level of pregnant women,when integrated as part of patient care. Pregnant women alsoseemed to appreciate and were satisfied with digital tools [7].
Nausea and vomiting in pregnancy (NVP) is one of the mostcommon pregnancy-related conditions. NVP affects up to 70%of pregnant women worldwide [8,9]. NVP symptoms oftenoccur during the first few weeks of pregnancy, on average, ataround gestational week 4 [10]. The etiology of NVP is notclearly understood, but it is thought to be multifactorial andcomplex [10]. The severity of NVP can range from mildlyuncomfortable to hyperemesis gravidarum (HG), which is themost severe form of NVP. HG affects 1%-3% of all pregnantwomen, and it is the most common reason for hospitalizationin early pregnancy [8]. Although HG is a relatively rarecondition, it is essential to recognize the burden of NVP ingeneral. Previous studies have shown that even mild NVPsymptoms significantly reduce quality of life (QoL) of pregnantwomen and their willingness to become pregnant again [11,12].Moreover, as the severity of NVP increases, the costs for societyincrease due to increased hospital and emergency roomadmissions, health care visits, prescribed medications, andincome loss for both the woman and her partner [13].
NVP treatment guidelines recommend early recognition andtreatment to prevent or reduce more severe symptoms. Thefirst-line management of mild symptoms consists ofnonpharmacologic measures, including lifestyle and dietarychanges (Multimedia Appendix 1). Pharmacological treatmentis indicated when NVP symptoms are moderate to severe orwhen symptoms significantly impact the women’s dailyactivities [14,15]. The first NVP symptoms typically occur earlyin pregnancy and, often, before the first maternal care visit.Therefore, it is important to empower pregnant women to ensurethat they can optimally manage NVP symptoms [15,16].
Digitalization, eHealth initiatives, and the wide use of theinternet have opened up new possibilities for using digital toolsin maternal care [17]. Mobile apps can enable pregnant womento take a more active role in self-care and disease managementduring pregnancy. Moreover, these apps can provide largeamounts of patient-generated data during pregnancy for researchpurposes [17,18]. The Pregnancy Unique Quantification ofEmesis (PUQE) score is an internationally validated tool forcategorizing the severity of NVP based on 3 questions regardingvomiting, nausea, and retching symptoms [19,20]. In the latest(2009) version of the PUQE score, women are asked to rate theseverity of symptoms that occurred in the last 24 hours [19]. Atranslated and validated Norwegian version of the PUQE scorebecame available in 2015 [21]. Incorporating the PUQE scoreinto an app could potentially empower women by improvingtheir management of NVP. The app could allow women to tracksymptoms over time and record responses to interventions.Because 99%-100% of women of reproductive age usesmartphones [22] and most women use health-related apps[23,24], digital tools should be particularly suitable for maternalcare.
A recent review pointed out that, although there is a growingnumber of apps available for monitoring and managinghealth-related issues, the majority are never tested nor clinicallyvalidated [25]. That finding implied that it remains largelyunknown whether available apps are beneficial or whether theyeven have an effect on clinical outcomes. A prior study showedthat integrating apps into professional clinical services couldpotentially improve the effectiveness of health care [26]. Ourprevious review concluded that the innovative use of eHealthinitiatives and digitalization could potentially empower pregnantpatients and improve maternal care [7]. However, at the sametime, a more scientific approach is needed for testing andevaluating these apps and other digital tools. Indeed, health careproviders should encourage patients to use only tools that arebeneficial and effective as a supplement to routine maternitycare.
ObjectiveThe primary aim of this study was to investigate whether theMinSafeStart (MSS) mobile app could impact NVP severity inpregnant women. The secondary aims were to assess whetherthe MSS app could affect the QoL of pregnant women andimprove their ability to make decisions regarding NVPtreatment.
Specifically, the primary research question was: Will womenwho use the MSS app for 2 weeks have different NVPsymptoms, based on PUQE scores, compared with women whofollow standard maternal care without the MSS app?
The specific secondary research questions were: (1) Will womenwho use the MSS app for 2 weeks have different QoL, based
JMIR Mhealth Uhealth 2022 | vol. 10 | iss. 7 | e36226 | p.29https://mhealth.jmir.org/2022/7/e36226(page number not for citation purposes)
Ngo et alJMIR MHEALTH AND UHEALTH
XSL•FORenderX

on Health-related Quality of Life for Nausea and Vomitingduring Pregnancy (NVPQOL) scores, compared with womenwho follow standard maternal care without the MSS app? (2)Will women who use the MSS app for 2 weeks have differentdecisional conflict scale (DCS) scores regarding NVP treatment,compared with women who follow standard maternal carewithout the MSS app? (3) Will the use of the MSS app modifythe association between the PUQE score and the NVPQOLscore (ie, is the MSS app an effect modifier)?
Methods
Study Design, Study Population, Recruitment, andSample SizeThe MinSafeStart study was a randomized controlled trial. Werecruited pregnant women in Norway between September 2019and June 2020. All pregnant women over 18 years old who werecurrently experiencing NVP, owned a smartphone (iOS orAndroid), and could speak and understand Norwegian wereeligible for inclusion.
Participants were primarily recruited through social mediaadvertisements. Invitations to participate in the study wereavailable on the study Facebook page, the NorwegianHyperemesis Gravidarum Patient Organization’s Facebookpage, and other pregnancy-related web pages or forums, suchas “altformamma.no” (all for mommy) and“tryggmammamedisin.no” (safe mother medications). Invitationswere additionally accessible through the Helseoversikt app.Helseoversikt is a digital platform used by health care centersall over Norway that provides relevant health information topregnant women and parents.
All invitations to participate contained a link to the onlineconsent form. When the women signed the consent form andresponded to the baseline questionnaire, they were automaticallyrandomized to either the intervention or control group. Bothgroups received emails with information about the study groupto which they were assigned. The intervention group alsoreceived an email with instructions on how to download anduse the app.
Results from the power analysis suggested that we would needa total of 250 pregnant women (n=125 in each group, 2-tailedhypothesis) to detect a mean difference of 3 points in the PUQE
score between the groups, with a power of 80% (Cohen d=0.5).This total sample size included a 25% dropout rate.
RandomizationAn automated software program was specifically developed forthe project. The software automatically managed participantenrollment, randomization to study groups, and emaildistributions of electronic information and online questionnairesto the study participants. This software was developed for theproject by the University Center for Information Technology(USIT) at the University of Oslo.
Development of the MinSafeStart Mobile ApplicationThe MSS app was a patient-centered app for women with NVP.Our research group developed the MSS app in collaborationwith interaction designers, programmers, and researchers fromUSIT. The app utilized the daily PUQE score (MultimediaAppendix 2) to categorize NVP severity (ie, mild, moderate, orsevere), and it displayed the fluctuations over time in a graph(Figures 1 and 2). The aim of the app was to assist pregnantwomen in identifying and managing NVP. The app tracked theirNVP symptoms every day and provided tailored adviceaccording to the severity of their symptoms. All women withNVP symptoms received lifestyle and dietary advice (eg, stayhydrated, eat small meals frequently, and get some rest). Womenthat experienced severe NVP also received information aboutmedical treatments. The app alerted the woman to seekappropriate treatment when she logged PUQE scores >13 formore than 3 consecutive days. The app was user tested in July2018. The user test included 9 women who completed astructured interview with a set of tasks and questions regardingthe app. Of these 9 women, 5 also participated in a focus groupto discuss and share their experiences and opinions about theapp. The user test results showed that the app was user-friendlyand had the potential to empower women who experienced NVPto improve their management skills and treatment decisions.Nevertheless, some minor issues were mentioned in the usertest and focus group that could be improved (ie, explanationsof terminologies, an opportunity to change the due date, linksto external information, an overview of previously loggedscores, and the layout and design). These suggestions wereincorporated into the app to make it as user-friendly as possiblebefore it was launched for iOS and Android smartphones.
JMIR Mhealth Uhealth 2022 | vol. 10 | iss. 7 | e36226 | p.30https://mhealth.jmir.org/2022/7/e36226(page number not for citation purposes)
Ngo et alJMIR MHEALTH AND UHEALTH
XSL•FORenderX

Figure 1. Front page of the MinSafeStart application (in Norwegian) for pregnant women to track nausea and vomiting, showing the user's gestationalweek at the top, text in the center (“How do you feel? Use the button below to log your NVP symptoms”), and button to log nausea and vomiting inpregnancy (NVP) symptoms.
JMIR Mhealth Uhealth 2022 | vol. 10 | iss. 7 | e36226 | p.31https://mhealth.jmir.org/2022/7/e36226(page number not for citation purposes)
Ngo et alJMIR MHEALTH AND UHEALTH
XSL•FORenderX

Figure 2. The MinSafeStart app (in Norwegian) for pregnant women with nausea and vomiting (NVP) shows the women’s NVP loggings (MineMalinger) as the user’s NVP scores (purple) as a graph over time (week [Uke], month [Måned], for all data recorded in the app [Total]), compared withthe mean Pregnancy Unique Quantification of Emesis (PUQE) score of other pregnant women (blue line), or as a table (Tabell). The bottom sectionshows the numeric rating scale for NVP symptoms. Alvorlig: severe; Moderat: moderate; Skår: Score.
Data CollectionIn this MinSafeStart study, we collected data from the MSS appand from 4 sets of questionnaires (Q1-Q4) that were completedelectronically. Q1 was administered to participants at enrollment(baseline), and Q2 was administered 2 weeks later. Q3 and Q4were additional follow-up questionnaires administered at 4weeks and 6 weeks after baseline, respectively. Allquestionnaires were sent to participants by email with theautomated software developed for the study. This study onlyanalyzed data from the Q1 and Q2 sets of questionnaires. Weselected a 2-week follow-up for this study because weconsidered that 2 weeks were sufficient to become familiar withthe app.
All data collected from the app and questionnaires wereautomatically encrypted and stored at the Service for SensitiveData at the University of Oslo (TSD). The TSD platform isavailable to collect, store, and analyze sensitive data [27]. Theplatform is protected by a 2-step password system and meetsall the necessary requirements to maintain compliance withNorwegian regulations regarding individual privacy. The dataare not accessible outside of the TSD. Only registered
researchers within the project had access to the data and theencryption key.
The study is reported in accordance with theCONSORT-EHEALTH checklist (Multimedia Appendix 3).
Intervention GroupAll women in the intervention group were given access to theMSS app in addition to standard maternal care. They were freeto log their NVP symptoms into the app whenever convenient.Standard maternity care in Norway is free of charge. It includes9 routine checkups with a midwife or physician and 1 ultrasoundscan at gestational week 18 [28].
The app recommended logging symptoms every 24 hoursbecause the PUQE score was calculated based on NVPsymptoms over the past 24 hours. Users could also comparetheir symptoms to the expected population average NVP score.Thus, women received individual treatment advice based ontheir PUQE scores (Multimedia Appendix 1). Women alsoreceived general dietary and lifestyle advice (eg, get some rest,stay hydrated, eat small meals frequently, and avoid fatty andspicy foods [29]) independent of their PUQE score. Womenwith moderate or severe symptoms received additional adviceabout antiemetic medications. When a woman scored ≥13 points
JMIR Mhealth Uhealth 2022 | vol. 10 | iss. 7 | e36226 | p.32https://mhealth.jmir.org/2022/7/e36226(page number not for citation purposes)
Ngo et alJMIR MHEALTH AND UHEALTH
XSL•FORenderX

(ie, severe NVP) for more than 3 consecutive days, she wouldsee a pop-up message that encouraged her to see the doctor.
Control GroupThe control group received only standard maternal care.
Outcome Measures
NVP SeverityThe PUQE score was internationally validated for rating theseverity of NVP symptoms over the past 24 hours (MultimediaAppendix 2) [19,21]. The scale consists of 3 questions. Eachquestion is rated from 1 to 5. The total score ranges from 3 to15 points, where ≤6 points indicate mild NVP, 7-12 pointsindicate moderate NVP, and 13 or more points indicate severeNVP. This study utilized the translated and validated Norwegianversion of the PUQE [21]. We evaluated the change in PUQEscores from Q1 to Q2 (ie, after 2 weeks).
Quality of LifeThe NVPQOL was used to rate QoL [30] over the past week(Multimedia Appendix 2). The score includes 30 items covering4 general domains: physical symptoms and aggravating factors,fatigue, emotions, and limitations. Each item is rated on a Likertscale that ranges from 1 (never) to 7 (all the time). The totalscore ranges from 30 to 210 points, and lower scores indicatea better QoL. The NVPQOL score is significantly associatedwith the SF-12 health-related QoL questionnaire [30]. Weevaluated the change in NVPQOL scores from Q1 to Q2.
Decisional ConflictDecisional conflict was measured with the decisional conflictscale (DCS). The DCS measures the individual’s perception ofuncertainty in choosing options, modifiable factors thatcontributed to uncertainty, and decision-making effectiveness[31,32] (Multimedia Appendix 2). The DCS has been widelyused in previous studies among pregnant women to evaluatetheir decision-making abilities regarding the use ofantidepressants and the choice between vaginal birth or cesareansection [33,34]. The DCS consists of 16 items and 5 responsecategories (strongly agree, agree, neither agree nor disagree,disagree, and strongly disagree). The total score ranges from 0to 100 points. Scores below 25 points indicate low decisionalconflict, scores of 25 to 37.5 points indicate moderate decisionalconflict, and scores above 37.5 points indicate high decisionalconflict. We evaluated the change in DCS scores from Q1 toQ2.
Statistical Analyses
Descriptive AnalysisCategorical variables (ie, relationship status, education level,work situation, parity, and prior NVP symptoms) are presentedas percentages for each group (intervention and control groups).Continuous variables are presented as the median and range(eg, gestational week) or the mean and SD (eg, maternal age).We performed a Pearson Chi-squared test to compare categoricalvariables, except when the expected cell count was less than 5;in those cases, we performed a Fisher exact test. We performed
a Student t test to compare continuous variables. All analyseswere performed with Stata/MP v.16.1. P values <.05 wereconsidered statistically significant.
Primary and Secondary AnalysesWe performed univariate and multivariable linear regressionanalyses to estimate associations between the use of the MSSapp and (1) NVP severity, (2) QoL, and (3) decisional conflict.All results are presented as the crude and adjustedbeta-coefficients (β) with 95% CIs. We adjusted themultivariable linear regression model with predefined covariates(ie, baseline PUQE score, baseline NVPQOL score, and baselineDCS) [35].
SubanalysesWe performed a prespecified stratified analysis to assess whetheremployment in the health sector modified the associationbetween the use of the MSS app and the PUQE score. Wereasoned that women employed in the health sector might havebetter access to information and advice regarding NVPmanagement, and thus, they may have less need for an app totrack their NVP symptoms, compared with women employedin other settings. Alternatively, they may have received moresupport or information from co-workers in the field that allowedthem to capitalize on the information provided by the app,compared with women employed in other settings.
Ethical ApprovalThis study was approved by the Regional Committees forMedical and Health Research Ethics in Norway (Ref:2018/2298). Informed consent to participate in the study wasobtained from all participants.
Results
Study PopulationOverall, 268 women consented to participate in the study (Figure3). Of these, 192 (86.5%) responded to the baselinequestionnaires (Q1) and were randomized to either theintervention group (n=89) or the control group (n=103). In total,137 women responded to the follow-up questionnaires 2 weekslater (Q2). The dropout rates were 34% (30/89) for theintervention group and 24.3% (25/103) for the control group.The main reason for dropout was “lack of response.”
At enrollment, the median stage of pregnancy was the same inboth groups: 8 (range 4-36) gestational weeks in the interventiongroup and 8 (range 4-39) gestational weeks in the control group.These groups had the same mean age at enrollment: 32 (SD 4.6)years and 32 (SD 3.9) years, respectively. Most women hadbeen pregnant previously (65/89, 73%, and 76/103, 73.8%,respectively). In both groups, 80% (52/89 and 61/103,respectively) had experienced NVP in at least one previouspregnancy. None of the women reported severe NVP (ie, PUQEscore ≥13) at baseline. A comparison of baseline characteristicsusing the Student t test, Chi-squared test, or Fisher exact testindicated no statistical difference (all P<.05) between the 2study groups (Table 1).
JMIR Mhealth Uhealth 2022 | vol. 10 | iss. 7 | e36226 | p.33https://mhealth.jmir.org/2022/7/e36226(page number not for citation purposes)
Ngo et alJMIR MHEALTH AND UHEALTH
XSL•FORenderX

Figure 3. Flowchart of the study participants in the enrolled group, allocation groups, and follow-up groups. app: MinSafeStart mobile app; PUQE:Pregnancy Unique Quantification of Emesis; Q1: Questionnaire 1.
Table 1. Baseline characteristics of the study population (n=192), stratified by whether they used the MinSafeStart (MSS) app (intervention) or receivedstandard maternity care (control).
Control group (n=103)Intervention group (n=89)Characteristics
8 (4-39)8 (4-36)Gestational week at enrollment, median (range)
32 (3.9)32 (4.6)Age (years), mean (SD)
Relationship status, n (%)
100 (97.1)85 (95.5)Married/cohabitation
3 (2.9)4 (4.5)Othera
Higher education, n (%)
85 (82.5)69 (77.5)Yes
18 (17.5)20 (22.5)No
Working situation, n (%)
60 (58.2)55 (61.8)Employed
31 (30.1)19 (21.4)Employed in the health sector
12 (11.7)15 (16.8)Otherb
Primigravida, n (%)
27 (26.2)24 (27.0)Yes
76 (73.8)65 (73.0)No
NVPc during previous pregnancy/pregnancies, n (%)
61 (80.3)52 (80.0)Yes
15 (19.7)13 (20.0)No
aIncludes single/unmarried and divorced/separated women.bIncludes students and unemployed women.cNVP: nausea and vomiting during pregnancy.
JMIR Mhealth Uhealth 2022 | vol. 10 | iss. 7 | e36226 | p.34https://mhealth.jmir.org/2022/7/e36226(page number not for citation purposes)
Ngo et alJMIR MHEALTH AND UHEALTH
XSL•FORenderX

The InterventionOf the 89 women randomized to the intervention group, 88downloaded the MSS app. These women performed a total of468 logs. Because they were not satisfied with the app, 2 womendropped out of the study. They reported no benefit in using theMSS app.
Impact on NVP SeverityThe groups showed no differences in the change in PUQE scoresbetween Q1 and Q2 (adjusted β 0.6, 95% Cl −0.1 to 1.2). Amongwomen employed in the health sector, those who used the MSSapp had a significantly higher PUQE score (adjusted β 2.1, 95%Cl 0.9 to 3.2) after 2 weeks than those who did not use the app.However, among women employed in other sectors, the PUQEscores were not significantly different between the interventionand control groups (Table 2).
Table 2. Associations between the use of the MinSafeStart (MSS) app and the Pregnancy Unique Quantification of Emesis (PUQE) score.
Change in PUQE score (Q2-Q1)Follow-up (Q2)PUQE score, mean(SD)
Baseline (Q1)
PUQE scorea,mean (SD)
Analysis
Adjusted difference in mean
changesb, β (95% CI)
Crude difference inmean changes, β(95% CI)
Mean change(SD)
Primary analysis
0.6 (−0.1 to 1.2)0.4 (−0.3 to 1.2)0.8 (2.0)5.6 (1.8)c4.9 (2.0)Intervention group (n=88)
ReferenceReference0.4 (2.3)4.9 (1.8)d4.7 (1.9)Control group (n=103)
Subanalyses by employment: women employed in the health sector
2.1 (0.9 to 3.2)2.1 (0.3 to 3.9)1.8 (2.5)6.6 (1.7)e4.6 (1.9)Intervention group (n=19)
ReferenceReference−0.3 (2.7)4.6 (1.6)f4.5 (1.9)Control group (n=31)
Subanalyses by employment: women employed in other sectors
0.0 (−0.7 to 0.7)−0.1 (−0.8 to 0.7)0.4 (1.7)5.2 (1.7)g4.9 (2.1)Intervention group (n=55)
ReferenceReference0.5 (1.9)5.1 (1.8)h4.7 (1.9)Control group (n=60)
aThis score ranges from 3 to 15 points, and symptoms are rated as follows: mild: ≤6 points; moderate: 7-12 points; severe ≥13 points.bAdjusted for the baseline PUQE score.cn=59.dn=78.en=14.fn=23.gn=38.hn=45.
Impact on Quality of LifeThe adjusted primary analysis showed that the changes inNVPQOL scores from baseline to Q2 were not significantly
different between the intervention and control groups (adjustedβ −5.3, 95% Cl −12.5 to 1.9; Table 3).
JMIR Mhealth Uhealth 2022 | vol. 10 | iss. 7 | e36226 | p.35https://mhealth.jmir.org/2022/7/e36226(page number not for citation purposes)
Ngo et alJMIR MHEALTH AND UHEALTH
XSL•FORenderX

Table 3. Association between the use of the MinSafeStart (MSS) app and quality of life.
Change in NVPQOL score (Q2-Q1)Follow-up (Q2)NVPQOL score, mean(SD)
Baseline (Q1)
NVPQOLa,b score, mean(SD)
Group
Adjusted difference in mean
changesc, β (95% CI)
Crude difference inmean changes, β(95% CI)
Mean change(SD)
−5.3 (−12.5 to 1.9)−4.2 (−11.9 to 3.5)−4.5 (22.4)143.8 (29.7)d145.7 (34.0)Intervention group(n=88)
ReferenceReference−0.3 (22.9)151.6 (28.9)e148.5 (28.8)Control group(n=103)
aNVPQOL: Health-Related Quality of Life for Nausea and Vomiting during Pregnancy scale.bThis score ranges from 30 to 210 points, and lower scores indicate better quality of life.cAdjusted for the baseline NVPQOL score.dn=59.en=78.
Impact on Decisional Conflict Scale ScoreThe mean changes in the DCS between Q1 and Q2 were −5.9(SD 16.4) for the intervention group and −5.3 (SD 15.5) for the
control group (Table 4). The changes in DCS were notsignificantly different between the women in the interventiongroup and the women in the control group (adjusted β −1.1,95% Cl −6.2 to 4.2).
Table 4. Association between the use of the MinSafeStart (MSS) app and the decisional conflict scale (DCS).
Change in DCSa (Q2-Q1)Follow-up (Q2) DCS,mean (SD)
Baseline (Q1) DCS, mean(SD)
Group
Adjusted difference in
mean changesb, β(95% CI)
Crude difference inmean changes, β(95% CI)
Mean change(SD)
−1.1 (−6.2 to 4.2)−0.7 (−6.1 to 4.7)−5.9 (16.4)36.2 (21.6)c40.3 (17.9)88Intervention group (n=88)
ReferenceReference−5.3 (15.5)38.1 (20.3)d42.5 (20.9)103Control group (n=103)
aThis score ranges from 0 points (no decisional conflict) to 100 points (extremely high decisional conflict).bAdjusted for the baseline decisional conflict score.cn=59.dn=78.
Association Between NVP Severity and Quality of LifeWomen with more severe NVP (higher PUQE scores) had lowerNVPQOL scores than women with less severe NVP (lowerPUQE scores; Figure 4).
JMIR Mhealth Uhealth 2022 | vol. 10 | iss. 7 | e36226 | p.36https://mhealth.jmir.org/2022/7/e36226(page number not for citation purposes)
Ngo et alJMIR MHEALTH AND UHEALTH
XSL•FORenderX

Figure 4. Association between the Health-Related Quality of Life for Nausea and Vomiting during Pregnancy score (NVPQOL) score and the PregnancyUnique Quantification of Emesis (PUQE) score. MSS app: MinSafeStart mobile application.
Discussion
Main FindingsThe MinSafeStart trial was the first to investigate theeffectiveness of a patient-centered mobile app that was designedto empower pregnant women to optimally manage their NVPsymptoms. We found no significant associations between theuse of the MSS app and the severity of NVP symptoms, QoL,or decisional conflict, compared with standard maternal care.These results should be interpreted with caution because thestudy was slightly underpowered, due to a higher dropout ratethan expected.
Earlier studies have shown that the majority of the pregnantpopulation owns a smartphone and over 50% use apps relatedto pregnancy [36]. Studies that have investigated the use ofhealth-related apps have shown that the apps could improve theknowledge levels of pregnant women and the apps wereperceived as tools during pregnancy [7,24]. Except for usersatisfaction, our results were not consistent with those fromprevious studies. We found no associations between the use ofthe MSS app and NVP symptoms at 2 weeks after baseline.This may be explained by several factors related to our studypopulation and study design. First, we included women at anygestational stage in pregnancy. In fact, 15% of the womenincluded were beyond the first trimester, which is the mostrelevant time window for NVP. On average, NVP occurs duringgestational week 4 [10] and peaks during gestational weeks10-16 [37,38]. However, our intervention group had completeda median of 8 gestational weeks at enrollment, with a range of4-36 weeks. Therefore, in many cases, it may have been toolate for women to benefit from the app. Moreover, we included
women with mild NVP, and this group may not derive the mostbenefit from the app. Second, a 2-week follow-up may not havebeen optimal for evaluating the effect of the intervention. Therationale for choosing a 2-week follow-up was based on earlierstudies that showed that PUQE scores decreased by 4.7 pointswhen treated within 1 week [39]. We could not exclude thepossibility that natural fluctuations in NVP severity could haveaffected the results or that a shorter follow-up time before theapp assessment might have been a better choice. In fact, theremight not be a particular time that is optimal for measuring theeffects of the app. Indeed, NVP severity varies from morningto evening and from day to day. Therefore, selecting a specifictime point for follow-up and reporting the PUQE score in Q2may not have fully captured the changes in NVP severity overtime. Future studies should consider these elements whendesigning a trial to evaluate the effect of using a digital toolduring pregnancy.
Another factor that may have affected the results was that thestudy included a high proportion of parous women with a priorNVP history. Moreover, most were in a relationship with apartner, which may have provided emotional support. Therefore,these women may have already been informed about optimalNVP management and treatment, and consequently, they maynot have felt they needed more information from an NVP tool.Many earlier studies have shown that women with a highersociodemographic status and women who are pregnant for thefirst time are more likely to search for information online[40-42]. In their first pregnancy, women often search forinformation about concerns and symptoms related to the firstperiod of pregnancy [6,40,43-45]. Therefore, our study may nothave targeted the appropriate subgroup of pregnant women.
JMIR Mhealth Uhealth 2022 | vol. 10 | iss. 7 | e36226 | p.37https://mhealth.jmir.org/2022/7/e36226(page number not for citation purposes)
Ngo et alJMIR MHEALTH AND UHEALTH
XSL•FORenderX

Strengths and LimitationsThe main strength of this study was that very few studies havebeen conducted to assess the effectiveness of mobile apps fordisease management among pregnant women. This studyprovided new insights in this regard. An important strength ofthis study was the use of the randomized controlled trial studydesign, which is considered the gold standard in evidence-basedmedicine [46]. Another strength of this study included our useof the internet for recruitment and electronic data collection.The main benefit of social media recruiting is that it isconvenient for sampling. Indeed, pregnant women in their firsttrimester are not given any routine care, and there is no idealplace to reach out to this group, outside of social media. Thisapproach facilitated the participation of pregnant women allover Norway, which may have increased the representativenessof the study sample and, thus, the generalizability of the results.In addition, the NVPQOL may have provided an advantageover other QoL scales because the NVPQOL is more specific[40].
The major limitation of this study was that we did not reach ourtargeted number of participants, which was 250 women,including a 25% dropout rate. Furthermore, as in all studiesbased on voluntary patient recruitment, there might have beena self-selection bias, where more motivated and resourcefulwomen are included in the study compared with the generalpopulation. Participants who were parous women with highersociodemographic status than the general birthing populationin Norway might also have contributed to a selection bias.Because these women might have been more informed aboutoptimal NVP management, they might have had less use forthe app. We could not exclude the possibility that this selectionbias might explain why we did not find any significant beneficialeffect of the app on NVP severity in this study.
Last, 15% of the women in the intervention group were beyondthe first trimester when the app was introduced. It may have
been too late for many of these women to take advantage of theapp because NVP often occurs in week 4 [10] and it peaksaround weeks 10-16 [37,38].
Future ResearchDigitalization and eHealth have provided opportunities todevelop innovative apps that support pregnant women. Thesemobile applications must be tested in clinical studies to establishevidence for health efficacy before they can be included in thehealth care system or recommended by health care personnel[47]. Our review from 2020, consistent with previous studies[48], demonstrated that decision support tools could potentiallyprovide benefit to pregnant women. However, the tools weremainly useful when relevant information was assembled intoone digital tool and when the woman could share her recordingswith her health care provider [7]. Based on the results of thisstudy, future research should focus on how to design trials todetermine the effect of digital tools on the pregnancy outcomesthat are most important to pregnant patients. Future studiesshould also investigate whether digital tools and apps might bemore effective when developed as part of a more extensivehealth intervention. Specific focus should be placed on howdigital tools might facilitate counseling and communicationbetween pregnant women and health care providers regardingNVP management in pregnancy.
ConclusionThis study showed that tracking NVP symptoms with a mobileapplication was not associated with reduced NVP symptoms,less decisional conflict, or improved QoL after 2 weeks of use.These findings may have been influenced by studydesign–related factors, such as the gestational week ofenrollment, women’s parity, time to follow-up, and sample size.Future studies should include a process evaluation to improveour understanding of how pregnant women use the app and howto optimize its utility within maternity care.
AcknowledgmentsThe authors would like to thank Pål Fugelli, Dagfinn Bergsager, and their team at the University Center for Information Technology(USIT) for the technical development, technical support, and maintenance of the MinSafeStart app. We also thank HyperemesisGravidarum Norway, tryggmammamedisin.no, altformamma.no, and Helseoversikt for their contribution to the recruitment forthe project and all of the women that participated in the study.
EN is funded by the Dam Foundation, Norwegian Women’s Public Health Association.
Authors' ContributionsEN, MBTT, and HN designed the study. EN conducted the main analysis. EN drafted the first version of the manuscript. EN,MBTT, DW, and HN contributed to the interpretation of the results and the critical appraisal of the manuscript. All authorsapproved the final manuscript.
Conflicts of InterestNone declared.
Multimedia Appendix 1Management of nausea and vomiting in pregnancy (NVP), according to treatment guidelines. PUQE= Pregnancy UniqueQuantification of Emesis score; this score ranges from 3 to 15 points.
JMIR Mhealth Uhealth 2022 | vol. 10 | iss. 7 | e36226 | p.38https://mhealth.jmir.org/2022/7/e36226(page number not for citation purposes)
Ngo et alJMIR MHEALTH AND UHEALTH
XSL•FORenderX

[DOCX File , 104 KB - mhealth_v10i7e36226_app1.docx ]
Multimedia Appendix 2The questions in the PUQE score, NVPQOL scale, and the decisional conflict scale. PUQE= Pregnancy Unique Quantificationof Emesis; NVPQOL=.[DOCX File , 16 KB - mhealth_v10i7e36226_app2.docx ]
Multimedia Appendix 3CONSORT-eHEALTH checklist (V 1.6.1)[PDF File (Adobe PDF File), 1164 KB - mhealth_v10i7e36226_app3.pdf ]
References1. Hughson JP, Daly JO, Woodward-Kron R, Hajek J, Story D. The rise of pregnancy apps and the implications for culturally
and linguistically diverse women: narrative review. JMIR Mhealth Uhealth 2018 Nov 16;6(11):e189 [FREE Full text] [doi:10.2196/mhealth.9119] [Medline: 30446483]
2. Agarwal P, Gordon D, Griffith J, Kithulegoda N, Witteman HO, Sacha Bhatia R, et al. Assessing the quality of mobileapplications in chronic disease management: a scoping review. NPJ Digit Med 2021 Mar 10;4(1):46 [FREE Full text] [doi:10.1038/s41746-021-00410-x] [Medline: 33692488]
3. Lynch MM, Squiers LB, Kosa KM, Dolina S, Read JG, Broussard CS, et al. Making decisions about medication use duringpregnancy: implications for communication strategies. Matern Child Health J 2018 Jan 12;22(1):92-100 [FREE Full text][doi: 10.1007/s10995-017-2358-0] [Medline: 28900803]
4. Song H, Cramer EM, McRoy S, May A. Information needs, seeking behaviors, and support among low-income expectantwomen. Women Health 2013 Nov 11;53(8):824-842. [doi: 10.1080/03630242.2013.831019] [Medline: 24215275]
5. Tripp N, Hainey K, Liu A, Poulton A, Peek M, Kim J, et al. An emerging model of maternity care: smartphone, midwife,doctor? Women Birth 2014 Mar;27(1):64-67. [doi: 10.1016/j.wombi.2013.11.001] [Medline: 24295598]
6. Bert F, Gualano MR, Brusaferro S, De Vito E, de Waure C, La Torre G, et al. Pregnancy e-health: a multicenter Italiancross-sectional study on Internet use and decision-making among pregnant women. J Epidemiol Community Health 2013Dec 01;67(12):1013-1018. [doi: 10.1136/jech-2013-202584] [Medline: 24072743]
7. Ngo E, Truong MB, Nordeng H. Use of decision support tools to empower pregnant women: systematic review. J MedInternet Res 2020 Sep 14;22(9):e19436 [FREE Full text] [doi: 10.2196/19436] [Medline: 32924961]
8. Austin K, Wilson K, Saha S. Hyperemesis gravidarum. Nutr Clin Pract 2019 Apr 18;34(2):226-241. [doi: 10.1002/ncp.10205][Medline: 30334272]
9. Einarson T, Piwko C, Koren G. Quantifying the global rates of nausea and vomiting of pregnancy: a meta analysis. J PopulTher Clin Pharmacol 2013;20(2):e171-e183. [Medline: 23863575]
10. Bustos M, Venkataramanan R, Caritis S. Nausea and vomiting of pregnancy - What's new? Auton Neurosci 2017Jan;202:62-72 [FREE Full text] [doi: 10.1016/j.autneu.2016.05.002] [Medline: 27209471]
11. Heitmann K, Nordeng H, Havnen GC, Solheimsnes A, Holst L. The burden of nausea and vomiting during pregnancy:severe impacts on quality of life, daily life functioning and willingness to become pregnant again - results from across-sectional study. BMC Pregnancy Childbirth 2017 Feb 28;17(1):75 [FREE Full text] [doi: 10.1186/s12884-017-1249-0][Medline: 28241811]
12. Tan A, Lowe S, Henry A. Nausea and vomiting of pregnancy: Effects on quality of life and day-to-day function. Aust NZ J Obstet Gynaecol 2018 Jun 26;58(3):278-290. [doi: 10.1111/ajo.12714] [Medline: 28949009]
13. Piwko C, Ungar WJ, Einarson TR, Wolpin J, Koren G. The weekly cost of nausea and vomiting of pregnancy for womencalling the Toronto Motherisk Program. Curr Med Res Opin 2007 Apr 06;23(4):833-840. [doi: 10.1185/030079907x178739][Medline: 17407640]
14. Clark SM, Costantine MM, Hankins GDV. Review of NVP and HG and early pharmacotherapeutic intervention. ObstetGynecol Int 2012;2012:252676-252678 [FREE Full text] [doi: 10.1155/2012/252676] [Medline: 22190950]
15. Committee on Practice Bulletins-Obstetrics. ACOG practice bulletin No. 189: nausea and vomiting of pregnancy. ObstetGynecol 2018 Jan;131(1):e15-e30. [doi: 10.1097/AOG.0000000000002456] [Medline: 29266076]
16. Shehmar M, Maclean MA, Nelson-Piercy C, Gadsby R, O'Hara M. The Management of Nausea and Vomiting of Pregnancyand Hyperemesis Gravidarum (Green-top Guideline No.69). Royal College of Obstetricians & Gynaecologists. 2016. URL:https://www.rcog.org.uk/globalassets/documents/guidelines/green-top-guidelines/gtg69-hyperemesis.pdf [accessed2021-12-23]
17. Eysenbach G. Improving the quality of web surveys: the Checklist for Reporting Results of Internet E-Surveys (CHERRIES).J Med Internet Res 2004 Sep 29;6(3):e34 [FREE Full text] [doi: 10.2196/jmir.6.3.e34] [Medline: 15471760]
18. Iyawa GE, Dansharif AR, Khan A. Mobile apps for self-management in pregnancy: a systematic review. Health Technol2021 Feb 04;11(2):283-294. [doi: 10.1007/s12553-021-00523-z]
JMIR Mhealth Uhealth 2022 | vol. 10 | iss. 7 | e36226 | p.39https://mhealth.jmir.org/2022/7/e36226(page number not for citation purposes)
Ngo et alJMIR MHEALTH AND UHEALTH
XSL•FORenderX

19. Koren G, Piwko C, Ahn E, Boskovic R, Maltepe C, Einarson A, et al. Validation studies of the PregnancyUnique-Quantification of Emesis (PUQE) scores. J Obstet Gynaecol 2005 Apr 02;25(3):241-244. [doi:10.1080/01443610500060651] [Medline: 16147725]
20. Koren G, Cohen R. Measuring the severity of nausea and vomiting of pregnancy; a 20-year perspective on the use of thepregnancy-unique quantification of emesis (PUQE). J Obstet Gynaecol 2021 Apr 19;41(3):335-339. [doi:10.1080/01443615.2020.1787968] [Medline: 32811235]
21. Birkeland E, Stokke G, Tangvik RJ, Torkildsen EA, Boateng J, Wollen AL, et al. Norwegian PUQE (Pregnancy-UniqueQuantification of Emesis and nausea) identifies patients with hyperemesis gravidarum and poor nutritional intake: aprospective cohort validation study. PLoS One 2015 Apr 1;10(4):e0119962 [FREE Full text] [doi:10.1371/journal.pone.0119962] [Medline: 25830549]
22. Bruk av IKT i husholdningene. Statistics Norway. URL: https://www.ssb.no/statbank/table/12344/tableViewLayout1/[accessed 2021-08-30]
23. Ford EA, Roman SD, McLaughlin EA, Beckett EL, Sutherland JM. The association between reproductive health smartphoneapplications and fertility knowledge of Australian women. BMC Womens Health 2020 Mar 04;20(1):45 [FREE Full text][doi: 10.1186/s12905-020-00912-y] [Medline: 32131809]
24. Wang N, Deng Z, Wen LM, Ding Y, He G. Understanding the use of smartphone apps for health information amongpregnant Chinese women: mixed methods study. JMIR Mhealth Uhealth 2019 Jun 18;7(6):e12631 [FREE Full text] [doi:10.2196/12631] [Medline: 31215516]
25. Wang K, Varma DS, Prosperi M. A systematic review of the effectiveness of mobile apps for monitoring and managementof mental health symptoms or disorders. J Psychiatr Res 2018 Dec;107:73-78. [doi: 10.1016/j.jpsychires.2018.10.006][Medline: 30347316]
26. Linardon J, Cuijpers P, Carlbring P, Messer M, Fuller-Tyszkiewicz M. The efficacy of app-supported smartphone interventionsfor mental health problems: a meta-analysis of randomized controlled trials. World Psychiatry 2019 Oct 09;18(3):325-336[FREE Full text] [doi: 10.1002/wps.20673] [Medline: 31496095]
27. About TSD. University of Oslo. URL: https://www.uio.no/english/services/it/research/sensitive-data/about/index.html[accessed 2022-03-22]
28. Pregnancy consultations. The Norwegian Directorate of Health. URL: https://www.helsenorge.no/en/pregnancy-and-maternity-care-in-norway/antenatal-checks-and-tests/ [accessed 2022-04-04]
29. Smith JA, Fox KA, Clark SM. Patient education: Nausea and vomiting of pregnancy (Beyond the Basics). UpToDate. URL:https://www.uptodate.com/contents/nausea-and-vomiting-of-pregnancy-beyond-the-basics [accessed 2021-12-06]
30. Lacasse A, Bérard A. Validation of the nausea and vomiting of pregnancy specific health related quality of life questionnaire.Health Qual Life Outcomes 2008 May 09;6(1):32 [FREE Full text] [doi: 10.1186/1477-7525-6-32] [Medline: 18471301]
31. O'Connor AM. Validation of a decisional conflict scale. Med Decis Making 2016 Jul 02;15(1):25-30. [doi:10.1177/0272989x9501500105]
32. Garvelink MM, Boland L, Klein K, Nguyen DV, Menear M, Bekker HL, et al. Decisional conflict scale use over 20 years:the anniversary review. Med Decis Making 2019 May 29;39(4):301-314. [doi: 10.1177/0272989x19851345]
33. Walton GD, Ross LE, Stewart DE, Grigoriadis S, Dennis C, Vigod S. Decisional conflict among women consideringantidepressant medication use in pregnancy. Arch Womens Ment Health 2014 Dec 9;17(6):493-501. [doi:10.1007/s00737-014-0448-1] [Medline: 25104244]
34. Hadizadeh-Talasaz F, Ghoreyshi F, Mohammadzadeh F, Rahmani R. Effect of shared decision making on mode of deliveryand decisional conflict and regret in pregnant women with previous cesarean section: a randomized clinical trial. BMCPregnancy Childbirth 2021 Feb 17;21(1):144 [FREE Full text] [doi: 10.1186/s12884-021-03615-w] [Medline: 33596854]
35. Kahan BC, Jairath V, Doré CJ, Morris TP. The risks and rewards of covariate adjustment in randomized trials: an assessmentof 12 outcomes from 8 studies. Trials 2014 Apr 23;15(1):139 [FREE Full text] [doi: 10.1186/1745-6215-15-139] [Medline:24755011]
36. Frid G, Bogaert K, Chen KT. Mobile health apps for pregnant women: systematic search, evaluation, and analysis offeatures. J Med Internet Res 2021 Oct 18;23(10):e25667 [FREE Full text] [doi: 10.2196/25667] [Medline: 34524100]
37. Lee NM, Saha S. Nausea and vomiting of pregnancy. Gastroenterol Clin North Am 2011 Jun;40(2):309-34, vii [FREE Fulltext] [doi: 10.1016/j.gtc.2011.03.009] [Medline: 21601782]
38. Furneaux EC, Langley-Evans AJ, Langley-Evans SC. Nausea and vomiting of pregnancy: endocrine basis and contributionto pregnancy outcome. Obstet Gynecol Surv 2001 Dec;56(12):775-782. [doi: 10.1097/00006254-200112000-00004][Medline: 11753180]
39. Lehmann AS, Renbarger JL, McCormick CL, Topletz AR, Rouse C, Haas DM. Pharmacogenetic predictors of nausea andvomiting of pregnancy severity and response to antiemetic therapy: a pilot study. BMC Pregnancy Childbirth 2013 Jun20;13(1):132 [FREE Full text] [doi: 10.1186/1471-2393-13-132] [Medline: 23786674]
40. Kavlak O, Atan US, Güleç D, Oztürk R, Atay N. Pregnant women's use of the internet in relation to their pregnancy inIzmir, Turkey. Inform Health Soc Care 2012 Dec 07;37(4):253-263. [doi: 10.3109/17538157.2012.710686] [Medline:22958087]
JMIR Mhealth Uhealth 2022 | vol. 10 | iss. 7 | e36226 | p.40https://mhealth.jmir.org/2022/7/e36226(page number not for citation purposes)
Ngo et alJMIR MHEALTH AND UHEALTH
XSL•FORenderX

41. Sayakhot P, Carolan-Olah M. Internet use by pregnant women seeking pregnancy-related information: a systematic review.BMC Pregnancy Childbirth 2016 Mar 28;16(1):65 [FREE Full text] [doi: 10.1186/s12884-016-0856-5] [Medline: 27021727]
42. Kamali S, Ahmadian L, Khajouei R, Bahaadinbeigy K. Health information needs of pregnant women: information sources,motives and barriers. Health Info Libr J 2018 Mar 13;35(1):24-37 [FREE Full text] [doi: 10.1111/hir.12200] [Medline:29131537]
43. Lagan BM, Sinclair M, Kernohan WG. Internet use in pregnancy informs women's decision making: a web-based survey.Birth 2010 Jun;37(2):106-115. [doi: 10.1111/j.1523-536X.2010.00390.x] [Medline: 20557533]
44. Larsson M. A descriptive study of the use of the Internet by women seeking pregnancy-related information. Midwifery2009 Feb;25(1):14-20. [doi: 10.1016/j.midw.2007.01.010] [Medline: 17408822]
45. Bakhireva LN, Young BN, Dalen J, Phelan ST, Rayburn WF. Patient utilization of information sources about safety ofmedications during pregnancy. J Reprod Med 2011;56(7-8):339-343. [Medline: 21838165]
46. Hariton E, Locascio JJ. Randomised controlled trials - the gold standard for effectiveness research: Study design: randomisedcontrolled trials. BJOG 2018 Dec 19;125(13):1716 [FREE Full text] [doi: 10.1111/1471-0528.15199] [Medline: 29916205]
47. Boudreaux ED, Waring ME, Hayes RB, Sadasivam RS, Mullen S, Pagoto S. Evaluating and selecting mobile health apps:strategies for healthcare providers and healthcare organizations. Transl Behav Med 2014 Dec 24;4(4):363-371 [FREE Fulltext] [doi: 10.1007/s13142-014-0293-9] [Medline: 25584085]
48. Whybrow R, Webster LM, Seed PT, Sandall J, Chappell LC. The effectiveness of decision aids for pregnancy relateddecision-making in women with pre-pregnancy morbidity; systematic review and meta-analysis. BMC Pregnancy Childbirth2022 Jan 29;22(1):81 [FREE Full text] [doi: 10.1186/s12884-022-04402-x] [Medline: 35093017]
AbbreviationsDCS: decisional conflict scaleHG: hyperemesis gravidarumMSS: MinSafeStartNVP: nausea and vomiting in pregnancyNVPQOL: Health-Related Quality of Life for Nausea and Vomiting during Pregnancy scalePUQE: Pregnancy Unique Quantification of EmesisQ1: Questionnaire 1Q2: Questionnaire 2Q3: Questionnaire 3Q4: Questionnaire 4QoL: quality of lifeTSD: Service for Sensitive Data at the University of OsloUSIT: University Center for Information Technology
Edited by L Buis; submitted 06.01.22; peer-reviewed by B Nievas Soriano, C Jacob; comments to author 24.02.22; revised versionreceived 11.04.22; accepted 19.04.22; published 05.07.22.
Please cite as:Ngo E, Truong MBT, Nordeng H, Wright DImpact of a Mobile Application for Tracking Nausea and Vomiting During Pregnancy (NVP) on NVP Symptoms, Quality of Life, andDecisional Conflict Regarding NVP Treatments: MinSafeStart Randomized Controlled TrialJMIR Mhealth Uhealth 2022;10(7):e36226URL: https://mhealth.jmir.org/2022/7/e36226 doi:10.2196/36226PMID:35787487
©Elin Ngo, Maria Bich-Thuy Truong, Hedvig Nordeng, David Wright. Originally published in JMIR mHealth and uHealth(https://mhealth.jmir.org), 05.07.2022. This is an open-access article distributed under the terms of the Creative CommonsAttribution License (https://creativecommons.org/licenses/by/4.0/), which permits unrestricted use, distribution, and reproductionin any medium, provided the original work, first published in JMIR mHealth and uHealth, is properly cited. The completebibliographic information, a link to the original publication on https://mhealth.jmir.org/, as well as this copyright and licenseinformation must be included.
JMIR Mhealth Uhealth 2022 | vol. 10 | iss. 7 | e36226 | p.41https://mhealth.jmir.org/2022/7/e36226(page number not for citation purposes)
Ngo et alJMIR MHEALTH AND UHEALTH
XSL•FORenderX

Original Paper
The Efficacy of “Foundations,” a Digital Mental Health App toImprove Mental Well-being During COVID-19: Proof-of-PrincipleRandomized Controlled Trial
Silvina Catuara-Solarz1, PhD; Bartlomiej Skorulski1, PhD; Iñaki Estella-Aguerri1, PhD; Claudia Bibiana Avella-Garcia1,
PhD; Sarah Shepherd1, MA; Emily Stott1, BA; Nicola R Hemmings1, MSc; Aleix Ruiz de Villa1, PhD; Laura Schulze1,
PhD; Sophie Dix1, PhDKoa Health, Barcelona, Spain
Corresponding Author:Sophie Dix, PhDKoa HealthCarrer de la Ciutat de Granada 121Barcelona, 08018SpainPhone: 44 7702 500882Email: [email protected]
Abstract
Background: Against a long-term trend of increasing demand, the COVID-19 pandemic has led to a global rise in commonmental disorders. Now more than ever, there is an urgent need for scalable, evidence-based interventions to support mentalwell-being.
Objective: The aim of this proof-of-principle study was to evaluate the efficacy of a mobile-based app in adults with self-reportedsymptoms of anxiety and stress in a randomized control trial that took place during the first wave of the COVID-19 pandemic inthe United Kingdom.
Methods: Adults with mild to severe anxiety and moderate to high levels of perceived stress were randomized to either theintervention or control arm. Participants in the intervention arm were given access to the Foundations app for the duration of the4-week study. All participants were required to self-report a range of validated measures of mental well-being (10-itemConnor-Davidson Resilience scale [CD-RISC-10], 7-item Generalized Anxiety Disorder scale [GAD-7], Office of NationalStatistics Four Subjective Well-being Questions [ONS-4], World Health Organization-5 Well-Being Index [WHO-5]) and sleep(Minimal Insomnia Scale [MISS]) at baseline and at weeks 2 and 4. The self-reported measures of perceived stress (10-itemPerceived Stress Score [PSS-10]) were obtained weekly.
Results: A total of 136 participants completed the study and were included in the final analysis. The intervention group (n=62)showed significant improvements compared to the control group (n=74) on measures of anxiety, with a mean GAD-7 score changefrom baseline of –1.35 (SD 4.43) and –0.23 (SD 3.24), respectively (t134=1.71, P=.04); resilience, with a mean change in CD-RISCscore of 1.79 (SD 4.08) and –0.31 (SD 3.16), respectively (t134=–3.37, P<.001); sleep, with a mean MISS score change of –1.16(SD 2.67) and –0.26 (SD 2.29), respectively (t134=2.13, P=.01); and mental well-being, with a mean WHO-5 score change of1.53 (SD 5.30) and –0.23 (SD 4.20), respectively (t134=–2.16, P=.02), within 2 weeks of using Foundations, with furtherimprovements emerging at week 4. Perceived stress was also reduced within the intervention group, although the difference didnot reach statistical significance relative to the control group, with a PSS score change from baseline to week 2 of –2.94 (SD6.84) and –2.05 (SD 5.34), respectively (t134= 0.84, P=.20).
Conclusions: This study provides a proof of principle that the digital mental health app Foundations can improve measures ofmental well-being, anxiety, resilience, and sleep within 2 weeks of use, with greater effects after 4 weeks. Foundations thereforeoffers potential as a scalable, cost-effective, and accessible solution to enhance mental well-being, even during times of crisissuch as the COVID-19 pandemic.
Trial Registration: OSF Registries osf.io/f6djb; https://osf.io/vm3xq
(JMIR Mhealth Uhealth 2022;10(7):e30976) doi:10.2196/30976
JMIR Mhealth Uhealth 2022 | vol. 10 | iss. 7 | e30976 | p.42https://mhealth.jmir.org/2022/7/e30976(page number not for citation purposes)
Catuara-Solarz et alJMIR MHEALTH AND UHEALTH
XSL•FORenderX

KEYWORDS
mental well-being; digital health; cognitive behavioral therapy; positive psychology; insomnia; COVID-19; mental health; mobileapp; anxiety; health app
Introduction
BackgroundMental illness is a highly prevalent and complex public healthissue. The total number of people with any mental healthdisorder reached 792 million in 2017 [1]. Moreover, accordingto the World Health Organization, the number of people withcommon mental disorders (CMD) such as mild to severedepression and anxiety is globally increasing over time [2].These figures are worrying since mental health conditionsaccount for a greater burden of disease based on years livedwith disability [3] and they also are the largest cost driver inhealth care, estimated to reach over US $2.2 trillion and to riseto nearly US $6 trillion by 2030 [4].
Within the context of the COVID-19 pandemic, the prospectsof the mental health status of society have become even moreconcerning. Numerous reports have highlighted that during theCOVID-19 pandemic, poor mental health has been exacerbatedglobally [5,6]. In the United Kingdom, the population prevalenceof clinically significant levels of mental distress rose from 18.9%(2018-2019) to 27.3% in April 2020 [7]. A recent study in theUnited States showed a 3-fold increase in depressive symptomsduring the COVID-19 epidemic compared with the previousrate [8]. More recently, a meta-analysis of 66 studies with221,970 participants reported an overall pooled prevalence ofdepression, anxiety, distress, and insomnia of 31.4%, 31.9%,41.1%, and 37.9%, respectively [9]. Taken together, themagnitude of the socioeconomic burden of CMD illustrates thatthe current model of mental health care has yet to be fullyoptimized. Thus, better, more easily scalable interventions areurgently needed.
Digital technologies have shown great potential to offer scalable,easy-to-access, and timely solutions to increase the delivery ofpsychotherapeutic interventions and evidence-basedrecommendations for self-care and self-management [10,11].During the COVID-19 pandemic, demand for these technologieshas increased on a global scale and the use of mental healthapps has risen exponentially. Although some apps have beenshown to have positive effects on mental well-being [10,12,13],concerns remain regarding the level of credibility and therobustness of evidence underlying the majority of the thousandsof available apps on the market [10,14]. More efforts towardthe proper demonstration of their efficacy are needed if digitalapps are to offer an adjunctive method to reduce the prevalenceand impact of CMD across the world, and to support the growingmental health crisis surrounding the COVID-19 pandemic.
ObjectivesThe aim of this 4-week proof-of-principle study was to test theefficacy of a digital intervention delivered via a mobile app,named Foundations, in comparison to a no-intervention controlgroup on a range of psychological measures, including anxiety,mental well-being, resilience, sleep, and stress. Morespecifically, we aimed to assess the efficacy of Foundations inimproving mental well-being. The study took place during themonths of April and May of 2020 throughout the first outbreakof the COVID-19 pandemic in the United Kingdom.
Foundations includes a plethora of interventions andpsychoeducational content that are scientifically robust (ie,cognitive behavioral therapy [CBT], meditation). Based on this,in combination with preliminary user research, we hypothesizedthat participants in the intervention group would showsignificant improvements compared with the control group inthe following targeted areas of well-being after 4 weeks: (1)anxiety, (2) mental well-being, (3) resilience, (4) sleep, and (5)stress.
Methods
Ethics ApprovalThis study protocol involving human participants was GeneralData Protection Regulation–compliant and developed inaccordance with Alpha Health’s ethics framework and principles[15], which are compliant with the World Medical Association’sDeclaration of Helsinki [16]. All participants provided informed,electronic consent to share their data, including for publicationof the results, prior to their enrollment in the study. Due tounforeseen logistical reasons, the study was not preregistered;however, all statistical testing was performed by a data analystwho remained blind to treatment assignment. Furthermore, theauthors confirm that all ongoing studies for the Foundationsapp are registered.
Trial DesignThis proof-of-concept study was a 2-armed randomizedcontrolled trial (RCT) comparing an app-based intervention(Foundations) to a nonintervention control group. At the timeof the study, the app was named Evermind. It was rebranded inNovember 2020 and we refer to it as its current name(Foundations) throughout this paper. Anxiety, sleep, resilience,and mental well-being were assessed at baseline, and at weeks2 and 4 of the study, and perceived stress was assessed weekly(at baseline through weeks 1 and 4; Figure 1). The study startedon April 22, 2020, and ended on May 20, 2020. Of note, at thestart of the study, the United Kingdom was at the first peak ofthe COVID-19 pandemic, and the reported numbers of positivecases and deaths were in decline at the end of the study [17].
JMIR Mhealth Uhealth 2022 | vol. 10 | iss. 7 | e30976 | p.43https://mhealth.jmir.org/2022/7/e30976(page number not for citation purposes)
Catuara-Solarz et alJMIR MHEALTH AND UHEALTH
XSL•FORenderX

Figure 1. Overview of the study design. PSS-10: 10-item Perceived Stress Score; ONS-4: Office of National Statistics Four Subjective Well-beingQuestions; GAD-7: 7-item Generalized Anxiety Disorder scale; WHO-5: World Health Organization-5 Well-Being Index; CD-RISC: Connor-DavidsonResilience Scale; MISS: Minimal Insomnia Scale.
Participants
RecruitmentStudy participants were recruited through a research companyspecializing in study recruitment between the first 2 weeks ofApril, according to a screening based on the followingpredefined criteria for inclusion and exclusion. Eligibleparticipants were between 30 and 50 years old, owned asmartphone and regularly used apps, were fluent in English,and had been employed for at least 3 months in the UnitedKingdom. In addition, participants were considered eligible forthe study if they showed moderate to high levels of perceivedstress (10-item Perceived Stress Score [PSS-10]>13 [18,19]),mild to severe anxiety (7-item Generalized Anxiety Disorder
scale [GAD-7] score of 5-18 [20]), and no to moderate sleepproblems (Minimal Insomnia Scale [MISS] score of 0-8 [21]).
Candidates were excluded from the study in case of currentpregnancy, current high-stress event (eg, family bereavementwith the exception of a COVID-19 crisis), currentpsychotherapeutic treatment or counselling, current diagnosisof psychiatric illness (with the exception of depression) by aspecialist/secondary care, regular use of mental health apps, ora recent (3 months) change in medication for mood disorders.
Assessment of Eligibility and RandomizationEligible participants were randomly allocated (1:1) to either theintervention group or control group. Assignment of participantsto the groups was performed with a computer-based algorithm(Python Software Foundation) that generated randomly
JMIR Mhealth Uhealth 2022 | vol. 10 | iss. 7 | e30976 | p.44https://mhealth.jmir.org/2022/7/e30976(page number not for citation purposes)
Catuara-Solarz et alJMIR MHEALTH AND UHEALTH
XSL•FORenderX

permuted blocks, which were stratified by gender (male orfemale) and age (30-40 years or 40-50 years), and were balancedregarding the degree of perceived stress (“moderate perceivedstress,” PSS-10 score of 13-26, or “high perceived stress,”PSS-10 score of 27-40) and sleep disturbances (“no sleepdisturbances,” MISS score of 0-4, or “moderate sleepdisturbances,” MISS score of 5-8). Furthermore, participants’baseline scores on the GAD-7 were analyzed for statisticaldifferences and were rerandomized if needed. The randomizationanalysis was performed by a statistician who remained blindedto the identity of the groups.
Study Conditions
Intervention GroupAfter randomization, the intervention group received accessand instructions to download the Foundations app. The
intervention app (Foundations) comprised interventions andpsychoeducational content aimed at decreasing stress andpromoting mental well-being (Figure 2). Content was organizedinto activities (ie, units of content) and could take a variety offormats, which are listed in Table 1. They all have a brief(typically 1-2 sentences) introduction and end with a closingsentence. Activities were either in the moment or part of aprogram. A program is a locked sequence of activities that isdelivered in daily steps designed to teach a skill such as healthysleep behaviors, positive psychology, working with thoughts,or relaxation techniques (see Table 2). In the moment activitieswere not part of a locked sequence of activities and could beaccessed at any time. These activities included sleep meditations,articles, and mindfulness. Programs and activities wereorganized into a library of themed modules.
Figure 2. Screenshots of the Foundations app.
JMIR Mhealth Uhealth 2022 | vol. 10 | iss. 7 | e30976 | p.45https://mhealth.jmir.org/2022/7/e30976(page number not for citation purposes)
Catuara-Solarz et alJMIR MHEALTH AND UHEALTH
XSL•FORenderX

Table 1. Activity formats and descriptions of the content delivered in Foundations.
DescriptionType of contentNumber ofactivities
Activity
Comprises individual screens of 1-2 sentences that the user swipes through.Usually 10-20 screens
Psychoeducation12Slides
User scrolls through to read. Typically 0.25-1 of A4 page in lengthPsychoeducation and tips13Article/blog
User can add free text (eg, thought records or gratitude journaling)Journaling/reflection10Add record
User selects a record created by the “add record” feature and can choose atheme label
Journaling/reflection5Label record
User selects a previous record and is asked a series of questions about therecord. There is a free-text box for the user to write in
Journaling/reflection5Question record
Log of record entriesJournaling/reflection4Record review
Mindful meditations (5-8 min), sleep meditations (30 min), relaxation tech-niques
Mindfulness/meditations17Audios
30-min relaxation sounds and soundscapes (eg, waves, rain)Ambient sounds8Ambient sounds
Reinforces psychoeducation with two-choice answersInteractive psychoeducation6Quiz
The user has to recall spatial sequencesSpatial working memory game1Game
Table 2. Description of programs and the number of activities within each program.
DescriptionNumber ofactivities
Program name
Teaches the skill of diaphragmatic breathing3Become a breathing master
Teaches the skill of progressive muscle relaxation2Relax your body and mind
CBTa-based journaling and reflection. Includes psychoeducation on cognitive distortions and questionsto balance unhelpful thoughts
5Working with thoughts
Gratitude journaling on achievements, reasons to be thankful, and people5Positive thinking
CBT psychoeducation on healthy sleep habits and sleep hygiene9Healthy sleep habits
CBT interactive psychoeducation on breaking bad habits4Break your bad sleep habits
CBT sleep scheduling9Take control of your sleep
Introduces constructive worry to put worries aside before bed4Constructive worry for sleep
CBT-based journaling and psychoeducation on automatic thoughts and balancing thoughts aboutoneself
103 days to improve your self-es-teem
Identify strengths3Boost your confidence
aCBT: cognitive behavioral therapy.
The study lasted 4 weeks and all participants started the studyat the same time. During the first 2 weeks of the study, theparticipants were required to perform a minimum number ofactivities and programs. In week 1, participants were instructedto complete the “Working with thoughts” program, consistingof journaling and CBT interventions focused on amelioratingcognitive distortions and unhelpful ruminative patterns, and aminimum of 4 free-choice activities. During week 2, participantshad to complete 1 program of their choosing and a minimumof 4 other activities (free choice). During weeks 3 and 4,participants were free to use the app as little or as much as theywished with complete free choice of activities and programs.
For the first 2 weeks of the research period, participants wereencouraged to use Foundations via daily text messages. Themessages were written and sent by the research manager via
the messaging service WhatsApp and included wording suchas:
Good morning! If you were able to start theprogramme yesterday then please do another activityof your choice from the Library page. If you weren’table to start the programme yesterday, please do thefirst day of the Working with thoughts programme.
Remember, if you need to contact us at any point, thebest way to get in touch is via email at:[email protected].
Control GroupThe control group completed the same questionnaires at thesame time points as the intervention group. At the end of thestudy, all participants were provided optional access to theFoundations app (waitlist control condition).
JMIR Mhealth Uhealth 2022 | vol. 10 | iss. 7 | e30976 | p.46https://mhealth.jmir.org/2022/7/e30976(page number not for citation purposes)
Catuara-Solarz et alJMIR MHEALTH AND UHEALTH
XSL•FORenderX

IncentivesAt the end of the study, each participant received a monetaryincentive as compensation for their involvement in the trial. Ascompensation was tied to the participants’ time, participants inthe control group received £35 (US $50) and those in theintervention group received £85 (US $115).
Outcome Measures
OverviewAll participants were invited to fill out questionnaires via anonline platform (Google Form) to assess their mental well-beingon a weekly basis starting with the first day of the study(baseline). All participants, regardless of group, were sent thelink to the online platform via the messaging service WhatsAppat the same time. Perceived stress was assessed weekly, whereasall other measures were assessed every 2 weeks (ie, baseline, 2weeks, and 4 weeks). All outcome measures were treated ascontinuous variables. Each measure and the associatedquestionnaire are detailed below.
AnxietyAnxiety levels were assessed through the GAD-7 scale [20], a7-item questionnaire that measures the severity of the subject’sanxiety over the previous week.
Sleep ProblemsThe MISS was used to examine sleep problems in the sampleand their evolution across the study [21]. The MISS includes 3items that cover issues of initiating sleep, waking up in the night,and not feeling refreshed in the morning.
ResilienceResilience levels were assessed by the Connor-DavidsonResilience Scale (CD-RISC-10), which includes 10 items thatassess the individual’s ability to cope successfully with adversity[22].
Mental Well-beingTo assess current mental well-being, the World HealthOrganization-5 Well-Being Index (WHO-5) questionnaire wasadministered to the study participants. Each of the 5 items isscored with a Likert scale ranging from 0 to 5 (at no time, someof the time, less than half of the time, more than half of the time,most of the time, all of the time, respectively) [23].
In addition, the United Kingdom Office of National Statisticsquestions on well-being (ONS-4) scale was used to measuresubjective well-being [24]. Each of the questions in this scaleis aimed at measuring a different aspect of well-being: lifesatisfaction, worthwhileness, happiness, and anxiety, which areeach rated by the subject from 0 (not at all) to 10 (completely).These questions are not designed to provide an aggregate score,but rather to illustrate different aspects of perceived well-being.
Perceived StressThe degree to which participants perceived their life situationsas stressful was assessed using the PSS-10 [18,19]. The timeframe selected for questions was the past week, which enabledexamination of weekly effects of the intervention. It should be
noted that participants were able to access the PSS-10 withinthe app whenever they liked. These additional data were notevaluated as part of the study.
Statistical Analyses
PowerA power analysis based on published data and previous pilotstudies [25] was performed (using the “pwr” R package) toestimate the required sample size for the study. The estimatedsample size was at least 78 participants in each arm providing0.8 power to detect an effect size of Cohen d=0.4 with an α of.05.
Data AnalysisTwo principal sets of analyses were performed on each of theoutcome measures. The first set of analyses, which we denoteby within-group analyses, sought to determine whether therewas a significant change within each group compared to themeasure at the start of the study (baseline). Within-group pairedtwo-tailed t tests were used for pre-post intervention assessmentsfor each group. Statistical significance was set at P<.05.Bonferroni correction for multiple comparisons was performedadjusting the significance level to 1.25% for PSS-10(significance level of 5% divided by 4 measures in time, baselineto weeks 1-4) and 2.5% (significance level of 5% divided by 2measures in time, baseline to week 4) for the rest of the outcomemeasures.
The second set of analyses, denoted as between-group analyses,sought to determine whether the change from baseline (Δ) wasequivalent in both groups. The analysis was performed usinglinear mixed models (LMMs) incorporating group (interventionor control), time, and group×time interaction terms, includinga change score of 0 at the baseline time point and modelingparticipant as a random effect. Significance of the group variablewas assessed using the likelihood ratio test. A confirmatory setof analyses was performed using an independent two-tailed ttest on the differences of each group’s scores in each measureat a given time point from their baseline scores (Δ). Statisticalsignificance was set at P<.05.
Results
ParticipantsFrom April 2020 to May 2020, 190 participants were enrolledin the study and randomized to either the intervention group(n=95) or control group (n=95). Of the 95 participants in theintervention group, 7 failed to complete the study (ie, did notuse the app as required) and were excluded from the primaryanalysis. A further 9 participants (5 in the intervention groupand 4 in the control group) were excluded due to missing data(failed to complete the outcome measure questionnaires). Anadditional 38 participants (21 in the intervention group and 17in the control group) were excluded from the analysis due to acalculation error of the PSS-10 at screening (PSS-10 score<13).Due to the study’s single-blind design, this error was notidentified until after the study was completed. Of the remainingparticipants, 74 (79%) from the control group and 62 (65%)from the intervention group completed the study and were
JMIR Mhealth Uhealth 2022 | vol. 10 | iss. 7 | e30976 | p.47https://mhealth.jmir.org/2022/7/e30976(page number not for citation purposes)
Catuara-Solarz et alJMIR MHEALTH AND UHEALTH
XSL•FORenderX

analyzed for the primary outcome and secondary outcomemeasures (Figure 3).
Table 3 provides the baseline demographics of the studyparticipants (N=136). Participants in the intervention (n=62)and control (n=74) groups did not differ significantly withrespect to gender, age, nor their levels of mental well-being atbaseline.
The values for the within-group and between-group analyses atdifferent points in time for each of the outcome measures are
shown in Table 4 and Table 5, respectively. In the following,we discuss the results for each outcome metric as well as forthe subgroup analysis and engagement. As described in theMethods section, for within-group analyses, significancethresholds were adjusted to account for multiple comparisons(Bonferroni correction) using a significance threshold of α=.025for all scales excluding the PSS-10, which had a significancethreshold of α=.0125.
Figure 3. CONSORT (Consolidated Standards of Reporting Trials) flowchart of participants. PSS-10: 10-item Perceived Stress Score.
JMIR Mhealth Uhealth 2022 | vol. 10 | iss. 7 | e30976 | p.48https://mhealth.jmir.org/2022/7/e30976(page number not for citation purposes)
Catuara-Solarz et alJMIR MHEALTH AND UHEALTH
XSL•FORenderX

Table 3. Characteristics of study participants at baseline.
Clinical interpretationP valueEffect size (d)Control group(n=74)
Foundation group(n=62)
Characteristic
Gender
N/A.32N/Aa4033Females, n
N/A.48N/A3429Males, n
N/A.30N/A39.49 (6.13)40.58 (6.08)Age (years), mean (SD)
moderate stress0.58–0.04 (nc)19.05 (3.58)19.19 (4.12)PSS-10b, mean (SD)
mild anxiety0.97–0.32 (small)6.91 (3.28)8.06 (3.83)GAD-7d, mean (SD)
poor well-being0.810.15 (n)12 (4.23)11.35 (4.29)WHO-5e, mean (SD)
N/A0.850.18 (n)23.64 (5.82)22.63 (5.14)ONS-4f, mean (SD)
problems in coping with stress orbouncing back from adversity
0.960.31 (small)24.91 (4.96)23.27 (5.76)CD-RISCg, mean (SD)
no sleep problems0.7–0.09 (n)4.6 (2.51)4.82 (2.3)MISSh, mean (SD)
aN/A: not applicable.bPSS-10: 10-item Perceived Stress Score.cn: negligible or no effect.dGAD-7: 7-item Generalized Anxiety Disorder scale.eWHO-5: World Health Organization-5 Well-Being Index.fONS-4: Office of National Statistics Four Subjective Well-being Questions.gCD-RISC: Connor-Davidson Resilience Scale.hMISS: Minimal Insomnia Scale.
JMIR Mhealth Uhealth 2022 | vol. 10 | iss. 7 | e30976 | p.49https://mhealth.jmir.org/2022/7/e30976(page number not for citation purposes)
Catuara-Solarz et alJMIR MHEALTH AND UHEALTH
XSL•FORenderX

Table 4. Within-group analyses showing the change from baseline on the outcome measures at each time point (week 2 and week 4).
Control groupIntervention groupOutcome measure
Effect size (d)P valueat (df=73)Mean (SD)Effect size (d)P valueat (df=61)Mean (SD)
GAD-7b
———6.92 (3.28)———c8.06 (3.83)Baseline
–0.06.27–0.616.69 (3.92)–0.31<.001–2.416.71 (4.79)Week 2
–0.22.03–1.926.14 (3.88)–0.50<.001–3.696.02 (4.29)Week 4
MISSd
———4.61 (2.51)———4.82 (2.30)Baseline
–0.10.17–0.964.35 (2.61)–0.51<.001–3.433.66 (2.28)Week 2
–0.21.02–2.034.05 (1.72)–0.79<.001–5.313.15 (1.90)Week 4
CD-RISC-10e
———24.91 (4.97)———23.27 (5.76)Baseline
–0.06.80–0.8424.59 (5.02)0.31<.0013.4525.06 (5.47)Week 2
0.05.280.5825.19 (5.78)0.42<.0014.0725.66 (5.48)Week 4
WHO-5f
———12.00 (4.23)———11.35 (4.29)Baseline
–0.05.68–0.4711.77 (4.38)0.32.012.2812.89 (5.10)Week 2
0.03.400.2512.12 (4.64)0.59<.001–3.8513.95 (4.45)Week 4
ONS-4g Life satisfaction
———6.08 (1.76)———5.69 (1.53)Baseline
0.15.091.336.69 (3.92)0.61<.0013.796.66 (1.64)Week 2
0.32.0062.606.61 (1.57)0.88<.0015.416.95 (1.32)Week 4
ONS-4 Worth
———6.30 (1.70)———6.34 (1.94)Baseline
0.07.260.646.42 (1.78)0.25.051.696.82 (1.89)Week 2
0.17.071.486.59 (1.70)0.41.0052.647.06 (1.56)Week 4
ONS-4 Happiness
———6.16 (1.72)———5.95 (1.51)Baseline
0.12.160.996.35 (1.53)0.35.012.326.55 (1.87)Week 2
0.18.081.396.47 (1.78)0.74<.0014.997.08 (1.55)Week 4
ONS-4 Anxiety
———5.09 (2.00)———4.65 (1.66Baseline
0.15.091.385.42 (2.25)0.22.051.645.13 (2.50)Week 2
0.01.460.095.12 (2.42)0.19.111.245.08 (2.77)Week 4
PSS-10h
———19.05 (3.58)———19.19 (4.12)Baseline
–0.32.002–2.9517.59 (5.03)–0.18.09–1.3518.32 (5.27)Week 1
–0.43<.001–3.3117.00 (5.50)–0.55<.001–3.3816.26 (6.20)Week 2
–0.40.002–3.0417.01 (5.93–0.72<.001–4.7915.65 (5.55)Week 3
–0.55<.001–3.9916.38 (5.72)–0.72<.001–4.8615.53 (5.82)Week 4
aComparisons were made for each time point relative to the baseline level; significance thresholds have been adjusted to account for multiple comparisons(Bonferroni): P<.025 for all outcomes except for PSS-10, which was set to P<.012.
JMIR Mhealth Uhealth 2022 | vol. 10 | iss. 7 | e30976 | p.50https://mhealth.jmir.org/2022/7/e30976(page number not for citation purposes)
Catuara-Solarz et alJMIR MHEALTH AND UHEALTH
XSL•FORenderX

bGAD-7: 7-item Generalized Anxiety Disorder scale.cnot applicable.dMISS: Minimal Insomnia Scale.eCD-RISC-10: Connor-Davidson Resilience Scale.fWHO-5: World Health Organization-5 Well-Being Index.gONS-4: Office of National Statistics Four Subjective Well-being Questions.hPSS-10: 10-item Perceived Stress Score.
Table 5. Between-group analyses showing the change of outcome measures (Δ) from baseline at each time point (week 2 and week 4).
Effect size (d)P valuet (df=134)Mean differenceControl Δ, mean (SD)Intervention Δ, mean (SD)Outcome measure
GAD-7a
0.29.041.711.13–0.23 (3.24)–1.35 (4.43)Week 2
0.32.031.871.26–0.78 (3.52)–2.05 (4.37)Week 4
MISSb
0.37.022.130.90–0.26 (2.29)–1.16 (2.67)Week 2
0.47.0042.701.12–0.55 (2.35)–1.68 (2.49)Week 4
CD-RISCc
–0.58<.001–3.37–2.10–0.31 (3.16)1.79 (4.08)Week 2
–0.48.003–2.78–2.100.28 (4.24)2.39 (4.62)Week 4
WHO-5d
–0.37.02–2.16–1.76–0.23 (4.20)1.53 (5.30)Week 2
–0.52.001–3.05–2.460.12 (4.20)2.59 (5.32)Week 4
ONS-4e life satisfaction
–0.41.01–2.36–0.720.24 (1.58)0.97 (2.01)Week 2
–0.41.009–2.38–0.730.53 (1.75)1.26 (1.53)Week 4
ONS-4 worth
–0.19.14–1.09–0.360.12 (1.63)0.48 (2.25)Week 2
–0.22.10–1.28–0.430.297 (1.76)0.73 (2.17)Week 4
ONS-4 happiness
–0.22.10–1.29–0.410.19 (1.64)0.596 (2.02)Week 2
–0.44.006–2.56–0.820.31 (1.92)1.13 (1.78)Week 4
ONS-4 anxiety
–0.07.33–0.43–0.160.32 (2.02)0.48 (2.32)Week 2
–0.16.18–0.91–0.410.03 (2.48)0.44 (2.77)Week 4
PSS-10f
–0.13.77–0.73–0.58–1.45 (4.25)–0.87 (5.09)Week 1
0.15.200.840.88–2.05 (5.34)–2.94 (6.84)Week 2
0.26.071.511.51–2.04 (5.77)–3.55 (5.84)Week 3
0.17.160.980.99–2.68 (5.77)–3.66 (5.93)Week 4
aGAD-7: 7-item Generalized Anxiety Disorder scale.bMISS: Minimal Insomnia Scale.cCD-RISC: Connor-Davidson Resilience Scale.dWHO-5: World Health Organization-5 Well-Being IndexeONS-4: Office of National Statistics Four Subjective Well-being Questions.fPSS-10: 10-item Perceived Stress Score.
JMIR Mhealth Uhealth 2022 | vol. 10 | iss. 7 | e30976 | p.51https://mhealth.jmir.org/2022/7/e30976(page number not for citation purposes)
Catuara-Solarz et alJMIR MHEALTH AND UHEALTH
XSL•FORenderX

Anxiety (GAD-7)Within-group t tests for those in the intervention arm(Foundations) showed that GAD-7 scores reduced significantlycompared with those at baseline at both week 2 and week 4. Incontrast, there was no change in GAD-7 scores in the controlgroup when comparing baseline to week 2 (Table 4).
For the between-group comparisons, LMM analysis of thechange from baseline (Δ) showed a significant global effect of
the intervention (P=.03), where the main impact seems to be atweek 4 with P=.05 for the interaction term (see Tables S1 andS2 in Multimedia Appendix 1). Posthoc comparisons confirmedsignificant differences at weeks 2 and 4 (Figure 4, Table 5),such that the intervention group had lower GAD-7 scores thanthe control group. These data suggest that Foundations reducedanxiety within 4 weeks of use.
Figure 4. Between-group analyses showing the change from baseline on outcome measures at each time point. Data points represent the mean and barsare standard errors. PSS-10: 10-item Perceived Stress Score; ONS-4: Office of National Statistics Four Subjective Well-being Questions; GAD-7: 7-itemGeneralized Anxiety Disorder scale; WHO-5: World Health Organization-5 Well-Being Index; CD-RISC: Connor-Davidson Resilience Scale; MISS:Minimal Insomnia Scale.
Sleep (MISS)Within-group analysis of the MISS score showed that the scorein the intervention group significantly improved both at week2 and week 4. In comparison, within-group analysis of thecontrol group showed no significant change in the MISS scorefrom baseline to week 2 or from baseline to week 4 (see Table4).
Between-group LMM analyses of the change from baselinerevealed a significantly greater improvement in MISS in theintervention group compared to the control group (P=.01). Eventhough there was a global decrease of MISS at week 4,interaction terms showed significant results within weeks 2 and4 (see Tables S3 and S4 in Multimedia Appendix 1). Posthoc
comparisons confirmed significant differences at weeks 2 and4 (Figure 4, Table 5), such that the intervention group had lowerMISS scores (higher sleep quality) than the control group (alsosee Tables S3 and S4 in Multimedia Appendix 1). These datasuggest that Foundations improves sleep within 2 weeks of use.
Resilience (CD-RISC-10)Within-group analyses of the two groups showed significantimprovement in resilience scores for the intervention group atboth weeks 2 and 4, but no effect in the control group (Table4).
There were significant between-group effects in the analysis ofthe change from baseline, such that the intervention groupshowed a greater change in score than the control group
JMIR Mhealth Uhealth 2022 | vol. 10 | iss. 7 | e30976 | p.52https://mhealth.jmir.org/2022/7/e30976(page number not for citation purposes)
Catuara-Solarz et alJMIR MHEALTH AND UHEALTH
XSL•FORenderX

(P<.001). Moreover, we found a significant positive effect(interaction terms) within the intervention group at both weeks2 and 4 (see Tables S5 and S6 in Multimedia Appendix 1).Posthoc comparisons confirmed significant differences at weeks2 and 4 (Figure 4, Table 5), such that the intervention grouphad higher CD-RISC-10 scores (higher resiliency) comparedwith those of the control group. These data suggest thatFoundations enhances resilience within 2 weeks of use.
Mental Well-being
WHO-5 ScoresWithin-group analyses of each group by time showed that theWHO-5 score significantly increased in the intervention groupat week 4 but not at week 2. Among controls, there was nosignificant change at either time point (Table 4).
Group differences were revealed in the LMM between-groupanalysis (see Tables S7 and S8 of Multimedia Appendix 1) ofthe change from baseline: the intervention group showed agreater change from baseline than the control group (P=.03) inboth weeks 2 and 4. Posthoc comparisons confirmed thesesignificant differences at weeks 2 and 4 (Figure 4, Table 5),such that the intervention group had higher WHO-5 scores(higher quality of life) compared with those of the control group.These data suggest that Foundations can enhance well-beingwithin 2 weeks of use, as measured by the WHO-5.
ONS-4 QuestionnaireThe ONS-4 questionnaire comprises four independent questionson life satisfaction, worth, happiness, and anxiety (the scale forthe latter has been reversed in the analysis, so that a larger scoremeans a greater positive impact on the participants). Thewithin-group analyses of the intervention group showedimprovements in life satisfaction at week 2 and week 4,improvements in worth at week 4, and improvements inhappiness at week 2 and week 4. No improvement in anxietywas found at either time point. In contrast, in the control group,only the measure of life satisfaction at week 4 showed asignificant improvement compared to baseline (Table 4).
All LMM analyses revealed only overall significant effects onONS satisfaction and happiness (P=.002 and P=.008,respectively; see Tables S9 and S13 in Multimedia Appendix1), with inconclusive effects on ONS on worth and anxiety (seeTables S11 and S15 in Multimedia Appendix 1). On ONSsatisfaction, we found a significant effect at both 2 and 4 weeks,whereas on ONS happiness, we only found significant effectsat week 4 (see interaction terms in Tables S9 and S13 inMultimedia Appendix 1). These results were confirmed by aposthoc t test, which showed higher scores in the interventiongroup than in the control group on the measures of lifesatisfaction and happiness (Figure 4, Table 5). These datasuggest that the intervention group experienced improvementin the sense of life satisfaction and happiness compared to thecontrol group.
Perceived Stress (PSS-10)In contrast to the other measures, perceived stress was measuredweekly. Within-group analyses showed that the PSS-10 scorewas significantly lower at 2, 3, and 4 weeks, but not at week 1,
compared to that measured at baseline for the intervention group(Table 4). However, the control group also showed significantlylower perceived stress levels at each of the four time points(Table 4).
In the same way, between-group analyses of the change frombaseline showed no statistically significant result. The likelihoodratio test on LMM showed a P value of .19 (see Tables S17 andS18 in Multimedia Appendix 1), and no significant groupdifferences were observed using t tests (Table 5). These datasuggest that perceived stress was reduced across the course ofthe study, but this reduction was no greater in the interventiongroup than in the control group.
Subclass AnalysesAdditional analyses were performed with the factors of genderand age included on each of the outcome measures for bothwithin-group and between-group comparisons. No statisticallysignificant differences were observed, due to the fact that thesize of groups was small. See Table S19 in MultimediaAppendix 1 for the age and gender interaction terms for eachof the metrics.
Engagement With the AppThe participants in the intervention group presented an averageusage of the app of 18 days out of the 28 (SD 5.1) total days ofthe study period (median days active: 17). On average,participants engaged with the app 15.25 minutes per day (medianminutes per day 13.93, SD 9.66). During the study period, userstried an average of 29 distinct activities and 3.9 programs.However, no correlation was found between the total amountof engagement with the app and the difference from baselineto 4 weeks in any of the outcome measures (all P>.05).
Research suggests that the level of engagement with a digitalintervention impacts the outcomes [26]. However, this was notthe case in our study, which may be due to the mechanisms ofaction taking place outside of the app in which the user isencouraged by the app to complete a healthy behavior. Once abehavior is learned or a skill is developed, the user may notneed to engage with the app to experience the benefits (eg, auser can maintain a healthy sleep routine without accessing theapp every night).
Discussion
Principal FindingsThe aim of the study was to investigate the efficacy of a mobileapp, Foundations, in improving mental well-being in adults withmoderate to high levels of stress and anxiety. Given the timingof the study (April 2020 to May 2020), our secondary aim wasto assess the efficacy of Foundations in mitigating the mentalhealth challenges surrounding the COVID-19 pandemic.
Encouragingly, results of this proof-of-principle study confirmedfour out of five of our hypotheses by demonstrating that the useof Foundations can significantly improve measures of (1)anxiety, (2) resilience, (3) well-being, and (4) sleep relative toa control group within 2 weeks of use, with greater effects after4 weeks. In contrast to our final hypothesis, perceived stress
JMIR Mhealth Uhealth 2022 | vol. 10 | iss. 7 | e30976 | p.53https://mhealth.jmir.org/2022/7/e30976(page number not for citation purposes)
Catuara-Solarz et alJMIR MHEALTH AND UHEALTH
XSL•FORenderX

was reduced within the intervention group, although the resultsdid not reach statistical significance relative to the control group.
Comparison With Prior WorkThe results of this study contribute to a limited number of RCTsexamining the efficacy of mental health apps that arecommercially available. Encouragingly, our findings areconsistent with published meta-analyses that have affirmed theefficacy of digital interventions over control conditions inimproving mental well-being. For example, a meta-analysis of18 RCTs reported that smartphone interventions weresignificantly more efficacious in reducing depressive symptomsin comparison to both waitlist and active control groups [27].Congruent with results from a recent meta-analysis of 66 RCTsof mobile apps for mental health, we found a greater reductionin anxiety among participants in the intervention versus controlgroup as well as greater improvements in resilience and overallmental well-being [28].
However, our results are at odds with previous RCTs reportinggreater reductions in stress in active versus control interventions[29,30]. These results were surprising given the positive resultson measures of anxiety, resilience, and well-being. This lack ofa statistically significant effect is due to an improvement overallin the control group across the period of the study. There areseveral potential factors that may have contributed to thisfinding. First, the study started at the peak of the COVID-19pandemic in the United Kingdom (April 2020). The reportednumbers of positive cases and deaths were reduced byapproximately 40% during the 4 weeks of the study [17].Further, as the population adjusted to lockdown measures,perceived stress levels may have naturally reduced. However,it is not clear why this would impact perceived stress to a greaterextent to, for example, anxiety and resilience. Another factormay be the frequency of testing. The PSS-10 was assessed ona weekly basis as opposed to every 2 weeks in the case of allother measures. Foundations’ users were also able to take thePSS-10 whenever they liked within the app; these werevoluntary assessments, and the data were not evaluated. It istherefore possible that survey fatigue or more frequent insightinto stress levels impacted perceived stress.
With regard to intervention features, Foundations differentiatesfrom many of the apps that have published efficacy data in thatit offers a breadth of interactive content delivered. For example,Sleepio [31] provides an internet-based CBT course targeted atindividuals with insomnia, and Woebot [32] providesCBT-directed mental health via an artificialintelligence–powered chatbot for individuals struggling withpoor mental health symptoms. Foundations provides a widerarray of support across the mental health spectrum via a numberof methodologies (CBT, acceptance and commitment training,positive psychology, and sleep science). Although it is unclearwhether single- versus multi-intervention apps differ in efficacy,at the very least, multi-intervention apps such as Foundationsoffer users flexibility and variety in the content andfunctionalities they can choose from, which has been shown toincrease app engagement and likability [33].
Despite the rapid upscaling of digital mental health interventionsduring the COVID-19 pandemic, literature on the efficacy of
these technologies is rather sparse at present. To the best of ourknowledge, this study is one of the few RCTs investigating theefficacy of a mental health app during the COVID-19 pandemic[34,35]. The importance of this research is two-fold. First, theresults from this study demonstrate that Foundations could adda scalable efficacious digital intervention to support mentalwell-being that can be accessed at any time. Second, thesefindings may help to inform the rationale and design of futurestudies and digital health technologies. Going forward, it willbe critical to maintain this momentum as the mental healthconsequences of the pandemic could be severe and long-lasting.
LimitationsSeveral important limitations of this study should be recognized.Perhaps the most important limitation is the notable number ofparticipants excluded from the primary analysis due to acalculation error of the PSS-10 at screening. It remains uncertainwhether a larger sample of patients would result in outcomesthat differ from those observed; however, the sample size forthe final analysis (N=136) is comparable to those reported inthe literature on digital interventions for mental well-being[27,28].
Second, it is possible that the daily scheduled broadcastmessages received by participants in the Foundations groupcontributed to a placebo effect or to results that do not reflectreal-world usage of the app. Conversely, it is also possible thatthe frequency of the notifications hindered engagement in somecases, as the amount of contact for optimizing user engagementlikely varies across participants. However, it is notable that thesize of the effect was greater at 4 weeks than at 2 weeks for allmeasures. Participants received no messages during weeks 3and 4 other than the links to fill out the questionnaires. Ittherefore seems unlikely that the daily messaging could accountfor the efficacy observed in the study. However, the impact ofthe frequency and content of notifications on well-beingoutcomes remains to be fully elucidated and further studies maybe warranted.
Another limitation of the study is the use of a monetary incentivefor participation. Previous studies have shown that monetaryincentives can increase engagement with wellness apps yet haveno impact on the outcome of the study [12]. However, the trueinfluence of the monetary incentive in this case is unknown.
Finally, it is necessary to acknowledge the limitations of asingle-blind design, as used here. Only the data analysts wereblind to the group assignment. The control group participantswere aware they were taking part in an intervention study, butwere only given access to the app after the study (and were notinformed they would have access until study completion). Thedesign of the study and the passive nature of the control groupdo not allow ruling out digital placebo effects in the interventiongroup derived from their expectations about the interventions[36]. Both groups, however, received the same messages andinvitations to fill out the outcome questionnaires. It remainspossible that insights into mental well-being through completionof the questionnaires, along with knowledge that they wereparticipating in an intervention trial may have impacted outcomemeasures. Future studies may explore the use of alternative
JMIR Mhealth Uhealth 2022 | vol. 10 | iss. 7 | e30976 | p.54https://mhealth.jmir.org/2022/7/e30976(page number not for citation purposes)
Catuara-Solarz et alJMIR MHEALTH AND UHEALTH
XSL•FORenderX

designs such as an active control or psychoeducation controlgroup.
Future ResearchBefore we can optimize the efficacy of digital healthtechnologies such as Foundations, we must build a richerunderstanding of which interventions are most effective forwhich individual needs. It was not feasible with the sample sizeof the current study to evaluate the efficacy of individualcomponents of the app with respect to symptom type andseverity, and the content that the participant engaged with duringthe course of the study. An important question for futureresearch is whether personalization of these interventions makescare more effective.
Similarly, it is unclear whether there was an effect of the levelof engagement (ie, a dose effect). Although a satisfactory levelof engagement was observed in this study, establishing adose-response relationship between usage and improvement inmental well-being could prove useful for interventionpersonalization and bears further investigation in future.
A specific domain that has gained attention in recent years isthat of work-related mental health. This is due to an increase ofawareness of the magnitude and costs of this issue. Concretely,it has been reported that an outstanding 72% of employees oflarge organizations in the United Kingdom have disclosed anincrease of CMD during 2019 [37]. Ill mental health in theworkplace is associated with decreased productivity, earlyretirement, increased sickness absence, presenteeism (notworking at capacity while at work), and staff turnover. All thistranslates into an estimated cost of over US $45 billion per yearfor companies, which has increased by 16% in the last few years
[37]. Although this study examined the efficacy of Foundationsin a working population, a truly rigorous investigation of itseffects on workplace mental health would require a future studyemploying randomized, controlled allocation of participants toan intervention arm (Foundations) or placebo arm, both in theabsence and presence of employment. At the very least, thesepreliminary observations provide evidence that working adultsusing the Foundations app can experience significantimprovement in their mental well-being during a 2-week period.
Future research is also required to evaluate the long-term effectsof Foundations on mental well-being both in terms ofpostintervention follow-up and longer sustained use of the app.Looking forward and if replicated in further studies, these resultsmay have important implications for addressing the treatmentgap in mental health care through the use of evidence-baseddigital interventions.
Overall, results from this study may help to propel the use ofmobile apps such as Foundations to assume a more widespreadrole in both the promotion and maintenance of mental health.This could offer new possibilities to further optimize the efficacyof these technologies while removing obstacles forevidence-based mental health care.
ConclusionsThis proof-of-principle study demonstrates that Foundationscan improve measures of anxiety, sleep, resilience, and mentalwell-being within 2 weeks of use, with a greater effect after 4weeks. Foundations may therefore offer potential as a scalable,cost-effective intervention to enhance mental well-being evenduring a period of crisis such as the COVID-19 pandemic.
AcknowledgmentsThe authors are grateful to Oliver Harrison (CEO, Koa Health) and Aleksandar Matic (Research and Development Director, KoaHealth) for support with this research.
Authors' ContributionsSD, SC, and CBA conceptualized the study and guided the study design. ES, BS, and IE provided input on the study design.Participant recruitment was supervised by SS. ARV, IE, and BS developed the plan for the statistical analyses. ARV analyzedthe data. ARV, BS, IE, and SD contributed to the interpretation of the data. SC, LS, NRH, and SD drafted the manuscript. Allauthors made revisions to the manuscript. LS had final responsibility for submission of the manuscript.
Conflicts of InterestAll authors, excluding NRH and LS, were employees of Telefónica Innovación Alpha at the time of the study. The app and theauthors have now transferred from Telefonica Innovation Alpha to Koa Health.
Editorial NoticeThis randomized study was only retrospectively registered, as due to unforeseen logistical reasons, authors were unable topreregister the study. The editor granted an exception from ICMJE rules mandating prospective registration of randomized trials,because the risk of bias appears low. However, readers are advised to carefully assess the validity of any potential explicit orimplicit claims related to primary outcomes or effectiveness, as retrospective registration does not prevent authors from changingtheir outcome measures retrospectively.
Multimedia Appendix 1Supplementary Tables S1-S19.[DOCX File , 31 KB - mhealth_v10i7e30976_app1.docx ]
JMIR Mhealth Uhealth 2022 | vol. 10 | iss. 7 | e30976 | p.55https://mhealth.jmir.org/2022/7/e30976(page number not for citation purposes)
Catuara-Solarz et alJMIR MHEALTH AND UHEALTH
XSL•FORenderX

Multimedia Appendix 2CONSORT-eHEALTH checklist (V 1.6.2).[PDF File (Adobe PDF File), 114 KB - mhealth_v10i7e30976_app2.pdf ]
References1. Dattani S, Ritchie H, Roser M. Mental health. Our World in Data. 2021. URL: https://ourworldindata.org/mental-health
[accessed 2021-05-13]2. Depression and other common mental disorders: global health estimates. World Health Organization. 2017. URL: https:/
/apps.who.int/iris/bitstream/handle/10665/254610/WHO-MSD-MER-2017.2-eng.pdf [accessed 2021-02-05]3. Wittchen H, Jacobi F, Rehm J, Gustavsson A, Svensson M, Jönsson B, et al. The size and burden of mental disorders and
other disorders of the brain in Europe 2010. Eur Neuropsychopharmacol 2011 Sep;21(9):655-679. [doi:10.1016/j.euroneuro.2011.07.018] [Medline: 21896369]
4. Gustavsson A, Svensson M, Jacobi F, Allgulander C, Alonso J, Beghi E, CDBE 2010 Study Group. Cost of disorders ofthe brain in Europe 2010. Eur Neuropsychopharmacol 2011 Oct;21(10):718-779. [doi: 10.1016/j.euroneuro.2011.08.008][Medline: 21924589]
5. Czeisler M, Lane RI, Petrosky E, Wiley JF, Christensen A, Njai R, et al. Mental health, substance use, and suicidal ideationduring the COVID-19 pandemic - United States, June 24-30, 2020. MMWR Morb Mortal Wkly Rep 2020 Aug14;69(32):1049-1057. [doi: 10.15585/mmwr.mm6932a1] [Medline: 32790653]
6. Vindegaard N, Benros ME. COVID-19 pandemic and mental health consequences: systematic review of the current evidence.Brain Behav Immun 2020 Oct 30;89:531-542 [FREE Full text] [doi: 10.1016/j.bbi.2020.05.048] [Medline: 32485289]
7. Pierce M, Hope H, Ford T, Hatch S, Hotopf M, John A, et al. Mental health before and during the COVID-19 pandemic:a longitudinal probability sample survey of the UK population. Lancet Psychiatry 2020 Oct;7(10):883-892 [FREE Fulltext] [doi: 10.1016/S2215-0366(20)30308-4] [Medline: 32707037]
8. Ettman CK, Abdalla SM, Cohen GH, Sampson L, Vivier PM, Galea S. Prevalence of depression symptoms in US adultsbefore and during the COVID-19 pandemic. JAMA Netw Open 2020 Sep 01;3(9):e2019686 [FREE Full text] [doi:10.1001/jamanetworkopen.2020.19686] [Medline: 32876685]
9. Wu T, Jia X, Shi H, Niu J, Yin X, Xie J, et al. Prevalence of mental health problems during the COVID-19 pandemic: asystematic review and meta-analysis. J Affect Disord 2021 Feb 15;281:91-98 [FREE Full text] [doi:10.1016/j.jad.2020.11.117] [Medline: 33310451]
10. Donker T, Petrie K, Proudfoot J, Clarke J, Birch M, Christensen H. Smartphones for smarter delivery of mental healthprograms: a systematic review. J Med Internet Res 2013 Nov 15;15(11):e247 [FREE Full text] [doi: 10.2196/jmir.2791][Medline: 24240579]
11. Naslund JA, Aschbrenner KA, Araya R, Marsch LA, Unützer J, Patel V, et al. Digital technology for treating and preventingmental disorders in low-income and middle-income countries: a narrative review of the literature. Lancet Psychiatry 2017Jun;4(6):486-500 [FREE Full text] [doi: 10.1016/S2215-0366(17)30096-2] [Medline: 28433615]
12. Kawadler JM, Hemmings NR, Ponzo S, Morelli D, Bird G, Plans D. Effectiveness of a smartphone app (BioBase) forreducing anxiety and increasing mental well-being: pilot feasibility and acceptability study. JMIR Form Res 2020 Nov10;4(11):e18067 [FREE Full text] [doi: 10.2196/18067] [Medline: 32969341]
13. Ponzo S, Morelli D, Kawadler JM, Hemmings NR, Bird G, Plans D. Efficacy of the digital therapeutic mobile app BioBaseto reduce stress and improve mental well-being among university students: randomized controlled trial. JMIR MhealthUhealth 2020 Apr 06;8(4):e17767 [FREE Full text] [doi: 10.2196/17767] [Medline: 31926063]
14. Larsen ME, Huckvale K, Nicholas J, Torous J, Birrell L, Li E, et al. Using science to sell apps: Evaluation of mental healthapp store quality claims. NPJ Digit Med 2019 Mar 22;2(18):18-1-. [doi: 10.1038/s41746-019-0093-1] [Medline: 31304366]
15. Ethical principles. Koa Health. URL: https://koahealth.com/legal/ethical-principles/ [accessed 2013-05-21]16. World Medical Association. World Medical Association Declaration of Helsinki: ethical principles for medical research
involving human subjects. JAMA 2013 Nov 27;310(20):2191-2194. [doi: 10.1001/jama.2013.281053] [Medline: 24141714]17. United Kingdom Coronavirus. Worldometer. 2020. URL: https://www.worldometers.info/coronavirus/country/uk/ [accessed
2021-05-13]18. Cohen S, Kamarck T, Mermelstein R. A global measure of perceived stress. J Health Soc Behav 1983 Dec;24(4):385-396.
[Medline: 6668417]19. Lee E. Review of the psychometric evidence of the perceived stress scale. Asian Nurs Res (Korean Soc Nurs Sci) 2012
Dec;6(4):121-127 [FREE Full text] [doi: 10.1016/j.anr.2012.08.004] [Medline: 25031113]20. Spitzer RL, Kroenke K, Williams JBW, Löwe B. A brief measure for assessing generalized anxiety disorder: the GAD-7.
Arch Intern Med 2006 May 22;166(10):1092-1097. [doi: 10.1001/archinte.166.10.1092] [Medline: 16717171]21. Broman J, Smedje H, Mallon L, Hetta J. The Minimal Insomnia Symptom Scale (MISS): a brief measure of sleeping
difficulties. Ups J Med Sci 2008;113(2):131-142. [doi: 10.3109/2000-1967-221] [Medline: 18509808]22. Campbell-Sills L, Stein MB. Psychometric analysis and refinement of the Connor-davidson Resilience Scale (CD-RISC):
validation of a 10-item measure of resilience. J Trauma Stress 2007 Dec;20(6):1019-1028. [doi: 10.1002/jts.20271] [Medline:18157881]
JMIR Mhealth Uhealth 2022 | vol. 10 | iss. 7 | e30976 | p.56https://mhealth.jmir.org/2022/7/e30976(page number not for citation purposes)
Catuara-Solarz et alJMIR MHEALTH AND UHEALTH
XSL•FORenderX

23. Topp CW, Østergaard SD, Søndergaard S, Bech P. The WHO-5 Well-Being Index: a systematic review of the literature.Psychother Psychosom 2015 Mar 28;84(3):167-176 [FREE Full text] [doi: 10.1159/000376585] [Medline: 25831962]
24. Dolan P, Metcalfe R. Measuring subjective wellbeing: recommendations on measures for use by national governments. JSoc Pol 2012 Jan 12;41(2):409-427. [doi: 10.1017/s0047279411000833]
25. Baik SH, Fox RS, Mills SD, Roesch SC, Sadler GR, Klonoff EA, et al. Reliability and validity of the Perceived StressScale-10 in Hispanic Americans with English or Spanish language preference. J Health Psychol 2019 Apr;24(5):628-639[FREE Full text] [doi: 10.1177/1359105316684938] [Medline: 28810432]
26. Perski O, Blandford A, West R, Michie S. Conceptualising engagement with digital behaviour change interventions: asystematic review using principles from critical interpretive synthesis. Transl Behav Med 2017 Jun;7(2):254-267 [FREEFull text] [doi: 10.1007/s13142-016-0453-1] [Medline: 27966189]
27. Firth J, Torous J, Nicholas J, Carney R, Pratap A, Rosenbaum S, et al. The efficacy of smartphone-based mental healthinterventions for depressive symptoms: a meta-analysis of randomized controlled trials. World Psychiatry 2017Oct;16(3):287-298. [doi: 10.1002/wps.20472] [Medline: 28941113]
28. Linardon J, Cuijpers P, Carlbring P, Messer M, Fuller-Tyszkiewicz M. The efficacy of app-supported smartphone interventionsfor mental health problems: a meta-analysis of randomized controlled trials. World Psychiatry 2019 Oct;18(3):325-336.[doi: 10.1002/wps.20673] [Medline: 31496095]
29. Coelhoso CC, Tobo PR, Lacerda SS, Lima AH, Barrichello CRC, Amaro E, et al. A new mental health mobile app forwell-being and stress reduction in working women: randomized controlled trial. J Med Internet Res 2019 Nov07;21(11):e14269 [FREE Full text] [doi: 10.2196/14269] [Medline: 31697244]
30. Fuller-Tyszkiewicz M, Richardson B, Little K, Teague S, Hartley-Clark L, Capic T, et al. Efficacy of a smartphone appintervention for reducing caregiver stress: randomized controlled trial. JMIR Ment Health 2020 Jul 24;7(7):e17541 [FREEFull text] [doi: 10.2196/17541] [Medline: 32706716]
31. Elison S, Ward J, Williams C, Espie C, Davies G, Dugdale S, et al. Feasibility of a UK community-based, eTherapy mentalhealth service in Greater Manchester: repeated-measures and between-groups study of 'Living Life to the Full Interactive','Sleepio' and 'Breaking Free Online' at 'Self Help Services'. BMJ Open 2017 Jul 20;7(7):e016392 [FREE Full text] [doi:10.1136/bmjopen-2017-016392] [Medline: 28729322]
32. Fitzpatrick KK, Darcy A, Vierhile M. Delivering cognitive behavior therapy to young adults with symptoms of depressionand anxiety using a fully automated conversational agent (Woebot): a randomized controlled trial. JMIR Ment Health 2017Jun 06;4(2):e19 [FREE Full text] [doi: 10.2196/mental.7785] [Medline: 28588005]
33. Alqahtani F, Orji R. Insights from user reviews to improve mental health apps. Health Informatics J 2020 Sep;26(3):2042-2066[FREE Full text] [doi: 10.1177/1460458219896492] [Medline: 31920160]
34. Boucher EM, McNaughton EC, Harake N, Stafford JL, Parks AC. The impact of a digital intervention (Happify) on lonelinessduring COVID-19: qualitative focus group. JMIR Ment Health 2021 Feb 08;8(2):e26617 [FREE Full text] [doi:10.2196/26617] [Medline: 33498011]
35. Fiol-DeRoque MA, Serrano-Ripoll MJ, Jiménez R, Zamanillo-Campos R, Yáñez-Juan AM, Bennasar-Veny M, et al. Amobile phone-based intervention to reduce mental health problems in health care workers during the COVID-19 pandemic(PsyCovidApp): randomized controlled trial. JMIR Mhealth Uhealth 2021 May 18;9(5):e27039 [FREE Full text] [doi:10.2196/27039] [Medline: 33909587]
36. Torous J, Firth J. The digital placebo effect: mobile mental health meets clinical psychiatry. Lancet Psychiatry 2016Feb;3(2):100-102. [doi: 10.1016/S2215-0366(15)00565-9] [Medline: 26851322]
37. Hampson E, Jacob A. Mental health and employers: refreshing the case for investment. Deloitte. 2020. URL: https://www2.deloitte.com/content/dam/Deloitte/uk/Documents/consultancy/deloitte-uk-mental-health-and-employers.pdf [accessed2021-05-13]
AbbreviationsCBT: cognitive behavioral therapyCD-RISC: Connor-Davidson Resilience ScaleCMD: common mental disorderGAD-7: 7-item Generalized Anxiety Disorder scaleLMM: linear mixed modelMISS: Minimal Insomnia ScaleONS-4: Office of National Statistics Four Subjective Well-being QuestionsPSS-10: 10-item Perceived Stress ScoreRCT: randomized controlled trialWHO-5: World Health Organization-5 Well-Being Index
JMIR Mhealth Uhealth 2022 | vol. 10 | iss. 7 | e30976 | p.57https://mhealth.jmir.org/2022/7/e30976(page number not for citation purposes)
Catuara-Solarz et alJMIR MHEALTH AND UHEALTH
XSL•FORenderX

Edited by L Buis; submitted 04.06.21; peer-reviewed by A Teles, D Pan; comments to author 29.09.21; revised version received19.10.21; accepted 06.12.21; published 01.07.22.
Please cite as:Catuara-Solarz S, Skorulski B, Estella-Aguerri I, Avella-Garcia CB, Shepherd S, Stott E, Hemmings NR, Ruiz de Villa A, Schulze L,Dix SThe Efficacy of “Foundations,” a Digital Mental Health App to Improve Mental Well-being During COVID-19: Proof-of-PrincipleRandomized Controlled TrialJMIR Mhealth Uhealth 2022;10(7):e30976URL: https://mhealth.jmir.org/2022/7/e30976 doi:10.2196/30976PMID:34978535
©Silvina Catuara-Solarz, Bartlomiej Skorulski, Iñaki Estella-Aguerri, Claudia Bibiana Avella-Garcia, Sarah Shepherd, EmilyStott, Nicola R Hemmings, Aleix Ruiz de Villa, Laura Schulze, Sophie Dix. Originally published in JMIR mHealth and uHealth(https://mhealth.jmir.org), 01.07.2022. This is an open-access article distributed under the terms of the Creative CommonsAttribution License (https://creativecommons.org/licenses/by/4.0/), which permits unrestricted use, distribution, and reproductionin any medium, provided the original work, first published in JMIR mHealth and uHealth, is properly cited. The completebibliographic information, a link to the original publication on https://mhealth.jmir.org/, as well as this copyright and licenseinformation must be included.
JMIR Mhealth Uhealth 2022 | vol. 10 | iss. 7 | e30976 | p.58https://mhealth.jmir.org/2022/7/e30976(page number not for citation purposes)
Catuara-Solarz et alJMIR MHEALTH AND UHEALTH
XSL•FORenderX

Original Paper
Awareness, Acceptability, and Perceived Effectiveness ofText-Based Therapy Among Graduate Students: Cross-sectionalStudy
Samari A Blair1,2, MPH; Andrea N Brockmann3, MA; Kelsey M Arroyo3, MS; Chelsea A Carpenter3, MPH, PhD;
Kathryn M Ross2,3, MPH, PhD1College of Medicine, University of Florida, Gainesville, FL, United States2Social and Behavioral Sciences Program, College of Public Health and Health Professions, University of Florida, Gainesville, FL, United States3Department of Clinical and Health Psychology, College of Public Health and Health Professions, University of Florida, Gainesville, FL, United States
Corresponding Author:Kathryn M Ross, MPH, PhDDepartment of Clinical and Health PsychologyCollege of Public Health and Health ProfessionsUniversity of FloridaPO Box 100165Gainesville, FL, 32610United StatesPhone: 1 352 294 8433Email: [email protected]
Abstract
Background: Research has suggested that there is a mental health crisis occurring among graduate students in the United States.Moreover, many students go without effective treatment owing to the limited availability of mental and behavioral health resourceson college campuses. Text-based therapy may represent a viable method for increasing access to mental health support for graduatestudents, but little is known regarding its acceptability in this population.
Objective: The purpose of this study was to assess how graduate students perceive text-based therapy and their likelihood ofseeking out this form of therapy.
Methods: In total, 265 graduate students completed a cross-sectional web-based survey that included multiple-choice andopen-ended questions assessing their perceptions of text-based therapy and the likelihood of seeking out this form of therapy.Chi-square tests, ANOVAs, and nonparametric Wilcoxon signed-rank tests were used to examine differences in multiple-choicequestions. The constant comparative method was used for qualitative analyses of the open-ended question responses.
Results: Participants (n=265) were predominately non-Hispanic White (166/265, 62.6%) and female (167/265, 63%) with amean age of 28.3 (SD 5.1) years. Over half of the participants (139/265, 52.5%) were not aware that text-based therapy existed;however, 65.3% (173/265) reported that they would consider using text-based services, if available. In comparison to face-to-facetherapy, participants reported being less likely to seek out text-based therapy and perceived it as less effective (P<.001). Qualitativeresults indicated that participants were concerned about the ability to effectively communicate and build rapport through text-basedtherapy and thought that this modality may be more effective for some mental and behavioral health concerns than others.Moreover, participants noted that text-based therapy would be best implemented as a way to supplement, rather than replace,face-to-face services.
Conclusions: Altogether, the results of this study suggest that text-based therapy holds the potential to increase access to anduse of mental and behavioral health services; however, graduate students remain concerned about its effectiveness and the optimalmethods of implementation. Future research should investigate how therapeutic processes (eg, effective communication andrapport-building) can be facilitated in digital environments and how text-based therapy could be best implemented to supplementand extend, rather than replace, face-to-face services.
(JMIR Mhealth Uhealth 2022;10(7):e34102) doi:10.2196/34102
JMIR Mhealth Uhealth 2022 | vol. 10 | iss. 7 | e34102 | p.59https://mhealth.jmir.org/2022/7/e34102(page number not for citation purposes)
Blair et alJMIR MHEALTH AND UHEALTH
XSL•FORenderX

KEYWORDS
mental health; text-based therapy; graduate students
Introduction
Approximately 18.9% of all adults in the United States live witha mental illness, with the highest prevalence rates observedamong young adults aged 18 to 25 years [1,2]. Mental healthdisorders account for approximately one half of the diseaseburden among young adults [3] and, when compared withneurological and substance use disorders, constitute the highestproportion of disability-adjusted life years [4]. Graduate studentsrepresent a particularly vulnerable population, with dataindicating greater risk of depression and anxiety compared withthe general population [5,6]. Therefore, many researchers haveargued that there is a mental health crisis occurring in thispopulation [5].
In-person therapy remains the most widely used method to treatindividuals with mental and behavioral health conditions [7].Across several one-on-one or group sessions, trained therapistsaim to help patients understand their thoughts, feelings, andpatterns of behavior while identifying ways to positively copewith psychosocial stressors [8,9]. Therapy has been proven tobe effective in treating common mental and behavioral healthdisorders, with substantial evidence supporting its effectivenessfor decreasing symptoms of major depressive disorder,generalized anxiety disorder, and panic disorder in adultpopulations [7,10].
There are several barriers experienced by undergraduate andgraduate students related to the use of mental and behavioralhealth services [11,12]. Individual-level barriers includescheduling conflicts, lack of time, negative self-stigmaassociated with seeking therapy, financial constraints, lack ofperceived need, and perceived ineffectiveness of treatment [13].Organizational-level barriers include a lack of insurancecoverage for mental and behavioral health services and extendedwaitlists for appointments on campus [11]. Innovative deliveryformats, such as delivery of treatment through the internet ormobile devices, have the potential to address several of thesebarriers and thus increase graduate students’use of mental healthservices. These approaches may be particularly well suited forthis population as technology has a strong presence amongyoung adults and students on university campuses [11,14].
The delivery of therapy via SMS text message, in particular,has been gaining momentum [15]. Text-based therapy relies onasynchronous communication and allows individuals to sendwritten messages to a certified counselor or a therapist using amobile device. The therapist then responds (via the sameplatform) at their earliest convenience [15]. Despite itsincreasing popularity [16], research on the efficacy andacceptability of text-based therapy has been limited. One studydemonstrated that adding SMS text messages to ongoingin-person therapy did not improve clinical outcomes in adultpopulations [17]; however, another found that the use of atext-based therapy service for 15 weeks produced significantreductions in symptoms and increased work productivity inadults with depression and anxiety [18]. In terms of
acceptability, 1 study found that asynchronous text therapy witha licensed therapist was viewed as acceptable and clinicallybeneficial for adults with various diagnoses and histories ofpsychological distress [19]. To date, no studies have investigatedthe acceptability of text-based therapy in graduate students.
To address this gap, this study aimed to survey current graduatestudents at a large southeastern university in the United Statesregarding their awareness, acceptability, and perceivedeffectiveness of text-based therapy for treating mental andbehavioral health challenges. Moreover, this survey aimed toidentify which factors would promote or prevent the use oftext-based therapy within this specific population. Finally, thisstudy examined whether there were differences in the likelihoodof seeking out face-to face and text-based therapy by age, race,gender, and sexual orientation. On the basis of the results froma previous study, which found that White individuals were morelikely than Hispanic, Black, or African American individualsto receive mental health treatment [20], it was hypothesizedthat individuals who were younger, female, heterosexual, andnon-Hispanic White would be more likely to seek out therapythan their respective counterparts.
Methods
RecruitmentThis study aimed to recruit current graduate students at boththe master and doctoral level who were employed by theirdepartments at the University of Florida in exchange for astipend (considered graduate assistants at the University ofFlorida). Potential participants were eligible to complete thesurvey if they were a current graduate assistant, were aged ≥18years, and were enrolled in GatorGradCare, anemployer-sponsored health plan specific to graduate assistantsat the University of Florida. At the time that the current surveywas conducted (spring 2019), GatorGradCare had startedoffering free asynchronous text-based therapy (via TalkSpace)as part of their health insurance plan benefits.
To recruit participants for this study, the first author (SAB, whoat the time was completing a public health internship atGatorCare) sent an email on January 21, 2019, to all currentUniversity of Florida graduate assistants through theGatorGradCare listserv. This email introduced the purpose ofthe study and provided participants with a link to complete thestudy survey through Qualtrics, a web-based survey platform.Participants were asked to read a statement that outlined thepurpose of the project; instructions describing how to completethe survey; and information about potential risks and benefits,confidentiality, voluntary participation, and participant rights(eg, the right to refuse to answer individual questions and towithdraw participation at any time). Individuals who providedweb-based consent to participate were prompted to completethe remainder of the survey questions. On February 1, 2019, 2weeks after the initial email was sent, the first author sent asecond follow-up email to the GatorGradCare listserv, to serveas a reminder for those who may have still wanted to participate.
JMIR Mhealth Uhealth 2022 | vol. 10 | iss. 7 | e34102 | p.60https://mhealth.jmir.org/2022/7/e34102(page number not for citation purposes)
Blair et alJMIR MHEALTH AND UHEALTH
XSL•FORenderX

The survey closed 1 month following initial contact (February15, 2019). No compensation was provided for completing thesurvey.
MeasuresThe survey used in this project consisted of 19 self-report items(with a mix of multiple-choice and open-ended questions)developed by the first author (SAB). Questions are describedby content area in subsequent sections.
DemographicsParticipants were asked to report their age, race, gender, andsexual orientation. No personal identifiers (eg, name, address,or email address) were collected from the survey.
Experiences With Traditional Face-to-Face TherapyParticipants were asked if they had previously used mental andbehavioral health services (defined as “therapy or counseling”)and, if so, for what concerns. Participants could check all thatapplied from the following options: substance abuse, alcoholabuse, anxiety, depression, stress management,attention-deficit/hyperactivity disorder, gender dysphoria,relationships, eating disorders, sexual assault, smoking cessation,autism spectrum disorder, or bereavement (these terms wereused as they were listed as example conditions for treatment bythe TalkSpace text-based therapy service [21]). There were alsooptions of “prefer not to answer” and “other,” which includeda text box that enabled participants to elaborate further.Participants were also asked about barriers that prevented themfrom using therapy or counseling services in the past, perceivedeffectiveness of face-to-face therapy, and their likelihood ofseeking out face-to-face therapy. Perceived effectiveness offace-to-face therapy was assessed using a 5-point Likert scaleranging from 1=extremely effective to 5=not effective at all. Thelikelihood of seeking out face-to-face therapy was also assessedon a 5-point Likert scale ranging from 1=very likely to 5=notlikely at all.
Experiences With Text-Based TherapyParticipants were asked if they were aware of text-based therapybefore the onset of the study, if they would consider usingtext-based therapy if available, the factors that would promotethem to use text-based therapy, the factors that would promotethem to not use text-based therapy, their likelihood of seekingout text-based therapy, and perceived effectiveness of text-basedtherapy. Perceived effectiveness of text-based therapy wasassessed using a 5-point Likert scale ranging from 1=extremelyeffective to 5=not effective at all. The likelihood of seeking outtext-based therapy for behavioral health issues was also assessedon a 5-point Likert scale ranging from 1=very likely to 5=notlikely at all.
Open-Ended Survey QuestionsParticipants were asked to provide free-text responses to threeopen-ended questions: (1) “Do you think text-based counselingcan be effective? Why or why not? What factors do you thinklimit its effectiveness?” (2) “Do you see any advantages to usingtext-based counseling over face-to-face counseling?Disadvantages?” (3) “Please provide any additional commentsregarding your perception of text-based therapy.”
Data AnalysisAll quantitative analyses were conducted using SPSS Statistics(version 25; IBM Corp). Descriptive statistics were used tosummarize the demographic and quantitative data. Chi-squaretests and ANOVAs were used to examine whether there was anassociation between past use of therapy or counseling andwillingness to use text-based therapy in the future, and if thisassociation varied by age, race, gender or sex, or sexualorientation. Nonparametric Wilcoxon signed-rank tests wereconducted to assess whether there were significant differencesbetween the perceived effectiveness and likelihood of seekingtherapy between text-based and face-to-face therapy services.
The constant comparative method, which is used by researchersto uncover similarities, differences, and patterns in data [22],was used for qualitative analyses of the responses from the 3open-ended questions. Open coding methods [22] were used toexamine, compare and contrast, and categorize the raw data.Data were then compiled into subthemes, and these subthemeswere then compiled into larger, overarching themes. Codingwas done individually by two authors (SAB and ANB) to limitsubjectivity and bias. SAB and ANB then compared results ofthis coding process, with disagreements resolved through aconsensus discussion and review by KMR.
Ethics ApprovalThis project was approved by the University of FloridaInstitutional Review Board (IRB#201802501).
Results
ParticipantsOf the 3609 graduate assistants who were contacted via theGatorGradCare listserv, 297 provided consent to participate inthis study (reflecting a response rate of 8.2%). Responses from32 participants were excluded owing to extensive missing data(ie, completing less than half of the survey questions), resultingin 265 participants being included in the current analyses.Demographic characteristics of survey participants are providedin Table 1. On average, participants were aged 28.3 (SD 5.1)years, and the majority identified as non-Hispanic White(166/265, 62.6%), female (167/265, 63%), and heterosexual orstraight (215/265, 81.1%).
JMIR Mhealth Uhealth 2022 | vol. 10 | iss. 7 | e34102 | p.61https://mhealth.jmir.org/2022/7/e34102(page number not for citation purposes)
Blair et alJMIR MHEALTH AND UHEALTH
XSL•FORenderX

Table 1. Participant demographics (N=265).
ValueCharacteristic
28.3 (5.1)Age (years; n=245), mean (SD)
Race and ethnicity, n (%)
32 (12.1)Asian, non-Hispanic
12 (4.5)Black or African American, non-Hispanic
28 (10.6)Hispanic or Latinx
166 (62.6)White, non-Hispanic
22 (8.3)Another race or multiple races selected
5 (1.9)Prefer not to answer or missing
Gender, n (%)
167 (63)Female
87 (32.8)Male
3 (1.1)Transgender
1 (0.4)Other
7 (2.6)Prefer not to answer or missing
Sexual orientation, n (%)
215 (81.1)Heterosexual or straight
20 (7.6)Bisexual
12 (4.5)Homosexual
9 (3.4)Another category
9 (3.4)Prefer not to answer or missing
Past Utilization of Behavioral Health Services andAwareness of Text-Based TherapyApproximately 60.4% (160/265) of survey participants reportedprevious use of some form of mental or behavioral healthservices. The top three concerns individuals sought face-to-facetherapy for were anxiety, depression, and stress management(Table 2). Additional concerns that participants mentionedpreviously seeking face-to-face therapy for included eatingdisorders, bereavement, parental divorce, posttraumatic stressdisorder, bipolar disorder, and suicidal ideation. Individuals
who identified with historically marginalized racial or ethnicgroups were significantly less likely to report having used mentalor behavioral health services compared with non-Hispanic Whiteparticipants (45/94, 48%, vs 112/166, 67.5%, respectively;
n=260, χ21=9.6; P=.002). Moreover, female students were more
likely to report having used these services in the past than malestudents (113/167, 67.7%, vs 38/87, 44%, respectively; n=254,
χ21=13.7; P<.001). There were no significant differences in
reports of past use by sexual orientation (n=256, χ22=2.3; P=.34)
or age (F1,245=2.6; R2=.01; P=.10).
Table 2. Top 5 concerns for which individuals sought face-to-face therapy.
Participants who sought out face-to-face therapy for this condition, n (%)Condition
110 (41.5)Anxiety
105 (39.6)Depression
70 (26.4)Stress management
45 (16.9)Relationships
20 (7.5)Sexual assault
Approximately half of participants (139/265, 52.5%) were notaware that text-based counseling existed before participating inthis study; however, 65.3% (173/265) of participants reportedthey would consider using text-based counseling if available.
Participants reported they would most likely seek text-basedtherapy for concerns such as stress management, anxiety, anddepression (Table 3).
JMIR Mhealth Uhealth 2022 | vol. 10 | iss. 7 | e34102 | p.62https://mhealth.jmir.org/2022/7/e34102(page number not for citation purposes)
Blair et alJMIR MHEALTH AND UHEALTH
XSL•FORenderX

Table 3. Top 5 concerns for which individuals would most likely seek text-based therapy.
Participants who reported that they would likely seek text-based therapyfor this condition, n (%)
Condition
136 (51.3)Stress management
131 (49.4)Anxiety
110 (41.5)Depression
81 (30.5)Relationships
23 (8.6)Sexual assault
Barriers to Accessing Face-to-Face and Text-BasedTherapy ServicesThe top barriers that prevented participants from seeking mentaland behavioral health services included cost (115/265, 43.4%),scheduling conflicts (107/265, 40.4%), that it was not needed(70/265, 26.4%), and that a therapist could not be found (66/265,24.9%). In total, 50/265 (18.9%) participants also reported“other” barriers and wrote responses including anxiety aboutstarting therapy, stigma, long wait times owing to an insufficientnumber of counselors, and insufficient coverage by insurance.
The top factors that would promote participants to seektext-based therapy were convenience (206/265, 77.7%), lowcost (141/265, 53.2%), anonymity from other individuals inperson (76/265, 28.7%), and a better sense of privacy andsecurity (70/265, 26.4%). In total, 29/265 (10.9%) participantsdescribed “other” reasons promoting the use of text-basedtherapy, including preferences for communicating via text versusin person and anxiety regarding face-to-face communication.Barriers that would prevent participants from seeking text-basedtherapy were a preference for face-to-face contact (189/265,71.3%), that they were not interested or did not need therapy(58/265, 21.9%), cost (40/265, 15.1%), and a preference foranonymity related to privacy and security (20/265, 7.5%). Intotal, 42/265 (15.8%) “other” barriers were reported, includingthe impersonal nature of text-based communications, perceptionsthat text-based communication would prevent development ofa deep relationship between therapist and client, and a perceivedlack of effectiveness.
Perceived Effectiveness and Likelihood of SeekingFace-to-Face Versus Text-Based PsychotherapyServicesFigure 1 provides ratings of perceived effectiveness of therapyby modality. Most participants (169/265, 63.8%) reported beliefsthat face-to-face therapy was "very effective" in treating mentaland behavioral health concerns. In comparison, only 13/265(4.9%) participants reported that text-based therapy was “veryeffective”; the remaining participants reported beliefs thattext-based therapy was “somewhat effective” or that theyremained “undecided.” Figure 2 provides responses related tothe likelihood of seeking therapy by each delivery modality.Although most participants (221/265, 83.4%) reported that theywere “extremely likely” or “somewhat likely” to seekface-to-face therapy, only 34.4% (90/262) of participantsresponded similarly for text-based therapy. Participants ratedthe perceived effectiveness of face-to-face therapy significantlyhigher than text-based therapy (z=−12.33; n=264; P<.001) andreported a significantly higher likelihood of seeking face-to-facetherapy than text-based therapy (z=10.69; n=262; P<.001). Therewas no significant association between past use of behavioralhealth services and willingness to use text-based therapy
(N=265, χ21=0.0; P=.91). Moreover, no significant differences
in likelihood of seeking text-based therapy were found by age
(F1,243=1.70; R2=.01; P=.19), race (n=260, χ24=6.0; P=.20),
sexual orientation (n=247, χ22=1.2; P=.54), or gender (n=257,
χ22=0.0; P=.99).
JMIR Mhealth Uhealth 2022 | vol. 10 | iss. 7 | e34102 | p.63https://mhealth.jmir.org/2022/7/e34102(page number not for citation purposes)
Blair et alJMIR MHEALTH AND UHEALTH
XSL•FORenderX

Figure 1. Participants’ perceived effectiveness of face-to-face versus text-based therapy.
Figure 2. Participants' reported likelihood of seeking face-to-face versus text-based therapy.
Qualitative ResultsParticipants provided 533 responses across the 3 open-endedsurvey questions, from which 1090 data points were coded,
reduced to 36 subthemes, and then 6 broader overarching themes(Table 4). The 6 themes that emerged are described in thefollowing sections.
JMIR Mhealth Uhealth 2022 | vol. 10 | iss. 7 | e34102 | p.64https://mhealth.jmir.org/2022/7/e34102(page number not for citation purposes)
Blair et alJMIR MHEALTH AND UHEALTH
XSL•FORenderX

Table 4. Themes and subthemes developed from open-ended questions assessing participants’ perceptions of text-based therapy.
Mentions, n (%)Theme
398a (36.51)Factors that promote the use of text-based therapy (advantages)
215 (19.72)Convenience
42 (3.85)Provides anonymity
39 (3.57)Less costly
37 (3.39)Mitigates social anxiety
23 (2.11)Technological features
18 (1.65)Easier to express thoughts
16 (1.46)Time efficient
4 (0.36)Less stigma than face-to-face therapy
4 (0.36)Past positive experiences with text-based therapy
325a (29.81)Factors that dissuade the use of text-based therapy (disadvantages)
159 (14.58)Does not provide robust therapy experience for patients
141 (12.93)Stunted communication
9 (0.82)Privacy and security risks
6 (0.55)Unsure of how it works
5 (0.45)Technological barriers
5 (0.45)Past negative experiences with text-based therapy
210 (19.26)Perceived effectiveness of text-based therapy
61 (5.59)Potential to be effective
43 (3.94)Face-to-face therapy is more effective
37 (3.39)Not an effective mode of communication
30 (2.75)Effective in some scenarios
23 (2.11)Unsure about effectiveness
11 (1.00)Effective for younger populations
5 (0.45)More effective than no counseling
94 (8.62)Overall perception of text-based therapy
32 (2.93)Increases access to mental health services
24 (2.2)Avoids providing adequate and effective mental health care
23 (2.11)Support implementation
10 (0.91)Potential to be helpful
5 (0.45)Oppose implementation
34 (3.11)Recommendations to improve effectiveness of text-based therapy
21 (1.92)Use as a supplement to face-to-face therapy
8 (0.73)Various options to communicate electronically with therapist
2 (0.18)Have consistent counselors
2 (0.18)Use as a way to triage patients
1 (0.09)Need to establish clear boundaries
29 (2.66)Likelihood of using text-based therapy
19 (1.74)Would not use it
7 (0.64)Would use it
2 (0.18)Would want a test trial before committing
JMIR Mhealth Uhealth 2022 | vol. 10 | iss. 7 | e34102 | p.65https://mhealth.jmir.org/2022/7/e34102(page number not for citation purposes)
Blair et alJMIR MHEALTH AND UHEALTH
XSL•FORenderX

Mentions, n (%)Theme
1 (0.09)Would use as a last resort
aEach participant could answer more than once; thus, the total may exceed 265.
Factors That Promote the Use of Text-Based TherapyThe most common overarching theme focused on factors thatpromote the use of text-based therapy (398/1090, 36.51%),which had 9 subthemes. Ease of finding a therapist, ability touse text-based therapy anywhere, and avoidance of long waittimes at the counseling center or other providers’ offices wereall elements mentioned by participants when referring to theconvenience of text-based therapy. For example, 1 participantexplained:
Text-based is far more immediate. If you’re strugglingwith something, you can get a response much morequickly. There’s also a lower activation energy tosetting up that service than to getting an appointmentwith a counselor face-to-face.
Another said, “It would be much easier to schedule around dailylife activities (as a grad student, I don’t have much free time).”
Factors That Dissuade the Use of Text-Based TherapyThe second most common theme represented factors that woulddissuade participants from using text-based therapy (325/1090,29.81%), which included 6 subthemes. Responses noted thatface-to-face therapy offers a “robust” experience including apersonal setting, engagement from both parties, and a strongtherapist-client relationship. In contrast, it was mentioned thatthese important characteristics are lost within text-based therapy,with one participant saying:
I believe that the key to the counselor/patientrelationship is face-to-face empathy and rapportbuilding. This might be more difficult to achieve viatext.
The lack of nonverbal communication was also frequentlymentioned as a barrier to text-based approaches, as boththerapists and patients would be unable to express and readnonverbal cues including facial expressions, emotions, and bodylanguage, leading to misinterpretation of text messages andstunted communication. This sentiment was reflected in thefollowing participant response:
Text messaging simply does not convey all the samecues, signals, and emotions as face-to-facecommunication (e.g., voice inflexion; body language).It is not as effective a mode of communication. I amnot convinced that a therapist would be able to makean accurate diagnosis or to have as deep of insightsover text as they would if they were able to observetheir patients face-to-face. I also do not think that Iwould be able to express myself and my feelings aswell via text as I would in person, even if I tried.
Perceived Effectiveness of Text-Based TherapyThe third most common theme represented participants’perceptions regarding the effectiveness of text-based therapy(210/1090, 19.26%) and included 7 subthemes. The
effectiveness of text-based therapy was described as beingdependent on the complexity of the issue and personalpreferences of the individual seeking care. For example, 1participant said, “For basic, straightforward issues such as stressmanagement techniques it might be fine, but for more complexissues I think the connection of direct face-to-facecommunication would be better and more effective.”
Similarly, another participant stated:
When it comes down to mental health issues, I wouldlike to speak to someone in person. So, in this case,technology get in the way in this case.
Overall Perception of Text-Based TherapyThe fourth most common theme focused on how participantsperceived the implementation of text-based therapy as a newand potentially viable option (94/1090, 8.62%). Someparticipants perceived text-based therapy as a step in the rightdirection for increasing access to and reach of services, fillinga gap in areas where there is a lack of available counselors. Oneparticipant said:
For students who do not have access to counselingin person, it will be very advantageous and forstudents who do not like to meet in person. I see itsadvantages and support the effort on campus.
Conversely, many participants viewed text-based therapy as acost-cutting measure that the university and other organizationsmay be using to avoid the problem of not having enoughcounselors available for use:
I appreciate that this can broaden the scope ofservices for graduate students and other populations(e.g., rural populations) but I also have concerns itcan be a band-aid that allows people to disregard thelarger problem of major disparities in access toadequate healthcare.
Recommendations to Improve Effectiveness ofText-Based TherapyThe fifth most common theme included various strategiesparticipants recommended to improve the effectiveness oftext-based therapy (34/1090, 3.1%). Participants stated thattext-based therapy should be used to augment, and not replace,face-to-face therapy. For example, 1 participant stated:
I think it has potential to help but that’s not to saythat we should be trying to do away with face-to-facecounseling. This should just be somethingsupplemental. Like if therapists/psychologists have“on-call hours” when their clients can text.
Another stated:
Something is better than nothing. Not a big fan of theidea, but if that is the way to facilitate mental healthsupport throughout the system, it is a good idea to
JMIR Mhealth Uhealth 2022 | vol. 10 | iss. 7 | e34102 | p.66https://mhealth.jmir.org/2022/7/e34102(page number not for citation purposes)
Blair et alJMIR MHEALTH AND UHEALTH
XSL•FORenderX
implement it side by side with the traditionalface-to-face resources.
In addition, some participants reported they would like to seetext-based therapy platforms include different features tocommunicate electronically, including video or audio chat witha therapist and group-based counseling.
Likelihood of Using Text-Based TherapyThe least common theme that emerged illustrated participants’likelihood of using text-based therapy (29/1090, 2.7%), whichhad 4 subthemes. When asked why they would not usetext-based therapy, some participants referenced that they “hatedtexting” and others noted that they would not want to use theirphone when experiencing behavioral health issues. Oneparticipant said, “I would never use text-based counselingbecause I don’t feel comfortable putting private, sensitiveinformation in writing.”
Conversely, other participants noted that they would usetext-based therapy because they used technology for everythingelse in their lives, with 1 participant stating:
I think it is a great idea especially as youngergenerations are becoming more and more dependenton technology and prefer communicating via textmessage. In addition, it allows the opportunity forindividuals with very busy schedules to be able to gethelp.
Discussion
Principal FindingsThe aim of this study was to assess awareness and acceptabilityof text-based therapy for the treatment of mental and behavioralhealth concerns in graduate students. Approximately half of theparticipants reported not being aware that text-based therapyservices existed, despite existing coverage by their insuranceplan. Promisingly, two-thirds of participants said they wouldconsider trying text-based therapy. Qualitative resultsdemonstrated that participants found text-based therapy servicesconvenient and less costly than traditional face-to-face servicesand that participants thought that these services providedbeneficial anonymity.
Despite most participants reporting that they would considerusing text-based therapy, participants were significantly lesslikely to report that they would seek these services comparedwith face-to-face therapy. This may have been driven bydifferences in perceived effectiveness, as participants perceivedtext-based therapy as significantly less effective thanface-to-face therapy. Qualitative results revealed that participantshad concerns over the ability of patients and therapists todevelop rapport given the inability to express emotion and moodthrough nonverbal cues (eg, eye contact, body posture, and toneof voice). Given that rapport, or therapeutic alliance, has beenestablished as one of the most influential factors in the successof therapy [23], this could be a key driver of the lower rates ofperceived effectiveness of text-based therapy. However, thereis emerging evidence that rapport can be successfully developedthrough text-based therapy [24] because of factors unique totext-based communication. For example, the web-based
disinhibition effect may allow individuals to feel safe sharingthings through digital means that they would not otherwise feelcomfortable sharing in person [25,26]. Interestingly, participantsin web-based therapy have reported both similar [27] andsignificantly higher [28] levels of therapeutic alliance than levelsreported by participants in face-to-face therapy. Future workshould continue to examine how the digital environment canbe used to better facilitate therapeutic processes.
Qualitative results also indicated that the type of mental andbehavioral health concern may also affect likelihood to engagewith text-based therapy services, as text-based therapy wasperceived by some respondents as more effective for someconcerns versus others. Nevertheless, participants reportedsimilar concerns for which they would seek face-to-face andtext-based therapy services. Overall, the top three concerns forwhich participants said they would seek text-based therapy werestress management, depression, and anxiety. Given that theseconditions are the most common mental health concerns ingraduate students [5,29] and research demonstrating thattext-based therapy can reduce anxiety and depression levels inyoung adults [30,31], the current results suggest that text-basedtherapy has potential to increase access to and the use of mentaland behavioral health services among graduate students.
Approximately 60% of respondents reported previous use ofbehavioral health services before the onset of this study, witha significantly higher proportion of female (vs male) andnon-Hispanic White (vs racial or ethnic minority) participantsreporting previous use of behavioral health services. Theseresults were consistent with lower rates of health care useobserved among men and individuals from racial or ethnicminority groups in previous studies [32-34]. In contrast, therewere no differences in likelihood of seeking text-based therapyby age, race or ethnicity, sexual orientation, or gender (and noassociation was found between past use of mental or behavioralhealth services and likelihood of using text-based therapy),suggesting this modality may also increase access to and useof mental and behavioral health services by individuals in groupsthat have historically demonstrated lower rates of use offace-to-face services [35,36].
Overall, qualitative results demonstrated that participantsperceived text-based therapy as having potential to increaseaccess to mental and behavioral health services; however,caution was suggested at the use of text-based therapy to replace,rather than supplement, face-to-face services. Participants notedthat text-based therapy would be best implemented as a methodof extending access to services (eg, providing services toindividuals who experience barriers to attending traditionalface-to-face sessions), but that face-to-face services should stillbe offered, especially for students experiencing more complexmental or behavioral health challenges. Some concern was alsoexpressed regarding the use of text-based therapy as a“Band-Aid” in place of larger systemic changes that may benecessary to address existing disparities in access to mental andbehavioral health services.
Strengths and LimitationsThere were several strengths of this study. First, this study wasthe first to assess perceptions of text-based therapy services in
JMIR Mhealth Uhealth 2022 | vol. 10 | iss. 7 | e34102 | p.67https://mhealth.jmir.org/2022/7/e34102(page number not for citation purposes)
Blair et alJMIR MHEALTH AND UHEALTH
XSL•FORenderX

graduate students, a key population at high risk for thedevelopment (and worsening) of mental and behavioral healthconditions [5]. Second, the mixed methods approach provideda deeper understanding of participants’perceptions of text-basedtherapy than would have been possible using only quantitativeanalysis approaches, allowing us to not only observe differencesin perceived effectiveness between the services but also toprovide potential avenues for future research andimplementation. Finally, data were coded independently by tworesearchers (SAB and ANB), which minimized the impact ofindividual bias on thematic coding.
This study also had important limitations. The sample wascomprised primarily of heterosexual, non-Hispanic Whitewomen, which limits the generalizability of results. TheUniversity of Florida has a status as a predominately Whiteinstitution, with 56.6% of students identifying as White in 2019[37]. Thus, the results may not be generalizable to institutionsof other classifications, such as historically Black colleges oruniversities. In addition, the sample included only graduateassistants at the University of Florida. These graduate studentshave a position that funds their education costs and provides ahealth insurance plan. It is possible that there are differences inperceptions of text-based counseling between graduate assistantswho have the GatorGradCare insurance plan versus othergraduate students who do not work for the university, who haveother forms of insurance, or who have no health insurance atall. It is also unclear how these perceptions may differ bysocioeconomic status, which is a variable worth exploring infuture studies. Finally, the low rates of awareness of text-basedtherapy may be attributed to the novelty of the modality and
the recent availability of the service; text-based therapy servicesbecame available within GatorCare only 3 months before theinitiation of the study [38]. GatorCare used a variety of differentmethodologies to increase awareness surrounding this benefit,including tabling at the new graduate student orientation andsending an email campaign to GatorGradCare subscribers;however, it appears that these initiatives were only partiallysuccessful in increasing awareness of the benefit and oftext-based therapy as a therapy modality.
ConclusionsThis study provided novel insights regarding perceptions oftext-based therapy among graduate students. Most participantsreported that they would consider using text-based therapy;however, participants reported that they were less likely to seekthese services compared with traditional face-to-face therapy.Although participants felt that text-based therapy had severaladvantages (eg, the ability to increase access to mental andbehavioral health services in both a convenient and cost-efficientway), most perceived text-based therapy as less effective thantraditional face-to-face therapy. Altogether, results suggest thattext-based therapy may hold potential to increase access to anduse of mental and behavioral health services but that concernsremain regarding its effectiveness and how it should best beimplemented. Future research should focus on methods tofacilitate effective therapeutic processes in digital environments(eg, using aspects of communication unique to digital mediumsto improve communication of emotion, mood, and tone) andon how text-based therapy services could be best implementedto supplement and extend, rather than replace, face-to-faceservices.
AcknowledgmentsThe authors would like to thank GatorCare at the University of Florida, along with all GatorGradCare participants who completedthe study survey.
Conflicts of InterestNone declared.
References1. Bose J. Key Substance Use and Mental Health Indicators in the United States: Results from the 2017 National Survey on
Drug Use and Health. Rockville, MD: Center for Behavioral Health Statistics and Quality, Substance Abuse and MentalHealth Services Administration; 2017:124.
2. Mental illness. National Institute of Mental Health. URL: https://www.nimh.nih.gov/health/statistics/mental-illness [accessed2022-02-02]
3. Mathers C. The Global Burden of Disease: 2004 Update. Geneva, Switzerland: World Health Organization; 2008:34-35.4. Whiteford HA, Ferrari AJ, Degenhardt L, Feigin V, Vos T. The global burden of mental, neurological and substance use
disorders: an analysis from the Global Burden of Disease Study 2010. PLoS One 2015;10(2):e0116820 [FREE Full text][doi: 10.1371/journal.pone.0116820] [Medline: 25658103]
5. Evans TM, Bira L, Gastelum JB, Weiss LT, Vanderford NL. Evidence for a mental health crisis in graduate education. NatBiotechnol 2018 Mar 06;36(3):282-284. [doi: 10.1038/nbt.4089] [Medline: 29509732]
6. Levecque K, Anseel F, De Beuckelaer A, Van der Heyden J, Gisle L. Work organization and mental health problems inPhD students. Res Policy 2017 May;46(4):868-879. [doi: 10.1016/j.respol.2017.02.008]
7. Khoury B, Ammar J. Cognitive behavioral therapy for treatment of primary care patients presenting with psychologicaldisorders. Libyan J Med 2014 Jan;9(1):24186 [FREE Full text] [doi: 10.3402/ljm.v9.24186] [Medline: 24690496]
8. Craighead WE, Craighead LW. The role of psychotherapy in treating psychiatric disorders. Med Clin North Am 2001May;85(3):617-629. [doi: 10.1016/s0025-7125(05)70332-1] [Medline: 11349476]
JMIR Mhealth Uhealth 2022 | vol. 10 | iss. 7 | e34102 | p.68https://mhealth.jmir.org/2022/7/e34102(page number not for citation purposes)
Blair et alJMIR MHEALTH AND UHEALTH
XSL•FORenderX
9. Wampold BE. The Basics of Psychotherapy: An Introduction to Theory and Practice, 2nd ed. Washington, D.C., UnitedStates: American Psychological Association; 2019:x, 176.
10. Linde K, Sigterman K, Kriston L, Rücker G, Jamil S, Meissner K, et al. Effectiveness of psychological treatments fordepressive disorders in primary care: systematic review and meta-analysis. Ann Fam Med 2015;13(1):56-68 [FREE Fulltext] [doi: 10.1370/afm.1719] [Medline: 25583894]
11. Eisenberg D, Hunt J, Speer N, Zivin K. Mental health service utilization among college students in the United States. JNerv Ment Dis 2011 May;199(5):301-308. [doi: 10.1097/NMD.0b013e3182175123] [Medline: 21543948]
12. Harvey AG, Gumport NB. Evidence-based psychological treatments for mental disorders: modifiable barriers to accessand possible solutions. Behav Res Ther 2015 May;68:1-12 [FREE Full text] [doi: 10.1016/j.brat.2015.02.004] [Medline:25768982]
13. Czyz EK, Horwitz AG, Eisenberg D, Kramer A, King CA. Self-reported barriers to professional help seeking among collegestudents at elevated risk for suicide. J Am Coll Health 2013;61(7):398-406 [FREE Full text] [doi:10.1080/07448481.2013.820731] [Medline: 24010494]
14. Sutton B. The effects of technology in society and education. Digital Common. URL: https://digitalcommons.brockport.edu/cgi/viewcontent.cgi?article=1196&context=ehd_theses [accessed 2022-02-08]
15. Hull T. A preliminary study of talkspace's text-based psychotherapy. Talkspace. 2015. URL: https://terapygoperu.com/static/files/Talkspace-Preliminary-Research-Study.pdf [accessed 2022-01-25]
16. Hoermann S, McCabe KL, Milne DN, Calvo RA. Application of synchronous text-based dialogue systems in mental healthinterventions: systematic review. J Med Internet Res 2017 Jul 21;19(8):e267 [FREE Full text] [doi: 10.2196/jmir.7023][Medline: 28784594]
17. Furber G, Jones GM, Healey D, Bidargaddi N. A comparison between phone-based psychotherapy with and without textmessaging support in between sessions for crisis patients. J Med Internet Res 2014 Oct 08;16(10):e219 [FREE Full text][doi: 10.2196/jmir.3096] [Medline: 25295667]
18. DellaCrosse M, Mahan K, Hull TD. The effect of messaging therapy for depression and anxiety on employee productivity.J technol behav sci 2018 Jun 26;4(1):1-5. [doi: 10.1007/s41347-018-0064-4]
19. Hull TD, Mahan K. A study of asynchronous mobile-enabled SMS text psychotherapy. Telemed J E Health 2017Mar;23(3):240-247. [doi: 10.1089/tmj.2016.0114] [Medline: 27797646]
20. Cook BL, Trinh N, Li Z, Hou SS, Progovac AM. Trends in racial-ethnic disparities in access to mental health care, 2004-2012.Psychiatr Serv 2017 Jan 01;68(1):9-16 [FREE Full text] [doi: 10.1176/appi.ps.201500453] [Medline: 27476805]
21. Personal match. Talkspace. URL: https://tinyurl.com/excjdsye [accessed 2022-01-30]22. Glaser BG. The constant comparative method of qualitative analysis. Soc Problems 1965 Apr;12(4):436-445. [doi:
10.2307/798843]23. Flückiger C, Del Re AC, Wampold B, Horvath A. The alliance in adult psychotherapy: a meta-analytic synthesis.
Psychotherapy (Chic) 2018 Dec;55(4):316-340 [FREE Full text] [doi: 10.1037/pst0000172] [Medline: 29792475]24. Schwartzman CM, Boswell JF. A narrative review of alliance formation and outcome in text-based telepsychotherapy.
Pract Innov 2020 Jun;5(2):128-142. [doi: 10.1037/pri0000120]25. Bambling M, King R, Reid W, Wegner K. Online counselling: the experience of counsellors providing synchronous
single-session counselling to young people. Counsel Psychother Res 2008 Jun;8(2):110-116. [doi:10.1080/14733140802055011]
26. Dowling M, Rickwood D. Online counseling and therapy for mental health problems: a systematic review of individualsynchronous interventions using chat. J Technol Human Service 2013 Jan;31(1):1-21. [doi: 10.1080/15228835.2012.728508]
27. Preschl B, Maercker A, Wagner B. The working alliance in a randomized controlled trial comparing online with face-to-facecognitive-behavioral therapy for depression. BMC Psychiatry 2011 Dec 06;11(1):189. [doi: 10.1186/1471-244x-11-189]
28. Cook JE, Doyle C. Working alliance in online therapy as compared to face-to-face therapy: preliminary results. CyberpsycholBehav 2002 Apr;5(2):95-105. [doi: 10.1089/109493102753770480] [Medline: 12025884]
29. American College Health Association. American College Health Association-National College Health Assessment II:Graduate and Professional Students Reference Group Executive Summary Spring 2018. Silver Spring, MD: AmericanCollege Health Association; 2018:13-16.
30. Benton SA, Heesacker M, Snowden SJ, Lee G. Therapist-assisted, online (TAO) intervention for anxiety in college students:TAO outperformed treatment as usual. Prof Psychol Res Pract 2016 Oct;47(5):363-371. [doi: 10.1037/pro0000097]
31. Fitzpatrick KK, Darcy A, Vierhile M. Delivering cognitive behavior therapy to young adults with symptoms of depressionand anxiety using a fully automated conversational agent (Woebot): a randomized controlled trial. JMIR Ment Health 2017Jun 06;4(2):e19 [FREE Full text] [doi: 10.2196/mental.7785] [Medline: 28588005]
32. Vaidya V, Partha G, Karmakar M. Gender differences in utilization of preventive care services in the United States. JWomens Health (Larchmt) 2012 Feb;21(2):140-145. [doi: 10.1089/jwh.2011.2876] [Medline: 22081983]
33. Bourdon JL, Moore AA, Long EC, Kendler KS, Dick DM. The relationship between on-campus service utilization andcommon mental health concerns in undergraduate college students. Psychol Serv 2020 Feb;17(1):118-126 [FREE Full text][doi: 10.1037/ser0000296] [Medline: 30299149]
JMIR Mhealth Uhealth 2022 | vol. 10 | iss. 7 | e34102 | p.69https://mhealth.jmir.org/2022/7/e34102(page number not for citation purposes)
Blair et alJMIR MHEALTH AND UHEALTH
XSL•FORenderX

34. Turner JC, Keller A. College health surveillance network: epidemiology and health care utilization of college students atUS 4-year universities. J Am Coll Health 2015;63(8):530-538 [FREE Full text] [doi: 10.1080/07448481.2015.1055567][Medline: 26086428]
35. Sussman LK, Robins LN, Earls F. Treatment-seeking for depression by black and white Americans. Soc Sci Med 1987Jan;24(3):187-196. [doi: 10.1016/0277-9536(87)90046-3]
36. Nam SK, Chu HJ, Lee MK, Lee JH, Kim N, Lee SM. A meta-analysis of gender differences in attitudes toward seekingprofessional psychological help. J Am Coll Health 2010;59(2):110-116. [doi: 10.1080/07448481.2010.483714] [Medline:20864437]
37. Facts. Institutional Planning and Research- University of Florida. URL: https://ir.aa.ufl.edu/uffacts/enrollment-1/ [accessed2022-02-05]
38. Talkspace - a free text-based therapy option for UF graduate assistants. News Notes Info ABE Graduate Students. URL:http://uf-abegrad.blogspot.com/2018/12/talkspace-free-text-based-therapy.html [accessed 2022-02-03]
Edited by L Buis; submitted 06.10.21; peer-reviewed by S Benton, L Günthner; comments to author 30.01.22; revised version received25.03.22; accepted 02.05.22; published 07.07.22.
Please cite as:Blair SA, Brockmann AN, Arroyo KM, Carpenter CA, Ross KMAwareness, Acceptability, and Perceived Effectiveness of Text-Based Therapy Among Graduate Students: Cross-sectional StudyJMIR Mhealth Uhealth 2022;10(7):e34102URL: https://mhealth.jmir.org/2022/7/e34102 doi:10.2196/34102PMID:35797098
©Samari A Blair, Andrea N Brockmann, Kelsey M Arroyo, Chelsea A Carpenter, Kathryn M Ross. Originally published in JMIRmHealth and uHealth (https://mhealth.jmir.org), 07.07.2022. This is an open-access article distributed under the terms of theCreative Commons Attribution License (https://creativecommons.org/licenses/by/4.0/), which permits unrestricted use, distribution,and reproduction in any medium, provided the original work, first published in JMIR mHealth and uHealth, is properly cited.The complete bibliographic information, a link to the original publication on https://mhealth.jmir.org/, as well as this copyrightand license information must be included.
JMIR Mhealth Uhealth 2022 | vol. 10 | iss. 7 | e34102 | p.70https://mhealth.jmir.org/2022/7/e34102(page number not for citation purposes)
Blair et alJMIR MHEALTH AND UHEALTH
XSL•FORenderX

Original Paper
Comparison of Accelerometry-Based Measures of PhysicalActivity: Retrospective Observational Data Analysis Study
Marta Karas1*, MS, PhD; John Muschelli1*, MS, PhD; Andrew Leroux2, MS, PhD; Jacek K Urbanek3, MEng, PhD;
Amal A Wanigatunga4, MPH, PhD; Jiawei Bai1, MS, PhD; Ciprian M Crainiceanu1, MS, PhD; Jennifer A Schrack3,4,MS, PhD1Department of Biostatistics, Bloomberg School of Public Health, Johns Hopkins University, Baltimore, MD, United States2Department of Biostatistics and Informatics, Colorado School of Public Health, University of Colorado, Aurora, CO, United States3Center on Aging and Health, Division of Geriatric Medicine and Gerontology, Department of Medicine, School of Medicine, Johns Hopkins University,Baltimore, MD, United States4Department of Epidemiology, Bloomberg School of Public Health, Johns Hopkins University, Baltimore, MD, United States*these authors contributed equally
Corresponding Author:Jennifer A Schrack, MS, PhDDepartment of EpidemiologyBloomberg School of Public HealthJohns Hopkins University615 N Wolfe StBaltimore, MD, 21205United StatesPhone: 1 410 303 1723Email: [email protected]
Abstract
Background: Given the evolution of processing and analysis methods for accelerometry data over the past decade, it is importantto understand how newer summary measures of physical activity compare with established measures.
Objective: We aimed to compare objective measures of physical activity to increase the generalizability and translation offindings of studies that use accelerometry-based data.
Methods: High-resolution accelerometry data from the Baltimore Longitudinal Study on Aging were retrospectively analyzed.Data from 655 participants who used a wrist-worn ActiGraph GT9X device continuously for a week were summarized at theminute level as ActiGraph activity count, monitor-independent movement summary, Euclidean norm minus one, mean amplitudedeviation, and activity intensity. We calculated these measures using open-source packages in R. Pearson correlations betweenactivity count and each measure were quantified both marginally and conditionally on age, sex, and BMI. Each measures pairwas harmonized using nonparametric regression of minute-level data.
Results: Data were from a sample (N=655; male: n=298, 45.5%; female: n=357, 54.5%) with a mean age of 69.8 years (SD14.2) and mean BMI of 27.3 kg/m2 (SD 5.0). The mean marginal participant-specific correlations between activity count andmonitor-independent movement summary, Euclidean norm minus one, mean amplitude deviation, and activity were r=0.988 (SE0.0002324), r=0.867 (SE 0.001841), r=0.913 (SE 0.00132), and r=0.970 (SE 0.0006868), respectively. After harmonization, meanabsolute percentage errors of predicting total activity count from monitor-independent movement summary, Euclidean normminus one, mean amplitude deviation, and activity intensity were 2.5, 14.3, 11.3, and 6.3, respectively. The accuracies forpredicting sedentary minutes for an activity count cut-off of 1853 using monitor-independent movement summary, Euclideannorm minus one, mean amplitude deviation, and activity intensity were 0.981, 0.928, 0.904, and 0.960, respectively. An R softwarepackage called SummarizedActigraphy, with a unified interface for computation of the measures from raw accelerometry data,was developed and published.
Conclusions: The findings from this comparison of accelerometry-based measures of physical activity can be used by researchersand facilitate the extension of knowledge from existing literature by demonstrating the high correlation between activity countand monitor-independent movement summary (and other measures) and by providing harmonization mapping.
JMIR Mhealth Uhealth 2022 | vol. 10 | iss. 7 | e38077 | p.71https://mhealth.jmir.org/2022/7/e38077(page number not for citation purposes)
Karas et alJMIR MHEALTH AND UHEALTH
XSL•FORenderX

(JMIR Mhealth Uhealth 2022;10(7):e38077) doi:10.2196/38077
KEYWORDS
accelerometry; actigraphy; activity counts; wearable computing; monitor-independent movement summary; MIMS; physicalactivity; aging; older adult population; wearable device; health monitoring; digital health; wearable technology; health technology
Introduction
The use of accelerometry-based activity monitors has becomeincreasingly popular in research studies because they providenoninvasive objective measures of physical activity, and withthese monitors, physical activity data can be collectedcontinuously for extended periods of time [1]. Modern wearableaccelerometers measure acceleration of a body at a highfrequency (typically 10-100 Hz). These raw data are thentypically aggregated into fixed-time epochs. Yet, the choice ofepoch-based measures varies across studies. For example, theBaltimore Longitudinal Study on Aging [2] used wrist-wornaccelerometers and summarized data using activity counts, ameasure proposed and implemented by ActiGraph [3].Monitor-independent movement summary [4] was used forwrist-worn accelerometry data collected for the National Healthand Nutrition Examination Survey (NHANES) 2011-2014 [5].The UK Biobank study [6] used wrist-worn accelerometers andEuclidean norm minus one [7]. Additional summary measuresof acceleration are mean amplitude deviation [8] and activityintensity [9].
Given the evolution of processing and analysis methods foraccelerometry data over the past decade, it is important to knowhow new summary measures compare with establishedmeasures. Harmonizing, or mapping, values of physical activitysummaries derived from different algorithms enables knowledgefrom the thousands of manuscripts that have been publishedusing ActiGraph activity count [10] (and for which no repositoryor access to raw accelerometry data is currently available).
In this study, we aimed to (1) provide simple summaries ofassociations between pairs of minute-level measures (ActiGraphactivity count and monitor-independent movement summary,Euclidean norm minus one, mean amplitude deviation, activityintensity) and a guide for the strength of these associations insubgroups defined by demographic information; (2) provide amapping between any 2 physical activity summary measuresconsidered; (3) derive cut-points of open-source physical activitymeasures that correspond to established cut-points to estimatetime spent in different physical activity intensities for activitycount.
Methods
Study Design and PopulationWe conducted a retrospective data analysis study using datacollected as part of the National Institute on Aging’s BaltimoreLongitudinal Study of Aging (BLSA) from participants whowere community-dwelling volunteers free of all major chronicconditions and cognitive and functional impairment at the timeof enrollment [2]. The data used in this work were fromparticipants who agreed to wear an accelerometer between July2015 and January 2019 .
Ethics Approval and Consent to ParticipateThe BLSA study protocol has ongoing approval from theInstitutional Review Board (IRB) of the National Institute ofEnvironmental Health Science, National Institutes of Health("Early Markers of Alzheimer’s Disease [BLSA]", IRB No.2009-074). Informed written consent was obtained from allparticipants.
Accelerometry Data Collection and ExportData had been collected with a triaxial accelerometer (ActiGraphGT9X Link; range: ±8 g; frequency: 80 Hz). Participants hadbeen instructed to wear the accelerometer on their nondominantwrist for 7 days, except for periods of extended swimming orbathing. The ActiLife software (version 6.13.4) was used to (1)export data into GT3X file format, (2) derive and exportminute-level ActiGraph activity count as CSV files, and (3)export raw acceleration data (in g) as three-dimensional timeseries with subsecond-level timestamps into CSV files. TheActiLife's low-frequency extension (a filtering option thatdecreases the lower end of the intensity threshold to increasesensitivity to low-intensity movements) was used based onrecommendations and findings of greater comparability witholder ActiGraph devices (model 7164) [11]. Hereon, activitycount is used to denote ActiGraph activity count.
Raw Accelerometry Data Quality ControlWe used 3 raw data quality check flags (Multimedia Appendix1) adapted from a set of 9 flags in the NHANES protocol [12].The selected flags subset represents intuitive flags that are meantto “determine signal patterns that were unlikely to be a resultof human movement” but are not aimed at identifying nonwear[12]. A raw data observation was valid if none of the 3 flagswere triggered and invalid otherwise.
Summary Measures of Raw Accelerometry DataCommonly used minute-level measures—monitor-independentmovement summary, Euclidean norm minus one, meanamplitude deviation, and activity intensity (MultimediaAppendix 2 [4, 7-9])—were calculated using raw accelerometrydata. With R software (version 3.6.3; The R Project), wedeveloped and used SummarizedActigraphy R package tocompute the measures. SummarizedActigraphy is a packagethat provides a unified data interface to compute a range ofmeasures; it references original software for computingmonitor-independent movement summary (R package:MIMSunit [13], version 0.9.2) and calibrating data forcomputation of Euclidean norm minus one (R package: GGIR[14], version 2.3).
Minute-Level Accelerometry Data PreprocessingWe defined minute-level data flags that represented whetherthe device was being worn or not using the get_wear_flagmethod (R package: arctools [15]; version 1.1.4), which
JMIR Mhealth Uhealth 2022 | vol. 10 | iss. 7 | e38077 | p.72https://mhealth.jmir.org/2022/7/e38077(page number not for citation purposes)
Karas et alJMIR MHEALTH AND UHEALTH
XSL•FORenderX

implements a wear status detection algorithm based on activitycount data [16]. A given minute was classified as nonwear if itbelonged to a 90-minute interval with consecutive 0-values inactivity count data; otherwise, the minute was classified as wear.A given minute was valid if no raw data-level quality controlflags had been triggered within the minute and it had beenclassified as wear, and invalid otherwise. A valid day wasdefined as a day (12:00 AM to 11:59 PM) with no more than10% (144 minutes) [17] invalid minutes. Only data fromparticipants who had at least 3 valid days of data, and only datafrom valid days, were included in further preprocessing andanalyses.
Activity count, monitor-independent movement summary,Euclidean norm minus one, mean amplitude deviation, andactivity intensity data were winsorized [18] to reduce the effectof extreme values in the data set, by computing themeasure-specific 0.999 quantile and then using it to replacevalues that exceeded this quantile.
A separate data set was constructed with imputed data, using amethod described in [19]. Imputation was conducted separatelyfor each measure: invalid minutes were replaced withcorresponding values from smoothed time series produced usingfunctional principal component analysis of the originalparticipant- and day-specific minute-level time series (in whichinvalid minutes data had been denoted by NA). We used thefpca.face method (R package: refund [20], version 0.1.23) forfunctional principal component analysis due to its computationalspeed and given the large volume of data. The resulting dataset was used in the summary of daily sums of measures valuesand in our application example where data without missingvalues were needed.
Statistical Data AnalysisThe mean daily sums of minute-level measures were computedfor each participant and then aggregated (mean and SD; medianand range) across participants.
Pearson correlation coefficients for 4 pairs of measures—activitycount and monitor-independent movement summary, activitycount and Euclidean norm minus one, activity count and meanamplitude deviation, and activity count and activityintensity—were computed for each participant. For each pair,mean correlations and standard errors were quantified usingintercept-only linear regression with participant-specificcorrelation as the outcome. The effects of demographiccharacteristics (covariates: age, BMI, and sex) on correlationswere estimated using adjusted linear regression withparticipant-specific correlation as the outcome and α=.05 todetermine the statistical significance of coefficients. Thisprocedure was repeated for secondary analyses with a subsample(participants’ age ≤65 years).
Harmonization
MappingTo derive the harmonization mapping, relationships wereestimated using generalized additive modeling for each pair ofmeasures. The generalized additive models were chosen to allowflexible adaptation to the data rather than imposing a particular
functional form of the fit. In each model, the outcome was aminute-level measure (monitor-independent movementsummary, or Euclidean norm minus one, or mean amplitudedeviation, or activity intensity), and a smooth term ofminute-level activity count was set as a predictor. For the smoothterm, cubic regression splines with a basis dimension equal to30 were used to allow a flexible relationship between themeasure and activity count. Models were estimated withnonparametric smoothing (method: gam; R package: mgcv [21],version 1.8.34). Smoothness of the nonlinear effects wasenforced via a second derivative penalty, and parameter selectionwas performed using cross-validation [22]. Data from allparticipants' valid minutes were used in the model fitting exceptfor minutes, which had activity count values equal 0. Theactivity count=0 exclusion was motivated by a large proportionof zero values, and the need to estimate the relation for smallactivity count values without it being inflated by the largenumber of zeros. Relationships were estimated as strictlymonotonic (without monotonicity having been constrainedexplicitly). The generalized additive model was used to providevalues for 2-way mapping between activity count and eachmeasure. All measurements were mapped into activity count,
where (x) represents the activity count value estimated bymapping the x value of a measure, where measure representsmonitor-independent movement summary, Euclidean normminus one, mean amplitude deviation, or activity intensity.
EvaluationTo assess mapping accuracy in estimating physical activityvolume statistics, total activity count (the sum of minute-levelactivity count values from a day) was computed for each
participant, using activity count data and , and the differencewas defined the estimation error. Estimation error wassummarized by calculating mean percentage error (MPE), meanabsolute percentage error (MAPE), median percentage error,and median absolute percentage error for each participant andaggregated across participants (mean and SD).
To assess whether mapping accuracy depended on participantactivity level, MPE values were plotted against the participant'saverage total activity count.
The utility of the mapping for classifying minutes into variousactivity intensity classes was assessed. We used activity countcut-offs derived to (1) separate sedentary and active minutes indata collected with a sensor worn on nondominant wrist in olderadults [23], (2) separate sedentary from light and (3) light frommoderate-to-vigorous activity intensity levels in data collectedwith a sensor worn on a nondominant wrist in young to olderadults [24]. In the classification task, for each minute, the truevalue was defined based on whether activity count > cut-off,
and the predicted value was defined based on whether >cut-off. Accuracy, sensitivity, and specificity were computedfor each participant and aggregated across participants (meanand SD).
Minute-Level Patterns of Daily Physical Activity
Minute-level activity count and were used to estimatesmoothed 24-hour time series of median activity count for age
JMIR Mhealth Uhealth 2022 | vol. 10 | iss. 7 | e38077 | p.73https://mhealth.jmir.org/2022/7/e38077(page number not for citation purposes)
Karas et alJMIR MHEALTH AND UHEALTH
XSL•FORenderX

groups <60 years, 60-67 years, 68-74 years, and ≥75 years, forwhich 24-hour time series of median activity count havepreviously been published [25]. Activity count–based and
-based estimates were compared by calculating MAPEdefined as sum of absolute value of the difference between apair of estimates divided by sum of activity count-basedestimates.
Results
Population CharacteristicsData from 655 individuals (Table 1) were included in theanalyses. The mean age was 69.8 (SD 14.2, range 22-97) years.There was a higher proportion of women (357/655, 54.5%) thanmen (298/655, 45.5%). The racial composition reflected that ofthe BLSA enrollment [2]. Of the 655 participants, 445
participants (67.9%) were White, 157 (24%) were Black, 44(6.7%) were classified as other race, and 9 participants (1.4%)did not provide this information. Almost 96% of participants(628/655, 95.9%) self-reported good, very good, or excellenthealth. The prevalences of hypertension, high blood cholesterollevels, and osteoarthritis were 43.5% (285/655), 52.8%(346/655), and 48.2% (316/655), respectively. Participants hada median of 6 (range 3-7) days of valid accelerometry data; forvalid days, participants had a mean of 1438 (SD 8) valid minutes(out of 1440 possible minutes per day).
The mean participant daily sums (Table 2) were 2,204,169 (SD600,965) for activity count, 11,299.7 (SD 2766.0) formonitor-independent movement summary, 47.7 (SD 13.3) formean amplitude deviation, 30.9 (SD 9.1) for Euclidean normminus one, and 4157.6 (SD 1068.8) for activity intensity.
JMIR Mhealth Uhealth 2022 | vol. 10 | iss. 7 | e38077 | p.74https://mhealth.jmir.org/2022/7/e38077(page number not for citation purposes)
Karas et alJMIR MHEALTH AND UHEALTH
XSL•FORenderX

Table 1. Study sample (N=655) characteristics.
ValueCharacteristic
Sociodemographic
Age
69.8 (14.2)Mean (SD)
72.0 (22.0-97.0)Median (range)
Weight (kg)
77.4 (17.1)Mean (SD)
76.3 (41.1-142.7)Median (range)
Height (cm)
168.0 (9.2)Mean (SD)
167.3 (143.8-196.2)Median (range)
BMI
27.3 (5.0)Mean (SD)
26.6 (17.1-52.5)Median (range)
Sex
357 (54.5)Female count (%)
298 (45.5)Male count (%)
Race
445 (67.9)White count (%)
157 (24.0)Black count (%)
30 (4.6)Chinese count (%)
11 (1.7)Hawaiian count (%)
3 (0.5)Other non-White count (%)
9 (1.4)Not reported count (%)
Sensor wear
Valid days
5.9 (0.4)Mean (SD)
6.0 (3.0, 7.0)Median (range)
Nonwear minutes (/day)
2.0 (7.8)Mean (SD)
0.0 (0.0, 77.0)Median (range)
Valid minutes (/day)
1437.8 (8.0)Mean (SD)
1440.0 (1361.7-1440.0)Median (range)
Health
Self-reported health
628 (95.9)Good, very good, or excellent count (%)
22 (3.4)Fair or poor count (%)
5 (0.8)Not reported count (%)
Medical history
55 (8.4)Myocardial infarction, congestive heart failure, ischemic chest pain,vascular procedure, or peripheral artery disease count (%)
285 (43.5)Hypertension count (%)
JMIR Mhealth Uhealth 2022 | vol. 10 | iss. 7 | e38077 | p.75https://mhealth.jmir.org/2022/7/e38077(page number not for citation purposes)
Karas et alJMIR MHEALTH AND UHEALTH
XSL•FORenderX
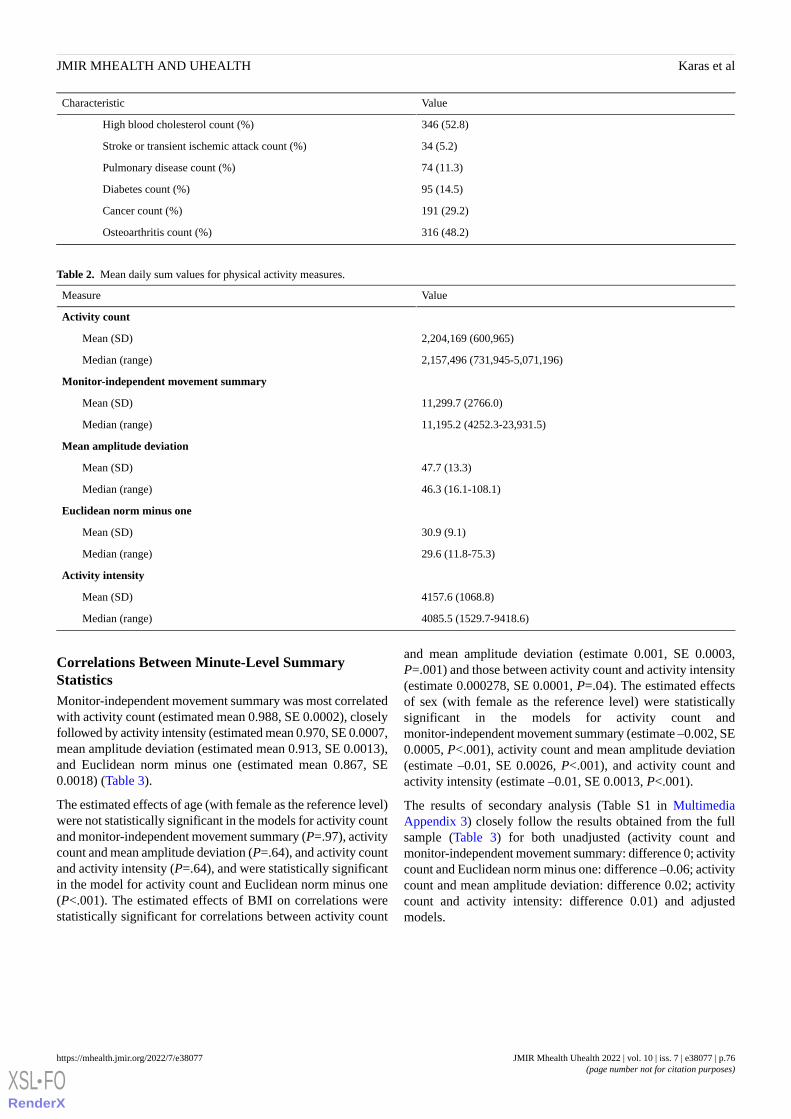
ValueCharacteristic
346 (52.8)High blood cholesterol count (%)
34 (5.2)Stroke or transient ischemic attack count (%)
74 (11.3)Pulmonary disease count (%)
95 (14.5)Diabetes count (%)
191 (29.2)Cancer count (%)
316 (48.2)Osteoarthritis count (%)
Table 2. Mean daily sum values for physical activity measures.
ValueMeasure
Activity count
2,204,169 (600,965)Mean (SD)
2,157,496 (731,945-5,071,196)Median (range)
Monitor-independent movement summary
11,299.7 (2766.0)Mean (SD)
11,195.2 (4252.3-23,931.5)Median (range)
Mean amplitude deviation
47.7 (13.3)Mean (SD)
46.3 (16.1-108.1)Median (range)
Euclidean norm minus one
30.9 (9.1)Mean (SD)
29.6 (11.8-75.3)Median (range)
Activity intensity
4157.6 (1068.8)Mean (SD)
4085.5 (1529.7-9418.6)Median (range)
Correlations Between Minute-Level SummaryStatisticsMonitor-independent movement summary was most correlatedwith activity count (estimated mean 0.988, SE 0.0002), closelyfollowed by activity intensity (estimated mean 0.970, SE 0.0007,mean amplitude deviation (estimated mean 0.913, SE 0.0013),and Euclidean norm minus one (estimated mean 0.867, SE0.0018) (Table 3).
The estimated effects of age (with female as the reference level)were not statistically significant in the models for activity countand monitor-independent movement summary (P=.97), activitycount and mean amplitude deviation (P=.64), and activity countand activity intensity (P=.64), and were statistically significantin the model for activity count and Euclidean norm minus one(P<.001). The estimated effects of BMI on correlations werestatistically significant for correlations between activity count
and mean amplitude deviation (estimate 0.001, SE 0.0003,P=.001) and those between activity count and activity intensity(estimate 0.000278, SE 0.0001, P=.04). The estimated effectsof sex (with female as the reference level) were statisticallysignificant in the models for activity count andmonitor-independent movement summary (estimate –0.002, SE0.0005, P<.001), activity count and mean amplitude deviation(estimate –0.01, SE 0.0026, P<.001), and activity count andactivity intensity (estimate –0.01, SE 0.0013, P<.001).
The results of secondary analysis (Table S1 in MultimediaAppendix 3) closely follow the results obtained from the fullsample (Table 3) for both unadjusted (activity count andmonitor-independent movement summary: difference 0; activitycount and Euclidean norm minus one: difference –0.06; activitycount and mean amplitude deviation: difference 0.02; activitycount and activity intensity: difference 0.01) and adjustedmodels.
JMIR Mhealth Uhealth 2022 | vol. 10 | iss. 7 | e38077 | p.76https://mhealth.jmir.org/2022/7/e38077(page number not for citation purposes)
Karas et alJMIR MHEALTH AND UHEALTH
XSL•FORenderX

Table 3. Summary of intercept-only linear regression and adjusted linear regression with outcome defined as participant-specific correlation betweenactivity count and other measures (monitor-independent movement summary, Euclidean norm minus one, mean amplitude deviation, or activity intensity).
SexbBMIAgeInterceptModel and response variablea
P valueEstimate (SE)P valueEstimate (SE)P valueEstimate (SE)Estimate (SE)
Unadjusted
——————c0.988042
(0.000232)
Monitor-independent move-ment summary
——————0.867158
(0.001841)
Euclidean norm minus one
——————0.913412
(0.001320)
Mean amplitude deviation
——————0.969984
(0.000687)
Activity intensity
Adjusted for age, BMI, and sex
<.001–0.001859(0.000466)
.480.000032(0.000046)
.970.000001
(0.000016)
0.987969
(0.001744)
Monitor-independent move-ment summary
.96–0.000206(0.003678)
.070.000653(0.000363)
<.001–0.000532
(0.000129)
0.886566
(0.013766)
Euclidean norm minus one
<.001–0.010410(0.002632)
.0010.000840(0.000260)
.640.000044
(0.000092)
0.892177
(0.009852)
Mean amplitude deviation
<.001–0.009576(0.001340)
.040.000278(0.000132)
.180.000063
(0.000047)
0.962364
(0.005016)
Activity intensity
aCorrelation with activity count.bFemale was used as the reference.cNot included in the model.
Mapping Between Minute-Level Summary Measures
Model FitFigure 1 shows the estimated association between minute-levelactivity count (x-axis) and minute-level monitor-independentmovement summary, Euclidean norm minus one, meanamplitude deviation, and activity intensity (y-axis). The black
solid line represents fitted values obtained from generalizedadditive models.
For a widely used activity count cut-off 1853 [23], thecorresponding cut-offs (Table 4) were 10.558(monitor-independent movement summary), 0.022 (Euclideannorm minus one), 0.039 (mean amplitude deviation), and 3.620(activity intensity).
JMIR Mhealth Uhealth 2022 | vol. 10 | iss. 7 | e38077 | p.77https://mhealth.jmir.org/2022/7/e38077(page number not for citation purposes)
Karas et alJMIR MHEALTH AND UHEALTH
XSL•FORenderX

Figure 1. Estimated minute-level mapping. A black solid line shows generalized additive model–fitted values of a measure (monitor-independentmovement summary, Euclidean norm minus one, mean amplitude deviation, activity intensity) given the activity count value. The points represent asubset of the data created by taking every 100th observations from all participant- and minute-specific observations; this subset is the same for all 4plots. AC: activity count; AI: activity intensity; ENMO: Euclidean norm minus one; MAD: mean amplitude deviation; MIMS: monitor-independentmovement summary.
Table 4. Corresponding values of each measure for activity count cut-off values.
Corresponding valueActivity countcut-off value
Method
Activity intensityMean amplitudedeviation
Euclidean normminus one
Monitor-independentmovement summary
3.6200.0390.02210.5581853Separate sedentary and active in older adults[23]
5.2730.0570.03315.0472860Separate sedentary and light activity inyoung to older adults [24]
7.0250.0780.04619.6143940Separate light and moderate-to-vigorousactivity in young to older adults [24]
Mapping EvaluationIn the task of estimating total activity count, MAPE values werelowest for monitor-independent movement summary (mean 2.5,SD 2.4), followed by activity intensity (mean 6.3, SD 5.1), meanamplitude deviation (mean 11.3, SD 8.4), and Euclidean normminus one (mean 14.3, SD 10.3). MPE values were similar formonitor-independent movement summary (mean 0.2, SD 3.2),activity intensity (mean 0.3, SD 7.6), mean amplitude deviation(mean –0.3, SD 13.3), and Euclidean norm minus one (mean4.6, SD 16.1). The findings for median absolute percentageerror and median percentage error were similar to those forMAPE and MPE, respectively (Table S2 in MultimediaAppendix 3).
Based on visual inspection, there was larger variability in MPEvalues among participants with smaller mean total activity countvalues, but there was no apparent tendency for lower or higherMPE values based on participants’ average total activity counts(Figure S1 in Multimedia Appendix 3).
In the task of predicting whether the activity count for a givenminute was above a certain cut-off, for the cut-off equal 1853,participant-specific classification accuracy (Table S3 inMultimedia Appendix 3) was the highest formonitor-independent movement summary (mean 0.981, SD0.005), followed by activity intensity (mean 0.960, SD 0.012),mean amplitude deviation (mean 0.928, SD 0.021), andEuclidean norm minus one (mean 0.904, SD 0.028). Overall,the accuracy of predicting whether the activity count for a given
JMIR Mhealth Uhealth 2022 | vol. 10 | iss. 7 | e38077 | p.78https://mhealth.jmir.org/2022/7/e38077(page number not for citation purposes)
Karas et alJMIR MHEALTH AND UHEALTH
XSL•FORenderX

minute was above a certain cut-off was better for higher activitycount cut-off values (ie, accuracy was higher for predictingwhether a given minute has activity count >3940 than forpredicting whether a given minute activity count >2860; TableS3 in Multimedia Appendix 3). This is consistent with ourobservation that the variability along the estimated mapping islower for higher activity values (Figure S1 in MultimediaAppendix 3).
Minute-Level Patterns of Daily Physical ActivityFigure 2 shows the estimated smoothed 24-hour median activitycounts across the previously published age groups: <60-yearold (green; N = 140), 60- to 67-year old (red; N = 102), 68- to
74-year old (blue; N = 129), ≥ 75-year old (orange; N = 284).Semi-transparent thick colour lines represent results obtainedwith activity count.Solid thin colour lines represent results
obtained with .
The -based curves yielded roughly the same information asthe activity count-based curves [25] for each age group (<60years: n=140; 60-67 years: n=102; 68-74 years: n=129; ≥75
years: n=284). MAPE for activity count-based and -basedestimates was the lowest for monitor-independent movementsummary (MAPE 3.2), followed by activity intensity (MAPE6.7), mean amplitude deviation (MAPE 11.1), and Euclideannorm minus one (MAPE 12.5).
Figure 2. Smoothed 24-hour median activity counts per minute for each age group: <60 years (green), 60-67 years (red), 68-74 years (blue), and ≥75years (orange). Semitransparent thick colored lines represent results obtained with activity count; they are the same for all 4 plots. Solid thin coloredlines represent results obtained with values mapped into activity count from monitor-independent movement summary, Euclidean norm minus one,mean amplitude deviation, or activity intensity. AC: activity count; AI: activity intensity; ENMO: Euclidean norm minus one; MAD: mean amplitudedeviation; MIMS: monitor-independent movement summary.
Discussion
Principal ResultsCorrelations between activity count and the other raw datasummary metrics were all large (mean r≥0.87) and wereespecially high for monitor-independent movement summaryand activity intensity (mean r≥0.97) (Table 3). Afterharmonization, monitor-independent movement summaryallowed for excellent accuracy in predicting total activity countand sedentary minutes using a cut-off that corresponded to anactivity count cut-off determined using [23]. Our analysis isespecially timely given the recent release of physical activitydata from NHANES 2011-2014 that uses the open-sourcemonitor-independent movement summary measure.
To the best of our knowledge, the correlation between activitycount and monitor-independent movement summary incontinuous data collected in the free-living environment hasnot been previously explored. The activity count measure hadthe highest mean participant-specific correlation withmonitor-independent movement summary (mean r= 0.988),closely followed by activity intensity (mean r=0.97), and meanamplitude deviation (mean r=0.913) and Euclidean norm minusone (mean r=0.867). Both monitor-independent movementsummary and activity intensity measures are based on variabilitywithin each dimension, whereas mean amplitude deviation andEuclidean norm minus one are based on the Euclidean norm ofthree-dimensional data; therefore, it is consistent withexpectations that monitor-independent movement summary andactivity intensity behave similarly and demonstrate similar
JMIR Mhealth Uhealth 2022 | vol. 10 | iss. 7 | e38077 | p.79https://mhealth.jmir.org/2022/7/e38077(page number not for citation purposes)
Karas et alJMIR MHEALTH AND UHEALTH
XSL•FORenderX

correlations with activity count. While we found there werestatistically significant effects of age (in the model forcorrelation between activity count and Euclidean norm minusone: P<.001), BMI (in the model for correlation between activitycount and mean amplitude deviation: P=.001; in the model forcorrelation between activity count and activity intensity: P=.04),and sex (in the model for correlation between activity count andmonitor-independent movement summary: P<.001; in the modelfor activity count and mean amplitude deviation: P<.001; in themodel for activity count and activity intensity: P<.001), theeffect sizes were of very small magnitude. In particular, theanalysis showed that monitor-independent movement summaryhad a correlation with activity count that did not differsignificantly for age (P=.97) or BMI (P=.48), and differedsignificantly (P<.001) between men and women by a magnitudeof 0.002. The results from secondary analysis, with a subsampleof the youngest participants (participants of age 65 years or less;31.9% of the full sample), were similar to those from the fullsample.
Harmonization mapping can be particularly useful to translatecommonly used cut-off values of physical activity intensitylevels from activity count into measures implemented inopen-source software. For the tasks of predicting sedentaryminutes for an activity count cut-off of 1853 [23], we observedexcellent accuracy for monitor-independent movement summary(accuracy 0.981) and activity intensity (accuracy 0.960). Theutility of the derived mapping was demonstrated in the examplein which previous findings [25] were replicated. The physicalactivity volume daily trajectories for age groups obtained withactivity count were closely matched with those from themeasures, with monitor-independent movement summaryyielding visually almost identical results (MAPE 3.2), followedby activity intensity (MAPE 6.7), mean amplitude deviation(MAPE 11.1), and Euclidean norm minus one (MAPE 12.5).
To the best of our knowledge, we are the first to provide freelyavailable R software (SummarizedActigraphy R package) witha unified interface for computation of the 4 open-sourcemeasures from raw accelerometry data, with complicatedmathematical formulas distilled into a reader-friendly text(Multimedia Appendix 2).
LimitationsFirst, the data were from a sample that consisted ofpredominantly middle-aged to older adults (Table 1). However,
we observed that (1) the level of activity of adults in the sampleranged from sedentary to moderate and vigorous activity, (2)mapping results did not exhibit any trend based on the averagelevel of the participant's physical activity, and (3) the variabilityof estimates was lower for higher activity values, which suggeststhat mapping could prove useful in future studies with younger(more active) populations [25].
Second, physical activity measures were computed using rawaccelerometry data collected at a frequency of 80 Hz. Whilethis frequency matches that of physical activity data fromNHANES 2011-2014 [12] that uses the monitor-independentmovement summary measure, caution should be used in adaptingour harmonization mapping to raw data collected at a differentfrequency.
Third, data had been collected with sensors worn on thenondominant wrist only. While we expect the results to begeneralizable to data from sensors worn on the dominant wrist,we presume that correlations and mapping would not beapplicable to chest- or hip-worn sensors, because physicalactivity volume statistics (eg, total activity count) calculatedfrom raw data collected by these devices are expected to besubstantially lower than when measured at wrist.
Fourth, harmonization mapping was estimated using generalizedadditive modeling, which does not offer an easy, closed-formformula of the transformation. While a closed-form formulacould be obtained using polynomial regression models, thechoice of generalized additive models allowed for thoroughestimation of a relationship between activity count and othermeasures in a more flexible way.
Finally, our results may be conditional upon the datapreprocessing methods used; however, we believe that the stepswe performed are commonly done [17,19] and are reasonablegiven the obtained data summary statistics and visual qualitychecks performed.
ConclusionsActivity count was highly correlated with monitor-independentmovement summary, Euclidean norm minus one, meanamplitude deviation, and activity intensity. Mapping providesa way to harmonize accelerometry data sets with differentsummary measures; however, further research is warranted totest the validity of mapping with data collected at a differentfrequency or from different body locations.
AcknowledgmentsThis work was funded by National Institute on Aging (grant U01AG057545) and a Johns Hopkins University Catalyst Award.
Data AvailabilityData used in this manuscript were collected as part of the National Institute on Aging’s Baltimore Longitudinal Study of Aging.A project repository with all data preprocessing and analysis code is publicly available on GitHub (muschellij2/blsa_mims).
Authors' ContributionsMK implemented the final version of the analyses and took the lead in finalizing the manuscript. JM co-initiated the work, wrotethe first draft of this manuscript and the analyses, and authored the SummarizedActigraphy package. CMC provided scientific
JMIR Mhealth Uhealth 2022 | vol. 10 | iss. 7 | e38077 | p.80https://mhealth.jmir.org/2022/7/e38077(page number not for citation purposes)
Karas et alJMIR MHEALTH AND UHEALTH
XSL•FORenderX

input and provided major edits to the manuscript draft. JAS co-initiated the work, provided scientific input, and led the interpretationof results. AL, JKU, AAW, and JB provided scientific input and helped with the interpretation of results. All authors providedcritical feedback and helped shape the research, analysis, and manuscript.
Conflicts of InterestCMC is a consultant for Bayer and Johnson and Johnson. Both these consulting contracts have been disclosed through the JohnsHopkins University Edisclose system. The current manuscript is not related to or influenced by any of these contracts.
Multimedia Appendix 1Raw accelerometry data quality control.[DOCX File , 24 KB - mhealth_v10i7e38077_app1.docx ]
Multimedia Appendix 2Open-source summary measures of raw accelerometry data.[DOCX File , 30 KB - mhealth_v10i7e38077_app2.docx ]
Multimedia Appendix 3Results.[DOCX File , 835 KB - mhealth_v10i7e38077_app3.docx ]
References1. Karas M, Bai J, Strączkiewicz M, Harezlak J, Glynn NW, Harris T, et al. Accelerometry data in health research: challenges
and opportunities. Stat Biosci 2019 Jul;11(2):210-237 [FREE Full text] [doi: 10.1007/s12561-018-9227-2] [Medline:31762829]
2. Kuo P, Schrack JA, Shardell MD, Levine M, Moore AZ, An Y, et al. A roadmap to build a phenotypic metric of ageing:insights from the Baltimore Longitudinal Study of Aging. J Intern Med 2020 Apr;287(4):373-394 [FREE Full text] [doi:10.1111/joim.13024] [Medline: 32107805]
3. Neishabouri A, Nguyen J, Samuelsson J, Guthrie T, Biggs M, Wyatt J, et al. Quantification of acceleration as activity countsin ActiGraph wearables. Research Square Preprint posted online on February 22, 2022. [doi: 10.21203/rs.3.rs-1370418/v1]
4. John D, Tang Q, Albinali F, Intille S. An open-source monitor-independent movement summary for accelerometer dataprocessing. J Meas Phys Behav 2019 Dec;2(4):268-281. [doi: 10.1123/jmpb.2018-0068] [Medline: 34308270]
5. Troiano RP, McClain JJ, Brychta RJ, Chen KY. Evolution of accelerometer methods for physical activity research. Br JSports Med 2014 Jul;48(13):1019-1023 [FREE Full text] [doi: 10.1136/bjsports-2014-093546] [Medline: 24782483]
6. Doherty A, Jackson D, Hammerla N, Plötz T, Olivier P, Granat MH, et al. Large Scale Population Assessment of PhysicalActivity Using Wrist Worn Accelerometers: The UK Biobank Study. PLoS One 2017;12(2):e0169649 [FREE Full text][doi: 10.1371/journal.pone.0169649] [Medline: 28146576]
7. van Hees VT, Gorzelniak L, Dean León EC, Eder M, Pias M, Taherian S, et al. Separating movement and gravity componentsin an acceleration signal and implications for the assessment of human daily physical activity. PLoS One 2013 Apr23;8(4):e61691 [FREE Full text] [doi: 10.1371/journal.pone.0061691] [Medline: 23626718]
8. Vähä-Ypyä H, Vasankari T, Husu P, Suni J, Sievänen H. A universal, accurate intensity-based classification of differentphysical activities using raw data of accelerometer. Clin Physiol Funct Imaging 2015 Jan 07;35(1):64-70. [doi:10.1111/cpf.12127] [Medline: 24393233]
9. Bai J, He B, Shou H, Zipunnikov V, Glass TA, Crainiceanu CM. Normalization and extraction of interpretable metricsfrom raw accelerometry data. Biostatistics 2014 Jan 01;15(1):102-116 [FREE Full text] [doi: 10.1093/biostatistics/kxt029][Medline: 23999141]
10. ActiGraph Corp. URL: https://actigraphcorp.com/about-us/#:~:text=Appearing%20in%20more%20than%2017%2C000,grade%20device%20of%20its%20kind [accessed 2022-06-27]
11. Cain KL, Conway TL, Adams MA, Husak LE, Sallis JF. Comparison of older and newer generations of ActiGraphaccelerometers with the normal filter and the low frequency extension. Int J Behav Nutr Phys Act 2013 Apr 25;10(1):51[FREE Full text] [doi: 10.1186/1479-5868-10-51] [Medline: 23618461]
12. National Health and Nutrition Examination Survey 2011-2012 data documentation, codebook, and frequencies. Centersfor Disease Control and Prevention. 2022. URL: https://wwwn.cdc.gov/Nchs/Nhanes/2011-2012/PAXMIN_G.htm [accessed2022-06-13]
13. John D, Tang Q, Albinali F, Intille S. MIMSunit: algorithm to compute monitor independent movement summary unit. TheComprehensive R Archive Network. 2019. URL: https://CRAN.R-project.org/package=MIMSunit [accessed 2022-07-04]
14. van Hees VT, Fang Z, Zhao JH, Heywood J, Mirkes E, Sabia S, et al. GGIR: raw accelerometer data analysis. TheComprehensive R Archive Network. 2022. URL: https://CRAN.R-project.org/package=GGIR [accessed 2022-07-04]
JMIR Mhealth Uhealth 2022 | vol. 10 | iss. 7 | e38077 | p.81https://mhealth.jmir.org/2022/7/e38077(page number not for citation purposes)
Karas et alJMIR MHEALTH AND UHEALTH
XSL•FORenderX

15. Karas M, Schrack J, Urbanek J. arctools: processing and physical activity summaries of minute level activity data. TheComprehensive R Archive Network. 2021. URL: https://CRAN.R-project.org/package=arctools [accessed 2022-07-04]
16. Choi L, Liu Z, Matthews CE, Buchowski MS. Validation of accelerometer wear and nonwear time classification algorithm.Med Sci Sports Exerc 2011 Feb;43(2):357-364 [FREE Full text] [doi: 10.1249/MSS.0b013e3181ed61a3] [Medline:20581716]
17. Wanigatunga A, Wang H, An Y, Simonsick EM, Tian Q, Davatzikos C, et al. Association between brain volumes andpatterns of physical activity in community-dwelling older adults. J Gerontol A Biol Sci Med Sci 2020 Jul 13;76(8):1504-1511.[doi: 10.1093/gerona/glaa294] [Medline: 33230557]
18. Hastings C, Mosteller F, Tukey JW, Winsor CP. Low moments for small samples: a comparative study of order statistics.Ann Math Statist 1947 Sep;18(3):413-426. [doi: 10.1214/aoms/1177730388]
19. Leroux A, Xu S, Kundu P, Muschelli J, Smirnova E, Chatterjee N, et al. Quantifying the predictive performance of objectivelymeasured physical activity on mortality in the UK Biobank. J Gerontol A Biol Sci Med Sci 2021 Jul 13;76(8):1486-1494.[doi: 10.1093/gerona/glaa250] [Medline: 33000171]
20. Goldsmith J, Scheipl F, Huang L, Wrobel J, Di C, Gellar J, et al. refund: regression with functional data. The ComprehensiveR Archive Network. 2021. URL: https://CRAN.R-project.org/package=refund [accessed 2022-07-04]
21. Wood SN. mgcv: mixed GAM computation vehicle with automatic smoothness estimation. The Comprehensive R ArchiveNetwork. 2011. URL: https://CRAN.R-project.org/package=mgcv [accessed 2022-07-04]
22. Wood SN. Fast stable restricted maximum likelihood and marginal likelihood estimation of semiparametric generalizedlinear models. J R Stat Soc Series B Stat Methodol 2011;73(1):3-36. [doi: 10.1111/j.1467-9868.2010.00749.x]
23. Koster A, Shiroma EJ, Caserotti P, Matthews CE, Chen KY, Glynn NW, et al. Comparison of sedentary estimates betweenactivPAL and hip- and wrist-worn ActiGraph. Med Sci Sports Exerc 2016 Aug;48(8):1514-1522. [doi:10.1249/MSS.0000000000000924] [Medline: 27031744]
24. Montoye AH, Clevenger KA, Pfeiffer KA, Nelson MB, Bock JM, Imboden MT, et al. Development of cut-points fordetermining activity intensity from a wrist-worn ActiGraph accelerometer in free-living adults. J Sports Sci 2020 Nov17;38(22):2569-2578. [doi: 10.1080/02640414.2020.1794244] [Medline: 32677510]
25. Schrack JA, Zipunnikov V, Goldsmith J, Bai J, Simonsick EM, Crainiceanu C, et al. Assessing the "physical cliff": detailedquantification of age-related differences in daily patterns of physical activity. J Gerontol A Biol Sci Med Sci 2014 Aug14;69(8):973-979 [FREE Full text] [doi: 10.1093/gerona/glt199] [Medline: 24336819]
AbbreviationsBLSA: Baltimore Longitudinal Study on AgingMAPE: mean absolute percentage errorMPE: mean percentage errorNHANES: National Health and Nutrition Examination Survey
Edited by L Buis; submitted 17.03.22; peer-reviewed by V Yadav, X Li; comments to author 08.04.22; revised version received 04.05.22;accepted 10.05.22; published 22.07.22.
Please cite as:Karas M, Muschelli J, Leroux A, Urbanek JK, Wanigatunga AA, Bai J, Crainiceanu CM, Schrack JAComparison of Accelerometry-Based Measures of Physical Activity: Retrospective Observational Data Analysis StudyJMIR Mhealth Uhealth 2022;10(7):e38077URL: https://mhealth.jmir.org/2022/7/e38077 doi:10.2196/38077PMID:
©Marta Karas, John Muschelli, Andrew Leroux, Jacek K Urbanek, Amal A Wanigatunga, Jiawei Bai, Ciprian M Crainiceanu,Jennifer A Schrack. Originally published in JMIR mHealth and uHealth (https://mhealth.jmir.org), 22.07.2022. This is anopen-access article distributed under the terms of the Creative Commons Attribution License(https://creativecommons.org/licenses/by/4.0/), which permits unrestricted use, distribution, and reproduction in any medium,provided the original work, first published in JMIR mHealth and uHealth, is properly cited. The complete bibliographic information,a link to the original publication on https://mhealth.jmir.org/, as well as this copyright and license information must be included.
JMIR Mhealth Uhealth 2022 | vol. 10 | iss. 7 | e38077 | p.82https://mhealth.jmir.org/2022/7/e38077(page number not for citation purposes)
Karas et alJMIR MHEALTH AND UHEALTH
XSL•FORenderX

Original Paper
Data Management and Privacy Policy of COVID-19Contact-Tracing Apps: Systematic Review and Content Analysis
Marco Bardus1,2, BA, MA, PhD; Melodie Al Daccache3, BSc, MSc; Noel Maalouf4,5, BE, PhD; Rayan Al Sarih5, BE;
Imad H Elhajj5, MSc, PhD1Institute of Applied Health Research, College of Medical and Dental Sciences, University of Birmingham, Birmingham, United Kingdom2Department of Health Promotion and Community Health, Faculty of Health Sciences, American University of Beirut, Beirut, Lebanon3Center for Research on Population and Health, Faculty of Health Sciences, American University of Beirut, Beirut, Lebanon4Department of Electrical and Computer Engineering, School of Engineering, Lebanese American University, Byblos, Lebanon5Department of Electrical and Computer Engineering, Maroun Semaan Faculty of Engineering and Architecture, American University of Beirut, Beirut,Lebanon
Corresponding Author:Marco Bardus, BA, MA, PhDInstitute of Applied Health ResearchCollege of Medical and Dental SciencesUniversity of BirminghamEdgbastonBirmingham, B15 2TTUnited KingdomPhone: 44 0121 414 3344Email: [email protected]
Abstract
Background: COVID-19 digital contact-tracing apps were created to assist public health authorities in curbing the pandemic.These apps require users’ permission to access specific functions on their mobile phones, such as geolocation, Bluetooth or Wi-Ficonnections, or personal data, to work correctly. As these functions have privacy repercussions, it is essential to establish howcontact-tracing apps respect users’ privacy.
Objective: This study aimed to systematically map existing contact-tracing apps and evaluate the permissions required andtheir privacy policies. Specifically, we evaluated the type of permissions, the privacy policies’ readability, and the informationincluded in them.
Methods: We used custom Google searches and existing lists of contact-tracing apps to identify potentially eligible apps betweenMay 2020 and November 2021. We included contact-tracing or exposure notification apps with a Google Play webpage fromwhich we extracted app characteristics (eg, sponsor, number of installs, and ratings). We used Exodus Privacy to systematicallyextract the number of permissions and classify them as dangerous or normal. We computed a Permission Accumulated RiskScore representing the threat level to the user’s privacy. We assessed the privacy policies’ readability and evaluated their contentusing a 13-item checklist, which generated a Privacy Transparency Index. We explored the relationships between app characteristics,Permission Accumulated Risk Score, and Privacy Transparency Index using correlations, chi-square tests, or ANOVAs.
Results: We identified 180 contact-tracing apps across 152 countries, states, or territories. We included 85.6% (154/180) ofapps with a working Google Play page, most of which (132/154, 85.7%) had a privacy policy document. Most apps were developedby governments (116/154, 75.3%) and totaled 264.5 million installs. The average rating on Google Play was 3.5 (SD 0.7). Acrossthe 154 apps, we identified 94 unique permissions, 18% (17/94) of which were dangerous, and 30 trackers. The average PermissionAccumulated Risk Score was 22.7 (SD 17.7; range 4-74, median 16) and the average Privacy Transparency Index was 55.8 (SD21.7; range 5-95, median 55). Overall, the privacy documents were difficult to read (median grade level 12, range 7-23); 67%(88/132) of these mentioned that the apps collected personal identifiers. The Permission Accumulated Risk Score was negativelyassociated with the average App Store ratings (r=−0.20; P=.03; 120/154, 77.9%) and Privacy Transparency Index (r=−0.25;P<.001; 132/154, 85.7%), suggesting that the higher the risk to one’s data, the lower the apps’ ratings and transparency index.
Conclusions: Many contact-tracing apps were developed covering most of the planet but with a relatively low number of installs.Privacy-preserving apps scored high in transparency and App Store ratings, suggesting that some users appreciate these apps.
JMIR Mhealth Uhealth 2022 | vol. 10 | iss. 7 | e35195 | p.83https://mhealth.jmir.org/2022/7/e35195(page number not for citation purposes)
Bardus et alJMIR MHEALTH AND UHEALTH
XSL•FORenderX

Nevertheless, privacy policy documents were difficult to read for an average audience. Therefore, we recommend followingprivacy-preserving and transparency principles to improve contact-tracing uptake while making privacy documents more readablefor a wider public.
(JMIR Mhealth Uhealth 2022;10(7):e35195) doi:10.2196/35195
KEYWORDS
COVID-19; mobile applications; contact tracing
Introduction
Strategies to Contain COVID-19Since the beginning of the COVID-19 pandemic in early 2020,in the absence of vaccines or pharmacological treatments forthe SARS-CoV-2 virus, some researchers have urgedgovernments and the global public health community to speedup the response to contain SARS-CoV-2, pushing for theimplementation of integrated nonpharmaceutical ornonpharmacological interventions (NPIs) [1]. Traditionally,NPIs adopted to curb an epidemic or pandemic such as influenzainclude mandating personal protective measures among healthcare professionals and citizens (eg, wearing masks),environmental measures such as isolating or quarantiningpositive cases [2], physical distancing, lockdowns, and travelrestrictions [3]. However, more than two years into thepandemic, even after several vaccines were developed and rolledout worldwide, many countries have struggled to effectivelyand efficiently implement NPIs. In the absence of aggressivetesting, contact tracing, and quarantining, an early studysuggested that the only way to control COVID-19 would haveincluded intermittent lockdowns until herd immunity was builtup, resulting in unnecessary deaths [4]. Unfortunately, thisseems to have been the case in many countries of the world,which observed alarming surges in cases of the SARS-CoV-2virus. As of April 2021, the virus had infected >130 millionindividuals and claimed the lives of >2.8 million worldwide[5]. NPIs require significant investments in human resourcesand equipment and a level of coordination that might not befeasible in all contexts. For example, many low- andmiddle-income countries do not have the resources to enforcecontainment and testing policies [6] or purchase large amountsof vaccines. In addition, quarantining and physical distancingmay not work among underprivileged and vulnerable segmentsof the population relying on daily wages for survival [7].
Contact tracing is one of the most cost-efficient NPIs availableto break the chain of viral transmission [8]. According to theinterim guidance of the World Health Organization, contacttracing consists of systematically identifying individuals exposedto confirmed positive cases, quarantining them, following upwith them to ensure rapid isolation, and, finally, testing andtreating them in case they develop symptoms [9]. This approacheffectively controlled COVID-19 as long as quick and efficientprocesses were followed [10]. A way to guarantee suchefficiency was to include digital technologies, particularlymobile phone–based tools, which are widely availableworldwide [11]. In the last year, a few systematic literaturereviews of COVID-19 apps mentioned contact-tracing apps asan essential type of app used in the context of the pandemic to
curb virus transmission [12-17]. On the basis of the experiencewith the Ebola [18] and H1N1 [19,20] viruses, digitaltechnologies have been increasingly used to supportgovernments in carrying out manual contact-tracing activities.Several conceptual papers and overviews exist on mobile appsfor COVID-19 contact tracing [21-27]. There are also a fewsystematic reviews on the topic [28-30], including a Cochranereview [30] and a literature review [29], focusing on digitalcontact tracing. The Cochrane review analyzed technologiesused in epidemics and was updated in May 2020 to include newCOVID-19–related studies. This review showed that suchtechnologies are most effective when used to complement ratherthan substitute manual contact-tracing activities [30]. A literaturereview by Jalabneh et al [29] identified 17 apps that could beused for contact tracing and mentioned the use of these apps tohelp governments contain the pandemic.
Digital Contact TracingAccording to the Centers for Disease Control and Prevention(CDC), 2 main types of digital contact-tracing tools are usedfor case management and proximity-tracing or exposurenotification apps [31]. Case management tools involve appsand devices that health workers involved in contact-tracingactivities can use to capture data and manage contact databasesof people tested for the virus. When a person tests positive,contact tracers interview them to recall where, when, and withwhom they have been. The contacts are then triaged forassignment to case managers who call and notify contacts,providing options for testing, self-isolation, and referral to ahealth care provider if necessary. This activity can be donemanually and on paper-and-pencil forms, so the technologyallows for the streamlining of the process of data entry andmanagement.
Proximity-tracing or exposure notification apps are designedfor citizens who voluntarily download and activate such appsto assist in contact-tracing efforts. These apps rely on Bluetoothtechnology or location-based information stored on the phoneto estimate the distance and duration of an encounter betweenusers [12]. The phones exchange alphanumeric strings or keysvia Bluetooth that contain such information. This informationcan be stored on the phone only (decentralized framework) oron a central server (centralized framework) and retained for alimited amount of time [12,32]. Depending on the type offramework, once a positive case is identified, the user or thecentral server flag their profile as positive, triggering thenetwork and urging them to take action and get tested,self-isolate, or seek the help of health care professionals. Thisway, exposure notification apps can expand the reach oftraditional manual contact tracers, who may fail to identifycases. The apps can reduce the burden on public health staff by
JMIR Mhealth Uhealth 2022 | vol. 10 | iss. 7 | e35195 | p.84https://mhealth.jmir.org/2022/7/e35195(page number not for citation purposes)
Bardus et alJMIR MHEALTH AND UHEALTH
XSL•FORenderX

allowing for the electronic self-reporting by cases and contactsor by using location data or other features to identify communitycontacts unknown to the case to look at possible exposure tothe virus. This study focuses on proximity-tracing or exposurenotification apps as these are designed for citizens.
Use and Application of Contact-Tracing AppsMany governments have developed digital contact-tracing appsfollowing international guidelines (eg, the World HealthOrganization [33], CDC [31], or European CDC [34]) andGoogle and Apple exposure notification frameworks [35]. Forexample, as of May 28, 2020, when we started working on thisproject, we identified 36 apps by searching in the Google Playand Apple App Stores. On the same date, the page entitledCOVID-19 apps on Wikipedia [36]—which was created onApril 1, 2020—included information on 37 contact-tracing apps.As of June 15, 2020, there were already 68 apps and, byDecember 2, 2020, the page included approximately 100 apps.A recent review of COVID-19 apps in the Google Play andApple App Stores identified 51 contact-tracing apps availableuntil May 2, 2020 [13]. In the same period, the TechnologyReview of the Massachusetts Institute of Technology (MIT)launched the Covid Tracing Tracker project [37] with thepurpose of monitoring and evaluating existing contact-tracingapps. A recent literature review published in July 2020 identified17 apps in 15 countries [29], whereas Wen et al [38] analyzed51 apps.
When can contact-tracing apps be considered effective?According to a seminal conceptual paper by Ferretti et al [25],contact-tracing apps can be deemed effective when at least 60%of the population uses them. More than a year after theCOVID-19 pandemic was declared, some reviews asked thefollowing question: Are these apps used by individuals [39]?Although many calls for evaluations of contact-tracing appshave been made [40], the evidence about contact-tracing appadoption and effectiveness is scant. A scoping review byThorneloe et al [41] reported only a couple of examples of appsused by 10% to 20% of the population using data reported innews media outlets. Similar numbers were presented in anoverview of contact-tracing apps [16] that provided descriptiveinformation on 14 apps based on publicly available information.The authors focused on technical characteristics (eg, centralizedor decentralized frameworks, tracing technology, and technicalflaws) and the proportion of the country’s population that usedthe apps, showing wide ranges (between 0.1% for BlueZoneVietnam and 60% for the Chinese Health Code used on Alipayand WeChat) [16]. In another conceptual paper, Seto et al [42]argued that the concept of privacy is context-specific and thatthere is a trade-off between privacy and public health value. Tothe best of our knowledge, the only comprehensive evaluationof contact-tracing apps is a longitudinal study involving theGerman Corona-Warn-App [43], one of the most downloadedcontact-tracing apps in Europe totaling 26.5 million downloadsas of March 25, 2021 [44].
How can this low global uptake be explained? The study on theGerman Corona-Warn-App by Munzert et al [43] reported adifferential app uptake depending on the users’ self-reportedsociodemographic and behavioral profiles. For example, app
use was positively associated with older age (≥50 years),education, socioeconomic status, health preconditions, and otherpreventive behaviors (eg, hand hygiene and mask wearing).App uptake was also higher among those who reported positivecases in their social network or who lived in areas of knownoutbreaks [43]; it was also higher among users who trusted thenational government, the health care system, and science ingeneral, and among those with a strong digital literacy whowere less concerned about privacy [43].
Privacy and Transparency in Data ProtectionPrivacy, data protection, and the problem of trust in thegovernment appear to be issues of concern, as reported in theaforementioned scoping review [41] and Cochrane review [30].Numerous conceptual papers in the system design literaturehave discussed the issue of privacy [45-47], mainly focusingon the use of tracing techniques (eg, location-based vs Bluetooth[48]) and on the use of centralized versus decentralizedframeworks, urging some researchers to develop theirprivacy-preserving apps and frameworks [49]. Decentralizedmodels are privacy-preserving by design; however, they aregenerally inefficient in responding to the needs of public healthsystems as they rely on individual users’ willingness to notifythe network, which might never occur or might happen withdelays that cannot be sustained when dealing with a highlytransmissible virus such as SARS-CoV-2 [50]. Conversely, arecent simulation study showed that centralized models couldbe effective only when 80% of the population uses thesetechnologies [51]. However, centralized models mightdiscourage uptake among users who do not trust theorganizations managing the centralized database. In theirseminal paper, Ferretti et al [25] argued that app designers andgovernments supporting contact-tracing apps should be guidedby ethical principles (eg, beneficence, reducing misery, equity,and social justice) and follow transparent practices to generatetrust in citizens and promote app uptake. Transparency couldbe achieved, for example, by creating independent oversightadvisory boards, publishing the code of the app and thealgorithms used, integrating evaluation and research by thirdparties, and clearly communicating privacy and data protectionprinciples. A way to express such principles is to use the apps’privacy policy documents, whose availability is requested bythe main app stores and recommended by numerous institutions,including the Privacy Trust Framework [52]; the US FederalTrade Commission [53]; and the General Data ProtectionRegulation (GDPR) of the European Union, which entered intoforce as of May 2018 [54]. The general recommendation fordevelopers is to produce privacy policy documents that are clearand easy to understand. A way to ensure clarity andcomprehensibility of documents is to provide a low readabilitylevel, which has been previously considered an element forevaluating apps’ privacy policies [55]; for instance, the PrivacyTrust Framework recommends a reading grade level of ≤12 anda Flesch reading ease of 45 [52]. A recent paper investigatingcontact-tracing apps [56] reported that transparency in thedocumentation was perceived as an essential element of trustin the apps and developers.
Beyond the conceptual and normative debates among scholars,are citizens’ concerns about privacy real? Are contact-tracing
JMIR Mhealth Uhealth 2022 | vol. 10 | iss. 7 | e35195 | p.85https://mhealth.jmir.org/2022/7/e35195(page number not for citation purposes)
Bardus et alJMIR MHEALTH AND UHEALTH
XSL•FORenderX

apps truly invasive of privacy? Are the developers orgovernments behind the apps able to provide transparent andclear information about data protection and treatment? Theanswers to these questions do not appear in the existing literatureon contact-tracing apps. There are a few systematic reviews ofCOVID-19 apps that mention contact-tracing apps as a typeused in the context of the pandemic [12-17]. There are also anumber of reviews of COVID-19 contact-tracing apps. Forexample, the aforementioned MIT Covid Tracing Trackerproject [37] provides some descriptive information on thetechnological infrastructure and uptake of these apps. The other2 overviews of COVID-19 contact-tracing apps [12,16] describegeneral vulnerabilities instead of considering privacy concernsusing the information included in the privacy policy documents.These reviews do not provide a comprehensive, specific analysisof the permissions and data protection [16]. A more recentreview of COVID-19 contact-tracing apps [38], published as aconference proceeding, focused on the user privacy aspects,potential data leakage, and other technical features of a sampleof 41 apps. The authors mentioned the role of transparency toensure uptake but did not investigate app characteristics thatcould enhance transparency beyond publishing the source code,an element present in a few open-source apps analyzed. Anothercontent analysis of contact-tracing apps [57] looked at the publicperception of these apps through user reviews and at the numberof downloads, tackling the issue of privacy-by-design. Anotherreview analyzed which permissions are needed to allow trackingand tracing and whether the apps have embodied principles ofprivacy and data protection by design [58]. Another reviewfocused on apps developed in the United States and on usabilityand qualitative features [59]. Finally, another review looked atthe readability of contact-tracing apps [60] without looking atprivacy aspects. In conclusion, none of these reviews ofcontact-tracing apps includes a combined analysis of privacyand data protection principles.
Furthermore, in April 2020, our research group embarked on aproject that a few months later resulted in the creation of anationwide contact-tracing app (Ma3an) [61] in collaborationwith the local Ministry of Public Health. Parallel to this project,we searched app databases to identify benchmark apps and usedthem as a reference for privacy-preserving contact-tracing apps.This was one of the main drivers urging us to undertake acomprehensive systematic review of contact-tracing apps andfocus on data protection and privacy aspects.
This study aimed to identify, map, and evaluate all availableCOVID-19 contact-tracing apps developed worldwide in asystematic way. The specific objectives of this study were to(1) identify and map existing contact-tracing apps; (2) evaluatethe type of data collected to define the risks to users’ privacybased on the permissions required; and (3) evaluate thereadability and content of privacy policy documents to establishwhether these documents transparently communicate detailsabout privacy, data protection, management, and retention.Finally, after more than a year of implementation of the searchprotocols, data extraction, and assessment, we decided that itwas time to respond to the recent call for COVID-19contact-tracing app evaluations launched by Colizza et al [40]on Nature Medicine, February 15, 2021.
Methods
We conducted a systematic review of information about existingCOVID-19 contact-tracing apps following a rigorous processof app identification, selection, data extraction, and analysis asused in a previously published app review by MB [62] andsimilar studies targeting different kinds of apps [63,64]. Inaddition, to address the research objectives, we performed acontent analysis of contact-tracing apps’ publicly availableGoogle Play pages and associated privacy policy documents.
Searches and Sources of InformationWe used two main strategies to identify contact-tracing apps:(1) searching for keywords in the Google Play and on the AppleApp Store using Google and (2) scanning the list of appsincluded in 5 websites identified via Google search.
For the first search strategy, we applied the following two searchqueries: (1) “allintext:COVID-19|covid|covid19|coronavirusAND tracing|exposure site:play.google.com” and (2)“allintext:COVID-19|covid|covid19|coronavirus ANDtracing|exposure site:play.google.com.” We conducted the initialsearches on May 7, 2020, and updated them almost monthly,on June 1, 2, and 24, 2020; August 18, 2020; November 27,2020; April 8, 2021; August 7, 2021; and October 31, 2021.
The second search strategy consisted of scanning 5 webpagescontaining lists of COVID-19 apps, such as the Wikipedia pageon COVID-19 apps (first published on April 1, 2020, and lastedited on October 20, 2021) [36]; the MIT Covid TracingTracker project (first published on May 7, 2020, and last updatedon January 25, 2021) [37]; the database of contact-tracing appsof the Council of Europe (last updated on June 10, 2020, andthen discontinued) [65]; an article on COVID tracing approundup on Android Police (published on September 1, 2020,and last updated on November 21, 2020) [66], with 26 US statesusing Google Exposure Notification System (ENS), 37international apps using the same ENS system, and 30 apps notusing the ENS framework; and the List of countries usingGoogle and Apple’s COVID-19 Contact Tracing API on theXDA Developers website (published on June 24, 2020, andupdated on February 25, 2021) [67]. All of these sources werelast checked on October 31, 2021.
Inclusion CriteriaTo be included, the apps had to (1) be explicitly aimed atCOVID-19 contact tracing or exposure notification, (2) havea publicly available page on the Google Play or Apple AppStores, and (3) have information on permissions and a privacypolicy document available from Google Play. Therefore, weexcluded apps designed for contact tracing not explicitly madefor COVID-19 that provided general information on COVID-19or that were symptom checkers without mentioningcontact-tracing features. We also excluded apps that had anavailable page only on the Apple App Store as the pages do notinclude information on permissions as in the Google Play. Wealso excluded apps if their privacy policy documents were notavailable (eg, through a broken link) or that did not include aprivacy policy explicitly related to the app.
JMIR Mhealth Uhealth 2022 | vol. 10 | iss. 7 | e35195 | p.86https://mhealth.jmir.org/2022/7/e35195(page number not for citation purposes)
Bardus et alJMIR MHEALTH AND UHEALTH
XSL•FORenderX

App Selection ProcessWe followed a multistage selection process. MB exported theGoogle search results by looking at the Apple App Store andGoogle Play in Microsoft Excel. MB then screened the linksfor relevance, and MAD confirmed the selection. Next, weresolved all disagreements through discussions. Finally, weentered the Google Play links in the Exodus Privacy database[68], which is the auditing platform for Android apps. TheExodus platform looks for embedded trackers (a software meantto collect user data) and permissions requested by each app. Anapp was excluded if the link to the Exodus database was notworking.
Data Extraction
App CharacteristicsWe extracted the following information from Google Play pages:number of installs, a link to the privacy policy document, 5-starreviews, number of reviews, version of the app, version of theoperating system, sponsor, and permission designations. Fromthe Apple App Store page (if available), we extracted thefollowing information: 5-star ratings and number of ratings,app version, seller, operating system version, and language. MBextracted the information, and MAD double-checked it. Anydiscrepancies were flagged and resolved through discussion.
Permission DataIn total, 4 authors (MB, MAD, NM, and RAS), in pairs andindependently, extracted the information on permissions usinga standardized web-based extraction form based on Exodusreports [68]. All permission items were entered as binary values(1=yes; 0=no). Overall, the raters achieved excellent interrateragreement (percentage of agreement=98.3%; Cohen κ=0.954;Krippendorff α=0.953). All disagreements were resolvedthrough discussion. The Exodus reports [68] label permissionsaccording to 2 levels of risk, as described on the Androiddevelopers' page [69]: Normal or Dangerous, includingSignature and SignatureOrSystem. As described in the bookAndroid Application Security Essentials [70], normalpermissions are those that “cannot do much harm to the user.They generally do not cost users money, but they might causeusers some annoyance...These permissions are automaticallygranted to the app.” Dangerous permissions are always shownto the user as “they can cause user privacy or financial loss.”Signature permissions allow 2 apps authored by the samedeveloper to access each other’s components. This type ofpermission is automatically granted to the app if it has the same
certificate as the app that declared the permission. Signature orsystem permissions are “granted to applications with the samecertificate as the app that defined the permission. In addition,this protection level includes an app with the same certificateas the Android system image. This permission level is mainlyused for applications built by handset manufacturers, carriers,and system apps. These permissions are not allowed forthird-party apps. These permissions let apps perform some verypowerful functions” [70].
Privacy Policy Data ExtractionFor apps with available privacy policy information, if thedocument was in a language other than English, it was translatedusing Google Translate and saved in PDF format with atimestamp. Similar to the procedure for extracting permissioninformation, 4 authors (MB, NM, MAD, and RAS)independently completed a privacy policy assessment using astandardized web-based checklist. The checklist was adaptedfrom a similar study focusing on data security and privacy inmobile apps addressing depression [71]. The inventory containeda total of 13 specific items (Table 1), which we grouped into 3main categories: 4 items were in the privacy category; 6 itemswere in the data management category; and 3 items were in thelegal framework category for data protection (eg, the GDPRfor European countries or any other framework) explicitlymentioned the right to delete or edit the data, which should beclarified in the legislative framework. We rated each item on anominal scale (yes=1, no=0, or not applicable, depending onthe item).
For this data extraction task, we conducted first a calibrationexercise with a sample of 15 randomly selected apps to ensuresufficient reliability and adjust the instrument before applyingit to the remaining set of apps. The aforementioned 4 authorsindividually and independently completed the same checklist.The exercise yielded a sufficient level of agreement (84.8%) aswell as reliability indexes (Cohen κ=0.823; Krippendorffα=0.696). Disagreements were resolved through discussion,which allowed for the clarification of a few interpretation issues.After we resolved the disagreements, the 4 raters independentlycompleted the checklist for other apps. The interrater reliabilitynotably improved (percentage of agreement=87.5%; Cohenκ=0.749; Krippendorff α=0.749). Finally, the reviewerscompleted the data extraction for the remaining apps in pairs.As in the previous task, we resolved disagreements throughdiscussion until we reached a consensus.
JMIR Mhealth Uhealth 2022 | vol. 10 | iss. 7 | e35195 | p.87https://mhealth.jmir.org/2022/7/e35195(page number not for citation purposes)
Bardus et alJMIR MHEALTH AND UHEALTH
XSL•FORenderX

Table 1. Privacy policy checklist and rubric used to calculate the Privacy Transparency Index (0-100).
ScoreDomain and items
Privacy (25 points)
Yes=0; partiala=5; no=10Does the app collect personally identifiable information?
Yesb=5; no=0Does the privacy policy mention that the app can be used without entering identifiable information?
Yes or (N/Ac)b=5; no=0Does the privacy policy mention that the app collects identifiable information such as full name, email, and phonenumber?
Yes or N/Ab=5; no=0Does the privacy policy mention that the app provides the option of a personal identification number, password,or log-in process to view and enter user data?
Data management (50 points)
Yes=15; no=0Does the privacy policy explicitly state which type of data are processed?
Yes=5; no=0Does the privacy policy contain a section on “how the app works” explicitly?
Yes=10; no=0Does the privacy policy state that the app or server encrypts the entered data?
Yes=5; no=0Does the privacy policy describe the process of data exchange and communication between server and phone relatedto user-entered information?
Yes=10; no=0Does the privacy policy state that the user information is stored on the phone or device?
Yes=5; no=0Does the privacy policy mention data retention?
Legal framework (25 points)
Yes=15; no=0Does the privacy policy mention the GDPRd? If not, does the privacy policy mention other legislative frameworks?
Yes=5; no=0Does the privacy policy state whether users can delete entered information?
Yes=5; no=0Does the privacy policy state whether users can edit entered information?
aIn this context, partial information is related to the use of location services only.bNot applicable options for apps that do not collect personal or identifying information.cN/A: not applicable.dGDPR: General Data Protection Regulation.
Data Elaboration
App CharacteristicsOn the basis of the information reported on the Google Playpage or on the other sources we used, we categorized the appsby country and continent according to the NationsOnlineclassification [72]. We also categorized the apps by the type ofcoverage (country or state, county, or city, depending on theirgeographical coverage) and type of sponsor (government;nonprofit organization; profit organization; andmultistakeholder, involving a combination of the previouscategories). Finally, we grouped the apps with the associatedGoogle Play information according to the number of installs(ranging from ≥50 to ≥100 million) as a relative measure ofpopularity.
Permission DataWe counted the number of trackers and permissions identifiedthrough the Exodus platform [68]. Next, we assigned numericvalues to each protection level: normal permissions=1;dangerous, signature, or system permissions=2; and trackers=3as they constitute a higher level of danger to users’ privacy. Wethen multiplied the number of permissions and trackers by theprotection level to calculate a Permission Accumulated RiskScore. The higher this score, the higher the risk.
Privacy Policy DataWe assigned different points to the aforementioned checklist(Table 1) to calculate a Privacy Transparency Index, whichcould range from 0 to 100. Similar to the PermissionAccumulated Risk Score, the higher the Privacy TransparencyIndex, the more transparent the privacy policy.
We also assessed the readability needed to understand the policyusing a combined estimate of readability indexes provided bythe Automatic Readability Checker, a web-based readabilitycalculator [73]. This tool outputs an estimate based on 7 popularreadability formulas: the Flesch Reading Ease Formula,Flesch-Kincaid Grade Level, Gunning fog index, SimpleMeasure of Gobbledygook Index, Coleman-Liau Index,Automated Readability Index, and Linsear Write Formula.Naturally, the lower the grade, the easier it is to understand. Forexample, the Privacy Trust Framework recommends a readinggrade level of ≤12 for policy documents [52].
AnalysesWe used descriptive statistics to summarize the apps’characteristics. For apps with permission and privacy policydata, we summarized continuous variables (eg, number ofratings, Permission Accumulated Risk Score, and PrivacyTransparency Index) using mean and SD or median and IQRfor count variables where appropriate. In addition, weinvestigated potential associations between app characteristics
JMIR Mhealth Uhealth 2022 | vol. 10 | iss. 7 | e35195 | p.88https://mhealth.jmir.org/2022/7/e35195(page number not for citation purposes)
Bardus et alJMIR MHEALTH AND UHEALTH
XSL•FORenderX

(such as type of sponsors, number of installs, and number ofreviews or ratings), Permission Accumulated Risk Score, andPrivacy Transparency Index using ANOVAs, chi-square tests,and Pearson correlation tests (significance level was assumedat P<.05).
Results
Search ResultsThe selection process is illustrated in Figure 1. We applied thesearch queries to Google on May 7, 2020; June 1, 2, and 24,2020; August 18, 2020; November 27, 2020; April 8, 2021;August 7, 2021; and October 31, 2021. We exported 1055records from Google Play and 1027 records from the AppleApp Store in Microsoft Excel. After removing duplicate links,we screened 15.64% (165/1055) of unique app links availablefrom Google Play and 16.85% (173/1027) of links availablefrom the Apple App Store. In this first screening stage, weexcluded 11.5% (19/165) and 25.4% (44/173) of apps fromGoogle Play and the Apple App Store, respectively, that weredeemed irrelevant as they were not related to COVID-19. Theremaining 88.5% (146/165) and 74.6% (129/173) of apps fromGoogle Play and the Apple App Store, respectively, wereassessed for eligibility together with 152 apps from theWikipedia page [36], 81 from the MIT Covid Tracing Trackerproject [37], 52 from the Council of Europe database ofcontact-tracing apps [65], 93 from the Android Police page [66],and 65 from the XDA Developers page [67]. Finally, weexcluded apps that were not designed for contact tracing(52/146, 35.6% from Google Play; 42/129, 32.6% from the AppStore; and 59/152, 38.8% from Wikipedia).
The final list included 180 unique COVID-19 contact-tracingapps that were potentially eligible for review. Of these, 85.6%(154/180) had a Google Play link to generate an Exodusplatform permission report [68], and 76.1% (137/180) had anassociated privacy policy document. A total of 14.4% (26/180)of the apps did not have a permission report either because aGoogle Play link was not available (19/26, 73%) or because itwas no longer available at the time of the analysis (7/26, 27%).The other 4.5% (7/154) of apps did not have a privacy policydocument available, and 11% (17/154) had privacy policy
documents that were not app-specific. Of the 180 selected apps,132 (73.3%) contained data related to both permissions andprivacy policies. A complete list of all 180 identified apps upto October 31, 2021, is included in Multimedia Appendix 1.The list contains links to the Google Play pages and to theExodus platform reports. The list is also publicly available onTableau Public from the link [74].
The identified 180 apps covered 152 geographical units(countries or regions, states or provinces, counties, territories,or cities) in 90 different countries spanning all 5 continents.Most apps came from the Americas (53/180, 29.4%), Asia(53/180, 29.4%), and Europe (46/180, 25.6%). The Africancontinent had 6.1% (11/180) of the apps, Oceania had 5%(9/180), and 4.4% (8/180) of the apps covered multiplecontinents or were developed to cover different countries. Theworld map in Figure 2 represents the global distribution of theCOVID-19 contact-tracing apps. The larger the bubble, thehigher the number of apps for each country.
The United States had the highest absolute number of apps as20% (36/180) were developed to cover different states. Thisnumber does not include 1.1% (2/180) of the apps, which camefrom the US unincorporated territories of Guam (Guam CovidAlert) and Puerto Rico (Rastrea el Virus). A total of 1.1%(2/180) of the apps (Care19 Alert and Care19 Diary) coveredthe states of North Dakota, South Dakota, and Wyoming. Thecountry with the second-highest number of apps was Australia(6/180, 3.3%). Germany, Great Britain, India, and thePhilippines had 2.8% (5/180) of the apps each; Brazil and Italyhad 2.2% (4/180) of the apps each; France, Malaysia, Mexico,Nepal, Russia, Singapore, South Africa, and Spain had 1.7%(3/180) of the apps each; and Canada, Iran, the Netherlands,Oman, Switzerland, and the United Arab Emirates had 1.1%(2/180) of the apps each.
Most contact-tracing apps were sponsored by governments(132/180, 73.3%), followed by private organizations (28/180,15.6%) and nonprofit organizations (14/180, 7.8%). A smallnumber of apps involved multiple stakeholders, includingconsortia of private, nonprofit, and governmental organizations(6/180, 3.3%).
JMIR Mhealth Uhealth 2022 | vol. 10 | iss. 7 | e35195 | p.89https://mhealth.jmir.org/2022/7/e35195(page number not for citation purposes)
Bardus et alJMIR MHEALTH AND UHEALTH
XSL•FORenderX

Figure 1. App selection process. COE: Council of Europe; MIT: Massachusetts Institute of Technology.
JMIR Mhealth Uhealth 2022 | vol. 10 | iss. 7 | e35195 | p.90https://mhealth.jmir.org/2022/7/e35195(page number not for citation purposes)
Bardus et alJMIR MHEALTH AND UHEALTH
XSL•FORenderX

Figure 2. Geographic distribution of the identified contact-tracing apps, aggregated by country.
App CharacteristicsThe list of 154 apps with permission data is provided inMultimedia Appendix 2 (tab 1). In Table 2, we report the basicdescriptive information for the sample of apps groupedaccording to the number of installs. As of October 8, 2021,based on Google Play install categories, the 154 apps totaled264.5 million installs (1.7 million on average), ranging from 10to 100 million. The most installed app was AarogyaSetu,developed by the Indian National Informatics Centre eGovMobile Apps department. The least installed app wasAggie-COVID-19, which was designed for New MexicoUniversity. Most apps were installed between 100,000 and 1million times (106/154, 68.8%), with approximately one-thirdbeing installed <100,000 times (48/154, 31.2%).
Most apps were developed by governments (116/154, 75.3%),private organizations (17/154, 11%), nonprofit organizations(11/154, 7.1%), and multistakeholder consortia (10/154, 6.5%).
No significant association between the type of sponsor andnumber of install categories was detected. The average ratingwas 3.5 (SD 0.7) on Google Play and 3.6 (SD 0.9) on the AppleApp Store based on a subsample of 120 apps with a valid AppStore page. The average number of reviews was 26,412 (SD143,803) on Google Play and 5120 (SD 28,826) on the AppStore.
The average number of reviews on Google Play wassignificantly associated with the number of installs (F3=5.04;
P<.001; η2=0.07), with apps installed ≥1 million times receivingmore reviews than those installed between 100,000 and 500,000times and more reviews than those installed <100,000 times.We detected a similar difference in the number of ratings on
the Apple App Store (F3=3.59; P=.02; η2=0.05); in this case,the average number of ratings was significantly higher in appsinstalled <100,000 times and those installed between 500,000and 1 million times.
JMIR Mhealth Uhealth 2022 | vol. 10 | iss. 7 | e35195 | p.91https://mhealth.jmir.org/2022/7/e35195(page number not for citation purposes)
Bardus et alJMIR MHEALTH AND UHEALTH
XSL•FORenderX

Table 2. Characteristics of the sample of apps organized by the number of installs (N=154).
P valueaNumber of installsTotalVariable
<100,000(n=48)
100,000 to500,000 (n=45)
500,000 to 1million (n=12)
≥1 million (n=49)
.05Type of sponsor, n (%)
28 (58.3)36 (80)10 (83.3)42 (85.7)116 (75.3)Government
11 (22.9)3 (6.7)1 (8.3)2 (4.1)17 (11)Private
3 (6.3)3 (6.7)1 (8.3)4 (8.2)11 (7.1)Nonprofit
6 (12.5)3 (6.7)0 (0)1 (2)10 (6.5)Multistakeholder
Average app ratings, mean (SD; range)
.17 (.13)3.61 (0.71;1.70-5.00)
3.41 (0.62;1.30-4.40)
3.16 (0.65;1.80-4.10)
3.53 (0.72; 1.00-4.70)
3.49 (0.69; 1.00-5.00)
Google Play
.52 (.64)3.74 (0.86;1.50-5.00)
3.69 (0.91;1.60-5.00)
3.42 (1.15;1.20-5.00)
3.46 (0.97; 1.00-4.90)
3.59 (0.94; 1.00-5.00)
Apple App Storeb
Average number of ratings, median (IQR; range)
<.001 (<.001)114 (137; 1-1135)
750 (569; 155-3275)
2362 (1200;1553-4094)
16,373 (32,382;960-1,600,000)
972 (5094; 1-1,600,000)
Google Play
.02 (<.001)25 (47; 1-595)112 (226; 1-2200)
464 (763; 4-1400)
1047 (3553; 1-287,200)
103 (591; 1-287,200)
Apple App Storeb
Permission data, median (IQR; range)
.27 (.19)12 (12; 4-41)8 (7; 2-42)7 (6; 6-44)10 (9; 6-40)9 (10; 2-44)Average number of permissions
.87 (.50)15 (21; 0-44)11 (19; 0-50)0 (20; 0-63)13 (21; 0-36)13 (21; 0-63)Average percentage of danger-ous permissions
.38 (.23)1 (1.25; 0-11)0 (2; 0-5)0 (1.3; 0-4)2 (2; 0-7)1 (2; 0-11)Average number of trackers
.34 (.11)23.5 (26; 4-65)14 (22; 4-70)10 (13; 6-74)14 (26; 6-63)16 (26; 4-74)Permission Accumulated RiskScore
.76Privacy policy data, n (%)
41 (85.4)37 (82.2)10 (83.3)44 (89.8)132 (85.7)Privacy policy available
7 (14.6)8 (17.8)2 (16.7)5 (10.2)22 (14.3)Privacy policy unavailable
Readabilityb
.07 (.13)12 (2; 8-18)12 (3; 7-19)11 (2; 7-16)12 (4; 8-23)12 (3; 7-23)Grade level, median (IQR;range)
.50Readability level, n (%)b
2 (4.9)4 (10.8)1 (10)7 (15.9)14 (9.1)Very difficult to read
21 (51.2)18 (48.7)4 (40)24 (54.6)67 (43.5)Difficult to read
18 (43.9)14 (37.8)4 (40)11 (25)47 (30.5)Fairly difficult to read
0 (0)1 (2.7)1 (10)2 (4.6)4 (2.6)Standard or average
.65 (.68)50 (20; 5-90)60 (35; 5-85)60 (36.3; 20-90)60 (31.3; 25-95)55 (30; 5-95)Policy—transparency index, median
(IQR; range)b
aP value for independent sample t tests (2-tailed), chi-square tests, or F tests comparing the number of install categories and the other variables. The Pvalue for the Kruskal-Wallis test, the nonparametric equivalent of an ANOVA, is indicated in parentheses.bThe calculations are available from a total of 132 apps with privacy policy documents.
Permission DataThe typology of permissions, identified through the Exodusplatform automatic permission extraction, is presented inMultimedia Appendix 3 (tab 2). Across the 154 apps with valid
permission data, there were 94 different types of permissions,of which 17 (18%) were dangerous or special.
Among the normal permissions, the one used in all apps wasInternet, have full network access (154/154, 100%). Thepermissions used by more than half of the apps were viewnetwork connections (150/154, 97.4%); wake lock, prevent
JMIR Mhealth Uhealth 2022 | vol. 10 | iss. 7 | e35195 | p.92https://mhealth.jmir.org/2022/7/e35195(page number not for citation purposes)
Bardus et alJMIR MHEALTH AND UHEALTH
XSL•FORenderX

phone from sleeping (142/154, 92.2%); run in foreground(137/154, 89%); run at startup (131/154, 85.1%); and thepermissions related to Bluetooth as pair with Bluetooth devices(118/154, 76.6%). The most frequently used dangerouspermission was access precise location (GPS andnetwork-based), which was used by approximately half of theapps (73/154, 47.4%). Other dangerous permissions used byapproximately one-third of the sample included accessapproximate location (network-based) (57/154, 37%), takepictures and videos (51/154, 33.1%), and modify or delete thecontents of your SD card (44/154, 28.6%). On average, eachapp collected 9 permissions (IQR 10, range 2-44). Only 0.6%(1/154) of the apps collected 2 permissions (TRACE Taguig,the Philippines), and only 0.6% (1/154) collected 44 permissions(Shlonik, Kuwait); 46.1% (71/154) of the apps required fewerpermissions.
The average proportion of dangerous permissions was 13%(IQR 21%, range 0%-63%). A total of 39% (60/154) of the appsdid not use any dangerous permissions, and 0.6% (1/154)reported using the most dangerous permissions (Corona Watch,Karnataka province, India).
In addition, the Exodus platform extracted approximately 30different trackers (Multimedia Appendix 3, tab 3). GoogleFirebase Analytics was the most frequently used tracker (80/154,51.9%), followed by Google CrashLytics for crash reporting(48/154, 31.2%). Although some apps had analytics and appstatistic information trackers, others had trackers used to profileusers (eg, Facebook log-in, Segment, AltBeacon, and DOV-E)or for advertising (Google AdMob; 6/154, 3.9%). On average,each app used 1 tracker (IQR 2, range 0-11). Although 41.6%(64/154) of the apps did not use any trackers, 0.6% (1/154) usedthe most trackers (Citizen SafePass).
On the basis of the number and type of permissions and trackers,the average Permission Accumulated Risk Score was 16 (IQR26, range 4-74). Of the 154 apps, 2 (1.3%) scored thelowest—TRACE Taguig (the Philippines) and Beat COVIDGibraltar—and 1 (0.6%) scored the highest—Shlonik (Kuwait).Approximately one-fifth of the sample (40/154, 26%) obtainedthe second- and third-lowest Permission Accumulated RiskScore (score of 6: 23/154, 14.9%; score of 7: 17/154, 11%).
Privacy Policy DataPrivacy policy data extraction was available for 85.7% (132/154)of the apps, as 14.3% (22/154) did not have a working privacypolicy link or document. A spreadsheet containing the privacypolicy data extraction for each app is available in MultimediaAppendix 4.
Regarding readability, the privacy documents required a mediangrade level of 12 (IQR 3, range 7-23). We found the lowest
level in the privacy policy documents of Stopp Corona (Austria)and The Territory Check-In (Northern Territory, Australia) andthe highest level in the policy document of the Taiwan SocialDistancing app.
Most of the privacy policy documents were difficult or verydifficult to read (81/132, 61.4%), with approximately one-thirdbeing fairly difficult to read (47/132, 35.6%). Only 3% (4/132)of the apps had a standard or average reading level. In additionto Stopp Corona and The Territory Check-In, the other 2 appswere COVID Alert (South Africa) and COVID Alert (Canada).
The sample distribution according to the privacy policy checklistitems is shown in Table 3. Notable strengths in terms of privacyincluded the fact that most policy documents explicitly statedwhen personal identifiers were collected (116/132, 87.9%) andwhat type of data was collected and for how long (100/132,75.8%). In addition, privacy policy documents mentioned thatthese data were protected through a personal identificationnumber or password (78/132, 59.1%). Nevertheless, most appscollected or partially collected personally identifiableinformation (89/132, 67.4%). Other limitations of datamanagement included the fact that most privacy policies didnot have a section clearly explaining how the app worked(86/132, 65.2%), did not state or explain how the app or serverencrypted the data, or did not describe the process of dataexchange (105/132, 79.5%).
In terms of the legal framework used, most policy documentsmentioned that they abided by the GDPR or other national-levellegislative data protection frameworks (82/132, 62.1%). Anothernotable strength of the right to be forgotten is that most of thepolicy documents stated that the users had the right to deletethe app or their profile (90/132, 68.2%). Nevertheless, a fewpolicies mentioned the right to rectify or edit the profile (50/132,37.9%).
On the basis of the privacy policy checklist, the average PrivacyTransparency Index was 56 (SD 22, range 5-95), which can beconsidered moderate as it is slightly above the median value of50. Of the 132 apps, 4 (3%) scored the lowest PrivacyTransparency Index—The Territory Check-In (Australia);Bardghat Municipality - COVID-19/Disaster Response andBharatpur Metropolitan|COVID-19 Response System (bothfrom Nepal); and Check On the other hand, oneTAS(Australia)—1 (0.8%) scored the highest Privacy TransparencyIndex—COVID Tracker Ireland—and 5 (3.8%) scored thesecond-highest Privacy Transparency Index(90/100)—Corona-Warn-App (Germany), NHS COVID-19 App(the United Kingdom; 2 versions, one pilot and one national),SwissCovid (Switzerland), and Protect Scotland.
JMIR Mhealth Uhealth 2022 | vol. 10 | iss. 7 | e35195 | p.93https://mhealth.jmir.org/2022/7/e35195(page number not for citation purposes)
Bardus et alJMIR MHEALTH AND UHEALTH
XSL•FORenderX

Table 3. Completed checklist of the Privacy Transparency Index applied to 132 apps.
Apps, n (%)Domain, item, and score
Privacy
Does the app collect personally identifiable information?
79 (59.8)Yes=0
10 (7.6)Partiala=5
43 (32.6)No=10
Does the privacy policy mention that the app can be used without entering identifiable information?
48 (36.4)Yes or N/Ab=5
84 (63.6)No=0
Does the privacy policy mention that the app collects identifiable information such as full name, email, and phone number?
116 (87.9)Yes or N/A=5
16 (12.1)No=0
Does the privacy policy mention that the app provides the option of a personal identification number, password, or log-in process to viewand enter user data?
78 (59.1)Yes or N/A=5
54 (40.9)No=0
Data management
Does the privacy policy explicitly state which type of data are processed?
100 (75.8)Yes=15
32 (24.2)No=0
Does the privacy policy contain a section on “how the app works” explicitly?
46 (34.8)Yes=5
86 (65.2)No=0
Does the privacy policy state that the app or server encrypts the entered data?
57 (43.2)Yes=10
75 (56.8)No=0
Does the privacy policy describe the process of data exchange and communication between server and phone related to user-enteredinformation?
27 (20.5)Yes=5
105 (79.5)No=0
Does the privacy policy state that the user information is stored on the phone or device?
51 (38.6)Yes=10
81 (61.4)No=0
Does the privacy policy mention data retention?
100 (75.8)Yes=5
32 (24.2)No=0
Legal framework
Does the privacy policy mention the GDPRc? If not, does the privacy policy mention other legislative frameworks?
82 (62.1)Yes=15
50 (37.9)No=0
Does the privacy policy state whether users can delete entered information?
90 (68.2)Yes=5
42 (31.8)No=0
JMIR Mhealth Uhealth 2022 | vol. 10 | iss. 7 | e35195 | p.94https://mhealth.jmir.org/2022/7/e35195(page number not for citation purposes)
Bardus et alJMIR MHEALTH AND UHEALTH
XSL•FORenderX

Apps, n (%)Domain, item, and score
Does the privacy policy state whether users can edit entered information?
50 (37.9)Yes=5
82 (62.1)No=0
aPartial score when the app used location services only.bN/A: not applicable.cGDPR: General Data Protection Regulation.
CorrelationsThe correlations among continuous variables representing appcharacteristics, Permission Accumulated Risk Score, readability,and Privacy Transparency Index are shown in Table 4. Therewas a small significant correlation between the average appratings in the 2 app stores (r=0.21; P=.02; 116/154, 75.3%).Similarly, there was a larger, highly significant correlationbetween the number of ratings reported in the Google Play andApple App Stores (r=0.87; P<.001; 116/154, 75.3%), which,in turn, was significantly correlated with the number of installs(Google Play ratings: r=0.96; P<.001; 150/154, 97.4%; AppleApp Store ratings: r=0.90; P<.001; 120/154, 77.9%). Thisfinding is consistent with the ANOVA reported at the end of
the App Characteristics section. The Permission AccumulatedRisk Score had a small negative correlation with the averagerating on the Apple App Store (r=−0.20; P=.03; 120/154,77.9%), suggesting that, the lower the rating, the higher the riskto the users’ privacy. The Privacy Transparency Index wasnegatively associated with the Permission Accumulated RiskScore (r=−0.25; P<.001; 132/154, 85.7%), suggesting that, thehigher the risk to one’s data, the lower the transparency indexof the related policy document.
Figure 3 is a screenshot of a map representing the relationshipbetween the Permission Accumulated Risk Score and PrivacyTransparency Index. The map is publicly available on TableauPublic [74].
Table 4. Correlation table for continuous variables.
7654321Variables
———————a1. Average rating (Google Play)
——————0.21b2. Average rating (Apple AppStore)
—————0.030.043. Number of ratings (GooglePlay)
————0.87c0.130.114. Number of ratings (Apple AppStore)
———0.90c0.96c0.040.025. Number of installs
——0.010.040.05−0.20b0.136. PARSd
—0.020.080.110.050.100.047. Grade level (readability)
−0.15−0.25f0.02<0.000.000.10−0.038. PTIe
aNot applicable.bP<.05.cP<.001.dPARS: Permission Accumulated Risk Score.ePTI: Privacy Transparency Index.fP<.01.
JMIR Mhealth Uhealth 2022 | vol. 10 | iss. 7 | e35195 | p.95https://mhealth.jmir.org/2022/7/e35195(page number not for citation purposes)
Bardus et alJMIR MHEALTH AND UHEALTH
XSL•FORenderX

Figure 3. Map representing the Permission Accumulated Risk Score (size of the bubble) and the Privacy Transparency Index (color).
Discussion
Principal FindingsThis paper presents the first systematic review of COVID-19contact-tracing apps developed worldwide that explored theapps’ approach to data protection and privacy. In addition, weassessed the number and type of permissions requested by theapps and how transparent the privacy policy documents wereabout data protection rules. This systematic review aimed to(1) identify and map existing contact-tracing apps, (2) evaluatethe potential risks to users’ privacy through the assessment ofthe type and quantity of permissions requested, and (3) evaluatethe readability and level of transparency of related privacy policydocuments.
We adopted a systematic search, selection, and identificationprocess using different sources [62]. This systematic approachallowed us to identify 180 COVID-19 contact-tracing appscovering 90 countries. Of these 180 apps, 154 (85.6%) had validlinks to extract permission data, and 132 (73.3%) had privacypolicy documents that could be analyzed. Our search strategyallowed us to generate a much larger sample than those reportedin recent COVID-19–related app audits [13,29,38]. Furthermore,the selection of apps we analyzed is more extensive than theone included in the MIT Covid Tracing Tracker project [37],which currently comprises 81 apps. The most updated sourceof information to date is Wikipedia’s COVID-19 apps page[36], which lists 152 apps. Although the number of apps forCOVID-19 contact tracing might grow over time with moregovernments embarking on digital contact-tracing efforts, someresearchers believe that the momentum is now over consideringhow the pandemic has evolved. In the absence ofzero–COVID-19 strategies, mitigation strategies and vaccinationcampaigns might take priority over contact tracing and otherNPIs [75]. Nevertheless, we hope that this review will sparkthe interest of the public health and global health community,who might want to contribute to the enlargement andmaintenance of the app database, which is already accessibleon Tableau Public [74].
Permission Data and Privacy RiskTo achieve the second objective, we analyzed publicly availableinformation from Google Play webpages and extracted it usingthe Exodus platform scanner [68]. This objective assessmentand data extraction allowed us to systematically identify andclassify the types of permissions and their relative risk to users’privacy. We developed a Permission Accumulated Risk Scoreto qualify the level of risk, accounting for some dangerouspermissions and the presence of invasive trackers. The widevariability in the number and type of permissions and trackersidentified across the sample of 154 apps included in this studysuggests that there is no single approach to privacy-preservingapp development. Consistent with the conclusions of Azad etal [58], many apps seem to collect more permissions thanneeded, some of which have the potential to breach users’privacy. Although the number and type of permissions variedacross the apps, it seems that some governments are particularlyinterested in collecting more data than others. On the one hand,most of the apps requested nondangerous permissions such asallowing for full network access, preventing the devices fromsleeping, and asking to pair Bluetooth devices. The use ofBluetooth technology for contact tracing seems to be almostubiquitous [58,76] and has been deemed a privacy-preservingapproach [45,48,51]; nevertheless, some apps included veryinvasive permissions or required constant internet connectivity,which might not be available at all times, making real-timeexposure notification difficult or impractical [77].
Moreover, some apps require read-and-write privileges to accessthe phone storage and camera to use QR codes, an approachthat seems appropriate for some types of offline self-checkactions for digital contact tracing [77]. Other apps require accessto the microphone, GPS location, and phone identity to allowfor government operations of contact tracing and networkexposure notification. Although it can be efficient from a publichealth perspective, this approach might generate some generalprivacy concerns. Our findings show a negative correlationbetween the Permission Accumulated Risk Score and theaverage rating of the selected apps on the Apple App Store,
JMIR Mhealth Uhealth 2022 | vol. 10 | iss. 7 | e35195 | p.96https://mhealth.jmir.org/2022/7/e35195(page number not for citation purposes)
Bardus et alJMIR MHEALTH AND UHEALTH
XSL•FORenderX

which might indicate that users did not like the design orusability or did not trust these apps, expressing a lower rating[78].
Readability and Transparency of Privacy PoliciesMost apps (81/132, 61.4%) included privacy policies that werevery difficult to read, suggesting that only educated users couldinterpret the information presented. This finding is consistentwith some studies evaluating the readability of contact-tracingapp privacy policies [60] and with other apps for other healthdomains such as mental health [71,79], health and fitness [63],and general health for young generations [54,55].
When it comes to transparency, of the 180 contact-tracing appsidentified, 24 (13.3%) did not include a valid link to a privacypolicy document or included a link to a policy document thatwas not specific to the app. Although not many users mightread a privacy policy before or after installing an app, not havingsuch a document available can raise concerns about thedevelopers’ transparency, negligence, or incompetence [79].Another notable finding was the inverse relationship betweenthe Permission Accumulated Risk Score and PrivacyTransparency Index, suggesting that, the higher the risk ofviolating one’s privacy through app permissions, the lower thelevel of transparency of the policy document. Although thisrelationship is based on our expert assessment of the documentsand the permission data, the data make sense. The data suggestthat some developers might collect more data than necessarywithout feeling the need to communicate this to the users [80].
As trust in governments seems to be dwindling worldwide, itwould be expected that contact-tracing apps would follow atruly decentralized framework and be based on transparencyand openness principles [25]. Of the 132 privacy policydocuments analyzed, most (81/132, 61.4%) achieved anabove-average rating in the bespoke Privacy TransparencyIndex. Most policy documents indicated that the apps collectedpersonal identifiers. Although it provides helpful informationabout data management, this suggests that a genuinelyprivacy-preserving and completely anonymous approach tocontact tracing may be unfeasible in real-life scenarios [49].Nevertheless, the privacy-preserving apps (ie, those with lowPermission Accumulated Risk Score) had higher ratings on theApple App Store. Their privacy policy documents had a higherPrivacy Transparency Index, suggesting that transparency andprivacy can go well together with positive app reviews, whichmay indicate better user engagement and sustained use.
Strengths and LimitationsThis is the first systematic review and evaluation of COVID-19contact-tracing apps that combines an assessment of the privacy
risk and the privacy policies’ transparency and readability. Anessential strength of this study is the methodological approachfollowing a specific protocol for selection, data extraction, andanalysis. Another strength is the availability of the data collectedacross 154 apps developed worldwide. The limitations of thisstudy include the use of bespoke measures to quantify the levelof risk (the Permission Accumulated Risk Score) and the levelof transparency (the Privacy Transparency Index). Althoughthese instruments require formal validation, we tried to minimizethe potential subjectivity and errors by completing a series oftrainings and assessing interrater agreement and reliabilityindexes to establish a good level of agreement in evaluating theapps. Another limitation was the use of data generated fromGoogle Play as some apps were developed only for iOS andwere not included in the study. Unfortunately, the App Storefor iOS does not include information about the permissions thatthe apps require; this is due to the different software architecturebetween iOS and Android. Another limitation is related to theextreme volatility of the mobile app market and itscharacteristics. We provided a global snapshot of all availablecontact-tracing apps as of October 31, 2021, after havingmonitored the market for approximately a year. Consideringthat the pandemic is still ongoing, existing contact-tracing appsmight disappear, new ones could be developed, or differenttechnological solutions could be adopted to provide exposurenotifications (eg, merging databases or aligning data exchangeprotocols between European or US states). This would implythat the existing apps might have different software permissionsand privacy policies. Our database provides a historicalclassification of contact-tracing apps that were developed overmore than a year, and we made such a list of apps availablefrom the Tableau link.
ConclusionsCOVID-19 contact-tracing app developers should find a balancebetween following privacy-preserving frameworks andcollecting personal information to serve the needs of publichealth institutions to ensure efficient and practical support formanual contact-tracing efforts. Developers should reduce theamount of data collected and relate it to the sole purpose ofcontact tracing. They should also put more effort into makingprivacy policy documents more accessible and easier to readand providing the information needed to foster trust ingovernments and institutions for the fight against COVID-19.Better and more useful digital contact-tracing apps would helpgovernments undertake contact-tracing efforts more efficientlyand effectively.
AcknowledgmentsThe authors would like to acknowledge the help of Ms Dalia Sarieldine, a graduate research assistant in the Department of HealthPromotion and Community Health, Faculty of Health Sciences, the American University of Beirut, who helped verify the inclusionof selected apps and update the data on the selected apps.
JMIR Mhealth Uhealth 2022 | vol. 10 | iss. 7 | e35195 | p.97https://mhealth.jmir.org/2022/7/e35195(page number not for citation purposes)
Bardus et alJMIR MHEALTH AND UHEALTH
XSL•FORenderX

Authors' ContributionsMB conceived and designed the review with intellectual input from IHE, NM, and RAS. MB developed the search strategy andperformed the searches. MB coordinated the selection process with the help of NM, RAS, and MAD. MB, NM, RAS, and MADindependently extracted the data. MB performed the data analyses, and NM, RAS, IHE, and MAD contributed to data interpretation.MB drafted the manuscript, which all authors then edited. All authors reviewed and approved the final version of the manuscript.
Conflicts of InterestNone declared.
Multimedia Appendix 1List of contact-tracing apps identified (N=180).[XLSX File (Microsoft Excel File), 28 KB - mhealth_v10i7e35195_app1.xlsx ]
Multimedia Appendix 2Characteristics of selected contact-tracing apps with permission data available (n=154).[XLSX File (Microsoft Excel File), 46 KB - mhealth_v10i7e35195_app2.xlsx ]
Multimedia Appendix 3Permission data for selected contact-tracing apps (n=154).[XLSX File (Microsoft Excel File), 46 KB - mhealth_v10i7e35195_app3.xlsx ]
Multimedia Appendix 4Privacy policy assessment of selected contact-tracing apps with an existing valid policy document (n=132).[XLSX File (Microsoft Excel File), 446 KB - mhealth_v10i7e35195_app4.xlsx ]
References1. Fisher D, Wilder-Smith A. The global community needs to swiftly ramp up the response to contain COVID-19. Lancet
2020 Apr 04;395(10230):1109-1110 [FREE Full text] [doi: 10.1016/S0140-6736(20)30679-6] [Medline: 32199470]2. Heymann DL, Shindo N. COVID-19: what is next for public health? Lancet 2020 Feb 22;395(10224):542-545 [FREE Full
text] [doi: 10.1016/S0140-6736(20)30374-3] [Medline: 32061313]3. Non-pharmaceutical public health measures for mitigating the risk and impact of epidemic and pandemic influenza: annex:
report of systematic literature reviews. World Health Organization. 2019. URL: https://apps.who.int/iris/handle/10665/329439 [accessed 2021-04-03]
4. Kissler SM, Tedijanto C, Goldstein E, Grad YH, Lipsitch M. Projecting the transmission dynamics of SARS-CoV-2 throughthe postpandemic period. Science 2020 May 22;368(6493):860-868 [FREE Full text] [doi: 10.1126/science.abb5793][Medline: 32291278]
5. Coronavirus Update (Live) - Worldometer. Worldometer. 2022. URL: https://www.worldometers.info/coronavirus/ [accessed2021-04-03]
6. Chowdhury R, Luhar S, Khan N, Choudhury SR, Matin I, Franco OH. Long-term strategies to control COVID-19 in lowand middle-income countries: an options overview of community-based, non-pharmacological interventions. Eur J Epidemiol2020 Aug;35(8):743-748 [FREE Full text] [doi: 10.1007/s10654-020-00660-1] [Medline: 32656618]
7. Smith JA, Judd J. COVID-19: vulnerability and the power of privilege in a pandemic. Health Promot J Austr 2020Apr;31(2):158-160 [FREE Full text] [doi: 10.1002/hpja.333] [Medline: 32197274]
8. Hellewell J, Abbott S, Gimma A, Bosse NI, Jarvis CI, Russell TW, et al. Feasibility of controlling COVID-19 outbreaksby isolation of cases and contacts. Lancet Global Health 2020 Apr;8(4):e488-e496 [FREE Full text] [doi:10.1016/S2214-109X(20)30074-7] [Medline: 32119825]
9. Contact tracing in the context of COVID-19. World Health Organization. URL: https://www.who.int/publications-detail-redirect/contact-tracing-in-the-context-of-covid-19 [accessed 2021-04-04]
10. Juneau C, Briand A, Pueyo T, Collazzo P, Potvin L. Effective contact tracing for COVID-19: a systematic review. BMJ2020 Jul 25 (forthcoming). [doi: 10.1101/2020.07.23.20160234]
11. Verhagen LM, de Groot R, Lawrence C, Taljaard J, Cotton M, Rabie H. COVID-19 response in low- and middle-incomecountries: don't overlook the role of mobile phone communication. Int J Infect Dis 2020 Oct;99:334-337 [FREE Full text][doi: 10.1016/j.ijid.2020.07.069] [Medline: 32763447]
12. Ahmed N, Michelin RA, Xue W, Ruj S, Malaney R, Kanhere SS, et al. A survey of COVID-19 contact tracing apps. IEEEAccess 2020;8:134577-134601. [doi: 10.1109/access.2020.3010226]
JMIR Mhealth Uhealth 2022 | vol. 10 | iss. 7 | e35195 | p.98https://mhealth.jmir.org/2022/7/e35195(page number not for citation purposes)
Bardus et alJMIR MHEALTH AND UHEALTH
XSL•FORenderX

13. Collado-Borrell R, Escudero-Vilaplana V, Villanueva-Bueno C, Herranz-Alonso A, Sanjurjo-Saez M. Features andfunctionalities of smartphone apps related to COVID-19: systematic search in app stores and content analysis. J Med InternetRes 2020 Aug 25;22(8):e20334 [FREE Full text] [doi: 10.2196/20334] [Medline: 32614777]
14. Davalbhakta S, Advani S, Kumar S, Agarwal V, Bhoyar S, Fedirko E, et al. A systematic review of smartphone applicationsavailable for corona virus disease 2019 (COVID19) and the assessment of their quality using the mobile application ratingscale (MARS). J Med Syst 2020 Aug 10;44(9):164 [FREE Full text] [doi: 10.1007/s10916-020-01633-3] [Medline: 32779002]
15. Kondylakis H, Katehakis DG, Kouroubali A, Logothetidis F, Triantafyllidis A, Kalamaras I, et al. COVID-19 mobile apps:a systematic review of the literature. J Med Internet Res 2020 Dec 09;22(12):e23170 [FREE Full text] [doi: 10.2196/23170][Medline: 33197234]
16. Li J, Guo X. COVID-19 contact-tracing apps: a survey on the global deployment and challenges. arXiv 2020 May 07. [doi:10.48550/arXiv.2005.03599]
17. Ming LC, Untong N, Aliudin NA, Osili N, Kifli N, Tan CS, et al. Mobile health apps on COVID-19 launched in the earlydays of the pandemic: content analysis and review. JMIR Mhealth Uhealth 2020 Sep 16;8(9):e19796 [FREE Full text] [doi:10.2196/19796] [Medline: 32609622]
18. Danquah LO, Hasham N, MacFarlane M, Conteh FE, Momoh F, Tedesco AA, et al. Use of a mobile application for Ebolacontact tracing and monitoring in northern Sierra Leone: a proof-of-concept study. BMC Infect Dis 2019 Sep 18;19(1):810[FREE Full text] [doi: 10.1186/s12879-019-4354-z] [Medline: 31533659]
19. Hashemian M, Stanley K, Osgood N. Leveraging H1N1 infection transmission modeling with proximity sensor microdata.BMC Med Inform Decis Mak 2012 May 02;12:35 [FREE Full text] [doi: 10.1186/1472-6947-12-35] [Medline: 22551391]
20. Hashemian M, Stanley K, Osgood N. Flunet: automated tracking of contacts during flu season. In: Proceedings of the 8thInternational Symposium on Modeling and Optimization in Mobile, Ad Hoc, and Wireless Networks. 2010 Presented at:8th International Symposium on Modeling and Optimization in Mobile, Ad Hoc, and Wireless Networks; May 31 - Jun 04,2010; Avignon, France.
21. Alwashmi MF. The use of digital health in the detection and management of COVID-19. Int J Environ Res Public Health2020 Apr 23;17(8):2906 [FREE Full text] [doi: 10.3390/ijerph17082906] [Medline: 32340107]
22. Support in the UK for app-based contact tracing of COVID-19. OSF Home. URL: https://osf.io/huqtr [accessed 2022-07-04]23. McKendry RA, Rees G, Cox IJ, Johnson A, Edelstein M, Eland A, et al. Share mobile and social-media data to curb
COVID-19. Nature 2020 Apr;580(7801):29. [doi: 10.1038/d41586-020-00908-6] [Medline: 32235939]24. Owusu PN. Digital technology applications for contact tracing: the new promise for COVID-19 and beyond? Glob Health
Res Policy 2020 Aug 3;5(1):36 [FREE Full text] [doi: 10.1186/s41256-020-00164-1] [Medline: 32766453]25. Ferretti L, Wymant C, Kendall M, Zhao L, Nurtay A, Abeler-Dörner L, et al. Quantifying SARS-CoV-2 transmission
suggests epidemic control with digital contact tracing. Science 2020 May 08;368(6491):eabb6936 [FREE Full text] [doi:10.1126/science.abb6936] [Medline: 32234805]
26. The Lancet Digital Health. Contact tracing: digital health on the frontline. Lancet Digit Health 2020 Nov;2(11):e561 [FREEFull text] [doi: 10.1016/S2589-7500(20)30251-X] [Medline: 33103094]
27. Fagherazzi G, Goetzinger C, Rashid MA, Aguayo GA, Huiart L. Digital health strategies to fight COVID-19 worldwide:challenges, recommendations, and a call for papers. J Med Internet Res 2020 Jun 16;22(6):e19284 [FREE Full text] [doi:10.2196/19284] [Medline: 32501804]
28. Braithwaite I, Callender T, Bullock M, Aldridge R. Automated and partially-automated contact tracing: a rapid systematicreview to inform the control of COVID-19. medRxiv 2020 [FREE Full text] [doi: 10.1101/2020.05.27.20114447]
29. Jalabneh R, Zehra Syed H, Pillai S, Hoque Apu E, Hussein MR, Kabir R, et al. Use of mobile phone apps for contact tracingto control the COVID-19 pandemic: a literature review. SSRN J 2020. [doi: 10.2139/ssrn.3641961]
30. Anglemyer A, Moore T, Parker L, Chambers T, Grady A, Chiu K, et al. Digital contact tracing technologies in epidemics:a rapid review. Cochrane Database Syst Rev 2020 Aug 18;8:CD013699 [FREE Full text] [doi: 10.1002/14651858.CD013699][Medline: 33502000]
31. Contact tracing: using digital tools. Centers for Disease Control and Prevention. URL: https://www.cdc.gov/coronavirus/2019-ncov/php/contact-tracing/index.html [accessed 2022-06-25]
32. Martin T, Karopoulos G, Hernández-Ramos J, Kambourakis G, Fovino I. Demystifying COVID-19 digital contact tracing:a survey on frameworks and mobile apps. arXivcs 2020 [FREE Full text] [doi: 10.1155/2020/8851429]
33. Digital tools for COVID-19 contact tracing. World Health Organization. 2020. URL: https://www.who.int/publications-detail-redirect/WHO-2019-nCoV-Contact_Tracing-Tools_Annex-2020.1 [accessed 2020-11-04]
34. Mobile applications in support of contact tracing for COVID-19: a guidance for EU/EEA Member States. European Centrefor Disease Prevention and Control. URL: https://www.ecdc.europa.eu/sites/default/files/documents/covid-19-mobile-applications-contact-tracing.pdf [accessed 2021-04-03]
35. Michael K, Abbas R. Behind COVID-19 contact trace apps: the Google–Apple partnership. IEEE Consumer Electron Mag2020 Sep 1;9(5):71-76. [doi: 10.1109/mce.2020.3002492]
36. COVID apps. Wikipedia. URL: https://en.wikipedia.org/wiki/COVID-19_apps [accessed 2021-10-31]37. A flood of coronavirus apps are tracking us. Now it’s time to keep track of them. MIT Technology Review. URL: https:/
/www.technologyreview.com/2020/05/07/1000961/launching-mittr-covid-tracing-tracker/ [accessed 2020-06-15]
JMIR Mhealth Uhealth 2022 | vol. 10 | iss. 7 | e35195 | p.99https://mhealth.jmir.org/2022/7/e35195(page number not for citation purposes)
Bardus et alJMIR MHEALTH AND UHEALTH
XSL•FORenderX

38. Wen H, Zhao Q, Lin Z, Xuan D, Shroff N. A study of the privacy of COVID-19 contact tracing apps. In: Security andPrivacy in Communication Networks. Cham: Springer International Publishing; 2020.
39. Chiusi F. Digital contact tracing apps: do they actually work? A review of early evidence. AlgorithmWatch. URL: https://algorithmwatch.org/en/analysis-digital-contact-tracing-apps-2021/ [accessed 2021-10-31]
40. Colizza V, Grill E, Mikolajczyk R, Cattuto C, Kucharski A, Riley S, et al. Time to evaluate COVID-19 contact-tracingapps. Nat Med 2021 Mar 15;27(3):361-362. [doi: 10.1038/s41591-021-01236-6] [Medline: 33589822]
41. Thorneloe R, Epton T, Fynn W, Daly M, Stanulewicz N, Kassianos A, et al. Scoping review of mobile phone app uptakeand engagement to inform digital contract tracing tools for COVID-19. PsyArXiv 2020. [doi: 10.31234/osf.io/qe9b6]
42. Seto E, Challa P, Ware P. Adoption of COVID-19 contact tracing apps: a balance between privacy and effectiveness. JMed Internet Res 2021 Mar 04;23(3):e25726 [FREE Full text] [doi: 10.2196/25726] [Medline: 33617459]
43. Munzert S, Selb P, Gohdes A, Stoetzer LF, Lowe W. Tracking and promoting the usage of a COVID-19 contact tracingapp. Nat Hum Behav 2021 Feb;5(2):247-255. [doi: 10.1038/s41562-020-01044-x] [Medline: 33479505]
44. Corona-Warn-App Open Source Project homepage. Corona-Warn-App Open Source Project. URL: https://www.coronawarn.app/en/ [accessed 2021-04-04]
45. Raskar R, Schunemann I, Barbar R, Vilcans K, Gray J, Vepakomma P, et al. Apps gone rogue: maintaining personal privacyin an epidemic. arXivcs 2020 [FREE Full text]
46. Sharma T, Bashir M. Use of apps in the COVID-19 response and the loss of privacy protection. Nat Med 2020 Aug26;26(8):1165-1167. [doi: 10.1038/s41591-020-0928-y] [Medline: 32457443]
47. Cho H, Ippolito D, Yu Y. Contact tracing mobile apps for COVID-19: privacy considerations and related trade-offs. arXiv2020 [FREE Full text] [doi: 10.48550/arXiv.2003.11511]
48. Berke A, Bakker M, Vepakomma P, Raskar R, Larson K, Pentland AS. Assessing disease exposure risk with location data:a proposal for cryptographic preservation of privacy. arXiv 2020 [FREE Full text] [doi: 10.48550/arXiv.2003.14412]
49. Yasaka TM, Lehrich BM, Sahyouni R. Peer-to-peer contact tracing: development of a privacy-preserving smartphone app.JMIR Mhealth Uhealth 2020 Apr 07;8(4):e18936 [FREE Full text] [doi: 10.2196/18936] [Medline: 32240973]
50. Scantamburlo T, Cortés A, Dewitte P, Van Der Eycken, D, Billa V, Duysburgh P, et al. Covid-19 and contact tracing apps:a review under the European legal framework. arXiv 2020 [FREE Full text] [doi: 10.48550/arXiv.2004.14665]
51. Hernández-Orallo E, Calafate CT, Cano J, Manzoni P. Evaluating the effectiveness of COVID-19 Bluetooth-based smartphonecontact tracing applications. Applied Sci 2020 Oct 13;10(20):7113. [doi: 10.3390/app10207113]
52. Peel D. Privacy trust framework. SSRN J 2013:13 [FREE Full text] [doi: 10.2139/ssrn.2231667]53. Federal Trade Commission. Mobile Privacy Disclosures Building Trust Through Transparency. Collingdale, PA: DIANE
Publishing Company; 2013.54. Mulder T. Health apps, their privacy policies and the GDPR. Eur J Law Technol 2019;10(1):3 [FREE Full text]55. Das G, Cheung C, Nebeker C, Bietz M, Bloss C. Privacy policies for apps targeted toward youth: descriptive analysis of
readability. JMIR Mhealth Uhealth 2018 Jan 04;6(1):e3 [FREE Full text] [doi: 10.2196/mhealth.7626] [Medline: 29301737]56. Oldeweme A, Märtins J, Westmattelmann D, Schewe G. The role of transparency, trust, and social influence on uncertainty
reduction in times of pandemics: empirical study on the adoption of COVID-19 tracing apps. J Med Internet Res 2021 Feb08;23(2):e25893 [FREE Full text] [doi: 10.2196/25893] [Medline: 33465036]
57. Elkhodr M, Mubin O, Iftikhar Z, Masood M, Alsinglawi B, Shahid S, et al. Technology, privacy, and user opinions ofCOVID-19 mobile apps for contact tracing: systematic search and content analysis. J Med Internet Res 2021 Feb09;23(2):e23467 [FREE Full text] [doi: 10.2196/23467] [Medline: 33493125]
58. Azad MA, Arshad J, Akmal SM, Riaz F, Abdullah S, Imran M, et al. A first look at privacy analysis of COVID-19contact-tracing mobile applications. IEEE Internet Things J 2021 Nov 1;8(21):15796-15806. [doi: 10.1109/jiot.2020.3024180]
59. Blacklow S, Lisker S, Ng M, Sarkar U, Lyles C. Usability, inclusivity, and content evaluation of COVID-19 contact tracingapps in the United States. J Am Med Inform Assoc 2021 Aug 13;28(9):1982-1989 [FREE Full text] [doi:10.1093/jamia/ocab093] [Medline: 34022053]
60. Zhang M, Chow A, Smith H. COVID-19 contact-tracing apps: analysis of the readability of privacy policies. J Med InternetRes 2020 Dec 03;22(12):e21572 [FREE Full text] [doi: 10.2196/21572] [Medline: 33170798]
61. Elhajj I, Abou ML, Germani A, Bardus M, Dohna H, Ghattas H, et al. Ma3an-together against corona, the official Lebanesecontact tracing app: experience and lessons learned. In: Emerging science, frontier technologies, and the SDGs - Perspectivesfrom the UN system and science and technology communities. New York: United Nations Interagency Task Team onScience, Technology and Innovation for the Sustainable Development Goals; 2021.
62. Bardus M, van Beurden SB, Smith JR, Abraham C. A review and content analysis of engagement, functionality, aesthetics,information quality, and change techniques in the most popular commercial apps for weight management. Int J Behav NutrPhys Act 2016 Mar 10;13:35 [FREE Full text] [doi: 10.1186/s12966-016-0359-9] [Medline: 26964880]
63. Rowan M, Dehlinger J. A privacy policy comparison of health and fitness related mobile applications. Procedia ComputSci 2014;37:348-355. [doi: 10.1016/j.procs.2014.08.051]
64. Sunyaev A, Dehling T, Taylor PL, Mandl KD. Availability and quality of mobile health app privacy policies. J Am MedInform Assoc 2015 Apr;22(e1):e28-e33. [doi: 10.1136/amiajnl-2013-002605] [Medline: 25147247]
JMIR Mhealth Uhealth 2022 | vol. 10 | iss. 7 | e35195 | p.100https://mhealth.jmir.org/2022/7/e35195(page number not for citation purposes)
Bardus et alJMIR MHEALTH AND UHEALTH
XSL•FORenderX

65. Contact tracing apps. Council of Europe. 2022. URL: https://www.coe.int/en/web/data-protection/contact-tracing-apps[accessed 2020-07-13]
66. Sholtz M. COVID tracing app roundup: all of the countries and US states that currently offer exposure notification apps.Android Police. URL: https://www.androidpolice.com/2020/11/21/covid-tracing-apps-ens-android/ [accessed 2020-11-27]
67. Rahman M. List of countries using Google and Apple's COVID-19 Contact Tracing API. XDA developers. 2021. URL:https://xda-developers.com/google-apple-covid-19-contact-tracing-exposure-notifications-api-app-list-countries/ [accessed2021-08-06]
68. Exodus privacy homepage. Exodus Privacy. 2022. URL: https://exodus-privacy.eu.org/en/ [accessed 2021-08-07]69. Manifest permission. Android Developer. URL: https://developer.android.com/reference/android/Manifest.permission
[accessed 2020-07-13]70. Rai P. Android Application Security Essentials. Birmingham, UK: Packt Publishing; 2013.71. O'Loughlin K, Neary M, Adkins EC, Schueller SM. Reviewing the data security and privacy policies of mobile apps for
depression. Internet Interv 2019 Mar;15:110-115 [FREE Full text] [doi: 10.1016/j.invent.2018.12.001] [Medline: 30792962]72. Continents of the World. Nations Online. URL: https://www.nationsonline.org/oneworld/continents.htm [accessed 2020-12-06]73. Automatic readability checker. Readability Formula. URL: https://readabilityformulas.com/free-readability-formula-tests.
php [accessed 2020-12-02]74. Bardus M. Systematic review of C19-Contact tracing apps: App List - Marco Bardus. Tableau Public. 2022. URL: https:/
/public.tableau.com/views/SR-C19-ContactTracingApps/AppList?:language=en-US&publish=yes&:display_count=n&:origin=viz_share_link [accessed 2021-09-02]
75. Phillips N. The coronavirus is here to stay - here's what that means. Nature 2021 Feb 16;590(7846):382-384. [doi:10.1038/d41586-021-00396-2] [Medline: 33594289]
76. Al Jutail M, Al-Akhras M, Albesher A. Associated risks in mobile applications permissions. J Inf Security 2019;10(02):69-90.[doi: 10.4236/jis.2019.102004]
77. Min-Allah N, Alahmed BA, Albreek EM, Alghamdi LS, Alawad DA, Alharbi AS, et al. A survey of COVID-19contact-tracing apps. Comput Biol Med 2021 Oct;137:104787 [FREE Full text] [doi: 10.1016/j.compbiomed.2021.104787][Medline: 34482197]
78. Wang H, Wang L, Wang H. Market-level analysis of government-backed COVID-19 contact tracing apps. In: Proceedingsof the 35th IEEE/ACM International Conference on Automated Software Engineering Workshops. 2020 Presented at: ASE'20: 35th IEEE/ACM International Conference on Automated Software Engineering; Sep 21 - 25, 2020; Virtual EventAustralia. [doi: 10.1145/3417113.3422186]
79. Robillard JM, Feng TL, Sporn AB, Lai J, Lo C, Ta M, et al. Availability, readability, and content of privacy policies andterms of agreements of mental health apps. Internet Interv 2019 Sep;17:100243 [FREE Full text] [doi:10.1016/j.invent.2019.100243] [Medline: 30949436]
80. Huckvale K, Prieto JT, Tilney M, Benghozi P, Car J. Unaddressed privacy risks in accredited health and wellness apps: across-sectional systematic assessment. BMC Med 2015 Sep 25;13(1):214 [FREE Full text] [doi: 10.1186/s12916-015-0444-y][Medline: 26404673]
AbbreviationsCDC: Centers for Disease Control and PreventionENS: Exposure Notification SystemGDPR: General Data Protection RegulationMIT: Massachusetts Institute of TechnologyNPI: nonpharmacological intervention
Edited by L Buis, A Mavragani; submitted 24.11.21; peer-reviewed by A Thongprasert, F Folkvord; comments to author 23.12.21;revised version received 04.01.22; accepted 17.02.22; published 12.07.22.
Please cite as:Bardus M, Al Daccache M, Maalouf N, Al Sarih R, Elhajj IHData Management and Privacy Policy of COVID-19 Contact-Tracing Apps: Systematic Review and Content AnalysisJMIR Mhealth Uhealth 2022;10(7):e35195URL: https://mhealth.jmir.org/2022/7/e35195 doi:10.2196/35195PMID:35709334
JMIR Mhealth Uhealth 2022 | vol. 10 | iss. 7 | e35195 | p.101https://mhealth.jmir.org/2022/7/e35195(page number not for citation purposes)
Bardus et alJMIR MHEALTH AND UHEALTH
XSL•FORenderX

©Marco Bardus, Melodie Al Daccache, Noel Maalouf, Rayan Al Sarih, Imad H Elhajj. Originally published in JMIR mHealthand uHealth (https://mhealth.jmir.org), 12.07.2022. This is an open-access article distributed under the terms of the CreativeCommons Attribution License (https://creativecommons.org/licenses/by/4.0/), which permits unrestricted use, distribution, andreproduction in any medium, provided the original work, first published in JMIR mHealth and uHealth, is properly cited. Thecomplete bibliographic information, a link to the original publication on https://mhealth.jmir.org/, as well as this copyright andlicense information must be included.
JMIR Mhealth Uhealth 2022 | vol. 10 | iss. 7 | e35195 | p.102https://mhealth.jmir.org/2022/7/e35195(page number not for citation purposes)
Bardus et alJMIR MHEALTH AND UHEALTH
XSL•FORenderX

Publisher:JMIR Publications130 Queens Quay East.Toronto, ON, M5A 3Y5Phone: (+1) 416-583-2040Email: [email protected]
https://www.jmirpublications.com/
XSL•FORenderX
Copyright © 2022 FDOKUMEN