
The 7th National and International Graduate Study ...
530
A Study of Factors Affecting the Ability to Work-based Learning of Student at Panyapiwat Institute of Management Chompunoot Putinatr 1 , Jariya Neanchaleay 2 1 Learning Innovation and Technology, Faculty of Industrial Education and Technology, King Mongkut’s University Of Technology Thonburi, Bangkok 2 Learning Innovation and Technology, Faculty of Industrial Education and Technology, King Mongkut’s University Of Technology Thonburi, Bangkok Corresponding author: [email protected] Abstract The objective of this research was to study factors affecting learning competence and real practice of the students in Faculty of Education, Panyapiwat Institute of Management. The sample groups were 70 students in Chinese Teaching, Faculty of Education, Panyapiwat Institute of Management. The random was used for the students with internship experience. Survey questionnaire was used for data collection five rating scale. The reliability of scale was found to be 0.875. The statistics used analysis mean, standard deviation and experimentation on factors affecting competence in learning and internship of the students from Faculty of Education, Panyapiwat Institute of Management were studied using multiple regression with Enter. The research results were as follows it is found that the factors affecting competence in learning and internship of the students the most are internship interaction, followed by internship attitude and internship adaptation, respectively. The mean values are 4.23, 4.11 and 3.92, respectively. The result on competence in learning and internship of the students from Faculty of Education, Panyapiwat Institute of Management is in moderate level with the meal value of 3.28. the independent variables with the significance on the dependent variables, also known as, the factors affecting competence in learning and internship of the students, are internship interaction and internship attitude (B = 0.339 and 0.217, respectively) predicting the variables on competence in learning and internship of the students at the percentage of 42. The multiple regression analysis result explains that the prediction variables enabling the predictibility of criterion variables The 7th National and International Graduate Study Conference 2017 " Thailand 4.0 Creative Innovation for Sustainable Development " I1
-
Upload
khangminh22 -
Category
Documents
-
view
1 -
download
0
Transcript of The 7th National and International Graduate Study ...

A Study of Factors Affecting the Ability to Work-based Learning of
Student at Panyapiwat Institute of Management
Chompunoot Putinatr1, Jariya Neanchaleay
2
1 Learning Innovation and Technology, Faculty of Industrial Education
and Technology, King Mongkut’s University Of Technology Thonburi,
Bangkok 2 Learning Innovation and Technology, Faculty of Industrial Education
and Technology, King Mongkut’s University Of Technology Thonburi,
Bangkok
Corresponding author: [email protected]
Abstract
The objective of this research was to study factors affecting
learning competence and real practice of the students in Faculty of
Education, Panyapiwat Institute of Management. The sample groups were
70 students in Chinese Teaching, Faculty of Education, Panyapiwat
Institute of Management. The random was used for the students with
internship experience. Survey questionnaire was used for data collection
five rating scale. The reliability of scale was found to be 0.875. The
statistics used analysis mean, standard deviation and experimentation on
factors affecting competence in learning and internship of the students
from Faculty of Education, Panyapiwat Institute of Management were
studied using multiple regression with Enter. The research results were as
follows it is found that the factors affecting competence in learning and
internship of the students the most are internship interaction, followed by
internship attitude and internship adaptation, respectively. The mean
values are 4.23, 4.11 and 3.92, respectively. The result on competence in
learning and internship of the students from Faculty of Education,
Panyapiwat Institute of Management is in moderate level with the meal
value of 3.28. the independent variables with the significance on the
dependent variables, also known as, the factors affecting competence in
learning and internship of the students, are internship interaction and
internship attitude (B = 0.339 and 0.217, respectively) predicting the
variables on competence in learning and internship of the students at the
percentage of 42. The multiple regression analysis result explains that the
prediction variables enabling the predictibility of criterion variables
The 7th National and International Graduate Study Conference 2017
" Thailand 4.0 Creative Innovation for Sustainable Development "
I1

(competence in learning and internship of the students) are internship
interaction and internship attitude prediction variables.
Key words (s) : Study of Factors, Competence in learning and internship,
Student at Panyapiwat Institute of Management
Introduction
At present, higher education management must be done to improve
Thai people towards physical, intelligent, ethical and cultural perfection in
order to live with others happily. Moreover, education management must
follow the concept stating all learners have capabilities to learn and
improve themselves. Learners are the most important as well. Education
management process must encourage learners so that they can naturally
improve with their full potential. Education management process has
various learning processes (Panthasak Polsaram, 2016). Producing
ethical and smart graduates is crucial for all higher education institutes.
Education in the twenty-first century has changed from the past. It is the
education to formulate knowldge and develop learners’ potentiality.
Graduates in the twenty-first century must put efforts persistently, work
hard and determine their performance. A major requirement of a graduate
follows self-efficacy theory to determine which level or capability he/she
can reach. An individual with high self-efficacy is able to pursue success.
When he/she confronts problems or challenges, he/she can solve them
with full attempt. When a failure occurs, he/she usually perceives the
situation as a result from insufficient attempt or lack of knowledge/skill.
On the other hand, an individual with low self- efficacy usually perceives
that he/she has low competence and thinks that difficult tasks are threats.
Thus, he/she escapes or gives up doing them. When a failure occur, he/she
usually perceives to be abortive. Kriangsook Fuengfupong (2011) stated
that an individual with high self-efficacy was high competent. He/she was
not afraid of hard work. Instead, challenging tasks were preferred for
hard-working practice. When any problems occurred, solutions were
sought out. Work-Based Learning (WBL) is a learning through internship
with the same work proportion as of real employees. Real work is used
instead of in-class learning. This type of learning is the combination
between theoretical learning and practical learning. In other words,
knowledge and real experience is obtained through learning process,
analysis and learning sharing. Importantly, learning and internship must
be concurrent so that new knowledge is synthesized for further
advantages. Besides, Work-Based Learning (WBL) is a tangibly
The 7th National and International Graduate Study Conference 2017
" Thailand 4.0 Creative Innovation for Sustainable Development "
I2
extensible and applicable learning process. It is a world of learning and
competition in working society. Learners can become aware of what they
like and dislike so that they can modify or develop themselves. Also, it
promotes multi-competency in the selected field of study. Hence, they are
more ready than those who receive regular learning. The learning method
and experience from WBL may be more demanded for business sectors in
knowledge-based economy era from knowledge accumulation and
knowledge creation for quick business performance or organizational
mission. Core knowledge is a tacit knowledge, rather than explicit
knowledge. Explicit knowledge is always ready for sharing from
cooperation or direct interaction, rather than in-class learning. Work
Based Learning (WBL) is a conventionally practical learning with trainer
program and systematical follow-up system. Learning management is an
alternating one between in-class learning and internship learning
according to the curriculum. Also, it is designed to match the institution’s
demand for the integration between theoretical and practical aspects
(Lertchai Suthammanon, 2016). Pichit Ritcharoon (2015) stated about the
assessment result on the students’ characteristics, both self-assessment
and advisor’s assessment ones for post-internship. The students had seven
aspects of qualifications including discipline, responsibility, honesty,
service-mind, communication skill, cooperation and tentative solving. The
finding revealed that learning management from real experience could
enhance the students’ qualifications. The development process allowed
the students to learn from real experience, matched work-based learning.
The students’ attitude adjustment was done because it was important for
performing tasks. The unique education model of Panyapiwat Institute of
Management arranged learning format according to the standard of
Ministry of Education with the number of working hours added. The
students were to study and work alternately during 4-5 years. It was a
work-based learning so the students were able to think and do things. So,
they could work effectively after graduation. The institute tried to make
the students become proficient, both theoretically and practically. The
most important objective is to cultivate good morale (Somphob
Manarangsan, 2016). During pre-internship, some of the students still
lacked of confidence because they never worked in real workplace before
so they did not know their duties. Also, the students did not want to do
perform their tasks far from their accommodations as they were worried
that they might be late for work and they might have to face increased
expense. These causes occurred because they were not ready in many
aspects. This research reveals factors affecting competence in learning and
internship for effective learning management guidelines according to the
curriculum’s objectives and the students’ quality development.
The 7th National and International Graduate Study Conference 2017
" Thailand 4.0 Creative Innovation for Sustainable Development "
I3

Objectives
1) To study factors affecting learning competence and real
practice of the students in Faculty of Education, Panyapiwat
Institute of Management
Research Methodology
Participants
The population were 104 students in Chinese Teaching,
Faculty of Education, Panyapiwat Institute of Management.
The sample groups were 70 students in Chinese Teaching,
Faculty of Education, Panyapiwat Institute of Management. The random
was used for the students with internship experience.
Table 1 The sample groups in Chinese Teaching, Faculty of Education,
Panyapiwat Institute of Management.
Grade level Amount Percentage
Third-year students 44 62.85
Second-year students 26 37.14
Total 70 100.00
Procedures
The data collection steps were as follows;
1) The researcher submitted written request form for data
collection in order to perform the research. The request form was
submitted by Faculty of Industrial Education and Technology,
KMUTT to the Dean of Faculty of Education, Panyapiwat Institute
of Management for permission and support in research data
collection from 70 post-internship students in Chinese Teaching
Field, Faculty of Education, Panyapiwat Institute of Management.
2) The researcher brought the questionnaires and the
written request form to Panyapiwat Institute of Management via
the Secretary of Faculty of Education for research data collection
time log.
3) The researcher collected the research data alone at
Faculty of Education, Panyapiwat Institute of Management. The
questionnaires returned were 70 copies, accounted for 100 percent.
The 7th National and International Graduate Study Conference 2017
" Thailand 4.0 Creative Innovation for Sustainable Development "
I4

Instrument
The questionnaire was used. Each questionnaire is divided
into three parts as follows;
Part 1: General Information (gender, age, pre-university
educational degree(s), GPA)
Part 2: Questionnaire on factors affecting competence in
learning and internship of the students from Faculty of Education,
Panyapiwat Institute of Management. Each questionnaire had of five-
rating scale questions in the total of 30. It reflected factors affecting
competence in learning and internship of the students and was divided
into three aspects – internship adaptation, internship interaction and
internship attitude.
Part 3: Opinions and Suggestions
The research brought the revised questionnaires for trying out with
30 post-internship students from Panyapiwat Institute of Management.
Then, the result was analyzed for its reliability using Cronbach’s alpha.
The questionnaire’s reliability value was 0.875.
Statistical Analysis
The mean, standard deviation and experimentation on factors
affecting competence in learning and internship of the students from
Faculty of Education, Panyapiwat Institute of Management were studied
using multiple regression with Enter.
Results/ Conclusion
According to the data analysis on factors affecting competence in
learning and internship of the students from Faculty of Education,
Panyapiwat Institute of Management, the results show that :
The 7th National and International Graduate Study Conference 2017
" Thailand 4.0 Creative Innovation for Sustainable Development "
I5

Table 2 The result study factors affecting learning competence and real
practice of the students in Faculty of Education, Panyapiwat Institute of
Management
Variable ( ) (S.D.) level
Internship adaptation (x1) 3.92 0.61 High
Internship interaction (x2) 4.23 0.68 High
Internship attitude (x3) 4.11 0.72 High
Competence in learning and internship (y) 3.28 0.91 Medium
From Table 2, it is found that the factors affecting competence in
learning and internship of the students the most are internship interaction,
followed by internship attitude and internship adaptation, respectively.
The mean values are 4.23, 4.11 and 3.92, respectively. The result on
competence in learning and internship of the students from Faculty of
Education, Panyapiwat Institute of Management is in moderate level with
the meal value of 3.28.
Table 3 The Statistics of Multiple Regression variables
Variable B SE B Beta t
Constant 2.020
Internship adaptation -0.129 0.089 -0.135 -1.446
Internship interaction 0.339 0.088 0.452 3.837*
Internship attitude 0.217 0.096 0.266 2.263*
R2 = 0.428
F = 16.509
Table 3, it is found that the independent variables with the
significance on the dependent variables, also known as, the factors
affecting competence in learning and internship of the students, are
internship interaction and internship attitude (B = 0.339 and 0.217,
respectively) predicting the variables on competence in learning and
The 7th National and International Graduate Study Conference 2017
" Thailand 4.0 Creative Innovation for Sustainable Development "
I6

internship of the students at the percentage of 42. The multiple regression
analysis result explains that the prediction variables enabling the
predictibility of criterion variables (competence in learning and internship
of the students) are internship interaction and internship attitude
prediction variables. The prediction equation can be written below.
Y= 2.020 -.13x1 + .33x2 + .21x3
Discussion
Faculty of Education, Panyapiwat Institute of Management used
Work-Based Learning (WBL) - a learning through internship with the
same work proportion as of real employees. This type of learning is the
combination between theoretical learning and practical learning. Because
most of the students had never experienced any internship in any real
work places, they were anxious and lacked of confidence.
Hence, the researcher was curious in studying factors affecting
competence in learning and internship of the students. The studied factors
include internship adaptation, internship interaction and internship
attitude. They have impacts on competence in learning and internship of
the students at the significance level of 0.05, consistent with the study of
Theerawat Imprakongsilp (2013) which examined the internship’s
requirements in Hotel Housekeeping Departments in Bangkok. The study
found that the opinions towards the internship students’ requirements
revealed that interaction was the most important quality. Moreover, it was
consistent with the study of Kelvarin Chantanasuksilpa et. al. (2015)
which examined internship problems and factors affecting the internship
effectiveness of the students in Chinese Teaching, Faculty of Education,
Panyapiwat Institute of Management. It was found that most of them had
positive attitudes towards internship leading to achievement. Also, they
were practised in discipling, conscientious and tentative problem-solving.
The results emphasized the importance of internship interaction and
internship attitude. Both should be embedded in the students’ minds for
quality development of all prospect graduates.
Recommendations
According to the study on factors affecting competence in learning
and internship of the students from Faculty of Education, Panyapiwat
Institute of Management, the researcher provides the following
suggestions;
^
The 7th National and International Graduate Study Conference 2017
" Thailand 4.0 Creative Innovation for Sustainable Development "
I7

1. The factors affecting competence in learning and internship of
the students are internship interaction and internship attitude. The research
results are appropriate for development planning in term of pre-internship
training.
2. This research is a quantitative one. Thus, qualitative research
sections should be added including group conversations and interviews for
better completeness.
References
Panthasak Polsaram.(2016). Reform learning and teaching in graduate
study and development learning process in undergraduate.
Accessed September 7, 2016. Available from ProQuest
www.edu.chula.ac.th/eduinfo/ed_resch/pansak.pdf
Kriangsook Fuengfupong. (2011). “Perception of Self-Efficacy, Optimism
and Job Engagment : A Case Study of Employees of Personal and
Health Care” Master dissertation, Faculty of Liberal Arts,
Thammasat University.
Lertchai Suthammanon.(2016). Panyapiwat Institute of Management
with Education management Work Based Education model .
Accessed September 9, 2016. Available from ProQuest
http://www.mua.go.th/users/he-commission/t-visit%20project/t-
visit%20book%202/22--g2--15-1.pdf
Pichit Ritcharoon. (2015). “Desirable traits study of Panyapiwat Institute
Of Management’s Studennts by using Work-based Learning
pedagogy in Convenience Stores." Panyapiwat Journal 8,
1(January- April): 200-212.
Somphob Manarangsan.(2016). Work-based Education real leran and real
internship at PIM. Accessed September 6, 2016. Available from
ProQuest www.pim.ac.th/th/
pages/student-life
Theerawat Imprakongsilp. (2013). “Desirble Characteristics of Student
Trainee in Housekeeper Department of The Hotels in Bangkok."
University of the Thai Chamber of Commerce Journal 36, 1(July-
September): 44-69.
Kelvarin Chantanasuksilpa et. al. (2015). “The study of practicum
problems and factors influencing the performance of Business
The 7th National and International Graduate Study Conference 2017
" Thailand 4.0 Creative Innovation for Sustainable Development "
I8

Chinese Students at Panyapiwat Institute Of Management."
Panyapiwat Journal 7, 1(January- April): 127-135.
The 7th National and International Graduate Study Conference 2017
" Thailand 4.0 Creative Innovation for Sustainable Development "
I9

Appendix
Author Chompunoot Putinatr, Jariya Neanchaleay (Advisor)
Program Doctor of Philosophy Learning Innovation and Technology,
Faculty of Industrial Education and Technology
Institute King Mongkut’s University Of Technology Thonburi
Tel 081-0117997 e-mail [email protected]
The 7th National and International Graduate Study Conference 2017
" Thailand 4.0 Creative Innovation for Sustainable Development "
I10

THE FACTORS OF CUSTOMER WHO CHOOSE CREDIT CARD OR DEBIT
CARD FOR PAYMENT WHEN THEY ARE GO ABOARD
Researcher: Ms. Nathida Rernggasettakorn, Master of Business Administration Program in
International Business, International College Silpakorn University Email:
Adviser 1: KEATKHAMJOHN MEEKANON, Ph.D., Master of Business Administration
Program in International Business, International College Silpakorn University Email:
Abstract
At present, Credit card and debit card are the first choice of customers to choose when
they are payment. Credit card is one of the first thing that people are carrying when they are
travel aboard or purchasing but it is not only in oversea. People usually use in their daily
similar as in other countries as well. Debit card is one type of payment that customer choose
for purchase. Debit card is using as similar as credit card but debit card will cut the money
directly from their own account.
This research is mention about customer who are interesting in credit card and debit card
when they are traveling aboard. Nowadays, lifestyle of people have been changed a lot so
they carry credit card and debit card rather than cash. Thus, this research is to finding about
how people use and problem of credit card and debit card. Credit card and debit card have so
many types and brands in Thailand such as Kasikorn bank, Bangkok bank or Siam
Commercial bank. Furthermore, co-branding is one of the brand that Thai people usually
have such as Citi bank, Aeon or KTC. They are also separate into 5 types of credit and debit
card including MasterCard, Visa, JCB, Union pay and AMEX.
Keywords: credit card, debit card, and go aboard, payment
Introduction
Background
Nowadays, people have high demand to spend their money by using a credit card or a
debit card rather than using cash when they are going aboard because of the convenience of
credit card or debit card. Credit card and debit card are the best choice for customers who are
traveling abroad. Credit card is one of the first thing that people are carrying when they are
traveling or purchasing but it is not only in oversea. People are also using as usual for daily
life as similar as in other countries such as Sweden and their neighbors including Norway,
Denmark and Finland. Sweden is fast becoming an almost entirely cashless society as similar
as Nordic neighbors Norway, Denmark and Finland. They said that they do not use cash
anymore, for anything and other said that Shops do not need cash even they would like to buy
candy bar. They use a card or phone to purchase (Henley, 2016). On the other hand, Korea
The 7th National and International Graduate Study Conference 2017
" Thailand 4.0 Creative Innovation for Sustainable Development "
I11
and China common to use credit card and debit card rather than use cash. Korea has Alipay
so it is an online payment service which provided by China. They have been opened first in
Seoul. Alipay comes to Korea to help Chinese traveler when they come oversea such as
online payment service to luggage storage and business lounge services (Yonhap, 2016).
However, it is not only Alipay that Korean people are using but they are also using Samsung
Pay and T-Money as well even there are going to GS25, Minishop, Seven-Eleven shop or
public transport. They are common using their mobile to pay rather than carry cash or card
(Traitanin, 2016). Moreover, in the metropolitan of China in huge area such as Beijing and
Shanghai. In China, they don’t need to carry a lot of cash to traveling because they can use
credit card. Furthermore, tourist who use credit card that don’t need to pay fees for change a
foreign transaction during their trip. China Union Pay is a China’s national bank payment
network which popular for Chinese. However, this is not Union pay that China has been
accepted but Discover also one of the brand that there are using in this country. Discover is
support their customer by programmed which called wallet-sized instruction card. This can
support in both languages as Chinese and English. Discover also withdraw money pass Union
Pay ATM machine in central of China in Advance and also have no foreign transection fees.
Many hotels, chain stores and tourist attractions accept other international credit cards,
including Visa, MasterCard, Diners Club and American Express. A number of cards don’t
charge foreign transaction fees and may offer other incentives that benefit frequent travelers.
The Bank America and travel Rewards credit card, for example, has no annual fee, charges
no foreign transaction fees and offers 1.5 points for every dollar you spend. The points can be
redeemed as a statement credit for any travel purchase including airfare, baggage fees and
hotels. Other cards that currently don’t charge foreign transaction fees include Capital One
Venture Rewards, Chase Sapphire Preferred, American Express Platinum and the
Barclaycard Arrival Plus World Elite MasterCard. Thus, Credit card and Debit card are
important nowadays for people in daily life. People are getting a lot of benefit for the credit
cards and debit card however, debit card and credit card also make a negative side.
Nevertheless, consumer has so many factors to choose about the payment methods and they
are also face a problem of payment during their journey when they are traveling such as
stores are not accept their card because issue of the card, type of card or some policy. There
are two type of card that people choose so one of them is debit card and another type is credit
card. People have many factor using the cards. For instance, people who chooses credit card
because they will gain a lot of benefits for credit card such as received a point of reward or
privilege for using in the future or in currently, pay later within 4 to 12 months or more, get
cash back promotion for person who use credit card so they will gain a lot of benefit from the
banks and cash back after used the credit card so consumer can use the voucher in the future.
In contrast, debit card that is a good ways for some consumer who doesn’t need to be
indebted. Thus, I have a lot of question about people who spend money from credit card why
they choose and their opinion about credit card. In my point of view, I thought credit card has
both side in positive side and negative side. Moreover, Credit card totally can change lifestyle
of people who addict to shopping or other reason to use. Credit card are not effect to financial
only it can effect to some of lifestyle such as traffic Jam, Change the job or promotion,
emotional of people. It is also have a lot of reason that can effect to people. That’s why I
would like to do research about Credit can change lifestyle of people.
Credit card
The 7th National and International Graduate Study Conference 2017
" Thailand 4.0 Creative Innovation for Sustainable Development "
I12

Credit card is separate into 4 types of credit card and debit card including Visa, Master,
JCB and Union pay. Firstly, Visa has 5 categories so it divided into Visa Classic, Visa Gold,
Visa Platinum, Visa Signature and Visa Infinite. However, all of them are also gain benefit in
separately depend on type of card. Secondly, MasterCard has 5 categories as similar as VISA
so there are separate into MasterCard Standard, MasterCard Gold, Master Card Platinum,
MasterCard world and MasterCard World Elite. Third, JCB (Japan Credit Bureau) is the one
of credit card’s Company that came from Japan. The main point of card is focus on traveling
including booking hotel, plane ticket, rent a car and many shops in Japan. In Thailand, people
know them in the name of AEON and KTC. Then, Union pay or China Union Pay establish
since 2002 so they have been cooperate with China bank They have 141 countries in
worldwide. In Thailand, the shops that accept Union Pay are Central, Siam Paragon, The
Emporium, Robinson, King Power and Boots. Lastly, AMEX has 2 type of issuer so he first
is issuer from AMEX Thai and other one is from Bangkok bank. Both of them gain discount
from AMEX select in worldwide. However, AMEX Credit card from Bangkok bank has no
charge card that customer has to purchase them all of total every month. They are also collect
mile to get a privilege from Thai airway.
Debit card
Debit card is one type of payment that customer choose for purchase. There is
convenient way for people to do not carry cash. Debit card is using as similar as credit card
but there is a bit different when purchase money back. This is because debit card will cut the
money directly from their own account. Normally, debit card has 2 types of transection use
which PIN-based and signature-based. First, PIN-based use the same technology as ATM
cards to withdrawal money from your own account. Thus, customer have to enter your
personal identification number (PIN) at the time of purchase as well as Signature transaction
is so similar to credit card transection so it can used only the place that credit cards are
accepted and then requires a signature. Moreover, debit card usually bear a VISA rather than
MasterCard.
Significant of the study
This research is researching about factor of customer who using credit card or debit
card during traveling aboard. This is focus on customer behavior of people’s lifestyle and
reason why people choose credit card and debit card for purchasing. In this research are focus
on four factors that may influence on customer who use credit card and debit card. Thus, the
factors that research is mentioning including convenient, security, brand and acceptance.
By definitions, “Credit card” is the card that issue by a bank or company which have
connection with the bank. The reason of credit card is to support customer when they are
would like to purchase product or service. Thus, this may safe for customer by do not need to
carry a lot of cash. Credit card is common for people around the world especially in Europe
and the United State. Business man usually use the credit card when they are traveling aboard
but it is not only go board. There are also using in their own country. However, travelers are
prefer to use credit card as similar as business man. This is because it is safety and convenient
The 7th National and International Graduate Study Conference 2017
" Thailand 4.0 Creative Innovation for Sustainable Development "
I13

for them during the journey. The credit card that is not for payment but people can withdraw
money from credit card as well (REF.) Credit card is so common for every generation.
“Debit card” is a plastic card as similar as credit card. This can use fraudulently and
should be protect similar to cash. Whether a thief takes your PIN, fakes your signature or
steals your card or card info, the person could use the card up to your everyday spending limit
and if you do not discover the fraud immediately, the thief could wipe out all the money in
your checking account.
Credit card and Debit card looks similar but they work differently so you can’t use
them to charge a purchase and pay it back over time as you can with a credit card. For the
debit card to work, so it must has enough money in the account to cover transactions, unless
you have overdraft protection. Debit cards are issued by banks to customers with checking
accounts. Moreover, debit cards can be used at cash machines (ATMs) to withdraw money
from the account and, like a check, they can be used to make purchases. The process of debit
card that processed over the same worldwide networks (MasterCard, Visa, etc.) used to
process credit card payments. The way to use debit card that has two ways so firstly, use PIN
or a personal identification number (PIN) to withdraw cash from an ATM or to request “cash
back” at stores when making a purchase and other way is use signature or PIN to pay for
goods, meals, gas and services by Consumer Action’s Managing Money Project (2007).
Credit card gain a lot of benefit and privileges to support their customer so every
banks have promotion to make customer interesting in their brand. Nowadays, people prefer
use card rather than cash to make them convenience, fast for payment. To keep yourself from
liability if your card is used fraudulently so, you have to performance with reasonable care
whenever you use it. This includes reporting a lost or stolen card straightaway. How to
protect your information is be careful position of sensitive paperwork and containing personal
or credit card information, such as receipts and credit card statements, Never share sensitive
financial information online, and keep other personal details to a minimum, do not email your
credit card details in case the message is intercepted, keep your credit card provider informed
of address changes and consider using a mail redirection service for a few months after
moving If you notice that a new / replacement card, statement or any other important
communication has not arrived, let your card provider know at once, delete emails or text
messages asking for financial details, without responding, do not open attachments from
unknown senders or any emails that strike you as suspicious, avoid updating financial details
by following links or calling numbers supplied via email or text message and only give your
card details over the phone if you have called a company you know to make a transaction by
Sainsbury’s bank (2015). Credit card can gain a lot of benefit and to make people convenient
but customer should learn how to protect their card. So many customer faces a lot of problem
about credit card. Mansfield, Pinto and Robb found that over 20 years ago, the use of credit
card were the problem that consumer concern in social and economic. The credit card gain an
opportunities for consumer to making a purchased. However, so many consumers are able to
purchase by credit card but there are seem to be capable to control their earnings habits.
The problem of credit card that usages had created by credit card were caused
apprehension among an educators, consumer and advocates and public policy administrators.
Kurtulus and Nasir (2006) found that the credit card companies had been expanded the
emerging market in order to exploit the opportunities which can provided by the emerging
market. The pattern emerging markets of the credit card also different from the well-
developed markets in the important ways. For example, Zafar U. Ahmed Ishak Ismail M.
Sadiq Sohail Ibrahim Tabsh Hasbalaila Alias, (2010) found that the proliferation of credit
cardholders take an indiscriminate to credit card’s user with negative effects. The consumer
The 7th National and International Graduate Study Conference 2017
" Thailand 4.0 Creative Innovation for Sustainable Development "
I14

in Malaysian seem likes to excessive buying behavior or called “compulsive buying”.
Compulsive buying gain adverse to customer to make them addiction to shopping and
excessive debt.
Around the world at the moment, tradition of debit cards is increasing as consumers
determine the value they provide in terms of convenience and money management so the
researcher found that “contrary to conventional wisdom, what most defined each of those
steps was the number of categories in which consumers were comfortable using the debit
card, rather than the actual quantity of transactions completed”,
Thus, this result of the research on this section found the keys about mature market
including Merchant trust and individual approaches to money management is one of the keys
that make customer confident to use debit card in different categories, Necessity is about
online payment that customer can use because they have no other type of payment that is
available, Grocery and fuel including insurance premiums or electronics home furnishing are
the categories that frequently prompt early card usage Bunn, Colvin, Pittier and Zanghi
(2012).
According to Borzekowski, Kiser and Ahmed (2006) found that “Respondents are
more likely to use debit cards if they have negative expectations about their future financial
condition, and are more likely to use credit cards rather than debit cards if their financial
situation has worsened recently. Thus, consumers appear to have an underlying preference for
spending from liquidity, and use credit as a source of liquidity during periods of financial
stress”. Zinman (2004) mention in Security and acceptance of debit card and credit card that
both of them is the factors on this research, Acceptance of Debit and credit enjoy similarly
widespread acceptance as payments device that will treat them as equivalent and also the
difference has come about due to the rise of “offline” debit, whereby an ATM card with a
Visa or MasterCard. The debit card and the credit card brand is accepted. Consequently debit
and credit are essentially equivalent along this margin when compared to cash or check.
Next, security of debit and credit now offer essentially identical fraud protection, and
hence offer similar protection against theft compared to cash or check. Noknoim Ngowsiri
and Boripunt (2009) found that customer are frequently used their debit card at department
store and also paid for their infrastructures. Debit card is change a little it when they are
expense behavior especially in food and drink consumption. Moreover, most of customers
well perceived on the service quality in all dimension of tangible, reliability, responsiveness,
assurance, and empathy. This research found that service marketing mixes influenced on
using debit card behavior are debit card, promotion, process, physical evidences, and
productivity and quality control. Moreover, all services about marketing mix influenced on
quality perceiving on using debit card. Debit card gain beneficial to set debit card marketing
mix strategy policy to stimulate consumer behavior on using debit card. Furthermore, most of
the consumer had only one debit card and used it for spending more than withdrawing money
from ATM so it is different form in the past that consumer used the debit card as ATM.
Purchase intentions have often been theorized and as a dimension of customer loyalty in
the line of setting. In the same method, various studies show that service quality is directly
proportionate to the purchase intention and risk is inversely proportionate to the purchase
intention. Purchase intentions are influenced by expectations of service quality. As
consumers’ expectations of a service seller increase, their probability of purchasing a service
from that seller or provider increases too. In addition, purchase risks are reduced if
expectations of service quality are high. This risk will be reduced, in turn, increase purchase
intentions. Product quality and price directly influence value, it is no surprise that the efforts
The 7th National and International Graduate Study Conference 2017
" Thailand 4.0 Creative Innovation for Sustainable Development "
I15

of marketers have focused on improving product quality and reducing price in order to
enhance perceptions of value, and consequently purchase intentions Khandelwal, Bajpai,
Sharma (2012). This research focuses on debit card and credit card purchasing intention.
A credit card is a kind of card that is owned by a bank or financial institution. Customers
are using used in buying products and services in domestic and foreign countries. It is also
withdrawing cash from ATM within a certain credit. Credit cards are highly complex
financial instruments. There is finding of credit card logo can associate with spending and so
influences spending. Credit card logo did not affect spending behavior Yilmaz (2013).
Furthermore, Khan (2011), said that credit card is not impacted on purchase behavior. In
France so use grocery store data, and show that the payment mode choice is related to total
amount of the transactions, with card use dominating in high-cost transactions.
Payment mode choice is directed by the cost of the transaction. So the purchase decisions
may not be directed by the card, but the final cost at the checkout may be the choice of
payment that is a function of the amount of cash available to the person at the point of
payment. Sriyalatha (2016) found that card holder intension is an important factor that should
be considered by banks offering credit cards. Most of the respondent use credit cards to
purchase day to day necessities and foreign purchases and they prefer these cards mostly for
online purchases.
Moreover, in the results suggest that perceived helpfulness and availability of information
concerning credit card have an important influence on attitude in the direction of credit card
usage. A number of methods can be utilized to increase the available information concerning
credit cards. For example, banks can afford more specific data with more transparency about
interest rates charge by banks on late payment, registration fees, annual renewal fees, etc.
Banks also can publish the latest information about credit cards, which should help to take the
decision regarding the holder of credit card which manner they have to use their credit cards.
The study revealed that majority of the respondents are been using credit cards intelligently
thus, the use of credit card will not lead to serious financial problems or heavy debt problem.
Debit cards are more frequently used if compared to other types of payment in non-food
retail, petrol, supermarket purchases and public transport use and that fast-food purchases be
present mostly paid for by cash. The mean purchase intention scores for an additional
purchase in a certain group was higher if previous expenses in that group were paid for by a
mechanism that did not allow performance and when payments were still in process Soman
(2001).
Objectives
This study aims to find factors that are influencing on customer behavior when they
use credit card or debit card.
This study aims to focus on problem of customer when they use credit card or debit
card in other countries.
Research Methodology
The 7th National and International Graduate Study Conference 2017
" Thailand 4.0 Creative Innovation for Sustainable Development "
I16
The research is mention about customer behavior which gives precedence to credit
card and debit card when they are traveling aboard. This chapter will explain the way to
answer requirement that pertinent of research question. This research is collect primary and
secondary data to analysis and support the research question. There is also do an individual
interview and group interview. In some situation of interview is informal interview. The
purpose of this research is to identify customer behavior which uses credit card and debit card
when they are traveling aboard. This is because at the present a lot of people are traveling
aboard and they are common to use credit card and debit card rather than cash. Other purpose
of this research that they are also to study tangible and intangible of credit card and debit card
which support demand of household nowadays. However, household is facing so many
problems from credit card and debit card when they were using the card. Then, the researcher
would like to study with their case and the opinion of household.
Research question
Research Questions have been determined after reviewing the existing literature. The data
span from December 2015 to May 2016. The data collected by interview about 20 household
including consumer of bank in Thailand such as Bangkok bank, Kasikornthai bank, Siam
Commercial bank, Krung Thai, Krungsri and other co-branding including AEON, KTC and
Citibank etc. This research is finding the about customer behavior and purchase intention of
customer who used credit card and debit card from Thai’s bank and find how customer
determine to use credit card and debit card, how to use or how to decide to choose the
companies and problem of them that may face when they are traveling aboard.
The population
The population of this research is a customer of bank of Thailand and co-branding which
came from other countries. All of them were traveling aboard and also use credit card or debit
card in Oversea. The age of interviewees is start from 25 to 49 years old. Their Job are
severally such as Accountant, programmer, Employees of Mahidol University, own business
and customer service.
Sampling
A sample size of this research is 10 interviewees who use credit card and debit card when
they are traveling aboard. Sample size of this research has been selected from their
experience and using the interview to collect the data. This research was interview individual
customer and group interview. Most of them which had an interview are informal interview.
This is because researcher would like to collect data and observe customer behavior to make
them comfortable to describe the information.
Data Collection
The 7th National and International Graduate Study Conference 2017
" Thailand 4.0 Creative Innovation for Sustainable Development "
I17

The process of interview was collected in a group during a meal and some of
customer collected by give them a phone called. It is take about 10 minute per each to collect
the data. Interview is quite informal because researcher would like to get an information that
a bit usual not formal. Almost all of the group are employees at the office or have own
businesses and a few people are unemployment. Their degree is Bachelor degree and Master
degree in University in Thailand. Only three people are graduated Master degree from
Oversea and living there for longtime over 2 years so they have a lot of experience from other
bank from oversea but this research are not mention much about it. A few interviewees are
living aboard and there are use credit card and debit card which issue in Thailand. This
survey is start from December 2015 to May 2016.
Result and Conclusion
Finding
As a result of this research, customer who is over 28 years old prefer using credit card
rather than debit card. Male and female also have similar lifestyle of payment in credit card
and debit card in currently. The income is one of the huge gaps of the research because they
have different rate of income to support themselves about credit card or debit card. However,
occupation is not be indicator that people who working in high position can support their
demand or benefit pass credit card and debit more than other. Moreover, education is
depending on the occupation rather than education as well. The age start from 28 years old
also have credit card and debit card more than 2 cards. There are choose credit card rather
than debit card when they are traveling aboard because they do not need to spend all of their
money for the trip and they do not prefer to withdraw money in oversea. Customers who have
income over 10,000 baht are prefer using debit card only and the customer who have income
more than 20,000 baht and over 30,000 baht or more Social are carry more than 2 credit
cards and debit card. They use both. The reason of respondents why they are choose credit
card because it is convenient and safe. Moreover, credit card can pay by installment for 3
months, 6 months, 12 months or more than 1 year depend of their choices. They also collect
point to exchange to be cash back or plane ticket in the future. In contrast, the respondent
who choose debit card because they can control their budget when they are traveling aboard
and has no liabilities when they are come back to Thailand. Siam commercial bank (SCB) has
the highest figure that customer are using both between debit card and credit card. The
second is Kasikorn Bank and Bangkok bank which customer use and another co-branding
that do not directly from the bank is Aeon, Citibank, Firstchoice or KTC are the brand that
customer use as well because of promotion from the card. It is not so many customers face a
problem of credit card and debit card. It is just a few people that are faced problem about
credit card such as OTP or issuer of the card. Nowadays they have an electronic-signature to
make people more convenient rather than in the past to finish their payment. In other
countries, it is not difficult to find card-reading machine in almost every shops because it is
common to use card rather than cash. ATM machine is also easy to find in oversea but they
do not prefer to withdraw in oversea. Almost everyone is aware of theft or lose their wallet,
handbag or fraudulent but they are trust in their bank so it may not a huge problem for them.
MasterCard and Visa are common in Thailand for longtime until now. In currently, a lot of
brands come to Thailand such as Union Pay, JBC or AMEX but they are not as popular as
similar as Visa and MasterCard. Visa is the most popular than MasterCard in Thailand
The 7th National and International Graduate Study Conference 2017
" Thailand 4.0 Creative Innovation for Sustainable Development "
I18

because almost every bank gives the types cards is Visa but Siam Commercial Bank that use
MasterCard on Credit card and Debit card.
Discussion
This research has four factors that researcher is separate into two categories such as
customer behavior and purchase intention. Researcher are given some an example of other
countries such as Malaysia that give some example of customer behavior. As you can see
customer behavior between Thailand and other countries are not a huge different the
customer behavior quite similar with some Thai’s people but their also have a gap that
different from each other. Thus, the process of payment that is different because of the
system and technology of those countries. Uncertainty, research is mention about system that
Thailand is one of the low-technology if compare with other countries that developed such as
Australia, Singapore or The United states. Next, purchase intention has often been theorized
and as a dimension of customer loyalty in line of setting. Purchase intentions are influenced
by expectations of service quality that make a service seller increase. Some journal found that
credit card logo cannot affect to customer but in this section service of bank and loyalty in
brand may affect to customer rather than logo. Furthermore, promotion also can affect to
customer as similar as service of the bank. Most of respondent use credit cards to purchase
day to day necessities and foreign purchases and they prefer these cards mostly for online
purchases because it is more convenient for them if they pay by card but it depends on
product or service. For example, people usually use it for grocery store data or other type
online in France. However, Debit cards are more frequently used if compared to other types
of payment in non-food retail, petrol, supermarket purchases and public transport use and
those fast-food purchases are present mostly paid by cash. Overall, customer behavior and
purchase intention are affect to determine of customer when they are choose the types of
card.
References
The 7th National and International Graduate Study Conference 2017
" Thailand 4.0 Creative Innovation for Sustainable Development "
I19

Ben Colvin, Carlos Pittier and Anna Zanghi Martin Bunn. (2012). Understanding
How Consumers Adopt A Debit Card Payment Preference. Global insights.
DILIP SOMAN. (2001). Effects of Payment Mechanism on Spending Behavior: The
Role of Rehearsal and Immediacy of Payments. JOURNAL OF CONSUMER
RESEARCH.
Elizabeth K. Kiser, Shaista Ahmed Ron Borzekowski. (2006). Consumers’ Use of
Debit Cards: Patterns, Preferences and Price Response. Washington DC: Finance
and Economics Discussion Series Divisions of Research & Statistics and Monetary
Affairs Federal Reserve Board.
Great Wall International UnionPay. (ม.ป.ป.). from bank of china:
http://www.bankofchina.com/th/th/pbservice/pb4/201210/t20121010_2005594.html
Guide to credit card security. (3 september 2015). Sainsbury's bank, pages 3-8.
Helen Russell. (12 November 2014 ). Welcome to Sweden - the most cash-free society
on the planet. from theguardian:
https://www.theguardian.com/world/2014/nov/11/welcome-sweden-electronic-
money-not-so-funny
Jean Folger. (23 February 2015). Best Credit Cards For Travel In China . เfrom
investopidia: http://www.cnto.org/best-credit-cards-for-use-when-traveling-in-china/
Jon Henley. (4 June 2016). Sweden leads the race to become cashless society. from
theguardian: https://www.theguardian.com/business/2016/jun/04/sweden-cashless-
society-cards-phone-apps-leading-europe
Jonathan Zinman. (2004). Why Use Debit Instead of Credit? New York: Federal
Reserve Bank of New York.
Mallika Appuhamilage Kumudini Sriyalatha. (2016 ). Determinants of Customers’
Attitude towards Credit Card Usage: Lessons Learned from Academics in Sri Lanka.
Sri Lanka: Macrothink Institute.
Michel Tuan Pham, Gita Venkataramani Johar Eric J. Johnson. (2004). Consumer
Behaviur and Marketing .
Miriam Caldwell. (15 December 2016). What Is the Difference Between a Credit
Card and a Debit Card. from thebalance: https://www.thebalance.com/difference-
between-a-credit-card-and-a-debit-card-2385972
Muthu Velayutham, Phli Abdul Brosekhan. (ม.ป.ป.). Consumer Buying Behaviour.
IOSR Journal of Business and Management.
Sutee Ngowsiri, Wannaporn Boripunt, Chetsada Noknoi. (2009). Have Debit Cards
Changed Thai Consumer Shopping Behavior. Thailand: International Journal of
marketing studies.
The 7th National and International Graduate Study Conference 2017
" Thailand 4.0 Creative Innovation for Sustainable Development "
I20

Traitanit. (9 January 2017). บทบาทของ Alipay ส าหรบ Cashless Society ในเกาหลใต. from
Ascend Developers:
https://developers.ascendcorp.com/%E0%B8%9A%E0%B8%97%E0%B8%9A%E0
%B8%B2%E0%B8%97%E0%B8%82%E0%B8%AD%E0%B8%87-alipay-
%E0%B8%AA%E0%B8%B3%E0%B8%AB%E0%B8%A3%E0%B8%B1%E0%B8
%9A-cashless-society-
%E0%B9%83%E0%B8%99%E0%B9%80%E0%B8%81%E0%B8%B2%E0%B8%A
B%E0%B8%A5%E0%B8
Understanding debit cards. (2007). from Managing Money: http://www.consumer-
action.org/downloads/english/debit_cards.pdf
University of pretoria. (ม.ป.ป.). CONSUMER BEHAVIOUR THEORY . University of
pretoria.
World's Top 10 Credit Card Issuers. (2009). from CNBC:
http://www.cnbc.com/2010/04/13/Worlds-Top-10-Credit-Card-Issuers.html?slide=11
The 7th National and International Graduate Study Conference 2017
" Thailand 4.0 Creative Innovation for Sustainable Development "
I21

AN EMPIRICAL STUDY OF THE FACTORS INFLUENCING CUSTOMERS’
PURCHASE INTENTION OF DIGITAL CAMERA
Authors: Tattep Sinjanakhom and Jantima Banjongprasert, Ph.D.
Program: Master of Business Administration in International Business
Institute: Silpakorn University International College
Abstract
The aim of this study is to explore marketing mix and characteristics of buyers
influencing purchase intention of digital cameras. The study addresses its research objective
through an empirical investigation adopting quantitative survey in digital camera sector. Data
were collected using an online survey (280 respondents). The results, analyzed through
multiple regression analysis, demonstrate positive impact of marketing mix and
characteristics of buyers on customers’ purchase intention. The research findings provide
guidance to managers as to how customers’ purchase intention is influenced by marketing
mix and characteristics of buyers. The theoretical and managerial implications of this
research are articulated.
Keywords: Marketing mix / Characteristics of buyers / Purchase intention
Introduction
Consumers’ purchase intention represents how efficiently a company implements its
strategies to satisfy market demands. This view is supported by Alipour et al. (2012) that a
relationship between corporate strategy and consumers’ purchase intention is very crucial as
successful marketing strategies are dependent upon profound and genuine understandings of
influential factors pertinent to purchase intention of consumers. To achieve this, companies
need a good grasp of preferences their customers have towards products and services
(Karbala and Wandebori, 2012). Kuyram (2013) states that the purchase intention of
consumers is a complicated issue as there are various factors involving in purchase decision.
Thus, enterprises need to understand how consumers respond to the factors affecting
purchase intention especially marketing factors. Moreover, customers’ characteristics are
considered as critical factors for understanding customers’ purchase intention. Therefore, this
study endeavors to investigate marketing mix, customers’ characteristic, and customers’
purchase intention.
Digital Camera
Digital camera has increasingly become one of the most popular segments of
consumer electronic products, as people have used cameras more frequently than ever. They
are now taking photographs for a wider range of purposes. Growing popularity in tourism and
fashion photography, for example, has led to increasing demand for digital cameras. Lodi
(2016) argues that with the introduction of mirrorless cameras, we have experienced a
dramatic increase in digital camera sales, which has, in turn, driven the overall growth of this
The 7th National and International Graduate Study Conference 2017
" Thailand 4.0 Creative Innovation for Sustainable Development "
I22

market over the years. Mirrorless camera, frequently accompanied by a slim body design, is a
combination of DSLR camera and compact camera. A product of this type offers
interchangeability of lenses, and is user friendly in terms of simpler menus and controls. One
widely accepted advantage of digital cameras over smartphones is higher image quality (Stirr,
2016). Other features of digital cameras, superior to those of smartphones, include a larger
sensor to ensure a better image quality, a usually longer battery life, a more powerful flash,
and their greater compatibility with a more variety of lenses with different focal lengths and
resolutions. Esser (2014) demonstrated that a lifecycle of digital camera is much longer that
of smartphone and laptop as it allows users to replace a lens as per their needs. These
qualities play a crucial role in impacting demands for interchangeable lens cameras over the
coming years (Lodi, 2016). Hence, this study focuses on digital camera customers.
Consumers’ purchase intention
Consumers' purchase intention is one important process that takes place in decision-
making which can be defined as a consumer’s tendency to buy a product. Mirabi et al. (2015)
defines purchase intention as a kind of decision making that focuses on the reason to buy a
particular product which is usually related to the behaviors, perceptions and attitudes of
consumers. According to Xie (2012), it can also be understood as the potentiality that a
consumer intends to purchase a product. Further, purchase intention can be employed as a
forecasting instrument for market research of future purchase decision. In short, purchase
intention has long become an important concept in marketing field as not only can it, as a
predicting tool, help marketers to evaluate the purchasing power of consumers, but it also
represents a degree of willingness of purchasing (Linh, 2014). As argued by Jaafar et al.
(2012), purchase intention can hint at a purchasing process of consumers, and helps
companies to better understand a market situation. However, there is a difference between the
intention to buy a product and the actual purchase as purchase intention involves a
considerable number of factors which affect a purchase decision. Mirabi et al. (2015) in their
study found that it may be interrupted by internal impulse and external environmental factors
during purchasing process such as their lifestyles or the recommendation form their family.
Moreover, unanticipated situational factors such as disliking a salesperson in a store are the
other reason why consumers often might change their mind about an intended purchase
decision (Kokoi, 2011). Mirabi et al. (2015) found that purchase intention may be interrupted
by internal impulse and external environmental factors during purchasing process. In many
situations, for instance, promotion can act as an unanticipated circumstance which causes a
different brand to become more desirable (Teunter, 2002).
Marketing mix
Marketing mix refers to a set of tactical marketing tools which comprises of four
elements: product, price, promotion, and place (The 4Ps) companies always use to
incorporate into their marketing strategies (Alipour et al., 2012). According to Domie (2013),
each element cannot be employed alone as all elements are, in all dimensions, equally
important; each element ideally supports the others. This process usually involves
considerations of how to create a successful mix of a right product or service, with a right
price, place and promotion (Munusamy and Hoo, 2008). In reality, there are discrepancies
among companies when it comes to using marketing mix, in part, due to availability of
resources, market conditions, and different needs and wants of customers.
The 7th National and International Graduate Study Conference 2017
" Thailand 4.0 Creative Innovation for Sustainable Development "
I23

Product refers to a goods or services for a consumer. Souar et al. (2015) defines a
product as anything that can be offered to a market for attention, use, or consumption in order
to satisfy needs and wants of customers, and most of the time, is used to predict that given
market. According to Kuyram (2013), and Karbala and Wandebori (2012), to develop
products with the right quality to meet the needs of target market, every company should
consider quality of product as one of the crucial factors. For the digital camera market, Lodi
(2016) comments that technology advancements have contributed to improvement of product
quality by offering more features, such as larger sensors and higher image quality. According
to Karbala and Wandebori (2012) and Deng (2009), for example, many brands such as Apple,
Target, and Nike, have become a leader in their respective industry as they have strategically
used a design as a differentiator to set themselves apart from competitors. After-sales service
play not less important role in creating positive feelings towards a certain product (Karbala
and Wandebori, 2012). Mirabi et al. (2015) asserts this concept that more and more
companies have offered their customers better problem solving, thereby winning heart of
their customers. For example, if customers are not satisfied with functionality, of a product
they have just bought, the purchased product can, according to many companies’ return
policy, be claimed within 7-14 days. According to Mirabi et al. (2015), and Ali et al. (2016)
showed that intention of customers can be influenced by the product with good quality, image
of the brand and attractive design. As a result, according to above discussions, the first
hypothesis is proposed: Product factors has positive impact on customers’ purchase
intention.
Price refers to any amount consumers have to pay to receive the offering goods or
services (Kuyram, 2013).Prior to price setting, companies need to understand its important
roles in determining value of their products in targeted markets (Gilaninia et al., 2013). In a
larger number of industries, especially consumer products, companies establish their pricing
policy using the competition-based strategy (Dang, 2014). Price can be consider as the most
sensitive element of all market mix elements because price can be fluctuating, depending
upon various factors: demand of customer, competition, government regulations. Such
factors, thus, are very crucial, and need to be taken into account in price setting. In many
cases, consumers tend to change their decision on buying a product when they perceive that
the value they would receive is not worth with the amount they have to spend. According to
Khan (2011), and Tolušić et al. (2002) also found that consumers will consider about price as
the important factor which can change their purchase intention. Thus, the second research
hypothesis is proposed: Price factors has positive impact customers’ purchase intention.
Place strategy can refers to a location where products and services are to be displayed
and made available to the customers, and also focuses on distribution channel and logistics
management which products will flow from company to consumers (Kuyram, 2013).
Consumers are now not only focusing on availability of products, but also paying more
attention to accessible location. Yasanallah and Bidram (2012) also confirms that customers
always search for convenience; and, thus, they expect to receive products and services
anywhere and anytime they like. Retailers and middleman play important roles in bridging
producers and consumers with a strong personal relationship by holding a variety of products
and also offers other services like promotion as well as after-sale services (Munusamy and
Hoo, 2008). Furthermore, new technologies have allowed companies to provide their
products without customers coming to their facilities. Companies can sell more products to
different geographically markets; and customers can carry out transactions through online
payment. However, there are many situations where contact between the provider and the
customer is still essential. Yasanallah and Bidram (2012) and Dang (2014), in their study also
confirmed that customers nowadays also expected the convenience place and the suitable
The 7th National and International Graduate Study Conference 2017
" Thailand 4.0 Creative Innovation for Sustainable Development "
I24

distribution channel can increase their purchase intention. Thus, the third hypothesis is
proposed: Place factors has positive impact on customers’ purchase intention.
Promotion is the set of methods concerning with bringing products to the awareness
of customers and persuading them to buy through various activities, advertising, personal
selling and sales promotion, for example. Kamsuwan (2015) points out that companies should
focus on sales promotion and communication strategies and on identifying who their
customers are, how they can be contacted, and what messages should be delivered. Free
samples, prize contests, premium on sale, shows and exhibitions are some illustrations of
sales promotion techniques. Rajalingam and Pushpanathan (2013) suggests that advertising is
so far the best tool to increase public awareness of both existing and new products as it can
communicate, through mass media, such as television, radio, newspapers, magazines, web
pages, posters, brochures, etc., with a vast number of people. Advertising is the component of
the promotion strategies which requires several decisions with regard to the theme of
advertising, media to be used, budget, and so on. Personal selling is the effective
communication process of presenting the products to customer by the company’s sales force
in order to make sales and create relationships between buyers and sellers (Dang, 2014). The
effectiveness of sales force depends upon performance appraisal which can estimated form
the call reports, customer feedback and invoices (Chand, 2016). However, no single method
of promotion is effective alone, there is no one ideal methods that fits all situations (Chand,
2016). The promotional campaign usually involves a combination of two or more
promotional methods because of the increasing competition of market. Mirabi et al. (2015) in
their study also investigated the impact of promotion on consumer buying behavior. As a
result, the fourth hypothesis is proposed: Promotion factors has positive impact on
customers’ purchase intention.
The characteristics of buyers
Apart from marketing mix, consumer purchase intention itself is also influenced by
characteristics of buyers, including personal, social, and psychological factors. These
characteristics are those beyond control of companies, such as, personality or economic
situations (Oancea, 2015). Since companies cannot change or control these factors, they need
to be aware of affecting factors so as to design their offerings in a way that draw their
customers’ attention (Sarker et al., 2013). They, thus, need to analyze how these stimuli
transform into responses inside the customers’ purchase intention (Sandu, 2014). As Kim and
Hyun (2011) suggests, companies must, by their nature of business, determine which factors
can most influence their customers’ purchase intention, which will, in turn, and triggers their
purchase decision.
Personal factor Personal factor can refer to wholeness of behavior with different
characteristics in different circumstances which can influence consumers’ purchase intention,
and simultaneously shapes their whole pattern of interacting. Sandu (2014) describes
personality as a combination of physical and mental characteristics of a person which varies
from one to another; and it reflects how one thinks, acts, and feels. Therefore, companies
need to gain an insight into customer personality in order to understand how they make a
decision because most, if not all, consumers choose a product that fits their personality
(Kowel, 2015). Lifestyle is another important factor that affects consumers’ purchase
intention. It refers to a way people live in a society which represents their surrounding that
determines their interests, opinions, activities. It shapes the whole pattern of consumers’
The 7th National and International Graduate Study Conference 2017
" Thailand 4.0 Creative Innovation for Sustainable Development "
I25

interacting responses (Vijayakshmi and Mahalakshmi, 2013). For this reasons, Muniady et al.
(2014) suggests that companies should, and must, pay close attention to the global trend as
the reflection of intention of customers. Further, EconEconomic situation is one of the
personal factors that influence consumers’ purchase intention because if income and savings
rise, customers will have more purchasing power, and therefore consumption and spending.
On the other hand, a lowered level of income and savings will inevitably limit purchasing
power, and, in many cases, people can become more price sensitive and seek to compare
goods of the same types and select what they perceive the best based on price, compromising
on the quality (Vijayakshmi and Mahalakshmi, 2013). Vijayakshmi and Mahalakshmi, (2013)
in their study showed that personal factors has great influence on customer purchase
intention. As a result, according to the above discussions, the fifth hypothesis is proposed:
Personal factor has positive impact on customers’ purchase intention.
Social factor such as friends, family members, social organizations, affect a selection
of specific brand heavily (Mirzaei and Ruzdar, 2010). Khan and Rohi (2013) notes that, in
many situations, people want to be part of a particular group, therefore, options and
preferences from family members or friends are an important influencing factor in product
selection, especially for an individual who lives alone. Furthermore, family is the factor that
plays an important role in shaping individuals’ attitudes and perceptions towards products,
because many people have a habit of choosing products and services they are familiar with
from their childhood. Social status throughout one’s life depends on family, friends,
organizations to which they belong. Each social status, and its roles, has a dignity which is
the respect that society has towards. As a result, people like to choose products that are
compatible with their roles and places in the society (Sandu, 2014). Thus, in the context of
consumers purchase intention, people will tend to purchase product when their social
environment encouraged them to purchase (Mirzaei and Ruzdar, 2010 and Sarker et al.,
2013), therefore, the sixth hypothesis is proposed: Social factor has positive impact on
customers ‘purchase intention.
Psychological factor consists of perception, motivation, and learning has a
significant, direct impact on the consumers’ purchase intention (Domie, 2013). Perception is
the process in which people perceive, select, organize, and interpret information surrounding
them in a way to produce a meaningful experience. Difference in opinions on a product
depends on how customers perceive information of that product (Furaiji et al., 2012).
Motivation is a psychological factors that starts within individuals when an individual wants
to get what they need. The nature of the needs is varied among individuals in terms of both
biological and social factors (Vijayakshmi and Mahalakshmi, 2013). Learning, in a marketing
sense, refers to the process described as changes in an individual's purchase intention after
obtaining product information or gaining experience with a product (Furaiji et al., 2012). This
can cause consumers to either buy a product for the second time, or to give up buying on that
product, or to seek more information on the product. In addition, Domie (2013), and
Lautiainen (2015), in their researches examined that psychological factors has a significant
effect on the purchase intention of customers. Therefore, the seventh research hypothesis is
proposed: Psychological factor has positive impact on customers’ purchase intention.
The 7th National and International Graduate Study Conference 2017
" Thailand 4.0 Creative Innovation for Sustainable Development "
I26

Objectives of the Study:
• To explore the impact of marketing mix factors on customers’ purchase intention.
• To investigate the impact of characteristics of buyers’ factors on customers’ purchase
intention.
Figure 1. Theoretical Framework
Research Methodology
Research Design
To satisfy the research objectives, this study is based on a quantitative approach; and
a structural design was drawn upon previous study by Vijayalakshmi and Mahalakshmi
(2013), and Furaiji et al. (2012), which employed both marketing mix factors and
characteristics of buyers’ factors as they offered the findings in more various dimensions, as
compared to a focus on one group of contributing factors. The primary data were collected
through the use of online survey. The survey instrument was a self-administered
questionnaire containing closed-ended scales questions. The data obtained were, then,
analyzed to determine the impact of marketing mix and customers’ characteristic on
customers ‘purchase intention of digital cameras.
Sample size
A target population here refers to digital camera users; and yet the survey aims at
online-based groups because of the appeal of this particular market as these groups tend to
receive new trends and appear to provide quick responses to new products. According to
The 7th National and International Graduate Study Conference 2017
" Thailand 4.0 Creative Innovation for Sustainable Development "
I27

Khan and Rohi (2013), non-probability sampling has been widely applied, owing to its ability
to gather data quickly and inexpensively. Another reason behind a focus on online-based
groups was that there were some certain circumstances in which collecting data from the
entire population in reality was not possible, the distribution of a survey in digital camera
exhibitions was not allowed. Despite of this, the total number of 280 completed
questionnaires is considered effective as the most effective sample size, as Roscoe (1975)
suggests, between 30 and 500.
Data collection and analysis
In this research, the questionnaire distribution targeted on 6 digital camera user
groups: Sony Alpha Club Thailand, Fuji X Series Club Thailand, Canon Club Thailand,
Nikon Club Thailand, OLYMPUS Club Thailand, and Panasonic Lumix Mirrorless Club
Thailand. To ensure complete understanding of the entire questionnaire, there were both Thai
and English version, and an explanation for any potential confusion was also available upon
request.
In order to obtain data from digital camera users, Google Docs, a free online survey
service provided by Google, is utilized; and the effectiveness of this process was confirmed
by Ling et al. (2014). The questionnaire comprised two sections in which the first section
contained 43 items about marketing mix (product factors, price factors, place factors, and
promotion factors), characteristics of buyers (personal factors, social factors, and
psychological factors), and purchase intention. All questionnaire items were based on a
Likert’ five scale to scaling responses with five scale point descriptors: “Strongly Disagree”,
“Disagree”, “Neutral”, “Agree”, and “Strongly Agree”. The questionnaire codes the
responses accordingly: Strongly Disagree = 1, Disagree = 2, Neutral = 3, Agree = 4, and
Strongly Agree = 5. The second section contained 11 items about demographics: gender, age,
marital status, occupation, highest educational attainment, and basic questions about making
use of digital camera.
Upon completion of data collecting, the Statistical Package for Social Sciences
(SPSS) version 21 was used for an analysis. To validate the data and to determine a
relationship between the independent variables and the dependent variable, an analysis was
performed through three tests: Descriptive Statistics, Reliability Analysis using Cronbach’s
Alpha, and Hypothesis testing using Pearson’s Correlation and multipleregression Analysis.
Also, all statistical data are presented in pie charts and tables.
Results
Demographic Information
Of 280 completed questionnaires, 138 respondents are male (49.3%), 139 are female
(49.6%), and the rest of 3 (1.1%) specified as ‘Other’. The majority of respondents age
between 21-25 years old (39.3%); are single (75%); earned a bachelor degree (78.6%); and
work for a private organization (40.7%). Respondents with at least 5-year experience in using
a digital camera represent the largest proportion of the population (28.6%), and 159
respondents (56.8%) possess only one camera. Of the total, 47.1% use a mirrorless camera,
while 26.1% prefer Fujifilm. Most respondents bought a digital camera at retailers, such as
Big Camera, and suggest an acceptable price range of 25,001-30,000 baht. When purchasing
The 7th National and International Graduate Study Conference 2017
" Thailand 4.0 Creative Innovation for Sustainable Development "
I28

digital camera, most respondents (179 respondents or 63.9%) relied on their own. Prior to
their purchase, they tend to look for information on their own, while recommendations from
family, friends, salesperson and reviewers are not as significant. What is interesting is that the
main purpose of a purchase of digital camera is for travel / recording memories. For the
payment method, the result showed that payment through a credit card (Non-Down payment)
is most popular.
Reliability Analysis
By using structural equation models, the composite reliability needs to be verified
through Cronbach's α which, as proposed by Nunnally (1978) should exceed the
recommended threshold of 0.7. In this study, the Cronbach alpha coefficients indexes are
above the threshold value of 0.7, therefore indicating the reliability of the questionnaire
items.
Table 1: Cronbach’s alpha
Item Number of Item Cronbach’s Alpha
Product 7 0.79
Price 3 0.70
Place 6 0.84
Promotion 5 0.82
Personal 6 0.77
Social 5 0.77
Psychological 5 0.85
Purchase intention 5 0.75
Correlation Analysis
The outputs indicate a strong relationship in the correlation matrix for the 7 variables:
product factors, price factors, place factors, promotion factors, personal factors, social
factors, psychological factors, and consumers’ purchase intention. The Pearson correlation
coefficients of all items are positively correlated with the dependent variable, at a
significance level of 0.01. The analysis results of Pearson’s correlations between the
independent variables and the dependent variable are 0.411, 0.472, 0.405, 0.385, 0.661,
0.436, and 0.628, respectively. Personal factors and psychological factors demonstrating the
strongest relationship on consumer purchase intention. Also, the results demonstrated that all
independent variables have a strongly correlation with one another, at a significance level of
0.01. Therefore, .a correlation analysis was performed to measure a direction and strength of
a relationship between the independent variables and the dependent variable.
The 7th National and International Graduate Study Conference 2017
" Thailand 4.0 Creative Innovation for Sustainable Development "
I29

Table 2: Correlations between the independent variables and the dependent variable
Correlations
Product
Average
Price
Average
Place
Average
Promotion
Average
Personal
Average
Social
Average
Psychological
Average
Purchase
Intention
Average
Pearson
Correlation .411** .472** .405** .385** .661** .436** .628**
Sig. (2-
tailed) 0 0 0 0 0 0 0
N 280 280 280 280 280 280 280
Multiple Regression Analysis
A multiple regression was used to predict customers’ purchase intention based on
product factors, price factors, place factors, promotion factors, personal factors, social
factors, and psychological factors. The result the overall multiple regression model with the
adjusted R² value of independent variables at 0.518. This suggests that 51.8% of variance in
the dependent variable (purchase intention) is explained by independent variables. The
significant value of the four independent variables (place factor, personal factor, social factor,
and psychological factor), affects the dependent variable (purchase intention) at a statistical
significance level of 0.05 (p < 0.05). This can be concluded that place factor, personal factor,
social factor, and psychological factor add statistical significance to the prediction, p <0.05.
However, there are three independent variables that do not affect the dependent variable, at a
statistical significance level of 0.05 (sig > 0.05), these being: product factor (0.453), price
factor2 (0.183), and promotion factor (0.059). This thus demonstrates that product factor,
price factor and promotion factor do not have a significant impact on customers’ purchase
intention.
Table 3: R-square value for a relationship between the independent variables and the
dependent variable
Model Summary
Model R R Square Adjusted R
Square
Std. Error of the
Estimate
1 .728a .530 .518 .55946
The 7th National and International Graduate Study Conference 2017
" Thailand 4.0 Creative Innovation for Sustainable Development "
I30

Table 4: the Coefficients of the relationship between the independent variables and the
dependent variable
Model Unstandardized
Coefficients
Standardized
Coefficients
t Sig. Collinearity
Statistics
B Std. Error Beta Tolerance VIF
1
(Constant) .103 .243 .421 .674
Product Average -.058 .077 -.044 -.752 .453 .514 1.945
Price Average .081 .061 .076 1.335 .183 .526 1.902
Place Average .116 .052 .118 2.214 .028 .606 1.649
Promotion Average -.119 .063 -.115 -
1.895
.059 .473 2.115
Personal Average .421 .078 .356 5.392 .000 .397 2.519
Social Average .128 .052 .125 2.447 .015 .664 1.506
Psychological
Average
.372 .063 .348 5.945 .000 .504 1.983
Conclusion
This research is a study of factors that influence consumers' purchase intention of
digital cameras. Two determinants of purchase intention identified and examined in this study
are marketing mix factors and characteristics of buyer’s factors. There are seven contributing
elements employed to run an analysis for this research in order to determine factors that
affect purchase intention of consumers of digital cameras. Of all survey questionnaires
distributed online, a total number of 280 questionnaires were completed; and the data
obtained were analyzed using SPSS. Four factors (place factors, personal factors, social
factors, psychological factors) have significant impact on consumers’ purchase intention,
while product factors, price factors, and promotion factors do not have significant impact on
consumers’ purchase Intention.
Discussion
In sum, price, for this particular business, is so important to customers not much in its
own influencing role as in its relation with product quality: high price with high quality. This
is consistent with the descriptive analysis, in that most respondents always paid attention to
the association between quality and price, while making a purchase decision. In addition, the
majority of respondents preferred buying a product at retailers to through online services as
they can try out a product.
However, a reason for which product has no significant impact on customers’
purchase intention is that manufacturers of digital cameras is now present in a small number,
and that they have been offering products with the same level of quality as well as compatible
The 7th National and International Graduate Study Conference 2017
" Thailand 4.0 Creative Innovation for Sustainable Development "
I31

functions, albeit a wide range of products. As for promotion, also with no significant impact
on customers’ purchase intention, it could be that promotional campaigns are not normally
given to products of this type, and that they are, if any, known within limited groupings.
Further, sale promotion is usually determined by retailers, tending to lower prices, to the
same level, of products with the same quality. Accordingly, purchase decision making of
customers is largely dependent upon their own preference, personalities, lifestyles and
recommendations from people around them. The main reasons for purchasing a digital
camera are travelling, memory recording, and relaxation, respectively. As they are likely to
search for information before purchasing, they usually make their own decision. When
accompanied by a product tryout, this helps facilitate consumers in terms of product
selection. As for statistical aspects, place factor, personal factor, social factor, and
psychological factor have an impact on customers’ purchase intention at a statistical
significance level of 0.05 (p < 0.05), where these factors can be used to explain purchase
intention, for 51.8%, respectively. Such figures, therefore, are useful also for predicting
future purchase intention.
Implication
Based on the results of this study, there are a number of implications that might be
useful in assisting digital camera manufacturers and distributors to better understand factors
influencing purchase intention of customers of digital cameras, so they will be able to pay
more accurate and precise attention to desirable target markets, and address issues they are
facing in current marketing situation. According to the research analysis, digital camera
manufacturers and distributors should pay more attention to personal factors as a key element
for an overall marketing strategy. For instance, companies may focus on products that suit
best to lifestyles of digital camera users, especially young adults (aged between 21 and 30) as
these two groups, when combined, represent the largest market segment through offering
products that serve their preferences, such as user-friendliness, functionality, and high quality
images. As seen from the Descriptive statistics, although, as an individual factor, digital
camera users may not give much importance to prices they always associate price with
product quality. Accordingly, all camera companies should allow for product attributes,
including warrantee and after-sales services, when setting a pricing policy. Finally,
companies should provide powerful information about their products through a variety of
sources, websites, televised advertising, printed media, salespersons, etc. to ensure that
consumers have sufficient access to their desired product information. This will, in turn, will
further facilitate their purchase decision, as when consumers obtain enough information and
experiences, they are more likely to purchase a product.
Limitation
Even though the objectives of this research is met, there were two main limitations in
this research. The first limitation involves distribution of a survey questionnaire. According
to exhibition's policies, any kind of survey conducting by students at exhibitions is not
permitted. Data collection, was, thus, carried out through online-based survey, instead. Upon
completion of data collecting, there were only 280 questionnaires which provided valid data
for research analysis. This, as a result, might not represent digital camera consumers’
purchase intention as a whole. The other limitation is that this research relied heavily on the
data collected from a questionnaire. One obvious problem regarding filling out a
The 7th National and International Graduate Study Conference 2017
" Thailand 4.0 Creative Innovation for Sustainable Development "
I32
questionnaire is that a there might be a number of respondents who do not regard the process
as seriously; therefore, they may randomly select an answer to a questionnaire item, thereby
reducing accuracy of the results.
Recommendation
For future studies concerning this topic, it is advisable that a research should be
conducted with a larger sample size so as to enable generalization of potential finding with
higher confident and alert the probability of uncertainty of invalid data and un-return
questionnaires (Ling et al., 2014). A larger size of target samples can cover and also represent
a more reliability of the results, as regards possibilities of finding relationships with a wider
range of correlation tests. Although this study proposed that ‘marketing mix’ and
‘characteristics of buyers’ can influence customers’ purchase intention of digital camera,
elements in other areas, consumer behavior in particular, may as well be crucial in describing
of customers’ purchase intention in other industries. Further study should, therefore, take into
account such elements. As this research suggests that most factors with significant impact on
customers’ purchase intention are those uncontrolled by companies, it is advisable for further
research to take into account controllable factors, which will, in turn, enable companies to
adopt and apply to their business more practically. Lastly, Chew et al. (2012) comments that
to ensure effectiveness of a research, an interviewing method should be incorporated into a
survey because it will help to produce more in-depth data and improve analysis outcomes in
terms of qualitative aspects.
References
Ali, M., Ilyas, M., & Rehman, C. A. (2016). IMPACT OF CONSUMER CENTRIC
MARKETING MIX ELEMENTS ON CONSUMER BUYING BEHAVIOR; AN
EMPIRICAL INVESTIGATION IN CONTEXT OF FMCG INDUSTRY OF
PAKISTAN. Kuwait Chapter of the Arabian Journal of Business and Management
Review, 5(5), 30.
Alipour, M., Moniri, S. M., Shareghi, B., & Zolali, A. (2012). Ranking the Marketing Mix
Elements Effect on the Behaviors of Industrial Electrical Heaters Consumers (Case
Study: Kaveh Industrial City). Middle-East Journal of Scientific Research 12 (11),
1560-1565.
Chand, S. (2016). Marketing-Mix: Definition, Nature and Determining the Marketing-Mix.
Retrieved from http://www.yourarticlelibrary.com/marketing/marketing-
management/marketing-mix-definition-nature-and-determining-the-marketing-
mix/27951/
Chew, J., Lee, J., Lim, C., Loke, W., & Wong, T. (2012). Exploring the factors affecting
purchase intention of smartphone: A study of young adults in Universiti Tunku Abdul
Rahman. Perak Campus, Malaysia.
Dang, T. (2014). The success of applying marketing mix 4Ps in Vietnamese dairy industry:
Vinamilk–a typical case.
Deng, X. (2009). Consumer response to visual aspects of packaging and product
design (Order No. 3363279). Available from ABI/INFORM Collection; ProQuest
Dissertations & Theses Global. (304978699). Retrieved from
http://search.proquest.com/docview/304978699?accountid=50150
The 7th National and International Graduate Study Conference 2017
" Thailand 4.0 Creative Innovation for Sustainable Development "
I33

Domie, S. P. (2013). ASSESSING THE FACTORS INFLUENCING CONSUMER
SWITCH FROM LOCAL TO IMPORTED PRODUCTS: A case study of Kasapreko
Company Limited-Ghana.
Esser, F. (2014). Mirrorless cameras and premium compacts are on the rise, despite a
shrinking camera market. Retrieved fromhttp://www.imaging-
resource.com/news/2014/06/09/mirrorless-cameras-and-premium-compacts-are-on-
the-rise-despite-a-shrinking
Furaiji, F., Łatuszyńska, M., & Wawrzyniak, A. (2012). An empirical study of the factors
influencing consumer behaviour in the electric appliances market. Contemporary
Economics, 6(3), 76-86.
Jaafar, S. N., Lalp, P. E., & Naba, M. (2012). Consumers’ perceptions, attitudes and purchase
intention towards private label food products in Malaysia. Asian Journal of Business
and Management Sciences, 2(8), 73-90.
Karbala, A., & Wandebori, H. (2012). Analyzing the factors that affecting consumers
purchase intention in Toimoi store, Indonesia. Paper presented at the 2nd
International Conference on Business, Economics, Management and Behavioral
Sciences.
Khan, S. (2011). MARKETING MIX STRATEGY ADAPTATION: A RETAIL
ORGANISATION’S RESPONSE TO THE GLOBAL ECONOMIC DOWNTURN. Cape
Peninsula University of Technology.
Khan, S., & Rohi, S. (2013). Investigating The Factors Affecting Youth Brand Choice For
Mobile Phones Purchase-A Study Of Private Universities Students Of Peshawar.
Management & Marketing, 8(2), 369.
Kim, J.-H., & Hyun, Y. J. (2011). A model to investigate the influence of marketing-mix
efforts and corporate image on brand equity in the IT software sector. Industrial
Marketing Management, 40(3), 424-438.
Kokoi, I. (2011). Female buying behaviour related to facial skin care products.
Kuyram, N. (2013). An investigation of the marketing mix factors influencing the purchasing
behavior of Thai hair salon owners regarding hair color products. Journal RMUTSB
Acad. J. 1(2): 138-147.
Lautiainen, T. (2015). Factors affecting consumers' buying decision in the selection of a
coffee brand.
Ling, L. P., Lang, P. K., Fong, T. C., & Perinpajothi, T. S. (2014). Factors Affecting
Purchase Intention Towards Smartphone Brand: A Study Of Young Female Adult
Consumers. UTAR.
Linh, L. T. (2014). Factors affecting consumers' purchase intention of safe vagetables in Ho
Chi Minh city. International University HCMC, Vietnam.
Lodi, E. (2016). The Best Mirrorless Camera for Beginners. Retrieved
fromhttp://thewirecutter.com/reviews/best-mirrorless-camera-for-beginners/
Mirabi, V., Akbariyeh, H., & Tahmasebifard, H. (2015). A Study of Factors Affecting on
Customers Purchase Intention. marketing, 2(1).
Mirzaei, H., & Ruzdar, M. (2010). The impact of social factors affecting consumer behavior
on selecting characteristics of purchased cars. Journal of Payame Noor University, 1-
11.
Munusamy, J., & Hoo, W. C. (2008). Relationship between marketing mix strategy and
consumer motive: an empirical study in major Tesco stores. Unitar e-journal, 4(2),
41-56.
Nunnally, J. C. (1978). Psychometric Theory (2nd Edit.) McGraw-Hill. Hillsdale, NJ.
The 7th National and International Graduate Study Conference 2017
" Thailand 4.0 Creative Innovation for Sustainable Development "
I34

Oancea, O. (2015). The Model of Integrated Marketing Communication: Who has the Role to
Influence Consumer Behaviour. Acta Universitatis Danubius. Œconomica, 11(1).
Roscoe, J. T. (1975). Fundamental research statistics for the behavioral sciences [by] John T.
Roscoe.
SANDU, M. C. (2014). IMPORTANT ELEMENTS IN CONSUMER’S DECISION-
MAKING PROCESS. Quality of Life (1018-0389)/Calitatea Vietii, 25(4).
Sarker, S., Bose, T., Palit, A., & Haque, E. (2013). Influence of Personality in Buying
Consumer Goods: A Comparative Study between Neo-Freudian Theories and Trait
Theory Based on Khulna Region. International Journal of Business and Economics
Research, 2(3), 41-58.
Souar, Y., Mahi, K., & Ameur, I. (2015). The Impact of Marketing Mix Elements on
Customer Loyalty for an Algerian Telecommunication Company. Expert Journal of
Marketing, 3(1), 1-10.
Stirr, T. (2016). A Few Thoughts About the Camera Market. Retrieved
fromhttps://photographylife.com/a-few-thoughts-about-the-camera-market
Tolušić, Z., Zmaić, K., & Deže, J. (2002). „Marketing-mix in the function of the organic food
of eastern croatia “. Ekonomski pregled, 53(7-8), 782-794.
Vijayakshmi, S., & Mahalakshmi, V. (2013). An impact of Consumer Buying Behavior in
Decision Making Process in Purchase of Electronic Home Appliances in Chennai
(India) - An Empirical Study. Elixir International Journal on Marketing
Management(59 (2013)), 15267-15273.
Xie, B. (2012). Factors Affecting Purchase Intention of Electric Cooking Appliance in
Thailand. University of the Thai Chamber of Commerce.
The 7th National and International Graduate Study Conference 2017
" Thailand 4.0 Creative Innovation for Sustainable Development "
I35

Title MEASURING SERVICE QUALITY OF FOREIGN AND THAI CUSTOMERS TOWARD LUXURIOUS SHOPPING MALLS IN BANGKOK THROUGH SERVQUAL Author: Nattaphol bangviroonrag
Program Faculty of International Business Institute Silpakorn University International College
Abstract
Purpose – At this moment, luxury shopping malls in Bangkok, Thailand had been popular for both Thai and foreign customers, leading this study to pay attention on service quality of these luxury shopping malls to improve customer satisfaction. Nowadays, Service quality and customer’s satisfaction maintenance became the important part, challenging for every shopping mall to respond the customer’s need. Therefore, this study would like to 1) identify whether there is a gap between customer’s expectation, perception towards Thai luxury shopping malls, 2) identify whether there is difference on customers’s expectation, perception between foreigner and Thai towards Thai luxury shopping malls, and 3) search for ways of improvement for Thai luxury malls to increase their service quality.
Design/ Methodology: The research used the quantitative research because it is explaining phenomenon by collecting numerical data that are analysed by using mathematics-based methods. It has collected 286 respondents from both foreigners and Thais shoppers at these luxury shopping malls through distributing questionnaires at the malls and also through online questionnaire.
Findings: There are two objectives that this study would like to find out. The results of SERVQUAL showed that there are gaps between expectation and perception of customers who visited the Thai luxury malls. This showed that there are rooms that Thai luxury malls could still improve themselves. The second objective of this study also wants to find out whether there is a significant difference between Thais' and foreigners' expectation and perception towards the Thai luxury shopping malls. Results from T Test also showed that there was a significant difference
The 7th National and International Graduate Study Conference 2017
" Thailand 4.0 Creative Innovation for Sustainable Development "
I36

between Thais and foreigners regarding their expectation, perception and satisfaction.
Keywords: SERVQUAL/ Service quality
Introduction
At present, tourism has been substantially considered as the one of the most noticeable industries that vastly drives the economy for a lot of countries. The term of tourism has been variously defined because tourism is a temporary movement of people to any destination which is not the common place or residence of tourists to leisure, business or other purposes. In theory, the duration of visit must not surpass one consecutive year. The associated service sectors that highly support and necessarily related with tourism are accommodation, transportation, recreation, food and beverage and entertainment like shopping malls sectors. All these sectors have helped the destinations visited by tourists to be substantially more efficient in being achieve the tourists’s experience (Thiumsak and Ruangkanjanases, 2016). Shopping is becoming one of the reasons in attracting tourists to travel because of expanding the shopping malls spaces which are more sprouting up and their improvement about the service quality in term of any convenience and comfortability in the downtown area to attract more customers (Ipsos loyalty, 2011). Also, the prices are low when compare with the quality which is generally high and the range and variety of products are amazing (Wiesmann, 2016). The unique shopping malls brings the dream of travelling in variety style such as they are a host of international high-end fashion brands, a giant movie theatre and bowling alley, concert hall and aquarium, and can get around easily. Therefore, shopping malls nowadays become the one of choices for tourists (huffpost.com: 2016).
The 7th National and International Graduate Study Conference 2017
" Thailand 4.0 Creative Innovation for Sustainable Development "
I37

Objectives
1) To identify whether there is a gap between customer’s expectation, perception towards Thai luxury shopping malls.
2) 2) To identify whether there is difference on customers’s expectation, perception between foreigner and Thai towards Thai luxury shopping malls.
3) 3) To search for ways of improvement for Thai luxury malls to increase their service quality.
Research Methodology
The research use the quantitative research because it is explaining phenomenon by collecting numerical data that are analysed by using mathematics-based methods (Aliaga & Gunderson, 2000) including surveys and customer satisfaction questionnaires can assist small firms to improve their products and services by enabling them to make informed decisions. In term of this study, use SERVQUAL dimensions which are tangible, reliability, responsiveness, assurance and empathy to evaluate customer satisfaction. Therefore, the study will use quantitative research by using the questionnaire to collect the data to know whether there is different between customer’s expectation and perception of service quality at luxury shopping malls in Bangkok, Thailand. Population: The characteristic of population is Thai and foreign people who have been visited Thai luxury shopping malls which are Siam Discovery, Siam Centre, Siam Paragon, Central World, Central Chidlom, Central Embassy, Terminal 21, The Emquatier or others in Bangkok, Thailand at that period of time. Using the quantitative research for 54 questions including demographic and opinion parts throughout those shopping malls and also use online research questionnaire to collect the data, so people who have visited those Thai luxury shopping malls are the respondents.
Sample size: The questionnaires’s target are 300 but researcher can get them back for 286 questionnaires which are divided for foreigners of 143 and 143 of Thai respondents. The ordinary way to spread the
The 7th National and International Graduate Study Conference 2017
" Thailand 4.0 Creative Innovation for Sustainable Development "
I38
questionnaires is giving them on travellers’s hand at shopping malls around Siam district and also take online google form to spread questionnaires to get faster answer.
Results/ Conclusion
This study uses SPSS analysis to analyse the data which are composed of frequencies techniques to analyse about personal data of the respondents which are gender, age, nationality, occupation, education, purpose of visiting Bangkok and the favourite shopping malls. To answer the objectives, it uses means, correlation and T- test techniques to analyse the data in term of opinion parts. In term of SERVQUAL dimensions, researcher can summarise to be 5 dimensions to answer the objective as following:
Tangibility: Customers both Thai and foreign expect more on the tangibles aspects of Thai luxury malls and having the highest gap of difference about a modern looking equipment which should be improved and the lowest gap is about physical facilities. Also, there is a significant difference between Thai and foreign customers which shows that foreign respondents has more expectation and perception of the luxury shopping malls than the Thai respondents’s expectation. Therefore, if Thai luxury shopping malls focuses on foreigners, they should provide a modern and outstanding layout and equipments that are more convenient and convinced them to keep a standardisation get more satisfaction. Furthermore, if Thai luxury shopping malls focus on Thai people, they should do about a physical or equipment that is more interesting to attract them and providing some gimmick to make a shopping malls more unique to get more interesting satisfaction.
Reliability: Both Thai and foreign customers expect more on the reliable aspects of Thai luxury malls. Having the highest gap of difference about right performance at the first time which should be improved that and the lowest gap is about promising to do something by a certain time is noticeably. Besides, there is a significant difference between Thai and foreign customers which displays that foreign respondents has more expectation and perception of the luxury shopping malls than the Thai respondents’s
The 7th National and International Graduate Study Conference 2017
" Thailand 4.0 Creative Innovation for Sustainable Development "
I39

expectation. Hence, Thai luxury shopping malls should more do and concern about performance of employees by providing the training and development class to make them more reliability and performance to increase customers satisfaction for both foreigner and Thai people because more reliable employees are, more satisfied customers are too.
Responsiveness: Respondents both Thai and foreign have more expectation on responsiveness aspects of perceptions of Thai luxury malls and having the highest gap of difference about giving an exact information to customers which should be improved that and the lowest gap is about being willing to help customers is remarkably. In addition, there is a significant difference between Thai and foreign customers which shows that foreign respondents has more expectation and perception of the luxury shopping malls than the Thai respondents’s expectation. Therefore, Thai luxury shopping malls should pay attention to employees by concerning about their performance and ability to respond to customers since first time of service because it can create more customer satisfaction in a long term.
Assurance: Both Thai and foreign customers have expected more on assurance aspects of perceptions of Thai luxury malls. The highest gap of difference about having a knowledge to answer customers which should be enhanced that and the lowest gap is about being confident in behaviour of customers is noticeably. Also, there is a significant difference between Thai and foreign customers which shows that foreign respondents has more expectation and perception of the luxury shopping malls than the Thai respondents’s expectation. Thai luxury shopping malls should more concentrate in term of employees’s behaviour and performance to respond to customer need which bring to get more customer satisfaction and loyalty because they have to make sure in an confidence of employees behaviour.
Empathy: Customers both Thai and foreign expect more on the empathy aspects of perceptions of Thai luxury malls and the highest gap of difference is about understanding the specific needs of customers which should be concerned. The lowest gap is about giving customers personal attention which is noticeably. Then, there is a significant difference between Thai and foreign
The 7th National and International Graduate Study Conference 2017
" Thailand 4.0 Creative Innovation for Sustainable Development "
I40
customers which shows that foreign respondents has more expectation and perception of the luxury shopping malls than the Thai respondents’s expectation. Thai luxury shopping malls need a service mind of employees to respond to customer because it can show that employees have more empathy to be willing help them. Therefore, employees should be taught by specialise people who can give them more energy and fulfil the service with heart from Thai luxury shopping malls management team to make customer more satisfaction in term of empathy aspect.
Discussion
In Thai luxury shopping malls industry, there are many services and facilities that Thai luxury shopping malls can offer to their customers. All of these features can either attract the customers or affect their decision when looking for a shopping malls to visit for their trip. Customer’s decision depends on the products that the service providers offer to their customers. Moreover, to attract customers (Alpert 1971) stated that the destination should differentiate their product along with the competition offers. To increase customer’s satisfaction, Thai luxury shopping malls have to understand what factors influence their customer because all customers have different expectations which require shopping malls to respond differently. Thai luxury shopping malls should try to make improvement in these critical areas, so they can have high customer satisfaction and gain more repeat customers. There are two objectives that this study would like to find out. The results of SERVQUAL showed that there are gaps between expectation and perception of customers who visited the Thai luxury malls. This showed that there are rooms that Thai luxury malls could still improve themselves. The second objective of this study also wants to find out whether there is a significant difference between Thais' and foreigners' expectation and perception towards the Thai luxury shopping malls. Results from T Test also showed that there was a significant difference between Thais and foreigners regarding their expectation, perception and satisfaction.
Recommendations
There are the suggestions in each five dimensions SERVQUAL as following: According to the data analysis, all of factors are very important
The 7th National and International Graduate Study Conference 2017
" Thailand 4.0 Creative Innovation for Sustainable Development "
I41

for Thai luxury shopping malls but some factors must be done perfectly in order to keep customers satisfied. There are some recommendations for Thai luxury shopping malls as following:1.Tangibility Modern equipment is the most influent that respondents expect towards Thai luxury shopping malls. Therefore, Thai luxury shopping malls should concern about something physical that customers can see and react. The recommendation is to develop the equipment more modern or attractive by using more technologies and some techniques to create customer’s perception in the future.2.Reliability Customers are the most satisfied with promising to do something of Thai luxury shopping malls. This becomes an advantage of Thai luxury shopping malls because they can make customers reliable. Therefore, Thai luxury shopping malls should keep this benefit to sustain customer reliability and being attractive new customers in the future. Thai luxury shopping malls should enhance about service being right at the first time by providing a course of training to employees to have more knowledges or skills to deal with customers.3.Responsiveness Thai luxury shopping malls should give the training to employees about an exact knowledge and information in communicating with customers to create a good responsiveness. Therefore, always up to date and information should be more concerned for employees in Thai luxury shopping malls. Employees of Thai luxury shopping malls are always willing to help the customers requests and it becomes an advantage for Thai luxury shopping malls in creating the good perception towards customers’s eyes.4.Assurance Thai luxury shopping malls have more confident of employees behaviour in creating the personal image to customers. Therefore, Thai luxury shopping malls should keep and continue to build the confident behaviour of employees to create more customers’s guaranty. Thai luxury shopping malls should give a development and training about the product knowledges and important information to employees in order to give the correct information to customers. At least, Thai luxury shopping malls should provide a supervisor or concierge who can deal with customers very well to help in an accidental case.
The 7th National and International Graduate Study Conference 2017
" Thailand 4.0 Creative Innovation for Sustainable Development "
I42

5.Empathy Thai luxury shopping mall has employees who take a good care of customers for personal attention at the best level in term of empathy aspects. Besides, this shows the feedback of customers whether they like kind of personal attention, so employees in Thai luxury shopping malls need to attend them to motivate their purchase and show the sympathy. Thai luxury shopping malls should improve and give employees a skill about how to understand the specific needs of customers by let’s get smalltalk with them first and ask them what are you looking for something special. It can help employees to get more easier to reach to customers need and come up with purchasing.
References
Cronin J.J., Steven Jr., Taylor A. (1992): Measuring service quality: A reexamination and extension, Journal of marketing, Vol. 56, July, pp. 55-68.
Buttle F. (1996): SERVQUAL: review, critique, research agenda, European journal of marketing, Vo. 30, No. 1, pp. 8-32.
Parasuraman A., Zeithaml V.A., Berry L.L. (1991): Refinement and reassessment of the SERVQUAL scale, Journal of retailing, Vol. 67, No. 4, pp. 420-450.
Parasuraman A., Zeithaml V.A., Berry L.L. (1994): Alternative scales for measuring service quality: A comparative assessment based on psychometric criteria, Journal of retailing, Vol. 70, No. 3, pp. 201-230.
Lee H, Lee Y, Yoo D. (2000): The determinants of perceived service quality and its relations with satisfaction, Journal of services marketing, Vol. 14, No. 3, pp. 217-231.
Kulašin Dž, Horvat J. (2004): Using the SERVQUAL for the customer satisfaction measurement process in Tecnical high school Bugojno,
Proceeding of 8th "
TMT 2004", 15-19.September, 2004, Neum, BiH.
Oliver R.I (1980): A cognitive model of the antecedents and consequences of satisfaction decisions, Journal of marketing research, Vol. 17. November, pp. 460-9.
The 7th National and International Graduate Study Conference 2017
" Thailand 4.0 Creative Innovation for Sustainable Development "
I43

Department of Tourism, Ministry of Tourism and Sports, “Statistic of international tourism in Bangkok,” 2012, Available: http://www.tourism.go.th .
D. George and P. Mallery, “SPSS for windows step by step: A simple guide and reference,” Boston: Allyn & Bacon, 11.0 update, 4th ed. 2003.
Boulding, W. (1993), “A dynamic process model of service quality: from expectations to behavioural intentions”, Journal of Marketing Research, Vol. 30, February, pp. 7-27.
Baker, D.A. (2000), “Quality, satisfaction and behavioral intentions”, Annals of Tourism Research Vol. 27 No. 3, pp. 785-804.
The 7th National and International Graduate Study Conference 2017
" Thailand 4.0 Creative Innovation for Sustainable Development "
I44

Title: Service provider’s perception of Chinese tourist behavior
Author: Miss Manassavee Jarurojpakorn and Keatkhamjorn Meekanon, Pd. D.
Program: International Business Management Institute: Silpakorn University International
College
Abstract
The purpose of this study is to approach service provider’s perception of Chinese
tourist behavior while increase the number of Chinese tourist travel abroad particularly in
Thailand. It is superior to understand service provider’s perception because perception and
attitudes of the service provider may influence their behavior in serving customers. This
study conducted an interview with 10 respondents which is service provider in different
career path for diverse of opinions and experiences. Result shows that most respondent have
neutrally to positive perception to Chinese tourist because Chinese tourist ameliorates
economic and financial benefits. However, respondent share experience and perception
toward Chinese tourist and defined that is personal behavior not every Chinese tourist have
bad manner. It is recommended that cross-cultural training and communication, such as basic
Chinese language, would be helpful for service provider.
Keywords: Service provider’s perception; Chinese tourist; Chinese tourist behavior
Introduction
Background
China recently became the largest economy and powerful country of the world.
Growing of economic and population make Chinese become well-being and better quality of
live. Website of Worldometers informs that the current population of China is 1,386,297,614
based on the latest United Nations estimates (www.worldometers.info, March 4, 2017). China
growing by leaps and bounds from the past, notice from high speed train, technology and
innovation, growth of building and structure, etc.
Today China is the biggest tourism in the world and The United Nations World
Tourism Organization (UNWTO) announced that the Chinese overtook Americans and
Germans as the world's top-spending tourists in 2013. In 2012, China is number one on top
international tourism spender amount at US 102 billion (edition.cnn.com, April 12, 2013).
The 7th National and International Graduate Study Conference 2017
" Thailand 4.0 Creative Innovation for Sustainable Development "
I45
Chinese tourist travel around the world mostly in Asian, European and American cities
respectively (Market Research Report on Chinese Outbound Tourist (City) Consumption,
2015). Purpose to travel in each country are different so behavior of Chinese tourist will be
different. China's economy has grown so international travel has become more common.
Many Chinese were new travelers and Chinese tourists consider travel as an important, it is
indicate quality of life and well-being.
For Chinese tourist, travel in Thailand more easier because Chinese passport may
apply for visa on arrival period of stay 15 days so this can increase number of Chinese tourist
(www.consolar.go.th, May 25, 2016). Thailand becomes one of popular destination for tourist
including Chinese traveler because of low cost of living, a variety of attraction, smile of Thai
people, etc. and travel becomes a major economic factor of Thailand. Thailand business news
release that from January to July 2016, Chinese visit to Thailand totaled 5,764,839, or a year-
on-year increase of 20.54 percent (www.thailand-business-news.com, September 12, 2016).
From north to south of Thailand especially tourist attraction are crowded with Chinese tourist
which is include group tour and individual tourist, this is interesting of difference Chinese
behavior between group tour and individual tourist.
According to increase of Chinese tourist the effects that come with Chinese tourist
behavior are renowned and Thailand also gets this effects. The media disseminate a variety of
Chinese tourist manner and different of demographic such as age, education level, gender,
etc. have influence to manner. There are many manners recognize from Chinese tourist but
not perception from service provider that contact with Chinese tourist directly so it is
interesting to study about service provider attitude to Chinese tourist.
Statement of problem
Increase numbers of Chinese tourist in Thailand affect to local in term of uncivilized
behavior in some group of people that the social focus on and different type of Chinese
tourist lead to several tourist behaviors. Service providers, who have to deal with several of
culture and communication problem, are the important person that organizations need to
understand their attitude to Chinese tourist behavior.
In each country have face with different problem from Chinese tourist such as number
of Chinese tourist in 2016 drop by more than 12% in the last quarter because Thai
government suppress zero dollar tour which is oversea control entire supply chain
The 7th National and International Graduate Study Conference 2017
" Thailand 4.0 Creative Innovation for Sustainable Development "
I46
(www.channelnewsasia.com, 28 Dec 2016), tour agencies use unlicensed guide for Chinese
tourist and another problem is Chinese tourist manner that service provider have directly face.
The different of Chinese tourist behavior that come with group tour and individual are affect
the local people especially attitude of service provider that directly communicate and deal
with the tourist. The problem found in service provider attitude to Chinese tourist behavior
that may affect with operation how Chinese tourist behavior affecting service provider
attitude. The existing studies about Chinese outbound tourist generally focus on travel
behavior of Chinese so the important cannot ignore and attention should be paid to attitude of
service provider to Chinese tourist behavior to understand how service provider have
viewpoint to Chinese tourist.
Significant of study
Nowadays Chinese tourist is the center of public attention because the tourism
countries have to grapple with tourist behavior problems. Many of problems in each area that
can found from media and comment form local mean to some group of Chinese tourist.
Chinese tourist behaviors become affecting to local people including service provider so
service provider attitude to Chinese tourist behavior is the important that organization should
concern to and studies have provided some useful information for understanding Chinese
outbound tourist.
The finding of this study will redound to the benefit of organization considering that
attitude of service provider to Chinese tourist. Organization that has main Chinese as
customer including hotels and stores may use the result of factor affecting employee attitude
for introduce employee. It is necessary to understand service provider attitude, the feeling on
behaved tourist and customer behavior, this is an important with work flow and operation.
More understand of employee are beneficial for organization using in training or adjust
employee attitude because organization cannot change customer behavior.
Literature review
Necessary to accept that Chinese tourist boost local tourism and the economy around the
world. Mohsin’s (2007) and Pan & Laws (2001) analyze that Chinese tourist increasing their
interested in tourism for knowledge by discovering new places and ideas. Local and foreigner
relationship are tenuous, it will take time for attitude to change although some group of
people do wrong. Chinese tourists are relatively lack of travel experienced so problems those
The 7th National and International Graduate Study Conference 2017
" Thailand 4.0 Creative Innovation for Sustainable Development "
I47

come with Chinese tourist is language barrier and local culture knowledge, its generate
widespread complaint about Chinese outbound tourist have hurt image of China (Seng Ooi,
2007). Not only Chinese that has this problem when become a new tourist but also happen
with American and Japanese were also criticized of their behavior when they became wealthy
enough and traveled abroad for the first time (Li, 2016; 2baht.com, March 21, 2016). Many
organizations respond the boom of Chinese tourist by employ the employee who has potential
speak Mandarin to communicate with them such as The Ritz Paris has a Chinese concierge,
Shangri-La and the Peninsula have restaurants serving Chinese breakfast, luxury store in
Paris have Chinese speaking staff (Cripps, 2013).
Factor that affect attitude of service provider to Chinese tourist behavior
Attitude of service provider generate from many factor which is positive or negative also
effect with operation. From the Cripps (2013) report that Chinese tourist often say that
service provider treat them like second class people even they spend a lot of money, service
provider do not treat the same way as westerner, this mean service provider face the
challenge of make Chinese tourist feel welcoming and Chinese tourist always discussing and
sharing their experiences on social media. Yeung and Leung (2007) said the perception and
attitudes of the service provider may influence their operate in serving customers so their
study investigated the perception and attitude of Hong Kong hotel guest-contact employees
toward Mainland Chinese tourists and the result expose that most of the hotel guest-contact
employees feel negatively with Mainland Chinese tourists to their appearance, personalities,
and behavior and positively perception in part of economic and financial they bring to Hong
Kong.
1. Chinese tourist ignorance of local rules
Manager Online reveal that Chinese tourists are new travelers on international stage so
they have lack of knowledge in part of culture, international law and regulation. Sometime
they do not realize that are not appropriate, they just do familiarity like home although
Chinese tourist have better manner but still have negative image (www.manager.co.th,
February 24, 2017) and from Chetanont (2015) also talk about Chinese tourism behavior that
tourist did not obey laws nor follow rules and regulations of visiting places, lack of
consciousness and tourism disciplines and disregard of local customs or visiting places. That
is consistent with Li (2014) which is disregard for customs and local rules created increase
tensions between Chinese tourist and host.
The 7th National and International Graduate Study Conference 2017
" Thailand 4.0 Creative Innovation for Sustainable Development "
I48

2. Uncivilized behavior
A lot of Chinese tourist is visiting major tourist attractions abroad, but their manners have
not leave a good impression of people from the destination, some Chinese tourists abroad is
inappropriate and embarrassed (Qian, 2006). China has launched a campaign to educate
Chinese outbound tourists to control the tourists that damage the image of china. The
complaints about uncivilized behavior found in many international media report and many
destination service providers such as Chinese tourists clear their throats loudly, littering,
spitting, smoke in public places, how they remove their shoes aboard planes and trains and
how they jump queues, taking off shoes and socks in public, speaking loudly, bad temper and
cursing, etc. (Seng Ooi, 2007, Agrusa et al, 2011). The other examples come from 15-year-
old Chinese tourist destroy a stone sculpture in a 3,500-year-old Egyptian temple with
graffiti, this generate many Chinese shame and embarrassment on them (Li, 2014).
3. Stinginess
Chinese traveler is a biggest spender as the world's top-spending tourists in 2013 that the
Chinese spent US$128.6 billion on international travel (www.scmp.com, December 31,
2014). But the other side Guide Linda Li shares her experience that some Chinese tourists
were on their first over sea trip reject to pay 0.7 euro for toilet and pee in public even though
they spent a thousand of euros on a watch (Li, 2014). Verot (2016) written on Chinahush
about top 10 Chinese tourists’ bad behaviors, one of that stories are talking about Chinese
tourist women who own $160,000 of luxury products have to pay a fee which is normal US
regulation but Chinese tourist women did not want to pay the fee so she offered a strange
service for undeclared products to the US customs official but US customs official did not
take that and decided to report her (www.chinahush.com, June 25, 2016). Chinese tourist are
not all about spend money in some case Chinese tourist are consider cheap like they do not
tip in restaurant and hotel because in China are lack of tipping culture and they not aware of
culture different when visit other country (InternshipChina, July 15, 2016).
4. Arrogance
Mainland Chinese are fond of shopping; they love all luxury brand and also enjoy the
local product such as luxury bags and products are particular fashionable from Europe,
Australia wool, Gold & Silver Hong Kong, fabrications crocodile skin Thailand, etc.
(Nasolomampionona, 2014) that why Chinese are the biggest international spender and WP
The 7th National and International Graduate Study Conference 2017
" Thailand 4.0 Creative Innovation for Sustainable Development "
I49
(2017) said that new Chinese generation, who prefers own trip or free and independent
traveler (FIT) more than join group tour, are high purchasing power group. InternshipChina
said that Chinese tourist just travelling to buy and show off luxury goods more than explore
historical and learn culture of destination country, they not concern about what they buy but
just concern that famous brand name or not (InternshipChina, July 15, 2016).
Objectives
1. To examine the attitude of service provider to Chinese tourist how service provider
have viewpoint to Chinese tourist behavior
2. To gain an understanding of Chinese tourist behavior and identified which factor that
affect employee attitude
3. The result may useful in human resources or manager for more understand service
provider attitude to Chinese tourist
Research Methodology
This research conducted to describe the perception of service provider to Chinese
tourist behavior when travel in Thailand and understand the attitude of service provider. It is
interesting that the perception and attitudes of service provider may influence their behavior
in provide service to customers or not. The methodology in this research use to explored the
relationship between service provider and Chinese tourist.
Research Design
This research designed to get in-depth information from service provider who is
guest-contact employees for get to know attitude of them. The qualitative research is the
proper way to get the information of service provider attitude for interpret and better
understand the reality of a given situation and give experience. The study designed to collect
information from service provider or guest-contact employee’s attitude and respondent
should be a person who provides service to Chinese tourist or have an experience with
Chinese tourist.
Data collection method
The process of collect information of service provider by interview help researcher
receives depth information. In-depth interview can get unexpected answer from respondent’s
experience so the research will get more interesting process to next research.
The 7th National and International Graduate Study Conference 2017
" Thailand 4.0 Creative Innovation for Sustainable Development "
I50

The question that use in this research will cover all factor that concern with attitude of
service provider to Chinese tourist and focus on how service provider have attitude to
Chinese tourist. To avoid ambiguity in the questions, this research require pre-interview for
avoid respondent ignore because too much question and unclear question. This research will
be use total 17 questions divided to 4-5 questions per factor and take around 20 minutes per
person. The method to collect information during interview is record by using paper,
notebook or voice recorder if respondent not allow all the equipment, interviewer have to
remember as much as possible and back to record within 24 hours for protect information
lost.
Population and sample characteristic
The population for the study is service provider work in Bangkok. The characteristic
of respondents need to communication and provide service to Chinese customer directly. This
research has interview 10 respondents who are service provider that has experience with
Chinese tourist for collect information. The selection of population mostly in hospitality
industry because Chinese tourist stay overnight at hotel and employee will face problem more
than other section especially front office and some respondent are not in hospitality industry
but will be guest-contact employees such as cabin crew and shopper assistance in luxury
shop. Difference work section of respondent, the research will get variety attitude of service
provider to Chinese outbound tourist.
Result/ Conclusion
After collect data from 10 respondents who work as service provider, finding from
interview show that most of respondent understand the nature of Chinese tourist and have
service mind as a service provider could do. Chinese tourist is main driver tourism economic
in Thailand so besides Chinese tourist adapt themselves to be international addition service
provider also get ready with Chinese tourist. To conclude finding from respondent,
categorized in each factor as following are easier to understand;
Ignorance of local rules
Each respondent have difference experience with Chinese tourist that ignorance of
local rules and violence of problem depend on situation. Most of the respondents cannot
accept who ignore the local rules because everybody should respect rules of visiting place but
some of respondent can accept in case of not too terrible. Every workplace of respondent has
The 7th National and International Graduate Study Conference 2017
" Thailand 4.0 Creative Innovation for Sustainable Development "
I51

rule to handle tourist who ignore the local rule so this may alleviate problem. Feeling of
respondent to Chinese tourist who ignore local rules are displeased and quite boring but
accustomed because they are customer. Base on respondents’ information, problem of
Chinese tourist ignorance of local rules can categorize in 3 parts;
1. Communication with Chinese tourist; Some of Chinese tourist will follow the rules
when they know so communication can reduce ignore local rules problem.
2. Personal behavior; Some of Chinese tourists understand everything but still ignore the
rules so it is personal behavior that difficult to fix and how much they respect the
local rules.
3. Acknowledgment local rule of Chinese tourist before travel; information from guide
or tour leader help Chinese tourist to understand the local rules.
Uncivilized behavior
Most of respondents think that some of Chinese tourist has uncivilized behavior but
cannot judge which generation are good or bad because every generation have good and bad
manner it depend on how much they can adapt themselves to international, culture and
personal behavior. From all respondent, they can accept uncivilized behavior of Chinese
tourist in some case that not affect surround people and some of respondent cannot accept
that uncivilized behavior because they feel misbehave and if one person does uncivilized
behavior, another will follow. Base on respondents’ information, to conclude uncivilized
behavior of Chinese tourist come from main 2 factors below;
1. Culture and personal behavior; their culture and behavior in daily life are difference
from Thai and the habits of doing thing in their own country so it may improper when
do the same thing in Thailand.
2. Lack of destination country knowledge; educate tourist by guide or tour leader before
travelling such as do/do not thing, culture, traditional and characteristic of destination
country, important is communication properly may reduce problems.
Stinginess
Stringiness mean in this factor is do not want to waste with something that should to
waste and opinion of each respondent are difference. Some do not have experience with
stringy Chinese tourist and most of respondent think that Chinese tourist are stingy but lesser
part and it is personal behavior. Opinion of respondent to stinginess of Chinese tourist is
The 7th National and International Graduate Study Conference 2017
" Thailand 4.0 Creative Innovation for Sustainable Development "
I52

various such as Respondent X said that is normal because everybody wants to get highest
benefit and Respondent IV said that it is personal behavior. Most of respondent said that
some stinginess behavior affect work that it waste time to explain, answer the same question
and if tourist did not pay fine, employee have to pay instead. Base on respondents’
information, to conclude stinginess behavior of Chinese tourist come from personal behavior
so communications to Chinese tourist understand reason.
Arrogance
This factor not found from hospitality employee respondent because Respondent V
provide the information that amount of money that Chinese tourist spend for hotel not too
high when compare with luxury shop which is Respondent VI, who work in luxury shop, said
that they have higher confident than the past so it seem like they have arrogance personality
which same opinion with Respondent VIII. So arrogance are depend on personal behavior not
every Chinese tourist are arrogance and it is not affect with operation because does not make
anyone suffer and service mind need to have in service provider so service provider need to
do is patient, these are information by all respondent.
Discussion
Discussion from previous research and respondent found that;
Communication barrier
Seng Ooi (2007) mention that Chinese tourists are relatively lack of travel
experienced so problems those come with Chinese tourist is language barrier also same
opinion with Respondent II that Chinese tourist ignorance of local rule because Chinese
tourist has communication barriers and Respondent V said that everything depend on
communication but problems is number of who can speak Chinese less than Chinese tourist
so when they do wrong, nobody provide suggestion in their language. Nasolomampionona
(2014) told that mostly Chinese tourist prefers to rely on travel agent not only for the
convenience and travel agent also help untie cultural difference, language barrier.
Lack of destination country knowledge
Zhou (2017) found that it is necessary to educate good manner to people start from
young age and Respondent IV found in same thing that Chinese tourist do not have much
experience traveling oversea and destination country knowledge so they do not realize their
The 7th National and International Graduate Study Conference 2017
" Thailand 4.0 Creative Innovation for Sustainable Development "
I53

behavior not suitable in host country culture because some act they do the same way at home.
Respondent V and Seng Ooi (2007) have same opinion that Chinese tourist do not have
destination country knowledge such as culture and traditional, it is generate widespread
complaint about Chinese outbound tourist have hurt image of China. Most of respondent have
same opinion with 2baht.com describe that not all of Chinese tourist have uncivilized
manner, it is only some group of people especially group tour that different from new
Chinese tourist who are better educate so uncivilized manner from package tourist may
because of they do not know destination culture which is similarly with Chetanont (2015)
said that well-educated Chinese tourists would not be as rude as the lower-educated and
disregard of local customs or visiting Places.
Respondent III said that some of Chinese tourist try to adapt themselves to be
international which is match with Zhou (2017) report in Chinese tourists’ manner improving
that Indonesia, France, Singapore, United Kingdom and the United States have positive reply
on Chinese tourists behavior. And Respondent VIII adds that they should improve and adapt
themselves to be international for change perception from other country.
Service provider’s perception
From Yeung and Leung (2007) report the perception and attitudes of the service
provider may influence their operate in serving customers so their study investigated the
perception and attitude of Hong Kong hotel guest-contact employees toward Mainland
Chinese tourists and the result expose that most of the hotel guest-contact employees feel
negatively with Mainland Chinese tourists to their appearance, personalities, and behavior
and positively perception in part of economic and financial they bring to Hong Kong.
Respondent V also unwilling with uncivilized behavior of Chinese tourist because tourism
industry can survives because of them.
Chetanont (2015) talk about Chinese tourism behavior that tourist did not obey laws
nor follow rules and regulations of visiting places, lack of consciousness and tourism
disciplines and disregard of local customs or visiting places. That is consistent with Li (2014)
which is disregard for customs and local rules created increase tensions between Chinese
tourist and host. From Most of the respondent cannot accept for who ignore the local rules
because everybody should respect rules of visiting place but some of respondent can accept in
case of not too terrible and feeling of respondent to Chinese tourist who ignore local rules are
displeased and quite boring but accustomed because they are customer. Respondent II said
The 7th National and International Graduate Study Conference 2017
" Thailand 4.0 Creative Innovation for Sustainable Development "
I54

that when traveling, tourist supposed to follow the rules strictly according to Respondent X
said that if not ready to respect the destination rules, they should travel inland and displeased
feeling can affect service quality are support by Respondent VIII.
Educate tourist by guide or tour leader before travelling such as do/do not thing,
culture, traditional and characteristic of destination country, important is communication
properly may reduce problems (Respondent II and V) and China has launched a campaign to
educate Chinese outbound tourists to control the tourists that damage the image of china. The
complaints about uncivilized behavior found in many international media report and many
destination service providers such as Chinese tourists clear their throats loudly, littering,
spitting, smoke in public places, how they remove their shoes aboard planes and trains and
how they jump queues, taking off shoes and socks in public, speaking loudly, bad temper and
cursing, etc. (Seng Ooi, 2007, Agrusa et al, 2011).
Recommendation
From interview and data analyzed help researcher more understand service provider
perception and realized a recommendation for organization especially training department
and manager. Understand service provider’s perception could be beneficial for training part
and manager, this may help smoothly operation and help service provider realize with
appearance and behavior of Chinese customer, this may help smoothly operation. Understand
service provider and training in right way help organization create service quality from
employee.
Based on information from service provider interview, because service provider
cannot change Chinese tourist behavior so can conclude for training part and manager that
recommendation for service provider as following;
To improve in perception of good relationship with people from different culture,
First service providers require to understand basic characteristic of Chinese is essential, it is
greater understanding of other culture because different of culture affect social practice so
this produce conflict between service provider and Chinese tourist. Service provider generally
recognized base behavior of Chinese tourist for additional cross-cultural training such as play
role help service provider in increasing their ability to be more tolerant of other people's
behavior.
The 7th National and International Graduate Study Conference 2017
" Thailand 4.0 Creative Innovation for Sustainable Development "
I55

To understand Chinese tourist requirement and build good relationship, Second
communication is the most important and now Chinese language require as third language
which is increase ability to solve problem and decrease misunderstanding. Communication
can reduces misunderstand between service provider and Chinese tourist so learn Chinese
language are necessary. Now a day some organization require employee need to be speak at
least basic Chinese such as hospitality industry, airline, mid-town department store, etc. In
hospitality industry, some hotels have Chinese class for their employee and teach about
vocabulary and conversations in daily operate.
References
Agrusa, J. (2011). Mainland Chinese tourists a logical target for Hawaii. Retrieved from
http://www.eturbonews.com/21239/mainland-chinese-tourists-logical-target-hawaii
China Population (LIVE). Retrieved from http://www.worldometers.info/world-
population/china-population/
Chetanont, S. (2015). Chinese Tourists’s Behaviors towards Travel and Shopping in
Bangkok. International Journal of Social, Behavioral, Educational, Economic, Business and
Industrial Engineering, 9(5), 1676-1681.
Cripps, K. (2013). Chinese tourism: The good, the bad and the backlash. Retrieved from
http://edition.cnn.com/2013/04/09/travel/chinese-tourism-impact/index.html?hpt=hp_mid
Cripps, K. (2013). Chinese travelers the world's biggest spenders. Retrieved from
http://edition.cnn.com/2013/04/05/travel/china-tourists-spend/
Dam-young, H. (2016). South Korean airport battles garbage dumped by Chinese tourists.
Retrieved from http://www.scmp.com/news/asia/east-asia/article/2042994/south-korean-
airport-battles-garbage-dumped-chinese-tourists
Dung, B. (2016). Chinese arrivals reach record numbers in Thailand. Retrieved from
https://www.thailand-business-news.com/tourism/54229-chinese-arrivals-reach-record-
numbers-thailand.html
Interships China. (2016, July 15). Badly Behaved Tourists and the Implications for China.
Retrieved from http://internshipschina.com/what-chinese-tourists-do-for-china/
The 7th National and International Graduate Study Conference 2017
" Thailand 4.0 Creative Innovation for Sustainable Development "
I56
Ipsos (2015), Market Research Report on Chinese Outbound Tourist (City) Consumption
2015. 1-6. Retrieved from https://www.ipsos.com/sites/default/files/2016-06/021.1-Chinese-
Outbound-Tourist.pdf
Jerome, A., Kim, S., & Wang, K. (2011). MAINLAND CHINESE TOURISTS TO HAWAII:
THEIR CHARACTERISTICS AND PREFERENCES. Journal of Travel & Tourism
Marketing, 28, 261–278. doi: 10.1080/10548408.2011.562853
Li, A. (2014). Rude awakening: Chinese tourists have the money, but not the manners.
Retrieved from http://www.scmp.com/news/china/article/1671504/rude-awakening-chinese-
tourists-have-means-not-manners
Li, A. (2016). Why are Chinese tourists so rude? A few insights. Retrieved from
http://www.scmp.com/news/china/article/1251239/why-are-chinese-tourists-so-
rude#U2YO7Iup0wqZ0QiQ.99
MGR online (2013). จนใชกฎหมายยกระดบการทองเทยว แกไขพฤตกรรมนกทองเทยว. Retrieved from
http://www.manager.co.th/China/ViewNews.aspx?NewsID=9560000127768
MGR online (2017). ผลส ารวจช พฤตกรรมนกทองเทยวจนดขน แมภาพลกษณยงตดลบ. Retrieved from
http://www.manager.co.th/china/ViewNews.aspx?NewsID=9600000019101
Mohsin, A. (2007). Analysis of Chinese travellers’ attitudes toward holidaying in New
Zealand: The impact of socio-demographic variables. Journal of Hospitality & Leisure
Marketing, 16(1–2), 21–40.
My2baht (2016). พฤตกรรมนกทองเทยวจน ท าไมถงท าตวแยสรางความวนวายไปทวโลก. Retrieved from
https://2baht.com/chinese-tourists-behavior/
Nasolomampionona, R. F. (2014). Profile of Chinese Outbound Tourists: Characteristics and
Expenditures. American Journal of Tourism Management, 3(1), 17-31. doi:
10.5923/j.tourism.20140301.03
Nation TV (2014, December 13). หนมสาวจนปวนแอรเอเชย หลงไมไดทนงตดกน. Retrieved from
http://www.nationtv.tv/main/content/social/378436431/
The 7th National and International Graduate Study Conference 2017
" Thailand 4.0 Creative Innovation for Sustainable Development "
I57

Pan, G. W., & Laws, E. (2001). Tourism marketing opportunities for Australia in China.
Journal of Vacation Marketing, 8(1), 39–48.
Qian, L. (2006). Chinese tourists expected good-mannered. Retrieved from
http://www.chinadaily.com.cn/china/2006-08/22/content_671181.htm
Seng-Ooi, C. (2007). Chinese Tourists in Denmark, 1-19. Retrieved from
https://www.researchgate.net/publication/238075834_Chinese_Tourists_in_Denmark
Tataski, M. (2017). The good, the bad and the ugly of Chinese tourists in Vietnam. Retrieved
from http://www.scmp.com/week-asia/society/article/2058279/good-bad-and-ugly-chinese-
tourists-vietnam#mzEkXTyIjrrfCH4q.99
Verot, O. (2016). Top 10 Chinese tourists’ bad behaviors. Retrieved from
http://www.chinahush.com/2016/06/25/top-10-chinese-tourist-bad-behaviors/
Wang, J. (2014). Mixed Feelings about Chinese Tourists. China Today, 62-63.
WP. (2017). เจาะลกทกมม “นกทองเทยวจนสไตล FIT” โอกาสมหาศาลของ “แบรนดไทย” ทไมควรมองขาม!!.
Retrieved from https://www.brandbuffet.in.th/2017/05/chinese-tourist-trends-and-
opportunities-for-thai-brand/
Yeung, S., & Leung C. (2007). Perception and attitude of Hong Kong hotel guest‐contact
employees towards tourists from Mainland China. International Journal of Tourism Research,
9(6), 395-407.
Zhou, S. (2017). Chinese tourists' manners improving. Retrieved from
http://usa.chinadaily.com.cn/epaper/2017-02/23/content_28320647.htm
The 7th National and International Graduate Study Conference 2017
" Thailand 4.0 Creative Innovation for Sustainable Development "
I58

The Development of a Social Media Experience-Based Instructional System
in Information Technology Course for the Lower Secondary Students
in Bangkok Metropolis and Surrounding Area
Author :
Rachata Dachathornvorapol1
Associate Professor Dr.Wasana Taweekulasup2
Associate Professor Dr.Sansanee Sungsunanun3
Associate Professor Dr.Thanit Poosiri4
1Educational Doctoral Program, Department of Educational Technology and Communications,
Sukhothai Thammathirat Open University, Thailand. e-mail: [email protected] 2,3,4
Department of Educational Technology and Communications, Sukhothai Thammathirat Open
University, Thailand
Abstract
The objectives of this research were (1) to develop a Social Media Experience-Based
Instructional System in Information Technology Course (SMEBA-IT) for the Lower Secondary
Students in Bangkok Metropolis and Surrounding Area; (2) to evaluate the try-out results of the
developed SMEBA-IT.
The research process comprised two stages. The first stage was the development of the
SMEBA-IT which consisted of the following steps: the first step was the study of documents,
texts, and related research studies; the second step was the study of the needs for SMEBA-IT; the
third step was the development of conceptual framework of the SMEBA-IT; the fourth step was
the interviews of experts concerning the conceptual framework of the system; the fifth step was
the system development based on conceptual framework as certified by the experts; the sixth step
was quality evaluation of the drafted version of the SMEBA-IT; and the seventh step was the
improvement of the first drafted system to system to obtain the complete version system for try-
out. The research sample consisted of 340 teachers and students in secondary schools in
Bangkok Metropolis and surrounding area, classified into 167 teachers and 173 secondary
students in the 2017 academic year, all of which were obtained by multi-stage random sampling;
seven experts for verification of conceptual framework of the system; and five specialists to
evaluate quality of the drafted version of the system. The employed research instruments were
questionnaires on the needs for the SMEBA-IT of teachers and students, an interview structure
for the experts, a system quality evaluation form for the specialists, and the developed SMEBA-
IT. The second stage was the evaluation of the try-out results of the developed SMEBA-IT. It
consisted of the following two activities: (1) the preliminary try-outs to determine efficiency of
the system, which comprised the individual try-out, small group try-out, and field try-out; and (2)
organizing a focus group seminar involving secondary school information technology teachers
concerning the developed SMEBA-IT. The research sample consisted of 40 Mathayomsuksa II
students studying in the academic year 2016, Rattanathibet school and 20 information
technology teachers at the secondary level. The employed research instruments in the second
The 7th National and International Graduate Study Conference 2017
" Thailand 4.0 Creative Innovation for Sustainable Development "
I59

stage were the developed SMEBA-IT, a learning achievement test, a questionnaire on student’s
satisfaction, and a questionnaire on teacher’s opinions. Research data was analyzed using the
frequency, percentage, E1/E2 efficiency index, t-test, mean, standard deviation, and content
analysis.
Research findings were as follows: (1) the developed SMEBA-IT was composed of the
input components consisting of philosophy, vision, policy, objectives, curriculum and
infrastructure; the process components consisting of Experience-Based Instructional, knowledge
center, social media channel and social media; and the output components consisting of the
evaluation and the following-up of the Experience-Based Instructional; meanwhile, the SMEBA-
IT comprised eight steps: the first step, the defining of ideology; the second step, the developing
of experience-based curriculum; the third step, the developing of experience facing approaches;
the fourth step, the developing of knowledge center; the fifth step, the producing of social media
Experience-Based Instructional; the sixth step, the developing of the infrastructure; the seventh
step, the facing of the experience with social media; and the eight step, the evaluating and
following-up of facing the experience. Then, this developed system was verified by the
specialists as having ‘high’ quality; and (2) regarding the evaluation of try-out results of the
developed SMEBA-IT, it was found that the developed SMEBA-IT was efficient at 79.80/79.13,
thus meeting the 80/80 efficiency criterion; the learning achievement of students who learned
from the SMEBA-IT increased significantly at the .01 level of statistical significance; and the
students were satisfied with SMEBA-IT at the ‘highest’ level; also the teachers’ opinions toward
the system were at the ‘highest’ level too.
Keywords: Systems, Social Media Experience-Based Instructional System, social media, Lower
Secondary
Introduction
The system approach is important for teaching and learning as follows: (1) It is a tool for
planning and teaching, responding the needs of the students; (2) To ensure success in teaching
and solving problems of students learning and teaching of teachers; (3) To follow the identified
teaching and learning process; (4) Teachers can evaluate, monitor, and solve problems in
teaching and learning; and (5) To use as a guideline for the development of teaching and learning
systems (Taweekulasup, 2012, p.6-7). Teachers need to set up teaching systems in each subject
area such as information technology courses. According to, information technology is used in
teaching and learning, using social media. In order to be a learning society, along with the
National Education Plan (2012-2016) and the policy by the Ministry of Education to use
information technology in the primary and the secondary education. Thus, social media is an
important innovation tool used to convey knowledge to learners. (Ministry of Education, 2008, p.
3)
The 7th National and International Graduate Study Conference 2017
" Thailand 4.0 Creative Innovation for Sustainable Development "
I60

From the importance of system approach, The researcher studied the information and
teaching technology in secondary education and found many problems: (1) The problem of
learning achievement of secondary education students from the ONET test by the National
Institute of Educational Testing Service, (2015) found that the score in IT subject was 45.42%
lower than the criteria; (2) The problem about limitation of skill and expertise, students lack of
the use of information technology knowledge because they lack of the learning process that
emphasizes them to do and focus on learning from knowledge rather than action. (Institute for
the Promotion of Teaching Science and Technology, 2015). In addition to the 21st century
education, it is important for learners to learn from doing, or learn by doing and use of ICT
literacy as much as possible; and (3) The problems of limitations of direct teaching only in the
classroom are not enough, electronic media is required using to encourage interaction and
practicing in virtual situations in the classroom. (Ministry of Information and Communication
Technology, 2015, p.3)
From the above mentioned problems, the researcher studied the concept of Experience-
Based approach which enable the student to practice. The study found that Experience-Based
approach was a teaching method that giving learners obtain the experience and observe what
happened, then bringing things up to think together until the students can create ideas or
assumptions to apply in new situations. (Khamanee, 2011, p.131). And also found that,
Experience-Based approach is the appropriate teaching methodology for information technology
and suitable for using with social media. Professor Chaiyong Bhramawong (2010, p. 8) said that
"Social media experience-based instructional is a study where students can learn by studying at
home or work place instead of having to sit in the classroom, execution an experience in the lab
which will practice in Virtual Labs through an interactive screen (On Screen Interactive-OSI), or
social media rather than allowing students to practice anytime"
It was evidence that Experience-Based approach will enable students to practice their
skills and expertise. In addition, students should learn through social media. The important of the
SMEBA-IT were as follows: (1) Helping teachers to plan and steps with appropriate instruction
to students provided quality teaching and effective teaching; (2) Helping students to understand
more about information technology; and (3) Allowing teachers and students to learn anywhere,
anytime through social media.
Objectives
1) To develop a Social Media Experience-Based Instructional System in Information
Technology Course for the Lower Secondary Students
2) To evaluate a Social Media Experience-Based Instructional System in Information
Technology Course for the Lower Secondary Students
The 7th National and International Graduate Study Conference 2017
" Thailand 4.0 Creative Innovation for Sustainable Development "
I61

Research Methodology
The research process comprised two stages. The first stage was the development of the
SMEBA-IT which consisted of the following steps: the first step was the study of documents,
texts, texts and related research studies; the second step was the study of the needs for SMEBA-
IT; the third step was the development of conceptual framework of the SMEBA-IT; the fourth
step was the interviews of experts concerning the conceptual framework of the system; the fifth
step was the system development based on conceptual framework as certified by the experts; the
sixth step was quality evaluation of the drafted version of the SMEBA-IT; and the seventh step
was the improvement of the first drafted system to system to obtain the complete version system
for try-out; and the second stage was the evaluation of the try-out results of the developed
SMEBA-IT. It consisted of the following two activities: (1) the preliminary try-outs to
determine efficiency of the system, which comprised the individual try-out, small group try-out,
and field try-out; and (2) organizing a focus group seminar involving secondary education
information technology which the teachers concerning the developed SMEBA-IT.
1. Research format: Research and Development (R&D)
2. Population and Sample
Population and Sample comprised two stages, following the research process. The first
stage was the development of the SMEBA-IT comprised three groups: First group for studying
requirements of the SMEBA-IT, the population was 11,339 teachers and 229,248 secondary
school students in Bangkok Metropolitan Area. The sample, totaling 340, consisted of 167
teachers and 173 secondary level students, obtained from the table of Krejcie & Morgan and
multi-stage random sampling technique; Second group for interviewing the conceptual
framework of SMEBA-IT. This study interview seven (7) experts consisting of three (3) experts
on Experience-Based approach, two (2) experts on Information Technology and one (1) expert
on Secondary education school; and third group for evaluating the quality of the developed
SMEBA-IT. The research has five specialists to evaluate quality of the drafted version of the
system; and the second stage was the evaluation of the try-out results of the developed SMEBA-
IT comprised to two groups. The sample was a 30 students Mathayomsuksa II student in
Rattanathibet school in the second semester of academic year 2015; and the second group was
information technology in secondary education conducted the seminar and questioned the
teachers’ opinions about the SMEBA-IT.
3. Research Instruments
Research Instruments comprised two stages, following the research process. The first
stage was the development of the SMEBA-IT, the research instrument were employed: (1) Two
questionnaires to teachers and students about the requirement of the SMEBA-IT for teachers and
Mathhayomsuksa I, II, III students by using five rating scale, multiple choices and open-ended
questions; The reliability of these questionnaires were 0.97 and 0.92 as following; (2) Structured
The 7th National and International Graduate Study Conference 2017
" Thailand 4.0 Creative Innovation for Sustainable Development "
I62

interview form, used for expert to give opinion on the conceptual framework of the system by
using multiple choice and open-ended questions; (3) Evaluated form of the quality of the
SMEBA-IT by specialists by using five rating scale, and open-ended questions with quality level
of very good, good, moderate, low and lowest; and (4) The SMEBA-IT; and the second stage
was the evaluation of the try-out results of the developed SMEBA-IT consisted of (1) a learning
package of SMEBA-IT developed according with the steps and processes; (2) 20 Pre-test and
post-test were the difficulty value (p) of the pre-test was 0.47-0.83 and the difficulty value (p) of
the post-test was 0.40-0.80 and the discriminative value (r) of the pre-test was 0.28-0.71 and the
post-test was 0.28-0.85. The reliability of the pre-test was 0.78 and the post-test was 0.81; (3)
The student satisfaction questionnaire of five rating scale (highest, high, medium, low, lowest)
and open-ended questions about the using of SMEBA-IT consisted of 5 parts; Part I was the
quality of SMEBA-IT’s content; Part II was the quality of the design of SMEBA-IT; Part III was
the knowledge gained from the SMEBA-IT; Part IV was the benefits of the SMEBA-IT; and Part
V was comments. The reliability of this questionnaire was 0.98; and (4) The teacher
questionnaire of five rating scale (highest, high, medium, low, lowest) and open-ended questions
giving their opinion about SMEBA-IT consisted of 4 parts; Part I was general information of the
respondents; Part II was the opinion on the main steps and sub steps; Part III was the using of the
SMEBA-IT; and Part IV was the comments. The reliability of this questionnaire was 0.95.
4. Data collection
Data collection comprised two stages, following the research process. The first stage was
the development of the SMEBA-IT, the data collection were employed: (1) Via post for
collecting data on questionnaires from teachers and students on SMEBA-IT; (2) Interviewing for
collecting data from experts on conceptual framework of the system; and (3) Collecting for the
system quality evaluation from specialists of the SMEBA-IT; and the second stage of evaluating
the use of SMEBA-IT consisted of (1) trail run on the quality assessment of SMEBA-IT with
Mathayomsuksa II students through three stages; individual testing, group testing, and field
testing to determine the students’ progress on learning achievement obtained from pretest and
posttests; (2) collecting data of students’ satisfaction which learn by using SMEBA-IT; and (3)
collecting data of teachers’ opinion questionnaires about SMEBA-IT.
5. Data Analysis
Data Analysis was conducted through statistical tools comprising frequency, percentage,
efficiency, E1 / E2, t-test, means, standard deviation and content analysis.
The 7th National and International Graduate Study Conference 2017
" Thailand 4.0 Creative Innovation for Sustainable Development "
I63

Results
1. Results on the development of SMEBA-IT were as follows.
1.1 On the needs of secondary education teachers regarding to the needs of the SMEBA-
IT which had the ‘highest’ level were as follows: (1) To study any time, any place to meet the
needs, interests and ease of learning; (2) To determine the ideology of the system, focusing on
the student's objectives; (3) To develop an experience-based curriculum, studying the nature of
the learners; (4) To develop a facing experience plan by identifying the format of experience; (5)
To develop a knowledge center; (6) to produce social media for social media experience; (7) To
develop an infrastructure by developing a networking; (8) to face the experience by doing a post-
test after facing experience; and (9) to evaluate and follow up the result of experience facing by
doing a trail-run testing SMEBA-IT’s learning package.
1.2 On the needs of secondary school students regarding to the needs of the SMEBA-IT
which had the ‘highest’ level were as follows: (1) The reason that students wanted to study in
SMEBA-IT because they could learn in many ways for example; Teacher Directed Learning,
Self Directed Learning and Peer Directed Learning; (2) To require orientation through social
media learning; (3) to require knowledge centers that contain text, images, animation and
narrative, and (4) to require a Facebook as a social media tools in the SMEBA-IT.
1.3 On the experts’ comment on conceptual framework of the SMEBA-IT were as
follows: (1) They agreed with all components consisting of inputs processes and outputs which is
appropriated and practical; and (2) They agreed with overall steps and sub-steps which
associated with main steps completely and practically to be implemented further.
1.4 On the specialists’ evaluation of the quality assessment on the draft of SMEBA-IT.
Overall, the specialist evaluated the quality of system at ‘good’ level.
1.5 On the development of SMEBA-IT was found that (1) The SMEBA-IT components
comprised of the components of inputs consisting of philosophy, vision, policy, objectives,
curriculum and infrastructure; the process components consisting of Experience-Based
Instructional, knowledge center, social media channel and social media; and the output
components consisting of the evaluation and the following up of experiences; (2) the SMEBA-IT
comprised eight steps: the first step, the defining of ideology; the second step, the developing of
experience based curriculum; the third step, the developing of experience facing approaches; the
fourth step, the developing of knowledge center; the fifth step, the producing of social media
Experience-Based Instructional; the sixth step, the developing of the infrastructure; the seventh
step, the facing the experience with social media; and the eight step, the evaluating and
following-up of facing the experience as Figure 1.
The 7th National and International Graduate Study Conference 2017
" Thailand 4.0 Creative Innovation for Sustainable Development "
I64

Figure 1 A model of the SMEBA-IT
2. Results on the evaluation of the SMEBA-IT
2.1 On the efficiency of the SMEBA-IT:
From the Trial Run of SMEBA-IT was conducted under ‘Data Communication’
subject. It was found that (1) The Efficiency of Process (E1) and the Efficiency of Product (E2)
of this subject obtained the E1/E2 values of 79.80/79.13; (2) The students’ learning achievement
was significantly increased at the .01 level, and (3) the satisfaction of the students towards the
SMEBA-IT was at the ‘Highest’ level as follows: (1) The content perspective, students satisfied
that ‘Facebook’ which offered students better understanding of content; (2) The design
perspective, students satisfied to have an interaction by using ‘Lines’; (3) The knowledge
perspective, students were enabled to practice by bringing their existing experiences intergrated
with new experiences enabling they understand more; and (4) The practicle of using perspective,
the students could apply the experiences to their daily lives.
2.2 On the quality of the SMEBA-IT for teachers:
After the Trial Run of the SMEBA-IT was conducted by seminar with teachers. It was
found that the satisfaction of the teachers toward the SMEBA-IT was at the ‘Highest’ level
indicating that the SMEBA-IT was useful and practical for teaching in secondary educational
schools.
The 7th National and International Graduate Study Conference 2017
" Thailand 4.0 Creative Innovation for Sustainable Development "
I65

Discussions
1. The SMEBA-IT was developed by studying the teachers and students’ requirement and
interviewing the experts according to the conceptual framework of the system. Overall the
experts they rated the quality of the SMEBA-IT conceptual Framework at the ‘Good’ level; then
the draft of the system through the evaluation of the quality of the system from specialists at the
‘Good’ level with clearly, completely and practically to use. From the reasons that; Firstly, the
process of developing this system has been verified by twelve (12) experts and specialists
confidently that this system has quality. Secondly, the SMEBA-IT had system components, the
steps of the system were the main steps and sub-steps which had inputs, processes and outputs.
Each of the main steps had a continuous relationship. There were also sub-steps in the main steps
that related to inputs, processes, and outputs supporting each other which is the outstanding point
making the operation of the system more controllable, systematic, simplified. The
implementation of the system could be easily understood which corresponding to the teachers’
opinions in seminars that the system could be applicable, easy to understand because there were
steps sequentially. The summarization from the study was corresponded to the importance of
system approach by Professor Chaiyong Bhramawong (2012) said, "The components and
system steps must be coordinated to support the various parts from collaboration enables the
elements in the process by providing the correct information, enabling them to function as
required" and Thirdly, the main steps of the eight steps: the first step, the defining of ideology;
the second step, the developing of experience based curriculum; were the steps of inputs which
similar to the first step was the identifying philosophy and vision of STOU PLAN (Distance
learning and distance learning process, p.6-7) and the experience-based learning system
(Bhramawong, 2013, p.2-3); moreover, the opinion of the teachers which had ‘highest’ level was
Step II, the developing experience based curriculum because the users were teachers. About the
third step, the developing experience facing approaches; the fourth step, the developing of
knowledge center; the fifth step, the producing of social media Experience-Based Instructional;
the sixth step, the developing of the infrastructure; the seventh step, the facing the experience
with social media were the steps of processes which (1) especially the fourth step, the developing
of knowledge center; the fifth step, the producing of social media Experience-Based
Instructional; the sixth step, the developing the infrastructure were allowed the users to develop
and produce social media themself. The school should develop the network to support the
teaching of information technology which corresponding to the opinion of the teachers which
had ‘highest’ level in step 4, step 5, and step 6 that it was applicable to use and (2) the seventh
step, the facing the experience with social media which was the important step to bring the
students obtaining the experience from the doing assigned task which corresponding to the
learning theory of Knowles (Kaemanee, 2002, pp. 70-74). This principle is shared by learners in
the learning process, helping students learned well with bringing the experience, knowledge,
skills, attitudes, values, and values they used to understand new things and new experiences.
Organizing learning experiences for learners was the opportunity for learners to choose what
they wanted to study and what they wanted to learn by themselves which is corresponding with
The 7th National and International Graduate Study Conference 2017
" Thailand 4.0 Creative Innovation for Sustainable Development "
I66

the experience-based teaching approached of Professor Chaiyong Bhramwong (2002), pp. 151-
152 said, "Experience-Based Approach is an international instructor system and was a system for
the future that aimed to the students having experiences that can be used to daily live. Therefore,
the experience based approach, it was necessary to have the process of facing the experience.
About the eight step, the evaluating and following-up of facing the experience which was the
output step in order to collect the results to continue to improve the system which is
corresponding with the thirteen step of The overall Evaluation” Briggs' Integrated Teaching
System (Gagne & Briggs, 1979, p.23) and is corresponding with the tenth step of the monitor
and evaluation of context and situation (Bhramawong, Chaiyong, 2013, p.23) and they ninth step
of evaluation in distance learning system. (Distance learning system, pp.4-7)
2. Evaluating the use of SMEBA-IT
From the research revealed that the Mathayomsuksa II students who learned with the
experience-based teaching package through social media ‘Data Communication’ subject. The
students’ learning achievement was significantly increased at the .01 level because SMEBA-IT
was designed by direct experience from the practicing to make students remembered longer,
especially the facing experience which need to completed tasks, students must bring their
existing experience and integrate with new experiences that students had learned from the
Knowledge Center which is the important step. The teacher had to produce social media, which
is the main media of the experience learning package by using Facebook, Lines and Youtube as a
main social media designed to be easy to access; grouping and interacting with friends to work
together. The assignment through social media bringing the students understanding the content
better from the completing assignments students got score 80%, resulting in post test scores was
higher than pretest.
From the students’ satisfaction. Students are satisfied towards the SMEBA-IT was at the
‘Highest’ level of working as a group because mostly Mathayomsuksa II had own smart phone.
They could select thier group to work with, create surveys and models. From the ‘high’ level of
statisfaction was the principle in learning because most of the tasks and assignment designed for
students are Peer Directed Learning (PDL), less in Self Directed Learning (SDL) because there
was an education only in the knowledge center.
Recommendations
1. Recommendations for Application of the Research Findings
1) Preparing for the network and the broadcasting of Social Media Experience-Based
Instructional Package for learning from schools and testing the networking before facing the
experiences making the experience of the students more faster and more convenient.
2) Preparing the tools and communication devices of smart phones for both student and
school effectively.
The 7th National and International Graduate Study Conference 2017
" Thailand 4.0 Creative Innovation for Sustainable Development "
I67

3) Preparing for the development of the knowledge center, teachers must gather relevant
content, bringing to the experience, analyze and categorize content. Due to the student had to
face the major and minor experiences, also doing the tasks and assignments as assigned from the
teacher.
4) Implementing the SMEBA-IT for Mathayomsuksa II students, the researcher educated
school management, administrators, teachers, staff members about processes, steps and applied
experience learning package through social media. Moreover, interaction with students in order
to clearly communication.
5) The SMEBA-IT was direct instructional by unit; therefore, Social Media Experience-
Based Instructional Package ‘Data Communication’ subject also directly as a unit instruction.
2. Recommendations for Further Research
1) Research should be done by researching and developing an Experience-Based
Approach to enhance student learning principles.
References
Bhramawong, Chaiyong (2012). Unit I: Systems and Systems Approach in Education, Systems
Approach in Education. Nontaburi: STOU Press.
Bhramawong, Chaiyong (2013). Distance Learning and Distance Learning Process. Nontaburi:
STOU Press.
Gayne R.M & Briggs. (1979). Principles of instructional design, New York: Halt Rinehart and
Winston.
Ministry of Education [MOE] (2008). The Basic Education Core Curriculum B.E. 2551 (A.D. \
2008).
National Institute of Educational Testing (2015). Learning Area of Information Technology.
Bangkok: Kurusapa Printing.
Thissana Khamanee (2011). The science of teaching knowledge for effective learning process.
Bangkok: Chulalongkorn Printing.
Wasana Taweekulasup (2012). Unit II System and System Approach in Education. Nontaburi:
STOU Press.
The 7th National and International Graduate Study Conference 2017
" Thailand 4.0 Creative Innovation for Sustainable Development "
I68
A Short Survey for Thai Teenager’s Attitudes towards Game-Play Learning
Author: Thanakorn Uiphanit, Kwanrat Suanpong, Pattarasinee Bhattarakosol
Program Technopreneurship and Innovation Management Program. Institute Graduate School,
Chulalongkorn University
Program Department of Commerce Institute Chulalongkorn Business School, Chulalongkorn
University
Program Department of Mathematics and Computer Science Institute Faculty of Science,
Chulalongkorn University
Abstract
Computer game has been applied to the learning system for a decade. However, there are
researches point out that using games cause negative impacts more than positive impacts.
Nevertheless, these studies have been processed in various countries except Thailand. Thus, in
this research, the investigation on game-play in Thai teenagers is survey using questionnaire.
Samples of 1017 students in a university are randomly selected. The results uncover that Thai
teenagers like playing the action game. Although Thai teenagers love playing game, they hardly
play for long times but play often. As a consequence, the negative impact in their point of view
do not exist.
Keywords: Game Genres, Undergraduate Students, Computer games, Behavior
Introduction
Computer games industry is the fastest growing in the entertainment industry because
computer games can be found everywhere, any places, with any types of devices. Recently, most
people in all ages are playing games as their hobby. This can be confirmed in (Entertainment
Software Association, 2017) that the best-selling game genres in U.S. was the strategy game with
36.4% from all responders. The second and third orders are the casual game and the role-playing
game, with 25.8% and 18.7% respectively. For the other types of games, such as shooting,
adventure, action, compilations, flight, racing, sport and arcade games have the playing rate less
than 10%. Based on types of games, different games provide different concepts and experiences
for players (Gose, 2014; Gros, 2007).
Consider the situation of the game industry in Thailand; Software Industry Promotion
Agency(SIPA) (Digital Economy Promotion Agency, 2016) informed that in the year 2015, the
growth rate of the Thai digital content industries reached 12,745 million Baht, which grew by
12.4% from the previous year. Since the digital content can be classified into two types, the
The 7th National and International Graduate Study Conference 2017
" Thailand 4.0 Creative Innovation for Sustainable Development "
I69

animation sector, and the game sector, so within 12.4% of the growth rate of the digital content,
there is 13.5% growth rate of the game sector, higher than the animation sector. Moreover, the
report of Electronic Transactions Development Agency(ETDA) said that the Internet usage in
Thailand has grown up rapidly, especially in the transgender and Generation Y groups (The
Millennial). The survey can inform that the category of downloading programs/series/music/game
is in the fourth rank, 45.6%, of activities of users that access the Internet via their desktops
(Electronic Transactions Development Agency, 2017).
The perceptions of playing games in the past decades are mainly in the negative impact,
such as behavioral addiction (Ferguson, Colwell, Mlačić, Milas, & Mikloušić, 2011), degrade
their academic performance (grade point average, GPA) (Jackson, Von, Fitzgerald, Witt, & Zhao,
2011; Ventura, Shute, & Zhao, 2013), hamper their interpersonal relationships with friends and
family (Jackson, Von, Fitzgerald, Witt, & Zhao, 2011; Ferguson, 2011), and some physical
problems. There are many medical records indicate that long-time playing over the Internet cause
some serious physical problems, such as insomnia, and psychological characteristics (Hasan,
Bègue, Scharkow, & Bushman, 2013; Jackson, Von, Fitzgerald, Witt, & Zhao, 2011; Lenhart,
Kahne, Middaugh, Macgill, Evans, & Vitak, 2008). Nevertheless, there was a research in a
Malaysian University that university students who play games do not have low GPA; or it can be
said that there is no relationship between GPA and the frequency of the game plays (Ventura,
Shute, & Zhao, 2013). On the other hand, this does not imply to students in the primary school
because the result showed that students who love to play games have low GPA than students
who hardly play games (Jackson, Von, Fitzgerald, Witt, & Zhao, 2011).
Though, many negative impacts are identified by researches, there are also some positive
views to be existed, such as promoting prosocial skills (Ferguson, Colwell, Mlačić, Milas, &
Mikloušić, 2011; Lenhart, Kahne, Middaugh, Macgill, Evans, & Vitak, 2008), visual-spatial
skills (Green, & Bavelier, 2007), and reduce violent behavior (Ferguson, Colwell, Mlačić, Milas,
& Mikloušić, 2011). These games are applied in different areas: Mathematics (Kebritchi, Hirumi,
& Bai, 2010), Health (Bartholomew, L. K., et al., 2000), and Foreign Language (Ferguson, Colwell,
Mlačić, Milas, & Mikloušić, 2011; Lenhart, Kahne, Middaugh, Macgill, Evans, & Vitak, 2008).
Since the culture and social life of teenagers in Thailand are much differences than other
countries, the results mentioned above may or may not be the same for young Thai students.
Therefore, this research has an aim to classify Thai teenager’s behavior and attitudes towards
playing game in their lives. In addition, this study is also able to identify the preference in the
type of games in Thai teenagers. Nonetheless, this study will randomly select samples from
undergraduate students of Suan Sunandha Rajabhat University because this place has students
The 7th National and International Graduate Study Conference 2017
" Thailand 4.0 Creative Innovation for Sustainable Development "
I70

from all parts of Thailand. Thus, the samples can be used to represent teenagers of Thailand as
good as selects from other places.
Objectives
1) To study the computer game players’ behavior
2) To study the attitudes of the computer game players towards its impacts: positive and
negative impacts.
3) To identify the game genres preference of Thai teenagers.
Population and Sample
This research focuses in the teenagers’ behavior, attitudes, and preferences towards game
playing in Thailand; so, the population is all Thai teenagers. Since Suan Sunandha Rajabhat
University has been opened for Thai people who wants to continue their knowledges in specific
areas in both undergraduate and graduate levels, most students, coming from several home
towns, in this university are in the age range of 17-25 years old as same as teenagers in Thailand.
Therefore, the samples of 1,017 students can be randomly selected from this university and it can
be representative of Thai teenagers as needed.
Data Collection Method
In this research, the collection method is performed using a questionnaire. This
questionnaire was distributed to the sample size of 1,017 students from every faculty. The
measurement topics are divided into 3 parts: demographic information, game playing attitude,
and game preference.
The demographic information consists of Gender, Faculty, GPA, playing frequency, and
playing duration time.
The measurement unit in the game playing attitude is Likert scale with 5 levels: 1 to 5
scores, where 1 means “strongly disagree”, and 5 means “strongly agree”.
The preference in each type of games is measured using 11-scale units: -1 means dislike
game in the list, 0 means don’t know the game in the list, 1 means extremely dislike this game
type, and 9 means extremely like the game type.
The 7th National and International Graduate Study Conference 2017
" Thailand 4.0 Creative Innovation for Sustainable Development "
I71

Data Analysis
The data from all questionnaires are analyzed using SPSSv22.0, license of Chulalongkorn
University. The objectives to calculate all statistical values, both descriptive and inferential, are
to answer the following questions.
1. What is the most popular game that Thai teenagers love to play?
2. What are the main characteristics of game players after they decide to play games?
3. How do teenagers feel about impacts of games?
4. Are there any similarities among faculties under the classification of games?
5. Are there any similarities between genders when they choose a game?
6. Is it possible to spend times less than before with family or friends because of games?
7. Is game the main cause of irresponsibility of the game players?
8. Can the game cause bad learning skill?
9. Do negative perceptions of the players come from games?
10. Is the mood of the game players always sensitive?
The result from this study indicates that the action-game is the most popular among
students in this university, 23.8% from all samples. The second place is simulation-game, 16.6%.
In addition, the players’ behavior for all games is that they generally play their games
more than one time per day, 40.3%, but each time they spend less than one hour, 39.2%. This
information is very interesting because this result should be able to indicate that teenagers in
Thailand mostly play games whenever they are available according to the short time play. Thus,
this result is consistent with the collected data that they have positive attitude towards the game
plays.
When focusing to the action-game, it is obviously found that faculties in this university
can be grouped into two different subgroups. The first subgroup consists of Faulty of Humanities
and Social Science, Faculty of Science and Technology, while another subgroup consists of
Faculty of Industrial Technology, Faculty of Management Science, Faculty of Education, and
Faculty of Fine Arts. Moreover, the action players indicate that the playing this game can affect
to their study while other game players cannot conclude to the same issue.
The depth statistical analysis was also performed, such as Analysis of Variance, and Chi-
Square; this statistical analysis uses 95% confidence level. So, another interesting issue has been
uncovered that the attitude of playing games between faculties is significantly difference, mostly
sig=0.00<0.05=α. Although the overall attitudes are positive, the attitudes of students from Faculty
of Industrial Technology is significant different from other students from other faculties.
When comparing between male and female for their appreciation of the game types,
using Chi-Square analysis with 95% confident level, it has been found that these two genders have
dissimilarity in the game types. The outcomes from this analysis can classify that male students
The 7th National and International Graduate Study Conference 2017
" Thailand 4.0 Creative Innovation for Sustainable Development "
I72

love to play games that they must make plans to win the game, such as strategy, role play, sports,
shooting, and fighting games. While the results show that female love to play games just for fun,
without or small stress, such as puzzle, action, and simulation games.
In this research, some negative impacts that have been mentioned in other researches,
such as the game player may leave their live away from their family or friends, playing game is
the main cause of irresponsibility of the players, have been investigated. Using a simple statistical
method, descriptive statistics, it can show that all investigate cases that mentioned in questions 6
to 10 above do not have any negative results. For examples, it shows that the samples do not
agree that playing game can cause problem in their studies, or playing game has nothing to do
with irresponsibility of the players.
Discussion
Currently, the learning styles of students have been changed and improved by various
methods. One of these techniques is the game-play method that students in the class learn the
contents of subjects by playing games. There are various researches show that using game can
have both positive and negative impacts to students, Nevertheless, this study shows that the
negative impacts mentioned in other researches do not arise in Thai teenagers; this might be Thai
culture is different from others. Moreover, students from different faculties may like different
game types. However, the popular game in this survey is the action games. Thus, choosing game
types for creating content for a subject should consider for students’ area and, also their
appreciations because both can lead to succeed or failure of their study as same as lead them to
win the game.
Conclusion
This research has shown that Thai teenagers have dissimilar to other game players of
other countries because the results disclose that all negative impacts that have been mentioned in
other research papers do not exist in Thai samples. Additionally, the result shows that action
game is the most popular game in the age range of Thai citizen. However, the appreciation of
games between different genders is dissimilar. Therefore, creating a game in this teenagers in
Thailand, the implementers should consider for the players’ specialties and interest.
The 7th National and International Graduate Study Conference 2017
" Thailand 4.0 Creative Innovation for Sustainable Development "
I73

References
Anand, V. (2007). A study of time management: The correlation between video game
usage and academic performance markers. CyberPsychology & Behavior.
Vol.10(4), 552-559.
Bartholomew, L. K., Gold, R. S., Parcel, G. S., Czyzewski, D. I., Sockrider, M.
M., Fernandez, M., & Swank, P. (2000). Watch, Discover, Think, and Act:
evaluation of computer-assisted instruction to improve asthma self-management in
inner-city children. Patient education and counseling. Vol.39(2), 269-280.
Digital Economy Promotion Agency. (2016). Retrieved May 12, 2017, The Software
Industry Promotion Agency (Public Organization) (SIPA) revealed that the survey
results of Thailand’s digital content industry in 2015 includes animation and
games,Digital Economy Promotion Agency website,
http://www.depa.or.th/en/news/sipa-announced-thai-digital-content-industry-
2015-grew-1241-percent
Dye, M. W., Green, C. S., & Bavelier, D. (2009). The development of attention skills in
action video game players. Neuropsychologia. Vol.47(8), 1780-1789.
Electronic Transactions Development Agency.(2017). Retrieved May 15, 2017,
Thailand Internet User Profile 2016,
Electronic Transactions Development Agency website,
http://www.theesa.com/wpcontent/uploads/2017/04/EF2017_FinalDigital.pdf
Entertainment Software Association.(2017). Retrieved May 15, 2017, Essential facts
about the computer and video game industry,
Entertainment Software Association website,
https://www.etda.or.th/publishing-detail/thailand-internet-user-profile-2016-
th.html
Ferguson, C. J. (2011). The influence of television and video game use on attention and
school problems: A multivariate analysis with other risk factors
controlled. Journal of psychiatric research. Vol.45(6), 808-813.
Ferguson, C. J., Colwell, J., Mlačić, B., Milas, G., & Mikloušić, I. (2011). Personality
and media influences on violence and depression in a cross-national sample of
young adults: Data from Mexican–Americans, English and Croatians. Computers
in Human Behavior. Vol27(3), 1195-1200.
Gose, E. G. (2014). What video game genres are teaching us(Doctoral dissertation,
University of Hawaii at Manoa).
Retrieved from http://scholarspace.manoa.hawaii.edu/handle/10125/100511
Green, C. S., & Bavelier, D. (2007). Action-video-game experience alters the spatial
resolution of vision. Psychological science. Vol.18(1), 88-94.
The 7th National and International Graduate Study Conference 2017
" Thailand 4.0 Creative Innovation for Sustainable Development "
I74

Gros, B. (2007). Digital games in education: The design of games-based learning
environments. Journal of research on technology in education.
Vol.40(1), 23-38.
Hasan, Y., Bègue, L., Scharkow, M., & Bushman, B. J. (2013). The more you play, the
more aggressive you become: A long-term experimental study of cumulative
violent video game effects on hostile expectations and aggressive
behavior. Journal of Experimental Social Psychology. Vol.49(2), 224-227.
Jackson, L. A., Von Eye, A., Fitzgerald, H. E., Witt, E. A., & Zhao, Y. (2011).
Internet use, videogame playing and cell phone use as predictors of children’s
body mass index (BMI), body weight, academic performance, and social and
overall self-esteem. Computers in Human Behavior. Vol.27(1), 599-604.
Kebritchi, M., Hirumi, A., & Bai, H. (2010). The effects of modern mathematics
computer games on mathematics achievement and class motivation.
Computers & education. Vol.55(2), 427-443.
Lenhart, A., Kahne, J., Middaugh, E., Macgill, A. R., Evans, C., & Vitak, J. (2008).
Teens, video games, and civics: teens' gaming experiences are diverse and
include significant social interaction and civic engagement. Washington DC :
Pew internet & American life project.
Ventura, M., Shute, V., & Zhao, W. (2013). The relationship between video game use
and a performance-based measure of persistence. Computers & Education.
Vol.60(1), 52-58.
The 7th National and International Graduate Study Conference 2017
" Thailand 4.0 Creative Innovation for Sustainable Development "
I75

The Effects of Drama Techniques in developing Students’ Speaking Ability
Ramanya Wongworapitak, and Phnita Kulsirisawad
Program: Teaching English as a Foreign Language, Faculty of Humanities,
Srinakharinwirot University, Thailand
Abstract
Drama techniques have been widely used in a language classroom. Drama
techniques are beneficial in a speaking classroom because they integrate language
skills in a natural way through verbal and nonverbal aspects of communication
(Maley & Duff, 2005). The present study investigates the effect of using drama
techniques to increase students’ speaking ability. It explores the effects of using
drama techniques in developing students’ speaking ability and the students’
satisfaction towards the use of drama techniques. The study involves 35 students who
were in the 10th grade studying English 31101 Course at Suankularb Wittayalai
Nonthaburi School. The students’ speaking abilities were measured by comparing
their pre-speaking test with their post-speaking test by using dependent T-test. At the
end of the course, the students were asked to complete a questionnaire in order to find
out their views towards the use of drama techniques in the classroom. A group
interview was also conducted in order to gain more detailed information about their
opinions. The findings revealed that teaching English through drama techniques had
a statistically significant influence on the students’ speaking ability. Their post-
speaking test scores were significantly higher than those of their pre-speaking test at
0.01 level. Moreover, the students had positive views toward the use of drama
techniques and they enjoyed learning through drama techniques.
Keywords: Drama techniques, English speaking
Introduction
The Thai government has long realized the importance of English
language as a core subject in school, and it has been a compulsory subject for several
decades (Nanthaboot, 2012). One of the goals of learning English is
‘communication’. Students should be able to communicate and connect with people
around the world (Minister of Education, 2008). Therefore, speaking proficiency is
necessary in both secondary and tertiary levels.
Even though Thai students have learnt English since they are in grade one,
most of them have low English proficiency and cannot communicate in English. It is
probably because they have no opportunities to practice speaking in English and use
language outside the classroom (Wiriyachitra, 2002). According to Khamkhien
(2010), the poor English speaking abilities among Thai EFL learners derive from the
problematic instruction in the classroom. Most teachers still use Thai as a medium of
instruction. They spend most of the class time practicing grammatical structures.
When teachers use traditional teaching approaches focusing on grammatical
structures, students will rarely get a chance to speak English and interact with other
students in the target language (Suraswadee, 1993). As a result, students have
minimal opportunity to actually use the language in a meaningful way. In addition,
The 7th National and International Graduate Study Conference 2017
" Thailand 4.0 Creative Innovation for Sustainable Development "
I76

Wanthanasut (2008) found that Thai students were afraid of making mistakes while
speaking English and were not confident to speak English.
There are several components that contribute to the development of
students’ English speaking ability. The memorization of linguistic forms is not
enough to enhance their speaking ability. It requires the knowledge of
communication contexts, the ability to interpret through verbal and nonverbal cues
(Janudom & Wasanasomsithi, 2009). Vygotsky (1987) similarly points out that
language learning development depends entirely on social interaction because it
enables the learners to construct knowledge which is meaningful to them. Therefore,
any learning activities that involve a meaningful and purposeful social interaction
may help the students develop their speaking skills.
Drama techniques are one of the effective pedagogical practices to develop
students’ speaking skill (Gomez, 2010). According to Maley and Duff (2005), drama
activities allow students to use language meaningfully and creatively. They integrate
language skills in a natural way through verbal and nonverbal aspects of
communication. They also bring about classroom interactions and also increases self-
esteem as well as confidence (Maley & Duff, 2005). Moreover, using drama
techniques in the English language classroom makes the language appear in context
and makes it come to life (Boudreaut, 2013). In addition, drama techniques are not
only good for encouraging students’ linguistic and emotional development but also
promoting creative thoughts simultaneously (Zafeiriadou, 2009).
Maley and Duff (2005) explain that drama techniques are helpful in an
English language class because these techniques can balance the physical and
intellectual aspects of learning by integrating language skills and verbal and non-
verbal aspects of communication. For cognitive domain, drama techniques can fully
contextualize the language which help learners focus on the meaning rather than the
structure only through classroom interactive activities. The students are more
motivated and they can see for themselves that language has a purpose. In addition,
Miccoli (2003) found that language comes alive through drama in an oral skill
development class. The confrontation of fears, and willingness to take risks, lead to
an improvement in students’ communication skills, as a consequence of
understanding the aspects that underlie oral communication (Kyriakopoulos, 2008).
To sum up, drama techniques are the teaching strategies which promote
communication competence and motivate students to feel more confident to speak
English. They also bridge the gap between the classroom and real life situations.
Given the benefits of drama techniques in a language classroom, this study aims to
use drama activities in developing students’ speaking ability.
Drama techniques consist of various activities which can be used in a
language classroom. Holden (1981), Dougil (1987) and Scrivener (2005) have divided
drama techniques into five to six categories including mime, role-play, improvisation,
simulations, drama games and acting play scripts. Role-play is the acting out or
performing a particular role (Rober and Rober, 2001). Simulation is an oral
communicative activities involving decision making, in which the participants may
act as themselves or in social roles (Bygate, 1993). Drama games refer to short games
with both verbal and non-verbal activities which involves movement and imagination
(Maley & Duff, 2005). Improvisation is a group activity which allows learners
understand the character they will act out and the teacher provides information about
The 7th National and International Graduate Study Conference 2017
" Thailand 4.0 Creative Innovation for Sustainable Development "
I77
a situation for students to improvise. Acting play scripts is based on acting out short
scenes or sketches by students (Scrivener, 2005).
In this study, the researcher adopted drama activities introduced by
Scrivener (2005) and Maley and Duff (2005) including drama games, role-play and
improvisation. These three activities are relevant to the lessons and are suitable for
the level of the students.
Drama techniques have been widely used in a language classroom. Several
researchers have employed drama activities in their language classrooms and found
that their students’ speaking abilities had improved significantly. Miccoli (2003) did
a study on a value of using drama activities in an oral skill class and found that drama
techniques created an atmosphere where students learned the language with fun and
no stress. In addition, Nofiadri (2015) did a study on implementing three types of
drama activities which consisted of mime, scripted play and unscripted play on
increasing ESL students’ speaking ability. It was found that students’ confidence
public speaking was increasing because the chronological procedures accommodate
their social awareness. Similar findings were found in the study of Al-Barri, Alqadi,
Al-Wa’ely, Khodair and Alshawashreh (2014). They did a study on the effectiveness
of the dramatic role-playing upon the linguistic achievement and the development of
verbal expressive performance among the basic 4th grade students. They found that
verbal expressive performance of 25 students were improved through the use of
dramatic and role playing methods. Furthermore, Gill (2013) did a similar study on
the effects of drama on oral English and found that 10 non-native students’ speaking
ability had improved after learning through drama-based lessons for twelve weeks.
Even though drama techniques are beneficial in English language teaching,
it is quite rare that a research study is done in an EFL context. Hence, this research
aims to fill the gap in previous research and the findings of this research will add to
the body of knowledge in English speaking development.
With regard to the context of this study, the participants are tenth graders.
They are taking English 31101 Course. Grounded on my 5-year teaching experience, I
have found that the students have difficulties in English speaking the most. They
cannot utter simple sentences correctly. They do not have enough confidence to
speak because they do not want to lose face in the classroom. Moreover, most of the
class time is devoted to drills and grammatical exercises. Therefore, this study aims
to address this problem, i.e. the lack of an opportunity for students to actually engage
in a meaningful social interaction.
Objectives 1. To examine the effect of using drama techniques in developing students’
speaking ability.
2. To determine the level of students’ satisfaction towards the use of drama
techniques in a language classroom.
Research Methodology
Participants
The participants were 35 tenth grade students at Suankularbwittayalai
Nonthaburi School in the first semester of 2016. They enrolled in English 33101
The 7th National and International Graduate Study Conference 2017
" Thailand 4.0 Creative Innovation for Sustainable Development "
I78

Course. The selection of the participants was conducted via a convenience sampling
method (as the researcher was assigned by the headmaster to teach grade 10 students)
Research Instruments
1) Lesson plans
There were three lesson plans which are going shopping, ordering food,
and asking and giving direction. These three topics that students in Mathayomsuksa 4
(Grade 10) had to study in the first semester of English 33101 Course. In each lesson
plan, drama techniques were designed to suit each topic. Experts in English language
teaching and learning examined the lesson plans in terms of the correctness of the
content, and relevancy to the course objectives. Then, the lesson plans were used to
pilot with another class of 40 students in Mathayomsuksa 4 (Grade 10). Each lesson
covered 2 periods (50 minutes in each period). The teaching processes were based on
three phases of drama-based instruction; introduction, development and quieting
started and along with oral principles of teaching speaking: pre-speaking, while-
speaking, and post speaking. For teaching Ordering Food, drama games were used to
motivate students and reduce the anxiety at the introduction phase. Then new
vocabulary and expressions were introduced at the development phase including the
practice of speaking through improvised role-play. During the quiet phase, the
students performed what they had learned. Below are the topics and details for each
lesson.
Table 1
Drama Techniques in each lesson
Lesson Plan Length Language Functions Drama Techniques
1 2 weeks Ordering food
Drama games
Role-play
Guided
Improvisation
2 2 weeks Shopping Drama games
Role-play
3 2 weeks Asking and giving
directions
Role-play
Guided
Improvisation
2) Learner’s Satisfaction Questionnaire
A 10-item using Likert’s 5 rating scales, adapted from Kulsirisawad
(2017) and Phisutthangkoon (2012), were used to evaluate the students’ satisfaction
The 7th National and International Graduate Study Conference 2017
" Thailand 4.0 Creative Innovation for Sustainable Development "
I79

toward the use of drama techniques. The participants answered the questionnaire
which was in the form of statements on a 5-point scale with 1: representing lowest
satisfaction; 2: low satisfaction; 3: moderate satisfaction; 4: high satisfaction; 5: very
high satisfaction.
The 10-item questionnaire was classified into three themes. Usefulness
(items 1-4), acceptance (items 5-7), and affect (items 8-10). The original
questionnaire was constructed in English and then translated into Thai to ensure the
participants’ understanding.
3) English Speaking Tests
The English speaking test comprised pre-tests and post-tests. The aim is to
assess students’ English speaking ability. Those two tests were identical. The test
consisted of 10 questions and three improvised situations including going shopping,
ordering food, and asking for and giving directions. The criteria for evaluation
involve fluency, accuracy, and comprehension. The pretest was conducted at the first
week of the class. The post-test was conducted at the final week of the class. To
examine the content validity of the test, three experts were asked to examine the pre-
test and post-test through the Index of Item-Objective Congruence (IOC). The
researcher used holistic scoring by using rubric of speaking test which was adapted
from Rcampus and Cambridge English. The three raters rated students’ performance.
Their scores from the pre-test and post-test were statistically compared via dependent
T-test to find out the mean scores and standard deviation.
Data collection
To answer the first research question, the students’ speaking ability was
measured. At the first week of the experiment, the students were asked to take a pre-
speaking test. The test comprised two parts. The first part included 10 questions.
The second part was an improvisation which the students were required to role play.
After that, the students were taught through drama techniques for four weeks. Each
lesson plan was carried out for four periods per week.
At the final week, the post-test was administered. The post-test was
identical to the pre-test, but in random order. Both tests were rated by three raters.
The total scores of the two tests were 15 points each based on holistic scoring method.
To answer the second research question, the students were asked to
complete a set of questionnaire. It was followed by a group interview.
Data Analysis In order to investigate whether the students’ speaking ability has increased
after learning through drama techniques, the students’ pre and post speaking tests
scores were analyzed by using SPSS program (Statistical Package for the Social
Sciences) in order to obtain descriptive statistics; means and standard deviations. The
average mean scores and standard deviations of the pre and post-tests were calculated
and then compared using a dependent T-test. To determine the level of students’
satisfaction toward the use of drama techniques in the classroom, the 10-item Likert
scales questionnaire was analyzed by using SPSS program (Statistical Package for the
Social Sciences) in order to obtain descriptive statistics; mean and standard
deviations.
The 7th National and International Graduate Study Conference 2017
" Thailand 4.0 Creative Innovation for Sustainable Development "
I80

Results
Research Question 1: Do Mathayomsuksa 4 (Grade 10) students at
Suankularbwittayalai Nonthaburi school develop their English speaking ability after
learning through drama techniques? Overall, it was found that the English speaking ability of Matthayomsuksa
4 students was significantly higher after learning through drama techniques activities
at the 0.01 level. The participants had significantly higher mean scores on the post-
test (M= 6.19, SD= 1.76) compared to that of the pre-test (M= 5.63, SD= 1.47).
Table 2 The Average Mean Score of Pre-Post Speaking Tests
N Score Mean Std. Deviation p-value
Pre-test 35 15 5.63 1.47 0.0014196
Post-test 35 15 6.19 1.76
From Table 2, it can be seen that the students performed better in the post-
speaking test.
Research Question 2: What are the students’ satisfaction towards drama techniques
in a language classroom? At the end of the study, all participants were asked to complete a
questionnaire. The questionnaire was adapted from Kulsirisawad (2017) and
Phisutthangkoon (2012). The students rated each item based on their satisfaction
towards drama techniques by using five points scale ranging from ‘very high
satisfaction’ to ‘very low satisfaction’ (4.21-5.00 = very high satisfaction, 3.41-4.20 =
high satisfaction, 2.61-3.40 = moderate satisfaction, 1.81-2.60 = low satisfaction and
1.00-1.80 = very low satisfaction). The checklist interpretation was adapted from
Phisutthangkoon (2012). The findings revealed that the participants had positive
views toward the use of drama techniques. The satisfaction of the students toward the
use of drama techniques were at ‘a very high satisfaction’ level with a mean score of
4.24 and the standard deviation of 0.69. The highest mean score was item 10 (I enjoy
learning through drama techniques) which was 4.40 and the standard deviation was
0.65. The second highest mean score was item 1 (Learning through drama
techniques increase motivation in speaking English) which had the mean score of
4.31 and the standard deviation of 0.76. The third highest mean score were item 2
and item 8 (Learning through drama techniques has increased my speaking fluency
and I feel no pressure when I speak with my friends in the class). They both had a
mean score of 4.29 with the S.D. of 0.62 and 0.71 respectively. It can be argued that
students had positive views toward the use of drama techniques in the English
language classroom. The findings were presented in Table 3.
The 7th National and International Graduate Study Conference 2017
" Thailand 4.0 Creative Innovation for Sustainable Development "
I81

Table 3 Findings of Students’ Satisfaction toward the Use of Drama Techniques.
Questionnaire Items Mean Std. Level of response
Section I : Usefulness
1. Learning through drama techniques
increase motivation in speaking English.
4.31 0.76 Very high
satisfaction
2. Learning through drama techniques has
increased my speaking fluency.
4.29 0.62 Very high
satisfaction
3. Learning through drama techniques
make me feel more confident to speak
English in the class.
4.23 0.60 Very high
satisfaction
4. Learning through drama techniques help
to promote solving skill.
4.23 0.81 Very high
satisfaction
Section II : Acceptance
5. Learning through drama techniques
promote engaging and positive learning
environment.
4.23 0.73 Very high
satisfaction
6. Learning through drama techniques was
a valuable and worthwhile experience.
4.23 0.69 Very high
satisfaction
7. I have more interaction with friends and
teachers in class.
4.09 0.74 high satisfaction
Section III : Affect
8. I feel no pressure when I speak with my
friends in the class.
4.29 0.71 Very high
satisfaction
9. I do not worry about making
grammatical mistakes after learning through
drama techniques.
4.14 0.60 high satisfaction
10. I enjoy learning through drama
techniques.
4.40 0.65 Very high
satisfaction
Totals 4.24 0.69 Very high
satisfaction
Conclusion
To sum up, it can be concluded that the students’ speaking ability
significantly increased after learning through drama techniques. In addition, they had
positive views toward the use of drama techniques. Furthermore, they enjoyed
learning English through role-plays, drama games and improvisation. From the group
interview, it was found that the students were happy and were willing to participate in
the role-plays, games and improvisation. One of them stated that all activities were
fun and relaxing, many students said that role-play was the best because it gave them
opportunities to practice speaking English with friends in a fun way.
Discussion
In this study, the researcher used drama activities to teach English
speaking to 35 tenth graders. Such activities involved role-plays, drama games and
guided improvisation. The classroom observation data revealed that the classroom
The 7th National and International Graduate Study Conference 2017
" Thailand 4.0 Creative Innovation for Sustainable Development "
I82

atmosphere was relaxing and the student had fun. Unlike the traditional language
classrooms where the focus was solely on grammatical forms, this classroom
emplasized on communication and the ability to get the message acrossed. The
researcher found that the students were more confident and motivated.
The quantitative analysis revealed that the students did better at the end of
the course which suggested that the drama techniques had positive impact on their
speaking performance. In addition, the students liked it when the teacher use drama
techniques. They stated that they found the enjoyable because they had a chance to
interact with their peers and they were at ease. They considered the learning
experience worthwhile and valuable.
The findings of this study were in line with the studies of El-Nady (2000),
Fabio (2015), and Nofiadri (2015) which also found that the students performed
significantly better through the use of drama activities. Such positive outcomes could
probably come from the fact that the students liked the activities and were not
reluctant to participate.
Recommendations for further studies On the basis of the research findings, the researcher would like to offer
some general thoughts of how to develop students’ speaking abilities. The intention is
also to further develop the communicative language teaching approach which has
begun to be implemented in Thailand.
To help students become more confident and motivated in speaking
English, the researcher would like to argue for the continual practice of teaching
English speaking through drama techniques. As supported by Maley and Duff (2005),
drama activities help students use the language in a meaningful and creative way. It
also increases self-esteem and confidence.
The positive impact that the drama techniques had on the students’
speaking abilities suggests that drama techniques could be an alternative method in
teaching English to Thai EFL learners. Moreover, drama activities such a role-plays
provide the students the opportunities to engage in classroom interactions.
References
Abu, R. (2010). Drama in chalk and talk classroom. Journal of Language Teaching
and Research, 1(4), 378-381.
Akdag, N., & T, O. F. (2010). The effect of drama method on achievement level in
English teaching: knowledge, comprehension and application levels.
International Journal of Human Sciences, 7(1), 824-835.
Al-Barri, Q., Alqadi, H., Al-Wa’ely, S., Khodair, R. & Alshawashreh, O. (2014). The
effectiveness of dramatic role-playing on the linguistic achievement and the
development of verbal expressive performance among the basic4th Grade
students in Jordan. Research on Humanities and Social Sciences, 4(21), 1-9.
Retrieved from http://www.iiste.org/journals/ Angwattanakul, S. (1994). English teaching methods. Bangkok: Chulalongkorn
University Press.
Boudreault, C. (2010). The benefits of using drama in the ESL/EFL classroom. The
Internet TESL Journal, 16(1). Retrieved from
http://iteslj.org/Articles/Boudreault-Drama.html
The 7th National and International Graduate Study Conference 2017
" Thailand 4.0 Creative Innovation for Sustainable Development "
I83

Bygate, M. (1993). Language teaching speaking. Oxford: Oxford University Press.
Dougil, J. (1987). Drama activities for language learning. London. Macmillan
Publishers.
El-Nady. (2000). Drama as a teaching techniques in the second language classroom.
Dialog on Language Instruction, 14(1&2), 41-48.
Fraenkel, J. R., & Wallen, N. E. (2006). How to Design and Evaluate Research in
Education (5th ed.). New York: McGraw-Hill Publishing.
Gill, C. (2013). Enhancing the English-Language OralSkills of International Students
through Drama. English Language Teaching, 6(4), 29-41.
Gomez, D. I. (2010). Using drama to improve oral skills in the ESL classroom.
International school Journal, 30 (1), 29-37.
Harmer, J. (2007). The practice of English language teaching. Essex: Pearson
Education.
Heaton, J. B. (1989). Classroom testing: testing speaking skills. London: Longman.
Holden. (1981). Drama in language teaching. London. Longman
Hughes, A. (2003). Testing for language teachers. Cambridge: Cambridge University
Press.
Iamsaard, P. & Kerdpol, S. (2015). A study of effect of dramatic activities on
improving English communicative speaking skill of Grade11th students.
English Language Teaching, 8(11), 69-78. Retrieved from
www.ccsenet.org/elt
Janudom, R., & Wasanasomsithi, P. (2009). Drama and questioning techniques:
Powerful tools for the enhancement of students’ speaking abilities and positive
attitudes towards EFL learning. Retrieved from http://www.esp
world.info/Articles_26/Original/Drama.pdf
Khamkhien, A. (2010). Teaching English speaking and English speaking tests in the
Thai context: A reflection from Thai perspective [Electronic version]. English
Language Teaching, 3, 184-190. Retrieved from
www.ccsenet.org/journal/index.php/ elt/ article/ download/ 5253/4351
Kulsirisawad, P. (2017). The Study on the Use of Journal Writing Activity in a Basic
Writing Classroom to Enhance Writing Fluency and the Students‟ Perceptions
towards Journal Writing. Manutsat Paritat: Journal of Humanities, 39(1). In
process.
Kyriakopoulos, P. (2008). Using practiced improvisation and role-play to improve
oral communication skills for English second language learners. Master
thesis, M.A. (Master of Arts). Quebec, Concordia University.
Maley, A., & Duff, A. (2005). Drama Techniques: A resource book for
communication activities for language teachers. Cambridge: Cambridge
University Press.
Miccoli, L. (2003). English through drama for oral skills development. ELT Journal,
57(2), 122-129.
Minister of Education. (2008). Basic Education Curriculum 2008. Bangkok:
Kurusapa Ladprao Publishing.
Nanthaboot, P. (2012). Using communicative activities to develop English speaking
ability of Mathayomsuksa three students. Master thesis, M.A. (Teaching
English as a Foreign Language). Bangkok: Graduate School, Srinakharinwirot
University.
The 7th National and International Graduate Study Conference 2017
" Thailand 4.0 Creative Innovation for Sustainable Development "
I84

Nofiadri, N. (2015). Drama techniques: A solution for improving students’ speaking
skill. RiELT Journal, 1(1), 37-48
Noom-ura, S. (2013). English-teaching problems in Thailand and Thai teachers’
professional development needs. Language Institute, Thammasat University,
Thailand. English Language Teaching, 6 (11), 139-147. Retrieved from http://www.ccsenet.org/journal/index.php/elt/article/viewFile/31115/18208
Nuktong, P. (2010). The effects of drama-based instruction on English oral
communication ability and motivation in learning English of eleventh grade
students. Master thesis, M.ED. (Teaching English as a Foreign Language).
Bangkok: Graduate School, Chulalongkorn University.
Phisutthangkoon, K. (2012). The use of communicative activities to develop English
speaking ability of the first year diploma vocational students. Master thesis,
M.A. (Teaching English as a Foreign Language). Bangkok: Graduate School,
Srinakharinwirot University.
Pongsawang, G. (2012). Using task-based language learning activities to enhance
speaking abilities of Prathomsuksa 5 students. Master thesis, M.A. (Teaching
English as a Foreign Language). Bangkok: Graduate School, Srinakharinwirot
University.
Punsiri, B. (2011). The Effectiveness of Drama Techniques on Foreign Language
Classroom Anxiety Reduction of Thai EFL Students. Master thesis, M.A.
(Teaching English as a Foreign Language). Bangkok: Graduate School,
Srinakharinwirot University.
Rober, A. & Rober, E. (2001). The penguin dictionary of psychology. Lonndon:
Penguin.
Sae-ong, U. (2010). The use of task-based learning and group work incorporating to
develop English speaking ability of Mattayomsuksa 4 students. Master thesis,
M.A. (Teaching English as a Foreign Language). Bangkok: Graduate School,
Srinakharinwirot University.
Scrivener, J. (2005). Learning teaching: A guidebook for English language teachers.
Macmilan Education, Macmillan Publishers Limited.
Seidlhofer, B. (2005). Key concepts: English as a lingua franca. ELT Journal 59(4),
339-341.
Sirisrimangkorn, L., & Suwanthep, J. (2013). The effects of integrated drama-based
role play and student teams achievement division (STAD) on students’
speaking skills and affective involvement”, Suranaree University of
Technology, Thailand. Retrieved from
http://research.ucc.ie/journals/scenario/02/05-SirisrimangkornSuwanthep-
2013-02-en.pdf
Sulaiman, K. A. (2013). Using educational drama and role-playing teaching English
in Gaza governorates. The Isalamic University of Gaza, Gaza, Palestine. Asian
journal of Education and e-learning, 1(1), 34-46.
Suraswadee, P. (1993). Human relation and English teaching: Bangkok
Chulalongkorn University Press.
Torrico, F. (2015). Drama techniques to enhance speaking skills and motivation in the
EFL secondary classroom. Retrieved from
http://eprints.ucm.es/32553/1/TFM%20%281%29.pdf
Thornbury, S. (2008). How to teach speaking. Malaysia: Pearson Education.
The 7th National and International Graduate Study Conference 2017
" Thailand 4.0 Creative Innovation for Sustainable Development "
I85

Underhill, N. (2000). Testing spoken language: A handbook of oral testing
techniques. Cambridge University Press.
Vygotsky, L.S. (1987). Mind in Society: The Development of Higher Psychological
Processes. Cambridge: Cambridge University Press.
Wanthanasut, L. (2008). The problems of English speaking of Mathayom suksa 1
students at Phosai Pittayakarn school, Ubonratchathani Education service
area 2. ( Unpublised master’s thesis). Ubonrachathani Rajabhat University,
Ubonrachathani, Thailand.
Weir, C. (1993). Understanding and developing language test. New Jersey: Prentice
Hall.
Wiriyachitra, A. (2002). English language teaching and learning in Thailand in this
decade. Thai Tesol Focus, 15(1), 4-9.
Zafeiriadou, N. (2009). Drama in language teaching: a challenge for creative
development. Retrieved from http://www.finchpark.com/courses/grad-
dissert/articles/drama.
Zyoud, M. (2012). Using drama activities and techniques to foster teaching English
as a foreign language: a theoretical perspective. Retrieved from
http://www.qou.edu/english/conferences/firstNationalConference/pdfFiles/mu
ntherZyoud.pdf
The 7th National and International Graduate Study Conference 2017
" Thailand 4.0 Creative Innovation for Sustainable Development "
I86

The 7th National and International Graduate Study Conference 2017
" Thailand 4.0 Creative Innovation for Sustainable Development "
I87

Problems and Difficulties of Overseas Chinese studying in Northeastern Thailand
Liu Xuefeng
1
Pennee Narot2
Abstract
This research surveyed problems and difficulties of Chinese international students
encounter while living and studying in the Northeastern of Thailand. The purposes of the study
were: 1) To learn and understand problems and difficulties oversea Chinese students facing while
studying in Northeastern Thailand universities. 2) To analyze the expectation before and after
coming to study in Thailand. 3) To propose policy suggestions.
The data collection was conducted by structured questionnaire. The in-depth interview was
administered with 20 oversea Chinese students studying at Khon Kaen University and
Mahasarakham University in the Northeastern of Thailand. The samples were drawn by snow
ball technique. The obtained data were analyzed by content analysis and summarized report in
descriptive manner according to the research objectives.
The findings can be summarized as follows: 1) The problems and difficulties faced by the
students including academic, economic, culture, law and regulation, daily life aspects.
Specifically, there are communication barriers, high monthly spending, unfamiliar with Thai’s
Buddhist practice, and some Thai laws as well as university regulations. The problem of not
being able to adjust to warm weather and food were also reported. 2) As they have been studying
in Thailand, the most of Chinese students found that the academic aspect meet their expectation
but not in living condition. Their cultural and economic expectations are inconsistent so it is
difficult to conclude. 3) The policy suggestions proposed to universities or related education
organizations and local government where the universities are located should be as follows: (1)
An establishment of well- developed strategic plan to accommodate overseas students, (2)
development and up-date of collaboration program between Thai and Chinese universities, (3)
provide actual information related to every aspect of the university and ways of living in each
university and locality not just a public relation for business purpose.
Key words: problems; difficulties; overseas students; cross-cultural; policy
Introduction
Research Background and Rationale
Having international students benefit the countries in many ways, especially economic
benefits to the host country. Per the Open Doors Report (2012) published by the Institute of
International Education, the international students contributed approximately $22.7 billion in one
academic year through tuition fees and living expenses. In Australia, the Department of Foreign
Affairs and Trade ranked education services the third largest export earner after iron and coal.
(AEI, 2012) International Education industry stands for 15% of the revenue of Australian
universities (Becker and Lolster, 2012). In additional to the economic benefit foreign students
1MPA. Candidate in Public Administration, College of Local Administration, Khon Kaen University. 2Associate Professor, College of Local Administration, Khon Kaen University.
The 7th National and International Graduate Study Conference 2017
" Thailand 4.0 Creative Innovation for Sustainable Development "
I88

bring, they also bring a positive social, cultural, and education impact on their host country
(ASEAN Economist, 2013). Ozturgust (2013) stated that international students can transfer their
knowledge and skills to scientific and technical field of the host country. According to a
Universities Scotland (2013), the considerable presence of international students on campus
helps in at least in four areas. First, international students will promote the learning of language
in more sociable and natural ways. Second, by having students of different cultures and
nationalities have a positive impact on multiculturalism and it help increasing domestic students’
global perspectives. Third, international students help by sharing knowledge and skills from their
own experience. Finally, international students as alumni in a school will promote global
connection. Undeniably, international students provide a significant economic benefit to the host
country.
With the rise of the Chinese economy, Chinese students studying abroad has become
common practice. In the past three decades, more and more Chinese students chose to pursue
higher education abroad. The number of Chinese students going study oversea rose sharply from
2,124 in 1980 to 523,700 in 2015 (National Bureau of Statistics of China, n.d.). Undoubtedly,
China has become the biggest consumer of overseas education in the world. (UNESCO, 2013)
When going abroad to study, international students from different countries are often facing
with challenges and difficulties both before and after entering their new schools or universities.
As it is evident that Chinese students are the majority of foreign students in Thailand, especially
in the Northeastern region of the country, so the investigation of their situations related to
studying overseas should provide body of knowledge for the future planning to accommodate
and preparation approach for the policy makers and new coming students.
International Students and International Market
According to the UNESCO Institute for Statistics, an “international student” refers to
students who left their countries or territories of origin and crossed national borders for the
specific purpose of studying. (University World News, 2015)
According to the Organization of Economic Cooperation and Development (OECD),
international students are those who travel to a country different from their own for the purpose
of tertiary study. However the definition of "international student" varies in each country in
accordance to their own national education system.
Previous research literatures revealed that the US, the UK, and Australia have been the key
players in the international student market because of their English-speaking environment,
international reputation in higher education and strong financial incentives (Verbik and
Lasanowsky, 2007). The study of Verbik and Lasanowsky (2007) further stated that Germany
and France as well as Canada have also successfully attracting international students because of
their close geographical and cultural tie with other European countries. While in Asian, many
countries and regions such as Hong Kong, South Korea, China have targeted themselves to
become higher education hubs, and within ASEAN, Singapore, Malaysia, Vietnam, and Thailand
are in competition (Jaroensubphayanont, 2014). Regarding recruiting international students
strategy of those countries, more or less practiced what Becker and Kolster (2012) have been
found; using tuition fee and scholarships, student visa and employment regulations, program
taught in other languages, and promotion instruments.
The 7th National and International Graduate Study Conference 2017
" Thailand 4.0 Creative Innovation for Sustainable Development "
I89

Education as a tool for economics implication, diplomacy approaches and culture
Wang Hengan, Zhao Lina, Zhang Qixin (2016) studied the instrumental value of education
represents the satisfaction of education to social development. From the point of view of the
subject, the subject of social development must be creative and dynamic person. The tool value
of education is realized by its people in culture, education through labor reproduction, cultivate
subjective initiative, creative people into various subsystems of society, have various effects. In
this study, there are three main subsystems of the social system: the cultural subsystem,
economic subsystem and political subsystem.
Wang Hengan, Zhao Lina, Zhang Qixin (2016) introduced the education cannot directly
generate value for the various subsystems of society, but it can produce value to the social
subsystem indirectly through the cultivation of certain people.
The cultural value of education is the value of education to the development and change of
human culture. Education and culture are two important areas of mutual development and mutual
integration of social undertakings. Education influences the development of culture, and culture
also affects the development of education.
The economic value of education refers to the value of education to promote the development
of social economy and the value of its own development.
The political value of education is accompanied by the emergence of class society, with a
very distinct class nature. In the process of being controlled by politics and politics, education
also fully embodies the political value of education. The political value of education means that
education can safeguard the interests of the ruling class, maintain social and political stability,
and realize the improvement and development of political system.
Through the introduction of the value of the above three kinds of education, we can sum up
the value of education to the macro society, which can promote the development of society and
the transformation of society.
Wang Hengan, Zhao Lina, Zhang Qixin (2016) concluded the value, task and purpose of
education are the guiding factors of education to exert its function. Therefore, the research of the
value of education, with the identity itself on the existence and development of education and
point to the role, this is where the significance of this study: (1) the essence of cognitive
education, this study plays an important role in people's understanding of education and
educational research; (2) return to education itself, to provide direction the development of micro
body in education or education; (3) make the function more perfect, so that the value of more
value, to promote the harmonious development of man and society, in order to adapt beyond,
research is in order to better development, the education itself the most basic theory to research
the problems can promote the development of education.
The research on the historical change of educational value and the value orientation of
education in the future is the key problem that cannot be ignored in order to develop.
Cross-cultural communication
The significance of cross - cultural communication
Cross-cultural communication usually refers to the communication behavior between people
of different cultural backgrounds. Cross-cultural communication may occur internationally as
well as between different cultural groups because of differences in region and ethnicity. To
observe the cultural perspective: communication and language, self-consciousness and space,
The 7th National and International Graduate Study Conference 2017
" Thailand 4.0 Creative Innovation for Sustainable Development "
I90

dress and dress up, time and time of food and eating habits, consciousness, seasonal concepts,
relationships, values and norms, beliefs and attitudes, thinking process and learning, work habits
and practice etc.. Understanding cultural systems can examine the systems of kinship,
educational systems, economic systems, political systems, religious systems, associations,
systems, health care systems, recreation systems, etc.. Cross-cultural communication occurs in
such a situation: the sender of information is a member of a culture, and the receiver is a member
of another culture. (Baidu library 2014)
Trend of Chinese students study overseas
Shawn Kelly (2010) studied China has become Thailand's largest student source country
(China news agency 2010) in the recent years, more and more Chinese families choose to send
their children study overseas. Thailand, being a new hot destination of Chinese oversea students,
we all knew that the internal factors Chinese oversea student choose higher education of
Thailand because of the Chinese economy growth, but know less the external factor is Thailand’s
higher education has a quite good quality with international recognition, and the Thailand’s
education system is complete and healthy.
Paweena Songsathaphorn, Chenin Chen, and Athapol Ruangkanjanases (2014) studied the
trend of students study overseas: The rapid economic growth in Asia has been a main cause of
the growth of trade in education as Asian countries have proved the importance of education in
accelerating economic growth. Development continues to fuel Asia’s demand for education. The
demand for higher education will continue to grow. Governments across the region welcome
trade in education intended for higher quality education and greater choice of studies.
In 2009, according to a survey conducted by Office of the Higher Education Commission,
there were 19,052 international students, from 124 countries, studying in 103 Thai higher
education institutions. The highest number of international students studying in Thailand was
Chinese students with 8,993 students or 47.2% of the total. As Chinese student is a majority and
the main source of international students in Thailand, thus, it seems to be the most critical target
group and is one of Thai’s prominent export markets for education services. International
education industry is growing and having intense competition. In order to attract more potential
Chinese students to come and study in Thailand, word-ofmouth or buzz marketing will pay an
important role. Satisfying students will be good and effective advertisers for promoting Thai
education for services. Thus, it is vital to recognize crucial factors that influence Chinese
students’ satisfaction toward Thai higher education. (Office of the Higher education, 2009)
The Chinese Ministry of Education reports that 523,700 Chinese students went abroad to
study in 2015. This represents a new record but also a second consecutive year in which year-
over-year growth has fallen short of long-term averages. The Ministry notes as well that Chinese
student are also being drawn back to the country’s attractive job market in greater numbers, with
roughly 70-80% of students abroad returning to China in recent years. (IECF monitor 2016)
. Miao Lyu,Zheng Jinlian,Wang Jianfang and Dong Qingqian(2015) studied that in the era of
globalization, China has already become the biggest international students exporting country,
Chinese international students accounts for a quarter of the total number of international students
in the world. Wang Huiyao, Miao Lyu and Zheng Jinlian (2015) studied the major choices had
become more diversification.
Miao Lyu, Zheng Jinlian, and Wang Jianfang(2016) studied in recent years, Chinese
returnees have increased rapidly. Most of them are choose go to the eastern developed cities,
The 7th National and International Graduate Study Conference 2017
" Thailand 4.0 Creative Innovation for Sustainable Development "
I91

which makes a result that in these cities have a market job competition has intensified. It makes
much more difficult for these returnees find a job totally match up with the major they learn in
universities.
Cao Chen and Bi Xi(2016) studied the oversea postgraduates returning rate remains stable,
and the ratio is about 60%, among which nearly 50% of the returnees choose to live in the
municipal cities directly under the central government. Miao Lyu, Zheng Jinlian and Wang Jiayu
(2016) studied with the increasing number of Chinese students studying abroad, Chinese
overseas students’ organizations are also developing rapidly. Miao Lyu, Li Qing and Zheng
Jinlian(2016) studied oversea returnees is an important force in representing China’s modern
image globally since they can better integrate the latest western management concept and
Chinese management model. More and more government stuff in China have a background have
a oversea study background, they can better integrate latest western management concept to and
Chinese management model, to improve local government system.
Zheng Jinlian, Zhang Qiran and Yangfei (2015) studied the overview of Chinese oversea
students all around the world follows: The United States and Canada have attracted a large
number of overseas students by virtue of high-quality educational resources and a sound
educational system.
Zhang Qiran, Yang Fei and Zhu Hua (2015) studied with the implementation of China
“the Belt and Road (B&R)”strategy, the exchange and cooperation in culture and education
between China and Europe has been further strengthened, and the choice of countries and majors
for Chinese students studying in Europe is more diversified. Dong Qingqian and Sun Xiaomeng
(2016) studied Australia and New Zealand have always been the main destinations for Chinese
students studying abroad.
Miao Lyu, Zheng Jinlian and Zhang Qiran(2016) found Japan, South Korea, and other
“the Belt and Road (B&R)” Asian countries such as Singapore and Malaysia, are “hot”
destinations for studying abroad with high levels of internationalization in education.
Previous research related to reasons of Chinese student study in overseas
Huicai You (2006) believed that Chinese students studying in Thailand for many reasons,
mainly summarized as 3 points: The smooth development of Sino Thai relations is a prerequisite
for Chinese students to study in Thailand; The stable development of politics, economy and
society in Thailand provides a good environment for Chinese students to study in Thailand; The
advantages of Thailand education are the decisive factors for Chinese students studying in
Thailand.
Hongzhi Yin, Athapol Ruangkanjanases, and Chenin Chen (2015) studied the five main
reasons: Acceptance of the degree from Chinese Ministry of Education; Family affiliation;
National Matriculation Exam ; Language skill ; Self-knowledge of the destination country are
significantly influential to Chinese students’ decision making toward continuing their higher
education in Thailand.
Paweena Songsathaphorn, Chenin Chen, and Athapol Ruangkanjanases (2014) studied the
satisfaction level of each students are different, it could influenced by following factors:
education, safety, image and prestige of institution, and student’s preparation, have significant
positive influence on overall Chinese students’ satisfaction toward Thai higher education, the
four main factors are influencing Chinese graduated student in Thai universities.
The 7th National and International Graduate Study Conference 2017
" Thailand 4.0 Creative Innovation for Sustainable Development "
I92

Liu Yingxiu and Dr. Sayamol Noungbunnak (2015) found that a significant relationship
between the demographic profiles of undergraduate Chinese students who study in Bangkok,
Thailand, such as gender, age, and education level. The study revealed that Chinese students with
different gender, age and education level have different levels of customer satisfaction about
student administration, the dormitory and the teachers. Such consistent results imply that Chinese
students with different demographic profiles tend to have different levels show different
customer satisfaction when they study in Thailand.
The most important factors of the marketing mix focused on by the Chinese students are that
Thailand's degrees are internationally recognized, it is not hard to apply for a scholarship in
Thailand, Thai universities have much international cooperation, studying in Thailand has good
employment prospects, the cost of living is lower than China, the price of air tickets from
Thailand to China is low, and it is convenient to go home and Bangkok has convenient
transportation.
Chinese students who study in Bangkok, Thailand pay more attention to the activities of the
university, the dormitory, the teachers and student administration.
Yi Lin, Pridi Banomyong (2014) found the results show that middle to lower classes
represented by the rural origins more intentionally capitalized on overseas education for new
opportunities abroad, while students from state cadre families were more inclined to return and
work in the home country.
At a stage near graduation, students with rural origins were more likely to be in a state of
looking for jobs while students from state cadre families were more likely to have plans for a
master degree. For the latter group of students, given the lack of drive for studying, it is probably
a decision or advice given by their parents rather than made by themselves. Among those who
were in a state of looking for jobs, students from state cadre and private owner families could not
wait to go back home, compared with others.
It is argued that institutional arrangements, formal or informal alike, play a critical role in
defining people’s opportunity structure and thus people’s rational actions. Overseas education
does not benefit everybody through an homogenous mechanism, rather, as shown in this article,
it both presents an upward (also geographically outward) mobility road for the middle-lower
classes in China, and serves equally well as a vehicle of inequality reproduction for those vested
with institutional advantages who plan to return and work in China.
To be specific, rational, constructive or reflective actors in practice are brought back to life.
After all, barring some complaints about unfairness from time to time, many Chinese never
hesitate to take chances to change their fates and indeed most people are living better lives in the
post-reform years.
Just like other new opportunities that emerged in the reforming years, overseas education can
either serve as a mechanism of maintaining inequality, or provide new opportunities for the
disadvantaged.
Known problems and difficulties of Chinese students studying in Thailand
Yi Lin and Worapinya Kingminghae (2014) studied with the backdrop of globalization,
increasing attention is being paid to international students’ experiences. In a sense, while
loneliness is intrinsic to the overseas experience for international students, failing to overcome it
may go hand in hand with mal adaptations. By analyzing data collected from a recent survey on
Chinese international students in Thai universities, the present study examined the roles played
The 7th National and International Graduate Study Conference 2017
" Thailand 4.0 Creative Innovation for Sustainable Development "
I93

by different types of social support on alleviating international students’ loneliness. Huicai
You(2006) found that Chinese students studying in Thailand, the main problems are the
following: Understanding of Thailand's higher education is not clear, the purpose of studying
abroad is not clear; Foreign language foundation is not solid; Do not understand Thailand's
national conditions; Economic considerations are not considered. Yan Ye (2014) found the
students with low satisfaction after come study in Thai universities could affect by following
reasons: Most of the university in Thailand used a strategy of “easy-entry, hard-graduation” for
international students’ admission and education; The students may not get used to the learning
styles in universities of Thailand in a short time; Some agent or agency exaggerated the
advantages of studying at universities of Thailand in order to recruit more Chinese students in
marketing competitions; Still lack of good channels for both Chinese and Thais to understand
more about mutual culture and real educational information.
Ye Yan (2014) also found the difficulties faced by Chinese students in Thailand are mainly
including to: Language but off; Learning method is not suited; Poor coordination of learning and
work; Learning is easy to distract; Not suited to the diversity of the atmosphere.
From the above literature reviewed, the author came to the development of conceptual
framework as shown below.
Research Objective
1. To learn and understand problems and difficulties oversea Chinese students facing while
study in Northeastern Thailand universities
2. To analyze the expectation before and after coming to study in Thailand
3. To propose policy suggestions
Research Methodology
This research is mainly based on qualitative research.
The key informants of this study including 20 oversea Chinese students come from two
universities whom study in northeastern of Thailand. Purposive sampling: 10 students from
Khon Kaen and 10 students Mahasarakham province.
The tool of this study is semi-structured in-depth interview forms. The researcher will draft
an interview outline with some open questions, which around the main question “What are the
problems and difficulties oversea Chinese students come across while studying in the
Northeastern region or Esan region of Thailand”.
This research will collect information with documentations and the semi-structured in-depth
interview.
Documentations include books and periodicals, academic journals, papers, news reports,
etc.
The 7th National and International Graduate Study Conference 2017
" Thailand 4.0 Creative Innovation for Sustainable Development "
I94

The data were also obtained from interview records. The questions will be ask followed by
the interview outline, but author will choose to the order of questions based on the progress of
the interview, and also may ask questions about the issues that are derived from the interview.
Through the interview researcher is not trying to define these problems and difficulties that must
happened to any single Chinese oversea student who study in northeastern Thailand, but trying to
analysis the common factors that causes these problems and difficulties happen, and give some
feasible suggestions to improve these problems.
Analyzing qualitative data from research is a challenging but necessary task in the
innovation process. In this paper, the obtained data would be analyzed by thematic analysis
method. Thematic analysis is one of the most common forms of analysis in qualitative research.
The method has been widely used across the social, behavioural and more applied for (clinical,
health, education, etc.) sciences. It emphasizes pinpointing, examining, and recording patterns
(or "themes") within data. Thematic analysis goes beyond simply counting phrases or words in a
text and moves on to identifying implicit and explicit ideas within the data. This approach
emphasizes the participants' perceptions, feelings and experiences as the paramount object of
study.
Thematic analysis can be used to make sense of seemingly unrelated material. It can be used
to analyze qualitative information and to systematically gain knowledge and empathy about a
person, an interaction, a group, a situation, an organization or a culture.
From the analysis of data related to problems and difficulties of overseas Chinese students
studying in the Northeastern Thailand. The proposed policies can be presented as following.
Fig
Identify issues
Problems and
difficulties of
Chinese overseas
students study in
northeastern
universities in
Thailand.
Analyze the issues
-Academic problems
-Economic problems
-Cultural problems
-Law and regulation
problems
-Daily life problems
Agenda setting
1.academic and
learning environment
problems
2.language and
cultural problems
Possible solutions
1. The university should set a unique stagey plan to accommodate overseas
students
( well structure student activities, language courses, distribution information
related to university courses, etc.)
2. Develop close and continuous relationship between Chinese and Thai
university
3. Develop a customized program to better fit the need of international
student market
4. Diplomatic development in terms of visa issue for overseas students
studying in Thai university. The 7th National and International Graduate Study Conference 2017
" Thailand 4.0 Creative Innovation for Sustainable Development "
I95

Result
In this research, data collection was conducted with 10 students from each university using
snow ball technical by random sampling. They were 5 female and 5 male students from MSU, 6
female and 4 male students from KKU. Most of them are first year or second year to come to
study in Thailand. Only two students from KKU are third year and fourth year to come to study
in Thailand. The searcher wrote the code for the 20 interviewees, as MSU-1 to MSU-10 and
KKU-1 to KKU-10.
The interview form with four points rating score was used to ask 20 students to rate. The
result can be shown in Table as follow. The score 1, 2 counting as not satisfy and low satisfy and
score 3, 4 counting as high and highly satisfy.
Level of satisfaction in various aspects
Items Level of Satisfaction
4-high 3-rather high 2-rather low 1-low
Academic (5)25% (5)25% (8)40% (2)10%
Economic (7)35% (3)15% (4)20% (4)20%
Culture (5)25% (5)25% (6)30% (4)20%
Law and regulations (16)80% (2)10% (0)0% (2)10%
Daily life (2)10% (4)20% (11)55% (3)15%
According to the interview results, we can see that the academic expectation met the
expectation of majority of student (50%).The daily life showed the lowest expectation
percentage (70%) which indicated that the students found this issue did not meet their
expectation. The expectation in law and regulations showed the highest expectation percentage
(90%) which indicated that most of students were satisfaction for this issue. The expectation in
economic and culture showed that each item is average close percentage, which indicated that in
economic and cultural, Chinese students according to their own circumstances have different
experiences. The obtained data revealed the situation related to problems and difficulties of overseas
Chinese studying in the Northeastern Thailand can be concluded as follows:
1) Problems and Difficulties of overseas Chinese studying in the Northeastern Thailand, it
was found that language problem was the biggest problem. The next issue was academic
problem. Some students were doing part-time job for their supplementary income while
studying. The next issue was cultural problem. Some students reported the difficulty of practice
and participation in Buddhist cultural environment. The next difficulty was related to laws and
The 7th National and International Graduate Study Conference 2017
" Thailand 4.0 Creative Innovation for Sustainable Development "
I96
regulations. It was interesting to learn about the situations where students facing some illegal
situation without know it. It was the case where students playing card in the university ‘dorm and
showed the picture in their Facebook. Then, they were called by their teacher and asked to delete
such a picture. Because playing card in Thailand is illegal. In this issue, there were many
situation seemingly to be minor cases, such as smoking in the campus, not wearing uniform to
the classes, the class attendant score was cut because the class absent due to students traveling
back home for Chinese New Year without notifying professor. The last minor case was the VISA
extension procedure was not well facilitated by the University.
2) The level of satisfaction of studying in the Northeastern Thailand, it was found that the
academic aspect was rather at the low level due to the difficulty in language. The daily-life
aspect, such as, hot weather, learning environment, recreation and entertainment as well as
student activities were also found to be low to very low in satisfaction.
3) Policy suggestions, the possible policy suggested should be as following: The university
should set a unique stagey plan to accommodate overseas students; Develop close and
continuous relationship between Chinese and Thai university; Develop a customized program to
better fit the need of international student market; Diplomatic development in terms of visa issue
for overseas students studying in Thai university.
Discussion
Academic problems and difficulties
It was found that English communication skill is a problem in studying in Thai university
classroom. At the same time in case of attending the class using Thai language as a medium of
instruction, the Chinese students also have insufficient background and level to meet the
proficiency level. So it is difficult to understand the contents instructed and lectured by the
teachers. This problem is in the same line as Ye Yan (2014) found that Chinese students in
Thailand had language problems.
Economic problems and difficulties
It was found that cost per month and they do not have enough to spend has become economic
problems for some students. The survey found that the cost of living per month of Chinese
students is in range of 10000baht to 25000baht. The accommodation cost is in range of 3000baht
to 5000baht.Through the study, the rest of cost is for food and entertainment. According to the
survey,the most popular entertainment activity of Chinese student in northeastern Thailand is
drink with friends in the bar. As the analysis of researcher, this is the main reason of Chinese
student meet the problem of economic as cost per month and they do not have enough to spend.
Rosenberg (2016) also found that the international students had financial problems.
Culture problems and difficulties
It was found that Thailand’s Buddhist cultural environment is a culture problem in culture
problems and difficulties. As everyone knows,Thailand is a Buddhist country, almost 90
percent of Thai population is Buddhist, so we can see that Buddhist Cultural is a very important
part of Thailand cultural environment. So adapt on the Thailand’s Buddhist cultural environment,
should be a serious problem for Chinese students.Hu Wenhua, Zhang Zhe (2013) also found
The 7th National and International Graduate Study Conference 2017
" Thailand 4.0 Creative Innovation for Sustainable Development "
I97
socio-cultural issues is a kind of international students’ adjustment problems at university.
Law and regulation problems and difficulties
(1) Playing cards in Public which is illegal in Thailand.
Playing cards is a very popular entertainment activity in China. Families and friends like to
play cards together when meet. We can say that it is part of Chinese culture (including to
mahjong). But it is an illegal issue that playing card in public, so Chinese student should focus
on this serious cross-cultural problem.
(2) Smoking is a violation of rules and regulations of the university in the campus area.
China has a large population of smoking. Many young people are addicted to smoking.
Thailand’s smoking population is far apart from China, Thailand also has a law prohibiting
smoking in public places, especial in the campus area. Chinese students should be strict with
themselves in this behavior.
(3) Thailand holidays and vacation are different from China. And the university does not
allow overseas students to take vacation on their holiday without getting the class attendance
subtracts.
(4) Students are required to wear uniforms every day.
In Chinese universities, they don’t have to wear uniforms. But this is important regulation
of Thai universities for undergraduate students.
(5) Immigration visa problem
Thailand’s basic process of education visa for Chinese students is 1) the universities send
necessary documents to the Chinese students in China.2) Chinese students go to the embassy to
take 3 months education visa of Thailand .3) Chinese students go to Thailand’s immigration
office to change it to a 1 year education visa.4) do the 90 days report during the year. It looks like
a little bit complicated but remember the process will help Chinese students a lot. But one
Chinese student mentioned that the officers in the immigration office sometimes are not friendly.
She thought a complaint mechanism will help improve this problem just like in China.
The above mentioned problems were not clearly stated in the previous research. But they
were aspects that should be considered as important factors.
Daily life problems and difficulties
(1) The hot weather in northeastern Thailand.
Thailand is a subtropical country. The temperature is high year after year. Chinese
students who are really afraid of hot weather or have related skin disease should take this factor
for make decision to come study in Thailand.
(2) The inconvenient traffic in northeastern Thailand.
A big part of interviewee Chinese students talked about this problem. They are not
satisfied with road conditions and traffic management in northeastern Thailand. They think
Thailand traffic system need to be improved.
(3) There are too few entertainment activities and places in the northeastern Thailand.
In case of the hot weather in Thailand, people like indoor activities much more than
outdoor activities much in the day time, which make the night life activities much more
interested.
(4) Adapt to different food flavors between China and Thai.
In many places in China, people like the salty, oiled and spicy food. In Thailand, people like
the sweet, acid and light food much. For the Chinese people who take a short time in Thailand,
The 7th National and International Graduate Study Conference 2017
" Thailand 4.0 Creative Innovation for Sustainable Development "
I98

they may love Thai food. But for the Chinese students, it could be a problem. As I know, many
Chinese students choose to take some sauce and flavoring when they came back from China.
The above problems seem to agree with Huicai You (2006) found similar problems
Chinese students studied in Thailand.
Recommendation
Suggestions for policy implementation cooperation
The university should develop the strategic plan to accommodate the overseas students in
every aspect.
The university should develop the institutional improvement for foreign students, such as
more reasonable course arrangement and teaching context for overseas students, to help them
better adapt to the life of studying abroad.
The university in Thailand and China should strengthen information exchange and
cooperation, to help a better understanding for each other as well as their students’ basic
information and statues.
The university in Thailand should provide warn learning and living environment for overseas
students by organizing activities while the Thai students and Chinese students can share and
cooperate their time.
At the present, the communication and cooperation between Thai universities and Chinese
universities are increasingly close, such as the “2+2” or “3+1” project. This is a great thing that
Chinese students and Thai students can experience the both side culture and environment during
the university life. But it is worth noting that the cooperation quality is declining. Some of
education cooperation is more and more close to the business model. Therefore the universities
should base their emotional management for oversea students separate from economic or
business scheme. Thai university should pay more attention to the overseas Chinese students,
understanding their problems and difficulties in academic, economic, culture, politics and daily
life,and make the effective solutions.
Suggestion for future research
Due to the limitation of this study in terms of coverage of the area, so the future research
should conduct the study of in every region of Thailand in order to obtain more constructive
body of knowledge related to the problem and difficulties of Chinese study in Thai universities.
The 7th National and International Graduate Study Conference 2017
" Thailand 4.0 Creative Innovation for Sustainable Development "
I99

References
Baidu Wenku (2014 Jan 3). The significance of cross - cultural communication. Retrieved from
https://wenku.baidu.com/view/f5cc95f16137ee06eff918ff.html?from=search
Chen, C., & Xi, B. (2016). An analysis of three years later the status quo of postgraduates
studying abroad after graduation. In C. f. Globalization, Annual Report on the Development of
Chinese Students Studying Abroad. Beijing: Center for China & Globalization.
China news agency. (2014, January 18). China has become Thailand’s largest student source
country. Retrieved March 16, 2015, from http://news.xinhuanet.com/edu/2014-
01/18/c_119028045.htm
Douglas, W. R. (2002). Cross-Cultural Research: An Introduction for students. Retrieved from
eclectic.ss.uci.edu/~drwhite/courses/Cross-Cultural_Research.pdf
Hengan, W., Lina, Z., Qixin, Z., & Jin, W. (2016, January 11). Educational instrumental value
and educational value. Retrieved May 16, 2015, from
https://wenku.baidu.com/view/66cf87fd5a8102d277a22f72.html
Hongzhi, Y., Ruangkanjanases, A., & Chen, C. (2015). Factors Affecting Chinese Students'
Decision Making toward Thai Universities. International Journal of Information and Education
Technology , 5 (3), 189.
Hsiao-ping, W., Garza, E., & Guzman, N. (2015). International student’s challenge and
adjustment to college. Education Research International , 2015, 1-10.
Huicai, Y. (2006). Issues on Chinese Students for Overseas Studies in Thailand. Around
Southeast Asia .
Huiyao, W., Lyu, M., & Jinlian, Z. (2016). The development of China’s studying abroad in an
era of globalization: characteristics and suggestions. In C. f. Globalization, Annual Report on the
Development of Chinese Students Studying Abroad. Beijing: Center for China & Globalization.
ICEF monitor (2016 Apr 6) A record number of Chinese students abroad in 2015 but growth is
slowing
From:http://monitor.icef.com/2016/04/a-record-number-of-chinese-students-abroad-in-2015-but-
growth-is-slowing/
Jaroensubphayanont, N. (2014). The International Student Policy in Thailand and the Implication
of the 2015 ASEAN Economic Community. Southeast Asian Studies in Asia from
Multidisciplinary Perspective International Conference. Kunming: China.
Jinlian, Z., Lyu, M., & Feiyi, W. (2016). An analysis of chinese returnees returned overseas and
the circulation. In C. f. Globalization, Annual Report on the Development of Chinese Students
Studying Abroad. Beijing: Center for China & Globalization.
The 7th National and International Graduate Study Conference 2017
" Thailand 4.0 Creative Innovation for Sustainable Development "
I100

Jinlian, Z., Qiran, Z., & Fei, Y. (2016). Chinese students studying in North America: current
situation and prospects. In C. f. Globalization, Annual Report on the Development of Chinese
Students Studying Abroad. Beijing: Center for China & Globalization.
Kelly, S. (2016, November 16). Chinese Keen on Thai studies. Retrieved January 10, 2015, from
Bangkok Post: http://www.bangkokpost.com/learning/education-features/206591/chinese-keen-
on-thai-studies
Lin, Y. (2014). Family Background and Overseas Education of Chinese Students in Thai
Universities. Thammasat Review , 17 (1), 122-149.
Lin, Y., & Kingminghae, W. (2014). Social Support and Loneliness of Chinese International
Students in Thailand. Journal of Population and Social Studies , 22 (2), 141-157.
Lyu, M., Jinlian, Z., & Jianfang, W. (2016). Investigating current situation of Chinese returnees
in 2016. In C. f. Globalization, Annual Report on the Development of Chinese Students Studying
Abroad. Beijing: Center for China & Globalization.
Lyu, M., Jinlian, Z., & Jiayu, W. (2016). The development of overseas Chinese students
organizations under the craze of studying abroad—A case of all-china students’ federation
(ACSF). In C. f. Globalization, Annual Report on the Development of Chinese Students Studying
Abroad. Beijing: Center for China & Globalization.
Lyu, M., Jinlian, Z., & Qiran, Z. (2016). Chinese students studying in East Asian and other “the
belt and road (b&r)” countries: current situation and prospects. In C. f. Globalization, Annual
Report on the Development of Chinese Students Studying Abroad. Beijing: Center for China &
Globalization.
Lyu, M., Jinlian, Z., Jianfang, W., & Qingqian, D. (2016). Investigating university graduates
studying abroad in 2015. In C. f. Globalization, Annual Report on the Development of Chinese
Students Studying Abroad. Beijing: Center for China & Globalization.
Lyu, M., Qing, L., & Jinlian, Z. (2016). A study on the phenomenon of returnees participated in
politics. In C. f. Globalization, Annual Report on the Development of Chinese Students Studying
Abroad. Beijing: Center for China & Globalization.
Office of the Higher Education Commission. (2009). Bureau of International Cooperation
Strategy. Ministry of Education.International Programmes in Higher Education Institutions.
Retrieved from
http://inter.mua.go.th/main2/list.php?id=fa02
Qingqian, D., & Xiaomeng, S. (2016). Chinese students studying in oceania: current situation
and prospects. In C. f. Globalization, Annual Report on the Development of Chinese Students
Studying Abroad. Beijing: Center for China & Globalization.
The 7th National and International Graduate Study Conference 2017
" Thailand 4.0 Creative Innovation for Sustainable Development "
I101

Qiran, Z., Fei, Y., & Hua, Z. (2016). Chinese students studying in Europe: current situation and
prospects. In C. f. Globalization, Annual Report on the Development of Chinese Students
Studying Abroad. Beijing: Center for China & Globalization.
Selvarajah, C. (2006). Cross-cultural study of Asian and European student perception: The need
to understand the changing educational environment in New Zealand. Cross cultural
management: An international Journal , 13 (2), 142-155.
Songsathaphorn, P., Chen, C., & Ruangkanjanases, A. (2014). A Study of Factors Influencing
Chinese Students’ Satisfaction toward Thai Universities. Journal of Economics, Business and
Management , 2 (2), 105-111.
Universities Scotland. (2013, September 3). Universities Scotland takes positive case for
overseas students studying in Scotland to UK Parliament with launch of new report. Retrieved
March 5, 2015, from http://www.universities-scotland.ac.uk/news/universities-scotland-takes-
positive-case-for-overseas-students-studying-in-scotland-to-uk-parliament-with-launch-of-new-
report/
University World News. (2009, September 20). GLOBAL: What defines an international
student? Retrieved January 2, 2015, from
http://www.universityworldnews.com/article.php?story=20090917182725104
Verbik, L., & Lasanowski, V. (2007). International student mobility: Patterns and trends. World
Education News and Reviews , 20 (10), 1-16.
Yan, Y. (2014). A Study on Factors Affecting Chinese Students’ Decision-making of Studying at
Universities in Thailand. Bangkok: Graduate School of Education, Assumption University.
Yan, Y. (2014). An Analysis of the Causes, Difficulties and Countermeasures of Chinese
Students Studying in Thailand. Retrieved May 23, 2015, from
https://wenku.baidu.com/view/cb22189ede80d4d8d05a4f0b.html
Yingxiu, L., & Noungbunnak, S. (2016). Factors affecting the decision of Undergraduate
Chinese students in Bangkok, Thailand. DPU graduate studies journal , 4 (3).
The 7th National and International Graduate Study Conference 2017
" Thailand 4.0 Creative Innovation for Sustainable Development "
I102
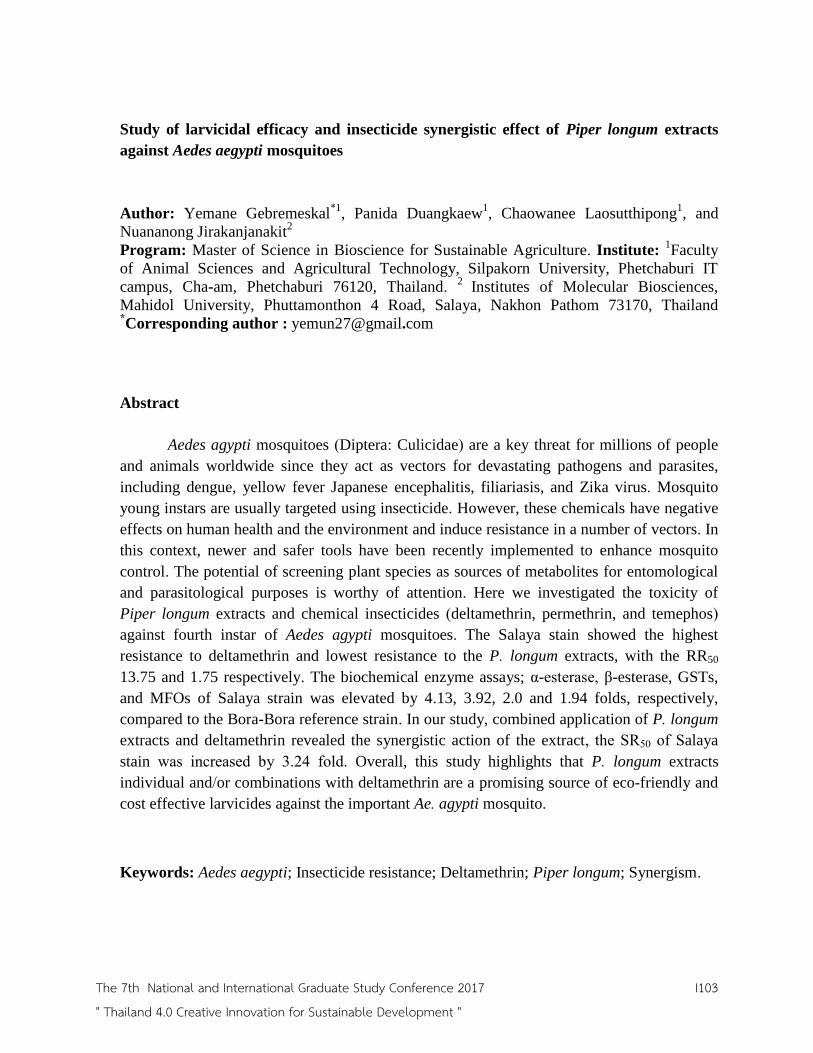
Study of larvicidal efficacy and insecticide synergistic effect of Piper longum extracts
against Aedes aegypti mosquitoes
Author: Yemane Gebremeskal*1
, Panida Duangkaew1, Chaowanee Laosutthipong
1, and
Nuananong Jirakanjanakit2
Program: Master of Science in Bioscience for Sustainable Agriculture. Institute: 1Faculty
of Animal Sciences and Agricultural Technology, Silpakorn University, Phetchaburi IT
campus, Cha-am, Phetchaburi 76120, Thailand. 2
Institutes of Molecular Biosciences,
Mahidol University, Phuttamonthon 4 Road, Salaya, Nakhon Pathom 73170, Thailand *Corresponding author : [email protected]
Abstract
Aedes agypti mosquitoes (Diptera: Culicidae) are a key threat for millions of people
and animals worldwide since they act as vectors for devastating pathogens and parasites,
including dengue, yellow fever Japanese encephalitis, filiariasis, and Zika virus. Mosquito
young instars are usually targeted using insecticide. However, these chemicals have negative
effects on human health and the environment and induce resistance in a number of vectors. In
this context, newer and safer tools have been recently implemented to enhance mosquito
control. The potential of screening plant species as sources of metabolites for entomological
and parasitological purposes is worthy of attention. Here we investigated the toxicity of
Piper longum extracts and chemical insecticides (deltamethrin, permethrin, and temephos)
against fourth instar of Aedes agypti mosquitoes. The Salaya stain showed the highest
resistance to deltamethrin and lowest resistance to the P. longum extracts, with the RR50
13.75 and 1.75 respectively. The biochemical enzyme assays; α-esterase, β-esterase, GSTs,
and MFOs of Salaya strain was elevated by 4.13, 3.92, 2.0 and 1.94 folds, respectively,
compared to the Bora-Bora reference strain. In our study, combined application of P. longum
extracts and deltamethrin revealed the synergistic action of the extract, the SR50 of Salaya
stain was increased by 3.24 fold. Overall, this study highlights that P. longum extracts
individual and/or combinations with deltamethrin are a promising source of eco-friendly and
cost effective larvicides against the important Ae. agypti mosquito.
Keywords: Aedes aegypti; Insecticide resistance; Deltamethrin; Piper longum; Synergism.
The 7th National and International Graduate Study Conference 2017
" Thailand 4.0 Creative Innovation for Sustainable Development "
I103
Introduction
Mosquitoes are well known as vectors of disease-causing agents to humans and
other animals (Mgbemena, 2016). Aedes aegypti is a predominately human-biting mosquito,
an important vector for most of the life threatening diseases such as dengue fever, yellow
fever, chikungunya fever and Zika virus (Mackenzie et al., 2004; Govindarajan and
Sivakumar, 2014; Dusfour I. et al., 2015). Of all the viral diseases carried by Ae. aegypti,
dengue fever has been reported to increase dramatically around the world in recent years.
The World Health Organization (WHO) estimates that there may be 50–100 million dengue
infections worldwide every year (WHO, 2012).
Vector control is the most widely used option to interrupt the transmission of the
disease as long as an effective, safe and affordable vaccine is not available for these arboviral
diseases. The control of this Aedes insect remains an important issue in agriculture and public
health in urban and countryside (Lima et al., 2011; Bisset et al., 2013). Disease preventive
operation still solely depends on the anti-vector measures using conventional chemical
insecticides (Kumar, 2010) such as carbamate (propoxur), organophosphate (temephos),
chlorinated hydrocarbons (DDT and chlordane), and pyrethroids (deltamethrin and
permethrin). Nevertheless, the extensive and widespread use of synthetic insecticides has led
to the emergence of resistance in mosquitoes globally and prompted an uncontrolled increase
in the mosquito population (Hemingway, 2000). Recent studies indicate that over 500 insects
and mite species are currently resistant to pesticides (Mann and Kaufman, 2012). In
Thailand, many synthetic insecticides have been applied for controlling of Aedes mosquito
for decades. Up to date, the resistance of Ae. aegypti to insecticides, including temephos,
DDT, permethrin, deltamethrin, have been reported from several areas of Thailand
(Pimsamarn, 2009; Huaycharoensuk et al., 2011). The resistance to temephos was found in
Ae. aegypti larvae from some areas of Thailand, such as Nakhon Sawan,Tak (Mae Sot), and
Mukdahan (Ponlawat et al., 2005). One of the recognized mechanisms is an overproduction
of detoxifying enzymes, also known as metabolic resistance. These enzymes are naturally
involved in the degradation or transformation of toxic compounds into non-toxic products
before elimination from the insect body. Three large enzyme families, the cytochrome P450
monooxygenases (P450s), Glutathione-S-transferases (GSTs) and carboxy/cholinesterases
(CCEs) have been implicated in the metabolism of insecticides in insects have been reported
(Li and Schuler, 2007).
Chemical insecticides for controlling mosquito-borne diseases are enhancing not
only problems like vector resistance to insecticides but also the insecticides themselves
present threats to the ecosystem and human health (WHO, 1995). In light of such trends the
urgent needs for the development of mosquito control alternatives that are eco-friendly and
cost effective should be addressed adequately and promptly. To this end, explorations of
natural products from plant origin with insecticidal properties are in the current trend.
The 7th National and International Graduate Study Conference 2017
" Thailand 4.0 Creative Innovation for Sustainable Development "
I104

Plant extracts have drawn a great deal of attention because they are considered to
be a potential source of bioactive chemical compounds that are relatively safe with few side
effects on the environment and human health (Sukumar et al.,1991; Ahn et al., 2006; Isman,
2006). Plants have been the traditional source of natural pesticides, as they often act at
various novel target sites (Kostyukovsky et al., 2002; Priestley et al., 2013) and thus
significantly retard the possibility of resistance development in mosquitoes. In literature
sources, only 344 of these plant species out from approximately 1200 species tested
exhibited mosquitocidal activity (Ghosh et al., 2012). Among plant tested, extract from Piper
species produced potent larvicidal activity against Ae. aegypti (Ghosh et al., 2012). Piper
longum and their bioactive constituents are reported to have remarkably larvicidal activity
against various mosquito species such as Culex pipiens pallens, Ae. aegypti, Aedes togoi, and
Aedes atropalpus (Pereda-Miranda et al., 1997, Lee, 2000; Park et al., 2002).
Since the resistance problem has been identified, besides using a single compound
in control of mosquito vectors, the idea of using a synergistic combination of biological and
chemical insecticides yields a promising alternative for insect pest management (Morales-
Rodriguez and peck, 2009; Nelson Grisale et al., 2013). Synergism provides similar control
at reduced concentrations of the two compounds relative to individually applied compounds,
then cost and toxic to mammalian and non-target organisms may be substantially reduced.
Synergism strategy is based on the probability that if resistance to one of the two insecticides
is a rare and independent event, then the probability that resistance will occur simultaneously
to both insecticides of the mixture could be extremely low (Curtis, 1985). Based on the
strategy that if detoxification is inhibited, the effectiveness of insecticides will increase due
to the prolong bioavailability of insecticides in the insect body.
In this context, the present investigation was carried out with the aim to determine
the effect of plant extract in both killing potential and synergism effect in control of a field-
collected pyrethroid-resistant Ae. aegypti. The Ae. aegypti population collected from the
suburban area, Salaya, Nakorn Pathom province, Thailand was investigated for insecticide
resistance status and assess for the underlying metabolic resistance mechanisms. Monitoring
insecticide resistance in mosquito populations and understanding the mechanisms involved is
a prerequisite to efficient implementation of vector control strategies. Larvicidal effect of P.
longum extracts alone and synergistic activity to pyrethroid insecticide were determined
against fourth instar larvae of this pyrethroid-resistant Ae. agypti population in order to
establish the use of this plant as an alternative in the control of Ae. aegyti mosquito. This
study is immensely important to develop future resistance management strategies.
Objectives
1) Evaluate the status of insecticide resistance/susceptibility of field-collected Ae. aegypti
2) Determine the detoxification enzymes potentially play a role in the resistance
The 7th National and International Graduate Study Conference 2017
" Thailand 4.0 Creative Innovation for Sustainable Development "
I105

3) Investigate larvicidal activity of P. longum extracts against field-collected Ae. Aegypti
4) Evaluate insecticide synergistic effect of P. longum extract against Ae. Aegypti
Research Methodology
Mosquito strains and rearing conditions
The test insect used in this study is mosquito of the species of Aedes aegypti
population collected from Salaya, Nakorn Pathom province, Thailand during 2014. The
reference for the susceptible population used in this study was Bora Bora (French Polynesia)
Ae. aegypti strain, obtained from Laboratories Lutte controls Insects Nuisibles (LIN/IRD),
WHO Collaborating Center for Vector Control, Montpellier, France (Jirakanjanakit et al.,
2007). Mosquito colonies were maintained in the insectarium at the Institute of Molecular
Biosciences, Mahidol University, Salaya campus, Nakhon Pathom province, Thailand, under
laboratory-controlled conditions at 28±2 °C, 70˗80% RH to the adult stage. Egg colony was
obtained and reared in the laboratory of Faculty of Animal Science and Agricultural
Technology, Silpakorn University, Thailand. In order to obtain synchronized larvae, eggs
were soaked in dechlorinated tap water for hatching larvae and maintained at 28±2°C. The
larvae were kept in the white basins half-filled dechlorinated tap water and were fed once a
day. Water in rearing container was refreshed every day. Care was taken to prevent
overcrowding until development to fourth instar larvae required for the study then larvae
were submitted to the bioassays.
Piper longum extraction
The dried fruits of P. longum fruit obtained from local market were powdered
coarsely. The method of (Gueye et al., 2011) was used for the process; 500 grams of powder
of P. longnum were macerated in 5 L of 95% ethanol for 72 h at room temperature avoiding
from the sunlight. The filtrate was pooled and subjected to the rotary evaporator apparatus
for the removal of ethanol solvent to obtain a crude extract. The crude extracts obtained are
finally weighed and kept in a refrigerator at -20oC until bioassays (Bhan et al., 2013).
For bioassay, 10g of residues were dissolved in ethanol to get stock solutions. A
range (1.25-30 mg/ml) of test concentrations was prepared from the crude extract by further
dilution from the stock solution using an absolute ethanol as a diluent.
Larvicidal toxicity bioassay
The technical materials of many organic compounds are insoluble in water. The
insecticides were dissolved in absolute ethanol to dilute solutions for laboratory testing.
The 7th National and International Graduate Study Conference 2017
" Thailand 4.0 Creative Innovation for Sustainable Development "
I106

Different working test concentrations were prepared by diluting the stock solution for the
exposure to mosquito larvae according to WHO (WHO, 2005).
Larvicidal bioassays were done according to the procedure recommended by WHO
(WHO, 2005). Batches of 20 fourth instar larvae were transferred to a disposable plastic
cups, each containing 100 ml of water. After 1 h, the unhealthy or damaged larvae were
removed and replaced. The appropriate volume of test insecticide or P. longum extract was
added to the cups to obtain the desired target dosage. Initially, the mosquito larvae were
exposed to a wide range of test concentrations and a control to find out the activity range of
the materials under test. After determining the mortality of larvae in the wide range of
concentrations, a narrower range of deltamethrin (0.0004-0.2ppm), permethrin and temephos
(0.000625-0.4 ppm), and P. longum extract (2.5-20ppm) concentrations yielding between
10% and 95% mortality in 24 h exposure was used. Four replicates were set up for each
concentration and an equal number of vehicle control cups were set up simultaneously. Each
test was run three times on different days. During the assay, the larval food was not added.
After 24 h exposure, larval mortality was recorded. Larva with abnormal morphology
and moribund larvae were counted and added to dead larvae for calculating percentage
mortality. Dead larvae are those that cannot be induced to move when they probed with a
needle in the siphon or the cervical region. Moribund larvae are those incapable of rising to
the surface or not showing the characteristic diving reaction when the water is disturbed.
Larvae that have pupated during the test period were neglected. If more than 10% of the
control larvae pupate in the course of the experiment, the test was discarded and repeated.
Percent larval mortality from all replicated was pooled for analysis of 50% lethal
concentration (LC50) values by a log dosage–probit analysis using StatPlus program (Analyst
Soft Inc., USA). Resistance ratios (RR50) were calculated by divided LC50 value of the
respective insecticide against Salaya population by those of Bora-Bora.
Synergist bioassays
To assess the role of the main detoxification enzyme families in deltamethrin
resistance, either PBO (piperonylbutoxide 90%, Sigma-Aldrich, Italy) or DEF (S.S.S-
tributylphosphorotrithioate 98.1%, Chem service, USA) which is the inhibitor of P450s and
esterases, respectively, was used in synergist bioassays. Before proceeding to the synergism
assay, different concentrations of test synergists were determined for larvicidal toxicity using
larvicidal bioassay as described in section c in order to obtain appropriate sub-lethal
concentrations (Riaz et al., 2013). Standard deltamethrin larval toxicity bioassays as
described in Larvicidal toxicity bioassay test with doses ranging from 0.0006–0.0354 ppm
were carried out with and without the addition of a specified sub-lethal concentration of
synergist: either PBO at 7.5 ppm, DEF at 2 ppm and Piper extract at 5 ppm. Synergism ratios
The 7th National and International Graduate Study Conference 2017
" Thailand 4.0 Creative Innovation for Sustainable Development "
I107

were calculated as the ratio between the LC50 obtained without synergist and the LC50
obtained with each test synergist.
Biochemical enzyme assay
Activity levels of α-esterases, β-esterases, glutathione-S-transferases (GSTs) and
mixed function oxidases (MFOs) were tested in Salaya larvae, with larvae from the Bora-
Bora strain used as a susceptible reference. Procedures were based on mosquito-specific
biochemical assay protocols reported elsewhere (Brogdon WG, 1984 and 1988; Polson et al.,
2011). Briefly, 30 individual larvae were homogenized in 100 µL of 0.1 M potassium
phosphate buffer pH 7.2 and then the volume was diluted to 1 mL. The homogenate was
centrifuged at 10,000 rpm for 5 min and the supernatant used as enzyme sources. Fifty
microliters of each sample was transferred by triplicate to a 96-well microtiter plate
(Microplate reader “Spectro Star Nano”, Germany). The reaction was performed in a total
volume of 300 µL per reaction adjusted by addition of reaction buffer. For nonspecific α- and
β-esterase assay, 100 µL of α- or β -naphthyl acetate were added to each well. After 10 min
incubation at room temperature, 100 µL of dianizidine were then added, followed by 2 min
incubation and then absorbance was read at a wavelength of 540 nm. For GSTs assay, 100
µL of reduced glutathione and 100 µL of 1-chloro-2, 4–dinitrobenzene (CDNB) were added
to each well. Absorbance readings were taken at time zero to 5 min at a wavelength of 340
nm with a one minute interval. The assay measure MFOs activity relied on detection of the
amount of haem. Tetra methyl-benzidine dihydrochloride (TMBZ) (200 µL) were added to
each well, followed by 25 µL of 3% hydrogen peroxide (H2O2). The microplate was
incubated at room temperature for 10 minutes before absorbance was reading at a wavelength
of 620 nm. To avoid bias due to natural variations in the size of the larvae, the total protein
content of each sample was determined. In triplicate, 200 µL of Bradford H reagent was
added to 20 µL of homogenate. The mixture was incubated at room temperature for 5 min
and the microplate was read at 595 nm. A standard bovine serum albumin calibration curve
was done for comparison of protein concentrations. Mean absorbance values of replicate
wells for each test were converted into enzyme activity and divided by the protein values.
The fold-changes in enzyme activity of Salaya population were calculated by the ratio of
enzyme activity of Salaya over those of Bora-Bora reference strain.
Statistical analysis
The LC50 values and other statistics including 95 % confidence of upper confidence
limit and lower confidence limit, P values, and chi-squared values were estimated by Probit
analysis using the Statistical software. Student t-test was performed using Graphpad Prism
ver. 5.0 (GraphPad Software, San Diego, CA).
The 7th National and International Graduate Study Conference 2017
" Thailand 4.0 Creative Innovation for Sustainable Development "
I108

Results
Assessment of insecticide resistance status and larvicidal efficacy of Piper longum
extract
The susceptibility status of Ae. agypti to insecticides was shown in Table 1. The
larvicidal bioassays with temephos, permethrin, deltamethrin and P. longum extract treatment
indicated that the Salaya strain was resistant to those insecticides with RR50 of 5.3, 7.0, 13.75
and 1.75, respectively, compared to Bora-Bora reference strain. The data revealed that Salaya
strain was highly resistant to deltamethrin pyrethroid insecticide and lowest resistance to P.
longum extract.
The present study showed that the extract of the fruit of P. longum expressed
larvicidal activity against the fourth-instar larvae of Ae. aegypti. The mortality of the
mosquito larvae was noted in the various concentrations (5.157–26.372 ppm) of the plant
extracts after 24 hours of exposure. The data presented in Table 1 revealed that P. longum
extract was effective with LC50 of 11.66 ppm for Salaya strain and 6.66 ppm for lab strain
(Bora-Bora strain).
Table 1 Bioassay of chemical insecticides and P. longum extract against fourth-instar Ae.
aegypti larvae.
Strain Treatment LC50a, ppm (95% CI) RR50
b
Salaya Temephos 0.0179 5.3
(0.0075–0.0426)
Permethrin 0.019 7.0
(0.0029–0.1243)
Deltamethrin 0.0055 13.75
(0.0006–0.0354)
P. longum extract 11.66 1.75
(5.157–26.372)
Bora- Bora Temephos 0.0034
(0.009–0.0126)
Permethrin 0.0027
(0.001–0.0072)
Deltamethrin 0.0004
(0.0001–0.0021)
P. longum extract 6.66
(2.55– 12.6) aLC50: Lethal concentration at which 50% of the population is killed.
bRR50: Resistance ratio at LC50, calculated as the ratio between Salaya and Bora-Bora LC50.
The 7th National and International Graduate Study Conference 2017
" Thailand 4.0 Creative Innovation for Sustainable Development "
I109

Biochemical assay
The results of the biochemical assays of detoxifying enzymes from different study
sites are presented in Figure 1.The investigations indicated the elevated levels of α- and β-
esterases, (MFOs), and glutathione –S-transferase (GST) enzymes in the Salaya population
compared with the susceptible Bora-Bora strain.
The greatest increase was observed in the α- and β-esterase assays with mean
activity in the Salaya strain 4.13, 3.92 times greater than the Bora-Bora strain respectively.
The corresponding fold changes for GST and MFOs activity are 2.0 and 1.94, respectively.
Figure 1 Fold-changed (mean ± SD) in enzymatic activity of Salaya populations
compared to Bora-Bora reference strain. * Indicates significant different between Bora-Bora
and Salaya within the same enzyme test by Student’s t-test (P<0.05).
Synergist bioassays
From insecticide susceptibility assessment, Salaya was manifested highly resistant to
deltamethrin (Table 1) therefore it was selected for synergism study.The results reveal that
deltamethrin treatment against resistant Salaya larvae in the presence of test synergist at the
sub-lethal concentration (7.5, 2 and 5 ppm for PBO, DEF and P. longum extract respectively)
showed lower LC50 values compared to treatment with deltamethrin alone (Table 2). The
synergism ratio (SR50) of P. longum extract, DEF and PBO is approximately 3.24, 11 and
18.33, respectively.
∗
∗
∗
0
1
2
3
4
5
6
α-esterase β-esterase GST MFO
fold
ch
ange
d a
ctiv
ity
Bora- Bora
Salaya
∗
∗
∗
The 7th National and International Graduate Study Conference 2017
" Thailand 4.0 Creative Innovation for Sustainable Development "
I110
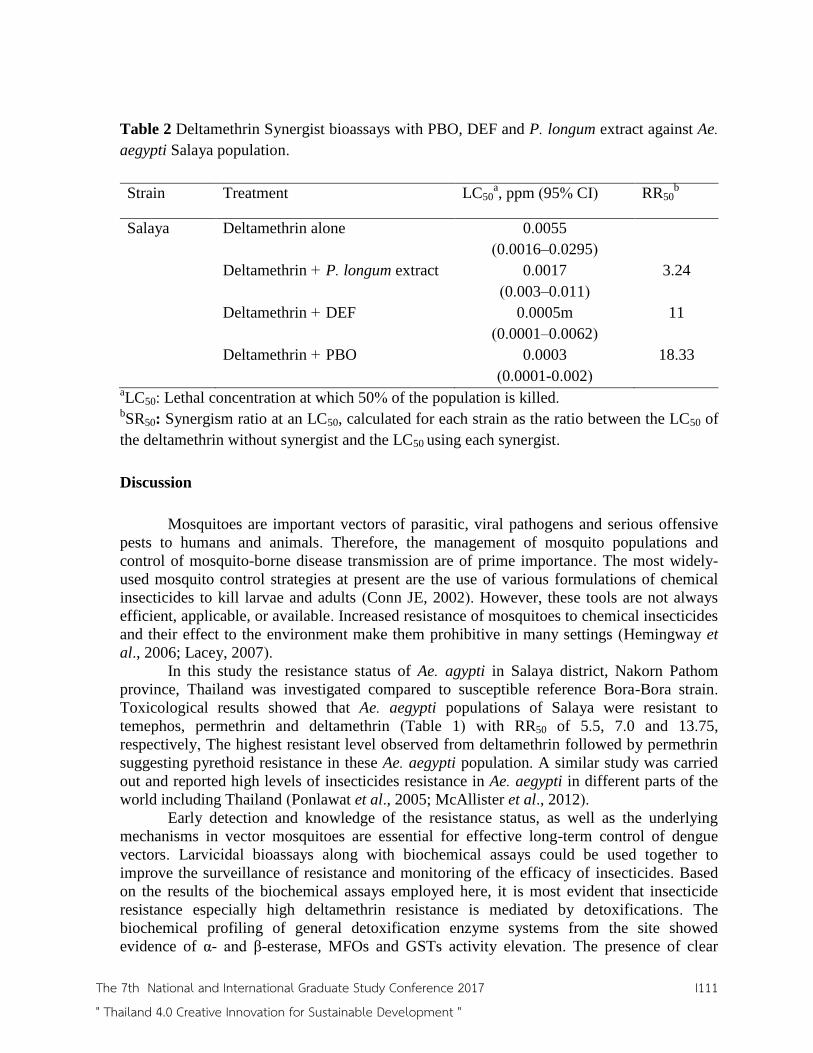
Table 2 Deltamethrin Synergist bioassays with PBO, DEF and P. longum extract against Ae.
aegypti Salaya population.
Strain Treatment LC50a, ppm (95% CI) RR50
b
Salaya Deltamethrin alone 0.0055
(0.0016–0.0295)
Deltamethrin + P. longum extract 0.0017 3.24
(0.003–0.011)
Deltamethrin + DEF 0.0005m 11
(0.0001–0.0062)
Deltamethrin + PBO 0.0003 18.33
(0.0001-0.002) aLC50: Lethal concentration at which 50% of the population is killed.
bSR50: Synergism ratio at an LC50, calculated for each strain as the ratio between the LC50 of
the deltamethrin without synergist and the LC50 using each synergist.
Discussion
Mosquitoes are important vectors of parasitic, viral pathogens and serious offensive
pests to humans and animals. Therefore, the management of mosquito populations and
control of mosquito-borne disease transmission are of prime importance. The most widely-
used mosquito control strategies at present are the use of various formulations of chemical
insecticides to kill larvae and adults (Conn JE, 2002). However, these tools are not always
efficient, applicable, or available. Increased resistance of mosquitoes to chemical insecticides
and their effect to the environment make them prohibitive in many settings (Hemingway et
al., 2006; Lacey, 2007).
In this study the resistance status of Ae. agypti in Salaya district, Nakorn Pathom
province, Thailand was investigated compared to susceptible reference Bora-Bora strain.
Toxicological results showed that Ae. aegypti populations of Salaya were resistant to
temephos, permethrin and deltamethrin (Table 1) with RR50 of 5.5, 7.0 and 13.75,
respectively, The highest resistant level observed from deltamethrin followed by permethrin
suggesting pyrethoid resistance in these Ae. aegypti population. A similar study was carried
out and reported high levels of insecticides resistance in Ae. aegypti in different parts of the
world including Thailand (Ponlawat et al., 2005; McAllister et al., 2012).
Early detection and knowledge of the resistance status, as well as the underlying
mechanisms in vector mosquitoes are essential for effective long-term control of dengue
vectors. Larvicidal bioassays along with biochemical assays could be used together to
improve the surveillance of resistance and monitoring of the efficacy of insecticides. Based
on the results of the biochemical assays employed here, it is most evident that insecticide
resistance especially high deltamethrin resistance is mediated by detoxifications. The
biochemical profiling of general detoxification enzyme systems from the site showed
evidence of α- and β-esterase, MFOs and GSTs activity elevation. The presence of clear
The 7th National and International Graduate Study Conference 2017
" Thailand 4.0 Creative Innovation for Sustainable Development "
I111

correlations between enzyme levels and resistance phenotypes indicate that detoxification
could be an underlying mechanisms contributing to resistance.In Thailand showed that
increased MFOs, α- and β-esterase activities in Ae. aegypti strains were associated with
pyrethroid (deltamethrin and permethrin) resistance (Paeporn et al., 2004). Thus our study
suggests that continuous resistance monitoring should be conducted in the Salaya to identify
the efficacy of compounds for dengue control and to facilitate selection of compounds with
the greatest promise for halting or minimizing dengue infections.
The pesticides of plant origin are biodegradable, efficient and suitable alternative for
mosquito control (Shaalan et al. 2005). Plant compounds have been reviewed for growth
retarding, reproduction inhibiting, ovicides, larvicides, synergistic, additive, and antagonistic
activities of the botanical mixture. Various other workers have reported botanicals as
effective mosquito larvicides (Kovendan and Murugan, 2011; Ghosh et al., 2012; Raveen et
al., 2014). In the present study, the ethanol extracts of P. longum was shown effective against
Salaya Ae. aegypti larva with LC50 value of 11.66 ppm. os compared to the previos reports ,
LC50 11.66 ppm of this study, was comparatively more effective than the acetone extracts of
P. longum LC50 15.64 ppm (Madhu et al, 2011), however less effective than the ethanol
extracts of P. longum LC50 8.13 ppm (Chaithong et al., 2006).The difference in the activity
and components may be due to the environment and nature of the plants and test organisms
used in the experiments. It is important to note that the bioactivity of the plant extracts
mainly depend on the number of compounds present, chemistry of photoproduct and nature
of the solvent and procedure followed for extraction.
The synergistic effect of various control agents has proved very advantageous in the
control of various pests (Seyoum et al., 2002). The joint action using a combination of
botanical extracts and different synthetic insecticide against several vectors have been
supported by several previous studies (Shaalan et al., 2005; Mohan et al., 2006 and 2007). In
our study, combined application of deltamethrin and the P. longum extracts revealed the
synergistic action of the extract against Salaya Ae. agypti. The binary mixture proved to be
more effective than deltamethrin or P. longum extracts when applied individually. The
synergistic activity may be due to the plant extract inhibiting some factors which can act
against synthetic chemicals as reported in Ae. aegypti such as detoxification systems
(Thangam and Kathiresan, 1991). Thus far, studies on synergistic/toxic effects of binary
mixtures involving phytochemicals and synthetic insecticides have been conducted on
agricultural pests (Mesbah et al., 2006 and 2007). For instance, Solanum xanthocarpum
extract induced synergism with cypermethrin against larvae of Culex quinquefasciatus
(Mohan et al., 2006).
Conclusion
Exploration of natural products from plants can be considered as an important
alternative insecticide for the control of mosquito larvae. Overall, our results showed that P.
longum extracts showed moderate larvicidal activity and synergistic activity with
deltamethrin against Ae. agypti larvae. Mixtures of phytochemicals and insecticides were
found to be more effective than insecticides or phytochemicals alone and could be a good
eco-friendly approach to reducing the dose of chemicals to be applied in vector control
The 7th National and International Graduate Study Conference 2017
" Thailand 4.0 Creative Innovation for Sustainable Development "
I112

programs. Active plant-derived compounds from P. longum with both larvicidal and
synergistic activity should be further determined.
Recommendations
Eco-friendly combination of insecticide and synergists are essential to achieve
effective, safety, environmental and economic benefits in vector control. This should be
taken into account when devising future vector control and insecticide resistance
management strategies.
Acknowledgements
This work was supported by National Research Council of Thailand (NRCT) grant
number 2559A11402070 and partially supported by Faculty of Animal Sciences and
Agricultural Technology, Silpakorn University, Thailand. Acknowledgement is extended to
Thailand International Corporation Agency (TICA) for the financial assistance. I would like
to express my grateful to Dr. Suphavadee Chimtong and Ms. Supawadee Suebsai for
technical assistance.
References
Ahn Y.J., Kim S.I., Kim H.K., and Tak J.H. (2006). “Naturally occurring house dust mites control agents: development and commercialization.” Advances Phytomedicine 3, 2 (October): 269-289.
Bhan S., Shrankhla, Sharma P., Mohan L., and Srivastava C.N. (2013). “Larvicidal toxicity of temephos and entomopathogenic fungus, Aspergillus flavus and their synergistic activity against malaria vector, Anopheles stephensi.” Journal of Entomol and Zoo Studies 1, 6 (November) 55-60.
Bisset J.A., Marín R., Rodríguez M.M., Severson D.W., Ricardo Y., French L, Díaz M., and Pérez O. (2013). “Insecticide resistance in two Aedes aegypti (Diptera: Culicidae) strains from Costa Rica.” Journal of Medical Entomology 50, 2 (March):352-61.
Chaithong U., Choochote W., Kamsuk K, Jitpakdi A., Tippawangkosol P., Chaiyasit D., Champakaew D., Tuetun B., and Pitasawat C.B. (2006). “ Larvicidal effect of pepper plants on Aedes aegypti (L.) (Diptera: Culicidae). Journal of the Society for Vector Ecology 31, 1 (June):138-144.
Conn J,E., Wilkerson R.C., Segura M.N., de Souza R.T., Schlichting C.D., Wirtz R.A., and Póvoa M. M. (2002). “Emergence of a new neotropical malaria vector facilitated by human migration and changes in land use.” The American Journal of Tropical Medicine and Hygiene 66, 1(January): 18–22.
Curtis C.F. (1985). “Theoretical models of the use of insecticide mixtures for management of resistance.” Bulltein of Entomological Research 75, 2 (June): 259–266.
Dusfour I., Zorrilla P., Guidez A., Issaly J., Girod R., Guillaumot L., Robello C., and Strode C. (2015). “Deltamethrin Resistance Mechanisms in Aedes aegypti Populations from Three French Overseas Territories Worldwide. PLOS Neglected Tropical Diseases 9, 11 (November) : e0004226
Ghosh A., Chowdhury N., and Chandra G. (2012). “Plant extracts as potential mosquito larvicides.” Indian Journal of Medical Research 135, 5 (May): 581–598.
The 7th National and International Graduate Study Conference 2017
" Thailand 4.0 Creative Innovation for Sustainable Development "
I113

Govindrajan M., and Sivakumar R. (2014). “Larvicidal, ovicidal, and adulticidal efficacy of Erythrina indica (Lam.) (Family: Fabaceae) against Anopheles stephensi, Aedes aegypti,and Culex quinquefasciatus (Diptera: Culicidae).” Parasitology Research 113, 2 (February) 777-791.
Gueye S., Diop M.T., and Seck D. (2011). “Sembene M. Biochemical fractions activity of Annona senegalensis pers. Extract leaves to protect groundnut against the seed-beetle Caryedon serratus Ol (Coleoptera, Chrysomelidea,Bruchinae).” International Journal of Plant, Animal and Environmental Science 1, 2 (January):122-130.
Hemingway J., Beaty B.J., Rowland M., Scott T.W., and Sharp B.L. (2006). “The innovative vector control consortium: improved control of mosquito-borne diseases.” Trends Parasitology 22, 7 (July): 308–312.
Hemingway J.,and Ranson H. (2000). “Insecticide resistance in insect vectors of human diseases.” Annual Review Entomology 45, 1 (January): 371-391.
Isman M.B. ( 2006). “Botanical insecticides, deterrents, and repellents in modern agriculture and an increasingly regulated world.” Annual Review of Entomology 51, (January): 45 – 66.
Jirakanjanakit N., Rongnoparut P., Saengtharatip S., Chareonviriyaphap T., Duchon S., Bellec C., and Yoksan S. (2007). “Insecticide susceptible/ resistance status in Aedes (Stegomyia) aegypti and Aedes (Stegomyia) albopictus (Diptera: Culicidae) in Thailand.” Journal of Economic Entomology 100, 2(April): 545-550.
Komalamisra N., Srisawat R., Phanbhuwong T., and Oatwaree S. (2011).“Insecticide susceptibility of the dengue vector, Aedes aegypti (L.) in metropolitan Bangkok.” Southeast Asian Journal of Tropical Medicine Public Health 42, 4 (July): 814-823.
Kostyukovsky M., Rafaeli A., Gileadi C., Demchenko N., and Shaaya E. (2002). “Activation of octopaminergic receptors by essential oil constituents isolated from aromatic plants: Possible mode of action against insect pests.” Pest Management Science 58, 11 (November): 1101-1106.
Kumar K., Singh P.K., Tomar J., and Baijal S. (2010). “Dengue: epidemiology, prevention and pressing need for vaccine development.” Asian Pacific Journal of Tropical Medicine 3, 12 (December): 997-1000.
Lacey L.A. (2007). “Bacillus thuringiensis serovariety israelensis and Bacillussphaericus for mosquito control.” Journal of the American Mosquito Control Association 23, sp2 (July): 133-163.
Lee S.E. (2000). “Mosquito larvicidal activity of pipernonaline, a piperidine alkaloid derived from long pepper, Piper longum.” Journal of the American Mosquito Control Association 16, 3 (September): 245-247.
Li X., Schuler M.A., and Berenbaum M.R. (2007). “Molecular mechanisms of metabolic resistance to synthetic and natural xenobiotics.” Annual Review of Entomology 52, (January): 231-253. DOI: 10.1146/annurev.ento.51.110104.151104.
Lima Estelita Pereira, Paiva M. H. S., Silva U. M., Oliveira L.N., Santana A.E., Barbosa C.N., Neto C.P., Ayres C.F.J., and Santos M.A.M. (2011). “Insecticide resistance in Aedes aegypti populations from Ceará, Brazil.” Parasites and Vectors. http://www.parasitesandvectors.com/content/4/1/5.
Mackenzie J. S., Gubler D. J., and Peterson L. R. (2004). “Emerging flaviviruses the spread and resurgence of japanese encephalitis, west nile and dengue viruses.” Journal of Natural Medicines 10, 12 (December): 98-109.
Madhu S.K., Vijayan V.A., and Shaukath A.K., (2011). “Bioactivity guided isolation of mosquito larvicide from Piper longum.” Asian Pacific Journal of Tropical Medicine 4, 2 (February): 112-116. 2011, Pages 112-116.
The 7th National and International Graduate Study Conference 2017
" Thailand 4.0 Creative Innovation for Sustainable Development "
I114

Mann R.S., and Kaufman P.E. (2012). “Natural product pesticides: their development, delivery and use against insect vectors.” Mini-reviews in Organic Chemistry 9, 2 (May): 185-202.
McAllister J.C., Godsey M.S., and Scott M.L. (2012).“Pyrethroid resistance in Aedes aegypti and Aedes albopictus from port-au-Prince, Haiti.” Journal of Vector Ecology 37, 2 (December): 325-332.
Mesbah H.A., Mourad A.K., and Rokaia A.Z. (2006). “Efficacy of some plant oils alone and combined with different insecticides on the cotton leaf worm Spodoptera littoralis (Boisd) (Lepidoptera) in Egypt.” Communications in Agricultural and Applied Biological Sciences 71, 2: 305–328.
Mesbah H.A., Saad A.S., Taman F.A., and Mohamed I.B. (2007). “Joint action of quercetin with four insecticides on the cotton leaf worm larvae Spodoptera littoralis (Boisd) (Lepidoptera) in Egypt.” Communications in Agricultural and Applied Biological Sciences 72, 3:455–457.
Mgbemena I. C. (2016). “The Synergistic Larvicidal Activities of Three Local Plants on Aedes aegypti. Global Journal of Science Frontier Research: Biological Science 16, 3 Version 1.0 USA, Online ISSN: 2249-4626 and Print ISSN: 0975-5896.
Mohan L., Sharma P., and Srivastava C.N. (2006). “Evaluation of solanum xanthocarpum extract as a synergist for cypermethrin against larvae of the filarial vector Culex quinquefasciatus.” Entomological Research 36, 4 (November): 220–225.
Mohan L., Sharma P., and Srivastava C.N. (2007). “Comparative efficacy of Solanum xanthocarpum extracts alone and in combination with a synthetic pyrethroid, Cypermethrin against malaria vector, Anopheles stephensi.” Southeast Asian Journal of Tropical Medicine Public Health 38, 2 (November) :256–260.
Morales-Rodrigue A., Peck D.C. (2009). “Synergies between biological and neonecotinoid insecticides for the curative control of white grubs Amphimallon majale and Popillia japonica.” Biological Control 51, 1 (October): 169–180.
Nelson Grisale, Rodolphe Poupardin, Santiago Gomez, Idalyd Fonseca-Gonzalez, Hilary Ranson, and Audrey Lenhart. (2013). “Temephos Resistance in Aedes aegypti in Colombia Compromises Dengue Vector Control.” PLOS Neglected Tropical Diseases 7, 9 (September): e2438.doi:10.1371/journal.pntd.0002438.
Paeporn P., K. Supaphathom, R. Srisawat., N. Komalamisra, V. Deesin, P. Ya-umphan, and S. Leeming Sawat. (2004). “Biochemical detection of pyrethroid resistance mechanism in Aedes aegypti in Ratchaburi province. Thailand.” Asian Pacific Journal of Tropical Biomedicine 21, 2 (December): 145–51.
Park I.K., Lee S.G., Shin S.C., Park J.D., and Ahn Y.J. (2002). “Larvicidal activity of isobutylamides identified in Piper nigrum fruits against three mosquito species.” Journal of Agriculture and Food Chemistry 50: 7(February): 1866-1870.
Pereda-Miranda R., C.B. Bernard, T. Durst, J.T. Arnason., P. Sánchez-Vindas, L. Poveda, and L. San Román (1997). “Methyl 4-hydroxy-3-(3´-methyl-2´-butenyl) benzoate, major insecticidal principle from Piper guanacastensis.” Journal of Natural Products 60, 3(March): 282-284.
Pimsamarn S., Sornpeng W., Akksilp S., Paeporn P. and Limpawitthayakul M. (2009). “Detection of insecticide resistance in Aedes aegypti to organophosphate and synthetic pyrethroid compound in the north-east of Thailand.” Dengue Bulletin 33, 194-202.
Ponlawat A., Scott J.G., and Harrington L.C. (2005). “ Insecticide susceptibility of Aedes aegypti and Aedes albopictus across Thailand.” Journal of Medical Entomology 42, 5 (September): 821-825.
Riaz M.A., Chandor-Proust A., Dauphin-Villemant C., Poupardin R., Jones C.M., Stode C., and Regent-Kleockner M. (2013). “Molecular mechanisms associated with increased
The 7th National and International Graduate Study Conference 2017
" Thailand 4.0 Creative Innovation for Sustainable Development "
I115

tolerance to the neonicotinoid insecticide imidacloprid in the dengue vector Aedes aegypti.” Aquatic Toxicology 126, 15 (January): 326–337.
Seyoum A., Palsson K., Kung’a S., Kabiru EW., Lwande W., Killeen G.F., Hassanali A., and Knols B.G. (2002). “Traditional use of mosquito repellent plants in western Kenya and their evaluation in semi-field experimental huts against Anopheles gambiae: ethnobotanical studies and application by thermal expulsion and direct burning.” Transactions of the Royal Society of Tropical Medicine and Hygiene 96, 3 (June): 225-231.
Shaalan E.A., Canyon D.V., Younges M.W.F., Abdel-Wahab H., and Mansour A. (2005). “A review of botanical phytochemicals with mosquitocidal potential.” Environment International Journal 31, 8 (October):1149-66.
Sukumar K.,Perich M.J., and Boobar L.R. (1991). “Botanical derivatives in mosquito control: Review.” Journal of the American Mosquito control Association 7, 2 (June) 210-237.
Thangam T.S., and Kathiresan K. (1991). “Mosquito larvicidal activity of marine plant extracts with synthetic insecticides.” Botanica Marina 34, 6 (October): 537–539.
World Health Organization (2005). “Guidelines for laboratory and field testing of mosquito larvicides.”WHO/CDS/WHOPES/GCPP/13.Geneva,Switzerland.World Health Organization.
World Health Organization (1995). Vector control for malaria and other mosquito–borndiseases WHO Tech Rep Ser; 857: 1-91.
World Health Organization (2012).World Health Organization, Geneva, Switzerland. Accessed July 2012. Available from http://www.who.int/whopes/Insecticides.
The 7th National and International Graduate Study Conference 2017
" Thailand 4.0 Creative Innovation for Sustainable Development "
I116

Constructed functional sheet scaffolds of coated silk fabric with silk fibroin
solution for soft tissue regeneration in cleft palate surgery
Supaporn Sangkert, Assoc. Prof. Jirut Meesane, Assoc. Prof. Suttatip
Kamonmattayakul, Prof. Michael Gelinsky
Institute of Biomedical Engineering, Faculty of Medicine, Prince of Songkla
University
Abstract
Cleft palate is a congenital malformation of the soft and hard tissue at the oral
cavity. An attractive treatment is an operation by substitution of scaffolds to induce
tissue regeneration at the defect area. This research proposes constructed silk fabric
coated in silk fibroin solutions for soft tissue regeneration of cleft palate. In this
research, silk fabrics were coated with 3% and 6% silk fibroin solutions. The
morphological structure of the silk fibroin fabric was observed by scanning electron
microscopy. The swelling behavior and protein release of the coated silk fabric was
used for evaluation of physical performance. L929 fibroblast cells were cultured on
the coated silk fabrics. Cell proliferation and viability were used to evaluate the
biological performance. The morphological structure of the coated silk fabric showed
fibers that were covered and glued with silk fibroin. The coated silk fabric had lower
swelling behavior than the non-coated silk fibroin fabric. Protein release and cell
proliferation of the coated silk fabric was higher than the non-coated silk fabric. The
results indicated that the coated silk fabric from silk fibroin solutions had good
performance for soft tissue regeneration for cleft palate surgery.
Key words: Silk fibroin fabric, Tissue engineering, Silk fibroin, Soft tissue
The 7th National and International Graduate Study Conference 2017
" Thailand 4.0 Creative Innovation for Sustainable Development "
I117

Introduction
Cleft palate is a congenital deformity that appears at the oral and maxillofacial
area and results from incomplete fusion of the palate. Cleft palate often leads to
problems with breast feeding and speech development. This birth defect presents with
incomplete layer formation of bone and soft tissue. Surgery is the method to treat cleft
palate. In the surgical approach, children need performance biomaterials implanted
into the defect area for tissue regeneration (Sheena et al.,2013; Cesar et al.,2012).
Some research presented the scaffolds as performance biomaterials for soft tissue
engineering (Jianjun et al.,2006; Steven et al.,2013). The scaffolds showed that the
sheet structure was suitable for the soft layer of the defect area (Richard et al.,2010).
In this research, sheet scaffolds for soft tissue engineering in cleft palate is proposed.
Silk fabric is a performance material which has high mechanical strength,
physical stability, and biocompatibility. The main component of silk fabric is silk
fibroin (SF) which is composed of glycine (43%), alanine (30%) and serine (12%)
(Leng-Duei Koha et al.,2015). SF also has the RGD amino acid sequence that has a
specific binding site for cells (Chinmoy Patra et al.,2012). In addition, SF can
promote cell proliferation and can control the rate of degradation (Sang-Hyug Park et
al.,2010). Some reports showed that silk fabric was suitable for fibroblast migration
and proliferation since the unique structure of silk fabric promotes fibroblast
attachment (Hanna Wendt et al.,2011). Therefore, silk fabric was selected as sheet
scaffolds for soft tissue engineering in cleft palate patients.
The main functions of the sheet scaffolds for cleft palate include inducing
fibroblast proliferation and shielding fibroblast migration that disturbs tissue
formation in the bone layer (Sasima et al.,2016). Therefore, coating silk fabric with
SF is suitable to complete those main functions.
In this research, the silk fabric was coated in SF solutions at different
concentrations. The morphologies and physical and biological performances of the
coated silk fabrics were then evaluated for soft tissue regeneration in cleft palate
surgery.
Objectives
1. To improve the SF fabric by coating in an SF solution
The 7th National and International Graduate Study Conference 2017
" Thailand 4.0 Creative Innovation for Sustainable Development "
I118

2. To compare the morphologies and performances of SF fabric between
different coating concentrations and without coating.
3. To develop SF fabric scaffolds for soft tissue engineering in cleft palate.
Research Methodology
Coating silk fibroin fabric
The SF fabric was provided by the Research Unit and Queen Sirikit Seri
Culture Centre, Narathiwat, Thailand. The SF fabric was cut into 1×1 cm pieces and
then coated with 3% and 6% SF solutions. The SF solutions were prepared by
dissolving the degummed SF fiber in 9.3 M LiBr in dH2O for 4 h at 70 C. After that,
the SF solution was dialyzed for 72 h and the water was changed every 30 min during
the first 4 h (B.Mandal et al.,2009). The SF solution was centrifuged to separate the
protein precipitate. The precipitate was weighed to calculate the SF concentration.
After coating with the 3% and 6% SF solutions, the SF fabric was kept at room
temperature for 24 h for water evaporation. Finally, all groups of the SF fabric were
soaked in 80% methanol to induce the beta-sheet structure (Qiang Lu et al.,2010).
Modification of silk fibroin fabric scaffolds
The SF fabric was modified by the 3%and 6% SF solutions. The silk fabric
scaffolds were dipped in the silk solutions and left at room temperature for 24 h.
There were 3 groups of different SF solutions (Table 1).
Table 1. Experiment groups.
Measurement of silk fabric thickness
The thicknesses of the SF fabrics in each group were measured at 3 random
points by a micrometer (Mitutoyo, USA).
Scanning electron microscopy (SEM) observation
The morphological structure of the SF fabric in all groups was observed by an
SEM machine (Quanta400, FEI, Czech Republic). The SF fabric was coated with gold
Groups Detail
A Silk fibroin fabric scaffold
B Coated 3% silk fibroin fabric scaffold
C Coated 6% silk fibroin fabric scaffold
The 7th National and International Graduate Study Conference 2017
" Thailand 4.0 Creative Innovation for Sustainable Development "
I119
using a gold sputter coater machine (SPI Supplies, Division of STRUCTURE PROBE
Inc., Westchester, PA, USA) before the investigation.
Swelling property
The SF fabric was immersed in a phosphate-buffered saline (PBS) solution at
37 °C and evaluated at 0.5, 1, 2, and 4 h. The weights of the SF fabrics were measured
before and after immersion. The swelling ratio was calculated from this equation.
Swelling ratio = (Ws – Wd)/Wd × 100
where Ws and Wd are the weight of the swollen scaffold and weight of the dry
scaffold, respectively (Nicholas et al.,2011).
Protein release
Protein release from the fabric was evaluated in all SF fabric groups by the
BCA Protein Assay Kit (Pierce BCA Protein Assay Kit, Thermo Scientific, USA).
The SF fabric in all groups was soaked in a PBS solution for different time durations:
15, 30, 60, 120 and 240 min. According to the instructions of the BCA Protein Assay
kit, 20 µL of solution was used for the assay.
Cell Culturing
The L929 fibroblast cell line was used in this study. The L929 cells were
cultured in alpha-MEM medium (α-MEM, GibcoTM
, Invitrogen, Carlsbad, CA, USA)
with the addition of 1% penicillin/streptomycin, 0.1% Fungizone and 10% fetal
bovine serum at 37 °C in a humidified 5% CO2/95% air incubator. The L929 cells
were seeded in the SF fabric with 2×10⁴ cells and the media was changed every 3-4
days (M.C. Serrano et al.,2004; B Thonemann et al.,2002).
Cell proliferation assay (PrestoBlueTM
on days 1, 3 and 5)
Cell proliferation of the L929 cells was evaluated at days 1, 3, 5, and 7 using
the PrestoBlue (PrestoBlue® Cell Viability Reagent, Invitrogen, USA) assay. The
media was removed and 1/10th volume of PrestoBlue reagent was added directly into
the complete media and incubated for 1 h at 37 °C. The proliferation rate of the cells
was measured by monitoring the wavelength absorbance at 600 nm emission.
Cell viability (fluorescence microscope on days 3 and 5)
The cell viability and cell morphology of the L929 cells in the SF fabric was
observed by staining with fluorescein diacetate (FDA). The FDA compound embeds
into the cellular cluster and extracellular matrix. Acetone was used to dissolve the
The 7th National and International Graduate Study Conference 2017
" Thailand 4.0 Creative Innovation for Sustainable Development "
I120

FDA at a ratio of 5 mg/ml. In the staining process, the media was removed and 1 mL
of fresh media was added. Next, 5 µL of the FDA solution was added and kept at 37
°C for 5 min and protected from the light. The SF fabric was rinsed with 1X PBS and
cell viability was observed by fluorescence microscope (John A. Mcdonald et
al.,1982).
Statistical analysis
The samples were measured and statistically compared by one-way ANOVA
and Tukey’s HSD test (SPSS 16.0 software package). Statistical significance was
defined at p < 0.05 and all data are shown as mean ± standard deviation.
Results/conclusion
Morphological structure of the silk fibroin fabric scaffolds
The non-coated SF fabric was whiter than the coated SF fabric. Moreover, a
looser arrangement of the fiber structure was found in the non-coated SF fabric
compared to the coated SF fabric. In addition, the SF fibers in the non-coated SF
fabric were facile to unbound with other fibers. The coated SF fabric had more
compact and tight features, particularly the coated 6% SF fabric, compared to the non-
coated SF fabric
Figure 1. Coated SF fabrics from different SF solution concentrations: (A) non-coated
SF fabric; (B) coated 3% SF fabric; (C) coated 6% SF fabric.
The thickness of the non-coated SF fabric was thinner than the coated 3% and
6% SF fabrics. The coated SF fabrics increased in thickness as the percentage of SF
solution increased. However, there was little difference between the 3% and 6% SF
fabrics (Figure 2).
A B C
The 7th National and International Graduate Study Conference 2017
" Thailand 4.0 Creative Innovation for Sustainable Development "
I121

Figure 2. Thicknesses of the SF Fabrics: (A) non-coated SF fabric; (B) coated 3% SF
fabric; (C) coated 6% SF fabric.
The morphological structures of the SF fabrics are shown in Figure 3. The
patterns of silk fiber arrangement were similar in all groups of the non-coated SF and
coated SF fabrics. In the case of the coated SF fabric, the fibers in bundles showed
denser spaces than the non-coated SF fabric. The 6% SF fabric had the densest space.
The 7th National and International Graduate Study Conference 2017
" Thailand 4.0 Creative Innovation for Sustainable Development "
I122

Figure 3. Surface morphologies of silk fabrics by scanning electron microscope(SEM)
with different magnifications: non-coated SF fabric (A-C); coated 3% SF fabric (D-
F); coated 6% SF fabric (G-I).
Swelling property
The percentage of swelling was tested at different time points from 30 min to
240 min. The results showed that the percentage of swelling increased as time
increased. The non-coated SF fabric had the highest swelling percentage in the first 30
min and continued to increase in 60, 120, and 240 min. After coating, the percentage
of swelling decreased. The coated 3% SF fabric had a higher swelling percentage than
the coated 6% SF fabric in all time points. As the percentage of SF solution increased,
the swelling percentage of the coated fabric decreased. The results indicated that the
SF coating solution had the effect of decreasing the swelling behavior. These results
A C B
1 mm 200 µm 500 µm
F E D
1 mm 500 µm 200 µm
I H G
1 mm 500 µm 200 µm
The 7th National and International Graduate Study Conference 2017
" Thailand 4.0 Creative Innovation for Sustainable Development "
I123
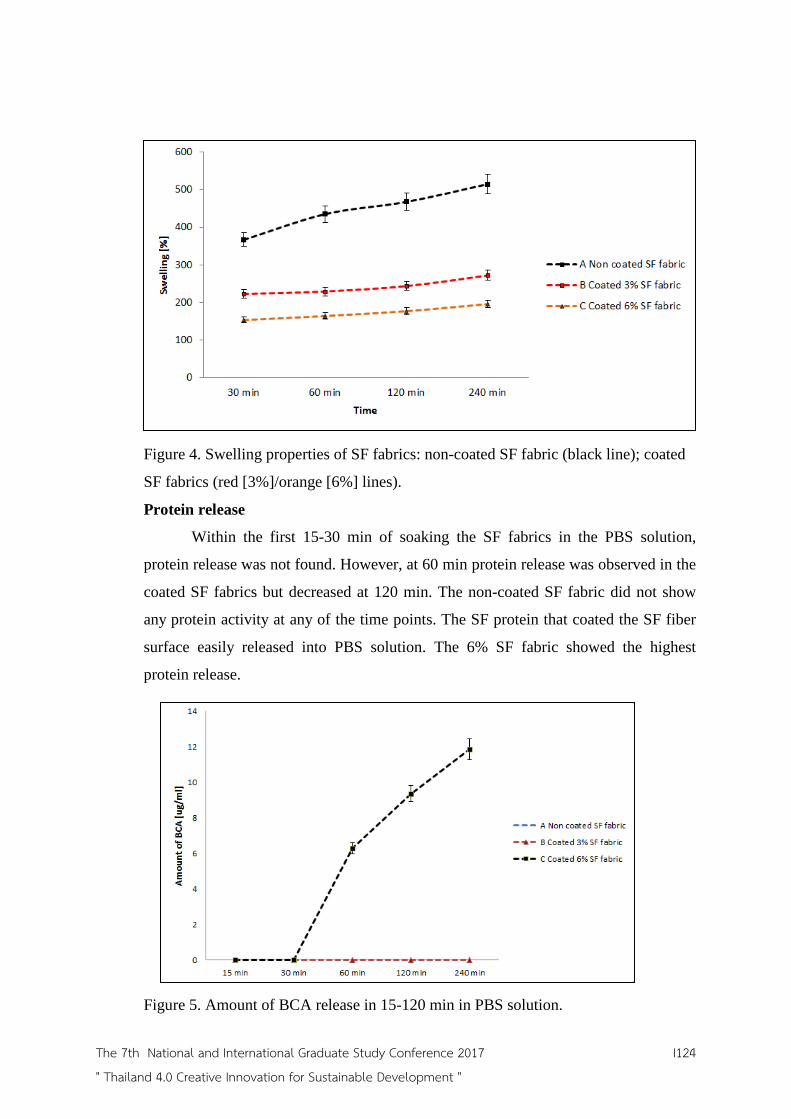
ly physical stability and the barrier function of coated SF fabrics that make the
scaffolds suitable as soft tissue layers in cleft palate.
Figure 4. Swelling properties of SF fabrics: non-coated SF fabric (black line); coated
SF fabrics (red [3%]/orange [6%] lines).
Protein release
Within the first 15-30 min of soaking the SF fabrics in the PBS solution,
protein release was not found. However, at 60 min protein release was observed in the
coated SF fabrics but decreased at 120 min. The non-coated SF fabric did not show
any protein activity at any of the time points. The SF protein that coated the SF fiber
surface easily released into PBS solution. The 6% SF fabric showed the highest
protein release.
Figure 5. Amount of BCA release in 15-120 min in PBS solution.
The 7th National and International Graduate Study Conference 2017
" Thailand 4.0 Creative Innovation for Sustainable Development "
I124

Cell proliferation
Cell proliferation in all groups showed an increasing trend from day 1 through
day 5. On days 1 and 3, the results were not significantly different between the non-
coated SF fabric and the coated 3% SF fabric. The coated 6% SF fabric had
significantly higher cell proliferation than the non-coated SF fabric on days 3 and 5.
An increased percentage of SF solution on the SF fabric can promote cell
proliferation.
Figure 6. Cell proliferation in the SF fabrics at days 1, 3, and 5: non-coated SF fabric
(A); coated 3% SF fabric (B); coated 6% SF fabric (C).
Cell viability
Cell viability was observed on days 3 and 5. Cell attachment in the non-coated
SF and coated SF fabric was considerable. On day 1, the non-coated and coated SF
fabric showed slight cell attachment but increased on day 3. On day 5, the coated SF
fabrics revealed a greater amount of cell attachment compared to the non-coated SF
fabric. The results showed that the coated SF fabric was biologically suitable for cell
viability.
The 7th National and International Graduate Study Conference 2017
" Thailand 4.0 Creative Innovation for Sustainable Development "
I125

Figure 7. Cell viability on the SF fabric after staining with FDA: non-coated SF fabric
at day 3 (A); coated 3% SF fabric at day 3 (B); coated 6% SF fabric at day 3 (C); non-
coated SF fabric at day 5 (D); coated 3% SF fabric at day 5 (E); coated 6% SF fabric
at day 5 (F).
Discussion
In this study, SF fabric was modified by coating in SF solutions. Coating SF
fabric with 3% and 6% SF solutions resulted in physical and biological properties that
are suitable for soft tissue regeneration. The morphological assessment of the coated
SF fabric indicated that the SF solution could diffuse and penetrate into the spaces.
The SF solution fulfilled the role as a welding glue. The glue could bind the fibers
into bundles. An evaluation of the physical performance by observing the swelling
behavior indicated that the SF solutions decreased the extent of swelling of the SF
Day 3 Day 5
A D
B E
C F
200 µm 200 µm
200 µm
200 µm
200 µm
200 µm
The 7th National and International Graduate Study Conference 2017
" Thailand 4.0 Creative Innovation for Sustainable Development "
I126

fabrics which implied sufficient physical stability and barrier function to serve as
scaffolds for soft tissue layer in cleft palate. The biological performance assessment
of the coated SF fabric revealed higher cell proliferation than the non-coated SF
fabric. This demonstrated that the coated SF fabric had the bioactive ability to induce
cell proliferation. Some research reported that the SF particles could induce cell
adhesion and proliferation (Jing Qu et al.,2013). Therefore, the high protein release of
the coated SF was possibly due to the active particles which induced the cell
proliferation. The results demonstrated that the coated SF fabric showed a suitable
performance for use as scaffolds for soft tissue engineering in cleft palate.
Recommendations
The concept of coating SF fabric with a silk fibroin solution and the results of
this research can be used for modification of other materials. Moreover, modified SF
fabric can be used at other sites of soft tissue.
References
Sheena Reilly, Julie Reid, Jemma Skeat, Petrea Cahir, Christina Mei, Maya Bunik.
(2013). ABM Clinical Protocol #18: Guidelines for Breastfeeding Infants
with Cleft Lip, Cleft Palate, or Cleft Lip and Palate. Australia :
Breastfeeding Medicine.
Cesar A. Guerrero. (2012). Cleft lip and palate surgery: 30 years follow-up.
Venezuela : Annals of Maxillofacial Surgery.
Jianjun Guan, John J. Stankus, William R. Wagner. (2006). Soft Tissue Scaffolds.
United States : Wiley Encyclopedia of Biomedical Engineering.
Steven Maude, Eileen Ingham, Amalia Aggeli. (2013). Biomimetic self-assembling
peptides as scaffolds for soft tissue engineering. United Kingdom :
Nanomedicine.
Richard T. Tran, Paul Thevenot, Yi Zhang, Dipendra Gyawali, Liping Tang, Jian
Yang. (2010). Scaffold Sheet Design Strategy for Soft Tissue Engineering.
USA : NIH Public Access.
Leng-Duei Koha, Yuan Cheng, Choon-Peng Tenga, Yin-Win Khina, Xian-Jun Loh,
Si-Yin Tee, Michelle Low, Enyi Ye, Hai-Dong Yu, Yong-Wei Zhang, Ming-
Yong Han. (2015). Structures, mechanical properties and applications of
silk fibroin materials. Singapore : Progress in Polymer Science.
Chinmoy Patra, Sarmistha Talukdar, Tatyana Novoyatleva, Siva R. Velagala,
Christian Mühlfeld, Banani Kundu, Subhas C. Kundu, Felix B. Engel. (2012).
Silk protein fibroin from Antheraea mylitta for cardiac tissue
engineering. Germany : Biomaterials.
The 7th National and International Graduate Study Conference 2017
" Thailand 4.0 Creative Innovation for Sustainable Development "
I127

Sang-Hyug Park, Eun Seok Gil, Hai Shi, Hyeon Joo Kim, Kyongbum Lee, David L.
Kaplan. (2010). Relationships Between Degradability of Silk Scaffolds and
Osteogenesis. USA : NIH Public Access.
Hanna Wendt, Anja Hillmer, Kerstin Reimers, Joern W. Kuhbier, Franziska Scha¨fer-
Nolte, Christina Allmeling, Cornelia Kasper, Peter M. Vogt. (2011). Artificial
Skin – Culturing of Different Skin Cell Lines for Generating an Artificial
Skin Substitute on Cross-Weaved Spider Silk Fibres. France : PLoS One.
Sasima Puwanun, Frazer J. Bye, Moira M. Ireland, Sheila MacNeil, Gwendolen C.
Reilly, Nicola H. Green. (2016). Production and Characterization of a
Novel, Electrospun, Tri-Layer Polycaprolactone Membrane for the
Segregated Co-Culture of Bone and Soft Tissue. Thailand : Polymers.
Biman B.Mandal, Sonia Kapoor, Subhas C.Kundu. (2009).
Silkfibroin/polyacrylamide semi-interpenetrating network hydrogels for
controlled drug release. India : Biomaterials.
Qiang Lu, Xiao Hu, Xiaoqin Wang, Jonathan A. Kluge, Shenzhou Lua, Peggy Cebe,
David L. Kaplan. (2010). Water-Insoluble Silk Films with Silk I Structure.
USA : NIH Public Access.
Nicholas Guziewicza, Annie Besta, Bernardo Perez-Ramireza, David L. Kaplan.
(2011). Lyophilized silk fibroin hydrogels for the sustained local delivery
of therapeutic monoclonal antibodies. United States of America :
Biomaterials.
M.C. Serrano, R. Pagani, M. Vallet-Regi, J. Pena, A. Ramila, I. Izquierdo, M.T.
Portoles. (2004). In vitro biocompatibility assessment of poly(ε-
caprolactone) films using L929 mouse fibroblasts. Spain : Biomaterials.
B Thonemann, G Schmalz, K.-A Hiller, H Schweikl. (2002). Responses of L929
mouse fibroblasts, primary and immortalized bovine dental papilla-
derived cell lines to dental resin components. Germany : Dental Materials.
John A. Mcdonald, Diane G. Kelley, Thomas J. Broekelmann. (1982). Role of
Fibronectin in Collagen Deposition : Fab' to the Gelatin-binding Domain
of Fibronectin Inhibits Both Fibronectin and Collagen Organization in
Fibroblast Extracellular Matrix. United States : Cell Biology.
Jing Qu, Lu Wang, Yongpei Hu, Lingshuang Wang, Renchuan You, Mingzhong Li.
(2013). Preparation of Silk Fibroin Microspheres and Its
Cytocompatibility. China : Journal of Biomaterials and Nanobiotechnology.
The 7th National and International Graduate Study Conference 2017
" Thailand 4.0 Creative Innovation for Sustainable Development "
I128

Appendix
Author: Supaporn Sangkert
Program: Biomedical Engineering
Institute: Faculty of Medicine, Institute of biomedical Engineering, Princes of
Songkla University.
Tel. 087-8363770 e-mail. [email protected]
Author: Associate Professor Jirut Meesane
Program: Biomaterials for tissue engineering
Institute: Faculty of Medicine, Institute of biomedical Engineering, Princes of
Songkla University.
Tel. 089-7358521 e-mail. [email protected]
Author: Associate Professor Suttatip Kamolmatyakul
Program: Preventive Dentistry
Institute: Faculty of Dentistry, Department of Preventive Dentistry, Prince of
Songkhla University.
Tel. 089-1983399 e-mail. [email protected]
Author: Professor Michael Gelinsky
Program: Bioengineering and Materials Engineering for tissue engineering.
Institute: Medical Faculty and University Hospital Carl Gustav Carus, TU Dresden.
Tel. +49 351 458 6694 e-mail. [email protected]
The 7th National and International Graduate Study Conference 2017
" Thailand 4.0 Creative Innovation for Sustainable Development "
I129

Biomedical performance scaffolds based on silk fibroin films for bone tissue
regeneration in maxillofacial surgery; Physical and biological performance
Jutakan Thonglam, Assoc. Prof. Thongchai Nanthanaranont, Assoc. Prof. Jirut
Meesane,
Institute of Biomedical Engineering, Faculty of Medicine, Prince of Songkla
University.
Abstract
Some cases for maxillofacial surgery have to use biomedical performance
scaffolds to promote bone tissue regeneration at the interfacial area between bone and
mucosa. In this research, silk fibroin was selected and fabricated into films which
were treated with 20% and 100% methanol. Then their morphology was observed
with Scanning Electron Microscopy (SEM). Physical performance was tested based
on their swelling behavior and protein release. Afterward, the films were cultured
with osteoblast cells (MG-63). Biological performance was evaluated in terms of cell
proliferation and viability. The results demonstrated that the treated films showed
more surface roughness than non-treated films. Regarding physical performance, the
treated films exhibited a lower rate of swelling behavior and protein release than non-
treated films. Furthermore, the treated films showed suitable biological performance
as they possessed better cell proliferation and viability than non-treated silk fibroin.
Especially, the films treated with 100% methanol had a suitable physical and
biological performance, which has promise in them serving as biomedical
performance scaffolds for bone regeneration in maxillofacial surgery.
Key word (s): Silk fibroin, Bone tissue regeneration
The 7th National and International Graduate Study Conference 2017
" Thailand 4.0 Creative Innovation for Sustainable Development "
I130

Introduction
Currently, there are many patients suffering bone tissue defect from traumas
and diseases in maxillofacial areas. In severe cases, such patients have to undergo an
operation with biomedical substitution into the defect areas [1]. Constructing
biomedical performance materials is still a challenging issue for materials scientists
and surgeons. Therefore, in this research, performance biomedical materials were
created to be used in corrective surgery for tissue defect in maxillofacial areas.
Notably, some defect parts which contact areas between the mucosa and bone
tissue require the use of performance films for substitution [2]. The main function of
these films is to induce bone tissue regeneration [3]. Furthermore, these films must
possess a barrier function to shield the invasion of mucosa tissue during bone
formation [4]. Because of their unique performace, the biomedical performance films
for bone tissue regeneration at such defect areas in maxillofacial surgery is
emphasized in this research.
Scaffolds are attractive materials, which have been used for tissue engineering
into two and three dimensions (2D and 3D) [5,6]. Principally, scaffolds show good
both physical and biological performance in maintaining the contour shape of tissue
defects and inducing new tissue formation [7]. Therefore, constructed scaffolds must
emphasize on these performances to complete new tissue formation. Due to their
unique performance, 2D scaffolds were selected and fabricated into films as
biomedical performance materials for bone tissue engineering in this research.
Silk fibroin is a natural protein, which has been used in many applications [8].
Especially, silk fibroin has been used in biomedical applications because it has the
unique physical performance of hight mechanical strength [9]. Furthermore, silk
fibroin has a biological performance which can enhance bone tissue regeneration [10].
Therefore, silk fibroin was selected to fabricate biomedical performance scaffold
films for bone tissue regeneration in maxillofacial surgery.
In this research, silk fibroin was facricated into films which were treated with
different concentrations of methanol. Then the physical and biological performance of
the films were evaluated for potential promise to be used in bone tissue regeneration
in maxillofacial surgery.
The 7th National and International Graduate Study Conference 2017
" Thailand 4.0 Creative Innovation for Sustainable Development "
I131

Objectives
1. To compare the morphology, properties and functionalities of silk fibroin
films after treatment with methanol in different concentrations.
2. To developed silk fibroin films for maxillofacial tissue engineering.
Research Methodology
Preparation of silk fibroin films
The silk fibroin scaffolds were prepared by cutting the silk cocoon into small
pieces and then boiling them in 0.02 M sodium carbonate (Na2CO3) at 90 ๐C for 20
min then rinsing with distilled water to remove sericin and drying in a hot air oven at
60 ๐C for 24 hr. During the next step, the silk fibers were dissolved in 9.3 M lithium
bromide (LiBr) at 70 ๐C for 3-4 hr; this solution was dialyzed against in distilled
water using a dialysis membrane for 3 days (changing the distilled water every 6 hr).
After that, the silk fibroin solution was centrifuged at 9000 rpm at 4 ๐C for 20 min.
That solution was then stored at 4 ๐C until used in the study [11]. To fabricate the silk
fibroin film, the silk fibroin solution was poured into plastic plates, and after that, the
silk film was dried at room temperature.
Modification of silk fibroin films
The experiment was designed in 3 groups: untreated silk fibroin films, silk
fibroin films treated with 20% methanol, and silk fibroin films treated with 100%
methanol (Table 1.)
Table 1. Experiment groups.
Groups Details
A Silk fibroin film
B Silk fibroin film treated with 20% methanol
C Silk fibroin film treated with 100% methanol
The 7th National and International Graduate Study Conference 2017
" Thailand 4.0 Creative Innovation for Sustainable Development "
I132
Scanning Electron Microscopy (SEM) Observation
The surface structure of the silk films from each group were observed using
Scanning Electron Microscopy (SEM), (Quanta400, FEI, Czech Republic). The
samples were pre-coated with gold using a gold sputter coater machine (SPI supplies,
Division of STRUCTURE PROBE Inc., Westchester, PA, USA).
Swelling properties
The films of all groups were soaked in PBS at different time points—30 min,
and 1, 6, 12, and 24 hr to check their swelling properties. The silk film weight was
recorded before and after soaking with PBS to calculate the weight increase. Finally,
the swelling (%) in each group was calculated using the following equation [12]:
Swelling (%) =
where Ws = film wet weight
Wd = film dry weight
Protein analysis
The protein release was measured with BCA Protein Assay Kit [Pierce BCA
Protein Assay Kit, Thermo Scientific, USA]. The silk fibroin film was immersed in
PBS for 0.5, 1, 6, 12 and 24 hr, then 20 µl of the solution were drained for protein
detection with the BCA Protein Assay Kit [Pierce BCA Protein Assay Kit, Thermo
Scientific, USA].
Cell Culture
The biocompatibility of each silk fibroin film was assessed using MG-63
osteoblast cells. The experiment cell cultures were maintained in an α-minimum
essential medium (Gibco BRL Life Technologies, Grand Island, NY) containing 10%
fetal bovine serum (Gibco BRL Life Technologies), 100 U/ml penicillin and 100
U/ml streptomycin. The cells were cultured under 100% humidity and 5% CO2 at 37
°C, changing the medium every 3 days. The size of the scaffold used a diameter of
1x1 cm for the culture cells. All of the silk films were seeded with MG-63 osteoblast
( Ws - Wd ) x 100
Wd
The 7th National and International Graduate Study Conference 2017
" Thailand 4.0 Creative Innovation for Sustainable Development "
I133
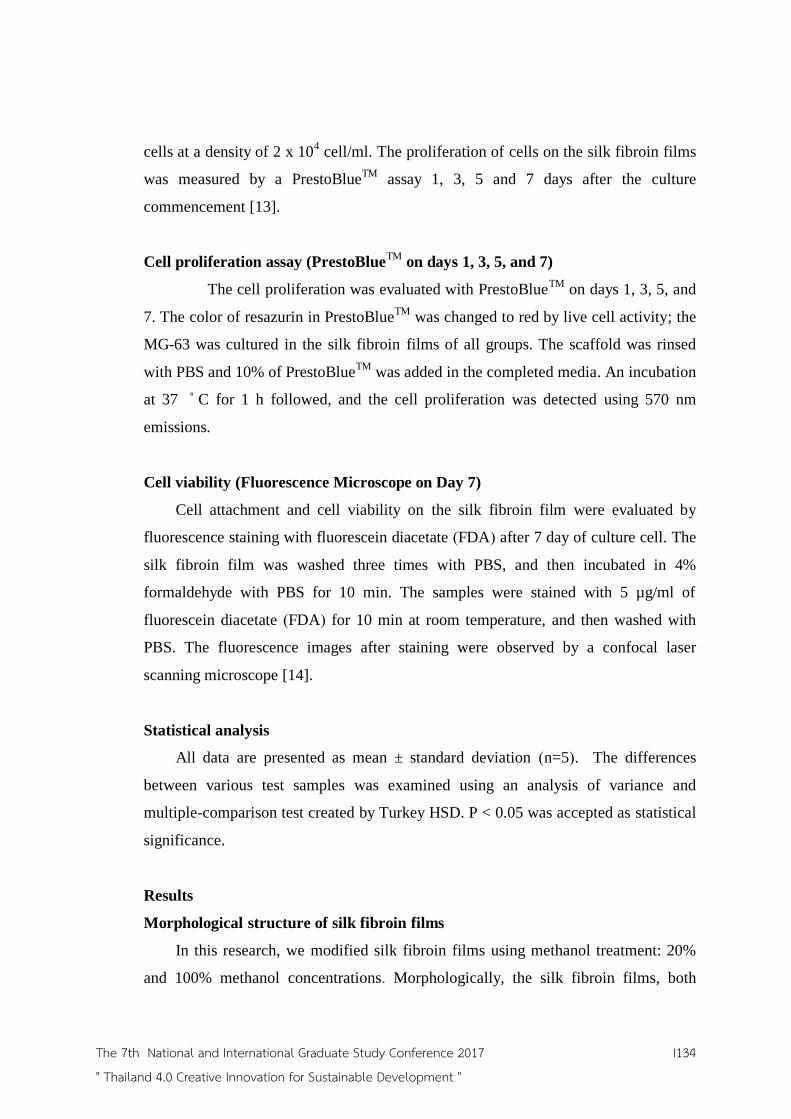
cells at a density of 2 x 10⁴ cell/ml. The proliferation of cells on the silk fibroin films
was measured by a PrestoBlueTM
assay 1, 3, 5 and 7 days after the culture
commencement [13].
Cell proliferation assay (PrestoBlueTM
on days 1, 3, 5, and 7)
The cell proliferation was evaluated with PrestoBlueTM
on days 1, 3, 5, and
7. The color of resazurin in PrestoBlueTM
was changed to red by live cell activity; the
MG-63 was cultured in the silk fibroin films of all groups. The scaffold was rinsed
with PBS and 10% of PrestoBlueTM
was added in the completed media. An incubation
at 37 C for 1 h followed, and the cell proliferation was detected using 570 nm
emissions.
Cell viability (Fluorescence Microscope on Day 7)
Cell attachment and cell viability on the silk fibroin film were evaluated by
fluorescence staining with fluorescein diacetate (FDA) after 7 day of culture cell. The
silk fibroin film was washed three times with PBS, and then incubated in 4%
formaldehyde with PBS for 10 min. The samples were stained with 5 µg/ml of
fluorescein diacetate (FDA) for 10 min at room temperature, and then washed with
PBS. The fluorescence images after staining were observed by a confocal laser
scanning microscope [14].
Statistical analysis
All data are presented as mean ± standard deviation (n=5). The differences
between various test samples was examined using an analysis of variance and
multiple-comparison test created by Turkey HSD. P < 0.05 was accepted as statistical
significance.
Results
Morphological structure of silk fibroin films
In this research, we modified silk fibroin films using methanol treatment: 20%
and 100% methanol concentrations. Morphologically, the silk fibroin films, both
The 7th National and International Graduate Study Conference 2017
" Thailand 4.0 Creative Innovation for Sustainable Development "
I134

50 µm
50 µm 50 µm
A B C
untreated and treated with methanol, were smooth and transparent. The silk fibroin
films are shown in Fig 1.
Figure 1. Untreated silk fibroin film; (A). Silk fibroin film treated with 20%
methanol; (B). Silk fibroin film treated with 100% methanol; (C).
In addition, the morphologies of the silk fibroin films were observed using
SEM measurements.(Fig. 2A) The non-treated silk fibroin films showed a smooth
surface, and the silk fibroin films treated with 20% and 100% methanol exhibited a
rough surface. However, the degree of roughness in the group of silk fibroin films
treated 20% methanol was greater than that of the group treated with 100% methanol.
This result indicated that the concentration of methanol affected the structure of the
silk fibroin films.
Figure 2. Scanning electron microscopy image of scaffolds. Untreated silk fibroin
film; (A). Silk fibroin film treated with 20% methanol; (B). Silk fibroin film treated
with 100% methanol; (C).
A B C
The 7th National and International Graduate Study Conference 2017
" Thailand 4.0 Creative Innovation for Sustainable Development "
I135

Swelling behavior
To investigate the impact of methanol on the swelling behavior of silk fibroin
films, they were analyzed at 0.5, 1, 6, 12, and 24 hrs in PBS (Fig. 3). The swelling
percentage graph showed a correlation with time—the swelling percentage increased
as the time increased. At 0.5 h, the silk fibroin films treated with 20% methanol had
the highest percentage of swelling when compared with those from other groups. The
untreated films and those treated with 100% methanol showed an nonsignificant
difference at 0.5, 1, 6, and 12 hrs, except at 24 hrs where the untreated films
expressed a higher swelling percentage than the 100% methanol treated ones. The
group of silk fibroin films treated 20% with methanol still showed the highest
swelling percentages at all time points
Figure 3. Swelling properties at 0.5, 1, 6, 12, and 24 hr on the silk films untreated and
treated with methanol
Protein release
The protein release from the silk films was evaluated by a BCA assay kit. The
results showed that the untreated silk fibroin films released more protein than the
other groups at 5 min. At the 10 min mark, the untreated silk fibroin films revealed a
significantly higher release rate than the films treated with 20% methanol, but a
The 7th National and International Graduate Study Conference 2017
" Thailand 4.0 Creative Innovation for Sustainable Development "
I136

statistically insignificant difference with the ones treated with 100% methanol. At 0.5
to 3 hrs, the untreated silk fibroin films showed a higher protein releasing rate than the
other groups at all time points.
Figure 4. Protein release from the silk fibroin films at different time points detected
by a BCA assay kit.
Cell proliferation
The biofunctionality of silk fibroin films in every groups was evaluated by means
of a PrestoBlueTM
assay. Osteoblast cells (MG-63) were used for cell proliferation
analysis. The osteoblast cell proliferation showed the increasing trend from day 1 to
day 7. On day 1, the 20%- and 100%-methanol treated silk fibroin films showed
significantly higher proliferation rates than the films that were not treated with
methanol. The 100%-methanol treated films revealed a significantly higher cell
proliferation when compared with the other groups on day 3, 5 and 7. Among the
20%-methanol treated films, cell proliferation was higher than in the untreated films,
but not in a statistically significant manner.
The 7th National and International Graduate Study Conference 2017
" Thailand 4.0 Creative Innovation for Sustainable Development "
I137
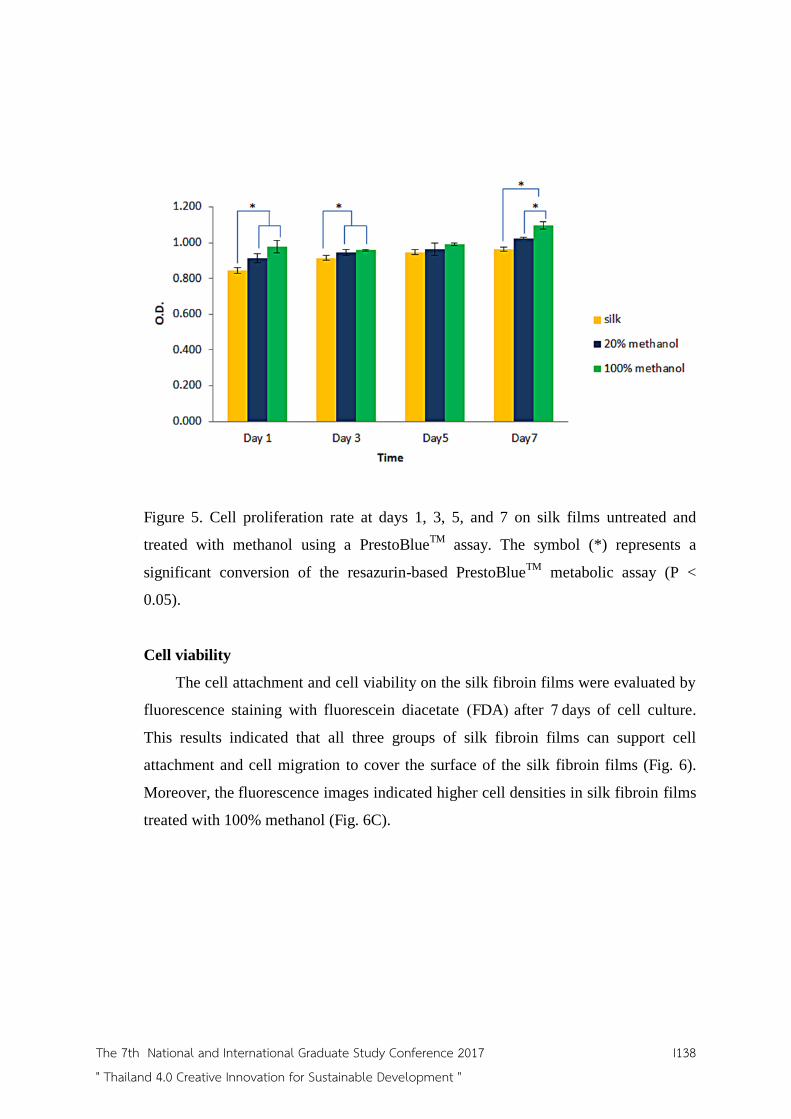
Figure 5. Cell proliferation rate at days 1, 3, 5, and 7 on silk films untreated and
treated with methanol using a PrestoBlueTM
assay. The symbol (*) represents a
significant conversion of the resazurin-based PrestoBlueTM
metabolic assay (P <
0.05).
Cell viability
The cell attachment and cell viability on the silk fibroin films were evaluated by
fluorescence staining with fluorescein diacetate (FDA) after 7 days of cell culture.
This results indicated that all three groups of silk fibroin films can support cell
attachment and cell migration to cover the surface of the silk fibroin films (Fig. 6).
Moreover, the fluorescence images indicated higher cell densities in silk fibroin films
treated with 100% methanol (Fig. 6C).
The 7th National and International Graduate Study Conference 2017
" Thailand 4.0 Creative Innovation for Sustainable Development "
I138
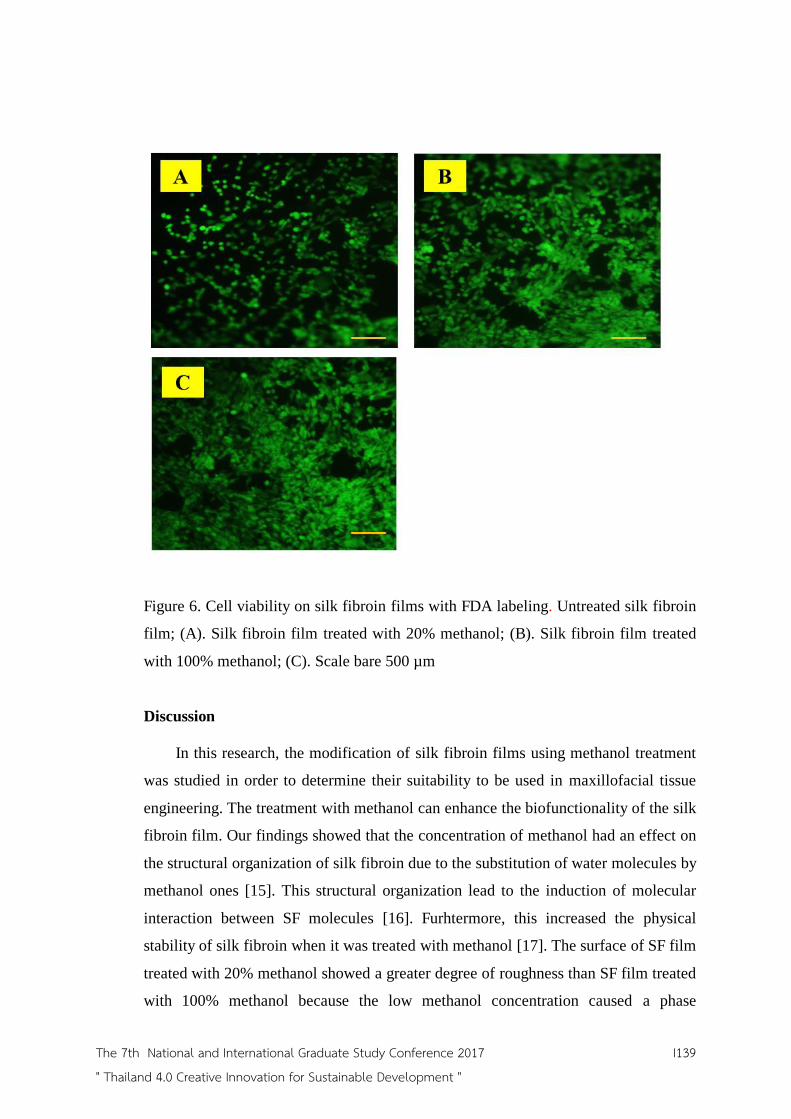
Figure 6. Cell viability on silk fibroin films with FDA labeling. Untreated silk fibroin
film; (A). Silk fibroin film treated with 20% methanol; (B). Silk fibroin film treated
with 100% methanol; (C). Scale bare 500 µm
Discussion
In this research, the modification of silk fibroin films using methanol treatment
was studied in order to determine their suitability to be used in maxillofacial tissue
engineering. The treatment with methanol can enhance the biofunctionality of the silk
fibroin film. Our findings showed that the concentration of methanol had an effect on
the structural organization of silk fibroin due to the substitution of water molecules by
methanol ones [15]. This structural organization lead to the induction of molecular
interaction between SF molecules [16]. Furhtermore, this increased the physical
stability of silk fibroin when it was treated with methanol [17]. The surface of SF film
treated with 20% methanol showed a greater degree of roughness than SF film treated
with 100% methanol because the low methanol concentration caused a phase
The 7th National and International Graduate Study Conference 2017
" Thailand 4.0 Creative Innovation for Sustainable Development "
I139
separation between SF molecules, leading to a more irregular surface [18]. The
highest level of the swelling property was obsevered in silk fibroin films treated with
20% methanol because the structure arrangement was more irregular than those of the
films in the other two groups, enabling a higher swelling percentage compared with
the others.
The silk fibroin films treated with 100% methanol showed the highest rates of
cell proliferation due to their suitable surface roughness, which can support both cell
attachment and proliferation on the film. Interestingly, the morphology of the cells
was spread out, covering the surface of the silk fibroin films treated with 100%
methanol. Our results indicate that silk fibroin film treated with methanol are suitable
for bone tissue engineering, which show some promise in being used in biomedical
performance scaffolds for maxillofacial surgery.
Conclusion
This research demonstrated that silk fibroin films treated with ethanol showed
suitable physical properties; low swelling behavior and protein releasing. Importantly,
the treated silk fibroin films exhibited a biological performance that induces both cell
proliferation and viability. Especially, the silk fibroin film with 100% methanol
showed enough suitable performance, indicating some promise in its application as a
material to create biomedical performance scaffolds for bone tissue regeneration in
maxillofacial surgery.
Recommendation
Methanol-treated silk fibroin films can be used to regenerate other tissues. The
modification of the biological functions of silk fibroin films is an important issue that
may enhance their performance in bone regeneration.
The 7th National and International Graduate Study Conference 2017
" Thailand 4.0 Creative Innovation for Sustainable Development "
I140

References
1. Leila Ghorbaniana, Rahmatollah Emadia, Seyed Mohammad Razavib,
Heungsoo Shinc, Abbas Teimourid. (2013). Fabrication and
characterization of novel diopside/silk fibroin nanocomposite scaffolds for
potential application in maxillofacial bone regeneration. Iran :
International Journal of Biological Macromolecules.
2. Lin Zhao, Junli Zhao, Shuanke Wang, Junsheng Wang, Jia Liu. (2011).
Comparative study between tissue-engineered periosteum and structural
allograft in rabbit critical-sized radial defect model. China : Biomedical
Materials Research Part B: Applied Biomaterials.
3. Seong-Gon Kim1, Min-Keun Kim, HaeYong Kweon, You-Young Jo, Kwang-
Gill Lee, Jeong Keun Lee. (2016). Comparison of unprocessed silk cocoon
and silk cocoon middle layer membranes for guided bone regeneration.
Korea : Maxillofacial Plastic and Reconstructive Surgery.
4. Yurong Cai, Junmao Guo, Cen Chen, Chenxue Yao, Sung-Min Chung,
Juming Yao, In-Seop Lee, Xiangdong Kong. (2017). Silk fibroin membrane
used for guided bone tissue regeneration. China : Materials Science and
Engineering.
5. Taek Gyoung Kim, Heungsoo Shin, Dong Woo Lim. (2012). Biomimetic
Scaffolds for Tissue Engineering. South Korea : Adv. Funct. Mater.
6. Banani Kundu, Nicholas E. Kurland, Subia Bano, Chinmoy Patra, Felix B.
Engel, Vamsi K. Yadavalli, Subhas C. Kundu. (2014). Silk proteins for
biomedical applications: Bioengineering perspectives. India : Progress in
Polymer Science.
7. Naresh Kasoju, Utpal Bora. (2012). Silk Fibroin in Tissue Engineering.
India : Adv. Healthcare Mater.
8. Gregory H. Altman, Frank Diaz, Caroline Jakuba, Tara Calabro, Rebecca L.
Horan, Jingsong Chen, Helen Lu, John Richmond, David L. Kaplan. (2003).
Silk-based biomaterials. USA : Biomaterials.
9. Hyeon Joo Kim, Ung-Jin Kim, Hyun Suk Kim, Chunmei Li, Masahisa Wada,
Gary G. Leisk , David L. Kaplan. (2008). Bone tissue engineering with
premineralized silk scaffolds. USA : Bone.
10. Banani Kundu, Rangam Rajkhowa, Subhas C. Kundu, Xungai Wang. (2013).
Silk fibroin biomaterials for tissue regenerations. India : Advanced Drug
Delivery Reviews.
11. Biman B.Mandal, Sonia Kapoor, Subhas C.Kundu. (2009).
Silkfibroin/polyacrylamide semi-interpenetrating network hydrogels for
controlled drug release. India : Biomaterials.
12. Nicholas Guziewicza, Annie Besta, Bernardo Perez-Ramireza, and David L.
Kaplanb. (2011). Lyophilized Silk Fibroin Hydrogels for the Sustained
Local Delivery of Therapeutic Monoclonal Antibodies. USA :
Biomaterials.
13. Ung-Jin Kim, Jaehyung Parka, Hyeon Joo Kima, Masahisa Wada, David L.
Kaplan. (2005). Three-dimensional aqueous-derived biomaterial scaffolds
from silk fibroin. United States : Biomaterials.
The 7th National and International Graduate Study Conference 2017
" Thailand 4.0 Creative Innovation for Sustainable Development "
I141

14. John A. Mcdonald, Diane G. Kelley, Thomas J. Broekelmann. (1982). Role of
Fibronectin in Collagen Deposition : Fab' to the Gelatin-binding Domain
of Fibronectin Inhibits Both Fibronectin and Collagen Organization in
Fibroblast Extracellular Matrix. United States : Cell Biology.
15. Brian D. Lawrence, Scott Wharram, Jonathan A. Kluge,Gary G. Leisk,
Fiorenzo G. Omenetto, Mark I. Rosenblatt, David L. Kaplan. (2010). Effect of
Hydration on Silk Film Material Properties. USA : Macromol Biosci.
16. Dohiko Terada, Yoshiyuki Yokoyama, Shinya Hattori , Hisatoshi Kobayashi,
Yasushi Tamada. (2016). The outermost surface properties of silk fibroin
films reflect ethanol-treatment conditions used in biomaterial
preparation. Japan : Materials Science and Engineering C.
17. Sandra Hofmann, Kathryn S. Stok , Thomas Kohler , Anne J. Meinel, Ralph
Muller. (2014). Effect of sterilization on structural and material properties
of 3-D silk fibroin scaffolds. Switzerland : Acta Biomaterialia.
18. Mashro Tsukada, Yoko Cotoh, Masanobu Nacura, Norihiko Minoura,
Nobutami Kasai, Ciuliano Freddi. (1994). Structural Changes of Silk
Fibroin Membranes Induced by Immersion in Methanol Aqueous
Solutions. Japan : Polymer Science: Part B: Polymer Physics.
The 7th National and International Graduate Study Conference 2017
" Thailand 4.0 Creative Innovation for Sustainable Development "
I142

Appendix
Author: Jutakan Thonglam
Program: Biomedical Engineering
Institute: Faculty of Medicine, Institute of biomedical Engineering, Princes of
Songkla University.
Tel. 061-2149597 e-mail. [email protected]
Author: Assistant Professor Jirut Meesane
Program: Biomaterials for tissue engineering
Institute: Faculty of Medicine, Institute of biomedical Engineering, Princes of
Songkla University.
Tel. 086-9582111 e-mail. [email protected]
Author: Assoc. Prof. Thongchai Nanthanaranont
Program: Oral & Maxillofacial Surgery
Institute: Faculty of Dentistry, Department of Oral & Maxillofacial Surgery, Prince
of Songkhla University.
Tel. 0874777015 e-mail. [email protected]
The 7th National and International Graduate Study Conference 2017
" Thailand 4.0 Creative Innovation for Sustainable Development "
I143

Constructed electro-spun fibers based on thermoplastic polyurethane to design tissue engineering scaffolds; Fabrication, morphological formation
Nattawat Watcharajittanont, Chatchai Putson, Prisana Paripattananon, Jirut Meesane
Institute of Biomedical Engineering, Faculty of Medicine, Prince of Songkla
University.
Abstract
Electro-spinning, is a famous method for small fiber fabrication. In this research, construct electro-spun fibers were presented as guidance to design scaffolds for tissue engineering.
Thermoplastic polyurethane (TPU) 10% w/v was dissolved in a mixing ration between; N,N-dimethylformide (DMF) and Tetrahydrofuran (THF) as 100:0, 70:30 and 50:50. Then, these TPU solutions were fabricated into small fibers, via the use of electro-spinining. The rheology of the polymer solution, fabrication parameters as well as the morphological formation was then evaluated. Results of rheology analysis exhibited that the storage modulus (G’) and loss modulus (G”) of all PU solution increased with an increasing THF amount in the solvent.
As to the fabrication parameter, nozzle gab and feeding flow rate these were then evaluated. Increasing the feeding flow rate made a large fiber diameter and uninform of the fibers. Increasing the nozzle gab distance brought about small fiber and uniform fibers, once the solvent completely evaporated from the polymer solution.
The results indicated that rheology and fabrication parameters had an effect on various morphological formations. Such formations were important in the design performance of the scaffolds for tissue engineering.
Key words : electrospinning fiber,polyurethane, DMF,THF, solvent ratio
1. Introduction
Currently, there are many patients, who have defective tissue from either having been involved in some sort of serious accident or the suffering of a disease. For clinic treatments, there are many processes to assist or cure such patients, and treatments often show that one of the main roles is to enhance as well as to regulate the formation function of new tissue at the defect site. Creating an attractive approach is, therefore, a challenge for researchers.
The 7th National and International Graduate Study Conference 2017
" Thailand 4.0 Creative Innovation for Sustainable Development "
I144
Interestingly, is one such attractive approach, as it has been used to induce new tissue formations (1,2). Tissue engineering consists of three crucial parts including; cells, growth factors along with scaffolds. Those crucial parts have the role of inducing new tissue regeneration (3). This is especially true for scaffolds, which contour with the structure and physical performance, so as to maintain the overall contour (Furthermore, scaffolds have a biological performance role in the promotion of cell adhesion, proliferation, and migration (4,5). Those structures and functions lead to enhanced and regulated tissue regeneration. Therefore, the creation of performance scaffolds has been emphasized in this research.
An Electro-spinning technique is widely used for the fabrication of tissue engineering scaffolds (6,7).This technique is an attractive technique, which uses electrical force to form polymer solution into fibers. Such fibers are produced into various sizes from micro to nano scale. According to its unique potential, electro-spinning was selected to fabricate a performance scaffold, which has certain fibrous structures for tissue engineering within this research.
Thermoplastic polyurethane (TPU) consists of two segments in the molecule, which includes both a soft and hard segment. The soft segment displays flexibility, whilst the hard segment supports the stiffness of the molecule. Interestingly, some research has reported that the connection as well as interaction of these two segments has an influence on its molecular behavior (8). Such molecular behavior has an effect on various structural formations and characteristic of electro-spun fibrous, which in turn makes it possible to design performance scaffolds.
In this research, electro-spun TPU fibers were created and presented as tissue engineering scaffolds. Those fibers were fabricated into various structures. Then the fabrication parameters and morphological formations were evaluated.
Objective
1. To fabricate electro-spun TPU fibers from solvents of DMF/THF. 2. To evaluate morphological formation of fibers from varying processes
parameters (flow rate, distance between nozzle tip and collector plate, Applied voltage).
3. To characterize physical performance of fibers.
Research Methodology
Solution preparation.
Thermoplastic polyurethane (TPU DP9370A, Bayer) (10% w/v) was dissolve in dimethylformamide (DMF) and tatrahydrfurane (THF) mixed solvents at different rations of 100/0, 70/30 and 50/50 at 80 o C for 6hrs with a magnetic stirrer. This work used PU 100, PU 70 and PU 50 in tread of PU 100/0, PU 70/30 and PU 50/50
The 7th National and International Graduate Study Conference 2017
" Thailand 4.0 Creative Innovation for Sustainable Development "
I145
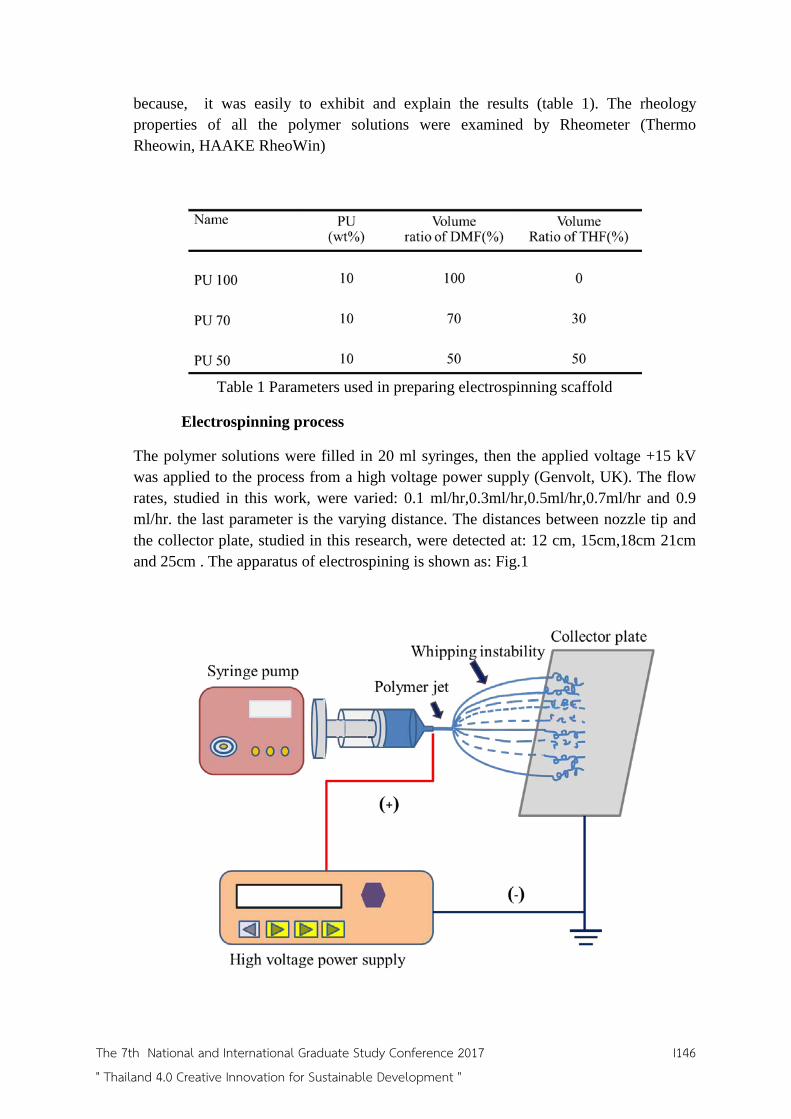
because, it was easily to exhibit and explain the results (table 1). The rheology properties of all the polymer solutions were examined by Rheometer (Thermo Rheowin, HAAKE RheoWin)
Table 1 Parameters used in preparing electrospinning scaffold
Electrospinning process
The polymer solutions were filled in 20 ml syringes, then the applied voltage +15 kV was applied to the process from a high voltage power supply (Genvolt, UK). The flow rates, studied in this work, were varied: 0.1 ml/hr,0.3ml/hr,0.5ml/hr,0.7ml/hr and 0.9 ml/hr. the last parameter is the varying distance. The distances between nozzle tip and the collector plate, studied in this research, were detected at: 12 cm, 15cm,18cm 21cm and 25cm . The apparatus of electrospining is shown as: Fig.1
The 7th National and International Graduate Study Conference 2017
" Thailand 4.0 Creative Innovation for Sustainable Development "
I146

Fig. 1 Apparatus of electrospining
SEM analysis of electrospining fiber.
The morphological structure of the PU fibers, in all groups, was observed by a SEM machine (TM3030Plus, Hitachi). The PU fibers were coated with gold using a gold sputter, coater machine (SPI Supplies, Division of STRUCTURE PROBE Inc., Westchester, PA USA) before the investigation. The fiber diameters were investigated with an Image J program.
Water contact angle analyses
The hydrophilic properties of the fibers were exhibited by the contact angle result. It was investigated by; optical system device (OCA 15CE, Dataphysics). 1ml. was dropped on every surface of the fibers membrane, then left for a time of; 5mins, 10mins, 15mins, 20mins and finally 25mins for contact angle studying.
Results/conclusion
Rheology results
Rheology is defined as an important parameter of material deformation and flow during
electro spinning from the nozzle (9). The parameters; storage and loss modulus were
presented rheological characteristic of the TPU solution in this research. Principally, G’
implies to the stiffness of molecules, which is presented into the store energy within
their structure. G” generally shows the viscous characteristic of said molecules, which
are presented into the loss of energy within their structure.
The results showed that the storage modulus of all PU solution expresses in the
Fig 2. The storage modulus increased when increasing the THF ratio in the mixing
solvent. This might come from hard segments, which can form as part of the molecular
interaction and self-organize into regularity within the solution, when increasing the
amount of THF (10).
The 7th National and International Graduate Study Conference 2017
" Thailand 4.0 Creative Innovation for Sustainable Development "
I147

Fig 2. Effect of Volume Fraction of the Polymer solution from different mixing rations
on storage modulus (G’)
Notably, in the case of loss modulus, increasing the THF amount in the solvent
had an effect on increasing the loss of modulus within the TPU solution (Fig 3). This
possibly comes from the dissolved soft segment, which can induce the mobility of the
TPU chains within the solution. The molecular mobility of TPU chains led to the
inducing of loss modulus.
The 7th National and International Graduate Study Conference 2017
" Thailand 4.0 Creative Innovation for Sustainable Development "
I148

Fig 3. Effect of Volume Fraction of the Polymer solution with different mixing rations
on loss modulus (G”)
Effect of distance between nozzle tip and collector on fiber morphology
The distance between the nozzle tip and the collector plate is another import
parameter, which directly has an impact on the fiber diameter. The results, from Fig 4,
showed that increasing the distance between nozzle tip and plate affected the fiber
morphology, as in it is more homogenous with a smaller diameter.
The rough, film polymer occurred at a short distance of 12cms and 15cms, owing to the
polymer solution fusing together before the solvent evaporated, absolutely. At distances
of 18cms to 24cms, all PU fibers had more fiber morphology. Comparison between the
morphology of three fibers, fabricated from different polymer solutions, found that the
fiber morphology, which produced for PU 100 composed of both large and the small
fibers, whereas, fiber produced from PU 50 were more homogenous than those fibers
produced from PU 50 and PU 70.
The 7th National and International Graduate Study Conference 2017
" Thailand 4.0 Creative Innovation for Sustainable Development "
I149

Fig 4. Scanning electron microscopy (SEM) images of electrospining 10 wt.%
Polyurethane fibers obtained from different mixing ration solvent, between DMF and
THF, at different collecting gap distances, (a) 12cms, 15cms, 18cms, 21cms and 24
cms, using electric power 15 kV and solution flow rate of 0.3 ml/hr constantly.
Increasing the distance between the nozzle tip and collector plate not only
decreased film feature on the fiber membrane, induced homogenous fibers in the fiber
membrane, but also had an effect on the fiber diameter. Fig. 5 shows the diameter of
the three fibers from difference PU solutions, decreased with increasing distance. Long
distances permitted a long time for the solvent used in the polymer solutions to
evaporate. PU 50 was solved in the mixing solvent between DMF and THF at a ratio
of: 50:50. THF has a low boiling point, it can, therefore, be easily evaporated (11). Due
to this factor, PU 50 solution, which solved with easily evaporated solvent, formed the
fiber feature with a short distance and exhibited in the 15cms, while PU 50 at 12 cms
still had a film feature occurring in the membrane.
The 7th National and International Graduate Study Conference 2017
" Thailand 4.0 Creative Innovation for Sustainable Development "
I150

Fig 5. Exhibited the impact of the distance between nozzle tip and collector on the all
PU fibers at different diameters. (12 cm, 15 cm, 18cm, 21 cm and 24 cm.)
Effect of feeding flow rate on the fiber morphology
The feeding flow rate must also be explained for the characterization of electro-
spun fiber diameters. Solution flow rate, which were varying, were used in order to
maintain a stability Taylor cone during the electro spinning process (12).Increasing the
feeding flow rate, during the process, while the maintaining the Taylor cone produces a
large fiber diameter (13). Increasing the flow rate too much causes the polymer solution
to move faster towards the collector plate (14).The solvent cannot completely evaporate
in the fiber regeneration, leading to flattened of the fiber, or a polymer film forming on
the collector plate (15.)
Fig.6 exhibited the effects of the flow rate on the fiber diameter of all PU
fibers. The studied flow rates in this work are: 0.1 ml/hr, 0.3 ml/hr, 0.5ml/hr, 0.7ml/hr
and 0.9 ml/hr. SEM images showed that with the low flow rate at 0.1 ml/hr and 0.3
ml/hr. Uniformed fibers were produced. PU 100 fibers began to become less
uniformed uninform at 0.5 ml/hr, because some solvent showed incomplete
evaporation. Therefore, there were some occurrences of molten fibers. Generally,
DMF has a higher boiling point than THF. The increasing amount of the THF in the
solvent had an effect on inducing of the evaporation rate of the solvent. Therefore,
evaporation of solvent in PU 50 and PU 70 were better than that of PU 100. PU 50 and
The 7th National and International Graduate Study Conference 2017
" Thailand 4.0 Creative Innovation for Sustainable Development "
I151

PU 70 began melting the fiber at 0.7 ml/hr, as well as which it showed partially
formation of polymer film at 0.9 ml/hr.
Fig 6. Scanning electron microscopy (SEM) images of electrospining 10 wt.%
Polyurethane fibres obtained via different mixing ration solvent between DMF and
THF along with different feeding flow rates: 0.1ml/hr, 0.3ml/hr, 0.5ml/hr, 0.7ml/hr and
0.9 ml/hr electric power 15 kV and a collecting gap distance of 24cms, constantly.
At a low flow rate (about 0.1-0.5 ml/hr) the electro-spun fibers were uniform.
At higher flow rates (about 0.7- 0.9 ml/hr) the fiber surface had more roughness than
the others. Notably, at those flow rates there was a partial formation of polymer film.
All PU fiber diameters increased with an increasing feeding flow rate. Comparison to
all PU diameters, demonstrated that the fiber of PU 50 was bigger than that of the other
polymer fibers. It is possible that this was caused by the THF solvent having more
interaction inside the polymer chain than that of DMF. While, PU 50 solution was
maintaining jet, the interaction inside the polymer chain within the solution produced a
large stream polymer. Once, the solvent completely evaporated, large fibers occurred
on the collector Fig 7.
The 7th National and International Graduate Study Conference 2017
" Thailand 4.0 Creative Innovation for Sustainable Development "
I152

Fig 7. Relationship between the fibers diameter and the feeding flow rate, showing the
average fiber diameter for: 0.1 ml/hr, 0.3 ml/hr, 0.5 ml/hr,0.7ml/hr and 0.9 ml/hr.
Discussions
This work studied the effects of the mixing ratio of; DMF and THF, which are
both solvents for PU solution. Each solvent directly impacted on the PU structure,
which is composed of two segments, noted as a soft and hard segment.
Increasing the THF amount in the solvent could increase storage modulus and loss
modulus of the PU solution. This possibly came from the THF having an effect on
regular formation and mobility of TPU molecules. The polymer solution property is an
important factor for PU fiber fabrications in the electro-spining process. The structure
inside the polymer solution dissolved in different solvents causing, different segment
interaction inside said polymer molecules in addition to having an effect on the fiber
morphology.
Furthermore, the electro-spinning process parameters such as; nozzle gap
distance and the feeding flow rate had an influence on both the fiber diameters and fiber
The 7th National and International Graduate Study Conference 2017
" Thailand 4.0 Creative Innovation for Sustainable Development "
I153
morphology. Increasing the nozzle gap, reduced the fibers diameter whereas, the fiber
diameter increased with an increasing of the feeding flow rate. The fiber sizes and
morphology of the all PU fibers was strongly, dependent on solvent evaporation within
the polymer solutions, which were jetted from the syringe.
Recommendations
Thermoplastic polyurethane is widely used for scaffolds, in tissue engineering research.
In this work, the effects of the mixing solvent on the polymer solution properties
coupled with the electro-spinning process parameters were considered.
The fiber sizes as well as the fiber morphology of these electro-spun fibers are
important factors for cell behavior, which in turn leads to inducing of tissue
regeneration. Those parameters of fabrication, which had an effect on the
morphological formation of said fibers, might be of continued guidance in the future
design and performance of scaffolds for various types of tissue engineering.
Interestingly, performance of TPU fibers might be developed by bioactive molecules
for future works.
Reference
1. Ceccaldi Caroline, Bushkalova Raya, Cussac Daniel, Duployer Benjamin, Tenailleau Christophe, Bourin Philippe, Parini Angelo, Sallerin Brigitte, Girod Fullana Sophie.(2017). Elaboration and evaluation of alginate foam scaffolds for soft tissue engineering.France: International Jounal of Phamaceutics.
2. Ming Li ,Susumu Ikehara.(2013). Bone-Marrow-Derived Mesenchymal Stem Cells forOrgan Repair.Japan: Stem Cells International.
3. Fergal J. O’Brien.(2011). Biomaterials & scaffolds for tissue engineering. Ireland:Materialstodays.
4. Hao-Yang Mi, SunMi Palumbo,Xin Jing, Lih-Sheng Turng,Wan-Ju Li,Xiang-Fang Peng.(2014).Thermoplastic polyurethane/hydroxyapatite electrospun scaffolds for bone tissue engineering: effects of polymer properties and particle size.China: Society of Biomaterials.
5. Jun-Hyeog Jang, Oscar Castano, Hae-Won Kim. (2009). Electrospun materials as potential platforms for bone tissue engineering.Korea : Advanced drug delivery reviews.
The 7th National and International Graduate Study Conference 2017
" Thailand 4.0 Creative Innovation for Sustainable Development "
I154

6. L. Wang. J. Ryan.(2011). Introduction to electrospinning. UK: Woodhead Publishing Limited.
7. Seema Agarwal, Joachim H. Wendorff, Andreas Greiner.(2008).Use of electrospinning technique for biomedical applications. Germany: Polymer
8. K.M.Lem, J.R. Haw , S. Curran, S. E. Sund , C. Brumlik, G.S. Song and D.S. Lee .(2013). Effect of hard segment Molecular Weight on Dilute Solution Properties of Ether Based Thermoplastic Polyurethanes.USA : Nanoscience and Nanaengineering.
9. V. Lisy, J. Tothova , B. Brutovsky.(2007). Rheology of Dilute Polymer Solutions with Time-Dependent Screening of Hydrodynamic Interactions. Slovakia :Physics/cond-mat.soft.
10. K.M.Lem, J.R. Haw , S. Curran, S. E. Sund , C. Brumlik, G.S. Song and D.S. Lee .(2013). Effect of hard segment Molecular Weight on Concentrated and bulk properties of Ether Based Thermoplastic Polyurethanes.USA : Nanoscience and Nanaengineering.
11. G. Tetteh, A.S. Khan, R. M. Delaine –smith, G.C. Reilly, I.U. Rehman.(2014). Electrospun polyurethane /hydroxyapatide bioactive Scaffold for bone tissue engineering: The role of solvent and hydroxyapatite particles.UK : Journal of the mechanical behavior of biomedical material.
12. A M Ga˜ n´an-Calvo1, N Rebollo-Mu˜noz, J M Montanero.(2013). The minimum or natural rate of flow and droplet size ejected by Taylor cone–jets: physical symmetries and scaling laws. Spain: New Journal of Physics.
13. Greory C. Rutledge, Sergey V. Fredlikh.(2007).Formation of fiber by electrospinning. USA: Advance Drug delivery reviews.
14. Travid J. Still, Horst A. Von Recom.(2008). Electrospinning: Application in drug delivery and tissue engineering.USA: Biomaterials.
15. Mohammad Chowdhury ,George Stylios. (2010). Effect of Experimental Parameters on the Morphology of Electrospun Nylon 6 fibres.UK: International Journal of Basic & Applied Sciences IJBAS-IJENS.
The 7th National and International Graduate Study Conference 2017
" Thailand 4.0 Creative Innovation for Sustainable Development "
I155

Title Quantitative Analysis of Lactobacillus in Infected Root Canals of Primary Teeth
Author: Miss Pim Khererat
Program Master of Science program in Dentistry (International program)
Institute Mahidol University
Abstract
Introduction: The primary dentition is important for childhood in term of speaking,
chewing and their appearance. Root canal infection is the main reason in premature loss
of primary teeth in children. Consequently, it is important to identify bacteria which act
as pathogens to improve an effective therapy of root canal treatment in children.
Objective: To analyze and compare Lactobacillus spp. levels in infected root canal
samples of primary teeth between two clinical situations; Group1; irreversible pulpitis,
and Group2; pulp necrosis, as well as evaluate the relationships with the history of
spontaneous pain and clinical abscess.
Research Methodology: 51 root canal samples (41 samples in Group1 and 10 sampels
in Group 2) were obtained from Thai children aged 2.9-8.8 years. After DNA from
samples were extracted, Real-time PCR by using specific primers of Lactobacillus
species and SYBR green were performed to quantify bacterial level. For each sample,
total CFU count was converted to a log10 count to normalize the data. Independent
Sample T-Test and Mann-Whitney U test were used for statistical analysis. The value
of p < 0.05 was accepted as statistically significant difference.
Results: The levels of Lactobacillus in primary teeth diagnosed with pulp necrosis was
significantly higher than irreversible pulpitis. In addition, Lactobacillus level in root
canal samples from subjects who had a history of spontaneous pain was significantly
higher than subjects who had no history. However, the presence of clinical abscess was
not related with the bacterial level of Lactobacillus in root canal infection.
Conclusion: The significantly high levels of Lactobacillus were found in root canal
infection of primary teeth that diagnosed with pulp necrosis and had a history of
spontaneous pain.
Keywords: LACTOBACILLUS/ REAL-TIME PCR/ ROOT CANALS INFECTION/
PRIMARY TEETH
Introduction
The primary dentition is important for childhood. They work as guides for
the eruption of permanent dentition and contribute to the development of jaws and
chewing process to promote nutrient assimilation. Premature loss of primary teeth can
produce change in the eruption of permanent teeth, which can cause phonetic
disturbances and harmful oral habit, such as tongue interposition and esthetic
consequences. Dental caries is considered as endogenous bacterial infected disease,
The 7th National and International Graduate Study Conference 2017
" Thailand 4.0 Creative Innovation for Sustainable Development "
I156
caused by oral cavity bacterial flora with have latent pathogenic potential. If caries is
not treated, the complications occur with endodontic infection.
Root canal infection which is commonly a consequence to dental caries can
cause premature loss in primary dentition. The pulp in primary dentition is histologically
similar to permanent teeth and could be affected by caries, restorative procedure and
trauma. The etiology and pathogenesis of dental infection in children are similar in the
primary and permanent dentition, but they are different in the process because the
primary teeth have specific anatomical and physiological conditions.
The accomplishment of endodontic treatment depends on several factors.
Nonetheless, the most important key is to reduce or eliminate the infection of
microorganisms. Therefore, the knowledge of variety in microorganism in root canal
infection should be explored for more understanding to improve an effective therapeutic
strategy in root canal treatment in primary teeth.
The method which rapidly detect and identify the microorganism have been
developed which is Quantitative PCR (Real-time PCR) with species-specific primers. It
can provide an accurate and sensitive method for detection and quantification of
individual species and bacterial populations. The ability to quantify the bacteria in a
sample has advantages to previous approaches in that it not only identifies a presence or
absence but also the amount of bacteria that could be related to clinical conditions.
Bacterial biology of root canal infection
In the way of invasive is via caries; the bacteria in the front of the carious
process may be the primary microorganisms to reach the pulp and initiate endodontic
infection. A study identified bacteria isolated from carious lesion biofilms and vital
carious exposures of pulps of deciduous teeth and observed that the microbiota of the
carious lesions exposed pulps were similar in composition to those of carious lesion
biofilms except that fewer species were identified from the pulps. Recent molecular
biology methods have established that the diversity and complexity of the microbiota
associated with caries are greater than the variety of microorganisms were found by
cultural method. Microbiological research using molecular method found that about 40-
60% of the microorganisms occurring in carious lesions consists of uncultatived species.
Several studies investigated the microbiota associated with endodontic infection in
adults and indicated that they were dominated with the presence of obligate and
facultative anaerobe bacteria on microbial composition. As the caries lesion advances
to deep into dentine, the composition of the involved microbiota shifts from a
predominance of facultative and saccharolytic Gram-positive bacteria in shallow lesions
to a predominance of proteolytic anaerobic bacteria in deep dentinal lesions.
Rocas IN et al studied and evaluated deep dental caries in permanent teeth
in term of the prevalence of bacterial species which associated with pulp exposures by
Quantitative PCR (qPCR). In this study, they found the presence and levels of
Streptococci and Lactobacilli which are high prevalent and they also associated with
dental caries. While both of bacterial groups were found in a high frequency, but they
The 7th National and International Graduate Study Conference 2017
" Thailand 4.0 Creative Innovation for Sustainable Development "
I157

comprised only 0.09% and 2% in the whole bacterial population, respectively. From
this results, researchers suspected that the bacteria which found in high prevalence in
deep carious lesion that resulted in pulp exposure may be important pathogens in
evoking pulp inflammation and initiating endodontic infection.
If the pulp is freely exposed to the caries biofilm, the inflammation of the
dental pulp usually develops to irreversible pulpitis. Even though the pulp is still alive,
the approach of bacteria into the pulp will not allow the pulp to heal and it will ultimately
result in necrosis, or death, of the pulp tissue, consequently. The bacterial effects on the
pulp are caused either by bacterial virulence factors and antigens that diffuse through
the dentinal fluid or by the bacterial cells themselves which may reach the pulp via
dentinal tubules. Due to differences of availability of nutrients and oxygen, the root
canal is unique site of infection in oral cavity. Once the pulp is necrotic, only a restricted
subset of species can colonize it. While the infectious or necrotic pulp extents to
periapical area, an acute periapical abscess which induces bone and tissue necrosis and
accumulation of purulence will occur. Furthermore, the previous study which compared
the bacterial community profiles between symptomatic and asymptomatic primary
infection by molecular fingerprinting techniques has found marked differences between
these conditions.
Diversity of bacteria in infected root canal in primary teeth
Studies about the bacteriology in infected root canals of primary teeth has
been reported since 1960. Due to a wide variety of organisms in infected root canals of
permanent teeth, researchers have questions about the difference of microorganism
between primary and permanent teeth.
Using bacterial culture, a few studies reported that the microorganism in the
root canal infection with pulp necrosis and periapical lesions in human deciduous teeth
are polymicrobial, and they are predominance with anaerobic microorganisms of 96.7-
100 %. According to the results of these studies, they hypothesized that predominance
of anaerobic microorganisms were affected by the occurrence of natural selection. The
proper microorganism selection of the microbial shift depends on many factors such as
gradual decreasing in oxygen tension in root canals, together with the nutritional needs
of microorganisms and the food chain.
After molecular techniques were introduced for the identification of bacteria
as more specific, accurate, sensitive and rapid technique especially uncultivable and
fastidious type. A pilot study in children with severe early childhood caries about the
microbiota of carious exposures of dental pulps had been made for a better
understanding of pulp pathogens. This study focused on bacteria in the exposed vital
coronal pulp and used combined cultural and molecular methods for analysis. The
bacteria samples from carious biofilm and pulp chambers were collected to identify
bacteria species by using sequences of 16S rRNA. From the results of this study, the
dominant species detected were S. mutans. Moreover, Parascardovia, Veillonella,
The 7th National and International Graduate Study Conference 2017
" Thailand 4.0 Creative Innovation for Sustainable Development "
I158
Actinomyces and Lactobacillus species in pulps suggests that these species might play
direct or supporting roles in pulp pathology in children.
The study from Qiu-Bo Yang, et al observed bacteria associated with acute
apical abscesses in children by PCR-DGGE technique. Purulence samples from infected
primary teeth diagnosed as acute apical abscess were analyzed. The most dominate
bacteria genera were Prevotella, Fusobacterium, Porphyromonas and Lactobacillus
spp. The findings in this study presented the predominant microorganisms as strict and
facultative anaerobic bacteria, which is in agreement with previous studies.
Relationship of Lactobacillus species and root canal infection
Lactobacilli are rod-shaped, Gram-positive, none spore forming, highly
acidogenic and acid-tolerant bacteria, which grows under anaerobic, facultative
anaerobic or microaerophillic conditions. They are generally considered nonpathogens,
except their association with dental caries. These bacteria are primarily associated with
dental caries progression due to their ability to produce lactic acid which can decalcify
enamel and dentine. A study in Thai children showed relationship between the
prevalence of Lactobacillus and caries status. The previous quantitative analysis by real-
time PCR in Thai children reported that the amount of Lactobacillus fermentum in
plaque from children with severe early childhood caries was significantly higher than
caries free group. Some studies reported the prevalence of Lactobacillus species in
infected root canal in primary and permanent dentition. The most common species found
in infected root canals are L. casei, L. salivarius, L. acidophilus, L. plantarum and L.
fermentum. The prevalence of Lactobacilli in infected root canals was scarcely reported
in previous studies. Some of them revealed that this microorganism was dominated over
other Gramm-positive rods, so the presence of Lactobacilli may have an important role
in root canal infection and associate with ecological change in the affected tissue.
By cultural method, one of microbiological studied isolated aerobic and
anaerobic microorganism from extracted teeth in different parts of deep carious lesions
with irreversible pulpitis to investigate the microbial changes between shallow dentinal
caries and infected pulp. The results were divided into two main groups consisting of
high and low level of Lactobacilli which are the most frequent organism in this study.
The results showed that, in high Lactobacilli group, gradually increasing level of
Lactobacilli was presented when the sampling moved down to the pulp. As a result, they
concluded that an extremely acidic environment in deep carious lesions and inside
infected dentine of the root canals tends to be more preferable for Lactobacilli. This
situation seems to be associated with root canal infection and pulpal death. Further study
might require to fully understand the issue.
By using microbiological technology, some researchers tried to contribute
the knowledge of the bacteria taxa occurring at the forefront layer of deep dentinal caries
associated with pulp exposure with symptomatic irreversible pulpitis by using the next-
generation of sequencing approach. The finding of this study reported the similar results
to the previous studies. Half of deep caries samples were heavily dominated by
The 7th National and International Graduate Study Conference 2017
" Thailand 4.0 Creative Innovation for Sustainable Development "
I159
Lactobacillus, while in the other half Lactobacilli were very low abundance but
dominated by the other bacteria species which was commonly detected in infected root
canals such as Pseudoramibacter, Olsenella, Streptococcus and Stenotrophomonas. The
researchers suspected that the difference in Lactobacilli abundance may represent a
transition from cariogenic microbiota to the one that participates in the initial infection
of the pulp tissue.
According to findings of previous studies, the high prevalence of
Lactobacillus related with in advanced caries and infected pulp in permanent teeth.
However, no study has ever reported the bacterial quantity of Lactobacillus spp. in root
canal infection of primary teeth. This study hypothesized that Lactobacillus level in root
canal infection of primary might relate with root canal infection diagnosed as pulp
necrosis and some of clinical signs and symptom of root canal infection.
Objectives
1) To identify and compare the levels of Lactobacillus spp. in root canal
samples of primary teeth diagnosed as irreversible pulpitis and pulp necrosis
in Thai children aged 2 to 10 years
2) To investigate the relationships between the levels of Lactobacillus spp.
and clinical signs and symptoms of root canal infection in primary teeth.
Research Methodology
Subjects and sample collection
This study was approved by the Ethical Institutional Review Board, Faculty
of Dentistry and the Faculty of Pharmacy, Mahidol University (MU-DT/PY-IRB
2016/014.0809) and it was under the consideration of the Ethical Institutional Review
Board, Faculty of Dentistry and the Faculty of Pharmacy, Mahidol University for the
annual extension.
The infected primary teeth which needed pulpectomy treatment from fifty-
three children (2-10 years old) who came to pediatric dental clinic, Mahidol University
were included in this study. All children had to have normal physical growth, no
systemic disease and cooperative. Those who had received any antibiotic therapy during
the last 3 months were excluded from the study. The informed consent was obtained
from the parents. Samples were collected by using strict asepsis according to Siqueira
et al. with slightly modification in term of agents that used for sterilization of operative
field. Briefly, the tooth was cleansed with pumice and isolated with a rubber dam. The
tooth and the surrounding field were sterile by Iodine solution. Complete access
preparations were made by using sterile burs with sterile normal saline solution.
Samples were initially collected by means of a #15 K-file. The files were introduced to
a level approximately 1 mm short of the tooth apex, then two to three sequential paper
points were placed to the same level and use to soak up the fluid in the canal. Leave the
paper points in wet canal for 60 seconds and then transfer to tubes containing 1.0 ml of
TE buffer. Then, samples were immediately frozen at -20°C.
The 7th National and International Graduate Study Conference 2017
" Thailand 4.0 Creative Innovation for Sustainable Development "
I160

DNA extraction and Real-time PCR
The bacterial strain of Lactobacillus fermentum (ATCC 14931) was used in
this study for the specificity and sensitivity tests of primers in PCR technique. Bacterial
DNAs were extracted from fluid in paper points by using FavorPrepTM Tissue Genomic
DNA Extraction kit (Favorgen®, Taiwan) according to the manufacturer’s instructions.
Species-specific primers for Lactobacillus were referred from the study of Mcorist et al.
in 2002. (Primer F; 5’-TGGAAACAGGTGCT AATACCG-3’, primer R; 5’-
CCATTGTGGAAGA TTCCC-3’) Real-time PCR was performed with KAPA SYBR®
qPCR Master Mix (KAPA Biosystems, USA). Quantities of bacterial DNAs in each
sample were calculated by comparing with Standard curve that was generated from
serial dilution of known bacterial DNA concentration in Real-time PCR. Each reaction
mixture in Real-time PCR consisted of 10 µL KAPA SYBR, 0.4 µL of each diluted
forward and reverse primer 1:10 mM and 9.2 µL of nuclease free water and DNA
volume. All amplifications and detections were carried out in Thermocycler (C1000™
Thermal cycler and CFX 96 Real-time System). Amplification was carried out as
follows: initial denaturation for 3 min at 95 °C, 40 cycles of denaturation for 10 s at 95
°C, primer annealing and extension for 30 s at 53.6 °C. The PCR products were
separated and confirmed by electrophoresis on agarose gel, stained with ethidium
bromide dye, and detected by UV box (Hoefer Inc., USA)
Results/conclusion
Fifty-one infected primary teeth from 51 children, who came to Mahidol
University for root canal treatment by pulpectomy procedure, were incorporated to this
study followed by inclusion and exclusion criteria. Real-time PCR using specific
primers was performed to detect bacterial levels of Lactobacillus. The bacterial levels
of Lactobacillus spp. were showed in Table 1. The prevalence of Lactobacillus spp. in
root canal samples was 100% (51/51 samples). Mean and median of bacterial quantities
were 1.87x10⁵ CFU (± 4.70x10⁵ CFU) and 1.87x10⁵ CFU, respectively.
Table 1 The data of bacterial quantities in this study.
Group N Mean ± SD (CFU)
Of Lactobacillus level
Mean log10 CFU
count ± SD p-value*
Pulpal status
Irreversible
pulpitis 41 1.33 x 10⁵±3.71 x 10⁵ 4.039 ± 1.054
0.031*,a
Pulp necrosis 10 4.11 x 10⁵±7.37 x 10⁵ 4.865 ± 1.062
History of
spontaneous
pain
Yes 28 2.44x10⁵ ± 5.84x10⁵ 4.47 ± 0.92
0.047*,b
No 23 1.18x10⁵ ± 2.70x10⁵ 3.87 ± 1.22
The 7th National and International Graduate Study Conference 2017
" Thailand 4.0 Creative Innovation for Sustainable Development "
I161

*p-value < 0.05, a Independent Samples t-test, b Mann-Whitney U-test
Comparison of bacterial quantities between irreversible pulpitis and pulp necrosis
Due to purposive sampling in this study, samples were categorized into two
main groups depended on clinical presence of infected pulpal status.
Group1; Irreversible pulpitis group (41 teeth), primary teeth which
diagnosed with irreversible pulpitis were clinical presence of infected pulpal tissue such
as excessive hemorrhage in root canal that could not control with a damp cotton pellet
applied for several minutes.
Group2; Pulp necrosis group (10 teeth), primary teeth which diagnosed with
pulp necrosis were clinical presence of infected pulpal tissue such as suppuration or
purulence.
For each sample, total CFU count was converted to a log10 count to
normalize the data. The results showed that the bacterial levels of Lactobacillus spp. in
pulp necrosis group were significant higher than the bacterial levels in irreversible
pulpitis group. (Figure 1)
Figure 1 showed the relationship between the bacterial levels in Group: 1 Irreversible
pulpitis and Group2: Pulp necrosis
The relationships between Lactobacillus levels and clinical signs and symptoms
This study showed the significant relationship between the Lactobacillus
level and pain history. Figure 2 demonstrated that the history of spontaneous pain from
the infected primary teeth was found remarkable association with the high level of
Lactobacillus species. However, this study showed no significant difference of
Lactobacillus levels between presence and absence of clinical abscess.
Clinical
abscess
Presence 6 1.72x10⁵±2.55x10⁵ 4.45 ± 1.02
0.513 b
Absence 45 1.89x10⁵±4.93x10⁵ 4.17 ± 1.11
The 7th National and International Graduate Study Conference 2017
" Thailand 4.0 Creative Innovation for Sustainable Development "
I162
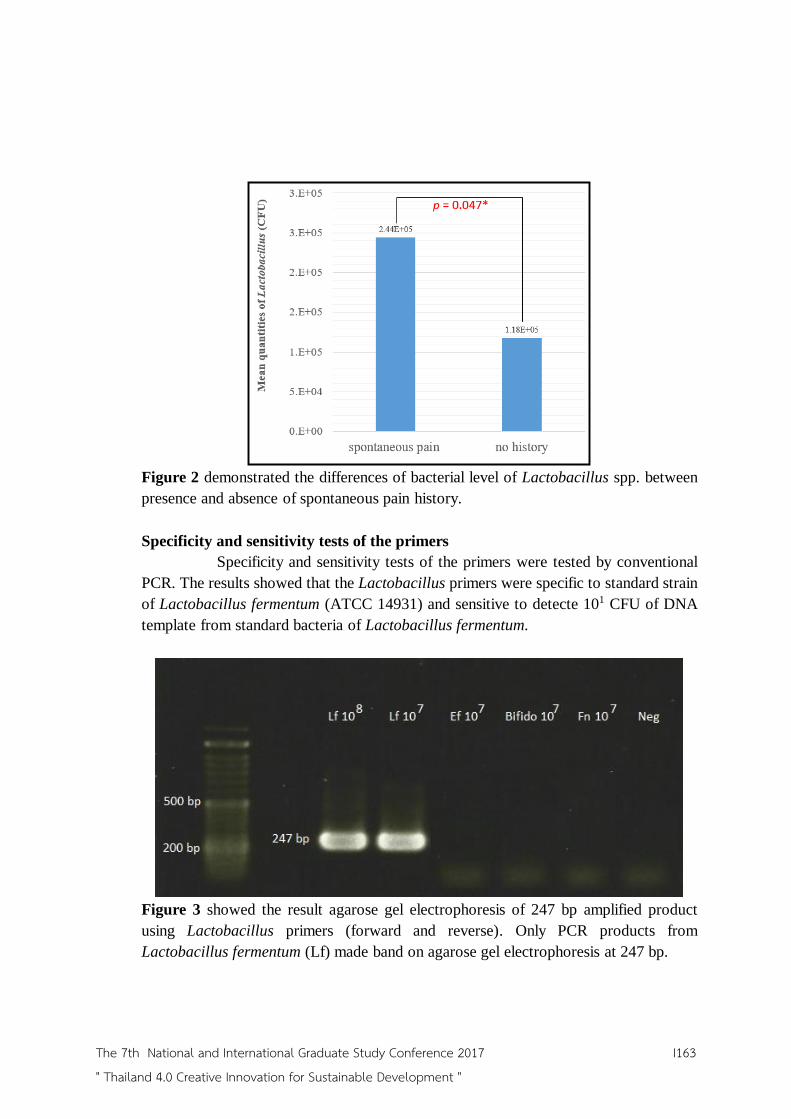
Figure 2 demonstrated the differences of bacterial level of Lactobacillus spp. between
presence and absence of spontaneous pain history.
Specificity and sensitivity tests of the primers
Specificity and sensitivity tests of the primers were tested by conventional
PCR. The results showed that the Lactobacillus primers were specific to standard strain
of Lactobacillus fermentum (ATCC 14931) and sensitive to detecte 101 CFU of DNA
template from standard bacteria of Lactobacillus fermentum.
Figure 3 showed the result agarose gel electrophoresis of 247 bp amplified product
using Lactobacillus primers (forward and reverse). Only PCR products from
Lactobacillus fermentum (Lf) made band on agarose gel electrophoresis at 247 bp.
The 7th National and International Graduate Study Conference 2017
" Thailand 4.0 Creative Innovation for Sustainable Development "
I163

Figure 4 showed the result of agarose gel electrophoresis from real-time PCR product
of 10-fold serially dilution to detect Lactobacillus primers from 108-101 CFU.
Discussion
Due to limited number of studies in microorganisms of infected root canal
in primary teeth, no previous study reported quantitative data of Lactobacillus spp. by
using real-time PCR technique.
This study reported that Lactobacillus spp. was found in all of root canal
samples and mean bacterial level was 1.87x10⁵ CFU. In this study, the level of this
microorganism is similar to the previous study that examine the microbiota in advanced
caries lesions associated with irreversible pulpitis in permanent teeth. Rocas, et al found
that Lactobacilli and Streptococci were high prevalence of advanced caries with
exposed pulp samples. Mean of Lactobacillus spp. in their study was 2.32 x 10⁶ (8.2
percent of total bacterial level).
In term of comparing the level of Lactobacillus spp. between irreversible
pulpitis and pulp necrosis groups, no previous studies reported the difference of
Lactobacillus spp. between these two conditions. However, the specific bacterial level
in pulp necrosis group might represent the predominant bacteria which relate to the
progression of root canal infection. In this study, the level of Lactobacillus spp. in
necrotic pulp samples was significantly greater level than irreversible pulpitis samples.
This finding was in a line to previous study. From the study by Ruviere et al, they
showed the significantly larger total bacterial cell numbers in pulp necrosis group than
in irreversible pulpitis group. The remarkably high level of Lactobacillus spp.in pulp
necrosis in this study might support the hypothesis that this bacteria take an important
role as one of pulpal pathogens to induce pulp inflammation and initiate endodontic
infection. Some of studies also supported this hypothesis. Hahn et al, investigated this
microorganism from teeth with irreversible pulpitis in permanent teeth. By cultural
method, high number and gradually increasing level of Lactobacilli were presented
when the sampling moved down to the pulp. They suggested that an extremely acidic
environment in deep carious lesions and inside infected dentine of the root canals tends
to be more preferable for Lactobacilli. Previous studies in primary teeth also identified
Lactobacillus species as predominant bacterial species in root canal infection of primary
The 7th National and International Graduate Study Conference 2017
" Thailand 4.0 Creative Innovation for Sustainable Development "
I164

teeth. Chalmers et al reported the presence of high bacterial level of Lactobacillus spp.
in pulp necrosis samples. Yang, et al also found that this species was the most dominant
bacteria in purulence samples in acute apical abscess. The finding in this study combined
with previous studies support that Lactobacillus spp. might play direct or assistant role
in pulp pathology in children.
According to the results of relationships between the levels of Lactobacillus
spp. with clinical signs and symptoms, they showed that the level of Lactobacillus spp.
in subjects who have history of spontaneous pain was significantly greater than the
subjects who have no history of spontaneous pain. This result was similar with the result
of previous study in permanent teeth. Rocas et al detected the significant association
between continuous pain and prevalence of Lactobacillus spp. in permanent teeth
diagnosed as irreversible pulpitis. According to this findings, clinicians should be more
consider about taking history of pain in children because it might influence to treatment
outcome in term of bacteria elimination. Although the success of endodontic treatment
depends on many factors, the reduction of bacteria is the important key. The finding in
this study assumed that history of spontaneous pain presence associated with highly
remarkable bacterial level in infected root canal, two visit pulpectomy treatment with
proper medication and antimicrobial irrigation should be considered. However, the
result of this study showed no significant difference between this bacterial level and the
presence of clinical abscess both of acute and chronic abscess. The amount of
Lactobacillus spp. in samples with abscess presence were higher than the samples which
have absence of clinical abscess, but no significant difference. The small sample size of
abscess group might affect in statistical analysis. Moreover, the previous studies by Qiu-
Bo Yang, et al showed that acute apical abscess samples in primary teeth with root canal
infection presented the predominance of other bacterial species such as Prevotella,
Fusobacterium and Porphyromonas.
This study concluded that the significantly high levels of Lactobacillus were
found in root canal infection of primary teeth that diagnosed with pulp necrosis and had
a history of spontaneous pain. However, the relationships between the bacterial levels
and the presences of abscess or symptomatic cases were not found in this study.
The limitation of this current study was small sample size. The appropriate
sample size will produce studies capable of identifying clinically relevant differences.
Further study in this topic should be more sample size to reach proper sample size for
each group of pulpal status.
Recommendations
For improvement of root canal treatment in children, further microbiological
studies are recommended to explore and identify pulp pathogens in infected root canals
in primary teeth.
The 7th National and International Graduate Study Conference 2017
" Thailand 4.0 Creative Innovation for Sustainable Development "
I165
References
Byun, R., Nadkarni, M. A., Chhour, K. L., Martin, F. E., Jacques, N. A., andHunter, N.
(2004). "Quantitative analysis of diverse Lactobacillus species present in
advanced dental caries." J Clin Microbiol 42, 7 (Jul):3128-3136.
Chalmers, N. I., Oh, K., Hughes, C. V., Pradhan, N., Kanasi, E., Ehrlich, Y., Dewhirst,
F. E., andTanner, A. C. (2015). "Pulp and plaque microbiotas of children with
severe early childhood caries." J Oral Microbiol 7:25951.
Chavez de Paz, L. E., Molander, A., andDahlen, G. (2004). "Gram-positive rods
prevailing in teeth with apical periodontitis undergoing root canal treatment."
Int Endod J 37, 9 (Sep):579-587.
Chhour, K. L., Nadkarni, M. A., Byun, R., Martin, F. E., Jacques, N. A., andHunter, N.
(2005). "Molecular analysis of microbial diversity in advanced caries." J Clin
Microbiol 43, 2 (Feb):843-849.
Cogulu, D., Uzel, A., Oncag, O., Aksoy, S. C., andEronat, C. (2007). "Detection of
Enterococcus faecalis in Necrotic Teeth Root Canals by Culture and
Polymerase Chain Reaction Methods." Eur J Dent 1, 4 (Oct):216-221.
Cogulu, D., Uzel, A., Oncag, O., andEronat, C. (2008). "PCR-based identification of
selected pathogens associated with endodontic infections in deciduous and
permanent teeth." Oral Surg Oral Med Oral Pathol Oral Radiol Endod
106, 3 (Sep):443-449.
Cohen, M. M., Joress, S. M., andCalisti, L. P. (1960). "Bacteriologic study of infected
deciduous molars." Oral Surg Oral Med Oral Pathol 13, (Nov):1382-1386.
da Silva, L. A., Nelson-Filho, P., Faria, G., de Souza-Gugelmin, M. C., andIto, I. Y.
(2006). "Bacterial profile in primary teeth with necrotic pulp and periapical
lesions." Braz Dent J 17, 2:144-148.
Diaz, P. I., Chalmers, N. I., Rickard, A. H., Kong, C., Milburn, C. L., Palmer, R. J., Jr.,
andKolenbrander, P. E. (2006). "Molecular characterization of subject-
specific oral microflora during initial colonization of enamel." Appl Environ
Microbiol 72, 4 (Apr):2837-2848.
Fabris, A. S., Nakano, V., andAvila-Campos, M. J. (2014). "Bacteriological analysis of
necrotic pulp and fistulae in primary teeth." J Appl Oral Sci 22, 2 (Apr):118-
124.
Fouad, A. F., Zerella, J., Barry, J., andSpangberg, L. S. (2005). "Molecular detection of
Enterococcus species in root canals of therapy-resistant endodontic
infections." Oral Surg Oral Med Oral Pathol Oral Radiol Endod 99, 1
(Jan):112-118.
Hahn, C. L., Falkler, W. A., Jr., andMinah, G. E. (1991). "Microbiological studies of
carious dentine from human teeth with irreversible pulpitis." Arch Oral Biol
36, 2:147-153.
Hata, S., Hata, H., Miyasawa-Hori, H., Kudo, A., andMayanagi, H. (2006).
"Quantitative detection of Streptococcus mutans in the dental plaque of
Japanese preschool children by real-time PCR." Lett Appl Microbiol 42, 2
(Feb):127-131.
Leonardo, M. R., Rossi, M. A., Silva, L. A., Ito, I. Y., andBonifacio, K. C. (2002). "EM
evaluation of bacterial biofilm and microorganisms on the apical external root
surface of human teeth." J Endod 28, 12 (Dec):815-818.
The 7th National and International Graduate Study Conference 2017
" Thailand 4.0 Creative Innovation for Sustainable Development "
I166

Marsh, S. J., andLargent, M. D. (1967). "A bacteriological study of the pulp canals of
infected primary molars." J Dent Child 34, 6 (Nov):460-470.
Martin, F. E., Nadkarni, M. A., Jacques, N. A., andHunter, N. (2002). "Quantitative
microbiological study of human carious dentine by culture and real-time
PCR: association of anaerobes with histopathological changes in chronic
pulpitis." J Clin Microbiol 40, 5 (May):1698-1704.
Mitrakul, K., Vongsavan, K., andSuratanachaikul, P. (2013). "Prevalence of
Streptococcus mutans and Lactobacillus fermentum and their association
with caries and dietary habits in preschool Thai children." Eur Arch
Paediatr Dent 14, 2 (Apr):83-87.
Munson, M. A., Banerjee, A., Watson, T. F., andWade, W. G. (2004). "Molecular
analysis of the microflora associated with dental caries." J Clin Microbiol
42, 7 (Jul):3023-3029.
Munson, M. A., Pitt-Ford, T., Chong, B., Weightman, A., andWade, W. G. (2002).
"Molecular and cultural analysis of the microflora associated with endodontic
infections." J Dent Res 81, 11 (Nov):761-766.
Nadkarni, M. A., Caldon, C. E., Chhour, K. L., Fisher, I. P., Martin, F. E., Jacques, N.
A., andHunter, N. (2004). "Carious dentine provides a habitat for a complex
array of novel Prevotella-like bacteria." J Clin Microbiol 42, 11 (Nov):5238-
5244.
Pazelli, L. C., Freitas, A. C., Ito, I. Y., Souza-Gugelmin, M. C., Medeiros, A. S.,
andNelson-Filho, P. (2003). "Prevalence of microorganisms in root canals of
human deciduous teeth with necrotic pulp and chronic periapical lesions."
Pesqui Odontol Bras 17, 4 (Oct-Dec):367-371.
Ricucci, D., Loghin, S., andSiqueira, J. F., Jr. (2014). "Correlation between clinical and
histologic pulp diagnoses." J Endod 40, 12 (Dec):1932-1939.
Rocas, I. N., Alves, F. R., Rachid, C. T., Lima, K. C., Assuncao, I. V., Gomes, P. N.,
andSiqueira, J. F., Jr. (2016). "Microbiome of Deep Dentinal Caries Lesions
in Teeth with Symptomatic Irreversible Pulpitis." PLoS One 11, 5:e0154653.
Rocas, I. N., Lima, K. C., Assuncao, I. V., Gomes, P. N., Bracks, I. V., andSiqueira, J.
F., Jr. (2015). "Advanced Caries Microbiota in Teeth with Irreversible
Pulpitis." J Endod 41, 9 (Sep):1450-1455.
Rocas, I. N., Siqueira, J. F., Jr., andSantos, K. R. (2004). "Association of Enterococcus
faecalis with different forms of periradicular diseases." J Endod 30, 5
(May):315-320. Ruviere, D. B., Leonardo, M. R., da Silva, L. A., Ito, I. Y., andNelson-Filho, P. (2007).
"Assessment of the microbiota in root canals of human primary teeth by checkerboard
DNA-DNA hybridization." J Dent Child (Chic) 74, 2 (May-Aug):118-123.
Sakamoto, M., Rocas, I. N., Siqueira, J. F., Jr., andBenno, Y. (2006). "Molecular
analysis of bacteria in asymptomatic and symptomatic endodontic
infections." Oral Microbiol Immunol 21, 2 (Apr):112-122.
Sassone, L., Fidel, R., Figueiredo, L., Fidel, S., Faveri, M., andFeres, M. (2007).
"Evaluation of the microbiota of primary endodontic infections using
checkerboard DNA-DNA hybridization." Oral Microbiol Immunol 22, 6
(Dec):390-397.
Sassone, L. M., Fidel, R., Faveri, M., Fidel, S., Figueiredo, L., andFeres, M. (2008).
"Microbiological evaluation of primary endodontic infections in teeth with
and without sinus tract." Int Endod J 41, 6 (Jun):508-515.
The 7th National and International Graduate Study Conference 2017
" Thailand 4.0 Creative Innovation for Sustainable Development "
I167

Siqueira, J. F., Jr., Rocas, I. N., Souto, R., de Uzeda, M., andColombo, A. P. (2000).
"Checkerboard DNA-DNA hybridization analysis of endodontic infections."
Oral Surg Oral Med Oral Pathol Oral Radiol Endod 89, 6 (Jun):744-748.
Siqueira, J. F., Jr., Rocas, I. N., Souto, R., de Uzeda, M., andColombo, A. P. (2002).
"Actinomyces species, streptococci, and Enterococcus faecalis in primary
root canal infections." J Endod 28, 3 (Mar):168-172.
Sundqvist, G., andCarlsson, J. (1974). "Lactobacilli of infected dental root canals."
Odontol Revy 25, 3:233-238.
Triches, T. C., de Figueiredo, L. C., Feres, M., de Freitas, S. F., Zimmermann, G. S.,
andCordeiro, M. M. (2014). "Microbial profile of root canals of primary teeth
with pulp necrosis and periradicular lesion." J Dent Child (Chic) 81, 1 (Jan-
Apr):14-19.
Vineet, R., Nayak, M., andKotigadde, S. (2016). "Association of endodontic signs and
symptoms with root canal pathogens: A clinical comparative study." Saudi
Endodontic Journal 6, 2 (May 1, 2016):82-86.
Yang, Q. B., Fan, L. N., andShi, Q. (2010). "Polymerase chain reaction-denaturing
gradient gel electrophoresis, cloning, and sequence analysis of bacteria
associated with acute periapical abscesses in children." J Endod 36, 2
(Feb):218-223.
The 7th National and International Graduate Study Conference 2017
" Thailand 4.0 Creative Innovation for Sustainable Development "
I168

Gelatin-based hybrid hydrogels as mimicked extracellular matrix scaffolds for bone
healing in maxillofacial defects
Atsadaporn Tangprasert, Assoc. Prof Jirut Meesane, Dr. Chittreeya Tansakul,
Assist. Prof Nuttawut Tuengsubun
Institute of Biomedical Engineering, Faculty of Medicine, Prince of Songkla University.
Abstract
Many patients suffer from maxillofacial defects and in some cases those defects require
performance biomaterials for treatments. In this research, gelatin based hybrid hydrogels were
mimicked as extracellular matrix to perform as biomaterials for bone healing. Gelatin was mixed
with methylcellulose (MC), poly (vinyl alcohol), and silk fibroin (SF) before fabrication into
hybrid hydrogel by freeze-thawing. Morphological formation was observed by scanning Electron
Microscopy. Then, the hybrid hydrogels were evaluated for physical performance by testing the
swelling behavior and protein release. The hybrid hydrogels were also tested with cultured MG-
63 cells. Afterward, the biological performance was evaluated for cell proliferation, viability, and
calcium deposition. The results demonstrated that hybrid hydrogel had small pore size. The hybrid
hydrogel of gelatin/MC demonstrated more protein release at a later stage than the other hybrid
hydrogels. Hybrid hydrogels of gelatin/MC and PVA exhibited suitable cell proliferation, cell
viability, and calcium deposition. The performance of those hybrid hydrogels is similar to
extracellular matrix in native tissue. This research demonstrated that gelatin/MC and PVA are
promising for bone healing in maxillofacial defects.
Keywords: Hydrogels, Gelatin, Bone Tissue Engineering, Extracellular matrix, Biomaterials,
maxillofacial defects
Introduction
Currently, many patients suffer from bone defects in maxillofacial area. Many research
studies have focused on functional biomaterials as the treatment to induce bone healing at those
defects [1]. Functional biomaterials perform as extracellular matrix (ECM) in native tissues [2].
Generally, ECM shows functionality as a native scaffold which has biological signal to induce cell
adhesion and proliferation [3] which enhance new tissue formation. Therefore, functional
biomaterials which perform as ECM scaffolds were fabricated in this research.
Mimicking is an attractive approach which has been used to build scaffolds for bone tissue
engineering [4]. Mimicked scaffolds such as hydrogels have the structure and functionality similar
to native ECM which can enhance bone healing [5]. The scaffolds were fabricated into many
forms, such as membranes, sponges, fibers, and hydrogels [6]. Therefore, hydrogels are presented
in this research as mimicked ECM scaffolds.
The 7th National and International Graduate Study Conference 2017
" Thailand 4.0 Creative Innovation for Sustainable Development "
I169

Hydrogel-based scaffolds are utilized in biomedical regeneration since they can replace or
degenerate defect tissues in animals. Hydrogels are crosslinked network of polymers that can
absorb a high volume of water in their structure. Mimicked hydrogels are attractive for tissue
regeneration because they can be generated in term of the function and structure that are similar to
native tissues. The natural and synthetic polymer can be used to fabricate hydrogels by physical or
chemical crosslinking network.
Gelatin is a natural polymer protein obtained from the hydrolysis of collagen, which is the
main component in skin, bone, and connective tissues. Due to the biocompatibility,
biodegradability, and non-immunogenic properties, gelatin is often fabricated into hydrogels for
pharmaceutical and medical applications [7]. Further, molecules of gelatin have the RGD amino
sequence which is the main trigger part in ECM components. The RGD has the important role of
inducing cell adhesion and proliferation. Hence, gelatin was selected as a based material to create
hydrogel as mimicked ECM scaffold.
Poly (vinyl alcohol) or PVA is a hydrophilic synthetic polymer that has excellent water
retention, biocompatibility, and good mechanical strength [8]. Therefore, it is widely used in
biomedical and pharmaceutical applications such as cartilage replacement, corneal implant, heart
valves, wound dressing, and drug delivery [9]. Since PVA shows good mechanical strength, it can
be blended with other water soluble polymers to form hydrogels. Therefore, PVA was selected as
a component of hydrogels in this research.
Methylcellulose (MC) is a modified cellulose in which methyl (-CH3) groups substitute for
the hydroxyl groups. Because of its biocompatibility with a good cell adhesion and gelling
properties, MC has been used for biomedical applications [10]. Further, the viscosity of MC is
similar to glycosaminoglycan in ECM of native tissues. Therefore, MC was chosen as a component
to mimic ECM scaffolds.
Silk fibroin (SF) is a protein which is a component of natural tissues. SF consists of the
important amino acids, such as alanine, glycine, serine, and tyrosine. The major structures of SF
are crystalline β-sheet, random coil, and alpha helical structure [11]. SF shows biodegradation,
biocompatibility, good mechanical properties, and low immunogenicity. SF-based biomaterials
have been utilized in the regenerations of many tissues such as vascular, skin, bone, and cartilage
tissue regenerations. In addition, SF has a biological and physical performances for cell adhesion
and structure maintenance, respectively. Those properties are similar to the functions of collagen
in ECM of native tissues. Therefore, SF was used as component to mimic ECM scaffolds.
In this research, gelatin was selected as the basic materials to fabricate hybrid hydrogels.
The gelatin was mixed with PVA, MC, and SF to mimic ECM scaffolds. The physical and
biological properties of hydrogels were evaluated for the promising goal of healing bone in
maxillofacial defects.
Objective
To develop and study the physical and biological behaviors of gelatin-based hydrogels
combined with MC, PVA, and SF for the healing of bone tissue in maxillofacial defects.
The 7th National and International Graduate Study Conference 2017
" Thailand 4.0 Creative Innovation for Sustainable Development "
I170

Research Methodology
Preparation of SF solution
The SF solution was prepared following the method from G. Chang et al [12]. Briefly,
cocoons were degummed by boiling in 0.02 M Na2CO3 for 30 min and rinsed with distilled water
to remove the sericin fraction. The SF without sericin was dissolved in 9.3 M LiBr solution at 70oC
for 30 min, dialyzed against water for 3 days to remove LiBr, and then centrifuged for 20 min at
4oC and 3500 RPM to separate the silk sediments. Finally, the SF solution was adjusted to a 5%
concentration for this experiment.
Preparation of gelatin, gelatin/PVA, gelatin/methylcellulose, and gelatin/silk fibroin
hydrogels
Gelatin (from porcine skin for microbiology), MC (Mn = 40000, viscosity 400.00 cps), and
PVA (Mw = 85,000-124,000 and 87-89% hydrolysis) solution were prepared by dissolution in
distilled water at 5% concentration. The 5% gelation solution was blended with the 5% PVA
solution, stirred, and poured into a 48-well plate. Then, the gelatin/PVA hydrogel was physically
crosslinked by freeze-thaw cycles and frozen at -20oC for 12 h and thawed at room temperature
for 12 h. The freeze-thaw procedure was carried out in 5 cycles. Gelatin/MC and gelatin/SF
hydrogels were prepared in a similar procedure as the gelatin/PVA hydrogels. However, after
freeze-thaw cycles, the gelatin/SF hydrogels were immersed in methanol to generate the β-sheet
structure and then washed with distilled water. The groups of hydrogels were shown in Table 1.
Table 1. Groups of hydrogels
Group Detail
A Gelatin hydrogel
B Gelatin/MC hydrogel
C Gelatin/PVA hydrogel
D Gelatin/SF hydrogel
Abbreviations: MC, methylcellulose; PVA, poly (vinyl alcohol); SF, silk fibroin.
Characterizations of the hydrogels
- Swelling testing
The swelling analysis of the hydrogels were performed by immersing hydrogels into
phosphate-buffer saline (PBS) solution at 37 C with different time periods. The samples were
taken out of the PBS, excess water was removed by filter paper, and they were weighed
immediately to obtain the wet weight (Wt). The dried weight (Wd) of the hydrogels was obtained
from the freeze dried hydrogels. The swelling ratio was calculated as following formula [13].
Swelling ratio = (Wt – Wd)/Wd
When Wt and Wd were defined as the weight of swollen and dried hydrogels, respectively.
The 7th National and International Graduate Study Conference 2017
" Thailand 4.0 Creative Innovation for Sustainable Development "
I171

- Hydrogel morphologies and Pore size distribution
The scanning electron microscope (SEM, Hitachi TM3030) was carried out to observe the
hydrogel morphologies. The pore size of these hydrogels obtained by SEM images were measured
by ImageJ program and the pore size distribution was calculated by Origin8.1 program.
- Protein release of the hydrogels
The protein release of the hydrogels was measured according to the manufacturer's
instructions (Pirece BCA protein assay kit, Thermo Scientific, USA). 1xPBS was added into
hydrogels and incubated at 37oC with different time periods. After incubated, 20 µL of PBS and
200 µL of BCA solution were added into a 98-well plate and then incubated again for 30 min. The
color of the sample solution changed from green to purple, which related to protein concentration
and was measured at a wavelength of 562 nm.
- MG-63 Cell culture
MG-63 cells were cultured in a 75 cm3 flask with alpha-MEM medium (Gibco, Invitrogen,
Carlsbad, CA, USA) containing 1% penicillin/streptomycin, 0.1% fungizone, and 10% fetal
bovine serum. The MG-63 cell cultures were kept in a 37oC incubator with 5% CO2 and the media
was changed every 2-3 days. An osteogenic medium containing 10 mM β-glycerophosphate, 50
mg/mL ascorbic acid, and 100 nM dexamethasone was prepared for MG-63 osteoblast
differentiation.
- Cell proliferation (PrestoBlue at day 1, 3, 5, and 7)
Cell proliferation of the hydrogels was measured on day 1, 3, 5, and 7 using PrestoBlue
(PrestoBlue® Cell Viability Reagent, Invitrogen, USA) reagent. The hydrogels were washed
twice with 1xPBS solution. The PrestoBlue solution was prepared by mixing with the media at a
ratio of 1:10 and then added into the hydrogels. The hydrogels were then incubated at 37oC for 1
h and the absorption was measured at a wavelength of 570 nm.
- Cell viability (Fluorescent microscope on day 1, 3, and 5)
The MG-63 osteoblast cell viability in the hydrogels was measured by staining the
hydrogels with fluorescein diacetate (FDA). FDA was converted from non-fluorescence to green
fluorescence in viable cells. To observe cell viability, FDA was dissolved in acetone at a
concentration of 5 mg/ml and added to fresh media of the hydrogels. The hydrogels were kept
away from light for 5 min, washed with PBS, and observed by fluorescent microscopy.
- Alizarin red staining for mineralization assay
Alizarin red was used to detect the mineralized bone matrix after osteogenic differentiation.
After cell culturing for 7 days, the cells were fixed in 4% formaldehyde for 10 min, and alizarin
red solution (2% in distilled water) was added into hydrogels. After staining for 20 min at room
temperature in the dark, the hydrogels were washed twice with distilled water to remove excess
stain and the mineralization on the hydrogels was observed under microscope.
The 7th National and International Graduate Study Conference 2017
" Thailand 4.0 Creative Innovation for Sustainable Development "
I172

- Statistical analysis
All data were statically analyzed using one-way ANOVA, Turkey’s HDS test (SPSS
20.0 software package). The data were presented as mean ± standard deviation was shown. P
values less than 0.05 were considered to be significant.
Results/Conclusion
- Morphological structure of hydrogels
After freeze-thawing, the appearances of all sample hydrogels were shown in Figure 1. The
pure gelatin (A) hydrogels were more transparent than other gels. When gelatin was combined
with MC, PVA, and SF, they showed the high turbidity.
Figure 1. (A) Gelatin, (B) Gelatin/MC, (C) Gelatin/PVA, and (D) Gelatin/SF hydrogels
The morphologies of the hydrogels were observed by (Figure 2). The pure gelatin
hydrogels had larger pore size than the other groups. The result showed that the pore size decreased
when the pure gelatin was blended with MC, PVA, and SF. Moreover, all of these hydrogels
exhibited interconnecting pores which are important for cell proliferation and attachment [14]. The
result showed the pore size distribution of the pure gelatin and hybrid gelatin hydrogels were in
the range 50-100 µm (Figure 3).
The 7th National and International Graduate Study Conference 2017
" Thailand 4.0 Creative Innovation for Sustainable Development "
I173

Figure 2. SEM morphologies of hydrogels: (A) gelatin, (B) gelatin/MC, (C)
gelatin/PVA, and (D) gelatin/SF hydrogels
Figure 3. Pore size distribution of hydrogels: gelatin, gelatin/MC, gelatin/PVA, and
gelatin/SF hydrogels
- Physical performance of the hydrogels
In this research, the swelling behavior and protein release were used to demonstrate the
physical performance of the hydrogels. First, the swelling behavior of the hydrogels is an important
factor that is influenced by the pore size of hydrogels which has an effect on the cellular behavior
[15]. In this work, the swelling ratios of these hydrogels were measured at the different time
periods (Figure 4). The gelatin/MC hydrogels showed the highest swelling behavior at the start
time, and reached to the equilibrium state near the initial start time. This was possibly due to the
The 7th National and International Graduate Study Conference 2017
" Thailand 4.0 Creative Innovation for Sustainable Development "
I174
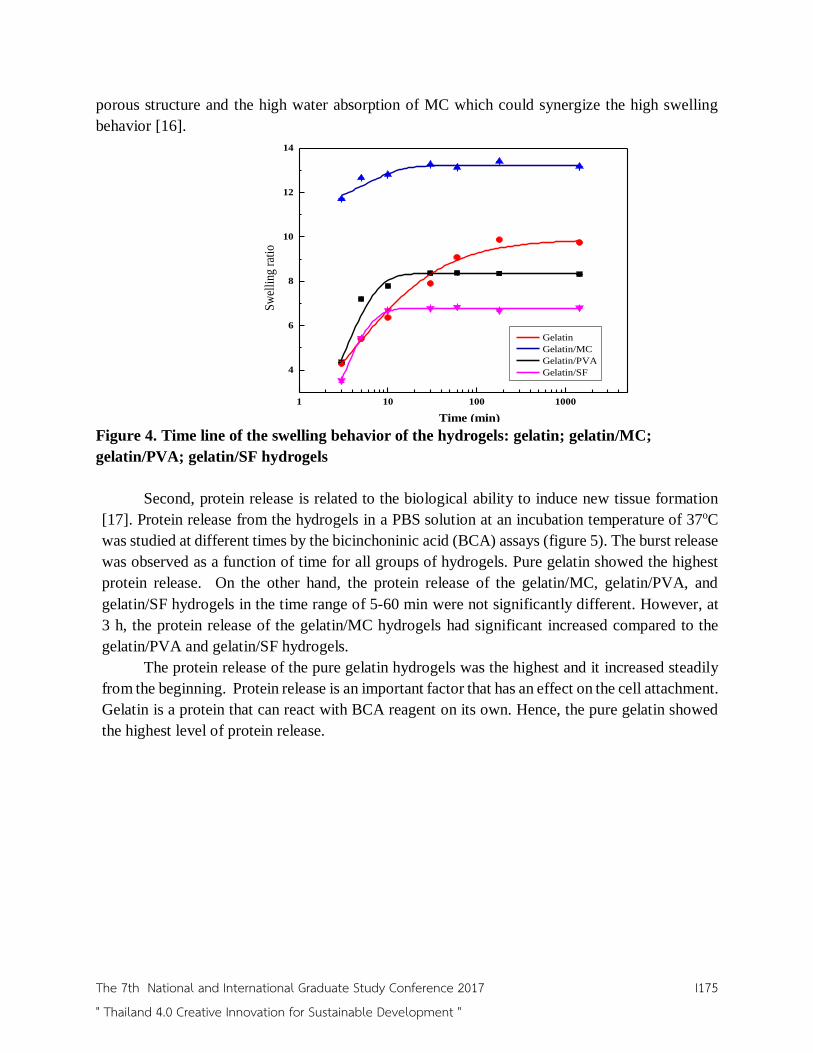
porous structure and the high water absorption of MC which could synergize the high swelling
behavior [16].
Figure 4. Time line of the swelling behavior of the hydrogels: gelatin; gelatin/MC;
gelatin/PVA; gelatin/SF hydrogels
Second, protein release is related to the biological ability to induce new tissue formation
[17]. Protein release from the hydrogels in a PBS solution at an incubation temperature of 37oC
was studied at different times by the bicinchoninic acid (BCA) assays (figure 5). The burst release
was observed as a function of time for all groups of hydrogels. Pure gelatin showed the highest
protein release. On the other hand, the protein release of the gelatin/MC, gelatin/PVA, and
gelatin/SF hydrogels in the time range of 5-60 min were not significantly different. However, at
3 h, the protein release of the gelatin/MC hydrogels had significant increased compared to the
gelatin/PVA and gelatin/SF hydrogels.
The protein release of the pure gelatin hydrogels was the highest and it increased steadily
from the beginning. Protein release is an important factor that has an effect on the cell attachment.
Gelatin is a protein that can react with BCA reagent on its own. Hence, the pure gelatin showed
the highest level of protein release.
1 10 100 1000
4
6
8
10
12
14
Gelatin
Gelatin/MC
Gelatin/PVA
Gelatin/SF
Sw
elli
ng r
atio
Time (min)
The 7th National and International Graduate Study Conference 2017
" Thailand 4.0 Creative Innovation for Sustainable Development "
I175

Figure 5. Protein release over time: gelatin; gelatin/MC; gelatin/PVA; and gelatin/SF
hydrogels
- Biological performances of hydrogels
The cell proliferation and viability, and calcium deposition was used to evaluate
biological performance of hydrogel in this research. For the cell proliferation, the biological
behavior of gelatin-based hydrogels were evaluated at day 1, 3, 5, and 7 using PrestoBlue reagent
(Figure 6). The cell proliferations of the hydrogels increased from day 1 to day 7. At day 1 and
day 3, the gelatin/SF hydrogels showed the highest cell proliferation compared the other groups.
The gelatin and gelatin/SF hydrogels dissolved in the media at day 5, and day 7, respectively.
Therefore, the gelatin hydrogel and gelatin/SF had no cell proliferation at those time points. At
day 7, cell proliferation of the gelatin/MC hydrogels was higher than the gelatin/PVA hydrogels.
The 7th National and International Graduate Study Conference 2017
" Thailand 4.0 Creative Innovation for Sustainable Development "
I176

Figure 6. The cell proliferation with different groups of hydrogels at day 1, 3, 5, and 7. The
symbol (*) presented significant changes (*p < 0.05).
Cell viability of the hydrogels was observed at day 1, 3, and 5 after staining the osteoblast
cells with FDA (Figure 7). The results showed that the osteoblasts could attach to the surface of
all types of hydrogels. The osteoblasts penetrated and spread into the emerged pores which
possibly came from the dissolved parts of the gelatin/MC and SF at day 3 and 5. Those pores can
promote cell migration and proliferation [18]. A dense aggregation of cells covered the whole
surface of the gelatin/PVA hydrogels at day 5. This was possible because the gelatin/PVA could
maintain the contour shape of the pores which had no dissolved parts of the hydrogel.
.
The 7th National and International Graduate Study Conference 2017
" Thailand 4.0 Creative Innovation for Sustainable Development "
I177

Figure 7. FDA cell staining of the gelatin, gelatin/MC, gelatin/PVA, and gelatin/SF hydrogels
at day 1, 3, and 5.
In this research, alizarin red staining was used to demonstrate calcium deposition on the
hydrogels. The calcium deposition (red color) on the gelatin/MC and the gelatin/PVA hydrogels
at day 7 and day 14 of cell culturing are shown in Figure 8. Those two types of hydrogels exhibited
high calcium deposition. Therefore, the gelatin/MC and gelatin/PVA hydrogels could promote
calcium synthesis from the osteoblast.
Figure 8. Alizarin red of the (A, B) gelatin/MC and (C, D) gelatin/PVA hydrogels at day
7 and day 14, respectively.
Discussion
The gelatin-based hydrogels with different polymers of MC, PVA, and SF were presented
as mimicked extracellular matrix scaffolds for healing of bone tissue in maxillofacial defect.
For the morphological formation, the results demonstrated that the pure gelatin hydrogel
displayed large pore size. This indicated that the gelatin had hydrophilic characteristics. The
hydrophilic characteristic of gelatin could hold a high amount of water which led to the formation
of large pore size [19]. On the other hand, the hybrid hydrogel had smaller pore size. This
demonstrated that the hybrid hydrogel had a low capacity to maintain water in their structure. That
low capacity effectively formed small pore size.
This research demonstrated that gelatin with MC had unique physical performance
swelling behavior and protein release. Gelatin/MC showed higher swelling ratio and protein
releasing than other hybrid hydrogels. The results demonstrated that the porous structure of the
hybrid hydrogels might have an effect on the prolonged swelling behavior to reach the steady state.
The higher protein release was also influence by hydrogel degradation. Therefore, the protein
release rate can be modulated by varying the gelatin ratio with other materials and it can be
improve cell behavior [20].
The 7th National and International Graduate Study Conference 2017
" Thailand 4.0 Creative Innovation for Sustainable Development "
I178

Interestingly, some reports demonstrated that extracellular matrix showed swelling
behavior and protein releasing from degradation during tissue regeneration [21]. This indicated
that gelatin/MC were similar to the physical functionality of extracellular matrix in native tissue
[22].
The results indicated that the dissolution of the gelatin hydrogels possibly came from the
low density structure and the high temperature sensitivity of the gelatin. The dissolution of the
gelatin/SF hydrogels was due to the phase separation between the dissolved gelatins and the
undissolved SF molecules in the water. The higher cell proliferation of gelatin/MC possibly came
from some parts of the hydrogel which dissolved. That dissolved parts led to higher porosity which
could enhance cell proliferation. Previous studies reported that some enzymes degraded the ECM
during new tissue formation [23]. The degraded ECM leads to a porous structure which can
enhance cell migration and proliferation [24]. Therefore, the result indicated that gelatin with MC
showed performance similar to ECM in native tissue.
Furthermore, the gelatin with MC demonstrated biological performance which could
promote cell proliferation, viability, and calcium deposition. That hydrogel exhibited physical and
biological performance similar to ECM in native bone tissue. This research indicated that hybrid
hydrogel of gelatin with MC have promise in healing bone tissue in maxillofacial surgery.
Recommendations
The low mechanical and water solubility of gelatin are the weakness of gelatin hydrogels.
Therefore, the modification of the gelatin with other materials or nanoparticles can be used to
improve the physical and biological properties of these hydrogels. Modified gelatin hydrogels
should be appropriate for treatments and they can generate the new tissue.
References
[1] R. Schmelzeisen, R. Schimming, M. Sittinger. (2003). Making bone: implant insertion into
tissue-engineered bone for maxillary sinus floor augmentation—a preliminary report.
Germany: Journal of Cranio-Maxillofacial Surgery.
[2] F. J. O'Brien. (2011). Biomaterials & scaffolds for tissue engineering. Ireland:
Materialstoday.
[3] C. M. Murphy, M.G. Haugh, F. J. O'Brien. (2010). The effect of mean pore size on cell
attachment, proliferation and migration in collagen–glycosaminoglycan scaffolds for bone
tissue engineering. Ireland: Biomaterials.
[4] E. Palin, H. Liu, T.J. Webster. (2005). Mimicking the nanofeatures of bone increases bone-
forming cell adhesion and proliferation. USA: Nanotechnology.
[5] S. Badylak, S. Arnoczky, P. Plouhar, R. Haut, V. Mendenhall, R.Clarke, C. Horvath. (1999).
Naturally Occurring Extracellular Matrix as a Scaffold for Musculoskeletal Repair. USA:
Clinical Orthopaedics & Related Research.
The 7th National and International Graduate Study Conference 2017
" Thailand 4.0 Creative Innovation for Sustainable Development "
I179

[6] R. C. Thomson, M. J. Yaszemski, J. M. Powers, A. G. Mikos. (1998). Hydroxyapatite fiber
reinforced poly (a-hydroxy ester) foams for bone regeneration. USA: Biomaterials.
[7] S. V. Vlierberghe, P. Dubruel, E. Schacht. (2011). Biopolymer-Based Hydrogels As
Scaffolds for Tissue Engineering Applications: A Review. Belgium: Biomacromolecules.
[8] J. A. Stammen, S. Williams, D.N. Ku, R. E. Guldberg. (2001). Mechanical properties of a
novel PVA hydrogel in shear and unconfined compression. USA: Biomaterials.
[9] M. I. Baker, S. P. Walsh, Z. Schwartz, B. D. Boyan. (2012). A review of polyvinyl alcohol
and its uses in cartilage and orthopedic applications. Georgia: Society for biomaterials.
[10] L. Klouda, A. G. Mikos. (2008). Thermoresponsive hydrogels in biomedical applications.
USA: European Journal of Pharmaceutics and Biopharmaceutics.
[11] Y. Qi, H. Wang, K. Wei, Y. Yang, R.Y. Zheng, I. S. Kim, K. Q. Zhang. (2017). A Review of
Structure Construction of Silk Fibroin Biomaterials from Single Structures to Multi-Level
Structures. China: Molecular Sciences.
[12] G. Chang, H.J. Kim, D.L. Kaplan, G. V. Novakovic, R. A. Kandel. (2007). Porous silk
scaffolds can be used for tissue engineering annulus fibrosus. Canada: European Spine Journal.
[13] J. Shi, M.M.Q. Xing, W. Zhong. (2012). Development of Hydrogels and Biomimetic
Regulators as Tissue Engineering Scaffolds. Canada: Membranes.
[14] M. Mastrogiacomo, S. Scaglione, R. Martinettie, L. Dolcinie, F. Beltrame, R. Cancedda, R.
Quarto. (2006). Role of scaffold internal structure on in vivo bone formation in macroporous
calcium phosphate bioceramics. Italy: Biomaterials.
[15] S. Lin, N. Sangaj, T. Razafiarison, C. Zhang, S. Varghese. (2011). Influence of Physical
Properties of Biomaterials on Cellular Behavior. USA: Pharmaceutical Research.
[16] S. J.Kim, S. J. Park, S. I. Kim. (2003). Swelling behavior of interpenetrating polymer
network hydrogels composed of poly (vinyl alcohol) and chitosan. South Korea: Reactive &
Functional Polymers.
[17] B. Li, T.Yoshii, A. E. Hafeman, J.S. Nyman, J. C. Wenke, S. A. Guelcher. (2009).The effects
of rhBMP-2 released from biodegradable polyurethane/microsphere composite scaffolds on
new bone formation in rat femora. USA: Biomaterials.
[18] B. B. Mandal, S. C. Kundu. (2009). Cell proliferation and migration in silk fibroin 3D
scaffolds. India: Biomaterials.
[19] Z.A. Nur Hanani, Y.H. Roos, J.P. Kerryc. (2014). Use and application of gelatin as potential
biodegradable packaging materials for food products. Ireland: International Journal of
Biological Macromolecules.
[20] Y. Liu, N. E. Vrana, P. A. Cahill, G. B. McGuinnes. (2008). Physically Crosslinked
Composite Hydrogels of PVA With Natural Macromolecules: Structure, Mechanical
Properties, and Endothelial Cell Compatibility. Ireland: Journal of biomedical materials
research.
[21] Joerg K. Tessmar, Achim M. Göpferich. (2007). Matrices and scaffolds for protein delivery
in tissue engineering. Germany: Advanced Drug Delivery Reviews.
The 7th National and International Graduate Study Conference 2017
" Thailand 4.0 Creative Innovation for Sustainable Development "
I180

[22] S.A. Sell, P. S. Wolfe, K. Garg, J.M. McCool, I. A. Rodriguez, G.L. Bowlin. (2010). The Use
of Natural Polymers in Tissue Engineering: A Focus on Electrospun Extracellular Matrix
Analogues. USA: Polymers.
[23] B. K. Mann, A. S. Gobin, A. T. Tsai, R. H. Schmedlen, J. L. West. (2001). Smooth muscle
cell growth in photopolymerized hydrogels with cell adhesive and proteolytically degradable
domains: synthetic ECM analogs for tissue engineering. USA: Biomaterials.
[24] B. A. C. Harley, H.D. Kim, M.H. Zaman, L. V. Yannas, D. A. Lauffenburger, and L. J.
Gibson. (2008). Microarchitecture of Three-Dimensional Scaffolds Influences Cell
Migration Behavior via Junction Interactions. USA: Biophysical Journal.
The 7th National and International Graduate Study Conference 2017
" Thailand 4.0 Creative Innovation for Sustainable Development "
I181

Appendix
Author: Atsadaporn Thangprasert
Program: Biomedical Engineering
Institute: Faculty of Medicine, Institute of biomedical Engineering, Princes of Songkla
University.
Tel. 086-3143816 e-mail. [email protected]
Author: Associate Professor Jirut Meesane
Program: Biomaterials for tissue engineering
Institute: Faculty of Medicine, Institute of biomedical Engineering, Princes of Songkla
University.
Tel. 089-7358521 e-mail. [email protected]
Author: Dr. Chittreeya Tansakul
Program: Organic chemistry
Institute: Faculty of Science, Department of Chemistry and Center of Excellence for Innovation
in Chemistry, Prince of Songkla University. Tel. 081-9901534 e-mail. [email protected]
Author: Assistant Professor Nuttawut Tuengsubun
Program: Bioengineering and Materials Engineering for tissue engineering.
Institute: Faculty of Dentistry, Department of Oral and Maxillofacial Surgery, Prince of Songkla
University.
Tel. 081-6903609 e-mail. [email protected]
The 7th National and International Graduate Study Conference 2017
" Thailand 4.0 Creative Innovation for Sustainable Development "
I182

Title Effects of thickness and materials on mechanical behaviors in a
sandwich structure under compression using a computational simulation
Author: Kittipong Phetnui and Surapong Chatpun
Program Institute of Biomedical Engineering, Faculty of Medicine Institute Prince
of Songkla University, Songkhla 90110, Thailand
Abstract
High impact load can cause fractures or damages to our body. Several studies
have applied a concept of multi layers or laminated layers to reduce shock load in some
products such as footwear, mouthguard and helmet. It is interesting to apply this
concept for a body protector using a sandwich structure. This study used a computer
simulation to investigate the mechanical changes of the constructed sandwich specimen
with different materials and thickness in the middle layer. The specimen was
constructed and the simulation was performed using SolidWorks software. Initial and
boundary conditions were applied regarding to the compression. Titanium alloy
(Ti6A), polycarbonate urethane (PCU) and ultra-high molecular weight polyethylene
(UHMWPE) were assigned as the middle layer whereas both top and bottom layers
were Ti6A. It was found that the maximum von Mises stress and maximum
compressive stress in the PCU middle layer decreased as the thickness of middle layer
reduced. There was a slight change in maximum von Mises stress and compressive
stress when the middle layer thickness decreased for Ti6A and UHMWPE specimens.
Strain in the middle layer tentatively decreased when PCU was used whereas strain in
the Ti6A middle layer and UHMWPE middle layer was quite unchanged. Therefore,
the thickness and material of middle layer in the sandwich structure play a role in the
mechanical behaviors of a specimen.
Keywords: Shock absorption, Impact load, Sandwich structure, von Mises Stress,
Strain
Introduction
There are many people who suffer from unexpected events such as accidents or
extreme daily activities that are related with both static and dynamic forces including
impact forces. These forces, especially high impact loads, cause wear and breakage in
any parts of our body. If these forces cannot be avoided, a protector is necessary to
reduce or relieve the excessive force. Impact load is considered as a high force or shock
applied over a short period which can cause damage or failure to objects. Therefore, the
reduction on impact load is an important concern to prevent the failure. There are
The 7th National and International Graduate Study Conference 2017
" Thailand 4.0 Creative Innovation for Sustainable Development "
I183
several studies that investigate about shock absorption in many aspects such as footwear
materials, mouthguard and human knee joints (Shimazaki et al.,2016; Hoshino et al.,
1987; Handa et al.,2011). The idea to reduce shock load or impact load can be easily
found in a motorbike helmet by using aluminum honeycomb structure as reinforcement
(Caserta et al.,2011). The other study has showed a multi-layer plate composed of
aluminum, rubber and foam as a sandwich model can protect the underwater shock
wave mitigation better than a triple aluminum plate (Hawass et al.,2015). Furthermore,
it was laboratory found that the new design on shock absorption with pre-laminated
material for mouthguard showed significant buffer capacity than a conventional design
in term of tooth distortion (Handa et al., 2011). Therefore, a sandwich model or
laminated model with an elastic middle layer might be interesting in shock absorption
for human body application.
Generally, metal materials have highly comparative mechanical properties such
as hardness and tensile strength. Furthermore, metals are very good for energy transfer
and fracture toughness. On the other hand, elastic materials are high energy absorption
because of their viscoelasticity. Therefore, it is interesting to improve the load
absorption by using different elastic materials as a body protector.
Objective
1) This study applied the sandwich structure with different middle layer
materials to improve load absorption. We therefore investigated the
mechanical changes of the constructed sandwich model using a computer
simulation such as von Mises stress, compressive stress and strain.
Research Methodology
1. Testing specimen model
The specimen was designed using a SolidWorks software version 2012. There
are 4 models which are different in thickness of three layers as showed in Table 1. The
total thickness of the specimen is 9 mm and the dimensions of the specimen are
presented in Figure 1. Top and bottom layer of the specimen were assigned as titanium
alloy (Ti6A). Furthermore, there were three materials at the middle layer to be selected
(Ti6A, polycarbonate urethane (PCU) and ultra-high molecular weight polyethylene
(UHMWPE)). The material properties were taken from the literature reviews and
commercial material datasheets (Elsner et al.,2010; Bergschmidt et al., 2016; Kluess et
al.,2011; Cournapeau et al.,2015; Nguyen et al., 2015; DSM Biomedical.,2011; Plastic
Products, Inc; ASM Aerospace Specification Metals Inc). The properties of materials
used in this study were showed in Table 2.
The 7th National and International Graduate Study Conference 2017
" Thailand 4.0 Creative Innovation for Sustainable Development "
I184

Table 1 The thicknesses of constructed specimen for each model
Layer Model #1 Mode #2 Model #3 Model #4
Top 1 mm 2 mm 3 mm 4 mm
Middle 7 mm 5 mm 3 mm 1 mm
Bottom 1 mm 2 mm 3 mm 4 mm
Figure 1 Dimensions of a constructed specimen.
Table 2 Material properties using for a constructed specimen
Materials
Yield
Strength
(N/m2)
Elastic
Modulus
(N/m2)
Poisson’s
ratio
Mass
Density
(kg/m3)
Ti6A 8.80x10⁸ 9.50 x10⁸
0.34 4,430
PCU 6.32 x10⁷ 6.32 x10⁷
0.45 1,220
UHMWPE 2.10 x10⁷ 6.90 x10⁸
0.35 934
The 7th National and International Graduate Study Conference 2017
" Thailand 4.0 Creative Innovation for Sustainable Development "
I185

2. Computer simulation method
The condition setting of this study was a linear static simulation function. The
specimen was constrained without moving downward in a y-axis. The applied force
was 750 N pressing on the top surface of the specimen as showed in Figure 2 to simulate
the situation as the load bearing condition (Elsner et al.,2010; Hoshino et al., 1987).
The simulation was performed using a SolidWorks software version 2012. The mesh
conditions were set up as presented in Table 3.
Figure 2 Constrain and compressive load applied on the specimen.
The 7th National and International Graduate Study Conference 2017
" Thailand 4.0 Creative Innovation for Sustainable Development "
I186

Table 3 The mesh information details
Mesh type Solid Mesh
Mesher Used: Standard mesh
Automatic Transition: Off
Include Mesh Auto Loops: Off
Jacobian points 4 Points
Element Size 1.05244 mm
Tolerance 0.0526222 mm
Mesh Quality High
Remesh failed parts with incompatible
mesh Off
Total Nodes 75960
Total Elements 52443
Maximum Aspect Ratio 3.8684
% of elements with Aspect Ratio < 3 99.9
% of elements with Aspect Ratio > 10 0
% of distorted elements(Jacobian) 0
Results/ Conclusion
The generated meshes of the specimen are presented in Figure 3a. After
computation, the results were graphically represented in the color plot and color bar as
showed in Figure 3b. Maximum von Mises stress, maximum compressive stress and
maximum strain occurred on the specimen in each model are presented in Figure 4-6,
respectively.
The 7th National and International Graduate Study Conference 2017
" Thailand 4.0 Creative Innovation for Sustainable Development "
I187
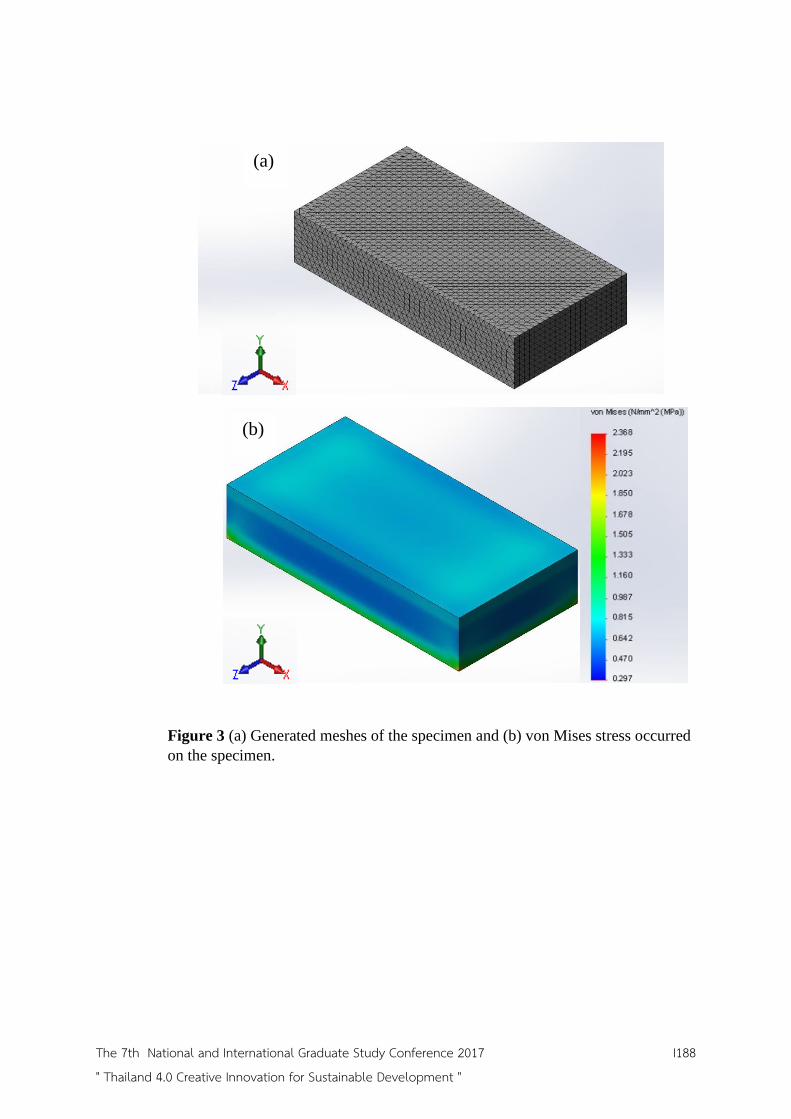
Figure 3 (a) Generated meshes of the specimen and (b) von Mises stress occurred
on the specimen.
(a)
(b)
The 7th National and International Graduate Study Conference 2017
" Thailand 4.0 Creative Innovation for Sustainable Development "
I188
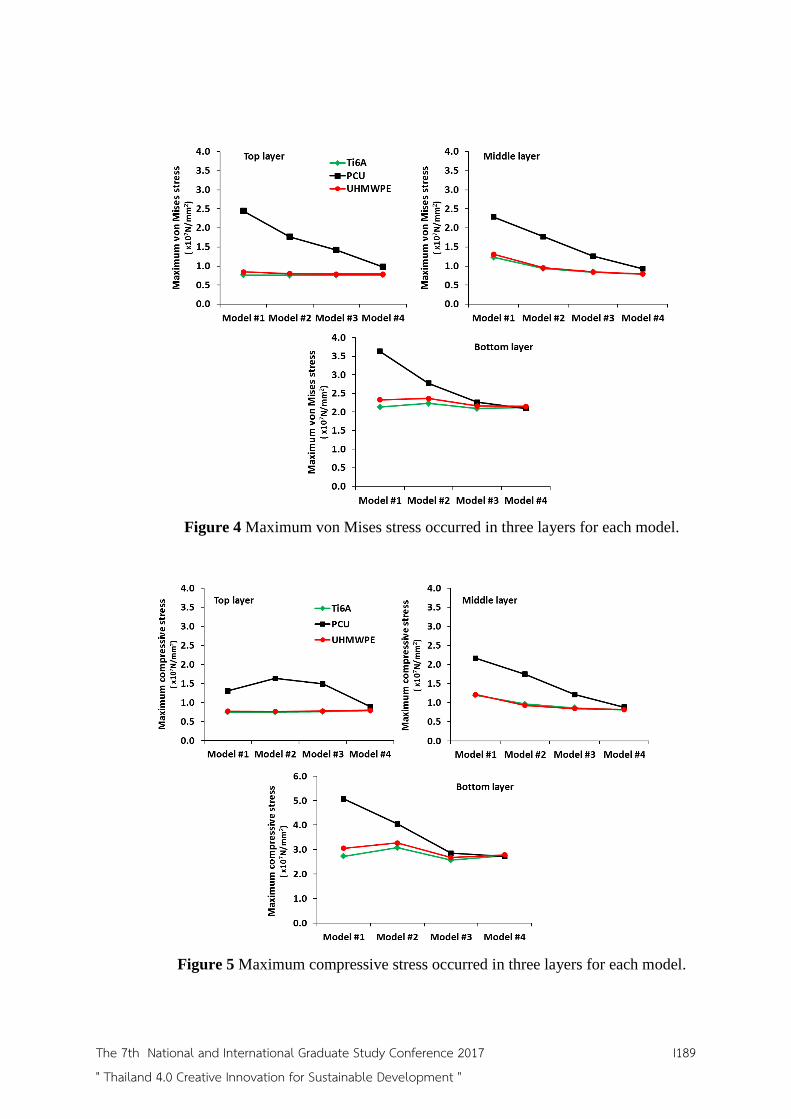
Figure 4 Maximum von Mises stress occurred in three layers for each model.
Figure 5 Maximum compressive stress occurred in three layers for each model.
The 7th National and International Graduate Study Conference 2017
" Thailand 4.0 Creative Innovation for Sustainable Development "
I189
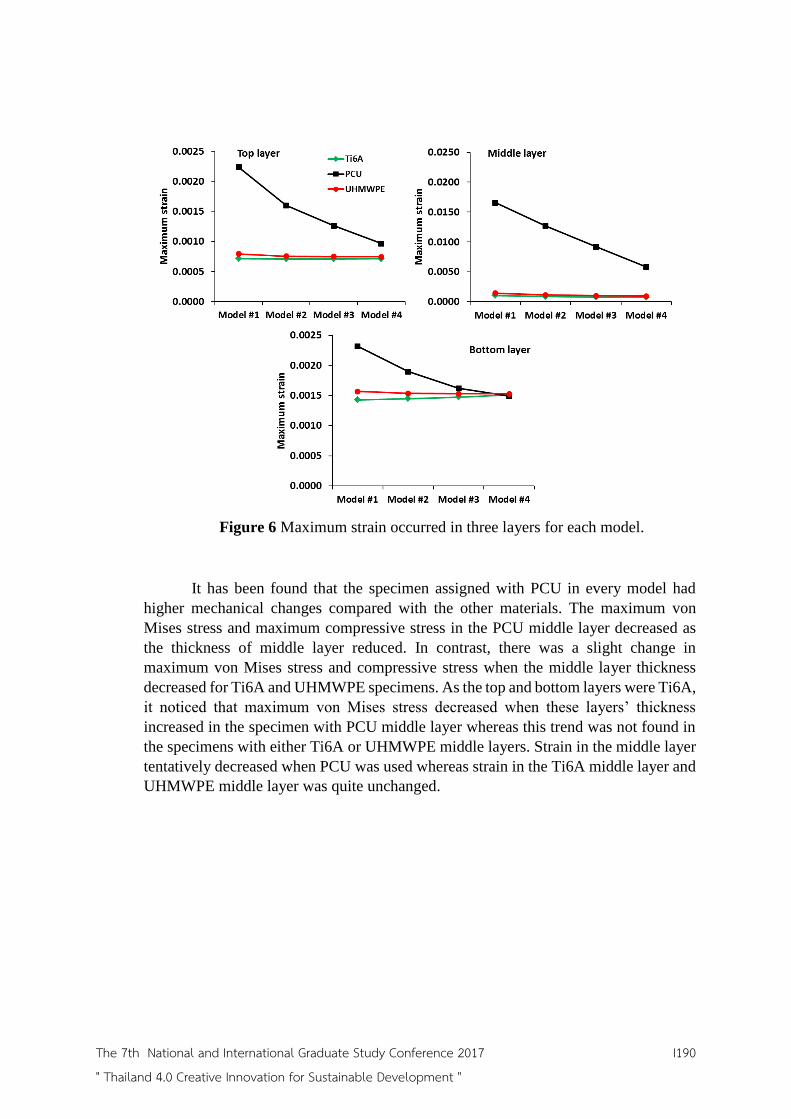
Figure 6 Maximum strain occurred in three layers for each model.
It has been found that the specimen assigned with PCU in every model had
higher mechanical changes compared with the other materials. The maximum von
Mises stress and maximum compressive stress in the PCU middle layer decreased as
the thickness of middle layer reduced. In contrast, there was a slight change in
maximum von Mises stress and compressive stress when the middle layer thickness
decreased for Ti6A and UHMWPE specimens. As the top and bottom layers were Ti6A,
it noticed that maximum von Mises stress decreased when these layers’ thickness
increased in the specimen with PCU middle layer whereas this trend was not found in
the specimens with either Ti6A or UHMWPE middle layers. Strain in the middle layer
tentatively decreased when PCU was used whereas strain in the Ti6A middle layer and
UHMWPE middle layer was quite unchanged.
The 7th National and International Graduate Study Conference 2017
" Thailand 4.0 Creative Innovation for Sustainable Development "
I190

Discussion
All models were not broken because the maximum von Mises stress and
maximum compressive stress were not over the yield strength of material in each layer.
Our study also showed that thickness and material of middle layer in the sandwich
structure play a role in the mechanical behaviors of a specimen. There was the study
using 3-D finite element analysis to analyze bonded joint under impact load by looking
at the effect of adhesive thickness and elastic modulus on the stress distribution (You
et al.,2010). They found that an increase of adhesive thickness led to a stress increment
along the upper edge of the adhesive but it decreased the stress along the lower edge
near the loading face. Their finding partly supports our results that an increase of
thickness of middle layer increased the stresses in the specimen especially, within
bottom layer when using PCU. In this study at the same thickness, compressive
distributed load was equally applied which implies that the differences in the
computational results should be regards to the properties of middle layer material. It
notices that PCU has lowest elastic modulus but the maximum von Mises stress was
highest in the specimen which has PCU as the middle layer. This finding was different
from the work done by You et al. (You et al.,2010). Their study reported that all stresses
increased along either the upper or the lower edge when the elastic modulus of adhesive
increased.
Our results showed that the strain in the PCU middle layer was highest
compared with other materials. In general, strain is a measure of the deformation of
material by comparing the change in length to the original length. Not only elastic
modulus of material but also Poisson’s ratio can affect the material deformation
(Greaves et al.,2011). Furthermore, increasing thickness of higher Poisson’s ratio and
lower elastic modulus materials (PCU and UHMWPE) increased the deformation as the
increment of maximum strain. There were several works studied on energy absorption
demonstrated that thickness, density and type of material can influence on peak load,
crushing and absorbed energy (Nemat-Nasser et al.,2007; Di Landro et al.,2002; Cui et
al.,2009). Furthermore, the number of layers of sandwich structure can also influence
on the energy absorption. Therefore, many factors are necessary to consider in the shock
absorber sandwich structure.
Recommendations
Using a computer simulation, this study demonstrated how the thickness and
material properties influence the mechanical behavior of sandwich structure which may
be beneficial to the design of shock or impact load absorber for medical application.
However, the experimental study is necessary to performed in order to verify these
simulation results.
The 7th National and International Graduate Study Conference 2017
" Thailand 4.0 Creative Innovation for Sustainable Development "
I191

References
ASM Aerospace Specification Metals Inc., Titanium Ti-6Al-4V (Grade 5). Pompano
Beach, Florida. Available from ProQuest .
http://asm.matweb.com/search/SpecificMaterial.asp?bassnum=mtp641.
Bergschmidt, P., Ellenrieder, M., Bader, R., Kluess, D., Finze, S., Schwemmer, B., &
Mittelmeier, W. (2016). "Prospective comparative clinical study of ceramic and
metallic femoral components for total knee arthroplasty over a five- year follow-
up period." The Knee 23, 5: 871-876. .
Caserta, G. D., Iannucci, L., & Galvanetto, U. (2011). "Shock absorption performance
of a motorbike helmet with honeycomb reinforced liner." Composite Structures
93, 11: 2748-2759. .
Cournapeau, J., Klouche, S., Bauer, T., & Hardy, P. (2015). "Survival and functional
results after a mean follow- up of 9years with the Ceragyr® highly congruent
mobile-bearing TKA." Orthopaedics & Traumatology: Surgery & Research
101, 4: 455-460. .
Cui, L., Kiernan, S., & Gilchrist, M. D. (2009). “Designing the energy absorption
capacity of functionally graded foam materials.” Materials Science and
Engineering 507, 1: 215-25. .
Di Landro, L., Sala, G., & Olivieri, D. (2002). “Deformation mechanisms and energy
absorption of polystyrene foams for protective helmets.” Polymer Testing 21, 2:
217-28.
DSM Biomedical. Bionate® Thermoplastic Polycarbonate Polyurethane (PCU). DMS
Company, Netherlands. 2011. Available from ProQuest .
https://www.dsm.com/content/dam/dsm/medical/en_US/documents/bionate(r)-
pcu-product-sheet.pdf.
Elsner, J. J., Portnoy, S., Zur, G., Guilak, F., Shterling, A., & Linder-Ganz, E. (2010).
"Design of a free-floating polycarbonate-urethane meniscal implant using finite
element modeling and experimental validation." Journal of biomechanical
engineering 132, 9: 095001. .
Greaves, G. N., Greer, A. L., Lakes, R. S., & Rouxel, T. (2011). “Poisson's ratio and
modern materials.” Nature Materials 10, 11: 823-37. .
Handa, J., Takeda, T., Kurokawa, K., Ozawa, T., Nakajima, K., & Ishigami, K.
(2011). "Influence of pre-laminated material on shock absorption ability in
specially designed mouthguard with hard insert and space." Journal of
prosthodontic research 55, 4: 214-220. .
Hawass, A., Mostafa, H., & Elbeih, A. (2015). "Multi-layer protective armour for
underwater shock wave mitigation." Defence Technology 11, 4: 338-343.
Hoshino, A., & Wallace, W. A. (1987). "Impact-absorbing properties of the human
knee." Bone & Joint Journal 69, 5: 807-811. .
The 7th National and International Graduate Study Conference 2017
" Thailand 4.0 Creative Innovation for Sustainable Development "
I192

.
Kluess, D., Mittelmeier, W., & Bader, R. (2010). "Intraoperative impaction of total
knee replacements: An explicit finite-element-analysis of principal stresses in
ceramic vs. cobalt–chromium femoral components." Clinical Biomechanics 25,
10: 1018-1024. .
Nemat-Nasser, S., Kang, W. J., McGee, J. D., Guo, W. G., & Isaacs, J. B. (2007).
“Experimental investigation of energy-absorption characteristics of components of
sandwich structures.” International Journal of Impact Engineering 34, 6: 1119-
46.
Nguyen, L. C. L., Lehil, M. S., & Bozic, K. J. (2015). "Trends in total knee
arthroplasty implant utilization." The Journal of arthroplasty 30, 5: 739-742.
Plastic Products, Inc., technical Product Data Sheets UHMWPE (ultrahigh molecular
weight polyethylene). Bessemer City .NC. Available from ProQuest
http://www.plastic- products.com/spec11.htm .
Shimazaki, Y., Nozu, S., & Inoue, T. (2016). "Shock-absorption properties of
functionally graded EVA laminates for footwear design." Polymer Testing 54:
98-103.
You, M., Yan, J. L., Zheng, X. L., Zhu, D. F., & Hu, J. R. (2010). "3-D Finite
Element Analysis of Bonded Joints under Impact Loading." Advanced Materials
Research 97, 101: 763-766.
The 7th National and International Graduate Study Conference 2017
" Thailand 4.0 Creative Innovation for Sustainable Development "
I193

Title: Cardiac functions assessed by 2D-echocardiography in older obese adolescents.
Author: Thamonwan Imerbtham, Teerapat Yingchonchareon, Teonchit Nuamchit, and
Duangduan Siriwittayawan
Abstract
The purpose of this study is to assess cardiac functions in older obese adolescents
comparing to that of non-obese participants by 2D-conventional echocardiography in Thai
adolescents. Eighty-one participants aged between 16-19 years old were divided into non-obese
group and obese group depending on their BMI. The participants were interviewed about their
demography and history of illness using a questionnaire. Anthropometric data were collected
by measuring weight, height, waist circumference, body mass index (BMI) and body fat
percentage by a trained cardio-thoracic technologist. All participants were tested for standard
blood analyses including complete blood count and lipid profile after an overnight fasting
(>12h). After that, they were investigated for resting heart rate, blood pressure, and 2D-
echocardiography. The comparison of these parameters between two groups was performed
using statistical analysis. The results showed that there was a significant increase in the LV
mass, LVMI, RWT, IVSDd, LVIDd and LVPWd in the obese adolescents comparing to the
non-obese adolescents (103.20 ± 4.60 vs. 140.80 ± 5.04 g, p < 0.001 for LV mass, 65.30 ±
2.27 vs. 74.35 ± 2.63 g/m2 and 0.32 ± 0.01 vs. 0.36 ± 0.00 cm, for LVM and RWT,
respectively, p < 0.05, 0.77 ± 0.02 vs. 0.90 ± 0.02 cm, 4.43 ± 0.06 vs. 4.82 ± 0.05 cm and
0.72 ± 0.02 vs. 0.85 ± 0.01 cm, for IVSd, LVIDd and LVPWD, respectively, p < 0.001).
However there was no significant difference in main systolic and diastolic function indices.
This study demonstrated significantly changes in cardiac morphology of older obese
adolescents but not in cardiac functions.
Keyword: cardiac functions, cardiac morphology, echocardiography, obesity, adolescents
Introduction
Obesity in adolescents is a major public health problem of Thailand and worldwide.
(Daniels, 2009; van Dam, Willett, Manson, & Hu, 2006). In the United States, prevalence of
overweight and obesity in teenagers has almost tripled in the last two decades (Ogden, Flegal,
Carroll, & Johnson, 2002). In Thailand, the National Statistical Office reported the increased
prevalence of obese adolescents from 22.2% in 2009 to 36.5% in 2010. It has been reported
The 7th National and International Graduate Study Conference 2017
" Thailand 4.0 Creative Innovation for Sustainable Development "
I194

that overweight adolescents tend to be obese when they are grown-ups (Serdula et al., 1993).
Obesity in adolescence is associated with risks of hypertension, stroke, sleep apnea, type 2
diabetes mellitus, metabolic syndrome, cancers, disability, liver disease, and cardiovascular
disease (Daniels, 2006). It was found that overweight was strongly correlated with coronary
artery and aorta atherosclerosis in children (Berenson et al., 1998; McGill et al., 2001).
Clinically, assessment of cardiac morphology and also cardiac function is routinely
performed by one of accurate non-invasive tools, 2D-conventional echocardiography. In
children and adolescents, there was evidence supporting the effects of obesity on cardiac
morphology and function. Previous studies have reported that obesity affected left atrial
dimension (Dhuper, Abdullah, Weichbrod, Mahdi, & Cohen, 2011; Koopman et al., 2012;
Mehta, Richards, Lorber, & Rosenthal, 2009; Ozdemir, Hizli, Abaci, Agladioglu, & Aksoy,
2010; J. J. Yu, Yeom, Chung, Park, & Lee, 2006), left ventricular (LV) dimension (Chinali et
al., 2006; Dhuper et al., 2011; Harris et al., 2012; Koopman et al., 2012; Mehta et al., 2009;
Ozcetin et al., 2012; Ozdemir et al., 2010; Saltijeral et al., 2011; Schuster et al., 2009; Van
Putte-Katier et al., 2008), and LV mass (Atabek, Akyuz, Selver Eklioglu, & Cimen, 2011;
Chinali et al., 2006; de Jonge et al., 2011; Dhuper et al., 2011; Di Bonito et al., 2008; Harris
et al., 2012; Koopman et al., 2012; Saltijeral et al., 2011; Schuster et al., 2009; Sharpe et al.,
2006; Van Putte-Katier et al., 2008). These cardiac geometry changes cause alterations in
cardiac function, both systolic and diastolic functions (Chinali et al., 2006; Dhuper et al.,
2011; Harada, Orino, & Takada, 2001; Harris et al., 2012; Ingul, Tjonna, Stolen, Stoylen, &
Wisloff, 2010; Lorch & Sharkey, 2007; Mahfouz, Dewedar, Abdelmoneim, & Hossien, 2012;
Mehta et al., 2009; Schuster et al., 2009; Sharpe et al., 2006; Van Putte-Katier et al., 2008).
Furthermore, previous studies reported systolic dysfunction at rest (Mahfouz et al., 2012) and
during exercise in obese children and adolescents (Schuster et al., 2009). However, the
effects of obesity on cardiac function are controversial since some studies indicated normal or
even supernormal LV function in obese subjects (Avelar et al., 2007; Grandi et al., 2000;
Wikstrand, Pettersson, & Bjorntorp, 1993). Erick et al found a normal LV endocardial
fractional shortening (%FS) with mildly decreased midwall fractional shortening in severely
obese participants (Avelar et al., 2007). In addition, some studies found normal LV systolic
function with reduced LV diastolic function in obese subjects (Grandi et al., 2000).
Moreover, supernormal LV systolic function was also demonstrated (Wikstrand et al., 1993).
Most studies about the impact of obesity on cardiac function were performed in
Caucasian subjects who have different structure and different BMI cut off point for obesity
from those of Asian population. Furthermore, there was limited data about the impact of
The 7th National and International Graduate Study Conference 2017
" Thailand 4.0 Creative Innovation for Sustainable Development "
I195

obesity on cardiac function in specific teenager stage, older adolescents (age 16-19).
Therefore, the purpose of this study is to assess cardiac function in older obese adolescents
comparing to that of non-obese participants by 2D-conventional echocardiography in Thai
adolescents.
Objectives: To assess cardiac function in older obese adolescents comparing to that of non-
obese participants by 2D-conventional echocardiography in Thai adolescents.
Research methodology
1. Participants
Eighty-one participants were recruited from the community around Naresuan
University. This study was approved by the Ethical Review Board, Naresuan University,
Phitsanulok, Thailand. All participants were informed about the purposes and procedures. A
written informed consent must be obtained from participants before concur into the study. The
data were collected between March and July 2016. Regarding to Asia-Pacific obesity
classification, the participants were classified into two groups as non-obese (BMI< 25 kg/m2)
and obese (BMI ≥ 25 kg/m2). The participants were male or female adolescences aged 16-19
years old without current illness. All participants must not exercise regularly. The participants
with structural cardiac abnormality and poor echocardiography window, and also who refused
echocardiography assessment were excluded.
1.1) Sample size calculation
The sample size was calculated using small sample size formula as shown below.
n=
When n is the required sample size, N is the population size,
e is the degrees of freedom of the error component (e = 0.05), Z is the value that specifies the
level of confidence (from 95% confidence interval, Z = 1.96), P and Q are the population
proportions (P = 0.1), (Q = 0.9) and the population size is 300. The calculated sample size
was 91. However, four participants had to be excluded due to poor echocardiographic image
quality and six participants drop out of the study for unknown reasons. Therefore, the sample
size (n) used in this study was 81 participants, 30 for non-obese group and 51 for obese
group.
The 7th National and International Graduate Study Conference 2017
" Thailand 4.0 Creative Innovation for Sustainable Development "
I196

2. Experimental design
The participants were interviewed about their demography and history of illness
using a questionnaire. Anthropometric data were collected by measuring weight, height, waist
circumference, body mass index (BMI) and body fat percentage by a trained cardio-thoracic
technologist. All participants were tested for standard blood analyses including complete
blood count and lipid profile after an overnight fasting (>12h). After that, they were
investigated for resting heart rate, blood pressure and 2D- echocardiography.
The data of non-obese and obese groups were then compared using unpaired t-test.
3. Blood pressure and laboratory test
The participants were measured for resting blood pressure and heart rate using
HEM-8712 (OMRON, Vietnam) for three times in sitting position after they had rest for 5
minutes in a quiet environment. Waist circumference, weight, height, and body fat percentage
were measured by a well-trained cardiothoracic technologist. Blood sample collection was
performed in the morning after overnight fasting. Complete blood count (CBC) and lipid
profile were analyzed using commercial kits (Human Diagnostics Worldwide, Germany).
4. Two-Dimensional Echocardiographic measurement
2D- echocardiographic measurements were performed using a Vivid S6 commercial
ultrasound scanner (GE Vingmed Ultrasound AS, Horten, Norway) with an active matrix
single-crystal phased-array transducer (GEM5S-D; GE Vingmed Ultrasound AS). Intra- and
inter-observer variability were tested before collecting the data. All participants were
measured by the same observer in the left side-lying position, after 5 minutes resting.
Grayscale images were recorded at a mean frame rate of ≥50 frames/s. Images were acquired
in the standard tomographic views of the LV (parasternal long- and short-axis, apical four-
chamber (A4C), apical three-chamber (A3C) and two-chamber views (A2C)). All
measurements were repeated three times and averaged value was used. 2D-echocardiographic
measurements were performed along with the criteria of the American Society of
Echocardiography (Sahn, DeMaria, Kisslo, & Weyman, 1978). Left ventricular systolic
function was measured including ejection fraction by Teichholz’s method (LVEF (Teicholz))
and fractional shortening (%FS) measured in the parasternal long axis views, using M mode,
left ventricular end diastolic volume (LVEDV (biplane)), end systolic volume (LVESV
(biplane)), and ejection fraction (LVEF (biplane) measured in the apical two chamber and
apical four chamber views. Diastolic function was measured by integrating Doppler
measurements of the mitral valve and tissue Doppler of the septal and lateral mitral annulus
The 7th National and International Graduate Study Conference 2017
" Thailand 4.0 Creative Innovation for Sustainable Development "
I197

velocity. The following parameters were obtained: mitral inflow velocities, peak early
diastolic velocity (MV E velocity), peak late diastolic velocity (MV A velocity), MV E/A
Ratio, E deceleration time (MV DecT), E’ septal, E’ lateral, E/E’ septal and E/E’ lateral. Left
ventricular dimension and geometric indices, interventricular septal at end diastole and end
systole (IVSDd and IVSDs), left ventricular internal diameter at end diastole and end systole
(LVIDd, LVIDs), left ventricular posterior wall at end diastole and end systole (LVPWd and
LVPWs) were evaluated using M mode. LV mass, LV mass index, and relative wall
thickness (RWT) were determined. Left atrium to aorta ratio (LA/Ao ratio) was measured,
Also, right ventricle systolic pressure (RVSP), right atrial pressure (RAP) were investigated,
aortic valve max velocity (AV Vmax) including pulmonic valve max velocity (PV Vmax)
were evaluated.
5. Statistical analysis
The data were presented as mean ± S.D. The distribution of sample mean was
analyzed using Shapiro-Wilk test. The data with normal distribution were analyzed with
unpaired t-test to compare the difference of parameters between obese group and non-obese
group. P-value <0.05 indicates to a statistical significance.
Results
1. Basic characteristics
Table 1 shows basic characteristics of the participants. Out of 81 participants, there
was no significant difference between numbers of male/female in obese and non-obese
groups (73% female in obese group vs. 61% female in non-obese group). The data showed
that mean age of the participants was significantly higher in the non-obese group compared
with that in the obese group (18.4 ± 0.1 vs. 17.8 ± 0.1 years, p < 0.05). Mean BMI was
significantly lower in the non-obese group when compared with that in the obese group (20.6
± 0.3 vs. 29.0 ± 0.5 km/m2, p < 0.001). Other indices related to body composition such as
weight, height, waist circumference, and body fat percentage were significantly lower in the
non-obese group when compared with those in the obese group. Mean SBP and DBP were
significantly lower in the non-obese group when compared with those in the obese group
(113.4 ± 2.5 vs. 123.5 ± 1.4 mmHg, p < 0.001 for SBP and 67.7 ±1.4 vs. 74.7 ± 1.1 mmHg, p
< 0.001 for DBP). However, there were no significant differences between the non-obese and
the obese groups regarding to sex, mean PP, and mean HR.
The 7th National and International Graduate Study Conference 2017
" Thailand 4.0 Creative Innovation for Sustainable Development "
I198

2. Laboratory findings
Table 2 shows the laboratory findings of the non-obese and the obese group.
Biochemical data showed that there was significantly lower of serum triglyceride in the non-
obese group as compared to that of the obese group (126.3 ± 6.9 vs. 159.6 ± 7.7 mg/dL, p <
0.05). Whereas serum HDL was significantly higher in the non-obese group compared to that
in the non-obese group (46.4 ± 1.9 vs. 41.4 ± 1.0 mg/dL, p< 0.05). Significantly, Hb and Hct
level was significantly lower in the non-obese group when compared with those in the obese
group (12.3 ± 0.2 vs. 13.1 ± 0.2 x10⁶ g/dL, p < 0.05, and 38.9 ± 0.6 vs. 41.3 ± 0.6%, p <
0.05). Monocyte level was also significantly higher in non-obese group when compared with
obese group (5.9 ± 0.3 and 4.4 ± 0.2%, p < 0.001). There were no significant differences
between groups with regard to cholesterol, LDL, WBC, RBC, MCV, MCH, MCHC, RDW,
platelet count, neutrophil, lymphocyte, eosinophil and basophil level.
3. Cardiac function assessed by 2D-conventional echocardiography
Inter and intra observer test demonstrated a good intra-observer agreement (ranged
between 0.883 to 0.996) and an excellent inter-observer agreement in all parameters (ranged
between 0.801 to 0.997). Regarding to left ventricular systolic function, the result presented
that there were no significant differences between the two groups with regard to mean LVEF
(biplane), mean %FS and mean LVEF (Tei). Significantly, mean LVEDV and mean LVESV
differed between the two groups (89.13 ± 3.32 vs. 120.10± 3.53 ml, 30.44 ± 1.35 vs. 42.29±
1.67 ml, respectively, p < 0.001).
Left ventricular diastolic function study showed that there were no significant
differences between the two groups regarding to mean MV E/A ratio, mean MV DecT, MV
E velocity, mean MV A velocity, mean E’ lateral, mean E/E’ sepal and mean E/E’ lateral.
However, mean E’ septal was significantly higher in non-obese group when compared with
obese adolescents (0.16 ± 0.00 vs. 0.15 ± 0.00, p < 0.05).
Left ventricular dimensions was assessment demonstrated that, mean IVSDd, mean
LVIDd and mean LVPWd was significantly lower in non-obese group when compared with
obese group (0.77 ± 0.02 vs. 0.90 ± 0.02 cm, 4.43 ± 0.06 vs. 4.82 ± 0.05 cm and 0.72 ± 0.02
vs. 0.85 ± 0.01 cm, respectively, p < 0.001). Mean LV mass, mean LV mass index and mean
RWT was significantly lower in non-obese participants when compared with obese group
(103.20 ± 4.60 vs. 140.80 ± 5.04 g, p < 0.001 for LV mass, 65.30 ± 2.27 vs. 74.35 ± 2.63
g/m2 and 0.32 ± 0.01 vs. 0.36 ± 0.00 cm, for LVM and RWT respectively, p < 0.05 ).
Additionally, it was shown that, there were no significant differences between groups
regarding to mean LA/Ao ratio, mean AV Vmax and mean PV Vmax, only mean RVSP was
The 7th National and International Graduate Study Conference 2017
" Thailand 4.0 Creative Innovation for Sustainable Development "
I199
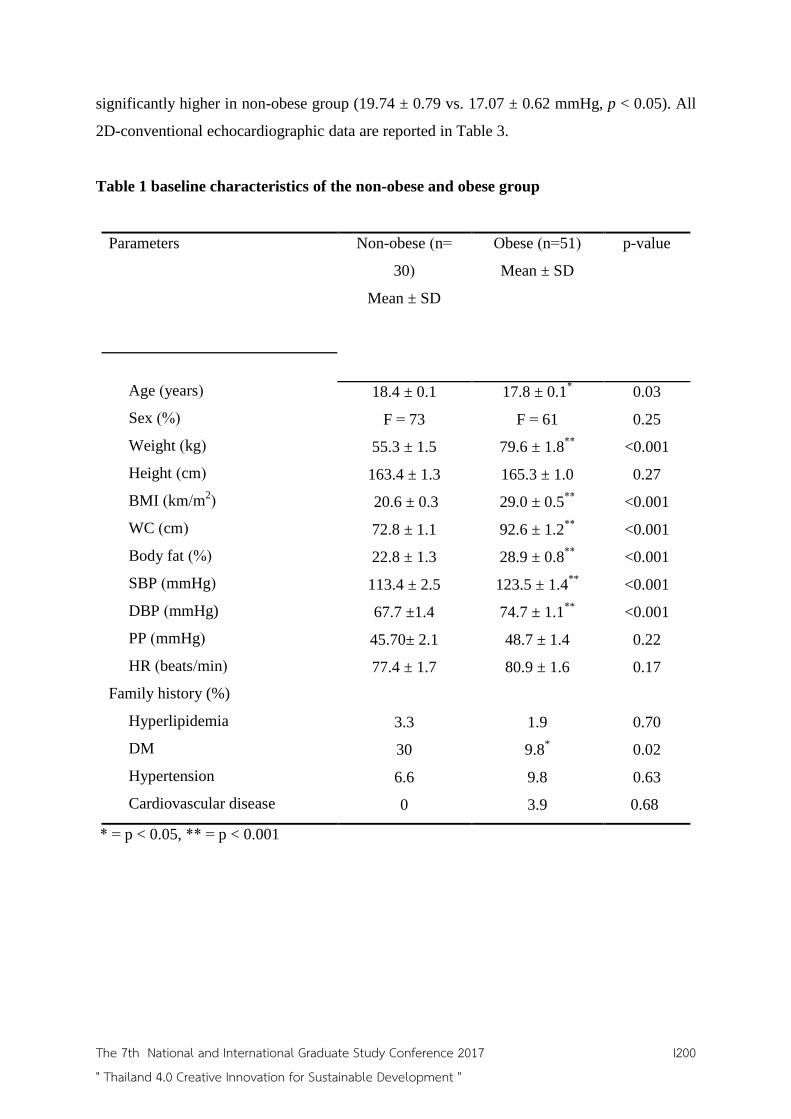
significantly higher in non-obese group (19.74 ± 0.79 vs. 17.07 ± 0.62 mmHg, p < 0.05). All
2D-conventional echocardiographic data are reported in Table 3.
Table 1 baseline characteristics of the non-obese and obese group
Parameters Non-obese (n=
30)
Mean ± SD
Obese (n=51)
Mean ± SD
p-value
Age (years)
Sex (%)
Weight (kg)
Height (cm)
BMI (km/m2)
WC (cm)
Body fat (%)
SBP (mmHg)
DBP (mmHg)
PP (mmHg)
HR (beats/min)
Family history (%)
Hyperlipidemia
DM
Hypertension
Cardiovascular disease
18.4 ± 0.1
F = 73
55.3 ± 1.5
163.4 ± 1.3
20.6 ± 0.3
72.8 ± 1.1
22.8 ± 1.3
113.4 ± 2.5
67.7 ±1.4
45.70± 2.1
77.4 ± 1.7
3.3
30
6.6
0
17.8 ± 0.1*
F = 61
79.6 ± 1.8**
165.3 ± 1.0
29.0 ± 0.5**
92.6 ± 1.2**
28.9 ± 0.8**
123.5 ± 1.4**
74.7 ± 1.1**
48.7 ± 1.4
80.9 ± 1.6
1.9
9.8*
9.8
3.9
0.03
0.25
<0.001
0.27
<0.001
<0.001
<0.001
<0.001
<0.001
0.22
0.17
0.70
0.02
0.63
0.68
* = p < 0.05, ** = p < 0.001
The 7th National and International Graduate Study Conference 2017
" Thailand 4.0 Creative Innovation for Sustainable Development "
I200

Table 2 laboratory parameters of the non-obese and obese group.
Factors
Non-obese
(n= 30)
mean ± SD
Obese
(n=51)
mean ± SD
p-value
Laboratory parameters
Triglyceride (mg/dL)
Cholesterol (mg/dL)
HDL (mg/dL)
LDL (mg/dL)
WBC (cell/cumm.)
RBC (x106 cell/µL)
Hb (g/dL)
Hct (%)
MCV (fL)
MCH (pg)
MCHC (g/dL)
RDW (%)
Platelet count (cell/cumm.)
Neutrophil (%)
Lymphocyte (%)
Monocyte (%)
Eosinophil (%)
Basophil (%)
126.3 ± 6.9
167.0 ± 8.8
46.4 ± 1.9
95.4 ± 7.5
5,530 ± 261.3
5.0 ± 0.1
12.3 ± 0.2
38.9 ± 0.6
78.6 ± 1.4
24.7 ± 0.5
31.5 ± 0.2
14.9 ± 0.1
305,200 ± 10430
59.5 ± 1.4
31.3 ± 1.7
5.9 ± 0.3
2.0 ± 0.2
0.1 ± 0.0
159.6 ± 7.7*
171.0 ± 4.4
41.4 ± 1.0*
97.5 ± 4.2
5,898 ± 217.2
5.3 ± 0.0
13.1 ± 0.2*
41.3 ± 0.6*
78.2 ± 0.9
24.5 ± 0.4
31.3 ± 0.2
14.8 ± 0.1
323,900 ± 10240
60.4 ± 0.8
32.4 ± 0.8
4.4 ± 0.2**
2.7 ± 0.2
0.1 ± 0.0
0.004
0.65
0.01
0.79
0.29
0.05
0.03
0.01
0.81
0.76
0.62
0.79
0.23
0.58
0.51
<0.001
0.07
0.23
* = p < 0.05, ** = p < 0.001
The 7th National and International Graduate Study Conference 2017
" Thailand 4.0 Creative Innovation for Sustainable Development "
I201

Table 3 2D-conventional echocardiographic results of the non-obese and obese group.
Factors
Non-obese
(n= 30)
mean ± SD
Obese
(n=51)
mean ± SD
p-value
2D-mode
LVEDV (biplane) (ml)
LVESV (biplane) (ml)
LVEF (biplane) (%)
89.13 ± 3.32
30.44 ± 1.35
65.79 ± 0.87
120.10± 3.53 **
42.29± 1.67 **
64.96 ± 0.82
<0.001
<0.001
0.51
M-mode
FS (%)
LVEF (Teicholz) (%)
LA/Ao ratio
IVSDd (cm)
LVIDd (cm)
LVPWd (cm)
LV mass (g)
LVMI (g/m2 )
RWT
38.82 ± 0.76
69.17 ± 0.93
1.20 ± 0.02
0.77 ± 0.02
4.43 ± 0.06
0.72 ± 0.02
103.20 ± 4.60
65.30 ± 2.27
0.32 ± 0.01
37.64± 0.66
67.32± 0.83
1.28 ± 0.02
0.90 ± 0.02 **
4.82 ± 0.05**
0.85 ± 0.01 **
140.80 ± 5.04**
74.35 ± 2.63*
0.36 ± 0.00*
0.26
0.15
0.07
<0.001
<0.001
<0.001
<0.001
0.02
0.03
* = p < 0.05, ** = p < 0.001
Table 3 (cont.) 2D-conventional echocardiographic results of the non-obese and obese
group.
Factors
Non-obese
(n= 30)
mean ± SD
Obese
(n=51)
mean ± SD
p-value
Doppler-mode
MV E velocity (ms)
MV A velocity (m/s)
MV E/A Ratio
MV DecT (ms)
E’ septal (m/s)
0.99 ± 0.02
0.46 ± 0.01
2.19 ± 0.09
184.80 ± 6.63
0.16 ± 0.00
0.96 ± 0.01
0.47 ± 0.01
2.11 ± 0.07
187.80 ± 5.18
0.15 ± 0.00*
0.50
0.65
0.56
0.72
0.03
The 7th National and International Graduate Study Conference 2017
" Thailand 4.0 Creative Innovation for Sustainable Development "
I202

E’ lateral (m/s)
E/E’ sep
E/E’ lat
RVSP (mmHg)
AV Vmax (m/s)
PV Vmax (m/s)
0.20 ± 00
5.93 ± 0.18
4.97 ± 0.16
19.74 ± 0.79
1.10 ± 0.02
0.99 ± 0.03
0.20 ± 00
6.36 ± 0.18
4.88 ± 0.13
17.07 ± 0.62*
1.10 ± 0.02
1.00 ± 0.02
0.91
0.12
0.66
0.01
0.92
0.83
* = p < 0.05, ** = p < 0.001
Discussion
The recent study found that, there were significant differences in SBP, DBP
LV mass, LVMI, RWT, IVSDd, LVIDd and LVPWd between obese and non-obese
adolescents. These results indicated the morphological changes induced by obesity. This
finding supports previous studies (Kinik, Varan, Yildirim, & Tokel, 2006; Koebnick et al.,
2013; Kono et al., 1994; Ozdemir et al., 2010; Van Putte-Katier et al., 2008) demonstrating
that obesity was associated with a higher prevalence of hypertension, LV hypertrophy and
increased LVM in children and adolescents. The structural changes may be due to higher
vascular resistance, presented as higher SBP, or may be involved in hormonal changes i.e.,
leptin or adiponectin (Chiolero, Cachat, Burnier, Paccaud, & Bovet, 2007; Rajapurohitam,
Javadov, Purdham, Kirshenbaum, & Karmazyn, 2006; Xu et al., 2004; Zeidan, Hunter,
Javadov, & Karmazyn, 2011). In the current study, global LV systolic function was assessed.
It was of found that there were increased LV end diastolic volume and end systolic volume
(LVEDV and LVESV) in obese subjects, although almost all within the normal range. The
evaluation of global LV systolic function assessed by LVEF and %FS was not different from
that of non-obese teenagers. This finding is relevant to many studies showing normal systolic
function in obese subjects (Alpert, Terry, & Kelly, 1985; Grossman, Oren, & Messerli;
Lauer, Anderson, & Levy, 1992). However, some studies indicated impaired systolic function
in obese adolescents (Chinali et al., 2006; Pascual et al., 2003). This discrepancy may be
explained by Chinali et al (Chinali et al., 2006) and Pascual et al (Pascual et al., 2003) who
reported that a reduction of indices of systolic function was only found in subjects with a
considerable degree of obesity suggesting that left ventricular function is affected late in the
course of obesity. It is possible that the alteration of cardiac function might be subclinical
heart disorder.
The 7th National and International Graduate Study Conference 2017
" Thailand 4.0 Creative Innovation for Sustainable Development "
I203
In the present study, there was no significant difference in main diastolic function
indices, E/A, Dec T, mitral early or late diastolic flow between the obese and non-obese
adolescents. Diastolic function by tissue Doppler imaging has been shown to be a more
sensitive marker of diastolic function in subclinical heart disease (Kadappu & Thomas; C.-M.
Yu, Sanderson, Marwick, & Oh, 2007) and in this study e’ was initially reduced when
compare to that of the non-obese adolescents. Few studies (Kinik et al., 2006; Levent,
Goksen, Ozyurek, Darcan, & Coker, 2005; Tei, 1995) have specifically investigated the
impact of obesity on diastolic function in children. In contrast to most results, Harada et al
(Harada et al., 2001) found altered transmitral and pulmonary venous velocities in 21 obese
children using pulse wave Doppler, suggesting a reduction in early diastolic filling. And one
recent study investigated diastolic function using TDI in 25 obese and overweight children
(Chinali et al., 2006) providing unique insights into the effects obesity on LV diastolic
function. They observed impaired early diastolic function (E′) in the overweight and obese
group. The relation between obesity and diastolic filling is not well understood. Although the
association of myocardial fatty infiltration with obesity is well recognized, it is not a
prominent finding at autopsy. However, altered LV relaxation could be related to early
alterations in the myocardial collagen-to-muscle ratio that are secondary to insulin resistance
and commonly seen in obese patients (Rabkin, 2007).The limitations of this study small
number of participants and also the single-center study. The strength of this study is the
proper cut off value for obesity for Asian population which can truly classify subjects as non-
obese or obese.
In conclusion, this study demonstrated that older obese adolescents had significant
changes in cardiac morphology but not in cardiac function.
Recommendations
It is recommended that mechanisms of cardiovascular changes in older adolescents
should be further investigated. The correlation between metabolic parameters, such as insulin
or leptin, and cardiac function of obese adolescents needs to be explored. High sensitive tool
for assessment of cardiac function i.e., speckle tracking, may be useful to detect subclinical
disorders.
The 7th National and International Graduate Study Conference 2017
" Thailand 4.0 Creative Innovation for Sustainable Development "
I204

References Alpert, M. A., Terry, B. E., & Kelly, D. L. (1985). Effect of weight loss on cardiac chamber
size, wall thickness and left ventricular function in morbid obesity. Am J Cardiol,
55(6), 783-786.
Atabek, M. E., Akyuz, E., Selver Eklioglu, B., & Cimen, D. (2011). The relationship between
metabolic syndrome and left ventricular mass index in obese children. J Clin Res
Pediatr Endocrinol, 3(3), 132-138. doi: 10.4274/jcrpe.v3i3.26
Avelar, E., Cloward, T. V., Walker, J. M., Farney, R. J., Strong, M., Pendleton, R. C., . . .
Litwin, S. E. (2007). Left ventricular hypertrophy in severe obesity: interactions
among blood pressure, nocturnal hypoxemia, and body mass. Hypertension, 49(1),
34-39. doi: 10.1161/01.hyp.0000251711.92482.14
Berenson, G. S., Srinivasan, S. R., Bao, W., Newman, W. P., 3rd, Tracy, R. E., & Wattigney,
W. A. (1998). Association between multiple cardiovascular risk factors and
atherosclerosis in children and young adults. The Bogalusa Heart Study. N Engl J
Med, 338(23), 1650-1656. doi: 10.1056/nejm199806043382302
Chinali, M., de Simone, G., Roman, M. J., Lee, E. T., Best, L. G., Howard, B. V., &
Devereux, R. B. (2006). Impact of obesity on cardiac geometry and function in a
population of adolescents: the Strong Heart Study. J Am Coll Cardiol, 47(11), 2267-
2273. doi: 10.1016/j.jacc.2006.03.004
Chiolero, A., Cachat, F., Burnier, M., Paccaud, F., & Bovet, P. (2007). Prevalence of
hypertension in schoolchildren based on repeated measurements and association with
overweight. J Hypertens, 25(11), 2209-2217. doi: 10.1097/HJH.0b013e3282ef48b2
Daniels, S. R. (2006). The consequences of childhood overweight and obesity. Future Child,
16(1), 47-67.
Daniels, S. R. (2009). Complications of obesity in children and adolescents. Int J Obes
(Lond), 33 Suppl 1, S60-65. doi: 10.1038/ijo.2009.20
de Jonge, L. L., van Osch-Gevers, L., Willemsen, S. P., Steegers, E. A., Hofman, A.,
Helbing, W. A., & Jaddoe, V. W. (2011). Growth, obesity, and cardiac structures in
early childhood: the Generation R Study. Hypertension, 57(5), 934-940. doi:
10.1161/hypertensionaha.110.163303
Dhuper, S., Abdullah, R. A., Weichbrod, L., Mahdi, E., & Cohen, H. W. (2011). Association
of obesity and hypertension with left ventricular geometry and function in children
and adolescents. Obesity (Silver Spring), 19(1), 128-133. doi: 10.1038/oby.2010.134
Di Bonito, P., Capaldo, B., Forziato, C., Sanguigno, E., Di Fraia, T., Scilla, C., . . . Moio, N.
(2008). Central adiposity and left ventricular mass in obese children. Nutr Metab
Cardiovasc Dis, 18(9), 613-617. doi: 10.1016/j.numecd.2007.09.002
Grandi, A. M., Zanzi, P., Piantanida, E., Gaudio, G., Bertolini, A., Guasti, L., & Venco, A.
(2000). Obesity and left ventricular diastolic function: noninvasive study in
normotensives and newly diagnosed never-treated hypertensives. Int J Obes Relat
Metab Disord, 24(8), 954-958.
Grossman, E., Oren, S., & Messerli, F. H. Left ventricular filling in the systemic hypertension
of obesity. American Journal of Cardiology, 68(1), 57-60. doi: 10.1016/0002-
9149(91)90710-3
Harada, K., Orino, T., & Takada, G. (2001). Body mass index can predict left ventricular
diastolic filling in asymptomatic obese children. Pediatr Cardiol, 22(4), 273-278. doi:
10.1007/s002460010228
Harris, K. C., Al Saloos, H. A., De Souza, A. M., Sanatani, S., Hinchliffe, M., Potts, J. E., &
Sandor, G. G. (2012). Biophysical properties of the aorta and left ventricle and
exercise capacity in obese children. Am J Cardiol, 110(6), 897-901. doi:
10.1016/j.amjcard.2012.05.019
The 7th National and International Graduate Study Conference 2017
" Thailand 4.0 Creative Innovation for Sustainable Development "
I205

Ingul, C. B., Tjonna, A. E., Stolen, T. O., Stoylen, A., & Wisloff, U. (2010). Impaired cardiac
function among obese adolescents: effect of aerobic interval training. Arch Pediatr
Adolesc Med, 164(9), 852-859. doi: 10.1001/archpediatrics.2010.158
Kadappu, K. K., & Thomas, L. Tissue Doppler Imaging in Echocardiography: Value and
Limitations. Heart, Lung and Circulation, 24(3), 224-233. doi:
10.1016/j.hlc.2014.10.003
Kinik, S. T., Varan, B., Yildirim, S. V., & Tokel, K. (2006). The effect of obesity on
echocardiographic and metabolic parameters in childhood. J Pediatr Endocrinol
Metab, 19(8), 1007-1014.
Koebnick, C., Black, M. H., Wu, J., Martinez, M. P., Smith, N., Kuizon, B., . . . Jacobsen, S.
J. (2013). High blood pressure in overweight and obese youth: implications for
screening. J Clin Hypertens (Greenwich), 15(11), 793-805. doi: 10.1111/jch.12199
Kono, Y., Yoshinaga, M., Oku, S., Nomura, Y., Nakamura, M., & Aihoshi, S. (1994). Effect
of obesity on echocardiographic parameters in children. Int J Cardiol, 46(1), 7-13.
Koopman, L. P., McCrindle, B. W., Slorach, C., Chahal, N., Hui, W., Sarkola, T., . . .
Mertens, L. (2012). Interaction between myocardial and vascular changes in obese
children: a pilot study. J Am Soc Echocardiogr, 25(4), 401-410.e401. doi:
10.1016/j.echo.2011.12.018
Lauer, M. S., Anderson, K. M., & Levy, D. (1992). Separate and joint influences of obesity
and mild hypertension on left ventricular mass and geometry: the Framingham Heart
Study. J Am Coll Cardiol, 19(1), 130-134.
Levent, E., Goksen, D., Ozyurek, A. R., Darcan, S., & Coker, M. (2005). Usefulness of the
myocardial performance index (MPI) for assessing ventricular function in obese
pediatric patients. Turk J Pediatr, 47(1), 34-38.
Lorch, S. M., & Sharkey, A. (2007). Myocardial velocity, strain, and strain rate abnormalities
in healthy obese children. J Cardiometab Syndr, 2(1), 30-34.
Mahfouz, R. A., Dewedar, A., Abdelmoneim, A., & Hossien, E. M. (2012). Aortic and
pulmonary artery stiffness and cardiac function in children at risk for obesity.
Echocardiography, 29(8), 984-990. doi: 10.1111/j.1540-8175.2012.01736.x
McGill, H. C., Jr., McMahan, C. A., Zieske, A. W., Malcom, G. T., Tracy, R. E., & Strong, J.
P. (2001). Effects of nonlipid risk factors on atherosclerosis in youth with a favorable
lipoprotein profile. Circulation, 103(11), 1546-1550.
Mehta, S. K., Richards, N., Lorber, R., & Rosenthal, G. L. (2009). Abdominal obesity, waist
circumference, body mass index, and echocardiographic measures in children and
adolescents. Congenit Heart Dis, 4(5), 338-347. doi: 10.1111/j.1747-
0803.2009.00330.x
Ogden, C. L., Flegal, K. M., Carroll, M. D., & Johnson, C. L. (2002). Prevalence and trends
in overweight among US children and adolescents, 1999-2000. Jama, 288(14), 1728-
1732.
Ozcetin, M., Celikyay, Z. R., Celik, A., Yilmaz, R., Yerli, Y., & Erkorkmaz, U. (2012). The
importance of carotid artery stiffness and increased intima-media thickness in obese
children. S Afr Med J, 102(5), 295-299.
Ozdemir, O., Hizli, S., Abaci, A., Agladioglu, K., & Aksoy, S. (2010). Echocardiographic
measurement of epicardial adipose tissue in obese children. Pediatr Cardiol, 31(6),
853-860. doi: 10.1007/s00246-010-9720-y
Pascual, M., Pascual, D. A., Soria, F., Vicente, T., Hernandez, A. M., Tebar, F. J., & Valdes,
M. (2003). Effects of isolated obesity on systolic and diastolic left ventricular
function. Heart, 89(10), 1152-1156.
Rabkin, S. W. (2007). Epicardial fat: properties, function and relationship to obesity. Obes
Rev, 8(3), 253-261. doi: 10.1111/j.1467-789X.2006.00293.x
The 7th National and International Graduate Study Conference 2017
" Thailand 4.0 Creative Innovation for Sustainable Development "
I206

Rajapurohitam, V., Javadov, S., Purdham, D. M., Kirshenbaum, L. A., & Karmazyn, M.
(2006). An autocrine role for leptin in mediating the cardiomyocyte hypertrophic
effects of angiotensin II and endothelin-1. J Mol Cell Cardiol, 41(2), 265-274. doi:
10.1016/j.yjmcc.2006.05.001
Sahn, D. J., DeMaria, A., Kisslo, J., & Weyman, A. (1978). Recommendations regarding
quantitation in M-mode echocardiography: results of a survey of echocardiographic
measurements. Circulation, 58(6), 1072-1083.
Saltijeral, A., Isla, L. P., Perez-Rodriguez, O., Rueda, S., Fernandez-Golfin, C., Almeria, C., .
. . Zamorano, J. (2011). Early myocardial deformation changes associated to isolated
obesity: a study based on 3D-wall motion tracking analysis. Obesity (Silver Spring),
19(11), 2268-2273. doi: 10.1038/oby.2011.157
Schuster, I., Karpoff, L., Perez-Martin, A., Oudot, C., Startun, A., Rubini, M., . . . Vinet, A.
(2009). Cardiac function during exercise in obese prepubertal boys: effect of degree
of obesity. Obesity (Silver Spring), 17(10), 1878-1883. doi: 10.1038/oby.2009.197
Serdula, M. K., Ivery, D., Coates, R. J., Freedman, D. S., Williamson, D. F., & Byers, T.
(1993). Do obese children become obese adults? A review of the literature. Prev Med,
22(2), 167-177. doi: 10.1006/pmed.1993.1014
Sharpe, J. A., Naylor, L. H., Jones, T. W., Davis, E. A., O'Driscoll, G., Ramsay, J. M., &
Green, D. J. (2006). Impact of obesity on diastolic function in subjects < or = 16 years
of age. Am J Cardiol, 98(5), 691-693. doi: 10.1016/j.amjcard.2006.03.052
Tei, C. (1995). New non-invasive index for combined systolic and diastolic ventricular
function. J Cardiol, 26(2), 135-136.
van Dam, R. M., Willett, W. C., Manson, J. E., & Hu, F. B. (2006). The Relationship
between Overweight in Adolescence and Premature Death in Women. Annals of
Internal Medicine, 145(2), 91-97. doi: 10.7326/0003-4819-145-2-200607180-00006
Van Putte-Katier, N., Rooman, R. P., Haas, L., Verhulst, S. L., Desager, K. N., Ramet, J., &
Suys, B. E. (2008). Early cardiac abnormalities in obese children: importance of
obesity per se versus associated cardiovascular risk factors. Pediatr Res, 64(2), 205-
209. doi: 10.1203/PDR.0b013e318176182b
Wikstrand, J., Pettersson, P., & Bjorntorp, P. (1993). Body fat distribution and left ventricular
morphology and function in obese females. J Hypertens, 11(11), 1259-1266.
Xu, F. P., Chen, M. S., Wang, Y. Z., Yi, Q., Lin, S. B., Chen, A. F., & Luo, J. D. (2004).
Leptin induces hypertrophy via endothelin-1-reactive oxygen species pathway in
cultured neonatal rat cardiomyocytes. Circulation, 110(10), 1269-1275. doi:
10.1161/01.cir.0000140766.52771.6d
Yu, C.-M., Sanderson, J. E., Marwick, T. H., & Oh, J. K. (2007). Tissue Doppler Imaging: A
New Prognosticator for Cardiovascular Diseases. J Am Coll Cardiol, 49(19), 1903-
1914. doi: https://doi.org/10.1016/j.jacc.2007.01.078
Yu, J. J., Yeom, H. H., Chung, S., Park, Y., & Lee, D. H. (2006). Left atrial diameters in
overweight children with normal blood pressure. J Pediatr, 148(3), 321-325. doi:
10.1016/j.jpeds.2005.10.042
Zeidan, A., Hunter, J. C., Javadov, S., & Karmazyn, M. (2011). mTOR mediates RhoA-
dependent leptin-induced cardiomyocyte hypertrophy. Mol Cell Biochem, 352(1-2),
99-108. doi: 10.1007/s11010-011-0744-2
The 7th National and International Graduate Study Conference 2017
" Thailand 4.0 Creative Innovation for Sustainable Development "
I207

Appendix
Thamonwan Imerbtham a, Teonchit Nuamchit
b, Teerapat Yingchonchareon, Duangduan
Siriwittayawan a*
a Department of Cardio-Thoracic Technology, Faculty of Allied Health Sciences, Naresuan
University, Phitsanulok, Thailand, 65000
b Department of internal medicine, Faculty of Medicine, Ramathibodi-hospital, Bangkok,
Thailand,
* Corresponding author: Duangduan Siriwittayawan, Ph.D. (Cardiovascular Sciences),
Department of Cardio-Thoracic Technology, Faculty of Allied Health Sciences, Naresuan
University, Phitsanulok, Thailand, 65000
Tel: +66 64 009 6222.
E-mail address: [email protected]
Author Contributions: Conceived and designed the experiments: DS and TY.
Performed the experiments: TM. Statistical Analysis: DS and TN. Contributed
materials/analysis tools: DS and TY. Drafted the manuscript: DS and TN. All authors have
read and approved the final version of the manuscript, and agree with the order of
presentation of the authors.
Competing Interests: None of the authors declare competing financial interests.
Funding: This work was supported by Naresuan University Research Fund.
The 7th National and International Graduate Study Conference 2017
" Thailand 4.0 Creative Innovation for Sustainable Development "
I208

Shallow Subsurface Structure Estimated from Geophysical Data in Mae On
District, Chiang Mai Province
Author: Srivipa Lerkratanawaree* and Siriporn Chaisri**
Program: Applied Geophysics Institute: Chiang Mai University
Abstract
Mae On district is located in eastern part of Chiang Mai province,
Thailand. There are volcanic rocks distribute in this area. The objective of this study
is to map quaternary layers, composing of a sedimentary layer, overlying volcanic
layer. This study integrates three geophysical investigations. Seismic reflection
method is a major investigation that focuses on the deeper part. Moreover, the
multichannel analysis of surface waves and electrical resistivity surveys were
conducted to provide more supporting information in the shallow part. There are two
survey lines, one in north-south and the other in east-west direction. The results show
that the top-soil layer has low resistivity and low seismic velocities (both P- and S-
waves) with 10 m estimated depth. The top-soil is underlaid by the high resistivity
and high seismic velocities layer, this could be interpreted as the basaltic layer with
more information from the basaltic outcrop contribution around the study area. The
study of sedimentary layer provides an information of the subsurface which is useful
for future land development.
Keywords: Geophysical Survey, Seismic Reflection, MASW, Resistivity
* Student, Master of Science Program in Applied Geophysics, Faculty of Science,
Chiang Mai University
** Department of Physics and Materials Science, Faculty of Science, Chiang Mai
University
The 7th National and International Graduate Study Conference 2017
" Thailand 4.0 Creative Innovation for Sustainable Development "
I209

Introduction
Mae On is a political district (amphoe) of Chiang Mai province in the
north of Thailand. It is located about 40 km eastern of Chiang Mai center. It is
situated on the foothill terrain with a long shape in north-south trend flanked by
mountains on the west and east sides. The subsurface information of this area is
supported by Department of Mineral Resources (DMR), Thailand, including well log
data (Department of Mineral Resources, 2003) released in 2004 and the geological
map (Figure 1) released in 2007. Mae On area is mostly covered by Quaternary
sediments related to recent fluvial and alluvial processes (Department of Mineral
Resources, 2007). The previous ground gravity data were collected by Suntamano and
Guntiya, (2014) and aeromagnetic data were obtained from DMR. Both anomaly
maps show high values in the study area. Generally, the sediments should provide the
low anomalies of gravity and magnetic data because of the lower density and
magnetic susceptibility. Moreover, the thickness of the Quaternary sediments from
well data is about 80 m underlaid by the basaltic rock. However, the well location is
about 6.5 km in South-West direction away from the study area, therefore, some
geological information might be varied especially the sedimentary thickness.
Consequently, the study area is interested in estimating depth of sediment.
It is also well known that the potential filed data (gravity and magnetic
anomalies) will suffer from the non-uniqueness because several earth models could
produce the same gravity and/or magnetic response. Furthermore, many solutions may
not be geologically realistic. Because of this inherent ambiguity and the nonlinear
nature of the geophysical problem, the subsurface geology of this area will be
interpreted from several geophysical methods. There were many investigations by the
integration of geophysical data such as for fault and complicate geology zone (Pinet,
2013; Mahmut and Berge, 2017), geology contact interpretation (Ali, Saad, and
Nordiana, 2013), and cave structure (Leucci and Giorgi, 2005). Therefore, the aim of
this study is to map the quaternary layer using integrated geophysical methods. A
geological model has been obtained by seismic surveys. To provide more evidence
about the shallow quaternary sediment, this study acquired a multichannel analysis of
surface wave (MASW, 2017) and electrical resistivity surveys. The study of
The 7th National and International Graduate Study Conference 2017
" Thailand 4.0 Creative Innovation for Sustainable Development "
I210

sedimentary layer such as its physical properties and thickness provides subsurface
information that useful for the area future development.
The geophysical methods are the subsurface investigation by using
specific instruments measure subsurface signals on the surface to determine the
subsurface geology. This study includes three geophysical methods, the reflection
seismic methods which focused on seismic body waves, the multichannel analysis of
surface wave method which concentrates on surface wave, and the electrical
resistivity method which measures how well the subsurface resist the flow of electric
current.
The basic technique of seismic exploration consists of generating seismic
waves into the ground and, then, the seismic energy disturbance several types of
waves propagating within the Earth and along its surface. The generated waves can be
divided into two main categories; body waves and surface waves. The propagating
waves are returned to the surface where encounter the layer of rock because of the
velocity and density contrasts. The body waves are transmitted through the interior of
the Earth while the surface wave is traveling near surface and characterized by
relatively higher amplitude with lower frequency in shot record. The instrument
collects the amplitude and time required for the waves to travel from the source to a
series of the receiver (Telford, Geldart, and Sheriff, 1990).
The electrical resistivity surveys are used in geophysics to measure the
subsurface variations in electrical resistivity. Resistivity measurements are carried out
with transmitting current from the surface into subsurface medium through one pair of
electrodes (source electrodes) and measuring the voltage different at another pair of
electrodes (potential electrodes). From the surface measurements, the apparent
resistivity of the medium will be obtained and processed to generate true electrical
resistivity model.
There are two selected geophysical survey lines (Figure 1) for this study.
The MO-1 survey line in the north-south direction with surface distance about 460 m
was investigated by seismic reflection and resistivity surveys. The application of
surface wave, MASW method, was also conducted in the middle part of MO-1. The
The 7th National and International Graduate Study Conference 2017
" Thailand 4.0 Creative Innovation for Sustainable Development "
I211

second survey line is MO-2 in the east-west direction with surface distance about
1000 m. This survey line was investigated with reflection seismic method only.
Figure 1 Geological map of the study area, Mae On district, Chiang Mai province,
with MO-1 and MO-2 survey lines and previous well log location. Modify after
(Department of Mineral Resources, 2007)
Geological setting
The volcanic rocks in Thailand are widely distributed in Paleozoic and
Cenozoic Era (Barr and Charusiri, 2011). The volcanic rock in this area were assigned
to Dan Lan Hoi or Mae Tha group in Chiang Mai volcanic belt. Field survey and
petrography described types of volcanic rock that are basalt, basalt porphyry,
amygdaloidal basalt, pillow basalt (Barr and MacDoNald, 1978; Barr, et al. 1990).
The petrography of Chiang Mai volcanic belt represents a zone of back-arc
continental extension. The evidence of age was the close association with Permian
limestone (Barr and Charusiri, 2011). After the basaltic extrusion, Mae On area was
deposited of sedimentary in the quaternary.
Objectives of the study
There are two main objectives in this study. The first objective is to
acquire the geophysical data from seismic and electrical resistivity surveys. The
second is to map the quaternary sedimentary layer in the study area by geophysical
data integration.
The 7th National and International Graduate Study Conference 2017
" Thailand 4.0 Creative Innovation for Sustainable Development "
I212

Methodology: Seismic reflection survey
The seismic waves were recorded as a function of the travel time (t) and
offset (x) in the seismic traces. The seismic velocities of the subsurface can be
calculated based on their arrival time. The reflected waves from the hyperbolic travel
time curves are used to estimate velocity in reflection processing and construct the
structure velocity model. Seismic cross-section is required to depict the image of
subsurface and it can be combined with another data for detailed investigation of
subsurface geometry structure.
The seismic surveys were conducted with three Geode Geometrics DZ
system (Geometrics, 2017), the total of 72 channels, and the Seismodule Controller
V9.1 as the acquisition software. Two types of energizing sources were used, a 20-lb
sledge hammer for line survey MO-1 and a 300kg elastic wave generator (EMG) for
line survey MO-2. The 72 of 28 Hz frequency respond geophones were used as the
signal receivers for each shot location. Every source location, three or five shots were
generated and vertically stacked to increase the signal-to-noise ratio (S/N). The source
and receiver locations georeferenced using differential global positioning system
(DGPS). The shot and geophone intervals are 4 m and 5 m for line MO-1 and line
MO-2, respectively. The data were acquired in a window of 1 s with a sampling
interval of 1 ms.
The first arrival in seismic shot gathers express the travel times of the
directed and refracted waves that examined for the velocity of top and underlaid
layers. The reciprocal slope of directed wave travel times, represent with red line on
Figure 2a, is the velocity of top-soil layer or weathering layer. It could be measured
directly as 600 m/s from the directed wave arrival. The second reciprocal slope of the
first arrival time is the refracted wave represented in yellow line which indicates the
velocity of second layer as 4000 m/s. The surface wave and air blast can also be
indicated with an apparent velocity about of 330 m/s and 200 m/s, respectively. After
examining, seismic data were processing with Vista5.5 software. The major
processing steps were applied to seismic data follow by
Firstly, the seismic data that collected on field survey were prepared for
processing, named pre-processing step. The locations of source and geophones were
The 7th National and International Graduate Study Conference 2017
" Thailand 4.0 Creative Innovation for Sustainable Development "
I213

inputted for geometry setting. Some error were removed from the input data with
carefully quality checked. The seismic data have the effect from the different in
source and receiver elevations. Therefore, elevation static correction is calculated to
adjust the source and receiver to a common datum. This study used floating datum
that smoothing radial 200 m. The main attenuations of seismic signals are due to
spherical divergent, scattering, and absorption. Consequently, the data were amplitude
corrected. This study used exponential function technique. The parameter of
exponential function is 0.5 to recovery weak seismic signal that reduces by time on
shot gather.
Figure 2 shows (a) the example of field seismic shot record from line MO-2. The
directed wave, reflected wave, air wave, and ground roll are indicated with velocity
information in red, yellow, green, and blue line, respectively. (b) The shot record after
noise attenuation, three reflectors are emphasized.
To eliminate noise, there are three main steps, FK-filter, frequency filter,
and deconvolution. FK-filter are the most utilized step to eliminate coherent linear
noises such as ground roll and air waves. The seismic shot gathers were examined in
FK spectrum domain, then, the FK fan (Velocity) was designed between 100-450 m/s
to remove coherence noises. Frequency filtering applied to remove seismic noises in
The 7th National and International Graduate Study Conference 2017
" Thailand 4.0 Creative Innovation for Sustainable Development "
I214

frequency domain. The reflected wave signals have the frequency range
approximately from 20 to 90 Hz. Therefore, the bandpass filter 10/20-90/120 was
applied. Follow by deconvolution, it was applied to eliminate wavelet. This study
used surface-consistent deconvolution technique that decomposition of log-amplitude
spectra to four components (source, receiver, offset and CDP) with the conventional
Guass-Saidal iteration inversion equation (Cary and Lorentz, 1993). Surface-
consistent deconvolution was applied with operator length 80 ms, and 12 ms of
predictive lag.
After that, seismic shot gathers were rearranged into common-mid-point
(CMP) gathers for velocity analysis, normal move-out (NMO) correction and
stacking. Velocity analysis determines a suitable velocity model, which used for
NMO correction (Yilmaz, 2001). Every CMP gather were simultaneously applied the
semblance analysis and constant velocity stack (CVS) techniques. After the velocity
analysis, the seismic CMP gather were NMO corrected to remove the difference
travel times that influence by difference offset and then stacked to obtain the seismic
stack section. Figure 3a and Figure 4 display the final seismic stack cross-section
from line MO-1 and MO-2 respectively.
Methodology: Multichannel Analysis of Surface Waves
The MASW (MASW, 2017) focus on surface waves that have velocity
dispersion property effected from subsurface layering contribution to velocity
variation with frequency. Because surface wave have lower frequency contents then
reflected wave, to capture more surface wave energy, the 4.5 Hz frequency respond
geophones were employed. The surface shot gathers were recorded with 24 channels
per shot, 2 m geophone spacing, 4 m shot spacing and the distance 8 m between shot
location and the first geophone. The MASW data were analyzed by software called
ParkSEIS (PS) (Park Seismic LLC, 2015). The field records were transformed into
phase velocity spectrum for dispersion analysis to estimate the fundamental mode
dispersion curves. The iteration of least-squares inverse routine was applied to
properly match between picked dispersion curve and calculated dispersion curve
which carry out from measurement and initial model respectively. The solution from
MASW method is the 2D S-wave velocity model displayed in Figure 3c.
The 7th National and International Graduate Study Conference 2017
" Thailand 4.0 Creative Innovation for Sustainable Development "
I215

Methodology: Electrical Resistivity survey
The resistivity survey was acquired with ABEM Terrameter SAS4000
resistivity-meter (ABEM Instrument AB, 2012). The dipole-dipole configuration, that
has comparatively high sensitivity and very good noise rejection circuitry, were used
with electrode spacing 5 m. The RES2DINV inversion demo program (Loke, 1998)
read the field apparent resistivity values and inverted that to create the calculated
apparent resistivity carried out from 2D true resistivity model with least-squares
method. The iteration of least-squares inverse routine was applied to properly match
between a field apparent resistivity and calculated apparent resistivity. Figure 3b
presents the true electrical resistivity model resulted from the inversion process with
the 10 iteration calculations and final 5% RMS error.
Survey Results
Both reflection seismic MO-1 (Figure 3a) and MO-2 (Figure 4) profiles
show three main seismic reflectors in the lower part of geological geometry. There are
upper (USR), middle (MSR), and lower (LSR) reflectors that represented with blue,
green, and yellow lines, respectively. The USR reflector presents the high continuity,
high amplitude and nearly horizontal pattern with travel time about 35-50 ms. The
MSR reflector shows high amplitude, moderate continuity, and nearly irregular
pattern with travel time about 80-110 ms. The deepest reflector, LSR, shows high
amplitude and moderate continuity with slightly dip to southward with 120-180 ms
two-way travel time. The reflector USR, MSR, and LSR separate four major seismic
units. The Upper unit (UU) has interval velocity about 1500 m/s with 30 m average
thickness. It is underlaid by the mid unit (MU) that divided as two sub units, MU1 and
MU2. The top unit, MU1, has interval velocity about 1800 m/s with an average
thickness of 80 m and the lower unit, MU2, has interval velocity 1900 m/s with 30 m
average thickness. The Lower unit (LU) has interval velocity higher than 2100 m/s.
The results from electrical resistivity survey and MASW survey, the true
electrical resistivity model and S-wave velocity model (Figure 3c), show detail of the
upper part geological structure. The true electrical resistivity model (Figure 3b) from
line MO-1 displays three nearly horizontal layers with the maximum investigation
The 7th National and International Graduate Study Conference 2017
" Thailand 4.0 Creative Innovation for Sustainable Development "
I216

depth of about 70 m. Whereas, the S-wave velocity model (Figure3c) explores more
detail of near surface layers with the maximum investigation depth of about 30 m.
The top soil layer with low resistivity less than 50 ohm.m and low S-wave velocity
less than 400 m/s has the thickness approximately 10 m corresponding to low P-wave
velocity of 600 m/s (directed wave, Figure 2a) which could not detect by seismic
reflected wave. However, from the first arrival time in shot record (Figure 2a), there is
the shallow high P-wave velocity (about 4000 m/s) layer that might be corresponding
to the unit UU indicated in Figure 3a and Figure 4. The corresponding to UU unit in
seismic section has the estimated thickness of 30 m with high resistivity range from
50 to 600 ohm.m. From MASW, the UU unit also has high S-wave velocity
approximately might higher than 2000 m/s in the southern part of line MO-1 which
could related to the hard rock layer. The deepest layer from electrical resistivity model
is corresponding to the MU1 of seismic section has resistivity range 35-200 ohm.m.
The 7th National and International Graduate Study Conference 2017
" Thailand 4.0 Creative Innovation for Sustainable Development "
I217

Figure 3. (a) Interpreted seismic reflection section (b) true electrical resistivity model
and (c) S-wave velocity model from line survey MO-1.
Figure 4 Interpreted seismic reflection section from line survey MO-2.
Discussion
The refraction seismic data exposed P-wave velocity contrast between top-
soil (600m/s) and the UU unit (4000 m/s), Figure 2a. This velocity contrast is caused
the strong multiple reflections very near surface in seismic reflection record. It made
less seismic energy transmitted through and lots of the interfering patterns resulted in
ambiguous primary reflection as seen in Figure 2b. This lithological problem makes
the seismic acquisition limited in shallow part because the seismic energy cannot
penetrate into the deeper part. However, the reflection seismic waves have some
energy penetrate deeper zone but cannot going down to 400 m depth from surface. In
reflection seismic processing, the raw shot gathers expose that it difficult to
distinguish a shallow reflection event from refraction event. In addition, the top-soil
thickness is very thin that is not able to detect by seismic reflection method because of
the vertical resolution limit. The velocity of above reflector URS is merged into one
velocity, which the average velocity of lithology URS reflector. Therefore, the
velocity analysis of upper layer is considered from refraction and MASW methods.
Conclusion
The geophysical methods have been done including seismic reflection
survey, MASW survey, and electrical resistivity survey to map the quaternary
sedimentary layer in the study area. Based on electrical resistivity model and S-wave
velocity model from MASW, the top-soil layer has low resistivity and low S-wave
The 7th National and International Graduate Study Conference 2017
" Thailand 4.0 Creative Innovation for Sustainable Development "
I218

velocity with 10 m estimated depth corresponding to the directed wave from seismic
reflection survey. From seismic reflection section, there are four major seismic units,
UU, MU1, MU2, and LU. Thickness of the UU unit is about 30 m located underlie
top-soil layer. The bottom of the UU unit presents at about 40 m from the surface. It
has very high resistivity and seismic velocities (P-wave and S-wave) which could be
interpreted as the basaltic layer with more information from the basaltic outcrop
contribution around the study area and well log data. The MU1, MU2, and LU units
can be interpretation to basaltic layer because of the limited support information.
Acknowledgement
We thank Chiang Mai University, and the Science Achievement
Scholarship of Thailand (SAST) for research funding supports. This work could not
be completed without help from the staffs of Geophysics Research Laboratory at
Department of Geological Sciences, Faculty of Science, Chiang Mai University, for
their supporting in field work and data discussion.
References
ABEM Instrument AB. (2012). Instruction Manual Terrameter LS. Sundbyberg,
Sweden.
Ali, N., Saad, R., and Nordiana, M. (2013). “Integration of Seismic Refraction and 2D
Electrical Resistivity in Locating Geological Contact”. Journal of
Geology, 7-12.
Barr, S. M., and Charusiri, P. (2011). “Volcanic rocks”. In The geology of Thailand,
415-440. London: The Geological Society.
Barr, S. M., and MacDoNald, A. S. (1978). “Geochemistry and petrogenesis of Late
Cenozoie alkaline basalt of Thailand.” Geology Society of Malaysia 10,
December, 25-52.
Barr, S. M., Tantisukrit, C., Yaowanoiyothin, W., and MacDonald, A. S. (1990).
“Petrology and tectonic implication of Upper PaleoZoic volcanic rocks of
tha Chiang Mai Belt, Northern Thailand.” Journal of Southeast Asian
Earth Sciences 4(1), 37-47.
The 7th National and International Graduate Study Conference 2017
" Thailand 4.0 Creative Innovation for Sustainable Development "
I219

Cary, P. W., and Lorentz, G. A. (1993). “Four-Component surface-consistent
deconvolution.” Geophysics 58(3), 383-392.
Chaiyamongkon, K. (2014). “Advanced gravity data processing of Geophysical
survey, Amphoe Mae on, Changwat Chiang Mai”, Independent Study,
Bachelor Degree of Science, Faculty of Science, University of Chiang
Mai.
Department of Mineral Resources. (2003). “Groundwater well log data in Chiang Mai
Province.” October 14.
Department of Mineral Resources. (2007). Geological map of Thailand. 1:250,000.
Bangkok.
Geometrics. (2017). Geode Ultra-Light Exploration Seismograph. Accessed May
25. Available from http://www.geometrics.com/geometrics-
products/seismographs/geode/
Leucci, G., and Giorgi, L. D. (2005). “Integrated geophysical surveys to assess the
structural conditions of a karstic cave of archaeological importance.”
Natural Hazards and Earth System Sciences, 17–22.
Loke, M. H. (1998). RES2DINV version 3.3, Rapid 2D resistivity and IP inversion
using the least squares method. Computer disk and manual. Penang,
Malaysia.
Mahmut, G., and Berge, M. A. (2017). “Integrated geophysical investigations in a
fault zone located on southwestern part of İzmir city, Western Anatolia,
Turkey.” Applied Geophysics, 114–133.
MASW. (2017). Multichannel analysis of surface waves (MASW) Accesed May
25. Available from: http://www.masw.com
Park Seismic LLC. (2015). ParkSEIS© (PS) - User Guide. (C. B. Park, Editor)
Accessed May 25. Available from ParkSEIS (PS):
http://www.parkseismic.com/
Pinet, N. (2013). “Gaspé Belt subsurface geometry in the northern Québec
Appalachians as revealed by an integrated geophysical and geological
study: 2 - Seismic interpretation and potential field modelling results.”
Tectonophysics, 100-117.
The 7th National and International Graduate Study Conference 2017
" Thailand 4.0 Creative Innovation for Sustainable Development "
I220

Siri, T. (2014) “Structure of Mae On Basin, Mae On District, Chiang Mai Province,
based on gravity data interpretation”, Independent Study, Bachelor Degree
of Science, Faculty of Science, University of Chiang Mai.
Telford, W. M., Geldart, L., and Sheriff, R. (1990). Applied Geophysics. 2nd
ed.
Cambridge: Cambridge University press.
Yilmaz, Öz. (2001). Investigations in Geophysics Seismic Data Analysis:
Processing, Inversion, and Interpretation of Seismic Data. Tulsa,
Society of Exploration Geophysicists.
The 7th National and International Graduate Study Conference 2017
" Thailand 4.0 Creative Innovation for Sustainable Development "
I221
Isolation and characterization of lytic bacteriophages for biocontrol of
Staphylococcus aureus in milk and dairy product
Author: Phiraphat Chaengphaniad and Rujikan Nasanit
Program: Biotechnology Institute: Silpakorn University
Abstract
Staphylococcus aureus is a gram positive bacterium in family Micrococcaceae
with highest pathogenicity in genus Staphylococci. This bacterium is frequency found,
especially in milk and dairy products and becomes a significant threat that can directly
affect human health. Although there are many methods both physical and chemical
methods to control this bacterium in milk and dairy products. However, these methods
have drawbacks such as it may result in residues or alters the sensory quality of food
products. A potential method to eliminate S. aureus in milk and dairy products is
bacteriophage therapy which is an interesting alternative method. Therefore, the
objectives of this study were to isolate specific lytic bacteriophages for S. aureus 01
and host range test of isolated phages. In total 105 samples collected from raw milk,
wastewater from cattle farms and expected sources of S. aureus in Nakhon Pathom and
Ratchaburi province, clear plaques were obtained from 23 samples by enrichment
method. 30 phage plaques were purified. The plaque sizes ranged from 1-2 mm. The
phage-host range test was performed by spot test in order to investigate the lysis activity
against other bacterial strains. It was found that 21 out of 30 phage lysates showed lytic
activity against all S. aureus strains (12 strains) in this study. However, all phage lysates
did not show lytic activity against other bacterial genera used in this study (Listeria
monocytogenes, Salmonella Enteritidis and Salmonella Typhimurium). The specificity
of phage is determined by receptors on the host cell and is an important reason why
phage is suitable for phage therapy.
Key Words: Staphylococcus aureus, Bacteriophage, Isolation, Host Range, Milk and
dairy product
Introduction
Food is a daily basic need for humans. It is considered as a main route of trans-
mission of diseases caused by pathogenic bacteria of more than 200 diseases that can
directly affect the consumer health if it is contaminated with excessive amounts of
pathogenic bacteria (Oliver et al., 2005). Milk and dairy products that are considered as
beverages and/or healthy food that are popular with high demand among different
consumer groups and also suitable for people of all ages. There are important sources
of calcium, proteins and other essential nutrients. It is found that 100 g of ready-to-
drink milk contains 3.3, 3.5 and 3.4 g of protein, fat and carbohydrate, respectively
(Department of health ministry of public health, 2011). These chemical compositions
make milk a highly nutritious food which acts as an excellent growth medium for
wide range of microorganisms (Ibrahim et al., 2015). Escherichia coli, Staphylococcus
aureus, Enterobacter spp., Klebsiella spp. and Pseudomonas pyocyaneus are
The 7th National and International Graduate Study Conference 2017
" Thailand 4.0 Creative Innovation for Sustainable Development "
I222

commonly found in raw milk at the prevalence rate of 75%, 52%, 42%, 36%, and 25%,
respectively (Pourhassan et al., 2011). According to the annual report of Department of
Medical Science for the major public health problems caused by food poisoning,
S. aureus is a major pathogenic microorganism that contaminates food. It is also found
that the infections of this bacteria cause the ongoing outbreaks in Thailand. Consuming
food that contaminated with this bacteria causes nausea, vomiting, severe diarrhea. In
severe case, the patients may shock. In addition, this bacteria also causes disease in
animals, such as mastitis in cattle which directly affects dairy farmers in Thailand.
In general, S. aureus can grow at the temperature range of 7-48 °C, while the
optimal temperature for growth is 37 °C. It is resistant to freezing and survives well in
food stored below -20 °C (Stewart, 2003). However, the viability is reduced at -20-0
°C. S. aureus can be destroyed by pasteurization process which is a thermal process at
about 66 °C for 30 minutes or 72 °C for 15 seconds. The pasteurization process can
reduce S. aureus and other pathogenic bacteria up to 95-99%. However, S. aureus
contamination in milk and dairy products can still occur, especially ready-to-eat foods
made from raw milk such as cheese which often found contamination. Jamali et al.
(2015) reported that from 2650 milk and dairy product samples including cow milk,
goat milk and cheese sold in retail shops, 328 samples (12.4%) were contaminated with
S. aureus. The contamination of this bacteria in milk and dairy products may be because
heat or duration during the pasteurization process are insufficient to kill pathogens in
raw milk which results in direct contamination in final products or cross-contamination
after the pasteurization process (Arques et al., 2005). This bacteria may cross-
contaminate from raw milk to processed dairy products in the same production line or
use the same tools and equipment during the production process from processing,
packaging and storage. This results in direct and indirect cross-contamination (Carton
et al., 2005; Vazques-Boland et al., 2001). Moreover, various S. aureus strains can
produce staphylococcal enterotoxins (SEs) which is the cause of staphylococcal food
poisoning. In general, the amount of SEs that can cause disease is at least 105-108 cfu
/g or cfu/ml. SEs are also highly-resistant to environmental condition and the
pasteurization temperature cannot destroy or affect SEs (Montville and Matthews 2008;
FDA 2012). Therefore, controlling S. aureus in milk and dairy products is very
important.
Although there are several ways to control S. aureus both physical and chemical
methods, however it often produces residues or changes the sensory quality of foods
(Gao et al., 2006). Recently, the use of bacteriophage or phage to control foodborne
pathogen has received a lot of attention as an alternative method that does not affect
food quality and does not produce residues (Mahony et al., 2011). The use of
bacteriophage is safe and nontoxic to consumers (Monk et al., 2010). Bacteriophages
are commonly found in nature. Each type of phage is highly specific to pathogenic
bacteria. Therefore, phages do not destroy or affect gut microbial of consumers and also
do not cause bacterial mutation, unlike antibiotics. The multiplication of phage occurs
only when bacterial host still exist so phage is considered as obligate parasite.
According to these characteristics it is clear that bacteriophage is suitable for use as
biocontrol to reduce the amount of pathogenic bacteria that may be contaminated in
The 7th National and International Graduate Study Conference 2017
" Thailand 4.0 Creative Innovation for Sustainable Development "
I223

foods or products. Therefore, this research aimed to isolate and characterize lytic
bacteriophages that are specific to S. aureus contaminated in milk, which could be used
as an alternative for controlling this pathogenic bacteria.
Materials & methods
Strains and growth conditions
In this study Staphylococcus aureus 01 isolated from raw milk obtained from
Nong Pho Veterinary Clinic, Ratchaburi was used as host cell for bacteriophage
isolation. The culture was streaked on selective Baird Parker Agar with Egg Yolk
Tellurite Emulsion (Titan biotech, India) and mannitol salt agar (Biokar diagnostics,
France), subsequently picked and grown in Tryptic soy broth (TSB) (Titan biotech,
India) at 37 °C. The cultures were grown to mid-log phase (3-h-old, OD600 nm = 1.3) by
incubation at 37 °C with shaking at 130 rpm.
For long-term storage, the mid-log phase S. aureus 01 in TSB containing 20%
(v/v) sterile glycerol was prepared and stored at -80 °C.
Sample collection and bacteriophage isolation
Total 105 samples were collected from raw milk, wastewater samples from
cattle farms and the sources that may contain S. aureus in Nakhon Pathom and
Ratchaburi provinces. All samples were screened for bacteriophage by enrichment
method according to Conveny et al. (2002) with slight modification. Debris and bacteria
were removed from 20 ml of sample by centrifugation at 10,000xg for 10 min at 4 °C.
The supernatant was pipetted and transferred to new tube. Then 1 ml of mid-log phase
S. aureus was added and incubated for 10 h at 37 °C with shaking at 130 rpm. The
culture media was centrifuged at 8,000xg for 10 min at 4 °C. The obtained supernatant
was filtered through 0.45 µm polyethersulfone (PES) (Whatman, UK). The filtrates
were stored at 4 °C until analysis. Plaque assay was performed using agar overlay assay
according to Adams et al. (1959) to examine the presence of S. aureus specific
bacteriophages. The mixture of 100 µl phage suspension and 200 µl of mid-log phase
S. aureus 01 was incubated for 10 min at 37 °C. Then the mixture was added into 3 ml
of molten soft agar (TSB with 0.45% agar) and overlaid on solid TSA medium surface.
The culture medium was incubated at 37 °C for 24 h and the plague formation was
observed.
Bacteriophage purification
Bacteriophage purification was adapted from Mohammed-Ali and Jumalludeen
(2015). Plaques obtained from agar overlay assay were collected using pipette tip to
penetrate agar piece containing single plaque and resuspended in 1 ml of sterile SM
buffer (0.05 M Tris-HCl, pH 7.5, 5 M NaCl, 1 M MgSO4 and 0.01% gelatin). The
suspension was stored at 4 °C overnight to allow phage diffuse from agar piece. The
obtained phage suspensions were purified by serial dilution and plating to soft agar
overlays as described above. The isolation of single plaques was repeated at least three
time to ensure phage purity. The appearance of homogeneous plaque morphology was
observed throughout the plate of purified phages. Phage lysate was prepared by adding
The 7th National and International Graduate Study Conference 2017
" Thailand 4.0 Creative Innovation for Sustainable Development "
I224
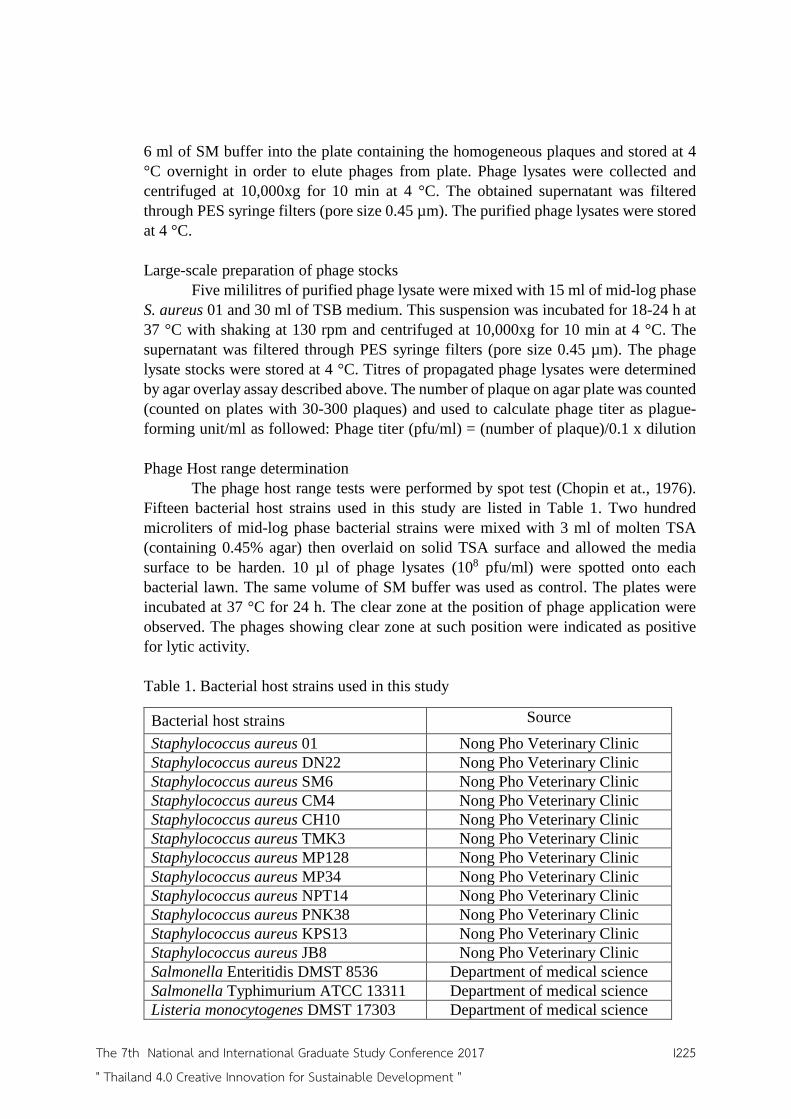
6 ml of SM buffer into the plate containing the homogeneous plaques and stored at 4
°C overnight in order to elute phages from plate. Phage lysates were collected and
centrifuged at 10,000xg for 10 min at 4 °C. The obtained supernatant was filtered
through PES syringe filters (pore size 0.45 µm). The purified phage lysates were stored
at 4 °C.
Large-scale preparation of phage stocks
Five mililitres of purified phage lysate were mixed with 15 ml of mid-log phase
S. aureus 01 and 30 ml of TSB medium. This suspension was incubated for 18-24 h at
37 °C with shaking at 130 rpm and centrifuged at 10,000xg for 10 min at 4 °C. The
supernatant was filtered through PES syringe filters (pore size 0.45 µm). The phage
lysate stocks were stored at 4 °C. Titres of propagated phage lysates were determined
by agar overlay assay described above. The number of plaque on agar plate was counted
(counted on plates with 30-300 plaques) and used to calculate phage titer as plague-
forming unit/ml as followed: Phage titer (pfu/ml) = (number of plaque)/0.1 x dilution
Phage Host range determination
The phage host range tests were performed by spot test (Chopin et at., 1976).
Fifteen bacterial host strains used in this study are listed in Table 1. Two hundred
microliters of mid-log phase bacterial strains were mixed with 3 ml of molten TSA
(containing 0.45% agar) then overlaid on solid TSA surface and allowed the media
surface to be harden. 10 µl of phage lysates (108 pfu/ml) were spotted onto each
bacterial lawn. The same volume of SM buffer was used as control. The plates were
incubated at 37 °C for 24 h. The clear zone at the position of phage application were
observed. The phages showing clear zone at such position were indicated as positive
for lytic activity.
Table 1. Bacterial host strains used in this study
Bacterial host strains Source
Staphylococcus aureus 01 Nong Pho Veterinary Clinic
Staphylococcus aureus DN22 Nong Pho Veterinary Clinic
Staphylococcus aureus SM6 Nong Pho Veterinary Clinic
Staphylococcus aureus CM4 Nong Pho Veterinary Clinic
Staphylococcus aureus CH10 Nong Pho Veterinary Clinic
Staphylococcus aureus TMK3 Nong Pho Veterinary Clinic
Staphylococcus aureus MP128 Nong Pho Veterinary Clinic
Staphylococcus aureus MP34 Nong Pho Veterinary Clinic
Staphylococcus aureus NPT14 Nong Pho Veterinary Clinic
Staphylococcus aureus PNK38 Nong Pho Veterinary Clinic
Staphylococcus aureus KPS13 Nong Pho Veterinary Clinic
Staphylococcus aureus JB8 Nong Pho Veterinary Clinic
Salmonella Enteritidis DMST 8536 Department of medical science
Salmonella Typhimurium ATCC 13311 Department of medical science
Listeria monocytogenes DMST 17303 Department of medical science
The 7th National and International Graduate Study Conference 2017
" Thailand 4.0 Creative Innovation for Sustainable Development "
I225
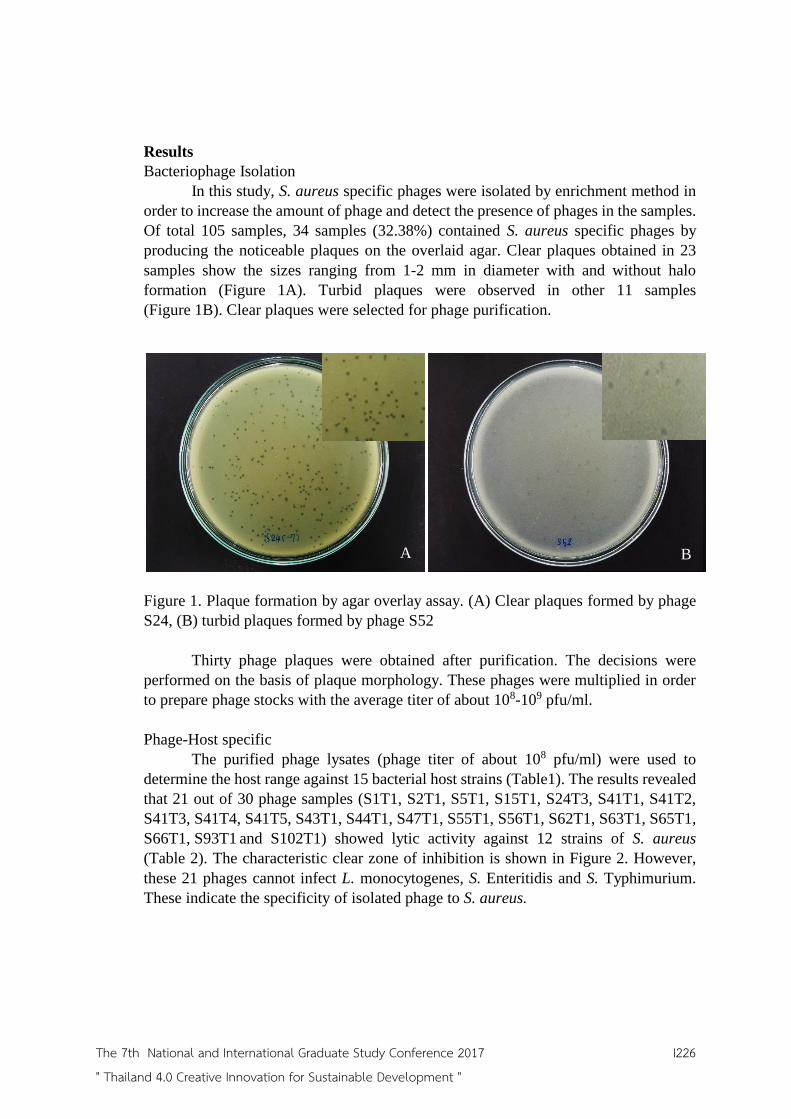
Results
Bacteriophage Isolation
In this study, S. aureus specific phages were isolated by enrichment method in
order to increase the amount of phage and detect the presence of phages in the samples.
Of total 105 samples, 34 samples (32.38%) contained S. aureus specific phages by
producing the noticeable plaques on the overlaid agar. Clear plaques obtained in 23
samples show the sizes ranging from 1-2 mm in diameter with and without halo
formation (Figure 1A). Turbid plaques were observed in other 11 samples
(Figure 1B). Clear plaques were selected for phage purification.
Figure 1. Plaque formation by agar overlay assay. (A) Clear plaques formed by phage
S24, (B) turbid plaques formed by phage S52
Thirty phage plaques were obtained after purification. The decisions were
performed on the basis of plaque morphology. These phages were multiplied in order
to prepare phage stocks with the average titer of about 108-109 pfu/ml.
Phage-Host specific
The purified phage lysates (phage titer of about 108 pfu/ml) were used to
determine the host range against 15 bacterial host strains (Table1). The results revealed
that 21 out of 30 phage samples (S1T1, S2T1, S5T1, S15T1, S24T3, S41T1, S41T2,
S41T3, S41T4, S41T5, S43T1, S44T1, S47T1, S55T1, S56T1, S62T1, S63T1, S65T1,
S66T1, S93T1 and S102T1) showed lytic activity against 12 strains of S. aureus
(Table 2). The characteristic clear zone of inhibition is shown in Figure 2. However,
these 21 phages cannot infect L. monocytogenes, S. Enteritidis and S. Typhimurium.
These indicate the specificity of isolated phage to S. aureus.
A B
A B
The 7th National and International Graduate Study Conference 2017
" Thailand 4.0 Creative Innovation for Sustainable Development "
I226
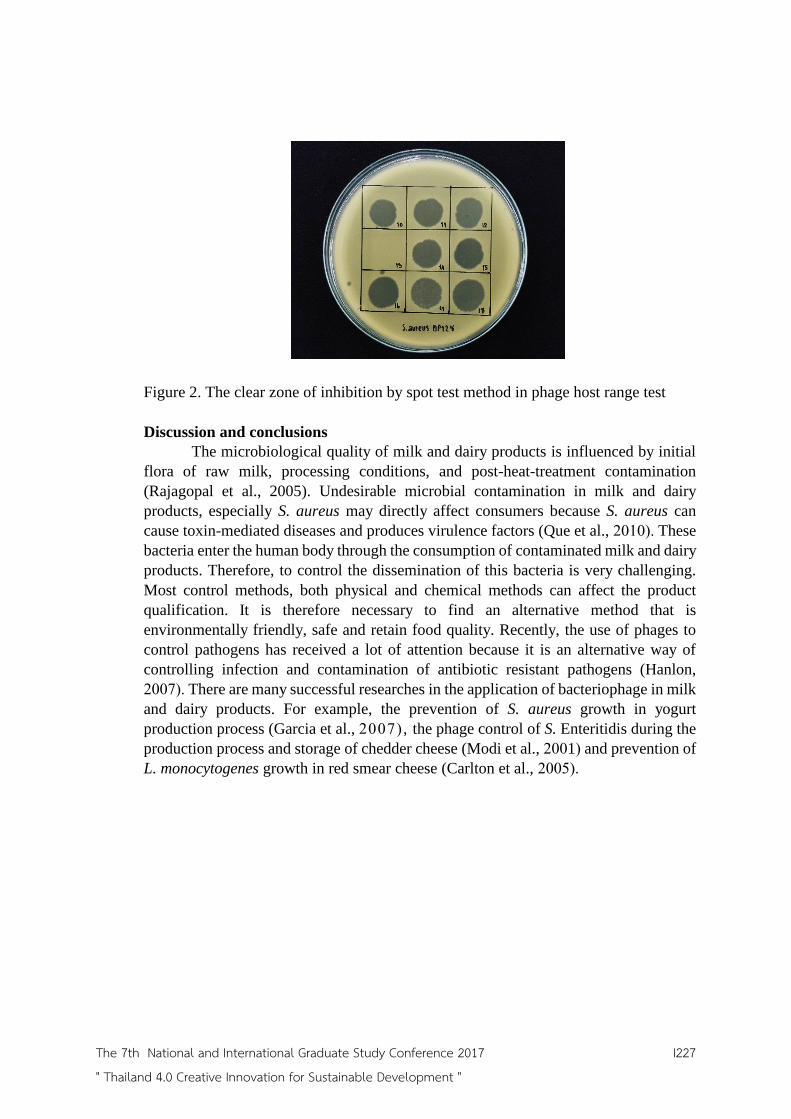
Figure 2. The clear zone of inhibition by spot test method in phage host range test
Discussion and conclusions
The microbiological quality of milk and dairy products is influenced by initial
flora of raw milk, processing conditions, and post-heat-treatment contamination
(Rajagopal et al., 2005). Undesirable microbial contamination in milk and dairy
products, especially S. aureus may directly affect consumers because S. aureus can
cause toxin-mediated diseases and produces virulence factors (Que et al., 2010). These
bacteria enter the human body through the consumption of contaminated milk and dairy
products. Therefore, to control the dissemination of this bacteria is very challenging.
Most control methods, both physical and chemical methods can affect the product
qualification. It is therefore necessary to find an alternative method that is
environmentally friendly, safe and retain food quality. Recently, the use of phages to
control pathogens has received a lot of attention because it is an alternative way of
controlling infection and contamination of antibiotic resistant pathogens (Hanlon,
2007). There are many successful researches in the application of bacteriophage in milk
and dairy products. For example, the prevention of S. aureus growth in yogurt
production process (Garcia et al., 2007) , the phage control of S. Enteritidis during the
production process and storage of chedder cheese (Modi et al., 2001) and prevention of
L. monocytogenes growth in red smear cheese (Carlton et al., 2005).
The 7th National and International Graduate Study Conference 2017
" Thailand 4.0 Creative Innovation for Sustainable Development "
I227

Table 2. Phage-Host specificity of 30 phage samples against 15 bacterial host strains
+ Clear zone, - No clear zone
The isolation of phages from environmental samples is possible, especially from
sources where the intended host is present (Higgins et al., 2007). In this study, S. aureus
specific bacteriophages were isolated from the samples that were expected to be the
host sources both in raw milk and livestock wastewater samples. Clear plaques and
Host
Strains
Phage
Sample
S. aure
us0
1
S. aure
us
DN
22
S. aure
us
SM
6
S. aure
us
CM
4
S. aure
us
CH
10
S. aure
us
TM
K3
S. aure
us
MP
128
S. aure
us
MP
34
S. aure
us
NP
T14
S. aure
us
PN
K38
S. aure
us
KP
S13
S. aure
us
JB8
L .m
onocy
togen
es
S. E
nte
riti
dis
S. T
yphim
uri
um
S1T1 + + + + + + + + + + + + - - -
S2T1 + + + + + + + + + + + + - - -
S5T1 + + + + + + + + + + + + - - -
S15T1 + + + + + + + + + + + + - - -
S24T1 + + + - + + + + + + + + - - -
S24T2 + + + - + + + + + + + + - - -
S24T3 + + + + + + + + + + + + - - -
S41T1 + + + + + + + + + + + + - - -
S41T2 + + + + + + + + + + + + - - -
S41T3 + + + + + + + + + + + + - - -
S41T4 + + + + + + + + + + + + - - -
S41T5 + + + + + + + + + + + + - - -
S42T1 + - + + - + - + + + + + - - -
S43T1 + + + + + + + + + + + + - - -
S44T1 + + + + + + + + + + + + - - -
S47T1 + + + + + + + + + + + + - - -
S55T1 + + + + + + + + + + + + - - -
S56T1 + + + + + + + + + + + + - - -
S62T1 + + + + + + + + + + + + - - -
S63T1 + + + + + + + + + + + + - - -
S65T1 + + + + + + + + + + + + - - -
S66T1 + + + + + + + + + + + + - - -
S76T1 + - + - - + - + + + + + - - -
S85T1 + - + - - + - + + + + + - - -
S85T2 + - + + - + - + + + + + - - -
S87T1 + - + + - + - + + + + + - - -
S88T1 + - + - - + - + + + + + - - -
S91T1 + - + - - + - + + + + + - - -
S93T1 + + + + + + + + + + + + - - -
S102T1 + + + + + + + + + + + + - - -
The 7th National and International Graduate Study Conference 2017
" Thailand 4.0 Creative Innovation for Sustainable Development "
I228

turbid plaques were obtained in this study. Phage that from clear plaques are considered
as virulent phages. These phages have lytic life cycle, when phage enters bacterial host
cell it will multiply inside the bacterial cell by using host components for producing
protein and genome. After that, the assembly of phage progeny occurs and bacterial cell
is lyzed in order to release progeny which can be observed as clear plaque. This is
different from turbid plaque forming phages which are considered as temperate phages.
In the lysogenic life cycle, when phage enters bacterial host cell it will not produce
phage progeny. However, phage genome will integrate into bacterial chromosome
which is due to the genetic recombination. Phage in this stage is called prophage.
Prophage division occurs during bacterial chromosome division. As a result, new
recombinant bacterial cell carries latent prophage genome. In addition, there is also
prophage that the phage genome does not integrate into bacterial chromosome but is
independent in the cytoplasm. Co-existence between hosts and lysogenic phage can
cause coevolution by acting as mobile genetic element in gene transferring between
organisms via lateral or horizontal gene transfer. This phenomenon causes many
changes to host whether evolution of antibiotic resistance in bacteria or changes from
nonpathogenic bacterial strains to virulent strains (Abedon, 2008).
According to the phage life cycles, lysogenic phages are not suitable for phage
control application. Only lytic phages are suitable for biological control application and
this is probably one of the safest methods to destroy pathogenic bacteria (Sillankorva
et al., 2012). Therefore, lytic phages were selected in this study. 30 clear plaques were
obtained after the purification. There are a variety of plaque characteristics and sizes
ranging from 1 -2 mm. The different sizes of plaques depend on a number of factors.
These include virion diffusivity (rate of virion particle diffusion without the presence
of the host), various rate constants for phage-bacterium attachment, phage latent period
and burst size. Phage with higher diffusivity would has larger plaque size, especially
the size would be a quadratic function of diffusivity. Too high or too low adsorption
rate would generally results in smaller plaque size. Whilst an optimal adsorption rate
lead to a maximal plaque size. The plaque size is also predicted to be negatively
correlated with the latent period (or lysis time). This means the more time the phage
progeny spends inside the host, the less time it would be able to diffuse to a new host.
It is also intuitively apparent that a larger burst size would result in a larger plaque size
(Abedon and Yin, 2009) . However, plaque size can only increase to a certain extent
(You and Yin, 1999).
In this present study, the ratio of purified phage lysate: mid-log phage S. aureus
: TSB medium at 1 : 3 : 6 was used to proliferate the high titer phage of about 1 0 8-1 0 9
pfu/ml which was considered as satisfactory. As can be seen, the bacterial volume is
higher than phage lysate, this allows phage to infect bacterial host and multiply as well
as prevent “lysis from without” phenomenon which could happen if phage titer is higher
than host cell. This phenomenon results in bacterial lysis before phage production
(Abedon, 2011).
One of the main topic to consider in selecting effective phage for biocontrol is
its lysis efficiency against host cells. An in vitro screening of a potential lytic phage
provides a rigorous assessment of it lysis capabilities. In this study, 21 phages had lytic
The 7th National and International Graduate Study Conference 2017
" Thailand 4.0 Creative Innovation for Sustainable Development "
I229

activity against all S. aureus strains. However, all phage samples could not infect
L. monocytogenes, S. Enteritidis and S. Typhimurium. The specificity of phage
infection is defined in attachment or adsorption step of the phage virion to the receptors
on bacterial cell wall during the initial stage of phage infection cycle (Parisien et al.,
2008). This is an important step in virus recognition of sensitive host cell. This makes
a specific bacteriophage able to infect a narrow host range or a concrete microbial
species or strains, which is in turn dependent on the nature and structural peculiarities
of receptors on bacterial cell surface (Braun and Hantke, 1997). The nature of receptor
contacting bacteriophages is different for representatives of diverse taxonomic groups
and is largely defined by composition of host cell wall and surface structures
(Rakhuba et al., 2010). There are reports described the importance of cell wall proteins
as receptors. Porins are one of the first outer membrane proteins of gram negative
microorganism to be characterized in detail, forming the channel in membrane (Nakae,
1976). Protein receptor of this type in E. coli cells are OmpC and OmpF. OmpC serves
as a receptor for phage T4 ( Scurray et al., 1 9 7 4 ) . Phage T4 utilized the protein as a
receptor in combination with cell wall lipopolysaccharide (LPS). It was shown in
experiments with LPS and OmpC mutants that absence of at least one receptor resulted
in reduced efficiency of infection, whereas loss of both receptors induced bacteriophage
resistance. Rakieten and Rakieten (1 9 3 7 ) was found that specific phage for S. aureus
might be also adsorbed onto Bacillus subtilis surface due to their structural similarity
(Jazwinski et al., 1975).
In conclusion, this study succeeded in isolating phages specific to S. aureus 01.
Most isolated phages had lytic activity against all S. aureus strains. These phages are
only specific to S. aureus without cross infection to other genera tested in this study.
Therefore, these phages are promising for further biocontrol of S. aureus. However,
phage genome characteristics, physical and biological properties of phage are needed
to be investigated.
References
Abedon, S.T. (2008). Bacteriophage ecology, population, evolution and impact of
bacterial viruses. UK: Cambridge University press.
Abedon, S.T. and Yin, J. (2009). Bacteriophage plaques: theory and analysis. Methods
in Molecular Biology. 501:161-174.
Abedon, S.T. (2011). Lysis from without. Bacteriophage. 1(1): 46-49.
Adams, M.H., (1959). Bacteriophages. Interscience Publishers, New York.
Arqués, J.L., Rodriguez, E., Gaya, P., Medina, M., Guamis, B. and Nunez, M. (2005).
Inactivation of Staphylococcus aureus in raw milk cheese by combinations of
high pressure treatments and bacteriocin producing lactic acid bacteria. Journal
of Applied Microbiology. 98(2): 254-260.
Braun, V. and Hantke, K. (1997). Bacterial receptors for phage and colicins as
constituents of specific transport systems. Microbial interaction. 3: 101-137.
Carlton, R.M., Noordman, W.H., Biswas, B., Meester, E.D. and Loessner, M.J. (2005).
Bacteriophage P100 for control of Listeria monocytogenes in foods: genome
sequence, bioinformatics analyses, oral toxicity study, and application.
The 7th National and International Graduate Study Conference 2017
" Thailand 4.0 Creative Innovation for Sustainable Development "
I230

Regulatory Toxicology and Pharmacology. 43(3): 301-312.
Cerveny, K.E., Depaola, A., Duckworth, D.H. and Gulig, P.A. (2002). Phage therapy
of local and systemic disease caused by Vibrio vulnificus in iron-dextran-treated
mice. Infect Immun. 70(11): 6251-6262.
Chopin, M.C., Chopin, A. and Roux, C. (1976). Definition of bacteriophage groups
according to their lytic action on mesophilic lactic streptococci. Applied and
Environmental Microbiology. 32(6): 741-746.
Department of health ministry of public health. (2011). Nutritive values of Thai food.
Bangkok: Nutrition Division.
FDA (2012) Bad bug book: Foodborne pathogenic microorganisms and natural toxins
handbook, 2nd ed. US Food and Drug Administration, Silver Spring, p. 87-92.
García, P., Madera, C., Martínez, B. and Rodríguez, A. (2007). Biocontrol of Staphylo-
coccus aureus in curd manufacturing processes using bacteriophages.
International Dairy Journal. 17(10): 1232-1239.
Gao, Y.L., Ju, X.R. and Jiang, H.H. (2006). Statistical analysis of inactivation of
Listeria monocytogenes subjected to high hydrostatic pressure and heat in milk
buffer. Applied Microbiology and Biotechnology. 70(6): 670-678.
Hanlon, G.W. (2007). Bacteriophages: an appraisal of their role in the treatment of
bacterial infection. International Journal of Antimicrobial Agents. 30(2): 118-
128.
Higgins, S.E., Higgins, J.P., Bielke, L.R. and Hargis, B.M. (2007). Selection and
application of bacteriophages for treating Salmonella enteritidis infections in
poultry. International Journal of Poultry Science. 6(3): 163-168.
Ibrahim, G.A., Sharaf, O.M. and Abd El-Khalek, A.B. (2015). Microbiological quality
of commercial raw milk, domiati cheese and kareish cheese. Middle East
Journal of Applied Sciences. 5(1): 171-176.
Jamali, H., Paydar, M., Radmehr, B. and Ismail, S. (2015). Prevalence and
antimicrobial resistance of Staphylococcus aureus isolated from raw milk and
dairy products. Food Control. 4(3): 277-84.
Jazwinski, S.M., Lindberg, A.A. and Kornberg, A. (1975). The lipopolysaccharide
receptor for bacteriophage ϕx174 and S13. Virology. 66(1): 268-282.
Mahony, J., Mcaukiffe, O., Ross, R.P. and Van, S.D. (2011). Bacteriophage as
biocontrol agents of food pathogens. Current Opinion in Biotechnology. 22(2):
157-163.
Modi, R., Hirvi, Y., Hill, A. and Griffiths, M.W. (2001). Effect of phage on survival of
Salmonella enteritidis during manufacture and storage of cheddar cheese made
from raw and pasteurized milk. Journal of Food Protection. 64(7): 927-933.
Mohammed-Ali, M.N. and Jamalludeen, N.M. (2015). Isolation and characterization
of bacteriophage against methicillin resistant Staphylococcus aureus. Journal
of Medical Microbiology & Diagnosis. 5(1): 213-220.
Monk, A.B., Ress, C.D., Barrow, P., Hagens, S. and Harper, D.R. (2011). Bacterio-
phage application: where are we now? Letters in Applied Microbiology. 51(4):
363-369.
Montville, T.J. and Matthews, K.R. (2008). Food microbiology. In: An introduction.
The 7th National and International Graduate Study Conference 2017
" Thailand 4.0 Creative Innovation for Sustainable Development "
I231

2nd ed. ASM Press, Washington D.C.
Nakae, T. (1976). Identification of the outer membrane protein of E. coli that produces
transmembrane channel in reconstituted vesicle membrane. Biochemical and
Biophysical Research Communications. 71(3): 877-84.
Oliver, S.P., Jayarao, B.M. and Almeida, R.A. (2005). Foodborne pathogens in milk
and the dairy farm environment: food safety and public health implications.
Foodborne Pathogens and Disease. 2(2): 115-29.
Parisien, A., Allain, B., Zhang, J., Mandeville, R. and Lan, C.Q. (2008). Novel alter-
natives to antibiotics: bacteriophages, bacterial cell wall hydrolases, and
antimicrobial peptides. Journal of Applied Microbiology. 104(1): 1-13.
Pourhassan, M. and Najafabadi T. (2011). The spatial distribution of bacteria
pathogens in raw milk consumption on malayer City, Iran. Shiraz E-Medical
Journal. 12(1): 2-10.
Que, Y. and Moreillon, P. (2010). Staphylococcus aureus (Including Staphylococcal
Toxic Shock). In Mandell, G.L., Bennette, J.E., Dolin, R., editors. Mandell,
Douglas and Bennett’s Principles and Practice of Infectious Diseases. 7th ed.
Elsevier Inc., Philadelphia, p. 2543-2578.
Rajagopal, M., Werner, B.G., and Hotchkiss, J.H. (2005). Low pressure CO2 storage
of raw milk: Microbiological effects. Journal of Dairy Science. 88(9): 3130-
3138.
Rakhuba, D.V., Kolomiets, E.I., Szwajcer Dey, E. and Novik, G.I. (2010).
Bacteriophage receptors, mechanisms of phage adsorption and penetration into
host cell. Polish journal of microbiology. 59(3): 145-155.
Rakieten, M.L. and Rakieten, T.L. (1937). Relationship between staphylococci and
bacilli belonging to the subtillis group as shown by bacteriophage adsorbtion.
Journal of Bacteriology. 34(3): 285-300.
Scurray, R.A., Hancock, E.W. and Reeves, P. (1974). Con- mutants: class of mutants in
E.coli K-12 lacking a major cell wall protein and defective inconjugation and
adsorption of a bacteriophage. Journal of Bacteriology. 119(3): 726-735.
Sillankorva, S.M., Oliveira, H. and Azeredo, J. (2012). Bacteriophages and Their Role
in Food Safety. International Journal of Microbiology.
Stewart, C.M. (2003). Staphylococcus aureus and Staphylococcal enterotoxins. In:
Hocking A.D., editor. Foodborne microorganisms of public health significance.
6th ed. Australian Institute of Food Science and Technology (NSW Branch),
Sydney, p. 359–380.
Vazquez-Boland, J.A., Kuhn, M., Berche, P., Chakraborty, T., Dominguez-Bernal, G.
and Goebel, W. (2001). Listeria pathogenesis and molecular virulence
determinants. Clinical Microbiology Reviews. 14(3): 584-640.
You, L. and Yin, J. (1999). Amplification and spread of viruses in a growing plaque.
Journal of Theoretical Biology. 200(4): 365-373.
The 7th National and International Graduate Study Conference 2017
" Thailand 4.0 Creative Innovation for Sustainable Development "
I232

Effect of α-Amylase Treatment on Color Formation via a Simulated Reducing
Sugar-Glycine Model
Chudarat Watcharinrat1, Prakit Sukyai2
1,2 Department of Biotechnology, Faculty of Agro-Industry, Kasetsart University
Abstract Starch is a sugarcane impurity that is distributed throughout its mature stalks.
The soluble starch have been considered problematic for sugar processing and other
products. A sugar factory uses α-amylase to hydrolyze starch into simple sugars.
Enzymatic treatment also promotes reducing sugar in the processing, which causes a
browning reaction via the Maillard reaction. On that basis, this research was performed
to study the effects and kinetics of α-amylase treatment by using a simulated reducing
sugar-glycine model for investigation of the influence of α-amylase treatment. The
simulated model prepared by concentrated sucrose solution containing starch and
treated with α-amylase in a mixture with glycine for storage at 40, 50 and 60°C. Color
development was positively associated with high temperature and the decreasing of
reducing sugar. The kinetics of color change followed the zero-order kinetics and the
effect of temperature on the reaction was described by Arrhenius equations. Therefore,
this research showed the effects of enzymatic treatment with a browning reaction and
indicated the kinetics of color development in sugar processing.
Keywords: Starch, Raw Sugar, Color, Storage, Arrhenius equation
Introduction
Starch ( α-14-glucan) is a polymer of glucose linked through the glycosidic
bond and produced in sugarcane as a storage polysaccharide (Souza et al, 2010). It is a
natural component in the stalks of sugarcane and is the most abundant in the leaves. It
may be converted into sugar ( Vignes et al., 1974; Zhou et al., 2008) . Its concentration
varies depending on region, season, variety, diurnal cycle and sugarcane maturity
( Galliard et al., 1987; Eggleston et al., 2008) . Currently, many problems in sugar
processing exist because starch granules are extracted into sugarcane juice (Imrie et al.,
1972; Zhou et al., 2008). It is an undesirable impurity that contributes to lost efficiency
in production during sugar processing, such as increasing viscosity, slowing filtration,
and lowering evaporation rates ( Godshall et al., 1996; Cuddihy et al., 2001) . Starch
negatively affects the quality and quantity of raw and refined sugar when contamination
reaches over 250 ppm (Eggleston et al., 2006; Promraksa, 2008; Zhou et al., 2008).
Starch is generally removed in the clarification process through precipitation,
but this is not enough to alleviate starch process problems ( Amyangwa et al., 1993;
Eggleston et al., 2003). The use of α-amylase is widely established in the sugar industry
for starch removal (Chen et al., 1993; Kampen et al., 2006; Souza et al., 2010). The α-
amylase ( α -1, 4-glucan, 4-glucanohydrolase) is primarily hydrolysis α-1, 4-glycosidic
linkages of starch into smaller molecules as a mixture of monosaccharides, which
comprise the reactant of the Maillard reaction ( Chen et al., 2008; Souza et al., 2010) .
If starch content is not causing critical contamination, the factory may carefully monitor
The 7th National and International Graduate Study Conference 2017
" Thailand 4.0 Creative Innovation for Sustainable Development "
I233

rather than add α-amylase because it saves money on unnecessary costs in the sugar
factory and causes color phenomena occurring in raw and refined sugar ( Chung et al.,
2012; Asikin et al., 2014) . Color is an important attribute in food product and can
change during sugar processing and storage by the Maillard reaction, which is an
important non-enzymatic browning reaction and involves a complex phenomenon
between reducing sugar and amino acids at a ratio of 1:1, ( Cocoa et al., 2004; Quintas
et al., 2010) . The Maillard reaction can be classified into three stages (initial,
intermediate and final stage) to change a dark brown color in food products (Martins et
al., 2001; Nursten, 2005; Chen et al., 2008) . The efficiency of Maillard color depends
on various factors such as reaction time and temperature, including chemical
compositions such as amino acids and reducing sugar (Saska et al., 2009; Chung et al.,
2012). Few studies have concentrated on the Maillard reaction during sugar storage and
its effect on sugar quality (Pacheco et al., 2012).
This work aimed to determine the effect of raw sugar storage after enzymatic
treatment and color formation. The experiments were carried out with a concentrated
sucrose solution containing starch and treated with α-amylase to build the simulated
reducing sugar-glycine model. The simulated reducing sugar-glycine model stored
goods with different storage conditions and proposed to express color development as
indicators of the Maillard reaction. The color kinetics of the simulated model via the
Maillard reaction followed the zero-order reaction kinetic model and was analyzed by
the Arrhenius equation. The Arrhenius equation is a formula for the temperature
dependence of reaction rates. It is common knowledge that reaction rates occur more
rapidly at higher temperatures. Therefore, the effect of temperature on the color of sugar
during storage showed different color developments in the simulated model systems.
This research can add to the knowledge of parameters affecting color formation and be
used to manage storage conditions in sugar factories to maintain suitable product
quality.
Objectives
1) The effect of enzymatic treatment on raw sugar processing
2) The development color of raw sugar during storage.
3) Analyzing the color development by Arrhenius equation. Research Methodology
1. Preparation of reaction mixtures
15% ( w/v) sucrose solution with soluble starch was prepared by dissolving 15
grams of commercial sucrose in distilled water and making up to a final solution volume
of 100 ml adding soluble starch at 500 ppm. The mixture was heated with stirring until
completely soluble.
2. Enzymatic treatment
The solutions were treated with 4 ppm α-amylase at 95°C for 20 minutes.
The reactions were stopped by keeping it in a boiling water bath for 15 minutes. The
reducing sugar and starch content after enzymatic treatment were determined.
The 7th National and International Graduate Study Conference 2017
" Thailand 4.0 Creative Innovation for Sustainable Development "
I234

3. Measurement of reducing sugar
The reducing sugar was determined by Somogyi-Nelson method. First, 1 ml of
sample was placed into a test tube, followed by adding 1 ml of Alkaline copper reagent
to each tube and boiling all the tubes for 15 minutes in a boiling water bath, which were
then cooled in a cooling bath. Arsenomolybdate color reagent was added into the tubes
with a brief vortex and then incubated in the dark at room temperature for 30 minutes.
The mixtures were diluted with 5 ml distilled water before measuring absorbance at
520 nm. Reducing sugar was calculated using the equation:
4. Measurement of starch content
Starch content was measured following the SPRI starch test. It was precipitated
by 90% ethyl alcohol, caught on a mat of filter aid and solubilized by boiling in 40%
CaCl2 solution. Then, it was reacted with iodine and colormetrically analyzed as the
blue starch-iodine complex by Genesys 10-UV spectrophotometer ( Rochester, NY,
USA) at a wavelength of 600 nm. All analyses were performed in triplicate. Starch
content was calculated using the equation:
5. Preparation of reducing sugar-glycine model
The simulated reducing sugar-glycine model was prepared after α-amylase
treatment by heating 15% sucrose solutions with up to concentrated 70% sucrose
solutions and adding glycine. The initial molar ratio of reducing sugar to glycine was
1:1 for the development of color via Maillard reaction. Incubation for 30 days at 40, 50
and 60 °C occurred for color development. The simulated glucose-glycine and the
sucrose-glycine model were used as positive and negative control, respectively.
6. Measurement of color change
The color of raw sugar was determined in terms of ICUMSA (International
Commission for Uniform Methods of Sugar Analysis) GS1/3-7 protocol. The weight
of one gram of sample was dissolved in 100 ml of distilled water and then adjusted to
pH 7.0 by using an HCl or NaOH solution while stirring with a magnetic stirrer. The
mixture was filtered through filter paper and immersed in a flask in an ultrasonic bath
for 3 minutes. Afterward, absorbance was measured at 420 nm by using a UV
spectrophotometer. Color was calculated using the equation:
where b is the cell path length used (cm) and C is the concentration of sugar solution
(g/ml).
Starch (ppm) = 1000 x (C) x V1 x V3
50 weight of sample (g) V2
Reducing sugar (µg/ml) = Absorbance x dilution
Slope from the standard graph
ICUMSA color unit or IU = (Absorbance x 1000)
(b x c)
The 7th National and International Graduate Study Conference 2017
" Thailand 4.0 Creative Innovation for Sustainable Development "
I235

7. Data analysis and statistical method
Analysis of reaction rates was performed and all samples were determined by
Arrhenius equation. Color has been found to follow the zero order reaction kinetics.
Following this evidence, it was reasoned that the thermal color increasing of Maillard
reaction prepared by the simulated reducing sugar-glycine model follows the zero order
kinetic model:
Cp = Cp0 + kt Eq.1
The dependence of the color development rate constant on temperature is represented
by the Arrhenius equation:
k = k0exp (-Ea/RT) Eq.2
Where k0 is the pre-exponential constant, Ea is the activation energy, R is the gas
constant (8.314 J mol-1 k-1), and T is the absolute temperature.
Results and Discussion
1) Effect of α-amylase treatment
Reducing sugar and starch content of 15% ( w/v) sucrose solution containing
500 ppm of soluble starch after α-amylase treatment is given in Table 1. Reducing sugar
after α-amylase treatment showed 2730.27 µg/ml because of 4 ppm α-amylases are
enzymes that catalyses the hydrolysis of the glycosidic linkage of starch into smaller
oligosaccharides and produced simple sugars such as glucose, maltose and maltotriose
units ( Souza et al., 2010) . However, the effect of its decomposition starch as reducing
sugar lead to non-enzymatic reaction to colored compounds ( Chuddihy et al., 2006;
Quintas et al., 2010) . Reducing sugars are sugars which have free aldehyde or
ketone group. These sugars can react with other compounds and provide electrons
to them ( Straathof et al.,2000) . This type of color is formed by the Maillard reaction
between reducing sugar and amino compounds in sugar cane juice ( Morrison et al.,
1983; Perez et al., 2009) . Therefore, when starch is critical contamination from
sugarcane in sugar production, the sugar factories should carefully use α-amylase
because the effect of reducing sugar after enzymatic treatment may occur the color in
raw and refined sugar products (Straathof et al., 2000; Schoones et al., 2006).
Table 1. The amount of starch and reducing sugar in 15% ( w/v) sucrose solution
containing 500 ppm of soluble starch after α-amylase treatment
Treatment time
(minutes) Starch content
(ppm)
Reducing sugar
(µg/ml) 20 0 2730.27
The 7th National and International Graduate Study Conference 2017
" Thailand 4.0 Creative Innovation for Sustainable Development "
I236

2) Effect of the simulated reducing sugar-glycine model on color development
The concentrated sucrose solution in the simulated reducing sugar-glycine
model was stored at different temperatures and showed increasing color change with
the Maillard reaction ( Martins et al., 2001; Kitts et al., 2005) . Ajandouz (2001)
explained that the Maillard reaction is the non-enzymatic browning reaction between
reducing sugar and amino acid. The reducing sugar and amino acid content were
disappeared for color formation which monitored from the reduction of reducing sugar
and brown color development. After 30 days of storage, the color values changed from
138.06 IU to 958.08 IU, 1616.77 IU and 2137.73 IU at 40, 50 and 60°C, respectively
( Fig. 1A) whereas reducing sugar was found at 2730.27 µg/ml to 2220.53 µg/ml,
1654.55 µg/ml and 1266.36 µg/ml at 40, 50 and 60°C, respectively (Fig. 1B). However,
the control samples, the positive control in the simulated glucose-glycine model showed
the darkest color, while the color of negative control in the simulated sucrose-glycine
model did not change significantly during storage. It indicated that reducing sugar
which generated from starch hydrolysis is an impact on color development with
temperature. Mohr (1971) reported that degradation of reducing sugar and amino acid
promote the browning reaction at high temperature that might be an important factor to
impact color change with the Maillard reaction more than low temperature.
Color of sugar is recognized as the index of sugar quality that was create by The
International Commission for Uniform Methods of Sugar Analysis (ICUMSA). It is a
standard value of categorizing sugars. ICUMSA color levels ( IU) may be classified as
refined sugar, crystal sugar and raw sugar. The low number of IU indicating low levels
of color such as 45 IU is a high demand products and the safest form of sugar that
removes bacteria and contaminants present in raw sugar whereas 1000 IU or more when
analyzing raw sugars. The results of color formation on this study may have some useful
practical implications in the food technology which are interaction between the sugar
and amino group and may be exposed during their processing (Van et al., 1996; Martins
et al., 2001; Zhou et al., 2008).
The 7th National and International Graduate Study Conference 2017
" Thailand 4.0 Creative Innovation for Sustainable Development "
I237
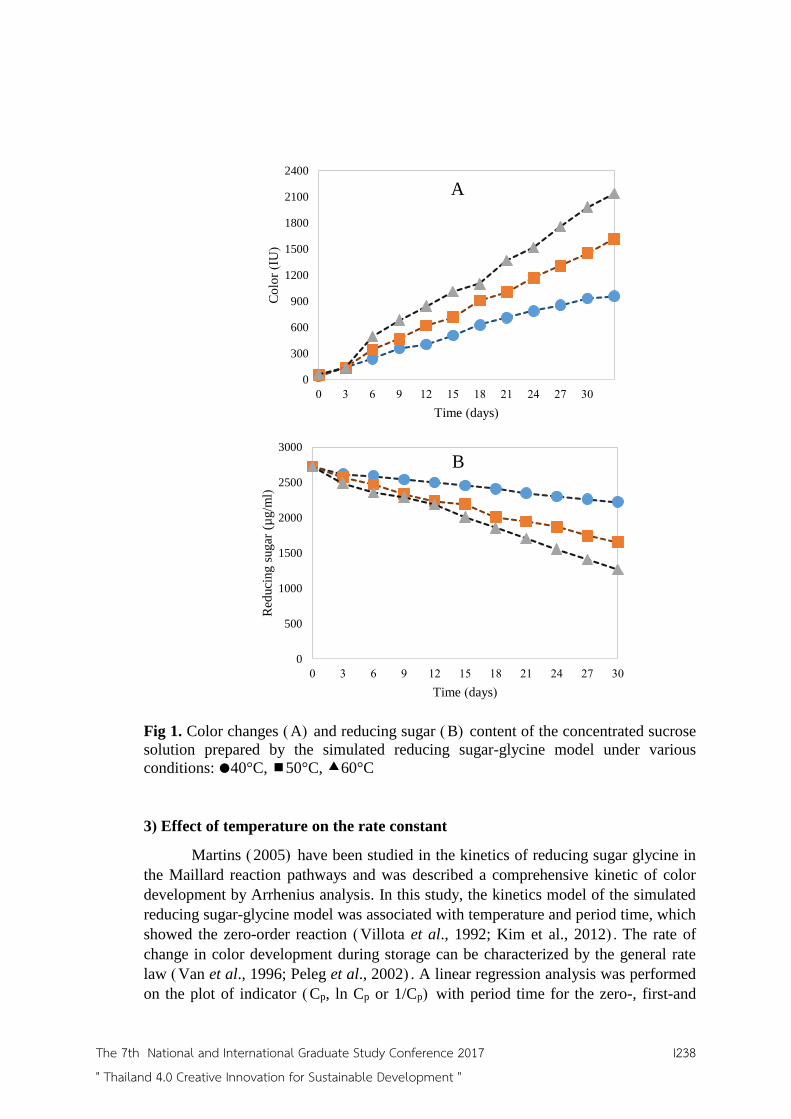
Fig 1. Color changes ( A) and reducing sugar ( B) content of the concentrated sucrose
solution prepared by the simulated reducing sugar-glycine model under various
conditions: 40°C, 50°C, 60°C
3) Effect of temperature on the rate constant
Martins ( 2005) have been studied in the kinetics of reducing sugar glycine in
the Maillard reaction pathways and was described a comprehensive kinetic of color
development by Arrhenius analysis. In this study, the kinetics model of the simulated
reducing sugar-glycine model was associated with temperature and period time, which
showed the zero-order reaction ( Villota et al., 1992; Kim et al., 2012) . The rate of
change in color development during storage can be characterized by the general rate
law ( Van et al., 1996; Peleg et al., 2002) . A linear regression analysis was performed
on the plot of indicator ( Cp, ln Cp or 1/Cp) with period time for the zero-, first-and
0
500
1000
1500
2000
2500
3000
0 3 6 9 12 15 18 21 24 27 30
Red
uci
ng s
ugar
(µ
g/m
l)
Time (days)
B
0
300
600
900
1200
1500
1800
2100
2400
0 3 6 9 12 15 18 21 24 27 30
Co
lor
(IU
)
Time (days)
A
The 7th National and International Graduate Study Conference 2017
" Thailand 4.0 Creative Innovation for Sustainable Development "
I238

second-order reaction, respectively. It showed value the coefficient of determination
(R2) in Table2.
In Fig2, showed the time courses of the color development at a given
temperature and the line was evaluated by the coefficient of determination ( R2) that
rewritten as: Cp=Cp0 + kt as the R2 values at 0.9992, 0.9978 and 0.9920 for 40°C, 50°C
and 60°C, respectively. It described the color of this reaction using the zero-order
reaction equation because R2 values of Cp and period time all above 0.90 (Rodinova et
al., 2005). The growth rate fell under a zero-order reaction that can be drawn by taking
the concentration of the reactant at any given time. Reaction rate constants increased
with temperature. This indicates that the reaction rate is independent of the reactant
concentration and that increasing the reactant concentration has no effect on rate
reaction (Rodinova et al., 2005; Schaefer et al., 2015)
Table 2. The reaction rate constant ( k) of the concentrated sucrose solution prepared
by the simulated reducing sugar-glycine model after storage for 30 days at different
temperatures
Temperature
(°C) Zero order
(Cp vs. time)
R2
First order
(In Cp vs. time)
R2
Second order
(1/Cp vs time)
R2
Reaction rate
constant (h-1)
(Zero order)
40 0.9992 0.8737 0.8138 28.295
50 0.9978 0.8670 0.8651 47.617
60 0.9920 0.8364 0.8151 63.236
Fig 2. Time courses of the color development of the concentrated sucrose solution
prepared by the simulated reducing sugar-glycine model under varied conditions:
40°C, 50°C, 60°C
y = 28.295x + 169.56
R² = 0.9992
y = 47.617x + 172.63
R² = 0.9978
y = 63.236x + 237.23
R² = 0.9920
0
500
1000
1500
2000
2500
0 3 6 9 12 15 18 21 24 27 30
Cp
Time (days)
The 7th National and International Graduate Study Conference 2017
" Thailand 4.0 Creative Innovation for Sustainable Development "
I239

The dependence of reaction rate constant (Table.2) on temperature followed the
Arrhenius relationship plot shown in Figure 3. The Arrhenius plots are often used to
analyze the effect of temperature on the rates of chemical reactions. It is obtained by
plotting the logarithm of the reaction rate constant (k) versus inverse temperature (1/T).
The result of the negative slope line is useful in finding the missing component of the
Arrhenius equation (Peleg et al., 2002; Schaefer et al., 2015).
After obtaining the activation energy and pre-exponential factor from the
Arrhenius plot, the rate constant at any temperature can be identified by using the
Arrhenius equation in Table 3, As a rule, higher Ea and k values indicate greater heat
sensitivity of color development during storage and the most biological and chemical
reaction. The Arrhenius parameters, Ea was estimated at 34.97 kJ/mol which is the
minimum energy needed for the reaction to occur ( Atkins et al., 2006) . The rate
constant ( k) of the color development from the simulated model as 29.27, 44.37 and
65.61 at 40, 50 and 60°C, respectively. This Arrhenius kinetic model is widely applied
nowadays to predict quality and color changes in food during storage. It is also a good
way to predict the rate constant of products for storage at any temperature ( Kim et al.,
2012; Rodinova et al., 2005).
Fig 3. The Arrhenius relationship between color development rate constant and
temperature of the concentrated sucrose solution prepared by the simulated reducing
sugar-glycine model: 40°C, 50°C, 60°C
Table 3. Arrhenius equation of color development and the rate reaction of color at
different temperatures
Temperature
(K)
Arrhenius equation Ea
(kJ/mol)
Rate reaction of color
development
(k) 313
ln (k) = -4207.2(1/T)+16.818
k = exp(-4207.2(1/T)+16.818)
34.97
29.27
323 44.37
333 65.61
ln k = -4207.2(1/T) + 16.818
0
0.5
1
1.5
2
2.5
3
3.5
4
4.5
0.00295 0.003 0.00305 0.0031 0.00315 0.0032 0.00325
ln k
1/T(K)
The 7th National and International Graduate Study Conference 2017
" Thailand 4.0 Creative Innovation for Sustainable Development "
I240

Conclusion
Starch is a cause of the problem in sugar production. The sugar factories widely
used α-amylase treatment for starch removal. However, enzymatic treatment also
promotes reducing sugar in the processing and impact the color development. The color
was determined by reducing sugar reacts with amino acids via the Maillard reaction
that prepared by the simulated reducing sugar-glycine model for storage at 40, 50 and
60°C. Color changes in the model systems tended to increase during storage, especially
at 60°C. The color increased, whereas reducing sugar decreased over 1 month of
storage. Color development can be followed the zero-order kinetics and the effect of
temperature on the reaction was described by Arrhenius equations. The rate of these
reactions does not depend on increasing or decreasing reactant concentrations. This
means that the rate constant is equal to the reaction rate. Additionally, this information
will identify the factors affecting sugar quality and the effect of enzymatic treatment on
sugar processing, including the usefulness of rate prediction for the storage conditions
of sugar products.
Recommendations
-
References
Ajandouz, EH., Tchiakpe, LS, Benajiba Puigserver. ( 2001) . “Effects of pH on
caramelization and Maillard reaction kinetics in fructose–lysine model
systems.” Journal of Food Science 66, 7 (September): 926-931.
Asikin, Yonathan., Masami Mizu, Kensaku Takara, Hajime Tamaki, Koji Wada.
( 2014) . “Changes in the physicochemical characteristics and Maillard reaction
products, of non-centrifugal cane brown Sugar during storage.” Food
Chemistry 149, (April): 170-177.
Chen, JCP., Chou CC. (1993). A Manual for Cane Sugar Manufacturers and Their
Chemists. J. Wiley, New York.
Chen, XM., Kitts, DD. ( 2008) . “Antioxidant activity and chemical properties of
crude and Fractionated Maillard reaction products derived from four sugar-
amino acid Maillard reaction model systems.” Ann. N.Y.Acad. Science
1126, 1 (April) 220–224.
Chung, Soo Yeon., Seog Hee Han and Seog Won Lee ( 2012) . “Effect of Maillard
reaction products prepared from glucose–glycine model systems on starch
digestibility.” Starch/Stärke 64, 8 (April): 657–664.
Cocoa, Monica., Teresa Garcia and Gerardo Gonzalez ( 2004) . “Study of coloured
components formed in sugar beet processing.” Food Chemistry 86, 3 ( July) :
421-433.
Cuddihy, JA., Porro ME, and Rauh JS. ( 2001) . “The presence of total polysaccharides
in sugar production and methods for reducing their negative effects”. J. Amer.
Soc. Sugarcane Technology 31, 3 (July): 73-91.
The 7th National and International Graduate Study Conference 2017
" Thailand 4.0 Creative Innovation for Sustainable Development "
I241

Din, Zia-ud., Ghulam Rasool. ( 2015) . “Physico-Chemical Analysis and Polarization
Value Estimation of Raw Sugar from Refining Point of View.” American
Journal of Plant Sciences 6, 1 (January): 1-5.
Eggleston Gillian. ( 2003) . “Recent developments in the use of oligosaccharides and
mannitol to understand and monitor sugarcane deterioration.” Proc Comm Int
Tech Sucr (CITS) 22, (March): 93-108.
Eggleston, Gillian; Benjamin Legender, Tom, Tew. ( 2004) . “Indicators of freeze-
damaged sugarcane varieties which can predict processing problems.” Food
Chemistry 87, 1 (August): 119-133.
Eggleston, Gillian., Morel du Boil, Walford SN. ( 2008) . “A review of sugarcane
deterioration in the United States and South Africa.” In: Proceedings of the
South African Sugar Technologists Association 81, (July): 72-85.
Figueira, Joelise de Alencar., Priscila Hoffmann Carvalho. ( 2012) . “Sugarcane
starch: quantitative determination and characterization.” Ciênc. Technology
Aliment 31, 3 (September): 806-815.
Godshall, MA. ( 1996) . “Starch, polysaccharide and proanthocyanidin in Louisiana
sugarcane varieties.” International Sugar Journal 98, 1168: 144-148.
Imrie, FK., Tilbury RH. ( 1972) . “Polysaccharides in sugar cane and its products.”
Sugar Technolgy Reviews, 1 (April): 291–361.
Javaid, Gulzar Shaikh., Muhammad Bilal Bhatti. ( 2011) . “To introduce the raw sugar
refinery, its operational concept and quality perspective in Pakistan.” Life
Science, 5 (January): 2053-2062.
Khaddour, Issam., Antonio Ferreira A, Luis Bento, Fernando Rocha. (2012) . “Sucrose
crystal growth in the presence of different molecular weights.” J. Cryst.
Growth. 355, 1 (June):17-25.
Kim, Yeon., Ah, Seung Won Jung, Hye Ri Park, Ku-Young Chung, Seung Ju Lee.
( 2012) . “Application of a prototype of microbial time temperature indicator
(TTI) to the prediction of ground beef qualities during storage.” Korean
Journal Food Science 32, 4: 448–457.
Kitts, David., Chun Hu. ( 2005) . “Biological and chemical assessment of antioxidant
activity of sugar-lysine model maillard reaction products.” Ann. N.Y. Acad.
Science 1043, 1 (January): 501–512.
Martins, Sara., Wim Jongen, Van Boekel, M. ( 2000) . “A review of Maillard reaction
in food and implications to kinetic modelling.” Trends in Food Science &
Technology 11, 9-10 (September): 364-373.
Martins, Sara., Van Boekel. (2005) . “A kinetic model for the glucose/glycine Maillard
reaction pathways.” Food Chemistry 90, 1 (March): 257–269.
Martins, RC., and CLM Silva. (2003). “Kinetics of frozen stored green bean (Phaseolus
vulgaris L.) quality changes: Texture, vitamin C, reducing sugars, and
starch.” Food Science 68, 7 (September): 2232–2237.
Mohr W, Roehrle D, Severin T. ( 1971) . “The formation of Cocoa flavor from the
precursors.” Fette Seifen An-strichsm 73, 1 (November): 515-521.
Morrison, William., and Bernard Laignelet, B. ( 1983) . “An Improved Colorimetric
Procedure for Determining Apparent and Total Amylose in Cereal and Other
Starches.” Journal of Cereal Science 1, 1 (January): 9-20.
Nelson, N. (1944). J. Biol. Chem. 153:375-380.
The 7th National and International Graduate Study Conference 2017
" Thailand 4.0 Creative Innovation for Sustainable Development "
I242

Nursten, Harry., ( 2005) .“The Maillard reaction: Chemistry, biochemistry, and
implications.” Cambridge: Royal Society of Chemistry.
Peleg, Micha., Pobert Engel, Consuelo Gonzalez-Martinez, and Maria Corradini.
( 2002) . “Arrhenius and non-WLF kinetics in food systems.” J. Science Food
Agriculture 82, 12 (August): 1346–1355.
Perez, Serge., Paul Baldwin, and Daniel Gallant (2009). “Structural Features of Starch
Granules” Starch (3rd ed.) San Diego: Academic Press.
Quintas, M., Branda Otrs. (2007). “Modelling autocatalytic behaviour of a food model
system– sucrose thermal degradation at high concentrations.” Journal of Food
Engineering 78, 2 (January): 537–545.
Rodinava, OE., AL Pomerantesev. (2005). “Estimating the parameter of the Arrhenius
equation.” Kinetic Catalyse 46, 3: 305-308.
Saska, Michael., V. Kochergin. ( 2009) . “Quality changes during storage of raw and
VLC sugar: Effects of pH and moisture.” International Sugar Journal 111,
1324 (April):234-238.
Schaefer, Joachim., Geoffrey Lee. ( 2015) . “Arrhenius activation energy to catalase
during spay-drying.” Int. J. Pharm 489, 1-2 (July): 124-130.
Schoones, BM. (2006). “The use of α-amylase to control starch levels in South African
cane sugar Factories.” Proceedings of the International Society of Sugar
Cane Technologists Processing Workshop, Baton Rouge, U.S. Souza, Paula Monteiro., Pérola de Oliveira e Magalhães ( 2010) . “Application of
microbial amylase in industry–a review” Brazilian Journal of Microbiology
41, 4 (October): 850-861.
Straathof, AJJ., Adlercreutz, P. ( 2000) . “Applied Biocatalysis.” Harwood Academic
Publishers, Amsterdam.
SPRI. ( 2002) . “A rapid starch test for use in cane mills.” Technical Report No SPRI
2002, October, Sugar Processing Research Institute.
Van Boekel. ( 1996) . “Statistical aspects of kinetics modelling for food science
problems.” Journal of Food Science 61, 3 (May): 477-485.
Vignes, EC. (1974). “Notes on Cane Starch and its Determinations.” Proc. ISSCT 15:
1288-1295.
Villota, Ricardo., James Hawkes. ( 1992) . “Reaction kinetics in food systems.”
Handbook of food engineering 93-114.
Zhou, M., Kimbeng, CA, Gillian Eggleston, Veremis, JC, and Gravois K. (2008).
“Issues of starch in sugarcane processing and prospects of breeding for low
starch content in sugarcane.” Sugar Cane International 26, 3 (May): 3–12.
The 7th National and International Graduate Study Conference 2017
" Thailand 4.0 Creative Innovation for Sustainable Development "
I243

Emissions of Major Air Pollutants from Charcoal Meat Grilling
Author: Nares Chuersuwan and Saranya Manatsakarn
Program in Environmental Pollution and Safety, School of Environmental Health,
Suranaree University of Technology
Abstract
This study estimates the emissions of criteria air pollutants (CO, NOx, SO2
and PM) and two greenhouse gases, CO2 and CH4, from charcoal meat grilling
activities. The emissions were quantified real-time in the experiment chamber using
eucalyptus charcoal as the fuel, with the exception of point measurements of PM and
CH4. All fifteen types of meat released high concentrations of CO, NOx and CO2 during
the flaming stage while CH4 concentrations were varied depending on the types of meat.
The average of emission rate of meat grilling ranged from 115.58±5.95 to 180.39±29.43
ppm/s for CO, 0.020±0.014 to 0.345±0.193 ppm/s for NOx, 841.31±12.66 to
1,569.63±324.86 ppm/s for CO2, 0.23±0.005 to 0.47±0.17 ppm/s for CH4. The
dominant size of PM emitted during meat grilling was between 0.4 and 0.7 μm, while
the emission rate of particulate matter ranged from 2.19±0.81 to 9.35±1.88 µg/s except
shrimp, squid, and meatball grilling provided the dominant size of 9.0-10 μm, with the
emission rate of particulate matter ranged from 2.53±0.78 to 4.13±0.90 µg/s. SO2 was
not detected in all samples. Measuring and monitoring real-time emissions yielded the
emission factors from charcoal meat grilling. The average emission factors of CO, NOx,
CO2, and CH4 were in the ranges of 13.53±4.12 to 121.11±11.05, 0.004±0.005 to
0.084±0.062, 153.16±47.27 to 1,541.42±214.58, and 0.75±0.06 to 6.07±2.15 g/MJ,
respectively. The average emission factor of PM10 ranged from 0.15±0.04 to 1.98±0.57
mg/MJ.
Keywords: charcoal meat grilling, major air pollutants, real-time measurement,
emission rate, emission factors.
Introduction
Under rapid expansion of industry and commerce included social change,
lifestyle and dietary habits of people change accordingly. The street food stalls can be
counted as an integral component of urban economy in Thailand. They are convenient
for consumers with accessible retail options. The street food stalls are very common
along the urban streets. Charcoal is the primary fuel for grilling foods. Meat grilling is
very popular among the food stalls but charcoal meat grilling emitted air pollutants into
the atmosphere. Charcoal meat grilling was found to be a significant source of
particulate matters (PM), carbon dioxide (CO2), carbon monoxide (CO), nitrogen
oxides (NOx), volatile organic compounds (VOCs), aldehyde, polycyclic aromatic
hydrocarbons (PAHs), and total hydrocarbons (THC) (Sung et al., 1997; U.S. EPA,
1999; Nordica, 2008; Ehsanul et al., 2011). Charcoal combustion have impact on
human, particularly in large cities where number of street food stalls is high and
increasing hazard of the nearby people exposed to pollutants with potential health risks
(Pandey, 2009). The most important environmental problem connected with charcoal
burning is the high probability of incomplete combustion. CO is one of the primary
products of incomplete combustion while NOx is produced when combustion
The 7th National and International Graduate Study Conference 2017
" Thailand 4.0 Creative Innovation for Sustainable Development "
I244

temperatures reach high enough level to burn nitrogen in the air (Harshika, et al., 2014).
Moreover, charcoal meat grilling has the potential to produce net global warming
especially CO2, the main driving force for the past global climate change (Zhang et al.,
2000; Andreae et al., 2001; IPCC, 2001). CO is considered an indirect greenhouse gas
due to its close coupling to atmospheric methane (Khalil and Rasmussen, 1985; Metz
et al., 2007)
Real-time measurement, emission rate, and emission factors are normally
used to estimate the emission from charcoal meat grilling. These studies were focused
on real-time measurements, emission rate, and emission factors for the criteria gas pollutants including particulate matters from different size ranges emitted from grilling
activities commonly found on of streets.
Objectives
1) To quantify criteria air pollutants emitted from grilling activities similarly
to the street food stalls.
2) To develop local emission factors for the criteria air pollutants in Thai’s
context.
Research Methodology
Source of experimental material
Fifteen types of meats were used in this study. All meat were used in the
experiment were purchased locally from markets in the area, i.e., pork, chicken, fish,
Thai sausage, Thai sour pork, seafood, and meatball. Charcoal derived from eucalyptus
woods was used exclusively as the solely fuel. Charcoal was also purchased from local
production. Table 1 shows details on variety of meat, range of wet weight for meat,
amount of fuel and grill time for charcoal meat grilling.
Table 1 Types and amount material for charcoal meat grilling
Meat Initial wet weight
(Range) (g/stick) Grill time (min)
Pork 35-55 20
Chicken 44-63 20
Chicken wing 34-63 20
Chicken liver 65-120 20
Catfish 340-450 20
Ruby fish 430-540 20
Tilapia 450-720 20
Shrimp 55-62 15
Squid 23-37 15
Thai sausage 31-52 20
Thai sour pork 75-97 20
Meatball 43-59 15
Pork ball 32-61 15
Fish ball 32-70 15
Chicken ball 38-53 15
The 7th National and International Graduate Study Conference 2017
" Thailand 4.0 Creative Innovation for Sustainable Development "
I245
Experimental design
The experiment were achieved by using combustion testing equipment,
schematically explained in Figure 1. The combustion testing equipment has been
designed and installed in a laboratory at Suranaree University of Technology. The
equipment is an inverted funnel with a cylinder bottom, 1.20 m in diameter and 0.80 m
in high. From the top of the cylinder, the tower decreases to 0.28 m in a length of 0.50
m, and is topped with a stack 1.70 m in height. Surface area of the stack is 0.03 m2. The
lowest position of the testing equipment is the aluminum rectangular box, used to
collect the ash obtained from combustion. The size of aluminum rectangular box is 0.50
m x 0.50 m. Meats were grilled on an aluminum mesh screen, 0.40 m. x 0.47 m. A gas
sampling point was at 0.50 m. below the top funnel. Temperatures and velocity of
airflow was measured at the same location.
Gas and particulate matter sampling
All measurements of CO, CO2, SO2, and NOx, were performed by a Testo
350 (Testo AG, Germany). The instrument was a brand new and factory calibrated prior
to the experiment. The probe was inserted inside the stack to measure gas
concentrations. Probe direction was laminar flow. The instrument was set to record
every 5 second of CO, CO2, SO2, and NOx concentrations. The Testo easyEmission®
software was used as the interface.
Grab sample was used for collecting methane gas in-stack. The samples were
sampling every 3 minutes using a polypropylene syringe and were transferred into
separated gas sampling bags (Tedlar® bag), about 200 ml in each bag. Methane was
quantified by a GC-FID (Agilent 7890A, USA). The GC was calibrated daily with a
standard CH4 gas (certified at 19.5 ppm, Air Liquid, Thailand). All gas sample bags
were analyzed within 24 h in the laboratory. All gas sampling bag used in each
experiment were flushed adequately with compressed clean air for at least three times
and evacuated prior use.
The particle mass concentrations were collected in-stack using the ANDERSEN
eight-stage impactor (Gresby-Anderson, USA). The impactor separated particles into
different aerodynamic diameters (Da) (<0.4, 0.4-0.7, 0.7-1.1, 1.1-2.1, 2.1-3.3, 3.3-4.7, 4.7-
5.8, 5.8-9.0, and 9.0-10.0 μm) at a flow rate of 28.3 L/min.
Experimental process
The background concentrations of test gases were also measured routinely
for 5 minutes at the beginning of each test. Prior to each grilling test, meats, charcoal,
and aluminum foil were pre-weighted with an analytical balance and recorded all the
weights. Aluminum pan was placed underneath to collect remaining ash. Charcoal
weighted about 700 g for each test and placed in the bottom of an aluminum mesh
screen. Another electronic balance, Mettler Toledo (MS32001L), was placed under the
combustion equipment and connected to a computer to record real-time mass changes.
The LabX™ software was used as the interface to continuously monitor the mass.
Emissions were recorded until the combustion was finished. Gas velocity in stack (m/s),
temperature (°C), sampling time (min), and weight loss (g) were also continuously
measured and recorded. All the grilling activities were ventilated naturally. Ash was
left at room temperature to cool down before weighted and recorded the remaining
mass. The total sampling time was 20 minutes each, except seafood and meatball
The 7th National and International Graduate Study Conference 2017
" Thailand 4.0 Creative Innovation for Sustainable Development "
I246
grilling was 15 minutes. The combustion was separated into 3 stages, ignition of
charcoal around 3 min, smoldering at the following 7-10 min and 10 min flaming.
Emission rates and emission factors of these combustion pollutants were calculated
based on the results.
Data analysis
The emission rate (ER, ppm/s) and emission factor (EF, g/MJ) of the air
pollutants from charcoal meat grilling were calculated by Eqs. (1), (2), and (3),
respectively.
t
C
ER
n
1i
i (1)
where: Ci is air pollutant concentration (ppm), i is the initial sampling time (s), n is the
final sampling time, t is sampling time (s).
fuel
iPM
M
MEF (2)
where: EFPM is the emission factor of particulate matter (mg/kg or g/kg), Mi is the mass
of emitted particles on the filter (mg or g), Mfuel is the mass of fuel consumed (g or kg).
dt22.4
wuCA
m
10E i
i
t
t
s
fd
3
i
f
o
(3)
where: Ei is the emission factor of gas i (g/kg), mfd is the mass of burned material (g),
t0 is the starting time accounted from fuel ignition (s), tf is the finishing time of burn
(s), As is the surface area of the stack (m2), u is the velocity of gas in the stack (m/s), Ci
is the concentrations of measured gas i (ppm), wi is the molecular weight of measured
gas i (g/g-mol).
Emission factors of gases and particulate matter were expressed in terms
of mass of pollutant per energy input, which can be derived from dividing the emission
factors of gases and particulate matter (in mass basis) by the fuel heating value, to obtain
emission factors in the unit of mg/MJ or g/MJ.
The 7th National and International Graduate Study Conference 2017
" Thailand 4.0 Creative Innovation for Sustainable Development "
I247

Figure 1 Schematic illustration of the combustion testing equipment
Results/Conclusions
Real-time measurements. Charcoal meat grilling showed three general combustion
stages included (1) after 1 min of ignition (ignition stage), (2) after about 3 minutes, the
charcoal glowing red and flames starting to flicker the over top of charcoal (smoldering
stage), (3) and then a relatively steady condition (flaming stage). In this study, the
ignition stage had the shortest duration and flaming stage had the longest duration.
Figure 2 illustrates these three stages with real-time data from Thai sour pork grilling.
Gas emissions increased rapidly during ignition stage. A large quantity of CO, and CO2
were generated during smoldering stage and further increased during the flaming stage
while NOx emissions gradually increased in ignition stage. During smoldering stage,
NOx generated rapidly and further increased during the flaming stage. In contrast, CH4
concentrations emitted from meat grilling activities showed inconsistent patterns.
Emission rate. CO emissions during ignition stage increased rapidly at the rate of about
29.54±14.46 to 125.33±29.96 ppm/s. A large quantity of CO were generated during
smoldering stage at the rate of about 98.53±29.07 to 174.41±21.56 ppm/s and further
increased during the flaming stage at the rate of about 153.32±30.74 to 212.63±14.67
ppm/s. At the ignition stage, NOx emissions gradually increased at the rate of
0.002±0.002 to 0.064±0.065 ppm/s for eight types of meat grilling while seven types
of meat grilling was unable to detected NOx, possibly due to lower temperature during
combustion. During smoldering stage, NOx was generated more rapidly at the rate of
0.012±0.010 to 0.111±0.029 ppm/s for twelve types of meat grilling and further
0000.00 g
Charcoal
Meat
PM
CH4
CO, NOx, SO2, CO2
The 7th National and International Graduate Study Conference 2017
" Thailand 4.0 Creative Innovation for Sustainable Development "
I248

increased during the flaming stage at the rate of 0.040±0.027 ppm/s to 0.533±0.295
ppm/s. Three types of meat grilling were unable to detected NOx. In all samples, CO2
increased quickly for 3 min after ignition and increased gradually until the end. The
rate of CO2 concentrations at the ignition stage, smoldering stage and flaming stage
were 251.39±145.28 to 846.89±177.43 ppm/s, 746.81±124.51 to 1,303.48±216.50
ppm/s, and 1,237.53±441.50 to 1,972.77±78.81 ppm/s, respectively. The rate of CH4
concentrations at the ignition stage, smoldering stage and flaming stage were 0.32±0.15
to 1.00±0.28 ppm/s, 0.25±0.04 to 0.43±0.11 ppm/s, and 0.17±0.05 to 0.40±0.09 ppm/s,
respectively. Figure 3 shows comparison emission rate of CO, NOx, CO2, and CH4 from
different type of meat grilling. The rate of emissions for difference type of meat grilling
is shown in Table 2. Table 3 shows the emission rate of particulate matter, the most
dominant size of particle emitted during meat grilling was size between 0.4-0.7 μm in
the range of 2.19±0.81 to 9.35±1.88 µg/s except grilling shrimp, squid, and meatball
the most dominant size of particle was 9.0-10 μm in the range of 2.53±0.78 to 4.13±0.90
µg/s.
Calorific value. The results of calorific value from charcoal derived from eucalyptus
woods was determined by calculating the heat provided by the combustion of a
specified quantity of the sample product in a bomb calorimeter. The average calorific
value of the charcoal was 28.55 MJ/kg.
The 7th National and International Graduate Study Conference 2017
" Thailand 4.0 Creative Innovation for Sustainable Development "
I249

0.00
0.50
1.00
1.50
2.00
2.50
3.00
3.50
4.00
4.50
5.00
NO
xco
nce
ntr
ati
on
(p
pm
)
NOx
0
1000
2000
3000
4000
5000
6000
7000
8000
9000
10000
11000
12000
13000
14000
CO
2co
ncen
tra
tion
(p
pm
)
0
10
20
30
40
50
60
70
80
90
100
110
120
130
140
0
60
120
180
240
300
360
420
480
540
600
660
720
780
840
900
960
1020
1080
1140
1200
CH
4co
ncen
tra
tion
(p
pm
)
Figure 2 Example of real-time behavior for CO, NOx, CO2, and CH4 emissions during
Thai sour pork grilling activities
0
100
200
300
400
500
600
700
800
900
1000
1100
1200
1300
1400C
O c
on
cen
tra
tion
(p
pm
)
CO
Smoldering stage Flaming stageIgnition
stage
Time (Sec)
0
0
0
The 7th National and International Graduate Study Conference 2017
" Thailand 4.0 Creative Innovation for Sustainable Development "
I250

Table 2 Emission rate of air pollutants for different types of meat grilling with charcoal.
Meat Stage
Average Emission rate (ppm/s) ±SD
CO NOx CO2 CH4
Pork
Whole stage (0-20 min)
Ignition stage (0-3 min)
Smoldering stage (3-10 min)
Flaming stage (10-20 min)
153.03±12.86
74.34±40.27
146.45±18.93
181.25±6.82
0.261±0.192
0.025±0.024
0.233±0.207
0.351±0.232
1,519.06±324.86
594.13±232.51
1,303.44±364.62
1,947.48±357.78
0.31±0.07
0.87±0.40
0.25±0.04
0.19±0.07
Chicken
Whole stage (0-20 min)
Ignition stage (0-3 min)
Smoldering stage (3-10 min)
Flaming stage (10-20 min)
167.45±8.59
93.49±10.64
154.18±13.05
198.93±9.78
0.345±0.193
0.060±0.050
0.199±0.126
0.533±0.295
1,569.63±101.34
846.89±177.43
1,303.48±216.50
1,972.77±78.81
0.25±0.03
0.40±0.24
0.27±0.04
0.20±0.02
Chicken
wing
Whole stage (0-20 min)
Ignition stage (0-3 min)
Smoldering stage (3-10 min)
Flaming stage (10-20 min)
159.26±19.60
85.78±17.61
145.69±26.58
190.80±28.58
0.248±0.091
0.064±0.065
0.150±0.082
0.372±0.137
1,370.44±141.85
731.67±106.15
1,150.71±202.26
1,715.88±199.98
0.26±0.07
0.58±0.37
0.27±0.06
0.17±0.05
Chicken
liver
Whole stage (0-20 min)
Ignition stage (0-3 min)
Smoldering stage (3-10 min)
Flaming stage (10-20 min)
166.13±5.95
94.47±40.41
172.84±17.98
182.93±12.53
0.190±0.188
0.019±0.018
0.147±0.212
0.272±0.239
1,392.46±12.66
576.02±210.20
1,240.20±117.32
1,743.97±69.68
0.42±0.03
0.85±0.23
0.43±0.11
0.28±0.05
Catfish
Whole stage (0-20 min)
Ignition stage (0-3 min)
Smoldering stage (3-10 min)
Flaming stage (10-20 min)
126.40±10.32
39.89±20.86
103.43±21.66
168.43±6.19
0.038±0.026
ND
ND
0.075±0.051
1,120.22±165.37
251.39±145.28
755.98±157.92
1,635.83±222.89
0.23±0.17
0.41±0.23
0.36±0.06
0.33±0.06
Ruby
fish
Whole stage (0-20 min)
Ignition stage (0-3 min)
Smoldering stage (3-10 min)
Flaming stage (10-20 min)
130.96±9.83
43.14±12.77
115.95±14.76
167.81±17.74
0.020±0.014
ND
ND
0.040±0.027
1,095.76±137.86
399.68±42.17
832.45±143.05
1,488.90±201.87
0.30±0.03
0.38±0.12
0.30±0.04
0.29±0.06
Tilapia
Whole stage (0-20 min)
Ignition stage (0-3 min)
Smoldering stage (3-10 min)
Flaming stage (10-20 min)
135.44±25.64
33.03±11.60
112.62±40.18
182.15±31.21
0.051±0.025
0.002±0.002
0.036±0.020
0.077±0.036
1,217.95±169.76
341.22±191.16
991.86±227.10
1,639.23±202.57
0.30±0.06
0.32±0.15
0.33±0.06
0.28±0.06
Shrimp
Whole stage (0-15 min)
Ignition stage (0-3 min)
Smoldering stage (3-10 min)
Flaming stage (10-15 min)
170.02±15.36
102.65±26.10
172.10±19.34
207.54±10.98
0.065±0.053
ND
0.024±0.023
0.161±0.143
1,350.51±119.44
744.51±122.96
1,289.15±117.31
1,800.00±191.79
0.47±0.12
0.93±0.28
0.38±0.13
0.32±0.10
Squid
Whole stage (0-15 min)
Ignition stage (0-3 min)
Smoldering stage (3-10 min)
Flaming stage (10-15 min)
152.64±12.24
86.50±39.39
155.73±16.59
188.01±24.78
0.071±0.031
0.005±0.006
0.055±0.021
0.134±0.068
1,316.44±135.16
672.50±309.25
1,245.57±204.45
1,802.04±121.08
0.45±0.14
0.85±0.22
0.39±0.17
0.29±0.12
Thai
sausage
Whole stage (0-20 min)
Ignition stage (0-3 min)
Smoldering stage (3-10 min)
Flaming stage (10-20 min)
115.58±20.35
29.54±14.46
98.53±29.07
153.32±30.74
0.029±0.010
ND
ND
0.058±0.021
1,065.08±190.91
310.00±146.66
797.26±210.94
1,479.08±235.89
0.34±0.005
0.42±0.12
0.37±0.07
0.29±0.05
Thai
sour
pork
Whole stage (0-20 min)
Ignition stage (0-3 min)
Smoldering stage (3-10 min)
Flaming stage (10-20 min)
180.39±29.43
112.22±16.37
174.41±21.56
205.03±47.02
0.119±0.063
0.023±0.016
0.111±0.029
0.155±0.106
1,359.52±124.30
680.14±49.20
1,170.77±136.10
1,695.46±186.53
0.45±0.10
0.97±0.48
0.39±0.11
0.33±0.15
Meatball
Whole stage (0-15 min)
Ignition stage (0-3 min)
Smoldering stage (3-10 min)
Flaming stage (10-15 min)
173.93±19.99
125.33±29.96
173.69±22.42
203.43±32.09
0.053±0.023
ND
0.036±0.024
0.109±0.050
1,395.91±197.63
785.99±172.65
1,341.88±218.84
1,837.52±233.13
0.47±0.11
1.00±0.28
0.37±0.10
0.29±0.13
Pork ball
Whole stage (0-15 min)
Ignition stage (0-3 min)
Smoldering stage (3-10 min)
Flaming stage (10-15 min)
157.97±23.88
91.20±29.96
156.09±33.46
200.68±13.18
0.057±0.030
0.006±0.003
0.044±0.028
0.105±0.060
1,090.56±213.30
593.68±185.17
1,020.21±239.87
1,487.17±215.04
0.46±0.07
0.76±0.17
0.38±0.08
0.40±0.09
The 7th National and International Graduate Study Conference 2017
" Thailand 4.0 Creative Innovation for Sustainable Development "
I251

Table 2 Emission rate of air pollutants for different type of meat grilling with charcoal
(Continued).
Meat Stage
Average Emission rate (ppm/s) ±SD
CO NOx CO2 CH4
Fish ball Whole stage (0-15 min)
Ignition stage (0-3 min)
Smoldering stage (3-10 min)
Flaming stage (10-15 min)
170.27±6.63
103.37±12.67
168.68±5.06
212.63±14.67
0.035±0.015
ND
0.014±0.012
0.084±0.032
1,316.62±212.76
683.89±61.78
1,217.83±223.40
1,834.56±307.14
0.46±0.05
0.92±0.14
0.36±0.05
0.33±0.08
Chicken
ball
Whole stage (0-15 min)
Ignition stage (0-3 min)
Smoldering stage (3-10 min)
Flaming stage (10-15 min)
134.59±21.16
64.94±30.90
128.03±16.24
185.57±27.67
0.033±0.029
ND
0.012±0.010
0.084±0.074
841.31±195.94
401.44±71.23
746.81±124.51
1,237.53±441.50
0.40±0.08
0.64±0.41
0.34±0.06
0.35±0.16
(a) (b)
(c) (d)
Figure 3 Emission rates of CO, NOx, CO2, and CH4 from different types of meat grilling
The 7th National and International Graduate Study Conference 2017
" Thailand 4.0 Creative Innovation for Sustainable Development "
I252

Table 3 Emission rate of particulate matter for different type of meat grilling with charcoal.
Meat Average emission rate of particulate matter (µg/s) ±SD
9.0-10 µm 5.8-9.0 µm 4.7-5.8 µm 3.3-4.7 µm 2.1-3.3 µm 1.1-2.1 µm 0.7-1.1 µm 0.4-0.7 µm <0.4 µm
Pork 2.93±0.28 2.17±0.22 1.79±0.58 2.16±0.16 1.95±0.27 2.10±0.11 3.32±1.05 6.76±2.91 2.56±1.02
Chicken 2.87±0.44 2.39±0.28 2.17±0.33 2.02±0.32 2.05±0.23 2.58±0.68 3.86±1.27 9.11±2.45 3.10±1.64
Chicken wing 3.50±0.52 2.55±0.52 2.21±0.38 2.14±0.53 1.88±0.54 2.49±0.58 3.50±0.72 9.35±1.88 2.65±1.73
Chicken liver 2.09±0.16 1.80±0.27 1.76±0.16 1.64±0.29 1.42±0.36 1.39±0.31 1.78±0.62 3.08±0.72 1.07±0.46
Catfish 2.29±0.30 2.24±0.29 1.76±0.11 1.76±0.05 1.69±0.33 1.36±0.18 2.08±0.63 3.89±1.06 1.01±0.15
Ruby fish 1.62±0.27 1.37±0.20 1.06±0.19 1.05±0.22 0.90±0.23 1.05±0.29 1.90±1.05 2.90±1.30 0.54±0.32
Tilapia 2.08±0.30 1.71±0.51 1.71±0.24 0.14±0.29 1.21±0.30 1.54±0.79 1.99±0.68 4.08±1.37 0.55±0.09
Shrimp 4.13±0.90 2.99±1.08 3.35±1.00 2.95±0.83 2.77±1.06 1.76±0.96 2.17±0.55 3.38±1.56 1.42±0.65
Squid 3.45±1.51 3.39±1.43 2.88±1.58 3.32±1.85 2.35±1.46 2.13±1.31 2.05±1.17 3.00±1.00 1.52±0.76
Thai sausage 2.94±0.83 2.61±0.84 2.18±0.60 1.98±0.93 1.71±0.67 1.98±0.38 3.65±2.90 5.12±2.68 1.25±0.86
Thai sour pork 3.09±0.67 2.69±0.59 1.79±0.24 1.96±0.58 1.95±0.44 2.58±0.65 3.42±1.06 5.86±1.55 1.04±0.16
Meatball 2.53±0.78 2.27±0.89 2.12±0.72 2.08±0.79 1.78±0.69 1.90±0.99 1.28±0.43 1.94±0.34 0.87±0.45
Pork ball 2.18±0.51 2.08±0.48 1.81±0.35 1.63±0.45 1.60±0.38 1.35±0.29 1.84±0.46 2.48±0.81 0.68±0.26
Fish ball 2.29±0.27 1.71±0.55 1.53±0.42 1.43±0.31 1.25±0.63 1.20±0.40 1.60±0.50 2.72±0.99 0.52±0.21
Chicken ball 1.92±0.45 1.74±0.41 1.27±0.29 1.31±0.49 0.99±0.39 0.99±0.32 1.50±0.28 2.19±0.81 0.35±0.26
The 7th National and International Graduate Study Conference 2017
" Thailand 4.0 Creative Innovation for Sustainable Development "
I253
Emission factor. Table 4 shows the emission factors of particulate matter and gases
from charcoal meat grilling, expressed as mass of emitted pollutant divided by the units
of energy (g/MJ). It was found that among fifteen meats, grilling shrimp had the highest
emission factors of CO, PM10, CO2, and CH4 while grilling the chicken had the highest
emission factor of NOx. The average emission factors ranged from 13.53±4.12 to
121.11±11.05 for CO, 0.004±0.005 to 0.084±0.062 for NOx, 153.16±47.27 to
1,541.42±214.58 for CO2, and 0.75±0.06 to 6.07±2.15 g/MJ for CH4. The average
emission factor of PM10 ranged from 0.15±0.04 to 1.98±0.57 mg/MJ.
Table 4 Emission factors of particulate matter and gaseous from charcoal meat grilling.
Meat
Emission factors ±SD
CO
(g/MJ)
NOx
(g/MJ)
PM10
(mg/MJ)
CO2
(g/MJ)
CH4
(g/MJ)
Pork 32.02±5.74 0.052±0.033 0.50±0.11 508.02±93.63 1.44±0.47
Chicken 36.51±5.54 0.084±0.062 0.46±0.07 501.86±112.62 1.10±0.35
Chicken wing 31.70±11.23 0.075±0.032 0.55±0.12 425.51±145.43 0.75±0.06
Chicken liver 37.30±12.29 0.051±0.048 0.32±0.08 452.98±107.86 1.49±0.62
Catfish 24.28±6.75 0.016±0.010 0.32±0.04 332.94±95.90 1.27±0.43
Ruby fish 19.89±5.11 0.010±0.000 0.15±0.04 250.40±64.32 0.86±0.20
Tilapia 26.32±11.36 0.020±0.018 0.22±0.04 337.85±145.61 1.05±0.38
Shrimp 121.11±11.05 0.060±0.063 1.98±0.57 1,541.42±214.58 6.07±2.15
Squid 25.35±7.40 0.027±0.022 0.38±0.15 337.85±97.09 1.39±0.16
Thai sausage 57.85±16.70 0.033±0.025 0.84±0.34 797.14±215.33 2.85±0.45
Thai sour pork 40.79±10.44 0.031±0.017 0.41±0.09 453.91±97.46 1.74±0.32
Meatball 23.11±1.33 0.013±0.006 0.21±0.07 292.06±41.01 1.14±0.14
Pork ball 15.79±2.88 0.007±0.007 0.18±0.02 171.32±31.16 0.92±0.25
Fish ball 34.75±3.77 0.016±0.008 0.28±0.07 383.87±138.23 1.50±0.23
Chicken ball 13.53±4.12 0.004±0.005 0.17±0.06 153.16±47.27 0.91±0.19
Discussion
Real-time measurement data were capable of identifying emission of criteria
air pollutants from charcoal meat grilling and shows that the emission varied from
stages of combustion. Grilling activity of Thai sour pork had higher emissions of CO
than other kinds of meats while grilling chicken had the highest emissions of NOx and
CO2. Grilling shrimp showed the highest emissions of CH4 and PM10. Incomplete
combustion from charcoal meat grilling led to high concentration of CO and led to low
concentrations of NOx and PM. Observation showed that the liquid content, probably
fat content of meats, dripping on the fuel during combustion caused high CO and NOx
concentrations. The results showed that all of meat grilling activities with the
eucalyptus charcoal was not associated with SO2 emission due to fuel and meats used
in the experiments have negligible sulfur content.
Recommendations
Future measurements may exclude SO2 from the similar experiments and
further study should be used charcoal derived from other wood for meat grilling
activity.
The 7th National and International Graduate Study Conference 2017
" Thailand 4.0 Creative Innovation for Sustainable Development "
I254

References
Andreae, MO., and Merlet, P. (2001). “Emission of trace gases and aerosol from
biomass burning.” Global Biogeochemical Cycles, 15 (December): 955-
956.
Ehsanul, K., Ki-Hyum, K., and Yoon., HO. (2011). “Trace metal contents in barbeque
(BBQ) charcoal products.” Journal of Hazardous Materials, 185
(January): 1418-1424.
Harshika, K., Avinash, Chandra., and Kaushik, S.C. (2014). “Comparative study on
emissions from traditional and improved biomass cookstoves used in
India.” International Journal for Research in Applied Science and
Engineering Technolog, 2 (August): 249-257.
IPCC (2001). Third assessment report climate change 2001. The scientific basis.
Cambridge University Press.
Khalil, M.A.K., and Rasmussen, R. A. (1985). “The behavior of trace gases in the
troposphere.” Science of The Total Environment, 48 (February): 169-
186.
Metz, B., Davidson, O.R., Bosch, P.R., Ave, R., and Meyer, L.A. (2007).
“Contribution of Working Group III to the Fourth Assessment Report of the
Intergovernmental Panel on Climate Change.” 499-540.
Nordica, M., Damon, M., Dean, S., Tami, B., and Christoph, R. (2008). “A laboratory
comparison of the global warming impact of five major types of biomass
cooking stoves.” Energy for Sustainable Development, 12 (June): 56-65.
Pandey, SK., Kim, KH., Kang, CH., Jung, MC., and Yoon, H. (2009). “BBQ charcoal
as an important source of mercury emission.” Journal of Hazardous
Materials, 162 (February): 536–538.
Sung, B., Kim, YS., and Perry, R. (1997). “Indoor air quality in homes, offices and
restaurants in Korean urban areas-indoor/ outdoor relationship.”
Atmospheric Environment, 31 (February): 529-544.
U.S. EPA. (1999). “U.S. Environmental Protection Agency, Emissions from Street
Vendor Cooking Devices (Charcoal Grilling).” Washington, DC: U.S.
Environmental Protection Agency. June.
Zhang, J., Smith, K.R., Ma, Y., YE, S., Jiang, F., Qi, W., Liu, P., Khalil, M.A.K..,
Rasmussen, R.A., and Thorneloe, S.A. (2000). “Greenhouse gases and
other pollutants from household stoves in China: a database for emission
factors.” Atmospheric Environment. 34 (August): 4537-4549.
The 7th National and International Graduate Study Conference 2017
" Thailand 4.0 Creative Innovation for Sustainable Development "
I255
Study of spray processing parameters and coating thickness of silica
hard coating film on polymethyl ethacrylate (PMMA) sheets
Author: Taksorn Jirathampradhab, Toemsak Srikhirin
Materials Science and Engineering Program, Multidisciplinary Unit,
Faculty of Science, Mahidol University
Abstract
To improve scratch-resistant property of transparent plastics such as
polymethyl methacrylate (PMMA), the hard coating film will be used as a protective
layer on the top of plastic surface. The hard coating is fabricated from a mixture of
silica nanoparticles and methyltrimethoxysilane (MTMS) via sol-gel process. The
effect of airbrush spray coating parameters of the nanocomposites hard coating film on
PMMA substrate will be investigated. The spray coating parameters including air
pressure and nozzle to substrate were effect on film formation. The effect of the
spraying coating on the film thickness, coating morphology and coating quality will be
investigated. The pencil hardness and adhesion strength between coating layer and
PMMA substrate with different coating thickness were reported.
Key Word (s): Spray deposition, Nanocomposite, Silica nanofiller
Introduction
Transparent plastic material is the materials that can transmit the visible
spectrum greater than 80%. It has been used to replace glass in many applications such
as window, building wall, display panels and optical devices. They are many
advantages over the glass in term of cost efficiency, machinability, thermoform ability
and safety. Transparent plastics are used primarily when the clarity of vision through
the material is concerned. They rarely stay perfectly transparent due damage from
abrasion and scratch during uses (M.S. Lee et al. 2002, L. Y.L. Wu et al. 2008). This is
a major drawback that limits the use of transparent plastic materials. Many researchers
create the hard coating film applied as the preventive layer on the substrates that
required optical clarity, durability and weathering resistant. The silica nanocomposites,
prepared by sol-gel processing, is the one of the widely used hard coating formulation
because they can be formulated at relatively low temperature (R. S.R. Kalidindi et al.
2014). The fabrication can be carried out by applying the coating solution on substrates
and cure. The pencil-hardness and cross-hatch adhesion tape test are used to evaluate
the hardness and cross-hatch adhesion tape test are used to evaluate the hardness and
adhesion of the hard coating film.
Previously our silica-MTMS nanocomposites hard coating formulation was optimized
for a dip coating process (R. Chantarachindawong et al. 2014, S. Yodmongkol et al.
2014, P. Kamonwanon et al. 2015) to improve the scratch resistant of PMMA
The 7th National and International Graduate Study Conference 2017
" Thailand 4.0 Creative Innovation for Sustainable Development "
I256
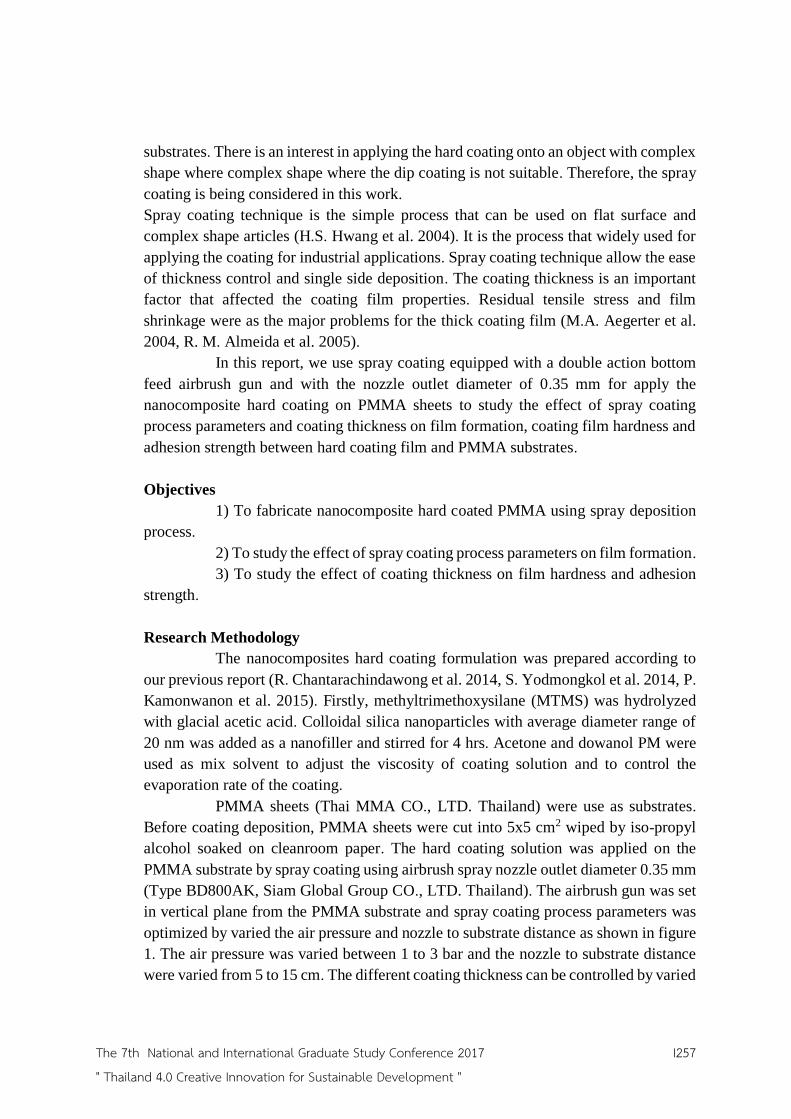
substrates. There is an interest in applying the hard coating onto an object with complex
shape where complex shape where the dip coating is not suitable. Therefore, the spray
coating is being considered in this work.
Spray coating technique is the simple process that can be used on flat surface and
complex shape articles (H.S. Hwang et al. 2004). It is the process that widely used for
applying the coating for industrial applications. Spray coating technique allow the ease
of thickness control and single side deposition. The coating thickness is an important
factor that affected the coating film properties. Residual tensile stress and film
shrinkage were as the major problems for the thick coating film (M.A. Aegerter et al.
2004, R. M. Almeida et al. 2005).
In this report, we use spray coating equipped with a double action bottom
feed airbrush gun and with the nozzle outlet diameter of 0.35 mm for apply the
nanocomposite hard coating on PMMA sheets to study the effect of spray coating
process parameters and coating thickness on film formation, coating film hardness and
adhesion strength between hard coating film and PMMA substrates.
Objectives
1) To fabricate nanocomposite hard coated PMMA using spray deposition
process.
2) To study the effect of spray coating process parameters on film formation.
3) To study the effect of coating thickness on film hardness and adhesion
strength.
Research Methodology
The nanocomposites hard coating formulation was prepared according to
our previous report (R. Chantarachindawong et al. 2014, S. Yodmongkol et al. 2014, P.
Kamonwanon et al. 2015). Firstly, methyltrimethoxysilane (MTMS) was hydrolyzed
with glacial acetic acid. Colloidal silica nanoparticles with average diameter range of
20 nm was added as a nanofiller and stirred for 4 hrs. Acetone and dowanol PM were
used as mix solvent to adjust the viscosity of coating solution and to control the
evaporation rate of the coating.
PMMA sheets (Thai MMA CO., LTD. Thailand) were use as substrates.
Before coating deposition, PMMA sheets were cut into 5x5 cm2 wiped by iso-propyl
alcohol soaked on cleanroom paper. The hard coating solution was applied on the
PMMA substrate by spray coating using airbrush spray nozzle outlet diameter 0.35 mm
(Type BD800AK, Siam Global Group CO., LTD. Thailand). The airbrush gun was set
in vertical plane from the PMMA substrate and spray coating process parameters was
optimized by varied the air pressure and nozzle to substrate distance as shown in figure
1. The air pressure was varied between 1 to 3 bar and the nozzle to substrate distance
were varied from 5 to 15 cm. The different coating thickness can be controlled by varied
The 7th National and International Graduate Study Conference 2017
" Thailand 4.0 Creative Innovation for Sustainable Development "
I257
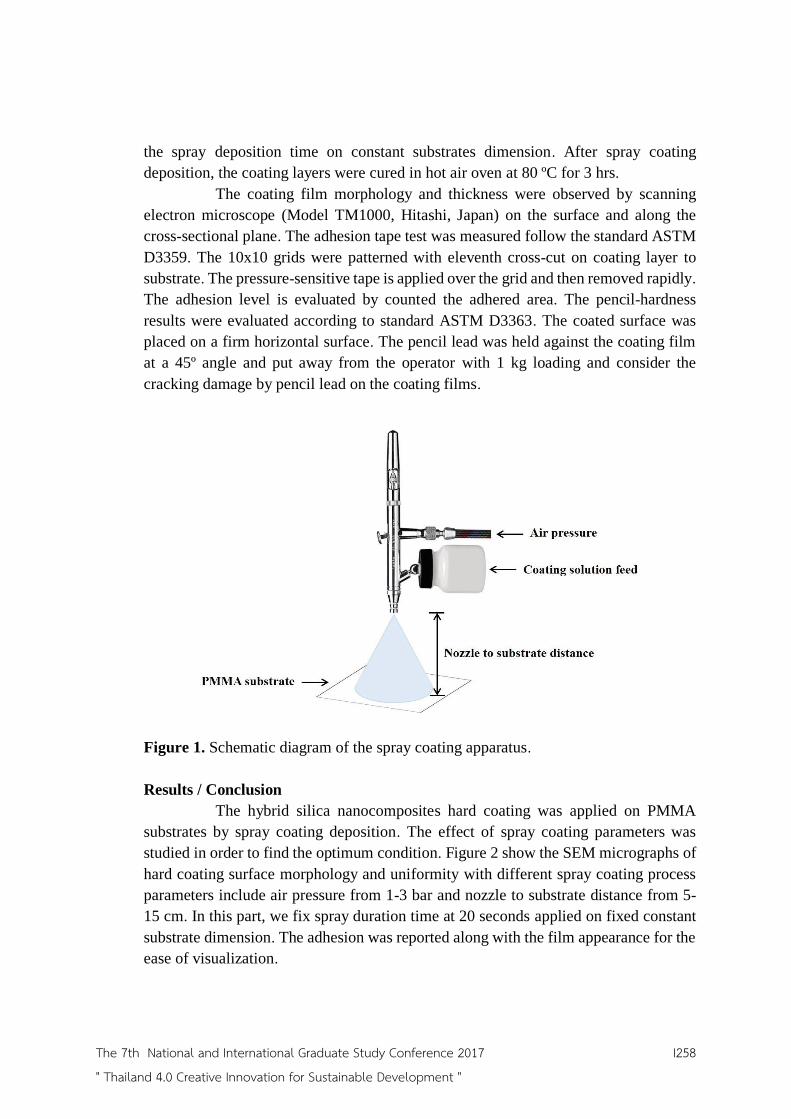
the spray deposition time on constant substrates dimension. After spray coating
deposition, the coating layers were cured in hot air oven at 80 ºC for 3 hrs.
The coating film morphology and thickness were observed by scanning
electron microscope (Model TM1000, Hitashi, Japan) on the surface and along the
cross-sectional plane. The adhesion tape test was measured follow the standard ASTM
D3359. The 10x10 grids were patterned with eleventh cross-cut on coating layer to
substrate. The pressure-sensitive tape is applied over the grid and then removed rapidly.
The adhesion level is evaluated by counted the adhered area. The pencil-hardness
results were evaluated according to standard ASTM D3363. The coated surface was
placed on a firm horizontal surface. The pencil lead was held against the coating film
at a 45º angle and put away from the operator with 1 kg loading and consider the
cracking damage by pencil lead on the coating films.
Figure 1. Schematic diagram of the spray coating apparatus.
Results / Conclusion
The hybrid silica nanocomposites hard coating was applied on PMMA
substrates by spray coating deposition. The effect of spray coating parameters was
studied in order to find the optimum condition. Figure 2 show the SEM micrographs of
hard coating surface morphology and uniformity with different spray coating process
parameters include air pressure from 1-3 bar and nozzle to substrate distance from 5-
15 cm. In this part, we fix spray duration time at 20 seconds applied on fixed constant
substrate dimension. The adhesion was reported along with the film appearance for the
ease of visualization.
The 7th National and International Graduate Study Conference 2017
" Thailand 4.0 Creative Innovation for Sustainable Development "
I258

Figure 2. SEM micrograph of hard coating layer on PMMA substrates with different
spray coating process parameters.
At air pressure of 1 bar, we obtained good film formation with every nozzle
to substrate distance (5-15 cm) but adhesion strength is unacceptable. At 3 bar, the
contamination from surrounding was induced by high velocity of air pressure (see the
arrows). Between 2 and 3 bar air pressure, the nozzle to substrate distance should be at
10 cm. It showed 100% adhesion strength of coating film and substrate. After we
consider the results of two main key parameters. The spray condition of air pressure at
The 7th National and International Graduate Study Conference 2017
" Thailand 4.0 Creative Innovation for Sustainable Development "
I259
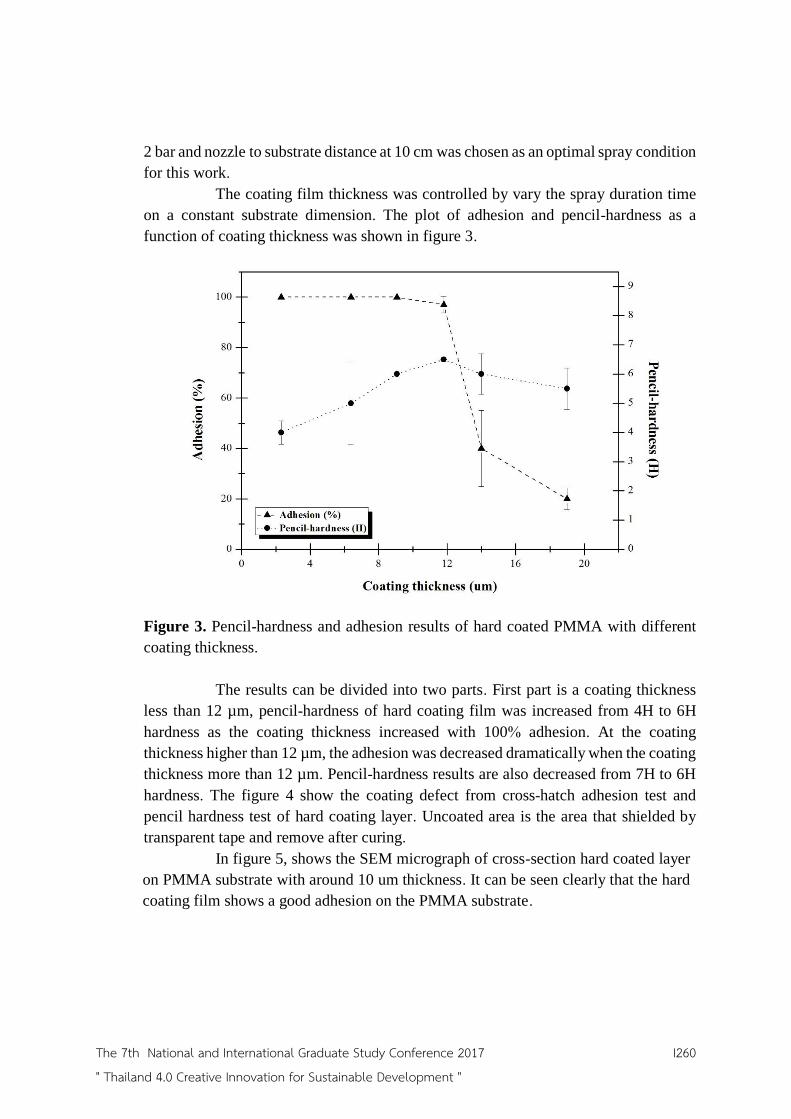
2 bar and nozzle to substrate distance at 10 cm was chosen as an optimal spray condition
for this work.
The coating film thickness was controlled by vary the spray duration time
on a constant substrate dimension. The plot of adhesion and pencil-hardness as a
function of coating thickness was shown in figure 3.
Figure 3. Pencil-hardness and adhesion results of hard coated PMMA with different
coating thickness.
The results can be divided into two parts. First part is a coating thickness
less than 12 µm, pencil-hardness of hard coating film was increased from 4H to 6H
hardness as the coating thickness increased with 100% adhesion. At the coating
thickness higher than 12 µm, the adhesion was decreased dramatically when the coating
thickness more than 12 µm. Pencil-hardness results are also decreased from 7H to 6H
hardness. The figure 4 show the coating defect from cross-hatch adhesion test and
pencil hardness test of hard coating layer. Uncoated area is the area that shielded by
transparent tape and remove after curing.
In figure 5, shows the SEM micrograph of cross-section hard coated layer
on PMMA substrate with around 10 um thickness. It can be seen clearly that the hard
coating film shows a good adhesion on the PMMA substrate.
The 7th National and International Graduate Study Conference 2017
" Thailand 4.0 Creative Innovation for Sustainable Development "
I260

Figure 4. Cross-hatch adhesion and scratch failure of pencil hardness test of 7H with
1 kg loaded on coated PMMA with 8 µm (left) and 16 µm thick layer (right)
Figure 5. SEM micrograph of cross-sectional plane of hard coating layer on PMMA
substrate
It can be concluded that air pressure, nozzle to substrate distance and spray
duration time are the key parameters for spray coating process that affected on
nanocomposites film formation. Air pressure of 2 bar and 10 cm of nozzle distance
were chosen for this work. The coating thickness can be controlled by vary spray
duration time. The critical cracking thickness of silica-MTMS nanocomposite film on
The 7th National and International Graduate Study Conference 2017
" Thailand 4.0 Creative Innovation for Sustainable Development "
I261
PMMA substrate by spray deposition process is around 12 µm. It was found that the
result shows the highest pencil-hardness at 7H with 1 kg loading and adhesion strength
at 100% adhesion.
Discussion
The two main key parameters that have an influence on the film formation
are operating air pressure and nozzle to substrate distance. There is no exactly spray
condition for every paint situation. The user needs vary and find the best spray condition
for each painting process. For the effect of air pressure, at 1 bar, the coating solution
was sprayed on to substrate with low velocity yielding a dry powder film with poor
adhesion. At moderate air pressure, 2 bar will decrease the size of the droplet size and
show more irregular film. If the coating process use too high air pressure (3 bar), the
droplets will be blown away and hit the substrate leading to non-homogeneous film
formation. Moreover, the nozzle to substrate distance is the important factor that
affected the adhesion strength of film and substrate because when we use the short
distance (5 cm), the coating film become wet and irregular film that affect the
decreasing of adhesion strength. This is believed to be an effect of wetting and droplet
to film formation. For long distance (15 cm), the volatile components in coating
solution will be evaporated on the way to the substrate and has a higher waste of coating
material.
The important factor that affects the film mechanical properties is the
coating thickness. The hard coating film with thickness higher than 12 µm can be
explained in term of different of thermal expansion properties between coating film and
substrates. During the densification, the residual solvent of coating solution was
evaporated and removed from the coating film to from the network film. For thick film,
there are very large stresses that can be generated during curing and cooling process
and also lead to film shrinkage and crack formation (R. M. Almeida et al. 2005).
Recommendations
The associated coating formulation should be compatible with various
coating process. The coating concentration, coating viscosity and evaporation rate can
be adjusted by control the amount or ratio of mix solvent in coating formulation to
applicable for wide range coating processes.
References
H.S. Hwang, N.H. Kim, S.K. Lee, D.Y. Lee, K. Cho and I. Park. (2011). Facile
fabrication of transparent superhydrophobic surfaces by spray
deposition. ACS Applied Materials and Interfaces 3 (July): 2179-2183.
L. Y.L. Wu, E. Chwa, Z. Chen and X.T. Zeng. (2008). A study towards improving
mechanical properties of sol-gel coatings for polycarbonate. Thin Solid
Films 516 (January): 1056-1062.
The 7th National and International Graduate Study Conference 2017
" Thailand 4.0 Creative Innovation for Sustainable Development "
I262

M.A. Aegerter and M. Mennig. (2004). Sol-Gel Technologies for Glass Producers
and Users. Kluwer Academic Publishers.
M.S. Lee and N.J. Jo. (2002). Coating of methyltriethoxysilane-modified colloidal
silica on polymer substrates for abrasion resistance. Journal of Sol-Gel
Science and Technology 24 (June): 175-180.
P. Kamonwanon, S. Yodmongkol, R. Chantarachindawong, S. Thaweeboon, B.
Thaweeboon, T. Srikhirin. (2015). Wear resistance of a modified
polymethyl methacrylate artificial tooth compared to five commercially
available artificial tooth materials. The Journal of Prosthetic Dentistry
114 (August): 286-292.
R. Chantarachindawong, W. Luangtip, P. Chindaudom, T Osotchan and T. Srikhirin.
(2012). Development of the scratch resistance on acrylic sheet with basic
colloidal silica (SiO2)-methyltrimethoxysilane (MTMS) nanocomposite
films by sol-gel technique. The Canadian Journal of Chemical Engineering
90 (August): 888-896.
R. S.R. Kalidindi and R. Subasri. (2014). Anti-abrasive nanocoatings: Current and
future applications. Woodhead Publishers.
R. M. Almeida and S. Sakka. (2005) “Handbook of Sol-Gel Science and
Technology Vol II: Characterization and Properties of Sol-Gel
Materials and Products. Kluwer Academic Publishers.
S. Yodmongkol, R. Chantarachindawong, S. Thaweboon, B. Thaweboon, T.
Amornsakchai and T. Srikhirin. (2014). The effects of silane-SiO2 nanocomposite films on Candida albicans adhesion and the surface and
physical properties of acrylic resin denture base material. The Journal
of Prosthetic Dentistry 112 (December): 1530-1538.
The 7th National and International Graduate Study Conference 2017
" Thailand 4.0 Creative Innovation for Sustainable Development "
I263

Title Effects of Glass Fiber Content on Engineering Properties of Glass Fiber Reinforced
Concrete
Authors: Ratthanan Ianleng and Thatchavee Leelawat
Program Mater’s Degree of Civil Engineering
Institute Department of Civil and Environmental Engineering Mahidol University
Abstract
The purposes of this study were to determine the compressive strength, flexural strength,
and modulus of elasticity of Glass Fiber-Reinforced Concrete (GFRC) varying the percentage
of fiber content. The mortar used for making GFRC were prepared by mixing white Portland
cement, silica sand, water, and Styrene Butadiene Rubber (SBR) latex. Attempt has been made
to control the percentage of sprayed glass fiber by volume of GFRC mix. The mechanical
properties of GFRC including compressive strength, flexural strength, and modulus of
elasticity were performed at 1 and 28 days after specimens were cast. The flexural strength
results of GFRC with high fiber content were found to be higher than those with low fiber
content. On contrasts, the compressive strength and modulus of elasticity of GFRC with high
fiber content were found to be lower than those with low fiber.
Keyword: Styrene Butadiene Rubber Latex, Glass Fiber Reinforced Concrete, Flexural
strength, Compressive strength, Modulus of elasticity, Glass Fiber Content
Introduction
Glass Fiber-Reinforced Concrete (GFRC) is a cementitious composite material made up
of mortar matrix and chopped glass fiber. GFRC is mainly used for exterior building façade
panels and architectural precast concrete because the properties of GFRC are tough, ductile,
and water-resistant. The GFRC is generally fabricated by sprayed technique where the mortar
matrix is pumped and mixed with the chopped fibers at the nozzle gun of the spraying machine.
The mortar matrix is usually blended by mixing cement, sand, water, and additive whereas the
chopped glass fibers, made up from alkali resistant glass ( AR- Glass) , are selected commonly
for making GFRC due to minimizing the degradation of glass fibers from alkaline of cement
[1-4]. The type of additive used in the GFRC is a polymer latex because the latex could improve
the flexural strength, workability, and toughness of GFRC [5].
However, very limited researches were found to study the effect of SBR content and
chopped fiber fractions on the engineering properties of GFRC for use in real exterior building
façade panels. Therefore, the main aim of the study was to determine the effect of glass fiber
content on compressive strength, flexural strength, and modulus of elasticity of GFRC
specimens which were fabricated by the spraying machine being used practically for making
exterior building façade panels.
Objective
The main aim of this paper was to determine the compressive strength, flexural strength,
and modulus of elasticity of Glass Fiber-Reinforced Concrete (GFRC) varying the percentage
of fiber content and SBR content.
The 7th National and International Graduate Study Conference 2017
" Thailand 4.0 Creative Innovation for Sustainable Development "
I264

Research Methodology
Materials
White Portland cement used was Tiger brand obtaining from Siam Cement Group (SCG)
Industry. Its specific gravity was 3.15. Silica sand with the maximum nominal size of 0.84 mm
(No.20) was used.
Glass fiber, conforming to ASTM D578, was AR- Glass type obtaining from Nippon
Electric Glass. The compositions of glass fiber contained 61% of silicon oxides, 15% of
sodium oxides, and 20.8% of zirconia oxides. The specific gravity of AR-glass was 2.74 g/cm3.
Polymer latex used was a Styrene Butadiene Rubber (SBR). The specific gravity of SBR
was 1.02 kg/l. The water content of SBR latex was 54.5%.
Mixing Proportion and Specimen Preparation
The summary of mix proportions for GFRC is given in Table 1. In the case of 1.5% latex
used to prepare needed to reduce the water content to achieve the pumpability and cohesion of
the mixes being fabricated with the spraying machine. The results are in line with those
obtained from Wang et al [5].
The mortar matrix was prepared by mixing water and SBR latex for 1 minute in the mixer.
Thereafter, silica sand and white portland cement were added into the mixer and mixed further
for 5 minutes.
The prepared mortar matrix was transferred to the container of the spraying machine and
then pumped continuously through the nozzle of the spray machine. The fiber roll was chopped
to obtain nominal lengths of fiber within the range of 38 and 50 mm. The chopped fibers and
the mortar matrix were then mixed at the spray nozzle. Attempt has been made to control the
fiber content in the GFRC mixture by manually adjusting the air pressure valve and pumping
speed of the spraying machine. The GFRC mixture was then sprayed in six cylindrical
specimens with the dimension of ø100×200 mm, six cylindrical specimens with the dimension
of ø150×300 mm, six prismatic specimens with the dimension of 350×150×25 mm, and one
0.1ft3 container to collect the fiber content. Thereafter, the specimens and the container were
consolidated using a tamping rod and vibrating table. The container was then wet-sieved
through the No20 sieve and all of the fibers retained on the sieve were collected and oven-
dried. Thereafter, the fiber content for each mix was then weighed and calculated as the
percentage of fiber content in the mix as shown in Table 2.
All of the specimens prepared were covered with plastic sheets. After demolded at the age
of 244 hours, the specimens were transferred to a moist-cured room, which was controlled at
the temperature of 23ºC and the relative humidity of 95%.
The 7th National and International Graduate Study Conference 2017
" Thailand 4.0 Creative Innovation for Sustainable Development "
I265
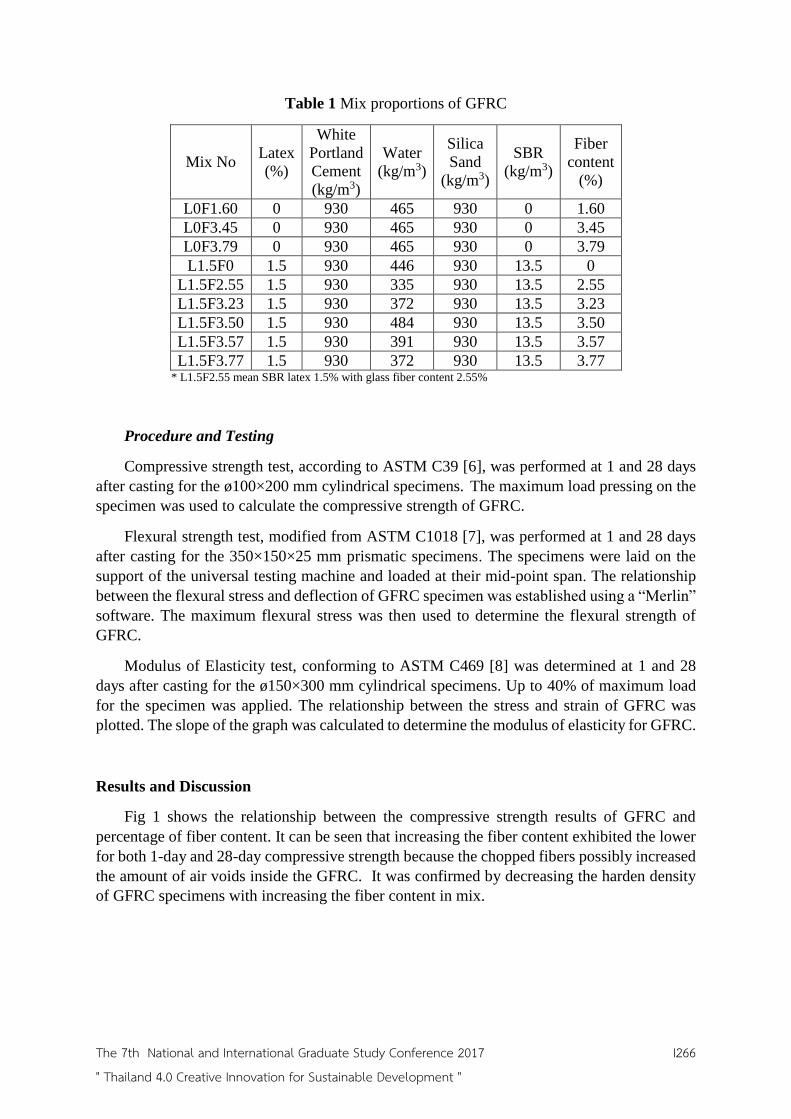
Table 1 Mix proportions of GFRC
Mix No Latex
(%)
White
Portland
Cement
(kg/m3)
Water
(kg/m3)
Silica
Sand
(kg/m3)
SBR
(kg/m3)
Fiber
content
(%)
L0F1.60 0 930 465 930 0 1.60
L0F3.45 0 930 465 930 0 3.45
L0F3.79 0 930 465 930 0 3.79
L1.5F0 1.5 930 446 930 13.5 0
L1.5F2.55 1.5 930 335 930 13.5 2.55
L1.5F3.23 1.5 930 372 930 13.5 3.23
L1.5F3.50 1.5 930 484 930 13.5 3.50
L1.5F3.57 1.5 930 391 930 13.5 3.57
L1.5F3.77 1.5 930 372 930 13.5 3.77 * L1.5F2.55 mean SBR latex 1.5% with glass fiber content 2.55%
Procedure and Testing
Compressive strength test, according to ASTM C39 [6], was performed at 1 and 28 days
after casting for the ø100×200 mm cylindrical specimens. The maximum load pressing on the
specimen was used to calculate the compressive strength of GFRC.
Flexural strength test, modified from ASTM C1018 [7], was performed at 1 and 28 days
after casting for the 350×150×25 mm prismatic specimens. The specimens were laid on the
support of the universal testing machine and loaded at their mid-point span. The relationship
between the flexural stress and deflection of GFRC specimen was established using a “Merlin”
software. The maximum flexural stress was then used to determine the flexural strength of
GFRC.
Modulus of Elasticity test, conforming to ASTM C469 [8] was determined at 1 and 28
days after casting for the ø150×300 mm cylindrical specimens. Up to 40% of maximum load
for the specimen was applied. The relationship between the stress and strain of GFRC was
plotted. The slope of the graph was calculated to determine the modulus of elasticity for GFRC.
Results and Discussion
Fig 1 shows the relationship between the compressive strength results of GFRC and
percentage of fiber content. It can be seen that increasing the fiber content exhibited the lower
for both 1-day and 28-day compressive strength because the chopped fibers possibly increased
the amount of air voids inside the GFRC. It was confirmed by decreasing the harden density
of GFRC specimens with increasing the fiber content in mix.
The 7th National and International Graduate Study Conference 2017
" Thailand 4.0 Creative Innovation for Sustainable Development "
I266

Fig 1: Relationship between compressive strength and fiber content of GFRC
Fig 2 shows the relationship between flexural stress and deflection of GFRC without glass
fiber content. Fig 3 shows the typical relationship between flexural stress and deflection of
GFRC with glass fiber content. It was found that the GFRC without glass fiber exhibited the
flexural strength about 2.0 and 4.9 MPa at 1 day and 28 days of specimen’s ages respectively.
The specimens were immediately broken after their flexural stress reached the first crack.
These results are in line with those stress-strain relationship given by Tassew and Lubell [9].
This is due to no or very little restrain of tension stress from mortar matrix. It was confirmed
by the tensile strength of cement mortar obtained by Singh et al. [10]. On the other hand, GFRC
specimens with 3.57% of fiber content exhibited the 28-day flexural strength at about 11 MPa
and the specimens continued to sustain load without broken after their flexural stress reached
the maximum value. The toughness, which was calculated from the area under the relationship
between flexural stress and deflection, of GFRC with fiber content was also found to be
significantly higher than that of GFRC without fiber content. This is due to transfer of tensile
strength from the glass fibers in the GFRC.
L0F3.79
L0F1.60 L0F3.45
L1.5F0
L1.5F2.55 L1.5F3.23
L1.5F3.50
The 7th National and International Graduate Study Conference 2017
" Thailand 4.0 Creative Innovation for Sustainable Development "
I267

Fig 2: Relationship between flexural stress and deflection of GFRC without glass fiber.
Fig 3: Typical relationship between flexural stress and deflection of GFRC
with 3.57% fiber content
Fig 4 shows the relationship between flexural strength and fiber content of GFRC. The
results showed that increasing fiber content exhibited the higher the flexural strength for both
1 and 28 days of specimen’s age. It was also found that, for a given glass fiber content, the 28-
day flexural strength results of GFRC with 1.5% latex polymer were higher than those
corresponding GFRC without latex polymer. This is possibly due to latex improving flexible
behavior of adhesive bond between aggregate particles. Moreover, the latex were improved
tensile crack capacity of GFRC.
Fig 5 shows the relationship between modulus of elasticity and fiber content of GFRC.
The results showed that increasing fiber content exhibited the lower modulus of elasticity of
GFRC because of higher air voids obtained from glass fiber composite.
0
50
100
150
200
250
300
350
400
0
2
4
6
8
10
12
14
16
0.0 0.5 1.0 1.5 2.0 2.5 3.0 3.5 4.0 4.5 5.0 5.5 6.0
Equ
ival
en
t Fl
exu
ral S
tre
ss (
ksc)
Equ
ival
en
t Fl
exu
ral S
tre
ss (
MP
a)
Deflection (mm)
11: FM-MF-L1.5-P455060-1d-1 11: FM-MF-L1.5-P455060-28d-1
11: FM-MF-L1.5-P455060-1d-2 11: FM-MF-L1.5-P455060-28d-2
11: FM-MF-L1.5-P455060-1d-3 11: FM-MF-L1.5-P455060-28d-3
0
50
100
150
200
250
300
350
400
0
5
10
15
20
25
30
35
40
0.0 0.5 1.0 1.5 2.0 2.5 3.0 3.5 4.0 4.5 5.0 5.5 6.0Eq
uiv
ale
nt
Fle
xura
l Str
ess
(ks
c)
Equ
ival
en
t Fl
exu
ral S
tre
ss (
MP
a)
Deflection (mm)
1-11-21-32-32-12-2
L1.5F0 (1) _1day
L1.5F0 (2) _1day
L1.5F0 (3) _1day
L1.5F0 (1) _28days L1.5F0 (2) _28days L1.5F0 (3) _28days
L1.5F3.57 (1) _1day
L1.5F3.57 (2) _1day
L1.5F3.57 (3) _1day
L1.5F3.57 (1) _28day
L1.5F3.57 (2) _28day
L1.5F3.57 (3) _28day
The 7th National and International Graduate Study Conference 2017
" Thailand 4.0 Creative Innovation for Sustainable Development "
I268

Fig 4: Relationship between flexural strength and fiber content of GFRC
Fig 5: Relationship between modulus of elasticity and fiber content of GFRC
L0F3.79
L0F1.60
L0F3.45
L1.5F0
L1.5F2.55 L1.5F3.23
L1.5F3.50 L0
L1.5
L0F3.79
L0F1.60
L0F3.45
L1.5F0
L1.5F2.55
L1.5F3.23
The 7th National and International Graduate Study Conference 2017
" Thailand 4.0 Creative Innovation for Sustainable Development "
I269

Conclusion
1) The compressive strength and modulus of elasticity of GFRC were found to decrease
with increasing glass fiber content.
2) GFRC specimens with glass fiber continued to sustain load without broken after their
flexural stress reached the maximum value.
3) The flexural strength results of GFRC were found to increase with increasing the glass
fiber content.
4) GFRC with 1.5% latex polymer exhibited the flexural strength higher than GFRC
without latex polymer.
Reference
1. Majumdar, A. J., Nurse, R. W. (1974). “Glass fibre reinforced cement” Materials Science
and Engineering 15: 107-127.
2. Hull, D. (1981). “An Introduction to Composite Materials”, Cambridge Solid State Science
Series 2: 14-15.
3. Proctor, B. A., Yale, B., Ubbelohde, A. R., Manfre, G. (1980). “Glass fibres for cement
reinforcement” Philos, Trans, London: The Royal Society.
4. Larner, L. J., Speakman, K., Majumdar, A. J. (1976). “Chemical Interactions between Glass
Fibers and Cement” Journal of NonCrystalline Solids 20: 43-74.
5. Wang, R., Wang, P.-M., Li, X.-G. (2005), “Physical and mechanical properties of styrene–
butadiene rubber emulsion modified cement mortars” Cement and Concrete Research 5:
900-906.
6. ASTM "American Society for Testing and Materials," in ASTM C39 Standard Test Method
for Compressive Strength of Cylindrical Concrete Specimens., ed. 100 Barr Harbor
Drive, PO Box C700, West Conshohocken, PA 19428-2959, United States: ASTM
International, 2007.
7. ASTM “American Siciety for Testing and Materials,” in ASTM C1018 Standard Test Method
for Flexural Toughness and First-Crack Strength of Fiber-Reinforced Concrete (Using
Beam With Third-Point Loading). 100 Barr Harbor Drive, PO Box C700, West
Conshohocken, PA, United States: ASTM International.
8. ASTM “American Siciety for Testing and Materials,” in ASTM C469 Standard Test Method
for Static Modulus of Elasticity and Poisson’s Ratio of Concrete in Compression. 100
Barr Harbor Drive, PO Box C700, West Conshohocken, PA, United States: ASTM
International.
9. S.T. Tassew, A. S. L. (2014). "Mechanical properties of glass fiber reinforced ceramic
concrete." Construction and Building Materials 51: 215-224.
10. S.B. Singh, P. M., Nikesh Thammishetti (2015). "Role of water/cement ratio on strength
development of cement mortar." Journal of Building Engineering 4: 94-100.
The 7th National and International Graduate Study Conference 2017
" Thailand 4.0 Creative Innovation for Sustainable Development "
I270
The 7th
National and International Graduate Study Conference 2017 I271
“Thailand 4.0 Creative Innovation for Sustainable Development”
Prototype Development of Authentication System on Cloud Computing Systems
Author: Ajchariya Saeung, Assoc. Prof. Panjai Tantatsanawong, Ph.D.
Master of Science Program in Information Technology, Faculty of Science
Silpakorn University
Abstract
This research has developed a prototype of the authentication system on
cloud computing. The proposes of this study are to development of cloud access
authentication mechanisms and to development Single sign-on (SSO) intermediary
system for different authentication systems to access resources from the Linux platform
and Windows platform. This paper use authentication namely Shibboleth technology,
which allows log in once. The results of the study were as follows enhances are the
security of system access, reduce user workloads and speed up to access.
Keywords: operating system security, single sign-on, Shibboleth, cloud authentication
Introduction
The Cloud Computing is the various service systems. The distinctive point is the
high effects of the processing even though using low cost. The trends of using are
increasing continuously. A user is able to have many accounts and each account
contains a username and password for system that was used. Because of much operating
systems (OS) in this time, such as Linux, Windows and UNIX. All users need to
register for creating an account in its own system. Therefore, there are too many
accounts in the system. As a user could have only an account, for logging in the Cloud
Computing, we must always register the new username and password by the existed
security devices e.g. the Security Assertion Markup Language, the Active Directory in
Windows, and the Lightweight Directory Access Protocol.
There are a lot of research works established by SingAREN [6] (Singapore
Advanced Research and Education Network) that is Singapore Access Federation, the
intermediary of information services providing the authentication system for education
and research by Shibboleth for authenticate per time. [9] People who want to sign into
any OS have to register and select which OS they'll use in order to enter to the resources
of singAREN's system. However, the users have to install the Identity Provider from
OS. To install, it needs to set by the prescribed form. If they change the computer after
installed main Metadata, they have to verify your identity in the new computer for
connecting to singAREN's Main system resource.
This research provides the alternative identification method by directory to be an
important complement of the Cloud Computing's [1] Network Management System
gathering clouds. It works by distribution of Cloud Computing system and by
communication the information from any resources. The Security devices used
Shibboleth, Active Directory and LDAP, which are the security standards. Users don’t
necessary to install the authentication system in computer, but they can enter via the
verified the Exchange system in each OS that they use.

The 7th
National and International Graduate Study Conference 2017 I272
“Thailand 4.0 Creative Innovation for Sustainable Development”
Objectives
1. To study and develop the authentication system in accessing the cloud
computing’s resources.
2. To develop the Exchange system for the authentication systems in the different
ways to access the resource of Linux and Windows platforms.
Literature Reviewed
1. Shibboleth [2]
Shibboleth is one of the Internet2’s works. It’s used for an Identification
Management (Federated System) [4] that OASIS SAML (Organization for the
Advancement of Structured Information System, Security Assertion Markup language)
is the defined standard forms in request, creation, communication and identity
verification. It’s the structure of authentication and permission on SAML’s standard.
The Federated Identity’s concepts consist of Identity Provider (IdP) and Service
Provider (SP).
WAYS (“Where Are You Form”) or Discovery Service is one of the Shibboleth
that will find out the key on SAML2 Metadata file to choosing the data provider.
Shibboleth’s work process shows on Fig.1
Figure 1 the Shibboleth’s process. [7]
According to Fig.1, Shibboleth’s work process presents operating when users
have already registered on the information providers.
1. Users try to access Shibboleth’s resources on the Network Service
Provider.
2. Shibboleth will send the request to WAYF.
3. Users choose the providers they want.
4. WAYF forwards the information to check by Handle Service.
5. The system will resend to users in order to authenticate username and
password, and then it will be sent back to Management Services to search

The 7th
National and International Graduate Study Conference 2017 I273
“Thailand 4.0 Creative Innovation for Sustainable Development”
for the accessible resource via Attribute Authority and Authentication
Authority.
6. The process of authentication from the Information Service Provider will
be sent to the Network Service Provider for Assertion Consumer Service
by making session.
7. Users’ attributes will be sent to the Information Service Provider after
verifying the data.
8. The Information Service Provider will send the users’ attributes to the
Network Service Provider.
9. The Network Service Provider will send the attributes and the required
resources back to users.
2. OpenLDAP [6]
Developed from the structure of LDAP (Lightweight Directory Access Protocol),
It was designed for small database that is able to search, read and access the information
efficiently more than general information. Furthermore, it’s high security because
working on Transport Layer Security (TLS).
Fig.2 shows the structure of Directory LDAP, [8] which presents the LDAP
organized by DNS structure that its name is udid=jsmith , unique DN name is
udid=jsmith, ou=People, dc=example, dc=com. The information forms are set in
RFC2253.
Figure 2 the structure of Directory LDAP. [3]
3. Active Directory (AD) [5]
Active Directory is the service for Network Management Resource including the
security system. It is comprised of the information, for example users, groups of users,
computers, domains, organizational units and security policies. Directories will be saved
in Domain Controller (DC) by the system Administrators, users or applications that are
able to enter to the saved information.
The Structure of Active Directory (DC)
The server installing AD is called ‘Domain Controller’. A domain might contain
lots of DCs that could change the database. If it changes, DC will transfer to other DCs
in automatic domain.

The 7th
National and International Graduate Study Conference 2017 I274
“Thailand 4.0 Creative Innovation for Sustainable Development”
AD Schema Object: Keep the important information in network
- Attributes: Object’s Attributes
- Schema: Determinant of each types of objects.
- Containers: Similar to folders in file system. Containers in AD are made up
of
Domains: Scope of Security
Sites: Network connecting by high bandwidth like LAN.
Organizational Units: Containers adding computers and
printer, but not for objects from other domains.
In the Active Directory, there are more parts of the previous Windows 2008,
Active Directory Domain Services (ADDS). They are the roles of working on
Authentication and Authorization by being the center of the Management Resource
System.
Comparisons of Authorization technology
Shibboleth, OpenLDAP and Active Directory’s processes are alike. Theses 3
technologies are just differences in unique to management system, effects, and
supportability in OS according to the table 1.
Table 1 compares the differences in identity verification technology.
Shibboleth LDAP Active Directory
Role
Among the world's
most widely deployed
federated identity
solutions, connecting
users to applications
both within and
between
organizations.
Protocol to access
directory service and
mostly used by
medium to large
organizations.
Database based system
that provides
authentication, directory,
policy, and other services
in a Windows
environment.
Purpose
Extend SSO to
services outside the
University, such as
journal access.
Authentication and
establishment of a
security layer on
which to carry out
subsequent
communication
Allow users to organize
their file systems into a
cohesive and high
performance directory
structure.
operating
system Linux / Windows Linux Windows
Support
for SSO Web SSO only Yes Yes

The 7th
National and International Graduate Study Conference 2017 I275
“Thailand 4.0 Creative Innovation for Sustainable Development”
Shibboleth LDAP Active Directory
levels Enterprise Organization individual
Research Methodology
1. Principle of Computer System Design
The research presents the security devices by simulating the Cloud Computing
that can provide the services on computers. To enter to the system, it was made to one
time access. The intermediary server with Shibboleth’s technology is the manager for
approaching the system that contains the exchange system forwarding user’s
information to the Cloud Computing by using AD security for Windows OS and
OpenLDAP for Linux OS.
2. Specifying the Authentication Mechanism
According to the Research Objectives and the development of Authentication
Mechanism, researchers suggest using Shibboleth’s technology. There are 2 mechanism
sides; those are the Information Service Provider and Network Service Provider by
using LDAP to save the data as Fig.3 System access mechanism.
The Information Service Provider consists of Authentication Engine and Relying
Party Configuration Manager to manage the attributes, screen by Attribute Filter and
verify by Attribute Resolver.
Figure 3 shows system access mechanism.
1. The Exchange System Access Once
According to the Objectives of intermediary development for the different
Authentication in Linux and Windows platforms, the required the exchange system by
accessing once from Shibboleth’s technology in this process, Researchers suggest using

The 7th
National and International Graduate Study Conference 2017 I276
“Thailand 4.0 Creative Innovation for Sustainable Development”
the exchange system that can send the data to Linux and Windows platforms as shown
in Fig.4. The exchange system mechanism is as below:
1. Connect to Windows OS
Connect to Windows OS crossing the platform in this research by
Winbind and Kerberos’s services. Request the information accesses for
checking by AD via Application Proxy,
Figure 4 the exchange system mechanism.
DNS (Domain Name System) is the determination for contacting
with AD.
NTP (Network Time Protocol) is the protocol for Time and OS
comparison.
PAM (Pluggable Authentication Modules) and NSS (Name
Service Switch) are the licenses for accessing the applications by
Kerberos, and using offline.
Winbind is a service for logging into Microsoft Remote
Procedure Call cooperating with PAM and NSS in order to access
domain windows.
Kerberos is AD Authentication Request Service by KDC (Key
Distribution Center) containing AD and setting Kerberos’s scope
for managing by Winbind.
According to the devices and services, users are able to access the
resources after checking that DNS is in the same NTP system. After that, they
can search for username and password from directory. Finally, users can access
the resources in Windows OS without logging into AD system again.

The 7th
National and International Graduate Study Conference 2017 I277
“Thailand 4.0 Creative Innovation for Sustainable Development”
2. Connect to Linux OS
Linux is the same OS with the exchange system hence it can transfer this
session via SAML to authentication by connecting and searching for user’s
information on OpenLDAP. When data found, users are allowed to access
resource.
Authentication on the Cloud Computing
According to the study and development of the Authentication on Cloud
Computing objectives and the exchange system access once objectives, Researchers
designed the Authentication architecture by 3 main servers; those are main systems that
work on Linux by using Shibboleth’s authentication technology set up by the
Information Service Provider and the Network Service Provider. Users are able to
access via application. There is the security system, guaranteed by SSL certificate and
X.509 Certificate. It transfers the information by the exchange system to the other 2 OS,
Linux platform installs the OpenLDAP and Windows platform installs the Active
Directory.
Figure 5 the proposed authentication architecture.
System Testing
This research used technology access once for system development referred to
the SingAREN’s Singapore Access Federation research. Researchers suggest the
concepts and methods to reduce the process of users but users are still able to access the
resource safely. The concepts of research systems are as the Fig.6

The 7th
National and International Graduate Study Conference 2017 I278
“Thailand 4.0 Creative Innovation for Sustainable Development”
Figure 6 the proposed system structure.
1. Logging into system by using Username and Password.
2. Logging into Shibboleth’s Authentication Request for sending Username
and Password to check.
3. After the verification, the information service provider will send the
Response Session back to the network service provider.
4. The network service provider will transfer the Response Session to the
exchange system for choosing OS that users want.
5. After selection, the exchange system will authenticate the Request for
OS.
Windows OS will transfer to verify in Active Directory.
Linux OS will transfer to verify in LDAP.
6. If the information is correct, the Security System will allow to Return
Resource.
7. Users are able to use either Linux or Windows OS.
According to Fig.6, the Structure of System is accessing once by username and
password (in case of not registering, registration is required). This process is to
authenticate by Shibboleth. The process 2 is to search in Directory System and transfer
the session values to the Network Service Providers to save in the process 3 as Fig.6 the
example of session.
Figure 7 example of sessions.
In the process 4 of the exchange system, Users can choose the OS. If the user’s
data isn’t found, the system will register and send the User ID from session back to
users in order to confirm permissions. In case of using Windows OS, it will be checked
in Active Directory, and the Linux OS will verify in LDAP. In the process 5 of Resource

The 7th
National and International Graduate Study Conference 2017 I279
“Thailand 4.0 Creative Innovation for Sustainable Development”
Request, system will send the required resource back to the network service provider in
the process 6 for using by users in the process 7.
Conclusion
This research proposes the role of authentication working on the Cloud
Computing by developing Authentication Mechanism that can access the resources in
Linux and Windows platforms from the exchange system with the access once structure.
In addition, it is able to use across the platforms between Linux and Windows that can
reduce the resource and the users’ process, but it doesn’t reduce the process of safety.
All processes have data encryption for information security and for monitoring each
step. Users have the ability to work on the exchange system only when there are the
different platforms.
References
[1] B. Grobauer, T. Walloschek, and E. Stocker, “Understanding Cloud Computing
Vulnerabilities,” IEEE Security Privacy, vol. 9, No. 2, 2011, pp. 50-57.
[2] C. Powell, T. Aizawa and M. Munetomo. (2014). “Design of an SSO
authentication infrastructure for heterogeneous inter-cloud environments.” 2014
IEEE 3rd International Conference on Cloud Networking (CloudNet), 1 (December).
[3] Craig Ellrod, “LDAP Authentication.” Accessed July 29 January 2015. Available
from https://www.citrix.com/blogs/2010/11/05/load-balancing-ldap-authentication
[4] Internet2®. (n.d.) . “What's Shibboleth?” Accessed July 6, 2016.
Available from https://shibboleth.net/about/ [5] Microsoft. (2017). “Active Directory Domain Services” Microsoft Developer
Network.” Accessed November 15, 2016. Available from http://msdn.microsoft.com/th-
th/library/aa362244(v=vs.85).aspx.
[6] SingAREN. (2016). “Singapore Access Federation.” Singapore Advanced
Research & Education Network. Accessed August 3, 2016. Available from
http://www.singaren.net.sg/SGAF.php
[7] SWITCHaai. (2017). “WAYF Service.” Accessed July 29, 2016. Available from
https://www.switch.ch/aai/support/tools/wayf/
[8] V. Koutsonikola, A. Vakali. “LDAP: framework, practices, and trends.” IEEE
Internet Computing., vol. 8, issue 5, Sept.-Oct. 2004, pp. 66 – 72.
[9] V. Radha, D. Hitha Reddy. “A Survey on Single Sign-On Techniques.” 2nd
International Conference on Computer, Communication, Volume 4, 2012, pp. 134-139.

Title: The investigation of shoppers’ intention in purchasing online global brand.
Author: Miss WarissaraVitoonphun and Keatkhamjorn Meekanon, Ph. D.
Program: M.B.A in International Business Institute: Silpakorn University International
College
Abstract:
The purpose of this research aims to investigate shoppers’ intention in purchasing
online global brand. Qualitative Research Method is designed to examine the 4 major factors
influencing shoppers' intention in purchasing online global brand. In order to reach the
customers' intention in purchasing online global brand, using Qualitative Research Method is
easier than others technique. This method can help webs online shopping understanding how
customers' intention is associated with the 4 major factors: convenience, experience, attitude
and safety.
26 Interview questions are used to question 20 respondents who prefer going online
purchasing global brand and those customers who are interested in global brands online
shopping. This method will help researcher to measure and evaluate the investigation of
shoppers’ intention in purchasing online global brand at the present time and in the future.
Nowadays online global brand is evolving and appearing in human’s life more day by
day. In the past, people used to go to department stores to buy their things, but now Internet
technology designs people's way of lives to be easier. It’s really convenient and mainly useful
for customers. People can communicate to the others by social networking services (SNSs).
It’s basically being as a major part of human's life. Online shopping trends to be an
interactive channel; it presently influences people to spend their time online. One of the most
favorite social networking websites is web shopping. Online shopping and webs shopping
turn to be more popular.
Web shopping seems to be an alternative to the shopping channel for customers to be
online. It is a strategy that online sellers try to make competitive advantages of cost savings
and improve their profit margins. Online sellers are able to supply difference of products for
customer’s decision when they have no inventory pressure like brick-and-mortar stores.That
is the best answer to the question why most of the sellers prefer to sell goods on the internet.
So the internet shopping is a remarkable appliance which is growing forward rapidly. The
exponential growth appears to be the major performer in the industry refers to a large stock of
market potential for e-commerce.
Keywords: Customers' Intention, Online shopping, Global brand, Convenience, Experience,
Attitude. Safety, Trust
The 7th National and International Graduate Study Conference 2017
" Thailand 4.0 Creative Innovation for Sustainable Development "
I280

Introduction:
People's way of life has been changed recently internet plays an important role
influencing their daily lives style. Communication among people in all the regions of the
world is getting more systemically convenient. People can send text message, search
information, go online either shopping or playing games by the usage of the internet.
Web shopping has been participated and accepted extensively as an alternative
channel for consumers to shop online conveniently. Online websites also provide consumers
beneficial information, various choices of product items and price comparison. Additionally,
consumers who have experienced shopping online satisfyingly or unfavorably, influence their
families, friends and the others to shop or avoid shopping on those webs shopping.
Consequently, good or bad shopping online experiences are liable to bring about to
consumers' good or bad attitude. Positive or negative attitude influences on consumers'
intention in purchasing online global brand is significant for web shopping administers' major
consideration.
On the other hand, shopping at the malls or stores is really lost the time. First of all,
driving to the place burns down gasoline. Being caught in traffic is stressful and takes time.
Looking for the space for car parked, walking around searching for a single right item,
standing in a line waiting for scanning bar-quote at the cashier counter is annoying.
Furthermore, in case of the item a shopper bought being under the term of guarantee
or returns, appears to be claimed, he or she has to take that item to the store for returning. The
investigation of shoppers' intention in purchasing online global brand was focused by the
main factors of: convenience, experience, attitude and safety; to explore the influencing on
shoppers' intention. The results indicate that the factors as the above mentioned is mightily
significant influencing shoppers' intention in purchasing online global brand as the model
illustration.
In Thailand, people can go online shopping conveniently. Thai consumers rather
attend to listen to the recommendation from families, relatives, friends or even social media
before making decision. The main drivers of buying decision in developed countries are
concerning of prices, quality and other product-related aspects. But the consideration could
be different from developing countries. Consumers mostly expect to receive useful
information and to browse through online shopping web sites favorably for their purchasing.
The theory of Purchase Intention and Consumer Behavior stimulate people to perform
to what their concentration and how they attempt to achieve their certain behavior. Applying
the theory of planned behavior (TPB) by Orapin (2009), on Thai consumers can be indicated
that the intention to shop online is mostly likely to be effected by perceiving behavioral
control and subjective norm, together with the aggregate of the attitudes from the people
The 7th National and International Graduate Study Conference 2017
" Thailand 4.0 Creative Innovation for Sustainable Development "
I281

surrounding them. Meanwhile, the shopping intention being as a substitute role playing for
purchasing behavior is needed to be explored.
Behavior of shoppers' intention online in Bangkok, Thailand is identified as the following:
1. Shopper characteristics: shopper demographics, convenient, experience, attitude and safety
2. Product characteristics: brands, prices, promotion, free delivery, guarantee and returns
3. Web-shopping characteristics: information quality, services, privacy and security control
4. Web-shopping environment: exposure, market tools, market competition
The research shows that young women regularly go online shopping global brand
products, as it was a dream of purchasing global brand accessory. While, there are various
webs shopping for shoppers to shop. Although the important younger age group may not
purchase many items but they have richer knowledge of luxury brands.
Convenience:
Convenience motivated shoppers' intention in purchasing online global brand as the
advantage that the shoppers are able to spend their time preferably shopping online 24 hours
whenever they would like to shop. Shopping online is exactly, an alternative channel
interactive which influences shoppers who have specific time but in-need to shop certain
things they really want.
Moreover, shopping online global brand is beneficial to who admire brand items such
as hard working people, busy students, housewives and others who have to spend their
daytime hours doing their routine work. Online websites can help them manage their time to
go online shopping after their busy day pleasantly.
Time saving is one of the most productive influencing factors. Being convenience
searching online global brand catalogues and comparing prices are available for shoppers to
save their time shopping, during purchasing. It is also short time taken for delivery the
products or services over webs shopping after making intention purchasing online global
brand.
Experience:
It was identified that most shoppers who have experienced satisfying the webs
shopping and having positive attitude towards the websites, preferably recommended family
and friends to shop on those webs.
Online shopping habit is being as a link between customer satisfaction and
expectation adjustment. As the matter of fact, online shopping experience is being as a
guideline to customer satisfaction. It is confirmed that customer satisfaction is an important
guideline for expectation adjustment and online repurchase intention.
The 7th National and International Graduate Study Conference 2017
" Thailand 4.0 Creative Innovation for Sustainable Development "
I282
Web experience, brand market share and product category are corroborative to affect
the significance of brands online. There is an evidence that brand familiarity and knowledge
dominates directly and positively effects on shoppers' intention, brand familiarity and
knowledge about the brand turning later to the online web shopping which the brand
familiarity influences purchasing. It is liable to imply that those brand familiarity and
knowledge of brand are connected with online channel.
One of the other important research found that familiarity with brand offered online
influenced perception of online shopping, associated with shopping online as well as
intentions to purchase online global brand. It is believed that people who plan to shop brand
items on the web, are more likely to search for product information on the specific web. The
relationship between web-searching and web-shopping intentions are connected to be
dominant shoppers on exploring through the list of products category.
Attitude:
Website design is showed to be one of the important attitude factor motivate shoppers'
intention in purchasing online global brand. The website design features of the brand webs
shopping are likely important to influence shoppers' intention. Website design leads shoppers
to feel satisfaction or dissatisfaction with a specific brand web shopping.
Some web shopping provides an option that invites customers to recommend a
product to a friend. Encouraging recommendation is brought into social networks and
emulating the social nature of fashion choices, later there may be a recommend from a friend
option by sending a friend's contact details to the other friend, when the friend makes a
purchase the recommender would receive a bonus plus credit.
The answer to the interview questions identified that shoppers are interesting in the
images of the online products. However, they are also pleased with the chances to view figure
of perspective separately, and display with cooperative items included. Various stage models
for the establishment of an Internet emerging for global brand webs shopping page design
have been offered to controlled shoppers' intention with a view to online connection and
global brand type.
Promotion offering has been affected to boost sales volume, customers' intention
become higher with those promotional offers. As the matter of fact, intention on purchasing
has been influenced customers' attitude during the period of making decision.
Loyalty project are operated influencing customers' attitude. Benefits of membership
of bonus include discount mailing, bonus day events, monthly price draws, website
promotion, exclusive offer, encourage shoppers' attitude to be satisfaction. Online
information is provided on those cards for customers, the card can be used for purchasing
where appropriate. However, these services are promoted to convince customers to be a part
of the brand community.
With the reference to the psychological and behavioral drivers of shoppers' intention
in purchasing online global brand, there is an explanation that being an adventurous online
The 7th National and International Graduate Study Conference 2017
" Thailand 4.0 Creative Innovation for Sustainable Development "
I283
shoppers and heavy catalogue shoppers, obtained the most productive on online global brand
intention.
Safety:
Fulfillment privacy, personal information security, responsiveness and contact are
significant determinants for safety in online webs shopping. This finding supports that one of
the most important aspect of the service quality of the global brand webs shopping
experience, is the product safety delivery by the webs.
The web site-related determinants of safety including privacy, security, trade route,
presentation, order fulfillment is indicated as an acceptance to perceive website quality,
significantly influences customer trust online webs shopping.
The customer determinants of trust include familiarity with the trustable website
online, online shopping experience, and entertainment or chat experience are described as a
value of webs shopping. Service quality is commonly defined as how good a delivered
service level matches customer expectation.
A lack of safety prevents shoppers from engaging in online shopping, they are
unlikely to choose the web-shopping that fail to bring a trustworthiness. Mainly, they feel to
lose the safety they trust initially. Online shopping is beneficial to effectiveness shopping
performance shoppers will eventually visit the webs and believe in those useful online
shopping.
Privacy is positively related to safety. Privacy refers to the degree of which the online
shopping web sites, is safe and protects the customers' information. The primary reason why
most shoppers, hesitates to shop online or to provide their personal information to unsafe
online web shopping.
Trend of online shopping involved the online payment, online transactions enhance
the use of credit card or debit card. The opportunity of online payment provide a facility to
recognize the legal of user and keeps the fraudulent machines away from the system by
saving during the payment OTP (One Time Password) will be generated and sent to user's
mobile number to be confirmed that user has provided the correct OTP. This is to prevent the
phishing attacks using user machine identification. It is convenience and safety for shoppers
to shop online global brand.
Objectives:
1. To study customer intention in purchasing online global brand.
2. To study what factor affects customer intention in purchasing online global brand.
The 7th National and International Graduate Study Conference 2017
" Thailand 4.0 Creative Innovation for Sustainable Development "
I284

Research Methodology:
To gain higher reliability understanding of shoppers' intention in purchasing online
global brand, qualitative method is used to collect data analysis. The 26 interview questions
were provided to inquire 20 participants were totally consistent with sample identified in the
research design. The population targeted in this research was people living in Bangkok who
have experienced in purchasing online global brand. Besides, these respondents were
classified from variety group such as high school students, university students, students in
higher education and working people.
In depth interview by 26 interview questions were rationally practiced to interview 20
respondents separated into 2 groups. First group of respondents was a group of students who
were studying in high schools, colleges, universities and the students in higher education. The
second group was a group of shoppers who were shopping during interviewing at the top
shopping malls and universities.
26 Preparation questions were designed and applied directly to be as the interview
issues, 2 sections were divided: Section 1composed of demographic information about gender
and age: Section 2 composed of 4 significant factors: convenient, experience, attitude and
safety linking to the objective of this research with the aim to approach the intention of
respondents toward shoppers' intention in purchasing online global brand.
In order to gain higher reliability understanding of shoppers' intention in purchasing
online global brand, 20 Participants in Bangkok are assorted to conduct focus group interview
answering the questions about their experiences and their attitudes of purchasing online
global brand, questioning about their feeling of convenience and the safety they have when
they intent to purchase online global brand. During the interview, the interviewer kept
investigating the responses by questioning for further cooperation.
The investigation was organized in Bangkok because focusing group of respondents
mainly lived in Bangkok. Moreover, there are many attractive shopping malls located in the
central of Bangkok. A lot of most popular shopping malls at Siam Square where top global
brand items are presented there motivate the shoppers' interest to shop. Those shopping malls
are included; Central World, Siam Discovery, Siam Paragon and Siam Square One. Doing the
investigation with the target sample above mentioned would provide higher reliability
understandings and the better effectiveness results for the research.
While interviewing all the answers, were wrote in paper note and then they were built
in Microsoft Word Program. It took about half an hour to one hour to interview each
respondent. Respondents were separated into 2 groups. First group of respondents were in the
university areas. The second group of respondents was shopping in the shopping mall such as
Siam Paragon or Central Department Store.
The 7th National and International Graduate Study Conference 2017
" Thailand 4.0 Creative Innovation for Sustainable Development "
I285
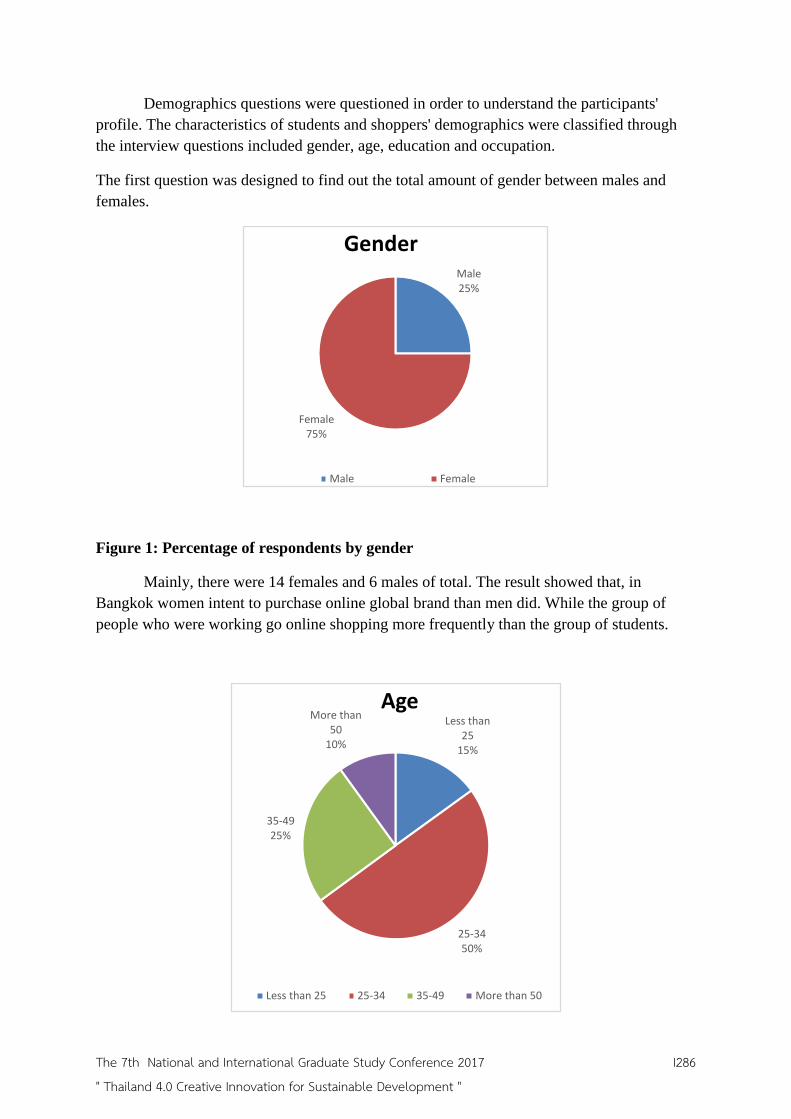
Demographics questions were questioned in order to understand the participants'
profile. The characteristics of students and shoppers' demographics were classified through
the interview questions included gender, age, education and occupation.
The first question was designed to find out the total amount of gender between males and
females.
Figure 1: Percentage of respondents by gender
Mainly, there were 14 females and 6 males of total. The result showed that, in
Bangkok women intent to purchase online global brand than men did. While the group of
people who were working go online shopping more frequently than the group of students.
Male25%
Female75%
Gender
Male Female
Less than 25
15%
25-3450%
35-4925%
More than 50
10%
Age
Less than 25 25-34 35-49 More than 50
The 7th National and International Graduate Study Conference 2017
" Thailand 4.0 Creative Innovation for Sustainable Development "
I286

Figure 2: Percentage of respondents by age
4 Categories of age: A. less than 25 years old, B. from 25 - 34 years old, C. from 35 -
49 years old, D. 50 years old and above. The sample was mainly from 25-34 years old and
35-49 years old
The result displays that the group of shoppers who are 25 to 34 years old and 35 to 49
years old are apparently, tend to purchase online global brand than the older and the younger
groups. It is probably that most people who are aged 25 -34 and 35 - 49 probably obtain job
stability with higher income. Certainly, they access their own mobile phones, laptops or
personal computers. They would have better knowledge to be able to associate with the social
connection and know how to shop online.
Figure 3: Percentage of respondents by education
With the reference to Figure 3 is assumed that the higher education levelis the higher
tendency in purchasing online global brand. The reason probably is those people are
educated. They are able to associate with social networking websites. Shopping online is
convenience and time saving for them. Besides, their higher education is likely to make them
earn more money to spend for purchasing online global brand.
College/University
55%
Postgraduate
45%
Education Level
College/University Postgraduate
The 7th National and International Graduate Study Conference 2017
" Thailand 4.0 Creative Innovation for Sustainable Development "
I287

Figure 4: Percentage of respondents by occupation
Figure 4.shows that working people group share the largest of occupation 65% while
students group account for 35% in purchasing online global brand. It is found that those
people who obtain job stability and earn more income would have enough financial condition
to purchase online global brand.
Result and Conclusion:
It is concluded that shoppers who have had previous online purchasing global brand
experiences may feel more confident to purchase the items on those webs shopping which
they experienced. It is also possible that information quality, such as how description the
information is or how easy the detail can be read, could be more important for webs shopping
to be considered.
The different several of information on the shopping websites may not be perceived,
as shoppers may not consider carefully the product information. That is because the
experiment is not an actual purchase situation.
The findings of this study can be defined that the amount of information available on
a web site may not be exactly important determinant for shoppers' intention in purchasing
online global brand. Brand familiarity could be used as internal information for shoppers'
intention in purchasing online global brand.
Thai people, especially in Bangkok, Thailand can always go online shopping in
anytime and anywhere whenever they prefer to do. Visiting webs shopping as frequently as
every day or even several times a day is possible for them.
As the matter of fact, most shops and shopping malls in Bangkok, are closed 2 or 3
hours before midnight while some consumers are busy working during the time mentioned.
Students35%
Working people
65%
Occupation
Students Working people
The 7th National and International Graduate Study Conference 2017
" Thailand 4.0 Creative Innovation for Sustainable Development "
I288

They can shop online after their working hours since the webs shopping offer consumers the
opportunity of direct interaction to the online shopping.Therefore, consumers is possible
interested how convenience shopping online is.
Apart from the reason mentioned about factors influencing shoppers' intention in
purchasing online global brands, the result also identifies that convenience, experiences,
attitude and safety, the main factors investigated by this research, was important. The
researcher also considered the important and obvious possibility influencing shoppers'
intention among the target group and the general public in Bangkok, Thailand.
The results of the investigation of shoppers' intention in purchasing online global
brand in Bangkok, Thailand, tends to be highly influenced by the factors of convenience,
experiences, attitude and safety.
The connection between purchasing intention and online shopping behavior showed
the strongest relationship. The result implied that university students' intention in purchasing
online global brand was influenced by perception of the families, friends and media.
The researcher believes that the majority of potential shopping websites in Bangkok,
Thailand, are suitable at the stage of investigating the actions of the others' intention in
purchasing online global brand in other cities in Thailand.
As the result shows that consumers who have not experienced with the unknown webs
shopping, are more likely to reject those websites, for the reason that consumers intend to
avoid of the security risk involved the unfamiliar web-shopping transactions.
Discussion:
This study is limited by several factors that need to be addressed in any further
research. First, probability sampling methods could be used in consideration. The sample
manipulated was composed of technically higher educated and graduated students which
although appropriate for this study, but it may not be the population-wide representative,
consequently limited summarizing would be defined.
Further studies should identify additional variables and include those variables in to
the model in order to produce a better description of the processes, leading to shoppers'
intention in purchasing online global brand. The agreement between online shoppers and the
relationship towards the intention to shop online global brand in this study was not indicated.
To evaluate shoppers' intention in purchasing online global band, a larger sample size
is desirable. Future research needs to focus on a larger cross section of shoppers' intention
and more diversified random samples to verify the findings of the current study to further
studies clarity of the factors influence on intention toward online shopping, other behavioral
model could be used and larger sample sizes, sample areas for the purpose should be
reconsidered for more accurate findings.
The 7th National and International Graduate Study Conference 2017
" Thailand 4.0 Creative Innovation for Sustainable Development "
I289

Analyzing the factors: convenience, experience, attitude, safety, influenced shoppers'
intention in purchasing online global brand is important to clarify the scientific approach to
shopping online. To understand online shopping as individual's actions are limited relatively
to intention in purchasing online. Focusing on aspects influenced consumers behavior is
identified the relationship between intention in purchasing online and the factors affecting the
intention.
Initially, customers' decision to go online shopping, starts with their need awareness,
information searching, alternative assessment, considering purchasing the items, and
following by post-purchasing behavior. When customers have enough information about the
products, they will need to compare those choices of products or services. They might search
for the product reviews or customer comments. Attractive design is important images to
persuade customers to be interested in buying product and services.
Well-organized web site structure and the attractive design are important to persuade
consumers to be interested in order to influence their attentions. A consumer would be more
likely to engage in web-shopping activities when he or she is satisfied with the web-shopping
experience. In consideration the effect of past web-shopping experience, however, the overall
consumer satisfaction with past web-shopping experiences was not considered in this study.
According to the model actively educates consumers obviously to improve frequency
of use and the knowledge gained, it will then in turn affect attitude formation. To
Investigation the way to realize consumer acceptance of web-shopping as showed in the
results that web-search behavior significantly mediate the relationship between web-shopping
attitude and web-shopping intentions is consistent with previous finding. The methods linking
web-shopping attitude to shopping intentions being actually interconnected, are not
considered in this study.
In term of worrying about safety and privacy and the perceived importance of safety
issues, the respondents are similar to the respondents in other studies. But right now
customers quite believe in safety more than in the past because now in online global brand
they have stronger security so respondents quite feel more secure with online global brand
more than in the past.
Truly, safely and privacy problems have long been similarly explored in the contexts
by many authors also suggest that perceived risk is an influencing factor which opposes
consumers in proceeding to adoption decisions. It is found that privacy refers to the degree to
which the online global brand websites is safe and protects consumers' information.
Recommendation:
Since transition into a global interconnection networking share and deliver
information, webs shopping have emerged as a useful marketing tool to serve consumers to
shop online conveniently.
To perceive a convenient way to explore and shop online at anytime and anywhere,
consumers are able to search products they want to buy and compare prices while they are
The 7th National and International Graduate Study Conference 2017
" Thailand 4.0 Creative Innovation for Sustainable Development "
I290

going online easily. Attractive webs shopping for brand styles should be designed to
influence the brand shoppers. Competitive prices and promotion offering are as the most
important for brand name clothing and accessories purchasing.
Shoppers' intention in purchasing online global brand changed the world of selling
and buying brand products. Trend of online shopping involved the online payment, online
transactions enhance the use of credit cards or debit cards, should likely be more convenience
and safety for shoppers.
To investigate the access through the customer's bank account for online payment
transfer was found that shoppers are secure with the procedure. Communicated through SMS
needed to be confidential using OTP (One Time Password), is provided the highest level of
safety for customers.
Suggestion to further studies as related to the investigation of shoppers' intention in
purchasing online global brand, researcher believes that there are some more significant
interview questions that suitable for further exploration, and a bigger size of respondents
sample should be considered and developed methodically to understand clearly the intention
in purchasing online global brand in the future.
Finally, researcher expects that these findings may benefit to other additional research
related "shoppers' intention on purchasing online global brand."
References:
Aghdaoe, S.F., Piraman, A., Fathi, S., (2011). “An Analysis of Factors Affecting the
Consumer’s Attitude of Trust and their Impact on Internet Purchasing Behavior”
International Journal of Business and Social Science, 147-158.
Ajzen, I. (1985),” Form intentions to actions: a theory of planned behavior”, in Kuhl, J. and
Beckmann, J, (Eds), Action-control: From Cognition to Behavior, Springer, Heidelberg, pp.
22-39.
Ajzen, I. (1988), Attitudes, Personality and Behavior, Dorsey Press,Chicago, II.
Ajzen, I. and Fishbein, M (1980), Understanding Attitudes and PredictingSocial Behavior,
Prentice-Hall, Englewood Cliffs, NJ
Ajzen, I. and Madden, T.J. (1986), “Prediction of goal-directed behavior: attitudes,
intentions, and perceived behavioral control”, Journal of Experimental Social Psychology,
Vol.22, pp. 453-74.
The 7th National and International Graduate Study Conference 2017
" Thailand 4.0 Creative Innovation for Sustainable Development "
I291

Cao, M., Zhabg, Q. and Seydel, J (2005), ” B2C e-commerce web site quality: and empirical
examination”, Industrial Management & Data Systems Vol. 105 No. 5, pp. 645-61
Dabholkar, P. (1994), “Incorporating choice into an attitudinal framework: analyzing models
of mental comparison processes”, Journal of Consumer Research, Vol. 21 No. 1, pp. 100-18
Degeratu, A., Rangaswamy. A. and Wu, J. (2000), “Consumer choice behavior in online and
traditional supermarkets: the effects of brandname, price, and other search attributes”,
International Journal of Research in Marketing Vol. 17, pp. 55-78”
Diallo, M.F., Chandon, J.-L., Cliquet, G., Philippe, J.,( 2013).” Factors influencing Consumer
Behavior towards Store Brands: Evidence from the French Market”. International Journal of
Retail & Distribution Management, 41(6), 422-441.
East, R. (1997), “Attitude, beliefs, intentions and behavior”, Consumer Behavior: Advances
and Applications in Marketing, Prentice-Hall, London, pp. 109-32.
Eroglu, S.A., Machleit, K.A and Davis, L.M. (2001), “Atmospheric qualities of online
retailing – a conceptual model and implications”, Journal of Business Research, Vol.54, pp.
177-84.
Fishbein, M. and Ajzen, I. (1975), “Belief, Attitude, Intention, and Behavior”: An
Introduction to Theory and Research, Addison-Wesley, Reading, MA.
Gong, W., Stump, R.L., Maddox, L.M., (2013), “Factors influencing consumers’ online
shopping in China.” Journal of Asia Business Studies, 7(3), 214-230
Hu, Y., Sun, X., Jing, Z., Zhang, X., Luo, F., Huang, L., (2009). “A University Student
Behavioral Intention Model of Online Shopping Based on TAM”. International Conference
on Information Management, Innovation Management and Industrial Engineering pp. 625-
628. IEEE Computer Society.
Huang, M.H. (2000), “Information load: its relationship to online exploratory and shopping
behavior”, International Journal of Information Management, Vol. 20, pp. 337-47.
Jamil, N. A., Mat, N. K., (2011), “To Investigate The Drivers of Online Purchasing
Behavioral In Malaysia Based on the Theory of Planned Behavior (TPB): A Structural
The 7th National and International Graduate Study Conference 2017
" Thailand 4.0 Creative Innovation for Sustainable Development "
I292
Equation Modeling (SEM) Approach”, International Conference On Management, pp. 453-
460
Jiang, J.C., Chen, C. A., Wang, C. C.,(2008),” Knowledge and Trust in E-Consumers’ Online
Shopping Behavior”. International Symposium on electronic Commerce and Security pp.
652-656, IEEE Computer Society.
Kim, S., Jones, C., (2009), “ Online Shopping and Moderating Role of Offline Brand Trust ”
Journal of Direct Marketing., pp. 282-300
Kindel, T.L (1983). “A partial theory of Chinese consumer behavior: marketing strategy
implications”, Hong Kong Journal of Business Management, Vol.1 p.105.
Lai, E., Wang, Z., (2012), “An Empirical Research on Factors Affecting Customer
Purchasing Behavior Tendency During Online Shopping” Institute of Electrical and
Electronics Engineers, pp. 583-586
Leeraphong, A., Mardko, A, (2013, November), “Trust and Risk in Purchase Intention
through Online Social Network: A Focus Group Study of Facebook in Thailand”. Journal of
Economics, Business and Management, 1(4), 314-316
Liao, Z. and Cheung, M.T. (2000), “Internet-based e-shopping and consumer attitudes: an
empirical study”, Information & Management, Vol. 38, pp. 299-306
Limayem, M., Khalifa, M. and Frini, A. (2000), “What makes consumers buy from the
internet? A longitudinal study of online shopping”, IEEE Transactions on Systems, Man and
Cybernetics, Vol. 30 No. 4, pp. 421-32.
Mathwick, C., Malhotra, N.K. and Rigdon, E. (2002), “The effect of dynamic retail
experiences on experiential perceptions of value: an internet and catalogue comparison”,
Journal of Retailing, Vol. 78, pp. 51-60
Menon, S. and Kahn, B. (2000), “Cross-category effects of induced arousal and pleasure on
the internet shopping experience”, Journal of Retailing, Vol. 78, pp. 31-40.
The 7th National and International Graduate Study Conference 2017
" Thailand 4.0 Creative Innovation for Sustainable Development "
I293

O’Cass, A and Fenech, T. (2002), “Web retailing adoption: exploring the nature of internet
users web retailing behavior”, Journal of Retailing and Consumer Services, uncorrected proof
available online 22 January 2002.
Oliver, R.L. (1997), Satisfaction: A behavioral Perspective on the Consumer, McGraw-Hill,
Boston, MA.
Peter, J. and Olson, J.C. (2002), Consumer Behavior and Marketing Strategy, Irwin McGraw-
Hill, Boston, MA.
Ranganathan, C. and Ganapathy, S.(2002), “Key dimensions of business-to- consumer web
sites”, Information & Management, Vol. 39 pp. 457-65
Salisburym, W.D., Pearson, R.A., Pearson, A.W. and Miller, D.W. (2000),”Perceived
security and world wide web purchase intention”, Industrial Management & Data
Systems, Vol. 101 No. 4, pp. 165-76
Shih, D., Chiang, H., Chan, C. and Lin, B. (2004), “Internet security: malicious e-mails
detection and protection”, Industrial Management and Data Systems, Vol. 104 No. 7, pp.
613-23
Shim, S., Eastlick, M.A. Lotz, S.L. and Warrington, P. (2001), “An online pre-purchase
intentions models: the role of intention to search”, Journal of Retailing. Vol. 77, pp. 397-416.
So, W.C. and Sculli, D. (2002), “The role of trust, quality, value and risk in conduction e-
business”, Industrial Management & Data Systems, Vol. 102 No. 9, pp. 503-12.
Zanna, M. and Rempel, J.K. (1988), “Attitudes: a new look at an old concept”, in Bar-Tal, D.
and Kruglanski, A.W (Eds), The Social Psychology of Knowledge, Cambridge University,
Cambridge, pp. 315-34
The 7th National and International Graduate Study Conference 2017
" Thailand 4.0 Creative Innovation for Sustainable Development "
I294

THE IMPACTS OF TRADITIONS AND CUSTOMS ON VIOLIN
TEACHING AND LEARNING
Abstract
The purpose of the study is to understand the Myanmar Traditions and
Customs how impacts on violin teaching and learning and to know positive and
negative impacts of Myanmar traditions and customs on violin teaching and learning.
This study used qualitative method, research interview and observation participated by
10 violin teachers and 15 violin students
Keywords: Myanmar Traditions and Customs/ Impacts/ Violin teaching and learning/
Positive and Negative impacts/ Violin teachers and students / Interview and
observation.
Introduction
Traditions and customs derived from the past to present and it is important
to every nation and human society. The families of structure and foundation of habits,
behaviors, manners and daily practices are affected by the traditions and customs and
they keep practicing and belief those of the elders and the ancestor of doctrine.
Traditions and customs passed from one generation to generation orally (“Common
usage, Customs, Tradition and Convention,”.n.d.). Between the traditions and customs
difference is - traditions which is long established practice from the past time to until
now and the people still keep doing as the same manners, behaviors, habits. It mostly
refers to wider arrange of scale, culture norms and the practice passed through the over
a history and derived from the ancestor or the old generation to new generation.
The 7th National and International Graduate Study Conference 2017
" Thailand 4.0 Creative Innovation for Sustainable Development "
I295

Customs is a kind of social norms which is the manners or behaviors are accepted by
groups or society (Trammell, 2015). Tradition is a kind of long study and customs that
can happen according to the circumstance but those customs happen many times and
again and again as long practice, it will become a tradition too.
Traditions are behaviors and actions that man engage again and again
(Mckay, Brett and Kate, 2013). Likewise, Customs and culture are also similar
tradition. Tradition, customs, culture and human’ living lifestyles, connected to life
and interrelation and depend on each other. There are affected and influence things for
human society too. Then those things will form people of morality, religion,
knowledge, habits, talk, dressing and living ways. According to the tradition and
customs, each of the different human societies will reflexed the different way of living
life style, greeting, eating and communication, teaching and learning also.
Most Burmese beliefs in Buddhist and their life style is the reflection of
Buddhism teaching way. Therefore they live their life very simple and honestly.
Moreover Burmese are very friendly and outgoing people and mostly they treat each
other nicely and more concern about their manner and behavior to act as good figure
in public. At the first meeting with other people, they used to act by good greeting
instead of judging, critic, bad talking, or showing bad emotion or aggression. Because
of they care about themselves, and other people feeling. They don’t want to make
them feel bad and their looks bad toward other people. Burmese of natural mind are a
heritage in eastern tradition and culture or according to the Myanmar tradition and
culture. Burmese characteristics are collectivists and individualists also. Burmese
society relationship accepts the power relations which constructed in all organizations
and levels in all Myanmar society. Power relationships mean giving respect the
seniority, rank, age, birth, position or achievement. Moreover, Burmese have the
feminine qualities which are politeness, caring other feeling, quietness, shyness.
According to these kinds of attitudes and manners can make the positive and negative
effects on musicianship and teaching and learning process.
Music education in Myanmar, since earliest, we did not have music
schools, universities or conservatories. Students want to learn music must go to their
The 7th National and International Graduate Study Conference 2017
" Thailand 4.0 Creative Innovation for Sustainable Development "
I296

teacher’s residence for private lessons. According to the past Myanmar traditional
custom, the children are supposed to give a lot of respect to teachers and could not
have chance to ask questions. Therefore the student’s critical thinking is shallow.
Those kinds of situations are an obstacle for student thinking and the quality of
learning. Nowadays, people become more educated and revolt form the old custom.
That is why education system is getting better. Prominently in 1900’s, the State School
of Dance, Drama and Music and University of Culture were opened in Yangon and
Mandalay which offer music lesson. For admission, the school and the university only
accepted the students who are 14 to 18 years old. For applicants, after they passed the
middle school level, then they can apply for the school. Even now, Generally Primary
School, Secondary School and High School do not have yet a music program and the
only music activity in the school is singing of the national anthem song every day.
In Myanmar, ideas about music are changing. Many music schools are
establishing, music and art activities are developing. After ending of military
dictatorship, it is more obvious in Myanmar and here people of the show interests in
music. They are willing to learn the music and perform, and love to watch concert.
Such as the situation, we can see the people who know the music taste and is
becoming an obsession for that According to this situation it is a good time and
opportunity to develop of music. Although Burmese’ tradition, customs of manner and
behaviors could be the obstacle when they study in music. The student will not be able
to perform emotionally when they feel shy. In the classroom, the students and teacher
relation will get affected by giving respect. It will limit the student mind of creativity
and critical thinking. If the students do not have the self – helping mind, in self –
learning is the weak part of the student.
Culture, tradition and customs refine the national identity and the country.
In Myanmar, according to the traditions and customs, the people have the character
like polite, simplicity, honesty, shy, frank, respecting to elders, hospitality, and
friendly and brave, self-esteem, low self-esteem, and self-confidence or fear. Those
characteristics, behavior, manner and thinking are coming from their initial
experiences. Communication and interrelationship between the children, their parents,
teachers and environment’ reflect to their children’ characters, habits, behaviors and
The 7th National and International Graduate Study Conference 2017
" Thailand 4.0 Creative Innovation for Sustainable Development "
I297

manners. For instance, if parents care for their children and serve everything instead of
children do for their own, those children will be less with self-sufficient and in
education, the children effort less for self-study. In Myanmar most of the parents care
for their children intensively and the foundation, Myanmar family base on love,
respects, responsibilities and this is not consideration from religious creed ( “My
family and perception,” .n.d.). Actually, Parents should teach their children how to
serve themselves instead of they do for their children.
Some of the Myanmar people think of showing their emotions in public
and used to behave with temperance. They hide their thought, emotion and feeling
(Hays, 2008). These characters, manner and thought could make good and bad effects
in music learning. Sometimes it will turn to have habits like shy, afraid or fear in
person and for the shy student, the symptom will show as ignorance and avoid ask the
question, against other people of idea and they are express less by them and will
follow easily by other. It seems to be less confidence to other as well. Moreover,
student may think teacher is always right. This situation can make the students’ critical
thinking to lose. Then, most of the young people, they still rely on their parents until
their adult age or more. Relying on other too much which manner can be the lack of
self-reliance. In communication with each other, the manner of temperance will make
the difficulties of showing body languages.
Objective of the Study
1) To examine the actual impacts of Myanmar traditions and customs on
the success and failure of violin teaching and learning
2) To outline general music studies requirements
Research Methodology
The topic of this study is “The impacts of Myanmar traditions and customs
on the violin teaching and learning”. In this investigation, 10 selected violin teachers
and 15 selected violin students would be interviewed and observed. The methodology
The 7th National and International Graduate Study Conference 2017
" Thailand 4.0 Creative Innovation for Sustainable Development "
I298

consists of Qualitative research because focuses on individuals’ experiences in
teaching and learning. Qualitative research method can explore the each participant of
violin teaching and learning experiences, their background story and moreover by
addition with the researcher of consideration and perspective for analysis. The purpose
of the research is to inquire how certain aspects of Myanmar traditions and customs
influence violin instruction, while taking place in their native environment. The
aspects considered are: beliefs, practice of traditional rules and disciplines, habits,
norms, behaviors, social attitudes, characteristics, generation to generation verbal
instruction (in the absence of written instruction), obedience and other possible
features of culture. This research is done in terms of Descriptive Analysis. The steps of
this method are:
1) Selecting of participants
2) Data collection technique and Research tools
3) Data analysis
Results and Conclusion
This research analyzing results came from questions and answers
interviewing and classroom observations with violin teachers and students under the
main objectives study 1) to examine the actual impacts of Myanmar traditions and
customs on the success and failure of violin teaching and learning and 2) to outline the
general music studies requirements. Under the question of 1) “the actual impacts of
Myanmar traditions and customs on success and failure of violin teaching and
learning” will explain by following eight topics which are:
1) The Actual Impacts of Myanmar Traditions and Customs on Success and Failure of
Violin Teaching and Learning
1.1) General Characteristics of Teachers and Students
The 7th National and International Graduate Study Conference 2017
" Thailand 4.0 Creative Innovation for Sustainable Development "
I299

1.2) Myanmar Traditions and Customs that become an Issue of Teaching and Learning
of violin, Evolution and Resolving the Problems
1.3) Students’ Likes and Appreciation of Violin Class and Teachers
1.4) In Teaching, Learning, and Playing Styles, about Young Students how they
diverge from long- established Myanmar Tradition and Customs and the Value of
Western Music
1.5) Value of Western Music Learning Impacts and Expectation
1.6) Expectation and Recognizing Achievement in Teaching and Learning
1.7) Music Resources and Teaching and Learning styles
1.8) Personal or Social Constrains to Violin Teaching and Learning Process
For the question of 2) “to outline the general music studies requirements” will explain
by following topics:
2) The Outline of General Music Studies Requirements
Now I will focus to present about three topics;
1) General Characteristics of Teachers and Students
2) Myanmar Traditions and Customs that become an Issue of Teaching and Learning
of violin, Evolution and Resolving the Problems
3) The outline of general music studies requirements
1. General Characteristic of Teachers and Students
Interview with teachers
Students in Myanmar are observed to have some general characteristics.
The traits tend to be those of innocence, respect, honesty, purity of thought and
sensitivity. They commonly enjoy helping their peers and treat each other well, and
are often seen to be sensitive to any negative feedback from others. This can
The 7th National and International Graduate Study Conference 2017
" Thailand 4.0 Creative Innovation for Sustainable Development "
I300

sometimes lead to sadness and suffering. Their innocent conscientiousness is also seen
in their respect for elders and teachers. Generally, their communication with them is
polite and they adopt their teachers’ doctrines and practices and think in the ways that
are suggested to them.
“At 18 and over ages, it does not seem as child but they are still innocent
that I think. According to our country of old and young people of relationship culture,
most of the students treat their every elder one very politely. For teacher, they give
respect as a special one for them and used to obey what their teacher said and doctrine.
Sometimes, I afraid it would make their thinking process to be narrow and contract
because they follow their teacher and less of their own decision and thinking to do
anything. That’s why, I am trying to make the teacher and student relationship in open
type and let the students to talk out their idea in any case. Give the permission to do as
the way of their thinking and I said if you think it is good, do it by your own decision.”
(Violin teacher, Male, Aged 39, 10 years of teaching violin)
Moreover, students tend toward honesty, and exhibit a positive social
character which contributes to a good relationship between teacher and students, and
their emotional sensitivity makes some of them predisposed toward shyness and low
self-esteem. When they making music with violin, at first, they need to know the
feeling how they feel and understand on music piece and should show their feeling
according their felt by produce the violin sound and body and face features. That is
really needs to be a good violinist, soloist and musician. So, every teacher and student
needs that ability in making music and normal living life style as well. People of
passion will make the life more alive and exciting. Life is going to be more interested.
“When the people shy to express themselves, I think it will be disturbing
in music. In music making, It will be better if the players can do by heartily and show
their feeling according to music how its make them,. Music will alive differently by
each person of own feeling and style because everyone has different traits and identity.
So I want my students to show their feeling and body movement as well in playing
music with violin. I do not want they have the behaviors and feeling like, shy, afraid,
The 7th National and International Graduate Study Conference 2017
" Thailand 4.0 Creative Innovation for Sustainable Development "
I301

contract minded when they playing violin and making music.” (Violin teacher,
Female, Aged 37, 8 years of teaching violin)
Myanmar students like encouragement from others. Encouragement can
inspire them to try even harder to please and to do things correctly. They do not like
strong judgments, critics and harsh conversation and it is easy to make them
depressed. According to their traditional doctrines, children were thought their
knowledge and ability by their own experience is less and they have to learn from their
elders, parents and teachers. To believe and know the children ability well by
themselves, a few parents do only. Most of the children were not taught to know their
instinct by themselves and the parents used to give the way what they want children to
do. That is the reason the children should not have the chance to know what are they
good at to do excellent which kind of emphasize by their talent. So, some of the
students came to school without their desire and they were less interest. Anyway,
teachers try to teach those students to enjoy the music and hope that they will be good
violinist.
“Some of the students don’t show interest and play violin well because
they came to school to fill the desire of parents. For those students, I try to make them
to enjoy the violin class and lesson. I am not strict and demand the students in teaching
and learning. I talk with them about funny things and famous musicians. I teach the
good easy melody and after all many students become interested in music and violin
playing. I believe everyone can be a good violinist and musician. Therefore, I cherish
them not to give up on violin playing” (Violin teacher, Male, Aged 45, 12 years of
teaching violin)
Interview with students
Students said most of our classmate has lots of characteristic if they say
details but generally, they are funny, friendly, helpful, respect, polite but sometimes a
bit rude, shy, contract mind and chill out and calm, then lazy as well. Anyway,
students said that they love their friends and that is one of the reasons to come to
The 7th National and International Graduate Study Conference 2017
" Thailand 4.0 Creative Innovation for Sustainable Development "
I302

school every day. Respect and polite characters build up the friendship and helping
each other then can solve the problems easily. For instance, when some students don’t
understand the lessons, other student explains as helping and sharing. They do not take
a pride like a teacher.
“We are helping each other and so friendly. Sometimes we have mocking
each other but rarely to have big problem. We do lesson together, playing violin,
music theory and music history and after all at taking rest time, we are talking or
discussing about our future plan, ambitious, knowledge and other funny things like
movie and television series. I love the violin class, my friends and teachers” (Violin
student, Female, aged 19, 3 years of studying violin)
Some students are shy to express by themselves to show their feeling. It is
good in some case but not for every cases. To know each other well, we have to
understand the other mind what kind of person they are and how they feel it in any
cases. So, our friend should build up the relationship in open type. If we feel friendly
to each other, those shiny men will not control too much to show their feeling.
Moreover, if this kind of good behavior will active in man, that will support and affect
in violin playing and music making. They will feel more comfort and confidence to do
the performance in public. Then some students have the feeling of fear and contract
mind. Those kinds of characters are disturbing in violin playing to express the feeling
and communication with people as well. They cannot mix easily with other people and
it takes longer time to build friendship with their classmates. Good friendship can rise
up self-confidence and encourage them.
“I feel so shy at first when I started study in violin playing in the class
room and to play in front of my teachers my homework revision and friends to show
my playing skills. After all along, I am so closed to my friends and being friendly with
them. Then some of changes became in my mind and the mind state situation engaged
me more free, less caring, calm and confidence. After those experiences when and
wherever I perform alone in public, I am trying to think like all of the people who
listen to me are my friends and my performance is not taking the exam and just
entertain to my friends. After all, I know well those kind of thinking process is make
The 7th National and International Graduate Study Conference 2017
" Thailand 4.0 Creative Innovation for Sustainable Development "
I303

me feel good and my performance going through well very much” (Violin student,
Male, Aged 21, 5 years of studying violin)
“If I say about my friends, they like them. I would like to play with them
not only music but also other kinds of many playing games as well. I am okay with all
of my friends. But sometimes it rarely happened, I need to patience and clam to
communicate when my friend gets angry about some mistakes or did something
wrong. I have a kind of patience characteristic and do not like to anger. I think those
traits will help me in violin practicing. I can practice long time. Some of the songs are
difficult and I cannot get during one week and I keep my patience for one month or
one year. After all I can have accomplishment to play completely the songs that I
practice. That is why I think some of my character helps me a lot in studying violin.”
(Violin student, Male, Aged 24 years old and 7 years of studying violin)
2. Myanmar Traditions and Customs that become an Issue of
Teaching and Learning of Violin, Evolution and Resolving the
Problems
Interview with teachers
Teachers said traditions and customs are very important for our country
and in any other country too and it should be a good issue to be concern. Myanmar
traditions and customs traits and about their positive and negative facts are shown in
tables.
The Impacts of Myanmar Tradition and Customs of Positive and
Negative Facts on Violin Teaching and Learning
Topic Positive Negative
Respect, Polite, humble It can make the Trust easily without
The 7th National and International Graduate Study Conference 2017
" Thailand 4.0 Creative Innovation for Sustainable Development "
I304

– Admiration,
Deference, Valuing
other-(Mostly, one of
Myanmar peoples’
customs is showing
respect to their elders.)
communication advantage in
human society because
treating each other nicely
instead of judging.
Moreover, do not insult,
mock and talk about people
behind their backs. Caring
other people feeling and do
not pressure them what they
do not want to do.
awareness and critical
mind then believe and
follow the way whatever
right or wrong is kind of
dangerous situation
because It can be
misleading to the wrong
way. Sometimes too much
politeness turn to humble
and it seem like out of
confidence as well.
Shyness, Fear and
Anxiety – Kind of Self-
conscious, bashful,
showing nervousness,
insecure and
unconfident-(Myanmar
people have ordinarily
shyness in character.)
Modest, calm, less
conversion and good listener,
deeper friendship, shrink
from compliments, thinking
carefully before act, prepared
well themselves to achieve
goals.
Express themselves less,
Reserve, Introvert, hidden
thought and opinion,
awkwardness and
uncomfortable, antisocial,
perform with less emotion,
body movements and eyes
contact.
Honesty – Purity of
Innocent, showing
maturity and self-
acceptance (Most of
Myanmar people
honestly and simple life
style.)
It is kind of doing the right
things like no lying and
talking frankly, no cheating
and be faithful, no deceiving
and candid. Live the life as
simple and telling the truth,
and self-respect. Honesty can
make the best connection
with the people because of
the people trust and come
closer to the honest person.
Honesty of traits such as
frank talker cannot hide
secret and simple thinking
can get cheating from
other. Sometimes frank
talking can make
embarrasses to other
according to the
circumstances.
Encouragement – good Encouragement can support Encouraging for the wrong
The 7th National and International Graduate Study Conference 2017
" Thailand 4.0 Creative Innovation for Sustainable Development "
I305

motivation and support
other – (Myanmar
people like encouraging
and usually the elders
encourage to their
younger.)
to evolve the students’ effort
for their study and deduct the
depression. Can build the
positive relationship and
supportive to other.
practice way, manners,
behaviors and attitude will
be bad.
Frank and Outgoing –
Myanmar people
usually warm and
friendly and talking
way is directly and
sincere.)
The habit of friendly to other
is good to make friendship in
a classroom and
environment. Good reason to
avoid the conflict and fight
with each other.
Criticism – A form of
communication,
Judgments ( Myanmar
people cannot accept the
bad critical talking and
so sensitive)
Accepting the critic about
themselves seem it’s has the
self-acceptance and some of
the critic should accept
because it can make to
improve the study or to
prevent the mind process, or
to stop ding mistakes
Individualism – Self-
reliance and independent
( some of Myanmar
people culture is
individualism)
Being individualist can
achieve in self-study with
their self-determination and
will depend less on other.
Collectivism – Tightness
and interdependence
( some of Myanmar
people of culture has
collectivism and they are
usually follow the
Being collectivism is good
for group activity and they
are dutiful and obligation
person.
The 7th National and International Graduate Study Conference 2017
" Thailand 4.0 Creative Innovation for Sustainable Development "
I306

society harmoniously)
Self- confidence and
self-esteem – believe in
him/herself, happy and
satisfy ( Usually
Myanmar people of
habits and viewing mind
process themselves has
self-esteem and self-
confidence is not stable
and according to
situation has the
tendency)
Being self-confidence that
habit set up in human can
make the people to achieve
their goal straightly, dare to
take the risk and adventure
as well. Being self-esteem, it
will brought you to happy
life and respecting others and
him/herself. They can accept
their mistakes and learn from
that.
Table2. The Traits of Myanmar Traditions and Customs and Development of
Violin Study
Topic Facts and Brief Explanation
Traditions
and Customs
between
Teachers and
Students and
their
relationship
Characteristics, Behaviors and feeling of nature mind
Teachers– according to old ages, teachers’ nature, they are basically
patience, encouragement, Creative, Strict, Flexible, Funny, most of
them good at public relation but not all teachers, sometimes
disappointing and a bit aggressive, Shy, Afraid to do bad things,
Students – polite, obedience, shy, afraid to do mistakes, innocence,
respect, honesty, purity of thought and sensitivity, friendly.
Collectivism
and
Individualism
To differentiate the Collectivism and Individualism – their
tendency is on the side of collectivism and it usually good at group
working. The weakness on the side Individualism is less express
them and hide their feeling. In that case good and bad effect is
together to be a good violin player and musician.
The 7th National and International Graduate Study Conference 2017
" Thailand 4.0 Creative Innovation for Sustainable Development "
I307

Violin Study Teaching and Learning – Violin studying is developed day by day
and according to digital age, the learners can study not only by
violin teachers and books but also from internet website, TV
channel as well.
Success and
Failure of
Violin
Teaching and
Learning in
Myanmar
Success for development and Still weak requirement for violin
study – Myanmar people of interest and studying about violin has
development and improved more and more even though music
education and violin techniques are still weak. Anyway it is better
than a lot if we compared the past.
4) Requirements of general music studies in Myanmar
Table Detailed in Topic and Explanation Facts
General
Music
Education
Music Education – There is no Primary, Secondary and High
School of Regular Music Education Curriculums and just do for
music activities and events occasionally.
Music University and Schools – There are a few numbers of Music
Universities and Schools.
Violin
Teaching and
Learning
Violin Study – There are lots of requirements and needs about
technically and literally to build up the good violin players. Several
of Violin Methods books and studies are need and qualified violin
teachers as well. Not only watching and virtuoso violinists on TV
channel and Internet website but also should have watch lots of
violin performance concert in outside for violin learner. Nowadays
of violin learner are getting those good chances and the situation I
better than past time.
Musicianship Myanmar people and Musicianship – to be a good musician,
Myanmar people still needs to train too many things and violin
practice. Anyway violin learners are improve in musicianship as
The 7th National and International Graduate Study Conference 2017
" Thailand 4.0 Creative Innovation for Sustainable Development "
I308

well if we compared in the past time.
The
Requirements
of Violin
Study
Good ahead to violin study in Myanmar- Nowadays of violin study
is a lot better than before and impressively improve day by day even
though still weak if we compared to other countries.
Discussion
Based on the data analysis on information of teachers and students
interviews and observation, by understanding the research questions of objective
study; The discussion of findings involve to discuss the facts about Myanmar
traditions and customs, general characteristic, divergent of teaching and learning
playing styles of violin, between teacher and students relationship, Musical studies
used in Myanmar, personal and social constrain to teaching and learning process and
to know the music and violin general studies requirements. All of these main finding
facts will discuss by following facts by combining;
1. Myanmar Traditions and Customs and Violin Study of success and failure
and teachers and students relationship from the past and present
2. The outline of General studies and requirements
1.) Teacher and Students relationship is important for classroom and studying. Brophy
suggest that if the teachers’ think of themselves primarily as instructors, their respond
will be negative to the students. They act like aggressively, interpersonally
disconnected to the students and classroom (Brophy, 1985). In case, according to data
analysis, teacher and student relation is quite good even though traditionally teacher
role play in Myanmar as an instructor or authority because most of teachers are kind to
their students, motivated and encourage according to their habit. Students are also
polite and give respect to their elders who is included parent, teachers, brothers and
sisters. That is why usually the classroom study of interrelation is harmoniously
between teachers and students. Politeness and nice treating each other is one of the
The 7th National and International Graduate Study Conference 2017
" Thailand 4.0 Creative Innovation for Sustainable Development "
I309

reason to avoid the fight and conflict. In Myanmar school, there may have some fight
or conflict and it rarely happen. Then that kind aggressive thing and anger event are
strongly restricted at school, home or other places too. Teacher want the students to
solve the problems by discussing, negotiating by improving their thinking process.
The other ways is if the students have the problems, teacher wants them to come and
let him know to solve the problems together. Teacher expects the classroom society
with valuing and trusts each other such as nice treating, no insult and caring the feeling
and emotion good or bad, supportive and helping.
2.) Music studying in Myanmar, the entire teacher used western violin lesson books
and they do not have the own Myanmar originated lesson or book about violin
studying. Researcher thought Western violin tutor is very systematically and good to
build up from the beginning until to advance. Moreover we should have the Myanmar
tradition violin tutor and etudes that based on violin Myanmar traditional music.
Violin teaching and learning process of personal constrain is related to teachers,
school and University, musical environment, parents supports, worldwide Internet and
musical concert. At first, violin teacher should be a good role model of violin playing
or famous at good teaching. University and School are very important to show their
ability what they can do for every learner like they have good teachers for students and
facilitates such as good sound safe studio rooms, instruments supporting. In students
and teaching and learning, parents are also very important and if the students can get
the parents supporting absolutely that will be more helpful in studying. About musical
environment, it is very important.
Recommendation
Some of Myanmar traditions and customs are good and some might be bad.
That is why the people should think which is more useful for them and good impacts
for daily life style, relationship, communication, health and any cases. Likewise in
violin teaching and learning as well, what kind of things should keep from the old
traditions and which one are should discard, they have to carefully think and act
The 7th National and International Graduate Study Conference 2017
" Thailand 4.0 Creative Innovation for Sustainable Development "
I310

wisely. For example, polite is good but do not need to so humble and sway on other
opinion, trust their own and act bravely what they want to, do not need to follow other
but they need to rise up as leader by themselves as well.
References
BIBLIOGRAPHY
Bloom, A. (1991). The republic of Plato, U.S.A: BasicBooks A Division of Harper
Collins Publishers
Hofstede, G. (1997).Culture and organizations: software of the mind. London:
MaGraw Hill.
Menuhin, R. (2009). The Violin an Illustrated History. Flammarion, Paris: Rizzoli
Intonations, Inc.
Young, W. (1990). An Integrated Music Program for Elementary School. New Jersey:
Prentice – Hall, Inc. U.S.A.
F, Heger, (1902). Alte Metalltromeln aus Sudest-Asie; Leipzig
Marshall, H.I, (1922). The Karen People of Burma: Columbus. A Study
in Anthropology and Ethnology
Marshall,H.I. (1929). Karen Bronze Drums, Journal of the Burma
Research Society, pp. 1-14.
Cooler, R. M. (1986). The Use of Karen Bronze Drums in the Royal
Courts and Buddhist Temples of Burma and Thailand: A
Continuing Mon Tradition?, Papers from a Conference on
Thai Studies in Honor of William J.Gedney Michigan
Papers on South and Southeast Asia, No 25, Ann Arbor, pp.
107-20.
Cooler, R.M. (1994).The Karen Bronze Drums of Burma, Leiden:
Types, Iconography, Manufacture, and Use
The 7th National and International Graduate Study Conference 2017
" Thailand 4.0 Creative Innovation for Sustainable Development "
I311

Talbot, J. (September, 1997). Mission Unstoppable, The Strad, Vol. 108:1289, pp.979,
981 – 982.
Galamian, I. (1985). Principles of Violin Playing and teaching third edition.
Englewood cliffs, New Jersey: Prentice-Hall, Inc.
Rush, M. (2006). Playing the Violin. New York: Routledge (Taylor and Francis
Group).
Howard, C (2008). How the Violin plays the violinist. USA: Ink Well Publishing
Arlington, MA.
Starr, W. (2000). The Suzuki violinist; A guide for teacher and parents (Rev. ed.).
U.S.A; Summy – Bichard Music.
Galamian, I. (1962). Principles of violin playing and teaching. Englewood cliffs, NJ:
Prentice – Hall.
The 7th National and International Graduate Study Conference 2017
" Thailand 4.0 Creative Innovation for Sustainable Development "
I312

Author Name – Miss Myat Thiri Nyein
ID Number – 5538131
Master’s Program/ Field of the Study – Music Education Program
Institute – College of Music, Mahidol University
The 7th National and International Graduate Study Conference 2017
" Thailand 4.0 Creative Innovation for Sustainable Development "
I313

A Comparative Study of Heavy Metal Contamination in Conventional and Organic Rice Kudkanut Cheunwongaroon Environmental Management and Technology Mahidol University Abstract
The present research study aimed to investigate and evaluate the amount of heavy metal contents in Mali Nil Surin Rice growing from two different rice cultivation techniques, conventional and organic farming systems. At different growth stages; vegetative, reproductive and ripening stages, rice plants were collected to measure and evaluate their physical development before oven dried and digested with wet-acid digestion technique. The amounts of Cadmium (Cd), Chromium (Cr), Copper (Cu), Lead (Pb) and Zinc (Zn) in the plant tissues were determined by using the Flame Atomic Absorption Spectrometry (F-AAS).
Due to the excessive rainfalls in July and early winter in the year of 2016, the rain-fed conventional farming system produced rice with short heights, less tillers, less numbers of panicles and grains compared to the organic rice which had its own water controlling system. As a result, the absolute growth rates of conventional rice plants displayed their exponential growth, the acceleration to produce grains in 80 days time while organic rice took nearly 100 days to grow.
In heavy metals analysis, metals found in rice plants at different growth stages were in the suitable range for plant to grow; Cr (1-3 mg kg-1 ), Cu (20-60 mg kg-1) and Zn (< 100 mg kg-1). Pb was undetected in both paddy fields. However, Cd found in the conventional rice grain (0.14 mg kg-1), was considered to be too high according to the FAO standard (Cd < 0.1 mg kg-1) but it was under the maximum level allowed in European and Asian countries (Cd < 0.2 mg kg-1). From the analysis of variance, the major factors which statistically affected the contaminations of heavy metals in rice were the stages of growth and the differences in parts of accumulations.
In conclusion, plants were capable to restrict toxic metals in root to minimize the threats from toxicity. However, under numerous variables in the environment and the agricultural activities, heavy metals could be brought to the soil alongside other essential nutrients for plants, which provided accessibility for plants to absorb and mobilize into reproductive organs of plants such as panicles and grains, and posed the threats to all consumers. Keywords: Heavy metals, Rice, Organic paddy field, Conventional paddy field Introduction
Rice is one of the major staple foods in the world, feeding half of world’s population (Redfern, Azzu and Binamira, 2012). Over centuries, rice is irreplaceable as the main basis of dietary especially in Asia (Sohn, 2014). For Asia’s people, rice is not only a major source of food and income, it was part of country’s history, culture and belief in Asian society (Gomez, 2001).
However, there are serious threats lies hidden inside the rice grains which are normally overlooked by most of the people. Rice consumers or even the farmers themselves are not aware of the serious threat from heavy metals poisoning (Sarah,
The 7th National and International Graduate Study Conference 2017
" Thailand 4.0 Creative Innovation for Sustainable Development "
I314

2013). Especially, in Asia’s developing countries where these toxic pollutants are undetected leaking into the environment, causing unusual and deadly illness to people (Arunakumara et al., 2013).
Even though, heavy metals are elements that can be naturally found in the earth crust, the industrialization, urbanization and the intensive agricultural practices are tremendously increasing the rates of extraction and accumulation of these heavy metals in the environment (Xu et al., 2014). Heavy metals are extremely pernicious because of their toxic, persistent and non-biodegradable characteristics in nature (APIS, 2014). Moreover, their toxicity can be magnified through various types of interactions with other elements presented in the nature (Wuana and Okieimen, 2011).
These metals are contaminated and accumulated in soil, air and water which later, transported into plants and living organisms, ready to be mobilized further into higher trophic of the food chains (Dalcorso, 2012). Heavy metal poisoning can cause serious health effects or death in humans and living organisms.
In the world of agriculture, rice farming is relying on the quality of soil and water. They are the most essential elements which can directly determine the quality and quantity of the crop productions.
Heavy metals can come from different sources, both direct and indirect pathways (Tangahu et al., 2011). Some can originate from far away sources carrying through wind and water. Some are already presented in the daily farm’s applications such as fertilizers and pesticides (Wuana and Okieimen, 2011). In spite of the increasing green agricultural practices, promoting the principle of the organic farming systems by avoiding the uses of all synthetic materials, the toxic metals are still presented in the agricultural soil. Even though environmental pollution and degradation can be recovered by nature, the understanding and effective managements are still relying in human hands (Boshoff et al., 2014).
In order to promote sustainable agriculture and notify the local farmers to beware of their utilizations of chemicals in their farmlands, concrete evidences and simple explanations are needed to be found and presented (Hu et al., 2014). It is the first major step that brings cooperation among the stakeholders, leading the conceptual ideas and plans into actions.
The present study can be further used as concrete evidence in raising local farmer’s awareness, promoting the organic farming system in the future for better living and environment. Objectives
1) To study the major practices of conventional and organic rice farming systems
2) To investigate the amount of heavy metals contents in Mali Nil Surin rice at different growth stages
3) To evaluate the amount of heavy metals contents in rice growing from both cultivation techniques
Research Methodology
Study sites were the local paddy fields located in Sakae Phrong, Mueang District, Buriram Province. The rice plant samples were collected from the organic and conventional paddy fields which belonged to the local farmers in the Ban Sawai
The 7th National and International Graduate Study Conference 2017
" Thailand 4.0 Creative Innovation for Sustainable Development "
I315

So community. Conventional paddy field was rainfed-rice farming system which totally depended on rainfall to grow rice while organic paddy field had its own pond and pumping system which could collect rainfalls and controlling water level in the field.
The conventional paddy field was located not far from the organic paddy field by having earth dyke and tall trees act as buffer between them. The selected areas were 80 m. x 45 m. (3,600 m2), which 6 plots based on the grid soil sampling techniques were selected as the sampling plots. The location of the conventional paddy field was on A spot while the organic paddy field was on B spot (Figure 1a). Rice plant samples were collected based on the growth and development stages of rice which in this case three phases were selected as follow; Phase 1: Vegetative stage, Phase 2: Reproductive stage and Phase 3: Ripening stage.
In each phase, plant samples were carefully collected and kept in plastic bags for future analysis. In this study, approximately 6 tillers of rice samples were collected per paddy field per phase. 6 plots in conventional paddy field were labeled as 1A, 2A, 3A, 4A, 5A and 6A while the plots in organic paddy field were labeled as 1B, 2B, 3B, 4B, 5B and 6B Rice plant sample in one meter radius of selected plot were collected in correspondent with soil sample (Figure 1b).
Figure 1 Study sites (a) and sampling plots (b)
In the first stage, rice plants collected from both paddy fields were mainly
divided into 3 parts which were root, stem and leaf. In the second stage, panicles were added in the parts needed to be analyzed and last in the third stage, husk and grain were added. Plant samples were separated into parts before their physical characteristics such as weight, height and length were measured. Including, numbers of panicles and grains were counted at the last two stages. (Table 1)
Absolute growth rates (AGR) which calculated from the height (AGRH) and weight (AGRW) of rice plants in each growth stage were used to determine the growth and development of rice plants. For conventional paddy field, numbers of days between intervals were 48, 21, and 10 days respectively. For organic paddy field, numbers of days between intervals were 62, 48, and 19 days respectively. Table 1 Rice samples and the parameters used in physical measurements No. Growth stage Parts of rice plants Parameters 1 Vegetative Root, stem, leaf - Wet/dry weight
- Length & width - Numbers of
panicle/grain 2 Reproductive Root, stem, leaf and panicle
3 Ripening Root, stem, leaf, husk and grain
The 7th National and International Graduate Study Conference 2017
" Thailand 4.0 Creative Innovation for Sustainable Development "
I316

Hence, plant samples which separated into different parts from both paddy
fields were weighed, oven-dried and digested into solutions to be ready for heavy metal analysis using flame atomic absorption spectrometry. All samples were measured and done in triplicates to minimize errors in the data outputs. The procedures and methods used were described in the following table (Table 2).
Table 2 Methods used and references
No. Procedures Methods References
1 Sample preparations Oven-dried at 60°C for 48 hrs Particle size reduction (Campbell and
Plank, 1998) 2 Organic matter
destruction Wet acid digestion : mixtures of HNO3, HCl and H2O2
3 Heavy metals analysis
Cd, Cr, Cu, Pb and Zn were determined by F-AAS (Soon, 1998)
The basic information on the practices of organic and conventional
faming, including all information about the inputs, prices of rice and etc., were obtained from informal interviews with the local farmers and the owner of the paddy fields. All the data was analyzed using descriptive, inferential statistics and ANOVA by IBM SPSS Statistics (version 21.0). Results
The major practices of the conventional and organic farming systems were studied through the informal interviews with the owners and the fields observations in each time the rice samples were collected. The seasonal calendar was displayed the practices of the famers throughout the year of growing rice (Table 3).
Table 3 Seasonal calendar of conventional and organic farming systems Jan Feb Mar Apr May Jun Jul Aug Sep Oct Nov Dec
GS Seedling Vegetative Reproductive Ripening
A - Soil preparations Prepared seeds
Chem. fertilizer
Sowing
Chem.
fertilizer
Chem. fertilizer
Harvesting period
B - Soil preparations Prepared seeds
Transplanting + manure
Weed elimination +
Pruning
Non-Disturbing
period
Harvesting period
Note: GS = Growth stage A = Conventional farming, B = Organic farming
The conventional rice farming was begun with the process of soil preparations which generally started in March. Usually, the old rice stalks would be burned to ashes before the beginning of soil plough process.
The 7th National and International Graduate Study Conference 2017
" Thailand 4.0 Creative Innovation for Sustainable Development "
I317

However, in this 2016 season, the burning process was decided not to be done in order to preserve and adjust the soil for future transition of growing organic rice farming. Instead of slash and burn, the famer used old rice straws to cover soil surface in its resting period to preserve moisture and avoid the organic matter destruction under the weather.
Conventional paddy field was using rice sowing technique to grow rice. Seeds were simply prepared and sowed in the field. Rain water was the only water source for the conventional paddy field. Chemical fertilizers, “Brand Top1”, with approximately 16-17 kg rai-1 were applied 3 times in one crop season. First time in the vegetative stage, 16:20:0 chemical fertilizer was applied, second in the early October before the panicle initiation, 15:15:15 was applied and finally in November, 7:14:21 was applied to the soil. However, some cow dunks could be found in the field from grazing of the local cows in the area because of the open access of the conventional paddy field. Rice in the conventional paddy field were allowed to be grown naturally, less agricultural activities were done during the growing period. Insects, crabs and mouse could be found in the paddy field. No measurements were conducted to eliminate these insects and pests. Weeds were plucked out. Rice would be ready to be harvested in late November to early December.
Organic rice farming was started similarly with soil preparation early in March. The processes were begun with plough the old rice stalks and plowing to replenish the soil. The sword bean was selected among legumes to be cultivated as green manure plants. In April, manure was applied to the soil before water was pumping up into the paddy field to eliminate weeds and made the soil ready for rice transplantation. In June, the process of seedling preparation was started. The farmers were growing rice seedling in the seedling trays which took around 20 to 30 days for rice seedling to be ready for transplanted in the paddy field. Organic rice transplantation was begun in late July. Rice seedlings would take around 90 days to develop and grow its tiller to maximum before start their panicle initiation in early October. During the rice vegetative stage, the processes of took care the rice were mostly done by the nature or the rice field ecosystem itself. The farmers allowed the nature took it cause. There was no insecticide or herbicide used. For weed elimination, machinery was used, as well as labors were used to take out the weed and pruning the plants. In reproductive stage, rice plants were allowed to grow in the non-disturbed environment. The farmers would make less interfere in this process. After growing more than 130 days, rice was in the ripening phase and ready to be harvested. In the harvesting period, no machines were used, including the harvesting process as well. Rice was harvested by the hands of the owners and friends, local farmers.
A total yield of the organic paddy field was around 490 kg rai-1. The Mali Nil rice in the organic paddy field was milled by local rice mill and packed in local package for sell. The price of organic Mali Nil rice was 80-100 baht kg-1.
Rice samples which had been collected from each phase were separated into various parts for physical measurements before heavy metals analysis. The results were represented rice growth and its development in each growth stage. (Table 4)
Rice plants were growing and increasing its biomass in each stage. The length of stem of conventional (a) and organic rice (b) were distinctly increasing from vegetative (Ma = 40.95, SDa = 0.64), (Mb = 33.33, SDb = 8.64) to reproductive (Ma =
The 7th National and International Graduate Study Conference 2017
" Thailand 4.0 Creative Innovation for Sustainable Development "
I318

70.56, SDa = 3.24), (Mb = 103.02, SDb = 20.70) and lastly in ripening stage (Ma = 71.75, SDa = 6.14) (Mb = 110.71, SDb = 12.76), respectively.
Including, leaves of conventional and organic rice which were slightly increasing in its length from vegetative (Ma = 37.37, SDa = 6.79), (Mb = 47.85, SDb = 11. 46) to reproductive (Ma = 37.74, SDa = 4.16), (Mb = 48.54, SDb = 7.70) and shortly declined in the ripening stage (Ma = 36.45, SDa = 3.28) (Mb = 47.79, SDb = 3.47), respectively.
In reproductive stage, organic rice produced higher number of panicles (Mb = 120, SDb = 23) than conventional rice (Ma = 88, SDa = 14). Therefore, the number of organic grains (Mb = 103, SDb = 15) were also slightly higher than conventional grains (Ma = 96, SDa = 18). Table 4 Physical Measurement of Rice Plants (Mean ± SD)
Stage Rice field
Plant Parts
Weight (g) Size (cm) Numbers
Wet Dry Length Width
Veg
etat
ive
stag
e A Root 2.12 ± 0.38 0.34 ± 0.06 9.00 ± 0.64 0.10 ± 0.00 - Stem 2.95 ± 0.84 0.76 ± 0.23 40.95 ± 0.64 0.69 ± 0.05 - Leaf 0.19 ± 0.04 0.11 ± 0.02 37.37 ± 6.79 0.78 ± 0.09 -
B Root 2.60 ± 0.66 0.34 ± 0.13 10.59 ± 4.55 0.11 ± 0.01 - Stem 4.28 ± 1.92 1.08 ± 0.63 33.33 ± 8.64 1.08 ± 0.16 - Leaf 0.33 ± 0.10 0.17 ± 0.06 47.85 ± 11.46 1.01 ± 0.23 -
Rep
rodu
ctiv
e st
age
A Root 1.10 ± 0.36 0.33 ± 0.08 9.21 ± 1.50 0.10 ± 0.00 - Stem 4.18 ± 0.58 1.50 ± 0.26 70.56 ± 3.24 0.90 ± 0.04 - Leaf 0.15 ± 0.03 0.10 ± 0.01 37.74 ± 4.16 1.10 ± 0.06 - Panicle 0.92 ± 0.27 0.55 ± 0.12 - - 88 ± 14
B Root 3.48 ± 2.12 0.88 ± 0.48 11.71 ± 1.52 0.11 ± 0.02 - Stem 7.08 ± 2.65 2.66 ± 0.92 103.02 ± 20.70 1.06 ± 0.16 - Leaf 0.26 ± 0.08 0.22 ± 0.06 48.54 ± 7.70 1.00 ± 0.10 - Panicle 1.16 ± 0.48 0.84 ± 0.28 - - 120 ± 23
Rip
enin
g st
age
A Root 1.58 ± 0.64 0.42 ± 0.14 10.85 ± 3.17 0.10 ± 0.00 - Stem 3.57 ± 0.76 1.06 ± 0.21 71.75 ± 6.14 0.91 ± 0.07 - Leaf 0.11 ± 0.02 0.10 ± 0.02 36.45 ± 3.28 1.21 ± 0.03 - Husk 0.07 ± 0.01 0.06 ± 0.01 - - - Grain 0.21 ± 0.05 0.13 ± 0.02 - - 96 ± 18
B Root 2.53 ± 0.77 0.49 ± 0.12 9.00 ± 1.34 0.10 ± 0.00 - Stem 7.32 ± 1.73 2.35 ± 0.61 110.71 ± 12.76 1.09 ± 0.15 - Leaf 0.20 ± 0.03 0.17 ± 0.02 47.79 ± 3.47 1.10 ± 0.08 - Husk 0.05 ± 0.01 0.04 ± 0.01 - - - Grain 0.14 ± 0.04 0.08 ± 0.02 - - 103 ± 15
Note: A = Conventional paddy field, B = Organic paddy field
The 7th National and International Graduate Study Conference 2017
" Thailand 4.0 Creative Innovation for Sustainable Development "
I319

The coefficient of variation was conducted to analyze the variability of the data set (Table 5). The highest dispersion of data was presented in the dataset of root which was high up to 42.97 % in the root’s length and up to 60.92 % in wet weight. The minimum dispersion was occurred in the width data sets of rice plants which the coefficients of variations were under 23 % for all rice in conventional and organic paddy fields.
Table 5 Coefficient of variations in the physical measurements of rice plant (%)
Stage Rice field
Plant Parts
Weight Size Wet Dry Length Width
Veg
etat
ive
stag
e A Root 17.92 17.65 7.11 0.00
Stem 28.47 30.26 1.56 7.25
Leaf 21.05 18.18 18.17 11.54
B Root 25.38 38.24 42.97 9.09
Stem 44.86 58.33 25.92 14.81
Leaf 30.30 35.29 23.95 22.77
Rep
rodu
ctiv
e st
age
A Root 32.73 24.24 16.29 0.00
Stem 13.88 17.33 4.59 4.44
Leaf 20.00 10.00 11.02 5.45
Panicle 29.35 21.82 - -
B Root 60.92 54.05 12.98 18.18
Stem 37.43 34.59 20.09 15.09
Leaf 30.77 27.27 15.86 10.00
Panicle 41.38 33.33 - -
Rip
enin
g st
age
A Root 40.51 33.33 29.22 0.00
Stem 21.29 19.81 8.56 -
Leaf 18.18 20.00 9.00 2.48
Husk 14.29 16.67 - -
Grain 23.81 15.38 - -
B Root 30.43 24.49 14.89 0.00
Stem 23.63 25.96 11.53 13.76
Leaf 15.00 11.76 7.26 7.27
Husk 20.00 25.00 - -
Grain 28.57 25.00 - - Note: A = Conventional paddy field, B = Organic paddy field
From the physical measurements, the absolute growth rate of rice plants from both conventional and organic paddy fields were evaluated to represented its growth since the beginning of the rice farming through each stage.
For phase 1 or vegetative stage, AGRH and AGRW of conventional rice were 1.82 cm day-1 and 0.03 g day-1, respectively while AGRH and AGRW of organic rice was 1.48 cm day-1 and 0.03 g day-1, respectively. AGR of conventional rice was a little bit higher but no significant differences (Figure 2).
The 7th National and International Graduate Study Conference 2017
" Thailand 4.0 Creative Innovation for Sustainable Development "
I320

For phase 2 or reproductive stage, AGRH and AGRW of conventional rice were higher at 5.60 cm day-1 and 0.12 g day-1, respectively while AGRH and AGRW of organic rice were 3.19 cm day-1 and 0.10 g day-1, respectively (Figure 2).
For phase 3 or ripening stage, AGRH and AGRW of conventional rice were still higher at 11.91 cm day-1 and 0.30 g day-1, respectively while AGRH and AGRW of organic rice was 8.82 cm day-1 and 0.23 g day-1, respectively (Figure 2).
Figure 2 Absolute growth rates of rice plants on height (a) and weight (b) basis
Therefore, conventional rice was growing late due to the excessive rainfall in July which caused the duration time of its growth to be shortened compared to the organic rice. Therefore, AGR of conventional rice displayed higher exponential rate. Rice plants were adapting themselves and accelerated their growth, ensuring to reproduce and produce grains before the crop season ended.
Heavy metal contents in different growth stages and different parts of rice
plants were presented in the following table (Table 6). The analysis of variances was conducted. The influences of the major factors (growth stage, sites and parts of plant) on the accumulation of heavy metals in rice plants were presented in the following tables (Table 7-9).
In vegetative stage, Cd content was highest in the root of both conventional and organic rice, 0.90 and 1.12 mg kg-1, respectively. Cd was declined in the upper parts of rice plant. The highest Cr content was in the root part of both conventional and organic rice as well, which were 13.72 and 7.92 mg kg-1, respectively.
The lowest amount in the stem was around 4.50 mg kg-1. Cr was considered high in the leaf of both rice plants which were around 7.63 and 6.85 mg kg-1, respectively. The highest mean concentration of Cu content was in the root of both conventional and organic rice, 28.84 and 22.62 mg kg-1, respectively. The highest mean concentration of Zn content was in the stem for conventional rice, 50.67 mg kg-1 and in the leaf part of organic rice, 46.15 mg kg-1 (Table 6).
In reproductive stage, Cd was still the highest accumulated in the root especially for conventional rice which was 0.32 mg kg-1 while in organic rice was only 0.19 mg kg-1. However, in the panicle, Cd content was higher than the accumulations in stem and leaf parts especially for conventional rice, Cd in panicle was 0.23 mg kg-1. Cr was highest in the rice panicle especially for organic rice which was high up 10.47 mg kg-1. Cu was still the highest in the root for conventional rice
The 7th National and International Graduate Study Conference 2017
" Thailand 4.0 Creative Innovation for Sustainable Development "
I321
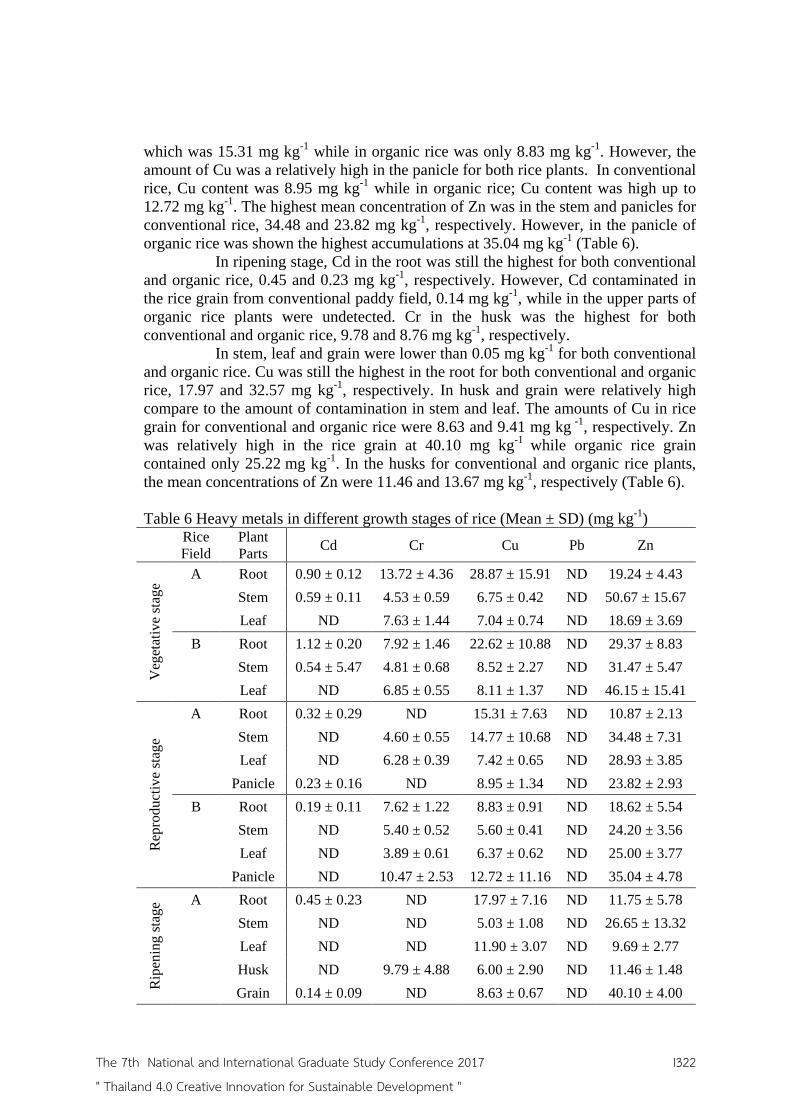
which was 15.31 mg kg-1 while in organic rice was only 8.83 mg kg-1. However, the amount of Cu was a relatively high in the panicle for both rice plants. In conventional rice, Cu content was 8.95 mg kg-1 while in organic rice; Cu content was high up to 12.72 mg kg-1. The highest mean concentration of Zn was in the stem and panicles for conventional rice, 34.48 and 23.82 mg kg-1, respectively. However, in the panicle of organic rice was shown the highest accumulations at 35.04 mg kg-1 (Table 6).
In ripening stage, Cd in the root was still the highest for both conventional and organic rice, 0.45 and 0.23 mg kg-1, respectively. However, Cd contaminated in the rice grain from conventional paddy field, 0.14 mg kg-1, while in the upper parts of organic rice plants were undetected. Cr in the husk was the highest for both conventional and organic rice, 9.78 and 8.76 mg kg-1, respectively.
In stem, leaf and grain were lower than 0.05 mg kg-1 for both conventional and organic rice. Cu was still the highest in the root for both conventional and organic rice, 17.97 and 32.57 mg kg-1, respectively. In husk and grain were relatively high compare to the amount of contamination in stem and leaf. The amounts of Cu in rice grain for conventional and organic rice were 8.63 and 9.41 mg kg -1, respectively. Zn was relatively high in the rice grain at 40.10 mg kg-1 while organic rice grain contained only 25.22 mg kg-1. In the husks for conventional and organic rice plants, the mean concentrations of Zn were 11.46 and 13.67 mg kg-1, respectively (Table 6). Table 6 Heavy metals in different growth stages of rice (Mean ± SD) (mg kg-1)
Rice Field
Plant Parts Cd Cr Cu Pb Zn
Veg
etat
ive
stag
e
A Root 0.90 ± 0.12 13.72 ± 4.36 28.87 ± 15.91 ND 19.24 ± 4.43 Stem 0.59 ± 0.11 4.53 ± 0.59 6.75 ± 0.42 ND 50.67 ± 15.67 Leaf ND 7.63 ± 1.44 7.04 ± 0.74 ND 18.69 ± 3.69
B Root 1.12 ± 0.20 7.92 ± 1.46 22.62 ± 10.88 ND 29.37 ± 8.83 Stem 0.54 ± 5.47 4.81 ± 0.68 8.52 ± 2.27 ND 31.47 ± 5.47 Leaf ND 6.85 ± 0.55 8.11 ± 1.37 ND 46.15 ± 15.41
Rep
rodu
ctiv
e st
age
A Root 0.32 ± 0.29 ND 15.31 ± 7.63 ND 10.87 ± 2.13 Stem ND 4.60 ± 0.55 14.77 ± 10.68 ND 34.48 ± 7.31 Leaf ND 6.28 ± 0.39 7.42 ± 0.65 ND 28.93 ± 3.85 Panicle 0.23 ± 0.16 ND 8.95 ± 1.34 ND 23.82 ± 2.93
B Root 0.19 ± 0.11 7.62 ± 1.22 8.83 ± 0.91 ND 18.62 ± 5.54 Stem ND 5.40 ± 0.52 5.60 ± 0.41 ND 24.20 ± 3.56 Leaf ND 3.89 ± 0.61 6.37 ± 0.62 ND 25.00 ± 3.77 Panicle ND 10.47 ± 2.53 12.72 ± 11.16 ND 35.04 ± 4.78
Rip
enin
g st
age A Root 0.45 ± 0.23 ND 17.97 ± 7.16 ND 11.75 ± 5.78
Stem ND ND 5.03 ± 1.08 ND 26.65 ± 13.32 Leaf ND ND 11.90 ± 3.07 ND 9.69 ± 2.77 Husk ND 9.79 ± 4.88 6.00 ± 2.90 ND 11.46 ± 1.48 Grain 0.14 ± 0.09 ND 8.63 ± 0.67 ND 40.10 ± 4.00
The 7th National and International Graduate Study Conference 2017
" Thailand 4.0 Creative Innovation for Sustainable Development "
I322
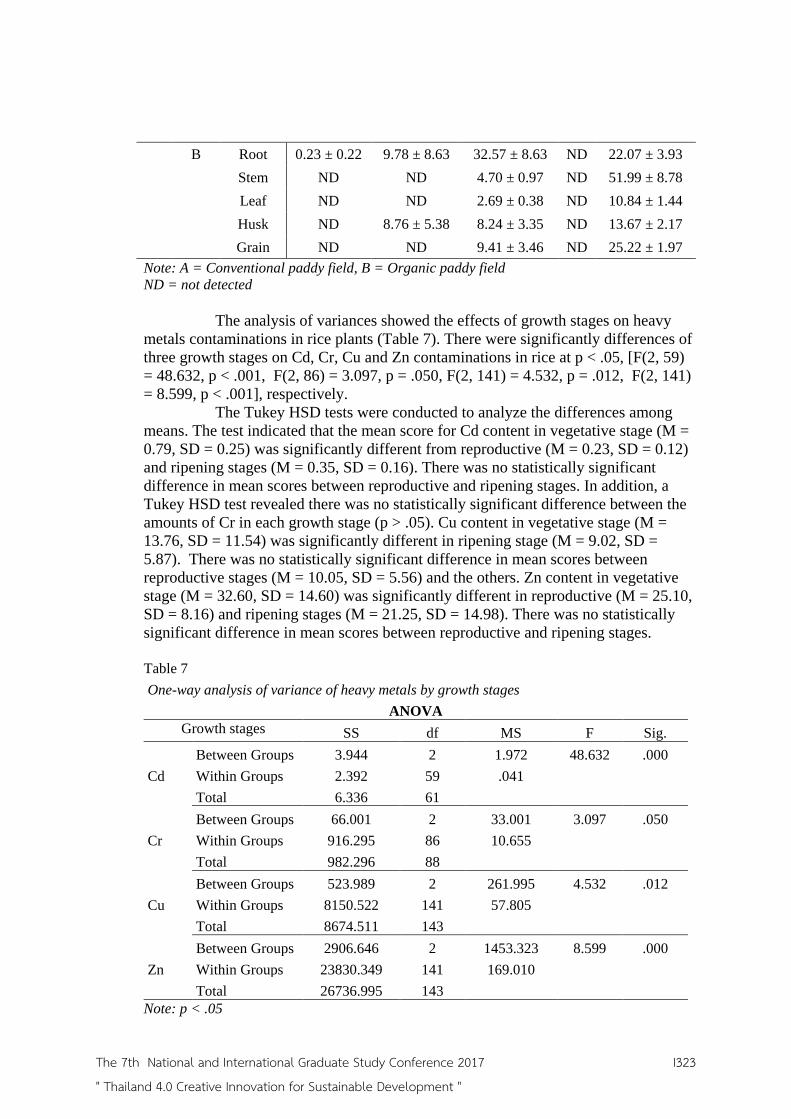
B Root 0.23 ± 0.22 9.78 ± 8.63 32.57 ± 8.63 ND 22.07 ± 3.93 Stem ND ND 4.70 ± 0.97 ND 51.99 ± 8.78 Leaf ND ND 2.69 ± 0.38 ND 10.84 ± 1.44 Husk ND 8.76 ± 5.38 8.24 ± 3.35 ND 13.67 ± 2.17 Grain ND ND 9.41 ± 3.46 ND 25.22 ± 1.97
Note: A = Conventional paddy field, B = Organic paddy field ND = not detected
The analysis of variances showed the effects of growth stages on heavy metals contaminations in rice plants (Table 7). There were significantly differences of three growth stages on Cd, Cr, Cu and Zn contaminations in rice at p < .05, [F(2, 59) = 48.632, p < .001, F(2, 86) = 3.097, p = .050, F(2, 141) = 4.532, p = .012, F(2, 141) = 8.599, p < .001], respectively.
The Tukey HSD tests were conducted to analyze the differences among means. The test indicated that the mean score for Cd content in vegetative stage (M = 0.79, SD = 0.25) was significantly different from reproductive (M = 0.23, SD = 0.12) and ripening stages (M = 0.35, SD = 0.16). There was no statistically significant difference in mean scores between reproductive and ripening stages. In addition, a Tukey HSD test revealed there was no statistically significant difference between the amounts of Cr in each growth stage (p > .05). Cu content in vegetative stage (M = 13.76, SD = 11.54) was significantly different in ripening stage (M = 9.02, SD = 5.87). There was no statistically significant difference in mean scores between reproductive stages (M = 10.05, SD = 5.56) and the others. Zn content in vegetative stage (M = 32.60, SD = 14.60) was significantly different in reproductive (M = 25.10, SD = 8.16) and ripening stages (M = 21.25, SD = 14.98). There was no statistically significant difference in mean scores between reproductive and ripening stages.
Table 7 One-way analysis of variance of heavy metals by growth stages
ANOVA Growth stages SS df MS F Sig.
Cd Between Groups 3.944 2 1.972 48.632 .000 Within Groups 2.392 59 .041
Total 6.336 61
Cr Between Groups 66.001 2 33.001 3.097 .050 Within Groups 916.295 86 10.655
Total 982.296 88
Cu Between Groups 523.989 2 261.995 4.532 .012 Within Groups 8150.522 141 57.805
Total 8674.511 143
Zn Between Groups 2906.646 2 1453.323 8.599 .000 Within Groups 23830.349 141 169.010
Total 26736.995 143 Note: p < .05
The 7th National and International Graduate Study Conference 2017
" Thailand 4.0 Creative Innovation for Sustainable Development "
I323

The analysis of variances showed the influences of rice plants parts on heavy metals contaminations (Table 8). There were significantly differences on Cd, Cr, Cu and Zn contaminations in different part of rice plant at p < .05, [F(4, 57) = 4.261, p = .004. F(4, 84) = 10.649, p < .001. F(5, 138) = 15.537, p < .001. F(5, 138) = 16.768, p < .001], respectively. Post- hoc Turkey HSD test revealed there was no statistically significant difference between heavy metal contents in each part of rice plant (p > .05), except in the root which showed the significant difference (p < .05). Table 8 One-way analysis of variance of heavy metals by parts of rice plant
ANOVA Parts of rice plant SS df MS F Sig.
Cd Between Groups 1.459 4 .365 4.261 .004 Within Groups 4.878 57 .086
Total 6.336 61
Cr Between Groups 330.522 4 82.631 10.649 .000 Within Groups 651.774 84 7.759
Total 982.296 88
Cu Between Groups 3124.351 5 624.870 15.537 .000 Within Groups 5550.160 138 40.219
Total 8674.511 143
Zn Between Groups 10104.589 5 2020.918 16.768 .000 Within Groups 16632.406 138 120.525
Total 26736.995 143 Note: p < .05
An independent sample t-test was conducted to compare the means of
heavy metals contamination between two study sites, conventional and organic paddy fields with 95% confidence interval of the difference (Table 9).
The results indicated that there was no significant differences in Cd contaminations in rice plants from conventional (M = 0.47, SD = 0.26) and organic paddy fields (M = 0.54, SD = 0.39); t(45) = -0.90, p = .929.
Similarly, there were no significant differences in Cr contaminations in rice plants from conventional (M = 7.64, SD = 3.93) and organic paddy fields (M = 6.88, SD = 2.80); t(66) = 1.024, p = .310.
There was no statistically difference in Cu content in rice from conventional (M = 11.64, SD = 8.46) and organic paddy fields (M = 9.46, SD = 6.94); t(142) = 1.692 , p = .093.
There was no significant differences in Zn contents in rice from conventional (M= 23.86, SD = 14.00) and organic paddy field (M = 26.88, SD = 13.27); t(142) = -1.331, p = .185.
The 7th National and International Graduate Study Conference 2017
" Thailand 4.0 Creative Innovation for Sustainable Development "
I324

Table 9 Compare means of heavy metals contents in conventional and organic rice
Independent t-test Levene's Test for
Equality of Variances t-test for Equality of Means
F Sig. t df Sig. (2-tailed)
Mean Difference
Std. Error Difference
95% Confidence Interval of the Difference
Lower Upper
Cd
Equal variances assumed 4.528 .037 -.093 60 .926 -.007742 .082926 -.173619 .158136
Equal variances not assumed
-.090 44.962 .929 -.007742 .086233 -.181427 .165944
Cr
Equal variances assumed 4.051 .047 1.067 87 .289 .761023 .713208 -.656555 2.178600
Equal variances not assumed
1.024 65.953 .310 .761023 .743086 -.722615 2.244660
Cu
Equal variances assumed 1.619 .205 1.692 142 .093 2.182639 1.289707 -.366867 4.732145
Equal variances not assumed
1.692 136.757 .093 2.182639 1.289707 -.367708 4.732985
Zn
Equal variances assumed .041 .840 -1.331 142 .185 -3.024417 2.272845 -7.517402 1.468569
Equal variances not assumed
-1.331 141.611 .185 -3.024417 2.272845 -7.517508 1.468675
Note: p < .05, p < .02 (two-tailed)
The 7th National and International Graduate Study Conference 2017
" Thailand 4.0 Creative Innovation for Sustainable Development "
I325

Discussion According to the informal interview with the owner, conventional rice
paddy field was started sowing late due to the excessive rainfalls in July and early upcoming winter in 2016. The rice plants grew from conventional paddy fields showed some visible signs indicated the delayed in growing during crop season. From field observation and physical measurements, conventional rice plants were shorter in height, produced less tillers and less panicles compared to the organic rice.
According to the Figure 2, the graph similarly indicated the higher growth rate of conventional rice, because rice plants were accelerated their growth, trying to grow and produce grains before the crop season was over. The amount of time or days after sowing for conventional rice was also shorter, around 80 days while organic rice took almost 100 days after transplanting.
For heavy metal contamination in rice plant, Cd found in the conventional rice grain was 0.14 mg kg-1. According to EU (2006) and standards in Asian countries (Thai MOPH, 1986; China MOH, 2012), Cd in conventional rice was under permitted level (Cd < 0.20 mg kg-1) but it was higher than the FAO Codex (1995) standard for food (Cd < 0.10 mg kg-1).
According to the results, majority of Cd content was restrained in the root parts, only small amount of Cd had been transported up to upper parts of rice plant. However, according to Dalcorso (2012), Cd could mobilize to the vegetative and reproductive organs, as similar as the results, which Cd was concentrated in the panicles (0.23 mg kg-1) and grains (0.14 mg kg-1) of the conventional rice.
Heavy metals could be easily uptake and transport by plants to accumulate in different parts, even though some metals such as Cd and Cr which were known as toxic metal with no biological function for plants (Dalcorso, 2012). Cd and Cr could be restrained in the root parts, but some were capable to be interrupted others metals or chemical compounds to be transport up in upper parts of rice plants.
For Cr, it was more complicated because of its complex chemistry. The concentration of Cr mostly accumulated in the root parts, but it could mobilize and accumulate in the upper parts of rice plants. Cr found in rice husks for both paddy fields but undetected in the rice grain.
The amount of Cr found in rice samples were under the suitable range, 1-3 mg kg-1 that plants were normally grew. There was no Cr found in the rice grain from both paddy fields. According to Arunakumara et al. (2013), rice plants could act as hyper-accumulators of Cr, Ni and Co, these metals could be transfer up from root to grain but the concentrations in the edible grain were significantly below the food standards. These two toxic metals could derived from chemical fertilizers especially Cd which mainly originated from anthropogenic sources. Similarly, no trace of Pb found in rice plants and its grains from both paddy fields.
For Cu and Zn, they were micronutrients for plants which the amounts found in plants were considered to be relatively high compared to other metals. Both Cu and Zn were found in the range that plants normally grew (20-60 mg kg-1 and < 100 mg kg-1), respectively (Chaney, 1982). Cu and Zn were micronutrients for plants. These metals could originate from parent materials and both livestock manure and phosphate-based fertilizers (Arunakumara et al., 2013).
From the analysis of variance and independent t-test, it showed that plant functional ability to absorb nutrients and metals available in the environment was the
The 7th National and International Graduate Study Conference 2017
" Thailand 4.0 Creative Innovation for Sustainable Development "
I326
major factor influencing the heavy metals found in each particular part of plant. Toxic metals such as Cd and Cr, plants had their own ability to restrict these metals in root to protect itself from harms.
However, under various factors and circumstances these toxic metals were mobilized to upper parts of rice plants alongside the other essential nutrients, which could accumulated in the reproductive organs such as panicles and grains, and posed the threats for all consumers. The activities of the farmers in different stages of rice growth were directly increased the metals input to the environment which allowed the accessibility for rice plants to uptake metals and accumulated into its grains.
Recommendations
1.) Plants samples should be measured their physical characteristics in few days after collected from the field because plant materials could easily loss their moisture and its physiques could easily change
2.) Plants samples should be dried in the oven at 60 – 70 ºC more than 48 hours in order to make sure it was properly dried and would not cause moles or other contaminants to generate in the samples
3.) All the laboratory glassware need to be cleaned and soaked in nitric acid for 24 hours before uses to eliminate residue and contaminants which could interfere the heavy metal contents in the analysis
References APIS (Air Pollution Information System). (2014). “Heavy metals: Introduction.”
Available from http://www.apis.ac.uk/overview/pollutants/overview_ HM.htm
Arunakumara, K.K.I.U., Walpola, B.C., and Yoon, M.H. (2013). “Current status of heavy metal contamination in Asia’s rice lands.” Reviews in Environmental Science and Bio/Technology, 12: 355-377.
Boshoff, M., DeJonge, M., Dardenne, F., Blust, R., and Bervoets, L. (2014). “The impact of metal pollution on soil faunal and microbial activity in two grassland ecosystems.” Environmental Research, 134:169–180.
Campbell, C.R., and Plank, C.O. (1992). “Preparation of plant tissue for laboratory analysis.” In Yash P. Kalra (Eds.), Handbook of reference methods for plant analysis, 37-49. United States: CRC Press.
Chaney, R.L. (1982). “Fate of toxic substance in sludge applied to cropland.” In: Proc International Symposium on Land Application of Sewage Sludge, Association for the Utilization of Sewage Sludge. Tokyo, Japan.
China MOH. (2012). “Maximum allowable level of metals in Rice.” May 22. Dalcorso, G. (2012). “Heavy Metal Toxicity in Plants.” Plants and Heavy Metals: 1-
25. EU. (2006). “Commission Regulations no. 1881/2006.” May 22. FAO. (1995). “Codex-stan 193-1995.” May 22. Gomez, K. A. (2001). “Rice, the grain of culture.” Paper presented at the Siam
Society Lecture Series, The Siam Society, Bangkok, Thailand. Hu, X.F., Jiang, Y., Shua, Y., Hu, X., Liu, L., and Luoa, F. (2014). “Effects of mining
wastewater discharges on heavy metal pollution and soil enzyme activity
The 7th National and International Graduate Study Conference 2017
" Thailand 4.0 Creative Innovation for Sustainable Development "
I327

of the paddy fields.” Journal of Geochemical Exploration, 147: 139–150.
Jones, J.B. Jr. (1998). “Handbook of Reference Methods for Plant Analysis.” In Y. P. Kalra (Eds.), Field sampling procedures for conducting plant analysis , 25-36. Florida, United States: CRC Press.
Thailand, MOPH (1986). “General Standard for Contaminants and Toxins in Food, B.E. 2529 (1986).” May 22.
Redfern, S.K., Azzu, N., and Binamira, J.S. (2012). “Rice in Southeast Asia: facing risks and vulnerabilities to respond to climate change.” Paper presented at the Building resilience for adaptation to climate change in the agriculture sector for Joint Workshop of FAO/OECD, Rome, Italy.
Sohn, E. (2014). “The toxic side of rice: Around the world, researchers are looking for ways to rid rice of a troublesome companion.” Nature: 514, 62-63.
Soon, Y.K. (1998). “Determination of As, Hg, Cd, Cr and Pb in plant tissue. In Yash P, Karla (Eds.)”, Handbook of reference methods for plant analysis, 183-198. Florida, USA: CRC Press.
Tangahu, B.V., Sheikh-Abudallah, S.R., Basri, H., Idris, M, Anuar, N., and Mukhlisin, M. (2011). “A review on heavy metals (As, Pb and Hg) uptake by plants through phytoremediation.” International Journal of Chemical Engineering: 1-32.
Wuana, R.A., and Okieimen, F.E. (2011). “Heavy Metals in Contaminated Soils: A review of sources, chemistry, risks and best available strategies for remediation.” ISRN of Ecology: 1-20.
Xu, X., Zhao, Y., Zhao, X., Wang, Y., and Deng, Y. (2014). “Sources of heavy metal pollution in agricultural soils of a rapidly industrializing area in the Yangtze Delta of China.” Ecotoxicology and Environmental Safety 108: 161–167.
The 7th National and International Graduate Study Conference 2017
" Thailand 4.0 Creative Innovation for Sustainable Development "
I328

Effect of indole acetic acid produced by Klebsiella variicola C1DO on simulated drought condition for evaluating grain filling and seed weight
of rice (Oryza sativa L.)
R.A.P.S. Wimalasenae1
, P. Na Chiangmaia1
, S. Khianngama1
, M. Kanjanamaneesathiana1
e1
Student in the Program for a Degree in Master of Science in Bioscience for Sustainable Agriculture
a1Faculty of Animal Science and Agricultural Technology, Silpakorn University,
Phetchaburi IT campus, Cha-Am, Phetchaburi, 76120, Thailand
Abstract
Rice is a food staple for people worldwide. However, rice production has been subjected to various limiting factors such as pests and drought. The objective of this study was to investigate effect of simulated drought condition by alternately wetting and drying (AWD) soil and application of exogenous indole acetic acid (IAA) on grain filling and grain weight of rice (Oryza sativa L.) of both upland rice (variety Nah San) and lowland rice (variety RD 31). The result showed that exogenous IAA (both syntactic and bacteria), watering schedule, and the interaction between them did not significantly affect percentage of filled grains and grain weight of both varieties. However, applied IAA showed a positive affect for increasing percentage value of grain filling in dry condition of variety Nah San.
Key Word (s): beneficial microorganisms, rice production
1. Introduction
Rice (Oryza sativa L.) is a food for people in Asia, part of Latin America and Africa. However, rice production has been subjected to various limiting factors such as pests and drought. In Asia, rice yield lost due to the adverse weather such as drought in 2014 has been reported to be very high, at approximately 5.3 million tons (FAO, 2015).
Drought stress at different growth stages incurs high percentage of unfilled grains (Davatgar et al., 2009) and low grain weight (Yang et al., 2001). The reduction is mainly due to the lowered number of endosperm cells, and decreased sink size (Yang et al., 2001). Application of plant growth regulators and water saving management methods has been investigated to deal with drought condition (Yang et al., 2001; Dawe, 2005 and Javid et al., 2011). Exogenous IAA application at the reproductive stage has been reported to increase the grain weight, fill grain percentage and rice yield (Javid et al., 2011).
IAA producing microorganisms is a source of exogenous IAA for plant growth promotion (Park et al., 2006; Mohite, 2013). Klebsiella sp. is the bacterium known to possess several beneficial characteristics such as production of IAA (Sachdev et al., 2009). Klebsiella variicola C1DO is capable of producing IAA (Wimalasena et al., 2017). IAA filtrated (at 25 µM) from the Klebsiella variicola C1DO culture was found
The 7th National and International Graduate Study Conference 2017
" Thailand 4.0 Creative Innovation for Sustainable Development "
I329

to have a positive effect in increasing the shoot height of rice seedlings (variety Nah San) (Wimalasena et al., 2017).
Objective
1. To evaluate the effect of IAA produced by Klebsiella variicola C1DO on grain filling and grain weight of rice under simulated drought conditions.
Research Methodology 1. Source of Klebsiella variicola C1DO
K. variicola C1DO, isolated from the organic compost, was obtained from Dr. Saowapar Khianngam, Faculty of Animal Science and Agricultural Technology, Silpakorn University, Phetchaburi IT campus, Cha-Am, Thailand. 2. Preparation of IAA solution from Klebsiella variicola C1DO
Klebsiella variicola C1DO was cultured in nutrient broth and IAA was extracted for spray to rice plants in the grain filling experiment. This was carried out by dissolving 0.15g of nutrient medium (Wimalasena et al., 2017) in 150 mL distilled sterile water (in 250 mL conical flasks) with L- tryptophan (at 100 µg mL
-1) as a substrate (Phetcharat and
Duangpaeng, 2011). Each flask was inoculated with 0.15 mL of bacterial suspension which had been adjusted to the optical density at 0.5 and incubated in a rotary shaker with 150 rpm at 30-32
o C. After 66 hours (Wimalasena et al., 2017), the medium was
sterilized using filtration method (Nissen et al., 1990). IAA was determined using Salkowski method (Gordon and Weber, 1951; Phetchara and Duangpaeng, 2011).
3. Determination of changes in soil water content (SWC) with time
This experiment was conducted to determine soil water content (SWC) over time by collecting soil samples with 4 replications in the greenhouse. Eight kilograms of commercially available planting substrate (the mixture of compost and manure) were put into the plastic pot (dimension: 26 cm in height and 35 cm in diameter). Saturation water volume was identified as 1.2 L, a volume of water that would be added to the planting substrate in the pots. The planting substrate samples (10 - 15 g) were taken from the center of the four pots at the 10 cm depth daily for eight days. The fresh weight of these samples was determined immediately and the dry weight was obtained after they had been dried in the hot- aired oven at 105
oC for 24 hours (Zhang et al., 2012). The water
holding capacity was calculated using following equation:
Soil water content (SWC) = 100 X (Fresh soil weight – Dry soil weight) / Fresh soil weight (Zhang et al., 2012) 4. Effect of exogenous IAA on grain filling under simulated drought
An experiment was conducted to study the effect of types of IAA, rice varieties and drought on grain filling of rice. The experiment was arranged in the 3 X 2 X 2 factorial completely randomized design (CRD) with 4 replications in the greenhouse. To prepare the rice plants, eight kilograms of commercially available planting substrate (pH 5.71, OM 14.2%, EC 6.3dS/m, N 67.5 mg/ kg, P 111.34 mg / kg, K 3465 mg / kg) were put into the plastic pots (dimension: 26 cm in height and 35 cm in diameter) after which either Nah San or RD 31 rice seeds (10 – 15 seeds per pot) were sown. After 10 days, excessive seedlings were removed and four seedlings per pot were retained for use in the experiment (one pot as a replicate, containing four plants). These rice plants were
The 7th National and International Graduate Study Conference 2017
" Thailand 4.0 Creative Innovation for Sustainable Development "
I330

watered until its reached flowering stage. After flowering, the drought condition (DC) was initiated by an alternate watering (up to saturation) - drying four cycles (7
days/
cycle, 7th
day leaf rolling was started)) soil in the pots. For the nil control treatment, the soil water content (at day 0 = 59.1 and at day 1 = 52.1) was regularly maintained (normal condition - NC). At the anthesis stage, these rice plants were transferred to the greenhouse which had overhead cover to avoid the effect of the rain.
To spray the rice plants, fifty milliliters of either filtered IAA produced by Klebsiella variicola C1DO, the synthetic IAA (at 2.5 X 10
-5 M concentration) or the
distilled sterile water [all with Tween 20 polysorbate (at 0.05% v/v) as surfactant (Park et al., 2006)] were sprayed three times to rice panicles at the beginning of anthesis in the evening at 6.00 p.m. (Javid et al., 2011) every seven days. At the 80 % of ripening stage, three panicles were harvested from each hill. Each panicle was divided into two equal parts at the middle between the tip and the end of rice panicle. The filled grain percentage and grain weight were assessed separately in the upper and the lower part of the panicle to identify the effect of the spray to each parts (Javid et al., 2011). Dry weight of the grains was determined after drying in the oven at 70
◦C for 48 hours (Zhang
et al., 2012).
5. Statistical analysis The results of the experiments were expressed as mean and standard deviation. The
data were analyzed using analysis of variance followed by Turkey test using R version 3.3.1(P ≤ 0.05) (R Core Team, 2016). Results 1. Determination of changes in soil water content (SWC) with time
Soil water content (SWC) of the commercially available planting substrate was 59.11 and 38.55 at the day 0 and day 7 respectively. SWC was found to decline at the rate of -2.59 (Figure 1).
Figure 1 Soil water content changes with time
2. Effect of exogenous IAA on grain filling under simulated drought The effect of drought (alternate wetting – drying, four cycles with seven days
interval) and IAA spray on the percentage of filled grains in both varieties are shown (Table 1 and Table 2). The varieties of rice, drought and the spray of IAA (regardless of the sources of IAA) and all the interactions between them did not significantly affect the percentage of filled grains in both the upper and the lower parts of the panicle.
The 7th National and International Graduate Study Conference 2017
" Thailand 4.0 Creative Innovation for Sustainable Development "
I331

The effect of drought (alternate wetting - drying cycle) and IAA spray on the weight of the grains of both varieties are shown (Table 3 and Table 4). Only the rice variety had the significant effect to grain weight, basing on the assessment of the grains in the upper and the lower parts of the panicle. Table 1 Effect of type of indole acetic acid and drought on grain filling percentage of the upper part of the panicle Treatment Nah
San, NC
Nah San, DC
A-B RD 31, NC
RD 31, DC
A-B Mean (IAA)
IAA Bacteria
53.81
±19.49
59.71
± 20.35 (A)
+ 2.38 65.74
± 7.92
62.00
±11.25 (A)
-2.73 60.31
±14.72
IAA Synthetic
57.31
±23.05
65.53
± 7.11
(A)
+ 8.20 64.84
± 7.39
59.72
±19.13 (A)
-5.01 61.85
±14.60
Control
52.76
± 9.07
57.33
± 5.89
(B)
74.59
± 6.19
64.73
± 4.47 (B)
62.35
±10.38
Mean (Nah San) = 57.74 ±14.59 Mean (RD 31) = 65.27 ±10.47
Mean (Dry Condition) = 61.50 ±11.87, Mean (Normal Condition) = 61.5
±14.54
CV (%) = 21.81 F test (P value) Varity = ns (0.0597), Watering = ns (0.9984), IAA = ns (0.9050),
Varity: IAA = ns (0.3590), Varity: Watering = ns (0.1162) Watering: IAA = ns (0.8896), Varity: Watering: IAA = ns (0.9655)
Table 2 Effect of type of indole acetic acid and drought on grain filling percentage of the lower part of the panicle Treatment Nah
San, NC
Nah San, DC
A-B RD 31, NC
RD 31, DC
A-B Mean (IAA)
IAA Bacteria 38.98
±13.21
40.71
± 31.56
(A)
+0.47 51.90
± 8.44
41.36
± 12.76 (A)
-11.9 43.24
± 17.56
IAA Synthetic
45.34
±14.49
42.04
± 17.34 (A)
+1.8 49.07
± 7.41
53.81a
± 12.55 (A)
+0.55 47.56
± 12.85
Control
50.58
± 5.38
40.24
± 20.91 (B)
55.62
± 7.19
53.26a
± 9.52 (B)
49.93
± 12.59
Mean (Nah San) = 42.98 ±17.21 Mean (RD 31) = 50.84
±9.99
Mean (Dry Condition) = 45.24 ±17.78, Mean (Normal Condition) = 48.58
±10.31
CV (%) = 32.18 F test (P value) Varity = ns (0.0798), Watering = ns (0.4480), IAA = ns (0.4538),
Varity: IAA = ns (0.9779), Varity: Watering = ns (0.8869) Watering: IAA = ns (0.7925), Varity: Watering: IAA = ns (0.5532)
The 7th National and International Graduate Study Conference 2017
" Thailand 4.0 Creative Innovation for Sustainable Development "
I332
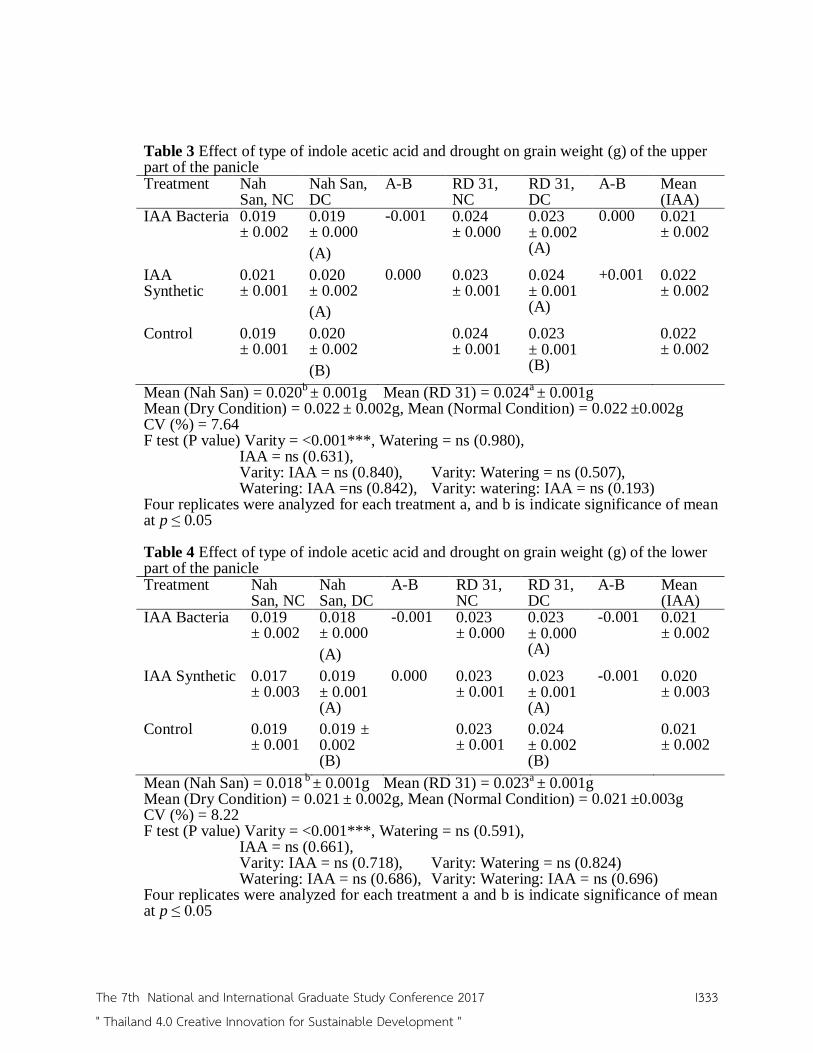
Table 3 Effect of type of indole acetic acid and drought on grain weight (g) of the upper part of the panicle Treatment Nah
San, NC Nah San, DC
A-B RD 31, NC
RD 31, DC
A-B Mean (IAA)
IAA Bacteria 0.019
± 0.002
0.019
± 0.000
(A)
-0.001 0.024
± 0.000
0.023 ± 0.002 (A)
0.000 0.021
± 0.002
IAA Synthetic
0.021
± 0.001
0.020
± 0.002
(A)
0.000 0.023
± 0.001
0.024
± 0.001 (A)
+0.001 0.022
± 0.002
Control
0.019
± 0.001
0.020
± 0.002
(B)
0.024
± 0.001
0.023
± 0.001 (B)
0.022
± 0.002
Mean (Nah San) = 0.020b ± 0.001g Mean (RD 31) = 0.024
a ± 0.001g
Mean (Dry Condition) = 0.022 ± 0.002g, Mean (Normal Condition) = 0.022
±0.002g
CV (%) = 7.64 F test (P value) Varity = <0.001***, Watering = ns (0.980),
IAA = ns (0.631), Varity: IAA = ns (0.840), Varity: Watering = ns (0.507), Watering: IAA =ns (0.842), Varity: watering: IAA = ns (0.193)
Four replicates were analyzed for each treatment a, and b is indicate significance of mean at p ≤ 0.05 Table 4 Effect of type of indole acetic acid and drought on grain weight (g) of the lower part of the panicle Treatment Nah
San, NC Nah San, DC
A-B RD 31, NC
RD 31, DC
A-B Mean (IAA)
IAA Bacteria 0.019
± 0.002
0.018
± 0.000
(A)
-0.001 0.023
± 0.000
0.023
± 0.000 (A)
-0.001 0.021
± 0.002
IAA Synthetic 0.017
± 0.003
0.019
± 0.001 (A)
0.000 0.023
± 0.001
0.023
± 0.001 (A)
-0.001 0.020
± 0.003
Control
0.019
± 0.001
0.019 ±
0.002 (B)
0.023
± 0.001
0.024
± 0.002 (B)
0.021
± 0.002
Mean (Nah San) = 0.018 b
± 0.001g Mean (RD 31) = 0.023a ± 0.001g
Mean (Dry Condition) = 0.021 ± 0.002g, Mean (Normal Condition) = 0.021
±0.003g
CV (%) = 8.22 F test (P value) Varity = <0.001***, Watering = ns (0.591),
IAA = ns (0.661), Varity: IAA = ns (0.718), Varity: Watering = ns (0.824) Watering: IAA = ns (0.686), Varity: Watering: IAA = ns (0.696)
Four replicates were analyzed for each treatment a and b is indicate significance of mean at p ≤ 0.05
The 7th National and International Graduate Study Conference 2017
" Thailand 4.0 Creative Innovation for Sustainable Development "
I333

Discussion The spray of IAA (at 2.5 X 10
-5 M concentration, 3 applications both Klebsiella
variicola C1DO and synthetic IAA) did not significantly affected grain filling percentage and grain weight in both upper and lower part of the panicle under simulated drought. Percentage of filled grain in the upper part is higher than that of the lower part in both verities. Upland rice (var. Nah San) treated with IAA had grain filling percentage higher than that of nil control for both upper and lower part (A-B). However, lowland rice (var. RD 31) treated with IAA had grain filling percentage lower than that nil control (A-B). Both rice variety treated with synthetic IAA had grain filling percentage and grain weight higher than that treated with IAA from Klebsiella variicola C1DO. It has been reported that the effect of IAA on grain filling is depending on other factors such as rice variety and concentration of exogenous IAA (Yang et al., 2001; Javid et al., 2011). There was a report that the IAA concentration in rice grain was varied based on rice varieties (Yang et al., 2001). Two applications of the exogenous IAA (at 5 X 10
-5 M
concentration at anthesis) significantly increased the grain yield and 1000-grain weight of rice under salinity and normal conditions (Javid et al., 2011). Application of naphthalene acetic acid, an artificial auxin at 90 ml/ha, at the grain development stage has been reported to promote grain filling and yield of rice (Bakhsh et al., 2011).
Simulated drought condition also did not significantly affect grain filling and grain weight in both rice varieties. In AWD treatment, soil water content fluctuated from 59.11 to 38.55 every seven days. Rice (var. Nah San), an upland rice which is comparatively tolerant to drought (Fukai and Cooper, 1995) had high grain filling percentage (in upper part) in the dry conditions than the normal condition. On the other hand, RD 31, a lowland rice variety, had high grain filling percentage (in upper part) in the wet conditions than dry condition. Drought at the flowering stage significantly affected the percentage of unfilled grains and grain yield of rice (Davatgar et al., 2009). In this experiment, water stress (by AWD) was created soon after flowering necessitating the need to identify the effect of drought condition on grain filling in each stage of rice growth. Conclusion
The spray of indole acetic acid (2.5 X 10 -5
M concentration, both synthetic and produced by Klebsiella variicola C1DO) and AWD (7-day cycles) did not significantly affect the percentage of grain filling and grain weight of rice. However, application of IAA increased the percentage of grain filling in the upper part of the panicle of rice (var. Nah San) in the simulated drought condition.
Recommendation
The effect of IAA under drought conditions should be investigated further to identify the optimal IAA concentrations with respect to grain filling of both rice varieties. Acknowledgment The first author would like to thank the Thailand International Cooperation Agency (TICA) for providing scholarship to study for Master of Science in Bioscience for Sustainable Agriculture at the Faculty of Animal Science and Agricultural Technology, Silpakorn University, Phetchaburi IT campus, Cha-Am, Thailand. The authors also like to thank TICA for providing grant to conduct this research work. The Faculty of Animal Science and Agricultural Technology, Silpakorn University, Phetchaburi IT campus, Cha-Am, Thailand is gratefully acknowledged for laboratory facilities.
The 7th National and International Graduate Study Conference 2017
" Thailand 4.0 Creative Innovation for Sustainable Development "
I334

References Bakhsh, I., I. Awan, M. Sadiq, M. Niamatullah, K. U. Zaman and M. Aftab. (2011).
“Effect of plant growth regulator application at different growth stages on the economical yield potential of coarse rice (Oryza Sativa L.)”. The Journal of Animal & Plant Sciences 21, 3 : 612-616.
Dawe, D. (2005). “Increasing water productivity in rice-based systems in Asia—past trends, current problems, and future prospects”. Plant Production Science 8 (December): 221–230.
Davatgar, N., M. R. Neishabouri, A. R. Sepaskhah, and A. Soltani. (2009). “Physiological and morphological responses of rice (Oryza sativa L.) to varying water stress management strategies”. International Journal of Plant Production 3, 4 (September): 19-32.
Food and Agriculture Organization of the United Nation. (2015). Rice market monitor. Food and Agriculture Organization of the United Nation 18, 1.
Fukai, S, and M. Cooper. (1995). “Development of drought-resistant cultivars using physiomorphological traits in rice”. Filed crop research 40 (February): 67- 86.
Gordon, S. A. and R. P. Weber. (1951). “Colorimetric estimation of indole acetic acid”. Plant Physiology 26, 4 (October): 192-195.
Javid, M. G., A. Sorooshzadeh, S. A. M. M. Sanavy, I. Allahdadi, and F. Moradi. (2011). “Effects of the exogenous application of auxin and cytokininon carbohydrate accumulation in grains of rice under salt stress”. Plant Growth Regulation 65 (June): 305-313.
Mohite, B. (2013). “Isolation and characterization of indole acetic acid (IAA) producing bacteria from rhizospheric soil and its effect on plant growth”. Journal of Soil Science and Plant Nutrition 13, 3: 638-649.
Nissen, S. J. and E. G. Sutter. (1990). “Stability of IAA and IBA in nutrient medium to several tissue culture procedures”. Hort Science 25, 7 (July): 800-802.
Park, K., D. Paul, and W. Yen. (2006). “Bacillus Vallismortis EXTEN -1 mediated growth promotion and disease suppression in rice”. The Plant Pathology Journal 22, 3 (September): 278-282.
Phetcharat, P., and A. Duangpaeng. (2011). “Screening of endophytic bacteria from organic rice tissue for indole acetic acid production”. Procedia Engineering 32 (November): 177-183.
R Core Team. (2016). R: A language and environment for statistical computing. Accessed 2016 December 05. Available from http://www. R-project.org/
Sachdev, D. P., H. G. Chaudhari, V. M. Kasture, D. D. Dhavale, and B. A. Chopade. (2009). “Isolation and characterization of indole acetic acid (IAA) producing Klebsiella pneumoniae strains from rhizosphere of wheat (Triticum aestivum) and their effect on plant growth”. Indian Journal of Experimental Biology 47, 12 (December): 993-1000.
Tabatabaei, S., P. Ehsanzadeh, H. Etesami, H. A. Alikhani, and B. R. Glick. (2016). “Indole-3-acetic acid (IAA) producing Pseudomonas isolates inhibit seed germination and α-amylase activity in durum wheat (Triticum turgidum L.)”. Spanish Journal of Agricultural Research 14,1 (March): 1-10.
Wimalasena, R. A. P. S., P. Na Chiangmai, S. Khianngam, and M. Kanjanamaneesathian. (2017). “Common household flavor enhancer as a nutrient for culturing Klebsiella variicola C1DO, a potential rice growth promoting bacterium”. In 8
th
International science, social science, engineering and energy conference, March 15-17,2017, Abstract book, 4. Pattaya, Thailand : Phranakhon Rajabhat University.
The 7th National and International Graduate Study Conference 2017
" Thailand 4.0 Creative Innovation for Sustainable Development "
I335

Yang, J., J. Zhang, Z. Wang, Q. Zhu and W. Wang. (2001). “Hormonal changes in the grains of rice subjected to water stress during grain filling”. Plant Physiology 127 (September): 315-323.
Zhang, Y., Q. Tang, S. Peng, D. Xing, J. Qin, R. C. Laza, and B. R. Punzalan. (2012). “Water use efficiency and physiological response of rice cultivars under alternate wetting and drying conditions”. The Scientific World Journal 2012 (November): 1-10.
The 7th National and International Graduate Study Conference 2017
" Thailand 4.0 Creative Innovation for Sustainable Development "
I336

Title Wound area measurement using image processing analysis
Author : Maemmoth Chuongsakun and Surapong Chatpun Program Institute of Biomedical Engineering, Faculty of Medicine, Institute Prince of Songkla University, Songkhla 90110, Thailand
Abstract
Wounds are physical damages or injuries which cause an opening or break of
the skin tissues. The healing potential is usually evaluated from the change of wound
area or wound diameter during the inspection period. This study aimed to create the
computer algorithm to assist the wound area measurement. The algorithm was based
on the image processing technique. Digital image of wound was converted to
grayscale image and black and white (B&W) image, respectively. Morphological
operations were then applied to B&W image such as dilating filling, cutting and
eroding. Image segmentation was performed for wound boundary detection and
wound area was then measured. Our algorithm was tested with two groups of images;
simple geometries and wounds. The accuracy of wound area measurement was
determined by comparing our algorithm with ImageJ software. The results showed
that it had high accuracy when testing with simple geometries (>96%). The accuracy
of wound measurement was quite high (>91%) but there was an image that could not
be determined wound area. Our results showed that the accuracy of area measurement
depended on the quality of digital image. It can be concluded that this algorithm will
reduce the hum an work for wound area measurement and it might reduce the inter-
observer variability.
Keywords: wound, area measurement, image analysis, ImageJ, morphological
operation
Introduction
Wounds are physical damages or injuries which cause an opening or break of
the skin tissues. In the repairing process of wound healing, there are four stages which
involve homeostasis, inflammation, proliferation and maturation or remodeling (Rhett
et al.,2008; Velnar et al., 2009). There are many techniques that have been
implemented to accelerate wound healing process. Vacuum-assisted closure
technique removed chronic edema and enhanced formation of granulation tissue
leading to efficacious wound closure (Argenta et al.,1997). Electrical stimulation has
been applied for wound healing and several studies showed that the electrical
The 7th National and International Graduate Study Conference 2017
" Thailand 4.0 Creative Innovation for Sustainable Development "
I337

stimulation could increase rate of healing (Rouabhia et al.,2013; Houghton et al.,2010
; Sebastian et al.,2011 ; Kloth .,2014). Light therapy using light-emitting diode (LED)
is a new technique to enhance wound healing (Adamskaya et al.,2011; De Sousa et
al.,2010; Minatel et al.,2009).
The healing potential is usually evaluated from the change of wound area or
wound diameter during the inspection period (Cardinal et al.,2008; Wood et al.,2014).
There are both manual and automatic methods to measure wound area. Nayak et al.
used transparency paper and a permanent marker to record wound size and then they
used graph paper to measure wound area (Nayak et al.,2009). In other study, wounds
were photographed, transferred to computer and measured with special size analysis
software (Atiba et al.,2011). Furthermore, an open source software such as ImageJ
was used to trace the outline of wound and to calculate the wound area (Chang et
al.,2011). Zordan and colleague wrote MATLAB algorithm to perform texture
segmentation to measure the wound area (Zordan et al.,2011). Therefore, the
computer-assisted analysis for wound size is still a challenge for biomedical research.
Objectives
1) This study aimed to create the computer algorithm to assist the wound area
measurement and compared the results with the open source image processing
program.
Research Methodology
The process of our algorithm to measure the wound area is generally described
as a diagram in Figure 1. The image was firstly converted from RGB to grayscale and
then it was converted to black and white image. After that, morphological operations
i.e. dilation, filling, cutting and erosion were applied to image as a step of image
processing. Image segmentation was then performed to trace the edge of area or
wound. Finally, area was determined with the area calculation code. We tested the
efficiency of the algorithm by determine the accuracy of area measurement.
Therefore, the measured area using our algorithm was compared with the result
determined by ImageJ (version 1.46r). The accuracy of area measurement has been
calculated as presented in equation 1.
% 𝑎𝑐𝑐𝑢𝑟𝑎𝑐𝑦 = 100 − (|𝐴𝑟𝑒𝑎𝑎𝑙𝑔𝑜𝑟𝑖𝑡ℎ𝑚−𝐴𝑟𝑒𝑎𝐼𝑚𝑎𝑔𝑒𝐽|
𝐴𝑟𝑒𝑎𝐼𝑚𝑎𝑔𝑒𝐽×100) …….………. (1)
There were two groups of images used to determine the efficiency of the algorithm.
First group contained images of known geometry whereas the second group contained
images of animal wounds. All images in our study were obtained from online sources.
The 7th National and International Graduate Study Conference 2017
" Thailand 4.0 Creative Innovation for Sustainable Development "
I338

Results/Conclusion
In the first group of images, using simple geometries, the differences in the
area measurement using ImageJ and our computer-assisted algorithm are showed in
Table 1. Furthermore, the accuracy of measurement had been determined and
presented in Table 1.The accuracy for the images in the first group is in a range of
96.1%-99.9 %. In the second group of images, wound image was processed
according to our algorithm. The images resulted from the image processing are
presented in Figure 2. Then, the wound areas and measurement accuracy were
calculated as showed in Table 2. The accuracy for the images in the second group is
in a range of 91.0%-97.7 %. However, we found that our algorithm could not
determine area for the image which has many voids after black and white conversion
as shown in last row in Table 2.
Figure 1 Diagram of image analysis processes to determine wound area
The 7th National and International Graduate Study Conference 2017
" Thailand 4.0 Creative Innovation for Sustainable Development "
I339

Figure 2 Example of images after processes to determine the wound area: (a) original
image, (b) grayscale image, (c) black and white image, (d) image after dilation, (e)
image after filling, (f) image after cutting, (g) image after erosion and (h) image after
tracing
The 7th National and International Graduate Study Conference 2017
" Thailand 4.0 Creative Innovation for Sustainable Development "
I340

Table 1 Area of given geometries and the accuracy of area measurement using the
computer-assisted algorithm and ImageJ
Image
Measured Area
(pixel) Difference of
area
(pixel)
Accuracy
(%) ImageJ Computer-
assisted
algorithm
10,525 10,940 415 96.1
14,199 14,676 477 96.7
19,106 19,104 2 99.9
7,473 7,674 201 97.3
1,2801 1,2761 40 99.7
The 7th National and International Graduate Study Conference 2017
" Thailand 4.0 Creative Innovation for Sustainable Development "
I341

Table 2 Area of animal wounds and the accuracy of wound area measurement using
the computer-assisted algorithm and ImageJ
Image
Measured Area
(pixel) Difference of
area
(pixel)
Accuracy
(%) ImageJ Computer-
assisted
algorithm
7,315 7,980 665 91.0
13,323 13,686 363 97.3
924 903 21 97.7
10,987 11,274 287 97.4
- 28,010 - -
41,999 - - -
The 7th National and International Graduate Study Conference 2017
" Thailand 4.0 Creative Innovation for Sustainable Development "
I342
Discussion
We have created an algorithm that determines the area of digital wound image.
It was found that our algorithm provided high accuracy of test images contained
different sizes of wound. We notice that images with light reflection have lower
accuracy than images without light reflection. Furthermore, the contrast between the
object and background can influence the image processing (Lopez-Molina et
al.,2013). There was a study showed that it is difficult to recognize the images of
human chronic wounds because of the variability of the wound bed and the
inhomogeneity of the patient skin (Papazoglou et al.,2010). In this study, it was
noticed in this study that ImageJ also could not give the value of wound area if the
wound (object) and the skin (background) was not clearly distinguishable. That means
the quality of image plays a role for wound detection. In addition, image noise also
causes the error in an image processing. Therefore, it is necessary to have an image
pre-processing to enhance a quality of image such as noise filtering, contrast
adjustment and histogram modification (You et al.,2008; Adel et al., 2008; Geetha et
al.,2014). Currently, our algorithm is not completely developed for wound
measurement. It is still a challenge to improve this algorithm to have an automatic
image quality enhancement and a boundary of wound detection. Moreover, it should
have a function to determine the percent of wound change from two images of wound
at the certain points in time. This algorithm will reduce the human work for wound
measurement and it might reduce the inter-observer variability.
Recommendations
Using the computer-assisted program can facilitate the wound measurement
and reduce the variation of inter-observer. Our results showed that the accuracy of
area measurement depends on the quality of image. Therefore, it should be concerned
before taking a digital photograph of wound. It is also necessary to verify the
repeatability of area measurement for different conditions of wounds such as dirty
wound bed, a large color contrast with surrounding tissues and wound with
inflammation.
The 7th National and International Graduate Study Conference 2017
" Thailand 4.0 Creative Innovation for Sustainable Development "
I343

References
Adamskaya, N., Dungel, P., Mittermayr, R., Hartinger, J., Feichtinger, G., Wassermann, K., Redl H. & van Griensven, M. (2011). “Light therapy by blue LED improves wound healing in an excision model in rats.” Injury 42, (September): 917- 921. .
Adel, M., Zuwala, D., Rasigni, M., & Bourennane, S. (2008). “Filtering noise on
mammographic phantom images using local contrast modification functions.” Image Vision Comput 26, 1 (September): 1219-1229. .
Argenta, L. C., & Morykwas, M. J. (1997). “Vacuum-Assisted Closure: A New Method for Wound Control and Treatment: Clinical Experience.” Annals of Plastic Surgery 38, (June): 563-577. . .
Atiba, A., Nishimura, M., Kakinuma, S., Hiraoka, T., Goryo, M., Shimada, Y., Ueno H. & Uzuka, Y. (2011). “Aloe vera oral administration accelerates acute radiation-delayed wound healing by stimulating transforming growth factor-beta and fibroblast growth factor production.” Am J Surg 201, (June):809-818.
.Cardinal, M., Eisenbud, D. E., Phillips, T., & Harding, K. (2008). “Early healing rates and wound area measurements are reliable predictors of later complete wound closure.” Wound Repair Regen 16, 18 (January): 19-22. .
Chang, A. C., Dearman, B., & Greenwood, J. E. (2011). “A comparison of wound area measurement techniques: visitrak versus photography.” Eplasty 11, 18 (April): e18. .
De Sousa, A. P. C., Santos, J. N., dos Reis Jr, J. A., Ramos, T. A., de Souza, J.,
Cangussú, M. C. T., & Pinheiro, A. L. (2010).” Effect of LED phototherapy of three distinct wavelengths on fibroblasts on wound healing: a histological study in a rodent model.” Photomed Laser Surg 8, 12 (August): 547-552. .
Geetha, P., & Chitradevi, B (2014). “An Overview on Image Processing Techniques.”
International Journal of Innovative Research in Computer and Communication Engineering 2, (March): 6466-6472. .
Houghton, P. E., Campbell, K. E., Fraser, C. H., Harris, C., Keast, D. H., Potter, P. J.,
& Woodbury, M. G. (2010). “Electrical stimulation therapy increases rate of healing of pressure ulcers in community-dwelling people with spinal cord injury.” Arch Phys Med Rehabil 91, (May): 669-678. .
Kloth LC. (2014).” Electrical Stimulation Technologies for Wound Healing.” Adv
Wound Care (New Rochelle) 3,: 81-90. .
Lopez-Molina, C., De Baets, B., & Bustince, H. (2013). “Quantitative error measures
for edge detection.” Pattern Recogn 46, (April): 1125-1139. .
.Minatel, D. G., Frade, M. A. C., França, S. C., & Enwemeka, C. S. (2009). “Phototherapy promotes healing of chronic diabetic leg ulcers that failed to respond to other therapies.” Lasers Surg Med 41, 8 (July): 433-441.
The 7th National and International Graduate Study Conference 2017
" Thailand 4.0 Creative Innovation for Sustainable Development "
I344
. . Nayak, B. S., Sandiford, S., & Maxwell, A. (2009). “Evaluation of the Wound-healing
Activity of Ethanolic Extract of Morinda citrifolia L. Leaf.” Evid Based
Complement Alternat Med 6, 10 (July):351-356. .
Papazoglou, E. S., Zubkov, L., Mao, X., Neidrauer, M., Rannou, N., & Weingarten, M. S. (2010).“Image analysis of chronic wounds for determining the surface area.” Wound Repair Regen 18, 11 (May): 349-358.
Rhett, J. M., Ghatnekar, G. S., Palatinus, J. A., O’Quinn, M., Yost, M. J., & Gourdie, R.G. (2008). “Novel therapies for scar reduction and regenerative healing of skin
wounds.” Trends in Biotechnology 26, (April): 173-180.
Rouabhia, M., Park, H., Meng, S., Derbali, H., & Zhang, Z. (2013). “Electrical
stimulation promotes wound healing by enhancing dermal fibroblast activity and
promoting myofibroblast transdifferentiation.” PLoS One 8, 19 (August): e71660.
Sebastian, A., Syed, F., Perry, D., Balamurugan, V., Colthurst, J., Chaudhry, I. H., &
Bayat, A. (2011). “Acceleration of cutaneous healing by electrical stimulation:
degenerate electrical waveform down-regulates inflammation, up-regulates
angiogenesis and advances remodeling in temporal punch biopsies in a human
volunteer study.” Wound Repair Regen 19, 19 (October): 693-708.
Velnar, T., Bailey, T., & Smrkolj, V. (2009). “The wound healing process: an overview of the cellular and molecular mechanisms.” J Int Med Res 37, 1 (October): 1528-1542.
Wood, S., Jayaraman, V., Huelsmann, E. J., Bonish, B., Burgad, D., Sivaramakrishnan, G., & Shafikhani, S. H. (2014). “Pro-inflammatory chemokine CCL2 (MCP-1) promotes healing in diabetic wounds by restoring the macrophage response.” PLoS One 9, 1 (March): e91574.
You, X., Bao, Z., Xing, C. F., Cheung, Y., Tang, Y. Y., & Li, M. (2008). “Image
denoising by using nonseparable wavelet filters and two-dimensional principal
component analysis.” Optical Engineering 47, 29 (October): 47.
Zordan, M. D., Mill, C. P., Riese, D. J., & Leary, J. F. (2011). “A high throughput,
interactive imaging, bright-field wound healing assay.” Cytometry A 79, 9
(February): 227-232. .
The 7th National and International Graduate Study Conference 2017
" Thailand 4.0 Creative Innovation for Sustainable Development "
I345

Analysis of Constraint Functions for Cost Optimization of Glass Fiber Reinforced
Concrete Cladding System with Steel Frame
Author: Phanupong Amornsirichokechai, Asst. Prof. Dr. Praveen Chompreda
Program Master of Engineering (Civil Engineering) Institute Mahidol University
Abstract
This study attempted to verify the accuracy of constraint functions between
theoretical equations and finite element method (FEM) for the purpose of cost
minimization of glass fiber reinforced concrete (GFRC) stud-frame system. Thickness
of GFRC panel, thickness and spacing of steel supports, and spacing and length of flex
anchor are the variables that were considered in optimization. Constraints equations
were developed to consider the strengths and deformations of the panels, steel
supporting frame, and the flex anchor. Finite element method was used as a tool to
verify the results from theoretical equations and formulate certain constraints. Based on
the results of this study, theoretical equations provide satisfactory accuracy for the
moment capacity of steel stud, deflection of steel stud, flexural strength of panel,
deflection of panel, mid-plate deflection, moment capacity of flex anchor, and direct
shear strength of flex anchor. The theoretical equations did not provide satisfactory
accuracy for the punching shear strength of panel and deflection of steel stud because
of the distortions of flex anchor and deflections of steel studs, respectively.
Keywords: Minimization, Nonlinear Programming, Finite Element, Façade, GFRC
Introduction
Nowadays, cladding is widely used worldwide to decorate the exteriors of
buildings. It’s mostly preferred by architects for aesthetic reasons. Conventionally,
cladding is manufactured as precast concrete panel, which provided good quality
control due to the factory production. However, precast concrete panel is very heavy
which leads to increasing in cost of the supporting structure, and construction cost to
transport and handle the heavy panel. To reduce the thickness of panel, glass fiber
reinforced concrete, also known as GFRC, is used.
The 7th National and International Graduate Study Conference 2017
" Thailand 4.0 Creative Innovation for Sustainable Development "
I346

GFRC is a composite material consisted of cement, glass fiber, fine
aggregates and polymers admixture. It provides high tensile strength and crack
resistance. Therefore, it can be formed into thin panels, which leads to savings in the
construction costs. Typically, GFRC cladding is often fabricated with stud-frame
system, as shown in Figure 1. The system consists of three primary components: 1)
GFRC panel, which is the surface of system. 2) Steel stud which is the supporting of
frame. 3) Flex anchor, which is a small steel bar that connects the panel to the
supporting system.
GFRC Panel
Flex Anchor
Steel Stud
Figure 1 GFRC Stud-frame system
From a previous study (Amornsirichokechai & Chompreda, 2016), cost
optimization of GFRC stud frame system was studied. In the optimization process, each
constrain function should capture the actual behavior of the system. However, there
was no verification of accuracy in the constraint functions provided. Thus, to increase
an efficiency and economic design in a cost optimization of GFRC stud-frame system,
the constraint functions should be investigated in more details. This study attempts to
verify the accuracy of constraint functions by comparing results between theoretical
equations and finite element method (FEM) for various constraint functions.
Objectives
The objectives are:
1) Verify the accuracy of constraint functions between theoretical
equations and FEM for the purpose of cost optimization of GFRC
stud-frame system.
2) Identify any complex behavior that might occur for each constraint
that cannot be captured by theoretical equation.
The 7th National and International Graduate Study Conference 2017
" Thailand 4.0 Creative Innovation for Sustainable Development "
I347

Research Methodology
This study considered constraint functions for cost optimization of GFRC
stud-frame system. The stud-frame system has a maximum panel size of 4000 mm, a
125×50 mm steel stud as a supporting frame, and 6 mm diameter flex anchor with 75
mm hook length connecting the panel to the frame, as shown in Figure 2.
Steel Stud
125×50 mm
GFRC Panel
Bonding PadFlex Anchor
diameter 6 mm
Hook Length 75 mm
Figure 2 Details of steel stud and flex anchor
The optimization problem consisted of variables, objective function, and
constraint functions.
Design Variables
Five variables were optimized in this study: namely the thickness of steel
stud (ts), thickness of panel (tp), spacing of stud (ss), spacing of flex anchor (sf), and
cantilever length of flex anchor (xf).
Objective Functions
The objective function is to minimize the cost of GFRC system per 1 square
meter ( TC ). This function is represented by materials and fabrication costs ( mC ),
transportation cost ( tC ), and erection cost ( eC ) as:
T m t eC C C C (1)
However, Amornsirichokechai (2016) found that the transportation cost
and erection cost can be removed when the panel thickness is at the lower limit of
practicality. The function of material and fabrication costs consist of the costs of face
mix ( FMC ), backing layers ( GFRCC ), steel frame ( SFC ), and flex anchors ( FC ), as:
m FM GFRC SF FC C C C C (2)
The 7th National and International Graduate Study Conference 2017
" Thailand 4.0 Creative Innovation for Sustainable Development "
I348

Constraints functions
The constraint functions were classified into three categories, namely: 1)
out-of-plane behavior constraints, 2) in-plane behavior constraints, and 3) practicality
constraints. Only out-of-plane and in-plane behaviors were compared to the results
from FEM. The wind load, dead load, construction live load, and shrinkage/thermal
contraction were considered in the constraint functions. These constraints are
summarized in Table 1. For all of the constraints, the design criteria were either that the
corresponding maximum stress or maximum deflection must not be over the strength
or deflection limits. The material properties for developing the constraint function are
summarized in Table 2. The related variables are substituted in each constraint function,
and then the results from hand calculation would be compared to that from the
corresponding finite element model.
Table 1 Summary of constraints
Category Constraint
Out-of-plane
behavior
Moment capacity of steel stud
Deflection of steel stud
Flexural strength of panel
Deflection of panel between studs
Mid-plate deflection
Punching shear of panel
Strength of panel while lifting
In-plane
behavior
Moment capacity of flex anchor
Direct shear of flex anchor
Deflection of flex anchor
Practicality Thickness of GFRC panel, spacing of steel stud, spacing of flex
anchor
Table 2 Material properties
Materials Properties Values
GFRC panel
Elastic Modulus 13,200 MPa**
Density 2,200 kg/m3
Compressive strength 10*, 20** MPa
Tensile strength (Modulus of Rupture) 4*, 8** MPa
Steel stud
Elastic Modulus 200,000 MPa
Density 7,850 kg/m3
Yield strength 240 MPa
Flex anchor
Elastic Modulus 200,000 MPa
Density 7,850 kg/m3
Yield strength 480 MPa
* 1 day, ** 28 day
The 7th National and International Graduate Study Conference 2017
" Thailand 4.0 Creative Innovation for Sustainable Development "
I349
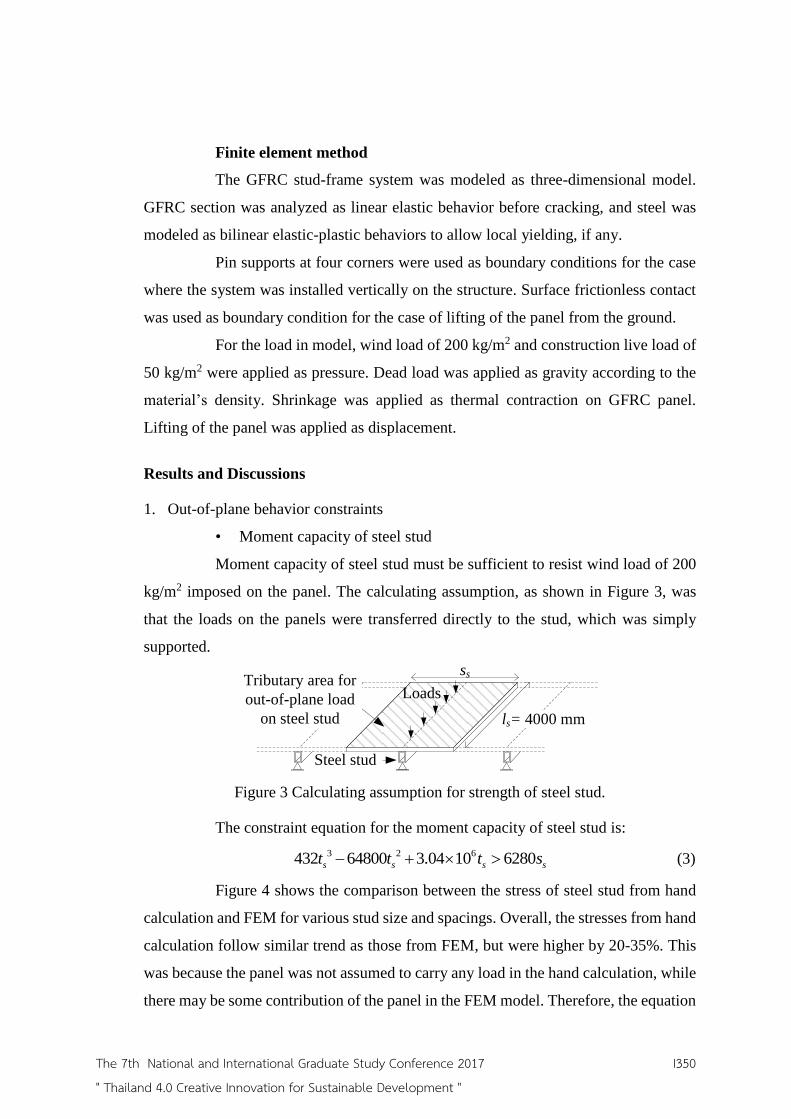
Finite element method
The GFRC stud-frame system was modeled as three-dimensional model.
GFRC section was analyzed as linear elastic behavior before cracking, and steel was
modeled as bilinear elastic-plastic behaviors to allow local yielding, if any.
Pin supports at four corners were used as boundary conditions for the case
where the system was installed vertically on the structure. Surface frictionless contact
was used as boundary condition for the case of lifting of the panel from the ground.
For the load in model, wind load of 200 kg/m2 and construction live load of
50 kg/m2 were applied as pressure. Dead load was applied as gravity according to the
material’s density. Shrinkage was applied as thermal contraction on GFRC panel.
Lifting of the panel was applied as displacement.
Results and Discussions
1. Out-of-plane behavior constraints
• Moment capacity of steel stud
Moment capacity of steel stud must be sufficient to resist wind load of 200
kg/m2 imposed on the panel. The calculating assumption, as shown in Figure 3, was
that the loads on the panels were transferred directly to the stud, which was simply
supported.
Loads
Steel stud
Tributary area for
out-of-plane load
on steel stud
ss
ls= 4000 mm
Figure 3 Calculating assumption for strength of steel stud.
The constraint equation for the moment capacity of steel stud is:
3 2 6432 64800 3.04 10 6280 s s s st t t s (3)
Figure 4 shows the comparison between the stress of steel stud from hand
calculation and FEM for various stud size and spacings. Overall, the stresses from hand
calculation follow similar trend as those from FEM, but were higher by 20-35%. This
was because the panel was not assumed to carry any load in the hand calculation, while
there may be some contribution of the panel in the FEM model. Therefore, the equation
The 7th National and International Graduate Study Conference 2017
" Thailand 4.0 Creative Innovation for Sustainable Development "
I350

from hand calculation can be safely used as a constraint function for moment capacity
of steel stud.
(a) Varying steel stud size
(b) Varying spacing
Figure 4 Comparison of stresses of steel stud between hand calculation and FEM
• Deflection of steel stud
The deflection of the steel stud should not be over the allowable deflection.
The calculating assumption, as shown in Figure 5, was that the GFRC panel and steel
stud frame were not working as a composite system under the wind load of 200 kg/m2.
The supports were assumed to be simple at the both ends of the steel stud.
s
Steel studLoad
ls= 4000 mm
Figure 5 Calculating assumption for deflection of steel stud
The constraint equation for steel stud deflection can be written as follows:
5 2 3 4
22.2(7.16 10 2
2450
1900 283 1.33 )
0 s
s ss s
s
t tt t
(4)
Figure 6 shows the comparison between the deflection of steel stud from
hand calculation and FEM. The deflections from hand calculation were 30-43% higher
than the values from FEM. The percentage difference may seems large but the actual
difference was only 1 to 4 mm over 4000 mm stud span, which were insignificantly
small considering the variabilities in materials and construction. Primary cause of the
difference was because the panel was not considered composite with the steel stud in
resisting the load. Since the deflections of steel stud from hand calculation follow
similar trend as those from FEM and always provide slightly higher value. It is
conservative and safe to use the equation from hand calculation as the constraint
function for the deflection of steel stud.
The 7th National and International Graduate Study Conference 2017
" Thailand 4.0 Creative Innovation for Sustainable Development "
I351

(a) Varying steel stud size
(b) Varying spacing
Figure 6 Comparison of deflections of steel stud between hand calculation and FEM
• Flexural strength of panel
The flexural strength of panel must be sufficient to resist the wind load of
200 kg/m2 imposed on the panel. Yield line theory (MacGregor and Wight, 2012) was
used to calculate the flexural strength of the GFRC panel. Four collapse mechanism, as
shown in Figure 7, were compared for the critical mechanism.
Collapse mechanism 2
PLAN
SECTION
ss
sf
Conti
nuous
Conti
nuous
2
ss
ss
sf
sf > ss
PLAN
SECTION
Conti
nuous
Conti
nuous
Collapse mechanism 3
2
ss
ss
sf
ss > sf
PLAN
SECTIONβss
Conti
nuous
Conti
nuous
Collapse mechanism 4
2
ss
Collapse mechanism 1ss ss
PLAN
SECTION
2
ss
Figure 7 Yield line collapse mechanisms
The critical one was found to be the collapse mechanism 2
(Amornsirichokechai & Chompreda, 2016). The constraint equation for flexural
strength of panel at 28 days can be written as follows:
2
2
15.50.00314
p
s
t
s (5)
The 7th National and International Graduate Study Conference 2017
" Thailand 4.0 Creative Innovation for Sustainable Development "
I352

Figure 8 shows the pattern of normal stress along x-axis of panel under the
wind load of 200 kg/m2. Dark red color represents the area of high tensile stresses.
Green color represents the area of zero stress and blue color represents the area of high
compressive stress. It can be observed that the locations of high stress from FEM appear
to be in the parallel direction to the steel stud, similar to the yield line collapse
mechanism 2. Therefore, the yield line equation of collapse mechanism 2 can be
conservatively used as the constraint function for the flexural strength of panel.
(a) ss 500 mm, sf 500 mm
(b) ss 800 mm, sf 500 mm (c) ss 1000 mm, sf 500 mm
Figure 8 Normal stress (X-axis) of panel
• Deflection of panel between studs
The deflection of panel should not be over the allowable deflection. The
calculating assumption, as shown in Figure 9, was that the wind load of 200 kg/m2 acted
uniformly on the panel. The critical panel was the one at the edge where the interior
side was continuous (fixed) and the exterior side was simply supported.
p
LoadContinuous side
ss
Figure 9 Calculating assumption for deflection of panel
The constraint equation for the deflection of panel can be written as follows:
39
30.005
7.25 05
16
p
s
t
s
(6)
Figure 10 shows comparison between the deflection of panel from hand
calculation and FEM. The deflections from hand calculation were 1-85% higher than
those from the FEM. The deflections from hand calculation tend to diverge from those
of FEM when the panel is thin and the stud is far apart. This was because the thin panel
and far stud spacing lead to a flexible system, where panel membrane action becomes
important factor in resisting the wind load. Nonetheless, in terms of practicality, the
difference of 1 mm is insignificant for 800 mm of stud spacing. Since the deflections
The 7th National and International Graduate Study Conference 2017
" Thailand 4.0 Creative Innovation for Sustainable Development "
I353

obtained from hand calculation are always higher than those from FEM, its equation
can be conservatively used as the constraint function for the deflection of panel.
(a) Varying thickness of panel
(b) Varying stud spacing
Figure 10 Comparison of deflection of panel between hand calculation and FEM
• Mid-plate deflection
The mid-plate deflection should not over the allowable deflection. It was
considered as the sum of the cross beam and the steel stud deflections. The assumption,
as show in Figure 11, was that the wind load of 200 kg/m2 acted on the panel surface
and the load was transferred directly to supporting steel frame, which consisted of cross
beam and steel stud. The cross beam was considered with either simple or fixed
supports. The steel stud was considered as simply supported.
cb
lcb = 4000 mm
l s /2
l s = 4
000
mm
/ 2w sw l
/ 2w sw l
(a) Cross beam
s
l s = 4
000
mm
ss
w sw s
(b) Steel stud
Figure 11 Calculating assumption for mid-plate deflection
The constraint equation for mid-plate deflection can be written as follows:
If the cross beam is simply supported:
7
4 3 2 5
4.91 10 2450022.2
1.33 283 21900 7.16 10
s
s s s s
s
t t t t
(7)
If the cross beam is fixed:
4 3
6
2 5
2450022.2
1.33 283 21900 7.16 10
9.81 10
s
s s s s
s
t t t t (8)
The 7th National and International Graduate Study Conference 2017
" Thailand 4.0 Creative Innovation for Sustainable Development "
I354
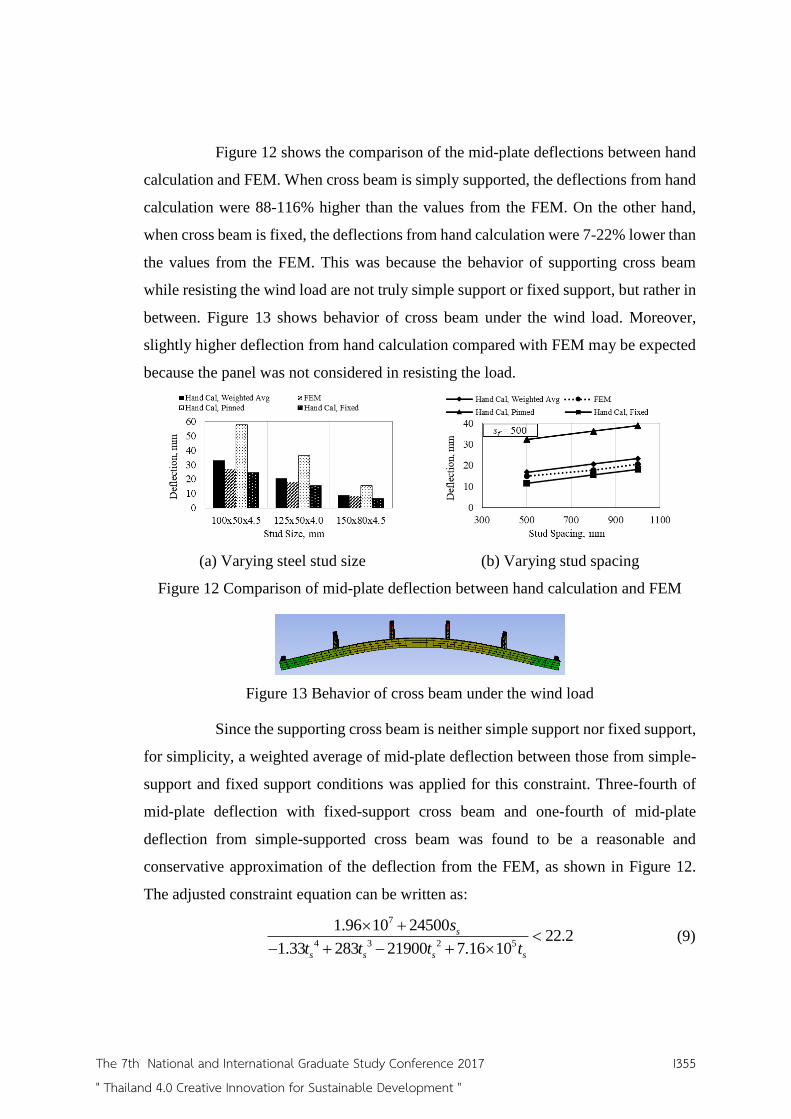
Figure 12 shows the comparison of the mid-plate deflections between hand
calculation and FEM. When cross beam is simply supported, the deflections from hand
calculation were 88-116% higher than the values from the FEM. On the other hand,
when cross beam is fixed, the deflections from hand calculation were 7-22% lower than
the values from the FEM. This was because the behavior of supporting cross beam
while resisting the wind load are not truly simple support or fixed support, but rather in
between. Figure 13 shows behavior of cross beam under the wind load. Moreover,
slightly higher deflection from hand calculation compared with FEM may be expected
because the panel was not considered in resisting the load.
(a) Varying steel stud size
(b) Varying stud spacing
Figure 12 Comparison of mid-plate deflection between hand calculation and FEM
Figure 13 Behavior of cross beam under the wind load
Since the supporting cross beam is neither simple support nor fixed support,
for simplicity, a weighted average of mid-plate deflection between those from simple-
support and fixed support conditions was applied for this constraint. Three-fourth of
mid-plate deflection with fixed-support cross beam and one-fourth of mid-plate
deflection from simple-supported cross beam was found to be a reasonable and
conservative approximation of the deflection from the FEM, as shown in Figure 12.
The adjusted constraint equation can be written as:
7
4 3 2 5
1.96 10 2450022.2
1.33 283 21900 7.16 10
s
s s s s
s
t t t t (9)
The 7th National and International Graduate Study Conference 2017
" Thailand 4.0 Creative Innovation for Sustainable Development "
I355

• Punching shear of panel
The punching shear capacity of panel must be sufficient to resist the wind
load of 200 kg/m2. The calculating assumption, as shown in Figure 14, was that the
perimeter area around flex anchor was the critical section for punching shear failure.
Steel stud
Critical perimeter
for punching shear
Plan
Punching shear area
Flex anchor
Steel stud
Section
tp + 75 mm
tp + 6 mm
Figure 14 Calculating assumption for punching shear
The constraint equation for punching shear can be written as follows:
2107 2.65 0.00157 0p p f st t s s (10)
Figure 15 shows the comparison between the punching shear of panel from
hand calculation and the FEM. The punching shear from the hand calculation were
found to be 44-51% lower than the values from FEM for the steel stud spacings of 500
and 800 mm. This was because the critical punching shear perimeters were located on
the steel studs which were distorted, as shown in Figure 16. For steel stud spacing of
1000 mm, the punching shear from hand calculation was 19% lower than the those from
the corresponding FEM. This was because the steel stud supporting the critical
punching shear perimeter was located at the center of panel, which had little distortion
so the result from both method agree with each other. Due to a large difference, the
hand calculation must be adjusted to allow for the steel stud distortion before it can be
used as a constraint. Since it is not easy to account for the distortion, the adjustment
factor of 2.0 was adopted to be the additional safety factor for this constraint. The
adjusted constraint equation can be written as:
210 07 2.65 0.00322p p f st t s s (11)
The 7th National and International Graduate Study Conference 2017
" Thailand 4.0 Creative Innovation for Sustainable Development "
I356

Figure 15 Comparison of punching shear
between hand calculation and FEM
Figure 16 Distortion of steel stud while
carrying the load
• Strength of panel while lifting
Generally, the panel was lifted by cables at two lifting points for stability.
However, there may be an instant where one cable is sagged while lifting, which causes
the panel to carry an usually high load at one corner. This leads to the critical stress in
the panel due to the longer span length between the lifting corner and the supporting
corner.
Lift
SupportRod
Figure 17 Lifting one point of the panel
In this case, due to complex geometry and load, it is complicated to
formulate a closed-form equation for hand calculation. Therefore, only FEM was used
to investigate the behavior of panel while lifting out of the mold. The displacement of
1 m was applied to the steel frame through a flexible rod, as shown in Figure 17.
The analysis of results indicate that the panel had very little stresses while
lifting out of the mold, as it has to carry only its self-weight which was significantly
smaller than the wind load experienced at later stages. At this stage, the maximum stress
of panel is about 10 times lower than its ultimate strength. Thus, this constraint is
unlikely to control the result of the optimization.
2. In-plane behavior constraints
• Moment capacity of flex anchor
Moment capacity of the flex anchor must be sufficient to resist the resultant
load caused by a combination of dead load, shrinkage, and thermal contraction of the
The 7th National and International Graduate Study Conference 2017
" Thailand 4.0 Creative Innovation for Sustainable Development "
I357
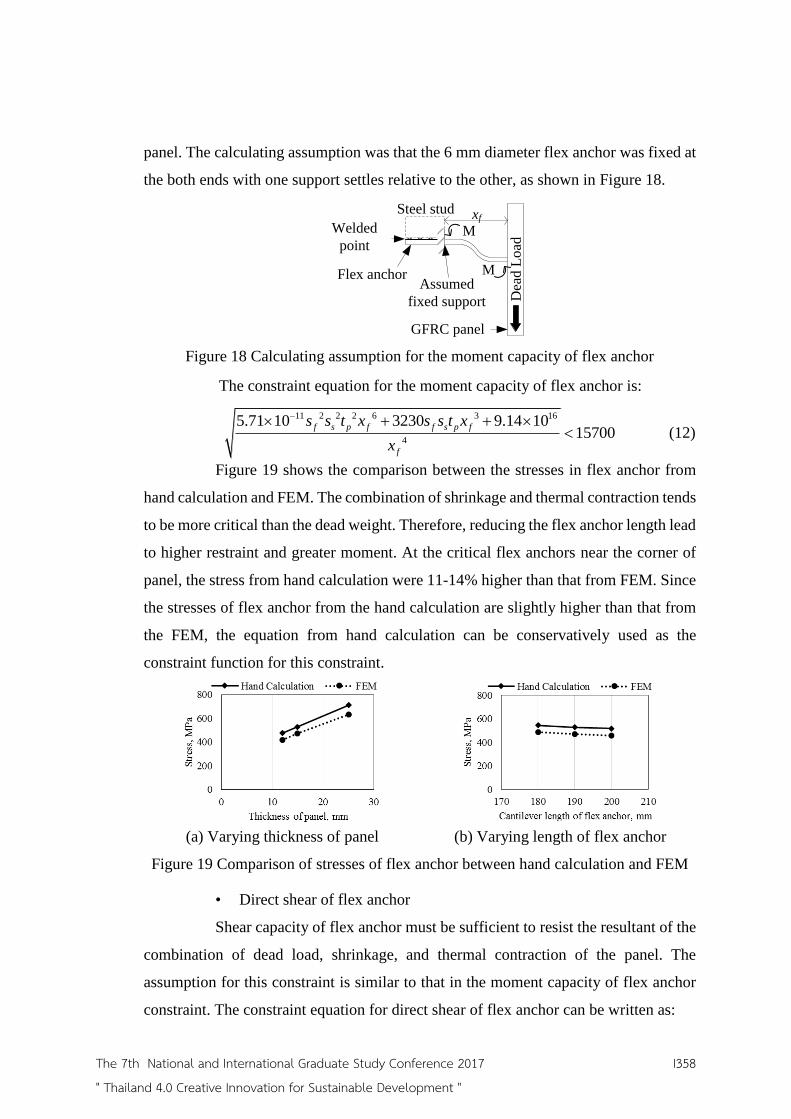
panel. The calculating assumption was that the 6 mm diameter flex anchor was fixed at
the both ends with one support settles relative to the other, as shown in Figure 18.
Steel stud
GFRC panel
xf
Dea
d L
oad
M
MFlex anchor
Welded
point
Assumed
fixed support
Figure 18 Calculating assumption for the moment capacity of flex anchor
The constraint equation for the moment capacity of flex anchor is:
21 21 2 6 3 16
4
5.71 3230 9.14157 0
10 100
f s p f f s p f
f
s s t x s s t x
x
(12)
Figure 19 shows the comparison between the stresses in flex anchor from
hand calculation and FEM. The combination of shrinkage and thermal contraction tends
to be more critical than the dead weight. Therefore, reducing the flex anchor length lead
to higher restraint and greater moment. At the critical flex anchors near the corner of
panel, the stress from hand calculation were 11-14% higher than that from FEM. Since
the stresses of flex anchor from the hand calculation are slightly higher than that from
the FEM, the equation from hand calculation can be conservatively used as the
constraint function for this constraint.
(a) Varying thickness of panel
(b) Varying length of flex anchor
Figure 19 Comparison of stresses of flex anchor between hand calculation and FEM
• Direct shear of flex anchor
Shear capacity of flex anchor must be sufficient to resist the resultant of the
combination of dead load, shrinkage, and thermal contraction of the panel. The
assumption for this constraint is similar to that in the moment capacity of flex anchor
constraint. The constraint equation for direct shear of flex anchor can be written as:
The 7th National and International Graduate Study Conference 2017
" Thailand 4.0 Creative Innovation for Sustainable Development "
I358

2 2 2 6 3 17
6
10 129002.28 1 3.67 0
0 174 0
0f s p f f s p f
f
s s t x s s t x
x
(13)
Figure 20 shows the comparison between the shear forces of flex anchor
from hand calculation and FEM. The shear forces from hand calculation follow similar
trend as FEM, and were 6-8% higher than the values from FEM. Since the shear from
hand calculation always provide slightly higher values than those from FEM. Thus, the
equation from hand calculation can be conservatively used as the constraint function
for this constraint.
(a) Varying thickness of panel
(b) Varying length of flex anchor
Figure 20 Comparison of shear in flex anchor between hand calculation and FEM
• Deflection of flex anchor
The defection of flex anchor should not be over the allowable deflection. In
this study, the allowable deflection for this constraint was chosen to be 5 mm due to
aesthetic concern. The calculating assumption for this constraint is similar to moment
capacity of flex anchor constraint. The constraint equation can be written as:
14 37.0 0 57 1 f s p fs s t x (14)
Figure 21 shows the comparison between the deflections of flex anchor from
hand calculation and FEM. The deflections from hand calculation were 8-17% lower
than the values from FEM. This was because the flex anchors at the edge and the corner
of panel carry the dead weight more than the tributary weight due to the deformation of
the steel frame. Thus, they deflects more than the average deflection used in the hand
calculation. To be able to use constraint equation from the hand calculation, an
adjustment factor of 1.2 must be adopted to be the additional safety factor for this
constraint. The adjusted constraint equation can be written as follows:
14 38.4 0 58 1 f s p fs s t x (15)
The 7th National and International Graduate Study Conference 2017
" Thailand 4.0 Creative Innovation for Sustainable Development "
I359
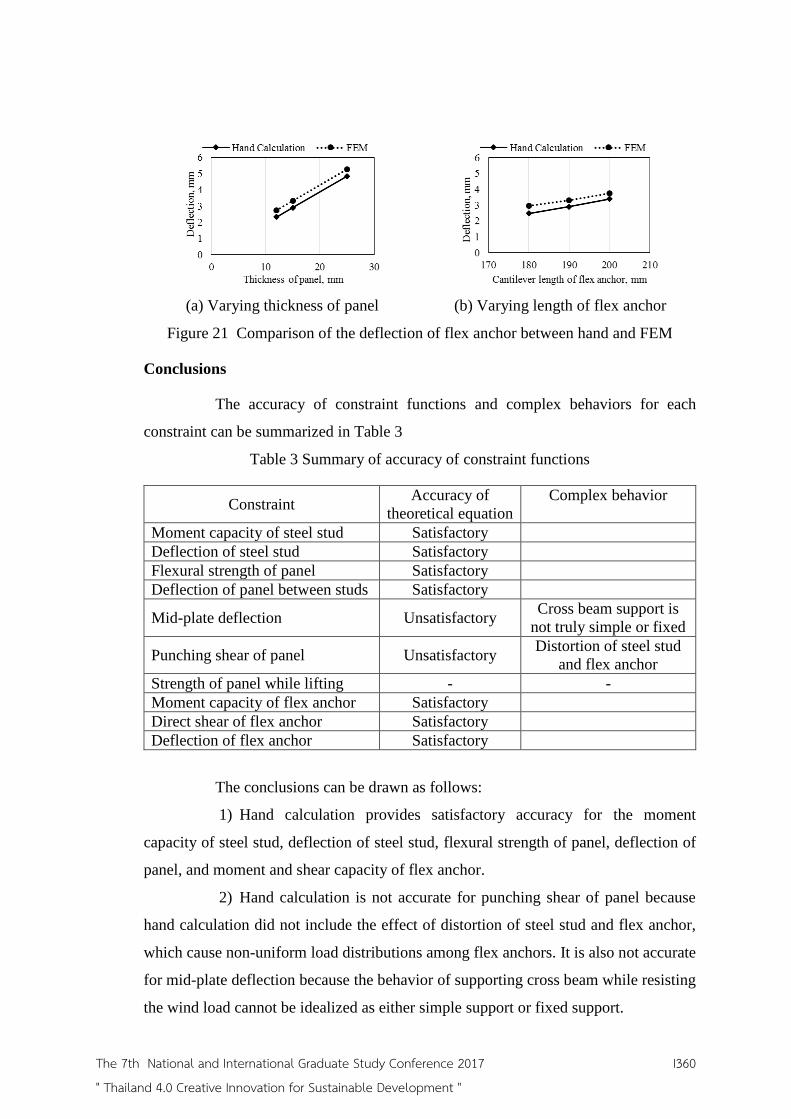
(a) Varying thickness of panel
(b) Varying length of flex anchor
Figure 21 Comparison of the deflection of flex anchor between hand and FEM
Conclusions
The accuracy of constraint functions and complex behaviors for each
constraint can be summarized in Table 3
Table 3 Summary of accuracy of constraint functions
Constraint Accuracy of
theoretical equation
Complex behavior
Moment capacity of steel stud Satisfactory
Deflection of steel stud Satisfactory
Flexural strength of panel Satisfactory
Deflection of panel between studs Satisfactory
Mid-plate deflection Unsatisfactory Cross beam support is
not truly simple or fixed
Punching shear of panel Unsatisfactory Distortion of steel stud
and flex anchor
Strength of panel while lifting - -
Moment capacity of flex anchor Satisfactory
Direct shear of flex anchor Satisfactory
Deflection of flex anchor Satisfactory
The conclusions can be drawn as follows:
1) Hand calculation provides satisfactory accuracy for the moment
capacity of steel stud, deflection of steel stud, flexural strength of panel, deflection of
panel, and moment and shear capacity of flex anchor.
2) Hand calculation is not accurate for punching shear of panel because
hand calculation did not include the effect of distortion of steel stud and flex anchor,
which cause non-uniform load distributions among flex anchors. It is also not accurate
for mid-plate deflection because the behavior of supporting cross beam while resisting
the wind load cannot be idealized as either simple support or fixed support.
The 7th National and International Graduate Study Conference 2017
" Thailand 4.0 Creative Innovation for Sustainable Development "
I360

Recommendations
The effect of distortion of steel stud and flex anchor should be developed
for hand calculation for the punching shear of panel constraint. The behaviors of steel
supporting frame while resisting the gravity load should be studied in more details
because it affects the load distribution of flex anchor.
References
Amornsirichokechai and Chompreda. (2016). “Cost Optimization for Glass Fiber
Reinforced Concrete Cladding System with Steel Frame.” The 21st
National Convention on Civil Engineering, Songkhla, Thailand.
Amornsirichokechai. (2016). “Analysis and Cost Optimization for Glass Fiber
Reinforced Concrete Cladding System with Steel Frame.” Master Degree
Thesis, Mahidol University.
TIS. (1990). Standard for Hollow Structural Sections, TIS 107-2533. Bangkok,
Thailand.
ACI. (1996). State-of-the-Art Report on Fiber Reinforced Concrete, ACI 544.1R-
96. Farmington Hills, Michigan.
ASCE. (2010). Minimum Design Loads for Buildings and Other Structures. ASCE
7-10. Reston, Virginia.
AISC (2003). Manual of Steel Construction Load and Resistance Factor Design.
3rd ed. Chicago, Illinois.
The 7th National and International Graduate Study Conference 2017
" Thailand 4.0 Creative Innovation for Sustainable Development "
I361

Multidiscipline Techniques in Spatial Audio
Author: Thomas Hanson
Program: Masters of Sonic Art and Acoustic Design
Institute: Silpakorn University
Abstract
Spatial audio is a term commonly used to describe both the acoustic phenomenon in
physical space and modern multi-source sound reproduction, in particular, those related to the
modern concept of ‘surround sound’. It is becoming an increasingly important area of study due
mostly to commercial industries furthering their exploration of virtual spaces (VR) and
interactive media. The commercialization of sound has been a particularly influential force on
the sonic arts in terms of not only how sound is created and consumed, but the intention and
meaning it carries. As this increasing interest in spatial audio furthers the commercial potential
of sound, it also ushers new tools for the artist to explore sonic possibilities previously obscured
by the popular misconception of sound as a commodity. These tools can provide new avenues for
the modern musician and sound artist but must be applied in new ways. Finding new ways to
apply this tools requires the artist to use a multidisciplinary approach. By looking at related fields
of study I believe the potential of spatial audio can expand beyond the confines of the industry
and commercial audio consumption.
Keywords: Multidisciplinary, Spatial Audio, Sonic Art, Buddhism, Asian Occult, Visual Sound,
Linguistics, Architecture, Philosophy, Linguistics, Mathematics, Art.
Introduction
I was first “turned-on” to spatial audio after visiting the Audium theatre in San Francisco.
Since 1967, Audium hosts weekly presentations of spatial audio compositions by Stan Shaf on
176 speakers. While I had been familiar with spatial audio at the time, the majority of my
experiences where those in traditional types of movie theatres and always in connection with a
film. The experience at the Audium was significant because it focused on the sound experience
rather than a particular story. What I experienced was much more inner reflection than
transportation. I became aware that spatial audio had the potential of not only recreating spaces,
but also invoking deeper listening: a process that could also lead within. As a musician this
sparked my curiosity and pushed me beyond the bounds of chords, notes, and musical language.
As I continued my research into areas of knowledge: about spaces, about acoustics, about
manipulation of sound, and the psychology of the listener, I quickly discovered that music had
the potential to be so much more.
Although inherent to the nature of sound itself, Spatial Music, as a distinct concept, was
first recognized just before the turn of the 21st century. It is true that all music is spatial, but
acoustic locality became a distinct element of music with the introduction of the loudspeaker and
the artificial reproduction of sound. Today the majority of music and composed sound is
delivered to listeners through the means of speakers and audio amplification. As technology
continues to develop we must find new ways of connecting modern capability with elemental
human needs.
The 7th National and International Graduate Study Conference 2017
" Thailand 4.0 Creative Innovation for Sustainable Development "
I371

Music and sonic performance served many roles for the early human and was commonly
used as a spiritual and communal tool for society. Today we find that the role of music and
sound has evolved. This evolution can be traced to the technologies and social practices of the
modern age. In particular, the industrial commercialization of music has changed sonic practices
in several major ways, including increased focus on sound as a commodity, increased consumer
access to the tools of sound production, and hyper-distribution via the internet. Furthermore, this
type of technological evolution has had a profound impact on all aspects of life; everything from
psychology and politics to the visual arts.
In this paper, I suggest ways in which we can continue this evolution more responsibly,
particularly with those elemental human needs in mind. I believe we can find new perspectives
for critiquing and improving modern sound practices by looking at other disciplines and how
they have reacted to the rapidly changing technology of today.
Objectives
1) Identify trending issues in the world of sonic arts.
2) Illustrate the benefits and importance of multidisciplinary perspectives in research.
3) Explore the relationship between the sonic art and other disciplines.
3) Create spatial audio works that incorporate the methodologies and perspectives of other
disciplines.
Research Methodology
From within each discipline there is an inherent understanding of other related
disciplines. In 1265 English philosopher Roger Bacon wrote “… mathematics is not beyond the
intellectual grasp of anyone. For the people, at large and those wholly illiterate know how to
draw figures and compute and sing, all of which are mathematical operations.” That is,
regardless of our skillset or level of ability, looking deeper into fields other than our own and
working alongside those who do gives us a greater understanding of our own methods.
A multidisciplinary approach to spatial audio requires an in-depth look at both the
conceptual and physical dimensions of working with sound. The primary method of research
here involves finding overlaps between the perspectives of other disciplines and their potential
application in the world of sonic arts. For example, the religious scholars and devotees of Hindu
and Buddhism have often spoken philosophically of the significance of sound in universal
understanding. As the world becomes increasingly secular has some of this insight been lost?
Can these perspectives help to inform some of the new spatial audio practices which are
predominately driven by personal and commercial interest? Likewise, we can look to the theories
and practices of architecture to learn more about the social and psychological effects of space
and how this insight can be further applied to the creation of sound and music in a spatial
environment.
Methodologies for identifying conceptual connections involve a deep look into the
literary works of scholars and artist working within the related disciplines. By reading the
The 7th National and International Graduate Study Conference 2017
" Thailand 4.0 Creative Innovation for Sustainable Development "
I372

theories of these disciplines we find both scientific and esoteric proof of sonic understanding,
long forgotten by the commercially driven practices of today’s sonic art.
Methodologies for further understanding the physical possibilities of sound require a
reassessment of space and sound as a physical element. By removing oneself from the
perspectives of a musician, sound designer, or sonic artist, the elements of sound and space take
on new roles. From the study of sound pollution and mental health to architectural experiments
on social interaction, there exists many models of efficiency and ulterior intentions for which the
sound artist may not have been previously concerned.
‘Philosophy’
“In ancient times words and music were used to attain an altered state of mind. Music
was an aid to develop the mind, spirit, emotions and sensitivity. In this modern age, different
forms of music have developed, like rock, heavy metal, jazz, etc., but until recent times music
was used not to please the mind but to tranquillize the agitations of the mind.” - Swami
Niranjanananda Saraswati
Starting with namely ancient Indian metaphysics, humans have had longstanding
philosophies of sound and vibration. Many of these theories and thoughts have since been lost in
today’s mathematical and scientific approach to sound design. When comparing the function of
ancient music with the popular music of today, it may seem obvious that music no longer serves
many of the roles it once played. Music was believed by the masses to connect us with a
universal energy, it was seen as capable of psychological healing, and a guiding measure for self-
reflection. While this perspective is arguably still present in the mindset of today’s musician’s,
the commercialism of music threatens it. As Swami Saraswati suggest in the quote above, there
is, in recent times, hope for greater functionality in the world of sound. I consider much of this
due to the recent technological developments that give sound artist greater control over sound
and increased interest in the environmental spaces where acoustic phenomenon occurs.
From the spiritually enlightened work of La Monte Young, which forces the listener to
explore space and note relation, to the sound therapy practices of Dr. Jeffrey Thompson, the
modern musician seeks to go beyond the thematic song and entertainment oriented perspective
and considers the tonal implication, physiological impact, and intention of their pieces.
‘Graphic Design’
“The comparison of various means with which each single art expresses itself, by
learning from each other, can only be successful and conclusive if the lesson is not only
superficial but truly fundamental. Thus, one art must learn from another how to use its common
principle and how to apply it to the fundamentals of its own medium. Borrowing these methods,
the artist must not forget that all mediums contain within themselves unique characteristics, and
it is up to him to discover the proper application.” - Wassily Kandinsky (On the Spiritual in Art,
1911)
The 7th National and International Graduate Study Conference 2017
" Thailand 4.0 Creative Innovation for Sustainable Development "
I373

Perhaps one of the most influential abstract painters and art theorists, Wassily Kandinsky
was a design teacher at the Bauhaus school of art in the 1920’s. Kandinsky, a color theorist, was
no stranger to multi-disciplinary study. Some of his most famous works of art were experiments
in synesthesia, or the attempt to visualize sound. While not a musician himself, he saw a
common language between the two very different mediums. On the topic of this commonality, he
stressed the importance of learning the limitations and advantages of each medium.
“In this application of form, music achieves results which are beyond the realm of
painting. On the other hand, painting outdistances music in many ways. For instance, music has,
at its disposal, the duration of time, while painting does not possess this advantage but presents
to the spectator Its entire message in one single Instance, something music is incapable of doing.
Music, by its very nature, is ultimately and fully emancipated” This suggest that while we may
find limitations in our medium, we can overcome these limitations by exploring its relationship
to another medium. In the case of music and art he concludes by saying, “…music can avoid the
extension of time while painting can utilize it.” By visualizing our sonic works, we can further
expand out palate; stretching time beyond its limitations, freezing it, and opening up new
connections between our composition and how others are capable of perceiving it.
‘Architecture’
“Architecture is frozen music.” - Johann Wolfgang Von Goethe. In perhaps one of
referenced quote in all of architecture, Goeth pronounces the relationship between architecture
and music to be that of a mere shift in state. Whether or not they are of the same origin, they
certainly have a deep relationship. For as long as people have been building structures they have
been making sound inside them. Throughout history, various cultures have taking to building
with acoustics in mind; from temples to theaters, and halls. Still very evident in today’s concert
venues and recording studios, musicians and engineers must work with architects to some extent
in search for creating quiet and ideal acoustic spaces.
Much has been said both for and against the infamous Goethe quote. David Foxe, an MIT
student who graduated with degrees in both architecture and music, responded in the quote in the
MURJ student journal by saying, “Goethe’s idea relating architecture to “frozen music” seems to
do a disservice to both disciplines; taken literally, architecture can often be quite flowing and
dynamic, while music doesn’t always feel thawed through. Searching for such “parallels”
between architecture and music shows that it is the descriptive, semantic language that is shared
rather than any actual content.” (Foxe, 2002) While it is up to the individual to see architecture
as fluid or music as structural, this statement reminds us that: no matter how similar two
disciplines or mediums might be they are not one and the same. The true significance of multi-
disciplinary study is to explore the full dynamics of each discipline and form a common
language for which the two can communicate.
‘Mathematics ‘
“Mathematics and music, the most sharply contrasted fields of intellectual activity which
can be found and yet related, supporting each other, as if to show forth the secret connection
which ties together all the activities of our mind…” - H. Von Helmholtz, 1884
The 7th National and International Graduate Study Conference 2017
" Thailand 4.0 Creative Innovation for Sustainable Development "
I374

Mathematics has long been an integral part of Music and without it, the developments of
all sonic understanding would be nearly nonexistent. Conversely there is a great divide between
the mathematical understanding of music and the physical or emotional relationship to sound.
For the greater part of music’s history, the musician has come to understand, in a very direct
way, the physicality of sound; everything from the relationships of frequencies to the sonic
effects of materials and the environment. When asked to explain these phenomena arithmetically
most musicians could barely scrape together a basic equation. As a result, the interaction
between mathematics and music has been fairly reciprocal in nature. A musician discovers
something he believes is of sonic significance and the mathematician seeks to explain it.
Consequently, the mathematician discovers both fundamental concepts of the sonic phenomenon
and equations for which they can be reproduced or expanded.
This relationship is evident in the creation of the western music system. What was
originally a mathematical analysis of ancient music language becoming a mathematically refined
set of rules which would later become a standard. (see the just intonation and equal temperament
systems). Because of mathematics musicians have gained the powerful function of transposition,
or the ability to change the fundamental of scales and musical motifs while retaining all the
relative ratios.
In spatial audio, mathematics is an integral tool to explaining the acoustic properties of
space. Spatial audio must be concerned, far more than conventional audio, the way in which the
audience perceives the sound. Sonic Arts researcher Gary S. Kendall explains that: “the listener’s
experience depends on many factors, among which are acoustic factors that directly affect the
listener’s spatial hearing and ultimately influence the spatial meanings understood by the
listener” Mathematics is essential to understand the acoustic phenomenon and to recognize the
acoustic principles that both prohibit and enhance the spatial listening experience. Spatial audio
concepts such as depth, envelopment, and precedence are best understood when analyzed in
controlled and calculated environments. Without this cross curricular focus, it is extremely
difficult to reproduce sound spatially with consistency.
‘Linguistics’
Linguistics is a field of study highly concerned with sound as Linguistics is the
study of language and refined communication, which, when concerned with oral expression, is a
type of sonic phenomenon. The connection between sound and meaning however is rocky one,
and the linguists of our times have searched far and wide to disprove the current rule of the
structural linguistics: the relationship between sound and meaning is arbitrary.
Current research on the topic of sound symbolism looks beyond the traditional umbrella
of language to disprove this long debated tenant of structural linguists. Considerable evidence
shows non-arbitrary connections in concepts such as: vocal intonation, ending rising tones
convey a question; intonation in relationship to size, e i y vowels convey small sizes and a o u
vowels convey large sizes; non-human vocalization, connections between animal ‘languages’;
and acoustic origins of body language, the smile and suggestive movements. (Ohala, 1997)
Through this type of research musicians and sound designers might find insight to the universal
The 7th National and International Graduate Study Conference 2017
" Thailand 4.0 Creative Innovation for Sustainable Development "
I375

meaning of sounds, the types of emotions they convey, and new methods of sonifying ideas and
themes.
Whether or not linguistics can provide proof to the inherent meaning of sound, It is a
significant field in relation to music and particularly spatial audio. The semantics of our language
is not unlike the structure of ours songs, the ups and down of our emotional expressions are not
unlike a melodic passage, and the evolution of language in response to each new means of
communication is not unlike the various musical genres and styles born from each new
technological offering.
In the modern age, technology allows the sound artist to move far beyond the poetic
constraints normally associated with music and focus instead on audibility, sonic manipulation of
language, and the synthesis of spoken languages. There is already significant progress in this
sector and one can look to Google’s progress in translation technologies, TTS technology for the
disabled, Vocaloid and other melodic voice synthesis software, and Adobe’s recent efforts in
voice modeling and the field of augmented reality.
‘Personal Methodologies’
My personal method of approaching multi-disciplinary studies is all about making
connections. The connections which I seek to identify vary in type and intensity. Quite often I
will find a simple word combination, such as you will see with my piece Ching I Ching, which I
will explain later on. Linguistics often times shares underlying concepts hidden beneath the
popular connotation of a word. For example, in music we may have concepts such as a flat or a
sharp note. By considering the other meanings of flat and sharp, you may be able to relate a
punctured tire with a flat note and knife with a sharp note. Results may often be arbitrary, but I
argue that there are underlying connections to be explored beneath the language that these
connections hide behind. A majority of my work focuses on establishing a connection between
sounds and our perception of them as humans. It is nearly impossible to listen to a sound and not
engage the thought process: connecting it with a theme, an emotion, a memory, or idea. This
sound consciousness can be brought to new levels by intentionally exploring the underlying
properties of what is at play. If I incorporate the sound of the ocean in a sound piece, the next
step is to explore every related concept. What can we learn about the ocean? Can we connect the
scientific knowledge of oceanic waves with those of sound waves? Can we communicate some
of the social issues regarding the ocean through sound alone? Can we take advantage of spatial
audio techniques to invoke the ocean’s vast movements? I find my inspiration in these types of
questions and believe this is an important step to furthering the sonic art practices.
Results
The results of my connection making and multi-disciplinary research are the basis of
several spatial audio projects which I shall explain piece by piece. Utilizing my personal method
of research, each piece starts with central object. Whether an it is unique perspective, an ancient
philosophy, or a collection of symbols, the object is explored through as many disciplines as
possible. By asking questions about their philosophical principles, mathematical explanation, or
aesthetic qualities I find many parameters which can be directly applied to spatial audio domain.
The 7th National and International Graduate Study Conference 2017
" Thailand 4.0 Creative Innovation for Sustainable Development "
I376

The intention for most of this work is to empower sound with new functionality. From
transporting the audience to a new perspective to inducing self-reflection, each piece seeks to
take the potential of sound beyond that of pure entertainment.
‘Foreign Ears’
Foreign Ears is an installation, previously installed as a part of the 2015-2016 As(ear)n
Exhibition at Museum Siam. Foreign Ears was the natural result of the multi-disciplinary aspects
of my life, particularly being a foreigner studying in a Thai University. It started first with an
obsession to record everything. With an effort to focus less on the quality of my sounds and more
on the content. I began to secretly record every day-to-day situation I found myself in. Upon
review of these sounds I discovered some great stories told to me by Thai taxi drivers whom I
would regularly have casual conversations with. At some point, I chose to share these recordings
with my peers and quickly discovered that the conversations between me, a foreigner, and the
driver, a native Thai, were linguistically unique. Particularly in terms of content. This usually
came in form of a Thai person explaining their perspective on Thailand in their own native
language with no intention to be translated. I realized that conversations of this type are quite
rare. While they may feel completely natural from my perspective, it is a very strange
perspective for native speakers to follow. Sonically and linguistically it also reveals
subconscious details about the way we communicate, in particular: the phrasing, semantics, and
tone a native speaker may use when trying to speak to a foreigner in their native language.
In the process of composition and mixing, many concepts of linguistics were also
borrowed. The poetic aspects of lyrical content and figurative themes in music have always taken
into consideration the linguistic property of each word. Each word has a connotation or hidden
meaning which opens the composer up to opportunities of word play. This allows the songs
meaning to twist and turn with each changing perspective. In Foreign Ears, the stories of each
taxi driver were analyzed and joined together at points of commonality. When two stories used
the same word or the same theme appeared the recordings were cropped and juxtaposed into a
new conversation. The result is a dream-like soundscape which flows between conversations
which are seemingly aimed at a person of the most peculiar perspective.
The spatial audio techniques used in this piece were focused on building a parallel story
structure. Because Foreign Ears is concern more with perspective than narrative, the
conversations were mixed on multiple channels and frequently over lapping each other. This
allows the audience to explore the piece, moving around to hear the different perspectives; not
only different perspectives of the sound in space but also the stories which varied from one area
to another. At times, it becomes difficult to focus on one particular conversation and the listener
begins to jump from one source to another based on their own personal interest. This was
intentional decision to force the listener to make connections, to create their own story, and to
establish their perception of the stories rather than be force to experience the stories in a linear
fashion. This type of spatial presentation gives the audience an opportunity to better understand
spatial audio as a concept. By physically exploring the space and listening closely to the various
stories or elements mixed within, the audience can begin to creating their own connections.
Conversely the audience is also presented with the opportunity to listen from the center of the
sound stage for which they can take in the totality of the sounds; reflect on the strangely foreign
The 7th National and International Graduate Study Conference 2017
" Thailand 4.0 Creative Innovation for Sustainable Development "
I377
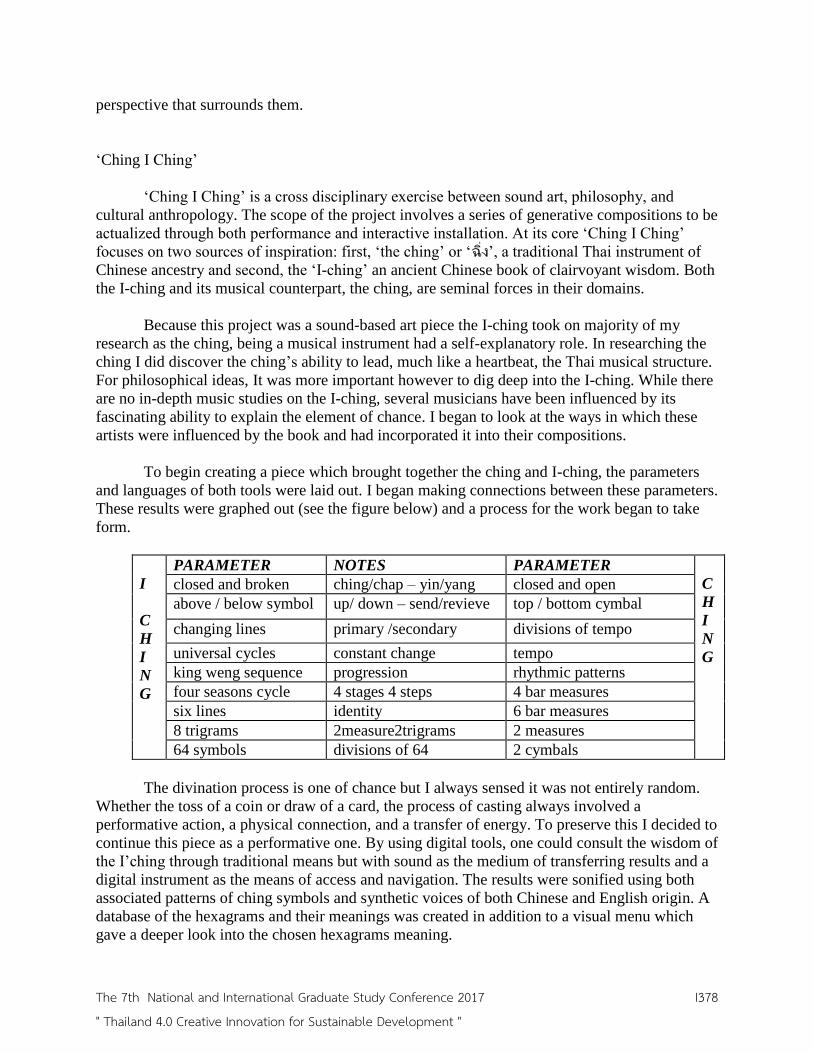
perspective that surrounds them.
‘Ching I Ching’
‘Ching I Ching’ is a cross disciplinary exercise between sound art, philosophy, and
cultural anthropology. The scope of the project involves a series of generative compositions to be
actualized through both performance and interactive installation. At its core ‘Ching I Ching’
focuses on two sources of inspiration: first, ‘the ching’ or ‘ฉง’, a traditional Thai instrument of
Chinese ancestry and second, the ‘I-ching’ an ancient Chinese book of clairvoyant wisdom. Both
the I-ching and its musical counterpart, the ching, are seminal forces in their domains.
Because this project was a sound-based art piece the I-ching took on majority of my
research as the ching, being a musical instrument had a self-explanatory role. In researching the
ching I did discover the ching’s ability to lead, much like a heartbeat, the Thai musical structure.
For philosophical ideas, It was more important however to dig deep into the I-ching. While there
are no in-depth music studies on the I-ching, several musicians have been influenced by its
fascinating ability to explain the element of chance. I began to look at the ways in which these
artists were influenced by the book and had incorporated it into their compositions.
To begin creating a piece which brought together the ching and I-ching, the parameters
and languages of both tools were laid out. I began making connections between these parameters.
These results were graphed out (see the figure below) and a process for the work began to take
form.
I
C
H
I
N
G
PARAMETER NOTES PARAMETER
C
H
I
N
G
closed and broken ching/chap – yin/yang closed and open
above / below symbol up/ down – send/revieve top / bottom cymbal
changing lines primary /secondary divisions of tempo
universal cycles constant change tempo
king weng sequence progression rhythmic patterns
four seasons cycle 4 stages 4 steps 4 bar measures
six lines identity 6 bar measures
8 trigrams 2measure2trigrams 2 measures
64 symbols divisions of 64 2 cymbals
The divination process is one of chance but I always sensed it was not entirely random.
Whether the toss of a coin or draw of a card, the process of casting always involved a
performative action, a physical connection, and a transfer of energy. To preserve this I decided to
continue this piece as a performative one. By using digital tools, one could consult the wisdom of
the I’ching through traditional means but with sound as the medium of transferring results and a
digital instrument as the means of access and navigation. The results were sonified using both
associated patterns of ching symbols and synthetic voices of both Chinese and English origin. A
database of the hexagrams and their meanings was created in addition to a visual menu which
gave a deeper look into the chosen hexagrams meaning.
The 7th National and International Graduate Study Conference 2017
" Thailand 4.0 Creative Innovation for Sustainable Development "
I378

While not deviating from the tradition method of I-ching divination, the Ching I Ching
sought to create a new aesthetic for fortune telling and oracle consulting. By using sound as the
medium, I believe the fortune for which you receive can be more than just analyzed visually, but
felt by the body and allowing a sonic connection to both the mathematics of the I-ching and the
elemental nature of the ching symbol.
The spatial audio techniques used in this piece focus on the elemental nature of the
I’ching hexagrams. Each symbol in the I’ching is an expansion of smaller concepts. The entire
Chinese system of philosophy stems from one singular energy, from which is divided by two
(yin-yang) and so forth until we reach the 64 hexagrams of the I’ching. Because the intention
was to bring these mathematical patterns to the sonic domain it seemed logical to illustrate each
element of the hexagram separately. If one speaker could represent one element of each
hexagram, then six speakers could give each hexagram their own unique presence in space,
something not possible with two speakers in which many configurations of sounds will be
identical when sonified.
‘Speak Spell’
Speak and spell is an ongoing series of generative sonic pieces that I have created based
on the visual compositions of various yant symbols. Yant symbols are a type of religious and
mystic diagram derived from the yantra symbology of ancient India some 2000 years ago. Today
yant symbols are a popular feature of Thai Buddhism and traditional Thai culture, particularly in
the art of tattoo. Yant symbols originated sound: transcribed mantras, or words and sounds to be
chanted in prayer or meditation. The mantras or ‘kata’ are then written, usually in ancient Khmer
script, and incorporated into geometric or figurative like visual forms to become yant.
The sonic installations of Speak Spell combine the two elements defined above using
spatial audio techniques and text to speech software. Composition considers many aspects and
parameters of each yant; primarily its numerical and geometric values but also its intended
meaning and even associated folklore. In terms of reproducing the symbols sonically these
parameters are translated into various spatial audio concepts: the number of speakers, speaker
placement, rhythmic patterns, frequency ratios, and the type of sonic content. See the figure
below for a visual comparison of a yant diagram and a spatial audio speaker diagram.
The 7th National and International Graduate Study Conference 2017
" Thailand 4.0 Creative Innovation for Sustainable Development "
I379

As Speak Spell is an ongoing project, the initial symbols to be realized are three of the
most significant and consequently most popular yant symbols: Hah Teaw, Gao Yort, and
Trinisinghae. To begin I analyzed the yant’s features and created a list of possible values. The
Trinisinghae, for example, features the following elements: 4 diamonds containing the number 5,
8 triangles containing 3 7 4 6 1 9 2 and 8 (in that order), 4 corners on two planes (a 2d
representation of a three-dimensional compass), and 8 loops or ‘knots’ that connect each corner
with ‘sealing’ spells written inside. In the order of traditional incantation, these combined
elements create a number stream of 3.7.5.4.6.5.1.9.5.2.8.5. Not only can the numerical content,
order, and location be considered in the sonification process but also the meaning of each
number. Ranging from the four emanations of Vishnu to the six guardian angels of heaven, each
numerical value represents the divine ruler of one domain.
The spatial audio techniques used in this piece are rather direct in their manner, the
elements of the yant are spatialized using speakers to represent the 8 knots of the symbol. The
speakers themselves are placed in the appropriate directions using a compass. Those four
speakers that represent the ‘knots’ will be given the short mantra associated with each seal of the
yant. Each sound inside the yant will be performed in its intended location and recording using a
microphone array. This type of recording involves a multi-channel recording of live acoustical
performance in a space identical to playback. Because the microphone will capture directionality,
no artificial localization of sounds is necessary. The performers inside the space during
recordings will be given instructions based on the divine being they will honor. The
compositional order of these elements will be based on the order of incantation. The frequency
and sound types they use with also relate to the number they represent. For example the square
which represent the number one is dedicated to the demon Mara. This square may be represented
by a single cymbal crescendo while the ‘three square’ that represents the Triple Gem may be the
strike of three harmonious bells.
The finalized installation layers these various sounds with the synthetic soundings of each
related mantra in addition to some harmonizing drones. The results is something between both
sound sculpture and digital enchantment. The intention is not only to explore the possibilities of
sonifying two dimensional graphics spatially, but also to explore the functionality. I believe that
by consorting ancient diagrams of the past, such as these yant symbols, we can better understand
the karmic nature of our sounds. Through specialization we can envelop listeners with sound;
enshrouding them with ancient wisdom.
Discussion
Locality and accessibility were once an extremely important element of music. No two
musicians think exactly alike and their personal interests take form as informants to their musical
expression. As the commercial markets of the world are unified by the internet, we find that
microeconomics become a new trend for consumption and that more and more humans are
reversing the effects of globalization and the virtual world by seeking a more physical and
localized relationship to their hyper-realities. This has a great effect on music as the musician
becomes far more common place and not that of international stardom. The gap between the
The 7th National and International Graduate Study Conference 2017
" Thailand 4.0 Creative Innovation for Sustainable Development "
I380

listener and the musician, a once idolized super figure, is once again narrowing. As the line
between the performer and listener narrows, how do you see the relationship between yourself
and music changing? Do you feel a deeper connection to a singer who, perhaps sitting directly
across from you, delivers a beautiful song than that of your favorite album on headphones? Can
technology bridge the gap between human’s natural relationship with sound and our complex
interaction with those of artefactual nature?
As we witness the incredible discoveries of engineers in the dawn of bioengineering, or
the integration of software and computer sciences in the social and political systems of the world,
the importance of cross-curricular and multidisciplinary study is becoming increasingly obvious.
Similarly, I believe that the field of sonic arts, and spatial audio in particular, is one that could
benefit greatly from the insight of other disciplines also concerned with perception, physicality,
and human expression. This sharing of perspectives will lead to not only an expanded pallet for
artists but a deeper understanding of the effect that sound has on us as a society.
Recommendations
By exploring concepts like the geometry of ancient Thai symbology, the philosophy of
change in Chinese divination, and the linguistic peculiarities of my life as a foreigner, I
discovered new perspectives to approach my practice as a sonic artist. These concepts not only
brought new wisdom, meaning, and intention to my pieces but informed me in the process of
exploring spatial audio. In a field (spatial audio) mostly concerned with entertainment and
reproducing reality, these fields of research helped to form deeper connection between the
origins of my inspiration and their future potential.
I recommend that now, more than ever, musicians and artists work ‘outside of the box’.
With today’s nearly endless number of styles and the rapid evolution of artistic tools available to
us the idea of ‘a box’ seems sometimes non-existent, but it still exists. One such box for the
modern musician is the speaker box (especially stereo) paradigm in which almost all of these
genres and styles squeeze into. By using technology (both forgotten and new) to escape these
confines, artist today will find new forms expression with a greater variety of influence, using
the multidisciplinary approach to justify and navigate these deviations.
References
Fauvel, John, Raymond Flood, and Robin Wilson. Music and Mathematics: from Pythagoras to
Fractals. Oxford: Oxford U Press, 2010. Print.
Kandinsky, Wassily, and Hilla Rebay. On the Spiritual in Art. New York: Pub. by the Solomon
R. Guggenheim Foundation, for the Museum of Non-objective Painting, 1946. Print.
Ohala, John J. 1997. Sound Symbolism. Proc. 4th Seoul International Conference on Linguistics
[SICOL] 11-15 Aug 1997. 98-103.
Goethe, Johann Wolfgang von, Margaret Fuller, and Johann Peter Eckermann. Conversations
with Goethe in the last years of his life. Boston: Hilliard, Gray, and Company, 1839. Print.
The 7th National and International Graduate Study Conference 2017
" Thailand 4.0 Creative Innovation for Sustainable Development "
I381

Foxe, David. Production and Reproduction; Architecture and Music
MIT Undergraduate Research Journal (MURJ) 7, 29, 2002.
"AUDIUM." AUDIUM. N.p., n.d. Web. 26 May 2017.
The 7th National and International Graduate Study Conference 2017
" Thailand 4.0 Creative Innovation for Sustainable Development "
I382

Comparison of dimensional accuracy of various impression techniques in PW
plus implant system.
Authors: Nattaya Poovarodom, Chaivut Prunkngarmpun and Wilawan Weraarchakul
Program: Master degree in Prosthodontics Institute: Khon Kaen University
Abstract
The aim of this research is to compare the dimensional accuracy of the two
impression techniques and the three impression materials for PW plus implants.
Material and methods: The acrylic resin model with two implant fixture (4.2 x 10.0
millimeters, PW Plus, Thailand) were placed paralleling to each other. The
impressions were made by closed-tray and open-tray techniques. The three impression
materials (polyether, vinylpolysiloxane -monophase, and vinylpolysiloxane- putty and
light body) were fabricated ninety working casts. The groups were subdivided into:
Gr. 1 Closed-tray with polyether, Gr. 2 Closed-tray with vinylpolysiloxane
(monophase), Gr. 3 Closed-tray with vinylpolysiloxane (putty and light body), Gr. 4
Open-tray with polyether, Gr. 5 Open-tray with vinylpolysiloxane (monophase), and
Gr. 6 Open-tray with vinylpolysiloxane (putty and light body). The linear distances
were examined between the implant abutments and measured with the measurement
microscope. The data was collected into the 4 linear distances ([AC], [AD], [BC], and
[BD]) and the distortion value that provided the illustration for the dimensional
accuracy of the working cast measurement difference from the reference model
measurement. After the data was transformed by logarithmic transformation, the
result was analyzed with Two-way ANOVA. Results: there is no significant
difference in means of dimensional accuracy for the impression materials, the
impression techniques and the interaction between the impression materials and the
impression techniques in term of the distortion value. However, the linear distance
[BD] value shows that the closed-tray technique has more distortion than the open-
tray technique with a statistical significance (p = 0.039). There is significant
difference in mean linear distance values for the interaction between the impression
materials and the impression techniques in term of the linear distance [AD] and linear
distance [BD] values (p = 0.002 and p = 0.020). Conclusions: The working casts were
fabricated from 6 method demonstrated differences from acrylic resin reference
model. The closed-tray technique is likely to be less accurate than the open-tray
technique.
Keywords: dental implant, impression techniques, impression materials
Introduction
The successful outcomes of implant-supported prosthesis are dependent
upon the passive fit between the connection of the fabricated prostheses and the
implant frameworks [1]. Passive fit is critical for the long-term successful of
osseointegrated implants [2]. Misfit between implant frameworks and prostheses may
result in problems such as mechanical failures of the prostheses (e.g. loosening of
prosthetic and abutment screws), failures of implant systems (e.g. fracture of
abutment screws or implant components), or biological complications of the
The 7th National and International Graduate Study Conference 2017
" Thailand 4.0 Creative Innovation for Sustainable Development "
I383

surrounding tissues (e.g. pain, tenderness, tissue responses, the loss of bone tissues,
and the loss of osseointegration) [3].
An acceptable prosthesis requires accuracy in all steps of procedure.
Distortion during master cast fabrication could lead to a misfit between implant
framework and prosthesis. The master cast must duplicate the surrounding tissues and
correct intraoral relation of the implant abutments position [4]. The first step of the
fabrication demands accurate position of the impression implant components and
records it with the impression procedure. Several impression techniques can be used
for implant prosthesis. There are two impression methods - at the abutment level and
at the implant level. The abutment level can be made either by a direct technique,
which makes impression on the abutment or by an indirect technique, which uses a
transfer impression coping, and then picking up coping on abutment. Two methods
can be applied for the implant level: direct technique (pick-up technique for open-
tray) using impression coping screwed onto implant body and unscrewed before
removing from the mouth, and an indirect technique (transfer technique for closed-
tray) using a narrow impression coping screwed onto implant body. Then, removed
the impression coping from the mouth and connected to the implant analog, and
reinserted into the impression [5].
Several impression materials had been studied, polyether and vinyl
polysiloxane (VPS) have been used at most and have been recommended for the
implant impression materials [6]. The polyether and the vinyl polysiloxane (VPS)
contributed to more accurate results comparing to other materials i.e. polysulfide,
condensation silicone, plaster impression, irreversible hydrocolloid and reversible
hydrocolloid [6-8].
From the present study, the passive fit demonstrates a significant impact
on success in implant-supported prosthesis. The crucial process is to copy the implant
positions through impression procedures. To accurately record the implant positions,
it is vital and sensitive to apply the proper impression materials and the impression
techniques. PW plus dental implant is a new generation of the Thai implant system.
There are only a few research topics on the PW plus dental implant. Therefore, it is
interesting to study that efficacy impression technique on PW plus dental implant that
could transfer accurately the location of the implant from the oral to the dental
laboratory. The objective of this research is to study the dimensional accuracy of two
impression techniques and three different impression materials for PW plus implant.
Objectives
The aim of this research is to compare the dimensional accuracy of the two
impression techniques and the three impression materials for PW plus implants.
Research Methodology
The in vitro study to compare two impression techniques (closed-tray and
open-tray techniques) and three impression materials : 1) polyether - medium body
(ImpregumPenta, 3M ESPE, Germany), 2) vinylpolysiloxane - monophase
(Monopren transfer, Kettenbach GmbH & Co. KG, Germany), 3) vinylpolysiloxane -
putty and light body-regular set (Express XT, 3M ESPE, Germany)
Six groups will subdivide into
Group 1 Closed-tray with polyether
The 7th National and International Graduate Study Conference 2017
" Thailand 4.0 Creative Innovation for Sustainable Development "
I384

Group 2 Closed-tray with vinylpolysiloxane (monophase)
Group 3 Closed-tray with vinylpolysiloxane (putty and light body)
Group 4 Open-tray with polyether
Group 5 Open-tray with vinylpolysiloxane (monophase)
Group 6 Open-tray with vinylpolysiloxane (putty and light body)
The reference acrylic resin model was fabricated and the two implant
fixture (4.2 x 10.0 millimeters, PW Plus, Thailand) drilled into the wax model which
center-to-center distance approximately 8 millimeters apart and paralleling to each
other, 10 millimeters in deep. After that the wax model was flasking and processing
into heat clear acrylic resin (Figure 1).
Figure 1 The reference acrylic resin model
For closed-tray technique, two closed-tray impression copings (PW Plus,
Thailand) were screwed onto the implants (Figure 2A). For open-tray technique, two
open-tray impression copings (PW Plus, Thailand) were tightened onto the implant
(Figure 2B). The model was used throughout the experiment. The impressions must
be made in an environmental stability test chamber, where construction is conducted
under a controlled temperature environment (36 ± 1°C) with relative humidity of 70%
± 5%. The impression trays were maintained in position with standard 5 kilograms
weight throughout the setting time.
Figure 2 Impression copings: closed-tray technique (A) and open-tray technique (B)
Two types of custom tray were made of stainless steel which carries 3
millimeters of internal space for consistent thickness of the impression materials. The
stainless steel trays were to be 2 millimeters in thickness and must be perforated
around for the use of retaining the impression material. For the open-tray, a window
was made on upper section of tray to expose the impression copings (Figure 3).
Applied the adhesive (Polyether tray adhesive or VPS tray adhesive,
Panasil tray adhesive) in each type of the impression material within the internal
surface of the tray for entirety and the application must be beyond on the external tray
border for 5 millimeters. It is expected that the adhesive must be allowed to dry and
A B
The 7th National and International Graduate Study Conference 2017
" Thailand 4.0 Creative Innovation for Sustainable Development "
I385
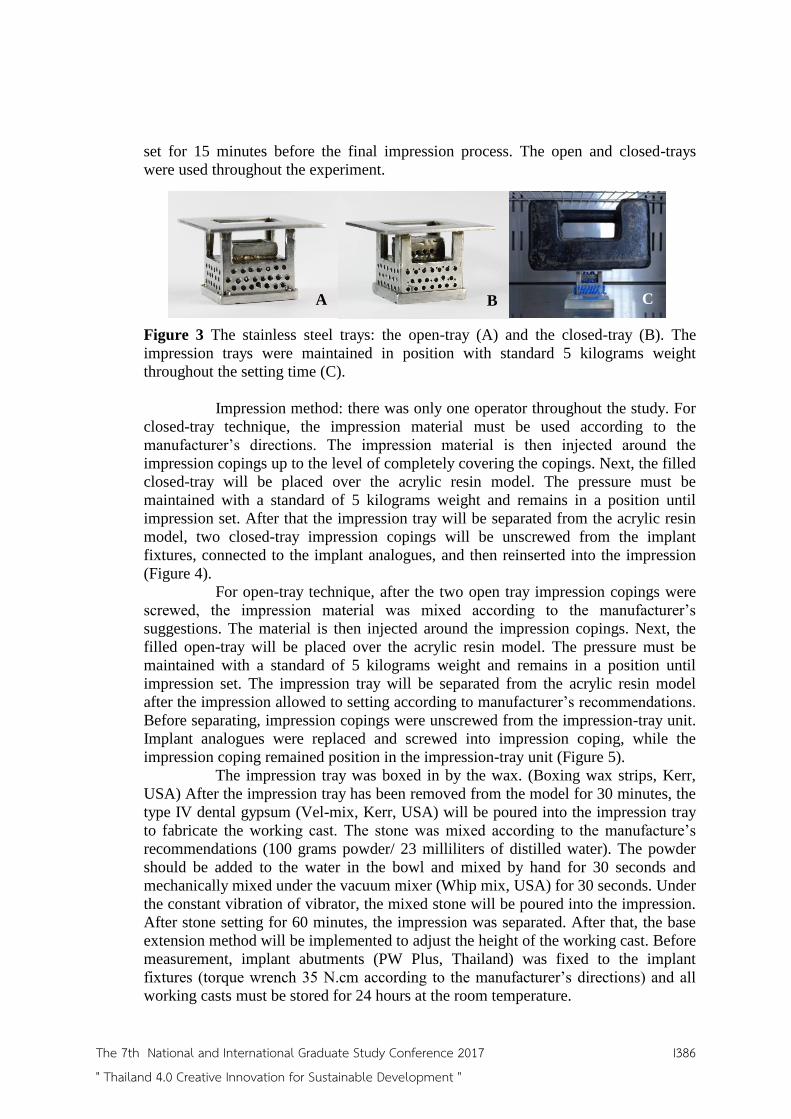
set for 15 minutes before the final impression process. The open and closed-trays
were used throughout the experiment.
Figure 3 The stainless steel trays: the open-tray (A) and the closed-tray (B). The
impression trays were maintained in position with standard 5 kilograms weight
throughout the setting time (C).
Impression method: there was only one operator throughout the study. For
closed-tray technique, the impression material must be used according to the
manufacturer’s directions. The impression material is then injected around the
impression copings up to the level of completely covering the copings. Next, the filled
closed-tray will be placed over the acrylic resin model. The pressure must be
maintained with a standard of 5 kilograms weight and remains in a position until
impression set. After that the impression tray will be separated from the acrylic resin
model, two closed-tray impression copings will be unscrewed from the implant
fixtures, connected to the implant analogues, and then reinserted into the impression
(Figure 4).
For open-tray technique, after the two open tray impression copings were
screwed, the impression material was mixed according to the manufacturer’s
suggestions. The material is then injected around the impression copings. Next, the
filled open-tray will be placed over the acrylic resin model. The pressure must be
maintained with a standard of 5 kilograms weight and remains in a position until
impression set. The impression tray will be separated from the acrylic resin model
after the impression allowed to setting according to manufacturer’s recommendations.
Before separating, impression copings were unscrewed from the impression-tray unit.
Implant analogues were replaced and screwed into impression coping, while the
impression coping remained position in the impression-tray unit (Figure 5).
The impression tray was boxed in by the wax. (Boxing wax strips, Kerr,
USA) After the impression tray has been removed from the model for 30 minutes, the
type IV dental gypsum (Vel-mix, Kerr, USA) will be poured into the impression tray
to fabricate the working cast. The stone was mixed according to the manufacture’s
recommendations (100 grams powder/ 23 milliliters of distilled water). The powder
should be added to the water in the bowl and mixed by hand for 30 seconds and
mechanically mixed under the vacuum mixer (Whip mix, USA) for 30 seconds. Under
the constant vibration of vibrator, the mixed stone will be poured into the impression.
After stone setting for 60 minutes, the impression was separated. After that, the base
extension method will be implemented to adjust the height of the working cast. Before
measurement, implant abutments (PW Plus, Thailand) was fixed to the implant
fixtures (torque wrench 35 N.cm according to the manufacturer’s directions) and all
working casts must be stored for 24 hours at the room temperature.
A B C
The 7th National and International Graduate Study Conference 2017
" Thailand 4.0 Creative Innovation for Sustainable Development "
I386

Figure 4 The closed-tray technique: the impression material is then injected around
the impression copings (A) up to the level of completely covering the copings (B).
Next, the filled custom tray will be placed over the acrylic resin model (C). The
impression tray was separated from the acrylic resin model (D).
Figure 5 The open-tray technique: the impression material is then injected around the
impression copings (A and B). Next, the filled custom tray will be placed over the
acrylic resin model (C). The impression tray will be separated from the acrylic resin
model. Before separating, impression copings were unscrewed from the impression-
tray unit (D).
C
A
D
B
A
D C
B
The 7th National and International Graduate Study Conference 2017
" Thailand 4.0 Creative Innovation for Sustainable Development "
I387
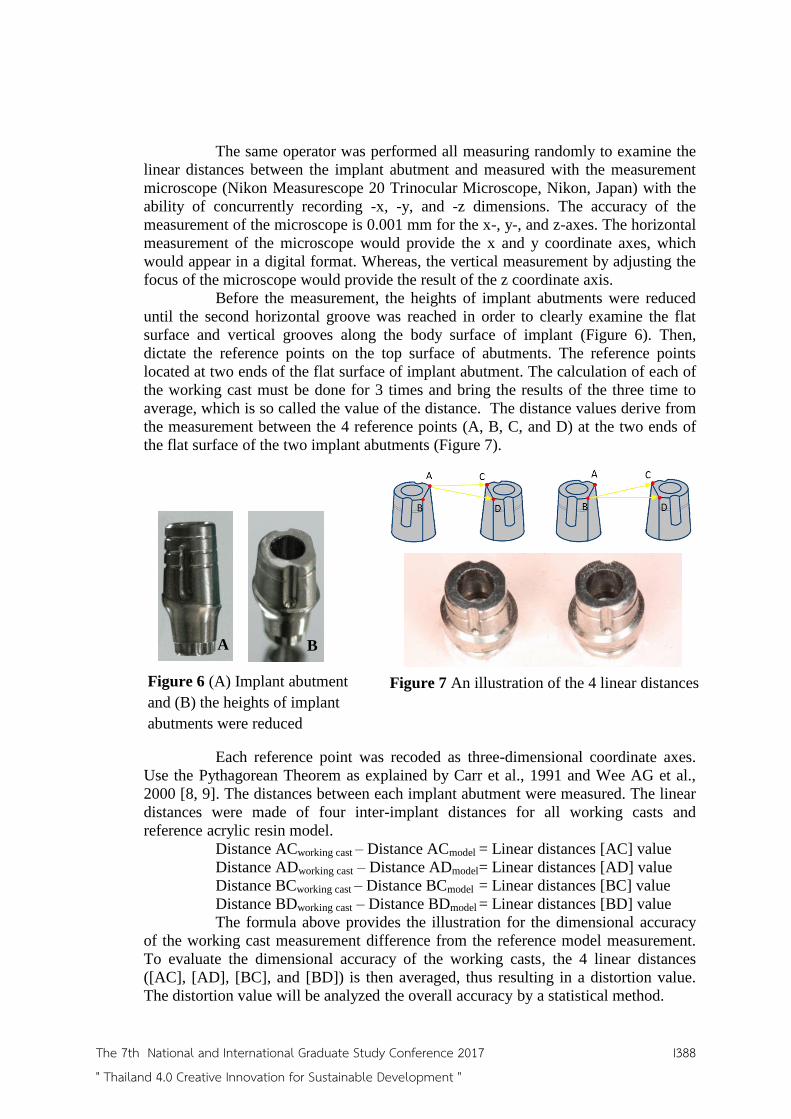
The same operator was performed all measuring randomly to examine the
linear distances between the implant abutment and measured with the measurement
microscope (Nikon Measurescope 20 Trinocular Microscope, Nikon, Japan) with the
ability of concurrently recording -x, -y, and -z dimensions. The accuracy of the
measurement of the microscope is 0.001 mm for the x-, y-, and z-axes. The horizontal
measurement of the microscope would provide the x and y coordinate axes, which
would appear in a digital format. Whereas, the vertical measurement by adjusting the
focus of the microscope would provide the result of the z coordinate axis.
Before the measurement, the heights of implant abutments were reduced
until the second horizontal groove was reached in order to clearly examine the flat
surface and vertical grooves along the body surface of implant (Figure 6). Then,
dictate the reference points on the top surface of abutments. The reference points
located at two ends of the flat surface of implant abutment. The calculation of each of
the working cast must be done for 3 times and bring the results of the three time to
average, which is so called the value of the distance. The distance values derive from
the measurement between the 4 reference points (A, B, C, and D) at the two ends of
the flat surface of the two implant abutments (Figure 7).
Each reference point was recoded as three-dimensional coordinate axes.
Use the Pythagorean Theorem as explained by Carr et al., 1991 and Wee AG et al.,
2000 [8, 9]. The distances between each implant abutment were measured. The linear
distances were made of four inter-implant distances for all working casts and
reference acrylic resin model.
Distance ACworking cast – Distance ACmodel = Linear distances [AC] value
Distance ADworking cast – Distance ADmodel = Linear distances [AD] value
Distance BCworking cast – Distance BCmodel = Linear distances [BC] value
Distance BDworking cast – Distance BDmodel = Linear distances [BD] value
The formula above provides the illustration for the dimensional accuracy
of the working cast measurement difference from the reference model measurement.
To evaluate the dimensional accuracy of the working casts, the 4 linear distances
([AC], [AD], [BC], and [BD]) is then averaged, thus resulting in a distortion value.
The distortion value will be analyzed the overall accuracy by a statistical method.
A B
Figure 6 (A) Implant abutment
and (B) the heights of implant
abutments were reduced
Figure 7 An illustration of the 4 linear distances
The 7th National and International Graduate Study Conference 2017
" Thailand 4.0 Creative Innovation for Sustainable Development "
I388

The SPSS software 19 (SPSS Inc., Illinois, Chicago, USA) was being used
in the analytical statistics. Normal distribution was done by using the Shapiro-Wilk
test. Two-way ANOVA was a major tool used to verify significant difference in the
dimensional accuracy of different combinations of three impression materials and two
impression techniques. On all analysis, α = 0.05 was the level of significance used for
the statistical analysis.
Results
Analysis of the distortion value
The distortion value was nonparametric and therefore must be transformed
by logarithmic transformation, and then the data was calculated with Shapiro-Wilk
test. The result was a normally distributed data.
The descriptive analysis of the means and standard deviations of the
distortion value are shown in Table 1. Group 4 (open-tray with polyether) showed the
lowest distortion value which means lowest distortion from the reference model and
had the lowest SD values (48.06 ± 30.66 µm). The distortion value for group 6 (open-
tray with putty and light body) had the greatest distortion from to the reference model
(90.33± 69.91 µm). Group 3 (closed-tray with putty and light body) showed the
greatest SD values (84.68± 86.29 µm) (Figure 8).
Table 1 Mean distortion value (µm)
Technique Material Group Mean (SD) Median
Closed-tray Polyether 1 78.88 (49.80) 63.67
Monophase 2 72.67 (46.30) 55.46
Putty and light body 3 84.68 (86.29) 49.87
Open-tray Polyether 4 48.06 (30.66) 45.24
Monophase 5 78.51 (63.54) 60.18
Putty and light body 6 90.33 (69.91) 70.86
The test of Two-way ANOVA has shown that there is no significant
difference in means of distortion value for impression materials, the impression
techniques, and the interaction between impression materials and impression
techniques (p = 0.566, p = 0.378, and p = 0.275).
Figure 8 The distortion value (µm) of 6 groups
78.88 72.67
84.68
48.06
78.51
90.33
0102030405060708090
100
Closed-tray
(polyether)
Closed-tray
(monophase)
Closed-tray
(putty and
light body)
Open-tray
(polyether)
Open-tray
(monophase)
Open-tray
(putty and
light body)
Dis
tort
ion
val
ue
(µm
)
The 7th National and International Graduate Study Conference 2017
" Thailand 4.0 Creative Innovation for Sustainable Development "
I389

Distortion values derived from the average of the 4 linear distances ([AC],
[AD], [BC], [BD]). The statistical analysis of the 4 linear distances has found that the
data was not normally distributed. Logarithmic transformation was then performed to
transform the data and examined the data with Shapiro-Wilk test. The result was a
normally distributed data, which was statistically tested by means of the Two-way
ANOVA and can be categorized the analysis into 4 distances.
Analysis of the linear distances [AC]
The descriptive analysis of the mean and standard deviation of the linear
distance [AC] values are shown in Table 2.The analysis was done using the Two Way
ANOVA. The result tells that there is no significant difference in mean linear distance
[AC] value of the impression techniques, the impression materials, and the interaction
between the impression materials and the impression techniques in the direction of the
AC distance (p = 0.950, p = 0.236, and p = 0.981).
Analysis of the linear distances [AD]
The descriptive analysis of the means and standard deviations of the linear
distance [AD] values are shown in Table 3. Two-way ANOVA analysis demonstrates
that there are significant differences in the mean linear distance [AD] values in the
interaction between the impression materials and the impression techniques (p =
0.002). But, there is no statistically significant difference in the mean linear distance
[AD] values in the impression techniques and the impression materials (p = 0.887 and
p = 0.763).
Analysis of the linear distances [BC]
The descriptive analysis of the means and standard deviations of the linear
distance [BC] values are shown in Table 4. The Two way ANOVA was used to
analyze. The result shows that there is no significant difference in mean linear
distance [BC] value of the impression techniques, the impression materials and the
interaction between impression materials and impression techniques in the direction
of the BC distance (p = 0.989, p = 0.578, and p = 0.285).
Analysis of the linear distances [BD]
The descriptive analysis of the means and standard deviations of the linear
distance BD value is shown in Table 5. The Two-way ANOVA demonstrates that
there are significant differences in mean linear distance [BD] value in impression
techniques and the interaction between the impression materials and the impression
techniques (p = 0.039 and p = 0.020). But there was no statistically significant
difference in mean linear distance [BD] value in the impression materials (p = 0.518)
The Pairwise Comparisons between the open tray and the closed tray
techniques of the linear distance [BD]. The result demonstrates that the closed-tray
technique has more distortion than the open-tray technique (mean difference = 27.886
µm) with a statistical significance (p = 0.039).
The 7th National and International Graduate Study Conference 2017
" Thailand 4.0 Creative Innovation for Sustainable Development "
I390

Table 2 Mean linear distances [AC] value (µm)
Technique Material Group Mean (SD) Median
Closed-tray Polyether 1 42.33 (34.46) 35.13
Monophase 2 43.76 (29.39) 40.10
Putty and light body 3 92.40 (123.78) 63.84
Open-tray Polyether 4 28.44 (19.58) 27.20
Monophase 5 60.28 (76.11) 28.22
Putty and light body 6 71.63 (76.04) 48.77
Table 3 Mean linear distances [AD] value (µm)
Technique Material Group Mean (SD) Median
Closed-tray Polyether 1 116.67 (73.47) 95.13
Monophase 2 84.08 (68.56) 62.49
Putty and light body 3 74.99 (85.71) 67.59
Open-tray Polyether 4 36.32 (28.15) 24.51
Monophase 5 105.89 (78.23) 89.78
Putty and light body 6 118.15 (97.35) 96.11
Table 4 Mean linear distances [BC] value (µm)
Technique Material Group Mean (SD) Median
Closed-tray Polyether 1 93.17 (57.06) 80.41
Monophase 2 96.45 (83.65) 74.19
Putty and light body 3 98.37 (145.03) 47.25
Open-tray Polyether 4 69.09 (62.15) 76.82
Monophase 5 123.27 (117.18) 94.31
Putty and light body 6 135.53 (123.45) 127.53
Table 5 Mean linear distances [BD] value (µm)
Technique Material Group Mean (SD) Median
Closed-tray Polyether 1 63.35 (63.72) 35.16
Monophase 2 66.39 (53.33) 53.79
Putty and light body 3 72.94 (68.20) 50.82
Open-tray Polyether 4 58.40 (45.75) 54.68
Monophase 5 24.59 (28.71) 15.30
Putty and light body 6 36.03 (34.49) 25.76
Figure 9 The graph of the mean linear distances [AD] value
Open-tray
technique
Closed-tray
technique
The 7th National and International Graduate Study Conference 2017
" Thailand 4.0 Creative Innovation for Sustainable Development "
I391

Figure 10 The graph of the mean linear distances [BD] value
Discussion
The results of this research show that when compared the distortion value
of the working cast to the reference model, given the three of the null hypothesis were
accepted, there is no significant difference in means of dimensional accuracy for the
impression materials, the impression techniques and different combinations of the
impression materials and the impression techniques.
Meanwhile, however, the linear discrepancies that express in terms of the
linear distances values of the 4 distances measurement ([AC], [AD], [BC] and [BD]),
the second null hypothesis was rejected due to the fact that the distance [BD] shows
that the open-tray technique is significantly more accurate than the closed-tray
technique in terms of the linear discrepancies when comparing with the reference
model. The third null hypothesis was rejected since the distance AD and the distance
BD shows that there is a significant difference in mean linear distance values in the
interaction between the impression materials and the impression techniques.
As a result, it can be found that the closed-tray impression technique has
demonstrated no difference between polyether, polyvinyl siloxane (monophase) and
polyvinyl siloxane (putty and light body). The result is similar with other studies e.g.
Chang et al., 2012 [10]. The study of the mechanical properties of the elastomeric
impression materials in 1998 by Chai et al. [11] reveals that VPS putty had high yield
strength, moderate strain tolerance, and moderately low tear resistance. Meanwhile,
the polyvinyl siloxane tray and syringeable materials showed moderate yield strength,
high strain tolerance, and relatively low rigidity. In the meantime, the polyether
displayed moderate yield strength, relatively low strain tolerance, and moderately
high tear resistance. To avoid a permanent dimensional distortion, it is mandatory that
the impression material must possess a large tolerable strain in the elastic range that
would allow the impression to flex over the undercutting tissues. On removal of the
impression from the mouth, high elastic recovery and acceptable flexibility can be
gained from the Elastomeric impression materials.
Thus, for the open-tray impression techniques, it can be concluded that the
polyether possesses the tendency to be less distorted than the polyvinyl siloxane
(monophase) and the polyvinyl siloxane (putty and light body) but no statistically
significant. The result was similar with other study e.g. Wee, 2000, Barrett et al.,
1993, Wenz et al., 2008, Del’Acqua et al., 2010, Mostafa et al., 2010 [8, 12-15]
Closed-tray
technique
Open-tray
technique
The 7th National and International Graduate Study Conference 2017
" Thailand 4.0 Creative Innovation for Sustainable Development "
I392

On the technique with the impression material for the open-tray technique,
adequate rigidity on the impression material is needed to hold the impression coping
in their position during the removal the impression from oral cavity. The polyether
possesses the great torque values and its rigidity provides resistance to the accidental
displacement of the direct impression coping when the analog was tightened, which
means the polyether may be favorable for open tray impression procedure. However,
the use of the polyether for an impression of a partially edentulous arch also presents
increased difficulty for the impression removal [8].
As Vigolo et al. [16] explains in 2004, when an impression with the
copings is removed from the internal connection implants, the vinyl polysiloxane
material may hypothetically reduce the permanent deformation of the impression
material determined by the stress created between the impression material and
impression copings. Vigolo et al. [16] suggested that the fabrication of the definitive
cast, the important factor is preventing the movement of the impression copings inside
the impression material throughout the procedures. The accuracy of the cast will be
compromised cause minor movement when unscrewing the guide pins from the
impression copings upon the impression tray is removed or screwing the implant
analog in the impression.
The result of the Two Way ANOVA analysis of the linear distance BD
value shows that the closed-tray technique has more distortion than the open-tray
technique with a statistical significance (p = 0.039). Other studies have also rendered
similar results e.g. Carr, 1991, Barrett et al, 1993., 2010 and Assif et al., 1992 [9, 12,
17]. More variation occurred in the position of an abutment and implant analogue
assembly in the resulting casts from the repositioning impression technique at the
implant level, according to the study by Daoudi et al. [18] in 2001. The repositioning
impression technique at the implant level is less predictable than the pickup
impression technique.
This study has found distortion value of the range between 11.25 to 324.57
µm. There were controversies over the clinically acceptable value of the passive fit,
revealed the literature. The values of the measurement of the fit implant support
prostheses differ significantly depending on whether the prostheses are trying directly
to the mouth or the master cast [19].
Branemark et al. was the first to measure the passive fit of the implant
framework. He maintained that the acceptable misfit shall not exceed 10 microns [20].
Jemt maintained that the misfit is acceptable when it is not exceed 150 microns. He
introduced the screw resistance test and revealed that screwing an extra one half turn
can help achieve the passive fit [21]. In the vivo study of primates, the result showed
no statistically significant differences in bone responding that can evaluated around
the misfit of the implants supporting frameworks range 38 to 345 μm [22].
Kallus and Bessing, in their retrospective study, have found that the 236
patients with actually misfit of the implant supported prosthesis for at least 5 years
had no signs of the osseointegration loss. In addition, the misfit of the superstructure
did not affect the maintenance of the marginal bone level [23]. Corresponding
measurements of the prosthesis misfit and marginal bone level in implants placed in
the edentulous maxilla, in a vivo study, have found that a mean of misfit of 111 μm
and 91 μm for the groups of following up between 1 year and 5 years. There is no
correlation between the change in the marginal bone level and misfits, the authors
The 7th National and International Graduate Study Conference 2017
" Thailand 4.0 Creative Innovation for Sustainable Development "
I393

reasoned. They, thus, concluded that the misfits reported in the study were clinically
acceptable [24].
Lee et al. [25] in 2008 presented a systematic review of the accuracy of the
implant impressions from 9 studies, which measured a linear discrepancy at the
connection level between the working cast and the experimental model. The
researchers have found that the discrepancies can be ranged between 0.6 µm and 136
µm.
The limitation of present study is that the examination of accuracy of
implant working casts was being studied using a reference model with the implant is
placed in parallel. In fact, the result might have been different if the implants were
angulated placed, as demonstrated in the earlier studies that study the effect on
accuracy of the impression if the implants were placed angulated [25, 26].
This study has found that the data was nonparametric. Thus, the mean and
median were presented as a result. The median value could better represent the center
of the data distribution. The SD value of some groups was found to be close to or
more magnitude than the mean distortion value. The errors may occur in any of the
required steps such as the machining tolerance of the implant units, the dimensional
change of the impression material, incorrect repositioning of the implant impression
coping, inaccurate connection of the implant component, the dental stone expansion,
and operator error [27]. The disadvantage of the measurement by the microscope was
a wrong placement of the optical positioning, which could result in an incorrect
measurement [28]. Many factors could contribute to this deviation. This variability
was not only limit the clinical procedure of the measurement technique, but it also
reduced the predictability of the test technique as well.
Conclusion
The limitations of present study in vitro study, the following conclusions
were drawn:
The result of the impression materials were similar which found no
significant differences (p > 0.05) in term of cast inaccuracy between three impression
materials (polyether, vinylpolysiloxane –monophase, and vinylpolysiloxane- putty
and light body). The working casts were fabricated from the two impression
techniques and the three impression materials for PW plus implants and it
demonstrated a differentiation from the acrylic resin reference model. The closed-tray
technique is likely to be less accurate than the open-tray technique.
References
1. Cabral LM, Guedes CG. (2007). “Comparative analysis of 4 impression techniques
for implants.” Implant dentistry. 16, 2 (June): 187-194.
2. Branemark PI. (1983). “Osseointegration and its experimental background.” The
journal of prosthetic dentistry. 50, 3 (September): 399-410.
3. Kan JY, Rungcharassaeng K, Bohsali K, Goodacre CJ, Lang BR. (1999). “Clinical
methods for evaluating implant framework fit.” The journal of prosthetic
dentistry. 81, 1 (January): 7-13.
4. Wee AG, Schneider RL, Aquilino SA, Huff TL, Lindquist TJ, Williamson DL.
The 7th National and International Graduate Study Conference 2017
" Thailand 4.0 Creative Innovation for Sustainable Development "
I394
(1998). “Evaluation of the accuracy of solid implant casts.” Journal of
prosthodontics : official journal of the american college of
prosthodontists. 7, 3 (September): 161-169.
5. Chee W, Jivraj S. (2006). “Impression techniques for implant dentistry.” British
dental journal. 7, 201, 7 (October): 429-32.
6. Prithviraj DR PM, Garg P, Shruthi DP. (2011). “Accuracy of the implant
impression obtained from different impression materials and techniques:
review.” Journal of clinical and experimental dentistry. 3, 2: 106-111.
7. Assuncao WG, Filho HG, Zaniquelli O. (2004). “Evaluation of transfer impressions
for osseointegrated implants at various angulations.” Implant dentistry.
13, 4 (December): 358-366.
8. Wee AG. (2000). “Comparison of impression materials for direct multi-implant
impressions.: The journal of prosthetic dentistry. 83, 3 (March): 323-
331.
9. Carr AB. (1991). “Comparison of impression techniques for a five-implant
mandibular model.” The international journal of oral & maxillofacial
implants. 6, 4 (Winter): 448-455.
10. Chang WG, Vahidi F, Bae KH, Lim BS. (2012). “Accuracy of three implant
impression techniques with different impression materials and stones.”
The international journal of prosthodontics. 25, 1 (January- February):
44-47.
11. Chai J, Takahashi Y, Lautenschlager EP. (1998). “Clinically relevant mechanical
properties of elastomeric impression materials.” The international
journal of prosthodontics. 11, 3 (May-June): 219-223.
12. Barrett MG, de Rijk WG, Burgess JO. (1993). “The accuracy of six impression
techniques for osseointegrated implants.” Journal of prosthodontics :
official journal of the american college of prosthodontists. 2, 2 (June):
75-82.
13. Wenz HJ, Hertrampf K. (2008). “Accuracy of impressions and casts using
different implant impression techniques in a multi-implant system with an
internal hex connection.” The international journal of oral &
maxillofacial implants. 23, 1 (January- February): 39-47.
14. Del’Acqua MA, Chavez AM, Amaral AL, Compagnoni MA, Mollo Fde A, Jr.
(2010). “Comparison of impression techniques and materials for an
implant-supported prosthesis.” The international journal of oral &
maxillofacial implants. 25, 4 (July-August): 771-776.
15. Mostafa TM, Elgendy MN, Kashef NA, Halim MM. (2010). “Evaluation of the
precision of three implant transfer impression techniques using two
elastomeric impression materials.” The international journal of
prosthodontics. 23, 6 (November-December): 525-528.
16. Vigolo P, Fonzi F, Majzoub Z, Cordioli G. (2004). “An evaluation of impression
techniques for multiple internal connection implant prostheses.” The
journal of prosthetic dentistry. 92, 5 (November): 470-476.
17. Assif D, Fenton A, Zarb G, Schmitt A. (1992). “Comparative accuracy of implant
impression procedures.” The international journal of periodontics &
restorative dentistry. 12, 2: 112-121.
18. Daoudi MF, Setchell DJ, Searson LJ. (2001). “A laboratory investigation of the
The 7th National and International Graduate Study Conference 2017
" Thailand 4.0 Creative Innovation for Sustainable Development "
I395

accuracy of two impression techniques for single-tooth implants.” The
international journal of prosthodontics. 14, 2 (March-April): 152-158.
19. Jemt T. (1996). “In vivo measurements of precision of fit involving implant-
supported prostheses in the edentulous jaw.” The international journal of
oral & maxillofacial implants. 11, 2 (March-April): 151-158.
20. Branemark PI ZG, Albrektsson T. (1985). Tissue –integrated prostheses.
Chicago: Quintessence. P 253.
21. Jemt T. (1991). “Failures and complications in 391 consecutively inserted fixed
prostheses supported by Branemark implants in edentulous jaws: a study
of treatment from the time of prosthesis placement to the first annual
checkup.” The international journal of oral & maxillofacial implants.
6, 3 (Fall): 270-276.
22. Carr AB, Gerard DA, Larsen PE. (1996). “The response of bone in primates
around unloaded dental implants supporting prostheses with different
levels of fit.” The journal of prosthetic dentistry. 76, 5 (November):
500-509.
23. Kallus T, Bessing C. (1994). “Loose gold screws frequently occur in full-arch
fixed prostheses supported by osseointegrated implants after 5 years.” The
international journal of oral & maxillofacial implants. 9, 2 (March-
April): 169-178.
24. Jemt T, Book K. (1996). “Prosthesis misfit and marginal bone loss in edentulous
implant patients.” The international journal of oral & maxillofacial
implants. 11, 5 (September-October): 620-625.
25. Lee H, So JS, Hochstedler JL, Ercoli C. (2008). “The accuracy of implant
impressions: a systematic review.” The journal of prosthetic dentistry.
100, 4 (October): 285-291.
26. Sorrentino R, Gherlone EF, Calesini G, Zarone F. (2010). “Effect of implant
angulation, connection length, and impression material on the dimensional
accuracy of implant impressions: an in vitro comparative study.” Clinical
implant dentistry and related research. 12 Suppl, 1(May): e63-76.
27. Rashidan N, Alikhasi M, Samadizadeh S, Beyabanaki E, Kharazifard MJ. (2012).
“Accuracy of implant impressions with different impression coping types
and shapes.” Clinical implant dentistry and related research. 14, 2
(April): 218-225.
28. Nicholls JL. (1980) “The measurement of distortion: concluding remarks.” The
journal of prosthetic dentistry. 43, 2 (February): 218-223.
The 7th National and International Graduate Study Conference 2017
" Thailand 4.0 Creative Innovation for Sustainable Development "
I396

Wound healing activity of recombinant TCTP protein from Elaeis guineensis
Jacq
Author: Ajchara Kaewjurat, Assoc. Prof. Dr. Jasadee Kaewsrichan,
Prof. Dr. Amornrat Phongdara
Program Molecular Biotechnology and Bioinformatics, Institute Department of
Molecular Biotechnology and Bioinformatics, Faculty of Science, Prince of Songkla
University
Abstract
A translationally controlled tumor protein of Elaeis guineensis Jacq (called
Eg-TCTP) had been identified. This protein acts as a constitutive promoter for
enhancing growth rate in calli of oil palm. In this study, wound healing activity of a
recombinant Eg-TCTP protein was investigated using L929 fibroblast cell line by the
scratch method. The mRNA expression levels of tumor associated genes, such as
sydecan-2, β-catenin, lrp6 and bmi1 were assessed by quantitative real-time PCR
(qPCR) technique. Results indicated that 50 ng/ml of Eg-TCTP significantly promoted
wound closure within 48 h after wounding. In addition, the transcription levels of those
genes were not significantly changed, suggesting that Eg-TCTP might be non-
oncogenic. The protein is premised in application for repairing wounded skin.
Keywords: Eg-TCTP protein, oil palm, wound healing, tumor associated genes
Introduction
Biomedical and clinical researches are important in development of
therapeutic proteins for wound healing application (Li et al., 2015). Wound healing is
a complex biological process involving several physiological events, such as
hemostasis, inflammation, proliferation, and remodeling (Matin, 1997; Singer and
Clark,1999; Gurtner et al., 2008) in order to trigger and regulate the healing of wounds.
(Li et al., 2007; Sosne et al., 2007)
The translationally controlled tumor protein (TCTP) is ubiquitously found in
both the animal and plant kingdoms. Its expression is associated with many cellular
processes, such as cell proliferation, cell growth, and programmed cell death (Brioudesa
et al., 2010; Hoepflinger et al., 2013). In plant, the TCTP is related to functions
regarding cell growth and differentiation of plant organs. Differential expression of
TCTP was evident under abiotic stresses, such as aluminum and mercuric ion exposure,
wounding, salinity, and water limitation, resulting in increased plant tolerance (Kim,
2012; Wang, et al., 2012 ; Li et al., 2013; Santa Brı´gida et al., 2014; Zhang et al., 2014). Moreover, the protein was shown to be a positive regulator of mitotic growth by
controlling the plant cell cycle. (Berkowitz et al., 2008; Brioudesa, et al., 2010 ; Qin et
al., 2010)
The TCTP from E. guineensis Jacq or Eg-TCTP was previously identified in
our laboratory (Nakkaew et al., 2010), which revealed 84- 91% sequence homology to
those TCTP proteins deposited in bioinformatics data bases. It contained 168 amino
acids with a calculated molecular mass of 19.2 kDa. This was in contrast to a result
analyzed by SDS-PAGE, which showed a protein band at 22.9 kDa. However, by
concerning its actual functions, the recombinant Eg-TCTP protein was evaluated for
wound healing activity in this study.
The 7th National and International Graduate Study Conference 2017
" Thailand 4.0 Creative Innovation for Sustainable Development "
I397
Objectives
To investigate wound healing activity of recombinant TCTP protein from
Elaeis guineensis Jacq (Eg-TCTP)
Research Methodology
Purification of recombinant Eg-TCTP from E. coli
Escherichia coli M15 (pRep4) cells were transformed with a recombinant
plasmid containing Eg-tctp encoding gene as previously described (Nakkaew et al.,
2010). After inducing protein expression, the cells were harvested by centrifugation
(1500xg, 15 min). The cell pellet was resuspended in lysis buffer (50 mM NaH2PO4,
pH 8.0, 300 mM NaCl and 10 mM imidazole) containing 1 mM phenylmethanesulfonyl
fluoride (PMSF). Then, the recombinant protein was purified using a Ni–NTA column
(QIAGEN, Germany) in conjunction with elution buffer (50 mM NaH2PO4, pH 8.0,
300 mM NaCl and 250 mM imidazole) containing 1 mM PMSF. The eluted protein was
verified via 12.5% sodium dodecyl sulfate polyacrylamide gel electrophoresis (SDS-
PAGE) and analyzed using Western blotting.
Cells and culture conditions
L929 cells were routinely grown in Dulbecco's modified Eagle's medium
(DMEM, Gibco, USA) supplemented with 10% fetal bovine serum (FBS) and 100
units/ml of penicillin and 100 μg/ml streptomycin (Gibco, USA) and incubated at 37ºC
in a 5% CO2 atmosphere. The cells were subcultured every 3-4 days using standard cell
culture technique.
Wound-healing assay
The L929 cells (5 × 10⁴ cells/ml) in DMEM supplemented with 10% FBS were
seeded in a 24-wells plate and incubated overnight. A wound was made in the center of
each confluent monolayer using a sterile pipette tip, and any cellular debris was
removed by washing with phosphate buffer saline (PBS). The wounded monolayers
were then cultured in serum-free DMEM in the presence or absence of 50 and 150 ng/ml
of purified Eg-TCTP protein for 48 h. The cell migration surrounding the wounded area
was captured by a 4x-magnification microphotograph (Olympus CK2, Japan). The %
migration was calculated using the equation below.
% Migration
=Average distance of the scratch on day 0 Average distance of the scratch on day 1, 2 or 3
Average distance of the scratch on day 0
The 7th National and International Graduate Study Conference 2017
" Thailand 4.0 Creative Innovation for Sustainable Development "
I398
Transcription levels of tumor associated genes following incubation with
Eg-TCTP
Total RNA was extracted from L929 normal cell line after incubated with 50
or 150 ng/ml Eg-TCTP for a desired time period using Trizol reagent (Invitrogen,USA).
The complementary DNA (cDNA) was synthesized from 1 µg of total RNA according
to the manufacturer’s instructions (Invitrogen, USA). The synthesized cDNAs were
used to analyse the transcription levels of tumor associated genes by qRT-PCR (BIO-
RAD, USA). The Ct (threshold cycle) value for each gene was calculated and
normalized by that of gapdh gene before reported.
Statistical analysis
Data were reported as mean S.D. Differences between test groups and
control groups were analyzed from data of one independent experiment performed in
triplicate (n = 3) using one-way analysis of variance (ANOVA) at p = 0.05.
Results/ Conclusion
Effect of Eg-TCTP on wound healing of cells
The L929 cells exposed to 50 ng/ml of Eg-TCTP showed a significant wound
closure at 48 h after treatment. (Figure 1a). In contrast, the protein of 150 ng/ml revealed
inhibitory effect on the cell migration. The highest percentage of cell migration was
found in cell incubated with Eg-TCTP at dose of 50 ng/ml for 48 h when compared
with other two groups (Figure. 1b). This result showed that Eg-TCTP elicited wound
healing property.
Transcription of tumor associated genes after treated with Eg-TCTP
In focusing on tumorigenic effect of Eg-TCTP on the cells after treatment,
transcription levels of β-catenin, lrp6, bmi1, and syndecan-2 genes were determined by
qPCR technique after the cells were incubated with 50 or 150 ng/ml Eg-TCTP for 1, 3,
5 and 7 days. Results indicate that Eg-TCTP protein only induced bmi1 expression at 3
and 7 day, in contrast to the other genes were not significantly increased throughout the
experiment (Figure 2), suggesting that the test protein was not tumorigenic.
The 7th National and International Graduate Study Conference 2017
" Thailand 4.0 Creative Innovation for Sustainable Development "
I399

Figure 1 Effect of Eg-TCTP on cell migration: (a), the monolayer cells of L929 were
scratched and incubated with 50 or 150 ng/ml Eg-TCTP for 48 h. Their migration was
monitored at 24 and 48 h after incubation using a 4x-magnification light microscope;
(b) The % cell migration (n = 3) ; * indicates significantly different ( p < 0.05).
(a)
(b)
The 7th National and International Graduate Study Conference 2017
" Thailand 4.0 Creative Innovation for Sustainable Development "
I400

Figure 2 Relative transcription levels of genes, including β-catenin, lrp6, bmi-1,and
syndecan-2 ,as measured by qPCR technique. The cells of L929 were incubated with
50 or 150 ng/ml Eg-TCTP for 1, 3, 5, and 7 days, followed by total RNA extraction.
The first cDNA strands were reversely transcribed and qPCR was performed The Ct
for each gene was recorded (n =3) and reported as folds increase in compared to that of
gapdh gene. * indicates significantly different (p < 0.05).
Discussion
We firstly report wound healing activity of Eg-TCTP on normal fibroblasts
(L929), based on the scratch assay. The protein at the dose of 50 ng/ml could accelerate
the migration of the cells, in contrast to the dose of 150 ng/ml that was revealed
inhibitory effect on the cell migration. Taken together, the results suggested
proliferative effect of the protein. To confirm that Eg-TCTP would not be tumorigenic,
stimulated transcription of tumor associated genes was verified by qPCR technique. In
this study was interested the transcription of genes associating the Wnt/β-catenin
signalling pathway for determine effect of protein in oncogenic properties such as, β-
catenin, lrp6, bmi1 and syndecan-2. From previous study reported that syndecan-2 is
representatives of anti-oncogenes (Villena et al., 2003; Modrowski et al., 2005; Orosco
et al., 2007;Dieudonné et al., 2010), whereas β-catenin (Chung et al.,2002; Gaujoux et
al.,2013), lrp6 (Li et al., 2004; Wang et al.,2004; Liu et al.,2010), and bmi1(Dimri et
al., 2002; Proctor et al., 2013) are the genes with oncogenic property. The expression
levels of β-catenin, lrp6, and syndecan-2 mRNAs in L929 were not significantly
increased after 1, 3, 5 and 7 days of incubation with the protein. Our result indicated
that Eg-TCTP induced bmi1 expression at 3 and 7 day, resulting in induced cell
The 7th National and International Graduate Study Conference 2017
" Thailand 4.0 Creative Innovation for Sustainable Development "
I401

proliferation. However, as bmi1 was over-expressed, safety in using Eg-TCTP by
incorporation in pharmaceutical products should be considered. Whereas, Eg-TCTP
was not affected on the expressions of β-catenin and lrp6 genes in dose dependent at 1,
3, 5 and 7 days. From our data, Eg-TCTP might play a proliferative role in wound
healing by activating the Wnt/β-catenin signaling pathway and not be implicated in
tumorgenicity. This finding suggests the possibility in that Eg-TCTP might be
beneficial in wound healing process.
Recommendations
Eg-TCTP promoted cell migration and proliferation that are advantageous in
wound healing process. Eg-TCTP is promising to be applied for healing the skin.
References
Adam J, Singer, and Richard, A.F. Clark. (1999). Cutaneous wound healing. USA:
The New England Journal of Medicine.
Armelle, Orosco, Olivia, Fromigué, Céline, Bazille, Natacha, Entz-Werle, Pierre,
Levillain, Pierre J, Marie, and Dominique, Modrowski. (2007). Syndecan-2
affects the basal and chemotherapy-induced apoptosis in osteosarcoma.
France: Cancer Research.
Ailton Borges, Santa Brígida, Sávio Pinho, dos Reis, Carinne de, Nazaré Monteiro
Costa, Cristina Michiko, Yokoyama Cardoso, Aline, Medeiros Lima, and
Cláudia Regina, Batista de Souza. (2014). Molecular cloning and
characterization of a cassava translationally controlled tumor protein
gene potentially related to salt stress response. Brazil: Molecular Biology
Reports.
Alisa, Nakkaew, Wilaiwan, Chotigeat, and Amornrat, Phongdara. (2010). Molecular
cloning and expression of Eg-TCTP, encoding a calcium binding protein,
enhances the growth of callus in oil palm (Elaeis Guineensis, Jacq).
Thailand: Songklanakarin Journal of Science and Technology.
Chia-Chen, Liu, Julie, Prior, David, Piwnica-Worms, and Guojun, Bua. (2010). Lrp6
overexpression defines a class of breast cancer subtype and is a target
for therapy. USA: Proceedings of the National Academy of Sciences.
Dejun, Li, Zhi, Deng, Xianghong, Liu, and Bi, Qin. (2013). Molecular cloning,
expression Profiles and characterization of a novel translationally
controlled tumor protein in rubber Tree (Hevea Brasiliensis). China:
Journal of Plant Physiology.
Dominique, Modrowski, Armelle, Orosco, Judicael, Thevenard, Olivia, Fromigue, and
Pierre J, Marie. (2005). Syndecan-2 overexpression induces osteosarcoma
cell apoptosis: implication of syndecan-2 cytoplasmic domain and Jnk
signaling. France: Bone.
Erica, Proctor, Meghna, Waghray, Cheong Jun, Lee, David, G. Heidt, Malica,
Yalamanchili, Chenwei, Li, Filip, Bednar, and Diane, M. Simeone. (2013).
Bmi1 enhances tumorigenicity and cancer stem cell function in
pancreatic adenocarcinoma. USA: PLoS One.
Eun Joo, Chung, Sang-Gu, Hwang, PhuongMai, Nguyen, Sunmin, Lee, Jung-Sik, Kim,
Jin Woo, Kim, Pierre, A. Henkart, Donald, P. Bottaro, Lilian, Soon, Paolo,
Bonvini, Su-Jae, Lee, Judith, E. Karp, Ho Jung, Oh, Jeffrey, S. Rubin, and
The 7th National and International Graduate Study Conference 2017
" Thailand 4.0 Creative Innovation for Sustainable Development "
I402

Jane, B. Trepel. (2002). Regulation of leukemic cell adhesion,
proliferation, and survival by beta-catenin. Baltimore: Blood.
Feijuan, Wang, Yongshen, Shang, Ling, Yang, and Cheng, Zhu. (2012). Comparative
proteomic study and functional analysis of translationally controlled
tumor protein in rice roots under Hg2+ stress. China: Journal of
Environmental Sciences (China).
François-Xavier, Dieudonne, Allison, Marion, Eric, Hay, Pierre, Jacques Marie, and
Dominique, Modrowski. (2010). High wnt signaling represses the
proapoptotic proteoglycan syndecan-2 in osteosarcoma cells. France:
Cancer Research.
Florian, Brioudes, Anne-Marie, Thierry, Pierre, Chambrier, Bertrand, Mollereau, and
Mohammed, Bendahmanea. (2010). Translationally controlled tumor
protein is a conserved mitotic growth integrator in animals and plants.
France: Proceedings of the National Academy of Sciences of the United
States of America.
Gabriel Sosne, Ping Qiu, and Michelle, Kurpakus-Wheater. (2007). Thymosin beta 4:
A novel corneal wound healing and anti-inflammatory agent. USA:
Clinical Ophthalmology.
Geoffrey C, Gurtner, Sabine, Werner, Yann, Barrandon, and Michael T, Longaker.
(2008). Wound repair and regeneration. USA: Nature.
Goberdhan P, Dimri, Jose-Luis, Martinez, Jacqueline J.L, Jacobs, Petra, Keblusek,
Koji, Itahana, Maarten van, Lohuizen, Judith, Campisi, David E, Wazer, and
Vimla, Band. (2002). The bmi-1 oncogene induces telomerase activity and
immortalizes human mammary epithelial cells. USA: Cancer Research.
Haichang, Li, Pu, Duann, Pei-Hui, Lin, Li, Zhao, Zhaobo, Fan, Tao, Tan, Xinyu, Zhou,
Mingzhai Sun, Minghuan, Fu, Matthew, Orange, Matthew, Sermersheim,
Hanley, Ma, Duofen, He, Steven M, Steinberg, Robert, Higgins, Hua, Zhu,
Elizabeth, John, Chunyu, Zeng, Jianjun, Guan, and Jianjie, Ma. (2015).
Modulation of Wound Healing and Scar Formation by MG53 Protein-
mediated Cell Membrane Repair. China: The Journal of Biological
Chemistry.
Jian-Min, Zhang, Liu-Feng, Ma, Wen, Li, Jie, Zhang, Deng-Di, Li, and Xue-Bao, Li.
(2014). Cotton tctp1 gene encoding a translationally controlled tumor
protein participates in plant response and tolerance to aphids. China:
Plant Cell, Tissue and Organ Culture.
Jie, Li, Juan, Chen, and Robert, Kirsner. (2007). Pathophysiology of acute wound
healing. USA: Clinics in Dermatology.
Joan, Villena, Christine, Berndt, Francesc, Grane´s, Manuel, Reina, and Sene´n, Vilaro.
(2003). Syndecan-2 expression enhances adhesion and proliferation of
stably transfected swiss 3t3 cells. Spain: Cell Biology International.
Marion Christine, Hoepflinger, Johannes, Reitsamer, Anja Maria, Geretschlaeger,
Norbert, Mehlmer, and Raimund, Tenhaken. (2013). The effect of
translationally controlled tumour protein (tctp) on programmed cell
death in plants. Austria: BMC Plant Biology.
Oliver, Berkowitz, Ricarda, Jost, Stephan, Pollmann, and Josette, Maslea. (2008).
Characterization of TCTP, the translationally controlled tumor protein,
from Arabidopsis Thaliana. Australia: Plant Cell.
Paul, Martin. (1997). Wound healing: aiming for perfect skin regeneration. London: Science.
The 7th National and International Graduate Study Conference 2017
" Thailand 4.0 Creative Innovation for Sustainable Development "
I403

Sebastien, Gaujoux, Constanze, Hantel, Pierre, Launay, Stephane, Bonnet, Karine,
Perlemoine, Lucile, Lefevre, Marine Guillaud-Bataille, Felix Beuschlein,
Frederique Tissier, Jerome Bertherat, Marthe Rizk-Rabin, and Bruno
Ragazzon. (2013). Silencing mutated beta-catenin inhibits cell
proliferation and stimulates apoptosis in the adrenocortical cancer cell
line H295r. France: PLoS One.
Xiaobo, Qin, Fan, Gao, Jinping, Zhang, Jihai, Gao, Sha, Lin, Yong, Wang, Luding,
Jiang, Yi, Liao, Lina, Wang, Yongjiong, Jia, Lin, Tang, Ying, Xu, and Fang,
Chen. (2011). Molecular cloning, characterization and expression of
cdna encoding translationally controlled tumor protein (Tctp) from
Jatropha Curcas L. China: Molecular Biology Reports.
Xiaohong, Wang, Neeta, Adhikari, Qinglu, Li, and Jennifer L, Hall. (2004). LDL
receptor-related protein LRP6 regulates proliferation and survival
through the Wnt cascade in vascular smooth muscle cells. China: The
American Journal of Physiology-Heart and Circulatory Physiology.
Yong-Min, Kim, Yun-Jeong, Han, Ok-Jin, Hwang, Si-Seok, Lee, Ah-Young, Shin, Soo
Young, Kim, and Jeong-II, Kim. (2012). Overexpression of arabidopsis
translationally controlled tumor protein gene Attctp enhances drought
tolerance with rapid Aba-induced stomatal closure. Korea: Molecules and
Cells.
Yonghe, Li, Wenyan, Lu, Xi, He, Alan L, Schwartz, and Guojun, Bu. (2004). Lrp6
expression promotes cancer cell proliferation and tumorigenesis by
altering beta-catenin subcellular distribution. USA: Oncogene.
The 7th National and International Graduate Study Conference 2017
" Thailand 4.0 Creative Innovation for Sustainable Development "
I404

Appendix
Author: Ajchara Kaewjurat
Program: Molecular Biotechnology and Bioinformatics
Institute: Department of Molecular Biotechnology and Bioinformatics, Faculty of
Science, Prince of Songkla University, Hat-Yai, Songkhla,90112 ,Thailand.
Tel. 093-7641739 e-mail. [email protected]
Author: Associate Professor Dr. Jasadee Kaewsrichan
Program: Pharmaceutical Chemistry
Institute: Department of Pharmaceutical Chemistry, Faculty of Pharmaceutical
Sciences, Prince of Songkla University, Hat-Yai, Songkhla 90112, Thailand.
Tel. - e-mail. [email protected] .com
Author: Professor Dr. Amornrat Phongdara
Program: Molecular Biotechnology and Bioinformatics
Institute: Center for Genomics and Bioinformatics Research, Faculty of Science,
Prince of Songkla University, Hat-Yai, Songkhla, 90112, Thailand.
Tel. - e-mail. [email protected]
The 7th National and International Graduate Study Conference 2017
" Thailand 4.0 Creative Innovation for Sustainable Development "
I405

Enhancing seismic resolution by Empirical Mode Decomposition
Author: Apiwat Hiran* Siriporn Chaisri**
Program Applied Geophysics Institute Chiang Mai University
Abstract
Seismic resolution is an important factor for interpretation. The increase in
resolution related to separate more detail of two features from seismic data. A new
method for analyzing seismic data, the Empirical Mode Decomposition (EMD) is
applied to reduce noise in seismic signal for improving the signal-to-noise ratio in
time domains (Battista et al.,2007). The EMD method is used to decompose non-
stationary and non-linear data into sub-signal referred as "intrinsic mode functions
(IMFs) . The first sub signal, IMF1, contains the highest frequency components of the
original signal, and the final sub signal contains the lowest frequency components. In
this study, we apply the EMD method for increasing seismic resolutions. The
response of EMD will be observed via thickness variation of a thin bed using the
synthetic data of a wedge model. The IMF1 section resulted from the EMD can
distinguish the two reflectors from top and bottom of wedge model with thinner
thickness than that from the original seismic section. Applying the EMD with the
original seismic data, the IMF1 section enhances the quantification resolution and
shows a better continuity reflection of the seismic data.
Keywords: seismic resolution, Empirical Mode Decomposition (EMD), wedge model, thin bed
* Student, Master of Science Program in Applied Geophysics, Faculty of Science, Chiang Mai University
** Department of Physics and Materials Science, Faculty of Science, Chiang Mai University
The 7th National and International Graduate Study Conference 2017
" Thailand 4.0 Creative Innovation for Sustainable Development "
I406

Introduction
The oil and gas industries are high investment with high risk and high benefits,
therefore it is highly required to explore for the new prospect which the most widely
geophysical technique used for this is seismic method. Seismic methods are the most
commonly conducted geophysical surveys for mapping subsurface geological
structures which used for interpreting structures related to oil and gas reservoirs. The
thin bed reservoir is one of the important exploration targets. Seismic resolution is the
ability to distinguish stratigraphic detail from seismic data, which includes vertical
and horizontal resolutions. This study focuses on vertical resolution which refers as
the abilities to detect the thickness between layers from seismic section.
The vertical resolution limit in seismic data is the ability to distinguish the
smallest layer thickness when that is about one-eighth of the wavelength, (λ/8), with λ
representing the predominant wavelength in the seismic data, Widess (1973). This
conclusion was based on an experiment in which a simplified wedge model was
embedded in a homogeneous rock, resulting in a pair of equal and opposite seismic
reflection coefficients corresponding to the top and bottom of the model. In the
presence of noise and the subsequent broadening of the seismic wavelet during its
subsurface path, the vertical resolution limit is usually reduced to one-quarter of the
signal dominant wavelength (λ/4) (Chopra et al., 2006, Luping et al., 2009). This
condition has been universally accepted as the vertical resolution limit for the
consideration in seismic data. At a spacing of less than one-quarter of the wavelength
(λ/4), the bed thickness becomes indistinguishable in seismic section, known as
the tuning thickness. Due to the tuning thickness and resolution limit, detecting thin
bed thickness has been a problem in seismic data processing.
The Empirical Mode Decomposition (EMD) is an analysis method which is
automatic, fully adaptive (data-driven), and time-variant (Flandrin and Goncalves,
2004). It is providing an adaptive decomposition of a sub-signal either within the time
or frequency axis, capturing the movement of the input signal. The main advantage of
EMD is that it gives an automatic decomposition which is fully adapted to the data,
and does not rely upon an assumed set of functions like the wavelet transformation
The 7th National and International Graduate Study Conference 2017
" Thailand 4.0 Creative Innovation for Sustainable Development "
I407
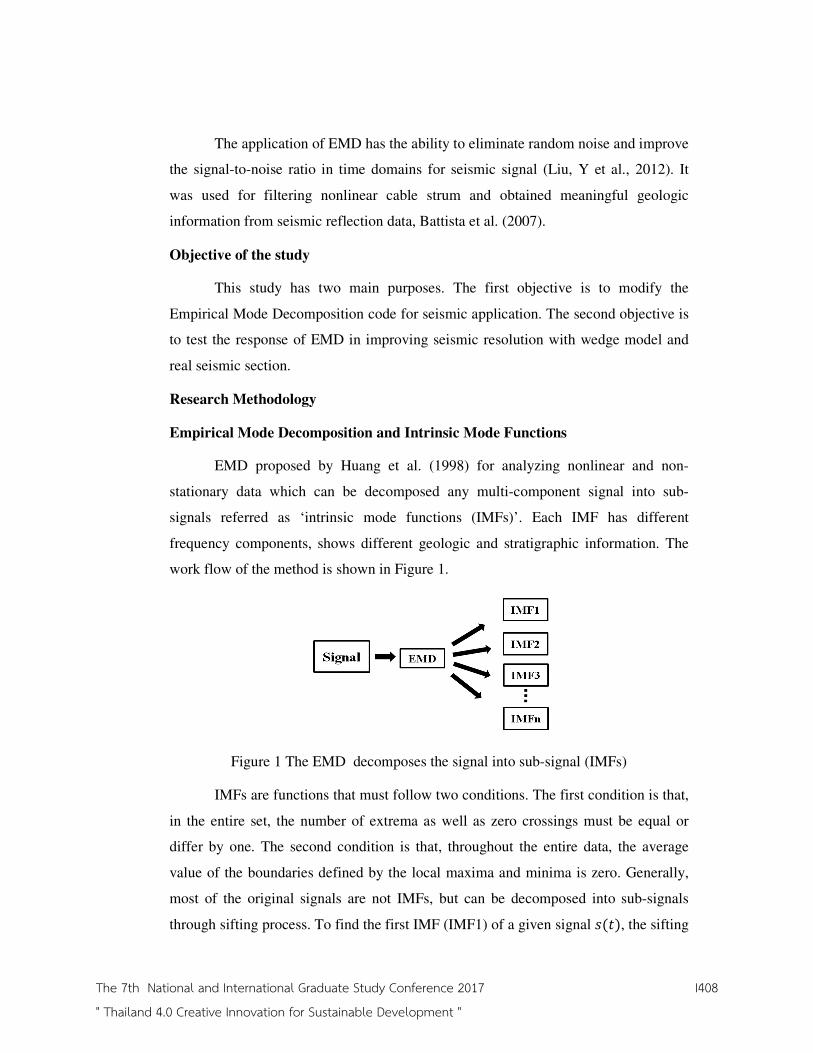
The application of EMD has the ability to eliminate random noise and improve
the signal-to-noise ratio in time domains for seismic signal (Liu, Y et al., 2012). It
was used for filtering nonlinear cable strum and obtained meaningful geologic
information from seismic reflection data, Battista et al. (2007).
Objective of the study
This study has two main purposes. The first objective is to modify the
Empirical Mode Decomposition code for seismic application. The second objective is
to test the response of EMD in improving seismic resolution with wedge model and
real seismic section.
Research Methodology
Empirical Mode Decomposition and Intrinsic Mode Functions
EMD proposed by Huang et al. (1998) for analyzing nonlinear and non-
stationary data which can be decomposed any multi-component signal into sub-
signals referred as ‘intrinsic mode functions (IMFs)’. Each IMF has different
frequency components, shows different geologic and stratigraphic information. The
work flow of the method is shown in Figure 1.
Figure 1 The EMD decomposes the signal into sub-signal (IMFs)
IMFs are functions that must follow two conditions. The first condition is that,
in the entire set, the number of extrema as well as zero crossings must be equal or
differ by one. The second condition is that, throughout the entire data, the average
value of the boundaries defined by the local maxima and minima is zero. Generally,
most of the original signals are not IMFs, but can be decomposed into sub-signals
through sifting process. To find the first IMF (IMF1) of a given signal �(�), the sifting
The 7th National and International Graduate Study Conference 2017
" Thailand 4.0 Creative Innovation for Sustainable Development "
I408

process is described briefly by Huang et al. 1998, Flandrin and Goncalves, 2004, as
follow;
(1) Identify all extrema of �(�); ℎ��(�) = ℎ(�) = �(�), �ℎ � � = 1, � = 0
(2) Find local maxima and local minima to generate lower envelope ���(�) and
upper envelope ���(�) of function ℎ��(�)
(3) Calculate the average and let � = � + 1gives the function
���(�) = �(�) = ( ���(�) + ���(�))/2 (2. 1)
(4) Subtract the average from the input signal
ℎ(�) = ℎ(�) − �(�) (2. 2)
or ℎ��(�) = ℎ�(��)(�) − ���(�)
If ℎ(�) does not meet the IMF conditions, repeat steps from (2) to (4) � times until
the function ℎ�(�) becomes an IMF. Therefore
�(�) = ℎ�(�) (2. 3)
where �(�) is IMF1. The stopping criteria for IMF1 can be done by restricting the
breadth of the standard deviation (SD) which can be determined from two consecutive
sifting results as
SD = " #$(ℎ(��)(�) − ℎ�(�))$%ℎ(��)% (�) &
'
() (2. 4)
Subtract IMF1, �(�), from the signal input function, the residue function is
*(�) = �(�) − �(�) (2. 5)
Then, the process steps from (2) to (4)are repeated with *(�) as the new input and the
new residual functions for �(+ iteration are
*�(�) = *(��)(�) − ��(�) (2. 6)
when *(�) = �(�)
where ��(�) is the �(+ IMF (IMFj). The sifting process can be stopped by *�(�) is
become monotonic function. The input signal �(�) can be constructed by
�(�) = " ��(�)��
�)+ *�(�) (2. 7)
The 7th National and International Graduate Study Conference 2017
" Thailand 4.0 Creative Innovation for Sustainable Development "
I409
which expressed as the sum of the IMFs and the last residue *�(�). Where ��(�)
denotes the resulting IMFj, � − 1 is the total number of IMFs, and *�(�) shows the
last residue of �(�) (Figure 2). It presents that �(�) has the highest frequency content,
�,(�) has the lowest frequency content and *(�), the residual, is the monotonic
function (Figure 3). For applying the EMD with seismic data, the Wu's EMD
MATLAB (2010) code, (Wu and Huang, 2009) was modified.
Result from Empirical Mode Decomposition of a wedge model
We observe the response of EMD to increase the seismic resolution via
thickness variation of a thin bed using the synthetic data of a wedge model that
consists with three layers of velocities 2000,1800 and 2400 m/s, shown in Figure 4a.
The synthetic seismogram is obtained from the convolution between wedge model
and a zero-phase 30 Hz Ricker wavelet presented on Figure 4b called IMF0, the zero-
intrinsic mode function. The thickness of the wedge is displayed on the top of the
synthetic seismogram in Figure 4b. The tuning thickness of the wedge model with
average velocity of 1900 m/s (consider the velocity from the top and the wedge layers
only) and 30 Hz Ricker wavelet is approximately 15.8 m (λ/4). However, it is hardly
recognized two reflectors from top and bottom of wedge model at the wedge
thickness less than 28 m and this number is larger than the seismic resolution limit.
The EMD then applies to the seismogram in Figure 4b and generates the first IMF
(IMF1) and the second IMF (IMF2) shown in Figure 4c and Figure 4d. The IMF1,
Figure 4c, has the dominant frequency about 35 Hz which higher frequency content
than that of the original seismogram. It can distinguish the two reflectors until the
wedge thickness at about 21 m, so the result show high resolution more than Figure
4b. The positive peak in the middle of the two reflectors can also be observed and this
might help to confirm the separation of those reflectors. The IMF2, Figure 4d, has
lower frequency content, dominant frequency about 25 Hz, the two reflectors are
interfering with longer or wider wavelet that make them hard to recognize as two
reflectors. As the results of the wedge model, the IMF1 obtained from the EMD could
increase seismic resolution.
The 7th National and International Graduate Study Conference 2017
" Thailand 4.0 Creative Innovation for Sustainable Development "
I410

Figure 2 EMD process work flow
The 7th National and International Graduate Study Conference 2017
" Thailand 4.0 Creative Innovation for Sustainable Development "
I411

Figure 3 Results of EMD process, �(�) is the original data (IMF0), �(�) − �,(�) are
sub-signal (IMF1−IMF5) and r(�) is the monotonic function
a)
b)
c)
d)
Figure 4 (a) The wedge model, (b) synthetic seismogram (IMF0) using zero-phase 30-
Hz Ricker wavelet with the vertical resolution limit about 15.8 m with λ/4, (c) IMF1
and (d) IMF2 from EMD
The 7th National and International Graduate Study Conference 2017
" Thailand 4.0 Creative Innovation for Sustainable Development "
I412

Result from Empirical Mode Decomposition of the real seismic data
The real seismic section is decomposed by the EMD and demonstrated the
results in Figure 5 corresponding each IMFs. The original seismic section, IMF0 in
Figure 5a, has the dominant frequency about 30 Hz. The corresponding IMF1 in
Figure 5b shows the higher frequency component of IMF0 with the 45 Hz dominant
frequency. It shows better detail of reflectors with more resolution as expected (Figure
6b). The lower frequency content of IMF0 presented by IMF2 (Figure 5c). The 25 Hz
dominant frequency shows the strong amplitude with rough and low frequency
reflectors (Figure 6c).
Figure 5 Results from EMD process (a) IMF0, the real seismic section, (b) IMF1, the
higher frequency content and (c) IMF2, the lower frequency content. Red and blue are
positive and negative amplitudes.
The 7th National and International Graduate Study Conference 2017
" Thailand 4.0 Creative Innovation for Sustainable Development "
I413

Figure 6 Illustrates of the highlighted zones from Figure 5 corresponding to (a) IMF0,
the real seismic section, (b) IMF1, the continuous and more reflection detail and (c)
IMF2, the lower frequency content. Red and blue are positive and negative
amplitudes.
Discussion
The EMD is applies with synthetic seismic from wedge model. It shows that
The IMF1 of EMD can improve the seismic resolution because it contains the higher
frequency contents from the original data then more wedge thickness could be
observed. When apply the EMD with real seismic data, it can also enhance the
quantify features and resolution of the seismic data. Especially, this method is
applicable to nonlinear and non-stationary data decomposed into IMFs. The
comparison between original seismic with seismic section from IMF1 shows a greater
continuity of reflection when the reflection cannot see in original seismic.
The 7th National and International Graduate Study Conference 2017
" Thailand 4.0 Creative Innovation for Sustainable Development "
I414

The EMD is the tool for decomposing the signal with automatic
decomposition that is fully adapted to the data liked doing the frequency filter in time
domain. It does not manipulate the signal unlike doing frequency filter with FFT (Fast
Fourier Transform) with the risk of the ringing effect when apply it with steep taper
function.
Conclusion
The EMD code was modified and tested for seismic application. The testing
results from wedge model and real seismic section indicate that we can apply the
EMD to increase the seismic resolution. The quality of the IMF1seismic section has a
strong reflectivity and display clearly reflection detail. Seismic data retrieved using
the EMD in the form of reflectivity data is very useful for making accurate
interpretations, of the thin bed seismic resolution.
Recommendations
The solution from the EMD, the IMF1 section, could be used as the seismic
input for the application such as the instantaneous attributes to obtain more reasonable
and reliable interpretation.
References
Battista, B.M., Knapp, C., McGee, T. and Goebel, V., 2007. Application of the
empirical mode decomposition and Hilbert–Huang transform to seismic
reflection data. Geophysics 72 (2), H29–H37.
Chopra, S., Castagna, J. and Portniaguine, O., 2006. Seismic resolution and thin-bed
reflectivity inversion. CSEG recorder, 31(1), 19-25.
Flandrin, P. and Goncalves, P., 2004. Empirical mode decomposition as data-driven
wavelet-like expansions. International Journal of Wavelet, Multiresolution
and Information Processing 2 (4), 477–496.
Huang, N.E., Shen, Z., Long, R.S., Wu, M.C., Shih, H.H., Zheng, Q., Yen, N.C.,
Tung, C.C. and Liu, H.H., 1998. The empirical mode decomposition and
the Hilbert spectrum for nonlinear and non-stationary time series analysis.
Proceedings of the Royal Society of London Series A 454, 903–995.
The 7th National and International Graduate Study Conference 2017
" Thailand 4.0 Creative Innovation for Sustainable Development "
I415

Liu, Y. P., Li, Y., and Ma, H. T. 2012, July. Seismic random noise reduction by
empirical mode decomposition combined with translation invariant scale-
adaptive threshold. In Wavelet Analysis and Pattern Recognition
(ICWAPR), 2012 International Conference (pp. 53-57). IEEE.
Robertson, J.D., and Nogami, H.H., 1984. Complex seismic trace analysis of thin
beds. Geophysics 49 (4), 344–352.
Sun, L., Zheng, X., Li, J., and Shou, H. 2009. Thin-bed thickness calculation formula
and its approximation using peak frequency. Applied Geophysics, 6(3),
234-240.
Widess, M.B., 1973. How thin is a thin bed. Geophysics 38 (6), 1176-1180.
Wu, Z., and Huang, N. E. 2009. Ensemble empirical mode decomposition: a noise-
assisted data analysis method. Advances in adaptive data analysis, 1(01), 1-
41.
Wu, Z., 2010. Empirical mode decomposition MATLAB codes. Retrieved on August
10, 2014. Available from http://rcada.ncu.edu.tw.
The 7th National and International Graduate Study Conference 2017
" Thailand 4.0 Creative Innovation for Sustainable Development "
I416

Title: Gold nanoparticle-graphene-chitosan modified disposable electrode
for detection of prohormone Dehydroepiandrosterone sulfate
Author: Karnpimon Krorakai
Program: Biochemistry Institute: Khon Kaen University
Abstract
Dehydroepiandrosterone sulfate (DHEAs) is the most abundant circulating
prohormone in human. DHEAs has been known as a biomarker of aging because DHEAs
levels in human decline markedly with age. There are many techniques for determination
of DHEAs including HPLC, GC-MS, LC-MS and ELISA. However, these techniques are
not available for application in point of care testing. The objective of this study is to
prepare electrochemical immunosensor based on gold nanoparticle-graphene-chitosan
(AuNPs-GP-CS) for DHEAs detection because this technique has high sensitivity and
specificity, simple to use, cost effective, using small samples volume and portable device.
AuNPs-GP-CS nanocomposite was synthesized and characterized by UV-vis
spectroscopy and transmission electron microscope. Amperometric detection was
performed at a potential of -0.2 V using 3,3′,5,5′-tetramethylbenzidine (TMB)/H2O2 as
substrate solution. The experimental conditions were optimized, including the
concentration of anti-DHEAs antibody, dilution ratio of DHEAs-HRP conjugate and
incubation time. Under optimal conditions, this immunosensor showed a linear range
from 0.001-10 g mL-1
with a detection limit of 0.089 g mL-1
.
Keywords : Dehydroepiandrosterone sul fate (DHEAs) , Aging b iomarker,
Electrochemical immunosensor
Introduction
Dehydroepiandrosterone sulfate (DHEAs) is the major prohormone produced by zona
recticularis of adrenal cortex. Its concentration in serum is more than 10 M. It functions
as a precursor to male and female sex hormone (androgens and estrogens). DHEAs has
been called fountain of youth or hormone of youth because DHEAs levels in serum peak
around the age of 20 to 30 and then decline dramatically with age, decreasing 1-2% per
year. (Ferrari et al., 2001) The benefit effects of DHEAs from in vivo and in vitro
experiment are anti-diabetes mellitus, anti-atherosclerosis, anti-dementia, anti-obesity,
anti-osteoporosis and modulation of immune system. Furthermore, low DHEAs levels are
found in diabetes, artherosclerosis, high pressure, gout, and metabolic syndrome patients.
(Arlt., 2004) Moreover, DHEAs has been widespread used as a food supplement in USA.
As many researches study the relationship between DHEAs and health or diseases,
DHEAs is considered to be a marker of individual function of adrenal cortex and a
biomarker of aging. Thus, the measurement of DHEAs is useful in the medical diagnosis
and applied to predict biological age.
There are many techniques for the determinat ion of DHEAs including
radioimmunoassay (RIA), High-performance liquid chromatography (HPLC), Liquid
chromatography-mass spectrometry (LC-MS) and chromatography–mass spectrometry
The 7th National and International Graduate Study Conference 2017
" Thailand 4.0 Creative Innovation for Sustainable Development "
I417

(GC-MS). Although these techniques offer high sensitivity and selectivity, the drawbacks
are expensive instruments, complicate detection and need specialist for analyze data.
Recently, the most common technique for DHEAs measurement in laboratory is enzyme-
linked immunosorbent assay (ELISA). The disadvantages of ELISA are expensive, high
volume of sample, time-consuming for the assays and the frequent negative or positive
false results so it is not suitable for point of care testing. (Zhang et al., 2016)
Electrochemical immunosensor is one of the alternative analytical methods for point of
care testing because of high sensitivity and specificity, low cost and portable device. To
best of our knowledge, we found that there are few reports using electrochemical
immunosensor for DHEAs detection. However, there are many reports using this
technique for determination of steroid hormone such as testosterone, estradiol and
cortisol.
Electrochemical immunosensor is based on the specific binding between antigen and
antibody. In the design electrochemical immunosensor, immobilization and signal
amplification are the important steps. Chitosan (CS) is considered as a suitable
immobilizing matrix for biological elements because it possesses excellent film forming,
good adhesion, nontoxicity, and high density of amino group. However, its usage is
limited for development and applications of electrochemical immunosensor due to its low
electrical conductivity. Many studies have been reported that graphene (GP) is an
excellent material for improved conductivity of immunosensor. Moreover, it has large
active surface area and inexpensive synthesis. Graphene combined with noble
nanoparticles are also considered as immobilization matrices with synergistic effects.
(Afkhami et al., 2017) Among noble nanoparticles, gold nanoparticles (AuNPs) are one
of the most widely used nanomaterials for immunosensor, due to their unique properties
such as good conductivity, electrocatalytic ability, and biocompatibility. More
importantly, antibodies were immobilized directly on AuNPs surface via the NH2- group.
(Samanman et al., 2015)
Objectives
1. To synthesize gold nanoparticle-graphene-chitosan (AuNPs-GP-CS)
2. To determine DHEAs by electrochemical immunosensor
Research methodology
Reagents Graphene material was provided by Dr.Adisorn Tuantranint (NECTEC). Chitosan,
Gold (III) chloride (HAuCl4), Bovine serum albumin and Acetic acid (CH3COOH) were
purchased from Sigma. Potassium ferricyanide was obtained from Ajex finechem. Anti-
DHEAs antibody, DHEAs standard and TMB substrate solution were purchased from
Abcam. DHEAs-HRP conjugate was purchased from Fitzgerald. Other reagents were
analytical grade. Phosphate buffered saline (PBS) as washing buffer.
Apparatus
Cyclic votammetry (CV) and amperometry measurement were carried out using
portable electrochemical analyzer 910 PSTAT software connected to a laptop computer.
The 7th National and International Graduate Study Conference 2017
" Thailand 4.0 Creative Innovation for Sustainable Development "
I418

Screen-printed carbon electrode (SPCE) was purchased from Dropsens that compose of
an Ag as reference electrode, carbon as auxiliary and working electrode. UV-vis
spectrometry was performed using EZ Read 2000 Microplate Reader (Biochrom). TEM
images were obtained from TEM FEI/TECNEI G2 20.
Preparation of AuNPs-GP-CS
0.25 wt% of Chitosan (CS) was dissolved in 1% (v /v) acetic acid with stirring for
1 h at room temperature. Then 5 mg of graphene (GP) was added and sonicated into 5 mL
of chitosan solution for 4 h. After that, the mixture solution was centrifuged at 10,000
rpm for 10 min. 2.5 mL of 1.0 mM HAuCl4 was mixed with the supernatant of GP-CS
with vigorous stirring for 30 min at room temperature and then incubated at 80oC for 1 h
with stirring until a pink solution was observed. In this step, Au3+
could be reduced to Au0
(gold nanoparticles) by chitosan. (Samanman et al., 2015)
Preparation of electrochemical immunosensor
Fig. 1 Schematic representation of the immobilization process of the DHEAs competitive
immunosensor based on AuNPs-GP-CS nanocomposite.
The immobilization process of DHEAs competitive immunosensor is shown in Fig.
1. First, 5 μL of AuNPs-GP-CS nanocomposite was dropped on the surface of SPCE and
dried in air for 1 h. Following, 5 μL of anti-DHEAs antibody was coated on the electrode
surface and then incubated at 4°C overnight. Subsequently, the fabricated electrode was
washed with PBS. To reduce non-specific binding, 1% BSA blocking solution was
applied on the surface and incubated at room temperature for 1 h. The electrode was
washed by PBS. The electrochemical immunosensor based on AuNPs-GP-CS was
successfully obtained and stored at 4oC prior to use. To perform the electrochemical
measurement, 5 L of DHEAs standard was mixed with 5 L DHEAs-HRP conjugate
and dropped on the immunosensor. After incubation for 1 h, the electrode was washed
with PBS. For electrochemical measurement, 50 μL of the TMB/H2O2 substrate solution
was dropped on the immunosensor. The enzymatic reaction between horseradish
peroxidase (HRP) and TMB/H2O2 is shown in Fig. 2. (Esteban-Fernández De Ávila et al.,
2013) The amperometric detection was performed with constant potential of -0.2 V,
interval time of 0.5 s and duration time of 100 s at room temperature.
HRP Anti-DHEAs antibody DHEAs DHEAs-HRP conjugate 1% BAS
HRP HRP TMB/H2O2
HRP HRP
AuNPs-GP-CS
The 7th National and International Graduate Study Conference 2017
" Thailand 4.0 Creative Innovation for Sustainable Development "
I419

Fig. 2 The enzymatic reaction between horseradish peroxidase (HRP) and TMB/H2O2
involved in the amperometric detection
Results and discussions
Characterization of AuNPs-GP-CS
Fig. 3 (A) UV–vis absorption spectra of GP–CS and AuNPs–GP–CS (B) TEM image of
AuNPs–CP-CS
UV-vis spectroscopy was used to confirm gold nanoparticles formation. The UV-vis
absorption spectra were recorded in the range of 350 to 750 nm. As shown in Fig. 3A, the
absorption spectra of GP-CS solutions exhibited no absorption peak while the AuNPs-
GP-CS solution had a maximum absorption band around 520 nm, which is a
characteristic plasmon resonance band for gold nanoparticles. The results indicated the
formation of gold nanoparticles prepared with chitosan as a reducing/stabilizing agent.
The morphology and size of the gold nanoparticles was investigated using TEM. Figure
3B shows the TEM image of gold nanoparticle prepared with chitosan. The TEM images
display the nanoparticles shape of spherical and polygonal. Other study was also
observed the polygonal particles when the nanoparticles were synthesized using medium
molecular weight chitosan. The study reported that the formation of polygonal particles
was caused by decomposition and recombination of preformed spherical nanoparticles.
(Huang & Yang., 2004) The particles were not uniform in size. The analysis of particle
400 500 600 700
0.0
0.2
0.4
0.6
Ab
sorb
an
ce
Wavelength/ nm
GP-CS
AuNPs-GP-CS
TMBox
TMBred
HRPox
HRPred
H2O2
H2O 2e
-
A B
The 7th National and International Graduate Study Conference 2017
" Thailand 4.0 Creative Innovation for Sustainable Development "
I420

size distribution was performed using image J. The diameters were in the range of from
2.3 to 39.4 nm with an average of 13.3 nm (n = 100).
Characterization of immunosensor
Fig. 4 (A) Cyclic voltammograms and (B) CV peak current of (a) bare SPCE (b) AuNPs-
GP-CS /SPCE (c) Anti-DHEAs antibody/AuNPs-GP-CS /SPCE (d) BSA/Anti-DHEAs
antibody/AuNPs-GP-CS /SPCE (e) DHEAs-HRP conjugate /BSA/Anti-DHEAs
antibody/AuNPs-GP-CS/SPCE in 5 mM [Fe(CN)6]3-/4-
containing 0.1 M KCl.
In order to characterize the fabrication process of the electrochemical
immunosensor, cyclic voltammetry was performed after each step. Fig. 4 showed (A)
cyclic voltammograms and (B) CV peak current of difference fabricated electrode in 5
mM [Fe(CN)6]3-/4-
containing 0.1 M KCl. The peak current increased greatly after
AuNPs-GP-CS was dropped onto the bare SPCE. The result illustrated that AuNP-GP-CS
had accelerated electron transfer between [Fe(CN)6]3-/4-
and electrode. The electro-active
surface areas were estimated based on the Randles–Sevcik equation:
Ip = (2.69 × 10⁵) n
2/3A D
1/2 1/2
Co (1)
where Ip is the redox peak current, n is the number of electrons per molecule
reduced or oxidized, A is the active surface area of the electrode surface (cm2), D is the
diffusion coefficient of potassium ferricyanide in 0.1 M KCl (0.76 × 10⁻⁶
cm2 s
−1), Co is
the concentration of potassium ferricyanide, and is the scan rate (Vs−1
). (Prasad et al.,
2012) The active surface areas of unmodified electrode (bare SPCE) and modified
electrode (AuNPs-GP-CS/SPCE) were 0.17 and 0.62 cm2, respectively. It is indicating
the electro-active surface of modified electrode increased almost 4-fold of bare SPCE
which provided signal amplification. The peak current significantly decreased when
coated with anti-DHEAs antibody (curve c), indicating that anti-DHEAs antibody acted
as barrier to electron transfer. The results showed that anti-DHEAs antibody was
successfully immobilized on the immunosensor. After immobilization of BSA and
DHEAs-HRP conjugate, the peak current decreased gradually because of an increasing
-0.3 -0.2 -0.1 0.0 0.1 0.2 0.3 0.4 0.5
-150
-100
-50
0
50
100
150
Cu
rren
t (
A)
Potential (V)
a b c d e
0
20
40
60
80
100
Cu
rren
t (
A)
a
b
c d e
A B
The 7th National and International Graduate Study Conference 2017
" Thailand 4.0 Creative Innovation for Sustainable Development "
I421

electron transfer blockage, indicating that the immobilization of BSA and DHEAs-HRP
was successful obtained.
Electrochemical responses of immunosensor based on AuNPs-GP-CS electrode
Fig. 5 current-time curves corresponding to Anti-DHEAs antibody/SPCE (a) Anti-
DHEAs antibody/AuNPs-GP-CS/SPCE (b) DHEAs-HRP conjugate/BSA/Anti-DHEAs
antibody/SPCE (c) DHEAs-HRP conjugate/BSA/Anti-DHEAs antibody/AuNPs-GP-CS
/SPCE (d) in TMB solution.
As shown in Fig. 5, curve c was the current-time curve for unmodified electrode
after immobilized with Anti-DHEAs antibody, BSA and DHEAs-HRP conjugate
(DHEAs-HRP conjugate/BSA/Anti-DHEAs antibody /SPCE). The current signal of curve
c gradually increased when compared with curve a that was the current-time curve for
Anti-DHEAs antibody immobilized on unmodified electrode ( Anti-DHEAs
antibody/SPCE). The difference in current signal between curve a and c was 0.13 A.
The result showed that the DHEAs-HRP conjugate was bound onto the anti-DHEAs
antibody to produce the current signal. The similar phenomenon was observed for the
modified electrode with AuNPs-GS-CS (curves b and d), but the current signals increased
significantly and the difference in current value between curve b and d was 0.39 μA.
Compared with the unmodified electrode, the current difference of the modified electrode
was more than 3 times, demonstrating that the AuNPs-GP-CS could significantly enhance
the amperometric current response.
0 20 40 60 80 100
-2.0
-1.5
-1.0
-0.5
0.0
Cu
rren
t (
A)
Time (s)
a
b
c
d
The 7th National and International Graduate Study Conference 2017
" Thailand 4.0 Creative Innovation for Sustainable Development "
I422

Optimization of experimental conditions
Fig. 6 Effect of experimental conditions on ampermetric response: (A) anti-DHEAs
antibody concentration (B) dilution ratio of DHEAs-HRP conjugate and (C) incubation
time of BSA/Anti-DHEAs antibody/AuNPs-GP-CS/SPCE and DHEAs antigen
In order to achieve excellent amperometric response, some experimental conditions
were optimized. The anti-DHEAs antibody was an important parameter in the
competitive format. To obtain the optimal anti-DHEAs antibody concentration, the
fabricated electrode was incubated with different concentration of anti-DHEAs antibody.
As shown in Fig. 6A, the current signal increased when the concentration of Anti-DHEAs
antibody increased and trended to level off at 40 g mL-1
. Thus, 40 g mL-1
was chosen
as the optimal anti-DHEAs antibody concentration. Dilution ratio of DHEAs-HRP
conjugate was optimized. In Fig. 6B, the maximum signal was obtained using a 1:2500
dilution ratio of DHEAs-HRP conjugate so 1:2500 was selected as the optimal dilution
ratio of DHEAs-HRP conjugate. Fig. 6C shows the effect of the incubation time of
BSA /Anti-DHEAs antibody /AuNPs-GP-CS /SPCE and DHEAs antigen. The current
0 10 20 30 40 50 60 70 80
0.18
0.19
0.20
0.21
0.22
-i (
A)
Concentration of anti-DHEAs antibody (g/mL)
10 20 30 40 50 60
0.10
0.15
0.20
0.25
0.30
0.35
-i (
A)
Incubation time (min)
A
1:10000 1:5000 1:2500 1:1000
0.22
0.24
0.26
0.28
0.30
-i (
A)
Dilution ratio of DHEAs-HRP conjugated
B C
The 7th National and International Graduate Study Conference 2017
" Thailand 4.0 Creative Innovation for Sustainable Development "
I423

signal of immunosensor was increased sharply with the incubation time for 30 min. After
that, the current signal increased slowly and trended to level off. The result indicated that
the time to equilibrium of antigen and antibody interaction was 30 min. Therefore, 30
min for incubation time was selected.
Analytical performance of immunosensor
Fig. 7 (A) Current–time curves corresponding to the immunosensor after incubating with
difference concentration of DHEAs standard (a) 0, (b) 0.001 g mL-1
, (c) 0.01 g mL-1
,
(d) 0.1 g mL-1
, (e) 1 g mL-1
, (f) 10 g mL-1
. (B) The linear relationship between
currents and logarithmic DHEAs standard concentration (from 0.001g mL-1
to
10 g mL-1
).
Under the optimal experimental parameters, the modified electrode was incubated
with the DHEAs standard at different concentrations mixed with DHEAs-HRP conjugate.
The DHEAs standard completed with DHEAs-HRP conjugate in solution to bind the
immobilized antibody. The amperometric response was measured based on the enzymatic
reaction between horseradish peroxidase (HRP) and TMB/H2O2. As shown in Fig.7A, the
current decreased with the increase of the concentration of DHEAs standard in the range
from 0.001g mL-1
to 10 g mL-1
. A good linear relationship between the current signal
and the logarithmic value of DHEAs standard concentrations was observed in Fig. 7B.
The linear regression equation was y = -0.0636X + 0.1561, R2
= 0.9677. A detection limit
of DHEAs standard could be estimated using 3s (where s is the standard deviation of the
blank solution, n=3) and was calculated to be 0.089 g mL-1
.
Conclusion
This study described an electrochemical immunosensor for determination of
DHEAs using AuNPs-GP-CS nanocomposite modified on a screen printed carbon
electrode. AuNPs-GP-CS successfully synthesized with the ease method. AuNPs-GP-CS
could enhance amperometric response. The optimal anti-DHEAs antibody concentration,
0 20 40 60 80 100
-1.5
-1.0
-0.5
0.0
cu
rren
t (
A)
Time (s)
-3 -2 -1 0 1
0.05
0.10
0.15
0.20
0.25
0.30
0.35
0.40
-i (
A)
Log concentration of DHEAs (ug/mL)
A B
a
e
The 7th National and International Graduate Study Conference 2017
" Thailand 4.0 Creative Innovation for Sustainable Development "
I424

dilution ratio of DHEAs-HRP conjugate and incubation time of BSA /Anti-DHEAs
antibody /AuNPs-GP-CS /SPCE and DHEAs antigen was 40 g mL-1
, 1:2500 and 30 min,
respectively. Under optimized conditions, this electrochemical immunosensor showed
a linear range from 0.001g mL-1
to 10 g mL-1
with a detection limit of 0.089 g mL-1
.
Acknowledgement We would like to thank department of biochemistry, faculty of science Khon Kaen
University for providing research facilities, Dr.Adisorn Tuantranont from National
Electronics and Computer Technology Center (NECTEC) for graphene, Assoc.Prof.Dr.
Wittaya Ngeontea from deparment of Chemistry, faculty of science Khon Kaen
University for Metrohm 9101 PSTAT mini. This work was supported by the Science
Achievement Scholarship of Thailand (SAST).
Referenes
Afkhami, A., Hashemi, P., Bagheri, H., Salimian, J., & Ahmadi, A. (2017). Biosensors
and Bioelectronics Impedimetric immunosensor for the label -free and direct
detection of botulinum neurotoxin serotype A using Au nanoparticles / graphene -
chitosan composite. Biosensors and Bioelectronic, 93, 124–131.
Arlt, W. (2004). Dehydroepiandrosterone and ageing. Best Practice and Research:
Clinical Endocrinology and Metabolism, 18(3), 363–380.
Esteban-Fernández De Ávila, B., Escamilla-Gómez, V., Campuzano, S., Pedrero, M.,
Salvador, J . P., Marco, M. P., & Pingarrón, J . M. (2013). Ultrasensitive
amperometric magnetoimmunosensor for human C-reactive protein quantification in
serum. Sensors and Actuators, B: Chemical, 188, 212–220.
Ferrari, E., Casarotti, D., Muzzoni, B., Albertelli, N., Cravello, L., Fioravanti, M., Magri,
F. (2001). Age-related changes of the adrenal secretory pattern: Possible role in
pathological brain aging. Brain Research Reviews, 37(1–3), 294–300.
Huang, H., & Yang, X. (2004). Synthesis of Chitosan-Stabilized Gold Nanoparticles in
the Absence / Presence of Tripolyphosphate, 2340–2346.
Prasad, K. S., Chuang, M. C., & Ho, J. A. A. (2012). Synthesis, characterization, and
electrochemical applications of carbon nanoparticles derived from castor oil soot.
Talanta, 88, 445–449.
Samanman, S., Numnuam, A., Limbut, W., Kanatharana, P., & Thavarungkul, P. (2015).
Highly-sensi t ive label -free electrochemical carcinoembryonic ant igen
immunosensor based on a novel Au nanoparticles-graphene-chitosan nanocomposite
cryogel electrode. Analytica Chimica Acta, 853(1), 521–532.
Zhang, X., Li, C., Wang, W., Xue, J., Huang, Y., Yang, X., Qiu, J. (2016). A novel
electrochemical immunosensor for highly sensitive detection of aflatoxin B 1 in corn
using single-walled carbon nanotubes / chitosan. Food Chemistry, 192, 197–202.
The 7th National and International Graduate Study Conference 2017
" Thailand 4.0 Creative Innovation for Sustainable Development "
I425

Isolation and Characterization of Bacteriophage Specific for Staphylococcus
aureus .
Author: Wongsatorn Sirisurapong and Rujikan Nasanit
Program: Biotechnology Institute: Silpakorn University
Abstract
Staphylococcus aureus is a common photogenic bacteria and important
bacteria that causes foodborne illness. S. aureus causes symptoms of food poisoning
including diarrhea, abdominal pain, nausea, and vomiting. In some cases, this
pathogen can cause serious problems leading to death. Generally, chemicals or
antibiotics have been used to control the number of pathogenic bacteria in agricultural
and food industries. These could have negative effect on consumer health according
to the residues of chemicals remained in food and environment. Moreover, antibiotic-
resistant bacteria can occur by treating with antibiotics in long term treatment.
Therefore, this study aimed to isolate bacteriophages that are specific to S. aureus as
an interesting alternative for biological controlling of S. aureus instead of using
chemicals and antibiotics. A total of 247 samples were collected from various sources
such as waste water from sewage and fresh pork markets for bacteriophage isolation.
Of these total, S. aureus specific bacteriophages were isolated from only 14 samples
by enrichment method. A Total of 40 bacteriophages were obtained and purified.
These consisted of 37 lytic phages and 3 lysogenic phages. The lytic bacteriophages
were selected for host-range test among different bacterial strains; S. aureus (11
strains), Listeria monocytogenes (1 strain), Salmonella enterica Typhimurium and
Salmonella enterica Enteritidis. The results showed that 9 phages can infect all
S. aureus. Moreover, we found 3 phages that can infect L. monocytogenes and 2
phages can infect S. Enteritidis. These results revealed that the isolated bacteriophages
have a potential for further application in biological controlling of S. aureus. These
bacteriophages will be selected for further genome analysis and characterized their
ability for further applications as biocontrol agent.
KeyWords: Staphylococcus aureus, Bacteriophages, Foodborne pathogens, Isolation,
Host-range
Introduction
Staphylococcus aureus is a small gram positive, non-motile, non-spore
forming and high heat resistant bacteria. The optimal growth temperature for
S. aureus is 35-37 °C (Bhumibhamon and Bilhmad., 2011), however it can grow in
temperature ranging from 7-48 °C. In general, this bacteria can be found on human
skin, snot, saliva, acne, abscess and pus. Moreover food and/or beverages may be
contaminated with S. aureus such as drinking water, meats, milk and dairy products.
(FDA., 2012). S. aureus is considered as primary pathogen that can cause infection in
humans and animals and produce enterotoxin. Angkitatrakul et al. (2014) reported
that contamination of S. aureus was found in 31.87% of 91 ground pork samples from
The 7th National and International Graduate Study Conference 2017
" Thailand 4.0 Creative Innovation for Sustainable Development "
I426

4 fresh-food markets and 4 department stores in Khon Kaen Municipality during
July - August 2012. The contamination of these bacteria have also been reported in
ready-to-eat food. For example Homthong et al. (2011) found the contamination of S.
aureus in 14 of 40 sushi samples from department stores in Sriracha district and the
area around Burapha University, Chonburi province during November 2008-January
2009. Consuming food contaminated with S. aureus can cause nausea, diarrhea,
vomiting and may be life-threatening in some cases (Chang et al., 2017). Al-Bahry et
al. (2014) reported that contamination of S. aureus was most commonly found in food
prepared by hand such as chicken bread, sandwich and spring roll.
The Centers for Disease Control and Prevention (CDC) in the United States
has reported up to 241,188 cases of foodborne illness from eating food contaminated
with S. aureus and there are 6 deaths every year (FDA, 2012). Generally, the control
of S. aureus has been performed by using antibiotics or chemicals such as Peracetic
acid, Chlorine and Cetylpyridinium chloride. However, these methods have major
disadvantages, such as misuse or overuse of antibiotics leads to the appearance of
antibiotic-resistant bacteria. The antibiotic resistance is a widespread problem that
makes treatment difficult and requires stronger antibiotics which may have side
effects and expensive (Siriwong and Chukeatirote., 2009). The use of chemicals has a
significant limitation which is the negative effect on sensory properties of food. Some
European countries do not allow the use of chemicals to remove contaminated
bacteria because the potential of chemical residues can adversely affect consumers
(Hungaro et al., 2013). It can be seen that such methods both the use of antibiotics and
chemicals have direct and indirect effects on products and/or human health.
Therefore, it is necessary to find new ways to control foodborne pathogens.
Recently, bacteriophages or phages have gained more interest for applications
in foodborne pathogen control as an alternative method. This is because phage has
high host specificity, thus it does not cause pathogen mutation, so it does not affect
human health which makes phage treatment safe. From the characteristics mentioned
above, it can be seen that phage is suitable for controlling foodborne pathogens.
Therefore, the objectives of this study were to isolate and characterize the properties
of specific bacteriophages for S. aureus for controlling pathogenic bacteria in food.
Research Methodology
Isolation of S. aureus
Raw pork samples were collected from local markets in Nakorn Pathom
province for isolation of S. aureus. Twenty five grams of raw pork sample was sliced
into small pieces and mixed with 225 mL of peptone water 10 g/L peptone; sodium
chloride 5 g/L, pH 7.2) in stomacher bag. The samples were homogenized using Bag
Mixer (Interscience, France) for 3 minutes at 8 strokes/sec. One millilitre of liquid
mixture was spreaded on the surface of Baird-Parker agar (Titan Biotech, India)
supplemented with 5% egg yolk tellurite and incubated at 37 °C for 24-48 h. The
colonies of S. aureus which are glossy black convex with opaque inner zone and clear
outer zone on the selective medium were selected and streaked on Baird-Parker agar
to obtain single colony. S. aureus isolates were cultured in Tryptic soy broth (TSB)
The 7th National and International Graduate Study Conference 2017
" Thailand 4.0 Creative Innovation for Sustainable Development "
I427

(Titan Biotech, India) overnight. The cultures were transferred into fresh medium and
incubated at 37 °C with shaking at 180 rpm for 3-4 h to obtain mid-log phase S.
aureus. For long-term storage, the mid-log phase S. aureus in TSB containing 20%
(v/v) sterile glycerol was prepared and stored at -80 °C.
Phage lysate preparation and Bacteriophage isolation
Total 247 samples were collected from various environments such as waste
water from sewage and fresh pork markets for bacteriophage isolation and the sources
that may contain S. aureus then the phage solution was prepared by enrichment
method (Modify from Nukdee (2007)). The samples were centrifuged at 1000×g for
15 minutes to get rid of debris. The supernatant (4.5 mL) was pipetted into new tube
mixed with 0.5 mL of mid-log phase S. aureus BPA3 and 10xTSB (0.5 mL). The
mixtures were incubated at 37 °C for 48 h with shaking at 180 rpm. The supernatants
were collected by centrifugation at 1000×g for 10 minutes and filtered through a
syringe filter with 0.45 µm pore size. The filtrate as phage solution was stored at
4 °C until used.
Double layer agar method
Double layer agar method of Adams et al. (1959) was adopted for the isolation
of S. aureus-specific phages with some modifications. Briefly, Two hundred
microliters of mid-log phage S. aureus were mixed with 100 µL phage solution and
incubated for 10 minutes to allow the phage to infect bacteria. The mixtures were then
added into 4 mL molten soft agar (TSB with 0.45% agar) and poured on TSA. The
plates were incubated at 37 °C for 24 h. The observed plaque sizes and the morpho-
logy of plaques (turbid or clear) were recorded.
Bacteriophage purification
Plaques formed in double layer agar were collected using pipette tip to
penetrate agar piece containing single plaque. The plug was resuspended in 500 µL of
sterile SM buffer (0.05 M Tris-HCI, pH 7.5, 5 M NaCI, 1 M MgSO4 and 0.01%
gelatin). The content was mixed well and leaved for 30 minutes to allow phage
diffusion from the agar piece. The obtained phage solutions were purified by the
double layer agar method for at least triplicates to ensure purified phage. 5 mL of SM
buffer were added on the plates with homogeneous plaque population and leaved
overnight at 4 °C to allow phage diffusion from the agar. The phage lysates were
centrifuged at 10,000×g for 10 minutes at 4 °C and filtered through 0.45 µm syringe
filter.
Bacteriophage prolifiration and phage stock preparation
Fifteen millilitres of mid-log phase S. aureus mixed with 30 mL of medium
and 5 mL of phage lysate then incubated at 37 °C for 16-24 h. The culture was
centrifuged at 10,000×g for 10 min at 4 °C. The supernatant was filtered through
0.45 µm filter. The obtained filtrate which is phage lysate stock was kept at 4 °C.
Determination of bacteriophage titer
Phage titer was determined by using double layer agar method as described
above. The number of plaque appeared on plate was counted (counted on plates that
had 30-300 colonies). The number of plaque was used to calculate bacteriophage titer
as plaque-forming unit/mL (pfu/mL) as followed:
The 7th National and International Graduate Study Conference 2017
" Thailand 4.0 Creative Innovation for Sustainable Development "
I428

Bacteriophage titer (pfu/mL) = number of plaque × dilution factor
0.1 mL
Determination of phage host range
The determination of phage host range was performed by spot test adapted
from Phumkhachorn (2010). Two hundred microliters of bacterial hosts used in this
study which were S. aureus (11 isolates), Listeria monocytogenes DMST 17303
(1 strain), Salmonella enterica Typhimurium ATCC 13311 and Salmonella enterica
Enteritidis DMST 8536 were mixed with 4 mL of molten soft agar and overlaid on
TSA agar. It was allowed to harden before dropping 10 µL of phage lysate
(108 pfu/mL). After incubating at 37 °C for 24 h, the lysis zone on the bacterial strains
was observed.
Results
Isolation of S. aureus in pork samples
In this study, nine isolates of S. aureus (BPA1-BPA9) were isolated from pork
samples collected from 5 shops in Nakhon Pathom city market. All isolates were
black shiny colonies with clear halo around the colonies of about 1-2 mm diameter on
baird-parker agar with 5% egg yolk tellurite (Figure 1).
Figure 1 S. aureus colonies on baird-parker agar with 5% egg yolk tellurite
Isolation and purification of bacteriophage
Of total 247 samples, only 14 samples (Table 1) contained S. aureus specific
phages. 40 plaques obtained after the purification consisted of 37 clear plaques
(Figure 2A) and 3 turbid plaques (Figure 2B). The plaques sizes were approximately
1-2 mm.
The 7th National and International Graduate Study Conference 2017
" Thailand 4.0 Creative Innovation for Sustainable Development "
I429

Table 1 Show source of samples and isolate bacterial strain
Bacterial strain Code Sample
S. aureus BPA 3 I11 Water from pork wash
S. aureus BPA 3 K11 Raw milk
S. aureus BPA 3 L1 Raw milk
S. aureus BPA 3 M1 Raw pork
S. aureus BPA 3 N1 Water from sewage
S. aureus BPA 3 O1 Water from sewage
S. aureus BPA 3 O2 Water from sewage
S. aureus BPA 3 O3 Water from pork stall
S. aureus BPA 3 O4 Water from pork stall
S. aureus BPA 3 O5 Water from pork stall
S. aureus BPA 3 O6 Water from pork wash
S. aureus BPA 3 O7 Water from pork wash
S. aureus BPA 3 O8 Raw pork
S. aureus BPA 3 O9 Raw pork
Figure 2 Plaques obtained on agar overlay assay (A) clear plaques, (B) turbid plaques
Determination of phage host range Thirty-seven lytic bacteriophages were selected for host-range test. The results
showed that 9 phages were able to infect all of S. aureus isolates. Interestingly, 5
phages showed infection across genus by 3 phages could infect Listeria
monocytogenes and 2 phages infect Salmonella enterica Enteritidis (Table 2).
2A 2B
The 7th National and International Graduate Study Conference 2017
" Thailand 4.0 Creative Innovation for Sustainable Development "
I430

Table 2 Host range test of S. aureus phages. The characteristics of phages
were indicated by: ++ Clear zone, + Relatively clear, - No clear zone. p
hag
es
S.
aure
us
BP
A1
S.
aure
us
BP
A2
S.
aure
us
BP
A3
S.
aure
us
BP
A4
S.
aure
us
BP
A5
S.
aure
us
BP
A6
S.
aure
us
BP
A7
S.
aure
us
BP
A8
S.
aure
us
BP
A9
S.
aure
us
01
S.
aure
us
DN
22
L.
monocy
togen
es
S. T
yphim
uri
um
S. E
nte
riti
dis
PO102.1 - ++ ++ - - ++ ++ ++ ++ ++ ++ - - -
PO102.2 - ++ ++ - - ++ ++ ++ ++ ++ + - - -
PO101 ++ ++ ++ + + ++ ++ ++ ++ ++ ++ + - -
PI1102 + ++ ++ + + ++ ++ ++ ++ ++ ++ - - -
PI1101 ++ ++ ++ ++ ++ ++ ++ ++ ++ ++ ++ + - -
PN201.2 + ++ ++ - - ++ ++ ++ ++ ++ ++ - - -
PN201.1 - ++ ++ - - ++ ++ ++ ++ ++ ++ - - -
PK1103 - ++ ++ - - ++ ++ ++ ++ ++ ++ - - -
PK1102 + ++ ++ + + ++ ++ ++ ++ ++ ++ - - -
PK1101 + ++ ++ - - ++ ++ ++ ++ ++ ++ - - -
PO201 - ++ ++ - - ++ ++ ++ ++ ++ ++ - - +
PO202 - ++ ++ - - ++ ++ ++ ++ ++ ++ - - +
PO203 + ++ ++ + + ++ ++ ++ ++ ++ ++ - - -
PN202.2 - ++ ++ - - ++ ++ ++ ++ ++ ++ - - -
PN202.1 - ++ ++ - - ++ ++ ++ ++ ++ ++ - - -
PN203.1 - ++ ++ - - ++ ++ ++ ++ ++ + - - -
PO301 - ++ ++ - - ++ ++ ++ ++ ++ ++ - - -
PO302 - ++ ++ - - ++ ++ ++ ++ ++ ++ - - -
PO303 - ++ ++ - - ++ ++ ++ ++ ++ ++ - - -
PO401 + ++ ++ + + ++ ++ ++ ++ ++ ++ - - -
PO402 + ++ ++ + + ++ ++ ++ ++ ++ ++ - - -
PO403 - ++ ++ - - ++ ++ ++ ++ ++ ++ - - -
PO501 - ++ ++ - - ++ ++ ++ ++ ++ ++ - - -
PO502 - ++ ++ - - ++ ++ ++ ++ ++ ++ - - -
PO503 - ++ ++ - - ++ ++ ++ ++ ++ ++ - - -
PO601 - ++ ++ - - ++ ++ ++ ++ ++ ++ - - -
PO602 - ++ ++ - - ++ ++ ++ ++ ++ ++ - - -
PO603 - ++ ++ - - ++ ++ ++ ++ ++ ++ - - -
PO701 - ++ ++ - - ++ ++ ++ ++ ++ ++ - - -
PO702 - ++ ++ - - ++ ++ ++ ++ ++ ++ - - -
PO703 - ++ ++ - - ++ ++ ++ ++ ++ ++ - - -
PO801 + ++ ++ + + ++ ++ ++ ++ ++ ++ - - -
PO802 + ++ ++ + + ++ ++ ++ ++ ++ ++ + - -
PO803 - ++ ++ - - ++ ++ ++ ++ ++ + - - -
PO901 - ++ ++ - - ++ ++ ++ ++ ++ ++ - - -
PO902 - ++ ++ - - ++ ++ ++ ++ ++ + - - -
Bacterial
strains
The 7th National and International Graduate Study Conference 2017
" Thailand 4.0 Creative Innovation for Sustainable Development "
I431

PO903 - ++ ++ - - ++ ++ ++ ++ ++ + - - -
Discussion
Over time, antimicrobial resistance has been reported and becomes a threat to
human and animal health. This makes it harder for physicians to treat diseases or
bacterial infections, which are usually treated by antibiotics. The problem arises
because pathogenic bacteria are increasingly resistant to antibiotics. One of the most
important pathogenic bacteria is S. aureus which often causes foodborne illness
(Wang et al., 2014; Zhang et al., 2012). Bhumibhamon and Bilhmad (2011) isolated
drug resistant S. aureus from pork collected from slaughterhouses in southern
Thailand during 2006-2008. They found that the percentage of 375 samples of
S. aureus that showed resistant to penicillin, amoxicillin, tetracycline and
streptomycin were 82.67, 76.53, 73.60 and 58.40%, respectively. Increasing of drug-
resistant bacteria is because these drugs are widely used in both humans and animals
for a long period of time. Misuse or overdose of antibiotics is a major cause of
antibiotic resistant bacteria. Therefore, it is necessary to find alternative methods of
treatments such as phage treatment which is a potential bactericidal agent (Basdew
and Laing., 2015; Fischetti., 2010). The bactericidal effect of phage is due to the
production of endolysin of phage. Endolysin breaks down cell wall of bacteria which
makes phage able to kill antibiotic resistant bacteria (Fan et al., 2016). The major
advantages of phage treatment are high specificity to bacteria, do not destroy useful
bacteria and no harm to humans and animals (Nukdee., 2007). During the last decade,
studies on phages biocontrol of S. aureus in food product have been reported. Garcia
et al. (2007) studied on phage cocktail used for control S. aureus in curd and whey.
Two phages, Ф 35 and Ф 88, were isolated from raw milk. The phage cocktail
treatment resulted in the reduction of S. aureus after 1 h of phage infection. Han et al.
(2013) isolated phage SAH-1 from sewage effluent near a dairy cow farm in
Gwacheon, South Korea and used for control S.aureus. The Multiplicity of infection
(MOI) was 100 for growth inhibition of S. aureus. Tabla et al. (2012) reported that the
combination of phages phiIPLA35 and phiIPLA88 with high hydrostatic pressure
treatments at 400 MPa was able to reduce the initial S. aureus contamination below
the detection limit (≤10 cfu/mL). Chang et al. (2017) combined LysSA97, an
endolysin extracted from bacteriophage SA97, with carvacrol a natural antimicrobial
compound, in order to improve potential in biocontrol treatment against S. aureus.
The results showed that this combination is more effective than treatments with either
LysSA97 or carvacrol.
In this study we obtained 9 isolates of S. aureus from 2 pork samples collected
from 5 fresh markets in Nakhon Pathom. It was found that S. aureus produced shiny
black and convex colony due to the reduction of tellurite to telluride with opaque
inner zone and clear outer zone which was due to lecithinase of S. aureus. Lecithinase
breaks down lecithin in egg yolk and forms halo (Baird-parker., 1962).
Phages have been isolated from various sources such as sea water, wastewater,
garbage etc. In effective phage isolation, samples should be collected from specific
sources for that phage because phage needs host for multiplication and survive (Li
and Zhang., 2014). In this study, we have succeeded in isolating phages specific to
S. aureus from various sources such as wastewater from drainpipe, pork, milk, etc. 40
plaques were isolated which composed of 37 clear plaque and 3 turbid plaque. In this
The 7th National and International Graduate Study Conference 2017
" Thailand 4.0 Creative Innovation for Sustainable Development "
I432
study, we interested in lytic phages because these phages can infect bacteria, multiply
and release phage progeny which make bacteria dies and clear plaque is formed. This
is different from lysogenic phages because after infection, phage genome will be
inserted into bacterial chromosome. The obtained plaque is opaque. Lysogenic phages
may cause bacterial mutation which is unsuitable for controlling of pathogenic
bacteria. Therefore, 37 lytic phages were collected for bacterial host range test. It was
found that 9 phages could infect 11 strains of S. aureus, 3 phages could infect
L. monocytogenes and 2 phages could infect S. Enteritidis. This indicates that isolated
phages have broad host range. The specificity of phage depends on adhesion or
adsorption between phage and receptor on bacterial cell during infection (Wong et al.,
2014). Phage has receptor-binding protein (RBPs) which play an important role in
determining the specificity of receptor and bacterial cell recognition. In conclusion,
the results of this study demonstrate the feasibility of using the isolated phages to
control wide range of S. aureus strains. However, the research on phage applications
is relatively new in Thailand. Therefore we interested in studying phage properties as
a guideline for controlling pathogens without using chemical or antibiotics and
expected that this information will be useful to those interested in the future.
References Adams, M. H., (1959) Bacteriophages. Interscience Publishers, New York.
Al-Bahry S. N., Mahmoud I. Y., Al-Musharafi S. K. and Sivakumar N. (2014)
Staphylococcus aureus Contamination during Food Preparation, Processing
and Handling. International Journal of Chemical Engineering and
Applications. 5(5): 388-392.
Angkititrakul, S., Sringam, P. and Polpakdee, A. (2014) Quality of Minced Pork Sold
in Khon Kaen Municipality. Khon Kaen University Research Journal. 19(6):
900-904.
Baird-parker, A. C. (1962) An Improved Diagnostic and Selective Medium for
isolating Coagulase Positive Staphylococci. Journal of Applied Bacteriology
25(1): 12-19.
Basdew, I. H. and Laing, M. D. (2015) Investigation of the lytic ability of South
African bacteriophages specific for Staphylococcus aureus, associated with
bovine mastitis. Biocontrol Science and Technology. 25: 429-443.
Bhumibhamon, T., Bilhmad, U. (2011) Antimicrobial resistance of S. aureus in pork
from slaughterhouses in the southern part of Thailand during 2006-2008.
Nation Institute of Animal Health. 6(1): 1-8.
Chang, Y., Yoon, H., Kang, D. H., Chang, P. S. and Ryu, S. (2017) Endolysin
LysSA97 is synergistic with carvacrol in controlling Staphylococcus aureus in
foods. International Journal of Food Microbiology. 244: 19-26.
Fan, J., Zeng, Z., Mai, K., Yang, Y., Feng, J., Bai, Y., Sun, B., Xie, Q., Tong, Y. and
Ma, Jingyun. (2016) Preliminary treatment of bovine mastitis caused by
Staphylococcus aureus, with trx-SA1, recombinant endolysin of S. aureus
bacteriophage IME-SA1. Veterinary Microbiology 191: 65-71.
FDA (2012) Bad bug book: Foodborne pathogenic microorganisms and natural toxins
handbook, 2nd ed. US Food and Drug Administration, Silver Spring, p. 87-92.
Fischetti, V. A. (2010) Bacteriophage endolysins: a novel anti-infective to control
The 7th National and International Graduate Study Conference 2017
" Thailand 4.0 Creative Innovation for Sustainable Development "
I433
gram-positive pathogens. International Journal of Medical Microbiology.
300: 357-362.
García, P., Madera, C., Martínez, B. and Rodríguez, A. (2007) Biocontrol of
Staphylococcus aureus in curd manufacturing processes using bacteriophages.
International Dairy Journal. 17(10): 1232-1239.
Han, J. E., Kim, J. H., Hwang, S. Y., Choresca, C. H., Shin, S. P., Jun, J. W., Chai, J.
Y., Park, Y. H. and Park, S. C. (2013) Isolation and characterization of a
Myoviridae bacteriophage against Staphylococcus aureus isolated from dairy
cows with mastitis. Research in veterinary science. 95: 758-763.
Homthong, S., Tanwutthibandit, J., Dungkong, N., Boodngam, A. and Nilnoree, B .
(2011) Prevalence of Staphylococcus aureus and Bacillus cereus in Sushi. Burapha Science Journal. 16(1): 69-76.
Hungaro, H. M., Mendonça, R. C. S., Gouvêa, D. M., Vanetti, M. C. D. and Pinto, C.
L. D. O. (2013) Use of bacteriophages to reduce Salmonella in chicken skin in
comparison with a chemical agents. Food Research International. 52: 75-81.
Li, L. and Zhang, Z. (2013) Isolation and characterization of a virulent bacteriophage
SPW specific for Staphylococcus aureus isolated from bovine mastitis of
lactating dairy cattle. Molecular Biology Reports. 41(9): 5838-5829.
Nukdee, K. (2007) Isolation of Bacteriophages Specific to Enteric Bacteria. Ubon
Ratchathani Research Journal. 9(3): 29-37.
Phumkhachorn, P. and Rattanachaikunsopon, P. (2010) Isolation of bacteriophage
specific to a giant tiger prawn pathogen, Vibrio harveyi, as a candidate for
disease control. African Journal of Microbiology Research. 4(16): 1794-1800.
Siriwong, N. and Chukeatirote, E. (2009) Antibiotic resistance in Staphylococcus
aureus and controlling. Songklanagarind Medical Journal. 27(4): 347-358.
Tabla, R., Martínez, B. Rebollo, E. J., González, J., Ramírez, R. M., Roa, I.,
Rodríguez, A. and García, P. (2012) Bacteriophage performance against
Staphylococcus aureus in milk is improved by high hydrostatic pressure
treatments. Journal of Food Microbiology. 156: 209-213.
Wang, X., Wang, X., Wang, Y., Guo, G., Usman, T., Hao, D., Tang, X., Zhang, Y.
and Yu, Y. (2014) Antimicrobial resistance and toxin gene profiles of
Staphylococcus aureus strains from holstein milk. Letters in Applied
Microbiology. 58: 527-534.
Wong, C. L., Sieo, C. C., Tan, W. S., Abdullah, N., Hair-Bejo, M., Abu, J. and Ho, Y.
W. (2014) Evaluation of a lytic bacteriophage, Φ st1, for biocontrol of
Salmonella enterica serovar Typhimurium in chickens. International Journal
of Food Microbiology. 172: 92-101.
Zhang, C. P., Song, L., Chen, H.J., Liu, Y., Qin, Y. L. and Ning, Y. B. (2012)
Antimicrobial susceptibility and molecular subtypes of Staphylococcus aureus
isolated from pig tonsils and cow's milk in China. Canadian Journal of
Veterinary Research. 76: 268-274.
The 7th National and International Graduate Study Conference 2017
" Thailand 4.0 Creative Innovation for Sustainable Development "
I434

The Investigation of Mixed Metal Nanoparticles for Potential Applications in the
Hydrogen Production
Author: Thitiwat Tanyalax
Program Chemistry Institute Mahidol University
Abstract
Hydrogen gas, a renewable and clean energy, generated from water splitting
with photocatalyst has drawn attention around the world. In this research, three types of
NiFe2O4 (NiFe2O4, mesoporous-NiFe2O4, and ferrocenated-NiFe2O4) were investigated as
photocatalysts which may be used for the production of hydrogen gas in the future. NiFe2O4
was prepared in a simple method by mixing NiCl2 and FeCl3 with molar ratio of 1:2 and
the mixture turned to orange precipitate after NaOH was added. Then, precipitate was
calcined at 500oC. Mesoporous-NiFe2O4 and ferrocenated-NiFe2O4 were prepared by the
same method but pluronic P-123 and ferrocenium were added during preparation,
respectively. Diffused reflectance UV-Vis spectroscopy, XRD, and SEM were performed
to characterize the prepared catalysts. For catalytic activity, the photocatalysts were tested
in a photoreactor filled with sacrificial reagent and water. The visible light was used as the
light source to proceed the reaction for 1 hour. The results showed that no hydrogen gas
was generated from all photocatalysts catalytic at 25oC for 1 hour. The further
investigation of the synthesis and photocatalysis of this materials for the production of
hydrogen gas will be proceeded in the future.
Keywords: Hydrogen production; NiFe2O4; photocatalyst
The 7th National and International Graduate Study Conference 2017
" Thailand 4.0 Creative Innovation for Sustainable Development "
I435

Introduction
Currently, fossil fuel has an important role for human activity
especially in the transportation. However, to use fossil fuel, the problem
involves exhaustion fossil fuel sources and global warming are facing. So
chemical fuels made by artificial photosynthesis like H2, NH3, and CH3OH have
drawn many attentions to solve these problems. There are many reactions that
can make chemical fuels such as methanol can provide from CO2 reduction, N2
reduction can provide NH3 from N2 and H2 can provide from electrolysis or
water splitting.
Hydrogen is one of the most abundant elements on the Earth’s surface, mostly
chemically bonded in hydrocarbons and water. Hydrogen can also be used as fuel energy.
Hydrogen energy is the green technology which has drawn attention from many researchers
around the world. Because the product of hydrogen combustion is water without any
pollutants as shown in the reaction (1)
H2 + 1/2O2 H2O (1)
Photocatalysts are the important materials that can convert the light energy for
redox reaction. Photocatalysts show many advantages to use in many fields such as
degradation of organic pollutants molecules, and water splitting in order to generate
hydrogen gas. However, the band gap energy is the necessary factor for photocatalyst. Due
to photocatalysts utilize the light energy to carry out the oxidation and reduction process
when light energy (hν) incident its surface, the electrons in conduction band (CB) are
excited to valence band (VB) and generate hole (h+) in CB. After that the oxidation and
reduction process are occurred from this phenomenon.
Recently, many reports have been revealed the hydrogen production by various
catalysts in the presence of irradiations such as TiO2, ZnO, CdS, WO3, NiO, and NiFe2O4.
The catalysts for the reaction require sufficient light energy (ultraviolet or visible light) to
promote electrons in valence band (VB) to conduction band (CB) and generate hole in
The 7th National and International Graduate Study Conference 2017
" Thailand 4.0 Creative Innovation for Sustainable Development "
I436

valence band. The water molecule receives electrons in conduction band and generate
hydrogen gas as shown in Scheme 1.
Scheme 1. Photocatalytic process of water with semiconductor
H.S. Kim et al. reported that NiFe2O4@TiO2, the semiconductor material with
magnetic and photocatalytic properties, generated hydrogen gas from the photo-spiltting
methanol/water solution around 18.5 mL after 8 h when the 0.5 gL-1 of NiFe2O4@TiO2
was used as shown in Scheme 2.
Scheme 2. Mechanism of charge separation and the photocatalytic process of
NiFe2O4@TiO2
Erik Casbeer, and et al. reported about the synthesis and photocatalytic activity of ferrites
under visible light. They reported the use of ferrites in photocatalytic conversion of
VB
CB e-
h+
Photon
H2O
H2
O2
H2O
Semiconductor + 2hv 2e- + 2h
+
Oxidation: H2O + 2h
+ 2H
+ + 1/2O
2
Reduction: 2H+ + 2e
- H
2
Overall: H2O + 2hv H
2 + 1/2 O
2
The 7th National and International Graduate Study Conference 2017
" Thailand 4.0 Creative Innovation for Sustainable Development "
I437

visible solar energy to generate e-/h+ for the degradation of the contaminants. They found
that the different band gap energy effected the ability of photocatalysts in order to absorb
light for degradation of contaminants in water.
Table 1. The band gap energies of some of these commonly used ferrites
Ferrite Band gap (eV)
CaFe2O4 1.9
MgFe2O4 2.18
ZnFe2O4 1.92
NiFe2O4 2.19
CuFe2O4 1.32
In this study, the objective of this work are to generate hydrogen gas from
photocatalysts. The band gap energy of the photocatalyst will modify for the optimize
condition in order to generate hydrogen gas.
Objectives
1) To synthesize photocatalysts for hydrogen production.
2) To characterize of the synthesized photocatalysts by diffuse reflectance UV-
Visible spectroscopy, Scanning electron microscope (SEM) and X-ray powder
diffractometer (XRD).
3) To evaluate the catalytic activity of the synthesized photocatalysts.
The 7th National and International Graduate Study Conference 2017
" Thailand 4.0 Creative Innovation for Sustainable Development "
I438

Research Methodology
1) Preparation of catalysts
1.1) Preparation of NiFe2O4
Prepare NiFe2O4 by mixing 1.28 g (0.01 mol) of NiCl2.6H2O and 3.22 g (0.02
mol) of FeCl3.6H2O in 20 mL of deionized water, the reaction was proceeded under room
temperature for 2 hours and the mixture turned to orange precipitate after NaOH was added.
Then, precipitate was calcined at 500oC to obtain NiFe2O4.
1.2) Preparation of mesoporous-NiFe2O4
Mesoporous-NiFe2O4 was prepared as in 2.1. Add the solution of pluronic P-
123 in ethanol into the mixture and then stir the mixture for 15 minutes. After that the
mixture turned to orange precipitate by adding NaOH. Then, precipitate was calcined at
500oC to obtain mesoporous-NiFe2O4.
1.3) Preparation of Ferrocenated-NiFe2O4
Ferrocenated-NiFe2O4 was prepared by dissolve 3.00 g (0.016 mol) of ferrocene
in 2.5 mL of conc.H2SO4. In the separate flask, mixing between 1.28 g (0.01 mol) of
NiCl2.6H2O and 3.22 g (0.02 mol) of FeCl3.6H2O and then stir the mixture for 15 minutes.
Slowly add the mixture into ferrocenium solution and calcined at 500oC to obtain
ferrocenated-NiFe2O4.
2) Material Characterizations
NiFe2O4, mesoporous-NiFe2O4, and ferrocenated-NiFe2O4 were analyzed by
using, X- Ray diffraction (XRD), Scanning Electron Microscope (SEM), diffused
The 7th National and International Graduate Study Conference 2017
" Thailand 4.0 Creative Innovation for Sustainable Development "
I439

reflectance UV-Visible spectroscopy, Cyclic voltammogram (CV), and Gas
Chromatography with Thermal Conductivity Detector (GC-TCD).
3) Hydrogen production
3 mg of NiFe2O4 was added into photoreactor with contain 50 mM of sacrificial
reagents in 4 mL of deionized water. Then light up (light source: Xe lamp (300W), CM-1
mirror, <400 nm filter cutoff) to photoreactor for 1 hr. The produced gas was taken and
analyzed by GC-TCD. The same method was applied to mesoporous-NiFe2O4 and
ferrocenated-NiFe2O4.
Results/Discussion
1) The morphologies of catalyst
The typical scanning electron micrograph of the catalysts are shown in Fig. 1
Fig. 1 SEM of a) NiFe2O4 and b) mesoporous-NiFe2O4 at 5.00x
Fig. 2 SEM of c) NiFe2O4 and d) mesoporous-NiFe2O4 at 15.00x
The SEM images show the spherical shaped particles can be seen
having grain size of ~ 160 nm for NiFe2O4 and ~ 220 nm for mesoporous-
a b
c d
The 7th National and International Graduate Study Conference 2017
" Thailand 4.0 Creative Innovation for Sustainable Development "
I440

NiFe2O4. The SEM results confirm that the template from pluronic-P123 can
increase the particles size of mesoporous-NiFe2O4.
2) X-ray diffraction
The XRD pattern of 3 types of NiFe2O4 are shown in Fig. 3
Fig. 3 X-ray diffraction patterns of NiFe2O4
The particles of NiFe2O4 and mesoporous-NiFe2O4 show same XRD
patterns, which the characteristic NiFe2O4 diffraction peaks at 2θ = 10.31, 30.37,
31.86(220), 33.26, 43.62(400), and 57.44(511). For ferrocenated-NiFe2O4 also
show peak pattern of carbon and NiFe2O4, 2θ = 23.94(002,graphite), 30.45(220),
32.07, 34.42, 35.88(311), 43.70(101,graphite), 45.83, 48.14,
56.77(004,graphite), and 75.59. The peaks obtained are identified and they are
similar to the pattern of NiFe2O4.
3) Study of UV-visible spectrum
Fig. 4 and Fig. 5, the results from diffused reflectance UV-visible spectrum,
suggest that all kind of NiFe2O4 exhibits light-harvesting property in visible light and the
band gap energy of each catalyst are shown in table 1.
10 20 30 40 50 60 70 80
2θ (degree)
NiFe2O4 mesoporous-NiFe2O4 ferrocenated-NiFe2O4
The 7th National and International Graduate Study Conference 2017
" Thailand 4.0 Creative Innovation for Sustainable Development "
I441
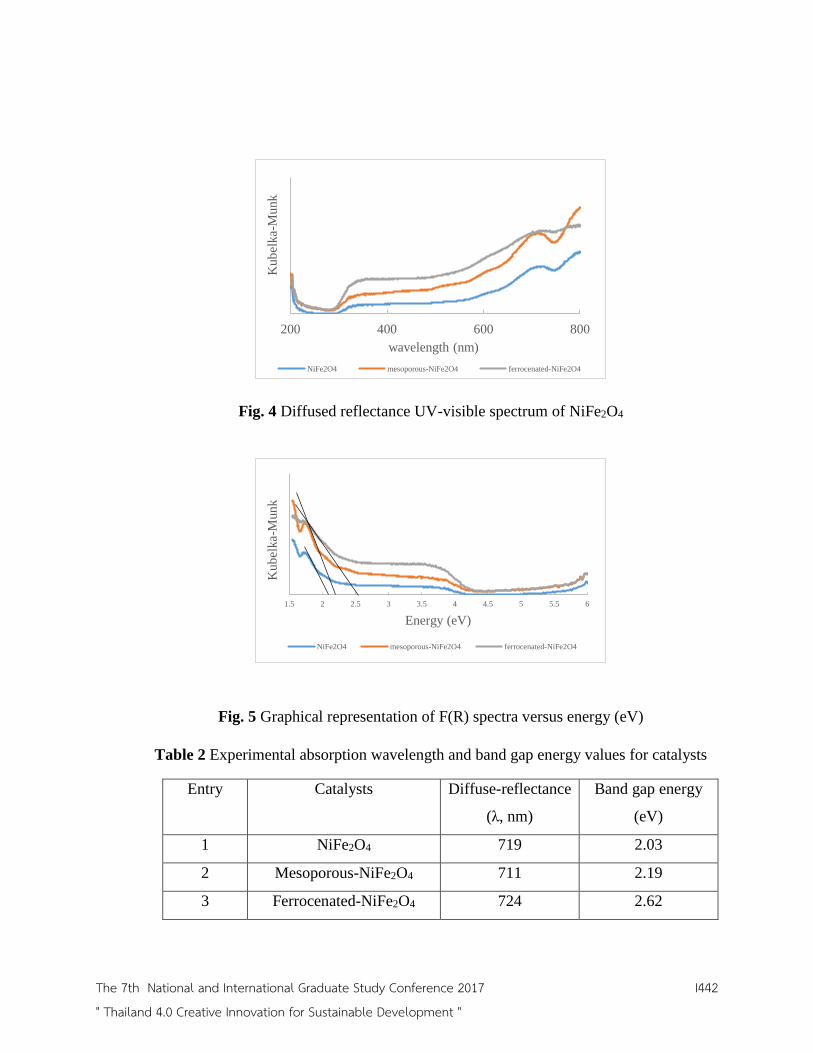
Fig. 4 Diffused reflectance UV-visible spectrum of NiFe2O4
Fig. 5 Graphical representation of F(R) spectra versus energy (eV)
Table 2 Experimental absorption wavelength and band gap energy values for catalysts
Entry Catalysts Diffuse-reflectance
(λ, nm)
Band gap energy
(eV)
1 NiFe2O4 719 2.03
2 Mesoporous-NiFe2O4 711 2.19
3 Ferrocenated-NiFe2O4 724 2.62
200 400 600 800
Kub
elka-
Munk
wavelength (nm)
NiFe2O4 mesoporous-NiFe2O4 ferrocenated-NiFe2O4
1.5 2 2.5 3 3.5 4 4.5 5 5.5 6
Kub
elka-
Munk
Energy (eV)
NiFe2O4 mesoporous-NiFe2O4 ferrocenated-NiFe2O4
The 7th National and International Graduate Study Conference 2017
" Thailand 4.0 Creative Innovation for Sustainable Development "
I442

4) Electrochemistry study
The cyclic voltammogram of all kind NiFe2O4 are shown in Fig. 6 and Fig.7.
The cyclic voltammogram results show that all kind of NiFe2O4 can serve as a
heterogeneous electrocatlyst for H2 production as shown in Fig. 6.
Fig. 6 Cyclic voltammogram of a) NiFe2O4, b) mesoporous-NiFe2O4, and c) ferrocenated-
NiFe2O4 in MeCN
Fig. 7 Cyclic voltammogram of NiFe2O4 deposited on GC electrode in MeCN and 10%H2O
at room temperature under Ar
-3 -2 -1 0 1 2
Potential(V vs. Ag/AgCl)
A1 A1+10%H2O
-3 -2 -1 0 1 2
Potential(V vs. Ag/AgCl)
B1 B1+10%H2O
-3 -2 -1 0 1 2
Potential(V vs. Ag/AgCl)
C1 C1+10%H2O
-2.5 -2 -1.5 -1 -0.5 0
Potential(V vs. Ag/AgCl)
A1 B1 C1 Blank MeCN
a b
c
The 7th National and International Graduate Study Conference 2017
" Thailand 4.0 Creative Innovation for Sustainable Development "
I443

Conclusion
The three kinds of NiFe2O4 (NiFe2O4, mesoporous-NiFe2O4, and ferrocenated-
NiFe2O4) were successfully synthesized and investigated as photocatalysts. The
characterization results confirm that 3 kinds of NiFe2O4 have different band gap energy
values by different synthesis method. For catalytic activity, the photocatalysts were tested
under visible light source to proceed the reaction. However, the results showed that no
hydrogen gas was generated from all photocatalysts catalytic at 25oC for 1 hour. The
further investigation of the synthesis and photocatalysis of this materials for the production
of hydrogen gas will be proceeded in the future.
References
Techalertmanee, T., Chancharoenrith, S., Namkajorn, M., Kiatisevi, S.,
Chaicharoenwimolkul, L., and Somsook, E. (2015). "Facile synthesis of zinc–
iron mixed oxide/carbon nanocomposites as nanocatalysts for the degradation
of methylene blue." Materials Letters 145, 224-228.
Jinasan, A., Poonsawat, T., Chaicharoenwimolkul, L., Pornsuwan, S., and Somsook, E.
(2015). "Highly active sustainable ferrocenated iron oxide nanocatalysts for the
decolorization of methylene blue." RSC Adv. 5 (40), 31324-31328.
Bai, Y. Y., Lu, Y., and Liu, J. K. (2015). "An efficient photocatalyst for degradation of
various organic dyes: Ag@AgMoO-AgBr composite." Journal of hazardous
materials 307, 26-35.
Wang, H., Chen, W., Zhang, J., Huang, C., and Mao, L. (2015). "Nickel nanoparticles
modified CdS – A potential photocatalyst for hydrogen production through
water splitting under visible light irradiation." International Journal of
Hydrogen Energy 40 (1), 340-345.
Wang, X., Liu, M., Chen, Q., Zhang, K., Chen, J., Wang, M.; Guo, P., and Guo, L. (2013).
"Synthesis of CdS/CNTs photocatalysts and study of hydrogen production by
The 7th National and International Graduate Study Conference 2017
" Thailand 4.0 Creative Innovation for Sustainable Development "
I444

photocatalytic water splitting." International Journal of Hydrogen Energy
38 (29), 13091-13096.
Barakat, N. A. M., Taha, A., Motlak, M., Nassar, M. M., Mahmoud, M. S., Al-Deyab, S.
S., El-Newehy, M., and Kim, H. Y. (2014). "ZnO&Fe2O3-incoportaed TiO2
nanofibers as super effective photocatalyst for water splitting under visible light
radiation." Applied Catalysis A: General 481, 19-26.
Koca, A., and Şahin, M. (2002). "Photocatalytic hydrogen production by direct sun light
from sulfide/sulfite solution." International Journal of Hydrogen Energy 27
(4), 363-367.
Kim, H.-i., Kim, J., Kim, W., and Choi, W. (2011). "Enhanced Photocatalytic and
Photoelectrochemical Activity in the Ternary Hybrid of CdS/TiO2/WO3
through the Cascadal Electron Transfer." The Journal of Physical Chemistry
C 115 (19), 9797-9805.
Peng, T., Zhang, X., Lv, H., and Zan, L. (2012). "Preparation of NiFe2O4 nanoparticles
and its visible-light-driven photoactivity for hydrogen production." Catalysis
Communications 28, 116-119.
Kim, H. S., Kim, D., Kwak, B. S., Han, G. B.; Um, M.-H., and Kang, M. (2014). "Synthesis
of magnetically separable core@shell structured NiFe2O4@TiO2 nanomaterial
and its use for photocatalytic hydrogen production by methanol/water
splitting." Chemical Engineering Journal 243, 272-279.
Preethi, V., and Kanmani, S. (2013). "Photocatalytic hydrogen production." Materials
Science in Semiconductor Processing 16 (3), 561-575.
Ahmad, H., Kamarudin, S. K., Minggu, L. J., and Kassim, M. (2015). "Hydrogen from
photo-catalytic water splitting process: A review." Renewable and
Sustainable Energy Reviews 43, 599-610.
Das, S., and Wan Daud, W. M. A. (2014). "Photocatalytic CO2 transformation
into fuel: A review on advances in photocatalyst and photoreactor." Renewable
and Sustainable Energy Reviews 39, 765-805.
The 7th National and International Graduate Study Conference 2017
" Thailand 4.0 Creative Innovation for Sustainable Development "
I445

Casbeer, E., Sharma, V. K., and Li, X.-Z. (2012). "Synthesis and photocatalytic activity
of ferrites under visible light: A review." Separation and Purification
Technology 87, 1-14.
The 7th National and International Graduate Study Conference 2017
" Thailand 4.0 Creative Innovation for Sustainable Development "
I446

Title Molecular cloning and characterization of Ig- like fibronectin III of
Gnathostoma spinigerum , GsIGF, for development of immunod iagnos is
Author : Preeyarut Malaithong , Poom Adisakwattana , Paron Dekumyoy ,
Dorn Wattanakulpanich , Jiraporn Ruangsittichai
Program Helminthology Institute Mahidol University
Abstract
Human gnathostomiasis is one of severe helminthic infection that is
difficult to diagnose. Recently, detection of specific antibody against 24 kDa
protein in crude somatic antigen of G. spinigerum L3 is a gold standard but
antigen preparation and time- consuming are claimed as a barrier. In this study,
we selected Ig- like fibronectin III protein (GsIGF) that has been identified from
our previous study. The nucleotide and amino acid sequences analyzed by
bioinformatics were demonstrated specific antigenic region of GsIGF at amino
acid residues 1,098 to 1,258 (GsIGF aa1,098 -1,258). cDNA encoding GsIGF
aa1,098 -1,258 was cloned into prokaryotic expression vector and then induced
recombinant protein expression (rGsIGF). rGsIGF was expressed at the
molecular weight of 18 kDa and reacted with anti-His tag antibody. The
immunodiagnostic potential of rGsIGF was evaluated with indirect ELISA and the
result suggested that this rGsIGF could differentiate G. spinigerum- infected sera
from negative healthy control . Our further study need to perform validation
of rGsIGF with heterologous sera and then calculated sensitivity and specificity.
The successive outcome may lead to establish a reliable immunodiagnosis of
gnathostomiasis that will be advantage for diagnostic laboratory and development
of diagnostic test kit in the future.
The 7th National and International Graduate Study Conference 2017
" Thailand 4.0 Creative Innovation for Sustainable Development "
I447

Keywords : Immunodiagnosis, recombinant protein, Ig-like fibronectin III,
Gnathostoma spinigerum
Introduction
Gnathostomiasis is the parasitic disease caused by nematode in the Genus
Gnathostoma. The outbreaks of the disease have been occurred frequently in Asia
and Central America (Daengsvang 1980, Almeyda-Artigas et al. 2000) and sporadic
cases in several countries when travelers returning home after visiting endemic
areas, especially Southeast Asia (Moore et al. 2003 , Katchanov et al. 2011).
G. spinigerum is the major species that causes human gnathostomiasis in Southeast
Asia particularly Thailand.
Subcutaneous or cutaneous intermittent migratory swelling with peripheral
eosinophilia are the most common clinical manifestations. However, the severe
case potentially observed when the parasite migrates to visceral organs such as
brain, spinal cord and eyes (Visudhiphan et al. 1980 , Chitanondh et al. 1967 ,
Boongird et al. 1977). For diagnosis, clinical signs and symptoms combination
with a history of ingestion of improperly second intermediate hosts or paratenic
hosts of Gnathostoma from endemic areas have been used in general.
Alternatively, immunodiagnosis have been developed and used as a supportive
diagnosis of gnathostomiasis. Immunoblotting to detect the 24 kDa crude somatic
antigen of G. spinigerum L3 is gold standard (Intapan et al. 2010) but the
whole process of antigen preparation is time consuming, seasoning dependence
and laborious. To improve immunodiagnosis, recombinant protein technology has
been applied to improve reliability of the essay (Laummaunwai et al. 2010).
However, there are few antigens show power of diagnosis but they are still in the
pipeline of validation. Therefore, several recombinant antigens may require for
increasing a successful outcome of immunodiagnostic. In this regard, our group is
identifying the diagnosis targets from excretory-secretory products of
G. spinigerum L3 using proteomics- immunomics approach. The recent result
The 7th National and International Graduate Study Conference 2017
" Thailand 4.0 Creative Innovation for Sustainable Development "
I448

shows several protein candidates including Ig- like fibronectin III protein (GsIGF)
interacted with G. spinigerum infected sera but less with other helminths. In
this study, we selected GsIGF for bioinformatics and biochemical analyses using
computational prediction, recombinant protein technology and ELISA,
respectively. This study may provide information regarding potential of GsIGF in
further development of immunod iagnos is.
Objectives
1. To produce recombinant proteins in prokaryotic expression system
2. To evaluate a potential diagnosis of recombinant proteins using ELISA
Research Methodology
Third-stage larvae G. spinigerum
The third stage larvae (L3) G. spinigerum were obtained from the
livers of naturally infected eels. In summary, the livers were removed and
then homogenized in 0.7% acid-pepsin using a blender. After that, the homogenate
were incubated at 37°C for 3 hr. in water bath with frequent stirring. After
digestion, the supernatant were removed and then the sediment were washed
several times with tap water. To obtain the larvae, the sediment were transferred
into several Petridishes and then looked for the parasite under stereomicroscope.
Larvae were washed several times with 0.85% normal saline solution (NSS) and
finally with distill water.
Bioinformatics analysis
Nucleotide sequence of GsIGF derived from in-house transcriptomes
database of G. spinigerum L3 (unpublished data) was used for prediction
amino acid sequence prior to bioinformatic analysis. The specific amino acid
regions of GsIGF compared with orthologs were analyzed with a multiple protein
The 7th National and International Graduate Study Conference 2017
" Thailand 4.0 Creative Innovation for Sustainable Development "
I449

alignment constructed with Clustal Omega (Goujon et al. 2010). All orthologs
recruited in this experiment are composed of Ascaris suum (accession no.
ERG85480), Haemonchus contortus ( accession no. CDJ98493), and Brugia malayi
(accession no. XP_001898707). Antigenic epitopes were predicted in the GsIGF
specific protein region to determine potential of antigen-antibody interaction using
web-based prediction program (http://imed.med.ucm.es/Tools/ antigenic.pl).
Amplification of GsIGF
Total RNA were isolated from G. spinigerum L3 using TRIZOL reagent
(Invitrogen, Carlsbad, CA) according to manufacturer’s instructions. After treating
total RNA with DNase I, f irst-strand cDNA was constructed by RevertAid First
Strand cDNA Synthesis Kit (Thermo Fisher Scientific, Watham, MA). The specific
amino acid region of GsIGF analyzed with Clustal Omega was used for design
specific primers, Forward : AATATGCATGCCGAGCCTTTCCACAACCTCATATC
and Reverse :ATACTGCAGTTAATAAGCATCACAGTGAGGTTGGTTC. Restriction
sites of Pae I and Pst I were incorporated into Forward and Reverse
primers, respectively (underlined). Amplification of GsIGF was performed by PCR
in a total volume of 50 l containing 1 x Taq DNA polymerase buffer, 2 mM
MgCl2, 0.2 mM each dNTP, 200 nM each degenerate primer, and 1 U of
Taq DNA polymerase (Thermo Fisher Scientific). The cycling conditions were
95 °C for 5 min, 40 cycles of 95 °C for 30 s, 45 °C for 30 s, and 72 °C for 30 s,
and a final extension step at 72 °C for 5 min. The partial cDNA sequence was
subcloned into the pGEM - T plasmid (Thermo Fisher Scientific) and the DNA
sequence was analyzed with DNA sequencing (AITbiotech Pte Ltd, Singapore).
Expression and purification of rGsIGF
The pGEM-T containing GsIGF cDNA and pQE30 vector (Qiagen GmbH,
Hilden, Germany) were digested with Pae I (Thermo Fisher Scientific) and Pst I
(Thermo Fisher Scientific) at 37 °C for 16–18 h. After gel purification, GsIGF
The 7th National and International Graduate Study Conference 2017
" Thailand 4.0 Creative Innovation for Sustainable Development "
I450

cDNA was ligated with pQE30 using T4 DNA ligase (Thermo Fisher Scientific),
and then transformed into E. coli strain JM109 and subsequently -strain M15,
respectively with the heat-shock technique (Froger and Hall 2007). M15 carrying
pQE30–GsIGF was cultured in LB broth containing 100 µg/ml ampicillin and 25
µg/ml kanamycin until growth reaches OD 600 0.4-0.6. After that, expression
of recombinant GsIGF (rGsIGF) was induced by adding 1 mM isopropyl--d-
thiogalactopyranoside (IPTG; Thermo Fisher Scientific) for 4 h. The bacteria
were harvested by centrifugation at 6,000 x g at 4 °C for 30 min, and the protein
was purified from the pellet under denaturing conditions, as described
previously (Pakchotanon et al. 2016).
Immunological assay
The crude worm antigen (CWA) were prepared as described previously
(Adisakwattana et al. 2007). A 100 l sample of rGsIGF (2.5 g/ml) or CWA
(5 g/ml) in 0.05 M carbonate buffer (pH 9.6) was coated onto each well of a
96-well microtiter plate (Nunc; Thermo Scientific, Denmark) and incubated at
37 °C until complete drying. An ELISA was performed as previously described, with
some modifications. In brief, nonspecific binding was blocked with blocking solution
(0.5% skim milk in 1x PBS) at 37 °C for 1 h, and the sections were then washed
with PBS–Tween. Human sera (1:400) were added to the wells and incubated at
37 °C for 1 h. After the wells were washed, HRP-conjugated goat anti-human IgG
antibody (1:2,000) was added. The samples were incubated at 37 °C for 1 h and
then visualized with the addition of ABTS substrate (Sigma-Aldrich). The
reaction was developed in the dark at room temperature for 30 min and then
stopped with 1% SDS. The optical density at a wavelength at 405 nm was
measured with the Sunrise™ absorbance reader (Tecan Group Ltd, Männedorf,
Switzerland).
The 7th National and International Graduate Study Conference 2017
" Thailand 4.0 Creative Innovation for Sustainable Development "
I451
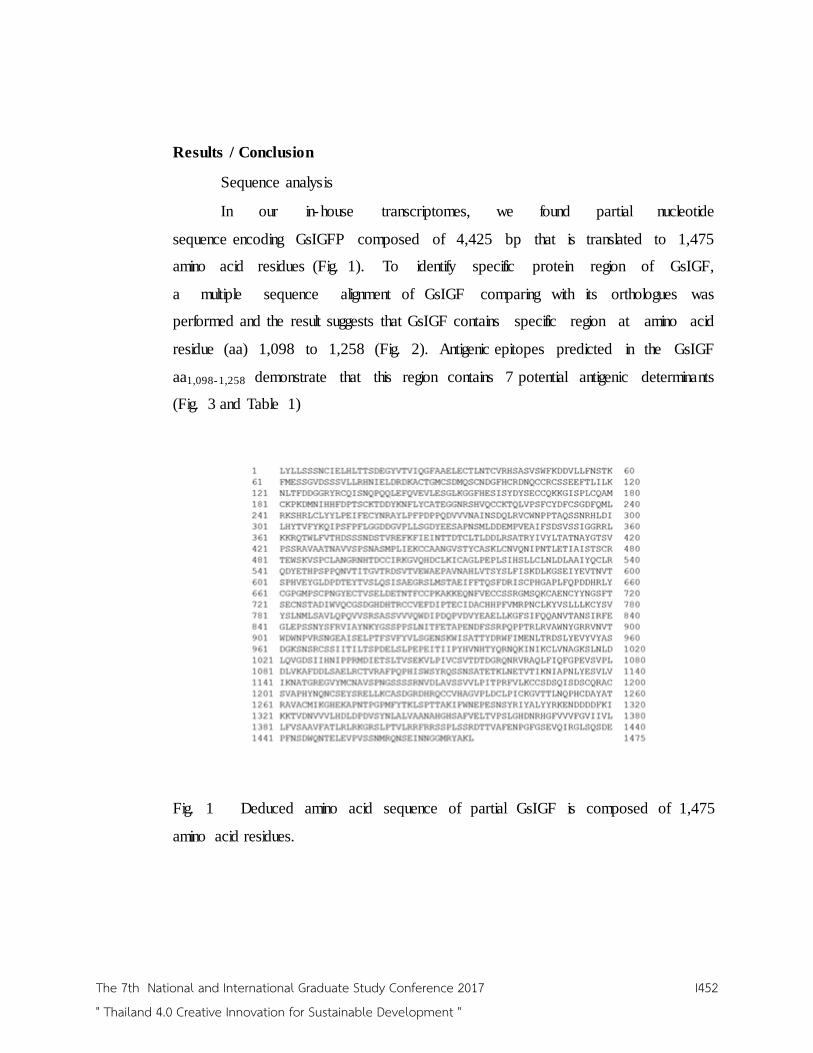
Results / Conclusion
Sequence analysis
In our in-house transcriptomes, we found partial nucleotide
sequence encoding GsIGFP composed of 4,425 bp that is translated to 1,475
amino acid residues (Fig. 1). To identify specific protein region of GsIGF,
a multiple sequence alignment of GsIGF comparing with its orthologues was
performed and the result suggests that GsIGF contains specific region at amino acid
residue (aa) 1,098 to 1,258 (Fig. 2). Antigenic epitopes predicted in the GsIGF
aa1,098-1,258 demonstrate that this region contains 7 potential antigenic determinants
(Fig. 3 and Table 1)
Fig. 1 Deduced amino acid sequence of partial GsIGF is composed of 1,475
amino acid residues.
The 7th National and International Graduate Study Conference 2017
" Thailand 4.0 Creative Innovation for Sustainable Development "
I452

Fig. 2 Multiple alignment of deduced amino acid sequences identified the
specific protein region of GsIGF. Identical and similar residues are indicated with
black and gray shading, respectively. Specific protein region of GsIGF (aa1 ,0 9 8-1,258).
Fig. 3 Seven potential antigenic determinants predicted in specific protein region
of GsIGF (aa1,098 -1,258) (bold with underlined).
The 7th National and International Graduate Study Conference 2017
" Thailand 4.0 Creative Innovation for Sustainable Development "
I453

Table 1 Antigenic determinants of GsIGF aa1,0 9 8 -1,258
No. Position Sequence
1 4-10 PQPHISW
2 33-45 IAPNLYESVLVIK
3 52-58 GVYMCNA
4 68-92 RNVDLAVSSVVLPITP RFVLKCCSD
5 95-107 ISDSCQRACSVAP
6 109-124 YNQNCSEYSRELLKCA
7 129-157 DHRQCCVHAGVPLDCLPICKGVTTLNQPH
Cloning, expression and purification of rGsIGF
cDNA encoding GsIGF aa1,098-1,258 was amplified by RT-PCR followed by
detecting the amplicon on agarose gel electrophoresis. The result showed
that the amplicon was amplified at a molecular size of 483 nucleotides
(Fig. 4A). After subcloning of the cDNA into prokaryotic expression system,
expression of rGsIGF was induced using IPTG and subsequently examined with
SDS-PAGE. The result demonstrated that rGsIGF was expressed with an
approximately molecular mass of 18 kDa (Fig. 4B). The water solubility was
determined and demonstrated that rGsIGF was expressed in an insoluble form,
which was reacted with an anti-His-tag antibody (Fig. 4C). rGsIGF was
purified under denaturing condition, and a major band of 18 kDa was eluted (Fig.
4D). The purified rGsIGF reacted with the anti-His-tag antibody (data not
shown).
The 7th National and International Graduate Study Conference 2017
" Thailand 4.0 Creative Innovation for Sustainable Development "
I454

Fig. 4 GsIGF cDNA was amplified by PCR and showed the amplicon at 483 bp (A).
M : 1 kb DNA marker (Thermo Fisher Scientific); 1 : GsIGF cDNA; arrowhead
indicates GsIGF cDNA. rGsIGF was heterologously expressed in E. coli (B) and then
western blot analysis with anti-His-tag antibody (C). M : broad-range prestained protein
marker; 1 : noninducing; 2 : inducing; 3 : inducing-soluble fraction; 4 : inducing-
insoluble fraction. rGsIGF was purified with a Co2+ affinity column under
denaturing condition (D). M : broad-range prestained protein marker; 1 : purified
rGsIGF, arrowhead indicates rGsIGF.
ELISA
To determine a potential of rGsIGF in diagnosis of G. spinigerum
infection, G. spinigerum-infected human sera and negative healthy sera were recruited in
this study. Initially, the optimal condition of ELISA was optimized using checker board
analysis and the result presented that at dilution 1:800 of human serum incorporating with
1:4,000 of conjugated antibody (data not shown). After performing ELISA, the result
suggested that G. spinigerum-infected sera reacted with rGsIGF at a higher OD405
than healthy control (Fig. 5).
The 7th National and International Graduate Study Conference 2017
" Thailand 4.0 Creative Innovation for Sustainable Development "
I455

Fig. 5 Evaluation the potential of rGsIGF for immunodiagnosis using ELISA.
positive: G. spinigerum infected human sera; negative: negative healthy control sera.
Discussion
The severe pathology and treatment management are still concerning
problems in gnathostomiasis. In this regard, reliable diagnosis is necessary issue
for clinical management and treatment follow-up. Immunodiagnosis is the gold
standard that has been used with high power of detection and differentiation.
Recently, Western blot analysis to detect antigen at the molecular weight of 24 kDa in
crude G. spinigerum L3 extract is accepted to be reference test for diagnosis of
gnathostomiasis (Maleewong et al.1988). However, obtaining the parasite from natural
source, complex life cycle, time-consuming in antigen preparation and non-quality
batch-to-batch are main barriers. In this study, we selected one protein candidate
identified from our ongoing research (unpublished data), namely GsIGF, to analyzed
by bioinformatics, recombinant protein expression, and ELISA.
The 7th National and International Graduate Study Conference 2017
" Thailand 4.0 Creative Innovation for Sustainable Development "
I456

A multiple alignment of GsIGF with other orthologs identified the
specific protein region aa1,098-1,258 that contains seven antigenic determinants. These
predicted epitopes may be a guidance to indicate the capacity of GsIGF
aa1,098 -1,258 region for immunodiagnosis. Moreover, this result may be suggested the
possibility to use the peptide epitopes to develop peptide-based immunodiagnosis.
In previous study, Fasciola gigantica cathepsin L-based synthetic peptide could be
used for diagnosis of parasite infected sheep and seem to discriminate between
early and late infection (Jezek et al. 2008).
rGsIGF was expressed in E. coli as an insoluble product with an approximate
molecular weight of 18 kDa. The expression of rGsIGF in insoluble form may be due to
incorrect conformation or lack of post-translation modification of the prokaryotic
expression system (Jana 2005). To express a soluble protein, novel expression condition
need to be optimized including different concentrations of IPTG, induction period,
growth temperature, shaking speed, as well as different types of culture media (Hossein
2014). Otherwise, changing to eukaryotic expression system is another option that
may increase protein solubility (Geisse et al. 1996).
To evaluate the immunodiagnostic potential of rGsIGF, ELISA was
initially tested with G. spinigerum-infected sera and healthy control sera. The result
demonstrated that rGsIGF could discriminate infections from healthy control. This
result may indicate that denature-linear epitopes of rGsIGF aa1,098-1,258 are sufficient in
diagnosis of gnathostomiasis. However, validation of rGsIGF with related- and unrelated
heterologous sera need to be performed for analysis of sensitivity and specificity.
In conclusion, rGsIGF was successfully expressed in E. coli and shows the
evidence to discriminate G. spinigerum- infected sera from healthy control. These may
lead to development of reliable immmunodiagnosis for gnathostomiasis that can be
applied to use in immunodiagnostic laboratory and developed to diagnostic kit in the
future.
The 7th National and International Graduate Study Conference 2017
" Thailand 4.0 Creative Innovation for Sustainable Development "
I457
References
Adisakwattana, Poom et al. (2007). Comparative molecular analysis of two asparaginyl
endopeptidases and encoding genes from Fasciola gigantica. Molecular and
Biochemical Parasitology 156(2): 102–116.
Almeyda-Artigas J, Roberto et al. (2000). “ITS-2 rDNA sequencing of Gnathostoma
species (Nematoda) and elucidation of the species causing gnathostomiasis in the
Americas.” Journal of Parasitology 86(3): 537-544.
Boongird, Prasert et al. (1977) . Neurological manifestations of gnathostomiasis. Journal
of the Neurological Sciences 31(2): 279–291.
Chitanondh, Hatai et al. (1967). Fatal eosinophilic encephalomyelitis caused by
the nematode Gnathostoma spinigerum. American Journal of Tropical
Medicine and Hygiene 16(5): 638-645.
Daengsvang, Svasti. (1 9 80 ) . A Monograph on the Genus Gnathostoma and
Gnathostomiasis in Thailand. Southeast Asian Medical Information Center.
Froger, Alexandrine and Hall E, James . (2007). Transformation of Plasmid DNA into
E. coli Using the Heat Shock Method. Journal of Visualized Experiments
6: 253.
Geisse, S. (1996). Eukaryotic expression systems: a comparison. Protein Expr Purif
8(3): 271-282.
Goujon, Mickael et al. (2010). A new bioinformatics analysis tools framework at
EMBL–EBI. Nucleic Acids Research 38(2): 695-699.
Hossein, Zarei Jaliani. (2 01 4 ) . Optimized Condition for Enhanced Soluble-
Expression of Recombinant Mutant Anabaena Variabilis Phenylalanine
Ammonia Lyase. Adv Pharm Bull 4(3): 261-266.
The 7th National and International Graduate Study Conference 2017
" Thailand 4.0 Creative Innovation for Sustainable Development "
I458
Intapan M., Pewpan et al. (2010). Immunoblot diagnostic test for neurognathostomiasis.
American Journal of Tropical Medicine and Hygiene 83(4): 927-929.
Jana S, Deb JK. (2005). Strategies for efficient production of heterologous proteins in
Escherichia coli. ApplMicrobiolBiotechnol 67(3): 289-298.
Jesek, J et al. (2008). Fasciola gigantica cathepsin L proteinase-based synthetic peptide
for immunodiagnosis and prevention of sheep fasciolosis. Biopolymers
90(3):349-357.
Katchanov , Juri et al. (2011). Neurognathostomiasis, A neglected parasitosis of the
central nervous system. Emerging Infectious Diseases Journal 17(7): 1174–
1180.
Laummaunwai, Porntip et al. (2010). Gnathostoma spinigerum : Molecular cloning,
expression and characterization of the cyclophilin protein. Experimental
Parasitology 126(4): 611-616.
Maleewong, Wanchai et al. (1988). Serodiagnosis of human gnathostomiasis. The
Southeast Asian journal of tropical medicine and public health 19(2):
201-205.
Moore A.J, David et al. (2003). Gnathostomiasis : an emerging imported disease.
Emerging Infectious Diseases Journal 9(6): 647–650.
Pakchotanon, Pattarakul et al. (2016). Molecular characterization of serine protease
inhibitor isoform 3, SmSPI, from Schistosoma mansoni. Parasitology Research
115(8): 2981-2994.
Visudhiphan, Pongsakdi et al. (1980). Causes of spontaneous subarachnoid hemorrhage
in Thai infants and children. A study of 56 patients. Journal of Neurosurgery
53(2): 185-187.
The 7th National and International Graduate Study Conference 2017
" Thailand 4.0 Creative Innovation for Sustainable Development "
I459

Title Effect of season and temperature shock on insecticide susceptibility of
Aedes aegypti in Thailand
Author: Promsup Supcharoen, Narumon Komalamisra, Raweewan Srisawat,
Siriluck Attrapadung, Nuananong Jirakanjanakit
Program Medical Entomology Institute Mahidol University
Abstract
In this study, eight strain of Aedes aegypti mosquitoes from four provinces
(Nakhon sawan, Kanchanaburi, Rayong, and Ranong) in two seasons (winter and
summer) in Thailand were used for testing on susceptibility test to commonly used
insecticides for mosquito control in Thailand. The insecticides include malathion,
deltamethrin, and propoxure. All of the Ae. aegypti strains were strongly resistant to
propoxure and showed incipient resistance to deltamethrin. In contrast, most Ae.
aegypti strains were susceptible to malathion. The insecticide susceptibility test showed
that seasonal temperature has some effect on insecticide susceptibility. The propoxure
susceptibility of Kanchanaburi and Rayong summer strains were higher than winter
strains. Malathion and deltamethrin susceptibility can be observed that the seasonal
temperature effect only in Rayong and Ranong strains, respectively. The effect of
temperature on insecticide susceptibility was also investigated in laboratory, all Ae.
aegypti strains were exposed at three temperatures (20±1C, 25±1C, and 30±1C) for 4
hours prior to insecticide susceptibility test with same insecticides. Mortality was
examined after 24 hour exposure. The results of deltamethrin susceptibility was showed
negative relationship with temperature in all strains. In the other hand, the results of
malathion and propoxure susceptibility were showed positive relationship with
temperature. We conclude that deltamethrin insecticide has higher toxicity to mosquito
when used in low temperature than high temperature while malathion and propoxure
are used in high temperature better than low temperature environment.
Keywords: Aedes aegypti, Season, Temperature, Insecticide susceptibility, Thailand
The 7th National and International Graduate Study Conference 2017
" Thailand 4.0 Creative Innovation for Sustainable Development "
I460

Introduction
Dengue fever is one of the serious mosquito-borne viral diseases in urban areas
of tropical countries and this disease is the most rapidly spreading around the world
(World Health Organization, 2012). The bite of an infected mosquito is a transmission
process for disseminating the problem of disease. The important mosquito vector is
Aedes aegypti, it is a primary vector in tropical and sub-tropical regions (World Health
Organization, 2009). In Thailand, the disease with the highest of cases and speedily
distributed disease are dengue (Chareonviriyaphap et al, 2013). Therefore, the
management of vector control is needed. Chemical control is the most effective method
for controlling mosquito-borne diseases transmission, several synthetic insecticides that
are commonly used included organochlorines, organophosphates, carbamates, and
synthetic pyrethroids. Synthetic pyrethroids are known for rapid knockdown effect, low
toxicity, and have a high insecticidal effect (Chareonviriyaphap et al, 2013).
Deltamethrin is the one of the most commonly used for the emergency control of Ae.
aegypti in Thailand. Malathion and fenitrothion are used for during the high period of
vectors, especially during the rainy season. The wrong used of chemical insecticides
can alter insecticide resistance, several researchers found Ae. aegypti in Thailand resist
to many insecticides including DDT, malathion, fenitrothion, temephos, cyfluthrin,
cypermethrin, deltamethrin, lambda-cyhalothrin, permethrin, etofenprox, and propoxur
(Thanispong et al, 2008; Chareonviriyaphap et al, 2013).
Changing climatic and environmental temperature influence density physiology
of mosquito, dengue virus susceptibility, and transmission (Patz et al, 2003; Vargas et
al, 2010; Alto et al, 2013). Temperature has a beneficial effect on mosquito population
dynamics and the rate they come to contact with humans (Patz et al, 2003). Mohammed
et al. (2011) found temperature changing affected on time of development, egg
hatching, larval and pupation. Moreover, the temperature influences the morphological
structure including size and shape of their wings, longevity, and survivorship (Swain et
al, 2008; Vargas et al, 2010).
In addition, the temperature to decrease extrinsic incubation period of the
vector-borne pathogen, at a higher temperature and decrease the viral replication (Patz
et al, 2003). More importantly, the changes of environmental temperature due to global
warming can alter the insecticide toxicity (Polson et al, 2012). An insecticide with a
The 7th National and International Graduate Study Conference 2017
" Thailand 4.0 Creative Innovation for Sustainable Development "
I461

negative temperature coefficient that has more toxic when a decrease in temperature or
vice versa for an insecticide with positive temperature coefficient become more toxic
when an increase in temperature (Glunt et al, 2013).
Khan et al. (2014) studied the effect of temperature on the insecticide toxicity in Musca
domestica, they found positive temperature coefficient in organophosphate insecticides
including profenofos and chlorpyrifos, in contrast to pyrethroid insecticides showed a
negative temperature coefficient. Little researchers are known about the impact of
temperature on insecticide toxicity in Ae. aegypti. Whiten et al. (2015) experimented
with adult female Ae. aegypti to permethrin and the results of toxicity were found
negative temperature coefficient. Therefore, the toxicity of pyrethroids insecticides is
negative temperature coefficient, whereas, organophosphate group exhibits a positive
temperature coefficient in the laboratory. It is expected that the result could be helpful
in selecting appropriate insecticides in the reasonable conditions.
Objective
The aim of the present study was to investigate the season and climatic effect
on the insecticides susceptibility against field Ae. aegypti in Thailand.
Research Methodology
Study site selection: The data of annual temperature was used for select study
sites and time to collecting samples. Four provinces were selected and divided to two
provinces represent for high different annual temperature and two provinces represent
for low different annual temperature. The average of annual temperature for five years
and the average 2 weeks of temperature before collect samples of each study sites in
winter and summer are given in Table 1 and 2, respectively.
Study sites: Four provinces of Thailand selected for collecting mosquito
populations were Nakhon sawan, Kanchanaburi for high different annual temperature
and Rayong, and Ranong provinces for low different annual temperature. Larvae and
pupae were collected from containers located indoor and outdoor in winter (January
2016) and summer (April to May 2016) shown in Fig. 1. GPS coordinated and
description of the location are provided in Table 1.
The 7th National and International Graduate Study Conference 2017
" Thailand 4.0 Creative Innovation for Sustainable Development "
I462
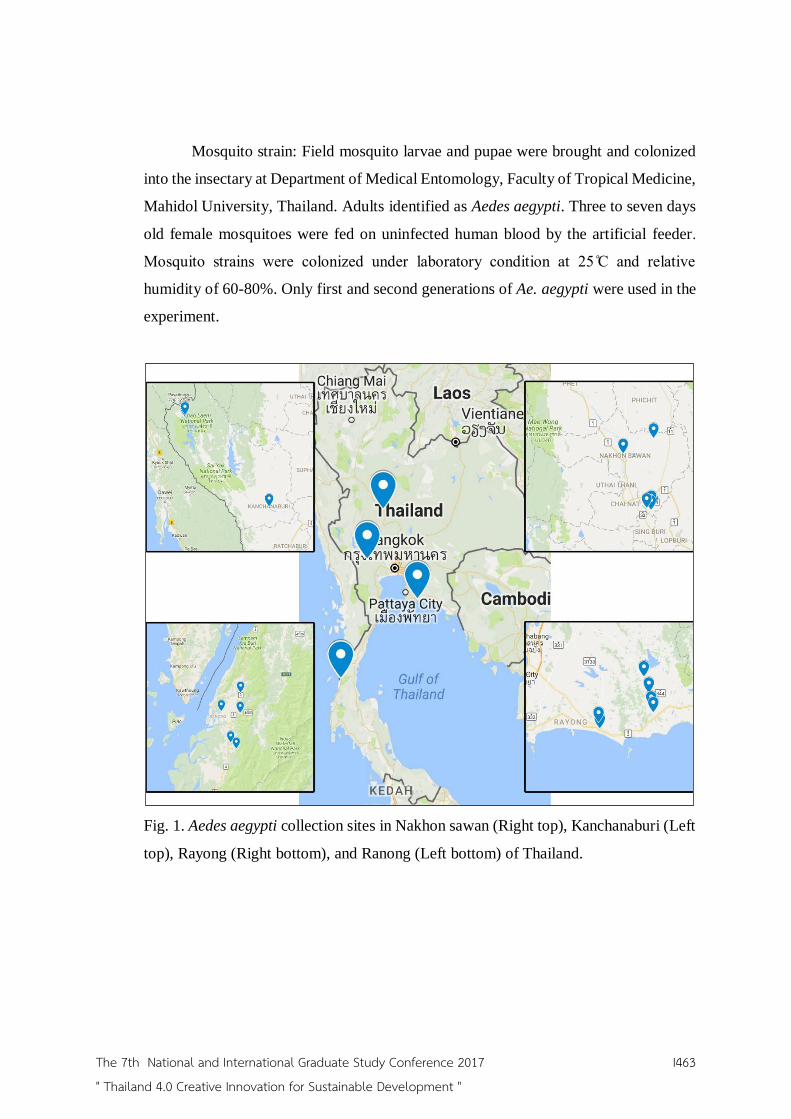
Mosquito strain: Field mosquito larvae and pupae were brought and colonized
into the insectary at Department of Medical Entomology, Faculty of Tropical Medicine,
Mahidol University, Thailand. Adults identified as Aedes aegypti. Three to seven days
old female mosquitoes were fed on uninfected human blood by the artificial feeder.
Mosquito strains were colonized under laboratory condition at 25 C and relative
humidity of 60-80%. Only first and second generations of Ae. aegypti were used in the
experiment.
Fig. 1. Aedes aegypti collection sites in Nakhon sawan (Right top), Kanchanaburi (Left
top), Rayong (Right bottom), and Ranong (Left bottom) of Thailand.
The 7th National and International Graduate Study Conference 2017
" Thailand 4.0 Creative Innovation for Sustainable Development "
I463
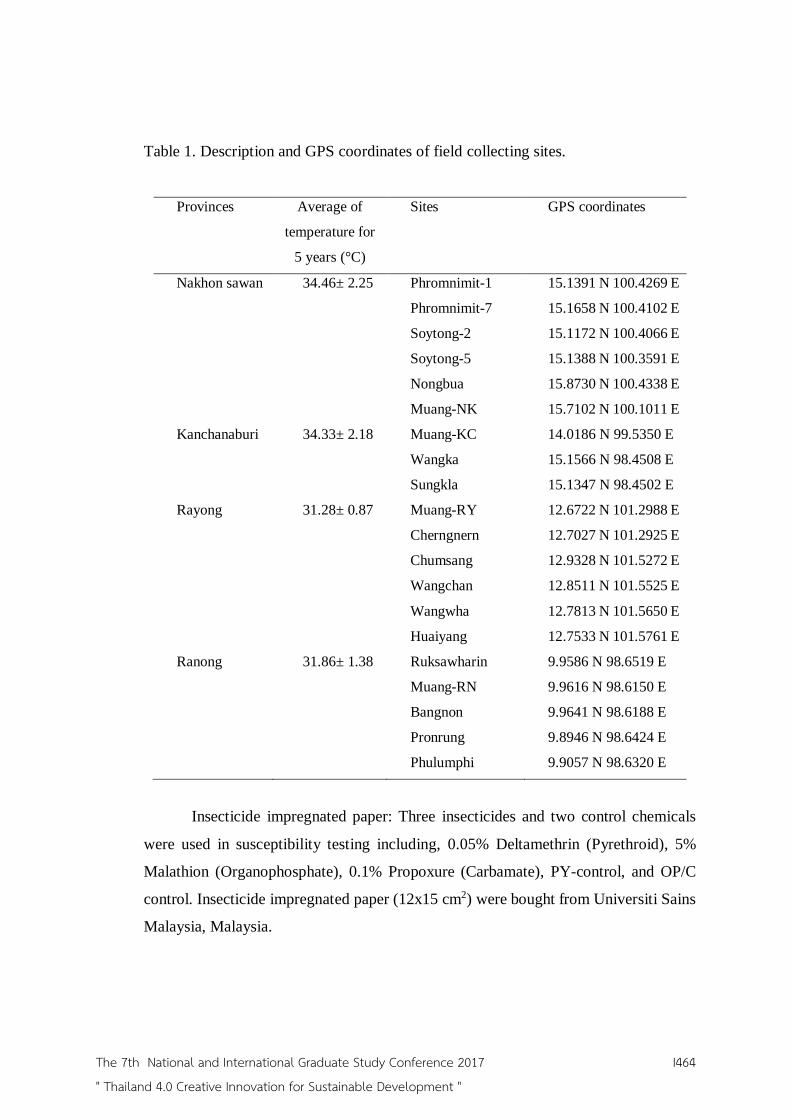
Table 1. Description and GPS coordinates of field collecting sites.
Provinces Average of
temperature for
5 years (°C)
Sites GPS coordinates
Nakhon sawan
Kanchanaburi
Rayong
Ranong
34.46± 2.25
34.33± 2.18
31.28± 0.87
31.86± 1.38
Phromnimit-1
Phromnimit-7
Soytong-2
Soytong-5
Nongbua
Muang-NK
Muang-KC
Wangka
Sungkla
Muang-RY
Cherngnern
Chumsang
Wangchan
Wangwha
Huaiyang
Ruksawharin
Muang-RN
Bangnon
Pronrung
Phulumphi
15.1391 N 100.4269 E
15.1658 N 100.4102 E
15.1172 N 100.4066 E
15.1388 N 100.3591 E
15.8730 N 100.4338 E
15.7102 N 100.1011 E
14.0186 N 99.5350 E
15.1566 N 98.4508 E
15.1347 N 98.4502 E
12.6722 N 101.2988 E
12.7027 N 101.2925 E
12.9328 N 101.5272 E
12.8511 N 101.5525 E
12.7813 N 101.5650 E
12.7533 N 101.5761 E
9.9586 N 98.6519 E
9.9616 N 98.6150 E
9.9641 N 98.6188 E
9.8946 N 98.6424 E
9.9057 N 98.6320 E
Insecticide impregnated paper: Three insecticides and two control chemicals
were used in susceptibility testing including, 0.05% Deltamethrin (Pyrethroid), 5%
Malathion (Organophosphate), 0.1% Propoxure (Carbamate), PY-control, and OP/C
control. Insecticide impregnated paper (12x15 cm2) were bought from Universiti Sains
Malaysia, Malaysia.
The 7th National and International Graduate Study Conference 2017
" Thailand 4.0 Creative Innovation for Sustainable Development "
I464

Table 2. The average 2 weeks temperature before collected samples of each study sites
in winter and summer season
Seasons Province Minimum-Maximum
temperature (°C)
Mean difference of
temperature (°C)
Winter
Summer
Nakhon sawan
Kanchanaburi
Rayong
Ranong
Nakhon sawan
Kanchanaburi
Rayong
Ranong
21.30-33.32
22.07-34.74
23.27-31.80
24.22-33.34
27.70-42.22
27.30-41.02
27.27-31.85
27.02-33.81
12.02±2.21
12.67±2.85
8.53±2.40
9.12±0.88
14.52±0.34
13.72±1.64
4.58±1.83
6.79±2.31
Temperature pre-exposed: Effect of temperature on insecticide susceptibility
was estimated by WHO insecticide susceptibility tube test. Three to five days old
females of Ae. aegypti were used in experiments. Twenty-five adults were anesthetized
by ice and introduced in WHO holding tube, 5 replicates (4 replicates for treatment and
another one for control) in each temperature there were 20±1C, 25±1C, and 30±1C.
After that the mosquitoes were exposed to these temperatures for 4 hours and then held
at 25±1C for 1 hour prior to insecticide susceptibility test. All of experiments were done
3 replicates.
Insecticide susceptibility test: Temperature for testing is 25±2C and relative
humidity 60-80%. The principle of the WHO insecticide susceptibility tube test is to
expose insects to a given dose of insecticide for a given time to assess susceptibility or
resistance. In this experiment, three groups of insecticides using diagnostic dose were
tested: Pyrethroid (0.05% Deltamethrin), Organophosphate (5% Malathion), and
Carbamate (0.1% Propoxure). They were gently blown into the exposure tubes
containing the insecticide-impregnated papers. After one hour of exposure, mosquitoes
were transferred back into holding tubes and provided with cotton wool moistened with
a 5% sugar solution. The number of dead mosquitoes at 24 hours were recorded.
The 7th National and International Graduate Study Conference 2017
" Thailand 4.0 Creative Innovation for Sustainable Development "
I465

Data analysis: Interpretation of results of insecticide susceptibility test were
determined according to WHO criteria. The WHO divided the results of susceptibility
test using diagnostic dose into three categories, 98-100% mortality indicates
susceptibility, 80-97% mortality suggest the possibility of resistance that needs to be
confirmed, less than 80% mortality suggests resistance. The correlation between the
mortality and experimental temperature exposure was calculated by Pearson correlation
using the statistical software package Statistical Package for Social Sciences (SPSS;
SPSS 18.0 for Windows.)
Results/ Conclusion
The results showed that all of the Ae. aegypti strains were strongly resistant to
propoxure. In contrast, most Ae. aegypti strains were susceptible to malathion, except
Nakhon sawan summer strain was resistant. With deltamethrin, all of the Ae. aegypti
strains showed incipient resistance to deltamethrin.
The results of susceptibility test of malathion, propoxure, and deltamethrin for
different Ae. aegypti strains are shown in Fig. 2.
Investigation of mosquito status and seasonal effect on insecticide susceptibility
to malathion, propoxure, and deltamethrin are given in Fig. 2. With malathion, all of
the mosquito populations in summer season were susceptible or close to susceptible
(95.33-99.33% mortality) except Nakhon sawan strain was resistant (66.33%
mortality). In the winter season, Rayong strain (72% mortality) showed less susceptible
to malathion. In the case of deltamethrin susceptibility, all of the Ae. aegypti strains of
winter and summer seasons were resistant, Nakhon sawan (37%, 41.67% mortality),
Kanchanaburi (34.67%, 40.67% mortality), Ranong (63%, 47% mortality), Rayong
(36%, 59.33% mortality). However, increasing of percent mortality to malathion of
Rayong strain was observed in the summer strain than winter strain while decreasing
of percent mortality to deltamethrin of Ranong winter strain than summer strain.
Similarly to propoxure, strong resistance was observed in all of the mosquito strains,
Nakhon sawan (19%, 8.33% mortality), Kanchanaburi (2.33%, 14.67% mortality),
Ranong (19%, 11.67% mortality), Rayong (5.67%, 18% mortality), summer strains of
Kanchanaburi and Rayong gave more percent mortality than the winter stains.
The 7th National and International Graduate Study Conference 2017
" Thailand 4.0 Creative Innovation for Sustainable Development "
I466

In this study was found seasonal temperature have some influence on insecticide
susceptibility (Fig. 2).
Fig.2. Percent mortalities of Aedes aegypti strains to different insecticides between
winter and summer seasons
Fig. 3. Effect of temperature on insecticide susceptibility to adult female Aedes aegypti
in winter season (A, B, C) and summer season (D, E, F) (NK = Nakhon sawan, KC =
Kanchanaburi, RN = Ranong, RY = Rayong, DT = Deltamethrin, PP = Propoxure, and
ML = Malathion).
The experimentation of temperature effect on insecticide susceptibility in field
Ae. aegypti strains were estimated at 20 C, 25 C, and 30 C (Fig. 3). The mortality of all
mosquito strains to deltamethrin were found negative correlated with the temperature
The 7th National and International Graduate Study Conference 2017
" Thailand 4.0 Creative Innovation for Sustainable Development "
I467

range tested. While, malathion and propoxure susceptibility were found positive
correlated. As a result, there were a positive correlated with temperature in both seasons
of Kanchanaburi whereas other provinces found positive correlation in some season
(see in Table 3).
Table 3. The correlation values between the mortality of mosquitoes to each insecticide
and temperature exposed.
Insecticides Seasons Sites P value Correlation value
(P < 0.05)
Deltamethrin Winter Nakhon sawan 0.004 -0.850
Kanchanaburi 0.001 -0.892
Rayong 0.000 -0.963
Ranong 0.005 -0.834
Summer Nakhon sawan 0.014 -0.776
Kanchanaburi 0.000 -0.989
Rayong 0.001 -0.904
Ranong 0.001 -0.912
Propoxure Winter Nakhon sawan 0.637 No correlation
Kanchanaburi 0.001 +0.914
Rayong 0.015 +0.772
Ranong 0.192 No correlation
Summer Nakhon sawan 0.956 No correlation
Kanchanaburi 0.002 +0.861
Rayong 0.129 No correlation
Ranong 0.009 +0.803
Malathion Winter Nakhon sawan 0.309 No correlation
Kanchanaburi 0.000 +0.922
Rayong 0.941 No correlation
Ranong 0.267 No correlation
Summer Nakhon sawan 0.498 No correlation
Kanchanaburi 0.001 +0.914
Rayong 0.019 +0.753
Ranong 0.476 No correlation
The 7th National and International Graduate Study Conference 2017
" Thailand 4.0 Creative Innovation for Sustainable Development "
I468
Discussion
The management of Aedes aegypti mosquito is very important for reducing
deadly disease transmission including dengue fever, chikungunya, yellow fever, and
zika syndrome. Chemical control is a major controlling measure for vector populations
(World Health Organization, 2006). In the present study, the influence of seasonal and
the effect of three temperature levels was determined on the mortality of different
insecticides in field Aedes aegypti. In nature, mosquitoes are stimulated by varying
different types of physical environmental stresses including heat. Consequently, the
extremes of temperature caused them to develop mechanisms in order to survive in
environmental conditions. Heat stress in Ae. aegypti have been found to affect the
population dynamics and the life cycle (Mohammed et al, 2011; Simoy et al, 2015).
In this study, we examined the effect of season and temperature shock on the
insecticide susceptibility of the primary dengue vector, Ae. aegypti. Our study was
investigated to assess the effects of seasons and temperature variations to mosquito
susceptibility to current insecticides. We detected a trend of negative correlation
between the susceptibility rate and temperature on deltamethrin insecticide, vice versa
to malathion and propoxure were showed a positive trend.
The effect of temperature on physiology and other information of Ae. aegypti
mosquito was found in several studies. Carrington et al, (2013) investigated of
fluctuating versus constant temperatures effects on selected life-history traits of larval
and adult Ae. aegypti and they found the survival of immature life stage and egg
production of large diurnal temperature fluctuation range (DTR) mosquito populations
were decreased as compared with a constant temperature at 26 °C.
In the present study was used field Ae. aegypti mosquito populations of Thailand
for estimate the effect of temperature on the insecticide susceptibility. The commercial
products for household pest control in Thailand are organophosphate, pyrethroid, and
carbamate (Chareonviriyaphap et al, 2013). In this study was also found some
relationship between season and the mortality in some strain that collected from
different locations and seasons. The results of the insecticide susceptibility test during
the different seasons in the different provinces were uncertain. Nevertheless, the season
is a determinant of transmission of dengue diseases and other mosquito-borne diseases,
especially rainy season. Rainfall may increase transmission by promoting other
The 7th National and International Graduate Study Conference 2017
" Thailand 4.0 Creative Innovation for Sustainable Development "
I469
breeding sites leads to Ae. aegypti larval increased during the rainy season as compared
with winter and summer seasons (Paul Reiter, 2001; Patz et al, 2003; Wongkoon et al,
2013). Moreover, Malar et al, (2015) studied about seasons and a population density of
mosquitoes in agro-rural areas, they found in the summer season density of Culex spp.
was higher than other seasons. Whereas for the density Armigeres and Mansonia in
winter were higher than others. The abundance of mosquito in the winter season
(December-February) more than summer season (March-May) to 3.97 fold (Malar et
al, 2015).
The mosquito-borne diseases including dengue are massive occurrence within
urban areas which in turn respond to changes in environmental stimulation especially
temperature. A combination of rainy season, high relative humidity, and appropriate
temperature leads to increase the density of insect vectors. The mortality of field Ae.
aegypti in Thailand to currently insecticides revealed a direct relationship with
temperature. The result would be helpful in planning effective pyrethroid insecticides
application for Ae. aegypti mosquito. In this result also increase understanding of how
Ae. aegypti mosquito adapts to temperature changes. Consequently, it can support the
development of the best practice management approach to control vector and help
predict dengue disease transmission.
Acknowledgement
This research was financial support by the Biodiversity-based Economy
Development Office (BEDO-NRCT 45/2558)
References
Alto, B. W., & Bettinardi, D. (2013). Temperature and dengue virus infection in
mosquitoes: independent effects on the immature and adult stages. The
American journal of tropical medicine and hygiene, 88(3), 497-505.
Carrington, L. B., Seifert, S. N., Willits, N. H., Lambrechts, L., & Scott, T. W. (2013).
Large diurnal temperature fluctuations negatively influence Aedes aegypti
(Diptera: Culicidae) life-history traits. Journal of medical entomology, 50(1),
43-51.
The 7th National and International Graduate Study Conference 2017
" Thailand 4.0 Creative Innovation for Sustainable Development "
I470

Chareonviriyaphap, T., Bangs, M. J., Suwonkerd, W., Kongmee, M., Corbel, V., &
Ngoen-Klan, R. (2013). Review of insecticide resistance and behavioral
avoidance of vectors of human diseases in Thailand. Parasites & vectors, 6(1),
280.
Glunt, K. D., Blanford, J. I., & Paaijmans, K. P. (2013). Chemicals, climate, and
control: increasing the effectiveness of malaria vector control tools by
considering relevant temperatures. PLoS Pathog, 9(10), e1003602.
Khan, H. A. A., & Akram, W. (2014). The effect of temperature on the toxicity of
insecticides against Musca domestica L.: implications for the effective
management of diarrhea. PloS one, 9(4), e95636.
Malar, K. S., & Pandian, R. G. R. S. (2015). Influential inflicts of monsoon and
agricultural practices among the population density of mosquitoes in the agro-
rural villages of Madurai.
McMichael, A. J. (2003). Climate change and human health: risks and responses.
World Health Organization.
Mohammed, A., & Chadee, D. D. (2011). Effects of different temperature regimens on
the development of Aedes aegypti (L.)(Diptera: Culicidae) mosquitoes. Acta
tropica, 119(1), 38-43.
Patz, J. A., Githeko, A. K., McCarty, J. P., Hussein, S., Confalonieri, U., & De Wet, N.
(2003). Climate change and infectious diseases. Climate change and human
health: risks and responses, 103-132.
Polson, K. A., Brogdon, W. G., Rawlins, S. C., & Chadee, D. D. (2012). Impact of
environmental temperatures on resistance to organophosphate insecticides in
Aedes aegypti from Trinidad. Revista Panamericana de Salud Pública, 32(1),
1-8.
Reiter, P. (2001). Climate change and mosquito-borne disease. Environmental health
perspectives, 109(Suppl 1), 141.
Simoy, M. I., Simoy, M. V., & Canziani, G. A. (2015). The effect of temperature on
the population dynamics of Aedes aegypti. Ecological Modelling, 314, 100-110.
Swain, V., Seth, R. K., Mohanty, S. S., & Raghavendra, K. (2008). Effect of
temperature on development, eclosion, longevity and survivorship of
The 7th National and International Graduate Study Conference 2017
" Thailand 4.0 Creative Innovation for Sustainable Development "
I471
malathion-resistant and malathion-susceptible strain of Culex
quinquefasciatus. Parasitology research, 103(2), 299-303.
Thanispong, K., Sathantriphop, S., & Chareonviriyaphap, T. (2008). Insecticide
resistance of Aedes aegypti and Culex quinquefasciatus in Thailand. Journal of
Pesticide Science, 33(4), 351-356.
Vargas, R. E. M., Ya-umphan, P., Phumala-Morales, N., Komalamisra, N., & Dujardin,
J. P. (2010). Climate associated size and shape changes in Aedes aegypti
(Diptera: Culicidae) populations from Thailand. Infection, Genetics and
Evolution, 10(4), 580-585.
Whiten, S. R., & Peterson, R. K. (2016). The influence of ambient temperature on the
susceptibility of Aedes aegypti (Diptera: Culicidae) to the pyrethroid insecticide
permethrin. Journal of medical entomology, 53(1), 139-143.
World Health Organization. (2009). Dengue guidelines for diagnosis, treatment,
prevention and control: new edition.
World Health Organization. (2012). Global strategy for dengue prevention and control
2012-2020.
Wongkoon, S., Jaroensutasinee, M., & Jaroensutasinee, K. (2013). Distribution,
seasonal variation & dengue transmission prediction in Sisaket,
Thailand. Indian Journal of Medical Research, 138(3), 347.
The 7th National and International Graduate Study Conference 2017
" Thailand 4.0 Creative Innovation for Sustainable Development "
I472

Development of luciferase enhancement assay for dengue virus enhancing antibody detection Kedsara Panyasu1, Suwipa Kaewsod1, Krongkan Saipin1, Chunya Puttikhunt2, 3, Sutha Sangiambut3, Chakrit Hirunpetcharat1, Nopporn Sittisombut4, Jiraphan Junjhon1* 1Department of Microbiology, Faculty of Public Health, Mahidol University, Bangkok 10400, Thailand. 2Division of Dengue Hemorrhagic Fever Research, Department of Research and Development, Faculty of Medicine, Siriraj Hospital, Mahidol University, Bangkok 10700, Thailand. 3Medical Biotechnology Research Unit, National Center for Genetic Engineering and Biotechnology, National Science and Technology Development Agency, Bangkok 12120, Thailand. 4Department of Microbiology, Faculty of Medicine, Chiang Mai University, Chiang Mai 50200, Thailand. *Corresponding author: Jiraphan Junjhon, Department of Microbiology, Faculty of Public Health, Mahidol University, Bangkok 10400, Thailand E-mail address: [email protected] Abstract Dengue virus (DENV) burdens the public health problem globally. DENV infection causes a range of symptom from dengue fever (DF) to the severe form of the disease, dengue hemorrhagic fever (DHF) and dengue shock syndrome (DSS). DSS has been documented to associate with antibody dependent enhancement (ADE) phenomenon. Currently, enhancing antibody facilitating ADE can be detected by plaque assay or flow cytometric assay. However, these are the technical complex processes, which sometimes cause an operator-error prone manual readout. This study aimed to develop the Luc-based enhancement assay in more feasible way in K562 cells. Surface staining of FcγRII showed mean 97.97 ± 0.29 %, (n=3) in among the population of K562 cell used in this study, allowing the permissive infection condition for the developed ADE assay. The Luc-based enhancement assay was first tested for enhancing activity of antibody against DENV in comparison to the flow cytometry assay by using DENV-2, stain 16681 and single-round infectious particle reporter (Luc-SIP) at 37°C. As expected, Luc-SIP infection was peak enhanced by 4G2 at 1:40 dilution, similar to the peak enhancement observed for DENV-2 stain 16681. This result was likely implied that Luc-SIP show similar antigenicity to the naturally occurring DENV particles. Moreover, the number of virus-infected cell by flow cytometry was well correlated to the luciferase activity employed in Luc-base enhancement assay using Luc-SIP. This finding strongly ensured that our Luc-SIP could be used in replacement of conventional ADE assay. We further investigated the influence of virus breathing on the infection enhancement phenomenon by exposing virus to antibody at 4°C and 25°C. Interestingly, Luc-SIP displayed 10% lower level of peak enhancement than DENV at 4°C and 25°C by the appearance of a strong correlation of intracellular virus infection and luciferase activity in these conditions. Hence, this result brought us to the hallmark of structural conformations due to virus
The 7th National and International Graduate Study Conference 2017
" Thailand 4.0 Creative Innovation for Sustainable Development "
I473

breathing on ADE assay. Taken together, the Luc-based enhancement assay developed in this study should be a robust method for detecting DENV enhancing antibody for diagnosis of dengue diseases. Key Words: dengue virus, enhancing antibody, ADE assay, luciferase assay Introduction DENV is enveloped, single-stranded positive-sense RNA virus, classified in the family Flaviviridae. Four different serotypes (DENV-1 to 4) have been circulated in the endemic region worldwide (Chamber et al., 1990). DENV is transmitted between people by mosquitoes called Aedes aegypti and Ae. albopictus. Diseases caused by DENV are a public health problem in many countries around the world. Almost 40% of the world population is at risk of DENV infection (Bhatt et al., 2013). The 50-100 million individuals are infected with DENV and approximately 390 million people are at risk of dengue infections per year (Bhatt et al., 2013, WHO, 2016). All four serotypes of DENV cause various disease severity in human. The majority of DENV infected patients has asymptomatic infection, while the others have the development of symptoms to DF, DHF and DSS. Primary DENV infection in human naturally occurs in person with naive DENV experience. The host immunity induced by this infection is usually life-long serotype specific but short-term cross-protection against heterotypic serotypes. An individual with secondary infection with another DENV serotype has a high risk to the severe form of the disease. Secondary heterotypic DENV infection sometimes causes the ADE phenomenon (Halstead et al., 1970). ADE occurs when the virus binds to heterotypic cross-protective antibody and then forms the complexes entering into cells via Fcγ receptor (FcγR)-mediated endocytosis. There are three main human FcγRs; FcγRI, FcγRIIa and FcγRIIb, found on myeloid cells (such as monocytes and macrophages) (Littaua et al., 1990, Rodrigo et al., 2008, Watanabe et al., 2015). These receptors relatively facilitate the uptake of IgG-bound virus immune complexes into host cells. FcγRI mediates ADE of DENV infections as shown in U937 cells (Kontny et al., 1988). In a related study, FcγRII was reported to mediate ADE of DENV infection in a human erythroleukemic cell line (K562) which has only FcγRII, more efficient at the uptake of IgG-bound DENV immune complexes (Littaua et al., 1990). Plaque assay using live viruses is currently the “gold standard” for measuring neutralizing or enhancing antibodies (Russell and Nisalak, 1967, Akihigo and Junko, 2013). This assay lacks standardize format, generating a low sample throughput to detect antibodies. ADE assay is conducted by firstly mixing the virus to an antibody of interest in different concentrations. When the incubation period is appropriate, the virus-antibody complex is formed, allowing the virus to enter the cells, where a progeny virus is generated. The number of infected cells will be then compared with no antibody condition (Olsen et al., 1992). The virus yield is determined by plaque assay (Russell and Nisalak, 1967) or flow cytometry (Boonnak et al., 2008 and 2011, Guy et al., 2004). The weakness in carrying the ADE assay for enhancing antibody detection is the requirement of labor-intensive, time-consuming and technical complex processes, which sometimes cause an operator-error prone manual readout. This study aimed to develop an ADE assay in more feasible way by using a Luc-SIP (Junjhon et al., unpublished result), so called Luc-based enhancement assay.
The 7th National and International Graduate Study Conference 2017
" Thailand 4.0 Creative Innovation for Sustainable Development "
I474

By using the Luc-SIP model, this should also benefit the development of ADE detection assay by eliminating the possibility of losing the reporter from the viral genome while it is being replicated inside the cells. This Luc-based enhancement assay is validated using monoclonal antibodies, demonstrating well correlation to the flow cytometry assay. Objectives To develop the robust Lucia-based enhancement assay for the detection of enhancing antibody against DENV. Research Methodology
Cell lines. The mosquito cell line, C6/36 (Igarashi, 1978) and capsid (C)-expressing mosquito cell line (Sangiambut et al., 2013) were maintained in Leibovitz L-15 medium (Gibco BRL) supplemented with 10% fetal bovine serum (FBS), 2 mM L-glutamine (Gibco BRL), 0.26% tryptose phosphate broth (Sigma-Aldrich), and 100 units/ml penicillin and 100 microgram (µg)/ml streptomycin (Gibco BRL) at 29°C. African green monkey kidney epithelial cell (Vero cells) (Yasumura and Kawakita, 1963) was cultured in Minimum Essential Media (MEM) (Gibco BRL) supplemented with 10% FBS, 2 mM L-glutamine (Gibco BRL), 100 units/ml Non-Essential Amino Acids (NEAA) and 100 units/ml penicillin and 100 µg/ml streptomycin (Gibco BRL) in the presence of 5% CO2 at 37°C. The Human erythroleukemic K562 cell line (Anderson et al., 1979) was kindly provided by Dr. Bunpote Siridechadilok, Medical Biotechnology Research Unit (BIOTEC), NSTDA. The K562 cell line was grown in RPMI 1640 supplemented with 10% FBS, 2 mM L-glutamine (Gibco BRL), 100 units/ml penicillin and 100 µg/ml streptomycin (Gibco BRL) in the presence of 5% CO2 at 37°C. Antibodies. The monoclonal antibody specific to flavivirus E protein, 4G2 (Henchal et al., 1982) and the clone Cap 2 S.1 (clone 2E11), DENV NS1 antibody were kindly provided by Dr. Chunya Puttikhunt, Medical Biotechnology Research Unit (BIOTEC), NSTDA. The anti-CD32 antibody conjugated with phycoerythrin (PE), goat anti-mouse IgG antibody conjugated with Cy3, goat anti-mouse IgM antibody conjugated with Alexa Fluor 488 and goat anti-mouse IgG (H+L) antibody conjugated with alkaline phosphatase (AP), were purchased from the company (Abcam, cambridge, UK).
Virus. DENV-2 strains 16681 (Russell and Nisalak, 1967) was kindly provided by Dr. Nopporn Sittisombut, Faculty of Medicine, Chiang Mai University. The virus was propagated in C6/36 cell line in L15 medium (Gibco BRL, Grand Island, NY, USA) supplemented with 1.5% FBS, 2 mM L-glutamine (Gibco BRL), 0.26% tryptose phosphate broth (Sigma-Aldrich), and 100 units/ml penicillin and 100 µg/ml streptomycin (Gibco BRL) at 29°C for virus stock preparation used in this study.
Luc-SIP. The Luc-SIP of DENV-2 was generated previously using reverse genetic technology (Junjhon et al, unpublished result). Briefly, the plasmid pBluescript II KS (pBK) containing cDNA full-length DENV-2 (Sriburi et al., 2001) was subjected to replacement of C coding region in DENV genome with a cassette of gene encoding 38 amino acids of C protein at 5’end, followed by Lucia luciferase and 2A peptide of foot-and-mouth disease virus (FMDV2A) genes at the 3’end,
The 7th National and International Graduate Study Conference 2017
" Thailand 4.0 Creative Innovation for Sustainable Development "
I475

generating the pBK(S1SP6-10,723)∆C_Lucia (Figure 1) (Junjhon et al, unpublished result). The resulting plasmid was used as the template for in vitro RNA synthesis and the transcribed RNA was transfected into C-expressing cells via Lipofectamine 3000 (Invitrogen, Carlsbad, CA, USA) to produce the Luc-SIP. This Luc-SIP can replicate within the cells for a single cycle due to depletion of C gene from its genome. However, amplification of Luc-SIP stock for used in all experiments was done in the C-expressing cell, where it can generate multiple rounds of infection.
Figure 1. Diagram of Luc-SIP generated from plasmid pBK(SISP6-10,723) ΔC_Lucia by transfection into the C-expressing C6/36 cells.
Focus immunoassay titration. The focus immunoassay titration was employed to determine the infectious titer of DENV-2, strain 16681 and Luc-SIP. Virus samples were serially diluted in a 10-fold steps with 2% FBS-MEM medium and 50 µl of each virus dilutions were added onto Vero cells seeded in a 96-well plate. After 2 hr of incubation at 37°C with the presence of 5% CO2, 125 µl of 1.5% carboxymethyl cellulose (CMC) in 4% FBS-MEM medium was added onto the cells to restrict the area of infected cells and the plate was further incubated at 37°C, 5% CO2 for 48 hr. Then, monolayers of infected cells were fixed with 3.7% formaldehyde in phosphate buffered saline (PBS) and permeabilized with 2% Triton X-100 in PBS.
In vitro transcription
FMV
D2A
C38 SP6
Lucia prME
pBK(S1SP6-10723)∆C_Lucia
NS1 2A 2B NS3 4A 4B NS5
Amp.
FMV
D2A
C38
Lucia prME NS1 2A 2B NS3 4A 4B NS5 3’UTP 5’UTP
CAP
RNA
Luc-SIP
Lucia luciferase
C-expressing C6/36 cells
Transfect
The 7th National and International Graduate Study Conference 2017
" Thailand 4.0 Creative Innovation for Sustainable Development "
I476

After permeabilization, the infected cells were reacted with 4G2 antibody at 37°C for 1 hr followed by the AP-conjugated goat anti-mouse IgG (H+L) antibody (Abcam, Cambridge, UK). The signal of infected cells was observed by the catalytic reaction of AP to its chromogenic substrate [5-bromo-4-chloro-3'-indolyphosphate p-toluidine salt (BCIP) and nitroblue tetrazolium chloride (NBT)], generating the dark purple spots. The virus titer was calculated from the spots number and expressed as focus-forming unit (FFU) per ml.
Luciferase activity assay. To investigate whether the luciferase enzyme was derived by Luc-SIP replication, the luciferase activity assay was employed. The 50 µl of Luc-SIP infected culture supernatant was mixed with equal amount of QUANTI-Luc substrate in a 96-well OptiplateTM and the luciferase signal was read promptly by the VICTORTM X series multilabel plate reader. The luciferase activity derived from the ADE experiments was also carried out as the procedure described above. ADE assay. The Luc-based enhancement assay was developed in comparison to the conventional ADE assay using flow cytometry. Initially, the amount of input virus for ADE experiment was investigated to obtain the ADE background level. DENV-2, strain 16681 or Luc-SIP was used to infect C6/36 cells and K562 cells at MOI of 0.001, 0.05 and 0.1 in a 24-well plate. After 48 hr of incubation at 29°C for C6/36 cells and 37°C with 5% CO2 for K562 cells, the infected cells were washed and determined the infection by intracellular staining and flow cytometric assay. To test whether Luc-SIP particles display similar antigenicity to DENV particles in Luc-based enhancement assay, a 4G2 MAb was used for comparison the enhancing activity. DENV-2, strain 16681 and Luc-SIP were reacted with the 4-fold serial dilutions of 4G2 MAb from 1:10 to 1:10,240 at 37°C for 1 hr. The particle-antibody complex was then allowed to infect K562 cells in 24-well plate for another 2 hr at 37°C. To remove excess complex, the cells were washed with 2% FBS-RPMI medium by centrifugation at 900 g for 3 min and the cells were transferred into 24-well plates, incubated for an additional 48 hr. The culture supernatant was collected for luciferase activity assay and the infected cells were analyzed by flow cytometry. The enhancing activity was evaluated by subtracting the percentage of infected cells or RLU value from cells harboring antibody-virus complex with the cells harboring virus alone. In addition, the Luc-based enhancement assay was set up at 4°C and 25°C to examine the effect of virus breathing on antibody binding. The enhancing activity was compared to the luciferase activity and intracellular infection obtained at 37°C.
Flow cytometry assay. To ensure the expression of FcγRII on K562 cells for ADE test, the cells were subjected to surface staining by flow cytometry assay. The 1×10⁶ of K562 cells were fixed with 4% formaldehyde in PBS at 4°C for 20 min. After washing the cells with PBS for 2 times, cells were stained with anti-CD32 antibody conjugated with PE (Abcam, Cambridge, UK) at 5 µg/ml in PBS at 4°C for 45 min in the dark. After final wash with 2% FBS-PBS for 2 times, the fluorescence-activated cell were analyzed by performing data acquisition on a Flow Sight® Imaging Flow Cytometer. The data of FcγRII expression was acquired from 3 independent experiments.
For the ADE experiment, percentage of virus infected K562 cells was determined by intracellular staining and flow cytometry assay. Cells were fixed with 4% formaldehyde at 4°C for 15 min followed by permeabilization with 0.5% Triton
The 7th National and International Graduate Study Conference 2017
" Thailand 4.0 Creative Innovation for Sustainable Development "
I477

X-100 in PBS at 4°C for 10 min. After the washing steps to remove Triton X-100, cells were stained intracellularly with 2E11 or 4G2 MAbs at 4°C for 45 min in the dark. To develop the fluorescent signal, the cells were washed 2 times with 0.2% Tween 20 in PBS before reacting with goat anti-mouse IgM conjugated with Alexa Fluor 488 or goat anti-mouse IgG conjugated with Cy3 at 4°C for 45 min in the dark. The signal of infected cells was analyzed by performing data acquisition on a Flow Sight® Imaging Flow Cytometer. Result Dominant expression of FcγRII on K562 cells
Surface staining of FcγRII on K562 cells was performed to ensure the presence of cell receptors facilitating irregular DENV infection pathway by ADE mechanism. A total of 1×10⁶ K562 cells were stained with anti-CD32 antibody conjugated with PE and the signal of FcγRII expression on the cell surface was detected by Flow Sight® Imaging Flow Cytometer. The yellow fluorescent signal from PE was observed on the CD32 positive cells (Figure 2A) with the fluorescent intensity greater than 1×10³ (Figure 2B), whereas CD32 negative cells expressed lower PE signal than that of the positive cells (Figure 2B). A total of 1×10⁴ gated single cells examined for FcγRII expression displayed mean 97.97 ± 0.29 %, (n=3) of CD32 positive cell, suggesting major population of K562 cell in this study can be served as the permissive target for DENV infection by ADE mechanism.
Figure 2. Flow cytometry analysis of FcγRII expression on K562 cells. A) Appearance of K562 cells stained with PE-conjugated anti-CD32 antibody. B) Scatter plot of gated single cell displayed CD32 positive (yellow dot) and negative (blue dot). The data was acquired from 3 independent experiments. Optimal virus input for Luc-based enhancement assay
K562 cell is the permissive target for DENV infection via antibody-dependent pathway. Thus, DENV infection in the absence of antibody was investigated to set the base line level for ADE assay in this cell line. The amount of DENV-2 strain 16681 ranges from MOI of 0.001, 0.05 and 0.1 was used to infect K562 cells and the level of virus infection was examined by intracellular staining with anti-DENV antibodies and analyzed by flow cytometer. DENV infection was not observed in K562 cells at the
97.97% 2.03%
Asp
ect R
atio
Brig
htfie
ld
Intensity CD32
B
Positive
Brightfield CD32
Negative
A
The 7th National and International Graduate Study Conference 2017
" Thailand 4.0 Creative Innovation for Sustainable Development "
I478

MOI of 0.001, similar to the mock control. When increased the MOI to 0.05 and 0.1, virus infection was slightly increased to 1.13% and 3.11%, respectively (Figure 3). However, this result was contradictory to the level of DENV infection in C6/36 cells, where the peak of virus infection was greater to 43.15% at MOI of 0.1 (Figure 3). This result strongly confirmed that K562 cell is not a natural permissive host for DENV infection. The MOI of 0.05 and 0.1 provided a significant different of virus infection in between K562 cells and C6/36 cells, suggesting the appropriate virus input for the Luc-based enhancement assay developed in this study.
Figure 3. Flow cytometry analysis of DENV infection in K562 cells and C6/36 cells. MOI of 0.001, 0.05 and 0.1 was used to determine the optimal virus input for K562 infection for further development of Luc-based enhancement assay. C6/36 cell infection was used as the positive control. Percentage of virus infection was obtained by intracellular straining of infected cells with DENV specific antibodies and counted by flow cytometer. Error bars indicate the standard deviations from two independent experiments.
Luc-SIP showed similar antigenic property to naturally occurring DENV particles Luc-SIP was genetic engineered to enclose the partial DENV genome linked with Lucia luciferase gene, which is differed from the natural DENV genome. To test whether this difference lead to structural organization changes of the viral antigens, prM and E proteins on the surface of Luc-SIP, DENV antibody enhancement assay was performed in comparison to DENV particles derived from the parental strain virus.
The MOI of 0.1 of DENV-2, stain 16681 and Luc-SIP were exposed to the four-fold serial dilutions of 4G2 antibody and measured the infection enhancement activity by flow cytometry and luciferase activity assay. At the baseline control (Ab absence), intracellular infection in K562 cells was 5.83% for Luc-SIP and 1.02% for DENV-2, 16681. In the presence of anti-E antibody, the peak enhancement was 36.42% for Luc-SIP which closely similar to DENV-2, 16681 (41.13%) (Figure 4A). This result implied that Luc-SIP had relatively similar antigenic epitope to live DENV particles. A well correlation of luciferase activity to the level of virus infection in all concentrations of the antibody tested was also observed (Figure 5A). A peak enhancement of luciferase activity was found at a concentration antibody of 1:40
The 7th National and International Graduate Study Conference 2017
" Thailand 4.0 Creative Innovation for Sustainable Development "
I479

(823,951 RLU) as compared to K562 cells infected with Luc-SIP in the absence of 4G2 antibody (104,907 RLU) (Figure 5A). A strong linear correlation (R2>0.99) was observed when the luciferase activity form Luc-SIP was plotted against the percentage of virus infection (Figure 5B).
Figure 4. ADE assay by flow cytometry and Luc-based enhancement assay. A) DENV-2, strain 16681 and Luc-SIP were exposed to 4G2 antibody at 37°C. B) 4°C, C) 25°C. D) Intracellular infection from DENV-2, 16681 plotted for 4°C, 25°C, and 37°C. E) Intracellular infection from Luc-SIP, strain 16681 plotted for 4°C, 25°C, and 37°C. Error bars indicate the standard deviations from two independent experiment, dashed line; base line of Luc-SIP (upper panel) and base line of DENV-2, 16681 (lower panel). Temperature-dependent enhancement of Luc-SIP by DENV antibody DENV particle is dynamic and the structural organization of surface protein is altered dependent upon temperature conditions so called “breathing” (Ansarah-Sobrinho et al., 2008). We therefore tested this effect on Luc-SIP indirectly by exposing the particles to 4G2 antibody at 4°C and 25°C in parallel to DENV-2, strain 16681 particles. Interestingly, there was 22.19% and 23.33% of intracellular infection enhancement by Luc-SIP at 4°C and 25°C, respectively (Figure 4B-C). This was 14.23% and 13.09% lower than that of the enhancement of infection detected for Luc-SIP at 37°C (Figure 5E). The similar result was found when tested with the DENV-2, 16681 in which the enhancement of infection was 16.88% and 16.96% for 4°C and 25°C, respectively (Figure 4B-C). Thus, there was 24.25% and 24.17% less than what observed at 37°C (Figure 5D). By using Luc-based enhancement assay, we confirmed that the peak virus enhancement expressed as the intracellular virus infection was well correlated with the peak luciferase activity (603,782 RLU for 4°C and 395,366 RLU for 25°C) (Figure 5A, 5C, 5E) and both values displayed a well linear relationship at all temperature tested (R2 = 0.97 for both 4 °C and 25 °C) (Figure 5B, 5D, 5F).
05
101520253035404550
Infe
ctio
n (%
)
Antibody dilution
37°C
DENV-2 16681Luc-SIP
Base line of Luc-SIP Base line of DENV-2 16681
0
5
10
15
20
25
30
35
40
45
50
Infe
ctio
n (%
)
Antibody dilution
4°C DENV-2 16681Luc-SIP
Base line of Luc-SIP Base line of DENV-2 16681
05
101520253035404550
Infe
ctio
n (%
)
Antibody dilution
25°C DENV-2 16681Luc-SIP
Base line of Luc-SIP Base line of DENV-2 16681
05
101520253035404550
Infe
ctio
n (%
)
Antibody dilution
DENV-2 16681 infection 4°C25°C37°C
05
101520253035404550
Infe
ctio
n (%
)
Antibody dilution
Luc-SIP infection 4°C25°C37°C
B C
D E
A
The 7th National and International Graduate Study Conference 2017
" Thailand 4.0 Creative Innovation for Sustainable Development "
I480

Figure 5. Enhancement of Luc-SIP infection at different temperatures. A, C, E) Intracelluar infection enhancement and luciferase activity enhancement of Luc-SIP when tested at 37°C, 4°C , 25°C, respectively B, D, F) Linear regression analysis of infection enhancement and luciferase activity enhancement of Luc-SIP at 37°C, 4°C, 25°C, respectively. Discussion
Secondary infection with another DENV serotype may lead to infection by enhancing antibody, which is believed to be a factor in promoting the DENV replication in monocyte (Halstead. 1970). ADE assay is the functional antibody testing method for enhancing antibody detection in flavivirus. A test is conducted by first exposing the virus of interest to antibody at different levels of concentration or to an appropriate antibody-serum. After an appropriate period of incubation, progeny virus yield or number of infected cells are determined and compared. Basically, yield of viral progeny increases when cells exposed to virus-antibody mixture (Halstead and O’Rourke, 1977). The viral yield can be detected by plaque assay (Russell and Nisalak, 1967), the IgG/IgG ELISA (Burk and Nisalak, 1982, Kuno et al., 1991,
0
5
10
15
20
25
30
35
40
45
50
0
100,000
200,000
300,000
400,000
500,000
600,000
700,000
800,000
900,000
1,000,000
Infection (%)
Luci
fera
se a
ctiv
ity (R
LU)
Antibody dilution
37°C Luciferase activity
Luc-SIP infection
Base line control
y = 18637x + 18949 R² = 0.9943
0
100,000
200,000
300,000
400,000
500,000
600,000
700,000
800,000
900,000
1,000,000
0 5 10 15 20 25 30 35 40 45 50
Luci
fera
se a
ctiv
ity (R
LU)
Luc-SIP infection (%)
37°C
y = 15755x + 54562 R² = 0.9731
0
100,000
200,000
300,000
400,000
500,000
600,000
700,000
800,000
900,000
1,000,000
0 5 10 15 20 25 30 35 40 45 50
Luci
fera
se a
ctiv
ity (R
LU)
Luc-SIP infection (%)
4°C
0
5
10
15
20
25
30
35
40
45
50
0
100,000
200,000
300,000
400,000
500,000
600,000
700,000
800,000
900,000
1,000,000
Infection (%)
Luci
fera
se a
ctiv
ity (R
LU)
Antibody dilution
4°C Luciferase activity
Luc-SIP infection
Base line control
y = 21278x - 27634 R² = 0.976
0
100,000
200,000
300,000
400,000
500,000
600,000
700,000
800,000
900,000
1,000,000
0 5 10 15 20 25 30 35 40 45 50
Luci
fera
se a
ctiv
ity (R
LU)
Luc-SIP infection (%)
25°C
0
5
10
15
20
25
30
35
40
45
50
0
100,000
200,000
300,000
400,000
500,000
600,000
700,000
800,000
900,000
1,000,000
Infection (%)
Luci
fera
se a
ctiv
ity (R
LU)
Antibody dilution
25°C Luciferase activity
Luc-SIP infection
Base line control
A B
C D
E F
The 7th National and International Graduate Study Conference 2017
" Thailand 4.0 Creative Innovation for Sustainable Development "
I481
Cardosa et al., 1992) or fluorescence in situ hybridization (Olsen, 1992). The plaque assay used for measurement of enhancing antibody by observing the presence of antibody that causes the virus to multiply within the cell (Kliks et al., 1989) using live viruses is currently the “gold standard” for measuring neutralizing or enhancing antibodies (Goncalvez et al., 2007). Later development of virus infection was done by flow cytometry (Guy et al., 2004, Boonnak et al., 2008 and 2011, Alwis et al., 2014, Mukkherjee et al., 2014, Dejnirattisai et al., 2010). The dengue virus reporter is developed as a robust tool for measuring dengue infection by labeling the virus with the luciferase enzyme or green fluorescent protein (GFP) (Zou et al., 2011, Song et al., 2014). It is capable of measuring fluorescence or enzyme activity to indicate the ability of virus replication within the cells. This method can detect enhancing antibodies more quickly. Recently, Song et al., 2014 developed a stable Renilla luciferase reporter DENV (Luc-DENV) and tested with various known monoclonal antibodies (MAbs) and clinical sample from infected patient for measuring neutralization and ADE assay against DENV. Infection rate and progeny viral yield was measured on FcγR expressing K562 cells, which have increased the degree of ADE of DENV infection by human anti-DENV antibody. However, this method is technically complex, as the lysis of infected cells is required for Luc-based enhancement assay.
Development of Luc-based enhancement assay in our study is more feasible by using a Luc-SIP (Junjhon et al., unpublished results), which provides the flash light signal in a long period of detection time by the activity of Lucia luciferase enzyme. The benefit of using Luc-SIP is that it generates a single cycle of replication within the cells due to depletion of C gene from its genome; therefore it has no safety concern. The K562 cells used to develop the Luc-based enhancement assay was previously described to demonstrate that virus entry during ADE infection of FcγRII-expressing cell by virus-Ab complexes (Littaua et al., 1990, Rodrigo et al., 2009, Chawla et al., 2013, Chotiwan et al., 2014). We showed here in our study that K562 cell is the unusual permissive cell for DENV infection unless the presence of enhancing antibody (Figure 2).
Luc-based enhancement assay demonstrated enhanced infection of DENV-2, strain 16681 and Luc-SIP in the presence of similar amount of 4G2 MAb in K562 cell (Figure 4A-C). This firmly ensured the similar antigenic property of Luc-SIP and DENV-2, 16681 and therefore it can be replace each other for DENV antibody detection. Production of infectious DENV-2, stain 16681 and Luc-SIP via enhancing antibody was also the temperature-dependent; the yield of infectious Luc-SIP and DENV at 37°C was significantly reduced when compared to experiment conducted at lower temperatures (Figure 4A-C). This result agreed well with the previous finding (Ansarah-Sobrinho et al., 2008). The flow cytometry assay determined the infection of Luc-SIP within the cells in various temperature conditions, whereas the Luc-based enhancement assay described in this study determined the luciferase activity. Linear correlation was established between the Luc-SIP infection and luciferase activity from Lucia luciferase enzyme released into the K562 cell culture supernatant (Figure 5). Thus, the development of Luc-based enhancement assay is comparable to the conventional flow cytometry assay. Moreover, our developed assay has more advantages. It allows easy reading, reliable, more consistency and time saving. The Luc-based enhancement assay developed in this study should be robust and useful
The 7th National and International Graduate Study Conference 2017
" Thailand 4.0 Creative Innovation for Sustainable Development "
I482

tool to detect the enhancing antibody in all DENV research areas, particularly the DENV vaccine trial where numerous samples are required to test.
Conclusion Development of Lucia-based enhancement assay for the detection of enhancing antibody against DENV by using Luc-SIP model demonstrated that Luc-SIP had similar antigenic property to the parental strain of DENV-2, strain 16681, when tested the enhancing property of the well-characterized anti-E 4G2 MAb. In addition, we demonstrated that temperature-dependent binding of Luc-SIP by DENV antibody and found that the highest expression of E protein inside the cell in 37°C, normal human body temperature. Further assay is to validate the test with DENV-infected serum to make sure it is applicable for dengue diagnosis. Therefore, this developed method will be helpful for laboratory detection and epidemiological investigation for DENV antibodies.
References Akihigo M and Junko M. (2013). “Review of diagnostic plaque reduction
neutralization tests for flavivirus infection.” Vet J, 195(1): 33-40. Alwis RD, Williams KL, Schmid MA, Lai CY, Patel, Smith SA, et al. (2014).
“Dengue viruses are enhanced by distinct populations of serotype cross-reactive antibodies in human immune sera.” PLoS Pathogens, 10(10).
Anderson LC, Nilsson K and Gahmberg CG. (1979). “K562 A Human erythroleukemic cell line.” Int J Cancer, 23(2): 143-7.
Ansarah-Sobrinho C, Nelson S, Jost CA, Whitehead SS and Pierson TC. (2008). “Temperature-dependent production of pseudoinfectious dengue reporter virus particles by complementation.” Virology, 381(1): 67-74.
Bhatt S, Gething PW, Brady OJ, Messina JP, Farlow AW, Moyes CL, et al. (2013). “The global distribution and burden of dengue.” Nature, 496(7446): 504-7 .
Bokisch VA, Top FH Jr, Russell PK, Dixon FJ and Muller-Eberhard HJ. (1973). “The potential pathogenic role of complement in dengue hemorrhagic shock syndrome.” N Eng J Eng J Med, 289(19): 996-1000.
Boonnak K, Slike BM, Burgess TH, Mason RM, Wu SJ, Sun P, et al. (2008). “Role of dendritic cells in antibody-dependent enhancement of dengue virus infection.” J Virol, 82(8): 3939-51.
Boonnak K, Dambach KM, Donofrio GC, Tassaneetrithep B and Marovich MA. (2011). “Cell Type Specificity and Host Genetic Polymorphisms Influence Antibody-Dependent Enhancement of Dengue Virus Infection.” J Virol, 85(4): 1671-83.
Burk DS, Nisalak A and Gentry MK. (1982). “Antibody capture immunoassay detection of Japanese encephalitis virus immunoglobulin M and G antibodies in cerebrospinal fluid.” J Clin Microbiol, 16(6): 1034-42.
Cardosa MJ, Tio PH, Nimmannitya S, Nisalak A and Innis B. (1992). “IgM capture ELISA for detection of IgM antibodies to dengue virus: comparison of 2 formats using hemagglutinins and cell culture derived antigens.” Southeast Asian J Trop Med Public Health, 23(4): 726-9.
The 7th National and International Graduate Study Conference 2017
" Thailand 4.0 Creative Innovation for Sustainable Development "
I483

Chamber TJ, Hahn CS, Galler R and Rice CM. (1990). “Flavivirus genome organization, expression and replication.” Annu Rev Microbiol, 44(1): 649-88.
Dejnirattisai W, Jumnainsong A, Onsirisakul N, Fitton P, Vasanawathana S, Limpitikul W, et al. (2010). “Cross-reactive antibodies enhance dengue virus infection in humans.” Science, 328(1): 745-8.
Goncalvez AP, Engle RE, St Claire M, Purcell RH and Lai CJ. (2007). “Monoclonal antibody-mediated enhancement of dengue virus infection in vitro and in vivo and strategies for prevention.” Proc Natl Acad Sci, 104(22): 9422-7.
Guy B, Chanthavanich P, Gimeneza S, Sirivichayakul C, Sabchareon A, Begue S, et al. (2004). “Evaluation by flow cytometry of antibody-dependent enhancement (ADE) of dengue infection by sera from Thai children immunized with a live-attenuated tetravalent dengue vaccine.” Vaccine, 22(27-28): 3563-74.
Halstead SB, Nimmannitya S and Cohen SN. (1970). “Observations related to pathogenesis of dengue hemorrhagic fever, IV. Relation of disease severity to antibody response and virus recovered.” Yale J Biol Med, 42(1): 311-28.
Halstead SB and O’Rourke EJ. (1977). “Dengue viruses and mononuclear phagocytes, I. Infection enhancement by non-neutralizing antibody.” J Exp Med, 146(1): 201-17.
Henchal EA, Gentry MK, McCown JM and Brandt WE. (1982). “Dengue virus-specific and flavivirus group determinants identified with monoclonal antibodies by indirect immunofluorescence.” Am J Trop Med Hyg, 31(4): 830-6.
Igarashi A. (1978). “Isolation of a Singh's Aedes albopictus cell clone sensitive to dengue and chikungunya viruses.” J Gen Virol, 40(3): 531-44.
Kliks SC, Nisalak A, Brandt WE, Wahl L and Burke D. (1989). “Antibody-dependent enhancement of dengue virus growth in human monocytes as a risk factor for dengue hemorrhagic fever.” Am J Trop Med Hyg, 40(4): 444–51.
Kontny U, Kurane I and Ennis FA. (1988). “Gamma interferon augments Fcγ receptor mediated dengue virus infection of human monocytic cells.” J Virol, 62(11): 3928-33.
Kou Z, Quinn M, Chen H, Rodrigo WW, Rose RC, Schlesinger JJ, et al. (2008). “Monocytes, but not T or B cells, are the principal target cells for dengue virus (DV) infection among human peripheral blood mononuclear cells.” J Med Viral, 80(1): 134-46.
Kuno G, Gomez I and Gubler DJ. (1991). “An ELISA procedure for the diagnosis of dengue infection.” J Virol Methods, 33(1-2): 101-13.
Littaua R, Kurane I and Ennis FA. (1990). “Human IgG Fc receptor II mediates antibody-dependent enhancement of dengue virus infection.” J Immunol, 144(8): 3183-6.
Mukherjee S, Pierson TC and Dowd KA. (2014). “Pseudo-infectious reporter virus particles for measuring antibody-mediated neutralization and enhancement of dengue virus infection.” In Dengue: Methods and Protocols, Methods in Molecular Biology, 75-97. Edited by
The 7th National and International Graduate Study Conference 2017
" Thailand 4.0 Creative Innovation for Sustainable Development "
I484

Radhakrishnan Padmanabhan and Subhash G. Vasudevan. Spring New York Heidelberg Dordrecht London.
Olsen CW, Corapi WV, Ngichabe CK, Baines JD and Scott FW. (1992). “Monoclonal antibodies to the spike protein of feline infectious peritonitis virus mediate antibody-dependent enhancement of infection of feline macrophages.” J Virol, 66(2): 956-65.
Rodrigo WW, Jin X, Blackley SD, Rose RC and Schlesinger JJ. (2006). “Differential enhancement of dengue virus immune complex infectivity mediated by signaling-competent and signaling-incompetent human FcγRIA (CD64) or FcγRIIA (CD32).” J Virol, 80(20): 10128-38.
Russell PK and Nisalak A. (1967). “Dengue virus identification by the plaque reduction neutralization test.” J Immunol, 99(2): 291-6.
Sangiambut S, Suphatrakul A, Sriburi R, Keelapang P, Puttikhunt C, Kasinrerk W, et al. (2013). “Sustained replication of dengue pseudo-infectious virus lacking the capsid gene by trans-complementation in capsid-producing mosquito cells.” Virus Research, 174(1-2): 37-46.
Sriburi R, Keelapang P, Duangchinda T, Pruksakorn S, Maneekarn N, Malasit P and Sittisombut N. (2001). “Construction of infectious dengue 2 virus cDNA clones using high copy number plasmid.” J Virol Methods, 92(1): 71-82.
Song KY, Zhao H, Jiang ZY, Li XF, Deng YQ, Jiang T, et al. (2014). “A novel reporter system for neutralizing and enhancing antibody assay against dengue virus.” BMC Microbiology, 14(1).
Watanabe S, Chan KW, Wang J, Rivino L, Lok SM and Vasudevan SG. (2015). “Dengue virus infection with highly neutralizing levels of cross-reactive antibodies causes acute lethal small intestinal pathology without a high level of viremia in mice.” J Virol, 89(11): 5847-61.
WHO. (1997). “Dengue hemorrhagic fever: diagnosis, treatment prevention and control.” Accessed February 20, 2017. Available from http://apps.who. int/iris/ bitstream/ 10665/41988/1/9241545003_eng.pdf.
WHO. (2016). “Dengue and severe dengue.” Accessed January 10, 2017. Available from http://www.who.int/mediacentre /factsheets/fs117/en/.
Yasumura Y and Kawakita M. (1963). “The research for the SV40 by means of tissue culture technique.” Nippon Rinsho, 21(6): 1201–19.
Zou G, Xu HY, Qing M, Wang QY and Shi PY. (2011). “Development and characterization of a stable luciferase dengue virus for high-throughput screening.”Antiviral Res, 91(1): 11-19.
The 7th National and International Graduate Study Conference 2017
" Thailand 4.0 Creative Innovation for Sustainable Development "
I485

Title: Preliminary Evaluation of the Anti-inflammatory Effect of Wannachawee
Recipe in Rats
Author: Sirawipak Thankanjanatorn1, 2
, Parirat Khonsung1, Ampai Panthong
3,
Seewaboon Sireeratawong1, Natthakarn Chiranthanut
1, Puongtip Kunanusorn
1,
Ariyaphong Wongnoppavich4
1Department of Pharmacology, Faculty of Medicine, Chiang Mai University, Chiang
Mai. 2Student in Graduate School Chiang Mai University, Department of
Pharmacology, Faculty of Medicine, Chiang Mai University, Chiang Mai. 3Department of Pharmacology and Center for Innovation in Chemistry, Faculty of
Medicine, Chiang Mai University, Chiang Mai. 4Department of Biochemistry,
Faculty of Medicine, Chiang Mai University, Chiang Mai.
Abstract
Wannachawee recipe is a Thai herbal medicine recipe which is often used
to treat psoriasis. It consists of eight Thai herb including kha, khao yen tai, khao yen
nuea thai, ngueak plaa mo, thong pan chang, non tai tak, hua ta pead, and khao yen
neua jeen. The primary pharmacological effects of these herbs include anti-
inflammation, anticancer and antimicrobial activity. This study evaluated the anti-
inflammatory effect of Wannachawee recipe in animal models. Application of the
water extract of Wannachawee recipe (WRE) to the ears of rats (2 mg/ear)
significantly reduced ear edema thickness induced by ethyl phenylpropiolate (EPP).
The reduction was similar to that with ibuprofen (1 mg/ear) at all evaluation times. In
addition, the paw edema volume tended to decrease in rats which received WRE at a
dose of 500 mg/kg, P.O. in a carrageenan-induced paw edema model. This study
showed that Wannachawee recipe exhibits anti-inflammatory effect in animals.
Keywords: Anti-inflammatory effect, Carrageenan, EPP, Wannachawee recipe
Introduction
Inflammation is a first-line body defense response to cell injury. The
response is the same irrespective of the nature of the agent of cell injury, whether
physical, chemical, ischemic or infectious [1]. In the inflamed vascularized areas, a
group of easily observable characteristics appear: redness, heat, swelling and pain
[2]. There are two major types of inflammation: acute and chronic. Acute
inflammation is a combination of vascular and cellular responses characterized by an
easily recognizable set of localized clinical manifestations such as redness, swelling,
and pain. The response of acute inflammation is short duration and continues only
until the immediate threat to the host is eliminated. This response begins immediately
after cellular injury or infection occur which that involves a vascular response,
activation of plasma protein systems, and activation of a variety of cells. This usually
The 7th National and International Graduate Study Conference 2017
" Thailand 4.0 Creative Innovation for Sustainable Development "
I486
takes 8 to 10 days from onset to healing. The exemplary vascular response is
vasodilation which involves with the releasing of prostaglandins and histamine on the
injury area. Chronic inflammation can continue for two weeks or more. The
physiological and histological characteristics of chronic inflammation are
indistinguishable from the acute response. Inflammation is related to and a cause of
diseases such as colitis, arthritis, and psoriasis [1].
Currently, nonsteroidal anti-inflammatory drugs (NSAIDs) such as
diclofenac, indomethacin, and ibuprofen are often used to treat inflammatory
disorders but side effects from those drugs often occur in the gastrointestinal (GI)
tract and in the kidneys [3]. Thai herbs or Thai herbal medicine recipes which have
been used to treat inflammation include kha, curcumin, phlai, and Sahatara recipe.
These herbs do not produce side effects in GI tract [4].
Wannachawee recipe is Thai herbal medicine recipe which is often used to
treat psoriasis at Prapokklao Hospital, Chanthaburi Province, Thailand. The recipe
consists of eight Thai herbs including kha, khao yen tai, khao yen nuea thai, ngueak
plaa mo, thong pan chang, non tai yak, hua ta pead, and khao yen neua jeen. They
have been reported to have primary pharmacological effects such as anti-
inflammation, anticancer and antimicrobial activity [5-16]. However, there have been
no reports of laboratory research on the anti-inflammatory effects of Wannachawee
recipe. The current study aimed to conduct a preliminary evaluation of the anti-
inflammatory effects of Wannachawee recipe in animal models.
Objectives
The main objective of this study was to evaluate the anti-inflammatory
effects of Wannachawee recipe in animal models.
Research Methodology
Extract preparation Wannachawee recipe extract was prepared at Prapokklao Hospital,
Chanthaburi Province, Thailand. Raw materials were identified by Assoc. Prof.
Noppamas Soonthornchareonnon. All samples of the herbs were stored in the
Department of Pharmacognosy at the Faculty of Pharmacy, Mahidol University. The
recipe was extracted with water and yielded about 12% by weight. The extract was
designated WRE.
Experimental Animals
Male Sprague Dawley rats were obtained from the National Laboratory
Animal Center, Mahidol University (Salaya), Nakorn Pathom, Thailand. All animals
were kept in a room at controlled conditions of 24±1°C and 12 h light/12 h dark cycle.
The 7th National and International Graduate Study Conference 2017
" Thailand 4.0 Creative Innovation for Sustainable Development "
I487
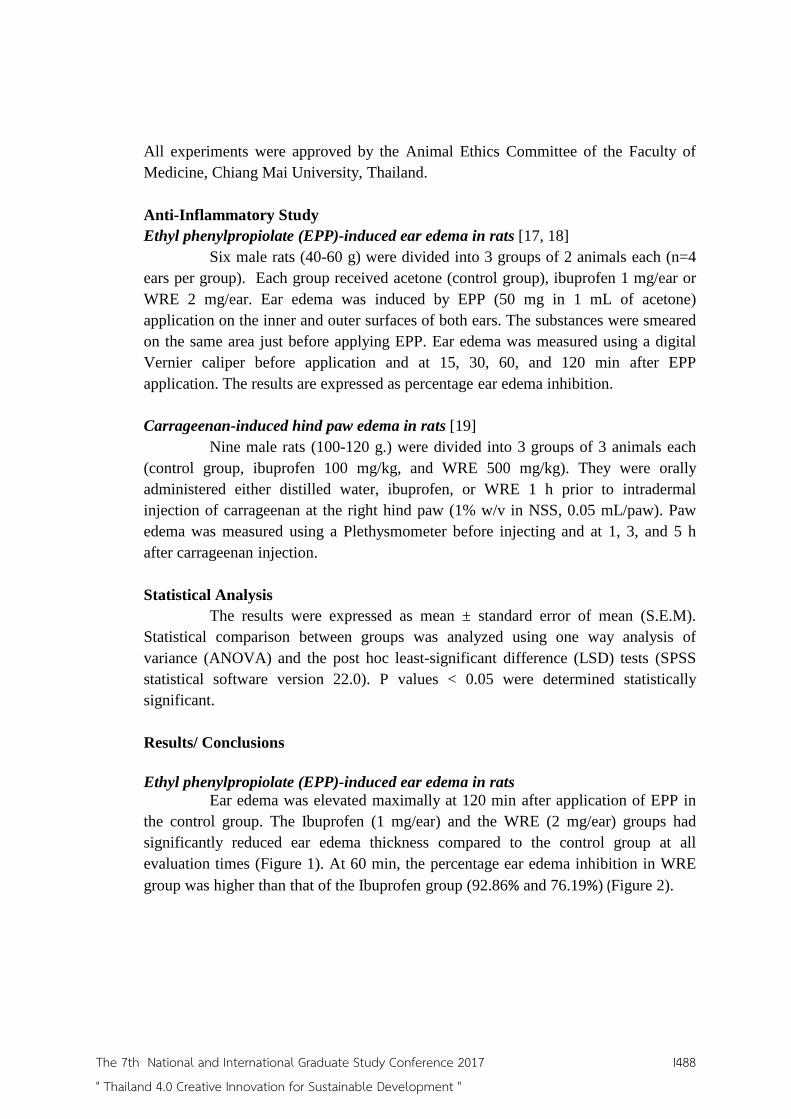
All experiments were approved by the Animal Ethics Committee of the Faculty of
Medicine, Chiang Mai University, Thailand.
Anti-Inflammatory Study
Ethyl phenylpropiolate (EPP)-induced ear edema in rats [17, 18]
Six male rats (40-60 g) were divided into 3 groups of 2 animals each (n=4
ears per group). Each group received acetone (control group), ibuprofen 1 mg/ear or
WRE 2 mg/ear. Ear edema was induced by EPP (50 mg in 1 mL of acetone)
application on the inner and outer surfaces of both ears. The substances were smeared
on the same area just before applying EPP. Ear edema was measured using a digital
Vernier caliper before application and at 15, 30, 60, and 120 min after EPP
application. The results are expressed as percentage ear edema inhibition.
Carrageenan-induced hind paw edema in rats [19]
Nine male rats (100-120 g.) were divided into 3 groups of 3 animals each
(control group, ibuprofen 100 mg/kg, and WRE 500 mg/kg). They were orally
administered either distilled water, ibuprofen, or WRE 1 h prior to intradermal
injection of carrageenan at the right hind paw (1% w/v in NSS, 0.05 mL/paw). Paw
edema was measured using a Plethysmometer before injecting and at 1, 3, and 5 h
after carrageenan injection.
Statistical Analysis
The results were expressed as mean ± standard error of mean (S.E.M).
Statistical comparison between groups was analyzed using one way analysis of
variance (ANOVA) and the post hoc least-significant difference (LSD) tests (SPSS
statistical software version 22.0). P values < 0.05 were determined statistically
significant.
Results/ Conclusions
Ethyl phenylpropiolate (EPP)-induced ear edema in rats
Ear edema was elevated maximally at 120 min after application of EPP in
the control group. The Ibuprofen (1 mg/ear) and the WRE (2 mg/ear) groups had
significantly reduced ear edema thickness compared to the control group at all
evaluation times (Figure 1). At 60 min, the percentage ear edema inhibition in WRE
group was higher than that of the Ibuprofen group (92.86% and 76.19%) (Figure 2).
The 7th National and International Graduate Study Conference 2017
" Thailand 4.0 Creative Innovation for Sustainable Development "
I488

Figure 1. Effect of ibuprofen and WRE on EPP-induced ear edema
0.00
0.05
0.10
0.15
0.20
0.25
15 30 60 120
Ed
ema
th
ick
nes
s (µ
m)
Time (min)
Control
Ibuprofen 1 mg/ear
WRE 2 mg/ear
*Significantly different from the control group, p < 0.05 (n = 4).
Figure 2. Percentage of ear edema inhibition of ibuprofen and WRE on EPP-
induced ear edema
36.36
56.52
76.1978.65
0.00
39.13
92.86
73.03
0.00
10.00
20.00
30.00
40.00
50.00
60.00
70.00
80.00
90.00
100.00
15 30 60 120
Per
cen
tag
e o
f E
ar
Ed
ema
in
hib
itio
n
Time (min)
Ibuprofen 1 mg/ear
WRE 2 mg/ear
*
* *
*
*
* *
*
The 7th National and International Graduate Study Conference 2017
" Thailand 4.0 Creative Innovation for Sustainable Development "
I489

Carrageenan-induced hind paw edema in rats
Hind paw edema reach a maximum at 5 h after carrageenan injection in the
control group. Rats which received ibuprofen (100 mg/kg) or WRE (500 mg/kg) had
decreased paw edema volumes at all evaluation times, but the differences were not
statistically significantly different from the control group (Figure 3). The percentage
of paw edema inhibition in rats which received ibuprofen or WRE was increased in
time dependent manner (Figure 4).
Figure 3. Effect of ibuprofen and WRE on carrageenan-induced hind paw edema
0.00
0.20
0.40
0.60
0.80
1.00
1 3 5
Ed
ema
vo
lum
e (m
l)
Time (h)
Control
Ibuprofen 100 mg/kg
WRE 500 mg/kg
Figure 4. Percentage of paw edema inhibition of ibuprofen and WRE on
carrageenan-induced hind paw edema
22.11
53.82
74.29
11.58
34.38
60.82
0.00
10.00
20.00
30.00
40.00
50.00
60.00
70.00
80.00
90.00
100.00
1 3 5
Per
cen
tage
og P
aw
Ed
ema i
nh
ibit
ion
Time (hr)
Ibuprofen 100 mg/kg
WRE 500 mg/kg
The 7th National and International Graduate Study Conference 2017
" Thailand 4.0 Creative Innovation for Sustainable Development "
I490

Discussion
The results of this study found that Wannachawee recipe (WRE) had an
efficient anti-inflammatory effect on the acute phase of inflammation. EPP-induced
ear edema in rats is a common model for screening and evaluating the anti-
inflammatory activity of test substances on the acute phase of inflammation and
related instantaneous irritation which brings about an increase in fluid and edema. The
mediators of inflammation in this model were histamine, serotonin, bradykinin and
prostaglandins (PGs). These mediators are capable of promoting vasodilatation and
increasing vascular permeability which increase edema [17, 18]. In the present study,
the WRE group (2 mg/ear) showed a significant reduction of ear edema thickness at
all evaluation times which were similar to the ibuprofen group (1 mg/ear). At 60 min,
WRE showed a percentage ear edema inhibition higher than the ibuprofen group. This
suggests that WRE possesses efficient anti-inflammatory activity and may involve the
release or synthesis of several inflammatory mediators.
Carrageenan-induced paw edema is commonly used in models of the
acute phase of inflammation and is widely used for testing potential anti-
inflammatory drug [19]. This model is known to be sensitive to COX inhibitors, but
not LOX inhibitors. Inflammation induced by carrageenan injection to the hind paws
of rats goes through 3 phases over a period of time as mediators are released [20].
During the primary phase, from the onset to 1.5 h, histamine and serotonin are
released. During the second phase, between 1.5 and 2.5 h, bradykinin is released.
Finally, during the third phase, between 2.5 to 6 h, PGs are released in response to
carrageenan [21]. The release of PGs in late phase relies on the mobilization of
neutrophils [22]. In the present study, WRE at a dose of 500 mg/kg reduced paw
edema volume at all evaluation times. The reduction was not significantly different
from that in the ibuprofen group which received a dose of 100 mg/kg. That lack of
statistical significance may have been due to the small number of rats in the study.
The prominent inhibitory effect of WRE on carrageenan-induced hind paw edema at 5
h might be related to inhibition of biosynthesis of PGs.
Recommendations
This study should be repeated with a larger number of animals to identify
important statistically significant relationships.
References
1. Bullock, Shane. (2013). “ Principles of pathophysiology.” in chapter 2
Inflammation and healing, 40-54. Australia.
2. Sue E. Huether Kathryn L. McCance. (2015). “ PATHOPHYSIOLOGY,
the Biologic Basis for Disease in Adults and Children, 7E” in chapter 7
Innate immunity: inflammation, 228-261. USA: College of Nursing,
University of Utah.
The 7th National and International Graduate Study Conference 2017
" Thailand 4.0 Creative Innovation for Sustainable Development "
I491

3. Rang H. P et al. (2016) “RANG AND DALE’S Pharmacology, 8E” in
chapter 26 Anti-inflammatory and immunosuppressant drugs, 324-341.
London.
4. มลนธฟนฟสงเสรมการแพทยแผนไทยเดมฯ โรงเรยนอายรเวท(ชวกโกมารภจจ). ต ำรำเภสช
กรรมไทย. พมพครงแรก. กรงเทพฯ: พฆเณศ พรนทตง เซนเตอร, 2548. 5. Ali Esmail Al-snafi. (2014). “The Pharmacological Activities of Alpinia
Galangal - A Review.” International Journal for Pharmaceutical Research
Scholars (IJPRS), V-3, I-1.2277 - 7873, 607–14.
6. Subramanian P. and Nishan M. (2015). “Biological Activities of Greater
Galangal, Alpinia Galanga - A Review.” A Review. Journal of Botanical
Sciences, 2015, 15–19.
7. Tiantian She and others. (2015). “Sarsaparilla (Smilax Glabra Rhizome)
Extract Inhibits Migration and Invasion of Cancer Cells by
Suppressing TGF-β1 Pathway.” PLoS ONE.
8. Chuan Li Lu and others. (2015). “Inhibitory Effects of Chemical
Compounds Isolated from the Rhizome of Smilax Glabra on Nitric
Oxide and Tumor Necrosis Factor-α Production in
Lipopolysaccharide-Induced RAW264.7 Cell.” Evidence-Based
Complementary and Alternative Medicine.
9. Ruangnoo, S. , Jaiaree, N.and others. (2012). “An in Vitro Inhibitory
Effect on RAW 264.7 Cells by Anti-inflammatory.” Asian Pac J Allergy
Immunol ;30:268-74.
10. Reanmongkol, W. , Itharat, A, and Bouking, P. (2007). “Evaluation of the
Anti-Inflammatory, Antinociceptive and Antipyretic Activities of the
Extracts from Smilax Corbularia Kunth Rhizomes in Mice and Rats
(in Vivo).” Songklanakarin Journal of Science and Technology, 59–67.
11. Jirakiattikul, Y. , Rithichai, P. , and Itharat, I. (2013). “Effects of Medium
Salt Strength and Plant Growth Regulators on Shoot Multiplication
and Root Induction of Smilax Corbularia.” Pharmacologyonline, 1–7.
12. Somchaichana, J. , Bunaprasert, T. , and Patumraj, S. (2012) “Acanthus
Ebracteatus Vahl. Ethanol Extract Enhancement of the Efficacy of the
Collagen Scaffold in Wound Closure: A Study in a Full-Thickness-
Wound Mouse Model.” Journal of Biomedicine and Biotechnology.
13. Bukke, S. , and others. (2011). “The Study on Morphological,
Phytochemical and Pharmacological Aspects of Rhinacanthus Nasutus.
(L) Kurz (A Review).” Journal of Applied Pharmaceutical Science, 26–32.
14. Victoria L. Challinor and others. (2012). “Steroidal Saponins from the
Roots of Smilax Sp.: Structure and Bioactivity.” Steroids, 77.5, 504–11.
15. Sittiwet, c., Niamsa, N. , and Puangpronpitag, D. (2009). “Antimicrobial
The 7th National and International Graduate Study Conference 2017
" Thailand 4.0 Creative Innovation for Sustainable Development "
I492

Activity of Acanthus Ebracteatus Vahl. Aqueous Extract: The
Potential for Skin Infection Treatment.”, International Journal of
Biological Chemistry, 95–98.
16. Bukke, S. , and others. (2011). “The Study on Morphological,
Phytochemical and Pharmacological Aspects of Rhinacanthus Nasutus.
(L) Kurz (A Review)”, Journal of Applied Pharmaceutical Science, 26–32.
17. Brattsand, R., Thalen, A., Roempke, K., Kallstrom, L. and Gruvstad, E. (1982). “Influence of 16 alpha, 17 alphaacetal substitution and
steriod nucleus fluorination on the topical to systemic activity ratio of glucocorticoids.” J. Steroid. Biochem. 16(6): 779 - 786.
18. Carlson, R.P., O’Neill-Davis, L., Chang, J. and Lewis, A.J. (1985).
“Modulation of mouse ear edema by cyclooxygenase and lipoxygenase
inhibitors and other pharmacological agents.” Agents Actions. 17: 197 -
204.
19. C. A. Winter, E. A. Risley, and G. W. Nuss, (1962). “Carrageenininduced
edema in hind paw of the rat as an assay for antiiflammatory drugs,”
Proceedings of the Society for Experimental Biology and Medicine. Society
for Experimental Biology and Medicine, vol. 11, pp. 544–547.
20. Di Rosa M. (1972). “Biological properties of carrageenan.” J Pharm
Pharmacol; 24: 89–102.
21. Vinegar R, Schreiber W, Hugo R. (1969). “Biphasic development of
carrageenin edema in rats.” J Pharmacol Exp Ther ;166:96-103.
22. Di Rosa, M., Giroud, J.P. and Willoughby, D.A. (1971). “Studies on the
mediators of the acute inflammatory response induced in rats in
different sites by carrageenan and turpentine.” J. Pathol. 104(1): 15 -
29.
The 7th National and International Graduate Study Conference 2017
" Thailand 4.0 Creative Innovation for Sustainable Development "
I493

Appendix
Author: Sirawipak Thankanjanatorn, Asst. Prof. Parirat Khonsung, Ph.D. (Adviser)
Major: Pharmacology Faculty: Medicine, Chiang Mai University.
Phone: 053-935352 Email: [email protected],
The 7th National and International Graduate Study Conference 2017
" Thailand 4.0 Creative Innovation for Sustainable Development "
I494

Effect of encapsulated cytotoxic T-cells on cancer cell destruction
Author: Porntida Wattanakull1 and Dakrong Pissuwan
1
1Materials Science and Engineering Program, Multidisciplinary Unit, Faculty of
Science, Mahidol University, Thailand. E-mail: [email protected], [email protected]
Abstract
Cytotoxic T-cells can destroy cancer cells by releasing cytotoxic molecules
to attack cancer cells. Therefore, the cell therapy by implanting cytotoxic T–cells for
cancer treatment has been of interest. However, to avoid the reaction of the immune
system on the implanted cells, the encapsulation technique has been applied. In this
study, the encapsulated cytotoxic T-cells were used for destroying breast cancer cells
(MCF-7 cells). Cytotoxic T-cells were encapsulated in poly(allyamine hydrochloride)
(PAH) as a first encapsulating layer and poly(styrene sulfonate) (PSS) as a second
layer. Thereafter, encapsulated cytotoxic T-cells were co-cultured with MCF-7 cells.
When compared with the control cells (MCF-7 cells cultured alone), the results
showed that the significant percentage of dead MCF-7 cells (13.11%) was detected in
MCF-7 cells co-cultured with encapsulated cytotoxic T-cells. As well, the significant
percentage of dead MCF-7 cells (14.67%) found in MCF-7 cells co-cultured with
non-encapsulated cytotoxic T cells. This implies that the encapsulation of cytotoxic
cells could remain some cell functions that could involve in cancer cell destruction. Key Word (s): Cytotoxic T-cells, Cell encapsulation, Cancer cells
Introduction
It is well-known that T lymphocyte cells (T-cells) are a main player in an
adaptive immune system. In the environment containing pathogens or malignancies,
effector T-cells called cytotoxic T-cells could work on specific target cell (TC)
destruction based on their antigen-specific receptor and their ability to release toxic
molecules. Therefore, the use of cytotoxic T-cells for TC destruction has been applied
in the field of immunotherapy. It was reported that T-cells could be induced to
cytotoxic T cells by activating with anti-CD3 antibodies (Tsoukas et al. 1985,
Tsoukas et al. 1985). After activation, these cytotoxic T-cells could destroy infected
cells and tumor cells (Alborán et al. 2003, Lindsten et al. 1989, Smith-Garvin et al.
2009, Wajant et al. 2005). However, these cytotoxic T-cells could also affect healthy
cells. Furthermore, in the case of implanted cytotoxic T-cells into the body for cancer
therapy, these cells may also face with the host immune reaction of the immune
system.
Recently, cell encapsulation has been proposed to avoid implanted cells
from the host immune reaction (Vos et al. 2002, Hernández et al. 2010, Lim & Sun,
1980, Visted & Lund-Johansen, 2003). Cell encapsulation can be done by
immobilizing living cells within the polymer matrix. The polymer used for
encapsulation should act as a semi-permeable membrane that can allow the diffusion
of small molecules such as oxygen and nutrients between inside and outside cells.
This diffusion helps maintain the cell viability and also helps implanted cells escaping
The 7th National and International Graduate Study Conference 2017
" Thailand 4.0 Creative Innovation for Sustainable Development "
I495

from immune cells and some antibodies (Lim et al. 2010, Orive et al. 2004, Uludag et
al. 2000). Some reports have shown that encapsulated living cells could release
important molecules used for some therapeutics (Goren et al. 2010, Uludag et al.
2000). Due to this reason, we were interested to encapsulate cytotoxic T-cells with
polyelectrolyte polymers and investigated the possibility of using encapsulated
cytotoxic T-cells for cancer treatment. In this study, the MCF-7 cells were used as a
model cancer cell. .
Therefore, in this study we activated T-cells with anti-CD3 anibodies and
encapsulated activated T-cell (cytotoxic T-cells) with poly(allyamine hydrochloride)
(PAH) and poly(styrene sulfonate) (PSS). After encapsulation, the ability of
encapsulated cytotoxic T-cells for killing cancer cells was observed by co-culturing
with breast cancer cell (MCF-7 cells).
Objectives
1) To activate T-cells to cytotoxic T-cell with anti-CD3 antibodies
2) To encapsulate cytotoxic T-cell
3) To investigate the cancer destruction of encapsulated and non-
encapsulated cytotoxic T-cells
Research Methodology Cell preparation. MCF-7 cells (breast cancer cells) were cultured in
Dulbecco’s Modified Eagle’s Medium (DMEM) plus Minimum Essential Medium
(MEM) (DMEM: MEM = 1:1) supplemented with 10% of fetal bovine serum (FBS).
The media were added with 1% penicillin and streptomycin and cells were incubated
at 37oC in a 5% CO2 incubator. T-cells used in this study were separated from
peripheral blood mononuclear cells (PBMCs). PBMCs were cultured in DMEM
without FBS for 3 h. Then, non-adherent cells (T-cells) were collected from the
culture dish. The separated T-cells were cultured in Roswell Park Memorial Institute
(RPMI) 1640 medium supplemented with 10% FBS plus 1% penicillin and
streptomycin. The cells were also incubated in an incubator at the same condition
used for MCF-7 cells.
Cytotoxic T-cell preparation. A 96 well plate were coated with a 50 µl of
anti-CD3 antibodies (clone: HIT3a; antibodies 0.05 µg/ml). The plate was incubated
at 4oC overnight. After incubation, the antibody solution was removed and the plate
was washed 3 times with sterile PBS. The suspension of T-cells (1x10⁶
cells/ml)
dispersed in culture media was prepared. A 200 µl of T-cells was added into a 96-well
plate previously coated with anti-CD3 antibodies. Next, the coated plate was
incubated at 37oC in a 5% a CO2 incubator for 3 days. Finally, T-cells were activated
and changed to cytotoxic T-cells. These cytotoxic T-cells were stored in liquid
nitrogen for using in further experiments.
Cell encapsulation. Two polyelectrolytes were used to encapsulate cells.
The first layer of cytotoxic T-cells was coated with poly(allyamine hydrochloride)
(PAH), which is a cationic polymer. Cytotoxic T-cells (at the number of 1x10⁶
cells in
1 ml) were centrifuged at 6500 rpm for 5 min. The pellet after centrifugation was
dispersed in RPMI without FBS. A 500 µl of 0.05 mg/ml PAH was added into cell
suspension and the cell suspension was mixed on a shaker for 5 min. After that, the
free PAH was removed by washing with RPMI without FBS. Thereafter, cytotoxic T-
The 7th National and International Graduate Study Conference 2017
" Thailand 4.0 Creative Innovation for Sustainable Development "
I496

cells were mixed with 0.1 mg/ml poly(styrene sulfonate) (PSS; anionic polymer) on a
shaker for 10 min. The PSS formed a second encapsulating layer on the surface of
cytotoxic T-cells. Similar to PAH, the PSS was removed by washing as described
previously. Finally, cytotoxic T-cells encapsulated with PAH/PSS were suspended in
RPMI-1640 medium. These cells were called as “PSS/PAH@CT” cells. The normal
T-cells encapsulated with PAH/PSS were also prepared using the same procedure. T-
cells encapsulated with PAH/PSS were called as “PSS/PAH@lym” cells.
Cancer destruction by encapsulated cytotoxic T-cell. The MCF-7 cells at a
number of 1x10⁴ cells (with a volume of 100 µl) were added into a 24-well plate. The
cells were cultured for 24 h at 37oC in a 5% CO2 incubator. After incubation,
PSS/PAH@CT, PSS/PAH@lym non-encapsulated T-cells, and non-encapsulated
cytotoxic T-cells at a number of 4x10⁵ cells (with a volume of 100 µl) were added
into a 24-well plate containing MCF-7 cells. This was a co-culture of each form of T-
cells with MCF-7 cells. The co-culture of cells was incubated for 24 h. After
incubation, PSS/PAH@lym, PSS/PAH@CT, non-encapsulated T-cells, and non-
encapsulated cytotoxic T-cells were removed from the plate by washing 3 times with
PBS containing Ca2+
and Mg2+
. Then, a 150 µl of RPMI without FBS was added into
a 24-well plate containing MCF-7 cells. Next, a 150 µl of trypan blue was added into
a 24-well plate and incubated for 5 min. After that, the trypan blue was removed and
the MCF-cells in a well plate were washed 2 times with PBS containing Ca2+
and
Mg2+
. The dead MCF-7 cells stained with blue colour were observed under inverted
microscope.
Results T-cells and cytotoxic T-cells could be encapsulated with PAH/PSS. After
encapsulation, their relative cell viability compared to non-encapsulated cells was
dropped from 100% to 73.19% for PSS/PAH@lym cells and 71.50% for
PSS/PAH@CT cells (Figure 1).
Figure 1. Cell viability of T-cells and cytotoxic T-cell encapsulated with PAH and
PSS.
The 7th National and International Graduate Study Conference 2017
" Thailand 4.0 Creative Innovation for Sustainable Development "
I497

As mentioned previously, cytotoxic T-cells can destroy cancer cells. Thus,
to investigate whether encapsulated cytotoxic T-cells could destroy cancer cells,
PSS/PAH@CT cells were co-cultured with MCF-7 cells for 24 h. After culturing, the
dead MCF-7 cells were observed by staining with trypan blue. The results showed
that the dead MCF-7 cells (shown in blue) were detected in MCF-7 cells co-cultured
with non-encapsulated cytotoxic T-cells (Figure 2D) and PSS/PAH@CT cells (Figure
2E). As expected, there were no dead MCF-cells after co-culturing with normal T-
cells with and without encapsulation (Figure 2B&C). These results confirm that
encapsulated cytotoxic T-cells still had an ability to destroy MCF-cells. In the case of
MCF-7 cells cultured alone, it also found that cells were healthy (Figure 2A).
Figure 2. The bright field image of MCF-7 cells cultured alone (A) and MCF-7 cells
after co-cultured with: normal T-cells (B), encapsulated normal T-cells cells (C), non-
encapsulated cytotoxic T-cells (D), and encapsulated cytotoxic T-cells (E) for 24 h
and stained with trypan blue.
The percentage of dead MCF-7 cells after co-culturing with different forms of
T-cells was shown in Figure 3.
The 7th National and International Graduate Study Conference 2017
" Thailand 4.0 Creative Innovation for Sustainable Development "
I498

Figure 3. The percentage of dead MCF-7 cells co-cultured with T-cells (lym cells),
cytotoxic T-cells (CT cells), PSS/PAH@lym cells (encapsulated T-cells), and
PSS/PAH@CT cells (encapsulated cytotoxic T-cells).
The small number of dead cells at ~ 0.16% was detected in MCF-7 cells. The
numbers of dead MCF-7 cells co-cultured with normal T-cells and PSS/PAH@lym
cells were similar to MCF-7 cells cultured alone. However, when MCF-7 cells were
co-cultured with cytotoxic T-cells and PSS/PAH@CT cells, the percentage of dead
MCF-7 cells was significantly increased to ~14.67% (for MCF-7 cells co-cultured
with cytotoxic T-cells) and 13.11% (for MCF-7 cells co-cultured with PSS/PAH@CT
cells) after comparing to MCF-7 cells cultured alone.
Discussion T-cells could be stimulated to cytotoxic T-cells by using anti-CD3
antibodies. When cytotoxic T-cells were cultured with cancer cells (MCF-7 cells), the
dead MCF-7 cells were detected. It was reported that cytotoxic T-cells could destroy
cancer cells through three possible pathways (Andersen et al. 2006). First, cytotoxic
T-cells may kill cancer cells by releasing cytokines such as tumour necrosis factor-α
and IFN-γ (interferon-gamma) resulting in induction of target cell death. Second, the
interaction between cytotoxic T-cells and target cells may lead to apoptotic cell death
through receptor triggering. And third, the release of cytotoxic molecules (perforin
and granzymes) can destroy their target cells. The results here could confirm that
cytotoxic T-cells could destroy MCF-7 cancer cells. As well, encapsulated cytotoxic
T-cells (PSS/PAH@CT cells) could effectively destroy MCF-7 cancer cells.
However, the pathway of cancer destruction between encapsulated and non-
encapsulated cytotoxic T-cells might be different. As shown in Figure 3, the
percentage of cell death of MCF-7 cells co-cultured with PSS/PAH@CT cells was
lower than that of MCF-7 cells co-cultured with non-encapsulated cytotoxic T-cells.
This implies that PSS/PAH@CT cells might destroy MCF-7 cells through indirect
pathway by releasing toxic cytokines to destroy MCF-7 cells. The direct killing of
MCF-7 cells by PSS/PAH@CT cells through receptor could be hardly occur because
the surface of cytotoxic T-cells was encapsulated with PAH and PSS. In the case of
The 7th National and International Graduate Study Conference 2017
" Thailand 4.0 Creative Innovation for Sustainable Development "
I499

non-encapsulated cytotoxic T-cells, the destruction of MCF-7 cells might occur
through all possible mechanisms mentioned above resulting in more efficiency in
killing MCF-7 cells. This outcome provides useful data to further develop the use of
encapsulated cytotoxic T-cells for cancer therapy.
Recommendations
The outcome of this work has shown that encapsulated cytotoxic T-cells
were capable to destroy cancer cells (MCF-7 cells) used as a model cell in this study.
The further work on detections of cytokines and toxic molecules involving in cancer
destruction should be further performed to clearly understand the mechanism of
cancer destruction by encapsulated cytotoxic T-cells. This information can be used to
further development encapsulated cytotoxic T-cells for cancer therapy.
References
Alborán, Ignacio Moreno, Marı Robles, x, S. a, Alexandra Bras, Esther Baena, Martı,
x, and Carlos nez-A. (2003). "Cell death during lymphocyte development
and activation." Seminars in Immunology 15, 3: 125-133.
Andersen, Mads Hald, David Schrama, Per thor Straten, and Jürgen C. Becker.
(2006). "Cytotoxic T Cells." Journal of Investigative Dermatology 126,
1: 32-41.
Goren, Amit, Nitsan Dahan, Efrat Goren, Limor Baruch, and Marcelle Machluf.
(2010). "Encapsulated human mesenchymal stem cells: a unique
hypoimmunogenic platform for long-term cellular therapy." The FASEB
Journal 24, 1: 22-31.
Hernández, Rosa M., Gorka Orive, Ainhoa Murua, and José Luis Pedraz. (2010).
"Microcapsules and microcarriers for in situ cell delivery." Advanced
Drug Delivery Reviews 62, 7–8: 711-730.
Lim, F, and AM Sun. (1980). "Microencapsulated islets as bioartificial endocrine
pancreas." Science 210, 4472: 908-910.
Lim, G. J., S. Zare, M. Van Dyke, and A. Atala. (2010). "Cell microencapsulation."
Adv Exp Med Biol 670: 126-136.
Lindsten, Tullia, Carl H. June, Jeffrey A. Ledbetter, Gregory Stella, and Craig B.
Thompson. (1989). "Regulation of lymphokine messenger RNA stability by
a surface-mediated T cell activation pathway." Science 244, 4902: 339-
343.
Orive, Gorka, Rose Maria Hernández, Alicia Rodrıguez Gascón, Riccardo Calafiore,
Thomas Ming Swi Chang, Paul de Vos, Gonzalo Hortelano, David
Hunkeler, Igor Lacık, and José Luis Pedraz. (2004). "History, challenges
and perspectives of cell microencapsulation." Trends in Biotechnology
22, 2: 87-92.
Smith-Garvin, Jennifer E., Gary A. Koretzky, and Martha S. Jordan. (2009). "T Cell
Activation." Annual review of immunology 27: 591-619.
Tsoukas, C D, B Landgraf, J Bentin, M Valentine, M Lotz, J H Vaughan, and D A
Carson. (1985). "Activation of resting T lymphocytes by anti-CD3 (T3)
The 7th National and International Graduate Study Conference 2017
" Thailand 4.0 Creative Innovation for Sustainable Development "
I500

antibodies in the absence of monocytes." The Journal of Immunology
135, 3: 1719-1723.
Tsoukas, Constantine D., Mary Valentine, Martin Lotz, John H. Vaughan, and Dennis
A. Carson. (1985). "The Role of the T3 Molecular Complex on Human T
Lymphocyte-Mediated Cytotoxicity." Mechanisms of Cell-Mediated
Cytotoxicity II 187, 1:365-385
Uludag, Hasan, Paul De Vos, and Patrick A. Tresco. (2000). "Technology of
mammalian cell encapsulation." Advanced Drug Delivery Reviews 42, 1–
2: 29-64.
Visted, and Morten Lund-Johansen. (2003). "Progress and challenges for cell
encapsulation in brain tumour therapy." (2003). Expert Opinion on
Biological Therapy 3, 4: 551-561.
Vos, P., A. F. Hamel, and K. Tatarkiewicz. (2002). "Considerations for successful
transplantation of encapsulated pancreatic islets." Diabetologia 45, 2: 159-
173.
Wajant, Harald, Jeannette Gerspach, and Klaus Pfizenmaier. (2005). "Tumor
therapeutics by design: targeting and activation of death receptors."
Cytokine & Growth Factor Reviews 16, 1: 55-76.
The 7th National and International Graduate Study Conference 2017
" Thailand 4.0 Creative Innovation for Sustainable Development "
I501

The 7th National and International Graduate Study Conference 2017
" Thailand 4.0 Creative Innovation for Sustainable Development "
I502

Thermal properties of poly (butylene carbonate) and its modification
Author: Tharathep Chunsakul, Supakij Suttiruengwong
Department of Materials Science and Engineering, Silpakorn University
Abstract
The aim of this work was to study the thermal properties of poly (butylene
carbonate) and modification. PBC was poor thermal stability to processing.
Copolymerization with PBA using MDI act as chain extender to improve the thermal
properties of PBC. In the FTIR spectra of PBC/PBA/MDI blends, the terminal
hydroxyl group of PBC and PBA reacted with the NCO group of MDI to produce an
amide bond at 1600 cm−1 (C = O) and (N − H) are shown at 1530 cm−1. In the thermal
properties, then adding PBA and MDI to PBC showed that the Tonset was increase
from 209.7 to 256.07oC as a result of PBA and MDI were reacted the hydroxyl end
group of PBC. The 1H NMR spectrum of PBC/PBA/MDI. The peaks at 6.92 ppm
(NH) and 7.68–7.71 ppm (aromatic ring), which could be ascribed to the urethane and
aromatic ring of MDI, confirm the existence of the terminal hydroxyl group of PBC
and PBA reacted with the NCO group of MDI to produce an amide bond.
Key Word (s): Poly (butylene carbonate), Poly (butylene adipate), MDI
Introduction
Poly (alkylene carbonate) is a thermoplastic polymer, which can be
synthesized from CO2 and epoxide group such as ethylene oxide, propylene oxide,
isobutylene oxide, cycloheptene oxide, cyclopentene oxide, cyclohexene oxide and
cyclic oxide etc. [1 , 2]. CO2 is particularly attractive due to its availability, low cost,
abundance, and non-toxicity. The conversion of carbon dioxide to useful chemicals is
a challenging task because CO2 has a low free energy therefor fixation through
reaction with the highly reactive reactant. Poly (alkylene carbonate) represent the
other interesting synthetic target of the coupling reaction between CO2 and epoxides
[1, 2]. The structure of poly (alkylene carbonate) is presented in Figure 1.
Figure 1. The general structure of poly (alkylene carbonate) [1].
Poly (butylene carbonate) is a bio-based amorphous to synthesized by 1, 2-
butylene oxide with CO2 using Zinc glutarate (ZnGA) as a catalyst [3-5].
Poly (butylene carbonate ) (PBC) is a bio-based amorphous and more than 50% of
CO2 by weight can be converted into PBC, showing the cost competitiveness and
environmental friendly advantages of PBC because carbon dioxide (CO2) is
The 7th National and International Graduate Study Conference 2017
" Thailand 4.0 Creative Innovation for Sustainable Development "
I503

a currently a major greenhouse gas causing global warming. These factors
demonstrate its potential to be a substitute for petroleum-based plastics [4].
The structure of PBC provide chain flexibility and favorable property of PBC
which gives opportunities to blending with PBC to enhance its poor stiffness and
improve toughness of the other polymer. However, the poor thermal stability of PBC
because the weak carbonate linkage in the backbone and reactive end groups of PBC
lead to its relatively low thermal decomposition temperature, which is unfavorable for
processing [6, 7]. To improve the thermal stability of PBC. Generally, the blending of
most polymers is performed at high temperatures, this the condition, PBC would be
degraded and poor blending is inevitable. Therefore, it is of great necessity to improve
the thermal stability of PBC [6].
Aliphatic polyesters are semi-crystalline polymers with a wide variety of
physical properties, mechanical properties, and biodegradability. It was polymerized
through a polycondensation reaction between a diol, and diacid, such as poly
(butylene succinate) (PBS) and poly (butylene adipate) (PBA), etc. PBA is
synthesized through polycondensation of adipic acid and 1, 4-butanediol using
Titanium (IV) butoxide (Ti (BuO)4) as a catalyst [8, 9].
This research will present and discuss the synthesis and characterization of
poly (butylene carbonate-co-butylene adipate) between poly (butylene carbonate)
(PBC) and poly (butylene adipate) (PBA) with methylene diphenyl diisocyanate
(MDI) act as chain extender.
Objectives
1 . To synthesis and characterization of poly (butylene carbonate)-co-poly
(butylene adipate) from poly (butylene carbonate) and poly (butylene adipate) using
MDI as a chain extender to improve the thermal property of PBC.
Research Methodology
Material
1, 2-butylene oxide (99%, density of 0.83g/ml) was purchased from TCI
Chemicals, Carbon dioxide (99.8%) was purchased from MSG. Zinc oxide (ZnO)
(99%) was purchased from UNIVAR. Glutaric acid (>99%), and toluene (density
0.87g/ml) was purchased from MERCK. Dichloromethane (99%) was purchased from
SCHARLAU. 1, 4-Butanediol, adipic acid were purchased from TCI Chemicals.
Titanium (IV) butoxide reagent grade, 97% and 4, 4′-Methylenebis (phenyl
isocyanate) (MDI) were purchased from Sigma-Aldrich.
Synthesis of PBC
The ZnGA was dried at 60ºC for 30 min. The dried ZnGA catalyst (1.00 g)
and 1, 2-butylene oxide were added into the reactor. The reactor was pressurized to 70
bar with CO2 after were cleaned out by dry argon gas. Then the reactor was heated up
to 95 °C. After the reaction time 52 h, the reactor was cooled to 50°C. The product
was dissolved in dichloromethane and extracted catalyst from the product solution by
adding a diluted hydrochloric acid. The extraction, washing and removed
dichloromethane from polymer solution. Then the product solution was precipitated in
excess methanol and dried at for 48 h at 60ºC.
The 7th National and International Graduate Study Conference 2017
" Thailand 4.0 Creative Innovation for Sustainable Development "
I504

Synthesis of PBA
Poly (butylene adipate) were synthesized from adipic acid and excess of
the 1, 4-butanediol (diol/diacid molar ratio of 2.2/1) by thermal polycondensation.
Titanium butoxyde (0.3 mol %) was used as a catalyst. Initially, the temperature was
kept at 190 °C under a slow stream of N2 to help eliminate the H2O and excess of diol.
After 2 h, the three neck was connected to a vacuum pump (0.8 bar), whereas the
temperature of the bath was raised to 250 °C for 9 hr. under vacuum. Precipitation in
excess methanol and dried at for 48 h at 60 ºC.
PBC/PBA Blend
Preparation the PBC/PBA/MDI form PLA and PPC, which blended in
50/50 ratio with the addition of 7 phr of MDI using internal mixer, the temperature,
time and rotor speed were set at 60∘C, 15 min, and 40 rpm, respectively. PBC and
PBA was dried in a vacuum oven for 12 h at 60∘C.
Characterization
Fourier Transform Infrared spectrophotometry (FTIR) using Bruker
Vertex 70 spectrometer at a resolution of 2 cm-1 and 32 scans were signal averaged.
The testing range was from 400 to 4000 cm-1 to analyze the functional groups of PBC,
PBA, and PBC/PBA/MDI. Thermal stability was measured in a nitrogen atmosphere
by Thermogravimetric analyzer (TGA), METTLER TGA. The samples, under a
nitrogen atmosphere, were heated from 50 to 600oC at a rate of 10oC/min-1. Nuclear
magnetic resonance (NMR) using NMR spectrometer from Varian (400 MHz) with 1H probes. In the NMR spectroscopic measurements, chemical shifts were calibrated
with the chemical shifts of the solvents used: chloroform-d.
Results/Conclusion
The chemical structure of PBC/PBA/MDI
Figure 2 presents the FTIR spectra of PBC, PBA, and the PBC/PBA/MDI
blends for comparison, and Table 1, 2 lists the vibration modes and wavenumbers of
the IR absorption peaks.
Figure 2. Comparison of FTIR of PBC, PBA, and PBC/PBA/MDI.
The 7th National and International Graduate Study Conference 2017
" Thailand 4.0 Creative Innovation for Sustainable Development "
I505
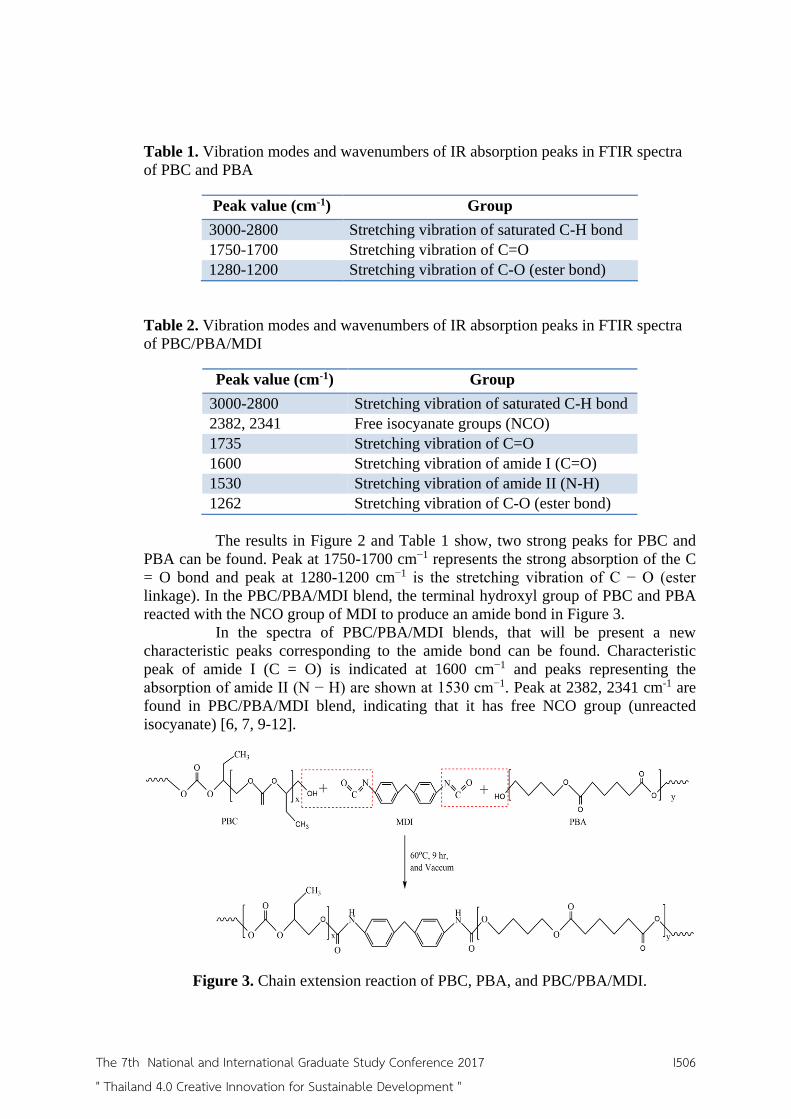
Table 1. Vibration modes and wavenumbers of IR absorption peaks in FTIR spectra
of PBC and PBA
Peak value (cm-1) Group
3000-2800 Stretching vibration of saturated C-H bond
1750-1700 Stretching vibration of C=O
1280-1200 Stretching vibration of C-O (ester bond)
Table 2. Vibration modes and wavenumbers of IR absorption peaks in FTIR spectra
of PBC/PBA/MDI
Peak value (cm-1) Group
3000-2800 Stretching vibration of saturated C-H bond
2382, 2341 Free isocyanate groups (NCO)
1735 Stretching vibration of C=O
1600 Stretching vibration of amide I (C=O)
1530 Stretching vibration of amide II (N-H)
1262 Stretching vibration of C-O (ester bond)
The results in Figure 2 and Table 1 show, two strong peaks for PBC and
PBA can be found. Peak at 1750-1700 cm−1 represents the strong absorption of the C
= O bond and peak at 1280-1200 cm−1 is the stretching vibration of C − O (ester
linkage). In the PBC/PBA/MDI blend, the terminal hydroxyl group of PBC and PBA
reacted with the NCO group of MDI to produce an amide bond in Figure 3.
In the spectra of PBC/PBA/MDI blends, that will be present a new
characteristic peaks corresponding to the amide bond can be found. Characteristic
peak of amide I (C = O) is indicated at 1600 cm−1 and peaks representing the
absorption of amide II (N − H) are shown at 1530 cm−1. Peak at 2382, 2341 cm-1 are
found in PBC/PBA/MDI blend, indicating that it has free NCO group (unreacted
isocyanate) [6, 7, 9-12].
Figure 3. Chain extension reaction of PBC, PBA, and PBC/PBA/MDI.
The 7th National and International Graduate Study Conference 2017
" Thailand 4.0 Creative Innovation for Sustainable Development "
I506

The 1H NMR spectra of PBC was in accordance with proposed structure.
1HNMR spectra of PBC is shown in Figure 4. The signal of polycarbonate (carbonate
linkage) confirmed its expected structure. The 1H-NMR spectrum of PBC reveals no
signal of –CH2- of ether linkage (3.5-3.6ppm).
Figure 5 shows 1H NMR spectra of these polyesters and corresponding
proton resonance signals, respectively. The signals occurring at 4.08, 2.3, 1.68, and
1.64 ppm can be assigned to the methylene protons d, e, b, and f, corresponding to
those of butylene adipate unit. The signals at 3.66 ppm assignable to proton of the
terminated hydroxyl group. These data indicate that synthesized linear PBA chains are
terminated by hydroxyl functional end groups [7, 13, 14].
Figure 4 1H NMR spectra of synthesized PBC.
Figure 5 1H NMR spectra of synthesized PBA.
The 7th National and International Graduate Study Conference 2017
" Thailand 4.0 Creative Innovation for Sustainable Development "
I507

From the figure 6 shows the 1H NMR spectrum of PBC/PBA/MDI. The
peaks at 6.92 ppm (NH) and 7.68–7.71 ppm (aromatic ring), which could be ascribed
to the urethane and aromatic ring of MDI, confirm the existence of the terminal
hydroxyl group of PBC and PBA reacted with the NCO group of MDI to produce an
amide bond [11].
Figure 6 1H NMR spectra of synthesized PBC/PBA/MDI.
The thermal properties of polymer blends
Figure 7 and Table 3 shows the TGA curves of PBC, PBA, and
PBC/PBA/MDI blend, and Table 3 lists the decomposition thermal of PBC, PBA, and
PBC/PBA/MDI.
As shown in Figure 7 and Table 3, PBC has two stages of weight loss. In
the initial temperature of weight loss was 209.70oC. The temperature at the first stage
of weight loss ranged from 180 to 250oC, and the final temperature at the second stage
[6] of weight loss was 250–320oC. According to the reported Inoue et al [15-17] have
indicated that the thermal decomposition of PBC exhibits two decomposition
mechanisms: main chain random scission (Figure 8) at high temperature and
unzipping degradation (Figure 9) at low temperature.
The 7th National and International Graduate Study Conference 2017
" Thailand 4.0 Creative Innovation for Sustainable Development "
I508

Figure 7. TGA curves of PBC, PBA, and PBC/PBA/MDI.
The reactive hydroxyl end group in PBC can lead to a chain unzipping
degradation mechanism from a “backbiting”, the terminal hydroxyl groups attack on
the carbonyl group. Therefore, PBC with uncapped end groups of lower molecular
weight more easily induces a chain unzipping reaction due to the existence of an
abundance of hydroxyl groups.
Table 3. Thermal degradation data of the PBC, PBA, and PBC/PBA/MDI
Formular Tonset (oC) Td (oC) T endset (oC)
Tonset,1 Tonset,2 Td,1 Td,2 T endset,1 T endset,2
PBC 209.70 - 220.52 - 238.52 -
PBC/PBA/MDI 256.07 329.74 267.4 345.74 276.29 367.57
PBA - 349.49 - 364.56 - 381.27
In contrast, PBC with a high molecular weight induces the main chain random
scission reaction due to a small amount of the active terminal group, and has higher
thermal stability than PBC with a low molecular weight, in which the decomposition
mechanism is controlled by chain unzipping degradation because the PBC has low
molecular weight [6]. Then adding PBA and MDI to PBC showed that the Ton set was
increase from 209.7 to 256.07OC as a result of PBA and MDI were reacted the
hydroxyl end group of PBC.
The 7th National and International Graduate Study Conference 2017
" Thailand 4.0 Creative Innovation for Sustainable Development "
I509

Figure 8. The degradation of PBC : random chain scission [6].
Figure 9. The degradation of PBC: unzipping degradation [6].
Conclusions
PBC was poor thermal stability to processing. Copolymerization with PBA
using MDI act as chain extender to improve the thermal properties of PBC. In the
FTIR spectra of PBC/PBA/MDI blends, produce an amide bond at 1600 cm−1 (C = O)
and (N − H) are shown at 1530 cm−1. In the thermal properties, then adding PBA and
MDI to PBC showed that the Ton set was increase from 209.7 to 256.07oC The 1H
NMR spectrum of PBC/PBA/MDI, which could be ascribed to the urethane and
aromatic ring of MDI to confirm the existence of the terminal hydroxyl group of PBC
and PBA reacted with the NCO group of MDI to produce an amide bond.
The 7th National and International Graduate Study Conference 2017
" Thailand 4.0 Creative Innovation for Sustainable Development "
I510

Discussion
Poly (butylene carbonate) was improved the thermal properties using MDI act
as chain extender with poly (butylene adipate). The thermal degradation temperature
of PBC increase from 209.7 to 256.07oC. It was explain that hydroxyl group of PBC
react with isocyanate group of MDI. The thermal degradation properties of PBC have
been improved.
Recommendations
The improvement of PBC thermal degradation properties with PBA and MDI
will result in the mechanical properties and impact properties of the polymer blends.
So MDI content should be added appropriately.
References
1. Ree, M., et al., New findings in the catalytic activity of zinc glutarate and its
application in the chemical fixation of CO2 into polycarbonates and their
derivatives. Catalysis Today, 2006. 115(1–4): p. 134-145.
2. Ree, M., et al., A new copolymerization process leading to poly(propylene
carbonate) with a highly enhanced yield from carbon dioxide and propylene
oxide. Journal of Polymer Science Part A: Polymer Chemistry, 1999. 37(12):
p. 1863-1876.
3. Gao, L.J., et al., Copolymerization of carbon dioxide and propylene oxide with
zinc glutarate as catalyst in the presence of compounds containing active
hydrogen. Journal of Applied Polymer Science, 2007. 104(1): p. 15-20.
4. Wang, J.T., et al., Copolymerization of carbon dioxide and propylene oxide
using zinc adipate as catalyst. Journal of Applied Polymer Science, 2006.
99(1): p. 200-206. 5. Meng, Y.Z., et al., Effects of the structure and morphology of zinc glutarate on
the fixation of carbon dioxide into polymer. Journal of Polymer Science Part
A: Polymer Chemistry, 2002. 40(21): p. 3579-3591.
6. An, J., et al., A novel method to improve the thermal stability of
poly(propylene carbonate). Polymer Chemistry, 2014. 5(14): p. 4245-4250.
7. Wang, X.-y., et al., Chain extension and modification of polypropylene
carbonate using diphenylmethane diisocyanate. Polymer International, 2015.
64(10): p. 1491-1496.
8. Herrera, R., et al., Characterization and degradation behavior of
poly(butylene adipate-co-terephthalate)s. Journal of Polymer Science Part A:
Polymer Chemistry, 2002. 40(23): p. 4141-4157.
9. Yang, J., et al., Temperature-dependent polymorphic crystalline structure and
melting behavior of poly(butylene adipate) investigated by time-resolved FTIR
spectroscopy. Journal of Polymer Science Part B: Polymer Physics, 2009.
47(20): p. 1997-2007.
10. Gan, Z., H. Abe, and Y. Doi, Temperature-Induced Polymorphic Crystals of
Poly(butylene adipate). Macromolecular Chemistry and Physics, 2002.
203(16): p. 2369-2374.
The 7th National and International Graduate Study Conference 2017
" Thailand 4.0 Creative Innovation for Sustainable Development "
I511

11. Rogulska, M., A. Kultys, and S. Pikus, The effect of chain extender structure
on the properties of new thermoplastic poly(carbonate–urethane)s derived
from MDI. Journal of Thermal Analysis and Calorimetry, 2017. 127(3): p.
2325-2339.
12. Zhong, W., et al., Study on biodegradable polymer materials based on
poly(lactic acid). I. Chain extending of low molecular weight poly(lactic acid)
with methylenediphenyl diisocyanate. Journal of Applied Polymer Science,
1999. 74(10): p. 2546-2551.
13. Saito, T., et al., Organophosphate-catalyzed bulk ring-opening polymerization
as an environmentally benign route leading to block copolyesters, end-
functionalized polyesters, and polyester-based polyurethane. Polymer
Chemistry, 2015. 6(24): p. 4374-4384.
14. Zulkifli, N.N.b., et al., Palm kernel oil-based polyurethane film:
Biocompatibility and antibacterial activity studies. AIP Conference
Proceedings, 2017. 1817(1): p. 020005.
15. Phillips, O., J.M. Schwartz, and P.A. Kohl, Thermal decomposition of
poly(propylene carbonate): End-capping, additives, and solvent effects.
Polymer Degradation and Stability, 2016. 125: p. 129-139.
16. Kuran, W. and P. Górecki, Degradation and depolymerization of
poly(propylene carbonate) by diethylzinc. Die Makromolekulare Chemie,
1983. 184(5): p. 907-912.
17. Sheng, X., et al., Efficient synthesis and stabilization of poly(propylene
carbonate) from delicately designed bifunctional aluminum porphyrin
complexes. Polymer Chemistry, 2015. 6(26): p. 4719-4724.
The 7th National and International Graduate Study Conference 2017
" Thailand 4.0 Creative Innovation for Sustainable Development "
I512

1
Title: Optimized Radiation Dose and Image Quality for Abdominal CT Protocol:
Phantom Study
Author(s): Saimai Siangyai1, Supawan Jivapong2, Pacharin Prapaisilp3, Dittapong
Songsaeng3, Malulee Tuntawiroon3
Institution(s): 1Navamindradhiraj University, 2Golden Jubilee Medical Center, Mahidol
University, 3Department of Radiology, Faculty of Medicine Siriraj Hospital.
Abstract
The purpose of this study was to determine an acceptable dose of radiation required to
achieve a diagnostically acceptable image quality of the computed tomography (CT) scan of
standard, large and very large size body phantom by using routine adult abdominal protocol at
different levels of noise index. The study was performed by 2 CT systems, 64-section MDCT
scanners (LightSpeed; GE Healthcare) and high definition CT (HDCT) 64-MDCT scanners
Model HD750 (GE Healthcare) at Siriraj Diagnostic Imaging Centers. The volume CT dose
index (CTDI)vol of CT images was measured in all sizes of phantom. By fix mode (500 mA)
and auto modulation (noise index 0 – 20), radiation doses were recorded and the image quality
was evaluated by measuring image noise of 5 regions of interest (ROI); right and left lobes of
liver, spleen, aorta and left kidney.
At different settings of noise index ranging from 0 to 20 and the slice thicknesses of
1.25 and 7.0 mm, the CTDIvol increased in all sizes of phantom but higher in thin slice (1.25
mm) than thicker slice (7 mm). An image quality was enhanced by noise index reduction in the
process of image reconstruction using adaptive statistical iterative reconstruction (ASIR) and
Model-Based iterative reconstruction (MBIR) software. Radiation doses increases with
phantom sizes; 4.57, 5.36 and 6.44 mGy, for standard, large and very large body size
respectively.
Factors affecting radiation dose and image quality were levels of noise index, slice
thickness and reconstruction method. Decreasing the noise index resulted in increased
radiation dose and increasing the patient size will increase the radiation dose. Thin slice
thickness gave poorer image quality than thicker slice but gave better details. Small change in
protocol could be used in the process for CT scan of upper abdomen to reduce the radiation
dose to patient while image quality remains high enough to preserve diagnostic use.
Keyword(s): CT PROTOCOL, BODY PHANTOM, NOISE INDEX
The 7th National and International Graduate Study Conference 2017
" Thailand 4.0 Creative Innovation for Sustainable Development "
I513

2
Introduction
Current imaging technology in medical diagnosis is developed very quickly. The
advancement of multidetector CT (MDCT) technology has markedly improve image quality as
well as significantly increase radiation doses to patients. Over the past decade, reducing
radiation dose delivered by CT scans has become a major concern, particularly with regards to
MDCT. Varieties of CT vendors introducing new generation of CT scanners and each CT
system has different algorithm tests (Protocol) according to different characteristics of the
machine. Different versions also have differences in detail sharpness of images. When
concerning about CT dose, it is important to understand factors and parameters affecting
radiation dose and image quality. The purpose of this study was to assess an acceptable dose of
radiation required to achieve a diagnostically acceptable image quality by measuring image
noise of the abdominal CT scan at 4 separate noise index levels using routine upper abdomen
protocol for adult. This study will pay particular attention on abdominal imaging because it is
the most frequently performed CT scan at the center. In some patients, abdominal CT
examination has been performed up to 4 times per year each and with more than one
acquisition phase.
Objectives
1. To assess an acceptable dose of radiation required to achieve a diagnostically
acceptable image quality of upper abdomen CT scan using routine abdominal protocol.
2. To compare image quality in association with radiation doses when routine upper
abdomen protocol was performed in BODY PHANTOM model at different setting of
noise index of the 2 different CT systems.
3. To compare quality when enhanced by noise index reduction in the process of image
reconstruction using adaptive statistical iterative reconstruction (ASIR) and Model-
Based iterative reconstruction (MBIR) software.
Research Methodology
This research is an experimental study in body phantom to measure the characteristics
of CT scan images using routine abdominal CT protocol at Imaging Center, Department of
Radiology, Faculty of Medicine Siriraj Hospital.
The 7th National and International Graduate Study Conference 2017
" Thailand 4.0 Creative Innovation for Sustainable Development "
I514

3
Materials
CT Scanners
The CT scanners at the Department of Diagnostic Radiology, Siriraj Hospital, used in
this study are 64-MDCT (VCT LightSpeed, General Electric Medical System (GE) (Fig. 1) and
64-HDCT (Discovery CT750 HD) (Fig. 2).
Figure 1 The 64 slices MDCT, GE Medical System Model VCT LightSpeed
Figure 2 The 64 slices MDCT, High definition CT (HDCT), GE Medical System Model
Discovery CT750 HD
The 7th National and International Graduate Study Conference 2017
" Thailand 4.0 Creative Innovation for Sustainable Development "
I515

4
Body Phantom
Anthropomorphic phantom (Fig. 3) was used to test the performance of the
scanner incorporating upper abdomen protocol. The body phantom has different test
modules used for assessing different image quality parameters. The material is specially
designed to be scanned or photographed in the field of medical imaging to evaluate,
analyze and tune the performance of variety of imaging devices.
Figure 3. Body Phantom
Bolus
Bolus (Fig. 4) is a material applied to the surface of a patient to negate the skin
sparing effect of megavoltage photons and some megavoltage electron fields or to
compensate for an irregular patient contour to achieve flat isodose lines at depth or to
smooth out sharp edges on the patient surface to prevent hot spot formation (particularly
for electron beams).
Figure 4 Bolus
The 7th National and International Graduate Study Conference 2017
" Thailand 4.0 Creative Innovation for Sustainable Development "
I516

5
Method
Three different size anthropomorphic phantoms were scanned using same vertical
centering and radiation dose was assessed with radiation dose–monitoring software. The
effect of vertical positioning on the radiation dose was studied using the volume CT dose
index, dose-length product, and size-specific dose estimates for different-sized phantoms.
Image noise was determined from CT number histograms. The body phantom was
vertically positioning for abdomen. The scanning range was set for abdomen and the
AEC was used to modulate tube current according to patient size and x-ray attenuation in
tissues.
AEC is an automatic exposure control in GE CT scanners. It is used to help reduce the
radiation dose to the patients. In GE CT scanners, the AECs are called Auto mA and Smart
mA. A noise index parameter allows to select the amount of x-ray noise that will be present in
the reconstructed images.
Veo: CT scanning reconstruction technology called Veo™ enable physicians to diagnose
patients with high-clarity images at previously unattainable low radiation dose levels.
Reconstruction method: The CT scan creates 3D X-ray images which can look into the
volume. The computer generated image. The images have a cross section of the storage
requirements carefully. The locations selected to store information includes right liver lobe, left
liver lobe, spleen, aorta, and left kidney.
Statistical analysis
Descriptive statistics was used to determine mean of image noise each value was
from triplicate measurements.
Results/ Conclusion
Size and Thickness
Large organs have higher image noise than small organs. Thin slice thickness (1.25
mm) gave higher image noise than thick slice thickness (7 mm) both in MDCT and HDCT.
MDCT image noises both in thick and thin slice are lower than HDCT by average (Table. 1).
Fig.5 (A) (B) (C) and (D) compare image noise of the right lobe of liver between 2 slice
thicknesses at 4 levels of noise index.
The 7th National and International Graduate Study Conference 2017
" Thailand 4.0 Creative Innovation for Sustainable Development "
I517

6
Table 1. Image noise of the CT images of body phantom (standard, large and very large size)
scanned by 2 CT systems (MDCT and HDCT) at 4 levels of noise index; 0, 10, 15, 20
and 2 slice thicknesses 1.25 and 7 mm.
Thin slice produced similar image noise in all size of phantom at different levels of
noise index in MDCT and HDCT. In contrast, thick slice produced much different image noise
between MDCT and HDCT.
Right Lobe of Liver (RL)
(A) Noise index = 0
Slide thickness 1.25 mm Slice thickness 7 mm
The 7th National and International Graduate Study Conference 2017
" Thailand 4.0 Creative Innovation for Sustainable Development "
I518

7
(B) Noise Index = 10
(C) Noise Index = 15
(D) Noise Index = 20
Fig.5 (A) (B) (C) and (D) compare image noise of the right lobe of liver between 2
slice thicknesses at 4 levels of noise index.
The 7th National and International Graduate Study Conference 2017
" Thailand 4.0 Creative Innovation for Sustainable Development "
I519

8
Reconstruction
Iterative reconstruction techniques have demonstrated the potential of image quality and
reducing radiation dose in CT. The reduction of image noises of the right and left lobes of liver,
spleen, aorta and left kidney scans were shown in Fig 6 to 10. An image noise was reduced in
both lobes of the liver but increases with the size of the patient. The measured SD value will
decrease at higher index of adaptive statistical iterative reconstruction (ASIR) noise and even
more reduced in Model-Based iterative reconstruction (MBIR).
Both CT machines use Different software, image quality obtained when using different
noise make different worlds. Using MBIR will produce images with less noise than ASIR and
NONE in standard thickness 1.25 mm.
Figure 6 Reduction of noises in the CT image of the right lobe of liver by methods of
reconstructions at 4 separate levels of noise index in standard, large and very large
phantom sizes.
The 7th National and International Graduate Study Conference 2017
" Thailand 4.0 Creative Innovation for Sustainable Development "
I520

9
Figure 7. Reduction of noises in the CT image of the left lobe of liver by methods of
reconstructions at 4 separate levels of noise index in standard, large and very large
phantom sizes.
Figure 8. Reduction of noises in the CT image of the spleen by methods of reconstructions at 4
separate levels of noise index in standard, large and very large phantom sizes.
0
5
10
15
20
25
0 10 15 20 0 10 15 20 0 10 15 20
Standard Large Very large
SP (Thickness 1.25 mm)
NONE
ASIR30 SD
ASIR40 SD
ASIR50 SD
MBIR MBIR
The 7th National and International Graduate Study Conference 2017
" Thailand 4.0 Creative Innovation for Sustainable Development "
I521

10
Figure 9. Reduction of noises in the CT image of the aorta by methods of reconstructions at 4
separate levels of noise index in standard, large and very large phantom sizes.
Figure 10. Reduction of noises in the CT image of the left lobe of liver by methods of
reconstructions at 4 separate levels of noise index in standard, large and very large
phantom sizes.
0
5
10
15
20
25
0 10 15 20 0 10 15 20 0 10 15 20
Standard Large Very large
LK (Thickness 1.25 mm)
NONE SD
ASIR30 SD
ASIR40 SD
ASIR50 SD
MBIR SD
The 7th National and International Graduate Study Conference 2017
" Thailand 4.0 Creative Innovation for Sustainable Development "
I522
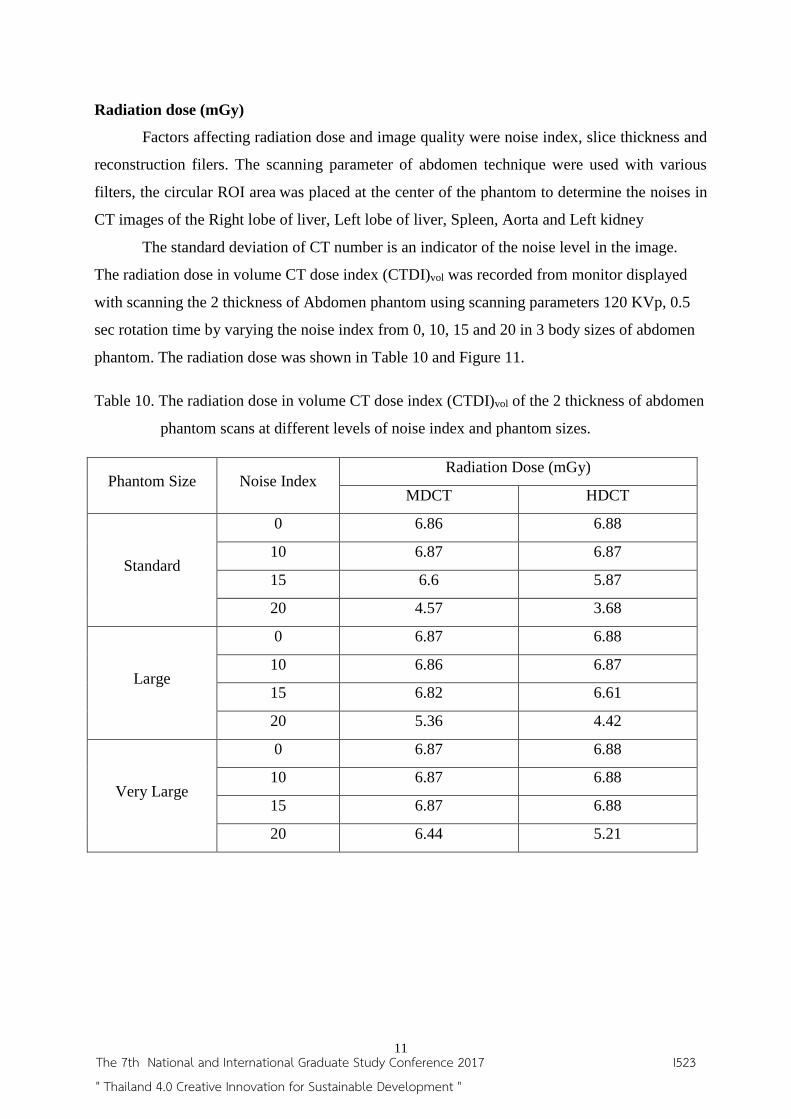
11
Radiation dose (mGy)
Factors affecting radiation dose and image quality were noise index, slice thickness and
reconstruction filers. The scanning parameter of abdomen technique were used with various
filters, the circular ROI area was placed at the center of the phantom to determine the noises in
CT images of the Right lobe of liver, Left lobe of liver, Spleen, Aorta and Left kidney
The standard deviation of CT number is an indicator of the noise level in the image.
The radiation dose in volume CT dose index (CTDI)vol was recorded from monitor displayed
with scanning the 2 thickness of Abdomen phantom using scanning parameters 120 KVp, 0.5
sec rotation time by varying the noise index from 0, 10, 15 and 20 in 3 body sizes of abdomen
phantom. The radiation dose was shown in Table 10 and Figure 11.
Table 10. The radiation dose in volume CT dose index (CTDI)vol of the 2 thickness of abdomen
phantom scans at different levels of noise index and phantom sizes.
Phantom Size Noise Index Radiation Dose (mGy)
MDCT HDCT
Standard
0 6.86 6.88
10 6.87 6.87
15 6.6 5.87
20 4.57 3.68
Large
0 6.87 6.88
10 6.86 6.87
15 6.82 6.61
20 5.36 4.42
Very Large
0 6.87 6.88
10 6.87 6.88
15 6.87 6.88
20 6.44 5.21
The 7th National and International Graduate Study Conference 2017
" Thailand 4.0 Creative Innovation for Sustainable Development "
I523
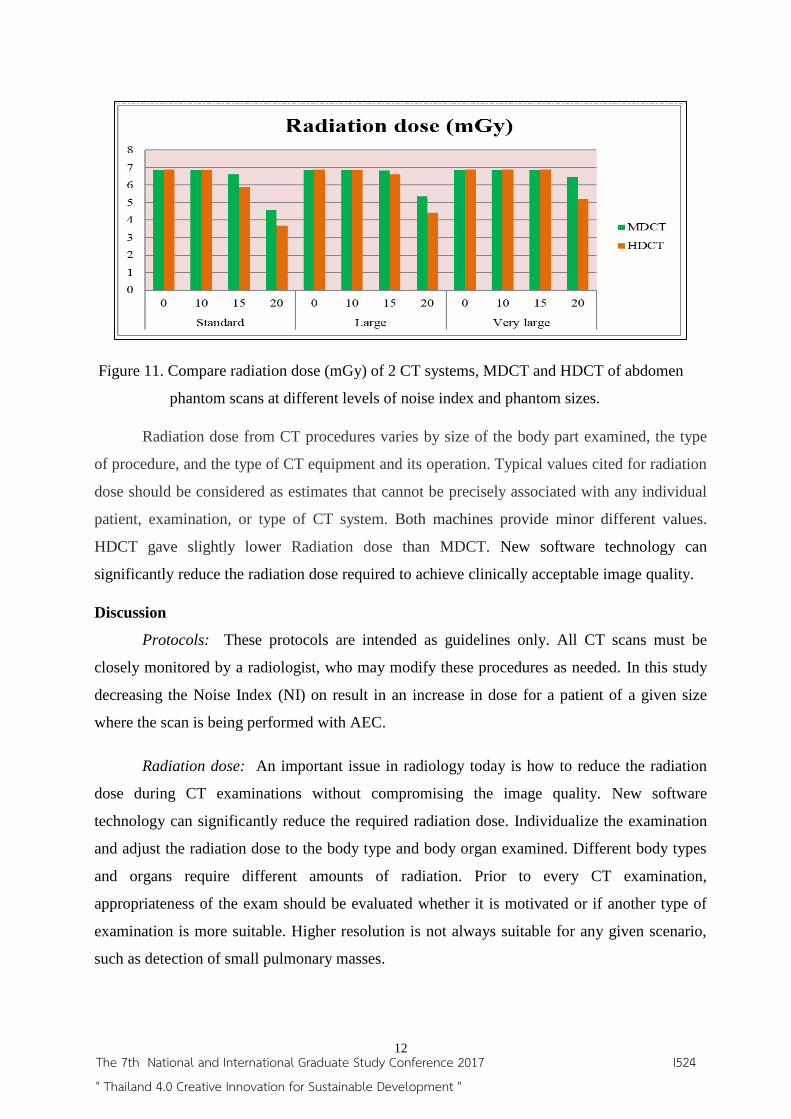
12
Figure 11. Compare radiation dose (mGy) of 2 CT systems, MDCT and HDCT of abdomen
phantom scans at different levels of noise index and phantom sizes.
Radiation dose from CT procedures varies by size of the body part examined, the type
of procedure, and the type of CT equipment and its operation. Typical values cited for radiation
dose should be considered as estimates that cannot be precisely associated with any individual
patient, examination, or type of CT system. Both machines provide minor different values.
HDCT gave slightly lower Radiation dose than MDCT. New software technology can
significantly reduce the radiation dose required to achieve clinically acceptable image quality.
Discussion
Protocols: These protocols are intended as guidelines only. All CT scans must be
closely monitored by a radiologist, who may modify these procedures as needed. In this study
decreasing the Noise Index (NI) on result in an increase in dose for a patient of a given size
where the scan is being performed with AEC.
Radiation dose: An important issue in radiology today is how to reduce the radiation
dose during CT examinations without compromising the image quality. New software
technology can significantly reduce the required radiation dose. Individualize the examination
and adjust the radiation dose to the body type and body organ examined. Different body types
and organs require different amounts of radiation. Prior to every CT examination,
appropriateness of the exam should be evaluated whether it is motivated or if another type of
examination is more suitable. Higher resolution is not always suitable for any given scenario,
such as detection of small pulmonary masses.
The 7th National and International Graduate Study Conference 2017
" Thailand 4.0 Creative Innovation for Sustainable Development "
I524
13
Recommendations
Radiologists, medical physicists, registered radiologist assistants, radiologic
technologists, and all supervising physicians have a responsibility for safety in the workplace
by keeping radiation exposure to staff, and to society as a whole, “as low as reasonably
achievable” (ALARA) and to assure that radiation doses to individual patients are appropriate,
taking into account the possible risk from radiation exposure and the diagnostic image quality
necessary to achieve the clinical objective. All personnel that work with ionizing radiation must
understand the key principles of occupational and public radiation protection (justification,
optimization of protection and application of dose limits) and the principles of proper
management of radiation dose to patients (justification, optimization and the use of diagnostic
reference levels or DRL).
Bibliography
Modified according to: http://media.wiley.com/product_data/excerpt/
63/04712376/0471237663.pdf (Last visited: July 13, 2016)
Courtesy of University Medical Centre Mannheim, Germany (SOMATOM Force) last updated:
Oct 5, 2016
Fundamentals of Body CT 2nd Edition. Webb Brant Helms
Whole Body Computed Tomography Second Edition Otto Hardcover Wegener – 1 Dec 1992
AAPM Report # 39 Specification and Acceptance Testing of Computed Tomography Scanners
Polacin A; Kalender WA; Marchal G. Evaluation of section sensitivity profiles and image noise
in spiral CT. Radiology, 1992 Oct, 185(1):29-35.
Polacin A; Kalender WA; Brink J; Vannier MA. Measurement of slice sensitivity profiles in
spiral CT. Medical Physics, 1994 Jan, 21(1):133-40.
McCollough CH, Zink FE. Performance evaluation of a multi-slice CT system. Med Phys
1999; 26:2223–2230.
Droege RT, Morin RL A practical method to measure the MTF of CT scanners. Med Phys 1982
Sep-Oct; 9(5):758-760.
McNitt-Gray, “Radiation dose in CT,” Radiographics 22:1541-1553 (2002)
The 7th National and International Graduate Study Conference 2017
" Thailand 4.0 Creative Innovation for Sustainable Development "
I525

14
FDA Notice dated 11-2-01 http://www.fda.gov/cdrh/safety/110201-ct.html
American Association of Physicists in Medicine (AAPM). Phantoms for performance
evaluation and quality assurance of CT scanners diagnostic radiology committee task force
on CT scanner phantoms.1977; 1.
American Association of Physicists in Medicine (AAPM). Specification and acceptance testing
of computed tomography scanners report of task group 2 diagnostic x-ray imaging
committee.1993; 39.
American Association of Physicists in Medicine (AAPM). The measurements reporting and
management of radiation dose in ct.2008.
Angjelina PR. Optimization of image quality in pediatric computed tomography
Education in Developing Asia Author: Saimai Siangyai, Department of Radiology Faculty of
medicine Siriraj Hospital, Bangkok 10700, Thailand
Email: [email protected]
The 7th National and International Graduate Study Conference 2017
" Thailand 4.0 Creative Innovation for Sustainable Development "
I526

Development of luciferase reduction neutralization test for DENV neutralizing
antibody detection
Suwipa Kaewsod1, Kedsara Panyasu
1, Krongkan Saipin
1, Chunya Puttikhunt
2,3, Sutha
Sangiambut3, Chakrit Hirunpetcharat
1, Nopporn Sittisombut
4, Jiraphan Junjhon
1*
1Department of Microbiology, Faculty of Public Health, Mahidol University, Bangkok
10400, Thailand. 2Division of Dengue Hemorrhagic Fever Research, Department of Research and
Development, Faculty of Medicine, Siriraj Hospital, Mahidol University, Bangkok
10700, Thailand. 3Medical Biotechnology Research Unit, National Center for Genetic Engineering and
Biotechnology, National Science and Technology Development Agency, Bangkok
12120, Thailand. 4Department of Microbiology, Faculty of Medicine, Chiang Mai University, Chiang Mai
50200, Thailand.
*Corresponding author: Jiraphan Junjhon, Department of Microbiology, Faculty
of Public Health, Mahidol University, Bangkok 10400, Thailand
E-mail address: [email protected]
Abstract
Dengue virus (DENV) is an important mosquito-borne viral disease in tropical
and subtropical areas, where the vaccine and specific antiviral drugs for the treatment and
prevention is absence. Although plaque reduction neutralization test (PRNT) or focus
reduction neutralization test (FRNT) has been accepted to use as the “gold standard”
method for the measurement of neutralizing antibody to DENV. These techniques require
the property of virus to generate plaque and are restricted to the virus strains used for
neutralization test. To overcome this bottleneck, we developed luciferase reduction
neutralization test (LRNT) for detecting DENV-2 neutralizing antibody by measuring the
luciferase enzyme released from Luc-SIP infected cells. The LRNT and FRNT resulted in
a close relative amount of anti-E antibody (4G2) driving 50% of Luc-SIP and live DENV
neutralization, implying similar antigenic property between both types of DENV
particles. In addition, a linear correlation of Luc-SIP neutralization by anti-DENV
antibody using FRNT and LRNT was observed (R2
= 0.9150). Therefore, the finding
strongly emphasized that our developed LRNT is well generated based upon the live
virus replication behavior. The Luc-SIP(H346Y) was also generated using the Luc-SIP
genome background. This purpose was to apply the developed LRNT in studying the role
of amino acid mutation on the change of antigenic property of DENV-2. We observed
that Luc-SIP(H346Y) displayed a similar LRNT50 and FRNT50 to the Luc-SIP parental
strain. However, since this result represented the total binding of antigen on the particles
by 4G2 antibody, it was noted that this mutation might not be a relevant epitope for the
antibody used. Further study using different types of anti-E antibody is required to draw
The 7th National and International Graduate Study Conference 2017
" Thailand 4.0 Creative Innovation for Sustainable Development "
I527

the complete conclusion. Collectively, our results generated the robust method for
detecting the neutralizing antibody, which can be widely applied in DENV vaccine trial,
high-throughput drug screening and other flavivirus research areas.
Keywords: DENV, neutralizing antibody, infectious particle reporter, neutralization test,
luciferase assay
Introduction
DENV infection is an important mosquito-borne viral disease. It is
approximately 100-200 million cases of dengue infection each year (WHO., 2009).
DENV is a single positive-strand RNA virus. It belongs to the genus Flavivirus in the
family Flaviviridae (Lindenbach BD et al., 2007). Four distinct serotypes are being
circulated in the endemic region. However, some have developed to various degrees of
diseases, including dengue fever (DF), dengue hemorrhagic fever (DHF), and a more
severe fatal form of disease dengue shock syndrome (DSS) (Gubler DJ.,1998; Halstead
SB., 2007; Guzman M et al., 2010). Currently, no vaccine or specific antiviral drugs for
the treatment and prevention present.
Primary infection with any of the four DENV serotypes provides life-long
immunity against the homologous type by the action of neutralizing antibodies (NAbs)
against viral proteins. The ectodomains III (EDIII) of envelope (E) protein is a major
target for neutralization (Rothman AL., 2011). Interestingly, the study of genetic
variation of DENV-2 E protein in Thailand, since 1974 to 2010 demonstrated that
majority of E protein sequence was mutated at amino acid position 346. The replacement
of Histidine (H) with Tyrosine (Y) is observed concomitantly to time. This conserve
change may be important for both antibody recognition or neutralization epitope
(Sukupolvi-Petty S et al., 2010; Puiprom O et al., 2011).
Currently, plaque reduction neutralization test (PRNT) is the “gold standard”
method for measuring the neutralizing antibody to DENV. This method is labor intensive,
time-consuming and technical complex processes, which sometimes cause an operator-
error prone manual readout. Recently, attempting to generate the single-round infectious
particle reporter (Luc-SIP) with the tag of Lucia luciferase in the DENV-2 genome
deleting partial capsid encoding sequence has been made (Junjhon J., unpublished
results). This Luc-SIP is able to replicate within the cells for a single cycle and the Lucia
luciferase is released into the culture supernatant upon Luc-SIP replication. Therefore,
the amount of Lucia luciferase detected outside the cells is based up on the Luc-SIP
infection.
This study developed more feasible and reliable method to detect DENV
neutralizing antibody by using Luc-SIP, so called LRNT. We demonstrated that Luc-SIP
displayed antigenic similarity to live DENV-2, strain 16681 when tested for the
neutralizing property of the well-characterized anti-E monoclonal antibody (MAb) 4G2.
This result suggested that Luc-SIP should be used to replace the live virus for detecting
DENV neutralizing antibody.
The 7th National and International Graduate Study Conference 2017
" Thailand 4.0 Creative Innovation for Sustainable Development "
I528

Objectives
To develop the LRNT for neutralizing DENV antibody detection by using
Luc-SIP of DENV-2 strain 16681.
Research Methodology
Cells and antibody. The african green monkey kidney (Vero) cells (Igarashi
A., 1978) was cultured in Minimum Essential Media (MEM) (Gibco BRL) supplemented
with 10% FBS, 2 mM L-glutamine (Gibco BRL), 100 units/ml Non- Essential Amino
Acids (NEAA) and 100 units/ml penicillin and 100 µg/ml streptomycin (Gibco BRL) in
the presence of 5% CO2 at 37°C. The mosquito (C6/36) cell lines (Igarashi A., 1978)
derived from Aedes albopictus and capsid-expressing mosquito cell lines (Sangiambut S.,
2013) were cultured in Leibovitz L-15 medium (Gibco BRL) supplemented with 10%
fetal bovine serum (FBS), 2 mM L-glutamine (Gibco BRL), 0.26% tryptose phosphate
broth (Sigma-Aldrich), and 100 units/ml penicillin and 100 microgram (µg)/ml
streptomycin (Gibco BRL) at 29°C. DENV-2 strains 16681(Russell and Nisalak, 1967)
was kindly provided by Dr. Nopporn Sittisombut, Faculty of Medicine, Chiang Mai
University. The virus was propagated in C6/36 cell line in L15 medium (Gibco BRL,
Grand Island, NY, USA) supplemented with 1.5% FBS, 2 mM L-glutamine (Gibco
BRL), 0.26% tryptose phosphate broth (Sigma-Aldrich), and 100 units/ml penicillin and
100 microgram (µg)/ml streptomycin (Gibco BRL) at 29°C for virus stock preparation
used in this study.
Dengue specific anti-E protein murine monoclonal antibody (MAb) 4G2 was
kindly provided by Dr. Chunya Puttikhunt, Medical Biotechnology Research Unit
(BIOTEC), NSTDA. 4G2 was used in the focus immunoassay titration, focus reduction
neutralization test (FRNT), and LRNT.
The Luc-SIP. The Luc-SIP of DENV-2 strain 16681 was generated
previously (Junjhon et al., unpublished result). Briefly, the cDNA full-length of dengue
virus serotype 2 containing plasmid, pBluescript II KS (pBK) (Sriburi et al., 2001) was
subjected to replacement of C coding region with a cassette of gene encoding 38 amino
acids of C protein at 5’ end, followed by Lucia luciferase and foot-and-mouth disease
virus (FMDV) 2A genes at the 3’ end, resulting in the pBK(SISP6-10,723)ΔCLucia
(Junjhon J, Unpublished result). The Luc-SIP was amplified in C-expressing C6/36 cells
and the supernatant was collected for further use through all experiments .
Generation of Luc-SIP(H346Y). The Luc-SIP(H346Y) was generated in
order to study the effect of H346Y mutation on antibody recognition to DENV epitope.
The PCR mutagenesis were performed to introduce point mutation at the amino acid
position 346 of E protein from histidine to tyrosine into the DENV 2 reporter genome
containing plasmid, pBK(SISP6-10,723)ΔCLucia. Briefly, JJ-8F and JJ-8R
oligonucleotides were designed for PCR-based site-directed mutagenesis (Table 1).
The 7th National and International Graduate Study Conference 2017
" Thailand 4.0 Creative Innovation for Sustainable Development "
I529

Table 1. Oligonucleotide primers for PCR-based site-directed mutagenesis, reverse
transcription PCR and nucleotide sequencing.
aNumber represents base position in the genome of strain 16681.
F, forward; R, reverse
A pBK(SISP6-10,723)ΔCLucia plasmid was used as a template in PCR
reaction with the following PCR parameters: denaturation 98°C, 20 s; annealing 60°C,
30 s; extension 72°C, 7 min for 30 cycles using Phusion DNA polymerase (Thermo
scientific, USA). The amplified products were transformed into E. coli strain DH5α.
After 4 days of incubation, the small transformed colonies were selected for further
growth at 22°C for 2 days. A plasmid DNA was extracted with QIAGEN plasmid Mini
kit (QIAGEN, Hilden, Germany) and a desired mutation containing plasmid was
screened by particular restriction enzyme digestion. A plasmid DNA were analyzed for
the nucleotide sequence using JJ-9F and JJ-1R oligonucleotides (Table 1) by Macrogen
sequencing services (GIBTHAI), before used as a XbaI-linearized cDNA for
RiboMax™ Large Scale RNA Production System–SP6 (Promega,USA). To generate
the Luc-SIP (H346Y), the transcribed RNA was subjected to trans-
complementation into C-expressing C6/36 cells (Sangiambut et al., 2013) via
Lipofectamine 2000 (Invitrogen, Carlsbad, CA, USA). The supernatant was collected
when appropriate cytopathic effect is observed. The Luc-SIP (H346Y) supernatant was
used to infect C-expressing C6/36 cells for making the stock, which was further used
through all experiments (Fig 1).
Designation Sequence (5'3') Rangea Introduced sequence
/restriction site
JJ-8F GAT CTC GAG AAA AGA
TAT GTC TTA GGT CGC
CTG ATT ACA GTC AAC CC
1957-1993 H346Y mutation (bold),
XhoI (underlined)
JJ-8R GGC GAC CTA AGA CAT
ATC TTT TCT CGA GAT
CCA TTA TCT CAA AAG GG
1987-1941 H346Y mutation (bold),
XhoI (underlined)
JJ-9F GTC ATA CTC TAT GTG
CAC AGG
1827-1847
JJ-1R ACC TCT AGA ACC TGT
TGA TTC AAC AGC ACC
10729-10700 XbaI (underlined)
The 7th National and International Graduate Study Conference 2017
" Thailand 4.0 Creative Innovation for Sustainable Development "
I530
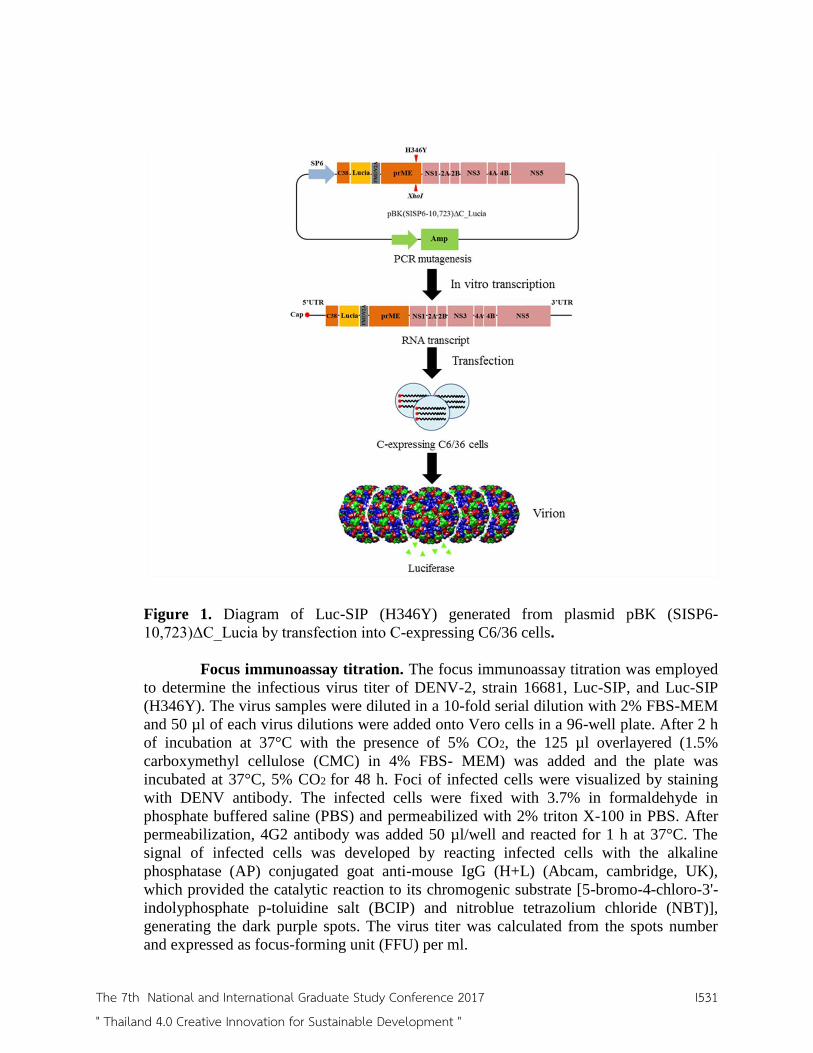
Figure 1. Diagram of Luc-SIP (H346Y) generated from plasmid pBK (SISP6-
10,723)ΔC_Lucia by transfection into C-expressing C6/36 cells.
Focus immunoassay titration. The focus immunoassay titration was employed
to determine the infectious virus titer of DENV-2, strain 16681, Luc-SIP, and Luc-SIP
(H346Y). The virus samples were diluted in a 10-fold serial dilution with 2% FBS-MEM
and 50 µl of each virus dilutions were added onto Vero cells in a 96-well plate. After 2 h
of incubation at 37°C with the presence of 5% CO2, the 125 µl overlayered (1.5%
carboxymethyl cellulose (CMC) in 4% FBS- MEM) was added and the plate was
incubated at 37°C, 5% CO2 for 48 h. Foci of infected cells were visualized by staining
with DENV antibody. The infected cells were fixed with 3.7% in formaldehyde in
phosphate buffered saline (PBS) and permeabilized with 2% triton X-100 in PBS. After
permeabilization, 4G2 antibody was added 50 µl/well and reacted for 1 h at 37°C. The
signal of infected cells was developed by reacting infected cells with the alkaline
phosphatase (AP) conjugated goat anti-mouse IgG (H+L) (Abcam, cambridge, UK),
which provided the catalytic reaction to its chromogenic substrate [5-bromo-4-chloro-3'-
indolyphosphate p-toluidine salt (BCIP) and nitroblue tetrazolium chloride (NBT)],
generating the dark purple spots. The virus titer was calculated from the spots number
and expressed as focus-forming unit (FFU) per ml.
The 7th National and International Graduate Study Conference 2017
" Thailand 4.0 Creative Innovation for Sustainable Development "
I531

Focus reduction neutralization test (FRNT). The FRNT was used as the
standard method to measure the neutralizing activity of antibody against DENV in
comparison to the developed Luc-based neutralizing activity assay. The 100 μl of 4-fold
serial dilutions of 4G2 antibody in 1X-MEM from 1:8 to 1:2,048 were reacted with an
equal volume of 100 FFU DENV-2 strain 16681 virus or Luc-SIPs in 2% FBS-MEM.
After 1 h of incubation at 37°C with the presence of 5% CO2, 200 μl of antibody-particle
reporter mixture were added onto Vero cell monolayer seeded in a 24-well plate for
additional 2 h. The infected cells were washed twice with 500 μl of sterile PBS to
eliminate luciferase residue and overlayered with 250 µl of 1.5% CMC in 4% FBS-
MEM. After further incubation at 37°C for 48 h, the infected cells were fixed and stained
with 4G2 antibody to determine the infectious titer by focus immunoassay titration. The
number of focus was counted under the light microscope and the FRNT50 is defined as the
antibody dilution resulting in 50% focus reduction referred to no antibody presence.
Luciferase activity assay. The luciferase activity assay was carried out to
determine luciferase activity derived from Luc-SIP. Briefly, 50 µl aliquots of Luc-SIP
infected culture supernatants was transferred onto a white opaque 96-well microplate and
reacted with 50 µl of QUANTI-Luc™ reagent (Invivogen, San Diego, USA). The
luciferase light signal was immediately detected by the VICTOR ™ X series multi-label
plate readers. For LRNT experiment, culture supernatant harvested at 48 h post infection
was subjected to determine the luciferase activity using a similar protocol mentioned
above.
LRNT. The LRNT was developed to examine the neutralizing activity of DENV
antibody. The 100 μl of 4-fold serial dilutions of 4G2 antibody in 1X-MEM from 1:8 to
1:2,048 were mixed with an equal volume of 100 FFU of DENV-2 16681 live virus or
single-round infectious particle reporters in 2% FBS-MEM. After 1 h of incubation at
37°C with the presence of 5% CO2, the 200 μl of antibody-particle reporter mixtures
were added onto Vero cell monolayer in 24-well plate and the virus adsorption was
allowed for 2 h at 37°C with 5% CO2. The complex of antibody-particle reporter was
then removed and the infected cells were washed twice with 500 μl of sterile PBS to
eliminate an excess luciferase residue. After 48 h additional incubation at 37°C with the
presence of 5% CO2, the culture supernatants were harvested for luciferase activity assay.
The 1X-MEM was served as the negative control for the absence of 4G2 antibody.. The
antibody dilution resulting in 50% reduction of RLU value referred to negative control
was defined as LRNT50.
The 7th National and International Graduate Study Conference 2017
" Thailand 4.0 Creative Innovation for Sustainable Development "
I532

Results
Optimization of luciferase activity assay To obtain the optimal amount of luciferase substrate for luciferase activity assay,
a set of different volume of QUANTI-Luc™ reagent (Invivogen,San Diego,USA) was
tested for luciferase activity with 50 μl of Lucia luciferase containing culture supernatant.
The luciferase activity was first detected at 130,545 RLU when the 5 μl of the
coelenterazine substrate was used (Figure 2). It was enhanced gradually upon increasing
the amount of the substrate and plateau at 940,866 RLU with 15 μl of substrate (Figure
2). This result suggested that 5 μl of the substrate was the optimal amount for further
luciferase assay.
Figure 2. Optimization of coelenterazine substrate amount for luciferase activity assay.
The equal amount of Lucia luciferase containing supernatant was reacted with the
coelenterazine substrate from 5, 10, 15, 20, 25, 30, 35, 40, 45, and 50 μl then the
luciferase activity was measured by VICTOR ™ X Series multi-label plate readers.
Correlation of Luc-SIP input and luciferase activity
Luc-SIP replicates inside the cells and secretes the Lucia luciferase enzyme into
the culture supernatant. To ensure the amount of luciferase activity detected from the
culture supernatant is derived by Luc-SIP replication, the correlation of Luc-SIP input
and luciferase activity was tested. The Luc-SIP input of 10, 100 and 1000 FFU was used
to infect Vero cells and the supernatant was collected at 24 and 48 hr for luciferase
activity assay. The detectable luciferase activity was less than 1,000 RLU when tested in
all virus input at 24 hr after infection (Figure 3A). Interestingly, the luciferase activity
increased in a virus input dependent manner from Luc-SIP input of 10 to 1000 FFU when
measured at 48 hr (Figure 3B). This result suggested that the luciferase activity
determined from the Luc-SIP infected cells reflected the number of Luc-SIP infection
into cells.
The 7th National and International Graduate Study Conference 2017
" Thailand 4.0 Creative Innovation for Sustainable Development "
I533

Figure 3. Correlation of Luc-SIP input and luciferase activity. A) Luciferase activity
obtained from Vero cells infected with Luc-SIP input of 10, 100, and 1000 FFU at 24 hr
and B) 48 hr. Mean represents three independent experiments.
Luc-SIP are antigenically equivalent to live DENV
Luc-SIP is generated to replace the use of live DENV in PRNT or FRNT
assay. However, Luc-SIP is the engineered DENV particle reporters, which lack of the
partial C encoding gene, causing the different genome size between Luc-SIP and DENV.
To test whether this difference alters the overall structure of Luc-SIP from live DENV
particles, the neutralization assay with well-characterized anti-E antibody was performed.
The four-fold serial dilutions of 4G2 was used to neutralize Luc-SIP and DENV-2, 16681
at 37 °C for 1 hr. The FRNT50 of Luc-SIP and DENV-2, 16681 were calculated at 1:108
and 1:120 of 4G2 dilution, respectively (Figure 4A). The Luc-SIP and DENV-2 16681
were neutralized by 4G2 similarly, indicating no total antigenic difference between both
particle types. As expectedly, the LRNT50 of Luc-SIP was at 1:165 of 4G2 dilution
(Figure 4B), which was closed to the FRNT50 of Luc-SIP. A strong linear correlation of
Luc-SIP was calculated between infectious particle reporter and luciferase activity given
the R2
= 0.9797 (Figure 4C). Collectively, this result implied that the luciferase activity
detected from LRNT was derived from the Luc-SIP infection.
The 7th National and International Graduate Study Conference 2017
" Thailand 4.0 Creative Innovation for Sustainable Development "
I534

Figure 4. FRNT and LRNT detecting of Luc-SIP neutralization by anti-E antibody. A)
FRNT of Luc-SIP and DENV-2, 16681. B) FRNT and LRNT of Luc-SIP. C) Linear
regression analysis of infectious titers and luciferase activity obtained from Luc-SIP
FRNT and LRNT.
H346Y mutation in E protein displayed similar antigenicity to parental DENV-2
strain
To apply the LRNT for studying the role of amino acid mutation at 346
position of DENV E protein, the Luc-SIP(H346Y) was generated. The mutant Luc-SIP
was then used to test for the neutralization by 4G2 antibody in comparison to Luc-SIP.
The FRNT50 of Luc-SIP and Luc-SIP (H346Y) were calculated to 1:141 and 1:156 of 4G
dilutions, respectively (Figure 5A). The LRNT50 of Luc-SIP and Luc-SIP(H346Y)
calculated from a fitting curve were 1:122 and 1:125 of 4G2 dilutions, respectively
(Figure 5B). A linear correlation calculated between infectious titers and luciferase
activity were R2
= 0.9867 and 0.9814, for Luc-SIP and Luc-SIP(H346Y), respectively
(Figure 5C-D). Taken together from the results, it was relatively implied that the
antigenicity of Luc-SIP(H346) was not altered from parental DENV strain when
recognized by 4G2 antibody. However, further testing with several types of antibody
against DENV is required to emphasize the concrete finding.
The 7th National and International Graduate Study Conference 2017
" Thailand 4.0 Creative Innovation for Sustainable Development "
I535

Figure 5. FRNT and LRNT detecting the neutralization of Luc-SIP(H346Y) compared to
Luc-SIP. A) FRNT of Luc-SIP(H346Y) and Luc-SIP. B) LRNT of Luc-SIP(H346Y) and
Luc-SIP. C-D) Linear regression analysis between infectious titers and luciferase activity
from Luc-SIP(H346Y) and Luc-SIP. Mean represents 3 independent experiments.
Discussion
PRNT has been used as the “gold standard” method for the measurement of
neutralizing antibody to DENV. This method is the technical complex processes, which
sometimes causes an operator-error prone manual readout. Therefore, by improving the
detection system, the green fluorescent protein (GFP) or luciferase enzyme is introduced
into the viral genome, generating various types of flavivirus particle reporters. The
DENV particles carrying GFP or luciferase have been used to replace the naturally
DENV particles when tested for the neutralizing activity. Instead of reading the number
of plaque or foci generating by live DENV, GFP expressing cells or luciferase activity
can be detected by flow cytometer and luminometer, respectively with rapidity, stability,
reproducibility for high-throughput screening of antiviral drugs (Zou G et al.,2011;
Schoggins J et ai.,2012). Recently, Song and coworkers (Song K et al., 2014) have
developed the stable Renilla luciferase reporter DENV (Luc-DENV) as a novel reporter
The 7th National and International Graduate Study Conference 2017
" Thailand 4.0 Creative Innovation for Sustainable Development "
I536

system for measuring neutralization activity of DENV antibody. Luc-DENV produces
robust luciferase signal in the BHK-21 cell. This developed assay is validated using
clinical samples from infected animal and patients, demonstrating a good correlation with
the traditional PRNT (Song K et al., 2014). However, there are limitations to technically
complex, as the lysis of infected cells is required for Luc-based neutralization assay and
the signal of luciferase reporter to be detected can be stable in a short period of time.
To develop a more feasible way to detect the luciferase activity from the
DENV particle reporters, we used the Luc-SIP expressing similar antigenicity to live
DENV as a tool for neutralizing antibody detection. This type of reporters secretes the
Lucia luciferase into the culture supernatant, avoiding the technical complex of cell lysis
steps. The Luc-SIP is also restricted for a single round of replication allowing a straight
forward for the result interpretation. It is noted that this replication characteristic of Luc-
SIP still permit the large scale production of the reporter stocks as we could derived large
amount of the particle by amplifying in C-expressing C6/36 cell line (Sangiambut et al.,
2013).
Commonly, neutralizing antibody is induced against three ectodomains (EDs)
of E protein (Gubler D.,1998). Most mouse monoclonal antibodies (MAbs) that strongly
neutralize DENV bind to epitope on the lateral ridge (LR) and A strand of EDIII (Pierson
TC et al., 2008; Shrestha B et al., 2010; Sukupolvi-Petty S et al., 2010). Interestingly, the
study of genetic variation of DENV-2 E protein in Thailand (data from the NCBI dengue
virus database), since 1974 to 2010 demonstrated that majority of E protein sequence was
mutated at amino acid position 346. The replacement of histidine with tyrosine is
observed concomitantly to time. Additionally, substitution at H346Y was previously
found in DENV-2 from mosquito and human plasma samples (Puiprom et al., 2010;
Pitaksajjakul et al., 2016). This occurrence suggests that the variation found at this
position is not due to the natural escape of DENV-2 from immune selection pressures
occurring in the hosts. E protein amino acid 346 is a surface-exposed residue on EDIII-
lateral ridge. This position is buried in the mature virus but may become surface
accessible as part of the ensemble of transitional states (Lok S et al., 2008), which likely
reflect “breathing” of the virion. This may explain why substitutions at position H346
reduced binding of several type-specific neutralizing antibodies (Sukupolvi-Petty S et al.,
2010). However, the neutralization behavior of anti-E antibody used in our study did not
show difference LNRT50 for Luc-SIP(H346Y) and Luc-SIP. This is suggested that a
single amino acid change in this position does not alter the total antigenicity to antibody
used in our study. It should be better to test the neutralization effect on this H346Y
mutation with other panel of anti-E specific antibody to obtain the strong results.
Conclusions In this study, we aimed to develop luciferase the LRNT for detecting DENV-2
neutralizing antibody using Luc-SIP. We demonstrated that Luc-SIP had antigenic
similarity to live DENV-2, strain 16681 when tested for the neutralizing property of the
well-characterized anti-E MAb 4G2. This result suggested that Luc-SIP should be used in
replacement of the live virus for detecting DENV neutralizing antibody. Further assay is
The 7th National and International Graduate Study Conference 2017
" Thailand 4.0 Creative Innovation for Sustainable Development "
I537

to validate the test with DENV-infected serum to make sure it is applicable. In addition,
we also applied the LRNT to study the role of H346Y mutation regarding to the
antigenicity change among DENV strains observed for times. Therefore, we should be
able to use this developed method in many directions to overcome the bottleneck in the
area of disease diagnosis, epidemiology study and vaccine development of DENV.
Reference Chompoosri J, Thavara U, Tawatsin A, Anantapreecha S, Siriyasatien P. (2011).
“Seasonal Monitoring of Dengue Infection in Aedes aegypti and Serological
Feature of Patients with Suspected Dengue in 4 Central Provinces of Thailand.”
Thai J Vet Med; 42(2): 185-193.
Fibriansah G, Thiam N, Kostyuchenko V, Lee J, Lee S, Wang J, Lok S. (2013).
“Strutural changes in dengue virus when exposed to a temperature of 37 C.” J
Virol. Jul; 87(13); 7585-9
Gubler DJ. “Dengue and dengue hemorrhagic fever.” (1998). Clin Microbiol Rev; 11:
480- 496.
Guzman M, Halstead S, Artsob H, Buchy P, Farrar J, Gubler D, Hunsperger E, Kroeger
A, Margolis H, Martínez E, Nathan M, Pelegrino J, Simmons C, Yoksan S,
Peeling R. (2010). “Dengue: a continuing global threat.” Nat. Rev. Microbiol; 8:
7–16.
Igarashi A. (1978). “Isolation of a Singh's Aedes albopictus cell clone sensitive to
Dengue and Chikungunya viruses.” J Gen Virol Sep; 40: 531-544.
Halstead SB. (2007). “Dengue.” Lancet; 370: 1644–1652.
Lindenbach BD, Jurgen TH, Rice CM. (2007). “Flaviviridae: the viruses and their
replication.” Fields virology,5th ed, vol 1; 1101-1152.
Lok SM, Kostyuchenko V, Nybakken GE, Holdaway HA, Battisti AJ, Sukupolvi-Petty S,
Sedlak D, Fremont DH, Chipman PR, Roehrig JT, Diamond MS, Kuhn RJ,
Rossmann MG.(2008). “Binding of a neutralizing antibody to dengue virus alters
the arrangement of surface glycoproteins.” Nat. Struct. Mol. Biol. 15:312– 317.
Okuno Y, Igarashi A, Fukai K. (1978). “Neutralization tests for dengue and Japanese
encephalitis viruses by the focus reduction method using peroxidase-anti-
peroxidase staining.” Biken J; 21:137–147.
Pierson TC, Fremont DH, Kuhn RJ, Diamond MS. (2008). “Structural insights into the
mechanisms of antibody-mediated neutralization of flavivirus infection:
implications for vaccine development.” Cell Host Microbe 4:229 –238.
Pitaksajjakul P, Benjathummarak S, Son H, Thongrungkiat S, Pongrama Ramasoota.
(2016). “Genomic studies of envelope gene sequences from mosquito and human
samples from bangkok, Thailand.” Springer plus; 5:1960.
Puiprom O, Yamashita A, Sasayama M, Limkittikul K, Boonha K, Jittmitraphap
A, Leaungwutiwong P, Kurosu T, Ramasoota P, Ikuta K. (2011). “Co-existence
of major and minor viral populations from two different origins in patients
The 7th National and International Graduate Study Conference 2017
" Thailand 4.0 Creative Innovation for Sustainable Development "
I538

secondarily infected with dengue virus serotype 2 in Bangkok.” Biochemical and
Biophysical Research Communications; 413: 136–142.
Rothman AL. (2011). “Immunity to dengue virus: a tale of original antigenic sin and
tropical cytokine storms”. Nature immunology; 532-543.
Russell PK and Nisalak A. (1967). “Dengue virus identification by the plaque reduction
neutralization test.” J Immunol, 99(2): 291-6.
Sangiambut S, Suphatrakul A, Sriburi R, Keelapang P, Puttikhunt C, Kasinrerk
W, Malasit P, Sittisombut N. (2013). “Sustained replication of dengue
pseudoinfectious virus lacking the capsid gene by trans-complementation in
capsid-producing mosquito cells.” Virus Res; 174: 37-46.
Schoggins JW, Dorner M, Feulner M, Imanaka N, Murphy MY, Ploss A. (2012).
“Dengue reporter viruses reveal viral dynamics in interferon receptor-deficient
mice and sensitivity to interferon effectors in vitro.” Proc Natl Acad Sci USA;
109: 14610-14615.
Shrestha B, Brien J, Sukupolvi-Petty S, Austin S, Edeling M. (2010). “The development
of therapeutic antibodies that neutralize homologous and heterologous genotypes
of dengue virus type 1”. PLoS Pathog. 6:e1000823.
Song KY, Zhao H, Jiang ZY, Li XF, Deng YQ, Jiang T, Zhu SY, Shi PY, Zhang FC, Qin
ED, Qin CF. (2014). “A novel reporter system for neutralizing and enhancing
antibody assay against dengue virus.”BMC Microbiology; 14: 44-52.
Sriburi R, Keelapang P, Duangchinda T, Pruksakorn S, Maneekarn N, Malasit P,
Sittisombut N. (2001). “Construction of infectious dengue 2 viruscDNA clones
using high copy number plasmid.” J Virol Methods;92(1):71-82.
Sukupolvi-Petty S, Austin KS, Engle M, Brien JD, Dowd KA, Williams KL, Johnson S,
Rico-Hesse R, Harris E, Pierson TC, Fremont DH, Diamond MS. (2010).
“Structure and Function Analysis of Therapeutic Monoclonal Antibodies against
Dengue Virus Type 2.” Journal of virology; 9227–9239.
Thavara U, Siriyasatien P, Tawatsin A, Asavadachanukorn P, Anantapreecha S,
Wongwanich R, Mulla MS. (2006). “Double infection of heteroserotypes of
dengue viruses in field populations of Aedes aegypti and Aedes albopictus
(Diptera: Culicidae) and serological features of dengue viruses found in patients
in southern Thailand”. Southeast Asian J Trop Med Public Health; 37(3): 468-
476.
WHO. (2009). “Dengue guidelines for diagnosis, treatment, prevention and control: new
edition.”
Zou G, Xu HY, Qing M, Wang QY, Shi PY. (2011). “Development and characterization
of a stable luciferase dengue virus for high-throughput screening”. Antiviral Res;
91: 11-19.
The 7th National and International Graduate Study Conference 2017
" Thailand 4.0 Creative Innovation for Sustainable Development "
I539