China's Maritime Rights and Interests: Organizing For Maritime Power
Upload
khangminh22Category
view
2download
0
April 20th-21st, 2017Solin, Croatia7th
InternationalMaritimeScienceConference
ORGANIZED BY:
FACULTY OFMARITIME STUDIESSPLIT, CROATIA
Book ofAbstracts
2017
UNIVERSITY OF SPLIT,SPLIT, CROATIA
ISSN 1847-1498
Book ofProceedings


HYDROGRAPHIC INSTITUTE OF THE REPUBLIC OF CROATIA, Split, Croatiawww.hhi.hr
POLISH NAVAL ACADEMY, Gdynia, Polandwww.amw.gdynia.plFACULTY OF MARITIME STUDIES, Kotor, Montenegrowww.fzpkotor.com
ORGANIZED BY: FACULTY OFMARITIME STUDIESSPLIT, CROATIAwww.pfst.hr
UNIVERSITY OF SPLITSPLIT, CROATIAwww.unist.hr
CO-ORGANIZED BY:
SPONSORED BY:
ORGANIZING COMMITTEE:
20177th
Pero Vidan, Ph D.Faculty of Maritime Studies, Split, Croatia
Nikola Račić, Ph D.Faculty of Maritime Studies, Split, Croatia
Nenad Leder, Ph D.Hydrographic Institute of the Republic of Croatia, Split, Croatia
Elen Twrdy, Ph D.Faculty of Maritime Studies and Transport, Portorož, Slovenia
Mihaela Bukljaš SkočibušićFaculty of Transport and Traffic Sciences, Zagreb Croatia
Danilo Nikolić, Ph D.Faculty of Maritime Studies, Kotor, Montenegro
Vinka KolićHydrographic Institute of the Republic of Croatia, Split, Croatia
Merica Slišković, Ph D.Faculty of Maritime Studies, Split, Croatia
Zdeslav Jurić, Ph D.Faculty of Maritime Studies, Split, Croatia
Vinko Vidučić, Ph D.Faculty of Maritime Studies, Split, Croatia
Gorana Jelić, Ph D.Faculty of Maritime Studies, Split, Croatia
Eli Marušić, Ph D.Faculty of Maritime Studies, Split, Croatia
Luka MudronjaFaculty of Maritime Studies, Split, Croatia
Maja KrčumFaculty of Maritime Studies, Split, Croatia
Anita GudeljFaculty of Maritime Studies, Split, Croatia
Luka VukićFaculty of Maritime Studies, Split, Croatia
Tonći PanžićHydrographic Institute of the Republic of Croatia, Split, Croatia
Nastia Degiuli, Ph D.Faculty of Mechanical Engineering and Naval Architecture, Zagreb, Croatia
INTERNATIONAL HYDROGRAPHIC ORGANISATIONwww.iho.int
REPUBLIC OF CROATIA - MINISTRY OF MARITIME AFFAIRS, TRANSPORT AND INFRASTRUCTUREwww.mppi.hr
TOWN OF SOLIN, Croatiawww.solin.hr
PORT OF PLOČE, Croatiawww.luka-ploce.hr
PLOVPUT Ltd., Croatiawww.plovput.hr
FACULTY OF MARITIME STUDIES AND TRANSPORTPortorož, Sloveniawww.fpp.uni-lj.siFACULTY OF TRANSPORT AND TRAFFIC SCIENCESZagreb, Croatiawww.fpz.unizg.hr
Indexing at: TRID

PROGRAMME COMMITTEE: Hercules Haralambiades (HOLLAND)
Nebo Jovanović (SOUTH AFRICA)
Mirko Puljić (BOSNIA AND HERZEGOVINA)
Mirsad Kulović (BOSNIA AND HERZEGOVINA)
Rosanda Mulić (CROATIA)
Pero Vidan (CROATIA)
Marija Bogataj (SLOVENIA)
Igor Vujović (CROATIA)
Šefkija Čekić (BOSNIA AND HERZEGOVINA)
Boris Tovornik (SLOVENIA)
Zoran Pandilov (MACEDONIA)
Bruno Sergi (ITALY)
Gordana Jovanovic Dolocek (MEXICO)
Ahmed Kovacevic (UNITED KINGDOM)
Zlatan Kulenović (CROATIA)
Josip Kasum (CROATIA)
Sanja Bauk (MONTENEGRO)
Jurij Kolenc (SLOVENIA)
F. Xavier Martinez de Oses (SPAIN)
Ivan Komar (CROATIA)
Nenad Vulić (CROATIA)
Danko Kezić (CROATIA)
Natalija Kavran (CROATIA)
Andrzej Gradziela (POLAND)
Špiro Ivošević (MONTENEGRO)
Tatijana Dlabač (MONTENEGRO)
Gojmir Radica (CROATIA)
Kristofor Lapa (ALBANIA)
Costel Stanca (ROMANIA)
Željko Akrap (CROATIA)
Ivana Šemanjski (BELGIUM)
Tomislav Batur (CROATIA)
Conor Mowlds (IRELAND)
Gilles Bessero (MONACO)
Violeta Roso (SWEDEN)
Tatjana Stanivuk (CROATIA)
Veljko Rogošić (CROATIA)

ISSN 1847-1498
Book of Proceedings7th International Maritime Science Conference
April 20th-21st, 2017, Solin Croatia

Helena Bule
Jadranka Kljajić
Čedomir Babić
DESIGN EDITORS:
FACULTY OF MARITIME STUDIES SPLIT
Ruđera Boškovića 37,
21000 Split, Croatia
www.pfst.unist.hr
PUBLISHER:
Pero Vidan, Ph.D.
Nikola Račić, Ph.D.
EDITORS IN CHIEF:
SENIOR EDITORS:
EXECUTIVE EDITORS:
EDITORS:
Tino Mrčelić
Branka Bedalov
COVER PHOTO:
MANUSCRIPT EDITOR:
Elen Twrdy, Ph.D.
Mihaela Bukljaš Skočibušič, Ph.D.
Gojmir Radica, Ph.D.
Luka Vukić, mag. ing
Luka Mudronja, mag. ing

i
CONTENTS
1 . . . . . . . .THE AUTOMATIC IDENTIFICATION SYSTEM (AIS) AS A DATA SOURCE FOR STUDYING MARITIME TRAFFICRonan Kerbiriou, Laurent Lévêque, Aboozar Rajabi, Arnaud Serry
18 . . . . . . .ROLE OF SOCIAL MEDIA TO ENHANCE MARITIME SAFETY IN SEARCH AND RESCUE OPERATIONOsama Fawzy Elbayoumi, Abd Elkhalik Kamal, Eldin Selmy
24 . . . . . . .INNOVATIVE FAST TIME SIMULATION TOOLS FOR BRIEFING / DEBRIEFING IN ADVANCED SHIP HANDLING SIMULATOR TRAINING AND SHIP OPERATIONKnud Benedict, Sandro Fischer, Michael Gluch, Matthias Kirchhoff, Michele Schaub, Michael Baldauf, Burkhard Müller
42 . . . . . . .EVALUATION OF THE FISHING VESSEL STABILITY IN DIFFERENT OPERATIONAL CONDITIONSKristofor Lapa, Miranda Vidhaj
52 . . . . . . .THE CONCEPT OF WATER MIST FIRE AND DETONATION PROTECTION FOR NAVAL VESSELSAndrzej Grządziela, Marek Dudziński
60 . . . . . . .SEAFARERS AND PUBLIC HEALTH RISKSRosanda Mulić, Ivo Šunjić, Mihaela Bukljaš Skočibušić
68 . . . . . . .PORT BOTANY – FACTORS THAT INFLUENCE DRY PORT IMPLEMENTATION - A DECADE LATERVioleta Roso, John Black, Eli Marušić
76 . . . . . . .INFORMATION SECURITY IN MARITIME DOMAINIvana Radmilo, Anita Gudelj, Pančo Ristov
83 . . . . . . .SECURITY FLAW OF INFORMATION RESOURCES ON SHIPSMartina Pivac, Pančo Ristov, Anita Gudelj
94 . . . . . . .ROLE AND IMPORTANCE OF INTEGRATED MANAGEMENT OF ALBANIAN COASTAL AREASShkëlqim Sinanaj
99 . . . . . . .MAIN LEARNING OUTCOMES MODULES FOR THE QUALIFICATION STANDARDS IN THE FIELD OF MARITIME MANAGEMENTAnita Gudelj, Merica Slišković, Helena Ukić
104 . . . . . .MARINA OPERATOR’S OBLIGATIONS FROM THE CONTRACT OF BERTH ACORDING TO THE BUSINESS PRACTICES OF CROATIAN MARINAS Vesna Skorupan Wolff, Ranka Petrinović, Nikola Mandić
112 . . . . . .IMPROVEMENT OF SEAFARERS RIGHTS ACCORDING TO THE AMENDMENTS OF 2016 TO THE CODE OF THE MARITIME LABOUR CONVENTION, 2006Petra Amižić Jelovčić, Ema Aralica
120 . . . . . .THE LEGAL STATUS AND REGIME OF ARCHIPELAGIC WATERS IN MARITIME LAWBojana Lakićević-Đuranović
126 . . . . . .STANDARD OFFSHORE WIND FARM PERSONNEL TRANSFER AND SUPPORT VESSEL CHARTER PARTY, WINDTIMEMarija Pijaca, Marjana Botić

ii
133 . . . . . .LAW OF THE SEA IMPLICATION TOWARDS INTERNATIONAL RELATIONS: MARITIME DELIMITATION CASEErmal Xhelilaj, Kristofor Lapa, Bledar Sakaj
141 . . . . . .MARINE ENGINEERS’ VIEWS ON ESP TEACHERSDavor Vodopija, Tomislav Skračić, Jelena Žanić-Mikuličić
148 . . . . . .DEMAND FOR CREW IN SEAFARER MARKET AND PREDICTIONS FOR THE FUTUREPero Vidan, Ivo Sunjić, Igor Stanovčić
156 . . . . . .OIL SPILL IN MARINE PROTECTED AREAS (MPAs) – A POSSIBLE ADJUSTMENT OF CROATIAN CONTINGENCY PLANLuka Vukić, Helena Ukić, Merica Slišković
163 . . . . . .COC COURSES TO REVALIDATE COMPETENCES BY USING SIMULATORSMarcel·la Castells, Francesc Xavier Martínez de Osés, Clara Borén
172 . . . . . .LEARNING STYLE AS A DETERMINANT OF USING MOODLEŽeljko Pekić, Srđan Jovanovski, Nađa Pekić, Tatijana Dlabač
181 . . . . . .CHARTER OF NAUTICAL TOURISM VESSELS IN CROATIAN AND MONTENEGRIN LAW – SIMILARITIES AND DIFFERENCESRanka Petrinović, Jelena Nikčević Grdinić, Nikola Mandić
187 . . . . . .CONTRIBUTION TO MARINE ELECTRICAL ENGINEERING AND INFORMATION TECHNOLOGIES CURRICULUMIvica Kuzmanić, Maja Krčum, Igor Vujović
193 . . . . . .RELATIONSHIP OF ADVANCES IN ELECTRONICS AND MARITIME TRAFFIC, WITH CASE STUDY OF FALL DETECTION IN SMART CABINSIgor Vujović, Ivica Kuzmanić, Zlatan Kulenović
200 . . . . . .CONTRIBUTION OF CROATIAN NAVY TO THE EUROPEAN UNION SECURITY THROUGH PARTICIPATION IN OPERATION “TRITON”Luka Mihanović, Slaven Sučević, Zlatimir Bićanić
213 . . . . . .CHALLENGES IN REGULATING ENVIRONMENTAL CRIMESAxel Luttenberger, Lidija Runko Luttenberger
221 . . . . . .SELECTION AND EVALUATION OF MARINE SHAFTING TORSIONAL VIBRATIONS CALCULATION SOFTWARENenad Vulić, Ivan Komar, Paul Jurišić
230 . . . . . .HUMAN ERRORS IN ECDIS RELATED ACCIDENTSZvonimir Lušić, Mario Bakota, Zoran Mikelić
243 . . . . . .ANALYSIS OF CRUISE SHIP TRAFFIC IN THE ADRIATIC SEA CONSIDERING MARPOL ANNEX IV AREAS OF LIMITED WASTEWATER DISCHARGESTina Perić, Nikola Račić
256 . . . . . .ANALYSIS OF THE SECURITY CHALLENGE IN MARITIME CLOUD COMPUTINGIve Botunac, Juraj Poljak, Dino Županović
264 . . . . . .ASSESSMENT OF THE VULNERABILITY TO EROSION FOR THE SVALBARD COASTAL REGIONSuszka Lechoslaw, Duje Veić, Sulisz Wojciech, Paprota Maciej, Majewski Dawid
272 . . . . . .NUMERICAL ANALYSIS OF THE BREAKING WAVE IMPACT ON THE MONOPILE SUPPORT STRUCTUREVeić Duje, Sulisz Wojciech

iii
283 . . . . . .RESULTS OF CALCULATIONS OF HOLTROP_MENNEN PROCEDURE OF “SHIP_POWER V_1.0” VERSUS OTHER COMMERCIAL SOFTWAREBlenard Xhaferaj, Agron Dukaj
290 . . . . . .COLLABORATIVE ENVIRONMENTAL MANAGEMENT (CEM) AS BASE FOR GREEN AIRPORT CONCEPTIgor Štimac, Monika Sente, Ornella Zibar
300 . . . . . .CROATIAN MARITIME HIGHER EDUCATIONAL INSTITUTIONS AND DISTANCE LEARNINGAndrija Nenadić, Marko Rudež
308 . . . . . .DATA BASED MODELLING OF THE MEAN WAVE PERIOD IN THE ADRIATIC SEAMarko Katalinić, Luka Mudronja, Petar Matić
319 . . . . . .DEVELOPMENT OF OCCUPATIONAL STANDARDS AND COMPETENCES IN MARITIME TRANSPORT AND LOGISTICSNeven Grubišić, Ana Perić-Hadžić, Mladen Jardas
330 . . . . . .DIGITAL LEARNING TOGETHER – TEACHING MARINE INSURANCE AND CHARTERPARTY ISSUES FOR FUTURE LEADERS AND EXPERTS OF THE SHIPPING COMPANIESPeter Ivar Sandell
335 . . . . . .SOME RESULTS OF NAUTICAL RISK ASSESSMENT IN PORTMaja Škurić, Vladislav Maraš
340 . . . . . .NEW POSSIBILITIES IN TEACHING THE MASTER MARINERS BY SIMULATING THE ACCIDENTS – COMBINING THE LEGAL AND SIMULATOR ENVIRONMENTNinna Roos, Peter Ivar Sandell
345 . . . . . .BOATING AND PLEASURE NAVIGATION AS CLIMATE-FRIENDLY TRANSPORTZoran Radmilović, Nataša Tomić Petrović, Vladislav Maraš
353 . . . . . .TWO-STROKE LOW SPEED DIESEL ENGINE SIMULATION MODEL FOR NOX ANALYSISBranko Lalić, Nikola Račić, Gojmir Radica
365 . . . . . .POTENTIAL OF ZAGREB INTERNATIONAL AIRPORT FOR THE ESTABLISHMENT OF LONGHAUL FLIGHTS WITH THE UNITED STATESDamir Vince, Ornella Zibar, Monika Sente
373 . . . . . .CHARTER AND NAUTICAL SERVICE QUALITY IN FUNCTION OF NAUTICAL TOURISM PORT COMPETITIVENESSNela Jadrijević, Ines Kolanović, Tatjana Stanivuk
381 . . . . . .PREVENTION OF POLLUTION BY YACHTS’ SEWAGE IN THE PORTS OF NAUTICAL TOURISM – THE LEGAL FRAMEWORKDorotea Ćorić, Adriana Vincenca Padovan, Lukša Čičovački
395 . . . . . .IMPLEMENTATION OF IT SYSTEMS FOR EMERGENCY MANAGEMENT AT THE ZADAR AIRPORTMarko Rapan, Igor Štimac, Sanja Steiner
404 . . . . . .SUSTAINABLE DEVELOPMENT IN MARITIME TRANSPORTATION FROM THE REGIONAL PERSPECTIVEMagda Wilewska-Bien, Lena Granhag
412 . . . . . .DEVELOPMENT POTENTIAL OF UAV OPERATIONS IN CROATIAVlaho Brajković, Boris Lazić, Filip Polanščak, Sanja Steiner
424 . . . . . .THE NEW PARADIGM OF MARITIME CONTRACTVedran Slapničar, Ivan Adum

430 . . . . . .METHODOLOGY OF IMPLEMENTING ENVIRONMENTAL LIFE- CYCLE COSTING IN SUSTAINABLE PUBLIC PROCUREMENTLidija Runko Luttenberger, Ante Šestan, Ivica Ančić
435 . . . . . .ENGINE MODEL DEVELOPMENT AND CALIBRATIONNikola Matulić, Toni Šantić, Nikola Račić, Gojmir Radica
445 . . . . . .BSM- BLACK SPOT MENAGEMENT AS MOTHODOLOGY APPROACH IN INCREASING SAFETY OF ROAD TRAFFICOsman Lindov, Fadila Kiso, Adnan Omerhodžić, Muhamed Begović
453 . . . . . .AN OVERVIEW OF E-LEARNING PLATFORMS FOR TRANSPORT AND INTERMODALITYAbidin Deljanin, Alem Čolaković, Belma Memić
463 . . . . . .DEVELOPMENT OF GUIDELINES FOR LOGISTICS OPERATORS SKILLS ENHANCEMENT TOOLS AND LEARNING METHODOLOGYSamir Čaušević, Muhamed Begović, Elma Avdagić-Golub, Adisa Hasković
474 . . . . . .CURRENT ELECTRONIC CHART DISPLAY AND INFORMATION SYSTEMS (ECDIS) IN USEMarko Čolak, Ivan Toman, Toni Bielić
481 . . . . . .ANALYSIS OF BALLAST WATER QUANTITY AND TYPE OF CARGO IN MAIN PORTS OF CROATIA FOR 2015.Maja Čović, Luka Vukić, Merica Slišković
487 . . . . . .ANALYSIS OF THROUGHPUT IN THE SELECTED PORTS OF SOUTH EAST EUROPEElen Twrdy, Marina Zanne, Milan Batista
497 . . . . . .LAYOUT DESIGN ISSUES OF THE ADRIATIC COASTAL CRUISERSIzvor Grubišić
508 . . . . . .THE IMPACT OF LARGE CONTAINER SHIPS ON THE TECHNOLOGY AND THE DEVELOPEMENT OF MODERN CONTAINER TERMINALSTomislav Batur
516 . . . . . .SATELLITE DERIVED BATHYMETRY – LOW COST SURVEY SYSTEMSNenad Leder, Tea Duplančić Leder
521 . . . . . .VIBRO-ACOUSTIC METHODS AS A TOOL TO IMPROVE CONDITION BASED MAINTENANCE PROCESS OF MARINE DIESEL ENGINESTomasz Lus
531 . . . . . .APPLICATION OF SIMULATION SOFTWARE IN ESTIMATION OF NOX EMISSION FROM SHIP’S MAIN ENGINE AT DIFFERENT LOADSMiroslav Vukičević, Radmila Gagić, Danilo Nikolić

1
Ronan Kerbiriou, Laurent Lévêque, Aboozar Rajabi, Arnaud Serry
THE AUTOMATIC IDENTIFICATION SYSTEM (AIS) AS A DATA SOURCE FOR STUDYING MARITIME TRAFFIC
THE AUTOMATIC IDENTIFICATION SYSTEM (AIS) AS A DATA SOURCE FOR STUDYING MARITIME TRAFFICRonan Kerbiriou, Laurent Lévêque, Aboozar Rajabi, Arnaud Serry
THE AUTOMATIC IDENTIFICATION SYSTEM (AIS) AS A DATA SOURCE FOR STUDYING MARITIME TRAFFIC
Ronan Kerbiriou1, Laurent Lévêque1, Aboozar Rajabi2, Arnaud Serry1
(1 University of Le Havre – UMR 6266 IDEES)
(2 University of Le Havre - LITIS)
(E-mail: [email protected])
ABSTRACT
The Automatic Identification System (AIS) is an automatic tracking system used on as a tool to increase navigation safety and efficiency as well as vessel traffic management. It enhances maritime safety and security. AIS’ contributions are undeniable in spite of some deficiencies and technical restrictions. This article presents the impacts and uses of AIS technology that can provide useful information to study maritime traffic, especially for the scientific community and port authorities. This desktop study is carried out in the framework of the implementation of a platform to reconstruct shipping routes using AIS data.
KEY WORDS
Automatic Identification System, AIS, maritime traffic, Research Platform, World maritime trade, Strategy of shipping companies
1. INTRODUCTION
Maritime transportation, the means used for 90% of international exchanges, is protected by several safety devices such as the development of maritime surveillance systems (Vandecasteele, Napoli, 2011). Nowadays, vessels take on board more and more aid to navigation systems. The aims of these systems is to simplify the positioning of vessels with regard to their environment (Devogele, 2009). Amongst these technologies, one must cite the ARPA1 radars that facilitate the relative positioning with other vessels in order to aid navigators in their choice of maneuvers, and information and mapping systems. AIS (Automatic
1 ARPA: Automatic Radar Plotting Aid
Identification System) receivers have of late been making an appearance in gateways. They manage the sending and receiving of GPS positions, speed, course, type, time and place of arrival of ships, towards and from the surrounding vessels. These shipboard or on-shore systems are all the more important the heavier the maritime traffic is, and which increases in the key transit points like straits and canals or in the congested areas of ports (e.g. North Sea). AIS is a system of data exchange between ships that was made mandatory by the International Maritime Organization (IMO) in 2004. AIS presents advantages for maritime transportation actors: improvements in safety, improvements in the management of fleets and navigation. Its distribution also presents numerous advantages in seaway management. However, the generalization of AIS poses problems of

7th INTERNATIONAL MARITIME SCIENCE CONFERENCE
2
April 20th-21st, 2017, Solin, Croatia
confidentiality for ship-owners, indeed for safety. In effect, the data transmitted by AIS are available to all, including the scientific community. The work presented is a synthesis of a reflection conducted during the development of a research platform for the analysis of maritime traffic and the assessment of the vagaries of maritime transportation, the CIRMAR platform. This tool makes it possible to envisage multiple operational applications that concern navigational safety as well as maritime economy, analysis of the strategies used by maritime actors or the environmental impact of maritime traffic. The article is based essentially on a documentary analysis of existing studies but also on in-depth bibliographical research which is both technical and within the field of human sciences even if there is a scarcity of Francophone literature dedicated to this new technology. The first part of the article puts forward a definition of AIS including its characteristics and objectives. The second part intends to highlight the contribution made by this system and its use. The third part focuses on the use of the data produced by AIS. Emphasis is given to the CIRMAR project which aims to construct and exploit a platform of data integration and application development based on the reconstruction of shipping routes using AIS signals transmitted by vessels of over 300 gross tonnage. The fourth section focuses on the case of the Adriatic Sea. By means initially of an empirical approach, the focus of this article, therefore, is to identify the relevance of AIS for the maritime and scientific communities.
2. CHARACTERIZATION OF THE AUTOMATIC IDENTIFICATION SYSTEM (AIS)
2.1. A Tool Designed for Security
The IMO helps with safeguarding the life at sea, improving the safety and efficiency of maritime navigation as well as protecting the marine environment. It attaches great importance to the development of systems that aim to facilitate and make maritime navigation safe by means of numerous groups working on electronic tools. So as to increase maritime safety, the IMO has adopted mandatory regulations concerning the installation of automatic identification systems capable of
providing information from one vessel to another as well as to on-shore authorities. These regulations form part of Chapter V of the SOLAS2 convention. These regulations have been adopted by most of the world’s merchant shipping fleet and concern principally all passenger ships whatever their size and vessels of a gross tonnage equal to or exceeding 300 tonnes (grt3) making international voyages. Based on the automatic exchange of communications by VHF radio4 between vessels on the one hand, between vessels and marine surveillance centers on the other and more recently via satellites, it enables identification of transmitting vessels in real time. This is included in the adoption of the ISPS code5 by the IMO, an international code for the safety of ships and port facilities which, besides establishing AIS, provides, inter alia, the appointment of safety officers, setting up safety plans or traceability of goods in transport units. There are, in fact, 2 classes of AIS: - Class A transponders are mandatory on board merchant ships exceeding 300 tonnages and all passenger ships meeting SOLAS standards (merchant navy, ferries, etc.). The Class A AIS system is used for the exchange of several types of signal that contain different information: information on the ships’ characteristics, their position, speed and course, their draught, type of cargo and destination (Cf. Figure 1). - Class B transponders concern small ships that are not required to comply with SOLAS conventions (recreational vessels, fishing vessels of less than 15 meters, etc.), so as to enable them to adapt voluntarily to the AIS system.
2.2. Operation and Technical Characteristics of AIS
The AIS system uses a transponder which transmits and receives in VHF. It also includes a GPS receiver 2 Safety of Life at Sea [http://www.imo.org/About/Conventions/ListOfConventions/Pages/International-Convention-for-the-Safety-of-Life-at-Sea-%28SOLAS%29,-1974.aspx]. 3 grt: the gross registered tonnage is one of the units of measurement for a vessel’s transportation capacity. 4 Very High Frequency/VHF is the part of the radio spectrum ranging from 30 MHz to 300 MHz. 5 International Ship and Port Facility Security is an international code.

3
Ronan Kerbiriou, Laurent Lévêque, Aboozar Rajabi, Arnaud Serry
THE AUTOMATIC IDENTIFICATION SYSTEM (AIS) AS A DATA SOURCE FOR STUDYING MARITIME TRAFFIC
which records the position and details of movement. Transmission and reception is carried out continuously and autonomously (Fournier, 2012). It transmits both static information of identification and type on the vessel and dynamic information on position (Cf. Figure1), and
information relating to the voyage on the nature of the cargo and ports of departure and destination. Generally, ships receive information in a radius of 15-20 nautical miles. Terrestrial stations located at higher altitudes can extend this radius to 40-60 miles, according to obstacles and weather conditions.
Figure 1. Nature of AIS data
Source: Le Guyader, Brosset, Gourmelon, 2011.
Launches of AIS satellites have been carried out since 2009 therefore considerably reducing the number of white areas (Chen, 2013). So, the latest change to the AIS technical standard includes a message specifically designed for AIS reception from satellite (AIS SAT). Any vessel equipped with AIS today is easily trackable, and this at any moment wherever it may be. The generalization of AIS does not entail removing the use of pre-existing systems and they are complementary: - In addition to shipboard systems, Vessel Traffic Services (VTS) actively monitor maritime traffic;
- The Global Maritime Distress and Safety System coordinates all the radio-communications means for rescue, nowadays paired for safety purposes with the Ship Security Alert System. The objective is to combine the pre-existing data coming from these sub-systems with an integrated system commonly called Vessel Traffic Monitoring Information System.
2.3. Objective of Control and Maritime Security
Owing to the new dimensions of all kinds of traffic and flows increasingly irrigating the whole planet,
Statistical Information Dynamic Information Information to the route
MMSI N°
IMO N°
Name
Type
Length and with
Ship’s position
UTC Date & Time
Speed & Course
Navigation Status
Radius of gyration
Nature of the cargo
Cargo’s Hazardousness
Departure port
Destination port

7th INTERNATIONAL MARITIME SCIENCE CONFERENCE
4
April 20th-21st, 2017, Solin, Croatia
the management maritime traffic has become a major contemporary issue (Faye, 2005). In fact, one of the challenges of the maritime community now is how to conciliate the surge in marine shipping while at the same time guaranteeing the protection of marine resources in a context of climatic change. In highly frequented waters, active surveillance of maritime traffic has taken on an even greater meaning. Maritime security and safety cover a wide and expanding area: from the management of commercial traffic to the fight against piracy, including sea rescue, counter-terrorism and the protection of port infrastructures. Recent measures aim to reinforce maritime safety with reference to the protection of life at sea, the preservation of transported goods, the protection of the vessel and prevention of collision. Often confused with security, safety is defined as a state of protection against threats or dangers coming from outside. In the maritime domain, safety can be defined as the prevention of unlawful acts liable to have a negative impact on the proper functioning of the supply chain and the safety of persons and goods (Fournier, 2012). Nevertheless, in practice, this classification is not inexplicable. As a matter of fact, an event linked to one of these notions can have repercussions on the whole of the maritime system.
3. CONTRIBUTIONS OF AIS AND USE OF DATA
The primordial contributions of AIS are in the field of maritime security and safety. The AIS system makes it possible to locate the great majority of vessels throughout the world. Therefore, several new services are available for the authorities or ship-owners, such as global maritime surveillance or constant knowledge of their boats’ positions (Prévost, 2012). Community websites have sprung up, allowing thousands of ships to be followed throughout the world.
3.1. AIS Efficiency
“AIS was initially intended to assist ships in avoiding collisions, and the port and maritime authorities in monitoring traffic and ensuring better surveillance of the sea” (Thery, 2012). This system enables vessels to be traced but also to anticipate their movements. Availability of precise data on the position of ships in real time renders it possible to manage traffic efficiently, to react more swiftly in the event of an accident or incident, while having more precise information on hazardous cargoes or indeed to improve surveillance of vessels in the interests of safety. The use of AIS as an aid to navigation is a precious source of information not only with regard to ships but also with regard to all the navigational aid beacons (Świerczyński, Czaplewski, 2013). AIS is placed notably as a relevant tool for the protection of the marine environment. Pollution from ships can take two principal forms. It occurs accidentally or through deliberate discharges, i.e. tank-cleaning operations and disposal of waste oils (Serry, 2013). In the former situation, AIS systems have a potential ability to reduce the frequency of polluting accidents linked to navigation by simply supplying an update of information concerning ships. Similarly, they can shorten the response time in the face of accidents by supplying information about the situation in near-real-time. AIS is therefore an important asset for the protection of the marine environment. (Schwehr, Mc Gillivary, 2007). Illegal discharges are the second cause of pollution of the marine environment. The impacts of these discharges are not as considerable as those of maritime disasters and consequently have not been of great concern. However, this form of pollution could be substantially reduced and AIS technology can make a contribution. For example, the Helsinki commission has been using AIS data since 2005 (HELCOM AIS) to assess the risks of hydrocarbon discharges associated with specific vessels (Cf. Figure 2). Today, Automatic Identification System

5
Ronan Kerbiriou, Laurent Lévêque, Aboozar Rajabi, Arnaud Serry
THE AUTOMATIC IDENTIFICATION SYSTEM (AIS) AS A DATA SOURCE FOR STUDYING MARITIME TRAFFIC
also be able used to estimate ships emissions. Jalkanen et al purposed a modeling system for maritime traffic exhaust emissions of NOx, SOx, and CO2 in the Baltic Sea area based on data obtained from AIS receivers (Maimun, 2013).
Figure 2. AIS, matching tools between traffic and
maritime discharges
This program has the ability to integrate AIS in order to create a link between ships and the discharges identified, for the purpose of criminal prosecution. For example, Lloyds of London has already used AIS data from the AISLive6 service in legal proceedings involving accidents of ships. AIS is expected to become an important element in the fight against marine pollution caused by ocean traffic, all the more so as, together with satellite and aircraft detection techniques, AIS coverage is growing both along the shoreline and out at sea, thus making it possible to reduce the ability of ships to unlawfully discharge hydrocarbons at sea.
3.2. Some Problems and Limits
“If the advantages of the new technologies are undeniable, as long as these advances form part of economic and social life, they run up against the risk of violations of privacy and individual liberties” (Deboosere, Dessouroux, 2012).
3.2.1. Technical Limits
Merchant ships of under 300 tonnages are exempt from the system which limits AIS’s capacity with regard to maritime surveillance. The great
6 http://www.aislive.com/
drawback at present is linked to the fact that the majority of small ships are not equipped and can therefore not be detected nor detect other boats using this system. Nor does the system enable them to detect fishing net buoys and any other unusual floating object (Dujardin, 2004). AIS is considered to be the best system of detection currently used in all ports worldwide, but it does not make it possible to detect every ship (Zouaoui-Elloumi, 2012). As a matter of fact, AIS reliability is far from perfect. The captain can cut off the system. There is no provision for duplication of equipment. It can break down or be defective, providing false indications. VHF links can deteriorate in certain conditions and, according to the position and altitude of the transmitting antenna on the ship and the 20 nautical miles of depth, equipment might not be covered. Information relative to the voyage on the nature of the cargo and the ports of departure and destination is entered manually on board. It could be erroneous, voluntarily or not. The majority of errors detected is essentially a result of omission (Harati-Mokhtari, Wall, Brooks and Wan, 2007). Then, a much debated issue concerns the use of AIS for the purpose of radio communications between ships to agree on maneuvers in order to avoid a collision. AIS will not change ARPA’s status of being the principal tool used to assist the navigator in collision avoidance maneuvers, not only because all ships will not be equipped with AIS, but also because of the system’s limitations. AIS and ARPA are in fact complementary and should be used in conjunction with one another, even if AIS provides more complete information than shipboard radars. Besides, reception of AIS signals via satellite is affected by interference from certain phenomena that do not exist or whose effect is limited when the reception is on ground level, like a higher noise level or collisions between AIS signals. The most effective way to avoid these “slot collisions” is to reduce AIS congestion. This is not possible on the existing AIS channels, given the ever-increasing number of AIS users, but could be accomplished if other channels were used for this new message. Lastly, the system is potentially vulnerable to more sophisticated attacks: - The system is vulnerable to intentional or unintentional interference because the technical

7th INTERNATIONAL MARITIME SCIENCE CONFERENCE
6
April 20th-21st, 2017, Solin, Croatia
characteristics are public (Dujardin, 2004), notably in high-traffic areas; - Intentional broadcast of erroneous information (fictitious ships, duplication with real ships); - Transmission of computer viruses (AIS is managed by a mini computer). The situation of a maritime area can therefore not be controlled exhaustively with AIS. As a matter of fact, AIS must be integrated in E-Navigation. Furthermore, one of the principal concerns is “consistency between the principle of freedom of movement on the seas with respect for a framework of increasingly regulated activity” (Terrassier, 2004). In effect, the high seas are often defined as a marine area which, in principle, eludes any sovereignty. Surveillance of maritime traffic in real-time seems to partially challenge this age-old freedom of navigation.
3.2.2. AIS and Piracy
Maritime piracy is not a new phenomenon but, faced with an increase in it, especially in the Gulf of Aden, we are entitled to question the apparent inability of the multinational marine force to fight effectively against these pirates. In effect, these sea bandits do not appear to encounter any difficulties in detecting their potential targets. The existence of a vast network of information in the principal ports of the Middle East and East Africa is a proven fact (Auzon, 2013). At the same time, the system is increasingly frequently used by modern-day pirates (Salim Chebli, 2009), in order to locate their potential targets. All these data are in fact available, of course, to all the officially authorized listening services but to anybody else as well. In its current form, the system does not allow the possibility to choose the direction and transponder to which the AIS information is sent. This simplifies the pirates’ work and suggests that they have command of these technologies. Besides, certain groups of pirates make a considerable profit which allows them to invest money, most notably in better technological systems and training. (Dumouchel, 2009). The mother ships are consequently equipped with the latest technology in the field of detecting in space which enables them to target and organize an attack with great accuracy by taking a targeted ship by surprise and dispatching speed boats which are sometimes undetectable.
Another, simpler, solution exists, that of an autonomous terminal, marketed freely and designed for amateur yachtsmen. For a few hundred euros, any potential pirate can see, on his screen, any ships within a radius of twenty or so miles around his position. All that is needed is for pirates to be in the right position to cover the usual itineraries of maritime traffic and choose their prey according to the name of the ship, its cargo or its destination. Furthermore, the AIS system can also be used to broadcast false information that can be fabricated with relative ease. The aim of these misleading messages (distress signal, wrong locality of the ship, etc.) is essentially to attract attention and lead the ships targeted into a trap. Prevention remains a key element in the fight against maritime piracy (Salim Chebli, 2009). Yet, even when navigating without lights, ships remain detectable through their VHF transmissions linked to AIS. In this case, the solution is to deactivate the AIS system of vessels entering at-risk areas such as the Gulf of Aden which are often also areas of heavy traffic in which recourse to AIS is primordial in order to reduce risks of collision.
3.2.3. Socio-Economic Activities and Consequences
Owing to its rapid development, AIS is a fantastic tracking tool. Together with information agencies, ship-owners were the first to take possession of it: it enables them to track their fleet from land and ensure that the logistics are optimum. If the data are free of charge as regards observation of AIS positions in real-time, this has no legal force especially for accessing archived databases. Recordings of arrival and departure are also provided by the Lloyd’s Register Fairplay for commercial purposes in the framework of their Sea-web database7 (Kaluza, Kölzsch, Gastner, Blasius, 2010). These big groups provide AIS information on a global scale but access to it is fee-based and relatively costly. For example, the Lloyd’s List possesses the world’s largest network of AIS receivers. Furthermore, open AIS information creates fears of commercial espionage. Maritime companies and shippers in fact wish to remain as discreet as
7 www.sea-web.com

7
Ronan Kerbiriou, Laurent Lévêque, Aboozar Rajabi, Arnaud Serry
THE AUTOMATIC IDENTIFICATION SYSTEM (AIS) AS A DATA SOURCE FOR STUDYING MARITIME TRAFFIC
possible regarding commercial data and information. Imparting information other than the automatic transmission of certain data such as the ship’s destination or its ETA8 makes them fear the risk of commercial espionage. Lastly, if tracking of a fishing fleet is initially ensured by the system of coverage via satellite, the Vessel Monitoring System, which monitors the entirety of activity of European shipping boats of over 12 meters, within the scope of the joint management of resources, the AIS system can be used for this activity. Its usefulness has already been recognized in areas where commercial traffic and fishing activities are considerable, even if fishermen do not appreciate having their positions made public and are sometimes reluctant to fit the equipment.
4. AIS AND SCIENTIFIC RESEARCH
The data obtained from AIS systems, in fact, constitute a new wealth of information not only for the maritime community and the wider public but for research scientists as well. They comprise a potential source of information on maritime traffic, essentially commercial traffic. Consequently, broadcasting it in real-time makes a real contribution especially to the scientific community.
4.1. A Recent Source with as yet Restricted Use
The state of the art, essentially founded on Francophone literature, brings to the fore works based principally on the subject of security (Fournier, 2012) or on the frequentation of specific, mainly coastal spaces (Bay of Brest, marine coastal areas and insular areas). Moreover, the analysis of works, reports, academic and research studies confirm the relative scarcity of works in Human Sciences and highlights a fragmented literature which approaches subjects like international maritime law, physics, signal processing, geopolitics and many others (Fournier, 2012). As for the far more extensive literature in English, it is a relatively different situation. More research 8 ETA denotes Estimated Time of Arrival, a term often used by freight and express parcel delivery companies. By convention, the ETA is given in the recipient’s local time.
has been done on AIS on different spatial scales both global (Shelmerdine, 2015), regional (Cairns, 2005) and local (Perkovic, Gucma, Przywarty, Gucma, Petelin, Vidmar, 2012). As appears in studies done by Richard L. Shelmerdine (Shelmerdine, 2015), the research focuses on surveillance of itineraries taken by maritime transport and the intensity of shipping traffic (Eriksen, Høye, Narheim, Meland, 2006), the prevention of maritime accidents and the detection of unusual situations (Kao, Lee, Chang and Ko, 2007) and on the environmental impacts of maritime traffic (Jalkanen, Johansson, Kukkone, 2013). So, the Eastern Research Group (ERG) used a Geographic Information System (GIS) to map and analyze both individual vessel movements and general traffic patterns on inland waterways and within 9 miles of the Texas coastline. ERG then linked the vessel tracking data to individual vessel characteristics from Lloyd’s Register of Ships, American Bureau of Shipping, and Bureau Veritas to match vessels to fuel and engine data, which were then applied to the latest emission factors to quantify criteria and hazardous air pollutant emissions from these vessels. The use of AIS data provides the opportunity for highly refined vessel movement and improved emissions estimation, however, such a novel and detailed data set also provides singular challenges in data management, analysis, and gap filling, which are examined in depth in this paper along with potential methods for addressing limitations (Perez, 2009). Some researchers also use AIS to study ships comportments due to meteorological circumstances. For instance, the Baltic Sea is a seasonally ice-covered sea located in a densely populated area in northern Europe. Severe sea ice conditions have the potential to hinder the intense ship traffic considerably. Thus, sea ice fore- and nowcasts are regularly provided by the national weather services. In their study, Löptien and Axell provide an approach by comparing the ship speeds, obtained by the AIS, with the respective forecasted ice conditions. They find that, despite an unavoidable random component, this information is useful to constrain and rate fore and nowcasts. More precisely, 62–67% of ship speed variations can be explained by the forecasted ice properties

7th INTERNATIONAL MARITIME SCIENCE CONFERENCE
8
April 20th-21st, 2017, Solin, Croatia
when fitting a mixed-effect model (Löptien, Axell, 2014). The website Marine Traffic 9is a very good example of the dissemination of information. It provides information, partially free of charge and in real-time, on the movement of ships in an almost global area of coverage (Thery, 2012). It is part of an academic project whose objective is to gather and disseminate these data with a view to exploiting them in various domains. This is an open project and the organizers are constantly looking for partners prepared to share data from their region so that they can cover more maritime areas and ports worldwide. Marine Traffic has disclosed it has no less than 5 million monthly users. Everyone can explore at leisure each of the areas for which the information is available. This exploration is made all the more interesting in areas where traffic is concentrated like in the English Channel (Cf. figure 3), the most frequented maritime route in the world. The Marine Traffic website shows a spectacular image of it. For example, Marine Traffic places 44 500 vessels of all types on the globe and 650 ships in the central Channel simultaneously, at time t (Cf. figure 3).
Beyond showing maritime itineraries, Marine Traffic also provides the means by which to observe the movement of vessels in ports, provided that they are equipped with AIS stations.
The AIS system being an open one, it has given rise to sites other than Marine Traffic like the British site ShipAIS. The sites broadcasting AIS information, therefore, have a great advantage, that of making it possible to visualize maritime traffic in real-time free of charge. In terms of research, the interest of these sites of visualization of AIS data is certainly more important than making archived databases available but it makes it possible namely to compare the reality of marine traffic with the rhetoric coming from shipping companies by checking, for example, the vessels
9 http://www.marinetraffic.com
operating on regular lines. By linking this information with a shipping database, it is additionally possible to determine the capacities offered by these same maritime lines.
4.2. Plainly Stated Potential
A greater use of AIS data is made possible thanks to the development of a network of stations covering more and more coastal areas, providing new possibilities to the mapping of transport activity. “Several studies carried out at the Institut de recherche de l’école navale (IRENAV) are based on the exploitation of AIS data with the aim of detecting unusual situations (risks of collision) and of qualifying the behaviour of vessels in real time. Thanks to the availability of AIS data, it is possible to identify, quantify and map navigation lanes of vessels” (Le Guyader, Brosset, Gourmelon, 2011). The method, founded on a spatial analysis within a geographical information system (GIS) combined with a database server, makes it possible to reconstruct each vessel’s trajectory in such a way as to identify the navigation lanes then to match the daily traffic in its temporal and quantitative dimensions. It is therefore possible to complete the maritime transport map which has been traditionally directed towards analyzing maritime networks and flows globally, towards recording the departure and arrival ports or analyzing the spatial influence of maritime transport. “In a global approach to running maritime activities, this information can be analyzed with other information describing the operation of nautical and fishing activities, in order to characterize their interaction and bring to light potential conflicts. In the medium term, applying maritime traffic tracking systems to the entirety of activities involving different types of vessels, as intended in the framework of E-Navigation, will no doubt represent a precious data source as an aid for navigation in real- time, fishing management and contribute to the integrated management of the sea and coast” (Le Guyader, Brosset, Gourmelon, 2011).

9
Ronan Kerbiriou, Laurent Lévêque, Aboozar Rajabi, Arnaud Serry
THE AUTOMATIC IDENTIFICATION SYSTEM (AIS) AS A DATA SOURCE FOR STUDYING MARITIME TRAFFIC
Figure 3. Ships in the English Channel according to the Marine Traffic website (2 March 2017 / 09.35) Source : http://www.marinetraffic.com
Furthermore, the Envisia device is an illustration of the relevance of AIS data. Created by the CETMEF (Centre d'études techniques maritimes et fluviales) at the initiative of the French State, it is a gathering and archiving system for a whole series of data, including AIS data, supplied by computer servers and coastal facilities (Guichoux et al., 2011). This system is already in use for identifying areas of high traffic density and therefore improving assessment of the risks linked to marine traffic, identifying coastal areas that can be developed or measuring the pressure of human activities on the marine environment. The use of AIS is based on a multi-scaled character; spatial scales (local/global) and temporal (short term/long term) of the information produced by AIS signals linked to other bases. This makes operating functions possible in a variety of areas. A potential application of archived AIS data, therefore, consists in extracting statistics of the voyage time for a population of ships (Mitchell et al, 2014). The availability of a reliable and consistent data source has proved difficult in order to make it possible to build a picture of flows of exchange in the short, medium and long terms, at both regional and global scales. Maritime companies’ schedules are very heterogeneous and subject to the above-mentioned vagaries, and movements recorded by the port authorities’ harbor master’s offices are very difficult to gather without considerable
means. The availability of archived AIS data opens interesting perspectives for the characterization of maritime activities on spatial, temporal and quantitative levels. There is great potential of AIS to contribute to scientific research: analysis of the maritime itineraries taken by vessels, estimation of vessel discharges, identification of port calls and duration, analysis of maritime companies’ strategies, mapping vessel flows, analysis of interactions with the vessel’s environmental elements such as climatic conditions, state of the sea or density of traffic. The automatic character of transmitting vessel positioning signals and the generalization of this to all ships of over 300 tonnage provides an opportunity to track and analyze the vessels’ itineraries. Once this source of information has been properly checked through matching it with external data with regard to vessels and ports, it opens the way to reasoning on a global scale as well as on the scale of port approaches, in real-time as well as long term. With regard to scientific research, it represents, for example, the possibility to test traffic models, be they predictive or dynamic, long or short term, which could also be of interest to port authorities. As for the professional world of shippers and logistics providers, it represents the possibility of better apprehending the vagaries of maritime transport which, by comparison with terrestrial logistics, is often seen as a “black box”. It is also the opportunity to equip

7th INTERNATIONAL MARITIME SCIENCE CONFERENCE
10
April 20th-21st, 2017, Solin, Croatia
themselves with tools for evaluating the positioning of ports in a global network of port calls so as to direct their local logistics arrangements according to the partner countries.
4.3. CIRMAR: A Research Platform Using AIS Data
Geo-economic entry in the use of AIS signals request a number of methodological and technical issues. Some related to the duration of observation which must be long enough to account for seasonal trends, others related to the geographic scope, which must be comprehensive if you want to account for the economic gap between different regions of the globe. All this requires the accumulation of large masses of data. Arises also the question of the intrinsic quality of the data transmitted by the AIS signals. The CIRMAR device is based on affiliation to a collaborative network. It allows to develop and test processing of analysis tools and representation of the data. Nowadays, the amount of data in our world is exploding and analyzing large data collections – so called big data – is unavoidable and has tremendous benefits. In maritime-related fields, the AIS messages could be considered as big data due to the huge amount of data transmitted every day. Therefore, a proper platform is needed to receive, decode, clean, store and analyze AIS messages. Our project is made of some different phases. During the first phase, AIS messages are received by an antenna which is installed at University of Le Havre. The received messages of each day are stored in a file with a proper file name that shows the arrival date of messages. We also use the messages stored on AISHub which are from all around of the world. As the received messages are coded, a Java application using an open source library decodes the messages and make them ready to be stored. We ignore messages which includes errors like checksum error. For this project, only AIS message types 1, 2, 3, 4, 5, 18 and 19 are interesting, so we ignore the other ones. The next step is to store AIS messages in the database. For this project, we have collected the AIS messages from the second half of 2015 and we have many files which are larger than 2GB, each of them including more than 10000000 AIS
messages. This is why we consider it as the big data. We developed an application which reads the collected files and stores decoded AIS messages in our MongoDB database. The MongoDB is a kind of NoSQL databases which is suitable for big data application. In addition, we have also made a web-based user interface using Ruby on Rails web framework to let geographers and other people from logistics and related fields access and work with the stored data. In the future, we will add some other big data technologies to facilitate working with the data and provide analyzing tools. Speaking about data treatment, the two major obstacles to produce information for geo-economic issues are the amount of data to process the quality of data and particularly static data. Even if they are of small size (39 characters for example) the number of AIS messages received, led to the formation of large amounts of data. A relevant analysis of marine traffic must also consider to the best of the seasonality of flows (Peak season, Chinese new year) and at least the duration of the transit times for the longest roads. The volume of data to decode and then analyze is therefore considerable. Regarding data quality, most of the problems relate to information that are populated on each trip by an operator on the ship. They concern the reference to the port of destination, the navigation status, the draught of the ship and ETA (estimated time of arrival). Positioning and road information transmitted automatically, entering the static information in the transponder is a subsidiary operation compared to other more crucial operations for navigation, especially during the approach or departure from the port. So, use of aggregated material from AIS messages to analyze maritime trade flows must be based preferably on dynamic data (positioning and road), which are more reliable than the static ones. That information must be validated by external data: therefore, we use a database of ships via the MMSI number and a referenced geo database on ports (Lévêque, 2016). So, during the treatment, the first step is to decode all the messages. The amount of data to process may require to allocate treatment on several sessions and machines to avoid excessive wait times. The results serve as a base for different types of analyses: port performance analysis

11
Ronan Kerbiriou, Laurent Lévêque, Aboozar Rajabi, Arnaud Serry
THE AUTOMATIC IDENTIFICATION SYSTEM (AIS) AS A DATA SOURCE FOR STUDYING MARITIME TRAFFIC
(duration of call and ship size…), shipping companies’ strategies, maritime network study, regional markets analysis.
5. ADRIATIC SEA CASE STUDY
At the time when Central Europe becomes more closely integrated into international commerce, new markets take shape for the ports of the Adriatic Sea. Though still with modest tonnage levels compared to their counterparts in the North Sea and the Western Mediterranean, these ports, given European perspectives and recent dynamism tied to new ambitions. The Adriatic Sea becomes more transport-intense. AIS data allows different geographical approaches. In the case of the Adriatic Region, we can develop some examples of treatment and uses (Note that this work is in progress and therefore still incomplete results). Thanks to the AIS data and in relationship with external databases, we determined all container ships that called at a BSR port between January 1st 2016 and December 31th 2016. We kept the first 10 ports by their container traffic to refine the analysis.
Figure 4. Container traffic of Adriatic Sea Ports in
2015
At first, we can use AIS data not only to obtain quite generic information like the number of port calls in a certain period and/or a specific area (Figure 2) but also the number of operators involved in maritime transportation. It is also interesting to focus on ships to monitor maritime roads, their adaptations to weather or economic imperatives. In the figure 5, we can observe a difference between the north and the South of the Adriatic Sea. For example, we observed the presence of 44 operators in the port of Venice and it represented 18% of port of calls. On the contrary, the Port in the South of the Adriatic Sea had less than 10 operators and represented less 4% of ports of calls. This observation is related to the economic dynamism of the area.
Figure 5. Container ships’ port calls and operators
from January 1st 2016 to December 31th 2016
According to our data, we can establish that in the studied period, 68 different operators have provided containerized services to ports. From our geo-economic point of view, we can go further in analyzing operators, their strategies or their networks. Indeed, the choice of companies, their presence (or not) in ports are good indicators for understanding the functioning of the port system and to evaluate its potential.

7th INTERNATIONAL MARITIME SCIENCE CONFERENCE
12
April 20th-21st, 2017, Solin, Croatia
So some companies like Joy Marine have quite local strategies with ships calling only in Bari when others like MSC propose services to almost all the ports. In addition, it is also possible to determine the capacity offered by each company in each port. For instance, during the period of the study, Maersk Line offered a capacity of 518 011 TEU in the port of Koper and 527878 in Rijeka but only 4740 TEU in Venice. It is an interesting way to focus on the three different types of actors present in the region: some major ones in the feeder field like Sea Consortium, some global carriers (MSC or CMA-CGM) and regional ones (Tarros SpA, Bia Shipping…). Furthermore, the mapping of maritime lines’ networks is another opportunity offered when data on flows are available: we can map the real network of services proposed by each operator in the Adriatic Sea. It clearly indicates that companies have different strategies: global carriers concentrate their flows on some ports like Koper which apparently has a regional hub when companies specialized in feeder services have a more decentralized network (Figure 6). For example, we mapped the capacity offered by COSCO in 2016. It is concentrated in the North of the Adriatic Sea principally in the ports of Koper, Trieste, Venice and Rijeka. COSCO uses the ports of Piraeus and Ayios Nikolaos (Greece) like a hub as it is the owner of these ports. Afterward, it transfers the goods to the Adriatic Sea. The behavior of COSCO matches with analyzes on the precedent map and a concentration of the calls is on the ports of the North of Adriatic Sea. Nodaway, the question of port competitiveness is crucial for port authorities and operators. It especially includes port operation efficiency level, handling charges, reliability or landside accessibility. Regarding the Adriatic Sea ports, we can analyze operation efficiency using the duration of port calls given by AIS data. The results must be apprehended with caution, do not hesitate to remove data that appear abnormal. For instance, discarding prolonged stops (one week or more), dedicated to the maintenance of ships. The critical examination of results is imperative, especially if one wants to start in evaluating port performance (Lévêque, 2016).
Figure 6. Sea Consortium capacity offered by COSCO from January 1st 2016 to December 31th
2016
Figure 7. Comparison of container ships’ capacity and duration of port call in Adriatic Sea ports
Adriatic container ports appear very different (Figure 7): three ports in particular, Koper, Rijeka and Trieste, are served by ships offering a bigger capacity than in the other ports. Combining this analyses to operator’s strategies is also interesting. By integrating the port traffic in the research process, it is possible to estimate the average length of handling of a TEU in each port. In that
13
Ronan Kerbiriou, Laurent Lévêque, Aboozar Rajabi, Arnaud Serry
THE AUTOMATIC IDENTIFICATION SYSTEM (AIS) AS A DATA SOURCE FOR STUDYING MARITIME TRAFFIC
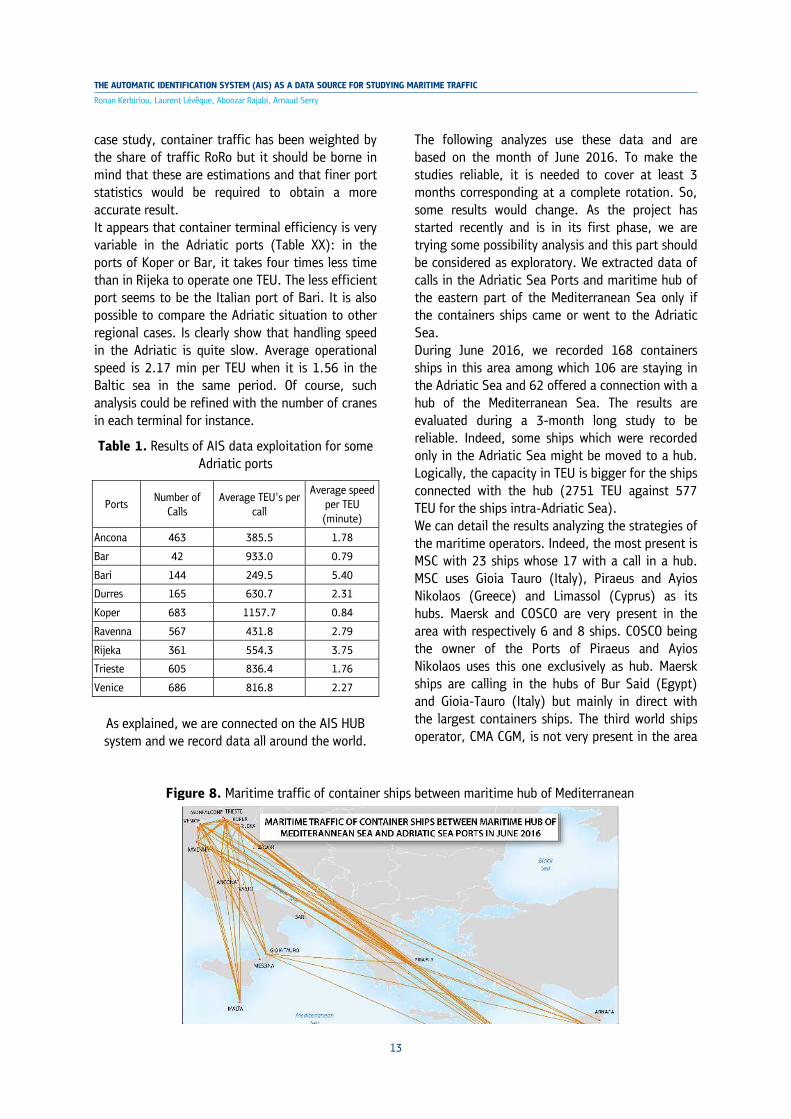
case study, container traffic has been weighted by the share of traffic RoRo but it should be borne in mind that these are estimations and that finer port statistics would be required to obtain a more accurate result. It appears that container terminal efficiency is very variable in the Adriatic ports (Table XX): in the ports of Koper or Bar, it takes four times less time than in Rijeka to operate one TEU. The less efficient port seems to be the Italian port of Bari. It is also possible to compare the Adriatic situation to other regional cases. Is clearly show that handling speed in the Adriatic is quite slow. Average operational speed is 2.17 min per TEU when it is 1.56 in the Baltic sea in the same period. Of course, such analysis could be refined with the number of cranes in each terminal for instance.
Table 1. Results of AIS data exploitation for some Adriatic ports
Ports Number of
Calls Average TEU's per
call
Average speed per TEU
(minute)
Ancona 463 385.5 1.78
Bar 42 933.0 0.79
Bari 144 249.5 5.40
Durres 165 630.7 2.31
Koper 683 1157.7 0.84
Ravenna 567 431.8 2.79
Rijeka 361 554.3 3.75
Trieste 605 836.4 1.76
Venice 686 816.8 2.27
As explained, we are connected on the AIS HUB system and we record data all around the world.
The following analyzes use these data and are based on the month of June 2016. To make the studies reliable, it is needed to cover at least 3 months corresponding at a complete rotation. So, some results would change. As the project has started recently and is in its first phase, we are trying some possibility analysis and this part should be considered as exploratory. We extracted data of calls in the Adriatic Sea Ports and maritime hub of the eastern part of the Mediterranean Sea only if the containers ships came or went to the Adriatic Sea. During June 2016, we recorded 168 containers ships in this area among which 106 are staying in the Adriatic Sea and 62 offered a connection with a hub of the Mediterranean Sea. The results are evaluated during a 3-month long study to be reliable. Indeed, some ships which were recorded only in the Adriatic Sea might be moved to a hub. Logically, the capacity in TEU is bigger for the ships connected with the hub (2751 TEU against 577 TEU for the ships intra-Adriatic Sea). We can detail the results analyzing the strategies of the maritime operators. Indeed, the most present is MSC with 23 ships whose 17 with a call in a hub. MSC uses Gioia Tauro (Italy), Piraeus and Ayios Nikolaos (Greece) and Limassol (Cyprus) as its hubs. Maersk and COSCO are very present in the area with respectively 6 and 8 ships. COSCO being the owner of the Ports of Piraeus and Ayios Nikolaos uses this one exclusively as hub. Maersk ships are calling in the hubs of Bur Said (Egypt) and Gioia-Tauro (Italy) but mainly in direct with the largest containers ships. The third world ships operator, CMA CGM, is not very present in the area
Figure 8. Maritime traffic of container ships between maritime hub of Mediterranean

7th INTERNATIONAL MARITIME SCIENCE CONFERENCE
14
April 20th-21st, 2017, Solin, Croatia
with only 2 ships record during the same period. CMA CGM is in the alliance “Ocean Alliance” with Sea and Adriatic Sea ports in June 2016. COSCO, enabling it to use the Hubs in Greece and feeder of COSCO to deserve ports of the Adriatic Sea. In general, the most important hub is the port of Piraeus and Ayios Nikolaos with 32 ship stopovers. During this month, we recorded 110 operators of containers ships. When we group them by nationality, we can observe an important presence
of some countries. On the table below, we can observe 21 Turkish operators, 18 of Netherlands and 18 of Germany. Turkish and Dutch operators proposed a service intra-Adriatic. For German operators, it was balanced (9 operators offered a maritime connection with a hub and 9 was only intra-Adriatic). Analyzing the capacity in TEU proposed by nationality, it’s logically the Switzerland with the presence of MSC and a total capacity of 2 million.
So, the Adriatic Sea case study shows some possibilities of using AIS in the field of geo-economic research.
6. CONCLUSION
Satellite Automatic Identification System (AIS) has quickly become an operational tool exploited by a large number of actors. In fact, it provides precious
information, not only to crews but also to terrestrial regulatory authorities, not forgetting individuals and research scientists. On-board security and safety for ships at sea are topical subjects owing to the growing number of acts of piracy. Among the tracking tools that exist for maritime traffic, AIS supplies information but does not reinforce ships’ safety. On the contrary, it sometimes even appears that it is used by the very pirates themselves. In fact, the cause of the system’s greatest defect comes from one of its
HUB INTRACountry Number operators Number operators TEU sum Number operators
Albania 1 416 1 Azerbaijan 1 450 1 Bulgaria 2 1 061 2 China 2 1 352 941 3 Cyprus 1 7 242 1 Denmark 1 918 758 1 Egypt 2 1 6 708 3 France 1 861 583 1 Germany 9 9 336 082 18 Greece 1 1 1 955 2 India 1 6 336 1 Israel 1 12 681 1 Italy 2 2 16 929 4 Lebanon 1 2 16 539 3 Lithuania 1 6 690 1 Marshall Islands 2 1 8 765 3 Morocco 1 5 634 1 Netherlands 5 13 57 310 18 Norway 3 10 381 3 Romania 2 2 038 2 Roumania 1 10 108 1 Russia 4 2 268 4 Switzerland 2 2 107 513 2 Taïwan 1 110 008 1 Turkey 5 16 92 610 21 Ukraine 1 4 14 289 5 United Arab Emirates 1 1 417 751 2 United Kingdom 2 1 51 117 3 USA 1 2 016 1
TOTAL 43 67 5 438 179 110
TOTAL
Table 2. Nationality of containers ships operators in June 2016

15
Ronan Kerbiriou, Laurent Lévêque, Aboozar Rajabi, Arnaud Serry
THE AUTOMATIC IDENTIFICATION SYSTEM (AIS) AS A DATA SOURCE FOR STUDYING MARITIME TRAFFIC
main assets: the data are originally free of charge, free to use and thus difficult to monitor. AIS technology has fundamentally changed the landscape for monitoring the maritime domain. Improving upon existing AIS technology already deployed aboard all large vessels and many smaller vessels around the globe, satellite AIS is truly revolutionary in providing a complete and global picture of the world's maritime shipping environment (Kocak & Browning, 2015). The possibilities for exploiting information from AIS signals gives this device a character of global information. It is in fact: • Multi-scaled, temporal and spatial, • Multi-purpose: an aid to navigation, tracking of global economic flows, analysis of the behavior of economic players, behavior of sailors, interaction with the environment, etc. • Multi-use: management of maritime lines, of traffic, of port calls, construction of indicators of reliability, performance, impacts on logistics chains, etc. • Wealth of opportunity for theoretical developments in a large number of disciplines since it is, together with its air traffic counterpart, the only source of continuous tracking of moving objects on a planetary scale. This enormous potential is being exploited within the CIRMAR project which aims to set up a platform to integrate the data and for application development founded on the use of AIS signals. This poses scientific challenges and results in the requirement of an interdisciplinary approach. First of all, to construct the platform for the acquisition of processing and availability of useable data according to the various ultimate aims and uses. The scientific validating of AIS data involves the implementation of new tools in close relation to computer processing specialists. At the same time, it is necessary to apprehend as widely as possible the different types of exploitation that will be required for this platform and consequently, collaboration is indispensable with all the different disciplines and professions concerned: geography, economics, statistics, engineering sciences, logistics providers, seagoing personnel, etc. It is preferable that this collaboration be done at the earliest possible stage so as to determine specifications for each development envisaged as this will help to improve the services provided by
the platform. Lastly, even if the results are immediately available, this is also a project built on the medium to long term together with archiving the data.
REFERENCES
1. AUZON OLIVIER (2013), La piraterie maritime est en baisse mais il ne faut pas baisser la garde, Diploweb, mars2013, http://www.diploweb.com /La-piraterie-maritime-est-en.html.
2. BEYER ANTOINE, SEVIN JEAN-CLAUDE (2008), Les ports-frontières de Trieste, Koper et Rijeka, futurs débouchés pour les conteneurs d’Europe centrale
3. CAIRNS WILLIAM R. (2005), AIS and Long
Range Identification & Tracking, Journal of Navigation, 58, pp 181-189
4. CHEN YULI (2013), Will Satellite-based AIS Supersede LRIT? », Marine Navigation and Safety of Sea Transportation: Advances in Marine Navigation, CRC Press, pp. 91-94.
5. DEBOOSERE PATRICK, DESSOUROUX CHRISTIAN, 2012, « Le contrôle de l’espace et de ses usage(r)s : avancées technologiques et défis sociaux », Espace populations sociétés, 2012/3, pp. 3-11.
6. DEVOGELE THOMAS (2009), Système d’information géographique temporelle maritime: des distances linéaires à l’analyse temps réels des trajectoires, Université de Brest, Habilitation à diriger des recherches de Géomatique.
7. DUJARDIN BERNARD (2004), L’AIS et ses capacités de surveillance maritime, La revue maritime, n°467.
8. DUMOUCHEL ANNE-CLAIRE (2009), Les atteintes à la sûreté en haute mer, Mémoire de Master recherche en relations internationales, Université Panthéon-Assas-Paris II.
9. ERIKSEN TORKILD, HØYE GUDRUN, NARHEIM BJORN, MELAND BENTE JENSLØKKEN (2006), Maritime traffic monitoring using a space-based AIS receiver, ActaAstronaut, 58:5, pp. 37–49.
10. FAYE FRANCIS (2005), Une stratégie navale pour le XXIe siècle La maîtrise de l'information

7th INTERNATIONAL MARITIME SCIENCE CONFERENCE
16
April 20th-21st, 2017, Solin, Croatia
sur mer, La Revue Maritime, 471, pp. 116-125.
11. FOURNIER MELANIE (2012), L’apport de l’imagerie satellitale à la surveillance maritime: contribution géographique et géopolitique, thèse de doctorat, Université de Montpellier 3.
12. GUICHOUX YANN & AL. (2011), ENVISIA – A scalable archiving system for AIS data storage, Global sharing of Maritime Data- IALA workshop 12-16 September, 2011.
13. HARATI-MOKHTARI ABBAS, WALL ALLAN, BROOKS PHILIP & WANG JIN (2007), Automatic Identification System (AIS): Data Reliability and Human Error Implications, Journal of Navigation, 60, pp. 373-389.
14. KALUZA PABLO, KÖLZSCH ANDRE, GASTNER MICHAEL T., BLASIUS BERND (2010), The complex network of global cargo ship movements, Journal of the Royal Society Interface, vol.7, No.48, 1093.
15. KOCAK D. M. & BROWNING P. (2015), Real-time AIS tracking from space expands opportunities for global ocean observing and maritime domain awareness, OCEANS 2015 - MTS/IEEE, Washington.
16. LE GUYADER DAMIEN, BROSSET DAVID, GOURMELON FRANÇOISE (2011), Exploitation de données AIS (Automatic Identification System) pour la cartographie du transport maritime, Mappemonde, N°104.
17. LÖPTIEN U. & AXELL L (2014), Ice and AIS: ship speed data and sea ice forecasts in the Baltic Sea, The Cryosphere, 8, pp. 2409-2418.
18. MAIMUN Adi & Al (2013), Estimation and Distribution of Exhaust Ship Emission from Marine Traffic in the Straits of Malacca and Singapore using Automatic Identification System (AIS) Data, Jurnal Mekanikal n°86, pp. 86-10.
19. MITCHELL KENNETH NED & AL (2014), Waterway Performance Monitoring via Automatic Identification System (AIS) Data, Transportation Research Board (TRB) 93rd Annual Meeting, Chicago, 12-16 janvier 2014.
20. PEREZ HEATHER M. (2009, Automatic Identification Systems (AIS) Data Use in Marine Vessel Emission Estimation, 18th Annual International Emissions Inventory Conference, Baltimore,
https://www3.epa.gov/ttnchie1/conference/ei18/session6/perez.pdf
21. PERKOVIC MARKO, GUCMA LUCJAN, PRZYWARTY MARCIN, GUCMA MACIEJ, PETELIN STOJAN , VIDMAR PETER (2012), Nautical risk assessment for LNG operations at the Port of Koper, StrojniskiVestnik-J Mech Eng, 58, pp. 607-613.
22. PREVOST RAOUL (2012), Décodage et localisation AIS par satellite, thèse de doctorat, Université de Toulouse.
23. SALIM CHEBLI ANTOINE (2009), La piraterie maritime au début du XXIème siècle, Mémoire pour le diplôme d’Université de 3ème cycle, Université Paris II.
24. SCHWEHR KURT, MC GILLIVARY PETER (2007), Marine Ship Automatic Identification System (AIS) for Enhanced Coastal Security Capabilities: An Oil Spill Tracking Application, Oceans07 MTS/IEEE, Vancouver.
25. SERRY ARNAUD (2013), Le transport maritime en mer Baltique, entre enjeu économique majeur et approche durable, Revue d’études comparatives Est-Ouest, n°44, 2013, pp. 89-123.
26. SHELMERDINE RICHARD L. (2015), Teasing out the detail: How our understanding of marine AIS data can better inform industries, developments, and planning, Marine Policy, vol.54, pp. 17–25.
27. ŚWIERCZYŃSKI S., CZAPLEWSKI K. (2013), The Automatic Identification System operating jointly with radar as the aid to navigation, Zeszyty Naukowe Akademia Morska w Szczecinie, 36, pp. 156-161.
28. TERRASSIER NICOLAS (2004), Les évolutions en matière de sécurité et de sureté dans le transport maritime : réglementation et enjeux économiques, ISEMAR.
29. THERY HERVE (2012), Marine Traffic Project, un outil d’observation des routes et des ports maritimes, Mappemonde, 104, http://mappemonde.mgm.fr/num32/internet/int11401.html.
30. VANDECASTEELE ARNAUD, NAPOLI ALDO (2011), La place du géodécisionnel dans les systèmes de surveillance maritime de nouvelle génération : Apport du géodécisionnel dans la surveillance maritime, SAGEO International Conference on Spatial Analysis and GEOmatics,

17
Ronan Kerbiriou, Laurent Lévêque, Aboozar Rajabi, Arnaud Serry
THE AUTOMATIC IDENTIFICATION SYSTEM (AIS) AS A DATA SOURCE FOR STUDYING MARITIME TRAFFIC
Conférence internationale de Géomatique et d'Analyse, 3-8 juillet 2011, Paris.
31. ZOUAOUI-ELLOUMI SALMA (2012), Reconnaissance de comportements de navires dans une zone portuaire sensible par approches
probabiliste et événementielle : Application au Grand Port Maritime de Marseille, thèse de doctorat, École Nationale Supérieure des Mines de Paris.
7th INTERNATIONAL MARITIME SCIENCE CONFERENCE
18
April 20th-21st, 2017, Solin, Croatia
ROLE OF SOCIAL MEDIA TO ENHANCE MARITIME SAFETY IN SEARCH AND RESCUE OPERATIONOsama Fawzy Elbayoumi, Abd Elkhalik Kamal, Eldin Selmy
victim’s needs, but it is necessary to filter huge number of shared reports and select those of high priority for decision making. The literature applied in this paper which dealing with marine accident concludes that modern shipping technologies are not critical for the safety at sea, in spite of this innovation, marine accidents still occur nowadays. Previous studies focused on using SMN in natural disasters such as floods , earthquakes, volcanoes and tsunamis, mostly located in the land or near the coast, this studies have not been focusing on the use of SMN in marine accident except in a few cases through some simple applications on the mobile phone, the gap analyses illustrate that the use of SMN in marine accidents still primitive, Since maritime accidents varies, depending on the causes and places of occurrence and level of risk, also limitation of internet networks coverage at the seas and oceans. The contribution of this research is to highlight the importance of adapting and generalizing integrated social media system under supervision of IMO to be used during marine accidents to save lives and environment at sea, qualitative research methodology was used in this paper, through describing and analyzing the data collected from some marine disasters and SMN definition reports, statistics, research paper and thesis, and marine SAR rules. Despite the vast variety of marine accident most of Marine accident investigation reports shows that 75% - 96% caused by Human error due to negligence, recklessness, Intoxication, fatigue and lake of training and applying safety rules, other causes are related to other factors such as bad weather or machine failure. In general marine accidents can be classified according risk level and causes. The objective of this paper is to highlight the importance of SMN in dealing and accessing the full stages of search and rescue operation, to reach the aim of this paper which is reducing the marine casualties resulting from marine accidents. 2. MARINE ACCIDENTS STATISTICS There are many Marine accidents statistics illustrate different types of accidents resulting loss of lives or injuries, as well as the economic losses in millions of dollars, three maritime disasters will be used as
examples which occurred in 2015 in terms of victims. The first in April, two boats carrying migrants capsized, one in Libya resulting 822 deaths and the second was in Italy causing 400 deaths. The third, in June a cruise ship hit by strong winds and rains capsized on the Yangtze River in China and 442 people perished. In 2012, 30 people were killed when the Costa Concordia cruise ship carrying 4,200 passengers went aground off the coast of Italy. The Costa Concordia incident was the costliest man-made disaster in 2012, causing 515 million$ in insured damages losses when it occurred. By mid-2014, insured losses for the disaster had risen to about 2 billion$. The greatest maritime disaster in peacetime happened in December 1987, when the Philippine ferry, the Doa Paz, collided with the Vector, a small coastal oil tanker, according to the National Maritime Museum in the United Kingdom. Only 24 of the 4,317 Doa passengers survived. (Insurance information institute, 2015).
During the 12-month period 2015-2016, figures show 206 cases of which 86% were deemed very serious or serious. These figures show an increasing improvement on the previous periods where total reported cases on the database
Figure 1. illustrates number of incident and lives lost (Seafarers rights, 2016)
Showed 310 for 2014/15, 393 for 2013/14 and 433 for 2012/13. Whilst this provides an encouraging picture of improved health and safety at sea, it is not a predictor of trends and may not include all incidents. Each of these cases represents the vessels rather than the total volume of individual casualties from each ship. However, as an indicator, in 2012 the IMO Secretariat counted
ROLE OF SOCIAL MEDIA TO ENHANCE MARITIME SAFETY IN SEARCH AND RESCUE OPERATION
Osama Fawzy Elbayoumi, Abd Elkhalik Kamal, Eldin Selmy
(College of Maritime Transport & Technology, Arab Academy for Science, Technology& Maritime Transport – AASTMT,
Alexandria – EGYPT)
( Email: [email protected])
ABSTRACT
Social media has become the first source of news due to rapid development in communication tools. Social media applications through internet network have many advantages as safety culture, awareness education, training, warning and collecting data. The literature was researched with the objective of reviewing all relevant scholarly journals addressing the question of uses of Social media. Accordingly, it is found that there is individual volunteer SAR Social media application but there is no global authorized network specified in SAR operation yet.
The main problem of this research, that there is a significant number of loss of lives due to delay in SAR operations despite the rapid development in communication tools especially Social media applications.
This descriptive research paper explains the importance of using Social media in SAR operations. Social media can help volunteer near the accident area to rescue survivors rapidly until the arrival of authorized rescue units.
To achieve the main aims of the research to enhance the Maritime safety in search and rescue operations and minimize the loss of lives, the role of IMO is to adopt, support and put requirements for social media software and applications to be used in global authorized network for SAR operation.
KEY WORDS
Social media network SMN, SAR operations, global authorized network, Parallel network, IMO.
1. INTRODUCTION
Marine disasters caused a loss of almost 2,487 persons, causing 1.7 billion dollars of insurance in 2015. Due to Technological development in the navigational systems and modern fleet management as well as strict inspection by classification societies, port state control through a package of international maritime organization (IMO) conventions, there is a decrease in overall
number of shipping accidents at the last few years, but the main problem of its impact of loss of lives, injuries and environment are still huge. (Insurance information institute, 2015) Nowadays a large number of people are using social media network (SMN), which make it ideal for helping Victims to request assistance or report injuries during the marine disaster, due to its efficiency of use, and it creates a fluency of timely reports for first responders and in search and rescue (SAR) organization to collect information about

19
Osama Fawzy Elbayoumi, Abd Elkhalik Kamal, Eldin Selmy
ROLE OF SOCIAL MEDIA TO ENHANCE MARITIME SAFETY IN SEARCH AND RESCUE OPERATION
victim’s needs, but it is necessary to filter huge number of shared reports and select those of high priority for decision making. The literature applied in this paper which dealing with marine accident concludes that modern shipping technologies are not critical for the safety at sea, in spite of this innovation, marine accidents still occur nowadays. Previous studies focused on using SMN in natural disasters such as floods , earthquakes, volcanoes and tsunamis, mostly located in the land or near the coast, this studies have not been focusing on the use of SMN in marine accident except in a few cases through some simple applications on the mobile phone, the gap analyses illustrate that the use of SMN in marine accidents still primitive, Since maritime accidents varies, depending on the causes and places of occurrence and level of risk, also limitation of internet networks coverage at the seas and oceans. The contribution of this research is to highlight the importance of adapting and generalizing integrated social media system under supervision of IMO to be used during marine accidents to save lives and environment at sea, qualitative research methodology was used in this paper, through describing and analyzing the data collected from some marine disasters and SMN definition reports, statistics, research paper and thesis, and marine SAR rules. Despite the vast variety of marine accident most of Marine accident investigation reports shows that 75% - 96% caused by Human error due to negligence, recklessness, Intoxication, fatigue and lake of training and applying safety rules, other causes are related to other factors such as bad weather or machine failure. In general marine accidents can be classified according risk level and causes. The objective of this paper is to highlight the importance of SMN in dealing and accessing the full stages of search and rescue operation, to reach the aim of this paper which is reducing the marine casualties resulting from marine accidents. 2. MARINE ACCIDENTS STATISTICS There are many Marine accidents statistics illustrate different types of accidents resulting loss of lives or injuries, as well as the economic losses in millions of dollars, three maritime disasters will be used as
examples which occurred in 2015 in terms of victims. The first in April, two boats carrying migrants capsized, one in Libya resulting 822 deaths and the second was in Italy causing 400 deaths. The third, in June a cruise ship hit by strong winds and rains capsized on the Yangtze River in China and 442 people perished. In 2012, 30 people were killed when the Costa Concordia cruise ship carrying 4,200 passengers went aground off the coast of Italy. The Costa Concordia incident was the costliest man-made disaster in 2012, causing 515 million$ in insured damages losses when it occurred. By mid-2014, insured losses for the disaster had risen to about 2 billion$. The greatest maritime disaster in peacetime happened in December 1987, when the Philippine ferry, the Doa Paz, collided with the Vector, a small coastal oil tanker, according to the National Maritime Museum in the United Kingdom. Only 24 of the 4,317 Doa passengers survived. (Insurance information institute, 2015).
During the 12-month period 2015-2016, figures show 206 cases of which 86% were deemed very serious or serious. These figures show an increasing improvement on the previous periods where total reported cases on the database
Figure 1. illustrates number of incident and lives lost (Seafarers rights, 2016)
Showed 310 for 2014/15, 393 for 2013/14 and 433 for 2012/13. Whilst this provides an encouraging picture of improved health and safety at sea, it is not a predictor of trends and may not include all incidents. Each of these cases represents the vessels rather than the total volume of individual casualties from each ship. However, as an indicator, in 2012 the IMO Secretariat counted
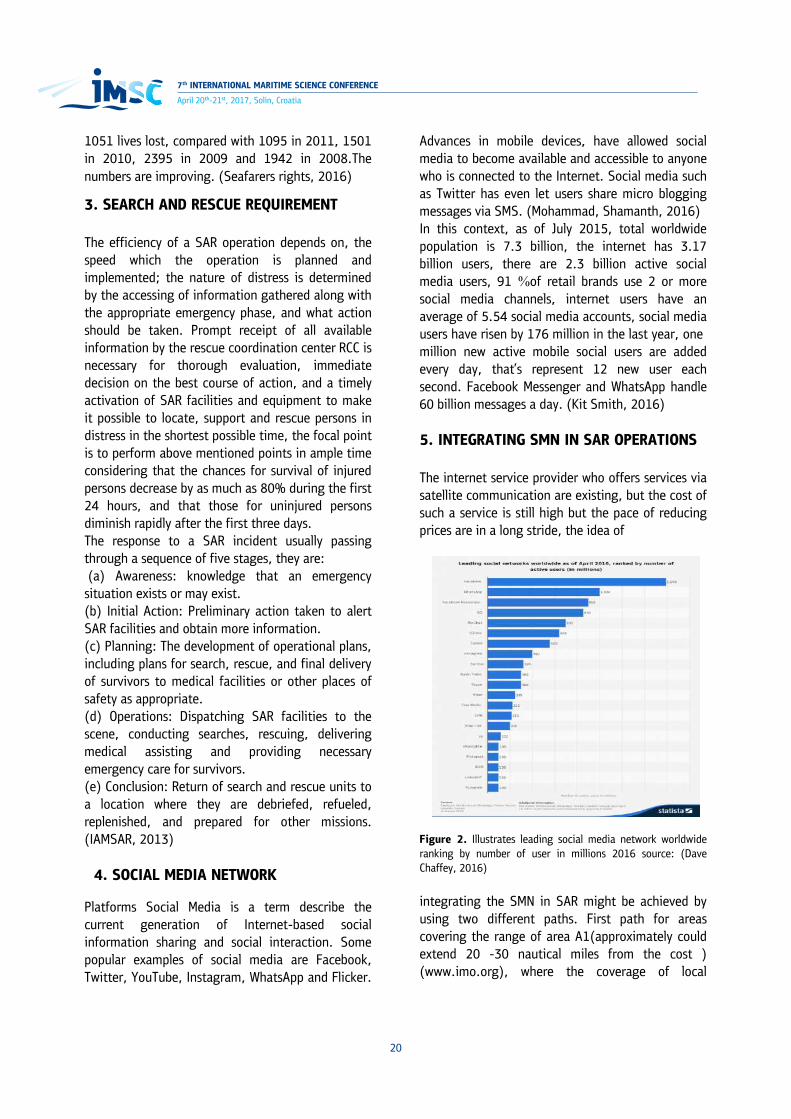
7th INTERNATIONAL MARITIME SCIENCE CONFERENCE
20
April 20th-21st, 2017, Solin, Croatia
1051 lives lost, compared with 1095 in 2011, 1501 in 2010, 2395 in 2009 and 1942 in 2008.The numbers are improving. (Seafarers rights, 2016)
3. SEARCH AND RESCUE REQUIREMENT The efficiency of a SAR operation depends on, the speed which the operation is planned and implemented; the nature of distress is determined by the accessing of information gathered along with the appropriate emergency phase, and what action should be taken. Prompt receipt of all available information by the rescue coordination center RCC is necessary for thorough evaluation, immediate decision on the best course of action, and a timely activation of SAR facilities and equipment to make it possible to locate, support and rescue persons in distress in the shortest possible time, the focal point is to perform above mentioned points in ample time considering that the chances for survival of injured persons decrease by as much as 80% during the first 24 hours, and that those for uninjured persons diminish rapidly after the first three days. The response to a SAR incident usually passing through a sequence of five stages, they are: (a) Awareness: knowledge that an emergency situation exists or may exist. (b) Initial Action: Preliminary action taken to alert SAR facilities and obtain more information. (c) Planning: The development of operational plans, including plans for search, rescue, and final delivery of survivors to medical facilities or other places of safety as appropriate. (d) Operations: Dispatching SAR facilities to the scene, conducting searches, rescuing, delivering medical assisting and providing necessary emergency care for survivors. (e) Conclusion: Return of search and rescue units to a location where they are debriefed, refueled, replenished, and prepared for other missions. (IAMSAR, 2013)
4. SOCIAL MEDIA NETWORK
Platforms Social Media is a term describe the current generation of Internet-based social information sharing and social interaction. Some popular examples of social media are Facebook, Twitter, YouTube, Instagram, WhatsApp and Flicker.
Advances in mobile devices, have allowed social media to become available and accessible to anyone who is connected to the Internet. Social media such as Twitter has even let users share micro blogging messages via SMS. (Mohammad, Shamanth, 2016) In this context, as of July 2015, total worldwide population is 7.3 billion, the internet has 3.17 billion users, there are 2.3 billion active social media users, 91 %of retail brands use 2 or more social media channels, internet users have an average of 5.54 social media accounts, social media users have risen by 176 million in the last year, one million new active mobile social users are added every day, that’s represent 12 new user each second. Facebook Messenger and WhatsApp handle 60 billion messages a day. (Kit Smith, 2016) 5. INTEGRATING SMN IN SAR OPERATIONS The internet service provider who offers services via satellite communication are existing, but the cost of such a service is still high but the pace of reducing prices are in a long stride, the idea of
Figure 2. Illustrates leading social media network worldwide ranking by number of user in millions 2016 source: (Dave Chaffey, 2016) integrating the SMN in SAR might be achieved by using two different paths. First path for areas covering the range of area A1(approximately could extend 20 -30 nautical miles from the cost ) (www.imo.org), where the coverage of local
internet service provider covers, in this area the production of a new application on the mobile phone will be easier, since the communication either by voice, SMS or via the application with various parties such fishermen ,passenger ferries will be easier, and hence the relay of information about the nature of distress and the parties like, relatives, media centers and RCC.
The second path is related to the off coast areas or deep water areas covering area A2 (this area typically extends to up to 150 nautical miles (280 km) offshore during night time) while area A3 (This area lies between about latitude 70 Degrees North and South, but excludes A1 and/or A2) (www.iho.int) which might need a different application using a different technology using satellite communication, though the technology already exists which using satellite communication but with a much cheaper rate. If using the Mobile phone, not only for alerting but also to coordinate rescue operations. However, a disadvantage of the Mobile phone for this purpose is that all the units involved in the mission cannot simultaneously follow what is being said. This can led to a gap of information that could even delay the rescue or in the worst case result in misunderstandings or incorrect information going uncorrected, but via the proposed application which can convert those disadvantages to advantages through Minimizing time factor through quick response, we also can benefit from SMN application to increase awareness of safety culture, education, and training among the groups.
With the help of telecommunication companies, mobile phones also shall let the SAR officer pinpoint exactly where the mobile phone has been used and at what date and time.
5.1. The proposed solution In order to minimize the time needed for rescue operation and improve the time response of SAR operations following a distress request and hence saving loss of lives, we propose a system depending on SMN application to have immediate and trusted flow of reports (messages, voice, photos, and videos) from the scene of disaster. These reports
will flow in different 3pathes volunteers near the scene, relatives, friends and relevant authorities. The role of volunteers is to drop lifesaving appliances, and at the same time report to the nearest SAR center while the role of relatives and friends reporting to relevant authorities and inform the media to be a means of media pressure as well as monitoring the progress in SAR operation, in the other hand mobile applications can also be a database of fishing, leisure boats where they can follow voyage data on line by the authorities, relatives and volunteers, also voyage data recorder VDR for passenger and cargo ships can be followed by the companies or authorities only, The following figure illustrates the flowchart of using SMN in SAR operations.
Figure 3. Illustrates using social media network in SAR operation source: Authors
5.2. New technology for internet connectivity
The idea is focused on a Parallel Network of the Internet which is an Invention made by an Egyptian engineering student named Noureldin Mohamed Abdelaal at AASTMT. This project is completely different from the internet because it uses a different way in communication between devices this way is different from that used in internet. Then, the way in data defragment is used for the first time in this project and it also different from that used in the internet; this way is the main

21
Osama Fawzy Elbayoumi, Abd Elkhalik Kamal, Eldin Selmy
ROLE OF SOCIAL MEDIA TO ENHANCE MARITIME SAFETY IN SEARCH AND RESCUE OPERATION
internet service provider covers, in this area the production of a new application on the mobile phone will be easier, since the communication either by voice, SMS or via the application with various parties such fishermen ,passenger ferries will be easier, and hence the relay of information about the nature of distress and the parties like, relatives, media centers and RCC.
The second path is related to the off coast areas or deep water areas covering area A2 (this area typically extends to up to 150 nautical miles (280 km) offshore during night time) while area A3 (This area lies between about latitude 70 Degrees North and South, but excludes A1 and/or A2) (www.iho.int) which might need a different application using a different technology using satellite communication, though the technology already exists which using satellite communication but with a much cheaper rate. If using the Mobile phone, not only for alerting but also to coordinate rescue operations. However, a disadvantage of the Mobile phone for this purpose is that all the units involved in the mission cannot simultaneously follow what is being said. This can led to a gap of information that could even delay the rescue or in the worst case result in misunderstandings or incorrect information going uncorrected, but via the proposed application which can convert those disadvantages to advantages through Minimizing time factor through quick response, we also can benefit from SMN application to increase awareness of safety culture, education, and training among the groups.
With the help of telecommunication companies, mobile phones also shall let the SAR officer pinpoint exactly where the mobile phone has been used and at what date and time.
5.1. The proposed solution In order to minimize the time needed for rescue operation and improve the time response of SAR operations following a distress request and hence saving loss of lives, we propose a system depending on SMN application to have immediate and trusted flow of reports (messages, voice, photos, and videos) from the scene of disaster. These reports
will flow in different 3pathes volunteers near the scene, relatives, friends and relevant authorities. The role of volunteers is to drop lifesaving appliances, and at the same time report to the nearest SAR center while the role of relatives and friends reporting to relevant authorities and inform the media to be a means of media pressure as well as monitoring the progress in SAR operation, in the other hand mobile applications can also be a database of fishing, leisure boats where they can follow voyage data on line by the authorities, relatives and volunteers, also voyage data recorder VDR for passenger and cargo ships can be followed by the companies or authorities only, The following figure illustrates the flowchart of using SMN in SAR operations.
Figure 3. Illustrates using social media network in SAR operation source: Authors
5.2. New technology for internet connectivity
The idea is focused on a Parallel Network of the Internet which is an Invention made by an Egyptian engineering student named Noureldin Mohamed Abdelaal at AASTMT. This project is completely different from the internet because it uses a different way in communication between devices this way is different from that used in internet. Then, the way in data defragment is used for the first time in this project and it also different from that used in the internet; this way is the main

7th INTERNATIONAL MARITIME SCIENCE CONFERENCE
22
April 20th-21st, 2017, Solin, Croatia
reason of increasing the network speed. Also, the security system used in this network based on Artificial intelligence which is the first from its kind in the history this system changes the encryption algorithms continuously and arranges the Network traffic by itself. This Network doesn’t rely on Telecommunications and it relies on wireless communications (satellite communication). So, this project is not an advanced application of the internet but it is a new Network doing the purpose of the internet with a different way and with a high efficiency and it will solve the problems of connectivity in remote areas at open seas with reasonable fees all ships can afford. The way of contact in the parallel network will not depend on telecommunications but it will depend on the wireless communication through the satellite. Broadcast network from broadcasting station to the satellite which will distribute coverage to all parts of the Globe. Thus received on the mini towers of the network are distributed on the ground which would convert network frequency coming from the satellite to the frequency can be received easily on all devices currently. In Reliance on this method of communication in the basis of the structure of the network will enable us to cover all parts of the globe. As well as the network will gain speed in the transfer of data and reduce the rates of loss of data.
5.3. Advantages of parallel network:
1. The average speed is higher than the speed of existing internet by 32 times.
2. During connect to these network devices will defend itself from viruses.
3. Will not need to complex infrastructure such as the Internet.
There is another satellite constellation, can produce internet service delivers affordable broadband connectivity everywhere on earth within 45 degrees of latitude north and south of the equator, with a collective population of more than 3 billion people. Support of the Networks satellite constellation requires the construction of seven "lights out" management gateways across the globe. These “lights out” gateways have a paramount role in ensuring satellite Networks service delivery as there
are no on-site technicians located at ground stations. Each of the seven “lights out” gateways will need to provide secure management access to Juniper Networks, RF Antenna devices serve as a local monitoring and alarm agent in the field. (spaceflight101, 2017)
6. CONCLUSIONS
The proposed system at the moment is not an alternative to the Global Maritime Distress Signal System (GMDSS) and this because it needs to new infrastructure and high investments and international conventions and rules binding on states parties to become an alternative to the GMDSS in the future, and here the UN's role comes through the International Maritime Organization IMO to adopt this project and put it into effect. A big challenge for academics and researchers is to attempt in future researches to continue developing this system especially in internet connectivity and in SAR social media applications. 7. RECOMMENDATIONS
• Establish the legal framework governing the global operation of the proposed SMN for SAR,
With the cooperation between IMO, social media owners, governments, and research centers to overcome economic and technology challenges is much needed.
• Establish the technical body to develop a social media application specialized in search and rescue operations controlled by united nation UN throw IMO.
REFERENCES 1. Dave Chaffey,2016, “Global social media
research summary 2016” available at: http://www.smartinsights.com/social-media-marketing/social-media-strategy/new-global-social-media-research/ accessed at : January 2017
2. IHO available at http://www.iho.int/iho_pubs/CB/C-55/Sea-Areas.
3. IMO.org available at http://www.imo.org/blast/blastDataHelper.asp?data_id=10750&filename=32.pdf
4. Insurance information institute, 2015. “Marine Accidents” available at: http://www.iii.org/fact-statistic/renters-insurance accessed at : January 2017
5. J. Gartner, “Ocean Power Fights Current Thinking,” Technology Review, Massachusetts Inst. of Technology, 2005; www.technologyreview.com/Energy/14268/page1.
6. Kit Smith on March 7th 2016 , " Marketing: 96 Amazing Social Media Statistics and Facts "available at: https://www.brandwatch.com/blog/96-amazing-social-media-statistics-and-facts-for- Disaster Relief - ASU Crisis Response Game", available at: 2016/ accessed at : January 2017
7. Mohammad, Shamanth, acceced at 2017. " Lessons Learned in Using Social Media for
8. https://pdfs.semanticscholar.org/ed64/4eede17a8c136bcde14d95a0139c39a13abd.pdf
9. Noureldin Mohamed Abdelaal the World intellectual property organization (WIPO) 2015 accessed at : January 2017
10. Seafarers rights, 2016. available at: http://seafarersrights.org/seafarers-subjects/deaths-and-injuries-at-sea/ accessed at : January 2017
11. Spaceflight101, 2017, "O3b Satellite Overview" available at: http://spaceflight101.com/spacecraft/o3b/ accessed at: February 2017.
12. Törnqvist, G. (2004). Creativity in time and space. Geografiska Annaler: Series B, Human Geography 86 (4), pp. 227–243. Accessed at: January 2017.

23
Osama Fawzy Elbayoumi, Abd Elkhalik Kamal, Eldin Selmy
ROLE OF SOCIAL MEDIA TO ENHANCE MARITIME SAFETY IN SEARCH AND RESCUE OPERATION
reason of increasing the network speed. Also, the security system used in this network based on Artificial intelligence which is the first from its kind in the history this system changes the encryption algorithms continuously and arranges the Network traffic by itself. This Network doesn’t rely on Telecommunications and it relies on wireless communications (satellite communication). So, this project is not an advanced application of the internet but it is a new Network doing the purpose of the internet with a different way and with a high efficiency and it will solve the problems of connectivity in remote areas at open seas with reasonable fees all ships can afford. The way of contact in the parallel network will not depend on telecommunications but it will depend on the wireless communication through the satellite. Broadcast network from broadcasting station to the satellite which will distribute coverage to all parts of the Globe. Thus received on the mini towers of the network are distributed on the ground which would convert network frequency coming from the satellite to the frequency can be received easily on all devices currently. In Reliance on this method of communication in the basis of the structure of the network will enable us to cover all parts of the globe. As well as the network will gain speed in the transfer of data and reduce the rates of loss of data.
5.3. Advantages of parallel network:
1. The average speed is higher than the speed of existing internet by 32 times.
2. During connect to these network devices will defend itself from viruses.
3. Will not need to complex infrastructure such as the Internet.
There is another satellite constellation, can produce internet service delivers affordable broadband connectivity everywhere on earth within 45 degrees of latitude north and south of the equator, with a collective population of more than 3 billion people. Support of the Networks satellite constellation requires the construction of seven "lights out" management gateways across the globe. These “lights out” gateways have a paramount role in ensuring satellite Networks service delivery as there
are no on-site technicians located at ground stations. Each of the seven “lights out” gateways will need to provide secure management access to Juniper Networks, RF Antenna devices serve as a local monitoring and alarm agent in the field. (spaceflight101, 2017)
6. CONCLUSIONS
The proposed system at the moment is not an alternative to the Global Maritime Distress Signal System (GMDSS) and this because it needs to new infrastructure and high investments and international conventions and rules binding on states parties to become an alternative to the GMDSS in the future, and here the UN's role comes through the International Maritime Organization IMO to adopt this project and put it into effect. A big challenge for academics and researchers is to attempt in future researches to continue developing this system especially in internet connectivity and in SAR social media applications. 7. RECOMMENDATIONS
• Establish the legal framework governing the global operation of the proposed SMN for SAR,
With the cooperation between IMO, social media owners, governments, and research centers to overcome economic and technology challenges is much needed.
• Establish the technical body to develop a social media application specialized in search and rescue operations controlled by united nation UN throw IMO.
REFERENCES 1. Dave Chaffey,2016, “Global social media
research summary 2016” available at: http://www.smartinsights.com/social-media-marketing/social-media-strategy/new-global-social-media-research/ accessed at : January 2017
2. IHO available at http://www.iho.int/iho_pubs/CB/C-55/Sea-Areas.
3. IMO.org available at http://www.imo.org/blast/blastDataHelper.asp?data_id=10750&filename=32.pdf
4. Insurance information institute, 2015. “Marine Accidents” available at: http://www.iii.org/fact-statistic/renters-insurance accessed at : January 2017
5. J. Gartner, “Ocean Power Fights Current Thinking,” Technology Review, Massachusetts Inst. of Technology, 2005; www.technologyreview.com/Energy/14268/page1.
6. Kit Smith on March 7th 2016 , " Marketing: 96 Amazing Social Media Statistics and Facts "available at: https://www.brandwatch.com/blog/96-amazing-social-media-statistics-and-facts-for- Disaster Relief - ASU Crisis Response Game", available at: 2016/ accessed at : January 2017
7. Mohammad, Shamanth, acceced at 2017. " Lessons Learned in Using Social Media for
8. https://pdfs.semanticscholar.org/ed64/4eede17a8c136bcde14d95a0139c39a13abd.pdf
9. Noureldin Mohamed Abdelaal the World intellectual property organization (WIPO) 2015 accessed at : January 2017
10. Seafarers rights, 2016. available at: http://seafarersrights.org/seafarers-subjects/deaths-and-injuries-at-sea/ accessed at : January 2017
11. Spaceflight101, 2017, "O3b Satellite Overview" available at: http://spaceflight101.com/spacecraft/o3b/ accessed at: February 2017.
12. Törnqvist, G. (2004). Creativity in time and space. Geografiska Annaler: Series B, Human Geography 86 (4), pp. 227–243. Accessed at: January 2017.
7th INTERNATIONAL MARITIME SCIENCE CONFERENCE
24
April 20th-21st, 2017, Solin, Croatia
INNOVATIVE FAST TIME SIMULATION TOOLS FOR BRIEFING / DEBRIEFING IN ADVANCED SHIP HANDLING SIMULATOR TRAINING AND SHIP OPERATIONKnud Benedict, Sandro Fischer, Michael Gluch, Matthias Kirchhoff, Michele Schaub, Michael Baldauf, Burkhard Müller
INNOVATIVE FAST TIME SIMULATION TOOLS FOR BRIEFING / DEBRIEFING IN
ADVANCED SHIP HANDLING SIMULATOR TRAINING AND SHIP OPERATION
Knud Benedict1, Sandro Fischer1, Michael Gluch1, Matthias Kirchhoff1, Michele Schaub1, Michael
Baldauf2, Burkhard Müller3
(1 Hochschule Wismar, University of Applied Sciences - Technology, Business and Design, Dept. of Maritime Studies
Warnemuende & MSCW, Institute ISSIMS / Germany)
(2 World Maritime University, Malmoe / Sweden, [email protected])
(3 AIDA Cruises, Maritime Simulation Training Centre, Rostock / Germany, [email protected])
(E-mail: [email protected])
ABSTRACT
The innovative “Simulation-Augmented Manoeuvring Design, Monitoring & Control” system (SAMMON) based on Fast Time Simulation (FTS) technology was developed at the Institute for Innovative Ship Simulation and Maritime Systems (ISSIMS) of the Maritime Simulation Centre Warnemuende MSCW. The system consists of software modules for (a) Manoeuvring Design & Planning, (b) Monitoring & Control based on Multiple Dynamic Prediction and (c) Trial & Training. It is based on complex ship dynamic models for rudder, thruster or engine manoeuvre simulation under different environmental conditions. It is an effective tool for lecturing and demonstrating ships’ motion characteristics, as well as for ship handling simulator training. It allows the trainee to immediately see the results of the actual rudder, engine or thruster commands, without having to wait for the real-time response of the vessel. The Maritime Simulation Centre of AIDA Cruises at Rostock /Germany and the CSMART Center for Simulator Maritime Training of Carnival Corporation at Almere /NL have some experience with the use of this new technology to improve simulator training in Advanced Ship Handling Training courses. Examples of its application in briefing / debriefing and introductory lectures for simulator exercises specifically for typical cruise ships with Twin-Screw and -Rudder systems will be presented in the paper and at the conference.
KEY WORDS
Fast-time simulation, manoeuvre planning, Navigation Simulator Training
* Reprinted with permission from: Transactions on Maritime Science (ToMS)

25
Knud Benedict, Sandro Fischer, Michael Gluch, Matthias Kirchhoff, Michele Schaub, Michael Baldauf, Burkhard Müller
INNOVATIVE FAST TIME SIMULATION TOOLS FOR BRIEFING / DEBRIEFING IN ADVANCED SHIP HANDLING SIMULATOR TRAINING AND SHIP OPERATION
1. DESCRIPTION OF THE FAST TIME SIMULATION USE CONCEPT
1.1. Need for Fast Time Simulation (FTS) and Simulation Support
Ship manoeuvring is and will remain a human-centred process in spite of anticipated further technological development. The most important elements of this process are human beings and the technical equipment supporting their efforts. However, most of the work still has to be done manually since even today almost no automation support is available either for routine or complex manoeuvres. There is as yet no electronic tool capable of demonstrating manoeuvring characteristics efficiently or designing an efficient manoeuvring plan – even in briefing procedures for ship handling training, the potential manoeuvres have to be “guessed” and drafted on paper or described by sketches and short explanations. The impact of wind or current is rather vaguely estimated based on experience. However, the new demands require the preparation of harbour approaches with complete berthing plans, especially by companies with high safety standards like cruise liners. These plans have to be agreed on by the bridge team, discussed and briefed with the pilot. Plan of potential manoeuvres needs to be developed – but only tentatively, by thinking ahead – by putting it on paper or describing it with self-made sketches and short explanations. The plans are drawn up manually, either on paper charts or electronic chart interface printouts, since the tools providing support for manoeuvring planning have yet to be developed. Ship Handling Simulation for simulator training has been proven to be highly effective. However, it is based on real time simulation, i.e. 1 sec in computer calculation time represents 1 sec in real world manoeuvring time. This means that in spite of all other advantages of full mission ship handling simulation, the process of collecting manoeuvring experiences remains utmost time-consuming. For instance, a training session for a berthing manoeuvre might take one hour – if the first attempt fails or an alternative strategy needs to be tried out, this second session takes an
additional hour, which can hardly be considered efficient. The Fast Time Simulation method will be used in the future to increase training effectiveness, as well as the safety and efficiency of real ship manoeuvring. Even when used on standard computers, it is capable of simulating a manoeuvre lasting about 20 min in 1 second computing time by using innovative simulation methods. Fast Time Simulation tools have been used in the research activities of the Institute for Innovative Ship Simulation and Maritime System ISSIMS at the Maritime Simulation Centre Warnemuende, which is a part of the Department of Maritime Studies of Hochschule Wismar, the University of Applied Sciences - Technology, Business & Design in Germany. They have been further developed by start-up company Innovative Ship Simulation and Maritime Systems (available at: ISSIMS GmbH Web page). 1.2. Overview of Fast Time Simulation
(FTS) software modules
A brief overview of FTS tool modules is provided, together with their potential application: SAMMON is the brand name of an innovative “Simulation Augmented Manoeuvring – Design, Monitoring & Control” system, consisting of four software modules for Manoeuvring Design & Planning, Monitoring & Conning with Multiple Dynamic Prediction and Simulation & Trial. The modules are as follows: • Manoeuvring Design & Planning Module:
designing ship manoeuvring concepts as a “Manoeuvring Plan” for harbour approach and berthing manoeuvres (steered by virtual handles on the screen by the mariner)
• Manoeuvring Monitoring & Conning Module with Multiple Dynamic Manoeuvring Prediction: monitoring of ship manoeuvres during simulator exercises or monitoring of real ship manoeuvres using bridge handles, simultaneous display of manoeuvring plan and predicted manoeuvres; calculation of various prediction tracks for full ship dynamic simulation and simplified route prediction, like Look Ahead for future ship motion.
• Manoeuvring Simulation Trial & Training Module: ship manoeuvring simulation on
* Reprinted with permission from: Transactions on Maritime Science (ToMS)

7th INTERNATIONAL MARITIME SCIENCE CONFERENCE
26
April 20th-21st, 2017, Solin, Croatia
laptop to view and exercise the manoeuvring concept (providing it has the function of a monitoring tool; steered by virtual handles on the screen)
These modules are suitable for application both: • in maritime education and training to support
ship manoeuvring exercises by demonstrating and facilitating the explanation of manoeuvring technology details and, more specifically, to prepare manoeuvring training in the SHS environment, i.e. by developing manoeuvring plans in briefing sessions, supporting manoeuvring during the exercise run and assisting with replay analysis and in discussions on quick demonstration of alternative manoeuvres during debriefing sessions; and
• onboard to facilitate the manoeuvring of real ships, e.g. by compiling manoeuvring plans for challenging harbour approaches requiring complex berthing / unberthing manoeuvres, assisting steering by providing multiple predictions during the manoeuvring process and even by supporting result analysis, as well as for onboard training with the Simulation & Trial module.
SIMOPT is an FTS-based Simulation Optimiser software module for standard manoeuvre optimization and ship math model parameter modification applicable in simulator ships, FTS Simulation Training Systems and onboard SAMMON System applications. SIMDAT is a software module for analysing simulation results obtained both from SHS or SIMOPT simulations and real ship trials: data on manoeuvring characteristics can be automatically retrieved and comfortable graphic tools are available for displaying, comparing and assessing the results. The use of SIMOPT and SIMDAT modules for simulator ship model parameter tuning was described in earlier papers (Benedict at al., 2003; Schaub at al., 2015) as was the application of
Multiple Dynamic Prediction & Control modules (Benedict at al., 2006) in onboard use as a steering assistance tool. This paper focuses on the potential of the SAMMON software to support the lecturing and briefing / debriefing process with elements specifically designed for simulator training in the framework of Advanced Ship Handling in Maritime Simulation & Training Centre MSTC of the AIDA Cruises Company at Rostock / Germany.
2. USE OF FTS FOR LECTURING AND FAMILIARISATION
2.1. Stopping – using Speed Vector as Stopping Distance Indicator
One of the elements of simulator training courses is familiarisation with a ship’s manoeuvring characteristics and their practical application – Fast Time Simulation is a smart tool shortening and raising the successfulness of this process. The following example deals with a ship's stopping capability. Cruise ship “AIDAblu” was used in examples in this paper; her dimensions are: length Lpp= 244.6m, beam B=32.2m draft T= 7.00 m. She has two pitch propellers and two rudders, two thrusters at the bow and two at the stern. To get an overview of the ship's stopping distances when navigating at several different speeds and with varying astern power, test trials could be conducted either with the Design & Planning tool (Figure 1) or with the SIMOPT and SIMDAT program (Figure 2). The Planning tool (Figure 1) allows the ship to be placed in the ENC window, in an initial MP 0 position, where the initial speed can be adjusted using the handles in the right window. The ships can then be moved using the slider at the bottom of the ENC window, e.g. into a position after 1 min, where MP 1 is set.
* Reprinted with permission from: Transactions on Maritime Science (ToMS)

27
Knud Benedict, Sandro Fischer, Michael Gluch, Matthias Kirchhoff, Michele Schaub, Michael Baldauf, Burkhard Müller
INNOVATIVE FAST TIME SIMULATION TOOLS FOR BRIEFING / DEBRIEFING IN ADVANCED SHIP HANDLING SIMULATOR TRAINING AND SHIP OPERATION
Figure 1. Display of the Manoeuvring Design & Planning Module: Two stopping manoeuvres for AIDAblu at different speeds to full astern (EOT=-100%):
• Left: Crash stop from full ahead (EOT=+100% for 22, 2 kn) at MP1 • Right: Stopping manoeuvre from half ahead (EOT=+53% for 12.6kn) at MP1
Figure 2. Results of SIMOPT program for series of stopping manoeuvres for cruise ship AIDAblu (Computing time 17 sec): Stopping diagram for distances (solid lines) and respective speed vector length times (dotted
lines) (SIMDAT)
* Reprinted with permission from: Transactions on Maritime Science (ToMS)

7th INTERNATIONAL MARITIME SCIENCE CONFERENCE
28
April 20th-21st, 2017, Solin, Croatia
Then handles are used to reverse the engine to EOT=-100% and one can immediately see the ship's maximum stopping distance and stopping position in the ENC window. In case of application of this stopping behaviour during voyage or in ports, visualising stopping distances in the ECDIS or RADAR could be helpful. The SAMMON Monitoring tool allows for high-level prediction of a ship's trail in case of change of the EOT or any other handle position after only 1 second (see Figure 15). Until this sophisticated dynamic prediction tool becomes available on the bridge, the speed vector can be used as an alternative. The basic idea is to adjust the speed vectors’ length to stopping distance: the required speed vector length can be easily calculated from the well-known formula speed = distance /time, i.e. time = distance / speed. This equation helps us calculate Vector time: tvector=Stopping distance / Starting speed, e.g. Crash Stop Stopping Distance of 1600m, given the starting speed of 22 kn (12 m/s): tvector= 1600 m / 12m/s =138 s = 2:18 min. If these calculations are performed for all stopping distances of the solid lines in Figure 2, we get the dotted graphs. The result is that vector time is 2.5 minutes (blue dotted line) for all crash stop manoeuvres (blue line) at Full Astern; this is illustrated in Figure 1 where the ship comes to a stop prior to the expiry of the 3 min speed vector. Therefore, the conclusion might be that setting the speed vector to tvector = 3 min would give us an extra safety distance – it would even allow stopping the ship with the astern power of a mere EOT= -30%!
2.2. Effect of rudders and thrusters on swept path and pivot point
In many situations occurring in narrow fairways and limited space, the manoeuvring space and the swept path are of utmost importance. Figure 3 illustrates that the swept path in turning manoeuvres is much bigger in rudder than thruster manoeuvres.
Figure 3. Comparison of a ship’s path when turning with rudders or thrusters, using SAMMON Design & Planning tool in forward motion at EOT=+20% ahead: • Top: turning with rudder STB 15°, thruster
0% • Below: turning with bow-thruster 100% STB,
rudder 0° If turning is achieved by means of a rudder, it produces a lift force similar to that of a wing of an airplane but in the horizontal plane: the force is pointing outward to port side. Then a drift angle ß sets in and the ship’s hull starts to act like a “wing” with lift force to starboard at the fore part of the ship; this force generates the so called “unstable moment” trying to increase the drift angle. Therefore, when turning motion r develops, it causes centrifugal forces to act on the centre of gravity of ships and hydrodynamic masses. A damping force sets in due to rotation, acting like
* Reprinted with permission from: Transactions on Maritime Science (ToMS)

29
Knud Benedict, Sandro Fischer, Michael Gluch, Matthias Kirchhoff, Michele Schaub, Michael Baldauf, Burkhard Müller
INNOVATIVE FAST TIME SIMULATION TOOLS FOR BRIEFING / DEBRIEFING IN ADVANCED SHIP HANDLING SIMULATOR TRAINING AND SHIP OPERATION
a “curved profile” and producing a moment in the opposite direction to balance the unstable moment in the circular motion. It has the same effect as “counter rudder”, since it counteracts both the initial rudder moment and the unstable moment until an equilibrium is established in a steady state of circular turning. The development of the Turning Circle Manoeuvre ends with a steady state, i.e. an equilibrium in balancing the transverse forces and moments. If the ship starts turning with a bow thruster, there is no drift angle – it is not required (or even becomes negative if the thruster is too powerful!) to push the ship “inward” from its initial course because thruster force is already pushing it inward. The drift angle and turning rate have an impact on the position of the pivot point (PP); the PP is located at the point in which crossflow speed (or the ship's transverse motion) is zero. Where is PP and what affects its position? Figure 4 gives several examples of turning manoeuvres in ahead and astern motion and with rudder or thrusters. The following conclusions can be drawn: • PP position is flexible and directly dependant
on the ship's motion, i.e. the ratio between drift and turning. E.g. at the beginning of the turn it is located mid ship and starts moving forward as the drift sets in; it remains in the fore part, on average at 1/3 ship length behind the bow for rudder manoeuvres, i.e. aft for bow thruster manoeuvres.
• In case of wind, there might be wind drift in addition to the drift caused by rudder effect during turning, e.g. when turning in windy conditions: at the beginning of the turn, the pivot point is far ahead
• The PP is not a suitable reference point for the discussion of acting forces due to its changing position – centre of gravity is preferable for understanding dynamic effects!
• In case of small drift angles, since PP is at mid ship, only minimum manoeuvring space is required, i.e. minimum swept path.
Figure 4. Comparison of a ship’s path and the location of the pivot point when the ship is turned with rudders or thrusters with SIMOPT & SIMDAT: a) Forward motion engine ahead EOT=+20%
• Blue: rudder 20°STB, no thruster • Green: bow thruster 100% STB
b) Astern motion engine astern EOT=-20% • Red: rudder 20° STB • Brown: stern thruster 100% STB • Grey: bow thruster -100% PT
More effects on ship manoeuvring characteristics studied by SAMMON, available in (Benedict at al., 2016) for wind & current and in (Benedict, 2016) for pivot point location and control.
2.3. Effect of split engines and rudders for twin screw – twin rudder ships
Many cruise ships and ferries have twin screw – twin rudder systems. Although these systems are normally continuously operated in synchronous mode during long voyage segments, when manoeuvring in ports, splitting the engines and propellers to allow their separate control might prove advantageous. As seen in Figure 5, split engine manoeuvres can reduce the stopping distance:
* Reprinted with permission from: Transactions on Maritime Science (ToMS)
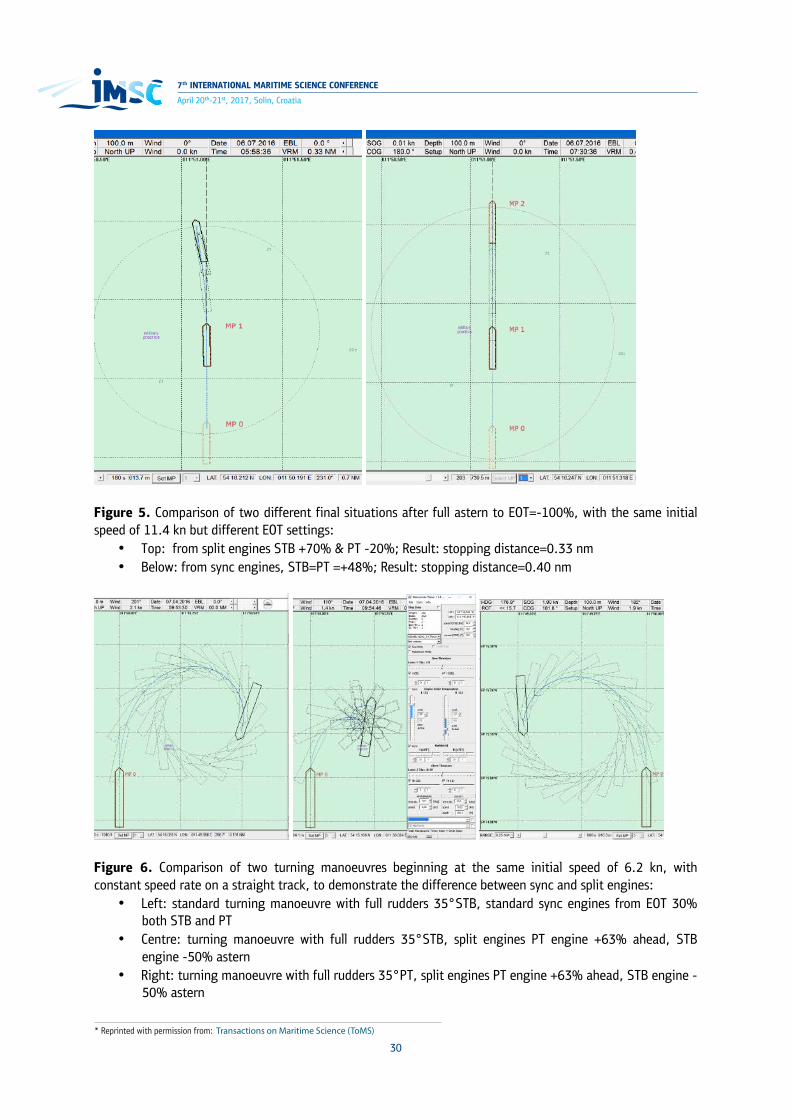
7th INTERNATIONAL MARITIME SCIENCE CONFERENCE
30
April 20th-21st, 2017, Solin, Croatia
Figure 5. Comparison of two different final situations after full astern to EOT=-100%, with the same initial speed of 11.4 kn but different EOT settings:
• Top: from split engines STB +70% & PT -20%; Result: stopping distance=0.33 nm • Below: from sync engines, STB=PT =+48%; Result: stopping distance=0.40 nm
Figure 6. Comparison of two turning manoeuvres beginning at the same initial speed of 6.2 kn, with constant speed rate on a straight track, to demonstrate the difference between sync and split engines:
• Left: standard turning manoeuvre with full rudders 35°STB, standard sync engines from EOT 30% both STB and PT
• Centre: turning manoeuvre with full rudders 35°STB, split engines PT engine +63% ahead, STB engine -50% astern
• Right: turning manoeuvre with full rudders 35°PT, split engines PT engine +63% ahead, STB engine -50% astern
* Reprinted with permission from: Transactions on Maritime Science (ToMS)

31
Knud Benedict, Sandro Fischer, Michael Gluch, Matthias Kirchhoff, Michele Schaub, Michael Baldauf, Burkhard Müller
INNOVATIVE FAST TIME SIMULATION TOOLS FOR BRIEFING / DEBRIEFING IN ADVANCED SHIP HANDLING SIMULATOR TRAINING AND SHIP OPERATION
Given the same speed with split engines, stopping distance at full astern is shorter, because one engine is already running astern, avoiding the reversing period altogether. The split mode also has some advantages with respect to steering capability, since the rudder inflow from the ahead engine allows higher rudder forces to be used to stay on course (e.g. under strong wind) than when synchronised engines are used. In addition, turning can be improved as seen in Figure 6, leading us to the following conclusions: when split engines are used, the turning circle is smaller on the side where the prop is reversed, the ship reacts faster and has a smaller circular motion radius. Turning is likewise improved due to faster speed loss with split engines to that side, increasing the ratio of rudder forces to hull forces. However, if the ship is turning to the opposite side, the turning capability is reduced: this is why the ship needs the rudder angle of PT -4.4° to balance the ship already moving along a straight track – i.e. the effective
rudder change is nearly 40° when turning STB, but only 30° when turning PT.
3. USE OF FAST TIME SIMULATION FOR SIMULATOR BRIEFING
3.1. Task description – introduction, conventional briefing and NEW CONCEPT
During the exercise briefing, a navigation officer gets information about the harbour area, the starting situation and the environmental conditions in the area, on a conventional sea chart illustrated in Figure 7. The objective is to bring the ship through the fairway channel of Rostock Port from the north, turn and head back through the channel to berth the ship port side at the passenger pier.
Figure 7. Exercise area and environmental conditions in the Port of Rostock in a berthing scenario, divided into two manoeuvre planning sections and completed by guessing the desired positions of the ship (as
contour)
Section 1: approach to turning area
Section 2 Turning area
Final position: Passenger berth, alongside PS: è
MV „AIDAblu“ at starting position: STW: around 6 kn; HDG: 161°
Section 3: return track & approach to the berth
* Reprinted with permission from: Transactions on Maritime Science (ToMS)
7th INTERNATIONAL MARITIME SCIENCE CONFERENCE
32
April 20th-21st, 2017, Solin, Croatia
The respective harbour area is divided into manoeuvring sections, with a specific goal:
1. Section 1: the ship’s speed should be reduced until she is ready to be turned, SOG should be around 3 kn to be prepared for section 2.
2. Section 2: the ship should be turned and its course adjusted to re-enter the fairway in the course opposite to the final berth.
3. Section 3: the ship should be stopped and berthed.
In conventional briefing, only these rough indications of manoeuvring status can be used to develop a potential ship berthing strategy. In conventional berthing plans ship contours are positioned in WORD or POWER POINT drawings - the specific manoeuvres and engine rudder and thruster settings cannot be discussed in detail because specific manoeuvring characteristics can hardly be used in specific situations and real time simulation is too time consuming.
Fast time simulation allows the application of new individual exercise preparation methods with self-developed manoeuvring concepts: • the Design and Planning tool allows us to
develop a more detailed manoeuvring concept, i.e. the manoeuvring plan;
• the tool allows us to optimise the concept by several planning trials,
• pre-training using the Trial and Training Tool allows us to try out the concept on a laptop, in a real-time simulation
3.2. Briefing by means of the „Manoeuvre Planning & Design Module“
3.2.1 Basic exercise with no wind and no current
New fast time simulation allows us to compile a manoeuvring plan representing a detailed strategy with settings specific to positions called manoeuvring points MP. Some basic functions and interface displays for fast time simulation in the Design and Planning Tool are illustrated in the following figures. Figure 8 explains the method in a sea chart environment represented by an interface which is a combination of an electronic navigational chart ENC window (centre), interface window of a ship’s steering panel (right) used to adjust the controls to the selected manoeuvring point MP and interface displaying the status of the actual current ship manoeuvring controls (left) at the next manoeuvring point MP, indicated as a red ship shape in the ENC. The course of action will be illustrated by a series of figures to obtain a complete manoeuvring plan, including control actions required to be taken at designated manoeuvring points MP – first for simple conditions with no wind and currents to explain the fast time planning procedure: In Figure 8, the initial position MP 0 is in the middle of the fairway, where the instructor has decided to position the ship. The ship has already been moved by using the slider at the ENC bottom to identify the next manoeuvring point MP 1: the stopping manoeuvres begin with EOT -30%. Based on handle positions, the ship is already predicted to slow down.
* Reprinted with permission from: Transactions on Maritime Science (ToMS)

33
Knud Benedict, Sandro Fischer, Michael Gluch, Matthias Kirchhoff, Michele Schaub, Michael Baldauf, Burkhard Müller
INNOVATIVE FAST TIME SIMULATION TOOLS FOR BRIEFING / DEBRIEFING IN ADVANCED SHIP HANDLING SIMULATOR TRAINING AND SHIP OPERATION
Figure 8. Fast time planning on a sea chart: initial ship position MP0 and predicted stopping manoeuvre at MP 1: based on set handle positions, the prediction already shows the ship reducing speed.
Figure 9. Ship position at MP2 and prediction for the turning manoeuvre: the prediction shows the ship turning based on set handle positions of bow and stern thrusters operating at 80%.
* Reprinted with permission from: Transactions on Maritime Science (ToMS)

7th INTERNATIONAL MARITIME SCIENCE CONFERENCE
34
April 20th-21st, 2017, Solin, Croatia
Figure 10. Final part of the manoeuvring plan: the vessel is brought into a position parallel to the berth, to be pushed to the pier by thrusters from the next MP 6
In Figure 9 the ship has almost come to a stop and turns by using the thrusters – the contour is moved to a position where the thrusters are stopped and the engines accelerate to return the vessel to the fairway in the opposite direction. In Figure 10 the vessel is brought close to the berth and at MP5 the engines are reversed to reduce speed and stop the ship at a position parallel to the berth, to be pushed to the pier by thrusters from the next MP 6. The plan than requires an additional MP to reduce transversal speed shortly before berthing.
3.2.2 Advanced exercise with strong wind
The full potential of fast time simulation can be seen in difficult weather conditions. In Figure 11 the scenario has now to be re-enacted at 25 kn wind from 61°. The initial position is the same as in the previous example but the trainee’s first task is to find the balance condition in the fairway: after several attempts, drift angle of about 16° and rudder angle of 3° were set and the ship contour was moved to the buoys at fairway
entrance. The next manoeuvring segment requires stopping and turning: the left side of Figure 12 clearly shows that if the ship were simply to stop here as in the previous exercise, she would drift heavily with the wind. Therefore, the engines are split to support turning by the STB engine, while the PT engine goes astern. In the final part of the manoeuvre, the crucial segments are difficult to execute due to strong wind on the return track in the opposite course: in Figure 13 the ship enters the fairway from the south, with strong wind from the bow, requiring heading, course and rudder adjustment. Splitting the engines is advantageous since the rudder is more effective when one engine operates with more power. In addition, the ship is better prepared to stop since one engine is already going astern and there is no additional reversing time. On the right side of the figure, the stopping manoeuvre requires the trainee to bring the ship into a position parallel to the berth. In Figure 14 thrusters and rudders work at full power to counteract the wind for the final berthing, the approaching speed of the drift motion towards the pier is below 0.8 kn (for 30 kn it would be over 1.5 kn).
* Reprinted with permission from: Transactions on Maritime Science (ToMS)

35
Knud Benedict, Sandro Fischer, Michael Gluch, Matthias Kirchhoff, Michele Schaub, Michael Baldauf, Burkhard Müller
INNOVATIVE FAST TIME SIMULATION TOOLS FOR BRIEFING / DEBRIEFING IN ADVANCED SHIP HANDLING SIMULATOR TRAINING AND SHIP OPERATION
Figure 11. Fast time planning on a sea chart under 25 kn wind blowing from 61°: initial ship position MP0
and future course prediction with drift angle
Figure 12. Ship position at MP2 and turning manoeuvre prediction with two strategies: • Left: turning with thrusters only (the same concept as without wind in Figure 9) • Right: more powerful solution with split engines and rudder support
* Reprinted with permission from: Transactions on Maritime Science (ToMS)

7th INTERNATIONAL MARITIME SCIENCE CONFERENCE
36
April 20th-21st, 2017, Solin, Croatia
Figure 13. Continued execution of the manoeuvring plan on the return track, in the opposite direction:
• Left: this time the ship enters the fairway from the south and heading, course and rudder are adjusted using split engines
• Right: the stopping manoeuvre intended to bring the ship into a position parallel with the berth
Figure 14. Complete manoeuvring plan with the final berthing manoeuvre.
* Reprinted with permission from: Transactions on Maritime Science (ToMS)

37
Knud Benedict, Sandro Fischer, Michael Gluch, Matthias Kirchhoff, Michele Schaub, Michael Baldauf, Burkhard Müller
INNOVATIVE FAST TIME SIMULATION TOOLS FOR BRIEFING / DEBRIEFING IN ADVANCED SHIP HANDLING SIMULATOR TRAINING AND SHIP OPERATION
3.2.3 Briefing by means of the „Manoeuvre Trial & Training module“
The Trial & Training Tool is a desktop simulation tool for real time manoeuvring simulation illustrated in Figure 13. It has the same handle panel on the right side as previously seen in the planning tool. It contains conning information, together with prediction and is capable of displaying the planned manoeuvring track. The central window shows the ENC with motion parameters for longitudinal and transverse speed. The ship’s position is displayed
in the centre of the ENC as the ship’s contour. Track prediction can also be indicated here either as a curved track or a chain of contours for the selected prediction time. Prediction parameters, like presentation range or interval, can be set in the control window on the left side. In Figure 13 the scenario of navigation under wind is shown, with the ship just having entered the turning area and beginning to turn. The table at the top of the ENC shows planned manoeuvre control settings, with the planned track designated by blue colour.
Figure 15. SAMMON Trail & Training Tool: real time simulation and manoeuvring prediction integrated into ECDIS, with the comparison of full dynamic prediction (dotted ship contours) and simple static prediction (magenta curve), together with planned manoeuvring track (blue line) (same in Monitoring Tool, with the
exception of the handle panel))
* Reprinted with permission from: Transactions on Maritime Science (ToMS)

7th INTERNATIONAL MARITIME SCIENCE CONFERENCE
38
April 20th-21st, 2017, Solin, Croatia
Execution of exercise and debriefing with fast time simulation 3.3. Use of simulation-augmented support
with SAMMON monitoring tool in a ship handling simulator
There are several ways to support execution and debriefing with FTS. Support during exercise execution depends on the extent to which the trainee is allowed to use the new manoeuvring prediction technology during the exercise. • At the lower end, multiple dynamic prediction
can be used to gradually introduce the student to potential control options at his disposal, as a means of good visualisation of manoeuvre quality – in this case, only the learning process is supported since the new technology is still unavailable on conventional ships
• At the highest level, the trainees are allowed to make full use of dynamic prediction and the prepared manoeuvring plan, they, as a rule, come closest to realizing the plan and get the best exercise results. The full use of prediction raises the safety and effectiveness even of advanced trainees
• Multiple dynamic predictions are always of great help to instructors (and peer students) because the chance for a trainee’s action to be successful can immediately be seen and the exercise may be terminated earlier if it is obvious that the trainee will fail.
In the debriefing, fast time tools allow for an in-depth assessment of the quality of manoeuvring results: • The assessment of results by comparison with
the trainee’s own concept or optimised plan can be shown in the replay function of the Monitoring tool, which can be used with the Multiple Prediction functionality; or in the SIMDAT tool for more detail, where the history of the trainee’s actions can be presented graphically, e.g. for rudder, thruster and engine activities
• Discussion of alternative manoeuvres at specific select situations can be supported by the Design & Planning tool; a particular situation is loaded during the exercise run and
the manoeuvring handles are operated in several different ways.
Multiple prediction can be useful for manoeuvres during the exercise. In Figure 16 the setup is either explained by the instructor or laptop is brought to the simulator bridge (where the manoeuvring plan might have been developed), the prediction is controlled by the bridge handles. The same laptop with the Monitoring tool can also be placed at the instructor’s station.
Figure 16. Using Multiple Prediction in simulator
training at the AIDA Cruises MSTC in Rostock Left: portable setup for prediction display in the
Monitoring tool on a trainee’s laptop on the bridge - the prediction is controlled by the bridge handle
via WLAN Right: prediction display in a debriefing session
(left screen): dynamic prediction can be used even during fast replay to complement the simulator
instructor display (right screen) The benefits of FTS use are: • Multiple dynamic predictions shown on the
instructor’s screen are always of great help to instructors and maybe even peer students looking over their shoulders to learn from the actions of the other trainees in charge on the bridge. They have a better overview of the current situation and the chances for a
* Reprinted with permission from: Transactions on Maritime Science (ToMS)

39
Knud Benedict, Sandro Fischer, Michael Gluch, Matthias Kirchhoff, Michele Schaub, Michael Baldauf, Burkhard Müller
INNOVATIVE FAST TIME SIMULATION TOOLS FOR BRIEFING / DEBRIEFING IN ADVANCED SHIP HANDLING SIMULATOR TRAINING AND SHIP OPERATION
trainee’s action to succeed can be seen immediately; the exercise can be stopped earlier if it is obvious that the trainee will fail.
• Multiple dynamic prediction can be used to gradually introduce the student to potential control options at his disposal, as a means of good visualisation of manoeuvre quality – in this case, only the learning process is supported since the new technology is still unavailable on conventional ships.
• If the trainees are allowed to make full use of dynamic prediction and the prepared manoeuvring plan, they, as a rule, come closest to realizing the plan and get the best exercise results. The full use of prediction raises the safety and effectiveness even of advanced trainees and can support the identification of the best performance.
3.4. Debriefing on the exercise and
comparison of results with the manoeuvring plan
There are several debriefing methods available after the training, using the FTS software. Whilst the Ship Handling Simulator (SHS) allows the training session to be additionally recorded using the „Monitoring & Manoeuvring Module“, the training and planning procedure can also be saved in the „Trial & Training“, as well as in the „Manoeuvre Design & Planning” modules. All files pertaining to planning and execution can be shown together, both in the form of the ship’s track, and as diagrams for several parameters throughout the manoeuvring time in the SIMDAT program. The following figures illustrate some of the possible result display methods.
In Figure 17 two simulator results of trainees with a different level of preparation are compared mutually and with the manoeuvring plan of the second trainee. The achievements of the better prepared trainee are obvious – the actually executed track comes very close to the planned manoeuvre and the actions of the controls also closely mimic the planned procedures. The use of the Fast Time Simulation tool in briefing and training not only reduces manoeuvring time; the thruster diagrams also show that a well-prepared manoeuvre can minimize the use of propulsion units, which makes the manoeuvre more efficient. Another great benefit of Fast Time Simulation is the opportunity to discuss alternative manoeuvres, the effects of and strategies of coping with different environmental conditions which might affect the ship unexpectedly at critical positions.
4. CONCLUSIONS / OUTLOOK
Fast Time Manoeuvring simulation has proven to be beneficial both for lecturing and training intended to improve ship handling knowledge and skills. The huge potential of this technology will be explored further, until it is incorporated onboard real ships. The majority of participants of ship handling courses hold that the Design & Planning module could be used for the compilation of a berthing plan onboard ships. There is high potential for optimisation, which would reduce manoeuvring time and fuel consumption /emissions. The FTS could also prove to be useful in various analyses (e.g. fairway layout, accidents) aiming to identify measures which would make shipping safer.
* Reprinted with permission from: Transactions on Maritime Science (ToMS)

7th INTERNATIONAL MARITIME SCIENCE CONFERENCE
40
April 20th-21st, 2017, Solin, Croatia
Figure 17. Results from two manoeuvring exercises in SIMDAT interface (Top: “Track Display” with contours; Blow: „Data Display“ of thruster activity history, Bottom: extract of sea chart from Track Display) and
comparison with the prepared manoeuvring plan (below) • Blue: run of the trainee without Fast Time Simulation support • Green: run of the trainee with full support and pre-planning with the Design and Planning module • Red: prepared manoeuvring plan with manoeuvring points MP
* Reprinted with permission from: Transactions on Maritime Science (ToMS)

41
Knud Benedict, Sandro Fischer, Michael Gluch, Matthias Kirchhoff, Michele Schaub, Michael Baldauf, Burkhard Müller
INNOVATIVE FAST TIME SIMULATION TOOLS FOR BRIEFING / DEBRIEFING IN ADVANCED SHIP HANDLING SIMULATOR TRAINING AND SHIP OPERATION
5. ACKNOWLEDGEMENTS
The research results presented in this paper were partly achieved in research projects “Multi Media for Improvement of MET” (MultiSimMan), funded by the German Federal Ministry of Education and Research (BMBF), surveyed by Research Centre Juelich PTJ. Additionally, it has to be mentioned that the professional version of the SAMMON software tools has been further developed by the start-up company Innovative Ship Simulation and Maritime Systems GmbH (ISSIMS GmbH; www.issims-gmbh.com).
REFERENCES
1. Benedict, K., (2016), Control your pivot point position in Ship Handling - Multimedia approach by Fast Time Simulation, IMSF 2016, AGM Seminar, June 13th – 16th, Ship handling Research and Training Centre Ilawa / Poland.
2. Benedict, K., Baldauf, M., Felsenstein, C., Kirchhoff, M., (2003), Computer-based support for the evaluation of ship handling simulator exercise results, MARSIM - International Conference on Marine Simulation and Ship Manoeuvrability, Kanazawa, Japan, August 25th – 28th, pp. 70-79.
3. Benedict, K., Baldauf, M., Fischer, S., Gluch, M., Kirchhoff, M., Schaub, M., Klaes, S., (2012), Fast Time Manoeuvring Simulation as Decision Support for Planning and Monitoring of Ship Handling Processes for Ship Operation
Onboard and Training in Simulators, MARSIM - International Conference on Marine Simulation and Ship Manoeuvrability, Singapore, April 23th – 27th, pp. 803-819.
4. Benedict, K., Baldauf, M., Fischer, S., Gluch, M., Kirchhoff, M., Schaub, M., Krueger, C-P., Klaes, S., (2016), Simulation Technology brings new visualisation of the future ships path – and advanced use of the well-known Speed Vector, The 24th International Maritime Lecturers Association Conference, Quality Standards in Maritime Education, November 10th – 14th, Texas A & M University at Galveston, TX /USA.
5. Benedict, K., Baldauf, M., Kirchhoff, M., Koepnick, W., Eyrich R., (2006), Combining Fast-Time Simulation and Automatic Assessment for Tuning of Simulator Ship Models, MARSIM - International Conference on Marine Simulation and Ship Manoeuvrability, Terschelling, Netherlands, June 25th – 30th, Proceedings, M-Paper 19 pp. 368-376.
6. ISSIMS GmbH Web page for SIMOPT & SIMDAT, available at: https://www.issims-gmbh.com/yoomla/, [accessed at 25 February 2017].
7. Schaub, M., Benedict, K., Gluch, M., Milbradt, G., Tuschling, G., Kirchhoff, M., (2015), Modelling of Ships for Simulator-Training and simulation-augmented Manoeuvring Support on board and from the shore, MARSIM - International Conference on Marine Simulation and Ship Manoeuvrability, Newcastle, September 8th – 11th.
* Reprinted with permission from: Transactions on Maritime Science (ToMS)

7th INTERNATIONAL MARITIME SCIENCE CONFERENCE
42
April 20th-21st, 2017, Solin, Croatia
EVALUATION OF THE FISHING VESSEL STABILITY IN DIFFERENT OPERATIONAL CONDITIONSKristofor Lapa, Miranda Vidhaj
EVALUATION OF THE FISHING VESSEL STABILITY IN DIFFERENT OPERATIONAL CONDITIONS
Kristofor Lapa, Miranda Vidhaj
(University “Ismail Qemali”, Skelë, Vlorë, Albania)
(E-mail: [email protected])
ABSTRACT
Ship stability is one of the most important factors in the overall safety of any fishing vessel. Fishing vessels, especially small-scale ones
represent the greatest percentage within marine vessels industry. This category of vessels, although it is among the oldest that are
built and operating, still poses safety issues for crew, ship and environment. One of the most difficult tasks for the fishing vessel
master is to ascertain that the vessel has adequate stability. The reason for this difficulty is that, unlike any other cargo ship which is
loaded at port, normally a fishing vessel is loaded while operating offshore, under severe weather conditions. Understanding the basic
concepts of stability and preservation of the vessel stability reserve is considered thus of a great importance. In this respect, this study
provides a stability assessment as well as a stabilizing behavior analysis of a small fishing vessel, operating under different conditions,
so that the vessel masters acquires the ability to make right decisions in each navigational circumstances.
KEY WORDS
Fishing vessel, stability, weather condition, MaxSurf software
1. INTRODUCTION
Stability is defined as the vessel’s ability to return to its upright position after its heeling by an external force, such as wind, wave or a strain from his fishing mechanism. It is determined by ship’s characteristics, such as hull’s shape and weight distribution, as well as the ship’s main functions. The fishing vessel stability does not reflect a constant state; it is subject to ongoing alternations during each voyage, as well as during vessel’s operational life. In this regard, a fishing boat
initially stable may suddenly become unstable due to weather changes as well as depending upon loading and operational factors. According to SOLAS (International Convention for the Safety of Life at Sea, 1974/78) "fishing vessel is a vessel that is used to hunt fish or other living creatures in the sea". The international practice has shown that the annual crew mortality caused by fishing vessels disasters (capsizing) in the global fishing industry varies of about 80 crew members
per 100,000 people, including here also non-fatal accidents that occur each year (FAO/ILO/IMO, 2005). The main reason behind these accidents is considered to be the disregard of safety rules, which is mainly related to fishing vessels instability ILO. According to the International Convention on Load Lines (1996), the minimum free board height, fishing vessels must be designed, constructed and operate in a way that to meet the minimum criteria of the stability established by the competent authority in all operating conditions. Information suitable for stability, prepared to fulfill the competent authorities’ requirements (AMA, 2009 and ARSI, 2016) shall be provided for each ship master to allow easy and instant evaluation of the ship stability in different operational conditions (FAO, 2012).
2. CASE STUDY: FISHING VESSEL 2K-300
Calculations are performed and stability diagrams are drawn to different operating conditions for small fishing boat flying Albanian flag (Xhaferaj, 2008). From these observations, we can verify the fulfillment of the stability criteria set by IMO. The following table presents the fishing boat’s weights distribution departing for the fishing grounds with 100% of the reserves.
2.1. Departing for fishing grounds with 100% of reserves
The following table presents the weights distribution for fishing boat when departing for the fishing grounds with 100% of the reserves.
Figure 1. General arraingement of fishing vessel 2K-300 Principal data of the fishing vessel 2K-300 are: LOA=25.23m, LWL=22.00m, B=5.60m, T=2.08m, H=2.60m

43
Kristofor Lapa, Miranda Vidhaj
EVALUATION OF THE FISHING VESSEL STABILITY IN DIFFERENT OPERATIONAL CONDITIONS
per 100,000 people, including here also non-fatal accidents that occur each year (FAO/ILO/IMO, 2005). The main reason behind these accidents is considered to be the disregard of safety rules, which is mainly related to fishing vessels instability ILO. According to the International Convention on Load Lines (1996), the minimum free board height, fishing vessels must be designed, constructed and operate in a way that to meet the minimum criteria of the stability established by the competent authority in all operating conditions. Information suitable for stability, prepared to fulfill the competent authorities’ requirements (AMA, 2009 and ARSI, 2016) shall be provided for each ship master to allow easy and instant evaluation of the ship stability in different operational conditions (FAO, 2012).
2. CASE STUDY: FISHING VESSEL 2K-300
Calculations are performed and stability diagrams are drawn to different operating conditions for small fishing boat flying Albanian flag (Xhaferaj, 2008). From these observations, we can verify the fulfillment of the stability criteria set by IMO. The following table presents the fishing boat’s weights distribution departing for the fishing grounds with 100% of the reserves.
2.1. Departing for fishing grounds with 100% of reserves
The following table presents the weights distribution for fishing boat when departing for the fishing grounds with 100% of the reserves.
Figure 1. General arraingement of fishing vessel 2K-300 Principal data of the fishing vessel 2K-300 are: LOA=25.23m, LWL=22.00m, B=5.60m, T=2.08m, H=2.60m

7th INTERNATIONAL MARITIME SCIENCE CONFERENCE
44
April 20th-21st, 2017, Solin, Croatia
Table 1.1. The weights distribution with the respective centers of gravity
Case 1
No. Weight Denomination Departing for fishing grounds with 100% of reserves
P (ton) ZG (m) M0X (tm)
1 Empty ship 82,26 2,33 191,67
2 Fuel (diesel) 4,96 1,63 8,08
3 Lubricating oil 0,34 1,70 0,58
4 Fresh Water: potable 1,50 0,70 1,05
5 Fresh Water: for washing 2,50 0,80 2,00
6 Crew and baggage 1,20 4,00 4,80
7 Food 0,50 4,00 2,00
8 Nets on deck 0,50 4,16 2,08
9 Fish cargo
93,76 2,26 212,26
It is given in the following table elements assessed for stability in Case 1 of loading.
Table 1.2. Elements for ship stability in case of loading 1
Title of the stability elements Units Value P Ship weight ton 93,76 T Ship Immersion m 1,91 ZG Height of G from the keel m 2.26 ZM Height of metacentric from baseline m 2.97 h Metacentric hight h=ZM-ZG m 0,71 r Transverse metacentric radius m 1,74
Table 1.3. Calculation of the righting arms for the ship in case 1 of loading for ϕ=0-800
φ sin φ ZG ZG.sinφ h h- ZGsinφ
10° 0.1736 2.31 0.40 0.52 0.12 20° 0.342 2.31 0.79 1.02 0.23 30° 0.500 2.31 1.15 1.45 0.30 40° 0.6428 2.31 1.48 1.76 0.28 50° 0.766 2.31 1.77 1.96 0.19 60° 0.866 2.31 2.00 2.09 0.09 70° 0.9397 2.31 2.17 2.13 -0.04 80° 0.9848 2.31 2.27 2.10 -0.17
After the calculations of the stability righting arms (Bentley, 2009), we draw up the stability diagram and make its verification according to the IMO norms (Lapa, 2004):
1. The area under the righting lever curve (GZ curve) should not be less than 0.055 m⋅rad up to 30° angle of heel and not less than 0.090 m⋅rad up to 40° or the angle of flooding ϕf if this angle is less than 40°. The area under the righting lever curve (GZ curve) between the angles of heel of 30° and 40° or between 30° and ϕf, if this angle is less than 40°, should not be less than 0.030 m⋅rad. 2. The righting lever GZ should be at least 200 mm at an angle of heel equal to or greater than 30°. 3. The maximum righting lever GZmax should occur at an angle of heel preferably exceeding 30° but not less than 25°. 4. The initial metacentric height GM0 should not be less than 350 mm.

45
Kristofor Lapa, Miranda Vidhaj
EVALUATION OF THE FISHING VESSEL STABILITY IN DIFFERENT OPERATIONAL CONDITIONS
Figure 2. Stability diagram of for Case 1 of the loading
Table 1.4. Verification of stability of the boat according to IMO norms for loading Case 1
Norms according
to IMO Actual Status
1
Area 0-30 degree 0,055 0,102 pass
Area 0-40 degree 0,090 0,153 pass
Area 30-40 degree 0,030 0,051 pass
2 GZ at 30 degree 0,200 0,300 pass
3 Angle of max. GZ 30,00 34,00 pass
4 Initial value of GMt 0,350 0,660 pass
2.2. Home port arrival with 25% of reserves
The following table presents the weights distribution for fishing boat when it arrives at home port with 25% of the reserves.
Table 2.1. The weights distribution with the respective centers of gravity
Case 2
No. Weight denomination Home port arrival with 25% of reserves
P (ton) ZG (m) M0X (tm)
1 Empty ship 82,26 2,33 191,67
2 Fuel (diesel) 1,24 1,20 1,49
3 Lubricating oil 0,08 1,12 0,09
4 Fresh Water: potable 0,38 0,43 0,16
5 Fresh Water: for washing 0,62 0,43 0,27

7th INTERNATIONAL MARITIME SCIENCE CONFERENCE
46
April 20th-21st, 2017, Solin, Croatia
6 Crew and baggage 1,20 4,00 4,80
7 Food 0,13 4,00 0,52
8 Nets on deck
9 Fish cargo 25,00 1,72 43,00
110,91 2,18 241,99
After the calculations of the righting arms of the stability (Bentley, 2009), we draw up the stability
diagram and make its verification according the IMO norms (Lapa, 2004).
Figure 3. Stability diagram for Case 2 of the loading
Table 2.2. Verification of stability of the boat according to IMO norms for loading Case 2
Norms according
to IMO Actual Status
1
Area 0-30 degree 0,055 0,121 pass
Area 0-40 degree 0,090 0,183 pass
Area 30-40 degree 0,030 0,062 pass
2 GZ at 30 degree 0,200 0,350 pass
3 Angle of max. GZ 30,00 35,00 pass
4 Initial value of GMt 0,350 0,860 pass
2.3. Return from fishing with 25% of reserves without fish
The following table presents the weights distribution for fishing boat when it returns from fishing with 25% of the reserves, but without fish.
-‐0.05
0
0.05
0.1
0.15
0.2
0.25
0.3
0.35
0.4
0 5 10 15 20 25 30 35 40 45 50 55 57.3 60 65 70 75 80
Righ%n
g arm GZ
Heeling angle ϕ
Stability diagram -‐ Case II

47
Kristofor Lapa, Miranda Vidhaj
EVALUATION OF THE FISHING VESSEL STABILITY IN DIFFERENT OPERATIONAL CONDITIONS
Table 3.1. The weights distribution with the respective centers of gravity
Case 3
No. Weight denomination Return from the fishing grounds with 25% of reserves, without
fish
P (ton) ZG (m) M0X (tm)
1 Empty ship 82,26 2,33 191,67
2 Fuel (diesel) 1,24 1,20 1,49
3 Lubricating oil 0,08 1,12 0,09
4 Fresh Water: potable 0,38 0,43 0,16
5 Fresh Water: for washing 0,62 0,43 0,27
6 Crew and baggage 1,20 4,00 4,80
7 Food 0,13 4,00 0,52
8 Nets on deck 0,50 4,16 2,08
9 Fish cargo
86,41 2,33 201,07
After the calculations of the stability righting arms (Bentley, 2009), we draw up the stability diagram
and make its verification according the IMO norms (Lapa, 2004).
Figure 4. Stability diagram for Case 3 of the loading
-‐0.3
-‐0.2
-‐0.1
0
0.1
0.2
0.3
0.4
0 5 10 15 20 25 30 35 40 45 50 55 57.3 60 65 70 75 80 Righ%n
g arm GZ
Heeling angle ϕ
Stability diagram -‐ Case III

7th INTERNATIONAL MARITIME SCIENCE CONFERENCE
48
April 20th-21st, 2017, Solin, Croatia
Table 3.2. Verification of stability of the boat according to IMO norms for loading Case 3
Norms according
to IMO Actual Status
1
Area 0-30 degree 0,055 0,096 pass
Area 0-40 degree 0,090 0,144 pass
Area 30-40 degree 0,030 0,048 pass
2 GZ at 30 degree 0,200 0,275 pass
3 Angle of max. GZ 30,00 33,00 pass
4 Initial value of GMt 0,350 0,620 pass
2.4. Home port arrival (koshilogu overboard) with 10% of stores, fuel and fish
The following table presents the weights distribution for fishing boat when arriving at home port with 10% of stores, fuel, and fish.
Table 4.1. The distribution of weights with the respective centers of gravity
Case 4
No. Weight denomination Home port arrival, koshilogu overboard, with 10% of stores, fuel, fish
P (ton) ZG (m) M0X (tm)
1 Empty ship 82,26 2,33 191,67
2 Fuel (diesel) 0,05 1,20 0,06
3 Lubricating oil 0,00 1,12 0,00
4 Fresh Water: potable 0,02 0,43 0,01
5 Fresh Water: for washing 0,03 0,43 0,01
6 Crew and baggage 1,20 4,00 4,80
7 Food 0,01 4,00 0,02
8 Nets on deck
9 Fish cargo 2,50 1,70 4,25
86,06 2,33 200,82
After the calculations of the stability righting arms (Bentley, 2009), we draw up the stability diagram
and make its verification according the IMO norms (Lapa, 2004).

49
Kristofor Lapa, Miranda Vidhaj
EVALUATION OF THE FISHING VESSEL STABILITY IN DIFFERENT OPERATIONAL CONDITIONS
Figure 5. Stability diagram for Case 4 of the loading
Table 4.2. Verification of stability of the boat according to IMO norms for loading Case 4
Norms according
to IMO Actual Status
1
Area 0-30 degree 0,055 0,121 pass
Area 0-40 degree 0,090 0,183 pass
Area 30-40 degree 0,030 0,062 pass
2 GZ at 30 degree 0,200 0,350 pass
3 Angle of max. GZ 30,00 35,00 pass
4 Initial value of GMt 0,350 0,840 pass
2.5. Home port arrival with 25% of the reserves with 2 ton fish on board
The following table presents the weights distribution for fishing boat when arriving at home port with 25% of the reserves, with 2 tons fish onboard.
-‐0.1
-‐0.05
0
0.05
0.1
0.15
0.2
0.25
0.3
0.35
0.4
0 5 10 15 20 25 30 35 40 45 50 55 57.3 60 65 70 75 80
Righ%n
g arm GZ
Heeling angle ϕ
Stability diagram -‐ Case IV

7th INTERNATIONAL MARITIME SCIENCE CONFERENCE
50
April 20th-21st, 2017, Solin, Croatia
Table 5.1. The weights distribution with the respective centers of gravity
Case 5
No. Weight denomination Return from fishing, with 25% of reserves, with 2 ton fish
onboard
P (ton) ZG (m) M0X (tm)
1 Empty ship 82,26 2,33 191,67
2 Fuel (diesel) 1,24 1,20 1,49
3 Lubricating oil 0,08 1,12 0,09
4 Fresh Water: potable 0,38 0,43 0,16
5 Fresh Water: for washing 0,62 0,43 0,27
6 Crew and baggage 1,20 4,00 4,80
7 Food 0,13 4,00 0,52
8 Nets on deck 0,50 4,16 2,08
9 Fish cargo 2,00 3,05 6,10
88,41 2,34 207,17
After the calculations of the stability righting arms (Bentley, 2009), we draw up the stability diagram
and make its verification according the IMO norms (Lapa, 2004).
Figure 6. Stability diagram for Case 5 of the loading
-‐0.15
-‐0.1
-‐0.05
0
0.05
0.1
0.15
0.2
0.25
0.3
0.35
0 5 10 15 20 25 30 35 40 45 50 55 57.3 60 65 70 75 80
Righ%n
g arm GZ
Heeling angle ϕ
Stability diagram -‐ Case V

51
Kristofor Lapa, Miranda Vidhaj
EVALUATION OF THE FISHING VESSEL STABILITY IN DIFFERENT OPERATIONAL CONDITIONS
Table 5.2. Verification of stability of the boat according to IMO norms for loading Case 5
Norms according
to IMO Actual Status
1
Area 0-30 degree 0,055 0,101 pass
Area 0-40 degree 0,090 0,155 pass
Area 30-40 degree 0,030 0,054 pass
2 GZ at 30 degree 0,200 0,300 pass
3 Angle of max. GZ 30,00 35,00 pass
4 Initial value of GMt 0,350 0,670 pass
Case 3 (Home port arrival with 25% of reserves, no fish) shows the value 0.096 (first condition), 0.275 (second condition) of the stability verification, which should be considered a slight loss of stability.
3. CONCLUSIONS
Ship registration legal requirements must be implemented by fishing vessels, obviously based on the fishing nature and operational areas, as to ensure that the ship stability book is efficiently utilized by the fishing industry. In this regard, stability calculations were made possible so that necessary technical legal documentation are developed and implemented by the Albanian Shipping Register. The fishing vessel’s loading process has to be carried out in the appropriate way as to improve the ship stability. Moreover, the hermetic doors or bulkheads have to be secured or sealed for any possible water flooding that threatens the boat. The crew should be trained on fishing vessel’s stability issues as well as its possible effects while on operation. Technical physical changes that were made continuously in fishing vessels should be data recorded and verifications have to be made whether there are any effects regarding the ship stability. On the other hand, stability calculations should be carried out in diverse types of fishing vessels load, mostly when there are physical modifications to her hull and especially when bulkheads lose their watertightness. Understanding each of the factors that reduce stability will help ship master to make the right
decisions and take the right actions to keep vessel safe. The factors that provide positive stability forces, such as full fuel tanks, are initially present in e vessel but being reduced overtime during a trip as fuel is burnt down. Therefore, having some fishing catch loaded in hold can also help positive stability forces. Fuel reductions and fishing operations steal margins of safety from the vessel’s stability. Nevertheless, the stability book can help the skipper to prepare for and check loading conditions at certain stages of the trip. These loading conditions can be considered by the skipper while planning a trip, and used as a set of parameters to check against and stay within. During the case study, it is shown that IMO stability criteria are fulfilled. Maxsurf packages once again show its credibility in carrying out these calculations.
REFERENCES
1. AMA - Albanian Maritime Administration. (2009).
2. ARSI - Albanian Regulation for Ship Inspection, 2016
3. FAO/ILO/IMO Voluntary Guidelines for the Design, Construction and Equipment of Small Fishing Vessels, 2005
4. FAO Fishieries and aquaculture technical paper 517 - Safety practices related to small fishing vessel stability, 2012
5. Bentley. (2009). Maxsurf. Australia: Formation Design Systems Pty Ltd.
6. Lapa K. (2004). Ship Hydrostatic and Stability. Tirana, AL: SHBLU.
7. Xhaferaj, B., & et al. (2008). Using of Maxsurf software systems for assessing of navigation safety of marine vehicles in Albanian Maritime Transport. In Proceedings of the Scientific Symposium “The credibility of the Maritime transport Vehicles”, Vlora, 52-61

7th INTERNATIONAL MARITIME SCIENCE CONFERENCE
52
April 20th-21st, 2017, Solin, Croatia
THE CONCEPT OF WATER MIST FIRE AND DETONATION PROTECTION FOR NAVAL VESSELSAndrzej Grządziela, Marek Dudziński
THE CONCEPT OF WATER MIST FIRE AND DETONATION PROTECTION FOR NAVAL VESSELS
Andrzej Grządziela, Marek Dudziński
(Polish Naval Academy, Gdynia, Poland)
(E-mail: [email protected])
ABSTRACT
Water spray is commonly applied for firefighting and dust reduction in marine, offshore technology and land industry. The paper is focused on the application such system for naval vessels including effects of blast loads coming from the explosion as well. The purpose of the system is to protect the all ship's compartments, citadels and rooms. The theoretical analysis of water mist extinguish phenomena is presented in the work. Problems of automatization, fast, optical detectors and intelligent operation system is featured. This paper is the first in a series of principles on the use of drops of water to extinguish fires, the thermodynamic calculations of extinguish detonation using water mist, the super-fast fire and detonation detectors and the principles of design installation of water mist. Presented paper Consists considerations the merits of the use of water mist for firefighting and absorption of a detonation wave.
KEY WORDS
Water mist, Firefighting, Naval vessels.
1. INTRODUCTION
Navies all over the world are constantly seeking ways to increase the safety of their personnel and resilience in operational deployment of their ships. For ease of acquisition the water - water spray is commonly applied for fire suppression in ships but has also been demonstrated to effectively mitigate blast loads and effects of fire from an explosion. With growing understanding of the physical phenomena involved, general interest in developing water spray technology for blast mitigation has increased considerably over the last decade. The significant effect of water spray on both peak and quasi static overpressure, detailed in
literature, offers the potential to enhance damage containment in ships. The main advantage of water mist system is the possibility of starting the system without the need for evacuation of people from a burning place which is very necessary for the crews of ships carrying out tasks they undertake. It is needed to presents considerations on autonomy of the system, the modularization and compliance with classification societies and defense standards. Applications containing a list of technological problems and recommendations for the design process for marine compartments with different thermal load.

53
Andrzej Grządziela, Marek Dudziński
THE CONCEPT OF WATER MIST FIRE AND DETONATION PROTECTION FOR NAVAL VESSELS
2. WATER MIST
Water mist systems combine the advantages of gas systems and conventional sprinkler systems. One of the advantages is displacement of oxygen from the areas as gas system and cools like a conventional sprinkler system, but the most important fact is that there is no need to evacuate the crew from a burning areas to startup the system which significantly speeds up the start time of the extinguish. 2.1. Theoretical foundations of spraying liquids
Below are shown properties, and physics behind these small droplets and their extinguishing ability. It is known that one of the most interesting properties of water in fire extinguishing is its ability to extract such a huge amount of heat when it is vaporized. It is also true that we need vaporization in order to have the desired oxygen depletion. So consequently, facilitating and increasing the extinguishing ability of water means facilitating water vaporization. The process of endothermic heat transfer is based on the exchange boundary layer. Here the boundary layer is actually the droplet surface. A simple small calculation will highlight the importance of fine mist atomization in order to increase the surface: - Assuming a droplet being spherical, due to its surface tension more important than friction forces, we can use the following formula:
𝑉𝑉 = !!𝜋𝜋 !
!
! (1)
𝑆𝑆 = 4𝜋𝜋 !!
! (2)
If it is taken 1 [g] of water at ambient temperature, assumed to have a volume Vt of 1 [cm3], split into droplets of 1 [mm], it gives us:
𝑉𝑉 = !!𝜋𝜋 !
!
!= 0,52 [𝑚𝑚𝑚𝑚!] (3)
𝑁𝑁 =𝑉𝑉!𝑉𝑉!
=10000,52
= 1910 𝑑𝑑𝑑𝑑𝑑𝑑𝑑𝑑𝑑𝑑𝑑𝑑𝑑𝑑𝑑𝑑
𝑆𝑆 = 4𝜋𝜋 !!
!= 3,14 [𝑚𝑚𝑚𝑚!] (4)
𝑆𝑆! = 𝑆𝑆! ∙ 𝑁𝑁 = 6000 𝑚𝑚𝑚𝑚! = 0,006[𝑚𝑚!]
Splitting 1 [cm3] into droplets of 1 [mm] gives 1910 droplets, offering a total contact surface of 60 [cm2]. Assuming that the same volume Vt = 1 [cm3], but split into droplets of 0,1 [mm] (so 10 time smaller):
𝑉𝑉 = !!𝜋𝜋 !
!
!= 0,52 [𝜇𝜇𝜇𝜇!] (5)
𝑁𝑁 =𝑉𝑉!𝑉𝑉!
=10000,52
= 1909859 𝑑𝑑𝑑𝑑𝑑𝑑𝑑𝑑𝑑𝑑𝑑𝑑𝑑𝑑𝑑𝑑
𝑆𝑆 = 4𝜋𝜋𝐷𝐷2
!= 31,42 [𝜇𝜇𝜇𝜇!]
𝑆𝑆! = 𝑆𝑆! ∙ 𝑁𝑁 = 60000000 𝜇𝜇𝜇𝜇! = 0,6[𝑚𝑚!]
Splitting 1 [cm3] into droplets of 0,1 [mm] gives 1.9 million droplets, offering a total contact surface of 6000 [cm2]. For the same volume of water, dividing by ten the size of the droplets allow an increase of contact surface to a factor of a hundred. Moreover, still focusing on the size, but without considering the evaporation factor, it is also important to have small droplets in order to have a sufficient rate of attenuating shielding, as well as a long enough suspension time in the air.
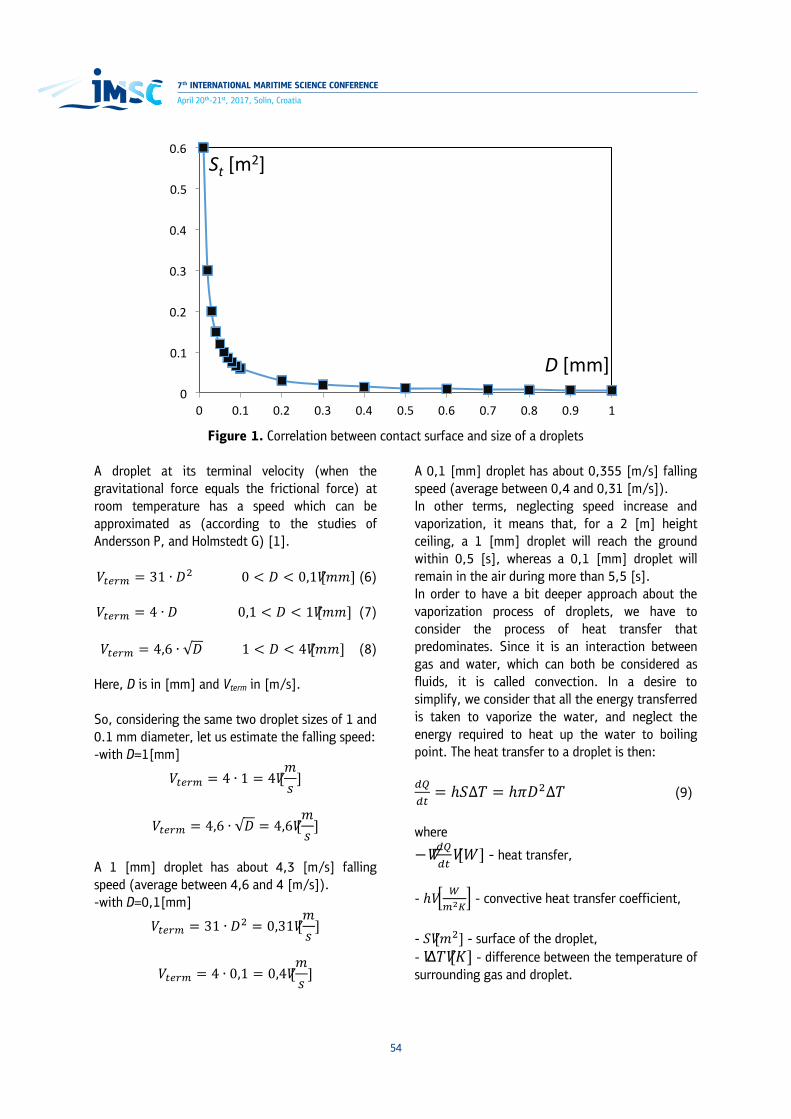
7th INTERNATIONAL MARITIME SCIENCE CONFERENCE
54
April 20th-21st, 2017, Solin, Croatia
Figure 1. Correlation between contact surface and size of a droplets
A droplet at its terminal velocity (when the gravitational force equals the frictional force) at room temperature has a speed which can be approximated as (according to the studies of Andersson P, and Holmstedt G) [1]. 𝑉𝑉!"#$ = 31 ∙ 𝐷𝐷! 0 < 𝐷𝐷 < 0,1 [𝑚𝑚𝑚𝑚] (6)
𝑉𝑉!"#$ = 4 ∙ 𝐷𝐷 0,1 < 𝐷𝐷 < 1 [𝑚𝑚𝑚𝑚] (7)
𝑉𝑉!"#$ = 4,6 ∙ 𝐷𝐷 1 < 𝐷𝐷 < 4 [𝑚𝑚𝑚𝑚] (8)
Here, D is in [mm] and Vterm in [m/s]. So, considering the same two droplet sizes of 1 and 0.1 mm diameter, let us estimate the falling speed: -with D=1[mm]
𝑉𝑉!"#$ = 4 ∙ 1 = 4 [𝑚𝑚𝑠𝑠]
𝑉𝑉!"#$ = 4,6 ∙ 𝐷𝐷 = 4,6 [𝑚𝑚𝑠𝑠]
A 1 [mm] droplet has about 4,3 [m/s] falling speed (average between 4,6 and 4 [m/s]). -with D=0,1[mm]
𝑉𝑉!"#$ = 31 ∙ 𝐷𝐷! = 0,31 [𝑚𝑚𝑠𝑠]
𝑉𝑉!"#$ = 4 ∙ 0,1 = 0,4 [𝑚𝑚𝑠𝑠]
A 0,1 [mm] droplet has about 0,355 [m/s] falling speed (average between 0,4 and 0,31 [m/s]). In other terms, neglecting speed increase and vaporization, it means that, for a 2 [m] height ceiling, a 1 [mm] droplet will reach the ground within 0,5 [s], whereas a 0,1 [mm] droplet will remain in the air during more than 5,5 [s]. In order to have a bit deeper approach about the vaporization process of droplets, we have to consider the process of heat transfer that predominates. Since it is an interaction between gas and water, which can both be considered as fluids, it is called convection. In a desire to simplify, we consider that all the energy transferred is taken to vaporize the water, and neglect the energy required to heat up the water to boiling point. The heat transfer to a droplet is then: !"!"= ℎ𝑆𝑆∆𝑇𝑇 = ℎ𝜋𝜋𝐷𝐷!∆𝑇𝑇 (9)
where
− !"!" [𝑊𝑊] - heat transfer,
- ℎ !!!!
- convective heat transfer coefficient,
- 𝑆𝑆 [𝑚𝑚!] - surface of the droplet, - ∆𝑇𝑇 [𝐾𝐾] - difference between the temperature of surrounding gas and droplet.
0
0.1
0.2
0.3
0.4
0.5
0.6
0 0.1 0.2 0.3 0.4 0.5 0.6 0.7 0.8 0.9 1
D [mm]
St [m2]

55
Andrzej Grządziela, Marek Dudziński
THE CONCEPT OF WATER MIST FIRE AND DETONATION PROTECTION FOR NAVAL VESSELS
Now, the volume decrease of the droplet in function of time is expressed as: !"!"= !
!∙!𝜋𝜋 !"!
!"= !
!𝐷𝐷! !"
!" (10)
Equation can be written, shown as below, which represents the required energy to vaporize water:
− !"!"= 𝐻𝐻!𝜌𝜌
!"!"= 𝐻𝐻!𝜌𝜌
!!𝐷𝐷! !"
!" (11)
where
- − !"!"[𝑊𝑊] heat required to vaporize
- 𝐻𝐻! [!"!"] heat of vaporization = 2260 [!"
!"] at
normal pressure
- 𝜌𝜌 [!"!!] density of water
- 𝑉𝑉[𝑚𝑚!] volume of the droplet And since the amount of heat transferred is equal to the amount required to vaporize, we can write the new expression:
−𝐻𝐻!𝜌𝜌!!𝐷𝐷! !"
!"= ℎ𝜋𝜋𝐷𝐷!∆𝑇𝑇 (12)
simplified: !"!"= !"∆!
!!! (13)
Before calculating reference droplets life time and falling duration, we have to explain what is the convective heat transfer coefficient (ℎ) and how to calculate it. It depends on external flow properties: - external flow velocity (𝑣𝑣) - external flow temperature (𝑇𝑇) - external flow heat conductivity (𝑘𝑘), - density (𝜌𝜌), - heat capacity or specific heat (𝑐𝑐), - kinematic viscosity (𝑣𝑣), - dynamic viscosity (𝜇𝜇). An empirical correlation can be written:
ℎ = !"∙!!
(14)
where 𝑁𝑁𝑁𝑁 = 2+ 0,6 ∙ 𝑃𝑃𝑃𝑃!/! ∙ 𝑅𝑅𝑅𝑅!/! (15)
(Applicable for 𝑃𝑃𝑃𝑃 > 0,6; Blasius correlation for laminar flow): 𝑁𝑁𝑁𝑁 - The Nusselt Number 𝑅𝑅𝑅𝑅 - The Reynolds number 𝑃𝑃𝑃𝑃 - the Prandtl number For a sphere in cross flow, Prandtl and Reynolds number can be defined as follow:
𝑃𝑃𝑃𝑃 = !"!
(16)
𝑅𝑅𝑅𝑅 = !"!
(17)
For this two examples, we meet two situations influencing convection. Droplets of 0,1 [mm] are so light that they are considered as behaving as a gas, and then are subjected to natural convection, whereas droplets of 1 [mm] size have a higher velocity, and therefore create a forced convection. Thus, for a droplet of 1 [mm] diameter, we are in the case of forced convection. Inspired by the researches of Stefan Särdqvist [2] case we can write the following equality (assuming the simplified equation): 𝑁𝑁𝑁𝑁 = 0,6 ∙ 𝑃𝑃𝑃𝑃!/! ∙ 𝑅𝑅𝑅𝑅!/! (18)
Since 𝑁𝑁𝑁𝑁 is much greater than 2 that the value can be neglected, for life time estimation:
𝑡𝑡!"#$ =!!!!!!!"∆!
(19)
Which gives us the falling length before total evaporation:
𝑙𝑙!"# =!!∙ !!!!!
!!"∆! (20)
where: 𝐷𝐷! - the initial droplet diameter, 𝐶𝐶 - is a constant calculated as [8]:
𝐶𝐶 = 0,6 ∙ !"!
!/!∙ !
𝑣𝑣
!/!∙ 𝑣𝑣 (21)

7th INTERNATIONAL MARITIME SCIENCE CONFERENCE
56
April 20th-21st, 2017, Solin, Croatia
where:
𝑐𝑐 [ !"!"#
] - is the specific heat of the surrounding
atmosphere,
𝜇𝜇 [!"!"] - the dynamic viscosity of the surrounding
atmosphere,
𝑘𝑘 [ !!"] - is the thermal conductivity coefficient of
the surrounding atmosphere,
𝑣𝑣 [𝑚𝑚2
𝑠𝑠 ] - is the kinematic viscosity of the
surrounding atmosphere,
𝑣𝑣 [!!] - is the falling speed of the droplet.
Assuming that the travel of droplet from ceiling to the ground, surrounded by a constant air temperature at 400 [°C], having a dynamic viscosity of 3,25·10-5 [kg/ms], a kinematic viscosity of 62,53·10-6 [m2/s], a specific heat of 1068 [J/kgK], a thermal conductivity of 0,0515 [W/mK], a water temperature of 100 [°C], and a falling speed of 4,3 [m/s]:
𝑐𝑐 = 229,9 [𝑘𝑘𝑘𝑘𝑘𝑘𝑘𝑘𝑘𝑘]
𝑡𝑡!"#$ = 318,1 [𝑠𝑠]
𝑙𝑙!"# = 683,9 [𝑚𝑚]
So, a 1[mm] diameter droplet has a life duration of 230 [s] and can travel 684 [m] in a 400 [°C] surrounding atmosphere before being totally vaporized. For a droplet of 0,1 [mm] diameter, in the case of natural convection, it has a life duration of 0,18 [s] and can travel 3,2 [cm] in a 400 [°C] surrounding atmosphere before being totally vaporized. It appears here clearly that 1 [mm] droplets will, regardless of the height, the propelling speed, and the temperature, either hit the floor or worst a hot wall. This will either cause an inevitable waste of water, causing property damage, or get vaporized and produce steam, which is dangerous in case of intervention in the room with BA fire fighters. Fine mist on the other hand is more likely to follow the air flows, and due to its small life duration, vaporize in the gaseous phase, instead of on a wall.
In order to produce water mist, there are five known methods of atomizing water: - Pneumatic atomization, - Atomization by gas expansion, - Mechanical atomization, - Use of overheated water, - Hydraulic atomization. Considering the five methods to produce the desired water mist, and keeping in mind the need for easy handling required by fire fighters, we can reasonably only outline two techniques, which are Mechanical atomization, and Hydraulic atomization. The water mist firefighting installation can have a wide range of applications for naval vessels. Appropriate selection of parameters and system design must meet all the tactical and technical requirements. Analysis of the most trivial case, which is the fire of fuel tank caused by the artillery ammunition shot requires a lot of theoretical considerations. Analysis should contain a aspects of the physical and chemical properties but also the logical algorithm of installation operation. The volume of water tanks, the manner and time of distribution water mist depends not only on the issue of heat during a fire or the detonation and also lying on the parameters of the detonation wave. Assuming that this phenomenon relies on the ship artillery fire that causes fire of the fuel tank to calculate the amount of heat emission to be made with the assumption that the heat will have its three sources. (7) The first source is the thermal energy coming from overshoot the side of the ship, the next is heat of the bullet’s detonation and the last one is the process of burning the fuel droplets - LFO. The heat of combustion of fuel is dependent on the volume of fuel, droplets size and chemical composition of the fuel. The calorific value of the organic substances containing carbon, hydrogen, sulfur and oxygen is described by the following empirical equation:
𝑊𝑊! = 33900 ∙ 𝐶𝐶 + 121000 𝐻𝐻! −𝑂𝑂!8
+∙
∙ +105000 ∙ 𝑆𝑆 − 2500 𝑊𝑊 + !!𝑂𝑂! !"
!" (22)
where W - the mass fraction of humidity

57
Andrzej Grządziela, Marek Dudziński
THE CONCEPT OF WATER MIST FIRE AND DETONATION PROTECTION FOR NAVAL VESSELS
Assuming central impact in the vessel’s broadside, the equation of the conservation of momentum allows to calculate residual kinetic energy of bullet inside the compartment. Rest of energy is transformed as a heat. (6) Knowledge of the hull’s material, its thickness and the parameters of the bullet ie. caliber, type and speed allow fairly easy to calculate the structure of impact energy. (5). Heat the remaining ingredients are much more difficult to calculate. Methodology of the simplified calculations will be shown in the next publication. It depends of many factors like diameter of fuel droplets, energy of detonation wave and physical parameters of atmosphere inside the compartment.
2.2. Example of system design
Water Mist System is more frequently modern system used to fight fires. Water spray is obtained in the sprinklers with high pressure working medium, which is provided as a separate high pressure pump unit. A pump unit may supply the cooling medium to multiple systems. This is very important because the ship need only one unit for all applications. However, to improve the reliability of the system, and using the principles mirror elements in the anti-failure defense of the ship, it should be applied to the two pump units. The unit should have different procedures of startup the system connected with the specification of the protected area. They should be varied for accommodation areas and engine rooms.
Figure 2. Example of system unit
1. Water supply – inlet connection. 2. Water Tank - capacity sufficient for 60 [s]
working the system at max. efficiency. 3. Warning Switch – controls the water level. 4. High Pressure Valve. 5. Manifold Connecting Pumps. 6. Main Closing Valve.
7. Water Supplying Manifold. 8. Pressure gauge. 9. Pressure Control Transmitter. 10. Test Valve. 11. Electric Motor. 12. Pilot pump - stand-by pressure 10 - 15
[bar].

7th INTERNATIONAL MARITIME SCIENCE CONFERENCE
58
April 20th-21st, 2017, Solin, Croatia
13. Total Flooding Pump. 14. High Pressure Main Pump. 15. Non-Return Valves.
16. Main Electric Motors for obtaining a high pressure in the system.
Figure 3. Example of system design
2.3. The Benefits of Water Mist System
The Benefits of Water Mist System are: • Fast quenching fires (displace oxygen from
the burning room with significant cooling of the air)
• Avoiding re-ignition (cooling effect of the extinguishing agent – water)
• Fast reuse (system are able to work in a short period of time)
• Minimum damage (considerably lower volume of water is used)
• The minimum volume of the system (low system weight important for ships stability)
• No evacuation the crew (system is friendly to health)
2.4. Classification societies and defense standards
Designing a system for cooling with water spray should be applied to the classification rules and defense standards. An example of a classification society rules is presented below. “- The number and arrangement of the nozzles shall be such as to ensure an effective average distribution of water of at least 5 l/m²/minute in the spaces to be protected, unless specified specifically in other sections. - Nozzles shall be fitted above bilges, tank tops and other areas over which oil fuel is liable to spread
and also above other specific fire hazards in the machinery spaces. - The system may be divided into sections, the distribution valves of which shall be operated from easily accessible positions outside the spaces to be protected so as not to be readily cut off by a fire in the protected space. - The pump and its controls shall be installed outside the space or spaces to be protected. It shall not be possible for a fire in the space or spaces protected by the water-spraying system to put the system out of action. - The system shall be kept charged at the necessary pressure and the pump supplying the water for the system shall be put automatically into action by a pressure drop in the system. - The pump shall be capable of simultaneously supplying at the necessary pressure all sections of the system in any one compartment to be protected. - The pump may be driven by independent internal combustion machinery, but, if it is dependent upon power being supplied from the emergency generator fitted in compliance with the provisions of SOLAS II-1/43 as appropriate, that generator shall be so arranged as to start automatically in case of main power failure so that power for the pump required is immediately available. The independent internal combustion machinery for driving the pump it shall be so situated that a fire in the protected space will not affect the air supply to the machinery.

59
Andrzej Grządziela, Marek Dudziński
THE CONCEPT OF WATER MIST FIRE AND DETONATION PROTECTION FOR NAVAL VESSELS
- Precautions shall be taken to prevent the nozzles from becoming clogged by impurities in the water or corrosion of piping, nozzles, valves and pump. - Water-mist fire-extinguishing systems for machinery spaces and cargo pump-rooms shall be approved.” (3) (Offshore standard, DNVGL-OS-D301 –July 2015, Page 39, Fire protection)
3. CONCLUSIONS
Water spray is commonly applied for fire suppression in ships but has also been demonstrated to effectively mitigate blast loads and effects of fire from an explosion. The significant effect of water spray on both peak and quasi static overpressure offers the potential to enhance damage containment in ships. It is envisaged that blast and fire suppression with water spray will increase operational safety, save lives and help to retain post-hit capabilities of the ship, i.e. maintaining essential ship functions. Using water mist system the risk of fire following an explosion will be lower. Moreover, the ship will be inherently safer for the crew to work on. The initial investment for blast mitigating systems is expected to be limited, since water mist is already foreseen for firefighting in many new ship designs. The presented paper is the first article on the system design of water mist for navy vessels. The authors will present in the next paper problems of pulse changes of physical parameters during a fire and detonation and the selection of super-fast optoelectronic sensors and accelerometers.
REFERENCES
1. Holsmedt, Andersson, P. and Göran. “Limitations of water mist as a total flooding agent.” s.l. :Journal of Fire protection engineering, (1999).
2. Särdqvist, S. „Water and other extinguishing agents.“ s.l. : Swedish Rescue Services Agency, (2002).
3. Offshore standard, DNVGL-OS-D301 –July 2015, Page 39, Fire protection.
4. Hinchliffe J. „Development of Ballistic Impact Device for Measuring the Impact Energy of Powder-Metal Bullets”, GE Applied Materials Program Penn State DuBois 1 College Place, DuBois, PA, 2015.
5. Starratt D, Sanders T, Cepuš E, Poursartip A, Vaziri R. „An Efficient Method for Continuous Measurement of Projectile Motion in Ballistic Impact Experiments.” International Journal of Impact Engineering 24.2 (2000): 155-170.
6. Di Benedetto A. Russo P. „Thermo-kinetic modelling of dust explosion“, Journal of Loss Prevention in the Process Industries, vol. 20, 2007, pp. 303 – 309.
7. Włodarczyk E. „Introduction to the mechanics of explosion“ [in Polish] Wydawnictwo naukowe PWN 1994.
8. Szargut J. „Technical thermodynamics” [in Polish] Wydawnictwo: Politechnika Śląska 2013.
7th INTERNATIONAL MARITIME SCIENCE CONFERENCE
60
April 20th-21st, 2017, Solin, Croatia
SEAFARERS AND PUBLIC HEALTH RISKSRosanda Mulić, Ivo Šunjić, Mihaela Bukljaš Skočibušić
SEAFARERS AND PUBLIC HEALTH RISKS
Rosanda Mulić1, Ivo Šunjić2, Mihaela Bukljaš Skočibušić3
(1 School of Medicine, University of Split)
(2 University of Split, Faculty of Maritime Studies, Split, Croatia)
(3 Faculty of Transport and Traffic Sciences, University of Zagreb)
(E-mail: [email protected])
ABSTRACT This paper discusses the potential risks of infectious diseases that Croatian seafarers may contract during navigation in national and international waters, and assesses possible threats to general public of Croatia. Furthermore, the study describes the system of prevention of infectious diseases in seafarers and other international travellers, as well as Croatia's most important legislative acts and international regulations which, along with the requirements and recommendations by World Health Organization, must be enforced in order to prevent and control infectious diseases.
KEY WORDS seafarers, infection risk, prevention.
1. INTRODUCTION Due to the nature of their profession, Croatian seafarers may be exposed to infections and transfer them into local communities. Exposure to infectious agents may occur during navigation in Croatian or international waters, affecting the seafarers and any other persons on board ships passing through risky areas. Seafarers are considered as migrant workers. The latter are generally exposed to higher risks of infection and hazardous behaviour which, again, increases the risk of various diseases, infections and injuries (1-3). The ability for sea service is determined on the basis of the seafarer’s health condition, physical and mental characteristics. In accordance to the Rules on Establishing Medical Fitness of Crew
Members of Maritime Ships, Boats and Yachts,1 medical examinations of crew members are performed by a licenced occupational medicine specialist who assesses the health ability, signs the certificate on medical fitness and inform the examined person on detected diseases, sick conditions and other factors affecting the examined person’s health state and the ability to carry out tasks and duties as a crew member (4). The health condition of seafarers is regularly checked. Medical examinations include prior (preliminary), regular, supervisory and special supervisory examinations (4). Prior medical examination is performed prior to issuing the seaman’s book or boarding approval. Regular medical examination is performed once in two years or, in persons under 18 and in
1 Pravilnik o utvrđivanju uvjeta zdravstvene sposobnosti članova posade pomorskih brodova, brodica i jahti, NN 93/07, 107/14 (Official Gazette, No. 93/07 and 107/14).

61
Rosanda Mulić, Ivo Šunjić, Mihaela Bukljaš Skočibušić
SEAFARERS AND PUBLIC HEALTH RISKS
persons under 21 on board fishing vessels, once a year. Supervisory medical examination is performed at the intervals shorter than regular examination, as recommended by the licenced occupational medicine specialist if he/she has set a shorter validity of the Certificate on medical fitness, after performing the prior or regular medical examination. Special supervisory medical examination is performed:
• after a temporary inability to work that lasts more than 30 days;
• after detecting an occupational disease; • after an injury at work followed by a
temporary inability to work; • after a shipwreck; • at request submitted by the master,
employer, commercial boat or yacht owner; and
• at personal request by a crew member. A special supervisory medical examination of a crew member can be ordered by the employer, commercial boat or yacht owner, or the crew member can apply for it himself / herself (4). As for the legal framework applying to infectious diseases, seafarers are not exempted in any way from the regulations that are in force in Croatia: Act on the Protection of the Population against Communicable Diseases (5), Ordinance on immunisation, seroprophylaxis and chemoprophylaxis (6) etc., or International Health Regulations (IHR 2005), accepted and signed by the Republic of Croatia (7). The paper discusses the most important potential risks for seafarers which are caused exclusively by infectious agents, and the measures of prevention that are taken before departure and upon arrival from abroad. 2. OBJECTIVE OF THE STUDY The objective of this study is to discuss the most relevant public health risks associated with the seafaring profession. 3. MATERIALS AND METHODS The information sources include relevant literature, Epidemiological News and Croatian
Health Statistics Yearbook issued by Croatian Institute of Public Health, and the research results produced and published in a number of papers by the authors. 4. RESULTS 4.1. Infection risks during the stay of
seafarers in Croatia and the EU states Croatia and other member countries of the European Union are the states meeting high public health and hygienic standards. Consequently, the risk of infection is low but it still exists. The European Committee’s web-site https://ec.europa.eu/consularprotection/traveladvice_en provides the information on possible risks, depending on the EU country that the traveller enters or leaves (8). The web-sites of the Centers for Disease Control and Prevention (CDC, Atlanta, USA) provide recommendations for travellers to Croatia to get vaccinated against hepatitis A, hepatitis B, while some categories of travellers (not including seafarers) are advised to get vaccinated against rabies. The CDC site gives the same recommendations in case of travelling to Germany and other EU countries (9). There were times when the European countries were considered as low-risk zones. Today, however, due to possible charges and claims, travellers are advised to ask their doctors about the potential health hazards, in particular the risks of infection. Another reason for increased precaution is the possibility of a sudden change in the epidemiological situation, with regard to recent outbreaks of severe acute respiratory syndrome (SARS, 2003), Ebola, avian influenza, Zika virus, etc. 4.2. Infectious risks for seafarers when
travelling abroad – outside the European Union
4.2.1. Malaria Seafarers and other travellers going to various places across the world may be exposed to infections that they would never, or rarely, contract in Croatia. The risks vary with the destinations. When travelling to rural areas of Africa, Asia, South America, Oceania or Polynesia, it is possible to contract the virus of malaria, see

7th INTERNATIONAL MARITIME SCIENCE CONFERENCE
62
April 20th-21st, 2017, Solin, Croatia
Figure 4 (10). According to the World Health Organization (WHO), this disease was eradicated in Croatia in 1964, with a certain number of imported cases that have been reported every year. These cases refer to people who caught the
virus in endemic areas, and got sick upon their arrival to Croatia (11). There are four types of malaria parasite species: Plasmodium vivax, Pl. ovale, Pl. malariae, and Pl. falciparum). Pl. Falciparum has the most severe clinical features.
Figure 1. Endemic areas of malaria throughout the world. Source: WHO (10, 12)
Available at: http://www.rollbackmalaria.org/files/files/about/9789241564830_eng.pdf The largest number of malaria cases has been recorded in Africa (Figure 2).
Figure 2. Malaria, areas at risk of transmission (10, 12).
Available at: http://www.rollbackmalaria.org/files/files/about/9789241564830_eng.pdf
The World Health Organization carefully and regularly monitors the situation regarding the areas at risk of malaria throughout the world. According to the WHO, coastal areas of West Africa is particularly dangerous as this is and endemic area where P. falciparum causes the most serious clinical features of the disease (10-12). The malaria parasite is transmitted by female Anopheles mosquitoes that can be also found in Croatia. However, the illness cannot be transmitted without a source, i.e. a person infected by malaria or gametocytes, and a mosquito, the carrier. The cases imported to Croatia, amounting to 10 cases per year, under present conditions, cannot represent a threat to public health, nor can they play any role in recurrence of the autochthonous malaria. The infection is commonly contracted due absence or inadequate application of chemoprophylaxis (10-12). As for prevention of the illness, given the fact that, so far, there have been no vaccines
available, general measures of precaution are taken against the mosquito bites and medicines are taken with the purpose of the prevention of this illness – chemoprophylaxis (6, 12). 4.2.2. Yellow fever Yellow fever is a very serious disease with a very high of the mortality rate. The cause of yellow fever is the virus transmitted by Aedes aegypti mosquito bites. Other ways of transmission are negligible. Croatia has never been home to Aedes aegypti mosquitos or yellow fever. The research conducted some thirty years ago revealed that the northern habitat boundary of these mosquitoes was Sutomore in Montenegro. However, due to climate change, it may be expected that this species eventually appears as Croatia’s autochthonous resident, as it was the case with Aedes Albopictus (Asian tiger mosquito). The world endemic areas have remained the same over the years – Figures 3 and 4.
Figure 3. Endemic areas of yellow fever in Africa (12). Available at: http://wwwnc.cdc.gov/travel/page/yellowbook-home-2014

63
Rosanda Mulić, Ivo Šunjić, Mihaela Bukljaš Skočibušić
SEAFARERS AND PUBLIC HEALTH RISKS
The World Health Organization carefully and regularly monitors the situation regarding the areas at risk of malaria throughout the world. According to the WHO, coastal areas of West Africa is particularly dangerous as this is and endemic area where P. falciparum causes the most serious clinical features of the disease (10-12). The malaria parasite is transmitted by female Anopheles mosquitoes that can be also found in Croatia. However, the illness cannot be transmitted without a source, i.e. a person infected by malaria or gametocytes, and a mosquito, the carrier. The cases imported to Croatia, amounting to 10 cases per year, under present conditions, cannot represent a threat to public health, nor can they play any role in recurrence of the autochthonous malaria. The infection is commonly contracted due absence or inadequate application of chemoprophylaxis (10-12). As for prevention of the illness, given the fact that, so far, there have been no vaccines
available, general measures of precaution are taken against the mosquito bites and medicines are taken with the purpose of the prevention of this illness – chemoprophylaxis (6, 12). 4.2.2. Yellow fever Yellow fever is a very serious disease with a very high of the mortality rate. The cause of yellow fever is the virus transmitted by Aedes aegypti mosquito bites. Other ways of transmission are negligible. Croatia has never been home to Aedes aegypti mosquitos or yellow fever. The research conducted some thirty years ago revealed that the northern habitat boundary of these mosquitoes was Sutomore in Montenegro. However, due to climate change, it may be expected that this species eventually appears as Croatia’s autochthonous resident, as it was the case with Aedes Albopictus (Asian tiger mosquito). The world endemic areas have remained the same over the years – Figures 3 and 4.
Figure 3. Endemic areas of yellow fever in Africa (12). Available at: http://wwwnc.cdc.gov/travel/page/yellowbook-home-2014

7th INTERNATIONAL MARITIME SCIENCE CONFERENCE
64
April 20th-21st, 2017, Solin, Croatia
Figure 4. Endemic areas of yellow fever in South America (12). Available at: http://wwwnc.cdc.gov/travel/page/yellowbook-home-2014
The yellow fever preventive actions include less efficient general precautions such as avoiding mosquito bites, but also a highly effective vaccine (6, 12). It is given as a single injection. It takes some time before the body develops immunity so that the international certificate of vaccination becomes valid ten days after vaccination. Although it has been proved that the vaccine is effective for life, seafarers receive a booster dose every 10 years for safety reasons. As the relevant international regulations do not allow the entrance to the endemic areas of yellow fever to travellers who have not been vaccinated, and given the fact that a vaccinated person cannot fall ill, Croatia is not at risk of yellow fever so far. 4.2.3. HIV/AIDS infection Human immunodeficiency virus infection and acquired immune deficiency syndrome (HIV/AIDS) is a well-known syndrome that was first recognised
in the USA in 1981. The source of illness is an infected person. The infection is spread primarily by unprotected sex with a HIV positive person, contaminated blood transfusions, contaminated needles used by drug addicts, hypodermic needles, and from mother to child during pregnancy, delivery, or breastfeeding. The dominant way of transmission is through sexual contacts, both heterosexual and homosexual (13). Seafarers can get infected in a number of ways, most commonly through sexual contacts. Transmission during blood transfusion is also possible if the medical facility performing transfusion has not implemented comprehensive measures aimed at HIV transmission prevention. These risks are practically non-existent in Croatia, owing to strict blood controls (14). There is no vaccine against this illness, and the preventive actions include education, abstinence and use of condoms (15). The prevalence of HIV/AIDS in Croatia is very low – Figure 5 (13, 15, 16).

65
Rosanda Mulić, Ivo Šunjić, Mihaela Bukljaš Skočibušić
SEAFARERS AND PUBLIC HEALTH RISKS
Figure 5. World prevalence of HIV infection in 2015. Available at: http://aidsinfo.unaids.org/ (13)
4.2.4. Intestinal infections The range of intestinal infections that can be contracted when staying in various parts of the world is rather large. The most important may include:
• Amoebiasis, • Giardiasis, • Hepatitis A, • Hepatitis E, • Cholera, • Typhoid fever, • Enterocolitis infection caused by bacteria
Escherichia coli, • Dysentery (12).
Education of migrant workers is essential prior to leaving for the areas at high risk of these diseases given the fact that they are transmitted in well-known ways (dirty hands, contaminated food and water). Some of the above listed diseases can be prevented by vaccination: hepatitis A, typhoid fever and cholera. However, travellers have to observe general preventive measures that are highly effective and can be summarised in a simple rule: “Boil it, cook it, peel it or forget it” (12).
4.2.5. Hepatitis B In developed countries, this is a disease that is typically spread by sexual contacts, while in developing countries it can be also transmitted by transfusion of contaminated blood and blood products. In Croatia, after the introduction of compulsory vaccination, hepatitis B has not been a threat to public health although a number of cases, caused by sexual contacts, have been reported over the years. Seafarers are advised to get vaccinated. The procedure involves three doses (0, 1st and 6th month). After receiving all doses, a person is considered protected, as the vaccine is immunogenic and the immunity is long-lasting (6, 17). 4.3. Medical examinations upon returning to Croatia When returning from endemic areas, seafarers should be submitted to epidemiologic survey at border crossings and advised to undergo, within five days upon arrival, stool tests for cholera and blood tests for malaria parasites – if coming from
7th INTERNATIONAL MARITIME SCIENCE CONFERENCE
66
April 20th-21st, 2017, Solin, Croatia
the areas affected by these diseases. The tests can be carried out at their nearest Institute of Public Health centre. However, it is a common case that seafarers coming from Asia or Africa change flights at European airports and circumvent the control as the administration loses track of their original departure point. These failures and carelessness result in six to ten cases of malaria imported to Croatia each year, mostly by seafarers. There is no regulation requiring test for HIV and it is generally considered that such tests should remain recommended but not compulsory. However, the rate of HIV+ (infected by AIDS virus) in seafarers in Croatia is much higher than in other populations (15), which indicates the possibility that the infected seafarers become the source of infection in the autochthonous population. 4.4. Prevention of contagious diseases in seafarers The tasks of the preventive medicine specialists, including occupational medicine specialists and other health workers is to prevent the occurrence and to suppress the transmission of contagious diseases across the local population, with particular attention paid to the monitoring of migrant workers and persons practising unsafe behaviour. Systematic monitoring of the health condition of seafarers through medical examinations, vaccination and chemoprophylaxis, and other public health measures taken according to health risk assessments for individual countries, are aimed at preservation of health and reduction of risk of contagious and other diseases both in seafarers and in autochthonous population. From the epidemiologic and public health viewpoint, seafarers are protected against contagious diseases by means of vaccination and/or education on hygienic and prophylactic measures that have to be taken when performing service at sea. The relevant education is provided during regular schooling and, to a certain extent, through training (Medical care certificate – D20). According to the International sanitary regulations (2005), every seafarer has to be vaccinated against yellow fever and, in endemic areas, take chemoprophylaxis against malaria. Vaccination against hepatitis A and B is also recommended.
Although the vaccine against cholera is available, prevention is best achieved by taking precautions such as using safe food and water. Maintaining general and personal hygiene is essential, in particular the regular hygiene of mouth and hands (1-3). 5. CONCLUSION From the epidemiologic and public health viewpoint, seafarers – including the ones returning from the international waters of Asia, Africa and South America – do not present a significant risk or threat to Croatia’s population. However, it is possible that some of them occasionally import malaria, HIV infection and other contagious diseases. It can be therefore concluded that the administration of medical monitoring should be improved and public health education of seafarers encouraged. REFERENCES 1. Perić D, Belošević Lj. Zdravstveni nadzor
radnika migranata u mirovnim misijama – primjer dobre prakse. In: Zbornik radova / Proceedings, Tribina Radnici migranti – kako smanjiti zdravstvene rizike. Zagreb, 2012.
2. Kosanović Ličina M. Rizici od zaraznih bolesti u populaciji radnika migranata (Risks of contagious diseases in migrant worker population). In: Sigurnost, 2014; 56, pp. 11-22.
3. Bubaš M. Utjecaj životnih i radnih uvjeta na zdravlje radnika migranata. In: Zbornik radova, Tribina Radnici migranti – kako smanjiti zdravstvene rizike. Zagreb, 2012.
4. Pravilnik o utvrđivanju uvjeta zdravstvene sposobnosti članova posade pomorskih brodova, brodica i jahti, NN br. 93/07, 107/14; Rules on Establishing Medical Fitness of Crew Members of Maritime Ships, Boats and Yachts, Official Gazette No. 93/07, 107/14.
5. Zakon o zaštiti pučanstva od zaraznih bolesti, NN 79/07, 113/08, 43/09, 22/14; Act on the Protection of the Population against Communicable Diseases, Official Gazette No. 79/07, 113/08, 43/09, 22/14.
67
Rosanda Mulić, Ivo Šunjić, Mihaela Bukljaš Skočibušić
SEAFARERS AND PUBLIC HEALTH RISKS
6. Pravilnik o načinu provođenja imunizacije, seroprofilakse, kemoprofilakse protiv zaraznih bolesti, te o osobama koje moraju podvrgnuti toj obvezi, NN 103/13; Act on the Protection of the Population against Communicable Diseases, Official Gazette No. 103/13.
7. WHO. International Health Regulations. Geneva, 2005. Available at: http://apps.who.int/iris/bitstream/10665/43883/1/9789241580410_eng.pdf [accessed: 13/07/2016]
8. European Commission. Travel advice. Available at: https://ec.europa.eu/consularprotection/traveladvice_en [accessed: 26/01/2017]
9. Centers for Disease Control and Prevention. Health Information for Travelers to Croatia. Traveler’s View. Available at: https://wwwnc.cdc.gov/travel/destinations/traveler/cruise_ship/croatia?s_cid=ncezid-dgmq-travel-leftnav-traveler [accessed: 26/01/ 2017]
10. WHO. World Malaria Report, 2014. Available at: http://www.rollbackmalaria.org/files/files/about/9789241564830_eng.pdf [accessed: 14/07/2016]
11. Mulić R, Aljinović L, Gizdić Ž, Petri NM. Malarija u Hrvatskoj: nekad, danas i sutra (Malaria in Croatia: yesterday, today and tomorrow). In: Liječnički Vjesnik, 2000; 122, pp. 51-55.
12. Yellow book. Travellers' Health. Available at: https://wwwnc.cdc.gov/travel/yellowbook/2016/updates [accessed: 26/01/ 2017]
13. Prevalencija HIV infekcije u svijetu, 2015. Available at: http://aidsinfo.unaids.org/ [accessed: 14/07/ 2016]
14. Zakon o krvi i krvnim derivatima. Pročišćeni tekst zakona. NN 79/06, 124/11; Act on Blood and Blood Products, consolidated text, Official Gazette No. 79/06, 124/11.
15. Mulić R, Vidan P, Poljak NK. HIV infection among seafarers in Croatia. International Maritime Health, 2010, 62(4), pp. 209-214.
16. HIV/AIDS u Hrvatskoj (HIV/AIDS in Croatia). Croatian Health Statistics Yearbook 2015, Croatian Institute of Public Health, Zagreb, 2016, pp. 187-189.
17. Kljajić Z, Petričević J, Poljak NK, Pranić S, Mulić R. The Epidemiological Characteristics of Hepatitis B in Croatia: Results of prevention. In: Coll Antropol. 2015, 39(3), pp. 809-817.

7th INTERNATIONAL MARITIME SCIENCE CONFERENCE
68
April 20th-21st, 2017, Solin, Croatia
PORT BOTANY – FACTORS THAT INFLUENCE DRY PORT IMPLEMENTATION - A DECADE LATERVioleta Roso, John Black, Eli Marušić
PORT BOTANY – FACTORS THAT INFLUENCE DRY PORT IMPLEMENTATION - A DECADE LATER
Violeta Roso1, John Black2, Eli Marušić3
(1Associate Professor, Division of Service Management and Logistics, Chalmers University of Technology, Gothenburg, Sweden)
(2Professor of Transport Engineering, School of Civil and Environmental Engineering, UNSW Australia) (3Assistant Professor, Faculty of Maritime Studies, Split, Croatia)
(E-mail: [email protected])
ABSTRACT
Port Botany, and its close inland intermodal terminals are very distinctive: there are very few ports in the world with such a well developed network of close dry ports. Study on Port Botany’s dry ports and factors that influence their implementation was performed a decade ago. The aim of the present paper is to follow up the development of the seaport inland access considering the fact that ten years ago the seaport gates and surrounding roads were critically congested and urgent measures/solutions were required. The basic idea behind the concept of a dry port is more efficient port access, movement of the seaport’s interface inland with shift of flows from road to rail resulting in a reduction of road transport to/from the seaport together with associated broad social and environmental benefits. A decade ago findings showed that the most common factors that impede dry port implementation are infrastructure, land use, environment and regulations. Hence, the same reduce the efficiency of freight movements on land access routes to and from seaports. Issues surrounding suburban freight terminals are a sub-set of the wider social and environmental problems of the interactions of seaports with their hinterland. The paper shows problematic aspect of long timeframes for the development of significant freight infrastructure and the main factors that influence the same.
KEY WORDS
dry port, inland intermodal terminals, environment, regulations, infrastructure, land use, Sydney
1. INTRODUCTION The increasing container volumes handled in seaports require both adequate land to be available nearby for port-associated functions and efficient inland multi-modal transport access. Some ports are physically constrained such that the ports and /or port terminal operators have become involved in developing dry ports (Roso, 2009, 2008; Ng and Gujar, 2009; Wilmsmeier et al, 2011). Whilst dry ports and their functions may be classified by
distance from the port: close, midrange and distant (Roso et al, 2009), this paper focuses on the close dry port – typically those located in large metropolitan areas. Services such as transshipment, storage, consolidation, depot, track and trace, maintenance of containers, and customs clearance are available at dry ports. This paper examines the complex factors influencing the location of close inland intermodal terminals with dry port characteristics - metropolitan intermodal terminals as they are usually referred to - and their
69
Violeta Roso, John Black, Eli Marušić
PORT BOTANY – FACTORS THAT INFLUENCE DRY PORT IMPLEMENTATION - A DECADE LATER
implementation with a case study of the Sydney metropolitan region and Port Botany, Australia. Issues surrounding suburban freight terminals are a sub-set of the wider social and environmental problems of the interactions of seaports with their hinterland. The concept of a dry port should facilitate more efficient port access, movement of the seaport’s interface inland with shift of flows from road to rail resulting in a reduction of road transport to/from the seaport together with associated broad social and environmental benefits (Henttu and Hilmola, 2011; Hanaoka and Regmi, 2011; Roso, 2013). Various types on inland intermodal terminals that fit into the concept of dry ports have been developed and studied around the world, for example in China (Beresford et al., 2012), Japan (Yoshizawa, 2012); India (Ng and Gujar, 2009), the United States (Rodrigue et al, 2010; Roso et al., 2015), Asia (Hanaoka and Regmi, 2011), Russia (Korovyakovsky and Panova, 2011), Australia and New Zealand (Roso 2008 and 2013), and Europe (Flämig and Hesse, 2011; Henttu and Hilmola, 2011; Monios, 2011; Bask et al, 2014). In practice, locating dry ports within already developed metropolitan space is a tricky balance between evidence-based land-use and transport analysis and the politics at the local, metropolitan, state and national scales. The methodology adopted in the examination of issues in the implementation of dry ports is based on in-depth interviews with key stakeholders/ on ports and dry ports (Roso, 2008; Roso, 2013; Roso et al 2015). Interviews in these studies have been undertaken with different actors of the transport system, such as seaport managers, inland terminal managers, rail and road operators, as well as policy makers. In addition, secondary data sources, such as internal company reports and internet-based documents, were combined with site visits in order to insure validity through triangulation. Whilst chosen for its distinctiveness with operational intermodal terminals, it is a fact that today there are few ports that have as many functioning close inland intermodal terminals or close dry ports. Therefore, the experience of the implementation of dry ports in Sydney may well resonate with researchers in other large cities and
provide messages that are relevant to governments and port operators elsewhere. 2. CONCEPT OF DRY PORTS Regarding intermodal terminals, there is a substantial body of research available on: how to find the optimal location for these terminals (Rutten, 1998; Macharis and Verbeke, 1999; Arnold et al., 2004); how to improve the efficiency of road-rail terminals (Ballis and Golias, 2002; Kozan, 2000). Höltgen (1995) deals with the basic problem of differentiation between “conventional” transhipment terminals and the various types of large-scale, intermodal logistics centres. The definitional issue is that the concept for intermodal logistics centres varies from country to country and substantial research has been completed, in general, about the concept (Roso 2008; Roso et al, 2009; Ng and Gujar, 2009; Notteboom and Rodrigue, 2010; Rodrigue et al, 2010; Roso, 2013). Inland intermodal terminals should: contribute to intermodal transport; promote regional economic activity; and improve land use and local goods distribution. These features may also be applied to a dry port - an inland intermodal terminal that has direct rail connection to a seaport, and where customers can leave and/or collect their goods in intermodal loading units, as if the transaction was directly with the seaport (Roso et al, 2009). As well as transhipment, which a conventional inland intermodal terminal provides, services such as storage, consolidation, depot, track and trace, maintenance of containers, and customs clearance are available at dry ports. The quality of access to a dry port, and the quality of the road–rail interface, determines the dry port’s performance (Bask et al, 2014). However, the quality of inland access depends on the behaviour of a large variety of actors, such as government planning agencies, regulatory authorities, terminal operators, freight forwarders, transport operators, and port authorities and this requires coordination between all actors involved (de Langen and Chouly, 2004; Van Der Horst and De Langen, 2008). Scheduled and reliable high-capacity transport by road and rail to and from the seaport is the prerequisite. Implementation of a close dry port in a seaport’s immediate hinterland increases the seaport’s terminal capacity and with it comes the

7th INTERNATIONAL MARITIME SCIENCE CONFERENCE
70
April 20th-21st, 2017, Solin, Croatia
potential to increase productivity because bigger container ships will be able to call at the seaport (Roso et al, 2009), provided that is not constrained by the depth of water. With a dry port implementation, the seaport’s congestion from numerous trucks at the land interface is avoided because one train can substitute some 35 trucks in Europe (Roso et al, 2009). The benefits from distant dry ports derive from the modal shift from road to rail, resulting in reduced congestion at the seaport gates, and their surroundings, as well as reduced external environmental effects along the route (Roso et al, 2009). A reduced number of trucks on the roads generate less congestion, fewer accidents, lower road maintenance costs and less vehicle emissions. Although road carriers would lose market share, in countries such as Australia, where long trailers are restricted to pass through city roads, a dry port is a good solution from their perspective as well. In addition to the general benefits to the environment and the quality of life by shifting flows from road to rail, the dry port concept mainly offers seaports a possibility to increase the throughput without physical expansion at the site of the port; i.e. it is a movement of the seaport’s “interface” inland (Roso et al, 2009). Success in the development of seaports and of inland terminals depends on the behaviour of a large variety of actors, such as government planning agencies, regulatory authorities, terminal operators, freight forwarders, transport operators, and port authorities and coordination between all actors involved. However, the devil is in the detail when it comes to co-operative behaviour and co-ordination with real-world examples. 3. PORT BOTANY’S INLAND TERMINALS IN 2007
The Botany Bay had issues with the port’s poor inland connections to the emerging industrial lands in the outer western suburbs of Sydney, limited rail access to the port, constraints imposed by its location and, significantly, community tolerance. All of these issues have haunted governments regarding the expansion of Port Botany up to this day. A number of intermodal terminals that were located within the Sydney metropolitan area nearly a decade ago are listed in Table 1.
Table 1 Metropolitan Sydney Intermodal
(SPC, 2008)
These are primarily located in close proximity to areas of concentrated industrial distribution: all within 45 km from the Port Botany. The total planned capacity is limited in some cases by the availability of freight train paths. These intermodal terminals service the port or function as a transfer point for interstate cargoes. Sydney Ports Corporation (2008) recognized the need to expand the intermodal network within Sydney as a prerequisite for the greater use of rail in line with a NSW Government transport policy objective – in fact, the expected capacity for TEU containers has increased by over 5.5 times. The NSW Government Metropolitan Strategy outlined a proposed network of additional intermodal terminals in the central-west, south-west and west of metropolitan Sydney to meet predicted demand (Sydney Ports Corporation, 2008). The NSW Government proposed new facilities at Enfield, Moorebank and Eastern Creek. Sydney Ports developed a proposal for an Intermodal Logistics Centre at Enfield that provides an intermodal facility to cater for demand generated in central-west Sydney. The private sector proposed an expansion of the Macarthur Intermodal Shipping Terminal at Minto and a joint venture arrangement between Kaplan Investment Funds, QR National and Stocklands for a new intermodal facility at Moorebank. The inclusion of warehousing and freight support services within each site is a mitigation strategy to reduce the number of large
Location Operators Capacity
(TEU)
Camellia Patrick PortLink 80 000
Chullora Pacific National (inter-state)
300 000
Cooks River Maritime Container Services
150 000
Villawood Mannway 20 000
Minto MIST 45 000
Yannora Patrick PortLink/QR National
50 000

71
Violeta Roso, John Black, Eli Marušić
PORT BOTANY – FACTORS THAT INFLUENCE DRY PORT IMPLEMENTATION - A DECADE LATER
truck movements within the local community surrounding the terminal facilities. In Sydney transport operators have no many options but to go by road because of the poor rail infrastructure from one side and lack of awareness of the congestion problem from the other. One potential solution was with the concept of dry ports for the Port Botany. Although a concept of a close dry port should bring numerous benefits to the actors of the transport system still there are many impediments to the implementation of the same as suggested by Roso (2008); such as land use, infrastructure, environmental and institutional impediments. A dry port must fit into a complex system where the necessary supporting infrastructure (roads, railways) is in place, maintenance is assured, and the legislative, regulatory, and institutional systems are properly designed to optimize the involvement of both the public and the private sector (ibid). 4. PORT BOTANY’S INLAND TERMINALS A DECADE LATER Port Botany is Australia’s second largest container port handling over 2 million TEU, approximately one third of the nation’s maritime containers. Container volumes are expected to increase annually over the next decade and projected to reach 7 million TEU by 2031 (SPC, 2015). Export and import of containers are rather balanced in amount of TEU, with East Asia being the leading region for full container imports. Chullora Intermodal Terminal Chullora, Pacific National’s facility, is the main interstate terminal geographically close to the centre of the city, located immediately to the south of the Sydney Operations Yard. However the drift of freight intensive activity to the west and south means that it is effectively to the east of the major industrial concentrations. The terminal is situated about 25 km from Port Botany and has four 680 m long rail sidings that accommodate about 40 trains a week resulting in a total throughput of 300,000 TEU/year (SPC, 2008, Roso 2013) but in 2015 that capacity was doubled. The facility is equipped with 2 gantry cranes; however, it does not offer customs clearance since it is used only for domestic freight movements (Roso, 2013). Two new rail mounted
gantries were commissioned earlier in 2015, increasing the capacity of the terminal from 300,000 to 600,000 and planning to use the terminal for import / export containers (ATRC, 2015). This facility can receive 1500 metre trains for break-up and shunting into the terminal itself. Expansion of the terminal is complicated due to the presence of endangered species around the site and interaction with the RailCorp facilities to the east. Macarthur Intermodal Shipping Terminal (MIST) The Macarthur Intermodal Shipping Terminal (MIST) site located at Minto is a 16 ha intermodal facility that has an annual throughput capacity of up to 200,000 TEUs. In 2012, Qube acquired MIST from the Independent Transport Group (ITG); as part of the transaction Qube acquired the freehold property at Minto with warehousing and its rail terminal and locomotives and wagons from ITG (ATRC, 2015). The terminal is entirely privately owned and run by MIST who saw the potential in using rail for the transport of containers to the seaport and in agreement with the seaport, but with its own investments, started a rail shuttle to/from the seaport. Services offered at the terminal are container haulage and transhipment between rail and road, storage, warehousing, maintenance of containers, customs clearance, quarantine, reefer storage, and packing/unpacking (Roso, 2103). The 45 km long shuttle services (approximately 4 per day) currently operate on the Sydney Trains network between Minto and the connection to the MFN at Sefton Park Junction. The terminal’s throughput is about 65,000 TEU a year (in 2010), of which one third is for exports. Besides the rail connection to the seaport, the terminal has rail connections to other inland terminals where empty containers (from the seaport) are dispatched to be filled with grains for export (Roso, 2103). On its 600 m rail sidings the terminal is able to accommodate long trains that will result in increased rail volumes. There is about 25,000 m2 of covered storage in use and an additional 10,000 m2 of warehouse.

7th INTERNATIONAL MARITIME SCIENCE CONFERENCE
72
April 20th-21st, 2017, Solin, Croatia
Cooks River Intermodal Terminal (St Peters) The Cooks River is adjacent to the dedicated rail freight line 10 km from the port and is owned by NSW Ports and operated by Maritime Container Services Pty Limited (MCS). The 17.3 ha intermodal terminal and empty container site with 14,500 TEU capacity was purchased by Sydney Ports in October 2005 and is currently utilized by container operators. The Cooks River Rail Depot and Empty Container Park (ECP), at St Peters receives empty containers from importers to be cleaned, stored and repaired before being sent for export loading or empty export. With 150,000 TEU throughput the facility contributes to the port’s strategy to manage the growth of containers by rail (Roso, 2103). During 2012 work was undertaken to upgrade and expand the Cooks River facility. This has included the extension of existing rail sidings to allow for trains of 600 metres in length. Yennora Intermodal Terminal Yennora Intermodal Terminal, operated by Qube, is located about 30 km from the port in the Western suburbs between Granville and Liverpool on the main southern line. There are two rail sidings 530m long and the total storage capacity for the facility is of 5,000 full and 9,000 empty containers (ATRC, 2015). The facility is mainly oriented towards the port market, though Aurizon (Australia's largest rail freight operator) also uses Yennora as its Sydney interstate terminal. Rail services to the port are restricted to outside the morning and afternoon peak passenger periods. This terminal was originally developed as the central wool warehouse facility for NSW but has been gradually redeveloped as an integrated multi-user intermodal terminal / warehouse facility and is owned by Stockland. Villawood Terminal Villawood (for the purposes of rail operations commonly known as Leightonfield) - operational since 2004 and situated about 26 km from the port - is owned by Toll and is used for steel distribution. It also operated as an intermodal terminal for export containers for a number of years up to 2012/13. Apart from transhipment function the terminal offers services of storage (open and covered) maintenance of containers, packing/unpacking of containers and freight
forwarding. The terminal connects to the Southern Sydney Freight Line (SSFL) and has two main rail sidings, currently 300m in length (ATRC, 2015). Toll and DP World announced a 50/50 joint venture to redevelop Villawood and operate it is an import / export terminal for up to 185,000 TEU commencing in 2017 (ATRC, 2015). Enfield Intermodal Logistics Centre Sydney Ports has developed an Intermodal Logistics Center at its 60 ha marshalling site at Enfield with the purpose to relieve the congested roads by moving more containers by rail to/from Botany. The existing freight line between Port Botany and Enfield / Chullora is a dedicated freight rail line. In 2010 the terminal finally progressed to the construction stage. Plans for the development of the former marshalling yard at Enfield started with planning approval in 1997 (Roso, 2008; SPC, 2008) and a statutory environmental assessment (Sinclair Knight Merz, 2005). Numerous obstacles hindered the realisation of the plan although the site is located in an industrial and commercial area adjacent to a dedicated freight railway line. The terminal has a warehouse for the packing and unpacking of containers and short-term storage for unpacked cargo, as well as an empty container storage facility depot for later packing or transfer by rail. The terminal was initially planned for 500,000 TEU per year but an independent review concluded and recommended that it was too large for the site and suggested a total of 300,000 TEU per year be moved in and out of the site by 2016 (SPC, 2008). In December 2015, rail-based transport company Aurizon entered into a Heads of Agreement with NSW Ports to take on the role as the Intermodal Terminal Operator for the Enfield ILC. Aurizon have undertaken due diligence and operational planning, with a view to commence intermodal operations by the middle of 2016. The New South Wales Government policy is to achieve a modal share on rail of 40% on rail through different initiatives by year 2031 (i.e. shift of containers from road to rail) to ease pressure on Sydney’s already congested roads. A well functioning network of terminals is crucial to achieve this goal and in the case of Port Botany there is a clear cooperation between national and
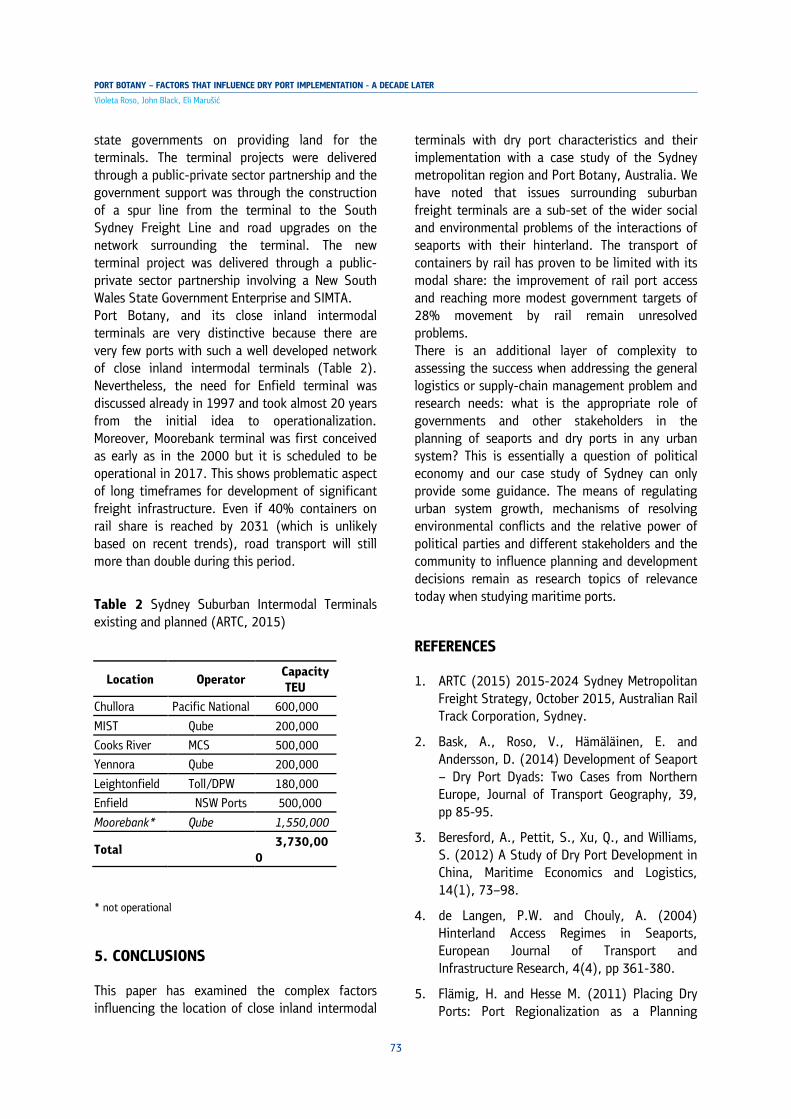
73
Violeta Roso, John Black, Eli Marušić
PORT BOTANY – FACTORS THAT INFLUENCE DRY PORT IMPLEMENTATION - A DECADE LATER
state governments on providing land for the terminals. The terminal projects were delivered through a public-private sector partnership and the government support was through the construction of a spur line from the terminal to the South Sydney Freight Line and road upgrades on the network surrounding the terminal. The new terminal project was delivered through a public-private sector partnership involving a New South Wales State Government Enterprise and SIMTA. Port Botany, and its close inland intermodal terminals are very distinctive because there are very few ports with such a well developed network of close inland intermodal terminals (Table 2). Nevertheless, the need for Enfield terminal was discussed already in 1997 and took almost 20 years from the initial idea to operationalization. Moreover, Moorebank terminal was first conceived as early as in the 2000 but it is scheduled to be operational in 2017. This shows problematic aspect of long timeframes for development of significant freight infrastructure. Even if 40% containers on rail share is reached by 2031 (which is unlikely based on recent trends), road transport will still more than double during this period.
Table 2 Sydney Suburban Intermodal Terminals existing and planned (ARTC, 2015)
* not operational
5. CONCLUSIONS
This paper has examined the complex factors influencing the location of close inland intermodal
terminals with dry port characteristics and their implementation with a case study of the Sydney metropolitan region and Port Botany, Australia. We have noted that issues surrounding suburban freight terminals are a sub-set of the wider social and environmental problems of the interactions of seaports with their hinterland. The transport of containers by rail has proven to be limited with its modal share: the improvement of rail port access and reaching more modest government targets of 28% movement by rail remain unresolved problems. There is an additional layer of complexity to assessing the success when addressing the general logistics or supply-chain management problem and research needs: what is the appropriate role of governments and other stakeholders in the planning of seaports and dry ports in any urban system? This is essentially a question of political economy and our case study of Sydney can only provide some guidance. The means of regulating urban system growth, mechanisms of resolving environmental conflicts and the relative power of political parties and different stakeholders and the community to influence planning and development decisions remain as research topics of relevance today when studying maritime ports.
REFERENCES
1. ARTC (2015) 2015-2024 Sydney Metropolitan Freight Strategy, October 2015, Australian Rail Track Corporation, Sydney.
2. Bask, A., Roso, V., Hämäläinen, E. and Andersson, D. (2014) Development of Seaport – Dry Port Dyads: Two Cases from Northern Europe, Journal of Transport Geography, 39, pp 85-95.
3. Beresford, A., Pettit, S., Xu, Q., and Williams, S. (2012) A Study of Dry Port Development in China, Maritime Economics and Logistics, 14(1), 73–98.
4. de Langen, P.W. and Chouly, A. (2004) Hinterland Access Regimes in Seaports, European Journal of Transport and Infrastructure Research, 4(4), pp 361-380.
5. Flämig, H. and Hesse M. (2011) Placing Dry Ports: Port Regionalization as a Planning
Location Operator Capacity TEU
Chullora Pacific National 600,000
MIST Qube 200,000
Cooks River MCS 500,000
Yennora Qube 200,000
Leightonfield Toll/DPW 180,000
Enfield NSW Ports 500,000
Moorebank* Qube 1,550,000
Total
3,730,000
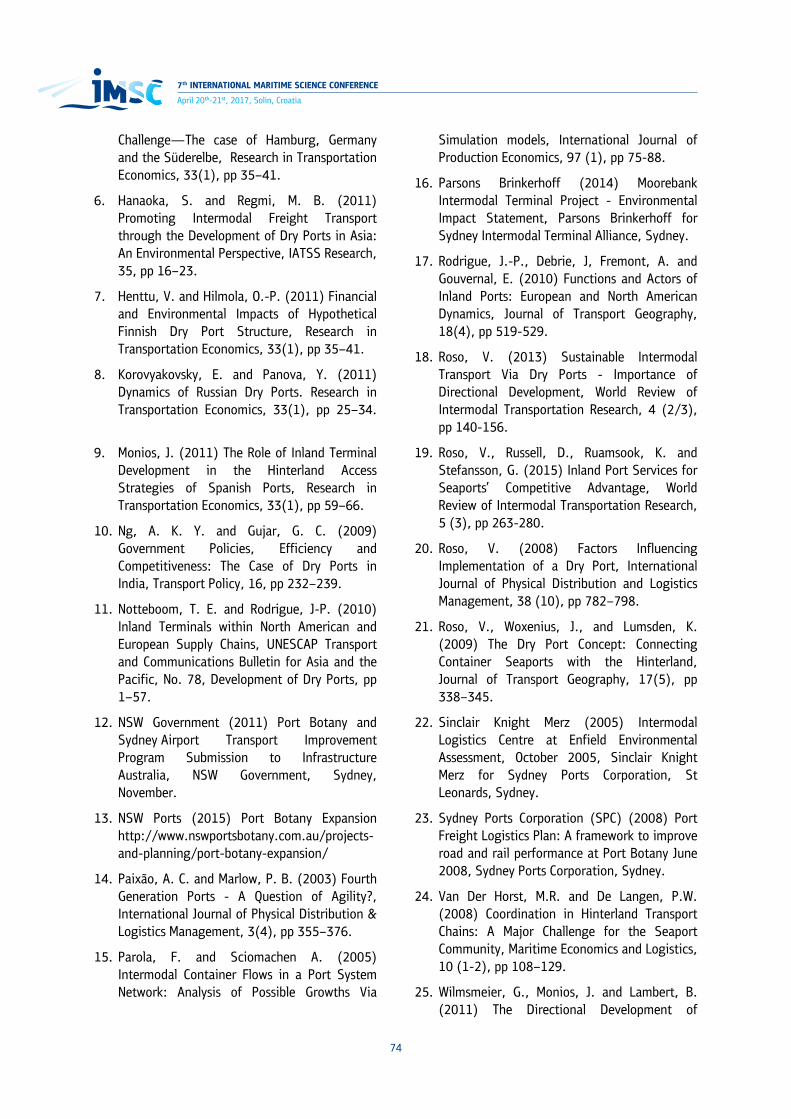
7th INTERNATIONAL MARITIME SCIENCE CONFERENCE
74
April 20th-21st, 2017, Solin, Croatia
Challenge—The case of Hamburg, Germany and the Süderelbe, Research in Transportation Economics, 33(1), pp 35–41.
6. Hanaoka, S. and Regmi, M. B. (2011) Promoting Intermodal Freight Transport through the Development of Dry Ports in Asia: An Environmental Perspective, IATSS Research, 35, pp 16–23.
7. Henttu, V. and Hilmola, O.-P. (2011) Financial and Environmental Impacts of Hypothetical Finnish Dry Port Structure, Research in Transportation Economics, 33(1), pp 35–41.
8. Korovyakovsky, E. and Panova, Y. (2011) Dynamics of Russian Dry Ports. Research in Transportation Economics, 33(1), pp 25–34.
9. Monios, J. (2011) The Role of Inland Terminal Development in the Hinterland Access Strategies of Spanish Ports, Research in Transportation Economics, 33(1), pp 59–66.
10. Ng, A. K. Y. and Gujar, G. C. (2009) Government Policies, Efficiency and Competitiveness: The Case of Dry Ports in India, Transport Policy, 16, pp 232–239.
11. Notteboom, T. E. and Rodrigue, J-P. (2010) Inland Terminals within North American and European Supply Chains, UNESCAP Transport and Communications Bulletin for Asia and the Pacific, No. 78, Development of Dry Ports, pp 1–57.
12. NSW Government (2011) Port Botany and Sydney Airport Transport Improvement Program Submission to Infrastructure Australia, NSW Government, Sydney, November.
13. NSW Ports (2015) Port Botany Expansion http://www.nswportsbotany.com.au/projects-and-planning/port-botany-expansion/
14. Paixão, A. C. and Marlow, P. B. (2003) Fourth Generation Ports - A Question of Agility?, International Journal of Physical Distribution & Logistics Management, 3(4), pp 355–376.
15. Parola, F. and Sciomachen A. (2005) Intermodal Container Flows in a Port System Network: Analysis of Possible Growths Via
Simulation models, International Journal of Production Economics, 97 (1), pp 75-88.
16. Parsons Brinkerhoff (2014) Moorebank Intermodal Terminal Project - Environmental Impact Statement, Parsons Brinkerhoff for Sydney Intermodal Terminal Alliance, Sydney.
17. Rodrigue, J.-P., Debrie, J, Fremont, A. and Gouvernal, E. (2010) Functions and Actors of Inland Ports: European and North American Dynamics, Journal of Transport Geography, 18(4), pp 519-529.
18. Roso, V. (2013) Sustainable Intermodal Transport Via Dry Ports - Importance of Directional Development, World Review of Intermodal Transportation Research, 4 (2/3), pp 140-156.
19. Roso, V., Russell, D., Ruamsook, K. and Stefansson, G. (2015) Inland Port Services for Seaports’ Competitive Advantage, World Review of Intermodal Transportation Research, 5 (3), pp 263-280.
20. Roso, V. (2008) Factors Influencing Implementation of a Dry Port, International Journal of Physical Distribution and Logistics Management, 38 (10), pp 782–798.
21. Roso, V., Woxenius, J., and Lumsden, K. (2009) The Dry Port Concept: Connecting Container Seaports with the Hinterland, Journal of Transport Geography, 17(5), pp 338–345.
22. Sinclair Knight Merz (2005) Intermodal Logistics Centre at Enfield Environmental Assessment, October 2005, Sinclair Knight Merz for Sydney Ports Corporation, St Leonards, Sydney.
23. Sydney Ports Corporation (SPC) (2008) Port Freight Logistics Plan: A framework to improve road and rail performance at Port Botany June 2008, Sydney Ports Corporation, Sydney.
24. Van Der Horst, M.R. and De Langen, P.W. (2008) Coordination in Hinterland Transport Chains: A Major Challenge for the Seaport Community, Maritime Economics and Logistics, 10 (1-2), pp 108–129.
25. Wilmsmeier, G., Monios, J. and Lambert, B. (2011) The Directional Development of

75
Violeta Roso, John Black, Eli Marušić
PORT BOTANY – FACTORS THAT INFLUENCE DRY PORT IMPLEMENTATION - A DECADE LATER
Intermodal Freight Corridors in Relation to Inland Terminals, Journal of Transport Geography. 19, pp 1379-1386.
26. Yoshizawa, J. (2012) JR Freight Company’s Quest for Intermodal Freight Transport, ICHCA’S Cargo World 2011/12, n.p

7th INTERNATIONAL MARITIME SCIENCE CONFERENCE
76
April 20th-21st, 2017, Solin, Croatia
INFORMATION SECURITY IN MARITIME DOMAINIvana Radmilo, Anita Gudelj, Pančo Ristov
INFORMATION SECURITY IN MARITIME DOMAIN
Ivana Radmilo, Anita Gudelj, Pančo Ristov
(University of Split, Faculty of Maritime Studies, Split, Croatia)
( E-mail: [email protected])
ABSTRACT
Information systems and information security systems within maritime affairs are a part of a critical infrastructure when it comes to the possibility of attacks or threats. In order to develop awareness of the maritime sector being a target of adverse events, it is necessary to educate the existing staff and those that are yet to become a part of it. Current situation regarding awareness, education and actions in certain situations is far from an enviable level, i.e. from the level in other Member States of the European Union. This conclusion is based on the relevant data collected for the purpose of writing diploma thesis by interviewing various business sectors within the maritime affairs sector. All data were collected anonymously from a sample comprising 20 respondents, and refer to the sector of agencies for placement of seamen, charter agencies, smaller and bigger shipyards, manufacturing, ship and ship equipment repairing, the service sector (port authority). Based on the conducted research, it can be concluded that the safety and security of information systems within the maritime affairs sector still greatly deviate from the European and global average, as well as that changes need to be introduced as soon as possible.
KEY WORDS
information, information systems maritime systems, security, protection
1. INTRODUCTION
Organizations and companies are becoming increasingly dependent on information technology (IT) for their daily operations. The marine sector is no exception. IT is increasingly used to gather data, to enable and automate essential maritime operations, from navigation to propulsion, from freight management to traffic control communications and monitor on-board security [5]. Consequently, with technology development, organization's networks and increasing accessibility to the Internet, organizations and their information systems (IS) become vulnerable to various types of
threats which can result with significant financial loses and damage to the information system resources. In fact, their information becomes exposed to cyber-attacks and their resulting damages. Threats can be caused by internal or external or both external and internal sources. Internal threats occur when someone, such as employee, a contractor or a temporary worker who have legitimate access to information and/or information technology and so he can cause damage from inside. For example, internal treats may occur from employees having access to the systems onboard, by introducing malware via removable media. Also, an internal threat may be an employee who accesses company data through public WiFi without the knowledge that it’s unsecured. These facts have considerable importance because most companies tend to secure

77
Ivana Radmilo, Anita Gudelj, Pančo Ristov
INFORMATION SECURITY IN MARITIME DOMAIN
their information and information system only against outsider attacks [2]. In the other hand, an external threats occur when hackers, crackers, crime groups or other entities seek to gain protected information by infiltrating and taking over profile of a trusted user from outside the organization. They do not have authorized access to the computer systems or network. The most obvious external threats are natural disasters: fires, floods and earthquakes. External threats can occur through connected networks (wired and wireless), physical intrusion or extranet. The types of damage caused by security threats are different. Some security threats have influence on confidentiality or reliability of stored data e.g. the entire information systems facility can be physical destructed by fire, flood, etc. From the other side, some security threats have influence on functionality and efficiency of entire information system. For example, ship's database can contain sensitive and highly confidential commercial data about the company's operations, its personnel, passengers or cargo. Hackers who breached ship’s information system can access sensitive data and used it to damage a company's operations, profits or reputation. Any vulnerabilities and weaknesses of a ship’s information system could result in a loss of service for the equipment and ship’s operations, interfering with controls on the bridge or in the engine room, by targeting navigation systems, propulsion or steering. It is absolutely vital that used applications and connections are as secure as possible. Most companies think information security is a technical issue and do not consider involvement of employees in ensuring continuous security of the information. Thus, managers, shipowners and operators need to know threats that influence their assets and identify their impact to determine what they need to do to prevent attacks by selecting appropriate countermeasures. With rapidly changing technology, relevant personnel should have training in identifying the typical modus of threats, hacker attacks and risks. Each employee is an important actor for ensuring security. Employees, as appropriate to their roles, should be aware of the relevant security risks and preventive measures. Current state regarding
awareness, education and actions in certain situations is far from an enviable level, i.e. from the level in other Member States of the European Union. Most companies think information security is a technical issue and do not consider involvement of employees in ensuring continuous security of the information. This conclusion is based on the relevant data collected for the purpose of writing diploma thesis by interviewing various business sectors within the maritime affairs sector. The goal of this paper is to recognize the importance of information systems and an information security awareness program for maritime sectors.
2. THREATS TO INFORMATION SECURITY
A threat is an object, person or any other entity that represents a constant danger to an asset. Information security is the process of preventing and detecting unauthorized use of information systems (hardware, software, dataware and network) that use, store and transfer information. Prevention measures help individuals and organizations to stop unauthorized users from accessing any part of a computer system. Detection helps to determine whether or not someone attempted to break into particular system and what they may have done. Security is the quality of information or the degree of protection from damage.
2.1. Information Security Goals
All information security measures try to address at least one of four goals: Confidentiality: Confidentiality is the ability to protect the information from disclosure to a passive attacker so that any information remains confidential. This is the most important issue in information security. Authentication: Authentication refers to ensure the reliability of the information by identifying its origin. Data authentication verifies the identity of the senders and receivers. Data authentication is achieved through symmetric or asymmetric crypto

7th INTERNATIONAL MARITIME SCIENCE CONFERENCE
78
April 20th-21st, 2017, Solin, Croatia
mechanisms where sending and receiving nodes share secret keys. Integrity: Integrity is needed to ensure the reliability of the data and refers to the ability to confirm that a message has not been tampered with, altered or changed, Availability: Availability of information refers to keeping data and resources available for authorized use, especially during emergencies or disasters.
2.2. Attacks to Information Security
The attack is specific to the company, ship, operation and/or trade. Potential attacks which may affect companies and ships can be divided in two main categories:
• untargeted attacks • targeted attacks.
Untargeted attacks are techniques available on the internet which can be used to locate known vulnerabilities in a company and onboard a ship [5]. A company or a ship’s systems and data are one of many potential targets. Some of the most common examples of these attacks include: Social engineering: A technique used by potential cyber attackers to trick computer users into revealing computer security or private information, e.g. passwords or email addresses by exploiting the natural tendency of a person to trust and/or by exploiting a person's emotional response. Phishing treats: Phishing is an attempt to obtain confidential information from an individual, group, or organization [5]. Sending e-mail cyber attackers, often masquerading as a trustworthy person or business, attempt to steal sensitive financial or personal information. Such an email may also request that an individual visits a fake website using a hyperlink included in the email. Phishers trick users into disclosing personal data, such as credit card numbers, online banking credentials, and other sensitive information. Viral Web Sites: Users can be enticed, often by email messages, to visit fake web sites that contain viruses or Trojans. These sites are often made to look like well-known web sites and can have similar web addresses to the sites they are imitating.
Ransomware. Malware which encrypts data on systems until such time as the distributor decrypts the information. Traffic monitoring. By monitoring the traffic flow an attacker can perform analysis of the type of communication happening in the network. Targeted attacks, where a company or a ship’s systems and data are the intended target. These attacks use tools and techniques specifically created for targeting a particular company or ship. Some examples of tools and techniques which may be used in these attacks include [4, 5]: Jamming attack. The messages sent to the access node can be lost or corrupted by jamming attack. The attack is done by sending powerful radio signals to the access node so as to block any signals coming towards it. Malicious message injecting. Attackers inject fake messages along with the actual message during the transmission of the signals. MAC Denial of Service (DoS) attacks. The intruder can continuously send unnecessary packets to any particular ship or access node so as to drain its battery. WPA2 targeted attack. WPA2 is the strongest security protocol available for the wireless network. Routing table poisoning attack. Routing tables can be modified by any intruder so as to have improper routing and routing towards any particular destination. Spear-phishing. Similar to phishing but the individuals are targeted with personal emails, often containing malicious software or links that automatically download malicious software. Attack by virus and worms. Operating system and access node can be affected by virus and worms. Mobile Malware. Security experts have seen risk in mobile device security since the early stages of their connectivity to the Internet. Considering our culture’s unbreakable reliance on cell phones it creates a catastrophic threat.
2.3. Information Security Measures
Dhillon has proposed two kinds of security measures to effectively secure an information system [2]: Technical security measures are mechanisms that protect the system from incidents or attacks.

79
Ivana Radmilo, Anita Gudelj, Pančo Ristov
INFORMATION SECURITY IN MARITIME DOMAIN
Those mechanisms are secure configuration for hardware and software, protocol designs, wireless access control, antivirus software packages, passwords, access control cards, biometric access control systems, backups, recovery software, virtual private networks, encryption, fire suppression systems … Formal security measures are business structures and processes that ensure the correct general conduct of business and reduce the probability of an incident or an attack, or at least minimize its impact. This field includes security strategies, policies, procedures, recovery plans, defined administrator privileges, a clear policy for the use of such media devices, etc. When assessing the risk, organizations should be aware of any specific aspect of their operations that might increase their vulnerability to threats. In the event of a risk incident, a response plan is needed to quickly recover systems and data and to maintain the safety and commercial operability of the ship. Thus, an organization needs to correctly implement both kinds of measures to effectively secure an information system. The absence of even one of these measures can threaten the effectiveness of the information security.
3. INFORMATION SECURITY SURVEY
3.1. Survey Approach
A motivation for this paper arises from the information system security survey conducted as part of the research for diploma thesis with title "Information Security in Maritime domains". To maximise the response rate and reduce the burden on respondents, survey questions were organized into the online questionnaire. In total, there were 20 respondents. The survey was anonymous and it had 31 questions. Persons responsible for information and information systems filled the survey. As with any survey of this nature, we would not necessarily expect every respondent to know the answers to every question.
Table 1. Representation of participants
Maritime organization Number of participants
Charter agency 4
Crew management and manning company
5
Ship design 1
Service centre for marine engines and drives
1
Port authority 2
Boat equipment export company 2
Charter service 1
Shipbuilding 3
Employers' Association 1
The great majority of the 20 participants who completed the survey work for companies based in Republic of Croatia (90%) while the rest have their headquarters abroad.
The goal of the survey is to recognize the IS importance for maritime sectors and information security to prevent any kind of threats to data, network infrastructures, communications and applications. Our intent is not only gain overview on the state of information security, but also to contribute toward improving that condition. Unfortunately, this survey has shown that the level of information security in Croatian organizations from maritime domains is relatively low. In the following, on the basis of this research and our own observations, we present five important signals.
3.2. Information Security Maturity
A number of survey questions refer to information security maturity with respect to respondents’ perception of their information security, the extent to which responsibilities around information security are defined and current information security maturity levels. Considering that two of organizations surveyed have had an outage due to a malware infection in the last year, it’s no wonder that 50% of respondents consider their organisation has sufficient secure information system (see Fig. 1).
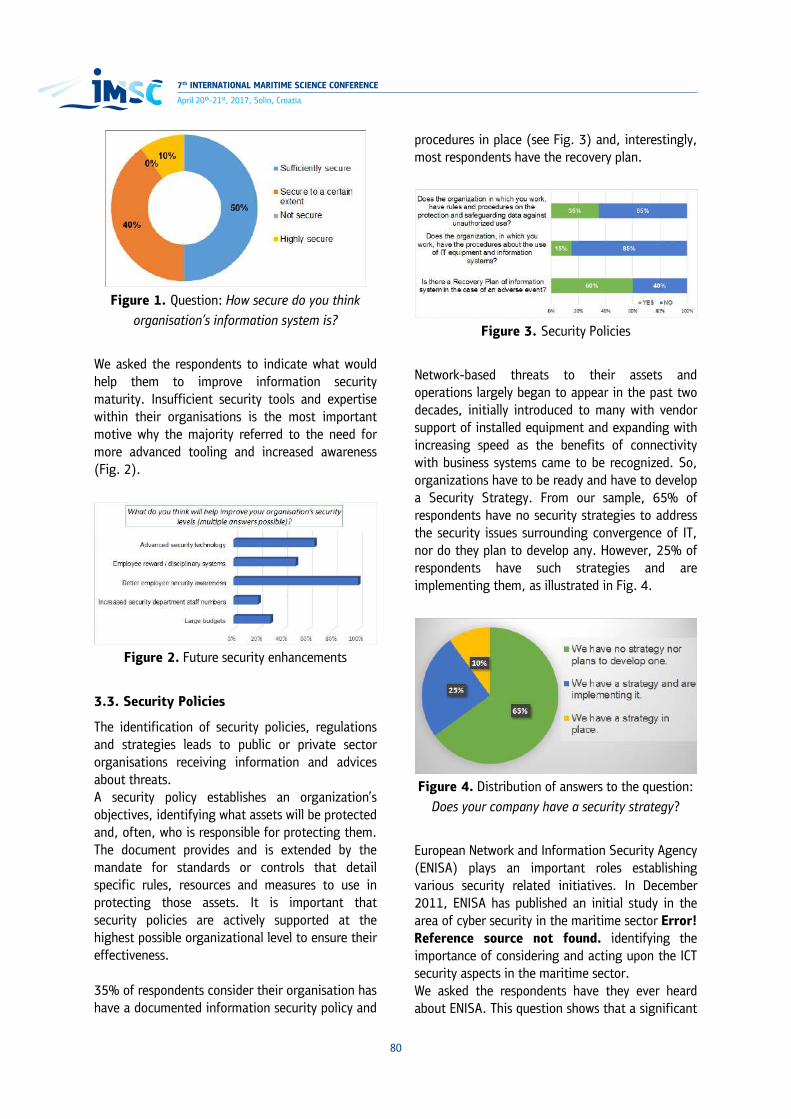
7th INTERNATIONAL MARITIME SCIENCE CONFERENCE
80
April 20th-21st, 2017, Solin, Croatia
Figure 1. Question: How secure do you think
organisation’s information system is?
We asked the respondents to indicate what would help them to improve information security maturity. Insufficient security tools and expertise within their organisations is the most important motive why the majority referred to the need for more advanced tooling and increased awareness (Fig. 2).
Figure 2. Future security enhancements
3.3. Security Policies
The identification of security policies, regulations and strategies leads to public or private sector organisations receiving information and advices about threats. A security policy establishes an organization’s objectives, identifying what assets will be protected and, often, who is responsible for protecting them. The document provides and is extended by the mandate for standards or controls that detail specific rules, resources and measures to use in protecting those assets. It is important that security policies are actively supported at the highest possible organizational level to ensure their effectiveness. 35% of respondents consider their organisation has have a documented information security policy and
procedures in place (see Fig. 3) and, interestingly, most respondents have the recovery plan.
Figure 3. Security Policies
Network-based threats to their assets and operations largely began to appear in the past two decades, initially introduced to many with vendor support of installed equipment and expanding with increasing speed as the benefits of connectivity with business systems came to be recognized. So, organizations have to be ready and have to develop a Security Strategy. From our sample, 65% of respondents have no security strategies to address the security issues surrounding convergence of IT, nor do they plan to develop any. However, 25% of respondents have such strategies and are implementing them, as illustrated in Fig. 4.
Figure 4. Distribution of answers to the question:
Does your company have a security strategy?
European Network and Information Security Agency (ENISA) plays an important roles establishing various security related initiatives. In December 2011, ENISA has published an initial study in the area of cyber security in the maritime sector Error! Reference source not found. identifying the importance of considering and acting upon the ICT security aspects in the maritime sector. We asked the respondents have they ever heard about ENISA. This question shows that a significant
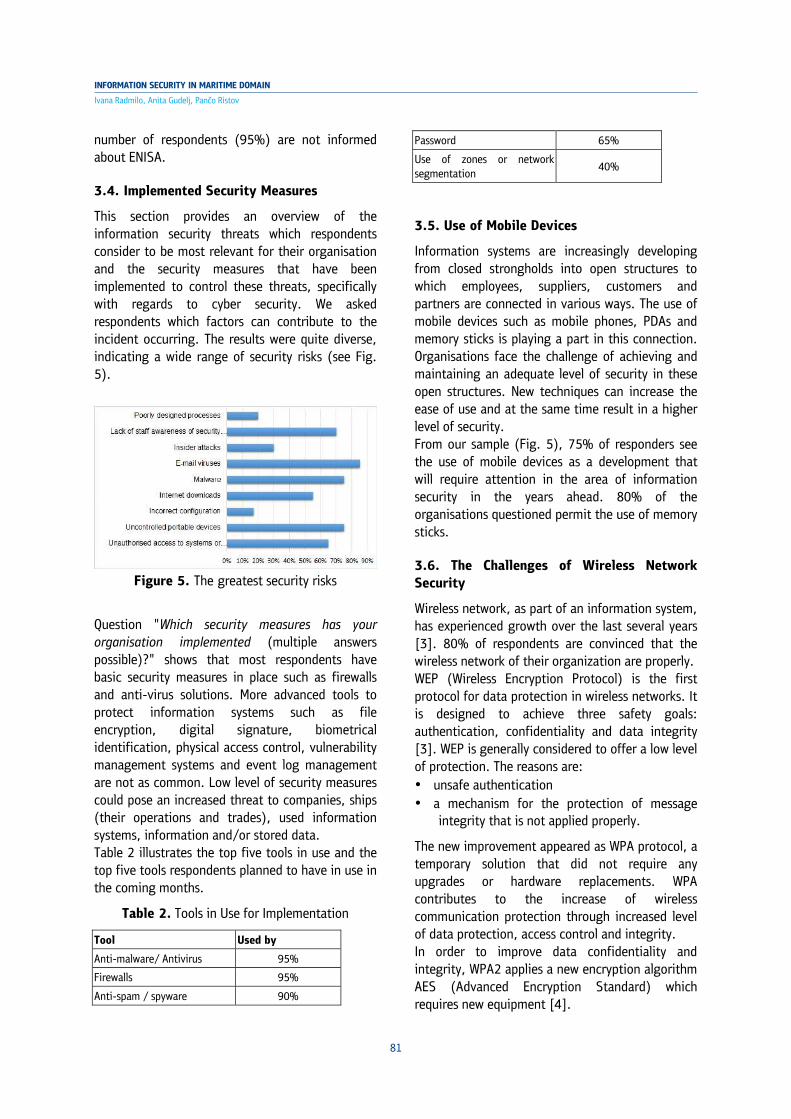
81
Ivana Radmilo, Anita Gudelj, Pančo Ristov
INFORMATION SECURITY IN MARITIME DOMAIN
number of respondents (95%) are not informed about ENISA.
3.4. Implemented Security Measures
This section provides an overview of the information security threats which respondents consider to be most relevant for their organisation and the security measures that have been implemented to control these threats, specifically with regards to cyber security. We asked respondents which factors can contribute to the incident occurring. The results were quite diverse, indicating a wide range of security risks (see Fig. 5).
Figure 5. The greatest security risks
Question "Which security measures has your organisation implemented (multiple answers possible)?" shows that most respondents have basic security measures in place such as firewalls and anti-virus solutions. More advanced tools to protect information systems such as file encryption, digital signature, biometrical identification, physical access control, vulnerability management systems and event log management are not as common. Low level of security measures could pose an increased threat to companies, ships (their operations and trades), used information systems, information and/or stored data. Table 2 illustrates the top five tools in use and the top five tools respondents planned to have in use in the coming months.
Table 2. Tools in Use for Implementation
Tool Used by
Anti-malware/ Antivirus 95%
Firewalls 95%
Anti-spam / spyware 90%
Password 65%
Use of zones or network segmentation
40%
3.5. Use of Mobile Devices
Information systems are increasingly developing from closed strongholds into open structures to which employees, suppliers, customers and partners are connected in various ways. The use of mobile devices such as mobile phones, PDAs and memory sticks is playing a part in this connection. Organisations face the challenge of achieving and maintaining an adequate level of security in these open structures. New techniques can increase the ease of use and at the same time result in a higher level of security. From our sample (Fig. 5), 75% of responders see the use of mobile devices as a development that will require attention in the area of information security in the years ahead. 80% of the organisations questioned permit the use of memory sticks.
3.6. The Challenges of Wireless Network Security
Wireless network, as part of an information system, has experienced growth over the last several years [3]. 80% of respondents are convinced that the wireless network of their organization are properly. WEP (Wireless Encryption Protocol) is the first protocol for data protection in wireless networks. It is designed to achieve three safety goals: authentication, confidentiality and data integrity [3]. WEP is generally considered to offer a low level of protection. The reasons are: • unsafe authentication • a mechanism for the protection of message
integrity that is not applied properly.
The new improvement appeared as WPA protocol, a temporary solution that did not require any upgrades or hardware replacements. WPA contributes to the increase of wireless communication protection through increased level of data protection, access control and integrity. In order to improve data confidentiality and integrity, WPA2 applies a new encryption algorithm AES (Advanced Encryption Standard) which requires new equipment [4].

7th INTERNATIONAL MARITIME SCIENCE CONFERENCE
82
April 20th-21st, 2017, Solin, Croatia
Based on the use of encryption, wireless networks can be classified into two main categories: • vulnerable networks
o no encryption o low level protection (WEP)
• protected networks o high level protection (WPA/WPA2).
Figure 6. Level of wireless network protection
Only 70% of organizations surveyed protect the WLAN with a firewall and only 63% of organizations have authentication to secure internal wireless LAN access.
4. CONCLUSIONS
Information system plays an increasingly important role in the organization with the development and application of computers and network. The information system has become an absolutely necessary tool for many business operations. The business process supported by information system are still confronted with operational and management risk. New risks also come by technological innovation and social developments. Proper information security is only possible on the basis of sound risk analysis: a periodic survey of the threats to which the organisation is exposed, the probability of occurrence of the identified threats and an indication of the potential impact of such threats. By conducting a survey we obtained the status of maritime sector in the Republic of Croatia and the awareness of employees and other users of the organization. An important message from the data gathered in this survey is that information security for the Croatian maritime organizations that participated in survey, is very low. Even though
organizations perceive increasing risk levels, they have not much done to secure data and their information systems. The survey showed that the number one priority of respondent is securing information systems against external attacks. That is reasonable because the maritime industry possesses a range of features that affect its vulnerability to external threats: • Multiple stakeholders are often involved in the
operation and the charter could potentially lead to a lack of responsibility for the IS infrastructure.
• Business-critical and commercially sensitive information shared with shore-based services.
• The availability and use of computer-controlled critical systems for the safety of the ship and for environmental protection.
It is remarkable that almost half the organisations do not use risk analysis in formulating information security policy. Authors believe that continuous investment in security threat knowledge, including any tools and practices that could be used to reduce security risk to acceptable levels, is paramount.
REFERENCES
1. ENISA – European Network and Information Security Agency, „Analysis of Cyber Security Aspects in the maritime Sector“, Heraklion (Greece, 2011).
2. Dhillon, G., "Violation of Safeguards by Trusted Personnel and Understanding Related Information Security Concerns", Computers & Security, Vol. 20, No. 2 (2001), pp.165-172.
3. Prodanović, R., Simić, D., “A Survey of Wireless Security”, Journal of Computing and Information Technology - CIT, Vol. 15, No. 3 (2007), pp. 237–255.
4. Stuxnet Analysis. Available: https://www.enisa.europa.eu/news/enisa-news/stuxnet-analysis
5. The Guidelines on Cyber Security onboard Ships”, Published by BIMCO, Denmark (BIMCO, 2016) Available: http://www.srhmar.com/images/stories/pdf/Guidelines_on_cyber_security_onboard_ships.pdf

83
Martina Pivac, Pančo Ristov, Anita Gudelj
SECURITY FLAW OF INFORMATION RESOURCES ON SHIPS
SECURITY FLAW OF INFORMATION RESOURCES ON SHIPSMartina Pivac, Pančo Ristov, Anita Gudelj
SECURITY FLAW OF INFORMATION RESOURCES ON SHIPS
Martina Pivac, Pančo Ristov, Anita Gudelj
(University of Split, Faculty of Maritime Studies, Split, Croatia)
( E-mail: [email protected]) ABSTRACT
The introduction of information systems on ships changed the structure and performance of the ship's business processes. The importance of information systems on modern ships is unquestionable; however, despite some of the key information systems have serious cyber security vulnerabilities. Cyber security aspect of such systems is inadequate, or even absent. Cyber attacks usually focus on the key elements of infrastructure by exploiting technical vulnerabilities or even security flaws protection system. This paper addresses the security trends, as well as methods of exploitation, some major navigation, communication and industrial systems that are essential to modern ships.
KEY WORDS
computer security, vulnerabilities, GPS, AIS, SCADA, ECDIS.
1. INTRODUCTION
The term Information resources includes all the elements of infrastructure which enable gathering, processing, storing of selected and important data, as well as their transfer to the user. Safety of the information resources includes three dimensions: Confidentiality, Integrity and Availability. Confidentiality of information resources refers to not allowing unauthorized access to the information’s, entities or processes. Integrity means that the available information’s are accurate and complete, while Availability means that all information’s, as well as other information resources, are available on demand of authorized user. With the term safety of information resources is connected the term safety risk. Safety risk is measure which signifies amount of threat from potential circumstances or events and likelihood of their happening. In context of the vessels safety risks are defined as risks connected with loss of confidentiality, integrity or availability of the
information’s or information resources which can potentially have unfavourable impact on the vessel or harbour operations. Information technology on the vessels has had great impact on conducting of all processes on the vessels. For the needs of shipping industry are designed, as well as implemented, various computer networks of different complexities. Computer networks onboard the vessels enable connecting and communication of different types of machinery [34]. Aldo the benefits of use of the information technologies onboard the vessels are undoubtedly, their use has also led to new security threats connected with them. Risk connected with the information technologies are known as Cyber risk. Maritime industry has been shown to be vulnerable to grate number of cyber risks. It has been noted, for example, a hacker attack on off-shore oil platform whose ballast controlling systems have
7th INTERNATIONAL MARITIME SCIENCE CONFERENCE
84
April 20th-21st, 2017, Solin, Croatia
been infected with malicious program and it took 19 days for it to be removed [33]. Even doe there were undoubtedly more hacker attacks on the vessels and maritime industry they often remain unreported to preserve the reputation of the shipping company. The satellite systems for communication and navigation, as well as satellite Internet on vessels have become an integral part for conducting business in shipping industry. The development of the satellite communication systems has enabled better interconnection of the vessels and land. Apart from voice communication, these systems provide tracking and control of the processes onboard the vessels as well as Internet access. In order to be able to use satellite communication specific Satellite Communication terminals (SATCOM terminals) are necessary. There are a number of satellite communication providers on market. However, in maritime Inmarsat has the largest market share. FleetBroadband (FB) is Inmarsat’s most prominent service providing satellite data transfer alongside satellite communication and satellite Internet. In maritime FB service is used for services, including but not limited to, updating ECDIS (Electronic Chart Display and Information Systems) charts, monitoring and SCADA (Supervisory Control and Data Acquisition) systems, storing and delivering GPS system data, receiving and sending notices to mariners. and other activities. Satellite Internet access support the use of standard Internet protocol, namely TCP/IP (The Transmission Control Protocol/Internet Protocol) but in use are also some specific protocols designed for use in satellite communication. Some SATCOM terminal manufacturers develop specific flavours of protocols designed to provide certain services e.g. Zing and TheraneLINK protocols [9,10]. Computer safety of SCADA systems is based on Security by Obscurity concept. Security by Obscurity is based on preventing of unauthorised access outside of the system itself. In case of SCADA systems this concept is based on the isolation of computer networks whose SCADA systems are essential pat from other networks. Because of presumption that the SCADA system networks are completely isolated great number of communication protocols that are in use do not provide any mean of encryption protection [16,23].
On ships most network systems are interconnected but only through dedicated applications that act as network nods. Since computer networks are essential part of ships system preventing unauthorised access is of grave importance. Traditionally, this problem was solved through the physical isolation of the network. But, with the development of technology and integration of ships systems with each other and with shore based systems, physical isolation alone does not guarantee the safety. This paper offers a proof of concept of exploring and investigating of the vulnerabilities of GPS (Global Positioning System), AIS (Automatic Identification System), ECDIS and SCADA systems.
2. GPS SYSTEM
In maritime GPS is one of the most common satellites positioning systems in use. GPS system is made up of a network of 24 satellites placed into orbit. GPS works in any weather conditions, anywhere in the world, 24 hours a day. GPS satellites circle the earth twice a day in a very precise orbit and transmit signal information to earth. GPS satellites transmit two microwave signals in two separate frequencies that are marked as L1 and L2. L1 signal has a frequency of 1575.42 MHz UHF and it is intended for civilian use. L2 signal has a frequency of 1227.60 MHz UHF and it is intended for by U.S. military forces. GPS signal is weak which makes it relatively easy to overpower and jam. Also, only L2 signal is coded whilst L1 signal has no method of confirming signal origin. For these reasons GPS signal is subjected to jamming and spoofing [1,2]. GPS signal jamming is conducted with the use of special devices that generate and transmit GPS frequency signal strength greater than the one real GPS signal preventing the GPS receiver from receiving real GPS signals. Jamming signal can be modulated as a continuous wave or as a narrowband Gaussian noise. GPS jamming devices of different strength and sizes are wildly available for sale, but it is also relatively easy to make one using easily available materials. GPS message consists of three parts: pseudo random code, ephemerides and almanac data. GPS message consists of 25 data frames each of which contains 1500 bits. Each frame is divided into five

85
Martina Pivac, Pančo Ristov, Anita Gudelj
SECURITY FLAW OF INFORMATION RESOURCES ON SHIPS
300 bit sub frames. It takes exactly 6 seconds for the GPS receiver to receive one sub frame and 30 seconds to receive one frame. GPS frames can be divided into three groups. First sub frame contains data for correcting clock offset between the clock of the GPS receiver and the clock of the GPS satellite. Sub frames 2 and 3 contain parameters for the calculation of exact location of each one of the GPS satellites, whilst sub frames 4 and 5 contain orbital pats data, time offset correction data and satellite status. All ephemerides and almanac data are available on web sites of The United States Department of Homeland Security and The National Aeronautics and Space Administration (NASA) [3,4]. For the analysis of security flaws of the GPS system in this paper Raspberry Pi Model B computer, RTL2832U R820T DVB-T USB 2.0 Digital TV Tuner and GNU Radio were used (Figure 1). GNU Radio is free open source development toolkit that enables signal processing and signal processing blocks to be used with cheap RF hardware.
Figure 1. Raspberry Pi SDR
Raspberry Pi Model B has quad core ARM Cortex-A7 processor and 1GB RAM (Random - Access Memory) memory. RTL2832U R820T is a radio tuner that can be used as a SDR (Software Defined Radio) since it allows transmission of computer modulated radio signals. All signal modulating in GNU Radio is done with the use of C++ programming language or with the use of flow graphs using the standard block libraries. Flow graphs can be written in C++ programming language. Signal processing applications in GNU radio can be written in C/C++ and Python programming languages. In this paper GNU Radio v3.7.9 was used together with Python application that allows the use of GPS-SDR-SIM
project program with GNU Radio and Raspberry Pi SDR. GPS-SDR-SIM program is designed to generate fake GPS signal which can be transmitted with the use of SDR. With the use of GPS-SDR-SIM program with ephemerides and almanac data using Python application fake GPS signal was generated which was then transmitted using Raspberry Pi SDR [5,6,7]. The results of the experiment from this paper were conducted on Android device with GPS Test application installed. GPS Test is an application that allows the display of GPS data from Android device GPS. Fake GPS signal from this paper was generated using Raspberry Pi SDR together with GPS-SDR-SIM program. From the following web site ephemerides and almanac data needed for generating fake GPS signal were used: ftp://cddis.gsfc.nasa.gov/gnss/ dana/daily/. For the example from this paper were used ephemerides and almanac data for 8 satellites. In order to transmit the fake GPS signal generated using GPS-SDR-SIM program in C programming language a program was generated (Raspberry Pi SDR Player). In creation of the fake GPS signal following coordinates were used: Paris (φ: 48° 55' 55.952'' N λ:002°25' 29.856''E). GPS signal spoofing from this paper was conducted using Raspberry Pi SDR Player which connects GPS-SDR-SIM program with Raspberry Pi SDR. Transmission of spoofed GPS signal was done using following terminal instruction: $raspberry_ pi_sdr_transfer-tgpssim.bin-f1575420000-s2600000-a1-x0-R-I55.55952, 002.2529856, 100. Results of GPS spoofing are shown in table 1, whilst figure 2 shows real and figure 3 shows spoofed location from GPS Test application.
Table1. Results of GPS signal spoofing
Hardware Raspberry Pi SDR
Testing device HTC Desire 626
Real location Split (φ: 43° 30' 43.643'' N λ:
016° 27' 55.559''E)
Spoofed location Paris (φ: 48° 55' 55.952'' N λ:
002° 25' 29.856''E)

7th INTERNATIONAL MARITIME SCIENCE CONFERENCE
86
April 20th-21st, 2017, Solin, Croatia
Figure 2. Real GPS location
Figure 3. Spoofed GPS location
3. SATCOM TERMINALS
SATCOM terminals have an important role in connecting the ships and land, but they also play significant part in the safety of the marine traffic. There are different SATCOM terminals that are in use and in different types of them security flaws that present significant threat to safety of ships and its crew were discovered. Discovered security flaws include Backdoors, the use of hardcoded credentials, the use of unsafe protocols and poorly protected password reset. Backdoors is a term that describes set of methods and mechanisms which are used for gaining unauthorized access to parts of computer systems. The input of credentials (user name and password) in source code, also known as Hardcoded Credentials is bad practise which enables easy gain of those credentials [8].
When this is the case credential are easily extracted with methods of reverse engineering. Cobham terminals use FTP protocol for updating of programs and therefore it is possible to gain, using credentials and FTP protocol, unauthorized access to the terminals. These terminals also use unsafe protocols such as ThraneLINK i Zing. Zing is a binary protocol which uses 1827 TCP port, and it is used in digital signal processing, memory data storing and communication between the terminals and the devices connected to them. ThraneLINK protocol is used for connecting terminals into a network which optimises their maintenance. ThraneLINK is used for system configuration, system updating, malfunction diagnostic and logging onto terminals. ThraneLINK also enables simple administrative password resetting. Procedure of the administrative password resetting is consisted of entering the serial number of the terminal into control interface after which the administrative credentials are set to factory settings which are (Username: admin, Password: 1234). ThraneLINK is based on OpenSLP protocol for locating of devices on networks and the configuration of network services. MD5 cryptography is also used. Since cryptography algorithm is known, as well as factory credential settings, password resetting process and communication protocols it is relatively easy to create packet which resets credentials to factory settings and gain control over the terminal [9,10].
4. AIS SYSTEM
The Automatic identification system (AIS) is an automatic system for navigational information exchange between ships as well as between ships and costal stations. In compliance with rule 19 chapter V of The International Convention for the Safety of Life at Sea AIS device is mandatory on all vessels greater than 300 GT that sail in international waters and all passenger ships regardless of size. The formats of the AIS are determent by protocol, and AIS systems use two determined VHF (Very high frequency) which is Chanel A at 161.975 Mhz and Chanel B at 162.025 Mhz. For the organisation of the transmission of time sharing method is used, that is Time Division Multiple Access (TDMA) which allows for multiple transmitters to use available time slots for the
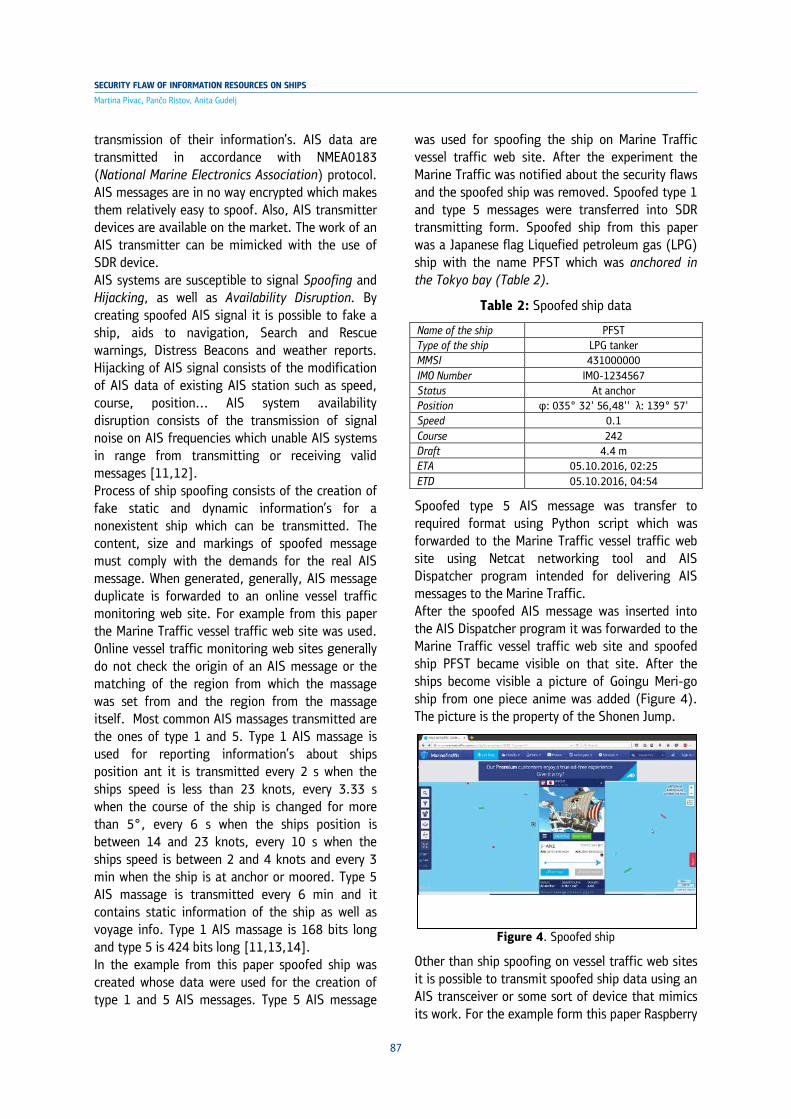
87
Martina Pivac, Pančo Ristov, Anita Gudelj
SECURITY FLAW OF INFORMATION RESOURCES ON SHIPS
transmission of their information’s. AIS data are transmitted in accordance with NMEA0183 (National Marine Electronics Association) protocol. AIS messages are in no way encrypted which makes them relatively easy to spoof. Also, AIS transmitter devices are available on the market. The work of an AIS transmitter can be mimicked with the use of SDR device. AIS systems are susceptible to signal Spoofing and Hijacking, as well as Availability Disruption. By creating spoofed AIS signal it is possible to fake a ship, aids to navigation, Search and Rescue warnings, Distress Beacons and weather reports. Hijacking of AIS signal consists of the modification of AIS data of existing AIS station such as speed, course, position... AIS system availability disruption consists of the transmission of signal noise on AIS frequencies which unable AIS systems in range from transmitting or receiving valid messages [11,12]. Process of ship spoofing consists of the creation of fake static and dynamic information’s for a nonexistent ship which can be transmitted. The content, size and markings of spoofed message must comply with the demands for the real AIS message. When generated, generally, AIS message duplicate is forwarded to an online vessel traffic monitoring web site. For example from this paper the Marine Traffic vessel traffic web site was used. Online vessel traffic monitoring web sites generally do not check the origin of an AIS message or the matching of the region from which the massage was set from and the region from the massage itself. Most common AIS massages transmitted are the ones of type 1 and 5. Type 1 AIS massage is used for reporting information’s about ships position ant it is transmitted every 2 s when the ships speed is less than 23 knots, every 3.33 s when the course of the ship is changed for more than 5°, every 6 s when the ships position is between 14 and 23 knots, every 10 s when the ships speed is between 2 and 4 knots and every 3 min when the ship is at anchor or moored. Type 5 AIS massage is transmitted every 6 min and it contains static information of the ship as well as voyage info. Type 1 AIS massage is 168 bits long and type 5 is 424 bits long [11,13,14]. In the example from this paper spoofed ship was created whose data were used for the creation of type 1 and 5 AIS messages. Type 5 AIS message
was used for spoofing the ship on Marine Traffic vessel traffic web site. After the experiment the Marine Traffic was notified about the security flaws and the spoofed ship was removed. Spoofed type 1 and type 5 messages were transferred into SDR transmitting form. Spoofed ship from this paper was a Japanese flag Liquefied petroleum gas (LPG) ship with the name PFST which was anchored in the Tokyo bay (Table 2).
Table 2: Spoofed ship data
Name of the ship PFST Type of the ship LPG tanker MMSI 431000000 IMO Number IMO-1234567 Status At anchor Position φ: 035° 32' 56,48'' λ: 139° 57'
05,35'' Speed 0.1 Course 242 Draft 4.4 m ETA 05.10.2016, 02:25 ETD 05.10.2016, 04:54
Spoofed type 5 AIS message was transfer to required format using Python script which was forwarded to the Marine Traffic vessel traffic web site using Netcat networking tool and AIS Dispatcher program intended for delivering AIS messages to the Marine Traffic. After the spoofed AIS message was inserted into the AIS Dispatcher program it was forwarded to the Marine Traffic vessel traffic web site and spoofed ship PFST became visible on that site. After the ships become visible a picture of Goingu Meri-go ship from one piece anime was added (Figure 4). The picture is the property of the Shonen Jump.
Figure 4. Spoofed ship
Other than ship spoofing on vessel traffic web sites it is possible to transmit spoofed ship data using an AIS transceiver or some sort of device that mimics its work. For the example form this paper Raspberry

7th INTERNATIONAL MARITIME SCIENCE CONFERENCE
88
April 20th-21st, 2017, Solin, Croatia
Pi Model B computer, RTL2832U R820T DVB-T USB 2.0 Digital TV Tuner and GNU Radio (Figure 1) were used. Type 1 and type 5 AIS messages were created and transferred into required NMEA format using Python script. Raspberry Pi SDR was used for the transmission of the spoofed messages. For checking of the efficiency of spoofed ship message transmission Furuno FA-170 type A AIS device and Fugawi Marine ENC navigational software were used. Same ship date from previous spoofing example were used expect the ship type was changed from LPG to passenger. For simplicity Type 5 AIS message contained only name of the ship, MMSI and type of the ship, while type 1 message contained only MMSI, course over ground and heading. Spoofed AIS messages were transmitted using Raspberry Pi SDR (Figure 1) and they were register on previously mentioned AIS device and navigational program. Figure 5 shows spoofed ship register on Fugawi Marine ENC navigational program. Since Raspberry Pi SDR is not an AIS device it wasn’t possible to create AIS message of required strength (12.5 watts for type A AIS device message) and significantly smaller antenna the range of Raspberry Pi SDR was significantly smaller. While the range of AIS device is between 10 and 20 miles, the range of Raspberry Pi SDR is about 5 m [11,15].
Figure 5. Spoofed ship registered with Fugawi Marine
ENC navigational program
5. SCADA SYSTEM
SCADA systems on ships have functions similar to the ones of land industrial facilities but on smaller more isolated area. On ships SCADA systems are used for monitoring and control over ships engines, machines and devices from single location (ship's
bridge and engine room) as well as for ships system monitoring from land [16,17,18]. There are four main functions of SCADA systems: data gathering, network communication, display of the gathered data and control. Those functions are executed by four SCADA components: sensors, Remote telemetry units (RTU), SCADA Master Unit and Communication Network. Programming of SCADA devices is done using Ladder Diagrams, Function Block Diagram and Instruction List. It is possible to control SCADA systems locally or from a remote location [16,19,20]. Safety of SCADA systems is based on the assumption that the control and managing over them will be done only inside closed environment in which they are placed. Also, the assumption is that the structure of the industrial networks is too complex. For those reasons great number of SCADA systems have little to none unauthorised access protection. Also, number of SCADA systems have none authorization levels, authentication methods or methods for checking of validity of data packages. SCADA network communication is often unencrypted. Security flaws of SCADA systems can be divided into [21,22]: • security flaws connected with network
connections,
• security flaws connected with platform variability’s,
• security flaws connected with administration flaws.
The safety of SCADA networks connected with other networks depends on the safety of all of those networks. One of major security flaws in SCADA systems is the way of network communication. Network packets that are exchanged between RTU unit and SCADA Master Unit are small and often repeated. Also, network packets that are exchanged between RTU unit and SCADA Master Unit are often unencrypted which makes their capturing, indentifying and exploitation easier. Encryption of those network packets is often difficult because of great number of repetitive packets with occasional changes and the delay that the encryption process would cause [23, 24]. In order to efficiently fit SCADA systems into computer networks IEEE (The Institute of Electrical and Electronics Engineers) 802.3 Ethernet and EEE

89
Martina Pivac, Pančo Ristov, Anita Gudelj
SECURITY FLAW OF INFORMATION RESOURCES ON SHIPS
802.11 Wi-Fi network technologies are used. In order for the interconnection of SCADA systems and different types of industrial systems could be possible different communication protocols are used. Alongside standard network protocols such as TCP/IP and UDP special industrial protocols were developed. Some of those special protocols such as ISO-TSAP and Modbus protocols are open source, while others are private property of the manufacturers. The documentation of the open source protocols is freely available, while the information’s on protocols in private property are gained by the methods of reverse engineering [20,23,25]. ISO-TSAP (International Organization for Standardization Transport Services Access Point) is one of the communication protocols that are commonly used in SCADA systems. Since the communication using ISO-TSAP is not encrypted and all of the messages are being sent in text format it represents big security threat. The structure of ISO-TSAP protocol is described in RFC 1006 (Request for Comments)[26]. Siemens systems use S7 communication protocol in which network communication is normally unencrypted. S7 protocol is private property so its exact structure is unavailable to general public. In this paper security flaws, as well as methods of their exploitation, of ISO-TSAP, Modbus and S7 industrial protocols are presented. For the examples from this paper S7-1200 STEP7 TIA V13 SP1 program tool together with SIMATIC S7-PLCSIM simulator were used. Control and all of the modules can be configured using STEP7 program which can then be uploaded into SIMATIC S7-PLCSIM which allows all of the functions of S7-1200 PLC device to be simulated. NetToPLCsim S7 program tool was also used for the simulation of network communication. NetToPLCsim S7 supplements SIMATIC S7-PLCSIM with TCP/IP interface which allows testing of SCADA systems without hardware [16,27]. For example from this paper Wireshark network protocol analyser and Python Scapy packet manipulation program were used. When it is necessary to locate certain devices on the computer network, or it is necessary to find out more about its structure Port scanner programs and Network packet sniffer programs are generally used. The goal of port scanning is finding potential
network configuration flaws. Pot scanning is done by sending TCP SYN packet to ports and if some of ports answers with SYN-ACK it is marked as open. With the process of port scanning information’s about potential network access points are gained [28,29]. Considering that both ISO-TSAP and S7 protocols are partially based on TCP protocol it is easy to catch and analyze network communication packages. Since those packages are not encrypted it is relatively easy to change them. Whit changed packages it is possible to download new programs into the memory, shut down the CPU, store malicious programs, change parameters etc. ISO-TSAP communication is conducted using port 102. Using network protocol analyser such as Wireshark it is relatively easy to catch and analyze ISO-TSAP unencrypted packages. Wireshark also allows filtering of a TCP stream. CPU stop instruction for S7 1200 is shown in figure 6. After analysing captured packages it is possible to craft fake ones that potentially allow executing of all tasks that system operator can do with the use of control programs.
Figure 6. CPU STOP TCP stream
When proper authorisation is necessary for any changes in SCADA systems it is possible to bypass authentication mechanisms by capturing real authentication packages. Captured authentication packages can be used to craft fake ones which can then be used to bypass authentication mechanisms. In case of ISO-TSAP protocol crafting fake authentication packages from real ones is relatively easy due to the fact that no encryption is used. An ISO-TSAP authentication package is shown in figure 7. The process of authentication in SCADA systems is generally done by comparing of authentication packages stored in RTU unit

7th INTERNATIONAL MARITIME SCIENCE CONFERENCE
90
April 20th-21st, 2017, Solin, Croatia
memory with the one in the authentication package. In case when both authentication packages are identical complete control over the system is allowed.
Figure 7. Authentication packages
The easiest way of getting authentication packages is by capturing and analysing the server sessions. In the black square on figure 7 generic connection package is shown, and the rest of the figure is an authentication package gotten from the example from this paper [20,30]. With the use of fake authentication package it s possible to completely bypass authentication mechanisms and gain complete access and control over SCADA system. The biggest security flaw of Modbus protocol is the fact the master unit does not need to have an address what makes unauthorised access to slave units fairly simple.
Figure 8. Modbus/TCP master unit request
An example of Modbus/TCP master unit request communication packet captured with Wireshark is shown in figure 8, while figure 9 shows slave unit response.
Figure 9. Modbus/TCP Slave unit response
Master unit request and communication for the example presented in this paper were created using Python Scapy 2.3.0 (Figure 10).
Figure 10. Python Scapy Modbus communication
6. ECDIS SYSTEMS
In accordance with Chapter V of The Safety of Life At Sea convention and International Maritime Organization ECDIS is accepted as the primary navigational and information system. ECDIS systems provide great navigational aid as well as introduce number of advantages (simplifying voyage planning, navigational planning...), but it represents potential cyber-attack point. Potential threat comes from the fact that on great number of ships ECDIS system is installed on a computer station with Windows system installed as well as Internet connection necessary for acquiring new and maintaining existing navigational charts and manuals. One of the security flaws of Furuno ECDIS systems allows for Directory Traversal Attack to be done. Directory Traversal Attack is possible because of use of

91
Martina Pivac, Pančo Ristov, Anita Gudelj
SECURITY FLAW OF INFORMATION RESOURCES ON SHIPS
Apache Web server which is vulnerable to them. Directory Traversal Attack is focused on the files stored outside the root file of the web server. The attack is done by the manipulation of the variables that mark file paths with strings of ˝dot-dot-slash (../)˝, as well as their variations or with the use of absolute paths to the files. With this attack it is possible to delete or modify existing file, or even to upload a new one, and this can be done with the use of curl toll for data transfer with PUT and DELETE HTTP (Hypertext Transfer Protocol) methods. Apache Web Server which is in use with Furuno ECDIS systems is also vulnerable to HTTP Header Injection Attacks. HTTP Header Injection Attacks is based on using host parameter which allows entry of new users. With the manipulation of host parameters of ECDIS systems it is possible to upload malicious payload [31,32].
7. CONCLUSION
Computer networks on ships enable connecting of all of the ships systems into single entity. For communication in ships networks standard network protocols are used (e.g. TCP/IP) as well as standard industrial protocols (e.g. Modbus), but also protocols intended for use in maritime industry (e.g. NMEA). GPS signal that is used for civilian purposes is in no way encrypted. Also, data that is contained inside GPS signal is freely available online. These facts make it relatively easy to fake and transmit a GPS signal which represents great security threat to ships. Also, when it arrives on the surface GPS signal is weak and so the fake GPS signal does not have to be very strong in order to overpower the real GPS signal. Other than the fake GPS signal it is possible to transmit GPS frequency noise which unable GPS receivers from receiving GPS signals. AIS messages are not encrypted and there is no mechanism for determining its origin which makes it relatively easy to fake AIS messages. Fake AIS messages can be transmitted using an appropriate device. SDR device was presented as an appropriate AIS message transmitting device. Aldo the range of the SDR from this paper was not great the exploitation of safety vulnerabilities was presented. Safety of SCADA systems is based on the presumption that the access from outside of the
system isn’t possible, and the presumption that the industrial systems whose SCADA systems are integral part are too complicated. In reality completely isolated systems that have no access from outside are rare. Because of these presumptions some of the most prominent protocols that are in use in SCADA systems are unencrypted which presents great security threat. With the use of open source tools, mainly Wireshark, security flaws of ISO-TSAP, Modbus and S7 protocols, used in Siemens S7 1200 systems as well as in other manufacturers are presented. By catching and analysing communication packages it is possible to create fake ones which can be used to disturb normal work of SCADA systems and the systems connected with them. Also, it is relatively easy to (in case of Siemens S7 1200 systems) bypass or disable authentication mechanisms. ECDIS system is frequently connected with GPS and AIS systems. One research showed that the work of ECDIS systems can be disturbed when GPS signal is unavailable. Also, the possibility of acquiring of new and updating of existing navigational charts and manuals can be used potential cyber-attack point.
REFERENCES
1. Hughes. K.K.: Hacking GPS, Wiley Publishing, 2005.
2. GPS Receiver Testing, [http://www .ni.com/white-paper/7189/en/], (05.02.2016).
3. Calais, E.: The Global Positioning System, [http://web.ics.purdue.edu/ ~ecalais/teaching/geodesy/GPS_observables.pdf], (25.01.2016).
4. Global Navigation Satellite Systems ,[http://www.unoosa.org/pdf/icg/2013/Ed_GNSS_eBook.pdf], (03.12. 2015).
5. Building GNU Radio on Ubuntu Linux, [http://gnuradio.org/redmine/ projects/gnuradio/wiki/UbuntuInstall],(10.01, 2016).
6. Raspberry Pi Image for Software Defined Radio, [http:// garethhayes.net /gnu-radio-for-raspberry-pi/], (27.02.2016).
7. Raspberry Pi 2 Model B, [https:// www.raspberrypi.org/products/raspberry-pi-2-model-b/], (13.01.2016).

7th INTERNATIONAL MARITIME SCIENCE CONFERENCE
92
April 20th-21st, 2017, Solin, Croatia
8. Satellite communications systems, [http://www.fao.org/docrep/003/w9633e/w9633e09.htm], (13.03.2016).
9. Santamarta, R.: SATCOM Terminals: Hacking by Air, Sea, and Land, [https://www .blackhat.com/docs/us-14/ materials/us-14-Santamarta-SATCOM -Terminals-Hacking-By-Air-Sea-And-Land-WP.pdf], (23.04.2016.).
10. Thera-Link, [https://www.thera-link. com/wp-content/uploads / 2014 /10/ thera-link-website-tc.pdf],(13.05.2016).
11. Balduzzi, M; Wilhoit, K; Pasta: AIS Exposed Understanding Vulnerabilities &Attacks 2.0, [https://www. blackhat.com/docs/asia-14 /materials /Balduzzi/Asia-14-Balduzzi-AIS-Exposed-Understanding-Vulnerabilities-And-Attacks.pdf], (10.03.2016).
12. Raymond, S.E.: AIVDM/AIVDO protocol decoding [http://catb.org/ gpsd /AIVDM.html], (15.07.2016).
13. Class A ais position report (messages 1,2,and3), [http://www.navcen.uscg.gov/?pageName=AISMessagesA], (15.07.2016).
14. M.1371: Technical characteristics for an automatic identification system using time-division multiple access in the VHF maritime mobile band, [http://www.itu.int/rec/R-REC - M.1371/en], (06.07.2016).
15. Balduzzi, M; Wilhoit, K; Pasta, A.: A Security Evaluation of AIS, [http://www.trendmicro.com/cloud-content/us/pdfs/security-intelligence /white-papers/wp-a-security-evaluation-of-ais.pdf], (14.03.2016).
16. Boyer, A.S.: SCADA, ISA-The Instrumentation, Systems, and Automation Society, 2004.
17. Acciani, G.; Amoruso, V.; Fornarelli, G.; Giaquinto A.: SOM-Based Approach for the Analysis and Classification of Synchronous Impulsive Noise of an In-Ship PLC Syste,[https://www.hindawi.com/journals/isrn/2012/105694/], (15.05.2015).
18. Maritime SCADA Video & Monitoring Systems, [http://www. riceelectronics. com/marine-scada.html], (15.05.2016).
19. Bailey, B.; Wright, D.: Practical SCADA for Industry, https://www. fer.unizg.hr /_download/repository/Practical_SCADA_for_Industry.pdf], (23.12.2016).
20. Beresford, D: Exploiting Siemens Simatic S7 PLCs, [https://media. blackhat.com/bh-us 11/Beresford/ BH_ US11_Beresford_S7_PLCs_WP.pdf], (15.03.2015).
21. Cornish, P; Livingstone, D.; Clement, D.; Yorke, C.: Cyber Security and the UK’s Critical National Infrastructure, [https:// www.chathamhouse.org/sites /files/chathamhouse/public/Research/International%20Security/r0911cyber.pdf], (21.02.2016).
22. [29] Tzokatziou, G.; Leandros, A.M.; Helge, J; He, Y: Exploiting SCADA vulnerabilities using a Human Interface Device, Vol. 6, No. 7, 2015.
23. Wrigh, A.K.; Kinast, J.A.; McCarty, J.: Low-Latency Cryptographic Protection for SCADA Comm unications, [http://scadasafe.sourceforge.net/security.pdf], (10.08.2016).
24. Low Cost and Portable GPS Jammer, Phrack magazine No.60.
25. New ECDIS mandatory requirements, [http://www.ukpandi.com/fileadmin/uploads/ukpi/LP%20Documents/LP_Bulletins/ECDIS%20Introduction.pdf], (13.02.2016).
26. GMDSS-approved systems, [http:// www.egmdss.com/gmdsscourses/mod/resource/view.php?id=2285], (15.3.16).
27. TIA Portal – your gateway to automation in the Digital Enterprise, [http://www.industry.siemens.com/topics/global/en/tiaportal/pages/default.aspx], (27.04.2016).
28. Eric D. Knapp, D.E.; Samani.R.: Applied Cyber Security and the Smart Grid: Implementing Security Controls, Syngress, 2013
29. Seitz, J.: Gray Hat Python: Python Programming for Hackers and Reverse Engineers, No Starch Press, 2009.
30. ISO Transport Service on top of the TCP Version:3, [https://tools.ietf. org /html/rfc1006], (18.03.2016).
31. Dyryavyy, Y.; Preparing for Cyber Battleships – Electronic Chart Display and Information System Security, [https://www.nccgroup.com/media/481230/2014-03-03_-_ncc_group_ -_whitepaper_

93
Martina Pivac, Pančo Ristov, Anita Gudelj
SECURITY FLAW OF INFORMATION RESOURCES ON SHIPS
32. _cyber_battle_ ship _v1-0.pdf], (19.06.2016).
33. HTTP Header Injection, [https:// www.gracefulsecurity.com/http-header-injection/].
34. Maritime Cyber Security, http: // www. reuters.com/article/us-cybersecurity-shipping-idUSBREA3M20820140424
35. Computer networks on board and shore, [http://www.mits-forum.org/ network.html], (14.03.2016)

7th INTERNATIONAL MARITIME SCIENCE CONFERENCE
94
April 20th-21st, 2017, Solin, Croatia
ROLE AND IMPORTANCE OF INTEGRATED MANAGEMENT OF ALBANIAN COASTAL AREASShkëlqim Sinanaj
ROLE AND IMPORTANCE OF INTEGRATED MANAGEMENT OF ALBANIAN COASTAL AREAS
Shkëlqim Sinanaj
(University of Vlora “Ismail Qemali”, Albania, Department of Nautical Science)
( E-mail: [email protected])
ABSTRACT
Studying the coastal area and its dynamics is one of the primary scientific problems faced in all countries, which have direct access in coastal areas. It represents a complex natural environment, where processes are continuous and dynamic; therefore decisions should be taken for rational use of resources, developing and protecting them from the existing and potential dangers. In this context, high priority should be given to pollution mitigation and the establishment of marine parks and reserves, in addition to preserving the integrity of ecosystems and biodiversity and the promotion of the best natural sustainable management methods. Global warming and rise of sea level, uncontrolled area development and the damage of fauna and flora are some of the main contributors to the degradation of the coastal area in Albania. For all this reason, the successful management of the Albanian coastal area requires the integration of the scientific opinion, taking into consideration the importance of administration, coordination and cooperation for the development and implementation of integrated strategies. Environmental impact problems related to economic development, in their identification and management stage should be adapted to the specific characteristics of the Albanian coast. The main aim of this paper is to emphasize the role of human influence on coastal areas and therefore its protection makes sense only if it is part of an integrated management system.
KEY WORDS coastal area, integrated management, environment, pollution, coastal line. 1. INTRODUCTION The coastal zone represents an environmental unit of considerable importance to natural phenomena and it is subject of economic, social, cultural and historical events that have occurred over time. During the course of time, people have had and continue to have a long and difficult relationship with coastal areas. Initially, the coast although rich in food resources, was seen as a source of disease and infections and consequently was avoided for safety reasons. Between the Middle Age and the seventeenth century as a result of constant pirate activity, the population moved farther away from the sea coast and settled in protected heights.
Exceptions are the maritime cities which draw their power on the sea and the maritime trade. Only the industrial revolution turned coastline home to urban development, industrial and commercial activities, and today this development requires a more careful sustainable management. Nowadays, the coastal area is a shared resource and is necessary to apply certain standards of management, analysis and control so that it can retain or regain its environmental integrity. It should be emphasized how important is to address this complex issue in an integrated and functional approach. The main problems arising from human activity of the coast
should be evaluated in a single dynamic process. This despite the differences rising from the fact that various human activities have affected in different ways the structure of the coast and its history. However, it is clear that every attempt to draw legislation to alleviate the causes of these problems raises conflicts of interest between different groups of users, entrepreneurs, urban planners and environmentalists, engineers and geologists, including landowners and economists. This is one of the main problems that make the management of the coastal line, a difficult and complex issue (Alan et al., 2010). 2. MAIN ISSUES REGARDING COASTAL ZONE MORPHOLOGY
Nowadays, coastal zone problems are: • rise of sea level; • penetration and sinking; • coastal erosion; • occupation and instable coast; • sinking of wetlands and estuaries; • chemical, physical and biological waste
destruction; • use of energy resources; • changing productivity and biodiversity of
ecosystems and human population growth;
The main goal is to arrive at an understanding of marine environments in the Albanian coast in order to rationalize any action and to select technical and environmental parameters that match the environment in which they operate. In this case, we must recognize that the problems of environmental impact related to the economic development of the area, both in their formulation and management stage should be framed in the context of the characteristics of the territory. Distribution of environmental problems is based on:
• recognition of damaged coastal communities;
• verification of possible links between biological and environmental parameters settlements;
• identification of useful parameters to help determine the composition of the community;
• identification of coastal environments under certain important and representative environmental parameters;
• Identification of present typical communities.
2.1. The concept of coastal zone
From the physical point of view the coast, is the end meeting between land, water and air, but from ecological point of view can be considered as a space in which terrestrial environments affect the marine environment and vice versa. For the Common Management of Environmental goods, there must be appropriate administrative and legislative instruments (Mitch & Gold, 1991). In the case of the sea, a common source for all mankind, the issues are too complex to be regulated by international treaties to which individual countries could ascend. However, in 1982 with the UNCLOS adaption and ratification by over 150 countries important innovations were introduced in international law. Under the Article 76, the Convention gives meaning to the definition of the continental shelf: "The continental shelf of a coastal State comprises the seabed and subsoil thereof, beyond the territorial sea throughout the extension of the natural expansion of the territory of that state, on the edge abroad continental, or at a depth of 200 nautical miles from the baselines from which the territorial sea is measured where the outer edge of the continental border is located at a short distance.” In addition all the inland waters of the state and the territorial sea, from 6 to 12 nautical miles from the base line, are part of the territory of the country where the sea space is adjacent and its use is under the control of this state. However, the right of “innocent" passage is allowed to any vessel, providing they wouldn’t jeopardize the security of the costal state. Passage of fishing vessels, cannot be considered innocent if they do not comply with regulations adopted by the coastal state. The area adjacent to the territorial sea, which extends up to 12 miles from the its boundaries, belongs to all countries, even if the coastal state may exercise certain rights as revenue control, customs, health and fishing. Open sea, finally, is not subject to the

95
Shkëlqim Sinanaj
ROLE AND IMPORTANCE OF INTEGRATED MANAGEMENT OF ALBANIAN COASTAL AREAS
ROLE AND IMPORTANCE OF INTEGRATED MANAGEMENT OF ALBANIAN COASTAL AREAS
Shkëlqim Sinanaj
(University of Vlora “Ismail Qemali”, Albania, Department of Nautical Science)
( E-mail: [email protected])
ABSTRACT
Studying the coastal area and its dynamics is one of the primary scientific problems faced in all countries, which have direct access in coastal areas. It represents a complex natural environment, where processes are continuous and dynamic; therefore decisions should be taken for rational use of resources, developing and protecting them from the existing and potential dangers. In this context, high priority should be given to pollution mitigation and the establishment of marine parks and reserves, in addition to preserving the integrity of ecosystems and biodiversity and the promotion of the best natural sustainable management methods. Global warming and rise of sea level, uncontrolled area development and the damage of fauna and flora are some of the main contributors to the degradation of the coastal area in Albania. For all this reason, the successful management of the Albanian coastal area requires the integration of the scientific opinion, taking into consideration the importance of administration, coordination and cooperation for the development and implementation of integrated strategies. Environmental impact problems related to economic development, in their identification and management stage should be adapted to the specific characteristics of the Albanian coast. The main aim of this paper is to emphasize the role of human influence on coastal areas and therefore its protection makes sense only if it is part of an integrated management system.
KEY WORDS coastal area, integrated management, environment, pollution, coastal line. 1. INTRODUCTION The coastal zone represents an environmental unit of considerable importance to natural phenomena and it is subject of economic, social, cultural and historical events that have occurred over time. During the course of time, people have had and continue to have a long and difficult relationship with coastal areas. Initially, the coast although rich in food resources, was seen as a source of disease and infections and consequently was avoided for safety reasons. Between the Middle Age and the seventeenth century as a result of constant pirate activity, the population moved farther away from the sea coast and settled in protected heights.
Exceptions are the maritime cities which draw their power on the sea and the maritime trade. Only the industrial revolution turned coastline home to urban development, industrial and commercial activities, and today this development requires a more careful sustainable management. Nowadays, the coastal area is a shared resource and is necessary to apply certain standards of management, analysis and control so that it can retain or regain its environmental integrity. It should be emphasized how important is to address this complex issue in an integrated and functional approach. The main problems arising from human activity of the coast
should be evaluated in a single dynamic process. This despite the differences rising from the fact that various human activities have affected in different ways the structure of the coast and its history. However, it is clear that every attempt to draw legislation to alleviate the causes of these problems raises conflicts of interest between different groups of users, entrepreneurs, urban planners and environmentalists, engineers and geologists, including landowners and economists. This is one of the main problems that make the management of the coastal line, a difficult and complex issue (Alan et al., 2010). 2. MAIN ISSUES REGARDING COASTAL ZONE MORPHOLOGY
Nowadays, coastal zone problems are: • rise of sea level; • penetration and sinking; • coastal erosion; • occupation and instable coast; • sinking of wetlands and estuaries; • chemical, physical and biological waste
destruction; • use of energy resources; • changing productivity and biodiversity of
ecosystems and human population growth;
The main goal is to arrive at an understanding of marine environments in the Albanian coast in order to rationalize any action and to select technical and environmental parameters that match the environment in which they operate. In this case, we must recognize that the problems of environmental impact related to the economic development of the area, both in their formulation and management stage should be framed in the context of the characteristics of the territory. Distribution of environmental problems is based on:
• recognition of damaged coastal communities;
• verification of possible links between biological and environmental parameters settlements;
• identification of useful parameters to help determine the composition of the community;
• identification of coastal environments under certain important and representative environmental parameters;
• Identification of present typical communities.
2.1. The concept of coastal zone
From the physical point of view the coast, is the end meeting between land, water and air, but from ecological point of view can be considered as a space in which terrestrial environments affect the marine environment and vice versa. For the Common Management of Environmental goods, there must be appropriate administrative and legislative instruments (Mitch & Gold, 1991). In the case of the sea, a common source for all mankind, the issues are too complex to be regulated by international treaties to which individual countries could ascend. However, in 1982 with the UNCLOS adaption and ratification by over 150 countries important innovations were introduced in international law. Under the Article 76, the Convention gives meaning to the definition of the continental shelf: "The continental shelf of a coastal State comprises the seabed and subsoil thereof, beyond the territorial sea throughout the extension of the natural expansion of the territory of that state, on the edge abroad continental, or at a depth of 200 nautical miles from the baselines from which the territorial sea is measured where the outer edge of the continental border is located at a short distance.” In addition all the inland waters of the state and the territorial sea, from 6 to 12 nautical miles from the base line, are part of the territory of the country where the sea space is adjacent and its use is under the control of this state. However, the right of “innocent" passage is allowed to any vessel, providing they wouldn’t jeopardize the security of the costal state. Passage of fishing vessels, cannot be considered innocent if they do not comply with regulations adopted by the coastal state. The area adjacent to the territorial sea, which extends up to 12 miles from the its boundaries, belongs to all countries, even if the coastal state may exercise certain rights as revenue control, customs, health and fishing. Open sea, finally, is not subject to the

7th INTERNATIONAL MARITIME SCIENCE CONFERENCE
96
April 20th-21st, 2017, Solin, Croatia
jurisdiction of any nation and limitations of activity in these waters are defined at the international level. In open sea is guaranteed the freedom of scientific research, navigation, fishing and other ancillary activities. This law establishes a certain model of international property. However, is not yet been accepted by all the coastal countries. Other activities as, for example the transit of warships is guaranteed by international law and in some cases fishing activities are not under the jurisdiction of individual coastal states. In other words, the provisions of jurisdiction and properties can vary with the distance from the coast and depending on the type of business you have in mind. In accordance with this agreement, Albania has signed bilateral agreements on the delimitation of the continental shelf in the Adriatic Sea with Italy, while with Greece the problem is still unresolved. In our country, the management and control of waters, seabed and coastal zone is responsibility of the state which conducts also the coastguard.
2.2. Coastal zone management
Proper management of the coastal zone can only be implemented through a series of legislative standards for the protection of the environment as a whole. It is important to note that the principles of the protection, conservation and management that we need to inspire, cannot be identified within the specifics of the open sea. The coastal area is influenced mainly by human activity and therefore its protection makes sense only if done as part of the integrated management. Nowadays, in order to ensure protection we must not only focus on rare or endangered species, but also on the preservation of ecosystems and their biodiversity and the complex components of the flora and fauna. In this context, a major role assumes the control of pollution and the creation of parks and marine reserves, with the main task of preserving the integrity of ecosystems and biodiversity while promoting good use of nature in a sustainable way. Ecosystems of the coastal areas are a significant source of the world food production and support a variety of economic activities, such as fishing, recreation, tourism and transport that cause various forms of pollution. In
recent years, many coastal areas have been the subject of intensive development projects and profound changes. The main problem today consist in bringing balance between accurate economic development while limiting its impact and ensure a good quality of life, as part of integrated management of the resources. 2.3. Damage of the Albanian’s coastal areas The Albanian coast is about 420 km long, and presents two different types of coasts: the coast of the Adriatic Sea of accumulative type and the southern Ionian coastline, of abrasive type (APH, 1982). Over the past decades, deterioration and decay of coastal environments has been observed in many regions as a result of human intervention. Intensive agricultural activities, development of industrial and urban areas, affects the aquatic and coastal systems releasing pollutants, such as resistant organic pollutants, nutrients, hydrocarbon, heavy metals, urban waste, etc. These downpours may affect the quality of surface water, groundwater, aquatic life and therefore biodiversity. Containment is considered of high priority for the conservation and management of natural existing resources. However, the complicated interactions, conflicts and clashes between the interests of investors, development and maintenance, activities are a serious barrier for the application of effective management strategies. Moreover, the gaps in knowledge about local ecosystems processes, together with ambiguous policies available, were identified as major factors in mitigating of pollution (Cullaj, 2005). Albanian coastal areas, especially after the 90-s, is characterized by rapid demographic developments, construction of tourist facilities and other residential buildings, business facilities and infrastructure. Along the coastal area there are several protected areas, some of which are of international importance. The maritime traffic in protected areas or in its surrounding areas can have a negative impact on the marine environment. The objective is to mitigate these negative impacts, as for the ships sailing to and from ports as well as for fishing boats, or pleasure crafts which sail in the marine protected
areas for recreational activities. Damages are related to the mooring system, discharges of oil, fuel, sewage or solid waste. A strict regulation is necessary to reduce these impacts. Anchoring systems should be placed in a protected marine area in the proximity of important areas.
Figure 1. Damaged areas of the Albanian coastline.
Another critical problem is the discharge of solid waste within the coastal zone but also in the surrounding areas. Solid wastes are mostly generated by tourists and shipping activity in the region. In many areas, improper waste disposal will create the impression of mismanagement and will reduce the assessment of natural resources by visitors. In Albania, extensive use of natural resources is made without taking into account environmental criteria. This practice resulted in the damage of 30% of the coastline, mainly caused by uncontrolled constructions in the whole country (Sinanaj, 2014). Albania has signed several conventions for various environmental issues, it has designed a development strategy, and more laws to protect the environment, so the legal background is present, but essential is the implementation of laws and commitments already ratified. The risk of pollution from oil spills is too large given the size of shipping activity in this area. Oil spills will have detrimental effects not only on the quality
of water but will cause serious harm to birds’ population and other animals (UNEP/MAP, 2012). While the maritime traffic management is outside the scope of this plan, the risk of pollution from oil spills is high, given the incomplete knowledge about the distribution of sensitive habitats. In addition, there are absences and deficiencies of equipment for oil spill control. The challenge is to understand the essential role of national institutions for the sustainable management of coastal territory in general and in particular protected areas.
3. COASTAL AND MARINE MANAGEMENT IN ALBANIA
3.1 Institutional framework Several national and local institutions share authority and responsability over the coastal and marine area in the territory under their jurisdiction. Institutions such as the Ministry of Environment, Ministry of Agriculture and Fisheries, Maritime Administration, the National Agency for Coastal and Ports of Vlora, Durrës, Saranda and Shëngjin, have broad authority to manage natural resources and in the regional planning process for marine and coastal area. Of high priority is the establishment of special management regimes in certain regions, and especially those areas that are fragile, mapped along the coastline as vulnerable to damage and destruction. Sustainable development requires a combination of conservation, planning, education and management through community involvement in the sustainable management of marine resources (Mark et al.,2007). The Albanian Maritime Administration has considerable authority in the field of management and implementation of laws concerning maritime traffic, pollution by ships and the use of space for fishing. Furthermore, the Coastal National Agency enforces laws and regulations on the country's coastline, including those concerning the protection of the marine environment, fisheries and use of beaches and coastline. As collaboration parties are the Naval Regional Authorities, Port Authorities and the Coast Guard.

97
Shkëlqim Sinanaj
ROLE AND IMPORTANCE OF INTEGRATED MANAGEMENT OF ALBANIAN COASTAL AREAS
jurisdiction of any nation and limitations of activity in these waters are defined at the international level. In open sea is guaranteed the freedom of scientific research, navigation, fishing and other ancillary activities. This law establishes a certain model of international property. However, is not yet been accepted by all the coastal countries. Other activities as, for example the transit of warships is guaranteed by international law and in some cases fishing activities are not under the jurisdiction of individual coastal states. In other words, the provisions of jurisdiction and properties can vary with the distance from the coast and depending on the type of business you have in mind. In accordance with this agreement, Albania has signed bilateral agreements on the delimitation of the continental shelf in the Adriatic Sea with Italy, while with Greece the problem is still unresolved. In our country, the management and control of waters, seabed and coastal zone is responsibility of the state which conducts also the coastguard.
2.2. Coastal zone management
Proper management of the coastal zone can only be implemented through a series of legislative standards for the protection of the environment as a whole. It is important to note that the principles of the protection, conservation and management that we need to inspire, cannot be identified within the specifics of the open sea. The coastal area is influenced mainly by human activity and therefore its protection makes sense only if done as part of the integrated management. Nowadays, in order to ensure protection we must not only focus on rare or endangered species, but also on the preservation of ecosystems and their biodiversity and the complex components of the flora and fauna. In this context, a major role assumes the control of pollution and the creation of parks and marine reserves, with the main task of preserving the integrity of ecosystems and biodiversity while promoting good use of nature in a sustainable way. Ecosystems of the coastal areas are a significant source of the world food production and support a variety of economic activities, such as fishing, recreation, tourism and transport that cause various forms of pollution. In
recent years, many coastal areas have been the subject of intensive development projects and profound changes. The main problem today consist in bringing balance between accurate economic development while limiting its impact and ensure a good quality of life, as part of integrated management of the resources. 2.3. Damage of the Albanian’s coastal areas The Albanian coast is about 420 km long, and presents two different types of coasts: the coast of the Adriatic Sea of accumulative type and the southern Ionian coastline, of abrasive type (APH, 1982). Over the past decades, deterioration and decay of coastal environments has been observed in many regions as a result of human intervention. Intensive agricultural activities, development of industrial and urban areas, affects the aquatic and coastal systems releasing pollutants, such as resistant organic pollutants, nutrients, hydrocarbon, heavy metals, urban waste, etc. These downpours may affect the quality of surface water, groundwater, aquatic life and therefore biodiversity. Containment is considered of high priority for the conservation and management of natural existing resources. However, the complicated interactions, conflicts and clashes between the interests of investors, development and maintenance, activities are a serious barrier for the application of effective management strategies. Moreover, the gaps in knowledge about local ecosystems processes, together with ambiguous policies available, were identified as major factors in mitigating of pollution (Cullaj, 2005). Albanian coastal areas, especially after the 90-s, is characterized by rapid demographic developments, construction of tourist facilities and other residential buildings, business facilities and infrastructure. Along the coastal area there are several protected areas, some of which are of international importance. The maritime traffic in protected areas or in its surrounding areas can have a negative impact on the marine environment. The objective is to mitigate these negative impacts, as for the ships sailing to and from ports as well as for fishing boats, or pleasure crafts which sail in the marine protected
areas for recreational activities. Damages are related to the mooring system, discharges of oil, fuel, sewage or solid waste. A strict regulation is necessary to reduce these impacts. Anchoring systems should be placed in a protected marine area in the proximity of important areas.
Figure 1. Damaged areas of the Albanian coastline.
Another critical problem is the discharge of solid waste within the coastal zone but also in the surrounding areas. Solid wastes are mostly generated by tourists and shipping activity in the region. In many areas, improper waste disposal will create the impression of mismanagement and will reduce the assessment of natural resources by visitors. In Albania, extensive use of natural resources is made without taking into account environmental criteria. This practice resulted in the damage of 30% of the coastline, mainly caused by uncontrolled constructions in the whole country (Sinanaj, 2014). Albania has signed several conventions for various environmental issues, it has designed a development strategy, and more laws to protect the environment, so the legal background is present, but essential is the implementation of laws and commitments already ratified. The risk of pollution from oil spills is too large given the size of shipping activity in this area. Oil spills will have detrimental effects not only on the quality
of water but will cause serious harm to birds’ population and other animals (UNEP/MAP, 2012). While the maritime traffic management is outside the scope of this plan, the risk of pollution from oil spills is high, given the incomplete knowledge about the distribution of sensitive habitats. In addition, there are absences and deficiencies of equipment for oil spill control. The challenge is to understand the essential role of national institutions for the sustainable management of coastal territory in general and in particular protected areas.
3. COASTAL AND MARINE MANAGEMENT IN ALBANIA
3.1 Institutional framework Several national and local institutions share authority and responsability over the coastal and marine area in the territory under their jurisdiction. Institutions such as the Ministry of Environment, Ministry of Agriculture and Fisheries, Maritime Administration, the National Agency for Coastal and Ports of Vlora, Durrës, Saranda and Shëngjin, have broad authority to manage natural resources and in the regional planning process for marine and coastal area. Of high priority is the establishment of special management regimes in certain regions, and especially those areas that are fragile, mapped along the coastline as vulnerable to damage and destruction. Sustainable development requires a combination of conservation, planning, education and management through community involvement in the sustainable management of marine resources (Mark et al.,2007). The Albanian Maritime Administration has considerable authority in the field of management and implementation of laws concerning maritime traffic, pollution by ships and the use of space for fishing. Furthermore, the Coastal National Agency enforces laws and regulations on the country's coastline, including those concerning the protection of the marine environment, fisheries and use of beaches and coastline. As collaboration parties are the Naval Regional Authorities, Port Authorities and the Coast Guard.

7th INTERNATIONAL MARITIME SCIENCE CONFERENCE
98
April 20th-21st, 2017, Solin, Croatia
3.2 Legal framework and policies Policies include the involvement of local communities and stakeholders in environmental decision-making and in the formulation of new laws and regulations. Local community often is the initiator of new initiatives in the sustainable development of local and national interest. Albania already has national laws that provide the framework for the management of marine and coastal zones. Furthermore, sustainable strategies include the adoption of the IMO conventions on the protection of coastal zones.
4. CONCLUSIONS We must have a clear strategy for participation in joint national efforts towards coastal area management, which is considered an integral part of the overall process of planning and decision making. Participation should not be focused on problem solving alone, but also in providing opportunities for economic prosperity and preservation in accordance with the broader goals of sustainable development. Trying to protect and develop the coastal areas in a sustainable way can succeed if all those who work and live in this area are committed to this objective. The Albanian Government through the relevant institutions has made serious efforts for the protection of the coastal zone, including measures for the rehabilitation of damaged areas. However, efficient methods should be used such as public awareness, the correct implementation of national laws and continuous monitoring of areas with national priority. Measures should also include the preservation of the marine and coastal environment
from pollution and shipping caused by fishing vessels. REFERENCES
1. UNEP/MAP, State of the Mediterranean Marine and Coastal Environment, Barcelona Convention, (Athens, 2012), pp. 5-12.
2. Alan, P. Rob, S. Maria, F. Patrycja, C. Erik, D. Integrated coastal zone management, participation practices in Europe (European Union, 2010), pp. 32-33.
3. Mark B, Marion H, Sandy K, Graham E, Veronica T. Coastal and marine resource management in the Galapagos Islands and the Archipelago of San Andres: Issues, problems and opportunities, Ocean & Coastal Management 50 (2007), pp. 148–173.
4. Mitch Mc, E. Gold, "The Modern Law of the Sea: Framework for the Protection and Preservation of the Marine Environment." Journal of International Law, Vol 23, No. 1 (1991), pp. 83-105.
5. Cullaj A. et al, Environmental state of some rivers of Albania Adriatik lowland, (Tiranë, 2005), pp. 77-90.
6. Army Publishing House, Navigation Guide for the Adriatic and Ionian Seas, (Tirana, 1982), pp. 35-47.
7. United Nations: Convention on Law of the Sea, (UNCLOS): United Nations Publication, (Geneva, 1982), pp. 23-30.
8. Sinanaj, Sh., "Albania national strategy in response to coastal pollution from ships and maritime disasters", IMSC 2014 Proceeding, Split, Croatia, April 2014, pp. 145-150.
99
Anita Gudelj, Merica Slišković, Helena Ukić
MAIN LEARNING OUTCOMES MODULES FOR THE QUALIFICATION STANDARDS IN THE FIELD OF MARITIME MANAGEMENT
3.2 Legal framework and policies Policies include the involvement of local communities and stakeholders in environmental decision-making and in the formulation of new laws and regulations. Local community often is the initiator of new initiatives in the sustainable development of local and national interest. Albania already has national laws that provide the framework for the management of marine and coastal zones. Furthermore, sustainable strategies include the adoption of the IMO conventions on the protection of coastal zones.
4. CONCLUSIONS We must have a clear strategy for participation in joint national efforts towards coastal area management, which is considered an integral part of the overall process of planning and decision making. Participation should not be focused on problem solving alone, but also in providing opportunities for economic prosperity and preservation in accordance with the broader goals of sustainable development. Trying to protect and develop the coastal areas in a sustainable way can succeed if all those who work and live in this area are committed to this objective. The Albanian Government through the relevant institutions has made serious efforts for the protection of the coastal zone, including measures for the rehabilitation of damaged areas. However, efficient methods should be used such as public awareness, the correct implementation of national laws and continuous monitoring of areas with national priority. Measures should also include the preservation of the marine and coastal environment
from pollution and shipping caused by fishing vessels. REFERENCES
1. UNEP/MAP, State of the Mediterranean Marine and Coastal Environment, Barcelona Convention, (Athens, 2012), pp. 5-12.
2. Alan, P. Rob, S. Maria, F. Patrycja, C. Erik, D. Integrated coastal zone management, participation practices in Europe (European Union, 2010), pp. 32-33.
3. Mark B, Marion H, Sandy K, Graham E, Veronica T. Coastal and marine resource management in the Galapagos Islands and the Archipelago of San Andres: Issues, problems and opportunities, Ocean & Coastal Management 50 (2007), pp. 148–173.
4. Mitch Mc, E. Gold, "The Modern Law of the Sea: Framework for the Protection and Preservation of the Marine Environment." Journal of International Law, Vol 23, No. 1 (1991), pp. 83-105.
5. Cullaj A. et al, Environmental state of some rivers of Albania Adriatik lowland, (Tiranë, 2005), pp. 77-90.
6. Army Publishing House, Navigation Guide for the Adriatic and Ionian Seas, (Tirana, 1982), pp. 35-47.
7. United Nations: Convention on Law of the Sea, (UNCLOS): United Nations Publication, (Geneva, 1982), pp. 23-30.
8. Sinanaj, Sh., "Albania national strategy in response to coastal pollution from ships and maritime disasters", IMSC 2014 Proceeding, Split, Croatia, April 2014, pp. 145-150.
MAIN LEARNING OUTCOMES MODULES FOR THE QUALIFICATION STANDARDS IN THE FIELD OF MARITIME MANAGEMENTAnita Gudelj, Merica Slišković, Helena Ukić
MAIN LEARNING OUTCOMES MODULES FOR THE
QUALIFICATION STANDARDS IN THE FIELD OF MARITIME MANAGEMENT
Anita Gudelj, Merica Slišković, Helena Ukić
(University of Split, Faculty of Maritime Studies, Croatia) (E-mail: [email protected])
ABSTRACT
Competitive educational system requires educational programs based on learning outcomes and in accordance with the needs of the labor market; transparent criteria of learning outcomes assessment; developed criteria and procedures for evaluation and recognition of outcomes of non-formal and informal learning. In order to strengthen and further development of lifelong learning and quality assurance acquisition of qualifications, it is extremely important to have a strong instrument governing the system of qualifications-Croatian Qualifications Framework. The aim of this paper is to present the developed categories of learning outcomes for the qualification standards on the level 6 and 7, in the field of maritime management. Developed qualifications standards and following learning outcomes are associated/connected with developed occupational standards that have been created with the help of employers from the real sector. In this way, for the first time, maritime education system is directly linked to labor market needs.
KEY WORDS
Educational system, learning outcomes, Croatian Qualifications Framework, qualification standard, occupational standard, labor market needs.
1. INTRODUCTION The global economy trends, and consequently the labor market trends showed a significant increase in demand for personnel who possess the knowledge and skills of more scientific and professional areas. In addition, there was a significant increase in multidisciplinary studies in Europe, involving the acquisition of knowledge in several sectors, based on which, the employment growth of this kind of experts is projected in the future. In the Croatian maritime sector, management of maritime and coastal facilities, city and county port authorities, shipping companies and maritime
agencies, marinas, charter agencies, management and supply vessels and other nautical tourism organizations, and all the major companies in the field of maritime affairs and the management of maritime and port facilities, the interest of employers for highly qualified work force in the area of maritime management is growing. The importance of the maritime economy, and related sectors like recreational craft industries and coastal tourism is stressed in European Communication COM (2014) 86 final on “A European Strategy for more Growth and Jobs in Coastal and Maritime Tourism”, especially for employment for the whole economy. In order to achieve competitiveness of the sector, we should

7th INTERNATIONAL MARITIME SCIENCE CONFERENCE
100
April 20th-21st, 2017, Solin, Croatia
not neglect the importance of education, i.e. educated and professional staff. Global shipping market future employee must be able to understand the maritime system and the forces that shape the maritime industry. Also, the future employee has to have the appropriate knowledge and operational skills from several scientific areas, primarily technical science in the field of traffic and transport, and social sciences in the field of economy, law, information science and others. Within the goal of 1.1. and Measure 1.1.1. Strategy of Education, Science and Technology of the Republic of Croatia – New Colors of Knowledge, in order to achieve sustainability and competitiveness of the education system, it is very important, for each study program that acquired learning outcomes and competencies are in accordance with the real needs of society-labor market. Croatian Qualifications Framework (CQF) is an instrument that regulates the entire system of qualifications at all levels of education in the Republic of Croatia through qualifications standards based on learning outcomes and aligned with the needs of the labor market, the individual and society as a whole. The key tools in linking the education system and labor market needs are occupational and qualifications standards, while the main link between the above standards are learning outcomes. The learning outcomes are the knowledge and skills, i.e. competences that an individual acquires through learning and prove or demonstrate through appropriate test. Knowledge and skills are defined by the employer, precisely they are determined in established occupational standards. Any qualification acquired in Croatia is determined by the level of set learning outcomes, which in turn belong to this qualification. By placing qualifications at a specific level it is possible to compare and link qualifications. 2. QUALIFICATION STANDARDS-HIERARCHY OF LEARNING OUTCOMES
Qualifications Standard represents content and structure of certain qualifications, including all the information necessary to determine the level, volume and profile, type and quality of
qualifications (Dželalija, Dragičević, 2016.). Qualification standards give a clear definition of learning outcomes that person (the holder of the qualification) should have. The qualification is proved by certificate, diploma or other document issued by an authorized person. These qualifications are based on learning outcomes and learning outcomes are grouped into logical units. Evaluated and assessed skills are called learning outcomes. Learning outcomes belong to a particular person and show that verification (evaluation, assessment) of their ownership (eg exams) is made. (Beljo Lucic, et al., 2009). There are several reasons regarding importance of learning outcomes. Firstly, learning outcomes make qualifications more transparent for students. Then, the range of graduates is becoming wider and thanks to learning outcomes, employers may have a better understanding of the acquired knowledge, skills and competences in order to recruit the most suitable candidate. Learning outcomes benefit for quality assurance as they increase transparency and comparability between qualification standards. (Adamson et al., 2010.). A set of learning outcomes has a total volume of all of the relevant learning outcomes aligned with the volume of all other modules. A set of learning outcomes, and module learning outcomes is for example subject (course). Each course can represent one or more learning outcomes sets (depending on the content of the course). A set of learning outcomes should be as smaller, so that it can be transferable from category to category. Minimal volume of a particular set of learning outcomes cannot be less than one. The higher education qualifications required for certain professions are regulated at national level or at international level. There are several examples where the learning outcomes are easily identifiable (Directive 2005/36/EC of the European Parliament and of the Council on the Recognition of Professional Qualifications). However, there are many that focus on (or include) ‘inputs’ which have to do with how (and for how long) people are educated, trained and assessed. (Adamson et al., 2010.). In the process of creating quality qualification standards it is important to follow good methodology. University College Cork experienced a process of implementation of a Learning

101
Anita Gudelj, Merica Slišković, Helena Ukić
MAIN LEARNING OUTCOMES MODULES FOR THE QUALIFICATION STANDARDS IN THE FIELD OF MARITIME MANAGEMENT
Outcomes Approach. According to Case Study of this University, one of the key elements to the success of the implementation program was the publication of a handbook Writing and using learning Outcomes – a Practical Guide. (Adamson et al., 2010.). Instructions are of great importance in the preparation of new qualification standards and updating the associated learning outcomes. Main guiding principle when the Faculty of Maritime Studies was creating the qualification standard and writing learning outcomes was to write them on such way that they are capable of being assessed. Also, it is important that the assessment tasks mirror the learning outcomes since, as far as the students are concerned, the assessment is the curriculum. (Ramsden, 2003). Regarding assessment; Biggs, 2003., highlights the strong link between curriculum and assessment as follows: to the teacher, assessment is at the end of the teaching-learning sequence of events, but to the student it is at the beginning. If the curriculum is reflected in the assessment, as indicated by the downward arrow, the teaching activities of the teacher and the learner activities of the learner are both directed towards the same goal. In preparing for the assessment, students will be learning the curriculum. Development of occupational and qualifications standards is long term process, and it requires the involvement of all stakeholders, the economy, higher education and upper secondary education units, as well as supporting state institutions. In order to create high quality qualification standard, it is necessary to initially investigate the labor market needs and develop occupational standards. The Faculty of Maritime Studies, together with its partners, through project “Maritime Management for the 21st Century - Sustainable and Intelligent Development of the Coastal Area through the Development of Occupational and Qualification Standards in the field of Maritime Management and the Enhancement of Corresponding Graduate University Programs“ developed occupational standards and related standards of qualifications in the field of Maritime management. Through developed standards, Maritime Management study program will correlate with and become more responsive to the needs of the labor market.
3. HIERARCHY OF LEARNING OUTCOMES IN THE FIELD OF MARITIME MANAGEMENT In the process of creating good hierarchy scheme for qualification standards it was important to consider the created occupational standards in the field of Maritime management. Created standards present the required knowledge and skills that employers are considered to be important, i.e. they display the current labor market needs. For example Faculty of Maritime Studies created occupational standard on level 7 called Manager in Marinas and Nautical Tourism precisely due to importance and potential of this sector. The Faculty realizes that shortages of unqualified employers will definitely be a stumbling block to the development of this sector. According to the Study on the competitiveness of the recreational boating sector (2015), the conducted research regarding skills needed to work within this sector are diverse and range from ‘actual on boat skills’ such as skipper licenses, to technical skills in maintenance an repairing of boats, to management skills and service skills. The Maritime Skills Alliance structures the required types of employees in marinas into three categories which have different skills requirements: 1. Marina manager (Yacht Harbour Manager): combination of on boat skills such as skipper licenses and managing skills; 2. Dockmaster (Operations Manager): services and management skills, understanding of technical aspects; 3. Marina operative (Berthing Assistant, Mooring Assistant, Yard Assistant): Skills on boat production and boat services, more technical skills. Due to complexity of created occupational standard from which can emerge a few different jobs, the work of making the qualification standard for the Maritime management students was quite extensive. For example, the above operations may be performed by Maritime management students, if they have acquired a qualification on the 7th level. In the process of creating qualification standard it was extremely important to make good link between required knowledge and skills with learning outcomes that students receive at the end of each module.

7th INTERNATIONAL MARITIME SCIENCE CONFERENCE
102
April 20th-21st, 2017, Solin, Croatia
The process of developing qualifications standards in the field of maritime management has begun with the establishment of a working group, which was composed of representatives of the partners who are all of from the maritime industry and the teachers who teach at the Faculty of Maritime Studies. As an additional, increased activity, and thus the support of the working group for the development of qualification standards, additional working group that worked on the modernization of the existing programs is formed. One of the first steps in forming and developing the qualification standards is to make changes in the courses through the set of learning outcomes, according to the needs of the labor market, and created occupational standards. The working group for development of qualification standards initially made fundamental classification of learning outcomes, and formed the main modules of learning outcomes (i.e. General outcomes). Within four main modules are categories of learning outcomes (specific outcomes), within the categories are groups and
finally the specific learning outcomes of the course. The main guiding principle was to divide/separate/fragment specific learning outcomes, precisely that each set of learning outcomes represents a colloquium. In this way, learning outcomes can be transferable. The 4 main modules for qualification standards in field of Maritime management on the level 6 and 7 are: • Maritime Economy, • Maritime Technology, • Marine Engineering and • Social and Interdisciplinary areas.
For example; within the module "Social and Interdisciplinary areas" are categories (sets of learning outcomes): Maritime English, Maritime Law and Regulations, Information and Communication Technologies in the maritime industry, and so on. The Figure 1 shows the main modules and principle of classification of learning outcomes.
Figure 1. Main modules of learning outcomes in field of maritime management

103
Anita Gudelj, Merica Slišković, Helena Ukić
MAIN LEARNING OUTCOMES MODULES FOR THE QUALIFICATION STANDARDS IN THE FIELD OF MARITIME MANAGEMENT
CONCLUSION
In Croatia, the development process of occupational and qualification standards is in its infancy, and within years is it possible to expect significant improvement in terms of the complete harmonization of study programs with the needs of the labor market. This is certainly a time consuming process that requires a lot of effort and constant consultations with the profession with the aim of ensuring the quality knowledge and skills, and providing skilled workforce to the labor market. Croatian Qualifications Framework is a reform instrument, and as such is not intended to be binding; a decision of entering the process of creating occupational and qualification standards must be made by high educational institutions. Precisely in this way, faculties provide their students an added value, but above all, they give them an extra chance for employment and the recognition in the labor market.
REFERENCES
1. Adamson, L., Becerro, M., Cullen, P., González-Vega, L., Sobrino, J.J., Ryan, N., (2010.), “Quality Assurance and Learning Outcomes”, European Association for Quality Assurance in Higher Education, Helsinki, Finland [Available online: www.enqa.eu/indirme/papers.../WSR%2017%20-%20Final.pdf]
2. Biggs J. (2003)., “Aligning teaching and assessing to course objectives”, Teaching and Learning in Higher Education: New Trends and Innovations. University of Aveiro.
3. Beljo Lučić, R., Buntić Rogić, A., Dubravac Šigir, M., Dželalija, M., Hitrec, S., Kovačević,
S., Tatalović, M. (2009).; “Uvod u kvalifikacije”, Zagreb: Vlada Republike Hrvatske Ministarstvo znanosti, obrazovanja i športa.
4. Directive 2005/36/EC of the European Parliament and of the Council on the Recognition of Professional Qualifications [Available online: eur-lex.europa.eu/legal-content/en/TXT/?uri=CELEX%3A32005L0036]
5. Dželalija, M., Dragičević, T. (2016), “Kako napisati ishode učenja?”, Faculty of Science, Split, Croatia. [Available online: stemp.pmfst.unist.hr/wp-content/uploads/2016/01/digitalna-brosura.pdf]
6. European Communication COM (2014) 86, “A European Strategy for more Growth and Jobs in Coastal and Maritime Tourism”. [Available online: https://ec.europa.eu/maritimeaffairs/sites/.../com_2014_86_en.pdf]
7. Maritime skills alliance [http://www.maritimeskills.org/careers/marine_leisure/ml_quals.htm#marinama].
8. Ramsden, P., (2003): “Learning to Teach in Higher Education”, London: Routledge.
9. Strategy of Education, Science and Technology of the Republic of Croatia – New Colors of Knowledge. [Available online:public.mzos.hr/fgs.axd?id=2551]
10. Study on the competitiveness of the recreational boating sector (Final Report), Rotterdam / Brussels, 2015. Available online: [ec.europa.eu/DocsRoom/documents/15043/attachments/1/translations/en/.../native].

7th INTERNATIONAL MARITIME SCIENCE CONFERENCE
104
April 20th-21st, 2017, Solin, Croatia
MARINA OPERATOR’S OBLIGATIONS FROM THE CONTRACT OF BERTH ACORDING TO THE BUSINESS PRACTICES OF CROATIAN MARINAS Vesna Skorupan Wolff, Ranka Petrinović, Nikola Mandić
MARINA OPERATOR’S OBLIGATIONS FROM THE CONTRACT OF BERTH ACORDING TO THE BUSINESS PRACTICES OF
CROATIAN MARINAS Vesna Skorupan Wolff1, Ranka Petrinović2, Nikola Mandić2
(1 Adriatic Institute, Croatian Academy of Science and Arts, Šenoina 4, Zagreb, Croatia)
(2 University of Split, Faculty of Maritime Studies, Split, Croatia)
(E-mail: [email protected])
ABSTRACT
Contract of berth is the contract that is not regulated by any special laws, meaning that its essential components, including the contractual obligations of the parties are not specifically prescribed. The practice of using general terms and conditions of marinas is adopted when concluding a contract and determining the scope and content of the parties’ obligations. The paper considers the obligations of marinas as a contractual party that provides specialized and complex services of berthing. The provisions of general conditions of marina business practices are analysed and interpreted in terms of obligations regarding the provision of technically acceptable and safe berth in the marina, control and custody of the vessels at berth. The paper explains the meaning and scope of specific contractual obligations and emphasises the impact of contract commitments on the subject of contractual liability and definition of the legal nature of a particular contract. For a better understanding of marina obligations, the paper compares them with the corresponding obligations of the berth user. The developed market of nautical tourism requires a balanced protection of economic and legal interests of marinas and berth users as its participants, which is reflected through the right balance of their contractual obligations. Bearing in mind contemporary conditions governing the nautical tourism and trends of its growth, the paper presents the thesis on the need for standardization of the provisions on the obligations of parties in specific general conditions of marinas in order to classify them into categories based on scope and content of services that marinas provide.
KEY WORDS
nautical tourism, berth contract, marina obligations, business practices of Croatian marinas
1. INTRODUCTION
Contract of berth is the type of contract that is not described in the law, which means that the obligations of the parties are not defined and prescribed. Therefore, the exact content of the rights and obligations of the parties shall be determined by analysing the content of the contract of berth and general terms and conditions of marinas as providers of berth services. General terms and conditions of local marinas in relation to
the obligations of the parties are not standardized and consistent, so the berth contract has not yet become a typical innominate contract.1 All that has
1 See Goldstein Alexander: Commercial contract law - international and comparative, Zagreb, 1991, p. 13; Padovan Adriana Vincenca: Responsibility of nautical port in the berth contracts and insurance, Comparative Maritime Law, vol. 52 (2013), No. 167, p. 1 to 35
105
Vesna Skorupan Wolff, Ranka Petrinović, Nikola Mandić
MARINA OPERATOR’S OBLIGATIONS FROM THE CONTRACT OF BERTH ACORDING TO THE BUSINESS PRACTICES OF CROATIAN MARINAS
been said complicates the legislative framework that leads to the application of contractual relationship of the parties to the berth contract.2 The specific regulation of the obligations of the marina is of the utmost importance because it has a direct impact on contractual liability. The fact that some marina general terms and conditions do not contain specific provisions on obligations, but they are to be understood from the provisions on the liability of the marina proves how important provisions on the obligations and liabilities are, and how they make an almost indivisible whole. Interpretation of the provisions on obligations of the parties to the berth contract is in itself a complex issue. The obligations of the parties should be viewed as a set of interdependent obligations that make up the whole. Their stipulation in the contract requires compliance with other contractual provisions and numerous principles of the law of obligations. All this leads to the fact that berth users when choosing a marina appreciate diversity offered by marinas and take into account the provisions in general terms and conditions on the obligations of the marina. The spectrum of marina obligations under the contract of berth varies primarily depending on the type of berth provided by the marina. Consequently a transit berth includes much narrower scope of obligations of the marina, which apart from providing technically and nautically sound and safe berths, supplying the electricity, water, etc. and maintaining security in the port has no other obligations. The service of transit berth use is provided on the basis of an informal contract that is considered concluded from the moment when the vessel lands in the marina and makes fast to its berth, thereby accepting the general terms and conditions of the marina.
2 The berth contract is primarily subject to the application of the Law on Obligations (Official Gazette No. 35/05, 41/08,125/11) that as a positive regulation governs the mandatory and contractual relations, provisions of the Maritime Domain and Seaports Act (Official Gazette No. 158/03, 100/04, 141/06, 38/09); Maritime Code (Official Gazette No. 17/94, 43/96, 181/2004, 76/07, 146/08, 61/11, 56/13, 26/15); Law on the Provision of Services in Tourism (Official Gazette No. 68/07, 88/10), the Consumer Protection Act (Official Gazette No. 79/07, 125/07, 79/09, 89/09, 133/09, 78/12, 56/13), and acts and the rules adopted on the basis of these laws.
On the other hand, a permanent berth is characterized by numerous more demanding obligations of marinas and it presents longer and more involved relationship of the parties in the area of defining the obligations and their fulfilment. In the permanent berth contract marinas often take on the obligation of providing the berth accommodation and the obligation of the vessels custody. The marina general terms and conditions rarely govern the service of custody of the vessel at berth. In addition to these features of permanent berth contracts, it should also be mentioned that in practice it is always made in writing for a period of time longer than a month, and as a rule, in practice the contract is usually concluded for an annual or semi-annual period of time. Also, an important feature of the contract of the permanent marina berth in which marinas undertake custody, or storing of vessels, is that they become a direct owner of the vessel at berth. The paper deals with the contractual arrangement of marina obligations under the berth contract according to standard business practices of 11 concessionaires of 32 Croatian marinas.3 The research focuses on the analysis of obligations related to nautical elements of the berth contract, as well as its part pertaining to safeguarding vessels at berth. In particular, it deals with the obligation of storing, although this obligation is not a common commitment to business practices of Croatian marinas and it is rarely governed by the general terms and conditions of Croatian marinas. Despite this, the obligation of vessels custody needs to be analyzed and considered by the researchers.4
3 The following documents were analyzed: General conditions on berth usage of Adriatic Croatia International Club Plc.; General terms and conditions of Trogir marina; General terms and conditions of Kaštela marina; General terms and conditions for berth accommodation in Agana marina; General terms and conditions of the Punat marina; General terms and conditions of Borik marina; General terms and conditions for vessels in nautical tourism of Lav marina; General terms and conditions for the boat in Zadar Color marina; General terms and conditions of Baotić marina; Agreement on the use of berth of Dalmacija marina; Agreement on the use of dry berth of Nauta Lamjana. 4 The study of the legal framework which should apply to the contractual relationship represents a scientifically relevant topic that will be discussed in a separate article.

7th INTERNATIONAL MARITIME SCIENCE CONFERENCE
106
April 20th-21st, 2017, Solin, Croatia
The goal of the research is to identify and classify marina obligations and to give a concise explanation for each obligation stating its content and the function it has in achieving the purpose of the berth contract. A special emphasis in the research is given not only to the description of the obligations but also to the definition of the effect of the meaning and scope that certain obligations have on the contractual liability of marinas. Consequently, there is consideration of consequences of failure to meet any obligations and commitments. The interpretation of obligations is followed by the substantive law to be applied in the event of a dispute between the parties of the berth contract. There is a mention of all other important issues that directly affect the scope and content of each obligation, primarily on the legal issues that arise in this matter and are related to the contractual liability for damage.
2. PROVIDING PLACE FOR BERTH
The main obligation of any berth contract includes the commitment of the nautical tourism port to allow the berth user who is also the owner of a particular vessel, to use the safe berth for the vessel's accommodation for a specific period of time. Therefore, the obligation of providing the berth for use is the most important and recognizable obligation, as a basic differentia specifica of this legal transaction. The provision of the berth used for vessels accommodation is an essential component of all types of berth contracts including those which are concluded only for the rent of the berthing space, as well as those whose contracts apart from space renting, also include control and custody of the vessel at berth. Provision of berth usually means that the nautical tourism ports allocate specific part of their waters, facilities and infrastructure and the corresponding port equipment to the berth users. When a sea berth is in question, it particularly refers to the part of the sea surface, pier for the access to the vessel, the anchor block and chain, with electricity and running water and the like. 5 Although the berth space is usually designated in the contract, the user of the berth does not have
5 PADOVAN, op. cit.
the exclusive right to the use of specific berth. Thus, the general terms and conditions of business transactions provide that marinas are authorized to move each vessel to another appropriate berth according to its needs. To move the vessel, the marina does not need the berth user’s approval, but the general conditions provide for a special obligation of marinas to inform the user about the performed berth transfer. By prescribing such business conditions marina is able to manage its berth accommodation facilities independently. The reason for moving the vessel may be of a commercial nature, however, in some cases moving the vessel may be caused by marina’s performance of public duties as a concessionaire responsible for the port’s safety, or having to conduct salvage operations in the port.6 This can be reflected to the question of liability for damage caused to the vessel during the moving operations.
2.1. Operation, safety and maintenance of berths provided for use and proper maintenance of marina infrastructure
According to analyzed terms and conditions of Croatian marina practices, one of the most important obligations of marinas is to provide the berth in sound condition, safe in technical and nautical terms and appropriate for a specific vessel with respect to the type, size and other technical characteristics of the vessel. This is a continuing obligation of marinas, which means that marinas are not only required to provide the berth that is technically and nautically safe, but this obligation also implies that for the entire duration of the contract, marina regularly checks and maintains its safety and operation. Apart from the proper operation of the berth, the marina is obliged to continuously maintain, clean and keep the port in good condition, as well as its infrastructure, buildings, installations and other port facilities. Providing a proper and safe berth and maintaining it for the duration of the contract is an obligation that must be fulfilled by marinas that observe
6 A salvage operations will be considered if the marina in this particular case takes specific activities that require exceptional skills and efforts which go beyond the usual and regular activities of the marina in the performance of their professional duties and activities in the berth contract, which are aimed at assisting the vessel and property in distress.

107
Vesna Skorupan Wolff, Ranka Petrinović, Nikola Mandić
MARINA OPERATOR’S OBLIGATIONS FROM THE CONTRACT OF BERTH ACORDING TO THE BUSINESS PRACTICES OF CROATIAN MARINAS
sound business practices and rules of professional conduct. Very often, in descriptions of this obligation in general terms and conditions of our nautical tourism ports, it is stated that this obligation includes the duty of the marina to employ a sufficient number of qualified employees trained for the work related to maintenance, supervision and care of technical and nautical safety of berths. Detailed description of this particular obligation is necessary because the berth’s operation and safety is an essential component of any berth contract. Therefore, Croatian marinas pertain to fair business practice of considering the berth’s sound operation in the technical and nautical sense an essential obligation of the nautical tourism port. This commitment contributes to a fair distribution of risks between the parties involved in a legal transaction, as a counterpart to this obligation, the berth users has to fit the vessels with appropriate quality mooring lines and fenders and to provide for their maintenance. In this context, it is important to emphasize that general terms and conditions provide that the nautical tourism port shall replace the mooring ropes and fenders of the vessel at berth at the expense of its user if they are not of adequate quality, or are in poor condition, or missing, and if the user does not take care of it himself after being advised to do so. This is done primarily with intention of keeping order and safety in the port.
3. VESSEL CONTROL
The special feature of the transit berth is that general terms and conditions expressly exclude the commitment to control the vessel at berth. As a rule, general terms and conditions state that the vessel during its full use of service of the transit berth is controlled by the user of the transit berth and that it is in no time, nor in any sense or part under the control of the marina. This arrangement is directly reflected to the issue of contractual liabilities of the marina. Namely, in this case, the marina is responsible solely and exclusively for technical and nautical safety and security of the berth and its equipment, and it does not assume any liability for the vessel. By contrast, one of essential features of a permanent berth according to the common practice
of Croatian marinas is that the subject of berth contracts, apart from providing berth accommodation, is also the obligation of controlling (supervising) the vessels at berth. The obligation to control the vessel according to the usual terms and conditions of our marinas comprises the control of the condition of the vessel and the berth. The marina performs this obligation by observing previously agreed protocols of periodical external examination of the condition of the vessel, its equipment and mooring gear. The control implies that the port of nautical tourism holds the keys and documents of the vessel. The obligation of controlling with occasional external inspection of the vessel also includes the obligation to inform and alarm the user on adverse changes in the condition of the vessel and its equipment or regarding unauthorized boarding of the vessel, its unauthorized use or departure. The obligation of the owner or user is to take care that the vessel is in good condition, primarily taking care of ropes and tarpaulin. If it is agreed only to control the vessel at berth, the port of nautical tourism shall not be obliged to remove the tarpaulin, open the vessel, ventilate it, or undertake any work or repairs on the vessel. An important feature of the obligation to control is a periodic external inspection of the vessel that involves informing and advising the user on any damaging changes.7 However, it should be noted that the obligation of controlling the vessel includes taking the usual prudent measures to protect the vessel from extraordinary external threat, such as adverse weather conditions, fire and the like. The marina commits to undertake these activities within the obligations of controlling vessels at berth, particularly in the framework of its activities and obligations of maintaining order in the port and proper technical, safety and other standards.8 Therefore, in the case of visible flooding and / or fire, the marina is obliged to intervene and take action in order to salvage the vessels and the marine property.9
7 PADOVAN, op. cit. 8 PADOVAN, op. cit. 9 Read more on the obligation of marinas to take reasonable measures necessary to preserve the vessels and equipment i.e., measures aimed at averting the danger more in infra t. 5

7th INTERNATIONAL MARITIME SCIENCE CONFERENCE
108
April 20th-21st, 2017, Solin, Croatia
General Terms and Conditions provide that the marina as part of its obligations set out in the terms and conditions, shall be liable for damage caused to the vessel and equipment for which there is a signed contract on the use of permanent berth, provided that the damage occurred while the marina had control over the vessel only if the damage was the result of the failure of due diligence on the part of the marina.
4. CUSTODY OF THE VESSEL
The obligation of vessels custody is very rare in business practices and in general conditions of Croatian marinas. Analyses of general business conditions of Croatian marinas governing permanent berths show that almost all marinas expressly exclude obligation of permanent custody of vessels at permanent berth. This is usually emphasized in general terms by a specific provision which stipulates that the agreement does not apply to the provisions of The Law of Obligations Act (ZOO) on the contracts on custody or by explicitly pointing out that the marina is not liable for the vessel’s custody. Thus, when it comes to the sea berth, the custody of vessels is not a typical activity of Croatian marinas. It is a business policy of marinas not agreeing to the vessels custody, but to work exclusively on the basis of berth rental, or the berth rental and control of vessels at berth. Although the subject of berth contracts with elements of custody requires to be analysed separately, at this point it should be stated that when it comes to the obligations of the contract of berth, the questions of whether the custody is agreed and if so, what the obligation scope and the extent of vessels custody is, and what it covers fall among the most contentious issues. The problem of non-unitary judicial practice in such matters is emphasized in the context of this problem. Due to the nature of the object of custody, which is the vessel at berth, the custody involves various activities. First of all, it should be noted that the scope of the obligation of vessels custody comprises those obligations that the parties have agreed to and which are described in general terms and conditions of the marina. The specific obligations relating to the custody of vessels mentioned in terms and conditions of
Croatian marinas are: to be in their custody 24 hours a day, so as to supervise the ropes provided by the owner for vessels mooring to the jetty / pontoon; conduct discharge of water from vessels by operating bilge pumps, checking whether the pumps are connected to the power supply, checking the plugs that allow the water flow from the vessel; ventilation of the vessel’s interior; covering the vessel with tarpaulin supplied by the owner and in accordance with his orders and the like. Therefore, terms and conditions include the obligations that are specific to the nature of having the vessel’s custody at berth, and that are reasonable and customary in fulfilling this service provided by the marina. The scope of obligation of the vessels custody includes holding of documents and keys. However, this is not a typical obligation exclusive to the custody, but it is included in the contract of controlling the vessel at berth. The holding of vessels’ documents is an obligation also in transit berth and their delivery serves the sole purpose of exercising the right of the vessel’s retention in order to settle the claims of the marina if necessary.10 The retention of documents and keys in the case of permanent berth contract with the elements of controlling or custody also has two other important functions. Handing over the keys and documentation represents handing over the possession of the vessel for the purpose of its control or custody, which means fulfilling the contractual obligations, but also enables the marina to have access to the vessel in order to fulfil its obligations as concessionaire that takes care of the safety of the port. The marina is obliged to render the service of vessel’s custody observing sound business practices. A considerable level of attention is required because the marina is obliged to provide the service of custody professionally for an agreed fee. Taking reasonable and customary measures is also included in the activities of protecting the vessel against external dangers, i.e., risks that do not originate from a defect in the vessel or its
10 It is about the claims related to services of providing the berth, the measures taken at the expense of the berth user, and claims arising from damages.

109
Vesna Skorupan Wolff, Ranka Petrinović, Nikola Mandić
MARINA OPERATOR’S OBLIGATIONS FROM THE CONTRACT OF BERTH ACORDING TO THE BUSINESS PRACTICES OF CROATIAN MARINAS
equipment.11 The nature of the service of vessels custody at berth does not generally include the test navigation in order to verify the operation of the engine, repair and various other interventions pertaining to the maintenance of the vessel, which would involve additional and special services apart from the services in the berth contract with elements of vessels custody. Of course, theoretically it is possible that parties include all services in one contract, i.e., a berth, custody and maintenance of vessels etc., even if this rarely happens in practice. It is important to point out that the obligation of vessels custody corresponds to the obligation of the berth user to keep and maintain the vessel and equipment of the vessel acting with appropriate care for the whole duration of the contract. In case of failure of due diligence, the marina is authorized at the expense of berth user to take measures and actions within its powers in order to safeguard the assets and prevent losses. In terms of fulfilment of the contract and contractual liability in the event of a dispute between the parties, it should be clearly distinguished what obligations of the parties are covered by the contract of berth, and whether the custody of the vessel is included in the contract, and that liability, namely, the work that the marina has undertaken under a special authorization outside the berth contract with elements of custody or acting in emergencies without the owners' orders but at their expense.12
If the parties of the berth contract with elements of custody do not exclude the application of provisions of The Law of Obligations Act (ZOO) on custody, the contract will in addition to general business conditions, be the subject of application of the provisions of The Law of Obligations Act (ZOO) on custody in relation to the issues that the parties did not settle in the contract other than dispositive legal provisions on the contract and custody.13
11 PADOVAN, op. cit. 12 more infra t. 5. on taking reasonable steps necessary to preserve the vessels and equipment and to prevent the danger if the berth user does not take the necessary measures after having been informed and warned by the marina, more infra t. 5. 13 More PADOVAN, op. cit.
5. NOTIFICATION OF CHANGES ON THE VESSEL AND TAKING REASONABLE MEASURES NECESSARY TO PRESERVE THE VESSELS AND EGUIPMENT AND TO PREVENT DANGER
The contract parties are subject to the application of general principles of The Law of Obligations Act (ZOO), and one of the fundamental principles is that the participants shall co-operate for a full and proper fulfilment of obligations and exercise of rights in those obligations (The Law of Obligations Act – ZOO, Art. 5). The duty of cooperation is primarily related to the duty of notification and informing the counterparties of the facts that have impact on their contractual relationship, particularly about all the changes and hazards. General terms and conditions applicable to the obligations of the parties in the contract on permanent berth provide that marina shall inform the berth user if they notice any changes in the vessel, equipment or mooring ropes. The purpose of prescribing this obligation is to enable the owner to determine specific measures for the preservation of objects and prevention of harmful consequences. By meeting these obligations, marinas transfer the liability to the berth user for the consequences that may arise if the vessel is in danger. In that case the logical sequence of events is that the owner of the vessel then takes, or more precisely, orders appropriate additional measures to preserve the vessel and equipment from damage, or to remove the risk that the vessel or equipment pose to other vessels or property within the marina. In fact, the owner of the vessel who is usually dislocated will make these arrangements through additional contracts with the marina or the third party. This will require a new authorization with specific and new obligations beyond the obligations covered by the conclusion of the berth contract. The new contractual relations between the marina and the owner of the vessel are subject to the provisions of this new agreement, and additionally the provisions of The Law of Obligations Act (ZOO) in the agreement on order, or contract on provision of services, or provision of MA for vessel repair and the like.14
14 Ibid.

7th INTERNATIONAL MARITIME SCIENCE CONFERENCE
110
April 20th-21st, 2017, Solin, Croatia
However, two other hypothetical situations are possible: 1) the owner has remained passive and did not take appropriate measures aimed at eliminating the danger to the vessel and equipment and therefore the danger that the vessel poses to other vessels or property within the marina and 2) there are circumstances in which it is necessary to urgently intervene and the marina has no time for informing and obtaining the authorization from the owner. It is logical that the marina being a direct holder of a vessel that is in danger and having the obligation of maintaining order and keeping safety in the port has, according to general terms and conditions, appropriate authority in dealing with vessels in these situations. Consequently, general business conditions of marina provide the authorization of marinas for taking reasonable measures necessary to preserve the vessels and equipment and to prevent the danger at the expense of the berth user. Herewith, it is necessary to distinguish between those measures which marinas are obliged to undertake at their own expense in order to maintain berth safety and operation. For example, if during the berth contract, an urgent intervention is required due to loosened anchor chain, the marina shall be liable and it shall be obliged to undertake necessary activities at its own expense. On the other hand, if there is a failure of the rope, its cost and responsibility lies with the owner because he is obliged to supply the vessel with quality ropes. The Law of Obligations Act (ZOO) Art. 348 is about the liability for failure to inform the other side of the facts which influence their mutual relations. It is stipulated that the Contracting Party that is obliged to notify the other party of the facts that influence their relations is liable for the damage suffered by the other party if it was not notified in time. In order for the obligor, in this case the marina, to be responsible for the failure of notification, the failure to inform the creditors of the facts that affect their relations must be causative to the damage.15 With the obligation to notify the other contractual party about the changes and dangers to the vessel, the marina is obliged to inform the competent
15 Crnić Ivica, Law of Obligations, notes, comments, jurisprudence and an alphabetical index of terms, Organizator, Zagreb, 2010, p. 578.
authorities about the damage to the vessel caused by other vessels and / or third parties. If it finds that the departure of the vessel has not been made in compliance with the berth user, the marina is obliged to inform the relevant national authorities immediately about the departure of the vessel and to cooperate in their further proceedings.
6. CONCLUSIONS
The provisions of general business conditions are generally structured according to the basic division of the contract on transit and permanent berths. Common to all berth contracts and their differentia specifica in relation to other duties of compulsory and commercial law is to provide the berth accommodation for vessels in the marina. As a rule, in the permanent berth contract, apart from the obligations to provide the berth, the marina obliges to undertake other services in relation to the vessel’s berth. Therefore, both theoretical and practical aspects of any further systematization and classification of the contract of berth have an underlying differentiation based on the content and scope of other liabilities of the marina, meaning those obligations the marinas undertake apart from the obligation of providing the berth accommodation. Consequently, permanent berths can be classified according to the berth contracts with elements of control, berth contracts with elements of custody of vessels, berth contracts with elements of custody and maintenance of the vessels and the like. The marinas that have the capacity and concession license may offer repair services, maintaining of vessels and the like, and all this can be covered by a single berth contract. The complexity and importance of defining the obligations of the berth contract encompass the issue of the role, operations and characteristics of nautical tourism activities in general. It is primarily a business decision of marinas which obligations they undertake and regulate in their general conditions. In that view it is necessary to point out, that currently, according to business practices of Croatian marinas, general business terms and conditions rarely include the obligation of vessels custody at berth. From a legal point of view, it is important to understand and acknowledge that it is necessary to accurately distinguish between the obligations

111
Vesna Skorupan Wolff, Ranka Petrinović, Nikola Mandić
MARINA OPERATOR’S OBLIGATIONS FROM THE CONTRACT OF BERTH ACORDING TO THE BUSINESS PRACTICES OF CROATIAN MARINAS
which the marina is obliged to carry out in the context of fulfilling the berth contract and of those commitments and obligations subsequently undertaken on the basis of a new mandate and a separate agreement with the owner of the vessel, as well as those obligations taken when it was necessary, and the owner has remained passive, or in an emergency situation when there is no time to obtain a mandate from the owner. In this regard, it is important to distinguish and determine the boundaries within the groups of commitments, which can be particularly important in a dispute regarding the contract of berth when an issue arises about the obligation of the marina and what practical measures it was supposed to undertake in fulfilling the particular contract. The developed market of nautical tourism requires a balanced protection of economic and legal interests of both marinas and berth users. This is among other things achieved by clear and precise definition of general conditions in terms of obligations of the parties. Bearing in mind the contemporary conditions governing the nautical tourism and trends of its growth, the paper puts forward the thesis of the need for standardization of the provisions on obligations of parties in specific general conditions of marinas in a way that they are categorised by the criteria of the scope and content of services that marinas provide. ACKNOWLEDGMENTS
This paper is a result of the authors' joint research under the research project of the Adriatic Institute of the Croatian Academy of Sciences and Arts, funded by the Croatian Science Foundation, titled Developing a Modern Legal and Insurance Regime for Croatian Marinas – Enhancing Competitiveness,
Safety, Security and Marine Environmental Standards (DELICROMAR, UIP-11-2013 No. 3061, project period: 1st March 2016 – 28th February 2019). More information about the project is available at www.delicromar.hazu.hr.
REFERENCES
1. Consumer Protection Act (Official Gazette No. 79/07, 125/07, 79/09, 89/09, 133/09, 78/12, 56/13)
2. Crnić Ivica, Law of Obligations, notes, comments, jurisprudence and an alphabetical index of terms, Organizator, Zagreb, 2010
3. Goldstein Alexander: Commercial contract law - international and comparative, Zagreb, 1991
4. Law on Obligations (Official Gazette No. 35/05, 41/08,125/11)
5. Law on the Provision of Services in Tourism (Official Gazette No. 68/07, 88/10)
6. Maritime Code (Official Gazette No. 17/94, 43/96, 181/2004, 76/07, 146/08, 61/11, 56/13, 26/15)
7. Maritime Domain and Seaports Act (Official Gazette No. 158/03, 100/04, 141/06, 38/09)
8. Padovan Adriana Vincenca: Responsibility of nautical port in the berth contracts and insurance, Comparative Maritime Law, vol. 52 (2013), No. 167, p. 1 to 35

7th INTERNATIONAL MARITIME SCIENCE CONFERENCE
112
April 20th-21st, 2017, Solin, Croatia
IMPROVEMENT OF SEAFARERS RIGHTS ACCORDING TO THE AMENDMENTS OF 2016 TO THE CODE OF THE MARITIME LABOUR CONVENTION, 2006Petra Amižić Jelovčić, Ema Aralica
IMPROVEMENT OF SEAFARERS RIGHTS ACCORDING TO THE AMENDMENTS OF 2016 TO THE CODE OF THE MARITIME
LABOUR CONVENTION, 2006
Petra Amižić Jelovčić, Ema Aralica
(University of Split, Faculty of Law, Domovinskog rata 8, Split, Croatia)
(E-mail: [email protected])
ABSTRACT
Maritime Labour Convention - MLC, also known as seafarers' bill of rights, was adopted in 2006 and entered in force in 2013. MLC was introduced with a goal of creating unique international document which would cover all aspects of seafares rights and deliver them, finally, sence of security in unsecure environment of maritime industry. It was amended, for the first time, in 2014 regarding financial guarantee system in the event of abandonment of seafarers. Led by the same aspiration, of insuring broader rights to all seafarers, new amendments of MLC were passed at the 105th annual meeting of International Labour Organization - ILO in June 2016. One of the MLC 2016 amendments, which will be analyzed in this paper, is related to Regulation 4.3 on occupational accidents, injuries and diseases and was intended to address more effectively the serious issue of harassment and bullying on board ships. It took into account the Guidance on eliminating shipboard harassment and bullying developed jointly by the ICS and the ITF. Unless there is significant disagreement, when amendments are circulated to governments that have ratified the MLC, 2006 these new requirements will enter into force by December 2018.
KEY WORDS Maritime Labour Convention, 2016 amendments, seafarers rights, harassment, bullying
1.INTRODUCTION
The Maritime Labour Convention 2006 - MLC is an international agreement of the International Labour Organisation - ILO, which sets out seafarers’ rights to decent conditions of work. Because of its contribution to the promotion of seafarers' rights and life conditions while are on work, It is sometimes even called the seafarers’ Bill of Rights. MLC applies to all seafarers, including those with jobs in hotel and other passenger services on cruise ships and commercial yacht. MLC 2006 sets minimum requirements for nearly every aspect of working
and living conditions for seafarers including recruitment and placement practices, conditions of employment, hours of work and rest, repatriation, annual leave, payment of wages, accommodation, recreational facilities, food and catering, health protection, occupational safety and health, medical care, onshore welfare services and social protection.(1) The MLC contains minimum standards only, which means that seafarers may have better standards under relevant national laws, or under their employment agreements. (2)
113
Petra Amižić Jelovčić, Ema Aralica
IMPROVEMENT OF SEAFARERS RIGHTS ACCORDING TO THE AMENDMENTS OF 2016 TO THE CODE OF THE MARITIME LABOUR CONVENTION, 2006
MLC was first amended on International Labour Convention 2014. The 2014 amendments require a financial security system to be put in place to make certain that shipowners ensure compensation to seafarers and their families in the event of abandonment, death or long-term disability due to an occupational injury, illness or hazard. These amendments came into force on January 18th 2017. It is expected that this new requirement of the MLC, 2006 will prevent the unfortunate situation of seafarers being stranded in port for long periods when shipowners abandon their crews without paying their wages or repatriating them to their home countries.(3) With the goal of further improvement of seafarers rights, only two years after, in February 2016, MLC 2006 was amended again. Amendments were made to Regulation 5.1 of the MLC, 2006 with a purpose of bringing the procedure for the renewal of the maritime labour certificate into line with the procedure for the certificates adopted under International Maritime Organization (IMO) Conventions. Besides this, amendments were also made to Regulation 2.2 with the aim to ensure the continued payment of wages during any period for which a seafarer was held captive by pirates, as well as to to Regulation 4.3 which was intended to address more effectively the serious issue of harassment and bullying on board ships. This very last amendment mentioned, will be an crucial issue analyzed in this paper.(4)
2. AMENDMENTS 2016 TO REGULATION 4.3 OF MLC, 2006
Provisions on occupational accidents, injuries and diseases were fortified by expanding paragraph 1 of a Guideline B4.3.1. The original text of MLC, 2006 prescribed that the provisions required under Standard A4.3, which refers to health and safety protection and accident prevention, should take into account the ILO code of practice entitled Accident prevention on board ship at sea and in
port, 1996 and subsequent versions and other related ILO and other international standards and guidelines and codes of practice regarding occupational safety and health protection, including any exposure levels that they may identify.
The new text emphasizes that account should also be taken of the latest version of the Guidance on eliminating shipboard harassment and bullying jointly published by the International Chamber of Shipping and the International Transport Workers’ Federation. Paragraph 3 of the Guideline 4.3.1. stipulates that the assessment of risks and reduction of exposure on the matters should take account of the physical occupational health effects, including manual handling of loads, noise and vibration; the chemical and biological occupational health effects; the mental occupational health effects; the physical and mental health effects of fatigue and occupational accidents. The necessary measures should take due account of the preventive principle according to which, among other things, combating risk at the source; adapting work to the individual, especially as regards the design of workplaces and replacing the dangerous by the non-dangerous or the less dangerous, have precedence over personal protective equipment for seafarers.
Furthermore, amendments were made in paragraph 4 of the same Guideline. This paragraph points out that the competent authority should ensure that the implications for health and safety are also taken into account, particularly in the areas of emergency and accident response; the effects of drug and alcohol dependency; and HIV/AIDS protection and prevention. The list of implications is now extended to the harassment and bullying, as well.
In addition, paragraph 2 of a Guideline B 4.3.6 on investigations of all occupational accidents and occupational injuries was supplemented with the subparagarph by including problems arising from

7th INTERNATIONAL MARITIME SCIENCE CONFERENCE
114
April 20th-21st, 2017, Solin, Croatia
harassment and bullying to be considered as a subject of investigation, besides other possible causes and circumstances of occupational accidents or injuries such as working environment; incidence in different age groups of occupational accidents and occupational injuries and disease; special physiological or psychological problems created by the shipboard environment; problems arising from physical stress on board a ship; problems arising from and effects of technical developments and their influence on the composition of crews and problems arising from any human failures. Investigations regarding the causes and circumstances of occupational accidents and occupational injuries and diseases resulting in loss of life or serious personal injury, and such other cases as may be specified in national laws or regulations, should be undertaken by the competent authority.(5)
3. GUIDANCE ON ELIMINATING SHIPBOARD HARASSMENT AND BULLYING
3.1. Harassment and bullying
Seafarers lead specific kind of life while on board. During that time, the ship is not just their work place, but also a home away from home. They are surrounded with the same people 24/7 for months. These unusual circumstances plus high level of stress at work and the fact that they are detached from their loved ones for a long period of time are hard enough on its own, even in healthy work environment. Unfortunately, healthy work environment is not a general rule. In practice, there're many recorded cases of maltreatment of seafarers by their co-workers.
Increased awarness of this problem together with an obligation of each Member State to satisfy itself that the provisions of its law and regulations respect the fundamental right to the elimination of discrimination in respect of employment and occupation, under the MLC, 2006, have resulted in
a Guidance on eliminating shipboard harassment and bullying prepared by shipowners’ and seafarers’ organisations in 2016. Harassment and bullying on board ships can have serious consequences for the physical and emotional health of seafarers.
Harassment is a form of discrimination which has the purpose or effect of violating the dignity of a person and of creating an intimidating, hostile, degrading, humiliating or offensive environment. (6) According to the Guidance, some of the examples of harassment are as following:
• displaying or circulating offensive or suggestive material; • sexist/racist/homophobic jokes or remarks; • use of offensive language in describing or making fun of someone with a disability; • comments about a person’s physical appearance or character which cause embarrassment or distress; • unwelcome attention such as spying, stalking, overly familiar behaviour or unwelcome verbal or physical attention; • making or sending unwanted, sexually suggestive, hostile or personally intrusive telephone calls, text messages, emails, comments on social networks, faxes or letters; • unwelcome sexual advances or repeated requests for dates or threats as wll as suggestions that sexual favoursmay further a person’s career; • leering, rude gestures, touching, grabbing, patting or other unnecessary bodily contact such as brushing up against others; and • spreading malicious rumours, or insulting someone (particularly regarding age, race, marriage, civil partnership, pregnancy and maternity, sex, disability, sexual orientation, religion or belief, and gender reassignment) On the other hand, bullying is the common denominator of harassment, discrimination, abuse, violence etc, and is behind all forms of harassment, discrimination, prejudice, abuse, persecution, terrorism, conflict and violence. Bullying includes hostile or vindictive behaviour and results with work environment in which group of people or an individual can feel threatened or

115
Petra Amižić Jelovčić, Ema Aralica
IMPROVEMENT OF SEAFARERS RIGHTS ACCORDING TO THE AMENDMENTS OF 2016 TO THE CODE OF THE MARITIME LABOUR CONVENTION, 2006
intimidated because of the negative or hostile behaviour of another group of people or individual. Examples of bullying are:
• Verbal or physical threats or abuse, such as shouting or swearing at colleagues, either in public or in private;
• Personal insults; • Sudden rages or displays of temper against an individual or group, often for trivial reasons; • Subjecting someone to unnecessary excessive or oppressive supervision, monitoring everything they do or being excessively critical of minor things; • Persistent or unjustified criticism; • Making unreasonable demands of staff or colleagues; • Ignoring or excluding an individual from social events, team meetings, discussions and collective decisions or planning; • Spreading malicious rumours, or insulting someone (particularly regarding age, race, marriage, civil partnership, pregnancy and maternity, sex, disability, sexual orientation, religion or belief, and gender reassignment). • Cyber bullying
Althrough there is much overlap between harrasment and bullying, there is also several essential differences between them. For instance, harrasment has a strong physical component, contact and touch in all its forms, intrusion into personal space and possessions, damage to possessions including a person's work, etc., while bullying is almost exclusively psychological or organisational, but may become physical especially if the bully is male. In addition, harrasment tends to be motivated by an outward personal characteristic of the target, such as gender, race, disability etc. while bullying ends to be motivated by a hidden personal characteristic of the target, such as competence, popularity or integrity. Harassment may involve racist, sexist or other discriminatory vocabulary and actions directed at the target, while bullying tends to consist of unwarranted criticisms and false allegations, often disguised as management and
without openly discriminatory terms. Then, acts of harassment at work are obviously not part of work-related communications (e.g. taunting, stalking, vandalising property etc.) while acts of bullying are hard to distinguish from work related communications (e.g. making unreasonable demands, making unwarranted criticisms of performance, taking credit for others' work etc.). Further, harassment is done for the sake of dominating the target while bullying is done for the sake of making the bully look more competent than the target. Bullying differs from harassment in that the latter can result from a small number of fairly serious incidents - which everybody recognises as harassment or assault - whereas bullying tends to be an accumulation of many small incidents over a long period of time. Each incident tends to be trivial, and on its own and out of context does not constitute an offence or grounds for disciplinary or grievance action. Finally, it is immediately obvious when there has been an act of harassment while bullying can be very subtle, so it will not be immediately obvious that there has been an act of bullying. (7) 3.2. Company's and seafarers' organization's obligations regarding the harassment and bullying cases
According to this Guidance, Companies and seafarers'organizations have concrete obligations regarding the elimination of harassment and bullying on board ships. Companies, as seafarers' employers are legaly responsible to provide a healthy working environment and of supervising and controling present work conditions. On the other hand, seafarers's organization are created in order to ensure that all seafarers' rights are respected and to constantly fight for their improvement. In order to achive that, among others, seafarers' organizations have focused on collective agreements concluded with shipping companies. Collective agreement is the document which details all the terms and conditions of the

7th INTERNATIONAL MARITIME SCIENCE CONFERENCE
116
April 20th-21st, 2017, Solin, Croatia
crew employed on the ship. It specifies entitlements such as pay, working hours, etc. ITF Standard collective bargaing agreement sets out the standard terms and conditions applicable to all Seafarers serving on any Ship in respect of which there is in existence a Special Agreement made between the Union, an affiliate of the International Transport Workers’ Federation and the Company who is the Owner/Agent of the Owner of the Ship. The Special Agreement requires the Company to employ the Seafarers on the terms and conditions of this Agreement, and to enter into individual contracts of employment with each Seafarer incorporating the terms and conditions of this Agreement. It needs to be emphasized that CBA Standard Agreement incorporates equality principle in its article 28 which says that each seafarer shall be entitled to work, train and live in an environment free from harassment and bullying whether sexually, racially or otherwise motivated, in accordance with ITF policy guidelines. (8)
Pursuant this, companies should have a clearly written policy statement on the elimination of harassment and bullying. The policy statement should contain a message from the Chief Executive or equivalent in the company and set out the company’s commitment to the elimination of harassment and bullying on board ships and to the goal of creating a working environment in which there is respect for the dignity and well-being of all seafarers. Person with overall responsibility for the policy should be director or appropriate member of senior management in the company and should be identified as such in the policy statement. Company's policy statement must have inclosed examples of the types of behaviour that may be classed as harassment and bullying, as well as contact information to enable seafarers to report incidents. It is desirable for policy statement to have included a statement regarding cyber bullying as well. (6)
Seafarers’ organisations should also support and promote adherence to the company policy and the procedures within and thus contribute to elimination of harassment and bullying on board ships. Moreover, seafarers’ organisations should have a clearly written policy statement on the elimination of harassment and bullying. It should remind seafarers that the ship is often their fellow crew members’ home for a long period of time and it is therefore very important for everyone to respect one another and to recognise different cultural styles and behaviours, and to embrace diversity on board the ship. This policy statement should also remind seafarers of their responsibilities towards fellow crew members in situations where they observe harassment and bullying and set out ways that encourage those who witness harassment and bullying to report such incidences either on board, or to a director ashore or appropriate member of senior management ashore with overall responsibility for the policy. Seafarers’ organisations should also produce information materials regarding how to handle incidences of cyber bullying.(6)
3.2.1. Reporting and complaints procedure
In order to prevent harassment and bullying on shipboard it is necessary for such case to be reported, whether by the sufferer himself or by other member of the crew who have noticed it. Unfortunatelly, in practice, most of these occurances pass unreported and, sometimes, even unnoticed. Usually, sufferers of harassment and bullying may endure it until the end of the voyage and then ask to be transferred to a different vessel for their next voyage, instead of reporting it. The reason for that may be the fact that seafarers are often undecisive about coming forward if they think they will be treated unsympathetically; or are likely to be confronted aggressively by the person about whose behaviour they complain.
If seafarer who have suffered the harassment or bullying, or have been the witness of it decides to make a complaint after all, the company should maintain fair procedures. This kind of procedure should provide for confidentiality and safeguards against victimisation of the complainant. Futhermore, it should provide safeguards for both sides; the complaint and the alleged perpetrator who should be accompanied by a fellow employee or seafarer representative of their choice; and ensure that the parties to the complaint are treated with equal dignity and fairness. (6)
The company should designate a person or persons to act as the first point of reference for each seafarer that wishes to make a complaint. This person could be a member of the ship’s crew, a company employee based ashore, or a person designated by the company to act on its behalf. All complaints should be investigated promptly and objectively, baring in mind that seafarers do not normally make an accusation unless they feel seriously distressed. Consequently, companies should ensure that no seafarer who makes a complaint suffers repercussions and include the right of the seafarer to be accompanied or represented during the complaints procedure as well as safeguards against the possibility of victimization of seafarers for filing complaints. Regarding the sexual harassment, where possible, a complaint should be investigated by an individual of the same gender as the person raising the complaint.
Besides the formal procedure, the company should provide the victim of harassment or bullying with the option, at their discretion, of resolving their complaint informally. This could involve the victim explaining the effects of the alleged perpetrator’s actions in the presence of another person from the company trained in resolution of complaints. The alleged perpetrator may then be offered an opportunity to apologise for their actions and undertake not to repeat them. In cases of informal procedure, a victim should never have to
encounter an alleged perpetrator if he/she doesn't wish to.
Anyhow, If a seafarer believes they are being harassed, every informal process should start by tell the person responsible that they find their behaviour inappropriate and ask them to stop. Sometimes people are not aware that their behaviour is unwelcome and causing distress. Seafarers may choose to refer any incident(s) of harassment confidentially to the person designated as the first point of reference on board the ship or ashore. The designated person should listen to the complaint and provide support and assistance if the victim does not wish to initiate a formal process. An informal discussion can often lead to greater understanding and an agreement for the behaviour to cease.
If harassment and bullying continues, or a victim is unable or unwilling to confront the alleged perpetrator, then the alleged incident should be reported to the designated person on board the ship. A meeting should be arranged where the seafarer - victim may be accompanied by another seafarer of their choice on board the ship concerned, at which the victim will be asked to make a formal complaint. Where a complaint has been made, an investigation should take place in accordance with company procedures to determine whether action should be taken. Where an investigation shows that a complaint is well founded it may be necessary to separate those involved. If it is decided to follow disciplinary proceedings the person being investigated should be able to be represented by an appropriate person.
Procedures should provide that hearings, including any resulting disciplinary hearings, are held in confidence. The principles of fair treatment should be applied to all disciplinary and grievance hearings. Accordingly, respondent should have the right to answer any complaint and give their version of events and circumstances. Both the

117
Petra Amižić Jelovčić, Ema Aralica
IMPROVEMENT OF SEAFARERS RIGHTS ACCORDING TO THE AMENDMENTS OF 2016 TO THE CODE OF THE MARITIME LABOUR CONVENTION, 2006
If seafarer who have suffered the harassment or bullying, or have been the witness of it decides to make a complaint after all, the company should maintain fair procedures. This kind of procedure should provide for confidentiality and safeguards against victimisation of the complainant. Futhermore, it should provide safeguards for both sides; the complaint and the alleged perpetrator who should be accompanied by a fellow employee or seafarer representative of their choice; and ensure that the parties to the complaint are treated with equal dignity and fairness. (6)
The company should designate a person or persons to act as the first point of reference for each seafarer that wishes to make a complaint. This person could be a member of the ship’s crew, a company employee based ashore, or a person designated by the company to act on its behalf. All complaints should be investigated promptly and objectively, baring in mind that seafarers do not normally make an accusation unless they feel seriously distressed. Consequently, companies should ensure that no seafarer who makes a complaint suffers repercussions and include the right of the seafarer to be accompanied or represented during the complaints procedure as well as safeguards against the possibility of victimization of seafarers for filing complaints. Regarding the sexual harassment, where possible, a complaint should be investigated by an individual of the same gender as the person raising the complaint.
Besides the formal procedure, the company should provide the victim of harassment or bullying with the option, at their discretion, of resolving their complaint informally. This could involve the victim explaining the effects of the alleged perpetrator’s actions in the presence of another person from the company trained in resolution of complaints. The alleged perpetrator may then be offered an opportunity to apologise for their actions and undertake not to repeat them. In cases of informal procedure, a victim should never have to
encounter an alleged perpetrator if he/she doesn't wish to.
Anyhow, If a seafarer believes they are being harassed, every informal process should start by tell the person responsible that they find their behaviour inappropriate and ask them to stop. Sometimes people are not aware that their behaviour is unwelcome and causing distress. Seafarers may choose to refer any incident(s) of harassment confidentially to the person designated as the first point of reference on board the ship or ashore. The designated person should listen to the complaint and provide support and assistance if the victim does not wish to initiate a formal process. An informal discussion can often lead to greater understanding and an agreement for the behaviour to cease.
If harassment and bullying continues, or a victim is unable or unwilling to confront the alleged perpetrator, then the alleged incident should be reported to the designated person on board the ship. A meeting should be arranged where the seafarer - victim may be accompanied by another seafarer of their choice on board the ship concerned, at which the victim will be asked to make a formal complaint. Where a complaint has been made, an investigation should take place in accordance with company procedures to determine whether action should be taken. Where an investigation shows that a complaint is well founded it may be necessary to separate those involved. If it is decided to follow disciplinary proceedings the person being investigated should be able to be represented by an appropriate person.
Procedures should provide that hearings, including any resulting disciplinary hearings, are held in confidence. The principles of fair treatment should be applied to all disciplinary and grievance hearings. Accordingly, respondent should have the right to answer any complaint and give their version of events and circumstances. Both the

7th INTERNATIONAL MARITIME SCIENCE CONFERENCE
118
April 20th-21st, 2017, Solin, Croatia
complainant and the respondent should be able to call witnesses.(6) Upon resolution, if the complaint is upheld, the company and seafarers’ organisation should ensure that appropriate action is taken with regard to handling the perpetrator of the harassment when taking remedial action and provision of necessary support to the victim. Unfortunatelly, the Guidance is pretty blurred regarding which apropriate actions should be taken so it is to be expected that this kind of formulation will result with inapplicability and abuse in practice. 3.3. Measures to eliminate harassment and bullying
In order to eliminate harassment and bullying company disciplinary codes may identify certain acts which could constitute harassment and/or bullying for which disciplinary action may be taken. The Guidance doesn't prescribe concrete disciplinary actions to be taken but so it is to be concluded that above refers on usual disciplinary actions which may be in the form of written warning, suspension, reduction in pay, demotion or termination. Furthermore, shipping companies and seafarers organisations should support the right of everyone to be treated with dignity and respect at work and actively promote a working environment in which harassment and bullying are not tolerated. The company should clearly identify standards of behaviour expected of seafarers. Seafarers should know to whom they can turn if they have a work-related problem, and managers should be trained in all aspects of the company’s policies in this sensitive area.
On the other hand, seafarers should support the right of everyone to be treated with dignity and respect at work and actively embrace a working environment in which harassment and bullying are not tolerated. In addition they should respect
appropriate standards of behaviour and ensure that colleagues are aware of their responsibilities under the company’s policy as well.(6)
Policies will only eliminate harassment and bullying on board ships if supported by positive action to make them effective. In this respect, communication and overall awareness are unomittable. Only presence of communication can ensure that seafarers understand the company’s commitment to prevention of harassment and bullying and their responsibility and role in the process. Seafarers should know how to seek advice and guidance and how to make a complaint. If all this above is honored, seafarers will be confident they will be heard effectively.
4. CONCLUSION
Maritime Labour Convention - MLC, also known as seafarers' bill of rights, was amended for the second time in 2016. Issue analyzed in this paper refers to the amendments to the Regulation 4.3 of the MLC, 2006 which are intended to address more effectively the serious issue of harassment and bullying on board ships. In view of this, Guidance on eliminating shipboard harassment and bullying was prepared by shipowners’ and seafarers’ organisations in 2016.
Harassment and bullying can permanently damage one's health. The intesity and type of health repercussion depends on several parameters; the intensity of harassment and bullying, duration of harassment and bullying and psycological characteristics of the victim. At first glance, harassment and bullying look the same, but in fact they have several essential differences. For example, presence of physical component is characteristic for harassment but not for bullying. Harrasment tends to be motivated by an outward personal characteristic of the target, while bullying ends to be motivated by his/her hidden personal characteristic. Bullying differs from
119
Petra Amižić Jelovčić, Ema Aralica
IMPROVEMENT OF SEAFARERS RIGHTS ACCORDING TO THE AMENDMENTS OF 2016 TO THE CODE OF THE MARITIME LABOUR CONVENTION, 2006
harassment in that the latter can result from a small number of fairly serious incidents whereas bullying tends to be an accumulation of many small and trivial incidents over a long period of time. According to Guidance companies and seafarers' organization's should have a clearly written policy statement on the elimination of harassment and bullying. Since the condition of prevention of harassment and bullying is for one to be reported, whether by the sufferer himself or by other member of the crew who have noticed it, the company should designate a person or persons to act as the first point of reference for each seafarer that wishes to make a complaint. Report is followed by informal or formal procedure. Although, procedures comply with principles of fair treatment, the problem derives from the fact that the Guidance doesn't prescribe concrete disciplinary actions to be taken nor apropriate actions against the perpetrators. This kind of deficient formulation can result with inapplicability and abuse in practice, so it needs to be regulated more precise in order to avoid these type of malfeasance. It is precisely this that shoud be considered as our general remark regarding the new Guidance, having trust, of course, that
Republic of Croatia will harmonize its Maritime Code with the new MLC amendments as soon as possible.
REFERENCES
1. R. Petrinović, I. Lovrić, Osiguranje pomoraca prema novoj Konvenciji o radu pomoraca, PPP, god. 54 (2015), 169,str. 145–170
2. http://seafarersrights.org/seafarers-subjects/maritime-labour-convention-mlc/
3. http://www.safety4sea.com/first-amendments-to-the-mlc-2006-come-into-force/
4. www.ilo.org/wcmsp5/groups/public/---ed_norm/-- normes/documents/meetingdocument/wcms_459566.pdf
5. http://www.ilo.org/wcmsp5/groups/public/---ed_norm/---relconf/documents/meetingdocument/wcms_488452.pdf
6. www.itfglobal.org/media/1279810/harassment-guide
7. www.bullyonline.org/index.php/bullying/3-the-difference-between-bullying-and-harassment
8. www.itfseafarers.org/files/seealsodocs/33559/ITF%20STANDARD%20CBA%202015.pdf

7th INTERNATIONAL MARITIME SCIENCE CONFERENCE
120
April 20th-21st, 2017, Solin, Croatia
THE LEGAL STATUS AND REGIME OF ARCHIPELAGIC WATERS IN MARITIME LAWBojana Lakićević-Đuranović
THE LEGAL STATUS AND REGIME OF ARCHIPELAGIC WATERS IN MARITIME LAW
Bojana Lakićević-Đuranović
(Faculty of Law, University of Montenegro, 13 Jula 2, Podgorica)
(E-mail:[email protected])
ABSTRACT
Archipelagic states exercise sovereignty over their archipelagic waters, seabed of the archipelagic waters, underwater resources heritage and the airspace above the archipelagic waters. The sovereignty over the archipelagic waters is not absolute – it is primarily limited by the rights of neighbouring states and the right of passage of foreign ships which will be further elaborated in the paper. An archipelagic state exercises sovereignty over its internal waters, archipelagic waters, and the territorial sea. It also exercises sovereign rights and jurisdiction over the continental shelf, the outer sea belt and the exclusive economic zone, if it declares them. The paper will also deal with the exceptions to the regime of innocent passage through archipelagic waters and the assessment of the legal regime of the archipelago. Particular attention will be paid to the role of international agreements as regards archipelagic waters with reference to certain examples and practice of States.
KEY WORDS
Archipelagic states, archipelagic waters, sovereignty
1. INTRODUCTION
The United Nations Convention on the Law of the Sea of 1982 provides for the status of an archipelago in Part IV (Article 46-54), which is entitled Archipelagic States. The convention defines that "archipelagic State" means a State constituted wholly by one or more archipelagos and may include other islands. First of all, the use of the term "archipelagic State" limits the recognition of the special status to independent archipelagic states only. The term also implies that all the islands that form an archipelago must be subjected to the sovereignty of one state. The institution of archipelagic waters is a sui generis creation, whose legal regime is between
the regime of internal waters and that of the territorial sea. It is the result of compromise between the immediate interests of archipelagic states and the interests of the world community, above all those of maritime powers. In his book International Law and Resources of the Sea, the international law professor J. Andrassy explains the claims of archipelagic states as a way to extend their jurisdiction into the sea. Claims to archipelagic status are not something that arises naturally but are more likely to be the result of new phenomena and trends in international relations.

121
Bojana Lakićević-Đuranović
THE LEGAL STATUS AND REGIME OF ARCHIPELAGIC WATERS IN MARITIME LAW
2. THE THIRD UNITED NATIONS CONFERENCE ON THE LAW OF THE SEA (UNCLOS III)
The issue of mid-ocean archipelagos was the subject of the Second Committee of the III Conference on the Law of the Sea. Maps of archipelagic states and Great Britain served as a starting point for discussion and for submitting detailed plans in the meeting in Caracas.1During the plenary meetings the archipelagic concept was supported by a large number of states, representatives of different regions, which agreed that it would be necessary that the future Convention on the Law of the Sea should contain provisions on archipelagos. None of the delegations was against the concept itself but there were objections as regards the definition of archipelago and the legal regime providing for archipelagic waters. The Third UN Conference on the Law of the Sea represented the final phase in the evolution of the archipelagic concept. The willingness of the international community to accept the study and standardization of the archipelagic concept at this conference had its cause in the political and historical context of the time. An important reason for the acceptability of the archipelagic concept lies in the fact that it was only one of the many traditional concepts of the law of the sea which was called into question.The difficulties as regards the archipelago issue at the conference concerned meeting different interests of third countries as regards free passage and political and economic interests of archipelagic states themselves. A compromise was provided due to the fact that the planned regime of archipelagic waters guaranteed to a satisfactory extent the right of passage for foreign ships of all categories.
1This is different as compared to the First UN Conference on the Law of the Sea of 1958. Also, at the Third Conference In Geneva, no official draft was prepared of the provisions of the Convention, so discussions and negotiations were conducted on the basis of the documentation of the Committee on the Seabed and the many proposals of states and groups of states.
3.THE LEGAL STATUS OF ARCHIPELAGIC WATERS
An archipelagic state exercises sovereignty over its archipelagic waters, resources in the subsoil and the airspace over the territorial sea. Archipelagic waters are the subject of the sovereignty of the archipelagic state.2This sovereignty is not absolute but is limited in two ways: a) by the rights of neighbouring countries, and b) by the right of passage of foreign ships.The issue of the rights of neighbouring countries was the subject of much discussion at the Third UN Conference within the concept of archipelagic states. While the great powers focused their criticism of the archipelagic regime mainly on the free navigation issue, a considerable number of countries, mainly those in the neighbourhood of archipelagic states, expressed their concern for theeconomic aspect of freedom of the sea.3 Archipelagic States initially refused to introduce specific provisions on the rights of neighbouring countries. They were more willing to address this issue, especially fishing rights, outside the framework of the conference, via bilateral agreements. However the countries concerned demanded that their rights be protected in an explicit way, that is, provided for in the Convention. Archipelagic States came under pressure to comply and they eventually did, so the Convention now guarantees the rights of neighbouring countries. An archipelagic state is obliged to adhere to the existing agreements and to recognize traditional fishing rights and other legitimate activities of directly neighbouring states in certain areas that are part of its archipelagic waters.
2C.F. Amerashinghe, “The problem of Archipelagos in the International Law of Sea”, ICLQ, 1974, p. 539 3Thus, Japan, for example, accepted the archipelagic concept on the condition of adequate protection of the rights and interests of the countries in the neighbourhood of archipelagic countries. ( Statement by Japan of August 12, 1974, UNCLOS, Official Records, vol.2, op.cit., p 261).

7th INTERNATIONAL MARITIME SCIENCE CONFERENCE
122
April 20th-21st, 2017, Solin, Croatia
From the restrictions as regards drawing the baselines if part of archipelagic waters is located between two directly neighbouring countries, it follows implicitly that the right of an archipelagic state to restrict the passage through certain sea lanes would not be applicable to those areas that have traditionally been used by neighbouring countries for direct traffic between two parts of their national territory. The issue of passage is essential to the regime of archipelagic waters. The Convention (art. 52, para 1) provides that: “... ships of all States enjoy the right of innocent passage through archipelagic waters...“. This right of innocent passage through archipelagic waters corresponds to the right of innocent passage through the territorial sea. The UN Convention on the Law of the Sea of 1982 standardizes the right of foreign warships to innocent passage through the territorial sea more clearly than the Convention on the Territorial Sea of 1958.4 An archipelagic State may designate sea lanes suitable for secure, uninterrupted and safe passage of ships through its archipelagic waters and territorial sea adjacent to them. If foreign ships use only certain sea lanes then they enjoy the right of passage through archipelagic sea lanes. Ships and aircraft which use archipelagic sea lanes are required to navigate through the archipelagic waters or fly over them swiftly and without stopping so as to have a practical and uninterrupted passage. 5 Waters of most archipelagic countries include straits, many of which are used for international navigation. This is due to the fact that mid-ocean archipelagos cover a huge water area in the middle of oceans and have a strategic significance. These areas were previously the high seas and the principle of freedom of the seas applied to them. Maintaining the right of smooth passage was of huge importance, especially for great powers, both economically and militarily.6
4 Rudolf, D., Međunarodno pravo mora, JZAU, Zagreb,1985, p. 82-85 5Churchill R.R and Lowe A.V, The Law of the Sea, 3rd ed. (United Kingdom, 1999) p.143–144. 6Reisman, W.M. „ The Regime of Straits and National Security: an Appraisal of International Lawmaking “ A.J..I.L. , Vol. 74, No 1 (1980), pp. 47-77
Passage through archipelagic sea lanes is analogous to transit passage through international straits, which is also a new legal institution. 7
4.THE ASSESSMENT OF THE LEGAL REGIME OF AN ARCHIPELAGO
By the adoption of the Convention on the Law of the Sea of 1982 it was recognized that an archipelago is an integral whole in which the island and other natural elements make a unique and separate geographical, political and economic entity. In accordance with the provisions of the Convention, an archipelagic State may draw a baseline within archipelagic waters to delineate internal waters. Although this classification applies only to estuaries, bays and harbours, it still allows for a certain measure of security of archipelagic states. When this provision is viewed in the context of other elements in the regime of archipelagic waters (e.g. the exclusive economic zone), it is clear that it will not have such drastic effects on archipelagic interests as it might seem at first glance.The territorial sea extends outiside the area of archipelagic waters, 12n/m from the baseline in the direction of the high seas which is characterized by the traditional right of innocent passage. The belt of water surrounding an archipelago serves as a protective zone between archipelagic waters, the exclusive economic zone, and the high seas. An exception to this general category of rights in the territorial sea is the right of transit passage in straits used for international navigation (this is a striking circumstance under the provision of Art. 16 of the 1958 Geneva Convention on the Territorial Sea and the outer sea belt). Although it is applied to waters outside straight baselines, this concept is connected to the archipelago issue, because it has an impact on the interests within the baselines. (e.g. pollution problem).
7Ibidem.

123
Bojana Lakićević-Đuranović
THE LEGAL STATUS AND REGIME OF ARCHIPELAGIC WATERS IN MARITIME LAW
One of the significant changes in maritime law brought about at the Third United Nations Conference on the Law of the Sea is the acceptance of the institution of the exclusive economic zone. This institution bears importance for the archipelagic regime in three aspects. Firstly, by adoption of this concept the problem of demarcation is solved with baselines, insofar as they relate to the economic interests within the archipelago. Secondly, the exclusive economic zone establishes the exclusivity of the coastal State, and finally, the exclusive economic zone will also contribute to the security of the archipelagic state As for the assessment of the regime of archipelagic waters, it is necessary to pay attention to whether the security interests of archipelagic States are respected in archipelagic waters as well as to what extent international community is guaranteed smooth sailing in these waters. A careful analysis of the regime of archipelagic sea lanes shows that this regime follows certain rules. The right of an archipelagic State to designate sea lanes represents a significant restriction on innocent passage of foreign ships because it narrows the area to which the rule is applied. Although the right of passage through archipelagic sea lanes is similar to transit passage, there is a major difference. While transit passage is provided by the Convention, the right of passage through archipelagic sea lanes can be enjoyed by ships only in those archipelagic waters designated by the archipelagic State. In addition, the archipelagic State shall have the right, when the circumstances require it, to replace each previously determined sea lane by another. In addition to the provisions of the UN Convention on the Law of the Sea, we should take into account some important general principles. First of all, we should bear in mind that the areas that under the Convention are included in the archipelagic waters used to be the high seas, and therefore subject to the principle of free
navigation. When changing the status of these areas, the existing rights and interests of third countries should have been taken into account. According to Article 8 of the UN Convention on the Law of the Sea: “ Where the establishment of a straight baseline … has the effect of enclosing as internal waters areas which had not previously been considered as such, a right of innocent passage as provided in this Convention shall exist in those waters.” This principle is an expression of a broader attitude that came to the fore in the judgment of the International Court of Justice in the Anglo - Norwegian fisheries case of 1951: " But the delimitation of sea areas has always an international aspect since it interests States other than the coastal State; consequently, it cannot be dependent merely upon the will of the latter.8 If it is true that the delimitation is necessarily unilateral because only the coastal State is competent to implement it, the validity of the delimitation with regard to other countries depends on international law. From all the above mentioned it can be concluded that in cases of delimitation of the territorial sea, primacy should be given to justified demands and interests of coastal States, in this case – archipelagic States, over the interests of one or more countries.
5.THE IMPORTANCE OF ARCHIPELAGIC STATES There are no archipelagic States in the Mediterranean. Article 46 of the Convention of 1982 defines an archipelagic State as a state that is entirely composed of one or more of the archipelagos. From this follows that a state which has at least a part of its territory on the mainland of a continent is not an archipelagic State. Therefore, even though they territories encompass groups of islands, countries such as Croatia,
8ICJ, Fisheries Case/ United Kindom v. Norway/, Judgment of December 18, 1951, report of judgments, Advisor/ opinions and orders

7th INTERNATIONAL MARITIME SCIENCE CONFERENCE
124
April 20th-21st, 2017, Solin, Croatia
Greece, or even Norway are not archipelagic States.9The same applies to Montenegro. The institution of archipelagic sea represents a compromise between the demands of archipelagic states to protect their political, economic and security interests and requirements of large naval forces to preserve to the greatest extent possible the right of passage of all ships. The adoption of this institution has positive effects because it protects the interests of economically and technologically underdeveloped countries (Fiji, Indonesia, Philippines, Mauritius, Tonga and others).10For Croatia this new institution of the law of the sea is not of great importance, but as a maritime country it is interested in maintaining freedom of navigation not only in principle but also in concrete terms and ranks among the states for which freedom of navigation and overflight must represent vital interests.11 There is a difference between coastal archipelagos whose dominant feature is the hierarchically higher position of the mainland as compared to the sea and mid-ocean archipelagos, where the focus is on the sea – it is not land that is predominant but the sea. It should be noted that in both cases there is a close connection between the territorial sea and the land, out of which the theory of archipelagos arose which discrimates between coastal and mid-ocean archipelagos. In Europe, this theory is extended in such a way that the islands that lie near the coast are connected to the mainland and the entire expanse of the sea that lies between the archipelago and the coast is considered to be internal waters. Although archipelago is primarily a geographical term and denotes a set of islands that make up a unique geographical entity12, it is sometimes used 9Vladimir Ibler, Medjunarodno pravo mora i Hrvatska, Zagreb, 2001, p. 68 10Milenko Kreća, Međunarodno javno pravo, osmo dopunjeno izdanje, Beograd, 2016, p.376 11Ibidem 12An archipelago was in this sense first defined by a Norwegian lawyer Evensen in the preparatory document for the Geneva Conference on the Law of the Sea of 1958, and it is this definition that has been most widely used since then
to denote sea with several groups of islands within. Therefore, an archipelago can also be defined as “sea or expanse of water filled with many islands”13 Scolarly literature puts great value on the validity of the theory of the archipelago before and after the 1951 judgment. It must also be mentioned that archipelagic countries play a significant role in the development of tourism.
6.CONCLUSION While claims of archipelagic countries for stricter control at sea were earlier considered excessive, they are now part of a general trend. The international community adopted the archipelagic concept. The archipelagic regime represents a successful compromise which satisfies the major interests of the two most affected groups od countries: The sovereignty of archipelagic states over archipelagic waters was recognized, while the institution of the right of passage through archipelagic waters is possible for the purpose of navigation and overflight in a usual way solely in order to enable continuous, rapid and smooth transit between two parts of the high seas. There is, certainly, a possibility of misunderstandings and disputes in the application of the regime of archipelagic sea lanes. Nevertheless, it should be noted that the provisions of the Convention are not inconsistent with the practice of states.
REFERENCES
1. Amerashinghe, C. F., The problem of Archipelagos in the International Law of Sea”, ICLQ, (1974), p. 539
2. Churchill, R.R., and Lowe A.V, The Law of the Sea, 3rd ed. (United Kingdom, 1999) p.143–144.
(U.N. Doc.A/ CONF.13/18,U.N. Conference on the law of the Sea, Preparatory documents 1958,( 1958) vol.1. 13 Shorter Oxford English Dictionary, 6 Edition, Oxford, Clarendon Press, 2007

125
Bojana Lakićević-Đuranović
THE LEGAL STATUS AND REGIME OF ARCHIPELAGIC WATERS IN MARITIME LAW
3. Ibler, V., Medjunarodno pravo mora i Hrvatska, (Zagreb, 2001), p. 68
4. ICJ, Fisheries Case/ United Kindom v. Norway/,Judgment of December 18, 1951, report of judgments, Advisor/ opinions and orders
5. Kreća, M., Međunarodno javno pravo, osmo dopunjeno izdanje, (Beograd, 2016) p.376
6. Reisman, W.M. „ The Regime of Straits and National Security: an Appraisal of International Lawmaking “ A.J.I.L. , Vol. 74, No 1 (1980), pp. 47-77.
7. Rudolf, D.,, Međunarodno pravo mora, JZAU, Zagreb,1985, p. 82-85
8. Shorter Oxford English Dictionary, 6 Edition, Clarendon Press, (Oxford 2007)
9. Statement by Japan of August 12, 1974, UNCLOS, Official Records, vol.2, op.cit., p 261
10. U.N. Doc.A/ CONF.13/18,U.N. Conference on the law of the Sea, Preparatory documents 1958, vol.1.

7th INTERNATIONAL MARITIME SCIENCE CONFERENCE
126
April 20th-21st, 2017, Solin, Croatia
STANDARD OFFSHORE WIND FARM PERSONNEL TRANSFER AND SUPPORT VESSEL CHARTER PARTY, WINDTIMEMarija Pijaca, Marjana Botić
STANDARD OFFSHORE WIND FARM PERSONNEL TRANSFER AND SUPPORT VESSEL CHARTER PARTY, WINDTIME
Marija Pijaca1, Marjana Botić2
(1 Maritime Department, University of Zadar, Zadar, Croatia)
(2 University of Zadar, Zadar, Croatia)
(E-mail: [email protected])
ABSTRACT
This paper analyses the provisions of BIMCO’s contract form Standard Offshore Wind Farm Personnel Transfer and Support Vessel Charter Party, codenamed WINDTIME. WINDTIME contract form is a standard time charter party for the transfer of wind farm personnel and equipment to and from offshore wind farm installations. It is one of the more recent BIMCO’s contract forms, given that the latest edition of this contract was issued in 2013. The analysis of the provisions of the form comprises several sections arranged by topic. Firstly, legal nature of the subject form is determined, parties to the contract are defined and specific details related to the charter period in accordance with the provisions of the form. After that, fundamental rights and obligations of the parties are established (delivery, redelivery, hire and payments, off-hire), followed by all other rights and obligations related to the use and execution of the contract (for example regulating vessel audit and survey, details of the master and crew, regulating bunker expenses). Provisions of the form on liabilities of the parties are also analysed as well as final provisions of contract form (terms of dispute resolution clause and requirements for sending notices). The paper provides critical review of those provisions of the form which might be considered to have different legal interpretations. In final analysis, solutions of the provisions of the form are summarized and a reference was given to some proposals on how to improve its content.
KEY WORDS
offshore wind farm, WINDTIME form, rights obligations and liability of the parties
1. INTRODUCTION
Offshore wind is an increasingly important source of renewable energy (Lange et al.). The historical development of the offshore wind market in Europe goes back to the start of the 90's of the previous century. Since then European offshore wind market has been progressively developing given that the offshore was recognized as a suitable area for exploiting wind energy (EWEA Annual Report, p. 11). Offshore wind farms are types of offshore structure. These are groups of wind turbines in bodies of water intended to produce electric power (Constable, p. 5.). It is important to
emphasize that vessels which serve for the transfer of wind farm personnel and equipment to and from offshore wind farm installations have an important role in development of wind farms sectors. However, importance of these vessels is clear. Here we may ask how to regulate the legal relationship of the parties − owner and charterer, services of transfer and hire of wind farms support vessels i.e. we can raise an issue of standard content the contract concluded between the owner and the charterer. As the answer to the progressive development of a large number of wind firm, Baltic and

127
Marija Pijaca, Marjana Botić
STANDARD OFFSHORE WIND FARM PERSONNEL TRANSFER AND SUPPORT VESSEL CHARTER PARTY, WINDTIME
International Maritime Council (BIMCO) has in July of 2013 published a standard contract form titled Standard Offshore Wind Farm Personnel Transfer and Support Vessel Charter Party – WINDTIME which is the first BIMCO contract for the offshore wind farm sector (for details regarding BIMCO's activities see Bekiashev, Serebriakov, p. 3 and BIMCO's Internet site). WINDTIME form is based on the content of the provisions of BIMCO's standard contract form titled Time Charter Party for Offshore Service Vessels – SUPPLYTIME 2005 which is used for service vessels in the offshore oil and gas industry. Provisions of the WINDTIME have been re-drafted with regard to the content of the SUPPLYTIME 2005 form and have been adjusted to the needs of offshore wind farm industry. Goal of this paper, which is primarily descriptive in nature, is to analyse the content of the provisions of the WINDTIME form and ascertain the manner in which the form regulates legal relationship between the parties. Analysis of the provisions of the form provided in this paper consist of several section divided by topics. In addition to introductory and final provisions, fundamental rights and obligations are also separated, followed by other rights and obligations related to the execution of the contract. Issue of liability of the parties as prescribed by the form is also being discussed. Before establishing the content of the rights and obligations of the parties pursuant to the form, the paper firstly established the legal nature and defines who the parties to the contract are.
2. LEGAL NATURE OF THE CONTRACT AND PARTIES TO THE WINDTIME FORM
WINDTIME is a time charter, namely, the nature of the contract is that of a time charter party (Soyer, Tettenborn, p. 13). This will imply that it is treated as such, and hence that precedents regarding similar problems and identical wordings in time charter will be relevant (see Wilford et al.). This is a reciprocal contract by virtue of which one party, the owner, undertakes to let the vessel and offer the service of transport vessel for wind farms operations while the other party, the charterer, hires the vessel for a certain charter period i.e. use
the service of transport vessel for wind farms operations and undertakes to pay the hire. Parties to this contractual relationship are the owner and the charterer. What is interesting is that the WINDTIME form does not provide a definition of the terms owner and charterer. Namely, in common with other BIMCO contracts, in its introductory part the WINDTIME form also contains a list of terms which have a specific meaning for the purpose of the contract. However, in the definition of the terms owner and charterer the WINDTIME form does not specify who are the parties to this contractual relationship, but is simply refer to the appropriate column in the first part of the form and stipulated that parties entered into box 2 and 3 are considered to be the parties. In this regard, in the form we note a lack of explicit definition of parties to the contract. Although we can assume that the purpose for the omission of a more clear explanation of these terms is the economy of the form, we are of an opinion that broader definition of the terms owner and charterer would not be detrimental to the appearance of the form. Therefore, we propose that definitions of these terms be incorporated in the content of the contract's introductory part.
3. INTRODUCTORY PROVISIONS OF THE WINDTIME FORM
3.1. Definitions
Introductory part of the form cites the relevant terms of the contractual relationship. For example, the form defines the term Day as a „clear working day (Saturdays, Sundays and local public holidays excluded) at the recipients' place of business“. In some clauses the parties need to be clear on what kind of day they are concerned with, and they are also well advised to remember the distinction if they amend the standard wording (Soyer, Tettenborn, 2015, p.14). Also, according to the definition of the term Working Day, the parties are free to agree the number of hours per day that will constitute the working day, whereas the term Offshore Unit defines specific offshore wind farm related structures and craft. All terms in introductory part are clearly defined by the form, except, as stated earlier, for the terms owner and

7th INTERNATIONAL MARITIME SCIENCE CONFERENCE
128
April 20th-21st, 2017, Solin, Croatia
charterer for which certain sections of the tabular view need to be followed.
3.2. Charter period
Even though provisions of the WINDTIME form on delivery and redelivery of the vessel together provide information on the duration of the contract (Charter Period), we consider the provision on duration of the contract to be a logical and useful part of the form. The provision indicates the time period for which the contract is being concluded i.e. for which the vessel is given into hire for personnel and equipment transfer. According to the same provision, “The Owners let and the Charterers hire the Vessel for the period as started in Box 9 from the time the Vessel is delivered to the Charterers […]” (clause 1(a), WINDTIME). The charter period may also be extended by the charterer to complete the immediate task, as provided in clause 1(c). Namely, in order to prevent a potential situation where the charterer may be forced to interrupt a task because the contract has come to an end, the charter period is automatically extended for the amount of time required to complete the immediate task (Explanatory notes). The parties agree on the maximum amount of time by which the contract can be extended and enter such period of time to box 11 of the first part of the WINDTIME form. By analysing the provision on payment of hire we will see what the terms are for payment of hire if the charter period is extended (infra).
4. FUNDAMENTAL RIGHTS AND OBLIGATIONS OF THE PARTIES TO THE WINDTIME FORM
4.1. Delivery of the vessel
In the provision on delivery, WINDTIME states that “If the Vessel is not delivered by midnight local time on the cancelling date […], the Charterers shall be entitled to cancel this Charter Party […]” (clause 2(c), WINDTIME). The provision needs to be interpreted in a way that the owner failed to meet his obligation if the vessel is not delivered by the date stated in the cancelling date section and therefore the charterer has a right to cancel the
contract. The clause also recognises that cancellation is not always an optimal solution for the charterer as he may not be able to obtain a substitute vessel at short notice. If the owner knows or expects that the vessel will be late, he is obliged to notify the charterer and propose a new delivery date (see clause 2(c), WINDTIME). Purpose of this obligation of owner is to avoid unexpected delays and the potential overall consequence on the project. The charterer do not have to accept the new delivery date and can choose simply to cancel the contract at that point (Explanatory notes). The form provide the parties with three options as to how liability for late delivery. The first option is that the charterer can cancel the contract without liability to the other for any losses incurred by reason of the non-delivery of the vessel or cancellation. Second option is for the parties to retain their right to claim general contractual damages in the event of late delivery or cancelling. Finally, the third option is that the owner pays liquidated damages per day or pro rate for part of a day as stated in box 14 (clauses 2(d), (e) and (f), WINDTIME). Also, when delivering the vessel, the owner is required to deliver the vessel in all respects fit for the service. In doing so, the owner must exercise due diligence to maintain the vessel as specified in the contract (clause 4, WINDTIME). Event though the term due diligence is not defined by the form, in interpreting this term we can follow the standpoints taken by the legal theory and judicial practice in cases from the charter party contract (see Cook, p. 45). According to the WINDTIME form, exercising due diligence pertains to making the vessel seaworthy. More broadly, the owner must ensure that at the time of delivery the vessel is classed as per terms of the contract and that it is in a thorough efficient state. Should the vessel not be classed, which is not always a mandatory requirement for small transfer vessels, approval by a relevant regulatory authority is necessary (clause 4, WINDTIME; Explanatory notes).
4.2. Redelivery of the vessel
Redelivery of vessel in the WINDTIME is regulated by provision 3 which contains items titled Redelivery and Demobilisation. According to the

129
Marija Pijaca, Marjana Botić
STANDARD OFFSHORE WIND FARM PERSONNEL TRANSFER AND SUPPORT VESSEL CHARTER PARTY, WINDTIME
redelivery provision, the vessel must be redelivered either at the end of the agreed charter period or the earlier termination of the contract (clause 3(a), WINDTIME). The provision did not omit regulating the issue of payment of a lump sum demobilisation fee which is payable either when charter reaches the end of the agreed period or on the earlier termination of the contract as per clause 31(a) titled Early Termination – At Charterers’ Convenience or 31(c) titled Early Termination – Default. Grounds for contract termination, followed by actions in accordance with the provision on redelivery of the vessel is regulated in detail by the provision 31 titled Early Termination. Even though the provision on redelivery is relatively short, we feel that it clearly defines the relationship between owner and charterer with regard to the regulating their rights and obligations in redelivery of the vessel.
4.3. Hire and Payments
Payment of charter hire is a fundamental obligation of the charterer so if the charterer fails to fulfil his payment obligations, the contract loses meaning. Amount of the charter hire, manner of payment, time of payment and other modes significant for accurate and timely fulfilment of the obligation to pay the charter hire are regulated by contract form. In the first paragraphs of the provision on charter hire the form stipulates that the charter hire is payable “per working day or pro rata for part thereof from the time that the Vessel is delivered to the Charterers until the expiration or earlier termination of this Charter Party” (clause 14(a), WINDTIME). The rate is supposed to be stated in box 22. If the charterer wants to extend the charter period, the parties have to agree on the hire rate for the additional period, failing which the option to extend cannot be exercised. If the parties failed to reach an agreement on the extension of the contract, the form states that “the Charterers shall not have the option to extend the Charter Period” (clause 14(b), WINDTIME). Form states that the charter hire must be paid „without discount“. This requirement is usual in all pecuniary payments which are the obligation of the charterer in the time charter contract forms. WINDTIME form also states that „[...] any
advances for disbursements made on behalf of and approved by the Owners may be deducted from Hire due“. Also, „if payment is not received by the Owners within five (5) Banking Days following the due date the Owners are entitled to charge interest at the rate stated in Box 29 on the amount outstanding from and including the due date until payment is received“ (clause 14(e), WINDTIME). With regard to the late charter hire payments the form prescribes that the owner must send a notice in writing to the charterer of his failure to pay hire. Also, the owner may then choose to suspend performance, either in total or selectively, until the due hire has been paid. During such suspension hire will remain payable (clause 14(f)(i), WINDTIME; Explanatory notes). An interesting solution is provided in further in the provision, according to which „if after the five (5) days of the written notice [...] the hire due has still not been received, the Owners may [...] withdraw the vessel“ (clause 14(f)(ii), WINDTIME). The owners’ right to withdraw must be exercised promptly and in writing and is not dependent upon the owner first exercising the right to suspend performance of his obligations under the charter party (clause 14(f)(ii), WINDTIME; Explanatory notes). In most cases this will mean that a notice of withdrawal should be given within a matter of days of the failure to pay following the grace period. If the owners take longer, for example, more than one week, to issue the withdrawal notice, it could be argued they have by their own delayed reaction waived their right to withdraw (Explanatory notes). From the review of the provision of the form on the charter hire payment we can see that any delay or general failure to pay the hire give the owner the right to withdraw. In order for the contract not to become liable to the demand of the owner to withdraw, charterer is obligated to pay the charter hire strictly in accordance with the provision of the charter hire form. Further to the above, we consider it necessary that the charterer carefully analysis his financial obligations pertaining to the hire when concluding the contract.

7th INTERNATIONAL MARITIME SCIENCE CONFERENCE
130
April 20th-21st, 2017, Solin, Croatia
4.4. Right of the charterer to suspend charter hire payments (off-hire clause)
WINDTIME form gives a rather wide and precise formulation of the off-hire clause by virtue of which it defines contentious situations of not utilising or under-utilising the vessel the consequence of which is the suspension of charter hire payments. These are risks that the charterer must bear owing to the very nature of a time charter and which reflects the legal dogma that a party cannot benefit from its own breach (Soyer, Tettenborn, p.19). According to the off-hire clause, no hire is payable if the vessel is prevented from working as a result of a number of incidents: “any deficiency of crew or of the Owners' stores, strike of Master, officers and crew, breakdown of the Vessel's machinery, damages to hull or other accidents to the Vessel” (provision 15(a), WINDTIME). Exceptions from this rule are also given in the provision according to which the vessel will remain on hire if, i.e. the vessel is prevented from working because of the carriage of dangerous or toxic cargo, quarantine or risk of quarantine, deviation at the request of the charterer, detention or damage by ice or any act or omission of the charterer, his servants or agents (clause 15(a), WINDTIME; Explanatory notes). The starting point of off-hire clause is that the Owners' liability is limited to suspension of hire and that claims for other losses such as loss of profit are excluded (clause 15(b), WINDTIME; Explanatory notes). In the continuation of the off-hire clause other details on the condition of its use are also given. Therefore, in accordance to the WINDTIME form „The Charterers shall grant the Owners a maximum of one (1) Working Day on hire, witch shall be cumulative, per month or pro rate for part of a month from the commencement of the Charter Period for maintenance [...]“ (clause 15(c), WINDTIME). Pursuant to the provision, the owner is granted a regular monthly “maintenance allowance” during the charter period whereby the vessel will remain on hire while undergoing essential maintenance (Explanatory notes).
5. OTHER PROVISIONS OF THE WINDTIME FORM RELATED TO THE EXECUTION OF THE CONTRACT
In the continuation of the paper we will consider several rights and obligations of the parties related to the use and execution of the contract. Some of them pertain to regulating vessel audit and survey, bunker expenses and position of the master and the crew. According to the WINDTIME form, both parties participate in the process of establishing the condition of the vessel at handover and return of the vessel. In this sense, WINDTIME form, in the provision titled Vessel Audit and Survey prescribes that the owner and the charterer must jointly appoint surveyors who must inspect and establish the condition of the vessel. The form also defines the manner in which the vessel inspection costs are allocated and according to the provision, the owner and the charterer must jointly bear the costs of such surveys (clause 6, WINDTIME). Another significant provision of the WINDTIME form is that the charterer does not pay for the fuel (bunker) of the vessel, but it is the charterer or the owner, as applicable, who must pay the shortfall or excess in the quantity of fuels remaining on board at redelivery as compared to the quantity on board at delivery at the price prevailing at the time and port of redelivery (clause 12(a), WINDTIME). One specific quality of the WINDTIME form is that the chartered vessel is not at the disposal of the charterer 24 hours a day, but that, according to the provision titled Master and Crew, the practice of the trade is to agree on shift periods and rates of charter hire for specifically agreed periods. The vessel and master will be at the charterers' service during the agreed working day of the contract, but if the charterer wishes to use the vessel outside the agreed working day, they must inform the owner in a timely manner (clause 8(a), WINDTIME).

131
Marija Pijaca, Marjana Botić
STANDARD OFFSHORE WIND FARM PERSONNEL TRANSFER AND SUPPORT VESSEL CHARTER PARTY, WINDTIME
6. LIABILITIES PURSUANT TO THE WINDTIME FORM
The liability regime of the WINDTIME is based on a knock-for-knock principle for damage to property and personnel. This principle provides that the charterer and owner bears responsibility for loss or damage to property and personal injury or death of personnel of the relevant party, its contractors and other related 'group' parties as specified (see clause 16(a), WINDTIME). The owner and charterer must through this provision indemnify, protect, defend and hold harmless the other party from „any and against all claims, cost, expenses, actions, proceedings, suits, demands and liabilities whatsoever arising out of or in connection with such loss, damage, liability, personal injury or death“ (clause 16(a)(i)(ii), WINDTIME). The knock-for-knock principle in the WINDTIME stipulates that the parties agree not to hold the other party liable, even when loss, damage, injury or death was caused „wholly or partially by the act, neglect, gross neglect or default“ (clause 16(a)(i)(ii), WINDTIME). Continuation of the liability provision of the WINDTIME forms includes a mutual exclusion of liability for the other party's, primarily loss of profit, use or production and consequential loss or damage, but not an express right to be indemnified from such losses suffered by the other party's contractors (clause 16(b), WINDTIME). The WINDTIME provides for a mutual liability cap which may be specifically agreed or amount to 20% of the total sum of hire due pursuant to the charter period as per Clause 16(c). However, the exclusions from the cap should be noted when considering the overall risk exposure under the charter (International Law Office, Newsletters).
7. FINAL PROVISIONS OF THE WINDTIME FORM
In the continuation of the paper we will consider the content of the provision on dispute resolution and on notices. Provision on the dispute resolution contains standard provision prescribed by BIMCO in the provision of other time charter forms bearing the same name. The provision contains several
paragraphs which pertain to the interpretation of the contract, court jurisdiction for dispute resolution and amicable dispute resolution. One of the innovative provisions of the form is the mentioning of the mediation as an option for resolving disputed between parties. Furthermore, the form stipulates that all notices which the parties deliver to one another must be made in writing. The provision also allows the communication of the parties through e-mail which is new compared to the time charter contract form which for the most part do not envisage exchange of notices in this way. Provision on notices establishes the manner in which the notices are delivered, however, it does not define when the counterparty must receive the notice. In the regular course of events, without dispute, this issue may be considered irrelevant, but is must not be left to chance, especially when we consider the importance of these notices, for example, in realisation of right on contract termination due to late delivery of the vessel (cancellation clause). Since the WINDTIME form does not provide a solution for this issue, it is recommended to add a paragraph on the interpretation of the time of the receipt of the notice within the provision on notices, whether they are sent by e-mail, telex etc.
8. CONCLUSION
WINDTIME form is the first form of the BIMCO association which is used in wind farms industry for regulation of rights and obligations of vessel owners and charterers for the purpose of personnel and equipment transfer to wind farm installations. This is a contract which by its legal nature is a time charter contract and therefore provision of the form are similar to those in time charter contract forms. It should be pointed out that the WINDTIME form contains a large number of provisions and that it regulated the contractual needs of the parties which provide and require service of transport vessels for wind farm operations very clearly and in great detail. Although it was not possible to examine the entire content of form’s provisions, we still hope that this paper has covered all important issues of the WINDTIME form. In the analysis of the content of the WINDTIME form provisions, we concentrated

7th INTERNATIONAL MARITIME SCIENCE CONFERENCE
132
April 20th-21st, 2017, Solin, Croatia
on fundamental rights and obligations of the parties. With truly excellent solutions in the provisions of the form, it is interesting to take another look on the terminological issue of the names and definition of the parties to the contract. Namely, in the form we observed a lack of definitions for the terms owner and charterer. We feel that reference to an appropriate column in the first section does not provide an answer to the question who the parties to this contractual relationship are, so we feel that it is necessary to add appropriate definitions to this form. Furthermore, analysis of the provisions of the form showed that the form protects the interests of both parties to the contract. Specifically, the WINDTIME form fundamentally rebalances the distribution of risks between the owner and the charterer. As a default, owner faces liquidated damages in the amount of the day rate for late delivery and risk paying damages if the vessel is not as agreed. It maintains a traditional knock for knock. With truly excellent solutions provided by the provisions of the form, such as that on liability, in some places in the paper we have noted proposals for improvement of their content. So, in the section dedicated to analysis of final provisions of the form, we pointed out that a paragraph on the interpretation of the time of the receipt of the notices should be added to the provision on notices. In the regular course of events, without dispute, this issue may be considered irrelevant, but is must not be left to chance, and for that reason we proposed an interpretation of the term receipt of notices.
REFERENCES
1. Standard Offshore Wind Farm Personnel Transfer and Support Vessel Charter Party – WINDTIME form, available on the BIMCO website www.bimco.com
2. Time Charter Party for Offshore Service Vessels – SUPPLYTIME 2005 form, available on the BIMCO website www.bimco.com
3. WINDTIME Explanatory notes, available on the BIMCO website www.bimco.com
4. Lange, K., Rinne, A., Haasisi, H.-D., “Planning Maritime Logistics Concepts for Offshore Wind Farms: A Newly Developed Decision Support System”, Computational Logistics: Third International Conference, ICCL 2012, Shanghai, China, September 24-26 2012, Proceedings, Hu, H. et al. (Eds.), pp. 142-158.
5. EWEA - European Wind Energy Associationa, Annual Report 2013, online resources, https://windeurope.org/about-wind/reports/ewea-annual-report-2013/
6. International Law Office, Newsletters, online resources http://www.internationallawoffice.com/Newsletters/Shipping-Transport/International/Wikborg-Rein/BIMCO-soon-to-release-the-Windtime
7. Constable, A., Keating on Offshore Construction and Marine Engineering Contracts, first edition, Sweet & Maxwell, Thomson Reuters, 2015.
8. Soyer, B., Tettenborn, A., Offshore Contracts and Liabilities, Inform law from Routledge, 2015.
9. Wilford, M., Coghlin, T., Kimball, J. D., Time Charter, fourth edition, Lloyd’s of London Press Ltd., London, 1995.
10. Cooke, J., Young, T., Taylor, A., Kimball, J.D., Martowski, D., Lambert, L., Voyage Charters, second edition, LLP, London, 2001.
11. Bekiashev, K. A., Serebriakov, V., International Maritime Organizations: Essays on Structure and Activites, Martinus Nijhoff Publishers, Hague-Boston-London, 1981.
LAW OF THE SEA IMPLICATION TOWARDS INTERNATIONAL RELATIONS:
MARITIME DELIMITATION CASE
Ermal Xhelilaj, Kristofor Lapa, Bledar Sakaj
(University “Ismail Qemali” Vlore, Albania)
(E-mail: [email protected]) ABSTRACT
One of the main issues within the realm of intenational relations reflects the territorial delimitation among sovereign States which often reveal potential political, economical and social implications of international nature. Among delimitation issues, maritime demarcation between coastal States is considered of a paramount concern due to the potential of generating conflicts or regional crises. Bearing in mind coastal States’ amplified objectives for legal authority upon maritime zones, legally reflected in UNCLOS 1982, within the international maritime organizations emerged the obligation to adopt legislation aiming dispute resolution with the purpose of preventing potential international or regional conflicts. Representing significant strategic, political and economic interests for coastal States, maritime zones’ legal regime plays a principal role towards international relations. In light of these considerations, this paper aims towards a comprehensive conception of the implications that maritime boundaries’ legislation has towards international conflicts. The study reveals that the legal vacuum and ambiguities of the law of the sea as well as the sensitivity and crucial importance that maritime zones represent for the coastal States, are the main contributors towards potential international conflicts regarding maritime boundaries’ delimitation. The authors’ oppinion mirror the view that the maritime zones’ articles within UNCLOS 1982 should undergo comprehensive revisions, and appropriate ammendments should be made in order to resolve this issue.
KEYWORDS Law of the sea, maritime delimitation, international relations, regional conflicts 1. INTRODUCTION
Regional conflicts and political crises between powerful States of the international system have been created as a result of securing a strategic maritime position along oceans’ coastline as well as to efficiently benefit politically, socially and economically from the maritime zones such as territorial waters, exclusive economic zone and
continental shelf, that UN Law of the Sea Convention (1982) promotes and jurisdictionally allows for every coastal States. Coastal States’ conflicts vis-a-vis the delimitation of maritime boundaries represent a paramount political, economical and social issue for the international relations in general. In this regard, the sensitive issue of maritime boundaries’ delimitation is considered more important for international system

133
Ermal Xhelilaj, Kristofor Lapa, Bledar Sakaj
LAW OF THE SEA IMPLICATION TOWARDS INTERNATIONAL RELATIONS: MARITIME DELIMITATION CASE
LAW OF THE SEA IMPLICATION TOWARDS INTERNATIONAL RELATIONS: MARITIME DELIMITATION CASEErmal Xhelilaj, Kristofor Lapa, Bledar Sakaj
LAW OF THE SEA IMPLICATION TOWARDS INTERNATIONAL RELATIONS:
MARITIME DELIMITATION CASE
Ermal Xhelilaj, Kristofor Lapa, Bledar Sakaj
(University “Ismail Qemali” Vlore, Albania)
(E-mail: [email protected]) ABSTRACT
One of the main issues within the realm of intenational relations reflects the territorial delimitation among sovereign States which often reveal potential political, economical and social implications of international nature. Among delimitation issues, maritime demarcation between coastal States is considered of a paramount concern due to the potential of generating conflicts or regional crises. Bearing in mind coastal States’ amplified objectives for legal authority upon maritime zones, legally reflected in UNCLOS 1982, within the international maritime organizations emerged the obligation to adopt legislation aiming dispute resolution with the purpose of preventing potential international or regional conflicts. Representing significant strategic, political and economic interests for coastal States, maritime zones’ legal regime plays a principal role towards international relations. In light of these considerations, this paper aims towards a comprehensive conception of the implications that maritime boundaries’ legislation has towards international conflicts. The study reveals that the legal vacuum and ambiguities of the law of the sea as well as the sensitivity and crucial importance that maritime zones represent for the coastal States, are the main contributors towards potential international conflicts regarding maritime boundaries’ delimitation. The authors’ oppinion mirror the view that the maritime zones’ articles within UNCLOS 1982 should undergo comprehensive revisions, and appropriate ammendments should be made in order to resolve this issue.
KEYWORDS Law of the sea, maritime delimitation, international relations, regional conflicts 1. INTRODUCTION
Regional conflicts and political crises between powerful States of the international system have been created as a result of securing a strategic maritime position along oceans’ coastline as well as to efficiently benefit politically, socially and economically from the maritime zones such as territorial waters, exclusive economic zone and
continental shelf, that UN Law of the Sea Convention (1982) promotes and jurisdictionally allows for every coastal States. Coastal States’ conflicts vis-a-vis the delimitation of maritime boundaries represent a paramount political, economical and social issue for the international relations in general. In this regard, the sensitive issue of maritime boundaries’ delimitation is considered more important for international system

7th INTERNATIONAL MARITIME SCIENCE CONFERENCE
134
April 20th-21st, 2017, Solin, Croatia
taken under consideration also that this process represent a very difficult matter to resolve since it envolves many complex political, legal, geographical, economical and strategic factors. Since maritime delimitation issue is considered a key factor contributing towards international crises, the dinamics of political decision-making by coastal States is quite anormal and extraordinary. Subsequently, this sort of decision making process, which per se is characterized by the high priority objectives of the State that is threaten by maritime delimitation issues, limited time of reaction by the political leadership as well as the unpredictable situations reflected sometime, has often created the appropriate grounds for the initiation of conflicts or crieses among coastal States. Therefore, is important that academic studies and scholars should be analizing further and in-depth this crucial matter in light of the law of the sea regime and international relations fields of study. In light of these considerations, this study discusses delimitation of maritime boundaries with regard to international conflicts, mainly through analizing and sheding light into important matters such as the determination of maritime delimitation issues leading to regional crises, legal issues pertaining to the delimitation of maritime boundaries as well as several main cases of maritime delimitation’ conflicts between coastal States, concluding as well with some final remarks regarding this fundamental matter.
2. MARITIME DELIMITATION ISSUES
LEADING TO CRISES The main issue which has probably contributed towards international or regional crises concerning the delimitation of maritime boundaries is linked to the law of the sea regime, which instead of ensuring an efficent and comprehensive definition of State sovrengnity over maritime zones in light of current challenges such as political, economical and social factors, promotes a inefficient and ambiguous system of legal norms reflected upon international conventions as well as in the jurisprudence literature
and scholarly studies (Churchill and Law, 1999). Additionally, conflicts are often escalated due to inmature political decisions by governments which are not willing to concide ground or show tolerance in a potential international conflict on martime boundaries because it might result in serious political consequences and undermine vital national interests. In this respect, there are four essential political decisions which appear to emerge in connection to maritime boundaries’ delimitation: the decision to negociate, the decision to propose a specific maritime delimitation, the decision to tolerate a potential territorial concesion in order to reach an agreement as well as the decision to politically accept this particular maritime demarcation agreement (Oxman, 1994-95). The governmental decision to respect a compulsory legal ruling from the international courts or arbitrage is also considered a political decision. Apart from political factor, maritime delimitation crises among States often escalate when there are strong economic, nationalistic and social interests. Territories and maritime zones may contain important natural resourses such as oil, natural gas, minerals as well as in cases when such maritime zones reflect crucial strategic and national interests for coastal States. Additionally, maritime zones may represent also historical value for States or provide an important ground for defence issues and national security. On the other hand, another cause for potential regional conflict may be considered the international competition on contested maritime resources or on maritime zones subject of international exploration (res communis), which have become quite intensive recently due to economical expansion and scientific progress, new technological developments, high financial value of maritime resouces, ocean environmental changes, unlimited exploitation of living and natural resources at sea as well as global climate issues, causing as a result the development or aggreviation of international disagremeents and sometimes regional conflicts. The jurisdiction on maritime resouces, as well as fishing rights on specific maritime zones under States’ authority, have particularly exerted considerable influence upon national politics and
governmental decisions, causing disagreemeents among coastal States regarding the delimitation of maritime boundaries, generating accordingly regional conflicts. In this respect, the fishing rights on disputed and overlapping EEZ, reflected in UNCLOS (1982) have potential in creating tensions among coastal States, leading subsequently in severe escalation of conflictual situations to even use of force or international crises (Churchill and Law, 1999). Experts of international relations are of the opinion that coastal States which want to avoid provocations against other States need to refrain undertaking sudden and determined actions in respect to the development of maritime activities of oil and natural gas exploitation, and to engage in constructive political bilateral cooperation in order to explore possible solutions for the maritime boundaries’ delimitation of maritime zones of national interests. Legal ambiguities existent in international law assists the aforementioned issue, contributing towards refraining the undertaking of such extrem governmental aktivities due to the presence per se of legal restriction effects upon oil and natural gas investors, international corporations with hugh finanacial capacities, as well as to the technological industries and companies under State jurisdiction. In such cases when the oil and natural gas explotation located in contested continental shelf and EEZ areas are subject of international boundaries delimitation diagreement between States, strong and immature decisions that States undertake in connection to the maritime resources might cause incidents, which often lead towards possible regional conflicts. Such incident is considered the disagreement between Malta and Libya, which almost escalated to a conflict of military nature, when in August 1980 a Libyan naval frigate interfered and halted the construction of a Maltese offshore oil platform in the contested maritime area of Medina (Kliot, 1989). This case went to ICJ for judgment, which subsequently laid down a legal resolution regarding the delimitation of continental shelf between aforementioned coastal States (Brown, 1983). The same fundamental principle is mirrored even in cases of State jurisdictional rights in respect to fishing and living marine resources in certain
maritime zones. Fishing vessels which illegally undertake their activities in disputed maritime zones historically have exercised and continue to exert inevitable influence towards the initiation of international conflicts. The natural resources exploitation from oceans provide hugh economic benefits and political power to States, therefore the exploitation of these particular resourses are considered the main reason which often causes disagreements or even conflicts between States. In this respect, it is generally accepted that Japan’s exploitation restriction of natural resources such as oil and natural gas, vital for the development of its heavy industry and national economy, was commonly the main cause which forced Japan towards open military conflict in the Pacific Ocean during WWII. Consequently, governements are always under constant pressure to undertake provocative actions to enforce their rights upon maritime zones with abundant natural resources. International conflicts reflect three main qualities connected to the natural ocean resources, which are: the need for industrial economy function; seabed oil and mineral resources found in a certain maritime zone, for which States may involved in armed conflicted in order to legally control it, and; that ocean natural resources have the tendency to present a global irregular distribution, found with abundance in one State and reflecting a total inexistence on others (Goldstein, 2001). These ocean natural resources’ qualities indicate that the trade of such resources is considered extremely profitable and normally very politicized, creating occasionally financial and economical turmoils which may turn into regional or international confrontations (Goldstein, 2001). International community have experienced a number of issues and conflicts regarding the delimitation of maritime boundaries or maritime zones’ overlying, resulting from the designation of 200 miles EEZ, and the protection needs for ocean natural resources exploitation, including military protection, laid down in the relevant provisions of UNCLOS. In this respect, it is worth mentioning the case of Canada, which in 1995 implemented new set of fishing rules beyond 200 nautical miles, using military power to enforce its legislation upon foreign fishing vessels. As a

135
Ermal Xhelilaj, Kristofor Lapa, Bledar Sakaj
LAW OF THE SEA IMPLICATION TOWARDS INTERNATIONAL RELATIONS: MARITIME DELIMITATION CASE
taken under consideration also that this process represent a very difficult matter to resolve since it envolves many complex political, legal, geographical, economical and strategic factors. Since maritime delimitation issue is considered a key factor contributing towards international crises, the dinamics of political decision-making by coastal States is quite anormal and extraordinary. Subsequently, this sort of decision making process, which per se is characterized by the high priority objectives of the State that is threaten by maritime delimitation issues, limited time of reaction by the political leadership as well as the unpredictable situations reflected sometime, has often created the appropriate grounds for the initiation of conflicts or crieses among coastal States. Therefore, is important that academic studies and scholars should be analizing further and in-depth this crucial matter in light of the law of the sea regime and international relations fields of study. In light of these considerations, this study discusses delimitation of maritime boundaries with regard to international conflicts, mainly through analizing and sheding light into important matters such as the determination of maritime delimitation issues leading to regional crises, legal issues pertaining to the delimitation of maritime boundaries as well as several main cases of maritime delimitation’ conflicts between coastal States, concluding as well with some final remarks regarding this fundamental matter.
2. MARITIME DELIMITATION ISSUES
LEADING TO CRISES The main issue which has probably contributed towards international or regional crises concerning the delimitation of maritime boundaries is linked to the law of the sea regime, which instead of ensuring an efficent and comprehensive definition of State sovrengnity over maritime zones in light of current challenges such as political, economical and social factors, promotes a inefficient and ambiguous system of legal norms reflected upon international conventions as well as in the jurisprudence literature
and scholarly studies (Churchill and Law, 1999). Additionally, conflicts are often escalated due to inmature political decisions by governments which are not willing to concide ground or show tolerance in a potential international conflict on martime boundaries because it might result in serious political consequences and undermine vital national interests. In this respect, there are four essential political decisions which appear to emerge in connection to maritime boundaries’ delimitation: the decision to negociate, the decision to propose a specific maritime delimitation, the decision to tolerate a potential territorial concesion in order to reach an agreement as well as the decision to politically accept this particular maritime demarcation agreement (Oxman, 1994-95). The governmental decision to respect a compulsory legal ruling from the international courts or arbitrage is also considered a political decision. Apart from political factor, maritime delimitation crises among States often escalate when there are strong economic, nationalistic and social interests. Territories and maritime zones may contain important natural resourses such as oil, natural gas, minerals as well as in cases when such maritime zones reflect crucial strategic and national interests for coastal States. Additionally, maritime zones may represent also historical value for States or provide an important ground for defence issues and national security. On the other hand, another cause for potential regional conflict may be considered the international competition on contested maritime resources or on maritime zones subject of international exploration (res communis), which have become quite intensive recently due to economical expansion and scientific progress, new technological developments, high financial value of maritime resouces, ocean environmental changes, unlimited exploitation of living and natural resources at sea as well as global climate issues, causing as a result the development or aggreviation of international disagremeents and sometimes regional conflicts. The jurisdiction on maritime resouces, as well as fishing rights on specific maritime zones under States’ authority, have particularly exerted considerable influence upon national politics and
governmental decisions, causing disagreemeents among coastal States regarding the delimitation of maritime boundaries, generating accordingly regional conflicts. In this respect, the fishing rights on disputed and overlapping EEZ, reflected in UNCLOS (1982) have potential in creating tensions among coastal States, leading subsequently in severe escalation of conflictual situations to even use of force or international crises (Churchill and Law, 1999). Experts of international relations are of the opinion that coastal States which want to avoid provocations against other States need to refrain undertaking sudden and determined actions in respect to the development of maritime activities of oil and natural gas exploitation, and to engage in constructive political bilateral cooperation in order to explore possible solutions for the maritime boundaries’ delimitation of maritime zones of national interests. Legal ambiguities existent in international law assists the aforementioned issue, contributing towards refraining the undertaking of such extrem governmental aktivities due to the presence per se of legal restriction effects upon oil and natural gas investors, international corporations with hugh finanacial capacities, as well as to the technological industries and companies under State jurisdiction. In such cases when the oil and natural gas explotation located in contested continental shelf and EEZ areas are subject of international boundaries delimitation diagreement between States, strong and immature decisions that States undertake in connection to the maritime resources might cause incidents, which often lead towards possible regional conflicts. Such incident is considered the disagreement between Malta and Libya, which almost escalated to a conflict of military nature, when in August 1980 a Libyan naval frigate interfered and halted the construction of a Maltese offshore oil platform in the contested maritime area of Medina (Kliot, 1989). This case went to ICJ for judgment, which subsequently laid down a legal resolution regarding the delimitation of continental shelf between aforementioned coastal States (Brown, 1983). The same fundamental principle is mirrored even in cases of State jurisdictional rights in respect to fishing and living marine resources in certain
maritime zones. Fishing vessels which illegally undertake their activities in disputed maritime zones historically have exercised and continue to exert inevitable influence towards the initiation of international conflicts. The natural resources exploitation from oceans provide hugh economic benefits and political power to States, therefore the exploitation of these particular resourses are considered the main reason which often causes disagreements or even conflicts between States. In this respect, it is generally accepted that Japan’s exploitation restriction of natural resources such as oil and natural gas, vital for the development of its heavy industry and national economy, was commonly the main cause which forced Japan towards open military conflict in the Pacific Ocean during WWII. Consequently, governements are always under constant pressure to undertake provocative actions to enforce their rights upon maritime zones with abundant natural resources. International conflicts reflect three main qualities connected to the natural ocean resources, which are: the need for industrial economy function; seabed oil and mineral resources found in a certain maritime zone, for which States may involved in armed conflicted in order to legally control it, and; that ocean natural resources have the tendency to present a global irregular distribution, found with abundance in one State and reflecting a total inexistence on others (Goldstein, 2001). These ocean natural resources’ qualities indicate that the trade of such resources is considered extremely profitable and normally very politicized, creating occasionally financial and economical turmoils which may turn into regional or international confrontations (Goldstein, 2001). International community have experienced a number of issues and conflicts regarding the delimitation of maritime boundaries or maritime zones’ overlying, resulting from the designation of 200 miles EEZ, and the protection needs for ocean natural resources exploitation, including military protection, laid down in the relevant provisions of UNCLOS. In this respect, it is worth mentioning the case of Canada, which in 1995 implemented new set of fishing rules beyond 200 nautical miles, using military power to enforce its legislation upon foreign fishing vessels. As a

7th INTERNATIONAL MARITIME SCIENCE CONFERENCE
136
April 20th-21st, 2017, Solin, Croatia
result of arresting several Spanish fishing vessels to enforce its laws, Canada was confronted with Spanish and other EU countries’ diplomatic and economic consequences (Byers, 2009).
. 3. LEGAL ISSUES PERTAINING TO THE
DELIMITATION OF MARITIME BOUNDARIES
Notwithstanding the existence of a particular legal literature of international maritime nature, the legal foundation upon which the maritime boundaries delimitation decisions are based, including here multilateral treaties and customary norms, is considered disparate and quite significant. In spite of political, economical and national factors, the main issue which has exerted great influence towards the development or resolution deficiency of international disagreements in respect to maritime boundaries delimitation, is probably caused similarly from the law of the sea regime, represented by considerable number of international conventions, which it appears that is characterized by a legal system lacking legal priorites and therefore reflecting many ambiguities and issues in its relevant provisions. The most fundamental impact regarding the development of international disagreements on maritime delimitations was probably caused by the adoption and legal formulation of UNCLOS (1982). During the final proceedings of the III UNCLOS Conference, the international practice had shed light on the existence of more than 375 bilateral or regional conflicts on maritime boundaries delimitation, among which only 90 of these disagreements were in process of intermediation or negotiations between coastal States in respect of the particular legal dispute resolution (Smith, 1982). While many maritime delimitation cases have been succefully reached an agreement, mainly through international; and national courts’ rulings or intermediation process, a considerable number of disagreements on maritime boundaries demarcation are yet unresolved. Moreover, in light of recent developments in international relation system,
predominantly in the international maritime law regime reflected mostly on the continental shelf delimitation issue, the number of international disagreements has been dramatically increased. This issue is caused as a result of the adoption of UNCLOS new legal norms, which have introduct a new 350 miles continental shelf, in contrast to 200 nautical miles continental shelf set of rules reflected in Geneva Convention on Continental Shelf (1958). Coastal States worldwide now have to engage in new negotiations or to solve possible tensions and disagreements among each other regarding the overlapping exclusive economic zones in different parts of the world. This situation has brought ambiguity and confusion among coastal States creating thus new conflicts or escalating old ones. The delimitation of new continental shelf by coastal States have now to be implemented only after a formal request is forwarded to the Continental Shelf Delimitation Commission, which under the provision 76 of UNCLOS undertakes the inquiry process and decides wether the States’ request is in conformity of international maritime law. In this context, it is apparent that in many ways the law of the sea vis-à-vis maritime delimitation is dynamic and yet in evolving and changing process, influencing therefore towards the instability of international relations. UNCLOS has dramatically changed the fundamental legal elements on the capability and rights of coastal States upon the exploitation of natural maritime resources. With regard to this issue, the most profound legal notion is considered the EEZ dwelling up to 200 nautical miles, in which coastal States exerts jurisdiction on the exploitation of natural resources, as well as to a certain legal extent on scientific research and environmental protection (UNCLOS, Part v). The second legal notion reflects norms and regulations under which States exert sovereignity rights upon continental shelf (seabed) area with the purpose of exploiting its natural resources (UNCLOS, Part VI). The fundamental importance of maritime delimitations sheds light on the perspective that conflicts regarding the overlapping maritime boundaries delimitation, as mirrored in the redelimitation cases of EEZ during the last decades, are considered the furthermost
crucial conflicts due to the direct linked that this issue provides with States’ national sovregnity (Klein, 2005). The significance of national interests involved in maritime delimitation issues hinders coastal States to unconditionally delegate decisions on maritime bounadaries demarcation during legal proceedings and international conferences. In this respect, throughout the international negotiations at the UNCLOS III Conference, the most important debates, multilateral disputes and controversial disagreements were focused on the legal provisions in connection to maritime boundaries delimitation. Basically, there are two essential legal provisons in UNCLOS dealing with maritime boundaries delimitations. The first provision found in Article 15 on the delimitation of territorial waters between States with opposite or adjacent coastline. The fundamental notion of this legal provision reflects on the international cooperation between States on the delimitation of territorial waters, which extends up to 12 miles from the States’ baseline. In case of a potential disagreement vis-à-vis this issue, the delimitation must occur based on equidistant principle which is defined from the nearest point on the baselines from which the breadth of territorial seas of each of the two States is measured. On the other hand, Article 74 sets the legal principle for the delimitation EEZ, following logically by Article 83 which lays down the delimitation of continental shelf between States with opposite or adjacent coastline. In light of these considerations, it may be submitted that both the aforementioned provisions are regarded as legally ambiguous. This ambiguity has resulted from generic legal terms utilized as well as limited wording reflected in both relevant provisions. Notwithstanding that Article 74 on EEZ, and Article 83 on the delimitation of continental shelf share similar wording, and the delimitation process is based on identical legal principle, the terminology and the legal notion reflected in both provisions is considered ambiguous and complicated legally and practically, offering ground for creation of disagreements and potential conflict amons States. Although the delimitation notion and wording appears similar in both provisions, yet they represent two distinct maritime zones which reflect
different purpose and usage, and moreover are subject of diverse jurisdiction. The fact that according to these provisions the delimitation process of relevant maritime zones reflects equitable solution as well as contains similar wording of technical nature, makes it more difficult for States to reach an acceptable or succesfull agreement in respect to this issue. A maritime delimitation which may be appropriate of EEZ purpose and objectives might not be righteous or suitable for the determination of continental shelf matter. This has resulted due to distinctive considerations, charasteristics and variations which reproduce each maritime zone in order to achieve a just and equitable resolution (Churchill & Law, 1999). Nevertheless, the central principle behind both provisions provides for internarional or bilateral cooperation in order to promote compromise towards equitable delimitation of relevant boundaries. When a EEZ nd continental shelf delimitation international disagreement emerges, within a reasonable time period, parties based on Article 74(2) and 83(2) have the responsibility to implement conflict resolution procedures consistent with UNCLOS Part XV provisions. Mandatory dispute resolution’s mechanisms according to Section 2, Part XV, deal with States’ disagreements on delimitation of territorial sea, continental shelf and EEZ. When party States have explicity rejected this particular legal dispute settlement mechanism, based in Article 298 (1)(a), they are not bound by it. 4. MARITIME DELIMITATION CONFLICTS
BETWEEN COASTAL STATES The adoption of contemporary legal principles on maritime boundaries delimitation appears to mirror severe issues due to the ambiguous and problematic interpretation of UNCLOS’ legal provisions terminology (Rothwell and Stephens, 2010). There are concerns on disorientation and problematic effects of Article 15 of UNCLOS regarding territorial sea’s equidistant delimitation notion among coastal States, which may create issues or bilateral

137
Ermal Xhelilaj, Kristofor Lapa, Bledar Sakaj
LAW OF THE SEA IMPLICATION TOWARDS INTERNATIONAL RELATIONS: MARITIME DELIMITATION CASE
result of arresting several Spanish fishing vessels to enforce its laws, Canada was confronted with Spanish and other EU countries’ diplomatic and economic consequences (Byers, 2009).
. 3. LEGAL ISSUES PERTAINING TO THE
DELIMITATION OF MARITIME BOUNDARIES
Notwithstanding the existence of a particular legal literature of international maritime nature, the legal foundation upon which the maritime boundaries delimitation decisions are based, including here multilateral treaties and customary norms, is considered disparate and quite significant. In spite of political, economical and national factors, the main issue which has exerted great influence towards the development or resolution deficiency of international disagreements in respect to maritime boundaries delimitation, is probably caused similarly from the law of the sea regime, represented by considerable number of international conventions, which it appears that is characterized by a legal system lacking legal priorites and therefore reflecting many ambiguities and issues in its relevant provisions. The most fundamental impact regarding the development of international disagreements on maritime delimitations was probably caused by the adoption and legal formulation of UNCLOS (1982). During the final proceedings of the III UNCLOS Conference, the international practice had shed light on the existence of more than 375 bilateral or regional conflicts on maritime boundaries delimitation, among which only 90 of these disagreements were in process of intermediation or negotiations between coastal States in respect of the particular legal dispute resolution (Smith, 1982). While many maritime delimitation cases have been succefully reached an agreement, mainly through international; and national courts’ rulings or intermediation process, a considerable number of disagreements on maritime boundaries demarcation are yet unresolved. Moreover, in light of recent developments in international relation system,
predominantly in the international maritime law regime reflected mostly on the continental shelf delimitation issue, the number of international disagreements has been dramatically increased. This issue is caused as a result of the adoption of UNCLOS new legal norms, which have introduct a new 350 miles continental shelf, in contrast to 200 nautical miles continental shelf set of rules reflected in Geneva Convention on Continental Shelf (1958). Coastal States worldwide now have to engage in new negotiations or to solve possible tensions and disagreements among each other regarding the overlapping exclusive economic zones in different parts of the world. This situation has brought ambiguity and confusion among coastal States creating thus new conflicts or escalating old ones. The delimitation of new continental shelf by coastal States have now to be implemented only after a formal request is forwarded to the Continental Shelf Delimitation Commission, which under the provision 76 of UNCLOS undertakes the inquiry process and decides wether the States’ request is in conformity of international maritime law. In this context, it is apparent that in many ways the law of the sea vis-à-vis maritime delimitation is dynamic and yet in evolving and changing process, influencing therefore towards the instability of international relations. UNCLOS has dramatically changed the fundamental legal elements on the capability and rights of coastal States upon the exploitation of natural maritime resources. With regard to this issue, the most profound legal notion is considered the EEZ dwelling up to 200 nautical miles, in which coastal States exerts jurisdiction on the exploitation of natural resources, as well as to a certain legal extent on scientific research and environmental protection (UNCLOS, Part v). The second legal notion reflects norms and regulations under which States exert sovereignity rights upon continental shelf (seabed) area with the purpose of exploiting its natural resources (UNCLOS, Part VI). The fundamental importance of maritime delimitations sheds light on the perspective that conflicts regarding the overlapping maritime boundaries delimitation, as mirrored in the redelimitation cases of EEZ during the last decades, are considered the furthermost
crucial conflicts due to the direct linked that this issue provides with States’ national sovregnity (Klein, 2005). The significance of national interests involved in maritime delimitation issues hinders coastal States to unconditionally delegate decisions on maritime bounadaries demarcation during legal proceedings and international conferences. In this respect, throughout the international negotiations at the UNCLOS III Conference, the most important debates, multilateral disputes and controversial disagreements were focused on the legal provisions in connection to maritime boundaries delimitation. Basically, there are two essential legal provisons in UNCLOS dealing with maritime boundaries delimitations. The first provision found in Article 15 on the delimitation of territorial waters between States with opposite or adjacent coastline. The fundamental notion of this legal provision reflects on the international cooperation between States on the delimitation of territorial waters, which extends up to 12 miles from the States’ baseline. In case of a potential disagreement vis-à-vis this issue, the delimitation must occur based on equidistant principle which is defined from the nearest point on the baselines from which the breadth of territorial seas of each of the two States is measured. On the other hand, Article 74 sets the legal principle for the delimitation EEZ, following logically by Article 83 which lays down the delimitation of continental shelf between States with opposite or adjacent coastline. In light of these considerations, it may be submitted that both the aforementioned provisions are regarded as legally ambiguous. This ambiguity has resulted from generic legal terms utilized as well as limited wording reflected in both relevant provisions. Notwithstanding that Article 74 on EEZ, and Article 83 on the delimitation of continental shelf share similar wording, and the delimitation process is based on identical legal principle, the terminology and the legal notion reflected in both provisions is considered ambiguous and complicated legally and practically, offering ground for creation of disagreements and potential conflict amons States. Although the delimitation notion and wording appears similar in both provisions, yet they represent two distinct maritime zones which reflect
different purpose and usage, and moreover are subject of diverse jurisdiction. The fact that according to these provisions the delimitation process of relevant maritime zones reflects equitable solution as well as contains similar wording of technical nature, makes it more difficult for States to reach an acceptable or succesfull agreement in respect to this issue. A maritime delimitation which may be appropriate of EEZ purpose and objectives might not be righteous or suitable for the determination of continental shelf matter. This has resulted due to distinctive considerations, charasteristics and variations which reproduce each maritime zone in order to achieve a just and equitable resolution (Churchill & Law, 1999). Nevertheless, the central principle behind both provisions provides for internarional or bilateral cooperation in order to promote compromise towards equitable delimitation of relevant boundaries. When a EEZ nd continental shelf delimitation international disagreement emerges, within a reasonable time period, parties based on Article 74(2) and 83(2) have the responsibility to implement conflict resolution procedures consistent with UNCLOS Part XV provisions. Mandatory dispute resolution’s mechanisms according to Section 2, Part XV, deal with States’ disagreements on delimitation of territorial sea, continental shelf and EEZ. When party States have explicity rejected this particular legal dispute settlement mechanism, based in Article 298 (1)(a), they are not bound by it. 4. MARITIME DELIMITATION CONFLICTS
BETWEEN COASTAL STATES The adoption of contemporary legal principles on maritime boundaries delimitation appears to mirror severe issues due to the ambiguous and problematic interpretation of UNCLOS’ legal provisions terminology (Rothwell and Stephens, 2010). There are concerns on disorientation and problematic effects of Article 15 of UNCLOS regarding territorial sea’s equidistant delimitation notion among coastal States, which may create issues or bilateral

7th INTERNATIONAL MARITIME SCIENCE CONFERENCE
138
April 20th-21st, 2017, Solin, Croatia
disagreements, as occurred during Nicaragua vs Honduras (Carribean Sea) legal case, when Article 15 wording and terminology generated serious debates among parties during ICJ 2007 legal proceedings (Rothwell & Stephens, 2010). Similar issues in respect to maritime boundaries delimitation have been experienced also during Qatar vs Bahrein conflict in 2001, both of which filed legal cases against each other to ICJ for the specific dispute resolution (Mendelson, 2001). Furthermore, the legal case Ukraina vs Rumania (2009) related to EEZ and continental shelf delimitation dispute on the Black Sea was characterized by the same fundamental legal issue. In this context, it must be noted that the legal principles of maritime delimitation, which are found on Article 15 of UNCLOS and Article 12 of Geneva Convention (1958) have been interpreted to some extent by international courts and arbitrage with uncertainty and obscurity. For this reason, it is hard to present a clear and comprehensive situation regarding the legl notion of maritime boundaries delimitation, as well as of the international conflicts characterized by these important issues. Apart from inherited generalization and legal ambiguity which reflect maritime delimitation lega principle, each maritime delineation process involves a specific practical, legal and theoretical situation which contains per se its particular and distinct features, which have to be taken under consideration during the designation and delimitation of maritime zones (Churchill and Law, 1999).
The developments on the European political, diplomacy and military field are characterized traditionally by regional conflicts regarding national jurisdiction over particular maritime zones. The adoption a nd nerty into force of UNCLOS by coastal States have resulted in the eruption of many conflicts in respect to maritime boundaries delimitation. One of these conflictual situations related to sovregnity issue and mariritme boundaries delimitation on the Egean Sea is reflected on the controversial biletaral relations between Turkey and Greece, which are characterized as quite dangerous and problematic during the last decades to date. Notwithstanding that both States are NATO allies, their maritime boundaries
delimitations disagreements during the years 1974, 1976, dhe 1986-1987, have almost been resulted in an open conventional military conflict (Keesing's Contemporary Archives). The international crises between these States is characterized by the escalation phase, reflected mostly via matters such as political issues, nationalistic manifestation, military demonstrations, ultimatums and even isolated military incidents which have resulted in loss of life and military hardware from both sides. This specific conflict of maritime nature, which is still active in nowdays, have had negative impact on international relations system, of both regional ang global consequences, increasing dramatically the threat for a potential military conflict in the entire region. Another serious disagreement on maritime delimitation boundaries on Ionain Sea has also revealed recently between Albania and Greece, which has created political, economical and diplomatical tensions, obstructing the bilateral and regional relations, encouraging thus extreme nationalism and destabilizing the political situation in that particular region. The UNCLOS legal provisions on the delimitation of maritime boundaries, as well as the natural resource management lovated in the Mediterranean Sea, revealed the considerable jurisdiction difference between the legal right to posses and legal obligations not to exert jurisdiction, reflecting as a consequence the controvertial and conflictual interests as well disagreements among Mediterranean coastal States. In this context, national legal practice on the boundaries delimitation and exploitation of maritime resources by these States, based on their interests, is considered diverse and controversial. France, Liban, Malta, Marok, Spain dhe Tunizia historically have adopted distinct national legislation for their maritime zones. A 100 miles EEZ for the purpose of maritime resources exploitation is designated earlier in time by Egypt and Maroc in Mediterranean, as well as by Franc, Spain and Maroc in Atlantic Ocean (Kliot, 1989). Neveretheless, the adoption of the new UNCLOS 200 miles legal right for the EEZ in Mediterranean Sea, has compromised the status quo situation in the entire maritime region because has encouraged the formation of a overlapping EEZ and
maritime boundaries system, which normally hava increased the number anf frequency of disagreements among Mediterranean States. The absence of a common legal standard on the delimitation of maritime boundaries delimitation and maritime resources exploitation in the Mediterranean Sea based on UNCLOS, consequently has negatively influenced towards the development or aggreviation of international disagreements in the context of international relation system.
5. CONCLUSIONS
The legal vacuum and ambiguities of the maritime legal regime, the absence of legal priorities, as well as the sensitivity and crucial importance that maritime zones represent for the coastal States, are the main contributors of potential international conflicts regarding delimitation of maritime boundaries. Consequently, the international legal regime of maritime boundaries, mainly based on UN Law of the Sea Convention (1982), should perhaps undergo a comprehensive revision/evaluation, and appropriate amendments should be made to relevant legal norms, which in turn may clarify this legal issue with the purpose of promoting peace and security in international system. Nevertheless, awaiting possible ammendments are made to relevant legal provisions of UNCLOS on maritime boundaries delimitation; there are several approaches of legal and political nature which may assist towards peaceful dispute resolution between States on the issue. The first approach reflects mandatory legal norms and mechanisms which may be followed. Obligatory procedures reflect dispute resolution by international courts, which State parties of UNCLOS have accepted to be bound by the relevant legal provisions. Non-mandatory procedures involve the intermediation proces, participation of third parties States or arbitrage courts’ decisions. On the other hand, polical settlement mainly achived through bilateral and regional cooperation might be more acceptable for States in order to resovle their disagreement.
REFERENCES 1. Bernard H. O. “International Maritime
Boundaries: Political, Strategic and Historical Considerations,” The University of Miami Inter-American Law Review, Vol. 26, No. 2 (1994/1995).
2. Buzan, B. “A Sea of Troubles: Sources of Dispute in the New Ocean Regime”.
3. Barbados v Trinidad and Tobago, 45 ILM 798, (2006).
4. Byers, M (2009). Understanding Sovereignty Disputes in the North: Who Ownes the Arctic?, Douglas & McIntyre Publishers, Toronto.
5. Churchill, R.R & Lowe, A (1999). Law of the Sea, 3rd ed, Manchester University Press, London.
6. Goldstein, J. S (2001). International Relations, Forth Edition, American University, Washington D.C.
7. Keesing's Contemporary Archives 30, P. 32766, 32791, 21887, 32943, 33042 (1984).
8. Kliot, N. “Cooperation and Conflicts in Maritime Issues in the Mediterranean Basin,” GeoJournal, Vol. 18, No. 3, Marine Geography (April 1989)
9. Klein, N (2005). Dispute Settlement in the UN Convention on the Law of the Sea, Cambridge University Press, UK.
10. Maritime Delimitation in the Black Sea (Rumania v Ukraine), Judgment of 3 Feb. 2009 (Black Sea).
11. Maurice Mendelson, “The Curious Case of Qatar v Bahrain in the International Court of Justice,” 72 British Year Book of International Law, (2001).
12. Nazih N. M Ayubi, “The Arab States and Major Sea Issues,” in The Mediterranean Region - Economic Cooperations, ed., G. Luciani, (Croom, Helm, Beckham: Kent, 1984).

139
Ermal Xhelilaj, Kristofor Lapa, Bledar Sakaj
LAW OF THE SEA IMPLICATION TOWARDS INTERNATIONAL RELATIONS: MARITIME DELIMITATION CASE
disagreements, as occurred during Nicaragua vs Honduras (Carribean Sea) legal case, when Article 15 wording and terminology generated serious debates among parties during ICJ 2007 legal proceedings (Rothwell & Stephens, 2010). Similar issues in respect to maritime boundaries delimitation have been experienced also during Qatar vs Bahrein conflict in 2001, both of which filed legal cases against each other to ICJ for the specific dispute resolution (Mendelson, 2001). Furthermore, the legal case Ukraina vs Rumania (2009) related to EEZ and continental shelf delimitation dispute on the Black Sea was characterized by the same fundamental legal issue. In this context, it must be noted that the legal principles of maritime delimitation, which are found on Article 15 of UNCLOS and Article 12 of Geneva Convention (1958) have been interpreted to some extent by international courts and arbitrage with uncertainty and obscurity. For this reason, it is hard to present a clear and comprehensive situation regarding the legl notion of maritime boundaries delimitation, as well as of the international conflicts characterized by these important issues. Apart from inherited generalization and legal ambiguity which reflect maritime delimitation lega principle, each maritime delineation process involves a specific practical, legal and theoretical situation which contains per se its particular and distinct features, which have to be taken under consideration during the designation and delimitation of maritime zones (Churchill and Law, 1999).
The developments on the European political, diplomacy and military field are characterized traditionally by regional conflicts regarding national jurisdiction over particular maritime zones. The adoption a nd nerty into force of UNCLOS by coastal States have resulted in the eruption of many conflicts in respect to maritime boundaries delimitation. One of these conflictual situations related to sovregnity issue and mariritme boundaries delimitation on the Egean Sea is reflected on the controversial biletaral relations between Turkey and Greece, which are characterized as quite dangerous and problematic during the last decades to date. Notwithstanding that both States are NATO allies, their maritime boundaries
delimitations disagreements during the years 1974, 1976, dhe 1986-1987, have almost been resulted in an open conventional military conflict (Keesing's Contemporary Archives). The international crises between these States is characterized by the escalation phase, reflected mostly via matters such as political issues, nationalistic manifestation, military demonstrations, ultimatums and even isolated military incidents which have resulted in loss of life and military hardware from both sides. This specific conflict of maritime nature, which is still active in nowdays, have had negative impact on international relations system, of both regional ang global consequences, increasing dramatically the threat for a potential military conflict in the entire region. Another serious disagreement on maritime delimitation boundaries on Ionain Sea has also revealed recently between Albania and Greece, which has created political, economical and diplomatical tensions, obstructing the bilateral and regional relations, encouraging thus extreme nationalism and destabilizing the political situation in that particular region. The UNCLOS legal provisions on the delimitation of maritime boundaries, as well as the natural resource management lovated in the Mediterranean Sea, revealed the considerable jurisdiction difference between the legal right to posses and legal obligations not to exert jurisdiction, reflecting as a consequence the controvertial and conflictual interests as well disagreements among Mediterranean coastal States. In this context, national legal practice on the boundaries delimitation and exploitation of maritime resources by these States, based on their interests, is considered diverse and controversial. France, Liban, Malta, Marok, Spain dhe Tunizia historically have adopted distinct national legislation for their maritime zones. A 100 miles EEZ for the purpose of maritime resources exploitation is designated earlier in time by Egypt and Maroc in Mediterranean, as well as by Franc, Spain and Maroc in Atlantic Ocean (Kliot, 1989). Neveretheless, the adoption of the new UNCLOS 200 miles legal right for the EEZ in Mediterranean Sea, has compromised the status quo situation in the entire maritime region because has encouraged the formation of a overlapping EEZ and
maritime boundaries system, which normally hava increased the number anf frequency of disagreements among Mediterranean States. The absence of a common legal standard on the delimitation of maritime boundaries delimitation and maritime resources exploitation in the Mediterranean Sea based on UNCLOS, consequently has negatively influenced towards the development or aggreviation of international disagreements in the context of international relation system.
5. CONCLUSIONS
The legal vacuum and ambiguities of the maritime legal regime, the absence of legal priorities, as well as the sensitivity and crucial importance that maritime zones represent for the coastal States, are the main contributors of potential international conflicts regarding delimitation of maritime boundaries. Consequently, the international legal regime of maritime boundaries, mainly based on UN Law of the Sea Convention (1982), should perhaps undergo a comprehensive revision/evaluation, and appropriate amendments should be made to relevant legal norms, which in turn may clarify this legal issue with the purpose of promoting peace and security in international system. Nevertheless, awaiting possible ammendments are made to relevant legal provisions of UNCLOS on maritime boundaries delimitation; there are several approaches of legal and political nature which may assist towards peaceful dispute resolution between States on the issue. The first approach reflects mandatory legal norms and mechanisms which may be followed. Obligatory procedures reflect dispute resolution by international courts, which State parties of UNCLOS have accepted to be bound by the relevant legal provisions. Non-mandatory procedures involve the intermediation proces, participation of third parties States or arbitrage courts’ decisions. On the other hand, polical settlement mainly achived through bilateral and regional cooperation might be more acceptable for States in order to resovle their disagreement.
REFERENCES 1. Bernard H. O. “International Maritime
Boundaries: Political, Strategic and Historical Considerations,” The University of Miami Inter-American Law Review, Vol. 26, No. 2 (1994/1995).
2. Buzan, B. “A Sea of Troubles: Sources of Dispute in the New Ocean Regime”.
3. Barbados v Trinidad and Tobago, 45 ILM 798, (2006).
4. Byers, M (2009). Understanding Sovereignty Disputes in the North: Who Ownes the Arctic?, Douglas & McIntyre Publishers, Toronto.
5. Churchill, R.R & Lowe, A (1999). Law of the Sea, 3rd ed, Manchester University Press, London.
6. Goldstein, J. S (2001). International Relations, Forth Edition, American University, Washington D.C.
7. Keesing's Contemporary Archives 30, P. 32766, 32791, 21887, 32943, 33042 (1984).
8. Kliot, N. “Cooperation and Conflicts in Maritime Issues in the Mediterranean Basin,” GeoJournal, Vol. 18, No. 3, Marine Geography (April 1989)
9. Klein, N (2005). Dispute Settlement in the UN Convention on the Law of the Sea, Cambridge University Press, UK.
10. Maritime Delimitation in the Black Sea (Rumania v Ukraine), Judgment of 3 Feb. 2009 (Black Sea).
11. Maurice Mendelson, “The Curious Case of Qatar v Bahrain in the International Court of Justice,” 72 British Year Book of International Law, (2001).
12. Nazih N. M Ayubi, “The Arab States and Major Sea Issues,” in The Mediterranean Region - Economic Cooperations, ed., G. Luciani, (Croom, Helm, Beckham: Kent, 1984).

7th INTERNATIONAL MARITIME SCIENCE CONFERENCE
140
April 20th-21st, 2017, Solin, Croatia
13. Rothwell, D. R & Stephens, T (2010). The International Law of the Sea, Hart Publishing, Oxford. and Portland
14. Robert W. Smith, “A Geographical Primer te Maritime Boundary-Making,” 12 Ocean Development and International Law 1, (1982).
15. Territorial and Maritime Dispute between Nicaragua and Honduras in the Carribeab Sea (Nicaragua v Honduras), Judgment of 8th October 2007 (Carribean Sea).
16. UN, United Nations Convention on the Law of the Sea, Pjesa XV

141
Davor Vodopija, Tomislav Skračić, Jelena Žanić-Mikuličić
MARINE ENGINEERS’ VIEWS ON ESP TEACHERS
13. Rothwell, D. R & Stephens, T (2010). The International Law of the Sea, Hart Publishing, Oxford. and Portland
14. Robert W. Smith, “A Geographical Primer te Maritime Boundary-Making,” 12 Ocean Development and International Law 1, (1982).
15. Territorial and Maritime Dispute between Nicaragua and Honduras in the Carribeab Sea (Nicaragua v Honduras), Judgment of 8th October 2007 (Carribean Sea).
16. UN, United Nations Convention on the Law of the Sea, Pjesa XV
MARINE ENGINEERS’ VIEWS ON ESP TEACHERSDavor Vodopija, Tomislav Skračić, Jelena Žanić-Mikuličić
MARINE ENGINEERS’ VIEWS ON ESP TEACHERS
Davor Vodopija1, Tomislav Skračić2, Jelena Žanić-Mikuličić2
(1 Croatian Defence Academy Dr. Franjo Tuđman, Split, Croatia)
(2 University of Split, Faculty of Maritime Studies, Split, Croatia)
(E-mail: [email protected])
ABSTRACT
Maritime English, as English for Specific Purpose (ESP), is focused on the development of students' specific language skills that will assist them in their professional environment. Faced with the ever increasing complexity of their role as ESP teachers and the arising dilemmas, the authors carried out a brief research at the Faculty of Maritime Studies in Split, focusing on the marine engineers attending the special training program for seafarers, in order to identify their needs, expectations and the ways they perceive ESP teachers, courses and themselves as users of English language onboard ships. Even though marine engineers do not view ESP teachers as specialists in their field of expertise, they do expect a knowledge of how language is used at sea – which involves some understanding of essential concepts and contexts, e.g. basic principles of engine operation, daily tasks of marine engineers, common instruments and procedures in modern engine rooms, etc. The quantitative and qualitative results of the research confirm that the marine engineers attending the Special education program expect the ESP teachers to act not only as researchers of their own practice, but also as coaches and consultants.
KEY WORDS
Maritime English, ESP teacher, research, marine engineers.
1. INTRODUCTION
Globalisation of maritime services has led to the adoption of Maritime English as a career tool, permitting mobility, flexibility and competitiveness. With ships carrying multi-cultural crews, effective communication on board, ship-to ship and ship-to-shore is essential. As Popescu and Varsami point out, most maritime accidents are caused by human error, notably by breakdowns in communication or cooperation. Consequently, the legislation in European countries emphasizes the importance of the English language proficiency in
relation to safety at sea.1 The standards governing communicative competence have been strengthened by International Maritime Organization (IMO) through its legal instruments. National authorities and education institutions are required to develop effective training strategies, which meet these new demands. Contemporary Maritime English teacher has to fulfil at least basic demands of IMO’s legal instruments, its advisory Model Course 3.17 and Standard Marine Communication Phrases (SMCP, 2001). The need for effective communications at sea and ashore is internationally recognised by all the shipping
1 Corina Popescu and Anastasia Varsami (2010), pp. 83-87.

7th INTERNATIONAL MARITIME SCIENCE CONFERENCE
142
April 20th-21st, 2017, Solin, Croatia
industry and the seafarers are obliged to gain the appropriate skills and knowledge to communicate efficiently. At higher education institutions in Croatia, Maritime English (ME) is a compulsory subject at undergraduate studies or the so-called Special education program for seafarers. Both models comply with the International Convention on Standards of Training, Certification and Watchkeeping for Seafarers (STCW 95, as amended in 2010 – Manila amendment), and national regulations regarding the education of seafarers and the acquisition of highest ranks. Both programs comprise ME as a compulsory subject and the ME courses are based on the similar syllabi. The essential difference lies in the available in-class time. For instance, ME course for marine engineers is squeezed into 50 hours, whereas the same program for regular students extends over 90 hours. This is a challenge both for the attenders and the teachers and represents a potentially delicate situation regarding the teacher’s planning, performance and fine-tuning to specific conditions. However, this situation is not new in the area of teaching English for Specific Purposes (ESP).
2. DILEMMA ABOUT ESP CONCEPT AND METHODOLOGY
A number of scholars perceive ESP not as a product but rather as an approach, where students’ needs are the foundation of the process. Other scientists describe ESP as designed to meet specified needs of the learner, related in content to particular disciplines, occupations and activities. In contrast with General English, ESP is normally goal-directed. According to P. Robinson, the characteristics involve the limited period of time in which the objectives should be achieved, and homogenous classes of adults in terms of the work or specialist studies the students are involved in. Dudley-Evans and St. John refer to the concept of absolute and variable characteristics.2 The absolute characteristics of ESP include: a) meeting the
2 In addition to P. Robinson (1991) and T. Dudley-Evans and M. J. St. John (1998), this chapter contains references to Hutchinson & Waters (1987), Strevens, (1988) and Zhang (2007), as cited in H. Sierocka, 2014, pp. 3-17.
specific needs of the learner; b) using the underlying methodology and activities of the disciplines it serves; and c) focusing on the language, skills, discourse and genres appropriate to these activities. As for the variable characteristics, ESP: a) may be related to, or designed for, specific disciplines; b) may use, in specific teaching situations, a different methodology from that of general English; c) is likely to be designed for adult learners, either at a tertiary level institution or a professional work situation; and d) is generally designed for intermediate or advanced students. For the opponents, ESP is nothing but General English for Specific Purposes where generic skills and forms of language are the same across a range of disciplines, professions or purposes. In this sense, ESP implies the specific use of language put in a particular context or situation but not as a specific language or code in itself. Pragmatically, all uses of English are somehow specific, as they serve particular purposes. The only real specificity is the purpose and the core of ESP is to recognize learners’ needs and to develop methods of meeting these needs. Likewise, the methodology of English for Specific Purposes has been subjected to numerous discussions and debates. The core issue in these considerations is whether or not there is a special methodology of ESP and whether such a methodology is needed. Dudley-Evans and St. John, for example, emphasize the point that specific ESP teaching has its own methodology, by which they mean that a) all ESP teaching should reflect the methodology of the disciplines and professions it serves, b) the activities the students need to carry out, generate and depend on registers and genres associated with the language that students need to be able to manipulate in order to carry out the activity, and c) the interaction between students and teacher may differ from that which occurs in the general English class. It is also maintained that in ESP classes generally, the interaction may be similar to that in a general English class; however, in the more specific ESP classes, the teacher sometimes becomes more like a language adviser and consultant, having equal status with the learners, who are often experts in the subject matter. Conversely, Robinson questions the specificity of

143
Davor Vodopija, Tomislav Skračić, Jelena Žanić-Mikuličić
MARINE ENGINEERS’ VIEWS ON ESP TEACHERS
ESP methodology stating that only two characteristic features of ESP can be identified: a) ESP activities derive from the students’ specialism (nevertheless, it is not a sine qua non condition), and b) ESP activities can (but may not) have an authentic purpose derived from the students’ target needs.
3. ESP TEACHER AS A PRACTITIONER, INSTRUCTOR, COACH AND CO-OPERATOR
It is generally agreed that a teacher must be creative, resourceful, and flexible to achieve success in ESP teaching. She or he should be a good time manager and leader and have good cross-communication, interpersonal and decision-making skills. However, all of these features can be attributed to any good English teacher. Good teachers, whether ESP teachers or not, are required to be researchers of their own practice, materials producers, evaluators, experimenters of new approaches, explorers of reality, syllabus builders, “teachers of not only language but also of strategies, builders of social contexts inside and outside the classroom, open to change, adaptable, ready to continuously review their own practice”.3 This definition substantially corresponds to the definition provided by Dudley-Evans and St. John who employ the term “ESP practitioner” in order to emphasise that the ESP teacher’s work involves much more than teaching.4 The ESP practitioner’s key roles include teaching, designing courses, providing materials, researching, evaluating, and collaborating. In ESP classes, the teacher is no longer a “primary knower”. In the case of very specific courses, such as Maritime English for marine engineers, the students themselves are frequently the primary knowers of the content. The ESP practitioner acts as course designer and materials provider due to the lack of materials for ESP courses – the more specialized the course, the greater the rarity of teaching materials. Provision of materials includes choosing materials, adapting material when published materials are unsuitable, and writing his/her own materials. The ESP practitioner as researcher should explore the 3 Maria A. A. Celani (2008), pp. 412–423. 4 Dudley-Evans and St. John (1998), pp. 13-14.
students’ goals which they want to achieve, while the ESP practitioner as collaborator involves cooperation with subject specialists: in case of ESP for marine engineers, the cooperation might include the seafarers themselves and teachers in relevant subjects. Evaluation is not a new function and it is performed in General English classes too. Nevertheless, there are differences. General English courses have been well-studied and improved by methodology specialists, whereas ESP courses are often tailor-made and unique, so that it is not feasible to prepare and design the course in order to satisfy all the ESP students’ needs, as they are likely to change with each ESP course. In order to communicate effectively, seafarers need to be able to use and understand Maritime English (ME), in speech and writing, in a range of situations. When seafarers demonstrate the ability to do this, they prove their communicative competence in English, states Borodina who advocates the communicative approach and refers to ME teachers as instructors rather than practitioners. The principles of the communicative approach are that: a) language is a tool of communication; b) teaching should be student-centred; c) English should be taught through English; d) students learn by active involvement, and e) learning tasks should reflect real life communication. The communicative student-centred approach encourages active learning via student involvement, under the instructor’s guidance, supervision and encouragement.5 According to Borodina, ESP instructors should establish micro real-life situations, an English-speaking environment in the classroom and the specific atmosphere of friendliness and positive emotions. Jokes, exchanging curious stories and periods of relaxation should be arranged and practiced by instructors, to make the compressed timetable bearable.
4. ESP TEACHERS AND SUBJECT KNOWLEDGE DILEMMA
How to deal with the content which the ESP teachers are not completely familiar with? Some believe that ESP teachers do not have to acquire 5 Natalya V. Borodina: Some aspects of the seafarers' language competence development (2014).

7th INTERNATIONAL MARITIME SCIENCE CONFERENCE
144
April 20th-21st, 2017, Solin, Croatia
specialist subject knowledge – the knowledge of the fundamental principles of the subject area was considered sufficient. Nevertheless, it is considered advisable to take advantage of the learners’ specialist knowledge and to ask for clarification of terminology and key concepts that the teacher does not know or understand. Other scientists note that the ESP teachers’ role involves understanding of the nature of the specialist material.6 Another disputed issue is the distinction between ESP teachers’ knowledge of the subject and that of the subject specialist. Conflicts may arise between a ME teacher and the subject teacher over, say, who should explain the phrases “loop scavenging”, “ECA area” or “crosshead” to students. While many researchers and teachers believe that English teachers should focus on English, other advocate a cooperative approach, i.e. establishing a framework of co-operation between language and subject specialists, which would enhance their relationships and contribute to better language acquisition.
Figure 1. ESP teacher’s complex roles (Source: authors, according to Ahmed, 2014)
6 Various approaches suggested by scholars are cited in: Halina Sierocka (2014).
In spite of various views on the roles of ESP teachers, the preferred approaches, methodologies and competences, the above discussion clearly shows that the ESP teacher is a complex service provider who organises the teaching process, creates and/or adapts teaching tools and materials, delivers lectures and perform exercises, explains, advises, evaluates, and acts as a team coach, needs analyst, manager, and collaborator with both students and subject specialist. The graph below helps to visualise the variety of the ESP teacher’s roles. At least one “cloud” in the graph remains empty, ready to be filled up in accordance with the development of future needs, demands and requirements in education and seafaring processes and technologies.
5. RESEARCH
Faced with the ever increasing complexity of their role as ESP teachers and the arising dilemmas, the authors carried out a research at the Faculty of Maritime Studies in Split, focusing on the marine engineers attending the Special education program for seafarers, in order to find out their expectations and the ways they perceive ESP teachers. At the time of their training, the great majority of them served as 3rd engineer officers on ships having propulsion engines of more than 3000 kW, while a few of them were 2nd engine officers or chief engineers on smaller vessels. 58% respondents were aged from 30 to 42, whereas 25% where older than 42. Their experience amounted to around 16 years of sea time on average. They were given a simple question allowing more than one responses: Given the fact that English teachers are not marine engineers, they should a) Teach general English; b) Teach English grammar; c) Be familiarised with the profession and teach professional English - mainly terminology; d) Be familiarised with the profession and teach professional English - both terminology and grammar.
ESP teacher
Teaching
Evaluation
Analysis of needs
Syllabus design
Development of materials
Research
Collaboration & negotiation
?

145
Davor Vodopija, Tomislav Skračić, Jelena Žanić-Mikuličić
MARINE ENGINEERS’ VIEWS ON ESP TEACHERS
Figure 2. Marine Engineers’ Views on ESP teacher’s roles (Source: authors) 73 responses were produced by 63 marine engineers attending the Special education program for seafarers at the Faculty of Maritime Studies in Split from 2015 to 2016. The results indicate that more than 70% of the respondents expected ESP teachers to be familiarised with the terminology and the basic principles and systems in marine engineering, and to organise English classes accordingly. Only 3 respondents believed that their teacher should be teaching English grammar, compared to 31 marine engineers (42.47%) who admitted the importance of learning grammar, provided that it was combined with other relevant segments such as professional terminology. 22 respondents (30.14% responses) expected their ESP teacher to focus exclusively on marine engineering profession, whereas 17 seafarers wanted to improve their competence in general English. In addition to quantitative data, the research also included brief interviews aimed at gathering additional qualitative information on the seafarers’ views and expectations. Again, most of them shared the opinion that the teacher should be familiar with their professional context. Although
pointing out that this would be “nice” but not “a must”, they believe that it does not make much sense to teach ESP without understanding the basic principles of the engine operation, daily tasks of marine engineers, common instruments and procedures in modern engine rooms, and alike. They expect Maritime English teachers to be familiar with new technologies, working conditions and requirements in the seafarer market, and are ready to help their teachers during classes and after their course is over. They also suggest that cooperation across the departments at Faculty of Maritime Studies in Split would be beneficial and useful for improving the syllabi of both English and specialist subjects. Finally, given their age, maturity, expertise and motivation, most of the seafarers admitted that they expected ESP and other courses to be performed in a relaxed, friendly environment, where the ESP teachers would act not only as researchers of their own practice, materials producers, syllabus builders and evaluators, but also as advisers, coaches and consultants – during and after the course. This post festum cooperation actually works. Through the internet or in person, ME teachers assist them whenever they have difficulties in correspondence, understanding written material, using grammar and alike. On the other hand, the seafarers provide practical manuals, explanations, diagrams, real-life stories, photographs and other materials that enable ME teachers to understand some of the technologies, principles, systems or working conditions in marine engineers’ environment, and to transfer this knowledge to full-time students – the future marine engineers.
6. CONCLUSION
The modern marine engineer is not just a crew member who maintains the ship’s machinery, checks the parameters or tightens loose studs. He or she is also a report maker, a manager who runs the team, a diplomate in a multilingual and multi-cultural crew, and a person whose competence, both language and professional, may result in making or avoiding costly mistakes. With regard to the disputes over the role of ESP teachers on the one hand, and the increasing complexity of marine engineering and sea-borne shipping technologies and practices on the other,
23.29%
4.11%
30.14%
42.47%
ESP teachers should Teach general English
Teach English grammar
Be familiarised with the profession and teach professional English -‐ mainly terminology Be familiarised with the profession and teach professional English -‐ both terminology and grammar

7th INTERNATIONAL MARITIME SCIENCE CONFERENCE
146
April 20th-21st, 2017, Solin, Croatia
teachers of Maritime English have been facing a number of challenges and dilemmas regarding their position as ESP teachers or, as some scholars would say, ESP practitioners or advisors. These were the reasons for conducting a brief quantitative and qualitative research at the Faculty of Maritime Studies in Split. It involved 63 marine engineers attending the Special education program for seafarers and was aimed at detecting their expectations and the ways they perceive ESP teachers. Despite its limitations in the scope and number of respondents, the research did resolve some of the dilemmas. It has been proven that: a) Maritime English as ESP for marine engineers involves a limited period of time (50 hours) in which the objectives should be achieved; b) ME involves homogenous classes of adults at a tertiary level institution and a professional work situation; c) ME has to meet the specific needs of these learners; d) ME focuses on the specific language, skills, discourse and genres; e) given the specific teaching situation, ME teachers are likely to use a different methodology from that of General English although ESP teaching does not necessarily have its own intrinsic methodology; f) the interaction between students and teacher differs from the one occurring in the General English class; g) in these specific ESP classes, the education inevitable becomes a two-way street: the teacher becomes more like a language adviser and consultant, having equal status with the learners, who are experts in the subject matter. The research results revealed that a) more than 70% of the respondents expected ESP teachers to be familiarised with the terminology and the basic principles and systems in marine engineering, and to organise English classes accordingly; b) 22 respondents (30.14%) expected their ESP teacher to focus exclusively on marine engineering profession; c) 31 seafarers (42.47%) admitted the importance of learning grammar, provided that it was combined with other relevant segments such as professional terminology; whereas d) only 3 seafarers believed that their teacher should mostly focus on teaching grammar; while e) 17 seafarers wanted to improve their competence in general English. The interviewed seafarers underlined that teaching Maritime English to marine engineers should imply an understanding of the basic principles of the
engine operation, common instruments and procedures in modern engine rooms, and daily tasks of marine engineers. They expected ME teachers to be familiar with new technologies, working conditions and requirements in the seafarer market, and expressed readiness to help their teachers in acquiring specialist knowledge. The respondents also suggested that cooperation across the departments at Faculty of Maritime Studies in Split would be beneficial and useful for improving the syllabi of both English and specialist subjects. .
REFERENCES
1. Ahmed, M. K., “The ESP Teacher: Issues, Tasks and Challenges”, English for Specific Purposes World, Issue 42, Vol. 15, 2014, ISSN 1682-3257.
2. Borodina, N. V., “Some aspects of the seafarers' language competence development”, available at: http://iamu-edu.org/wp-content/uploads/2014/06/21-some-aspects-of-the-seafarers-language-competence-development.pdf (accessed 2017-02-11)
3. Celani, M. A. A., “When myth and reality meet: Reflections on ESP in Brazil”, English for Specific Purposes 27 (2008) pp. 412–423.
4. Dudley-Evans, T. and St. John, M. J., Developments in English for Specific Purposes: A multi-disciplinary approach, Cambridge University Press, 1998, pp. 2-14.
5. Guidance on the Implementation of IMO Model Courses. London, International Maritime Organization, 1999.
6. Maritime English. Model Course 3.17. London, International Maritime Organization, 2001.
7. Popescu, C. and Varsami, A., “Maritime English – A Necessity for Nowadays Apprentices”, Advances in Maritime and Naval Science and Engineering, Proceedings of the 3rd International Conference on Maritime and Naval Science and Engineering, Constantza Maritime University, Romania, September 3-

147
Davor Vodopija, Tomislav Skračić, Jelena Žanić-Mikuličić
MARINE ENGINEERS’ VIEWS ON ESP TEACHERS
5, 2010, WSEAS Press, ISBN: 978-960-474-222-6, pp. 83-87.
8. Robinson, P., ESP Today: a Practitioner’s Guide. Hemel Hempstead: Prentice Hall International, 1991.
9. Sierocka, H., Curriculum Development for Legal English Programs, Cambridge Scholars
Publishing, 2014, pp. 3-17. ISBN (10): 1-4438-5437-9, ISBN (13): 978-1-4438-5437-5.
10. STCW 95. London, International Maritime Organization, 2000.

7th INTERNATIONAL MARITIME SCIENCE CONFERENCE
148
April 20th-21st, 2017, Solin, Croatia
DEMAND FOR CREW IN SEAFARER MARKET AND PREDICTIONS FOR THE FUTUREPero Vidan, Ivo Sunjić, Igor Stanovčić
DEMAND FOR CREW IN SEAFARER MARKET AND PREDICTIONS FOR THE FUTURE
Pero Vidan1, Ivo Sunjić1, Igor Stanovčić2
(1 University of Split, Faculty of Maritime Studies, Split, Croatia)
(2 University of Montenegro, Faculty of Maritime Studies, Kotor, Montenegro)
(E-mail: [email protected])
ABSTRACT
Shipping is one of the main aspects of global economy. It represents the largest European industry. The global supply of seafarers in
2015 was estimated at 1,647,500 seafarers, of whom 774,000 were officers and 873,500 were ratings. However, the BIMCO and ICS
report estimated that there was a surplus of about 119,000 ratings (15.8%), while the demand had increased by just about 1% since
2010. Significantly, China is thought to have overtaken the Philippines as the largest single source of seafarers. At Croatian faculties
of maritime studies and at foreign higher education institutions that are engaged as partners in IMSC co-organization, this trend can
be observed through the increased interest of students in enrolling maritime study programs. In spite of this, the capacity of these
institutions, the STCW standards and quality limits do not permit the enrolling quotas to increase.
KEY WORDS
Seafarers, market, manpower
1. INTRODUCTION
Shipping is one of the main factors in global economy. The global supply of seafarers in 2015 was estimated at 1,647,500 seafarers, of whom 774,000 were officers and 873,500 were ratings [4]. The global supply of seafarers has increased over the past five years, and the number of qualified officers and ratings available to the international merchant fleet continues to rise. The number of officers was reported to grow by 34% between 2005 and 2010, and it was estimated that the number increased by 24 % in the following five years, until 2015. According to the estimates of the individual country contribution to the worldwide supply of seafarers, the top five
countries with the largest numbers of seafarers in 2015 included China, the Philippines, Indonesia, the Russian Federation and Ukraine, whereas the top five manpower suppliers indicated by companies were China, the Philippines and the Russian Federation, followed by Ukraine and India [4]. In 2015, the Manpower Report prepared by the Baltic and International Maritime Council (BIMCO) and the International Chamber of Shipping (ICS) specified that the world merchant fleet comprised 68,723 ships [4]. General cargo ships represented the largest category, having a share of 31% of the total ships by number, followed by bulk carriers with 16% and offshore supply vessels with 10%. The 2015 report included information on the tanker industry and various

149
Pero Vidan, Ivo Sunjić, Igor Stanovčić
DEMAND FOR CREW IN SEAFARER MARKET AND PREDICTIONS FOR THE FUTURE
types of offshore vessels to achieve a more accurate report by indicating the demand for seafarers in these trades. While the estimated demand for officers and ratings increased between 2005 and 2010 by 33.8% and 27.5% respectively, the trend of the demand for officers continued after 2010, whereas only a slight increase in demand for ratings has been indicated since 2010.
The growing demand for seafarers considerably affects the quality of seafarers’ education and training centers, academies and universities, especially in the Far East region where many world prominent shipping companies have their own training centers and academies. This phenomenon leads to substandard education and training and, eventually, to potential material damage and human casualties as the end result.
In 2015 Croatia’s GDP amounted to 89.76 billion USD. In this country there are around 27,000 active seafarers (2015), mostly officers, who sail via seaman’s book and are officially registered (tax
administration). It is estimated that at least 2000 more seafarers are at sea, sailing without official evidence (via passport, foreign seaman’s book etc.). It is also estimated that every year Croatian seafarers bring around 1 billion USD into Croatia, which is a considerable income for such a small economy (1,11 %).
2. ESTIMATED SUPPLY AND DEMAND SITUATION IN 2015
The comprehensive 2015 Manpower Report prepared by BIMCO and ICS indicated that the global supply of seafarers was around 1,647,500 seafarers, including approximately 774,000 officers and 873,500 ratings, and that the global demand for seafarers in that period was around 1,545,000 seafarers, with the industry requiring approximately 790,500 officers and 754,500 ratings.
Figure 1. Current estimated global supply and demand of seafarers
Source [4]
-‐200000
0
200000
400000
600000
800000
1000000
1200000
1400000
1600000
1800000
Officers Ra1ngs Total
Supply Demand Shortage/Surplus

7th INTERNATIONAL MARITIME SCIENCE CONFERENCE
150
April 20th-21st, 2017, Solin, Croatia
Table 1. Estimated global supply and demand of seafarers in 2015
Officers Ratings Total Supply 774,000 873,500 1,647,500 Demand 790,500 754,500 1,545,500 Shortage/Surplus -16,500 119,000 102,500 Percentage 2.1% 15.8% 6.6% Source [4]
Recruitment and training levels were estimated to increase over the previous five years and wastage rates (i.e. retaining qualified seafarers and increasing the time they serve at sea) were apparently reduced below the rates identified in previous reports. The 2015 report provided information on the turnover and wastage rates by
rank and role, as well as for selected seafarer supply countries. While the estimated wastage and turnover rates were considered to be generally positive, the identified contribution of recruitment and training was, and still is, insufficient to reduce the shortage of officers or to keep pace with the forecast demand for officers in the future [3]
Table 2. Estimated supply-demand balance for officers
2015 2020 2025 Supply 774,000 789,500 805,000 Demand 790,000 881,500 952,500 Shortage/Surplus -16,500 -92,000 -147,500 Percentage 2.1 11.7 18.3
Figure 2. Current estimated global supply and demand of seafarers
Source [4] The 2015 report points out that the predicted growth in the world merchant fleet over the next ten years, and its expected demand for manpower, will likely continue the trend of an overall shortage
in the supply of officers, despite the improved recruitment and training levels and reductions in officer wastage rates over the past five years.
-‐400000
-‐200000
0
200000
400000
600000
800000
1000000
1200000
2015 2020 2025
Supply Demand Shortage/Surplus

151
Pero Vidan, Ivo Sunjić, Igor Stanovčić
DEMAND FOR CREW IN SEAFARER MARKET AND PREDICTIONS FOR THE FUTURE
Table 3. Nationality of manpower in the world
Ranking Seafarers (all) Officers Ratings 1 China China Philippines 2 Philippines Philippines China 3 Indonesia India Indonesia 4 Russian Federation Indonesia Russian Federation 5 Ukraine Russian Federation Ukraine
Source [4]
In the past five years the maritime shipping industry has made good progress in increasing the recruitment and training levels and reducing officer wastage (i.e. retaining qualified seafarers and increasing the time they serve at sea). However, the report indicates that, unless training levels are increased significantly, the growth in demand for seafarers could generate a serious shortage in the total supply of officers. On the other hand, it is estimated that there is a current surplus of about 119,000 ratings (15.8%), with the demand increased by just about 1% since 2010. Significantly, China is thought to have overtaken the Philippines as the largest single source of seafarers qualified for international trade (although the Philippines still remains the largest source of ratings). However, the data provided by international shipping companies suggest that the extent to which Chinese seafarers are available for international service may be more limited, with the Philippines and Russia seen as equally important sources of officers, followed closely by Ukraine and India.
3. EDUCATION AND TRAINING OF SEAFARERS
Education of seafarers is regulated by STCW convention and governed by national legislations. Higher education is compulsory for acquiring management ranks at ships, i.e. positions such as captains, chief mates, chief engineers, and second engineers in some of the countries that are engaged in IMSC co-organization (Slovenia,
Croatia, and Poland). In Montenegro, acquiring position of master mariner and chief engineer is possible with course only (not high education).
The 3-year undergraduate study programs performed in Slovenia, Croatia, and Poland guarantee a high quality of officers’ education and training. Upon successful completion of these programs, students are awarded the BSc degree in nautical studies or marine engineering.
There are four higher-education institutions (HEI) providing maritime study programs in Croatia (Rijeka, Zadar, Split and Dubrovnik). There is one in Slovenia, two in Montenegro and four in Poland (two in Szczecin and two in Gdynia). These institutions perform a number of study programs, but for the purpose of this research, only nautical studies and marine engineering studies are subject to comparison. These two studies are almost similar and comply with the recommendations of the International Convention on Standards of Training, Certification and Watchkeeping – STCW). The STCW Convention defines minimum standards of education for a master and a chief mate of a ship of 3,000 GT or more and for second engineers and chief engineers on ships with main propulsion machinery of 3,000 kW or more.
A high interest of students in acquiring maritime education was evident in the academic year 2013/2014 at all IMSC co-organizing faculties of maritime studies (Table 4). According to the statistical data shown in Table 4, there were more nautical students than marine engineers, although the demand for marine engineers is higher.

7th INTERNATIONAL MARITIME SCIENCE CONFERENCE
152
April 20th-21st, 2017, Solin, Croatia
Table 4. Number of students in the academic year 2013/2014 acquiring BSc degree
Faculty Nautical students Marine engineering students
Rijeka 360 223 Split 325 117 Dubrovnik 91 33 Zadar 100 77 Kotor 330 186 Portorož 102 47 Gdynia 520 171 Total 1,828 854
Source: [7]
Table 5. Number of teaching staff meeting STCW and HE requirements in 2013/2014
Faculty Full prof Associated prof Assistant prof Total Rijeka 7 3 10 20 Split 0 0 5 5 Dubrovnik 1 1 1 3 Zadar 0 1 0 1 Kotor 2 0 0 2 Portorož 0 0 2 2 Gdynia 9 8 13 30
Source [7]
In compliance with the STCW Convention standards, the university professors have to meet qualification and training requirements. According to the rules and regulations laid down by national ministries of science, PhD degree is compulsory. This implies that teachers at maritime faculties must have both the STCW certificate of
competence (CoC) and the PhD degree (Table 5). These requirements are rarely fulfilled in the market. According to Table 5, the number of teaching staff complying with HEI and STCW standards was relatively small in the academic year 2013/14.
Table 6. Number of students in the academic year 2015/2016 acquiring BSc degree
Faculty Nautical students Marine engineering students
Rijeka1 361 354 Split 443 202 Dubrovnik2 190 109
Zadar3 334 163
Kotor 4 246 430 Portoroz5 126 46 Gdynia6 479 171 Total 2,179 1,475
1 University of Rijeka, I. Rudan 2 University of Dubrovnik, M. Bupić 3 University of Zadar, T. Brković 4 University of Montenegro, T. Dlabač 5 University of Ljubljana, E. Twrdy 6 Polish Naval Academy, A. Zaleska-Fornal

153
Pero Vidan, Ivo Sunjić, Igor Stanovčić
DEMAND FOR CREW IN SEAFARER MARKET AND PREDICTIONS FOR THE FUTURE
Table 7. Number of teaching staff meeting STCW and HE requirements in 2016/2017
Faculty Full prof Associated prof Assistant prof Total Rijeka1 4 5 10 19 Split 2 2 4 8 Dubrovnik2 1 1 3 5 Zadar37 0 1 1 2 Kotor 4 2 0 0 2 Portorož5 0 0 0 0 Gdynia6 5 10 16 31
When comparing Tables 6 and 4, it can be concluded that the observed higher education institutions (HEI) experienced an increased number of students who graduated and were awarded BSc degrees. It would not be wise to conclude that this was just the result of higher enrolling quotas. The reasons may as well include higher quality of the teaching process, better educational background of students, higher motivation, or, quite simply, less difficulties in studying. When observing the data in Table 7, the number of teachers complying with HEI and STCW standards did not follow this trend.
4. DISCUSSION
It has been clearly recognized that the world shipping industry needs more competent personnel at sea and ashore than ever before. The mandatory implementation of STCW provisions by national authorities increases the barriers for sub-standard maritime education providers that lack the necessary requirements to join the processes of education and training of seafarers. Even in cases where monetary resources are adequate for a shore-based physical plant, other constraints persist. One such major challenge that many maritime institutions experience, regardless of location, is their inability to attract appropriately qualified instructors.
Education for seafarers is rather expensive, because maritime education and training (MET) institutions have to provide necessary equipment such as simulators, lifesaving equipment, video material, laboratories, and workshops. Comparing with other HEI (humanistic studies, economy, law) the implementation of maritime study programs is a costly business. Moreover, national rules and
regulations in some countries require training on school vessels which additionally increases the costs of training and education.
As public institutions, most of the MET discussed in this research receive state funds, but they do have to provide for the necessary equipment by themselves. This results in their need to carry out additional activities, such as operating as training centers in the seafarer market. It has to be noted that salaries of with STCW certificates but without PhD degree are not attractive; therefore, it is difficult to find this sort of staff at labor market, especially on a part-time basis.
Workload is another constraint. Acquiring PhD and STCW certificates of competence (CoC) is difficult and time-consuming, which reduces teachers’ motivation to join MET institutions. Most of the employed PhD teachers with CoC have a tremendous workload, i.e. large amount of lessons, exercise and paperwork, which adversely affects their scientific work. Nevertheless, HEI employ STCW teachers as lecturers and assistants, mostly on part-time basis, in order to keep the quality of STCW training at maximum level. Most of these teachers have more workload than their peers at other educational institutions.
The number of students at the observed MET institutions has been increasing because of higher demand for seafarers worldwide. They are largely outnumbered by the Far East students/seafarers, but the quality of their education, skills and approach to work makes them very competitive in the seafarer market and recognizable by employers.
Currently, more than 1.5 million people are employed as seafarers across the world. If the global economy continues to grow, the demand

7th INTERNATIONAL MARITIME SCIENCE CONFERENCE
154
April 20th-21st, 2017, Solin, Croatia
for highly trained and qualified seafarers will grow accordingly. Related industries such as shipbuilding, ship repair and ship recycling will also have growing requirements for manpower resources.
If the global fleet increases in size by 70% between now and 2030 (as has been widely predicted, based on the growth trend over the last five decades), the current number of 500,000 officers needs to be increased to 850,000. If half of the existing officers retire by 2030, this means that 600,000 new officers will have to be recruited and trained, i.e. about 40,000 officers per year from now on [3].
At the same time, a number of combined factors make modern ships more complex and sophisticated than ever before. Environmental pressures, the need to operate at optimum efficiency in difficult economic times and the quest for sustainable development, are the factors that raise the bar with respect to the skill levels of seagoing personnel. [2]
Present demand for seafarers has encouraged scientists, designers and engineers to design and building new ships with reduced crew size and the unmanned vessels. Some of researches in the last few years have produced very good results [4].
IMO also started to recognize these types of vessels in their presentations at 2016 MSC sessions.In addition to qualified teachers, seafarers, designers, builders and scientists, the growing maritime industry and the world trade fleet require a large number of supervisors and superintendents. Unfortunately, due to shortage of adequate manpower, some shippers tend to employ people with no previous seafaring and engineering experience. This results in reduced salaries and overall labor cost, but also in reduced standards of safety aboard and increased irregularities. The STCW Convention requires all seafarers to be properly qualified for the position that they hold on board, and the ISM Code requires the company to assess and document the position of responsibility and individual competency of each crew member. Instructors, supervisors and assessors themselves are also required to be appropriately qualified. STCW levels of competencies are minimum levels for ensuring
safe and environmentally responsible shipping but as long as various players in the maritime industry stick with these minimum levels, it will be difficult to cope with the increasing size and complex nature of today's ships and shipping in general [6].
5. CONCLUSION
The maritime community is facing a number of serious challenges. Future demands for seafarers will be driven by various factors. Firstly, it is obvious that the world trade will keep on growing and so will the global shipping fleet. This, in turn, will result in the growth of ship productivity which will be determined by highly qualified manpower and technology embodied in new ships. [5]
Demands for workforce will encourage shippers to reduce crew qualification requirements to the minimum and to seek minimum manning documents which are typically offered by the flags of convenience.
Insufficient number of seafarers will force maritime industry and organizations to hasten the approval of the crew downsizing and the introduction of unmanned vessels.Nationality of crews across the world fleet will be further changed by the increased percentage of Chinese, Indian and other seafarers from the East. The crew from the western countries, including ratings and officers, will be decreasing accordingly.
Without intervention of European seafaring nations, i.e. without subventions and subsidies in education of seafarers, European crews will become uncompetitive. The number of teachers with STCW CoC and PhD will be further reduced. This trend will be followed by decrease in students at MET institutions. In addition, the growth of economy and GDP in these countries will make the manpower from these countries more expensive and less competitive.
Therefore, it is advised to make new curriculums for maritime students who will be able to operate new high technologies (offshore, LNG, LPG) at management level, but also for future superintendents and corporate managers, so that

155
Pero Vidan, Ivo Sunjić, Igor Stanovčić
DEMAND FOR CREW IN SEAFARER MARKET AND PREDICTIONS FOR THE FUTURE
the higher education and training could respond to global trends.
REFERENCES
1. Alert, Issue No. 20, April 2009; website: http://www.he-alert.org/objects_store/alert_20.pdf
2. Circular Letter No. 3578-World Maritime Day-2015, 17 August 2015
3. http://www.drewry.co.uk/publications/view_publication.php?id=325
4. http://www.ics-shipping.org/docs/default-source/resources/safety-security-and-operations/manpower-report-2015-executive-summary.pdf?sfvrsn=14
5. http://www.imo.org/en/About/strategy/Documents/NGOs%20-%20tdc/IAMU%20-%20Input%20to%20TDCs.pdf
6. http://www.unmanned-ship.org/munin/ 7. Twrdy, E., Bielić, T., Solution for Education of
Seafarers, IMSC, Solin, 2014.

7th INTERNATIONAL MARITIME SCIENCE CONFERENCE
156
April 20th-21st, 2017, Solin, Croatia
OIL SPILL IN MARINE PROTECTED AREAS (MPAs) – A POSSIBLE ADJUSTMENT OF CROATIAN CONTINGENCY PLANLuka Vukić, Helena Ukić, Merica Slišković
OIL SPILL IN MARINE PROTECTED AREAS (MPAs) – A POSSIBLE ADJUSTMENT OF CROATIAN CONTINGENCY PLAN
Luka Vukić, Helena Ukić, Merica Slišković
(University of Split, Faculty of Maritime Studies, Split, Croatia)
(E-mail: [email protected])
ABSTRACT
A sudden oil spill in marine protected area (MPA) has the consequences larger than in any other parts of marine space. It threatens the very purpose of establishing MPA as well as the future of communities which depend on it. Croatia protects the most valuable parts of the sea through the protection levels adjusted to the International Union for Conservation of Nature (IUCN) guidelines what makes 2% of a total sea area throughout the coastline. The Croatian Contingency Plan for Accidental Marine Pollution of 2008 recognizes the importance of MPA by giving it the priority in action, but recent findings suggest that should be updated (the need for adjustment) since the priority in acting is not enough privilege of MPA. When a majority of pollution comes as the operational spill from ships, there is a need for permanent control and sampling of the sea inside MPA. As response time is a crucial factor, especially trained staff and equipment should be available on the site as close as possible to the protected area of the sea. This paper presents recommendations that should be taken into consideration while updating (in drafting) new Croatian Contingency Plan.
KEY WORDS
Contingency plan, MPA, oil spill, Croatia.
1. INTRODUCTION The most wide-ranging definition of MPA defines it as “any area of intertidal or subtidal terrain, together with its overlying water and associated flora, fauna, historical and cultural features, which has been reserved by law or other effective means to protect part or all of the enclosed environment” (IUCN, 2001; Tejedor and Spinosa, 2006). Sustainable use of resources from some types of protected areas, and exclusion of such uses from others, is an important part of the protection
(Lockwood et al., 2006). All such regions have a vital ecological importance and are very attractive to human development considering their unique characteristics such as demographic density and distribution, cultural traditions, primary local activities, environmental use, and the extent of the dependence on natural resources (through fishery and tourism, especially) (Maggi, 2011). In many countries, parks and protected areas have become “the cornerstone of tourism and recreation” (Campbell et al., 2008). But as global population and consumption levels rise, protected areas are

157
Luka Vukić, Helena Ukić, Merica Slišković
OIL SPILL IN MARINE PROTECTED AREAS (MPAs) – A POSSIBLE ADJUSTMENT OF CROATIAN CONTINGENCY PLAN
coming under increasing pressure by land users and its uses and needs including local communities, agriculture, and mineral and fossil fuel companies (Marsh, 2015). The ever-increasing worldwide demand for energy is driving oil and gas exploration into ocean depths, polar landscapes and once-remote corners of the globe, including protected areas (Marsh, 2015). Oil spills from platforms and tankers are the biggest latent threat to the marine environment (Centre, 2015). An oil spill in these areas would certainly have catastrophic consequences - not only for the ecological systems (most of them with endemic species) but to the local communities that depend on the nature for their survival (Maggi, 2011). 2. MARINE PROTECTED AREAS IN MEDITERRANEAN SEA
The Mediterranean Sea is especially sensitive to oil spill because it is closed all around, it has a number of gulfs, bays and straits and thousands of islands. It is home for millions of people suffering the pressure of big and growing maritime traffic and frequent drilling platforms. It is the sea of great risk of oil spill. One of the most important aspects of oil spill response is planning. The Network of Managers of Marine Protected Areas in the Mediterranean (MedPAN) has mapped Mediterranean MPAs (Tempesta and Piante, 2008). The environmental sensitivity maps have been made and the special sensitive areas on oil spill marked (Figure 1.).
Figure 1. Mediterranean MPAs by MedPAN (2008)
These maps are fundamental for planning protection priorities, defining response strategies and efficiently combating oil spills (Maggi, 2011). As the zones currently designated as MPAs in the Mediterranean amount to less than 0.5% of the sea’s total surface area, MedPAN try to foster the creation of new MPAs (Tempesta and Piante, 2008). 3. SPECIFICITIES OF OIL SPILL IN THE MPA MPA’s are very sensitive regions that exist in very close to people and their activities. They are protected to be preserved of normal, everyday influences because they are threatened in ‘normal’ circumstances already. IUCN (2008) defines six levels of protection considering regime of the entrance, stay and activities inside the area:
Ia – Strict natural reserve Ib – Wilderness area II – Natural park III – Natural monument or feature IV – Habitat/species management area V – Protected landscape/seascape VI – Protected area with sustainable use of natural resources The countries can spread and adapt these levels of restriction according to their circumstances. The higher level of restriction makes the protected area more sensitive for preservation. There is no physical barrier between MPA and unprotected areas. It is why the MPA is more sensitive to damage than the inland protected area of the same level. There is also our own lack of awareness and care when the signs of borders of the MPA are not visible. It gradually changes the originality and biodiversity of the MPA, and its uniqueness. If there are motorized cruises inside it with vehicles using fuel oil, the damage is permanent. The oil spill and similar accidents influenced by human activity in the MPA destroys the purpose of its existing. The damage cannot be recovered in the original form. Even if the sea, landscape, and biodiversity recover somehow, it is the "unnatural product" as a result of an artificial catastrophe, and not the natural one. There are not many reasons for further managing of a formerly protected area except in the commercial part, and

7th INTERNATIONAL MARITIME SCIENCE CONFERENCE
158
April 20th-21st, 2017, Solin, Croatia
it doesn’t reflect the main purpose of MPA.. The agony of Great Barrier Reef shows the sensitivity and vulnerability of MPA despite a lot of taken actions, restrictions, and bans (Normile, 2016). 4. RESPONSE TO MARINE OIL SPILL The goal of oil spill response is to minimize the overall impacts on natural and economic resources. The decisions to select response methods should consider the potential of each possible method for reducing the environmental consequences of the spill and the response itself (including a natural recovery alternative) (Spill Response Strategy, 2015). Due to MPA the Senate Bill 414, US Senate has amended the Rapid Oil Response Act to make oil spill response faster and more effective. Among other things, it requires to study and use the best achievable technology for oil spill cleanup and conduct a follow-up study on negative impacts that the use of dispersants has had (Bacher, 2015). The development of cleanup techniques and equipment includes also the development of computer-based decision tools to facilitate contingency planning and response management, the improvements on oil spill remote sensing systems or the development of techniques for recovering oil in fast current environments (Tejedor and Spinosa, 2006). 5. MPA IN CROATIA According to database MAPAMED (Marine Protected Areas in the Mediterranean), there are ten main MPAs in Croatia grouped in three protection categories: national parks, nature parks, and special reserves. There are also a lot of individual, small protected islands, caves, and capes which are not included in MAPAMED (RAC/SPA and IUCN-Med., 2014). The positive regulations enable the control of illegal activities in MPA by the ranger
service giving them a respectable quantity of jurisdiction. They use resources from the budgets of state, county, municipal or city and the income from the use of protected regions (Nature Protection Law, 2013). The increased number of visitors in MPAs increases an income of companies that manage with MPAs, enabling them a further investment. By self-financing, MPA not only justifies its existence but as the interested party aims to improve the management. Including the oil spill response in the scope of work, it is more likely for MPA to be preserved and for employees to save the jobs. Under the auspices of the FAO (Food and Agricultural Organization) Legal Office of the United Nations and on the basis of the Barcelona Convention of 1976, the Republic of Croatia signed the Protocol Concerning Specially Protected Areas and Biological Diversity Mediterranean (SPA/BD Protocol) in 1995 and ratified by in 2002. It enables "the creation, protection, and management of Specially Protected Areas (SPAs), the establishment of a list of Specially Protected Areas of Mediterranean Importance (SPAMIs) and the protection and conservation of species" (Natural Protection, 2012). Since then none of Croatian MPA was included in the SPAMI list anymore. According to Annex I, chapter D, point 8 of the Protocol, "to be included in the SPAMI List an area will have to be endowed with a monitoring program. This program should include the identification and monitoring of a certain number of significant parameters..."(FAO, 1996). Given to the methodology of calculation, Croatia protects 1-2% of the marine area. The total share in the surface and percentage of counties is shown in Table 1. Protected areas also participated with 2% of the total coastal sea. If the special reserve along the eastern coast of the islands of Cres and Losinj is included (currently is not, due to revision) then the Croatian MPAs are slightly larger.

159
Luka Vukić, Helena Ukić, Merica Slišković
OIL SPILL IN MARINE PROTECTED AREAS (MPAs) – A POSSIBLE ADJUSTMENT OF CROATIAN CONTINGENCY PLAN
Table 1. MPAs in Republic of Croatia, the surface and percentage of counties and coastal sea (State
Institute for Nature Protection, 2016) Area of Republic of Croatia
MPA (ha)
%
Istra County
Primorje-Gorski Kotar County
Lika-Senj County
Zadar County
Šibenik-Knin County
Split-Dalmatia County
Dubrovnik-Neretva County
Total (All Counties)
*Part of the sea along the Eastern
coast of the islands of Cres and
Losinj
Total (*included)
Coastal Sea (*not included)
Coastal Sea (*included)
4,309.81
4,470.70
108.85
4,493.73
25,114.84
20.34
23,172.55
61,763.16
52,576
114,339.16
61,763.16
114,339.16
1.531
1.246
0.02
1.23
8.4
0.004
13.024
1.092
0.848
1.94
1.96
3.63
6. CONTINGENCY PLANS AND MPA Despite recommendations site-specific oil spill contingency plans developed for the MPAs (Gladstone et al., 2003) still, do not exist. During emergency response operations, available information may be highly uncertain and fragmented at best, as do forecasts of environmental conditions or evaluations of response equipment need (Spill Response Strategy, 2015). Contingency plans do not provide the technique that has to be used in certain situation, yet the decision is made on the spot after estimation of the circumstances and conditions. The MPAs are very often located just close to the
sources of pollution. For example, three Croatian national parks (islands of Mljet, Kornati and Brijuni), two nature parks (Lastovo island, Telascica bay) and four special reserves (sea and seabed of the Limski bay, part of the sea along the eastern coast of the islands of Cres and Losinj, south-eastern part of the Neretva river delta and Malostonski bay and Malo more) are inside twelve miles distant from international maritime route, or are situated on the access route to the great ports as Port of Ploce, Port of Rijeka, Port of Koper (Slovenia) and Port of Trieste (Italia) (GOV CRO, 2008). There are also the drilling platforms on the Ravenna-Pula line. There is a very similar situation in other Mediterranean parts. The largest MPA in the Mediterranean Sea is located in the Ligurian Sea just on the access route to Port of Genova, one of the biggest Mediterranean ports. The presence of an MPA does not seem to prevent vessel oil spills or reduce the amount of oil spilled (Dalton and Jin, 2010). 7. CONTINGENCY PLANS FOR MPA An oil spill can pollute the MPA in very short time (few hours) or just in a moment. The oil slick can be hardly controlled if the procedure does not include some kind of automatism. It also assumes the need to be equipped with unique technique applicable and successful in all circumstances and weather conditions, especially at rough sea. MPAs are often profitable resources and a good management can assure the funds for purchase the own cleanup technology. Contingency plans for the oil spill in MPA should be different than in another area. There is no time to waste here. The response to the oil spill, in this surrounding, cannot be done on time. The actions should be performed immediately. The immediate response can be taken if:
• the equipment is available on the spot, • it is applicable in all weather conditions, • the technique does not change physical and
chemical features of the sea, • the application is simple and does not require
the qualified team.

7th INTERNATIONAL MARITIME SCIENCE CONFERENCE
160
April 20th-21st, 2017, Solin, Croatia
This equipment should prevent oil slick spreading and enable cleaning until the arrival of the authorized teams according to the current contingency plan. It implies 24 hours duty service. There is also a clear interest and need of MPA to have its own equipment for employee training and education in applying the technique. The most suitable technique is suggested by experts. The cost is covered by self-financing from the service revenues.
8. CROATIAN CONTINGENCY PLANS AND MPA The Contingency Plan for Accidental Marine Pollution (Contingency plan) in ANNEX V lists marine areas protected by the law. Although protection procedure for MPAs is not described in the single article but is scattered throughout the text, one cannot say that the plan ignores the MPA (The Government of the Republic of Croatia, 2008). Since the plan has existed for eight years and the importance of MPAa has increased, a revision due to oil spill response would be welcomed. A lot of oil spill sources are cited in the Contingency plan. The most frequent source of the oil spill at sea is missed: ship operational oil spill (Hassler, 2011). It means that the frequency of oil spill in the MPA is higher than we are aware of, especially if there are tours with motor boats inside the MPA. It needs permanent monitoring and sampling of the sea. The permanent service needs to be equipped with sampling equipment and trained. The Contingency plan predicts priority when the oil spill happens in the MPA. The priority in acting is not enough privilege of MPA. The action must start immediately; therefore the service should be on the spot. The warehouse with equipment for oil spill response should be located inside the MPA. The booms and sorbents have proved as the best solution under these conditions (Guidi, 2016). The training of permanent service should be carried out together with other operational forces how indicates the Contingency plan already. Personnel of the permanent service in the MPA can be an employee of MPA managing company, a member of operational forces already determined for acting in
such circumstances, or the best, a ranger who has been defined by the law of nature protection (NN 80/13). The cost of a permanent service in MPA would be financed from own MPA resources (public institution managing the MPA or concessionaires). It could be also a concession requirement. Possible adjustment of Croatian contingency plan is shown in Table 2.
Table 2. Suggestions for possible adjustment of Croatian contingency plan for MPA
Permanent Service inside MPA
Permanent guard, monitoring and sampling
Equipment located inside or as close as possible
Sampling equipment, booms, sorbents
Immediate oil spill response
Training with other operational forces
Personnel – ranger
Financing from own resources
- public institution
- concessionaires
9. CONCLUSION Among various protected areas the MPAs are recognized as especially sensitive. The everyday ship operational oil spill is the biggest threat to them. Being close to the maritime routes or on the access routes to ports and enabling motor boat cruises, Croatian MPAs are strongly exposed to this kind of pollution. Although Croatian Contingency Plan gives some privileges to the MPAs in operational procedure, according to new insights, the revision and necessary adjustment are required.
REFERENCES
1. Bacher D, Brown signs two oil spill bills, but marine protected areas aren't fully protected, 26st October, 2015,

161
Luka Vukić, Helena Ukić, Merica Slišković
OIL SPILL IN MARINE PROTECTED AREAS (MPAs) – A POSSIBLE ADJUSTMENT OF CROATIAN CONTINGENCY PLAN
https://www.indybay.org/newsitems/2015/10/26/18779278.php
2. Campbell LM, Gray NJ; and Meletis ZA, Political ecology perspectives on ecotourism to parks and protected areas, In: Hanna KS, Clark DA, Slocombe DS, (eds), Transforming parks and protected areas, Routledge, New York-London, 2008, p.200-221
3. Centre for peaceful studies, All scenarios of exploitation of natural resources in Adriatic sea (In Croatian), Project „Let it hear the voice of people“, Zagreb 2015, www.cms.hr
4. Dalton T, Jin D, Extent and frequency of vessel oil spills in US marine protected areas, Marine pollution bulletin, Elsevier, 2010
1. DOI: 10.1126/science.aah7364 5. FAO, 1996, Foot and Agricultural
Organization Of the United Nations, FAOLEX- legislative database of FAO Legal Office, Available from: http://faolex.fao.org/cgi-bin/faolex.exe?rec_id=030055&database=faolex&search_type=link&table=result&lang=eng&format_name=@ERALL
6. Gladstone W, Krupp F, Younis M, Development and management of a network of marine protected areas in the Red Sea and Gulf of Aden region, Ocean & coastal management, Elsevier, 2003
7. Guidi G, Sliskovic M, Violante AC, Vukic L, Best available techniques (BATs) for oil spill responsein the Mediterranean Sea: calm sea and presence of economic activities, Environ Sci Pollut Res (2016) 23:1944–1953, DOI 10.1007/s11356-015-5543-y
8. Hassler B, 2011, Accidental Versus Operational Oil Spills from Shipping in the Baltic Sea: Risk Governance and Management Strategies, Ambio. 2011 Mar; 40(2): 170–178. doi: 10.1007/s13280-010-0128-y
9. IUCN categories of protected areas, 2008, http://www.dzzp.hr/zasticena-podrucja/kategorije-zasticenih-podrucja/iucn-kategorije-zasticenih-podrucja-251.html
10. IUCN Protected Area Categories System, In: Marine Protected Areas: Tools for Sustaining Ocean Ecosystem, Chapter: Appendix F, The National Academic Press, 2001, p.237, http://www.nap.edu/read/9994/chapter/18
11. Lockwood M, Worboys GL, Kothari A, (eds), Managing protected areas: A global guide, Earthscan, 2006.
12. Maggi P, Oil Spill Response Plans for Sensitive Areas in Brazil. International Oil Spill Conference Proceedings: March 2011, Vol. 2011, No. 1, pp. abs291.
13. Marsh D, Where oil and gas development and protected areas overlap, Fauna & Flora International (FFI), When boundaries break down: oil and gas in protected areas, http://www.fauna-flora.org/when-boundaries-break-down-oil-and-gas-in-protected-areas/
14. Natural Protection Web Portal, 2012, Ministry of environmental and Nature Protection, Croatia. Available from: http://www.zastita-prirode.hr/eng/Projects-International-Cooperation/International-agreements/Protocol-Concerning-Specially-Protected-Areas-and-Biological-Diversity-Mediterranean-SPA-BD-Protocol
15. Nature Protection Law, NN 80/2013, Croatia
16. Normile D, Some relief for Great Barrier Reef, Science, 2016,
17. RAC/SPA, IUCN-Med., 2014, Croatia and Marine Protected Areas: Legal and Institutional framework assessment for conservation of coastal and marine biodiversity and the establishment of MPAs. IUCN-Med. Ed. RAC/ SPA - MedMPAnet Project, Tunis. 60 pp.
18. Spill response strategy for oil spill cleanup, 2015, http://www.dawginc.com/oil-spill-response-ar18
19. State Institute for Nature Protection of the Republic of Croatia, 2016. http://www.dzzp.hr/ekoloska-mreza/natura-2000/ekoloska-mreza-rh-natura-2000-1300.html (7.11.2016)

7th INTERNATIONAL MARITIME SCIENCE CONFERENCE
162
April 20th-21st, 2017, Solin, Croatia
20. Tejedor A, Spinosa L, Oil spill prevention and response: The U.S. institutional system in the coast of California, Friends of Thoreau Program, Research Institute of North American Studies, University of Alcalá, Madrid, 2006
21. Tempesta M, Piante C, MedPAN: the Network of Managers of Marine Protected Areas in the Mediterranean, IEEP meeting - 22nd January 2008, http://www.ieep.eu/assets/368/t_page_cs_medpan_present.pdf
22. The Government of the Republic of Croatia, Contingency plan for accidental marine pollution, 2008, http://www.mppi.hr/UserDocsImages/CONTINGENCY%20PLAN%20AMP%20(OF%2092-08).pdf (7.11.2016)
23. The Government of the Republic of Croatia, Digital Information-Documentation Office, 2016. Available from: http://www.digured.hr/Adresari-i-imenici/Adresar-tijela-javne-vlasti/Opci-podaci-o-RH (7.11.2016)

163
Marcel·la Castells, Francesc Xavier Martínez de Osés, Clara Borén
COC COURSES TO REVALIDATE COMPETENCES BY USING SIMULATORS
COC COURSES TO REVALIDATE COMPETENCES BY USING SIMULATORSMarcel·la Castells, Francesc Xavier Martínez de Osés, Clara Borén
COC COURSES TO REVALIDATE COMPETENCES BY USING SIMULATORS
Marcel·la Castells, Francesc Xavier Martínez de Osés, Clara Borén
(Department of Engineering and Nautical Science, Universitat Politècnica de Catalunya - BarcelonaTECH, Spain)
(E-mail: [email protected])
ABSTRACT
This paper presents main results of the International Association Maritime Universities (IAMU) Project titled “COC course to revalidate competences by using simulators”. Use of simulation is considered relevant for maritime education and training, in accordance with Part A, Chapter I, Section I/11 of the STCW Code. Every master, officer and radio operator holding a certificate issued or recognized under any chapter of the Convention other than chapter VI, who is serving at sea or intends to return to sea after a period ashore, shall, in order to continue to qualify for seagoing service, be required, at intervals not exceeding five years, to establish continued professional competence. So the revalidation of certificates (if required) for continued professional competence shall be established, among others, successfully completing an approved training course or courses. The main objective of this contribution is to propose four complete revalidation courses (deck and marine engineer disciplines) using simulation technology to assessment, examination and certification of seafarers’ competence in accordance with the provisions of STCW Code for existing marines who need upgrade their professional maritime certificates.
KEY WORDS
Maritime Education and Training (MET), Simulation, STCW Code, Revalidation of certificates
1. INTRODUCTION
International Maritime Organization’s (IMO) international convention on Standards of Training, Certification and Watch-keeping for seafarers (STCW) was ratified by all maritime nations. Today, IMO has advised/encouraged all contracting governments/interested parties to review and, as necessary, to revise their crew academic/vocational competency described in STCW. Furthermore, the European Maritime Safety Agency (EMSA) started a regular assessment process providing quality improvement in the Maritime Education and
Training (MET) institutions throughout European Union members, candidate countries and others. In accordance with Part A, Chapter I, Section I/11, every master, officer and radio operator holding a certificate issued or recognized under any chapter of the Convention other than chapter VI, who is serving at sea or intends to return to sea after a period ashore, shall be required to demonstrate continued professional competence in order to keep his/her qualification for seagoing service. This requirement shall not exceed a 5 years interval. This last also in accordance with the standards
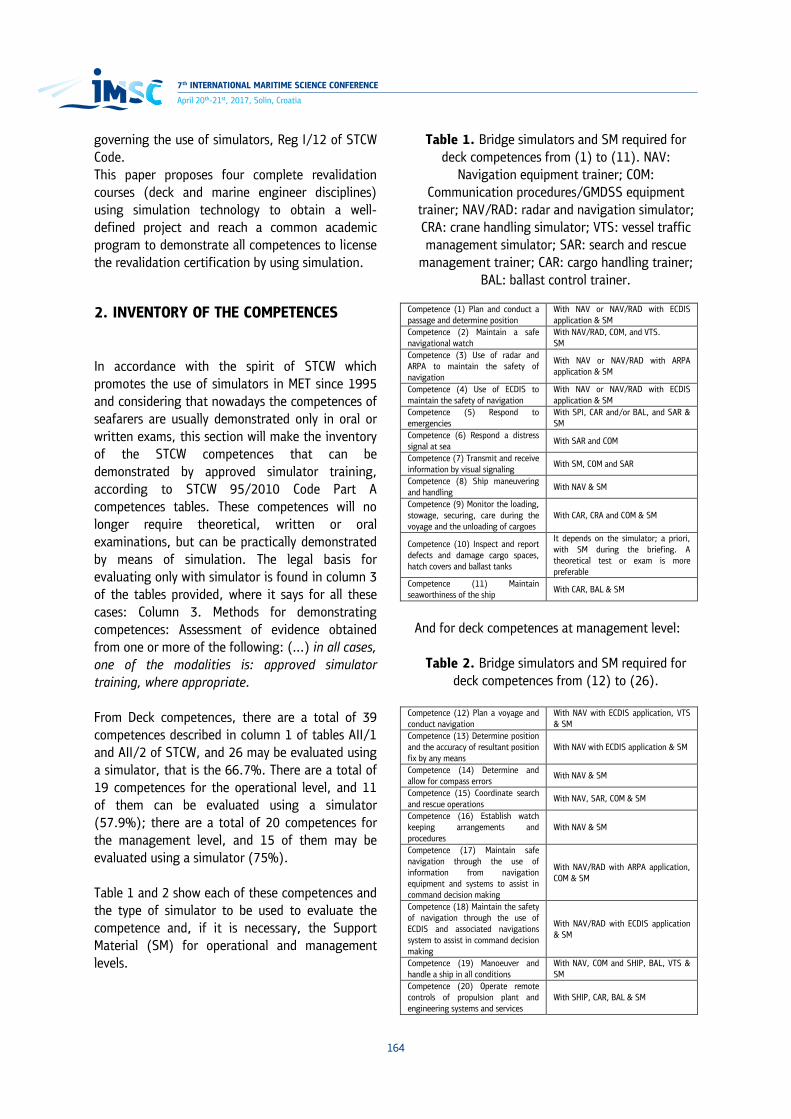
7th INTERNATIONAL MARITIME SCIENCE CONFERENCE
164
April 20th-21st, 2017, Solin, Croatia
governing the use of simulators, Reg I/12 of STCW Code. This paper proposes four complete revalidation courses (deck and marine engineer disciplines) using simulation technology to obtain a well-defined project and reach a common academic program to demonstrate all competences to license the revalidation certification by using simulation.
2. INVENTORY OF THE COMPETENCES
In accordance with the spirit of STCW which promotes the use of simulators in MET since 1995 and considering that nowadays the competences of seafarers are usually demonstrated only in oral or written exams, this section will make the inventory of the STCW competences that can be demonstrated by approved simulator training, according to STCW 95/2010 Code Part A competences tables. These competences will no longer require theoretical, written or oral examinations, but can be practically demonstrated by means of simulation. The legal basis for evaluating only with simulator is found in column 3 of the tables provided, where it says for all these cases: Column 3. Methods for demonstrating competences: Assessment of evidence obtained from one or more of the following: (…) in all cases, one of the modalities is: approved simulator training, where appropriate. From Deck competences, there are a total of 39 competences described in column 1 of tables AII/1 and AII/2 of STCW, and 26 may be evaluated using a simulator, that is the 66.7%. There are a total of 19 competences for the operational level, and 11 of them can be evaluated using a simulator (57.9%); there are a total of 20 competences for the management level, and 15 of them may be evaluated using a simulator (75%). Table 1 and 2 show each of these competences and the type of simulator to be used to evaluate the competence and, if it is necessary, the Support Material (SM) for operational and management levels.
Table 1. Bridge simulators and SM required for deck competences from (1) to (11). NAV:
Navigation equipment trainer; COM: Communication procedures/GMDSS equipment
trainer; NAV/RAD: radar and navigation simulator; CRA: crane handling simulator; VTS: vessel traffic management simulator; SAR: search and rescue
management trainer; CAR: cargo handling trainer; BAL: ballast control trainer.
Competence (1) Plan and conduct a passage and determine position
With NAV or NAV/RAD with ECDIS application & SM
Competence (2) Maintain a safe navigational watch
With NAV/RAD, COM, and VTS. SM
Competence (3) Use of radar and ARPA to maintain the safety of navigation
With NAV or NAV/RAD with ARPA application & SM
Competence (4) Use of ECDIS to maintain the safety of navigation
With NAV or NAV/RAD with ECDIS application & SM
Competence (5) Respond to emergencies
With SPI, CAR and/or BAL, and SAR & SM
Competence (6) Respond a distress signal at sea
With SAR and COM
Competence (7) Transmit and receive information by visual signaling
With SM, COM and SAR
Competence (8) Ship maneuvering and handling
With NAV & SM
Competence (9) Monitor the loading, stowage, securing, care during the voyage and the unloading of cargoes
With CAR, CRA and COM & SM
Competence (10) Inspect and report defects and damage cargo spaces, hatch covers and ballast tanks
It depends on the simulator; a priori, with SM during the briefing. A theoretical test or exam is more preferable
Competence (11) Maintain seaworthiness of the ship
With CAR, BAL & SM
And for deck competences at management level:
Table 2. Bridge simulators and SM required for deck competences from (12) to (26).
Competence (12) Plan a voyage and conduct navigation
With NAV with ECDIS application, VTS & SM
Competence (13) Determine position and the accuracy of resultant position fix by any means
With NAV with ECDIS application & SM
Competence (14) Determine and allow for compass errors
With NAV & SM
Competence (15) Coordinate search and rescue operations
With NAV, SAR, COM & SM
Competence (16) Establish watch keeping arrangements and procedures
With NAV & SM
Competence (17) Maintain safe navigation through the use of information from navigation equipment and systems to assist in command decision making
With NAV/RAD with ARPA application, COM & SM
Competence (18) Maintain the safety of navigation through the use of ECDIS and associated navigations system to assist in command decision making
With NAV/RAD with ECDIS application & SM
Competence (19) Manoeuver and handle a ship in all conditions
With NAV, COM and SHIP, BAL, VTS & SM
Competence (20) Operate remote controls of propulsion plant and engineering systems and services
With SHIP, CAR, BAL & SM

165
Marcel·la Castells, Francesc Xavier Martínez de Osés, Clara Borén
COC COURSES TO REVALIDATE COMPETENCES BY USING SIMULATORS
Competence (21) Plan and ensure safe loading, stowage, securing, care during the voyage and unloading of cargoes
With SHIP, CAR, BAL, COM & SM
Competence (22) Assess reported defects and damage to cargo spaces, hatch covers and ballast tanks and take appropriate action
With SM and a simulation depending on the simulator
Competence (23) Carriage of dangerous goods
With SM. It depends on the simulator
Competence (24) Control trim, stability and stress
With CAR, BAL & SM
Competence (25) Monitor and control compliance with legislative requirements and measures to ensure safety of life at sea, security and the protection of the marine environment
This competence consist of a wide knowledge of legislative requirements which can be explained an devaluated with SM.
Competence (26) Use of leadership and managerial skill
With any simulator, a specific circumstance may be simulated
From Marine Engineering competences, there are a total of 31 competences described in column 1 of tables AIII/1 and AIII/2 of the STCW. Of them 16 may be evaluated using simulator that is 51.6%. There are a total of 17 competences for the operational level, and 6 of them may be evaluated by simulator: that is the 35.5%; there are a total of 14 competences for the management level and 10 of them may be assessed by simulator; that is 71.4%. As can be seen, management competencies are those that can mainly be evaluated through the simulator. Table 3 and 4 show a resume a lists with the specific knowledge areas for each competence and the use of Engine Room Simulator (ERS).
Table 3. ERS and SM required for competences from (1) to (6).
Competence (1) Maintain a safe engineering watch
With ERS
Competence (2) Use internal communication systems
With ERS
Competence (3) Operate main and auxiliary machinery and associated control systems
With ERS
Competence (4) Operate fuel, lubrication, ballast and other pumping systems and associated control systems
With ERS &a) Operational characteristics of pumps and piping systems, including control systems. With ERS; some SM may be used during briefing (dismantling schemes, power point presentations or video tutorials)
Competence (5) Operate electrical, electronic and control systems
With ERS & Control system: Various automatic control methodologies and characteristics. With SM during briefing. Proportional-Integral-Derivative (PID) control characteristics and associated systems devices for process control. It depends on the simulator.
Competence (6) Maintain seaworthiness of the ship
With ERS & Ship stability. With SM during briefing and debriefing understanding that comprehension must be demonstrated
by simulated action. Ship construction. With SM during briefing such as structural ship design programs.
And for engine competences at management level:
Table 4. ERS and SM required for competences from (7) to (16).
Competence (7) Manage the operation of propulsion plant machinery
With ERS
Competence (8) Plan and schedule operations
With ERS & Physical and chemical properties of fuels and lubricants. With SM during briefing. Technology of materials. Depending on the simulator. c) Naval architecture and ship construction, including damage control. With SM during briefing such as structural ship design programs
Competence (9) Operation, surveillance, performance assessment and maintaining safety of propulsion plant and auxiliary machinery
With ERS
Competence (10) Manage fuel, lubrication and ballast operations
With ERS
Competence (11) Manage operation of electrical and electronic control equipment
With ERS
Competence (12) Manage trouble-shooting, restoration of electrical and electronic control equipment to operating condition
With ERS
Competence (13) Detect and identify the cost of machinery malfunctions and correct faults
With ERS
Competence (14) Control trim, stability and stress
With ERS &With the SM during briefing and debriefing, understanding that comprehension must be demonstrated by simulated action
Competence (15) Monitor and control compliance with legislative requirements and measures to ensure safety of life at sea, security and protection of the marine environment
This competence consists of a wide knowledge of legislative requirement, which can be explained and evaluated with the SM during the briefing. Nevertheless, some skills may be simulated, like for example, discharging oily water using a virtual flow-meter according to MARPOL.
Competence (16) Use leadership and managerial
With ERS
If a knowledge aspect is assessable by using additional material apart from the simulator, rather than mentioning the type of simulator, this is indicated as Supporting Material (SM). In case of a specific knowledge that today cannot commonly be assessed by simulator or SM, it is indicated by “it depends on the simulator”.
3. SCHEME OF THE EXERCISES FOR THE MODERN COC COURSE
It is observed that many skills/knowledge areas may be explained and evaluated in a single

7th INTERNATIONAL MARITIME SCIENCE CONFERENCE
166
April 20th-21st, 2017, Solin, Croatia
exercise. For instance, the use of navigational equipment, such as radar, ARPA, steering control systems or ECDIS, can be assessed at the same time that the deck watch keeping procedures. On the other hand, the use of engine room equipment such as main engines, diesel or turbo generators, boilers or bilge water system can be assessed at the same time that the engine room watch keeping procedures. Therefore, for each level and discipline, it is possible to do some long exercises (7 for deck and 7 for engineers) for training; simulating (Table 5 and 6).
Table 5. Operational and management deck competences assessed in each standard exercise.
Exercise Competences at
Operational level Competences at Management level
1.Familiarization
2.Planning a voyage (1) (2) (12) (18)
3.Watchkeeping (1) (2) (3) (4) (13) (14) (16) (17)
4.Maneuvering (8) (19) (20)
5.Cargo handling (9) (10) (21) (22) (23)
6.Emergencies and rescue
(5) (6) (7) (15)
7.Controlling the operations
(11) (24) (25) (26)
Table 6. Operational and management engineer’s competences assessed in each standard exercise.
Exercise Competences at
Operational level Competences at Management level
1. Familiarization 2. Starting and stopping engine room machinery
(3) (4) (8)
3. Engine room Watch keeping
(1) (3) (7) (8)
4. Preparing Engine Room for the port arrival and port departure
(2) (3) (7) (8)
5. Troubleshooting (3) (12) (13)
6. Electrical, electronic and control
(5) (8) (11)
7. Controlling & managing the operations of the ship and care on board
(4) (6) (8) (9) (10) (14) (15) (16)
4. DESIGN THE MODERN COC COURSE STRUCTURE
Including all competences assessed with a simulator mentioned in the above section, four modern revalidation courses have been designed: two for
deck officers (operational and management level) and two for engine room officers (operational and management level). Each course has been designed following the main parts of IMO model courses: Part A. Course framework: those who successfully complete this course should be able to demonstrate sufficient knowledge, skill and understanding of the competences (that can be evaluated using a simulator). Part B. Course outline and timetable: this section presents the topics of the 43-h course in a simplified outline format allocated in the following manner (see Table 7). Table 7.Distribution of the total number of hours
of the revalidation courses.
Familiarization
with simulators
Briefings, debriefings
& no-simulation
explanations
Simulation
trainings
Evaluation
in simulators
Evaluation
theoretical exam
Operational
(Deck) 2.0 16.0 22.0 2.0 1.0
Management
(Deck) 2.0 19.5 18.5 2.0 1.0
Operational
(Engine) 2.0 9.0 29 3.0 0.0
Management
(Engine) 2.0 8.0 30 3.0 0.0
All topics are organized into seven general subject areas or exercises. A 7-day course is considered to be sufficient to evaluate all competences using different simulation scenarios, taking into account that students only have to refresh a knowledge they have previously acquired. Generally, each simulation training has duration of 2 hours being the first half hour as briefing and the last half hour as debriefing, with 1 hour of simulation in between. The timetable has been thought for doing two sessions in the mornings and one session in the afternoons during 7 days. Between both morning sessions, a break of 0.5 h is recommended.

167
Marcel·la Castells, Francesc Xavier Martínez de Osés, Clara Borén
COC COURSES TO REVALIDATE COMPETENCES BY USING SIMULATORS
Otherwise, a more intensive course may be done with two sessions in the morning and two more in the afternoons for 5 days, adding a sixth morning for revaluation the trainees. In both cases, the course consists of 20 sessions of 2 h and 1 exam of 3 h. Appendix 1 shows an example of a course timetable for deck operational level. Part C. Detailed teaching syllabus: the material listed in the course framework has been used to structure the detailed teaching syllabus, in particular:
• Teaching aids (indicated by A), • Bibliography (indicated by B), • IMO references (indicated by R) • Textbooks (indicated by T)
Table 8 includes the knowledge of one topic, as an example, and the teaching aids and references that are used for the specific level. Table 8. Example of detailed teaching syllabus for one topic (operational level - deck). Teaching Aids
(A), IMO References (4) and Textbooks (T) are described in the Reference section.
Knowledge, Understanding and Proficiency
Teaching Aid Reference
7. Controlling the operations (3.0 h)
7.1. Ship stability (2.0 h) – Topic 36
A1 A2 A4
R1 R2 R4 R5
R30 R42
R43 A/B R44 R45 R46 R47 R48 R49 R50 R51 R52 XXX T26 T27 T28
T33 T34
7.1.1. Working knowledge and application of stability, trim and stress tables, diagrams and stress-calculating equipment
7.1.2. Understanding of fundamental actions to be taken in the event of partial loss of intact buoyancy
7.1.3. Understanding of the fundamentals of watertight integrity
7.2. Ship construction (1.0 h) – Topic 37
A1 A2 A4
General knowledge of the principal structural members of a ship and the proper names for the various parts.
Part D. Evaluation and assessment.
Part E. Instructor manual. The instructor manual section defines the scenario for each of the tasks, taking into account that each exercise has different parts contents and objectives. An example scenario considering “Part E. Instructor manual” section is described as follows:
Title: Simulator Familiarization Vessel Model: Tanker LCC Exercise nr: ERS 3 Duration: - Briefing: 30 minutes. - Simulator run: 60 minutes. - Debriefing: 30 minutes. Objectives: This exercise familiarizes the student with: Steam plant, Familiarization on starting up auxiliary boiler and Boilers’ fuel system. Prerequisites: Basic theoretical steam generators knowledge. Training materials: - Engine Room Simulator ERS 5000 (including all auxiliary systems). - Overhead sheets and/or PowerPoint presentation. Initial condition simulator: ME stopped, DG1 working and connected to the net, DG2 on stand-by HFO and DO service tanks at right level. The boiler is empty, off pressure and cold. Briefing: - Getting acquainted with students. - Introduction of engine room exercises during this session. - Explanation of an engine room exercise (briefing, training, debriefing). - Pointing out and explanation of mnemonic diagrams. Student action: - During briefing: Attend lecture and explanation of the use of simulators. - During exercise: Get familiar with and try out different actions to be taken with Simulator. Instructor action: - Before starting the simulation, explain simulator mnemonic diagrams.

7th INTERNATIONAL MARITIME SCIENCE CONFERENCE
168
April 20th-21st, 2017, Solin, Croatia
- Before handing over the Watch point out the main engine and auxiliaries situation. - Monitor and observe students and ascertain if objectives are met. Debriefing: - Reiterate objectives and check if they are met. - Point out positive actions - Start a discussion by means of peer review. - Summarize students’ actions and conclusions. - Discuss points for improvement. Evaluation: Check if students are capable (all objectives met) of using the Engine Room equipment properly in coming exercises. Exercise resolution step by step: 1) Steam boiler start up with Diesel and rising pressure. - Aux-BFS: Select Diesel oil as feeding fuel. - Check tank levels and make up if needed. - Check all valves are open. - Start up fuel pumps (6 bar working pressure). - Open valves to burners. - Aux-SP: open deaerating valve. - Check boiler water level and make up if needed. - Open super heater valve. - Start up fan and burners. - Set the Auto mode and select 15bar maximum pressure. - Start up feeding pump and set control to Auto. - Once boiler pressure rises to 1,5 bar, close deaerating valve and open cooling water valve to condenser. - Once boiler pressure rises up to 12 bar, open the Main Steam Valve to feed the steam consumers. - Open valves to Deck, Cabins, Separators, FO tank, HFO tank, TG when needed. 2) Boiler feeding fuel change: from Diesel Oil to Fuel Oil - Once the pressure in the boiler is higher than 12 bar and the fuel tank is at right temperature (90ºC), we can change to fuel. - Aux-SP: stop burners. - Aux-BFS: stop pumps (on manual mode). - Select Fuel Oil. - Open preheating steam valve setting the output to 120ºC. - Start up pumps again and set Auto mode. - Aux-SP: start up the burners again.
3. CONCLUSIONS
A simulator is a tool used in a learning process so the requirement to measure its effectiveness on the attainment of a learning objective is as valid as with any other tools. The development of four simulation COC courses will provide the required education level and will homogenize the approaches for different counties concerning revalidation programs in accordance with the provisions of the STCW Code for existing seafarers who need to upgrade their professional maritime knowledge. These courses will also provide training using simulation material. Moreover, these courses will offer a guide for schools and maritime authorities with a modern way to examine the revalidation of the expired COCs and provide maritime industry revalidated and newly educated seafarers. However, these courses require a complementary structure for other competences that cannot be assessed by simulation. This should be developed in further work. Another important point is that the course is only applicable for the revalidation purpose previous Maritime Administration recognizes and approves the method in the revalidation process according to their prevailing procedures.
ACKNOWLEDGMENTS
The materials and data in this publication have been obtained through the support of the International Association of Maritime Universities (IAMU) and The Nippon Foundation in Japan.
REFERENCES
1. R1 Standards of Training, Certification and Watchkeeping for Seafarers, 1978 (STCW Convention), as amended, 2011 Edition, IMO
2. R2 International Convention for the Safety of Life at Sea, 1974, as amended (SOLAS), Consolidated Edition 2009, IMO
3. R4 Model Course 7.03 – Officer in Charge of a Navigational Watch, 1999 Edition, IMO

169
Marcel·la Castells, Francesc Xavier Martínez de Osés, Clara Borén
COC COURSES TO REVALIDATE COMPETENCES BY USING SIMULATORS
4. R5 Model Course 1.22: Ship Simulator and Bridge Teamwork, 2002 Edition, IMO
5. R30 International Convention for the Prevention of Pollution from Ships, 1973/78 (MARPOL), Consolidated edition 2011, IMO.
6. R42 International Conference on Load Lines, 1966, 2005 Edition, IMO
7. R43A Assembly Resolution A.760(18) - Symbols related to life-saving appliances and arrangements. Amended by MSC.82(70)
8. R43B Resolution MSC.82(70), Amendments to resolution A.760(18) on symbols related to life-saving appliances and arrangements, 1998
9. R44 Assembly Resolution A.921(22) - Assembly resolutions superseded by the 1995 amendments to the 1978 STCW Convention
10. R45 International Conference on Special Trade Passenger Ships Agreement, 1971, 1972 Edition, IMO
11. R46 Protocol on Space Requirements for Special Trade Passenger Ships, 1973, (SPACE STP 1973), IMO
12. R47Athens convention relating to the Carriage of Passengers and their Luggage by Sea, 1974 (PAL 1974), IMO
13. R48 International Convention on Tonnage Measurement of Ships, 1969, IMO
14. R49 Assembly Resolution A.769(18) – Procedures and Arrangements for Issuing GMDSS Certificates to Holders of Non-GMDSS Certificates
15. R50 IMO/ILO Document for Guidance, 1985, IMO
16. R51 International Safety Management Code (ISM Code) and Guidelines on implementation of the ISM Code, 2010 Edition, IMO
17. R52 International Life-Saving Appliance (LSA Code), 2010 Edition, IMO
18. T26 Derret, D.R.; Barrass, B. Ship Stability for Masters and Mates, 7th ed. Oxford: Butterworth-Heinemann, 2008. ISBN 978-0080970936
19. T27 ISGOTT: International Safety Guide for Oil Tankers & Terminals, 5th ed. Revised. London: Witherby& Co. Ltd, 2006. ISBN 978-1856092913
20. T28 Lavery, H.I. Shipboard Operations, 2nd ed. London: Heinemann, 1990. ISBN 0-4434-91094-0
21. T33 Taylor, D.A. Merchant Ship Construction, 4th ed. London: Institute of Marine Engineers, 1998. ISBN 978-1902536002
22. T34 Roberts, P. Watchkeeping safety and cargo management in port. London: The Nautical Institute, 1995. ISBN 1-870077-29-6

7th INTERNATIONAL MARITIME SCIENCE CONFERENCE
170
April 20th-21st, 2017, Solin, Croatia
Appendix 1
Table 9. Example of a course timetable for operational level (deck)
Day/ Period
1st Period (2.0 hours)
2ndPeriod (2.0 hours)
3rd Period (2.0 hours)
Day1
01. Knowledge of the fundamentals and limitations of the simulators used in the course (0.5 h) S
02. Ability to operate and to interpret and analyse information obtained from simulators
(1.5 h) S
03.Thorough knowledge of and ability to use nautical charts, such as sailing directions, tide tables, notices to mariners, radio navigational warnings and ship’s routeing information
(0.5 h) S and (1 h) NS combined
04. The use of routeing in accordance with the General Provisions on Ship’s Routeing(0.5 h) NS
07. Electronic system of position fixing and navigation (0.5 h) S
08. Echo-sounders (0.5 h) S
09. Compass – magnetic and gyro (0.5 h) NS (briefing)
10. Steering control system (0.5 h) S
Day2
12. Thorough knowledge of the content of the International Regulations for Preventing Collisions at Sea, 1972, as amended (2.0 h) NS
18. Knowledge of the fundamentals of radar and automatic radar plotting aids(0.5 h) NS (briefing)
19. Ability to operate and to interpret and analyse information obtained from radar (1.0 h) S
12. Thorough knowledge of the content of the International Regulations for Preventing Collisions at Sea, 1972, as amended (0.5 h) NS (debriefing)
20. Principal types of ARPA, their display characteristics, performance standards and the dangers of over-reliance on ARPA(0.5 h)NS (briefing)
21. Ability to operate, interpret and analyse information obtained from ARPA (1.0 h) S
06. Terrestrial and costal navigation : dead rackoning (0.5 h) NS (debriefing)
Day3
06. Terrestrial and costal navigation (1.5 h) S, combined with
16. The use of reporting of accordance with the General Principles for Ship Reporting Systems and the VTS procedures (0.5 h) S
11. Meteorology (0.5 h):
weather systems, reporting procedures and recording systems NS (briefing)
15. Knowledge of blind pilotage techniques (1.0 h) S, combined with
11. Meteorology (0.5 h) S
13. Thorough knowledge of the Principles to be observed in keeping a navigational watch (0.5)
NS (briefing)
14. The use of information from navigational equipment for maintaining a safe navigational watch
(0.5 h) S, combined with
11. Meteorology (0.5 h) S
17. Knowledge of bridge resource management principles (0.5 h)
NS (debriefing)

171
Marcel·la Castells, Francesc Xavier Martínez de Osés, Clara Borén
COC COURSES TO REVALIDATE COMPETENCES BY USING SIMULATORS
Day4
22. Knowledge of the capability and limitations of ECDIS operations (0.5 h) NS (briefing)
23. Proficiency in operation, interpretation, and analysis of information obtained from ECDIS (1.5 h) S
23. Proficiency in operation, interpretation, and analysis of information obtained from ECDIS (1.0 h) S, combined with
11. Meteorology (1.0 h) S
05. Celestial navigation (2.0 h) NS
NS
Day5
24. Effect of deadweight, draught, trim, speed and under-keel clearance on turning circles and stopping distances (0.5 h) S
25. Effects of wind and current on ship handling (0.5 h) S
26. Maneuvers and procedures for rescuing a person overboard (1.0 h) S
27. Squat, shallow-water and similar effects (0.5 h) S
28. Proper procedures for anchoring and mooring (1.5 h) S
29. Knowledge of the effect of cargo, including heavy lifts, on the seaworthiness and stability of the ship (0.5 h) NS (briefing) 30. Knowledge of safe handling, stowage and securing of cargoes, including dangerous cargoes, hazardous and harmful cargoes, and their effect on the safety of life and the ship (1.0 h) S
29. Knowledge of the effect of cargo, including heavy lifts, on the seaworthiness and stability of the ship (0.5 h) NS (debriefing)
Day 6
29. Knowledge of the effect of cargo, including heavy lifts, on the seaworthiness and stability of the ship (0.5 h) NS (briefing) 30. Knowledge of safe handling, stowage and securing of cargoes, including dangerous cargoes, hazardous and harmful cargoes, and their effect on the safety of life and the ship (1.0 h) S
31. Ability to establish and maintain effective communications during loading and unloading (0.5 h)
NS (debriefing)
29. Knowledge of the effect of cargo, including heavy lifts, on the seaworthiness and stability of the ship (1.0 h) NS
32. Inspect and report defects and damage to cargo spaces, hatch covers and ballast tanks (1.0 h) NS
33. Emergency procedures (0.5 h)
NS (briefing)
33. Emergency procedures (0.5 h) S 34.Search and rescue: knowledge of the contents of the International Aeronautical and Maritime Search and Rescue (IAMSAR) Manual (1.0 h) S
Day 7 35. Visual signaling (1.0 h) S 37. Ship construction (1.0 h) NS
36. Ship stability (0.5 h): understanding of the fundamentals of watertight integrity NS (briefing)
36. Ship stability (1.5 h) S (briefing)
38. Evaluation with theoretical
exam (1.0 h) NS
39. Evaluation in simulators
(2.0 h) S

7th INTERNATIONAL MARITIME SCIENCE CONFERENCE
172
April 20th-21st, 2017, Solin, Croatia
LEARNING STYLE AS A DETERMINANT OF USING MOODLEŽeljko Pekić, Srđan Jovanovski, Nađa Pekić, Tatijana Dlabač
LEARNING STYLE AS A DETERMINANT OF USING MOODLE
Željko Pekić, Srđan Jovanovski, Nađa Pekić, Tatijana Dlabač
(Maritime faculty Kotor, Montenegro, Faculty of Information technology, Podgorica, Montenegro)
(E-mail: [email protected])
ABSTRACT
In this paper, we examined the nature and distribution (direction and intensity) of motivation for using e-learning, focusing the connection between the independent variables on one side and the Felder's learning style on the other. The most relevant information that we wanted to examine and present is the individual ways of the respondents in adopting the same material. We were also interested in the ways to technically adjust the information delivery. The results confirm the statistical significance of the initial idea.
KEY WORDS
e-Learning, motivation, learning style, placement of materials, adoption of information 1. INTRODUCTION
In the forties of the twentieth century, the teams of engineers and psychologists were actively working on examining the relationship between the optimization in handling different types of machinery and efficient transmission and reception of information. It was found that the transmission and reception of information had limitations that were not of technological nature, but limitations of the cognitive system. Attention, selection and optimization of information transmission have become the focal problem of the research. In order to fully comprehend such a problem, it is necessary to find a reasonable analogy between an abstract communication system and functioning of the nervous-sensory apparatus. The mathematical formulation of information theory was given by Claude Shannon, but the basics of the approach were given by Andrei Kolmogorov [26]. They define the information as
the probability of events in a system, where the content of the information is irrelevant. If the probability of the event is lower then the quantity of the information carried by this event is higher. This means that the amount of information carried by an event is inversely proportional to its probability. Martin Dougiamas, working on his doctoral dissertation on the use of open source software to support education on the Internet, launched the idea of developing the Moodle platform. Dougiamas is the leading Moodle programmer of today[10].
2. LEARNING
It is important to emphasize that learning permeates almost every human activity. There is a large number of factors acting as indirect learning

173
Željko Pekić, Srđan Jovanovski, Nađa Pekić, Tatijana Dlabač
LEARNING STYLE AS A DETERMINANT OF USING MOODLE
tasks. Firstly, it is the perception, as a general human mode of operation and a dose of idiosyncrasy. Stimulated by various stimuli, it presents its own value. Its latent importance is in the perception of the previously seen, through experiences and connections with the new. Motivation also plays an important role in acquiring knowledge. Certainly, a man of certain age has defined certain motives, but additional motives can be excited by other people or by specific relevant materials. Today, in the 21st century we live in a computer world where production, processing and storage of knowledge are a very important factor of a complete social progress. Education as one of the basic pedagogical category anticipates vocational training and life skills development through the acquisition of knowledge [20]. The basic elements of education are knowledge and competence, where knowledge is defined as a system of scientifically based facts that students gain and practically apply. The term information technology was first used by Jim Domsik in 1981 as a substitute for the term data processing, but the information technology anticipates the use, storage, production and exchange of information [19]. In the last decades the development of information technology has recorded unprecedented growth and is further progressing. The essence of technological development comprises a complex range of information and communication technologies. The future development of information technology lies in the integration of the system, standardization of equipment, the Internet dispersal, higher speeds, but it also depends on new inventions, changing the world even more than expected [7].
3.MOODLE PLATFORM
Electronic learning (e-Learning) is a type of education based on the use of modern technologies for creating, presenting of educational content, as well as the adoption of the material. Suppose we have a forum where a student has the opportunity to download some material but also to ask questions to a professor [1]. Asking questions does not guarantee a response within a specified time period, the professor will answer questions when available and "online". The disadvantages of this
approach have been avoided by the use of synchronous technologies such as web and video conferencing, IP telephony. Attending lectures and discussions in real time provide added value to distance education, so that group work leads to generating more ideas. This form of communication has been experienced more responsibly by students than professors. They are 2-3 times more likely to send messages and much more responsive to those received [21]. Educational platforms are complex tools that enable controlled distribution of multimedia and text lessons to all or to selected users enrolled in a course, either through conventional or distance education. That way we can track approaches to a text, note changes and add comments. To testing the student on computers you can use many free and simple programs that can easily fit into classes, so it is very easy to test students who are not physically present in the classroom [28]. The market offers specific tools that enable easy content creation, setting presentations, forums, all with the aim to enable users to focus on the content itself, not on the techniques of presentation [6]. Moodle is a free, open source platform for e-Learning. This very popular platform has more than 57 million users. According to many surveys published on the Internet, moodle is one of the best accepted platforms in its segment .[22]. Moodle is a Course Management System (CMS), also known as a Learning Management System (LMS), or a Virtual Learning Environment (VLE). It is a free web application that educators can use for creating efficient online learning sites. There are also many additional ways to use it [2]. The focus of the Moodle project is to provide teachers with the best tools to manage and promote learning. Built-in functionality that allows exactly the same procedures in the work whether it has a couple of users, or dozens, hundreds of thousands of active users. Due to its scalability it has been applied both with private users that provide courses for a small number of userw, and with huge systems having over 50 thousand users [24]. Moodle characteristics are as follows [25] : • Built-in support for the evaluation and
monitoring of the student activities,

7th INTERNATIONAL MARITIME SCIENCE CONFERENCE
174
April 20th-21st, 2017, Solin, Croatia
• The roles system can be adjusted to the level of activity
• Supports collaboration through forums, chat, wiki's and other modules,
• Supports the development of tests with different types of tasks,
• Supports imports of standardized packages for learning objects,
• A number of free plug-ins are available on the Internet
• Moodle has been localized in 78 languages.
4. FELDER LEARNING STYLES
Motives are movers, tendency to achieve and adopt the goal and psychological processes supporting us in our efforts. The psychological motives comprise learning incentives (means of motivation) such as: grades, praise, critics, competition etc. [27]. It is important to understand the difference between traditional learning and modern active teaching. The emphasis is not on technology, but on a higher involvement of students, their encouraged motivation, resulting in knowledge. In the traditional teaching we had a simple system, the professor teaches, the students listen (regardless of the attention, motivation and desire). In more contemporary form of teaching students do not feel such a drastic hierarchical distinction between themselves and the lecturers. This way they are equally involved, important, and can provide innovative contributions to this kind of teaching. The important finding is that learning has stimulating effect on the involvement of two sensory modalities (hearing and vision), unlike traditional style, solely listening. But active teaching is just one step that binds innovation in teaching and online learning. It brings a series of new ways and knowledge sharing and acquiring. In particular, strict requirements regarding attendance for lessons and exercises and limited number of examination terms are absolutely incompatible with the needs of active seafarers, who spend few months, half a year, or longer onboard ships, but who would like to, or need to improve their knowledge in order to keep their jobs and/or get a career advancement [4]. The material adopted by students through these classes needs to be related to earlier contents,
preferably through experience, through a positive transfer [15]. Furthermore, the student should have a personal way of adopting materials, adjusted to the most suitable strategyof idiosyncratic personality and diversity of opinion. Interpretation is also a free alternative upon each individual. It is also an opportunity for expressing a personal touch of each participant. There are two types of motivation [13].: Extrinsic (external) motivation: • focused on fulfillment of obligations in the
subject is strongly influenced by incentives or pressures coming from outside;
• leads towards superficial approach to learning and the fear from failure;
• outcomes are not flexible and cannot be easily transferred to various application contexts (knowledge is "rigid").
Intrinsic (internal) motivation: • reflects a personal goal; • results from the interest in the field of study; • depends on personal engagement in tasks that
can be selected; • depends on the feeling of their own
competence and self-confidence; • leads to a deep approach to learning and
understanding of concepts; • outcomes are flexible and can be easily
transferred to various application contexts.
5. FELDER'S LEARNING STYLES
Learning styles can be defined as a method through which an individual focuses on new and complex information, process them, reform them into knowledge, persisting and using the acquired knowledge. "The style of learning is an established and dominant way of receiving, processing and use of stimulus / information in the learning process, and the most recognizable in the course of organized learning in the classroom; it's a way of dominating the mental representation and processing of the learning content" [5]. Learning can be defined as a complex process acnowledging the influence students, teachers,

175
Željko Pekić, Srđan Jovanovski, Nađa Pekić, Tatijana Dlabač
LEARNING STYLE AS A DETERMINANT OF USING MOODLE
motivation, interaction and cohesion of these factors [9]. The earlier learning process has changed. The basics have remain the same. The principle transfer - adopt knowledge is still the main driver of the process. Everything that comes along are additional learning motivators, positively correlated by their intensity. The technical revolution has brought a number of innovations with their advantages and disadvantages. Felder-Silverman model examines three issues [18].: a) a distinctive learning style with an alternative way to process information and its significance for engineering education; b) learning style most prefered by students and teaching style most favored by teachers and c) strategies undertaken by students, which are not equivalent to standard methods of engineering education. Learning in a structured educational system has two important steps: a) reception of external information through senses; b) the inside information, to be processed by a specific method or simply ignored. A further process may include short-term or long term memory, through repetition or detailed analysis. Felder-Silverman model classifies students into one of the four learning styles: a) Sensory students (specifically, practically oriented towards facts and procedures) or intuitive students (conceptual, innovative, oriented theories and very important); b) Visual learners (prefering visual presentations of the material - images, diagrams) and verbal learners (prefering written and spoken explanations); c) Active students (through interaction and continuous work) or reflective students (working and thinking by themselves); d) Sequential learners (neat, learn in small steps, upon a detailed scheme and work division) or
global learners (holistic, systematic thinkers, learning in big steps forward) [11]. The model emphasizes the importance of adapting the teaching process to one of the styles or at leas one of the two style dimesions, e.g. visual or intuitive style of teaching, and stimulating environment for such a strategic type. The first dimension - sensory / intuitive, is one of the four dimensions of the Jung's theory of psychological types, and the third dimension - active / reflective, is a component of the Kolb’s learning style. The second dimension - visual / verbal, is analoguous to the visual-auditory-kinesthetic modality of the theory formulation and rooted by the cognitive study of information processing. The fourth dimension - sequential / global, has been developed eclectically. For the sensual students to remember and understand information, it is best to enable them sense the way it relates to the real world. If they are in the class where the most of the material is of an abstract and teoretic type , they will be prone to have difficulties. Instructors for specific examples of suitable concepts examples will know which model should be applied in practice. If the instructors do not provide sufficient specifics, stimuli and motivation, it will not produce a positive effect. In the Felder's model, visual dimension refers to internal processing (such as visualization) rather than a sensory stimulus. There are evidences from studies on brain hemispheres and clinical observations showing that global learners are more likely to use visual processors, a sequential learners are more likely to use verbal processors [11]. Felder made two significant changes to his model in 1987. The first change was the deletion of inductive / deductive dimension due to the missunderstandings of the instructors in the distribution of materials for inductive or deductive methods of teaching. The second change was the renaming of category visual learners / spectators into visual / verbal. Felder made this change to allow both spoken and written word to be included in the verbal category [12].

7th INTERNATIONAL MARITIME SCIENCE CONFERENCE
176
April 20th-21st, 2017, Solin, Croatia
Kolb says that learning involves the provision of abstract concepts that can be flexibly applied in various situations. In the Kolb's theory, a stimulus for the development of new concepts provides new experiences [17].
6. AIM AND OBJECTIVES OF THE RESEARCH
The initial aim of the research is to assess the nature and distribution (direction and intensity) of motivation in e-learning, as an independent variables on one side and the Felder's learning styles, as a dependent one on the other. Research goals The research has a two-fold objective: a) Scientific objective- aiming to determine the type and nature of relationship between e-Learning motivation and learning styles, also wishing to use the obtained results for further research on this and similar fields. b) Practical objective – aiming to use the data obtained for contributing to more efficient and practical work of educational institutions in the country and encourage effective engagement of individuals (students and teachers) who would readily act towars enhancing the educational system of Montenegro. Variables in the research: a) Considering the dependent variable, we have been examining the students’ motivation for e-Learning at the Maritime Faculty of Kotor. The motivation scale has 5 items and has been designed by the author. The Krombah's alpha coefficient is 0.67; b) As intervening variables we examined the impact of the Felder's learning styles to knowledge acquisition. The testing scale for the Felder's learning styles, with 44 items and of the Likert's type, was designed by Richard M. Felder and Linda Silverman. It had been originally designed by Felder and Solomon, with subsequent modification. c) The independent variables were students experiences with e-Learning..
7. RESEARCH METHODOLOGY
7.1. THE SAMPLE
The survey was conducted on a sample of 100 respondents. It consists exclusively of the students of the Maritime Faculty in Kotor. The sample has elements of intentional. The processing of data applied the following statistical procedures: a) the frequencies and percentages; b) differentiation measures for the segments of crossed variables (Pearson Chi-square); c) measures that indicate the rate of correlation among the variables (C - Contingency coefficient). 7.2. RESEARCH RESULTS
Table 1. Results of the dependent (variable motivation for using e-Learning)
No. Items A.S.
1. This kind of learning is an innovation leading the educational process into progress.
3.90
2. Learning this way is efficient both for students and teachers.
3.74
3. I gladly give suggestions for possible changes in the work of electronic forms of teaching process.
3.66
4. Aquisition of knowledge by this method of learning is easy.
3.51
5. E-Learning is a motivating method of teaching/learning.
3.04
The arithmetic mean - the average is the most commonly used measure of central tendency. Its definition is simple: sum of data values divided by the number of data.
Table 1 shows the order of items that are had the highest to the lowest value of the aritmetic mean. Item No. 1 is the claim with the mean value perceived by students as the most positive one. And so on for all the five. They are very minor differences in the values of all items which implies that the students are generally strong motivated for the use of this type of learning.

177
Željko Pekić, Srđan Jovanovski, Nađa Pekić, Tatijana Dlabač
LEARNING STYLE AS A DETERMINANT OF USING MOODLE
Table 2. Display items independent variables (general experience of e-Learning)
VARIABLE FREQUENCY PERCENTAGE
I like the e-Learning method YES NO
89 11
89% 11%
This kind of learning I evaluate as BAD GOOD AND EXCELLENT
9 91%
9% 91%
Table 2 shows the percentage of student motivation and satisfaction with e-Learning. In a large percentage (89%) students like this kind of work and evaluated it as good or excellent (91%). This means that this kind of teaching generally suits the respondents, with the modification of
individual segments, i.e. while adapting the learning styles. Table 3. Frequency percent of the Felder's learning
styles LEARNING STYLE FREQUENC
Y PERCENT
Active / reflective 19 19% Visual / verbal 41 41%
Sensory / intuitive 22 22% Sequential / global 18 18%
Table 3. shows the frequency percent of the Felder's learning styles. What is the most striking is that more than 40% of the respondents preferred the visual-verbal learning style, while other styles are quite balanced.
Table 4. Correlations between dependent and independent variables (motivation and learning styles)
1. Motivation for the use of e-learning and the active-reflective subjects χ2= 2.888 df= 4 c=0.179 p=0.875 2. Motivation for the use of e-learning and visual-verbal χ2=11.007 df= 4 c= 0.157 p=0.050 3. Motivation for the use of e-learning and sensory-intuitive χ2= 4,355 df= 4 c=0.156 p=0.512 4. Motivation for the use of e-learning and sequential-global χ2=5.677 df= 4 c=0.197 p=0.617
Differentiation measures for the segments of crossed variables (Pearson Chi-square). Pearson's correlation coefficient (r) is used in cases where the variables of observed model show a linear correlation and continuous normal distribution. The value of the Pearson correlation coefficient ranges from +1 (a perfect positive correlation) to -1 (perfect negative correlation). The “+” or “-“indicates the direction of correlation - whether positive or negative, but it does not refer to the strength of the correlation.
The p value indicates the statistical significance that exists or does not exist. If there is one, then its value ranges from 0.000 to 0.050. Table 4. clearly shows the correlation between the motivation for the use of e-Learning and the Felder’s learning styles. Out of the four learning styles, only the visual / verbal style is positively correlated with motivation. This is indicated by the value p = 0.050, which is the statistical significance at the level 0.05 and Hi square value of 11. This means that the students with greatest interest in this kind of learning belong to the visual-verbal learning style.

7th INTERNATIONAL MARITIME SCIENCE CONFERENCE
178
April 20th-21st, 2017, Solin, Croatia
The measures show the degree of correlation between the variables (C - Contingency coefficient), a measure of association between statistical variables which have quantitative categories of unequal magnitude or at least one of which can be classified only qualitatively.
Df is the number of degrees of freedom, i.e. the number of values in the final statistical calculation, which is free to vary. x2 (Chi-squared)
f0 - required frequency ft - expected frequency ∑ - sum
8. CLOSING REMARSKS
At the beginning of the paper we were engaged in theoretical part and hypotheses about impact on the adoption of information among the respondents. In particular, we focused the dependent variable, ie. The Index of the Felder's styles of learning that have proved to be a relevant variable in this study. Through operational defining of the variables we obtained the results that the visual-verbal learning style is the one most dominantly present among the respondents and the only one having a positive correlation with the independent variable.
The visual learners are best in remembering the contents they can see, whether schemes, diagrams, graphs, demonstrations. The verbal respondents were better in remembering by using sensory materials, meaning that they are prone to acquire information with sound but with no images. These are audio recordings, oral texts, verbal presentations [16]. It should be noted that many studies showed that the majority of the visual-verbal respondents belong to the visual type. This percentage reaches up to 70% [11].
9. CONCLUSION
The existing technologies enable and provide the basis for the existence of universal society i.e. information society. No one is to be excluded from the education society, as guaranteed by the Law. Knowledge is a public property accessible by everyone. The technological progress i.e. the emergence and development of technological innovation allow for the development of creativity and further innovation, or generation of new ideas. Regardless of the student motivation and satisfaction with the teaching forms of today, it is necessary to introduce continuous innovation also at the level of individual. As this and other studies show, students and teachers are still not aware enough of the possibilities to make their jobs easier and practical with an appropriate form of providing information. The research results show the following: • 89% of the respondents are satisfied with e-
Learning; • 91% of the respondents who are satisfied with
e-learning believe that this form of learning is good or excellent;
• As for the Felder's learning styles, more than 40% of the respondents preferred the visual-verbal learning style, while other styles being quite balanced and
• In examining the correlation between dependent and independent variables, the
found statistical significance was at the level 0.05, with the satisfaction in e-Learning and visual-verbal type of acquiring knowledge.
As shown by the research results, it is necessary to note that the subjects/respondents mostly have an emphasized visual intelligence. Individuals who have a high coefficient in this kind of capabilities have a personal style of adopting information. When such an individual attempts to extract information from the long term memory, (s)he uses the visualization mnemonics and creating images in her/his mind. This ability is a good predictor of geometry jobs, jobs with the spatial orientation, but in the adaptation to a new environment. They find it easier to interpret images, layouts, diagrams, charts, numbers, etc. They like to assemble three-dimensional objects. And as their future occupations they usually choose engineering, architecture, sculpture, mechanics and visual arts. These data leave place for further research in the same and similar fields. They also confirm the fact that e-Learning is a specific and attractive form of education, and, as such, it modifies the human awareness, simplifying the process of teaching/learning and adapting it to the needs of its users.
REFERENCES
1. Aničić, O., Barlovac, B. (2010). Učenje na daljinu – e-obrazovanje. U: Tehnika i inforamtika u obazovanju, 3. Internacionalna Konferencija, Čačak, Tehnički fakultet
2. Bauk S., Dlabač T., Pekić Ž., “Implementing E-learning modes to the students and seafarers education: Faculty of maritime studies of Kotor case study”, IMSC 2012., June 16 th -17th, Split 2012. (Zbornik radova, pp 247-254)
3. Bauk S., Kopp M., Avramović Z., A Case Study on Introducing E-learning into Seafarers' Education, JITA - Journal of Information
Technology and Applications (ISSN:2232-9625), Volume 3, Issue 1,June 2013, Page(s) 34-43
4. Bjekić, D., Dunjić-Mandić, K. (2007). Stilovi učenja i profesionalne preferencije maturanata gimnazije, Preuzeto 26.02.2010. iz Pedagogija LXII 1/07, 48-59. sa veb stranice: http://scindeks-clanci.nb.rs/data/ pdf/0031-3807/2007/0031-38070701048B.pd
5. Bjekić, D. (2008). Psihologija e-učenja i e-nastave 6, 1-17
6. Bishop M., (2004). Introduction to Computer Security, Chapter 18: Evaluating Systems Wesley and Sons, November 1
7. Bransford, J. (2000). How people learn: Brain, mind, experience, and school. Washington, D. C.: National Academy Press.
8. Cooper, C. (1975) .Theories of Group Process, London: John Wiley. T.A. Litzinger, S.H. Lee, J.C. Wise, and R.M.
9. Dougiamas, M. and Taylor, P.C. (2003) Moodle: Using Learning Communities to Create an Open Source Course Management System. Proceedings of the EDMEDIA 2003 Conference, Honolulu, Hawaii.
10. Felder, R.M. and Silverman, L. K. (1988). Learning and Teaching Styles in Engineering Education, Foreign Language Annals, 28 (1), 21–31 (1995)
11. Felder, R.M. and Silverman, L.K. (1987) “Learning Styles and Teaching Styles in Engineering Education,” Presented at the 1987 Annual Meeting of the American Institute of Chemical Engineers, New York.
12. Goleman, D. (1995). Emotional intelligence. New York: Bantam.
13. He, K. (2004). Blending learning and the development of educational technology theory. Educational Technology of China.
14. Heiskanen, E., Pantzar, M.: Toward Sustainable Consumption: New Perspectives, Journal of Consumer Policy, No. 20, 1997.

179
Željko Pekić, Srđan Jovanovski, Nađa Pekić, Tatijana Dlabač
LEARNING STYLE AS A DETERMINANT OF USING MOODLE
found statistical significance was at the level 0.05, with the satisfaction in e-Learning and visual-verbal type of acquiring knowledge.
As shown by the research results, it is necessary to note that the subjects/respondents mostly have an emphasized visual intelligence. Individuals who have a high coefficient in this kind of capabilities have a personal style of adopting information. When such an individual attempts to extract information from the long term memory, (s)he uses the visualization mnemonics and creating images in her/his mind. This ability is a good predictor of geometry jobs, jobs with the spatial orientation, but in the adaptation to a new environment. They find it easier to interpret images, layouts, diagrams, charts, numbers, etc. They like to assemble three-dimensional objects. And as their future occupations they usually choose engineering, architecture, sculpture, mechanics and visual arts. These data leave place for further research in the same and similar fields. They also confirm the fact that e-Learning is a specific and attractive form of education, and, as such, it modifies the human awareness, simplifying the process of teaching/learning and adapting it to the needs of its users.
REFERENCES
1. Aničić, O., Barlovac, B. (2010). Učenje na daljinu – e-obrazovanje. U: Tehnika i inforamtika u obazovanju, 3. Internacionalna Konferencija, Čačak, Tehnički fakultet
2. Bauk S., Dlabač T., Pekić Ž., “Implementing E-learning modes to the students and seafarers education: Faculty of maritime studies of Kotor case study”, IMSC 2012., June 16 th -17th, Split 2012. (Zbornik radova, pp 247-254)
3. Bauk S., Kopp M., Avramović Z., A Case Study on Introducing E-learning into Seafarers' Education, JITA - Journal of Information
Technology and Applications (ISSN:2232-9625), Volume 3, Issue 1,June 2013, Page(s) 34-43
4. Bjekić, D., Dunjić-Mandić, K. (2007). Stilovi učenja i profesionalne preferencije maturanata gimnazije, Preuzeto 26.02.2010. iz Pedagogija LXII 1/07, 48-59. sa veb stranice: http://scindeks-clanci.nb.rs/data/ pdf/0031-3807/2007/0031-38070701048B.pd
5. Bjekić, D. (2008). Psihologija e-učenja i e-nastave 6, 1-17
6. Bishop M., (2004). Introduction to Computer Security, Chapter 18: Evaluating Systems Wesley and Sons, November 1
7. Bransford, J. (2000). How people learn: Brain, mind, experience, and school. Washington, D. C.: National Academy Press.
8. Cooper, C. (1975) .Theories of Group Process, London: John Wiley. T.A. Litzinger, S.H. Lee, J.C. Wise, and R.M.
9. Dougiamas, M. and Taylor, P.C. (2003) Moodle: Using Learning Communities to Create an Open Source Course Management System. Proceedings of the EDMEDIA 2003 Conference, Honolulu, Hawaii.
10. Felder, R.M. and Silverman, L. K. (1988). Learning and Teaching Styles in Engineering Education, Foreign Language Annals, 28 (1), 21–31 (1995)
11. Felder, R.M. and Silverman, L.K. (1987) “Learning Styles and Teaching Styles in Engineering Education,” Presented at the 1987 Annual Meeting of the American Institute of Chemical Engineers, New York.
12. Goleman, D. (1995). Emotional intelligence. New York: Bantam.
13. He, K. (2004). Blending learning and the development of educational technology theory. Educational Technology of China.
14. Heiskanen, E., Pantzar, M.: Toward Sustainable Consumption: New Perspectives, Journal of Consumer Policy, No. 20, 1997.

7th INTERNATIONAL MARITIME SCIENCE CONFERENCE
180
April 20th-21st, 2017, Solin, Croatia
15. Honey, P & Mumford, A, (1983). Using Your Learning Styles. Maidenhead, UK, Peter Honey Publications
16. Kolb. D. A. & Fry, R. (1975). Toward an applied theory of experiential learning.
17. Litzinger, S.H. Lee, J.C. Wise, and R.M. Felder, "A Psychometric Study of the Index of Learning Styles." J. Engr.Education,96(4),309-319(2007).Reliability,factor structure,and construct validity of the IndexofLearningStyles
18. ] Milosavljević M., Grubor G., Osnovi bezbednosti i zaštite informacionih sistema, Univerzitet Singidunum, 2006.
19. Pekić Ž., Đikanović N., “Stav o e-Learningu i stilovi učenja”, Informacione tehnologije IT 2013., Februar 26 th – March 1th, Žabljak 2013.
20. Pekić Ž., Pekić N., Kordić S., Kovač D., Dlabač T., “Analiza online komunikacije i interakcije kroz e-Learning”, Informacione tehnologije IT 2014, Žabljak 2014.
21. Pekić Ž., Pekić N., Kovač D., Dlabač T., “HOW LEARNING STYLES AFFECT THE EXPIRIENCE OF
E-LEARNING”, IMSC 2014., April 28 th -29th, Solin 2014.
22. Pekić, Ž., Pekić, N., Kovač, D., “Influence motivational factors and learning styles on efficiency e-learning”, 8th International Conference on Ports and Waterways, POWA 2013
23. Sasikumar, M. (2008). Moodle Your Way to Elearning. Copyright CDAC Mumbai
24. Shannon, C. E. (1948). "A Mathematical Theory of Communication". Bell System Technical Journal. 27
25. Stevanović, B. (1984): „Pedagoška psihologija“. Zavod za udžbenike i nastavna sredstva, Beograd.
26. http://slidehot.com/resources/integracija-moodle-sms-master-rad-biljana-djukanovic-fon.832511/

181
Ranka Petrinović, Jelena Nikčević Grdinić, Nikola Mandić
CHARTER OF NAUTICAL TOURISM VESSELS IN CROATIAN AND MONTENEGRIN LAW – SIMILARITIES AND DIFFERENCES
CHARTER OF NAUTICAL TOURISM VESSELS IN CROATIAN AND MONTENEGRIN LAW – SIMILARITIES AND DIFFERENCESRanka Petrinović, Jelena Nikčević Grdinić, Nikola Mandić
CHARTER OF NAUTICAL TOURISM VESSELS IN CROATIAN AND MONTENEGRIN LAW – SIMILARITIES AND DIFFERENCES
Ranka Petrinović1, Jelena Nikčević Grdinić2, Nikola Mandić1
(1 University of Split, Faculty of Maritime Studies, Split, Croatia)
(2 University of Montenegro, Maritime Faculty Kotor, Kotor, Montenegro)
(E-mail: [email protected])
ABSTRACT
Before Croatia became the member state of the European Union the activities of renting vessels were performed by natural or legal persons – charter companies registered for that purpose in the Republic of Croatia. These charter companies could rent their own vessels or those owned by other domestic natural or legal persons, which was regulated by the 2005 Ordinance on the conditions to be met by vessels, and natural or legal person performing the activity of leasing vessels. This practice was radically changed by the Croatian accession to the European Union. Since then, the charter business can also be performed by vessels flying flags of the European Union Member States, and to a limited extent, by vessels under the flag of the third country which have been authorized for cabotage by the Ministry responsible for maritime affairs. In Montenegro, the renting of nautical tourism vessels is regulated by the Law on Yachts, as well as the Law on Tourism, which consider the activities of renting navigation facilities for rest, recreation and sailing as a kind of tourist service in nautical tourism. The renting of nautical tourism vessels is performed by a company or entrepreneur (legal or natural person) registered in Montenegro for that kind of activity. It is possible to rent own vessels, or ones belonging to another domestic or foreign legal or natural person. In this regard, the vessels can fly domestic or foreign flags. The Montenegrin laws are more liberal at present than the regulations that were in force in the Republic of Croatia before the European Union accession. However, it will be necessary to amend existing provisions in the process of harmonization of Montenegrin legislation with the European Union acquis.
KEY WORDS
charter business, charter companies, nautical tourism vessels, cabotage.
1. INTRODUCTION
Historically, parallel to the development of nautical tourism began the development of charter activities - renting vessels of nautical tourism and providing accommodation on them. In Croatia, commercial charter activities occurred with the construction of the first marinas. Today in Croatia there is a growing number of companies registered for charter activities. Complete development of charter business in Croatia took place after the
Maritime Code came into force in 2004 and the bylaw legislation on the basis of which Ordinance on boats and yachts1 from 2005 should be specifically mentioned because it regulated in detail the legal status of vessels in nautical tourism. The adoption of these regulations removed the possibility for further development of
1 Official Gazette 27/05, 57/06, 80/07, 3/08, 18/09, 56/10, 97/12, 137/13 and 18/16.

7th INTERNATIONAL MARITIME SCIENCE CONFERENCE
182
April 20th-21st, 2017, Solin, Croatia
the so-called black charter, which till then substantially marked this business. The positive trend of increasing the representation of business with vessels of nautical tourism in the Croatian maritime economy, which has resulted in an increasing number of domestic and foreign yachts and boats in Croatian waters, followed the negative trend of the increase in illegal renting foreign vessels in our seas (the so-called black charter), which in Croatia escalated in the late nineties. The government's tough measures restored order in the prospective market of renting boats.2 Because of these problems with black charter, the Maritime Code of 2004 introduced restrictive provisions on cabotage in the Croatian internal waters and territorial sea, including sailing yachts and boats for economic purposes.3 Further changes in this sector followed in 2013, after the Croatia accessed the European Union, due to the harmonization of national legislation with the EU acquis. In fact, there was a further legal regulation of this activity in the part of conditions and ways of performing activities or chartering a boat with or without crew (charter), also including the services of providing accommodation of guests on a yacht or a boat. Charter activity in Montenegro is regulated by the Law on yachts in 2007. The law was prepared by Montenegrin government in cooperation with the private experts in order to create a legal framework conducive to investment in nautical tourism. However, in the implementation of the Law on yachts in practice many inconsistencies were noticed. Despite the efforts of the legislature to establish a quality legal framework, there was a broader phenomenon of black charter. But, parallel with the adoption of the Law on yachts, there was no quality control system of charter activities of foreign vessels. The evidence was the fact that the state budget did not have an income from these
2 It may be noted that an important step forward is made in the Maritime Code of 2004, where the yacht is defined as a special type of vessel, which was previously regarded as a subtype of the ship or boat. See more Ranka Petrinović - Ante Perkušić - Nikola Mandić, a Contract of lease of yachts and boats, Proceedings of the Faculty of Law in Split, Vol. 45, no. 4, Split, 2008, p. 863-884. 3 See more Tihomir Lukovic et al., Yachting Croatian, Split, 2015, p. 187-188.
activities even though such vessels performed charter activity in the waters of Montenegro.
2. CABOTAGE BY VESSELS OF NAUTICAL TOURISM IN CROATIA
According to the Maritime Code4, cabotage is the carriage of goods and passengers between Croatian ports, which includes coastal cabotage (carriage of passengers or goods by sea between ports located on land without landing on the islands), the supply of the offshore plants (carriage of passengers or goods by sea between any port and offshore plants or structures that are located in the continental shelf of the Republic of Croatia), island cabotage (the transport of passengers and goods by sea between ports on the mainland and the ports on one or more islands and ports on islands) and transport of passengers by boat or yacht within the internal waters and territorial sea with hire (further: cabotage of vessels of nautical tourism).5 Cabotage vessels of nautical tourism, i.e. rental activity of yachts or boats with or without crew (charter), can be performed under conditions and in the manner determined by the Ordinance on the conditions for vessel rental activity with or without crew and the provision of accommodation services to guests on board (further: Regulation on the charter) 6 which brought the minister of maritime affairs with the consent of the minister of tourism. Charter activity can be carried out exclusively with yachts and boats for economic purposes. Foreign
4 Official Gazette 181/04, 76/07,146/08, 61/11, 56/13 and 26/15. 5 The coastal cabotage, supplying offshore plants and island cabotage which are carried out by special ships, are regulated by Article 9th of Maritime Code and the Ordinance on the conditions for carrying out cabotage in the Republic of Croatia (Official Gazette 56/14). 6 Official Gazette 99/13. Regulation on the charter was adopted on the basis of Article 137 of the Law on Amendments to the Maritime Code (Official Gazette 56/13) and in conjunction with Article 9, item 3 and Article 9a of the Maritime Code of the minister responsible for maritime affairs. On the effective date of the mentioned Ordinance, the Ordinance on the conditions to be met by vessels, and natural or legal person performing the activity of leasing vessels ceased to be valid (OG, 41/05 and 62/09).
183
Ranka Petrinović, Jelena Nikčević Grdinić, Nikola Mandić
CHARTER OF NAUTICAL TOURISM VESSELS IN CROATIAN AND MONTENEGRIN LAW – SIMILARITIES AND DIFFERENCES
yachts and boats intended for leisure, sport or recreation, not pursuing an economic activity of renting, can navigate and stay in the internal waters and territorial sea of the Republic of Croatia, except in restricted areas7, in accordance with the Ordinance on conditions for the arrival and stay of foreign yachts and boats designed for sport and pleasure in the internal sea waters and territorial sea of the Republic of Croatia8 adopted by the Croatian Government.
3. RENTING THE VESSELS OF NAUTICAL TOURISM
Charter activity was until 2014, i.e. until the adoption of amendments to the Law on providing services in tourism9 governed by regulations of the Ministry responsible for tourism and the ministry responsible for maritime affairs. From that moment, ways and conditions for charter activities were entirely left to the ministry responsible for maritime affairs and ministry for tourism defined
7 Prohibited zones in internal waters of the Republic of Croatian, according to Article 16th of Croatian Maritime Code, may be prescribed by the minister responsible for defense affairs, with the consent of the minister responsible for maritime affairs. The restricted areas in the territorial sea of the Republic of Croatia, according to Article 29th of Croatian Maritime Code, may be prescribed by the minister responsible for maritime affairs as a much-needed measure of safety or the minister responsible for defense affairs to perform training with the use of weapons. Prohibited zones in internal waters and territorial sea shall be published in the Announcement for Mariners. 8 Official Gazette 97/13. Regulation on arrival and stay of foreign vessels was made on the basis of the Article 134, indent 2 of the Law on Amendments to the Maritime Code (Official Gazette 56/13), and in conjunction with Article 12th of Maritime Code (Official Gazette 181/04, 76/07, 146/08, 61/11, 56/13 and 26/15) by the Croatian Government. On the effective date of that Regulation, the Ordinance on conditions for the arrival and stay of foreign yachts and boats designed for sport and pleasure in the internal waters and territorial sea of Croatia in 2006 ceased to be valid (Official Gazette 40/06) 9 Official Gazette 30/14
the basic concepts related to the charter activities.10 Regulation on the charter stipulates the conditions and manners of performing activities or chartering a boat with or without crew (charter) including the provision of accommodation of guests on a yacht or boat (further: the vessel) in the internal waters and territorial sea of the Republic of Croatia (Article 1). The vessel charter includes giving the vessel to the user for the purpose of entertainment, with or without crew, without the accommodation of guests, for a charge that is predefined and publicly available. Providing accommodation means giving the vessel to the end user, with or without crew, in the period of time during which passengers spend the night on board, for a charge that is predefined and publicly available. (Article 2, paragraph 1, point 3 and 4) The vessel charter is service of renting the vessel or accommodation on board in internal waters and territorial sea of the Rebublic of Croatia pursuant to special legislation that regulates the provision of services in nautical tourism (Article 2, paragraph 1, point 2). The Charter activity can be performed by: vessels of Croatian nationality, vessels flying the flag of a Member State of the European Union and vessels flying the flag of the third country which has obtained approval for cabotage (Article 3). The vessel that performs charter activity must meet specific requirements relating to equipment, technical supervision, minimum number of crew members and the needs of the document.11
10 See more Tihomir Lukovic et al., Yachting Croatian, Split, 2015, pp. 126-128. 11 The specific conditions that the vessel should meet are: must be equipped with a minimum of equipment as required by the provisions of the regulations governing the statutory certification of boats and yachts of Croatian nationality of vessels of the same technical characteristics and uses; technical supervision of the vessel must be carried out within a period not longer than 12 months, and the results of the monitoring must be issued in the appropriate documents; must have a minimum number of crew members needed for safe navigation according to the provisions of the regulations governing the minimum number of crew members required for the safe operation of boats and yachts of Croatian nationality for vessels of the same technical characteristics and uses; must have other valid documents and books in accordance with the regulations of the flag state; must have a liability insurance policy

7th INTERNATIONAL MARITIME SCIENCE CONFERENCE
184
April 20th-21st, 2017, Solin, Croatia
A crew member of the vessel which carries out charter activities must be qualified and possess a document proving the qualification in accordance with the Ordinance on boats and yachts and the International Convention on Standards of Training, Certification and Watchkeeping for Seafarers, 1978, as amended (STCW Convention). In addition to the above documents, a crew member of the vessel which carries out charter business can own document proving the qualification, issued by the competent authority of another state, under condition that the same is recognized by the ministry responsible for maritime affairs. A foreigner, a member of the crew of the vessel which carries out charter activity, in addition to the foregoing, must comply with the provisions of special regulations governing the stay of foreigners in the Republic of Croatia (Article 5). Charter company is a natural or legal person that is the owner or user of the vessel or took the responsibility from the owner or the user on the basis of a written contract for operating the vessel and other responsibilities prescribed by the Ordinance on the renting vessels and legislation of Croatia relating to safe navigation and protection of the sea from pollution (Article 2 (1) (5)). According to the Ordinance on the conditions to be met by the vessel, and natural or legal person performing the activity of leasing vessels from 2005 charter companies could only be natural or legal person registered in the Republic of Croatia for vessel rental activity. Charter company that provides accommodation solely on yachts with professional crew12 must: dispose of equipment for electronic submission of crew and passengers including internet connection,
for damage to the third parties covering even adverse events in the area of internal waters and territorial sea of the Rebublic of Croatia. The vessel used for the provision of accommodation should be built and equipped in a way that allows multi-day accommodation of crew and passengers. (Article 4 of the Regulation of the charter) 12 The yacht with a professional crew is the yacht that can be rented or which provides accommodation services exclusively to the members of the crew who, with the owner or user of the yacht or charter company, made a contract or other agreement governing the relationship between employer and employee, regarding the working conditions, benefits and obligations, Article 2 (1) (6)
equipment for the use of advanced electronic signatures; give crew and passenger list before each mission in the central database of the Ministry responsible for maritime affairs; charge a fee for tourist tax in accordance with special regulations; report the stay of foreigners in accordance with the special regulations governing the stay of foreigners in the Republic of Croatia. Charter companies that rent only boats (without crew) must: dispose of the room for the reception of guests; designate at least one person who (with the charter company) has an employment contract or other agreement which determines the relationship between employer and employee regarding working conditions, benefits and obligations, who is responsible for technical accuracy and the takeover of the vessel of the charter company in accordance with the provisions of the Ordinance on the renting vessels and Croatian legislation, as well as to support the guests during the cruise; carry out the handover of the vessel13 with the person responsible for the management of the vessel. Charter activities in accordance with the provisions of the Ordinance on the renting vessels can perform even the vessels that fly the flag of the third country (a state that is not the Republic of Croatia nor the Member State of the European 13 The handover of the vessel includes at least the following elements: the verification of skills of the person responsible for management of the vessel; handing over all valid documents and documents of the vessel prescribed for safe navigation; checking the proper operation of ship’s devices and equipment; getting acquainted with the basic rules of safety of navigation and prevention of marine pollution; getting acquainted with the phone numbers of search and rescue and other emergency services; getting acquainted with the procedure in the event of a maritime accident; familiarization with the system of weather reports and weather alerts, etc. On the procedure of handover shall be made a record signed by the person who, on the side of charter companies, performed a handover and of the person responsible for the management of a boat. The minutes (record) shall be drawn up in two copies one of which must be located on the vessel and the other in the official premises of the charter company and the same must be presented, on request, to an authorized person. On the boat that is rented, along with the minutes (record), must be also the invoice that is issued in accordance with special regulations. (Article 7 of the Ordinance on the renting vessels)

185
Ranka Petrinović, Jelena Nikčević Grdinić, Nikola Mandić
CHARTER OF NAUTICAL TOURISM VESSELS IN CROATIAN AND MONTENEGRIN LAW – SIMILARITIES AND DIFFERENCES
Union), but only those with hull length greater than 40 meters, which obtained approval for cabotage. Accordingly, the vessel which flies the flag of the third country, and whose hull length is less than 40 meters, cannot perform charter activity in the Republic of Croatia. Approval for cabotage is issued by the minister for maritime affairs in the period not longer than one year. The annual number of approvals for such cabotage is 5% of the total number of vessels which have provided service of accommodation in the previous calendar year.14 The activities of charter companies for the third flag vessels can perform a natural or legal person that is registered in the Register of maritime agents (Article 8).15
4. CABOTAGE BY VESSELS OF NAUTICAL TOURISM IN MONTENEGRO
According to the Law on Sea16, cabotage is the transport of goods and passengers between domestic ports that is performed by ships, yachts or boats of domestic nationality. In this sense, cabotage is not considered as the transport of persons by foreign yacht or boat side, if the carriage is performed free of charge, unless a special law provides otherwise. Notwithstanding the above definition of cabotage, the ministry responsible for maritime affairs may authorize a foreign vessel to transport empty containers in their exploitation between domestic ports, on condition of reciprocity and foreign ship, yacht or boat to transport passengers and goods between domestic ports, if required by the economic interests of Montenegro. A similar provision also contained the Maritime code of the Republic of Croatia before harmonization of Croatian maritime legislation with the European Union acquis. The opinion on the economic interest of performing
14 According to data from the Ministry in charge of Maritime Affairs of the Ordinance on the renting vessels from 2013, altogether 45 vessels of the third countries received approval for cabotage. In 2014, there was 28, in 2015 19 and in 2016, 13 authorization for cabotage. 15 The Register of Maritime Agents enter the legal or natural persons registered for carrying out maritime agency business - maritime agents, and on this basis they are entitled to perform these activities. 16 Official Gazette of Montenegro 17/07 and 06/08.
cabotage of foreign yachts and boats had to give Croatian Chamber of Economy. Therefore, in the Law on Sea of Montenegro remains unclear who and based on what criterion determines the economic interest of Montenegro.
5. RENTING VESSELS OF NAUTICAL TOURISM IN MONTENEGRO
Law on yachts17, as lex specialis, in part IV specifically regulates the activity of renting yachts.18 Renting a yacht carries natural or legal person required to be registered in Montenegro for that kind of activity. Charter companies can charter your own yacht or the yacht owned by other domestic or foreign legal or natural persons and the one that is flying domestic or a foreign flag. If the charter companies rent a yacht that is not owned by them, all the obligations, rights and responsibilities prescribed by the Law on yacht has charter company, which does not exclude the liability of the owner in accordance with special regulations. If the yacht is rented without crew, a person who leases it, must take all the rights, obligations and responsibilities of charter companies in accordance with the Law on yachts and special regulations (Article 36). Charter companies must keep the record book on yacht renting. The master or skipper of a chartered yacht must endorse the crew and passengers list in the harbor master's office or branch office before departure, and such a list must be located on the yacht. According to the Law on tourism19 renting of vessels with or without crew, with or without the provision of accommodation services, for rest, recreation and cruising of yachtsmen (charter, cruising, etc.) is one of the tourist services in nautical tourism ports - marinas (article 57) i.e. in
17 Official Gazette of Montenegro 46/07, 73/10, 40/11 and 42/15. 18 In accordance with article 38a of the Law on Yachts provisions on business lease (rent), except for yachts, also apply to the boat. Law on Yachts defines foreign boat as a vessel that has a foreign flag. The disadvantage of this definition is that nowhere in the law is defined the term boat as not foreign, so the given definition is incomplete. 19 Official Gazette 61/10, 40/11, 53/11 and 31/14.

7th INTERNATIONAL MARITIME SCIENCE CONFERENCE
186
April 20th-21st, 2017, Solin, Croatia
tourism services on vessels in nautical tourism (Article 60). Minimum technical requirements and method of providing services related to the rent (lease) of vessels with or without crew, with or without the provision of accommodation services, for rest, recreation and cruising sailors must prescribe the ministry responsible for maritime affairs, with the consent of government bodies responsible for maritime affairs and transport.
6. CONCLUSIONS
Croatia and Montenegro, although countries with a similar legal framework, accessed the problem of cabotage of vessels of nautical tourism in a different way. For both countries, segment of nautical tourism is an important economic factor. However, due to problems with black charter, Croatia decided to make a restrictive attitude towards foreign vessels to which it forbade dealing with renting the boats of nautical tourism (cabotage), which led to complete state control over this segment. In this way, with regulations and practice, it was ready to welcome the accession to the European Union and the harmonization of these regulations with liberal rules on competition in the field of cabotage. Therefore, the entry of Croatia to European Union liberalized the cabotage market also for nautical tourism. Since then the market charter activities are open to all charter companies that are registered in a Member State of the European Union. The precondition for compliance with European Union regulations was arranging then applicable legislation which changes put an end to the illegal renting of foreign vessels in the nautical tourism. Montenegro already has a liberal approach and allows vessels of all flags the cabotage navigation in their internal waters and territorial sea under the condition existence of economic interests of Montenegro, so that the charter activity may be performed exclusively by legal or natural persons registered in Montenegro. However, without quality control enforcement, de facto legalization of black charter is allowed, because of an effort to attract more wealthy foreign charter companies. In this
way, a large part of the significant income from these activities has gone into the gray economy. Considering the fact that Montenegro is in the process of joining the European Union, it is necessary to regulate the market charter activities additionally with more modern legislation and it is more important to introduce a quality control over the income coming from these activities. Therefore, the example of the Republic of Croatia can serve as a roadmap to Montenegro in adapting its legislation with the acquis. REFERENCES
1. The Maritime code of the Republic of Croatia, Offizial Gazette 181/04, 76/07, 146/08, 61/11, 56/13 and 26/15.
2. Ordinance on boats and yachts, Offizial Gazette 27/05, 57/06, 80/07, 3/08, 18/09, 56/10, 97/12, 137/13 and 18/16.
3. Ordinance on the requirements for vessel rental activity with or without crew and performing accommodation services to guests on board, Offizial Gazette 99/13.
4. Ordinance on the conditions for carrying out cabotage in the Republic of Croatia, Offizial Gazette 56/14.
5. Ranka Petrinović – Ante Perkušić – Nikola Mandić, Leasing contract of yachts and vessels, Proceedings of the Faculty of Law in Split, vol.45, no. 4, Split, 2008, pp. 863-884.
6. Tihomir Luković and all, Nautical tourism of the Republic of Croatia, Split, 2015.
7. Regulation on conditions for the arrival and stay of foreign yachts and boats designed for sport and pleasure in the internal waters and territorial sea of the Republic of Croatia, Official Gazette 97/13.
8. Law on Yachts of Montenegro, Official Gazette of Montenegro 46/07, 73/10, 40/11 and 42/15.
9. Law on Sea of Montenegro, Official Gazette of Montenegro 17/07 and 6/08.
10. Law on Tourism of Montenegro, Official Gazette of Montenegro 61/10, 40/11, 53/11 and 31/14.

187
Ivica Kuzmanić, Maja Krčum, Igor Vujović
CONTRIBUTION TO MARINE ELECTRICAL ENGINEERING AND INFORMATION TECHNOLOGIES CURRICULUM
CONTRIBUTION TO MARINE ELECTRICAL ENGINEERING AND INFORMATION TECHNOLOGIES CURRICULUMIvica Kuzmanić, Maja Krčum, Igor Vujović
CONTRIBUTION TO MARINE ELECTRICAL ENGINEERING AND INFORMATION TECHNOLOGIES CURRICULUM
Ivica Kuzmanić, Maja Krčum, Igor Vujović
(University of Split, Faculty of Maritime Studies, Split, Croatia)
(E-mail: [email protected])
ABSTRACT
This paper deals with improving the curriculum for the Marine Electrical Engineering and Information Technologies Department at the Faculty of Maritime Studies in Split, with a particular focus on the master level. While the BSc level is defined by the STCW 7.03 (lower level) and 7.08 (higher level) requirements, the MSc level structure is largely blurred. So, finding a right niche in the labor market ashore should be the goal of the curriculum improvements. It is important to assist the 3-year program students in finding shore-based jobs by introducing adjustments to the current curriculum. Nowadays, it is not expected that any one will remain aboard for the entire work life. It is more natural to keep developing various skills and, at some point, start working ashore at private or government agencies / services, possibly in the area of inspection, education, logistics, fleet management or other related professions. For electro-technical officers (ETOs) it is even possible to find work in the fields that are not directly related to marine technologies, but rather to the electrical know-how. A new curriculum for the master level should enable such engagements but also, at the same time, it should avoid parallelism problems with pure electrical engineering studies at similar higher education institutions, e.g. electrical engineering faculties. One of the fields that lack skilled employees is the IT and software industry. When dealing with software requirements, the ability to function in different working and business environments should be an imperative in future traffic applications. These skills will also help in finding jobs in shore-based and IT businesses. The paper presents a workflow of the plans to change the curriculum for the Marine Electrical Engineering and Information Technologies (MEEIT) Department in order to position MEng of MEEIT clearly at the EU labor market.
KEY WORDS
Curriculum, Marine electrical engineering, STCW 7.08, Electrotechnical officer (ETO), Marine education
1. INTRODUCTION
Figure 1 shows the structure of the undergraduate and graduate studies provided by the Faculty of Maritime Studies in Split, with remarks on STCW compliance. This paper discusses only one of these study programs – Marine electrical engineering and information technologies. IMO STCW 95, as amended in 2010 (Manila amendment), anticipates the introduction of a certified position of an electro-technical officer. The general duties of this officer include [1]:
- maintenance of all electrical engines onboard (both deck and engine room), - maintenance of all switchboards, fire alarm systems, ship’s alarms, - responsibility for fire detectors, electronic systems fitted onboard, all batteries, refrigeration units, air conditioning, refrigerated containers, cargo and engine room crane electrical system, - while maneuvering, he/she must be present in the engine room, and can assist in watch keeping routines ordered by the chief engineer,

7th INTERNATIONAL MARITIME SCIENCE CONFERENCE
188
April 20th-21st, 2017, Solin, Croatia
- finally, she/he has to assist ship’s engineers and deck officers in solving electrical problems. This list of duties and responsibilities makes it obvious that a graduated marine electro-technical officer (ETO) is able to carry out similar shore-based tasks in the supervision and maintenance of electrical equipment (engines, sensors, alarms, air condition, refrigeration, power distribution, and similar) but, despite ETO’s competence, he or she is formally not certified to perform these tasks. This is
covered by the thee-year BSc curriculum at the Marine Electrical Engineering and Information Technologies (MEEIT) Study. These students may find work at shore-based companies engaged in power distribution, grid regulation and maintenance, or in firms operating power plants or having high power consumers, providing services for electric equipment, and alike.
Figure 1. Study structure with respect to STCW (Faculty of Maritime Studies in Split)
MEEIT study also enables the acquisition of other maritime-related certificates, which are, again, different from those issued by electrical engineering departments at non-maritime faculties. The study is not designed for developing and designing general purpose electrical and electronic equipment, grids, and circuits. Also, ETO should have some other psychological characteristics related to ship’s specifics and to officer competences, such as team leading ability, ability to command, etc. This paper considers the differences and qualification framework for MEEIT students, and potentials to find jobs ashore.
The paper is organized as follows: the next section deals with the forecast of the future needs, while the third section discusses the current curriculum and possible future trends. Conclusions are given at the end.
2. FORECAST OF FUTURE NEEDS FOR KNOWLEDGE WITH GUIDELINES FOR DEVELOPMENT
Basic functions and competences of the electro-technical officer (ETO), as incorporated at the BSc level, are [2]:
- electrical, electronic, and control engineering at the operational level,
- maintenance and repair at the operational level, and
- controlling the operation of the ship and care for persons on board at the operational level.
Such jobs could be performed also ashore but it is obvious that these skills do not fit the rank of the Master level. On the contrary, there are hardly even for the BSc level. These skills can mostly be acquired at technical high school. Hence, it is a challenge to upgrade such basic functions to BSc level and to harmonize learning outcomes. Moreover, the graduate student has to be multidisciplinary, because it is possible that ETO serves as a watch keeping officer in the engine room. That implies the inclusion of mechanical engineering courses and outcomes as well. Furthermore, all of this should be framed into qualifications framework [3]. It is expected that the educational needs for this job profile in the near future will include familiarization of students with marine experience, market, STCW framework and new trends in technology. Hence, the education of ETOs and their further education level should be developed in three branches: - servers, local networks and information
systems, - automation, and - power distribution, power grid project analysis,
and consulting in developing of ship’s power distribution.
The first branch deals with the requirements of big and complex ships. These ships are more and more demanding regarding the local area network (LAN) maintenance. There are a lot of actions that should be performed, like restarting servers, dealing with malfunctions and errors, problems with routers, communication protocols between devices and stations, protocols of negotiations [4], etc. These working positions will be even more demanding in future due to the advancement in IoT, which is expected to be introduced aboard ships as well. The second branch deals with development of advanced automated ship systems, maintenance of current automatics, and development of future automation components. Skill development in this branch should be geared towards the IoT technology in control and monitoring of ship’s automation operation. This also represents a
potential supplement for the master level, because of future developments in advanced control algorithms such as artificial neural networks, fuzzy controllers, genetic algorithms, and artificial intelligence. This knowledge is not required by STCW for ETO, but these technologies will mark the future. The third branch is important on every ship. But it is also a niche for employment of experienced ETOs and master-level MEEIT population ashore, e.g. in departments in charge of research and development. They do not need to have the right for signature as developers or system’s architect, but they possess experience that may help the company in assessment and decision making about future development. This branch also includes (at a lower level) on-board knowledge to install new grid consumption units and components, i.e. inclusion of new devices and power consumption units, calculations of cables, breakers and other additional distribution parts. Croatian qualifications framework [3] should classify these demands into several jobs. These jobs could be performed by people who have completed MEEIT. Alternatively, people who graduated from electrical engineering faculties could be educated for such positions by attending courses containing marine specifics, and other basic maritime courses required by the STCW. A demand for actual real-life knowledge make the employers appreciate people with know-how more than the diplomas and other papers they may or may not hold. What kind of work can our MEEIT students perform ashore? They might find a job at IT companies if they know the trade. Therefore, another potential niche for students of MEEIT could be IT sector. Possible positions also include services dealing with small house appliances and devices, computers, even installations. It is obvious that faculties of information science, computer science, and electrical engineering cannot cope with the needs of IT sector. There is a constant demand for IT experts of various expertises. Hence, if the curriculum does not provide enough space for developing such expertise at the BSc level, it might be found at the master stage of education, e.g. through elective courses. That would enable students who do not wish to work in marine industry to find employment ashore. Further advancement in this area could be

189
Ivica Kuzmanić, Maja Krčum, Igor Vujović
CONTRIBUTION TO MARINE ELECTRICAL ENGINEERING AND INFORMATION TECHNOLOGIES CURRICULUM
- electrical, electronic, and control engineering at the operational level,
- maintenance and repair at the operational level, and
- controlling the operation of the ship and care for persons on board at the operational level.
Such jobs could be performed also ashore but it is obvious that these skills do not fit the rank of the Master level. On the contrary, there are hardly even for the BSc level. These skills can mostly be acquired at technical high school. Hence, it is a challenge to upgrade such basic functions to BSc level and to harmonize learning outcomes. Moreover, the graduate student has to be multidisciplinary, because it is possible that ETO serves as a watch keeping officer in the engine room. That implies the inclusion of mechanical engineering courses and outcomes as well. Furthermore, all of this should be framed into qualifications framework [3]. It is expected that the educational needs for this job profile in the near future will include familiarization of students with marine experience, market, STCW framework and new trends in technology. Hence, the education of ETOs and their further education level should be developed in three branches: - servers, local networks and information
systems, - automation, and - power distribution, power grid project analysis,
and consulting in developing of ship’s power distribution.
The first branch deals with the requirements of big and complex ships. These ships are more and more demanding regarding the local area network (LAN) maintenance. There are a lot of actions that should be performed, like restarting servers, dealing with malfunctions and errors, problems with routers, communication protocols between devices and stations, protocols of negotiations [4], etc. These working positions will be even more demanding in future due to the advancement in IoT, which is expected to be introduced aboard ships as well. The second branch deals with development of advanced automated ship systems, maintenance of current automatics, and development of future automation components. Skill development in this branch should be geared towards the IoT technology in control and monitoring of ship’s automation operation. This also represents a
potential supplement for the master level, because of future developments in advanced control algorithms such as artificial neural networks, fuzzy controllers, genetic algorithms, and artificial intelligence. This knowledge is not required by STCW for ETO, but these technologies will mark the future. The third branch is important on every ship. But it is also a niche for employment of experienced ETOs and master-level MEEIT population ashore, e.g. in departments in charge of research and development. They do not need to have the right for signature as developers or system’s architect, but they possess experience that may help the company in assessment and decision making about future development. This branch also includes (at a lower level) on-board knowledge to install new grid consumption units and components, i.e. inclusion of new devices and power consumption units, calculations of cables, breakers and other additional distribution parts. Croatian qualifications framework [3] should classify these demands into several jobs. These jobs could be performed by people who have completed MEEIT. Alternatively, people who graduated from electrical engineering faculties could be educated for such positions by attending courses containing marine specifics, and other basic maritime courses required by the STCW. A demand for actual real-life knowledge make the employers appreciate people with know-how more than the diplomas and other papers they may or may not hold. What kind of work can our MEEIT students perform ashore? They might find a job at IT companies if they know the trade. Therefore, another potential niche for students of MEEIT could be IT sector. Possible positions also include services dealing with small house appliances and devices, computers, even installations. It is obvious that faculties of information science, computer science, and electrical engineering cannot cope with the needs of IT sector. There is a constant demand for IT experts of various expertises. Hence, if the curriculum does not provide enough space for developing such expertise at the BSc level, it might be found at the master stage of education, e.g. through elective courses. That would enable students who do not wish to work in marine industry to find employment ashore. Further advancement in this area could be
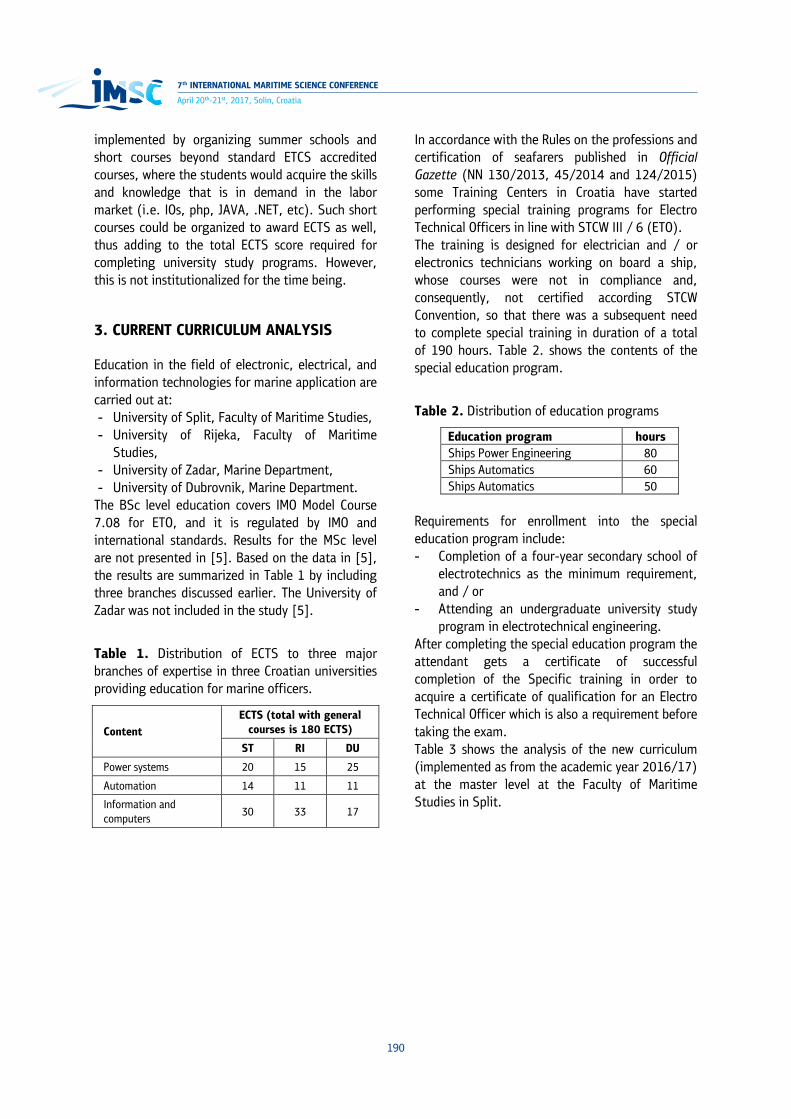
7th INTERNATIONAL MARITIME SCIENCE CONFERENCE
190
April 20th-21st, 2017, Solin, Croatia
implemented by organizing summer schools and short courses beyond standard ETCS accredited courses, where the students would acquire the skills and knowledge that is in demand in the labor market (i.e. IOs, php, JAVA, .NET, etc). Such short courses could be organized to award ECTS as well, thus adding to the total ECTS score required for completing university study programs. However, this is not institutionalized for the time being.
3. CURRENT CURRICULUM ANALYSIS
Education in the field of electronic, electrical, and information technologies for marine application are carried out at: - University of Split, Faculty of Maritime Studies, - University of Rijeka, Faculty of Maritime
Studies, - University of Zadar, Marine Department, - University of Dubrovnik, Marine Department.
The BSc level education covers IMO Model Course 7.08 for ETO, and it is regulated by IMO and international standards. Results for the MSc level are not presented in [5]. Based on the data in [5], the results are summarized in Table 1 by including three branches discussed earlier. The University of Zadar was not included in the study [5].
Table 1. Distribution of ECTS to three major branches of expertise in three Croatian universities providing education for marine officers.
Content ECTS (total with general
courses is 180 ECTS)
ST RI DU
Power systems 20 15 25
Automation 14 11 11
Information and computers
30 33 17
In accordance with the Rules on the professions and certification of seafarers published in Official Gazette (NN 130/2013, 45/2014 and 124/2015) some Training Centers in Croatia have started performing special training programs for Electro Technical Officers in line with STCW III / 6 (ETO). The training is designed for electrician and / or electronics technicians working on board a ship, whose courses were not in compliance and, consequently, not certified according STCW Convention, so that there was a subsequent need to complete special training in duration of a total of 190 hours. Table 2. shows the contents of the special education program.
Table 2. Distribution of education programs
Education program hours Ships Power Engineering 80 Ships Automatics 60 Ships Automatics 50
Requirements for enrollment into the special education program include: - Completion of a four-year secondary school of
electrotechnics as the minimum requirement, and / or
- Attending an undergraduate university study program in electrotechnical engineering.
After completing the special education program the attendant gets a certificate of successful completion of the Specific training in order to acquire a certificate of qualification for an Electro Technical Officer which is also a requirement before taking the exam. Table 3 shows the analysis of the new curriculum (implemented as from the academic year 2016/17) at the master level at the Faculty of Maritime Studies in Split.

191
Ivica Kuzmanić, Maja Krčum, Igor Vujović
CONTRIBUTION TO MARINE ELECTRICAL ENGINEERING AND INFORMATION TECHNOLOGIES CURRICULUM
Table 3. Distribution of ECTS to three major branches of expertise at MSc level at the MEEIT in Split
Course ECTS (total of 180 ECTS including general courses)
Power systems Automation Information and
computers Other electrical and electronics
Other marine related
New technologies of materials in electrical engineering
4
Mechatronics 7
Electrical engines and drives control 3 1
Process measurements and instrumentation 5
Simulation and modelling in electrical engineering
6
Ship's local computer networks 4
New technologies in diagnostics and control
5
Object oriented programming 5
Maintenance and reliability of ship’s engine systems
4
Navigation integrated systems* 4
Maritime systems’ optimization * 4
Discrete systems’ control 4
Practicum of ship’s system leading 2 2
Advanced topics in signal processing 5
Marine integrated information systems 4
Intelligent ship’s engines 4
Cross-platform programming* 4
Hydraulic pneumatic systems * 4
Navigation subsystems ergonomy * 3
Integrated communication and information technology
5
Renewable source energy 4
Monitoring and manufacturing systems’ synthesis
4
Hydrographic engineering * 4
Process modelling and simulation * 6
Total: 13 27 34 14 19
* elective
4. CONCLUSIONS The paper analyzes the current level of ETO education at three Croatian universities. Table 1 shows that the universities of Rijeka and Split provide the highest ECTS concentration in IT branch at the BSc level. The highest level of power courses is provided at the University of Dubrovnik. Maintenance of electrical equipment (engines, sensors, alarms, air condition, refrigeration, power distribution, and similar) should be included at the
Croatian classification framework, enabling the students finishing MEEIT to find adequate working positions ashore as well. The second part of the analysis deals with the current MSc curriculum of MEEIT at the Faculty of Maritime Studies in Split. Future development has been considered. Table 3 shows that power systems are the weakest part of the curriculum at the MSc level. Power design, power architecture and distribution courses should be included. The purpose is to provide the

7th INTERNATIONAL MARITIME SCIENCE CONFERENCE
192
April 20th-21st, 2017, Solin, Croatia
graduate student with knowledge that would enable him/her to give advices and to consult the company about changes in ship’s power distribution. IT part seems adequate for future development and creating appropriate jobs ashore. REFERENCES
1. “Duties of Electrical Officer on Board Ship”, available at: http://www.marineinsight.com/ careers2/dutiesofelectricalofficeronboardship/ (accessed: 2017-01-16)
2. “Model course – Electro-Technical Officer“, IMO, 2012.
3. Croatian Qualification Framework http://www.kvalifikacije.hr/hko-en (accessed: 2017-01-16)
4. [Mu, L., “Information and Communication Technologies for Integrated Operations of Ships”, PhD thesis, University of Agder, Faculty of Engineering and Science, Kristiansand, 2013.
5. Project KIKLOP web pages. http://www.kiklop.eu/ (accessed: 2017-01-16)

193
Igor Vujović, Ivica Kuzmanić, Zlatan Kulenović
RELATIONSHIP OF ADVANCES IN ELECTRONICS AND MARITIME TRAFFIC, WITH CASE STUDY OF FALL DETECTION IN SMART CABINS
RELATIONSHIP OF ADVANCES IN ELECTRONICS AND MARITIME TRAFFIC, WITH CASE STUDY OF FALL DETECTION IN SMART CABINSIgor Vujović, Ivica Kuzmanić, Zlatan Kulenović
RELATIONSHIP OF ADVANCES IN ELECTRONICS AND
MARITIME TRAFFIC, WITH CASE STUDY OF FALL DETECTION IN SMART CABINS
Igor Vujović, Ivica Kuzmanić, Zlatan Kulenović
(University of Split, Faculty of Maritime Studies, Split, Croatia)
(E-mail: [email protected]) ABSTRACT The advancement in bleeding-edge traffic systems is closely connected with advancement in electronics and automatic systems’ algorithms. Computer control of ship systems further contributes to automatization, and the development of robotic ships. The intent of the present paper is to connect the fields of traffic and control systems with advances in hardware/software components. Advances in artificial intelligence (AI), radio-frequency identification (RFID), Internet of things (IoT), cross-platform and other technologies make possible further development of automated/smart traffic and IoT control of traffic flow, important for the optimization of greenhouse gas emissions by increasing the speed of traffic flow, disembarkation /embarkation of persons and loading/unloading of cargos. Although smart traffic has been developing on land, some efforts in this direction have also been made in marine traffic. The negative effect of the sea environment (and vibrations caused by a ship’s engines and natural phenomena) on electronic systems limits the available choices for hardware realization of smart systems. The reaction to these effects will determine the course of hardware/software development for maritime applications. The relationship between advances in electronics and the improvement of maritime traffic is difficult to comprehend, due to the time required for the new technologies to come to be used aboard ships. There are far more advanced electronics than those allowed to be used on ships due to various regulations. The paper describes potential IoT technology usage aboard ships, including the usage of accelerometers and gyroscopes integrated in smart phones/ watches to detect medical and dangerous situations aboard cruise/passengers ships. New fall detection algorithm based on data fusion is proposed.
KEY WORDS Fall detection, Internet of Things, Smart Traffic, PLC, Smart Cabin, Cross-platform Software, Computer control of technical systems
1. INTRODUCTION
Advancement in electronics provides an opportunity to develop bleeding-edge technologies with application in maritime affairs. Such technologies have to deal with several aspects that will be of tremendous importance for the success of the future traffic systems and newly adopted ship system technology. For example, advances in artificial intelligence (AI) and other adoptable control algorithms can be useful in traffic control due to their ability to improve traffic flow. New
technologies tend to integrate into some sort of Internet of Things (IoT). IoT has a need for big data analytics and data mining, which is everywhere, from edge note, offline desktop to cloud. Several aspects of development of such systems are considered. An aspect which should be taken into consideration in the development of future vehicles and traffic technology, as well as in the modification of present technologies, is the life span. Since people

7th INTERNATIONAL MARITIME SCIENCE CONFERENCE
194
April 20th-21st, 2017, Solin, Croatia
live longer then ever before and there is an insufficient number of medical experts to take care of them all the time, especially when they are in need, the integration of life-facilitating technologies should be of vital importance for the quality of life in old age. Some aspects of this are covered in [1 – 7]. However, these papers fail to emphasize the importance of such technology in traffic applications (transportation of humans by, for example, trains and passenger / cruise ships, and similar). This is the aspect relevant for this paper, as well as for designers of future vehicles (either maritime, land or air). Another aspect is security and privacy. One of the solutions provided in the references is to use mobile devices to continuously authenticate the operations performed or sent/received information [8]. This is the problem with applications used by smart devices, i.e. Raspberry Pi, a Webcam and ThingS in [9], which is the example of IoT application in (land) traffic analysis. This example illustrates the manner of use of automated cloud analytics and familiar Matlab technology to develop analytics for the edge device. Traffic analytics are necessary for the development of smart traffic. Land examples of IoT are i.e. [10, 11]. Although there is an array of possible marine applications, published papers dealing with this aspect of maritime traffic are lacking. However, intelligent surveillance systems could be helpful in the detection of smuggling and terrorist activities. Such systems could silently alert authorities in case of threat and reduce the number of the required surveillance and security personnel. Other related topics are the smart organization of traffic / merchandise flow to minimize travel time, and similar. The paper is organized as follows. Some issues relating to the implementation of novel technologies into maritime applications are discussed in the second section. The third section deals with one select issue – fall detection of the elderly, as an example of application of electronics in maritime traffic. The fourth section proposes a solution to the fall detection problem, as an integral part of smart cabins aboard ships. Finally, conclusions are given with discussion of possible advancements in overall traffic applications.
2. CONSIDERATION OF SOME PROBLEMS WITH THE IMPLEMENTATION OF NEW TECHNOLOGIES IN MARITIME
The problem with IoT in maritime is the application devices. These devices should be designed to successfully deal with both the particularities of the maritime environment, and the specificities encountered aboard ships. For example, connectors for PLCs (Programmable Logical Controller) are far more robust and tolerant to vibrations than connectors for microcontrollers. One could say that microcontrollers are smaller and, hence, take up smaller volume. However, there is the need for the invention of appropriate hermetic shielding and packaging, which would increase overall volume. Namely, such packaging should fix the position of the microcontroller to make it robust to vibrations. This is merely one example of the selection of electronics for marine traffic applications. PLCs are normally used aboard modern ships with computer control of technical systems. Older ships rely on a different type of automatic elements – relays. PLCs are also often used in on-shore applications. Another example is RFID (Radio Frequency Identification) tagging. Tagging allows barcode-based control and monitoring of the flow of goods from the manufacturer to the customer. An individual product may be said to be transported from point A to point B. Hence, it is possible to control the flow of natural gas to increase the speed of its delivery to consumers. In this case, the origin of the gas is irrelevant, what matters is getting it to the consumer as fast as possible. The suppliers are compensated, because they only deliver the ordered amount of gas. However, such regulation of gas flow would require all gas sources to provide gas of the same quality. Smart cabins are widely present aboard cruise and other passenger ships. Smart cabin integrates various alarms and sensors (security). Cabins of the future should also integrate a variety of services, i.e. WiFi, Internet, and other passenger-related services. Owing to the increasing age of the general population, and, hence, passengers, the future development of smart cabins should provide different health monitors. Fall detection could be an important service. The probability of a fall is higher aboard ships due to the particularities of the ship’s environment

195
Igor Vujović, Ivica Kuzmanić, Zlatan Kulenović
RELATIONSHIP OF ADVANCES IN ELECTRONICS AND MARITIME TRAFFIC, WITH CASE STUDY OF FALL DETECTION IN SMART CABINS
(waves, maneuvering, engines operation). Fall detection could be accomplished by installation of surveillance cameras, were it not for the privacy issues. Hence, fall detection involving minimum invasion of privacy is required. Additional problems could be shipborne movements and vibrations, which could render less-intrusive sensors incapable of correctly detecting falls. However, there are no privacy problems in case of yachts. The system could prove useful in case of a person falling into sea. It could stop the engines and alert the coast guard. One of the ways to detect fall is the three-axis accelerometer. Although it could be the solution to the issue of fall detection in the smart cabin, the elderly population could resist carrying it around all the time. Finally, the psychological factor should not be easily dismissed. New technologies are frequently not gladly embraced by the elderly. For example, a chip equipped with a gyroscope or an accelerometer and a transmitter device could be installed under the skin, but resistance to “man-chipping” would likely be overwhelming. Finally, robotic, totally autonomous, ships are expected to be introduced into maritime traffic. They are anticipated to be used on short distance routes, such as in fjords or rivers, within 3 years, while ocean-going robotic ships could become a reality within the next 10-15 years. New technologies are expected to considerably reduce the number of maritime traffic incidents. This is a technology which will finally enable all maritime traffic to be controlled by computers using new electronics technologies. Since obviously not all technologies mentioned can be covered in a manner they deserve, only one example will be provided – that of a smart cabin and improving it to sense falls. Such system would improve passenger safety and raise the quality of cruise or travel.
3. CASE STUDY: ARCHITECTURE OF A FALL DETECTION SYSTEM
Phases of fall, which could be used in fall detection algorithms, are [12]:
- pre-fall or idle period, - the free-fall (falling),
- the impact (with vertical shock), - the post-fall stability (resting or adjustment),
and - recovery (still motionless).
Fall detection architecture includes [13]:
- input sensors, - signal acquisition, - analysis, and - communication module.
Input sensors and data acquisition are usually referred to as the “Sense” module. Usual sensors are: kinematic (accelerometer, gyroscope, magnetic), barometer, camera, and similar non-evasive devices. There are several approaches which use more aggressive devices, such as EEG (Electro-Encephalo-Gram). Analysis is performed by feature extraction and classification algorithms. The communication module can include e-mails, SMS, MMS, voice call or similar. Communication module is activated when an actual fall is concluded to have occurred. In this case, the leading device (for example smart phone, SP), should inform the authorities about the accident. If there are no injuries, call for help should be canceled by human-to-human (H2H) voice communication. An experienced medical professional should decide if there is any danger (elderly people could give misleading cues due to pride or thinking they can manage the injury themselves). Figure 1 illustrates the fall detection problem. Figure 1 illustrates that fall detection is characterized by rapid change in acceleration over a short interval of time. Fall detection is often performed by threshold-based algorithms, because they are less complex, and, hence, ideal for battery saving at SP.
a)

7th INTERNATIONAL MARITIME SCIENCE CONFERENCE
196
April 20th-21st, 2017, Solin, Croatia
b)
Figure 1. Ilustration of the fall problem: a) space-time change, b) visual-acceleration relation in time
For example, threshold-based algorithms use Signal Magnitude Vector (SMV). This measure is thresholded. The expression for SMV is [13]:
222zyx AAASMV ++= (1)
where Ax, Ay, and Az are accelerometer signals of x, y, and z-axis. The second group of algorithms used, apart from threshold-based, are machine learning algorithms. They could be ideal in systems using smart sensors with transmitters, allowing processing to be performed on a distant terminal or server. However, SP usage is not yet recommended due to computational power and energy consumption of SPs. Other features that could be used are [14]: AV (angle variation), CA (change in angle), VA (vertical acceleration), or OD (orientation angles). These are expressed as [14]:
⎟⎟
⎠
⎞
⎜⎜
⎝
⎛
⋅
⋅⋅=
+
+−
1
11cos180
nn
nn
AAAAAV
π (2)
where ⋅ denotes the Euclidian norm, and A a
component of the acceleration vector. The CA is defined as [14]:
⎟⎟
⎠
⎞
⎜⎜
⎝
⎛
⋅
⋅⋅= −
eb
eb
AAAA
CA 1cos180π
(3)
where bA and eA are average acceleration over
the first and the last second in 4 seconds window. VA is defined as [14]:
ggLVA ⋅
= (4)
where g is the gravity vector, obtained by subtraction of total acceleration and linear acceleration (L). OD is defined as [14]:
[ ]nana
np
np
nr
nr OOOOOO
tOD −+−+−⋅
Δ= +++ 1111 (5)
where p, r, and a denote pitch, roll, and azimuth angles of the sensor’s output. Algorithm evaluation is performed by numerical evaluation parameters commonly used in video processing algorithms, and the basic definitions are the same [12, 15]:
TNFP
TNySpecificit+
= (6)
TPFN
TPySensitivit+
= (7)
FNTNFPTP
TNTPPCC+++
+= (8)
TNFP
FPFPR+
= (9)
TNFP
TPecision+
=Pr (10)
TNFN
FPecisionFDR+
=−= Pr1 (11)
TNFN
FNFOR+
= (12)
FORNPV −=1 (13)
ySensitivitecisionySensitivitecisionFmeasure
+
⋅=PrPr2 (14)
where TP denotes True Positives, TN True Negatives, FP False Positives, and FN False Negatives, FPR denotes False Positive Rate, FDR False Discovery Rate, FOR False Omission Rate, NPV Negative Predictive Value. PCC (Percentage of Correct Classifications) is sometimes called accuracy. PCC is the usual term for the measure used in video processing, while accuracy is the term normally used in fall detection without pixel evaluation. Mathematical expressions for acceleration and pixels are practically the same. It is only the difference in the practical calculation of TP, TN, FP, and FN.

197
Igor Vujović, Ivica Kuzmanić, Zlatan Kulenović
RELATIONSHIP OF ADVANCES IN ELECTRONICS AND MARITIME TRAFFIC, WITH CASE STUDY OF FALL DETECTION IN SMART CABINS
4. PROPOSED SMART CABINE FALL DETECTION
In this section, we propose a sensor fusion-based fall detection system. Two types of sensors are used: visual and accelerometer. Figure 2 shows the overall algorithm flow. There are two branches of the algorithm.
The first deals with accelerometer. It is used to detect sudden rapid changes in acceleration, possibly related to the fall event. The second branch deals with the camera input. This input requires more computational power. Hence, it is performed on the ship’s computer
dedicated to security and safety or to smart cabins, and not on the SP. It has to perform motion segmentation, human detection and a specific feature – recognition of lying on the floor– in real time. Both branches are unified by data fusion rules, which infer the fall – did the fall actually occur or not. Namely, if there is no rapid change in acceleration, there is no fall. Someone can lie down on the floor for a number of reasons. However, when both conditions are met, the fall can be concluded to have occurred. Figure 3 illustrates the proposed setup in the smart cabin.
Figure 2. Fall detection algorithm based on data fusion
Figure 3. Smart cabin example

7th INTERNATIONAL MARITIME SCIENCE CONFERENCE
198
April 20th-21st, 2017, Solin, Croatia
5. FUTURE DEVELOPMENT AND CONCLUSIONS
Many technologies are mentioned in the paper. Since not all of them can be addressed as they deserve for lack of space, the greatest part of the paper focuses on a single technology. The paper proposes a new algorithm for fall detection in smart cabins aboard ships. Due to the nature of the problem (fall detection of elderly people), it is more natural to use smart watch (SW) than the SP. Namely, SW can operate when the subject is sleeping, allowing fall detection when a person is unaware. Falls occurring in the shower or bathtub remain an open issue since in these situations, SP is left behind, and camera is not recommended due to privacy issues. However, falls in the bathroom should be seriously considered. Advances in computer technology can be concluded not to imply similar advancement in IoT (see above open issue), which should be the most important course of near-future technology. The relationship between advances in electronics and traffic applications is not easy to grasp, because new technologies are implemented on new ships, while old ships continue to use old technologies. So, advances will be shown as new ships appear on seas.
REFERENCES
1. Bennett, T. R. , Wu, J., Kehtarnavaz, N., Jafari, R., “Inertia Measurement Unit-based Wearable Computers for Assisted Living Applications”, IEEE Signal Processing Magazine, Vol. 33, No. 2 (2016), pp. 28-35., doi: 10.1109/MSP.2015.2499314
2. Erden, F., Velipasalar, S., Alkar, A. Z., Cetin, A. E., “Sensors in Assisted Living”, IEEE Signal Processing Magazine, Vol. 33, No. 2 (2016), pp. 36-44., doi: 10.1109/MSP.2015.2489978
3. Savazzi, S., Sigg, S., Nicoli, M., Rampa, V., Kianoush, S., Spagnolini, U., “Device-free Radio Vision for Assisted Living”, IEEE Signal Processing Magazine, Vol. 33, No.
2 (2016), pp. 45-58., doi: 10.1109/MSP.2015.2496324
4. Witrisal, K., Meissner, P., Leitinger, E., Shen, Y., Gustafson, C., Tufvesson, F., Haneda, K., Dardari, D., Molisch, A. F., Conti, A., Win, M. Z., “High-Accuracy Localization for Assisted Living – 5G Systems Will Turn Multipath Channels from Foe to Friend”, IEEE Signal Processing Magazine, Vol. 33, No. 2 (2016), pp. 59-70., doi: 10.1109/MSP.2015.2504328
5. Amin, M. G., Zhang, Y. D., Ahmad, F., Ho, K. C. (Dominic), “Radar Signal Processing for Elderly Fall Detection”, IEEE Signal Processing Magazine, Vol. 33, No. 2 (2016), pp. 71-80., doi: 10.1109/MSP.2015.2502784
6. Debes, C., Merentitis, A., Sukhanov, S., Niessen, M., Frangiadakis, N., Bauer, A., “Monitoring Activities of Daily Living in Smart Homes”, IEEE Signal Processing Magazine”, Vol. 33, No. 2 (2016), pp. 81-94., doi: 10.1109/MSP.2015.2503881
7. Nejati, H., Pomponiu, V., Do, T.-T., Zhou, Y., Iravani, S., Cheung, N.-M., “Smartphones and Mobile Image Processing for Assisted Living”, IEEE Signal Processing Magazine, Vol. 33, No. 4 (2016), pp. 30-48., doi: 10.1109/MSP.2016.2549996
8. Patel, V. M., Chellappa, R., Chandra, D., Barbello, B., “Continuous User Authentication on Mobile Devices”, IEEE Signal Processing Magazine, Vol. 33, No. 4 (2016), pp. 49-61., doi: 10.1109/MSP.2016.2555335
9. Wetjen, E., "Counting Cars and Analyzing Traffic with a Raspberry Pi”, a Webcam and ThingSpeak, available at: http://makerzone.mathworks.com/blog/counting-cars-and-analyzing-traffic-raspberry-pi-thingspeak/
10. Semanjski, I., Lopez, A. J., Gautama, S., “Forecasting Transport Mode Use with Support Vector Machines Based Approach”, Transactions on Maritime

199
Igor Vujović, Ivica Kuzmanić, Zlatan Kulenović
RELATIONSHIP OF ADVANCES IN ELECTRONICS AND MARITIME TRAFFIC, WITH CASE STUDY OF FALL DETECTION IN SMART CABINS
Science, Vol. 5, No.2 (2016), pp. 111-120., doi: 10.7225/toms.v05.n02.002
11. Lopezof S., “Travelled Distance Estimation for GPS-Based Round Trips Car-Sharing Use Case”, Transactions on Maritime Science, Vol. 5, No. 2 (2016), pp. 121-129., doi: 10.7225/toms.v05.n02.003
12. Casilari, E., Luque, R., Morón, M.-J., "Analysis of Android Device-Based Solutions for Fall Detection“, Sensors, Vol. 15 (2015), pp. 17827-17894., doi:10.3390/s150817827
13. Habib, M. A., Mohktar, M. S., Kamaruzzaman, S. B., Lim, K. S., Pin, T. M., Ibrahim, F., "Smartphone-Based
Solutions for Fall Detection and Prevention: Challenges and Open Issues“, Sensors Vol. 14 (2014), pp. 7181-7208., doi:10.3390/s140407181
14. Figueiredo, I. N., Leal, C., Pinto, L., Bolito, J., Lemos, A., "Exploring smartphone sensors for fall detection“, The Journal of Mobile User Experience, Vol. 5(2016), article ID: 2, doi: 10.1186/s13678-016-0004-1
15. Vujović, I., Šoda, J., Kuzmanić, I., "Stabilising illumination variations in motion detection for surveillance applications“, IET image processing, Vol. 7, No. 7 (2013), pp. 671-678.

7th INTERNATIONAL MARITIME SCIENCE CONFERENCE
200
April 20th-21st, 2017, Solin, Croatia
CONTRIBUTION OF CROATIAN NAVY TO THE EUROPEAN UNION SECURITY THROUGH PARTICIPATION IN OPERATION “TRITON”Luka Mihanović, Slaven Sučević, Zlatimir Bićanić
CONTRIBUTION OF CROATIAN NAVY TO THE EUROPEAN UNION SECURITY THROUGH PARTICIPATION IN OPERATION
“TRITON”
Luka Mihanović1, Slaven Sučević1, Zlatimir Bićanić2
(1 Croatian Military Academy)
(2 University of Split, Faculty of Maritime Studies, Split, Croatia)
(E-mail: [email protected])
ABSTRACT
Croatian soldier today is ready to participate all over the world to contribute global peace and stability, whatever is the character of
the operation which requires engagement of member of Military Forces RH. Aiming to support Italian authorities to preserve borders of
European Union at sea and save migrants in the waters of Mediterranean sea in EU JO EPN „Triton“ members of Croatian Navy and
Ministry of the Interior with Andrija Mohorovičić ship. During the operation the crew of ŠB-72 saved 2516 people, 551 child, 448
women and 1517 men. The purpose of this paper is to show, through quantitative and qualitative analysis of all of the relevant data,
Croatian Navy contribution to the EU safety through the „Triton“ operation.
KEY WORDS
EU security issues, Operation Triton, Croatian Navy contribution analyses
1. SAFETY – MARITIME SAFETY
Safety represents efforts and intentions of individuals, organizations, countries and international community to preserve physical integrity and values considered vital for survival. It arises from individual's need to after satisfying biological needs keeps his surroundings stable, predictable and safe1. With society and civilization development, man made his interest in survival and safety a goal and value he aspires [1]. His safety and safety of the community he lives in has preoccupied him since the beggining beacuse threats to his survival are constant. The word ''safe'' roots back to Latin word securus whch 1 The creator of humanistic psychology, Abraham
Maslow described the need for security as the fundamental psychological need for constancy, order, structure and the need for predictability of events in the near or distant future.
stands for reliable, fearless, constant... [2]. Safety is a dinamic category exposed to everyday changes [3]2, and subjects in charge for creating safe conditions must always question the safety level, possible threats and accordingly respond to challenges. Maritime safety is integral part of a man's individual safety, national safety and international safety on sea area. The general aim of maritime safety is safe, stable and secure maritime way and human action on it. Bigger focus of international organizations, countries and maritime companies on maritime safety beacuse of possible threats on seas and from sea is expected. Goals and priorities of global maritime safety in which are involved countries with merchant and war marines, coast guards, government and non government agencies,
2 www.imo.org

201
Luka Mihanović, Slaven Sučević, Zlatimir Bićanić
CONTRIBUTION OF CROATIAN NAVY TO THE EUROPEAN UNION SECURITY THROUGH PARTICIPATION IN OPERATION “TRITON”
maritime companies, international organizations, regional projects and iniciatives are:
-‐ To improve navigation and general sea safety,
-‐ To empower safety of land components which are on sea shores,
-‐ To build safety abilities and capacities fo patners.
2. THREATS TO THE SAFETY OF INDIVIDUAL AND COMMUNITY
Global safety threats as conventional wars and armed conflicts are deteriorating, on the other hand new war ways, terrorism, ecological threats, illegall migration are rising, Figure 1.
Figure 1. Increase in illegal stay in the EU countries during 2014 [4]
Modern world is endagered because of its dynamic, development and technological progress endagered with new threats which have known natural causes but also human action causes. One of the dominate forms of global safety endagerement is defined as ''Hybrid war''. Modern wars, simply put, are led through combination of of many elements of national power. Today this conventional danger is seen through frequently used phrase „using all the tools in the toolkit“ or as newer definition of smart power use “using smart power“.
Universal definition for ''Hybrid war'' does not exist, the closest would be diverse and dynamic combination of conventional and uncoventional, terrorist and criminal resources to achieve planned goal, it is not connected only for an isolated conflict, we can recognize it in a string of different conflict led all over the plannet. During
the study of migrant crisis, its consequences and challenges that the European Union (EU) as a result of these crises encountered, it is possible to identify and reveal some of the features included in the concept of Hybrid War. From the security aspect European Union (EU) is faced with two main challenges on its borders: constant growth of migrations and increased terrorist threat with constant growth in the number of passengers. Since the 1980s, illegal migration in Europe has quickly spread. Indisputable economic advantage, especially in the western European countries, major conflicts in Africa, Asia and on the Middle East, affects of global poverty in undeveloped countries, but all restrictive migration policies and approach to the labor market are a few of the factors which encourage the growth of this complex phenomenon. In the last couple of years, political turmoil in arabic world, and especially during the Sirian crisis have increased number of

7th INTERNATIONAL MARITIME SCIENCE CONFERENCE
202
April 20th-21st, 2017, Solin, Croatia
migrants which cross EU borders [5]. According to the International Organization for Migration - IOM, in 2015., over a million migrants and refugees arrived in Europe mainly from African and Asian developing countries, which is the biggest migrational wave since the World War 2. European Border and Coast Guard Agency (Frontex) is expecting significant increase in migrant arrival on EU borders with estimated number of 1.5 million irregular border crosses [6]. As a response on expected development of migrational crisis countries in Europe have their eyes on external borders trying to control increased number of migrnats entering EU, while discouraging the influx by illegal flows which has developed as a primary goal of european safety policy.
The connection between illegal migration and migrant smuggling, although violent and cruel job, is relatively new, established in Europe during the first big migrational crisisfrom the middle of 1990s. By then, smuggling wasn't punished, nor treated as a criminal act as it is today. In the history people smuggling had a positive meaning, smuggling of Jews to safety during the Second World War was an act of heroism. Listed facts are partially the reason why EU didn't have common policy against people smuggling. Common EU policy against people smuggling started during the year 2000. with the preparation of proposals for the European Council in the framework of the
"Decision on strengthening the penal framework to prevent discrimination in favor of unauthorized entry and residence within the borders of the EU". That same year, the adoption of the United Nations Protocol against the smuggling of migrants by land, air and sea globally recognized the seriousness of the new criminal phenomenon as a factor endangering security and smuggling of migrants, and officially included in the fight against organized crime [7].
The direction of the Central Mediterranean as a way of joining the EU is generally desirable to the sub-Saharan population, especially Eritreans, Gance, Nigerian, Senegalese and Somalis. Despite recent changes, meaning slow fall, this direction registered massive number of illegal entrances in the EU during the last 10 years. The competent authorities of Italy registered the peak of the influx of migrants to their limits during years 2006. to 2007., that trend maintained in the period 2009.-2010., following the agreement of the Government of Italy with the Gaddafi regime in Libya on the return of people who went to the Libyan coast to Italy back. The number of illegal migrants grew dramatically in early 2011. and again in years 2013. to 2014. The arriving trend was still high during 2015., although a relative fall in the total number of irregular crosses compared to the yea befor was evidented, Figure 2., [6], [8].
Figure 5. The number of migrants arriving in the EU's Mediterranean route [6]
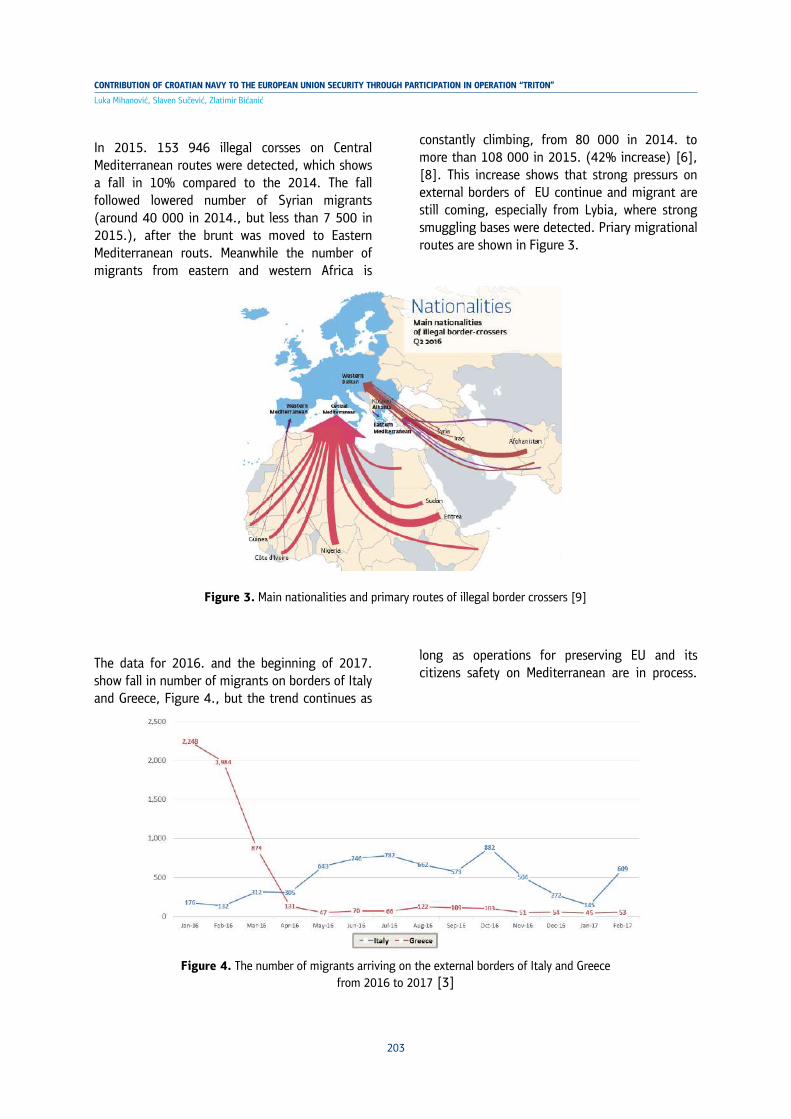
203
Luka Mihanović, Slaven Sučević, Zlatimir Bićanić
CONTRIBUTION OF CROATIAN NAVY TO THE EUROPEAN UNION SECURITY THROUGH PARTICIPATION IN OPERATION “TRITON”
In 2015. 153 946 illegal corsses on Central Mediterranean routes were detected, which shows a fall in 10% compared to the 2014. The fall followed lowered number of Syrian migrants (around 40 000 in 2014., but less than 7 500 in 2015.), after the brunt was moved to Eastern Mediterranean routs. Meanwhile the number of migrants from eastern and western Africa is
constantly climbing, from 80 000 in 2014. to more than 108 000 in 2015. (42% increase) [6], [8]. This increase shows that strong pressurs on external borders of EU continue and migrant are still coming, especially from Lybia, where strong smuggling bases were detected. Priary migrational routes are shown in Figure 3.
Figure 3. Main nationalities and primary routes of illegal border crossers [9]
The data for 2016. and the beginning of 2017. show fall in number of migrants on borders of Italy and Greece, Figure 4., but the trend continues as
long as operations for preserving EU and its citizens safety on Mediterranean are in process.
Figure 4. The number of migrants arriving on the external borders of Italy and Greece
from 2016 to 2017 [3]
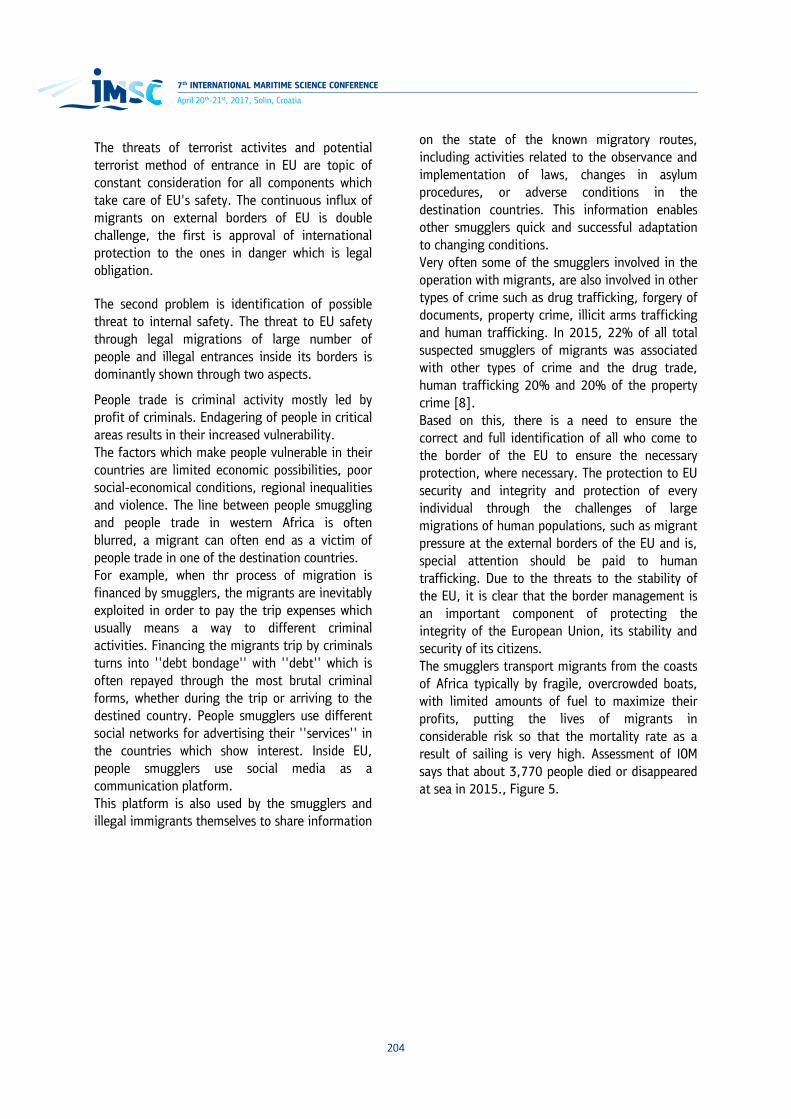
7th INTERNATIONAL MARITIME SCIENCE CONFERENCE
204
April 20th-21st, 2017, Solin, Croatia
The threats of terrorist activites and potential terrorist method of entrance in EU are topic of constant consideration for all components which take care of EU's safety. The continuous influx of migrants on external borders of EU is double challenge, the first is approval of international protection to the ones in danger which is legal obligation.
The second problem is identification of possible threat to internal safety. The threat to EU safety through legal migrations of large number of people and illegal entrances inside its borders is dominantly shown through two aspects.
People trade is criminal activity mostly led by profit of criminals. Endagering of people in critical areas results in their increased vulnerability. The factors which make people vulnerable in their countries are limited economic possibilities, poor social-economical conditions, regional inequalities and violence. The line between people smuggling and people trade in western Africa is often blurred, a migrant can often end as a victim of people trade in one of the destination countries. For example, when thr process of migration is financed by smugglers, the migrants are inevitably exploited in order to pay the trip expenses which usually means a way to different criminal activities. Financing the migrants trip by criminals turns into ''debt bondage'' with ''debt'' which is often repayed through the most brutal criminal forms, whether during the trip or arriving to the destined country. People smugglers use different social networks for advertising their ''services'' in the countries which show interest. Inside EU, people smugglers use social media as a communication platform. This platform is also used by the smugglers and illegal immigrants themselves to share information
on the state of the known migratory routes, including activities related to the observance and implementation of laws, changes in asylum procedures, or adverse conditions in the destination countries. This information enables other smugglers quick and successful adaptation to changing conditions. Very often some of the smugglers involved in the operation with migrants, are also involved in other types of crime such as drug trafficking, forgery of documents, property crime, illicit arms trafficking and human trafficking. In 2015, 22% of all total suspected smugglers of migrants was associated with other types of crime and the drug trade, human trafficking 20% and 20% of the property crime [8]. Based on this, there is a need to ensure the correct and full identification of all who come to the border of the EU to ensure the necessary protection, where necessary. The protection to EU security and integrity and protection of every individual through the challenges of large migrations of human populations, such as migrant pressure at the external borders of the EU and is, special attention should be paid to human trafficking. Due to the threats to the stability of the EU, it is clear that the border management is an important component of protecting the integrity of the European Union, its stability and security of its citizens. The smugglers transport migrants from the coasts of Africa typically by fragile, overcrowded boats, with limited amounts of fuel to maximize their profits, putting the lives of migrants in considerable risk so that the mortality rate as a result of sailing is very high. Assessment of IOM says that about 3,770 people died or disappeared at sea in 2015., Figure 5.

205
Luka Mihanović, Slaven Sučević, Zlatimir Bićanić
CONTRIBUTION OF CROATIAN NAVY TO THE EUROPEAN UNION SECURITY THROUGH PARTICIPATION IN OPERATION “TRITON”
Figure 5. Number of deaths of migrants in the Mediterranean during the 2014 -2015 year [10]
The study of transport of migrants observed lack of wooden boats with an increasing share of
rubber boats in 2015. Selection of uninhabitable vessels transporting migrants in Figure 6.,
Figure 6. Vessels with migrants
enhanced search and rescue operations as critical in saving the lives of a large number of migrants.
Nevertheless, the successful search and rescue operations also contributed to enriching smugglers who could reduce travel expenses, knowing how exactly SAR rescue operations make travel safer, increasing demands for crossings.
3. MEDITERRANEAN AND EUROPEAN SAFETY
In order to ensure maritime transport through Mediterranean Sea NATO and EU organized a series of operations in the Mediterranean region to facilitate safe navigation in the Mediterranean and to strengthen the security of the EU as a whole. EU operations in the Mediterranean are shown in Figure 7.

7th INTERNATIONAL MARITIME SCIENCE CONFERENCE
206
April 20th-21st, 2017, Solin, Croatia
Figure 7. EU operations [3] The membership and acitivities of the Republic of Croatia in regional political agreements, initiatives and projects is affecting the security and stability in Southeast Europe, the Mediterranean and the Adriatic Sea. Increasing the level of maritime security reduces the risk of security threats to the external maritime borders of the EU and the EU as a whole. Croatian Navy carried out various forms of military and security cooperation in order to protect national interests and security area which geographically and culturally it belongs. The contribute of Croatian Navy to European security is expressed through participation in the implementation of a variety of military and political agreements and initiatives. The participation of the Navy in the EU operation JO EPN „Triton“ best reflects the real contribution of the Croatian Armed Forces to the European security and is definitely a historic moment for the Croatian Navy, because this is the first time a ship od the Croatian Navy participated in an international operation.
4. AGENCY FOR EUROPEAN BORDER AND COAST GUARD – FRONTEX
Frontex is an agency substantiated by the EU to control the external European land and sea borders with it's headquarters in Warsaw [10]. Frontex helps EU countries and also countries associated to the Schengen area in the management of their external borders. It also helps in harmonizing border controls throughout the EU. The Frotenx agency facilitates cooperation between border authorities in all EU countries in a way that provide tehnical support and expertise transfers. This makes coordination of the deployment of additional technical equipment and specially trained border personnel. Countries with external border have sole responsibility for border control, but Frontex can provide additional technical support to EU countries facing serious migratory pressure. The fact is the significant increase in the number of
207
Luka Mihanović, Slaven Sučević, Zlatimir Bićanić
CONTRIBUTION OF CROATIAN NAVY TO THE EUROPEAN UNION SECURITY THROUGH PARTICIPATION IN OPERATION “TRITON”
migrants in recent years at the external borders of Europe who wish to join the EU. Today, Frontex coordinates maritime operations (eg. In Greece, Italy and Spain), as well as operations on the external land borders of other countries, in Bulgaria, Greece, Hungary, Romania, Poland, Slovakia and others. Employees of Frontex are also present in many international airports across Europe [10]. Frontex has several areas of responsibility, laid down in Regulation (EZ) No. 2007/2004 and include the following:
• Risk analysis. • Joint operations.
• Fast reaction.
• Research.
• Training. • Common return.
• Sharing of information. Frontex does not have any available human resources and their own equipment or border guards that can be deployed in crisis areas. To coordinate joint operations depends on EU Member States which voluntarily made available their border guard, boats, aircraft and other necessary resources. But during the deployment of the Frontex reimburses the deployment of border guards and transportation costs, fuel and basic maintenance of equipment. In all areas of it's operations, such as operations, risk analysis, training, research and development, Frontex has a coordinating role and establish specialized networks among border authorities so that among the border authorities of the EU and the countries assigned to the Schengen Area may develop and share the best practices. Every year about 700 milion people are crossing the external borders of Europe. Therefore, one of the biggest challenges is the detection of illegal activities and that it does not slow down the normal flow of goods and passengers. Controls on the external borders are more important that the countries of the Schengen area because they have no permanent border controls. Schengen countries rely on the quality of border controls and controls carried out by other EU countries [10].
Increased pressure of refugees on the EU external border and sea border of Italy caused the launch of the EU operation „Triton“ in 2014.
5. OPERATION „TRITON“
Frontex has launched operation „Triton“ on 1st November 2014 coordinating the deployment of two aircraft, three offshore patrol ships, four patrol ships and one helicopter in the area of central Mediterranean with the allocated budget of 2.9 milion euros per month. Command operations is in the hands of the Ministry of Internal Affairs in cooperation with the Italian Coast Guard and the Financial Police. As all operations under the jurisdiction of the EU operation „Triton“ in his work in full respect takes place in accordance with international law and EU obligations, including respect for fundamental rights and the principle of non-refoulement, which excludes automatic return of migrants. The area of operation was initally circling the territorial waters of Italy as part of a zone of search and rescue (Search and Rescue – SAR) or Italy and Malta. Although the focus of operations is to control sea borders of the EU, with time as the main priority of the operation proved saving lives. According to statistics for 2014 during the operation „Triton“, in the covered area, there were 499 cases of illegal migration with a total of 70.178 people. Most of them came from Eritrea, Somalia and other Sahara countries and from West Africa. The aim of the operation, in which participates Croatian Coast Guard, is to implement coordinated acitivities at the external sea borders of the EU in the central Mediterranean in order to monitor irrgeular migration flows, with the fight against cross-border crime. The task of all participants, including the ship of the Croatian Navy, is assisting Italian authorities in border control and surveillance of the European Union at sea, monitoring the movement of ships and aircraft, search and rescue at sea, control of fishing activities, transshipment and search suspicious vessels and what is the most important transshipment and rescue and treatment of migrants of course also to assist people in need, Figure 8.

7th INTERNATIONAL MARITIME SCIENCE CONFERENCE
208
April 20th-21st, 2017, Solin, Croatia
Figure 8. Transhipment migrants abroad the ship Andrija Mohorovičić
Apart from Croatia, the operation involved 263 other European Union members, within a budget of 38 million euros for 2016.
The area of operation covers the territorial waters of Italy and Malta, as well as parts of the Italian and Maltese search and rescue area. According to Frontex, the area intensified operation „Triton“ has been extended to 138 nautical miles south of Sicily, Figure 9.
Figure 9. Area of operations "Triton"
3 A total of 27 EU Member States participating in the
operation Triton, either through technical support or human resources: Austria, Belgium, Croatia, Czech Republic, Denmark, Estonia, Finland, France, Germany, Greece, Iceland, Ireland, Latvia, Lithuania, Luxembourg, Malta, Netherlands, Norway, Poland, Portugal, Romania, Slovenia, Slovakia, Spain, Sweden, Switzerland and United Kingdom.
6. CONTRIBUTION OF CROATIAN NAVY TO OPERATION „TRITON“
Croatia has made their participation in the operation „Triton“ with the deployment of ships of the Croatian Navy SB–72 „Andrija Mohorovičić“ in the area of operations. The ship „Andrija Mohorovičić“ sailed on 30th July from the port „Lora“ to the Mediterranean with an aim to participation in the EU operation „Triton“. Starting from 1 August to the end of October 2015 (in the port Lora sailed on 5th November 2015) the ship during the operation supported the Italian authorities in guarding the sea border and rescue migrants in the Mediterranean Sea. The first Croatian contingent (first HRVCON) consisted of a total 50 (fifty) members of the Armed Forces (Coast Guard and additional medical team), as well as a total of twenty (20) members of the Border Police – MUP of Republic of Croatia. (HRVCON) in operation is adressed by the decision of the Croatian Parliament on the participation of the Armed Forces in a joint humanitarian operation of the European Union „Triton“ in the Mediterranean. Based on the initial assessment of the implementation of the operation, is secured 15 million croatian currency (HRK), while unofficial estimates of spent are approximately 11 million HRK of which was refunded a substantial part by Frontex from it's budget. SB–72 „Andrija

209
Luka Mihanović, Slaven Sučević, Zlatimir Bićanić
CONTRIBUTION OF CROATIAN NAVY TO THE EUROPEAN UNION SECURITY THROUGH PARTICIPATION IN OPERATION “TRITON”
Mohorovičić“ is a school ship class „Moma“ who was built in 1971 in the shipyard Stocznia
Północna in Gdańsk, Poland. In use is since 1972. but in the Croatian navy since 1991.
Figure 10. Ship ŠB - 72 "Andrija Mohorovičić"
The ship SB–72 „Andrija Mohorovičić“ and crew consisted of 1st HRVCON „Triton 2015“ which together with the police officers boarded the Ministry of Interior addressed in a joint operation (Joint Operations – JO) EPN4 „Triton 2015) in the Middle Mediterranean. Participation in the operation was carried out in coordination with Italy as the host country and other associated forces of the participating countries of operation, with the purpose of carrying out assigned tasks in accordance with the operational plan of the Agency EU „Frontex“, in order to control the external borders of the European Union, the prevention of illegal migration to the territory of the European Union, providing assistance to illegal migrants through the search and rescue operations and combating
4 The European Patrols Network (EPN) is an international maritime cooperation platform
committing crimes while crossing the borders of the European Union. Time period of participation of members of the Armed Forces and Ministry of Interior of the Republic of Croatia in the „Triton 2015“ was on 30th July 2015 to 5 November 2015, for a total of 99 (ninety nine) days, of which 92 (ninety-two) on the area of operation. In the EU operation JO EPN „Triton 2015“ the first Croatian contingent in the area of operation counted a total of fifty Armed Forces of the Republic of Croatia (48 on ship SB – 72 „Andrija Mohorovičić“ and two on the mainland, Catania, as logistical support). The main tasks of all forces taking part in Operation EU JO EPN „Triton 2015“ were the following:
• Detection, identification, reporting, monitoring and, if necessary, intercept all suspicious vessels carrying persons who intend or are preparing to cross the border at sea in a illegal manner, review the border control point or boarding
7th INTERNATIONAL MARITIME SCIENCE CONFERENCE
210
April 20th-21st, 2017, Solin, Croatia
involved in the smuggling of migrants at sea in the areas of operations.
• Prevention of illegal border crossing. • Providing insight into the state of the
field operations by identifying normal and abnormal maritime traffic.
• Documentation (pictures and / or video clips) all activities (detection, tracking and interception) and the presentation of all available material International Coordination Center (International Coordination Centre – ICC) in Rome.
• Implementation and other tasks assigned by the ICC.
In this respect, the tasks ot the ship SB–72 „Andrija Mohorovičić“ are defined as explicit and implied tasks as follows:
• Explicit tasks - Supervision of the external bordes of
the EU to the sea. - Preventing human trafficking and
narcotis. - Preventing illegal fishing. - Prevention of marine pollution.
• Assuming tasks - Search and rescue – SAR - Collection and exchange of
intelligence information.
However, in accordance with the existing situation, assuming task or tasks of search and rescue at sea – SAR, proved to be a major task during the implementation of the entire operation. During participation in the EU operation JO EPN „Triton 2015“ ship SB–72 „Andrija Mohorovičić“ participated in 14 (fourteen) action of search and rescue at sea where the total rescued 2,516 (two thousand five hundred sixteen) migrants, of which 551 (five hundred and fifty one) children (21.88%), 448 (four hundred and forty eight) women (17.79%), 1517 (one thousand five hundred and seventeen) men (60.24%). During the operation on intercepting vessels were found two (2) dead persons (0.0079%). In the implementation of SAR actions the 2,516 (two thousand five hundred
sixteen) living migrants (99.92%) have been saved.
During participation in the operation, crew has achieved the following:
• Days on the navigation: 79 • A total of 1560 hours 42 min of
navigation; from that days: 777 hours 55 min., and nights: 782 hours 47 min.
• Distance traveled: 15 634.0 NM; day 7 665.4 NM, at night: 7 988.6 NM.
• Hours drive: 1507 hours 45 min. • Hours patrol: 1472 hours 28 min. • Total spent fuel: 504597 lit.
The complexity of the implementation of the main task is emphasized by the complex procedure of reception and care of migrants on the ship. Reception and care of migrants was conducted in a fixed and a specially prepared space (the front deck of the ship), so the ship by the criterion of possible infectious jeopardize, was divided into three separate areas: red, orange and green.
• Red area (area of high infectious threaten) refers to any place where they can be found migrants.
• Orange area (area of medium infectious threaten), the decontamination area and all the spaces where they were migrants.
• Green area is the interior of the ship that does not jeopardize the possibility of infectious if employees comply with all measures of preventive health care.
Taking care of migrants and their stay can take more than 24 hours, during which is necessary medical care and nutrition of the migrants and re - entry of workers in the contaminated area, when the crew carried out all the required protective measures. Disembarkation of migrants in the port is shown in Figure 11.
After disembarking the migrants carried out repeated disinfection and cleaning of surfaces of decks and passages that were in contact with migrants.

211
Luka Mihanović, Slaven Sučević, Zlatimir Bićanić
CONTRIBUTION OF CROATIAN NAVY TO THE EUROPEAN UNION SECURITY THROUGH PARTICIPATION IN OPERATION “TRITON”
Figure 11. Check out migrants in the port accept
7. CONCLUSION
Global security threats today are presented by new forms of threats such as terrorism, environmental threats, illegal migration and their acoompanying consequences that greatly burden the backup image of the European Union. As a result of a series of events in Africa and Middle East have been launched a significant population migration to the area of Western Europe, causing great pressure on the sea borders of the EU particularly in Greece and Italy. In order to secure it's external borders and preserving the security of it's citizens the EU has taken a series of operations to assist it's members in protecting borders and controlling the entry of migrants to the EU area. Agency for European Border and Coast Guard – Frontex, is the agency founded by the EU to control the external European land and sea borders. Frontex helps to EU countries and countries associated to the Schengen area in the management of their external borders. The operation „Triton“ was founded in 2014 by Frontex in order to ensure effective border controls in the Mediterranean, and simultaneously provide assistance to persons or vessels in distress in the area of responsibilty.
The Republic of Croatia in the „Triton“ participated by sending the ship BS–72 „Andrija Mohorovičić“ in the area of operations. Through working in a multinational environment in tasks and events of importance for the whole operation of the EU JO EPN „Triton 2015“, members od the 1st HRVCON gave a quality contribution to the implementation of the operation and at the same time acquire new knowledge and experience in the execution of maritime operations. It's active participation in the operation, contributed to the overall security of the EU today in the most critical area, migration in the context of the disturbed security and possible terrorist activities for a range of criminal groups. The main achievement in the implementation of the entire operation was the execution of tasks – Search and Rescue - SAR. During participation in the EU operation JO EPN „Triton 2015“ first HRVCON participated in a total of 14 cases of search and rescue at sea – SAR events, with a total of 2,516 migrants who were rescued.

7th INTERNATIONAL MARITIME SCIENCE CONFERENCE
212
April 20th-21st, 2017, Solin, Croatia
REFERENCES
1. Tatalović S., Nacionalna i međunarodna sigurnost, Zagreb: Politička kultura, Nakladno-istraživački zavod, 2006.
2. Klaić B., Rječnik stranih riječi, Zagreb: Nakladni zavod Matice Hrvatske, 1988.
3. "www.imo.org," [Online]. [Accessed 10 Siječanj 2017].
4. Frontex, "Annual risk analysis 2015," Frontex, Warsaw, 2015.
5. F. L. M.L. McAuliffe, "Migrant Smuggling Data and Research: A global review of the emerging evidence base," International Organization for Migration, Geneva 19, Switzerland, 2016.
6. Frontex, "Risk Analysis for 2016, Annual Report," Frontex, Warsaw, Poland, 2016.
7. v. Liempt, "A Critical Insight into Europe’s Criminalisation of Human Smuggling," European Policy Analysis, vol. 3, no. 2016, 2016.
8. "www.europol.europa.eu," [Online]. [Accessed 15 Siječanj 2017].
9. "http://frontex.europa.eu," [Online]. [Accessed 10 12 2016].
10. "www. iom.int," [Online]. [Accessed 17 Siječanj 2017].
11. "www.undp.org," [Online]. [Accessed 17 12 2016].

213
Axel Luttenberger, Lidija Runko Luttenberger
CHALLENGES IN REGULATING ENVIRONMENTAL CRIMES
CHALLENGES IN REGULATING ENVIRONMENTAL CRIMESAxel Luttenberger, Lidija Runko Luttenberger
CHALLENGES IN REGULATING ENVIRONMENTAL CRIMES Axel Luttenberger1, Lidija Runko Luttenberger2
(1University of Rijeka, Faculty of Maritime Studies Rijeka) (2University of Rijeka, Department of Polytechnics Rijeka)
(E-mail: [email protected])
ABSTRACT
Environmental crimes can be broadly defined as illegal acts that directly harm the environment. Often perceived as victimless and incidental crimes, environmental crimes frequently rank low on the law enforcement priority list, and are commonly punished with administrative sanctions which are themselves often unclear and minor. The paper is pointing to the relevance of the Directive 2009/99/EC of the European Parliament and of the Council of 19 November 2008 on the protection of the environment through criminal law (ECD) which itself is not as an instrument of criminal law, as the provision on environmental liability can help prevent environmental crime by making perpetrators liable for consequences of their action and clean-up measures. The lack of legal certainty may also be a weakness in ECD which defines what constitutes an environmental crime by reference to a behaviour being unlawful under other directives. Also, it implies that the definition of environmental crime depends upon the violation of national legislation implementing the environmental acquis. In authors’ opinion proper interrelationship between criminal law and non-criminal law enforcement avenues are of utmost importance to achieve the objectives of environmental protection more effectively.
KEY WORDS
environmental crimes, regulation, environmental protection, implementation
1. INTRODUCTION The paper is focused on the phenomena of rising number of environmental offences and at their effects, which are increasingly extending beyond the borders of the States in which the offences are committed. Such offences pose a threat to the environment and therefore call for an appropriate response. Generally environmental crimes involve wildlife crime such as illegal exploitation of the world’s wild flora and fauna, while pollution crime is the trade and disposal of waste and hazardous substances in contravention of national and international laws. Moreover, in addition to those, new types of environmental crime are emerging, such as carbon trade and water management crime.
Practice has shown that the existing systems of penalties have not been sufficient to achieve
complete compliance with the laws for the protection of the environment. Such compliance can and should be strengthened by the availability of criminal penalties, which demonstrate a social disapproval of a qualitatively different nature compared to administrative penalties or a compensation mechanism under civil law. Perceived as ‘victimless’ and low on the priority list, such crimes often fail to prompt the required response from governments and the enforcement community.
2. THE MAIN AREAS OF ENVIRONMENTAL CRIMES According to the European Commission, environmental crime covers acts that breach environmental legislation and cause significant harm or risk to the environment and human health. Main areas of environmental crime are the

7th INTERNATIONAL MARITIME SCIENCE CONFERENCE
214
April 20th-21st, 2017, Solin, Croatia
illegal emission or discharge of substances into air, water or soil; trade in wildlife; trade in ozone-depleting substances; as well as shipment or dumping of waste [1].
Environmental crimes are not victimless. The economic, environmental and health impacts of illegal trade can be sufficiently important to disrupt whole economies and ecosystems, undermining legal and environmentally sustainable activities and reducing future options for the use of resources.
Environmental crime is interrelated with the corruption at all levels and unless corrupt officials are tackled, efforts to combat environmental crime will be impeded - a fact that should be acknowledged within cross-cutting resolutions on environmental crime of the United Nations and within the UN Convention against Corruption [2].
3.THE RESPONSE TO THE ENVIRONMENTAL CRIME While the definition of environmental crime is not universally agreed, it is often understood as a collective term to describe illegal activities harming the environment and aimed at benefitting individuals or groups or companies from the exploitation of, damage to, trade in or theft of natural resources, including serious crimes and transnational organized crime. Many emerging definitions for environmental crime have actually constrained the term by limiting it to crimes associated with breaches of environmental legislation only to result in easement of prosecution and punishment, since environmental crime is typically only seen as referring to infractions (fines) or misdemeanours (fines or shorter term imprisonment), rather than felonies.
Since shortcomings of environmental protection system are also reflected in facilitating the incurrence of damage within a weak regulatory framework, there is a need to recognize inherent rights of the environment, of other species and
water itself, outside of their usefulness to humans [3].
The presence of organized criminal groups acting across borders is one of the many factors that have favoured considerable expansion of environmental crimes in recent years. Led by vast financial gains and facilitated by a low risk of detection and scarce conviction rates, criminal networks and organized criminal groups are becoming increasingly interested in such illicit transnational activities.
Environmental crime is highly lucrative, it can be as profitable as illegal drug trafficking, but the sanctions are much lower which make this activity extremely attractive for organized crime [4]. A person who commits environmental crime exploits the lack of international consensus and the divergence of approaches taken by countries. What may constitute a crime in one state is not so in another. This effectively enables criminals to go forum shopping and use for example one country to conduct poaching, another to prepare merchandise, and export via a third transit state [5].
The INTERPOL General Assembly Resolution in 2010 states that there is a vital need for a global response to combat environmental crime and INTERPOL should play a leading role in supporting the international enforcement efforts [6].
Unlike any other known crime, environmental crimes are aggravated through their additional cost and impact on the environment and cost to future generations. It also deprives governments of much-needed revenues and undermine legal businesses. Many environmental crimes, by contrast, remain unregistered in spite of the massive scale. This has been a primary cause of low awareness of both the scale and the different modi operandi of effective laundering methods in the enforcement sector. In addition, the capacity of governments to enforce criminal law greatly varies. Therefore, the community must recognize and address environmental crimes as a serious threat to peace and sustainable development and

215
Axel Luttenberger, Lidija Runko Luttenberger
CHALLENGES IN REGULATING ENVIRONMENTAL CRIMES
strengthen the environmental rule of law at all levels.
4.THE EUROPEAN REGULATION ON ENVIRONMNTAL CRIME 4.1 Directive 2008/99/EC of the European Parliament and the Council of 19 November 2008 on the protection of the environment through criminal law (ECD)
The ECD provides for minimum rules Member States are free to adopt or maintain more stringent measures regarding the effective criminal law protection of the environment. It establishes measures relating to criminal law in order to protect the environment more effectively.
Recital of Article 3 of the ECD quotes that Member States shall ensure that the following conduct constitutes a criminal offence, when unlawful and committed intentionally or with at least serious negligence:
(a) the discharge, emission or introduction of a quantity of materials or ionising radiation into air, soil or water, which causes or is likely to cause death or serious injury to any person or substantial damage to the quality of air, the quality of soil or the quality of water, or to animals or plants;
(b) the collection, transport, recovery or disposal of waste, including the supervision of such operations and the after-care of disposal sites, and including action taken as a dealer or a broker (waste management), which causes or is likely to cause death or serious injury to any person or substantial damage to the quality of air, the quality of soil or the quality of water, or to animals or plants;
(c) the shipment of waste, where this activity falls within the scope of Article 2(35) of Regulation (EC) No 1013/2006 of the European Parliament and of the Council of 14 June 2006 on shipments of waste and is undertaken in a non-negligible quantity, whether executed in a single shipment or in several shipments which appear to be linked;
(d) the operation of a plant in which a dangerous activity is carried out or in which dangerous substances or preparations are stored or used and which, outside the plant, causes or is likely to cause death or serious injury to any person or substantial damage to the quality of air, the quality of soil or the quality of water, or to animals or plants;
(e) the production, processing, handling, use, holding, storage, transport, import, export or disposal of nuclear materials or other hazardous radioactive substances which causes or is likely to cause death or serious injury to any person or substantial damage to the quality of air, the quality of soil or the quality of water, or to animals or plants;
(f) the killing, destruction, possession or taking of specimens of protected wild fauna or flora species, except for cases where the conduct concerns a negligible quantity of such specimens and has a negligible impact on the conservation status of the species;
(g) trading in specimens of protected wild fauna or flora species or parts or derivatives thereof, except for cases where the conduct concerns a negligible quantity of such specimens and has a negligible impact on the conservation status of the species;
(h) any conduct which causes the significant deterioration of a habitat within a protected site;
(i) the production, importation, exportation, placing on the market or use of ozone-depleting substances [7].
According to ECD Member States shall ensure that inciting, aiding and abetting the intentional conduct is punishable as a criminal offence and shall take the necessary measures to ensure that the offences be punishable by effective, proportionate and dissuasive criminal penalties [7].
Legal persons can be held liable for offences where such offences have been committed for their benefit by any person who has a leading position

7th INTERNATIONAL MARITIME SCIENCE CONFERENCE
216
April 20th-21st, 2017, Solin, Croatia
within the legal person, acting either individually or as part of an organ of the legal person, based on a power of representation of the legal person, an authority to take decisions on behalf of the legal person or an authority to exercise control within the legal person. Member States shall also ensure that legal persons can be held liable where the lack of supervision or control, by a person, has made possible the commission of an offence referred or the benefit of the legal person by a person under its authority. Liability of legal persons does not exclude criminal proceedings against natural persons who are perpetrators, inciters or accessories in the offences [7].
Member States shall take the necessary measures to ensure that legal persons held liable are punishable by effective, proportionate and dissuasive penalties [7].
Thus, the ECD defines a number of serious offences that are detrimental to the environment and it requires EU countries to introduce effective, proportionate and dissuasive penalties. Common rules on criminal offences make it possible to use effective methods of investigation also on environmental crimes.
It must be pointed out that ECL Directive does not create a list of new illegal acts, because the existing law already provides for these prohibitions. Therefore, the Member States, by transposing this directive will only have to attach to these existing prohibitions some criminal sanctions.
The ECD only sets a minimum standard of environmental protection through criminal law to be adopted by the Member States and Member States are free to maintain or introduce more stringent protective measures. It does not lay down measures concerning the procedural part of criminal law nor does it touch upon the powers of prosecutors and judges.
4.2 Directive 2004/35/CE of the European Parliament and the Council of 21 April 2004 on environmental liability with regard to the prevention and remedying of environmental damage (ELD)
The ELD aims at ensuring that the financial consequences of certain types of harm caused to the environment will be borne by the economic operator who caused this harm. Insofar as the ELD provides for the financial responsibility of an operator, it lays down a framework, based on the polluter-pays principle, which can be qualified as one of environmental liability”, even though liability under the ELD has little in common with standard civil liability rules.
The designated competent authorities by Member States will ensure effective implementation and enforcement of the ELD; they will also safeguard the legitimate interests of relevant operators and other interested parties.
There are three categories of environmental damage under the ELD:
(a) damage to protected species and natural habitats, which is any damage that has significant adverse effects on reaching or maintaining the favourable conservation status of such habitats or species. The habitats and species concerned are defined by reference to species and types of natural habitats identified in the relevant parts of the Birds Directive 79/409 and the Habitats Directive 92/43;
(b) water damage, which is any damage that significantly adversely affects the ecological, chemical and/or quantitative status and/or ecological potential, as defined in the Water Framework Directive 2000/60, of the waters concerned;
(c) land damage, which is any land contamination that creates a significant risk of human health being adversely affected as a result of the direct or indirect introduction, in, on or under land, of substances, preparations, organisms or micro-organisms [8].

217
Axel Luttenberger, Lidija Runko Luttenberger
CHALLENGES IN REGULATING ENVIRONMENTAL CRIMES
4.3 Convention on the Protection of Environment through Criminal Law
The Council Convention on the Protection of Environment through Criminal Law, Strasbourg, 4.XI.1998, is aimed at improving the protection of the environment at European level by using criminal law in order to deter and prevent conduct that is most harmful to it. It also seeks to harmonize national legislation in this field [9].
This new legal instrument, not in force and with only 3 ratifications, obliges Contracting States to introduce specific provisions into their criminal law or to modify existing provisions in this field. It establishes as criminal offences a number of acts committed intentionally or through negligence where they cause or are likely to cause lasting damage to the quality of the air, soil, water, animals or plants, or result in the death of or serious injury to any person.
The Convention defines the concept of criminal liability of natural and legal persons, specifies the measures to be adopted by states to enable them to confiscate property and define the powers available to the authorities, and provides for international co-operation. The sanctions available must include imprisonment and pecuniary sanctions and may include reinstatement of the environment, the latter being an optional provision in the Convention.
Another major provision concerns the possibility for environmental protection associations to participate in criminal proceedings concerning offences provided for in the Convention.
5.THE APPROACH TOWARDS CRIMINALISING ENVIRONMENTAL HARMS The important issues are whether the implementation of EU instruments in the field of the protection of the environment results in consistent outcomes in national law and legal certainty.
As criminal law came to be viewed as an ultimate solution, it was placed under exclusive judicial control, and all violations of social norms meriting punishment were united in a single criminal code. Subsequently, a plethora of social, economic, and, inevitably, environmental legislation produced a set of complementary penal norms outside the criminal codes [10].
The lack of legal certainty may also be a weakness in ECD that defines what constitutes an environmental crime by reference to a behaviour being unlawful under other environmental directives. Explicitly, the structure chosen implies that the definition of environmental crime depends upon the violation of national legislation implementing the environmental acquis. Therefore, the approach towards criminalising environmental harm of the ECD makes it difficult to determine which behaviour constitutes environmental crime.
At the same time, the Council of Europe Convention on the Protection of the Environment through Criminal Law, 1998 has a different structure, which is the behaviour that has to be criminalised as described in a more direct manner in the Convention itself, which has never entered into force.
6.PROTECTION IF ENVIRONMENTAL SECURITY In 2014, the INTERPOL General Assembly passed a Resolution on INTERPOL’s response to emerging threats in Environmental Security. In that Resolution, instead of defining environmental crime, INTERPOL instead focused on environmental security by recognizing the impact that environmental crime and violations can have on a nation’s political stability, environmental quality, its natural resources, biodiversity, economy and human life [11].
At the European level, there are more than 200 directives in force on environment as subject matter environment in force. Nevertheless, there

7th INTERNATIONAL MARITIME SCIENCE CONFERENCE
218
April 20th-21st, 2017, Solin, Croatia
are cases of severe non-observance of European environmental law [12].
National legislatures have addressed environmental exploitation through a more or less comprehensive network of administrative laws. National laws have made regulations as to the extent of permissible pollution and acceptable risks in most environmental areas, frequently leaving to the administrative entity the task of establishing the allowable level of pollution in individual cases.
There definitely exists a close relationship between administrative laws and criminal law in the provisions of administrative law regulating allowed use of environment in statutory provisions, provision of subsidiary legislation, such as ordinance or regulations, or by administrative decisions aimed at environmental security.
The authors bring forward the opinion that an active role of the judiciary may essentially contribute to environmental protection [13].
7.THE ENVIRONMENTAL CRIME IMPLEMENTATION IN THE REPUBLIC OF CROATIA
Croatian Criminal Code in its Part XX regulates criminal acts against environment specifying the crimes of environment (Art. 193), discharging the polluting substances from the vessel (Art. 194), endangering ozone layer (Art. 195), endangering the environment with waste (Art. 196), endangering the environment with industrial plant (Art. 197), endangering the environment by radioactive substances (Art. 198), endangering with noise, vibrations or ionizing radiation (Art. 199), destroying protected natural areas (Art. 200), destroying habitat (Art. 201), trading in protected natural values (Art. 202), illicit introduction of wildlife or GMO in the environment (Art. 203), illicit hunting and fishing (Art. 204), killing or torturing of animals (Art. 205), transmitting contagious diseases and organism harmful for plants (Art. 206), manufacturing and
putting on the market harmful means for treatment of animals (Art. 207), unconscionable administering of veterinary assistance (Art. 208), devastation of forest (Art. 209), altering water regime (Art. 210), illicit exploitation of mineral resources (Art. 211), illegal construction (Art. 212), beneficial repentance (Art. 213) and severe crime against environment (Art. 214) [14].
Although Croatian legislation establishes high degree of environmental protection, the awareness of threats of the severe consequences of this type of crimes is not yet sufficient neither with criminal prosecution body nor with administrative body [15].
In 2015 a total of 1 imprisonment punishments, 112 probation imprisonment sanctions, 12 fines and 5 community service sentences has been pronounced [16].
The reason for low number of detected and reported crimes is in still insufficient activity of competent institutions whose task is detecting and reporting the crimes, although timely detecting of such acts and reporting the criminal act is indispensable for the purposes of prevention. In practice, there are cases where state attorney qualifies the crime endangering the environment by improper waste management as minor infringement.
8. CONCLUSIONS Environmental crimes represent an emerging form of transnational organized crime requiring more analysis and better responses. What makes environmental crime so lucrative is that a small number of perpetrators are actually caught and even fewer are punished. Few perpetrators are sentenced to jail, sentences that are pronounced are often light and fines are negligible compared to the profits and gains.
An offence is a crime only if the state decides to punish certain behaviour through criminal law. It implies that the definition of environmental crime

219
Axel Luttenberger, Lidija Runko Luttenberger
CHALLENGES IN REGULATING ENVIRONMENTAL CRIMES
depends upon the violation of national legislation implementing the environmental acquis.
Criminalizing an environmental offence can be an effective and dissuasive way to achieve proper implementation of environmental law. However, there are large differences between the criminal sanctions provided for environmental offences and often existing criminal sanctions are not sufficiently stringent to ensure a high level of environmental protection. At the level of the European Union, the lack of legal certainty may also be a weakness in ECD, which defines what constitutes an environmental crime by reference to a behaviour being unlawful under other directives.
Environmental crime should not be seen to refer to infractions resulting in fines or misdemeanours consequential to fines or shorter-term imprisonment, because, in authors’ opinion environmental crimes should fall under already established laws on serious crimes.
In authors’ view, proper interrelationship between criminal law and non-criminal law enforcement avenues is of utmost importance to achieve the objectives of environmental protection more effectively. Nevertheless, compliance with environmental administrative law cannot always preclude criminal liability.
REFERENCES
1. European Commission, Environmental Crime, http://ec.europa.eu/environment/legal/crime/
2. United Nations Convention against Corruption, New York, 31 October 2003, United Nations, Treaty Series, vol. 2349, Doc. A/58/422.
3. Runko Luttenberger, L., Luttenberger, A., Earth-centric approach in environmental protection, Pomorstvo: Journal of maritime studies (1332-0718) 26 (2012), 1; 27-44
4. Rucevska I., Nellemann C., Isarin N., Yang W., Liu, N., Yu K., Sandnæs S., Olley K., McCann H., Devia L., Bisschop L., Soesilo D., Schoolmeester T., Henriksen, R., Nilsen, R. 2015. Waste Crime – Waste Risks: Gaps in Meeting the Global Waste Challenge. A UNEP Rapid Response Assessment. United Nations Environment Programme and GRID-Arendal, Nairobi and Arendal, ISBN: 978-82-7701-148-6
5. Nellemann, C. (Editor in Chief); Henriksen, R., Kreilhuber, A., Stewart, D., Kotsovou, M., Raxter, P., Mrema, E., and Barrat, S. (Eds). 2016. The Rise of Environmental Crime – A Growing Threat to Natural Resources Peace, Development and Security. A UNEP INTERPOL Rapid Response Assessment. United Nations Environment Programme and RHIPTO Rapid Response–Norwegian Centre for Global Analyses, ISBN 978-82-690434-0-2
6. INTERPOL Resolution AG-2010-RES-03
7. Directive 2008/99/EC of the European Parliament and the Council of 19 November 2008 on the protection of the environment through criminal law (ECD), Official Journal of the European Union, L 328/28, 6.12.2008, Art. 3
8. Directive 2004/35/CE if the European Parliament and the Council of 21 April 2004 on environmental liability with regard to the prevention and remedying of environmental damage, Official Journal of the European Union, L 143/56, 30.4.2004
9. Convention on the Protection of Environment through Criminal Law, Council of Europe, European Treaty Series - No. 172
10. Vercher, A., The Use of Criminal Law for the Protection of the Environment in Europe: Council of Europe Resolution (77) 28, 10 Nw. J. Int'l L. & Bus. 442 (1989-1990)
11. INTERPOL Resolution AG-2014-RES-03

7th INTERNATIONAL MARITIME SCIENCE CONFERENCE
220
April 20th-21st, 2017, Solin, Croatia
12. Gerstetter, Christiane, Christoph Stefes, Andrew Farmer, Michael G. Faure, Teresa Fajardo del Castillo, Katharina Klaas, Mitsilegas Valsamis, et al. "Environmental Crime and the EU: Synthesis of the Research Project 'European Union Action to Fight Environmental Crime' EFFACE". Report in the framework of the EFFACE research project. Berlin: Ecologic Institute, 2016.
13. Luttenberger, A., L. Runko Luttenberger, L., Uloga pravosuđa u suzbijanju klimatskih promjena i zaštiti morskog okoliša, Pomorsko poredbeno pravo, god. 54 (2015), 169, str. 515–53
14. Kazneni zakon, Narodni novine, 125/11., 144/12, 56/15, 61/15
15. Pleić, Marija, Kazneni progon i istraživanje kaznenih djela protiv okoliša, Zbornik radova Pravnog fakulteta u Splitu, god. 53, 2/2016, str. 601.-622.
16. Izvješće Državnog odvjetništva Republike Hrvatske za 2015., RH DORH, Zagreb, 2015.

221
Nenad Vulić, Ivan Komar, Paul Jurišić
SELECTION AND EVALUATION OF MARINE SHAFTING TORSIONAL VIBRATIONS CALCULATION SOFTWARE
SELECTION AND EVALUATION OF MARINE SHAFTING TORSIONAL VIBRATIONS CALCULATION SOFTWARENenad Vulić, Ivan Komar, Paul Jurišić
SELECTION AND EVALUATION OF MARINE SHAFTING TORSIONAL VIBRATIONS CALCULATION SOFTWARE
Nenad Vulić1, Ivan Komar1, Paul Jurišić2
(1Faculty of Maritime Studies, Ruđera Boškovića 37, HR 21000 Split, Croatia) (2Croatian Register of Shipping, Marasovićeva 67, HR 21000 Split, Croatia)
(E-mail: [email protected])
ABSTRACT
Calculation of torsional vibrations shall be performed in an early phase of designing a ship propulsion system, immediately after defining the ship propeller, selection of the main propulsion engine, eventual reduction gearbox and dimensioning of each particular shaft cross section. Both the shipyard designer and the classification society technical specialist, approving technical documentation, are to have on their disposal appropriate computer software for this purpose. The paper presents the procedure that has been done in the Croatian Register of Shipping (CRS) with the aim to select and adopt the computer program for review of marine shafting torsional vibrations calculations, within the plan approval process. After that, an extensive evaluation of the selected program was performed, by testing on selected examples of two-stroke and four-stroke engine systems. On the basis of this evaluation, it was recommended that the CRS chooses SimulationX software program, capable of practical and correct modelling of excitation, various types of damping, non-linear characteristics of flexible couplings and propeller behavior in ice. Several modifications were also needed in terms of developing new elements. Results of testing showed satisfactory program capabilities and achieved precision of its results. In addition to this, based upon experience gained at the CRS, the Faculty of Maritime Studies decided to use SimulationX in education to enable the students and researchers simulating various technical systems.
KEY WORDS
marine propulsion system, shafting , torsional vibrations, SimulationX
1. INTRODUCTION
The main task of any ship propulsion system designer in the earliest design phase is to select the propeller that enables the ship to achieve contracted speed for the given ship hull form, as well as to select the proper main propulsion prime mover (e.g. Diesel engine, steam or gas turbine plant and reduction gearbox) to drive this propeller transmitting the required power through the main propulsion shafting [1], [2].
The ship classification society technical specialist has also a very important task: to check out whether the designed main propulsion shafting meets the approval criteria required by the classification society rules. These are the low cycle and the high cycle fatigue criteria [3], [4]. The low cycle fatigue criterion (with typical number of loading cycles below than 104) is essential for the basic dimensioning of thrust, intermediate and propeller shaft(s). This criterion, representing the primary loading cycles represented by zero to full

7th INTERNATIONAL MARITIME SCIENCE CONFERENCE
222
April 20th-21st, 2017, Solin, Croatia
load and back to zero, including reversing torque, is expressed by well-known classification rules simple formulae for dimensioning the propeller and intermediate shafts, in e.g. [4]. Basically the formula determines shaft diameters upon engine maximal continuous rating power, relevant engine speed and the shaft material static strength properties. The high cycle fatigue criterion (with a typical number of loading cycles highly above 107) takes into account the torsional vibration stresses permitted for continuous operation, as well as reverse bending stresses. It is defined by the limits of torsional vibrations stresses vs. shafting speed (rpm), as specified in [3] and [4], separately for continuous operation and quick transition within a selected interval of shafting speed range. In order to check this criterion it is necessary to perform a very complex task: calculation of propulsion shafting torsional vibrations. The present paper deals with the software applicable for the shafting torsional vibrations calculations. The aim of the paper is to encourage classification societies technical specialists, engaged in review and approval of the torsional vibrations calculations, to enable themselves to get the necessary competencies to perform complex calculations such as the mentioned one by means of modern software packages (like SimulationX) [5], no matter what the effort may be required to achieve proficiency in using such programs. Achieving this aim will certainly contribute to better functionality and even safety of ship, due to a more reliable propulsion shafting system. The tasks of the paper are the following: to briefly describe the background for the torsional vibrations calculations, then to explain the basis for the selection of SimulationX as the most appropriate software for these calculations at the CRS. The next task was to present methodology how to judge what additional steps were required to implement the program (selecting the engine modelling approach with a different level of complexity and even to develop own additional elements to model damping expressed by dynamic magnification) [5]. Finally, the tasks were to present the results obtained by the program testing, setting the reference values by [6] and [7], compare the results with these values and draw out conclusions about the best applicable
approach for the evaluation of the steady state torsional stress response at various shafting speeds. The tests, their results and conclusions, presented hereafter, focus primarily on two-stroke low-speed Diesel engine propulsion systems with normal firing in engine cylinders. Hopefully, the paper will, by achieving the stated tasks, help future users of SimulationX (technical specialists) in small classification societies similar to the CRS, machinery installation plan approval offices to resolve certain ambiguities, doubts and questions they may be faced with in their everyday work. The last task was to encourage marine engineering MSc course students and younger faculty researchers to get familiar with powerful capabilities of SimulationX software product.
2. TORSIONAL VIBRATIONS CALCULATIONS: THE WHYS AND HOWS
Preliminary dimensions, i.e. external and internal diameters of particular shafts may be easily determined by the ship propulsion system designer on the basis of MCR power, relevant rotational speed and mechanical properties of the selected material by implementing classification Rules [4]. These classification Rules are generally based upon IACS Unified Requirement UR M68 [3], comprising simple formulae applied to the calculation of these diameters.
2.1. Torsional vibrations calculations review by class society - why
After initial dimensioning, i.e. defining shaft diameters based upon the nominal torque transmitted and shaft material strength, the designer has to determine final design form, select final dimensions, material and service loading for each shaft itself [2]. However, in this very first design phase it is very important to determine the shafting steady state response to the engine excitation and propeller variable torque excitation around the shafting axis, i.e. torsional vibrations response. It is a difficult task, because the entire shafting system has not been completely defined in this phase yet. Unfortunately, in case of improper design concept, there is not much that can be done in later phases, other than providing and installing a torsional

223
Nenad Vulić, Ivan Komar, Paul Jurišić
SELECTION AND EVALUATION OF MARINE SHAFTING TORSIONAL VIBRATIONS CALCULATION SOFTWARE
vibration damper. For this reason, proper calculation of torsional vibrational response is needed in the initial phase of the marine shafting design [1].
2.2. Torsional vibrations calculations review by class society – how
On the other hand, the classification society technical specialists face this problem also in an early approval phase of the ship machinery documentation, immediately after the approval of shafting general plan. In accordance with the IACS Quality Systems Certification Scheme (QSCS) the review calculations shall be based upon different methods to those that were already used by designers in the originally submitted calculations [8]. For this reason, selection of powerful simulation modelling software, based upon general concept, may be considered a reasonable option. In general, torsional vibrational response of shafting depends by all means upon its design form, dimensions, material and service loading [2]. The most appropriate model for the analysis of shafting system torsional vibrations is the model with lumped masses (represented by their mass moments of inertia around the shafting axes), massless shafts (representing stiffness and damping of parts of the system) and engine loading [2]. Considering steady-state response in terms of angular, torque and stress amplitudes for various shafting rotational speeds in the operational speed range, the particular necessary data to be provided are the mass moments of inertia for each concentrated mass, the torsional stiffness of shafts, structural damping in the shafts, damping of propellers, flexible couplings and torques due to cylinder pressures and inertial forces of the reciprocating parts of engine systems for a single engine cycle (two-stroke or four stroke) [1], [2].
2.3. Requirements to be met by the software
The software program shall by all means be capable of using mentioned input data in any form and to provide all the necessary types of results: natural frequencies, vibratory modes, steady state responses in terms of mass rotation angles, angular velocities, accelerations, torques, stresses and power loss.
The selected software is to be extensively tested on carefully selected examples common to the ships classed by the classification society. In general, these examples are to comprise both two-stroke direct drive engines, as well as four-stroke propulsion systems with a reduction gearbox. It is also important that the program can accept damping in any form of its definition (physical, Lehr’s damping factor, dynamic magnifier, etc.). Further on, the program shall be capable of entering the engine excitation data in form of cylinder pressure vs. crank angle, crank torque vs. crank angle, or crank torque trigonometric approximation (Fourier’s) coefficients. The calculations for comparison may be taken from the class society archives as performed in the past, or they can be readily obtained by few of available freeware programs that could have been found.
3. METHODS FOR SOFTWARE SELECTION, ITS AMENDING AND FINDING BEST PRACTICE MODELING TECHNIQUES
3.1. Requirements for the torsional vibrations calculation software
The task of a classification society technical specialist is not to design the ship propulsion system. That is the task of the shipyard’s machinery equipment designer that has already been previously preliminary completed. The actual class technical specialist’s job is to evaluate the designer’s proposal against the classification society technical rules [8]. So, the class society has the torsional vibration calculation available on disposal and aims to review the calculation itself, formulating and imposing class remarks and notes within the approval process, as well to define the calculation approval status. For this reason the software to be used for review does not need to be that extensive as the one for the design. A feasible idea would be that the software is based upon general multiphysics approach to cover generalized similar problems. Ease of use, meaning ease of data preparation, entry, as well as ease of obtaining and interpreting of the output results is also essential. In addition to this, the calculation procedure is to be based upon the state-of-the-art technical rules, with built-in acceptance criteria and the possibility

7th INTERNATIONAL MARITIME SCIENCE CONFERENCE
224
April 20th-21st, 2017, Solin, Croatia
of taking into account all the actual influences (such as the non-linearity of highly-flexible couplings stiffness, as in e.g. [9]). It is important to obtain all of the results required by the technical rules, for all of the required calculation cases, correctly visualized, understandable and comparable to the acceptance criteria for all the propulsion systems possible service operating configurations.
3.2. Selection of candidate software for class purpose
To develop own class society software was rejected by the CRS as an idea on the very beginning. The reason was obvious: it would take a lot of effort, in terms of time and money, with a doubtful final result. A small class society, such as CRS, cannot devote time of its technical specialists to the development of such a complex software package. Ship classification is in fact a commercial job, performed on a highly demanding international market, consuming almost all of the available work load of the classification technical specialists, so a ready-made software was preferred and had to be found. The selected software was also to be based upon a modern operating system computer platform, so that it can be easily transferred to the newest version of (e.g. MS Windows) operating system once it becomes the only-choice-left. However, some of the software programs found-in-the-wilderness, were based upon obsolete operating systems (e.g. PC DOS) belonging today into the category freeware (or better: abandonware), with the possibility of being used as invaluable tools for testing of a modern software program, rather than the first choice for the class review software. For all of the reasons specified above SimulationX by ESI Group, Dresden, drew the authors’ attention to be the most fit-for-purpose, as a general analysis tool, against several other designer-oriented programs available on the market, e.g. [10].
3.3. Required tests for the selected software
However, SimulationX requires a testing procedure, not to test the program itself, but to test the correct understanding and interpretation of input data and the results by the future users. It was also
necessary to find out which modifications, or even new elements, had to be developed to implement the software in a proper way. In accordance with [11], a software product is defined as the set of computer programs, procedures, and possibly associated documentation and data, where software is synonymous with software product. There is no doubt that the producer of such an extensive software product, as the SimulationX, has passed all the essential stages in its design and development specified by [11]: review, verification and validation. The hereafter testing of SimulationX may be in some aspects understood as similar to its validation performed by the producer. The most important issue to be resolved was to find out whether the user of the software would be capable of correct understanding and interpreting on certain presumptions in input data preparation, correct selection of processing type, as well as correct interpretation of final output results.
3.4. Additional elements that needed to be developed and implemented
CRS testing and evaluation of the SimulationX revealed at the start that the system with four-stroke high- or medium-speed Diesel engine(s), commonly with highly-flexible coupling(s) and reduction gearbox(es) do not impose any practical doubts how to model the system. The only issue was whether to model the propeller damping by Frahm’s model, Archer’s model, or Lehr’s damping factor. A very good agreement of the results with the reference ones was easily obtained by the now-obsolete program used by the CRS, developed long ago by the esteemed third-party producer in Fortran, operating on MS DOS operating system [6]. So, the actual problem, to be dealt with, was the modeling procedure for conventional two-stroke slow-speed Diesel engine systems directly coupled to the fixed-pitch propeller by means of intermediate shaft(s) and a single propeller shaft. The analyses in question were both free-undamped vibrations and the steady-state torsional stress response. Free vibration results needed to be expressed by the system natural frequencies. Forced vibrations calculations results of interest were the torsional stress amplitude harmonic

225
Nenad Vulić, Ivan Komar, Paul Jurišić
SELECTION AND EVALUATION OF MARINE SHAFTING TORSIONAL VIBRATIONS CALCULATION SOFTWARE
components for a selected shafting section, their mean value and summation vs. shafting speed. In these two-stroke engine systems usually every lumped mass model component has its damping expressed as dynamic magnification value. This value has to be related with the inertial moment (i.e. “rotational mass” of the component, thus requiring a new modeling element [12].
SimulationX allows special additional elements to be either directly developed by means of Modelica programming language for physical systems modeling [13], or by assembling the new compound elements by means of the basic ones, or as the combination of Modelica and compound elements [5]. Figure 1 shows the schematic layout of the newly developed special element of absolute damping [12]
.
Figure 1. Special element of absolute damping
The developed element describes absolute frequency dependent damping. This separately developed SimulationX compound element is used to model damping expressed by the dynamic magnification factor, M, and it consists of the several basic elements.
An additional issue, found out to be very practically essential to the calculation results was whether the connecting rod modeling in each and every cylinder model should have been based upon so called “physical modeling” or the “crank angle approach” [5].
This damping may be expressed by complex mass in the frequency area, proportional to the acceleration. Torque for frequency independent damping is expressed as:
. constbbTD =→Δ⋅= ω (1) On the other hand, the torque for frequency dependent damping originates from the dynamic magnification factor, M [12]:
MJb
bJM ⋅
=→⋅
=ω
ωω
ω )( )( (2)
Torque for frequency dependent damping by means of complex properties [12]:
)()(2 ωϕωϕω jkjMJjJTE ⋅+⋅⎟⎠⎞
⎜⎝⎛ ⋅−⋅−= (3)
The derived equation (3) was directly implemented in the compound element presented in Figure 1.
source2sensor1
f(x)
DynamicMag nifier
f(x1,x2)
damping TorquephaseShift
ctr1

7th INTERNATIONAL MARITIME SCIENCE CONFERENCE
226
April 20th-21st, 2017, Solin, Croatia
3.5. Engine modeling approach of various levels
In general, main propulsion engine modeling in SimulationX torsional vibration calculation models can be based upon the following model levels [5]: • Compact engine model (Figure 2), • Individual torsional vibrations analysis cylinder
models (Figure 3), • Power transmition cylinder models, with a
separate model for combustion pressure space or crank torque (Figure 4).
Figure 2. Compact engine model
Figure 3. Individual TVA cylinder model Figure 4. Power transmition models
4. RESULTS AND DISCUSSION
Steady-state torsional vibration analysis by SimulationX torsional vibrations modeling package has been selected as the most important one to be reviewed by the CRS as the possible future user. So, the transient analysis is not of a significant practical value for the classification society technical specialists. Test calculations have been performed on several 5- 6- or 7-cylinder engine systems. For the presentation of typical results hereafter the 5-cilinder engine system has been selected, with a typical model configuration shown in Figure 5. Acceptance criteria were separately defined for the analysis of free undamped vibrations (natural frequencies and mode shapes) and for forced damped vibrations (torsional twist angles, shear strains, internal torque moments and torsional stresses). The testing results have been presented in the Table 1 for the free vibrations and in Table 2 for the steady state forced torsional vibrations response in terms of peak stresses at the critical speeds. The reference results were obtained by the freely available (but today obsolete and therefore also abandonware) MAN B&W program GTorsi [7] and also now-obsolete version of the powerful program TorVic purchased by the CRS very long ago, but today still in use [6]. The presented results refer solely to the case of normal firing in each of the engine cylinders. The Figure 5 shows also the newly developed elements as described in section 3.4) in their compact symbolic representation. They are all denoted as “dynMagn” in the Figure 5 (with their expanded presentation in Figure 1). These damping elements were essential to be applied in order to obtain the proper calculation results. The calculation results presented in Tables 1 and 2 achieve the best match to the reference values by implementing crank torque model in power cylinder engine model (in which the excitation torque is applied by a separate concentrated torque element, Figure 4, right). It is important to note that the 2nd match (with not any significant difference to the best one) has been obtained by a more practical model with crank torque TVA cylinders (elements in Figure 3 and the system in Figure 5).
inlineCylinder1

227
Nenad Vulić, Ivan Komar, Paul Jurišić
SELECTION AND EVALUATION OF MARINE SHAFTING TORSIONAL VIBRATIONS CALCULATION SOFTWARE
Figure 5. Typical testing system configuration with individual TVA engine cylinders
Table 1. Free vibrations results
Absolute values crit. speed
n1 n2 n3
case program [rpm] [rpm] [rpm]
1. TorVic, v1.1 310,7 1587,0 3222
2. GTORSI, v3.6.1 310,6 1587,0 3222
3. TVA cyl's, crnk_torq 309,5 1588,0 3222
4. TVA cyl's, cyl_press 309,4 1586,6 3222
5. Pow cyl's, crnk_torq 309,6 1588,0 3222
6. Pow cyl's, crnk_torq 309,4 1586,6 3222
7. 5L engine, crnk_torq 309,5 1588,0 3222
8. 5L engine, cyl_press 309,4 1586,6 3222
Relative values [%]
case program n1 n2 n3
1. TorVic, v1.1 0,0% 0,0% 0,0%
2. GTORSI, v3.6.1 0,0% 0,0% 0,0%
3. TVA cyl's, crnk_torq -0,4% 0,1% 0,0%
4. TVA cyl's, cyl_press -0,4% 0,0% 0,0%
5. Pow cyl's, crnk_torq -0,4% 0,1% 0,0%
6. Pow cyl's, crnk_torq -0,4% 0,0% 0,0%
7. 5L engine, crnk_torq -0,4% 0,1% 0,0%
8. 5L engine, cyl_press -0,4% 0,0% 0,0%
MAN B&W 5S50MC, 7150 kW/127 rpm
Crank torque excitation - Normal firing
MdynMag n7
CamshDrive TurningWheel Flang e
TuningWheel
shaftF
ThrustShA IntmShaft PropShaft
Cyl_1
sens
or1
meanValueFilter
f(x)
inj
torque1
PowerSensor
Propeller_AW
MdynMag n1
MdynMag n8
MdynMag n9
MdynMag n2
MdynMag n3
MdynMag n4
MdynMag n5
MdynMag n6
Cyl_2 Cyl_3 Cyl_4 Cyl_5

7th INTERNATIONAL MARITIME SCIENCE CONFERENCE
228
April 20th-21st, 2017, Solin, Croatia
Table 2. Forced vibrations results
Absolute values tot. tors. stress max. amp.
critical speed
thrust shaft
intm. shaft
prop. shaft
case program [rpm] [MPa] [MPa] [MPa]
1. TorVic, v1.1 62,0 25,9 106,5 58,8
2. GTORSI, v3.6.1 62,1 27,9 114,5 63,2
3. TVA cyl's, crnk_torq 62,1 26,2 108,0 59,6
4. TVA cyl's, cyl_press 61,8 25,5 104,9 57,9
5. Pow cyl's, crnk_torq 62,1 25,8 106,2 58,6
6. Pow cyl's, crnk_torq 61,8 25,4 104,6 57,8
7. 5L engine, crnk_torq 62,1 27,3 112,4 62,1
8. 5L engine, cyl_press 61,8 26,5 109,0 60,2
5. CONCLUSION
SimulationX has been selected and evaluated software product by the presented procedure as an excellent choice to be used by the CRS technical specialists. Presenting all details of this extensive evaluation would be much above the scope of this paper. SimulationX has been proven its fitness-for purpose, being capable of modeling special situations requiring non-linear incremental-iterative calculations, originating from e.g. progressive elastic characteristic of highly-flexible couplings, e.g. in [9]. The program allows detailed modeling of elastic and damping characteristics of system components, e.g. engine cylinders, avoiding any possible misinterpretation in the model (f.i. modeling of engine connecting rod, where several models may be used) [5]. Damping can be entered in any form that the designers would have used (absolute damping, relative damping, Lehr’s damping factor, dynamic magnification factor, etc.). Special elements needed to be developed for this purpose. Cylinder excitation loading can be entered in several possible forms such as cylinder pressures or
crank torques vs. crank angle, or harmonic components of crank angles. This has a certain non-neglectable influence to the final results. Propeller loading can also be modeled for ship operations in ice, based upon Finnish-Swedish Ice Class Rules [14] (this was not actually tested, but the propeller model is declared capable of this by the SimulationX producer). The amount of practice needed to transfer to the new modern software from the old well-known obsolete platform, avoiding all the possible errors and misunderstandings with the propulsion shafting designers and the authors of the torsional vibrations calculations is rather demanding and high, but it may be considered as an attractive challenge to the class technical specialists. Ambiguities in selecting model for the engine connecting rod was not deeply investigated. The authors have chosen to rather recommend implementing the simpler and direct “approach by crank angle (nonreactive)”, as denoted by the SimulationX producer, against the “physical model” [5]. Developed damping elements proved also to be correct, owing to the demonstrated satisfactory comparison with the reference results. If this had failed, the SimulationX would not have been rated that high as a candidate software.

229
Nenad Vulić, Ivan Komar, Paul Jurišić
SELECTION AND EVALUATION OF MARINE SHAFTING TORSIONAL VIBRATIONS CALCULATION SOFTWARE
Higher discrepancies in misfiring modelling, were actually found, but have not been presented here. They will be a matter of future work. Owing to the above specified reasons it can be finally concluded that the CRS technical specialists should with no hesitation rely on SimulationX modeling, procedures and results in their reviews of propulsion systems torsional vibrations calculations, which are being submitted for approval by shipyards’ machinery installation designers. Another valuable consequence of this evaluation was the decision to implement the SimulationX software product (based upon its academic license) in the simulation modelling courses at the Marine Engineering MSc degree studies at the Faculty of Maritime Studies, Split, Croatia as an interesting challenge to students and junior researchers. If and when students and the faculty researchers accept this challenge and decide to get really acquainted in deep with the details of torsional vibrations calculations by SimulationX, there is no doubt that classification societies (such as the CRS) will benefit employing them as technical specialists in charge of review and approval of torsional vibrations calculations. This expectable benefit strongly depends upon the amount of cooperation among ship machinery designers, classification society technical specialists, as well as their educators (such as maritime faculties). Future will certainly show the final outcome.
ACKNOWLEDGMENTS
The authors acknowledge the help of Mr. Andreas Abel, ESI ITI GmbH, Dresden, in providing extensive explanations of certain issues that arose during the acceptance testing of SimulationX.
REFERENCES
1. Batrak, Y., Torsional vibration calculation issues with propulsion systems, www.shaftdesigner.com, accessed 31.12.2011
2. Vulić, N., Dobrota, Đ., Komar,I., Damping and excitation in the torsional vibrations
calculation of ship propulsion systems (paper TR03_ID73) CIET 2016 Contemporary Issues in Economy & Technology, Split, 16-18.06.2016.
3. … Unified Requirement (UR) M68 Dimensions of propulsion shafts and their permissible torsional vibration stresses, (Rev.2, Apr 2015), IACS International Association of Classification Societies, London, 2015
4. ... Rules for the Classification of Ships, Part 7-Machinery Installation, Croatian Register of Shipping, Split, 2013
5. ... SimulationX, Library Manual-Torsional Vibration Analysis, ITI-Software GmbH, Dresden, 2015
6. ... TorViC, version 1.11 User’s Manual, CADEA, Split, 2000
7. … Torsional Vibration Calculation Program GTORSI, Version 3.6.1 External, User’s Manual, MAN Diesel & Turbo, Copenhagen, 2012
8. … IACS Quality System Certification Scheme (QSCS), Rev. 1, IACS International Association of Classification Societies, London, 2012
9. … The Highly Flexible VULASTIK-L Coupling, edition 03/2013, Vulkan Kupplungs- und Getriebebau, Herne, 2013.
10. … ShaftDesigner - The Shaft Calculation Software, SKF Solution Factory, website: www.shaftdesigner.com, accessed May 2015
11. … ISO/IEC 90003:2014, Software engineering - Guidelines for the application of ISO 9001:2008 to computer software, International Organization for Standardization, Geneve, 2014
12. Abel, A., Direct communication, e-mail ITI-Software GmbH, May 2015
13. … Modelica-A Unified Object-Oriented Language for Physical Systems Modeling-Language Specification, Version 3.2, Revision 2, Modelica Association, 2013
14. … Guidelines for the Application of the Finnish-Swedish Ice Class Rules, TraFi, Helsinki, 2011.
7th INTERNATIONAL MARITIME SCIENCE CONFERENCE
230
April 20th-21st, 2017, Solin, Croatia
HUMAN ERRORS IN ECDIS RELATED ACCIDENTSZvonimir Lušić, Mario Bakota, Zoran Mikelić
HUMAN ERRORS IN ECDIS RELATED ACCIDENTS
Zvonimir Lušić, Mario Bakota, Zoran Mikelić
(University of Split, Faculty of Maritime Studies, Split, Croatia)
(E-mail: [email protected])
ABSTRACT
With the mandatory introduction of ECDIS navigation system (starting on 1st July 2012 for the new passenger ships over 500 GT and new tankers over 3000 GT, in force until 1st July 2018, terms depending on the type of vessel and GT), its role has become dominant in the process of maritime voyage planning and realization. Maritime accidents caused by navigational errors are in many ways related to the use of ECDIS. This includes its insufficient usage in planning and realization of the voyage, inadequate implementation of ECDIS in SMS, or ECDIS features that allow unwanted interaction of specific security functions and therefore cause their inoperability. The purpose of this paper is to determine the deck officers’ level of knowledge and usage of ECDIS by means of analysis of their ability to use the system and their understanding of the ECDIS safety functions settings. With this in mind, a single-blind study was designed and implemented, during which participants using Transas ECDIS system showed their skills in a practical example of voyage planning and realization. Also, they gave answers to the questions in the corresponding survey. The practical task included the creation of the navigational route Rotterdam PS - Ceuta PS for the ship (a chemical tanker with predefined draft, speed), and chart plotting of the content of NAVTEX message related to the shipping area. Having analyzed the results, correlation between their previous training, experience, and achieved results was observed. Consequently, certain conclusions were made, and guidelines for further ECDIS course training for seafarers have been proposed. The acquired knowledge can be applied in the training of full-time students under the mandatory STCW courses.
KEY WORDS
ECDIS assisted accidents, ECDIS training and familiarisation, Alarm settings, Route check procedure
1. INTRODUCTION
The introduction of the navigation system ECDIS, Electronic Chart Display and Information System, has been the most significant innovation in the process of voyage planning and realization since the introduction of radar on the merchant fleet ships, although, in the meantime, other electronic systems have been introduced into the service, such as AIS, VDR system, or satellite communications systems. While such devices perform functions on ships that are completely new and do not succeed to previous devices of similar or identical purpose, unlike them, the introduction of the ECDIS has not ended the use of paper navigational charts. The use of ECDIS with support of other independent system (retaining
paper navigational charts as the second independent auxiliary system for the completion of the voyage) has been made possible since 2002, as specified in SOLAS V / 19-2.1.4 resolution. With amendments to the Rules 19-2 in 2009, the ECDIS became mandatory for all newly built tankers above 3000 GT and newly built cruise ships over 500 GT. Introduction period for existing ships and the newly planned ones depends on their purpose and size, and it is required for all existing ships above 10 000 GT after July 2018. Exemption is made for vessels that are to be permanently withdrawn from the service within two years of the date of mandatory ECDIS introduction for their category. [8] ECDIS has revolutionized the process of voyage planning, and it has set new challenges
231
Zvonimir Lušić, Mario Bakota, Zoran Mikelić
HUMAN ERRORS IN ECDIS RELATED ACCIDENTS
for the deck officers, as well as shipping companies and onshore support staff, seafarers training centres, and all other participants in the process of safe and efficient marine navigation.
The benefits of the introduction of the system are significant with regard to the realization of navigation. A report from 2012 [1] states that the new technology has enabled reduction of navigation risks by leaving the navigators more time to focus on their tasks, improving the visual representation of the fairway and enabling more efficient updating of charts. The same author cites reduction in the number of stranding from 11% - 38% (depending on the area of navigation), as well as reducing the risk of collision by 3%, primarily due to liberation of time to focus on monitoring traffic picture. In addition to the positive results, the introduction of a new comprehensive navigation system pointed out the shortcomings in the approach to the training of officers, since the introduction of ECDIS has not been followed since the beginning by adequate regulations related to the training of seafarers who need to use it. Although 1995 IMO Resolution A817 (19)1, among other things provided the minimum training requirements for proper use of ECDIS (Model course 1.27), only the STCW Convention2 with Manila Amendments3 in 2010 (entered into force on 1st Jan. 2012) made this training mandatory for all deck officers. The Convention stipulates the obligation of generic type ECDIS or general training for the use of ECDIS, while training for a particular type by a specific manufacturer that will be used by officers (so-called specific type ECDIS) is only recommended, and decisions and organisation of training are left to the shipping companies and flag states to decide [4].
Since the implementation of ECDIS, using the experience of the introduction of radar on ships the investigation of marine accidents pays
1 Performance Standards for Electronic Chart Display And Information System. 2 The International Convention on Standards of Training, Certification and Watch keeping for Seafarers (STCW) 1978. 3 The 2010 Manila Amendments to the STCW Convention.
particular attention to the role of ECDIS in these accidents [3]. The analysis carried out result in recommendations to ECDIS equipment manufacturers, the recommendations to the shipping companies related to Ship Management System (SMS) procedures and ECDIS check lists, proposals addressed to the IMO and to other international organizations, and other interested participants.
Especially valuable data are given in the reports of Marine Accident Investigation Branch (MAIB), the government agency from Britain, which investigates and publishes reports on maritime accidents, with specific classification of so called 'ECDIS assisted accidents'. In those accidents, use of ECDIS, in a certain way, had supported the development of the situation which resulted in maritime accident. The connection of ECDIS to accidents is evident in the analyses of their reports on accidents of RoRo ship 'Pride of Centerbury' (2008)[12], CFL 'Performer' (2008) [9], LT 'Cortesia "(2008) [5], MV" Maersk Kendal' (2009) [10], BC 'Thames' (2011) [7][2] and in the last such report of the chemical tanker 'Ovit' in 2013 [11].
The fundamental objective of the research is to determine at what level the active deck officers use ECDIS, and how much they are familiar with all its functions, capabilities and limitations. Therefore anonymous single-blind study was created that involved creation of concrete navigational route and use of additional functions of TRANSAS Navi Sailor 5000 ECDIS. Participants were asked to create a navigational route from the set position PS Mass (port of Rotterdam) to the PS port of Ceuta, and in addition to, on predefined position on the map, draw the contents of the NAVTEX message relevant to their voyage. Additionally, participants were asked to fill out a survey questionnaire.
2. PARTICIPANTS AND DATA COLLECTION
Data related to route creation included: position of PS Mass (lat 51o59.0’N, long 003o47.0’E) and position of Ceuta PS (lat 35o54.2’N, long 005o18.7’W) and information about the area

7th INTERNATIONAL MARITIME SCIENCE CONFERENCE
232
April 20th-21st, 2017, Solin, Croatia
prohibited for navigation that should be charted (canter in position lat 46o15.8’N, long 008o23.0’W, with a diameter of 115 nm.) Also, values for max draught (9.0 m) and max speed (14 kn) were given. The questions of the additional questionnaire were related to:
1. experience in the position of a deck officer, 2. current rank, 3. having a generic ECDIS type certificate, 4. having Transas specific type ECDIS certificate, 5. experience in using Transas ECDIS.
Altogether 21 active deck officers participated in the research, all of Croatian nationality and all were participants of Alternative studies for active deck officers organized by the Maritime Faculty of the University of Split. The time for solving the survey task was not limited. The limitation in the implementation of data collection is reflected in the number of participants and the fact that they all are of the same nationality.
The structure of participants is shown in figures 1 and 2.
Figure 1. The structure of participants according to their active sea experience
Figure 1 shows equal participation of mates with active navigation experience in the categories of up to five years and 5 to 10 years (by seven participants), and five mates have from 11 to 20 years of experience. Two participants have more than 20 years of service.
Figure 2. The structure of participants according to their officer's rank
By observing their structure according their current rank in figure 2 it is evident that most of them are serving as the second deck officers (11 participants), five participants are serving as the first mate on ships of 3000 GT or less, and four participants hold the master’s position on ships of 3000 GT or less. One participant serves as the third deck officer.
3. SURVEY RESULTS
The results of investigation on 'ECDIS assisted accidents' undoubtedly show that of all ECDIS associated errors that deck officers committed in these accidents, the most common ones are related to the incorrect setting of voyage safety parameters, ignorance of alarm systems and their adjustment, and the lack of checks and route corrections. Therefore, the additional questionnaire was created to verify the survey results and individually evaluate the following: accuracy of the safety setting, accuracy of the drawn content of the NAVTEX message, a selection of an appropriate route from the Traffic Separation Scheme (TSS) area, number and type of errors committed and checking of the route. The results are shown according to active sea experience and current rank of the participants, with separate results related to the NAVTEX message.
3.1. SURVEY RESULTS REGARDING THE NAVIGATIONAL EXPERIENCE OF PARTICIPIANTS
The results show the share of successfully configured safety parameters (safety contour,
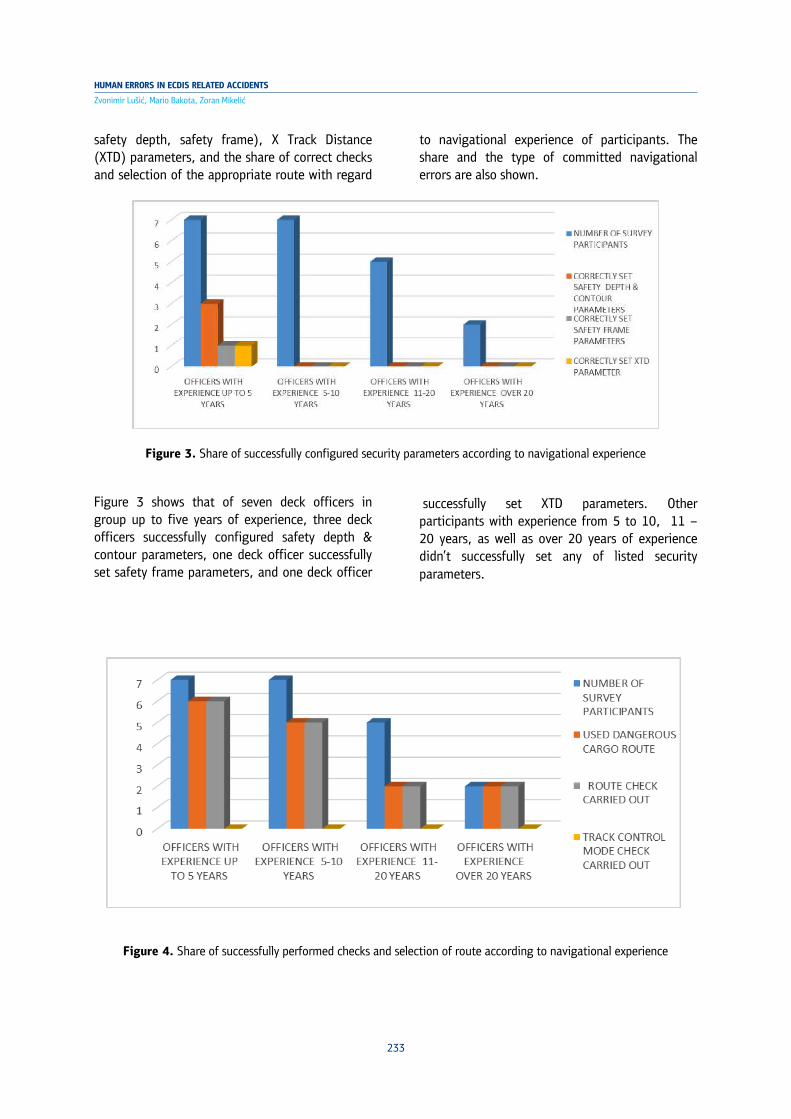
233
Zvonimir Lušić, Mario Bakota, Zoran Mikelić
HUMAN ERRORS IN ECDIS RELATED ACCIDENTS
safety depth, safety frame), X Track Distance (XTD) parameters, and the share of correct checks and selection of the appropriate route with regard
to navigational experience of participants. The share and the type of committed navigational errors are also shown.
Figure 3. Share of successfully configured security parameters according to navigational experience
Figure 3 shows that of seven deck officers in group up to five years of experience, three deck officers successfully configured safety depth & contour parameters, one deck officer successfully set safety frame parameters, and one deck officer
successfully set XTD parameters. Other participants with experience from 5 to 10, 11 – 20 years, as well as over 20 years of experience didn’t successfully set any of listed security parameters.
Figure 4. Share of successfully performed checks and selection of route according to navigational experience

7th INTERNATIONAL MARITIME SCIENCE CONFERENCE
234
April 20th-21st, 2017, Solin, Croatia
Figure 4 shows that six of seven deck officers up to five years of experience successfully selected dangerous cargo route during voyage planning. In this group six deck officers successfully carried out route check, while none of them carried out track control mode check. In group with experience five to ten years, five deck officers successfully selected dangerous cargo route during route creation. Also six deck officers successfully carried out route check, while none of them carried out
track control mode check. In group with experience 11 – 20 years two deck officers successfully selected dangerous cargo route during route creation. Two deck officers successfully carried out route check. None of them carried out track control mode check. Two deck officers with experience over 20 years selected dangerous cargo route and carried out route check, however none of them carried out track control mode check.
Figure 5. Share and type of committed navigational errors according to navigational experience
From figure 5 it’s evident that, in group of deck officers with experience up to five years, four deck officers created route that incorrectly entered/passed TSS area, one deck officer created route over area with insufficient depth, and three deck officers didn’t create the route according to the common practice of route planning. In group of deck officers with experience five to ten years, routes created by three deck officers incorrectly entered/passed TSS area. Three deck officers didn’t create the route according to the common practice of route planning, while one deck officer created route over area with insufficient depth. In group with experience 11– 20 years all five deck officers created route that incorrectly entered/passed TSS area, three of them created route over area with insufficient depth.
All participants in this group created route in accordance with the common practice of route planning. Deck officers with experience over 20 years didn’t commit any navigational error.
3.2. SURVEY RESULTS REGARDING THE RANK OF PARTICIPIANTS
The results show the share of successfully configured safety parameters (safety contour, safety depth, safety frame), X Track Distance (XTD)4 parameters, and the share of correct check and selection of the appropriate route with regard to navigational experience of participants. The
4 X Track Distance is the term for the boundary lines of the area to the port and starboard of the planned route which enables safe navigation, anticipated aberration from ideal route lines.

235
Zvonimir Lušić, Mario Bakota, Zoran Mikelić
HUMAN ERRORS IN ECDIS RELATED ACCIDENTS
share and the type of committed navigational errors are also shown.
Figure 6. Share of successfully configured security parameters according to the rank of participants
Figure 6 shows that none of participants with rank of a master on vessel less than 3000 GT didn’t successfully configure any safety parameter. In group deck officers who serve as a first mate on vessels less than 3000 GT two participants correctly set safety depth & contour parameters, while none of them
successfully set safety frame and XTD parameters. One of seven participants that serve as a second mate successfully set safety depth & contour parameter, safety frame and XTD parameter. A participant who serves as a third mate didn’t correctly set any of security parameters.
Figure 7. Share of successfully performed checks and selection of routes according to the rank of participants
Figure 7 shows that in group of deck officers in rank of master on vessels less than 3000 GT, two of four participants successfully selected dangerous cargo route and carried out route check. None of participants in this group didn’t carry out track control mode check. In group of participants who hold the first mate’s position on vessels less than 3000 GT four officers successfully selected dangerous cargo route and carried route
check as well. None of them didn’t carry out track control mode check. In group of participants who serve as a second mate eight of eleven participants successfully selected dangerous cargo route and carried out route check. None of them didn’t carry out track control mode check. Participant who serves as a third mate successfully selected dangerous cargo route and carried out

7th INTERNATIONAL MARITIME SCIENCE CONFERENCE
236
April 20th-21st, 2017, Solin, Croatia
route check, however didn’t carry out track control mode check.
Figure 8. Share and type of committed navigational errors according to the rank of participants
Figure 8 shows that in group of deck officers in rank of master on vessels less than 3000 GT, three deck officers created route over area with insufficient depth. Three deck officers created route that incorrectly entered/passed TSS area. In group of deck officers who serve as a first mate on vessels less than 3000 GT, three deck officers created route which incorrectly entered/passed TSS area. Two deck officers didn’t create route according to the common practice of route planning. In group of officers who serve as a second mate, five officers created route that incorrectly entered/passed TSS area, one of them created route over area with insufficient depth,
and four of them didn’t create route according to the common practice of route planning. Deck officer who serves as a third mate created route over area with insufficient depth.
3.3. SURVEY RESULTS RELATED TO THE CONTENT OF NAVTEX MESSAGE
The results show successfully drawn content of the NAVTEX messages according to navigational experience and the rank of participants, and according to whether they have Transas ECDIS certificate and / or experience in working with the same.

237
Zvonimir Lušić, Mario Bakota, Zoran Mikelić
HUMAN ERRORS IN ECDIS RELATED ACCIDENTS
Figure 9. Number of correctly drawn content of NAVTEX messages according to navigational experience Figure 9 shows that in group of deck officers with experience up to five years two officers successfully drew content of message. In
groups with experience 5 to 10, 11 – 20 years and over 20 years one participant in each group successfully drew required content of NAVTEX message.
Figure 10. Number of correctly drawn content of NAVTEX messages according to the rank of participants
Figure 10 shows that in group of deck officers who hold master position one participant successfully drew content of message. In groups of deck officers who serve as first mate
and second mate, one participant per group successfully drew required content of message. Deck officer who serves as a third mate didn’t successfully draw content of the message.

7th INTERNATIONAL MARITIME SCIENCE CONFERENCE
238
April 20th-21st, 2017, Solin, Croatia
Figure 11. Number of correctly drawn content of NAVTEX message according to experience in using Transas ECDIS
Figure 11 shows that, from total number of participants, eight of them had a Transas ECDIS specific certificate or experiance in working with it.Three of five participants who correctly drew content of message, had experience in using Transas ECDIS, while two participants who successfully drew content of the message didn't have any previous experience in use of Transas ECDIS.
3.4. ANALYSIS OF SELECTED PARAMETERS OF THE SURVEY
Safety parameters which must be set when creating a route are definitely safety depth safety contour, safety frame and XTD parameter. Safety depth depends on the draft of the ship, squat of the ship, tide, minimum values of under keel clearance (UKC) and additional coefficient. These values are precisely specified in the SMS of shipping companies, and serve as the basis of any voyage planning. Safety contour represents the value whose alterations change the contours of the areas safe for navigation from the ones that can be unsafe, so it is the mandatory ECDIS function and alarm. By adjusting the safety contour according to these data, and activation the 'four shades' function, changes on screen appearance
of the safety contour line that divides the area open for navigation from the area potentially dangerous for navigation. In doing so, the depths are marked in four categories: 1. Dark blue marks shallow waters that are
shallower than the draught of vessels, and this is an area prohibited for navigation. On paper charts they are usually marked as NoGo Area.
2. The adjacent areas with deeper, but still potentially unsafe waters are marked with light blue. The line that separates the areas with shallow water from unsafe areas is called shallow contour. Entering the correct values for safety contour and safety depth changes the display of this area on the ECDIS screen. For the survey route default safety contour value was set at 15.85 m.
3. By entering that value ECDIS would set the next higher value of 20 m (the following larger rounded value) as the border of safe and potentially dangerous areas for navigation, and it would be displayed in gray. At the same time, security alarms would also be set to the same value.
4. The following greater depths are shown in white.
By setting the safety contour & depth parameters security alarm setting is changed, since any

239
Zvonimir Lušić, Mario Bakota, Zoran Mikelić
HUMAN ERRORS IN ECDIS RELATED ACCIDENTS
crossing of the safety contour lines activates the alarm. Maker's value for the safety contour is 30m. Safety frame is an option that enables the creation of the area around the vessel whose limits will trigger alarms in case of danger of grounding and collision. The distance from the bow is defined in minutes and thus depends on the speed of the ship, while the distance to the port and starboard side of the ship is defined in miles (by default) to 0.2 m and five minutes ahead. Parameters of safety frame should be set as large as possible as circumstances allow [6] XTD are the distances to the port and starboard of the planned route line that form the boundaries of the planned route, they are expressed in nm and considered allowable deviation from the route. The value that will be set for XTD depends on the navigation area, speed and characteristics of the ship. The exit from the area bounded by XTD values triggers the mandatory ECDIS alarm. The XTD parameter is set by default to 0.1nm. Described parameters form the basis of safety settings for creation and checking of routes, without which a route cannot be used. The results show that of 21 participants one second mate successfully created the route and set the corresponding parameters. Additionally, two first mates adequately set the values for the safety depth & contour parameters, but not for the safety frame. All three officers have navigational experience of less than five years each. Other participants did not change the values set by the manufacturers (default set of parameters). The second group of control points of the survey includes control of route checking performance. The check is activated by means of 'check route' function which enables the program to check the route according to parameters set for checking, of which some can be included/excluded for verification (for example, multiple types of zones and areas where the route passes, the check according to the objects on the seabed etc.) while certain navigational alarms cannot be excluded from checking. Additional checking of the route includes the so-called 'track control mode' route checking. During this verification, the ECDIS
checks only the entered XTD values and the turning radius of a ship. By choosing a specific type of ship ECDIS determines these values by itself, and they just need to be entered manually. This function checks whether the autopilot can function with regard to course alterations in the route, ie. whether the ship's autopilot can steer the ship on a given route given the applied XTD value and turning radius, since the value of the turning radius of the ship is defined by wheel over point (WOP). Route verification also includes the selection of appropriate navigation area when passing through TSS. Since the vessel in the survey is a chemical carrier, a 'dangerous cargo route' is to be selected within each TSS areas. If the TSS area does not specify a designated part intended for the passage of ships with dangerous cargo, the passage from the 'outside' - further side should be used. In the given route, all TSS areas have marked the lanes for the passage of ships with dangerous cargo. The results show that out of 21 participants, 15 successfully carried out the navigation route checking and chose a 'dangerous cargo traffic lane'. They were evenly represented in all groups given their navigational experience and ranks. The fact that none of the participants used a 'track control mode' check route is alarming. The content of the NAVTEX message was supposed to be plotted and marked on the chart using the ECDIS tools within the system. It was necessary to plot and mark the area prohibited for navigation of 115nm in diameter at the given position. The Transas ECDIS has the option 'maps' for this purpose and participants were informed about this possibility. Another possibility is to use the 'manual correction" function, but given the nature of the survey, participants were instructed to use the first option for entering the marks on the map. Five participants successfully marked the requested area (exact location and the exact size and mark of the messages). The 'maps' option is not mandatory option for entering symbols and changes on the map (mandatory option is 'manual correction') and the lower level of success in solving the task was expected. However, out of eight participants with a specific type Transas certificate and/or working experience in Transas

7th INTERNATIONAL MARITIME SCIENCE CONFERENCE
240
April 20th-21st, 2017, Solin, Croatia
ECDIS system, three successfully solved the task, while two participants who successfully solved the task had no previous working experience in Transas ECDIS system.
4. INTERPRETATION OF THE SURVEY RESULTS
The results obtained from the survey fit into the research results published in the MAIB reports of maritime accidents associated with inappropriate use of ECDIS, which is primarily related to the ignorance of the meaning of safety parameters.
It is evident that the majority of participants (85%) are not familiar with the basic safety functions, alarms, and particularly with safety frame and XTD function. Checking the route after its creation was carried out by 71.4% of participants, however, they did not subsequently repeat the check since default safety parameters generate dozens of safety contour and safety depth alarms. The explanation lies in the fact that after creating a route and start the check, participants visually examined and zoomed routes on the screen, and thus concluded that the route was correct.
However, given the fact that nearly one in four participants (23.8%) reported as a valid the route that passes through areas where groundings have taken place (due to the insufficient depth) it is obvious that the visual inspection of the route was hasty. This enhances the fact that the officers with navigational experience of over 20 years, regardless of their current rank, paid more attention when checking routes and avoided this error (regardless of their level of knowledge of handling ECDIS system). Other errors were observed when passing or entering the TSS (errors committed by 57.1% of all participants and 45.5% of second deck officers). In creation of the route, contrary to the principles of navigational economy and efficiency, errors were committed by 28.6% of participants. It is evident that these errors were not committed by participants with navigational experience of 20 years and more, nor those serving as masters, while it was committed by 36.4% of second deck officers.
Manual checks of the route is in any case necessary and desirable, but ignorance and subsequent ignoring of activated safety alarms leads to maritime accidents, which was clearly stated in investigation reports. The explanation of the fact that none of the participants used the track control mode in their check may be because it is a new feature that was not present in earlier versions of Transas ECDIS, and participants were not familiar with this function. Entering corrections, Temporary and Preliminary Notices to Mariners, and any other written messages on paper charts is an essential part of the duties of every deck officer, regardless of the type of a vessel. Since the transition to ECDIS, methods of updating and correction making on the display of electronic charts have significantly changed (the system will automatically install the 'Notices to Marines' via the Internet or media for data transfer). Also, ECDIS is integrated with a NAVTEX receiver which enables an automatic display of the corresponding text message and a NAVTEX symbol at the position that the message refers to. However, in case where the message text refers to the area that needs to be represented graphically on a map and set up alerts important for navigation, manual entering of symbols and text is applied. In the given case the route was passing through the areas marked prohibited for navigation, so the route needed to be changed accordingly. The task message was successfully charted by 23.8% of the participants, which definitely is an unsatisfactory result, particularly as 52.4% of the participants sail as a second deck officers whose duty is to update ECDIS and thus to have the knowledge of the means for entering changes. In accordance with the purpose of research and conducted survey, authors of the study propose specific guidelines for future work with participants of training programs for the use of ECDIS. It is obvious that a significant number of the active deck officers know the capabilities and limitations of ECDIS in the lowest possible level, and they use the system with minimum options. Therefore it is proposed:
• to devise, within existing frame of IMO Model course 1.27 training, additional exercises that would address the

241
Zvonimir Lušić, Mario Bakota, Zoran Mikelić
HUMAN ERRORS IN ECDIS RELATED ACCIDENTS
mandatory safety functions including setting up depth, contour and associated alarms.
• Participants should confirm their knowledge and understanding by answering a specially designed set of test questions specific to the safety settings of the system.
The proposed changes introduced to the performance of exercises and placing additional emphasis on the safety settings and features of ECDIS should increase the level of its use on ships, and significantly contribute to increasing the safety of navigation in terms of use of electronic navigation systems.
5. CONCLUSION
Since ECDIS is not only an electronic version of a paper chart, but more comprehensive navigation and information system, complete mastery of its resources and knowledge of the system limitations is of crucial importance for safe navigation. Studies of maritime accidents, which mention the improper use of ECDIS as one of the causes shows that, although the system itself is not completely free of defects, critical mistakes are made by officers with their misuse of ECDIS. The most important among them are mistakes related to the system of safety and alarms settings. Results of the survey confirm the findings in the reports of investigation agencies, which is not entirely surprising since the transition from paper navigational aids to electronic system with its multiple aspects, poses a challenge to active seamen who have used paper charts throughout their active career. The conducted survey revealed alarmingly low level of use and knowledge about the capabilities of the ECDIS, which directly endangers the safety of navigation. The obtained results undoubtedly suggest that it is necessary to introduce appropriate changes in the training and to intensify the exercises of those segments of ECDIS usage in which deck officers showed the worst results. In addition, it is necessary to conduct the evaluation of acquired knowledge continuously, which would certainly be a guideline addressed to shipping companies, as they equally
share the responsibility and are obliged to organize training of their seafarers. Also, deck officers should be enabled to continuously improve their knowledge, since the new versions of ECDIS devices bring new features and changes that do not always have to be fully adopted by the seafarers.
REFERENCES
1. Asyali E., 2012, 'The Role of ECDIS in Improving Situation Awareness', 2012 IAMU Conference paper, pp 124.
2. Khattab T.M., Eslam M.G.,2016, 'Electronic Chart Display And Information System (ECDIS) Legal aspects and case study on CLM Thames', International Journal of Mechanical Engineering (IJME),Vol. 5, Issue 1, pp 96.
3. Mads R.N., 2016, 'How a ship's bridge knows its position – ECDIS assisted accidents from a contemporary human factors perspective', Lund university, pp 14.
4. Ott C., Drablos K., 2014,'Electronically guided Accidents', Sklud PI, pp 93, 94.
5. Pleskacz K.,Uriasz J.,2011, 'Understanding Information Systems', Annual of Navigation, Maritime University of Szczecin, pp 5.
6. Zakirul B., 2012,'ECDIS Display, Safety Settings and Alarm Management', 2012, IAIN Conference, pp 6.
7. 'Grounding of CSL THAMES', MAIB Accident Report 2012, available from https://assets.publishing.service.gov.uk/media/547c6f8240f0b60244000021/CSLThames.pdf
8. IMO - SOLAS Chapter V Regulation 19.2, available from http://www.ecdis-info.com/media/msc-282-86----chap-v-reg-19.pdf
9. 'Report on the investigation of the grounding of CFL Performer Haisborough Sand North Sea 12 May 2008', Report No 21/2008, Southampton 2008, available from https://assets.publishing.service.gov.uk/media/547c7001e5274a428d000063/CFLPerformerReport.pdf
10. 10.'Report on the investigation of the grounding of mv Maersk Kendal on Monggok Sebarok reef in the Singapore Strait on 16 September 2009', Report No 10/2010,

7th INTERNATIONAL MARITIME SCIENCE CONFERENCE
242
April 20th-21st, 2017, Solin, Croatia
Southampton 2010, available from https://assets.publishing.service.gov.uk/media/547c6fc9ed915d4c10000041/MaerskKendalReport.pdf
11. 'Report on the investigation of the grounding of Ovit', MAIB Accident Report 2013, Southampton 2014, available from https://assets.publishing.service.gov.uk/media/547c6f2640f0b60244000007/OvitReport.pdf
12. 'Report on the investigation into the grounding of Pride of Canterbury, MAIB Accident Report No 9/2009', Southampton 2009 , available from https://assets.publishing.service.gov.uk/media/547c700ded915d4c0d000071/PrideofCanterburyReport.pdf

243
Tina Perić, Nikola Račić
ANALYSIS OF CRUISE SHIP TRAFFIC IN THE ADRIATIC SEA CONSIDERING MARPOL ANNEX IV AREAS OF LIMITED WASTEWATER DISCHARGES
ANALYSIS OF CRUISE SHIP TRAFFIC IN THE ADRIATIC SEA CONSIDERING MARPOL ANNEX IV AREAS OF LIMITED WASTEWATER DISCHARGESTina Perić, Nikola Račić
ANALYSIS OF CRUISE SHIP TRAFFIC IN THE ADRIATIC SEA CONSIDERING MARPOL ANNEX IV AREAS OF LIMITED
WASTEWATER DISCHARGES Tina Perić, Nikola Račić
(University of Split, Faculty of Maritime Studies, Split, Croatia) (E-mail: [email protected])
ABSTRACT
Marine pollution by wastewater is a problem specially pronounced on large cruise ships because the quantity of discharged wastewater is directly related to the number of persons on board. While the most of merchant marine ships have around 20 persons on board, on cruise ships this number is significantly higher and can reach 8000 persons. Available data on cruise ship traffic in the Adriatic are insufficient to evaluate cruise ship wastewater pollution so a case study was made. The purpose of this paper is to present cruise ship traffic trends in the Adriatic Sea and to discuss and analyze empirical data obtained in a case study which included one-year monitoring of cruise ship traffic in the Adriatic Sea and recording of retention times of cruise ships in MARPOL Annex IV areas of limited wastewater discharges.
KEY WORDS
Cruise ship traffic, MARPOL Annex IV, wastewater
1. INTRODUCTION
The Adriatic Sea is considered as the closed type of sea and therefore it's especially vulnerable to all kinds of pollution. Enough attention was paid to the prevention of various types of marine pollution from ships; from oil pollution, problem of foreign species introduced with ship's ballast to air pollution. However, the scientific literature lacks information on pollution of the Adriatic Sea by sanitary wastewater from ships. Sanitary wastewater has negative impact on the environment. That problem is particularly pronounced on large cruise ships because with the
capacity of persons transporting, they are the size of small cities. Wastewater on cruise ships is generated in large quantities. That is why the method of wastewater management on board and the quality of wastewater discharged into the sea is very important. Annex IV of MARPOL Convention is governing standards for the discharge of sanitary wastewater according to 3 areas of navigation: sea area in a distance until 3 nautical miles from the nearest land (zone 2); sea area between 3 and 12 nautical miles from the nearest land (zone 3); sea area

7th INTERNATIONAL MARITIME SCIENCE CONFERENCE
244
April 20th-21st, 2017, Solin, Croatia
beyond 12 nautical miles from the nearest land (zone 4). However, legislation is treating merchant navy ships with usually 30 persons on board same as cruise ships where the number of persons on board may exceed 8,000 people. Given the constant increase in cruise ship traffic globally as well as an increase in ships themselves and their capacities, there is a need for effective assessment of marine pollution by wastewater from cruise ships. To solve that problem a case study was made with detailed analysis of cruise ship traffic in the Adriatic Sea, cruise ship routes and retention times in MARPOL Annex IV areas of limited wastewater discharges.
2. CRUISE SHIP TRAFFIC TRENDS IN THE ADRIATIC SEA
Data on cruise ship traffic in the Republic of Croatia is officially monitored and published by the National Bureau of Statistics, since 2002. These are the data they provide: number of cruises, sojourns1 and number of passengers on board, by flag of vessel or by months. According to them, in 2016, foreign vessels realized 825 cruises in the Republic of Croatia. During these cruises, a total of 1 092 199 passengers arrived. They stayed for 1 813 days in the Republic of Croatia, that is, 2 days on average. As compared to the same period in 2015, the number of cruises increased by 7.4% and the number of passengers entering the Republic of Croatia in this manner by 4.2%. In the same period, the total number of sojourns in Croatia was higher by 15.9% [1]. Number of cruises, sojourns and number of passengers on board in the Republic of Croatia in the last decade was shown in figure 1 [1]. Keeping in mind that the number of crew members is not included in the calculation, the total number of people on cruise ships increases by almost a third. Cruise ships in Croatia most frequently visited Dubrovnik, with 529 calls [4] or 64% of all calls in 2016 and carried nearly 800,000 passengers.
1 The total number of sojourns represents the total number of days a ship spends in the internal sea waters of the Republic of Croatia.
Figure 1. Cruise ship traffic trend in the Republic of Croatia.
3. CASE STUDY
Available data mentioned above doesn't include retention time of cruise ships in the Adriatic Sea and distribution of that time in MARPOL Annex IV areas of limited wastewater discharges. It also doesn't tell us routes of the cruise ships nor the ports of call for the cruise ships. Therefore, these data on cruise ship traffic in the Adriatic are insufficient to evaluate cruise ship wastewater pollution so a case study was made. Case study included monitoring of cruise ship traffic in the Adriatic Sea during the period of one year (1.8.2014 – 31.7.2015). Traffic was monitored using an internet monitoring system "Marine Traffic". For this case study limit was set for the capacity of cruise ships and were observed only those ships carrying more than 500 passengers as relevant to the impact on the quantity of discharged wastewater.
3.1. Cruise ship traffic analyses
In the year of survey 63 cruisers carrying 500 or more passengers came into the Adriatic Sea. Out of 34 world cruise companies2, mentioned ships represent 26 of them. During their stay in the Adriatic, cruisers had 21 different ports of call, of which eleven Croatian. The most frequent destinations for cruisers are Venice with 387 and Dubrovnik with 338 times as a port of call, which is twice more than third-placed Kotor which was port
2 Refers to cruise companies that have at least one cruiser with passenger capacity of 500 or more.

245
Tina Perić, Nikola Račić
ANALYSIS OF CRUISE SHIP TRAFFIC IN THE ADRIATIC SEA CONSIDERING MARPOL ANNEX IV AREAS OF LIMITED WASTEWATER DISCHARGES
of call 169 times. Frequencies for all ports of call in the Adriatic Sea are given in Table 1. Cruise ships spent a total of 1,814 days in the Adriatic in the observed period: 712 days in port and 1102 days at sea out of which 66.61 days in zone 2, 195.78 days in zone 3 and 840.42 days in zone 4. Distribution of time in each zone for each ship is shown in Table 2.
Table 1. Frequencies for all ports of call in the Adriatic Sea
Port of call Number of calling
Port of call Number of calling
Venice 387 Hvar 17 Dubrovnik 338 Ancona 16 Kotor 169 Durres 5 Bari 136 Rijeka 4 Split 110 Rovinj 4 Zadar 52 Šibenik 4 Koper 34 Bol 1 Brindisi 34 Pula 1 Trieste 33 Trogir 1 Ravenna 26 Chioggia 1 Korčula 20
Table 2. Retention times of all cruise ships in the Adriatic Sea according to MARPOL Annex IV zones of navigation in days, hours and minutes.
company/ ship name
ZONE 1 ZONE 2 ZONE 3 ZONE 4 ZONE
(2+3+4) ∑ ZONE
Croatian port
Foreign port
Total port time
Retention time in zones Total
naviga-tion time
Total time in
the Adriatic
Zone 1a Zone 1b < 3M 3 - 12 M > 12 M
AIDA / AIDAaura 07 20:03
15 01:14
22 21:17
02 17:39
06 22:09
27 01:24
36 17:12
59 14:29
AIDA / AIDAvita
09 01:31 21
13:00 30
14:31 03
10:48 06
22:02 29
21:08 40
05:58 70
20:29 Phoenix Reisen /
Albatros 00 13:24 02
15:12 03
04:36 00
03:11 00
17:51 04
06:27 05
03:29 08
08:05 Phoenix Reisen /
Amadea 01 06:37
01 06:39
02 13:16
00 06:11
00 22:18
02 07:03
03 11:32
06 00:48
P & O Cruises / Arcadia 02 23:27
01 17:05
04 16:32
01 02:58
02 08:32
08 08:53
11 20:23
16 12:55
P & O Cruises / Aurora
01 11:54 02
06:58 03
18:52 00
11:33 01
04:22 05
13:38 07
05:33 11
00:25 Azamara Cruises / Azamara Journey
05 15:05 05
03:36 10
18:41 01
07:20 01
20:32 05
08:07 08
11:59 19
06:40 Azamara Cruises /
Azamara Quest 04 11:09 05
10:11 09
21:20 01
16:16 01
23:15 07
01:58 10
17:29 20
14:49 P & O Cruises /
Azura 00 07:49
00 09:36
00 17:25
00 01:45
00 10:00
01 15:55
02 03:40
02 21:05
Fred Olsen Cruise Lines / Black Watch 01 14:20
01 09:00
02 23:20
00 06:51
00 18:14
02 07:40
03 08:45
06 08:05
Fred Olsen Cruise Lines / Braemar
00 17:15 01
08:51 02
02:06 00
03:25 00
13:03 02
11:29 03
03:57 05
06:03 Celebrity Cruises /
Celebrity Constellation 07 04:29 13
16:16 20
20:45 01
14:14 03
13:39 13
06:38 18
10:31 39
07:16 Celebrity Cruises / Celebrity Equinox 01 04:35
05 06:42
06 11:17
00 05:34
01 13:48
05 13:16
07 08:38
13 19:55
Celebrity Cruises / Celebrity Silhouette
02 09:37 09
05:24 11
15:01 00
15:28 03
05:22 15
03:14 19
00:04 30
15:05 Costa Cruises / Costa Deliziosa 03 01:40
08 16:01
11 17:41
00 23:40
04 21:02
22 14:05
28 10:47
40 04:28

7th INTERNATIONAL MARITIME SCIENCE CONFERENCE
246
April 20th-21st, 2017, Solin, Croatia
Costa Cruises / Costa Diadema
00 11:49 01
15:21 02
03:10 00
02:33 00
13:45 01
15:30 02
07:48 04
10:58 Costa Cruises / Costa Fascinosa 03 21:33
13 04:37
17 02:10
01 15:24
05 10:55
35 18:12
42 20:31
59 22:41
Costa Cruises / Costa Magica 01 22:20
09 22:11
11 20:31
00 17:15
03 13:44
27 18:22
32 01:21
43 21:52
Costa Cruises / Costa Mediterranea
08 03:12 21
15:28 29
18:40 03
10:28 09
05:51 36
06:17 48
22:36 78
17:16 Costa Cruises /
Costa neoClassica 05 02:46 19
18:16 24
21:02 02
03:56 04
20:50 16
08:35 23
09:21 48
06:23 Crystal Cruises / Crystal Serenity
01 23:20 02
05:34 04
04:54 00
09:26 01
02:22 01
19:12 03
07:00 07
11:54 Princess Cruises / Emerald Princess 00 08:47
01 22:26
02 07:13
00 09:26
01 02:22
01 19:12
03 07:00
07 11:54
Hapag Lloyd / Europa 2
02 01:46 02
22:17 05
00:03 01
09:03 01
02:01 02
11:12 04
22:16 09
22:19 MANO Maritime /
Golden Iris 01 01:34
02 17:04
03 18:38
00 06:00
01 03:46
05 00:58
06 10:44
10 05:22
Iberocruceros / Grand Celebration 03 01:27
10 18:03
13 19:30
01 00:06
03 11:30
10 20:24
15 08:00
29 03:30
Princess Cruises / Island Princess
00 00:00 06
15:36 06
15:36 00
00:00 00
08:40 06
23:55 07
08:35 14
00:11 Louis Cruises /
Louis Aura 01 00:59 03
05:45 04
06:44 00
08:18 00
18:00 01
17:17 02
19:35 07
02:19 TUI Cruises / Mein Schiff 3
07 20:57 11
17:49 19
14:46 00
22:32 01
11:33 15
18:47 18
04:52 37
19:38 MSC Cruises / MSC Fantasia 04 09:01
09 15:17
14 00:18
00 21:06
03 23:16
26 06:38
31 03:00
45 03:18
MSC Cruises / MSC Lirica 10 13:40
10 05:49
20 19:29
04 02:04
08 21:58
28 08:13
41 08:15
62 03:44
MSC Cruises / MSC Magnifica
03 14:42 09
16:11 13
06:53 01
10:25 05
13:53 23
22:41 30
22:59 44
05:52 MSC Cruises / MSC Musica 00 21:18
13 21:55
14 19:13
00 12:32
05 23:32
25 09:06
31 21:10
46 16:23
MSC Cruises / MSC Opera
00 14:22 02
06:42 02
21:04 00
02:44 01
03:00 07
07:16 08
13:00 11
10:04 MSC Cruises / MSC Orchestra 01 02:58
05 12:23
06 15:21
00 04:58
02 01:06
10 14:18
12 20:22
19 11:43
MSC Cruises / MSC Poesia
03 05:48 08
02:39 11
08:27 01
08:39 03
20:03 22
20:25 28
01:07 39
09:34 MSC Cruises / MSC Preziosa
03 14:41 08
18:16 12
08:57 01
05:36 03
11:34 23
12:39 28
05:49 40
14:46 Holland America Line/
Nieuw Amsterdam 05 19:13 17
18:32 23
13:45 00
21:01 06
12:24 27
02:20 34
11:45 58
01:30 Holland America Line /
Noordam 02 06:50
03 10:05
05 16:55
00 16:28
01 12:15
04 12:39
06 17:22
12 10:17
Norwegian Cruise Line / Norwegian Jade 09 07:47
13 00:36
22 08:23
03 04:09
08 21:57
51 01:11
63 03:17
85 11:40
Norwegian Cruise Line /Norwegian Spirit
00 09:27 13
14:01 13
23:28 00
02:00 00
23:16 18
08:35 19
09:51 33
09:19 Majestic Int. Cruises /
Ocean Majesty 04 15:06 02
23:33 07
14:39 02
06:27 02
05:34 04
04:45 08
16:46 16
07:25 Princess Cruises /
Ocean Princess 01 14:27 04
23:39 06
14:06 00
09:56 01
16:31 07
21:37 10
00:04 16
14:10 P & O Cruises /
Oceana 03 05:46
16 13:22
19 19:08
00 16:06
03 16:12
22 16:37
27 00:55
46 20:03
P & O Cruises / Oriana 00 11:08
01 03:37
01 14:45
00 00:37
00 08:22
01 19:45
02 04:44
03 19:29

247
Tina Perić, Nikola Račić
ANALYSIS OF CRUISE SHIP TRAFFIC IN THE ADRIATIC SEA CONSIDERING MARPOL ANNEX IV AREAS OF LIMITED WASTEWATER DISCHARGES
Holland America Line / Prinsendam
00 06:29 01
10:17 01
16:46 00
04:01 00
08:33 02
19:37 03
08:11 05
00:57 Cunard Line /
Queen Elizabeth 04 12:08 08
20:19 13
08:27 01
20:14 03
02:28 17
19:15 22
17:57 36
02:24 Cunard Line / Queen Victoria 02 10:15
04 23:44
07 09:59
00 10:46
01 04:36
05 12:50
07 04:12
14 14:11
Princess Cruises / Regal Princess
01 07:43 07
09:28 08
17:11 00
02:42 01
03:53 06
23:36 08
06:11 16
23:22 Oceania Cruises /
Riviera 02 19:35 11
00:10 13
19:45 01
01:54 02
10:02 07
11:18 10
23:14 24
18:59 Holland America Line /
Ryndam 00 23:24
01 04:28
02 03:52
00 06:22
00 21:50
02 21:58
04 02:10
06 06:02
Saga Cruises / Saga Sapphire 01 10:05
00 17:10
02 03:15
00 09:49
01 05:46
01 16:24
03 07:59
05 11:14
Princess Cruises / Sea Princess
00 09:26 01
02:07 01
11:33 00
01:46 00
09:17 01
15:28 02
02:31 03
14:04 Royal Caribbean Cr. / Serenade of the Seas
02 18:08 06
21:52 09
16:00 00
20:31 02
07:07 09
01:58 12
05:36 21
21:36 Regent Seven Seas Cr./
Seven Seas Mariner 04 19:06 12
15:22 17
10:28 01
22:12 04
15:05 10
22:03 17
11:20 34
21:48 Silver Sea Cruises /
Silver Spirit 08 08:42
19 16:53
28 01:35
02 03:48
06 00:09
11 22:09
20 02:06
48 03:41
Royal Caribbean Cr. / Splendour of the Seas 06 04:22
16 06:22
22 10:44
02 12:20
14 03:46
49 14:12
66 06:18
88 17:02
Thomson Cruises / Thomson Celebration
18 10:39 12
09:57 30
20:36 03
18:34 06
22:44 26
02:03 36
19:21 67
15:57 Thomson Cruises / Thomson Majesty 10 06:29
14 17:54
25 00:23
02 18:03
10 01:21
24 07:41
37 03:05
62 03:28
P & O Cruises / Ventura 01 22:37
08 21:57
10 20:34
00 11:34
03 03:48
13 05:51
16 21:13
27 17:47
Viking Ocean Cruises / Viking Star
02 11:21 05
20:57 08
08:18 00
09:26 01
00:55 03
23:43 05
10:04 13
18:22 Royal Caribbean Cr. / Vision
of the Seas 00 00:00 08
13:42 08
13:42 00
00:00 01
03:30 08
15:05 09
18:35 18
08:17 Croisieres de France /
Zenith 00 18:35
02 04:59
02 23:34
00 05:25
00 16:44
03 17:33
04 15:42
07 15:16
Holland America Line / Zuiderdam 04 06:48
05 04:14
09 11:02
01 13:11
02 18:28
07 06:20
11 13:59
21 01:01
TOTAL 216 23:31
495 02:41
712 02:12
66 14:37
195 18:51
840 10:00
1102 19:28
1814 21:40
Monitoring of cruise ships in the survey showed that they take predictable navigational routes with respect to the ports of call. Recording of time of entry and exit from defined navigation zones on a specific route based on number of different cruise ships allows us formulation of equations of movement with respect to the ports of call and navigation time between ports. In this way, results obtained in case study allow us to forecast the movement of cruise ships in the future which is a key factor for the assessment of marine pollution by sanitary wastewater [3]. Data analysis of movement of multiple cruisers on the same route together with their retention times
in navigation zones allows us to determine percentage of time spent in each zone for every route 𝑟𝑟! which is called zone share part with general symbol 𝑈𝑈𝑈𝑈!:
𝑟𝑟!𝑟𝑟!⋮𝑟𝑟!
↔
𝑈𝑈𝑈𝑈2! 𝑈𝑈𝑈𝑈3! 𝑈𝑈𝑈𝑈4!𝑈𝑈𝑈𝑈2! 𝑈𝑈𝑈𝑈3! 𝑈𝑈𝑈𝑈4!⋮ ⋮ ⋮
𝑈𝑈𝑈𝑈2! 𝑈𝑈𝑈𝑈3! 𝑈𝑈𝑈𝑈4!
(1)
Table 3 shows all routes used by cruise ships in the year of monitoring together with share parts and number of travels for each route. All 22 ports of call in the Adriatic Sea are given by their mark as follows by their position from southeast counter clockwise: Durres (DUR), Kotor (KOT), Dubrovnik (DUB), Korčula (KOR), Hvar (HVA), Supetar (SUP),

7th INTERNATIONAL MARITIME SCIENCE CONFERENCE
248
April 20th-21st, 2017, Solin, Croatia
Split (SPL), Trogir (TRO), Šibenik (ŠIB), Zadar (ZAD), Rijeka (RIJ), Pula (PUL), Rovinj (ROV), Koper (KOP), Trst (TRS), Venice (VEN), Chioggia (CHI), Ravenna (RAV), Ancona (ANC), Bari (BAR)
and Brindisi (BRI), also including point of entry (UL) and exit (IZL) to/from the Adriatic Sea.
Table 3. Share parts and number of travels for each route in the Adriatic Sea.
Route Share part in navigational zone
Trav
els
Route Share part in navigational zone
Trav
els
Zone 2 Zone 3 Zone 4 Zone 2 Zone 3 Zone 4
r1 UL - DUB 0.0739 0.0903 0.8358 188 r62 ŠIB - KOR 0.3411 0.3851 0.2738 4
r2 DUB - VEN 0.0612 0.3541 0.5847 161 r63 VEN - RIJ 0.1276 0.4879 0.3845
3
r3 BAR - IZL 0 0 1 109 r64 DUB - TRS 0.0360 0.4173 0.5467
r4 VEN - BAR 0 0.0187 0.9813 100 r65 DUB - DUR 0.0710 0.2355 0.6935
r5 UL - VEN 0 0.1122 0.8878 92 r66 DUB - ROV 0.0464 0.2348 0.7188
r6 KOT - IZL 0 0 1 88 r67 KOT - HVA 0.0696 0.4232 0.5072
r7 DUB - IZL 0.0550 0.0877 0.8572 65 r68 BAR - KOT 0 0 1
r8 VEN - IZL 0 0.0355 0.9645 64 r69 SPL - TRS 0.1079 0.2959 0.5962
r9 UL - KOT 0 0 1 52 r70 KOP - DUB 0.0463 0.3913 0.5624
r10 VEN - DUB 0.0578 0.3510 0.5913 50 r71 KOP - ZAD 0.2135 0.1359 0.6506
r11 VEN - SPL 0.1213 0.1808 0.6980 47 r72 KOP - RAV 0 0 1
r12 DUB - KOT 0.1006 0.2743 0.6251 44 r73 RAV - DUB 0.0241 0.4311 0.5448
r13 SPL - IZL 0.1252 0.1775 0.6973 31 r74 RAV - HVA 0.0502 0.1783 0.7715
r14 VEN - KOT 0.0084 0.2576 0.7340 30
r75 HVA - IZL 0.0926 0.1427 0.7647
r15 SPL - VEN 0.1114 0.1902 0.6984 r76 RIJ - DUB 0.1370 0.4099 0.4531
r16 KOT - DUB 0.1093 0.2573 0.6334 29 r77 ROV - VEN 0.0441 0.1642 0.7917
r17 VEN - TRS 0 0.1638 0.8362 25
r78 UL - DUR 0 0 1
2
r18 KOT - VEN 0.0152 0.3507 0.6341 r79 VEN - HVA 0.0495 0.2760 0.6745
r19 BRI - IZL 0 0 1 24 r80 DUB - BAR 0.0654 0.0891 0.8455
r20 UL - SPL 0.1412 0.1717 0.6871 23
r81 DUB - RAV 0 0.4626 0.5374
r21 BARI - DUB 0.0773 0.0880 0.8347 r82 DUB - KOR 1 0 0
r22 ULA - BARI 0 0 1
22
r83 KOT - BAR 0 0 1
r23 SPL - KOT 0.1683 0.3553 0.4763 r84 SPL - KOP 0.0980 0.4233 0.4787
r24 KOP - VEN 0 0 1 r85 SPL - HVA 0.9445 0.0555 0
r25 DUB - ZAD 0.2176 0.5556 0.2267 21
r86 SPL - ANC 0.1723 0.2220 0.6057
r26 ZAD - VEN 0.1807 0.2546 0.5647 r87 ZAD - KOR 0.6505 0.3495 0.0000
r27 SPL - DUB 0.2637 0.5657 0.1706 17 r88 BRI - KOT 0 0 1
r28 VEN - BRI 0.0000 0.0662 0.9338 16
r89 TRS - DUB 0.0460 0.3864 0.5676
r29 VEN - RAV 0 0 1 r90 KOR - VEN 0.1011 0.1463 0.7526
r30 ANC - VEN 0 0 1 15 r91 KOR - DUB 1 0 0
r31 VEN - ZAD 0.2275 0.2164 0.5561 14
r92 HVA - DUB 0.1922 0.5010 0.3068
r32 DUB - ANC 0.1588 0.4529 0.3883 r93 DUR - SPL 0.0888 0.2992 0.6120
r33 TRS - SPL 0.1180 0.1096 0.7724 12 r94 DUR - IZL 0 0 1
r34 UL - BRI 0 0 1 10 r95 UL - KOR 0.0961 0.1201 0.7838
1 r35 UL - KOP 0 0.2495 0.7505 9
r96 UL - HVA 0.0904 0.1715 0.7381
r36 VEN - KOP 0 0.1401 0.8599 r97 DUB - SPL 0.2919 0.7081 0

249
Tina Perić, Nikola Račić
ANALYSIS OF CRUISE SHIP TRAFFIC IN THE ADRIATIC SEA CONSIDERING MARPOL ANNEX IV AREAS OF LIMITED WASTEWATER DISCHARGES
r37 ZAD - DUB 0.2115 0.6745 0.1140
8
r98 DUB - BRI 0.0402 0.0803 0.8795
r38 BRI - DUB 0.0843 0.0766 0.8390 r99 DUB - RIJ 0.1113 0.4286 0.4601
r39 TRS - IZL 0 0.0279 0.9721 r100 DUB - SUP 0.7660 0.2340 0
r40 VEN - KOR 0.1652 0.1103 0.7245 7 r101 DUB - PUL 0.0633 0.3676 0.5690
r41 DUB - KOP 0.0341 0.5116 0.4543
7
r102 BAR - SPL 0.1181 0.3312 0.5507
1
r42 KOT - BRI 0 0 1 r103 SPL - RAV 0.1048 0.2282 0.6670
r43 ZAD - SPL 0.3671 0.2575 0.3753 r104 ZAD - HVA 0.7558 0.2442 0
r44 RAV - VEN 0 0 1 r105 KOP - SPL 0.0888 0.2992 0.6120
r45 KOR - IZL 0.0792 0.0944 0.8264 r106 KOP - TRS 0 0.3467 0.6533
r46 KOT - ZAD 0.1511 0.3767 0.4722 6
r107 KOP - CHI 0 0 1
r47 ZAD - KOP 0.2113 0.3948 0.3939 r108 TRS - VEN 0 0 1
r48 DUB - HVA 0.4589 0.5411 0
5
r109 RAV - BARI 0 0.0429 0.9571
r49 KOT - SPL 0.1450 0.5062 0.3488 r110 RAV - ZAD 0.2401 0.0749 0.6850
r50 ZAD - KOT 0.1024 0.5067 0.3908 r111 RAV - TRO 0.1063 0.1176 0.7760
r51 TRS - BAR 0 0.0222 0.9778 r112 RAV - IZL 0 0.0674 0.9326
r52 TRS - ZAD 0.2312 0.1555 0.6133 r113 HVA - ZAD 0.3161 0.6839 0
r53 RAV - SPL 0.1579 0.1883 0.6539 r114 HVA - KOP 0.0622 0.5612 0.3766
r54 KOR - SPL 0.6013 0.3987 0 r115 HVA - ROV 0.1942 0.5150 0.2908
r55 HVA - KOT 0.1198 0.4629 0.4173 r116 DUR - KOT 0 0 1
r56 UL - RAV 0 0.1166 0.8834
4
r117 RIJ - VEN 0.1717 0.4051 0.4232
r57 VEN - ŠIB 0.1220 0.1449 0.1449 r118 ROV - TRS 0.0566 0.4746 0.4688
r58 KOT - KOR 0.1159 0.2916 0.2916 r119 SUP - SPL 0.7615 0.2385 0
r59 RAV - KOT 0 0.3065 0.3065 r120 PUL - VEN 0.0670 0.2320 0.7010
r60 KOR - BAR 0.0917 0.1811 0.1811 r121 TRO - KOT 0.2352 0.6667 0.0981
r61 HVA - VEN 0.0315 0.4020 0.4020 r122 CHI - ZAD 0.1762 0.5057 0.3181
From 122 routes used in the monitored year, only a quarter of them were used ten times or more and only a tenth of all routes were used more than 40 times. A half of all routes were used four times or less. This leads to a conclusion that cruise ships use established itineraries in the Adriatic Sea.
3.2. Cruise ship distribution analysis
Case study shows that cruise ships navigate eight months a year in the Adriatic Sea (April-November) and, contrary to the belief of the season peak in July and August, cruise ships spend most of their time in June and September, as graphically shown in Figure 2.
Figure 2. Cruise ship retention time distribution.

7th INTERNATIONAL MARITIME SCIENCE CONFERENCE
250
April 20th-21st, 2017, Solin, Croatia
For the purposes of cruise ship distribution analyses in some cases planed traffic for 2017 was taken into account. Cruise ship traffic for 2017 is estimated from cruise ship itineraries provided on numerous web sites with purpose of cruise booking or advertising [5][6][7]. Comparison of the year of case study and 2017 is given in table 4.
Table 4. Comparison of cruise ship traffic in the Adriatic Sea.
Cruise ships in the Adriatic Sea
2014/2015 2017
Number of ships 63 48
Number of companies 26 23
Arrivals in Croatian ports 551 553
Arrivals in foreign ports 853 909
Average capacity of ships 2575 2134
Wastewater treatment technology3 (AWT:MSD)
48:52 52:48
From the data in table 3 it can be concluded that the number of ships and companies in the Adriatic Sea together with the average capacity of the ships is reducing through the years. However, number of arrivals in ports, both Croatian and foreign is increasing. Therefore, cruise ships are spending more time in the Adriatic Sea with more ports includes in their itineraries. According to their capacity cruise ships are divided into ten classes. Figure 3 shows the distribution of the number of ships by class size in the global cruise fleet, in the year of the case study (2014/2015) and in 2017 (according to data provided by ships itineraries). It can be concluded that most ships generally fall into the category of large cruise ships in the class of 2400 - 3100. A small and extremely large ships are least represented.
3 Wastewater treatment technology available on cruise ships can be divided in Marine Sanitation Device (MSD) and Advanced Wastewater Treatment (AWT) Plant. The main difference between these systems is in quality of discharged wastewater. AWT systems have incomparably better results in wastewater purification that MSD (see [2]).
Figure 3. Cruise ship distribution according to capacity classes.
Analysis of cruise ship retention time in the Adriatic Sea according to their capacity concluded that ships in capacity class 3100 – 3800 have longest retention time in the Adriatic, figure 4. The average capacity of all cruise ships in the monitored period, calculated considering retention time of every ship and its capacity, is 2909 people.
Figure 4. Cruise ship retention time distribution according to capacity classes.
Data comparison from figures 3 and 4 shows that, although the number of ships visiting Adriatic from class 2400 – 3100 is twice as the number of ships from class 3100 – 3800, bellowed mentioned spent significantly more time in the Adriatic Sea.
3.3. Case study results
Case study analysis gave us zone share parts (𝑈𝑈𝑈𝑈2!, 𝑈𝑈𝑈𝑈3! and 𝑈𝑈𝑈𝑈4!) calculated as a share of the average period of retention time of cruise ships in these zones for every route. By knowing shares

251
Tina Perić, Nikola Račić
ANALYSIS OF CRUISE SHIP TRAFFIC IN THE ADRIATIC SEA CONSIDERING MARPOL ANNEX IV AREAS OF LIMITED WASTEWATER DISCHARGES
parts in the MARPOL Annex IV areas of limited wastewater discharges it is possible to see the load of each zone which is the main parametar for calculation of wastewater pollution, but for more detailed analysis of wastewater pollution in the Adriatic it is necessary to know the distribution of that load in specified geographical areas. Therefore, each route 𝑟𝑟! is further broken down into geographical areas of navigation. This allows knowledge of not only retention time of cruise ships in areas of limited discharges, but also retention time in smaller, defined geographical areas of the Adriatic Sea. Each MARPOL Annex for navigation zone is divided in several geographical areas, table 5.
Table 5. Geographical areas of navigation with corresponding marks.
MARPOL Annex IV
zones
Geographical areas of navigation
Mark gz Color
Zone 2 zone 2 20
Zone 3
North Istria 30
West Istria 31
Zadar - Unije area 32
Šolta - Kornati area 33
Vis - Lastovo area 34
Jabuka- Biševo area 35
Lastovo area 36
marginal sea area 37
Mljet area 38
Dubrovnik - Kotor area 39
Zone 4
northern Adriatic 40
central Adriatic 41
southern Adriatic 42
Thus, zone 4 is divided into three geographical areas: northern, central and southern Adriatic. Zone 3, or the territorial waters of the Republic of Croatia, is divided into ten geographical areas of navigation. zone 3 in the northern Adriatic is divided into: North Istra, West Istra and Zadar – Unije area. Zone 3 in the centaral Adriatic is divided into five areas: Šolta – Kornati area, Jabuka – Biševo area, Vis – Lastovo area, Lastovo area and marginal sea area. Zone 3 in the southern Adriatic is divided into: Mljet area and Dubrovnik – Kornati area. Each geographical zone is associated with a color and label. The division of the geographical areas of navigation is shown in Figure 5. Each route in case study was analyzed based on all cruise ships that used it. The route was drawn on to the chart, average time of navigation on the route was calculated and travel distance in each geographical area was calculated which allowed development of share parts (𝑈𝑈𝑈𝑈!") for each geographical area on that route. So share parts for geographical areas were calculated for all 122 routes. However, given that the half of routes was used four times or less, insufficient number of examples for analysis possibly allows larger errors. It is believed that, for all routes used less than twenty times, is necessary to further monitor cruise ship traffic and amend share parts for geographical areas. Also, cruise ships may use new, previously unused routes in the future or include new ports of call in their itineraries.

7th INTERNATIONAL MARITIME SCIENCE CONFERENCE
252
April 20th-21st, 2017, Solin, Croatia
Figure 5. The scope of geographical areas of navigation.
Table 6 shows share parts for geographical areas for fifteen most commonly used routes. All of them have more than 30 travels i.e. a sufficient number
of samples to accurately predict the retention time in geographical areas.
Table 6. Share parts in geographical areas of navigation for fifteen most commonly used routes in the Adriatic Sea.
Rout
es
GEOGRAPHICAL AREA
Zone
2
ZONE 3 ZONE 4
Nort
h Is
tria
Wes
t Ist
ria
Zada
r -
Unije
Šolta
-
Korn
ati
Vis
- La
stov
o
Jabu
ka-
Biše
vo
Last
ovo
mar
gina
l se
a
Mlje
t
Dubr
ovni
k -
Koto
r
nort
hern
Ad
riatic
cent
ral
Adria
tic
sout
hern
Ad
riatic
UB20 UB30 UB31 UB32 UB33 UB34 UB35 UB36 UB37 UB38 UB39 UB40 UB41 UB42
r1
0,07
39
0,09
03
0,83
58
r2
0,03
57
0,07
60
0,08
75
0,08
44
0,09
05
0,01
51
0,10
26
0,36
08
0,14
74
r3
1
r4
0,39
88
0,37
46
0,22
66
r5
0,05
42
0,10
29
0,28
74
0,19
51
0,36
04
r6
1
r7
0,05
51
0,08
77
0,85
72
r8
0,02
98
0,27
57
0,27
15
0,42
30
r9
1
r10
0,04
14
0,08
81
0,07
94
0,10
02
0,09
00
0,42
19
0,17
90
r11
0,12
08
0,18
08
0,58
72
0,11
12
r12
A1 0,08
61
0,22
54
0,68
85

253
Tina Perić, Nikola Račić
ANALYSIS OF CRUISE SHIP TRAFFIC IN THE ADRIATIC SEA CONSIDERING MARPOL ANNEX IV AREAS OF LIMITED WASTEWATER DISCHARGES
Table 6. Share parts in geographical areas of navigation for fifteen most commonly used routes in the Adriatic Sea.
Rout
es
GEOGRAPHICAL AREA
Zone
2
ZONE 3 ZONE 4
Nort
h Is
tria
Wes
t Ist
ria
Zada
r -
Unije
Šolta
-
Korn
ati
Vis
- La
stov
o
Jabu
ka-
Biše
vo
Last
ovo
mar
gina
l se
a
Mlje
t
Dubr
ovni
k -
Koto
r
nort
hern
Ad
riatic
cent
ral
Adria
tic
sout
hern
Ad
riatic
UB20 UB30 UB31 UB32 UB33 UB34 UB35 UB36 UB37 UB38 UB39 UB40 UB41 UB42
r1
0,07
39
0,09
03
0,83
58
r2
0,03
57
0,07
60
0,08
75
0,08
44
0,09
05
0,01
51
0,10
26
0,36
08
0,14
74
r3
1
r4
0,39
88
0,37
46
0,22
66
r5
0,05
42
0,10
29
0,28
74
0,19
51
0,36
04
r6
1
r7
0,05
51
0,08
77
0,85
72
r8
0,02
98
0,27
57
0,27
15
0,42
30
r9
1
r10
0,04
14
0,08
81
0,07
94
0,10
02
0,09
00
0,42
19
0,17
90
r11
0,12
08
0,18
08
0,58
72
0,11
12
r12
A1 0,08
61
0,22
54
0,68
85

7th INTERNATIONAL MARITIME SCIENCE CONFERENCE
254
April 20th-21st, 2017, Solin, Croatia
r12
B2 0,16
94
0,41
74
0,41
32
r13
0,12
62
0,07
30
0,09
24
0,02
92
0,67
92
r14
A3
0,08
07
0,06
19
0,08
07
0,09
68
0,08
60
0,36
85
0,15
35
0,07
19
r14
B4
0,07
58
0,03
56
0,28
95
0,31
31
0,28
60
r15
0,11
20
0,12
55
0,16
63
0,48
41
0,11
21
1 navigation time more than 8 h, 2 navigation time less than 8 h, 3 navigation time less than 24 h, 4 navigation time more than 24 h
4. CONCLUSIONS
Cruising tourism is a growing industry with increasing number of ships and their capacities. That is a reason for concerns about marine pollution from cruise ships because generated wastewater is directly proportional to the number of persons on cruise ships and their retention time in the Adriatic Sea. Annex IV of MARPOL Convention divides sea in three navigation areas with different requirements for quality of discharged wastewater. To evaluate marine pollution from cruise ships in the Adriatic Sea retention time of ships in these areas was a needed parameter so a case study was made. Results of that case study showed us detailed cruise ship traffic elements presented in this paper such as: ship distribution in ports of call, cruise ship retention time distribution by ships or by months, cruise ship distribution by capacity etc. Case study also provided data for calculation of share parts (𝑈𝑈𝑈𝑈2!, 𝑈𝑈𝑈𝑈3! and 𝑈𝑈𝑈𝑈4!) in MARPOL Annex IV areas of limited wastewater discharges and share parts (𝑈𝑈𝑈𝑈!") in fourteen defined geographical areas for every route in the Adriatic Sea. Contribution of this paper is considered in defined share parts on routes in the Adriatic Sea. They allow us to predict retention time of cruise ships in defined geographical areas by knowing only itineraries of ships in a chosen period of time. These retention times can be basis for calculation
of wastewater pollution in the Adriatic Sea from cruise ships in different working scenarios of ships, purpose for they were originally developed. Different scenarios include different wastewater managements on board with possibility of changing parameters such as working modes of the wastewater treatment technology (quality of discharged wastewater) according to legal regulations for different navigational zones or discharge rate of wastewater from cruise ships (quantity of discharged wastewater). Without distribution of retention times of cruise ships in defined geographical areas evaluation range of wastewater pollution in different scenarios could not be concluded. Retention times can also be used for analysis of future cruise ship traffic in the Adriatic Sea and as data for evaluation of other types of pollution from cruise ships.
REFERENCES
1. Croatian Bureau of Statistics, Foreign vessels on cruise in the Republic of Croatia, available at: http://www.dzs.hr
2. Perić, T., "Wastewater Pollution from Cruise Ships in Coastal Sea Area of the Republic of Croatia", Pomorstvo – Scientific Journal of Maritime Research, Vol. 2, No. 30 (2016), pp. 160-164.

255
Tina Perić, Nikola Račić
ANALYSIS OF CRUISE SHIP TRAFFIC IN THE ADRIATIC SEA CONSIDERING MARPOL ANNEX IV AREAS OF LIMITED WASTEWATER DISCHARGES
3. Perić, T., Komadina, P., Račić N., "Wastewater Pollution from Cruise Ships in the Adriatic Sea", Promet – Traffic&Transportation, Vol. 4, No. 28 (2016), pp. 425-433.
4. Port of Dubrovnik, Cruise statistics, available at: http://www.portdubrovnik.hr
5. Iglu Cruise, available at: http://www.iglucruise.com
6. Clean Cruising – Find Your Dream Cruise Faster, available at: http://www.cleancruising.com.au
7. Cruise Mapper, available at: http://www.cruisemapper.com

7th INTERNATIONAL MARITIME SCIENCE CONFERENCE
256
April 20th-21st, 2017, Solin, Croatia
ANALYSIS OF THE SECURITY CHALLENGE IN MARITIME CLOUD COMPUTINGIve Botunac, Juraj Poljak, Dino Županović
ANALYSIS OF THE SECURITY CHALLENGE IN MARITIME CLOUD COMPUTING
Ive Botunac1, Juraj Poljak2, Dino Županović3
(1 Samostalne satnije Briševo 11, 23000 Zadar, Croatia) (2 Kolodvorska 117, 31000 Osijek, Croatia)
(3 Maritime Department, University of Zadar, Mihovila Pavlinovića 1, 23000 Zadar, Croatia) (E-mail: [email protected])
ABSTRACT
The development and application of information technologies in the maritime affairs significantly increased the levels of safety and efficiency in carrying out intended tasks. The introduction of cloud computing within the maritime industry improved not only the organization, but also the communication between all its entities. This significantly reduces the financial cost of investments in the new infrastructure which often requires a lot of financial investments and it also allows the sharing of information resources and their availability. This technology opens up the possibility of using a number of innovative solutions which can be easily implemented, especially because of the minimum financial investments in the necessary infrastructure. Despite the benefits which cloud computing provides, the concern about the security of its application continues to grow. Security itself poses a major problem and its menace calls into question the confidentiality, integrity and availability of the data. This paper analyses the security threats related to cloud computing through a review of the used basic models. Furthermore, it provides a classification of the most significant threats to the maritime industry which offers an extremely wide range of professions and jobs. Finally, it presents the proposals of possible solutions in order to prevent possible malicious attacks and suggests the guidelines for future researches on the analyzed topic.
KEY WORDS
cloud computing, cyber security, information security, maritime cloud, security threats
1. INTRODUCTION
In the last ten years, cloud computing has become an extremely important element of modern computing. Its development and technical improvement provide a handful of benefits that are required in today's conditions of the computing business. Maritime industry recognized the benefits of cloud computing and started to implement it along the lines of its technology. This system is nowadays more frequently used and is more often encountered in large maritime companies.
Despite numerous advantages and benefits to the users, the biggest disadvantage of this system is the issue of security and the risk concerning information and data. The priority is the raise of security to the highest possible level, so a whole range of professionals deals with this problem through technical support. The aim of this paper is to study numerous points of cloud computing in the maritime industry through the methods of analysis, description, synthesis and comparison, and to closely describe its current and future application. Moreover, the
257
Ive Botunac, Juraj Poljak, Dino Županović
ANALYSIS OF THE SECURITY CHALLENGE IN MARITIME CLOUD COMPUTING
system is analyzed through security issues, including the representation of the most important safety items and the thorough explanation of general security and risk questions. The paper greatly emphasizes the questions of security in cloud computing, because it represents the biggest obstacle for present and future users of the system.
2. ARCHITECTURE OF CLOUD COMPUTING
In the 1960s, John McCarthy came up with the idea according to which computing would be represented in terms of the public service. After 40 years, the largest IT companies, such as Apple, Google, HP and Microsoft encouraged themselves to start using cloud computing. It is based on the idea that data processing is significantly easier and more efficient if the data is stored in large databases which are always available via the Internet [1]. Cloud computing tends to increase the capacity and capabilities of the individual systems, but without necessary investments in the new infrastructure. The occurrence of cloud computing increased the former possibilities of IT and significantly enhanced the capabilities of data storage, transfer, protection, processing and security [2]. Cloud computing has significantly developed, so today it is used in many scientific and engineering applications, research data, computer financing, social networking and computer games, as well as in numerous other services which intensely and greatly store their information. It also provides flexible and customizable data storage services so the users of the service pay it accord to their usage. This kind of use strategy increases reliability and security, of what the service providers take great care and put in constant efforts [1]. Despite the numerous already provided benefits, cloud computing will experience its full development after the removal of the security issues, which still make this system vulnerable and sensitive.
2.1. Cloud Service Models
In recent years, virtual machines have become a standard developmental object, as well as the prevailing abstraction and the developmental unit in many industries. They represent the smallest common interface which divides the service
providers from the developmental organizations. Virtualization enables the existence of dynamic databases in which physical servers provide a large amount of resources that are retrieved as needed. Virtual machines and applications greatly enhance the ability of rapid development and the creation of applications, that is why the key to the future development of cloud computing lies precisely in the combined use of virtual machines and applications [2]. There are three basic classifications of cloud service models: IaaS (Infrastructure as a Service): this model redirects computing from the physical to the virtual infrastructure and thus provides all virtual sources with virtual machines configured by service provider [3]. Users do not buy software, servers, network equipment or space for data storage, but the resources. The user has the possibility of processing, storage, networking, and can also run different kinds of software [2]. However, despite the numerous advantages, this model is lagging behind in terms of security. Many attacks are directed towards virtual machines and the data stored on them, so the provider can not guarantee the absolute security. PaaS (Platform as a Service): this model provides the user with the option of independent creation and development of applications using programming languages and tools supported by the service provider. Applications are delivered to the user via server interface which can be obtained via the Internet [2]. PaaS model offers quick developmental process, the ease of use and maintenance and the work of different teams, since development teams are connected through PaaS platforms. As in the previous model, the problem of security questions and data compromise emerges, primarily because the data are stored on third-party servers. In addition, PaaS offers less flexibility to developers in creating applications and greatly depends on the Internet connection [3]. SaaS (Software as a Service): in this model, the user can use the available applications located in the cloud infrastructure which are available from different devices with the help of the interface.

7th INTERNATIONAL MARITIME SCIENCE CONFERENCE
258
April 20th-21st, 2017, Solin, Croatia
SaaS is a platform that enables application availability through the Internet in the form of different services. They can be downloaded as needed, instead of being bought as a separate program that needs an installation on the computer [2]. Some of the services on this platform can be accessed from devices that do not have much space for data storage, in other words, they are less exposed to potential attacks. A common provider of SaaS platform usually provides business services, document management, mail service and social networks [3]. Of course, security is threatened because of the large number of users, and there is a possibility of the leak of confidential information and data. SaaS platform requires Internet connection, while a high-quality access is strictly determined by the speed of the Internet connection [3].
2.2. Cloud Deployment Models
Regardless of the cloud service models referred to in the previous chapter (IaaS, PaaS, SaaS), there are four different cloud deployment models. Each of them has particular performance, which depends on specific needs, requirements, financial budget and degree of safety. Therefore, in the beginning of the cloud computing business, it is important to choose the right model for service execution. Private cloud: private cloud is defined as a cloud infrastructure available only to one organization and it is managed by the organization itself or someone else. The organization owns the infrastructure, has the control over the distribution of applications, installs programs, stores the data and manages the structure of clouds [2]. Private cloud is relatively small and easy to maintain, and provides the user with a high level of security and privacy. Public cloud: public cloud is open and available to the public and it is owned by the company that sells the cloud computing service. The same servers contain different users' applications, networks, and storage systems, what, therefore, raises the question of the data security. It offers the ability of increase or decrease of the reserved instances of the cloud according to the principle of “pay as you use” [2]. Its creation does not require the developing infrastructure, there are no
maintenance costs, it is significantly cheaper than other cloud models, it is very customizable and has no restrictions on the number of users. Such a large number of users raises a question of security and privacy, whose autonomy is not possible [3]. Community cloud: by using this model, several organizations with common needs, missions and security requirements, share the structure of one cloud. It somewhat resembles the private cloud; it allows the teamwork on the cloud, the division of responsibilities in an organization and it is yet more secure than public cloud. However, safety features do not have the same level of quality as in the private cloud, so it is unsuitable for the use unless there is a need for teamwork on it [3]. Hybrid cloud: the structure of the hybrid cloud is composed of two or more different clouds (private, community, public) which remain unique entities, but which are mutually connected and allow efficient and reliable transfer of applications and data. In order to maintain service levels and to bear heavy loads more easily and reliably, this model makes possible the ability of expansion of private cloud with the resources of public cloud. Hybrid clouds face the problem of complex determination of how to distribute applications for private and public cloud. Besides, the relationship between the data and resource processing must certainly be taken into account [2]. Hybrid cloud is complex to manage and maintain due to constant need for balance between two or more cloud models [3].
3. IMPLEMENTATION OF CLOUD COMPUTING IN MARITIME INDUSTRY
The maritime industry has always met the requirements and the laws of the global market. Cloud computing enables optimized exploitation of sources of information, significantly reduces the costs of shipping companies' business, and provides operators with the option of offering their services at lower prices with guaranteed quality level [5]. In the last few years, cloud computing is being used on ships, shipping companies and other maritime institutions. The benefits of using it is numerous and they are reflected in the reduction of

259
Ive Botunac, Juraj Poljak, Dino Županović
ANALYSIS OF THE SECURITY CHALLENGE IN MARITIME CLOUD COMPUTING
operating costs and prices of IT elements, maintenance of computer resources without additional education of new staff or purchase of new licenses for programs and applications [5]. In addition, there are numerous other advantages, concerning the access to data from any device with Internet connection, capabilities of performing services at all company's ships, possibilities of permanent monitoring of maritime processes and storage of all information and documents in one place. Along with the advantages, there are also disadvantages which manifest in terms of security and confidentiality, intellectual property, dependency on a single software support provider and absence of standardized interfaces for transfer of data and services between two clouds [5].
3.1. Usage of Cloud Computing in Maritime
The use of cloud computing in maritime started through the idea of “Single Window” System. It is designed for relieving international trading and it allows storage of standardized information and documents through a single-entry point to the parties involved in trade and transport, in order to simplify flow of information between the government, global trade, customs and border administration [4]. The most famous examples of the cloud computing application in this area are: SOGET's e-Maritime Port Single Window Project – since 1983, SOGET is a leading operator of Port Community System in France, and public-private partnership between the French custom administration, the port company and the harbour authority of Le Havre. E-Maritime technology provides access to data in real time to all users of the system what improves the efficiency of business processes and provides interoperability with the European and global, and port's and government's “Single Window” systems [4]. MESPAS – the world's leading software for fleet management based on cloud computing and the fastest growing SaaS service in maritime transport. It provides access and management of the data, applications and IT infrastructure via the Internet. It is the most effective, most versatile and most innovative software for fleet management that provides affordable and flexible approach. Software
automatically maintains and updates directly into MESPAS, while the addition or removal of the ships from the fleet becomes a matter of days, not months, making the company more competitive [4]. Maritime companies can store data, applications, and functions in the cloud. Based on the analyses of business processes on board and in maritime company, the SaaS model is imposed as an important and acceptable cloud deployment model. It covers all the important business processes, as well as the technical management conditions of the ships' fleet, and includes all the important characteristics which cloud needs to have: scalability, reliability, speed, security and privacy. It most often covers the following functional modules: management of the ship or the fleet, maintenance management, document management and reporting [5]. Cloud computing usually comprises two types of data: 1. general data-information to the equipment manufacturers, operating instructions, spare parts (free access to all employees) 2. specific data– financial state of ship or fleet, plans for the introduction of new services, plans for the purchase of new ships (open access only for the authorized company's personnel) [5]
3.2. Next Generation of Maritime Cloud Computing
Cloud computing services allows the development of next generation of custom service, expansion of global markets, economic development and a number of many business opportunities [4]. Several IT companies already develop and provide cloud computing services exclusively for the maritime industry, what offers a whole range of new opportunities and business challenges for the shipping companies. Each shipping company has to know whether it can bear the risk associated with the selected cloud deployment model [5]. Shipping companies have large amounts of collected data that require different types of analysis. It is therefore possible to predict that, in the near future, the shipping companies will start using AaaS (Analysis as a Service) cloud computing model. It analyzes the collected data, for example,

7th INTERNATIONAL MARITIME SCIENCE CONFERENCE
260
April 20th-21st, 2017, Solin, Croatia
the fuel consumption of a particular ship, or of all the ships in the fleet and sets up a hypothesis before the application of the obtained results. Such results are real; they are not based on subjective perceptions, so this model helps the administration in making decisions connected with the company’s business in the future [5]. The use of cloud computing services offers opportunities for financial savings in development and maintenance of internal IT infrastructure. It gives the shipping company a possibility of faster and stronger development, of the upgrade of existing services, of the introduction of new business services, or investments in the development of the individual IT sector. In the future, more shipping companies will recognize the positive sides of cloud computing and will implement it in the management of their fleets, regardless of the company’s size [5].
4. SECURITY THREATS AND ATTACKS TO CLOUD COMPUTING
A major problem and challenge encountered in the use of cloud computing is the security and privacy of data. Given that cloud computing is a set of different computer technologies, it arises a wide range of threats, whereby each of the structural technologies carries its inherent threats, which synergistically very often cause emergence of new security threats. It is important to note that these threats and attacks do not greatly differ from the traditional ones in the context of information security. By ensuring the correct use of cloud computing, it is essential to understand the faced security challenges, in order to lessen the risk of the exposure to potential attacks.
4.1. Threat Overview
Cloud computing is developed with the aim of storing data on remote servers, so that it would ensure timely and reliable data access to all the participating entities. Consequently, the security of stored data can be defined as an essential aspect of this business model, while the violation of the data security and the data exposure to unauthorized users can be defined as one of the most significant threats. Owing to the increased use of network applications and devices, data storage, as well as
data security poses a big problem [6]. In accordance with the enumerated facts, the continuous paragraphs tend to describe the biggest threats to the use of cloud computing. Data Breaches and Loss: this threat is defined as any attempt of unauthorized and unlawful obtaining of data, what consequently results in the breach of security, confidentiality and integrity. When it comes to such a scenario, an attacker exploits the vulnerability of a system or carries out some of the attacks in order to accomplish a goal. One of the ways in which we can ensure the data security, if requested, is the application of some encryption standard for data protection [7]. In the context of data security, another potential problem is data loss which can be caused by improper handling or misplacement. Data loss can happen in many ways. Some of them include the record deletion, backup deletion, loss of encryption key, or loss caused by some catastrophe [8]. Data Availability: the main objective of cloud computing service is the insurance of the data availability for clients, so that they can request information anywhere and anytime [6]. Attacks which would abridge the data availability on servers are called Denial of Service (DoS) attacks. These attacks cause a number of complications, both for the server and for the client, because the server cannot provide the client with a service to which the server is contractually obligated. This threat becomes even more dangerous because cloud computing clients share the same infrastructure. For example, an attack on one of the clients may crash the whole cloud [7]. In order to prevent this kind of threat, service providers have the tendency of using security mechanisms such as firewalls and other filters that will block unwanted network packets. Session Hijacking: the connection to a web server creates a session between the server and the user, in which the data exchange takes place. Every created session is marked with its own ID which is valid as long as the session lasts, and which stops when the session ends. Session data are usually stored in so-called cookies, or as a parameter within a URL. Session hijacking is a sophisticated attack that enables an attacker to gain control over

261
Ive Botunac, Juraj Poljak, Dino Županović
ANALYSIS OF THE SECURITY CHALLENGE IN MARITIME CLOUD COMPUTING
certified session authorized by the user. This is also a specific type of attack which occurs while the user's session is active, and which continues even after the user logs off. Such threat is carried out by the sniffing attacks in order to find out the session ID at user login. This type of attack is known as “man in the middle”. Malicious Insiders: this kind of threat can be caused both by the server and the client. For example, an employee who works in the server center may intentionally take confidential information from clients and thereby threaten the confidentiality, or cause any other type of damage to the client. Also, the user can cause the internal data breach, in case the access to more than one person is enabled. This threat could seriously undermine the trust between the user and the server and thus negatively impact the business [9]. Data encryption can be applied as a method of protection against these threats, in order to ensure that only authorized people have permitted access [10].
4.2. Attack Analysis
After defining the most common threats, it is necessary to explain types of computer attacks used in order to achieve the above-mentioned threats. The attacks themselves do not substantially differ from the ubiquitous computer attacks that afflict other users of the Internet. However, taking into account that, in the context of cloud computing, we mention the application within the maritime industry, we analyze the attacks that we consider relevant. Authentication Attacks: the goal of this attack is to enter the system by logging in as a valid user and thus gain access to the assigned privileges. The authorization is considered to be the weakest point of the system and is thus most frequently attacked. The most commonly used method is the standard one - logging in to the system via user name and password, with which the user confirms the identity and logs in to the system [11]. The best-known ways of carrying out this type of attack are known under the name “Brute Force attacks”. An attacker runs the program which attempts to randomly guess the password by using all possible combinations of letters, numbers, and other
characters, until the password is guessed [12]. Another well-known type of attack is phishing attack. Malware Injection Attack: SaaS model is generally considered as one of the fastest network information servers. Standard web servers are vulnerable to numerous attacks; most notable of them are cross-site scripting (XSS) and SQL injection attacks. An attacker inserts malicious part of programming code within the target virtual machines, or web application, depending on the cloud model. Once the attack is successfully carried out, the attacker can conduct certain malicious activities, for example, he can manipulate user’s data [13]. Today, XSS attacks are commonly used to retrieve information stored in cookies and thus the attacker can retrieve the active user's session. The attacks are carried out primarily by exploiting flaws inside the application code that are inadvertently left behind by the creators of the application. Man-in-the-Middle Attack: this is one of the well-known attacks in the area of computer security and it thus represents a challenge both for the attackers and for professionals in the field of security. This attack can be described in terms of an attacker taking the control over a communication channel, by placing himself between two or more entities. This method enables him the interception of traffic which takes place among the above mentioned entities, by which he can come into possession of sensitive information or data. One of the subspecies of MITM attack is called “spoofing based MITM” in which an attacker intercepts a legitimate communication by pretending he is one of the entities by faking their data [14]. Today, the possibility of this kind of attack is greatly reduced using the security network protocols such as SSL/TSL. By doing so, all the traffic which takes place between the user and the server is encrypted by the use of digital certificates, or public key infrastructure. Denial of Service Attacks: the main goal of this attack is to overload the server by sending false requests, in order to prevent the response to legitimate requests. The server is not able to respond to all requests, what consequently results

7th INTERNATIONAL MARITIME SCIENCE CONFERENCE
262
April 20th-21st, 2017, Solin, Croatia
in the overload and demolition of the system itself. The cloud system is vulnerable to this type of attack, because it supports the joining of resources in its functioning [12]. While carrying out this attack, an attacker uses another approach in which he joins the independent systems, so that he could conduct DoS attack, which is therefore called “a distributed DoS” (DDoS). In a DDoS attack, the attacker sends his command to a system which is called command and control server and which coordinates a network of infected computers which send fake requests. Infected computers are popularly referred to as zombies and together form the so-called botnet network [15]
5. CLOUD COMPUTING SECURITY RECOMMENDATIONS
This paper gives an overview of threats and attacks to which cloud computing is exposed. On the basis of all the mentioned facts, it is evident that security is one of the most important qualities that this form of business model has to offer to its users. In order to better prevent the occurrence of security threats, this paper proposes the measures that can be undertaken, so that it is possible to increase the security level. Storage of Data: the backup data storage is considered to be one of the fundamental features that cloud computing has to offer. Securing the authenticity and integrity of the data can be achieved by applying the method of encryption [16]. In order to additionally ensure the availability and prevent possible data loss, it is important to perform periodic backups. Transmission of Data: the focus of the transmission of data is on the avoidance of possible sniffing by third party. Today, there are already well developed security mechanisms that are used for this purpose, in order to ensure the secure transmission of data. Here we mention the security protocols SSL/TSL, which are located between the transport and application network layer and which take care of the establishment of secured, protected session [17].
Authorization Methods: except from the standardized user authorization with a user name and password, some of the other models can be applied. These are, for example, the application of digital certificates, use of the token or fingerprint-scanning device. Audit and Monitoring: the application of specialized software solutions for the monitoring of computer work can be used to avoid internal threats by malicious users. In this way, servers can monitor the actions of the employees. This way, data leakage can be prevented and in case of such oversights, prompt reactions can be ensured.
6. CONCLUSIONS
Cloud computing represents a new business model that is applied in many industries and by private users. This paper is dedicated to the analysis of its application within the maritime industry, as well as to the review of the advantages arising from its use. Maritime industry strives to keep pace with the development of modern IT technologies, through which it tends to improve a number of aspects of the business. Despite all the benefits of the use of cloud computing, the security issues should not be ignored. This paper highlights threats whose realization can provoke many material and financial damages, dangerous for maritime industry. In order to better understand the subject, the paper also presents the types of attacks, as well as recommendations for improving the security of cloud computing application. Further researches include optimization area of cloud computing exploitation with the aim of improving the entire business and raising the level of service. Moreover, it leaves room for the introduction of a number of security enhancements to provide security, which the maritime industry advocates.
REFERENCES
1. Marinescu, D. C., Cloud Computing Theory and Practice, Morgan Kaufmann, (2013).
2. CARNet, Cloud computing NCERT-PUBDOC-2010-03-293, (2010).
263
Ive Botunac, Juraj Poljak, Dino Županović
ANALYSIS OF THE SECURITY CHALLENGE IN MARITIME CLOUD COMPUTING
3. Chandrasekaran, K., Essentials of Cloud Computing, CRC Press, (2015).
4. Joszczuk-Januszewska, J., The Benefits of Cloud Computing in the Maritime Transport, TST 2012, CCIS 329, Springer-Verlag Berlin Heidelberg, (2012), pp. 258-266.
5. Ristov, P., Perić, M., Tomas, V., „The implementation of cloud computing in shipping companies “, Scientific Journal of Maritime Research, (2014) pp.80-87.
6. Singh, S., Jeong, Y. S., Park, J. H., „A survey on cloud computing security: Issues, threats, and solutions “. Journal of Network and Computer Applications, (2016), pp. 200-222.
7. Alani, M. M., “Securing the Cloud: Threats, Attacks and Mitigation Techniques,” J. Adv. Comput. Sci. Technol., Vol. 3, No. 2, (2014), pp. 202.
8. Gupa, S., Kumar, P., “Taxonomy of Cloud Security,” Int. J. Comput. Sci. Eng. Appl., Vol. 3, No. 5, (2013), pp. 47–67.
9. Bamiah, M. A., Brohi, S. N., “Seven deadly threats and vulnerabilities in cloud computing,” Int. J. Adv. Eng. Sci. Technol., Vol. 9, No. 1, (2011), pp. 87–90.
10. Kandias, M., Virvilis, N., Gritzalis D., “The insider threat in cloud computing,” in International Workshop on Critical Information Infrastructures Security, (2011), pp. 93–103.
11. Singh, A., Shrivastava, D. M., „Overview of attacks on cloud computing “. International
Journal of Engineering and Innovative Technology, (2012)
12. Sumitra, B., Pethuru, C. R., Misbahuddin, M., „A survey of cloud authentication attacks and solution approaches “. International journal of innovative research in computer and communication engineering, (2014)
13. Sharma, N., Alam, M., Singh, M., „Web Based XSS and SQL Attacks on Cloud and Mitigation “. Journal of Computer Science Engineering and Software Testing, (2015).
14. Conti, M., Dragoni, N., Lesyk V., “A Survey of Man In The Middle Attacks,” IEEE Commun. Surv. Tutor, Vol. 18, No. 3, (2016) pp. 2027–2051.
15. Masdari, M., Jalali M., “A survey and taxonomy of DoS attacks in cloud computing: DoS attacks in cloud computing,” Secur. Commun. Netw., Vol. 9, No. 16, (2016) pp. 3724–3751.
16. Modi, C., et al, “A survey on security issues and solutions at different layers of Cloud computing,” J. Supercomput., Vol. 63, No. 2, (2013) pp. 561–592.
17. Zissis, D. Lekkas D., “Addressing cloud computing security issues,” Future Gener. Comput. Syst., Vol. 28, No. 3, (2012), pp. 583–592.

7th INTERNATIONAL MARITIME SCIENCE CONFERENCE
264
April 20th-21st, 2017, Solin, Croatia
ASSESSMENT OF THE VULNERABILITY TO EROSION FOR THE SVALBARD COASTAL REGIONSuszka Lechoslaw, Duje Veić, Sulisz Wojciech, Paprota Maciej, Majewski Dawid
ASSESSMENT OF THE VULNERABILITY TO EROSION FOR THE SVALBARD COASTAL REGION
Suszka Lechoslaw, Duje Veić, Sulisz Wojciech, Paprota Maciej, Majewski Dawid
(Institute of Hydro-engineering, Polish Academy of Sciences, Gdansk, Poland) (E-mail: [email protected])
ABSTRACT
In this study, vulnerability to erosion of a coastline in vicinity of Calypsobyen, Bellsund (Spitsbergen, Svalbard) is assessed using an extended Coastal Vulnerability Index (CVI), further named Polar Coastline Risk Index (PCRI). An additional parameter is introduced to properly describe coastal erosion in polar regions, namely the duration of open from ice-cover water season (OWS). Information from the Dynamic Interactive Vulnerability Assessment (DIVA) database and additional geomorphological data are analysed to derive the extended CVI. Satellite images available from the application of the European Organization for the Exploitation of Meteorological Satellites (EUMETSAT) are to retrieve OWS and information about glaciers in coastline. The proposed extended CVI constitutes a promising approach to the problem of coastal erosion in polar regions.
KEY WORDS
coastal erosion, Coastal Vulnerability Index, Open Water Season, Svalbard
1. INTRODUCTION
In times of global warming, polar coastal regions are exceptionally vulnerable to erosion. Permafrost, glaciers, snow and ice cover, ice caps and sheets, sea ice constitute an integral and generic part of polar climate system, which is significantly changing in context of changing climate. These changes may affect nature, people and societies, not only in the Arctic region but throughout the world. Recently, the changes affecting Arctic coastlines have become more dynamic [5], [29]. In Alaska at Drew Point, according to Barnhart et al. [6] and Aguirre et al. [7] shoreline retreat reaches even 17 m/year.
Circum-polar regions, being less important from the point of view of density of population and economy, attracted little scientific attention in the past with respect to erosion of coasts. It was mainly due to a fact that permafrost areas were not vulnerable to erosion in view of their nature. Recently, an extended open water season resulted in a longer period, when stormy wind action may generate higher waves and develop more extreme storm surges. As a consequence, increased erosion was observed. The length of an open water season (OWS) expanded at a rate of 1.75 day/year over a period 1979-2009 [8], [28].
In order to cope with an assessment of risks related to erosion of coasts, scientists and engineers have made an attempt to determine the variables and develop methods which are applicable in case of erosion of coastlines due to increasing sea level, particularly caused by climate change. Several methods are already available to assess vulnerability to erosion of coasts. Ramieri et al. [9] distinguish: (a) index-based methods, (b) indicator-based approach, (c) GIS-based decision support and (d) methods based on dynamic computer models. In the present study, the first method that includes the coastal vulnerability index (CVI) is applied. It is a well known and often used quantitative method. The original CVI was published by Gornitz [1] and [10] in a following form:
CVI = (𝑎𝑎 ∗ 𝑏𝑏 ∗ 𝑐𝑐 ∗ 𝑑𝑑 ∗ 𝑒𝑒 ∗ 𝑓𝑓 ∗ 𝑔𝑔)/7 (1)
where: a – relief, b – rock type, c –landform, d – vertical movement, e – shoreline displacement, f – tidal range, g – wave height Many studies were devoted to coastal vulnerability assessment by means of the CVI [11], [12], [13], [14], [15], [16].
In the present paper, an extended form of the CVI is proposed and applied to a coastline of Calypsobyen, which is a part of Bellsund coastal zone located in western part of Spitsbergen (Svalbard). First, a description of variables used to analyse vulnerability of the region is provided. In the next section, an extended CVI is introduced, named Polar Coastline Risk Index (PCRI). Its form enables analysis of vulnerability to erosion of polar coasts and is applied to the Calypsobyen region. The paper is the case study of extended work within a framework of the ARCOASTS project covering most of the Arctic coastline [17], [18], [19], [20], [21], [22].
2. INPUT DATA
Quantification of coastal vulnerability through application of CVI methodology is based on identification of variables that are representative in case of the selected region of interest. In this paper CVI is adapted for describing current state of vulnerability to erosion for part of a Svalbard coastline. By comparison of sea level rise to the height of wind surges and waves, it is found that the sea level rise (about 3 mm/year) is about three orders of magnitude lower than the height of waves and surges, and therefore may be neglected. Moreover, an additional parameter is proposed, namely the duration of the Open Water Season (OWS), which is necessary for circum-polar regions to adequately analyse the problem of coastal vulnerability. The presence of sea ice impedes wave-induced erosion and acts as a limiting factor during generation of waves by wind. The following eight variables are proposed to be used in case of Svalbard or other polar regions:
• Coast types geomorphology
• Additional properties of coast
• Coastal slope (º) • Bathymetry – distance from the shoreline
to the isobath of - 20 m
• Wave climate (m) • Surge height (m)
• Mean tidal range (m)
• Duration of Open Water Season (OWS) as percent of total time
These variables for Svalbard coasts are obtained from different sources, namely the DIVA set (see Vafeidis et al. [2]), consisting of 103 segments describing five variables (c-g), and geomorphological data (a-b) of Svalbard coasts [3]. The available data provide information on: the coast height, the hardness of the coast material, the ice on a beach, the delta, lagoon or tidal flat. The coastal slope, wave climate, surge

265
Suszka Lechoslaw, Duje Veić, Sulisz Wojciech, Paprota Maciej, Majewski Dawid
ASSESSMENT OF THE VULNERABILITY TO EROSION FOR THE SVALBARD COASTAL REGION
In order to cope with an assessment of risks related to erosion of coasts, scientists and engineers have made an attempt to determine the variables and develop methods which are applicable in case of erosion of coastlines due to increasing sea level, particularly caused by climate change. Several methods are already available to assess vulnerability to erosion of coasts. Ramieri et al. [9] distinguish: (a) index-based methods, (b) indicator-based approach, (c) GIS-based decision support and (d) methods based on dynamic computer models. In the present study, the first method that includes the coastal vulnerability index (CVI) is applied. It is a well known and often used quantitative method. The original CVI was published by Gornitz [1] and [10] in a following form:
CVI = (𝑎𝑎 ∗ 𝑏𝑏 ∗ 𝑐𝑐 ∗ 𝑑𝑑 ∗ 𝑒𝑒 ∗ 𝑓𝑓 ∗ 𝑔𝑔)/7 (1)
where: a – relief, b – rock type, c –landform, d – vertical movement, e – shoreline displacement, f – tidal range, g – wave height Many studies were devoted to coastal vulnerability assessment by means of the CVI [11], [12], [13], [14], [15], [16].
In the present paper, an extended form of the CVI is proposed and applied to a coastline of Calypsobyen, which is a part of Bellsund coastal zone located in western part of Spitsbergen (Svalbard). First, a description of variables used to analyse vulnerability of the region is provided. In the next section, an extended CVI is introduced, named Polar Coastline Risk Index (PCRI). Its form enables analysis of vulnerability to erosion of polar coasts and is applied to the Calypsobyen region. The paper is the case study of extended work within a framework of the ARCOASTS project covering most of the Arctic coastline [17], [18], [19], [20], [21], [22].
2. INPUT DATA
Quantification of coastal vulnerability through application of CVI methodology is based on identification of variables that are representative in case of the selected region of interest. In this paper CVI is adapted for describing current state of vulnerability to erosion for part of a Svalbard coastline. By comparison of sea level rise to the height of wind surges and waves, it is found that the sea level rise (about 3 mm/year) is about three orders of magnitude lower than the height of waves and surges, and therefore may be neglected. Moreover, an additional parameter is proposed, namely the duration of the Open Water Season (OWS), which is necessary for circum-polar regions to adequately analyse the problem of coastal vulnerability. The presence of sea ice impedes wave-induced erosion and acts as a limiting factor during generation of waves by wind. The following eight variables are proposed to be used in case of Svalbard or other polar regions:
• Coast types geomorphology
• Additional properties of coast
• Coastal slope (º) • Bathymetry – distance from the shoreline
to the isobath of - 20 m
• Wave climate (m) • Surge height (m)
• Mean tidal range (m)
• Duration of Open Water Season (OWS) as percent of total time
These variables for Svalbard coasts are obtained from different sources, namely the DIVA set (see Vafeidis et al. [2]), consisting of 103 segments describing five variables (c-g), and geomorphological data (a-b) of Svalbard coasts [3]. The available data provide information on: the coast height, the hardness of the coast material, the ice on a beach, the delta, lagoon or tidal flat. The coastal slope, wave climate, surge

7th INTERNATIONAL MARITIME SCIENCE CONFERENCE
266
April 20th-21st, 2017, Solin, Croatia
heights and the mean range of tides are identified based on [23], [24], [25], and [26].
The distance between average position of the shoreline and the isobath of 20 m directly measured for each section was obtained from the website of the Norwegian Polar Institute [27]. The website served as a valuable source of information about glaciers having their limits at the shore. The OWS values are obtained by inspection of everyday satellite images available from the application of the European Organization for the Exploitation of Meteorological Satellites (EUMETSAT) [4]. OWS is calculated as the percentage of the duration of the coastline free from the ice with respect to the total time.
3. COASTAL VULNERABILITY
Vulnerability of coastal parts of Svalbard is assessed basing on eight variables. The extended CVI named for polar conditions Polar Coastline Risk Index (PCRI) is calculated as the square root of a product of ranked variables divided by their number, accordingly:
PCRI= (𝑎𝑎 ∗ 𝑏𝑏 ∗ 𝑐𝑐 ∗ 𝑑𝑑 ∗ 𝑒𝑒 ∗ 𝑓𝑓 ∗ 𝑔𝑔 ∗ ℎ)/8 (2)
In case of Calypsobyen, the scatter of data variables used were ranked from 1-5 in an order of increasing vulnerability to erosion (Table 1). A value of 1 corresponds to the lowest risk and 5 to the highest risk. Geomorphology and special features are non-numeric variables and undergo a qualitative assessment. The remaining quantitative variables are assigned to a particular risks according to predefined ranges. According to Thieler et al.[11], coastline with high tides is assigned a low risk, inversely to reasoning of Gornitz et al.[1[. They claimed that storms have the main influence on coastal evolution and their impact depends on the tidal range. They explained it through a following example: on a tidal coastline, there is only a 50 percent chance of storm occurrence at the high tide. Thus, for a region with a 4 m tidal range, a storm having a 3 m surge height is still at least 1 m below the elevation of high tide for half of a tidal cycle. A microtidal coastline, on the other hand, is essentially always "near" high tide and the reason for great risk of inundation. Their concept is applied in the work by18 and herein.
Table 1. Ranking of Polar Coastline Risk Index (based on [11])
VULNERABILITY Very low Low Moderate High Very high
VARIABLE 1 2 3 4 5
a) a) Geomorphology Rock High and low
cliffs in bedrock High and low cliffs
in sediment Talus (to sea level)
Beach ridge, calving glaciers front, flat sediment beach
b) Special features of coast Other than in risk 5
Ice on beach, deltas, lagoons, tidal flat
c) Coastal slope (º) > 2.0 > 1.8 > 1.2 > 1.0 ≤ 1.0 d) Distance from the average shore to the isobaths of 20 m (m)
> 2500 > 1200 > 600 > 300 ≤ 300
e) Wave height (m) < 2.5 < 3.5 < 5.0 < 6.5 ≥ 6.5 f) Surge height (m) < 0.86 < 0.90 < 0.98 < 1.10 ≥ 1.10 g) Mean tide range (m) > 1.26 > 1.06 > 0.86 > 0.66 ≤ 0.66 h) Duration of Open Water Season as percent of the total time (%)
< 20 < 30 < 40 < 50 ≥ 50

267
Suszka Lechoslaw, Duje Veić, Sulisz Wojciech, Paprota Maciej, Majewski Dawid
ASSESSMENT OF THE VULNERABILITY TO EROSION FOR THE SVALBARD COASTAL REGION
4. RESULTS AND DISCUSSION
The major outcome of the analysis is a map of Calypsobyen region indicating a degree of vulnerability of Calypsostranda and adjacent coastal parts of Bellsund. The map presented in Fig. 1 shows the variability of the calculated Polar Coastline Risk Index (PCRI) along the coastline. The PCRI value ranges from 8.6 to 96.8. The mean PCRII value for the whole Svarbald coast is 24.21. Analysis of results indicates that the coastline in
the area of interest is diversified with respect to a degree of vulnerability to erosion of the analysed coastline (Fig. 1). The differences in susceptibility of polar coasts of Calypsobyen to hydro- and lithodynamic conditions are mainly due to the geological structure of the shore (Fig. 2). The special features parameter affects the quantification only in few small segments of the analysed coastline (Fig. 3). The remaining parameters are constant in the particular case of the selected Calypsobyen part of Svalbard.
Figure 1. Calculated PCRI values for the Calypsobyen coastline.

7th INTERNATIONAL MARITIME SCIENCE CONFERENCE
268
April 20th-21st, 2017, Solin, Croatia
Figure 2. Geomorphology of the Calypsobyen coastline.
Figure 3. Special features parameter for the Calypsobyen coastline.

269
Suszka Lechoslaw, Duje Veić, Sulisz Wojciech, Paprota Maciej, Majewski Dawid
ASSESSMENT OF THE VULNERABILITY TO EROSION FOR THE SVALBARD COASTAL REGION
5. CONCLUSIONS
The aim of the study was to assess the vulnerability to erosion of the Calypsobyen coastline (Spitsbergen, Svalbard). The quantitative Polar Coastline Risk Index (PCRI) was used to analyse the problem of coastal erosion in the region of interest. For the first time, the index is applied to polar conditions. Two parameters valid for the temperate climate, namely: the relative sea level (RSL) change and the shoreline erosion rate, were replaced by the variables suitable for the Arctic. Basing on available data, we distinguished 3300 segments around Svalbard and for each one we calculated the PCRI values. The analysis of results focuses on Calypsobyen region. The coastline exhibits large diversification with respect to a degree of vulnerability, which is mainly due to the geomorphology of the shore. The presented vulnerability analysis is planned to be expanded to cover the whole Svarbald archipelago and, as an ultimate goal, the Arctic.
ACKNOWLEDGMENTS
This study could be completed owing to the data obtained from Prof. Bernd Etzelmüller, Rune Ødegård, Dr. Jochen Hinkel and the European Organization for the Exploitation of Meteorological Satellites (EUMETSAT). The research leading to these results has received funding from the Polish-Norwegian Research Programme operated by the National Centre for Research and Development under the Norwegian Financial Mechanism 2009-2014 in the frame of Project Contract No. POL-NOR/200336/95/2014.
REFERENCES
1. Gornitz V.M., “Vulnerability of the East Coast, USA to future sea level rise”, Journal of Coastal Research, 1990. Special Issue No.9, pp. 201-237.
2. Vafeidis A.T., Nicholls R.J., McFadden L., Tol R.S.J., Hinkel J., Spencet T., Grasshoff P.S., Boot G., and Klein R.J.T., “A new global coastal database for impact and vulnerability analysis to sea-level rise”, Journal of Coastal Research, 2008, 24(4), pp. 917-924.
3. Etzelmüller B., Ødegård R.S., Sollid J.L., “The spatial distribution of coast types on Svalbard, Arctic Coastal Dynamics”, Report of 3nd International Workshop 2002, pp. 35-40.
4. http://osisaf.met.no/index.shtml 5. Lantuit H., Overduin P.P., Wetterich S.,
“Recent Progress Regarding Permafrost Coasts”, Permafrost and periglacial processes, 2013, 24, pp. 120-130.
6. Barnhart K.R., Overeem I., Anderson R.S., “The effect of changing sea ice on the physical vulnerability of Arctic coasts”, The Cryosphere, 2014, 8, pp. 1777-1799.
7. Aguirre A., Tweedie C.E., Brown J., Gaylord A., “Erosion of the Barrow Environmental Observatory coastline 2003-2007, Barrow Alaska”, In Proc. Of the Ninth International Conference on Permafrost, Kane DL, Hinkel KM (eds.), 2008, Institute of Northern Engineering , University of Alaska Fairbanks: 1, pp. 7-12.
8. Overeem I., Anderson R.S., Wobus S.C.W., Clow G.D., Urban F.E., Matell N., “Sea ice loss enhances wave action at the Arctic coast”, Geophysical Research Letters, 2011, 38: L 17503.
9. Ramieri E., Hartley A., Barbanti A., Santos F.D., Gomez A., Hilden M., Laihonen P., Marinova N., Santini M., “Methods for assessing coastal vulnerability to climate change”, ETC CCA Technical Paper 1/2011, European Environmental Agency.
10. Gornitz V.M., White T.W., Cushman R.M., “Vulnerability of the U.S. to future sea-level rise”, in Proc. Of Seventh Symposium on Coastal and Ocean Management. Long Beach, CA (USA), 1991, pp. 2354-2368.

7th INTERNATIONAL MARITIME SCIENCE CONFERENCE
270
April 20th-21st, 2017, Solin, Croatia
11. Thieler E.R., Hammar-Klose E., “National assessment of coastal vulnerability to sea-level rise. Preliminary results for U.S. Atlantic Coast”, Open-file report 99-593. 1999, U.S. Geological Survey, Reston, VA, 1
12. Ojeda-Zújar J., Álvarez-Francosi J.I., Martín-Cajaraville D. and Fraile-Jurado P., “El uso de las TIG para el cálculo del índice de Vulnerabilidad costera (CVI) ante una potencial subida del nivel del mar en la costa andaluza (España)”, GeoFocus, 2009, 9, pp. 83-100.
13. Davis W.T., “Applying a Coastal Vulnerability Index (CVI) to the Westfjords, Iceland: a preliminary assessment”, 2012. Master’s Thesis, University Centre of the Westfjords, Iceland.
14. Abuodha P.A.O., Woodroffe C.D., “Assessing vulnerability of coast to climate change: a review of approaches and their application to the Australian coast”, University of Wollongong, 2006. Faculty of Science Papers, Research Online.
15. Yin J., Yin Z., Wang J., Xu S., “National assessment of coastal vulnerability to sea-level rise for the Chinese coast”, Journal of Coastal Conservation, Vol.16, 2012, Issue 1, pp. 123-133.
16. Ozyurt G., Ergin A., “Application of sea level rise vulnerability assessment model to selected coastal areas of Turkey”, Journal of Coastal Research, SI 56 (Proceedings of the 10th International Coastal Symposium), 2009, Lisbon, Portugal, pp. 248-251.
17. Paprota M., Sulisz W., Majewski D. 2016. „Wave-induced temperature profile evolution of a frozen sand bottom and its effect on erosion”, Proceedings of the 12th International Conference on Hydrodynamics (ICHD).
18. Sulisz W., Paprota M. 2016. “An efficient approach for optimization of physical modeling of wave-induced phenomena”, Proceedings of the 5th International Conference on Engineering Optimization, Rio
de Janeiro: Federal University of Rio de Janeiro, Brazil
19. Reda A., Sulisz W., Majewski D., Paprota M., Szmytkiewicz M. 2015. „Application of a new approach for modeling coastal erosion in Arctic areas”, In: 2nd International Workshop on Hydraulic Structures: Data Validation. Red. Rita F. Carvalho, Stefano Pagliara, Coimbra, Portugal: University of Coimbra, pp. 217-221
20. Sulisz W., Szmytkiewicz M., Majewski D., Paprota M., Reda A. 2015. „A new approach for the prediction of coastal erosion in Arctic areas”, In: Proceedings of the 9th Symposium on River, Coastal and Estuarine Morphodynamics. Center for Research and Education of the Amazonian Rainforest CREAR
21. Paprota M., Majewski D., Sulisz W., Szmytkiewicz M., Reda A. 2015. „Effects of climate changes on coastal erosion in Svalbard”, In: Proceedings of the SCARC 2015
22. Majewski D., Sulisz W., Paprota M., Szmytkiewicz M.: “Water wave measurements at Bellsund in the western Spitsbergen”, In: Full Proceedings: IJREWHS 2016. Logan/USA: IAHR, Utah State University, 2016, 79-85
23. ETOPO2/NGDC- recently NCEI – National Centers for Environmental Information, 2001, https://www.ngdc.noaa.gov
24. LOICZ - Land Ocean Interactions in the Coastal Zone
25. Muis S., Verlaan M., Winsemius H.C., Aerts C.J.H., Ward P.J., “A global reanalysis of storm surges and extreme sea levels”, 2016, Nature Communications, 7.
26. Pickering M. 2014. “The impact of future sea-level rise on the tides”, University of Southampton, Ocean and Earth Science, Doctoral Thesis, 2014.
27. Map of Svalbard: http://topoSvalbard.polar.no
28. Barnhart K.R., Anderson R.S., Overeem I., Wobus C., Clow G.D., Urban F.E. 2014. “Modeling erosion of ice-rich permafrost bluffs along the Alaskan Beaufort Sea coast”,

271
Suszka Lechoslaw, Duje Veić, Sulisz Wojciech, Paprota Maciej, Majewski Dawid
ASSESSMENT OF THE VULNERABILITY TO EROSION FOR THE SVALBARD COASTAL REGION
Journal of Geophysical Research, Earth Surface, 2014, pp. 1155-1178.
29. Lantuit H., Overduin P.P., Couture N., Wetterich S., Are F., Atkinson D., Brown J., Cherkasov G., Drozdov D., Forbes D.L., Graves-Gaylord A., Grigoriev M., Hubberten H.W., Jordan J., Jorgenson T., Ødegård R.S.,
Ogorodov S., Pollard W.H., Rachold V., Sedenko S., Solomon S., Steenhuisen F., Streletskaya I., Vasiliev A. 2012. “The Arctic Coastal Dynamics Database: A new Classification Scheme and Statistics on Arctic Permafrost Coastlines”, Estuaries and Coasts 35, pp. 383-400.

7th INTERNATIONAL MARITIME SCIENCE CONFERENCE
272
April 20th-21st, 2017, Solin, Croatia
NUMERICAL ANALYSIS OF THE BREAKING WAVE IMPACT ON THE MONOPILE SUPPORT STRUCTUREVeić Duje, Sulisz Wojciech
NUMERICAL ANALYSIS OF THE BREAKING WAVE IMPACT ON THE MONOPILE SUPPORT STRUCTURE
Veić Duje, Sulisz Wojciech
(Institute of Hydroengineering, Polish Academy of Sciences (IBW PAN)) (E-mail: [email protected])
ABSTRACT
Hydrodynamic loading on monopile foundations for an offshore wind turbine are numerically analyzed using a fully 3D nonlinear solver. The numerical model is based on the decompositions strategy developed at DTU between two open source codes, namely OceanWave 3D and OpenFOAM. Special attention is given to the mesh grid dependency analysis, where wave impact is analysed by taking into account different levels of the free-surface sharpness. Numerical results are compared against the recommended analytical solution.
KEY WORDS
Plunging breaking wave, Incompressible Navier-Stokes/VOF, OpenFOAM, OceanWave3D
1. INTRODUCTION
Projection for European Union energy demand for year 2030 is 3.178 TWh, EWEA (2015). It is expected that clean and renewable wind energy will cover 24.4% of European Union electricity demand, out of which 16.7% involves onshore and 7.7% offshore wind energy.
The majority of the support structures for offshore wind turbines are monopiles installed up to the 40m depth. In this relatively shallow water, the progressive waves have high possibility of reaching breaking limit. Since breaking waves release a high amount of energy, the structure could be excited with the extreme impact (slamming) loads.
The general trend in wind industry is that wind turbines are getting larger (up to the 10 MW) and
heavier, which requires larger foundations (larger diameter of the monopile). The wave loading is scaling with the square of the pile diameter which implies that the hydrodynamic loading from waves and breaking waves in particular may become design drivers.
The impact forces from breaking waves on the vertical cylindrical structures have mostly been studied experimentally. The limitation of laboratory tests is that information such as pressure is only measured at a limited number of locations selected prior to the tests. Experimental procedures are in general very challenging and subjected to the range of measurement uncertainties. The existing formulas for calculation of impact forces from breaking waves are empirical and semi-empirical, and thus subjected to the experimental observations. Numerical computations, however,

273
Veić Duje, Sulisz Wojciech
NUMERICAL ANALYSIS OF THE BREAKING WAVE IMPACT ON THE MONOPILE SUPPORT STRUCTURE
provide the results of high spatial and temporal resolution in a controlled environment. Therefore, numerical analysis could yield the new insight into the breaking wave impact phenomena.
The numerical models regarding two-phase air-water modelling of undisturbed breaking wave phenomena could be found in the studies of Chen et al. (1999), Christensen (2006), Wang et al. (2009), Jacobsen et al. (2012), Chella et al. (2015a). The scope of numerical models on breaking waves includes analysis on: breaking wave kinematics, overturning jet, air entrapments and turbulence parameters during the breaking wave process. The numerical results show a good comparison against the experimental data, in e.g. the experimental campaign on spilling breakers from Ting & Kirby (1994-1996). Similar numerical model could be used for analysis of the fully 3D breaking wave impact on the structures. In the recent studies of Kamath et al. (2015) and Bihs et al. (2015), evaluation of the breaking-wave forces on the vertical cylinder is solved within the framework of the open-source code REEF3D (incompressible Navier-Stokes /Level set method). However, their relatively large computational domain (> 15 millions of computational cells) and long-time of realization (>25s) is computationally too expensive.
In order to increase the computational efficiency, Paulsen, et al. (2014) proposed a domain decomposition strategy. The model is based on one-way coupling between fully non-linear potential flow solver and fully non-linear Navier-Stokes/VOF solver. For the case of non-breaking wave loading, Paulsen demonstrated a good comparison between the numerical model solutions and experimental results. However, some discrepancies were observed in the peak of the in-line force signal for the case where breaking wave interacts with the structure. Using the same decompositions strategy, in his recent study, Ghadirian et al. (2016) studied impact forces from the phase-focused breaking waves on vertical cylindrical structure. Discrepancies of the line-force signal between the numerical model and laboratory measurements could be found as well.
In the present study, the same numerical technique is used for the analysis of an extreme hydrodynamic loading on the monopile support structure, observed from laboratory measurements
during the simulation of realistic 50-year storm condition. The 50-year storm condition is idealized with the JONSWAP energy spectrum. Parameters of the spectrum (model scale) are: 𝐻𝐻! = 0.22𝑚𝑚, 𝑇𝑇! = 1.9𝑠𝑠, gamma = 3.3. The reference monopile model corresponds to the commonly installed monopile prototypes. The chosen water depth is 𝑑𝑑 = 30𝑚𝑚. The diameter of the monopile is 𝐷𝐷 = 7𝑚𝑚. Numerical model is solved assuming Froude model scaling according the scale factor 45. Special attention is given to the grid dependency analysis, where wave impact is analysed by taking into account different levels of the free-surface sharpness. The results from the numerical study are compared against the proposed analytical solution given in IEC 61400-3 (2009) standard.
2. ANALYTICAL APPROACH
The offshore structures are designed according to the design standards, which recommend formulations for calculation of hydrodynamic loads. For slender structures, such as jacket and monopile, hydrodynamic loads are usually calculated according to the well-known Morison’s equation, (Morison et al. (1950)). The Morison’s equation is a sum of two terms; one being an empirical drag term proportional to the square of the wave particle velocity and the other being an inertia term, derived from potential flow theory and proportional to the wave particle acceleration. The Morison’s equation is defined as follows:
𝐹𝐹! = 12 𝐶𝐶! 𝜌𝜌𝜌𝜌 𝑢𝑢 𝑢𝑢 + 𝐶𝐶! 𝜌𝜌𝜌𝜌 𝑢𝑢 (1)
where empirical coefficients 𝐶𝐶! and 𝐶𝐶!,are inertia and drag coefficient respectively. The Morison’s equation based on a stream function wave kinematics and empirically determined coefficients, predicts hydrodynamic loading of weakly non-linear waves with a good engineering accuracy.
However, the impact forces from the breaking waves are completely out of the scope of the Morison’s equation. When hydrodynamic loading is governed by the impulse force from the breaking wave, the total hydrodynamic force is calculated as:

7th INTERNATIONAL MARITIME SCIENCE CONFERENCE
274
April 20th-21st, 2017, Solin, Croatia
𝐹𝐹!"!#$ = 𝐹𝐹!"# $%"& + 𝐹𝐹!" #$%& (!"#$$ %&' ) (2) The impact forces from the plunging wave breakers are expected to induce the most violent loads on the structure, and they are usually calculated according to the analytical proposal of Wienke (2001). Wienke’s solution is based on the solution developed by Wagner (1932), who described the impact of infinitely long cylinder hitting the calm water by a potential flow theory, where the flow is assumed to be incompressible, inviscid and irrotational. Furthermore, the surface tension of the fluid and forces due to gravity are neglected and cylinder is assumed to be rigid. The potential flow around the cylinder is assumed to be equivalent to the potential flow around the flat plate. According the definition of the velocity potential (𝛷𝛷 ) (see Faltinsen 1993, page 286) and assumption of the constant velocity of the impact (c [m/s]), Wagner solved only the temporal part of the Bernoulli's equation, while Wienke included solutions for spatial derivatives too. Bernoulli's equation:
𝑝𝑝 = − 𝜌𝜌 !"! "
− !!
(!"!")! + (!"
!")! + 𝑝𝑝 (𝑡𝑡 )
(3) By integrating the pressure along the pressure plane, the so-called line force (𝑓𝑓![N/m]) is determined:
𝑓𝑓! = 0 .5 𝐶𝐶! 𝑡𝑡 𝜌𝜌𝜌𝜌 𝑐𝑐 ! ; [N/m] (4) where, 𝐶𝐶! is the slamming coefficient, and c is the impact velocity, but for calculation of the breaking wave impact it denotes the water particle velocity in the plunging wave crest. As breaking wave occurs when water-particle velocities under the wave crest exceed the wave celerity, Wienke proposed to use the value of wave celerity 𝑐𝑐! for the calculation.
Temporal development of the slamming coefficient is presented in Figure 1. The abscissa presents the azimuth angle of the wetted area (α).
At the instant of the impact (𝑡𝑡 = 0s) the magnitude of the line force is maximum, and when the cylinder wetted area (see Figure 1) is around α=50˚ the line force falls to zero. The peak value of the slamming coefficient is 𝐶𝐶! = 2𝜋𝜋.
Figure 1. Integration of pressure distribution for different time steps - Wienke(2001) solution
To obtain the total breaking wave impact force
(𝐹𝐹!"#$%&[N]), 2D line impact forces (𝑓𝑓![N/m]) are integrated over the impact area. Typically, this is done in a discrete manner where the integral is replaced by a sum of discrete elements, as it is illustrated in Figure 2, and hence expressed as:
𝐹𝐹!" #$%& = 𝑓𝑓 𝑓𝑓 (5)
The curling factor parameter (𝜆𝜆), indicates the
area of the impact, or in other words, how much of the wave crest (𝜂𝜂!) is contributing to the impact (slamming) force, Figure 2. The curling factor is usually estimated semi-empirically and in the case of the plunging wave breaker the curling factor might be approximated as 𝜆𝜆 = 0.4, e.g. Goda (1966), Wienke and Oumeraci (2005).
With the assumption of the rectangular distribution of the line forces along the impact area (Wienke (2001)) the slamming force is determined as:
= 0 .5 𝐶𝐶! 𝑡𝑡 𝜌𝜌𝜌𝜌 𝑐𝑐! ! 𝜆𝜆 𝜂𝜂 ! (6)

275
Veić Duje, Sulisz Wojciech
NUMERICAL ANALYSIS OF THE BREAKING WAVE IMPACT ON THE MONOPILE SUPPORT STRUCTURE
Figure 2. Schematic view - wave impact (inspired by Wienke (2001) figure)
3. NUMERICAL MODEL
The numerical model is based on the decomposition strategy proposed by Paulsen et al. (2014), where incompressible Navier-Stokes/VOF equations are solved in a very small "inner" region of interest, while wave propagation up to the "inner" region of interest is solved with a potential flow solver, as it is illustrated in Figure 3. This technique significantly reduces the computational time. Simulations of the wave propagation in a long Navier-Stokes/VOF domain could be influenced by the numerical diffusion. This is manifested by the artificial reduction of the propagating wave height. Hence, the decomposition strategy which allows shorter numerical domain is favourable regarding the numerical diffusion issue as well.
Figure 3. Sketch of decomposed domain
The Navier-Stokes equations are solved in
combination with a volume of fluid (VOF) surface capturing scheme. The governing equations are solved within the framework of the open-source computational fluid dynamics toolbox OpenFoam®. The equations are discretized using a finite volume approximation on generally unstructured grids. Wave generation and absorption relaxation zones are applied at the inlet and outlet boundary respectively (OF relaxation zones, see Figure 3). The solutions in relaxation zones are forced towards the known solution from the “outer” region, Figure 4. Wave propagation in “outer” region is solved within the framework of OceanWave3D (OCW3D) toolbox, developed by Engsig-Karup et al. (2009). The OCW3D solves fully nonlinear wave propagation up to the limit of the wave breaking. More detailed description of numerical model and corresponding governing equations could be found in the study of Paulsen et al. (2014).
The seabed is modelled as flat and impermeable. At the atmosphere boundary, an inlet/outlet boundary condition is applied. This boundary condition allows air and water to escape the domain, however, only air is able to re-enter. The non-slamming part of the force is governed by the low Keulegan-Carpenter number, and the slamming part of the force is governed by the wave impact of high frequency, hence it is justified to neglect the viscous effects on the forcing. So, the slip conditions were applied at all solid surfaces. The time step size is controlled with adaptive time stepping based on Courant-Friedrichs-Lewy (CFL) criterion. For all computations in this study CFL number is kept <0.2.
The Navier-Stokes/VOF numerical domain used in this study is presented in Figure 4. The domain is defined with the length ≈ 1 wave length and with half-width ≈ 5 cylinder diameter.

7th INTERNATIONAL MARITIME SCIENCE CONFERENCE
276
April 20th-21st, 2017, Solin, Croatia
Figure 4. Sketch of the numerical domain
4 NUMERICAL ANALYSIS
4.1. Grid dependency analysis
The solution of numerical wave propagation depends on the grid density around the free surface area. The non-breaking wave propagation is usually captured with 15-20 computational cells per wave height (where the aspect ratio of the cell is best to be 1, but at least ¼). Moreover, in order to capture the process of the local wave breaking, additional grid refinement is necessary. As part of this study, 44 computational cells per wave height have been sufficient to capture the wave propagation and the local wave breaking in the numerical domain. However, in order to analyse the breaking wave - monopile structure interaction, the grid has to be further refined in the zone of the impact area. Next paragraphs explain the argument why the grid resolution is an important parameter in presented numerical model for the analysis this phenomena.
The numerical solution in this study is based on the incompressible Navier-Stokes equation for the two phase flow of water and air:
!! "𝜌𝜌𝒖𝒖 + 𝛻𝛻 ⋅ 𝜌𝜌𝒖𝒖𝒖𝒖 ! = − 𝛻𝛻 𝑝𝑝 ∗ + 𝒈𝒈 ⋅ 𝒙𝒙𝛻𝛻𝛻𝛻 + !
!𝛻𝛻 ⋅
𝜇𝜇 𝛻𝛻𝒖𝒖 (7) where, 𝒖𝒖 = (𝑢𝑢, 𝑣𝑣,𝑤𝑤) is the instantaneous velocity in Cartesian coordinates and 𝑢𝑢, 𝑣𝑣 and 𝑤𝑤 are the velocity components in the three Cartesian coordinates 𝑥𝑥, 𝑦𝑦 and 𝑧𝑧; 𝜌𝜌 is the density, 𝑝𝑝∗ is the pressure in excess of the hydrostatic pressure, 𝒈𝒈 is the acceleration due to gravity, 𝒙𝒙 is the Cartesian
coordinate vector, µμ is the dynamic molecular viscosity (see e.g. Paulsen et. al (2014) for more details). The density is calculated regarding the linear weighting:
𝜌𝜌 = 𝛼𝛼 𝜌𝜌! + 1 − 𝛼𝛼 𝜌𝜌! (8) where α is water volume fraction, obtained from equation:
!"! "
+ 𝛻𝛻 ⋅ 𝒖𝒖𝛼𝛼 + 𝛻𝛻 ⋅ 𝒖𝒖 𝒓𝒓𝛼𝛼 1 − 𝛼𝛼 = 0 (9)
The marker function 𝛼𝛼 is 1, when the computational cell is filled with water and 0, when it is empty. In the free surface zone the marker function will have a value in the interval 𝛼𝛼 ∈ [0; 1] indicating the volume fraction of water and air respectively.
The numerically computed free-surface, based on the VOF method is often smeared due to the numerical discretisation error, as it is illustrated in Figure 4 and Fig 5. Furthermore, because the coupling between dynamic pressure and density in the momentum equation, spurious air velocities are present. This is presented in Figure 6, where velocity distribution exist in both phases: water and air. The Figure 6 presents horizontal velocity distribution in the numerical domain for the moment slightly prior to the wave impact on the monopile structure. The figure is supported with the wave profiles which correlate to the different levels of water fraction in computational cells at the moment of impact, α = 0.01, 0.1, 0.5, 0.95 respectively. This shows that at the instant of the wave impact on the structure,

277
Veić Duje, Sulisz Wojciech
NUMERICAL ANALYSIS OF THE BREAKING WAVE IMPACT ON THE MONOPILE SUPPORT STRUCTURE
Figure 5. The free-surface smearing in the numerical domain, "alpha" presents percentage of the water in the computational cells ; refinement zones used in presented study
the computed pressure is governed by the presence of the artificial velocity in the air and the small amount of water fraction in the computational cells. Hence, according to the equations Eq.(7) – Eq.(9), the computed impact pressures are artificially damped. Therefore, for the case of the presented numerical model, the impact pressure signals around the structure are sensitive to the size of the numerical grid.
Figure 6. The horizontal velocity field prior the wave impact; wave profiles which coresopnds to the equal water fraction levels in computational cells, looknig from up: 𝛂𝛂 = 0.01, 0.1, 0.5, 0.95
Hence, the grid dependency analysis is conducted. The unstructured hexahedral mesh is used to refine the zone around the free-surface and the impact area, as it is illustrated in Figure 5. The finest mesh in the near boundary region is defined
with the grid size 𝑑𝑑𝑑𝑑 = 𝑑𝑑𝑑𝑑 = 𝑑𝑑𝑧𝑧 =0.001m (level_4). This numerical domain corresponds to the near 4.4 million cells in total. The total number of nodes for the refinement levels defined according to the Figure 5 is presented in Figure 7.
Figure 7. Comparioson of the breaking wave profiles for different levels of computational grid
refinement; total number of nodes for the different level of the grid
Small discrepancies in the shape of the breaking wave profiles are observed for different levels of the grid refinements, as it is presented in Figure 7. However, significant discrepancies are observed in both the magnitude and the distribution of the impact pressure. Series of figures Figure 8 - Figure 10, present dynamic pressure distribution on the monopile structure for the different grid resolution levels. The figures are supported with the shape of

7th INTERNATIONAL MARITIME SCIENCE CONFERENCE
278
April 20th-21st, 2017, Solin, Croatia
the breaking wave profile at the corresponding moment of impact. The peak impact pressure observed for the case “level_4” is even 300% higher than the peak impact pressure observed for the case “level_2”.
Figure 8. Dynamic pressure disribution and corresponding shape of the wave profile for grid
resolution "level_2"
Figure 9. Dynamic pressure disribution and corresponding shape of the wave profile for grid
resolution "level_3"
The comparison between the impact force signals considering the different grid resolution levels are presented in Figure 11. It is found that impact forces are not yet converging to the final solution, although the discrepancies between the peak impact forces are smaller compared to the discrepancies in the peak impact pressures.
Figure 10. Dynamic pressure disribution and corresponding shape of the wave profile for grid
resolution "level_4"
Figure 11. Comparison between the hydrodynamic loading on the monopile structure for three
different grid resolution levels
4.1. Results & comparison
The results of the study are referenced to the numerical model presented in the section_3. The vertical line-force (𝑓𝑓![N/m]) distribution is obtained by integrating the pressure field around the circumference of the monopile structure. The vertical line force distribution on the monopile structure regarding the selected case “level_4” is presented in Figure 12 for the three different time-steps. The vertical line force distribution before the impact (non-slamming force) corresponds to the time slightly before 𝑡𝑡 < 𝑡𝑡!. The vertical line force distribution which contributes to the impact force is presented as a blue shadowed area. It could be approximated that the vertical impact line force distribution follows triangular shape. This corresponds to the laboratory measurements on the

279
Veić Duje, Sulisz Wojciech
NUMERICAL ANALYSIS OF THE BREAKING WAVE IMPACT ON THE MONOPILE SUPPORT STRUCTURE
breaking wave impact pressures at the front line of the vertical cylinder, which follows the triangular distribution as well, e.g. Zhou et. al (1991), Chan et al. (1995).
Figure 12. The vertical line force 𝒇𝒇𝒊𝒊 [N/m] distribution for the case "level_4" which corresponds to the different time steps
The maximum obtained slamming coefficient for the case “level_4” is 𝐶𝐶! = 0.5𝜋𝜋, which is significantly lower than the maximum slamming coefficient proposed by Wienke (2001). The comparison regarding the laboratory studies of Tanimoto et al.(1986) and Ros et al. (2011), as well as regarding the numerical solution from Hildebrand et al. (2011) are presented in Table 1.
Table 1 The slamming coefficient compariosn
Author Cs/π
Wienke (2001), theoretical = 2
Tanimoto (1986). experimental
≈ 1
Ros (2011), experimental
≈ 1.37
Hildebrandt (2011), numerical
≈ 1.1
level_4, numerical
≈ 0.5
The reason of the high discrepancies presented in Table 2 might be found in the nature of the breaking wave–structure interaction. The breaking wave impact on the monopile support structure is strongly 3-dimensional phenomena. The solution based on the theoretical 2-dimensional model
might provide with the too conservative results. Discrepancies in results found from laboratory analysis indicates possible influence of the air entrapments and the shape of the breaking wave on the impact force measurements. The results from presented numerical model are however, found to be grid dependable and this could be a source of high discrepancies in the value of the slamming coefficient.
Figure 13. Comparison between the analytical and numerical solution for the: hydrodynamic breaking
wave force; - wave elevation
The hydrodynamic force obtained from the proposed numerical model is compared to the analytical solution given in IEC 61400-3 (2009) standard. The total hydrodynamic load on the monopile structure is calculated according to the Eq. (2). The parameters for the Morison’s equations are: 𝐶𝐶! = 1.8, 𝐶𝐶! = 0.95, 𝐻𝐻 = 0.32𝑚𝑚, 𝑇𝑇 = 0.95𝑠𝑠, where the wave kinematics is solved by assuming the stream-function wave theory. The parameters for calculation of the slamming force according Eq. (6) are: 𝑐𝑐! = 2.8 m/s, 𝑅𝑅 = 0.08 m, ρ =1000 kg/m! and 𝜂𝜂! = 0.25𝑚𝑚. The slamming coefficient 𝐶𝐶! is related to the solution presented in Figure 1. The slamming force is calculated assuming the triangular force distribution. Therefore, the slamming force formulation from Eq. (4) is multiplied by the factor 0.5.
The comparison between the analytically calculated and numerically computed hydrodynamic force on the monopile structure is presented in Figure 13. The non-slamming part of the force is found similar in the analytical and numerical solution. However, the slamming part of

7th INTERNATIONAL MARITIME SCIENCE CONFERENCE
280
April 20th-21st, 2017, Solin, Croatia
the force is significantly different comparing analytical to numerical solution. The presented numerical model captures fully 3-dimensional nature of the breaking wave-structure interaction. As it is presented in Figure 11, the magnitude of the impact force is dependable on the sharpness of the free-surface. However, the duration of the impact force only slightly depends on the grid size (Figure 11). Therefore, it could be observed that the analytical solution proposed by Wienke (2001) estimates significantly shorter impact force time (for the breaking wave case under the consideration). Moreover, the analytical solution proposed by Wienke (2001) provides much higher magnitude of the impact force. This could be correlated with the shape of the breaking wave under the consideration. However, because the computed impact force is dependable on the grid size, more validation cases are required before conclusions could be made.
5. CONCLUSIONS
The numerical model based on incompressible Navier-Stokes/VOF solution is established. The advantage of the selected numerical model is fully 3-dimensional solution of the breaking wave – structure interaction, where the physics can be evaluated with a high spatial and temporal resolution in a controlled environment. The presented numerical model could lead to improved design methodology and fundamental understanding of the wave slamming forces, which might results with optimization of offshore wind turbine foundations and lower costs.
Regarding the analysis on selected case, the conclusions are:
• The artificial velocity in the air phase and
smeared water-air interface are source of artificial damping of the impact pressures.
• The spatial and temporal distribution of the impact pressures are dependable on the size of computational grid. Correspondingly, the characteristic of the total impact force is affected too. For the presented case, the impact force magnitude is significantly influenced by the computational grid size. However, the duration of the impact force is
found to be similar regardless the grid refinement level.
• In order to reach convergence of the impact force signal, a further grid refinement is necessary. However, this would be too expensive solution. An alternative approach is to reduce the effects of the artificial velocity in the air and effects of the smeared free-surface interface in the computation.
• The vertical line-force distribution follows the triangular shape.
• For the breaking wave case under the consideration, the maximum obtained slamming coefficient is four times lower than analytical proposal by Wienek (2001). Moreover, the obtained slamming coefficient is significantly lower compared to studies presented in Table 3. However, as presented model is found to be grid dependable, a more validation cases are required before conclusions could be made.
• For the breaking wave case under the consideration, the analytical solution proposed by Wienke (2001) significantly underestimates the duration of the impact force, which is an important parameter for the evaluation of the monopile structure response.
• The future work includes extension of the grid sensitivity analysis for proposed numerical model. The future work also includes parametric study regarding the influence of the breaking wave shape on the magnitude and duration of the impact force.
REFERENCES
1. Bihs, H., Kamath, A., Alagan Chella, M., & Arntsen, Ø. A. (2016). Breaking-Wave Interaction with Tandem Cylinders under
2. Different Impact Scenarios. Journal of Waterway, Port, Coastal, and Ocean Engineering, 04016005.
3. Chan, E. S., Cheong, H. F., & Tan, B. C. (1995). Laboratory study of plunging wave impacts on vertical cylinders. Coastal Engineering, 25(1), 87-107.
4. Chella, M. A., Bihs, H., Myrhaug, D., & Muskulus, M. (2015). Breaking characteristics

281
Veić Duje, Sulisz Wojciech
NUMERICAL ANALYSIS OF THE BREAKING WAVE IMPACT ON THE MONOPILE SUPPORT STRUCTURE
and geometric properties of spilling breakers over slopes. Coastal Engineering, 95, 4-19.
5. Chen, G., Kharif, C., Zaleski, S., & Li, J. (1999). Two-dimensional Navier–Stokes simulation of breaking waves. Physics of fluids, 11(1), 121-133.
6. Christensen, E. D. (2006). Large eddy simulation of spilling and plunging breakers. Coastal Engineering, 53(5), 463-485.
7. Engsig-Karup, A. P., Bingham, H. B., & Lindberg, O. (2009). An efficient flexible-order model for 3D nonlinear water waves. Journal of computational physics, 228(6), 2100-2118.
8. EWEA (2015), Giorgio Corbetta, Andrew Ho, Iván Pineda, Wind energy scenarios for, 2030.
9. Faltinsen, O. (1993). Sea loads on ships and offshore structures (Vol. 1). Cambridge university press.
10. Ghadirian, A., Bredmose, H., & Dixen, M. (2016, September). Breaking phase focused wave group loads on offshore wind turbine monopiles. In Journal of Physics: Conference Series (Vol. 753, No. 9, p. 092004). IOP Publishing.
11. Goda, Y., Haranaka, S., & Kitahata, M. (1966). Study of impulsive breaking wave forces on piles. Report Port and Harbour Technical Research Institute, 6(5), 1-30
12. Hildebrandt, A., & Schlurmann, T. (2012). Breaking Wave Kinematics, local Pressures and Forces on a Tripod Support Structure. In Proceedings of the Coastal Engineering Conference (No. 33)
13. IEC 61400-3 (2009), International Electrotechnical Commission
14. Jacobsen, N. G., Fuhrman, D. R., & Fredsøe, J. (2012). A wave generation toolbox for the open source CFD library: OpenFoam®. International Journal for Numerical Methods in Fluids, 70(9), 1073-1088
15. Kamath, A., Chella, M. A., Bihs, H., & Arntsen, Ø. A. (2015). Breaking Wave Interaction with a Vertical Cylinder and the
Effect of Breaker Location. CFD based Investigation of Wave-Structure Interaction and Hydrodynamics of an Oscillating Water Column Device, 171.
16. Morison, J. R., Johnson, J. W., & Schaaf, S. A. (1950). The force exerted by surface waves on piles. Journal of Petroleum Technology, 2(05), 149-154
17. Paulsen, B. T., Bredmose, H., & Bingham, H. B. (2014). An efficient domain decomposition strategy for wave loads on surface piercing circular cylinders. Coastal Engineering, 86, 57-76
18. Paulsen, B. T., Bredmose, H., & Bingham, H. B. (2014). An efficient domain decomposition strategy for wave loads on surface piercing circular cylinders. Coastal Engineering, 86, 57-76.
19. Ros Collados, X. (2011). Impact forces on a vertical pile from plunging breaking waves, Master Thesis
20. Ting, F. C., & Kirby, J. T. (1994). Observation of undertow and turbulence in a laboratory surf zone. Coastal Engineering, 24(1-2), 51-80.
21. Ting, F. C., & Kirby, J. T. (1995). Dynamics of surf-zone turbulence in a strong plunging breaker. Coastal Engineering, 24(3-4), 177-204.
22. Ting, F. C., & Kirby, J. T. (1996). Dynamics of surf-zone turbulence in a spilling breaker. Coastal Engineering, 27(3-4), 131 -160.
23. Wagner, H. (1932). ÜberStoß‐und Gleitvorgängean der Oberfläche von Flüssigkeiten. ZAMM‐Journal of Applied Mathematics and Mechanics/ Zeitschriftfür Angewandte Mathematik und Mechanik, 12(4), 193-215.
24. Wang, Z., Yang, J., Koo, B., & Stern, F. (2009). A coupled level set and volume-of-fluid method for sharp interface simulation of plunging breaking waves. International Journal of Multiphase Flow, 35(3), 227-246.
25. Wienke, J. (2001). Druckschlagbelastung auf schlanke zylindrische Bauwerke durch

7th INTERNATIONAL MARITIME SCIENCE CONFERENCE
282
April 20th-21st, 2017, Solin, Croatia
26. brechende Wellen. Technical University of Braunschweig, Germany.
27. Wienke, J., & Oumeraci, H. (2005). Breaking wave impact force on a vertical and inclined slender pile—theoretical and large-scale model investigations.Coastal Engineering, 52(5), 435-462.
28. Zhou, D., Chan, E. S., & Melville, W. K. (1991). Wave impact pressures on vertical cylinders. Applied Ocean Research, 13(5), 220-23 Zylindrische Bauwerke durch brechende Wellen. Technical University of Braunschweig, Germany.

283
Blenard Xhaferaj, Agron Dukaj
RESULTS OF CALCULATIONS OF HOLTROP_MENNEN PROCEDURE OF “SHIP_POWER V_1.0” VERSUS OTHER COMMERCIAL SOFTWARE
RESULTS OF CALCULATIONS OF HOLTROP_MENNEN PROCEDURE OF “SHIP_POWER V_1.0” VERSUS OTHER COMMERCIAL SOFTWAREBlenard Xhaferaj, Agron Dukaj
RESULTS OF CALCULATIONS OF HOLTROP_MENNEN
PROCEDURE OF “SHIP_POWER V_1.0” VERSUS OTHER COMMERCIAL SOFTWARE
Blenard Xhaferaj, Agron Dukaj
(University of Vlora “Ismail Qemali”, Albania, Department of Engineering and Marine Technology)
(E-mail: [email protected])
ABSTRACT
Predicting the resistance and power of ship is an important and complex task of the entire ship design process, especially in initial stage of ship design process, when the ship hull form is still undetermined definitively. “Ship Power V_1.0” is a computer software developed, at the University “Ismail Qemali” of Vlora (Albania), in the environment of Visual Basic programming language, which enables the prediction of resistance and power of ship in a parametric way, making it an important tools for predicting the resistance and power of ship in early stages of ship design process. In the actual version of the software "Ship Power” the MARIN regression models are used and a procedure entitled “Holtrop Mennen procedure” is developed for the prediction of resistance and power, as well as other hydrodynamic parameters. Furthermore for the prediction of resistance and power the software take in consideration the effect of ship hull roughness, hull appendices, and additional power margin due to weather conditions. Obviously each user when using computer calculation tools during design analysis would like to have information about the degree of accuracy of the tools that he uses. In this paper through concrete examples of the evaluation of resistance and power is carried out a comparing analysis between the results of calculation of the HOLTROP_MENNEN procedure of the software “Ship Power V_1.0”, based on MARIN regression models, with other commercial software, analysing the corresponding differences of the results of calculations.
KEY WORDS Resistance, Power, Ship, Regression analysis, Design
1. INTRODUCTION
Ship Power V_1.0 is a computer program developed in Visual Basic environment in order to evaluate the resistance and effective power of ship. The program is developed based on regression models for parametric evaluation of resistance and power of ship. The program is based on MARIN
regression model for prediction of resistance and power. This model is one of the most reliable models and is used successfully in parametric evaluation of resistance of the ship. “Ship Power V_1.0” is a program that can be used as a very

7th INTERNATIONAL MARITIME SCIENCE CONFERENCE
284
April 20th-21st, 2017, Solin, Croatia
good tool for the prediction of resistance and power, since the early stages of ship design process, when the ship hull is not determined exactly.
The main objectives set for the development of this program can be summarized as the following:
• To be easy for use. • To minimize the difficulties and the
required time for calculations. • To provide assessments with satisfactory
accuracy. • To provide assessments for different data
combinations. • To assist the user step by step. • To respect the ISO requirements for the
development of computer software.
One of the main objectives in the development of the software “Ship Power V_1.0” has been that of providing results as reliable as possible. Based on this objective, in the following paragraphs of this paper through a concrete comparative analysis, are presented comparative examples of results of calculations of the software “Ship Power V_1.0” v.s other commercial software.
2. MATERIAL AND METHODS
Given the regression model (MARIN regression), in which “Ship Power V_1.0” is based, the evaluation of resistance is carrying out according the following relation.
𝑅𝑅! = 𝑅𝑅! 1+ 𝑘𝑘! + R! + R! + R!" +𝑅𝑅!"" + 𝑅𝑅! + 𝑅𝑅!"# + 𝑅𝑅!"#$%& (1)
Based on these calculated components of resistance, “Ship Power V_1.0” calculates also the respective a-dimensional coefficients of resistance, power, and coefficients of interaction between hull and propeller. The commercial software which is used for the comparative analysis is the software Hull Speed, which is part of the MAXSURF computer package. In order to ensure an equal basis of geometrical data, the hulls chosen for the analysis in both programs are generated in MAXSURF program and the data for “Ship Power V_1.0” calculations, are exactly the same. Following, are presented the main stages of the procedure for the analysis under consideration.
1. Hull generation in MAXSURF and the
identification of the main dimensions. 2. Calculation of principal hydrostatic
characteristics in HYDROMAX program (which is also part of Maxsurf computer package)
3. Identification of hydrostatic characteristics needed as input data for “Ship Power V_1.0”
4. Carrying out the calculations of resistance and power in Hull speed program (which is also part of MAXSURF computer package)
5. Carrying out the calculations of resistance and power in “Ship Power V_1.0”
6. Comparing the results of calculations from the programs taken into consideration (Hull speed and Ship Power V_1.0).
7. Conclusions. In figure 1 is presented the flowchart of the above comparative analysis procedure.

285
Blenard Xhaferaj, Agron Dukaj
RESULTS OF CALCULATIONS OF HOLTROP_MENNEN PROCEDURE OF “SHIP_POWER V_1.0” VERSUS OTHER COMMERCIAL SOFTWARE
Figure 1. Comparative flowchart analysis.
3. RESULTS AND DISCUTIONS
To carry out the comparative analysis two ship hulls has been chosen. These hulls belong to two systematic series, BSRA series and Ridgley-Nevitt.
3.1 Comparative analysis for the hull of BSRA series.
BSRA Series is a very important series, which can be used for the design of single screw ships. This series can be used in the design of cargo ships with block coefficient CB = 0.65 – 0.75. [1] The model chosen for the comparative analysis is the model of series with block coefficient CB = 0.75. Other dimensions of this model are as follow: [1] - Length Between Perpendiculars LBP = 121.5 m - Length on water line LWL = 125.398 m. - Beam B = 16. 869 m - Draft T = 7.992 m
For the purposes of this paper the digital CAD model of the databases of reference [2] is used. In figure 2 is presented the rendered CAD model taken in consideration.
Figure 2. CAD model of the hull taken in consideration. [1], [2]
The geometric CAD model is imported in the Hull Speed computer software, chosen for the comparative analysis. In table 1 are presented some main characteristics of this hull calculated according “Hull Speed Software”. To ensure the same input data base with “Ship Power V1_0“ software, these parameters are respected during the analysis of this hull in “Ship Power V1_0“ software.
Table 1. General Ship data calculated according Hull Speed.
Elements Value Units
LWL 125.398 m
Beam 16.869 m
Draft 7.992 m
Displaced volume 12267.16 m3
Wetted area 3181.15 m2
Prismatic coefficient 0.744
Water plane area coefficient 0.83
1/2 angle of entrance 22.26 deg.
LCG from midships (+ve for'd) 1.326 m
Max sectional area 131.521 m2
In table 2 are presented the results of calculations of resistance and power according “Ship Power V_1.0” and Hull Speed software, in the field of velocity 10-20 knots. In figure 3 is presented the screen of Graphical User Interface (GUI), with the report of calculation of resistance, of “Ship Power V_1.0”, for the ship under consideration. In figure 4 is presented the graphical representation of calculations with both software. In figure 5 is presented the graphical representation of resistance components, of the software “Ship Power V_1.0” versus the speed of ship.
Hull generation in Maxsurf program and the identification of main dimensions
Calculations of the main hydrostatic characteristics
Identification of hydrostatic characteristics needed as input data for “Ship Power V1.0”
Calculations of resistance and power in “Ship Power V1.0”
Calculations of resistance and power in “Hull Speed”
Comparing the results of calculations
Conclusions
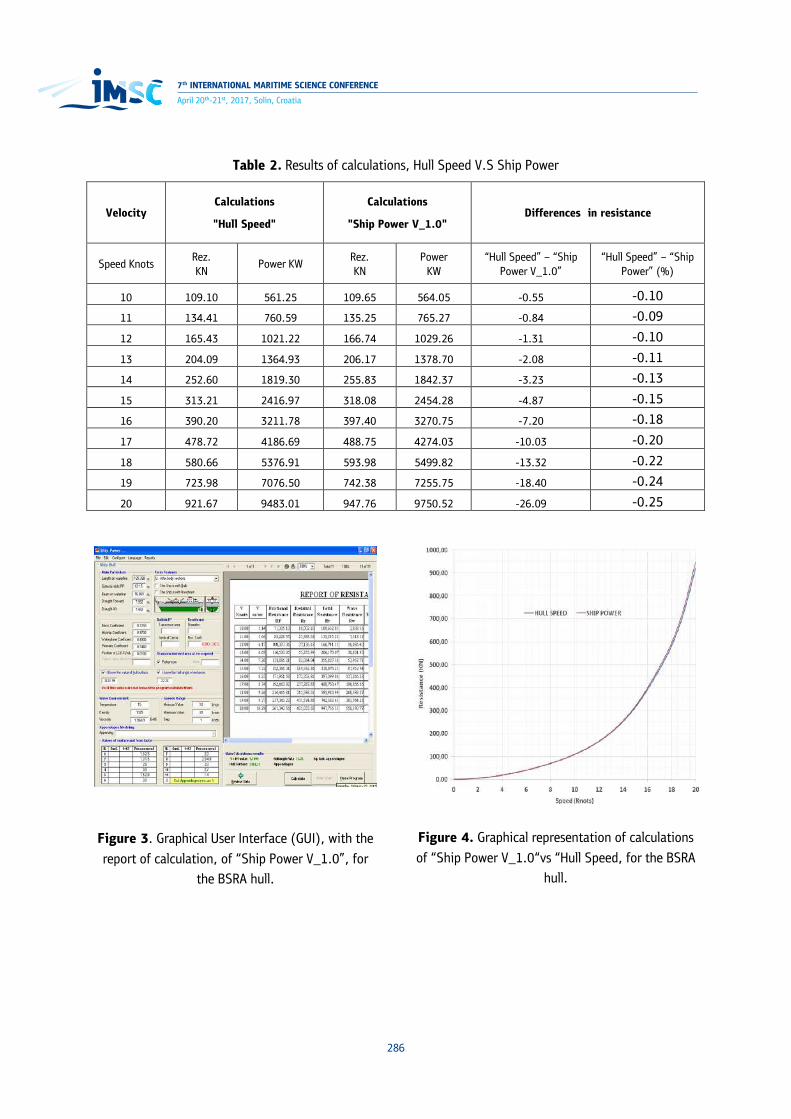
7th INTERNATIONAL MARITIME SCIENCE CONFERENCE
286
April 20th-21st, 2017, Solin, Croatia
Table 2. Results of calculations, Hull Speed V.S Ship Power
Velocity Calculations
"Hull Speed"
Calculations
"Ship Power V_1.0" Differences in resistance
Speed Knots Rez. KN
Power KW Rez. KN
Power KW
“Hull Speed” – “Ship Power V_1.0”
“Hull Speed” – “Ship Power” (%)
10 109.10 561.25 109.65 564.05 -0.55 -0.10
11 134.41 760.59 135.25 765.27 -0.84 -0.09
12 165.43 1021.22 166.74 1029.26 -1.31 -0.10
13 204.09 1364.93 206.17 1378.70 -2.08 -0.11
14 252.60 1819.30 255.83 1842.37 -3.23 -0.13
15 313.21 2416.97 318.08 2454.28 -4.87 -0.15
16 390.20 3211.78 397.40 3270.75 -7.20 -0.18
17 478.72 4186.69 488.75 4274.03 -10.03 -0.20
18 580.66 5376.91 593.98 5499.82 -13.32 -0.22
19 723.98 7076.50 742.38 7255.75 -18.40 -0.24
20 921.67 9483.01 947.76 9750.52 -26.09 -0.25
Figure 3. Graphical User Interface (GUI), with the report of calculation, of “Ship Power V_1.0”, for
the BSRA hull.
Figure 4. Graphical representation of calculations of “Ship Power V_1.0“vs “Hull Speed, for the BSRA
hull.

287
Blenard Xhaferaj, Agron Dukaj
RESULTS OF CALCULATIONS OF HOLTROP_MENNEN PROCEDURE OF “SHIP_POWER V_1.0” VERSUS OTHER COMMERCIAL SOFTWARE
Figure 5. Graphical representation of resistance components, of the software “Ship Power V_1.0”
versus the speed of ship, for the BSRA hull
3.2 Comparative analysis for the hull of Rigley-Nevitt series.
Ridgely-Nevitt series is a systematic series with high value of displacement-length ratio report and can be used for single screw fishing vessel design. The original parent model of the series has the prismatic coefficient CP=0.65, displacement-length ratios Δ∆/L1/3=300, beam/draft ratios B/T=2.3. The three other models of the series has the prismatic coefficient CP=0.55, 0.60 and 0.70. The model chosen for the comparative analysis is the model of series with prismatic coefficient CP = 0.75. Other dimensions of this model are as follow: [3] - Length Between Perpendiculars LBP = 30.5 m - Length on water line LWL = 31,545 m. - Beam B = 7,422 m - Draft T = 3.188 m For the purposes of this paper the digital CAD model of the databases of reference [2] is used. In figure 6 is presented the rendered CAD model taken in consideration. The geometric CAD model is imported in the Hull Speed computer software, chosen for the comparative analysis. In table 3 are presented some main characteristics of the hull calculated according “Hull Speed Software”. To ensure the same input data base with “Ship Power V1_0“ software, these parameters are respected during
the analysis of this hull in “Ship Power V1_0“ software.
Figure 6. CAD model of the hull taken in
consideration. [2],[3]
Table 3. General Ship data calculated according Hull Speed.
Elements Value Units
LWL 31.545 m
Beam 7.422 m
Draft 3.188 m
Displaced volume 281.67 m^3
Wetted area 245.894 m^2
Prismatic coefficient 0.542 Water plane area coefficient 0.66 1/2 angle of entrance 14.52 deg.
LCG from midships (+ve for'd) -0.762 m
Max sectional area 16.465 m^2
In table 4 are presented the results of calculations of resistance and power according “Ship Power V1.0” and Hull Speed software, in the field of velocity 2-14 knots. In figure 7 is presented the screen of Graphical User Interface (GUI), with the report of calculation, of “Ship Power V_1.0”, for the ship under consideration. In figure 8 is presented the graphical representation of calculation with both software. In figure 9 is presented the graphical representation of resistance components, of the software “Ship Power V_1.0” versus speed, for the ship under consideration.

7th INTERNATIONAL MARITIME SCIENCE CONFERENCE
288
April 20th-21st, 2017, Solin, Croatia
Figure 7. Graphical User Interface (GUI), with the report of calculation, of “Ship Power
V_1.0”
Figure 8. Graphical representation of calculations of “Ship Power V1.0“ v.s “Hull Speed”
Table 4. Results of calculations, Hull Speed, Ship Power
Velocity Calculation "Hull Speed" Calculations "Ship Power V_1.0" Differences in resistance
Speed Knots Rez (KN)
Power (KW)
Rez (KN)
Power (KW)
Hull Speed – “Ship Power”
“Hull Speed” – “Ship Power” (%)
2 0.53 0.55 0.53 0.54 0.00 0.09%
4 1.95 4 1.93 3.99 0.01 0.51%
6 4.22 13.02 4.20 12.98 0.02 0.36%
8 8.14 33.52 8.10 33.36 0.03 0.43%
10 17.15 88.25 16.98 87.38 0.16 0.95%
12 35.08 216.54 34.59 213.54 0.49 1.39%
14 83.44 600.95 84.67 609.77 -1.23 -1.48%
Figure 9. Graphical representation of resistance components, of the software “Ship Power V_1.0”
versus the speed of ship.
4. CONCLUSIONS
From the results of calculations of “Ship Power V_1.0”, based on “Holtrop Mennen” procedure, and its comparison with the results of calculations of “Holtrop Mennen” procedure of “Hull Speed”, for two case studies taken in consideration can be concluded that the results of calculations are very close to each other. In the first case study, the average difference of calculations of resistance between the two software, in absolute terms is 0.16%, while in the second case study the difference between the two software in absolute terms is 0.31%. Numerical differences in values
between the two programs are mainly related to rounding and approximation from the number of decimal digits, which lead to final results which are not identically the same in both computer programs. Despite these differences the results of calculations are very close. So we can conclude that the “Holtrop Mennen” procedure of the software “Ship Power V_1.0” can be used as well as other similar procedures of well-known commercial software.
REFERENCES 1. Moor, D.I. et al, “The BSRA. Methodical Series
- An overall presentation; Geometry of forms and variation of resistance with block coefficient and longitudinal centre of buoyancy”, Transaction of Royal Institution of Naval Architects, Vol 103 (1961), pp 329-419.
2. Xhaferaj, B., “Modelimi i karenave te anijeve ne ambientin CAD dhe zhvillimi i nje softi kompjuterik per vleresimin e cilesive lundrimore te mjeteve detare”, PhD thesis (in Albanian),2015
3. Ridgely-Nevitt, C, “The Development of Parent Hulls for a high displacement-Length Series of trawler forms”, Transaction of the Society of Naval Architects and Marine Engineers, Vol 71 (1963), pp 5-30.
4. Xhaferaj, B. et al, “The Architecture of Software Ship Power V_1.0”, Annals of Constanta Maritime University, Year XV, Issue XXII, page 23-30, 2014
5. HOLTROP, J. et al, "An Approximate Power Prediction Method," International Shipbuilding Progress, Vol. 29, No. 335, pp 166-170, 1982.
6. HOLTROP, J. "A Statistical Re-Analysis of Resistance and Propulsion Data," International Shipbuilding Progress, Vol. 31, No. 363, pp - 272-276, 1984
289
Blenard Xhaferaj, Agron Dukaj
RESULTS OF CALCULATIONS OF HOLTROP_MENNEN PROCEDURE OF “SHIP_POWER V_1.0” VERSUS OTHER COMMERCIAL SOFTWARE
between the two programs are mainly related to rounding and approximation from the number of decimal digits, which lead to final results which are not identically the same in both computer programs. Despite these differences the results of calculations are very close. So we can conclude that the “Holtrop Mennen” procedure of the software “Ship Power V_1.0” can be used as well as other similar procedures of well-known commercial software.
REFERENCES 1. Moor, D.I. et al, “The BSRA. Methodical Series
- An overall presentation; Geometry of forms and variation of resistance with block coefficient and longitudinal centre of buoyancy”, Transaction of Royal Institution of Naval Architects, Vol 103 (1961), pp 329-419.
2. Xhaferaj, B., “Modelimi i karenave te anijeve ne ambientin CAD dhe zhvillimi i nje softi kompjuterik per vleresimin e cilesive lundrimore te mjeteve detare”, PhD thesis (in Albanian),2015
3. Ridgely-Nevitt, C, “The Development of Parent Hulls for a high displacement-Length Series of trawler forms”, Transaction of the Society of Naval Architects and Marine Engineers, Vol 71 (1963), pp 5-30.
4. Xhaferaj, B. et al, “The Architecture of Software Ship Power V_1.0”, Annals of Constanta Maritime University, Year XV, Issue XXII, page 23-30, 2014
5. HOLTROP, J. et al, "An Approximate Power Prediction Method," International Shipbuilding Progress, Vol. 29, No. 335, pp 166-170, 1982.
6. HOLTROP, J. "A Statistical Re-Analysis of Resistance and Propulsion Data," International Shipbuilding Progress, Vol. 31, No. 363, pp - 272-276, 1984

7th INTERNATIONAL MARITIME SCIENCE CONFERENCE
290
April 20th-21st, 2017, Solin, Croatia
COLLABORATIVE ENVIRONMENTAL MANAGEMENT (CEM) AS BASE FOR GREEN AIRPORT CONCEPTIgor Štimac, Monika Sente, Ornella Zibar
COLLABORATIVE ENVIRONMENTAL MANAGEMENT (CEM) AS BASE FOR GREEN AIRPORT CONCEPT
Igor Štimac1, Monika Sente2, Ornella Zibar3
(1 Zagreb Airport Ltd., Zagreb, Croatia) (2 Martinec Orehovički 31, 49221 Bedekovčina)
(3 Brune Bušića 27, 10020 Zagreb) (E-mail: [email protected])
ABSTRACT
The reduction of the negative impact of air transport on the environment has become a strategic issue of sustainable airport development. The biggest impact of air traffic on the environment can be seen in the airport area, which brings to a direct synergy of many stakeholders. Although the aircraft noise at the end of the 20th century was one of the main negative elements that was continuously monitored, today, besides noise, other parameters such as emissions, water pollution, soil pollution and electricity are being observed. In order to achieve significant results in terms of reducing the negative impact of air traffic on the environment, it was determined that only a joint collaboration of all the stakeholders can lead to significant environmental protection with an increasingly effective control of all operations in the air traffic. As the attempt was to create a system of environmentally friendly airport, the project named "Green Airport" was developed. The categorization of the airport as a "Green Airport" in an ecological sense was a recognition for the airport in its dedication to a higher level of environmental protection and responsibility to the local community, but it was also used as the basis for a successful marketing promotion. One of the guidelines for the realization in the view of the "Green Airport" status has been recognized in the implementation of Collaborative Environmental Management (CEM) into the operations of all the stakeholders related to the airport. Defining the parameters for the implementation of CEM, as well as phasing of its implementation and benefits, will be part of this paper.
KEY WORDS Environmental protection, airport, collaborative environmental management, aircraft noise, emissions in aviation, air transport ecology
1. INTRODUCTION
Air transport industry is a globally competitive sector which provides efficient transportation of people and goods on the global level and generates employment of more than three million jobs in Europe [1]. In the history of air transport there have been many ups and downs, but looking at a longer period, the demand for air transport services is growing continuously. These growing trends have generated certain negative effects on
the environment, out of which the most influence, in terms of noise and emissions, comes from the air transport. The first significant problems related to the negative impact of air transport on environment appeared at the early 1960s, and those problems were related to noise issues generated by aircraft engines. After the deregulation of air transport in 1978, the demand for air services increased, which led to an

291
Igor Štimac, Monika Sente, Ornella Zibar
COLLABORATIVE ENVIRONMENTAL MANAGEMENT (CEM) AS BASE FOR GREEN AIRPORT CONCEPT
increasing number of jet aircraft, and increased simultaneously the intensity of the noise. The first research of the noise in the aviation started in the late fifties of the last century, with the aim to detect the characteristics of the noise source and its impact on the environment. Noise reduction and airofoil research were particularly developed in the wind tunnels in the United States, where the air flow around the airframe, landing gear and engines have been tested. At the end of 2007 in Europe a research project codenamed "ERAT - Environmentally Responsible Air Transport” was launched, with the aim to develop a concept that would allow reduction of the negative impacts of aviation on the environment, as one of the major generators of noise and emissions at the airport surroundings. The noise level of a modern aircraft today is 75% lower than the noise level of aircraft operated 40 years ago. The goal in the future is to reduce the present noise level by 50% in the period till 2020. Although the aircraft noise tries to be reduced at all segments, the implementation of operational procedures by the airports and ATCs can have a significant impact on the airport business and its secondary stakeholders in its operational and financial way. As the noise and emissions are the most important elements of environmental pollution in the aviation sector, there are several others which must be taken into consideration when talking about aviation pollution, such as soil and water pollution, as well as waste which is mostly generated by the airport and the aircraft. The international document that covers the aircraft noise and emissions on a global level is ICAO - International Civil Aviation Organization Annex 16 Volume 1 & 2, and beside this document there are several directives of the European Union which cover the noise topics, such as the “Directive 2002/49/EC relating to the assessment and management of environmental noise” and the “Directive 2002/30/EC on the establishment of rules and procedures with regard to the introduction of noise-related operating restrictions at Community airports”. In 2014 the
Directive 2002/30/EC was replaced by the “Directive 598/2014 on the establishment of rules and procedures with regard to the introduction of noise-related operating restrictions at Union airports within a Balanced Approach”. From the national point of view, every country brings its own directives, laws and regulations concerning noise which must be complementary to the documents on the global and regional levels. In Croatia there are several laws and regulations on the subject of noise protection, such as the Law on Noise Protection (Official Gazette 30/09, 55/13, 153/13, 41/16), Regulations on the maximum permissible noise levels in areas where people work and live and the Ordinance on the establishment of the rules and procedures regarding the introduction of operating restrictions on aircraft noise at airports in the territory of the Republic of Croatia (Official Gazette 39/13).
2. IMPACT OF AIRPORT OPERATIONS ON ENVIRONMENTAL SUSTAINABILITY
The aircraft noise can be defined as unwanted sound produced by the aircraft, and it is considered differently from any other pollutants. The aircraft noise can be divided into three groups by its source. The first group is aircraft engines, the second one aircraft airframe, while the third group presents an interference between the first two. The noise can also be divided by the types of operations that are carried out, such as noise generating from aircraft take-off, landing, taxing, ground handling or engine testing. For each aircraft operation phase, there is a difference of intensity of noise by source at the time of take-off or landing (Fig. 1). During the take-off, the most common sources of noise are generated by the fan exhaust, blades, combustion chamber and jet engine exhaust. During the landing the main sources are the fan inlet and fan exhaust, but also a large part of the noise is generated by the aircraft airframe that occurs due to a high drag.

7th INTERNATIONAL MARITIME SCIENCE CONFERENCE
292
April 20th-21st, 2017, Solin, Croatia
Figure 1. Aircraft noise source at approach/landing and take-off Source: NASA; http://www.nasa.gov/centers/glenn/about/fs03grc.html
When referring to the noise at the airports, such noise can be divided into two main parts related to its sources. The first part is airside and it includes runways, taxiways, aprons and passenger terminal after security check. In this part the main noise sources are aircraft, ground handling vehicles and airport infrastructure buildings located on airside. The second part is landside. The landside area covers roads and parking lots, airport heating and cooling plants, as well as the infrastructure for freight transport. On the landside area, the main noise sources are those where noise comes from vehicles used by the passengers, employees (from all stakeholders), and noise from the infrastructure (such as the heating plant). Noise is one of the biggest problems but in the second place on the list are emissions which are equally important. Main emission pollutants at the airport are aircrafts, and the most harmful emissions from the aircraft engines are CO2, NOx and UFP (Ultrafine Particles). All aircraft operations have some consequences which affect the existing wildlife and the human population. It is estimated that the aircraft are responsible for about 10% of greenhouse gas emissions, out of which 2% are CO2 [2]. Although the noise and emissions are the main negative elements that affect pollution around an airport, waste pollution is another important segment that is largely generated by the airport and its stakeholders. Airports generate significant amounts
of waste; thus it is very important to know the origin and the structure of the waste, with the aim to handle it appropriately and according to the local regulations. The typical waste generated by the airport can be divided into six categories: 1. hazard waste that comes from the airport
maintaining (colour, cleaning fluid, oil, antifreeze, cans of spray, lamps with mercury);
2. waste generated by the passengers and tenants of the terminal and other infrastructure space, food scraps, plastic, aluminium, batteries, glass;
3. various waste generated at the security check which comes from passengers and hand luggage;
4. waste from the apron, taxiways and runways (aircraft parts and parts of equipment for aircraft ground handling, pallets);
5. waste water and storm water contaminated by petroleum, glycol and other de-icing fluids;
6. land contaminated by different liquids and materials that come into it with the manoeuvring area (the remains of tires, paint residues, de-icing fluid).

293
Igor Štimac, Monika Sente, Ornella Zibar
COLLABORATIVE ENVIRONMENTAL MANAGEMENT (CEM) AS BASE FOR GREEN AIRPORT CONCEPT
Figure 2. Main stakeholders which generate pollution around an airport Source: Štimac, I.; presentation „Ecological Viability of Air Traffic“; 2nd Aviation Business Arena, Zagreb, 2012
Although the air traffic impact on the environment is very large, all the stakeholders in aviation industry are continuously improving the equipment, procedures and infrastructure to reduce the negative effects to a minimum. One of the newest and most important processes nowadays is the implementation of Collaborative Environmental Management (CEM). What CEM is, its implementation phases and benefits, will be elaborated in the next chapter.
3. IMPLEMENTATION OF CEM AT AIRPORT
The CEM is a commonly agreed strategic management process for establishing an airport environmental partnership between the key operational stakeholders at an airport. This partnership will prioritise and meet environmental challenges caused by the direct environmental impacts of aircraft operations. The CEM can be initiated by the airport (airport operators), air navigation service providers (ANSPs) or aircraft operators. This partnership is based upon four levels of collaboration: shared understanding; shared information; consultation and joint implementation. It is essential that all the stakeholders make decisions in a common and unique way to improve the environmental performance of the very airports. The CEM key objectives involve unification and better coordinated interface between airport stakeholders, reducing the risk of environmentally
related conflicts between the stakeholders and improving the communication between the airports involved in the processes of the CEM to share information and good practice. The CEM is not an alternative to individual stakeholder Environmental Management Systems (EMS), but it is augmented by these and complements them. Aircraft related environmental impacts, primarily noise, local air quality and climate change, contribute significantly to the total adverse impact of an airport. Furthermore, the efficient use of scarce resources, such as fuel, is becoming increasingly important from both environmental sustainability and cost-reduction perspectives. The CEM can help in developing a shared vision of the environmental impact by the airport and assist in prioritizing, implementing or approving awards for each operational improvement that can mitigate environmental impacts. There is a list of topics which are supported by the CEM. These topics are: Continuous Descent Approach and Low Power Low-Drag; more efficient airfield operations (e.g. Collaborative Decision Making); improved adherence to noise routes; preferred runway configuration management; airspace changes and new navigation methods (e.g. P-RNAV) [3]. Following business and operation processes of each stakeholder, it is clear that no single stakeholder can achieve these ATM environmental improvements unilaterally. Only the collaboration of each stakeholder can lead to the results which can have a significant positive impact on the environment. If the stakeholders do not

7th INTERNATIONAL MARITIME SCIENCE CONFERENCE
294
April 20th-21st, 2017, Solin, Croatia
collaborate, there are numerous negative results which can happen, such as increasing operational costs, environmental-related conflicts between the stakeholders and many more. By analysing the CEM in an operational way, there are many potential topics for it, such as: Departure-track keeping; Noise preferred runway; Arrival management; Continuous descent approach (CDA); Departure noise abatement; Fleet management; Operational restrictions; Market-based measures; Airspace design and many more [3]. The CEM process comprises two phases and several sublevels: 1. Pre-implementation phase - whereby the CEM
is initiated and developed to a point where full top-level commitment to implement the CEM is achieved. The CEM phase one can be initiated by any airport stakeholder.
2. Joint implementation phase – is phase which is conducted by four CEM ‘levels’ as following: • CEM Level 1: Understanding - This
achieves a common understanding of all local environmental issues.
• CEM Level 2: Information Sharing - Based upon the common understanding, the CEM Level 2 ensures that appropriate performance information and monitoring systems are established to track progress.
• CEM Level 3: Consultation and Planning - provides processes to facilitate joint decision making. This level determines the overall plan to address the priorities agreed in Level 1. The CEM Level 3 also establishes the two-way communication channels with the interested parties.
• CEM Level 4: Action Level - is where the stakeholders implement the planned operational improvements agreed in the CEM level 3.
It can be said that the airports in the Republic of Croatia with its operations are environmentally conscious in a way to invest some effort in environmental protection according to their specific characteristics, aircraft operations number and distances from populated areas. Although, Republic of Croatia has 7 international airports. The main airport, Zagreb International Airport over the years has invested the most in its sustainable development and environmental protection. This refers primarily on implemented system for 24-hour noise monitoring (installed 4 noise
monitoring stations) with a developed action plan for any noise increase above the legally defined limits around the airport. The airport has installed a system for stationary measurement of emissions and it is also active in the ACI Airport Carbon Accreditation program which currently holds the Certificate Level 2 "ACA Reduction". In addition, significant investments over the years have been made in the rain water system (36 km of pipes around the airport). Zagreb International Airport introduced an integrated management system ISO 14001:2004. Although in each company (airports, air traffic control, Croatia Airlines) environmental protection system is very developed, but it is still not enough for reaching a level of each company participating in the program, such as CDM or CEM. Little progress has been made between the Zagreb International Airport and Croatian Air Traffic Control but with the minimal segments, such as the introduction of "one engine taxi 'and the partial use of CDA procedures.
4. CEM AS PART OF GREEN AIRPORT CONCEPT
The CEM as part of the Green Airport concept appears in different segments which are associated with air transport. The Green Airport concept is a new program which starts to become very popular between the airports, and it is based on innovation, cooperation and joint actions. Accordingly, with stated its recognizes and encourages the airlines, airports, ANSPs and aviation professionals to collaborate in terms of exchange of knowledge, experience and support in the implementation of measures for environmental improvements. The CEM as part of the Green Airport concept allows suggestions for reducing environmental pollution in each of the segments (airports, airlines, ANSPs), and considers the visual interconnection between all the stakeholders as very important in achieving an interaction for the successful implementation of the CEM. The important factor in the area around the airport is the previously mentioned “noise”, to which the local population is most exposed during the landing and take-off operations. Very often the population at the airport surrounding area perceives the aircraft noise as the noise produced by the airport. It is important to bear in mind that

295
Igor Štimac, Monika Sente, Ornella Zibar
COLLABORATIVE ENVIRONMENTAL MANAGEMENT (CEM) AS BASE FOR GREEN AIRPORT CONCEPT
an airport produces a certain level of noise during the ground handling operations, but such noise is much quieter than the noise produced by the aircraft owned by airlines. Due to this reason, several measures are adopted to decrease the
aircraft noise as much as possible, while keeping the safety level on a very high level. Those measures can be divided by stakeholders showed in table 1.
Figure 3. Diagram of CEM Process phase 1 and 2 Source: European Organisation for the Safety of Air Navigation (EUROCONTROL); Airport Environmental Partnership” November 2008.

7th INTERNATIONAL MARITIME SCIENCE CONFERENCE
296
April 20th-21st, 2017, Solin, Croatia
Table 1. Procedures which are supporting CEM implementation for environmental sustainability
Stakeholder Actions for reducing noise and emissions
Aircraft manufactures
• Using composites materials with aim to reduce aircraft weight • Airframe is made from advanced materials (combining composites with titanium and aluminium alloys) • New structure and technology lead to higher fuel efficiency • Innovation items as high-bypass engines and a raked wingtip • Incorporated new sound absorbing materials, lighter and quieter system, improved engine acoustics
Airports
• Incentive and penalty systems to encourage airlines to use quiet aircraft • Use of preferred runways where possible (in consultation with ATC) • Taxi power control and TQM (taxi queue management) • Noise quotas on night flights • Ban on aircraft engine testing or training flights at certain times • APU management - encouragement of minimum use of APU’s • Sound insulation grants: double-glazing in the noisiest areas • Hush houses and engine run up management • Noise monitoring systems – monitor noise level of each aircraft • Public complaint services • Movement limits • Forbidden reverse thrust during night (where it’s possible) • Being part of Airport Carbon Accreditation Program (reducing emissions)
ANSP’s
• Continuous Descent Approach (CDA/CDO) • Increased Glide Slope on Approach • Low Power - Low Drag (LP/LD) Approach • Curved Approach (advanced CDA) • Displaced threshold • Preferential runways • Continuous Climb Operation (CCO)
Airlines
• Changing fleet with quieter aircraft (less noise) • Implementation of Hush kit (less noise) • Follow Noise abatement operational procedures (less noise) • Using GPU instead APU (saving fuel / less emissions) • Implementation of one engine taxi procedure (saving fuel / less emissions)
Source: Štimac, I.; presentation „Ecological Viability of Air Traffic“; 2nd Aviation Business Arena, Zagreb, 2012 and official websites from aircraft manufacture, airlines, airports and aviation organisations (ICAO, ACI)
Noise and emissions are not the only pollutants although they are major ones. European airports are also investing in renewable energy sources such as biomass, geothermal power, solar panels and windmills. Companies that provide ground handling services replace their existing vehicles with more environmentally friendly - electric vehicles, hybrid vehicles, vehicles on LPG (Liquefied Petroleum Gas) technology such as towing tractors for baggage
and cargo, towing aircraft between terminals and maintenance hangars. Just saving on the aircraft movement between the terminal and hangar brings savings of more than 15 million litters of fuel and cuts CO2 emissions by 40 million pounds per year. On figure 4 and 5 it is shown which procedures were used in 1990 and what procedures are being used nowadays reloaded to reducing noise, emissions and saving fuel.

297
Igor Štimac, Monika Sente, Ornella Zibar
COLLABORATIVE ENVIRONMENTAL MANAGEMENT (CEM) AS BASE FOR GREEN AIRPORT CONCEPT
Figure 4. Aircraft and airport procedures during end of last century at most of airports Source: made by authors
Figure 5. Spectre of aircraft, ANSP, and airport procedures for environmental sustainability Source: made by authors
5. EUROPE CEM BEST PRACTICES
There are two airports that were one of the pioneers in the implementation of CEM and can be characterized as the best examples of CEM and Green Airport concept. These airports are Manchester Airport and Budapest Airport. Manchester Airport, serves more than 70 airlines and has 24 million passengers a year. The current
airport capacity is 55 million passengers per year which are being handled in three passenger terminals and two runways. Given the large number of passengers and cargo traffic, Manchester Airport currently has more than 21,500 employees. The importance of the airport stands out in a number of destination / countries, what airport servers. In 2015/16 it was carried out 175,645 flights to 210 destinations connecting 60 countries. The most

7th INTERNATIONAL MARITIME SCIENCE CONFERENCE
298
April 20th-21st, 2017, Solin, Croatia
desirable destinations from Manchester Airport are Dubai, Dublin, Amsterdam, Tenerife and Mallorca. Each airport must be well connected to the city, but in Manchester Airport case it supports connectivity by rail, bus and metro which is an additional benefit when applying CEM. Due to the large number of people (22 million) living in a catchment area of two hours driving, Manchester Airport has recognized the importance of the CEM implementation and the creation of a "Green Airport" concept. Manchester Airport was awarded for best airport in the United Kingdom two years in a row, which was certainly a great incentive for further progress and development. CEM at the airport Manchester was implemented five years ago, and it gathers a small group whose focus is aimed at improving the environment, but also to maintain the operational focus and high level of efficiency. The topics of discussion related to CEM at the airport Manchester are CDOs (Continuous Decent Operations), CCO (Continuous Climb Operations, PRNAV trials, Approach procedures, Ground power, SID truncation, Performance reporting, Intersection departures, Airfield lighting, Optimised flight, Legislative updates, Reduced engine taxiing, Night noise review, APU use, Airspace change, Aircraft de-icing, Departure track adherence, Climate change adaptation. In the first five years of adaptation CEM Manchester has made improvements in several categories: • optimization of flight routes by
implementation of direct routes, CDO and CCO,
• SID (Standard Instrument Departure) Truncation enabled fuel savings of 19,000 tons per year,
• implementation of reduced engine during taxiing, which allowed the reduction of CO2 emissions by 30%[4].
The second best practice airport is Budapest Ferihegy International Airport which was opened in 1966. Budapest Airport is mostly focused on inter Europe flights, but also has flights to Africa, Asia, Middle East and North America. Currently Budapest Airport has 850 employees, more than 200 vehicles, consumes 33GWh of electricity per year and generates 950 tonnes of waste. At Budapest Airport, there are 200 different entities which have in total 8,500 employees, using more than 600
vehicles on airside, consuming 13GWh of electricity per year and generates 550 tonnes of waste. The preparation before implementation of Green Airport Program at Budapest Airport was: detailed analysis of most significant tenants, creation of attractive brand logo, active involvement of all business units from beginning in all discussions. The main objective of the program is to reduce carbon dioxide emissions, with the following measures: reducing energy consumption at the airport, creating opportunities for the use of renewable energy sources, development electric mobility, expanding selective waste collection at the airports. It is significant to emphasize that CO2 emissions in 2010 were 3,75 kg/passenger while in 2014 this amount was reduced by 32.5% and now is 2,53 kg/passenger [5]. Regarding statement from Budapest Airport management benefits from implementation of Green Airport Programs was following: regular information on the environmental performance of the airport and related opportunities; Quarterly meetings between the partners to exchange experience; Access to environmental training and communication materials; joint media events relating to environmental developments; Professional support for the organisation’s environmental measures, from launch to implementation [6].
6. CONCLUSION
The purpose of this paper is to point out the problems of the airline industry related to the environment and air traffic increase. The main feature of the aviation industry is safe and fast transport that has a great upward trend. However, it is important to pay attention to the impact of air traffic on the environment. Due to increasing traffic, there is a problem of the noise impacts, waste water and engine emissions by aircraft and other vehicles. It is extremely important to comprehend the degree of environmental pollution by air transport stakeholders. Airlines, airports, aircraft manufacturers and air traffic control in the recent years have been focusing portion of the business on the implementation of regulatory measures, restrictions and new technologies on

299
Igor Štimac, Monika Sente, Ornella Zibar
COLLABORATIVE ENVIRONMENTAL MANAGEMENT (CEM) AS BASE FOR GREEN AIRPORT CONCEPT
reducing the impact of air traffic on the environment. Technologies and restrictions which are being used in the recent years greatly assisted ecological balance. Due to restrictions, subsidies and projects made possible in recent years, harmful emissions and noise were reduced by 80%. Green Airport program which is trying to reduce the harmful effects on the environment by all stakeholders of the air traffic, also indicates awareness of the stakeholders on the ecology importance. Green Airport offers many advantages, the most important ones are: possibility of joint decision-making and innovation, use of new technologies and information exchange. Given the current situation, the implementation of various innovations and projects may indicate that air traffic tends to sustainable development.
REFERENCES
1. Tatalović M., Mišetić I., Bajić J.: Menadžment zrakoplovne kompanije, MATE i ZŠEM, Zagreb:, 2012.
2. Golubić, J.: Impact of traffic Policy Regulative on Reduction of Greenhouse gas, Croatian Academy of Sciences and Arts, pp161-169, 2011
3. European Organisation for the Safety of Air Navigation (EUROCONTROL); Airport Environmental Partnership” November 2008.
4. Freeman, A.: CEM in action- Manchester Airport; Budapest 2016
5. Green Budapest official website; https://greenbudapest.ge/en/, 2017.
6. Kis, F. Green Airport; Budapest Airport Green Partner Program, workshop, September 2016
7. NASA; Official website http://www.nasa.gov/centers/glenn/about/fs03grc.html
8. Štimac, I.; presentation „Ecological Viability of Air Traffic“; 2nd Aviation Business Arena, Zagreb, 2012 and official websites from aircraft manufacture, airlines, airports and aviation organisations (ICAO, ACI)

7th INTERNATIONAL MARITIME SCIENCE CONFERENCE
300
April 20th-21st, 2017, Solin, Croatia
CROATIAN MARITIME HIGHER EDUCATIONAL INSTITUTIONS AND DISTANCE LEARNINGAndrija Nenadić, Marko Rudež
CROATIAN MARITIME HIGHER EDUCATIONAL INSTITUTIONS AND DISTANCE LEARNING
Andrija Nenadić1, Marko Rudež2
(1 University of Split, Faculty of Maritime Studies, Split, Croatia) (2 Ante Starčevića 35, 21300 Makarska, Croatia)
(E-mail: [email protected])
ABSTRACT
Many people, for whom traditional methods of education for any reason does not correspond (for example: people who are work related to the places where there are no appropriate educational institutions, the elderly, persons with disabilities, persons who can not match their commitments with the requirements of educational institutions) today more and more, particularly with the use of modern information and communication technologies (ICT), are educating at distance. Since the wave of new modern tehnologies is globally affecting all of society and all its segments, he also caught Maritime and sailors as part of that society. Considering that the seamen belong to the group- people who are work related to places where there are no appropriate educational institutions- is more than obvious that the Maritime, Maritime science and especially higher educational institutions can and should find its place when it comes to the application of modern ICTs in education and training of seamen. Also, all the rules and legislation in the field of maritime affairs and the past practice of the western developed maritime countries have shown that it is possible and necessary. Sudden and almost daily technical and technological advances force seamen and candidates for seamen to acquire new knowledge and skills, but due to the rapid development of ICT , they must show maximum flexibility in acquiring new knowledge and skills. In this sense, new technologies especially in the field of education and training of seamen based on ICTs are enabling them to learn in the best and efficient way. The advantage of ICT is in fact they are flexible regarding time and place where an individual access to educational resources. E-learning and distance education with their programs and models can greatly facilitate and contribute to the improvement of education of seamen. In this paper we will try to bring a display of the Croatian tertiary maritime education institutions distance education or e-learning.
KEY WORDS
Information and communication technologies, distance education, e-learning, seamen.
1. INTRODUCTION
In Western countries distance education for seafarers, according to present knowledge has greatly advanced; especially in Australia, the United States and Canada. The progress in the European Union by the fact that the territory of the European Union adopted 'final report complete education in shipping, so-called. METNET
(Thematic Network on Maritime Education, Training and Mobility of Seafarers, 2003) with a special emphasis on new technologies and lifelong learning (Life-long learning - LLL) seafarers.[13] Maritime Faculty in Croatia, Sailors and candidates Croatian maritime high schools are forced to monitor and follow all the changes in the domestic and international maritime field. As a country of
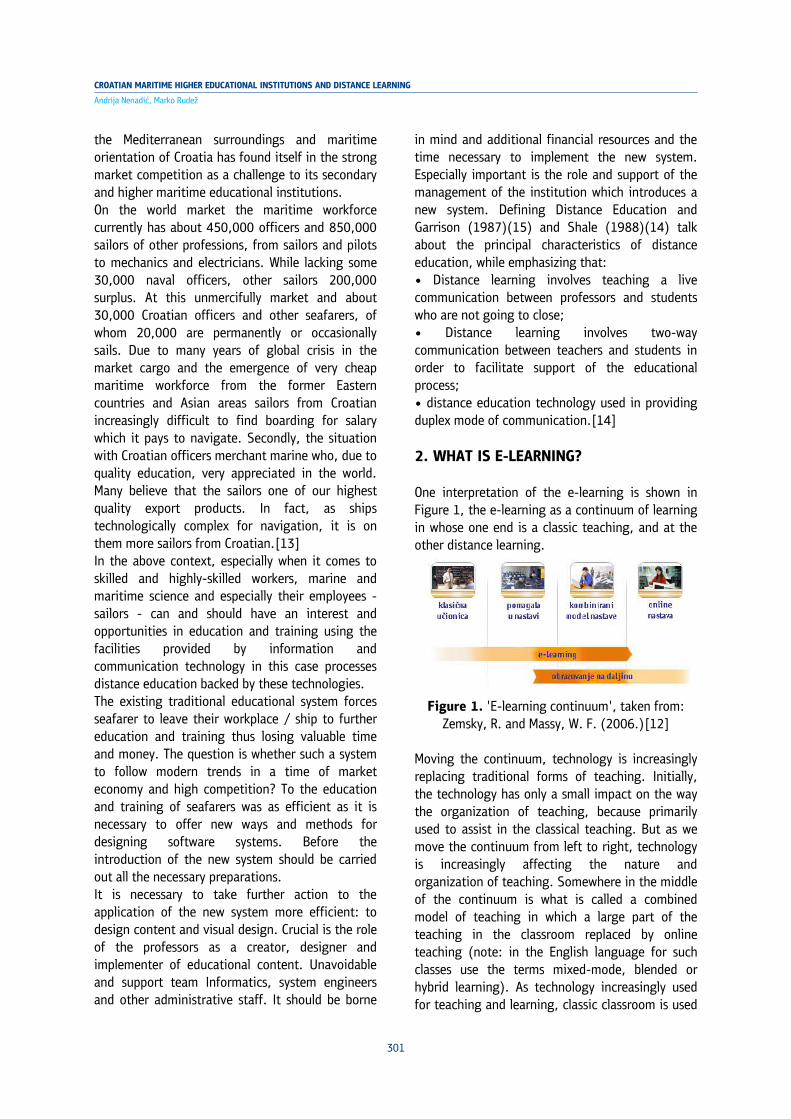
301
Andrija Nenadić, Marko Rudež
CROATIAN MARITIME HIGHER EDUCATIONAL INSTITUTIONS AND DISTANCE LEARNING
the Mediterranean surroundings and maritime orientation of Croatia has found itself in the strong market competition as a challenge to its secondary and higher maritime educational institutions. On the world market the maritime workforce currently has about 450,000 officers and 850,000 sailors of other professions, from sailors and pilots to mechanics and electricians. While lacking some 30,000 naval officers, other sailors 200,000 surplus. At this unmercifully market and about 30,000 Croatian officers and other seafarers, of whom 20,000 are permanently or occasionally sails. Due to many years of global crisis in the market cargo and the emergence of very cheap maritime workforce from the former Eastern countries and Asian areas sailors from Croatian increasingly difficult to find boarding for salary which it pays to navigate. Secondly, the situation with Croatian officers merchant marine who, due to quality education, very appreciated in the world. Many believe that the sailors one of our highest quality export products. In fact, as ships technologically complex for navigation, it is on them more sailors from Croatian.[13] In the above context, especially when it comes to skilled and highly-skilled workers, marine and maritime science and especially their employees - sailors - can and should have an interest and opportunities in education and training using the facilities provided by information and communication technology in this case processes distance education backed by these technologies. The existing traditional educational system forces seafarer to leave their workplace / ship to further education and training thus losing valuable time and money. The question is whether such a system to follow modern trends in a time of market economy and high competition? To the education and training of seafarers was as efficient as it is necessary to offer new ways and methods for designing software systems. Before the introduction of the new system should be carried out all the necessary preparations. It is necessary to take further action to the application of the new system more efficient: to design content and visual design. Crucial is the role of the professors as a creator, designer and implementer of educational content. Unavoidable and support team Informatics, system engineers and other administrative staff. It should be borne
in mind and additional financial resources and the time necessary to implement the new system. Especially important is the role and support of the management of the institution which introduces a new system. Defining Distance Education and Garrison (1987)(15) and Shale (1988)(14) talk about the principal characteristics of distance education, while emphasizing that: • Distance learning involves teaching a live communication between professors and students who are not going to close; • Distance learning involves two-way communication between teachers and students in order to facilitate support of the educational process; • distance education technology used in providing duplex mode of communication.[14] 2. WHAT IS E-LEARNING? One interpretation of the e-learning is shown in Figure 1, the e-learning as a continuum of learning in whose one end is a classic teaching, and at the other distance learning.
Figure 1. 'E-learning continuum', taken from:
Zemsky, R. and Massy, W. F. (2006.)[12] Moving the continuum, technology is increasingly replacing traditional forms of teaching. Initially, the technology has only a small impact on the way the organization of teaching, because primarily used to assist in the classical teaching. But as we move the continuum from left to right, technology is increasingly affecting the nature and organization of teaching. Somewhere in the middle of the continuum is what is called a combined model of teaching in which a large part of the teaching in the classroom replaced by online teaching (note: in the English language for such classes use the terms mixed-mode, blended or hybrid learning). As technology increasingly used for teaching and learning, classic classroom is used

7th INTERNATIONAL MARITIME SCIENCE CONFERENCE
302
April 20th-21st, 2017, Solin, Croatia
less and less. At the right end of the e-learning continuum traditional instruction does not exist anymore. Teaching becomes fully online, and teaches the use of technology. 3. A SHORT DESCRIPTION OF THE SOFTWARE SYSTEM MOODLE Moodle is an application for creating and maintaining an online course via the Internet. The project is being continuously developed with the purpose of supporting the so-called. educational environment of social constructionism. "The word Moodle is an acronym of the term modular object-oriented dynamic learning environment (eng. Modular Object-Oriented Dynamic Learning Environment).[4] It's also a verb that describes the process of slowly passing through a material, trying to do when he wants (or needs), enjoying the work that leads to a deeper knowledge and creativity (Author's Note - uttered by! :)). The verb best describes how the emergence and development of the Moodle system, as well as the way in which students and teachers can access the educational process in distance learning. A person who uses Moodle is moodler (personalized Croatian IT slang - Mudlaš :)). "(MoodleDocs).[4] Moodle is an open source project (Open source), which means that the user is granted access to the source code, with the possibility of changes in the application and adaptation to their own needs. Moodle is released under the GNU Public License, which means that, even though it is protected, users are allowed to use, copy and modify the code, if allow others to use your code at the same conditions, can not change the original license no protection, and apply this same license to any other work which stems from Moodle. The application can be downloaded for free from the official Moodle website. Moodle is a Web application written in PHP and supports multiple types of databases (especially MySQL and PostgreSQL), and has excellent documentation and support.[4] 4. SYSTEM FOR E-LEARNING - MERLIN Merlin system for e-learning was established as a platform for projects of e-learning, and performance of the college of university studies
with the use of e-learning technologies. Merlin is based on a system of open source Moodle, which is further developed and tailored to user needs. Virtual environment for e-learning Merlin consists of a system for e-learning Merlin system for webinars and e-portfolio system and connected to the system ISVU (Information System of Higher Education Institutions).[5] Connecting system with Merlin system ISVU allows institutional administrators to system Merlin opening of all the courses in the system ISVU the Merlin system and registration of professors and students. The system of e-learning Merlin reports via electronic identity of the AAI system. The electronic identity assigned parent institution (higher education). Terms of the system are defined in the Regulations on the organization and use of e-learning Merlin. The system held employees of the Centre for e-learning, and allows institutions, professors and students a reliable platform for e-learning free of charge. The system is constantly evolving and adapting to the needs of its users. 5. BRIEF DESCRIPTION OF WORK PROGRAM SYSTEM SEAGULL 5.1. About Seagull Maritime
Seagull is the leading provider of computer-based training systems for seafarers worldwide. They offer a complete training management solution tailored to the career development cycle of seafarers and the management needs of shipping companies, ship operators, ship managers, crew managers, and training centres.
Founded in 1996 by experienced mariners, we have grown into a dynamic company with over 100 employees at eight offices worldwide. They owe their success to our close partnership with leading shipping companies in developing and delivering a full range of assessment and management tools that ensure they meet and exceed STCW, IMO, and industry standards.[6]
5.2. Assessment and management training for the maritime industry
The Seagull training system offers:

303
Andrija Nenadić, Marko Rudež
CROATIAN MARITIME HIGHER EDUCATIONAL INSTITUTIONS AND DISTANCE LEARNING
• Training administration • Competence management • Ability profiling • Knowledge assessment • eLearning knowledge library • Safety training films • Onboard courses.(6)
At Seagull, they understand the unique training challenges facing the maritime industry today and they focus on providing a suite of software tools that are needed for a successful and affordable company training programme. They accomplish this in a scalable and flexible way so as to offer the complete solution and to keep your training costs down and manageable.
It can bee start simply and add on the software tools you need and pay only for what you use in a predictable annual fee. Seagull's solutions have been delivered to over 8,000 ships and office installations around the world.[6]
5.3. Online and onboard training
The Seagull training system (STS) is a suite of software tools that combines training administration, training records and reporting, statistical training analysis, career planning and proficiencies, psychometric ability assessment, knowledge assessment, proficiency profiling, and eLearning knowledge. The system can be used onshore online as well as onboard your vessels, either installed on the ship's LAN network, or used from a laptop or desktop computer. It is customised to your requirements and scalable to your fleet needs.[6]
Figure 2. Courses and training; int.source: http://www.seagull.no/Courses-
training(12.02.2017.)
Figure 3. Courses and training; int.source: http://www.seagull.no/Courses-
training(12.02.2017.)
5.4. Onboard training library
Onboard library consists of over 188 computer-based training (CBT) modules and selected safety training DVDs. New titles are constantly added in response to changing industry and customer requirements and existing modules are frequently revised to reflect these changing needs.
Each CBT module is a dedicated multimedia program consisting of a number of chapters of learning material followed by an assessment section. The final assessment chapter contains a database of multiple choice questions from which final assessment tests can be randomly generated. Lessons are delivered with a sequential text and normally include a mixture of illustrations, animations and video clips as appropriate to the text. A training session can be interrupted at any time and continued at a later date; however, the final assessment can only be performed once. 6. STATE OF E-LEARNING ON CROATIAN MARITIME HIGHER EDUCATIONAL INSTITUTIONS When it comes to higher education Croatian maritime institutions from a short survey website it could be concluded that in this area made major changes. The four largest maritime universities (Split, Dubrovnik, Zadar and Rijeka) are already using software systems for e-learning Moodle and Merlin until the Faculty of Maritime Studies Split benefits Seagull system. In addition insight into web portals shows that in each of them there are a number of elements of the e-learning system that professors use in teaching. Here it will enumerate
7th INTERNATIONAL MARITIME SCIENCE CONFERENCE
304
April 20th-21st, 2017, Solin, Croatia
just some of the services: About Faculty, Admissions, Notifications, legal acts, organization, curriculum, Chair, Expert services, teaching staff, workspace and equipment, laboratories and simulators, centers for training of seafarers, Students, libraries Useful links .... 6.1. Department of Maritime Studies Zadar, University of Zadar University of Zadar used Merlin system for e-learning. Under the Marine Department Figure 4, it can be seen courses on which instruction is online.
Figure 4. Home of the University, int.source:http://www.unizd.hr/Default.aspx?alias=www.unizd.hr/promet-pomorstvo&(12.02.2017.)
Figure 5. Some of the courses at the Department
of Maritime Studies Zadar, University of Zadar int.source:http://moodle.srce.hr/2016-
2017/course/index.php?categoryid=92(12.02.2017.)
6.2. Faculty of Maritime Studies Rijeka and e-Learning On the web pages of Maritime Faculty in Rijeka are the following information regarding the e-learning: Abbreviation wisely is a customized solution for
lectures in distance fundamental to the open source software Moodle. MudRi are free to use by all members of the academic community of the University of Rijeka (professors, students and other employees of the University), as a service that has enabled the development of a broader system for the implementation of e-learning in teaching at our University. System can be accessed using a single AAI @ Edu identity which is provided to all members of the academic community.
Figure 6. Homepage wisely - University of Rijeka, int.source: https: //mudri.uniri.hr/,
(12.02.2017.)
Total number of e-courses at the Faculty of Maritime Studies, 54 as can be seen from Figure 7.
Figure 7. Works Course on maritime direction on
the page wisely - University of Rijeka, .: https://mudri.uniri.hr/course/category.php?id=11
&perpage=20&page=2, (12.02.2017.) 6.3. Department of Maritime studies Dubrovnik, University of Dubrovnik On the official website of the Maritime Faculty in Dubrovnik are the following information regarding the e-learning: DUEL (Dubrovnik University E-Learning) is a system for distance learning based on Moodle software solution for the production and maintenance of online courses via the internet. The system is in a state of continuous development with the purpose of supporting the educational

305
Andrija Nenadić, Marko Rudež
CROATIAN MARITIME HIGHER EDUCATIONAL INSTITUTIONS AND DISTANCE LEARNING
environment of the so-called. sociologycal Constructivism. Duel contains 20 courses for the Department of Maritime Affairs Fig 8.
Figure 8. Homepage DUEL, int.source: http: //duel.unidu.hr/, (12.02.2017.)
6.4. Faculty of Maritime Studies Split and e-Learning On the official website of the Maritime Faculty in Split are the following information regarding the e-learning: After examining the official website of the Maritime Faculty in Split shows that college has systematized software package for e-learning that covers all directions of the education program (see Fig. 9). According to that shown in the pages of the Faculty there is a link to 'Distance Learning' which still refers to 'Seagull'. Seagull is a closed software package in this case designed for students in the direction of the maritime Vehicles.
Figure 9. Link for distance learning in the software package Seagull - education and training
of seafarers, int.source: http://www.pfst.unist.hr/hr/sadasnji-studenti/nastava/ucenje-na-daljinu,
(11.02.2017.)
The system Seagull (see below figure No. 10,11, 12), composed of so-called. modules /lessons CBT
(Computer Based Training). Access Seagull-in is done in a way that students log previously obtained passwords and usernames.
With the previously selected modules of the subject professor teaching students to access selected teaching materials. Teaching materials / modules are organized in a way that students must pass all required lessons, before solving approaches the final exam of this module. One of the advantages of this kind of ways with e-learning is that the student does not have the same amount of time to pass all required lessons in the module. In other words, students were due to some personal reasons may be real break and store working hours lessons and continue to operate it when it suits them. After students have studied all the lessons given each module access to the so-called. 'Assessment-in' (assessment and evaluation of acquired knowledge). By addressing module students get results success passing the module in percentage. An application that is set in the resolution module is a minimum of 75% or more above that percentage.
Figure 10. Page for application software package
Seagull,.: int.source:https://sta.seagull.no/GCCProxy/views/
customerloginscreenview.aspx, (02.11.2017.)
Figure 11. Personal card participants in the program package Seagull-in; int.source:
https://stacdn.seagull.no/STA40/Views/PersonnelScreenView.aspx?ForceCustomerName=uos&login
(02.11.2017.)

7th INTERNATIONAL MARITIME SCIENCE CONFERENCE
306
April 20th-21st, 2017, Solin, Croatia
Figure 12. The modules are offered for assessment at Seagull;
int.source:https://stacdn.seagull.no/STA40/Views/PersonnelScreenView.aspx?ForceCustomerName=
uos&login (02.13.2017.)
7. CONCLUSION From all pre-specified in the work is more than obvious that the marine, marine science and especially higher-educational institutions can and should find its place when it comes to the application of modern information and communication technologies in education and training of seafarers. What's more, all the rules and legislation in the field of maritime affairs and the past practice of the western developed maritime countries have shown that it is possible and necessary. The sudden and almost daily technical technological advances force sailors and candidates for seafarers to acquire new knowledge and skills with those that due to the rapid development of which must show maximum flexibility in acquiring new knowledge and skills. In this sense, new technologies especially in the field of education and training of seafarers based on information and communication technologies to enable them to best and efficient way. The advantage of ICT is in fact what are flexible with regard to time and place where an individual access to educational resources. E-learning and distance education with their programs and models can greatly facilitate and contribute to the improvement of education of sailors. Lifelong learning for staff involved in the maritime sector is a reality in a world that every day becomes more complex. There comes a time, in fact it is, when it has to introduce and organize a new flexible technique which certainly include 'just-in-time' educational models. This will also lead to the need for mutual recognition qualification to ensure that a course is completed under the
jurisdiction of one applies to the other. Lifelong learning will extend to all members of the maritime sector and high standards of competence will become the norm. REFERENCES 1. Bekić Z., Kučina-Softic S., From good strategy
to successful application of e-learning - a view from the ‘Srce’, University Computing Center, ‘Srce’ Zagreb, 2007-2010.
2. Bosnic, I., Manual for the seminar, Croatian Society for Open Systems and Internet, Zagreb, 2006.
3. Ćukušić, M., Jadrić M, E-learning: concept and application, ‘School books’, Zagreb, 2012.
4. Jadrić, M; Ćukušić, M .; Lenkić, M. E-learning: Moodle in practice. Split: Faculty of Economics, 2012.
5. Merlin system for e-learning; Virtual environment for e-learning in higher education, int.source .: http://moodle.srce.hr/2016-2017/(20.03.2017.)
6. Seagull; Computer-Based Training System for the Maritime Industry, int.source: http://www.ship-technology.com/contractors/simulators/seagull/(2003.2017.)
7. Newsman, P., Teaching - learning and teaching, Internet source: http://www.bosanskialim.com/rubrike/tekstovi/000098R018.PDF, (04.03.2017.)
8. Sinković, F. .; Kaluđerčić, A. E-Learning - a challenge Croatian higher education. //Economic Research Economic research: journal. 19, 1., (2006.), p. 105-113.
9. Stankov, S., E-learning, School books, Zagreb, 2010.
10. Vuksanovic, I. Options for e-learning in the Croatian education system. // Progress, Vol.150 No.3-4 October 2009.int.source.;http://hrcak.srce.hr/index.php?show=clanak&id_clanak_jezik=123254(22.03.2017.)
11. Vuksanovic, I., E-learning, ‘School books’, Zagreb, 2011.
12. Zemsky, R. and Massy, W. F. Hampered innovation: What happened to the e-learning and why (Introduction). Edupoint, 47 (V).

307
Andrija Nenadić, Marko Rudež
CROATIAN MARITIME HIGHER EDUCATIONAL INSTITUTIONS AND DISTANCE LEARNING
(2006). Available on the web at: http://www.carnet.hr/casopis/47/clanci/3, (access to 12.02.2017.)
13. Thematic Network on Maritime Education, Training and Mobility of Seafarers, Günther Zade, METNET, Contract No. 1999-TN.10983, Project Coordinator, World Maritime University, WMU, Malmo, Sweden, Final Report for Publication, WMU, with inputs from work package and task leaders), 2003. Project funded by the European Union.
14. Shale, D. G., Toward a reconceptualization of distance education. // The American Journal of Distance Education, 2 .3 (1988.), P. 25-35. int.source: http: //old.ihets.org/consortium/ipse/fdhandbook/resrch.html. (13. 03. 2017.)
15. Garrison, D. R. Computer conferencing The post-industrial age of distance education : Open Learning. // The American Journal of Distance Education, 12, 2, (1997.), p. 3-11.

7th INTERNATIONAL MARITIME SCIENCE CONFERENCE
308
April 20th-21st, 2017, Solin, Croatia
DATA BASED MODELLING OF THE MEAN WAVE PERIOD IN THE ADRIATIC SEAMarko Katalinić, Luka Mudronja, Petar Matić
DATA BASED MODELLING OF THE MEAN WAVE PERIOD IN THE ADRIATIC SEA
Marko Katalinić, Luka Mudronja, Petar Matić
(University of Split, Faculty of Maritime Studies, Split, Croatia)
(E-mail: [email protected])
ABSTRACT
This paper investigates an ability to apply data based modelling methods for mean wave period modelling in a single point in the
Adriatic Sea, while examining the influence of different input variables and their respective time series. For that purpose, regression
analysis and artificial neural network were used. Total of 22-year data with 6h step size, i.e. 33604 data samples acquired from a
satellite calibrated numeric model, were used to form the models. Available data set was divided in two subsets, 20-year data, i.e.
30684 data samples, which were used to calibrate the models, and 2-year data, i.e. 2920 data samples, that were used to test the
model performance. Simulations were performed in Matlab, with the results proving the efficiency of modelling approaches, where
artificial neural network provided more accurate results than traditional statistical models. Furthermore, the advantage of the neural
network was more prominent for the case of multiple input variables.
KEY WORDS
sea wave modelling, Adriatic Sea, data based modelling, mean wave period, Matlab
1. INTRODUCTION
In this paper, two data based approaches were investigated for the mean wave period modelling in the Adriatic Sea, artificial neural network (ANN) and regression analysis, while examining the influence of a different input variables and its time series. The mean wave period (MWP) is one of the parameters that describe sea state and represents the mean of all wave periods in a time-series. In general terms, a model can be formed based on the mathematical formulation of the physical processes that occur in the system being modelled, and that model is called physical model. The model can also be formed based on the measured values of the input and output variables of the system. That model is called the
experimental or statistical model, and although it does not give insight to the physical properties of the system, it better describes the input-output behavior of the system (Matić et al., 2015). Two modelling approaches are often used for that matter, a regression analysis and artificial neural networks (ANNs). While regression based models require a strict mathematical form of a model to be defined, neural network uses more flexible structure to adjust to the data. ANNs can be regarded as an alternative to traditional, regression based statistical models that are expected to provide better modelling results especially in complex cases where multiple variables influence the output. So far, ANNs were successfully applied to a large number of different computational problems such as pattern
* Reprinted with permission from: Transactions on Maritime Science (ToMS)
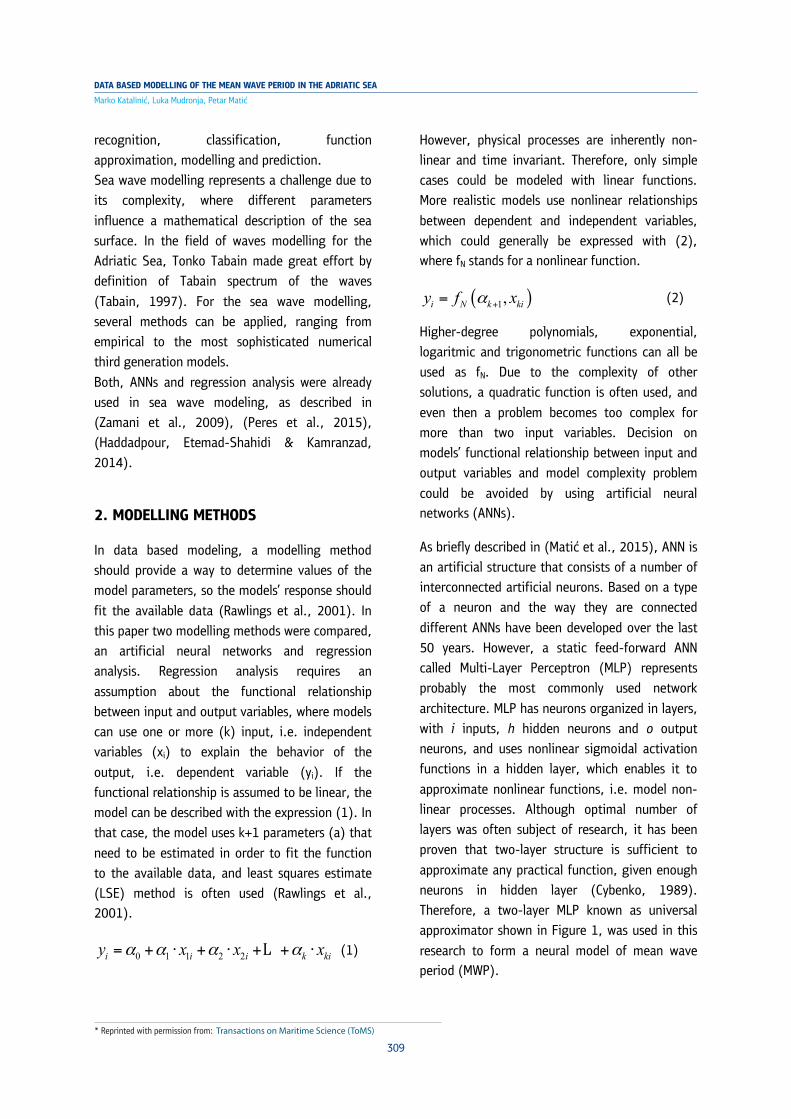
309
Marko Katalinić, Luka Mudronja, Petar Matić
DATA BASED MODELLING OF THE MEAN WAVE PERIOD IN THE ADRIATIC SEA
recognition, classification, function approximation, modelling and prediction. Sea wave modelling represents a challenge due to its complexity, where different parameters influence a mathematical description of the sea surface. In the field of waves modelling for the Adriatic Sea, Tonko Tabain made great effort by definition of Tabain spectrum of the waves (Tabain, 1997). For the sea wave modelling, several methods can be applied, ranging from empirical to the most sophisticated numerical third generation models. Both, ANNs and regression analysis were already used in sea wave modeling, as described in (Zamani et al., 2009), (Peres et al., 2015), (Haddadpour, Etemad-Shahidi & Kamranzad, 2014).
2. MODELLING METHODS
In data based modeling, a modelling method should provide a way to determine values of the model parameters, so the models’ response should fit the available data (Rawlings et al., 2001). In this paper two modelling methods were compared, an artificial neural networks and regression analysis. Regression analysis requires an assumption about the functional relationship between input and output variables, where models can use one or more (k) input, i.e. independent variables (xi) to explain the behavior of the output, i.e. dependent variable (yi). If the functional relationship is assumed to be linear, the model can be described with the expression (1). In that case, the model uses k+1 parameters (a) that need to be estimated in order to fit the function to the available data, and least squares estimate (LSE) method is often used (Rawlings et al., 2001).
0 1 1 2 2i i i k kiy x x xα α α α= + ⋅ + ⋅ + + ⋅L (1)
However, physical processes are inherently non-linear and time invariant. Therefore, only simple cases could be modeled with linear functions. More realistic models use nonlinear relationships between dependent and independent variables, which could generally be expressed with (2), where fN stands for a nonlinear function.
( )1,i N k kiy f xα += (2)
Higher-degree polynomials, exponential, logaritmic and trigonometric functions can all be used as fN. Due to the complexity of other solutions, a quadratic function is often used, and even then a problem becomes too complex for more than two input variables. Decision on models’ functional relationship between input and output variables and model complexity problem could be avoided by using artificial neural networks (ANNs).
As briefly described in (Matić et al., 2015), ANN is an artificial structure that consists of a number of interconnected artificial neurons. Based on a type of a neuron and the way they are connected different ANNs have been developed over the last 50 years. However, a static feed-forward ANN called Multi-Layer Perceptron (MLP) represents probably the most commonly used network architecture. MLP has neurons organized in layers, with i inputs, h hidden neurons and o output neurons, and uses nonlinear sigmoidal activation functions in a hidden layer, which enables it to approximate nonlinear functions, i.e. model non-linear processes. Although optimal number of layers was often subject of research, it has been proven that two-layer structure is sufficient to approximate any practical function, given enough neurons in hidden layer (Cybenko, 1989). Therefore, a two-layer MLP known as universal approximator shown in Figure 1, was used in this research to form a neural model of mean wave period (MWP).
* Reprinted with permission from: Transactions on Maritime Science (ToMS)

7th INTERNATIONAL MARITIME SCIENCE CONFERENCE
310
April 20th-21st, 2017, Solin, Croatia
Figure 1. MLP network, a universal approximator
To form a neural model of the system, ANN needs to be trained, which is done based on the examples presented to the network during the training (or learning) process. During that process an algorithm is used to modify the network parameters (w) in order to minimize the error between network output and desired value for a given input values. ANNs model the process in a similar way human brain does when it “gets to know the system”, it learns from experience. However, this is also the way statistical models work; they also “learn” from the examples of input-output data pairs. The knowledge they both have about the system is stored in the adjustable parameters of the model. The difference is that ANNs uses a flexible neural structure to adjust to the data, which enables it to approximate any simple or composite function, unlike statistical models where exact function needs to be defined in advance. In this paper, Bayesian regularization (BR) algorithm from Matlabs’ neural network toolbox was used to train the neural models. BR is a useful tool in determining sufficient number of hidden neurons, making an improvement to the Levenberg-Marquardt (LM) algorithm, already proven to be the fastest and most appropriate
algorithm for training networks containing up to few hundreds of adjustable parameters (Beale et al., 2010). Number of hidden neurons determines the quality of the neural model, and therefore represents inevitable subject of research in model development process.
3. CASE STUDY – MEAN WAVE PERIOD MODELLING OF THE ADRIATIC SEA WAVE
Available data were obtained from the company for environmental monitoring Fugro OCEANOR with the aim of use in DATAS (Damaged Tanker in The Adriatic Sea) project funded by the Croatian Science Foundation. Collected data are based on a numerical hindcast which was calibrated with satellite altimetry mapping in period between January 1992 and January 2016, with time step of 6 hours in 40 points in the Adriatic Sea. Calculations in this paper deal with data in a single point in the Adriatic Sea (42.00 N, 17.00 E). The chosen point is on a frequent merchant ship route from Otrant (SE entrance in the Adriatic Sea) towards ports in the NE part (Rijeka, Venezia, Koper). The total available data included 12 variables, while in this study only 4 variable data were used, as presented in Table 1.
* Reprinted with permission from: Transactions on Maritime Science (ToMS)

311
Marko Katalinić, Luka Mudronja, Petar Matić
DATA BASED MODELLING OF THE MEAN WAVE PERIOD IN THE ADRIATIC SEA
Table 1. Data used for modelling purposes
Variable name Abbreviation Unit
Significant wave height SWH m (meters)
Mean wave period MWP s (seconds)
Wind speed at 10 m height WSP m/s (meters/second)
Wind direction at 10 m height WDIR ° (degrees)
3.1. Data analysis
The correlation analysis was performed to examine the influence of the potential input variables, with
the results presented in Table 2, providing an insight to the input and output variable dependence.
Table 2. Correlation analysis for potential input variables for the chosen point in the Adriatic Sea
WSPt WDIRt SWHt MWPt-1
MWPt 0.421069 -0.09684 0.691128 0.839201
Based on the results shown in Table 2, it can be assumed that MWPt is strongly influenced by the SWHt and its own value from previous calculation step, i.e. MWPt-1, while WSPt has some influence to the MWPt and WDIRt has none. Therefore, time series of the variables: SWH, WSP and MWP are investigated as the potential inputs to the MWPt model through a set of model based experiments.
3.2. Model formulation
From the set of 22-year data available, 20-year data were used for calibrating the models and 2-
year data for testing the models, which resulted in 30684 samples for calibrating and 2920 samples for testing the models performances, due to the 6h sample rate. In order to define optimal input variables to model current value of the mean wave period (MWPt), a set of potential input variables was evaluated through series of experiments as described in Table 3.
* Reprinted with permission from: Transactions on Maritime Science (ToMS)

7th INTERNATIONAL MARITIME SCIENCE CONFERENCE
312
April 20th-21st, 2017, Solin, Croatia
Table 3. Experiment setup for optimal input variables detection
i Formulation
1 MWPt = f (MWPt-k1)
2 MWPt = f (MWPt-k1, SWHt-k2)
3 MWPt = f (MWPt-k1, SWHt-k2, WSPt-k3)
4 MWPt = f (SWHt-k2, WSPt-k3)
5 MWPt = f (SWHt-k2)
First, the influence of the variable with the highest score in correlation test was examined as a single input variable, and then other variables were included. Therefore, experiment 1 was used to determine the optimal number of the MWP time series members as inputs (k1). In experiment 2, k1 number of inputs was expended with SWH time series, and the optimal number of the time series members k2 was determined. In experiment 3, the input set of variables was furtherly expanded by the WSP time series in order to determine optimal number k3. Therefore, maximal number of inputs in all experiments was Ni_max = k1+k2+k3, which was reduced in experiments 4 and 5, as defined in table 3 to examine the impact of the variables added later to the set of inputs. For each experiment i ∈ [1, 5] two models were formed, a neural network model (NNMi), and a regression model (RMi).
3.3. Model evaluation
To evaluate models performances graphical and numerical methods can be used. Graphical methods enable visual comparison of the model response to the actual values, while numerical methods measure the exact quantity of models response deviation from the actual value. The authors of (LeGates and McCabe, 1999) proposed a set of different statistical measures to evaluate the quality of the model, and recommended that the set should include at least one relative and one absolute measure. In paper (Moriasi et al., 2007), model classification is made based on the values of CE, RSR and PBIAS quality measures. In the
paper (Gupta et al, 1999) the application of Persistence Index (PI) is also recommended.
Therefore, to evaluate the models quality in this paper, both graphical and following numerical measures are used, absolute: root mean squared error (RMSE), mean absolute error (MAE); and relative: Nash-Sutchllife coefficient of efficiency (NSC, or CE), percent bias (PBIAS), RMSE to standard deviation ratio (RSR) and persistency index (PI).
Furthermore, in order to compare modelling approaches, i.e. neural networks and regression analysis, a model comparison coefficient (MCCPI) was created in this paper, as described with the expression (3).
max
max
1RMPI
NM
PI PIMCC
PI PI−
= −−
(3)
Since PI has been identified as the most sensitive criterion among the numerical measures used in this paper, MCCPI uses PI values of the RM and NM to calculate the value which ranges from –∞ to
+∞. Positive values indicate better performances of the NM, negative values indicate better performances of the RM expressed in percentages, and value of the MCCPI close to zero indicates that there is no advantage in either models performance.
4. RESULTS AND DISCUSSION
As defined in Table 3, experiments 1 to 5 were performed to determine optimal set of input
* Reprinted with permission from: Transactions on Maritime Science (ToMS)

313
Marko Katalinić, Luka Mudronja, Petar Matić
DATA BASED MODELLING OF THE MEAN WAVE PERIOD IN THE ADRIATIC SEA
variables for modelling MWP, and the results are presented in Table 4. The best performances of the models from experiment 1 can be obtained when two time series members are used as inputs, i.e. MWPt-1 and MWPt-2. Therefore, neural model NM1 has two input neurons and performs best with 40 hidden neurons to calculate MWPt. Optimal RM11 model is described with the expression (4), where y stands for MWP.
yt = 0.0477 ⋅ yt−12 +0.5613⋅ yt−1
−0.0312 ⋅ yt−22 +0.1473⋅ yt−2 +0.8462
(4)
The models from experiment 2 perform best when three time series members of SWH are used as input variables, i.e. SWHt, SWHt-1, SWHt-2, in addition to MWPt-1 and MWPt-2, determined in experiment 1. Optimal set of input variables was determined through a model based experiment using artificial neural network, and the same variables were used to form a regression model, described with (5), where x(1) stands for SWH. Neural network used in the experiment has 40 neurons of hidden layer, also determined as a subject of the experiments performed.
yt = 0.0271⋅ yt−12 +0.5189 ⋅ yt−1 −0.013⋅ yt−2
2
+0.1495⋅ yt−1 +0.032 ⋅ xt(1)( )
2+0.4524 ⋅ xt
(1)
−0.224 ⋅ xt−1(1)( )
2+1.0952 ⋅ xt−1
(1)
+0.1311⋅ xt−2(1)( )
2−1.0294 ⋅ xt−2
(1) +0.6407
(5)
In order to improve model performances another input variable was included in the experiment 3, namely a WSP, and the experiments performed on a neural model suggested 4 time series members to be included in the set of input variables (WSPt, WSPt-1, WSPt-2, WSPt-3) in addition to already established members of the input set. All neural models were formed using 40 neurons of the hidden layer. The same variables were used to
form a regression model, described with (6), where x(2) stands for WSP.
yt = 0.0316 ⋅ yt−1( )2+0.5118 ⋅ yt−1
−0.0119 ⋅ yt−2( )2+0.1371⋅ yt−2 +
−0.0928 ⋅ xt(1)( )
2+1.9301⋅ xt
(1)
−0.1719 ⋅ xt−1(1)( )
2−0.0035⋅ xt−1
(1)
+0.1403⋅ xt−2(1)( )
2−1.0878 ⋅ xt−2
(1)
−0.0028 ⋅ xt(2)( )
2−0.1286 ⋅ xt
(2)
+0.0041⋅ xt−1(2)( )
2+0.011⋅ xt−1
(2)
+0.0002 ⋅ xt−2(2)( )
2+0.024 ⋅ xt−2
(2)
+0.0002 ⋅ xt−3(2)( )
2+0.0173⋅ xt−3
(2)
+0.7487
(6)
For the purpose of the experiment 4, MWP time series was excluded from the input set of variables. The neural network was trained using 40 neurons of the hidden layer, and the regression model was formed based on the expression (7).
yt = −0.0717 ⋅ xt(1)( )
2+1.7557 ⋅ xt
(1)
−0.216 ⋅ xt−1(1)( )
2+1.4855⋅ xt−1
(1) −0.0275⋅ xt−2(1)( )
2
+0.1383⋅ xt−2(1) −0.0012 ⋅ xt
(2)( )2−0.1443⋅ xt
(2)
−0.0011⋅ xt−1(2)( )
2+0.078 ⋅ xt−1
(2) −0.0015⋅ xt−2(2)( )
2
+0.0565⋅ xt−2(2) −0.0025⋅ xt−3
(2)( )2+0.041⋅ xt−3
(2)
+2.6518
(7)
In the experiment 5, an input set of variables was furtherly reduced by the variable WSP. The neural network was trained using 40 neurons of the hidden layer, and the regression model was formed based on the expression (8).
* Reprinted with permission from: Transactions on Maritime Science (ToMS)

7th INTERNATIONAL MARITIME SCIENCE CONFERENCE
314
April 20th-21st, 2017, Solin, Croatia
yt = 0.1295⋅ xt(1)( )
2−0.0192 ⋅ xt
(1)
−0.2088 ⋅ xt−1(1)( )
2+1.4863⋅ xt−1
(1)
+0.0122 ⋅ xt−2(1)( )
2+0.13⋅ xt−2
(1)
+2.4289
(8)
Table 4. Numerical evaluation of neural and regression MWP models
Model Absolute Relative RMSE MAE PI CE PBIAS RSR NM1 0.648 0.419 0.232 0.766 -0.562 0.571 RM1 0.684 0.438 0.144 0.739 -0.95 0.624 NM2 0.483 0.292 0.573 0.87 -1.535 0.388 RM2 0.582 0.325 0.378 0.811 -2.241 0.497 NM3 0.394 0.208 0.716 0.914 -1.604 0.309 RM3 0.544 0.27 0.459 0.835 -1.963 0.456 NM4 0.676 0.341 0.162 0.745 -6.4 0.658 RM4 0.776 0.418 -0.105 0.664 -8.202 0.854 NM5 0.808 0.498 -0.198 0.636 -7.442 0.893 RM5 0.835 0.532 -0.277 0.611 -8.482 0.966
Based on the numerical evaluation presented in Table 4, it can be noted that NM1 and RM1 are fair representatives of the system, where NM1 is slightly better evaluated by all of the numerical
measures used. However, Figure 2 shows that both models suffer from a lag effect, as a serious deficiency of the models.
Figure 2. Models responses comparison to actual values of MWP from experiment 1
NM2 and RM2 are better evaluated than the models from experiments 1, where NM2 is better
evaluated than RM2 by all numerical measures. Based on the graphical evaluation shown in Figure
* Reprinted with permission from: Transactions on Maritime Science (ToMS)

315
Marko Katalinić, Luka Mudronja, Petar Matić
DATA BASED MODELLING OF THE MEAN WAVE PERIOD IN THE ADRIATIC SEA
3, it can be noted that NM2 and RM2 fit the actual MWP data quite accurately and mostly without the
lag effect. However, in some cases lag effect can still be noted.
Figure 3. Models responses comparison to actual values of MWP from experiment 2
Numerical and graphical evaluation indicate that both NM3 and RM3 benefit from the inclusion of the WSP time series into the set of model inputs, while NM3 produces better results. As Figure 4
shows, the remaining prediction lag from the experiment 2 is almost completely removed in experiment 3.
Figure 4. Models responses comparison to actual values of MWP from experiment 3
To examine the impact of the variables added later to the set of inputs, MWP, as the most influential variable, was excluded from the set of input variables in experiment 4. It can also be assumed
that MWP time series at the input are responsible for the lag effect. Therefore, in experiment 4 that assumption was investigated.
* Reprinted with permission from: Transactions on Maritime Science (ToMS)

7th INTERNATIONAL MARITIME SCIENCE CONFERENCE
316
April 20th-21st, 2017, Solin, Croatia
Figure 5. Models responses comparison to actual values of MWP from experiment 4
Although graphical evaluation presented in Figure 5 shows no signs of lag effect, based on the numerical evaluation presented in Table 4, it can be noted that NM4 and RM4 are less accurate models of the system. Therefore, it can be concluded that MWP modelling of sufficient accuracy and without lag effect is possible using SWH and WSP time series at the input, excluding the MWP time series would downgrade models overall quality.
In similar way, excluding WSP variable from set of input variables also decreases models performances, as can be seen from the numerical evaluation presented in table 4. Furthermore, it can be noted that NM5 and RM5 are evaluated as unsatisfactory accurate models of the system by PI and RSR measures of quality. On the other hand, graphical evaluation from the figure 6 shows no sign of a lag effect, and a solid fit of the models responses to the actual data.
Figure 6. Models responses comparison to actual values of MWP from experiment 5
Based on the simulation results it can be concluded that MWP can be modelled with data based modelling methods, i.e. regression analysis and artificial neural network, where best results can be obtained when ANN with 9 input variables is used as inputs, namely: MWPt-1, MWPt-2, SWHt,
SWHt-1, SWHt-2, WSPt, WSPt-1, WSPt-2, WSPt-3 for the case study presented in this paper.
The models comparison based on MCCPI criterion is presented in Table 5 and in Figure 7. Table 5 shows MCCPI values for the experiments 1 to 5 and the number of inputs those models use.
* Reprinted with permission from: Transactions on Maritime Science (ToMS)

317
Marko Katalinić, Luka Mudronja, Petar Matić
DATA BASED MODELLING OF THE MEAN WAVE PERIOD IN THE ADRIATIC SEA
Table 5. NM and RM model performance comparison based on the MCCPI
MCCPI values presented in Table 5 suggest that NM1 is 12% more accurate than the RM1, where both models use 2 input variables. NM2 is 46% more accurate than the RM2, where both models use 5 input variables, etc. Based on the MCCPI it can be concluded that the NM is better than the RM in general, and that the advantage of NM over RM increases as the number of input variables of the model increases.
Figure 7. MCCPI values for the experiments 1 to 5
5. CONCLUSION
The purpose of this paper was to investigate the ability of Adriatic Sea waves mean wave period (MWP) modelling using data based modelling methods, i.e. artificial neural networks (ANN) regression analysis.
Based on the results presented in section 4 it can be concluded that data based modelling can be successfully applied to mean wave period modelling of the Adriatic Sea waves, where artificial neural networks produce better results than regression models. Furthermore, neural model was more dominant over the regression model for more input variables used. The advantage of neural network is also expressed in simplicity of model formulation, which allows easier experiment performing.
Therefore, neural model served as a base model for investigating optimal number of time series members for each input variable, i.e. MWP, SWH and WSP, and regression model was only used to validate neural model performances on the same set of inputs. For the case study, the best results can be obtained when 9 input variables are used as inputs, namely: MWPt-1, MWPt-2, SWHt, SWHt-1, SWHt-2, WSPt, WSPt-1, WSPt-2, WSPt-3; i.e.: two preceding mean wave periods, current and two preceding significant wave heights, current and three preceding wind speeds.
Regarding time series investigation of the input variables, interesting conclusion can be made. By showing the significance of including longer time series of the WSP, experiments revealed the importance of wind duration information to the MWP modelling which is indirectly included through time series of WSP.
Challenges of the further research include prediction ability investigation, as well as prediction horizon determination. Furthermore, modelling and prediction of other sea state variables are of special interest, as well as extension of the experiments to all of the 40 available points in the Adriatic Sea. The resulting model from the following research should provide reliable information for the ship response modelling purposes with final goal of the optimizing route in the heavy seas. Generally, wave period information, i.e. the corresponding wave frequency and length in deep water, is important when designing ship and/or offshore structures in order to avoid resonant rolling or pitching motions by choosing the appropriate overall dimension which will not coincide with dominant wave lengths from various directions
EXPERIMENT 1 2 3 4 5 MCCPI 0.12 0.46 0.91 0.32 0.10 Ni 2 5 9 7 4
* Reprinted with permission from: Transactions on Maritime Science (ToMS)

7th INTERNATIONAL MARITIME SCIENCE CONFERENCE
318
April 20th-21st, 2017, Solin, Croatia
that will be encountered in service. In such a way the natural response frequency of a ship or an offshore structure can be “moved away” from dominant wave excitation frequencies thus minimizing undesirable response.
The model proposed in this paper serves as a starting point in developing an efficient, simple, real-time decision making tool that could be used for navigation during bad weather in the Adriatic Sea, based on easily measurable data, i.e. wind speed and direction.
ACKNOWLEDGMENTS
This work has been supported in part by Croatian Science Foundation under the project 8658-DATAS on Faculty of Mechanical Engineering and Naval Architecture, Zagreb University. Company Fugro OCEANOR provided academic license for using sea states data of the Adriatic Sea under the project DATAS. Authors Katalinić Marko and Mudronja Luka are PhD students on Faculty of Mechanical Engineering and Naval Architecture and participate in DATAS project. REFERENCES 1. Beale, Mark Hudson, Martin T. Hagan, and
Howard B. Demuth. "Neural network toolbox 7." User’s Guide, MathWorks (2010).2. Hall, C., "Fleet Management", ToMS, Vol. 2, No. 2 (2011), pp. 77-81. [A reference to a journal article ...]
2 Cybenko, G., 1989. Approximation by Superpositions of a Sigmoidal Function, Math. Control Signals Systems 2, pp. 303-314.
3. Gupta, H.V., Sorooshian, S. and Yapo, P.O., 1999. Status of automatic calibration for hydrologic models: Comparison with multilevel expert calibration. Journal of Hydrologic Engineering, 4(2), pp. 135-143.Biographie
4. Haddadpour, S., Etemad-Shahidi, A., Kamranzad, B., 2014. Wave energy forecasting using artificial neural networks in the Caspian Sea, ICE-Maritime Engineering, DOI: 10.1680/maen.13.00004.
5. Katalinić, M., Ćorak, M., Parunov, J. Analysis of wave heights and wind speeds in the Adriatic Sea, Maritime Technology and Engineering, Gudes Soares, C., Santos, T. (ed.), London, Taylor & Francis Group, 2015. 1389-1394. Matić, P., Golub Medvešek, I. and Perić, T., 2015. System Identification in Difficult Operating Conditions Using Artificial Neural Networks. Transactions on Maritime Science, 4(02), pp. 105-112.
7. Moriasi, D.N., Arnold, J.G., Van Liew, M.W., Bingner, R.L., Harmel, R.D. and Veith, T.L., 2007. Model evaluation guidelines for systematic quantification of accuracy in watershed simulations. Trans. Asabe, 50(3), pp. 885-900.
8. Peres, D.J., Iuppa, C., Cavallaro, L., Cancelliere, A., Foti, E., 2015. Significant wave height record extension by neural networks and reanalysis wind data, Ocean Modelling 94, 128–140.
9. Rawlings, John O., Sastry G. Pantula, and David A. Dickey, 2001. Applied regression analysis: a research tool. Springer Science & Business Media, 2001.
10. Tabain T. Standard wind wave spectrum for the Adriatic Sea revisited. Brodogradnja. 1997;(45), pp. 303-313. 11. Zamani, A., Azimian, A., Heemink, A., Solomatine, D., 2009. Wave height prediction at the Caspian Sea using a datadriven model and ensemble-based data assimilation methods, Journal of Hydroinformatics 11.2, pp. 154 – 164 (doi: 10.2166/hydro.2009.043)
* Reprinted with permission from: Transactions on Maritime Science (ToMS)

319
Neven Grubišić, Ana Perić-Hadžić, Mladen Jardas
DEVELOPMENT OF OCCUPATIONAL STANDARDS AND COMPETENCES IN MARITIME TRANSPORT AND LOGISTICS
DEVELOPMENT OF OCCUPATIONAL STANDARDS AND COMPETENCES IN MARITIME TRANSPORT AND LOGISTICSNeven Grubišić, Ana Perić-Hadžić, Mladen Jardas
DEVELOPMENT OF OCCUPATIONAL STANDARDS AND COMPETENCES IN MARITIME TRANSPORT AND LOGISTICS
Neven Grubišić, Ana Perić-Hadžić, Mladen Jardas
(Faculty of Maritime Studies, University of Rijeka, Studentska 2, 51000 Rijeka, Croatia)
(E-mail: [email protected])
ABSTRACT
Croatian Qualifications Framework (HKO) is a reform instrument that regulates the system of qualifications in the Republic of Croatia. It aims to increase the transparency and quality of the entire educational system, to establish a link between educational programmes and labour market and to facilitate the mobility of the European Higher Education Area and European labour market. Within the KIKLOP project, the real needs of the labour market in the area of maritime transport and logistics have been studied and key occupations and the necessary competences to perform key tasks within these professions have been identified. The research has been carried out by analysing databases from different sources, analysing the demand for the labour market, surveying entrepreneurs engaged in different sectors of maritime transport and logistics, tracking the number and structure of the advertisements available over the internet sources and social networks, and by interviewing several key experts in the targeted areas. Based on this information, the organization of the maritime sector has been mapped. The organization specifies and groups particular business services and occupations. Based on the criteria developed, 23 occupations have been selected and allocated to these professions for which the standards of competences and a matrix have been created.
The paper aims at describing the methodological procedure for the creation of occupational standards and a matrix of competences. Examples of these standards have been presented with an emphasis on new professions which appeared on the market, arising from changes in the maritime industry and in the increasing specialization of maritime activities.
KEY WORDS
Croatian Qualifications Framework, occupational standards, matrix of competences, maritime transport and logistics
1. INTRODUCTION
Croatian Qualifications Framework (HKO) regulates the system of qualifications in the Republic of Croatia [1]. HKO is a key reform instrument that aims to increase the transparency and quality of the entire educational system, to establish a link between educational programmes and labour market needs and to facilitate the recognition of non-formal and informal learning. Furthermore, HKO needs to be recognizable within the European Qualifications Framework - EQF [2] and associated to the Qualifications Framework of the European Higher Education Area - QF-EHEA [3]. This facilitates the long-term mobility of citizens in terms of learning to the European Higher Education Area and the mobility and
competitiveness of Croatian workers on the European market.
The mechanism of HKO is designed to articulate the needs of the labour market towards the education sector. It is a key link in the cycle of development of knowledge in the function of the relevance of education for economic development. The aim is to coordinate the development of education with the current and future needs for competencies and skills on the labour market.
The Strategy of Maritime Development and the 2014-2020 Integrated Maritime Policy of the Republic of Croatia clearly focus on strengthening the role of maritime affairs in the development and competitiveness of Croatian economy making

7th INTERNATIONAL MARITIME SCIENCE CONFERENCE
320
April 20th-21st, 2017, Solin, Croatia
the maritime affairs one of the most important industries in Croatia. Furthermore, it stimulates the development and promotion of Croatia as an international centre of excellence for the education and training of maritime occupations. This includes strengthening the influence of Croatian maritime sector to European and world markets [4]. For the realization of the above mentioned objectives, the system of education will have a key role
For this reason, the project KIKLOP - Development of Qualification and Innovative Methods of Competence Acquisition in Logistics and Maritime Transport [5] has been designed, aiming at carrying out a research in order to recognize the real needs of the labour market in the field of maritime transport and logistics, the needs for new skills and occupations and to develop a proposal of occupational standards and a matrix of competences based on the principles of Croatian Qualifications Framework (HKO) in accordance with the market needs.
2. METHODOLOGY FOR THE DEVELOPMENT OF OCCUPATIONAL STANDARDS AND MATRIX OF COMPETENCES
The development of occupational standards in the subsector of maritime transport and logistics, as standards of individual performance that must be competent when carrying out activities in the workplace, together with specifications of the underpinning knowledge and understanding, should be based on the research needs of the labour market. The aim is to provide a functional system of education and lifelong learning programmes [6] that connect the requirements and needs of the labour market and the requirements for the qualifications acquired through the educational system [7]. The educational system should cover the current market needs, but also it should follow the dynamics of movement and the future demand for certain occupations. The research methodology is based on the fact that the standards of occupation in Croatia are not defined [8]. The methodology of occupational standards and competence matrix is shown in Scheme 1.
Figure 1. Methodology for the Development of Occupational Standards and Competence Matrix
Source: Authors
The first step in the development of occupational standards is the analysis of the existing national databases, such as the database of the Ministry of Labour and Pension System, the Croatian Employment Service, the list of occupations according to the National Classification of Occupations etc. [9] in order to identify the existing occupations and in cooperation with employers and project partners identify potential new occupations arising from the labour market. The criteria taken into account when selecting possible occupations for a further development of national standards are [10]:
− market attractiveness and representation among partners and other employers,
− representation of different areas and activities within the subsector of Maritime Transport and Logistics,
− balance ratio between seagoing occupation (interest in the work of the board) and maritime and logistics interest ashore, the potential for the development of small and medium enterprises (SMEs),
− occupation from the current National Classification of Occupations [11] and the occupation from the ESCO - the multilingual classification of European Skills, Competences, Qualifications and Occupations
The main task in the development of occupational standards is to determine the key tasks/activities and identify the knowledge and skills necessary to perform them. Knowledge and skills combine competences that the employee must acquire through educational system or work experience [12].
Analysing the work processes and the key activities performed in the workplace, the existing and new competences, occupational standards have been detected. Based on the recognised competences, the occupational standards, qualifications standards and educational programmes can be (re)developed. The proposal of the Ministry of Labour and Pension System and the Croatian Employment Service (HZZ) represents a developed survey on the occupational standards for the employer as a methodology tool. [8] The survey contains questions on key job activities in
the workplace and required knowledge and skills, or competences.
The structure of the proposed questionnaire has been adapted within the description of the key tasks and competences [10]. In fact, all employers who participated in the consultations and preliminary study have highlighted the necessity to change the form and input of the survey in defining the key job activities and competences.
The adjustment of the questionnaire has been effected within the description of key job activities and competences in order to simplify the filling in of the questionnaire and to achieve the objective of the survey - getting data from employers on key tasks, knowledge and skills required for a particular occupation. The proposed questionnaire has not been changed when testing the generic skills and psychomotor abilities and characteristics of the workplaces. A special attention has been dedicated to the preparation of the questionnaire. Moreover, besides the questionnaires, there are other methodological tools that have been used, such as interviews, focus groups, workshops, etc.
Grouping all the competences of occupational standards, it was possible to develop matrix of competences - a tool that creates a set of competences from several occupations covered by each qualification and programme of study (curriculum). This is the point where it is possible to clearly determine whether it is or not the competence gap in relation with the learning outcomes of individual curriculum. If there is a gap or incompatibility, it is important to find a solution how to change, improve and (re)develop the existing study programme in the HKO sector of Maritime Transport and Logistics or how to compensate the gap with an additional educational programme which is, in general, the worst solution [13].
3. DATA COLLECTION AND MODEL FORMULATION
3.1. Identification of the Maritime
System and Its Specifics
After the independence of Croatia and the transition to market economy, there have been

321
Neven Grubišić, Ana Perić-Hadžić, Mladen Jardas
DEVELOPMENT OF OCCUPATIONAL STANDARDS AND COMPETENCES IN MARITIME TRANSPORT AND LOGISTICS
The first step in the development of occupational standards is the analysis of the existing national databases, such as the database of the Ministry of Labour and Pension System, the Croatian Employment Service, the list of occupations according to the National Classification of Occupations etc. [9] in order to identify the existing occupations and in cooperation with employers and project partners identify potential new occupations arising from the labour market. The criteria taken into account when selecting possible occupations for a further development of national standards are [10]:
− market attractiveness and representation among partners and other employers,
− representation of different areas and activities within the subsector of Maritime Transport and Logistics,
− balance ratio between seagoing occupation (interest in the work of the board) and maritime and logistics interest ashore, the potential for the development of small and medium enterprises (SMEs),
− occupation from the current National Classification of Occupations [11] and the occupation from the ESCO - the multilingual classification of European Skills, Competences, Qualifications and Occupations
The main task in the development of occupational standards is to determine the key tasks/activities and identify the knowledge and skills necessary to perform them. Knowledge and skills combine competences that the employee must acquire through educational system or work experience [12].
Analysing the work processes and the key activities performed in the workplace, the existing and new competences, occupational standards have been detected. Based on the recognised competences, the occupational standards, qualifications standards and educational programmes can be (re)developed. The proposal of the Ministry of Labour and Pension System and the Croatian Employment Service (HZZ) represents a developed survey on the occupational standards for the employer as a methodology tool. [8] The survey contains questions on key job activities in
the workplace and required knowledge and skills, or competences.
The structure of the proposed questionnaire has been adapted within the description of the key tasks and competences [10]. In fact, all employers who participated in the consultations and preliminary study have highlighted the necessity to change the form and input of the survey in defining the key job activities and competences.
The adjustment of the questionnaire has been effected within the description of key job activities and competences in order to simplify the filling in of the questionnaire and to achieve the objective of the survey - getting data from employers on key tasks, knowledge and skills required for a particular occupation. The proposed questionnaire has not been changed when testing the generic skills and psychomotor abilities and characteristics of the workplaces. A special attention has been dedicated to the preparation of the questionnaire. Moreover, besides the questionnaires, there are other methodological tools that have been used, such as interviews, focus groups, workshops, etc.
Grouping all the competences of occupational standards, it was possible to develop matrix of competences - a tool that creates a set of competences from several occupations covered by each qualification and programme of study (curriculum). This is the point where it is possible to clearly determine whether it is or not the competence gap in relation with the learning outcomes of individual curriculum. If there is a gap or incompatibility, it is important to find a solution how to change, improve and (re)develop the existing study programme in the HKO sector of Maritime Transport and Logistics or how to compensate the gap with an additional educational programme which is, in general, the worst solution [13].
3. DATA COLLECTION AND MODEL FORMULATION
3.1. Identification of the Maritime
System and Its Specifics
After the independence of Croatia and the transition to market economy, there have been

7th INTERNATIONAL MARITIME SCIENCE CONFERENCE
322
April 20th-21st, 2017, Solin, Croatia
inevitable changes that followed worldwide maritime trends. With the globalization of the maritime shipping market, the traditional organization of shipping has also experienced changes. The reason for this change lies in the fact that it was no longer possible to operate
functionally without dispersion of certain activities to specific occupational groups or separation of them into specific firms. The complexity of the today's structure of the maritime transport sector and cluster activities is shown in scheme 2.
Figure 2. Maritime System and Its Specifics
Source: Authors
At the level of the Croatian maritime cluster, activities that are related to maritime traffic, maritime transport, transport logistics activities, activities related to the maritime offshore industry can be extracted. The basic cluster group in the maritime sector includes all activities that are closely related to maritime transport. Activities can be divided in several groups: maritime safety, ports and terminals, ship management, sea freight shipping (liners, trumps, tankers, off-shore), marine passenger shipping (liners, tourists), shipping agencies and brokerage, booking of ships and cargo (ship - brokering), control activities,
cargo surveying, ship supply services, maintenance and repair of marine equipment, marine insurance and public administration. Specialization is especially emphasized in the group of ship management. The following activities such as crew management, technical management, HSEQ management (Health, Safety, Environment and Quality) and ship chartering have been pointed out [14]. In addition to the traditionally important shipbuilding industry in Croatia, there is an increasing importance of nautical tourism and activities that contribute to the nautical and excursion tourism and the

323
Neven Grubišić, Ana Perić-Hadžić, Mladen Jardas
DEVELOPMENT OF OCCUPATIONAL STANDARDS AND COMPETENCES IN MARITIME TRANSPORT AND LOGISTICS
production and maintenance of crafts and their equipment.
It should be noted that the result of a narrow specialization within the Croatian shipping business in recent years has resulted in the establishment of many small companies (SMEs) that are looking for their position on the market by doing business with large shipping companies operating on the global market [15]. Higher specialization leads to higher demands in terms of quality business which is associated with growing demands of the market and stronger competition among companies involved in sectoral activities. Besides that, the foreign shipping companies and other companies have founded firms in Croatia, which are 100% owned by them (e.g., shipping agencies, ship-management agencies, etc.).
This leads to a conclusion that changes raised from the process of globalization of the maritime sector have contributed to the changes in the structure of local employers and small company development which is considerably more flexible and more successfully adaptable to business dynamics that follow rapid adjustments of shipping companies on the global transport market [14].
3.2. Identification of Occupations in the Sub-sector of Maritime Transport and Logistics
For the realization and fulfilment of the results obtained in the development of occupational standards, it was important to adjust the previously proposed methodology to the given survey of the Ministry of Labour and Pension System [10]. In order to follow the instructions of the Ministry of Labour in order to extent better the implementation of the questionnaire, consultations have been carried out with project partners, but also with a number of key employers covering important sectoral areas. For this purpose, it was necessary to redefine the methodological procedure that determines the occupational choice, because the choice of occupation is a precondition for the implementation of the survey wherefore a preliminary study was necessary.
As part of its own activities, each of the project partners (employers) has conducted an analysis among customers and business partners, and proposed representative occupations for certain areas within the sector. The preliminary study has been attended by about 10 business entities [16].
In this way, 59 occupations of the sector have been identified within a relatively short period of time. Since this was a much larger number than provided by the project, it was necessary to reduce the number and make a selection of about 20 occupations that would be developed further. Based on the mentioned criteria, competences for 23 occupations have been identified.
Due to the characteristics of the maritime sector, it was important to observe the relationship of occupations that are typically "on board occupations" e.g. seamen and ashore occupations. Such division is common in various sources that analyse maritime occupations at the maritime industry. From a total of 23 occupations, 5 occupations have been allocated as "on board occupations", while others as ashore occupations. Among the occupations on land, only two selected occupations have been outside the maritime transport (and fall in the general part of the traffic) and two occupations in the field of logistics, but are closely related to maritime transport [5].
3.3. Questionnaire of the Ministry of Labour and Social Security
Each of the business partners and employers, who have participated in the preliminary study, have elaborated occupations from their area and filled in the questionnaire within the description of key tasks and specific knowledge and skills required for a particular occupation and workplace. In this way, key tasks and specific competences have been pre-defined for each occupation. The employer who took the survey has been given the opportunity to choose the proposed key tasks and competences in advance, their evaluation according to importance as well as the opportunity to fill in additional key tasks and competences that were not offered in the menu.
The structure of the second part of the questionnaire, specifying general competences,

7th INTERNATIONAL MARITIME SCIENCE CONFERENCE
324
April 20th-21st, 2017, Solin, Croatia
generic skills, psychomotor skills and characteristics of the workplace, has not been changed and has been accepted as appropriate by the project partners and by other employers who have taken part in the preliminary study.
The surveys have been sent to 359 e-mail addresses [17], relatively to an identified number of employers [18] employing above 23 occupations. The number of the employers, as per activities performed, are shown in the following spreadsheet.
Table 1. List of Employers by Activity in the Maritime Cluster
Activity Number of Employers
Ship management 4 Sewage reception and cleaning 8 Hydrography 1 Public administration 7 Companies classification 4 Cargo surveying 27 Port operations 19 Towage 2 Management of urban transport 17 Crew management 44 Maritime shipping 18 Nautical tourism 30 Maintenance and repair of ship equipment 25 Forwarding 39 Pilotage 8 Shipping agency 39 Transport logistics 53 Ship supply services 12 Science and education 2 Total 359
Of the total 359 surveyed, 132 people or about 36% of the interviewee filled in the questionnaire with valid data. For the occupations of a ship master, chief mate, chief engineer, second engineer, marine cargo surveyor, fleet manager, crew manager, marine electrical system specialist, marine communications and navigation systems engineer and marine classification surveyor, additional methods of interviewing have used where discussions have been held with representatives of employers responsible for personnel management. In some cases these companies already have standardized forms of job descriptions and descriptions of competences which have been confirmed by the survey / interview. The survey results have shown that, for all occupations included in the survey, postsecondary education is required. The level of
qualification required according to the survey results is 6 or 7 for certain occupations. [19]
4. RESULTS OBTAINED FROM THE DATA ANALYSIS OF THE TECHNOLOGY AND ORGANIZATION OF TRANSPORT STUDY PROGRAMME
For each individual occupation; out of a total of 23 occupations that have been identified in the previous procedure, key tasks and competences that are required for their implementation have been determined. Occupations are associated to the corresponding undergraduate and graduate study programme in order to achieve the goal of the project – establishment of qualification standards. The number of associated competences depending on occupation is presented in table 2 [5].

325
Neven Grubišić, Ana Perić-Hadžić, Mladen Jardas
DEVELOPMENT OF OCCUPATIONAL STANDARDS AND COMPETENCES IN MARITIME TRANSPORT AND LOGISTICS
Table 2. Number of Competences Depending on Occupational Study Programmes
Occupations as per Study Programmes Number of Individual
Competences Marine Engineering Chief Engineer 68
Second Engineer 68
Marine Electronic Engineering and Information Technology Electro-technician Officer 44
Marine Communications and Navigation Systems Engineer 33
Marine Electrical Systems Specialist 43
Logistics and Management in Maritime Industry and Transport Logistics Manager 62
Warehouse Operation Manager 53
Ship Agent 71 Shipbroker 65
Nautical Studies and Maritime Transport Technology
Ship Master 42
Chief Mate 41
Fleet Manager 42
Crew Manager 45
Harbour Master 63
Pilot 48
Safety of Navigation Coordinator 59
Marine Classification Surveyor 33
Technology and Organization of Transport
Vessel Operation Organizer 39
Yard Operation Organizer 31
Marine Cargo Surveyor 41
Voyage Planner 49
Data Processing Analyst 34
Head of Traffic Engineering and Analytical Data Processing Office 38
Source: Authors
As it can be seen from Table 2, 23 occupations have been identified for all study programmes carried out at the Rijeka Faculty of Maritime Studies. By the identification of key tasks for each individual occupation through surveys, focus groups, workshops, etc., a series of competences have emerged. Each particular occupation is associated to study programmes within which the required competence should be learned. For each
occupation 6-7 key tasks have been determined out of which competences have derived. Students who have completed the Technology and Transport Organization study programme should acquire 168 competences and 34 aggregate competences [19].
Table 3. Matrix of Competences for Maritime Transport Engineers
OCCUPATION KEY JOB ACTIVITIES AGGREGATE COMPETENCES
Data Analyst Analysis and Process Control Activities
Public Transport Planning GIS Application in Transport Urban transport Management Statistics

7th INTERNATIONAL MARITIME SCIENCE CONFERENCE
326
April 20th-21st, 2017, Solin, Croatia
Communications with other Departments Transport Operation Planning Urban Transport Management
General Competences Generic skills Key Competences
Public Transport Operation Planning Transport Networks Public Transport Planning Spatial and traffic planning
Public Transport Monitoring and Control
Transport Networks Public Transport Planning Transport Infrastructure Spatial and Traffic planning
Documentation Preparation and Reporting
Quality Assurance Transport Operation Planning GIS Application in Transport Urban Transport Management
Vessel Operation Organizer
Documentation Preparation and Reporting Technical Maintenance and Process Control Cargo Handling Technique & Organization
Cargo Handling Operation Plan Preparation
Port Infrastructure and Equipment Tactical & Operational Planning of Container Terminals Container Packing Optimization Cargo Handling Technique & Organization
Safety and Process Quality Control Management
Quality Assurance Ship Stability & Stress Technical Maintenance and Process Control Cargo Characteristics Cargo Handling Technique & Organization
Supervision and Performance Control
Quality Assurance Port Infrastructure and Equipment Tactical & Operational planning of Container Terminals Technical Maintenance and Process Control
General Competences
Social Competences Generic Skills Key Competences Psychomotor Skills
Preparation for Vessel Arrival and Handling
Cargo Loading and Stowage Port Infrastructure and Equipment Tactical & Operational Planning of Container Terminals Maritime Transport Resources Ship Stability & Stress
Yard Operation Organizer
Documentation Preparation and Reporting Technical Maintenance and Process Control Cargo Handling Technique & Organization
Yard Stowage Plan Preparation Port Infrastructure and Equipment Tactical & Operational Planning of Container Terminals Container Packing Optimization
Safety and Process Quality Control Management
Quality Assurance Ship Stability & Stress Cargo Characteristics Technical Maintenance and Process Control
General Competences Social Competences
Generic Skills Psychomotor Skills
Yard Shifting Plan Preparation Tactical & Operational Planning of Container Terminals Container Packing Optimization
Tracking and Controlling Yard Transport Operations
Port infrastructure and equipment Tactical & Operational Planning of Container Terminals Technical Maintenance and Process Control Cargo Handling Technique & Organization
Voyage Planner
Preparing Vessel Cargo Plan according to Port Rotation
Cargo Loading and Stowage Tactical & Operational Planning of Container Terminals Container Packing Optimization Ship Stability & Stress
Preparing Fleet Timetable Schedule Optimization in Maritime Transport Voyage Planning Technical Maintenance and Process Control
Control and Management of Service Regularity Port Business Tactical & Operational Planning of Container Terminals

327
Neven Grubišić, Ana Perić-Hadžić, Mladen Jardas
DEVELOPMENT OF OCCUPATIONAL STANDARDS AND COMPETENCES IN MARITIME TRANSPORT AND LOGISTICS
Optimization in Maritime Transport Voyage Planning
General Competences Social Competences Generic Skills Key Competences
Port Taxes Negotiation
Port Business Transport Management Optimization in Maritime Transport Cargo Handling Technique & Organization
Coordination of Operation Procedures in Consortia and Pools
Merchant Shipping Business
Service Capacity Calculation
Port Infrastructure and Equipment Voyage Planning Merchant Shipping Business Maritime Market and Flows of Goods Maritime Transport Resources
Cargo Shipments Surveyor
General Competences Generic Skills Key Competences Psychomotor skills
Proceedings in case of Vessel/Cargo Damage
Transport Safety Ship’s Survey Transport Operations Cargo Damage & Survey of Loss
Survey Procedures and Cargo Handling Control
Cargo Loading and Stowage Maritime Insurance Transport Safety Cargo Characteristics Cargo & Draft Surveying Cargo damage & loss survey
Inspection of Cargo Loading Holds
Maritime Transport Resources Cargo Characteristics Ship’s Survey Cargo & Draft Surveying
Container Survey
Cargo Loading and Stowage Container Packing Optimization Ship’s Survey Transport Operations
Draft Survey Cargo Loading and Stowage Ship Stability & Stress Cargo & Draft Surveying
Public transport operation manager
Communication with other Departments Transport Operational Planning
Supervision and Operation Control Quality Assurance Transport Operation Planning GIS Application in Transport
General Competences Generic Skills Key Competences
Public Transport Planning and Organization
Transport Networks Transport Operation Planning Public Transport Planning Spatial and Traffic Planning
Analytics Management Statistics Public Transport Planning Quality Assurance
Public Transport Operation Management
Transport Networks Public Transport Planning Transport Infrastructure Spatial and Traffic Planning
Documentation Preparation and Reporting
Quality Assurance Transport Operation Planning GIS Application in Transport Urban transport Management
Table 3 shows the matrix of competences for Maritime Transportation Engineers, a qualification
that is supported through the undergraduate and graduate study programme of Technology and

7th INTERNATIONAL MARITIME SCIENCE CONFERENCE
328
April 20th-21st, 2017, Solin, Croatia
Organization of Transport. The study programme should educate students for the selected six occupations.
In terms of the study programme for Maritime Transportation Engineers, it should be noted that some new occupations and competences have been identified in the framework of occupational standards that are not covered by this programme. Once established requirements in terms of the needed competence recognised by the market, and after the analysis of the current study programme, it can be concluded that for some of them there are no appropriate basis in terms of knowledge and skills in the existing programmes. [19]
This fact has been pointed out by alumni students who are employed in the maritime sector, on different working places and occupations by different employers. For instance, competence for occupations such as Fleet Manager, Crew Manager, Voyage Planner are not recognized in the curriculum. Therefore, it is necessary, in this case, to develop new learning outcomes at the study programme level, and at the Course level as well in accordance with the developed matrix of competencies for occupational standards. In this context it will be necessary to consider the need for adaptation of the existing courses and teaching content and, where necessary, to introduce new content and courses.
5. CONCLUSION
Out of the results obtained in this research, it is clearly seen that the elaboration of standard occupations and competence matrix is the key part of the programme development either of the sub-sector of maritime transport and logistics or of any another industry sector. The research has pointed out the importance of cooperation with partners and employers within the sector itself that, with information and first hand data, can considerably assist in the development of occupational standards and competence matrix. As much as the development of occupational standards and competence matrix seems to be complicated, the basic principles are very simple. Occupational standards are nothing else but a list of competences that a worker must have in order
to perform key tasks arising from the identified occupations.
The development of occupational standards and competence matrix forms the basis for the development of standards of qualifications that contain real skills and learning outcomes that students should acquire in educational institutions in order to adapt themselves more easily and adequately to the job market. As can be seen from the Technology and Organization of Transport study programme and following the established requirements in terms of competence, it must be said that for most of them there are no adequate skill and knowledge bases within the existing study programme which requires the introduction of new contents and courses as well as of a regular update training for teachers themselves.
REFERENCES
1. Hrvatski kvalifikacijski okvir. (Croatian Qualification Framework).http://www.kvalifikacije.hr, (15.01.2017.)
2. European Centre for the Development of Vocational Training. http://www.cedefop.europa.eu, (19.01.2017.)
3. European Higher Educational Area. http://www.ehea.info/. (19.01.2017.)
4. The Ministry of Maritime Affairs, Transport and Infrastructure, http://www.mppi.hr/default.aspx?id=9468, (22.01.2017.)
5. Project KIKLOP, http://www.kiklop.eu, (23.01.2017.)
6. Commission of the European Communities. (2000). Memorandum on Lifelong Learning, Brussels, 30.10.2000., SEC (2000) 1832: Working paper of the European Commission.
7. Zakon o Hrvatskom kvalifikacijskom okviru (The Law on the Croatian Qualifications Framework). Narodne novine, br.22/2013., Pravilnik o Registru Hrvatskog klasifikacijskog okvira (Regulations on the Register of

329
Neven Grubišić, Ana Perić-Hadžić, Mladen Jardas
DEVELOPMENT OF OCCUPATIONAL STANDARDS AND COMPETENCES IN MARITIME TRANSPORT AND LOGISTICS
Croatian classification framework). Narodne novine, br.62/2014.
8. Ministry of Labour and Pension System. (2015). Metodologija za izradu i tumačenje Profila sektora (The methodology for the preparation and interpretation of Sector Profiles). Hrvatski Kvalifikacijski Okvir, Zagreb.
9. Ministry of Labour and Pension System and Croatian Employment Service, baza podataka (internal database of employment), workshop, July 2015. godine.
10. Ministry of Labour and Pension System. (2016). Smjernice za izradu standarda zanimanja (Guidelines for the development of occupational standards), Zagreb.
11. Nacionalna klasifikacija zanimanja (National Classification of Occupations). Narodne Novine 1998., Narodne novine 2008.
12. Agency for Vocational and Adult Education (2012), Promet i logistika, Profil sektora, (Transport and Logistics, Sector profile), Jačanje institucionalnog okvira za razvoj strukovnih standarda zanimanja, kvalifikacija i kurikuluma, IPA 2007-2009; EuropeAid/127472/d/SER/HR2012, http://www.asoo.hr/UserDocsImages/projekti/kvalifikacije/ishodi/planiranje%20kv/promet.pdf
13. Crnković-Pozaić, S. (2011). Metodologija za unaprjeđenje postojećeg profila sektora. (The methodology for improving existing sector profiles), projekt Strengthening Institutional
Framework for the Development of the VET Occupational Standards/Qualifications & Curricula, IPA 2007-2009; EuropeAid/127472/d/SER/HR2012,
14. Project KIKLOP (2016) Katalog pomorskog gospodarstva (Catalog of Maritime Industry), Pomorski fakultet Sveučilišta u Rijeci, Rijeka.
15. Ministry of Economy of the Republic of Croatia (2013) Prijedlog Strateških smjernica za razvoj Sektora pomorske industrije (Proposal Strategic Guidelines for the development of the maritime industry).
16. Perić Hadžić A., Grubišić N, Tijan E., Development of qualifications and innovative methods of competence acquisition in Logistics and Maritime transport – KIKLOP, International Association of Maritime Universities 16th Annual General Assembly Opatija, Croatia : University of Rijeka, Faculty of Maritime Studies, Croatia , 2015. 287-293 (ISBN: 978-953-165-116-5).
17. Project KIKLOP, survey, http://www.kiklop.eu/survey/admin/, (28.01.2017.)
18. Croatian Chamber of Commerce, database, http://www.biznet.hr/, (28.01.2017.)
19. Project KIKLOP, http://www.kiklop.eu/wp-content/uploads/2016/03/EP1%20Rezultat%204.%20Privitak%202.%20Matrica%20kompetencija%20za%20SZ%20Teh.pdf, (05.02.2017.)

7th INTERNATIONAL MARITIME SCIENCE CONFERENCE
330
April 20th-21st, 2017, Solin, Croatia
DIGITAL LEARNING TOGETHER – TEACHING MARINE INSURANCE AND CHARTERPARTY ISSUES FOR FUTURE LEADERS AND EXPERTS OF THE SHIPPING COMPANIESPeter Ivar Sandell
DIGITAL LEARNING TOGETHER – TEACHING MARINE INSURANCE AND CHARTERPARTY ISSUES FOR FUTURE LEADERS AND EXPERTS OF THE SHIPPING COMPANIES
Peter Ivar Sandell
(Satakunta University of Applied Sciences, Rauma, Finland) (E-mail:[email protected])
ABSTRACT
There is a growing need for Master Mariners with sea going background in shipping companies and management companies. Master Mariner education is usually based on a bachelor degree in most countries. Master of maritime management degree is a higher education aiming at higher university degree, which gives the essential skills for Captain´s who wish to take the next step into company management and specialize in expert or leading position in a Shipping or Management Company. Marine insurance and charter parties are essential topics which are based on international development and which can be taught on a global basis. English law and Nordic law are in core and simultaneously developments in these jurisdictions often follow each other with many similarities. Teaching these issues has a huge potential for co-operation between Maritime Universities. The potential includes student’s exchange and cost efficiency, which can be combined to digital learning. Digital learning means more than just e-learning and video conference lectures. It makes the world smaller and wider at the same time as the students in highly digitalized world can now interact with each other despite the time and place. For Master Mariners this means today a real possibility to study on board without interruptions. For the last 13 years Satakunta University has developed a degree programme concentrating to digital teaching of Master Mariners and has now taken the next step to broaden the education to English language open for all bachelor degree holders to able to apply. In this article, we explain our methods how persons with STCW education and seagoing background can now efficiently gain the knowledge needed in a land-based organization. The use of electronic materials, group work, e-lectures and companies involvement will be delivered in the article and presentation using also video material to make the presentation alive to envisage the use of the methods based on 13 years of experience in developing the programme.
KEY WORDS
Digital learning, marine insurance, charterparties, student exchange & co-operation
1. INTRODUCTION
Satakunta University of Applied Sciences has developed a degree programme concentrating to digital teaching of Master Mariners. The project has taken thirteen years of development work. Since
we are now fully confident that the solutions we have tested on national level, we are now taking the next step further to broaden the education to English language open for all bachelor degree holders to able to apply. In this article we explain our methods how persons with STCW education and seagoing background can
now efficiently gain the knowledge needed in a land based organisation and how studies can be efficiently be managed 85 percent through digital learning. The use of electronic materials, group work, e-lectures and companies involvement will be delivered in the article and presentation using also video material to make the presentation alive to envisage the use of the methods based on 13 years of experience in developing the programme.
2. DIGITAL LEARNING
Digital learning and e-learning has been a topic of maritime training seminars for more than a decade. Most Universities use some form of digital solutions. E-learning platforms are used for dividing materials and information and many professors already find it useful to collect also materials delivered by students to a virtual platform instead of hunting their papers. Giving feedback through e-learning platform for the student´s papers is also no longer strange phenomenon
2.1. Digital learning today
Traditional exams on paper are still used by most, but digital exams are increasingly used especially by younger generation of teachers. [1] Use of multiple-choice questions, which the e-learning platform automatically evaluates frees the professor from the weeks of hard work after the exam period. After hard lecturing periods before the vacation, the students are also happy to receive their results immediately without having to wait 2 weeks for the results. This is the situation in general where we are now in Finnish higher education. Situation is however changing rapidly through demands from the government and ministry of education to hasten the graduation of students and to give the students more possibilities to finish their studies faster and besides working. In addition, economical pressure for using the spaces of the University more efficiently encourages the students to work more from distance and spending less time in the classrooms. Satakunta University of Applied Sciences decided in spring 2016 that all student have to be able to
study also from distance and starting September 2016 all students have to equip themselves with own laptops also carried with them to lectures. Delivering papers for students is exceptional and all materials delivered has to be in electronic form. This is also a way to cut the expenses of the University - The number of computer classes can be minimized in the future. This development is natural continuance of the school reforms in High School system in Finland. Most High Schools are already paperless and students are already there equipped with laptops. Some High Schools buy the laptops or pads for the students, but most still urge the students to buy their own. The development of digitalisation culture in education is therefore already necessitated - Or demanded by ministry of education. Before the students even enter the University. In addition, the matriculation examination in Finnish School system will be in electronic form 2018. Due to this process we will have in very near future students starting at the University who are no longer even used to write their exams on paper. Professors who ask them to write essays on paper will soon be considered as dinosaurs from the past. They need to renew themselves and their thinking or they will perish as they will be considered too old fashioned.
3. DIGITAL LEARNINGS POSSIBILITIES IN THE FUTURE
As I started to teach Master Mariners in Finland 2001 beside lecturing to future lawyers at the University of Oslo 2001 I realised the cultural differences in teaching methodology. Technologically orientated profession used the means of technology already then much more than traditional old fashioned University. A group of innovative teachers was far in developing the virtual platform as a place for studies. Even virtual persons’ study environments like Second Life were being tested and developed already then. After 2003 when I moved back to Finland and started the development of Master of Maritime Management degree programme I turned first to testing the virtual environments and their possible use for studying also from the sea as the task was to make the studies available from the sea

331
Peter Ivar Sandell
DIGITAL LEARNING TOGETHER – TEACHING MARINE INSURANCE AND CHARTERPARTY ISSUES FOR FUTURE LEADERS AND EXPERTS OF THE SHIPPING COMPANIES
now efficiently gain the knowledge needed in a land based organisation and how studies can be efficiently be managed 85 percent through digital learning. The use of electronic materials, group work, e-lectures and companies involvement will be delivered in the article and presentation using also video material to make the presentation alive to envisage the use of the methods based on 13 years of experience in developing the programme.
2. DIGITAL LEARNING
Digital learning and e-learning has been a topic of maritime training seminars for more than a decade. Most Universities use some form of digital solutions. E-learning platforms are used for dividing materials and information and many professors already find it useful to collect also materials delivered by students to a virtual platform instead of hunting their papers. Giving feedback through e-learning platform for the student´s papers is also no longer strange phenomenon
2.1. Digital learning today
Traditional exams on paper are still used by most, but digital exams are increasingly used especially by younger generation of teachers. [1] Use of multiple-choice questions, which the e-learning platform automatically evaluates frees the professor from the weeks of hard work after the exam period. After hard lecturing periods before the vacation, the students are also happy to receive their results immediately without having to wait 2 weeks for the results. This is the situation in general where we are now in Finnish higher education. Situation is however changing rapidly through demands from the government and ministry of education to hasten the graduation of students and to give the students more possibilities to finish their studies faster and besides working. In addition, economical pressure for using the spaces of the University more efficiently encourages the students to work more from distance and spending less time in the classrooms. Satakunta University of Applied Sciences decided in spring 2016 that all student have to be able to
study also from distance and starting September 2016 all students have to equip themselves with own laptops also carried with them to lectures. Delivering papers for students is exceptional and all materials delivered has to be in electronic form. This is also a way to cut the expenses of the University - The number of computer classes can be minimized in the future. This development is natural continuance of the school reforms in High School system in Finland. Most High Schools are already paperless and students are already there equipped with laptops. Some High Schools buy the laptops or pads for the students, but most still urge the students to buy their own. The development of digitalisation culture in education is therefore already necessitated - Or demanded by ministry of education. Before the students even enter the University. In addition, the matriculation examination in Finnish School system will be in electronic form 2018. Due to this process we will have in very near future students starting at the University who are no longer even used to write their exams on paper. Professors who ask them to write essays on paper will soon be considered as dinosaurs from the past. They need to renew themselves and their thinking or they will perish as they will be considered too old fashioned.
3. DIGITAL LEARNINGS POSSIBILITIES IN THE FUTURE
As I started to teach Master Mariners in Finland 2001 beside lecturing to future lawyers at the University of Oslo 2001 I realised the cultural differences in teaching methodology. Technologically orientated profession used the means of technology already then much more than traditional old fashioned University. A group of innovative teachers was far in developing the virtual platform as a place for studies. Even virtual persons’ study environments like Second Life were being tested and developed already then. After 2003 when I moved back to Finland and started the development of Master of Maritime Management degree programme I turned first to testing the virtual environments and their possible use for studying also from the sea as the task was to make the studies available from the sea

7th INTERNATIONAL MARITIME SCIENCE CONFERENCE
332
April 20th-21st, 2017, Solin, Croatia
worldwide. In the beginning I faced severe difficulties. The internet connections in ships were not yet on a level to make the studies possible from the seven seas. Since 2010 however the situation has changed dramatically. Through development of technology and especially when the demands of the bandwidth in video technology has decreased. It is already reality that all the students gather in virtual classroom to listen to lectures online - Even though they are working at sea. During the last school year, I arranged the Maritime Law courses in a class at the University where the lectures could be recorded easily in a system called HILL (HILL- class) and where a students working at sea could participate. They were also able to make their presentations from the sea with their own laptops. If they were not able to follow the lectures online because of their duties at sea, they were able to watch others presentations afterwards as recordings. This is a one solution for the maritime Universities in the future. When arranging mandatory practice at sea becomes ever more difficult, we are forced to become more flexible and allow our student to organize the practice also at times when we organize the lectures at the University. This is also an answer to the governmental demands to cut the study times and to hasten the students passing their studies. Increasing Digital learning is therefore not just one solution but it will also become a necessity also in Bachelor studies leading to Master Mariner profession. Many solutions, which have been developed and tested when creating the Master of Maritime Management programme, can be used also in bachelor programs in the future when we need to arrange the studies in a way that practice at sea is possible also during the months when we normally teach the students at school. In Master degree programme, the students are working almost without exception. Most at sea, but some already work in shipping companies, maritime administrations, classification societies etc. ashore. The digital learning is the only way to make the studies possible in the future. The essential element is the participation through video connection. Previously when participation from sea was not possible, the video recording in classroom or recording sound together with the PowerPoint presentation was used. These are still used but
their disadvantage is the lack of communication from sea. Already now and increasingly in the future the recordings of contact lectures cover both persons in the classroom and at sea when technology has now made it possible. When the students are already highly skilled professionals, they divide valuable information and experiences to lectures and their fellow students. Those few who because of their duties at sea cannot participate in all lectures through video connection are able to watch the recordings. When seminars are held online, the students reserve electronically their groups and presentation times so that they can participate online. All seminars will be recorded and used as study material. Access to the material can immediately be added to as a link to the virtual platform. Material for individual exercises as well as group work are available online. Different solutions for group work are available. Video connection can be established also for participants of the group who are able to modify their work online practically the same way as they would be writing it in same physical space. Teaching digitally can be as close to teaching in class as the teacher wants in the future. [2] The question is how can it be made even better than in the classroom? There we need digital teaching methodology. Preparing for the lectures and the assignments can be made mandatory and this according to our experiments increases the study results immensely. it also saves a lot of time when students are already familiar with basic materials. The studying the materials can be made a precondition for entering the lectures or assignments by for example preliminary multiple choice questions in which the platform chooses questions from a data bank and the test has to be renewed until a pre-set percent of right answers is achieved. Let us next take some examples of implementing this into practice. 4. MARINE INSURANCE AND CHARTER PARTIES Marine insurance and charter parties are topics, which the masters already graduating from bachelor level studies should be aware of – At least

333
Peter Ivar Sandell
DIGITAL LEARNING TOGETHER – TEACHING MARINE INSURANCE AND CHARTERPARTY ISSUES FOR FUTURE LEADERS AND EXPERTS OF THE SHIPPING COMPANIES
they should according to STCW know the main elements of these topics in order to take the issues into consideration when making the necessary decisions. [3] Constantly the Universities get complaints however that more of these topics should be taught to masters already at the bachelor level studies. In Master of Maritime Management studies, they are self-evidently therefore some of the key issues. Both of these topics are based on international development and they can be taught on a global basis. The teaching method, which is used is based on using digital technology. The students are first lectured the key elements. Thereafter they get familiar with the contracts, which they study independently and thereafter they are tested by using multiple chose questions. When they pass the test they are given cases studies which are carefully studied and chosen, often taking into consideration the background and working experience of the student. The student prepares a case presentation and sends the Power Point presentation through e-learning environment together with his commentaries to the teacher to be evaluated and for feedback before he is allowed to present it in videoconference. If the teacher is not satisfied, he need to study it more carefully. The presentation time is reserved after the presentation has been approved. In videoconference, all the participants in turn analyze the presentation and ask questions from the presenting student and the teacher. All this is recorded and made study material for the exam. The students also practice individually their skills on cases by answering multiple-choice questions before the exam. The study results are often amazing. Those who know the practice at sea open up the practical issues in the cases and they combine the practice with the theory they have learned. Testing years after they still remember the case studies and the alumni´s explain sometimes in detail how they have been able to use in practice what they have learned from the cases and how the method has helped them to analyze fast the information from the conditions.
5. SHIP OWNERS TO BENEFIT FROM DIGITALISATION
There is a growing need for Master Mariners with sea going background in shipping companies and management companies. Master Mariner education is usually based on a bachelor degree in most countries. Master of maritime management degree is a higher education aiming at higher university degree, which gives the essential skills for Captain´s who wish to take the next step into company management and specialize in expert or leading position in a Shipping or Management Company. Ship owners need to further educate their best potential – Either to work on board or to ashore. Digital learning makes this also economically lucrative for them as the studies can be effectively combined with work. Thesis in Master programme is also a development work, which is usually combined to developing ship owner´s business. They are often combined tightly to the activities, which the ship owner should carry out and invest in anyway. During the studies, the ship owner´s employee receives support in development work from the University that helps to develop the business and solve the problems. All this process is now possible by using digital solutions.
6. CONCLUSIONS
English law and Nordic law are in core and simultaneously developments in these jurisdictions often follow each other with many similarities. Teaching Marine Insurance and charter party issues has a huge potential for co-operation between Maritime Universities. The potential includes teacher exchange, student exchange and cost efficiency which can be combined to digital learning. Digital learning means more than just e-learning and video conference lectures. Development of digital model courses in the future would also be possible when Universities work together. Digital co-operation makes the world smaller and wider at the same time as the students in highly digitalized world can now interact with each other despite the time and place. For Master Mariners this means today a real possibility to study on board without interruptions.

7th INTERNATIONAL MARITIME SCIENCE CONFERENCE
334
April 20th-21st, 2017, Solin, Croatia
REFERENCES
1. Mattila – Jasu-Kuusisto, Oppimistehtävä verkko-opetuksessa, 2007, Pori, Satakunnan Ammattikorkeakoulu.
2. Keränen – Penttinen, Verkko-oppimateriaalin tuottajan opas, 2007, Porvoo, Docendo
3. Gorton – Hillenius – Ihre – Sandevärn, Shipbroking and chartering practice, 6th ed. 2004, London, LLP

335
Maja Škurić, Vladislav Maraš
SOME RESULTS OF NAUTICAL RISK ASSESSMENT IN PORT
SOME RESULTS OF NAUTICAL RISK ASSESSMENT IN PORTMaja Škurić, Vladislav Maraš
SOME RESULTS OF NAUTICAL RISK ASSESSMENT IN PORT
Maja Škurić1, Vladislav Maraš2
(1 University of Montenegro, Maritime Faculty, Kotor, Montenegro)
(2 University of Belgrade, Faculty of Transport and Traffic Engineering, Belgrade, Serbia)
(E-mail: [email protected]) ABSTRACT
In this paper we deal with the identification of possible risk events in the Kotor cruise port located in Boka Kotorska Bay, Montenegro. During the last decade Kotor cruise port is recognized to be very attractive location for tourist visit and according to that, it is a noticeable the increase of traffic volume and passengers’ throughput. In addition, the daily ferry passenger transport inside the Boka Kotorska Bay has been increasing as a consequence of the tourists’ stay in this part of Montenegro. Considering this, we investigate the navigational safety where the daily throughput of cruise ships records five or six ships that need to be serviced according to the appropriate operational policies in the narrow coastal area such as Boka Kotorska Bay. The methodology of calculating the probability of risk event is proposed together with the consequence of possible risk events. Experimental analysis has been provided with the discussion of output results. Finally, the directions of creating new scenario for possible reduction of risk events in Boka Kotorska Bay have been reported.
KEY WORDS
Cruise port, risk, navigation area, ferry transport.
1. INTRODUCTION
In literature, the analysis of nautical risk assessment has been elaborated a lot in the previous period. The rules of navigation especially in restricted and limited navigation area that represents narrow passage have to be respected by the direct participants. i.e. ships. The researches have shown that human error in navigation plays an important role in possible accidents, while on the other side, from the mathematical point of view, ship collision is described by geometric distribution (Debnath and Chin, 2010; Li et al., 2012; Montewka et al., 2010; Pedersen, 2002, 2010; Seong, 2012; Tan and Otay, 1999). Fowler and Sorgard (2000) stated that the accident is occurring as a result of the encounter between two ships and those are treated to be independent and different events. According to the analysis done by
United States Coast Guard USCG (1999), different ships’ encounters were discussed. According to Merrick et al. (2002), ship can change its speed and course in order to avoid the collision. On the other side, some authors used automatic identification system in order to determine the level of congestion of maritime traffic in narrow passages. Their results were useful from the macroscopic maritime traffic modeling point of view. Main role of ships in modeling the avoidance of collisions is described and reported in Fujii and Tanaka (1971). This paper elaborates the nautical risk assessment in the case of Kotor cruise port (Boka Kotorska Bay, Montenegro), Figure 1. The expert's judgement model has been used in order to calculate the probability and consequence of risk events. This investigation is being interesting because Kotor is recognized as an attractive cruise port in the last

7th INTERNATIONAL MARITIME SCIENCE CONFERENCE
336
April 20th-21st, 2017, Solin, Croatia
decade and also in Boka Kotorska Bay the ferry ship activities have been increased, respectively. This includes the daily passenger transportation such as excursions and leisure activities. Beside that Boka Kotorska Bay is divided into the four minor: Kotor, Risan, Tivat and Herceg-Novi, the high frequency of ship arrivals are related to the Kotor Bay because of the location of the cruise port. Actually, the trend of increased traffic is noticeable. In 2006 the total number of port calls of cruise ships was 155 while in 2015, 411 ships with around 440 thousand passengers visited Kotor cruise port. The average year increase in ships’ traffic is 29%. Finally, the average number of passengers per ship call in 2006 was 235; in 2011 it was 600, while in 2015 it was 1075 (Škurić and Maraš, 2016a,b).
Figure 1. Boka Kotorska Bay.
Having in mind the before mentioned, we collected the appropriate data and proposed a model that will identify the possibilities of risk event. The organization of the paper is as follows. In Section 2, we give the main issues about the nautical risk assessment model. The experimental analysis of the model has been presented in Section 3 with the few examples, while final section gives concluding remarks.
2. NAUTICAL RISK ASSESMENT MODEL
For creating the nautical risk assessment model, it is well known that there are two methodologies for determining the level of risk are based on statistical data or expert judgments (Savić and Stanković, 2012; Škurić and Maraš, 2016b). In this analysis, we apply the second one which is based on expert assessment. This methodology is used because of
the insufficient information about the nautical risk probability, so it is possible to model the realization of risk events. The probability of risk event 𝑃𝑃!" is in function of relative frequency of risk events:
𝑃𝑃!" =�!!!"
(1)
where 𝑅𝑅! represent the number of risk events of the same type during a specified period of time; 𝑛𝑛!" is a number of possible realization of risk events in the same period. The values of risk events probability are from 0 to 1. In this case, the experts are giving their opinions about the frequency of risk events as well as loss rate of their realization. In that way we provide the data of expected value of nautical risk, i.e. number of passengers from cruise and ferry ships that can be exposed to risk (see more in Škurić and Maraš (2016b)). Regarding the experts' opinion, it should be necessary to calculate the coefficient of concordance. In the case that coefficient of concordance is greater than 0.7, it is treated that the consensus of experts is provided. Otherwise, the process of evaluation should be succeeded (Savić, 2013; Škurić and Maraš, 2016b). After the evaluation of experts’ consensus, the next is to determine the most probable values of frequencies and loss rate as well as the mean values of all experts. The expected risk value is calculated (Savić and Stanković, 2012; Цхадая я Подосенова, 2008; Škurić and Maraš, 2016b):
𝑅𝑅 = 𝑓𝑓!"!!!!! 𝐿𝐿! (2)
where 𝑓𝑓!"! is a mean frequency of risk event j,
while 𝐿𝐿! is a mean of rate loss produced by risk event j. According to findings provided by Sulaiman et al. (2011) and Zaman et al. (2015), the classification of risk events is specified in Figure 2. The quantification of risk is based on the value of probability of risk event (𝑃𝑃!").

337
Maja Škurić, Vladislav Maraš
SOME RESULTS OF NAUTICAL RISK ASSESSMENT IN PORT
Figure 2. Quantification of risk.
3. NUMERICAL EXAMPLES
The expert judgment provided in this analysis included consultations with pilots and ship’s captains in order to separately give the estimation of the frequency and consequences of different risk events, namely: ship’s collision, overtaking,
grounding, navigation error, bad weather conditions and ship’s breakdown (Škurić and Maraš, 2016b). We present some experimental analysis for calculating the expected values of risks in Kotor cruise port, mainly in Kotor Bay, based on the data of achieved traffic volumes of ships and passengers during a year (PKAD, 2015). For calculating expected values of risk, we interviewed total of three experts and got their opinions regarding risk events’ frequency and risk events’ consequence of six different categories of risks. The methodology has been applied from Škurić and Maraš (2016b). The results are presented in Figure 3. Three experts with six events are related to the first example, three experts with first five events are related to the second example, two experts with six events in the case of third example and two experts with the first five events are related to the fourth example.
Figure 3. Numerical results.
The obtained results express the probability of risk event as well as the expected value of risk calculating the period between the realizations of two consecutive risk events in Boka Kotorska Bay (expressed in years). The model has been coded in MATLAB 7.12.0. As it can be seen, in the first numerical example, we obtained the probability of risk event to be 0.0162 and it takes 62 years
between the two consecutive risk events; in the following examples, the values of first parameter are 0.00108, 0.00133 and 0.00209 respectively, while the result of second parameter is 926, 752 and 479 years, respectively. The number of passengers that are exposed to risks are: 7297, 487, 599 and 942, respectively for first, second, third and fourth example. The classification of risks
0.01
62
0.00
108
0.00
133
0.00
209
0.72
97
0.04
87
0.05
99
0.09
42
EXAMPLE 1 EXAMPLE 2 EXAMPLE 3 EXAMPLE 4
Probability of risk event Expected risk value (10^-‐4)

7th INTERNATIONAL MARITIME SCIENCE CONFERENCE
338
April 20th-21st, 2017, Solin, Croatia
in the first example is occasionally, while for the rest of three is small. The first example represents the real world case in the Kotor Bay. 4. CONCLUSIONS
In the case of the permanent increase of cruise shipping transport and ferry service employment in Boka Kotorska Bay, it is important to pay attention on the safety level of maritime transportation. The ships' frequency is higher and there is some suggestion of taking the ships out from the Kotor Bay. Perhaps, the idea of moving the cruise ships' servicing in other bays such as Risan or Tivat can be found. This analysis would be a huge challenge for the future researches. The mentioned investigation can be completed with the development of simulation model. However, in this paper we showed the methodology for calculating the probability of risk event and the expected risk value. The results have been shown through the four examples that dealt with the experts’ opinion regarding the total of six different risk events, namely: ship’s collision, overtaking, grounding, navigation error, bad weather conditions and ship’s breakdown. The study area is reported as well as the nautical risk assessment model. Additionally, the whole methodology is very useful and accordingly we classified the frequency of risk event and predicted the time between the two consecutive events. On the other hand, the investigations such as this can serve to improve the communication and navigation issues in order to minimize the risk events in the future. Safety conditions need to be satisfied especially in passenger ports such as Kotor. Therefore, there is a lot of space for improvement of this methodology, so further studies can be directed to the aspect of communication and electronic equipment that can be employed in the Boka Kotorska Bay in order to decrease the possibility of risk event realization.
REFERENCES
1. Debnath, A.K., Chin, H.C., "Navigational traffic conflict technique: A proactive approach to quantitative measurement of collision risks in port waters", The Journal
of Navigation, Vol. 63, No. 1 (2010), pp. 137-152.
2. Fowler, T.G., Sorgard, E., "Modeling ship transportation risk", Risk Analysis, Vol. 20, No. 2 (2000), pp. 225-244.
3. Fujii, Y., Tanaka, K., "Traffic Capacity", The Journal of Navigation, Cambridge: Cambridge Journals, Vol. 24 (1971), pp. 543-552.
4. Li, S., Meng, Q., Qu, X., "An Overview of Maritime Waterway Quantitative Risk Assessment Models", Risk Analysis, Vol. 32, No. 3 (2012), pp. 496-512.
5. Merrick, J.R.W., van Dorp, J.R., Mazzuchi, T., Harrald, J.R., Saphn, J.E., Grabowski, M., "The Prince William Sound risk assessment", Interface, Vol. 23, No. 6 (2002), pp. 25-40.
6. Montewka, J., Hinz, T., Jujala, P., Matusiak, J., "Probability modelling of vessel collisions", Reliability Engineering and System Safety, Vol. 95, No. 5 (2010), pp. 573-589.
7. Pedersen, P.T., "Collision risk for fixed offshore structures close to high density shipping lanes", Journal of Engineering for the Maritime Environment, Vol. 216, No. 1 (2002), pp. 29-44.
8. Pedersen, P.T., "Review and application of ship collision and grounding analysis procedures", Marine structures, Vol. 23, No. 3 (2010), pp. 241-262.
9. PKAD (Port of Kotor A.D.), (2015), Port of Kotor A.D. Reports of 2015, Kotor.
10. Savić, S., Stanković, M., Teorija sistema i rizika, Akademska misao, (Beograd, 2012).
11. Savić, M., Metodologija razvijanja upitnika uz pomoć Delfi metoda na kursevima iz statistike, In Vodič kroz metodologiju nastave primenjene statistike (Odabrana poglavlja iz metodologije nastave primenjene statistike), Univerzitet u Novom Sadu, Centar za primenjenu statistiku, (2013), pp. 17-29.
12. Seong, Y.C., Jeong, J.S., Park, G.K. "The relation with width of fairway and marine traffic flow", International Journal on Marine Navigation and Safety of Sea Transportation, Vol. 6, No. 3 (2012), pp. 317-321.
13. Sulaiman, O.O., Saharuddin, A.H., Kader, A.S.A., Laily, A.R.N., "Safety and Environmental Risk and Reliability Model for

339
Maja Škurić, Vladislav Maraš
SOME RESULTS OF NAUTICAL RISK ASSESSMENT IN PORT
Inland Waterway Collision Accident Frequency", International Journal of Energy and Environment, Vol. 5, No. 4 (2011), pp. 461-477.
14. Škurić, M., Maraš, V., "Determining the size of ferry fleet: Fuzzy logic approach", In Maritime Technology and Engineering 3, Guedes Soares & Santos (Eds), 2016, Taylor & Francis Group, London, (2016a), pp. 117-121, ISBN 978-1-138-03000-8.
15. Škurić, M., Maraš, V., "Analysis of the nautical risk assessment in passenger ports", International Conference on Traffic and Transport Engineering, ICTTE 2016, 24-25 November, Belgrade, Serbia, (2016b), pp. 333-338, ISBN 978-86-916153-3-8.
16. Tan, B., Otay, E.N., "Modelling and analysis of vessel casualties resulting from
tanker traffic through narrow waterways", Naval Research Logistics, Vol. 46, No. 8 (1999), pp. 871-892.
17. Цхадая, Н.Д., Подосенова, Н.С., Управление безопасностью труда, ЦентрЛитНефтеГаз, (Москва, 2008).
18. United States Coast Guard, USCG, Regulatory Assessment Use of Tug to Protect Against Oil Spills in the Puget Sound Area, Report No. 9522-002, (1999), United States Coast Guard.
19. Zaman, M.B., Santoso, A., Kobayashi, E., Wakabayashi, N., Maimun, A., "Formal Safety Assessment (FSA) for Analysis of Ship Collision Using AIS Data", The International Journal on Marine Navigation and Safety of Sea Transportation, Vol. 9, No. 1 (2015), pp. 67-72.

7th INTERNATIONAL MARITIME SCIENCE CONFERENCE
340
April 20th-21st, 2017, Solin, Croatia
NEW POSSIBILITIES IN TEACHING THE MASTER MARINERS BY SIMULATING THE ACCIDENTS – COMBINING THE LEGAL AND SIMULATOR ENVIRONMENTNinna Roos, Peter Ivar Sandell
NEW POSSIBILITIES IN TEACHING THE MASTER MARINERS BY SIMULATING THE ACCIDENTS – COMBINING THE LEGAL AND
SIMULATOR ENVIRONMENT Ninna Roos, Peter Ivar Sandell
(Satakunta University of Applied Sciences, Rauma, Finland)
(E-mail:[email protected]) ABSTRACT
The aim of this article is to examine the shipmaster’s legal position and his rights, responsibilities and obligations in connection with maritime accidents. In addition, the purpose of this thesis is to clarify the general view of the master’s roles and tasks in legal and contractual context and to examine how different changes in the transport industry over time have affected the development. The shipmaster’s role has changed over the time especially through development of technical means. The technical possibilities of further education of masters through efficient use of simulator training for accident situations is combined with legal framework and legal procedures following the incidents. The focus of the article is to describe the present situation and predict some of the coming changes in horizon together with foreseeing how the technical means of education can benefit teaching master mariners to meet the demands they need to be able to cope in accident situations according to international legislation. Shipping is controlled by various international and national laws, which affect the master and ship’s crew. The changes in laws and regulations create new challenges for the master to maintain his/her knowhow and legal knowledge. This creates a constant challenge for the Maritime Universities, but it also offers possibilities and need for further education. Some models for further educating the Masters to meet the legal challenges in relation to accidents through combination of legal issues combined with simulator training will be offered. The article focuses on accidents at sea and general average decision making from the master’s point and the new possibilities, which the modern simulator environment enables.
KEY WORDS
Maritime accidents, e-learning simulator environments, environmental legislation
1. INTRODUCTION
The shipmaster’s role and status are exceptional compared to many other managerial duties ashore. On board the vessel, he / she controls global operation of many matters and advantages of the different interest groups. His / her duty is to act behalf of the ship owner and the charterer. When operating a vessel in the international traffic, the master has to act under several different
legislations and be aware of and to take into account laws and rules, which are valid in different sea areas and harbors. The shipmaster's essential role is to manage risks, which are related to safety of the ship, crew, passengers, cargo and environment. The master should always be authorized to make independent decisions and perform whatever acts are necessary for the safe prosecution of the voyage.

341
Ninna Roos, Peter Ivar Sandell
NEW POSSIBILITIES IN TEACHING THE MASTER MARINERS BY SIMULATING THE ACCIDENTS – COMBINING THE LEGAL AND SIMULATOR ENVIRONMENT
2. NEW DEMANDS FOR MASTER MARINERS
Shipping is controlled by various international and national laws, which affect the master and ship’s crew. The changes in laws and regulations create new challenges for the master to maintain his/her knowhow and legal knowledge.
2.1. Increasing demand for legislative information
The shipmaster’s role has changed over the time especially through development of technical means of communication and increase of internalization of legislation and contract practice. This creates a constant challenge for the Maritime Universities, but it also offers possibilities and need for further education. Various international and national laws control shipping and affect the ship operation. [1] The master is the agent of the ship owner and the bailee of the cargo and he/ she has to act as if the ship and cargo were his/her own uninsured property to complete the voyage with the minimum of delay and the minimum of expense. [2] According to most time-charter parties, the master and the vessel's crew have to give ”customary assistance" to charterers, which means that, they have to give the same assistance to the time charterers as they would give to ship owners if they were trading for their account. [3] The shipmaster is responsible for implementing ISM code on board the vessel and motivating the crew in the observation of shipping company's safety and environmental-protection policy. According to ISM Code, the master has ”the overriding authority and responsibility to make decisions with respect to safety and pollution prevention and to request the Company's assistance as may be necessary." On the other hand, the Shipping Company’s obligation is to make sure that master and other personnel are qualified and trained for their tasks. [4] Sometimes position of the master as an employer of the shipping company and as trustee of the charterer can be challenging, for example under the circumstances, which are related to both safety / seaworthiness and time / economic issues. The threshold to settle against the employer can be high if priorities differs.
2.2. Making the Masters meet the new demands
The shipmaster's role has changed within time with development of a technology and society. Increasing international and national legislation and rules challenge both seafarers and shore operators to update their knowledge and competence. The essential feature for masters and supporting organizations ashore is that most decisions at sea need to be taken fast if not immediately. Courts of law can weigh the facts of the case even years while the master has to act often in minutes based on the existing knowledge and often without possibility for consultation. The ever-growing amount of legislation and technology creates challenges also for education and further education during the careers at sea and in supporting roles of those ashore in shipping companies and in maritime administrations. [5] Before we turn into the problem of preparing the masters for these challenges through education, we take up some issues, which describe more closely the challenges the masters meet. In addition, more closely what kind of decisions they have to make in modern seafaring: Like environmental legislation and General Average.
3. TRAINING ENVIRONMENTAL LEGISLATION BY SIMULATION
Increasing amount of environmental legislation needs to be addressed by the Master Mariners who navigate their vessels in domestic or non-domestic waters. The especially environmentally sensitive and vulnerable areas need special attention in this relation. Many cruise vessels enter these areas because of their natural beauty and fauna as well as animals, which needs to be preserved. The preservation of these areas has been made a legal issue by multiple different legislation, which the Master needs to take into consideration before and during the vessel is entering the especially sensitive area.
The authors of this article have developed an experimental system for teaching the maritime environmental legislation in simulator environment, combining the entrance to such area
7th INTERNATIONAL MARITIME SCIENCE CONFERENCE
342
April 20th-21st, 2017, Solin, Croatia
with a vessel in simulator to learning the environmental legislation.
The reason for the project is twofold. For the first, it is difficult to motivate the students in learning environmental legislation. It does not interest the students if it is not combined with a real atmosphere. The concrete consequences also motivate when they can be simulated for the students.
Maritime students need practical teaching and the theory needs to be combined with practice to make it deliverable to the students. For this reason we have put up a project plan on which the three IAMU Universities all connected to the highly sensitive areas would together prepare simulation models for vessels entering highly sensitive areas in different parts of the world. The idea of the project is to deliver the teaching method rapidly to tens of Maritime Universities around the Globe. The project is currently under consideration of the IAMU IEB and results of the application process will be published by the IMSC conference.
The methodology, which has been developed combines the simulator training and environmental legislation in the following way – The students are lectured the basics of environmental law and they need to prepare the voyage planning in the highly sensitive areas after the lectures in simulator environment. Their voyage plans are received by the teachers through e-learning platform, which makes it possible for teachers with special skills on the topic to guide the students from distance.
Therefore, not every Maritime University has to have a specialist of their own, but this enables sharing the expertise among the Maritime Universities.
Before the students finalize their voyage plans, they receive the corrective information from the e-learning platform. This can be either predetermined autonomous action by the platform or manually corrected answer or guidance prepared individually by the teacher through the e-learning platform system.
The simulation process continues thereafter under guidance of the simulator instructor in the simulator environment, either in the simulator or through distance - In a simulator in another
University, guidance taking place through video connection as well as the use of the simulator.
Environmental accidents can be integrated in the teaching process. The modern simulators already make this possible. Adding oil spills to the scenario is already a tool, which can be combined in the simulation. This can also be done in ice conditions or near a vulnerable reef in warm climate.
The same simulation, which the students have prepared in the earlier part of their studies, can be used in the courses to follow. STCW based course on maritime liabilities is generally considered theoretical by the students. Combining the theory to practice makes environmental legislation alive when an accident scenario is added to the simulation previously conducted by the students.
Most effectively the process is visualized in several sections like: 1) the introduction to environmental liability regimes, 2) simulation of the accident, based on previous simulation practice 3) accident handling procedures by maritime authorities and IOPC fund established in region (either in one or two countries affected by the incident).
This process clearly brings the consequences of a maritime accident alive for the students and increases their environmental awareness.
Highly sensitive areas are very different in nature. The sensitiveness can be caused for example by vulnerability due to especially vulnerable species due to low or high temperatures, which makes the corrective actions especially difficult. The expertise related to prevention or limiting environmental catastrophes is usually local as it needs to be highly developed for special needs of the specific environment.
This possibility of using the expertise from an institution closely related to maritime environmental research or a University closely related to the highly sensitive areas itself, encourages students to specialize in these topics outside their own nationality. The aim of the project is that the co-operation between Maritime Universities would also result in common research activities in the area.
For the Master Mariners it is nowadays essential part of their careers that they are able to follow the environmental legislation. We have been able to

343
Ninna Roos, Peter Ivar Sandell
NEW POSSIBILITIES IN TEACHING THE MASTER MARINERS BY SIMULATING THE ACCIDENTS – COMBINING THE LEGAL AND SIMULATOR ENVIRONMENT
read about Masters who have been deprived their freedom due to even small violations on environmental legislative demands. This topic can be part of the lectures after the liabilities lectures or part of them.
4. GENERAL AVERAGE SIMULATIONS – A CHALLENGE FOR THE SIMULATION ENVIRONMENT
Simulation of the catastrophes is not the core task of the simulation environments - But avoiding them is. Therefore the simulation environment, although they highly developed, are not yet fully ready for practicing how the casualties are taken care of.
The new York-Antwerp Rules for General Average situations have been accepted by Comité Maritime International (CMI) in May 2016. [6] It is the aim of the authors to bring these Rules in the awareness of the students.
In the discussions of the International Association of Maritime Universities (IAMU) conference in Haiphong in October 2016 Mr. Douglas A.Hard from the United States Merchant Academy (USA) expressed his concern of the neglect of the Maritime education institutes of today in teaching GA Rules and practices to Master Mariner students. [7]
According to many responses to the outcome of Mr. Hard these concerns are true. STCW has diminished the Curriculums in Maritime Universities in a way that many topics previously taught to students are now neglected.
The second author of this article has been a member of the CMI International Working Group 2012-2016, that developed the Rules, which were prepared through international work by 12 experts in GA supported by the industry organizations of the shipping world.
The new Rules were approved in May 2016 after their introduction also by other industry organization BIMCO and by its documentary committee. BIMCO anonymously decided to insert the 2016 York-Antwerp Rules into all new
documents and charter parties, which have a reference to and recommend their use.
The YAR Rules - Which have been accepted by the both sides of the industry (both the ship owners and Marine Insurers organizations worldwide) – Have a tendency to last over three decades before a new edition is needed.
Therefore, it is the evident wish of the authors that the simulator manufacturers would now be interested in development of also casualty simulation in their simulators.
The time has come to modernize the teaching in this respect when we have Uniform rules in the world for decades to come. The teaching of the new York-Antwerp Rules is a topic, which could be combined with a modern simulator environment if there would be interest from the manufacturer´s side to hear the wishes of the training institutions.
The law of general average is a legal principle of maritime law according to which all parties in a sea venture proportionally share any losses resulting from a voluntary sacrifice of part of the ship or cargo to save the whole in an emergency (for instance, when the crew throws some cargo overboard to lighten the ship in a storm).
This, for example could be simulated and practiced in the simulator environment. The authors are involved in a research to prepare casualty scenarios for highly sensitive area container vessel accident where HNS convention would be tested and casualty response scenarios will be created for one of the highly sensitive areas recognized by the IMO.
The next generation simulation environments for casualty management should also be generated to make it possible to train masters and crew to act according to planned scenarios.
In the accidents the vessels face at sea, crew members often have precious little time in which to determine precisely whose cargo they are jettisoning. While general average traces its origins in ancient maritime law still it remains part of the Admiralty law and Law of Marine Insurance and Average in Shipping community.
Before the STWC code and its implementation, YAR was taught to students worldwide. When the STCW convention does not mention it specifically, teaching GA rules has been neglected by many
7th INTERNATIONAL MARITIME SCIENCE CONFERENCE
344
April 20th-21st, 2017, Solin, Croatia
Universities in last decades. Bringing it back to curriculums as a practical skill of a master and crew is possible through developing the simulator environment, which makes the skills practicable instead of just theory. The research plan of authors is to build up a system how the Rules could be trained by the Masters, who need to implement the Rules in practice. This integrate the law and practice and makes it in e-learning environment, which makes delivery of the skills possible by experts worldwide.
The Masters make the decisions worth tens or even hundreds of millions often in minutes without a possibility to ask questions from anyone in the shipping or insurance company. It would be fair – In our opinion – If they would be able to practice before they make them.
The Master Mariner education still does not make use of all technology, which is available today. The simulator environment can be easily adjusted to casualty management practices if the simulator developers are financially encouraged to this work. It is up to the Maritime Universities to encourage them and lead the way by being creative and co-operative in their research and development work.
5. CONCLUSIONS
This article focuses on Masters role in legal environment, environmental legislation, accidents at sea and general average decision making from the master’s point and the new possibilities, which the modern simulator environment enables for teaching. We share the idea that new teaching methods and technologies of e-learning and simulations needs to be used in order to make the learning more flexible and more challenging for the students as it also visualizes them the reality of ever more challenging working life in the future. Our students are familiar with simulations and games. They are more familiar with e-learning than conventional learning when they enter the Maritime University. The matriculation
examinations in Europe are soon based on electronic testing throughout Europe. We need to develop our teaching and skills or we as teachers will be considered dinosaurs’ by our students in the years to come. Therefore, the environmental law & practice project described above in this article, will hopefully benefit the students in a large number of Maritime Universities before 2020. If the simulator developers hear the wishes of the Modern Maritime Universities and they gather their forces, the Casualty response simulation in maritime education will follow in the beginning of 2020´s.
REFERENCES
1. Roos N, Aluksen päällikön oikeudellinen asema, Satakunta University of Applied Sciences, (2012).
2. Hopkins F N, BUSINESS & LAW for the ship master, Brown, Son & Ferguson, LTD, (1989).
3. Gorton L, Ihre R and Sandevärn A, Shipbroking and chartering practice, fifth ed., London: LLP Limited, (1999
4. IMO, ISM Code International Safety Management Code, 2014 Edition.
5. Lasse Brautaset, Hans Jacob Bull, Thor Falkanger, Scandinavian Maritime Law The Norwegian Perspective, 2017 4th ed.
6. http://comitemaritime.org/York-Antwerp-Rules-and-General-Average-Interest-Rates/0,2754,15432,00.html
7. Hard, Douglas A, Standardisation and Simplification for Teaching the International Collision Regulations (72COLREGS), 17th International Convention of international Association of Maritime Universities, Seminar proceedings, 2016 Haiphong.

345
Zoran Radmilović, Nataša Tomić Petrović, Vladislav Maraš
BOATING AND PLEASURE NAVIGATION AS CLIMATE-FRIENDLY TRANSPORT
BOATING AND PLEASURE NAVIGATION AS CLIMATE-FRIENDLY TRANSPORTZoran Radmilović, Nataša Tomić Petrović, Vladislav Maraš
BOATING AND PLEASURE NAVIGATION AS CLIMATE-FRIENDLY TRANSPORT
Zoran Radmilović, Nataša Tomić Petrović, Vladislav Maraš
(University of Belgrade, Faculty of Transport and Traffic Engineering) (E-mail: [email protected])
ABSTRACT
Boating and pleasure navigation are not main driving forces to increase climate change by greenhouse gas (GHG) emissions and other human activities as whole. However, the pleasure navigation sector should evaluate through the possibilities to a reduction of anthropogenic GHG emissions to emphasize navigation as an environmentally sound mode. Moreover, the boating and pleasure navigation could be observed as the GHG emitter on two ways as “zero-carbon” navigation or non-motorized navigation (sailing, yachting, sport boating) and “low-carbon “ navigation or motorized pleasure navigation. Meanwhile, the Paris Agreement adopted in December 2015 entered into force, and so far it was ratified by 97 countries responsible for GHG emissions, including the United States and China. For these reasons, this paper discusses the Strategic Research Agenda for boating and pleasure navigation with mitigation and adaption measures. The structure of Agenda is composed by six main parts. Concluding, this Agenda has an impact on three main axes: social, economic and research impacts.
KEY WORDS
Boating and pleasure navigation, Climate-friendly transport, Sustainability, Environmental protection
1. INTRODUCTION In 2011, the European Commission reiterated its commitment to low-carbon transport in its new transport strategy.The strategy outlines the Commission’s ambition of a 60% cut in carbon emission from transport by 2050 through promoting low-carbon technologies and modal shift, (European Commission, Transport 2050, 2011). While the European Commission has consistently invested in technological research and development in transport area including
navigation, funding at societal and behavioral programme level is less consistent. For these reasons, this paper will tackle trans-disciplinary issues and supply knowledge and tools to support a quick and successful adoption of improved solutions to promote boating and pleasure navigation. Cooperative efforts will be focused on developing strategic research agenda (SRA) for specific boating and pleasure navigation. The primary focus of the strategic research agenda in climate-environmentally-friendly navigation is to provide the water space and coastal regions with

7th INTERNATIONAL MARITIME SCIENCE CONFERENCE
346
April 20th-21st, 2017, Solin, Croatia
strategic roadmaps for research to achieve European targets to green navigation system. A strategic research agenda will represent an identifiable, coherent, forward-looking and adaptable framework for innovations. It provides clear signals and a path for the both national and regional administrations, public entities responsible for the preservation and utilization of natural values, inhabitants and other interested decision-makers and stakeholders for funding priorities in order to achieve a successful, energy saving and clean navigation. The targets related to challenges for such an agenda are EU targets for carbon reduction (i.e. carbon emissions reduction by 20% by 2020) and the research areas in the different transport sectors that have an impact on carbon reduction. The SRA for climate-environmentally-friendly navigation will help direct investment and science and define the policy stance over the next 20 years, indentify targets that need to be met and address related innovation challenges (European Expert Group, 2011; Lue A., et al. 2014). In other words, SRA can be considered as strategic tool for the definition of research priorities, developing future roadmaps and suggesting realistic and desirable targets. The paper is divided into four sections: Introduction; General features and hierarchical structure of the strategic research agenda for boating and pleasure navigation; Assessment of the specific research areas for a climate-environmentally-friendly boating and pleasure navigation system; and Conclusions.
2. GENERAL FEATURES AND HIERARCHICAL STRUCTURE OF THE STRATEGIC RESEARCH AGENDA FOR BOATING AND PLEASURE NAVIGATION The first stage in the development of the strategic research agenda for boating and pleasure navigation comprised desk research. The desk analysis suggested ways by which the SRA for boating and pleasure navigation could be developed, the main objectives and drivers and expected outputs. This SRA took the ERTRAC SRA, 2010, as its basic model: it has a clear structure and provided detailed descriptions of the research areas, roadmaps and paths. Consequently, the core of the SRA for boating and pleasure navigation is represented by main fields or pillars, classified and organized in a hierarchical structure. Two grouping pillars are created in order to introduce primary subdivision of the whole spectrum of research areas:
1. Engineering and Information Technology. 2. Law, Economics, Social and Politics
Science. Each pillar is detailed through a logical and hierarchical flow by means of a tree-structure. The roof node is the SRA; each branch is then divided into sub-branches: main fields, sectors, research approaches and main research areas and leaves of the tree, the most detailed level, correspond specific research areas. The structure of the Strategic Research Agenda – Boating and Pleasure Navigation is given in Fig. 1.

347
Zoran Radmilović, Nataša Tomić Petrović, Vladislav Maraš
BOATING AND PLEASURE NAVIGATION AS CLIMATE-FRIENDLY TRANSPORT
Figure 1. The higher levels of the hierarchical tree structure of SRA-Boating and Pleasure Navigation (Radmilovic, et al. 2010). Moreover, the tendency to focus on long-term technological solutions cannot be left aside from short-term behavioral change that becomes crucial if the benefits of new technology are to be fully realized (Chapman, 2007). The second level of classification are the sectors. For the Engineering and Information Technology as main field or pillar, the sectors correspond to the navigation modes: motorized/combined and non-motorized boating and pleasure navigation. For the Law, Economics, Social and Politics Science, the
sectors refer to different geographical and spatial planning systems, social and behavioral and economic measures and policies. The further levels of classification are provided: Research Approaches, Main Research Areas and Specific Research Areas. The Specific Research Area is the most detailed classification available within the structure of the SRA-Boating and Pleasure Navigation, as shown in Fig. 2.

7th INTERNATIONAL MARITIME SCIENCE CONFERENCE
348
April 20th-21st, 2017, Solin, Croatia
Figure 2. Strategic Research Agenda – Boating and Pleasure Navigation, (Radmilovic et al. 2010)
Main field Sector Research Approach Main Research
Area Specific Research Area Studies Existing initiatives and
projects
Navigator Human-machine- waterway interface
Intelligent navigation systems
Navigator assistance, navigation aids, integrated modelling and forecasting tools interfaced with atmospheric models, Route planning parameters on energy consumption, navigation assistance systems
New combustion concepts Extended homogeneous range in diesel engines, low engine-out emissions
Fuels and lubrificants for advanced Internal Combustion Engines (ICEs)
Adapted fuels for new combustion processes, advanced lubrificants and reduced lube oil consumption
Wind and solar energy Optimised wind and solar/hybrid energy use in boating/pleasure navigation
Energy saving design and materials Control systems, renewable materials, recycling
Energy saving hydrodynamic profile; innovative boat concepts
Improved hull design and smooth bottom paint to reduce drag; environmentally friendly design, manufacturing and maintenance; coating performance for boats, innovative composite materials, ice and flooding control; testing infrastructure
Boating operations and training Environmental friendly boating operations, manoeuvring,
rough whether boating operations, winter navigation, communication systems, river-lake-canal networks
Pleasure navigation Promotion of pleasure navigation, competitiveness
of pleasure navigation, innovative and sustainable pleasure navigation
Waste and Emissions
Management Boat emissions reduction systems
Economic retrofit-packages for existing boats/vessels; exhaust gas and water ballast monitoring equipments, end- of-life strategies, recycling operations, oil removal from boatwrecks.
Propulsion Equipment Alternative propulsion
systems Non-fossil based propulsion (solar and wind) solutions for economic application on boats, boat propulsion - propellers
Energy Management Systems
On board power generation and management Use of fuel cells on boats for climate friendly on board
power generation
Small port operations Small ports and environment, navigation in small ports
Oil spill response Oil spill management, devices, policies
Manufacturing and maintenance Cost effective and environmental friendly manufacturing
and maintenance
Innovative boat concepts Improved boat design, lightweight boat components, packing, environmentaly friendly design
Manufacturing and maintenance Innovative composite materials, end-of-life strategies,
recycling operations, renewable materials and energy
Provisions for zero- carbon boating Coastal Zones,
Anchorage, Routes Benchmarking indicatros, promotion of nulti-carbon pleassure navigation
Design and Materials Manufacturing and
maintenance Cost-effective and environmentally friendly manufacturing and maintenance
Design and Materials
Boats: Sailboats, Yachts, Small fish boats, Rowboats,
Canoes, Rafts, Kayaks
Infrastructure / Environment
Boat / Vessel
Infrastructure / Environment Design and Materials
Design and Materials
Advanced fuels and technologies
Traffic Management
Egin
eeri
ng a
nd
Info
rmat
ion
Tec
hn
olog
y
Tech
nol
ogy
N
on-m
oto
rize
d B
oati
ng
B
oati
ng
an
d P
leas
ure
Nav
igat
ion
Nav
igat
ion
Mot
oris
ed B
oati
ng
and
Ple
asu
re N
avig
atio
n
Nav
igat
ion

349
Zoran Radmilović, Nataša Tomić Petrović, Vladislav Maraš
BOATING AND PLEASURE NAVIGATION AS CLIMATE-FRIENDLY TRANSPORT

7th INTERNATIONAL MARITIME SCIENCE CONFERENCE
350
April 20th-21st, 2017, Solin, Croatia
3. ASSESSMENT OF THE SPECIFIC RESEARCH AREAS FOR A CLIMATE-ENVIRONMENTALLY-FRIENDLY BOATING AND PLEASURE NAVIGATION SYSTEM The main objective of the SRA is to prioritize research areas relevant to certain technologies or policies. Clearly, there is a correlation between priority and the expected contributions of such technologies or policies to the reduction of greenhouse gases. Since the focus of the SRA is primarily on greenhouse gases effects, the primary criteria chosen to assess and rate to the specific research areas are:
1. Contribution to reduce greenhouse gases (GHG) emissions asks an evaluation of how much a specific research area can be effective in reducing GHG emissions.
2. Cost-efficiency in reduction of GHG emissions considers the financial effort (cost) of removing a unit of GHG: the higher the criterion value, the higher the ratio between GHG savings and costs.
3. Other effects evaluate research impacts on specific areas, for example, social equity or job creation.
4. Feasibility evaluates the potential of a specific research area to overcome social and/or political obstacles (e.g. it is acceptable or political inconvenient) to its development.
5. Overall priority allows a general assessment of the priority of specific research areas in terms of importance for climate-friendly navigation research (very low to very high).
6. Research demand indicates the timeframe for research and development discriminating between basic, applied research and implementation stages taking the year 2030 as its end point. The research demand criterion is defined on a year-based scale: it identifies how much each research stage (basic, applied, implementation) is expected to last the time horizon of 2030.
The testing of SRA for boating and pleasure navigation has been focused on: • the internal coherence classification, i.e.,
correctly establishing hierarchical relationships between research areas and lower and upper classification levels;
• the completeness of classification. i.e., checking whether research themes were lacking or were unnecessarily duplicated.
Furthermore, based on the open Expert Consultation process (REACT, 2011), the specific research areas have been ranked in three ways: • by sector: Motorized Boating and Pleasure
Navigation; Non-motorized Boating and Pleasure Navigation; Geography, Spatial Planning; Social Sciences and Education; Economics and Policies – RANK 1
• by main field/pillar: Engineering and Information Technology; and Law, Economics and Politics Science – RANK 2
• total, including all specific research areas – RANK 3.
Here, we will present overall ranking of the specific research areas (RANK 3), as shown in Tab.1.
Table 1. Overall highest ranked specific research areas in climate-environmentally-friendly navigation
Rank Specific research area SRA Pillar SRA Sector
1. Alternative Propulsion Systems Engineering and Information
Technology Motorized Boating and Pleasure
Navigation
2. Integration of Spatial Planning, Land
and Water Planning, Boat Traffic Planning and Economic Policies
Law, Economics, Social and Politics Science
Geography, Spatial Planning
3. Energy Saving Hydrodynamic Profile:
Innovative Boat Concepts Engineering and Information
Technology Motorized Boating and Pleasure
Navigation
4. Non-motorized Mobility Planning Law, Economics, Social and Politics
Science Geography, Spatial Planning

351
Zoran Radmilović, Nataša Tomić Petrović, Vladislav Maraš
BOATING AND PLEASURE NAVIGATION AS CLIMATE-FRIENDLY TRANSPORT
5. Boating Operations and Training Engineering and Information
Technology Motorized Boating and Pleasure
Navigation
6. Boat emissions, Reduction systems Engineering and Information
Technology Motorized Boating and Pleasure
Navigation
7. Public Navigation Planning Law, Economics, Social and Politics
Science Geography, Spatial Planning
8. European Regulation on Emission
Performance Standards for New Boats Law, Economics, Social and Politics
Science Policies
9. Route Planning, Supplying, Provisions Law, Economics, Social and Politics
Science Geography, Spatial Planning
10. Social and Ecological Costs of
Motorized Navigation, Internalization of External Costs
Law, Economics, Social and Politics Science
Economics
4. CONCLUSIONS Boating and pleasure navigation at European level, including climate-environmentally-friendly navigation research, has so far been rather fragmented; and while the EC strongly encouraged the creation of technology platforms to coordinate and strategically identify future research needs, these have been limited to specific modes. Furthermore, given their focus on technological research and development, they did not address social, economic, institutional or planning research. However, boating and pleasure navigation is a complex system that depends on multiple factors, including the dispersal of residential populations, technological solutions available, patterns of consumption and habit, socio-economic parameters and values, and the availability and quality of different types of infrastructure (Whitmarsh and Kohler, 2010). Owing to the complexity of the navigation system and its interactions with so many factors, any intervention in navigation sector must be based on a long-term vision for safer, more efficient and more sustainable navigable movement of people, not least because policies of a infrastructural character take a long time to be implemented and must be planned well in advance. The comparability of such different specific research areas as the fuels and lubricants for advanced internal combustion engines and the evaluation of boat labeling remains problem. Despite using consistent evaluation criteria, comparative assessments are difficult because most stakeholders only have expertise in certain aspects of research (e.g. automotive engineering,
behavior). Furthermore, there is a lack of robust, empirical research about the impact of single measures, which in reality are implemented not separately but in a combined manner. Finally, while our SRA for boating and pleasure navigation helps to take forward a more strategic, coordinated approach for climate-friendly navigation, it has not the fundamental challenge of making growth and sustainability compatible, by decoupling environmental impacts from economic growth, while assuring the competitiveness and innovative character of the pleasure navigation industry. In other words, we can no longer afford to regard environmental consequences as costly side-effects of financial growth. Current growth models should be challenged and the concept of “growth” adopted to the realities of climate change and resource depletion. REFERENCES
1. Chapman, L., “Transport and climate change: a review, Journal of Transport Geography, Vol. 15, No. 5 (2007), pp. 354-367.
2. EC (European Commission), Transport
2050. Roadmap to a Single European Transport Area – Towards a competitive and resource efficient transport system, COM (2011) 144 final. http://ec.europa.eu/transport/strategies/2011_white_paper_en.htm.
3. ERTRAC, Strategic Research Agenda 2010.
http://www.ertrac.org .

7th INTERNATIONAL MARITIME SCIENCE CONFERENCE
352
April 20th-21st, 2017, Solin, Croatia
4. European Expert Group, Future Transport Fuels (2011). http://ec.europa.eu/transport/index_en.htm
5. Lue, A., Bresciani, C., Colorni, A., Lia, F.,
Maraš, V., Radmilović, Z., Whitmarsh, L., Xenias, D., Anoyrkati, E., “Future Priorities for a Climate-Friendly Transport. A European Strategic Research Agenda Towards 2030”, Journal of Sustainable Transportation, Vol. 10, No. 3, (2016), pp. 236-246, DOI: 10.1080/15568318.2014.893043.
6. Radmilović. Z., Maraš, V., Pašković, K., Boating and Canal Navigation as Climate-friendly Transport, World
Canal Conference – 2010, Rochester-USA
7. REACT (2011). Paper on Strategic Research Agenda in climate-friendly transport systems and services (FP7 Project REACT, supporting REseArch on Climate-friendly Transport), Deliverable 2.4., http://www.react-transport.eu. Accessed June 2013.
8. Whitmarch, L., Kohler, J., “Climate change and cars in the EU: the roles of auto firms, consumers and policy in responding to global environmental change”, Cambridge Journal of Regions, Economy and Society, Vol. 3, No. 3 (2010), pp. 427-442.

353
Branko Lalić, Nikola Račić, Gojmir Radica
TWO-STROKE LOW SPEED DIESEL ENGINE SIMULATION MODEL FOR NOX ANALYSIS
TWO-STROKE LOW SPEED DIESEL ENGINE SIMULATION MODEL FOR NOX ANALYSISBranko Lalić, Nikola Račić, Gojmir Radica
TWO-STROKE LOW SPEED DIESEL ENGINE SIMULATION MODEL FOR NOX ANALYSIS
Branko Lalić1, Nikola Račić1, Gojmir Radica2
(1 University of Split, Faculty of Maritime Studies, Split, Croatia)
(2 Faculty of Electrical Engineering, Mechanical Engineering and Naval Architecture, University of Split, Split, Croatia)
(E-mail: [email protected])
ABSTRACT
All commercial marine engines have to comply with IMO regulations on emissions, especially of nitrogen oxides. This paper describes
the gases produced in the combustion process in the diesel engine, and the manner of pollutant creation. Several models of slow-
speed diesel engines have been developed and analysed. The characteristics of the simulation model are compared with the
characteristics obtained on the testbed, and their differences considered. Using the term for the formation of NOx, as well as
independently developed programs in MATLAB, the rate of nitrogen oxide formation was obtained as a function of excess air, pressure
and temperature. The reduction of excess air increases adiabatic flame temperature and has an effect on NOx emissions. The obtained
results are compared with the actual values measured on the testbed.
KEY WORDS
Marine two-stroke diesel engine. NOx emission. Internal combustion engine modelling
1. INTRODUCTION
Exhaust gases from marine diesel engines are the primary source of emissions from ships and significantly contribute to environmental pollution due to the characteristics of the combustion process, typical for large marine two-stroke low speed engines and the use of heavy fuels. Ocean-going ships are the major contributors to global emissions of several hazardous air pollutants, such as nitrogen oxides (NOx), sulphur oxide (SOx), fine particulate matter (PM), hydrocarbons (HCs), carbon monoxide (CO) and greenhouse gas carbon dioxide (CO2). These pollutants do not only have local, but global impact as well. While impact on local (or regional) air quality is mostly due to pollutants such as PM, NOx and sulphur, CO2 has impact on global climate. The quantity of gases emitted from marine engines into the atmosphere is directly related to the total fuel oil consumption. Regulations governing air pollution from merchant shipping are developed at the global level. Since
shipping is inherently international in character, having uniform regulations on issues such as air emissions from ships is vital. The shipping industry is principally regulated by the International Maritime Organization (IMO), an UN agency based in London, responsible for the safety of life at sea and the protection of the marine environment. IMO ship pollution rules are contained in the “International Convention on the Prevention of Pollution from Ships”, i.e. MARPOL 73/78, Annex VI - the first set of regulations on marine exhaust emissions. This paper analyses the effect of modification of an engine’s characteristics on nitrogen oxide emissions (Komar and Lalić, 2015). Scappin (Scappin et al., 2012) attempts to develop a correlation to predict thermal NOx formation in compression ignition (CI) engine fuelled with diesel and biodiesel. Attention was paid to both fuel properties and engine design factors. NOx emissions predicted by the correlation were found to be comparable to the actually measured
* Reprinted with permission from: Transactions on Maritime Science (ToMS)
7th INTERNATIONAL MARITIME SCIENCE CONFERENCE
354
April 20th-21st, 2017, Solin, Croatia
emissions. Saravanan (Saravanan et al., 2012.) does something similar by developing a method for energy system analysis for low speed diesel marine engines to predict their performance and NOx emissions. The extended Zeldovich mechanism was used to predict the NOx emissions. An electronically controlled engine simulated to validate the model was found to be capable of predicting NOx emissions and specific fuel oil consumption with 95% confidence intervals. However, Larsenb et al. (Larsenb et al., ????) study looked into two-stroke diesel machinery for ships, with five varying configurations to explore the trade-off between increased NOx emissions and reduction in fuel consumption. By implementing a waste heat recovery system using an organic Rankine cycle and a hybrid turbocharger, fuel consumption decreased by up to 9% and NOx up to 6.5%. On the other hand, Andreadis (Andreadis et al., 2009) uses a large two-stroke marine diesel engine operating at full load to explore the pilot injection strategies using simulations of computational fluid dynamics along with an Evolutionary Algorithm. The solutions obtained were analysed and identified based on Pareto dominance. NOx emissions centred on early and late pilot injection improved. Guan (Guan et al., 2015) used a modular zero-dimensional engine model built in MatLab and Simulink environment to study the operation of large two-stoke marine diesel engines. Engine shop trial values were compared to the derived performance parameters of the engine, simulated under steady conditions, followed by the discussion of the operating strategies of the engine and their influence on CO2 emissions and fuel savings. The purpose of the Varbantes (Varbantes et. al., 2012) research is to highlight the methods improving diesel engine efficiency. The purpose of control is the even distribution of load between the cylinders, providing the fuel equipment and main diesel systems are operating as usual. The power plant capacity, fuel efficiency and compliance with MARPOL environmental restrictions depend on it. In their previous studies, the authors (Radica, Račić) explored the possibility of increasing the efficiency of a low speed two-stroke turbocharged main diesel engine operating with waste heat recovery by combined heat and power production (Grljušić et al., 2014; Grljušić et al., 2015). Paper (Spahni et al., 2015) deals with a different concept realisation
of Generation X-engines, namely (X-tra efficiency, X-tra manufacturing-friendly, X-tra reliability, X-tra environmentally-friendly). The differences between engines W-X35, W-X40, W-X52, W-X62 W-X72, W-X82 and W-X92 are due to differences in engine size, shipyard requirements or the availability of technical concepts.
2. RESULTS AND DISCUSSION
2.1. The formation of thermal nitrogen oxides
Although nitrogen monoxide NO and NO2 constitute the majority of nitrogen oxides NOx, nitrogen monoxide formed in combustion processes predominates. NO and NO2 create nitric oxide N2O, nitrogen trioxide N2O3 and N2O5 nitrogen peroxide which is present in much smaller quantities. Although the oxidation of molecular nitrogen is the basis for the formation of NO, if fuel contains a substantial amount of nitrogen, the oxidation of the nitrogen components of the fuel functions as an additional source of NO. Diesel fuels contain higher percentage of nitrogen than petrol. Since NO is the primary product (over 90%) of combustion in diesel engines, its formation merits further clarification. The formation of thermal nitric oxide was described in (Heywood, 1988; McAllistar et al., 2011; Lalić et al.,, 2014; Lalić et al., 2016). The reactions required for the formation of NO from atmospheric nitrogen have been studied extensively. The following reactions show an almost stoichiometric combustion mixture of fuel and air to create NO from molecular nitrogen:
2
2N O NO N
N O NO O
N OH NO H
+ ↔ +
+ ↔ +
+ ↔ +
(1)
This is often called the extended Zeldovich mechanism. Zeldovich was the first to recognize the importance of the first two reactions, while Lavoie added the third reaction which is of minor importance. The emergence of nitrogen oxides can be presented as shown in the following equation (McAllistar et al., 2011):
* Reprinted with permission from: Transactions on Maritime Science (ToMS)

355
Branko Lalić, Nikola Račić, Gojmir Radica
TWO-STROKE LOW SPEED DIESEL ENGINE SIMULATION MODEL FOR NOX ANALYSIS
( )2 2
21 0,5
67520 0,51
1, 476 10
ppms
xNON O
T
dx x
dt
Pe
R T
−
−
≅ ⋅ ⋅ ⋅ ⋅
⋅⋅
⎛ ⎞⎜ ⎟⎝ ⎠
(2)
Where T is absolute temperature; xN2
is mole
fraction of nitrogen; xO2 is mole fraction of oxygen;
P is maximum pressure for the given temperature; R is universal gas constant (8314 Jkmol-1K-1). The greatest influences on the formation of thermal nitrogen oxide (NO) are local temperature in the combustion chamber (Ti), pressure (influenced by the concentration of ingredients), local air surplus (λi), retention time (τi) observed particles of composition in an area with conditions (Ti) and (λi). Figure 1 illustrates the dependence of nitric oxide (NO) formation speed on combustion temperature for a wide range of ratios of equality, and very small quantities of nitric monoxide (NO) are shown to be formed when combustion temperature is below 1800 K.
Figure 1. Formation of nitric oxide (NO) in the
function of mixture concentration and combustion temperature (McAllistar et al., 2011)
As shown in Figure 1, nitric oxide levels can be decreased by reducing the rate of reaction velocity, which lowers combustion temperature, and consequently, reduces oxygen O and nitrogen N levels. As for conditions of combustion in the engine, τNO is compared to the time it takes to change the conditions in the engine (equal or more), which means that the process is a kinetically controlled formation of NO.
( )5830016
1
2
8 10 es
T
NOT
p
τ−⋅ ⋅ ⋅
=
(3)
Where 𝜏𝜏!" is time of NO formation expressed in seconds.
2.2. Low speed diesel engine model
This type of slow speed marine diesel engine is an open system with input and output streams. In order to simplify the simulation, the engine was treated as a closed system in which the state of equilibrium was assumed to change in control volumes (quasi stationary model), while unsteady gas dynamic effects were neglected. A set of mathematical equations represents the mathematical model of attributes of physical processes, including parameters obtained by measuring or estimating the physical model. The cylinder pressure, temperature and gas composition are assumed to be equal in all cylinder chambers. Weight losses due to leaks are taken into consideration in the high-pressure part of the process, while kinetic energy is ignored.
Figure 2. Simplified working matter flows and
influential model output parameters in low speed diesel engine
The heat in the cylinder is transferred by convection and later by radiation during combustion. Heat transfer coefficients are not the same throughout the cylinder, i.e. the temperature field is unsteady and inhomogeneous. Heat transferred to the cylinder walls is calculated for each crankshaft angle. Heat loss is described with
* Reprinted with permission from: Transactions on Maritime Science (ToMS)

7th INTERNATIONAL MARITIME SCIENCE CONFERENCE
356
April 20th-21st, 2017, Solin, Croatia
Woschni’s model, and the parameters of the law of combustion are determined by analytical form in the function of combustion according to Vibe (Radica, 2008).
2.2. Calculation of nitrogen oxide emissions
Since the software package used was unable to simulate nitric oxide NO emissions, the estimated NO emissions needed to be calculated according to equation (2) (Benson, 1982). As M. Stoffels wrote in (Stoffels, 1999), the critical period of NO formation in diesel engines is marked by the moment of maximum combustion temperatures. The NO formation rate increases with the duration of combustion and growing pressure. Once maximum pressure is reached, the temperature of combusted gases decreases due to volume expansion and they begin to mix with cooler gases within the cylinder, resulting in decreasing NO emissions. The calculation of NO formation rate requires the establishment of the maximum temperature of combustion products. As stated in
(Benson, 1982), the temperature of products will reach its maximum when there are no heat losses to the environment and when all the energy released in the combustion process is used to heat combustion products. This temperature is called the adiabatic flame temperature (TAFT) and an analysis of combustion at constant pressure is used for its calculation. Adiabatic flame temperature for poor mixture (for equivalence ratio Φ ≤ 1) is (Benson, 1982):
( ) ,1s
AFT Rs p P
f LHVT T
f c
Φ ⋅ ⋅= +
+Φ ⋅ ⋅
(4)
Where TR is absolute temperature of the reactants, Φ is equivalence ratio, fs is stoichiometric fuel/air ratio, LHV is fuel lower heat value, and 𝑐𝑐!,! is mean specific heat capacity of products. Compression temperature at the moment of fuel injection, used as the temperature of the reactants TR, is easily determined from the temperature diagram in Figure 3.
Figure 3. Temperature in crankshaft angle function (MAN B&W 6S50)
Mean specific heat capacity of products 𝑐𝑐!,! is taken as the average temperature of reactants and products, which is:
2P RT T
T+
= (5)
The temperature of the reactants may safely be assumed to be equal to exhaust temperature, since its change would not significantly affect the
specific heat capacity. Assume that the temperature of products TP is 623 K, or 350° C. The average temperature of exhaust gas reactants and products (T = 675 K) can now be determined. The specific heat capacities of exhaust gas products for poor mixture are indicated in thermodynamics tables, i.e. Table 1.
* Reprinted with permission from: Transactions on Maritime Science (ToMS)

357
Branko Lalić, Nikola Račić, Gojmir Radica
TWO-STROKE LOW SPEED DIESEL ENGINE SIMULATION MODEL FOR NOX ANALYSIS
Table 1. Specific heat capacity of exhaust gas products
Product Specific heat capacity kJkg-1K-1
Water H2O 2.13
Carbon dioxide 1.15
Oxygen O2 1.05
Nytrogen N2 1.12
The mean value of the specific heat capacity of products 𝑐𝑐!,!, can be calculated by entering the heat capacities of combustion products indicated in the table into the following expression (Guan et al., 2015):
2 2 2 2, , , , -1 -1
, ,1
kJkg K4
1
p H O p CO p O p N
N
p P p iPi
c
c c c c
cN =
+ + +
= =∑(6)
Adiabatic flame temperature (TAFT) largely depends on the relative air/fuel ratio and compression ratio, elaborated in further text. The establishment of connection between adiabatic flame temperature and relative air/fuel ratio requires taking several relative air/fuel ratios into account. The ratios are obtained by calculating corresponding temperatures using the Matlab software package.
Table 2 contains values required for the calculation of the adiabatic flame temperature. When these values are entered into Matlab, the values of the adiabatic flame temperature may be obtained depending on the relative air/fuel ratio. The dependence of adiabatic flame temperature TAFT range on the relative air/fuel ratio is shown in Figure 4. The diagram in Figure 4 suggests that as the increase in air surplus reduces the TAFT, calculated by expression (6), there is simultaneously a clear increase in real fuel/air ratio (Z), and a reduction in relative air/fuel ratio, i.e. an increase in fuel mass (mg) within the cylinder reduces the relative air/fuel ratio. The increase in fuel mass in the cylinder is accompanied by an increase in temperature, and therefore an increase in energy. The increase in temperature is justified due to reduced air surplus.
Table 2. Values required for TAFT calculation (MAN B&W 6S50MC)
Parameter Value
Temperature of reactants TR 727 K
Relative fuel/air ratio λ 1.7 – 2.3
Stehiometric fuel/air ratio fs 0.069
Fuel lower heat value LHV 42.7 MJkg-1
Mean specific heat capacity of products 𝑐𝑐!,! 1.363 kJkg-1K-1
* Reprinted with permission from: Transactions on Maritime Science (ToMS)

7th INTERNATIONAL MARITIME SCIENCE CONFERENCE
358
April 20th-21st, 2017, Solin, Croatia
Figure 4. Dependence of adiabatic flame
temperature on air surplus (MAN B&W 6S50)
Figure 3, obtained from the software package, can now be related to the resulting adiabatic flame temperature range and indicates a range of crankshaft degrees (on the abscissa) required for the pressure values, mole fraction of oxygen O2 and nitrogen N2. Their values are shown in the diagrams in Figure 5. Matlab was used to calculate the values and tabulate the diagrams shown. Using the expression (2) for the rate of production of NO and expression (3) for NO formation time, NO emission can be obtained. The rate of NO production is given in ppm/s, and formation time in seconds, i.e. the product of these two expressions is the value of NO emissions at a given time:
ppmNONO NO
dxxdt
τ= ⋅ (7)
Figure 5a. Dependence of cylinder pressure on crankshaft angle
Figure 5b. Value of cylinder pressure for TAFT (within vertical lines)
* Reprinted with permission from: Transactions on Maritime Science (ToMS)

359
Branko Lalić, Nikola Račić, Gojmir Radica
TWO-STROKE LOW SPEED DIESEL ENGINE SIMULATION MODEL FOR NOX ANALYSIS
Figure 5c. Dependence of mole fraction of N2 on crankshaft angle
Figure 5d. Value of nitrogen in the cylinder for TAFT range (within vertical lines)
Figure 5e. Dependence of mole fraction of O2 on crankshaft angle
Figure 5f. Value of oxygen in the cylinder for TAFT range (within vertical lines)
* Reprinted with permission from: Transactions on Maritime Science (ToMS)

7th INTERNATIONAL MARITIME SCIENCE CONFERENCE
360
April 20th-21st, 2017, Solin, Croatia
When tabulated values of the model are entered in the expression (7), NO emission can be obtained, and shown as a function of temperature and pressure, Figure 6 a and b. The analysis will be conducted for two engines having the same characteristics, but different compression ratios and RPMs (crankshaft revolutions per minute). Since both engines are produced by the same manufacturer and are of the same type - MAN 6S50 MC - to prevent confusion they will be marked as: Engine 1:
− Real compression ratio 13.21, − RPM 121 min-1.
Engine 2: − Real compression ratio 13.54, − RPM 110 min-1.
So far, the analysed data pertains to Engine 1.
Figure 6a. NO emissions as a function of pressure
Figure 6b. NO emissions as a function of
temperature
Comparison between Engine 1 and Engine 2 is illustrated in Figure 7. Values for Engine 2 are obtained as shown in the calculation procedure for Engine 1.
Figure 7a. NO emissions: based on the pressure of engines no.1 & 2
Figure 7b. NO emissions based on the
temperature of engines no.1 & 2.
Evidence of traceability data has increased compression ratio for each engine by 0.5, which means:
− Engine 1: actual compression ratio 13.71 − Engine 2: actual compression ratio 14.04
In Figure 8 all diagrams of engines with both initial and altered compression ratios are compared. Diagrams (b) and (c) illustrate the effect of compression ratio on NO emission volume. Compression temperature increases linearly with compression ratio increments, identified earlier in this paper as the temperature of the reactants TR. Expression (6) suggests that the increment of reactant temperature also increases adiabatic flame temperature TAFT. An increase in compression temperature is known to affect NO emission concentration. The preceding diagram shows that engines with different compression ratios have different NO emissions. Since NO emissions were higher in engines with higher compression ratios, cylinder pressure, which increases with the compression ratio, can be concluded to play an important role. Diagram (b) illustrates that higher temperatures cause greater deviation in the curve,
i.e. an increase in NO concentration can be said to have occurred. This means that engines with lower compression ratios achieve their maximum pressure values, and hence their maximum NO concentration, earlier. The same conclusion can be drawn from diagram (c) in which the curves of Engine 1 and 2 are seen to intersect due to Engine 1 having a lower compression ratio and thus achieving its peaks, which are also lower, earlier (Lalić et al., 2016).
Figure 8a. NO emissions as a function of pressure
for engines no.1 & 2, with initial and modified compression ratios
Figure 8b. NO emissions as a function of
temperature for engines no.1 & 2, with initial and modified compression ratios
Figure 8c. NO emissions as a function of temperature for engines no.1 & 2, with initial and
modified compression ratios
To further clarify the impact of pressure on NO emission formation, Figure 9 (a) depicts NO emissions as a function of pressure for a wider range of temperatures inside the cylinder, i.e. for a wider range of pressures. The diagram suggests that high emission depends on pressure, where the pressure drop is still at a slight increase due to the temperatures still being high. Emission curves can be seen to start to decline with sharper pressure drop, since after achieving maximum pressures, temperatures begin to fall, reducing emissions.
Figure 9a. NO emissions as a function of pressure
* Reprinted with permission from: Transactions on Maritime Science (ToMS)

361
Branko Lalić, Nikola Račić, Gojmir Radica
TWO-STROKE LOW SPEED DIESEL ENGINE SIMULATION MODEL FOR NOX ANALYSIS
i.e. an increase in NO concentration can be said to have occurred. This means that engines with lower compression ratios achieve their maximum pressure values, and hence their maximum NO concentration, earlier. The same conclusion can be drawn from diagram (c) in which the curves of Engine 1 and 2 are seen to intersect due to Engine 1 having a lower compression ratio and thus achieving its peaks, which are also lower, earlier (Lalić et al., 2016).
Figure 8a. NO emissions as a function of pressure
for engines no.1 & 2, with initial and modified compression ratios
Figure 8b. NO emissions as a function of
temperature for engines no.1 & 2, with initial and modified compression ratios
Figure 8c. NO emissions as a function of temperature for engines no.1 & 2, with initial and
modified compression ratios
To further clarify the impact of pressure on NO emission formation, Figure 9 (a) depicts NO emissions as a function of pressure for a wider range of temperatures inside the cylinder, i.e. for a wider range of pressures. The diagram suggests that high emission depends on pressure, where the pressure drop is still at a slight increase due to the temperatures still being high. Emission curves can be seen to start to decline with sharper pressure drop, since after achieving maximum pressures, temperatures begin to fall, reducing emissions.
Figure 9a. NO emissions as a function of pressure
* Reprinted with permission from: Transactions on Maritime Science (ToMS)

7th INTERNATIONAL MARITIME SCIENCE CONFERENCE
362
April 20th-21st, 2017, Solin, Croatia
Figure 9b. NO emissions as a function of temperature
The diagram in Figure 9 (b) likewise illustrates emissions for a wider range of temperatures inside the cylinder. At the very end of the emission curve where maximum temperature is reached, the beginning of emission decline can be observed. Huge impact of pressure are evident. Although temperatures in the cylinder are still high, nitrogen oxide emissions are lower due to low pressure and decreasing temperature (McAllistar et al., 2011).
3. EXPERIMENTAL SECTION
This section presents emission values obtained by test bed measurements of the MAM B&W 6S60MC engine, provided in Table 3.
Table 3. Exhaust emission data obtained by testbed measurements
Time Power % kW
Speed % rpm
NOx ppm
CO Ppm
CO2 %
O2 %
HC ppm
10:27 25 / 2064 63 / 76.5 982 30 3.92 15.3 54
10:56 50 / 4720 79 / 96.2 1026 28 3.87 15.3 51
11:23 75 / 6580 91 / 109.8 1059 40 4.07 15.09 57
13:20 100 /8631 100 / 121 883 51 4.25 14.85 66
Figure 10 shows the point on the simulation curve for the value obtained from the engine test bed at 100% MCR.
Figure 10. Measured value in the NO emission diagram obtained by simulation model.
Figure 11. Excess air for temperature indicated in measured values
* Reprinted with permission from: Transactions on Maritime Science (ToMS)

363
Branko Lalić, Nikola Račić, Gojmir Radica
TWO-STROKE LOW SPEED DIESEL ENGINE SIMULATION MODEL FOR NOX ANALYSIS
4. CONCLUSIONS
The need to preserve the environment is a major problem in the construction and production of slow speed diesel engines. Organizations such as the “IMO” and “EPA” set emission standards manufacturers are required to comply with. They must meet emission requirements while maintaining the same standard of performance. In this paper NOx emission was taken as the key parameter. Engine models were simulated, the obtained values analysed and compared with the actual tested values. In a developed computer program, NOx emissions were obtained by using simulated values and expressions for nitric oxides formation and compared with actual values. Air surplus, pressure, adiabatic flame temperature and compression temperatures were analysed to establish their effect on nitric oxides formation. The results showed air surplus reduction to increase temperature, since increased fuel mass (mf) increases heat. The diagrams depicting NOx emissions as a function of temperature and pressure do not only show the strong influence of temperature, but also an area in which NOx emissions decrease in spite of high temperature. This phenomenon is interpreted as a critical period in NOx formation. The rate of formation increases with the duration of combustion and an increase in pressure in the cylinder. Once maximum pressure is reached, the temperature of combusted gases decreases due to their mixing with cooler gases, resulting in the decrease of nitric oxides emissions.
REFERENCES
1. Andreadis, P., Chryssakis, C., Kaiktsis, L., (2009), Optimization of Injection Characteristics in a Large Marine Diesel Engine Using Evolutionary Algorithms, SAE Technical Paper 2009-01-1448.,
https://doi.org/10.4271/2009-01-1448
2. Benson, R. S., (1982), The Thermodynamics and Gas Dynamics of Internal-Combustion Engines, Oxford: Clarendon Press.
3. Grljušić, M., Medica, V. and Račić, N., (2014), Thermodynamic Analysis of a Ship Power Plant
Operating with Waste Heat Recovery through Combined Heat and Power Production, Energies, 7(11), pp. 7368-7394.,
https://doi.org/10.3390/en7117368
4. Grljušić, M., Medica, V., Radica, G., (2015), Calculation of Efficiencies of a Ship Power Plant Operating with Waste Heat Recovery through Combined Heat and Power Production, Energies, 8(5), pp. 4273-4299.,
https://doi.org/10.3390/en8054273
5. Guan, C., Theotokatos, G. and Chen, H., (2015), Analysis of Two Stroke Marine Diesel Engine Operation Including Turbocharger Cut-Out by Using a Zero-Dimensional Model, Energies, 8(6), pp. 5738-5764.,
https://doi.org/10.3390/en8065738
6. Heywood, J. B., (1988), Internal Combustion Engine Fundamentals, New York: McGraw-Hill.
7. Komar, I. and Lalić, B., (2015), Sea Transport Air Polution, in: Nejadkoorki, F. (ed.), Current Air Quality Issues, Rijeka: InTech, pp. 165-202.,
https://doi.org/10.5772/59720
8. Lalić, B., Komar, I. and Nikolić, D., (2014), Optimization of Ship Propulsion Diesel Engine to Fulfill the New Requirements for Exhaust Emission, Transactions on Maritime Science, 3(1), pp. 20-31.
https://doi.org/10.7225/toms.v03.n01.003
9. Lalić, B., Radica, G. and Račić, N., (2016), Analysis of Exhaust Gas Emission in the Marine Two-stroke Slow-speed Diesel Engine, Brodogradnja, 67(3), pp. 17 – 35.,
https://doi.org/10.21278/brod67302
10. Larsenb, U., Pierobona, L., Baldib, F., Haglinda, F. and Ivarsson, A., (2015), Development of a Model for the Prediction of the Fuel Consumption and Nitrogen Oxides Emission Trade-Off for Large Ships, Energy, 80, pp. 545–555.,
https://doi.org/10.1016/j.energy.2014.12.009
11. McAllistar, S., Chen, J-F., and Fernandez-Pello, A. C., (2011), Fundamentals of Combustion Processes, New York: Springer-Verlag.
* Reprinted with permission from: Transactions on Maritime Science (ToMS)

7th INTERNATIONAL MARITIME SCIENCE CONFERENCE
364
April 20th-21st, 2017, Solin, Croatia
12. Radica, G., (2008), Expert System for Diagnosis and Optimization of Marine Diesel Engines, Strojarstvo, 50(2), pp. 105-116.
13. Saravanan, S., Nagarajan, G., Anand, S. and Sampath, S., (2012), Correlation for Thermal NOx Formation in Compression Ignition (CI) Engine Fuelled with Diesel and Biodiesel, Energy 42 (1), pp. 401-410.,
https://doi.org/10.1016/j.energy.2012.03.028
14. Scappin, F., Stefansson, S. H., Haglind, F., Andreasen, A. and Larsen, U. , (2012), Validation of a Zero-Dimensional Model for Prediction of NOx and Engine Performance for Electronically Controlled Marine Two-Stroke Diesel Engines, Applied Thermal Engineering, 37, pp. 344-352.,
https://doi.org/10.1016/j.applthermaleng.2011.11.047
15. Spahni, M., Schumacher, B. and Karamitsos, A., (2015), Concepts, Testing and First Service Experience with the Generation X-Engines, WinGD Low-speed Engines Licensees Conference, Interlaken, available at:
16. https://www.wingd.com/media/1435/marcspahni_generation-x-engines.pdf, [accessed 12 January 2017.].
17. Stoffels, G. G. M., (1999), Nitric Oxidein a Diesel Engine: Laser-Based Detectionand Interpretation, Profesor thesis, Katholieke Univesiteit Nijmegen, available at: https://www.utwente.nl/en/et/thw1/People/Professors%20and%20senior%20staff/staff/stoffels/Thesis%20Genie.pdf, [accessed 12 January 2017.].
18. Varbanets, R. A. and Karianskiy, S. A., (2012), Analyse of Marine Diesel Engine Performance, Journal of Polish CIMAC, 7(1), pp. 269 – 296.
* Reprinted with permission from: Transactions on Maritime Science (ToMS)
POTENTIAL OF ZAGREB INTERNATIONAL AIRPORT FOR THE ESTABLISHMENT OF LONGHAUL FLIGHTS
WITH THE UNITED STATES
Damir Vince1, Ornella Zibar2, Monika Sente3
(1 Zagreb Airport Ltd., Zagreb, Croatia)
(2 Brune Bušića 27, 10020 Zagreb)
(3 Martinec Orehovički 31, 49221 Bedekovčina)
(E-mail: [email protected]) ABSTRACT
Globalization and economic development are the main drivers of demand for passenger and goods transport. Although liberalization generally opens the way for a rapid economic growth, there are still many countries that are trying to oppose the liberalization by using administrative measures. Administrative barriers, the disintegration of Yugoslavia, development of the independent states, war and uncertainty of air traffic are some of the reasons for having waited for more than 20 years and still a regular flight between Zagreb and some of the destinations in the United States has not been established. The demand for air transport services is one of the key determinants that affect the establishment of new lines. To re-establish regular long haul flights, numerous analyses of traffic flows should be carried out, potential air carriers detected, as well as the regulations and directives in the field of air transport analysed, so as to have the results showing the potential of the Zagreb International Airport and its catchment area. By signing the "Agreement between the European Union and the United States on air transport” with the impact of all EU Member States according to the " Open Skies Agreement", an important step was made in the normalization of the international air traffic status. It meant the creation of open air space in the transatlantic zone, without any restrictions in air traffic. This means that, for the first time European and American airlines can, without any limitation, conduct traffic from any point in the EU to any point in the United States and vice versa. Following the research of demand for air transport services, potential of catchment area of the Zagreb International Airport and detecting potential carriers, regarding their fleet and spectrum of destinations serviced in Europe, it will be possible to determine the likelihood of establishing direct lines in transatlantic traffic.
KEY WORDS Long haul flights, Zagreb International Airport, Open Sky, USA, market liberalization
1. INTRODUCTION
Globalization and integration processes affect the strategy of entering and conquering the market, which also affect the market changing conditions and the ways of competition. Nowadays, airlines economical operations depend on several factors of which the most important are: efficiency level, exploiting a niche in new markets, reducing costs,
finding new customers, finding strategic partners, opening new distribution channels, launching new products and services to achieve price advantage in the market. In accordance with the conclusion of bilateral agreements on the establishment of air traffic, regulations of the flight rules between the two countries are being defined, determining the city pairs, flights frequency,

365
Damir Vince, Ornella Zibar, Monika Sente
POTENTIAL OF ZAGREB INTERNATIONAL AIRPORT FOR THE ESTABLISHMENT OF LONGHAUL FLIGHTS WITH THE UNITED STATES
POTENTIAL OF ZAGREB INTERNATIONAL AIRPORT FOR THE ESTABLISHMENT OF LONGHAUL FLIGHTS WITH THE UNITED STATESDamir Vince, Ornella Zibar, Monika Sente
POTENTIAL OF ZAGREB INTERNATIONAL AIRPORT FOR THE ESTABLISHMENT OF LONGHAUL FLIGHTS
WITH THE UNITED STATES
Damir Vince1, Ornella Zibar2, Monika Sente3
(1 Zagreb Airport Ltd., Zagreb, Croatia)
(2 Brune Bušića 27, 10020 Zagreb)
(3 Martinec Orehovički 31, 49221 Bedekovčina)
(E-mail: [email protected]) ABSTRACT
Globalization and economic development are the main drivers of demand for passenger and goods transport. Although liberalization generally opens the way for a rapid economic growth, there are still many countries that are trying to oppose the liberalization by using administrative measures. Administrative barriers, the disintegration of Yugoslavia, development of the independent states, war and uncertainty of air traffic are some of the reasons for having waited for more than 20 years and still a regular flight between Zagreb and some of the destinations in the United States has not been established. The demand for air transport services is one of the key determinants that affect the establishment of new lines. To re-establish regular long haul flights, numerous analyses of traffic flows should be carried out, potential air carriers detected, as well as the regulations and directives in the field of air transport analysed, so as to have the results showing the potential of the Zagreb International Airport and its catchment area. By signing the "Agreement between the European Union and the United States on air transport” with the impact of all EU Member States according to the " Open Skies Agreement", an important step was made in the normalization of the international air traffic status. It meant the creation of open air space in the transatlantic zone, without any restrictions in air traffic. This means that, for the first time European and American airlines can, without any limitation, conduct traffic from any point in the EU to any point in the United States and vice versa. Following the research of demand for air transport services, potential of catchment area of the Zagreb International Airport and detecting potential carriers, regarding their fleet and spectrum of destinations serviced in Europe, it will be possible to determine the likelihood of establishing direct lines in transatlantic traffic.
KEY WORDS Long haul flights, Zagreb International Airport, Open Sky, USA, market liberalization
1. INTRODUCTION
Globalization and integration processes affect the strategy of entering and conquering the market, which also affect the market changing conditions and the ways of competition. Nowadays, airlines economical operations depend on several factors of which the most important are: efficiency level, exploiting a niche in new markets, reducing costs,
finding new customers, finding strategic partners, opening new distribution channels, launching new products and services to achieve price advantage in the market. In accordance with the conclusion of bilateral agreements on the establishment of air traffic, regulations of the flight rules between the two countries are being defined, determining the city pairs, flights frequency,
7th INTERNATIONAL MARITIME SCIENCE CONFERENCE
366
April 20th-21st, 2017, Solin, Croatia
aircraft types that will serve agreed destinations, fares and rules for issuing driving licenses. Liberalization process has a significant impact on demand for air transport services leading to economically rational market structures, increasing the economy effects, which directly result in the new opportunities in entering new markets, although many countries are trying to enclose it with protective measures. Before the establishment of the new route it is necessary to conduct a number of analyses, such as analysis of traffic parameters, traffic flow, study of the prescribed regulations at European and national level in order to determine the advantages and disadvantages of introducing the listed route. Currently, between Croatian and American destinations direct connection doesn’t exist. All trips made between the USA and Croatia are via one of the transfer hubs in Europe. Trips that require more than two stops until the final destination are not attractive and are avoided often by passengers and they choose destinations that are better-connected. Tourism, as a subsystem of the overall economy in the future, in becoming a strong support for the overall country development, its further development has to be on improving traffic connections with potential source markets.
2. REPUBLIC OF CROATIA LEGAL REGULATIONS THAT REGULATE AIR TRAFFIC
Efforts to establish direct flights from Zagreb to destinations in the USA exist since Croatian independence. In addition to the Zagreb Airport, other airports in Croatia have been developing strategies to attract foreign air carriers to arrange direct transatlantic flights. In the previous period, numerous meetings between airports and air carriers were held; foreign consultants for feasibility studies were hired to introduce a direct route between the two markets, who carried out a large number of business trips to the "ROUTES" conference or to the headquarters of air carriers. For the establishment of international air traffic, obligation is to establish a legal framework, which is based on international agreements and contracts. A number of agreements are signed at
the present time, based on the principles of respect of common rules relating to safety, security and air traffic management. Special attention is paid to the field of harmonization of national legislation with international regulations and practices, harmonization of standards in training of operating personnel, standards of aircraft and equipment maintenance and on issues on environmental protection. Policy of international air traffic is based on the key elements: • bilateral and horizontal agreements, • ECAA (European Common Aviation Area)
Agreement - Agreement on the European common air space and the Open Skies Agreement (contract between the EU and the USA),
• global partnership.
The segments above are consumed under the same competition conditions without discrimination based on nationality, with the objective of full liberalization in terms of capacity, frequencies and fares. The Republic of Croatia due its geographical location is potentially important transit area, because air corridors through the space present the shortest routes between the United States, Western Europe, the Middle and Far East. USA and Croatia reached an agreement on the expansion and liberalization of civil aviation between the two countries through the Open Skies agreement. The international legal framework for the establishment of regular air traffic between the Croatian and the USA, the legal acts under the name: "The agreement between the Croatian Government and the Government of the United States on air transport" ("Open Skies"). Another key document is "Agreement between the European Union and the United States on air transport" (The EU-US Air Transport Agreement), with effect on all EU member States. Conclusion of this Agreement based on the "Open Skies" is an important step in the liberalization of international air transport unfolding. For the European Union, it is the creation of open space in the transatlantic air traffic zone: represents a single aviation market between the EU and the USA and the free flow of capital without restrictions. This means that for the first time European and American airlines can, without limitation, conduct traffic from any point in the EU to any point in the USA and vice versa.
367
Damir Vince, Ornella Zibar, Monika Sente
POTENTIAL OF ZAGREB INTERNATIONAL AIRPORT FOR THE ESTABLISHMENT OF LONGHAUL FLIGHTS WITH THE UNITED STATES
American airlines have additional right, and that is the right to fly between points in different EU member states. European airlines were given the right to fly between the United States and the countries which are not members of the EU (e.g. Switzerland). "The agreement between the European Union and the United States on air transport" is replaced by the agreement on air traffic (according to the "Open Skies"), which had previously been entered into the USA with individual EU member states. The “Open Skies" agreement allows a significant expansion of the establishment of international passenger and cargo flights to and from the USA, which removes administrative barriers to the establishment of air traffic between the two major markets, and significantly reduces interference of state authorities in the commercial decisions of air carriers on routes, engaged capacities and fares. In that way, competition is allowed, sense of competition and its positive effects on the service quality and the supply flexibility, which contributes to the development of market services in the air transport and increasing consumer demand for services at affordable rates.
3. PARAMETERS OF LONG-HAUL AIR TRAFFIC DEVELOPMENT
For the establishment of long-haul routes, it is necessary, first to make a qualitative analysis of state of key parameters such as: technical and financial assumptions, administrative requirements, including analysis of the actual current circumstances. In addition, it is important to research demand in aviation market and detect promising starting points and destinations through data analysis. Within the parameters to be observed, the most important are: • size of traffic when it comes to the potential
new routes (statistic information and airport reports),
• the reason for the establishment of potential routes,
• "purpose of travel" - basis, which is usually interpreted to develop new lines,
• time of travelling – certain days in a week, • market segmentation – determine the target
group of passengers, • passengers’ desires when purchasing tickets -
for example, surveys, • the number of transported passengers
according to a specific destination • estimated number of passengers who would
want to travel on this route, • stimulating market demand methods.
The effective adaptation of the aviation fleet at the annual expected occupancy solves the problem of different traffic demand. Selection of the optimal structure of the fleet is defined by the following factors: 1) operational exploitation - performance
aircraft, range, speed, block-time, flight time and fuel consumption,
2) financial, load factor, network flights capacity, target operating target profit, interest cost, loan repayments, and other income and expenses,
3) marketing commercial - a modern fleet, flight frequency, direct / indirect flights,
4) contractual- ordering size, price escalation, correspond concessions, special equipment and the aircraft requirements.
The original problem selecting the required fleet in serving long haul flights between Croatia and the United States stems from the seasonal traffic. In the Republic of Croatia there is a very large oscillation for the transport services between the summer and winter months, demand. The problem lies in finding appropriate solutions between different aircraft sizes to various phenomena peak loads [2]. Given the specificity of long-distance traffic it is necessary to allocate aircraft types that can serve long-haul routes. The most suitable aircraft that meet the requirements are listed in Table 1.

7th INTERNATIONAL MARITIME SCIENCE CONFERENCE
368
April 20th-21st, 2017, Solin, Croatia
Table 1. List of aircraft that have range from the USA to the Croatia on sample of air carriers Airline Aircraft type In service On Order MTOW (t) Range (km)
A330-200 15 0 242 12.500 A330-300X 9 0 242 10.500 A350-900XWB 0 22 280 16.120 B767-300ER 30 0 187 11.070 B777-200ER 47 0 298 13.080 B777-300ER 20 0 352 13.650 B787-8 18 2 228 13.621 B787-9 6 16 254 14.140
Total 145 40
A350-1000XWB 0 35 308 14.800 B747-400 18 0 397 13.490 B767-300ER 35 0 187 11.070 B767-400ER 16 0 204 10.415 B777-200(ETOPS) 19 0 298 13.080 B777-200ER 55 0 298 13.080 B777-300ER 2 12 352 13.650 B787-10 0 14 254 11.908 B787-8 12 0 228 13.621 B787-9 19 11 254 14.140
Total 176 72
A330-200 11 0 242 12.500 A330-300 9 1 242 10.500 A330-300E 21 0 242 10.500 A330-900neo 0 25 242 13.900 A350-900XWB 0 25 280 16.120 B747-400 7 0 397 13.490 B767-300ER 58 0 187 11.070 B767-400ER 21 0 204 10.415 B777-200ER 8 0 298 13.080 B777-200LR 10 0 347 15.840
Total 145 51 Source: CAPA Centre for Aviation, 2017.
From the table, it can be seen that Croatia
Airlines as the largest national carrier does not meet the requirements defined in the fleet for the purposes of servicing long-distance traffic. For this reason and because of the previously mentioned legal aspects, come to the conclusion that the only possibility of establishing a long-haul flight is on the assumption that the observance enforced by US air carriers. To achieve a rational and productive business, it is needed to long-haul traffic served by the carrier which has a broad structure of the fleet with regard to capacity. When the correlation put the demand for air traffic and capacity aircraft which have sufficient range to fly without landing between the origin and the destination, the choice boils down to only two to three types of aircraft with less capacity seats. Since this is a relatively old type of aircraft that is equipped with engines of high consumption, only a small number of
companies held them in the fleet. It is important to question the feasibility and the introduction of the line for the following reasons: • big expenses that come after introducing a
new line to traffic; • high risk because of lack of ticket sales; • lower ticket prices that stimulate market for
larger demand; • economic situation that dictates international
trade. Currently there are three major carriers (Delta Air Lines, United Airlines, American Airlines) performing transatlantic flights but they, however, are focused on major hub in Europe, most notably Paris, London, Amsterdam and Frankfurt which are located in western and developed part Europe with a high concentration of the population is large gross national product. The pictures below show

369
Damir Vince, Ornella Zibar, Monika Sente
POTENTIAL OF ZAGREB INTERNATIONAL AIRPORT FOR THE ESTABLISHMENT OF LONGHAUL FLIGHTS WITH THE UNITED STATES
the lines of the three largest air carriers from their main hubs in the United States to Europe.
Figure 1. American Airlines routes from the airport Dallas, Fort Worth International to Europe
Source: CAPA Centre for Aviation, 2017.
Figure 2. United Airlines routes from the airport Chicago O'Hare International (ORD) to Europe
Source: CAPA Centre for Aviation, 2017.
Figure 3. Delta Air Lines routes from airport Atlanta, Hartsfield-Jackson International to Europe
Source: CAPA Centre for Aviation, 2017.
According to current indicators of transport demand it is evident that the bulk of transatlantic traffic takes place over four largest airports which are also the seat of the largest airlines and alliances led (Lufthansa - Star Alliance, British Airways - OneWorld, Air France and KLM - Sky Team). The biggest market potential have Great Britain and Germany in the area of which Frankfurt
manifested as the primary airport for long-haul traffic. In most states, where the airport is outlined as the main transportation hub, the system "hub and spoke" is applied. Frankfurt as a main hub for transatlantic traffic in 2015 had 3.348,700 passengers which is a third of the total 61,040,613 million passengers whose destination was the United States; representing 11.5% of total
7th INTERNATIONAL MARITIME SCIENCE CONFERENCE
370
April 20th-21st, 2017, Solin, Croatia
turnover. Major US destinations are New York (JFK), San Francisco (SFO) and Toronto (YYZ). Factor affecting potential development of the airports is the dominant carrier. In the previous period, States have developed and defended various administrative barriers to domestic carriers, often national carrier, that is, including transport policy and economic interests of the domicile country developed network of destinations. In recent times, there were more cases of takeover of smaller carriers by large or within a carrier formed a new company that has used another business model (Eng. Low cost). Croatia Airlines, as part of the alliance Star Alliance, founded by Lufthansa, currently serves as a "feeder" to major hubs and is the main interest of Lufthansa as a strategic partner that Croatia is established transatlantic traffic because it will lose this part of the passengers on their flights. At the same time, Croatia Airlines, which was unable to due to inadequate fleet establish a transatlantic flight, lose part of potential passengers. The above shows that, in addition to adequate transport policy and a strong dominant or national carrier, a key factor for the development of the airport and the volume of transfer traffic.
4. POTENTIAL OF ZAGREB INTERNATIONAL AIRPORT
The opportunity and potential of Zagreb International Airport when establishing a long-haul flight is mainly manifested in connecting the Croatian Diaspora in the USA which is one of the largest in the world and represent the Republic of Croatia as a desirable tourist destination. Based on the assessment of the Croatian Embassy and the Consulate General of the Republic of Croatia in the United States, Croatian Catholic missions, the census in the USA and based on the evaluation of the Croatian community in the United States today has a population of 1.2 million Croats and their descendants. The most numerous Croatian communities with the highest population of Croatian origin are located in: • Chicago and the surrounding area - 150,000
inhabitants, • St. Louis - 40,000 inhabitants, • Detroit - 7,000 inhabitants,
• San Pedro - 35,000 inhabitants, • San Jose - 5,000 inhabitants, • New York - 80,000 inhabitants, • New Jersey - 80,000 inhabitants, • Connecticut around 80,000 inhabitants
In addition, in Canada there are about 250,000 Croats. The figures show that in North America has a large population of displaced Croats. Croats have emigrated due to economic and political reasons but it can be concluded that there were cases of immigration either of the above reasons. In the refugee wave, with the Croats, there's emigrant community of other nations from the former state (SFRY - Socialist Federal Republic of Yugoslavia), which as the final destination for a new life chose the US. They all have significant potential to generate demand for direct flights between North America and some of the destinations close to their final destination, or areas prior to emigration. For that reason, there is a question about the possible establishment of Zagreb as the main hub of Southeast Europe, in order to enable better and more direct connections abroad. In this way, it would be possible to spread the gravitation zone of Zagreb International Airport, and to significantly increase the potential of Zagreb. Zagreb can be developed into a regional hub that would gravitated travelers from neighboring countries, but it is necessary to look at the big picture of the whole idea. Until recently, none of the airport, in the wider environment, had established a direct line toward North America. It was not until last year where the route between Belgrade and New York, served by Air Serbia was established. With this route is possible to connect passengers from the Croatian daily flights to Belgrade, which are then transported to the United States. With that, Belgrade has become a competitive airport that preceded International Airport Zagreb and Croatia in general. There is no question of the development of Zagreb as a regional hub due to the fact that in the former Yugoslavia most of the traffic to destinations in North America took place through Zagreb. At that time, there were direct flights New York - Zagreb - New York, which has served the airline PAN AM. Due to the increasing demand of tourists, circular line New York - Zagreb - Dubrovnik - New York was introduced- which is serviced by the same
company. Air Canada serviced the line Toronto - Zagreb - Toronto. At that time, JAT, as the national carrier of Yugoslavia, was considered a solid carrier and is served flights / lines from Zagreb to New York, Chicago, Los Angeles, Montreal and Toronto. JAT owned a fleet of two wide-body aircraft DC10-30 and depending on the demand in the lease had aircraft Lockheed L-1011 TriStar of company Royal Jordanian.
5. PROPOSAL OF PROGRAMS FOR ESTABLISHING LONG HAUL FLIGHTS TO INTERNATIONAL AIRPORT ZAGREB
The Republic of Croatia has been recognized as an attractive, Mediterranean, tourist destination. Tourism is an important segment of the Croatian economy and therefore there is no question in establishing a system of indicators in evaluating and monitoring the sustainability of tourism. But there are limiting factors relating to: the availability of hotel capacities of higher categories, the lack of entertainment. In the recent years, there has been a significant increase in tourists from the North American market. Unfortunately, due to many barriers by 2016 no air carrier has established a direct or even the seasonal long-distance traffic between the USA and Croatia. Taking into account that the total volume of air traffic that is generated by all airports in the Republic of Croatia is slightly higher than the 8.1 million passengers per year (in 2016), there is a little chance for any airport in the region to establish a regional traffic throughout the year with the North American market. It is known that a small number of frequencies is not attractive for business traveling and business travelers will continue to plan their trips through some of the transfer hubs, leading with shortest trip duration. In the case of Croatia, as a tourist destination it would be preferable to turn direction in getting a better connection; seasonal flights. The introduction of seasonal flights does not generate a significant increase in the volume of total traffic nor increase the number of frequencies which will arouse the interest of large carriers to establish direct flights to markets with weak and varying potentials. All passengers from distant countries who come to the Republic of Croatia must use one or more
transfer hubs which significantly extend the travel time, reduces pleasure during the trip, and thought-provoking in choosing other destination which has direct flights. Although most developed economies emerged from recession cycle or are at the exit, the effects of the economic recession are still visible in air traffic. Therefore, all air carriers must be very careful when making decisions on the establishment of new routes, especially on the markets that do not have extreme potential and are not able to assert itself as a regional hub which are capable to attract transfer traffic.
6. CONCLUSION
The aim of this paper is to highlight the complexity of the factors of air traffic and the many factors that determine the demand for air transport services in the further development of air transport. Although the Republic of Croatia adopted new Transport Development Strategy in 2014, without adequate transport policy and and promoting the "hub and spoke" model of operation of air carriers, the continuous development of the network destination and the establishment of new direct lines in regions gravitate to each regional hub, it is impossible to expect a significant increase in demand for services of air traffic in the future as well as the establishment of a transatlantic or other long-distance traffic. Such focus of future air transport development should follow the development of the dominant domestic carrier. Due to the small potential of the domestic market, as emissive markets and relatively weak demand in the transatlantic or global source markets for destinations in Croatia, air carriers are not interested in seriously evaluating the economic feasibility of establishing a line in regular traffic to Croatian airports. In the next period, it can be expected to have only limited organized charter flights and only during the summer season. To change this situation, primary need is to establish better transport links with neighboring regions and develop a network of destinations in order to increase transfer traffic. Only by crossing the border of 4-5 million passengers at each airport it is possible to expect expressions of interest of airlines to establish a long-distance traffic.

371
Damir Vince, Ornella Zibar, Monika Sente
POTENTIAL OF ZAGREB INTERNATIONAL AIRPORT FOR THE ESTABLISHMENT OF LONGHAUL FLIGHTS WITH THE UNITED STATES
company. Air Canada serviced the line Toronto - Zagreb - Toronto. At that time, JAT, as the national carrier of Yugoslavia, was considered a solid carrier and is served flights / lines from Zagreb to New York, Chicago, Los Angeles, Montreal and Toronto. JAT owned a fleet of two wide-body aircraft DC10-30 and depending on the demand in the lease had aircraft Lockheed L-1011 TriStar of company Royal Jordanian.
5. PROPOSAL OF PROGRAMS FOR ESTABLISHING LONG HAUL FLIGHTS TO INTERNATIONAL AIRPORT ZAGREB
The Republic of Croatia has been recognized as an attractive, Mediterranean, tourist destination. Tourism is an important segment of the Croatian economy and therefore there is no question in establishing a system of indicators in evaluating and monitoring the sustainability of tourism. But there are limiting factors relating to: the availability of hotel capacities of higher categories, the lack of entertainment. In the recent years, there has been a significant increase in tourists from the North American market. Unfortunately, due to many barriers by 2016 no air carrier has established a direct or even the seasonal long-distance traffic between the USA and Croatia. Taking into account that the total volume of air traffic that is generated by all airports in the Republic of Croatia is slightly higher than the 8.1 million passengers per year (in 2016), there is a little chance for any airport in the region to establish a regional traffic throughout the year with the North American market. It is known that a small number of frequencies is not attractive for business traveling and business travelers will continue to plan their trips through some of the transfer hubs, leading with shortest trip duration. In the case of Croatia, as a tourist destination it would be preferable to turn direction in getting a better connection; seasonal flights. The introduction of seasonal flights does not generate a significant increase in the volume of total traffic nor increase the number of frequencies which will arouse the interest of large carriers to establish direct flights to markets with weak and varying potentials. All passengers from distant countries who come to the Republic of Croatia must use one or more
transfer hubs which significantly extend the travel time, reduces pleasure during the trip, and thought-provoking in choosing other destination which has direct flights. Although most developed economies emerged from recession cycle or are at the exit, the effects of the economic recession are still visible in air traffic. Therefore, all air carriers must be very careful when making decisions on the establishment of new routes, especially on the markets that do not have extreme potential and are not able to assert itself as a regional hub which are capable to attract transfer traffic.
6. CONCLUSION
The aim of this paper is to highlight the complexity of the factors of air traffic and the many factors that determine the demand for air transport services in the further development of air transport. Although the Republic of Croatia adopted new Transport Development Strategy in 2014, without adequate transport policy and and promoting the "hub and spoke" model of operation of air carriers, the continuous development of the network destination and the establishment of new direct lines in regions gravitate to each regional hub, it is impossible to expect a significant increase in demand for services of air traffic in the future as well as the establishment of a transatlantic or other long-distance traffic. Such focus of future air transport development should follow the development of the dominant domestic carrier. Due to the small potential of the domestic market, as emissive markets and relatively weak demand in the transatlantic or global source markets for destinations in Croatia, air carriers are not interested in seriously evaluating the economic feasibility of establishing a line in regular traffic to Croatian airports. In the next period, it can be expected to have only limited organized charter flights and only during the summer season. To change this situation, primary need is to establish better transport links with neighboring regions and develop a network of destinations in order to increase transfer traffic. Only by crossing the border of 4-5 million passengers at each airport it is possible to expect expressions of interest of airlines to establish a long-distance traffic.

7th INTERNATIONAL MARITIME SCIENCE CONFERENCE
372
April 20th-21st, 2017, Solin, Croatia
Airlines that have for years enjoyed subsidies from the state budget and protect market various administrative barriers, which prevent foreign market entry competitive carriers, missed the opportunity to adapt to new market conditions, where the process of liberalization started. Sluggish and inefficient systems with individual air carriers caused the loss of competitive ability for competition. Air carriers that are not able to adapt to new market conditions are doomed to failure (bankruptcy) and exiting from the market. Delayed reaction in terms of restructuring, the application of some of the new business model, the inability to compete with other carriers in entering new markets will use the leaders of the alliance who've already mutually shared small markets and thereby meet their business interests. Business policies implemented by the market leaders in air transport will significantly affect the operations of the Croatian airports. Air carriers, in the near future, will be the key factors that will satisfy their own business interests and relations in certain markets and dictate the dynamics of the individual markets. In this way, it will have a direct impact on the pricing policies of airports and the routing of traffic flow of passengers to the destinations that best suits them or where they can expect the greatest profit. In a broader context, this means that the mutual interests of airlines significantly affect the attractiveness of certain destinations, hotel occupancy rate of resources, and thus the overall performance of the tourism industry. Accordingly, based on the analysis of the routes of individual airlines, the potential market of air traffic in Croatia is small and not sufficiently attractive for deeper evaluation of the cost-effectiveness of introducing new lines. Time of politically conditioned opening line is long gone, especially after the liberalization process and the signing of " Agreement between the European Union and the United States on air transport " (The EU-US Air Transport Agreement). Now airlines decide independently on the elimination of unprofitable and the introduction of new lines, for which feasibility studies have shown their profitability.
In the next 10-15 years, it’s not expected for any air carrier of the United States to open all year liner services between any city in the United States and Croatia. If that line could attract business travelers and part of commodity
shipments, it would be necessary to maintain lines with a minimum three to four frequencies per week. Such frequency of flights requires a large gravitational zone, which is industrial and transportation developed and the airport which has built adequate infrastructure and equipped with equipment for handling wide-body aircraft category "E" and "F". The analyzed data show that with all the traffic that is now done through all Croatian airports (total 8.1 mil. Passengers in and check-out in 2016), none of the airport have enough resources to generate even minimal demand for long-haul traffic. Without coordinated cooperation between carriers and airports it can’t be expected to get new flights. Efforts from only airports are not sufficient to ensure the viability and profitability of the newly established line.
REFERENCES
1. Tatalović M., Mišetić I., Bajić J.: Menadžment zrakoplovne kompanije, MATE i ZŠEM, Zagreb:, 2012.
2. CAPA Centre for Aviation, http://www. centreforaviation.com, 2017.
3. Frankfurt Airport Air Traffic Statistics 2015
4. Internetska stranica „Hrvati izvan RH“; http://www.hrvatiizvanrh.hr
5. IATA; Vision 2050, Singapore, 2011
6. DKMA; ACI: Global Traffic Forecast 2006-2025, edition 2007
7. CAPA & OAG database – http://www. centreforaviation.com
8. Anna Aero database – http://www.anna.aero
9. Google Earth Map
10. Ministarstvo turizma Republike Hrvatske – http.//www.mint.hr
11. Državni zavod za statistiku - http://www.dzs.hr
12. Official website Delta Airlines http://www.delta.com/
13. Official website United Airlines https://www.united.com

373
Nela Jadrijević, Ines Kolanović, Tatjana Stanivuk
CHARTER AND NAUTICAL SERVICE QUALITY IN FUNCTION OF NAUTICAL TOURISM PORT COMPETITIVENESS
CHARTER AND NAUTICAL SERVICE QUALITY IN FUNCTION OF NAUTICAL TOURISM PORT COMPETITIVENESSNela Jadrijević, Ines Kolanović, Tatjana Stani-vuk
CHARTER AND NAUTICAL SERVICE QUALITY IN FUNCTION OF
NAUTICAL TOURISM PORT COMPETITIVENESS
Nela Jadrijević1, Ines Kolanović1, Tatjana Stanivuk2
(1 University of Rijeka, Faculty of Maritime Studies, Rijeka, Croatia)
(2 University of Split, Faculty of Maritime Studies, Split, Croatia)
(E-mail: [email protected])
ABSTRACT
The range of charter services has considerably grown in the Republic of Croatia over the past years. Such a trend indicates further growth in demand for charter services as well as the increase of service interference and coordination activities between nautical tourism ports and charter companies. The purpose of this paper is to identify the areas of interference between charter and nautical service production processes and to determine the significance of service quality in achieving nautical tourism ports competitiveness. The areas of interference have been identified through the nature and facilities of the nautical services that have been researched and described in scientific literature, and the nature and facilities of the charter services that have been examined through the analysis of the management of charter agency Croatia Yachting. The produced research results indicate that the quality of charter services provided in the nautical tourism ports significantly affects their competitiveness in the nautical market.
KEY WORDS
Charter Service, Nautical Tourism Ports, Nautical service, Service Quality
1. INTRODUCTION Achieving a competitive position in nautical tourism market requires the ports of nautical tourism to adjust to the growing demands and expectations of boaters in terms of competitive prices and a number of other service components. Accordingly, managing structures in nautical ports have to develop high-quality services in order to attract and maintain nautical tourists [6, p. 67]. As there are not enough scientific studies dealing with the nautical service quality, the available literature that analyses the port services quality will be taken into consideration and included in the discussion by establishing adequate analogies. The port service quality has been examined and
described through the prism of ten established quality dimensions, including reliability, commitment, competence, accessibility (availability), kindness, communication, credibility, safety, understanding, and tangibility [8, p. 220], [16, p. 47]. On the basis of the established regularities and principles that are used for defining the port service quality, certain analogies will be drawn when attempting to define the quality of the charter and nautical services. It is worth noting that, due to the overlapping nature of charter and nautical service production processes, the nautical service study also involves a logistic aspect of the charter service production process.

7th INTERNATIONAL MARITIME SCIENCE CONFERENCE
374
April 20th-21st, 2017, Solin, Croatia
2. DEFINITION OF THE NAUTICAL AND CHARTER SERVICE The scientific studies on nautical tourism model tend to separate charter activities from nautical port activities. This paper has a different approach as it attempts to identify the interactions between these activities. Clearly, a number of authors take into consideration the elements of charter service production process when defining the nautical service production process. As a result, the nautical service definition implies embarking / disembarking of nautical tourists, crew change-over after a completed one-week charter, maintenance and supply of vessels, assistance in berthing / unberthing, and other services [19, p. 203]. Therefore, the nautical service production process includes the weekly crew change as a part of charter activities performed by charter agencies in nautical tourism ports [6, p. 68]. The importance of defining the intensive interaction between the nautical service production process in ports and charter service development process is apparent through the definition of the nautical service as the correlation between nautical service providers and users. The truth is that a nautical service is a specific form of tourism, as its development requires boats, regardless of whether the boats’ owners are present or not present at the moment of providing the service [12, p. 207]. The presence of a boat’s owner is not required during the nautical service, which implies that charter and nautical services are essentially related. These facts and the findings of the scientific studies lead to the conclusion that a charter service development makes part of a nautical service production process [6, p. 68]. In scientific papers, the charter activities imply commercial boat rental as part of nautical service to boaters through various tourist packages [3, p. 77]. Likewise, according to the Ordinance on the conditions for providing boat charter with or without crew and providing the accommodation services for guests on the boat (Official Gazette 99/13), charter activities are defined as boat rentals for recreation and accommodation of guests over an agreed period of time [15]. These definitions are very narrow: they describe charter services as boat rentals, whereas a number of complex processes have to be involved in order
to provide a charter service to the end user. Numerous operators and other personnel employed by charter agencies are engaged in these processes and are responsible for organisation of operations and for cooperation with the nautical tourism ports. It is obvious that the charter activities performed by agencies in nautical ports are intertwined with the services provided by nautical ports themselves. Therefore, it can be concluded that the nautical tourism port competitiveness is affected not only by the nautical service quality but also by the charter service quality provided by the charter agencies in nautical ports [6, p. 69]. 3. THEORETICAL DETERMINANTS OF THE QUALITY OF NAUTICAL AND CHARTER SERVICES Speaking etymologically, the word quality stems from Latin word qualitas representing virtue, value, good feature, characteristic, property [1, p. 778]. From the standpoint of the service provision, quality is in function of a user’s satisfaction with the provided service and involves all service features that meet the requirements of users [17, p. 294]. Analogously, the nautical service quality can be defined as the satisfaction of the boater with the nautical service provided. At this point, it should be taken into account that the boaters indirectly evaluate the nautical services of the nautical port where the chartering processes take place, while evaluating the very charter service provided by charter agencies. Here is the description of the nautical and charter services in line with the five [18, p. 101] established general features of services. 1. intangibility – according to the general definition of the service characteristics, it is assumed that the service cannot be used before it has been created, although the material aspects of the nautical service often include the visual impression of the port, organisation of reception, graphic layout of the promotion material, tidiness of port facilities, etc. [6, p. 70]. 2. perishability – from the nautical service standpoint, the purpose of a successful performance of nautical tourism ports is to use their capacities to a full extent, i.e. optimal sea

375
Nela Jadrijević, Ines Kolanović, Tatjana Stanivuk
CHARTER AND NAUTICAL SERVICE QUALITY IN FUNCTION OF NAUTICAL TOURISM PORT COMPETITIVENESS
and dry berths occupancy. Otherwise, failing to realise the full use of resources decreases the potential income in port business operations [6, p. 70]. 3. heterogeneity – this refers to various quality levels of identical nautical services, depending on the individual nautical tourism port. Heterogeneity is apparent in the categorisation of nautical ports, where a number of berths is taken for the purpose of defining the quality level of the provided nautical service [6, p. 70]. On the other hand, a marina that is categorised as a higher-category facility is likely to provide a higher quality of service [12, p. 219]. 4. absence of ownership – the purchase of a nautical service does not imply the acquisition of ownership but enables a customer to use the nautical port facilities and capacities through making individual sea or dry berth contracts. From the aspect of charter service provision, the general characteristic of the service is purchasing the charter service and getting entitled to use charter boats over the agreed period of time, without any changes in ownership of the vessels [6, p. 70]. 5. simultaneous processes of service production and consumption – boaters call at specific nautical tourism port as per their preferences. Within the charter service context, there are situations where the simultaneous processes of service production and consumption take place in such a way that the service provider approaches the boater. For example, in case of technical failure or damage to the chartered boat, the emergency situation requires technicians of the charter agency to go to the vessel’s position to render technical assistance to the boaters [6, p. 70]. The development of nautical and charter services in nautical tourism ports occurs through the interaction of two parallel processes through the use of infrastructure, superstructure and the personnel of both the charter agency and the port, as shown in Figure 1. The first segment of the nautical service development process refers to the activities in the domain of the port management, while the segment of developing the charter service refers to the activities created and performed by charter agencies located in nautical ports [6, p. 73].
Figure 1. shows the areas where, from the logistics point of view, the charter activities overlap with the process of nautical service production. The charter service production process starts with marketing activities aimed at encouraging the boaters to rent vessels in accordance with their preferences. The next stage of the process refers to the reception of boaters at charter base facilities where paperwork is completed. Figure 1. has shaded areas that indicate the interference points in the process of providing nautical and charter services. Within this context, the secondary services provided in nautical tourism ports include, according to Šamanović, the supply of power, water, fuel, provisions, and the assistance of port personnel when leaving / entering the port. Figure 1. also indicates exceptional circumstances such as technical failure and damage during the charter sailing period, when technical assistance is required. However, it is more likely that the charter service production process will resume without obstructions and technical assistance until it reaches its natural end, which is indicated by the field “end of sailing”. The process is reaching towards the end in the field marked as “check-out” where the interference between charter and nautical services occurs at the end of charter period that involves berthing operation performed by dock assistants. At the process stage of “check-out”, the interference between the charter and nautical port activities comprises the diver’s underwater survey of the boat as well as on-board checks performed by charter agency staff, in accordance with the inventory list. The further process of charter service development may then resume in two directions. It is possible that there are damages to the vessel, for which the charter service user is found responsible. The identified damages may result in additional nautical port services such as lifting the boat out of the water for repair. After all, procedures related to damage and other “check-out” formalities are completed, the boaters leave the nautical tourism port. If their expectations are satisfied, it is likely that boaters will return to the same marina in the future. If not, the charter service production process is terminated due to the boaters’ dissatisfaction or unfulfilled expectations.

7th INTERNATIONAL MARITIME SCIENCE CONFERENCE
376
April 20th-21st, 2017, Solin, Croatia
Start of the process
Meeting guests on land -
transfer (airport, ferry port, etc.)
Reception of charter base –!paperwork
(crew list, residence tax, security deposit
etc.)
Start of sailing start (emission
port)Failure
End of sailing (emission/
receptive port)
Check out
Leaving the port/transfer (by airplane, ferry,
train, etc.)
End of the process
Sailing in agreed charter period
Effected by:
Advertising (global)
Tradition
Agency arrangement
Club arrangement
Vessel booking procedure
Check in
Damage
nosmaller
Fulfilled clients`
expectations
no
yes
no
yes
Technical support
Lifting the vessel, the
repair
larger
Secondary services in NTP:
supply of power, water, fuel, provisions, assistance of port personnel (mariner)
Secondary services in NTP: slipways, travel lifts, repairs of the vessel, spare
parts provision.
Secondary services in NTP: slipways, travel lifts, repairs of the vessel, spare
parts provision.
diver’s underwater
surveyservices
Assistance of port personnel (mariner)
Figure 1. Interference areas between charter and nautical services in nautical tourism port [6]
Further interaction reinforcement between nautical tourism ports and charter activities is expected in the following period. 4. DETERMINANTS OF SERVICES QUALITY IN NAUTICAL TOURISM PORTS With regard to nautical service provision, nautical tourism ports affect the opinion of the boaters in two following ways: 1. by increasing the quality of nautical services and by avoiding drawbacks in providing these services, thus improving the business performance of marinas [14, p. 96]. 2. by marketing activities carried out by the marina managements and enabling insights into the services offered in the nautical market [14, p. 96].
Competitiveness and quality are interrelated, as higher levels of quality inevitably result in better competitiveness of business entities [13]. Therefore, if a nautical tourism port tends to achieve a higher level of competitiveness in the nautical market, the core activities have to be focused on raising the quality of nautical services. This is also confirmed by the identified correlation between the user’s service quality perception and the increase of the port profitability. Consequently, the service quality is one of the essential prerequisites for competitive performance [14, p. 260]. The above-discussed dimensions of the service quality serve as the basis for measuring boaters’ perceptions and expectations. When evaluating the quality of provided services, the users typically take into consideration the ten criteria known as the

377
Nela Jadrijević, Ines Kolanović, Tatjana Stanivuk
CHARTER AND NAUTICAL SERVICE QUALITY IN FUNCTION OF NAUTICAL TOURISM PORT COMPETITIVENESS
“determinants of service quality” [16, p. 47], which are presented in Figure 2. 1. Reliability of the charter service implies observing the terms of the charter contract and may, therefore, refer to technical and logistic ability of the rented vessel over the agreed charter time. Within the context of the nautical service provision, reliability may refer to observing the provisions of the agreement between the port and the charter agency operating in the port [6, p. 78]. 2. Commitment within the context of the nautical service implies the readiness of nautical tourism port staff to timely provide services to boaters [6, p. 78]. 3. Competence in charter service is a dimension of the service quality referring to the competence of charter agency personnel in performing check-in and check-out procedures, and in familiarising the boaters with technical and other features of the chartered vessels and their equipment. Within the context of the nautical service provision, the port personnel ability also refers to the competence of port personnel to provide technical support and service [6, p. 78]. 4. Accessibility (availability) as a nautical service quality dimension, from the viewpoint of physical access, requires the nautical tourism port to be located in the vicinity of the main traffic infrastructure. The traffic connection of the nautical tourism port with various modes of transport positively affects the availability as a nautical service quality dimension as well as the charter service quality dimension. From the aspect of information accessibility, the charter service quality depends on providing timely and accurate information for unobstructed sailing and the boaters’ sojourn onboard the vessel. The essential information typically includes accessible and
updated weather forecast, technical characteristics of vessels, interesting destination and itineraries, etc. [6, pp. 78-79] 5. Kindness, as a charter service quality dimension, refers to the kind-heartedness of personnel. In nautical industry and charter business, the kindness of charter operators and supporting staff implies a high level of politeness, respect and understanding during the chartering period. It can be noted that, once again, there is a strong interference between charter and nautical services because, in addition to charter agency employees, the boater evaluates the kindness of dock assistants and other marina employees who are in contact and interaction with charter tourists [6, p. 79]. 6. Communication within the context of the charter service provision is a quality of enabling efficient flow of information between the charter service providers and users. The aim of this important aspect of quality is to satisfy the needs and expectations of boaters in terms of providing a complete insight into the process of the charter service provision, including the technical aspects of the vessel, liabilities, handling the contract and insurance forms, and familiarisation of boaters with individual vessels and their equipment. Likewise, communication within the context of the nautical service is a quality of enabling efficient flow of information between the staff working in the port of nautical tourism and the boaters as the users of nautical services [6, p. 79]. 7. Credibility in relation to the quality of nautical service refers to the image and reputation of the nautical tourism port, honesty and sincerity of the port personnel in the process of providing nautical service [6, p. 79].

7th INTERNATIONAL MARITIME SCIENCE CONFERENCE
378
April 20th-21st, 2017, Solin, Croatia
Booking procedure
Service in charter base
Chartered vessels
condition
Examined charter service
segments
ResponsivenessVessel
cleanliness-interior
Staff kindness
Competence
Staff competence
Check in procedure
Check out procedure
Support
Vessel cleanliness-
exterior
Visual impression
Technical condition
Equipment
Commitment
Competence
Reliability
Accessibility
Kindness
Safety
Communication
Credibility
Understanding
Tangibility
Figure 2. Charter service segmentation and associated dimensions of the service quality. Source: [6] 8. Safety as an aspect of the charter service quality implies proper operation of the rented vessel, which results from good and regular maintenance of the vessel during winter. As a consequence, this reduces the risk of malfunction and failure in charter season, which increases the level of safety of boaters, navigation and the vessel itself. [6, p. 79]. The high safety standards also require the renewal of the charter fleet once in five years due to high rate of wear of rented vessels. [5, p. 66]. The introduction of new boats into the charter fleet enables the charter agencies to follow the trends in the market, respond more efficiently to the changing needs and demands of the nautical clientele, to charge higher prices for the new vessels and to increase general safety of the service. Within the context of the nautical service, safety is a quality of enabling the nautical ports to provide safe shelter from the wind and sea in various weather conditions and to protect the life, health and property of their guests in general [6, p. 80].
9. Understanding implies awareness of customers’ preferences when selecting the vessel, with regard to the type, size, equipment and other features. Within the context of the nautical service, understanding represents an ability to recognize the preferences of the boaters, which can be identified and analysed with the aid of qualitative surveys of their needs, desires and expectations [6, p. 80]. 10. Tangibility as an aspect of the charter service quality dimension refers to visual impression and technical equipment of the rented vessel, behaviour of the personnel in charter base, advertising material of charter agency, etc. Within the context of the nautical service quality dimension, tangibility refers to the quality of the port’s infrastructure and superstructure (slipways, travel lifts, and such). Just like in charter service, tangibility of the nautical service also refers to visual impression of nautical tourism port, behaviour of the personnel, port`s advertising material, etc. [6, p. 80].

379
Nela Jadrijević, Ines Kolanović, Tatjana Stanivuk
CHARTER AND NAUTICAL SERVICE QUALITY IN FUNCTION OF NAUTICAL TOURISM PORT COMPETITIVENESS
The above-discussed dimensions of the nautical and charter services from the viewpoint of the boater represent the basis for determining the boater’s satisfaction. 5. CONCLUSION There is an important correlation between the nautical service quality and the competitiveness of nautical tourism port. Therefore, special attention has been paid to the analysis of the nautical service quality. When defining nautical services, it can be concluded that the production process of the nautical and charter services in nautical tourism ports occurs through the interaction of two parallel processes through the use of infrastructure, superstructure and the personnel of the charter agency and the nautical tourism port [6, p. 168]. It is obvious that the charter activities performed by charter agencies in nautical ports are intertwined with the nautical services provided by nautical tourism ports themselves. Therefore, it can be concluded that the nautical tourism port competitiveness is affected not only by the quality of nautical tourism service but also the charter service quality of charter agencies. The areas of interference have been identified and discussed, by comparing the features of the nautical service which are researched and discussed in scientific papers, and the features of the charter service provided by charter agencies operating in the nautical tourism ports, with the aspect of logistics taken into due consideration. The scientific papers tend to separate the activities of nautical tourism ports from the charter activities although it is obvious that there is a strong and intensive interaction between these activities when providing services to the boaters. The expected growth of the charter service demand implies that the cooperation and interaction between nautical tourism ports and charter agencies will grow as well. It has been confirmed that the charter services quality that is provided in nautical tourism ports considerably benefits the performance and competitiveness of these ports. Accordingly, if boaters are satisfied with the charter service, they are also indirectly satisfied with the nautical service in the areas where these two forms of nautical tourism service overlap. As a
result, it is likely that a boater will again call at the nautical tourism port where he experienced a service that he was satisfied with. Therefore, it can be concluded that nautical tourism port competitiveness is affected by the quality of charter services that are provided by charter agencies. The results of this study suggest that the boaters’ needs and expectations should be identified and analysed in order to achieve a higher competitiveness of Croatian nautical tourism ports in the international market. The quality of nautical and charter services represents an important aspect of the competitive strategy to be designed by port and charter agency managements. The long-term strategy of the nautical ports management should be geared towards raising the quality of all elements of nautical services in order to meet boaters’ preferences and achieve competitive performance in the nautical market.
REFERENCES
1. Anić, Š., Klaić, N., and Domović, Ž., Rječnik stranih riječi - tuđice, posuđenice, izrazi, kratice i fraze, Sani-Plus (Zagreb, 2002), p. 778.
2. Bakija, I., “Osiguranje kvalitete po ISO 9000“, Privredni vjesnik (1991), Zagreb, p. 1.
3. Dulčić, A., Nautički turizam i upravljanje lukom nautičkog turizma, Ekokom (Split, 2002)
4. Funda, D., “Sustav upravljanja kvalitetom u logistici“, Tehnički glasnik, 4/1-2 (2010), pp. 94.-98.
5. Gračan, D., Zadel, Z., and Rudančić- Lugarić, A., “Four star charter quality“ u charter-djelatnosti Republike Hrvatske“, Naše more, 58/1-2 (2011), pp. 64-73.
6. Jadrijević,N., Model utvrđivanja konkurentnosti luka nautičkog turizma, Pomorski fakultet Sveučilišta u Rijeci (Rijeka 2016), doctoral thesis
7. Kesić, B., & Jugović, A., Menadžment pomorskoputničkih luka, Pomorski fakultet Sveučilišta u Rijeci (Rijeka 2006)

7th INTERNATIONAL MARITIME SCIENCE CONFERENCE
380
April 20th-21st, 2017, Solin, Croatia
8. Kolanović, I., “Temeljne dimenzije kvalitete lučke usluge“, Pomorstvo, 21/2 (2007), p. 207.-224.
9. Kolanović, I., Dundović, Č., & Jugović, A., “Customer-based Port Service Quality Model“, Promet – Traffic & Transportation, 23/6 (2011), pp. 495-502.
10. Kolanović, I., Zenzerović, Z., and Skenderović, J., “Metodološki pristup empirijskom istraživanju kvalitete lučke usluge“, Pomorstvo, 23/1 (2009), p. 275; referring to Parasuraman, A., Zeithaml, V., and Berry, L. L., op. cit., pp. 41-50.
11. Kondić, Ž., “Kvaliteta i ISO 9000 – primjena“, Varaždin, Tiva, (2002)
12. Krce Miočić, B., “Valorizacija učinaka promotivnih aktivnosti u nautičkom turizmu u Hrvatskoj“, Acta Turistica Nova, 23/2 (2011), pp. 203.-231.
13. Lazibat, T., & Zakarija, M., “Kvaliteta u funkciji povećanja konkurentnosti“, Peta Hrvatska konferencija o kvaliteti, Hrvatsko društvo za kvalitetu, 2004, Šibenik
14. Luković, T., & Gržetić, Z., “Nautičko turističko tržište u teoriji i praksi Hrvatske i europskog dijela Mediterana“, Split, HHI Split (2007)
15. Narodne novine / Official Gazette 99/13, Article 2, http://www.propisi.hr/print.php?id=6920 (accessed 02/02/2015)
16. Parasuraman A., Zeithaml V., and Berry L. L., “A conceptual model of service quality and its application for service quality research“, Journal of Marketing, 49 (1985), pp. 41-50.
17. Pekanov Starčević, D., Mijoč, J., and Vrdoljak, T., ”Mjerenje utjecaja potpunog upravljanja kvalitetom na financijsku uspješnost hrvatskih poduzeća”, Preliminary communication, Ekonomski vjesnik, (2012), p. 293.-304.
18. Pupovac, D., “Međuodnos kvalitete i cijena prijevoznih usluga“, Suvremeni promet, 19/1-2 (1999), pp 101-106.
19. Šamanović, J., Nautički turizam i management marina, Visoka pomorska škola u Splitu, (Split 2002)

381
Dorotea Ćorić, Adriana Vincenca Padovan, Lukša Čičovački
PREVENTION OF POLLUTION BY YACHTS’ SEWAGE IN THE PORTS OF NAUTICAL TOURISM – THE LEGAL FRAMEWORK
PREVENTION OF POLLUTION BY YACHTS’ SEWAGE IN THE PORTS OF NAUTICAL TOURISM – THE LEGAL FRAMEWORKDorotea Ćorić, Adriana Vincenca Padovan, Lukša Čičovački
PREVENTION OF POLLUTION BY YACHTS’ SEWAGE IN THE PORTS OF NAUTICAL TOURISM – THE LEGAL FRAMEWORK
Dorotea Ćorić1, Adriana Vincenca Padovan2, Lukša Čičovački3
(1 Faculty of Law, University of Rijeka, Rijeka, Croatia)
(2 Adriatic Institute, Croatian Academy of Sciences and Arts, Zagreb, Croatia)
(3 Ministry of the Sea, Transport and Infrastructure, Zagreb, Croatia)
(E-mail: [email protected])
ABSTRACT
The paper deals with the positive law regulating the standards of prevention of pollution by sewage from yachts and pleasure craft and its specific application in the context of the ports of nautical tourism (marinas). The problem of pollution by sewage from yachts and other recreational is specific considering the large and increasing number of yachts sailing in Croatian waters, the particular technical characteristics of pleasure craft, the way they are constructed and certified, the manner in which they are used and operated, and the fact that the nautical ports in which the yachts and other pleasure craft are berthed are special purpose ports subject to a specific legal and management regime. Croatia, is a party to MARPOL, the main international convention covering prevention of pollution of the marine environment by ships. In particular, the standards of prevention of pollution by sewage are governed by MARPOL Annex IV. Whilst MARPOL regulates prevention of pollution standards for the larger vessels, most of the yachts and pleasure craft are outside its scope of application. However, these vessels are subject to the Directive 2013/53/EU on recreational craft and personal watercraft imposing mandatory installation of holding tanks to watercraft fitted with toilets. The relevant MARPOL and EU standards are implemented in the national law through the Croatian Maritime Code, the Maritime Domain and Seaports Act and the respective bye-laws, enforced through the flag and port state jurisdiction of the Republic of Croatia and the system of inspection control and sanctioning of maritime offences. The discharge of sewage into the sea is prohibited within the Croatian territory. The adequate port reception facilities must be fitted in all Croatian ports, including the ports of nautical tourism where it is a responsibility of the concessionary of the port. The authors critically examine whether and how the relevant pollution prevention standards are implemented in the context of yachting and marinas with a view of proposing certain improvements.1
KEY WORDS
Marine pollution, Sewage, Yacht, Recreational craft, Marina, MARPOL, Directive 2013/53/EU, Nautical touri
1 This paper is a result of the authors' joint research under the research project of the Adriatic Institute of the Croatian Academy of Sciences and Arts, funded by the Croatian Science Foundation, titled Developing a Modern Legal and Insurance Regime for Croatian Marinas – Enhancing Competitiveness, Safety, Security and Marine Environmental Standards (DELICROMAR, UIP-11-2013-3061, project period: 1st March 2016 – 28th February 2019). More information about the project is available at www.delicromar.hazu.hr.

7th INTERNATIONAL MARITIME SCIENCE CONFERENCE
382
April 20th-21st, 2017, Solin, Croatia
1. INTRODUCTION Nautical tourism, and particularly further development of the ports of nautical tourism is of a strategic interest for the Republic of Croatia. It is the role of the state to set the optimal balance between private and public interests, by attracting further investments in this sector whilst ensuring that the development is planned, controlled and sustainable. In this respect, it is important to consider the specific aspects of pollution prevention related to the activities usually carried out within the ports of nautical tourism. In the official Nautical Tourism Development Strategy of the Republic of Croatia 2009 – 20192 it is rightly stated that the biggest threat to the to long-term development of nautical tourism is the uncontrolled use of naturally formed areas and natural resources.”3 Therefore, the responsible management and environmental protection “is an imperative for the creators of economic development.”4 The negative influence of tourism on the area and the environment can be reduced to the minimum only by regulating its development and implementing the adequate environmental protection measures.5 One of such measures is a mandatory system of reception facilities in the ports for the collection of various types of wastes from vessels (sewage, oil, communal waste), which, along with the compliance with the global environmental standards, effectively contributes to environmental protection.6 In this paper, the authors deal with the standards of prevention of pollution by sewage from yachts and other pleasure craft with a special focus on the relevant aspects related to the legal status, statutory duties and business practice of the ports of nautical tourism. The authors critically analyse the relevant legal framework, with a view of
2 Ministry of the Sea, Transport and Infrastructure & Ministry of Tourism, Zagreb (December 2008), http://www.mppi.hr/UserDocsImages/Strategija%20razvoja%20nautickog%20turizma%20ENGL%201.pdf (21/02/2017) 3 Ibid, p. 21. 4 Ibid. 5 Ibid, p.22. 6 Ibid
identifying the main obstacles for a more efficient implementation of the prescribed standards and of making proposals for potential improvements. 2. STANDARDS OF PREVENTION OF MARINE POLLUTION BY SEWAGE FROM RECREATIONAL WATERCRAFT
2.1. MARPOL Standards The problem of marine pollution by ship's sewage has been regulated on the international level by Annex IV of MARPOL 73/78 (Regulations for the prevention of pollution by sewage from ships).7 MARPOL prescribes the equipment (ship sewage systems such as sewage treatment plants, sewage comminuting and disinfesting systems or holding tanks, standard discharge connections of the port reception facilities’ pipes and the ship’s discharge pipelines, sewage reception facilities at ports and terminals), control of the discharge of sewage into the sea and the corresponding survey and certification system. According to MARPOL standards, the discharge of sewage into the sea is prohibited within 12 nautical miles from the nearest land, subject to certain exceptions, when the ship uses an approved comminuting and disinfecting sewage system, or a system of an approved, certified and tested sewage treatment plant. In any case, the sewage that has been stored in holding tanks shall not be discharged instantaneously.8 Furthermore, it is prescribed that the port states that are parties to MARPOL must ensure the provision of facilities at ports and terminals for the reception of sewage.9 Generally, MARPOL applies to all ships flying the flags of the states parties to the MARPOL convention and to all ships operating under the authority of a state party.10 However, the MARPOL standards relating to prevention of marine
7 International Convention for the Prevention of Pollution from Ships, 1973 as modified by the Protocol of 1978, (further: MARPOL). 8 Regulation 11, Annex IV of MARPOL. 9 Regulation 12, Annex IV of MARPOL. See more on this aspect infra. 10 MARPOL, Art. 3(1).

383
Dorotea Ćorić, Adriana Vincenca Padovan, Lukša Čičovački
PREVENTION OF POLLUTION BY YACHTS’ SEWAGE IN THE PORTS OF NAUTICAL TOURISM – THE LEGAL FRAMEWORK
pollution by ship sewage (Annex IV) apply to ships engaged in international voyages with GT of 400t and above, or those with GT below 400t certified to carry more than 15 persons.11 The Republic of Croatia applies the MARPOL standards to the ships registered in the Croatian Register of Shipping and through port state control to the ships sailing into Croatian ports. In addition, under Art. 49.b of the Croatian Maritime Code12 (further: CMC), there is a general prohibition of discharge of sewage into the sea or on the shore applying to all types of maritime objects (vessels, floating facilities, fixed offshore facilities). This prohibition applies to the territorial sea and internal waters, whilst in the ecological and fisheries protection zone, the discharge of sewage is prohibited if contrary to Regulation 11 of MARPOL Annex IV.13 Under CMC, Art. 49.c all types of vessels and floating objects are allowed to discharge sewage from the holding tanks exclusively on the designated locations in the ports or outside the ports where the adequate reception facilities are provided. When we speak of marine pollution by ship sewage in the marinas and other ports of nautical tourism14, we primarily deal with the problem of pollution from recreational vessels, i.e. yachts and pleasure boats, since these are the most usual types of vessels berthing in the ports of nautical tourism. It should be clarified that in this context the term sewage is mainly meant to include the so called black waters (drainage and other wastes from any form of toilets and urinals) and grey waters (waste waters from the sinks, tubs, shower cabinets, bathrooms, vessel kitchen etc.).15 Considering the above mentioned scope of
11 Regulation 2, Annex IV of MARPOL. 12 Croatian Maritime Code, Official Gazette no. 181/2004, 76/2007, 146/2008, 61/2011, 56/2013, 26/2015, Art. 49.b 13 See Art. 7. of the Ordinance on the Protection of Marine Environment in the Ecological Fisheries Protection Zone, Official Gazette, no. 47/2008. 14 Under Croatian legislation, the ports of nautical tourism are regulated as special purpose ports. Marina is the most developed and the most recognisable type of nautical tourism port. 15 See The Rules for the Statutory Certification of Seagoing Ships, Part 22 - Pollution Prevention, Official Gazette no. 97/2015 – Annex V. Prevention of Pollution by Sewage, Rules 5.1.2.3 – 5.1.2.4.
application of the relevant MARPOL standards, it follows that most of the vessels using the ports of nautical tourism do not fall under the application of MARPOL, except large yachts of GT 400t and above, or of over 24 meter length, or those which are certified to carry more than 15 persons (including passengers and crew).16
2.2. EU Standards
As regards the recreational watercraft of up to 24 meter length, the relevant standards of prevention of pollution by sewage on the EU level are provided under the Directive 2013/53/EU of the European Parliament and of the Council of 20 November 2013 on recreational craft and personal watercraft and repealing Directive 94/25/EC (further: Directive 2013/53/EU).17 In the preamble of this Directive it is stated that “In order to contribute to the protection of the marine environment, it is appropriate to adopt a requirement imposing mandatory installation of holding tanks to watercraft fitted with toilets.”18 One of the requirements prescribed by this Directive is that “Watercraft shall be constructed so as to prevent the accidental discharge of pollutants (oil, fuel, etc.) overboard. Any toilet fitted in a recreational craft shall be connected solely to a holding tank system or water treatment system. Recreational craft with installed holding tanks shall be fitted with a standard discharge connection to enable pipes of reception facilities to be connected with the recreational craft discharge pipeline. In addition, any through-the-hull pipes for human waste shall be fitted with valves which are capable
16 These large yachts are usually subject to the certification and classification standards applying to seagoing ships or similar international standards such as e.g. MCA – The Large Commercial Yacht Code. In Croatia, the large and mega yachts are subject to the Rules for the Certification of Seagoing Ships, in particular, when prevention of pollution by sewage is at stake, to Annex V. (Prevention of Pollution by Sewage) of the Rules for the Statutory Certification of Seagoing Ships – Part 22, Pollution Prevention, Official Gazette no. 97/2015. 17 OJ L 354, 28.12.2013. 18 Directive 2013/53/EU, ibid.

7th INTERNATIONAL MARITIME SCIENCE CONFERENCE
384
April 20th-21st, 2017, Solin, Croatia
of being secured in the closed position.”19 The deadline for the transposition of this directive into the national laws was 18 January 2016. Prior to Directive 2013/53/EU, the standard for the prevention of pollution by sewage from recreational craft was prescribed under Directive 94/25/EC of the European Parliament and of the Council of 16 June 1994 on the Approximation of the Laws, Regulations and Administrative provisions of the Member States Relating to Recreational Craft, (further: Directive 94/25/EC),20 as amended by the relevant subsequent EU legislation. This Directive, similarly prescribed that “Craft shall be constructed so as to prevent the accidental discharge of pollutants (oil, fuel, etc.) overboard. Craft fitted with toilets shall have either: (a) holding tanks, or (b) provision to fit holding tanks.21 Craft with permanently installed holding tanks shall be fitted with a standard discharge connection to enable pipes of reception facilities to be connected with the craft discharge pipeline. In addition, any through-the-hull pipes for human waste shall be fitted with valves which are capable of being secured in the closed position.”22 Directive 94/25/EC was in application in all EU countries from 16 June 1996 until 17 January 2016 when it was repealed by Directive 2013/53/EU.23
19 Ibid, Annex I (Essential Requirements), Rule 5.8. (Discharge prevention and installations facilitating the delivery ashore of waste) 20 OJ L 164, 30.6.1994. 21 The original text of this provision before the amendments was “provision to fit holding tanks on a temporary basis in areas of use where the discharge of human waste is restricted.” Therefore, logically, if a country prescribes by its national laws that the discharge of sewage within its jurisdiction is prohibited, the subsequent fitting of the recreational craft with holding tanks will be mandatory during the time the vessel remains within the jurisdiction of that country. 22 Directive 94/25/EC, ibid, Annex I (Essential Requirements), Rule 5.8. (Discharge prevention and installations facilitating the delivery ashore of waste) 23 Directive 2013/53/EU provided a transitional period under Art. 55 according to which it was allowed to place on the market or to put into service (for the first time) watercraft conforming to Directive 94/25/EC, latest by 17 January 2017. Directive 94/25/EC, on the other hand, prescribed that EU
2.3. Croatian National Law Standards
Considering Croatia’s strategic orientation towards further development of nautical tourism, and the constantly growing number of vessels sailing in Croatian waters for the purpose of nautical tourism, marine pollution by waste waters from yachts and other pleasure craft, particularly by sewage, poses a threat to the preservation of marine environment. It is therefore essential to have in place adequate national regulation for the prevention of pollution from yachts and pleasure craft registered in Croatia, as well as such foreign flag vessels sailing in Croatian territorial waters and berthing in the Croatian ports.
The control of seaworthiness for the yachts and other pleasure craft registered in Croatia is regulated under the CMC. Art. 11 provides that a yacht or a boat is seaworthy for the navigation within certain geographical areas and for a specified use if it fulfils the requirements prescribed by the CMC, the relevant by-laws and rules for the statutory certification that, inter alia, refer to pollution prevention.24 Whilst Croatian Register of Shipping determines seaworthiness of yachts registered in Croatia through the regular technical inspections, seaworthiness of boats is subject to the competence of the harbour master’s offices.25 In accordance with CMC, Art. 113., technical inspection also takes place upon the construction or conversion of yachts and boats. The Ordinance on Boats and Yachts26 (further: OBY) and the Rules for the Statutory Certification of Boats and Yachts27 (further: Rules) prescribe
Member States had to accept the placing on the market and putting into service the recreational craft which complied with the rules in force in their territory on the date of the adoption of the Directive (16/06/1994) during a period of four years from that date (16/6/1998). 24 CMC, Art. 111.1.2. 25 CMC, Art. 112.1 and 112.3. 26 Ordinance on Boats and Yachts, Official Gazette, no. 27/2005, 57/2006, 80/2007, 3/2008, 18/2009, 56/2010, 97/2012, 137/2013, 18/2016 27 The Rules for the Statutory Certification of Boats and Yachts, Official Gazette, no. 19/2016. These rules prescribe the technical requirements for the yachts and boats of Croatian nationality with regard to the procedures of conformity

385
Dorotea Ćorić, Adriana Vincenca Padovan, Lukša Čičovački
PREVENTION OF POLLUTION BY YACHTS’ SEWAGE IN THE PORTS OF NAUTICAL TOURISM – THE LEGAL FRAMEWORK
special requirements that yachts and boats must fulfil. It should be pointed out that the OBY and the Rules are harmonised with the Directive 2013/53/EU prescribing “the necessary elements for effective conformity assessment procedures and CE-marking, accreditation of notified bodies (the certifying bodies), and market surveillance including the control of products from outside the Union, creating a more coherent regulation for the EU single market.” 28 The directive sets the conditions for the first time sale and putting into service of recreational craft, their engines and certain components in Europe.29 This ensures that recreational vessels placed on the market and/or put into service within the EU fulfil the standards of the safety of navigation and pollution prevention. It is interesting to note that according to OBY, Art. 2 the provisions of this Ordinance apply to yachts and boats registered in Croatia and to all the yachts and boats sailing in Croatian internal waters and territorial sea when it is expressly provided so under OBY.30 However, the provisions of OBY or of the Rules relating to pollution prevention apply to all yachts and boats sailing in internal waters, territorial sea and the ecological and fisheries protection zone of the Republic of Croatia,31 which seems to include the technical requirements relating to prevention of pollution by sewage prescribed by the Rules. The scope of application of these particular requirements relating to prevention of pollution by sewage includes the recreational craft, meaning boats and yachts intended for sport and leisure between 2,5 m and 24 m length, regardless of the propulsion system, excluding personal watercraft having a water jet pump as its primary source of propulsion and designed to be operated by a person or persons sitting, standing or kneeling on, rather than within
assessment of design and construction, statutory certification of the vessels intended for sport and leisure (recreational craft) and conformity assessment after construction, technical norms for the inspections of seaworthiness of yachts and boats. (Rules, Art. 1). 28 Guide to the New Recreational Craft Directive 2013/53/EU, European Boating Industry/International Council of Maritime Industry Associations, Spring 2015, http://www.europeanboatingindustry.eu/boatingdownloadables/EUGUIDE_pdf_version.pdf (20/02/2017) 29 Ibid. 30 OBY, Art. 2.1. 31 OBY, Art. 2.2.
the confines of a hull.32 Similarly as the Directive 2013/53/EU, the Rules provide that the vessels must be constructed so as to prevent the accidental discharge of pollutants into the sea (oil, fuel, etc.).33 Any toilet fitted in a recreational craft shall be connected solely to a holding tank system or water treatment system.34 Recreational craft with installed holding tanks shall be fitted with a standard discharge connection to enable pipes of reception facilities to be connected with the recreational craft discharge pipeline.35 Any through-the-hull pipes for human waste shall be fitted with valves which are capable of being secured in the closed position.36 If the implemented sewage system complies with the Croatian norm HRN EN ISO 8099:2004 – “Small vessels – sewage collection system”, the conformity is presumed.37 In addition to these essential technical requirements applying to all recreational craft, the Rules provide for certain technical requirements for statutory certification of yachts of Croatian nationality. The relevant provisions with regard to the standard of prevention of pollution by sewage prescribe that the yachts of up to 24 m length built on 1 January 2006 or later intended to carry up to 15 persons (including passengers and crew) must comply with the requirements of the Croatian norm HRN EN ISO 8009:2004 – “Small vessels – System for the collection of sewage” or an equivalent technical norm.38 The existing yachts, i.e. those already registered in the Croatian Register of Yachts, built before 1 January 2006, of up to 24 m length, certified to carry up to 15 persons, that have a toilet with a direct outlet into the sea, must be fitted with a holding tank for sewage and with a discharge connection or another solution allowing for the reception of the waste on land, provided that this requirement had to be complied with latest by the first regular inspection in 2007. If such yacht is fitted with two or more toilettes, the holding tank must be provided for at least one of the toilettes which is then the only toilette that
32 Arg. Annex II (Surveilance and Conformity Assessment During the Construction of the Yacht or Boat), Rule 2.6.8. in connection with the Rules 1.2.1. – 1.2.3. 33 Annex II, Rule 2.6.8.1 34 Annex II, Rule 2.6.8.2 35 Annex II, Rule 2.6.8.3 36 Annex II, Rule 2.6.8.4 37 Annex II, Rule 2.6.8.5 38 Annex II, Rule 5.3.4.2.1

7th INTERNATIONAL MARITIME SCIENCE CONFERENCE
386
April 20th-21st, 2017, Solin, Croatia
may be used whilst the yacht is in the area where it is prohibited to discharge sewage into the sea.39 All the other toilettes must be marked with the text “Do not use whilst on berth or anchorage”.40 However, this particular technical provision is not in line with the relevant CMC provisions prohibiting the discharge of sewage anywhere within the territorial sea and internal waters of the Republic of Croatia, and should therefore de lege ferenda be amended to the effect that all the other toilettes are kept out of use whilst in the territorial sea and internal waters of the Republic of Croatia. All such yachts built before 1 January 2000 may be exempted from the requirement of a mandatory holding tank, provided that a documentary evidence, showing that such exemption is justifiable considering the year of built, the technical problems related to the retrofit and the price of this conversion compared to the value of the yacht, is submitted to the Croatian Register of Shipping.41 Furthermore, the Rules prescribe that the agents used for disinfection of sewage must not be hazardous for the marine species. 42 As already explained above, the yachts of over 24 m length and those certified to carry more than 15 persons (including passengers and crew) follow the Rules for the Statutory Certification of Seagoing Ships – Part 22. Pollution Prevention and the relevant MARPOL standards.43 Finally, the Rules provide that it is prohibited to discharge sewage into the sea within 0,5 Nm from the mainland, islands or the sea farms of less than 10 m water depth, provided that sewage must not be discharged instantaneously and during discharge the yacht must be en route.44 As regards this provision, it is submitted that, first, its place is not in the Rules the purpose of which is to set the technical standards for the respective types of vessels. Second, such provision is in direct contradiction with the relevant national law, i. e.
39 In connection thereto, under Croatian law, as already explained, it is generally prohibited to discharge sewage into the sea anywhere within the internal waters and the territorial sea (CMC, Art. 49.b, 49.c). 40 Annex II, Rule 5.3.4.2.3 41 Annex II, Rule 5.3.4.2.4 42 Annex II, Rule 5.3.4.2.6 43 Annex II, Rules 5.3.4.2.2 and 5.3.4.2.5. See fn. 16 44 Annex II, Rule 5.3.4.2.7
the general prohibition of the discharge of sewage within the internal waters and the territorial sea arising from the CMC, Art. 49.b and from the CMC, Art. 49.c according to which all types of vessels and floating objects are under a duty to discharge sewage from the holding tanks exclusively on the designated locations in the ports or outside the ports where the adequate reception facilities are provided. Therefore, de lege ferenda such provision of subsidiary legislation, which is not in line with the overriding provisions of the CMC, should be cancelled from the Rules in the interest of legal certainty. It should be pointed out that the standard of prevention of pollution by sewage envisaged by Annex I, Rule 5.8 of the Directive 1994/25/E, was introduced for the first time into the Rules for the Statutory Certification of Boats and Yachts adopted by the Decision on the Technical Rules of the Croatian Register of Shipping of 2005.45 The relevant technical requirements, as provided first by the Directive 94/25/EC as amended, and subsequently by the Directive 2013/53/EU, have been applicable in Croatia for the vessels built after 1 January 2000. The latest edition of the Rules, as cited, prescribes for a “retrofit” applying to yachts built before that date. However, it is submitted that there is a substantial number of pleasure boats intended for a longer stay at sea registered in the boat registries of Croatian harbour master’s offices and sailing in Croatian territorial waters, that are built before the year 2000, and which do not conform to the respective technical requirements relating to the prevention of pollution by sewage.46 On the other hand, it is strictly prohibited to discharge sewage into the sea from any type of maritime object (CMC, Art. 49.b). Therefore, de lege ferenda, it is necessary to amend the relevant Rules for the Statutory Certification of Boats and Yachts, to prescribe the obligation of “retrofit” within a transitional period. I.e. the obligation to subsequently install the adequate holding tanks for sewage, should apply to pleasure boats built before 1 January 2000, as well as those built after that date but which have not been fitted with such a holding tank, similarly as it has been done for the yachts. It is submitted that such de lege ferenda
45 Official Gazette, 20/2005. 46 See tables 1, 2 and 3

387
Dorotea Ćorić, Adriana Vincenca Padovan, Lukša Čičovački
PREVENTION OF POLLUTION BY YACHTS’ SEWAGE IN THE PORTS OF NAUTICAL TOURISM – THE LEGAL FRAMEWORK
proposal would affect the recreational boats registered in Croatia, but also those under foreign flags that are used commercially for the purpose of charter or rental.47 Namely, under the Ordinance on the Conditions for the Carrying out of the Business of Chartering of the Vessels With or Without Crew and Providing Accommodation of Guests on the Vessels48, it is prescribed that such activities may be carried out by the vessels of Croatian nationality, or by those flying the flag of one of the EU countries, or of a third country if approval for cabotage has been obtained (Art. 3). In such case the foreign vessel by which the activity is carried out must comply with the technical standards and requirements that are at least equivalent to those prescribed by the relevant Croatian rules for the statutory certification of vessels.49
Table 1. Pleasure craft registered in Croatia in 201550
Year: 2015 BOATS YACHTS TOTAL: 113.523 2.292
Table 2. Pleasure craft registered in Croatia in 201651
Year: 2016 BOATS YACHTS 9 m < (built before
2000) 2.371
7 – 9 m (built before 2000)
5.673
2,5 – 7 m (built before 2000)
75.135
SUBTOTAL (built before y. 2000)
83.179
SUBTOTAL (built in 37.090
47 Although in practice there are not many recreational boats commercially used for chartering that are built before the year 2000, since the operation of such boats usually follows the leasing cycle (5 years). The effect of “retrofit” would be much more significant in respect of the pleasure boats in private non-commercial use. 48 Official Gazette, no. 99/2013. 49 Ordinance on the Conditions for the Carrying out of the Business of Chartering of the Vessels With or Without Crew and Providing Accommodation of Guests on the Vessels, Art. 4. See also Instructions for Charter Companies Intending to Carry out Chartering of Foreign Yachts and Boats, Ministry of the Sea, Transport and Infrastructure, Zagreb, March 2014, http://www.mppi.hr/UserDocsImages/eng-UPUTA%20Charter%20sa%20stranim%20plovilima%202014%2021-3_14.pdf (20/2/2017) 50 Statistical data of the Croatian Ministry of the Sea, Transport and Infrastructure. 51 Ibid.
2000 or later) TOTAL: 120.269 2.544
Table 3. Pleasure craft registered in Croatia: comparison for the years 2015 and 201652
Years compared: From 2015 to 2016 BOATS YACHTS TOTAL: +5,91% +11,09%
It is noted hereby that under Art.55.1 of the Directive 2013/25/EU, “Member States shall not impede the making available on the market or the putting into service of products covered by Directive 94/25/EC which are in conformity with that Directive and which were placed on the market or put into service before 18 January 2017.” This means that if such vessel was placed on the EU market or put into service for the first time within that deadline, it can be freely used and resold any time thereafter, without impediment by any of the EU Member States. The prescribed “retrofit” of yachts and de lege ferenda proposal of “retrofit” of boats as explained above, does not amount to such impediment, because: - recreational craft (i.e. pleasure boats and
yachts) covered by the previous Directive already had to have a holding tank or a provision to fit a holding tank,
- such holding tank, had to in fact be fitted and used during the navigation in Croatian territorial sea and internal waters due to the prohibition of the discharge of sewage into the sea and the obligation to discharge sewage exclusively into the adequate reception facilities on land (CMC, Arts. 49.b, 49.c – in force since May, 2013).
As for the older vessels already registered in Croatia and built before the year 2000, that do not conform to the Directive 94/25/EC or Directive 2013/53/EU respectively, the state may set the standard of prevention of pollution by sewage by prescribing the adequate technical requirement to be met within a transitional period.
52 Ibid.

7th INTERNATIONAL MARITIME SCIENCE CONFERENCE
388
April 20th-21st, 2017, Solin, Croatia
3. STANDARDS OF PREVENTION OF MARINE POLLUTION BY SEWAGE IN THE PORTS OF NAUTICAL TOURISM The Republic of Croatia, as a party to the MARPOL Convention, which requires ships operating in waters under its jurisdiction and visiting ships while in its waters to comply with the pollution prevention standards undertakes to ensure the provision of facilities at ports and terminals for the reception of sewage and other waste and cargo residues, without causing delay to ships, adequate to meet the needs of the ships using them.53 MARPOL pollution prevention standards applying to ports are implemented into Croatian law through CMC, the Maritime Domain and Seaports Act54 (further MDSPA) and the respective bye-laws. According to CMC, Art. 56.1, the ports shall comply with the conditions prescribed for the safety of navigation as well as for the prevention of marine pollution.55 Port administrations and the concessionaries in the special purpose ports are bound to comply with the rules on the port order, safety of navigation, protection of life at sea and the protection from marine pollution,56 as prescribed by the Ordinance on the Conditions and Methods for the Maintenance of the Order in the Ports and Other Parts of Internal Waters and the Territorial Sea of the Republic of Croatia (further: Ordinance on the Port Order).57 In addition to MARPOL pollution standards, the CMC has been harmonized with the Directive 2000/59/EC of the European Parliament and of the Council of 27 November 2000 on port reception facilities for ship-generated waste and cargo residues, as amended by the subsequent legislation (further: Directive 2000/59/EC)58 which was brought to ensure joint ecological standards for port reception facilities (for liquid and crude waste from ships and cargo residues) in all ports within
53 MARPOL, Annex IV, Regulation 12. 54 Official Gazette, no. 158/2003, 100/2004, 141/2006, 38/2009, 123/2011, 56/2016 55 CMC, Part 3, Ports and other Parts of Internal Waters, Art. 56.1 56 CMC, Art. 56.2 57 Official Gazette no. 90/2005, 10/2008, 155/2008, 127/2010, 80/2012, 56/2013, 7/2017 58 OJ L 332, 28.12.2000, p. 81–90.
the EU. It enhances the availability and use of port reception facilities and establishes a regime of enforcement, including a system for inspections and for the exchange of information. The environmental protection requirements apply to all ships (including yachts and boats), regardless of the flag, sailing into the ports of the EU and to all ports within the EU countries (including the ports of nautical tourism as special purpose ports).59 In this respect, the ports of nautical tourism are special purpose ports subject to a special legal and management regime, whereby the obligation to comply with the respective MARPOL, EU and national pollution prevention standards lies on the concessionaries of the ports of nautical tourism as they are the operators of these special purpose ports responsible for the maintenance of the port order.60 3.1. Reception Facilities According to the CMC and the Ordinance on the Port Order, the concessionaries of the ports of nautical tourism as special purpose ports have to provide adequate equipment and facilities for handling and acceptance of solid and liquid waste (including sewage) as defined in MARPOL 73/7 and to prepare and implement the waste reception and handling plan. 61 The plan should be approved by the harbourmaster’s office for a period of maximum three years. The equivalent duty of the concessionaries is prescribed by the MDSPA and the Regulation on the Requirements to Be Met by the Ports.62 59 Summary of Directive 2000/59/EC on port reception facilities for ship-generated waste and cargo residues, http://eur-lex.europa.eu/legal-content/EN/LSU/?uri=CELEX:32000L0059 (20/02/2017) 60 Ordinance on the port order, Art. 2.1.6, Art. 3. 61 CMC, Art. 56.a; Ordinance on the port order, Art. 62. 62 MDSPA, Art. 83; Regulation on the Requirements to Be Met by the Ports, Official Gazette, no. 110/4, Art. 2, Art. 3., Annex I. It is noted that this parallel regulation relating to the pollution prevention standards in the ports, which also entails the parallel legislative system of the corresponding sanctions and inspections, is a result of the situation whereby both MDSPA and CMC were under revision and the policy decision was to shift the elements of the port order related to maritime safety and pollution prevention from the MDSPA to the CMC. However, whilst the CMC successfully passed through the legislative drafting and parliamentary procedure leading to its revision in 2013, the revision of the MDSPA, on the other

389
Dorotea Ćorić, Adriana Vincenca Padovan, Lukša Čičovački
PREVENTION OF POLLUTION BY YACHTS’ SEWAGE IN THE PORTS OF NAUTICAL TOURISM – THE LEGAL FRAMEWORK
The concessionaries of the ports of nautical tourism have to equip the port with the reception facilities capable of accepting the types and amounts of liquid and solid waste63 considering the type and size of vessels that commonly use the port, and considering the size and geographical position of the port, in a manner that does not cause unnecessary delays of vessels. Waste reception facility means the fixed, floating or mobile facility capable of receiving the waste from vessels.64 The above mentioned waste reception and handling plan prepared and implemented by the concessionaries of the port of nautical tourism must contain the assessment of the need for port reception facilities considering the needs of the vessels commonly using the port, description of the type and capacities of the port reception facilities, instructions for use of the reception facilities, description of the waste collection system, procedures for the reporting of the deficiencies of the reception facilities, procedures for the consultations with the users of the port, the waste handling contractors, operators and other interested persons, types and amounts of the collected and processed waste from the vessels, summaries of the relevant legislation and formalities related, the list of persons responsible for the plan implementation, and certain other technical descriptions according to Annex 1 of the Regulation on the requirements that have to be met by the ports. Authorised persons of the concessionaries are obliged to report to the
hand, has not passed the legislation making process to this date. The reasons are many and complex, such as conceptual disagreements amongst the professionals and the decision makers regarding the legal status of the maritime domain and ports, but they are beyond the topic of this paper. The drafting of the revised MDSPA is currently underway within the Ministry of the Sea Transport and Infrastructure. With its long expected revision, the elements of the port order relating to maritime safety and pollution prevention should be removed from the MDSPA and remain regulated by the CMC and the relevant subsidiary legislation. 63 Waste from the maritime objects means all types of waste, including sewage and the residues that occur during the use of the ship and to which Annexes I, IV and V of MARPOL apply, except for cargo residues. (Regulation on the Requirements to Be Met by the Ports, Art.2). 64 Regulation on the Requirements to Be Met by the Ports, Art. 2.
Ministry of Maritime Affairs on the condition of the waste reception facilities once a year.65 The reception facilities for sewage have become mandatory for all ports, including the ports of nautical tourism, since the entry into force of the amendments to the CMC in May 2013.66 However, in practice, many of the ports of nautical tourism have not implemented in full the respective standard, in the absence of the expected new subsidiary legislation as well as the lack of demand on the part of the recreational craft. The issue of non-conformity, i.e. the lack of the adequate reception facilities also exists in many of the ports open to public traffic where the capacity of nautical berths for pleasure craft is substantially increasing. It should, however, be taken into account that the true efficiency of the implementation of the respective ecological standards also depends on the adequacy of the existing communal sewage and drainage infrastructure. To reach the desired results further investments into the port reception facilities for sewage should be made in harmony with the development of the adequate infrastructure of the ports’ hinterland, particularly in the coastal areas where there are no facilities for the treatment and processing of the waste waters discharged from the land into the sea. For a better implementation in practice, the relevant provisions of the CMC relating to the port reception facilities need to be thoroughly elaborated through the new Ordinance on the Method and Conditions for the Maintenance of the Order in the Ports and other Parts of the Internal Waters and the Territorial Sea of the Republic of Croatia which is currently in the final phase of drafting within the Ministry of the Sea, Transport and Infrastructure. During the respective legislative drafting process, inter alia, it was necessary to evaluate the existing port reception facilities and services, considering their availability and cost. It is expected that the new Ordinance, will have a strong impact on the successfulness of the implementation of the pollution prevention standards, especially regarding the issue of the port reception facilities.
65 Ibid, Art.14. 66 Amendments to the Maritime Code, Official Gazette no. 56/2013.

7th INTERNATIONAL MARITIME SCIENCE CONFERENCE
390
April 20th-21st, 2017, Solin, Croatia
3.2. Reporting and Reception of Waste The provisions of the Ordinance on the Port Order relating to the reporting and reception of waste refer to all ships, yachts and boats, regardless of their nationality, entering the ports in Croatia, excluding warships and state ships, and to all ports used by the above mentioned vessels.67 It is important to stress that pursuant to Art. 64 of the Ordinance on the Port Order, boats and yachts must keep the waste until they arrive to the port, where they must deliver it. It is a duty of the master of the vessel to deliver all of the waste to the port reception facilities before leaving port. In exceptional cases, the vessel may proceed to the next port without delivering the waste if it is clear that there is sufficient space on board to accommodate all of the existing waste and the waste that will be produced during the intended voyage of the vessel to the next port of call where the waste will be delivered to the reception facilities. However, there is no obligation for the masters of yachts and boats to report the waste in the prescribed written form before entry into the port pursuant to Art. 63 and Annex 1. of the Ordinance which applies to ships only (except fishing ships). It is a duty of the port operator, in this case the concessionary of the port of nautical tourism, to ensure that the reception of waste occurs during the cleaning and the regular use of the vessels in the port.68 3.3. The Role of the Concessionaries of the Ports of Nautical Tourism in the Implementation of Pollution Prevention Standards The ports must comply with the prescribed standards of protection from pollution. The concessionaries in the ports of nautical tourism are under a duty to equip the port with the adequate facilities for the reception of sewage from the vessels.69 The concessionary, as the operator of the port of nautical tourism is obliged to adopt the Regulations on the Order in the Port70 and the
67 Ordinance on the Port Order, Art. 61. 68 Ibid, Art.62 and 63. 69 MDSPA, Art. 83, CMC, Art. 56.a. 70 MDSPA, Art. 84.
Waste Reception and Handling Plan71 and is responsible for their implementation. Both acts must be approved by the competent harbourmaster’s office.72 The concessionary is therefore responsible for the maintenance of the order in the port, including the protection of the port area from pollution. In such capacity, the concessionary shall order the person polluting the sea to immediately stop the pollution and remove the waste.73 The concessionary is also in a position to notice the pollution within the marina, to secure the evidence to respond to the pollution by taking the preventive and cleaning measures and to report the case to the maritime police and the competent harbourmaster’s office to prosecute for the offence (arg. CMC, Art. 900). Furthermore, the concessionary may notice a lack of technical conformity of a vessel with the prescribed pollution prevention standards (e.g. in the course of providing the service of maintenance or repair) and encourage the client to remove such deficiency or, eventually, report on the deficiency to the competent harbourmaster’s office, which would then be under a duty to send an inspector to carry out the inspection control in the port and to prosecute for the offence.74 In an example of the concessionary’s (marina operator’s) regulation on the order in the port relating to the environmental protection it is prescribed that the use of vessel toilets is prohibited in the marina, that any discharge and dumping into the sea will incur a fine, and that in the event of a major pollution the marina will determine the cause, take measures to prevent contamination and notify the Port Authority and other relevant national authorities, and the costs incurred will be charged to the vessel owner.“75 The same marina includes the so called “fines” for the discharging and illegal disposal of environmentally
71 CMC, Art. 56.a.1. 72 MDSPA, Art. 84; CMC, Art. 56.a. 73 MDSPA, Art. 85 74 Ordinance on the Carrying out of the Inspection Control of the Safety of Navigation, Official Gazette, no. 39/2011, 112/2014, 33/2015, 86/2015, 29/2016., Art. 81. 75 Servisni centar Trogir d.o.o., Regulations on Maintaining Order in Marina Trogir, 2015, http://www.sct.hr/en/media/pdf/REGULATIONS-ON-MAINTAINING-ORDER-IN-MARINA-TROGIR-2016.pdf (21/02/2017).
391
Dorotea Ćorić, Adriana Vincenca Padovan, Lukša Čičovački
PREVENTION OF POLLUTION BY YACHTS’ SEWAGE IN THE PORTS OF NAUTICAL TOURISM – THE LEGAL FRAMEWORK
harmful substances on land and the discharging of environmentally harmful substances into the sea in its pricelist.76 In this example, the “fine” by its legal nature is rather a contractual penalty, since the concessionary in the marina as a private legal person does not have the authority to issue a public or administrative fine for an offence. This charge against the person who contracted berth in the marina would be in addition to the fine payable for the corresponding maritime offence prescribed by the CMC or MDSPA. 4. INSPECTIONS AND SANCTIONING Inspection control over compliance with the mandatory standards of prevention of pollution by sewage prescribed by the CMC and the relevant subsidiary legislation77 relating to the ports of nautical tourism and to the recreational boats and yachts is in the competence of the inspectors of the safety of navigation of the Ministry of the Sea, Transport and Infrastructure and of the harbourmaster’s offices.78 Such inspection of a yacht or a boat may take place in a port or in the territorial sea or internal waters of the Republic of Croatia and is primarily undertaken in the case of a report, doubt or direct observation of a lack of conformity to the relevant technical requirement (e.g. a yacht is not fitted with a holding tank, or it has one which is by-passed), or of an actual pollution (i.e. a discharge of sewage into the sea).79
76 Servisni centar Trogir d.o.o., Marina Trogir - Price List in Euro, from 01.11.2016 until 31.10.2017; http://www.sct.hr/en/media/pdf/CJENIK_31-10-17_EUR_ENG.pdf (21/02/2017). 77 The relevant subsidiary legislation in the context of our topic includes: a) in respect of the technical standards of vessels – OBY and the relevant rules for the statutory certification of vessels (ships; boats and yachts); b) in respect of the standards in the ports - Ordinance on the Port Order. 78 CMC, Art. 165. The system of the inspection control is prescribed under the CMC, Arts. 165 – 178 and further regulated by the Ordinance on the Carrying out of the Inspection Control of the Safety of Navigation. About the potential overlap with the system of inspection control under the MDSPA (Arts. 94 et seq.) which is in the competence of the inspectors of the harbourmaster's offices and the maritime domain inspectors of the Ministry of the Sea, Transport and Infrastructure, see supra fn. 62. 79 Ordinance on the Carrying out of the Inspection Control of the Safety of Navigation, Art. 81.
The regular technical inspection of seaworthiness80 of the yachts registered in Croatia for the purposes of statutory certification is in the competence of the inspectors of the Croatian Register of Shipping, whilst the seaworthiness of the boats registered in Croatia is subject to the regular technical inspection by the competent harbourmaster’s offices.81 As regards the monitoring of the implementation of the pollution prevention standards, and considering the frequency of the reports of pollution by sewage, it is important to intensify the inspections of the recreational boats and yachts berthed in the marinas, other ports of nautical tourism, but also in the ports open to public traffic since there is a considerable increase of the number of nautical berths in those ports, too. Specifically, it is recommended to organise concentrated random inspections within the inspection control system, especially during the top season. Furthermore, targeted surveys should be undertaken within the regular technical inspections of seaworthiness of yachts and pleasure boats for the purpose of verifying that the vessels conform to the specific technical requirements for the prevention of pollution by sewage. As for the sanctioning of the non-conformity of yachts and boats with the technical pollution prevention standards, it should be pointed out that such non-conformity renders the vessel unseaworthy and therefore presents a maritime offence defined under the CMC, Art. 1011.1.2. The fine for that offence is 5.000 – 10.000 HRK against the legal person owning the vessel; 800 to 5.000 kn against the natural person owning the vessel or the responsible person within the legal person owning the vessel and against the master.82 This offence can be determined upon the inspection by the competent harbourmaster’s office inspector of the safety of navigation through the system of inspection control.
80 The conformity of the yachts and boats to the technical standards of prevention of pollution by sewage is part of the assessment of seaworthiness within this system of technical inspection and statutory certification. Non-compliance with the relevant pollution prevention standards presents the lack of unseaworthiness as defined under CMC, Art. 111. 81 CMC, Arts. 111 et seq. 82 CMC, Art. 1011.1.2, 1011.2, 1011.3.

7th INTERNATIONAL MARITIME SCIENCE CONFERENCE
392
April 20th-21st, 2017, Solin, Croatia
With regard to the sanctioning of pollution by sewage from yachts and pleasure craft, the CMC prescribes that discharging sewage into the sea or on the shore, as well as emptying the sewage tanks into the sea or on the shore outside of the reception facilities is a maritime offence for which there is a fine of 5.000-50.000 HRK against the master of the yacht or boat, 20.000-300.000 kn against the owner, operator and the manager, and another 5.000 – 50.000 kn against the liable natural person within the company owning, managing or operating the vessel.83 However, for practical reasons it is very difficult to prove such offence, i.e. to ascertain the vessel from which the pollution was caused, except when the discharge took place in a port or elsewhere whilst on berth or anchorage. In our opinion, it is not recommendable to introduce any measures that would administratively burden the operation of the yachts and boats, such as the mandatory reporting, logbooks, certificates and similar documentation ascertaining the compliance with the respective pollution prevention standards. Instead, a possible solution would be that the providers of the service of reception of the waste on land issue a receipt or a similar confirmation showing that a particular vessel actually emptied the holding tanks on a particular date in a particular place and that there is an obligation to keep these receipts on board e.g. for a period of one year and to show them to the inspector at his request. Furthermore, to stimulate the users to regularly empty the holding tanks in the port reception facilities, this service should be made easily accessible, user friendly and inexpensive. The price or the cost of this service could be calculated in the price of the berth, rather than charged separately in addition thereto.
5. CONCLUSIONS
Under Croatian law, there is a general prohibition of discharge of sewage from maritime objects into the sea. Sewage from the vessels and other maritime objects must be discharged into the adequate reception facilities on land. In practice, these pollution prevention standards are not adequately implemented due to the lack of conformity of the vessels, particularly yachts and
83 CMC, Art. 1001.a
boats, but also on the side of the domestic ports, including the ports of nautical tourism. The Republic of Croatia, as a party to the MARPOL Convention and an EU member state, implements the international and EU standards of prevention of pollution by sewage from vessels in the national legislation enforced through its flag and port state jurisdiction. The MARPOL Annex IV standards relating to ship’s sewage, apply to ships of over 400 GT, or certified to carry more than 15 persons, and to large yachts of over 24 m length of hull, enforced through the international system of ship inspections through port state control - Paris MoU. Yachts and other recreational vessels of up to 24 m length are subject to the EU Directive 2013/53/EU transposed into Croatian law by the CMC, OBY and the Rules for the Statutory Certification of Ships 2016. According to the EU standards, any toilet fitted in a recreational craft shall be connected solely to a holding tank system or water treatment system preventing the discharge of sewage into the sea. Currently the standard applies to the vessels built after 1999, whereas the yachts built before the year 2000 must be refitted to conform to the standard within a transitional period. Considering a substantial number of other recreational vessels registered, berthed or sailing in Croatia that do not conform to the prescribed standard, de lege ferenda proposal is to amend the Rules by prescribing an obligation of “retrofit” for all such vessels. As for the enforcement, the proposal is to intensify the inspection control over these types of vessels in the ports of nautical tourism, as well as in the other ports providing berths for recreational craft. The regular technical inspections of seaworthiness of the yachts and boats should specifically target the conformity with this specific pollution prevention standard. The other side of this problem is the lack of conformity of the domestic ports, including the ports of nautical tourism with the mandatory standards prescribed by the CMC and the subsidiary legislation relating to the port reception facilities implementing the MARPOL and EU standards of pollution envisaged under Directive 2000/59/EC as amended. It is expected that the new Ordinance on the Conditions and Methods for the Maintenance of the Order in the Ports and Other Parts of Internal

393
Dorotea Ćorić, Adriana Vincenca Padovan, Lukša Čičovački
PREVENTION OF POLLUTION BY YACHTS’ SEWAGE IN THE PORTS OF NAUTICAL TOURISM – THE LEGAL FRAMEWORK
Waters and the Territorial Sea of the Republic of Croatia, which is in the final phase of legislative drafting, will result in a substantial improvement in the implementation of the pollution prevention standards in the ports. However, to reach the desired results further investments into the port reception facilities for sewage should be made in harmony with the development of the adequate infrastructure of the ports’ hinterland. The specific role of the ports of nautical tourism in this context, and their potential contribution to the implementation of the relevant ecological standards can be significant. The concessionaries in the ports of nautical tourism, i.e. the marina operators should be stimulated to invest in the adequate user friendly port reception facilities and make them easily available to their clients. Finally, it is the responsibility of the marina operator as the concessionary of the port of nautical tourism to ensure that the order in the port is respected.
REFERENCES
1. Nautical Tourism Development Strategy of the Republic of Croatia 2009 – 2019, Ministry of the Sea, Transport and Infrastructure & Ministry of Tourism, Zagreb (December 2008), http://www.mppi.hr/UserDocsImages/Strategija%20razvoja%20nautickog%20turizma%20ENGL%201.pdf (21/02/2017)
2. International Convention for the Prevention of Pollution from Ships, 1973 as modified by the Protocol of 1978 (MARPOL)
3. Croatian Maritime Code, Official Gazette no. 181/2004, 76/2007, 146/2008, 61/2011, 56/2013, 26/2015
4. Ordinance on the Protection of Marine Environment in the Ecological Fisheries Protection Zone, Official Gazette, no. 47/2008
5. The Rules for the Statutory Certification of Seagoing Ships, Part 22 - Pollution Prevention, Official Gazette no. 97/2015
6. Directive 2013/53/EU of the European Parliament and of the Council of 20 November
2013 on recreational craft and personal watercraft and repealing Directive 94/25/EC, OJ L 354, 28/12/2013
7. Directive 94/25/EC of the European Parliament and of the Council of 16 June 1994 on the Approximation of the Laws, Regulations and Administrative provisions of the Member States Relating to Recreational Craft, OJ L 164, 30/6/1994
8. Ordinance on Boats and Yachts, Official Gazette, no. 27/2005, 57/2006, 80/2007, 3/2008, 18/2009, 56/2010, 97/2012, 137/2013, 18/2016
9. Guide to the New Recreational Craft Directive 2013/53/EU, European Boating Industry/International Council of Maritime Industry Associations, Spring 2015, http://www.europeanboatingindustry.eu/boatingdownloadables/EUGUIDE_pdf_version.pdf (20/02/2017)
10. Rules for the Statutory Certification of Boats and Yachts adopted by the Decision on the Technical Rules of the Croatian Register of Shipping of 2005, Official Gazette, 20/2005
11. Ordinance on the Conditions for the Carrying out of the Business of Chartering of the Vessels With or Without Crew and Providing Accommodation of Guests on the Vessels, Official Gazette, no. 99/2013
12. Instructions for Charter Companies Intending to Carry out Chartering of Foreign Yachts and Boats, Ministry of the Sea, Transport and Infrastructure, Zagreb, March 2014, http://www.mppi.hr/UserDocsImages/eng-UPUTA%20Charter%20sa%20stranim%20plovilima%202014%2021-3_14.pdf (20/2/2017)
13. Maritime Domain and Seaports Act, Official Gazette, no. 158/2003, 100/2004, 141/2006, 38/2009, 123/2011, 56/2016
14. Ordinance on the Conditions and Methods for the Maintenance of the Order in the Ports and Other Parts of Internal Waters and the Territorial Sea of the Republic of Croatia, Official Gazette no. 90/2005, 10/2008, 155/2008, 127/2010, 80/2012, 56/2013, 7/2017

7th INTERNATIONAL MARITIME SCIENCE CONFERENCE
394
April 20th-21st, 2017, Solin, Croatia
15. Directive 2000/59/EC of the European Parliament and of the Council of 27 November 2000 on port reception facilities for ship-generated waste and cargo residues, OJ L 332, 28/12/2000
16. Summary of Directive 2000/59/EC on port reception facilities for ship-generated waste and cargo residues, http://eur-lex.europa.eu/legal-content/EN/LSU/?uri=CELEX:32000L0059 (20/02/2017)
17. Ordinance on the Carrying out of the Inspection Control of the Safety of
Navigation, Official Gazette, no. 39/2011, 112/2014, 33/2015, 86/2015, 29/2016
18. Servisni centar Trogir d.o.o., Regulations on Maintaining Order in Marina Trogir, 2015, http://www.sct.hr/en/media/pdf/REGULATIONS-ON-MAINTAINING-ORDER-IN-MARINA-TROGIR-2016.pdf (21/02/2017).
19. Servisni centar Trogir d.o.o., Marina Trogir - Price List in Euro, from 01.11.2016 until 31.10.2017; http://www.sct.hr/en/media/pdf/CJENIK_31-10-17_EUR_ENG.pdf (21/02/2017)

395
Marko Rapan, Igor Štimac, Sanja Steiner
IMPLEMENTATION OF IT SYSTEMS FOR EMERGENCY MANAGEMENT AT THE ZADAR AIRPORT
IMPLEMENTATION OF IT SYSTEMS FOR EMERGENCY MANAGEMENT AT THE ZADAR AIRPORTMarko Rapan, Igor Štimac, Sanja Steiner
IMPLEMENTATION OF IT SYSTEMS FOR EMERGENCY MANAGEMENT AT THE ZADAR AIRPORT
Marko Rapan1, Igor Štimac2, Sanja Steiner3
(1 Zadar Airport Ltd., Zemunik Donji, Croatia)
(2 Zagreb Airport Ltd., Zagreb, Croatia)
(3 University of Zagreb, Faculty of Transport and Traffic Sciences, Zagreb, Croatia)
(E-mail: [email protected]) ABSTRACT
Emergency situations at airports, primarily related to the aircraft, challenge each airport operational service or division. Situations such as the emergency landing of aircraft because of equipment failure, fire, kidnapping or emergency medical interventions, require quick response and coordination between all involved services. In all documents and regulations or their individual parts related to emergency situations, clearly and unambiguously is stated that the main objective of emergency response is saving human lives, and that’s why is necessary to take all measures to allow quick and correct decision making. Today, when the information technology (IT) is at very high level of development in all aspects of customer needs, its use in emergency response planning for all kinds of emergency situations at the airport, would enable faster and better coordination between services. In this paper, it will be presented the implementation of IT systems for emergency planning, with the example of the Zadar Airport and plans for its further development.
KEY WORDS emergency situation, planning, IT implementation, Zadar Airport 1. INTRODUCTION Situation such as the landing of aircraft because of equipment failure, fire, kidnapping or every other situation which endangers human lives is called crisis situation or simply – emergency. This also includes situations outside the scope of aircraft operations, which are deviation from planned or expected behaviour. Emergency usually happens unexpectedly and demands immediate response to stabilize the situation, in order to save lives or reduce the possibility of damage to property.
To respond immediately, it is critical to have the right data at the right time, in order to make a right decision and take appropriate action. In other words, for every person or service that is involved in crisis situation, it is critical to follow the plan, so it is necessary to establish emergency management at the airport. Emergency management encompasses a wide range of activities, which could be grouped as components or described as aspects of emergency planning. But most of authors and emergency professionals generally

7th INTERNATIONAL MARITIME SCIENCE CONFERENCE
396
April 20th-21st, 2017, Solin, Croatia
agree that these activities are part of the one cycle that can be divided into five phases:
1) Planning, 2) Mitigation, 3) Preparedness, 4) Response and 5) Recovery.
The first three phases, planning, mitigation and preparedness occur before crisis situation, response during crisis situation, while recovery encompasses actions after the accident or some other catastrophic event (Figure 1.).
Figure 1. Phases of emergency management: blue –
before crisis situation, red – during crisis situation; grey – after crisis situation
Today, when the information technology (IT) is at very high level of development in all aspects of customer needs, its use in emergency management would enable the most appropriate information for all actions in previous mentioned three phases that occur before crisis situation, faster and better coordination between services and rescue teams during response and it should also make response time shorter and recovery actions more efficient. In this paper, the phases of IT system implementation are going to be briefly described and also some results of preliminary analysis for emergency planning at the Zadar Airport will be shown. Zadar Airport is mixed aerodrome which is consist of military airbase and civil airport and from the aspect of physical characteristics of manoeuvring area it is unique aerodrome in Croatia
and from the aspect of the number of daily operations it is the busiest Croatian aerodrome, considering that most of the operations are military training flights. In case of Zadar Airport there are many challenges associated with the implementation of IT tools for emergency management and aerodrome operator has already began with the process of implementation which is currently focused on analysis and planning phase. 2. SOME ELEMENTS OF CURRENT
RESEARCH There are lots of definitions of airport emergency but mostly in documentation which are published it is used following: “An airport emergency is any occasion or instance, natural or man-made that warrants action to save lives and protects property and public health”. Airport operations are highly regulated and for providing emergency management it is necessary to established Emergency Response Plan (ERP). Purpose of ERP is to facilitate the timely and appropriate response to emergencies occurring on or in the immediate vicinity of the city. Analysing materials which are covering ERP it can be categorizes on three categories by sources: research institutes and international organizations, airports and airlines. As ERP is a complex topic, new technology was implemented with the aim to increase respond time and to disperse important information to all stakeholders. There are several scientific papers who research those topics. First is Abdalla, R. [16] who work on 3D Web-based GIS Visualization and Significance of 3D modelling for Emergency Preparedness at Airports. The next research paper [17] covering standards for airport emergency planning and geoinformation for airport emergency planning. Geodata d.o.o. company from Croatia develop for Split Airport application “WebGIS Airport Emergency Planning”. The objectives of that application are to enable wide access of AEP in its current version (the AEP is continuously updating) and to provide additional information concerning the shortest path for selected emergency vehicle. Same author made additional research also on WEB GIS for Airport

397
Marko Rapan, Igor Štimac, Sanja Steiner
IMPLEMENTATION OF IT SYSTEMS FOR EMERGENCY MANAGEMENT AT THE ZADAR AIRPORT
Emergency Response - EML Model [18]. Beside those scientific papers [19], ACRP Report 88 was published titled “Guidebook on Integrating GIS in Emergency Management at Airports”. In that document, it is clearly stated how to Start and Manage a GIS-EM Integration Initiative at an Airport (describe Vision, Recourses and Launch, Develop and Implement, Progress and Enhance). There are another two companies who develop innovated IT Systems related to Emergency Management. One of those companies is called Veoci [20] and another is called Innovative Systems [21]. Both companies develop IT solutions (platforms) how to manage Emergency Response using IT System. 2.1. Research institutes and international
organizations From research institutes and international organizations good example of research was made from following. Faculty of Transportation Sciences in Prague [1] develop document titled “Airport Emergency Plan Guidelines and Template”. In this document, it is defined in detail who are stakeholders, organizations included in ERP and what are they assignment and responsibilities. Addition to that in document each step how develops and maintenance ERP was defined. Furthermore, they recognize importance of specific hazard in ERP and dividing it into 6 categories as following:
1) Aircraft incidents and Accidents, 2) Natural Disasters 3) Bomb incidents 4) Hazardous Materials Incidents 5) Structural Fires 6) Failure of Power for Movement Area
Lighting. All those 6 categories are role of each responsible person during ERP are in detail explained. Smith F. [6] made research in topic “Airport disaster preparedness in a community context”. In that study author made analysis over 30 airports from US and describe their reaction on emergency operations via several benchmarks. Florida Department of Transportation published document “Aviation Emergency Response Guidebook” [8] in which they describe emergency
types, agencies who are involved and Special Equipment needed for Aviation Specific Emergencies. Benefit from that document is that there are emphasize good management practices how to develop ERP. Addition to previous document, Raylene, A. [11] showed in his presentation good example how to establishing an Emergency Response Plan. He defined what are the questions what need to be answered related to ERP, what ERP need to cover and who should be involved. From aviation organizations, there are mostly documents from ICAO and IATA. ERP is describing mostly in ICAO Doc 9859 Safety Management Manual (SMM) [15]. There are several presentations [3] where it is shown ICAO SMS compliance required related to International Standards Require a Safety Management System, including an ERP with following statements “An operator shall have a plan detailing the procedures to be followed in the event of an accident, incident or other emergency. In those presentations, it was stated what are Common Emergency Response Problems in term of:
1) Lack of planning, 2) Lack of training, 3) Lack of resources, 4) Lack of communication, 5) Lack of coordination and Defined Key
Components of an Emergency Response Plan.
Company Gates Aviation published CD with Emergency Response Planning (ERP) Guidance Manual with the air to help users to define emergency response process fit for purpose. In those materials three main sections are defined as following: Emergency Response Planning Basic Principles Guidelines and regulations; Emergency Response Planning General Guidance Direction; Emergency Response Planning Framework. Furthermore, in that document segment of emergency response plan was describe, emergency contacts, flow of information and positions, organizations and roles of each participant in EP. Addition to that different types or emergencies are describe. There are lots of available templates for use as example who to develop ERP. Those examples are published by New Hampshire Aviation System [1,7, 12].

7th INTERNATIONAL MARITIME SCIENCE CONFERENCE
398
April 20th-21st, 2017, Solin, Croatia
2.2. Airports From airport side, there are several airport and airport related organizations who published their examples of ERP. In ACI Asia-Pacific region Mr. Kanaya develop document “Emergency Planning and Crisis management for Airport Business” [2]. In his document, Crisis management and Emergency Plan were defined. Focus of that document was made on Conceivable Crises and Risks at Airports and influence of earthquake to airport operational disturbance. Also research project on solving problem how to react on Earthquake related to airport operations was explained in Tribhuvan International Airport ERP [4]. In their research they describe Methodology how to develop ERP, Concepts of TIA Disaster Response Plan, Contents of the Plan. Another example is from Kirkland Lake Municipal Airport [5]. Good example how to handled emergency on smaller airports are shown from research University of Minnesota in appendix A “General Aviation Airport Emergency Plan Template”[10]. Another good example of ERP in term of major airport came from Rome airport "Leonardo Da Vinci Fiumicino” [13]. In that document standards and procedures for emergency statuses or aircraft accident was describe in detail. 2.3. Airlines Although there are mostly airports defining emergency plan, airline called ABCX airways published their Crisis Response Planning Manual and Emergency Response Plan which is related to their Station Managers [9]. In that document all information and procedures how to handle their aircraft in emergency on airport are describe. IATA published document titled “Emergency Response Plan - A template for Air Carriers” [12]. In that document, it is shown how to prepare ERP, how to communicate and it gives good examples of forms for fulfilling during ERP. KLM was another airline who explained their Emergency Response Plan [14]. In their presentation, they divided chronology of developing ERP and how they upgrade ERP to best useful one.
3. REGULATIONS
Following regulations are crucial element when ERP was developed, used and updated. Regulations clearly define outer boundaries and describe how process must be define. By its definition regulations is a rule of order having the force of law, prescribed by a superior or competent authority, relating to the actions of those under the authority's control. When we define regulations related ERP it is crucial to split those regulations into three categories as following:
1) International 2) European Union Directives and Regulations 3) Croatian Regulations
3.1. First level - International The first level is mostly defined by ICAO and it comes in form as International Standards and Recommended Practices (SARP’s). Those documents which describe process of ERP are:
‒ ICAO Annex no. 14 Aerodromes – Chapter 9
‒ ICAO DOC. 9137 – Airport Service Manual Part 1, Rescue and Fire fighting
‒ ICAO DOC. 9137 – Airport Service Manual Part 7, Airport Emergency Planning
‒ ICAO Doc 9774, Manual on certification of Aerodromes, Appendix 1, Part 4.3
‒ ICAO Doc9859, Safety Management Manual, Appendix 3 to Chapter 5 - Emergency Response Planning
3.2. Second level – European Union Directives
and Regulations
‒ EC/996/2010 on the investigation and prevention of accidents and incidents in civil aviation and repealing Directive 94/56/EC
‒ ENAC – Regulations for the Construction and Operation of Airports, am. 8 of 21/12/2011, Chap. 9
‒ ENAC – Circular APT-18A of 30/01/2008 ‒ EASA regulation ADR.OPS.B.005
Aerodrome emergency planning EASA regulation

399
Marko Rapan, Igor Štimac, Sanja Steiner
IMPLEMENTATION OF IT SYSTEMS FOR EMERGENCY MANAGEMENT AT THE ZADAR AIRPORT
‒ EASA AMC1 ADR.OR.D.005 - Coordination of the Aerodrome Emergency Response Plan
3.3. Third level – Croatian Regulation
‒ Air Traffic Act, Official Gazette No 69-09, 84-11, 54-13, 127-13, 92-14
‒ Airports Act, Official Gazette No 78-15, 19-98, 14-11
‒ Ordinance of rescue and fire protection at the airport, Official Gazette No 39/09
‒ Ordinance on emergency medical services at the airport Official Gazette No 57/12
‒ Firefighting Act, Official Gazette No 106/99, 117/01, 36/02, 96/03, 139/04, 174/04, 38/09, 80/10
‒ Fire Protection Act, Official Gazette No 92/10
4. PROCESS OF IT SYSTEM IMPLEMENTATION
Although IT system as a product is recognized as integration of automated hardware and intelligent software solutions, implementation is
comprehensive process with a wide range of activities, very detailed analysis and planning. The specific implementation process can vary from organization to organization and it is mostly dependent on the size of the airport, number of aircraft movements and also on details of the actual strategic plan. But majority of activities (analysing requirements, infrastructure planning, configuration, customization, testing, training etc.) are common to all types of airports, what led us to the conclusion that every implementation process should consist of these four basic phases:
1) Analysis, 2) Planning, 3) Construction/installation and 4) Implementation
The implementation (as the fourth phase) is actually the result of the first three phases, as shown in Figure 2., but it should be observed as phase because it involves a change, precisely, transforming from something familiar to something new. More complex and detailed first three phases will ensure that changes are fully integrated and accepted what makes implementation successful and cost effective.
Figure 2. Phases of IT system implementation
4.1. Analysis The first phase of the implementation process is gathering and collecting various types of data. The goals of this analysis phase are to identify the need for change, determine what innovation or set of practices are likely to meet that need, and to decide what is going to be the most appropriate way to move ahead with implementation process. Some of the analyses that should be included in this phase are: geographic analysis (location
of the aerodrome, surrounding and populated area, closest public safety and health institutions etc.), environmental analysis (land use adjacent to the aerodrome etc.,), infrastructure analysis (access roads, physical characteristics of the manoeuvring area, possibility of upgrading current buildings and plans for development etc.), documentation analysis and their compliance with the regulations, air traffic analysis etc.
Analysis Planning Construction Implementation
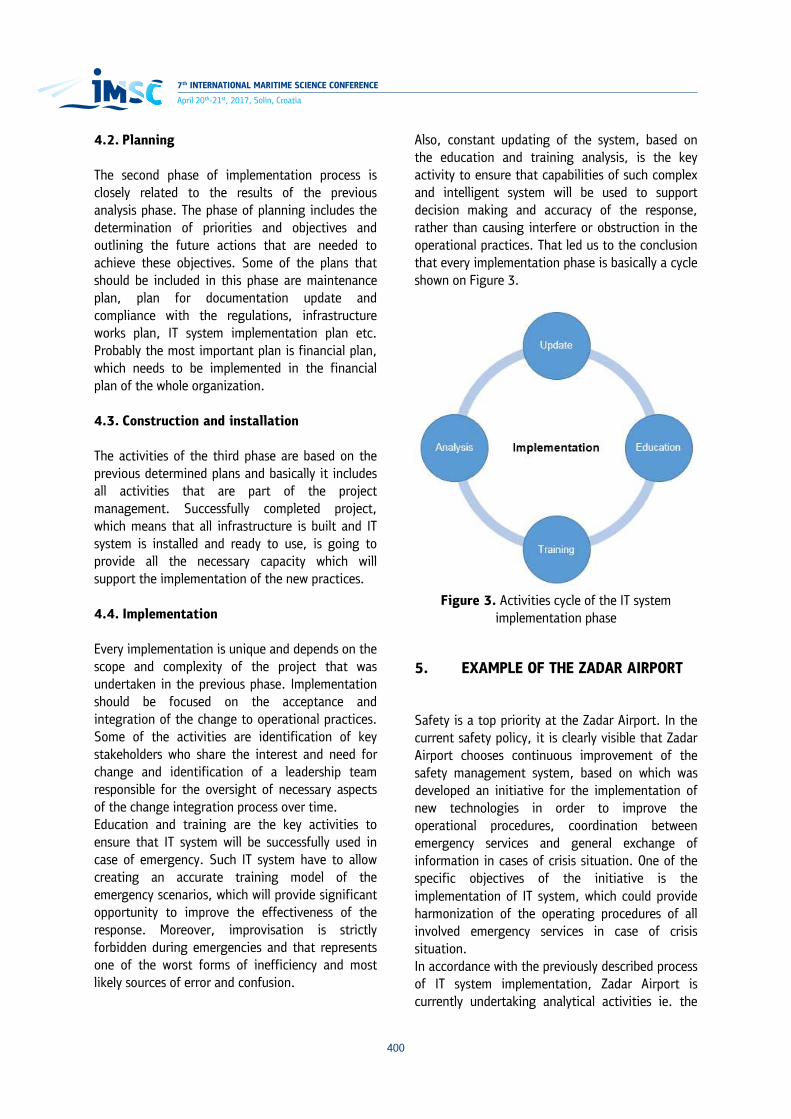
7th INTERNATIONAL MARITIME SCIENCE CONFERENCE
400
April 20th-21st, 2017, Solin, Croatia
4.2. Planning The second phase of implementation process is closely related to the results of the previous analysis phase. The phase of planning includes the determination of priorities and objectives and outlining the future actions that are needed to achieve these objectives. Some of the plans that should be included in this phase are maintenance plan, plan for documentation update and compliance with the regulations, infrastructure works plan, IT system implementation plan etc. Probably the most important plan is financial plan, which needs to be implemented in the financial plan of the whole organization. 4.3. Construction and installation The activities of the third phase are based on the previous determined plans and basically it includes all activities that are part of the project management. Successfully completed project, which means that all infrastructure is built and IT system is installed and ready to use, is going to provide all the necessary capacity which will support the implementation of the new practices. 4.4. Implementation Every implementation is unique and depends on the scope and complexity of the project that was undertaken in the previous phase. Implementation should be focused on the acceptance and integration of the change to operational practices. Some of the activities are identification of key stakeholders who share the interest and need for change and identification of a leadership team responsible for the oversight of necessary aspects of the change integration process over time. Education and training are the key activities to ensure that IT system will be successfully used in case of emergency. Such IT system have to allow creating an accurate training model of the emergency scenarios, which will provide significant opportunity to improve the effectiveness of the response. Moreover, improvisation is strictly forbidden during emergencies and that represents one of the worst forms of inefficiency and most likely sources of error and confusion.
Also, constant updating of the system, based on the education and training analysis, is the key activity to ensure that capabilities of such complex and intelligent system will be used to support decision making and accuracy of the response, rather than causing interfere or obstruction in the operational practices. That led us to the conclusion that every implementation phase is basically a cycle shown on Figure 3.
Figure 3. Activities cycle of the IT system
implementation phase
5. EXAMPLE OF THE ZADAR AIRPORT
Safety is a top priority at the Zadar Airport. In the current safety policy, it is clearly visible that Zadar Airport chooses continuous improvement of the safety management system, based on which was developed an initiative for the implementation of new technologies in order to improve the operational procedures, coordination between emergency services and general exchange of information in cases of crisis situation. One of the specific objectives of the initiative is the implementation of IT system, which could provide harmonization of the operating procedures of all involved emergency services in case of crisis situation. In accordance with the previously described process of IT system implementation, Zadar Airport is currently undertaking analytical activities ie. the

401
Marko Rapan, Igor Štimac, Sanja Steiner
IMPLEMENTATION OF IT SYSTEMS FOR EMERGENCY MANAGEMENT AT THE ZADAR AIRPORT
first phase of implementation - analysis. For that purposes, during 2015. and 2016. several field researches were performed and large amount of data was collected. Until now, infrastructure, documentation and air traffic (aeronautical) analyses were completed [21] while geographic and environmental analyses are going to be completed by the end of 2017. The results have shown various needs for improvement and the need for implementing new practices and technologies. For example, during field research, more than 20 kilometres of roads and paths around the airport were inspected, of which 13,2 kilometres was processed in the infrastructure analysis. Roads and paths were observed as access roads to the airport and were divided in the three zones, related to location of the runways. Results have shown which roads and paths are suitable for access to the aerodrome in all conditions in case of the emergency, and where the improvements can be made. Also, results have shown that airport operator should implement new operational practices and technologies for inspection of the aerodrome fence, more rendezvous locations, etc.
There are also other benefits of the field researches, especially for the education of the rescue and firefighting (RFF) staff. Because the most of the collected data can be shown on the map, an application was developed, to be used with Google Earth software. User friendly interface and the fact that the Google Earth is used on a daily basis for a variety of purposes, were arguments for selection of this software for education of the RFF staff. With this application, it is possible to visualize all the theoretical data that is usually part of the education (Figure 4.), as well as the location of the access roads and paths, rendezvous points, gates on the aerodrome fence etc. With the completion of geographical and environmental analysis, Zadar Airport will be ready for the planning phase of the implementation. Considering that in 2016. Airside development study and Terminal building development study were completed and some other projects are realized that will support the initiative, the planning phase should be focused on financial plan and the IT system implementation plan. EU funds or some other financial programs are one of the opportunities in this case.
Figure 4. Application for education in the Google Earth Pro

7th INTERNATIONAL MARITIME SCIENCE CONFERENCE
402
April 20th-21st, 2017, Solin, Croatia
6. CONCLUSION
The use of the IT systems for the emergency responses and other activities, such as education and training, are a significant benefit to operational procedures and practices. With constant improvements and upgrades, it should significantly reduce the response time, which is most important and the main reason for its implementation. Using IT systems significantly increase dispersion of necessary information for fast emergency response. Furthermore, with using those IT systems for ERP, visualization of terrain and for example aircraft crash site could be presented on dynamic geological layer what will additional help all rescue team (internal Zadar Airport response team and external medical and firefighting rescue team from City of Zadar and surroundings) to be more orientated during approaching area of accident. Example of the Zadar Airport shows that although implementation process it is not yet finished, and that many challenges will be with the future work, there are already benefits that can improve reaction and decision making in case of the emergency.
REFERENCES
1. Faculty of Transportation Sciences in Prague (Czech Technical University in Prague); Airport Emergency Plan Guidelines and Template; website; http://www.fd.cvut.cz/
2. Kanaya, H.; Emergency Planning and Crisis management for Airport Business; Narita International Airport, Corporation, January; 2012
3. Lindsay, R.; Emergency Response Planning; Gates Aviation
4. Pandey, B.; Ventura, C.; Moser, T.: Development of Earthquake Emergency Response Plan for Tribhuvan International Airport, Kathmandu, Nepal; Earthquake Engineering Research Facility Center; The University of British Columbia; Vancouver, BC. Canada, 2013.
5. Kirkland Lake Municipal Airport; Airport Emergency Response Plan Kirkland Lake Municipal Airport; Kirkland Lake, Ontario; 2014
6. Smith, J.; Airport disaster preparedness in a community context; American Public University System; February 4, 2009
7. Bureau of Aeronautics; Airport Emergency Plan (AEP) - Emergency Plan Template; January, 2015
8. Florida Department of Transportation published document “Aviation Emergency Response Guidebook
9. ABCX Airways; Crisis Response Planning Manual and Emergency Response Plan, 2016
10. University of Minnesota; General Aviation Airport Emergency Plan Template
11. Raylene, A.; Establishing an Emergency Response Plan
12. IATA, Emergency Response Plan - A template for Air Carriers, Montreal, Canada, 2009
13. Rome Airport Leonardo Da Vinci Fiumicino; Standards and procedures for emergency statuses or aircraft accident, Rome 2014.
14. Kees van der Louw; Aviation Safety & Crisis Management - Emergency Response Plan - Safety Management, Schiphol, October, 2013
15. ICAO, Safety Management Manual (SMM), Montreal, 2013.
16. Abdalla, R.; Utilizing 3D Web-based GIS for infrastructure protection and emergency preparedness; GeoICT Lab, Center for Research in Earth and Space Science, York University; Toronto, Ontario, Canada,
17. Baučić, M.; Medak, D.; Roguljić, S.: WebGIS for Emergency at Airports, 7th International Conference on Geoinformation for Disaster Management (Gi4DM), At Antalya, Turkey, 2011
18. Baučić, M.; Medak, D.; Web GIS for Airport Emergency Response - UML Model; PROMET –

403
Marko Rapan, Igor Štimac, Sanja Steiner
IMPLEMENTATION OF IT SYSTEMS FOR EMERGENCY MANAGEMENT AT THE ZADAR AIRPORT
19. Traffic & Transportation: pp 155-164, Zagreb, 2015
20. Barich, F.; Phy, J.; Jividen, D.; Gartenfeld, M.; Agnew, R.; Meyers,R.; Cofer, C.: Airport Cooperative Research Program; ACRP REPORT 88 - Guidebook on Integrating GIS in Emergency Management at Airports; Transportation Research Board Washington, D.C., 2013 Veoci Company Official Website; https://www.veoci.com/emergency-management, 2017
21. Innovative Systems Official Website; http://www.innovsys.com/innovsys/international-airport-deploys-apmax-firebar/ , 2017
22. Rapan, M; Diklić M.: Elaborat o stanju I prohodnosti servisnih I pristupnih putova u zoni Zračne luke Zadar, Sustav upravljanaj sigurnošću Zračne luke Zadar, Zračna luka Zadar, 2016.

7th INTERNATIONAL MARITIME SCIENCE CONFERENCE
404
April 20th-21st, 2017, Solin, Croatia
SUSTAINABLE DEVELOPMENT IN MARITIME TRANSPORTATION FROM THE REGIONAL PERSPECTIVEMagda Wilewska-Bien, Lena Granhag
SUSTAINABLE DEVELOPMENT IN MARITIME TRANSPORTATION FROM THE REGIONAL PERSPECTIVE
Magda Wilewska-Bien, Lena Granhag
(Chalmers University of Technology, Gothenburg, Sweden)
(E-mail: [email protected])
ABSTRACT
It is estimated that today around 90% of the world trade currently is carried by the shipping industry, which is not without impact on the marine environment. The Mediterranean Sea and the Baltic Sea are enclosed basins that host an intensive maritime traffic. The Mediterranean Sea and the Baltic Sea have been designated special areas by IMO under MARPOL Annex I (Oil) and Annex V (Garbage). The Baltic Sea is additionally a special area under Annex IV (Sewage) and Annex VI (Air pollution). The Baltic Sea suffers from high nutrient loads and almost the whole basin is considered to be eutrophicated. In the Mediterranean Sea eutrophication is also present, but merely at local scale. In both regions, the protection of the marine environment, is in focus of the regional sea conventions; Helsinki Convention and the Barcelona Convention. The governing body of the Helsinki Convention actively work towards the reduction of sewage disposal in the sea and development of adequate port reception facilities. In the evaluation of the PRF Directive, the increased volumes of collected sewage were highlighted the Baltic Sea region whereas the collection of garbage was similar in both regions. The Baltic Sea with the stringer regulations and sustainable actions is a frontrunner in the sustainable management of emissions from shipping yet the implementation of regulations in the entire region is challenging. The progress in the in Mediterranean Sea Region is slower due to several reasons including the many surrounding countries, but there is a noteworthy potential as shown in examples from ports with renewable energy use and reuse of waste. Both regions can learn from each other and share experience from developing initiatives towards sustainable shipping, however concern should be taken to regional differences.
KEY WORDS
environmental protection, shipping, Mediterranean Sea, Baltic Sea, waste management
1. INTRODUCTION
It is estimated that around 90% of the world trade currently is carried with shipping industry [1]. Transport of cargo and passengers by the sea provides both opportunities and challenges. The latter includes, among others, emissions to air and water. One aspect is the ship-generated waste, which if managed improperly can be a source of pollution in the marine environment. Increasing awareness about the pollution is one of the factors
that can lead the industry towards more sustainable actions. In general, the tools are legislative instruments, standards and voluntarily actions. Baltic Sea and Mediterranean Sea are enclosed marine basins with intense maritime traffic. Both basins are surrounded by coastlines shared by many countries and therefore, a commitment and involvement of many actors is needed in order to reach the environmental improvement.

405
Magda Wilewska-Bien, Lena Granhag
SUSTAINABLE DEVELOPMENT IN MARITIME TRANSPORTATION FROM THE REGIONAL PERSPECTIVE
This paper aims to compare the similarities and differences in development of sustainable shipping between the Baltic Sea and Mediterranean Sea region, with emphasis on the management of ship-generated waste. The study includes overview of the relevant information published in academic journals and reports published by the maritime industry.
2. GEOGRAPHY AND MARITIME TRAFFIC
The two sea areas in the Northern Hemisphere are located roughly 2500 km from each other. The Baltic Sea is in the Northern Europe and the Mediterranean Sea is located more in the southern regions, between Europe, Africa and Asia. The Baltic Sea is bounded by the Scandinavian Penisula, Eastern and Central Europe, and Danish islands. Nine countries share the coastline1. As the sea is situated on a continent, it is a shallow sea, with average depth of 50 m [2]. The Baltic Sea is brackish water in a semi-enclosed basin, connected to the North Sea in the Atlantic only by the narrow Danish Straits. The water is stratified in layers of different salinity which also limits the exchange of water. The Mediterranean Sea is surrounded by twenty-one countries that share its coastline2. Like the Baltic Sea, it is an enclosed area, connected with the Atlantic Ocean only by the narrow and shallow channel of the Strait of Gibraltar. Further it is connected with the Black Sea through Dardanelles, the Sea of Marmara and the strait of Bosporus, and also with the Red Sea by the Suez Canal [3]. In contrast to the Baltic Sea the Mediterranean Sea is situated between continents, why the sea is deeper than the Baltic Sea and has an average depth of ca 1500 m [4].
2.1. Maritime activities Both seas are characterized by intense maritime activities. There are about 450 ports in the Mediterranean Sea and about one third of the
1 Sweden, Germany, Russia, Poland, Finland, Denmark, Estonia, Latvia and Lithuania 2 Albania, Algeria, Bosnia-Herzegovina, Croatia, Cyprus, Egypt, France, Greece, Israel, Italy, Lebanon, Libya, Malta, Monaco, Montenegro, Morocco, Slovenia, Spain, Syria, Tunisia, Turkey
global traffic takes place in this region [5]. On the Baltic Sea there are about 2000 ships at any time [6]. There are about 200 ports and roughly 15% of the worlds cargo transportation takes place on the waters of the Baltic Sea [7, 8]. In both regions cruise ship tourism is an important branch and there are cruise ports associations, MedCruise and Cruise Baltic established with the aim to promote this industry. The Mediterranean is the second largest cruise market in the world [9]. About 14 000 cruise ships calls to MedCruise ports in 2014 moving about 26 million passengers [10]. The ports with most cruise ship passengers in the Mediterranean are Barcelona (Spain), Civitevecchia, Rome (Italy), Balearic Islands (Spain), Venice (Italy) and Marseille (France) [11]. The Baltic Sea is the largest segment in the Northern Europe market [12]. Here the cruise season is mainly concentrated between April and October and corresponds to roughly 7 million person-days transported on ca 80 international cruise ships [13]. The ports with the most calls in the Baltic Sea region are St. Petersburg (Russia), Copenhagen (Denmark), Tallinnn (Estonia), Helsinki (Finland) and Stockholm (Sweden) [13]. 3. Environmental issues related to the maritime traffic The maritime traffic is one of the significant factors that can affect the vulnerable marine ecosystems of the seas. Both sea regions are enclosed and under pressure from human activities on land and on sea. In the Baltic Sea catchment area about 85 million people live which have significant impact. The threats to the Baltic Sea are inputs of nutrients and pollutants, increasing ship traffic with operational emissions and associated higher risk of oil spills and accidents, overexploitation and climate change [14]. The environmental threats associated with the maritime traffic in the Mediterranean Sea include anthropogenic noise, physical impacts, air emissions, oil spills, discharge of sewage and litter and transfer of invasive alien species [15]. While noise pollution just recently was identified, there is currently not enough information to understand the full extent of the noise problem and possible impact on aquatic food webs. The physical impacts include direct collisions with species, during

7th INTERNATIONAL MARITIME SCIENCE CONFERENCE
406
April 20th-21st, 2017, Solin, Croatia
anchoring, abrasion by ship hulls in shallow waters, propeller scarring, groundings and sediment disturbance. The presence of alien species can cause significant changes in ecosystems and in biodiversity. Sewage and litter contribute to eutrophication and contamination from pathogens [15]. 3.1 Eutrophication phenomena Both seas are semi-enclosed and thus can have tendency be subject to eutrophication. Though the extent and scale of the problem is different in each sea. Almost the entire Baltic Sea was assessed as affected by eutrophication in 2007-2011, with the exception of the open Bothnian Bay [16]. Despite measures taken in the Baltic Sea to reduce external inputs of nitrogen and phosphorus to the sea, good status for eutrophication has not yet been reached. The large input of nutrients to the Baltic Sea from land and sea-based sources leads to increased production of phytoplankton. The decay of phytoplankton results in low oxygen levels in bottom layers which are one of the major problems in the region. The main water body of the Mediterranean is characterized by very low nutrient concentrations and classified as one of the most oligotrophic seas in the world [4]. Nevertheless, coastal areas in the northern part of the basin where big cities, tourist resorts, and harbors are situated, are affected by the eutrophication as excessive loads of nutrients from sewage effluents, rivers, aquaculture farms, fertilizers, and industrial facilities reach the marine environment [4].
4. REGULATIONS
One of the big impacts from shipping is the generation of wastes and residues, that if managed improperly can be a source of pollution to the marine environment. In the work towards reduction of discharges from ships the regulations governing the management of waste is important together with provision of adequate port reception facilitates and incentive system. The issue of ship-generated wastes is addressed by international regulations. The International Convention for the Prevention of Pollution from Ships (MARPOL
73/78) contains Annex IV which regulates management of sewage and Annex V which regulates management of garbage and cargo residues. Both Baltic Sea and Mediterranean Sea are special areas under MARPOL Annex V (Table 1). That specifies that the sea discharge of waste may be performed not closer than 12 nautical miles from the coastline and these wastes are limited only to ground food waste and non hazardous cargo residues and cleaning agents contained in wash water. Currently only Baltic Sea is designated special area under Annex IV with regulation to reduce nutrient discharges. The regulations forbid the sea discharge of sewage from new passenger ships from 2019 and from existing passenger ships from 2021. The allowed alternatives are treatment onboard using type approved equipment with significant reduction of nutrients3 or disposal of the sewage in port reception facilities. The special area restrictions were formally delayed as not all countries reported in time that adequate port reception facilitates are provided. Table 1. Dates of entry into effect of regulations
for MARPOL special areas [17] Special Areas under MARPOL 73/78
Baltic Sea
Mediterranean Sea
In effect from: Annex I (Oil)
1983 1983
Annex II (Noxious liquid substances)
Not designated
Not designated
Annex IV (Sewage)
2021 Not designated
Annex V (Garbage)
1989 2009
Annex VI (Air pollution)
2006 Not designated
For the longest time (33 years) both regions have been special areas under Annex I meaning that there should be provided adequate port reception facilities for oily mixtures and residues originated from ships. The Baltic Sea is a SOx emission control area and since 2015 the sulphur content of marine
3 20 mg nitrogen/liter, 1 mg phosphorous/liter

407
Magda Wilewska-Bien, Lena Granhag
SUSTAINABLE DEVELOPMENT IN MARITIME TRANSPORTATION FROM THE REGIONAL PERSPECTIVE
fuel used by ships in this area must not exceed 0.1 % (alternatively the emissions need to be treated, with use of a scrubber, to reach the same sulphur emission limits). Based on requirements in MARPOL 73/78, the European Community adopted in 2000 the Directive 2000/59/EC on port reception facilities for ship-generated waste and cargo residues (PRF Directive). This directive highlights the responsibility on EU countries to provide facilities that meet the needs of the ships without causing abnormal delays (EU Commission, 2000). The Directive states that the waste reception and handling (WRH) plans should be formulated at the ports, the fee system should be introduced where all ships contribute significantly (at least 30%) to the costs of the waste facilities, irrespectively of the amount of waste disposed. Ports may differentiate the fee in relation to the ship category, size or environmental performance. Ships are obliged to offload waste in the port reception facilities and in advance send notification with the intended amounts of waste to be disposed in the port. The Directive offers the possibility to grant exemptions from mandatory delivery of waste for ships engaged in regular, scheduled traffic [18]. However, the combination of EU and non EU countries that share the coastlines results in that neither of the seas is fully governed by EU regulations. In case of the Baltic Sea there are 8 EU countries4 of 9 in total, whereas in case of Mediterranean Sea it is also 8 EU countries5 but out of 21 in total. There are also regional agreements and cooperation on the protection of the marine environment. The regional conventions are the Barcelona and Helsinki conventions. The Barcelona Convention for Protection against Pollution in the Mediterranean Sea was signed in 1976. With regard to shipping The Barcelona Convention states that “the parties are required to take all measures in conformity with international law to prevent, abate, combat, and to the fullest possible extent eliminate pollution of the Mediterranean Sea caused by discharges from ships
4 Germany, Finland, Sweden, Denmark, Poland, Estonia, Latvia Lithuania 5 France, Italy, Spain, Cyprus, Croatia, Slovenia, Malta, Greece
and to ensure the effective implementation of that area of rules which are generally recognized at the international level relating to the control of this type of pollution”. The Regional Marine Pollution Emergency Response Centre for the Mediterranean Sea (REMPEC) is the regional center set to help to prevent and reduce pollution from ships and also combat pollution in emergency situations [19]. With regard to the port reception facilities, several activities have been carried out by REMPEC to analyses the current status and needs for the development. Convention on the Protection of the Marine Environment of the Baltic Sea Area (Helsinki Convention) was signed in 1974. The governing body of the convention is Helsinki Commission (HELCOM) which plays an important role in the Baltic’s protection towards environmental improvements and has enhanced the coordination among countries in the region. Since 1998, there is a HELCOM recommendation to apply use no-special-fee systems (NSF), where the costs of reception of ship-generated wastes are included in the port fee independently if the ship uses the port reception facilities [20]. This is in line with the PRF Directive. Within HELCOM a maritime group has been formed to promote actions to limit pollution generated at sea and increase navigation safety in the Baltic Sea. The group works to ensure enforcement and harmonized implementation of the IMO regulations in accordance with the Helsinki Convention. One of the current issues for the maritime group has been the sewage from ships and provision of the adequate port reception facilities in the region which is related to the designation of the Baltic Sea a ‘special area’ under Annex IV. The IMO decision to designate the Baltic Sea as a ‘special area’ in 2011 was based on a proposal by Baltic Sea countries submitted in 2010.
5. SUSTAINABLE DEVELOPMENTS
5.1 Regulating air emissions from shipping It has been noticed that the sustainable developments in the northern and southern part of Europe do not go at the same pace regarding the regulations for the maritime traffic [21]. One example are regulations concerning emissions to

7th INTERNATIONAL MARITIME SCIENCE CONFERENCE
408
April 20th-21st, 2017, Solin, Croatia
air from shipping. The regulations limiting the sulphur content to 0.1 % in the marine fuels came into force in 2015 the Baltic Sea (SECA) but in Mediterranean the limit is still 3.5% sulphur when ships are in the open waters. The measurements performed one year after the introduction of the stricter regulations indicated reduction of the air pollution in the Baltic Sea [21]. To combat NOx emissions from shipping the Baltic Sea has been designated as NOx Emission Control Area (NECA) starting from January 1, 2021. The regulation applies to all vessels built after 2021 and requires reduction of NOx emissions by 80% compared to the present emission level. The total anticipated reduction is about 22 000 tons nitrogen: 7,000 tons is estimated to be reduction from direct deposition to the Baltic Sea surface and the remaining 15,000 tons is estimated to be reduced from deposition to the catchment area [22]. 5.2. Provision of adequate port reception
Provision of the adequate PRF is required by the EU directive, in order to accommodate waste from ships and reduce discharges to the sea. It is estimated that a passenger on a cruise ship generates daily between 19-38 liter of sewage and 3.5 kg waste [23]. The greywater (wastewater from showers, galley and laundry) is the largest liquid waste stream and the daily generation is estimated to 320 liters per person [23]. Currently, in the discussed areas, only ground food waste and sewage can be discharged legally from ships and not closer than 12 NM from the nearest coast6,7.The discharge of greywater is however not regulated by IMO. The treated sewage can, under specific conditions6, be discharged closer to the coastline.
The historical data show that in general the PRF Directive had impact on the management of waste however there were fluctuations in the amount of garbage delivered to the European ports in the period between 2005-2010 [24]. A peak, of disposed garbage, for both studied regions was noticed in 2008/9 which can be explained by the increase in cruise traffic. Another finding was that only the Baltic Sea ports received sewage in any larger volumes between 2005-2010 which can be
6 MARPOL 73/78 Annex V 7 MARPOL 73/78 Annex IV
linked to the decision to designate the Baltic Sea special area. Offering port reception facilities does not translate directly that the ships will use it. A quick look the annual statistics from the Port of Barcelona, major port for cruise ships in the Mediterranean, shows that ships rarely dispose of sewage in the PRF. The discharge of oily wastewaters in the port occur nearly 50 times more often [25]. A survey performed on 50 MedCruise ports shown that the majority of the ports has waste reception facilities for Annex V waste (garbage) at all berths and they operate the PRF under 24 hours, seven days a week [10].Regarding the fee for garbage, in the Baltic Sea the implementation of indirect fee for garbage is quite common in comparison to the Mediterranean region [24]. Though, the majority of the MedCruise ports apply either indirect fee or a combination of direct and indirect fee. One fourth of the MedCruise ports apply direct fee [10]. Moreover the MedCruise ports tend to offer rebated fees if the waste is segregated onboard [10]. In contrast to fee for the garbage, a direct fee for sewage is charged by ports in the Mediterranean. Six out nine interviewed ports in Mediterranean charged direct fee for sewage and two remaining charged indirect fee. On the other hand the application of the indirect fee for sewage is more common in the Baltic Sea Region [24].However the volume of sewage included in the NSF may vary from port to port.
6. SUSTAINABLE PORTS
Apart from the activities enforced by the regulations on the regional level there are examples from both regions on how the ports, based on their own driving forces, initiate environmental services and projects that aim to reduce the impact from shipping. Ports can offer rebate on waste fee in case the waste has been segregated and this approach can be found in both regions [10, 26]. Port of Helsinki (Finland) is one of the pioneers in actually offering discount on the fee if the ships decide to offload the sewage. In the area of energy, ports in the Baltic Sea develop currently the LNG infrastructure where Stockholm and Gothenburg are driving ports [21]. Further has Copenhagen and Malmö Port decided to only purchase energy from renewable sources [27]. The

409
Magda Wilewska-Bien, Lena Granhag
SUSTAINABLE DEVELOPMENT IN MARITIME TRANSPORTATION FROM THE REGIONAL PERSPECTIVE
example in the field of energy management from the Mediterranean region can be the Port of Genoa that develops a new port environmental energy plan which is a unique instrument in Italy to promote renewable energy efficiency in port areas. The project offers potential of 20 000 tonnes CO2 reduction by 2020 [28]. Another example is the Port of Koper, that was awarded by ESPO for its positive practices in reusing and reprocessing of the waste materials [29]
7. DISCUSSION AND CONCLUSIONS
The sea areas have similarities both being enclosed seas only connected to surrounding water bodies with narrow sounds or canals. In line with the provisions of MARPOL Annex I (Oil) and Annex V (Garbage), both the Mediterranean Sea and the Baltic Sea are special areas, where discharge criteria are stricter than for other marine areas. However there are still differences visible in the sustainable developments. The sustainable actions are visible in the Baltic Sea which aim to work actively to reduce impact from shipping, whereas these actions started later in the Mediterranean and they are also performed at lower pace. The differences between two regions may be explained to some extent by structural factors. Number of riparian states in each case varies considerably and is much higher for the Mediterranean Sea. The differences between countries at economic, political and cultural level are also more visible in case of Mediterranean Sea region. Although there is mix of EU and non-EU countries in both regions, the proportions are different. Therefore, the Baltic Sea where 89% is represented by the EU countries is protected to the larger extent by the EU regulations than Mediterranean. The sustainable developments in the Baltic Sea region were triggered by the 1992 Rio Conference which had much stronger impact on the Baltic Sea region than on other regions [30] and stimulated many processes at national and local levels. One hypothesis behind why these processes started is the fact that the Nordic countries are recognized as environmental pioneers whereas other countries in the region at the Baltic Sea were the most developed in the former communist bloc [30] An important fact is that there is a governing body (Helsinki Commission) of the Helsinki Convention
which is active in protecting the marine environment. A similar governing body is currently missing in the Mediterranean. There are also opinions that implementing stricter regulations in the Baltic region has drawbacks because as it can create less fair market conditions for maritime transport in this region in comparison to other regions in Europe [7]. The example of the Baltic Sea also shows that even in the region of only 9 countries, the enforcement of the regulations is not without challenges and takes time. The dates to introduce special area status for sewage in the Baltic Sea was delayed due to the fact that PRF were not developed on time. There are also different interpretations of the NSF system. Much focus is put on the eutrophication problems in the Baltic Sea and therefore there is intensive work with regulations concerning discharge of nutrients, also from the maritime sources. As eutrophication is not spread to the same degree in the Mediterranean Sea, the work might have been focused on garbage and developing sustainable waste handling on land. As eutrophication yet occurs in the coastal areas in the region special care should be put on the proper sewage and waste handling in the coastal areas visited by the recreational yachts. The designation of the Baltic Sea to be a special area under Annex IV can possibly have an indirect positive effect on other regions as the industry will need to invest in the onboard sewage treatment plants certified for the Baltic sea area that will hopefully stay in place even if the ships operate in other regions. Additionally, the awareness of sewage discharges and their impact has been raised among employees in the shipping lines and the passengers.
Summing up, spreading of the sustainable developments over the regions is beneficial for the environment and for the human health. It is in common interest that the gaps in the developments are reduced and a more balanced state is achieved. The activities of the Baltic countries in the areas of environmental maritime management can serve as a set of good practices that can be followed by other European regions, however a concern should be taken to the regional differences. It is of importance that the solutions, in order to be successful, are adapted for the local conditions.
7th INTERNATIONAL MARITIME SCIENCE CONFERENCE
410
April 20th-21st, 2017, Solin, Croatia
REFERENCES
1. ICS. Shipping and World Trade. 2016 2016-12-01].
2. Håkanson, L., The Baltic Sea, in Environmental Science. Understanding, protecting and managing the environment in the Baltic Sea Region. 2003, The Baltic University Programme, Uppsala University: Uppsala.
3. Britannica, E. Mediterranean Sea. 2010 2017-02-18]; Available from: https://global.britannica.com/place/Mediterranean-Sea.
4. Karydis, M. and D. Kitsiou, Eutrophication and environmental policy in the Mediterranean Sea: a review. Environmental Monitoring and Assessment, 2012. 184(8): p. 4931-4984.
5. Kohutnicka, L.T. Sustainable Maritime Transport in the Baltic and mediterranean Region: Policies and Challenges. in International Maritime Science Conference. 2014.
6. HELCOM, Maritime Activities in the Baltic Sea. An integrated thematic assessment on maritime activities and response to pollution at sea in the Baltic Sea region., in Baltic Sea Environment Proceedings No.123. 2010b.
7. Klopott, M., The Baltic Sea as a model region for green ports and maritime transport. 2016, Baltic Ports Organization.
8. Anderberg, S., Hamnasrnas rustas för fartygens avloppsvatten (in Swedish), in Sjöfarten kring Sverige och dess påverkan på havsmiljön. 2014, Havsmiljöinstitutet Göteborg.
9. Sciozzi, D., T. Poletan Jugović, and A. Jugović, Structural analysis of cruise passenger traffic in the world and in the Republic of Croatia. Scientific Journal of Maritime Research, 2015. 29: p. 8-15.
10. Pallis, A.A. and A. Papachristou, Waste reception facilities in Cruise Ports: The case of the Med, in The Fifth International Symposium on Ship Operations, Management & Economics (SOME 2015). 2015: Athens, Greece.
11. Pallis, T., K. Arapi, and A. Papachristau, Cruise Activities in Medcruise ports. 2016, MedCruise Association: Piraeus, Greece.
12. CLIA, THE CRUISE INDUSTRY. Contribution of Cruise Tourism to the Economies of Europe. 2015 Edition 2015.
13. HELCOM, Baltic Sea Sewage Port Reception Facilities. HELCOM Overview 2014. Revised Second Edition. 2015: Helsinki, Finland
14. Hongisto, M., Impact of the emissions of international sea traffic on airborne deposition to the Baltic Sea and concentrations at the coastline. OCEANOLOGIA, 2014. 56(2): p. 349–372.
15. Abdulla, A. and O. Linden, Maritime traffic effects on biodiversity in the Mediterranean Sea Review of impacts, priority areas and mitigation measures. 2008, Malaga, Spain: IUCN,.
16. HELCOM, Eutrophication status of the Baltic Sea 2007-2011 - A concise thematic assessment. Baltic Sea Environment Proceedings No. 143. 2014: Helsinki, Finland.
17. IMO. Special Areas under MARPOL. 2016a 2016-12-01]; Available from: http://www.imo.org/en/OurWork/Environment/SpecialAreasUnderMARPOL/Pages/Default.aspx.
18. EU, REFIT Evaluation of Directive 2000/59/EC on port reception facilities for ships-generated waste and cargo residues. Report from the Commission to the European Parliament and the Council. 2016: Brussels.
19. REMPEC. About ReMPEC. 2017 2017-02-20]; Available from: http://www.rempec.org/.
20. HELCOM, HELCOM Recommendation 28/1 *). Application of the no-special system to ship-generated wastes in the Baltic Sea area, in HELCOM Recommendation 28/1 *), HELCOM, Editor. 2007.
21. Oeliger, D., Mind the gap! Are northern European ports ahead of the south in terms of green infrastructure and policies?, in GreenPort Conference. 2016: Venice.

411
Magda Wilewska-Bien, Lena Granhag
SUSTAINABLE DEVELOPMENT IN MARITIME TRANSPORTATION FROM THE REGIONAL PERSPECTIVE
22. HELCOM. Shipping sector cuts Nitrogen loads to the Baltic Sea. 2016 2017-02-18].
23. Herz, M., Cruise Control A report on how cruise ships affect the marine environment. 2002, The Ocean Conservancy: Washington.
24. EMSA, The final report of the study on the Delivery of Ship-generated Waste and Cargo Residues to Port Reception Facilities in EU Ports. EMSA/OP/06/2011. 2012.
25. Barcelona, P.d. Environment. Ship's waste. 2017 2017-02-20]; Available from: Ship's waste.
26. ESPO, Green Guide Annex 1: Good practice examples in line with the 5 Es. 2013: Brussels.
27. CMP. Copenhagen Malmo Port. Energy. 2012 2017-02-18].
28. Tommasetti, A., O. Troisi, and C. Tuccillio, Smart and Green Technologies in the Mediterranean Ports: The Genoa Port Case Study, in 2nd International Conference on Contemporary Marketing Issues. 2014: Athens, Greece.
29. ESPO. Port of Koper wins ESPO Award 2014. 2014 2017-02-17]; Available from: http://www.espo.be/news/port-of-koper-wins-espo-award-2014.
30. Joas, M., D. Jahn, and K. Kern, Governing a Common Sea: Environmental Policies in the Baltic Sea Region. 2008, London: Routledge.

7th INTERNATIONAL MARITIME SCIENCE CONFERENCE
412
April 20th-21st, 2017, Solin, Croatia
DEVELOPMENT POTENTIAL OF UAV OPERATIONS IN CROATIAVlaho Brajković, Boris Lazić, Filip Polanščak, Sanja Steiner
DEVELOPMENT POTENTIAL OF UAV OPERATIONS IN CROATIA
Vlaho Brajković1, Boris Lazić1, Filip Polanščak1, Sanja Steiner2
(1 Students of Graduate Study, University of Zagreb, Faculty of Transport and Traffic Sciences, Zagreb, Croatia)
(2 University of Zagreb, Faculty of Transport and Traffic Sciences, Zagreb, Croatia)
(E-mail: [email protected])
ABSTRACT
The industry of unmanned aerial vehicles (UAV) is a fast growing market with an increasing number of users, providing the technology of “door-to-door” transport. The paper elaborates the possibility of using unmanned aerial vehicles (drones) for the purpose of supplying the Adriatic islands and the coastal areas with medicines and medical equipment, transplants and urgent postal packages. Croatia has 47 inhabited islands, of which only 16 have medical pharmacies. The optimal characteristics of drones have been analyzed for the Adriatic islands as well as the criteria of locating and sizing the potential medical centers regarding the island population, the deployment of the island and tourist capacities. Drones are favorable means of linking the continental and island medical centers for the purpose of delivering medical equipment and medicines. In elaboration of the insufficient transport links of the islands and the mainland, as a possible functional solution a model of UAV has been proposed, which meets the environmental, economic and social requirements. The exploitation advantages and shortcomings of UAV have been analyzed in relation to the helicopter and sea-going vessels.
KEY WORDS
air transport, unmanned aerial vehicle, supply of remote areas, emergency medical service, Adriatic islands and coastal areas
1. INTRODUCTION
Over the recent years the use of drones has been greatly expanding, and they are becoming more available to humans for their basic use. Also, the operative advantage of using drones for various purposes has been recognized, where it can practically replace various other aircraft regarding economy, simplicity, and efficiency of usage. A high benefit of drones is the possibility of usage for door-to-door operations. In this respect a large potential of using drones lies in the implementation within the telemedicine, i.e. transport of medicines, equipment, blood and organs over large distances at minimal costs. The possibilities of using drones for medical purposes for the Adriatic islands of Croatia have been studied, and the positive impact of drones on the
possibility of inhabiting the islands and fast and efficient transport of various types of goods has been presented. The relation of drone and helicopter performances are analyzed and noting a great potential in using of drones for the purpose of transporting goods and the possibility of improving the connections of the indented coast and the increase of tourist potentials.
2. UAVs RELATED REGULATIONS IN CROATIA
The flying of drones has been regulated in the Republic of Croatia by the Unmanned Aircraft Regulations. The Regulations are implemented for unmanned aircraft of operational mass of 150 kg

413
Vlaho Brajković, Boris Lazić, Filip Polanščak, Sanja Steiner
DEVELOPMENT POTENTIAL OF UAV OPERATIONS IN CROATIA
and less. The unmanned aircraft are classified according to the operative mass:
1. Class 5 – up to 5 kilograms; 2. Class 25 – from 5 kilograms to 25
kilograms; 3. Class 150 – from 25 kilograms up to and
including 150 kilograms.
The classification of the flying area is done in relation to the build-up level, population density and the presence of people and this has been presented in Table 1.
Table 1 – Classification of the flying area
Drone flying is performed in compliance with the valid regulations for the use of the Croatian airspace and the provisions of the Regulations. The pilot must ensure that the drone flight is performed so as not to endanger human lives, health or property, check the functioning of the drone before the flight, consider the meteorological and other conditions that might endanger the flight performance, insure that all the equipment or cargo be adequately fixed. For flying a drone over a distance greater than 500 meters from the pilot an Agency permit has to be obtained [1].
3. CLASSIFICATION OF UAVs FOR IMPLEMENTATION IN CROATIA
Regarding the implementation in Croatia, the drones may be used for the following purposes:
a) EMS (Emergency Medical Service) operations;
b) firefighting; c) SAR (Search and Rescue) operations; d) state border surveillance; e) surveillance of the Croatian Adriatic
against pollution; f) surveillance against floods; g) collecting data about the terrain; h) surveillance and assistance in agricultural
industry; i) transport of urgent postal items.
3.1. UAV in EMS operations
EMS represents a drone flight in order to ensure urgent medical assistance at places where fast transport of medical supplies (equipment, medicines, blood, organs) is required. Among the medical supplies the drones would transport medical equipment and medicines, and possibly blood, but to transport blood they would have to be equipped with a tank (“fridge”) with temperature norms and the safety of the drone itself having to be additionally increased. Thus, the drones would dispatch medical equipment and medicines to inhabited islands and the Adriatic coastal area of the Republic of Croatia replacing in this way the helicopters. Further analysis of the possibility of implementing drones in order to supply the Adriatic islands and the coastal area with medical equipment and medicines will be explained in more detail in Section 4.
3.2. UAV in firefighting
In relationship to the world average, most fires occur in Canada, i.e. there are about 7,500 forest fires every year, which is on the average about 2.5 million hectares of burnt surfaces annually, and Canada is the most advanced country regarding the usage of drones in firefighting activities, which makes it possible for them to reduce the costs which amount to about a billion dollars [2]. The drones with thermal screening or infrared thermography can scout a large area of fire in conditions of dense smoke and fire, and this system would be implemented in the Republic of Croatia. While implementing the firefighting system, apart from their primary task (transport of
Class 1
Area where there are no high buildings or facilities and no people, except the manager and personnel
required for flying;
Class 2
Area in which there are auxiliary industrial facilities or buildings not intended for people and
where there are no people, except for the manager and personnel required for flying. Only
occasional passing is allowed, without staying, of people through this area (cyclists, walkers, etc.)
Class 3
Area with buildings or facilities primarily intended as residences, offices or recreation (apartment buildings, residential houses, schools, offices,
sports facilities, parks, etc.)
Class 4 Area of narrow urban zones (centers of cities,
towns and settlements).

7th INTERNATIONAL MARITIME SCIENCE CONFERENCE
414
April 20th-21st, 2017, Solin, Croatia
medical equipment and medicines in EMS and SAR operations) the drones would also perform the task of participating in the firefighting activities in Croatia.
3.3 UAV in SAR operations
The drones can be used in search and rescue (SAR) activities, primarily in the absence of helicopters. Besides, in comparison to drone, helicopter has some shortages such as long response time to accident, high exploitation costs and high fuel consumption. A drone is capable of carrying also a defibrillator to a paramedic at hard to reach places. In SAR regulations it is necessary to use IAMSAR (International Aeronautical and Maritime Search and Rescue Manual). In SAR operative implementation it is very easy to find people with thermal screening, regardless of whether the SAR action is performed at night or in foggy conditions. In these conditions the drones are more efficient in relation to helicopters regarding their economy and safety [3]. In the absence of helicopters, a drone can start and support:
a) the Mountain Rescue Service (GSS - Gorska služba spašavanja) in climatic and configuration requirements of the demanding hills and mountain regions – in reconnaissance from high altitudes in search for the victims;
b) in the maritime search and preventive action – in search in which it is equipped for night search, in locating the victims, such as swimmers or injured persons who are far from the coast due to strong currents. The possibility of action would include ejection of safety belts that are automatically activated in the fall and allow a maximum of three people to hold themselves onto the belt. While waiting for a transport rescue vehicle to arrive, the drone would circle above them using the Shark Shield device. The Shark Shield device emits electrical impulses that irritate the sharks’ senses (or any other dangerous sea animals). This method is
as yet only being tested and implemented in Australia [4].
3.4 UAV for other applications in Croatia
In controlling the state border, a drone would be used in order to: prevent and detect crimes and offenses, prevent illegal migrations, prevent other threats to public safety and public order, as well as national security. In control of the Croatian Adriatic against pollution, in case of emergency in the Adriatic, i.e. oil pollution, a drone would be used for a more detailed survey, so that the oil-cleaning ships and Air Tractor AT-802 (which is ideally equipped for such events, except fires) could act fast and efficiently in order to protect the fishing and ecological zone. When collecting data about the ground, a drone would perform tasks related to geodesy, cartography, cadastre and other tasks for administrative and professional activities of the State Geodetic Administration. When monitoring of floods, a drone would be used for the interior of the Republic of Croatia, starting from Karlovac, Varaždin all the way to the extreme parts of Slavonia and Baranja. The central UAV operational center would be Zagreb that would control the majority of secondary applications such as control of state border, control of floods, affairs of the State Geodetic Administration, and it would be in the state of preparedness of the SAR system and for the purpose of other applications.
4. POSSIBILITY OF UAV OPERATIONS FOR THE PURPOSE OF SUPPLYING MEDICAL EQUIPMENT AND MEDICINES
In the Republic of Croatia there are 1,171 pharmacies per 4,284,889 citizens [5], out of which 39 pharmacies cover 118,488 island population, which means that 3.33% of pharmacies on the islands account for 2.77% of the Croatian population, which is a greater coverage than the average coverage of pharmacies per total population of the Republic of Croatia. On the islands, there is one pharmacy covering 3,038.15 citizens, while on the mainland the coverage is 3,674.85 citizens per pharmacy. All the Adriatic islands suffer from the problem of

415
Vlaho Brajković, Boris Lazić, Filip Polanščak, Sanja Steiner
DEVELOPMENT POTENTIAL OF UAV OPERATIONS IN CROATIA
lack of road traffic connection, and the method of supplying the pharmacies themselves is difficult due to the sea-going vessel capacities and the number of navigation timetable frequency due to the distances between the islands and the mainland. Adding to the permanent residents the share of tourists who stay there during the summer, the number of temporary island population rises by 2,606,900 citizens (2015). Table 2 shows the number of residents and the number of tourists in relation to the number of pharmacies and the number of possible requirements for medicines. Other inhabited islands that do not have a pharmacy (31 islands) have a population of 6,467 citizens, with the recorded data about the number of tourists on two islands (Mljet and Lastovo) with an increase of temporary citizens by 26,100 [6]. Adding the tourists to the residential population results in an average of 66,843.59 tourists per one pharmacy, and on the islands without pharmacy there are officially 26,100 tourists without the possibility of access to medicines, considering that during the summer seasons 15 otherwise uninhabited islands are temporarily inhabited. During the summer season the pharmacies on the inhabited islands
cover 66,843.59 tourists, i.e. the population rises from the residential population to temporary population in a ratio of 21:1. The problem lies in the arrangement of pharmacies on an island, where some settlements have no pharmacy on inhabited sites whereas certain places on the island have several pharmacies. The main problems of the islands with and without pharmacies lie in the supply of the island with medicines, due to the low level of line frequencies between the islands and the mainland, so that there is often a lack of supplies in peak times of the tourist season. All the mentioned problems can be solved by introducing the operative action of using drones for deliveries. A drone has the possibility of fast transfer from the centers on the mainland to island pharmacies and medical centers. Figure 1 shows the arrangement of 31 inhabited islands that have no aspect of medical care, such as a pharmacy. The highest density of islands without pharmacies can be observed in central Adriatic, and in southern Adriatic. A drone has the possibility of high speeds, short delivery time, reliability and the possibility of “door-to-door” operations.
Table 2 - Relationship of residential population and tourists per number of pharmacies [7], [8]
Inhabited islands Number of pharmacies
Population (2011)
Average population/tourists per one pharmacy Tourists (2015)
Krk 6 19,383 3,230.5 / 113,700 682,200 Korčula 3 15,522 5,174 / 43,266.67 129,800
Brač 7 13,956 1,993.7 / 29,028.57 203,200 Hvar 3 11,077 3,892.3 / 84,466.67 253,400 Rab 3 9,328 3,109.3 / 81,366.67 244,100 Pag 4 9,059 2,264.7 / 89,275 357,100
Lošinj 1 7,587 7,587 / 293,400 293,400 Ugljan 3 6,049 2,016.3 / 13,800 41,400 Čiovo 1 5,908 5,908 / - - Murter 1 4,895 4,895 / 147,400 147,400
Vis 2 3,445 1,722.5 / 20,800 41,600 Cres 1 3,079 3,079 / 114,800 114,800 Vir 1 3,000 3,000 / - -
Pašman 1 2,845 2,845 / 23,600 23,600 Šolta 1 1,700 1,700 / 12,100 12,100
Dugi otok 1 1,655 1,655 / 36,700 36,700 Total 39 118,488 3,053.5 / 66,843.59 2,606,900

7th INTERNATIONAL MARITIME SCIENCE CONFERENCE
416
April 20th-21st, 2017, Solin, Croatia
Figure 1 - Arrangement of inhabited islands (31) in the Adriatic Sea without pharmacies
5. PROPOSAL OF A SOLUTION FOR CONNECTING ISLANDS BY UAVs FOR THE PURPOSE OF SUPPLYING MEDICAL EQUIPMENT AND MEDICINES
The headquarters of the drones for the delivery of medical equipment and medicines are located in the cities with major medical institutions (clinical hospital centers or general hospitals) and they represent the operational centers:
1. operational center General Hospital Dubrovnik;
2. main operational center KBC (Clinical Hospital Center) Split;
3. operational center General Hospital Zadar;
4. operational center KBC Rijeka. Apart from transport by drones there is also their administration and maintenance, and the main operational center KBC Split, apart from its scope of activity, represents also the entire logistics of drone transport in connecting the islands with the Croatian coastal area. In the Adriatic there are 16 inhabited islands with pharmacies where about 120,000 citizens are living, and 31 inhabited islands without pharmacies with about 6,500 citizens. Although Table 3 shows also the possibility of delivering medical equipment and medicines to islands with pharmacies, the highest priority is given to the supply of islands that have no pharmacies.
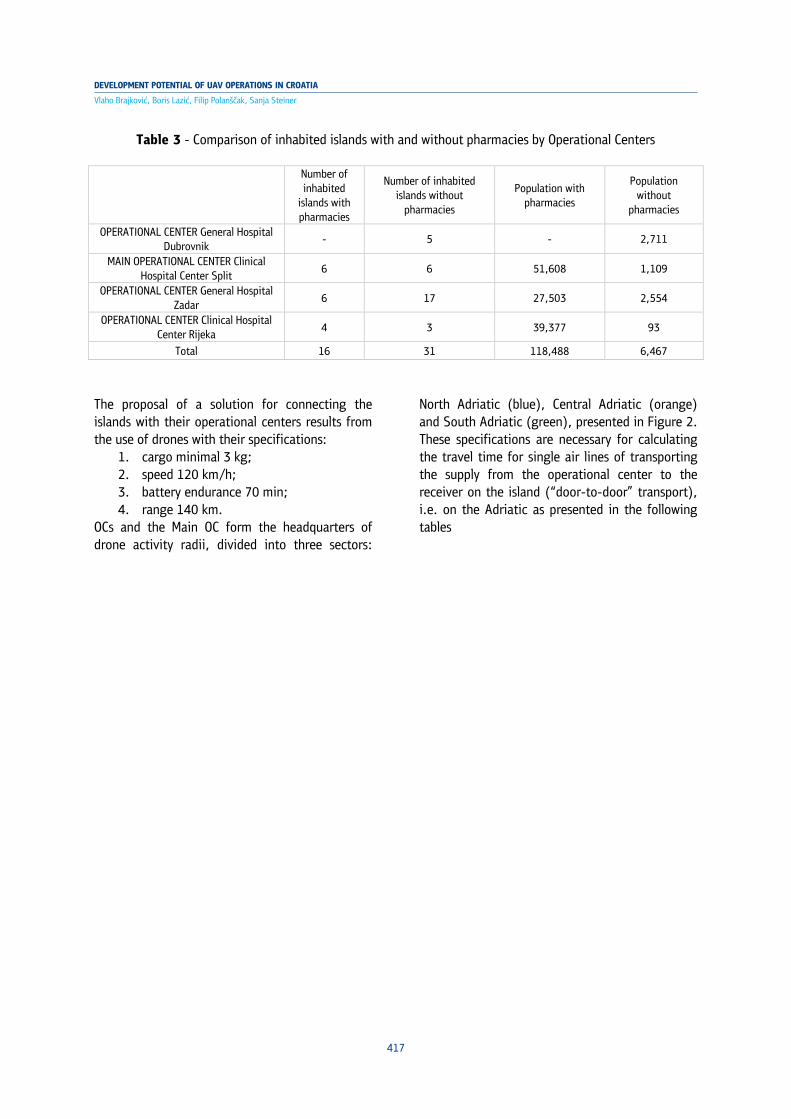
417
Vlaho Brajković, Boris Lazić, Filip Polanščak, Sanja Steiner
DEVELOPMENT POTENTIAL OF UAV OPERATIONS IN CROATIA
Table 3 - Comparison of inhabited islands with and without pharmacies by Operational Centers
The proposal of a solution for connecting the islands with their operational centers results from the use of drones with their specifications:
1. cargo minimal 3 kg; 2. speed 120 km/h; 3. battery endurance 70 min; 4. range 140 km.
OCs and the Main OC form the headquarters of drone activity radii, divided into three sectors:
North Adriatic (blue), Central Adriatic (orange) and South Adriatic (green), presented in Figure 2. These specifications are necessary for calculating the travel time for single air lines of transporting the supply from the operational center to the receiver on the island (“door-to-door” transport), i.e. on the Adriatic as presented in the following tables
Number of inhabited
islands with pharmacies
Number of inhabited islands without
pharmacies
Population with pharmacies
Population without
pharmacies
OPERATIONAL CENTER General Hospital Dubrovnik
- 5 - 2,711
MAIN OPERATIONAL CENTER Clinical Hospital Center Split
6 6 51,608 1,109
OPERATIONAL CENTER General Hospital Zadar
6 17 27,503 2,554
OPERATIONAL CENTER Clinical Hospital Center Rijeka
4 3 39,377 93
Total 16 31 118,488 6,467

7th INTERNATIONAL MARITIME SCIENCE CONFERENCE
418
April 20th-21st, 2017, Solin, Croatia
Figure 2 - Sectorization of operational centers
Table 4 - Operational Center – General Hospital Dubrovnik with its operational activities
Table 5 - Main Operational Center - CHC Split with its operational activities
OPERATIONAL CENTER – General Hospital Dubrovnik Inhabited island with
pharmacy Population Air distance
(km) Travel time
/ / / / Inhabited island without
pharmacy Population Air distance
(km) Travel time
Koločep 163 7 4 min Lopud 249 12 6 min Šipan 419 19 10 min Mljet 1088 48 24 min
Lastovo 792 99 50 min
MAIN OPERATIONAL CENTER – Clinical Hospital Center Split Inhabited island with
pharmacy Population Air distance
(km) Travel time
Čiovo 5,908 14 7 min Šolta 1,700 19 10 min Brač 13,956 28 15 min Hvar 11,077 42 21 min

419
Vlaho Brajković, Boris Lazić, Filip Polanščak, Sanja Steiner
DEVELOPMENT POTENTIAL OF UAV OPERATIONS IN CROATIA
Table 6 - Operational Center – General Hospital Zadar with its operational activities
Table 7 - Operational Center – Clinical Hospital Center Rijeka with its operational activities
Vis 3,445 55 28 min Korčula 15,522 73 37 min
Inhabited island without pharmacy
Population Air distance (km)
Travel time
Drvenik Veli 150 26 14 min Drvenik Mali 87 31 16 min
Krapanj 170 48 24 min Zlarin 284 54 27 min Prvić 403 60 30 min
Biševo 15 69 35 min
OPERATIONAL CENTER – General Hospital Zadar Inhabited island with
pharmacy Population Air distance
(km) Travel time
Ugljan 6,049 7 4 min Dugi otok 1,655 20 10 min Pašman 2,845 21 11 min
Vir 3,000 26 14 min Pag 9,059 41 21 min
Murter 4,895 45 23 min Inhabited island without
pharmacy Population Air distance
(km) Travel time
Ošljak 29 4 2 min Iž 615 13 7 min
Rava 117 17 9 min Rivanj 31 17 9 min
Sestrunj 48 20 10 min Zverinac 43 27 14 min Kornati 19 34 17 min Vrgada 249 36 18 min Molat 197 37 19 min
Ist 182 43 22 min Olib 140 47 24 min Silba 292 55 28 min
Premuda 64 58 29 min Kaprije 189 60 30 min Žirje 103 62 31 min Ilovik 85 67 34 min Susak 151 87 44 min
OPERATIONAL CENTER – Clinical Hospital Center Rijeka Inhabited island with
pharmacy Population Air distance
(km) Travel time
Krk 19,383 36 18 min Cres 3,079 42 21 min Rab 9,328 70 35 min
Lošinj 7,587 73 37 min Inhabited island without
pharmacy Population Air distance
(km) Travel time
Unije 88 80 40 min Vele Srakane 3 85 43 min Male Srakane 2 86 44 min

7th INTERNATIONAL MARITIME SCIENCE CONFERENCE
420
April 20th-21st, 2017, Solin, Croatia
According to Table 4, OC – General Hospital Dubrovnik with its radii i.e. sectors serves five inhabited islands without pharmacies, out of which four islands (Koločep, Lopud, Šipan and Mljet) are relatively close to the coast, but the island of Lastovo is about 100 km away (50 min of travel) and it requires another drone. Thus, the OC – General Hospital Dubrovnik should have a total of two drones. The use of two drones holds also for OC – KBC Rijeka with its three inhabited islands without pharmacies (Table 7). OC – KBC Split has six inhabited islands without pharmacies (Table 5) with air lines from 26-69 km, i.e. all are located in the 2nd scope of activity up to a range of 80 km or 40 min of drone endurance. Regarding the sector of activity, for OC – KBC Split there should be three drones. OC – General Hospital Zadar (Table 6) has 17 inhabited islands without pharmacies, the most of other operational centers thus requiring a higher number of drones than other operational centers. In case of this operational center of 17 islands the division into sectors (radii) of activity comes to the fore:
1) sector of activities up to 20 km flight range or 10 min of drone endurance – for 5 islands in the respective sector would require two drones;
2) sector of activities up to 80 km flight range or 40 min of drone endurance – for 11 islands in the respective area would require five drones;
3) sector of activities up to 140 km flight range or 70 min of drone endurance – for one island in the respective sector would require one drone.
Thus, for the medical supply of 17 inhabited islands without pharmacies, OC – General Hospital Zadar, would require 8 drones. Based on the analyses from the table, regarding the sectors of activities of single operational center, for 31 inhabited islands without pharmacies in the Adriatic 15 drones would be required, which represents a huge project of the Republic of Croatia. This would be necessary, particularly if on these islands, apart from the residential population, during the tourist season there is a large number of tourists. This would provide
savings on huge operative costs of helicopters since it would mean a “door-to-door” transport directly to the receiver. In case of emergency on the Adriatic and the Croatian coastal area during the tourist season, e.g. fire, a small part of drones intended for medical supply of the Adriatic islands and coast could be transferred to the application of firefighting, depending on the location. The same holds also for SAR and control of the Adriatic against pollution.
6. SPECIFICATION OF DRONES FOR THE TRANSPORT OF MEDICAL EQUIPMENT AND MEDICINES
In selecting a drone, several factors need to be taken into consideration. One of the main factors is the speed of the drone that should be as high as possible, and in no way lower than 30 m/s (108 km/h). A drone would be primarily used for the transport of medicines to island towns and cities, which requires a flight above the open sea, where there is often wind, so that the drone would have to have the capability of flying in the conditions of wind of 12 m/s (43.2 km/h) or more. The weight of the drone itself should be as low as possible, and after being fitted with the equipment of HD camera and sensors, maximum cargo that the drone can transport should be 3 kg or more. The drone has to be equipped with GPS and HD camera, with a range of sight of 120°, and the real-time image transfer. The flying altitude should be minimum 300 meters, and the battery endurance minimally 70 minutes, with maximally short time of full charging. The drone has to be equipped also with a second auxiliary battery. The batteries can be charged via AC outlet or the drone can be equipped by solar panels, thus charging the battery. The drone that is to be used is controlled by one pilot who will perform the piloting via the base ground station. The control will be done by a remote control (via satellite), but it is desirable that the drone be equipped with an autopilot system. The drone has to be equipped with 4 rotors. Since the major part of the flight will be performed above the sea areas, there is danger of the drone falling into the sea; therefore, the drone has to be equipped with balloons filled with air, which will prevent the drone from sinking, and at the same time allow also landing on the water surface. It is necessary to set also the

421
Vlaho Brajković, Boris Lazić, Filip Polanščak, Sanja Steiner
DEVELOPMENT POTENTIAL OF UAV OPERATIONS IN CROATIA
base platforms on the water area, towards which the drone will automatically direct the flight and land safely, if the control or connection with it is lost. The flight from point A to point B can be performed also by means of the so-called check points that must be equipped with surveillance devices, whereas in this case the drone has to be equipped by sensors that will automatically follow the signal of the tracking device. In this transport mode one has to take into consideration the range of the signal.
7. COMPARASION OF TRANSPORT AND TECHNOLOGICAL FEATURES OF DRONES AND HELICOPTERS
The main competitor to drone in the transport of medicines by air is certainly a helicopter. In the comparison one should take into consideration numerous parameters, such as response time “from call to take-off”, price of procurement, maintenance and hour of flight, dimensions and a lot of others. The price of helicopter purchase differs in tens of millions of dollars compared to the purchase of a drone. The price of one hour of helicopter flight is about 1,000 euro, whereas the price of one hour of drone flight is dictated only by the price of the pilot working hour, since it is powered by a battery. Currently, in the Republic of Croatia for the needs of emergency medical assistance by air, helicopter of HRZ (Croatian Air Force) is used, and it results in a complicated and time-consuming process of dispatching a helicopter (from call to take-off a minimum of 15 min). The drone would be connected to the operational center, and it would be ready for take-off within only a few minutes. Noise and vibrations generated by a helicopter are much higher in relation to the drone that produces no sound. The impact on the environment goes also in favor of the drone since it does not generate any burn
products from the engine, as the case with helicopters. Maximum take-off mass is lower in case of drones, but since the purpose is the transport of medicines, no high take-off mass is required as in the case of helicopters. The flying speed is higher for helicopters (about 250 km/h), whereas the flying speed in case of drones is about 120 km/h. Great advantage of helicopters is that they can fly in much stronger winds than the drone. Also, the flying altitude that can be reached by a helicopter compared to a drone is higher, but it should be taken into consideration that the transport of medicines by drone would be performed at the altitude of up to 300 m, at which helicopters create great noise. The flying range and endurance are certainly on the side of the helicopter. The helicopter flying range of 950 km and endurance of several hours are still the biggest advantage of helicopters in relation to the drone whose flying range is 140 km, and the endurance 70 minutes (with one battery). It should be also noted that the drones are a new but fast growing branch of air traffic, and that innovations of new technologies are moving the frontiers. Comparing the dimensions, with huge fuselage dimensions of several tens of meters, a helicopter also has a large diameter of the main rotor, without the isolation of the tail rotor, representing a threat to people for the time spent on the ground in the idle regime. On the other hand, a drone is of small fuselage dimensions that amount to 1 – 1.5 m, and four smaller rotors of a diameter of several tens of centimeters. Due to its large dimensions and weight of 6 – 7 tons, a helicopter requires a big and hard landing platform, with secured approach and take-off surfaces, whereas the drone has a mass of up to 10 kg and it can land on smaller areas. The advantages and drawbacks of helicopters and drones are presented in Table 8.

7th INTERNATIONAL MARITIME SCIENCE CONFERENCE
422
April 20th-21st, 2017, Solin, Croatia
Table 8 – Comparison of transport and technological features of helicopters and drones
*Range and endurance with one battery
The comparison should include the consideration of the possibility of accidents. In case of fall of a helicopter, the consequences can be disastrous with huge material, ecological and financial consequences, and human victims (personnel and people on the ground). In case a drone falls there is no danger of ecological pollution, and in case of fire outbreak the fire would not be of huge dimensions and would be extinguished fast and simply, even without firefighter interventions. In case of fall it only endangers the people on the ground, who can be hit by the drone or one of its parts. During the flight, the drone is also endangered by the birds, and the contact with them will most certainly result in the loss of control and fall. The introduction of drones in the operative does not require investments into building of infrastructure and purchase of the handling equipment, but rather only investing funds for the purpose of establishing operational centers. This would also mean opening of new workplaces.
8. CONCLUSION
The regulations related to drones in the Republic of Croatia are incomplete and not fully defined, particularly for the use in the public sector. The potentials of using drones in Croatia are significant, and they have a sign of positive impact on activating tourist, industrial, economic
and development potentials of the Republic of Croatia. The study has shown that helicopters and other sea-going vessels are inferior in relation to drone operations, although the use of drones started only several years ago, and the technologies of use have not been clearly defined. In the use of supplying the islands with and without pharmacies, i.e. door-to-door service, drone is an excellent solution from the aspect of safety, exploitation, maintenance, ecology and comfort. A drone with optimal specifications for the Adriatic islands arranged centers within hospital centers will allow the replacement of the helicopter interventions for the purpose of transporting medical devices, blood and medicines. This will result in faster response, and the delivery will be more flexible regarding the possibility of “door-to-door” delivery. It will allow re-inhabitation of islands, creation of new workplaces, improvement of services regarding tourism, allow development of new technologies related to air transport and connect islands with the mainland.
REFERENCES
1. Pravilnik o sustavima bespilotnih letjelica (Unmanned Vehicle Regulations).
HELICOPTER DRONE Purchase Price > 15,000,000 € 10,000 € – 60,000 €
Price per hour of flight + 1,000 € Depending on the price of pilot working hour Maintenance Cost Very high Very low
Response Time (min) 15 – 20 2 – 3 Noise and Vibration Very high None Flight Speed (km/h) 250 120
Wind Sensitivity Medium High Range / Endurance 500 – 950 km / few hours 70 – 140 km / 70 minutes* Dimensions (meter) > 15 1 – 1.5
Main Rotor Surface (meter) > 20 4 rotors, few cm diameter Weight (kg) 6,000 – 7,000 10 – 15
Environment Impact High No impact
423
Vlaho Brajković, Boris Lazić, Filip Polanščak, Sanja Steiner
DEVELOPMENT POTENTIAL OF UAV OPERATIONS IN CROATIA
2. Available at: http://narodne-novine.nn.hr/clanci/sluzbeni/2015_05_49_974.html
3. Natural Resources Canada. Available at: http://www.nrcan.gc.ca/forests/fire-insects-disturbances/fire/13143
4. Kamloops Search and Rescue tests infrared drone. Available at: http://www.cknw.com/2015/11/22/kamloops-search-and-rescue-tests-infrared-drone/
5. Gold Coast Bulletin. Available at: http://www.goldcoastbulletin.com.au/lifestyle/pets-and-wildlife/drones-to-bomb-sharks-for-safety-to-keep-swimmers-and-surfers-
safe/news-story/c986e18bfaf27f262b96ac1d5789e4be
6. State Bureau of Statistics. Available at: http://www.dzs.hr/
7. Ministarstvo turizma RH: Turizam u brojkama 2015 (Croatian Ministry of Tourism: Tourism in figures 2015), Zagreb, 2016, p. 33
8. List of pharmacies. Available at: http://www.hljk.hr/Registri/RegistarljekarniuRH/tabid/67/Default.aspx
9. Croatian Bureau of Statistics: Statistical Yearbook of the Republic of Croatia 2015, p. 47

7th INTERNATIONAL MARITIME SCIENCE CONFERENCE
424
April 20th-21st, 2017, Solin, Croatia
THE NEW PARADIGM OF MARITIME CONTRACTVedran Slapničar, Ivan Adum
THE NEW PARADIGM OF MARITIME CONTRACT
Vedran Slapničar1, Ivan Adum2
(1 University of Zagreb, Faculty of Mechanical Engineering and Naval Architecture, Zagreb, Croatia)
(2 Torbarova 14, 10000 Zagreb, Croatia)
(E-mail: [email protected])
ABSTRACT
This paper at the beginning summarizes the present and future ships design and performance and describes current shipbuilding contracts. Next it elaborates the risk distribution, control, financing and the legal matters as well as the importance of the intended world class standard. At the end, the paper proposes a new type of contract. In the conclusions the plausible benefits of o new type of contract are listed. Contract should not only be codified as a list of responsibilities and prerogatives of partners, if such, in a shipbuilding process, it should also be a reflection of commercial environment and practices and also technical and technological developments at foreseeable future. In any case has to reflect period of time not less than, projected and expected life expectancy of the vessel. Risks involved in vessels design could be shared but also the responsibility of either of the participants during the whole process. Design should be commercially viable, and at a same time be safe and reliable to operate and must conform to the rules and regulations not only currently at force but should also be able to incorporate expected changes within the projected life span of the vessel. Commercial risks are not fully controllable since closely connected with the exceedingly volatile environment but could be listed and taxed. Production and quality control risks could and should be practically eliminated by using real time shared distance control and management. Commercially viable design combined with production quality control and responsible and sustainable financing should be reflected in a new type of international standard maritime contract – ISMC.
KEY WORDS
maritime contract, commercial environment, risks, control and management
1. INTRODUCTION
Necessity creates rational solutions, one of these solutions is the standard ship type suitable for modular construction which was introduced by the shipbuilding group Kaiser and brought to its pinnacle during WWII. Then for the first time the focus of shipbuilding strongly turned to the Pacific Coast where about 5,800 types of ships Liberty and Victory were built. The ship's assembly time was minimized to the hitherto hardly imaginable 26 days. It should be noted that the Croatian engineer Đuro Stipetić (Belamarić, 2013) who later worked
as a professor at the University of Zagreb already in 1916 promoted the modular construction building submarines. Croatian shipyard in Kraljevica – established 1729, mid-seventies 20th century built ferries on the same principle for only 47 days, from the keel laying to delivery. After the WWII there were relatively successful- unsuccessful attempts for replacing Liberty type. Best known such attempt was Austin & Pickersgill, mid-sixties of the 20th century the shelter deck project SD 14 (Žuvić, 2013), but according to many experts the best proposal for this ship type replacement was

425
Vedran Slapničar, Ivan Adum
THE NEW PARADIGM OF MARITIME CONTRACT
the ship type Zagreb, designed by the Croatian engineer Igor Belamarić (Belamarić, 2017). The project is defined as entrepreneurship while the design is defined as a drawing and/or description for shipbuilding, testing and delivery to the buyer, shipowner, shipping company or operator of the ship, which may not necessarily be the same legal entity. The total modular principle in addition to the shipbuilding should be implemented and expanded to the whole process i.e. to the design and operation of the ship. One should discern contracts of purchase, construction, buying and leasing. When you change business environment you should also change the legal practice. Late fifties and/or early sixties of the 20th century the focus of commercial shipbuilding and shipbuilding activities, began to relocate from Europe to Asian Pacific coast. Once common practice changed from builder- buyer relationship where buyer had a final word not only in the pre-contract period but also throughout whole shipbuilding process it was exercised by authorized buyer’s representatives in the shipyard who interfered the shipbuilding process and therefore the costs. For example, well-known incident in a Japanese shipyard where shipowner representatives were thrown overboard as a sign of a protest. In that particular shipyard the supervision of shipowner and/or his representatives abruptly ended. The rationale of this event raises the following question: When buying a car do you have a representative in the factory? You don't! So, it's the same when buying the ship. But, how to deal with a new, innovative owner's design or with a design done by specialized design office being hired by the owner and/or operator of the ship. In this case you could have two situations, shipyard or its design reception which we often called the Project office and/or Technical department, must assess whether the design is compatible with the technical capabilities of the shipyard and whether such design can be carried out in a commercially acceptable manner. In a case the shipyard can fully accept the design and treat it as its own with all responsibilities for the technical specifications and the final ship performances.
Such a strong absorption capable shipyards will adapt the design and even improve it. However, in the case that the shipyard is just the assembly place for someone else’s technical and technological solutions, then the shipbuilding supervision is not only desirable but is also necessary. The explosion, and then the partial implosion of shipbuilding capacities in China and Vietnam made it clear that the shipbuilding industry is not only primarily the shipyard as a platform for ship assembling, but is also dominantly thinking process.
2. PRESENT AND FUTURE SHIPS - PERFORMANCE MEASURES
Today ships for general commercial purposes i.e. general cargo ship evolved into a ship for transportation of quantum, modules or containers. We have several indicators that can be used for measuring the ship performance. In our opinion we think that the two parameters could and should be introduced as a key ones and indeed indispensable ones. The first one is of course economic parameter, whether the ship of particular type, size and speed will find a satisfactory long-term employment with the charter rates sufficient to pay off all costs, financial, building, depreciation and operating costs (Adum et all, 2010). The second parameter should be environmental sustainability, such as, for example greenhouse emissions and, and ballast water treatment and management. When the mandatory penalization will be introduced through increased port dues it will strengthen the environmental awareness. Today it is not the time for mass production of ships series and many shipyards in the Far East will found themselves in financial difficulties due to overly aggressive policy of growth with no long-term sustainable investments, and lack of quality design. We must think innovatively and in non-standard manner, so just polishing the surface quality is not sufficient, although necessary.
3. EXISTING CONTRACTS AND SHIPBUILDING
The starting point of the contract is an agreement where the subject of the contract should always be
7th INTERNATIONAL MARITIME SCIENCE CONFERENCE
426
April 20th-21st, 2017, Solin, Croatia
clearly and unambiguously defined. At first, existed verbal agreement, for e.g. build a ship like the XX or with the addition of increased poop, hold, hatch or cubic, for YY money that will be paid in the ZZ manner. Shipbuilders in the past were experienced and proven, the drawings existed but generally were not attached to the contract and were not an integral and inseparable part of it. Shipbuilding industry, as a labour-intensive industry moved to the areas and countries with the lower labour costs. That created a phenomenon that ships are increasingly being built in the new shipyards without enough experience, knowledge and/or proven practices and quality control. Results were the ships that received infamous nickname "sisters in distress", unloved and unwilling ships that continuously broke down. Although, they were relatively young but in essence they were worn-out and useless. Such economic and business policy exacerbates management conditions and in essence permanently generates insecurity. Volatility is the substrate on which speculation prospers but which ultimately limits the meaningful and sustainable entrepreneurship. It is interesting that a sustainable as a term is often used as a slogan but it is rarely applied in practice. We are buying ships at the discount price and quality, ships sub-standardly manned, frugally maintained and badly managed. Banks are increasingly insecure and aggressive in seeking quick and disproportional profits. Entire system inevitably generates excess aggressiveness and business acumen that leaves much to be desired. Maritime market is volatile and under the constant pressure to generate high yields, quick in and quick out. It is not inherently wrong to shorten capital recovery period in order to avoid market doldrums but it could generate unacceptable risks.
4. RISK DISTRIBUTION, CONTROL, FINANCING AND LAW
Plan should be a major, if not the most important part of the contract, instrument with which we control business process. Anticipated risks as the early warning system, alerts us that something could go wrong, giving us the time to react and
control the damage. Delayed or untimely reaction only minimizes the damage but it is not essentially risk management (Adum et all, 2013). We have all the means of shipbuilding standard contracts (Goldrein et all, 2012). Every country, supportive of shipbuilding industry, tries to impose their type of standard contract. Without going into the details which is better or more appropriate we believe that we should develop and adopt the new world standard, defining not only the contract subject i.e. ship, but also the practice of shipbuilding (Adum et all, 2014).
4.1. Supervision
Supervision refers to the shipbuilding and the ship service as well. By applying new and now widely available IT technology we could record and monitor all the shipbuilding process and ship operation in real time. Shipyard could have daily, constant, impartial and neutral control of a ship in service eliminating the need to have a guarantee engineer on board. By engaging advanced techniques we can reduce costs and improve quality. There is no valid reason not to extend the warranty period to minimum three or even five years with a classic condition "normal wear and tear excluded."
4.2. New way of financing
We should buy the ships on Bare Boat Hire Purchase (BBHP). How are risks shared? Shipyard and its bank in a year or two build a vessel and record a gain or loss, definitive and irreversible gain/loss. Shipowner and its bank and/or investment fund can throughout the period (20-25-40 years) of a vessel life span can generate profit and recover eventual losses. Shipowner's position may be reversible, shipyards position is definite and static. Due to volatility of the market shipowner’s banks are seeking higher profits in order to compensate the risks involved. Let us re-arrange the position of participants in such a way that instead of being parties to the contract they become partners to the contract. Banks that finance the shipyard and the shipowner should share the risks and profit during the whole period of shipbuilding and service. This would eliminate the finality and certainty of business on the verge of profitability and create a long-term partnership with the shipowner and the shipyard.

427
Vedran Slapničar, Ivan Adum
THE NEW PARADIGM OF MARITIME CONTRACT
"Sisters in distress" would become "sisters of reputation", environmentally conscious and economically viable.
4.3. Law
English law prevailed in maritime matters, not only because the British Empire effectively ruled the waves but perhaps primarily because English law is most similar to the Roman law which is largely based on common sense. Does it need to be changed and do we have a suitable alternative? Assuming that Brexit means the abandoning of City is a compromise possible, to keep the English law and move courts somewhere else, e.g. Strasbourg or Frankfurt? Perhaps the most important difference in legal systems is the one dealing with mortgage but the difference between continental legal systems and English law which is immanently maritime, could be bridged by introducing shortcuts such as, but not exclusively, pledge of shares. One other possibility is pre-arranged and negotiated transfer of ownership for an agreed nominal sum, good and valuable consideration. The banks could be opponents instead participants. Coordination agreement should regulate and arrange relations between all participating banks.
5. WORLD CLASS STANDARD, CONSIDERATION/ HARMONIZED GLOBAL STANDARD
We have IACS standard rules (IACS-Bulk and Tanker, 2012) but this is sort of an illusion since there actually exist division on the global societies such as Llloyd's Register of Shipping, Bureau Veritas, DNV/GL and the others. Despite the global power of their states, neither American Bureau of Shipping nor Russian Maritime Register of Shipping are globally accepted as benchmarks. Adoption of Common Structural Rules is for sure something that must be commended but it should be noted that there is a hidden and widespread practice of tolerance that includes reduced stringency in the strict application of the rules. Hidden discounts in the form of less stringent obedience of the very spirit of the rules. National authorities, such e.g. Board of trade and similar will be undoubtedly the most powerful obstacle for harmonization of quality and international practice. Governments will
undouble retain their right to apply their own rules which is considered “per se” as the very essence of sovereignty. However, there are no real conceptual obstacles for fulfilling common interest, harmonizing maritime safety legislation where possibly IMO should have a key role.
6. CUT THROUGH AND BRIDGING CLAUSES - SHORTCUTS AND LINKS
Changes in the market are the essence of the market and so is the speculation. The contract should foresee these situations and accurately, explicitly specify when they occur and how they manifest. We believe that arbitrations should be avoided, no matter how they were common and proven in practice. Surprises are always possible and so is the tendency that the money prevails. Strong and powerful always find a way to enforce their interest. If damage occurs a lot of time and money is needed to compensate it. Coordination agreement should govern the relationship of all the banks involved in the process. Register of ships under the construction as well as the mortgage on the ship under the construction should be in the same manner automatically conducted to enable effective transfer of new ownership. The new entity i.e. company that can continue with the contract by changing financing structure or by selling the company to anyone who is willing to finish vessel under the existing contract or to renege it. If the more ships are contracted simultaneously all in a single ship company system it is relatively easy to control it by mutual guarantees i.e. cross collateral security.
7. NEW TYPE CONTRACT
Beside usually and traditional parts of the contract such as Subject, Price and When, important part is How. This will create quality and safety. Beside the detailed ship description, specification and drawings it is necessary to add the detailed description of the procedures that will be applied in the shipbuilding process (for e.g., but not limited to steel processing, corrosion protection, etc.). Also, detailed and definite maker’s list, as well as a detailed building plan that can and must be monitored via computer should be included. In

7th INTERNATIONAL MARITIME SCIENCE CONFERENCE
428
April 20th-21st, 2017, Solin, Croatia
fact, there is no reason why client i.e. customer should not supervise the shipbuilding process by cameras mounted in a shipyard instead of employing large number of authorized representatives. Such camera recordings would be then effectively used instead of hardcopy records and everything can be conducted and supervised in the real time. In such a way the efficient and continuous quality control will be achieved. The shipbuilding process recordings would be handed over at delivery as integral part of delivery documentation. This could be a significant cost saving on the of shipbuilding supervision and perhaps entirely eliminate it. In this way all shipyards will be somehow placed on an equal position, where for the well-developed and experienced shipyards it will not be any problem and for less developed this could be the a step forward to make an effort in unifying its practice with good ones. The shipyards would have continuous own supervision, client would have less supervision costs. Banks would have lesser risks and consequently could lower the interest rate. This is a classic "win, win" solution. Shipbuilding plan mentioned in section 4 should answer the contract’s fifth key parameter “when”. The contract should in fact primarily, but not exclusively, answer the sequence of questions: 1. Who 2. What 3. Price, 4. How and 5. When. The plan is of course schedule but not exclusively, it is, or it should be, a logical and interdependent list of activities, which ultimately result in fulfilment of the contract. So-called Planned economy determined plan as the management for action. Today we can laugh at it, but today, when we have computers and IT techniques to use the Gantt charts as valid planning documents is ludicrous. We have algorithms such as Program evaluation and review technique (PERT) (Lawrence, 1966) that can be corrected on a daily basis and should be an integral part of any serious contract. Both contracted parties can, in the basic document stored on a "cloud service", make changes based on conducted activities and compare it. In such a way a coordinated and daily revised document will eliminate many sources of potential disputes. It is significant to point out that the PERT planning could be used not only for shipbuilding supervision,
but it would be desirable and logical to monitor all financial activities and financial transactions. In the same time this enables control of builder’s cost and control of customer payments.
8. CONCLUSIONS
Risk cannot be eliminated but can be limited or shared in the same way as it is done with insurance, provided that the partners agree in advance how they will share the risks and profits. This is modular principle not only in building but also in financing and ship operation. Classical vertical organization doesn’t give the best results. Why? It has inherent flaw not to select competitive and commercially viable components. Mere surplus of energy, state money and support for shipbuilding is not good enough to make shipbuilding commercially viable. Such efforts didn’t bear results not even in the most developed countries (Germany, Sweden, Japan). There is absolutely no reason to be successful anywhere else. Why? Not because they did not try hard enough or because they lacked the will but because it is a wrong principle. When something is wrong and does not work well, it must be disassembled into parts, defective parts should be replaced with new ones. We take the best design, take the best developed existing shipyards with modern technology and then build the ships and supervise the quality in real time using all the benefits of IT technology, merge the client's and builder's banks by coordination agreement and incorporate all this in the International Maritime Shipbuilding Contract (IMSC). In the system with much greater solidity and safety where the buyer is an established and registered in countries that have normal and transparent public fiscal system, meaning the non-tax haven countries, the additional insurance should be introduced. The company is liable with its all assets up to the total contract sum and agreed compensations, if any. We believe that such a system will substantially discourage speculative ordering, buying slot options in a rising market. If one is betting on the growth or decline of the

429
Vedran Slapničar, Ivan Adum
THE NEW PARADIGM OF MARITIME CONTRACT
market he can bet on its own account and may take the risks, who has the profit has the risk. Merchant ships should not be built at all if one cannot earn on them.
REFERENCES
1. Belamarić, I, Alma Mater, Kapitol, Zagreb, 2013, pp. 60-80., in Croatian
2. Žuvić, M, The Story of the Liberty Ships, ToMS, Vol. 02, No. 02, 2013., pp. 133-142.
3. Belamarić, I, Brod i more - Zapisi jednog projektanta, (Ship and Sea – Notes of one Designer) publisher Zoran Bošković, biblioteka Baština 42, 2017, in Croatian
4. Adum, I., Slapničar, V., Gugić, D., Measures of merit as criteria in ship design, XIX Symposium Theory and practice in Shipbuilding SORTA 2010, Lumbarda, 2010, pp. 100-104., in Croatian
5. Adum, I., Slapničar, V., Adum, A., Management and risk control, 2013, Zagreb, manuscript in Croatian, pp. 1-80.
6. Goldrein QC, I., Hannaford, M., Turner, P., Ship Sale and Purchase, Informa Law form Routledge, sixth edition, 2012
7. Adum, I., Slapničar, V., The ship contract for building, purchasing, conversion and repair, Conference PROMARINE 2014, Zadar, pp. 1-24., in Croatian
8. IACS, Common Structural Rules for Double Hull Oil Tanker, 2012
9. IACS, Common Structural Rules for Bulk Carriers, 2012
10. Lawrence, C. D., Program Evaluation and Review Technique, University Press of America, 1966

7th INTERNATIONAL MARITIME SCIENCE CONFERENCE
430
April 20th-21st, 2017, Solin, Croatia
METHODOLOGY OF IMPLEMENTING ENVIRONMENTAL LIFE- CYCLE COSTING IN SUSTAINABLE PUBLIC PROCUREMENTLidija Runko Luttenberger, Ante Šestan, Ivica Ančić
METHODOLOGY OF IMPLEMENTING ENVIRONMENTAL LIFE-CYCLE COSTING IN SUSTAINABLE PUBLIC PROCUREMENT
Lidija Runko Luttenberger1, Ante Šestan2, Ivica Ančić2
(1 Faculty of Humanities and Social Sciences, University of Rijeka, Rijeka, Croatia)
(2 Faculty of Mechanical Engineering and Naval Architecture, University of Zagreb, Zagreb, Croatia)
(E-mail: [email protected])
ABSTRACT
Transportation sector, including maritime transport, exerts significant environmental impact. Public procurement as a policy strategy instrument which applies to the purchase of transport means, construction of infrastructure and the provision logistic services in supplying the goods, services and executing of works must integrate environmental considerations in the contract award procedures. The aim of this paper is to propose an environmental life-cycle costing (LCC) method that could be used to assess integral environmental impact of different marine power systems, including integrated and hybrid power systems, for the purpose of public procurement. While conventional LCC is based on four categories to be assessed e.g. investment, operation, maintenance and end-of-life disposal expenses, the environmental LCC method also takes into account the external environmental costs. This method is universally applicable and provides a fair basis for evaluating ships energy efficiency and environmental impact. The authors advocate clean and energy-efficient maritime transport ensuring effective implementation of environmental policy objectives and targets and emphasize the role of public authorities and entities in fostering the inclusion of environmental externalities in calculation of LCC.
KEY WORDS
life-cycle costing, public procurement, marine power systems
1. INTRODUCTION
Public procurement means the purchase of goods, services and works by governments and state-owned enterprises. In 2011, on average, general government procurement spending represented 29% of total general government expenditures, or 13% of GDP (OECD 2013). Public procurement should also be an instrument for public authorities and entities to demonstrate the ways of purchasing the products, works and services which are least harmful for natural
ecosystems, the people and the climate (Luttenberger et Runko Luttenberger 2016). Transportation sector itself exerts significant environmental impact and although a number of rules and regulations have been imposed with the objective of reducing environmental impacts from ships, no systematic cradle to grave analysis has been performed for the maritime transportation sector to provide a total view on which policy development and research and development priorities can be based (DNV 1998). The concept of

431
Lidija Runko Luttenberger, Ante Šestan, Ivica Ančić
METHODOLOGY OF IMPLEMENTING ENVIRONMENTAL LIFE- CYCLE COSTING IN SUSTAINABLE PUBLIC PROCUREMENT
environmental life cycle costing (LCC) summarizes all costs associated with the life cycle of a product that are directly covered by one or more of the actors in that life cycle (e.g. supplier, producer, user or consumer) and those involved at the end of life. Externalities that are expected to be internalized in the decision-relevant future must also be included. LCC cannot be approximated by the market price as the price reflects only costs from the cradle to the point of sale. It is an assessment method, not an economic cost-accounting method (Swarr et al. 2011). The paper analyses the concept of sustainable procurement, environmental life-cycle costing, externalities component of LCC formula developed on the basis of triple-bottom line (TBL) concept which takes into account environmental and social impacts. The paper also presents how the Energy Efficiency Design Index (EEDI) developed by the Marine Environment Protection Committee (MEPC) takes into account innovative energy efficient technologies and recognizes it as a possible measure that could be used in sustainable public procurement.
2. LIFE-CYCLE COSTING
Although life-cycle costing (LCC) is sometimes confused with life-cycle assessment (LCA), they are very different. Where LCC calculates the costs of a product throughout its life cycle (which can include giving a monetary value to environmental externalities), LCA assesses the environmental impacts, such as greenhouse gas emissions, over the life cycle (ICLEI 2014; Runko Luttenberger 2000). Therefore, LCA and LCC are two different sciences governed by considerably different considerations (IISD 2015). An environmental LCC methodology takes into account four main cost categories plus external environmental costs. The latter may originate from LCA analyses on environmental impacts, such as global warming contribution associated with emissions of different greenhouse gases. It must be pointed out that LCC can play a role in public and private procurement and may be used to measure the profitability of environmentally adapted choices (Schau et al. 2011). A relatively simple formula for calculating life-cycle cost used by US Forest Service (USDA 2015) should be extended by one more addendum,
i.e. the externalities (Luttenberger et Runko Luttenberger 2016). Externalities can be more or less established in the society as (a) those that are already paid by someone along the value chain and are not included in the market transaction, for example municipal waste disposal, health costs and increased safety features of a product beneficial for the society (e.g. pedestrian protection), job security and benefits of improved infrastructure for society, (b) those that can be monetized, are not intentionally paid, benefited, or gained by someone, and are not included in the market transaction (e.g. impacts from CO2 emissions), (c) those that can be monetized, are intentionally benefited by an actor and are not included in market transaction (e.g. free rider) and (d) those that are difficult to monetize (e.g. the aesthetic value of a species or product, or wellness) (Steen et al. 2008). One of the possibilities of calculating externalities is the TBL framework developed by Elkington which besides financial performance incorporates social and environmental dimensions. Since in TBL approach the three separate accounts cannot easily be added up as it is difficult to measure the planet and people accounts in the same terms as profits, the challenge is therefore to devise a formula to allocate the weight to ecological and social components (Slaper and Hall 2011; Lenzen et al. 2006).
3. ENERGY EFFICIENCY DESIGN INDEX (EEDI)
At its 62nd session Marine environment protection committee (MEPC) adopted resolution MEPC.203(62) (MEPC 2011). Resolution includes amendments to the revised Annex VI of MARPOL. As stated in resolution these amendments intend to improve energy efficiency for ships through a set of technical performance standard. MEPC decided that the Annex VI was the best instrument to implement mandatory technical and operational energy efficiency measurements. So a new chapter 4 was added at the end of the Annex. Regulations presented in that chapter apply to all ships of 400 gross tonnages and above engaged in international shipping. Measures for improving energy efficiency

7th INTERNATIONAL MARITIME SCIENCE CONFERENCE
432
April 20th-21st, 2017, Solin, Croatia
that were considered were divided in: technical, operational and market based. Chapter 4 includes Energy Efficiency Design Index (EEDI) as technical and Ship Energy Efficiency Management Plan (SEEMP) as operational measure. For every new ship the Attained EEDI has to be calculated and not higher than the Required EEDI which is calculated according to the EEDI reference line value and an appropriate reduction factor. The EEDI can be used to determine the energy efficiency of a ship and compare it to the fleet of ships. The formula for the calculation of the EEDI already takes into account innovative energy efficient technologies, even though some modification to the formula might be needed in order to make it an appropriate measure for the public procurement.
4. INNOVATIVE ENERGY EFFICIENT TECHNOLOGIES
Improvements to the ship energy efficiency through innovative energy efficient technologies are divided into 3 categories, according to the Guidance on Treatment of Innovative Energy Efficiency Technologies. Category A technologies shift the power curve, so the propulsion power can be reduced, while keeping the speed constant. Optimization of the hull, the propulsor optimization, or low friction coatings are examples of technologies that would fall into this category. Category B technologies reduce the propulsion power, while keeping the speed constant. The difference between Category A and Category B technologies is that Category B technologies can be turned off. Furthermore, these technologies can be divided into subgroups B-1, technologies which can be used at any time, and B-2, technologies which can be used at their full output only under limited conditions. The example of B-1 technology is Air lubrication system which reduces the ships drag, while wind power system (kites or sails) are an example of B-2 technology. Category C technologies on the other hand generate electricity. These technologies can also be divided into C-1 technologies, which can be used at any time, and C-2 technologies, which can be used at their full output only under limited conditions. C-1 technologies include: waste heat recovery
system, engine optimizations, improved engine controls, improved power system configuration (integrated and/or hybrid), use of alternative power supply through fuel cells and other. Photovoltaic power generation systems or wind power systems are considered C-2 technologies.
4.1. Wind power systems
Wind power can be used as a thrust to support ship propulsion system, as a B-2 technology, or to produce electric power, as a C-2 technology. Here a double benefit can be recognized in integrated power systems, because the electric power produced by the wind power system can be used both for the propulsion, as well as for other auxiliary purposes. First of all, it has to be emphasized that the Attained EEDI is calculated at the reference speed assuming the weather is calm with no wind and no waves. So the influence this system can have on the attained EEDI is only in possible savings during the operation, but not for the design conditions. The Guidance defines the available effective power of the system depending on the reference speed, the wind propulsion system force matrix and the wind probability matrix. This calculation is very simplified. To obtain more precise results, more complex calculations are required, based on the wind probability matrix for the Adriatic Sea and the ship speed and course. The influence of the wind technologies on the EEDI calculated in this way is rather small. Since one of the main goals is to increase the production of energy from renewable sources, the calculation should be modified in order to stimulate the implementation of such technologies (Ancic et al, 2014).
4.2. Photovoltaic power generation system
A photovoltaic (PV) power generation system is a technology that can provide electric power, and is classified in as category C-2 technology. In conventional ship power systems this power can be used for auxiliary purposes only, while in integrated power systems this power can be used also for the propulsion. The nominal maximum generated PV power Pmax can be calculated based on the average power of 120 W/m2 and the available area on the sun deck that could be covered with PV modules. It has to be pointed out that the current methodology to

433
Lidija Runko Luttenberger, Ante Šestan, Ivica Ančić
METHODOLOGY OF IMPLEMENTING ENVIRONMENTAL LIFE- CYCLE COSTING IN SUSTAINABLE PUBLIC PROCUREMENT
calculate the EEDI tries to take into account the entire lifetime of a ship. In this case, it means that it also takes into account night. Ships engaged in the short-sea shipping usually sail during the day meaning that the influence of the PV technologies on the reduction in the CO2 emission during summer months is much higher. Assuming that this ship operates only during the day, and consumes most of the auxiliary power on the AC, the average power available would be much higher. The irradiation in the Adriatic Sea is highest around noon, peaking around 980 W/m2, when the AC power requirements are also the highest. The average irradiation during the day is around 652 W/m2 being lowest early in the morning and late in the evening. This means that the power reduction during summer days is much higher. If the effect of the insulation which PV modules have is added, then the application of the PV power generation system is not only feasible, but reasonable.
5. CONCLUSIONS
The paper analyzed the concept of sustainable procurement, as well as environmental life-cycle costing including externalities component of LCC formula developed on the basis of TBL concept which takes into account environmental and social impacts. The paper also presented how the EEDI developed by the MEPC takes into account innovative energy efficient technologies and recognizes it as a possible measure that could be used in sustainable public procurement. The next step would be to incorporate the EEDI into the sustainable public procurement through methodology that would encourage the increase of energy efficiency and the reduction of environmental impact.
REFERENCES
1. Ancic I, Sestan A, Vladimir N, Klisaric V (2014) Influence of new power sources on the attained EEDI, Proceedings of the International Conference on Influence of EEDI on Ship Design, London, UK: The Royal
Institution of Naval Architects (RINA), 121-126
2. DNV (1998) Life cycle evaluation of ship transportation—development of methodology and testing, research report. Det Norske Veritas
3. ICLEI (2014) The procura+ manual—a guide to implementing sustainable public procurement. 3rd Edition, ICLEI-Local Governments for Sustainability
4. IISD (2015) Life cycle costing—a question of value, International Institute for Sustainable Development. http://ec.europa.eu/environment/gpp/pdf/WP-LifeCycleCosting.qx.pdf. Accessed 3 March 2015
5. Lenzen M, Foran B, Dey C (2006) Triple-bottom-line accounting of economy and environment: a new software and a case study of Australian mining. International Symposium for Interactive Analysis of Economy and Environment, Tokyo 4 March 2006
6. Luttenberger A, Runko Luttenberger L (2016) Sustainable procurement and environmental life-cycle costing in maritime transport, WMU Journal of Maritime Affairs 15, 1-13
7. OECD (2013) Government at a glance. OECD iLibrary. http://www.oecd-ilibrary.org/governance/governmentat-a-glance-2013_gov_glance-2013-en. Accessed 14 Nov 2013
8. Runko Luttenberger L (2000) Life cycle assessment (LCA)—a system tool in industrial ecology. Engineering Review 20:53–60
9. Schau MS et al (2011) Life cycle costing in sustainability assessment—a case study of remanufactured alternators. Sustainability 3:2268–2288
10. Slaper TF, Hall TJ (2011) Triple bottom line: what is it and how does it work. Indiana Business Review, Spring 2011
11. Steen B et al (2008) Integrating External Effects into Life Cycle Costing.Environmental Life Cycle Costing. SETAC and CRC Press, pp 59–76

7th INTERNATIONAL MARITIME SCIENCE CONFERENCE
434
April 20th-21st, 2017, Solin, Croatia
12. Swarr TE et al. (2011) Environmental life cycle costing: a code of practice. Society of Environmental Toxicology and Chemistry (SETAC)
13. USDA (2015) Life-cycle cost analysis for buildings is easier than you thought. USDA Forest Service. http://www.fs.fed.us. Accessed 25 May 2015

435
Nikola Matulić, Toni Šantić, Nikola Račić, Gojmir Radica
ENGINE MODEL DEVELOPMENT AND CALIBRATION
ENGINE MODEL DEVELOPMENT AND CALIBRATION
Nikola Matulić1, Toni Šantić1, Nikola Račić2, Gojmir Radica1
(1 Faculty of Electrical Engineering, Mechanical Engineering and Naval Architecture, University of Split, Split, Croatia)
(2 University of Split, Faculty of Maritime Studies, Split, Croatia)
(E-mail: [email protected])
ABSTRACT
The efficiency and safe operating conditions of an engine combustion process are of great importance to overall power system performance. In recent times the simulation models have taken primacy in combustion development technology. Various types of non-predictive and predictive combustion models are presented and described in this study. The other sub-models that have influence on combustion itself, such as heat transfer and scavenging model, are explained and used in this analysis. The design and calibration of the model are carried out with the aid of Ricardo WAVE software. Results of the simulation are verified with the actual engine measurements.
KEY WORDS
Combustion modelling, two-stroke marine engine, calibration
1. INTRODUCTION
It is necessary to use the existing combustion models or to design new ones in order to perform an analysis of combustion parameters as the most influential parameters of engine performance. Quite often, the developed cylinder pressure is the only available piece of information in assessing combustion behaviour in the engine cylinder. Researchers have developed several models of a low speed two-stroke turbocharged main diesel engine for investigation behaviour of engines [1, 2, 3, 4]. Andreadis et al. [5] uses a large two-stroke marine diesel engine, operating at its full load to explore the pilot injection strategies using
simulations of computational fluid dynamics along with an Evolutionary Algorithm. Guan et al. [6] used a modular zero-dimensional engine model that was built in MatLab and Simulink environment to investigate a large two-stoke marine diesel engines operation. Varbanets et al. [7] purpose of study was to survey the methods upon which the ship’s diesel process efficiency can be improved.
There are simplified models for obtaining heat release rate from the tail pressure in the cylinder, but these models may use various approaches and assumptions related to thermodynamic properties and heat transfer, which results in varied results when compared to the models designed with Ricardo WAVE software. The heat release analysis
ENGINE MODEL DEVELOPMENT AND CALIBRATIONNikola Matulić, Toni Šantić, Nikola Račić, Gojmir Radica

7th INTERNATIONAL MARITIME SCIENCE CONFERENCE
436
April 20th-21st, 2017, Solin, Croatia
represents a combustion model that allows the user to enter the profile of pressures developed in the cylinder, which have been obtained through measurement. This leads to the heat release profile that uses the applied model for heat transfer and thermo-dynamic properties, while the end result is the burned fuel mass profile that WAVE uses for combustion calculations.
2. COMBUSTION AND HEAT TRANSFER MODELS
2.1 . Heat release analysis
The starting point of the heat release analysis is the beginning of the working medium compression in the engine cylinder. The WAVE simulation is suspended when starting the analysis of the model for releasing the heat through the closed loop of a part of the engine cycle, out of the context, in order to determine the heat release rate and the rate of fuel mass combustion. The fuel mass combustion rate is then applied to the observed cylinder(s) during subsequent combustion processes.
This is the secondary model for diesel combustion [10]. It is required that the primary combustion model is associated with all cylinders. The semi-automatic process of the heat release analysis for individual cylinders allows for creation of generic multi-component Vibe combustions.
In closed loops of the engine cycle elements, the heat release is determined by applying the first law of thermo-dynamics to the mixture in the cylinder, which is typically interpreted as the change in internal energy (dE) that is equal to the heat transfer into the system (dQI), reduced by the work produced by the system (dW).
𝑑𝑑𝑑𝑑 = −𝛿𝛿𝑄𝑄! − 𝛿𝛿𝛿𝛿 (1)
The change in internal energy can be divided in two parts: part of formation, 𝑑𝑑𝐸𝐸!, and sensitive part, 𝑑𝑑𝐸𝐸!. The change in energy during the formation is caused by combustion reaction, while the change in energy during the sensitive part results from the change in temperature. The first law of thermo-dynamics states:
𝑑𝑑𝐸𝐸! + 𝑑𝑑𝐸𝐸! = −𝛿𝛿𝑄𝑄! − 𝛿𝛿𝛿𝛿 (2)
The change in energy during the sensitive part results from the change in temperature and it is known that:
𝑑𝑑𝐸𝐸! = 𝑚𝑚𝐶𝐶! △ 𝑇𝑇 (3)
In the equation of state, the change in temperature (𝐷𝐷𝐷𝐷) is determined by the change in pressure (𝐷𝐷𝐷𝐷), volume (𝐷𝐷𝐷𝐷) and gas constant (𝐷𝐷𝐷𝐷): △!!= △!
!+ △!
!− △!
! (4)
For each time step, the work is calculated by using the values of pressure delivered in the tail pressure:
△𝑊𝑊 = !!𝑃𝑃! + 𝑃𝑃! △ 𝑉𝑉 (5)
The definition of the heat transfer coefficient makes it possible to calculate the heat loss at each growing crank angle with regard to the cylinder liner, piston and cylinder head, by using:
△ 𝑄𝑄! = 𝐴𝐴ℎ 𝑇𝑇! − 𝑇𝑇! △ 𝑡𝑡 (6)
The heat transfer coefficient, ℎ, is calculated using the selected WAVE heat transfer model. Then the change in energy during the formation part (heat release) can be expressed by the equation:
𝑑𝑑𝐸𝐸! = −𝛿𝛿𝑄𝑄! − 𝛿𝛿𝛿𝛿 − 𝑑𝑑𝐸𝐸! (7)
It is obvious that the heat release value can be used for determining the mass of fuel consumed. WAVE uses current air/fuel ratio calculated through the stoichiometric model and types of thermodynamic properties in order to determine the mass of fuel and fresh air that needs to be burned to achieve necessary changes in energy creation.
2.2 . Woschni heat transfer model
The Woschni heat transfer model [10] involves homogeneous charge compression ignition, assumes a unique coefficient of heat flow and rate across the entire cylinder surface, and calculates the amount of heat released from charging, based on the above assumptions.
Heat transfer coefficient:

437
Nikola Matulić, Toni Šantić, Nikola Račić, Gojmir Radica
ENGINE MODEL DEVELOPMENT AND CALIBRATION
Woschni heat transfer coefficient is calculated using the equation:
ℎ! = 0.0128𝐷𝐷!!.!"𝑃𝑃!.!"𝑇𝑇!!.!"𝑣𝑣!!.!𝐶𝐶!"!! (8)
The characteristic rate is the sum of the mean piston speed and the added combustion-related speed that varies with the difference between the cylinder pressure and the pressure that would exist under compression conditions. The characteristic rate is expressed by the original Woschni correlation [8]:
𝑣𝑣! = 𝑐𝑐!𝑣𝑣! + 𝑐𝑐!!!!!!�!!
𝑃𝑃 − 𝑃𝑃!"# (9)
Or by the modified Woschni correlation [9] which includes the load compensation:
𝑣𝑣! =
𝑚𝑚𝑚𝑚𝑚𝑚𝑐𝑐!𝑣𝑣! + 𝑐𝑐!
!!!!!!!!
𝑃𝑃 − 𝑃𝑃!"# ,
𝑐𝑐!𝑣𝑣! 1 + 2 !!!
!𝐼𝐼𝐼𝐼𝐼𝐼𝐼𝐼!!.!
(10)
The coefficient 𝑐𝑐! is non-dimensional, gives the influence of swirl in the cylinder and is expressed as:
• During scavenging
𝑐𝑐! = 6.18 + 0.417 !!!! (11)
• When the valves are closed
𝑐𝑐! = 2.28 + 0.308 !!!! (12)
The swirl rate, 𝑣𝑣!, is calculated using the assumed or inserted swirl ratio:
𝑣𝑣! = 𝜋𝜋 ∗ 𝑅𝑅!"#$% ∗ 𝐷𝐷 ∗!"#!"
(13)
The coefficient 𝑐𝑐! is constant:
• During combustion
𝑐𝑐! = 3.24×10!! !!∗!
(14)
• During scavenging and before combustion
𝑐𝑐! = 0 (15)
Diesel jet model:
In equation 8, 9 and 10 for a Diesel jet model the following coefficient are:
𝐶𝐶!"!! = 1 (16)
𝑐𝑐! = 2.28 𝐷𝐷𝐷𝐷𝐷𝐷𝐷𝐷𝐷𝐷𝐷𝐷𝐷𝐷𝐷𝐷 (17)
𝑐𝑐! = 3.233𝐸𝐸!! 𝐷𝐷𝐷𝐷𝐷𝐷𝐷𝐷𝐷𝐷𝐷𝐷𝐷𝐷𝐷𝐷 (18)
Where 𝐷𝐷𝐷𝐷𝐷𝐷𝐷𝐷𝐷𝐷𝐷𝐷𝐷𝐷𝐷𝐷 and 𝐷𝐷𝐷𝐷𝐷𝐷𝐷𝐷𝐷𝐷𝐷𝐷𝐷𝐷𝐷𝐷 values are inserted. This expression determines the heat transfer due to general flows within the cylinder, expressed as 𝑐𝑐!𝑣𝑣! , while the heat transfer due to combustion is presented by another expression.
2.3 . Diesel jet combustion model
The Diesel jet combustion model [10] is more advanced than standard Diesel combustion models. It is used with primary combustion models such as Diesel Vibe, multi-zone Vibe or arbitrary combustion profiles. It is able to calculate the heat release rate during combustion using the fuel injection rate and the injector geometry as defined by users. In addition, the Diesel jet combustion model anticipates NOx and soot emissions. Calculation of NOx emission is based on the expanded Zeldovich mechanism. Calculation of soot emission comprises two aspects: the rates of formation and oxidation. Soot formation is based on Hiroyasu equations, while the soot oxidation model is based on Nagle and Strickland-Constable mechanism.
Many parameters that are available for adjusting the jet combustion model are related to the rates, turbulence levels and effects of gas mixing in the combustion chamber. It can be assumed that the heat transfer, air circulation and re-circulation of exhaust gases in the combustion zone may lead to increased speed and turbulence level in the cylinder. Conversely, they may decrease the above values as the conditions within the cylinder approach the idle state.
The Diesel jet combustion model relies on the profile of the fuel mass flow and the size and number of the nozzle orifices. The user enters and maintains the jet characteristics such as the nozzle pressure drop, jet rate and size of atomized fuel droplets. The duration of atomization is divided into a number of packages, each one holding the fuel that is injected during one time interval.
The Diesel jet combustion model is a secondary model that is activated in the cycle. The primary

7th INTERNATIONAL MARITIME SCIENCE CONFERENCE
438
April 20th-21st, 2017, Solin, Croatia
Diesel combustion model is allocated to the cylinder on which the Diesel jet combustion model is applied. The combustion process is controlled by the following factors:
• Vaporisation of droplets • Air/Fuel mixing • Ignition • Air supply • Burn out
Vaporisation of droplets represents another constraint to the air/fuel mixing rate. Empirical correlations are used to determine Stokes mean droplet diameters in fuel/air packages, along with the vaporization rate.
Mixing of air and fuel is described through the atomization formation mechanism. After a short period of decomposition, fuel forms an atomized jet. The jet penetration is defined by empirical correlations. Before decomposition, the jet penetration is linear with regard to time, whereas afterwards it varies with the square root of time. A standard equation, based on the moment of flow continuity, is used for calculating the mechanics of fuel jet atomization. However, in order to take into consideration the motion of air, e.g. swirl, in the combustion chamber, the equation is upgraded with two influential parameters. The first one is the Air Entrainment Before Combustion, used during the periods of air intake or fuel vaporization, thus controlling the combustion, while the second parameter is the Air Entrainment During Combustion, used over the combustion cessation period.
The application of these parameters is further enhanced by the Burned Air Entrainment factor that regulates the ratio of fresh air to combustion gases contained in the atomized jet. This ratio corresponds to the ratio of burned gas to non-seized fresh air in the combustion area out of the atomized jet range.
If the atomized jet hits the wall, it is assumed that the jet will continue to move across its surface. The air circulation and jet penetration occur at the unobstructed atomized jet rate, multiplied by the Wall Spray Penetration factor.
The default or customized Swirl Ratio is used for reducing the penetration and rate of the atomized
fuel jet. The ignition delay, 𝜏𝜏, results from empirical correlations. The ignition occurs when:
!"!
!"! = 1 (19)
Where:
𝜏𝜏 = 𝐴𝐴𝐴𝐴!!𝜙𝜙!!𝑒𝑒!! ! (20)
Maximum allowed ignition delay is:
𝜏𝜏!"# = 1540 𝐹𝐹!"#
𝑠𝑠 (21)
3. DESIGN OF THE MODEL FOR A SLOW-
SPEED TWO-STROKE DIESEL ENGINE
The software package Ricardo WAVE – engine simulation tool [10], has been used for designing the engine model with the purpose of obtaining a calibrated engine model that would support various attempts to enhance engine characteristics. A single-cylinder diesel engine model has been designed in Ricardo WAVE software.
Figure 1. Simple single-cylinder engine model [2]
On the left side there is an actuator which serves for calling the variable boost_pressure (source1), i.e. the charging pressure of the turbocharger, which is measured for each selected load. The model takes parameters of the state of environment (301), and conditions before intake pipes (701 and 7001) while the pressure is defined by the variable boost_pressure (3.5 bar) and temperature of 300 K. The length of the intake pipe 701 is 1000 mm and the bore is 400

439
Nikola Matulić, Toni Šantić, Nikola Račić, Gojmir Radica
ENGINE MODEL DEVELOPMENT AND CALIBRATION
mm. Initial conditions include the fluid temperature of 320 K and the pipe wall temperature of 340 K. The length of the intake pipe 7001 is 1000 mm, the left bore is 400 mm, the right one is 354 mm. Initial conditions include the fluid temperature of 340 K and the pipe wall temperature of 370 K. The pipe connectors 501 and 551 represent just the connecting elements without any physical effect within the model.
On the right side there is a blue cloud named 351 which represents the state of environment at the end of exhaust pipes (7501 and 751). Its pressure is set at 1.0 bar and fluid temperature at 300 K. The length of the exhaust pipe 7501 is 500 mm, its left bore is 300 mm, the right bore is 350 mm, and the initial set conditions include the pressure of 1.0 bar, exhaust gas temperature of 470 K, and the wall temperature of 470 K. The length of the exhaust pipe 751 is 500 mm, its left bore is 350 mm, the right bore is 350 mm, and the initial set conditions include the pressure of 1.0 bar, exhaust gas temperature of 900 K, and the wall temperature of 850 K. The icon named 1 represents a fuel injector (A/F total injector) fitted to the cylinder 401 in the above grey figure. The orange circle having the mark 401 is the engine cylinder provided with the cylinder head, valves, crankshaft and combustion profile. The associated icons under the cylinder and pipes enable graphic printing of the data that the user wishes to control at the outlet.
The data gathered through the examination of the two stroke low speed engine are entered into the
model, along with the engine geometry data such as the piston bore and stroke, compression ratio, valve bores and lifts, valve opening and closing angles, engine speed, start of ignition angle, turbocharging pressure, and temperatures of the cylinder head, liner and piston.
The task of this model is to allow minimum calibration time and the produced results as accurate as possible.
Further analysis uses the model for obtaining a calibrated model where methods of parameter optimisation and enhancement can be applied.
3.1 Model calibration
After designing a simple model, the user gathers and marks the variables that can be altered in order to achieve the desired results. Supplementary predictive models are introduced to obtain finer modelling. In addition to the primary Diesel Vibe combustion model, secondary models such as Diesel jet and Heat release analysis are engaged. In order to enable the secondary models to perform calculations accurately, the primary model has to be a two-zone type and the Woschni's heat transfer model is introduced.
All these models have their own parameters that need to be adjusted, i.e.
they have to be varied in order to achieve as accurate results as possible.

7th INTERNATIONAL MARITIME SCIENCE CONFERENCE
440
April 20th-21st, 2017, Solin, Croatia
Table 1. Model variables
The goal is to achieve the best possible match between the measured and simulated data (Figures 2 and 3). The injection pressure is derived in accordance with the crank angle from
the data measured during fuel injection. This information is entered into the model to define the rate of injection.
Figure 2. Measurement of pressures developed in the cylinder [10]
Figure 3. Derived injection rule
The achievement of the satisfactory match of the curves results in the calibrated model that enables the optimisation of individual parameters. Initially, the model calibration was performed by manual iterative adjustment of the variables with the aid of the WAVE experiment for a fine regulation of parameters.
4. RESULTS OF MODEL CALIBRATION
The final model calibration produces the results of the comparison of the measured and simulated pressures in the cylinder. The calibration has been performed for two different predictive combustion models (Diesel jet and Heat release analysis). The
VARIABLES VALUE UNIT Reference speed 113.0 rpm
Start of combustion (ATDC) 2.1 CA
Premix fuel fraction 0.02 - Piston Bowl Diameter 528.0 mm Combustion Start imposed - Swirl Ratio 1.84 - Number of Nozzle Holes 12.0 - Nozzle Hole Diameter 1.25 mm Ignition Delay Stabilizing Factor
0.84 -
Wall Spray Penetration 0.8 - Air Entrainment Before Combustion
2.86 -
Air Entrainment During Combustion
3.15 -
Burned Gas Entrainment 0.16 - Velocity Multiplier 1.0 - Combustion Multiplier 0.86 - NOx Emissions Scaling Factor
1.0 -
Soot Formation Rate Scaling Factor
1.0 -
Soot Oxidation Rate Scaling Factor
1.0 -
Starting Crank Angle for Heat Release Calculation
Actuated at SOI
CA
Step Size for Cylinder Pressure Lookup Table
0.1 -
Adjustment to Start of Heat Release Profile
0.005 -
Model Type original - Heat Transfer Multiplier When Intake Valves are Open
1.0 -
Heat Transfer Multiplier When Intake Valves are Closed
1.01 -
Scavenging Profile Type cubic curve -
Charge Temperature Averaging Threshold
0.0 -
Start Point 0.0 - End Point 0.76 - Fuel/Air Ratio 0.0359 - Start of Injection (SOI) -1.0 CA Mixture Temperature 350.0 K Mean Fuel Drop Diameter 40.0 µm Engine speed 113.0 rpm Compression ratio 16.2 -

441
Nikola Matulić, Toni Šantić, Nikola Račić, Gojmir Radica
ENGINE MODEL DEVELOPMENT AND CALIBRATION
differences between the two models are shown in Figures 4 and 5.
Figure 4. Comparison of results obtained by the Diesel jet model simulation and the measurement
Figure 5. Comparison of results obtained by the Heat release analysis model simulation and the measurement
The values of the cylinder pressure and the normalized fuel burn rate for the loads of 40, 60 and 100%, achieved by the Diesel jet combustion model are shown in Figures 6, 7 and 8:
Figure 6. Development of the cylinder pressure and fuel burn rate at 40% load
Figure 7. Development of the cylinder pressure and fuel burn rate at 60% load

7th INTERNATIONAL MARITIME SCIENCE CONFERENCE
442
April 20th-21st, 2017, Solin, Croatia
Figure 8. Development of the cylinder pressure and fuel burn rate at 100% load
Figure 9 shows the values of the cylinder pressure and the normalized fuel burn rate for the 100% load, achieved by applying the Heat release analysis combustion model:
Figure 9. Development of the cylinder pressure and fuel burn rate at 100% load by applying the Heat release analysis combustion model
Compared to an abrupt and turbulent combustion achieved by the Diesel jet model, the Heat release analysis model predicts significantly different and a more balanced rate of fuel combustion. The comparison of the two calibration models has shown that the matching deviation is within 1%, which implies that both models can be equally used for obtaining desired results. The Diesel jet model is exclusively used in simulating the combustion of fuel that is directly injected into the cylinder, whereas the Heat release analysis model can also be used for spark ignition engines.
5. DESIGN OF THE EXPERIMENT (DOE) OF MODEL
The model calibration and achievement of the target results are followed by the optimisation of the individual parameters. Optimisation is a way to attempt to increase the engine output and efficiency, and to reduce fuel consumption. The selected variable SOI (start of ignition) has crank angles ranging from −3° to 1° with a 0.5° step. Another selected variable defines the start of combustion (SOC), with crank angles ranging from 1.5° to 2.5° and a 0.5°step. Specific fuel consumption and power are controlled in order to obtain better engine performance.

443
Nikola Matulić, Toni Šantić, Nikola Račić, Gojmir Radica
ENGINE MODEL DEVELOPMENT AND CALIBRATION
Figure 10. Pressure values in the cylinder at 100% load for the DOE using SOI and SOC variables
6. CONCLUSION
The research presented in this paper has been aimed at developing a simulation model for a two-stroke low-speed marine engine. The engine model has been designed in Ricardo WAVE software package. The model calibration has been carried out by using predictive models of combustion, with the ultimate goal to obtain a calibrated engine model that is ready for virtual parameter optimisation for the purpose of improving engine characteristics.
Naturally, a number of problems appeared during the design and calibration of the model. Some of them are less important, while the other problems may considerably affect the reliability of results. The major issue is the engine size and the very construction which differs from other engines. Other essential difficulties include the complex geometry of the combustion area and scavenging ports.
Further development of this model will include additional programs for a more robust model optimisation. By applying the coupled simulation method, Ricardo WAVE software package (simulating the engine operation) will be supported by compatible optimisation program packages such as Simulink, able to vary adequate variables. This will result in more accurate simulation results during optimisation.
ACKNOWLEDGEMENTS We would like to extend our sincere gratitude and appreciation to Ricardo Software Powertrain CAE Solutions for using their software package and their support in the development of this model.
SYMBOLS
𝑚𝑚 - Mass in the cylinder
𝐶𝐶! - Specific heat at constant volume
∆𝑇𝑇 - Change in temperature
𝐴𝐴 - Surface of the piston, cylinder head and liner
ℎ - Heat transfer coefficient
𝑇𝑇! - Adequate surface temperature
𝑇𝑇! - Gas temperature
∆𝑡𝑡 - Value of the time step
𝐷𝐷 - Cylinder bore
𝑃𝑃 - Cylinder pressure
𝑇𝑇 - Cylinder temperature
𝑣𝑣! - Characteristic rates
𝐶𝐶!"!! - Heat transfer multiplier
𝑣𝑣! - Mean piston speed
𝑉𝑉! - Volume of the cylinder
𝑇𝑇! - Referent temperature
𝑃𝑃! - Referent pressure
𝑉𝑉! - Referent volume
𝑃𝑃!"# - Motored pressure
𝑉𝑉! - Swept (compression) volume
𝑉𝑉 - Current volume of the cylinder
𝐼𝐼𝐼𝐼𝐼𝐼𝐼𝐼 - Mean indicated pressure in the cylinder
∅ - Ratio of package equivalence
𝐹𝐹!"# - Ignition delay factor
𝐴𝐴,𝐵𝐵,𝐶𝐶,𝐷𝐷 - Empirical constants
7th INTERNATIONAL MARITIME SCIENCE CONFERENCE
444
April 20th-21st, 2017, Solin, Croatia
REFERENCES
1. Radica, G., Račić, N., Lušić, F.: Simulation of the marine engine performance with purpose of predicting parameters, 6th IMSC Proceeding, Split, Croatia, 2014.
2. Medica, V., Račić, N., Radica, G.: Performance Simulation of Marine Slow-Speed Diesel Propulsion Engine With Turbocharger Under Aggravated Conditions, Strojarstvo Vol 51 No. 3, (2009), pp. 187-198.
3. Radica, G.: Expert System for Diagnosis and Optimisation of Marine Diesel Engines, Strojarstvo, Vol 50 No.2, (2008), pp.105-116.
4. Lalić, B.,Radica, G.,Račić, N.: Analysis of exhaust gas emission in the marine two-stroke low speed diesel engine, Brodogradnja; Vol 67 No. 3, 2016.
5. Andreadis, P., Chryssakis, C., Kaiktsis, L.: “Optimization of Injection Characteristics in a Large Marine Diesel Engine Using Evolutionary Algorithms”, SAE Technical Paper 2009-01-1448, 2009.
6. Guan, C.,Theotokatos, G., Chen, H.: “Analysis of Two Stroke Marine Diesel Engine Operation Including Turbocharger Cut-Out by Using a Zero-Dimensional Model”, Energies, 8, 5738-5764, 2015.
7. Varbanets, R.A., Karianskiy, S.A.: “Analyse of Marine Diesel Engine Performance”, Journal of Polish CIMAC , pp. 269-275, ISSN 1231 – 3998, Gdansk, 2012.
8. Woschni, G.:“Universally Applicable Equation for the Instantaneous Heat Transfer Coefficient in the Internal Combustion Engine”, SAE Paper 670931, 1967.
9. Woschni, G.:“Die Berechnung der Wandverluste und der thermischen Belastung der Bauteile von Dieselmotoren” (“Calculation of Heat Loss to Walls and Thermal Loading of Diesel Engine Components”) MTZ31 pp. 491-499, 1970.
10. Ricardo Wave help system & support; https://www.software.ricardo.com

445
Osman Lindov, Fadila Kiso, Adnan Omerhodžić, Muhamed Begović
BSM- BLACK SPOT MENAGEMENT AS MOTHODOLOGY APPROACH IN INCREASING SAFETY OF ROAD TRAFFIC
BSM- BLACK SPOT MENAGEMENT AS MOTHODOLOGY APPROACH IN INCREASING SAFETY OF ROAD TRAFFICOsman Lindov, Fadila Kiso, Adnan Omerhodžić, Muhamed Begović
BSM- BLACK SPOT MENAGEMENT AS MOTHODOLOGY APPROACH IN INCREASING SAFETY OF ROAD TRAFFIC
Osman Lindov, Fadila Kiso, Adnan Omerhodžić, Muhamed Begović
(Faculty of Traffic and Communications University of Sarajevo, Sarajevo, BiH)
(E-mail: [email protected])
ABSTRACT
This General assessment of the situation in road transport is most often characterized by the level of development of road infrastructure, as well as the consequences that causes, such as traffic accidents. The basic objective of management within the safety of road transport is the safety and protection of all participants in road traffic within the limits of their mental and physical abilities, with good organization of traffic, applied technical and technological transportation systems, meet the ergonomic factors and minimizing the cost of transport. This paper presents the basics of management methodology black spots (black spot management BSM). That methodology is one of the most important measures in the field of increasing the safety of road infrastructure, and the same is based on the objectives of directive 2008/96 / EC on the safety of road infrastructure. Furthermore, the most basic problems in managing the black spots, the best international experience and achieved results. A special section is devoted to past experience, the implemented activities and results achieved on the issue of management of black spots in Bosnia and Herzegovina. This paper presents a proposal for a framework model for process black spots management in Bosnia and Herzegovina, and the recommendations and opinions of taking concrete priority measures to intensify activities on the mentioned issues and to the degree of safety of road traffic raised to a higher level.
KEY WORDS
Safety, Road, Black spot, Infrastructure
1. INTRODUCTION
In the process of dynamic development of road transport appeared negative consequences that are generally characterized by inconsistent development of the automotive industry with the development of transport infrastructure. This has resulted in many negative impacts on road traffic, which are the most important traffic accidents involving people and cause significant material damage. Thus, the society in addition to the positive effects of road transport as a generator of
economic development, on the other hand as a necessity needs to bear also and negative effects of road traffic, which brings huge economic losses. For this reason, it is necessary to strive for the establishment of efficient and effective system of safety management of road traffic. One of the most important methodologies, which should be an essential and integral part of any management system, road safety, represents methodology of management of black spots (Black Spot Management).

7th INTERNATIONAL MARITIME SCIENCE CONFERENCE
446
April 20th-21st, 2017, Solin, Croatia
2. BASIS MANAGEMENT OF ROAD TRAFFIC SAFETY
The Starting with the importance of road safety performance of activities and tasks that are realized through the control and regulation, there is a need for continuous analytical monitoring the state of road safety, its improvement, the enrichment of the methodology and content of work, because the model for achieving some absolute traffic safety does not exists.[15] The wide application spectrum of methodological framework and activities in management system of road safety requires a multidisciplinary approach in all stages of this complex system of planning and design to the implementation of specific technical solutions. In order to negative effects and consequences of road traffic were adequately treated and to respond effectively to the same, it is necessary to create a complex, planned, synchronized system of interconnected organizational, social, educational, technical, economic and other scientific and expert-based measures and activities which will reduce the risk which is always present, in a socially acceptable level. Successful and effective management of road traffic safety, implies a good knowledge of the current situation, define realistic desired state and take concrete measures that the current situation get closer to the desired. [17] It is necessary to aspire to the desired state defined as real as possible, so that its implementation justify invested funds and to have positive effects on the confidence of all stakeholders in the management of road safety and the whole society. The basic platform on which should be based efficient and effective management system of road safety, should be development and adoption of strategies and programs of road safety. As one of the most widely accepted model for the management of road safety, which the United Nations adopted as a recommendation, represents a national program of raising the level of traffic safety developed by TRRL.[20] According to the modern understanding management of road safety is based on three interdependent components: institutional management functions, measures (intervention) and results.[12] Institutional management function
is part of the social and business environment for the promotion of measures and achieving results. Viewed from a broader point of view measures represent a strategy and programs for achieving the adopted goals. Final results are correlated with social costs or benefits, and represent goals or desired state.
3. STRATEGIC DIRECTIONS IN THE SYSTEM OF ROAD SAFETY MANAGEMENT
The European Commission on 2 June 2003, adopted 3rd European action program road safety, which included an ambitious target to reduce by 50% the number of deaths in traffic accidents till 2010. Subsequent evaluation of the program were published in order to analyze the impact, the degree of implementation and effectiveness of the program. Although the initial target is not reached, the program has been a strong catalyst of efforts that members invested to raise the level of road safety.
Figure 1. The number of dead from 1990 to 2010 [5]
United Nations General Assembly, on March 2nd, 2010, declared the „Decade of Action for Road Safety 2011-2020“ and on 10th May 2010 adopted a Resolution A/64/255 [21] on the improvement of road safety. It requires a 50% reduction in the estimated number of victims on the roads by 2020. In accordance with national and local legal regulations states are encouraged to conduct their activities within the five main areas of action presented in the following columns („pillars“): [21] 1. Security management traffic 2. Safer roads and mobility
3. Safer vehicles 4. Safer road users 5. The effect after collision
4. BASIC METHODOLOGY IN BLACK SPOT MANAGEMENT IN ROAD TRAFFIC
Black Spot Management is a complex and comprehensive method which consists of a large number of iterative procedures and stages. Algorithms and characteristics of the entire process differ between countries depending on the legislative framework that regulates this issue, involvement and support of state authorities, mutual coordination and cooperation between relevant institutions and authorities responsible for this area, method of data collection, the availability of suitable data, the precision and accuracy of data, technical support and professional qualifications of persons involved in the analyzed problems.
4.1. Methodological approach of increasing the level of road safety in accordance with Directive 2008/96/EC
With its Directive of the European Parliament and the Council of Europe no. 2008/96 / EC on the safety management of road infrastructure, the European Union has adopted a clear decision on measures for increasing road safety. The Directive aims with common approach to contribute achieving a high level of safety on the EU's roads, and allow the integration of aspects of safety in all phases of implementation of infrastructure projects using available resources for the implementation and maintenance of roads. With Directive 2008/96/EC [7], the European Union made a package of methodology and measures to improve road safety, the most important are: − Road Safety Impact Assessment-RIA; − Road Safety Audit-RSA; − European Road Assessment Program -
EURORAP; − Road Safety Inspection-RSI; − Black Spot Management-BSM; − In-Depth Studies-IDS; − Safety Ranking and Network Safety
Management-NSM.
Figure 2. An integrated part of the management of road safety [16]
4.2. Defining and treatment of black spots
In the literature there is no unique universal definition of black spots on the road network. The black spot on road network can be defined as a specific place, or micro-location on the road with an increased risk of accidents compared to the rest of the road network. The risk in road traffic is always present and can not be eliminated. Increased risk can be defined as the increased probability of appearance of accidents and can be quantified based on previous track record of traffic accidents.
Figure 3. The basic elements for defining black spots [16]
The basis for calculation the risk of traffic accidents are the statistics on road accidents and data on consequences of accidents (casualties and material damage). An adequate approach to the problem of road safety on the road network that is primarily characterized by the number of traffic accidents and the consequences thereof, implies adequate risk treatment, or identification, quantification and ranking risks on specific segments of the road network, or black spots. Defining the black spots

447
Osman Lindov, Fadila Kiso, Adnan Omerhodžić, Muhamed Begović
BSM- BLACK SPOT MENAGEMENT AS MOTHODOLOGY APPROACH IN INCREASING SAFETY OF ROAD TRAFFIC
3. Safer vehicles 4. Safer road users 5. The effect after collision
4. BASIC METHODOLOGY IN BLACK SPOT MANAGEMENT IN ROAD TRAFFIC
Black Spot Management is a complex and comprehensive method which consists of a large number of iterative procedures and stages. Algorithms and characteristics of the entire process differ between countries depending on the legislative framework that regulates this issue, involvement and support of state authorities, mutual coordination and cooperation between relevant institutions and authorities responsible for this area, method of data collection, the availability of suitable data, the precision and accuracy of data, technical support and professional qualifications of persons involved in the analyzed problems.
4.1. Methodological approach of increasing the level of road safety in accordance with Directive 2008/96/EC
With its Directive of the European Parliament and the Council of Europe no. 2008/96 / EC on the safety management of road infrastructure, the European Union has adopted a clear decision on measures for increasing road safety. The Directive aims with common approach to contribute achieving a high level of safety on the EU's roads, and allow the integration of aspects of safety in all phases of implementation of infrastructure projects using available resources for the implementation and maintenance of roads. With Directive 2008/96/EC [7], the European Union made a package of methodology and measures to improve road safety, the most important are: − Road Safety Impact Assessment-RIA; − Road Safety Audit-RSA; − European Road Assessment Program -
EURORAP; − Road Safety Inspection-RSI; − Black Spot Management-BSM; − In-Depth Studies-IDS; − Safety Ranking and Network Safety
Management-NSM.
Figure 2. An integrated part of the management of road safety [16]
4.2. Defining and treatment of black spots
In the literature there is no unique universal definition of black spots on the road network. The black spot on road network can be defined as a specific place, or micro-location on the road with an increased risk of accidents compared to the rest of the road network. The risk in road traffic is always present and can not be eliminated. Increased risk can be defined as the increased probability of appearance of accidents and can be quantified based on previous track record of traffic accidents.
Figure 3. The basic elements for defining black spots [16]
The basis for calculation the risk of traffic accidents are the statistics on road accidents and data on consequences of accidents (casualties and material damage). An adequate approach to the problem of road safety on the road network that is primarily characterized by the number of traffic accidents and the consequences thereof, implies adequate risk treatment, or identification, quantification and ranking risks on specific segments of the road network, or black spots. Defining the black spots

7th INTERNATIONAL MARITIME SCIENCE CONFERENCE
448
April 20th-21st, 2017, Solin, Croatia
requires three elements: the number of traffic accidents, length of the observed location and observed time period. [13] The overall effects of the measures taken for the treatment of black spots have a wide range of variations. Treatment of black spots can be considered as a general approach for improving safety on the roads, where the data of accidents and other information are used to identify and adopt the most effective possible measures and to implement these measures. Realistically is expect that the results of the studies of treatment of black spots effects indicate that treatment of black spots [9] and black location on the road network, reduced the number of traffic accidents on the treated location. The treatment has less effect on traffic accidents with material damage than the traffic accident with casualties (Table 1).
Table 1. Effects of treating black spots on traffic accidents [10]
Consequences of accidents
Type of accidents Best estimate
95% confidence interval
Treatment of black spot
Accidents with injuries Only material damage
All accidents at the point All accidents at the point
-14 +0
(-31;+7) (-27;+38)
Treatment of black section
Accidents with injuries Only material damage
All accidents at the section All accidents at the section
-44 -16
(-61;-18) (-39; +15)
4.3. The importance and effects of adequate identification of black spots and application of specific measures
The importance of methodology black spot management can be seen in the effects and results of the measures taken on black spots, or specific micro-locations on the road network. This means that with a relatively small investment, reconstruction and rehabilitation can achieve extraordinary effects that can be measured through the savings that result in smart investing only in specific hazardous segments of the road network,
not the entire section. Also, on the other hand legal and significant effects are achieved through reducing the number of traffic accidents and injured persons. Thus, any error or wrong approach at the stage of identifying black spots, automatically results in erroneous investing in chosen measure and sunk costs, and in the worst case can lead to an increase in the number of traffic accidents and injured persons. The most important activities within the identification phase of black spots represents recording data on road accidents, development of a database on road accidents and defining criteria for identifying black spots. In addition to the enhanced importance of identifying black spots, also, special attention should be paid to the stage of identification of the basic causes of accidents at identified locations of black spots. It is commonly to make decision on the selection of specific measures at the identified location of black point based on the identified primary causes of traffic accidents. Because of this, for proper analysis, identification and the black spots management it is necessary to do in parallel and in-depth analysis of traffic accidents (In-Depth Studies-IDS). [6] Reconstruction, rehabilitation and maintenance of existing roads are strategically important measures for the effective functioning of the traffic safety system. Considering the basic characteristics of these measures (cumbersome system of organization, the needs in human and technological resources, financial resources, etc.) it is necessary to ensure that the application of those measures implement to achieve as good effects as possible. [18] In order to effects were positive, great attention is paid to possibility of defining the status and problems of traffic safety based on the monitoring of certain indicators. [11] By the indicators of traffic safety is meant each parameter which is related to the occurrence of an accident. The importance of indicators can be assessed based on the strength of the relation and the contribution to the occurrence of an accident. Traffic safety problems can be caused by decisions that are made or the procedures, during the various stages of development and exploitation of the road network (Table 2).

449
Osman Lindov, Fadila Kiso, Adnan Omerhodžić, Muhamed Begović
BSM- BLACK SPOT MENAGEMENT AS MOTHODOLOGY APPROACH IN INCREASING SAFETY OF ROAD TRAFFIC
Table 2. Sources of road safety problems in various stages of development and exploitation of
the road network [2]
Stage Example Planning Separation of changeable and
available functions using hierarchical improving of safety conditions
Project Roads with high standards are safer. However, the road project should not be sufficient by filling standard, but should rely on expert assessment of Engineers
Construction Problems in the design may result from constructive defects, reducing the safety
Maintenance and exploitation
Dealing with various problems such as, poor street lighting, the disproportion between the road and reinforced shoulders, a large number of access points, inadequate maintenance of traffic signalling, poor maintenance areas, etc.
4.4. Methodological process of black spot management
Currently there is no standardized methodology for managing black spots, but according to professional aspect and best international practice the basic concept which consists of several stages is defined (Table 3).
Table 3. Typical stages in BSM (RiPCORD-iSEREST, 2007) [1]
1. Data Collection Collection of data on roads, traffic and accidents
2. Dividing Dividing the road network into different road elements and sections
3. Identification Ranking and identification of black spots/hazardous road sections
4. Analysis In-office and on-site analysis of accidents
5. Treatment Proposing of treatment for true black spots/hazardous road sections
6. Pre-evaluation Pre evaluation pf proposed treatment
7. Ranking Ranking of projects and location of treatment
8. Implementation Implementation and operation of treatment
9. Post-evaluation Before-and-after evaluation of effect of treatment
The interventions on locations with accumulated traffic accidents are considered one of the most effective approaches in the prevention of accidents on the roads. There are a number of techniques for identifying black spots, some of which are frequently used: [8] the number of traffic accidents in the analyzed period, the rate of traffic accidents (number of accidents per million vehicle, kilometer), combined number of traffic accidents and the rate of traffic accidents over the average value and the empirical Bayes [4] assessment of the expected number of traffic accidents on the analyzed locations. According to the proven and accepted international best practices and experiences, identification of black spots should be based on a scientific approach using empirical Bayes method (Figure 4).
Figure 4. Illustration of the empirical Bayes method [19]
Tables However, due to the many differences in the approach of black spots management and all other necessary conditions, it is not possible in all countries at once and for a short time to establish and implement an empirical Bayes method. Thus, the recommendations of relevant research studies are the traditional model for identification based on local risk factors relating to the design of roads and traffic control. Besides traditional model, recommendation is application of category model based on the volume of traffic.
5. BLACK SPOT MANAGEMENT IN BOSNIA AND HERZEGOVINA
From the aspect of road safety management, road safety situation in Bosnia and Herzegovina is not satisfactory. Bosnia and Herzegovina still has not

7th INTERNATIONAL MARITIME SCIENCE CONFERENCE
450
April 20th-21st, 2017, Solin, Croatia
adopted a strategy of road safety and the Council for road safety, although are legally required and should be the basis for the formation of road safety management system. EU accession is a strategic priority of Bosnia and Herzegovina. The European integration process requires a comprehensive adjustment of policy, institutional framework and the legally system in order to achieve European standards in all areas. [13] In the segment of road safety, and the management of road infrastructure, Bosnia and Herzegovina is only partially in some areas initiated and implemented measures under Directive 2008/96 / EC. In Bosnia and Herzegovina there is no unique national methodological framework for managing the black spots on road network. Only Public Company The Roads of Federation B&H, as manager of main roads in the past period, has dealt with problems of black spots and undertook specific actions that can be described as the process of black spot management. According to the methodological framework of Public Company The Roads of Federation B&H, under the black spot is implied: The intersection or section of road to 300 (m) on the road if in that place in the past three years, happened: [14] − 12 or more accidents with injured or killed
persons, − 3 or more of the same traffic accident (the
same group of participants and the way events) with injured or killed persons,
− 15 or more accidents, regardless of the consequences.
The process of identification of black spots is done based on occasional study researches of statistical data of traffic accidents, after which road managers perform a specific type of in-depth analysis of identified black spots, and make decisions to undertake certain measures of reconstruction and rehabilitation. Figure 5, shows a map of black spots on the main roads of FB&H, with 109 identified black spots and dangerous places based on the study research of traffic accidents that occurred in period from 2013 to 2016 (Figure 5).
Figure 5. Map of black spots on main roads of
FB&H [14]
Regarding to the best international practices and recommendations [3], and regarding the real objective possibility of the current situation in Bosnia and Herzegovina, below is presented a framework model for the establishment and application methodology of black spot management on road network in Bosnia and Herzegovina, with the key elements which are necessary to implement 1. Treating the importance of black spots on the roads in laws and regulations; 2. Identification and clearly specifying the key entities responsible for the black spot management; 3. Establishing a financial framework for the implementation of black spot management; 4. Institutional strengthening and coordination of key stakeholders in the black spot management; 5. Adoption of strategies and action plans in black spots management; 6. Comprehensive expert analysis in order to establish a unique and effective methodology for identification of black spots; 7. Expert approach and treatment of black spots in the process of applying in-depth analysis; 8. Continuous action in black spot management; 9. Notify the public about the activities undertaken and the results achieved.
6. CONCLUSIONS
Methodology of black spot management on the road network is one of the most effective methodologies in order to improve the level of road safety. Interventions with concrete measures of reconstruction and rehabilitation of the identified
locations of black spots, are considered as the most effective approach in the prevention of accidents. Due to the specific conditions of the road traffic and the circumstances under which traffic accidents occur, the risk in road traffic is always present and can not be eliminated. This requires continuous application of black spots management on the road network in all key stages such as data collection, identification, analysis, taking actions and evaluation. Identification of black spots is a key stage in black spot management, but in order to that process management is adequate and to expect positive effects, it is necessary to perform in-depth analysis of black spots. In-depth analysis of black spots can be seen as a special methodological framework which should be based on professional approach. The results of in-depth analysis are basis for treatment and taking concrete measures on black spots, based on what will the evaluation of results and the taken measures, will evaluate the effects and effectiveness of the entire process management on the analyzed black spot. Besides above framework model for the establishment and application of methodology of black spot management on the road network in Bosnia and Herzegovina, as a priority, we can identify the following activities to be implemented as soon as possible: − Adopt a definition of the term "black spot" and
include it in the Law on basics of traffic safety on the roads in Bosnia and Herzegovina;
− Adopt a unique form of record of the investigation of an accident throughout Bosnia and Herzegovina;
− Establish a mechanism for the mandatory registration of data on the exact location of the occurrence of an accident in record of the investigation of an accident;
− Establish a database of road accidents which will be matched with a unique form of record of the investigation of an accident;
− In the Law on basics of traffic safety on the roads in Bosnia and Herzegovina, define the obligation of keeping a database of traffic accidents;
− In the Law on basics of traffic safety on the roads in Bosnia and Herzegovina, define the obligation of giving data and documentation
on traffic accidents for road administrators and authorized professional institutions that will manage black spots on the roads.
REFERENCES
1. Adedokun, A., Application of Road Infrastructure Safety Assessment Methods at Intersections, Department of Science and Technology (Linköping, 2016) pp. 10-11.
2. Andersson, J. et al, Roadside Infrastructure for Safer European Roads, European best practice for roadside design: guidelines for maintenance and operations of roadside infrastructure, Chalmers University of Technology (Goteborg, 2006) pp. 12.
3. Black Spot Identification and Treatment Guidelines, Sweroad, Public company Roads directorate of Federation of B&H (Sarajevo, 2011)
4. Brijsy, T., Karlisz, D., Van den Bosschey, F., Wetsy, G., „A Bayesian Model for Ranking Hazardous Road Sites“, Transportation Research Institute - Hasselt University, Department of Statistics Athens University of Economics and Business, Journal of the Royal Statistical Society series A, 170 (2007) pp.1-17.
5. CARE, EU road accidents database, http://ec.europa.eu/transport/road_safety/specialist/statistics_en#
6. Clarke, D., Ward, P., Bartle, C., Truman, W., „An In-depth Study of Workrelated Road Traffic Accidents“, Road Safety Research Report No. 58, University of Nottingham, Department for Transport (London, 2008)
7. Directive 2008/96/EC of the European Parliament and of the Council, Official Journal of the European Union, L 319/59 (Brussels, 29.11.2008)
8. Elvik, R., Comparative Analysis of Techniques for Identifying Hazardous Road Location, Annual meeting of Transportation Research Board Washington, D.C. (Washington, D.C., 2008)
9. Elvik, R., Evaluation of road accident black spot treatment: a case of the Iron Law of evaluation studies, Accident Analysis and Prevention (1997) pp. 29, 191-199.

451
Osman Lindov, Fadila Kiso, Adnan Omerhodžić, Muhamed Begović
BSM- BLACK SPOT MENAGEMENT AS MOTHODOLOGY APPROACH IN INCREASING SAFETY OF ROAD TRAFFIC
locations of black spots, are considered as the most effective approach in the prevention of accidents. Due to the specific conditions of the road traffic and the circumstances under which traffic accidents occur, the risk in road traffic is always present and can not be eliminated. This requires continuous application of black spots management on the road network in all key stages such as data collection, identification, analysis, taking actions and evaluation. Identification of black spots is a key stage in black spot management, but in order to that process management is adequate and to expect positive effects, it is necessary to perform in-depth analysis of black spots. In-depth analysis of black spots can be seen as a special methodological framework which should be based on professional approach. The results of in-depth analysis are basis for treatment and taking concrete measures on black spots, based on what will the evaluation of results and the taken measures, will evaluate the effects and effectiveness of the entire process management on the analyzed black spot. Besides above framework model for the establishment and application of methodology of black spot management on the road network in Bosnia and Herzegovina, as a priority, we can identify the following activities to be implemented as soon as possible: − Adopt a definition of the term "black spot" and
include it in the Law on basics of traffic safety on the roads in Bosnia and Herzegovina;
− Adopt a unique form of record of the investigation of an accident throughout Bosnia and Herzegovina;
− Establish a mechanism for the mandatory registration of data on the exact location of the occurrence of an accident in record of the investigation of an accident;
− Establish a database of road accidents which will be matched with a unique form of record of the investigation of an accident;
− In the Law on basics of traffic safety on the roads in Bosnia and Herzegovina, define the obligation of keeping a database of traffic accidents;
− In the Law on basics of traffic safety on the roads in Bosnia and Herzegovina, define the obligation of giving data and documentation
on traffic accidents for road administrators and authorized professional institutions that will manage black spots on the roads.
REFERENCES
1. Adedokun, A., Application of Road Infrastructure Safety Assessment Methods at Intersections, Department of Science and Technology (Linköping, 2016) pp. 10-11.
2. Andersson, J. et al, Roadside Infrastructure for Safer European Roads, European best practice for roadside design: guidelines for maintenance and operations of roadside infrastructure, Chalmers University of Technology (Goteborg, 2006) pp. 12.
3. Black Spot Identification and Treatment Guidelines, Sweroad, Public company Roads directorate of Federation of B&H (Sarajevo, 2011)
4. Brijsy, T., Karlisz, D., Van den Bosschey, F., Wetsy, G., „A Bayesian Model for Ranking Hazardous Road Sites“, Transportation Research Institute - Hasselt University, Department of Statistics Athens University of Economics and Business, Journal of the Royal Statistical Society series A, 170 (2007) pp.1-17.
5. CARE, EU road accidents database, http://ec.europa.eu/transport/road_safety/specialist/statistics_en#
6. Clarke, D., Ward, P., Bartle, C., Truman, W., „An In-depth Study of Workrelated Road Traffic Accidents“, Road Safety Research Report No. 58, University of Nottingham, Department for Transport (London, 2008)
7. Directive 2008/96/EC of the European Parliament and of the Council, Official Journal of the European Union, L 319/59 (Brussels, 29.11.2008)
8. Elvik, R., Comparative Analysis of Techniques for Identifying Hazardous Road Location, Annual meeting of Transportation Research Board Washington, D.C. (Washington, D.C., 2008)
9. Elvik, R., Evaluation of road accident black spot treatment: a case of the Iron Law of evaluation studies, Accident Analysis and Prevention (1997) pp. 29, 191-199.

7th INTERNATIONAL MARITIME SCIENCE CONFERENCE
452
April 20th-21st, 2017, Solin, Croatia
10. Elvik R., Høye A., Vaa T., Sørensen, M., The Handbook of Road Safety Measures, Emerald Group Publishing Limited (Bingley, 2004)
11. European Transport Safety Council, Transport Safety Performance Indicators (Brussels, 2001)
12. European Union Road Federation, Good-practice Guidelines to infrastructural Road Safety (Brussels, 2002)
13. Lindov, O., Omerhodzic, A., Tatarevic, A., "Model of Evaluation and Assessment of Safety Parameters of Dangerous Places on Roads." Suvremeni Promet-Modern Traffic 34.3-4 (Zagreb, 2014)
14. Lindov, O., Čaušević, S., et al, "Study of black spots on the main roads in Federation of B&H based on traffic accidents data in the period of 2013 - 2015", Faculty of Traffic and Communications, University of Sarajevo, Public company Roads of Federation of B&H (Sarajevo, 2016)
15. Lindov, O., Road Traffic Safety, University book, Faculty of Traffic and Communications (Sarajevo, 2008)
16. Lindov, O., Safety and Security in Traffic and Transport, Faculty of Traffic and Communications, University of Sarajevo (Sarajevo, 2012)
17. Lipovac, K., Traffic Safety, Official Gazette of FRY (Belgrade, 2008)
18. Lipovac, K., Jovanović, D., „Identification of dangerous places on the roads as a function of roads rehabilitation process“, Faculty of Civil Engineering, University of Belgrade, Scientific conference "Rehabilitation and reconstruction of roads," (Zlatibor, 2007)
19. Sorensen, M., Elvik, R., Black Spot Management and Analysis of Road Networks – Best Practice Guidelines and Implementation Steps, 6th Framework Programme RIPCORD-ISEREST-Deliverable, (Oslo, 2008)
20. TRRL, Transport Road Research Laboratory www.trl.co.uk
21. World Health Organization, Global Plan for the Decade of Action for Road Safety 2011-2020 http://www.who.int/violence_injury_prevention/publications/road_traffic/UN_GA_resolution-54-225-en.pdf

453
Abidin Deljanin, Alem Čolaković, Belma Memić
AN OVERVIEW OF E-LEARNING PLATFORMS FOR TRANSPORT AND INTERMODALITY
AN OVERVIEW OF E-LEARNING PLATFORMS FOR TRANSPORT AND INTERMODALITYAbidin Deljanin, Alem Čolaković, Belma Memić
AN OVERVIEW OF E-LEARNING PLATFORMS FOR TRANSPORT AND INTERMODALITY
Abidin Deljanin, Alem Čolaković, Belma Memić
(Faculty of Traffic and Communications, Sarajevo, BiH)
(E-mail: [email protected])
ABSTRACT
E-learning is a computer based educational tool or system that enables possibility to learn anywhere and anytime. Technology has advanced so much that the geographical gap is bridged with the use of tools that make you feel as if you are inside the classroom. E-learning offers the ability to share material in all kinds of formats such as videos (eg. mp4, .flv, mpeg, avi), slideshows (eg. .ppt, .pptx), word (doc, docx), Portable Document Format (.pdf), etc. These days learners are well versed in the use of smart phones, text messaging and using the internet which made using and running an online course to become a simple affair. E-Learning, in comparison with traditional learning, significantly reduces the time needed to locate information. It also offers access to online resources, databases, periodicals, journals and other materials you wouldn't normally have access from a library. The main objective of e-learning modules for transport is to create knowledge that will be available to stakeholders regardless of geographic distance. Using e-learning platforms in transport systems can help in the analysis of transport processes, improvement and optimization of transport processes, shaping an holistic approaches to protect the environment, development in strategic plans regarding sustainable mobility solutions, etc. E-learning platforms in transport can help adapt to the curricula in high schools and universities in order to acquire theoretical and practical knowledge and skills for employment in the transport companies.
KEY WORDS
ICT, e-Learning, e-Platforms, Training, SCORM, Transport systems
1. INTRODUCTION
Application of e-learning tools and systems in transport is becoming more and more popular because of its advantages over traditional learning. The main advantages are possibilities to learn wherever and whenever it suits to learner.
Enabling technologies provide numerous possibilities for development of transport e-learning platforms. These platforms significantly reduces the time needed to locate information, offers access to online resources and databases. Transport e-learning platforms provide database of
knowledge that is available to all stakeholders regardless of geographic distance. Stakeholders can exchange experience which can help in the analysis of transport processes, improvement and optimization, reduce impact on environment, etc.
The rest of this paper is organized as follows: Section 2 describes basic concept, features and advantages of e-learning platforms. In this section we present main elements of e-learning platforms as well as standards. The main objective of e-learning modules for transport is provided in Section 3. Also in this section we give short
7th INTERNATIONAL MARITIME SCIENCE CONFERENCE
454
April 20th-21st, 2017, Solin, Croatia
description of some transport and intermodal e-learning platforms that are available online. Section 4 provides some conclusion remarks.
2. E-LEARNING PLATFORMS
The foreign experience is observed intensive and fast-growing development and use of ICTs for learning, especially during the last twenty years. From the onset of personal computer market in the early 80s of the last century, the use of ICT has become a normal part of everyday life for many people. When personal computers became more affordable, there is a first effort to develop ICT supportive of the learning process. This development was the precursor to the Internet as a medium for learning. It was assumed that the Computer Based Training (CBT) programs enable learning easier and less expensive. The venture was expanded last 20 years leading to international and particularly European program to integrate the use of ICT in education and practice. The introduction of E-Learning does not end with the construction of a suitable platform of learning but only then begins the real challenge.
Following up the conclusions of the Lisbon European Council, it set out the principles, objectives and lines of eLearning action, defined as " the use of new multimedia technologies and the Internet to improve the quality of learning by facilitating access to resources and services as well as remote exchanges and collaboration" [8].
The eLearning initiative is part of the comprehensive eEurope Action Plan [9], which aim is to allow Europe to exploit its strengths and overcome the barriers holding back the uptake of digital technologies. E-learning represents an electronic learning form based on the use of modern computer and communications technology, with special emphasis placed on interactivity and customization of learning needs of the individual.
In most cases, this is done using an internet connection. E-learning user must use a computer, mobile phone and Internet for accessing platform. Using eLearning allows you to complete activities
and obtain data that wouldn't otherwise be available through more traditional face-to-face training approaches. Some organizations have had success with utilizing eLearning as an "on demand" program where employees can access learning they need when it. Benefits from e-Learning: • Temporal and spatial flexibility. • Allowing access to multimedia presentations,
documents and other resources. • The use of ICT (Information and
Communication Technology) for the purpose of learning.
• Approaching and merging the Internet and learning.
• Acquiring new knowledge and skills. • Contents for learning can be adapted to
individual users.
• The process of approaching educational resources - ensuring the learning conditions for more different remote places.
In that sense, learning is facilitated and improved use of information and communication technologies (ICT). E-learning relies on technology and requires hardware, software, and network infrastructure Today, most of e-learning environments are Web-based, i.e. they are accessed via Web browsers (using HTTP) over a TCP/IP network such as the Internet or an intranet (e.g., a big transport companies).
In general, e-learning does not have any special hardware or networking requirements. In theory, there is a need for Internet access and computer capable of running a Web browser to access Web-based e-learning applications. In practice, however, many applications use client-side scripting (using JavaScript, Adobe Flash, or Java Applets) or contain media or documents requiring proprietary software (such as Apple QuickTime or Microsoft Windows Media players for movies or Microsoft PowerPoint for presentations). This means that a certain amount of computing power must be available and the choice of operating systems may be restricted.

455
Abidin Deljanin, Alem Čolaković, Belma Memić
AN OVERVIEW OF E-LEARNING PLATFORMS FOR TRANSPORT AND INTERMODALITY
An institution that is offering e-learning needs standard server hardware and Internet connectivity, both of which must, of course, be sized according to demand, i.e., it depends on factors such as the number of users simultaneously using the system and the type and amount of media being served. Many types of software and network services can be used for e-learning; examples include e-mail, Usenet, chats, discussion forums, wikis, and blogs. The functionality of e-learning platforms typically includes access to learning content and tests, communication and collaboration tools for users. E-learning platforms may also include administrative functionality or interfaces to administrative systems for managing users.
2.1. Learning Management Systems
E-Learning system consists of three main elements: 1. Learning Management System (LMS) 2. Content 3. Collaboration
Learning Management System is a set of standardized components for learning, designed in such a way to connect learning with existing IT systems within an organization or through a web portal learning. Its purpose is providing a centralized learning environment using a computer that does not depend on the geographical relocation of clients, their previous knowledge and their role in organizations, in the short time.
LMS stands for Learning Management System and it's a global term for a computer system specifically developed for managing online courses, distributing materials and allowing collaboration between participants.
LMS are built on various platforms, commonly PHP, .Net or Java and they will hook up to a database such as PostgreSQL, MySQL or SQL Server. LMSs do vary in the features they offer, but most systems are likely to have some or all of the following features: • Easy Graphical User Interface (GUI) • Customization
• Enrolment • Virtual Classroom • Social Networking • Communication • Reports
Easy Graphical User Interface (GUI): GUI stands for Graphical User Interface. Most LMSs offer customization options for the interface to allow the user to give a unique flavour to his learning platform. Although the GUI is there to make the environment more aesthetically pleasing, it’s also meant to be functional.
Customization: Aside from the GUI an LMS will oftentimes offer several different options for customization to tailor the system. Language options, notification settings and other important features can be changed to suit the users.
Enrolment: The system may allow users to enrol online and keep track of their details, course progress and test results. It may also allow user to pay their course fees online via credit card, debit card or PayPal.
Virtual Classroom: LMS may integrate with whiteboard systems for virtual classroom sessions and help to schedule sessions. It may offer the ability to send out invites or reminders for sessions and integrate with an online calendar system or with Outlook.
Social Networking: An LMS may be able to integrate with social media so can share content or news items via Twitter or Facebook etc. at the click of a button. Communication: LMS system should also have built in functionality for communicating with users, such as sending out a bulk email to everyone on a particular course, to individual user or groups users. Reports: Any good LMS will have a reporting system can tap into, generating reports that can export into Excel, and also offering graphical representation of data for ease of understanding.
Content is a crucial part of the learning process. Different models of e-learning and providing multimedia learning experience using image, sound

7th INTERNATIONAL MARITIME SCIENCE CONFERENCE
456
April 20th-21st, 2017, Solin, Croatia
(voice) and animation. Learning modules are not statically but are intelligently managed auditory and visual by applying interactive feedback which participants kept to the target system by simulating real situations. Participant can be reached to the goal only if all the steps are correctly made. Each module can be accessed as many times as necessary to make the final result become satisfactory.
Communication within the system is multidimensional. The primary goal of communication is collaboration between the user and supervisor of instruction, and communication between users. Cooperation allows the supervision system and enhances learning, because remote station for learning (computer and attendant) connects to the community.
Table 1. Short description of 10 e-learning platforms
Platform Description Type
Moodle
Moodle (Modular Object-Oriented Dynamic Learning Environment) is one of the most popular and most used open source system for a control line learning (Learning Management System - LMS). This online application that is installed on the server, and is accessed from any computer in the network via a web browser. According to data for January 2010, Moodle had a user base of 45.721 registered and verified sites, and used by 32 million users in 3 million items.
Open source
Edmodo Edmodo is a free educational social networking application. It is being used as an alternative to LMMs by universities and Ministries of Educations and schools.
Free
ConnectEDU Integrated, web-based platform that is accessible to students and to persons who assist students during education and career transitions.[10]
Blackboard
Installed in over 2,000 academic institutions. Emphasis is placed on the three key areas of the platform, which includes a multitude of tools that facilitate content management and use of the same. These areas are: Content Management courses, communication and evaluation.
Commercial
SumTotal Systems SumTotal Learning Management manages all aspects of global education and training by automating and optimizing the administration, management, delivery, and end user experience of blended learning programs. [11]
Commercial
Cornerstone From one centralized learning management system, deliver instructor-led training (ILT), virtual learning, exams, certifications, and compliance content for developing employees. [12]
Commercial
Schoology Schoology is a learning management system (LMS) for K-12 schools, higher education institutions, and corporations that allows users to create, manage, and share content and resources.
Commercial
SuccessFactors (SAP)
SuccessFactors is the leading provider of cloud-based HCM software, which delivers business results through solutions that are complete, beautiful, and flexible enough to start anywhere and go everywhere. [13]
Commercial
Collaborize Classroom
Create, share and/or download inquiry-based discussions on any topic. Each lesson has its own unique URL (unique to you) and can easily be shared via email, social networks, or even embedded on any website or e-publication. [14]
Free
SkillSoft
SkillSoft is a web interface and a mobile app, for learning with hundreds of SkillSoft books, courses, and videos in many areas, including: technological and digital skills; human resources; business and leadership skills, and compliance courses.
Commercial
2.2. E-learning standards
The standards should ensure more efficient and economical development, use and maintenance system for e-learning. Having the need for e-
learning standards, "Institute of Electrical and Electronics Engineers' (IEEE) and "Leading IMS Global Consortium" (IMS GLC) started work on creating standards.

457
Abidin Deljanin, Alem Čolaković, Belma Memić
AN OVERVIEW OF E-LEARNING PLATFORMS FOR TRANSPORT AND INTERMODALITY
In January 1998 was initiated and later accepted, "Advanced Distributed Learning" (ADL) initiative, by the American organization "Department of Defence", "Department of Labour" and "White House Office of Techno-logy", whose goal was the standardization of learning materials.
The goal of ADL was defining standards in practice and recommendations for the creation of materials for learning. The final result of this work is a document that represents a specification or standard - SCORM (Sharable Content Object Reference Model).
SCORM is a standard and widely accepted specification that was developed for the purpose of improvement and global acceptance e-learning. The goal of this standard is easier availability to access high-quality education that is tailored to the
needs of each individual. SCORM combines parts of other specifications in a special document that is very easy to implement.
3. SYSTEM FOR E-LEARNING MODULES FOR TRANSPORT
The main objective of e-learning modules for transport is to create knowledge that will be available to everyone regardless of geographic distance. There are many e-learning platforms that are implemented for transport and intermodal transport. The following describes each of the individual platform and modules that are available for learning on the platform.
Table 2. Short description some transport & intermodal e-learning platforms
E-learning platform Short description
Transport learning The main objective of TRANSPORT LEARNING was to create knowledge and capacity on sustainable transport policies and measures in municipalities of Europe's convergence regions.
4Pillars e-learning platform Learn about EUSAIR macro-regional strategy and its four thematic pillars: Blue growth, Connecting the region (transport and energy networks), Environmental quality and Sustainable tourism.
CASE e-Centre Atlantique de Shortsea shipping Europeen
The CASE e-learning platform gives trainees access to rich and interactive content on multimodal transport, both during their training and afterwards.
Transport Security Description how to ensure nuclear and radioactive material is transported safely and securely
EU SHIPSAN ACT The impact on maritime transport of health threats due to biological, chemical and radiological agents, including communicable diseases.
EATT e-learning ATC’s newly launched E-learning platform was used for the first time for the European Air Transport Training (EATT)
E-TREAM
The objective of e-TREAM was to complement the activities of the STEER-projects on capacity building-(COMPETENCE, e-ATOMIUM, TREATISE), by integrating their training modules in an e-learning platform. The general aim was to reduce energy consumption and promote alternative fuels and sustainable transport.
MED-PCS e-learning platform Part of the program European Union "PORT COMMUNITY SYSTEM" in several Mediterranean ports that allows an effective communication of such systems.
3.1 . E-learning platform “Transport learning”
TRANSPORT LEARNING was an EU-project, which ran from 2011 to 2013. It was designed to support practitioners to develop better solutions for urban transport systems in order to improve citizens' mobility. The main objective of this platform was to create knowledge and capacity on sustainable
transport policies and measures in municipalities of Europe's convergence regions. E-learning platform consists of 8 modules related to sustainable transport: 1. Parking space management, access restriction
and speed control;

7th INTERNATIONAL MARITIME SCIENCE CONFERENCE
458
April 20th-21st, 2017, Solin, Croatia
2. Mobility management for families, kindergartens and schools;
3. Land use and housing in mobility management;
4. Public transport models; 5. Street design, streetscape and traffic calming; 6. Walking and cycling – counselling
municipalities; 7. Design and implementation of sustainable
mobility campaigns; 8. Communication training
Figure 1. E-learning platform “Transport learning” [15]
Create and implement 64 training events with at least 650 employees trained and at least 170 practical training projects implemented.
3.2. Pillars e-learning platform
In the framework of the 4PILLARS Molise Region (Italy) was in charge of the development of 4 e-learning modules to be delivered through an e-learning platform created within the project by the Marche Region. The modules, implemented on the basis of the training materials produced by five IPA Adriatic CBC projects capitalized by 4PILLARS, are the following: a) Module 1 - capitalizing "AdriGov - Adriatic Governance Operational Plan" - training module on
European funds for European Territorial Cooperation from 2014 to 2020 and for operators in the creative sector (EU Programme "Creative Europe";
b) Module 2 - capitalizing "SHAPE - Shaping an Holistic Approach to Protect the Environment between Adriatic coast and sea" and project "ECO.SEA - protection, improvement and integrated management of the sea environment and of cross-border natural resources" - training module on an integrated Mediterranean coastal zone management through the "Protocol on Integrated Coastal Zone Management in the Mediterranean (ICZM Protocol)", considering a common management of maritime space and of the fisheries and aquaculture policy;
c) Module 3 - capitalizing "INTERmodality - MOdel for the Development of the Adriatic Littoral - training module on the development of strategic plans regarding sustainable mobility solutions with pilot projects analysis and their results;
d) Module 4 - capitalizing "HERA - Tourism of Adriatic heritage - training module on integrated joint action plan for the management of cultural heritage sites and tourism in the Adriatic area.
3.3. CASE e-Centre Atlantique de Shortsea shipping Europeen
The CASE e-learning platform gives trainees access to rich and interactive content on multimodal transport, both during their training and afterwards. Through a modern and attractive online platform, users can access all the course materials, as well as advance through the modules, work on case studies, take quizzes, find information on thematic forums and chat with CASE experts. CASE e-learning platform has 7 modules:
1. General organization of physical merchandise flows;
2. Vectors for multimodal transport; 3. Tools for the modal shift; 4. CSR and multimodal transport;

459
Abidin Deljanin, Alem Čolaković, Belma Memić
AN OVERVIEW OF E-LEARNING PLATFORMS FOR TRANSPORT AND INTERMODALITY
5. Practical courses and case studies; 6. River transport; 7. Rail transport.
Figure 2. E-learning platform “CASE” [16]
3.4. E-learning platform “Transport Security”
E-learning platform "Transport Security" provides explanations how to ensure nuclear and radioactive material is transported safely and securely through the following topics:
1. Objectives of transport security 2. International and national requirements,
recommendations and guidance; 3. Background of safety regulations; 4. Basic principles and fundamentals; 5. Application of security functions; 6. Transport security technologies; 7. Transport security plans, readiness reviews and
corrective actions.
Figure 3. E-learning platform “Transport Security” [17]
Transportation security platform is created on the SCORM standard.
3.5. EU SHIPSAN ACT
E-learning platform arises from the EU SHIPSAN ACT Joint Action which has received funding from the European Union, in the framework of the Health Programme. It describes the impact on maritime transport of health threats due to biological, chemical and radiological agents, including communicable diseases.
Figure 4. E-learning platform “SHIPSAN”[18]

7th INTERNATIONAL MARITIME SCIENCE CONFERENCE
460
April 20th-21st, 2017, Solin, Croatia
Modules contained on this platform are: 1. EU SHIPSAN Act Vocational Training Program for
the Passenger Shipping Industry; 2. Inspections of passenger ships according to the
European Manual for Hygiene Standards; 3. Inspection's GalleryM; 4. Advanced training course for water safety on
ships; 5. Inspection of Hygiene & Health Standards on
Passenger Ships (Professional Seafarers); 6. Inspection of Hygiene & Health Standards on
Passenger Ships (Port Health Officers); 7. Training course for professional Seafarers:Tivoli
Terme, Rome, Italy.
3.6. EATT e-learning
EATC’s newly launched E-learning platform was used for the first time for the European Air Transport Training (EATT) in Beja (Portugal).
The aim of the E-learning platform is to better prepare the participants from the EATF member nations to the different training events, to share and standardize the tactical knowledge among the transport air crews over Europe and to have access to the most recent harmonized TTPs. The platform currently focuses on courses for air crews, but EATC plans to offer at a later stage also E-learning tools to aeromedical experts, paratroopers, maintenance personnel and others.
Figure 5. E-learning platform “EATT” [19]
3.7. E-learning platform “E-TREAM“
e-TREAM is a STEER project of the Intelligent Energy Europe Programme of the European Commission, combining the experience of Energy Agencies in nine European countries to address mobility issues such as the need to reduce energy consumption in transport, and to promote alternative fuels and more sustainable transport modes.
E-learning platform - 9 learning modules in 10 languages for individual training sessions. The learning modules include best practices, audio and video files, presentations, links and other features. A tutor is available for each language. Thematic forums have been also implemented. In 10 months, the e-platform reached around 314 users. This number is going to increase thanks to the continuing promotion activities.
The training materials included are structured in 9 Modules, as follows:
1. Fundamentals of transport and energy (introduction);
2. Production and utilization of bio fuels; 3. Alternative fuels and vehicles (excluding bio
fuels); 4. Driving style and in car devices; 5. Mobility Management for municipalities; 6. Mobility Management for companies and
institutions; 7. Mobility Management for schools; 8. Demand Management (urban planning and
transport, access management, telemetric, parking management);
9. Mobility marketing (transport information, awareness raising, marketing, participation and change management).
Figure 6. E-learning platform “E-TREAM” [20]

461
Abidin Deljanin, Alem Čolaković, Belma Memić
AN OVERVIEW OF E-LEARNING PLATFORMS FOR TRANSPORT AND INTERMODALITY
3.8. MED-PCS e-learning platform
A key factor in the socioeconomic development of European territories on the Mediterranean Sea is the growth in sea trade, in which ports play an essential role.
The competitiveness of ports depends not only on its own efficiency, but on the efficiency of all the operators in the logistic chain, and on the quality of the communications among them. Ports have the ability to influence the management efficiency of the whole logistic chain, and on the communications among operators.
MED PCS platform consists of three modules:
1. Basic principles of freight, logistics and maritime transport UNINA;
2. Advanced topics on PCS and maritime transport;
3. Motorways of the Sea and sustainable transport in the framework of Port Community Systems RAM.
Figure 7. E-learning platform “MED-PCS” [21]
4. CONCLUSIONS
E-learning platforms are becoming more and more popular in all segments of transport. They can provide a solution for many stakeholders because they are flexible in terms of:
• Time: learn whenever and as long as can. • Location: learn wherever. • Content: choose the information you
really need.
There is only need for internet access and stakeholders can use all features of the platform by using various terminals such as personal computers, tablets, mobile phones, etc. There are numerous e-leraning platforms that can be applied in diffierent purposes. For example, open source e-learning platforms can be used for developing transport e-learning platforms that provide numerous possibilities such as to create database of knowledge that is available to all stakeholders regardless of geographic distance. In this paper we have presented some of transport e-learning platforms that are available online and developed under various projects.
REFERENCES
1. Chang, L.K. et al, Maritime Routing, Bejing Institu, pp. 90-97. 1997.
2. Hall, C., Fleet Management, ToMS, Vol. 2, No. 2, pp. 77-81. 2011.
3. Anderson, T. & Elloumi F. Theory and Practice of Online Learning. Athabasca University.
4. Bouras, C., Giannaka, E., Tsiatsos Th. Designing Virtual Spaces to Support Learning Communities and e-Collaboration. Computer Engineering and Informatics Dept., Univ. Of Patras, Greece. Research Academic Computer Technology Institute, Greece.
5. Hong Tan Van, Fumihiko Nakamura, Satoshi Fujii, Hisashi Emori, Educational methods to change the attitudes of transport planners towards environmentally sustainable transportation systems in developing countries, IATSS Research, Volume 31, Issue 2, Pages 74–83, 2007.
6. Rosenberg, M.J. Beyond E-learning: Approaches and Technologies to enhance Organizational Knowledge, Learning and Performance, 2006.

7th INTERNATIONAL MARITIME SCIENCE CONFERENCE
462
April 20th-21st, 2017, Solin, Croatia
7. Klemke R., Kurapati S., Lukosch H., Specht M.,Transferring an Educational Board Game to a Multi-user Mobile Learning Game to Increase Shared Situational Awareness. In: Zaphiris P., Ioannou A. (eds) Learning and Collaboration Technologies. LCT 2015.
8. http://eur-lex.europa.eu/
9. http://europa.eu.int/
10. http://www.bloomberg.com/
11. http://www.elearningatlas.com/
12. https://www.cornerstoneondemand.com/
13. http://go.sap.com/
14. http://library.collaborizeclassroom.com/
15. http://transportlearning.net/
16. http://www.case-optimodal.eu/en/
17. http://elearning.iaea.org/
18. http://elearning.shipsan.eu/
19. http://eatc-mil.com/
20. https://ec.europa.eu/energy/
21. http://med-pcs.learningservices.it/

463
Samir Čaušević, Muhamed Begović, Elma Avdagić-Golub, Adisa Hasković
DEVELOPMENT OF GUIDELINES FOR LOGISTICS OPERATORS SKILLS ENHANCEMENT TOOLS AND LEARNING METHODOLOGY
DEVELOPMENT OF GUIDELINES FOR LOGISTICS OPERATORS SKILLS ENHANCEMENT TOOLS AND LEARNING METHODOLOGYSamir Čaušević, Muhamed Begović, Elma Avdagić-Golub, Adisa Hasković
DEVELOPMENT OF GUIDELINES FOR LOGISTICS OPERATORS SKILLS ENHANCEMENT TOOLS AND LEARNING METHODOLOGY
Samir Čaušević, Muhamed Begović, Elma Avdagić-Golub, Adisa Hasković
(Faculty of Traffic and Communications, Sarajevo, BiH)
(E-mail: [email protected])
ABSTRACT
Many studies show that the transport sector is facing a problem with shortage of skilled workers due to different kinds of reasons. These reasons are listed in the paper and they vary from fast changing learning demands, rapid development and constant introduction of innovation in the industry, obstacles in the form of language barriers, aging and retirement of skilled working force, problems with attracting workers in the transport sector, etc. This paper provides brief analysis of trends and patterns in skills and labor shortages and proposes some initiatives according to that analysis. Those initiatives include process of improving the supply of skilled workers by adapting the curricula in high schools and universities, reengineering the learning process in a transport company, microtraining as a support mechanism for informal learning, as well as guidance on language management strategies and best practice in European SMEs which is given through PIMLICO project.
KEY WORDS
Transport operators, labor shortages, skill improvement, formal and informal learning.
1. INTRODUCTION
Many countries have noticed the problem of the lack of quality and qualified workers with the necessary skills to work in the transport sector. Given the overall economic and social importance that this sector has on the global level, it is necessary to adequately treat the problem and find ways to resolve it. If companies or countries do not address these problems seriously and systematically, they will not be able to cope with increasingly demanding market conditions and fast changes of the modern world, which are reflected on the operations of transport. First of all it is necessary to identify key disadvantages in the existing ways of attracting
and training workers in transport, to explore what are the areas in transport particularly critical in terms of the lack of adequately trained workers, and then find ways in which this problem can be solved systematically, effectively and long term. This paper provides an overview of current research in some developed countries, identifying some of the main problems that companies face today in the absence of adequate workforce, represents several initiatives that will help mitigate this problem, and presents a number of ways of improving and redesigning learning processes in transport companies.

7th INTERNATIONAL MARITIME SCIENCE CONFERENCE
464
April 20th-21st, 2017, Solin, Croatia
2. IDENTIFYING THE LACK OF WORKERS AND SKILLS IN THE TRANSPORT SECTOR
Transport sector is an important factor in today's economy and society and has a large impact on growth and employment. The transport industry directly employs around 10 million people and accounts for about 5% of gross domestic product (GDP). Effective transport systems are fundamental for the ability to compete in the world economy. Logistics, such as transport and storage, account for 10–15% of the cost of a finished product for European companies. Also, the quality of transport services has a major impact on people's quality of life. On average 13.2% of every household's budget is spent on transport goods and services. [12]
Problems in the absence of manpower and skills range from workers who work on operational positions up to the need for staff with an academic background. In addition to demographic reasons that are difficult to influence, there are reasons that can be relatively easily mitigated such as non-existence of adequate training and education that would unlock the potential of workers and allow them to acquire skills that will improve their working ability and efficiency thereby bringing benefits to the company that employs them.
Following text in this chapter is based on principles that are applicable to any other country or area, and can be used to analyze crucial issues and to propose skill and knowledge enhancement initiatives.
The main problems in terms of shortage of workers according to the researh of trends and patterns in skills and labour shortages report are: [5]
• Lack of awareness of employment opportunities
Attracting workers to this industry, including professional logisticians, was the most common challenge noted. Lack of awareness about this field of work was cited as a major contributing factor to the difficulty of attracting workers, such as warehousing operators and parts technicians. One of the jurisdictions in the research notes employment in their warehousing sector has grown by approx. 40.000 jobs over 5 years, and the
province employs roughly 120.000 workers in warehousing.
• Shortage of drivers Developing and adopting national standards for driver training and testing is seen by many as one of the major initiatives that would improve the quality of drivers entering the industry and hence help alleviating the shortage. Companies should actively address this issue in collaboration with representatives from provincial and territorial ministries of education/training, colleges and universities, employment/labour and transportation, as well as from the trucking industry, insurance, labour and the federal government. Further encouragement of apprenticeship programs and the promotion of financial/information resources about training and employment opportunities were identified as ways that could help mitigate the shortage of truck drivers. Improving programs to allow fleets to bring in qualified foreign truck drivers was also noted as one way of addressing the shortfall. Industry is also actively addressing the shortages by raising its standards for hiring new and existing drivers. Insurance companies are assisting by recognizing properly trained new entrants versus newly licensed/non-trained individuals. Industry can also increased in-house training and mentoring programs to improve driver retention.
• Shortage of professional logisticians Logistics industry is unable to attract and retain professional logisticians. Qualified logisticians must possess sales and market knowledge, as well as knowledge of carriers and the transportation industry, which is hard to come by.
• Shortage of engineers and technologists/technicians
A shortage of construction engineers and technologists (primarily civil) is a strong theme for this sector, with 6 of the 9 respondents to a research noting this as a challenge. This includes construction estimators and construction managers.
• Shortage of skilled trades Many respondents also noted a widespread shortage of skilled labourers, mechanics and heavy equipment technicians and operators. One of the
465
Samir Čaušević, Muhamed Begović, Elma Avdagić-Golub, Adisa Hasković
DEVELOPMENT OF GUIDELINES FOR LOGISTICS OPERATORS SKILLS ENHANCEMENT TOOLS AND LEARNING METHODOLOGY
respondents indicated this worker shortage extends beyond the road sector into the marine/ports area with planned gateway improvements.
• Aging workforce The aging workforce is cited as one of the reasons contributing to the Shortages. Many of transportation engineering staff are long-term employees and are currently approaching retirement. Study shows that approximately 30% of staff is projected to retire within the next five years. The imminent retirees are predominantly in supervisory/management positions. Current demographics make recruiting equally experienced replacements very difficult, if not impossible. Younger employees typically do not have enough experience to replace the retirees and be fully effective in doing the work revised by those positions.
• Lack of adequate training programs One of the respondents noted difficulty in recruiting due to lack of adequate training programs related to road-building and limited resources available to advertise within the industry. Migration of workers to other countries is also noted as contributing to the problem. Rail and transit operators need to develop effective security training programs in order to address outstanding security concerns and gaps, and identify a series of measures that operators should take in order to meet needs in this area. Virtually every skilled trade in the transport sector is noted as experiencing shortages. Many training programs for these trade occupations are experiencing declining enrolment. Development and implementation of formalized training programs for rail security and emergency preparedness is noted as a challenge. Employee training is critical to the success of a rail operator’s security and emergency preparedness program. Consultations with rail stakeholders have revealed a major need in this area, and have specifically identified staff training as a priority measure in reducing risk to industry operations. The challenge is to help operators develop formalized training programs that achieve a level of national consistency and meet each operator’s individual security needs.
Over 40 % of those employed in the freight transport and logistics sector have no vocational
qualification. If this sector of the economy is to have a promising future, the skills of its workforce have to be improved. [11]
3. SKILLS INITIATIVES 3.1. Improving the supply of skilled workers
The mentioned problems in the previous chapter request serious systematic approach to their solving in long-term plan. Therefore, we suggest several steps whose gradual implementation could help to alleviate mentioned disadvantages and provide a constant increase of skilled and qualified workers in the transport sector:
1. Adapt the curricula in high schools and universities in order to acquire theoretical and practical knowledge and skills for employment in the logistics companies. Adding new student spaces at colleges, university-colleges, universities and institutes across all countries that noticed, and are dealing with the same problems.
2. Maintain skills in legislative and regulatory drafting, socio - economic and scientific analysis, communication and public consultation: Focus on technical/ scientific personnel, Alignment and harmonization of regulations and legislation of the non EU countries with those of the EU.
3. Training in Safety Management Systems and Quality Assurance: Conversion from prescriptive to performance–based activities, Risk management process being utilized for decision-making, More safety analysis, Continued safety promotion and education, Initiating safety management documentation and information management, Continued safety performance monitoring.
4. The adoption and application of harmonized Terminology in combined transport (for employees of the logistics companies, operators and stakeholders) prepared by the UN / ECE, the European Conference of Ministers of Transport and the European Commission (EC).

7th INTERNATIONAL MARITIME SCIENCE CONFERENCE
466
April 20th-21st, 2017, Solin, Croatia
In the EU Commission document Freight Transport Logistics Action Plan, the subject of personnel and training is being mentioned in the chapter “Sustainable Quality and Efficiency”. EU Commission plans to work together with European social partners and stakeholders on the mutual recognition of training certificates and launching a dialogue to find ways of improving the attractiveness of freight transport logistics occupations.
In their Freight Transport and Logistics Master plan, The Federal Government of Germany in one of the chapters devoted special attention to good working conditions and good training in the freight transport industry. The Master plan has following steps: [11]
1. Step up the enforcement of social legislation in the road haulage sector to improve road safety
2. Launch a basic and further training initiative
3. Hold regular summits on the subject of work and training in the freight transport and logistics sector
4. Launch a lighthouse project to improve the international profile of logistics courses in higher education
5. Monitor the working conditions in the freight transport and logistics sector as part of the market observation activities of the Federal Office for Goods Transport
6. Improve seafarers‘ working and living conditions
As the best practice example in terms of workforce dealt with in Logistics Best Practice Guide [13] was stated that fuel consumption for the drivers that were trained for EcoDriving was reduced by an average of 10.9%. The proposed measure for achieving this was the publication of a handbook that collects various measures targeted at improving fuel efficiency by addressing the driver of the transport vehicle. Document also revealed reduction of accidents through Driver Training, with a reduction of 25%, which amounted to savings of €88.000 in 6 months.
3.2. Adapting and modernizing the learning process in transport companies
Many of the changes happening in the modern era have caused the need for changes in the transport sector and have set new challenges for companies and workers in the sense of acquiring new skills necessary for mastering the daily tasks and integration into the modern trends of business. As a result of those changes, as well as demographic changes, changing consumption, employment and trade patterns and reduced population growth, many countries (areas), companies and almost all integral parts of the transport sector are facing a shortage of skilled transportation workers.
Logistic processes (coordinated transport of goods, transport chains, freight handling, time windows, and planning arrangements) are supported by good organized business processes in combination with dedicated transport software to ensure a minimum of errors and a maximum of efficiency. Very fast innovations in this industry as well as constant and frequent changes in legal issues and governmental regulations make it hard to conserve and improve this mastery because modernization is a necessary thing, but also can be a burden in this case. [1] Companies should improve the learning capacity in order to be able to give adequate response to the demands for change and innovation. Considering that, an important issue is the mobility of the workforce (of which the majority are truck drivers, who are away from home and office most of their time). A main goal is to involve this target group in the information, learning and performance improvement processes that largely define the capacity for innovation in the organization. The learning capacity of any organization is being enhanced by better integrating information and learning into the business processes. [1] Research plan can be based on Corporate Learning Strategy (CLS) model (see Figure 2). Developing sustainable learning strategy is enabled by a holistic approach. Management should, through information and learning process, set a goal to brief the employees with the mission of the company, its vision and values, and have a tool to cope in a sustainable way with new development, change and innovation. One of the key factors and issues to deal with nowadays in the information and learning process

467
Samir Čaušević, Muhamed Begović, Elma Avdagić-Golub, Adisa Hasković
DEVELOPMENT OF GUIDELINES FOR LOGISTICS OPERATORS SKILLS ENHANCEMENT TOOLS AND LEARNING METHODOLOGY
is the problem of mobility of the workers. It is hard to expect them to be able to attend formal training and learning events (workshops, courses…), so other alternative models of (mobile) learning must be found for these types of workers.
Figure 1. Three types of learners
Three levels of learners can be distinguished by the level of knowledge they already have: [14]
− early development − competent and experienced and − experts (see Figure 1)
Newcomers need more formal learning. More experienced employees are better served with a largely informal learning situation that better fits ad hoc learning needs, common for workplace related learning. For people with expert knowledge and experiences, formal learning can even become counter-productive. The experienced workers need to rely much more on the self-initiative of the worker to support their learning process. 80% of the knowledge we need to do our work well is obtained through informal processes, the remaining 20% through formal channels. But 80% of the training budget is spent on formal business training efforts. This can be qualified as an over-investment. In daily practice the company can profit much more from the support of informal learning than continue to invest in traditional learning practices which increasingly show to be ineffective. There are three dimensions of requirements: [4]
- Information: information system as a low threshold resource;
- Learning: Sustainable alternative learning concept;
- Performance: KPI (Key Performance Indicators) – transparency of job descriptions will allow employees to be aware of the requirements they must comply.
The transport company has a multidimensional character, so the new learning strategy needs to be also multidimensional. Social constructivism says that we all have our own “mental model” which is developed in interaction with world around us. People primarily learn by actively trying and learning is related to a particular social context. Learner plays a central role in the development of learning activities. Motivation becomes an important stimulating factor. The relevance of this concept for the transport case is that the learning demand of the employer is an important trigger for learning to take place. Works well for informal, practical, ad-hoc, and spontaneous learning. Connectivism focuses on the changes in society when it comes to knowledge and learning. New information media, like You Tube, Facebook and Wikis make it possible to connect different “nodes” of knowledge to “connected knowledge”. This observation is relevant in transport case, because the lorry drivers are increasingly using mobile phones and the Internet which affects their communication patterns, information acquisition and their learning. Weak ties should be used to optimize the links between employees in an organization. Use of mobile devices (smartphones, tablets, laptops) and Internet services like email, YouTube or Facebook, enable the weak links (drivers) to be better informed and have more opportunities to communicate, which can strengthen the social network of the company. Lorry drivers as mobile workers have a “weak tie” with colleagues. In the context of a strong tie group (when workers are friends), learning is not well served, because of the internally directed focus of the group. Learning comprises all interactions with information and as a consequence deals with the capacity of the employees to manage information in a meaningful way. Main actions to integrate the different functionalities into a complete cross functional process: [1]
THREE LEVELS OF LEARNERS
Early development
Competent, experienced Experts

7th INTERNATIONAL MARITIME SCIENCE CONFERENCE
468
April 20th-21st, 2017, Solin, Croatia
- Integration of learning policy in strategic business plans (link between business plan and learning curriculum): This learning plan should contain the vision, the approach and tools for the business plan as prepared for the holding and the different companies, the departments, the job positions and the related tasks.
- Communication Requirements: According to a study, main sources of information are colleagues (85%). Communication should be open, honest and inspiring, respectful, interactive and available for everyone.
- Online newsletter: Offers different features form paper newsletter, such as the comments, which can be used and read by everyone, and can help getting better feedback. The electronic newsletter allows conveying the message in the right context and evoking public interaction. Editors, employees and managers all contribute to the news flow by sending in messages, links, reports, pictures, mobile phone video clips, etc. All this information is being tagged that allows for easy access. Information like diesel prices, pump instructions and so on, should encourage people to use the system. Each employee could have the option to develop an online profile, wich will allow for better
use of the connections with the weak tie colleagues and strengthen the company’s network.
- Microtraining: This can be used as a concept of short focused sessions in group meetings. The microtraining method in practise is perceived as clear and logical. This topic is discussed in next chapter.
- Online Courses: As it was mentioned before, mobile workers are not able to attend place and time fixed learning events. E-learning helps to make learning less place and time dependent. Downside of this model is so called ‘lonely learner experience’ as being very different from what people were used to in the past.
The use of the theoretical concepts and visions as a development framework plays an important role in discussions on choices to be made regarding the feature development of the learning strategy. On virtually any level of development, these concepts supply guidance which is very helpful to transfer the main ideas. Two items seem are crucial. A holistic approach is not only useful to get a good overview, but provides a better insight in the business processes, the opportunities and barriers and the relevance of the redesign. The second item is involvement. The needs and wishes of management and employees are at the core of what this strategy is about. If it fits their needs, they will use it and start depending on it.
Figure 2. The Corporate (e-) Learning Strategy Model [1]

469
Samir Čaušević, Muhamed Begović, Elma Avdagić-Golub, Adisa Hasković
DEVELOPMENT OF GUIDELINES FOR LOGISTICS OPERATORS SKILLS ENHANCEMENT TOOLS AND LEARNING METHODOLOGY
3.3. Principles and benefits of informal learning using microtraining as a support mechanism
Companies very much overestimate and overinvest in formal training programs, while missing out the opportunities to foster more natural and informal learning processes. For informal learning to flourish it is crucial to develop flexible mechanisms which support this kind of learning, while avoiding the drawbacks that coincide with informality. The Microtraining method is being developed as a mechanism to support predominantly informal learning activities. The Microtraining concept is a learning arrangement of about 15 minutes for each learning occasion. [15]
Know-how and learning have become critical properties to have for most companies because of the swift socio-economic and technological changes which reduce the time span from the moment knowledge is gained till it becomes the obsolescent. The incapability of the traditional training and learning organizations to cope with the rising request of the employer mostly relate to inflexibility in time and place of teaching and learning, the irrelevance of the content, the unavailability of experts and the sheer applicability in the workplace of what is learned. The need of forming the collaboration between the formal and informal learning is crucial for improving the methods of learning and introducing the concept of e-learning. Formal learning (in classes and workshops) is not working anymore. As mentioned before 80% of knowledge is acquired by means of informal learning that takes place in the vicinity of the workplace and is in general more relevant for job performance than anything else. Mix of formal and informal training (see Figure 3) can improve the social activity in the company and the individuals themselves. Informal learning is less predictable, nevertheless it is a very natural way of learning, but is often not recognized as learning though to its experience transferring into communication learning which includes the know-how of its previous owners and its new sights of new owners aspects of seeing these knowledge by supporting informal, unofficial, unplanned and ad-hoc learning
processes as well as semi-formal learning activities, using the same basic arrangement. [5] The Microtraining arrangement comprises a time period of 15-20 minutes for each learning occasion, being face-to-face, online or in a blended mode to have a whole process developed for the same cause of learning and improving skills to be more important as an individual in a company.
Figure 3. Acquisition of knowledge and skills through a combination of formal and informal
learning
Microtraining requires an organisational framework to effectively apply this method relative to the learning issue, the skills of the initiator and the employees and their daily working schedule. [15] The seances can be organized rapidly by any of the stakeholders in an up to date and realistic fashion. To be effective the learning act needs to take in consideration the employees' knowledge and experience needs to have a high level of applicability to the daily work routine of the employees and should foster self-directed learning, leading to an economic and efficient knowledge acquisition. In practice, it is shown that this framework helps to collectively develop solutions for workplace related learning with ample opportunities for information transfer. Microtraining supports informal learning close to the workplace, thereby increasing the learning capacity of the company. The Microtraining concept is being developed in the framework of the Leonardo da Vinci program of the European Union. [15]
Knowledge and skills
Informal learning
Formal learning

7th INTERNATIONAL MARITIME SCIENCE CONFERENCE
470
April 20th-21st, 2017, Solin, Croatia
The conditions for Microtraining to function in an organizational setting can be summarized as a set of basic principles: [5]
- Qualifications for the company; - Requirements for the design of a
Microtraining seances; - Requirements for the design of a
Microtraining learning unit; - Developing a Microtraining unit or a series
of units. Experiences with microtraining has lead to following elements wich can show that: [5]
- Individuals connect, collaborate and produce resources that can be used company wide;
- People are brought together and problems are solved collectively;
- Learning processes can take place in the vicinity of the workplace, with ample opportunities for information transfer;
- Target-oriented self-directed learning motivates the staff;
- It saves time by focussing on the activation of essential advancements;
- Companies have to decide about their learning policy in line with their business goals. Employees must recognize the potentials of self development with a share of individual responsibility and for the development of the company;
- On account of its shortness the preparation of microtraining units might take as much time to prepare, as an equally long sequence of traditional training, but allowing much more flexibility in the execution;
- When employees and executives take over the role of a trainer, they need competences to design Microtrainings in an activating way.
Every participants in Microtraining program has to ask the questions that can improve his or hers level of implication in adjustable processes that can be comparable to other level of knowledge in the same field, which can make the 15 minutes of the microtraining even more effective. In general, companies are not sufficiently aware of the benefit of informal learning and underestimate the possibilities they have to use this potential in supplement to their current training and
development programs. Microtrainings can help to add flexibility in the organisation of learning processes, close the void of motivating and supporting the learners to develop, share and apply knowledge to increase their competences and to be better able to assess their performance.
3.4. Language management strategies and best practice in european SME1s: The PIMLICO2 project [10]
According to a survey, a significant amount of business is being lost in Europe as a result of a lack of language skills. Across the sample of 1964 businesses, 11% of respondents had lost a contract as a result of a lack of language skills, but the real figure is likely to be under-reported. Four characteristics of companies were associated with higher performance in international trade:
- the employment of native speakers; - recruiting employees with existing
language skills; - using professional interpreters and
translators; - having a language management plan (or
strategy) in place. Investing in these four elements achieved export sales 44.5% higher than those not making any of these investments. Successful companies use various forms of language management strategies (LMSs) to address the diverse communication interfaces of their international activity. The 40 PIMLICO case studies tend to share a pattern of common characteristics in their language management:
- Functional capability across a range of languages;
- High-level competence in English; - Ability to operate globally and adapt to
differing linguistic demands; - Use of local agents for solving linguistic
and cultural issues; - Pervasive internationalisation underpinned
by HR strategy. There are many different levels of business support available to help companies improve their international trade, which include chambers of
1 Micro, small and medium-sized enterprises 2 Promoting, Implementing, Mapping Language and Intercultural Communication Strategies
471
Samir Čaušević, Muhamed Begović, Elma Avdagić-Golub, Adisa Hasković
DEVELOPMENT OF GUIDELINES FOR LOGISTICS OPERATORS SKILLS ENHANCEMENT TOOLS AND LEARNING METHODOLOGY
industry and commerce, as well as education and government organisations. The discrete level of help for languages is, however, variable between states and between different intermediary organisations. Wide dissemination of the PIMLICO Report and its findings through the information initiative (to business, education and directly to companies) and via the Business Language Platform can significantly enhance companies' prospects of operating more effectively in an increasingly competitive, global and multilingual trading environment. Recommendations for education in the field of language skills and competence:
- Influence schools and universities to take greater account of language issues in the curriculum;
- Set up websites advising SMEs (the category of micro, small and medium-sized enterprises) how to adopt language strategies with specific country information to help trade in those markets;
- Support business intermediaries in the holding of events, campaigns and other dissemination exercises designed to promote the greater use and understanding of language management strategies;
- Link business intermediary websites to the project website so as to promote greater understanding of best practice by international SMEs around Europe;
- Form groups with other exporting SMEs and share resources;
- Link up with SMEs and business intermediaries and offer support services;
- Consider offering a foreign student placement service if not already doing so;
- Make contact with local international SMEs for knowledge exchange purposes, namely to
- seek their assistance in developing new language curricula adapted to international trade, or in developing a relevant service for local businesses, such as the training of language auditors;
- To make sure the language management strategy is well understood and introduced
into MBA courses and other executive education programmes.
5. NEW APPROACHES AND FUTURE EDUCATION
MOOC - Massive Open Online Courses is defined in Oxford dictionary as a course of study made available over the Internet without charge to a very large number of people: anyone who decides to take a MOOC simply logs on to the website and signs up. While MOOCs have arguably been around for a quite long, Dave Cormier is credited with coining the term “MOOC” to describe the Connectivism and Connective Knowledge course delivered by George Siemens and Stephen Downes in 2008. A good examples of MOOCs are Coursera, Udacity’s, MIT Open Courseware etc. Lukosch H. et al. [16] recognise that a big challenge that remains is the motivation of learners in large learning environments. They suggest a board game targeting at an integrated view on disruption and communication management in an intermodal transportation situation. Researh shows that online game works better with fewer roles, requires immediate feedback, and an engaging way of challenge to keep players motivated. Kurapati, S. et al. [17] introduce a new concept of learning and training in complex and dynamic enbironment called Microgames. They represent a shortened form of simulation games with a strong focus on a specific problem and introduce a Microgame ‘Yard Crane Scheduler’ designed for training students and professionals on integrated yard planning in container terminal operations. The initial results of usability studies strongly favor the effectiveness of Microgames for training students and professionals. Klemke R. et al. [18] show that multi-user mobile games can be beneficial to educational scenarios. They suggest the design of an educational board game for the field of disruption handling in logistics processes with aim to foster shared situational awareness, and introduce an open-source mobile serious games platform. Considering the jobs nature variability, there is evident an importance of skills existence to develop new competences and life-long learning. Basic

7th INTERNATIONAL MARITIME SCIENCE CONFERENCE
472
April 20th-21st, 2017, Solin, Croatia
skills and knowledge needs by job function are presented in the following: [19] Managers – have skills that give them ability to recognize new trends, explore new markets and channels, invest in customer relations, optimize processes and comply with new environmental and safety regulations. Business and finance professionals – job function that requires many knowledge and skills aspects as: regulation and finance issues, trade (focus on new trade types), professionals communication, networking, language and intercultural exchange. Engineers – There is focus on interdisciplinary abilities, that also include: e-skills, analytical skills and the ability to learn and implement new technologies. Drivers of vehicles, ship officers and pilots – Job function that requires high level of technological and e-skills since new technologies are likely to be introduced in all transport sectors.
6. CONCLUSIONS
Redesigning the learning process and the introduction of modern technology for educational purposes should be implemented gradually and systemically. In many cases, experience has shown that large financial investments in a complete system are not necessary, and that this approach to training of their own workforce ensured companies the return of their investment and long-term benefits. Training methods of employees in transport companies need to follow modern educational trends and training processes that have already produced positive effects in practice, but the learning process must be at the same time adapted to the core business of the company, its size, number of employees and their current level of education.
REFERENCES
1. Pieter de Vries, Heide Lukosch, Reengineering the Learning Process in a Transport Company, Delft University of Technology, Netherlands
2. De Vries, P.: An Analysis Framework Approach for Managing Corporate E-learning Development, Brussels: De Vries. Doctoral dissertation. (2005)
3. De Vries, P. & Leege. T.: Final Report WP1: Baumaerkte und Lernen: eine Bedarfsanalyse. Reload project. DE/07/LLP-LdV/TOI/147058. Leonardo Project European Union, (2008)
4. De Vries, P. & Lukosch, H.: Supporting Informal Learning at the Workplace. In: IJAC, International Journal of Advanced Corporate Learning. Vol 2, No 3. August 2009. Pp. 39-44. www.i-jac.org (2009)
5. Ray Barton Associates Ltd. Final report: Trends and patterns in Skills and labour shortages, Orleans, Ontario, (2008)
6. Pieter de Vries, Delft University of Technology, Netherlands; Stefan Brall, RWTH Aachen University, Germany, Microtraining as a support mechanism for informal learning, eLearning Papers (2008)
7. Institute of microtraining: http://micro-training.com/
8. Institute of microtraining UK: http://micro-training.co.uk/
9. Hong Tan Van, Fumihiko Nakamura, Satoshi Fujii, Hisashi Emori, Educational methods to change the attitudes of transport planners towards environmentally sustainable transportation systems in developing countries, IATSS Research, Volume 31, Issue 2, 2007, Pages 74–83
10. Report on language management strategies and best practice in European SMEs: The PIMLICO project Chang, L.K. et al, Maritime Routing, Bejing Institue (Bejing, 1997), pp. 90-97.
11. German Federal Ministry of Transport, Building and Urban Affairs, Freight Transport and Logistics Masterplan, Referat A 32, September 2008
12. Transport sector economic analysis: https://ec.europa.eu/jrc/en/research-topic/transport-sector-economic-analysis

473
Samir Čaušević, Muhamed Begović, Elma Avdagić-Golub, Adisa Hasković
DEVELOPMENT OF GUIDELINES FOR LOGISTICS OPERATORS SKILLS ENHANCEMENT TOOLS AND LEARNING METHODOLOGY
13. Logistics Best Practice Guide. A guide to implement best practices in logistics in order to save energy and reduce the environmental impact of logistics. European organisation for forwarding and logistics, retrieved from: http://www.clecat.org/media/sr004osust091104clecatbpgv.1.0.pdf
14. Rosenberg, M.J. Beyond E-learning: Approaches and Technologies to enhance Organizational Knowledge, Learning and Performance. (2006).
15. Open Education Europa: https://www.openeducationeuropa.eu
16. Lukosch H. et al. Design Considerations for Building a Scalable Digital Version of a Multi-player Educational Board Game for a MOOC in Logistics and Transportation. In: Bottino R., Jeuring J., Veltkamp R. (eds) Games and Learning Alliance. GALA 2016.
17. Kurapati, S., Groen, D., Lukosch, H., Verbraeck, A.: Microgames in practice: a case study in container terminal operations. In: The Shift from Teaching to Learning: Individual, Collective and Organizational Learning Through Gaming Simulation, pp. 333–346 (2014)
18. Klemke R., Kurapati S., Lukosch H., Specht M. (2015) Transferring an Educational Board Game to a Multi-user Mobile Learning Game to Increase Shared Situational Awareness. In: Zaphiris P., Ioannou A. (eds) Learning and Collaboration Technologies. LCT 2015.
19. Investing in the Future of Jobs and Skills: Scenarios, implications and options in anticipation of future skills and knowledge needs; European Community Programme for Employment and Social Solidarity - PROGRESS (2007-2013).
7th INTERNATIONAL MARITIME SCIENCE CONFERENCE
474
April 20th-21st, 2017, Solin, Croatia
CURRENT ELECTRONIC CHART DISPLAY AND INFORMATION SYSTEMS (ECDIS) IN USEMarko Čolak, Ivan Toman, Toni Bielić
CURRENT ELECTRONIC CHART DISPLAY AND INFORMATION SYSTEMS (ECDIS) IN USE
Marko Čolak, Ivan Toman, Toni Bielić
(University of Zadar, the Maritime Department, Zadar, Croatia) (E-mail: [email protected])
ABSTRACT The paper illustrates ECDIS - Electronic Chart and Display Information System, its basic performance standards and components, RCDS and ECDIS modes and differences between Raster Navigational Charts (RNCs) and Electronic Navigational Charts (ENCs). Also, different standardized displays and formats, such as S-57 and S-52 formats, are presented. In addition to this, advantages and disadvantages of ECDIS to paper charts have been discussed.
KEY WORDS
Electronic Chart and Display Information System - ECDIS, Raster Navigational Chart - RNC, Raster Chart Display System - RCDS, Electronic Navigational Chart- ENC
1. INTRODUCTION
Fixing ship’ position and plotting the position on a chart are one of the basic tasks of every navigator. As far as paper charts are concerned, the navigator used to spend more time taking fixes and plotting the results than assessing the safety of the ship and her position in terms of navigation hazards. Moreover, the fix only showed where the ship was at the time the fix was taken causing the plotted position to always be “behind the vessel”. In areas where there is a hazard to navigation, particularly in the coastal areas, this is the essential element of safety which needs to be improved.
Technological development has enabled the transfer of paper charts data into computers and integration of real-time positions with the chart display. Along with the ship’s position, the system enables the navigator to use the whole spectrum of other aids such as integrated radar and AIS objects display, kinematic data of ship’s movement such as course, speed or swaying, pilot data display, etc. Satellite fixes are taken far more often than any navigator ever could by classical fixing methods and are far more accurate. Electronic Chart and Display Information System (ECDIS) has been introduced in order to allow the navigator to pay more attention to other

475
Marko Čolak, Ivan Toman, Toni Bielić
CURRENT ELECTRONIC CHART DISPLAY AND INFORMATION SYSTEMS (ECDIS) IN USE
navigational tasks, notably collision avoidance. The system displays electronic charts information and position information obtained from the connected navigation sensors thus allowing the navigator a passage planning and management, and display of relevant navigational data for the purposes of safe navigation. Electronic Navigational Chart (ENC) means the database, standardized as to content, structure and format, issued for use with ECDIS on the authority of a government-authorized Hydrographic Office or other relevant institution and is in compliance with the regulations of the International Hydrographic Organization. The ENC contains all the chart information needed for safe navigation and may contain supplementary information in addition to that contained n the paper chart, such as sailing directions.
2. ECDIS SYSTEMS
There are two types of electronic charts that an ECDIS can display: Raster Navigational Chart (RNC) and vector Electronic Navigational Chart (ENC). Raster Navigational Charts (RNCs) are digital copies of paper charts. It appears on screen as a paper navigational chart. They are produced by scanning paper charts which simplifies the production and reduces the cost of charts. However, these charts are limited in accuracy and data that can be displayed. Zooming in will not enable the appearance of more details; it will merely show details already charted more distinctively. A vector chart is a representation of a database of information. These data are stored in layers and record every nautical chart feature such as coastal relief, land relief or bathymetry of a specific area in a separate layer. All layers mutually overlap. The mariner can view these layers in any combination (coastal relief, bathymetry, ports, sea traffic, Traffic Separation Schemes,etc.) Vector charts contain much more data, they have better zooming options and number of details is larger with larger scale.
The navigator can configure charts and entry relevant data independently, according to his needs. The correction of charts is simple and can be done over the Internet or by external media such as compact discs, USB flash drives, etc. Correction can be also done manually, but in cases when the official correction is still not available for the area of navigation, and it is necessary to enter the correction. According to IMO regulations1 ECDIS is mandatory for all newly built vessels and by mid-2018 all cargo vessels under 3000 GT are requested to install and operate ECDIS. In addition to primary ECDIS system, vessels must have an adequate back-up arrangements in case of an ECDIS failure. The alternate solution is an additional and independent ECDIS which shall be provided as a back-up. The back-up ECDIS should be connected to an independent power supply. The other possibility is carriage and maintenance of up-to-date paper charts.
3. COMPONENTS OF ECDIS
Computer processor, software and network These components control the processing of data from the vessel’s navigation sensors and the flow of information between various system components. Electronic charts allow the integration of data obtained from radar, autopilot, echo sounder and other navigational sensors and equipment into the display. The integration of different types of navigational equipment into a common system significantly reduces navigator’s workload who no longer has to monitor several devices simultaneously as all the relevant information for the safety of navigation are in one place - on the electronic navigational chart which contains several marine navigational data layers that can be switched on and off as needed. Ultimately, such an integration of elements into the common Integrated Bridge System have greatly contributed to the traffic safety, which is the main objective of all the

7th INTERNATIONAL MARITIME SCIENCE CONFERENCE
476
April 20th-21st, 2017, Solin, Croatia
efforts in modernizing both, the navigational equipment and procedures. Chart database The basis of any ECDIS System is a database of digital charts, which may be in either raster (RNC – Raster Navigational Chart) or vector format (ENC – Raster Chart Display System). Charts are stored on a computer disc in files readable by ECDIS. System display This unit displays the electronic chart and indicates the vessel’s position on it and provides other information such as heading, speed, distance to the next waypoint/port of call/destination, etc. There are two modes of display, relative and true. In the relative mode the ship remains fixed in the centre of the screen and the chart shows head-on situation and ship's speed. In true mode, the chart remains fixed and the ship moves across the chart. The display may be north-up, course-up or head-up, depending on the availability of data from a heading sensor (i.e. compass). User interface ECDIS uses interface which allows the navigator to change system parameters, enter data, adjust the display and operate the various functions of the system.
4. ENC COMPONENTS
The basic types of vector data are points, lines and polygons (areas). Points represent latitude and longitude and are used for objects with nonadjacent features, such as lighthouses, buoys, shallows, etc. Lines connect points into one vector object. Common examples are coastline, boundaries of Traffic Separation Schemes (TSS), etc. Polygons are areas enclosed by lines that have the same first and last point. Examples of such objects are Traffic Separation Schemes (TSSs), islands, etc.
5. RCDS MODE
The global Electronic Navigational Chart (ENC) data coverage hasn’t been introduced yet. Instead, Raster Navigational Charts (RNC) and Raster Chart Display System (RCDS) mode are used in areas where there are no ENCs available. This mode is considered an alternative one to the Electronic Chart Display and Information System (ECDIS). Raster data may still be in use until ENC coverage becomes global. When ECDIS operates in RCDS mode it must be used along with the appropriate up to date paper charts. In other words, the system operating in RCDS mode cannot, like ECDIS, replace paper navigational charts. When navigating areas not covered by ENC, ship must be equipped with paper charts for the purpose of navigation, and RCDS should be considered as a mere aid to navigation. The RCDS mode does not have the full functionality of ECDIS. The limitations of RCDS mode are:
• Chart features cannot be simplified or removed to suit particular navigational circumstances or task at hand
• Orientation of the RCDS display may affect the readability of chart text and symbols
• It is not possible to gain additional information about charted objects
• The accuracy of the raster chart data may be less than that of the position-fixing system being used (i.e. Differential GPS). In some instances, this may appear as a shift in position.
• RCDS data will not trigger automatic alarms
• It is not possible to display a depth contour, ship’s safety contour nor many other features necessary for the safe navigation
• Zooming in or zooming out does not influence the quantity of data and it can seriously degrade the legibility of the chart image

477
Marko Čolak, Ivan Toman, Toni Bielić
CURRENT ELECTRONIC CHART DISPLAY AND INFORMATION SYSTEMS (ECDIS) IN USE
6. ECDIS MODE
The system operates in ECDIS mode when Electronic Navigational Charts (ENCs) are used. ENC, as a vector chart, represents the database used by computer which retrieves data and generates the chart display. Electronic Navigational Chart is organized into many separate files or layers allowing the adjustment of chart object display. The system operating in ECDIS mode is considered an equivalent to the up-to-date paper chart.
ECDIS software creates a database from the ENC data called the system electronic navigational chart (SENC) and from this selects information for display. It is an internal system format of Electronic Navigational Chart and is unique for each manufacturer. On the other hand, ECDIS was designed to use internationally standardized ENCs (Electronic Navigational Charts). Only when using ENC data can ECDIS create a SENC chart. Therefore, every manufacturer should be able to use ENCs when installing charts into the system. ECDIS should display the following navigational data:2
• Own ship’s position • Past track with time marks for primary
track • Vectors for speed made good • Electronic range markers • Dead reckoning • Position line and time • Navigation hazards • Planned course, speed and position • Waypoints • Distance to run • Position and time of "wheel over".
Also, the system must have the ability of:
• Radar image and chart overlay for the purpose of noting and identifying navigation marks and hazards
• Determining the difference between true and minimum under- keel clearance
• Information on AIS obtained navigation marks and aids to navigation
• Information on current latitude and longitude, course, speed, minimum under-keel clearance and the wheel over speed
For the purpose of safe navigation, additional navigation systems incorporated into ECDIS can be displayed:
• Objects detected by radar or AIS (Automated Identification System)
• AIS Safety Related Broadcast Messages • Man overboard manoeuvre and Search
and Rescue manoeuvre • NAVTEX (Navigation Telex) messages • Information on tides and currents • Meteorological warnings and weather
forecasts • Information on ice movements
7. TYPES OF ENC DISPLAY
There are four different ENC display settings depending on the information needed by the navigator:3 BASE DISPLAY (the basic display) consists of information which are visible on the chart at all times and they cannot be removed from the display. This includes the following objects:
• Coastline • Own ship’s safety contour • Underwater obstructions (shallow waters,
shipwrecks, etc.) • Surface obstructions (bridges, cables,
etc.) • Traffic separation schemes • Chart scale • Units of depth and height
The base display is an absolute minimum and cannot be reduced. It is not intended to be sufficient for safe navigation.
STANDARD DISPLAY contains all the information found in the base display and some additional information, such as:
7th INTERNATIONAL MARITIME SCIENCE CONFERENCE
478
April 20th-21st, 2017, Solin, Croatia
• Buoys, beacons and other aids to navigation
• Boundaries of fairways • Prohibited and restricted areas • Different warnings
ALL DISPLAY (ALL OTHER INFORMATION DISPLAY) is a type of display which contains information in the form of ENC objects. Such examples, which are not found in Standard Display, but are found in All Other Information Display, are:
• Spot soundings • Submarine cables and pipelines • Ferry routes • Magnetic variation • Place names.
CUSTOMIZED DISPLAY shows certain objects depending on the need of the navigator.
8. ECDIS PERFORMANCE STANDARDS – ENC FORMATS
ENC performance and production standards are important from the aspect of universal usage of technology of different manufacturers and for combining systems and applications. British Admiralty Vector Charts, for example, can be used with ECDIS of different manufacturers, on ships, other navigational simulators and all other ECDIS applications. The same refers to any official ENC version, regardless of the manufacturer. Standardization of ENCs has also enabled standardization of displays. Contours, colours, symbols and all the other ENC elements have been standardized and will be displayed on the screen the same way, regardless of the manufacturer or the ECDIS System. This fact makes mariner’s familiarization with ECDIS easier and reduces the risk of the wrong chart interpretation. S-57 FORMAT S-57 format was published in IHO (International Hydrographic Organization) Special publication No. 57 and was adopted and put in force in its
first 1992 version. S-57 is the IHO standard for the efficient exchange of digital hydrographic data. It has been used almost exclusively for encoding Electronic Navigational Charts (ENCs) to be used by any ECDIS device. S-57 chart standard describes in detail all the hydrographic objects in the Object Catalogue. The Catalogue consists of two chapters that define object classes and object attributes.4 S-52 FORMAT Parallel to the S-57 the IHO has introduced the S-52 format. Its purpose is to standardize ENC display on the ECDIS monitor thus greatly enhancing the safety and efficiency of navigation. Also, some of its objectives are to determine the basic chart content and display aspects, symbol standards, colours and to improve compatibility of the chart display with IHO specifications of the paper chart. Also, it is important to ensure the readability of charts, to avoid any misunderstanding of symbols and to ensure that the ENC display is the same on every ECDIS, regardless of the manufacturer. In addition to S-57 and S-52 there is a whole range of other standards/formats with the objective to improve the ECDIS system and contribute to the safety of navigation as much as possible.
9. ADVANTAGES OF ECDIS
Some of important advantages of ECDIS over paper charts are:
• Continuous monitoring of vessel’s position in real time
• Automatic control of a planned route • Automatic route monitoring, warnings
and indications of navigation hazards • Pilot information available at all times • The use of ECDIS display for the display of
radar, AIS and other equipment • Automatic chart corrections • Standardized display, measure units and
geodetic datum • Head-up orientation

479
Marko Čolak, Ivan Toman, Toni Bielić
CURRENT ELECTRONIC CHART DISPLAY AND INFORMATION SYSTEMS (ECDIS) IN USE
• Possibility of manual adjustment • Voyage record
10. DISADVANTAGES OF ECDIS
There are some limitations of the ECDIS systems as well. These are some of ECDIS and ENC disadvantages.5
• Chart Accuracy • Over-Reliance • Information Overload • Human error • Technical limitation of navigational
sensors • Adjacent chart scales and geodetic datum
do not match • The possibility of technical failure since
the operation relies on power supply
For example, “the size of ECDIS chart display is significantly smaller than the size of the traditional, paper nautical chart. In order to have insight into different scale charts in ECDIS, the operator uses commands “zoom-out/in”, i.e. increased or reduced scale. Such requirements of passing through different scales of one and the same chart in order to have detailed insight into a specific area create the effect of “key- hole” .This is due to the similarity with the attempt to observe a certain area of the paper nautical chart through a narrow key-hole (Evaluating Shipboard Automation, 1996:6-7). In this process, a great deal of information regarding larger chart area must be memorized in order to mentally represent the relationship of a required detailed area with the rest of the chart. It is this strain to memorize that can finally lead to oversight and the wrong decision“ 6 Watchkeepers´ failure to use ECDIS aptly has been identified as one of the causal factors in a number of recent accidents. One example is grounding of oil/chemical tanker Ovit.7 An investigation revealed that: “The deck officers were unable to safely navigate using the vessel’s ECDIS. The route was not properly checked, inappropriate depth and cross track error settings were used, and the scale of ENC in use was unsuitable for the area. The ECDIS
audible alarm was inoperative. Although the crew were aware of this defect, it had not been reported. ECDIS training undertaken by the ship’s master and deck officers had not equipped them with the level of knowledge necessary to operate the system effectively. The serious shortcomings with the navigation on board Ovit highlighted in this investigation had not been identified during the vessel’s recent audits and inspections. There is a strong case to develop and provide tools for auditors and inspectors to check the use and performance of ECDIS. Several of the features of the Maris 900 ECDIS on board Ovit were either difficult to use or appeared not to comply with international standards. As ECDIS is increasingly widely fitted in accordance with mandatory IMO carriage requirements, there would potentially be significant benefit from a testing regime similar to that required for VDRs.” An analysis of the grounding and flooding of the ro-ro ferry Commodore Clipper showed that “ECDIS was not utilised effectively as a navigation aid. In particular, the safety contour value was inappropriate, the cross track error alarm was ignored and the audible alarm was disabled. The layout of the central bridge console prevented the chief officer from utilizing the ECDIS display to support the master during pilotage. The ECDIS non-conformity went undetected by audits and inspections”8. An report of collision between multipurpose cargo vessel Rickmers Dubai with a crane barge, Walcon Wizard, being towed by tug Kingston presents: “It is almost certain that the late detection of Kingston by Rickmers Dubai ’s OOW and his ignorance of the proximity of Walcon Wizard were due to an over-reliance on AIS information shown on the ECDIS.“9 Therefore it concludes: “ECDIS is capable of providing a wealth of information to the user, including charts, waypoints, safe water and overlaid AIS information. However, it is not a ‘one-stop shop’ which is able to provide all of the information required by an OOW. ECDIS must be used in conjunction with other aids to navigation and collision avoidance, particularly radar and visual lookout.“9

7th INTERNATIONAL MARITIME SCIENCE CONFERENCE
480
April 20th-21st, 2017, Solin, Croatia
These examples of accidents show that several issues has to be addressed in order to improve the use of ECDIS equipment on board. Since there are over 30 manufacturers of ECDIS equipment, each with their own designs of user interface, type-specific training is essential7. Furthermore, since ECDIS systems can be operated at a very low level of functionality and with key safety features disabled or circumvented it is important to emphasize the importance of critical safety settings and the significance of the system’s alarms during training and familirisation. Additionaly, generic and type specific trainings should underline limitations of equipment in order to prevent over-reliance.
11. CONCLUSION
The mutual efforts of The International Hydrological Organisation (IHO) and the International Maritime Organisation (IMO) have transformed the navigational cartography and brought it to a whole new level. For centuries, paper charts were ensuring a safe navigation. Their electronic versions were introduced no earlier than the 21st century and they soon became the navigational standard on board new ships. The advantages of ECDIS contributed to the safer navigation. However, training and familirisation should be improved to achieve a proper usage of ECDIS on board.
REFERENCE
1. IMO, Solas Chapter V Regulation 19.2
2. IMO resolution A.817 (19): Performance Standards for Electronic Chart Display and Information Systems (ECDIS)
3. IMO resolution A.817 (19): Performance Standards for Electronic Chart Display and Information Systems (ECDIS), Appendix 2 – SENC Information Available for Display During Route Planning and Route Monitoring
4. Lovrinčević D., Kljajić I., Overview of Standards for Electronic Navigational Charts, Naše more, Vol.61 No.3-4, rujan 2014.
5. Brčić, D., Posebnosti prelaska s papirnatih na elektroničke navigacijske karte, Nastupno predavanje, Pomorski fakultet u Rijeci, Rijeka, 2016.
6. Bielić T., Belamarić G, Actual Problems on Man – Machine Relationship on Board Modern Vessel, 4th International Conference on Ports and Waterways – POWA 2009.
7. MARINE ACCIDENT INVESTIGATION BRANCH, Report on the investigation of the grounding of Ovit in the Dover Strait on 18 September 2013, https://assets.publishing.service.gov.uk/media/547c6f2640f0b60244000007/OvitReport.pdf
8. MARINE ACCIDENT INVESTIGATION BRANCH, Report on the investigation of the grounding and flooding of the ro-ro ferry Commodore Clipper in the approaches to St Peter Port, Guernsey on 14 July 2014, https://assets.publishing.service.gov.uk/media/55c3108aed915d534600000c/MAIBInvReport-18_2015.pdf
9. MARINE ACCIDENT INVESTIGATION BRANCH, Report on the investigation of the collision of Rickmers Dubaiwith the crane bargeWalcon Wizard being towed by the tug Kingston in the south-west lane of of the Dover Strait Traffic Separation Scheme on 11 January 2014, https://assets.publishing.service.gov.uk/media/55c3108aed915d534600000c/MAIBInvReport-18_2015.pdf
481
Maja Čović, Luka Vukić, Merica Slišković
ANALYSIS OF BALLAST WATER QUANTITY AND TYPE OF CARGO IN MAIN PORTS OF CROATIA FOR 2015.
ANALYSIS OF BALLAST WATER QUANTITY AND TYPE OF CARGO IN MAIN PORTS OF CROATIA FOR 2015.Maja Čović, Luka Vukić, Merica Slišković
ANALYSIS OF BALLAST WATER QUANTITY AND TYPE OF CARGO IN MAIN PORTS OF CROATIA FOR 2015.
Maja Čović, Luka Vukić, Merica Slišković
(University of Split, Faculty of Maritime Studies, Split, Croatia)
(E-mail: [email protected])
ABSTRACT
It is estimated that approximately 10 million tons of ballast water is being transmitted per year in Adriatic, from which 1m3 can contain up to 10 000 marine organisms. Transfer of invasive species occurs while loading water at one position, or discharging it on another, which affects stability of the vessel. Potential assimilation of invasive species can lead to the exclusion of native species, which then leads to the disturbance of the ecosystem. In order to protect biodiversity, and to reduce risk of pollution International Convention for the Control and Management of Ships Ballast Water and Sediments was adopted in 2004. This paper analyses type of cargo and quantity of ballast in main Croatian ports for year 2015.
KEY WORDS
Ballast water, convention, cargo type, quantity of ballast water, Croatia.
1. INTRODUCTION
Ships need ballast for safe and successful navigation (National Academies, 1996). Various cargo and/ore passengers may cause ship instability especially when it is not fully laden. The ballast is an additional weight compensating lack of cargo.
Various material have been used before, but today it is used only fresh, brackish or salt water. In 2013, the quantity of ballast water (BW) discharged from vessels exceed 3.1 billion tonnes in the international seaborne trade (David, 2015). Ballast water capacities for different types of ships are shown in Table 1.

7th INTERNATIONAL MARITIME SCIENCE CONFERENCE
482
April 20th-21st, 2017, Solin, Croatia
Table 1. Ballast water capacities for different types of ships
Source: GloBallast Partnerships, 2013
Bulk carriers and oil tankers have greatest capacities for ballast water. Vessel Types, Ballast Needs, and Pumping Rates are shown Table 2. Table 2. Typical Vessel Types, Ballast Needs, and
Pumping Rates
Ballast Needsa Vessel Types Typical Pumping Rates (m3/h)
Ballast replaces cargo Dry bulk carriers 5,000-10,000 Ballast required in large quantities, primarily for return voyage.
Ore carriers 10,000
Tankers 5,000-20,000 Liquefied-gas
carriers 5,000-10,000
Oil bulk ore carriers
10,000-15,000
Ballast for vessel control Container ships 1,000–2,000 Ballast required in almost all loading conditions to control stability, trim, and heel.
Ferries 200–500
General cargo vessels
1,000–2,000
Passenger vessels 200–500 Roll-on, roll-off
vessels 1,000–2,000
Fishing vessels 50 Fish factory
vessels 500
Military vessels 50–100 Ballast for loading and unloading operations
Float-on, float-off vessels
10,000–15,000
Ballast taken on locally in large volumes and discharged in same location.
Heavy lift vessels 5,000
Military amphibious assault vessels
5,000
Barge-carrying cargo vessels
1,000–2,000
Source: National Academies, 1996 Ships can modify the full capacity of ballast in a very short time loading and unloading enormous quantity of water. Ballast water is one of the main vectors of invasive alien species and responsible for the transfer of between 7,000 and 10,000 different species globally each day (Carlton, 1999). Ships' ballast tanks and cargo/ballast holds are their most important location (Carlton and Geller, 1993). The number of introductions by ballast is growing continuously (NRC, 1995). Since 1960 more than 40 species have contaminated the Great Lakes; since 1970 San Francisco Bay has been polluted with more than 50 species (National Academies, 1996); they have also been imported into Dutch ports and some of non-native and toxic phytoplankton can survive and permanently develop (Wetsteyn and Vink, 2001) threatening the natural biodiversity. Such examples show Table 3.
Table 3. Examples of Shipborne Introductions Worldwide since the 1980s
Species Origin Location Dinoflagellates Gymnodinium catenatum Japan Australia Comb Jellyfish (Ctenophora)
Mnemiopsis leidyi North America
Black and Azov Seas
American Comb Jellyfish Polychaete Worms (Annelida)
Marenzelleria viridis North America
Western and Northern Europe
Spionid Tubeworm Mussels and Clams (Bivalvia)
Ensis americanus North America
Western and Northern Europe
American Razor Clam Musculista senhousia Japan New Zealand Japanese Mussel Crabs (Decapoda) Sources: Carlton and Geller, 1993; Carlton et al., 1995; LeMaitre,1995 Convention for the Control and Management of Ships Ballast Water and Sediments was adopted in 2004 (IMO, 2004). Law on Adoption of the International Convention for the Control and Management of Ships’ Ballast Water and Sediments was brought by the Croatian Parliament on 30 April

483
Maja Čović, Luka Vukić, Merica Slišković
ANALYSIS OF BALLAST WATER QUANTITY AND TYPE OF CARGO IN MAIN PORTS OF CROATIA FOR 2015.
2010 (Učur, 2011). International convention is set to enter into force on September 8th, 2017.
2. AIM AND METHOD
In order to analyse preparation of Croatian ports for implementation, data considering quantity of ballast and type of cargo is being observed for period of 2 years (2014 and 2015). Data regarding quantity of ballast water and type of cargo is analysed using comparative method to observe trends regarding subject. Data analysed in paper is obtained both from The Ministry of Maritime Affairs, Transport and Infrastructure of the Republic of Croatia and Croatian ship owners association Mare Nostrum (Mare Nostrum, 2016).
3. BW QUANTITY AND TYPE OF VESSELS IN CROATIAN PORTS Data observing ballast water information for 2 year interval are gathered, which allows analysis of ballast water quantity. Data included in analysis is obtained from Ministry of Maritime Affairs, Transport and Infrastructure of the Republic of Croatia (Ministry 2016). The quantity of ballast
water in Croatian main ports in 2015 is shown in Table 4. 3.1. BW in 2014 and 2015
In 2015, 971 vessels unloaded 3.140.829,17 m3 of ballast, from total of 7.316.440,521 m3 of ballast imported in Adriatic Sea. It is slightly less comparing to 2014 when 3.497.178,719 m3 was discharged, from total of 6.497.139,862 m3 ballast driven by vessels. There were 5517 arrivals from which 1124 vessels unloaded ballast water. In Croatia, the largest amount of water was discharged in Port of Rijeka. Port of Split and Port of Dubrovnik had a slight growth in 2015 comparing to 2014. In main Croatian ports there were decreasing trend regarding volume of ballast water discharged in observed years, i.g. Port of Rijeka where 1.828.201,799 m3 was discharged in 2014, and 1.595.295,49 m3 in 2015. All other ports were reporting decreasing trend; only Port of Split had growth in discharged quantity of BW, from 412.710,5 m3 in 2014 to 546.823,35 m3 in 2015.
Table 4. Ballast water data in Croatian main ports in year 2015
Harbour
Master's Office
No. of
arrivals
Reported BW
BW capacity
[m3]
Vessels with BW
Shipped over
BW [m3]
No. of vessels that have discharged
BW
Volume of
ballast water discharged BW
[m3]
RIJEKA
1056
988
10.278.546,67
809
5.097.207,348
283
1.595.295,49
PLOČE
302
302
1.778.760,233
233
486.979,86
64
100.259,18
PULA
1307
484
1.332.700,099
402
446.371,976
263
796.275,56
ŠIBENIK
152
127
208.006,406
96
108.671,64
51
77.234,89
ZADAR
223
207
275.657,514
179
82.865,19
34
21.753,19
DUBROVNIK
948
800
1.348.501,23
702
345.703,51
9
3187,51
SENJ
2
0
0
0
0
0
0
SPLIT
1414
1197
2.012.742,924
916
748.640,9967
267
546.823,35
Source: Made by author using data provided from Ministry of Maritime Affairs, Transport and Infrastructure of the Republic of Croatia 2016
The Port of Split has recorded more arrivals comparing with Port of Rijeka, but only 1/3 volume of ballast water discharged in Rijeka was discharged in port of Split. This can be explained by the fact that
Split is largest passenger port in Croatia with about 80% of passenger vessels in arrival while Rijeka is mostly cargo port with only few percent passenger ships per year.

7th INTERNATIONAL MARITIME SCIENCE CONFERENCE
484
April 20th-21st, 2017, Solin, Croatia
3.2. Origin of BW discharged in Croatia In 2015, 76% of ballast water came from Adriatic Sea. Figure 1. shows the origin of discharged ballast water in 2015.
Figure 1. Origin of discharged ballast water discharged in 2015 (Source: Made by author using data provided from Ministry of Maritime Affairs, Transport and Infrastructure of the Republic of Croatia 2016)
In 2015, there is slight growth regarding the ballast from other Sea, but there were less vessels from Adriatic Sea discharging ballast. Quantity increased mostly for ballast water from other Sea; from
approximately 250.000 m3 in 2014 the quantity grew up to almost 800.000 m3 in 2015.
This is a continuous trend considering that 90% of ballast water discharged in 2011 was from Adriatic Sea, and only 76% in year 2015 is from Adriatic Sea. In 2015, 9% of BW was from other seas.
Also, quantity of ballast water from Mediterranean Sea shows decreasing trend in year 2015.
The difference in salinity from other Sea is enough to cause a difference in density which is why Ordinance on ballast water management and control in Article 13 states that ships which perform ballast water exchange as a method of ballast water management can discharge sea-water with salinity above 36‰ or in cases when ballast water salinity is lower than 36‰, additional analyses are required.
The average salinity of the Adriatic Sea is higher than world average, about 38.3‰.
Figure 2. shows comparison between years 2014 and 2015 according to origin of discharged BW.
Figure 2. Total BW discharged in 2014 and 2015 (m3) (Source: Made by author using data provided from Ministry of Maritime Affairs, Transport and Infrastructure of the Republic of the Croatia 2016
76%
15% 9% From Adria0c Sea
From Adria0c Sea From Mediterranean Sea From other Sea 2014 2839095.649 410301.87 247781.2
2015 2120027.98 247288.15 773513.04
0
500000
1000000
1500000
2000000
2500000
3000000
Total of B
W discharged (m
³) fo
r 20
14. a
nd 2
015.
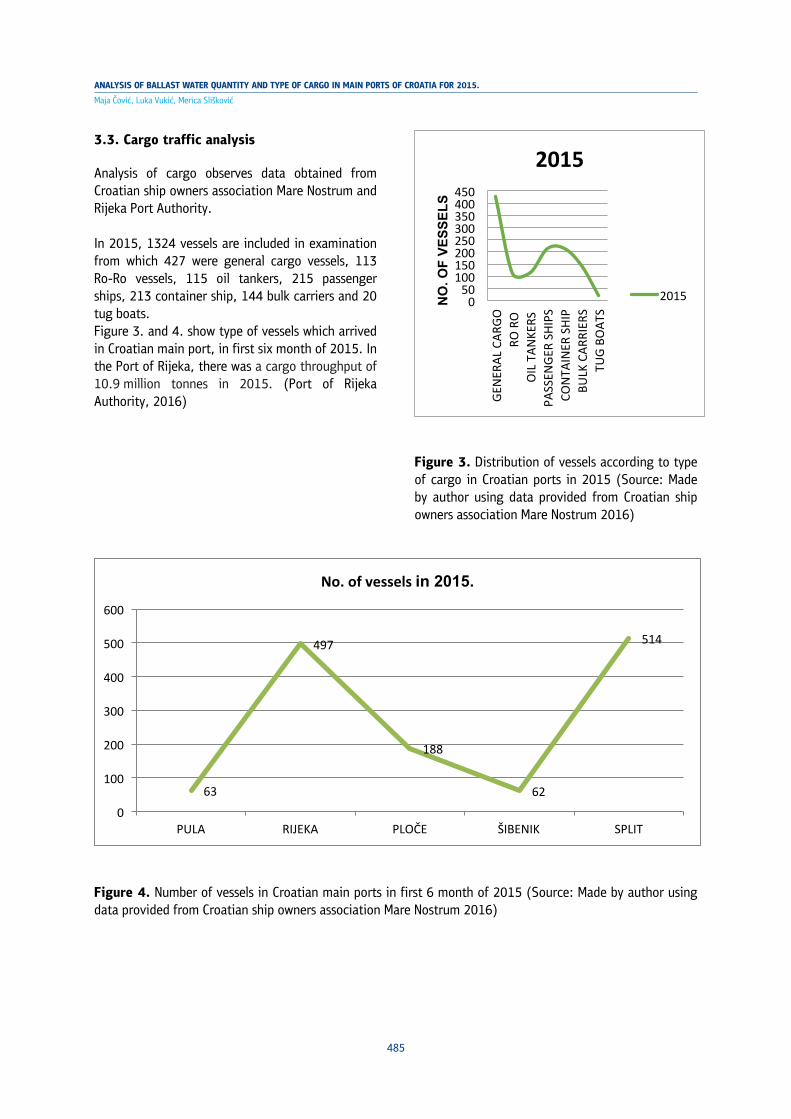
485
Maja Čović, Luka Vukić, Merica Slišković
ANALYSIS OF BALLAST WATER QUANTITY AND TYPE OF CARGO IN MAIN PORTS OF CROATIA FOR 2015.
3.3. Cargo traffic analysis
Analysis of cargo observes data obtained from Croatian ship owners association Mare Nostrum and Rijeka Port Authority. In 2015, 1324 vessels are included in examination from which 427 were general cargo vessels, 113 Ro-Ro vessels, 115 oil tankers, 215 passenger ships, 213 container ship, 144 bulk carriers and 20 tug boats. Figure 3. and 4. show type of vessels which arrived in Croatian main port, in first six month of 2015. In the Port of Rijeka, there was a cargo throughput of 10.9 million tonnes in 2015. (Port of Rijeka Authority, 2016)
Figure 3. Distribution of vessels according to type of cargo in Croatian ports in 2015 (Source: Made by author using data provided from Croatian ship owners association Mare Nostrum 2016)
Figure 4. Number of vessels in Croatian main ports in first 6 month of 2015 (Source: Made by author using data provided from Croatian ship owners association Mare Nostrum 2016)
0 50
100 150 200 250 300 350 400 450
GENER
AL C
ARGO
RO
RO
OIL T
ANKE
RS
PASS
ENGE
R SH
IPS
CONTA
INER
SHI
P BU
LK C
ARRI
ERS
TUG
BOAT
S
NO
. OF
VESS
ELS
2015
2015
63
497
188
62
514
0
100
200
300
400
500
600
PULA RIJEKA PLOČE ŠIBENIK SPLIT
No. of vessels in 2015.

7th INTERNATIONAL MARITIME SCIENCE CONFERENCE
486
April 20th-21st, 2017, Solin, Croatia
4. CONCLUSION
Croatia is currently in procedure of implementing orders which regard International convention set to enter into force on September 8, 2017. By gathering data about ballast quantity and origin, it is possible to determine and control potential risks regarding ecological safety of the sea. There is a constant rising trend of ballast water from other seas. The largest quantity of ballast is discharged by cargo vessels which use ballast water to provide stability. Bulk carriers and oil tankers are the largest BW users. It explains why the largest quantity of ballast water is discharged in Port of Rijeka with the largest annual cargo throughput. REFERENCES
1. Carlton J, Reid D, van Leeuwen H 1995, The role of
shipping in the introduction of nonindigenous aquatic
organisms to the coastal waters of the United States
(other than the Great Lakes)
and an analysis of control options. Shipping study I.
USCG report no. CG-D-11-95. National
Technical Information Service, Springfield
2. Carlton JT 1999. The scale and ecological consequences
of biological invasions in the world’s oceans. In: O.T.
Sandlund, P.J. Schei & A. Viken (eds.). Invasive species
and biodiversity management. Kluwer Academic
Publishers, The Netherlands: 195-212.
3. Carlton JT, Geller JB, 1993. Ecological roulette: The
global transport of nonindigenous marine organisms.
Science 261: 78-82.
4. David M 2015, Vessels and Ballast Water, In: David M,
Gollasch S (eds.) 2015, Global Maritime Transport and
Ballast
Water Management, Invading Nature - Springer Series in
Invasion Ecology 8,
DOI 10.1007/978-94-017-9367-4_2
5. GloBallast Partnerships 2013, Ballast water as a vector. Available from: http://globallast.imo.org/ballast-water-as-a-vector/
6. IMO 2004, International Convention for the Control and Management of Ships' Ballast Water and Sediments (BWM). Available from: http://www.imo.org/en/About/Conventions/ListOfConventions/Pages/International-Convention-for-the-Control-and-Management-of-Ships'-Ballast-Water-and-Sediments-(BWM).aspx
7. LeMaitre R 1995, On the introduction of the Indo-Pacific
portunid crab Charybdis helleri, in Florida. Proceedings,
Biological Society of Washington 108:643–648.
8. Mare Nostrum 2016, Croatia - GloBallast National Global Industry Alliance (GIA) Conference on Ballast Water Management, Croatian ship owners’ association. Available from: http://csamarenostrum.hr/en/dogadanja/?index=5&cont=date_87
9. Ministry of Maritime Affairs, Transport and Infrastructure of the Republic of Croatia 2013, Ordinance on ballast water management and control. Available from: http://www.mppi.hr/UserDocsImages/BWM%20Regulation%20-%20Croatia%20-%20Objavljeni%20Pravilnik%20ENG%2010-5_13.pdf
10. National Academies of Sciences, Engineering, and Medicine 1996, Stemming the Tide: Controlling Introductions of Non-indigenous Species by Ships' Ballast Water (1996) National Academy Press, Washington, D.C.,DOI: https://doi.org/10.17226/5294
11. NRC 1995, Understanding Marine Biodiversity: A Research
Agenda for the Nation. Ocean Studies Board, National
Research Council. Washington, D.C.: National Academy
Press.
12. Port of Rijeka Authority, avilable from http://www.portauthority.hr/documents/Promet+po+vrstama+tereta.pdf
13. Učur M 2011, International convention for the control
and management of ships’ ballast water and sediments
(IMO, 2004), „Naše more“ 58 (3-4), 124-131.
14. Wetsteyn LPMJ, Vink M 2001, Ballast water, Report
RIKZ/2001.026. Available from:
http://edepot.wur.nl/174300

487
Elen Twrdy, Marina Zanne, Milan Batista
ANALYSIS OF THROUGHPUT IN THE SELECTED PORTS OF SOUTH EAST EUROPE
ANALYSIS OF THROUGHPUT IN THE SELECTED PORTS OF SOUTH EAST EUROPEElen Twrdy, Marina Zanne, Milan Batista
ANALYSIS OF THROUGHPUT IN THE SELECTED PORTS OF SOUTH EAST EUROPE
Elen Twrdy, Marina Zanne, Milan Batista
(University of Ljubljana, Faculty of Maritime Studies and Transport, Portorož, Slovenia)
(E-mail: [email protected])
ABSTRACT
The ports of North Adriatic, Aegean and west Black Sea have a geographic precondition to serve the markets of South East Europe. Together these ports were together handling around 200 million tons per year in the last decade. In this paper, the authors have analyzed the throughput of nine selected ports in the three regions for three main cargo groups, namely containers, liquid cargo and dry bulk cargo. For the purpose of analysis, a pre-processor was created to allow the extraction and cleaning of Eurostat data. Besides determining the trends, the authors have also calculated the Herfindahl-Hirschman index to estimate the degree of concentration in every single market. However, to better determine the level of competition among the ports further division of cargo has been done and maritime destinations and origins have been identified. Unfortunately, the available data does not allow the determination of inland markets.
KEY WORDS
Port’s throughput, Herfindahl-Hirschman index, North Adriatic ports, Aegean ports, west Black Sea ports, port’s hinterland, South East Europe
1. INTRODUCTION
Ports are complex entities that have an important role in transportation of freight, given the fact that from 80 (UNCTAD, 2014) to 90 percent (ICS, 2015) of global trade in terms of volume is at certain point transported by sea. As such, they play an important role in national economies as well as in the economies in catchment areas. Ports are important for the EU as well. On around 70,000 km of coast, there are approximately 1,200 seaports that all together handled more than 3.78 billion tons of cargo in 2015 (Eurostat, 2016). In fact, around 74% of extra-EU goods as well as 37% of the intra-EU goods are shipped
through the ports (EC, 2013). However, not all ports are equally represented in European seaborne trade. Ports differ in various aspects, primarily in the mode of governance and management as well as in their business policies. These elements are driven by the existing demand, national legislation and availability of resources, and are reflected in the size and importance of the port. In this paper we are focused on the international multi-purpose cargo ports located on the shores of “continental” part of South-Eastern Europe (SEE), meaning that we left Turkey out of our analysis; but, we have included some ports of Adriatic Italy, because of

7th INTERNATIONAL MARITIME SCIENCE CONFERENCE
488
April 20th-21st, 2017, Solin, Croatia
geographic proximity and potentially shared hinterland. In literature we can find many publications dealing with port performance, competition or success factors determination, but these publications mainly deal with the container ports (see eg. Hoshino, 2010; Bichou, 2013; De Oliveira & Cariou , 2015; Twrdy & Batista, 2016). We are not seeking to determine the factors affecting the performance of the selected ports or to provide any forecasts, instead, we are interested to check how cargo enters or leaves the South East European countries by sea, how the throughput in selected SEE ports changes over time and what are the main maritime origins and destinations of the cargo.
2. DATA AND METHODS
Our main source of data on ports’ throughput is Eurostat, more precisely quarterly data on gross weight of goods transported to and from main ports by direction and type of traffic (national and international). The latest update of this data base is from January 2017, and this version includes 856,231 values ranging from 1997Q1 to 2016Q3 (Eurostat, 2016). With the home developed pre-processor, we performed extraction and cleaning of data to form a time series for the ten-year period from 2006 to 2015. Ports operate in different economic, social, and fiscal environments. Thus, in a multiport performance evaluation approach, where the performance of one port is compared to that of another, similar ports should be used (Talley, 2009). However, ports evaluate their performance also by comparing their actual and optimum throughputs or by evaluating their performance in a time series and in such a way assess the adequacy of supply in relation to demand. We have selected nine ports in the SEE based on their annual throughput and the importance in trading flows. For easier handling we divided these ports into three groups, namely NAPA (North Adriatic Ports Association), Aegean Sea and (west) Black Sea. We have analyzed the time series of total throughput in these ports. Then we have conducted the comparative analysis for these ports for overall throughput and for the
throughput of three main cargo groups, to be exact, containers, dry bulk and liquid bulk cargos. In this way we searched for similarities and differences among the ports. Finally, we calculated Herfindahl-Hirschman index for all cargo types. The Herfindahl-Hirschman Index (HHI) is a method for estimating the degree of concentration in a selected market. In a perfectly competitive market, HHI approaches zero. In a monopoly, HHI approaches 10,000. It can be simply calculated by the following equation:
∑=
=N
IisHHI
1
2 (1)
where si is the market share of port i, and N is the number of ports.
3. THE REGION OF OUR INTEREST
The past decades have been a period of great and rapid changes in the political regime and economic status of several SEE countries. Many of these countries have abandoned their closed regimes, undergone transition process, and are now members of European Union (EU). With the opening of the countries ten Pan-European corridors linking Central Europe with the countries of East and South East Europe were defined. Now, freshly defined TEN-T corridors pass through the new European member states, and in fact, eight out of nine ports under investigation in this paper are included in the core TEN-T from 2014. These ports are the Slovenian port of Koper, Italian ports Trieste and Venice, Croatian port of Rijeka, Greek ports Piraeus (Athens) and Thessaloniki, Romanian port of Constanta and Bulgarian port of Burgas. The remaining Bulgarian port of Varna, which is included in our analysis, is included in the comprehensive TEN-T network. These nine ports together handled around 212 million tons of cargo in 2015 to serve the economies of many countries in the South East and also Central Europe. The economic catchment area that a ports serves is called hinterland. Its size can depend on combination of economic structure, size and distribution of industry, population and geography, but also on the ease, speed and cost of transportation between port and the hinterland destinations (Sorgenfrei, 2013).

489
Elen Twrdy, Marina Zanne, Milan Batista
ANALYSIS OF THROUGHPUT IN THE SELECTED PORTS OF SOUTH EAST EUROPE
The primary hinterland of a seaport can be defined as region with no-interport competition and strong focus on local volumes. The secondary hinterland compounds the area with intense competition of different logistic chains (Ninnemann, 2015). Božičević (1996) approximated these catchment areas with the distances; primary hinterland lies within a radius of 250 km, and the secondary hinterland in the radius of around 500 km from the port. However, large seaports can have catchment areas of 1,000
km or more for particular cargos. For example, the hinterland of Constanta port comprises countries from Central and Eastern Europe, including Germany, Austria, Czech Republic, Slovakia, Hungary, Slovenia, Croatia, Serbia, Bulgaria and Moldavia (Racautanu, 2013). Besides Romania of course. On the other hand, a 1,200 km distant port of Koper serves the Slovenian economy as well as Austrian, Italian, Hungarian, Slovak, Czech, German as well as Croatian, Bosnian and Serbian economy.
Legend: port
catchment area (300, 600 & 800 km)
Germany Czech Republic
Switzerland
Poland
KoperTrieste
VeniceRijeka
Constanta
Burgas
Varna
Piraeus
Thessaloniki
Figure 1. Selected ports in SEE and their overlapping catchemnt areas
Although the catchment areas of at least some ports of our interest reach also the countries of Central Europe, their key markets are the countries of “continental” SEE with around 145 million inhabitants. Their average GDP per capita is 16,800 EUR1 (calculated from CIA, 2016 with average exchange rate between EUR and US$ for 2015 being 1US$=0.885EUR) which is well below the EU average of around 28,000 EUR. However, if GDP per capita is translated into purchasing
power parity this difference shrinks. Share of industrial production within GDP composition is around 27%, which is similar to EU level; however, unemployment rate is in majority of these countries above the EU average. Nevertheless, the economy is growing, but this region still produced less freight flows than other parts of Europe. In addition, according to CIA (2016), these countries mainly trade with the neighboring countries; only China is an important import partner for several

7th INTERNATIONAL MARITIME SCIENCE CONFERENCE
490
April 20th-21st, 2017, Solin, Croatia
SEE (and also Central European) countries. Thus is not surprising that growing intra-European freight flows (Orlandi & Pitaccolo, 2010) are recorded in this region and they are mainly supported by road infrastructures.
4. THE ANALYSIS
The ports of our interest are involved in three types of maritime transport, namely long-distance intercontinental maritime transport and short to medium-distance intra-Mediterranean transport, including feeder services (international services) as well as in domestic transport.
Table 1. Total throughput in the selected ports in the period from 2006 to 2015
Zone Port 2006 2009 2012 2015 Average (2006-2015)
AAGR (2006-2015)
CAGR (2006-2015)
IN/OUT (average)
NAPA Koper 15,391 13,322 16,906 19,931 16,384 3.3 2.9 69/31
Trieste 44,644 40,986 42,145 44,798 42,521 0.3 0.0 86/14
Venice 32,010 26,640 24,598 20,489 26,070 -4.7 -4.8 83/17
Rijeka* 12,289 11,896 9,427 10,769 11,033 -0.7 -1.5 72/28
SUM 104,334 92,844 93,076 95,987 96,008 -0.9 -0.9 81/19
Aegean Sea
Piraeus 19,954 10,061 35,189 38,322 24,944 13.9 7.5 52/48
Thessaloniki 16,359 14,213 13,964 14,710 14,873 -0.6 -1.2 73/27
SUM 36,313 24,274 49,153 53,032 39,818 6.2 4.3 60/40
Black Sea Burgas 17,551 13,337 14,869 16,075 15,156 -0.7 -1.0 61/39
Varna 9,962 8,555 11,145 11,090 10,670 2.2 1.2 40/60
Constanta 42,887 29,181 31,939 36,277 36,276 -0.8 -1.8 47/53
SUM 70,400 51,073 57,953 63,442 62,102 -0.4 -1.1 49/51 TOTAL SUM 211,047 168,191 200,182 212,461 197,928 0.3 0.1 67/33
Note: * - Rijeka consists of three separate port areas, namely Rijeka, Bakar and Omišalj
The calculation of AAGR can produce some misleading results if the period in which high oscillations occurred is included in the analysis; the drop cannot exceed 100% while the following increase can be more than 100%, therefore the calculation of CAGR can provide more accurate information by annihilating large short-term fluctuations. As can be seen, the ports within the single regions do not follow the same path;
however, the summarized throughput has dropped in the analyzed period in all of the regions. Some ports have somewhat altered their throughput structure in the period from 2006 to 2015; for example, the port of Venice handled in 2015 43% of dry cargo less than in 2006, while at the same time the same cargo group traffic increased by 32% in the port of Constanta, and Piraeus became completely container oriented port.
__________________________ 1 Italian regions are excluded

491
Elen Twrdy, Marina Zanne, Milan Batista
ANALYSIS OF THROUGHPUT IN THE SELECTED PORTS OF SOUTH EAST EUROPE
Figure 2. Throughput by port in 2006 and 2015
Container throughput increased the most in the port of Koper; in fact, it increased by 343% from 2006 to 2015 and in 2015 container throughput represented 36% of total throughput in comparison to 14% in 2006. The traffic of other cargos registered the highest growth in the ports of Koper and Trieste; 208 and 266% respectively. In all other analyzed ports, the traffic of these cargoes decreased.
In most ports included in our research, the throughput of liquid cargoes declined; however, it still represents the largest amount of cargo handled in these ports. Similarly, also the traffic of dry bulk cargos decreased, and consequently containers became the second most important cargo group handled in the ports of SEE as can be seen from the Figure 3.
Figure 3. Throughput by cargo type in 2006 and 2015
0 5
10 15 20 25 30 35 40 45 50
Kop
er
Trie
ste
Veni
ce
Rije
ka
Pira
eus
Thes
salo
niki
Bur
gas
Varn
a
Con
stan
ta
Kop
er
Trie
ste
Veni
ce
Rije
ka
Pira
eus
Thes
salo
niki
Bur
gas
Varn
a
Con
stan
ta
2006 2015
Mill
ion
tons
Containers Dry bulk goods Liquid bulk goods Other goods
0 10 20 30 40 50 60 70 80 90 100
Other cargo
Liquid bulk
Dry bulk
Conatiners
Other cargo
Liquid bulk
Dry bulk
Conatiners
2015
20
06
Million tons Koper Trieste Venice Rijeka Piraeus

7th INTERNATIONAL MARITIME SCIENCE CONFERENCE
492
April 20th-21st, 2017, Solin, Croatia
Between 2006 and 2015 the largest growth of traffic was recorded for containers; the total traffic increased by almost 70%. In addition, the traffic of other cargo increased (8%), while dry bulk and liquid bulk flows decreased by 10 and 20% respectively.
4.1. The throughput of containers in selected SEE ports
According to Eurostat data the port of Piraeus is the most important port for container traffic in the SEE region. As such it significantly influences the total throughput of containers arriving or leaving the region as can be seen from the
following figure. Enormous growth of container traffic in the port of Piraeus started when COSCO Pacific Limited, subsidiary of COSCO Group, which is one of the world's top terminal operators, started with the operations. In 2015 the port of Piraeus handled 95% of all containers handled in Greece. At the same time, the traffic of containers is dropping in the Black Sea ports; in 2015 the Black Sea ports handled only 57% of container throughput in 2006. Among these ports, Bulgarian ports are completely unimportant with 1 (Burgas) and 3% (Varna) of total containers throughput respectively.
Figure 4. Throughput of containers in selected SEE ports; average share and trends
The Herfindahl-Hirschman Index for the container throughput is 2,666 and it indicates highly concentrated market; the concentration of container flows is in the port of Piraeus. However, as can be seen from the following table the ports from distant sub-regions serve different markets
(NAPA ports versus Aegean and Black Sea ports), at least by the available data, so the growth of throughput in the port of Piraeus currently does not endanger seriously the container throughput in NAPA ports.
Table 2. Main maritime origins and destination for container flows in the region; averaged for the period from 2006 to 2015
Port Inwards Outwards Average of total (000 tons)
IN/OUT share
Trend
Piraeus Turkey (19%), Italy (9%), Greece (7%)
Turkey (15%), Italy (8%), Greece (6%)
19,559 51/49 ö
Constanta* Turkey (3%), Italy (2%), Greece (2%)
Turkey (13%), Ukraine (6%), Egypt (5%)
7,012 48/52 ø
Koper Egypt (21%), South Korea (20%), Italy (18%)
Egypt (39%), Italy (16%), Israel (10%)
4,089 50/50 ö
Note: * 83% of inward and 29% of outward flows are identified as “unknown”
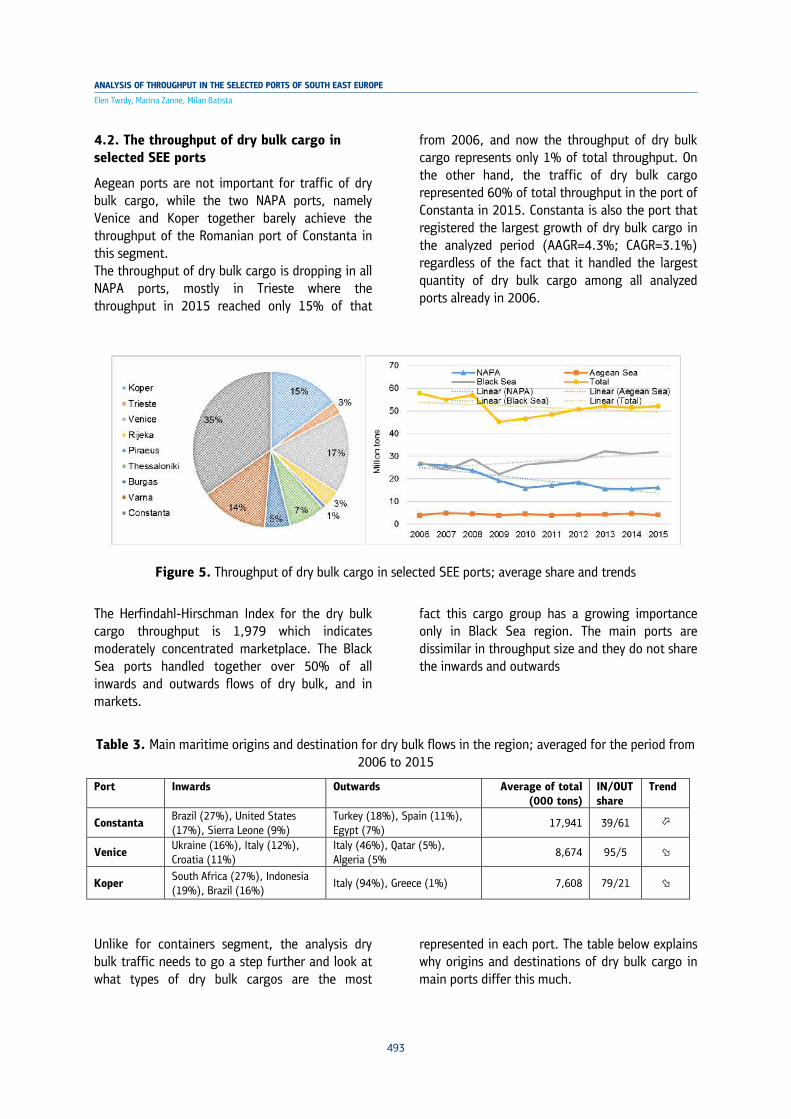
493
Elen Twrdy, Marina Zanne, Milan Batista
ANALYSIS OF THROUGHPUT IN THE SELECTED PORTS OF SOUTH EAST EUROPE
4.2. The throughput of dry bulk cargo in selected SEE ports
Aegean ports are not important for traffic of dry bulk cargo, while the two NAPA ports, namely Venice and Koper together barely achieve the throughput of the Romanian port of Constanta in this segment. The throughput of dry bulk cargo is dropping in all NAPA ports, mostly in Trieste where the throughput in 2015 reached only 15% of that
from 2006, and now the throughput of dry bulk cargo represents only 1% of total throughput. On the other hand, the traffic of dry bulk cargo represented 60% of total throughput in the port of Constanta in 2015. Constanta is also the port that registered the largest growth of dry bulk cargo in the analyzed period (AAGR=4.3%; CAGR=3.1%) regardless of the fact that it handled the largest quantity of dry bulk cargo among all analyzed ports already in 2006.
Figure 5. Throughput of dry bulk cargo in selected SEE ports; average share and trends
The Herfindahl-Hirschman Index for the dry bulk cargo throughput is 1,979 which indicates moderately concentrated marketplace. The Black Sea ports handled together over 50% of all inwards and outwards flows of dry bulk, and in
fact this cargo group has a growing importance only in Black Sea region. The main ports are dissimilar in throughput size and they do not share the inwards and outwards
markets.
Table 3. Main maritime origins and destination for dry bulk flows in the region; averaged for the period from 2006 to 2015
Port Inwards Outwards Average of total (000 tons)
IN/OUT share
Trend
Constanta Brazil (27%), United States (17%), Sierra Leone (9%)
Turkey (18%), Spain (11%), Egypt (7%)
17,941 39/61 ö
Venice Ukraine (16%), Italy (12%), Croatia (11%)
Italy (46%), Qatar (5%), Algeria (5%
8,674 95/5 ø
Koper South Africa (27%), Indonesia (19%), Brazil (16%)
Italy (94%), Greece (1%) 7,608 79/21 ø
Unlike for containers segment, the analysis dry bulk traffic needs to go a step further and look at what types of dry bulk cargos are the most
represented in each port. The table below explains why origins and destinations of dry bulk cargo in main ports differ this much.

7th INTERNATIONAL MARITIME SCIENCE CONFERENCE
494
April 20th-21st, 2017, Solin, Croatia
Table 4. Structure of dry bulk cargo flows in main ports
Port Inwards Outwards
Constanta Coal (30%), ores (21%), agricultural products (12%)
Agricultural products (73%), ores (5%), coal (2%)
Venice Coal (24%), agricultural products (23%), ores (3%)
Agricultural products (37%)
Koper Coal (43%), ores (30%), agricultural products (11%)
Coal (93%), agricultural products (6%)
While iron ore from Brazil represents 28% of the dry bulk cargo handled in the three main ports of SEE, the ore comes from various countries, mainly from United States, Indonesia and South Africa.
4.3. The throughput of liquid bulk cargo in selected SEE ports
The throughput of liquid bulk cargo is growing only in Koper (+58% in 2015 in respect to 2006), Piraeus (+36%), Varna (+32%) and Burgas
(+2%); however, this cargo is of marginal importance for all these ports, representing only around 10% of total throughput in 2015 in each. In spite of this growth, the total throughput of liquid bulk dropped by more than 20% in the selected SEE ports in the period from 2006 to 2015, because the decrease of throughput was recorded in two main ports for liquid cargos, that is in Trieste and Venice. The decrease was 16 and 39% respectively.
Figure 6. Throughput of liquid bulk cargo in selected SEE ports; average share and trends
The Herfindahl-Hirschman Index for the liquid bulk cargo throughput is 2,298 which indicates moderately concentrated market; in fact, two
thirds of all liquid cargo flows in the SEE ports are handled by NAPA ports.
Table 5. Main maritime origins and destination for liquid cargo flows in the region; averaged for the period from 2006 to 2015
Port Inwards Outwards Average of total (000 tons)
IN/OUT Trend
Trieste Russia (30%), Libya (20%), Turkey (11%)
Italy (52%), Russia (11%), Turkey (10%)
31,570 98/2 ø
Venice Italy (47%), Libya (16%), Egypt (14%)
Italy (82%), Netherlands (3%), Algeria (3%)
10,841 90/10 ø
Burgas Russia (80%), Ukraine (14%), Georgia (2%)
Singapore (22%), Turkey (16%), Gibraltar (16%)
10,248 65/35 ó

495
Elen Twrdy, Marina Zanne, Milan Batista
ANALYSIS OF THROUGHPUT IN THE SELECTED PORTS OF SOUTH EAST EUROPE
The sea origins and destinations of liquid cargo handled in the SEE ports differ in accordance to the structure of throughput; however, Russia and
in previous years Libya are the most important origins.
Table 6. Structure of dry liquid cargo flows in main ports
Port Inwards Outwards
Trieste Crude oil (94%), refined products (3%)
Crude oil (65%), refined products (20%)
Venice Crude oil (46%), refined products (44%)
Refined products (60%), crude oil (18%)
Burgas Crude oil (87%), refined products (11%)
Refined products (94%), crude oil (3%)
The port of Trieste and the port of Burgas are mainly handling crude oil; they especially serve as entrance points for crude oil into SEE region. Regardless of the sanctions imposed to Russia in February 2014, the import of Russian crude oil through the port of Burgas increased to 5 million tons in 2015 in comparison to 4 million tons a year before. In average, crude oil import from Russia represents 81,5% and in 2015 it represented 83%. Ukraine was the second most important import market for crude oil, but the imports completely stopped in 2011. In 2015 Turkey, Georgia and Egypt as the three most important import market after Russia, together accumulated barely 10,1%. On the other hand, the imports of crude oil to the port of Trieste are more spread; 86.5% of total imports are distributed among seven countries, with Russia still being the most important one with the share of 30%, followed by Libya (21%) and Turkey (11%).
5. CONCLUSIONS
The analyzed ports are mainly import-oriented; however, they differ significantly among each other. The analysis of throughput of the three main cargo groups shows that the ports do not compete directly, at least not considerably. In fact, the ports have their own specializations and sub-specializations, so besides analyzing barely the throughput also the analysis of markets is important. Unfortunately, we were only able to determine maritime origins or destinations, and not the inland markets.
Of course, sole analysis of numerical data and definition of trends, although paired with the knowledge of overseas markets, do not allow the prediction of port flows. It would be necessary to be familiar with the development plans and policies of every single port. Nevertheless, the Eurostat data represents a good basis to get the overview on the importance of single ports in the region, and the home-made pre-processor allowed fast extraction of selected data; without it more than 800,000 data would not be manageable.
REFERENCES
1. Božičević, D. (1996). Osnove vodnog prometa. Zagreb: Fakultet prometnih znanosti.
2. CIA. (2016). The World Factbook. Retrieved June 3, 2016, from Central Intelligence Agency: https://www.cia.gov/library/publications/the-world-factbook/wfbExt/region_eur.html
3. Eurostat. (2016). Gross weight of goods transported to/from main ports by direction and type of traffic (national and international) - quarterly data. Retrieved January 2017, from Eurostat: http://ec.europa.eu/eurostat/en/web/products-datasets/-/MAR_GO_QM
4. ICS. (2015). Shipping and World Trade. Retrieved May 16., 2016, from International Chamber of Shipping: - http://www.ics-shipping.org/shipping-facts/shipping-and-world-trade

7th INTERNATIONAL MARITIME SCIENCE CONFERENCE
496
April 20th-21st, 2017, Solin, Croatia
5. Ninnemann, J. (2015). Relevance of efficient hinterland access for the inter-port competitiveness of European Container ports. In J. Dethloff, H.-D. Haasis, H. Kopfer, H. Kotzab, & J. Schönberger (Eds.), Logistics Management: Products, Actors, Technology. New York - Dordrecht - London: Springer.
6. Orlandi, J., & Pitaccolo, M. (2010). The role of ports in South East Europe and Danube region in promoting economic development. Venice: Watermode project. Retrieved September 2016, from http://ec.europa.eu/regional_policy/archive/consultation/danube/doc/contrib/eur_watermode.pdf
7. Racautanu, C. (2013). The port of Constanta - The European eastern gate. UNECE. Retrieved September 2016, from https://www.unece.org/fileadmin/DAM/trans/doc/2013/wp5/Romania_100913_WP5_workshop.pdf
8. Sorgenfrei, J. (2013). Port business. Norderstedt: BoD-Books.
9. Talley, W. K. (2009). Port economics. Oxon - New York: Routledge.
10. UNCTAD. (2014). Review of Maritime Transport 2014. Retrieved from United Nations conference on trade and development: http://unctad.org/en/pages/PublicationWebflyer.aspx?publicationid=1068

497
Izvor Grubišić
LAYOUT DESIGN ISSUES OF THE ADRIATIC COASTAL CRUISERS
LAYOUT DESIGN ISSUES OF THE ADRIATIC COASTAL CRUISERSIzvor Grubišić
LAYOUT DESIGN ISSUES OF THE ADRIATIC COASTAL CRUISERS
Izvor Grubišić
(University of Zagreb, Faculty of Mechanical Engineering and Naval Architecture, Zagreb, Croatia)
(E-mail:[email protected])
ABSTRACT
Considerable number of new vessels is yearly added to the already existing fleet of coastal cruisers operating in the Croatian part of the Adriatic Sea. The coastal cruisers are built under rules of the Croatian Register of Shipping and the Croatian maritime law. In addition, the ships are classed by the Croatian Ministry of tourism under the Rule for categorizing vessels operating in nautical tourism. A number of recently built or upgraded vessels are analyzed in respect of the problems of layout design. Passenger and crew external and internal communications pose special problem that is made even more difficult to solve as passengers with disability are admitted. Design limitations posed by the application of the rules as well as the limitations due to typical itinerary of cruises are reviewed. Typical itinerary and the mode of daily operation are studied. Attention is drawn to the latest features of the new vessel design dealing with stern platform, taking boats, kayaks or bicycles on board and with issues of the diving activity space and safety considerations. Addressed are the constraints due to the ship and passenger safety problems (stability, fire). The Example Ship is used in order to illustrate the layout design issues. Recommendations for designers and operators are put forward.
KEY WORDS
coastal cruiser, passenger accommodations, layout, habitability
1. INTRODUCTION
An increasing number of coastal cruising vessels are built and are entering domestic service in the Croatian Adriatic region. By using relatively small vessels visiting small ports and bays becomes viable. In that way tourism is brought to small isolated communities without building large hotels and without significant demand on local infrastructure. The vessels are designed so as to take advantage of the applicable rules and regulations and still produce most habitable vessels that are attractive to the passengers.
Habitability deals with the problems of accommodation layout, whole-body vibration, noise, indoor climate and lighting, but here only the layout design will be addressed.
2. PRINCIPAL LAYOUT
Layout is the critical element of passenger ship design. There are many possibilities but some of them offer clear advantages. Apart from ship classification and statutory rules that apply to the ship there is regulation issued by the Ministry of

7th INTERNATIONAL MARITIME SCIENCE CONFERENCE
498
April 20th-21st, 2017, Solin, Croatia
tourism related to the ship class as a tourist floating object. Taking relevant rules into account and considering cruising business directions it is possible to define some advantageous elements in design of the ships.
2.1 Cruising itineraries
Typical itineraries for 6-8 days voyage may be presented by two Dubrovnik-Split itineraries (Fig 1):
Figure 1. Dubrovnik-Split short and long itineraries [1]
Average distance travelled in 6 to 8 days voyage is about 250 NM resulting in average 4 to 5 hours sailing per day at cruising speed of 9 to 10 knots. Longer distances, e.g. Dubrovnik - Opatija (approximately 320 NM), require higher speed (10-12 knots). In most cases sailing is performed in daylight conditions only. Nights are mostly spent in port or sometimes at anchor. Passenger vessels that are in national service belong one of the sea area classes (B, C, D) Fig.2.
Figure 2. Classification of sea areas
Geography of the Adriatic and the weather conditions in the summer period make it possible to design cruising vessels in the Class-D. Class-D Passenger vessel in national service that navigates in areas where the probability of significant wave heights over 1,5 m is lower than 10% in the summer period of navigation (April 1 to October 31). Class-D ship in navigation stays within 6 NM from the place of refuge and 3 NM from the coast that is accessible in the case of accident.
2.2 Categorization of ships
Most tourist agencies adopted comfort classification as follows [1]:
1. Deluxe Ships 2. A+ category 3. A category 4. B category 5. Gullets
Croatian Ministry of tourism adopted somewhat different classification [2] based on number of "steering wheels" assigned to the appropriate ship category (5 being the highest class). Analyzing principal data of vessels in service that are advertized on the internet it may be concluded that new built vessels are mostly "deluxe" category with some belonging to the "A+" category. Other categories consist mostly of the existing vessels that are thoroughly rebuilt and modernized. For that reason here we will deal with the deluxe and A+ category vessel that are approximately equivalent to the 4 and 5 "steering wheels" by the Ministry of tourism classification.

499
Izvor Grubišić
LAYOUT DESIGN ISSUES OF THE ADRIATIC COASTAL CRUISERS
2.3 Design solutions
Coastal cruisers suitable for the Adriatic service and capable of taking 36 passengers at deluxe standard should have 3 decks arrangement plus sun deck at the top. There are numerous possible solutions in distributing passenger cabins, crew accommodation, restaurant, galley, lobby, engine room, service spaces, tanks, etc. Only few solutions proved practical and economical.
2.4 Basic disposition
In most cases the following nomenclature is adopted: • Sun deck • Upper deck • Main deck • Lower deck Some operators use different markings like A-deck, B-deck, etc.
2.5 Double bottom
Double bottom is required for safety and tank capacity reasons. According to [4 and 5] ships of classes B, C and D with length less than 50m a double bottom must extend from fore peak bulkhead to the after peak bulkhead. This requirement rules out non-metal hull construction. Passenger accommodation is allowed on the first deck below freeboard deck. Here freeboard deck is identical to the main deck. From [5] it follows that minimal height of double bottom should be 0,75 m above base line. Providing volume for fresh water, sludge and ballast tanks will usually require higher double bottom than minimal.
2.6 Collision bulkhead
The fore peak length is limited by the following: (SOLAS 2014, Ch II-1, Reg 12.1)
0,050,05 30,08
FP PP
FP PP
FP PP
L LL L mL L
≥ ⋅
≤ ⋅ +
≤ ⋅ Assuming typical cruising vessel length of 45 m, the collision bulkhead should be located between 2,25m and 3,60m behind fore perpendicular. No accommodations are allowed forward of the collision bulkhead.
2.7 Subdivision
According to [6 and 7] the subdivision length (LS) of the ship - is the greatest projected molded length of that part of the ship at or below deck or decks limiting the vertical extent of flooding with the ship at the deepest subdivision draught. Main deck is assumed to be equivalent to the bulkhead deck since bulkheads are made watertight up to that deck. Margin line is a line drawn at least 76 mm below the upper surface of the bulkhead deck at side. If the distance between two adjacent transverse watertight bulkheads (or their equivalent) is less than the minimal value of the: 3 m + 3% LS, 10% of LS, 11m), only one of the two bulkheads will be considered as a part of ship subdivision arrangement. For LS=45 m this distance is 4,5 m. The CRS subdivision rules [7] require that where not more than 36 persons are carried, a damage length of 0,015 LS but not less than 3 m is to be assumed, in conjunction with a penetration inboard of 0.05 B but not less than 0,75 m. For a LS=45 m damage length is 3,0 m and penetration 0,75 m. For the forward 0,3L length of damage length is: d=(LS
2/3)/3. I.e. for LS=45 m, d=4,217m Reaching practical arrangement and taking the requirements of [7], the number of watertight bulkheads for LS=45 m should be 5, including the collision bulkhead. The floodable length curve for full load displacement with symmetrical flooding indicates possible arrangement of bulkheads (Fig. 7)
3. EXAMPLE SHIP
In order to demonstrate design problems for the class of vessels a conceptual design of an "Example ship" is presented.
3.1 Hull form
The round bilge hull form with transom stern is designed in order to be close to the optimal at cruising speed. For LWL=43 m the Froude number is: for 9 knots cruising: FN=0.225 while for 10

7th INTERNATIONAL MARITIME SCIENCE CONFERENCE
500
April 20th-21st, 2017, Solin, Croatia
knots FN=0.250. The hull form is presented in Fig. 3 and Fig. 4.
3.2 Ship principal particulars
Principal particulars (Table 1) take into account all constraints that apply to the type of vessel.
Table 1.Example Ship principal particulars
Length over all LOA= 47,00 m Waterline length LWL= 43,00 m Beam molded BM= 9,000 m Beam at DWL BX= 8,615 m Draft molded TX= 2,500 m Depth to main deck DX= 4,100 m Displacement volume VFL= 445,0 m3
Displacement DFL= 460,0 t Tonnage 495 GT L/V1/3= 5,63 LWL/BX= 4,99 BX/TX= 3,45 Block coefficient CB= 0,48 Prismatic coefficient CP= 0,65 Centre of buoyancy LCB= -1%
Engines: 2 x John Deere at M2 rating, RPM=1900 Propulsion power 2x373= 746 kW Service speed US= 10 kn Generators 380 V PEG= 2x120 kVA Passengers NPAX= 36 Passenger beds NBED= 40 Crew (max. total) NCREW= 8
Figure 3. Example Ship -Hull form

501
Izvor Grubišić
LAYOUT DESIGN ISSUES OF THE ADRIATIC COASTAL CRUISERS
Figure 4. Example Ship -Body plan
3.3 Powering
Propulsion power should provide for economical cruising at about 10 knots and enough margins for adapting to the longer cruises where 12 knots may be required in order to keep cruising time table. Resistance curve is shown in Fig. 5.
Figure 5. Example Ship -Resistance curve
To find optimal conditions a diagram of the CT/FN ratio for a range of FN is presented in Fig. 6. Two 3-blade propellers of the WB-series with the following particulars were designed: Diameter / Pitch=1,22 m / 0.85 m AE/A0= 0,50. Trial speed=13 kn (FN=0,33).
Figure 6. Example Ship -Range of optimal Froude
numbers
Estimated fuel consumption for propulsion at 10 kn service speed is 2 x 41 kg/h. Since typical daily engine operation is estimated at 5 hours maximum, expected daily fuel consumption is 410 kg/day. Cruising for 8 days will require 3280 kg fuel. Adding margin for adverse weather conditions and for electrical power generation at 25%, total fuel for 8 days cruising is 4100 kg. Tank capacity should have a minimum of 10% volume and additional expansion volume of about 7%. Total fuel tank capacity should be not less than 5,7 m3. Depending on fuel availability in the cruising area it may be useful to install double fuel tank capacity, i.e. about 12 m3.
3.4 Construction
The vessel construction is of the A-grade shipbuilding steel. Frame spacing of 500 mm is adopted and it also determines the modulus for layout shaping. If four deck levels are used the sun deck should be of light alloy construction in order to improve ship stability.
3.5 Watertight compartments
Starting from the bow the hull volume is divided into: fore peak, crew quarters, passenger accommodation, engine room and lazarette (aft peak). Therefore, a minimum of 5 watertight bulkheads should be installed. Having only one bulkhead between engine room and passenger accommodation makes it easier to insulate against heat and noise (Fig 7). Double bottom containing fresh water tanks and sewage tanks is placed between the collision

7th INTERNATIONAL MARITIME SCIENCE CONFERENCE
502
April 20th-21st, 2017, Solin, Croatia
bulkhead and the forward bulkhead of the engine room. Fuel tanks are placed in the engine room.
The floodable length curve for symmetrical flooding is shown in Fig. 8
Figure 7. Example Ship -Watertight compartments
Figure 8. Example Ship -Floodable length curve
3.6 Deck levels
Shipboard activities are assigned to the deck levels in order to optimize passenger comfort:
Table 2. Deck levels
Sun deck Sunbathing, Jacuzzi, wheelhouse, master quarters
Upper deck Restaurant, lounge, bar, passenger cabins, open deck (~60 m2)
Main deck passenger cabins, lobby, stern swimming platform, open deck forward, open deck aft(~40 m2)
Lower deck passenger accommodation crew quarters
Double bottom water tanks, sewage tanks
Vertical distance between decks should be enough for passenger comfort, but excessive height will lead to stability problems. Minimal headroom in passenger area should be 2050 mm [6]. Taking into account thickness of the ship structure, deck covering and lining, the height between decks of 2400 mm will provide passenger headroom of about 2150 mm. The highest deck is for sun bathing and may be equipped with articulated sun shading, sunbathing chairs and often Jacuzzi.

503
Izvor Grubišić
LAYOUT DESIGN ISSUES OF THE ADRIATIC COASTAL CRUISERS
3.7 Passenger accommodation
On the Adriatic coastal cruisers all passenger cabins are provided with private facilities and air-conditioning. With maximal ship beam of about 9 m and deducting deck space taken by the hull structure, lining and insulation, the total cabin area satisfying CRS requirements [5 and 6], can be between 12 m2 and 16 m2. Obviously, in "deluxe" classed vessels a higher cabin area is preferred. Passenger cabins are arranged on 2 or 3 levels depending on general ship layout. At the lower deck there are usually 2 groups of 4 cabins, each with access from the main deck via staircase and short corridor in order to stay inside limitations [5].The length of the cabin (with private sanitary space) is dictated by the separation available between watertight bulkheads. In most cases a group of 4 cabins within watertight compartment is the best solution for optimal space utilization. Main part of the crew accommodation is usually located in front of passenger cabins up to the collision bulkhead. Cabins under main deck are provided with 1 or 2 portholes of the fixed type. Opening these portholes would call for special attention of the crew before departure and should be avoided. Portholes are 250 mm or 300 mm diameter, with shutter and installed so as to avoid being damaged by the fender when alongside. The rest of cabins are situated partly on the main deck and partly on the upper deck.
3.8 Cabin arrangement
Bed size is dictated by the rule requirements and also by available standard mattress sizes. Accepted practice is to fit beds of either queen size double bed or twin beds that in some cases may be convertible into a king size bed. Bed dimensions are based on the standard mattresses size that is 2000x1600 mm for the queen size and 2000x900mm for a single bed in twin combination. A king size bed is 2000x1800 mm. The main deck passenger cabins enjoy more natural light and make for easier access for disabled persons. If side deck passages are provided there
must be a minimum of 750 mm between ship side rail and the side of deckhouse. Cabins on the main deck must be made longer than the cabins on the lower deck since the width of deck passages must be subtracted from the beam of the vessel. Cabin area between 12 m2 and 14 m2 is usually used. If there are passenger cabins on the upper deck they are similar to the main deck ones. Some of the cabins may have one extra bed to accommodate families with infant. Apart from beds and in accord with [2], the cabins are provided with wardrobe, desk, chair, mirror, reading lamps, safe deposit box, radio, hair dryer, 220 V / 50 Hz electrical supply, life vests, luggage compartment (underneath the bed), safety and fire alarm and information broadcasting system. Wi-Fi is usually available free or at small cost. Lower deck cabins are located closer to the waterline and are less exposed to ship movements and accelerations. They also have dual ventilation (cabin and sanitary space have separate systems). Cabins at the main deck and at the upper deck have larger windows (1 or 2). All cabins are provided by sound proofing insulation and have fire resistant door. Several possibilities of passenger cabin arrangement are shown in sequel (Fig.9....Fig. 14). All dimensions and area are given as gross measures. Question of bed orientation is not clearly resolved. Traditionally beds were oriented parallel to the ships plane of symmetry, i.e. longitudinally. However, there are examples of cabins with transverse beds that give better deck area utilization. It may be argued that since coastal cruisers are constrained to coastal area (B, C or D) and since they mostly navigate only in daylight, the orientation of beds does not pose significant problem with passenger comfort.

7th INTERNATIONAL MARITIME SCIENCE CONFERENCE
504
April 20th-21st, 2017, Solin, Croatia
Figure 9. TWIN cabin, longitudinal beds, gross
area=10,5 m2
Figure 10. TWIN cabin, transverse beds, gross
area=9,7 m2
Figure 11. DOUBLE cabin, longitudinal bed, gross
area=14,8 m2
Figure 12. DOUBLE deluxe cabin, longitudinal
bed, gross area=17,5 m2
Figure 13. DOUBLE deluxe cabin, longitudinal
bed, gross area=16,5 m2
Figure 14. DOUBLE cabin, transverse bed, gross
area=13,4 m2

505
Izvor Grubišić
LAYOUT DESIGN ISSUES OF THE ADRIATIC COASTAL CRUISERS
3.9 Public spaces
Open deck spaces are provided on the main deck, on the upper deck and on the sun deck. Removable or fixed tables and deck chairs are provided for open air dining. Main deck open space can be shielded via flexible and partly transparent tent to protect passengers on windy day or chilly night. On the main deck and close to restaurant and longue there should be at least two public toilettes.
3.10 Stairways
Vertical communication between decks is provided by comfortable stairways inside superstructure. Additionally, opened stairways are connecting stern of the main deck to the upper deck and the sun deck. All stairways should on each side be fitted with a handrail that is continued unbroken from the slope of the stairway to the handrails in the corridor. Stairways should be pitched fore and aft, (long athwart ships stairways should be avoided), and should be inclined at not more than 45o to the horizontal [6]. Passenger comfort and safety will be better if a 38o inclination from the horizontal is used [8 and 9], specially if elderly passengers are expected. As a general rule the rise of each step should be kept constant (applicable to all passenger stairways onboard) to facilitate easy movement up/down the stairway, especially in an emergency. For height between decks of 2400 mm it is necessary to provide 14 steps for comfortable usage. Therefore steps come out as 172 mm rise and 220 mm going for a comfortable 38 degrees inclination to horizontal. (Fig. 15 ... Fig. 19).
Figure 15. STAIRWAY - 1 flight -14 steps for height difference of 2400 mm
Figure 16. STAIRWAY - L, 2 flights -14 steps for
height difference of 2400 mm
Figure 17. STAIRWAY -double L, 3 flights -14 steps for height difference of 2400 mm
Figure 18. STAIRWAY -single flight -14 steps at 38 deg. for height difference of 2400 mm

7th INTERNATIONAL MARITIME SCIENCE CONFERENCE
506
April 20th-21st, 2017, Solin, Croatia
Figure 19. STAIRWAY -L 2 flights -14 steps at 38 deg. for height difference of 2400 mm
Figure 20. block of 4 deluxe cabins with stairway
3.11 Swimming platform
A swimming platform at the stern is becoming a "must have" item being retrofitted to most of existing ships 2-4 years old. It is teak decked and it is provided with two ladders for access to the water and with two showers (with hot and cold water).
3.12 Dining area
Dining area consists of restaurant, lounge and bar. Required area per passenger is about 1,3 m2/person for dining and about 1,7 m2/person for lounge [10]. Based on one vessel in service the combined restaurant, bar and lounge area is 1,89 m2/person. Additionally an open deck dining space of about 1,5 m2/passenger is provided. The space is air-conditioned. Dining tables with comfortable chairs can be easily rearranged in order to provide space for entertainment. Audio
system with speakers and large LCD TV set is used for music, announcements, presentations and lectures. Wireless internet is a "must". Buffet arrangements for breakfast and bar furniture are provided.
3.13 Galley
Location of galley is a major issue in passenger vessel design. Galley is a source of smell, noise and heat that may adversely influence comfort on board. Locating galley on the upper deck is advantageous since it is easier to eliminate odors through short ventilation system. Also, locating dining area on the upper deck makes for short distance from galley. On the negative side, locating galley high up makes it necessary to locate dry and refrigerated storage in the vicinity and that may have negative influence on ship stability. Standard area requirement for the galley area is 0,64 m2/person [10]. For 36+8 persons galley area should be about 28 m2. Based on one vessel in service the galley area is 0,375 m2/person, i.e. 16,5 m2 for the Example Ship. Refrigeration stores are recommended at 0,04 m3 per person, per day, i.e. 44 persons for 7 days require about 17 m3, or deck area of about 7,2 m2. It is expected that for the benefit of passengers and crew the meals prepared in the galley should be in accordance with the requirements of HACCP (Hazard Analysis and Critical Control Points standards).
4. CONCLUSIONS
Designing new coastal cruising ship is subject to multitude of constraints. In order to produce viable and economical vessel designer of the Adriatic coastal cruising vessel should observe the following elements: • Cruising speed 9-10 knots is enough for the typical itineraries. • maximal speed about 12 knots • length < 45m (rules) • beam < 9,2 m (available docks)

507
Izvor Grubišić
LAYOUT DESIGN ISSUES OF THE ADRIATIC COASTAL CRUISERS
• navigation draft < 2,8 m (pier depth) • tonnage < 499 GT (rules) • propulsion power < 750 kW (crew) • number of passengers 36 (rules) • ship operations 5 members (rules) • service and entertainment 3 members • provisions capacity for 8 days (may be replenished for longer cruises) • Fresh water capacity based on 44 persons @ 0,25 m3 per person, i.e. for 8 days + 10% ~90 m3 if no desalinators are installed. • Fuel oil capacity is based on 750 kW for propulsion and 60 kW for electricity. At an average
5 sailing hours per day required capacity for 8 days cruising with adequate reserve should be above 10 m3. • Passenger habitability is correlated to layout design and must be well studied. • Although the ABS guidelines [8 and 9] are mainly intended for large cruisers, they are still in many respects applicable as well to small cruisers and may help designer to reach better solutions. Basic proposal for layout design is given in Fig. 21.
Figure 21. Example Ship -Layout proposal
REFERENCES
1. http://www.katarina-line.com/ 2. Guide to the categorization of floating objects
for nautical tourism, Zagreb, Official gazette of May 30 1996 with amendments of 2008, 2009 and 2015.
3. Maritime Law of the Republic of Croatia, Official gazette 181/2004, 76/2007, 146/2008 and 61/2011 and 56/2013
4. Directive 2009/45/EC of the European Parliament and of the Council of 6 May 2009 on safety rules and standards for passenger ships (Recast by the Directive of European Commission: 2010/36/EU of 01.06.2010.)
5. Croatian Register of Shipping - Rules for the Statutory Certification of Passenger Vessels Engaged in Domestic Voyages - Split, 2013. −
6. Croatian Register of Shipping -Rules for Statutory Certification of Seagoing Ships, Part 21, Transport of Passengers, Split 2009.
7. Croatian Register of Shipping -Rules for Classification of Seagoing Ships, Part 5 -Subdivision Split 2013.
8. ABS GUIDE FOR PASSENGER COMFORT ON SHIPS -APPENDIX 3 Accommodations Criteria 2001.
9. ABS GUIDE FOR CREW HABITABILITY ON SHIPS, February 2016.
10. D.G.M. Watson -PRACTICAL SHIP DESIGN -Elsevier ocean engineering book series -volume 1, 1998.

7th INTERNATIONAL MARITIME SCIENCE CONFERENCE
508
April 20th-21st, 2017, Solin, Croatia
THE IMPACT OF LARGE CONTAINER SHIPS ON THE TECHNOLOGY AND THE DEVELOPEMENT OF MODERN CONTAINER TERMINALSTomislav Batur
THE IMPACT OF LARGE CONTAINER SHIPS ON THE TECHNOLOGY AND THE DEVELOPEMENT OF MODERN
CONTAINER TERMINALS
Tomislav Batur
(Port of Ploče Authority, Ploče, Croatia)
(E-mail: [email protected])
ABSTRACT
Ports are extremely important infrastructure facilities, vital links of international transport and logistics chains. The ability of the port
to ensure efficient transfer of cargo has always been one of their basic tasks. The last few years have witnessed the phenomena of
growing container ships that call at the ports around the world. Larger ships are requiring larger port terminals and ports which
include: longer operational bearths, more depth in ports, larger port operational areas, and bigger ship to shore cranes.
On the other hand, economies of scale with regard to the shipping industry only makes sense if is reduced ship’s stay in port. Thus,
increasing the size of the ships in circulation means a higher concentration of cargo in a smaller number of ports. This means that the
large ports are becoming even larger, whilst reducing the traffic in small ports. In recent years at the global level, the productivity of
port container terminals serving large container ships has declined. The decline in productivity of container terminals means that ships
in the ports are staying longer, which causes delays and delays in maintaining regular navigation lines. All this ultimately means higher
operating costs for shipping companies.
Assuming that the existing technology and degree of automation are satisfactory, it is necessary to adapt existing technologies
according to changeable requirements of the technological process at the terminal due to the large variations in the amount of
containers that in certain time periods occur. The resulting problems can be compensated through better and closer cooperation
between shipping companies and port terminals by strengthening trust, improving communication, better planning and better mutual
understanding of key processes important for both sides.
KEY WORDS
large container ship, terminal productivity, berth productivity
1. INTRODUCTION
Ports have always been present since there is human civilization. They are extremely important infrastructure facilities, vital links of international transport and logistics chains. In addition to traditional port activities inside ports are performed other economic activities, particularly those with a focus on creating added value. Ports are important economic multipliers that have significant direct and indirect impact on the creation of value and employment in their
environment. Recently, we have witnessed the emergence of the so-called. mega-port, which rightly can be regarded as an indispensable part of the global economic system. The ability of ports to ensure efficient transfer of cargo has always been one of their basic tasks. The last few years have witnessed the rise of the more larger and larger container ships that call in ports around the world with a capacity of almost 20,000 TEU1. (Fig 1.)
1 Twenty-foot-equivalent unit

509
Tomislav Batur
THE IMPACT OF LARGE CONTAINER SHIPS ON THE TECHNOLOGY AND THE DEVELOPEMENT OF MODERN CONTAINER TERMINALS
Built/ year
Name Length overall
(m)
Length overall (ft)
Beam (m)
Beam (ft)
Maximum TEU
GT Owner
2015 MSC Oscar 395.4 1,297 59 194 19,224 192,237 MSC
2015 MSC Oliver 395.4 1,297 59 194 19,224 193,000 MSC
2015 MSC Zoe 395.4 1,297 59 194 19,224 193,000 MSC
2015 MSC Maya 395.4 1,297 59 194 19,224 193,000 MSC 2015 CSCL Indian
Ocean 399.67 1,311.3 58.6 192 19,100 187,541 CSCL
2015 CSCL Atlantic Ocean
399.67 1,311.3 58.6 192 19,100 187,541 CSCL
2015 CSCL Arctic Ocean
399.67 1,311.3 58.6 192 19,100 187,541 CSCL
2015 Barzan 400 1,300 58.6 192 18,800 195,636 UASC
2015 CMA CGM Georg Forster
398 1,306 54 177 18,000 175,000 CMA-CGM
2015 CMA CGM Bougainville
398 1,306 54 177 17,722 CMA CGM
Figure 1. List of 10 largest container ships
Source: Wikipedia
Ever larger ships requiring the larger port terminals and ports which include: longer operational bearths, more depth in ports, larger operational areas, and larger ship to shore cranes. Due to the increasing volume of cargo ie. the number of containers per each ship call, the existing technology of the terminal should be adapted, in order to increase productivity and reduce the costs of shipping companies arising from the prolonged stay of the ship in port and possible delays in the providing of regular navigation service.
On the other hand, economy of scale with regard to the shipping industry only makes sense if is reduced ship's stay in port. Thus, increasing the size of the ships in circulation means a higher concentration of cargo in a smaller number of ports. This means that the large ports are becoming even larger, whilst reducing the traffic in small ports. The emergence of large container ships has led to consolidation in the maritime sector and the formation of so-called. maritime alliancies which in turn affected the increase in the concentration of traffic in certain ports. The
modern trend of strengthening the consolidation of shipping companies through the creation of alliances particularly in the container segment will inevitably lead to the strengthening of competitiveness and ultimately cause the failure of individual companies within the maritime sector.
2. DEVELOPEMENT OF CONTAINER SHIPS
From the onset of the classic (cellular) container ships in the early seventies of the twentieth century, we have witnessed increasing capacity of container ships of 2,400 TEU size (240 meters long) to the latest generation of large container ships that reach a capacity of approx. 20000 TEU and 400 m in length. On the other hand, the container terminals at the ports, historically, were built wtih operating bearths between 300-350 meters in length, which means that the ships of the latest generation are simply too large for the current length of bearths. Until the mid 90's of the last century, ie. until the moment when the shipping company decided to build container ships outside dimension restrictions for the sailing through the Panama Canal, primarily due to

7th INTERNATIONAL MARITIME SCIENCE CONFERENCE
510
April 20th-21st, 2017, Solin, Croatia
restrictions caused by the channel width, they built the ships that were relatively long in terms of their construction. This means that the additional required capacity was achieved by increasing the length of ships which resulted in some problems with the stability of the ship, as well as bending and torsion of which suffered construction of such ships. This, among other things require the loading of larger amounts of ballast during navigation on certain routes which is of course, a
negative impact on the economics of exploitation of the ship.
Since the mid-90s, we witnessed a situation that the width of container ships has grown proportionately faster than length, which resulted that the capacity of ships as expressed in TEUs almost doubled in the last 20 years, with a capacity of 20 to 45 TEU by meter length of the ship (Fig.2.).
YEAR CAP./TEU LOA(m) BEAM(m) TEU/m Growth LOA
Growth BEAM
1974 2.400 239 30.0 10.0 - - 1981 3.600 267 32.3 13.5 12% 8% 1988 4.800 294 32.3 16.3 10% 0% 1995 6.600 318 42.9 20.8 8% 33% 2001 8.724 352 42.9 24.8 11% 0% 2006 15.500 397 56.5 39.0 13% 32% 2013 18.000 400 59.0 45.0 1% 4% 2020 24.000 456 63.9 52.6 14% 8%
Figure 2. Ship size developements
Source:The Journal of Ports and Terminals, Special edition: Top 30 papers 2014-2016,p.70., www.Porttechnology.org
If one take the assumption that the average overall efficiency of the ship has not significantly declined in recent years, it is evident that the number of movements per call of the ship had to increase proportionally. According to available data, the largest ship in service in 2001. generated an average of 2200 movements per call, while the largest ship in service in 2013
generated an average of 3850 movement per call which is an increase of about 75% (Fig.3.) . This data can be in good part confirmed by the announcement of PSA (Port of Singapore Authority) where their experience shows the increase in the average number of movements per call of the ship in the period from 2001. to 2012. of 67%2.
More movements per call and more movements per meter length of the ship creates the need for using additional number of ship to shore gantry cranes (STS) with potentially higher rate of productivity, which should mean an increase in the
2 www.singaporepsa.com
total capacity of port terminal provided that the storage capacity supports this possibility.
At the end of 2006. appeared ships with a capacity of over 15,000 TEU which caused the use of an additional number of STS cranes. However, increase in the number of STS cranes in use is still not in line with the increase in ship“s capacity and the number of movements per port of call, which resulted in an increase in the number of days that ship spend in port. Prolonged stay of the ship in the port caused additional problems such as endangering the navigational schedules, reducing the time available for the performance of port operations as well as the possible involvement of additional ships in the regular rotation, all of which ultimately resulted in an increase in costs and time spent. Despite, the initial increase in the number of deployed STS cranes, recent years have witnessed the reduction of port productivity on the largest container ships of about 6%3.
3 www.JOC.com/port_productivity

511
Tomislav Batur
THE IMPACT OF LARGE CONTAINER SHIPS ON THE TECHNOLOGY AND THE DEVELOPEMENT OF MODERN CONTAINER TERMINALS
YEAR TEU PORTS MOV./ PORT
MOV./ MET.
INCR- EASE
QC MOV./ QC
QC MPH
PORT DAYS
% INC.
1974 2.400 9 757 3.2 - 3.0 252 28 3.4 6% 1981 3.600 9 1135 4.3 34% 3,5 324 28 4,3 8% 1988 4.800 11 1239 4.2 -1% 3,8 326 28 5,3 10% 1995 6.600 11 1703 5.4 27% 4,2 406 28 6,6 12% 2001 8724 11 2181 6,2 16% 4,5 485 28 7.9 10% 2006 15500 11 3875 9,8 58% 6.0 646 28 10.6 14% 2013 18000 11 4500 11,3 15% 6,5 692 28 11,3 15% 2020 24000 11 6000 13,2 17% 7,0 857 28 14,0 18%
Figure 3. Ship size developements
Source:The Journal of Ports and Terminals, Special edition: Top 30 papers 2014-2016,p.70., www.Porttechnology.org
Previously was mentioned that the port efficiency has not kept pace with the growth of ship“s capacity and size, so ships spend more time in ports during rotation, leading to a reduction in the total time available for the performance of port operations. This often leads to failure of the ships from sailing schedule causing delays in arrivals and departures of ships, and that ultimately all affect the operating costs of shipping companies. These problems can be in a good part compensated through better and closer cooperation between shipping companies and port terminals, strengthening the confidence, improving communication, better planning and better mutual understanding of key processes important for both sides. Key processes, such as: creation of ship“s stowage plans, berth planning, technology on the stockyard and permeability of input / output to the terminal, as well as better coordination in case of delay of ships on arrival and departure must be the focus of their common interest.
Port operators will no doubt have some increase in costs due to the arrival in their harbor of large container ships, however, regardless of the size of the ship, container handling is still the same. The port terminals need larger port container cranes, more robust and longer berths and larger storage space. The cost of capital for the ports in this case can be significant. This cost can be partially
compensated through more efficient operations. Nevertheless, port terminals must improve their work processes to increase efficiency. On the other hand, it is realistic to expect that the shipping companies are not willing to accept the additional costs because the port terminals have become less effective. So, in that sense, further efforts are needed on the shipping and port operators side. They must hire additional resources to maximize the efficiency of port terminals to meet the needs resulting from performance of large container ships.
Most of the major big container ports declares that are ready to accept large container ships, in this context, the harbor basins have been deepen at depths of over 17 meters, theoretically, the dimensions of STS cranes are sufficient, with reach to 25-th row of containers and height below the spreader of over 50 meters, but whether it is really so in practice, remains a question that requires an answer. On the other hand, on the terminals that serve large container ships not much has changed in recent years.
The average berth productivity is in the range of 100-150 container movements per hour, even with the latest generation of semi-automatic and fully automated terminals (Fig. 4). Also, according to JOC Port Productivity data4 the total number of
4 www.JOC.com/special-topics/port_productivity
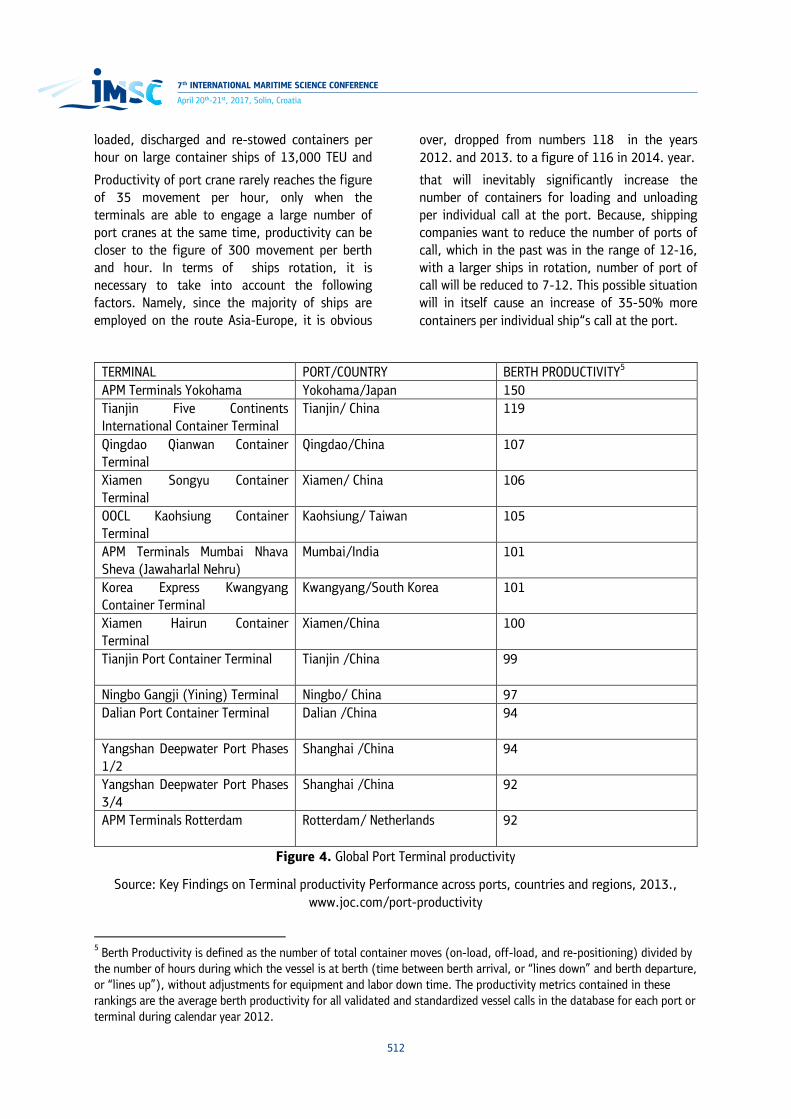
7th INTERNATIONAL MARITIME SCIENCE CONFERENCE
512
April 20th-21st, 2017, Solin, Croatia
loaded, discharged and re-stowed containers per hour on large container ships of 13,000 TEU and
over, dropped from numbers 118 in the years 2012. and 2013. to a figure of 116 in 2014. year.
Productivity of port crane rarely reaches the figure of 35 movement per hour, only when the terminals are able to engage a large number of port cranes at the same time, productivity can be closer to the figure of 300 movement per berth and hour. In terms of ships rotation, it is necessary to take into account the following factors. Namely, since the majority of ships are employed on the route Asia-Europe, it is obvious
that will inevitably significantly increase the number of containers for loading and unloading per individual call at the port. Because, shipping companies want to reduce the number of ports of call, which in the past was in the range of 12-16, with a larger ships in rotation, number of port of call will be reduced to 7-12. This possible situation will in itself cause an increase of 35-50% more containers per individual ship“s call at the port.
TERMINAL PORT/COUNTRY BERTH PRODUCTIVITY5 APM Terminals Yokohama Yokohama/Japan 150 Tianjin Five Continents International Container Terminal
Tianjin/ China 119
Qingdao Qianwan Container Terminal
Qingdao/China 107
Xiamen Songyu Container Terminal
Xiamen/ China 106
OOCL Kaohsiung Container Terminal
Kaohsiung/ Taiwan 105
APM Terminals Mumbai Nhava Sheva (Jawaharlal Nehru)
Mumbai/India 101
Korea Express Kwangyang Container Terminal
Kwangyang/South Korea 101
Xiamen Hairun Container Terminal
Xiamen/China 100
Tianjin Port Container Terminal
Tianjin /China 99
Ningbo Gangji (Yining) Terminal Ningbo/ China 97 Dalian Port Container Terminal Dalian /China 94
Yangshan Deepwater Port Phases 1/2
Shanghai /China 94
Yangshan Deepwater Port Phases 3/4
Shanghai /China 92
APM Terminals Rotterdam Rotterdam/ Netherlands 92
Figure 4. Global Port Terminal productivity
Source: Key Findings on Terminal productivity Performance across ports, countries and regions, 2013., www.joc.com/port-productivity
5 Berth Productivity is defined as the number of total container moves (on-load, off-load, and re-positioning) divided by the number of hours during which the vessel is at berth (time between berth arrival, or “lines down” and berth departure, or “lines up”), without adjustments for equipment and labor down time. The productivity metrics contained in these rankings are the average berth productivity for all validated and standardized vessel calls in the database for each port or terminal during calendar year 2012.

513
Tomislav Batur
THE IMPACT OF LARGE CONTAINER SHIPS ON THE TECHNOLOGY AND THE DEVELOPEMENT OF MODERN CONTAINER TERMINALS
Very soon, the amount of approximately 10,000 TEU for loading and unloading per call will become standard. With port productivity of 100-150 movements per hour it will mean that ships in the ports will stay about two days instead of one day as it was the case so far. As a result, it will be necessary to add another ship in order to maintain a regular weekly services.
Therefore, will significantly increase the cost of the ship, not only due to the engagement of larger ships, but also for double the time spent in port. In order to reduce negative effects caused because of this, during the design of new terminals and improvement of existing ones, great attention should be paid to increase productivity at the terminal in order to reduce costs, which will undoubtedly have the shipping companies that handle large container ships.
Another consequence of increasing the number of containers per ship's call and reducing the number of ports of call, is the drastic increase in the number of containers to be transshipped ie. delivered and stored. This situation creates additional problems for port operators to efficiently use the port resources, primarily berths, operational storage areas and port machinery.
3. INEFFICIENCIES IN PRODUCTION PROCESSES AT THE TERMINAL AND POSSIBLE IMPROVEMENTS
Historically, it can be concluded that there are four different types of organization on container terminals around the world:
1. Rubber Tyer Gantry (RTG) cranes on the stockyard in combination with tractors and trailers,
2. Rail Mounted Gantry (RMG) cranes on the stockyard in combination with tractors and trailers,
3. Automated RMG on the stockyard with vertically arranged container blocks,
4. Complete operation only with portal straddle carriers on the stockyard (Full straddle carrier operation).
Each of these four types of organization has its advantages and disadvantages and is implemented differently in ports around the world.
1. Use of RTG cranes on the stockyard - mostly applied in countries with relatively low labor cost, such as Asia. This kind of terminals achieve high productivity of over 30 movements per crane and work hour. Container blocks are stacked paralely with operational berths which provides the necessary flexibility. Effective disposal of containers is possible without conflict between shore cranes and RTG which can serve several container blocks. However, it can be said that this type of organization on the terminal has reached its peak. Specifically, in the case where five or six STS cranes are working on a container ship,there is a need of approximately 8-10 manually operated tractors per crane engaged which creates a total figure of 50 or more hand-operated tractors on the terminal. This situation causes inefficient use of horizontal transport means on the stockyard with only about 50% of the effective time spent on driving, the other 50% of time, vehicles are waiting in line for loading containers. Since the unloading of containers on trailers is performed between the legs of the crane, due to the use of five or six STS cranes per ship, the space for movement under the ship is limited. In this case, all vehicles must approach the ship from the front or rear side, this situation causes delays due to traffic congestion.
2. Use of RMG cranes on stockyard in combination with horizontal transport means - can roughly achieve the same efficiency as previously explained method of operation with RTG. The advantage of this mode is that RMG cranes can achieve better productivity, i.e. more container move per hour, and this method has better ability to control the relationship between the crane and the horizontal transport means. Container blocks are also placed in parallel with the operational berth which is very suitable for transhipment.
3. Use of automated crane on rails (RMG) with a vertically positioned container blocks - also known as (Automatic Stacking Crane or ASC) resolved an important issue, and that is the separation of operations at the stockyard for loading containers on the veichels for transportation by road or train so called „foreign vehicles“, from operations with

7th INTERNATIONAL MARITIME SCIENCE CONFERENCE
514
April 20th-21st, 2017, Solin, Croatia
containers that take place in front of the ship. This way of organizing the operations requires the use of portal straddle carriers or aditional crane on stockyard for loading the containers on the veichels for transportation on the landside. In this way one can achieve productivity of STS cranes from 30-35 CMPH and berth productivity of about 150 CMPH.
4.The organization of operation on the stockyard with complete use only of portal straddle cariers (Full straddle carier operation) - is a simple but effective way of operation. It is used by the ports of Antwerp and Bremenhaven. The disadvantage of this mode is that it requires large storage surfaces in order to achieve the desired productivity. While performing this kind of operation on large container ships it can be expected to use a large number of straddle carriers which will cause congestion in the operation and reduce productivity of container disposal at the stockyard. Therefore, it is difficult to expect that this organization of operations can achieve needed productivity of 300 CMPH.
As we have seen from the foregoing, notwithstanding the concept of the organization of operation at the terminal, required productivity of about 300 CMPH is still far from reality. In this context it is necessary to find technological solutions as a best mix of proven technologies in order to achieve the necessary level of productivity of the terminal. In order to increase the overall productivity of the terminal is necessary to increase productivity in several important elements of the entire technological process6.
This is primarily related to an increase in productivity of ship to shore gantry cranes. In fact, one of the important consequences due to the increasing size of ships is an extension of the working cycle of the crane, that is, from the moment of catching container on board until his disposal to land vehicle and vice versa. The great difference in the duration of the cycle in the case of catching the container in the first row on the
6 See, Talley, W., „Optimum throughput and performance evaluation of marine terminals“, Marine Policy and management, 15(4), 327-331., 1988.
deck of the ship and the container which is located at the bottom of the ship's hold. Due to this, the use of automated cranes can increase the predictability of the cycle times and actively respond in this regard due to which it can increase productivity. Crane productivity also can be improved by the appropriate use of twin-lift and the so-called tandem lift technology. Large container ships with a large quantity of containers that are loaded or unloaded at the same "bay" provide an ideal opportunity to use these technologies.
One of the main problems detected in the technological processes at the terminal is the appropriate use of the so-called horizontal machinery or vehicles on the terminal (Internal Terminal vehicle, ITV). Namely, per one STS crane must be between 30-70 internal vehicles depending on the technology, productivity and technological needs. Significant variations in the demand for internal vehicles also create problems in operations and in this respect is needed a certain flexibility in order to overcome these problems. Especially large differences in demand by STS cranes are from the process of unloading containers and loading of containers in the ship.
During the unloading process cranes easily dispose containers to ready-made trailers and in that sense there is no problem. But when loading, since the container should be stacked at a particular place onboard the ship, that takes much more time and in this case loaded trailers are waiting for a long time under the ship which creates delays in the operation process. Also, one of the "bottlenecks" that burden the operations of the modern terminal is the fact that the internal vehicles on the terminal come too late under the ship which creates congestion and loss of useful time. In this regard, one possible solution is the use of "buffer" technology ie. the disposal of containers on shore under the crane or temporary storage on the single trailer.
Improving the technology of operations on the stockyard also can increase the overall productivity of the terminal. Technologies with parallel or upright postioned container blocks each has its advantages and disadvantages. Given the nature of the terminal in the sense that are mostly used as import, export or transshipment
515
Tomislav Batur
THE IMPACT OF LARGE CONTAINER SHIPS ON THE TECHNOLOGY AND THE DEVELOPEMENT OF MODERN CONTAINER TERMINALS
terminal, it is necessary to select the appropriate technology. In general, it can be concluded that for the export and transshipment terminals better works technology with parallel container blocks and the use of cantilever crane on rails (RMG) for the reason of delivering full containers to the appropriate positions and relatively short trip to the vessel. On the other hand, in predominantly import terminal relatively better works technology with automated cranes on the stockyard (Automatic stacking cranes, ASC) and verticay positioned container blocks.
4. CONCLUSION
In recent years at the global level, the productivity of port container terminals serving large container ships is declining. The decline in productivity of container terminals means that ships in the ports are staying longer, which causes delays and delays in maintaining regular navigation lines. All this ultimately means higher operating costs for shipping companies. Increasing congestion in ports is partly the result of the inability to increase productivity at the container terminals. Based on the foregoing in the article can be concluded that large container ships require terminal productivity of 250-300 container moves per hour (CMPH), while the existing productivity is about 100-150 CMPH, which is almost twice less. It is obvious that the current productivity of the terminal does not fully meet the needs of large container ships and therefore should expect increased operating costs of large container ships. The solution is to increase productivity of existing terminals and in better mutual cooperation between shipping companies and terminal operators. Assuming that the existing technology and degree of automation are satisfactory, it is necessary to adapt existing technologies according to changeable requirements of the technological process at the terminal due to the large variations in the amount of container that in certain time periods occur. The resulting problems can be in good part
compensated through better and closer cooperation between shipping companies and port terminals by strengthening trust, improving communication, better planning and better mutual understanding of key processes important for both sides. Key processes, such as: creation of ship“s stowage plans, berth planning, technology on the stockyard,permeability of input/ output to the terminal, as well as better coordination in case of delay of ships must be the focus of their common interest.
REFERENCES
1. Bendall, H. And Stent, A., „On measuring cargo handling productivity“, Maritime Policy and management, 14(4), 337-343., 1987.
2. Dowd, T. and Leschine, T., „Container terminal productivity : a perspective“, Maritime Policy and Management, 17(2), 107-112, 1990.
3. Key Findings on Terminal productivity Performance across Ports, Countries and Regions, 2013., www.joc.com/port_productivity
4. Merk, O.Dang, T. „Efficiency of World ports in container and bulk cargo(oil,coal,ores and grain)“, OECD Regional Developement Working Papers, OECD Publishing, 2012.
5. Review of Maritime Transport, 2015., United Nations Publication, Geneva.
6. Talley, W., „Optimum throughput and performance evaluation of marine terminals“, Marine Policy and management, 15(4), 327-331., 1988.
7. Time Efficiency at World Container ports, International Transport Forum, 2014., www.internationaltransportforum.org/jtrc/Discussion Papers/jtrcpapers.html
8. The Journal of Ports and Terminals, Special edition: Top 30 papers 2014-2016., 2016. www.porttechnology.org

7th INTERNATIONAL MARITIME SCIENCE CONFERENCE
516
April 20th-21st, 2017, Solin, Croatia
SATELLITE DERIVED BATHYMETRY – LOW COST SURVEY SYSTEMSNenad Leder, Tea Duplančić Leder
SATELLITE DERIVED BATHYMETRY – LOW COST SURVEY SYSTEMS
Nenad Leder1, Tea Duplančić Leder2
(1 Hydrographic Institute of the Republic of Croatia, Split, Croatia)
(2 Faculty of Civil Engineering, Architecture and Geodesy, Split, Croatia)
(E-mail: [email protected])
ABSTRACT
Satellite Derived Bathymetry (SDB) uses satellite or other remote multispectral imagery for depth determination. Recent advances in satellite technology (spectral, radiometric, temporal and spatial resolution improved) have increased the potential of this method as a source of hydrographic data. This method became widely used in the last few years. SDB is a survey method founded on analytical modelling of light penetration through the water column in visible and infrared bands. SDB become the most important low cost source of hydrographic data. In this article SDB method was applied by using Landsat 8 satellite images to get bathymetric data in the area of Kaštela Bay in the Middle Adriatic. The procedures and algorithms of SDB processing, as well as reconnaissance tool, were described. The “preliminary” bathymetric map of the Kaštela bay, obtained by the SDB method for the only one satellite scene, was compared with Electronic nautical chart 47 of that area with satisfying result. Finally, improvement of the presented SDB methodology was proposed.
KEY WORDS
Key words: Satellite Derived Bathymetry, Hydrography, Adriatic Sea.
1. INTRODUCTION
Satellite Derived Bathymetry (SDB) is a relatively new survey method which uses satellite or other remote multispectral imagery for depth determination (Marks, 2016). SDB supports various hydrographic and marine applications (bathymetry, coastal management, benthic habitat survey, water quality monitoring…). Recent advances in satellite technology (spectral, radiometric, temporal and spatial resolution improved) have increased potential of this method as a source of hydrographic data. This method was developed in the late 1970s, but the last few years become widely available and used (UKHO, 2015). SDB is a survey method founded on analytical
modeling of light penetration through the water column in visible and infrared bands. It should be pointed out that accuracy of SDB does not meet current International Hydrographic Organization (IHO) S-44 standards (IHO, 2008), but can be useful tool for survey planning of an areas that require a new hydrography survey (Pe’eri et al., 2013). SDB data has potential to become most important low cost source of a large number of spatial data including hydrographic data also. Nowadays in the USA about 50% of their territories were surveyed before single-beam echo-sounder era and positioned by sextant (Marks, 2016). We can assume that at least 50% of the total global area of the continental shelf was unsurveyed or

517
Nenad Leder, Tea Duplančić Leder
SATELLITE DERIVED BATHYMETRY – LOW COST SURVEY SYSTEMS
surveyed with horizontal and vertical inadequate accuracy defined according to IHO S-44 standards. In the Republic of Croatia there is 45.09% of the marine territory (internal waters, territorial sea, economic zone) with depths below 200 m, which are unsurveyed or surveyed with inadequate accuracy (Leder, unpublished). SDB method could be, therefore, an ideal tool for the determination of bathymetric data in the marine areas without bathy-metric data or in the areas with old bathymetric data. The main goal of this paper is to apply SDB method to get bathymetric data in the area of the Kaštela Bay in the Middle Adriatic (Fig. 1) and compare it with multibeam echo-sounder (MBS) bathy-metric data.
2. STUDY AREA
The Kaštela Bay (Fig.1) is situated in the Middle Adriatic and represents a semi enclosed low energy wave environment with a tidal range of about 0.3 m, total area of 60 km2 and the volume of 1.4 km3 (Leder et al., 1998). Bay is relatively shallow with average depth of 23 m (maximum depth of 45 m at the inlet of the bay). Bay is located in the middle of the Adriatic Sea at 43°32′00″N 16°21′00″E. From the north and northeast, the bay is closed by land masses, on the southern side it is bounded by the Split peninsula, and from the west and southwest it borders the island of Čiovo (Fig. 1). Heavy traffic across this area is under the jurisdiction of the Port Authority Split consisting of passenger port (4.5 million passengers and 650 000 vehicles) and 4 trade port (operating ports has unloaded 3.2 million tons of cargo) total length of operative coast is 6.2 km. In addition to these facilities, there are large number of ports and moorings for small boats (URL 1).
Figure 1. Kaštela Bay
3. METHODOLOGY
SDB offers a cost effective solution for bathymetric survey of shallow coastal waters with little or no existing hydrographic data and no prospect of obtaining surveys using other higher accuracy methods in the near future. In our research we use the Landsat program as a longest-running satellite imagery mission of series of Earth-observing satellites. Landsat 8 satellite is launched in 2013. It is collaboration between National Aeronautics and Space Administration (NASA) and the United States Geological Survey (USGS). Landsat scene is 185 km long and 185 km wide (Fig. 2) and can be downloaded through the USGS EarthExplorer website. Program is intended for research and has many applications.
Figure 2. Landsat 8 image of the Middle Adriatic
area on 21th December 2016
The Landsat-8 Operational Land Imager (OLI) satellite acquires total of 9 bands: eight bands with 30 m and one (panchromatic) band with 15 m spatial resolution (Tab. 1). Temporal resolution of this mission is 16 days. Landsat orbit is un-synchronous at an altitude of 705 km with 233 orbit cycles per day. Orbit inclined 98.2° and equatorial crossing time is 10:00 a.m. +/-15 minutes.

7th INTERNATIONAL MARITIME SCIENCE CONFERENCE
518
April 20th-21st, 2017, Solin, Croatia
Table 1. Landsat 8 bands wavelengths and spatial resolutions (Marks, 2016).
Spectral Band Wavelength (µm)
Spatial res. (m)
OLI Band 1 - Coastal 0.433 – 0.453 30 Band 2 - B 0.450 – 0.515 30 Band 3 - G 0.525 – 0.600 30 Band 4 - R 0.630 – 0.680 30 Band 5 - NIR 0.845 – 0.885 30 Band 6 - SIR 1.560 – 1.660 30 Band 7 - SIR 2.100 – 2.300 30 Band 8 – Pan. 0.500 – 0.680 15 Band 9 - Cirrus 1.360 – 1.390 30
3.1. Methods
The procedure (workflow) to obtain bathymetric data from satellite imagery includes following basic steps (Gao, 2009):
1. Pre-processing or downloaded satellite imagery based on geographic location and environmental conditions (e.g., cloud coverage and sun glint);
2. Water separation or removed dry land and most of the clouds by obtained threshold value from B and G bands images;
3. Converting each pixel of satellite image into a floating point repre-sentation;
4. Spatial filtering with low-pass filter to remove ‘Speckle noise’ from imagery;
5. Glint/cloud correction used Hedley et al. (2005) algorithm used to correct radiometric contributions from Sun glint and low clouds: 𝑅𝑅!! = 𝑅𝑅! − 𝑏𝑏!(𝑅𝑅!"# −𝑀𝑀𝑀𝑀𝑀𝑀!"#) (1)
Ri’= Sun glint-corrected pixel 𝑅𝑅!=pixel value in the B and G bands; 𝑏𝑏!=regression slope; 𝑅𝑅!"# −𝑀𝑀𝑀𝑀𝑀𝑀!"#=difference between pixel NIR (near infrared) value of 𝑅𝑅!"# and ambient NIR level 𝑀𝑀𝑀𝑀𝑀𝑀!"# which gives the 𝑅𝑅!! Sun glint-corrected pixel brightness of NIR with no Sun glint and can be assessed by the minimum NIR value.
6. Bathymetry algorithm is calculated according Stumpf et al. (2003) algorithm on the B and G bands:
𝑧𝑧 = 𝑚𝑚!!" (!!"# !"#$! )!" (!!"#(!"#$!))
−𝑚𝑚! (2)
𝐿𝐿!"#=observed radiance of bands; 𝑚𝑚!,𝑚𝑚!=offset and gain determined empirically; 𝐵𝐵𝐵𝐵𝐵𝐵𝐵𝐵!=B band; 𝐵𝐵𝐵𝐵𝐵𝐵𝐵𝐵!=G band; 𝑧𝑧 =depth.
7. Identifying the extinction depth – The optic depth limit for inferring bathymetry (also known as the extinction depth) is calculated by calculated 𝑚𝑚!,𝑚𝑚! parameters.
8. Vertical referencing meaning reference depth to the chart datum.
Figure 3. SDB of Kaštela Bay

519
Nenad Leder, Tea Duplančić Leder
SATELLITE DERIVED BATHYMETRY – LOW COST SURVEY SYSTEMS
Figure 4. ENC of Kaštela Bay
3.2. Cost of SDB processing
SDB is cost effective and rapid survey method. This is independent technology, supporting uncertainty estimation. SDB cost generally depends on costs of satellite images, which are between 0 (free of charge) and 60 €/km2, depending on image quality. Image spatial resolutions are from 0.5 to 30 m (Tab. 2).
Table 2. Spatial resolution and the cost of individual satellite scenes used for SDB (ARGANS,
2016)
Satellite Spatial res. (m) Cost/km2 (€) Quickbird 0.6-2.4 22 Pleiades 0.5-2 5
TerraSar-X 1-3 2.64 WorldView2 0.5-2 14-60
RapidEye 5 0.95 Sentinel 2 10 Free Landsat 8 30 Free
2.3. Costs and Effective performances
According to the IHO Standards for Hydrographic Surveys (S-44) (IHO, 2008), multibeam echo-sounder (MBES) data typically met the quality of data: positional data accuracy of ±5 m + 5% of depth; vertical or depth accuracy of ±0.50 m + 1% of depth, while almost all SDB data were within positional accuracy ±500 m and depth accuracy of ±2 m + 5% of depth. Available SDB data were vertically accurate to approximately ±2-3 m.
In very shallow waters (shallower than 10 m), SHOM researchers compared results of different methods to obtain the bathymetry data (Tab. 3).
Table 3. Comparison of the characteristics of acoustic, Lidar and SDB methods (SHOM, 2015)
Acoustic (EM204)
Lidar (CZMI)
Satellite (Palaides)
Survey (€/km2) 2.5 1.5 0.01 Survey (hour/km2) 7 0.08 0 Prosessing (hour/km2)
21 4 3
Total cost (€/km2) 3.3 1.7 0.1 Total duration (hour/km2)
28 4 3
Hor. res. (m) 0.2 0.5 2 Ver. res. (m) 0.1 0.2 1 Density (depth/m2) 25 4 0.25 Hor. acc. (m) 0.5 1 10 Ver. acc. (m) 0.2 0.3 10-30% of
depht
4. RESULTS
The result of satellite derived bathymetry (SDB) method (described in Chapter 3), which used Landsat 8 image on 21 December 2016, for depth determination in the area of the Kaštela Bay is shown in Fig. 3. The only one Landsat 8 image was processed because of small number of images that was on disposal recently (free of charge) and without atmospheric/ oceanographic “noise”. Therefore bathymetric map of the wider area of the Kaštela Bay (Fig. 3) could be considered as the

7th INTERNATIONAL MARITIME SCIENCE CONFERENCE
520
April 20th-21st, 2017, Solin, Croatia
“preliminary” bathymetric map. The stripe shown in Fig.3 is consequence of airplane flight at the moment of satellite imagery. By comparing the “preliminary” bathymetric map shown in Fig. 3 with Electonic nautical chart 47 (Fig. 4; Hydrographic Institute of the Republic of Croatia) it can be seen that generally depth gradients and coastline are very well surveyed by using SDB method, while individual shoals are not detected because of low spatial resolution of the SDB method.
5. CONCLUSIONS
SDB method is suitable for bathymetric survey of shallow areas with clear water (approximately to the depth of 2 secchi disc depth). The eastern Adriatic Sea coastal area is relatively shallow water, mostly very clear in a large part of the year. Thus SDB method met two basic components which are preconditions for its usage. When choosing satellite scene we chose the free Landsat mission, but on the same principle can be the depth calculate with commercial satellite mission, which have a higher spatial resolution (e.g. Worldview 3 or 4 with spatial resolution of 0.3 m). We chose winter scene because there is a high probability of blooms occurrence in the spring and summer time. The results obtained are satisfying for the only one satellite scene and without knowledge of the atmospheric/oceano-graphic conditions in the Kaštela Bay area. Finally it can be concluded that SDB method, presented in this paper, must be scientifically improved by experiments with the procedure described in the Chapter 3.1, especially with proposed empirical parameters and by using higher quality satellite scenes which are not free of charge.
REFERENCES
1. ARGANS, “SDB Developments - seen from an R & D perspective”, NSHC32 Dublin, (2016).
2. Gao, J. “Bathymetric mapping by means of remote sensing: Methods, accuracy and limitations”, Prog. Phys. Geogr., Vol. 33, (2009), 103–116.
3. Hedley, J. et al, Simple and robust removal of sun glint for mapping shallow-water benthos, Inter. Jour. of Rem. Sensing, Vol. 26, (2005), 2107-2112.
4. IHO, “IHO standards for hydrographic survey: Special Publication No. 44”, (2008), Inter. Hydro. Bureau, Monaco.
5. Leder, N. et al, „Neki rezultati fizikalno-oceanografskih mjerenja u istočnom dijelu Kaštelanskog zaljeva (Bazen Vranjic)“, Zbornik Kaštela kolijevka Hrvatske, Matica hrvatska - Kaštela (1998), 359-366.
6. Marks K. M., “IHO-IOC GEBCO Cook Book: 2016 Progress Report, NOAA Laboratory for Satellite Altimetry”, College Park, (2016), Maryland, USA
7. Pe’eri, S. et al, “Satellite-derived Bathymetry - A Reconnaissance Tool for Hydrography”, Hydro Int. (2013) 16-19.
8. SHOM, “Satellite Derived Bathymetry - Coastal mapping update”, (2015).
9. Stumpf, R.P. et al, “Determination of water depth with high-resolution satellite imagery over variable bottom types”, Limnol. Oceanogr, Vol. 48, (2003), 547–556.
10. UKHO. “Satellite Derived Bathymetry as Source Data for Navigational Charts”, (2015).
URL 1. Port of Split, http://portsplit.com/ (15.02.2016.)

521
Tomasz Lus
VIBRO-ACOUSTIC METHODS AS A TOOL TO IMPROVE CONDITION BASED MAINTENANCE PROCESS OF MARINE DIESEL ENGINES
VIBRO-ACOUSTIC METHODS AS A TOOL TO IMPROVE CONDITION BASED MAINTENANCE PROCESS OF MARINE DIESEL ENGINESTomasz Lus
VIBRO-ACOUSTIC METHODS AS A TOOL TO IMPROVE
CONDITION BASED MAINTENANCE PROCESS OF MARINE DIESEL ENGINES
Tomasz Lus
(Polish Naval Academy, Gdynia, Poland)
(E-mail: [email protected])
ABSTRACT
Marine diesel engines technical condition assessment is a very complex process. There are some tools available in vibro-acoustic signal analysis which gives opportunity to trace changes in signal patterns in real-time on-line monitoring systems. Acoustic signals processing methods which are attractive by their simplicity are not efficient in real assessing conditions especially on board the ship in very narrow and noisy engine compartments. In this respect vibration signals processing methods seems to be much more effective. Vibration methods give opportunity to change the whole engine maintenance process philosophy. It is possible using on-line monitoring systems to go from scheduled to condition based engines maintenance without fear about real operating engine conditions[1,2,3]. Diagnostic methods based on vibration signal analysis which are used on marine low-, medium- and high-speed diesel engines are presented in this paper. Vibration signals generated by diesel engines and their components need different signal processing methods to be effective and faultless in engines diagnostics. These methods which based on vibration signals analysis are sensitive on engine load and speed changes. Methods presented in the paper based mostly on vibration signals processing in time/crank angle domain. Using these methods checking technical condition of the marine diesel engines without stopping and dismantling them is possible.
KEY WORDS
Maritime transport, marine diesel engine, diagnostics, vibration analysis, maintenance.
1. INTRODUCTION
One of the most important factor in navy and merchant fleet activity are the costs of maintenance. These are higher when the fleet become older. Vessel’s crew qualifications, still lowering crew numbers, and higher and higher demand for ship operational availability are the reasons for some fleet operators /ship owners to change maintenance strategy of the ship. Up to
now in most civilian maritime companies maintenance is based on equipment running hours and calendar time scheduling. This strategy of maintenance was dominated also in Polish Navy (PN) up to the end of eighties. In that time Polish Naval Academy (PNA) together with PN prepared and introduced new maintenance strategy dedicated to diesel engines and gas turbine engines installed on board the ships. This new

7th INTERNATIONAL MARITIME SCIENCE CONFERENCE
522
April 20th-21st, 2017, Solin, Croatia
strategy which based on several condition monitoring techniques had change, for some types main and auxiliary engines, planned maintenance strategy (PM) into condition based maintenance strategy (CBM). In most world’s navies and in PN such condition monitoring techniques as performance parameters analysis and lubricating oil analysis were used after WWII to achieve longer times between overhauls (TBO) and lower maintenance costs. Big sense of this two methods connected with PM system was especially valuable when navy ships were in medium age and run very few hours in the year. In mid-eighties another few condition monitoring techniques such as cylinder pressure analysis, vibration analysis and remote visual inspection (endoscopy) have been introduced in PN engines maintenance system. Some condition monitoring techniques which were work out in PNA and used in PN will be presented in this paper. Special attention will be given to vibration analysis regard to low-, medium- and high-speed marine diesel engines.
2. VIBRATION ANALYSIS AS CONDITION MONITORING TECHNIQUE IN MARINE DIESEL ENGINES
Vibration observed on marine diesel engine parts could be caused by various sources, resulting from the combination of combustion and inertia forces which act on moving parts of the engine. The main sources of diesel engine vibration are: combustion process, inertia forces, pistons slaps, high pressure processes in fuel system, impacts in fuel valves, impacts in valve gear mechanism, gas flows in engine manifolds, oil flows in hydraulic systems, rotation of turbocharger rotor and others. Moving parts of the engine accelerate by combusting pressure or by cams running across their clearances what causes mechanical impacts. These impacts are
found to be the main cause of the predominant high frequency noise and could be observed by vibro-acoustic methods.
Vibration signals from diesel engines could be analyzed in time/crank angle domain or in the frequency domain using the Fast Fourier Transformation (FFT). The frequency analysis is very useful and the most frequently used for stationary signals. For the non-stationary signals generates by diesel engine the frequency content varies with time and in this case time-frequency or angle-frequency analysis tools should be used. From experience gained in many years of test in PNA vibration acceleration amplitude curves/runs in time/engine crankshaft rotation angle domain were chosen as a diagnostic tool in engine analyzers constructed in PNA.
2.1. Low-Speed Marine Diesel Engines
Polish Navy operates only one type of low-speed diesel engine. It is SULZER 6TD48 two-stork six-cylinder trunk engine with nominal output 1800 HP at 220 rpm. Engine has cross-scavenging system with higher exhaust ports. Most of the malfunctions and troubleshooting in these diesel engines are generated by fuel system – fuel injectors and fuel pumps. According to the engine manuals, crews should inspect these elements in relatively short periods. Opening and closing of the fuel injectors and fuel valves in high pressure fuel pumps generate vibration signals. These signals are observed, measured and analyzed by engine analyzers constructed in PNA. Example of vibration signal (blue curve) generated by fuel injector of SULZER 6TD48 type engine together with cylinder pressure curve in time domain (red curve) are shown in Figure 1.

523
Tomasz Lus
VIBRO-ACOUSTIC METHODS AS A TOOL TO IMPROVE CONDITION BASED MAINTENANCE PROCESS OF MARINE DIESEL ENGINES
Figure 1. Vibration signal (blue curve) generated by fuel injector of one cylinder of SULZER 6TD48 type engine together with cylinder pressure (red curve) in time domain
Magnified signals in crank angle (CA) domain for only one crankshaft revolution (-180 to +180 CA degrees) are shown in Figure 2. Moving parts of fuel valves are source of impacts which are observed as accelerations of the vibrations. Needle up and down movements coincide with sharp impacts on the fuel valve main body and needle
seat as it is shown in Fig. 2. To get such signals from working injectors the vibration sensor should be installed directly on the injector or very close to it. Such placement of vibration sensor is not a problem in case of the engine with cylinder diameter of 48 cm.
Figure 2. Vibration signal (blue curve) generated by fuel injector of one cylinder of SULZER 6TD48 type engine together with cylinder pressure curve (red curve) in crank angle domain

7th INTERNATIONAL MARITIME SCIENCE CONFERENCE
524
April 20th-21st, 2017, Solin, Croatia
If the fuel delivery system works properly two sharp and strong vibration signals – picks – created by the fuel valve needle are usually observed in crankshaft angle domain, but when jamming or other malfunction occurs the signal pattern is
changed. The first pick is usually a little bit stronger than the second one(Figure 3), what can be explained by pressure value during the fuel delivery process.
Figure 3. “Zoom” of vibration signal (blue curve) generated by fuel injector of one cylinder of SULZER 6TD48 type engine together with cylinder pressure curve (red curve) in crank angle domain
Values of angles of fuel valves openings (AFVO) and closings (AFVC), angels of fuel valves periods (AFVP) together with other operational parameters
measured by engine analyzer for all six SULZER 6TD48 engine cylinders in bar graphs and in the table form are shown in Figures 4.1. and 4.2.
Figure 4.1. Bar graphs with SULZER 6TD48 type engine parameters A fuel [deg] – angles of fuel valves openig and closing – total angles of fuel delivering to engine’s six
cylinders – to the right

525
Tomasz Lus
VIBRO-ACOUSTIC METHODS AS A TOOL TO IMPROVE CONDITION BASED MAINTENANCE PROCESS OF MARINE DIESEL ENGINES
Figure 4.2. Tabe with SULZER engine 6TD48 type parameters AFVO – angle of fuel valve openig , AFVC – angle of fuel valve closing
2.2. Medium-Speed Marine Diesel Engines
Medium-speed marine diesel engines have very wide representation in PN. The most frequent installed medium-speed engines are SULZER type A four-stroke engines in different numbers of cylinder and configurations. Access to fuel valves and other engine moving parts such as valve gear mechanism
is restricted by cylinder heads covers. In this case vibration sensor is mounted on the screw which fastened cylinder head cover to the cylinder head – Figure 5. Vibration signals generated by fuel valve nozzles and intake and exhaust valves (Figure – 6) are observed as envelopes of acceleration vibration signals (blue lines) together with cylinder pressure (red line) – Figure 7 - thanks to special PNA engine analyzer construction.
Figure 5. Vibration sensor mounted on cylinder head cover screw of SULZER 6AL20/24 type engine
Figure 6. Main sources of vibration signals in cylinder head of SULZER 6AL20/24 type engine –
fuel nozzle and valve gear mechanism

7th INTERNATIONAL MARITIME SCIENCE CONFERENCE
526
April 20th-21st, 2017, Solin, Croatia
Figure 7. Vibration signals (blue curve) generated by fuel injector (in the middle) and valve gear mechanism of one cylinder of SULZER type A engine together with cylinder pressure curve (red curve) in crank angle
domain
In case of these type of medium-speed marine diesel engines vibration signal is measured in crank angle domain, duplicated and averaged in the range of -360 to +360 CA degrees. Signals generated by fuel valve opening and closing (in the middle) and signals generated by valve gear mechanism are easily observed.
Similar results were achieved for medium-speed marine diesel engines type 4-2DŁ42M with unit injectors installed on submarine. But difficult access to unit injectors and a common cover of cylinder heads on which vibration sensor was mounted resulted in weaker and less reliable vibration signal – Figure 8.
Figure 8. “Zoom” of vibration signal (blue curve) generated by unit injector (in the middle) and valve gear mechanism of one cylinder of 4-2DŁ42M submarine diesel engine together with cylinder pressure curve (red
curve) in crank angle domain

527
Tomasz Lus
VIBRO-ACOUSTIC METHODS AS A TOOL TO IMPROVE CONDITION BASED MAINTENANCE PROCESS OF MARINE DIESEL ENGINES
2.3. High-Speed Marine Diesel Engines
Polish Navy similarly like other small navies exploit quite big amount of small vessels and prime movers on them are off course high-speed diesel engines. There were made tests to adopt the same diagnostic method which was successfully introduced on low- and medium-speed diesel engines based on vibration analysis to high-speed diesel engines. In some engines types characteristic points of engine operation process (beginning of the fuel injection, open and closing of intake and exhaust valves) could be observed and measured as a symptom of engine tuning or technical condition. The typical visual analysis of the vibration signal of these engines in the time/angle domain gives usually limited information. The signal analyzing method presented in this paper precisely is the angle analysis of the envelope of vibration acceleration curve. That method for low-, medium- and high-speed marine diesel engines was worked out in the Technical Institute of Ship Maintenance of the Polish Naval Academy in Gdynia and is still
evaluated for a new and more complex marine diesel engines with higher rpm’s. The signal is analyzed as an event in time/angle domain and when the sampling frequency is high enough as well as the time/angle axis is stable, having appropriate reference signals one could easily check the signal sequence order (signal pattern). The proper vibration signals sequence order (proper signal pattern) means that the engine is in a good technical condition. A problem with accuracy of the method appears when one have to observe vibration signals on high-speed multi-cylinder engines. Research was made on high-speed 12-cylinder diesel-generator units on the one of the Polish Navy vessels. Engines were loaded up to 50% and 100% of the nominal load during the tests. Patterns of envelope of vibrations observed on analyzer’s screen for one bank of cylinders are shown in Figure 9. To achieve better signal visualization followed signals are moved-up by a few volts. In signal pattern at 100% nominal engine load opening and closing points of fuel valves are seen. Also angles of intake and exhaust valves closing are easy to observe.
Figure 9. Envelopes of vibration acceleration signals registered on one of the banks of six cylinders auxiliary
diesel generator WOLA H12 engine speed = 1509 rpm, engine load = 100% of nominal load
Similar tests were carried out on high-speed diesel engines installed on submarines as diesel-generators. Vibration signals registered simultaneously on cylinder heads of one of the two banks of 12 cylinders MB820 diesel engine are
shown in Figure 10. Cylinder pressure signal from cylinder No. 1 is presented together with vibration traces. There is not easy to recognize and assign to the separate signals exact events in the engine fueling or valve gear systems.

7th INTERNATIONAL MARITIME SCIENCE CONFERENCE
528
April 20th-21st, 2017, Solin, Croatia
Figure 10. Cylinder pressure signal from cylinder No. 1 as a reference signal for vibrations traces from six
cylinder heads in the same bank of high-speed marine diesel engine
In the Figure 11 the vibration signal traces from six cylinder heads at engine rated power were moved up by 0,2 volt but it is still not easy to recognize
the characteristic timing points of the working engine.
Figure 11. Vibrations traces from six cylinder heads in the same bank of high-speed marine diesel engine
moved up by 0,2 volt – engine at rated load In the next step the vibration signal traces from six cylinders were shifted to the TDC (Fig.12) of the first (in this bank) cylinder to assure higher accuracy of analysis. Additionally, on the Fig.12 the static engine timing points are shown: ZZw – means static value of angle of exhaust valves
closes, ZZd – means static value of angle of inlet valves closes, PW – means static point of start of fuel feed-in when idling, OZw – means static exhaust valves opens and OZd – means static inlet valves opens.

529
Tomasz Lus
VIBRO-ACOUSTIC METHODS AS A TOOL TO IMPROVE CONDITION BASED MAINTENANCE PROCESS OF MARINE DIESEL ENGINES
Figure 12. Vibrations traces from six cylinder heads in the same bank of high-speed marine diesel
The places where signals from different (adjacent) cylinders could interfere (for 4-stroke 6 cylinder diesel engine it is usually ±120o , ±240o
to TDC) are shown on the Fig. 13. The strongest signals from adjacent cylinders could make some limitations in the tuning and diagnostic process.
Figure 13. Specific places where vibration signals from different cylinders interfere with one another 3. CONCLUSIONS Economy enforced navies and merchant ships operators to cut costs of fleet exploitation. One of the biggest costs is maintenance of the vessel. Different navies together with ship classification societies through many years of experience adopted some new maintenance strategies and introduced Integrated Conditioned Monitoring
System (ICMS)[4]. This system enable ship-owners to utilize condition monitoring as part of their on-going machinery survey requirements. More recently [5] ships are being recognised as major assets and with that, the application of asset management tools and techniques are being more widely seen within ship management. This has been further aided by the involvement of Lloyds register in the development of ISO 55001 – The

7th INTERNATIONAL MARITIME SCIENCE CONFERENCE
530
April 20th-21st, 2017, Solin, Croatia
international management standard for Asset Management systems. One of the tools which could be helpful with introducing ICMS and lowering maintenance costs could be marine diesel engine technical condition monitoring based on vibration analysis.
REFERENCES 1. Klockars T., Eykerman A., Mayr I., Making the
most of perfect maintenance timing, indetail,
Wärtsilä Technical Journal (01.2010) pp. 57-
60, Finland.
2. Lus T., Tuning method for high-speed marine Diesel engine MB820 type, Journal of KONES POWERTRAIN AND TRANSPORT 2010 Vol.17, No2, pp. 277-284, Warszawa, 2010. ISSN 1231-4005.
3. Lus T., Vibration signals as a tool for diesel
engine diagnostics and tuning. 13th EAEC
European Automotive Congress Proceedings,
Valencia, 13-16 June 2011.
4. McNeill E., Condition monitoring
maintenance, GOORANGAI, Occasional papers
of the Royal Australian Naval reserve
professional studies program, Volume 4
Number 3, March 2010.
5. Tomlinson N.A., What is the ideal
maintenance strategy? A look at both MoD
and commercial shipping best practice, BMT
Defence Service, UK, 2015.

531
Miroslav Vukičević, Radmila Gagić, Danilo Nikolić
APPLICATION OF SIMULATION SOFTWARE IN ESTIMATION OF NOX EMISSION FROM SHIP’S MAIN ENGINE AT DIFFERENT LOADS
APPLICATION OF SIMULATION SOFTWARE IN ESTIMATION OF NOX EMISSION FROM SHIP’S MAIN ENGINE AT DIFFERENT LOADSMiroslav Vukičević, Radmila Gagić, Danilo Nikolić
APPLICATION OF SIMULATION SOFTWARE IN ESTIMATION OF NOX EMISSION FROM SHIP’S MAIN ENGINE AT DIFFERENT
LOADS
Miroslav Vukičević, Radmila Gagić, Danilo Nikolić
(University of Montenegro, Maritime Faculty Kotor, Kotor, Montenegro)
(E-mail: [email protected])
ABSTRACT
Air pollution from ships has become one of the leading issues in the worldwide, and it is necessary to track the value of these emissions. Today's operating systems on board use mainly diesel engines, and to a smaller extent steam and gas turbines. These operating devices, emitting harmful gases and particles, significantly contribute to air pollution and have negative impact to the environment. Emissions of nitrogen oxides (NOx) are considered as one of the biggest problems when it comes to the maritime traffic. Monitoring of NOx emissions from ships is necessary in order to comply with Annex VI of the MARPOL Convention. To avoid expensive measuring NOx emissions on board, it is possible in certain circumstances to use of simulator software of marine engine to simulate combustion process, and estimate amount and type of combustion products from the engine. The purpose of this research is to estimate the value of NOx emissions from two-stroke low-speed main engines for different engine load using simulation software. Estimated results were compared to directly taken data during operation of the ship. Results of NOx emissions at 70% and 80% engine load were analyzed, performed in a completely loaded ship and in conditions of calm sea. Using simulation software the emission of NOx from marine diesel engines for different load conditions there could be estimated with great accuracy.
KEY WORDS
Ships, Slow speed marine diesel engines, Exhaust emission, Nitrogen oxides, Emission simulation softwar
1. INTRODUCTION
Preservation of the human environment has become one of the most important segments of scientific research. Given the fact that they are so far primarily dealt with issues of pollution from the land, today more attention is paid to air pollution from various sources. As already known, nitrogen oxides (NOx) play a major role in the formation of smog, acid rain and deterioration of air quality at the local level. As a result of traffic growth, emission of NOx is still growing, mostly due to combustion of
liquid fuels. Marine diesel engines are significant polluters of the atmosphere. Power systems on ships are using primarily diesel engines, but also to a lesser extent steam turbines, and even more rarely gas turbines. The higher efficiency of low-speed marine diesel engine, among other power systems, is achieved by shortening the time of combustion of fuel in the cylinder, so the engine with a long stroke of the piston increases the compression ratio. This leads to combustion of fuel in the cylinder at higher temperatures, causing the harmful emission of NOx in exhaust gases.
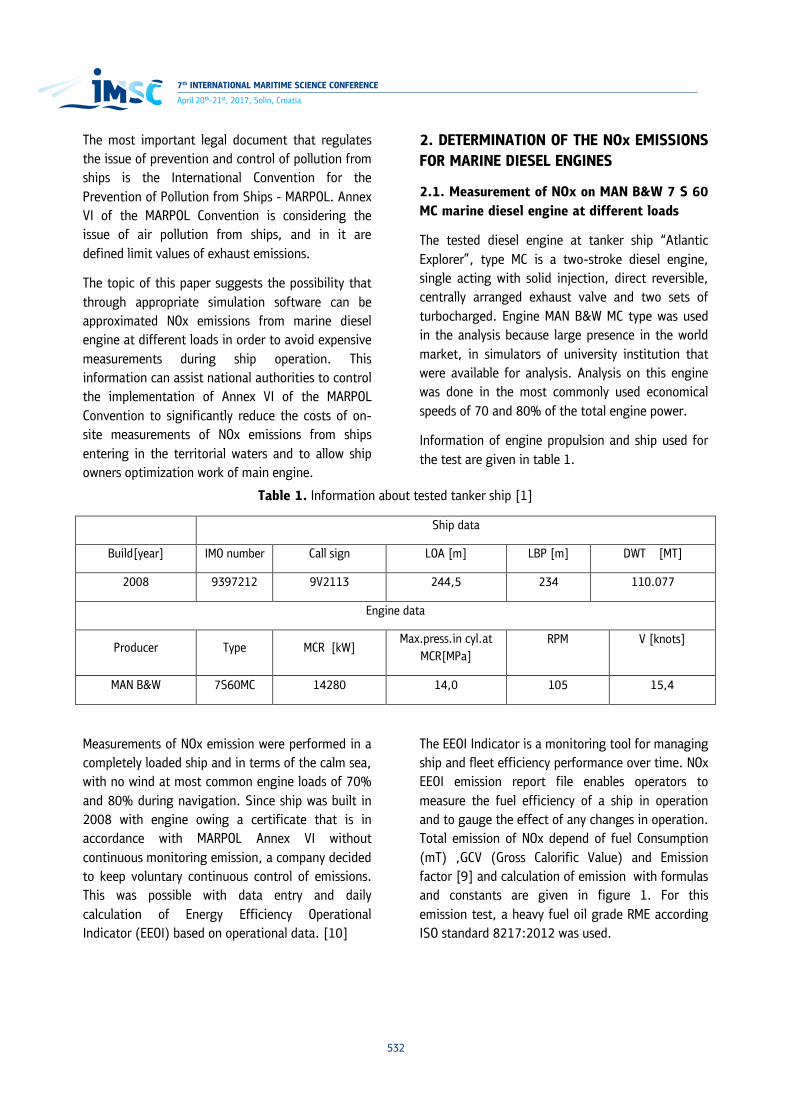
7th INTERNATIONAL MARITIME SCIENCE CONFERENCE
532
April 20th-21st, 2017, Solin, Croatia
The most important legal document that regulates the issue of prevention and control of pollution from ships is the International Convention for the Prevention of Pollution from Ships - MARPOL. Annex VI of the MARPOL Convention is considering the issue of air pollution from ships, and in it are defined limit values of exhaust emissions.
The topic of this paper suggests the possibility that through appropriate simulation software can be approximated NOx emissions from marine diesel engine at different loads in order to avoid expensive measurements during ship operation. This information can assist national authorities to control the implementation of Annex VI of the MARPOL Convention to significantly reduce the costs of on-site measurements of NOx emissions from ships entering in the territorial waters and to allow ship owners optimization work of main engine.
2. DETERMINATION OF THE NOx EMISSIONS FOR MARINE DIESEL ENGINES
2.1. Measurement of NOx on MAN B&W 7 S 60 MC marine diesel engine at different loads
The tested diesel engine at tanker ship “Atlantic Explorer”, type MC is a two-stroke diesel engine, single acting with solid injection, direct reversible, centrally arranged exhaust valve and two sets of turbocharged. Engine MAN B&W MC type was used in the analysis because large presence in the world market, in simulators of university institution that were available for analysis. Analysis on this engine was done in the most commonly used economical speeds of 70 and 80% of the total engine power.
Information of engine propulsion and ship used for the test are given in table 1.
Table 1. Information about tested tanker ship [1]
Ship data
Build[year] IMO number Call sign LOA [m] LBP [m] DWT [MT]
2008 9397212 9V2113 244,5 234 110.077
Engine data
Producer Type MCR [kW] Max.press.in cyl.at
MCR[MPa] RPM V [knots]
MAN B&W 7S60MC 14280 14,0 105 15,4
Measurements of NOx emission were performed in a completely loaded ship and in terms of the calm sea, with no wind at most common engine loads of 70% and 80% during navigation. Since ship was built in 2008 with engine owing a certificate that is in accordance with MARPOL Annex VI without continuous monitoring emission, a company decided to keep voluntary continuous control of emissions. This was possible with data entry and daily calculation of Energy Efficiency Operational Indicator (EEOI) based on operational data. [10]
The EEOI Indicator is a monitoring tool for managing ship and fleet efficiency performance over time. NOx EEOI emission report file enables operators to measure the fuel efficiency of a ship in operation and to gauge the effect of any changes in operation. Total emission of NOx depend of fuel Consumption (mT) ,GCV (Gross Calorific Value) and Emission factor [9] and calculation of emission with formulas and constants are given in figure 1. For this emission test, a heavy fuel oil grade RME according ISO standard 8217:2012 was used.

533
Miroslav Vukičević, Radmila Gagić, Danilo Nikolić
APPLICATION OF SIMULATION SOFTWARE IN ESTIMATION OF NOX EMISSION FROM SHIP’S MAIN ENGINE AT DIFFERENT LOADS
Figure 1. NOx EEOI Emissions Report Form with formulas and constants for HFO [9]
Daily consumption is based on main engine fuel flow meter in engine room and is compared with daily sounding of fuel tanks. As shown in figure 1. GCV for HFO is a constant of 41,13601 MBTU/mT.
Base NOx emission for HFO is 4,21 lbs/MBTU and multiplying with constant of 0,0004536 is obtained 0,0019096 mT/MBTU which required for the calculation of thermal NOx contribution.
The concentration of “thermal NOx” is controlled by the nitrogen and oxygen molar concentrations and the temperature of combustion. Combustion at temperatures well below 1,300 °C (2,370F) forms much smaller concentrations of thermal NOx. [12]
Thermal NOx contribution is determined as per [9] :
Thermal NOx Contribution= Base x Humidity Adjustment x Hydrogen Adjustment (1)
Thermal NOx Contribution = 0,0019096 [mT/MBTU] x 0,68 x 1,09 = 0,0014154 mT/MBTU (2)
Fuels that contain nitrogen, create “fuel NOx” that results from oxidation of the already-ionized nitrogen contained in the fuel. Fuel NOx
contibutions is 0.53 lbs/MBTU and multiplying with constant of 0,0004536 is obtained 0,0002404 mT/MBTU [12].
For calculation Overall NOx emission required constant of Total NOx Contribution which is 0.0016558 mT/MBTU from figure 1 and Control Adjustment as shown in formula 3 [9];
Overall NOx emission factor = Total NOx Contribution x Control Adjustment (3)
Overall NOx emission factor =0.0016558 [mT/MBTU ] x 0.65= 0.0010763 [mT/MBTU ] (4)
Formula (3) is based on IMO circulated guidelines for voluntary use of the ship energy efficiency operational indicator (MEPC 1/Circ.684) [10] and result are shown in table 3.
Finally, for determination of Total NOx emission a fuel oil consumption per day and calculated emission factor are taken into account, as shown in formula (5);
Total NOx Emissions = Consumption x GCV x Emission Factor (5)

7th INTERNATIONAL MARITIME SCIENCE CONFERENCE
534
April 20th-21st, 2017, Solin, Croatia
Table 2. Spreadsheet MOLT (E) NOx EEOI emissions report for tested days in the month of April 2014. [2]
Environmental Management System Form SAF 005
Date 3.7.2011
File NO,:6.4
Subject: MOLT(E) NOx EEOI Emissions Report Form
Rev. No. 4
Page 1
Vessel: Atlantic Explorer Date: April
Type of fuel HFO
Engine ME
Date Voy.
Num.
Location: Sea/
Anchor/
Berth
Cargo
(mT)
Distance
( NM)
Cons.
(mT)
Spec.
Gravity
Sulp.
Cont.
Viscosity
@50° C
25.04 76 Sea 80854 332 44 0.9901 3.48
365
26.04
76 Sea 80854 329 46.6 0.9901 3.48 365
In table 2. form (SAF 005) is shown collected data related to volume of cargo, passed distance and consumption with constants like specific gravity, percentage of sulfur in fuel and viscosity which are important for calculations and determination of NOx. From same form can be seen that daily consumption of heavy fuel oil was 44 and 46.6 (mT). Therefore Total NOx Emissions is calculated as:
Total NOx Emissions =44[mT] x41,13601 MBTU/mT x 0.0010763 [mT/MBTU ] =1.95 [ mT ] (6)
Total NOx Emissions =46.6[mT] x41,13601 MBTU/mT x 0.0010763 [mT/MBTU ] =2.06 [ mT ] (7)
Table 3. Result of daily emissions calculated for tested engine 4. [2]
NOx
(mT)
IMO EEOI MOL EEOI (Laden)
Date: (Fuel x Cf) (mTxNM) EEOI (Fuel x Cf) (mTxNM) EEOI
25.04. 1.95 137.03 26843528 5.10 137.03 26843528 5.10
26.04. 2.06 145.13 26600966 5.46 145.13 26600966 5.46
For further discussion will take data when ship maintained a speed of 94 rpm and 97 rpm which
is possible using company stern tube form in table 4.

535
Miroslav Vukičević, Radmila Gagić, Danilo Nikolić
APPLICATION OF SIMULATION SOFTWARE IN ESTIMATION OF NOX EMISSION FROM SHIP’S MAIN ENGINE AT DIFFERENT LOADS
Table 4. Stern tube form with information about tested speed in rpm (among other data) [1]
Stern tube log Form ENG 025
Date 10.5.2010
File NO.:11.4 Rev.No. 1
Page 1
Vessel: Atlantic Explorer Date: April
LO grade Atlanta Marine D 3005
Engine ME
Date
Location: Sea/
Anchor/
Berth
AFT
Draft (m) Engine (rpm)
25.04 Sea 12.1 94
26.04 Sea 12.4 97
To get optimal value of 70% and 80% load for case study, engine revolution data (rpm) from table 4 can be compared with the results from shop trial summary and performance test with analysis software for laden ship [11]. Comparing results from tested engine in this two cases with the test result from shop trial in ballast condition (table 5) and performance test of loaded ship (figure 2 and 3), can be seen that speed of 94 rpm is nearest 70% load and speed of 97 rpm nearest 80% load which shown in table 5 and that is goal of this case study.
Table 5. Tabulation of different load and the speed of the ship in rpm (among other data) [1]
TE2459 Data Sheet No. 2459110
Summary Data of Shop Trial
Date Mar. 25. 2008
Data Sheet No. 2459111 2459112 2459113 2459114 2459115 2459116 2459117
Load % 25 50 70 85 100 100 110
Room Temp. °C 12.5 13.5 14.0 14.5 15.0 14.5 15.0
Baro.Press. hPa 1017 1017 1017 1017 1016 1016 1016
Engine Speed min -1
66.1 83.3 93.2 99.5 105.0 105.0 108.4

7th INTERNATIONAL MARITIME SCIENCE CONFERENCE
536
April 20th-21st, 2017, Solin, Croatia
Figure 2. Performance of tested ship at 93,9 rpm. [11]
Figure 3. Performance of tested ship at 97,3 rpm. [11]
From figure 2 it can be seen that at 93.9 rpm (approximately at 70% load) in performance test total power is 9636 kW and in figure 3 at 97.3 rpm and 80% load ship have power of 10029 kW.
To convert total NOx value from mT in g/kWh at 70% load and engine power of 9638 kW and 80% load at 10029 kW [11] is possible using formula [11]:

537
Miroslav Vukičević, Radmila Gagić, Danilo Nikolić
APPLICATION OF SIMULATION SOFTWARE IN ESTIMATION OF NOX EMISSION FROM SHIP’S MAIN ENGINE AT DIFFERENT LOADS
mT (daily) = 1,000,000 g/ kWh (8)
a) 70% load
1.95 [mT daily] = 1.95 x 1,000,000[g]/9638x24= 8,43 [g/kWh] (daily) (9)
b) 80% load
2.06 [mT daily] = 2.06 x 1,000,000[g]/10029x24= 8.56 [g/kWh] (daily) (10)
Comparing these two cases it can be seen different in total NOx emission (9 and10) and that emission depend from engine load.
2.2. Measurement NOx emission on a ship simulator TRANSAS at different loads
ERS 5000 TechSim is an engine room simulator provided by Transas. This simulator is in accordance with international requirements and fully meet the requirements of the IMO Convention on Standards of Training, Certification and Watchkeeping for Seafarers( STCW )and its resolution, meets IEC standards and the requirements of STCW 2010 and certified by DNV (Standard for Certification of Maritime Simulators No.2.14) [8]. Transas simulator is property of Maritime faculty Kotor. For purpose of this experiment, engine model
6S50MC was used. Basic data of engine type and ship model of simulator is given in table 6.
Table 6. Information’s about tested Transas
simulator model ship
Ship model-Product tanker
LOA [m] Breadth [m]
Draft [m] V [knots]
183 32,2 11 15,4
Engine data
Maker Type
MCR [kW]
Stroke
[mm]
Bore
[mm] RPM
8600
1910 500 MAN B&W
6S50MC 127
The simulation was performed in a completely loaded ship and in conditions of calm sea with no wind. The simulation was set for 70 % and 80 % engine load (figure 4.) in terms of the ambient temperature of 25 °C and 50 % humidity. Obtained data from the simulator in these conditions are as follows: NOx emission of 817ppm for 70 % load and 883 ppm for 80% load.

7th INTERNATIONAL MARITIME SCIENCE CONFERENCE
538
April 20th-21st, 2017, Solin, Croatia
Figure 4. 70 % and 80% load on Transas simulator (MAN B & W 6S 50 MC)
To be able to compare the data obtained NOx emissions which are expressed in (ppm) with the other data which are expressed in (g / kWh)
will be used result for tested engine type (10K 60MC) on the bed test . This data in table 7 is presented below.
Table 7. Emissions of engine 10K 60MC obtained on the test table [3]
Calculated exhaust gas composition for 10K60MC ( 18 900kW)
Ambient temperature 25°C ambient humidity 50%
Concentrations Emission factors
Units ppm%
(wet)
ppm%
(dry)
ppm% ppm% ppm% ppm% gNm3 g/bhph g/kWh
(15%O2) (13%O2) (5%O2) (0%O2)
NOx 1570 1660 1362 1820 3652 4767 3.41 13.70 18.63
Fuel oil sulphur: 2.25% *Dry
As shown in table 6 it is noticed that at an ambient temperature of 25 ° C, at humidity of 50%, and 1570 ppm of NOx emission, represents a value of 18.63 g /kWh. If these parameters are compared with the loads of 70% and 80% the following information could be stated:
• at 70% load NOx emissions amounts to 817 ppm, which corresponds to 9.7 g / kWh;
• at 80% load NOx emissions amounts to 883ppm, which corresponds to 10.47 g / kWh.
Simulation on Transas engine model, can be seen a slight increase in NOx emissions comparing to load percentage on the MC type of engine that has been tested under the same conditions as engine on the test bed.

539
Miroslav Vukičević, Radmila Gagić, Danilo Nikolić
APPLICATION OF SIMULATION SOFTWARE IN ESTIMATION OF NOX EMISSION FROM SHIP’S MAIN ENGINE AT DIFFERENT LOADS
2.3. Measurement NOx-emissions on a ship simulator "ERS KONGSBERG" at different loads
KONGSBERG's simulator known like K-Sim engine, is engine room training simulator installed at Maritime faculty Split (Croatia). K-Sim Engine exceeds requirements in the STCW convention, Regulation 1/12 and is certified and approved according to DNV GL's Standard for Certification of Maritime Simulators ST-033 January 2011 [7]. All engine models are based on data from real engines which makes simulator’s dynamic behavior very close to real engine response and conditions. Tested engine model was 5L90MC with 5 cylinders and basic information about ship model, engine is given in table 8.
Table 8. Information about tested simulator model ship [3]
Ship model-VLCC ( very large crude carrier)
LOA [m]
LPP [m]
DWT [MT] V
[knots]
305 295 188.000 14
Engine data
Maker Type
MCR [kW]
Stroke
[mm]
Bore [mm] RPM
18000
3200 900 MAN B&W
5L90MC 74
The simulation was performed in a completely laden ship and in conditions of calm sea with no wind. The simulation results collected in 70% and 80% engine load. For research purposes, following data was used, table 9.
Table 9. Tabulation of NOx emissions in (g / kWh) on Kongsberg simulator VLCC tankers [3].
M/E on 70% LOAD
1. ME RPM 65,6
2. ME Fuel link 43,02 %
3. ME Shaft Torque 1652 kNm
4. ME SFOC 182,86 g/kWh
5. ME exh.gas NOx content 11,07 g/kWh
M/E on 80% LOAD
1. ME RPM 70
2. ME Fuel link 48,71 %
3. ME Shaft Torque 1895 kNm
4. ME SFOC 180,16 g/kWh
5. ME exh.gas NOx content 14,01 g/kWh
Since all tested engine are the same engine manufacturer MAN B & W MC and the same series MC, it can be applied diagram of MAN's development process shown in (figure 5). From this figure it can be seen a slight increase in NOx emissions from 70% until 80% of the engine load , and later the NOx emissions is falling, primarily for MC types of engines that are topic used for this research

7th INTERNATIONAL MARITIME SCIENCE CONFERENCE
540
April 20th-21st, 2017, Solin, Croatia
Figure 5. The percentage of emission of NOx (%) in relation to the engine load (%) [4]
3. ANALYSIS OF THE RESULTS
Collected data from Kongsberg simulator with the type of engine (MAN B & W 5L 90MC), Transas simulators with type of engine (MAN B & W 6S 50MC) and measured actual values
obtained from mt "Atlantic Explorer "(MAN B & W 7S 60MC) are expressed in table 10, and differences in emission from the different type of MC engine are visible in the diagram at figure 6.

541
Miroslav Vukičević, Radmila Gagić, Danilo Nikolić
APPLICATION OF SIMULATION SOFTWARE IN ESTIMATION OF NOX EMISSION FROM SHIP’S MAIN ENGINE AT DIFFERENT LOADS
Table 10. Comparison of the results obtained with the engine MAN B & W MC series
Model KONGSBERG simulator MT “ATLANTIC EXPLORER
“ TRANSAS simulator
Engine type MAN B&W 5L90MC MAN B&W 7S 60MC MAN B&W 6S 50MC
Maximum speed in (rpm) 74 105 127 Engine load (%) 70 80 70 80 70 80
Tested engine revolutions ( rpm ) 65.6 70 93.9 97.3 115 122
Specific fuel consumption( SFOC in g/kWh) 182.86 180.16 170.2 170.1 163 161.7
Emission NOx (g/kWh) 11.07 14.01 8.43 8.56 9.7 10.47 Engine power (kW) 11348 13891 9638 10029 7320 8334 Exhaust gas temperature (˚C) 328 336
Emission NOx ( ppm ) at 25º C ambient temperature and 50% humidity (only for Transas simulator)
817 883
Figure 6. Comparison of the results obtained with the engine MAN B & W MC series
By analysis of presented data it can be concluded that:
• In all three cases test was done during ship loaded conditions (full cargo) and in conditions of calm sea with no wind.
• All analyzed engine are MAN MC series and tested at the same constant load of 70% and 80%
• Changing engine load from 70% to 80% in all cases, among others there is an increase of: NOx emission, exhaust temperature, power and engine speed.
• In all cases there is a slight decrease in specific fuel consumption (SFOC in g/kWh), which means that at 80% load and higher speed will be smaller (g/kWh) consumption than in 70% load and smaller engine speed. This reduction affect in carbon dioxide (CO2) reduction
Comparing the results with the requirements of Annex VI it can be concluded that the tested engines meet the requirements of NOx emissions-a Tier I and II, figure 7. Since all engines were built before 1 January 2016 restrictions of Tier III do not apply.
0
5
10
15
70% 80%
11.07
14.01
8.43 8.56 9.7 10.47
Valu
e in
(g/k
Wh)
Load (%)
Emission NOx Konsberg
At.Explorer
Transas

7th INTERNATIONAL MARITIME SCIENCE CONFERENCE
542
April 20th-21st, 2017, Solin, Croatia
Figure 7. Comparison of the obtained data with the limits of emission factors in Tier I, II and III. [5]
4. CONCLUSION
For this paper, set of calculations of exhaust emissions from two stroke, slow speed marine diesel engine at tanker ship “Atlantic Explorer”, being in operation for 7 years, was carried out. Calculations and engine performance test were conducted for most common load of 70 and 80%.To determine the total NOx emissions from diesel engine the IMO guidelines for voluntary use of the ship energy efficiency operational Indicator (EEOI) was implemented.
For this research, calculated emissions from tanker ship were compared with data collected using simulation software from Transas and Kongsberg engine room simulators of different manufactured with similar ship model. Diesel engines were simulated for different operating regimes.
Comparing data from the real ship engine, with data simulated by Transas and Kongsberg engine room simulator, it can be observed a tendency of increase NOx emission, a reduction in specific fuel
consumption and emissions of CO2 at 70 and 80% of the load.
Using both simulators has been shown that the results have a similar trend with results obtained through analysis on the test diesel engine, and it is a good basis for further research in this area.
This confirms that modern sophisticated engine room simulators are credible in presenting the trend of NOx exhaust emission at different loads.
REFERENCES
1. Mitsui engineering & shipbuilding co.ltd.chiba work, Test result from official shop trial for main engine (March 25th 2008) p.p.2459110
2. The official forms of company MOL - Mitsui O.S.K. Lines (ship owner of mt „Atlantic Explorer“ file no. 6.4, 11,4)
3. Komar, I., The results obtained from the simulator Kongsberg at Maritime faculty Split, Croatia (2016)
0
2
4
6
8
10
12
14
16
18
Konsberg simulator m/t "Atlan9c Explorer" Transas simulator
Valu
e in
(g/k
Wh)
Emission of NOx comparing Tier (I,II and III)
Tier I
Tier II
Tier III
70% load
80% load
4. Kjemtrup, N., “Emission Reduction Methods, Theory, Practice and Consequences by MAN-B&W Diesel A/S” (2002) p.p.5 [A reference to a presentation at a Maritime Air Quality Technical Working Group]
5. Witherby Seamanship International, “Marine fuel & emissions” (Scotland May 2013) p.p.105.6. www.epa.gov/ozone-pollution
6. 7.www.kongsberg.com/en/kongsbergdigital/maritime%20simulation/engine%20room%20simulator/
7. 8.www.transas.com/products/simulation/engine-room-and-cargo-handling-simulators/ERS5000
8. EEOI Emission report -the official form of MOL - Mitsui O.S.K. Lines , owner of the ship mt "Atlantic Explorer"
9. International Maritime Organization – IMO; Guidelines for voluntary use of the ship energy efficiency operational indicator (EEOI), MEPC.1/Circ.684, August 2009.
10. Company official analysis software Doctor 32 for mt „Atlantic Explorer“ at different load.
11. Nitrogen Oxides (NOx), Why and How They Are Controlled EPA-456/F-99-006R November 1999 ( page 5)
543
Miroslav Vukičević, Radmila Gagić, Danilo Nikolić
APPLICATION OF SIMULATION SOFTWARE IN ESTIMATION OF NOX EMISSION FROM SHIP’S MAIN ENGINE AT DIFFERENT LOADS
4. Kjemtrup, N., “Emission Reduction Methods, Theory, Practice and Consequences by MAN-B&W Diesel A/S” (2002) p.p.5 [A reference to a presentation at a Maritime Air Quality Technical Working Group]
5. Witherby Seamanship International, “Marine fuel & emissions” (Scotland May 2013) p.p.105.6. www.epa.gov/ozone-pollution
6. 7.www.kongsberg.com/en/kongsbergdigital/maritime%20simulation/engine%20room%20simulator/
7. 8.www.transas.com/products/simulation/engine-room-and-cargo-handling-simulators/ERS5000
8. EEOI Emission report -the official form of MOL - Mitsui O.S.K. Lines , owner of the ship mt "Atlantic Explorer"
9. International Maritime Organization – IMO; Guidelines for voluntary use of the ship energy efficiency operational indicator (EEOI), MEPC.1/Circ.684, August 2009.
10. Company official analysis software Doctor 32 for mt „Atlantic Explorer“ at different load.
11. Nitrogen Oxides (NOx), Why and How They Are Controlled EPA-456/F-99-006R November 1999 ( page 5)

Higher education of seafarers in Split began with the establishment of the Maritime College in 1959.
Maritime affairs by definition imply knowledge and skills related to the sea. The teachers of the Faculty of Maritime Studies in Split have knowledge and experience in education of many generations of students who have decided to find a profession related to the sea and maritime affairs. We are proud of many generations of seamen and maritime experts whose acquired knowledge has made them successful in maritime professions.
The Faculty employs teachers with high research and teaching titles as well as highest ranks in merchant shipping. Lectures take place on the Faculty premises and in the nautical and mechanical engineering simulators, GMDSS simulator as well as in the electrical engineering laboratory, The practical part of the teaching process takes place on board training and research vessel “Naše more“, training vessel “Kraljica mora” as well as Jadrolinija vessels. Professional practice is carried out in “Brodosplit” shipyard workshops, while navigational practice is carried out by going sailing with students.Education meets the requirements of STCW convention and The Reg-ulation on Requirements for the Award of Ranks and Certification of Seafarers on Board Merchant Ships of the Republic of Croatia.
The Faculty of Maritime Studies is a partner institution of the post-graduate doctoral study “Maritime Affairs” organised by and carried out at the Faculty of Maritime Studies in Rijeka.The Faculty cooperates with many other faculties of Croatia and Eu-rope as well as many shipping companies and companies involved in sea-related activities. Faculty is member of International Association of Maritime Universities (IAMU) and European Association of Sci-ence Editors (EASE). Faculty is recognized by Japanese education system (Ministry of Sea and Land of Japan and Association of Ship-pers of Japan). From 2017 it will start with military programmes for education of naval students together with Military Academy “Franjo Tuđman”.
The Faculty of Maritime Studies in Split has founded a professional and scientific journal “Transactions on Maritime Science” - ToMS and International Maritime Science Conference - IMSC.
CONTACT
UNIVERSITY OF SPLIT - FACULTY OF MARITIME STUDIESRuđera Boškovića 37,HR-21000 Split, CroatiaTel. 1: +385 (0)21 619-402Tel. 2: +385 (0)21 619-399Fax: +385 (0)21 619-499
DEANERYTel.: +385 (0)21 619-402E-mail: [email protected]
FACULTY SECRETARYTel.: +385 (0)21 619-409E-mail: [email protected]
LIBRARYTel.: +385 (0)21 619-413E-mail: [email protected]
SEAMAN’S TRAINING CENTERTel.: +385 (0)21 619-435E-mail: [email protected]
IT CENTERTel.: +385 (0)21 619-417E-mail: [email protected]
STUDENT SERVICETel.: +385 (0)21 619-415E-mail: [email protected]
University of Split Faculty of Maritime Studies
ABOUT ORGANIZER

Transactions on Maritime Science (ToMS) is a scientific journal with international peer review which publishes scientific papers in the following areas:
~ Marine Engineering,~ Navigation,~ Safety Systems~ Marine Ecology,~ Hydrography,~ Marine Automation and Electronics,~ Transportation and Modes of Transport,~ Marine Information Systems,~ Maritime Law,~ Management of Marine Systems,~ Marine Finance,~ Bleeding-Edge Technologies,~ Multimodal Transport,~ Psycho-social and Legal Aspects of Long-term Working Aboard.
The journal is published in English as an open access journal, and as a classic paper journal (in limited editions).
ToMS aims to present best maritime research from South East Europe, particularly the Mediterranean area. Prior to being accepted for publication, each paper is reviewered by at least two reviewers. With the intention of providing an international perspective at least one of the reviewers will be from abroad. TOMS also promotes scientific collaboration with students and has a section titled Students’ ToMS. These papers also undergo strict peer reviews. Furthermore, the journal publishes short reviews on significant papers, books and workshops in the fields of maritime science.
The views and opinions expressed in the papers are those of individual authors, and not necessarily those of the ToMS editors. Therefore, each author will take responsibility for his or her contribution as presented in the paper.
Upcoming twelfth issue of Transactions on Maritime Science
SubscriptionSubscription runs for full calendar year. The price per volume, supplements and surface postage included: institutional € 15, individual € 10, and student € 8, or equvivalent in other currencies; for Croatia: institutional HRK 120, individual HRK 70, and student HRK 50. Orders can be placed at Faculty of Maritime Studies (for ToMS); IMEX Bank, account number 7000001039, IBAN HR7724920087000001030, BIC/SWIFT IMXXHR22.
12
ToMS Vol.6 No.2, October 22nd, 2017
EDITOR-IN-CHIEFIvica Kuzmanić
SENIOR EDITORZvonimir Lušić
REGIONAL EDITORSAndrej Dávid (Slovakia)Andrzej Grzadziela (Poland)Nebo Jovanović (South Africa)Tatjana Krilić (United Kingdom)Mirsad Kulović (Bosnia and Her-zegovina)F. Xavier Martinez de Oses (Spain)Danilo Nikolić (Montenegro)Liane Roldo (Brasil)Frank Witlox (Belgium)
ADVISORY BOARDSanja Bauk (Kotor, Montenegro)Zlatimir Bićanić (Split, Croatia)Rudolf B. Husar (St. Louis, USA)Natalija Kavran (Zagreb, Croatia)Danko Kezić (Split, Croatia)Tomislav Kos (Zagreb, Croatia)Zlatan Kulenović (Split, Croatia)Artur Makar (Gdynia, Poland)Krešimir Malarić (Zagreb, Croatia)Rosanda Mulić (Split, Croatia)Predrag M. Petković (Niš, Serbia)Ranka Petrinović (Split, Croatia)Pippa Smart (London, UK)Alen Soldo (Split, Croatia)Tatjana Stanivuk (Split, Croatia)Sanja Steiner (Zagreb, Croatia)Elen Twrdy (Portorož, Slovenia)
EDITORIAL OFFICETransactions on Maritime ScienceFaculty of Maritime StudiesRuđera Boškovića 37,21000 Split, [email protected]
PUBLISHERFaculty of Maritime StudiesRuđera Boškovića 37,21000 Split, [email protected]
Abstracting/Indexing:Hrčak, Index Copernicus, TRID (the tris and ITRD database), BMT | Marine Science and Technology, Google Scholar , Digitale Bibliothek Braunschweig, INSPEC, SCOPUS.

ISSN 1847-1498
ISSN 1847-1498
Copyright © 2022 FDOKUMEN