THE 22 MONTH SWIFT -BAT ALL-SKY HARD X-RAY SURVEY
27
ACCEPTED BY THE ASTROPHYSICAL J OURNAL SUPPLEMENT Preprint typeset using L A T E X style emulateapj v. 08/22/09 THE 22-MONTH Swift-BATALL-SKY HARD X-RAY SURVEY J. TUELLER 1 , W. H. BAUMGARTNER 1,2,12,18 , C. B. MARKWARDT 1,3,12 , G. K. SKINNER 1,3,12 , R. F. MUSHOTZKY 1 , M. AJELLO 4 , S. BARTHELMY 1 , A. BEARDMORE 5 , W. N. BRANDT 7 , D. BURROWS 7 , G. CHINCARINI 8 , S. CAMPANA 8 , J. CUMMINGS 1 , G. CUSUMANO 10 , P. EVANS 5 , E. FENIMORE 11 , N. GEHRELS 1 , O. GODET 5 , D. GRUPE 7 , S. HOLLAND 1,12 , J. KENNEA 7 , H. A. KRIMM 1,12 , M. KOSS 3,1,12 , A. MORETTI 8 , K. MUKAI 1,2,12 , J. P. OSBORNE 5 , T. OKAJIMA 1,13 , C. PAGANI 7 , K. PAGE 5 , D. PALMER 11 , A. PARSONS 1 , D. P. SCHNEIDER 7 , T. SAKAMOTO 1,14 , R. SAMBRUNA 1 , G. SATO 17 , M. STAMATIKOS 1,14 , M. STROH 7 , T.N. UKWATTA 1,15 , L. WINTER 16 Draft version September 17, 2009 ABSTRACT We present the catalog of sources detected in the first 22 months of data from the hard X-ray survey (14– 195 keV) conducted with the BAT coded mask imager on the Swift satellite. The catalog contains 461 sources detected above the 4.8σ level with BAT. High angular resolution X-ray data for every source from Swift XRT or archival data have allowed associations to be made with known counterparts in other wavelength bands for over 97% of the detections, including the discovery of ∼ 30 galaxies previously unknown as AGN and several new Galactic sources. A total of 266 of the sources are associated with Seyfert galaxies (median redshift z ∼ 0.03) or blazars, with the majority of the remaining sources associated with X-ray binaries in our Galaxy. This ongoing survey is the first uniform all sky hard X-ray survey since HEAO-1 in 1977. Since the publication of the 9-month BAT survey we have increased the number of energy channels from 4 to 8 and have substantially increased the number of sources with accurate average spectra. The BAT 22-month catalog is the product of the most sensitive all-sky survey in the hard X-ray band, with a detection sensitivity (4.8σ) of 2.2 × 10 -11 erg cm -2 s -1 (1 mCrab) over most of the sky in the 14–195 keV band. Subject headings: Catalogs — Survey: X-rays 1. INTRODUCTION Surveys of the whole sky which are complete to a well- defined threshold not only provide a basis for statistical pop- ulation studies but are also a vehicle for the discovery of new phenomena. Compared with lower X-ray energies, where var- ious missions from Uhuru (Forman et al. 1978) to ROSAT have systematically surveyed the sky and where slew surveys 1 NASA/Goddard Space Flight Center, Astrophysics Science Division, Greenbelt, MD 20771 2 Joint Center for Astrophysics, University of Maryland Baltimore County, Baltimore, MD 21250 3 Department of Astronomy, University of Maryland College Park, Col- lege Park, MD 20742 4 SLAC National Laboratory and Kavli Institute for Particle Astrophysics and Cosmology, 2575 Sand Hill Road, Menlo Park, CA 94025 5 X-Ray and Observational Astronomy Group/ Department of Physics and Astronomy, University of Leicester, Leicester, LE1 7RH, United Kingdom 7 Department of Astronomy & Astrophysics, The Pennsylvania State Uni- versity, 525 Davey Lab, University Park, PA 16802 8 Osservatorio Astronomico di Brera(OAB)/ Istituto Nazionale di As- trofisica (INAF), 20121 Milano, Italy 9 ASDC/ ESA of ESRIN, Via Galileo Galilei, 00044 Frascati (RM), Italy 10 IASF-Palermo/ Istituto di Astrofisica Spaziale e Fisica Cosmica di Palermo/ Istituto Nazionale di Astrofisica (INAF), 90146 Palermo, Italy 11 LANL/Los Alamos National Laboratory, Los Alamos, NM 87545 12 CRESST/ Center for Research and Exploration in Space Science and Technology, 10211 Wincopin Circle, Suite 500, Columbia, MD 21044 13 Department of Physics & Astronomy, The Johns Hopkins University, 3400 North Charles Street Baltimore, Maryland 21218 14 Oak Ridge Associated Universities (ORAU), OAB-44, P.O. Box 117 Oak Ridge, TN 37831 15 Department of Physics/ The George Washington University (GWU), 2121 I Street, N.W., Washington, DC 20052 16 Center for Astrophysics and Space Astronomy, University of Colorado, 389 UCB, Boulder, CO 80309 17 Institute of Space and Astronautical Science, JAXA, Kanagawa 229- 8510, Japan 18 Corresponding author: [email protected] of later missions have added detail, our knowledge of the sky at hard X-rays (> 10 keV) has been rather patchy and insen- sitive. The sensitivity of the HEAO-A4 13–180 keV survey (Levine et al. 1984) was such that only 77 sources were de- tected. Recently INTEGRAL-IBIS has provided some observa- tions (Bird et al. 2007; Beckmann et al. 2006, 2009; Krivonos et al. 2007) that are much more sensitive but have concen- trated on certain regions of the sky; the exposure in the latest IBIS ‘all-sky’ catalog varies from one part of the sky to an- other by a factor of a thousand, some regions of the sky hav- ing only a few thousand seconds of observation. The RXTE all-sky slew survey (Revnivtsev et al. 2004) covers much of the sky in the 3-20 keV band and detects 294 sources, but the coverage is not uniform or complete and the sensitivity is weighted to lower energies such that the BAT and RXTE sources are not the same. A survey in the hard X-ray band is important for several reasons. Observations below 15 keV can be drastically af- fected by photoelectric absorption in certain sources, giving a false indication of their luminosity. Populations of heav- ily absorbed or Compton-thick Active Galactic Nuclei (AGN) have been hypothesized in order to explain the portion of the spectrum of the diffuse hard X-ray background ascribed to unresolved sources (Gilli et al. 2007), but such objects have not been found in the necessary numbers, prompting ques- tions as to the composition and evolution of a population of AGN that could explain its form (Treister et al. 2009). Hard X-ray emission is also being discovered from an unexpect- edly large number of previously unknown Galactic sources, notably from certain cataclysmic variables, symbiotic stars and heavily obscured high mass X-ray binaries (Bird et al. 2007). The Burst Alert Telescope (BAT) on Swift (Gehrels et al. arXiv:0903.3037v2 [astro-ph.HE] 17 Sep 2009
Transcript of THE 22 MONTH SWIFT -BAT ALL-SKY HARD X-RAY SURVEY

ACCEPTED BY THE ASTROPHYSICAL JOURNAL SUPPLEMENTPreprint typeset using LATEX style emulateapj v. 08/22/09
THE 22-MONTH Swift-BAT ALL-SKY HARD X-RAY SURVEY
J. TUELLER1 , W. H. BAUMGARTNER1,2,12,18 , C. B. MARKWARDT1,3,12 , G. K. SKINNER1,3,12 , R. F. MUSHOTZKY1 , M. AJELLO4 ,S. BARTHELMY1 , A. BEARDMORE5 , W. N. BRANDT7 , D. BURROWS7 , G. CHINCARINI8 , S. CAMPANA8 , J. CUMMINGS1 ,G. CUSUMANO10 , P. EVANS5 , E. FENIMORE11 , N. GEHRELS1 , O. GODET5 , D. GRUPE7 , S. HOLLAND1,12 , J. KENNEA7 ,
H. A. KRIMM1,12 , M. KOSS3,1,12 , A. MORETTI8 , K. MUKAI1,2,12 , J. P. OSBORNE5 , T. OKAJIMA1,13 , C. PAGANI7 , K. PAGE5 ,D. PALMER11 , A. PARSONS1 , D. P. SCHNEIDER7 , T. SAKAMOTO1,14 , R. SAMBRUNA1 , G. SATO17 , M. STAMATIKOS1,14 , M. STROH7 ,
T.N. UKWATTA1,15 , L. WINTER16
Draft version September 17, 2009
ABSTRACTWe present the catalog of sources detected in the first 22 months of data from the hard X-ray survey (14–
195 keV) conducted with the BAT coded mask imager on the Swift satellite. The catalog contains 461 sourcesdetected above the 4.8σ level with BAT. High angular resolution X-ray data for every source from Swift XRT orarchival data have allowed associations to be made with known counterparts in other wavelength bands for over97% of the detections, including the discovery of ∼ 30 galaxies previously unknown as AGN and several newGalactic sources. A total of 266 of the sources are associated with Seyfert galaxies (median redshift z∼ 0.03) orblazars, with the majority of the remaining sources associated with X-ray binaries in our Galaxy. This ongoingsurvey is the first uniform all sky hard X-ray survey since HEAO-1 in 1977.
Since the publication of the 9-month BAT survey we have increased the number of energy channels from 4to 8 and have substantially increased the number of sources with accurate average spectra. The BAT 22-monthcatalog is the product of the most sensitive all-sky survey in the hard X-ray band, with a detection sensitivity(4.8σ) of 2.2×10⁻¹¹ erg cm−2 s−1 (1 mCrab) over most of the sky in the 14–195 keV band.Subject headings: Catalogs — Survey: X-rays
1. INTRODUCTIONSurveys of the whole sky which are complete to a well-
defined threshold not only provide a basis for statistical pop-ulation studies but are also a vehicle for the discovery of newphenomena. Compared with lower X-ray energies, where var-ious missions from Uhuru (Forman et al. 1978) to ROSAThave systematically surveyed the sky and where slew surveys
1 NASA/Goddard Space Flight Center, Astrophysics Science Division,Greenbelt, MD 20771
2 Joint Center for Astrophysics, University of Maryland Baltimore County,Baltimore, MD 21250
3 Department of Astronomy, University of Maryland College Park, Col-lege Park, MD 20742
4 SLAC National Laboratory and Kavli Institute for Particle Astrophysicsand Cosmology, 2575 Sand Hill Road, Menlo Park, CA 94025
5 X-Ray and Observational Astronomy Group/ Department of Physics andAstronomy, University of Leicester, Leicester, LE1 7RH, United Kingdom
7 Department of Astronomy & Astrophysics, The Pennsylvania State Uni-versity, 525 Davey Lab, University Park, PA 16802
8 Osservatorio Astronomico di Brera(OAB)/ Istituto Nazionale di As-trofisica (INAF), 20121 Milano, Italy
9 ASDC/ ESA of ESRIN, Via Galileo Galilei, 00044 Frascati (RM), Italy10 IASF-Palermo/ Istituto di Astrofisica Spaziale e Fisica Cosmica di
Palermo/ Istituto Nazionale di Astrofisica (INAF), 90146 Palermo, Italy11 LANL/Los Alamos National Laboratory, Los Alamos, NM 8754512 CRESST/ Center for Research and Exploration in Space Science and
Technology, 10211 Wincopin Circle, Suite 500, Columbia, MD 2104413 Department of Physics & Astronomy, The Johns Hopkins University,
3400 North Charles Street Baltimore, Maryland 2121814 Oak Ridge Associated Universities (ORAU), OAB-44, P.O. Box 117
Oak Ridge, TN 3783115 Department of Physics/ The George Washington University (GWU),
2121 I Street, N.W., Washington, DC 2005216 Center for Astrophysics and Space Astronomy, University of Colorado,
389 UCB, Boulder, CO 8030917 Institute of Space and Astronautical Science, JAXA, Kanagawa 229-
8510, Japan18 Corresponding author: [email protected]
of later missions have added detail, our knowledge of the skyat hard X-rays (> 10 keV) has been rather patchy and insen-sitive. The sensitivity of the HEAO-A4 13–180 keV survey(Levine et al. 1984) was such that only 77 sources were de-tected.
Recently INTEGRAL-IBIS has provided some observa-tions (Bird et al. 2007; Beckmann et al. 2006, 2009; Krivonoset al. 2007) that are much more sensitive but have concen-trated on certain regions of the sky; the exposure in the latestIBIS ‘all-sky’ catalog varies from one part of the sky to an-other by a factor of a thousand, some regions of the sky hav-ing only a few thousand seconds of observation. The RXTEall-sky slew survey (Revnivtsev et al. 2004) covers much ofthe sky in the 3-20 keV band and detects 294 sources, butthe coverage is not uniform or complete and the sensitivityis weighted to lower energies such that the BAT and RXTEsources are not the same.
A survey in the hard X-ray band is important for severalreasons. Observations below 15 keV can be drastically af-fected by photoelectric absorption in certain sources, givinga false indication of their luminosity. Populations of heav-ily absorbed or Compton-thick Active Galactic Nuclei (AGN)have been hypothesized in order to explain the portion of thespectrum of the diffuse hard X-ray background ascribed tounresolved sources (Gilli et al. 2007), but such objects havenot been found in the necessary numbers, prompting ques-tions as to the composition and evolution of a population ofAGN that could explain its form (Treister et al. 2009). HardX-ray emission is also being discovered from an unexpect-edly large number of previously unknown Galactic sources,notably from certain cataclysmic variables, symbiotic starsand heavily obscured high mass X-ray binaries (Bird et al.2007).
The Burst Alert Telescope (BAT) on Swift (Gehrels et al.
arX
iv:0
903.
3037
v2 [
astr
o-ph
.HE
] 1
7 Se
p 20
09
2 TUELLER ET AL.
2004) has a large field of view and is pointed at a large num-ber of different directions which are well distributed over thesky. The resultant survey provides the most uniform hard X-ray survey to date and achieves a sensitivity sufficient to detectvery large numbers of sources, both Galactic and extragalac-tic. Markwardt et al. (2005) have published the results fromthe first three months of BAT data, and Tueller et al. (2008)have published a survey of sources seen in the first 9 monthsof Swift observations, concentrating on the 103 AGN seen atGalactic latitudes greater than 15. We present here a catalogof all sources detected in the first 22 months of operations,(2005 Dec 15 – 2006 Oct 27) increasing the number of AGNto 266 and including all other sources seen across the entiresky.
2. Swift-BATSwift is primarily a mission for the study of gamma-ray
bursts. Swift combines a wide field instrument, BAT, to de-tect and locate gamma-ray bursts (GRBs) with two narrowfield instruments to study the afterglows (the X-ray Telescope(XRT) (Burrows et al. 2005) and the Ultra-Violet/OpticalTelescope (UVOT) (Roming et al. 2005)). Swift-BAT is awide field (∼2 sr) coded aperture instrument with the largestCdZnTe detector array ever fabricated (5243 cm2 consistingof 32,768 4mm detectors on a 4.2mm pitch) (Barthelmy et al.2005). BAT uses a mask constructed of 52,000 5x5x1 mmlead tiles distributed in a half-filled random pattern andmounted in a plane 1m above the detector array.
This configuration results in a large field of view and apoint-spread-function (PSF) that varies between 22′ in thecenter of the field of view (FOV) and ∼14′ in the cornersof the FOV (50off axis). When many snapshot images (asnapshot is the image constructed from a single survey ob-servation of ∼ 5minutes) are mosaicked together the effectivePSF is ∼19.5′.
Point sources are found using a fast Fourier Transform con-volution of the mask pattern with the array of detector rates;this effectively uses the shadow of the mask cast by a sourceonto the detector array to create a sky image.
Over much of the BAT field of view, the mask shadow doesnot cover the whole array. The partial coding fraction is de-fined as the fraction of the array that is used to make the imagein a particular direction and varies across the FOV. The BATfield of view is 0.34, 1.18 and 2.29 sr for areas on the sky withgreater than 95%, 50% and 5% partial coding fractions.
Swift is in low Earth orbit, but because it can slew rapidlyit can avoid looking at the Earth. The narrow field instru-ments cannot be pointed within 45of the Sun, within 30ofthe Earth limb, or within 20of the Moon.
The pointing plan for Swift is optimized to observe GRBs.This strategy produces observations spread out over a fewdays and at nearly random positions in the sky. The BAT FOVis so large that most of the sky is accessible to BAT on anygiven day, but the pointing is deliberately biased toward theanti-Sun direction in order to facilitate ground based opticalfollow-up observations of gamma-ray bursts. Even thoughthe Swift pointing plan is optimized for GRB observations,BAT’s large FOV and Swift’s random observing strategy re-sult in very good sky coverage (50–80% at >20 mCrab in oneday) for transients (Krimm et al. (2006)18). Over a longerterm, this observing strategy produces an even more uniform
18 online at: http://swift.gsfc.nasa.gov/docs/swift/results/transients/
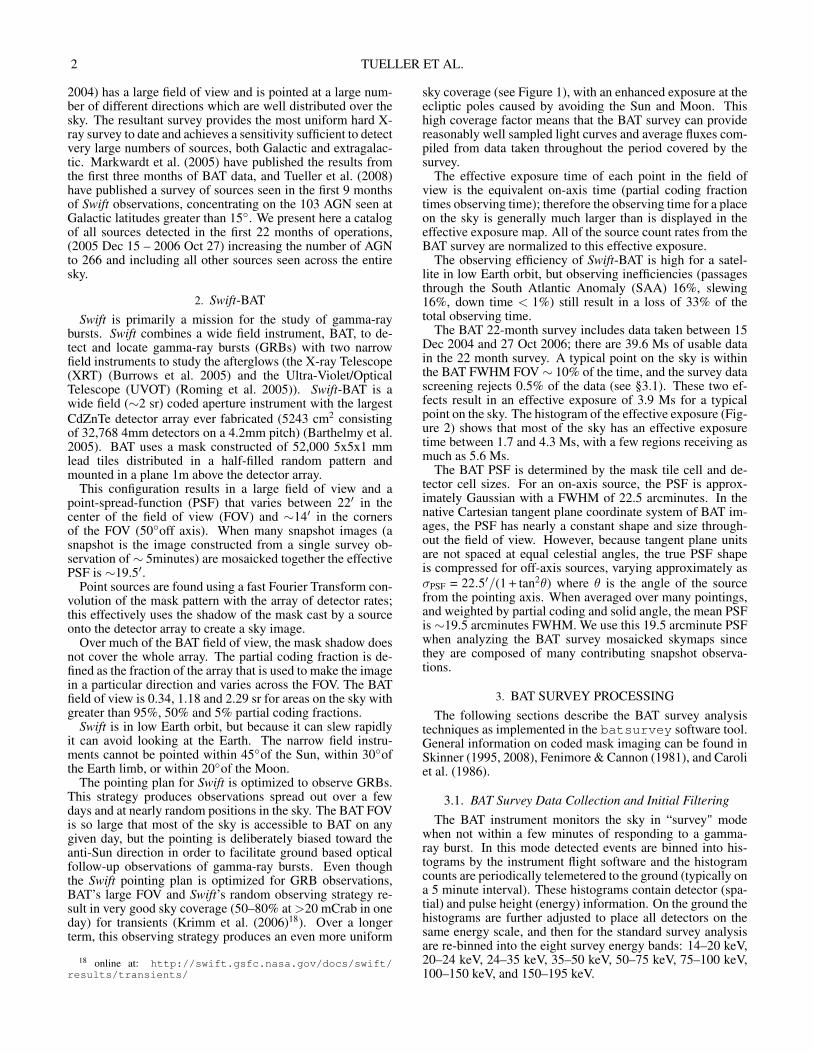
sky coverage (see Figure 1), with an enhanced exposure at theecliptic poles caused by avoiding the Sun and Moon. Thishigh coverage factor means that the BAT survey can providereasonably well sampled light curves and average fluxes com-piled from data taken throughout the period covered by thesurvey.
The effective exposure time of each point in the field ofview is the equivalent on-axis time (partial coding fractiontimes observing time); therefore the observing time for a placeon the sky is generally much larger than is displayed in theeffective exposure map. All of the source count rates from theBAT survey are normalized to this effective exposure.
The observing efficiency of Swift-BAT is high for a satel-lite in low Earth orbit, but observing inefficiencies (passagesthrough the South Atlantic Anomaly (SAA) 16%, slewing16%, down time < 1%) still result in a loss of 33% of thetotal observing time.
The BAT 22-month survey includes data taken between 15Dec 2004 and 27 Oct 2006; there are 39.6 Ms of usable datain the 22 month survey. A typical point on the sky is withinthe BAT FWHM FOV∼ 10% of the time, and the survey datascreening rejects 0.5% of the data (see §3.1). These two ef-fects result in an effective exposure of 3.9 Ms for a typicalpoint on the sky. The histogram of the effective exposure (Fig-ure 2) shows that most of the sky has an effective exposuretime between 1.7 and 4.3 Ms, with a few regions receiving asmuch as 5.6 Ms.
The BAT PSF is determined by the mask tile cell and de-tector cell sizes. For an on-axis source, the PSF is approx-imately Gaussian with a FWHM of 22.5 arcminutes. In thenative Cartesian tangent plane coordinate system of BAT im-ages, the PSF has nearly a constant shape and size through-out the field of view. However, because tangent plane unitsare not spaced at equal celestial angles, the true PSF shapeis compressed for off-axis sources, varying approximately asσPSF = 22.5′/(1 + tan2θ) where θ is the angle of the sourcefrom the pointing axis. When averaged over many pointings,and weighted by partial coding and solid angle, the mean PSFis∼19.5 arcminutes FWHM. We use this 19.5 arcminute PSFwhen analyzing the BAT survey mosaicked skymaps sincethey are composed of many contributing snapshot observa-tions.
3. BAT SURVEY PROCESSINGThe following sections describe the BAT survey analysis
techniques as implemented in the batsurvey software tool.General information on coded mask imaging can be found inSkinner (1995, 2008), Fenimore & Cannon (1981), and Caroliet al. (1986).
3.1. BAT Survey Data Collection and Initial FilteringThe BAT instrument monitors the sky in “survey" mode
when not within a few minutes of responding to a gamma-ray burst. In this mode detected events are binned into his-tograms by the instrument flight software and the histogramcounts are periodically telemetered to the ground (typically ona 5 minute interval). These histograms contain detector (spa-tial) and pulse height (energy) information. On the ground thehistograms are further adjusted to place all detectors on thesame energy scale, and then for the standard survey analysisare re-binned into the eight survey energy bands: 14–20 keV,20–24 keV, 24–35 keV, 35–50 keV, 50–75 keV, 75–100 keV,100–150 keV, and 150–195 keV.

SWIFT-BAT 22 MONTH HARD X-RAY SURVEY 3
FIG. 1.— The top panel shows the effective exposure map for the 22-month Swift-BAT survey in a Hammer-Aitoff projection on Galactic coordinates. Theecliptic poles and equator are also shown; the largest exposures are toward the north and south ecliptic poles (the units on the colorbar are Ms). The bottompanel shows the measured 5σ sensitivity across the sky in units of mCrab in the 14–195 keV band. The bright spots at l=344.1, b=-44.0 (GRB060614), l=271.8,b=-27.2 (GRB060729), and l=254.7, b=-1.4 (GRB060428a) are areas of high systematic noise due to very long exposures (> 800 ks) performed early in themission before dithering in roll angle was instituted.
Several quality filters are applied to the BAT survey data.First, the spacecraft must be in stable pointing mode, whichmeans that the attitude control “10 arcmin settled" flag mustbe set. The spacecraft star tracker must be reporting “OK"status, and the boresight direction must be at least 30 abovethe Earth’s limb. Second, BAT must be producing good qual-ity data, which means that the overall array event rate mustnot be too high or low (3000 cts s−1 < rate < 12,000 cts s−1);a count rate lower than 3000 cts s−1 means that the detector isnot operating correctly, and a rate higher than 12,000 cts s−1
only occurs during passages through the SAA. A minimumnumber of detectors must be enabled (> 18,000 detectors outof 32,768), and no histogram bins can be reported as missingdata because of bad telemetry. In addition, histogram time in-tervals that cross the UTC midnight boundary are discardedsince the spacecraft has at times been commanded to make
small maneuvers during that time. These temporal filters pro-duce a set of good time intervals over which the histogramsare summed. The finest time sampling of this survey anal-ysis is approximately a single pointed snapshot (which havedurations of ∼150–2000 s). The good time intervals are fur-ther checked so that the spacecraft pointing does not changeappreciably during the interval (1.5 arcmin in pointing, 5 ar-cmin in roll), and data are excluded if the pointing has varied.Short intervals of 150 seconds or less are discarded in orderto ensure enough counts across the detector for the balancingstage (see §3.2) of the processing to work correctly.
After temporal filtering each pointed snapshot is reducedto a set of eight detector count maps, one for each energyband. Since the systematic noise in the sky images depends onthe quality of individual detectors, significant effort is madein optimizing the spatial filtering of the data (i.e, the mask-ing of undesirable detectors). All detectors disabled by the

4 TUELLER ET AL.
!
!"#
!"$
!"%
!"&
'
'"#
! ' # ( $ ) % *
+,-.##./012345-678,9.:+;<=.>2.?@A
BCD.E0F><.G<?H2;01
6IJ0KL<>.:MKA
FIG. 2.— Spatial uniformity in the 22-month BAT hard X-ray survey. The left panel is the effective exposure time histogram (bin size = 40 ks), and the rightpanel compares the fraction of sky seen by the BAT and INTEGRAL surveys as a function of effective exposure times.
BAT flight software are masked. In addition the detectorcounts maps are searched for noisy (“hot") detectors using thebathotpix algorithm; any detectors found to be noisy aremasked. Finally, detectors with known noisy properties (i.e.high variance compared to Poisson statistics) are discarded.The “fixed pattern” noise (see §3.3) is also subtracted fromeach map.
3.2. Removal of Bright SourcesBright point sources and the diffuse sky background con-
tribute systematic pattern noise to the entire sky image, at ap-proximately 1% of the source amplitude, due to the codedmask deconvolution technique. By subtracting the contribu-tions of these sources from the detector images, the systematicnoise can be significantly reduced. We used the batcleanalgorithm to remove bright sources and diffuse background atthe snapshot level. The diffuse background is represented asa smooth polynomial in detector coordinates. Bright sourcesare represented by the point source response in the detectorplane. The source responses are generated using ray tracingto determine the shadow patterns. Bright sources are identi-fied by making a trial sky map, and any point source detectedabove 9σ in any energy band is marked for cleaning. In ourexperience–and based on the properties of the BAT mask—nonew bright sources become detectable after the batcleancalculation, so it is not necessary to iterate the process again.In order to preserve the original bright source intensities, weinsert the fluxes from the uncleaned maps into the cleanedmaps around the locations of these sources.
At the batclean stage the maps are also “balanced" sothat systematic count rate offsets between large scale spatialregions on the detector are removed. Sources shining throughthe mask do not produce this kind of coherent structure, there-fore this balancing stage helps to remove systematic noise.This process involves dividing the array into detector modulesides (128 detectors, [= 16×8]), which are separated by gapsof 8.4–12.6 mm from neighboring detector module sides. The
mean counts in both the outer edge detectors (44 detectors),and the inner detectors (84 detectors), are subtracted for eachmodule separately, so that the mean rate is as close as pos-sible to zero. Count rate variations from module to moduleare believed to occur because of variations in the quality ofCZT detector material and because of dead time variations inthe module electronics caused by noisy pixels. Variations be-tween outer edge and inner detectors in each module are dueto cosmic ray scattering and X-ray illumination of detectorsides. The BAT coded mask modulates the count rate of cos-mic sources on essentially detector-to-detector spatial scales,so the subtraction of the mean count rates averaged over manytens of detectors does not affect the coded signal.
Very bright sources which are partially coded will castshadows of the mask support structures on the edges of themask. These shadows are not coded by the mask, are highlyenergy dependent, and thus must be treated carefully. This isdone by masking detectors in regions of the detector plane af-fected by mask-edge regions for bright sources (∼0.3 Crab orbrighter) determined via ray tracing.
After subtracting bright sources and background, detectorswhose counts are more than 4σ from the mean are discardedin order to further remove contributions from noisy detectors.
3.3. Fixed Pattern NoiseNon-uniform detector properties cause variations between
the background count rates measured in different detectors.These spatial differences form a relatively stable pattern overtimescales much longer than a day and are not addressedby the batclean algorithm. These spatial differences alsocomprise a fixed noise in detector coordinates which is trans-formed by the survey processing into unstructured noise inthe sky image. This fixed pattern is determined by construct-ing long term averages of the residual BAT count rates ofeach individual detector, after subtracting the contributions ofbright sources as described above. In this construction, vari-able terms average to zero and only the stable pattern remains.

SWIFT-BAT 22 MONTH HARD X-RAY SURVEY 5
This pattern maps are then subtracted from each snapshot de-tector image. The benefit of removing this fixed pattern noiseis that each individual detector is addressed, thereby remov-ing systematic noise on a finer scale than the balancing stagementioned previously.
The contributions of some detectors to this fixed pattern istime dependent as a result of temporal variations in detectorperformance. We address this time dependence in each de-tector by fitting a polynomial to the daily average value. Thefits are done on data spanning weeks to many months, and thepolynomial used has ∼ 1 order per 30 days fit.
This approach (subtracting the long-term average fixed pat-tern noise from the data) avoids removing any legitimate sig-nal from sources since Swift changes its pointing direction onmuch shorter time scales.
In practice, the entire survey processing must be run onceinitially for all of the data, with the pattern contribution set tozero, in order to determine the residual rates mentioned above.Once the pattern maps have been computed, the processing isrun a second time using those values.
3.4. Sky MapsSky maps are produced for each snapshot using the
batfftimage algorithm which cross-correlates the detec-tor count maps with the mask aperture pattern. Sky mapsare sampled at 8.6 arcmin on-axis, which corresponds to halfthe natural element spacing for the coded mask. The natu-ral sky projection for these maps is tangent-plane; thus, thesky-projected grid spacing becomes finer by a factor of ∼2at the extreme edges of the field of view. The angular ex-tent of a sky map from one snapshot covers the region in thesky where the BAT has some non-zero response. This field ofview is approximately 120×60, although the sensitivity ismuch reduced at the edges of the field of view due to projec-tion effects through the mask (foreshortening of the mask andshadowing due to the mask thickness at large off-axis angles)and partial coding.
The snapshot maps are corrected for partial coding, geo-metric projection effects, and the number of active detectors.Thus, they represent the BAT count rate per fully illuminateddetector, corrected approximately to the on-axis response. Anexamination of the measured count rates of the Crab nebula(considered to be a stable point source for the BAT) showssome systematic residual trends as a function of off-axis an-gle and energy. These effects are primarily due to absorptionby passive materials in the field of view, whose absorptionlengths scale approximately as secθ, where θ is the off-axisangle. The absorptions can be as high as 50% at the lowestenergies and largest angles, but are typically smaller. Aftercorrection for these effects, the count rate estimates are accu-rate to within a few percent.
Partial coding and noise maps which represent the partialexposure of each pixel in the sky map are created for eachpointed snapshot. The partial coding maps are further ad-justed to correct for the fact that some parts of the sky areocculted by the Earth during the observation. For each ob-servation, a map of the average Earth occultation is computedshowing the fraction of the observation time each pixel is oc-culted, and the partial coding map is multiplied by this oc-cultation map to account for the reduced effective observingtime. The noise maps are generated by computing the localr.m.s. of the pixel values in an annulus around each position(see §3.6).
Individual pointed snapshot sky maps are discarded if the
differences between the model used in the bright source re-moval and the cleaned, binned detector plane data lead to areduced chi-square value greater than 1.25. This filtering ex-cluded primarily data around the bright X-ray source Sco X-1, which produces such strong count rate modulations thatthey aren’t reduced to zero at the Poisson statistical level bybatclean. This does produce a significant exposure deficitaround Sco X-1 and the Galactic center region.
3.5. MosaickingThe sky images from each snapshot are weighted by inverse
variance (i.e. noise−2) and combined into all-sky maps. Eachsnapshot sky map contributing to the mosaic is trimmed suchthat all areas of the snapshot have greater than 15% partialcoding. The sky is divided into six facets in Galactic coordi-nates, with grid spacing of the pixels 5 arcmin at the center ofeach facet. The Zenithal Equal Area projection was used inorder to minimize distortion far from the center of projection.Each individual sky image is projected and resampled onto theall-sky grids by bilinear interpolation, as are the partial codingand noise maps. The final result is a set of weighted flux maps,propagated noise maps and effective exposure maps for eachenergy band and facet combination, plus an additional one forthe total energy band of 14–195 keV.
This analysis procedure produces a sky image where eachpixel represents the best estimate of the flux for a point sourceat the corresponding position in the sky (see Fenimore & Can-non (1981) for more information on coded mask image recon-struction).
3.6. Source DetectionA “blind" source detection algorithm was used to search
for sources in the mosaicked significance maps using the fullsurvey bandpass of 14–195 keV. The significance map is theratio of the counts map to the local noise map.
The RMS noise map is calculated from the mosaicked skymap using an annulus of radius 30 pixels (2.5) with an innerexclusion radius of 8 pixels (40′). An 8 pixel radius aroundthe position of all known BAT sources is also excluded fromthe regions used for background calculation. We do not at-tempt to fit the PSF of the source for the noise calculation andhence the positions of sources must be eliminated from thiscalculation to get an accurate measure of the underlying noisein the image.
The noise is assumed to be a smooth function of image po-sition and so the value at the center of the annulus is wellapproximated by the average value in the annulus. This calcu-lated noise includes both statistical and systematic noise andis therefore a better estimate of the total noise in the imagethan the noise calculated from a PSF fit. The noise from ev-ery source is distributed over the whole image, just as the sig-nal from the source is distributed over the detector array, sono local enhancement of noise at the position of the source isexpected.
The blind search algorithm first finds all peaks in the mapby searching for pixels that are higher than each of the sur-rounding 8 pixels. If the significance in a peak pixel is greaterthan our detection threshold of 4.8σ (see §4.4), the excessis considered to be a detection in the blind search for newsources.
4. THE Swift-BAT 22-MONTH CATALOGThe catalog of sources detected by Swift-BAT using the first
22 months of data includes sources at all Galactic latitudes.

6 TUELLER ET AL.
TABLE 1COUNTERPART TYPES IN THE Swift-BAT 22-MONTH CATALOG
Class Source Type # in catalog
0 Unidentifieda 191 Galactic b 32 Extragalacticc 173 Galaxy Clusters 74 Seyfert Galaxies 2295 Beamed AGNd 326 CVs / Stars 367 Pulsars / SNR 158 X-ray Binaries 121
a Sources listed as unidentified have an object with unknown physical type asa counterpart. Some of these objects are associated with a source detected atanother wavelength.b Sources classified as galactic are so assigned because of observed transientbehavior in the X-ray band along with insufficient evidence to place them inanother class.c Sources in the extragalactic class are seen as extended in optical or near-IRimagery, but do not have firm evidence (such as an optical spectrum) fromother wavebands confirming whether they harbor an AGN.d Sources classified as “beamed AGN” include blazars, BL Lacs, FSRQs,quasars, and other high redshift AGN.
The 22-month catalog and associated data in electronic formcan be found online at the Swift website.19
Figure 3 shows the distribution of sources on the sky colorcoded by source type, with the symbol size proportional tothe source flux in the 14–195 keV band. Table 1 gives thedistribution of objects according to their source type. Sourcesclassified as “unidentified” are those where the physical typeof the underlying object (e.g., AGN, CV, XRB, etc) is un-known. These sources have a primary name derived from theBAT position. Some unidentified BAT sources are associatedwith sources in the X-ray or gamma-ray bands (with posi-tions unable to sufficiently determine an optical counterpart orphysical source type), and these sources can be distinguishedby having a name in the catalog derived from the observa-tion in the other waveband. The few sources classified onlyas “Galactic” generally lie in the plane and have shown sometransient behavior which indicates a Galactic source, but noother information is available that would allow further clas-sification. “Extragalactic” sources are detected as extendedsources in optical or near-IR imaging, but do not have otherindications of being an AGN. The “Beamed AGN” categoryincludes BL Lacs, blazars, and FSRQs.
Table 5 is the listing of all the sources detected above the4.8σ level in a blind search of the 22-month Swift-BAT surveymaps. The first column is the source number in the 22-monthcatalog. The second column of the table is the BAT name,constructed from the BAT source position given in columnsthree and four. In cases where the source has been previouslypublished with a BAT name corresponding to a slightly differ-ent location (e.g., a source position from a previous BAT cata-log with less data), we have used the first published name buthave given the correct 22-month BAT coordinates in columnstwo and three. The fifth column is the significance of the blindBAT source detection in sigma units. Instances where morethan one possible counterpart to a single BAT source is likelyare indicated with ditto marks in columns 2–5.
The sixth column gives the name of the identified counter-part to the BAT hard X-ray source with the most preciselyknown position. These are often optical galaxies, or 2MASS
19 http://swift.gsfc.nasa.gov/docs/swift/results/bs22mon/
sources, and are associated with a source detected in themedium-energy X-ray band (3–10 keV) in Chandra, XMM-Newton, or XRT images. Counterpart determination is dis-cussed in §4.2. The seventh column gives an alternate namefor the counterpart. We have preferred to list a well knownname (e.g., Sco X-1) or a name from a hard X-ray instrumentor high energy detection. The best available coordinates of thecounterpart (J2000) are given in the table in columns 8 and 9.
The 10th and 11th columns give the 14–195 keV flux of theBAT source (in units of 10−11 ergs sec−1 cm−2) and its 1σ error.The BAT flux for each counterpart is extracted from the hardX-ray map at the location of the counterpart given in columns8 and 9. The flux determination method is described in §4.5.
The 12th column indicates whether there is source confu-sion: there is source confusion either if there is more than onepossible XRT counterpart or if two likely hard X-ray sourceslie close enough together to make a proper extraction of theflux not possible with the standard method. The treatment ofconfused sources is discussed in more detail in §4.3. We de-fine two classes of source confusion: “confused” sources, and“confusing” sources. A source is “confusing” for the purposesof this column if a fit to the map indicates that the source con-tributes to the hard X-ray flux of a neighboring source. A“confused” source has received more than 2% of its flux froma neighboring source. A confused source is labeled with an“A” in this column, and a confusing source with a “B” (thecase of a very bright source next to a weak one would resultin the bright source labeled with a “B” and the weak sourcewith an “A”). A source that is both confused and confusing(e.g., the case where there are two similar strength sourcesclose to each other, such as when there are two possible XRTcounterparts to a single BAT source) is labeled with an “AB”.
When a source has an entry in column 12, a best estimate ofthe counterpart flux is listed in column 10 from a simultaneousfit of all the counterparts in the region to the BAT map. Whenthe entry is “A” or “AB” in column 12 (indicating a confusedsource), the error on the flux is not well defined, and column11 is left blank. (See §4.5).
The 13th and 14th columns list the source hard X-ray hard-ness ratio and its error computed as described in §4.7. Thehardness ratio is defined here as the ratio of the count ratein the 35–150 keV band divided by the count rate in the 14–150 keV band.
The 15th and 16th columns give the redshift and BAT lu-minosity of the counterpart if it is associated with a galaxyor AGN. The source luminosity (with units log[ergs s−1]in the 14–195 keV band) is computed using the redshiftand flux listed in the table and a cosmology where H0 =70 km s−1 Mpc−1, Ωm = 0.30, and ΩΛ = 0.70.
The 17th column lists a source type with a short verbal de-scription of the counterpart.
4.1. Source Positions and UncertaintiesThe BAT position is determined by using the BAT public
software tool batcelldetect to fit the peak in the map tothe BAT PSF (a two dimensional Gaussian with a FWHM of19.5 arcminutes). The batcelldetect program performsa least-square fit using the local rms noise to weight the pixelsin the input map. These fit positions were used to generate theBAT positions in the catalog and the names of newly detectedBAT sources.
The PSF fit using batcelldetect also reports a formalposition uncertainty based on the least-square covariance ma-

SWIFT-BAT 22 MONTH HARD X-RAY SURVEY 7
FIG. 3.— All sky map showing classification of the BAT 22-month survey sources. The figure uses a Hammer-Aitoff projection in Galactic coordinates; theflux of the source is proportional to the size of the circle. The source type is encoded by the color of the circle.
trix. However, because neighboring pixels in the coded maskimages are inherently correlated, the formal uncertainty re-ported by this technique will not be representative of the trueuncertainty. Therefore we choose to use the offset betweenthe fit position and the counterpart position as an indicator ofthe BAT position error.
The batcelldetect program also has the option of fit-ting source locations using an input catalog of starting po-sitions. We have used this capability to test the stability ofthe source positions found by batcelldetect by using aninput catalog where all the starting positions have been off-set by 8 arcminutes in a random direction from the sourceposition found in the blind search. We have performed thistest with several different offsets and find that the fit con-verges to within 1 arcminute of the counterpart position forBAT sources that are not confused. For a few sources, the fitsometimes converges onto a side peak instead of the primarypeak, but this error is not repeated in additional tests startingfrom other randomized positions. This type of systematic er-ror in the position determination does not occur in the blindsearch (§3.6) since we use the maximum pixel to start the fitinstead of a randomized spot 8 arcminutes from the blind po-sition. Anomalous offsets in the source position are identifiedby examination of the image and refitting.
In order to judge the accuracy of the BAT positions, weplot in Figure 4 the angular separation between the BAT po-sition and the counterpart position against the significance ofthe BAT source detection. The accuracy of the BAT posi-tion improves as the significance of the detection becomesstronger. There are 461 BAT sources in Table 5 with detec-tion significances greater than 4.8σ; there are 479 possiblecounterparts, and of these 25 are located grater than 5 arcmin-utes from the BAT position. Therefore, there is only a ∼ 5%chance of a BAT-detected source (> 4.8σ) having a counter-
FIG. 4.— The BAT position error as a function of the BAT detection signifi-cance. The angular separation between the counterpart position and the fittedBAT position is used to determine a measured position error for each source.This measured position error is plotted as a function of BAT detection signif-icance. The dashed line in the plot shows the 96% error radius as a functionof BAT source detection significance. Sources with large position errors arealmost always low galactic latitude sources falling in regions of high sourcedensity and locally higher noise.

8 TUELLER ET AL.
part farther away than 5 arcminutes.In Figure 4 we also plot a line showing our estimate of the
BAT position error for a given source significance. This es-timate for the error radius (in arcminutes) can be representedwith the function
BAT error radius =
√√√√( 30(S/N − 1
))2
+ (0.25)2, (1)
where S/N is the BAT detection significance. This empiricalfunction includes a systematic error of 0.25 arcmin deducedfrom the position errors of very significant sources. This errorradius includes 96% of the sources that are greater than 5from the Galactic plane and 15 from the Galactic center. Theerror radius encloses 85% of sources in the Galactic plane.Sources known to be confused are not included in the plot.
4.2. CounterpartsCounterparts to the BAT sources were primarily discovered
by examining X-ray images taken with instruments with goodangular resolution. Chandra resolution is sometimes requiredon the plane, otherwise XMM-Newton, Suzaku or ASCA im-ages were examined. ROSAT images and source catalogswere of relatively low importance for counterpart identifica-tion because of ROSAT’s lack of effective area in the hardX-ray band, because of the poor correlation between ROSATflux and the BAT hard X-ray flux (see Tueller et al. (2008),Figure 7), and because of the high chance probability of find-ing a ROSAT source in the BAT error circle.
If no archival X-ray images existed for the location of aBAT source, we requested Swift-XRT followup observationsof the field containing the BAT source. A 10 ks obser-vation with XRT is deep enough to detect almost all BATsources. BAT extragalactic sources are usually AGN con-tained in bright (J ∼ 13), nearby galaxies at redshift z < 0.1and are easily identified in an XRT observation.
The X-ray counterpart to an unabsorbed BAT source is avery bright XRT source, which is easily detected with a 2 ksXRT observation. However, most of the new BAT sources areheavily absorbed in the X-ray band and were not detected byROSAT. We have found empirically that XRT can detect es-sentially all of the BAT sources (including the absorbed ones)in a 10 ks observation.
We require consistency of the BAT and the X-ray spectrum(> 3 keV) when simultaneously fit with an absorbed powerlaw allowing only a renormalization between BAT and XRTto account for variability. This consistency of the spectra isrequired for all sources not previously known to be hard X-rayemitters, except transients and sources known to have highlyvariable spectra where the BAT spectrum averaged over yearscannot be directly compared to the XRT measurement from asingle observation.
A small fraction of XRT follow-up observations in the 5–10 ks range detected multiple sources consistent with the BATposition. In these cases the counterpart to the BAT source wasalmost always identified by limiting the bandpass of the X-rayimage to the higher energy 3–10 keV band. This bandpassfiltering usually reduced the number of sources in the field toa single hard source.
In the few cases where two or more hard sources still remainafter bandpass filtering, all are considered possible counter-parts to the BAT source and listed in the catalog with a flag in-dicating that the counterpart identification suffers from source
confusion. There are 18 more possible counterparts in Table 5than there are blind BAT sources (461) because of the 15 caseswhere there are one or more possible counterparts to a singleBAT source.
Because the counterpart identification requires an X-raypoint source with a small error radius (∼ 4 arcsec), a posi-tional coincidence with a known source or bright galaxy, andan X-ray spectrum consistent with the BAT flux, we believethat the counterpart misidentification rate is extremely small.All of the identified counterparts listed in Table 5 are hardX-ray sources.
4.3. Confused SourcesSources are labeled as confused in our table when the high-
est pixel associated with the BAT source in the mosaickedmaps (the “central pixel” value) has a significant contribu-tion from adjacent sources. This includes the cases when twopossible X-ray counterparts lie within a single BAT pixel andwhen two BAT sources are close enough that each contributesflux to the location of the adjacent source.
Using the positions of the X-ray counterparts as an inputcatalog, we calculated the fractional contribution of each BATsource to its neighbors. We used the significance measuredin the blind search and the 19.5 arcminute FWHM GaussianBAT PSF to calculate the intensity of each source at the po-sition of its neighbors. The central pixel value for each BATsource was assumed to be the sum of the source plus all thecontributions from its neighbors. This creates a set of linearequations that can be solved for the true significance of eachsource. We solved these equations with the constraint thatsources were not allowed to have negative significance. Thisprocedure was devised to determine cases where the BAT sig-nificance is altered because of the presence of a very strongnearby source.
If we found that the resulting fit S/N from the technique thataccounted for contributions from neighbors was lower thanthe central pixel S/N from the blind search by 2%, we labeledit as confused.
4.4. Detection Significances and LimitsThe detection significance for the BAT sources in the cat-
alog is extracted from the mosaicked significance map at theBAT position (see §3.6). The significance is taken from thehighest pixel value in the blind search.
Figure 5 shows the distribution of individual pixel signifi-cances from the mosaicked map of the entire sky. As is usualfor a coded mask imager, the noise distribution is a Gaussianfunction centered at zero significance, with a width of σ = 1and a total integrated area equal to the number of pixels inthe map. The large tail at positive significance is due to realastrophysical sources present in the map.
The distribution of the pixel significances in Figure 5closely follows a Gaussian distribution for the negative sig-nificances. The positive side of the distribution also follows aGaussian, but with the addition of pixels with enhanced sig-nificances because of the presence of real sources in the map.
Examination of the negative fluctuations provides a goodmeasure of the underlying noise distribution. There is only1 negative pixel in the entire map with a magnitude greaterthan 5σ. We therefore choose our detection limit to be 4.8σ.This detection limit is also the same as used in the 9-monthversion of the Swift-BAT catalog. While it is clear that thereare several real sources with significances somewhat smaller

SWIFT-BAT 22 MONTH HARD X-RAY SURVEY 9
FIG. 5.— Histogram showing the significances of the pixels in the 22-monthsurvey. The gray line is not a fit to the data; it is a Gaussian distribution withσ = 1 and normalized to the peak of the observed distribution.
FIG. 6.— The integral distribution of sky coverage versus sensitivityachieved in the survey. The 1 mCrab sensitivity limit (for 50% sky cover-age) corresponds to a flux of 2.3× 10⁻¹¹ ergs cm−2 s−1 in the 14–195 keVband.
than 4.8σ, we choose this value in order to minimize falsesources caused by random fluctuations. We expect randomfluctuations to account for 1.54 sources at the 4.8σ level inour sky map of 1.99×10⁶ independent pixels.
Figure 6 shows the integral distribution of sky coverage ver-sus sensitivity achieved in the survey. We achieve a sensitivityof better than 1 mCrab for half the sky, which corresponds toa flux of < 2.3×10⁻¹¹ ergs cm−2 s−1 in the 14–195 keV band.
4.5. Counterpart Fluxes
Fluxes of the counterparts to BAT sources were extractedfrom the mosaicked maps using the pixel containing the posi-tion of the identified counterpart. For sources where a coun-terpart is not known, we use the fitted BAT position to deter-mine the flux.
We have chosen to normalize source fluxes in the 8 surveybands to the Crab because the systematic uncertainties in thesurvey averaged Crab spectrum are smaller than the uncer-tainties in the BAT survey response matrix. The source fluxesin each band were computed by comparing the source countrate to the measured rate of the Crab Nebula in each band:
BAT source flux =(
BAT source count rateCrab count rate
)Crab flux, (2)
where the Crab flux in each band is given by
Crab flux =∫ b
aE F(E) dE, (3)
where a and b are the lower and upper BAT band edges and Ethe energy in keV.
We take the Crab counts spectrum to be
F(E) = 10.17 E−2.15(
photonscm2 sec keV
), (4)
determined by fitting a power-law model to BAT on-axis cal-ibration observations taken early in the Swift mission. Thesevalues are consistent with characterizations of the Crab spec-trum using data from Integral/SPI (Jourdain & Roques 2008),Integral/IBIS (Jourdain et al. 2008), HETE/FREGATE (Oliveet al. 2003), SAX/PDS (Fiore et al. 1999), and GRIS (Bartlett1994).
The total Crab flux is then
Crab flux =∫ 195 keV
14 keVE F(E) dE = 2.44×10⁻⁸
( ergscm2 sec
).
(5)Sources with a spectral index very different from the Crab
can have a small but significant residual systematic error inthe fluxes determined with this method.
In order to gauge this error we generated counts spectra fordifferent models in the eight survey bands using the BAT on-axis spectral response matrix. The Crab comparison flux de-termination method described above was used to obtain themodel fluxes in each of the eight survey bands. The flux er-rors between the computed fluxes and the model fluxes in theindividual bands were always < 10% for a range of modelspectral indices between 1 and 3 and so we deem this tech-nique acceptable for producing the source fluxes in each ofthe survey bands.
We fit the 8-channel spectra with a power law model inorder to produce an overall hard X-ray flux for each BATsource. We used XSPEC and a diagonal matrix to fit the 8-channel spectra with the pegpwrlw model over the entire14–195 keV BAT survey energy range in order to extract thesource flux in this band. This approach was selected becauseit weights the energy bands by their individual uncertainties;a simple sum of the bands would produce a very large errordue to the high weight it assigns to the noisiest bands at thehighest energies.
The 1σ error in the overall flux was determined by using theerror function in XSPEC and is given in Table 5. For the high-est significance BAT sources (> 100 sigma), this proceduredoes not produce a good fit (reduced χ2 1), but this is to be

10 TUELLER ET AL.
expected from the very high significances of each point andthe coarse energy binning. To evaluate the systematic error inthe fitting we performed fits to our model spectra generatedfrom the response matrix. For power law spectra, the system-atic error in the flux is dominated by the error in the individualdata points as calculated above. Sources with hardness ratiosless than 0.1 are not well fit with a power law, and the system-atic uncertainty in the flux can be significantly larger.
The fluxes for sources marked as confused were calculatedin a slightly different way. Instead of using the count rateextracted from the map at the counterpart position, we per-formed a simultaneous fit to find the fluxes of all the sources inthe confused region as described in §4.3. For these sources wedo not quote an error on the flux estimate because the behav-ior of the errors with this fitting technique is not well known.Any source with a confused flag should be considered as de-tected by BAT but the flux should be considered as an upperlimit.
4.6. Sensitivity and Systematic ErrorsIn this section, we compare the expected statistical errors
with the actual measured statistical noise in the final mosaicmaps. From the perspective of pure Poisson counting statis-tics, the uncertainties are governed primarily by the propertiesof the coded mask and the background (see Skinner (2008)for details). The expected 5σ noise level can be expressed as(adapting from Skinner (2008) Eqn. 23 and 25):
5σPoisson = 5
√2b
αNdet T, (6)
where b is the per-detector rate, including background andpoint sources in the field of view; Ndet is the number of activedetectors (Ndet ≤ 32768); T is the effective on-axis exposuretime; and α is a coefficient dependent on the mask pattern anddetector pixel size (α = 0.733 for BAT). The partial coding,p, enters the expression through the “effective on-axis expo-sure” time, T = pTo, where To is the actual exposure time. Us-ing nominal values (b = 0.262 cts s−1 detector−1; Ndet = 23500(the exposure-weighted mean number of enabled detectors);and Crab rate = 4.59× 10⁻² cts s−1 detector−1), we find theestimated Poisson 5σ noise flux level to be
f5σ = 0.99 mCrab(
T1 Ms
)−1/2
. (7)
We consider this to be a lower limit to the expected Poissonnoise level for a given effective exposure. In reality, the back-ground rate b may be higher than the nominal value by upto 50% depending on the particle environment of the space-craft. Also, along the Galactic plane the contributions ofbright sources such as the Crab, Sco X-1 and Cyg X-1, arenot strictly negligible, and will raise the overall level of b byup to ∼10%. All of these adjustments would cause a Poissonnoise level larger than given by equation 7, by an amount thatdepends on the specific satellite conditions during the survey.We estimate that, averaged over the entire survey duration, thetrue Poisson noise level may be 5–15% higher than the lowerlimit quoted above.
Figure 7 compares the measured noise and expected noiseversus effective on-axis exposure. We see that both noisemeasures are decreasing approximately as T −1/2, which sug-gests that the dominant errors are uncorrelated over time. Italso suggests that pointing strategies such as roll-angle dither-
FIG. 7.— Measured 5σ BAT sensitivity limit for pixels in the all-sky map,as a function of effective exposure time, T , for the 3-month (red; Markwardtet al. (2005)), 9-month (green; Tueller et al. (2008)) and 22-month (blue;this work) survey analyses. The contours indicate the number of pixels witha given sensitivity and effective exposure. The contour levels are linearlyspaced. The red dashed line represents the original T −1/2 sensitivity curvequoted in Markwardt et al. (2005). The black dashed line represents a lowerlimit to the expected Poisson noise level (see §4.6). The measured noise isapproximately 30–45% higher than the expected Poisson noise.
ing have been successful in reducing pointing-related system-atic errors. However, the measured noise is still higher thanthe expected Poisson noise by ∼30–45%, and we take this tobe a measure of the unmodeled systematic variations on thedetector plane.
The largest likely contributors to systematic variations areimproper subtractions of diffuse background, and of brightsources. BAT count rates are background-dominated — thebackground rate is equivalent to ∼6–9 Crab units — so thecoded mask analysis is particularly sensitive to imperfect sub-traction of spatial background variations. While the patternmap method and the functions fitted during the cleaning stageproduce a good model of the detector background, some im-perfections remain. One effect is that detector-to-detector sen-sitivity differences, coupled with varying exposures to the X-ray background, can lead to excess residuals.
For similar reasons, bright sources may also contribute sys-tematic noise. The brightest sources are clustered along theGalactic plane, and thus contribute noise in those preferredlocations. Indeed, we note that the measured noise is ∼50%higher in the Galactic center region, where there is a concen-tration of bright point sources. This is a larger factor thancan be accounted for by a larger count rate. Modeling ofpoint sources may be imperfect for the same reasons as forthe background. Also, there may be other effects such as sideillumination of detectors that may contribute additional noise.Here, “side illumination” refers to the facets of the individualCdZnTe detectors which do not face the pointing direction,but are still sensitive to X-rays. Off-axis sources will shinethrough the mask and illuminate the sides, producing an addi-tional (although fainter) coded signal. At the moment, illumi-

SWIFT-BAT 22 MONTH HARD X-RAY SURVEY 11
nation of the sides of detectors is not modeled at the imagingor cleaning steps, and thus there will be an additional noisedue to the effect.
Proper modeling of these systematic error contributors willbe the subject of future work. At this stage we do not havean in-depth analysis of the quantitative contributions of eacheffect to the systematic noise, and in some cases the analysismay be prohibitively difficult. Still, at the current exposurelevels, the noise level seems to be decreasing with exposure,and we do not appear to be reaching an ultimate systematiclimit in this analysis.
4.7. Spectral AnalysisIn §4.5 we use a simple power-law fit to the data to esti-
mate the source flux. However, because the catalog containssources with various different physical natures and spectralshapes, we choose to use the more robust characterizationgiven by a hardness ratio to describe the BAT spectra.
Hardness ratios for the Swift-BAT sources were calculatedby taking the sum of the count rate in the 35–150 keV bandand dividing by the count rate in the 14–150 keV band. Errorson the hardness ratio were calculated by propagating the er-rors on the count rates in the individual 8 bands except whenthe source is listed as confused. Figure 8 shows a map of thesource positions on the sky, with the source flux representedby the size of the point and the source hardness by the color(red is softer and blue is harder). Figure 9 shows the hardnessratios of the 22-month BAT sources by source class.
A mapping can be made between hardness ratio and power-law index for sources that have spectral shapes well describedby a simple power-law model (e.g., the majority of AGN inour catalog). This mapping is well represented by
Γ = 3.73 − 4.52 HR, (8)
where Γ is the power-law index and HR is the hardness ra-tio as defined above. Figure 10 shows the correlation be-tween power-law index and hardness ratio for the BAT surveysources. The correlation holds well for sources with hard-nesses above about 0.15, but begins to break down for softersources. An illustration of this problem is the soft BAT spec-tra of clusters of galaxies, which have thermal spectra withtemperatures ∼ 10 keV and are usually detected only in thelowest energy BAT band and are not well fit by a power-lawmodel. We leave to a later paper a more careful spectral anal-ysis using models appropriate to the physical nature of thesources.
5. Swift-BAT SURVEY SOURCESAlthough it is for extragalactic astronomy that the present
survey represents the greatest step forward, a comparison ofthe results for Galactic sources with earlier work also has in-teresting implications.
Of the 479 sources in Table 5, 97% have reasonably firmassociations either with objects known in other wavebands orwith previously known X-ray or gamma-ray sources. Morethan 60% of the associations are with extragalactic objects.At high Galactic latitudes (|b|> 10) the density of identifiedextragalactic sources is 22.6 sr−1, and it is only only slightlyreduced at low latitudes to 19.2 sr−1. This suggests that only∼ 7 extragalactic sources in the plane are missed through re-duced sensitivity, lack of information in other wavebands, orconfusion, and illustrates the uniformity of the survey.
153 BAT AGN were previously reported in the BAT 9-month AGN survey (Tueller et al. 2008). Winter et al. (2009)
provide X-ray spectral fits for these sources and provide mea-sures of the luminosity, nH , etc. for the sources in the 9-monthcatalog. Most of the sources in the 9-month catalog also ap-pear here in the 22-month catalog; however, variability in thesources has caused 11 sources to drop out of the 22-month listthat were in the 9-month catalog.
5.1. New sourcesDuring the survey BAT has detected a number of new
sources that are transients or other Galactic objects not pre-viously reported as hard X-ray sources. Some of these havebeen reported in Astronomer’s Telegrams or elsewhere, othersappear for the first time in this compilation. For conveniencethese are summarized in Table 2.
In Table 3 we note other sources that are detected in thissurvey and where XRT follow-up has provided additional in-formation, but where a unique optical, IR, or radio counter-part is still lacking, or where there is only a BAT detection.Some of these are almost certainly Galactic objects as may bejudged from their proximity to the Galactic plane.
Table 4 list the new AGN discovered in the 22-month Swift-BAT survey. Table 4 lists those objects discovered with BATwhose AGN nature could be confirmed with an optical spec-trum. In column 3 of the table we list the source of the opticaldata, and columns 4 and 5 list our own typing of the spectrumand the redshift. The optical spectra are mostly obtained fromdata in the public domain such as SDSS or 6df, but in a fewcases we have obtained data from our own observations takenat the 2.1m telescope on Kitt Peak.
5.2. Extragalactic SourcesMost of the extragalactic identifications are with relatively
nearby Seyfert galaxies and many of the remainder are withbeamed AGN (blazars, BL Lac, FSRQ, etc) sources at muchhigher z.
Figure 11 shows some typical BAT source host galaxy im-ages from the Palomar digital sky survey. The field of viewis 2 arcmin across for each subimage. The figure was pro-duced by dividing the hardness-luminosity plane into 70 binsand randomly choosing a BAT source from that category todisplay. Of note are the high fraction of spiral galaxy hosts(as opposed to ellipticals), and the high number of interactinggalaxies.
The 234 sources that have an identification with a well es-tablished Seyfert galaxy more than double the number in anyprevious hard X-ray survey. The distribution of column densi-ties, spectral indices, and luminosities for the survey sourceswill be presented in a separate paper. As elsewhere in this pa-per, we emphasize that this catalog is based on mean flux lev-els over the entire 22 month period. The detections of sourceswith significant temporal variability over the survey periodand the implications of such variability will be discussed else-where (Skinner et al., in preparation).
Figure 12 shows a histogram of the redshifts of all the AGNfound in the 22-month catalog. The distribution of the Seyfertgalaxy redshifts from the 22-month survey (left panel of Fig-ure 12) is highly biased towards low redshifts (z∼ 0.03) witha tail extending out to z ∼ 0.1 and a few more distant objectsout to z∼ 0.3. The right panel of Figure 12 shows the redshiftdistribution of the beamed AGN. This distribution is quite dif-ferent from the Seyfert galaxies in the left panel, with redshiftsthat extend to z∼ 4 and with no objects at z< 0.033. Since wehave no selection biases with respect to these beamed AGN

12 TUELLER ET AL.
TABLE 2NEW HIGH ENERGY SOURCES IN THE 22-MONTH CATALOG THAT ARE GALACTIC, OR PROBABLY GALACTIC, AND
WERE FIRST DETECTED AS HARD X-RAY SOURCES BY Swift-BAT
Source First Notesreported
SWIFT J0026.1+0508 Here Of several sources in an XRT follow-up observation, only one is hard and it istaken to be the counterpart. It could be a CV.
SWIFT J0732.5−1331 ATel 697 CV of subtype DQ Her. ATels 757, 760, 763.SWIFT J1010.1-5747 ATel 684 = CD−57 3057. ATel 669 gives XRT position for BAT source SWIFT J1011.1-
5748 = IGRJ 10109-5746 associated with Symbiotic star CD-57 3057 (ATel715).
SWIFT J1515.2+1223 Here In a 7400 s XRT follow-up, only one source is detected in the hard band at(α,δ) = (151447, + 122244). No known counterparts at this position.
SWIFT J1546.3+6928 Here The BAT source is confused. There are TWO hard (>3 keV) sources in theXRT image, 1RXS J154534.5+692925 AND 2MASS J15462424+6929102.There are some indications that the ROSAT source is extended, perhaps an in-teracting pair (making a possible third source). The 2MASS object is extendedand clearly a galaxy.
SWIFT J1559.6+2554 ATel 668/9 = T CrB. The Swift source is identified with this symbiotic star in XRT follow-up.
SWIFT J1626.9−5156 ATel 678 Peculiar (HMXB?) transient. 15.37 s pulsations. Optical counterpart2MASS16263652−5156305. Short (100–1000s) flares (Reig et al. 2008).
SWIFT J1753.5−0130 ATel 546 Short period (3.2 hr; ATel 1130) BH LMXB transient observed with manyother instruments following BAT detection.
SWIFT J1907.3-2050 Here = V1082 Sgr. XRT follow-up shows a strong hard source coincident with thepulsating variable star. Steiner et al. (1988) have found that this star in itshard state has properties similar to a CV of subtype DQ Her. Thorstensen etal. (2009) has determined an orbital period of 20.821 hr for this object whichclassifies it as a long period CV.
SWIFT J1922.7−1717 ATel 669 Transient observed with RXTE and Integral after BAT detection (Falanga etal. 2006)
SWIFT J1942.8+3220 Here = V2491 Cyg. We find a weak hard X-ray source whose position is consistentwith V2491 Cyg in data taken before its eruption as Nova Cyg 2008b. (seealso Ibarra et al. (2009), ATel 1478)
SWIFT J2037.2+4151 ATel 853 Transient; later seen with Integral (ATel 967)SWIFT J231930.4+261517 ATel 1309 XRT data show that this source is the same as 1RXS J231930.9+261525, re-
ported and identified as a CV of subtype AM Her in ATel 1309. Mkn 322 andUGC 12515 may also contribute to the BAT counts
SWIFT J2327.6+0629 Here There is no clear source in the XRT field.
TABLE 3UNIDENTIFIED NEW SOURCES
Source la () b () Notes
SWIFT J0826.2−7033 284.21 −18.09 = 1ES 0826−703, 1RXS J082623.5−703142. The 4.1" radius XRT position is1.2" from T Tau star 2MASS J08262350−7031431.
SWIFT J1515.2+1223 16.44 +53.28 Nearest XRT source is a weak one 7.8’ away, just outside the 5’ radius BATerror circle.
SWIFT J1546.3+6928 104.27 40.74 Two hard XRT sources lie within the BAT error circle. One is associated with1RXS J154534.5+692925, about which nothing is known, the other is coinci-dent with the extended source 2MASX J15462424+6929102, which is identi-fied with LEDA 2730634, a side-on spiral galaxy.
SWIFT J1706.6−6146 328.72 −12.40 = IGRJ17062−6143. Bright XRT counterpart gives precise position but no ap-parent optical/IR/Radio counterpart.
SWIFT J1709.8−3627 349.55 2.07 = IGR J17098−3628. IGR J17091−3624 is only 8.5’ away. XRT provides posi-tions for both (ATel 1140). The BAT position corresponds to IGR J17098−3628,but the XRT error circle contains a complex of IR sources and a radio sourceand it is not clear which are counterparts.
NOTE. — These sources have new information but no firm identification with an optical/IR/Radio object.a Galactic coordinates are given as an indication of whether the sources is likely to be Galactic.

SWIFT-BAT 22 MONTH HARD X-RAY SURVEY 13
FIG. 8.— All sky map showing spectral hardness of BAT 22-month survey sources. The figure uses a Hammer-Aitoff projection in Galactic coordinates; thesize of the circle is proportional to the flux of the source. Blue sources are harder, and red sources are softer.
TABLE 4NEW AGN DETECTED IN THE Swift-BAT 22-MONTH SURVEY WITH OPTICAL SPECTROSCOPIC
CONFIRMATION
BAT Name Host Galaxy Optical Spectruma Galaxy Type redshift
SWIFT J0100.9-4750 2MASX J01003490-4752033 6df Sy1.8SWIFT J0623.8-3215 ESO 426- G 002 6df Sy2SWIFT J0923.9-3143 2MASX J09235371-3141305 6df Sy1.8SWIFT J1513.8-8125 2MASX J15144217-8123377 6df Sy1.8
SWIFT J0249.1+2627 2MASX J02485937+2630391 KP XBONGb 0.058SWIFT J0353.7+3711 2MASX J03534246+3714077 KP Sy2 0.01828SWIFT J0543.9-2749 MCG -05-14-012 KP XBONG 0.0099SWIFT J0544.4+5909 2MASX J05442257+5907361 KP Sy1.9 0.06597SWIFT J1246.6+5435 NGC 4686 KP XBONG 0.0167SWIFT J1621.2+8104 CGCG 367-009 KP Sy2 0.0274SWIFT J1830.8+0928 2MASX J18305065+0928414 KP Sy2 0.019SWIFT J2118.9+3336 2MASX J21192912+3332566 KP Sy1 0.0507SWIFT J2341.8+3033 UGC 12741 KP Sy2 0.0174
a The optical spectra sources are as follows: 6df = Six degree field galaxy survey, SDSS = Sloan DigitalSky Survey, KP = 2.1 m at Kitt Peak.b XBONG = (hard) X-ray Bright, Optically Normal Galaxy

14 TUELLER ET AL.
FIG. 9.— Hardness ratios of BAT 22-month sources by source class.

SWIFT-BAT 22 MONTH HARD X-RAY SURVEY 15
FIG. 10.— The correlation between power law index and hardness ratio forthe BAT survey sources.
(as opposed to optical searches for blazars) these different red-shift distributions are a fundamental property of these classesand are directly related to their luminosity functions and evo-lution (Ajello et al. 2009).
Figure 13 is a histogram of the luminosities of the Seyfertgalaxies detected in the BAT 22-month survey. The luminos-ity distribution of the Seyfert galaxies continues to show a dif-ference between the type Is and type IIs as noted in Winter etal. (2008). This indicates that the true luminosity distributionis indeed different for these two classes, which is inconsistentwith the unified model of AGN. A K-S test of these two lumi-nosity distributions shows that they are drawn from the sameparent distribution with a probability of only 0.30.
As in earlier hard X-ray surveys, the second most commoncategory of extragalactic sources are beamed AGN, which in-clude types such as blazars, BL Lacs, FSRQs, etc. Thereare 32 objects in this category. The highest redshift is forQSO J0539−2839 at z = 3.104.
We have detected 10 clusters of galaxies at> 4.8σ; Perseus,Coma, Ophiuchus, Cygnus A, Abell 2319, Abell 754,Abell 3266, Abell 2142, Abell 3571, and Triangulum Aus-tralis. The BAT spectra of Cygnus A and Abell 2142 inthe 14–100 keV band are dominated by the AGN componentin or around the clusters. The other 8 clusters are all hot(kT ∼10 keV); their BAT spectra are consistent with an ex-tension of the thermal emission modeled with ASCA/XMM-Newton/Chandra archival data in the 2–10 keV band and donot require any additional component for a good fit. In otherwords, there is no evidence of a non-thermal diffuse compo-nent in these clusters. We estimated the upper limit of the non-thermal emission by adding a power-law model to the spectralfit for the 10 detected clusters. The upper limit is ∼ 6×10⁻¹²
ergs cm−2 s−1 on average and the lower limit for the magneticfield B ranges from ∼ 0.2–1 µG, assuming inverse Comptonscattering of Cosmic Microwave Background photons by rel-ativistic electrons in the cluster. More details are describedin the papers by Ajello et al. (2009) and Okajima et al. (ApJ,
submitted).Some 20 sources are clearly identified, largely through
follow-up Swift-XRT observations, with galaxies from whichno sign of nuclear activity has yet been reported in other wave-bands. Their mean luminosity is only slightly lower thanthat of those classed as Seyferts on the basis of optical spec-tra (1043.53 compared with 1043.75 erg s−1). These are prob-ably low-z counterparts to the X-ray bright, optically nor-mal (XBONG) sources discovered in the Chandra and XMM-Newton deep fields (Barger et al. 2005; Comastri et al. 2002).
5.3. Galactic Sources5.3.1. X-ray Binaries
As can be seen from Table 5, approximately two-thirds ofthe Galactic sources are X-ray binaries. Of those whose na-ture is known, about 40% are high mass X-ray binaries, whichreflects the BAT’s sensitivity to hard-spectrum X-ray sources.60% are low mass X-ray binaries, which typically have softerspectra but can have a higher total flux. The low mass X-ray binary population is concentrated near the Galactic planeand bulge, whereas the high mass X-ray binary population ismore distributed, including significant contributions from theMagellanic clouds.
The sensitivity of the survey is such that high luminositysources (> Lx ∼ 1036 erg s−1) are detectable anywhere in theGalaxy and the catalog is complete for sources that emit con-tinuously at this level. However, since many X-ray binariesare transient it is likely that there are a significant number ofadditional X-ray binaries that are not seen in the present anal-ysis (which is based on fluxes averaged over 22 months), butthat can be detected in specific shorter intervals. This will bethe subject of further work. The detection of outbursts fromtransients that do not repeat, or that repeat only on timescalesof several years, should scale approximately linearly with thelength of the survey.
5.3.2. CVs and Other Accreting White Dwarf Systems
Accreting white dwarf binaries constitute the second mostcommon category of Galactic sources. Of these, 31 have beenidentified as cataclysmic variables (CVs) or CV candidates.Of the 31 CVs detected with BAT, 14 are in the Barlow etal. (2006) (INTEGRAL) list, while 17 are new detections inhard X-ray surveys. Because the INTEGRAL catalog goesdeeper near the Galactic plane but the BAT catalog is moresensitive at higher latitude, the lists of CVs in the two catalogsare complementary. With the expanded list, we confirm thatthe hard X-ray selected CVs are dominated by magnetic CVsof the intermediate polar (IP) subtype, also known as DQ Hertype stars (see also Brunschweiger et al. (2009)).
In addition, 4 hard X-ray bright symbiotic stars have beendetected by BAT, as summarized by Kennea et al. (2007), andthere is now a candidate to be the fifth member of the class. Fi-nally, BAT has also detected one Be star, gam Cas, for whichan accreting white dwarf companion is one of three possibili-ties proposed as the origin of the X-ray emission (Kubo et al.1998).
5.3.3. SNRs and Non-Accretion Powered Pulsars
We detect hard X-ray emission from 8 pulsars and/or theirassociated Pulsar Wind Nebula (PWN) or supernova rem-nants (SNRs). Our upper limit on PSR J1846−0258 is con-sistent with the flux level at which it was detected in along INTEGRAL-IBIS observation and reported in Bird et al.

16 TUELLER ET AL.
FIG. 11.— Typical host galaxies of BAT detected Seyfert galaxies. The individual images are taken from the Palomar Digital Sky Survey, and are 2′ on a side.The BAT hardness-luminosity plane is divided into 70 bins, and a BAT source from that bin randomly selected to display.
FIG. 12.— Histograms showing the redshift distribution of the AGN in the 22-month survey. The left panel shows the Seyfert distribution, and the right panelshows the beamed AGN distribution. The beamed AGN panel has redshift bins that are 0.5 units wide.

SWIFT-BAT 22 MONTH HARD X-RAY SURVEY 17
FIG. 13.— The distribution of Seyfert galaxy luminosities in the BAT 22-month survey.
(2007). In the case of HESS J1813−178 it appears that weare detecting emission that is from the point source seen atlower energies (Funk et al. (2007)) rather than directly relatedto the slightly extended VHE gamma-ray emission. The onlySNR-related source that is not associated with a PWN is CasA.
5.3.4. The Galactic Center
Because of the limited resolution of the BAT instrumentthe emission reported as from Sgr A* should be regarded asthe net emission from a region of ∼ 6′ radius centered on theGalactic center. It is possible that a number of sources con-tribute.
6. CONCLUSIONSThe 22 month BAT catalog reinforces and enhances the re-
sults from the 3 month (Markwardt et al. 2005) and 9 month(Tueller et al. 2008) catalogs and shows that the BAT surveycontinues to increase in sensitivity roughly as the square rootof time and is far from being confusion or systematics lim-ited. Future papers will discuss the X-ray spectral and tim-ing properties of these sources as well as the nature of theoptical identifications, in a manner similar to that of Winteret al. (2008, 2009). We have also obtained extensive opticalimaging and spectroscopy of the AGN population (Koss, inpreparation; Winter et al. (2009)), more detailed X-ray obser-vations as well as Spitzer IR spectroscopy (Melendez et al.2009) and radio data which will be presented in future publi-cations. These results will allow the first large scale catego-rization of the AGN phenomenon from a large uniform andunbiased sample as well as a detailed comparison with resultsobtained with other selection techniques.
REFERENCES
Ajello, M., et al. 2007, Deepest Astronomical Surveys, 380, 163Ajello, M., Greiner, J., Kanbach, G., Rau, A., Strong, A. W., & Kennea,
J. A. 2008, ApJ, 678, 102Ajello, M., et al. 2009, ApJ, 690, 367Ajello, M., et al. 2009, ApJ, submittedBade, N., et al. 1998, A&AS, 127, 145Barger, A. J., Cowie, L. L., Mushotzky, R. F., Yang, Y., Wang, W.-H.,
Steffen, A. T., & Capak, P. 2005, AJ, 129, 578Barlow, E. J., Knigge, C., Bird, A. J., J Dean, A., Clark, D. J., Hill, A. B.,
Molina, M., & Sguera, V. 2006, MNRAS, 372, 224Barthelmy, S. D., Cline, T. L., Butterworth, P., Kippen, R. M., Briggs, M. S.,
Connaughton, V., & Pendleton, G. N. 2000, Gamma-ray Bursts, 5thHuntsville Symposium, 526, 731
Barthelmy, S. D., et al. 2005, Space Science Reviews, 120, 143Bartlett, Lyle. Ph.D. Thesis, Astronomy Department, University of
Maryland College Park.Beckmann, V., Gehrels, N., Shrader, C. R., & Soldi, S. 2006, ApJ, 638, 642Beckmann, V., et al. 2009, arXiv:0907.0654Bikmaev, I. F., Sunyaev, R. A., Revnivtsev, M. G., & Burenin, R. A. 2006,
Astronomy Letters, 32, 221Bikmaev, I. F., Burenin, R. A., Revnivtsev, M. G., Sazonov, S. Y., Sunyaev,
R. A., Pavlinsky, M. N., & Sakhibullin, N. A. 2008, Astronomy Letters,34, 653
Bodaghee, A., Walter, R., Zurita Heras, J. A., Bird, A. J., Courvoisier,T. J.-L., Malizia, A., Terrier, R., & Ubertini, P. 2006, A&A, 447, 1027
Bodaghee, A., et al. 2007, A&A, 467, 585Bird, A. J., et al. 2007, ApJS, 170, 175Brunschweiger, J., Greiner, J., Ajello, M., & Osborne, J. 2009,
arXiv:0901.3562Burenin, R. A., Mescheryakov, A. V., Revnivtsev, M. G., Sazonov, S. Y.,
Bikmaev, I. F., Pavlinsky, M. N., & Sunyaev, R. A. 2008, AstronomyLetters, 34, 367
Burrows, D. N., et al. 2005, Space Science Reviews, 120, 165Butler, S. C., et al. 2009, ApJ, 698, 502Caroli, E., Stephen, J. B., Spizzichino, A., di Cocco, G., & Natalucci, L.
1986, Data Analysis in Astronomy II, 77Chakrabarty, D., Wang, Z., Juett, A. M., Lee, J. C., & Roche, P. 2002, ApJ,
573, 789Cieslinski, D., Steiner, J. E., & Jablonski, F. J. 1998, A&AS, 131, 119Coe, M. J., et al. 1994, MNRAS, 270, L57Comastri, A., et al. 2002, ApJ, 571, 771Falanga, M., Belloni, T., & Campana, S. 2006, A&A, 456, L5Fenimore, E. E., & Cannon, T. M. 1981, Appl. Opt., 20, 1858
Fiore, F., Guainazzi, M., & Grandi, P. SAX Cookbook,http://heasarc.gsfc.nasa.gov/docs/sax/abc/saxabc/saxabc.html
Forman, W., Jones, C., Cominsky, L., Julien, P., Murray, S., Peters, G.,Tananbaum, H., & Giacconi, R. 1978, ApJS, 38, 357
Funk, S., et al. 2007, A&A, 470, 249Gehrels, N., et al. 2004, ApJ, 611, 1005Gilli, R., Comastri, A., & Hasinger, G. 2007, A&A, 463, 79Homer, L., Anderson, S. F., Margon, B., Downes, R. A., & Deutsch, E. W.
2002, AJ, 123, 3255Ibarra, A., et al. 2009, arXiv:0902.3943Israel, G. L., et al. 2001, A&A, 371, 1018Jourdain, E., Götz, D., Westergaard, N. J., Natalucci, L., & Roques, J. P.
2008, Proceedings of the 7th INTEGRAL Workshop. 8 - 11 September2008 Copenhagen, Denmark. Online athttp://pos.sissa.it/cgi-bin/reader/conf.cgi?confid=67, p.144
Jourdain, E., & Roques, J. P. 2008, Proceedings of the 7th INTEGRALWorkshop. 8 - 11 September 2008 Copenhagen, Denmark. Online athttp://pos.sissa.it/cgi-bin/reader/conf.cgi?confid=67, p.143
Juett, A. M., & Chakrabarty, D. 2005, ApJ, 627, 926Kennea, J. A., Mukai, K., Tueller, J., Sokoloski, J., Luna, J., Burrows, D., &
Gehrels, N. 2007, Bulletin of the American Astronomical Society, 38, 149Krimm, H., et al. 2006, The Astronomer’s Telegram, 904, 1Krivonos, R., Revnivtsev, M., Lutovinov, A., Sazonov, S., Churazov, E., &
Sunyaev, R. 2007, A&A, 475, 775Kubo, S., Murakami, T., Ishida, M., & Corbet, R. H. D. 1998, PASJ, 50, 417Levine, A. M., et al. 1984, ApJS, 54, 581Markwardt, C. B., Tueller, J., Skinner, G. K., Gehrels, N., Barthelmy, S. D.,
& Mushotzky, R. F. 2005, ApJ, 633, L77Masetti, N., et al. 2008, A&A, 482, 113Masetti, N., et al. 2009, A&A, 495, 121McBride, V. A., et al. 2008, A&A, 477, 249Melendez, M., et al. 2009, American Astronomical Society Meeting
Abstracts, 213, #421.10Olive, J.-F., et al. 2003, Gamma-Ray Burst and Afterglow Astronomy 2001:
A Workshop Celebrating the First Year of the HETE Mission, 662, 88Reig, P., Belloni, T., Israel, G. L., Campana, S., Gehrels, N., & Homan, J.
2008, A&A, 485, 797Renaud, M., et al. 2006, ApJ, 647, L41Revnivtsev, M., Sazonov, S., Jahoda, K., & Gilfanov, M. 2004, A&A, 418,
927Rodriguez, J., Tomsick, J. A., & Chaty, S. 2009, A&A, 494, 417Roming, P. W. A., et al. 2005, Space Science Reviews, 120, 95Shafter, A. W., Davenport, J. R. A., Güth, T., Kattner, S., Marin, E., &
Sreenivasamurthy, N. 2008, PASP, 120, 374

18 TUELLER ET AL.
Skinner, G. K. 1995, Experimental Astronomy, 6, 1Skinner, G. K. 2008, Appl. Opt., 47, 2739Steiner, J. E., Cieslinski, D., & Jablonski, F. J. 1988, Progress and
Opportunities in Southern Hemisphere Optical Astronomy. The CTIO25th Anniversary Symposium, 1, 67
Thorstensen, J. R., Peters, C. S., Sheets, H. A., & Skinner, J. N. 2009,American Astronomical Society Meeting Abstracts, 213, #491.07
Tomsick, J. A., Chaty, S., Rodriguez, J., Walter, R., & Kaaret, P. 2008, ApJ,685, 1143
Treister, E., Urry, C. M., & Virani, S. 2009, ApJ, 696, 110Tueller, J., Mushotzky, R. F., Barthelmy, S., Cannizzo, J. K., Gehrels, N.,
Markwardt, C. B., Skinner, G. K., & Winter, L. M. 2008, ApJ, 681, 113
Walter, R., et al. 2006, A&A, 453, 133Wilson, C. A., Patel, S. K., Kouveliotou, C., Jonker, P. G., van der Klis, M.,
Lewin, W. H. G., Belloni, T., & Méndez, M. 2003, ApJ, 596, 1220Winter, L. M., Mushotzky, R. F., Tueller, J., & Markwardt, C. 2008, ApJ,
674, 686Winter, L. M., Mushotzky, R. F., Reynolds, C. S., & Tueller, J. 2009, ApJ,
690, 1322

SWIFT-BAT 22 MONTH HARD X-RAY SURVEY 19TA
BL
E5
CA
TAL
OG
OF
SO
UR
CE
SIN
TH
E22
-MO
NT
HSw
ift-B
AT
SU
RV
EY
#B
AT
Nam
eaR
Ab
Dec
S/N
Cou
nter
part
Nam
eO
ther
Nam
eC
tptR
Ac
Ctp
tDec
Flux
der
ror
Ce
Hra
tfH
err
Red
shif
tgL
umh
Type
1SW
IFT
J000
6.2+
2012
1.55
520
.192
7.05
MR
K03
351.
5813
20.2
029
2.47
0.41
0.31
0.07
0.02
5843
.57
Sy1.
22
SWIF
TJ0
010.
5+10
572.
613
10.9
587.
59M
RK
1501
2.62
9210
.974
94.
100.
550.
400.
050.
0893
44.9
1Sy
1.2
3SW
IFT
J002
5.8+
6818
6.44
368
.303
5.76
2MA
SXJ0
0253
292+
6821
442
6.38
7068
.362
33.
020.
660.
510.
090.
0120
42.9
9Sy
24
SWIF
TJ0
026.
1+05
086.
550
5.12
15.
55SW
IFT
J002
615.
1+05
0417
6.56
315.
0715
4.13
1.12
0.59
0.12
?5
SWIF
TJ0
028.
9+59
177.
224
59.2
8424
.30
V70
9C
asR
XJ0
028.
8+59
177.
2036
59.2
894
8.91
0.39
0.25
0.02
CV
/DQ
Her
6SW
IFT
J003
6.0+
5951
9.00
059
.842
5.76
QSO
B00
33+5
951E
S00
33+5
958.
9694
59.8
346
1.96
0.34
0.19
0.07
0.08
6044
.56
BL
Lac
7SW
IFT
J003
7.2+
6123
9.29
761
.380
6.45
BD
+60
73IG
RJ0
370+
6122
9.29
0261
.360
12.
850.
470.
350.
06H
MX
B8
SWIF
TJ0
042.
9−23
3210
.745
−23
.503
7.00
NG
C23
5A10
.720
0−
23.5
410
4.12
0.48
0.35
0.05
0.02
2243
.67
Sy1
9SW
IFT
J004
8.8+
3155
12.1
7631
.978
28.8
5M
rk34
812
.196
431
.957
013
.66
0.56
0.42
0.02
0.01
5043
.84
Sy2
10SW
IFT
J005
1.8−
7320
12.9
53−
73.3
2811
.40
RX
J005
2.1-
7319
2E00
50.4
-733
513
.092
1−
73.3
181
5.70
0.42
0.28
0.03
HM
XB
11SW
IFT
J005
1.9+
1724
12.9
9217
.465
7.36
MR
K11
4812
.978
317
.432
92.
800.
410.
240.
060.
0640
44.4
4Sy
112
SWIF
TJ0
055.
4+46
1213
.854
46.2
006.
521R
XS
J005
528.
0+46
1143
13.8
671
46.1
953
1.97
0.28
0.10
0.07
CV
/DQ
Her
13SW
IFT
J005
6.7+
6043
14.1
8360
.711
24.0
3G
amm
aC
as4U
0054
+60
14.1
772
60.7
167
7.08
0.26
0.08
0.02
Star
/Be
14SW
IFT
J005
9.4+
3150
15.0
0731
.828
9.50
Mrk
352
14.9
720
31.8
269
4.16
0.50
0.37
0.05
0.01
4943
.31
Sy1
15SW
IFT
J010
0.9−
4750
15.3
07−
47.8
866.
44E
SO19
5-IG
021
NE
D03
15.1
457
−47
.867
62.
080.
450.
350.
080.
0483
44.0
6Sy
1.8
16SW
IFT
J010
9.0+
1320
17.2
4413
.340
8.60
3C03
317
.220
313
.337
24.
060.
520.
380.
050.
0597
44.5
4Sy
217
SWIF
TJ0
113.
8−14
5018
.449
−14
.841
5.49
MR
K11
5218
.458
7−
14.8
456
2.50
0.45
0.28
0.07
0.05
2744
.22
Sy1.
518
SWIF
TJ0
117.
8+65
1619
.443
65.2
7051
.69
V66
2C
as4U
0114
+65
19.5
112
65.2
916
17.1
40.
370.
220.
01H
MX
B/N
S19
SWIF
TJ0
117.
8−73
2719
.448
−73
.450
111.
96SM
CX
-14U
0115
-73
19.2
714
−73
.443
338
.20
0.29
0.08
0.00
HM
XB
/NS
20SW
IFT
J012
2.9+
3420
20.7
3734
.329
5.98
SHB
LJ0
1230
8.7+
3420
492E
0120
.3+3
404
20.7
860
34.3
469
2.12
0.43
0.28
0.08
0.27
2045
.69
BL
Lac
21SW
IFT
J012
3.8−
3504
20.9
62−
35.0
1411
.37
NG
C52
6A20
.976
6−
35.0
654
5.96
0.51
0.39
0.03
0.01
9143
.69
Sy1.
522
SWIF
TJ0
123.
9−58
4620
.984
−58
.772
12.3
8Fa
iral
l920
.940
8−
58.8
057
5.07
0.45
0.33
0.03
0.04
7044
.42
Sy1
23SW
IFT
J012
4.5+
3350
21.1
2633
.827
4.80
NG
C05
1321
.111
933
.799
52.
060.
430.
250.
090.
0195
43.2
5Sy
224
SWIF
TJ0
134.
1−36
2523
.529
−36
.473
6.58
NG
C06
1223
.490
6−
36.4
933
5.35
0.61
0.50
0.05
0.02
9844
.04
Rad
ioga
laxy
25SW
IFT
J013
8.6−
4001
24.6
88−
39.9
5112
.97
ESO
297-
018
24.6
548
−40
.011
47.
370.
540.
450.
030.
0252
44.0
3Sy
226
SWIF
TJ0
146.
0+61
4326
.512
61.7
1813
.28
PSR
J014
6+61
26.5
934
61.7
509
12.2
90.
890.
650.
04A
XP
27SW
IFT
J015
2.8−
0329
28.1
93−
3.50
15.
67M
CG
-01-
05-0
4728
.204
2−
3.44
682.
780.
460.
280.
070.
0172
43.2
7Sy
228
SWIF
TJ0
201.
0−06
4830
.269
−6.
855
18.2
0N
GC
788
30.2
769
−6.
8155
9.33
0.57
0.46
0.03
0.01
3643
.59
Sy2
29SW
IFT
J020
6.2−
0019
31.5
65−
0.28
75.
55M
rk10
1831
.566
6−
0.29
143.
610.
640.
470.
080.
0424
44.1
8Sy
1.5
30SW
IFT
J020
9.7+
5226
32.4
6452
.484
11.7
5L
ED
A13
8501
32.3
929
52.4
425
5.48
0.53
0.37
0.04
0.04
9244
.50
Sy1
31SW
IFT
J021
6.3+
5128
34.0
7551
.387
6.95
2MA
SXJ0
2162
987+
5126
246
34.1
243
51.4
402
2.93
0.48
0.34
0.07
?lik
ely
Sy2
32SW
IFT
J021
8.0+
7348
34.2
7973
.846
6.99
[HB
89]0
212+
735
34.3
784
73.8
257
3.33
0.57
0.43
0.06
2.36
7048
.16
BL
Lac
33SW
IFT
J022
5.0+
1847
36.2
6018
.785
5.42
RB
S03
1536
.269
518
.780
22.
710.
600.
420.
082.
6900
48.2
1B
LL
ac34
SWIF
TJ0
228.
1+31
1837
.024
31.2
9914
.34
NG
C93
137
.060
331
.311
76.
560.
500.
300.
030.
0167
43.6
1Sy
1.5
35SW
IFT
J023
1.6−
3645
37.9
69−
36.6
806.
09IC
1816
37.9
625
−36
.672
12.
580.
480.
390.
070.
0170
43.2
2Sy
1.8
36SW
IFT
J023
4.1+
3233
38.5
1332
.576
5.69
NG
C09
7338
.583
832
.505
63.
090.
580.
420.
080.
0162
43.2
6Sy
237
SWIF
TJ0
234.
6−08
4838
.658
−8.
758
7.70
NG
C98
538
.657
4−
8.78
763.
450.
460.
330.
050.
0430
44.1
7Sy
138
SWIF
TJ0
235.
3−29
3438
.784
−29
.617
7.91
ESO
416-
G00
238
.806
1−
29.6
047
3.40
0.60
0.46
0.06
0.05
9244
.46
Sy1.
939
SWIF
TJ0
238.
2−52
1339
.518
−52
.175
10.1
7E
SO19
8-02
439
.582
1−
52.1
923
4.98
0.50
0.41
0.04
0.04
5544
.38
Sy1
40SW
IFT
J024
0.5+
6118
40.1
3261
.307
7.04
LS
I+61
303
V61
5C
as40
.131
961
.229
33.
090.
520.
350.
06H
MX
B41
SWIF
TJ0
241.
3−08
1640
.326
−8.
272
7.08
NG
C10
5240
.270
0−
8.25
583.
750.
670.
430.
070.
0050
42.3
2Sy
242
SWIF
TJ0
242.
6+00
0040
.638
0.00
07.
07N
GC
1068
40.6
696
−0.
0133
3.72
0.53
0.37
0.06
0.00
3842
.07
Sy2
43SW
IFT
J024
4.8+
6227
41.1
7262
.441
16.5
4[H
B89
]024
1+62
241
.240
462
.468
58.
590.
570.
390.
030.
0440
44.5
9Sy
144
SWIF
TJ0
249.
1+26
2742
.275
26.4
556.
002M
ASX
J024
8593
7+26
3039
142
.247
226
.510
93.
910.
820.
470.
080.
0579
44.5
0Sy
245
SWIF
TJ0
251.
3+54
4142
.684
54.7
225.
182M
FGC
0228
042
.677
554
.704
93.
300.
570.
430.
080.
0152
43.2
3G
alax
y46
SWIF
TJ0
252.
7−08
2243
.064
−8.
534
5.10
MC
G-0
2-08
-014
43.0
975
−8.
5104
2.43
0.47
0.28
0.08
0.01
6843
.19
Sy2,
hidd
en47
SWIF
TJ0
255.
2−00
1143
.774
−0.
199
17.5
3N
GC
1142
43.8
008
−0.
1836
10.1
30.
600.
430.
020.
0289
44.2
9Sy
248
SWIF
TJ0
256.
2+19
2544
.047
19.4
087.
11X
YA
ri2E
0253
.3+1
914
44.0
375
19.4
414
3.12
0.46
0.28
0.06
CV
/DQ
Her
49SW
IFT
J025
6.4−
3212
44.1
15−
32.2
307.
29E
SO41
7-G
006
44.0
898
−32
.185
63.
060.
460.
360.
060.
0163
43.2
6Sy
250
SWIF
TJ0
304.
1−01
0845
.951
−1.
096
7.47
NG
C11
94L
ED
A11
537
45.9
546
−1.
1037
3.64
0.60
0.43
0.07
0.01
3643
.18
Sy1
51SW
IFT
J031
1.1+
3241
47.7
7832
.685
4.89
2MA
SXJ0
3104
435+
3239
296
47.6
850
32.6
580
1.85
0.44
0.28
0.10
0.12
7044
.89
Sy52
SWIF
TJ0
311.
5−20
4547
.855
−20
.706
5.28
RX
J031
1.3-
2046
47.8
284
−20
.771
72.
980.
600.
500.
080.
0660
44.5
0Sy
1.5
53SW
IFT
J031
8.7+
6828
49.6
2068
.477
4.85
2MA
SXJ0
3181
899+
6829
322
49.5
791
68.4
921
3.16
0.58
0.40
0.07
0.09
0144
.81
Sy1.
954
SWIF
TJ0
319.
7+41
3249
.960
41.5
1524
.24
NG
C12
7549
.950
741
.511
76.
850.
280.
140.
020.
0176
43.6
8Sy
255
SWIF
TJ0
324.
8+34
1051
.198
34.1
685.
91B
203
21+3
3N
ED
0251
.171
534
.179
44.
830.
830.
500.
070.
0610
44.6
4Sy
156
SWIF
TJ0
324.
9+40
4451
.270
40.7
036.
29U
GC
0272
451
.356
540
.773
12.
860.
580.
380.
080.
0477
44.1
9Sy
2bi
nary
AG
N

20 TUELLER ET AL.TA
BL
E5
—C
ontin
ued
#B
AT
Nam
eaR
Ab
Dec
S/N
Cou
nter
part
Nam
eO
ther
Nam
eC
tptR
Ac
Ctp
tDec
Flux
der
ror
Ce
Hra
tfH
err
Red
shif
tgL
umh
Type
57SW
IFT
J032
8.4−
2846
52.1
38−
28.7
535.
15PK
S03
26-2
8852
.152
2−
28.6
989
3.25
0.73
0.54
0.09
0.10
8044
.99
Sy1.
958
SWIF
TJ0
329.
3−13
2052
.335
−13
.397
4.84
SWIF
TJ0
329.
3-13
2052
.334
7−
13.3
966
2.09
0.63
0.43
0.09
59SW
IFT
J033
1.1+
4355
52.7
7543
.923
13.6
9G
KPe
r3A
0327
+438
52.7
993
43.9
047
4.83
0.35
0.18
0.04
CV
/DQ
Her
60SW
IFT
J033
3.6−
3607
53.3
77−
36.1
1120
.10
NG
C13
6553
.401
6−
36.1
404
7.19
0.44
0.35
0.02
0.00
5542
.68
Sy1.
861
SWIF
TJ0
334.
9+53
0853
.737
53.1
3231
2.24
BQ
Cam
EX
O03
31+5
3053
.749
553
.173
290
.31
0.27
0.08
0.00
HM
XB
/NS
62SW
IFT
J033
6.6+
3217
54.1
4632
.281
6.55
4C32
.14
54.1
255
32.3
082
3.09
0.51
0.34
0.06
1.25
8047
.45
QSO
63SW
IFT
J033
6.5−
2509
54.2
00−
25.2
435.
36E
SO48
2-14
SWIF
TJ0
336.
8-25
1554
.263
2−
25.2
492
2.25
0.56
0.42
0.08
0.04
3744
.00
Sy2
64SW
IFT
J034
2.0−
2115
55.4
77−
21.2
079.
64E
SO54
8-G
081
55.5
155
−21
.244
44.
570.
490.
400.
040.
0145
43.3
3Sy
165
SWIF
TJ0
349.
2−11
5957
.320
−11
.954
7.28
QSO
B03
47-1
211E
S03
47-1
2.1
57.3
467
−11
.990
82.
840.
440.
270.
060.
1800
45.4
1B
LL
ac66
SWIF
TJ0
350.
1−50
1957
.601
−50
.328
7.03
2MA
SXJ0
3502
377-
5018
354
57.5
990
−50
.309
93.
090.
490.
420.
060.
0365
43.9
8Sy
X6d
f67
SWIF
TJ0
353.
4−68
3058
.148
−68
.531
5.24
PKS
0352
-686
58.2
396
−68
.521
41.
650.
370.
260.
080.
0870
44.4
9B
LL
ac68
SWIF
TJ0
353.
7+37
1158
.483
37.1
905.
212M
ASX
J035
3424
6+37
1407
758
.427
037
.235
01.
720.
450.
270.
090.
0183
43.1
1Sy
269
SWIF
TJ0
355.
5+31
0158
.882
31.0
2510
6.34
XPe
r4U
0352
+309
58.8
462
31.0
458
60.1
30.
580.
360.
00H
MX
B/N
S70
SWIF
TJ0
402.
4−18
0760
.600
−18
.102
5.20
ESO
549-
G04
960
.607
0−
18.0
480
2.65
0.61
0.57
0.11
0.02
6343
.62
Sy2
LIN
ER
71SW
IFT
J040
7.4+
0339
61.8
373.
748
6.92
3C10
561
.818
63.
7072
3.89
0.62
0.37
0.06
0.08
9044
.89
Sy2
72SW
IFT
J041
4.8−
0754
63.6
87−
7.97
15.
58IR
AS
0412
4-08
0363
.719
5−
7.92
782.
520.
480.
310.
070.
0379
43.9
3Sy
173
SWIF
TJ0
418.
3+38
0064
.595
38.0
3225
.59
3C11
1.0
64.5
887
38.0
266
14.1
20.
610.
400.
020.
0485
44.8
9Sy
174
SWIF
TJ0
422.
7−56
1165
.644
−56
.223
5.26
ESO
157-
G02
365
.600
8−
56.2
260
3.02
0.49
0.44
0.07
0.04
3544
.13
Sy2
75SW
IFT
J042
6.2−
5711
66.4
95−
57.1
815.
041H
0419
-577
66.5
035
−57
.200
12.
110.
330.
230.
070.
1040
44.7
7Sy
176
SWIF
TJ0
431.
3−61
2767
.822
−61
.458
5.10
AB
EL
L32
6667
.799
7−
61.4
063
1.23
0.22
0.16
0.09
0.05
8944
.01
Gal
axy
clus
ter
77SW
IFT
J043
3.0+
0521
68.2
625.
386
19.2
23C
120
68.2
962
5.35
4311
.89
0.63
0.39
0.02
0.03
3044
.48
Sy1
78SW
IFT
J043
8.2−
1048
69.5
54−
10.8
375.
85M
CG
-02-
12-0
5069
.559
1−
10.7
959
2.11
0.40
0.23
0.08
0.03
6443
.81
Sy1.
279
SWIF
TJ0
443.
9+28
5670
.983
28.9
404.
88U
GC
0314
270
.945
028
.971
83.
430.
630.
420.
080.
0217
43.5
6Sy
180
SWIF
TJ0
444.
1+28
1371
.029
28.2
2910
.28
2MA
SXJ0
4440
903+
2813
003
71.0
376
28.2
168
7.02
0.69
0.44
0.04
0.01
1343
.30
Sy2
81SW
IFT
J045
0.7−
5813
72.8
69−
58.2
055.
44R
BS
594
72.9
335
−58
.183
53.
170.
600.
480.
080.
0907
44.8
2Sy
1.5
82SW
IFT
J045
2.2+
4933
73.0
1949
.566
13.2
41R
XS
J045
205.
0+49
3248
73.0
208
49.5
459
6.87
0.56
0.39
0.03
0.02
9044
.12
Sy1
83SW
IFT
J045
3.4+
0404
73.3
124.
094
6.45
CG
CG
420-
015
73.3
573
4.06
164.
080.
680.
470.
080.
0294
43.9
1Sy
284
SWIF
TJ0
456.
3−75
3274
.065
−75
.538
4.86
ESO
033-
G00
273
.995
7−
75.5
412
2.61
0.45
0.33
0.07
0.01
8143
.29
Sy2
85SW
IFT
J050
3.0+
2302
75.7
2723
.004
6.14
LE
DA
0970
6875
.742
622
.997
73.
410.
630.
350.
070.
0577
44.4
3Sy
186
SWIF
TJ0
505.
8−23
5176
.455
−23
.861
13.9
52M
ASX
J050
5457
5-23
5113
976
.440
5−
23.8
539
7.16
0.54
0.43
0.03
0.03
5044
.31
Sy2
HII
87SW
IFT
J051
0.7+
1629
77.6
8816
.477
15.7
2IR
AS
0507
8+16
264U
0517
+17
77.6
896
16.4
989
9.34
0.68
0.38
0.03
0.01
7943
.83
Sy1.
588
SWIF
TJ0
514.
2−40
0278
.559
−40
.030
14.0
7N
GC
1851
XR
B4U
0513
-40
78.5
275
−40
.043
64.
010.
260.
170.
03L
MX
B/N
S89
SWIF
TJ0
516.
2−00
0979
.001
−0.
143
14.1
2A
rk12
079
.047
6−
0.14
987.
080.
570.
360.
030.
0323
44.2
3Sy
190
SWIF
TJ0
501.
9−32
3979
.865
−32
.686
13.7
8E
SO36
2-18
79.8
993
−32
.657
86.
220.
520.
430.
030.
0125
43.3
3Sy
1.5
91SW
IFT
J051
9.5−
4545
79.9
73−
45.8
028.
82PI
CTO
RA
79.9
570
−45
.779
03.
780.
460.
380.
040.
0351
44.0
3Sy
1/L
INE
R92
SWIF
TJ0
520.
9−71
5680
.226
−71
.930
5.85
LM
CX
-24U
0520
-72
80.1
168
−71
.964
81.
650.
160.
000.
08L
MX
B93
SWIF
TJ0
519.
5−31
4080
.762
−36
.458
7.74
PKS
0521
-36
80.7
416
−36
.458
63.
420.
490.
470.
050.
0553
44.4
0B
LL
ac94
SWIF
TJ0
524.
1−12
1080
.988
−12
.187
5.93
IRA
S05
218-
1212
81.0
271
−12
.166
62.
500.
540.
370.
080.
0490
44.1
5Sy
195
SWIF
TJ0
529.
2−32
4782
.408
−32
.859
18.9
8T
VC
ol3A
0527
-329
82.3
560
−32
.817
95.
110.
290.
190.
02C
V/D
QH
er96
SWIF
TJ0
532.
5−66
2383
.129
−66
.391
77.1
2L
MC
X-4
4U05
32-6
6483
.207
5−
66.3
705
31.6
40.
34B
0.15
0.00
HM
XB
/NS
97"
""
"R
XJ0
531.
2-66
09IG
RJ0
5319
-660
182
.805
4−
66.1
181
4.99
A0.
20H
MX
B/N
S98
SWIF
TJ0
534.
6+22
0483
.644
22.0
6732
82.7
6C
rab
Neb
ula/
Puls
ar83
.633
222
.014
523
86.1
50.
660.
350.
00PS
R/P
WN
99SW
IFT
J053
8.8+
2620
84.6
8926
.326
132.
18V
725
Tau
3A05
35+2
6284
.727
426
.315
881
.41
0.51
0.20
0.00
HM
XB
/NS
100
SWIF
TJ0
539.
0−64
0684
.762
−64
.098
7.08
LM
CX
-34U
0538
-64
84.7
342
−64
.082
33.
110.
480.
320.
06H
MX
B/N
S10
1SW
IFT
J053
9.5−
6943
84.8
69−
69.7
209.
22L
MC
X-1
4U05
40-6
984
.911
3−
69.7
433
3.98
0.39
0.25
0.04
HM
XB
/NS
102
SWIF
TJ0
539.
9−69
1984
.970
−69
.320
8.41
PSR
B05
40-6
985
.032
2−
69.3
348
4.80
0.53
0.38
0.04
PSR
103
SWIF
TJ0
539.
9−28
3984
.986
−28
.692
7.12
[HB
89]0
537-
286
84.9
762
−28
.665
55.
060.
690.
590.
073.
1040
48.6
3B
laza
r10
4SW
IFT
J054
2.6+
6051
85.6
4860
.842
7.03
BY
Cam
4U05
41+6
085
.703
860
.858
82.
910.
420.
210.
06C
V/A
MH
er10
5SW
IFT
J054
3.2−
4104
85.7
96−
41.0
636.
08T
XC
ol1H
0542
-407
85.8
343
−41
.032
01.
800.
260.
130.
07C
V/D
QH
er10
6SW
IFT
J054
3.9−
2749
85.9
37−
27.6
174.
90M
CG
-05-
14-0
1285
.887
3−
27.6
514
2.05
0.44
0.36
0.08
0.00
9942
.65
Gal
axy
107
SWIF
TJ0
544.
4+59
0986
.083
59.1
545.
232M
ASX
J054
4225
7+59
0736
186
.094
159
.126
72.
540.
670.
380.
090.
0660
44.4
3Sy
1.9
108
SWIF
TJ0
550.
7−32
1287
.689
−32
.279
9.05
PKS
0548
-322
87.6
699
−32
.271
63.
280.
430.
330.
050.
0690
44.5
8B
LL
ac10
9SW
IFT
J055
2.2−
0727
88.0
50−
7.44
054
.89
NG
C21
1088
.047
4−
7.45
6235
.01
0.70
0.43
0.01
0.00
7843
.67
Sy2
110
SWIF
TJ0
554.
8+46
2588
.736
46.4
7816
.32
MC
G+0
8-11
-011
88.7
234
46.4
393
9.64
0.61
0.37
0.02
0.02
0543
.96
Sy1.
511
1SW
IFT
J055
8.0+
5352
89.5
0153
.871
8.20
V40
5A
urR
XJ0
558.
0+53
5389
.497
053
.895
83.
170.
370.
150.
05C
V/D
QH
er11
2SW
IFT
J055
7.9−
3822
89.5
01−
38.3
0210
.44
2MA
SXJ0
5580
206-
3820
043
4U05
57-3
889
.508
3−
38.3
346
3.99
0.37
0.27
0.04
0.03
3944
.02
Sy1
113
SWIF
TJ0
602.
2+28
2990
.572
28.4
717.
89IR
AS
0558
9+28
2890
.544
628
.472
86.
820.
840.
380.
050.
0330
44.2
3Sy
1

SWIFT-BAT 22 MONTH HARD X-RAY SURVEY 21TA
BL
E5
—C
ontin
ued
#B
AT
Nam
eaR
Ab
Dec
S/N
Cou
nter
part
Nam
eO
ther
Nam
eC
tptR
Ac
Ctp
tDec
Flux
der
ror
Ce
Hra
tfH
err
Red
shif
tgL
umh
Type
114
SWIF
TJ0
601.
9−86
3691
.494
−86
.603
6.41
ESO
005-
G00
491
.423
5−
86.6
319
4.48
0.60
0.49
0.07
0.00
6242
.59
Sy2
115
SWIF
TJ0
615.
8+71
0194
.005
71.0
1325
.20
Mrk
393
.901
571
.037
515
.65
0.61
0.47
0.02
0.01
3543
.81
Sy2
116
SWIF
TJ0
617.
2+09
0794
.290
9.12
587
.32
V10
55O
ri4U
0614
+091
94.2
804
9.13
6951
.72
0.62
0.30
0.00
LM
XB
/NS
117
SWIF
TJ0
623.
8−32
1595
.920
−32
.200
6.56
ESO
426-
G00
295
.943
4−
32.2
166
2.72
0.45
0.40
0.07
0.02
2443
.49
Sy2
118
SWIF
TJ0
640.
4−25
5410
0.02
4−
25.8
6410
.94
ESO
490-
IG02
610
0.04
87−
25.8
954
4.29
0.45
0.31
0.04
0.02
4843
.78
Sy1.
211
9SW
IFT
J064
0.1−
4328
100.
234
−43
.340
5.16
2MA
SXJ0
6403
799-
4321
211
100.
1583
−43
.355
82.
000.
460.
370.
09?
Gal
axy
120
SWIF
TJ0
641.
3+32
5710
0.28
532
.880
6.59
2MA
SXJ0
6411
806+
3249
313
100.
3252
32.8
254
4.76
0.93
0.46
0.07
0.04
7044
.39
Sy2
121
SWIF
TJ0
651.
9+74
2610
3.02
074
.457
15.8
5M
rk6
103.
0511
74.4
271
7.61
0.55
0.42
0.03
0.01
8843
.78
Sy1.
512
2SW
IFT
J065
5.8+
3957
103.
959
39.9
576.
29U
GC
0360
110
3.95
6440
.000
24.
380.
670.
400.
060.
0171
43.4
6Sy
1.5
123
SWIF
TJ0
731.
5+09
5711
2.86
69.
955
5.80
BG
CM
i3A
0729
+103
112.
8708
9.93
962.
150.
400.
170.
07C
V/D
QH
er12
4SW
IFT
J073
2.5−
1331
113.
134
−13
.516
9.29
SWIF
TJ0
7323
7.6-
1331
09SW
IFT
J073
2.5-
1331
113.
1563
−13
.517
82.
970.
370.
190.
05C
V/D
QH
er12
5SW
IFT
J074
2.5+
4948
115.
675
49.8
2610
.57
Mrk
7911
5.63
6749
.809
74.
890.
520.
370.
040.
0222
43.7
4Sy
1.2
126
SWIF
TJ0
746.
3+25
4811
6.60
825
.814
8.10
SDSS
J074
625.
87+2
5490
2.2
116.
6078
25.8
173
7.79
1.01
0.61
0.06
2.97
9348
.77
Bla
zar
127
SWIF
TJ0
747.
5+60
5711
6.89
860
.970
5.05
MR
K10
116.
8714
60.9
335
3.12
0.54
0.46
0.07
0.02
9343
.79
Sy1.
212
8SW
IFT
J074
8.8−
6743
117.
207
−67
.722
76.8
7U
YVo
lE
XO
0748
-676
117.
1388
−67
.750
034
.49
0.44
0.31
0.00
LM
XB
/NS
129
SWIF
TJ0
750.
9+14
3911
7.81
614
.731
7.22
PQG
emR
XJ0
751.
2+14
4411
7.82
2514
.740
23.
030.
390.
120.
06C
V/D
QH
er13
0SW
IFT
J075
9.8−
3844
119.
893
−38
.749
10.0
32M
ASS
J075
9418
1-38
4356
0IG
RJ0
7597
-384
211
9.92
08−
38.7
600
5.62
0.56
0.38
0.04
0.04
0044
.32
Sy1.
213
1SW
IFT
J080
0.5+
2327
120.
028
23.4
196.
882M
ASX
J075
9534
7+23
2324
1C
GC
G11
8-03
611
9.97
2823
.390
14.
280.
720.
510.
070.
0292
43.9
2Sy
213
2SW
IFT
J080
0.1+
2638
120.
080
26.6
385.
37IC
0486
120.
0874
26.6
135
3.22
0.70
0.42
0.07
0.02
6943
.73
Sy1
133
SWIF
TJ0
804.
2+05
0712
1.02
45.
054
11.5
0Ph
oeni
xG
alax
y12
1.02
445.
1138
5.34
0.57
0.35
0.04
0.01
3543
.34
Sy2
134
SWIF
TJ0
823.
4−04
5712
5.81
0−
4.90
85.
30FA
IRA
LL
0272
125.
7546
−4.
9349
4.02
0.71
0.57
0.08
0.02
1843
.64
Sy2
135
SWIF
TJ0
826.
2−70
3312
6.59
8−
70.5
625.
191R
XS
J082
623.
5-70
3142
1ES
0826
-703
126.
5979
−70
.528
32.
080.
360.
220.
08SR
C/X
-ray
136
SWIF
TJ0
835.
2−45
1312
8.80
7−
45.2
1929
.44
Vel
aPu
lsar
PSR
B08
33-4
512
8.83
61−
45.1
764
18.1
90.
560.
400.
01PS
R13
7SW
IFT
J083
8.0+
4839
129.
507
48.6
557.
78E
IUM
aR
XJ0
838.
3+48
3812
9.59
1648
.633
83.
210.
360.
230.
05C
V/D
QH
er13
8SW
IFT
J083
8.4−
3557
129.
590
−35
.955
5.19
FAIR
AL
L11
4612
9.62
83−
35.9
926
3.27
0.51
0.30
0.06
0.03
1643
.87
Sy1.
513
9SW
IFT
J083
9.6−
1213
129.
944
−12
.218
6.00
3C20
612
9.96
09−
12.2
428
2.87
0.51
0.37
0.07
0.19
7645
.51
QSO
140
SWIF
TJ0
841.
4+70
5213
0.31
770
.932
16.5
4[H
B89
]083
6+71
013
0.35
1570
.895
18.
480.
570.
480.
032.
1720
48.4
8B
laza
r14
1SW
IFT
J090
2.1−
4034
135.
517
−40
.574
1074
.22
VE
LA
X-1
4U09
00-4
013
5.52
86−
40.5
547
393.
200.
370.
140.
00H
MX
B/N
S14
2SW
IFT
J090
4.3+
5538
136.
039
55.6
265.
512M
ASX
J090
4369
9+55
3602
513
6.15
4055
.600
81.
910.
400.
320.
080.
0370
43.7
8Sy
114
3SW
IFT
J090
8.9−
0933
137.
222
−9.
542
6.11
AB
EL
L07
5413
7.20
87−
9.63
661.
760.
230.
000.
100.
0542
44.0
9G
alax
ycl
uste
r14
4SW
IFT
J091
1.2+
4533
137.
821
45.5
466.
112M
ASX
J091
1299
9+45
2806
013
7.87
4945
.468
31.
810.
440.
300.
080.
0268
43.4
7Sy
214
5SW
IFT
J091
7.2−
6221
139.
137
−62
.288
8.24
IRA
S09
149-
6206
139.
0392
−62
.324
93.
260.
460.
320.
050.
0573
44.4
1Sy
114
6SW
IFT
J091
8.5+
1618
139.
637
16.3
158.
09M
rk70
413
9.60
8416
.305
33.
630.
510.
350.
050.
0292
43.8
5Sy
1.5
147
SWIF
TJ0
920.
5−55
1114
0.12
2−
55.1
9118
.57
2MA
SSJ0
9202
647-
5512
244
4U09
19-5
414
0.11
05−
55.2
070
9.00
0.42
0.28
0.02
LM
XB
148
SWIF
TJ0
920.
8−08
0514
0.17
4−
8.11
18.
91M
CG
-01-
24-0
1214
0.19
27−
8.05
614.
580.
510.
330.
050.
0196
43.6
0Sy
214
9SW
IFT
J092
3.7+
2255
140.
921
22.9
4710
.19
MC
G+0
4-22
-042
140.
9292
22.9
090
4.46
0.59
0.39
0.05
0.03
2344
.03
Sy1.
215
0SW
IFT
J092
4.2−
3141
141.
043
−31
.676
5.42
2MA
SXJ0
9235
371-
3141
305
140.
9739
−31
.691
91.
770.
410.
220.
090.
0422
43.8
7Sy
1.9
151
SWIF
TJ0
925.
0+52
1814
1.32
152
.292
14.1
4M
rk11
014
1.30
3652
.286
36.
150.
470.
390.
030.
0353
44.2
5Sy
115
2SW
IFT
J092
6.2+
1244
141.
548
12.7
405.
12M
RK
0705
141.
5137
12.7
343
2.13
0.45
0.30
0.09
0.02
9143
.62
Sy1.
215
3SW
IFT
J094
5.6−
1420
146.
434
−14
.313
8.95
NG
C29
9214
6.42
52−
14.3
264
4.82
0.63
0.41
0.05
0.00
7742
.80
Sy2
154
SWIF
TJ0
947.
6−30
5714
6.89
3−
30.9
7941
.91
MC
G-0
5-23
-016
146.
9173
−30
.948
920
.77
0.56
0.35
0.01
0.00
8543
.52
Sy2
155
SWIF
TJ0
947.
7+07
2614
6.93
47.
429
4.87
3C22
714
6.93
807.
4224
2.65
0.50
0.35
0.08
0.08
5844
.69
Sy1
BL
RG
156
SWIF
TJ0
950.
5+73
1814
7.61
973
.294
4.80
VII
Zw
292
147.
4410
73.2
400
1.74
AB
0.38
0.05
8144
.15
NL
RG
157
""
""
RIX
OS
F305
-011
147.
8070
73.3
100
1.47
AB
0.39
0.25
1045
.45
AG
N15
8SW
IFT
J095
9.5−
2248
149.
861
−22
.854
17.1
6N
GC
3081
149.
8731
−22
.826
310
.24
0.67
0.42
0.03
0.00
8043
.16
Sy2
159
SWIF
TJ1
001.
7+55
4315
0.42
355
.716
7.40
NG
C30
7915
0.49
0855
.679
83.
440.
440.
430.
050.
0037
42.0
2Sy
216
0SW
IFT
J100
9.3−
4250
152.
415
−42
.834
5.33
ESO
263-
G01
315
2.45
09−
42.8
112
2.61
0.51
0.30
0.07
0.03
3343
.82
Sy2
161
SWIF
TJ1
010.
0−58
1915
2.49
7−
58.3
1217
.65
GR
OJ1
008-
5715
2.44
17−
58.2
917
7.49
0.40
0.21
0.02
HM
XB
162
SWIF
TJ1
010.
1−57
4715
2.77
4−
57.8
085.
16C
D-5
730
57IG
RJ1
0109
-574
615
2.76
23−
57.8
039
2.25
0.36
0.13
0.07
Sym
b/W
D16
3SW
IFT
J101
3.5−
3601
153.
368
−35
.988
5.23
ESO
374-
G04
415
3.33
30−
35.9
827
2.82
0.60
0.39
0.08
0.02
8443
.72
Sy2
164
SWIF
TJ1
023.
5+19
5215
5.88
719
.840
29.5
4N
GC
3227
155.
8774
19.8
651
14.1
30.
500.
380.
010.
0039
42.6
7Sy
1.5
165
SWIF
TJ1
031.
7−34
5115
7.91
1−
34.8
5416
.57
NG
C32
8115
7.96
70−
34.8
537
9.01
0.66
0.43
0.03
0.01
0743
.36
Sy2
166
SWIF
TJ1
038.
8−49
4215
9.64
5−
49.7
695.
982M
ASX
J103
8452
0-49
4653
115
9.68
83−
49.7
816
4.89
0.76
0.55
0.07
0.06
0044
.63
Sy1
167
SWIF
TJ1
040.
7−46
1916
0.09
6−
46.4
896.
21L
ED
A09
3974
160.
0939
−46
.423
83.
680.
650.
390.
070.
0239
43.6
8Sy
216
8SW
IFT
J104
9.4+
2258
162.
402
23.0
047.
10M
rk41
716
2.37
8922
.964
43.
740.
510.
460.
060.
0328
43.9
7Sy
216
9SW
IFT
J105
2.8+
1043
163.
115
10.7
245.
322M
ASX
J105
2329
7+10
3620
516
3.13
7010
.606
02.
600.
610.
510.
090.
0878
44.7
0Sy
117
0SW
IFT
J110
4.4+
3812
166.
144
38.2
1263
.14
Mrk
421
166.
1138
38.2
088
19.1
90.
310.
240.
010.
0300
44.6
0B
LL
ac

22 TUELLER ET AL.TA
BL
E5
—C
ontin
ued
#B
AT
Nam
eaR
Ab
Dec
S/N
Cou
nter
part
Nam
eO
ther
Nam
eC
tptR
Ac
Ctp
tDec
Flux
der
ror
Ce
Hra
tfH
err
Red
shif
tgL
umh
Type
171
SWIF
TJ1
106.
5+72
3416
6.71
672
.545
30.4
7N
GC
3516
166.
6979
72.5
686
12.5
40.
450.
420.
010.
0088
43.3
4Sy
1.5
172
SWIF
TJ1
120.
9−60
3717
0.23
5−
60.6
1924
9.54
Cen
X-3
V77
9C
en17
0.31
58−
60.6
230
88.9
40.
270.
040.
00H
MX
B/N
S17
3SW
IFT
J112
7.5+
1906
171.
853
19.1
825.
162M
ASX
J112
7163
2+19
0919
81R
XS
J112
716.
6+19
0914
171.
8178
19.1
556
3.45
0.67
0.49
0.07
0.10
5544
.99
Sy1.
817
4SW
IFT
J113
0.1−
1447
172.
522
−14
.776
6.66
PKS
1127
-14
172.
5294
−14
.824
34.
700.
880.
520.
071.
1840
47.5
7B
laza
r17
5SW
IFT
J113
1.0−
6256
172.
758
−62
.925
14.1
4IG
RJ1
1305
-625
617
2.64
17−
62.9
300
5.44
0.44
0.23
0.03
HM
XB
176
SWIF
TJ1
132.
7+53
0117
3.18
453
.024
5.64
NG
C37
1817
3.14
5253
.067
92.
69A
B0.
610.
0033
41.8
1Sy
1L
INE
R17
7"
""
"U
GC
0652
7N
ED
0317
3.16
7852
.950
42.
68A
B0.
570.
0278
43.6
8Sy
217
8SW
IFT
J113
6.7+
6738
174.
179
67.5
975.
072M
ASX
J113
6300
9+67
3704
217
4.12
5367
.617
91.
610.
370.
270.
090.
1342
44.8
9B
LL
ac17
9SW
IFT
J113
9.0−
3743
174.
776
−37
.709
34.5
7N
GC
3783
174.
7572
−37
.738
619
.45
0.66
0.38
0.01
0.00
9743
.61
Sy1
180
SWIF
TJ1
142.
7+71
4917
5.98
571
.687
6.96
DO
Dra
YY
Dra
175.
9098
71.6
890
1.74
0.24
0.13
0.07
CV
/DQ
Her
181
SWIF
TJ1
144.
0−61
0517
5.98
8−
61.0
7811
.86
IGR
J114
35-6
109
1RX
SJ1
1435
8.1-
6107
36?
175.
9667
−61
.150
05.
060.
440.
210.
04H
MX
B/N
S18
2SW
IFT
J114
3.7+
7942
176.
070
79.6
2410
.84
UG
C06
728
176.
3168
79.6
815
2.95
0.37
0.32
0.05
0.00
6542
.44
Sy1.
218
3SW
IFT
J114
5.6−
1819
176.
401
−18
.427
9.28
2MA
SXJ1
1454
045-
1827
149
176.
4186
−18
.454
36.
380.
740.
440.
050.
0329
44.2
0Sy
118
4SW
IFT
J114
7.2−
6156
176.
810
−61
.937
73.3
71E
1145
.1-6
141
176.
8692
−61
.953
930
.96
0.44
0.23
0.01
HM
XB
/NS
185
SWIF
TJ1
157.
8+55
2917
9.44
655
.477
6.32
NG
C39
9817
9.48
3955
.453
63.
030.
480.
510.
070.
0035
41.9
1Sy
1L
INE
R18
6SW
IFT
J120
0.8+
0650
180.
206
6.83
85.
402M
ASX
J120
0579
2+06
4822
6C
GC
G04
1-02
018
0.24
136.
8064
2.45
0.48
0.32
0.08
0.03
6043
.87
Sy2
187
SWIF
TJ1
200.
2−53
5018
0.63
7−
53.8
048.
04L
ED
A38
038
180.
6985
−53
.835
54.
340.
610.
350.
050.
0280
43.8
9Sy
218
8SW
IFT
J120
3.0+
4433
180.
750
44.5
5711
.92
NG
C40
5118
0.79
0144
.531
34.
340.
350.
310.
030.
0023
41.7
1Sy
1.5
189
SWIF
TJ1
204.
5+20
1918
1.06
020
.293
5.98
AR
K34
718
1.12
3720
.316
23.
850.
580.
450.
060.
0224
43.6
4Sy
219
0SW
IFT
J120
6.2+
5243
181.
629
52.7
106.
96N
GC
4102
181.
5963
52.7
109
2.58
0.38
0.37
0.06
0.00
2841
.66
LIN
ER
191
SWIF
TJ1
209.
5+47
0218
2.31
447
.069
5.29
MR
K01
9818
2.30
8847
.058
32.
150.
420.
340.
070.
0242
43.4
6Sy
219
2SW
IFT
J120
9.4+
4340
182.
371
43.6
859.
21N
GC
4138
182.
3741
43.6
853
3.69
0.45
0.43
0.05
0.00
3041
.85
Sy1.
919
3SW
IFT
J121
0.5+
3924
182.
629
39.3
7912
1.30
NG
C41
5118
2.63
5739
.405
762
.23
0.46
0.42
0.00
0.00
3343
.18
Sy1.
519
4SW
IFT
J121
3.2−
6458
183.
339
−64
.914
6.22
SWIF
TJ1
2131
4.7-
6452
314U
1210
-64
183.
3208
−64
.880
02.
060.
360.
190.
07H
MX
B/N
S19
5SW
IFT
J121
7.3+
0714
184.
317
7.23
35.
40N
GC
4235
184.
2912
7.19
162.
400.
550.
390.
080.
0080
42.5
4Sy
119
6SW
IFT
J121
8.5+
2952
184.
626
29.8
237.
67M
rk76
618
4.61
0529
.812
92.
420.
290.
190.
050.
0129
42.9
6Sy
1.5
197
SWIF
TJ1
219.
4+47
2018
4.86
247
.365
4.83
M10
618
4.73
9647
.304
02.
800.
630.
510.
090.
0015
41.1
4Sy
1.9
LIN
ER
198
SWIF
TJ1
222.
4+75
2018
5.61
175
.326
7.02
MR
K02
0518
5.43
3375
.310
72.
370.
430.
370.
070.
0708
44.4
6B
LL
acSy
119
9SW
IFT
J122
3.7+
0238
185.
817
2.64
95.
31M
RK
0050
185.
8506
2.67
913.
530.
640.
470.
070.
0234
43.6
4Sy
120
0SW
IFT
J122
5.8+
1240
186.
467
12.6
5151
.62
NG
C43
8818
6.44
4812
.662
134
.64
0.52
0.43
0.01
0.00
8443
.74
Sy2
201
SWIF
TJ1
202.
5+33
3218
6.49
533
.507
5.60
NG
C43
9518
6.45
3833
.546
83.
120.
410.
360.
050.
0011
40.8
9Sy
1.9
202
SWIF
TJ1
226.
6−62
4418
6.65
7−
62.7
3567
5.04
GX
301-
218
6.65
67−
62.7
706
261.
130.
360.
060.
00L
MX
B/N
S20
3SW
IFT
J122
7.8−
4856
186.
952
−48
.932
5.26
1RX
SJ1
2275
8.8-
4853
4318
6.99
54−
48.8
956
3.17
0.60
0.31
0.07
CV
204
SWIF
TJ1
229.
1+02
0218
7.26
22.
043
68.6
63C
273
187.
2779
2.05
2438
.35
0.60
0.44
0.01
0.15
8346
.42
Bla
zar
205
SWIF
TJ1
234.
7−64
3318
8.69
1−
64.5
8015
.01
RT
Cru
188.
7239
−64
.565
67.
190.
490.
280.
03Sy
mb/
WD
206
SWIF
TJ1
235.
6−39
5418
8.89
6−
39.8
6735
.96
NG
C45
0718
8.90
26−
39.9
093
22.5
10.
680.
400.
010.
0118
43.8
5Sy
220
7SW
IFT
J123
8.9−
2720
189.
697
−27
.283
22.0
2E
SO50
6-G
027
189.
7275
−27
.307
813
.75
0.72
0.44
0.02
0.02
5044
.29
Sy2
208
SWIF
TJ1
239.
3−16
1118
9.82
1−
16.1
6610
.85
LE
DA
1701
94IG
RJ1
2392
-161
218
9.77
63−
16.1
799
6.87
0.76
0.45
0.04
0.03
6744
.33
Sy2
209
SWIF
TJ1
239.
6−05
1918
9.92
4−
5.31
319
.64
NG
C45
9318
9.91
43−
5.34
439.
790.
620.
410.
020.
0090
43.2
5Sy
121
0SW
IFT
J124
0.9−
3331
190.
183
−33
.557
5.38
ESO
381-
G00
719
0.19
56−
33.5
700
3.96
0.78
0.48
0.09
0.05
5044
.46
Sy1.
521
1SW
IFT
J124
1.6−
5748
190.
485
−57
.795
5.07
WK
K12
6319
0.35
70−
57.8
340
4.03
0.78
0.58
0.10
0.02
4443
.74
Sy1.
521
2SW
IFT
J124
6.6+
5435
191.
716
54.5
367.
22N
GC
4686
191.
6661
54.5
342
3.08
0.45
0.42
0.06
0.01
6743
.29
Gal
axy,
XB
ON
G21
3SW
IFT
J124
9.3−
5907
192.
332
−59
.111
21.7
44U
1246
-58
1A12
46-5
8819
2.41
40−
59.0
874
9.91
0.50
0.28
0.02
LM
XB
214
SWIF
TJ1
252.
3−29
1619
3.07
4−
29.2
736.
73E
XH
ya19
3.10
17−
29.2
491
2.54
0.35
0.15
0.07
CV
/DQ
Her
215
SWIF
TJ1
256.
2−05
5119
4.03
1−
5.78
66.
913C
279
194.
0465
−5.
7893
4.97
0.74
0.55
0.07
0.53
6246
.75
Bla
zar
216
SWIF
TJ1
257.
4−69
1519
4.35
7−
69.2
5418
.93
4U12
54-6
9019
4.40
48−
69.2
886
5.80
0.23
0.05
0.02
LM
XB
/NS
217
SWIF
TJ1
259.
7+27
5519
4.91
427
.923
8.29
Com
aC
lust
er19
4.95
3127
.980
73.
590.
190.
020.
030.
0231
43.6
4G
alax
ycl
uste
r21
8SW
IFT
J130
1.2−
6139
195.
298
−61
.655
5.71
GX
304-
119
5.32
17−
61.6
019
2.45
0.52
0.25
0.09
HM
XB
219
SWIF
TJ1
302.
0−63
5819
5.49
5−
63.9
648.
81IG
RJ1
3020
-635
919
5.49
83−
63.9
683
3.99
0.42
0.22
0.04
PSR
220
SWIF
TJ1
303.
8+53
4519
6.05
353
.783
8.86
SBS
1301
+540
195.
9978
53.7
917
4.02
0.43
0.41
0.04
0.02
9943
.92
Sy1
221
SWIF
TJ1
305.
4−49
2819
6.38
1−
49.5
0642
.73
NG
C49
4519
6.36
45−
49.4
682
32.9
80.
770.
500.
010.
0019
42.4
1Sy
222
2SW
IFT
J130
6.4−
4025
196.
618
−40
.404
7.96
ESO
323-
077
196.
6089
−40
.414
64.
700.
660.
350.
050.
0150
43.3
8Sy
1.2
223
SWIF
TJ1
309.
2+11
3919
7.27
611
.678
13.0
8N
GC
4992
197.
2733
11.6
341
6.16
0.52
0.44
0.03
0.02
5143
.95
Sy2
XB
ON
G22
4SW
IFT
J131
2.1−
5631
197.
920
−56
.492
5.12
2MA
SXJ1
3103
701-
5626
551
SWIF
TJ1
311.
7-56
2919
7.65
40−
56.4
490
1.96
0.71
0.46
0.13
?G
alax
y22
5SW
IFT
J132
2.2−
1641
200.
644
−16
.717
6.31
MC
G-0
3-34
-064
200.
6019
−16
.728
63.
150.
450.
250.
060.
0165
43.2
9Sy
1.8
226
SWIF
TJ1
325.
4−43
0120
1.37
2−
43.0
1413
8.27
Cen
A20
1.36
51−
43.0
191
92.6
20.
710.
420.
000.
0018
42.8
3Sy
222
7SW
IFT
J132
6.9−
6207
201.
713
−62
.114
48.1
74U
1323
-619
201.
6504
−62
.136
124
.60
0.53
0.29
0.01
LM
XB
/NS

SWIFT-BAT 22 MONTH HARD X-RAY SURVEY 23TA
BL
E5
—C
ontin
ued
#B
AT
Nam
eaR
Ab
Dec
S/N
Cou
nter
part
Nam
eO
ther
Nam
eC
tptR
Ac
Ctp
tDec
Flux
der
ror
Ce
Hra
tfH
err
Red
shif
tgL
umh
Type
228
SWIF
TJ1
335.
8−34
1620
3.92
8−
34.3
1713
.03
MC
G-0
6-30
-015
203.
9741
−34
.295
67.
820.
570.
320.
030.
0077
43.0
2Sy
1.2
229
SWIF
TJ1
338.
2+04
3320
4.56
34.
549
14.3
8N
GC
5252
204.
5665
4.54
268.
180.
590.
450.
030.
0230
43.9
9Sy
1.9
230
SWIF
TJ1
347.
4−60
3320
6.80
2−
60.6
4614
.51
4U13
44-6
020
6.90
00−
60.6
178
9.59
0.66
0.41
0.03
0.01
2943
.55
Sy1.
523
1SW
IFT
J134
9.3−
3018
207.
342
−30
.309
56.9
5IC
4329
A20
7.33
03−
30.3
094
33.0
80.
620.
370.
010.
0160
44.2
8Sy
1.2
232
SWIF
TJ1
349.
7+02
0920
7.42
32.
133
6.29
UM
614
207.
4701
2.07
912.
240.
470.
340.
080.
0327
43.7
4Sy
123
3SW
IFT
J135
2.8+
6917
208.
263
69.3
1315
.04
Mrk
279
208.
2644
69.3
082
5.30
0.38
0.35
0.03
0.03
0444
.05
Sy1.
523
4SW
IFT
J135
6.1+
3832
209.
013
38.5
306.
29M
RK
0464
208.
9730
38.5
746
2.21
0.32
0.25
0.07
0.05
0144
.12
Sy1.
523
5SW
IFT
J141
2.9−
6522
213.
224
−65
.363
43.4
2C
irci
nus
Gal
axy
213.
2913
−65
.339
027
.48
0.57
0.35
0.01
0.00
1442
.10
AG
N23
6SW
IFT
J141
3.2−
0312
213.
304
−3.
200
44.7
8N
GC
5506
213.
3119
−3.
2075
25.6
40.
500.
350.
010.
0062
43.3
4Sy
1.9
237
SWIF
TJ1
417.
9+25
0721
4.50
625
.098
13.7
3N
GC
5548
214.
4981
25.1
368
8.08
0.50
0.41
0.03
0.01
7243
.73
Sy1.
523
8SW
IFT
J141
9.0−
2639
214.
887
−26
.644
7.07
ESO
511-
G03
021
4.84
34−
26.6
447
4.71
0.65
0.44
0.06
0.02
2443
.73
Sy1
239
SWIF
TJ1
421.
4+47
4721
5.34
747
.781
5.12
SBS
1419
+480
215.
3742
47.7
902
2.11
0.39
0.34
0.07
0.07
2344
.43
Sy1.
524
0SW
IFT
J142
8.7+
4234
217.
180
42.6
748.
521E
S14
26+4
2821
7.13
6142
.672
42.
330.
290.
260.
050.
1290
45.0
1B
LL
ac24
1SW
IFT
J143
6.4+
5846
219.
104
58.7
955.
06M
RK
0817
219.
0920
58.7
943
2.21
0.36
0.35
0.07
0.03
1443
.70
Sy1.
524
2SW
IFT
J144
2.5−
1715
220.
546
−17
.253
14.5
7N
GC
5728
220.
5997
−17
.253
210
.54
0.71
0.43
0.03
0.00
9343
.31
Sy2
243
SWIF
TJ1
451.
0−55
4022
2.85
3−
55.6
407.
64W
KK
4374
222.
8881
−55
.677
34.
36A
B0.
390.
0180
43.5
0Sy
224
4"
""
"2M
FGC
1201
822
2.30
30−
55.6
050
3.71
AB
0.47
?G
alax
y24
5SW
IFT
J145
3.4−
5524
223.
344
−55
.408
6.20
1RX
SJ1
4534
1.1-
5521
46IG
RJ1
4515
-554
222
3.45
58−
55.3
622
2.28
0.35
B0.
100.
08C
V/A
MH
er24
6SW
IFT
J145
4.9−
5133
223.
719
−51
.550
5.09
WK
K44
3822
3.82
30−
51.5
710
2.02
0.54
0.34
0.11
0.01
6043
.07
NL
Sy1
247
SWIF
TJ1
457.
8−43
0822
4.46
4−
43.1
025.
99IC
4518
A22
4.42
16−
43.1
321
3.29
0.52
0.24
0.07
0.01
6343
.29
Sy2
248
SWIF
TJ1
504.
2+10
2522
6.01
010
.411
6.33
Mrk
841
226.
0050
10.4
378
2.93
0.53
0.37
0.06
0.03
6443
.96
Sy1
249
SWIF
TJ1
506.
7+03
5322
6.63
53.
842
5.42
2MA
SXJ1
5064
412+
0351
444
226.
6840
3.86
202.
12A
B0.
300.
0377
43.8
4Sy
225
0"
""
"M
RK
1392
226.
4860
3.70
701.
99A
B0.
340.
0361
43.7
8Sy
125
1SW
IFT
J151
2.8−
0906
228.
212
−9.
106
7.45
PKS
1510
-08
228.
2106
−9.
1000
6.56
0.76
0.48
0.06
0.36
0046
.46
QSO
252
SWIF
TJ1
513.
8−59
1022
8.43
9−
59.1
6539
.85
PSR
B15
09-5
8C
irpu
lsar
228.
4813
−59
.135
827
.50
0.72
0.42
0.01
PSR
/PW
N25
3SW
IFT
J151
3.8−
8125
228.
567
−81
.415
5.29
2MA
SXJ1
5144
217-
8123
377
228.
6751
−81
.393
92.
560.
480.
320.
070.
0684
44.4
6Sy
1.9
254
SWIF
TJ1
515.
0+42
0522
8.77
042
.009
5.12
NG
C58
9922
8.76
3542
.049
92.
150.
450.
430.
090.
0086
42.5
4Sy
225
5SW
IFT
J151
5.2+
1223
228.
799
12.4
314.
86SW
IFT
J151
5.2+
1223
SWIF
TJ1
5144
7.0+
1222
4422
8.69
5812
.378
92.
050.
540.
300.
09?
256
SWIF
TJ1
521.
0−57
1123
0.25
5−
57.1
8240
.35
BR
Cir
Cir
X-1
230.
1703
−57
.166
713
.76
0.26
0.03
0.01
LM
XB
257
SWIF
TJ1
533.
2−08
3623
3.38
7−
8.67
65.
33M
CG
-01-
40-0
0123
3.33
63−
8.70
053.
760.
570.
340.
070.
0227
43.6
4Sy
225
8SW
IFT
J153
5.9+
5751
233.
935
57.9
095.
25M
rk29
023
3.96
8257
.902
62.
550.
410.
330.
060.
0296
43.7
1Sy
125
9SW
IFT
J154
2.6−
5222
235.
658
−52
.362
69.2
3Q
VN
orH
1538
-522
235.
5971
−52
.386
130
.41
0.38
0.09
0.01
HM
XB
260
SWIF
TJ1
546.
3+69
2823
6.53
869
.466
5.77
2MA
SXJ1
5462
424+
6929
102
236.
6014
69.4
861
15.4
60.
55B
0.26
0.01
0.03
8044
.72
Sy2
261
""
""
1RX
SJ1
5453
4.5+
6929
2523
6.39
3869
.490
31.
69A
0.20
?SR
C/X
-RA
Y26
2SW
IFT
J154
7.9−
6232
236.
981
−62
.525
17.0
91X
MM
J154
754.
7-62
3404
4U15
43-6
223
6.97
62−
62.5
698
5.70
0.29
0.06
0.03
LM
XB
/NS
263
SWIF
TJ1
548.
0−45
2923
7.00
6−
45.4
7918
.06
NY
Lup
IGR
J154
79-4
529
237.
0608
−45
.477
810
.14
0.55
0.29
0.02
CV
/DQ
Her
264
SWIF
TJ1
548.
5−13
4423
7.06
8−
13.7
385.
92N
GC
5995
237.
1040
−13
.757
84.
510.
610.
360.
070.
0252
43.8
1Sy
226
5SW
IFT
J155
8.4+
2718
239.
602
27.2
988.
42A
BE
LL
2142
239.
5672
27.2
246
2.39
0.32
0.23
0.05
0.09
0944
.69
Gal
axy
clus
ter
266
SWIF
TJ1
559.
6+25
5423
9.90
325
.905
14.8
0T
CrB
Nov
aC
rB18
66/1
946
239.
8757
25.9
202
6.40
0.36
0.25
0.02
Sym
b/W
D26
7SW
IFT
J161
3.2−
6043
242.
997
−60
.644
7.41
WK
K60
9224
2.96
42−
60.6
319
3.99
0.58
0.30
0.06
0.01
5643
.34
Sy1
268
SWIF
TJ1
612.
9−52
2724
3.23
3−
52.4
4397
.13
QX
Nor
4U16
08-5
2224
3.17
92−
52.4
231
49.8
20.
520.
270.
00L
MX
B26
9SW
IFT
J161
7.5−
4958
244.
385
−49
.964
5.70
1RX
SJ1
6163
7.1-
4958
47IG
RJ1
6167
-495
724
4.28
00−
49.9
600
2.08
0.38
0.10
0.09
CV
270
SWIF
TJ1
619.
4−28
0824
4.85
6−
28.1
297.
75U
SNO
-A2.
0U
0600
-202
2709
1IG
RJ1
6194
-281
024
4.88
75−
28.1
272
4.74
0.45
0.19
0.05
Sym
b/N
S27
1SW
IFT
J161
9.2−
4945
244.
947
−49
.722
8.71
2MA
SSJ1
6193
220-
4944
305
IGR
J161
95-4
945
244.
8842
−49
.741
83.
550.
430.
150.
06?
Poss
ible
HM
XB
/FX
T27
2SW
IFT
J162
0.1−
1539
245.
014
−15
.650
4635
.67
V81
8Sc
oSc
oX
-124
4.97
95−
15.6
402
1821
.87
0.30
0.01
0.00
LM
XB
/NS
273
SWIF
TJ1
621.
2+81
0424
5.20
981
.081
6.74
CG
CG
367-
009
244.
8302
81.0
465
3.20
0.52
0.47
0.06
0.02
7443
.74
Sy2
274
SWIF
TJ1
620.
9−51
2924
5.22
2−
51.4
869.
642M
ASS
J162
0369
8-51
3036
3IG
RJ1
6207
-512
924
5.15
42−
51.5
100
4.34
0.47
0.22
0.05
HM
XB
275
SWIF
TJ1
626.
9−51
5624
6.71
8−
51.9
329.
09SW
IFT
J162
636.
2-51
5634
SWIF
TJ1
626.
6-51
5624
6.65
10−
51.9
428
3.84
0.36
0.11
0.05
XR
B/N
S27
6SW
IFT
J162
7.8−
4913
246.
956
−49
.209
25.0
44U
1624
-490
4U16
24-4
90/B
igdi
pper
247.
0118
−49
.198
58.
950.
270.
040.
02L
MX
B/N
S27
7SW
IFT
J162
8.1+
5145
247.
094
51.7
7910
.02
Mrk
1498
247.
0169
51.7
754
4.37
0.44
0.39
0.04
0.05
4744
.49
Sy1.
927
8SW
IFT
J163
2.1−
4753
248.
016
−47
.877
47.0
1A
XJ1
631.
9-47
52IG
RJ1
6320
-475
1;H
ESS
J163
2-47
824
8.00
79−
47.8
742
26.5
20.
460.
170.
01PS
R27
9SW
IFT
J163
2.1−
4849
248.
032
−48
.820
76.7
7IG
RJ1
6318
-484
824
7.96
67−
48.8
083
48.1
50.
540.
270.
01H
MX
B/N
S28
0SW
IFT
J163
2.4−
6729
248.
090
−67
.480
64.7
84U
1626
-67
248.
0700
−67
.461
926
.33
0.34
0.04
0.01
LM
XB
281
SWIF
TJ1
638.
7−64
2024
9.67
5−
64.3
355.
94Tr
AC
lust
er24
9.56
71−
64.3
472
2.36
0.34
0.00
0.09
0.05
0844
.16
Gal
axy
clus
ter
282
SWIF
TJ1
639.
2−46
4124
9.79
6−
46.6
7617
.44
IGR
J163
93-4
643
249.
7583
−46
.676
79.
370.
380.
060.
02Sy
mb/
NS
283
SWIF
TJ1
640.
8−53
4325
0.19
9−
53.7
1810
0.33
V80
1A
ra4U
1636
-536
250.
2313
−53
.751
444
.22
0.44
0.18
0.00
LM
XB
284
SWIF
TJ1
641.
9−45
3125
0.48
7−
45.5
1611
.34
IGR
J164
18-4
532
2MA
SSJ1
6415
078-
4532
253
?25
0.43
75−
45.5
200
7.27
0.45
0.13
0.03
SRC
/GA
MM
A

24 TUELLER ET AL.TA
BL
E5
—C
ontin
ued
#B
AT
Nam
eaR
Ab
Dec
S/N
Cou
nter
part
Nam
eO
ther
Nam
eC
tptR
Ac
Ctp
tDec
Flux
der
ror
Ce
Hra
tfH
err
Red
shif
tgL
umh
Type
285
SWIF
TJ1
643.
1+39
5125
0.77
639
.858
6.43
3C34
525
0.74
5039
.810
33.
340.
640.
470.
070.
5928
46.6
9H
PQ28
6SW
IFT
J164
5.7−
4538
251.
424
−45
.635
175.
21G
X34
0+0
4U16
42-4
525
1.44
88−
45.6
111
77.9
30.
32B
0.02
0.00
LM
XB
/NS
287
SWIF
TJ1
647.
9−45
1125
1.97
1−
45.1
8412
.36
2MA
SSJ1
6480
656-
4512
068
IGR
J164
79-4
514
251.
9958
−45
.216
78.
73A
B0.
22H
MX
B/fa
sttr
ans
288
""
""
IGR
J164
65-4
507
251.
6480
−45
.117
02.
84A
B0.
1528
9SW
IFT
J164
8.0−
3037
252.
082
−30
.545
10.1
52M
ASX
J164
8152
3-30
3503
725
2.06
35−
30.5
845
8.36
0.70
0.40
0.04
0.03
1044
.27
Sy1
290
SWIF
TJ1
649.
3−43
5125
2.33
3−
43.8
569.
252M
ASS
J164
9269
5-43
4909
0IG
RJ1
6493
-434
825
2.33
75−
43.8
100
4.85
0.45
0.19
0.04
XR
B/N
S29
1SW
IFT
J165
0.5+
0434
252.
657
4.58
25.
39L
ED
A21
4543
252.
6781
4.60
503.
380.
610.
480.
090.
0321
43.9
0Sy
229
2SW
IFT
J165
2.9+
0223
253.
208
2.42
79.
38N
GC
6240
253.
2454
2.40
097.
300.
620.
440.
040.
0245
44.0
0Sy
229
3SW
IFT
J165
3.8−
3952
253.
448
−39
.859
49.7
8G
RO
J165
5-40
253.
5006
−39
.845
835
.24
0.65
0.35
0.01
LM
XB
/BH
294
SWIF
TJ1
654.
0+39
4625
3.49
439
.795
14.8
8M
rk50
125
3.46
7639
.760
25.
460.
390.
270.
030.
0337
44.1
5B
LL
ac29
5SW
IFT
J165
6.1−
5200
254.
032
−52
.005
5.75
1RX
SJ1
6560
5.6-
5203
4525
4.02
34−
52.0
614
3.81
0.77
0.41
0.08
0.05
4044
.42
Sy1.
229
6SW
IFT
J165
6.3−
3302
254.
041
−33
.001
8.86
2MA
SSJ1
6561
677-
3302
127
SWIF
TJ1
656.
3-33
0225
4.06
99−
33.0
369
8.50
0.81
0.47
0.05
2.40
0048
.58
Bla
zar
297
SWIF
TJ1
657.
7+35
1825
4.43
235
.305
281.
06H
ZH
erH
erX
-125
4.45
7635
.342
490
.54
0.28
0.07
0.00
LM
XB
/NS
298
SWIF
TJ1
700.
6−42
2225
5.14
1−
42.3
686.
10A
XJ1
700.
2-42
2025
5.10
50−
42.3
170
3.46
0.50
0.25
0.07
299
SWIF
TJ1
700.
8−41
3925
5.19
1−
41.6
5016
8.95
Roc
hest
ar10
BO
AO
1657
-415
255.
1996
−41
.673
197
.40
0.50
0.23
0.00
HM
XB
/NS
300
SWIF
TJ1
700.
9−46
1025
5.21
8−
46.1
7157
.73
XT
EJ1
701-
462
255.
2436
−46
.185
724
.02
0.30
0.01
0.01
LM
XB
301
SWIF
TJ1
702.
8−48
4925
5.70
8−
48.8
1638
.26
V82
1A
raG
X33
9-4
255.
7063
−48
.789
738
.26
0.80
0.48
0.01
LM
XB
302
SWIF
TJ1
703.
9−37
5325
5.97
9−
37.8
8358
1.69
V88
4Sc
o4U
1700
-377
255.
9866
−37
.844
136
2.89
0.49
0.23
0.00
HM
XB
/NS
303
SWIF
TJ1
705.
9−36
2425
6.47
4−
36.4
0025
9.90
V11
01Sc
oG
X34
9+2
256.
4354
−36
.423
111
7.09
0.31
0.00
0.00
LM
XB
/NS
304
SWIF
TJ1
706.
2−43
0325
6.54
4−
43.0
5873
.91
Ara
X-1
4U17
02-4
2925
6.56
38−
43.0
358
40.4
30.
480.
220.
00L
MX
B/N
S30
5SW
IFT
J170
6.7+
2401
256.
675
24.0
127.
49V
934
Her
4U17
00+2
425
6.64
3823
.971
83.
930.
460.
320.
05L
MX
B/N
S30
6SW
IFT
J170
6.6−
6146
256.
686
−61
.755
5.52
SWIF
TJ1
7961
6.4-
6142
40IG
RJ1
7062
-614
325
6.56
77−
61.7
113
3.81
0.63
0.39
0.07
307
SWIF
TJ1
708.
5−40
0825
7.13
7−
40.1
305.
47R
XJ1
7084
9.0-
4009
1025
7.20
50−
40.1
530
5.06
0.86
0.55
0.10
NS/
AX
P30
8SW
IFT
J170
8.7−
3216
257.
180
−32
.267
8.09
2XM
MJ1
7085
4.2-
3218
584U
1705
-32
257.
2267
−32
.316
06.
160.
680.
370.
05L
MX
B30
9SW
IFT
J170
8.9−
4404
257.
213
−44
.061
69.4
84U
1705
-440
257.
2270
−44
.102
029
.50
0.34
0.11
0.01
LM
XB
/NS
310
SWIF
TJ1
709.
8−36
2725
7.44
8−
36.4
586.
33SW
IFT
J170
945.
9-36
2759
IGR
J170
98-3
628
257.
4424
−36
.466
06.
08A
B0.
42SR
C/G
AM
MA
311
""
""
IGR
J170
91-3
624
257.
2750
−36
.411
03.
49A
B0.
40SR
C/G
AM
MA
312
SWIF
TJ1
710.
3−28
0625
7.58
1−
28.1
038.
291R
XS
J171
012.
3-28
0754
XT
EJ1
710-
281
257.
5513
−28
.131
75.
160.
500.
260.
04L
MX
B31
3SW
IFT
J171
2.2−
4051
258.
056
−40
.855
7.84
1RX
SJ1
7122
4.8-
4050
344U
1708
-40
258.
0958
−40
.843
33.
000.
300.
080.
05L
MX
B31
4SW
IFT
J171
2.5−
2322
258.
134
−23
.363
19.0
3O
phC
lust
er25
8.10
82−
23.3
759
9.70
0.36
0.07
0.02
0.02
8044
.24
Gal
axy
clus
ter
315
SWIF
TJ1
712.
7−24
1225
8.16
5−
24.1
959.
45V
2400
Oph
1RX
SJ1
7123
6.3-
2414
4525
8.15
19−
24.2
457
5.27
0.42
0.16
0.04
CV
/DQ
Her
316
SWIF
TJ1
712.
8−37
3725
8.19
2−
37.6
1411
.96
1RX
SJ1
7123
7.1-
3738
34SA
XJ1
712.
6-37
3925
8.14
17−
37.6
433
7.10
0.55
0.27
0.03
LM
XB
/NS
317
SWIF
TJ1
717.
1−62
4925
9.26
3−
62.8
5915
.53
NG
C63
0025
9.24
78−
62.8
206
10.3
50.
640.
370.
030.
0037
42.5
0Sy
231
8SW
IFT
J171
9.6−
4102
259.
907
−41
.035
6.32
1RX
SJ1
7193
5.6-
4100
54C
XO
UJ1
7193
5.8-
4100
5325
9.89
83−
41.0
151
3.59
0.43
0.12
0.05
CV
319
SWIF
TJ1
719.
7+49
0025
9.91
949
.003
5.22
AR
P10
2B25
9.81
0448
.980
41.
890.
450.
350.
090.
0242
43.4
0Sy
1L
INE
R32
0SW
IFT
J172
0.3−
3115
260.
076
−31
.249
6.99
2MA
SSJ1
7200
591-
3116
596
IGR
J172
00-3
116
260.
0254
−31
.283
93.
580.
420.
070.
06H
MX
B32
1SW
IFT
J172
5.1−
3616
261.
272
−36
.275
18.5
42M
ASS
J172
5113
9-36
1657
5E
XO
1722
-363
261.
2975
−36
.283
112
.03
0.45
0.12
0.02
HM
XB
/NS
322
SWIF
TJ1
725.
2−32
5826
1.30
8−
32.9
685.
16IG
RJ1
7254
-325
726
1.35
00−
32.9
500
3.25
0.53
0.24
0.07
SRC
/GA
MM
A32
3SW
IFT
J172
7.4−
3046
261.
862
−30
.774
52.6
64U
1722
-30
4U17
24-3
026
1.88
83−
30.8
019
32.4
00.
510.
240.
01L
MX
B32
4SW
IFT
J173
0.4−
0558
262.
590
−5.
964
10.8
41R
XS
J173
021.
5-05
5933
1H17
26-0
5826
2.58
96−
5.99
266.
780.
510.
290.
03C
V/D
QH
er32
5SW
IFT
J173
1.6−
1657
262.
903
−16
.953
87.0
4V
2216
Oph
GX
9+9
262.
9342
−16
.961
735
.58
0.29
0.00
0.00
LM
XB
/NS
326
SWIF
TJ1
731.
9−24
4426
2.96
4−
24.7
3714
9.22
V21
16O
phG
X1+
426
3.00
90−
24.7
456
109.
080.
570.
300.
00H
MX
B/N
S32
7SW
IFT
J173
2.1−
3349
263.
025
−33
.820
145.
26Sl
owbu
rste
r4U
1728
-33
262.
9892
−33
.834
770
.50
0.38
0.09
0.00
LM
XB
/NS
328
SWIF
TJ1
737.
5−29
0826
4.37
5−
29.1
0714
.84
AX
J173
7.4-
2907
GR
S17
34-2
9226
4.35
12−
29.1
800
12.3
30.
690.
380.
030.
0214
44.1
1Sy
132
9SW
IFT
J173
8.3−
2657
264.
578
−26
.953
33.2
4SL
X17
35-2
69SL
X17
35-2
6926
4.56
67−
27.0
044
24.9
40.
620.
330.
01L
MX
B/N
S33
0SW
IFT
J173
9.2−
4428
264.
792
−44
.473
147.
81V
926
Sco
4U17
35-4
426
4.74
29−
44.4
500
61.5
90.
290.
010.
00L
MX
B/N
S33
1SW
IFT
J174
0.0−
3651
265.
011
−36
.845
5.23
IGR
J174
04-3
655
265.
1110
−36
.927
02.
860.
490.
250.
07X
RB
332
SWIF
TJ1
740.
6−28
2126
5.14
3−
28.3
5015
.92
SLX
1737
-282
265.
2375
−28
.310
010
.20
AB
0.34
LM
XB
333
""
""
CX
OJ1
7005
8.6-
4611
08.6
XT
EJ1
739-
285
264.
9748
−28
.496
37.
68A
B0.
29L
MX
B33
4SW
IFT
J174
3.1−
3620
265.
769
−36
.339
5.80
XT
EJ1
743-
363
265.
7500
−36
.345
03.
530.
550.
300.
06SR
C/X
-ray
335
SWIF
TJ1
743.
7−29
4626
5.93
7−
29.7
6180
.30
1E17
40.7
-294
226
5.97
85−
29.7
452
76.1
00.
74B
0.40
0.00
LM
XB
/BH
336
SWIF
TJ1
746.
2−32
1426
6.56
1−
32.2
398.
02H
1743
-322
266.
5650
−32
.233
55.
950.
600.
300.
04L
MX
B33
7SW
IFT
J174
6.3−
2931
266.
564
−29
.509
44.9
02E
1742
-292
91A
1742
-294
266.
5229
−29
.515
323
.95
AB
0.17
LM
XB
338
SWIF
TJ1
746.
3−28
5026
6.58
5−
28.8
3732
.02
CX
OG
CJ1
7470
2.6-
2852
58SA
XJ1
747.
0-28
5326
6.76
08−
28.8
830
15.0
2A
B0.
25L
MX
B33
9"
""
"2E
1743
.1-2
842
266.
5800
−28
.735
313
.48
AB
0.19
LM
XB
340
""
""
IGR
J174
61-2
853
266.
5250
−28
.882
017
.33
AB
0.24
Mol
ecul
arcl
oud?
341
""
""
SGR
A*
266.
4168
−29
.007
814
.83
AB
0.26
Gal
actic
cent
er

SWIFT-BAT 22 MONTH HARD X-RAY SURVEY 25TA
BL
E5
—C
ontin
ued
#B
AT
Nam
eaR
Ab
Dec
S/N
Cou
nter
part
Nam
eO
ther
Nam
eC
tptR
Ac
Ctp
tDec
Flux
der
ror
Ce
Hra
tfH
err
Red
shif
tgL
umh
Type
342
SWIF
TJ1
747.
4−27
1926
6.85
3−
27.3
238.
40IG
RJ1
7473
-272
126
6.82
53−
27.3
441
7.87
0.77
B0.
420.
05X
RB
burs
ter
343
SWIF
TJ1
747.
4−30
0326
6.85
8−
30.0
5325
.58
AX
J174
7.4-
3000
SLX
1744
-299
266.
8579
−29
.999
414
.38
AB
0.20
LM
XB
/NS
344
""
""
AX
J174
7.4-
3003
SLX
1744
-300
266.
8558
−30
.044
715
.38
AB
0.21
LM
XB
345
SWIF
TJ1
747.
7−22
5326
6.92
0−
22.8
764.
82N
VSS
J174
729-
2252
4526
6.87
40−
22.8
790
3.37
0.61
0.32
0.08
?Po
ssib
leQ
SO34
6SW
IFT
J174
7.9−
2631
266.
969
−26
.509
60.0
5G
X3+
14U
1744
-26
266.
9833
−26
.563
625
.48
0.30
0.00
0.01
LM
XB
/NS
347
SWIF
TJ1
748.
8−32
5726
7.20
3−
32.9
566.
812M
ASS
J174
8551
2-32
5452
1IG
RJ1
7488
-325
326
7.22
97−
32.9
145
4.88
0.67
0.33
0.06
0.02
0043
.65
Sy1
348
SWIF
TJ1
749.
4−28
2226
7.35
2−
28.3
6817
.72
SWIF
TJ1
7493
8.1-
2821
16.9
IGR
J174
97-2
821
267.
4088
−28
.354
716
.34
0.78
0.45
0.02
LM
XB
349
SWIF
TJ1
750.
2−37
0126
7.56
0−
37.0
2017
.53
4U17
46-3
726
7.55
29−
37.0
522
7.33
0.32
0.03
0.02
LM
XB
/NS
350
SWIF
TJ1
753.
5−01
3026
8.38
5−
1.49
415
0.99
SWIF
TJ1
7532
8.5-
0127
04SW
IFT
J175
3.5-
0127
268.
3679
−1.
4525
129.
950.
720.
450.
00L
MX
B/B
HC
351
SWIF
TJ1
759.
9−22
0126
9.97
1−
22.0
2110
.09
XT
EJ1
759-
220
IGR
J175
97-2
201
269.
9417
−22
.015
06.
890.
490.
190.
03L
MX
B35
2SW
IFT
J180
1.1−
2504
270.
270
−25
.062
238.
67G
X5-
127
0.28
42−
25.0
792
127.
440.
330.
010.
00L
MX
B/N
S35
3SW
IFT
J180
1.1−
2544
270.
271
−25
.734
173.
081X
MM
J180
112.
7-25
4440
GR
S17
58-2
5827
0.30
12−
25.7
433
196.
300.
790.
440.
00L
MX
B/B
H35
4SW
IFT
J180
1.5−
2031
270.
385
−20
.509
113.
79G
X9+
127
0.38
46−
20.5
289
53.1
90.
330.
000.
00L
MX
B/N
S35
5SW
IFT
J180
8.7−
2024
272.
179
−20
.400
7.12
CX
OU
J180
839.
3-20
2439
SGR
1806
-20
272.
1638
−20
.411
06.
760.
850.
430.
06SG
R35
6SW
IFT
J181
4.6−
1709
273.
661
−17
.156
79.8
1V
5512
Sgr
GX
13+1
273.
6315
−17
.157
434
.91
0.32
0.04
0.00
LM
XB
/NS
357
SWIF
TJ1
815.
1−12
0827
3.77
1−
12.1
2881
.92
4U18
12-1
227
3.80
00−
12.0
833
58.1
70.
650.
350.
01L
MX
B/N
S35
8SW
IFT
J181
5.8−
1403
273.
948
−14
.051
265.
05N
PSe
rG
X17
+227
4.00
58−
14.0
364
127.
180.
310.
010.
00L
MX
B/N
S35
9SW
IFT
J181
7.8−
3301
274.
451
−33
.011
19.2
1X
TE
J181
7-33
027
4.43
14−
33.0
188
15.1
50.
620.
330.
02X
RB
/BH
C36
0SW
IFT
J182
2.0+
6421
275.
503
64.3
535.
35[H
B89
]182
1+64
327
5.48
8864
.343
41.
740.
350.
260.
080.
2970
45.6
9Sy
136
1SW
IFT
J182
3.7−
3023
275.
917
−30
.380
170.
724U
1820
-30
275.
9186
−30
.361
185
.23
0.35
0.02
0.00
LM
XB
/NS
362
SWIF
TJ1
824.
3−56
2427
6.07
3−
56.3
928.
04IC
4709
276.
0808
−56
.369
25.
300.
670.
370.
050.
0169
43.5
3Sy
236
3SW
IFT
J182
5.4+
0000
276.
344
0.00
714
.06
4U18
22-0
0027
6.34
21−
0.01
225.
380.
270.
000.
03L
MX
B/N
S36
4SW
IFT
J182
5.7−
3705
276.
426
−37
.075
101.
08V
691
CrA
4U18
22-3
7127
6.44
50−
37.1
053
45.1
50.
350.
050.
00L
MX
B36
5SW
IFT
J182
9.4+
4846
277.
359
48.7
704.
823C
380
277.
3820
48.7
460
2.56
0.54
0.47
0.10
0.69
2046
.73
Sy1.
5L
PQ36
6SW
IFT
J182
9.4−
2346
277.
360
−23
.763
244.
65V
4634
Sgr
Gin
ga18
26-2
427
7.36
75−
23.7
969
175.
790.
610.
300.
00L
MX
B/N
S36
7SW
IFT
J183
0.8+
0928
277.
686
9.50
66.
722M
ASX
J183
0506
5+09
2841
427
7.71
109.
4783
3.94
0.64
0.36
0.06
0.01
9043
.51
Sy2
368
SWIF
TJ1
833.
7−21
0527
8.41
8−
21.0
788.
52PK
S18
30-2
127
8.41
62−
21.0
611
9.41
0.91
0.51
0.05
2.50
0048
.67
Bla
zar
369
SWIF
TJ1
833.
7−10
3227
8.42
5−
10.5
3613
.54
SNR
G21
.5-0
0.9
278.
3833
−10
.560
08.
630.
630.
330.
03SN
R37
0SW
IFT
J183
5.0+
3240
278.
760
32.6
6516
.94
3C38
227
8.76
4132
.696
38.
420.
500.
350.
020.
0579
44.8
3Sy
137
1SW
IFT
J183
5.6−
3259
278.
907
−32
.990
33.3
8X
B18
32-3
3027
8.93
38−
32.9
914
24.3
10.
630.
360.
01L
MX
B/N
S37
2SW
IFT
J183
6.9−
5924
279.
225
−59
.403
5.56
FAIR
AL
L00
4927
9.24
29−
59.4
024
2.93
0.54
0.30
0.08
0.02
0243
.43
Sy2
373
SWIF
TJ1
837.
9−06
5727
9.46
4−
6.94
98.
21PS
RJ1
838-
0655
AX
J183
8.0-
0655
/HE
SSJ1
837-
069
279.
4279
−6.
9275
4.69
0.67
0.41
0.07
PSR
/PW
N37
4SW
IFT
J183
8.4−
6524
279.
638
−65
.448
17.2
9E
SO10
3-03
527
9.58
48−
65.4
276
11.1
40.
590.
350.
020.
0133
43.6
4Sy
237
5SW
IFT
J184
0.0+
0501
279.
992
5.02
598
.36
MM
Ser
SerX
-127
9.98
965.
0358
33.5
80.
240.
010.
00L
MX
B/N
S37
6SW
IFT
J184
1.2−
0458
280.
304
−4.
973
11.3
0A
XP
1E18
41-0
45K
es73
280.
3300
−4.
9364
10.8
90.
810.
540.
04A
XP
377
SWIF
TJ1
842.
0+79
4528
0.65
579
.768
25.2
43C
390.
328
0.53
7579
.771
410
.97
0.46
0.39
0.02
0.05
6144
.92
Sy1
378
SWIF
TJ1
844.
5−62
2128
1.12
0−
62.3
576.
93Fa
iral
l005
128
1.22
49−
62.3
648
4.57
0.66
0.44
0.07
0.01
4243
.31
Sy1
379
SWIF
TJ1
844.
9−04
3528
1.23
6−
4.58
15.
19A
XJ1
845.
0-04
33IG
RJ1
8450
-043
528
1.25
88−
4.56
533.
460.
670.
340.
07H
MX
B38
0SW
IFT
J184
5.7+
0052
281.
420
0.87
011
.48
Gin
ga18
43+0
028
1.41
250.
8917
6.28
0.52
0.27
0.04
HM
XB
381
SWIF
TJ1
846.
5−02
5728
1.62
3−
2.94
24.
88A
XJ1
846.
4-02
5828
1.60
20−
2.97
403.
450.
600.
390.
08PS
R38
2SW
IFT
J184
8.2−
0310
282.
054
−3.
161
14.8
2IG
RJ1
8483
-031
128
2.07
50−
3.16
179.
030.
560.
290.
03H
MX
B/N
S38
3SW
IFT
J185
3.0−
0843
283.
256
−8.
712
26.2
34U
1850
-086
283.
2703
−8.
7057
14.7
20.
590.
330.
02L
MX
B/N
S38
4SW
IFT
J185
5.0−
3110
283.
760
−31
.170
18.7
7V
1223
Sgr
283.
7593
−31
.163
59.
710.
460.
130.
02C
V/D
QH
er38
5SW
IFT
J185
5.5−
0237
283.
866
−2.
616
39.3
9X
TE
J185
5-02
628
3.88
04−
2.60
6721
.54
0.48
0.25
0.01
HM
XB
/NS
386
SWIF
TJ1
856.
1+15
3928
4.02
215
.644
5.47
2E18
53.7
+153
428
4.00
5315
.634
93.
160.
530.
390.
070.
0840
44.7
4Sy
138
7SW
IFT
J185
6.2−
7829
284.
061
−78
.479
5.06
2MA
SXJ1
8570
768-
7828
212
284.
2823
−78
.472
52.
47A
B0.
420.
0420
44.0
1Sy
138
8"
""
"[H
B91
]184
6-78
628
3.48
60−
78.5
400
1.75
AB
0.49
0.07
6044
.39
Sy1
389
SWIF
TJ1
858.
9+03
2928
4.73
43.
480
5.12
XT
EJ1
858+
034
284.
6790
3.43
402.
200.
320.
030.
08H
MX
B/N
S39
0SW
IFT
J190
0.2−
2455
285.
050
−24
.914
79.7
7H
ET
EJ1
900.
1-24
5528
5.03
60−
24.9
205
55.7
40.
640.
330.
00L
MX
B/m
sPSR
391
SWIF
TJ1
901.
6+01
2928
5.40
11.
475
10.2
5X
TE
J190
1+01
428
5.42
081.
4385
6.73
0.60
0.34
0.04
SRC
/GA
MM
A39
2SW
IFT
J190
7.3−
2050
286.
882
−20
.830
5.78
V10
82Sg
r28
6.84
11−
20.7
808
2.75
0.53
0.25
0.08
CV
393
SWIF
TJ1
909.
6+09
4828
7.40
89.
804
66.6
24U
1907
+09
287.
4079
9.83
0326
.23
0.34
0.05
0.01
HM
XB
/NS
394
SWIF
TJ1
910.
8+07
3928
7.68
87.
645
58.1
02M
ASS
J191
0482
1+07
3551
64U
1909
+07
287.
7000
7.59
8325
.79
0.46
0.23
0.01
HM
XB
/NS
395
SWIF
TJ1
911.
2+00
3628
7.80
70.
603
21.2
5A
qlX
-128
7.81
670.
5850
13.1
70.
560.
320.
02L
MX
B39
6SW
IFT
J191
2.0+
0500
287.
999
5.00
327
.20
SS43
328
7.95
654.
9827
12.0
10.
430.
210.
02uQ
uasa
r39
7SW
IFT
J191
4.0+
0951
288.
496
9.85
331
.99
2MA
SSJ1
9140
422+
0952
577
IGR
J191
40+0
951
288.
5083
9.88
8316
.82
0.46
0.23
0.01
HM
XB
398
SWIF
TJ1
915.
3+10
5728
8.81
610
.953
840.
73G
RS
1915
+105
288.
7983
10.9
456
386.
660.
400.
170.
00L
MX
B/B
H

26 TUELLER ET AL.TA
BL
E5
—C
ontin
ued
#B
AT
Nam
eaR
Ab
Dec
S/N
Cou
nter
part
Nam
eO
ther
Nam
eC
tptR
Ac
Ctp
tDec
Flux
der
ror
Ce
Hra
tfH
err
Red
shif
tgL
umh
Type
399
SWIF
TJ1
918.
6−05
1628
9.65
4−
5.26
531
.84
V14
05A
ql4U
1916
-053
289.
6995
−5.
2381
16.1
70.
510.
220.
01L
MX
B/N
S40
0SW
IFT
J192
1.1+
4356
290.
273
43.9
2510
.36
AB
EL
L23
1929
0.18
8943
.961
92.
620.
260.
100.
050.
0557
44.2
9G
alax
ycl
uste
r40
1SW
IFT
J192
1.1−
5842
290.
275
−58
.694
8.23
ESO
141-
G05
529
0.30
90−
58.6
703
5.27
0.58
0.32
0.04
0.03
6044
.20
Sy1
402
SWIF
TJ1
922.
7−17
1629
0.69
2−
17.2
8320
.96
SWIF
TJ1
922.
7-17
16SW
IFT
J192
237.
0-17
1702
290.
6542
−17
.284
214
.69
0.67
0.33
0.02
XR
B/u
Qua
sar?
403
SWIF
TJ1
924.
5+50
1429
1.11
450
.239
7.87
CH
Cyg
2MA
SSJ1
9243
305+
5014
289
291.
1378
50.2
414
2.26
0.24
0.08
0.06
Sym
b/W
D40
4SW
IFT
J193
0.5+
3414
292.
656
34.1
937.
632M
ASX
J193
0138
0+34
1049
529
2.55
7534
.180
53.
260.
520.
400.
070.
0629
44.4
9Sy
140
5SW
IFT
J193
3.9+
3258
293.
426
32.9
385.
432M
ASS
J193
3471
5+32
5425
91R
XS
J193
347.
6+32
5422
293.
4483
32.9
061
2.30
0.49
0.37
0.08
0.05
7844
.26
Sy1.
240
6SW
IFT
J194
0.3−
1028
295.
076
−10
.473
10.2
5V
1432
Aql
295.
0478
−10
.423
65.
400.
490.
210.
04C
V/A
MH
er40
7SW
IFT
J194
2.6−
1024
295.
684
−10
.322
11.2
8N
GC
6814
295.
6694
−10
.323
57.
820.
690.
380.
040.
0052
42.6
7Sy
1.5
408
SWIF
TJ1
942.
8+32
2029
5.69
032
.339
4.81
V24
91C
yg29
5.75
8232
.320
51.
840.
540.
380.
11C
V/N
ova
409
SWIF
TJ1
943.
5+21
2029
5.95
721
.289
7.94
SWIF
TJ1
9435
3.0+
2121
19IG
RJ1
9443
+211
729
5.98
4221
.306
44.
420.
550.
380.
05SR
C/X
-ray
410
SWIF
TJ1
947.
3+44
4729
6.83
344
.790
5.13
2MA
SXJ1
9471
938+
4449
425
296.
8307
44.8
284
2.44
0.52
0.40
0.09
0.05
3944
.23
Sy2
411
SWIF
TJ1
949.
5+30
1229
7.42
330
.156
20.9
8K
S19
47+3
0029
7.37
7130
.206
78.
180.
380.
240.
02H
MX
B/N
S41
2SW
IFT
J195
2.4+
0237
298.
039
2.44
95.
453C
403
298.
0660
2.50
704.
270.
810.
550.
090.
0590
44.5
5Sy
241
3SW
IFT
J195
5.8+
3203
298.
953
32.0
4997
.31
TY
C26
73-2
004-
14U
1954
+31
298.
9264
32.0
970
35.5
20.
330.
170.
00L
MX
B41
4SW
IFT
J195
8.4+
3510
299.
602
35.1
7143
04.2
3C
ygX
-129
9.59
0335
.201
622
45.7
60.
520.
410.
00H
MX
B/B
H41
5SW
IFT
J195
9.4+
4044
299.
807
40.7
3125
.99
Cyg
nus
A29
9.86
8240
.733
912
.23
0.49
0.37
0.02
0.05
6144
.96
Sy2
416
SWIF
TJ1
959.
6+65
0729
9.99
065
.195
11.2
3Q
SOB
1959
+650
1ES
1959
+650
299.
9994
65.1
485
3.87
0.36
0.24
0.04
0.04
7044
.30
BL
Lac
417
SWIF
TJ2
000.
6+32
1030
0.06
332
.176
7.87
USN
O-A
2.0
1200
-141
3154
12M
ASS
J200
0218
5+32
1123
230
0.09
1332
.189
43.
250.
400.
260.
05H
MX
B41
8SW
IFT
J200
9.0−
6103
302.
159
−61
.078
8.71
NG
C68
6030
2.19
54−
61.1
002
6.50
0.73
0.40
0.05
0.01
4943
.51
Sy1
419
SWIF
TJ2
018.
8+40
4130
4.69
740
.691
5.36
2MA
SXJ2
0183
871+
4041
003
IGR
J201
87+4
041
304.
6613
40.6
834
3.36
0.55
0.47
0.08
0.01
4443
.19
Sy2
420
SWIF
TJ2
028.
5+25
4330
7.11
425
.784
14.8
8M
CG
+04-
48-0
0230
7.14
6125
.733
38.
770.
590.
450.
030.
0139
43.5
8Sy
242
1SW
IFT
J203
2.2+
3738
308.
053
37.6
2627
6.33
EX
O20
30+3
7530
8.06
3337
.637
599
.67
0.35
0.21
0.00
HM
XB
/NS
422
SWIF
TJ2
032.
5+40
5530
8.12
540
.915
753.
06C
ygX
-3V
1521
Cyg
308.
1074
40.9
578
238.
900.
320.
160.
00H
MX
B/N
S42
3SW
IFT
J203
3.4+
2147
308.
341
21.7
746.
484C
+21.
5530
8.38
3521
.772
93.
260.
490.
380.
060.
1735
45.4
4Q
SO42
4SW
IFT
J203
7.2+
4151
309.
214
41.8
717.
02SW
IFT
J203
705.
78-4
1500
5.1
SWIF
TJ2
037.
2+41
5130
9.30
0041
.850
01.
710.
190.
000.
07tr
ansi
ent
425
SWIF
TJ2
042.
3+75
0731
0.75
375
.121
13.4
94C
+74.
2631
0.65
5475
.134
05.
020.
410.
320.
030.
1040
45.1
4Sy
142
6SW
IFT
J204
4.0+
2832
311.
042
28.5
105.
83R
XJ2
044.
0+28
3331
1.01
8828
.553
42.
530.
460.
350.
070.
0500
44.1
7Sy
142
7SW
IFT
J204
4.2−
1045
311.
047
−10
.699
14.8
9M
rk50
931
1.04
06−
10.7
235
9.44
0.68
0.37
0.03
0.03
4444
.41
Sy1.
242
8SW
IFT
J205
2.0−
5704
312.
979
−57
.057
10.9
3IC
5063
313.
0098
−57
.068
88.
590.
720.
400.
040.
0114
43.3
9Sy
242
9SW
IFT
J211
4.4+
8206
318.
530
82.0
659.
442M
ASX
J211
4012
8+82
0448
331
8.50
4982
.080
14.
210.
510.
440.
050.
0840
44.8
7Sy
143
0SW
IFT
J211
7.5+
5139
319.
365
51.6
496.
882M
ASX
J211
7474
1+51
3852
331
9.44
8051
.648
33.
140.
520.
460.
06?
Gal
axy
431
SWIF
TJ2
118.
9+33
3631
9.71
533
.638
4.84
2MA
SXJ2
1192
912+
3332
566
319.
8714
33.5
491
1.53
0.44
0.39
0.12
0.05
0743
.97
Sy1
432
SWIF
TJ2
123.
5+42
1732
0.87
142
.279
4.99
V20
69C
yg32
0.93
7042
.301
01.
210.
290.
100.
12C
V43
3SW
IFT
J212
3.6+
2506
320.
911
25.0
954.
863C
433
320.
9356
25.0
700
1.74
0.44
0.29
0.08
0.10
1644
.66
Sy2
NL
RG
434
SWIF
TJ2
124.
6+50
5732
1.15
651
.000
43.1
54C
50.5
5IG
RJ2
1247
+505
832
1.16
4150
.973
817
.81
0.47
0.39
0.01
0.02
0044
.21
BL
RG
,not
Sy1
435
SWIF
TJ2
127.
4+56
5432
1.95
356
.892
9.99
SWIF
TJ2
1274
5.58
+565
635.
6IG
RJ2
1277
+565
632
1.93
7356
.944
43.
870.
390.
250.
040.
0147
43.2
7Sy
143
6SW
IFT
J212
9.9+
1209
322.
468
12.1
4722
.11
NG
C70
78A
C21
14U
2129
+12
322.
4929
12.1
674
9.16
0.45
0.27
0.02
LM
XB
437
SWIF
TJ2
132.
0−33
4332
2.97
2−
33.6
988.
266d
FJ2
1320
22-3
3425
432
3.00
92−
33.7
150
5.55
0.74
0.42
0.05
0.02
9344
.04
Sy1
438
SWIF
TJ2
133.
6+51
0532
3.40
951
.080
16.4
9R
XJ2
133.
7+51
0732
3.43
2051
.123
65.
230.
330.
190.
03C
V/D
QH
er43
9SW
IFT
J215
6.1+
4728
324.
064
47.5
236.
112M
ASX
J213
5539
9+47
2821
732
3.97
5047
.472
72.
680.
47B
0.41
0.07
0.02
5043
.58
Sy1
440
""
""
IGR
J213
47+4
737
323.
8460
47.5
770
1.50
A0.
44X
RB
441
SWIF
TJ2
135.
5−62
2232
4.06
7−
62.3
877.
371R
XS
J213
623.
1-62
2400
324.
0963
−62
.400
23.
880.
570.
350.
060.
0588
44.5
1Sy
144
2SW
IFT
J214
2.7+
4337
325.
686
43.6
2113
.88
SSC
yg32
5.67
8443
.586
14.
570.
330.
180.
03C
V/D
war
fN44
3SW
IFT
J214
4.7+
3816
326.
166
38.2
7425
7.42
Cyg
X-2
326.
1717
38.3
217
59.9
90.
180.
020.
00L
MX
B/N
S44
4SW
IFT
J215
2.0−
3030
328.
002
−30
.503
12.4
2PK
S21
49-3
0632
7.98
14−
30.4
649
10.5
80.
960.
540.
042.
3450
48.6
5B
laza
r44
5SW
IFT
J220
0.9+
1032
330.
144
10.5
676.
16M
RK
520
330.
1724
10.5
524
3.58
0.64
0.43
0.07
0.02
6643
.76
Sy1.
944
6SW
IFT
J220
1.9−
3152
330.
550
−31
.838
27.3
7N
GC
7172
330.
5080
−31
.869
818
.11
0.70
0.42
0.02
0.00
8743
.48
Sy2
447
SWIF
TJ2
202.
8+42
1833
0.69
842
.304
7.72
BL
Lac
330.
6804
42.2
778
4.40
0.51
0.44
0.06
0.06
8644
.70
BL
Lac
448
SWIF
TJ2
207.
8+54
3233
1.95
254
.539
61.6
4B
D+5
327
904U
2206
+54
331.
9843
54.5
185
22.4
40.
400.
280.
01H
MX
B/N
S44
9SW
IFT
J220
9.4−
4711
332.
301
−47
.191
8.06
NG
C72
1333
2.31
77−
47.1
667
5.75
0.67
0.44
0.05
0.00
5842
.64
Sy1.
545
0SW
IFT
J221
7.5−
0812
334.
467
−8.
371
13.0
2FO
AQ
R33
4.48
10−
8.35
135.
850.
360.
110.
03C
V/D
QH
er45
1SW
IFT
J222
3.9−
0207
335.
977
−2.
119
7.62
3C44
533
5.95
66−
2.10
344.
370.
580.
400.
050.
0562
44.5
2Sy
245
2SW
IFT
J222
3.8+
1143
335.
991
11.8
015.
71M
CG
+02-
57-0
0233
5.93
8011
.836
02.
080.
450.
320.
090.
0290
43.6
0Sy
1.5
453
SWIF
TJ2
229.
9+66
4633
7.35
466
.753
5.37
87G
B22
2741
.2+6
6312
433
7.29
9966
.784
62.
790.
610.
510.
080.
1130
44.9
6Sy
145
4SW
IFT
J223
2.5+
1141
338.
136
11.6
856.
20[H
B89
]223
0+11
433
8.15
1711
.730
84.
170.
650.
530.
071.
0370
47.3
8B
laza
rHP
455
SWIF
TJ2
235.
9−26
0233
8.90
6−
26.1
179.
31N
GC
7314
338.
9426
−26
.050
34.
630.
590.
370.
050.
0048
42.3
7Sy
1.9

SWIFT-BAT 22 MONTH HARD X-RAY SURVEY 27TA
BL
E5
—C
ontin
ued
#B
AT
Nam
eaR
Ab
Dec
S/N
Cou
nter
part
Nam
eO
ther
Nam
eC
tptR
Ac
Ctp
tDec
Flux
der
ror
Ce
Hra
tfH
err
Red
shif
tgL
umh
Type
456
SWIF
TJ2
235.
9+33
5833
9.00
633
.925
8.35
NG
C73
1933
9.01
4833
.975
73.
960.
520.
410.
050.
0225
43.6
6Sy
245
7SW
IFT
J223
6.7−
1233
339.
176
−12
.550
6.41
MR
K09
1533
9.19
38−
12.5
452
4.99
0.71
0.49
0.07
0.02
4143
.82
Sy1
458
SWIF
TJ2
246.
0+39
4134
1.46
239
.638
9.43
3C45
234
1.45
3239
.687
73.
780.
480.
370.
050.
0811
44.7
9Sy
245
9SW
IFT
J225
1.9+
2215
343.
008
22.2
815.
14M
G3
J225
155+
2217
342.
9729
22.2
937
3.11
0.63
0.52
0.09
3.66
8048
.59
QSO
460
SWIF
TJ2
253.
9+16
0834
3.47
716
.140
26.1
33C
454.
334
3.49
0616
.148
215
.89
0.65
0.53
0.02
0.85
9047
.76
Bla
zar
461
SWIF
TJ2
254.
1−17
3434
3.49
1−
17.5
7217
.90
MR
2251
-178
343.
5242
−17
.581
99.
170.
530.
350.
020.
0640
44.9
6Sy
146
2SW
IFT
J225
5.4−
0309
343.
838
−3.
154
8.83
AO
Psc
3A22
53-0
3334
3.82
49−
3.17
792.
920.
280.
070.
06C
V/D
QH
er46
3SW
IFT
J225
8.9+
4054
344.
761
40.8
966.
14U
GC
1228
234
4.73
1240
.931
52.
490.
500.
380.
070.
0170
43.2
1Sy
1.9
464
SWIF
TJ2
259.
7+24
5834
4.93
224
.942
7.17
KA
Z32
034
4.88
7124
.918
22.
880.
510.
370.
070.
0345
43.9
0Sy
146
5SW
IFT
J230
3.3+
0852
345.
800
8.83
915
.16
NG
C74
6934
5.81
518.
8740
6.66
0.44
0.32
0.03
0.01
6343
.60
Sy1.
246
6SW
IFT
J230
4.8−
0843
346.
168
−8.
697
18.3
8M
rk92
634
6.18
11−
8.68
5710
.17
0.57
0.39
0.02
0.04
6944
.72
Sy1.
546
7SW
IFT
J231
8.4−
4223
349.
630
−42
.380
16.2
4N
GC
7582
349.
5979
−42
.370
67.
920.
550.
400.
030.
0052
42.6
8Sy
246
8SW
IFT
J231
8.9+
0013
349.
734
0.22
09.
70N
GC
7603
349.
7359
0.24
404.
700.
510.
340.
040.
0295
43.9
7Sy
1.5
469
SWIF
TJ2
319.
4+26
1934
9.89
326
.307
5.14
MR
K32
235
0.01
3026
.216
00.
64A
0.19
0.02
6643
.02
Gal
axy
470
""
""
UG
C12
515
349.
9630
26.2
630
1.28
0.37
B0.
240.
110.
0265
43.3
1G
alax
y47
1"
""
"SW
IFT
J231
930.
4+26
1517
349.
8765
26.2
548
0.28
A0.
13C
V/A
MH
er47
2SW
IFT
J232
3.3+
5849
350.
830
58.8
1322
.84
Cas
A35
0.85
0058
.815
06.
780.
320.
190.
02SN
R47
3SW
IFT
J232
5.5−
3827
351.
334
−38
.484
5.64
LC
RS
B23
2242
.2-3
8432
035
1.35
08−
38.4
470
2.41
0.47
0.27
0.07
0.03
5943
.86
Sy1
474
SWIF
TJ2
325.
6+21
5735
1.41
021
.952
4.85
2MA
SXJ2
3255
427+
2153
142
351.
4760
21.8
870
1.63
0.42
0.22
0.10
0.12
0044
.79
Sy1
475
SWIF
TJ2
327.
6+06
2935
1.93
56.
418
4.92
SWIF
TJ2
327.
6+06
2935
1.93
506.
4180
2.55
0.62
0.40
0.09
?47
6SW
IFT
J232
8.9+
0328
352.
218
3.46
55.
04N
GC
7682
352.
2664
3.53
332.
27A
B0.
350.
0171
43.1
8Sy
247
7"
""
"N
GC
7679
352.
1944
3.51
142.
33A
B0.
350.
0171
43.1
9Sy
1/L
IRG
478
SWIF
TJ2
341.
8+30
3335
5.46
430
.614
6.69
UG
C12
741
355.
4811
30.5
818
4.00
0.59
0.52
0.07
0.01
7443
.44
Gal
axy
479
SWIF
TJ2
358.
4+33
3935
9.60
133
.642
4.85
SWIF
TJ2
358.
4+33
3935
9.60
1033
.642
02.
080.
610.
420.
10?
RE
FE
RE
NC
ES.
—B
ikm
aev
etal
.(20
08,2
006)
;Bod
aghe
eet
al.(
2006
,200
7);B
uren
inet
al.(
2008
);B
utle
ret
al.(
2009
);C
hakr
abar
tyet
al.(
2002
);C
oeet
al.(
1994
);H
omer
etal
.(20
02);
Isra
elet
al.(
2001
);Ju
ett&
Cha
krab
arty
(200
5);
Mar
kwar
dtet
al.(
2005
);M
aset
tiet
al.(
2008
,200
9);R
odri
guez
etal
.(20
09);
Tom
sick
etal
.(20
08);
Tuel
lere
tal.
(200
8);W
alte
reta
l.(2
006)
;Wils
onet
al.(
2003
)a
Ifa
BA
Tna
me
exis
tsin
the
9-m
onth
cata
log
(Tue
llere
tal.
2008
),th
enth
atna
me
isus
ed.I
fthe
reis
no9-
mon
thB
AT
nam
e,th
enth
eB
AT
nam
elis
ted
here
isth
ena
me
that
was
used
tore
ques
tXR
Tfo
llow
upob
serv
atio
ns(a
ndus
edin
the
HE
ASA
RC
arch
ive)
.Whe
nno
prev
ious
BA
Tna
me
fort
his
sour
ceex
ists
,we
listh
ere
aB
AT
nam
ede
rived
from
the
BA
Tpo
sitio
nin
this
cata
log.
bT
heB
AT
sour
cepo
sitio
nslis
ted
here
are
allu
nifo
rmly
gene
rate
dfr
oma
blin
dse
arch
ofth
e22
-mon
thda
taan
dar
eJ2
000
coor
dina
tes.
cT
heco
unte
rpar
tpos
ition
isth
em
osta
ccur
ate
posi
tion
know
nof
the
obje
ctin
the
’nam
e’co
lum
nin
J200
0co
ordi
nate
s,an
dis
usua
llyta
ken
from
NE
Dor
SIM
BA
D.I
fno
coun
terp
arti
skn
own,
the
blin
dB
AT
posi
tion
islis
ted.
dT
heflu
xis
extr
acte
dfr
omth
eB
AT
map
sat
the
posi
tion
liste
dfo
rthe
coun
terp
art,
isin
units
of10
−11
ergs
s−1 cm
−2 ,a
ndis
com
pute
dfo
rthe
14–1
95ke
Vba
nd.
eT
hem
eani
ngof
the
conf
usio
nfla
gis
asfo
llow
s:A
=’C
onfu
sed’
sour
ce,B
=’C
onfu
sing
’sou
rce,
AB
=B
oth
conf
used
and
conf
usin
g.To
mak
ese
nse
ofth
isco
nfou
ndin
gsc
enar
io,s
ee§4
and
§4.3
.f
The
hard
ness
ratio
isth
era
tioof
the
35–1
50ke
Vco
untr
ate
toth
e14
–150
keV
coun
trat
e.g
The
reds
hift
sar
eta
ken
from
the
onlin
eda
taba
ses
NE
Dan
dSI
MB
AD
orin
afe
wca
ses
from
ouro
wn
anal
ysis
ofth
eop
tical
data
.Abl
ank
indi
cate
sth
atth
eob
ject
isG
alac
atic
,and
a?
indi
cate
sth
atth
eob
ject
has
anun
know
nre
dshi
ft.
hT
helu
min
osity
isco
mpu
ted
from
the
flux
and
reds
hift
inth
ista
ble,
with
units
oflo
g[er
gss−
1 ]in
the
14–1
95ke
Vba
nd.