Thailand Internet User Profile 2015 - UNCTAD
124
-
Upload
khangminh22 -
Category
Documents
-
view
0 -
download
0
Transcript of Thailand Internet User Profile 2015 - UNCTAD


Title Thailand Internet User Profile 2015
Compiled by Survey and Indices Section
Office of Strategy
Electronic Transactions Development Agency
(Public Organization)
Ministry of Information and Communication Technology
ISBN ISBN 978-974-9765-73-9
1st Edition March 2016
Number of Copies 500 issues
Price 200 Baht
Copyright ©2013 by ETDA. All Rights Reserved.

2 Thailand Internet User Profile 2015
Atcharaporn MutradenDirector, Office of Strategy
Ratthasart KorrasudNattapong WorapivutPaises Charoenpanish Napadol UtsanaboonsiriNattanai RoudreiwJirayut Kunlaphuk
English VersionDuangtip SurintatipSenior Adviser for Foreign Affairs
Abhassara Charubha
Jirawan BoonpermChairman of the Executive Board
of Directors, ETDA
Surangkana WayuparbExecutive Director and CEO, ETDA
Report Compilation Team
Jiraporn TangpoolcharoenSpecialist, Office of Strategy
Jirawan Boonperm Surangkana WayuparbWanawit AhkuputraSansanee Limpong Atcharaporn Mutraden
AdvisersBongkoj WibultananunStatistician, Senior Professional Level,National Statistical Office
Working Group
Promotion andGraphic Design Team
Jiraporn Tangpoolcharoen
Data Analysisand Reporting
Editors
Pornprapat ButrprasertSukanya Yuchuchaimongkol
Coordinatiors
Surangkana WayuparbThosaporn Kompat
ETDA Team

1. Mrs. Jirawan Boonperm Chairman
2. Mrs. Songporn Komolsuradej Ex o�cio Member
3. Mr. Somsak Chotirattanasiri Ex o�cio Member
4. Mr. Thaweesak Koanantakool Ex o�cio Member
5. Mr. Chartsiri Sophonpanich Expert Member(Finance and E-Commerce)
6. Mr. Tanawong Areeratchakul Expert Member (Engineering, Social Science and Personnel Management)
7. Ms. Vilawan Vanadurongvan Expert Member (Finance)
8. Mr. Chavalit Uttasart Expert Member (Law)
9. Mr. Teera Aphaiwongse Expert Member(Computer Science)
10. Ms. Sibporn Thavornchan Expert Member(Computer Science and Finance)
11. Mrs. Surangkana Wayuparb Member and Secretary
The Electronic Transactions Development Agency (Public Organization) or ETDA public agency that develops, promotes and
supports the nation’s electronic transactionsAn Executive Board of Directors administers and formulates policies for its operations.
(2015-2018)

1. Mrs. Jirawan Boonperm Chairman
2. Mrs. Songporn Komolsuradej Ex o�cio Member
3. Mr. Somsak Chotirattanasiri Ex o�cio Member
4. Mr. Thaweesak Koanantakool Ex o�cio Member
5. Mr. Chartsiri Sophonpanich Expert Member(Finance and E-Commerce)
6. Mr. Tanawong Areeratchakul Expert Member (Engineering, Social Science and Personnel Management)
7. Ms. Vilawan Vanadurongvan Expert Member (Finance)
8. Mr. Chavalit Uttasart Expert Member (Law)
9. Mr. Teera Aphaiwongse Expert Member(Computer Science)
10. Ms. Sibporn Thavornchan Expert Member(Computer Science and Finance)
11. Mrs. Surangkana Wayuparb Member and Secretary
The Electronic Transactions Development Agency (Public Organization) or ETDA
An Executive Board of Directors administers and formulates policies for its operations.
(2015-2018)

6 Thailand Internet User Profile 2015
(Mrs.Surangkana Wayuparb) Executive Director and CEO
Electronic Transactions Development Agency (Public Organization)
Ministry of Information and Communication Technology
Because “Internet is power,”
a survey on Thai Internet User’s Profile is critical
to building a strategy to drive the nation’s online
transactions.

Electronic Transactions Development Agency (Public Organization) 7

8 Thailand Internet User Profile 2015
PrefacePolicy makers are in need of a set of data that reflects how the
Internet is used by all sectors of the population if they were to come up with ICT policies that could contribute to national and agency level planning that truly responds to the needs of the people. The data ought to be compiled continuously on an annual basis in order to demonstrate the changing directions, and trends of Internet usage and its users’ behavior. Besides, new e-commerce entrepreneurs or existing ones could come to an understanding of Internet usage and users’ behavior as shown by the data so that they could plan their marketing strategies to suit their target customers. The government sector could use the data to plan its policy framework to ensure that the Internet is used widely and appropriately.
The Electronic Transactions Development Agency (Public Organization) or ETDA is mandated to develop, promote and support the nation’s electronic transactions. It participated in the national efforts to lay down infrastructures that are conducive to electronic transactions and to support service businesses related to electronic transactions while establishing ICT standards that are secure and reliable. ETDA recognizes the importance of data compilation on Internet users’ profiles and has been conducting the survey on Thai Internet users’ profiles since 2013. Data on Thai users’ characteristics and behavior forms the database for analysis. ETDA plans to conduct such a survey every year.
The survey findings are normally divided into two major parts: the first part concerns the behavior of users, based on basic questions that are comparable to those used in earlier surveys; the second part is a survey on a topic of current interest which necessarily changes every year. This year’s special survey was on online purchasing behavior in a digital economy, a

Electronic Transactions Development Agency (Public Organization) 9
topic that attracts current public attention. Internet users were questioned before deciding to purchase goods/services, when they took the plunge to purchases goods/services, and in the aftermath of the purchase.
This survey was conducted online through the process of self- selection on the part of respondents. Statistically speaking, the compiled and processed data does not represent the entire Thailand Internet user population. However, as many as 17,010 users elected to respond to the questionnaire, with 10,434 valid responses in the final count. The resulting data could be used as a reference to a certain extent for Internet usage behavior and online purchasing of goods/services. For the purpose of processing and analyzing the data, a working group was also set up, represented by expert and experienced agencies, to ensure the accuracy of the survey as dictated by the science of Statistics.
This particular survey received wide support from several agencies, both public and private, in terms of banner publicity on their websites and in-house public relations efforts to attract would be respondents. ETDA would like to recognize the contribution of those agencies whose names appear in the annex to this report. It is our hope that the report will prove to be useful to both public and private agencies, especially to operators of electronic commerce and the interested public.
(Mrs.Surangkana Wayuparb) Executive Director and CEO, Electronic Transactions Development Agency (Public Organization) Ministry of Information and Communication Technology February 2016

10 Thailand Internet User Profile 2015
Contents
Preface ........................................................................................................... 8
List of Charts ............................................................................................... 12
List of Statistical Tables .......................................................................... 16
Executive Summary ................................................................................... 18
Introduction................................................................................................. 26
Survey Objectives ....................................................................................... 27
Survey Procedure .........................................................................................27
Survey Methodology ....................................................................................28
Internet Usage Behavior ........................................................................... 30
Devices Used to Access the Internet .................................................... 36
Period of Internet Usage by Type of Devices ...................................... 39
Internet Usage Sites .....................................................................................43
Online Activities ............................................................................................46
Favorite Social Media Sites.........................................................................50
Major Problems in Internet Usage ............................................................53

Electronic Transactions Development Agency (Public Organization) 11
Purchasing of Goods/Services Online by “Thai People” in the Digital Economy Era ............................................56
Purchasing Behavior of Goods/Services Online ....................................58
Factors Influencing Decisions to Visit Websites Selling Goods/ Services Online ..............................................................................................59
Preferred Categories of Goods/Services Purchased Online ................64
Number and Value of Online Purchases of Goods/Services ..............70
Factors Influencing Decisions to Buy Goods/Services Online ............74
Provision of Personal Information to Vendors .......................................77
Payment Channels for Goods/Services ...................................................81
Problems Arising from Buying Goods/Services Online .........................84
Complaint Channels ....................................................................................85
Annex ..............................................................................................................88
Profiles of Respondents of Thailand Internet User Profile 2015 .......89
Questionaire on Thailand Internet User Profile 2015 ..........................99
Statistical Tables ........................................................................................ 109

12 Thailand Internet User Profile 2015
List of ChartsChart 1 Percentage of Internet Users, Classified by the Number of Hours Spent on the Internet per Week ...................................... 33
Chart 2 Average Number of Hours Spent on the Internet per Week, Classified by Internet User’s General Attributes ...................... 35
Chart 3 Devices Used to Access the Internet, Classified by Average Number of Hours Used per Day ................................................... 36
Chart 4 Devices Used to Access the Internet, Classified by Gender and Generation ......................................................................................... 39
Chart 5 Users’ Preferred Periods of Usage, Classified by Type of Devices ............................................................................................... 41
Chart 6 Internet Users Classified by Internet Usage Site ........................43
Chart 7 Internet Users Classified by Gender, Generation and Internet Usage Site .......................................................................................... 45
Chart 8 Online Activities Carried Out on Mobile Devices or Computers ......................................................................................... 47
Chart 9 Internet Users’ Regularly Used Social Media Sites .................. 51
Chart 10 Internet Users’ Regularly Used Social Media Sites, Classified by Gender and Generation .................................................................. 52
Chart 11 Users’ Problems while Carrying Out Online Activities ............ 55

Electronic Transactions Development Agency (Public Organization) 13
Chart 12 Internet Users’ Reasons for Not Purchasing Goods/Services Online ................................................................... 59
Chart 13 Buyers of Goods/Services Online, Classified by Factor Influencing Their Decisions to Visit Websites Selling Goods/Services Online ................................................................... 60
Chart 14 Buyers of Goods/Services Online, Classified by Gender and Generation, Based on Factors Influencing Their Decisions to Visit Online Shops’ Websites .................................................. 63
Chart 15 Buyers of Goods/Services Online, Classified by Product/Service Category ............................................................................................. 65
Chart 16 Buyers of Goods/Services Online, Classified by Gender and Generation, Based on Categories of Purchased Goods/ Services .............................................................................................. 68
Chart 17 Average Number of Online Purchases of Goods/Services in the Past 6 Months, Classified by Product/Service Category ......... 70
Chart 18 Buyers of Online Goods/Services, Classified by Transaction Value in Each Product Category ........................................... 72 - 73
Chart 19 Buyers of Goods/Services Online, Classified by Factor Influencing Their Decisions ..............................................................75
Chart 20 Buyers of Goods/Services Online, Classified by Type of Personal Information Provided to Vendors .................................78

14 Thailand Internet User Profile 2015
Chart 21 Buyers of Goods/Services Online, Classified by Generation Based on Types of Personal Information Provided to Vendors ................................................................................................80
Chart 22 Buyers of Goods/Services Online, Classified by Payment Channel ................................................................................................81
Chart 23 Buyers of Goods/Services Online, Classified by Generation, Based on Payment Channels ..........................................................83
Chart 24 Buyers of Goods/Services Online, Classified by Delivery Channel ..............................................................................................84
Chart 25 Buyers of Goods/Services Online, Classified by Problem Encountered .......................................................................................85
Chart 26 Buyers of Goods/Services Online Who Had Lodged Complaints, Classified by Complaint Channel ...........................86
Chart 27 Buyers of Goods/Services Online Who Had Not Lodged Complaints, Classified by Reason Given ......................................87
Chart 28 Internet Users Classified by Gender ..............................................89
Chart 29 Internet Users Classified by Marital Status ..................................90
Chart 30 Internet Users Classified by Generation .......................................92
Chart 31 Internet Users Classified by Residence.........................................93
Chart 32 Internet Users Classified by Educational Attainment................94
Chart 33 Internet Users Classified by Employment Status .......................95

Electronic Transactions Development Agency (Public Organization) 15
Chart 34 Internet Users Classified by Average Monthly Personal Income .................................................................................................96
Chart 35 Internet Users Classified by Average Monthly Household Income .................................................................................................97

16 Thailand Internet User Profile 2015
List of Statistical TablesTable 1 Devices Used to Access the Internet, Classified by Users’ Gender and Generation .............................................................. 110
Table 2 Devices Used to Access the Internet at Different Periods by Users, Classified by Generation ................................................. 111
Table 3 Internet Usage Sites Preferred by Users, Classified by Gender and Generation ............................................................................. 112
Table 4 Online Activities Carried out on Computers by Users, Classified by Gender and Generation ...................................... 113
Table 5 Online Activities Carried out on Mobile Devices by Users, Classified by Gender and Generation ...................................... 114
Table 6 Social Media Sites Regularly Used by Users, Classified by Gender and Generation .............................................................. 115
Table 7 Factors Influencing Users’ Decision to Visit Websites Selling Goods/Services Online, Classified by Gender and Generation ..................................................................................... 116
Table 8 Type of Goods/Services Purchased Online by Users, Classified by Gender and Generation ........................................................ 117
Table 9 Factors Influencing Users’ Decision to Purchase Goods/ Services Online, Classified by Gender and Generation ........ 118
Electronic Transactions Development Agency (Public Organization) 17
Table 10 Type of Information Provided by Users to Online Vendors of Goods/Services, Classified by Gender and Generation ....... 119
Table 11 Payment Channels of Online Purchase of Goods/Services, Classified by Users’ Gender and Generation .......................... 120

18 Thailand Internet User Profile 2015
Executive SummaryThe Survey, Thailand Internet User Profile 2015, was conducted to
collect and compile data on various aspects of the characteristics and behaviour of Internet users in Thailand, from the devices they used, the time spent online, their online activities, to the problems encountered in their Internet usage. Each year one part of the survey is dedicated to special annual questions pertinent to that year’s interesting issues.
This year, the survey explored the common pre-purchase and post- purchase behaviour of Internet users in the digital era who, in keeping with today’s social norms, purchased products/services online. It covered the whole process, from the factors influencing their decisions to visit product websites all the way to the final stage when they decided to purchase products/services online. The questionnaire starts with questions on factors attracting respondents to online purchases of products/services, their preferred product categories and payment channels, and ends with questions on their post-purchase behaviour when faced with problems and actions taken to address such problems. The findings of the survey will be useful to agencies concerned, both public and private, especially E-Commerce business operators and those interested in using them to formulate policies on E-Commerce business promotional activities that respond to the needs of their target groups.
This survey was conducted online. ETDA posted the survey questionnaire on various websites and social network sites from the end of March to the end of May 2015. Answers from 10,434 of the total 17,010 voluntary respondents were complete and used for data processing.

Electronic Transactions Development Agency (Public Organization) 19
Major FindingsGeneral Information on Internet Users
Of all the respondents in the 2015 survey, more women (55.8 per cent) then men (42.4 per cent) answered our questionnaire, while only 1.8 per cent of respondents were transgender. This year respondents were classified by age group into four generations , Generation Z, Generation Y, Generation X, and Baby Boomers.
The highest number of respondents came from Generation Y (64.4 per cent), when compared to Generation Z (2.9 percent), Generation X (26.2 per cent) and Baby Boomers (6.5 per cent).
Distribution of respondents by residence was fairly equal between Bangkok and the provinces and the distribution of gender, age, education, employment status, and household income was consistent with the demographic structure, which rendered them viable for inter-group comparative studies.
Internet Usage Behaviour
online increased during every period of usage when compared to findings in 2014. The highest number of hours per week spent on the Internet was found in the transgender and Generation Y groups, at 58.3 and 54.2 hours per week respectively.
Smartphones continued to be Internet users’ device of choice, at 80 per cent, with daily average usage of 5.7 hours per day. Users in the

20 Thailand Internet User Profile 2015
groups of Generation X, Generation Y and Generation Z preferred to use smartphones to surf the net while desktop PCs were the device most commonly used by Baby Boomers to access the Internet.
This was the first year that the survey findings indicated that smartphones were the device of choice most commonly used by respondents to connect to the Internet all day long. The top three online activities of Internet users via mobile devices were communicating via online social networks such as Facebook, Instagram and LINE, at 82.7 per cent; 2) web searching, at 56.6 per cent; and 3) reading e-news and e-books, at 52.2 per cent. The top three activities of users accessing the Internet via desktop PCs were: 1) web search, at 62.2 per cent; 2) email correspondence at 53.7 per cent, and 3) online communication via social networks, at 45.3 per cent.
According to these Internet users, the top three major Internet usage problems were: 1) slow connection (72.0 per cent); 2) the volume of annoying unsolicited online advertisements (41.6 per cent); and 3) difficulties accessing the Internet and frequent dropped connections (33.8 per cent).
Online Purchases of Goods and Services by Thai Internet Users in the Digital Economy Era
Of all the respondents, 35.1 per cent indicated that they had never purchased goods and services online. The reasons given were: fear of deception (57.6 per cent); lack of pre-purchase opportunity to touch or try the products (42.1 percent); and desired products not available on websites or online shops (32.2 per cent). Most (58.2 per cent) of those who have purchased goods or services online surfed websites selling

Electronic Transactions Development Agency (Public Organization) 21
goods or services to read reviews/comments from buyers/users of such goods or services before deciding whether to purchase them. More female and transgender buyers (60.8 per cent and 59.1 per cent respectively) than their male counterparts (56.4 per cent) used this shopping channel. With regard to visiting online shops’ websites, more buyers in Generation Z and Generation Y were influenced by recommendations of bloggers/net idols/actors and actresses/and celebrities than respondents in other groups. The top three products purchased online were: 1) fashion goods such as clothing, shoes, handbags, and costume jewelry, at 42.6 percent; 2) IT devices such as personal computers, mobile phones, and tablet computers, at 27.5 percent; and 3) health and beauty products such as cosmetics, and dietary supplements at 24.4 per cent.
More respondents in the Generation X, Y and Z groups than Baby Boomers bought fashion goods such as gems/costume jewelry and entertainment products. More respondents in the Baby Boomer, Generation X, and Generation Y groups than those in the Generation Z group indicated that they had bought healthcare and beauty products, IT devices, and tour/travel packages.
Responding to the question on the average number of times they purchased goods and services online in the past six months, the top three answers were: 1) purchases pertinent to financial matters/investment such as stocks and mutual funds, at 6.2 times; 2) purchases of services such as ringtone/song/film/online game downloading, at 5.7 times; and 3) purchases of fashion items and tour/travel packages, at 3.1 times.
The survey findings showed that during the six months prior to the survey most of online buyers spent less than 1,000 Baht per transaction

22 Thailand Internet User Profile 2015
to buy goods and services online. The top two respondents’ preferred product categories under 1,000 Baht were: 1) ringtone/song/film/online game downloading services, at 78.8 per cent; and 2) products in the gems/costume jewelry category, at 57.0 per cent. Products ranking third and fourth based on buyers’ similar preferences were: 3) products for entertainment purposes such as tickets for movies, concerts, and shows; and 4) fashion goods, at 45.3 and 45.1 per cent respectively.
The top five factors influencing respondents’ decisions to buy goods and services online were:1) websites’ presentations of goods and services (51.2 per cent); 2) clear and attractive images of goods (50.5 per cent); 3) lower prices when compared to buying from traditional shops (46.4 per cent); 4) less travelling time and expenses and the convenience of online product ordering 24 hours a day (46.1 per cent); and 5) appealing promotional/special offers (41.6 per cent).
When buying goods and services online, buyers are likely to be required to provide personal information such as their name and last name, address and telephone number. However, some important personal information such as email address, personal income level, and citizen ID card number, if falling into the hands of criminals, could cause damage to the buyer’s life and property. Findings from this survey showed that more Baby Boomer and Generation X respondents provided such personal information than respondents in other groups, and thus were more prone to damage caused by their personal information being misused by crooks than those in other age groups.
Internet users’ top two preferred payment methods continued to be through offline payment channels, i.e. bank transfer (65.5 per cent) and

Electronic Transactions Development Agency (Public Organization) 23
payment via ATM terminals (31.2 per cent), reflecting the fact that today’s online buyers still remained insecure about online payment. Ranking third was online payment by credit cards (26.4 per cent).
When payment channels were classified by age group of buyers of goods and services online, it was found that more respondents in the Generation X and Baby Boomer groups, at 50.4 and 51.5 per cent respectively, effected payment by credit cards. Prior survey findings also showed that a higher percentage of respondents in these two groups provided personal information such as email address, income level, and citizen ID card number when compared to those belonging to other generations. These findings suggest that respondents in these two categories were more prone to damage from payment for goods and services bought online, as they tended to use credit cards for this purpose but failed to take sufficient precaution when providing their important personal information to online shops.
Questions on problems arising from buying goods and services online were included in this survey. The top three problems frequently faced by respondents were: 1) delayed delivery of ordered goods (58.7 per cent); 2) items received not matching the descriptions shown on websites (29.9 per cent); and 3) damaged/defective goods (24.0 per cent).
Most of online buyers having these problems tried to take matters into their own hands first, by filing complaints to websites of problematic products/ services (79.7 percent) or via online social networks (25.7 per cent). They also used other channels such as sellers’ call centres or direct contact with sellers to demand replacement or return of products

24 Thailand Internet User Profile 2015
(8.2 per cent). Of note is the fact that only 3.6 per cent filed complaints through government agencies.
Reasons given by online buyers who encountered these problems but chose not to file complaints were negligible damage of products (7.2 per cent of respondents) and lack of information on the procedures, means, and channels for filing complaints (6.4 per cent of respondents). The Electronic Transactions Development Agency (Public Organization), or ETDA, has established its Online Complaint Centre (OCC) entrusted with the duty to provide initial advisory service regarding these complaints and coordinate with, or refer the matters to, other agencies concerned such as the Office of the Consumer Protection Board (OCPB), the Food and Drug Administration (FDA), or the Foundation for Consumers, in order to build the public’s trust and confidence in electronic transactions.

Electronic Transactions Development Agency (Public Organization) 25

26 Thailand Internet User Profile 2015
IntroductionThe mission of the Electronic Transactions Development Agency (Public
Organization) or ETDA, is to develop, promote and support the nation’s electronic transactions, including e-commerce and online government services. It actively participates in putting in place IT infrastructure that is conducive to electronic transactions. It supports service business relating to electronic transactions and formulates IT standards that render online transactions secure and trustworthy. ETDA’s mission necessitates a set of data that reflects Internet usage behavior from all demographic groups and could be used to determine directions for the development, promotion and support of the country’s electronic transactions—data that could provide answers and truly meet the public demand.
ETDA therefore conducted a survey on Thailand Internet User Profile 2015. This annual survey collected data on Internet user’s behavior, with a special annual question. This year, the survey explored the ways Internet users purchased goods and services online, which was considered part of value creation in the digital economy. It is sincerely hoped that the survey findings would prove to be useful to government agencies that can use them to formulate plans and policies that correspond to various Internet users’ groups. The private sector, especially e-commerce operators, can also use them to formulate their business plans or to adjust their marketing strategies, rendering them more efficiently and effectively responsive to their target customers’ needs or behavior, and resulting in an increased volume of e-Transactions in the country as a whole.

Electronic Transactions Development Agency (Public Organization) 27
Survey Objectives
1. To compile data on Thai Internet users’ behavior every year on a regular basis in order to reflect the changing trends.
2. To compile information on a topic of public interest in the year of the survey. Interested public will be able to use the information on a timely basis.
3. To make available significant and necessary information on electronic transactions to data users from the public and private sectors and interested public as an on-going service.
4. To equip ETDA with information that can be used to formulate strategies for promotion of and support to electronic transactions, and for its monitoring and evaluation thereof.
Survey Procedure
Like last year, this year’s survey was conducted online. ETDA posted survey questionaire banners on various websites of cooperating public and private agencies. The questionaire was also disseminated via social media sites, such as Facebook, in order to reach all target groups.
The survey was conducted from end of March to end of May 2015. A total of 10,434 self-selected respondents answered the questionaire in its entirety. The responses were then computed by a statistical program.

28 Thailand Internet User Profile 2015
Survey Methodology
This survey has as its objective a compilation of data on Thai Internet users’ behavior. It opted for online responses to the questionaire via the Internet and social media networks. Sampling methodology adopted was non-probability sampling because the research team did not have a list of all Internet users’ names.
It was through self-selection that respondents chose to answer the questionnaire. When each individual group of users was taken into account, the percentage of sampled Internet users might differ from the percentage of Thailand’s entire Internet User population. Therefore, to compute the figures in the final analysis, weighting was used, based on the percentage of age groups of the entire population of Thailand’s Internet users, as established in a survey on household usage of ICT, conducted by the National Statistical Office in 2014.

Electronic Transactions Development Agency (Public Organization) 29
?

30 Thailand Internet User Profile 2015
Internet UsageBehavior

Electronic Transactions Development Agency (Public Organization) 31
Internet UsageBehavior
Internet Usage BehaviorA total of 17,010 interested Internet users responded to our
questionnaire in this 2015 survey. However, only 10,434 respondents1 who completed the questionnaire in its entirety could be used for the analysis. Survey results have been processed and analyzed in order to show Thai people’s Internet usage behavior in several dimensions, namely, duration of usage, usage site, devices used to access the Internet, activities carried out online, and problems encountered in Internet usage and its duration.
Nowadays, Internet usage is widespread to the extent that it is part of users’ everyday activities from getting up in the morning to turning in at night. Several factors have been credited for playing a role in increasing its popularity. First are the lower prices of all mobile devices -- smartphones or tablet computers-- allowing consumers to own them quite conveniently. Then there is fierce competition among software developers to come up with diverse contents and applications that mobile device users can choose to download for their recreation or for more convenient online transactions.
Finally, there is the growth of networks to provide Internet service via mobile phones. This year has seen the expansion of 3G network to a fledgling 4G LTE. All service providers of mobile phones are competing to expand their networks in order to meet target users’ demands at appropriate prices. Meanwhile, the government has changed its policy direction and
1 Respondents here refer to Internet users who responded to the questionnaire because this survey was conducted online. From now on, the term “Internet users’ will be used.

32 Thailand Internet User Profile 2015
been formulating a digital economy policy. Efforts are now being stepped up to expand the country’s coverage of information infrastructure at the village level, in terms of size, stability, and price. Its aim is to equip Thailand with high-speed or broadband Internet infrastructure that is stable and cheap2 that will help drive a nationwide usage of quality and reasonably priced Internet service.
Survey findings in 2015 reveal that most users or 23.2 per cent spent 42-76.9 hours per week on the Internet. This number of hours spent in a week was the same as those spent by 2014 users who, however, represented only 20.2 per cent of users.
The second most popular duration for 2015 was between 21-41.9 hours per week, reported by 21.3 per cent of users. However, the second most popular duration for 2014 was between 10-20.9 hours, reported by only 19.3 per cent of users.
It is worth noting that in 2015, although the ranking in the percentage of users for their preferred usage period may differ slightly when compared to that of 2014, e.g. the second and third ranks of 2015 switched places in 2014, percentage of users ranked second and third was found to be closer than that of users, holding the same ranks in 2014, as shown in Chart 1.
2 Policy on Digital Economy, Ministry of Information and Communication Technology, http://www.mict.go.th/view/1/Digital%20Economy, searched on 17 July 2015.

Electronic Transactions Development Agency (Public Organization) 33
Chart 1: Percentage of Internet Users, Classified by the Number of Hours Spent on the Internet per Week.
In Chart 2, a comparison was drawn between the average number of hours spent on the Internet and the general attributes of Internet users, namely, gender, generation, residence, educational attainment, and household income, it was found that the transgender group spent the longest hours on the Internet, at 58.3 hours per week on average. The male and female groups spent the same number of hours on average, at 50.4 hours per week.
When compared with other age groups, Generation Y group spent on average the longest hours on the net, at 54.2 hours per week—a pattern which is consistent with the behavior of members of this generation who were growing up while the Internet and social media were very popular, rendering them hugely interested in IT and online communication.
13.916.1
20.2
16.719.320.0 21.3 23.2
13.09.1
< 10 Hrs.0.05.0
10.015.020.025.030.035.040 .0
10 - 20.9 Hrs.
21 - 41.9Hrs.
42 - 76.9Hrs.
77 - 104.9Hrs.
13.5
> 105 Hrs.
13.7
2558
2557
Percent

34 Thailand Internet User Profile 2015
Internet users who resided in Bangkok and its metropolitan area spent on average 53.8 hours a week on the Internet, longer than users living in the provinces whether inside or outside the municipal areas, who spent on average 47.7 hours a week and 44.4 hours a week respectively. This implies that Bangkok’s IT infrastructure was more readily available than that in the provinces.
Besides, it was found that the number of hours spent on the net varied according to the level of educational attainment and household income of users. The more the users were educated or the more their household incomes were, the longer they spent on the Internet. Those with at least a Bachelor’s degree, whose average household income was higher than 50,001 Baht, spent on average more than 50 hours per week surfing the net.

Electronic Transactions Development Agency (Public Organization) 35
Chart 2: Average Number of Hours Spent on the Internet per Week, Classified by Internet User’s General Attributes.
24 Thailand Internet User Profile 2015 Chart 2: Average Number of Hours Spent on the Internet per Week,
Classified by Internet User’s General Attributes.
48.550.450.4
58.341.4
54.247.1
32.553.8
47.744.4
38.545.345.8
52.354.6
57.347.8
57.556.5
48.937.6
50.844.9
39.746.8
49.352.151.6
53.354.4
58.460.4
0.0 10.0 20.0 30.0 40.0 50.0 60.0 70.0
AverageMale
FemaleTransgender
Gen ZGen YGen X
Baby BoomerBangkok Metropolitan areas
Inside municipal areas in other provincesOutside municipal areas in other provinces
Lower than upper secondary educationUpper secondary education
Vocational certificate/Higher Vocational…Bachelor’s degree
Master’s degreeHigher than Master’s degree
Civil servant/public officer, government…Enterprise owner/self-employed
Employee of a private agencyStudent
Househusband/housewifeUnemployed
Others≤ 10,000
10,001 – 30,00030,001 – 50,00050,001 – 70,00070,001 – 90,000
90,001 – 110,000110,001 – 130,000130,001 – 150,000
> 150,000
Gend
erGe
nera
tion
Resid
ence
Educ
atio
nEm
ploy
men
t Sta
tus
Aver
age
Mon
thly
Hou
seho
ldIn
com
e (b
aht)
Hours

36 Thailand Internet User Profile 2015
Devices Used to Access the Internet3
Because of increasingly cheaper prices of mobile devices, network developments, design of content and application that responds to users’ demand, survey findings do reflect the choice of devices to access the Internet, and the number of hours per day being spent on average using each device. As a whole, more than 80 per cent of users’ number one device of choice was smartphones which they used on average 5.7 hours a day. Ranked second were desktop computers, used to access the net by 54.7 per cent of users who spent on average 5.4 hours a day. Laptop computers were ranked third, reportedly used by 45.2 per cent of users to surf the net on average 5.0 hours a day as shown in Chart 3:
3 Out of the 10,434 Internet users, some 7,136 users reported that they used anyone of the following devices to access the Internet, namely, desktop computers, laptop computers, tablets, smart phones or smart TVs.
Smartphone
82.1% of users 5.7 hrs/ day on average
54.7% of users 5.4 hrs/ day on average
Desktop Computer
45.2% of users5.0 hrs/ day on average
Laptop Computer
0.6% of users5.0 hrs/day on average
Others
?21.1 % of users
3.8 hrs/day on average
Tablet Computer
8.6% of users3.0 hrs/day on average
Smart TV
Chart 3: Devices Used to Access the Internet, Classified by Average Number of Hours Used per Day.

Electronic Transactions Development Agency (Public Organization) 37
As shown in Chart 4, when comparison was drawn between various devices used to access the Internet and users’ gender and generation, it was found that male and female users used various devices that were consistent with the above presentation of an overall picture.
An exception must be made of transgender users who, although favored smartphones to access the Internet like their male and female counterparts, preferred laptop computers as the second device of choice, followed by desktop computers as their third choice, at 52.1 and 44.6 per cent respectively.
It is worth noting that more than female and transgender users, male users chose practically every kind of device, except smartphones, to access the Internet. Transgender users (86.8 per cent) actually used more smartphones to access the Internet than male users (79.6 per cent) and female users (83.9 per cent).
Besides, it was found that more male users (56.2 per cent) and female users (53.9 per cent) used desktop computers to access the Internet than their transgender counterparts (44.6 per cent). The trend was the same in the use of smart TVs to surf the net as reported by male users (8.8 per cent) and female users (8.4 per cent) compared to transgender users (5.8 per cent). Meanwhile, the same number of male and transgender users (52.1 per cent) reported that they used laptop computers to surf the net more than their female counterparts (39.7 per cent).
When generation groups were taken into account, it was found that Generation X, Y and Z exhibited their preference of devices that was consistent with the norm, with the exception of the Baby Boomer group
38 Thailand Internet User Profile 2015
whose device of choice was desktop computers, followed by smartphones, at 68.1 and 59.8 per cent respectively.
Besides, it was found that Generation Z group favoured desktop computers the least, at 41.2 per cent, while 17.2 per cent preferred to surf the net by smart TVs, the proportion of which differed markedly from other generation groups.
Generation X group (44.3 per cent) and Generation Y group (46.9 per cent) reported their use of laptop computers to access the net, more than Generation Z and Baby Boomer Groups (both at 35.8 per cent). Meanwhile, Generation X group (26.8 per cent) and Baby Boomer group (29.3 per cent), reported their use of tablet computers to surf the net, at a higher proportion of Generation Y group (18.1 per cent) and Generation Z group (21.1 per cent). (See more details from Table 1 on the list of tables in the Annex)

Electronic Transactions Development Agency (Public Organization) 39
Chart 4: Devices Used to Access the Internet, Classified by Gender and Generation
Period of Internet Usage by Type of Devices
As earlier stated, cheaper mobile devices, well developed contents and applications, and growth of networks to provide Internet service via mobile devices --all contributed towards easy and convenience access to cyberspace anywhere, anytime.
Electronic Transactions Development Agency (Public Organization) 27
than Generation Z and Baby Boomer Groups (both at 35.8 per cent). Meanwhile, Generation X group (26.8 per cent) and Baby Boomer group (29.3 per cent), reported their use of tablet computers to surf the net, at a higher proportion of Generation Y group (18.1 per cent) and Generation Z group (21.1 per cent). (See more details from Table 1 on the list of tables in the Annex) Chart 4: Devices Used to Access the Internet, Classified by Gender
and Generation
N.B. More than 1 device may be chosen.
56.2 53.9
44.6 41.2
50.4
63.968.1
52.1
39.7
52.1
35.8
46.9 44.3
35…
22.819.8 19.0 21.1
18.1
26.8 29.3
79.683.9
86.880.9
84.4 81.9
59.8
8.8 8.45.8
17.2
8.9 7.3 6.7
0.0
10.0
20.0
30.0
40.0
50.0
60.0
70.0
80.0
90.0
Male Female Transgender Z Y X BabyBoomer
GenerationGender
Desktop computer Smartphone Smart TV
Per cent
Tablet computerLaptop computer
N.B. More than 1 device may be chosen.

40 Thailand Internet User Profile 2015
This year’s findings reveal that this is the first year that smartphones became the device of choice for Internet users who reportedly used them at any time of day as shown in Chart 5. The most preferred period for users to surf the net with smartphones was between 16.01 – 20.00 hrs (54.2 per cent); followed in second place by 20.01 - 24.00 hrs.(52.0 per cent); in third place was the period 12.01 - 16.00 hrs (44.5 per cent); in fourth place was the period 08.01 - 12.00 hrs (42.4 per cent); in fifth place was between 00.01 - 04.00 hrs (8.8 per cent) and in the last place was between 04.01 - 08.00 hrs (7.9 per cent).
Furthermore, it was found that during office/school hours, from 08.01 - 16.00 hrs, desktop computers came second as the preferred device after smartphones. They were reportedly used during the period 08.01 - 12.00 hrs and 12.01 - 16.00 hrs, by 32.7 per cent and 33.4 per cent of users respectively.
After office hours until early morning (16.01 - 08.00 hrs), laptop computers came second as the preferred device after smartphones. They were reportedly used during the period 16.01 - 20.00 hrs, 20.01 - 24.00 hrs, 00.01 - 04.00 hrs, 04.01 - 08.00 hrs by 20.5, 22.6, 3.7, and 1.3 per cent of Internet users respectively.

Electronic Transactions Development Agency (Public Organization) 41
When generation groups were compared for their choice of devices, it was found that during office/school hours (08.01 - 16.00 hrs), Generation Y and Generation Z groups used smartphones to access the net more than any other devices, which was consistent with the general trend. Generation Y (45.9 per cent) and Generation Z (35.9 per cent) groups used smartphones to surf the net during the period 08.01 - 12.00 hrs, while the period 12.01 - 16.00 hrs were reportedly more favored by Generation Y and Z groups at 49.1 and 37.9 per cent respectively.
A different picture of office/school hours (08.01 - 16.00 hrs) net-surfing habit emerged from Generation X and Baby Boomer groups. Both groups preferred desktop computers to smartphones to access the net. During the
DesktopComputer 32.7%
TabletComputer 6.8%
LaptopComputer 16.6%
Smart TV 2.8%
08.01 - 12.00 hrs
Smartphone 42.4%
12.01 - 16.00 hrs
DesktopComputer 33.4%
Tablet Computer 6.8%
LaptopComputer 18.2%
Smart TV 2.1%
Smartphone 44.5%
16.01 - 20.00 hrs
TabletComputer 11.7%
LaptopComputer 20.5%
Smart TV 5.1%
Smartphone 54.2%
DesktopComputer 18.8%
20.01 - 24.00 hrs
TabletComputer 11.8%
LaptopComputer 22.6%
Smart TV 7.0%
Smartphone 52.0%
DesktopComputer 13.5%
00.01 - 04.00 hrs
TabletComputer 1.7%
LaptopComputer 3.7%
Smart TV 0.7%
Smartphone 8.8%
DesktopComputer 2.0%
04.01 - 08.00 hrs
LaptopComputer 1.3%
Smart TV 0.5%
Smartphone 7.9%
DesktopComputer 0.9%
TabletComputer 1.1%
Chart 5: Users’ Preferred Periods of Usage, Classified by Type of Devices.
N.B. More than one period may be chosen for each device.

42 Thailand Internet User Profile 2015
period 08.01 - 12.00 hrs desktop computers were used by Generation X and Baby Boomers at 53.4 and 52.7 per cent respectively, while during the period 12.01 - 16.00 hrs, desktop computers were used to access the net by Generation X and Baby Boomers at 49.6, and 43.1 per cent respectively.
After office hours until early morning (16.01 - 08.00 hrs), smartphones came first, followed by laptop computers. When generation groups were compared, it was found that during the period 16.01 - 20.00 hrs, Generation X and Y groups used laptop computers as the second preferred device after smartphones, which is consistent with the general trend, with the exception of Generation Z and Baby Boomer groups who used desktop computers during that period as their second choice after smartphones. They were supposed to go online to do their homework (21.2 per cent) or do some research (16.0 per cent).
During the early morning hours (04.01 - 08.00 hrs), Generation Y and Generation Z groups used laptop computers to surf the net as their second choice after smartphones, which is consistent with the norm, with the exception of Generation X and Baby Boomer groups, who were using tablet computers to surf the net as their second choice after smartphones, at 1.9 and 1.8 per cent respectively. (See more information in Table 2 on the List of Tables in the Annex)

Electronic Transactions Development Agency (Public Organization) 43
1.2%3.1%19.8%
EducationalInstitutions 13.2%
26.0%43.2%88.8%Home/Accommodation Workplace Travelling
Public Places Internet Cafes Others
N.B. Answer no more than 3 choices.
Internet Usage Sites
Survey findings reveal that users’ home/accommodation and workplace were the sites most frequently used by 88.8 per cent and 43.2 per cent of Internet users respectively, as shown in Chart 6.
Chart 6: Internet Users Classified by Internet Usage Site
In Chart 7, when the gender of users was taken into consideration and compared with their usage sites, it was found that every gender followed the main trend of the first and second preferred sites. An interesting aspect surfaced, that is the transgender group went online at the office least of all (38.4 per cent) when compared with male users (57.7 per cent) and female users (52.4 per cent).

44 Thailand Internet User Profile 2015
However, more transgender users (34.2 per cent) went online while they were travelling, such as on an electric train, in a private car or on public transport when compared with their male (26.1 per cent) and female (28.5 per cent) counterparts. Transgender users (22.6 per cent) also surfed the net from public places, such as restaurants, department stores, hotels at a higher proportion than male users (13.6 per cent) and female users (11.7 per cent).
When the generation groups were taken into account, it was noted that Generation Y and Z groups preferred to go online from Internet Cafés more than other groups at 3.5 and 3.9 per cent respectively. This usage was consistent with their usage at other public places, such as restaurants, department stores, and hotels, where Generation Y and Generation Z groups went online at 13.8 and 14.4 per cent respectively, at a higher proportion than other generation groups. (See more information from Table 3, on the List of Tables in the Annex.)

Electronic Transactions Development Agency (Public Organization) 45
Chart 7: Internet Users Classified by Gender, Generation and Internet Usage Site.
N.B. Answer no more than 3 choices.
Electronic Transactions Development Agency (Public Organization) 33
Chart 7: Internet Users Classified by Gender, Generation and Internet Usage Site.
N.B. Answer no more than 3 choices.
26.1
28.5
34.2
20.6
28.4
28.3
19.7
13.6
11.7
22.6
14.4
13.8
10.4
10.1
3.1
2.5
4.2
3.9
3.5
1.5
0.7
15.8
14.8
27.9
33.7
21.5
2.0
2.5
57.7
52.4
38.4
2.6
45.1
79.6
68.9
86.2
86.9
91.1
97.1
89.3
80.4
80.9
0.0 10.0 20.0 30.0 40.0 50.0 60.0 70.0 80.0 90.0 100.0
Male
Female
Transgender
Z
Y
X
Baby Boomer
Gend
erGe
nera
tion
Home/accommodation Workplace Educational institutions
Internet café Public places Travelling
per cent

46 Thailand Internet User Profile 2015
Online Activities
In this Digital Economy era, Internet users are able to connect to cyberspace by a variety of devices, from mobile devices4 to computers (desktop and laptop computers). This survey focused on getting Internet users to identify the devices they used in carrying out activities on the Internet. The results thus obtained should contribute to better planning of marketing strategies by business operators that correspond with target consumers’ behavior / activities.
Survey findings, as shown in Chart 8, reveal that as a whole the first five popular activities carried out on mobile devices by Internet users were as follows:1)communication through social network sites, such as Facebook, Instagram, and LINE (82.7 per cent); 2) search for information (56.6 per cent); 3) reading e-news/e-books (52.2 per cent); 4) watching TV/films/listening to online radio (42.3 per cent); and 5) email correspondence (35.7 per cent).
Moreover, computers were used for the following first five activities: 1)search for information (62.2 per cent); 2) email correspondence (53.7 per cent); 3) communication through social network (45.3 per cent); 4) reading e-news, e-books (40.7 per cent); 5) watching TV/films, listening to online radio (38.9 per cent). It is noticeable that the five activities carried out by users of mobile devices and computers were the same activities, only with different ranking, as dictated by users’ preferences.
4 Mobile devices refer to communication devices that can be carried on the user’s person, such as feature phones, smartphones and tablet computers.

Electronic Transactions Development Agency (Public Organization) 47
N.B. More than one device and activity may be chosen.
Chart 8: Online Activities Carried Out on Mobile Devices or Computers
Electronic Transactions Development Agency (Public Organization) 35 Chart 8: Online Activities Carried Out on Mobile Devices or Computers
N.B. More than one device and activity may be chosen.
When users’ gender was taken into account, it was found that both male and female users went online to carry out the first five activities on computers that was consistent with the general trend, with the exception of male users, 42.8 per cent of whom used computers to
1.2
8.4
9.4
16.2
15.9
23.6
19.8
32.7
53.7
38.9
40.7
62.2
45.3
1.4
9.9
11.3
14.2
21.6
25.8
28.1
30.3
35.7
42.3
52.2
56.6
82.7
0.0 10.0 20.0 30.0 40.0 50.0 60.0 70.0 80.0 90.0
Others
Selling goods and services
Checking out stocks news
Booking/buying public transport tickets online
Carrying out financial transactions
Purchasing goods and services
Playing online games
Downloading software/ music/ drama/ games
E-mail correspondence
Watching TV, films/ Listening to online radio
Reading e-books
Searching for information
Social Network
Mobile device Computer
Per cent

48 Thailand Internet User Profile 2015
When users’ gender was taken into account, it was found that both male and female users went online to carry out the first five activities on computers that was consistent with the general trend, with the exception of male users, 42.8 per cent of whom used computers to download software/ music/ dramas/ games as the fifth most popular activity.
When transgender users chose computers to carry out online activities, their order of preferences differed totally from the general trend as follows: 1) searching for information (60.3 per cent); 2) watching TV, films/Listening to online radio (52.4 per cent); 3) email correspondence (49.7 per cent); 4) downloading software/ music/ drama/ games (47.9 per cent); 5) communication through social media (47.1 per cent).
Meanwhile, each generation group had its own top favorite activities befitting its different age. All entertainment activities, such as online gaming, watching TV, films/listening to online radio, were favored most by Generation Y and Z groups, who used computers to play online games at 21.7 and 27.8 per cent respectively. Generation Y and Z groups used computers to watch TV, films/ listen to online radio at 43.1 and 37.6 per cent respectively.
It could be observed that other remaining activities were all concerned with work, finance/investment, and purchasing/selling of goods/services online. These activities suited Baby Boomer, Generation X and Y groups. It was established by the survey that the three generation groups carried out all these activities at a higher proportion than Generation Z group. (See more information from Table 4 on the List of Tables in the Annex.)

Electronic Transactions Development Agency (Public Organization) 49
When gender was taken into consideration, it was found that the general trend of usage was consistent with the first top five activities. Nevertheless, it should be noted that the transgender group carried out the following first four activities at a higher proportion than the other two gender groups,: 1) communication through social media (90.5 per cent); 2) search for information (61.9 per cent); 3) reading/checking out e-news/ reading e-books (57.1 per cent); and 4) watching TV, films/ listening to online radio (49.7 per cent).
Besides, it was revealed that transgender users chose to connect by mobile devices for entertainment purposes more than their male and female counterparts. They accessed the net by mobile devices to download software/music/dramas/games and to play online games at 40.0 and 36.0 per cent respectively.
Meanwhile, female users (30.3 per cent) and transgender users (29.1 per cent) preferred to use mobile devices for online shopping at a higher proportion than their male counterparts (22.2 per cent). More male users (16.4 per cent) than female (10.4 per cent) and transgender (10.5 per cent) users chose mobile devices to check out online information on stocks.
Generation wise, it was found that Generation X and Y users chose mobile devices to chat via social media at 83.0 and 86.7 per cent respectively, at a higher proportion that Baby Boomer and Generation Z groups at 65.3 and 78.4 per cent respectively.
Besides, both Generation X and Y groups used mobile devices for email correspondence, at 45.2 and 39.5 per cent respectively, at a higher

50 Thailand Internet User Profile 2015
proportion than Baby Boomer and Generation Z groups, at only 29.8 and 20.3 per cent respectively.
Similarly, Generation X and Y groups used mobile devices for financial transactions at 28.5 and 26.2 per cent respectively, at a higher proportion than Baby Boomer and Generation Z groups at only 12.3 and 8.5 per cent respectively.
Generation X and Y groups preferred to use mobile devices to reserve /purchase public transport tickets online, at 15.9 and 15.8 per cent respectively, proportionally higher than Baby Boomer and Generation Z groups at only 5.9 and 11.8 per cent respectively.
Meanwhile, Generation Z used such mobile devices for entertainment in the main. About 43.5 per cent of them were downloading software and 49.0 per cent were watching TV, films/listening to online radio, at a higher proportion than other generation groups.(See more information from Table 5 on the List of Tables in the Annex.)
Favorite Social Media Sites
Survey findings reveal that Internet users’ favorite activity on mobile devices was chatting on social media. In this connection, the survey examined the current most popular social media sites. It was found that Facebook remained the number one site of choice, followed by LINE application as the second choice and Google+ as the third choice as reported by 92.1, 85.1 and 67.0 per cent of users respectively, as shown in Chart 9.

Electronic Transactions Development Agency (Public Organization) 51
Chart 9: Internet Users’ Regularly Used Social Media Sites
When gender was taken into consideration as shown in Chart 10, it was found that every gender followed the general trend. However, it is worth noting that female users (72.8 per cent) visited Google+ more than male users (60.2 per cent) and transgender users (58.9 per cent). Transgender users (59.5 per cent), meanwhile, used Instagram more than female users (45.8 per cent) and male users (32.6 per cent). Likewise, Twitter proved to be a favorite site of transgender users (35.3 per cent), when compared with female users (19.7 per cent) and male users (17.6 per cent).
From the generation group perspective, it was found that more than 90 per cent of Generation X,Y and Z users favored Facebook for their online communication, at 90.5, 94.9 and 91.5 per cent respectively, leaving Baby Boomer group (75.6 per cent) far behind.
LINE application was widely used by Baby Boomer (81.6 per cent), Generation X (92.5 per cent) and Generation Y (88.3 per cent) users. Only 71.9 per cent of Generation Z users chose LINE application.
Google+ found favor among Baby Boomer, and Generation X users, more than 70 per cent of whom reportedly used the site.
43.9% 21.0%
85.1%92.1%
2.8%
67.0%
N.B. More than 1 answer may be chosen.

52 Thailand Internet User Profile 2015
Instagram and Twitter were a hit among the young Generation Y and Z users. Instagram was used by Generation Y (49.8 per cent) and Generation X (57.5 per cent) users, at a significantly higher proportion than any other groups. Instagram, meanwhile, was reportedly used by Generation Y (23.2 per cent) and Z (27.5 per cent) users, comparatively more than other generations. (See more information from Table 6 on the List of Tables in the Annex.)
N.B. Users may choose more than 1 answer.
Chart 10: Internet Users’ Regularly Used Social Media Sites, Classified by Gender and Generation.
Electronic Transactions Development Agency (Public Organization) 41
Chart 10: Internet Users’ Regularly Used Social Media Sites, Classified by Gender and Generation.
N.B. Users may choose more than 1 answer. Major Problems in Internet Usage
The government currently has a priority policy to drive Thailand towards a digital economy. It implies the application of Information Technology to economic and social activities. The private sector has also been stepping up their efforts to expand mobile Internet service networks as mentioned earlier.
3.6
3.3
5.3
0.7
3.2
4.5
3.3
17.6
19.7
35.3
27.5
23.2
11.4
5.6
32.6
45.8
59.5
57.5
49.8
23.0
10.2
60.2
72.8
58.9
66.0
64.9
70.9
75.7
87.3
89.3
87.4
71.9
88.3
92.5
81.6
92.0
92.6
97.4
91.5
94.9
90.5
75.6
0.0 10.0 20.0 30.0 40.0 50.0 60.0 70.0 80.0 90.0 100.0
Male
Female
Transgender
Z
Y
X
Baby Boomer
Gend
erGe
nera
tion
Facebook Line Google+ Instagram twitter WhatsApp
per cent

Electronic Transactions Development Agency (Public Organization) 53
Major Problems in Internet Usage
The government currently has a priority policy to drive Thailand towards a digital economy. It implies the application of Information Technology to economic and social activities. The private sector has also been stepping up their efforts to expand mobile Internet service networks as mentioned earlier.
However, survey results as shown in Chart 11, reveal that Internet users perceived five major problems in their Internet usage as follows: 1) slow connection/service (72.0 per cent); 2) volume of annoying unsolicited online advertisements (41.6 per cent); 3) difficulties accessing the Internet or frequently dropped connections (33.8 per cent); 4) high expenses on service fees, paraphernalia costs (26.0 per cent); and 5) inadequate coverage of Internet service (20.3 per cent).

54 Thailand Internet User Profile 2015
It is noticeable that the major problems, ranked 1st, 3rd, 4th and 5th were related to Internet service infrastructure. All agencies concerned, both from the public and private sectors, should step up their efforts to solve the problems, in order to mitigate their severity and eradicate them eventually. The findings can contribute most aptly to the government’s drive towards digital economy.
Besides, the problem of obsessive and long-hour surfing of the net was ranked 6th at 19.1 per cent, which was not far behind the 5th rank. This implies that Internet users considered this problem rather important, practically on the same level as the preceding problem. Therefore, it is important for all parties concerned, from public and private agencies to the family, to be vigilant and ensure that your officials/personnel/children and grandchildren are spending their time properly on the net or using the net with self-discipline.

Electronic Transactions Development Agency (Public Organization) 55
8.4%Disturbed
by pornography
XXX
1.2%Internet fraud
Obsessive,long-hour net surfing
Disturbed by spam
2.0%
2.6%
8.8%Infected by computer virus
10.8%
Volume of annoying onlineadvertisements
41.6% 19.1%
Not knowing who to turnto for help When problem occur.
Data privacy being infringed
Help ?Help ?Help ?
Slow connection/Slow Internet service.
72.0%
Difficulties in accessing the net orfrequently dropped connections.
33.8%
High expenses
26.0%
Inadequate Internet servicecoverage
20.3%
Not confidentthat data found
on the net is reliable.
?
14.9%
Chart 11: Users’ Problems while Carrying Out Online Activities

56 Thailand Internet User Profile 2015
Purchasing of Goods/ServicesOnline by “Thai People”
in the Digital Economy Era

Electronic Transactions Development Agency (Public Organization) 57
Purchasing of Goods/Services Online by “Thai People” In the Digital Economy Era
The government’s policy on digital economy ensures a strategic drive of the country towards a sustainable digital economy. It is undeniable that in all likelihood Thai people are taking steps along the path to the digital economy era.
Inevitably, people will have to be involved in digital technology in the conduct of their working and private lives, whether it is web search/data storage, communication, follow-up on news, education, transportation, commerce or any transactions whatsoever.
This part of the survey questioned Internet users on their behavior in purchasing goods/services online which was part of value creation of the digital economy. The survey questioned users at the pre-purchase phase, whether they had bought goods/services online. If not, what were their reasons not to? If they had done so, what factors influenced their decision to visit websites selling goods/services online.
Once they had decided to purchase goods/services online, they were questioned which products were their favorite, as shown by the number of transactions and value of the purchase of each type of goods and services online, the factors that influenced them to choose goods/services online, their current payment method for online goods/services.
58 Thailand Internet User Profile 2015
The final part concerns post-purchase behavior of Internet users. They were questioned on the problems that they came across and their approach to problem-solving. This information should prove to be useful to everyone concerned, especially those E-Commerce entrepreneurs who could use it as the basis for their business plans or their marketing strategies that could be rendered more efficient and effective by responding directly to the needs or behavior of their target customers.
Purchasing Behavior of Goods/Services Online
Out of 17,010 respondents to our survey questionnaire, only 10,434 responded fully to the questionnaire and can be processed for the survey. It was found that 64.9 per cent of Internet users had purchased goods/services online, while 35.1 per cent had not.
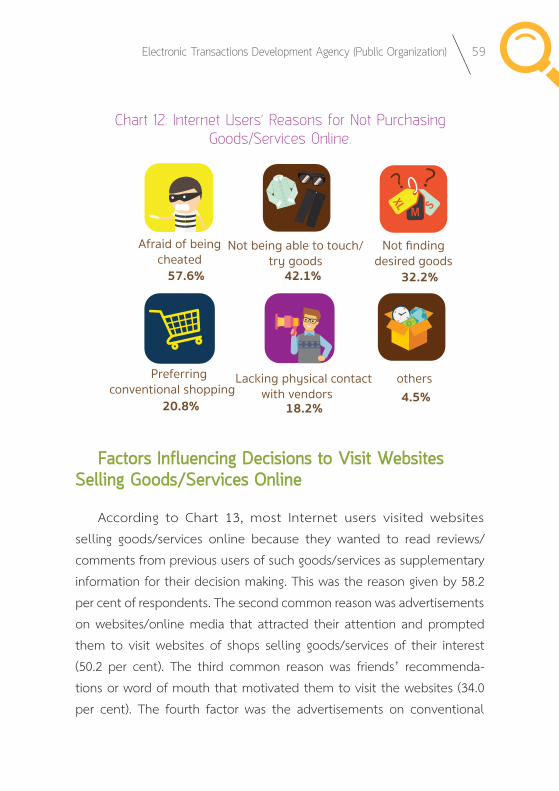
Major reasons given by users were as follows: afraid of being cheated, reported by 57.6 per cent, followed by not being able to touch/try the goods before purchasing (42.1 per cent), not finding desired goods at the websites or online shops (32.2 per cent), preferring conventional shopping at shops and department stores to online shopping (20.8 per cent), lacking physical contact with vendors (18.2 per cent) as shown in Chart 12.
Electronic Transactions Development Agency (Public Organization) 59
Chart 12: Internet Users’ Reasons for Not Purchasing Goods/Services Online.
Factors Influencing Decisions to Visit Websites Selling Goods/Services Online
According to Chart 13, most Internet users visited websites selling goods/services online because they wanted to read reviews/ comments from previous users of such goods/services as supplementary information for their decision making. This was the reason given by 58.2 per cent of respondents. The second common reason was advertisements on websites/online media that attracted their attention and prompted them to visit websites of shops selling goods/services of their interest (50.2 per cent). The third common reason was friends’ recommenda-tions or word of mouth that motivated them to visit the websites (34.0 per cent). The fourth factor was the advertisements on conventional
57.6% 42.1% 32.2%
20.8% 18.2%4.5%
Not being able to touch/try goods
Lacking physical contactwith vendors
othersPreferringconventional shopping
Not findingdesired goods
Afraid of beingcheated

60 Thailand Internet User Profile 2015
media, such as television, radio, newspapers, billboards, and brochures, and at trade fair (32.3 per cent). The fifth factor was Internet users’ desire to purchase certain goods/services (31.5 per cent). This led them to look for information by using search engines. The online shops they visited were among the top search results.
Chart 13: Buyers of Goods/Services Online, Classified by Factor Influencing Their Decisions to Visit Websites
Selling Goods/Services OnlineInformation gathered from reviews/Comments of previous product users
Advertisements on websites/online media
Friends’ recommendations/word of mouth
Advertisements on TV, radio, newspapers,bill boards, brochures, at trade fairs, etc.
Top search results via search engines
Opinions of bloggers, net idols, actors and actresses,singers, celebrities, etc.
Others
50.2%
34.0%
32.3%
31.5%
20.8%
5.1%
58.2%
Electronic Transactions Development Agency (Public Organization) 61
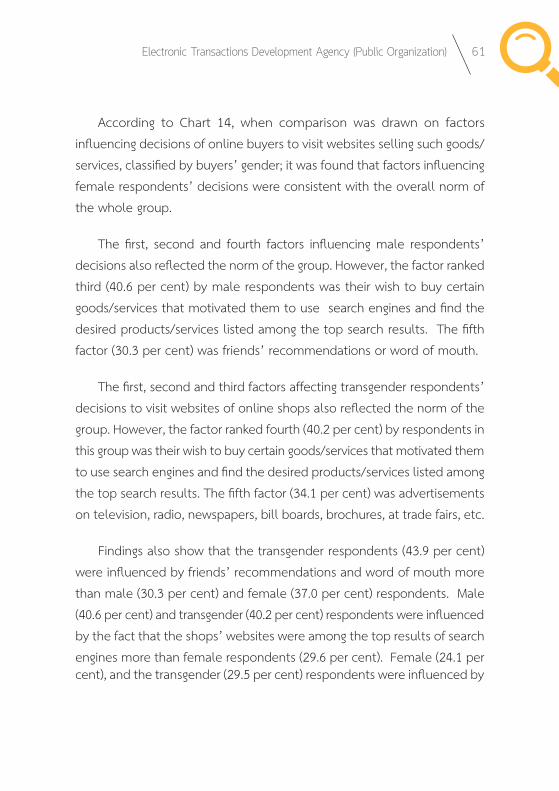
According to Chart 14, when comparison was drawn on factors influencing decisions of online buyers to visit websites selling such goods/services, classified by buyers’ gender; it was found that factors influencing female respondents’ decisions were consistent with the overall norm of the whole group.
The first, second and fourth factors influencing male respondents’ decisions also reflected the norm of the group. However, the factor ranked third (40.6 per cent) by male respondents was their wish to buy certain goods/services that motivated them to use search engines and find the desired products/services listed among the top search results. The fifth factor (30.3 per cent) was friends’ recommendations or word of mouth.
The first, second and third factors affecting transgender respondents’ decisions to visit websites of online shops also reflected the norm of the group. However, the factor ranked fourth (40.2 per cent) by respondents in this group was their wish to buy certain goods/services that motivated them to use search engines and find the desired products/services listed among the top search results. The fifth factor (34.1 per cent) was advertisements on television, radio, newspapers, bill boards, brochures, at trade fairs, etc.
Findings also show that the transgender respondents (43.9 per cent) were influenced by friends’ recommendations and word of mouth more than male (30.3 per cent) and female (37.0 per cent) respondents. Male (40.6 per cent) and transgender (40.2 per cent) respondents were influenced by the fact that the shops’ websites were among the top results of search engines more than female respondents (29.6 per cent). Female (24.1 per cent), and the transgender (29.5 per cent) respondents were influenced by

62 Thailand Internet User Profile 2015
opinions of bloggers, net idols, actors and actresses, singers, and celebrities more than their male counterparts (14.7 per cent).
When factors influencing decisions of buyers of goods/services online to visit online shops’ websites were compared by generation, Generation X (56.4 per cent), Generation Y (61.0 per cent), and Generation Z (59.6 per cent) were influenced by reviews/comments of previous product users more than Baby Boomer respondents (40.4 per cent). Similarly, friends’ recommendations and word of mouth had more influence on respondents in Generation X (34.3 per cent), Generation Y (34.9 per cent) and Generation Z (33.5 per cent) than those in the Baby Boomer Group (26.8 per cent).
More respondents in the Baby Boomer, Generation X and Generation Y groups than those in the Generation Z group were influenced by advertisements on websites/online media, offline media such as television, radio, newspapers, billboards, brochures, trade fairs, and websites’ being among top search results.
Opinions of bloggers/net idols/actors and actresses/celebrities had the least effect on respondents in the Baby Boomer and Generation X groups, at 5.9 per cent and 12.7 per cent respectively, but had the most influence on those in the Generation Z and Generation Y groups, at 24.2 per cent and 23.8 per cent respectively.
The above information reflects the factors having influence on Internet users’ decisions to visit websites selling goods/services online. This information will be useful for new E-Commerce entrepreneurs who are entering online businesses as well as entrepreneurs currently engaged in these businesses, enabling them to select communication or public relations tools that can be effectively and appropriately adapted to their target customers, thus making the money invested in buying public relations or marketing media more cost effective. (See more details in Table 7 in the Annex).

Electronic Transactions Development Agency (Public Organization) 63
N.B. Select not more than three most important factors
Chart 14: Buyers of Goods/Services Online, Classified by Gender and Generation, Based on Factors Influencing Their Decisions to Visit Online Shops’ Websites
Electronic Transactions Development Agency (Public Organization) 51
Chart 14: Buyers of Goods/Services Online, Classified by Gender and Generation, Based on Factors Influencing
Their Decisions to Visit Online Shops’ Websites
Note: Select not more than three most important factors
14.7
24.1
29.5
24.2
23.8
12.7
5.9
40.6
29.6
40.2
20.5
33.8
36.7
37.9
37.2
30.0
34.1
29.8
33.3
32.4
34.9
30.3
37.0
43.9
33.5
34.9
34.3
26.8
56.2
50.2
56.1
37.9
51.5
56.0
63.2
56.4
60.8
59.1
59.6
61.0
56.4
40.4
0.0 10.0 20.0 30.0 40.0 50.0 60.0 70.0
Male
Female
Transgender
Gen z
Gen y
Gen x
Baby Boomer
Gend
erGe
nera
tion
Information gathered from reviews/comments of previous buyersAdvertisements on websites/online mediaFriends’ recommendations/word of mouth Advertisements on TV, radio, newspapers, etc.Websites among top search resultsOpinions of bloggers, net idols, actors and actresses, celebrities, etc.
per cent

64 Thailand Internet User Profile 2015
Preferred Categories of Goods/Services Purchased Online
Varieties of goods/services are available online. In this survey Internet users having purchased good/services online were asked about their preferred choices of such goods/services. Survey findings show that the first of the top five goods/services purchased online were fashion goods such as clothing, shoes, handbags, and accessories, at 42.6 per cent. Ranked second were IT devices such as computers, mobile phones, tablet computers, etc., at 27.5 per cent. Third on the list were wellness and beauty products such as cosmetics and dietary supplements, at 24.4 per cent. Ranked fourth were tour/travel service such as booking plane tickets/accommodation and car rental at 23.2 per cent. The fifth choice was ringtone/song/film/drama/game online downloading service, at 21.0 per cent, as shown in Chart 15.
It is noticeable that 13.1 per cent of the respondents who chose other product categories indicated restaurants’ special deals, ordering food at websites, buying books/magazines, educational products/services such as tutoring courses/training courses or seminars, paying utility bills, paying fixed line and mobile phone service fees, both in the top-up and monthly payment systems, and ordering products such as cameras/accessories.

Electronic Transactions Development Agency (Public Organization) 65
42.6% 24.4% 23.2%27.5% 21.0% 13.0%
12.0% 10.8%5.8%
Home appliances
Others
Entertainment Finance/investment
Gems and jewellery Mother and child care
Fashion goods Wellness and beauty products
Tour/travel IT devices Downloadingservice
5.5% 3.4%
Chart 15: Buyers of Goods/Services Online, Classified by Product/Service Category
According to Chart 16, when comparison was drawn by gender and generation with regard to the categories of goods/services purchased on line, it was obvious that female (54.0 per cent) and transgender (50.8 per cent) respondents purchased fashion goods more than male respondents (24.8 per cent). Similarly, female (6.3 per cent) and transgender (5.3 per cent) respondents purchased gems/jewellery products more than male respondents (2.6 per cent). As for wellness and beauty products, female (35.6 per cent) and transgender (33.3 per cent) respondents purchased more goods in this category than their male counterparts (14.7 per cent).
Male (46.6 per cent) and transgender (28.8 per cent) respondents purchased IT devices more than female (16.1 per cent) respondents. This trend was also seen in payment for downloading ringtones/songs/films/dramas/games online, etc., where more male (26.1 per cent) and transgender (28.0 per cent) respondents purchased these services when compared to female (17.8 per cent) respondents.

66 Thailand Internet User Profile 2015
Respondents in the transgender group (18.9 per cent) purchased the most entertainment products such as tickets to movies, concerts and shows when compared to male (12.2 per cent) and female (12.0 per cent) respondents. However, transgender respondents (3.8 per cent) made the least financial investment when compared to male (10.4 per cent) and female (5.0 per cent) respondents.
When comparison was made by generation based on the categories of goods/services purchased online, Generation X, Generation Y, and Generation Z respondents bought more fashion goods, gems/jewellery, and entertainment products than Baby Boomers.
Generation X, Generation Y, and Generation Z respondents purchased more fashion goods, at 32.4, 46.4 and 49.1 per cent respectively, when compared to Baby Boomers, at only 21.0 per cent.
Similarly Generation X, Generation Y, and Generation Z respondents purchased more goods in the gems/jewellery category, at 4.5, 4.3 and 9.3 per cent respectively, than Baby Boomers, at only 2.9 per cent.
Also, Generation X, Generation Y, and Generation Z respondents purchased more entertainment products, at 10.9, 13.1 and 13.0 per cent respectively, than Baby Boomers, at only 4.4 per cent.
Findings also show that Generation Y, Generation X and Baby Boomers purchased more wellness and beauty products, IT devices, and tour/travel services than Generation Z.
Baby Boomers, Generation X and Generation Y purchased more wellness and beauty products online at 21.0, 25.2, and 28.3 per cent respectively, than Generation Z respondents, at only 14.3 per cent.

Electronic Transactions Development Agency (Public Organization) 67
More IT goods were purchased by Baby Boomers, Generation X and Generation Y, at 38.2, 31.7 and 27.7 per cent respectively, when compared to Generation Z respondents, at only 20.5 per cent.
The percentage of Baby Boomers, Generation X and Generation Y who had bought tour/travel service, at 39.0, 37.5 and 23.5 per cent respectively, was higher than that of Generation Z, at only 8.7 per cent. (See more details in Table 8 in the Annex.)

68 Thailand Internet User Profile 2015
Chart 16: Buyers of Goods/Services Online, Classified by Gender and Generation, Based on Categories of
Purchased Goods/Services
56 Thailand Internet User Profile 2015
Chart 16: Buyers of Goods/Services Online, Classified by Gender and Generation, Based on Categories of Purchased Goods/Services
Note: Multiple answers are possible.
27.9
27.0
27.3
8.7
23.5
37.5
39.0
26.1
17.8
28.0
19.9
22.5
18.7
22.1
12.2
12.0
18.9
13.0
13.1
10.9
4.4
10.4
5.0
3.8
0.6
5.5
12.0
9.6
3.0
5.3
1.5
0.0
3.6
6.8
1.8
46.6
16.1
28.8
20.5
27.7
31.7
38.2
14.5
12.3
3.8
0.0
10.0
19.8
29.0
14.7
35.6
33.3
14.3
28.3
25.2
21.0
2.6
6.3
5.3
9.3
4.8
4.5
2.9
24.8
54.0
50.8
49.1
46.4
32.4
21.0
0.0 10.0 20.0 30.0 40.0 50.0 60.0
Male
Female
Transgender
Z
Y
X
Baby Boomer
Gend
erGe
nera
tion
Fashion goodsWellness and beauty productsIT devicesFinance/investmentDownload
Gems , jewellery Home appliances Mother and child care Entertainment Tour/travel
per cent
N.B. Multiple answers are possible.

Electronic Transactions Development Agency (Public Organization) 69

70 Thailand Internet User Profile 2015
Number and Value of Online Purchases of Goods/Services
As shown in Chart 17, findings on the average number of online purchases classified by product category in the past six months show that the highest number of online purchases was in the finance/ investment category, such as buying stocks and LTF and RMF funds, when compared to purchases of other products/services, with an average of 6.2 transactions. This was followed by purchases of ringtone/song/film/drama/online games downloading service, at 5.7 transactions, and purchases of fashion goods, such as clothing, shoes, handbags and accessories, and tour/travel packages such as plane tickets, accommodation and car rental services, with an average of 3.1 transactions.
Chart 17: Average Number of Online Purchases of Goods/Services in the Past 6 Months, Classified by Product/Service Category.
Transactions6.2
Transactions5.7
Transactions3.1
Transactions3.1
Transactions2.9
Transactions2.7
Transactions2.6
Transactions2.1
Transactions1.8
Transactions1.6HomeappliancesEntertainment
Finance/Investment
Gems/jewellery
Motherand child care
Fashion goods
Wellness andbeauty products
Tour/travel
IT devices
Downloading

Electronic Transactions Development Agency (Public Organization) 71
According to Chart 18, during the period of six months prior to the survey, most buyers spent less than 1,000 Baht per transaction to buy goods/services online, except in the case of goods in finance/ investment and tour/travel categories. The most preferred products of buyers who spent less than 1,000 Baht per transaction was ringtone/song/film/drama/online game downloading service, at 78.8 per cent. The second most preferred choices were gems/jewellery, at 57.0 per cent. The third and fourth preferences were products for entertainment purposes such as tickets for movies, concerts, shows, etc., at 45.3 per cent and fashion goods at 45.1 per cent.
76.6 and 37.2 per cent of buyers, who spent more than 10,000 Baht per transaction, purchased finance/investment products and tour/travel packages respectively.

72 Thailand Internet User Profile 2015Ch
art 18
: Buy
ers
of O
nline
Good
s/Se
rvices
, Class
ified
by T
rans
actio
n Va
lue
in E
ach
Prod
uct Ca
tego
ry
57.0%
17.4%
6.4%
8.1%
4.3%
6.8%
35.6%
23.3%
15.3%
12.6%
8.5% 4.6%
35.4%
20.6%
10.7%
14.8%
9.5% 9.0%
35.5%
15.4%
9.1%
12.1%
10.3%
17.6%
Gem
s/je
wel
lery
Wel
lnes
san
d be
auty
Hom
eap
plia
nces
IT d
evic
es
45.1%
21.8%
11.3%
11.4%
6.5% 3.9%
Mor
e th
an10
,000
Bah
t
1,001 -
2,00
0 Ba
ht
2,001 -
3,00
0 Ba
ht
3,001 -
5,00
0 Ba
ht
5,001 -
10,00
0 Ba
ht
Fash
ion
Le
ss tha
n1,0
00 B
aht
Mor
e th
an10
,000
Bah
t
1,001 -
2,00
0 Ba
ht
2,001 -
3,00
0 Ba
ht
3,001 -
5,00
0 Ba
ht
5,001 -
10,00
0 Ba
ht
Less
tha
n1,0
00 B
aht
Mor
e th
an10
,000
Bah
t
1,001 -
2,00
0 Ba
ht
2,001 -
3,00
0 Ba
ht
3,001 -
5,00
0 Ba
ht
5,001 -
10,00
0 Ba
ht
Less
tha
n1,0
00 B
aht
Mor
e th
an10
,000
Bah
t
1,001 -
2,00
0 Ba
ht
2,001 -
3,00
0 Ba
ht
3,001 -
5,00
0 Ba
ht
5,001 -
10,00
0 Ba
ht
Less
tha
n1,0
00 B
aht
Mor
e th
an10
,000
Bah
t
1,001 -
2,00
0 Ba
ht
2,001 -
3,00
0 Ba
ht
3,001 -
5,00
0 Ba
ht
5,001 -
10,00
0 Ba
ht
Less
tha
n1,0
00 B
aht

Electronic Transactions Development Agency (Public Organization) 73
27.8%
24.1%
14.8%
13.4%
8.3% 11.6%
2.3% 1.7% 1.4%
7.4%
10.5%
76.6%
45.3%
20.3%
9.3%
11.0%
10.1%
4.0%
78.8%
9.4% 3.7%
4.1%
3.2%
0.8%
3.6%
9.4% 9.7%
16.7%
23.3%
37.2%
Fina
nce/
Inve
stm
ent
Mot
her
and
child
car
e
Tour
/tra
vel
Ente
rtai
nmen
t Do
wnl
oadi
ng
Mor
e th
an10
,000
Bah
t
1,001 -
2,00
0 Ba
ht
2,001 -
3,00
0 Ba
ht
3,001 -
5,00
0 Ba
ht
5,001 -
10,00
0 Ba
ht
Less
tha
n1,0
00 B
aht
Mor
e th
an10
,000
Bah
t
1,001 -
2,00
0 Ba
ht
2,001 -
3,00
0 Ba
ht
3,001 -
5,00
0 Ba
ht
5,001 -
10,00
0 Ba
ht
Less
tha
n1,0
00 B
aht
Mor
e th
an10
,000
Bah
t
1,001 -
2,00
0 Ba
ht
2,001 -
3,00
0 Ba
ht
3,001 -
5,00
0 Ba
ht
5,001 -
10,00
0 Ba
ht
Less
tha
n1,0
00 B
aht
Mor
e th
an10
,000
Bah
t
1,001 -
2,00
0 Ba
ht
2,001 -
3,00
0 Ba
ht
3,001 -
5,00
0 Ba
ht
5,001 -
10,00
0 Ba
ht
Less
tha
n1,0
00 B
aht
Mor
e th
an10
,000
Bah
t
1,001 -
2,00
0 Ba
ht
2001 -
3,00
0 Ba
ht
3,001 -
5,00
0 Ba
ht
5,001 -
10,00
0 Ba
ht
Less
tha
n1,0
00 B
aht

74 Thailand Internet User Profile 2015
Factors Influencing Decisions to Buy Goods/Services Online
The top five factors influencing respondents’ decisions to buy goods and services online were : 1) website presentation of goods and services (51.2 per cent); 2) clear and attractive images of goods (50.5 per cent); 3) lower prices when compared to buying from traditional shops (46.4 per cent); 4) less travelling time and expenses and the convenience of 24-hour product ordering (46.1 per cent); and 5) appealing promotional/special offers (41.6 per cent), as shown in Chart 19.

Electronic Transactions Development Agency (Public Organization) 75
Clea
r and
att
ract
ive
imag
es o
f goo
dsLo
wer
pric
es o
f goo
ds/s
ervi
ces
whe
n co
mpa
red
totr
aditi
onal
sto
res
BUY
Free
Web
site
pre
sent
atio
nof
goo
ds/s
ervi
ces
Less
trav
ellin
g tim
ean
d ex
pens
es,a
nd 2
4-ho
urpr
oduc
t ord
erin
g24 Hr.
Appe
alin
g pr
omot
iona
l/sp
ecia
l off
ers
Conv
enie
nce
in w
ebsi
te se
arch
for g
oods
51.2
%50
.5%
46.4
%46
.1%
41.6
%38
.8%
Confi
denc
e in
ord
erin
gan
d pa
ymen
t sys
tem
sVa
rietie
s of g
oods
on
web
site
sCo
nven
ient
and
spee
dyde
liver
y se
rvic
eFr
ee d
eliv
ery
serv
ice
if th
e pu
rcha
se a
mou
ntm
et th
e m
inim
um re
quire
men
t
Good
repu
tatio
n/cr
edib
ility
of v
endo
rs
of g
oods
/ser
vice
s
Pack
agin
g qu
ality
and
stan
dard
s
33.5
%29
.5%
29.4
%29
.4%
28.6
%22
.6%
Web
site
s de
sign
ed to
supp
ort d
iffer
ent d
evic
esCa
sh p
aym
ent o
n de
liver
y Sa
tisfa
ctio
n gu
aran
teed
;“M
oney
bac
k gu
aran
tee
if no
t sat
isfie
d”
Good
s sol
d on
line
only
Call
cent
er se
rvic
eO
ther
s
20.2
%18
.414
.5%
14.2
%12
.3%
1.6%
Char
t 19
: Buy
ers
of G
oods
/Ser
vice
s On
line, C
lass
ified
by
Factor
Influ
encing
The
ir De
cision
s

76 Thailand Internet User Profile 2015
When factors influencing buyers’ decisions to buy goods/services online were compared by gender, the results were not consistent with the norm of the whole survey cohort. Website presentation of goods/service and less travelling time and expenses and the convenience of 24-hour product ordering were the top two factors influencing the decisions to purchase goods/services online of male and transgender respondents, which were consistent with the overall norm of the survey cohort.
Lower prices of goods/services when compared to buying from traditional shops (47.9 per cent), clear and attractive images of goods (47.7 per cent), and convenience in searching for goods on websites (45.9 per cent) were the 3rd- 5th factors influencing male respondents’ decisions.
On the other hand, clear and attractive images of goods (50.0 per cent), appealing promotional offers (46.2 per cent), and lower prices of goods/services when compared to buying from traditional shops (43.9 per cent) were the 3rd- 5th factors influencing the transgender respondents’ decisions.
The top five factors influencing female respondents’ decisions to buy goods/services online were: 1) clear and attractive images of goods (52.2 per cent); 2) website presentation of goods/services (50.4 per cent); less travelling time and expenses and the convenience of 24-hour ordering (47.9 per cent); 4) lower prices of goods/services when compared to buying from traditional shops (47.6 per cent); and 5) appealing promotional offers (43.9 per cent).
When factors influencing decisions to buy goods/services were compared by generation, findings show that the factors obviously influencing the decisions of Generation X, Generation Y, and Generation Z

Electronic Transactions Development Agency (Public Organization) 77
respondents more than those of Baby Boomers were designs of websites that support different devices, clear and attractive images of goods, and packaging quality and standards.
Factors that noticeably influenced the decisions of Generation X and Generation Y more than those of Baby Boomers and Generation Z included convenience in searching for goods/services on websites, lower prices of goods/services when compared to buying from traditional shops, appealing promotional offers, and free delivery service if the purchase amount met the minimum requirement (See more details in Table 9 of the Annex.)
Such information will be very useful to E-Commerce business operators in their business planning/marketing strategy formulation and marketing mix management, in order to appropriately reach their target groups.
Provision of Personal Information to Vendors
We may not realize that in spite of its many benefits, there may be hidden danger of the “Internet” every time we click to order goods online or fill out information on the website, because malevolent people can capture and use our personal and other important information5.
If personal information such as ID card number, personal phone number, and credit card number has to be disclosed on social networks, caution must be taken to see whether such websites can be trusted. Consideration must be given to contents on websites, which should state their intention to provide service. They should be well-known websites to avoid capture of personal information from phishing and prevent
5 Source: “Secret Tips for Online Shoppers, Beware of Cyberthreats” Edition, (in Thai) p. 10, first published in September 2014. https://www.etda.or.th/document-for-download.html

78 Thailand Internet User Profile 2015
disclosure of information that the owners do not wish to make public on the search engine system6.
Survey findings in Chart 20 show that most or 90.6 per cent of online buyers provided addresses for product delivery more than information in other categories. This was followed by names and last names, at 89.5 per cent and telephone numbers, at 73.0 per cent.
Chart 20: Buyers of Goods/Services Online, Classified by Type of Personal Information Provided to Vendors
When comparison was made by generation, older buyers of goods/services online provided important personal information to online shops more than younger buyers.
According to Chart 21, Baby Boomers and Generation X were age groups that were more prone to damage caused by their important personal information, such as email address, income level, and ID card number, being misused by malevolent people than respondents in other age groups.
6 Ibid: “10 Caveats Against Online Threats, p.20.
Address for productdelivery
Name and last name Telephone number Email address
90.6%89.5% 73.0% 55.7%
NAME
Date of birth ID card number Profession Income level14.7% 8.6% 5.5% 3.6%
1928374650XXX

Electronic Transactions Development Agency (Public Organization) 79
Online buyers in the Baby Boomer group provided information on their email addresses, income level, and citizen ID card numbers to online shops at 72.8, 7.7 and 15.8 per cent respectively, while generation X respondents provided such information at 75.4, 6.1, and 10.7 per cent respectively, more than that of other age groups. (See more details in Table 10 in the Annex).
To prevent such damage, those interested in buying goods/services online should buy from trusted online shops or websites. They may choose shops certified by a Trustmark or look up the profiles of such shops on the Internet to find out whether there was any incident of deception, or whether there were people posting positive comments to mislead buyers to believe that such shops can be trusted.

80 Thailand Internet User Profile 2015
N.B. Multiple answers possible.
Chart 21: Buyers of Goods/Services Online, Classified by Generation, Based on Types of Personal Information
Provided to Vendors
Electronic Transactions Development Agency (Public Organization) 67
Chart 21: Buyers of Goods/Services Online, Classified by Generation, Based on Types of Personal Information
Provided to Vendors
Note: Multiple answers possible
6.8
7.9
10.7
15.8
4.3
5.1
7.7
7.7
1.9
3.1
6.1
7.7
35.4
56.0
75.4
72.8
55.3
75.5
84.4
82.4
7.5
15.5
19.9
21.3
90.1
91.5
90.0
86.8
86.3
90.0
91.8
87.5
0.0 10.0 20.0 30.0 40.0 50.0 60.0 70.0 80.0 90.0 100.0
Z
Y
X
Baby Boomer
Address for product deliveryTelephone numberIncome level
Name and last name Date of birthEmail address Profession ID card number
Per cent

Electronic Transactions Development Agency (Public Organization) 81
Payment Channels for Goods/Services
At present, buying goods/services via the Internet is convenient and easy. The same can be said about payment for such goods/services. Buyers can pay through online channels such as various electronic cards and via offline channels such as bank transfer, ATM terminals, and cash payment on delivery.
According to survey findings, most online buyers used offline channels to pay for goods/services purchased online. Payment by bank counter transfer accounted for over 65 per cent, followed by payment via ATM terminals at 31.2 per cent, reflecting the fact that online buyers still did not trust online payment channels. The third preferred method was online payment by credit cards (26.4 per cent) as shown in Chart 22.
Chart 22: Buyers of Goods/Services Online, Classified by Payment Channel
Credit card26.4%
Online banking service18.5%
Payment Service Provider8.4%
Debit card6.5%
Top-up card1.3%
Cash card1.1%
Bank counter service 65.5%
ATM terminal 31.2%
Cash payment on delivery 18.8%
Cash payment at service counter 12.7%
Payment to vendor in person 7.3%
Online Offline

82 Thailand Internet User Profile 2015
Based on Chart 23, when payment channels for goods/services bought online were compared by age group, Generation X and Baby Boomers paid by credit cards more than other age groups by over 50 per cent. Based on findings on risks related to providing personal information to vendors presented earlier, this means that these two groups were considerably more at risk of damage caused by payment for goods/services bought online than other groups. This was due to the fact that they were the groups that preferred to use credit cards to pay for goods/services bought online but failed to take sufficient precaution while providing important personal information to online shops. (See more details in Table 11 in the Annex)

Electronic Transactions Development Agency (Public Organization) 83
Chart 23: Buyers of Goods/Services Online, Classified by Generation, Based on Payment Channels.
N.B. Multiple answers possible.
70 Thailand Internet User Profile 2015
Chart 23: Buyers of Goods/Services Online, Classified by Generation, Based on Payment Channels.
N.B. Multiple answers possible.
8.1
7.7
6.7
4.4
73.3
66.6
56.2
52.9
14.3
17.8
21.4
34.9
0.6
1.4
0.9
1.1
7.5
24.2
50.4
51.5
2.5
9.6
3.7
2.9
1.9
1.3
0.5
1.1
34.8
34.5
21.5
19.1
11.8
21.8
21.3
13.2
9.9
14.1
10.8
14.3
3.7
10.0
9.3
9.6
0.0 10.0 20.0 30.0 40.0 50.0 60.0 70.0 80.0
Z
Y
X
Baby Boomer
Cash payment at service counterATM terminalDebit cardCash cardBank counter service
Payment Service Provider Online banking service Top-up cardCredit cardCash payment on delivery Payment to vendor in person
per cent

84 Thailand Internet User Profile 2015
Parcel post Courier service Product pick-up by buyer Others87.4% 30.7% 12.4% 3.8%
More than 87 per cent of those ordering goods/services online requested delivery by post. The next methods preferred by 30.7 and 12.4 per cent of buyers were delivery by courier service and product pick-up by the buyers respectively. Other channels, including e-Coupons or e-Tickets for redemption were chosen by 3.8 per cent of buyers.
Chart 24: Buyers of Goods/Services Online, Classified by Delivery Channel
The survey also explored the behavior of buyers of goods/services online on completion of the purchase and payment processes. There were questions about problems arising from buying goods/services online and the ways to resolve such problems.
Problems Arising from Buying Goods/Services Online
According to survey findings, 23.1 per cent of the 6,774 respondents who had bought goods/services online did encounter some problems. The top three problems cited by respondents were: 1) delayed delivery of ordered goods, reported by over 58 per cent; 2) items received not matching the descriptions shown on websites, reported by 29.9 per cent; and 3) damaged/defective goods, reported by 24.0 per cent. Other problems accounted for 9.1 per cent, which included goods being out of stock; loss of goods; expired products, etc. as shown in Chart 25.
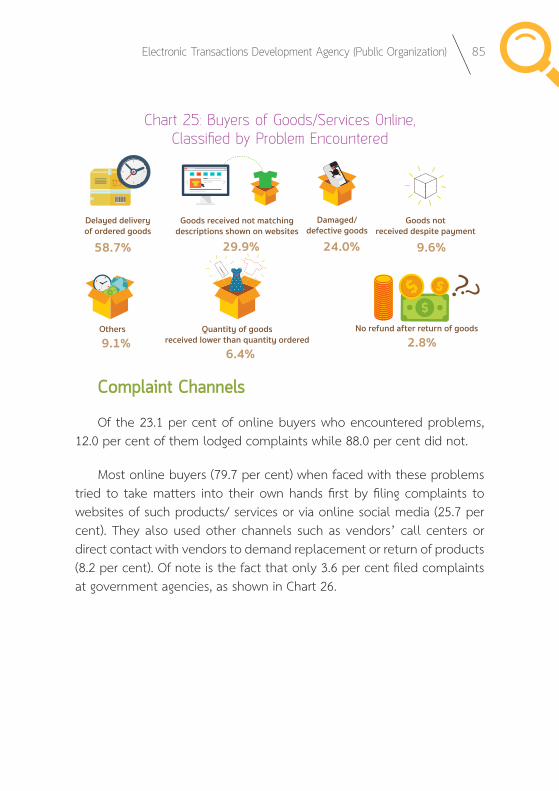
Electronic Transactions Development Agency (Public Organization) 85
Chart 25: Buyers of Goods/Services Online, Classified by Problem Encountered
Complaint Channels
Of the 23.1 per cent of online buyers who encountered problems, 12.0 per cent of them lodged complaints while 88.0 per cent did not.
Most online buyers (79.7 per cent) when faced with these problems tried to take matters into their own hands first by filing complaints to websites of such products/ services or via online social media (25.7 per cent). They also used other channels such as vendors’ call centers or direct contact with vendors to demand replacement or return of products (8.2 per cent). Of note is the fact that only 3.6 per cent filed complaints at government agencies, as shown in Chart 26.
Delayed deliveryof ordered goods
Goods received not matchingdescriptions shown on websites
Damaged/defective goods
Goods notreceived despite payment
Quantity of goodsreceived lower than quantity ordered
No refund after return of goods
58.7% 29.9% 24.0% 9.6%
9.1%6.4%
2.8%Others

86 Thailand Internet User Profile 2015
Product/service websitesProduct/service websites
via social media
Government agencies Complaint lodged with Police Others
79.7% 25.7%
3.6% 1.5% 8.2%
Chart 26: Buyers of Goods/Services Online Who Had Lodged Complaints, Classified by Complaint Channel
According to Chart 27, the reason given by online buyers who encountered these problems but chose not to file complaints (7.2 per cent) was negligible damage. Of note was the reason given by 6.4 per cent of respondents that they lacked information on the procedures, means and channels to file complaints. This was consistent with the fact that only 3.6 per cent of respondents chose to file complaints through government agencies.
The Electronic Transactions Development Agency (Public Organization), or ETDA, has established its Online Complaint Center (OCC) as part of a Green E-Commerce Project, because ETDA attaches importance to action taken to reduce online frauds and violations of privacy. During the first phase, the Online Complaint Center was entrusted with the duty to oversee shops that were members of the website
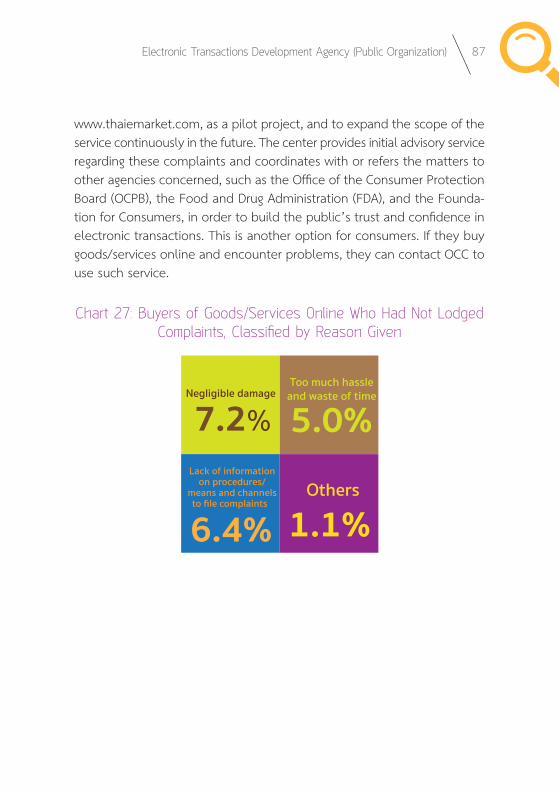
Electronic Transactions Development Agency (Public Organization) 87
www.thaiemarket.com, as a pilot project, and to expand the scope of the service continuously in the future. The center provides initial advisory service regarding these complaints and coordinates with or refers the matters to other agencies concerned, such as the Office of the Consumer Protection Board (OCPB), the Food and Drug Administration (FDA), and the Founda-tion for Consumers, in order to build the public’s trust and confidence in electronic transactions. This is another option for consumers. If they buy goods/services online and encounter problems, they can contact OCC to use such service.
Chart 27: Buyers of Goods/Services Online Who Had Not Lodged Complaints, Classified by Reason Given
7.2%
6.4%
5.0%
1.1%
Negligible damage
Lack of informationon procedures/
means and channelsto file complaints
Too much hassleand waste of time
Others

88 Thailand Internet User Profile 2015
Annex

Electronic Transactions Development Agency (Public Organization) 89
42.4% 55.8%1.8%
Chart 28: Internet Users Classified by Gender
Profiles of Respondents of Thailand Internet User Profile 2015
A total of 17,010 persons answered the 2015 survey questionnaire on websites and social media sites. Data from 10,434 respondents were complete and processed. Their distribution may be classified by the following attributes:
Gender
Internet users consisted of 42.4 per cent male, 55.8 per cent female, and 1.8 per cent transgender as shown in Chart 28.

90 Thailand Internet User Profile 2015
Marital Status
The majority of Internet users, or 70.7 per cent, were single. 24.1 per cent claimed to be married, while 3.0 and 2.2 per cent were cohabiting and divorced/separated/widowed respectively, as shown in Chart 29.
Generation
For this year’s survey, Internet users were classified by generation instead of age group. They were divided into five generations according to the Overcoming Generation Gap in the Workplace Report prepared by the United Nations Joint Staff Pension Fund7 as follows:
7 Overcoming Generational Gap in the Workplace, United Nations Joint Staff Pension Fund, http://www.un.org/staffdevelopment/pdf/Designing%20Recruitment,%20Selection%20&%20Talent%20Management%20Model%20tailored%20to%20meet%20UNJSPF’s%20Business%20Development%20Needs.pdf
24.1% 70.1%
Cohabiting
Divorced/Separated/Widowed
Married, marriage registeredand not registered
Single
3.0%
2.2%
Chart 29: Internet Users Classified by Marital Status

Electronic Transactions Development Agency (Public Organization) 91
1. Traditionalists: people born from 1925 to 1945.
2. Baby Boomers: people born from 1946 to 1964, during which the use of technology was not widespread and communication was by fixed line or public telephones.
3. Generation X or Gen X in short: people born from 1965 to 1980, during the time that technology became more advanced. E-mail and mobile phones were being used for communication, although in Thailand mobile phone service was provided for the first time in 19868.
4. Generation Y or Gen Y: people born from 1981 to 2000 when the Internet and social media were widely used. This was the period when people were addicted to online communication.9
5. Generation Z or Gen Z: people born from 2001 onwards, who were exposed to technology from birth. Members of Generation Z prefer to communicate by text messaging on a mobile phone screen or a computer monitor instead of talking.
8 The Birth of Mobile Phones in Thailand, ASTV Manager Online, 2 May 2007 http://www.manager.co.th/Cyberbiz/ViewNews.aspx?NewsID=9500000049938. Search conducted on 19 July 2015.
9 Siam Commercial Bank Research Center Discloses 5 Outstanding Characteristics of Gen Y and Guidelines on Strategies to Attract and Retain Them. Siam Commercial Bank Economic Intelligence Center, November 2014 http://www.brandbuffet.in.th/2014/11/how-to-attack-gen-y-scb-eic/. Search conducted on 19 July 2015.

92 Thailand Internet User Profile 2015
In this survey, the oldest respondents of the survey questionnaire belonged to the Baby Boomer Group. Therefore, the survey findings show the behavior of four generations only. Percentage of respondents in each generation was as follows: Generation Z, 2.9 per cent; Generation Y with the highest number of respondents, 64.4 per cent; Generation X, 26.2 percent; and Baby Boomers, 6.5 per cent, as shown in Chart 30.
Chart 30: Internet Users Classified by Generation
Baby BoomerGen XGen YGen Z2.9% 64.4% 26.2% 6.5%

Electronic Transactions Development Agency (Public Organization) 93
Bangkok and vicinity
Other provinces
56.3%
Inside municipal areas 60.7%
Outside municipal areas 39.3%
43.7%
Chart 31: Internet Users Classified by Residence
Residence
Where residence was considered, it was found that 56.3 percent of Internet users were residents of Bangkok and vicinity while 43.7 per cent lived in the provinces. Among these provincial residents, 60.7 per cent lived inside the municipal areas while 39.3 per cent resided outside the municipal areas, as shown in Chart 31.

94 Thailand Internet User Profile 2015
1.5
21.0
48.7
5.7
18.64.5
0.0
Higher than Master’s degreeMaster’s degree
Bachelor’s degreeVocational certificate/
Higher Vocational certificate/Technical diploma/Associate degree
Upper secondary educationBelow upper
secondary education10.0 20.0 30.0 40.0 60.050.0
per cent
Chart 32: Internet Users Classified by Educational Attainment
Educational Attainment
48.7 per cent of Internet users held a Bachelor’s degree, followed by 21.0 per cent who held a Master’s degree. The rest, at 30.3 per cent, had below upper secondary education, upper secondary education or were holders of a vocational certificate/higher vocational certificate/ technical diploma/associate degree, or higher than a Master’s degree as shown in Chart 32.

Electronic Transactions Development Agency (Public Organization) 95
Employment Status
The majority, or 35.9 per cent of respondents were government officials, government personnel/employees/employees of state enterprises/ independent agencies, followed by 31.3 and 22.7 per cent who were students and personnel/employees of the private sector respectively, as shown in Chart 33.
Chart 33: Internet Users Classified by Employment Status
Unemployed
1.8%
Student
31.3%Government official,
employee of a public agency/state enterprise/
independent agency
35.9%
5.3%3.0%
Househusband/housewife
Business owner/self-employed
Employee of aprivate agency
22.7%

96 Thailand Internet User Profile 2015
Chart 34: Internet Users Classified by Average Monthly Personal Income
> 90,000
50,001 - 70,00070,001 - 90,000
40,001 - 50,00030,001 - 40,00020,001 - 30,00015,001 - 20,00010,001 - 15,0005,001 - 10,000
< 5,000
2.9
1.9
5.5
5.1
9.3
15.8
13.8
10.28.8
26.6
5.0 10.0 15.0 20.0 25.0 30.0per cent
Baht
Average Monthly Personal Income
With regard to the average monthly personal income of Internet users, 26.6 per cent was in the group with an average monthly income of 5,000 Baht, while 15.8 per cent and 13.8 per cent were in the groups with an average monthly income of 20,001-30,000 Baht and 15,001-20,000 Baht respectively, as shown in Chart 34.

Electronic Transactions Development Agency (Public Organization) 97
Average Monthly Household Income
When the average monthly household income was considered, it was found that 23.9 per cent of Internet users lived in households that had an average monthly income of 30,001-50,000 Baht while 23.4 and 15.2 per cent lived in households that had an average monthly income of 10,001-30,000 Baht and 50,001-70,000 Baht respectively. Internet users having an average monthly household income of more than 150,000 Baht accounted for 8.8 per cent as shown in Chart 35.
> 150,000
110,001 - 130,000130,001 - 150,000
90,001 - 110,00070,001 - 90,00050,001 - 70,00030,001 - 50,00010,001 - 30,000
< 10,000
8.8
3.04.7
6.8
8.515.2
23.923.4
5.7
5.0 10.0 15.0 20.0 25.0
Baht
per cent
Chart 35: Internet Users Classified by Average Monthly Household Income

98 Thailand Internet User Profile 2015

Electronic Transactions Development Agency (Public Organization) 99
Electronic Transactions Development Agency (Public Organization) 7
Questionaire on Thailand Internet User Profile 2015 Part 1: General Information (8 questions) 1. Gender
Male Female Transgender
2. Marital Status
Single Married, marriage registered/married, marriage not registered Cohabiting Divorced/separated/widowed
3. Age……….years
4. Your residence at present (not necessarily as shown in census registration):In Province, Provincial, inside municipal areas Provincial, outside municipal areas (If you are living abroad at present, please stop here.)
5. Your highest educational attainment or what you are currently studying for:
Below upper secondary education Upper secondary education Vocational certificate/Higher Vocational certificate/Technical
diploma/Associate degree Bachelor’s degree Graduate diploma Master’s degree Higher than Master’s degree

100 Thailand Internet User Profile 2015
8 Thailand Internet User Profile 2015
6. Your main career/occupation
Government official, employee of a public agency/ state enterprise/independent agency Business owner/self-employed Employee of a private agency Student Househusband/housewife Unemployed Others (Please specify.)....................
7. Your average monthly personal income (monetary income)
Not exceeding 5,000 Baht 5,001 – 10,000 Baht 10,001 – 15,000 Baht 15,001 – 20,000 Baht 20,001 – 30,000 Baht 30,001 – 40,000 Baht 40,001 – 50,000 Baht 50,001 – 70,000 Baht 70,001 – 90,000 Baht Over 90,000 Baht
8. Average monthly household income (monetary income)
Below 10,000 Baht 10,001 – 30,000 Baht 30,001 – 50,000 Baht 50,001 – 70,000 Baht 70,001 – 90,000 Baht 90,001 – 110,000 Baht 110,001 – 130,000 Baht 130,001 – 150,000 Baht Over 150,000 Baht
Part 2: Internet Usage Behaviour (6 questions) 9. In the last seven days, what was the total time you spent on the Internet?
Up to 10 hours 10–20.9 hours 21–41.9 hours 42 – 76.9 hours 77 – 104.9 hours 105 hours or more

Electronic Transactions Development Agency (Public Organization) 101
Electronic Transactions Development Agency (Public Organization) 9
10. In the last seven days, to what extent did you use the Internet (via eachtype of devices), and during what hours?
Average Hours Per
Day
Hours Of Usage
08.01 – 12.00hours
12.01 – 16.00hours
16.01 – 20.00hours
20.01 – 24.00hours
00.01 – 08.00hours
04.01 – 08.00hours
Desktop Computer
……….
Laptop computer ……….
Tablet PCs such as iPad, Galaxy Tab
……….
Smartphone ………. Smart TV ………. Others (Please specify)
……….
11. In the last seven days, where did you most often use the Internet? (Selectup to 3 choices.) At home/residence At work At school/college At Internet café At public place While travelling Others (Please specify.) ……………………………………………….

102 Thailand Internet User Profile 2015
10 Thailand Internet User Profile 2015
12. In the last three months, what activities did you perform via the Internetand which type of devices did you use?
Activities Computer Mobile Devices1
Social network such as Facebook, Instagram, LINE Sending-receiving e-mails Searching for information Reading/following news/reading e-books Following stock trading Financial Transactions Buying goods and services Selling goods and services Booking/buying public transport tickets online Downloading software/music/dramas/games Playing online games Online entertainment (watching TV/films; listening to radio) Others (Please specify)………………………………..…………
13. In the last 3 months, which social networksites did you use regularly?(multiple answers possible)
Others (please specify) ……………..
1 Mobile devices refer to mobile phones, smartphones, and tablet computers

Electronic Transactions Development Agency (Public Organization) 103
Electronic Transactions Development Agency (Public Organization) 11
14. With respect to your online activities during the last 3 months, what werethe main problems you encountered (maximum 3 answers)?
Slow connections/delayed Internet access Internet service not widely available Interference from online advertisements Prevalence of computer viruses Fraud on the Internet Obsession with Internet usage Not knowing where to seek assistance when faced with problems Difficulty connecting or dropped connections High cost of service fees, devices for usage, etc. Volume of junk mail/spam mail Pornography disseminated on the Internet Concern about privacy or personal data violation Unsure about data integrity on the Internet Others (Please specify.).............................................................................
Part 3: Online Purchases of Goods and Services by Thai Internet Users in the Digital Economy Era (12 questions) (Answers to questions in Part 3 should be based on what happened during the last 6 months) 15. In the last 6 months, did you purchase goods/services online?
Yes Never, due to … (multiple answers possible)
Lack of pre-purchase opportunities to touch/try the products Desired products not available online Lack of opportunities to meet vendors Preference for shopping in traditional stores
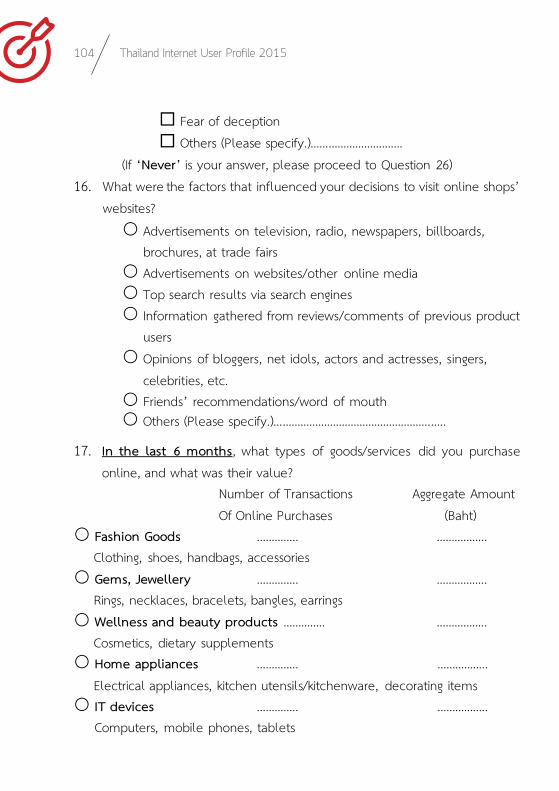
104 Thailand Internet User Profile 2015
12 Thailand Internet User Profile 2015
Fear of deception Others (Please specify.)………………………….
(If ‘Never’ is your answer, please proceed to Question 26) 16. What were the factors that influenced your decisions to visit online shops’
websites? Advertisements on television, radio, newspapers, billboards,
brochures, at trade fairs Advertisements on websites/other online media Top search results via search engines Information gathered from reviews/comments of previous product
users Opinions of bloggers, net idols, actors and actresses, singers,
celebrities, etc. Friends’ recommendations/word of mouth Others (Please specify.)……………………………………………..…..
17. In the last 6 months, what types of goods/services did you purchaseonline, and what was their value?
Number of Transactions Aggregate Amount Of Online Purchases (Baht)
Fashion Goods ………….. …………….. Clothing, shoes, handbags, accessories Gems, Jewellery ………….. …………….. Rings, necklaces, bracelets, bangles, earrings Wellness and beauty products ………….. …………….. Cosmetics, dietary supplements Home appliances ………….. …………….. Electrical appliances, kitchen utensils/kitchenware, decorating items IT devices ………….. ……………..
Computers, mobile phones, tablets

Electronic Transactions Development Agency (Public Organization) 105
Electronic Transactions Development Agency (Public Organization) 13 Mother and child care products………….. …………….. Diapers, infant formula milk, toys, children’s clothing Finance/investment products………….. …………….. Stocks, funds, such as LTF, RMF Entertainment products ………….. …………….. Tickets for movies, concerts, and shows Downloading services ………….. …………….. Ringtones, songs, films, dramas, games online, LINE stickers, e-books, mobile applications Tour/travel packages ………….. …………….. Plane tickets, accommodation, car rental service Others (Please specify) ………….. ……………..
18. In the last 6 months, what were the factors influencing your decisions to purchase goods/services online? Website presentation of goods/services Convenience in searching for goods on websites Designs of websites which support different devices, such as mobile
sites Clear and attractive images of goods Varieties of goods on websites Goods sold online only Lower prices of goods/services when compared to buying from
traditional stores Appealing promotional/special offers Goods reputation/credibility of vendors of goods/services Confidence in ordering and payment systems Less travelling time and expenses, and the convenience of 24-hour
product ordering Convenient and speedy delivery service

106 Thailand Internet User Profile 2015
14 Thailand Internet User Profile 2015
Free delivery service if the purchase amount met the minimum requirement
Cash-on-delivery service Packaging quality and standards Satisfaction guaranteed; “money back guaranteed if not satisfied” Call center service Others (Please specify.) ……………………………
19. In the last 6 months, what personal information did you give to vendors when you purchased goods/services online? (Multiple answers possible) Name and last name Address for product delivery Date of birth Telephone number Email address Income level Profession ID Card number Others (Please specify.) ………………………………………..
20. What were your payment methods for goods/services purchased online? (Multiple answers possible.) Paying to vendor in person Bank transfer Cash payment on delivery Cash card Credit card Debit card Top-up card Via ATM terminal Online banking service Cash payment at service counters at Lotus, Big C, 7-11, Family Mart,
etc. Payment service providers such as PayPal, PaysBuy, mPay,
TrueMoney Others (Please specify.) …………………………..

Electronic Transactions Development Agency (Public Organization) 107
Electronic Transactions Development Agency (Public Organization) 15 21. Through which channels did you receive goods purchased online?
(Multiple answers possible.) Parcel post Courier service I picked them up myself. Others (Please specify.)…………….
22. When you purchased goods/services in the last 6 months, did you come across any of the following problems? Yes. Problems encountered were: (Multiple answers possible.)
Goods received not matching descriptions shown on websites
Quantity of goods received lower than quantity ordered Delayed delivery of ordered goods Damaged/defective goods No refund after return of goods Others (Please specify.) ………………….
No. (If ‘No’ is your answer, please proceed to Question 24)
23. When faced with problems after purchasing goods/services online, did you lodge your complaint/made comments about your problems? Yes, by: (Multiple answers possible.)
Lodging complaints on websites of such goods/services Making comments via social networks Filing a complaint with the police Lodging complaints with public agencies
(Please specify.)………………………………………………….. Others (Please specify.)………………………………………
No, because: (Multiple answers possible.) Too much hassle and waste of time/negligible damage Lack of information on procedures/means to file
complaints

108 Thailand Internet User Profile 2015
16 Thailand Internet User Profile 2015
Lack of information on channels to file complaints
24. When faced with frauds or treated unfairly, what was the value ofgoods/services purchased that would prompt you to lodge a complaint todemand fair treatment? …………………… Baht.
25. Besides purchasing goods/services online, did you plan to sellgoods/services online? (Multiple answers possible.) I am already a vendor I plan to sell goods/services online within this year (2015) I plan to sell goods/services online in 2016. I do not plan on selling goods/services online.
26. Through which channel(s) did you learn about this questionnaire? (Multipleanswers possible.) A website (Please specify.).................................................................... Facebook Twitter E-mail from workplace Recommended by a friend/an acquaintance Others (Please specify.)............................................................................
*******Thank you for taking the time to answer this questionaire. *******
Others (Please specify.)………………………………………………..

Electronic Transactions Development Agency (Public Organization) 109
StatisticalTables

110 Thailand Internet User Profile 2015
Table
1: D
evice
s Use
d to
Acc
ess t
he In
terne
t, Clas
sified
by U
sers’
Gen
der a
nd G
enera
tion
pe
r cen
t De
sktop
Comp
uter
Lapt
op C
ompu
ter
Table
t C
ompu
ter
Smart
phon
e Sm
art TV
Gend
er
Male
56
.2
52
.1
22
.8
79.6
8.8
Fema
le
53.9
39.7
19.8
8
3.9
8.
4 Tra
nsge
nder
44.6
52.1
19.0
8
6.8
5.
8
Gene
ration
Z
41.2
35.8
21.1
8
0.9
17.2
Y
50
.4
46
.9
18
.1
84.4
8.9
X
63.9
44.3
26.8
8
1.9
7.
3 Ba
by Bo
omer
68.1
35.8
29.3
5
9.8
6.
7

Electronic Transactions Development Agency (Public Organization) 111
Ele
ctron
ic Tra
nsac
tions
Dev
elopm
ent A
genc
y (Pu
blic O
rganiz
ation
) 1
9
Table
2: D
evice
s Use
d to
Acc
ess t
he In
terne
t at D
iffere
nt Pe
riods
by U
sers,
Clas
sified
by G
enera
tion
per c
ent
Deskt
op C
ompu
ter
Lapt
op C
ompu
ter
Table
t C
ompu
ter
Smart
phon
e Sm
art TV
08.01 - 12.00 12.01 - 16.00 16.01 - 20.00 20.01 - 24.00 00.01 - 04.00 04.01 - 08.00 08.01 - 12.00 12.01 - 16.00 16.01 -20.00 20.01 - 24.00 00.01 - 04.00 04.01 - 08.00 08.01 - 12.00 12.01 - 16.00 16.01 -20.00 20.01 - 24.00 00.01 - 04.00 04.01 - 08.00 08.01 - 12.00 12.01 - 16.00 16.01 -20.00 20.01 - 24.00 00.01 - 04.00 04.01 - 08.00 08.01 - 12.00 12.01 - 16.00 16.01 -20.00 20.01 - 24.00 00.01 - 04.00 04.01 - 08.00
Gene
ration
Z 11
.8 17
.3 21
.2 11.8
1.3
0.3 11
.1 9.2
20.3 1
8.3 3
.9 1.6
8.2
6.5 13
.1 7.8
1.3
0.7 35
.9 37
.9 48.4
40.8
7.5 6
.2 5.2
4.2
8.5 9
.5 0.3
0.7
Y 32
.1 33
.5 18.9
15.0
2.6 1
.0 17
.2 20
.1 22
.5 26
.5 4.6
1.2
5.5 6
.4 9.9
11.1
2.0 1
.0 45
.9 49
.1 58.3
59.4
11.2
8.1 2
.4 1.7
4.3
6.6 0
.7 0.4
X 53
.4 49
.6 16.8
10.3
1.2 1
.3 21
.9 23.8
17.3 1
8.1 2
.0 1.2
8.1
7.7 14
.7 17.8
1.4
1.8 44
.5 43
.1 55
.7 52
.4 5.7
10.0
1.3 1
.1 4.0
6.2
0.7 0
.5
Baby
Bo
omer
52.7
43.1
16.0
13.9
1.0 1
.0 17
.5 17
.0 13
.2 15
.9 1.3
0.9
8.9 8
.0 13
.2 12
.6 0.7
1.9
31.9
32.6 3
8.2 30
.5 3.7
7.0
1.5 1
.0 2.7
5.0
1.2 0
.6

112 Thailand Internet User Profile 2015
20 Th
ailan
d Int
ernet
User
Profile
2015
Table
3: In
terne
t Usag
e Site
s Pre
ferred
by U
sers,
Clas
sified
by G
ende
r and
Gen
eratio
n
pe
r cen
t Ho
me/
Acco
mmod
ation
Wo
rkplac
e Ed
ucati
onal
Institu
tion
Intern
et Ca
fé
Publi
c Pla
ce
Trave
lling
Gend
er
Male
86.2
57.7
15.8
3.1
13.6
26.1
Fema
le 86
.9 52
.4 14
.8 2.5
11
.7 28
.5 Tra
nsge
nder
91
.1 38
.4 27
.9 4.2
22
.6 34
.2
Gene
ration
Z 97
.1 2.6
33
.7 3.9
14
.4 20
.6 Y
89.3
45.1
21.5
3.5
13.8
28.4
X 80
.4 79
.6 2.0
1.5
10
.4 28
.3 Ba
by
Boom
er
80.9
68.9
2.5
0.7
10.1
19.7

Electronic Transactions Development Agency (Public Organization) 113
Electr
onic
Trans
actio
ns D
evelo
pmen
t Age
ncy (
Publi
c Orga
nizati
on)
21
Ta
ble 4
: Onl
ine A
ctivit
ies C
arried
out o
n Co
mput
ers b
y Use
rs, C
lassif
ied b
y Gen
der a
nd G
enera
tion
Social Network
Email correspondence
Search for information
Reading e-books
Checking out news on stocks
Carrying out financial transactions
Purchasing goods and services
Selling goods and services
Booking/buying public transport tickets
Downloading software/music/ dramas/games
Playing online games
Watching TV, film /listening to online radio
Gend
er
Male
55.2
65.9
72.4
51.2
15.5
24.5
30.2
10.9
18.9
42.8
23.3
42.5
Fema
le 41
.9 58
.8 64
.3 41
.0 7.5
15
.7 24
.2 8.5
18
.4 26
.8 12
.9 36
.1 Tra
nsge
nder
47
.1 49
.7 60
.3 41
.3 10
.5 18
.0 32
.8 12
.2 18
.4 47
.9 30
.7 52
.4
Gene
ration
Z 35
.3 22
.9 38
.9 21
.6 3.2
7 2.9
11
.4 3.9
7.5
27
.1 27
.8 37
.6 Y
48.4
56.2
64.7
42.8
9.35
17.7
26.5
10.0
18.6
37.6
21.7
43.1
X 48
.0 77
.2 76
.6 51
.7 14
.23
26.1
31.4
10.6
20.1
28.5
8.7
31.7
Baby
Boom
er
43.2
70.3
74.7
55.5
16.79
17
.8 19
.7 4.5
18
.2 23
.4 8.9
30
.1

114 Thailand Internet User Profile 2015
22 Th
ailan
d Int
ernet
User
Profile
2015
Table
5: O
nline
Acti
vities
Carr
ied ou
t on M
obile
Dev
ices b
y Use
rs, C
lassif
ied b
y Gen
der a
nd G
enera
tion
Social Network
Email correspondence
Search for information
Reading e-books
Checking out news on stocks
Carrying out financial transactions
Purchasing goods and services
Selling goods and services
Downloading software/music/ dramas/games
Playing online games
Watching TV, film /listening to online radio
Gend
er
Male
81.8
43.0
56.9
53.6
16.4
28.2
22.2
8.8
15.4
26.2
26.1
35.8
Fema
le 85
.5 37
.3 59
.0 54
.0 10
.4 23
.0 30
.3 10
.9 14
.8 27
.6 29
.6 44
.8 Tra
nsge
nder
90
.5 40
.7 61
.9 57
.1 10
.5 31
.2 29
.1 13
.2 17
.9 40
.0 36
.0 49
.7
Gene
ration
Z 78
.4 20
.3 52
.0 47
.4 5.2
8.5
22
.9 9.5
11
.8 43
.5 30
.1 37
.6 Y
86.7
39.5
60.3
55.7
11.7
26.2
29.3
11.4
15.8
30.1
30.7
43.1
X 83
.0 45
.2 57
.4 53
.8 17
.1 28
.5 25
.0 8.8
15
.9 21
.5 25
.5 31
.7 Ba
by Bo
omer
65
.3 29
.8 43
.2 39
.8 11
.6 12
.3 11
.7 2.5
5.9
14
.7 13
.7 30
.1
Booking/buying public transport tickets
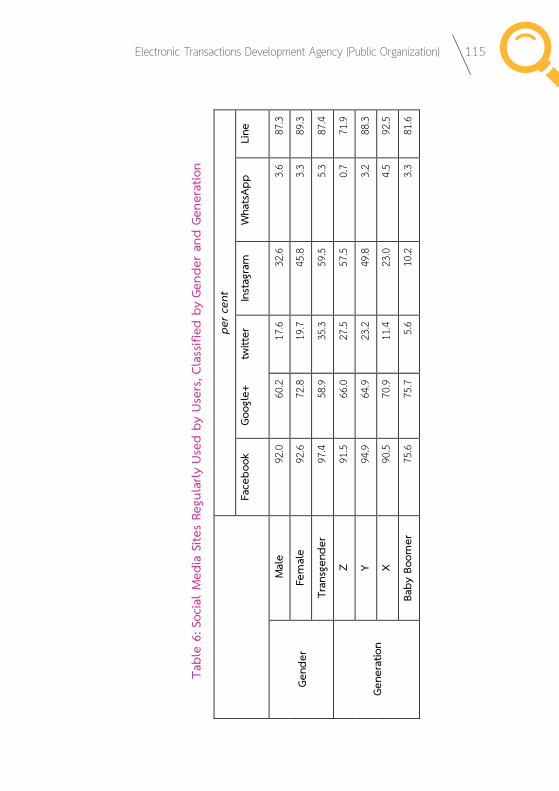
Electronic Transactions Development Agency (Public Organization) 115
Electr
onic
Trans
actio
ns D
evelo
pmen
t Age
ncy (
Publi
c Orga
nizati
on)
23
Table
6: S
ocial
Med
ia Sit
es Re
gular
ly Us
ed b
y Use
rs, C
lassif
ied b
y Gen
der a
nd G
enera
tion
per c
ent
Face
book
Go
ogle+
tw
itter
Instag
ram
Whats
App
Line
Gend
er
Male
92.0
60.2
17.6
32.6
3.6
87.3
Fema
le 92
.6 72
.8 19
.7 45
.8 3.3
89
.3 Tra
nsge
nder
97
.4 58
.9 35
.3 59
.5 5.3
87
.4
Gene
ration
Z 91
.5 66
.0 27
.5 57
.5 0.7
71
.9 Y
94.9
64.9
23.2
49.8
3.2
88.3
X 90
.5 70
.9 11
.4 23
.0 4.5
92
.5 Ba
by Bo
omer
75
.6 75
.7 5.6
10
.2 3.3
81
.6

116 Thailand Internet User Profile 201524
Thail
and
Intern
et Us
er Pro
file 20
15
Table
7: F
acto
rs Inf
luenc
ing U
sers’
Dec
ision t
o Visit
Web
sites
Sellin
g Goo
ds/Se
rvice
s Onl
ine,
Classi
fied
by G
ende
r and
Gen
eratio
n
Advertisements from TV, radio, newspaper, billboard, brochure, trade fair etc.
Advertisements from websites/ other online media
Websites are search engine Optimized.
Information obtained from review/ opinion of product users.
Opinions expressed by bloggers, net idols, film/TV stars, singers, celebrities.
Friends recommendations/ word of mouth
Others
Gend
er
Male
37.2
56.2
40.6
56.4
14.7
30.3
4.7
Fema
le 30
50
.2 29
.6 60
.8 24
.1 37
5.1
Tra
nsge
nder
34
.1 56
.1 40
.2 59
.1 29
.5 43
.9 5.3
Gene
ration
Z 29
.8 37
.9 20
.5 59
.6 24
.2 33
.5 6.8
Y
33.3
51.5
33.8
61
23.8
34.9
4.5
X 32
.4 56
36
.7 56
.4 12
.7 34
.3 6.1
Ba
by Bo
omer
34
.9 63
.2 37
.9 40
.4 5.9
26
.8 3.7

Electronic Transactions Development Agency (Public Organization) 117
Electr
onic
Trans
actio
ns D
evelo
pmen
t Age
ncy (
Publi
c Orga
nizati
on)
25
Table
8: T
ype
of Go
ods/S
ervice
s Pu
rchase
d On
line b
y Use
rs, C
lassif
ied b
y Gen
der a
nd G
enera
tion
Fashion
Gem/jewellery
Wellness and beauty
Home appliances
IT devices
Mother and baby care products
Finance/investment
E Entertainment
Download
Travel/tourism
Gend
er
Male
24.8
2.6
14.7
14.5
46.6
3.0
10.4
12.2
26.1
27.9
Fema
le 54
.0 6.3
35
.6 12
.3 16
.1 5.3
5.0
12
.0 17
.8 27
.0
Trans
gend
er
50.8
5.3
33.3
3.8
28.8
1.5
3.8
18.9
28.0
27.3
Gene
ration
Z 49
.1 9.3
14
.3 0.0
20
.5 0.0
0.6
13
.0 19
.9 8.7
Y 46
.4 4.8
28
.3 10
.0 27
.7 3.6
5.5
13
.1 22
.5 23
.5
X 32
.4 4.5
25
.2 19
.8 31
.7 6.8
12
.0 10
.9 18
.7 37
.5
Baby
Boom
er
21.0
2.9
21.0
29.0
38.2
1.8
9.6
4.4
22.1
39.0

118 Thailand Internet User Profile 2015
26 Th
ailan
d Int
ernet
User
Profile
2015
Table
9: F
acto
rs Inf
luenc
ing U
sers’
Dec
ision t
o Pur
chase
Goo
ds/Se
rvice
s Onl
ine,
Classi
fied
by G
ende
r and
Gen
eratio
n
Website presentation of goods/services
Websites designed for any device
Clear and attractive images of goods
Variety of goods offered by a Website
Goods sold only online
Lower prices of goods/services than those in brick and mortar shops
Quality and standard of Packaging.
Satisfaction guaranteed “Money back guarantee if not satisfied”
Appealing promotion
Well-known/trustworthy vendor of goods/services.
Reliable order and payment systems
24-hour order, saving time and travelling
Convenient and speedy delivery
Free delivery if order exceeds minimum value
Cash payment on delivery
Call center service
Gend
er
Male
56.4
45.9
23.5
47.7
29.4
14.2
47.9
21.8
24.6
44.9
31.1
34.3
48.2
35.4
30.9
17.5
14.9
Fema
le 50
.4 37
.9 15
.4 52
.2 27
.5 13
.8 47
.6 19
.5 17
.8 43
.9 26
.5 29
.0 47
.9 34
.2 30
.2 13
.1 11
.3 Tra
nsge
nder
57
.6 38
.6 28
.0 50
.0 21
.2 9.1
43
.9 27
.3 22
.7 46
.2 34
.1 35
.6 56
.8 41
.7 30
.3 19
.7 17
.4
Gene
ration
Z 44
.1 32
.3 18
.0 55
.3 34
.2 15
.5 42
.9 31
.1 17
.4 30
.4 28
.6 20
.5 39
.1 27
.3 25
.5 11
.8 9.9
Y
53.1
41.9
20.5
53.0
28.6
14.4
46.8
21.9
19.5
44.8
27.8
29.7
47.4
34.4
30.2
14.0
12.0
X 53
.2 41
.0 16
.5 45
.7 26
.4 12
.3 51
.2 17
.8 24
.1 45
.0 31
.0 36
.1 50
.5 36
.8 32
.7 16
.8 15
.2 Ba
by Bo
omer
54
.8 36
.4 10
.3 30
.1 28
.3 14
.7 42
.6 11
.0 21
.7 40
.8 27
.2 35
.3 51
.8 34
.9 24
.6 23
.2 14
.7
Convenient search for products on a website

Electronic Transactions Development Agency (Public Organization) 119
Electr
onic
Trans
actio
ns D
evelo
pmen
t Age
ncy (
Publi
c Orga
nizati
on)
27
Table
10:
Type
of In
forma
tion
Provid
ed b
y Use
rs to
Onl
ine Ve
ndors
of G
oods
/Servi
ces,
Classi
fied
by G
ende
r and
Gen
eratio
n Fir
st na
me &
Su
rname
Addr
ess
for go
ods
deliv
ery
Date/
year
of Bir
th Te
lepho
ne
no.
Inc
ome
Leve
l Pro
fessio
n ID card
no
.
Gend
er
Male
89.9
88.6
20.4
84.0
70.2
5.3
7.2
10.9
Fema
le 90
.7 92
.6 13
.7 72
.8 54
.7 3.
1 4.
7 7.
3 Tra
nsge
nder
88
.6 91
.7 22
.0 79
.5 56
.8 5.
3 10
.6 11
.4
Gene
ration
Z 86
.3 90
.1 7.
5 55
.3 35
.4 1.
9 4.
3 6.
8 Y
90.0
91.5
15.5
75.5
56.0
3.1
5.1
7.9
X 91
.8 90
.0 19
.9 84
.4 75
.4 6.
1 7.
66
10.7
Baby
Bo
omer
87
.5 86
.8 21
.3 82
.4 72
.8 7.
7 7.
72
15.8

120 Thailand Internet User Profile 201528
Thail
and
Intern
et Us
er Pro
file 20
15
Table
11:
Paym
ent C
hann
els fo
r Onl
ine Pu
rchase
of G
oods
/Servi
ces,
Classi
fied
by U
sers’
Gen
der a
nd G
enera
tion
Meeting with vendors
Bank transfer
Cash on delivery
Cash card
Credit card
Debit card
Top-up/prepaid card
ATM terminal
Online banking service
Cash payment at service counter.
Payment Service Provider
Gend
er
Male
10.9
57.9
22.4
1.8
36.7
10.7
1.1
24.6
23.6
12.4
14.4
Fema
le 4.6
67
.6 17
.0 0.8
28
.3 5.2
1.0
34
.4 19
.2 13
.5 6.1
Trans
gend
er
8.3
65.2
20.5
1.5
20.5
11.4
0.8
43.9
21.2
18.2
10.6
Gene
ration
Z 8.1
73
.3 14
.3 0.6
7.5
2.5
1.9
34
.8 11
.8 9.9
3.7
Y 7.7
66
.6 17
.8 1.4
24
.2 9.6
1.3
34
.5 21
.8 14
.1 10
.0
X 6.7
56
.2 21
.4 0.9
50
.4 3.7
0.5
21
.5 21
.3 10
.8 9.3
Baby
Boom
er
4.4
52.9
34.9
1.1
51.5
2.9
1.1
19.1
13.2
14.3
9.6

Electronic Transactions Development Agency (Public Organization) 121