Global Trade Update 2022 - UNCTAD
8
February 2022 Global trade growth accelerated during the last quarter of 2021 but is expected to slow in Q1 2022. During Q4 2021, trade in goods remained strong and trade in services finally returned to its pre-pandemic levels. Developing countries’ trade outperformed that of developed countries in Q4 2021. South-South trade growth was above the global average. Global trade reached a record high in 2021, about US$ 28.5 trillion; an increase of almost 13 per cent relative to pre- pandemic levels. Global trade continues to grow Source: UNCTAD estimates based on national statistics. Note: Data excludes services. Trade grows, and so do trade imbalances Trade balance as percentage of global trade 1.2 0.4 0.3 0.5 0.4 0.6 1 1 3.5 4.5 -4.3 -0.7 -0.6 -0.5 -0.6 -0.8 -0.3 -0.2 0 -5.2 United States India LDCs Other Developed Other Developing European Union East Asia (ex. China) Australia Russian Federation China Deficit Surplus Pre-pandemic 2021 EMBARGO The contents of this document and the related report should not be quoted or summarized in the print, broadcast or electronic media before 17 February 2022, 6:00 a.m. GMT (7:00 a.m. Geneva) @UNCTAD @UNCTADtrade GL BAL UPDATE
-
Upload
khangminh22 -
Category
Documents
-
view
0 -
download
0
Transcript of Global Trade Update 2022 - UNCTAD

February 2022
Global trade growth accelerated during the last quarter of 2021 but is expected to slow in Q1 2022.
During Q4 2021, trade in goods remained strong and trade in services finally returned to its pre-pandemic levels.
Developing countries’ trade outperformed that of developed countries in Q4 2021. South-South trade growth was above the global average.
Global trade reached a record high in 2021, about US$ 28.5 trillion; an increase of almost 13 per cent relative to pre-pandemic levels.
Global trade continues to grow
Source: UNCTAD estimates based on national statistics. Note: Data excludes services.
Trade grows, and so do trade imbalancesTrade balance as percentage of global trade
1.2
0.4 0.30.5 0.4 0.6
1 1
3.5
4.5
-4.3
-0.7 -0.6 -0.5 -0.6 -0.8-0.3 -0.20
-5.2
UnitedStates India LDCs Other
DevelopedOther
DevelopingEuropean
UnionEast Asia(ex. China) Australia Russian
FederationChina
De�cit
SurplusPre-pandemic 2021
EMBARGOThe contents of this document and the related report should not be quoted or summarized in the print, broadcast or electronic media
before 17 February 2022, 6:00 a.m. GMT(7:00 a.m. Geneva)
@UNCTAD@UNCTADtrade
GL BAL
update

2GLOBAL TRADE UPDATE
Global trade trends and nowcast Global trade growth remained strong during 2021, as its value continued to increase through each quarter of 2021. Trade growth was not only limited to goods. Trade in services also grew substantially through 2021, to finally reach pre-pandemic levels during Q4 2021.
Overall, the value of global trade reached a record level of about US$ 28.5 trillion in 2021, an increase of about 25 per cent relative to 2020 and an increase of about 13 per cent relative to the pre-pandemic level of 2019. While most global trade growth took hold during the first half of 2021, growth continued in the second half of 2021. After a relatively slow third quarter, trade growth picked up again in Q4 2021, when the value of global trade increased by about 3 per cent relative to Q3 2021.
Trade in goods and trade in services followed similar patterns during 2021, with stronger increases during the first half of the year. Trade growth continued to be positive for both goods and services in Q3 2021 and especially in Q4 2021. During Q4 2021, trade in goods increased by almost US$ 200 billion to reach about US$ 5.8 trillion, a new record. During the same period, trade in services rose by about US$ 50 billion to reach about US$ 1.6 trillion, a value just above pre-pandemic levels. On a year-over-year basis, trade in goods strongly outperformed trade in services, with increase of about 27 per cent and 17 per cent respectively.
The UNCTAD nowcast indicates that trade growth will continue to slow during Q1 2022. Positive growth rates are expected for both trade in goods and in services, albeit only marginally, keeping trade values at similar levels to Q4 2021.
Source: UNCTAD calculations based on national statistics. Note: Quarterly growth is the quarter over quarter growth rate of seasonally adjusted values. Annual growth refers to the last four quarters. Figures for Q4 2021 are preliminary. Q1 2022 is a nowcast.
0
1
2
3
4
5
6
7
-30%
-20%
-10%
0%
10%
20%
30%
Q1 Q2 Q3 Q4 Q1 Q2 Q3 Q4 Q1 Q2 Q3 Q4 Q1 Q2 Q3 Q4 Q1 Q2 Q3 Q4 Q1
2017 2018 2019 2020 2021 2022
World Trade(right axis)
QuarterlyGrowth
AnnualGrowth
ServicesGoods
Preliminary
Nowcast
US$
trillio
n

3GLOBAL TRADE UPDATE
Global trade outlookThe positive trend for international trade in 2021 was largely the result of increases in commodity prices, subsiding pandemic restrictions and a strong recovery in demand due to economic stimulus packages. As these trends are likely to abate, international trade trends are expected to normalize during 2022. Overall, the evolution of world trade in 2022 is likely to be affected by the following factors:
• Slower than expected economic growth Economic growth forecasts for 2022 are being revised downwards. For example, the International Monetary Fund cut its world economic growth forecast for 2022 by 0.5 points (from 4.9 to 4.4.) because of persistent inflation in the United States and concerns related to China’s real estate sector. It is likely that global trade trends will reflect these macroeconomic trends, with lower than expected trade growth.
• Continuing challenges for global supply chainsThe COVID-19 pandemic resulted in unprecedented pressures on supply chains. Logistic disruptions, a semiconductor shortage and rising energy prices have further contributed to supply shortages and spiraling shipping costs. As a result, major companies have become strongly focused on improving reliability and managing risks for their supply networks, but delays have persisted nevertheless. Efforts to shorten supply chains and to diversify suppliers could affect global trade patterns during 2022.
• Trade agreements and regionalization trendsOn January 1, 2022, the Regional Comprehensive Economic Partnership (RCEP) entered into force. This trade agreement facilitates trade among many of the East Asian and Pacific economies, and is expected to significantly increase trade between members, including by diverting trade from non-member countries. The regionalization of trade flows is also expected to increase in other parts of the world in line with other regional initiatives (e.g., the African Continental Free Trade Area) and also due to increasing reliance of geographically closer suppliers.
• Transition towards a greener global economy Trade patterns in 2022 are expected to reflect the increasing global demand for products that are environmentally sustainable. Such patterns may also be supported by government policies regulating the trade of high-carbon products. Moreover, global trade patterns could also be influenced by increased demand of strategic commodities required to support greener energy alternatives (e.g., cobalt, lithium, and rare earth metals).
• Rising concerns about debt sustainability Given the record levels of global debt, concerns of debt sustainability are likely to intensify in the incoming quarters due to mounting inflationary pressures. A significant tightening of financial conditions would heighten pressure on the most highly indebted governments, amplifying vulnerabilities and negatively affecting investments and international trade flows.

4GLOBAL TRADE UPDATE
Trade trends in the major economiesThe import and export trends of some of the world’s major trading economies further illustrate the patterns of trade growth during recent quarters. In Q4 2021, trade in goods in all major economies was well above pre-pandemic levels in 2019, for both imports and exports. Negative quarter-over-quarter rates reveal that the positive exports trends reversed for some of the major economies during Q4 2021. Nevertheless, export growth in this period remained strong for China, the United States and also for the Republic of Korea. Conversely, import trends continued to be positive.
Data on services is reported with a lag of one quarter. In Q3 2021, trade in services for most major economies was still substantially lower than pre-pandemic averages of 2019. However, as shown by quarter-over-quarter rates, Q3 2021 marked a substantial recovery in services trade for all major economies, with the exception of Japan.
Imports and exports of major trading economies
Source: UNCTAD calculations based on national statistics. Note: Growth rates are relative to year averages for 2019 and of previous quarter. Data is seasonally adjusted. Statistics for the EU exclude intra-EU trade.
GOODSQ4 2021 RELATIVE TO 2019 AVERAGE Q4 2021 RELATIVE TO Q3 2021
IMPORTS EXPORTS IMPORTS EXPORTS
Brazil 33% 23% 11% 7%
China 32% 43% 2% 6%
India 32% 25% 4% 1%
Japan 13% 6% 2% 2%
Republic of Korea 34% 26% 6% 3%
Russian Federation 24% 33% 2% 3%
South Africa 9% 35% 0% 2%
United States 20% 12% 5% 4%
European Union 27% 10% 9% 1%
SERVICESQ3 2021 RELATIVE TO 2019 AVERAGE Q3 2021 RELATIVE TO Q2 2021
IMPORTS EXPORTS IMPORTS EXPORTS
Brazil 26% 1% 2% 3%
China 10% 46% 6% 14%
India 3% 7% 18% 17%
Japan 6% 19% 4% 0%
Republic of Korea 5% 24% 0% 12%
Russian Federation 21% 10% 13% 6%
South Africa 12% 30% 5% 8%
United States 8% 11% 5% 3%
European Union 4% 1% 4% 2%
5GLOBAL TRADE UPDATE
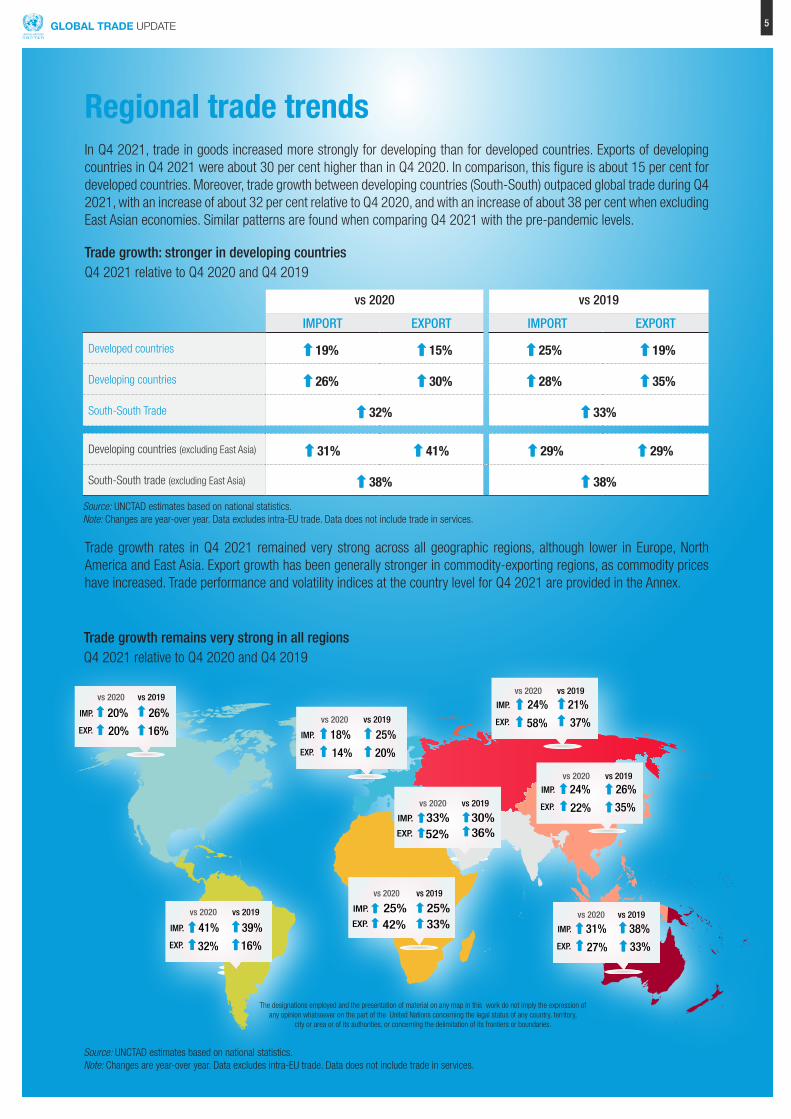
Regional trade trendsIn Q4 2021, trade in goods increased more strongly for developing than for developed countries. Exports of developing countries in Q4 2021 were about 30 per cent higher than in Q4 2020. In comparison, this figure is about 15 per cent for developed countries. Moreover, trade growth between developing countries (South-South) outpaced global trade during Q4 2021, with an increase of about 32 per cent relative to Q4 2020, and with an increase of about 38 per cent when excluding East Asian economies. Similar patterns are found when comparing Q4 2021 with the pre-pandemic levels.
Trade growth: stronger in developing countriesQ4 2021 relative to Q4 2020 and Q4 2019
Trade growth rates in Q4 2021 remained very strong across all geographic regions, although lower in Europe, North America and East Asia. Export growth has been generally stronger in commodity-exporting regions, as commodity prices have increased. Trade performance and volatility indices at the country level for Q4 2021 are provided in the Annex.
Trade growth remains very strong in all regionsQ4 2021 relative to Q4 2020 and Q4 2019
Source: UNCTAD estimates based on national statistics. Note: Changes are year-over year. Data excludes intra-EU trade. Data does not include trade in services.
26%
35%
24%
22%
IMP.
EXP.
25%
20%
18%
14%
IMP.
EXP.
26%
16%
20%
20%
IMP.
EXP.
vs 2020 vs 2019
vs 2020 vs 2019
21%
37%
24%
58%
IMP.
EXP.
30% 36%
33% 52%
IMP.
EXP.
25% 33%
25% 42%
IMP.
EXP.
vs 2020 vs 2019
39%
16%
41%
32%
IMP.
EXP.
vs 2020 vs 2019
38%
33%
31%
27%
IMP.
EXP.
vs 2020 vs 2019
vs 2020 vs 2019
vs 2020 vs 2019
vs 2020 vs 2019
The designations employed and the presentation of material on any map in this work do not imply the expression of any opinion whatsoever on the part of the United Nations concerning the legal status of any country, territory,
city or area or of its authorities, or concerning the delimitation of its frontiers or boundaries.
Source: UNCTAD estimates based on national statistics. Note: Changes are year-over year. Data excludes intra-EU trade. Data does not include trade in services.
vs 2020 vs 2019
IMPORT EXPORT IMPORT EXPORT
Developed countries 19% 15% 25% 19%
Developing countries 26% 30% 28% 35%
South-South Trade 32% 33%
Developing countries (excluding East Asia) 31% 41% 29% 29%
South-South trade (excluding East Asia) 38% 38%

6GLOBAL TRADE UPDATE
Global trade trends at the sectoral levelWith the exception of transport equipment, all economic sectors saw a substantial year-over-year increase in the value of their trade in Q4 2021. High fuel prices are behind the strong increase in the value of trade of the energy sector. Trade growth was also above average for metals and chemicals. As a result of the global shortage of semiconductors, trade growth in communication equipment, road vehicles and precision instruments was subdued during Q4 2021.
Strong trade growth continues in most sectors (US$ % changes)
Q4 2021 vs Q4 2019 Q4 2021 vs Q4 2020
Source: UNCTAD estimates based on national statistics. Note: Percentage changes in world trade are year-over-year. Changes are estimated from HS6 digits data of China, European Union, and United States. Data excludes intra-EU trade.
OtherManufacturing
Apparel
Energy
Textiles
Pharmaceuticals
Chemicals
Metals
Of�ceEquipment
Communication Equipment
Minerals
Agri-food
Machinery
Road Vehicles
PrecisionInstruments
TransportEquipment
31%
24%
43%
18%
39%
31%
59%
38%
33%
35%
36%
16%
16%
27%
-40%
20%
22%
35%
6%
97%
19%
41%
17%
17%
18%
31%
8%
3%
9%
-12%

7GLOBAL TRADE UPDATE
Annex 1: Export performance and volatility in Q4 2021
COUNTRIES EXPORTPERFORMANCE
EXPORTVOLATILITY
COUNTRIES EXPORTPERFORMANCE
EXPORTVOLATILITY
Albania 0.61 0.21 Lesotho 0.51 1.37Algeria 0.84 0.17 Madagascar 0.88 0.30Angola 0.75 0.32 Malawi 0.40 1.52Argentina 0.44 1.13 Malaysia 0.63 0.17Armenia 0.67 0.21 Mali 0.86 1.65Australia 0.60 0.30 Mauritius 0.32 0.21Azerbaijan 0.53 1.52 Mexico 0.48 0.06Bahrain 0.83 0.38 Morocco 0.42 0.09Bangladesh 0.82 0.38 Mozambique 0.94 0.16Belarus 0.76 0.08 Myanmar 0.71 0.53Benin 0.07 2.80 Namibia 0.87 0.84Bolivia (Plurinational State of) 0.88 0.28 Nepal 0.86 1.13Bosnia and Herzegovina 0.72 0.01 New Zealand 0.30 0.86Brazil 0.39 0.71 Nicaragua 0.73 0.22
Cambodia 0.49 0.46 Nigeria 0.73 0.37
Cameroon 0.93 0.49 Norway 0.92 0.14Canada 0.62 0.05 Oman 0.89 0.13Chile 0.53 0.10 Pakistan 0.78 0.07China 0.66 0.02 Panama 0.64 2.27Colombia 0.81 0.12 Papua New Guinea 0.52 0.29Costa Rica 0.62 0.18 Paraguay 0.53 0.84Côte d'Ivoire 0.49 0.12 Peru 0.73 0.14Dominican Republic 0.85 0.25 Philippines 0.56 0.08EU-27 0.51 0.01 Qatar 0.81 0.01Ecuador 0.75 0.19 Republic of Korea 0.63 0.01Egypt 0.95 0.18 Republic of Moldova 0.72 0.03El Salvador 0.51 0.03 Russian Federation 0.82 0.12Ethiopia 0.29 0.20 Saudi Arabia 0.89 0.02Gabon 0.59 0.79 Senegal 0.73 0.32Georgia 0.92 0.23 Serbia 0.65 0.01Ghana 0.66 0.66 Singapore 0.60 0.03Guatemala 0.76 0.24 South Africa 0.49 0.07Guyana 0.98 2.39 Sri Lanka 0.53 0.09Haiti 0.57 0.48 Switzerland 0.67 0.03Honduras 0.55 0.26 Taiwan, Province of China 0.62 0.00Hong Kong (China) 0.54 0.09 Thailand 0.55 0.02Iceland 0.55 0.29 Togo 0.01 0.74India 0.61 0.24 Tunisia 0.47 0.06Indonesia 0.78 0.04 Turkey 0.65 0.04Iran (Islamic Republic of) 0.52 0.35 Uganda 0.00 0.03Israel 0.64 0.08 Ukraine 0.77 0.51Jamaica 0.06 1.88 United Arab Emirates 0.73 0.07Japan 0.45 0.04 United Kingdom 0.60 0.28Jordan 0.81 0.64 United Republic of Tanzania 0.68 0.73Kazakhstan 0.63 0.77 United States of America 0.59 0.02Kenya 0.44 0.08 Uruguay 0.90 0.03
Kuwait 1.00 0.28 Venezuela (Bolivarian Rep. of) 0.66 0.78
Lao People's Dem. Rep. 0.68 0.49 Viet Nam 0.56 0.12Lebanon 0.24 0.08 Zambia 0.41 0.55
Source: UNCTAD estimates based on national statistics.Note: Export performance is a composite indicator which includes growth rates, performance vs peers, and competitiveness in major and dynamic markets. A greaterscore implies higher export performance. Export volatility tracks export performance across the last 6 months to identify volatility patterns. A greater score implies higherexport vulnerability. Data excludes intra-EU trade.

UNCTAD – Division on International Trade and Commodities
@UNCTAD@UNCTADtrade
This
doc
umen
t has
not
bee
n fo
rmal
ly ed
ited
- UN
CTAD
/DIT
C/IN
F/20
22/1
GL BAL
update