Thailand Coping with Structural Change in a Dynamic Economy
237
Report No. 3067a-TH FILE COPY Thailand Coping with Structural Change in a Dynamic Economy December23, 1980 EastAsia and Pacific Regional Office FOR OFFICIAL USEONLY Document of the World Bank This document has a restricted distribution and may be used by recipients onlyin the performance of their official duties. Its contents may not otherwise be disclosed withoutWoridBark authorization. Public Disclosure Authorized Public Disclosure Authorized Public Disclosure Authorized Public Disclosure Authorized
-
Upload
khangminh22 -
Category
Documents
-
view
0 -
download
0
Transcript of Thailand Coping with Structural Change in a Dynamic Economy

Report No. 3067a-TH FILE COPYThailandCoping with Structural Change in aDynamic EconomyDecember 23, 1980
East Asia and Pacific Regional Office
FOR OFFICIAL USE ONLY
Document of the World Bank
This document has a restricted distribution and may be used by recipientsonly in the performance of their official duties. Its contents may nototherwise be disclosed without Worid Bark authorization.
Pub
lic D
iscl
osur
e A
utho
rized
Pub
lic D
iscl
osur
e A
utho
rized
Pub
lic D
iscl
osur
e A
utho
rized
Pub
lic D
iscl
osur
e A
utho
rized


FOR OFFICIAL USE ONLY
FOREWORD
This report was prepared by a Mission that visited Thailand inFebruary/March 1980. The Mission's objectives were to review the economicsituation in Thailand with government agencies and to discuss the policiesand programs that would be necessary to alleviate current economic problemsand to improve Thailand's longer term prospects for sustaining high ratesof growth and reducing poverty. The Mission consisted of John Shilling(Mission Chief), Ian Porter (Deputy Mission Chief), Madhusudan Joshi (SeniorFiscal Economist), Knud Ross (Monetary Economist), and Wafik Grais(Econometrician). The Mission was greatly assisted in their analysis anddata gathering by the staffs of the Bank of Thailand, Ministry of Finance,and National Economic and Social Development Board, in particular, and bymany other officials of the Thai Government. The Mission would like toexpress its heartfelt appreciation for their assistance. The analysis andconclusions of this report are nonetheless the responsibility of theMission. Parvez Hasan (Chief Economist), Willem Bussink (Senior Economist)and Bela Balassa (Senior Advisor, DPS) joined the Mission for its final weekof discussions. A draft version of this report was discussed with theGovernment in September 1980 by a mission led by Edward V. K. Jaycox(Director, East Asia and Pacific Country Programs Department) and includingMessrs. Bussink, Shilling, Porter, and Roy Pepper (Economist).
This report has been prepared at a time when the Government itselfis reviewing Thailand's emerging economic problems in detail as part of theprocess of preparing the Fifth National Economic and Social DevelopmentPlan. In February, 1980, the Government appointed a Steering Committee forthe Fifth Plan. Twenty-four subcommittees have since been established toassist the Steering Committee in reviewing major economic problems anddeveloping appropriate policies and programs. In October, 1980, theGovernment prepared a statement outlining major policies and strategies forthe Fifth Plan. The National Economic and Social Development Board is nowpreparing a "Fifth Plan Frame" which will provide further details on theproposed policies and programs for the Fifth Plan period. The final draftof the Fifth Plan is scheduled for completion by October, 1981.
This document has a restricted distribution and may be used by recipients only in the performance oftheir official duties. Its contents may not otherwise be disclosed without World Bank authorization.

THAILAND
COPING WITH STRUCTURAL CHANGE IN A DYNAMIC ECONOMY
Table of Contents
Page No.
SUMMARY . . . . . . ... . . . . . . . . . . . . . . . . . . i-vii
I. INTRODUCTION .... . . . . . . . . . . . . . . . . . . . . 1
II. THE DYNAMICS OF TWO DECADES OF DEVELOPMENT . . . . . . . . . 5
The Record of Growth: 1960-1979 . . . . . . . . . . . . . . 6Components of Growth: 1960-1979 . . . . . . . . . . . . . . 7Distribution of Growth . . . . . . . . . . . . . . . . . . 11
III. STRESSES OF THE PAST HALF DECADE . . . . . . . . . . . . . . 13
High Growth and Financial Imbalances . . . . . . . . . . . 15Production Growth .15Trade Growth and the Current Account Deficit. . . . . . . 16Fiscal Deficits .20Inflation . . . . . . . . . . . . . . . . . . . . . . . . 22Financial Sector Growth .23Monetary Policy .24
Energy Policy .25Production Constraints .30Agriculture .30Industry . . . . . . . . . . . . . . . . . . . . . . . . 32Investment .33
Other Constraints on Growth .34The Tensions and Tradeoffs .36
IV. POLICY OPTIONS FOR STRUCTURAL ADJUSTMENT . . . . . . . . . . 40
The Magnitude of the Required Adjustment . . . . . . . . . 42Policies for Structural Adjustment . . . . . . . . . . . . 47Fiscal Policy and Public Resource Mobilization . . . . . 47
Policy Recommendations .53Monetary Policy, External Balances
and Financial Sector Development. . . . . . . . . . . . 55Policy Recommendations .57
Energy Policy .58Policy Recommendations .64
Industrial Development Policy . . . . . . . . . . . . . . 65Policy Reconmmendations .68
Agricultural Policy .69Policy Recommendations .71
Combined Policy Action ................. . 73

-2-
Page No.
ANNEXES
I. Analytical Tools: The Social Accounting Matrix andthe Simulation Model . . . . . . . . . . . . . . . . . . . 77
II. Financial Institutions . . . . . . . . . . . . . . . . . . . 125
STATISTICAL APPENDIX .... . . . . . . . . . . . . . . . . . . 133
Tables in Text
2.1 GDP Growth Rates . . . . . . . . . . . . . . . . . . . . . . 62.2 Inflation Rates . . . . . . . . . . . . . . . . . . . . . . 72.3 Agricultural Diversification . . . . . . . . . . . . . . . . 82.4 Sources of Industrial Growth . . . . . . . . . . . . . . . . 92.5 Energy Consumption . . . . . . . . . . . . . . . . . . . . . 102.6 Poverty Indicators . . . . . . . . . . . . . . . . . . . . . 113.1 Growth Rates by Sector . . . . . . . . . . . . . . . . . . . 153.2 Growth in the Value of Exports and Production . . . . . . . 173.3 Growth in the Volume of Exports and Production . . . . . . . 183.4 External Balances . . . . . . . . . . . . . . . . . . . . . 193.5 Shares of Public Sector Revenue and Expenditure in GDP . . . 213.6 Structure of Taxes by Source . . . . . . . . . . . . . . . . 223.7 Financial Sector Growth. . . . . . . . . . . . . . . . . . . 243.8 Inflation and Interest Rates . . . . . . . . . . . . . . . . 263.9 Energy Price Movements . . . . . . . . . . . . . . . . . . . 273.10 Actual and Appropriate Energy Prices . . . . . . . . . . . . 293.11 Petroleum Revenues . . . . . . . . . . . . . . . . . . . . . 303.12 Resource Mobilization . . . . . . . . . . . . . . . . . . . 343.13 Growth of Gross Regional Product (GRP) . . . . . . . . . . . 384.1 Selected Indicators in Reference Simulation . . . . . . . . 464.2 Impact of Greater Public Sector Resource Mobilization
and Saving . . . . . . . . . . . . . . . . . . . . . . . . 524.3 Impact of Full Adjustment of Energy Prices . . . . . . . . . 634.4 Impact of Policies to Accelerate Manufactured Exports . . . 674.5 Impact of Increased Agricultural Production . . . . . . . . 714.6 Impact of Coordinated Policy Action . . . . . . . . . . . . 75
THAILAND
COPING WITH STRUCTURAL CHANGE IN A DYNAMIC ECONOMY
SUMMARY
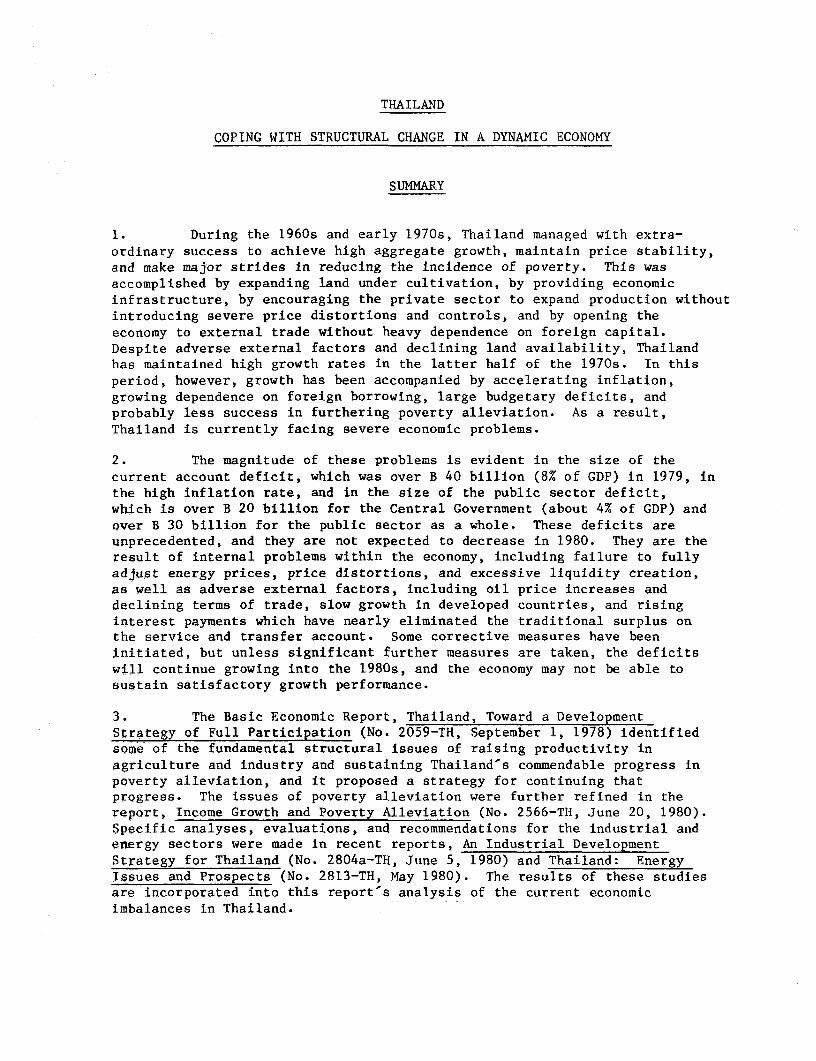
1. During the 1960s and early 1970s, Thailand managed with extra-ordinary success to achieve high aggregate growth, maintain price stability,and make major strides in reducing the incidence of poverty. This wasaccomplished by expanding land under cultivation, by providing economicinfrastructure, by encouraging the private sector to expand production withoutintroducing severe price distortions and controls, and by opening theeconomy to external trade without heavy dependence on foreign capital.Despite adverse external factors and declining land availability, Thailandhas maintained high growth rates in the latter half of the 1970s. In thisperiod, however, growth has been accompanied by accelerating inflation,growing dependence on foreign borrowing, large budgetary deficits, andprobably less success in furthering poverty alleviation. As a result,Thailand is currently facing severe economic problems.
2. The magnitude of these problems is evident in the size of the
current account deficit, which was over B 40 billion (8% of GDP) in 1979, inthe high inflation rate, and in the size of the public sector deficit,which is over B 20 billion for the Central Government (about 4% of GDP) andover B 30 billion for the public sector as a whole. These deficits areunprecedented, and they are not expected to decrease in 1980. They are theresult of internal problems within the economy, including failure to fullyadjust energy prices, price distortions, and excessive liquidity creation,as well as adverse external factors, including oil price increases anddeclining terms of trade, slow growth in developed countries, and risinginterest payments which have nearly eliminated the traditional surplus onthe service and transfer account. Some corrective measures have beeninitiated, but unless significant further measures are taken, the deficitswill continue growing into the 1980s, and the economy may not be able tosustain satisfactory growth performance.
3. The Basic Economic Report, Thailand, Toward a DevelopmentStrategy of Full Participation (No. 2059-TH, September 1, 1978) identifiedsome of the fundamental structural issues of raising productivity inagriculture and industry and sustaining Thailand's commendable progress inpoverty alleviation, and it proposed a strategy for continuing thatprogress. The issues of poverty alleviation were further refined in thereport, Income Growth and Poverty Alleviation (No. 2566-TH, June 20, 1980).Specific analyses, evaluations, and recommendations for the industrial andenergy sectors were made in recent reports, An Industrial DevelopmentStrategy for Thailand (No. 2804a-TH, June 5, 1980) and Thailand: EnergyIssues and Prospects (No. 2813-TH, May 1980). The results of these studiesare incorporated into this report s analysis of the current economicimbalances in Thailand.

4. The World Bank-s analysis indicates that the outlook for the worldeconomy does not offer prospects for sustained improvement over the comingdecade: oil prices will continue to rise in real terms, OECD growth willnot recover very rapidly, and inflation and high interest rates willcontinue. Favorable transitory factors notwithstanding, the Thai economywill have to make fundamental adjustments to accommodate itself to thischanged environment, to rectify the domestic imbalances that have developedover the past five years, and to restore the balanced growth pattern thathas led to the impressive rate of poverty alleviation of the past twodecades.
5. Thailand has maintained an exceptionally high real GDP growth rateover the past five years (9% p.a.) despite sharply decreased availability ofadditional land resources for increasing agricultural production, stagnationof yields of many crops, declining terms of trade, and a tendency towardmore restrictions in external markets. In the process, however, it hasincreased its exposure to price and volume fluctuations resulting from itslonger participation in external trade, and its reliance on foreign saving.Growth has been facilitated by exceptionally good export performance forboth agricultural exports and manufactured exports, with total export growthaveraging 15% p.a. in real terms. Aggregate demand and investment rateswere high, savings, particularly in the public sector, did not match thegrowth in investment, and import values grew more rapidly than in the past,all of which contributed to an increase in the trade account deficit.Rising net service payments led to even more rapid growth of the currentaccount deficit.
6. Due to frequent changes in government during this period, it wasnot easy to pursue a coherent economic strategy, although there was aconsensus, in principle, in favor of promoting growth, restraininginflation, and alleviating poverty. In practice, the hard economic policychoices tended to be resolved in favor of measures that promoted demand andmore growth in the short run without due consideration of the longer-termconsequences for inflation, the balance of payments, poverty alleviation, oreven the longer-term growth potential of the economy. Measures that rapidlyincreased public sector expenditures without increasing revenues, policiesthat seriously underpriced energy and several other key goods such ascement, actions that created excessive liquidity to accommodate governmentbudgetary deficits and speculation in the financial sector, interestceilings that resulted in low or negative real interest rates, andprotectionist policies that increased price distortions in the productivesectors are all part of this pattern of policy making. It has stimulatedin unsustainably too high a level of activity in the economy in the pastfive years while allowing severe domestic structural imbalances andextraordinary external and fiscal deficits to emerge.
7. The policies the country has pursued have also favored the modern,urban sectors at the expense of the rural, agricultural sectors. The shiftin the relative growth rates in favor of the former and a systematic decline

i-iii -
in the agriculture-nonagriculture terms of trade since 1975 also suggest thatit is unlikely that much progress has been made in rural poverty alleviationsince 1975, despite high aggregate growth.
8. Attempts to maintain high growtlh in the near and medium term bypolicies similar to those used in the past several years will onlyexacerbate the imbalances and undermine the stability of the economicstructure that has permitted sustained economic growth in all sectors andfacilitated widespread distribution of the benefits of that growth. Thishas been recognized and some corrective measures have been initiated.Initial evidence indicates these measures are having some positive impact;however, this report concludes that significantly more action will herequired. If it can be initiated quickly and implemented in an effectivemanner, the short-term costs to the economy will be moderate, and thelong-term potential for growth and poverty alleviation will be enhanced.
9. In addition to overcoming the effects of the adverse externalfactors and the inadequate or inappropriate domestic policies that have ledto the large current account and fiscal deficits, fundamental structuralchanges in the productive sectors of the economy will also be necessary totransform agriculture to more intensive patterns of production and to stimu-late more export-oriented industrial production. These transformations area normal part of the dynamics of development. If these processes can befacilitated and accelerated, the need to reduce the growth rates of con-sumption and imports will be mitigated and the adjustment process eased.Conversely, if they are retarded, the measures required to reduce theexternal and fiscal deficits may lead to a prolonged period of slow growth.
10. It appears that the limits of expanding the area of land underagricultural use have been reached during the past half decade, altboughagricultural production growth rates have remained at nearly historicallevels - 4-1/2% to 5% - during most of this period. This has been the resultof rapid expansion of export crops (cassava, pineapples, rubber, etc.) asmarkets were opened and high-yielding rubber varieties introduced. Some ofthese crops are now facing market limitations. Even maintaining theserecent growth rates will require a significant effort to devise appropriatesupporting policies in agriculture and to increase use of modern inputs.
11. The industrial sector has grown rapidly, and manufactured exportshave increased even faster during the 1970s. Maintaining high export growthrates in the future will require more intensive export-promotion activity,both through specific measures and through appropriate macroeconomicpolicies. Some branches of industry have turned toward more exportorientation and their efficiency has improved. ilowever in other branches,protection, price controls, and other restrictive measures such as domesticvalue-added requirements have increased, which has introduced inefficienciesinto the industrial sector. A number of large, capital-intensive investmentprojects are also being considered which could strain the resources
- iv -
available to the economy and move it away from its comparative advantage.The combined effect of these developments could impair the growth potentialof Thai industries and reduce the competitiveness of Thai exports.
12. Thailand has been able to maintain its high growth rates in recentyears without adequately adjusting to the exogenous increases in energyprices and without raising domestic savings commensurate with investmentbecause it has been able to borrow increasing amounts from abroad to financethe domestic saving deficit, which has been largely in the public sector.The full impact of debt incurred since the mid-1970's is now being felt inrising debt service payments. The debt-service ratio for the public sectorhas increased from 4.5% in 1978 to an expected 10% in 1981. Concerns areincreasing about Thailand's creditwortlhiness. Its gross borrowingrequirement to fund increasing current account deficits is expanding veryrapidly. To maintain even a constant net borrowing requirement (i.e.,current account deficit) in these circumstances, the trade balance wouldhave to improve significantly since service payments will continue to grow.It is unlikely that Thailand will enjoy its current high credit standing andaccess to foreign resources much longer unless it undertakes a comprehensiveprogram to reduce its dependence on growing levels of foreign resources.
13. Thailand has already taken policy actions in a number of areas,including sharp increases in prices for most petroleum products and forelectricity in 1979 and 1980, measures to increase government revenues in1980, and introduction of regulations to increase financial stability andexercise more monetary restraint in 1979 and 1980. These actions arebeginning to have noticeable effects on the economy. In conjunction withfavorable but transitory developments in the trade and capital accounts,/lthey have led to some short-run improvement in the balance of payments andmay keep the absolute level of the government deficit from increasing.
14. The report analyzes the effects of these policy actions given theexpected trends in the world economy over the next several years./2 For thisanalysis, it is assumed that some of the recent energy price increases wouldbe passed on to consumers; that more domestic energy would be produced andconsumed; that there would be no increased pressure from excess demand todrive up the demand for imports, increase inflationary pressure, and reducethe competitiveness of Thai exports; and that export growth would besustained at about 10% p.a. Under these assumptions, import growth would bereduced to under 5% per annum. Slower import growth is expected to resultfrom increased use of domestic energy resources, the tapering of the invest-ment boom, lower overall demand, and some import substitution.
/1 Including acceleration of rice exports in the first half of 1980 andshort term capital inflows in response to changing interest ratesdifferentials.
/2 These estimates are based on a simulation model developed for the reportand used in simulating the effects of alternate policy measures.
- v -
15. Although this scenario is based on relatively optimistic assump-tions about external developments, takes into account recent policy action,and assumes some further action as noted above, the outcome is still notfavorable. The fiscal and external deficits would continue to grow and thedebt situation would become exceedingly difficult before 1985, if no furtherpolicy adjustments are made. The current account deficit would rise to $4billion by 1985, still over 7% of GDP,/1 and the public sector deficit wouldremain well above 5% of GDP. Growth would fall below 6% p.a. in 1980-85,and in 1985 the economy would be in even more difficult straits than now.It is unlikely that external resources will be available to finance currentaccount deficits rising from nearly $3 billion in 1980 to approximately $4billion in 1985 and $5 billion in 1990. Accumulated debt would exceed $20billion in 1985 and $40 billion in 1990, and the debt service ratio would beabout 25% and 30%, respectively. If the relatively favorable tradeassumptions were not realized, as is clearly possible in the present worldsituation, the Thai economy would indeed be in even greater difficultybefore 1985.
16. Even taking account of the positive response of the economy torecent policy changes, the Thai Government cannot afford to postpone under-taking further adjustment measures. The risk is too great that externaldeficits would grow to levels that would lead foreign lenders to force rapidand severe adjustments by reducing access to foreign borrowing. This wouldseverely disrupt the long-run growth potential of the economy and seriouslyaffect the prospects of the poor for rising out of poverty. However, if theGovernment were to commit itself to a comprehensive adjustment program to beimplemented over a period of, say, five years and if this program wereperceived to be sufficient to effect the adjustment, then it should bepossible to mobilize the necessary foreign resources to finance the deficitsthat would occur during the adjustment period. The Bank would certainly beable to support Thailand in seeking that additional financing. In thesecircumstances, a reasonable rate of growth could be maintained and thedeficit reduced gradually for the rest of the decade. After about 1985, theeconomy could again accelerate its growth rate and return to a stable growthpath with sustainable external and fiscal accounts.
17. If a comprehensive set of policy adjustments of the order ofmagnitude discussed in this Report were implemented over the next fiveyears, the size of the current account and public sector deficits would bereduced to approximately 4-1/2% and 4% of GDP, respectively, by 1985. Ifproductivity increases are also achieved, there would be little sacrifice inthe long-term growth potential after 1985, and growth might accelerate
/1 The current account deficit would grow in absolute size because of theinitial size of the trade deficit and because of the growing servicepayments. The favorable trade growth rates would actually begin toreduce the trade deficit before 1985, but interest payments wouldincrease faster and raise the current account deficit.

- vi -
moderately above 6% p.a. before 1985. In these circumstances, Thailandwould be able to return to its longer-term growth rate of 7-8% p.a. in thelatter half of the 1980½s and have firm control of its balance-of-paymentsand public sector deficits. Current account deficits would not exceed$3 billion p.a.; the debt service ratio would barely exceed 20% in the mid-1980s and could decline below that level by 1990. It would be possible toeliminate the current account deficit by 1990, but gross borrowing require-ments to service the debt outstanding would still exceed $3 billion peryear. At that point, the economy would have a number of options to pursueregarding the current account balance it would accept.
18. This report discusses five areas of crucial importance wherepolicy measures should be implemented as part of a comprehensive programto minimize the risk that the growth process would be seriously disrupted.These are: (a) resource mobilization, particularly in the public sector;(b) monetary policy, including measures to maintain high rates of privatesaving and to manage external debt and the capital account; (c) energypolicy and conservation, with particular attention to pricing; (d) indus-trial policy and measures to promote industrial exports; and (e) agricul-tural policy and measures to maintain high rates of growth of agriculturalproduction and exports. Specific policy proposals in each area are presentedin the Report and their rationale discussed in detail.
19. A comprehensive adjustment program should consist of coordinatedmeasures in each of these areas. The burden of placing too much of theadjustment in one or two areas would be too great and probably introducefurther distortions into the economy. The objectives of the program shouldbe to move quickly to begin reducing the share of the fiscal and currentaccount deficits in GDP in the short run and to increase the productivity ofthe economy in the longer term in order to restore high growth rates in thechanged world economic situation. The fiscal and external deficits will beimproved by policies which lessen demand growth and encourage more saving.A large part of this adjustment will fall on the public sector, which willhave to control its expenditures and increase revenues, including publicenterprise tariffs. To influence the private sector, appropriate monetaryand interest rate policies will have to be followed to encourage continuedhigh levels of savings and appropriate allocation of investment. Thesepolicies will tend to reduce aggregate demand growth and the savings-investment gap by both increasing savings and slowing the rate of invest-ment. This will reduce the demand for imports in general and freeadditional domestic resources for export.
20. Reducing the savings-investment gap will also lessen the demand forforeign saving, as expressed in the growing current account deficit.However, because of the structure of import demand and of the supply ofexportables, attempts to increase domestic saving will not reduce theexternal deficit fast enough unless quite severe measures are taken.Specific measures to reduce the demand for imports relative to domesticgoals are also necessary. For example, failure to adjust energy pricesfully has led to an excessive oil import bill - nearly one third of current

- vii -
imports. Further upward adjustment of energy prices will be an essentialelement in any adjustment program. Such price increases will directlyreduce demand for and imports of petroleum. These price adjustments shouldreflect the considerations of raising sufficient revenues from the energysector, reducing consumption and imports, and a long-run policy on thedevelopment and use of energy resources. Direct action to increase thesupply of both agricultural and manufactured exports will complement themeasures reducing aggregate demand and help speed the reduction in theexternal deficit. In addition to reducing the investmentsavings gap, excessdemand, and the demand for imports, these measures will also tend to reduceconsumption and income growth, particularly in the modern sector, and toimprove the relative position of the rural and exporting sectors. Theseshifts are essential if the economy is to effect an adequate adjustment.
21. Measures to improve industrial and agricultural policy should alsobe initiated quickly, although their full effect can only be felt over alonger time horizon. These measures will contribute to raising productionand productivity and to improving the terms of trade for the agriculturaland other exporting sectors. They will be necessary complements to policieswhich reduce the savings gap and part of the dynamic adjustment to decliningland availability and increasing need to absorb more labor into the modernsector. Over the medium term, successful measures in these areas willenable the economy to restore its historical growth rates, albeit with achanged domestic production structure more adapted to the changed externalenvironment of the 1980's. Implementation of policies in all these areaswill not only involve making and enforcing difficult economic decisions, butit will also involve making fundamental institutional changes to improve theresponsiveness and effectiveness of government agencies in supporting thenecessary policy changes.
22. The analysis of this report implies that the risks of not takingfurther concerted action to reduce the external and fiscal deficits would bevery high. Relatively small adverse developments, either domestic or exter-nal, could have very damaging economic consequences. On the other hand,a coordinated program of measures along the lines suggested below wouldgreatly reduce the exposure of the economy to such risks while enhancing itsmedium- and longer-term prospects for sustaining high rates of growth andmeeting its objectives of reducing poverty. Implementing such a policywould require making difficult policy decisions and possibly forgoing somegrowth in the short term, but it would significantly improve the economy slonger-term stability and capacity to withstand future economic shockswithout severe disruption. Within the constraints imposed by externaleconomic and political developments, the outcome depends primarily on theGovernment's ability to implement appropriate policy measures.
- viii -
23. The Government recognizes that Thailand is facing a difficulteconomic situation due both to adverse external factors and to certaininappropriate domestic policies. During the past year, it has taken actionto alleviate some of the economic difficulties through measures to increasedomestic resource mobilization, to improve the viability of publicenterprises, and to stimulate exports. The Government also recognizes thatfurther measures are still required and that they should be coordinatedwithin an appropriate development of the Thai economy. To this end, astatement outlining major policies and strategies for the Fifth NlationalEconomic and Social Development Plan has been prepared, and the NationalEconomic and Social Development Board (NESDB) is now in the process ofpreparing a "Fifth Plan Frame", which will provide further details concerningGovernment policies and programs for the Fifth Plan period. This work, aswell as the ultimate preparation of a plan which includes detailed policymeasures and programs, are important steps in ensuring that the Governmentwill be able to implement a comprehensive adjustment program. The objectivesof the program are to reduce fiscal and current account deficits in the shortterm while improving income distribution and increasing the longer termproductivity of the Thai economy.

THAILAND
COPING WITH STRUCTURAIL CHANGE IN A DYNAMIC ECONOMY
I. INTRODUCTION
1.01 Thailand's achievements in economic growth and development overthe past two decades have been impressive. Real GDP has quadrupled, and GDPper capita has more than doubled. Life expectancy has increased from 51 to61 years, primary education has reached essentially the entire population,and the incidence of poverty has been cut in half to about 31% of thepopulation. Thailand-s growth pattern has been relatively free fromdistortions, has maintained consistently high agricultural growth rates, andhas generated widespread improvements in the standard of living, but it hasnot relied heavily on foreign capital or concessional assistance. This pastsuccess, however, provides no assurance that such development can continuewithout major adjustments in Tlai. policy. Growth since 1975 has beenaccompanied by increasing public sector deficits, accelerating inflation,depletion of tangible and intangible assets, and current account deficitsthat cannot be sustained into the 1980s. These are serious disequilibriathat must be resolved if Thailand is to continue its rapid rate ofdevelopment.
1.02 Favorable endowments of arable land, a responsive labor force,improving external terms of trade until the mid-1970's, and expanding exportmarkets have contributed to Thailand-s commendable growth record. But thecountry has not escaped the tensions associated with rapid growth and thetransition from a traditional, subsistence-oriented economy to a modern,market-oriented economy. Differences in income levels and life stylesbetween rural and urban areas have become more pronounced. Traditionalproduction practices cannot sustain historic growth rates. Regional issuesare becoming more important. Events during the 1970½s have aggravated thesetensions and added new dimensions to the structural adjustments required ofthe Thai economy.
1.03 Several major structural problems in the productive sectors of theeconomy have been identified since the early 1970½s. They pertain to thelonger-term development issues of transforming agricultural production,increasing the role of industry in sustaining high growth rates, andcreating enough additional employment for the growing labor force. Theimpending exhaustion of additional arable land will require a transition tomore intensive production techniques; the completion of the easy, firststages of import substitution in consumer goods industries will requireeither pushing import substitution into intermediate and capital goods or

-2
giving further encouragement to the economy's export activities; and themodernization of the economy will require the Government to improve itssupply and distribution of supporting economic and social infrastructure andto make the bureaucracy more responsive to the needs of an increasinglycomplex and integrated economy./l These issues are an integral part of thedynamics of sustaining rapid economic growth and modernization, and theyneed to be addressed by the country's long-run development strategy.
1.04 Elements of these transformations are occurring. In agriculture,yields have increased significantly in the central plain and other areassusceptible to water control. New cash crops have been widely adopted.But in many rainfed areas, the appropriate technology is not well known andless progress has been made. The industrial sector, led by textiles, isdeveloping an export orientation and is becoming a major foreign exchangeearner. It is also increasing its absorption of new increments into thelabor force. However, protection is increasing and export incentives do notfully compensate for the impediments to local production for export.Industry remains concentrated in the Bangkok area, and outlying areas havelittle access to modern-sector employment. Programs are under way toimprove the distribution of public services, including education beyondfourth grade, health care, and extension services, but they are stillheavily concentrated in the more affluent areas. Accelerating the pace ofall these transformations has now become more important as resourceconstraints arising from large public sector and balance of paymentsdeficits weigh more heavily on the economy.
1.05 In the past five years, adverse external factors and insufficientdomestic response have led to severe disequilibria in the external andfiscal accounts, adding to the structural adjustments required of theeconomy. The current account deficit reached a record high 8% of GDP in1979, and will be at least as high in 1980. The public sector saving deficitreached 6% of GDP in 1979 and is unlikely to decline in 1980. The mostsignificant changes in the external environment have been the rapidincreases in the price of imported energy, the decline in net transfers andservice payments to Thailand from abroad, and the conjunction of inflationand recession throughout the world. It is now clear that the economy sproductive structure will have to adjust to much higher energy prices andcorrespondingly lower energy use than the pattern which was developing priorto 1973. Energy import prices more than doubled in 1979/80, and areexpected to continue rising in real terms for the rest of the decade.
/1 These issues were identified and discussed in the Fourth Five-Year Planand analyzed in the Basic Economic Report, Thailand, Toward a DevelopmentStrategy of Full Participation (Report No. 2059-TH, September 1, 1978).

- 3 -
Domestic energy prices had not fully adjusted to the earlier price increase,and the economy was ill-prepared to absorb the recent one. In the past,high net service and tran;sfer inflows have allowed Thailand to carry largetrade account deficits without negative impacts on the balance of payments.Declining international transfers and rising service payments abroad havesignificantly reduced this cushion and placed more of the burden of currentaccount adjustment on the trade account. Thailand-s participation in anddependence on trade have increased dturing the 1970-s, but the terms of tradehave deteriorated since 1974.
1.06 The domestic counterpart to the growing external deficit has beenan increasing investment-saving gap, particularly in the public sector.Government revenues have stagnated in relation to CDP, and chronic budgetarydeficits can no longer be financed by domestic savings, These deficits, aswell as external price increases, have contributed to the recent accelera-tion of inflation to over 20% p.a. The fiscal imbalances are due to delaysin adjusting to external energy Drice increases, instability in somefinancial markets, and the inability of the public administration to adjustrapidly enough to the changing circumstances. They threaten to lnderminethe stability of the growth process and of the domestic political economy.
1.07 The external financial community is not likely to continue to fundpersistent current account deficits of the magnitudes of the past threeyears without evidence that efforts are being made to rectify these disequi-libria. Adjustments will have to be made quickly to restrain the externaldeficits and the investment-savings gap, and to absorb external priceincreases while reducing inflationary pressures due to excessive demand.Some adjustments are already being implemented to increase governmentrevenues, improve controls over the financial sector, and promote exports;and others are under consideration. Hlowever, the analysis of this reportconcludes that additional adjustments will be necessary to redress thefinancial imbalances and to promote production. While tihe impact ofdifferent measures will be felt over different time horizons, it is vitallyimportant to initiate action quickly. There is a great danger that if thesefinancial issues are not addressed imniediately, the imbalances will worsen.The economy would then be forced to unldertake more severe adjustments whichwould be more disruptive to its long-termn development prospects.
1.08 The difficulty of making the domestic adjustments and restoringthe external balance is increased by the fact that a significant part of theproblem is due to the necessity of transferring large and increasing levelsof real resources to energy exporting countries, with resulting losses indomestic real income growth. Failure to recognize this fact in practice,particularly with regard to raising energy prices, has been a major factorin retarding the adjustment process and exacerbating the financialimbalances. In the short run, consumption will have to be constrained tofree resources for transfer abroad and for investing in the expansion ofdomestic productive capacity. To the extent this latter occurs, moreresources will be available in the future for both external transfers and

- 4 -
for raising domestic consumption. These economic factors are compounded bypolitical factors including both the difficult security situation inIndochina and the related refugee situation which are demanding growinglevels of the Government's attention as well as larger defense expenditures,and the danger that the increasing perception of economic inequality amongThais will reduce the political stability and cohesion within Thailand.
1.09 In addition to the field work and evaluations of the Mission, theanalysis and recommendations of this report draw on the general backgroundprovided by the Basic Economic Report and on the specific analyses andrecommendations of several recent sector reports: "Industrial DevelopmentStrategy in Thailand," (Report No. 2804a-TH, June 5, 1980), "Income Growth andPoverty Alleviation in Thailand: Results of Some Special Studies, (ReportNo. 2566-TH, June 20, 1980), and Thailand: Energy Issues and Prospects(Report No. 2813-TH, May 1980, in green cover).
1.10 The next section will briefly review the growth record of Thailandover the past two decades to highlight the underlying dynamics of the growthprocess as they have worked so far. The third section will analyze thestresses of the past half decade, how they have led to the currentsituation, and what tensions and tradeoffs the economy faces in adjusting toa sustainable growth path. The fourth section will analyze the principalproblems: resource mobilization, financial imbalances, energy policy,industrial expansion, and agricultural transformation. It will discuss theirimplications and interrelations, outline the necessary corrective responses,and propose appropriate policy options for consideration. Thesealternatives will be analyzed as components of a medium-term adjustmentprogram to re-establish a sustainable growth path without seriouslydisrupting progress in poverty alleviation. A simulation model has beendeveloped to aid in this analysis, and various options will be compared bymeans of sensitivity analyses. The model is presented in detail in Annex I.

II. THE DYNAMICS OF TWO DECADES OF DEVELOPMENT
2.01 Thailand-s pattern of development has been based on exploitationof natural resources, in this case, agricultural land. Rapid growth inagriculture and rising exports have been major factors supportingthe growth in the rest of the economy. The availability of additional landallowed expansion of traditional subsistence production, and helped absorba growing labor force. It also facilitated the rapid diversification intonew cash crops, which was the mainstay of the rapid growth of agriculturalexports. These foreign exchange earnings allowed high levels of capital andintermediate goods imports for the whole economy. Agricultural expansionhas contributed to the growth of commerce and trade, and agriculturalincomes have been a major component in domestic demand, the primary sourceof industrial growth.
2.02 Economic markets have operated relatively efficiently in Thailand.The private market structure has provided outlets for agricultural surplusesat remunerative prices and supplied credit, support services, modern inputs,and "incentive" consumer goods to encourage the production of those surpluses.Industrial markets have been largely competitive, despite some protectionistpolicies, and dynamic indigenous entrepreneurs have been a primary factor inthe sector-s growth. There is no evidence of significant imperfections orsegmentation in labor markets, and real wage rates for unskilled laborers donot vary widely throughout the country. There is considerable labor mobil-ity, and the availability of a large potential supply of unskilled labor atrelatively low and stable wages has been an important factor in Thailand'sindustrialization and competitiveness in manufactured exports.
2.03 The principal contributions of the public sector were to provideand maintain the basic social and economic infrastructure, to ensure thepolitical stability necessary for the expansion of marketing throughout thecountry, to maintain a stable currency to facilitate foreign and domestictrade, and to encourage the monetization of the economy. After earlyadventures into direct involvement in productive activities in the 1950-s,the Government recognized its relative inefficiency in that area and hassince withdrawn from most production activities other than utilities. TheGovernment has, however, intervened directly in the economy to promote orprotect certain industries and to control certain prices for variousreasons. This has had indirect effects on the structure of production andon productivity.
2.04 Large parts of the population in Thailand have enjoyed sustainedreal income growth, and their expectations for future growth are rising.This has led to increasing pressures on the Government from a variety ofspecial-interest groups, particularly in Bangkok, to satisfy theseexpectations. These groups now represent not only the traditionalbusiness and military interests, but also various labor groups and

- 6 -
associations of small businessmen, such as commercial fishermen or truckdrivers.
2.05 There is growing concern within the Government and among otherrinfluential groups in Thailand about the persistence of rural poverty. Withadditional arable land essentially exhausted, the traditional dynamic ofrural growth and poverty alleviation will no longer function as effectively.It is also becoming increasingly clear that maintaining security throughoutthe rural parts of the country will depend on assuring that the ruralpopulation benefits from economic growth.
The Record of Growth: 1960-1979
2.06 Thailand has sustained an aggregate GDP growth rate of nearly 8%p.a. over this period. In the 1960's, agricultural expansion of over 5% p.a.and growing domestic demand were the major elements sustaining growth. Pooragricultural harvests, the impact of the 1973-74 oil price increase, fiscalrestraint, and the world recession slowed growth somewhat in the first halfof the 1970's. The sectoral growth rates shown in Table 2.1 indicate thestability and balanced growth among the various sectors. The rate ofper-capita GDP growth was maintained in the 1970's despite a fall inaggregate growth rate because the population growth rate declined.
Table 2.1: GDP GROWTH RATES /a(% per annum, constant Baht)
1960- 1965- 1970- 1975- 1960- 1970-65/b 70/b 75/c 79/c 70/b 79/c
GDP 7.4 8.6 6.4 8.9 8.2 7.6Agriculture 5.2 5.7 5.1 4.8 5.3 5.3Industry 11.3 10.7 7.3 13.0 11.8 10.1Manufacturing 10.7 10.8 9.8 11.9 11.1 10.9
Tertiary 7.3 9.5 6.8 9.1 8.5 7.6GDP per capita 4.0 5.1 3.4 6.4 4.7 4.8
/a Unless otherwise indicated, all growth rates in this report arecalculated by time trend semi-log regression over the time periodindicated, inclusive of end points.
/b 1962 constant Baht._C 1972 constant Baht, 1979 data preliminary.
Source: NESDB.
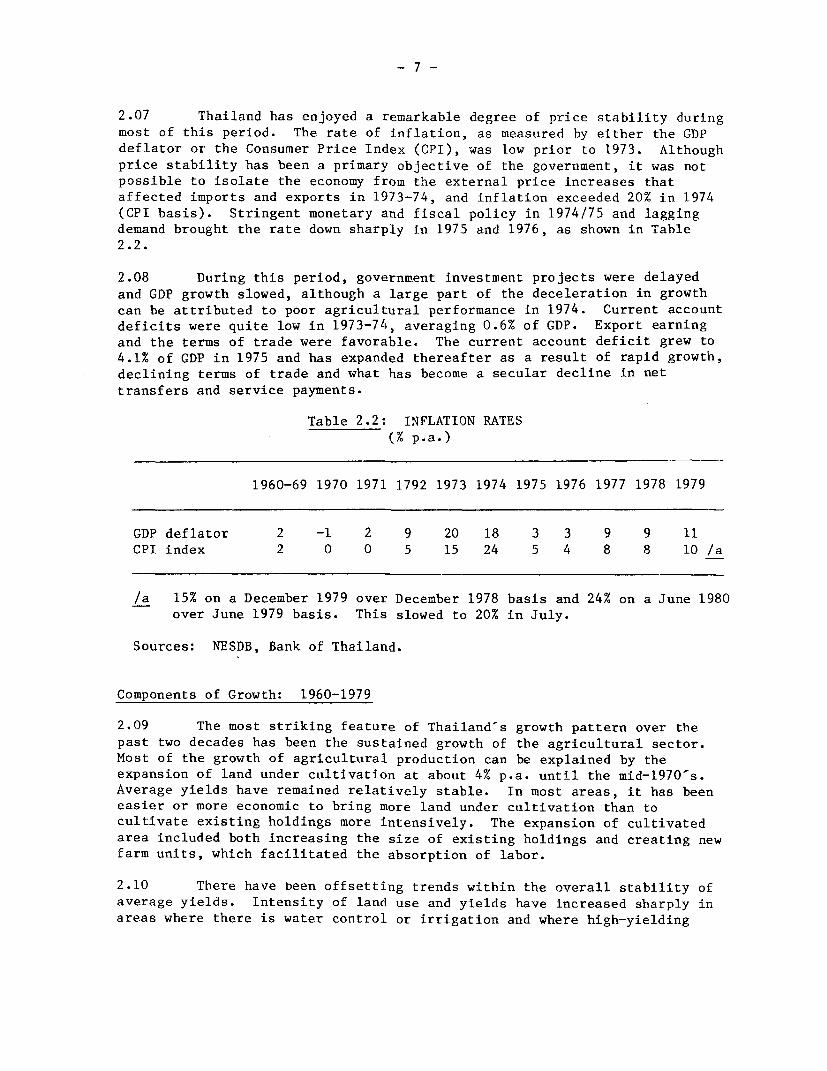
2.07 Thailand has enjoyed a remarkable degree of price stability during
most of this period. The rate of inflation, as measured by either the GDP
deflator or the Consumer Price Index (CPI), was low prior to 1973. Although
price stability has been a primary objective of the government, it was not
possible to isolate the economy from the external price increases that
affected imports and exports in 1973-74, and inflation exceeded 20% in 1974
(CPI basis). Stringent monetary and fiscal policy in 1974/75 and lagging
demand brought the rate down sharply in 1975 and 1976, as shown in Table
2.2.
2.08 During this period, government investment projects were delayed
and GDP growth slowed, although a large part of the deceleration in growthcan be attributed to poor agricultural performance in 1974. Current account
deficits were quite low in 1973-74, averaging 0.6% of GDP. Export earningand the terms of trade were favorable. The current account deficit grew to
4.1% of GDP in 1975 and has expanded thereafter as a result of rapid growth,declining terms of trade and what has become a secular decline in net
transfers and service payments.
Table 2.2: INFLATION RATES(% p.a.)
1960-69 1970 1971 1792 1973 1974 1975 1976 1977 1978 1979
GDP deflator 2 -1 2 9 20 18 3 3 9 9 11
CPI index 2 0 0 5 15 24 5 4 8 8 10 /a
/a 15% on a December 1979 over December 1978 basis and 24% on a June 1980over June 1979 basis. This slowed to 20% in July.
Sources: NESDB, Bank of Thailand.
Components of Growth: 1960-1979
2.09 The most striking feature of Thailand-s growth pattern over the
past two decades has been the sustained growth of the agricultural sector.
Most of the growth of agricultural production can be explained by the
expansion of land under cultivation at about 4% p.a. until the mid-1970's.Average yields have remained relatively stable. In most areas, it has been
easier or more economic to bring more land under cultivation than to
cultivate existing holdings more intensively. The expansion of cultivated
area included both increasing the size of existing holdings and creating new
farm units, which facilitated the absorption of labor.
2.10 There have been offsetting trends within the overall stability of
average yields. Intensity of land use and yields have increased sharply in
areas where there is water control or irrigation and where high-yielding

varieties have been. introduced. On the other hand, in many areascultivation has expanded into less fertile, marginal areas with loweraverage yields. The average increases in agricultural value added per unitof land have been limited, about 1% p.a.. They are due primarily to doublecropping and diversification into higher value crops. The availability ofadditional land to bring into holdings is now rapidly diminishing in mostparts of the country, and the area of farm holdings may even have declinedin recent years.
2.11 Cash crops, such as maize, cassava, sugar and pineapples, haveexpanded rapidly and reduced Thailand's dependence on rice as the principalcrop for sale and export (see Table 2.3). During the 1970½s, productionincreased faster than domestic demand, and an increasing share of incre-mental output went into exports. This was a major factor in the rapidexport growth during that decade.
Table 2.3: AGRICULTURAL DIVERSIFICATION(% of value added, current Baht)
1960-65 1966-70 1971-75 1976-79
Expansion in area of farm holdings(growth, % p.a.) - 3.6/a 4.7 -1.0/b
Average share of all cropsin agriculture 73.7 71.7 .73.6 74.1
Average share in crops of:Rice (paddy) 49.1 47.6 44.0 36.7Rubber 7.5 5.3 4.6 5.7Maize 3.3 5.9 7.3 5.0Sugarcane 2.0 2.2 5.2 5.7Cassava 2.8 2.4 4.1 7.4Other crops 35.1 36.5 34.8 39.5
/a 1962-71./b 1975-79.
Source: NESDB, Ministry of Agriculture, Office of Agricultural Economics.
2.12 Growth in the industrial sector throughout the period was basedprimarily on meeting the demands of the expanding domestic market. In the

- 9 -
1960's, import substitution was the next most important source, accountingfor about one third of industrial sector growth. Export expansion becamethe second most important source of industrial growth in the 1970's, as shownin Table 2.4. The easy stage of import substitution into consumption goodshad been essentially completed by the early 1970's, and there was littleincentive for the private sector to press into substitution in theintermediate or capital goods sectors without substantial increases inprotection, which declined from 1968 to 1974, but has since risen.
Table 2.4: SOURCES OF INDUSTRIAL GROWTH(%)
1966-72 1972-75 1975-78
Domestic demand 64.1 91.0 79.5Import substitution 29.4 0.5 -7.7Export expansion 6.5 8.5 28.2
Total 100.0 100.0 100.0
Source: Industrial Development Strategy in Thailand, ReportNo. 2804a-TH, June 5, 1980.
2.13 Rather than press import substitution further, exportopportunities for manufactured goods were pursued. OECD quotas on importsof textiles and garments from certain other developing countries created alarge potential for Thai textile exports. In conjunction with foreigndirect investment and joint ventures, the economy was able to capture arelatively larger share of the growth in OECD textile markets. Thailand hassince earned its own quotas, but only after firmly establishing an exportorientation in the textile industry. Thailand has also entered a number ofother export markets, and textiles and garments now account for only one-half of manufactured exports (defined as SITC 5-8 less 68).
2.14 Economic growth has led to increasing energy use. The demand forenergy grew 1.8 times faster than GDP in the 1960's, and it slowed only to1.3 times faster in the 1970s. There was a significant reduction in thegrowth of energy consumption in 1974, when it grew at 1.8%, or 0.3 times as

- 10 -
fast as GDP./I As indicated in Table 2.5, most of the reduction in energydemand occurred after 1975. In fact, a significant portion of the reductionin the elasticity is due to the exceptionally high growth in GDP in 1978,(led by agriculture) and a sharp reduction in hydro-electric production inthat year due to the low water levels resulting from the drought in 1977.This elasticity is within the "normal" range observed for developingcountries. Growtlh of energy consumption has been due to a number offactors: the extension of commercial agriculture relies heavily on theroad-based transport system; agriculture is increasingly turning tomechanization and pumps to raise production; the growing industrial andcommercial sectors consume large amounts of energy; and rising incomes areleading to higher private use of energy for automobiles, air conditioners,lighting and home appliances. Restrained energy price increases contributedto continued relatively high growth of demand and consumption after 1974.However, the decline in the relative demand growth for energy in recentyears can be partly attributed to the effects of the price increases thattook place. This indicates a significant negative price elasticity, andshows that is an effective policy.
Table 2.5: ENERGY CONSUMPTION
1960-69 1970-74 1975-78 1979
Growth of commercial energy consumption(% p.a.) 15.6 10.6 9.2
Elasticity of energy consumption withrespect to GDP 1.8 1.9 1.0
Share of total commercial energyimported (% of energy equivalent) 86.2 88.2 81.1
Value of energy imports (B, billion) 1.5 5.1 18.0 32.6Energy imports share of total imports (%) 9 13.4 21.1 21.3
Source: NESDB, Bank of Thailand Statistical Bulletin, NEA
2.15 The growth of productive activities was accompanied by significantdevelopments in the financial sector. Banking and other financial institu-tions have spread throughout the country, and there are now branch banks inevery provincial capital. In the 1960's, banks shifted their primary atten-tion from financing foreign trade to supporting domestic production activi-ties. Finance companies, which raise funds by issuing promissory notes, andface fewer regulations than banks, grew rapidly since 1964. They now havecombined assets equal to about a quarter of those of commercial banks andengage in both industrial and consumer lending. A stock exchange wasestablished in 1975 to broaden equity financing. Specialized financialinstitutions for lending in support of agriculture, small-scale industries,and long-term industrial activities have also been created.
/1 Supply shortages may also have contributed to slow consumption growththat year. Some domestic prices were not allowed to increase enoughto cover producers' costs, and products were withheld from markets.

- 11 -
2.16 External resources were not a constraint throughout most of thisperiod, and Thailand borrowed relatively little abroad. Thailand has longmaintained a conservative attitude about incurring foreign debt and has hadsufficient domestic resources and savings to sustain high growth rateswithout reliance on external resources. The current account deficitaveraged less than 2% of GDP for the entire period 1960-75, and the externaldebt outstanding totaled about $1.3 billion by 1975, including $700 millionof private non-guaranteed debt. Trade deficits were often larger duringthis period, but high net inflows on the transfer and service accountsreduced the external borrowing requirements.
Distribution of Growth
2.17 The benefits of growth have been relatively well distributedthroughout the country. Since most agricultural production is by small-holders, most of the income growth in that sector has accrued to the ruralproducers themselves. The overall incidence of poverty has been reducedfrom about 57% in the early 1960's to about 31% by the middle 1970 s, andfrom 61% to 35% in the rural sector. Poverty remains largely a ruralphenomenon, and it is unevenly distributed throughout the country (see Table2.6).
Table 2.6: POVERTY INDICATORS
1962/63/a 1968/69 1975/76
Incidence of poverty (% of totalpopulation) 57 39 31Rural 61 43 35Urban 38 16 14
Distribution of poverty (% of povertypopulation) 100 100 100Rural 88 94 90Urban 12 6 10
/a Due to classification of sanitary districts as urban in the 1962/63Household Expenditure Survey, these results are not strictly comparableto the later surveys where the sanitary districts are more appropriatelyclassified as rural. As a result, the urban and total poverty incidenceand urban poverty distribution are somewhat overstated in 1962/63, andthe rural incidence and distribution slightly understated.
Source: Income Growth and Poverty Alleviation in Thailand, Report No.2566-TH, June 20, 1980).

- 12 -
2.18 Most poverty is concentrated in the Northeast and parts of theNorth, where the fertility of the land is low. The rural areas have notbeen stagnant, however, as evidenced by the dramatic reduction in poverty.They have maintained average per-capita income growth rates comparable tothose of the urban areas. On the basis of household survey data through1975, average inter-regional and rural-urban per-capita household incomedifferentials were not increasing as a function of rapid growth. However,the differences in average incomes between urban and rural areas remainlarge. Within the rural and urban sectors, income differentials haveincreased as some areas have enjoyed substantial growth in the past twodecades while other areas have not experienced any real growth.

- 13 -
III. STRESSES OF THE PAST HALF DECADE
3.01 Thailand appeared to absorb the immediate impacts of the 1973/74economic shocks with no significant disruption of its growth rate. Lowagricultural growth and declining construction activity had depressed growthin the early 1970's, and the post-1973 record is no worse than 1970-73./1 Theinitial balance of payments effect of the oil price increase was cushionedby high export prices and continued high transfer and service accountearnings through 1975. Most of the other external price changes wereabsorbed in 1973 and 1974. Domestic inflation shot up and then was broughtunder control in 1975 as a result of tight fiscal policy. This fiscalrestraint was in part unintentional./2 There was great concern that thisreaction had unduly retarded growth, which fell to 5.0% in real terms in1974. However, the decline was at least as much due to slow agriculturalgrowth of 1.4%, which was little affected by these factors, as it was tothe decline in public investment expenditures. Agricultural growthrecovered to 8.9% in 1975, and GDP grew at 7.6%. The nonagriculturalsectors grew at 7.3% in 1974 and 6.8% in 1975, lower than 1972-73, but insubsequent years they averaged more than 10% p.a.
3.02 The one area where the economy had not fully adjusted by 1975 wasin absorbing energy prices. Excise taxes and retail margins were reduced onpetroleum products to keep domestic energy prices down, and only part ofthe import: price increase was absorbed in 1974. It was not until 1977 thatenergy prices were allowed to rise and begin to restore earlier tax levelsand margins. Thailand adopted a policy of gradual adjustment on energyprices because energy was viewed as essential for growth and some lowercost domestic energy sources were being developed. Also, the energy pricewas a very sensitive political issue. Failure to raise energy pricesbetween 1974 and 1977 encouraged continued rapid growth of consumption andimports.
3.03 By 1975, most Thai officials and other observers felt that theThai economy had largely adjusted to the shocks of 1973/74. Their primaryconcern was directed towards restoring the high growth rates of the 1960-s,expanding public investment and social service expenditures in order tofurther poverty alleviation, and restraining inflation. The externaldeficits then projected were considered manageable and acceptable in theinterests of growth, although they were larger than the economy was
/1 Average GDP growth in 1970-73 was 6.1% p.a. compared to 6.3% p.a. for1973-75; for the nonagricultural sectors, the rates are 6.9% p.a. forthe earlier period and 6.8% for the latter.
/2 The rise in trade values unexpectedly increased tariff and export taxcollections, and domestic price increases required renegotiation ofa number of government contracts which delayed capital expenditures. Anoverall budgetary surplus was recorded in FY74.
- 14 -
accustomed to. The analysis of the Basic Economic Report /1 supported thisposition and placed a greater emphasis on growth and distriTution than onfurther adjustments of energy prices or on reducing the financial deficits.
3.04 Thailand has achieved a real growth rate of 9% p.a. since 1975,which is extraordinary in view of Thailand's deteriorating externalsituation and the general decline in growth rates experienced throughout therest of the world. Unfortunately, this growth was not simply a continuationand acceleration of the growth pattern which dominated prior to the energyprice inceases, nor was it due to a successful adjustment to the changedexternal situation. The high 1975-79 growth rate is the result of severalpolicies and other factors which are not likely to be repeated in the early1980's.
3.05 Measures which promoted growth included controlling certain keyprices, such as energy and cement prices, maintaining a ceiling on interestrates, increasing protection, expanding public sector expenditures anddeficits, and permitting rapid credit creation to support higher demand.
These actions were able to stimulate growth because excess capacity wasavailable in 1975, export growth was exceptional, increasing levels offoreign resources could be mobilized to fill the growing external anddomestic savings deficits, price stability had been re-established, and realoil import prices were stable or falling after the 1973 increase. Withinflation again accelerating, capacity constraints binding in severalsectors, large budgetary and current accounts deficits to be financed,continuing real oil price increases to be absorbed, and foreign commercialbanks becoming more cautious about further extension of credit to developingcountries, many of the growth-promoting measures of the late 1970's cannot becontinued. In fact, these measures contributed to worsening severalstructural disequilibria, such as the budgetary and external deficits, andto excess demand. They have left the economy uncomfortably exposed toexternal shocks, such as the doubling of oil prices which occurred in late1979.
3.06 Recent growth has also been sustained by depleting certain assetsof the economy. High rice exports have been maintained by depleting stocksfrom an estimated 3 million tons in 1977 to a current level of about 0.7million tons. This depletion is nearly equal to one year's rice exports.Controls on petroleum product prices and power tariffs have depleted thefinancial assets of public enterprises in the sector and greatly increasedtheir indebtedness, which will only lead to higher price increases in thefuture and weaker financial situations for these enterprises. Pricecontrols on goods such as cement have led to deferred or forgone investmentin capacity and higher-cost imports, reducing the longer-term productivecapacity of a major industry. Growing levels of borrowing abroad haveabsorbed a large part of Thailand's borrowing potential and future increases
/1 The report was prepared in 1978 on the basis of preliminary 1977 data,and was discussed with the Government in 1978.

- 15 -
will not be as easy to achieve once Thailand reaches its country creditlimits with commercial banks. It is far more difficult to raise theselimits to increase borrowing than it is to increase borrowing up tothe established limits.
High Growth and Financial Imbalances
3.07 Production Growth. A number of separate elements contributed tothe high rates of growth since 1975. Despite wide variation, agricul-tural production remained high throughout the period, falling only slightlybelow its average historical growth rate (compare Table 2.1 (p. 6) toTable 3.1). Expansion of double cropping in irrigated areas of the centralplain, rapid expansion of upland crops such as sugar, cassava, and others,and the recovery of rubber production all contributed to agriculturalgrowth. This added to the overall growth impetus in other sectors andsupplied high levels of exports. The industrial and total nonagriculturalsectors grew substantially more rapidly than agriculture in 1975-79 than inthe previous half decade. The margin of the nonagricultural sectors growthover agriculture in 1975-79 also exceeds that of the earlier decade and mayindicate a change in the relative structure of growth in favor of thenonagricultural sectors.
Table 3.1: GROWTH RATES BY SECTOR(% p.a., 1972 baht)
1970-75 1976 1977 1978 1979
Agriculture 5.1 6.1 -0.6 14.7 -2.0Crops 5.2 7.5 -4.7 18.6 -2.7
Industry 7.3 15.7 14.7 11.5 10.1Manufacturing 9.8 15.5 13.3 9.8 9.8Construction -0.6 17.6 20.0 17.5 9.2
Tertiary 6.8 8.0 8.2 10.1 10.1
GDP 6.4 9.3 7.3 11.7 6.7
Source: NESDB.
3.08 Industrial growth was led by sharp increases in both the manufac-turing and construction sectors. The former was due to a resurgence of do-mestic demand after the recession of 1974-75, to strong export demand, andto growing investment demand. Textiles and wearing apparel, various kinds ofmachinery, transport equipment, and beverages were important factors in sus-taining growth throughout the period. The food (declining sugar produc-tion), tobacco, wood (exhaustion of forests and bans on logging), and pet-roleum refining (capacity limitations) branches were the principal elements
- 16 -
in the decline in manufacturing growth in 1978 and 1979. Supply or capacityconstraints were reached. Growth in the other branches declined onlyslightly from the 1976-77 levels. As a result of efforts to promotedomestic industrial growth and reduce the trade deficits, protectionincreased from an average nominal level of 35% in 1974 to 51% in 1978 fornonimport-competing goods, and from 25% to 36% for import-competinggoods./l This has contributed to the demand for investment byimport-substituting industries, but has allowed lower efficiency in the useof capital goods./2 /3
3.09 Construction activity benefitted from high private demand, therecovery of government capital expenditures, and the growing investmentprograms of the public enterprises. The growth of public sector demand forconstruction fell in 1979, but private sector demand continued at highlevels. Policies which maintained low interest rates when inflationaccelerated and which restrained the costs of major construction inputs,including petroleum products and cement, lowered the effective price ofconstruction relative to other goods and to financial assets. This contri-buted to a construction boom as investors shifted into real estate.Tertiary sector output increased as a function of expanded activity in theprimary and secondary sectors, the rapid growth in external trade, and therapid expansion of government current expenditures, which grew at 25% p.a.in 1977-79.
3.10 Trade Growth and Current Account Deficits. Export growth ratessubstantially exceeded GDP growth in the 1970's, reversing the pattern of the1960s. Thailand enjoyed relatively high demand for most of its agriculturalexports, and its manufactured exports captured a growing share of a number ofmarkets. Thailand now accounts for nearly 2% of all manufactured exportsfrom developing countries, compared to less than 0.4% in 1970. The actual
/1 Potential effective protection rose from 39% to 99% for nonimport-competing goods and from 45% to 86% for import-competing goods over thesame period. Import-competing goods are defined as goods where importsare 10% or more of domestic consumption; nonimport-competing goods arethose where imports are less than 10% of domestic consumption. All ofthis protection was not realized in many sectors, where stiff domesticcompetition kept domestic prices below import-price-plus-duty levels.Data are from An Industrial Development Strategy for Thailand, Table 7.
/2 Since protection allows domestic value added to increase without therenecessarily being a corresponding increase in real output measured inworld prices, some of the recorded industrial growth may be due to theeffects of protection rather than to real increases in production.
/3 Despite this growing protection, import substitution has declined slightlyin 1975-78 as shown in Table 2.4. This further indicates the decliningefficiency of import substitution industries, whiclh cannot even maintaintheir market shares with this amount of increasing protection. See theBackground papers to An Industrial Development Strategy for Thailand formore discussion of this.

- 17 -
growth rates for manufactured exports were higher in the early 1970's than inthe latter half of the decade, but the earlier growth was from a very small
base. The latter period is more remarkable because it occurred froma larger base and in spite of the imposition of import quotas on Thai textilesin OECD countries and a world-wide recession.
3.11 The growth in the value of exports greatly exceeded growth ofdomestic production at current prices./1 This is most evident in themanufacturing sector, but also true for agriculture, as shown in Table 3.2.The value of imports grew less rapidly than exports in both halves of the1970s, compared to twice the growth rate of exports in the 1960's. However,in recent years export growth slowed and imports accelerated so that importgrowth exceeded export growth in 1977-79 by 25% p.a. to 23% p.a. The demandfor imports of energy and of capital and intermediate goods was high andtheir prices were rising. In addition to the deterioration in the tradebalance since 1976, the declining net transfers and services contributedto the growing current account deficits (see paras. 3.14 and 3.15).
Table 3.2: GROWTH IN THE VALUE OF EXPORTS AND PRODUCTION(Current prices, % p.a.)
1960-70 1970-75 1975-79
Agriculture exports 3.2 28.9 17.3Agricultural production /a 7.2 22.3 11.6
Manufactured exports 16.0 65.5 38.1Manufacturing production /a 12.5 21.1 19.0
Total Exports 5.8 29.7 23.0Total Imports 12.0 23.7 21.7
GDP 10.3 19.0 17.6
/a Value added.
Source: NESDB, Bank of Thailand.
3.12 A similar pattern holds in constant prices as shown in Table 3.3.Here the shift in the relative export and import growth rates is even morepronounced. Most of the growth in the value of agricultural exports in1970-75 was due to price increases for rice, rubber, cassava, sugar andmaize. The increase in export volume only kept pace with agriculturalproduction. In contrast, with the exception of rising rubber prices, volumegrowth was the key factor in agricultural export growth in 1975-79, led bycassava exports to the EEC, rubber, rice and canned pineapple. Much of the
/1 Part of this is due to rice exports from stocks since 1977.
- 18 -
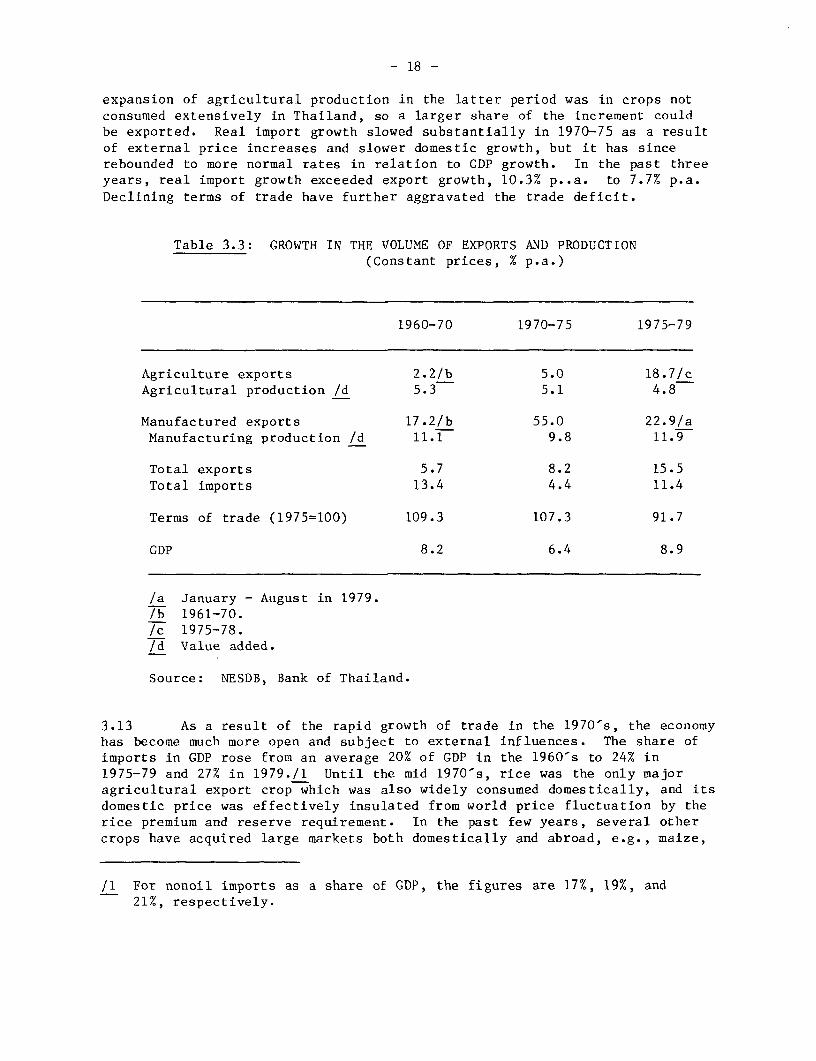
expansion of agricultural production in the latter period was in crops notconsumed extensively in Thailand, so a larger share of the increment couldbe exported. Real import growth slowed substantially in 1970-75 as a resultof external price increases and slower domestic growth, but it has sincerebounded to more normal rates in relation to GDP growth. In the past threeyears, real import growth exceeded export growth, 10.3% p..a. to 7.7% p.a.Declining terms of trade have further aggravated the trade deficit.
Table 3.3: GROWTH IN THE VOLUME OF EXPORTS AND PRODUCTION(Constant prices, % p.a.)
1960-70 1970-75 1975-79
Agriculture exports 2.2/b 5.0 18.7/cAgricultural production /d 5.3 5.1 4.8
Manufactured exports 17.2/b 55.0 22.9/aManufacturing production /d 11.1 9.8 11.9
Total exports 5.7 8.2 15.5Total imports 13.4 4.4 11.4
Terms of trade (1975=100) 109.3 107.3 91.7
GDP 8.2 6.4 8.9
/a January - August in 1979./b 1961-70./c 1975-78./d Value added.
Source: NESDB, Bank of Thailand.
3.13 As a result of the rapid growth of trade in the 1970's, the economyhas become much more open and subject to external influences. The share ofimports in GDP rose from an average 20% of GDP in the 1960's to 24% in1975-79 and 27% in 1979./l Until the mid 1970's, rice was the only majoragricultural export crop which was also widely consumed domestically, and itsdomestic price was effectively insulated from world price fluctuation by therice premium and reserve requirement. In the past few years, several othercrops have acquired large markets both domestically and abroad, e.g., maize,
/1 For nonoil imports as a share of GDP, the figures are 17%, 19%, and21%, respectively.
- 19 -
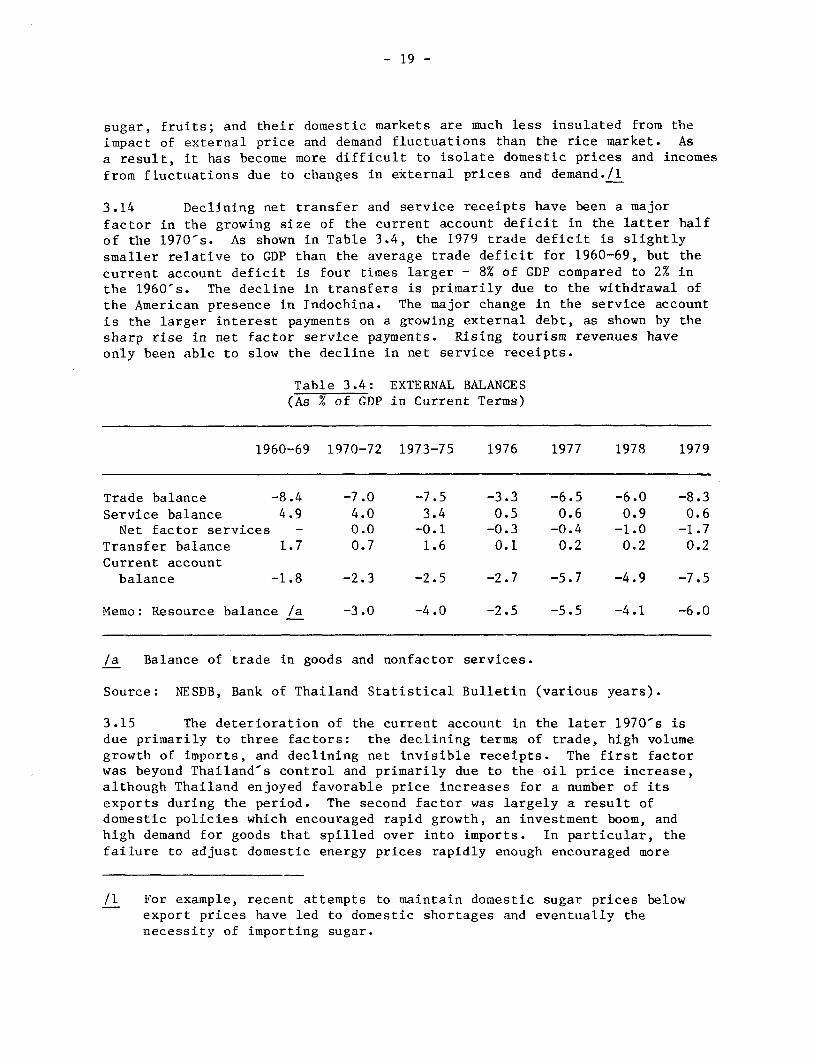
sugar, fruits; and their domestic markets are much less insulated from theimpact of external price and demand fluctuations than the rice market. Asa result, it has become more difficult to isolate domestic prices and incomesfrom fluctuations due to changes in external prices and demand./l
3.14 Declining net transfer and service receipts have been a majorfactor in the growing size of the current account deficit in the latter halfof the 1970's. As shown in Table 3.4, the 1979 trade deficit is slightly
smaller relative to GDP than the average trade deficit for 1960-69, but thecurrent account deficit is four times larger - 8% of GDP compared to 2% inthe 1960's. The decline in transfers is primarily due to the withdrawal ofthe American presence in Indochina. The major change in the service accountis the larger interest payments on a growing external debt, as shown by thesharp rise in net factor service payments. Rising tourism revenues haveonly been able to slow the decline in net service receipts.
Table 3.4: EXTERNAL BALANCES(As % of GDP in Current Terms)
1960-69 1970-72 1973-75 1976 1977 1978 1979
Trade balance -8.4 -7.0 -7.5 -3.3 -6.5 -6.0 -8.3Service balance 4.9 4.0 3.4 0.5 0.6 0.9 0.6Net factor services - 0.0 -0.1 -0.3 -0.4 -1.0 -1.7
Transfer balance 1.7 0.7 1.6 0.1 0.2 0.2 0.2Current accountbalance -1.8 -2.3 -2.5 -2.7 -5.7 -4.9 -7.5
Memo: Resource balance /a -3.0 -4.0 -2.5 -5.5 -4.1 -6.0
/a Balance of trade in goods and nonfactor services.
Source: NESDB, Bank of Thailand Statistical Bulletin (various years).
3.15 The deterioration of the current account in the later 1970's isdue primarily to three factors: the declining terms of trade, high volumegrowth of imports, and declining net invisible receipts. The first factorwas beyond Thailand-s control and primarily due to the oil price increase,although Thailand enjoyed favorable price increases for a number of itsexports during the period. The second factor was largely a result ofdomestic policies which encouraged rapid growth, an investment boom, andhigh demand for goods that spilled over into imports. In particular, thefailure to adjust domestic energy prices rapidly enough encouraged more
/1 For example, recent attempts to maintain domestic sugar prices belowexport prices have led to domestic shortages and eventually thenecessity of importing sugar.
- 20 -
growth of petroleum imports than the economy could afford. The third factorresulted from a combination of external and internal causes. The decline intransfer receipts resulted mainly from reduced US activity in the area.Growing interest payments were a result of generally rising interest ratesplus the larger level of external debt that was acquired during the period.These payments will continue to grow as a result of the high level ofcurrent borrowing. It is only due to the superlative export performance ofthe economy that these three factors have not resulted in even more seriousbalance of payments deficits.
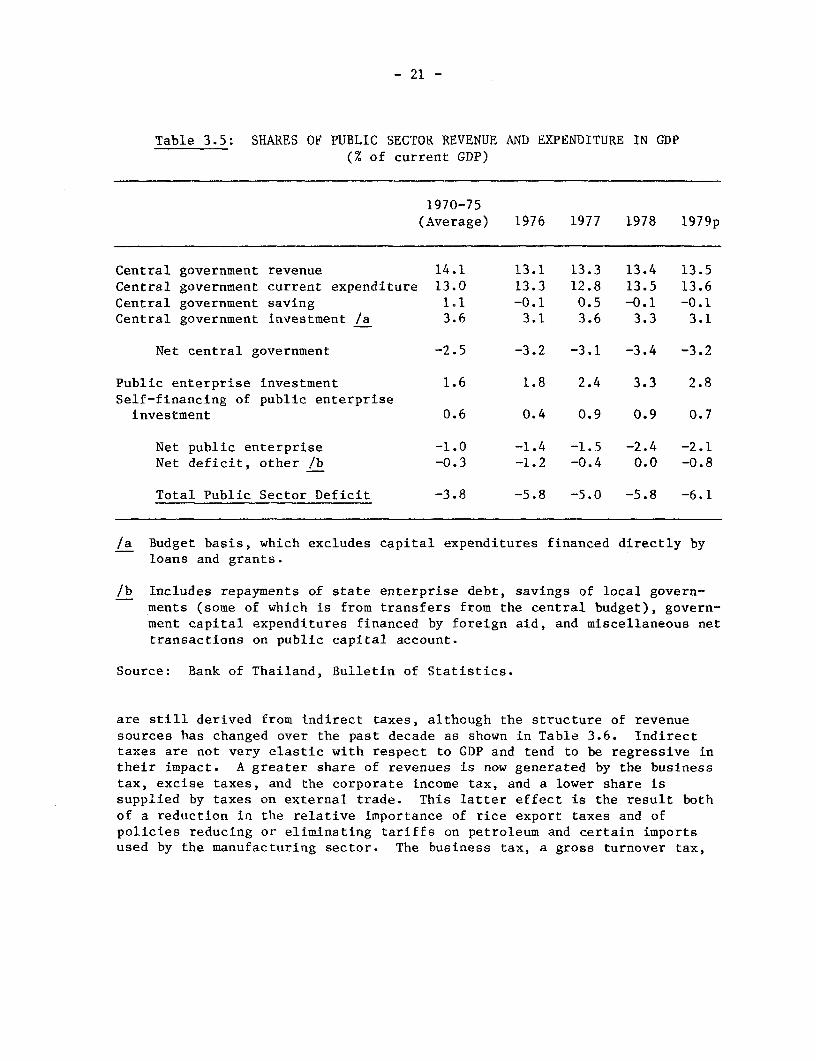
3.16 Fiscal Deficits. Total central government expenditures (currentand capital) have recovered from their unusually low levels of the mid-1970½s,growing from about 14% of GDP in 1974-75 to about 17% in 1976-79 as shownin Table 3.5. This compares to 18% in 1970-73 (see Table 3.5). The growthof current expenditures was led by central government expenditures ondefense and administration, which grew at 35% per annum. These categoriesnow comprise 40% of total current expenditures, compared to 35% in FY71.Current expenditures have been increasing more rapidly than capitalexpenditures and now account for 67% of total central government expendi-tures, compared to 60% in FY71. Despite the objectives of the Fourth Plan,the capital expenditure share of the total budget has fallen from 16% to 12%for the economic sectors. Lagging central government investment has beenoffset by public enterprise and local government investments. They nowaccount for 41% and 14% of total public sector investments, respectively,compared to 24% and 9% in FY71. As a result of the growth of publicenterprise investments, total public sector expenditures now account forover 20% of GDP, compared to 18% in 1970-75.
3.17 Growth in central government expenditures since 1975 was notmatched by a similar growth in revenues, and large budgetary deficitsensued. Iotal central government revenues as a share of GDP have stagnatedat about 13%, and taxes at a little more than 12%, both down marginally fromtheir share in 1970-75. Central government savings have been slightlynegative in most years since 1975, and the central government deficit hasgrown to over 4% of GDP, or about B 20 billion ($1 billion). This has beenfinanced to a much greater degree by borrowing abroad - 57% of the deficit inFY79 compared to an average of 17.8% in FY71-75. Domestic financing of thebudget deficit from monetary authorities increased from 55% of the total inFY71 to 72% in FY79. Given the much larger total deficits, this has had asignificant inflationary impact.
3.18 The overall buoyancy of the tax system is about unity, and the taxincidence is roughly proportional across income groups, with a slighttendency toward being regressive at the extremes./l About 80% of revenues
/1 See An Analysis of Fiscal Activities in Thailand, A Background Paper tothe Basis Economic Report, November 1978.
- 21 -
Table 3.5: SHARES OF PUBLIC SECTOR REVENUE AND EXPENDITURE IN GDP(% of current GDP)
1970-75(Average) 1976 1977 1978 1979p
Central government revenue 14.1 13.1 13.3 13.4 13.5Central government current expenditure 13.0 13.3 12.8 13.5 13.6Central government saving 1.1 -0.1 0.5 -0.1 -0.1Central government investment /a 3.6 3.1 3.6 3.3 3.1
Net central government -2.5 -3.2 -3.1 -3.4 -3.2
Public enterprise investment 1.6 1.8 2.4 3.3 2.8Self-financing of public enterpriseinvestment 0.6 0.4 0.9 0.9 0.7
Net public enterprise -1.0 -1.4 -1.5 -2.4 -2.1Net deficit, other /b -0.3 -1.2 -0.4 0.0 -0.8
Total Public Sector Deficit -3.8 -5.8 -5.0 -5.8 -6.1
/a Budget basis, which excludes capital expenditures financed directly byloans and grants.
lb Includes repayments of state enterprise debt, savings of local govern-ments (some of which is from transfers from the central budget), govern-ment capital expenditures financed by foreign aid, and miscellaneous nettransactions on public capital account.
Source: Bank of Thailand, Bulletin of Statistics.
are still derived from indirect taxes, although the structure of revenuesources has changed over the past decade as shown in Table 3.6. Indirecttaxes are not very elastic with respect to GDP and tend to be regressive intheir impact. A greater share of revenues is now generated by the businesstax, excise taxes, and the corporate income tax, and a lower share issupplied by taxes on external trade. This latter effect is the result bothof a reduction in the relative importance of rice export taxes and ofpolicies reducing or eliminating tariffs on petroleum and certain importsused by the manufacturing sector. The business tax, a gross turnover tax,
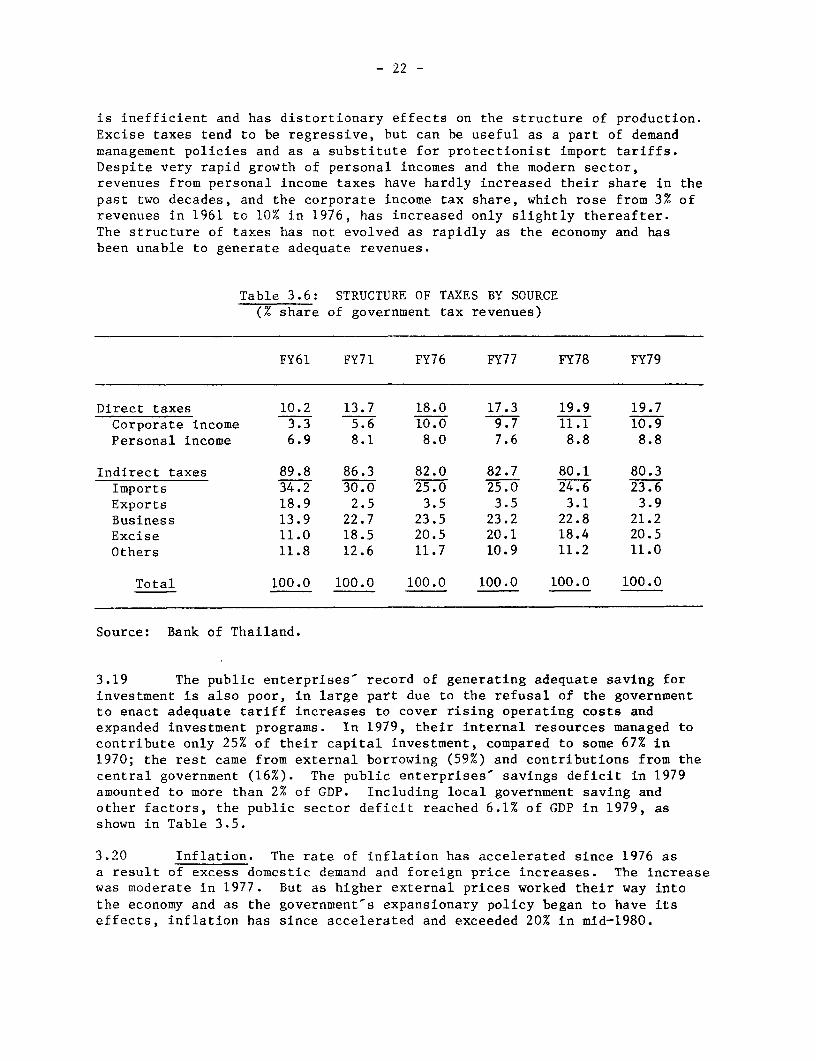
- 22 -
is inefficient and has distortionary effects on the structure of production.Excise taxes tend to be regressive, but can be useful as a part of demandmanagement policies and as a substitute for protectionist import tariffs.Despite very rapid growth of personal incomes and the modern sector,revenues from personal income taxes have hardly increased their share in thepast two decades, and the corporate income tax share, which rose from 3% ofrevenues in 1961 to 10% in 1976, has increased only slightly thereafter.The structure of taxes has not evolved as rapidly as the economy and hasbeen unable to generate adequate revenues.
Table 3.6: STRUCTURE OF TAXES BY SOURCE(% share of government tax revenues)
FY61 FY71 FY76 FY77 FY78 FY79
Direct taxes 10.2 13.7 18.0 17.3 19.9 19.7Corporate income 3.3 5.6 10.0 9.7 11.1 10.9Personal income 6.9 8.1 8.0 7.6 8.8 8.8
Indirect taxes 89.8 86.3 82.0 82.7 80.1 80.3Imports 34.2 30.0 25.0 25.0 24.6 23.6Exports 18.9 2.5 3.5 3.5 3.1 3.9Business 13.9 22.7 23.5 23.2 22.8 21.2Excise 11.0 18.5 20.5 20.1 18.4 20.5Others 11.8 12.6 11.7 10.9 11.2 11.0
Total 100.0 100.0 100.0 100.0 100.0 100.0
Source: Bank of Thailand.
3.19 The public enterprises record of generating adequate saving forinvestment is also poor, in large part due to the refusal of the governmentto enact adequate tariff increases to cover rising operating costs andexpanded investment programs. In 1979, their internal resources managed tocontribute only 25% of their capital investment, compared to some 67% in1970; the rest came from external borrowing (59%) and contributions from thecentral government (16%). The public enterprises' savings deficit in 1979amounted to more than 2% of GDP. Including local government saving andother factors, the public sector deficit reached 6.1% of GDP in 1979, asshown in Table 3.5.
3.20 Inflation. The rate of inflation has accelerated since 1976 asa result of excess domestic demand and foreign price increases. The increasewas moderate in 1977. But as higher external prices worked their way intothe economy and as the government's expansionary policy began to have itseffects, inflation has since accelerated and exceeded 20% in mid-1980.
There is now some evidence that the inflation rate is moderating as foodprices are falling. But this may be only transitory as energy and cementprice increases cannot be postponed much longer. When international pricesare rising, it is not possible to avoid some degree of inflation in aneconomy as open as Thailand-s; however, domestic policy also contributed tothe inflation./l Government efforts to slow inflation have concentrated onattempting to control certain highly visible prices. But, at best, the pricecontrols can only delay price increases and are not effective antiinflationmeasures. Other policies affecting aggregate demand have augmentedinflationary pressures, including rapid credit expansion to support thefinance companies, large public sector deficits financed by borrowing fromthe central bank, and low interest ceilings.
3.21 Financial Sector Growth. The rapid growth of production in the late1970-s was accompanied and facilitated by a rapid expansion of the financialsector. The Bank of Thailand actively encouraged expansion of branch bankingoutside of Bangkok and mandated higher levels of lending to agriculture tostimulate growth in rural areas. The banks themselves grew very rapidly andbecame more aggressive in seeking new domestic business and participating inexternal markets (see Table 3.7). In the late 1970's, commercial banksborrowed abroad heavily to meet growing domestic demands for credit. Netforeign liabilities of the banking sector grew rapidly from about $200 millionin the early 1970's to $700 million in 1977 and over $1.5 billion in mid-1979.Net liabilities abroad have since declined moderately. However, because usurylaws set upper limits on interest rates which could be changed by banks, ratespayable to savers were also limited and when foreign rates rose above the Thairates, short-term capital quickly moved abroad, and there were outflows ofseveral hundred million dollars in short periods in 1978 and 1979 due tointerest rate differentials. This caused a great deal of concern at the Bankof Thailand and was a major factor leading to raising the usury ceilings inJanuary 1980.
3.22 Finance companies also grew quite rapidly and, as a result of weakcontrols, rather precariously. They were highly levered and closely linkedwith the commercial banks, which were their primary source of funds. Thefinance companies were heavily involved in the expansion of consumer creditand lent extensively for purchasing (often speculative) equity shares. Thesecompanies contributed to the rapid expansion of credit during the 1970's thathelped maintain the high level of aggregate demand.
3.23 The Securities Exchange of Thailand (SET) was established in 1975and grew quickly in the ensuing three years. The paid-up capital of listed
/1 The Bank of Thailand estimates that, as a very rough calculation, a 1%increase in import prices adds almost 0.5% to domestic prices, includingdirect plus indirect effects. Import prices rose 46% from 1976 to theend of 1979, which would imply a 23% increase in domestic prices. TheCPI grew 37% in the same period, and the WPI grew 35%. It is interestingto note that the WPI for imported goods rose only 15% during this periodwhile the WPI for domestic goods rose 43%, also indicating that a signi-ficant amount of inflation is not due solely to rising import prices.Export prices may also have contributed to domestic price increases in1974-75, but their effect on the general price level is not likely tohave been significant since.
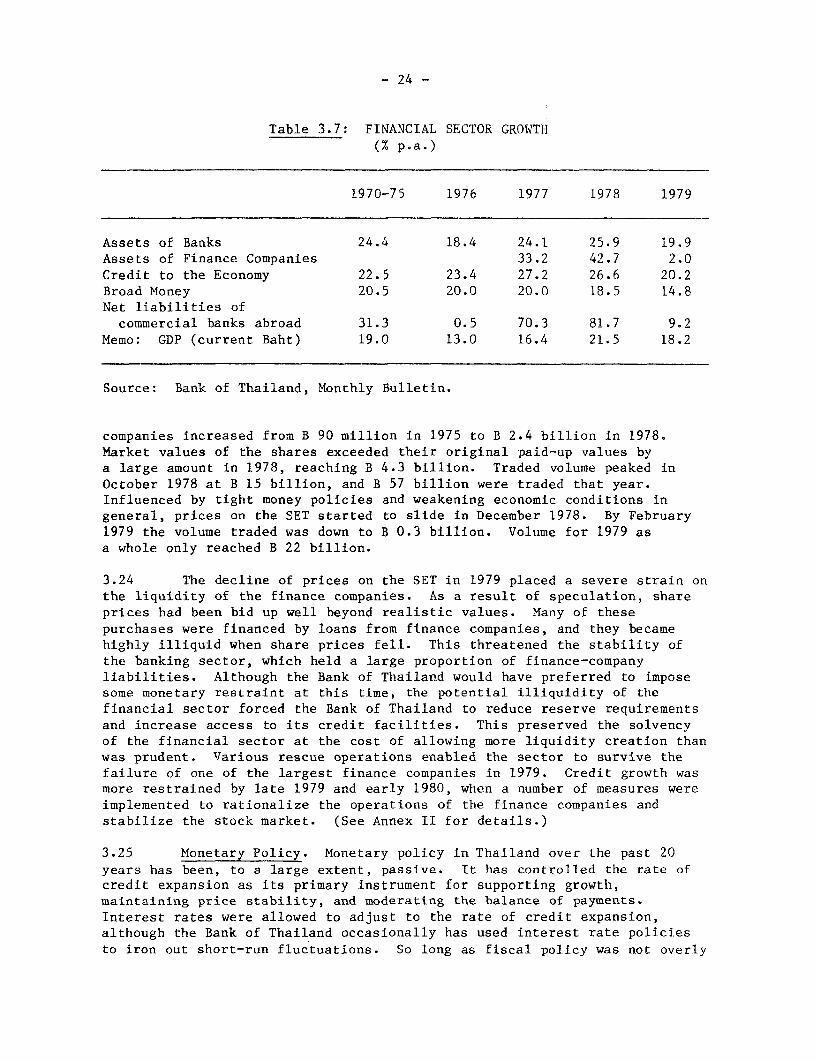
- 24 -
Table 3.7: FINANCIAL SECTOR GROWTH(% p.a.)
1970-75 1976 1977 1978 1979
Assets of Banks 24.4 18.4 24.1 25.9 19.9Assets of Finance Companies 33.2 42.7 2.0Credit to the Economy 22.5 23.4 27.2 26.6 20.2Broad Money 20.5 20.0 20.0 18.5 14.8Net liabilities ofcommercial banks abroad 31.3 0.5 70.3 81.7 9.2
Memo: GDP (current Baht) 19.0 13.0 16.4 21.5 18.2
Source: Bank of Thailand, Monthly Bulletin.
companies increased from B 90 million in 1975 to B 2.4 billion in 1978.Market values of the shares exceeded their original paid-up values bya large amount in 1978, reaching B 4.3 billion. Traded volume peaked inOctober 1978 at B 15 billion, and B 57 billion were traded that year.Influenced by tight money policies and weakening economic conditions ingeneral, prices on the SET started to slide in December 1978. By February1979 the volume traded was down to B 0.3 billion. Volume for 1979 asa whole only reached B 22 billion.
3.24 The decline of prices on the SET in 1979 placed a severe strain onthe liquidity of the finance companies. As a result of speculation, shareprices had been bid up well beyond realistic values. Many of thesepurchases were financed by loans from finance companies, and they becamehighly illiquid when share prices fell. This threatened the stability ofthe banking sector, which held a large proportion of finance-companyliabilities. Although the Bank of Thailard would have preferred to imposesome monetary restraint at this time, the potential illiquidity of thefinancial sector forced the Bank of Thailand to reduce reserve requirementsand increase access to its credit facilities. This preserved the solvencyof the financial sector at the cost of allowing more liquidity creation thanwas prudent. Various rescue operations enabled the sector to survive thefailure of one of the largest finance companies in 1979. Credit growth wasmore restrained by late 1979 and early 1980, when a number of measures wereimplemented to rationalize the operations of the finance companies andstabilize the stock market. (See Annex II for details.)
3.25 Monetary Policy. Monetary policy in Thailand over the past 20years has been, to a large extent, passive. It has controlled the rate ofcredit expansion as its primary instrument for supporting growth,maintaining price stability, and moderating the balance of payments.Interest rates were allowed to adjust to the rate of credit expansion,although the Bank of Thailand occasionally has used interest rate policiesto iron out short-run fluctuations. So long as fiscal policy was not overly
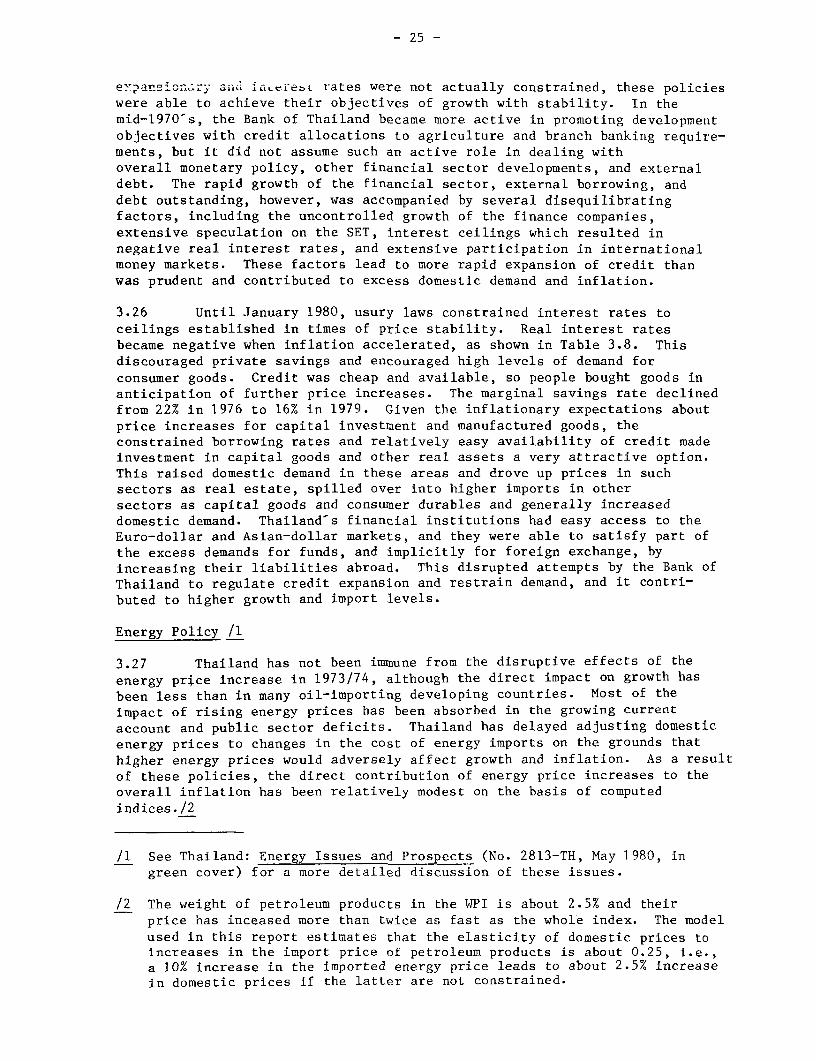
- 25 -
e-pan I a -rebL rates were not actually constrained, these policieswere able to achieve their objectives of growth with stability. In themid-1970½s, the Bank of Thailand became more active in promoting developmentobjectives with credit allocations to agriculture and branch banking require-ments, but it did not assume such an active role in dealing withoverall monetary policy, other financial sector developments, and externaldebt. The rapid growth of the financial sector, external borrowing, anddebt outstanding, however, was accompanied by several disequilibratingfactors, including the uncontrolled growth of the finance companies,extensive speculation on the SET, interest ceilings which resulted innegative real interest rates, and extensive participation in internationalmoney markets. These factors lead to more rapid expansion of credit thanwas prudent and contributed to excess domestic demand and inflation.
3.26 Until January 1980, usury laws constrained interest rates toceilings established in times of price stability. Real interest ratesbecame negative when inflation accelerated, as shown in Table 3.8. Thisdiscouraged private savings and encouraged high levels of demand forconsumer goods. Credit was cheap and available, so people bought goods inanticipation of further price increases. The marginal savings rate declinedfrom 22% in 1976 to 16% in 1979. Given the inflationary expectations aboutprice increases for capital investment and manufactured goods, theconstrained borrowing rates and relatively easy availability of credit madeinvestment in capital goods and other real assets a very attractive option.This raised domestic demand in these areas and drove up prices in suchsectors as real estate, spilled over into higher imports in othersectors as capital goods and consumer durables and generally increaseddomestic demand. Thailand-s financial institutions had easy access to theEuro-dollar and Asian-dollar markets, and they were able to satisfy part ofthe excess demands for funds, and implicitly for foreign exchange, byincreasing their liabilities abroad. This disrupted attempts by the Bank ofThailand to regulate credit expansion and restrain demand, and it contri-buted to higher growth and import levels.
Energy Policy /1
3.27 Thailand has not been immune from the disruptive effects of the
energy price increase in 1973/74, although the direct impact on growth hasbeen less than in many oil-importing developing countries. Most of theimpact of rising energy prices has been absorbed in the growing currentaccount and public sector deficits. Thailand has delayed adjusting domesticenergy prices to changes in the cost of energy imports on the grounds thathigher energy prices would adversely affect growth and inflation. As a resultof these policies, the direct contribution of energy price increases to theoverall inflation has been relatively modest on the basis of computedindices./2
/1 See Thailand: Energy Issues and Prospects (No. 2813-TH, May 1980, ingreen cover) for a more detailed discussion of these issues.
/2 The weight of petroleum products in the WPI is about 2.5% and theirprice has inceased more than twice as fast as the whole index. The modelused in this report estimates that the elasticity of domestic prices toincreases in the import price of petroleum products is about 0.25, i.e.,a 10% increase in the imported energy price leads to about 2.5% increasein domestic prices if the latter are not constrained.
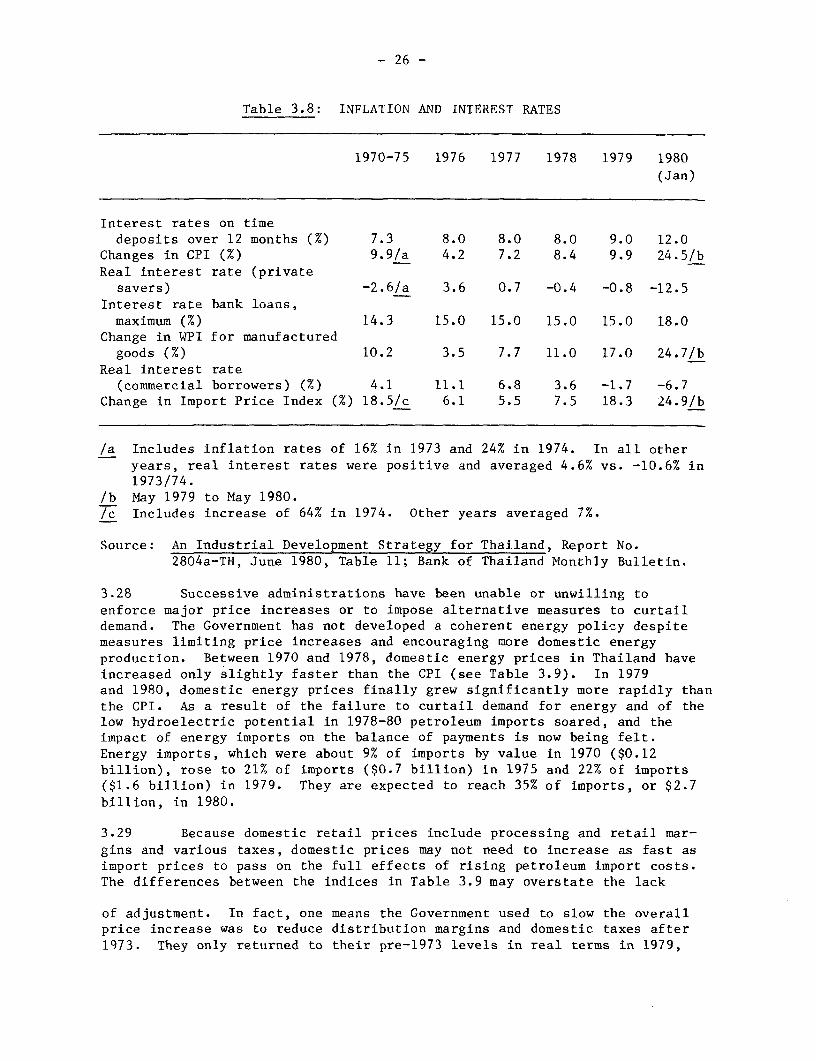
- 26 -
Table 3.8: INFLATION AND INTEREST RATES
1970-75 1976 1977 1978 1979 1980
(Jan)
Interest rates on timedeposits over 12 months (%) 7.3 8.0 8.0 8.0 9.0 12.0
Changes in CPI (%) 9.9/a 4.2 7.2 8.4 9.9 24.5/bReal interest rate (private
savers) -2.6/a 3.6 0.7 -0.4 -0.8 -12.5Interest rate bank loans,maximum (%) 14.3 15.0 15.0 15.0 15.0 18.0
Change in WPI for manufacturedgoods (%) 10.2 3.5 7.7 11.0 17.0 24.7/b
Real interest rate(commercial borrowers) (x) 4.1 11.1 6.8 3.6 -1.7 -6.7
Change in Import Price Index (%) 18.5/c 6.1 5.5 7.5 18.3 24.9/b
/a Includes inflation rates of 16% in 1973 and 24% in 1974. In all otheryears, real interest rates were positive and averaged 4.6% vs. -10.6% in1973/74.
/b May 1979 to May 1980./c Includes increase of 64% in 1974. Other years averaged 7%.
Source: An Industrial Development Strategy for Thailand, Report No.2804a-TH, June 1980, Table 11; Bank of Thailand Monthly Bulletin.
3.28 Successive administrations have been unable or unwilling toenforce major price increases or to impose alternative measures to curtaildemand. The Government has not developed a coherent energy policy despitemeasures limiting price increases and encouraging more domestic energyproduction. Between 1970 and 1978, domestic energy prices in Thailand haveincreased only slightly faster than the CPI (see Table 3.9). In 1979and 1980, domestic energy prices finally grew significantly more rapidly thanthe CPI. As a result of the failure to curtail demand for energy and of thelow hydroelectric potential in 1978-80 petroleum imports soared, and theimpact of energy imports on the balance of payments is now being felt.Energy imports, which were about 9% of imports by value in 1970 ($0.12billion), rose to 21% of imports ($0.7 billion) in 1975 and 22% of imports($1.6 billion) in 1979. They are expected to reach 35% of imports, or $2.7billion, in 1980.
3.29 Because domestic retail prices include processing and retail mar-gins and various taxes, domestic prices may not need to increase as fast asimport prices to pass on the full effects of rising petroleum import costs.The differences between the indices in Table 3.9 may overstate the lack
of adjustment. In fact, one means the Government used to slow the overallprice increase was to reduce distribution margins and domestic taxes after1973. They only returned to their pre-1973 levels in real terms in 1979,

Table 3.9: ENERGY PRICE MOVEMENTS
1970 1971 1972 1973 1974 1975 1976 1977 1978 1979 1980
Average import priceof oil (B/bbl) 43.1 49.0 50.8 64.2 209.2 232.0 250.1 269.1 286.3 409.0 650.0/i
Index 100.0 113.7 i17.9 149.0 485.4 538.3 580.3 624.4 664.3 949.0 1508.1
Electricity /a (B/kwh) 0.28 0.28 0.28 0.28 0.37 0.46 0.48 0.50 0.61 0.61 0.90
Index 100.0 100.0 100.0 100.0 132.1 164.3 171.4 178.6 217.9 217.9 321.4
Premium gasoline /b (B/1) 2.10 2.10 2.10 2.30/c 3.62/d 3.62 3.62 4.22/e 4.22 5.60/f 9.80/h
Index 100.0 100.0 100.0 109.5 172.4 172.4 172.4 201.0 201.0 266.7 466.7
High speed diesel /b (B/1) 0.98 0.98 0.98 1.05/c 2.33/d 2.33 2.33 2.64/e 2.64 4.88/f 6.54/h
Index 100.0 100.0 100.0 107.1 237.8 237.8 237.8 269.4 269.4 498.0 667.3 -
Fuel oil /b (B/1) /g /g /g /g 1.44 1.44 1.44 1.61/e 1.61 2.90/f 3.61/h
Index
CPI Index 100.0 100.4 105.3 121.7 151.3 159.3 166.0 177.9 192.8 211.8 256.3/j
/a EGAT price for bulk electricity to MEA./b Retail in Bangkok.Th In July; gasoline raised to B 3.01 and diesel raised to B 1.60 in December./d Raised in February.te Raised in March./f Raised in January to B 5.60 for gasoline, B 2.98 for diesel and 1.77 for fuel oil, raised to figures shown in
table in July./g Uncontrolled prior to October 1974.Th Raised in February, diesel was raised to B 7.39, but rolled back to this level in March.
/i Estimate./j May 1980.
Source: Thailand, Energy Issues and Prospects (Report No. 2813-TH, May 1980, Green cover).
Bank of Thailand
- 28 -
when the government began to accept the necessity of making the economyabsorb greater energy price increases.
3.30 Table 3.10 shows what appropriate" prices would have been inselected years if taxes had been kept at the same level as in 1970-73 forpetroleum products. The appropriate rate assumes processing and distributioncosts grow at the same rate as the CPI, petroleum costs grow with the importprice, and taxes are the same real level as 1970-72 (grow with the CPI), inappropriate rates A, or the same percentage of the retail price in appropriaterates B. For electricity, the appropriate rate is assumed to be that whichgenerates an 8% return on revalued assets. As can be seen from the table,only about two thirds of the 1973/74 energy price increase had been absorbedby the economy by 1979, when the economy was faced with further major priceincreases for energy imports./l
3.31 In addition to the negative impact on the balance of payments,efforts to keep energy prices low have added to the public sector deficits.Government taxes on energy products were reduced and subsidies were paid torefiners at various times. As a consequence, public sector saving hassuffered. It is estimated that such subsidies ran as high as B 3 billion in1979./2 The gross share of government revenues from petroleum product
/1 Technically, retail petroleum prices are now approximately equivalent tothe import price of crude plus processing and distribution costs and sometaxes. Fuel oil has often been priced below cost and cross-subsidized byhigher prices of other products or borrowing by the Oil Fuel Organization[currently by the Petroleum Authority of Thailand (PTT)] to offsetoperating losses due to the low selling price of fuel oil. However, theseretail prices have been well below those obtaining in other oil importingdeveloping countries. They are too low to discourage consumptionadequately, encourage investment in energy conservation, or encouragedevelopment of alternative domestic sources. Since Thailand is expectedto remain a large net importer of energy, such retail prices are notconsistent with restoring and maintaining a sustainable current accountdeficit. Import and excise taxes must be imposed to achieve domesticprices sufficient to encourage the conservation required to restrain thegrowth of petroleum imports to sustainable rates. Thus "absorbing priceincreases" and "appropriate" prices refer to pricing policies whichachieve the objectives of constraining imports of energy by encouragingconservation and alternative domestic energy development.
/2 This includes allowances to refineries to offset the higher spot price ofproduct imports that could not be passed on to consumers and guaranteedborrowing of the Oil Fund to maintain a low fuel price to the Electri-city Generating Authority of Thailand (EGAT) when the Oil Fund-s revenueswere exhausted. To a large extent these subsidies to energy producershave been funded by government-guaranteed borrowing rather than by directpayments, and they do not appear on the government budget. They aredifficult to trace. Unless a budgetary transfer is made, these debtswill have to be repaid out of yet higher future tariffs and taxes onenergy.

- 29 -
Table 3.10: ACTUAL AND "APPROPRIATE" ENERGY PRICES
1970 1973 1975 1978 1979 1980
Average oil importprice B/bbl 43.1 64.2 232.0 286.3 409.0 650.0 /d
Electricity actual(B/kWh) 0.28 0.28 0.46 0.61 0.61 0.90Appropriate /a - - n.a. n.a. 1.00 1.50
Premium gasolineactual (B/liter) 2.10 2.30 3.62 4.22 5.60 9.80Appropriate A /b - - 5.38 6.92 8.99 11.95Appropriate B /c - - 7.86 9.09 12.42 17.21
High speed dieselactual (B/liter) 0.98 1.05 2.33 2.64 4.88 6.54Appropriate A /b - - 3.17 4.26 5.67 7.83Appropriate B /c - - 3.48 4.58 6.32 8.87
Fuel oil actual (B/liter) 0.70 /d n.a. 1.44 1.61 2.90 3.61Appropriate A /b - 2.27 2.98 4.06 5.61Appropriate B /c - - 2.35 3.10 4.25 5.91
/a Rate necessary to achieve 8% return on revalued assets.
lb Assuming that 80% of ex-refinery prices in 1975 and 90% of ex-refineryprices in 1978-80 represent oil import costs and grow at rate of oilimport prices and that remaining share of refinery prices, taxes, andretail margins grow at CPI rate.
/c Same as (b) except taxes are assumed to be same percentage share of theretail price as in 1970-72: 43% for gasoline, 16% for diesel and 7% forfuel oil.
/d Estimate.
Source: Mission estimates.
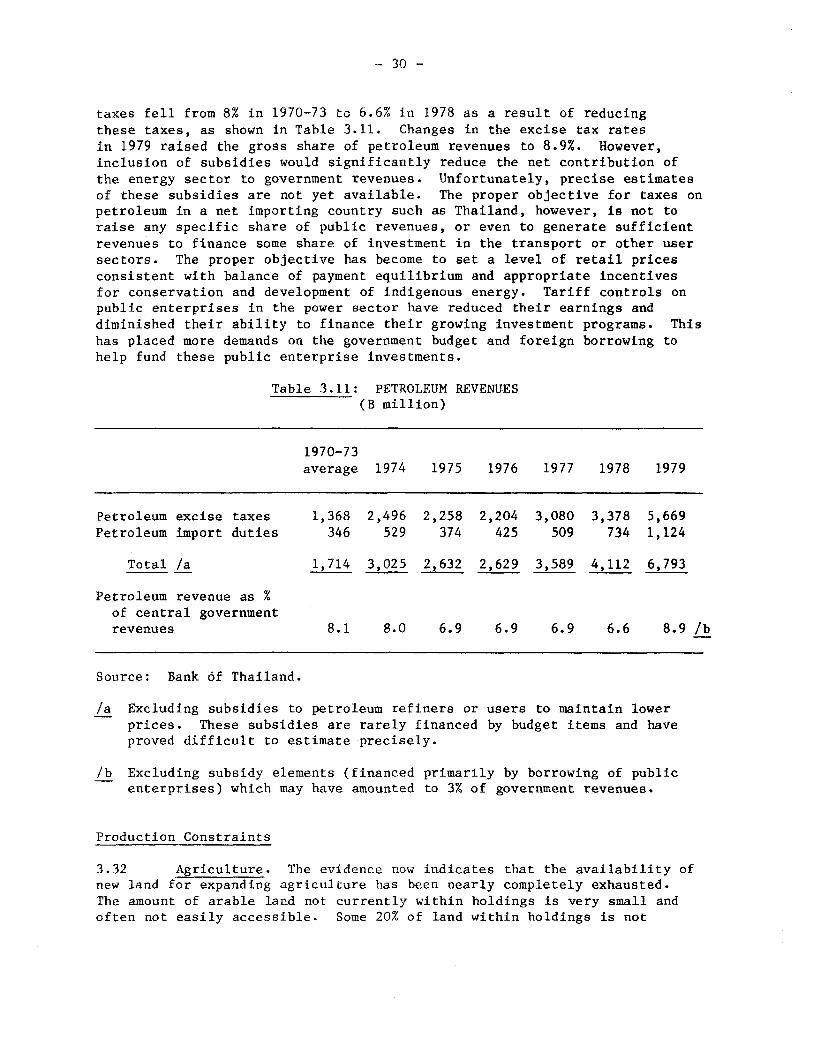
-30 -
taxes fell from 8% in 1970-73 to 6.6% in 1978 as a result of reducing
these taxes, as shown in Table 3.11. Changes in the excise tax ratesin 1979 raised the gross share of petroleum revenues to 8.9%. However,inclusion of subsidies would significantly reduce the net contribution ofthe energy sector to government revenues. Unfortunately, precise estimatesof these subsidies are not yet available. The proper objective for taxes onpetroleum in a net importing country such as Thailand, however, is not toraise any specific share of public revenues, or even to generate sufficientrevenues to finance some share of investment in the transport or other usersectors. The proper objective has become to set a level of retail pricesconsistent with balance of payment equilibrium and appropriate incentivesfor conservation and development of indigenous energy. Tariff controls onpublic enterprises in the power sector have reduced their earnings anddiminished their ability to finance their growing investment programs. Thishas placed more demands on the government budget and foreign borrowing tohelp fund these public enterprise investments.
Table 3.11: PETROLEUM REVENUES(B million)
1970-73average 1974 1975 1976 1977 1978 1979
Petroleum excise taxes 1,368 2,496 2,258 2,204 3,080 3,378 5,669Petroleum import duties 346 529 374 425 509 734 1,124
Total /a 1,714 3,025 2,632 2,629 3,589 4,112 6,793
Petroleum revenue as %of central governmentrevenues 8.1 8.0 6.9 6.9 6.9 6.6 8.9 /b
Source: Bank 6f Thailand.
/a Excluding subsidies to petroleum refiners or users to maintain lowerprices. These subsidies are rarely financed by budget items and haveproved difficult to estimate precisely.
/b Excluding subsidy elements (financed primarily by borrowing of publicenterprises) which may have amounted to 3% of government revenues.
Production Constraints
3.32 Agriculture. The evidence now indicates that the availability ofnew land for expanding agriculture has been nearly completely exhausted.The amount of arable land not currently within holdings is very small andoften not easily accessible. Some 20% of land within holdings is not
3 -
currently cultivated and represents an additional resource, althoughthere is a practical limit on the amount of land within a holding that canbe cultivated at any one time because of fallow requirements, localtopography, woodlots, house plots, etc. Against this must be discounted theland currently under cultivation which is poorly suited to that purpose andshould be withdrawn for reasons of soil and watershed conservation, etc.,when land-use patterns are rationalized.
3.33 Over the past five years, the total area under holdings does notappear to have expanded at all. Production increases mist have been theresult of more intensive use of land within holdings, including diversifi-cation to highervalued crops. In irrigated parts of the central plain andsome other areas, significant intensification of land use is already takingplace, and modern practices are replacing traditional techniques. Thetechnology for this intensification into high-yielding varieties of rice andmaize under water-controlled conditions has been well-researched and iswidely applied in suitable areas. Where there is irrigation or adequateresidual moisture, double cropping has increased the effective amount ofland under cultivation: some 20% of irrigated land is double cropped.Currently about 10% of arable land is irrigated, and this could be raised to20% by 1990.
3.34 Much less is known about the technologies for intensification ofproduction and increasing yields in the more uncertain conditions of rainfedareas, which constitute the majority of Thai agriculture./l Sustainedagricultural growth in those areas will have to be based on more intensiveuse of the available land through improved techniques, stabilization ofwater supply, and more diversification into higher value crops.
3.35 In addition to the natural water constraint in rainfed areas withrelatively low rainfall, the availability of reliable water supply isbecoming a constraint to expanding agrictultural production in some irrigatedareas. The potential sustained flow from reservoirs limits the amount ofland that can be brought under irrigation, and there are conflicting demandsfor that water from the power sector. The "drought" that has reduced secondcropping this year in the central plain to 30% to 40% of its normal extentis due in part to prior use of water for power generation in order todecrease the use of imported energy. Beyond this, rice is a verywater-intensive crop, and its cultivation restricts the total areas that canbe irrigated. Although some irrigated areas are suited only to ricecultivation, other areas may well be suitable to less water-using crops,which would allow larger areas to be irrigated. In some rainfed areas, ashift into less water-using crops would also increase the land's productivepotential. The general availability and allocation of water resources willincreasingly become a constraining factor in modernizing agriculture, andwill require more careful planning.
/1 Farm-level techniques are now known for increasing production of cassavaand sugarcane, where yields have been slipping in the past two years.It remains, however, to find means of disseminating and implementingthese changes.
- 32 -
3.36 Industry./l Industrial output has expanded rapidly in the pastdecade. However, protection has also increased in the past six years, and anumber of price controls have been introduced in an attempt to restraininflation. These policies introduce distortions and lead to supply shortagesin the economy that will adversely affect the growth prospects of severalindustries. For example, price controls on cement have reduced investmentincentives and turned that branch from a net exporter into a net importer.
3.37 Tariff protection, import and export quotas or bans, anddomestic value added requirements have allowed the rapid expansion of someindustries. This has been achieved at high domestic resource cost inrelation to their contribution to real growth, and there is no convincingevidence that these measures have reduced total imports./2 For example, theautomobile industry, which has grown faster than manufacturing as a whole,generates negative value added to world prices. Protection-induced pricedistortions raise the costs of other sectors, including those whichproduce for export. It is estimated that protection and other distortionscan reduce an exporter's value added by up to 30% compared to a situationwith no distortions, even allowing for tariff rebates on exports./3Protectionist measures also raise the domestic prices of the protectedgoods, fueling inflation, and eventually retarding investment and growth.Although many of these distortions have been introduced in the name ofencouraging domestic production, they will act as a constraint on growth inthe longer term./4
/1 See An Industrial Development Strategy for Thailand (No. 2804a-TH, June5, 1980) for a detailed discussion of these issues.
/2 If imports of capital and intermediate goods into import-substitutionindustries and the higher domestic demand from protection-generatedincomes are taken into account, increased protection may increasetotal imports.
/3 This estimate is based on effective rates of protection calculations.
/4 In Thailand, the first stages of import substitution behind protectioncontributed to growth in final goods industries and could be defended oninfant-industry grounds. Because most import substitution occurred inconsumer goods industries, the resulting price increases did notgenerally affect the cost structure of other industries. However, asattempts are made to encourage substitution in intermediate goodssectors by protection or domestic content regulations, the resultingdistortions and inefficiencies could have more serious consequences onthe growth prospects of other, efficient, import-substituting orexporting industries.

- 33 -
3.38 Thailand's rapid growth of manufactured exports has been based inlarge part on low production costs in relation to competitor countries.
These low costs are a function of low wage rates and past price stability inThailand. Domestic inflation is accelerating, driving up wage rates andother cost factors. The minimum wage has increased faster than therate of inflation since 1977, and this must have had an effect on rais-ing other wages. Under the existing exchange regime, these cost increasesare passed directly onto the dollar cost of exported goods, which mayendanger the competitiveness of Thai manufactured exports if the inflationof Thai costs in dollar terms is any higher than that of its competitors.
3.39 The structurre of industrial incentives in Thailand has tended tofavor relatively capital-intensive projects, which have had a relatively highimport content. This tendency has been reinforced recently by severalspecific proposals for large-scale, capital-intensive projects seekingvarious forms of government assistance or support. In view of the serioussavings and balance of payments constraints facing the economy at this time,continuation of such trends will tend to raise capital-output ratios andreduce the growth and employment impact of the investment resources availableto the economy.
3.40 Investment. The adjustment process, as well as the underlyingtransformation of the economy to modern production techniques and to lessenergy using processes, cannot be achieved without continued substantiallevels of investment in industry and in agriculture. The investment levelsreached in the past two years, however, may have been too high and not veryefficiently allocated. Achieving adequate levels of investment will dependon the efficacy of resource mobilization from both domestic or foreignsources. On average, the private sector has saved enough to meet its owninvestment needs; the public sector has not, as shown in Table 3.12.
3.41 In the past, the public sector has been able to mobilize privatesavings surpluses when available, or to borrow foreign resources. Untilthree years ago, the magnitudes involved were not large, and external finan-cing was not a constraint. The availability of adequate private domesticsavings to finance public investment cannot be counted on, however. Contin-ued inflation, low or possible negative real interest rates, and slower realincome growth will tend to reduce the private sector's propensity to save.Continued borrowing at present levels will increase Thailand's debt burdenand impair its excellent credit standing. Under these circumstances,sufficient foreign resources may become more difficult, if not impossible, toobtain. In addition, commercial sources abroad may become less willing torisk exposure in LDCs in general./l
/1 Net foreign lending of US banks may slow down as a result of increasedconcerns over their LDC exposure, stricter surveillance by regulatoryagencies, and concern regarding the adequacy of their capital base.Strict funding requirements laid down by the Ministry of Finance haveslowed down net lending by Japanese banks.
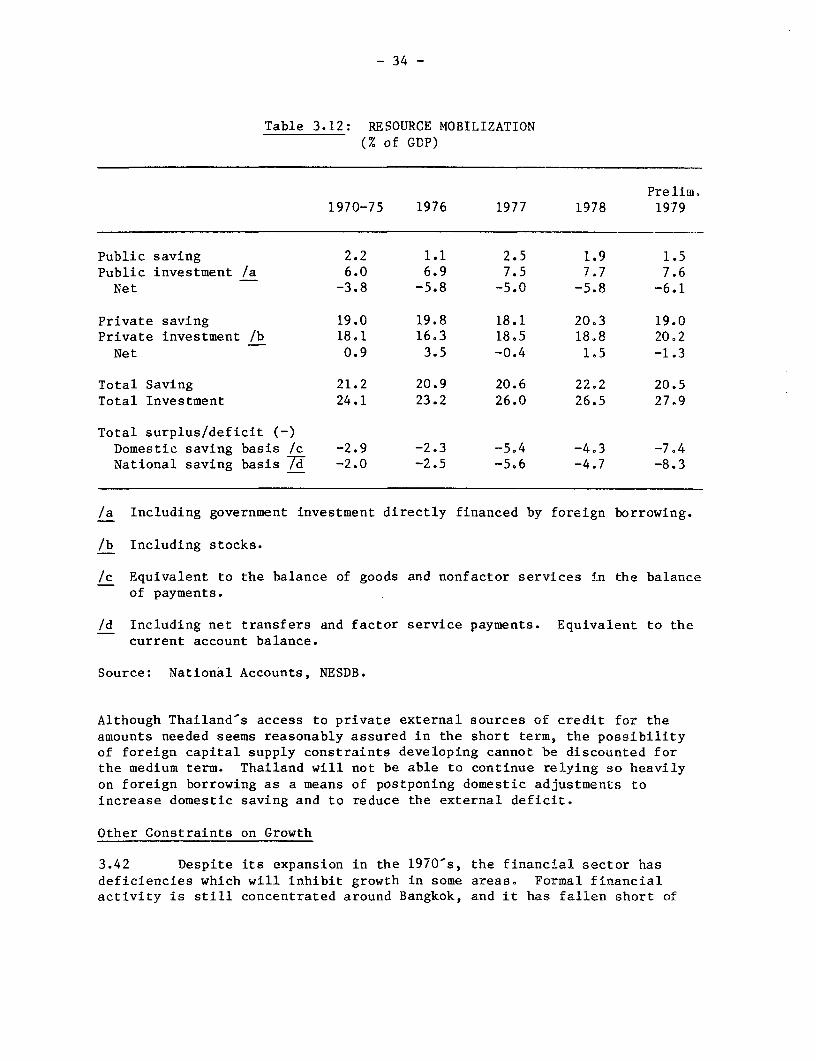
- 34 -
Table 3.12: RESOURCE MOBILIZATION(% of GDP)
Prelim.1970-75 1976 1977 1978 1979
Public saving 2.2 1.1 2.5 1.9 1.5Public investment /a 6.0 6.9 7.5 7.7 7.6Net -3.8 -5.8 -5.0 -5.8 -6.1
Private saving 19.0 19.8 18.1 20.3 19.0Private investment /b 18.1 16.3 18.5 18.8 20.2
Net 0.9 3.5 -0.4 1.5 -1.3
Total Saving 21.2 20.9 20.6 22.2 20.5Total Investment 24.1 23.2 26.0 26.5 27.9
Total surplus/deficit (-)Domestic saving basis /c -2.9 -2.3 -5.4 -403 -7.4National saving basis 7d -2.0 -2.5 -5.6 -4.7 -8.3
/a Including government investment directly financed by foreign borrowing.
/b Including stocks.
/c Equivalent to the balance of goods and nonfactor services in the balanceof payments.
/d Including net transfers and factor service payments. Equivalent to thecurrent account balance.
Source: National Accounts, NESDB.
Although Thailand's access to private external sources of credit for theamounts needed seems reasonably assured in the short term, the possibilityof foreign capital supply constraints developing cannot be discounted forthe medium term. Thailand will not be able to continue relying so heavilyon foreign borrowing as a means of postponing domestic adjustments toincrease domestic saving and to reduce the external deficit.
Other Constraints on Growth
3.42 Despite its expansion in the 1970 s, the financial sector hasdeficiencies which will inhibit growth in some areas. Formal financialactivity is still concentrated around Bangkok, and it has fallen short of
- 35 -
meeting the credit needs of agriculture, smaller-scale enterprises, andproductive activities in the regions outside of the greater Bangkok area.Bills and loans to agriculture amounted to only 5% of outstanding lending ofcommercial banks in 1979, up from 3% in 1975. The remainder of the mandated13% credit allocation to agriculture (including 2% to agro-industries) isbeing satisfied by deposits with the Bank for Agriculture and AgriculturalCooperatives (BAAC). Efforts to promote lending to small-scale industrythrough the Small Industries Finance Office (SIFO) have met with littlesuccess, and local lending requirements on branch banks outside of Bangkokhave primarily been satisfied by loans to finance commerce and consumerpurchases. There is little long-term lending other than through theIndustrial Finance Corporation of Thailand (IFCT), a semi-public developmentfinance company which accounts for less than 2% of industrial lending.
3.43 The role of the Government in supporting economic development hasbeen profoundly changed by the growth and dynamism of the Thai economy since1960. However, due to the lack of continuity in political leadership duringthis period and the bureaucracy's resistance to change, the organization andoperations of the public sector have been slow to adjust to the currentrequirements of social and economic development.
3.44 Growing awareness of the need to improve development managementled to some important bureaucratic reforms during the second half of theL9 70s, particularly in the internal organization of the civil service andthe delegation of certain planning functions to provincial administrations.However, these measures did not form part of an overall long-term plan forthe modernization and rationalization of public sector activity, anda number of critical institutional weaknesses still exist. Foremost amongthese is the absence of an authoritative and effective planning system forpublic sector expenditures and programs. Although the four nationaldevelopment plans produced since 1961 have provided clear statements ofoverall Government policies and objectives, they have generally failed tospecify priorities, sectoral strategies, and development programs insufficient detail to serve as a viable basis for annual budgeting and policyformulation. The actual allocation of resources within the public sectorhas tended to be more strongly influenced by internal bureaucratic pressuresand short-term considerations than by a long-term national strategy.
3.45 The institutional structure of the Government limits its abilityto implement programs to raise rural incomes and productivity or to improveaccess to social services. The highly centralized character of the publicsector interferes with rural development programs and skews the distributionof the benefits of development. The general lack of delegation ofauthority, the centralized decision-making procedures, and the emphasis onmaintaining rigid financial controls reduce the responsiveness of publicagencies to local problems and local initiatives. The concentration ofGovernment resources and personnel in Bangkok biases public programs andexpenditures towards the service of urban needs. Coordination ofdepartmental activities in the implementation of rural development programsis seriously impaired by the proliferation of departments and divisions with

- 36 -
overlapping functions and little incentive to cooperate. Lack of lateralmobility within the civil service tends to reinforce this compartmentaliza-tion. As resources are becoming more constrained and the requirements ofstructural adjustment more demanding, the quality of the Thai Government-seconomic analysis and policy formulation; its ability to mobilize, allocate,and manage public resources; and its capacity to provide services willbecome far more crucial./l
Tensions and Tradeoffs
3.46 Rectifying the financial disequilibria currently faced by the Thaieconomy will add to the tensions inevitably created by the rapid developmentin the productive sectors. Policy measures required in the short run toreduce public sector deficits and improve the balance of payments willunavoidably involve compromises and tradeoffs among economic objectives thathave differential effects on the economic well-being of various groupswithin the economy. The problems of establishing and adhering to prioritiesare further complicated by the relatively open, but still uncertain,political system that is evolving in Thailand. There is a high probabilitythat economically necessary measures will be politically difficult toimplement. Thailand's policy making over the past several years has beenaffected by this tension and, as a result, it has been dominated byshort-run, ad hoc measures in response to political as well as economicpressures. The Government has lacked an effective guiding framework forestablishing priorities among different development objectives (although thePlan has laid down some general objectives). Frequent changes ofadministration have exacerbated this problem.
3.47 Since the brief recession of 1974, it appears thatt growth hasemerged from the uncoordinated policy making process as the first priority ofsuccessive administrations, as revealed by their policy decisions. Thisresults in part from the short planning horizons of successive governments.It was politically less risky to resolve hard economic problems by favoringmeasures which promoted demand and growth in the short run without dueconsideration being given the longer-term consequences. Implicit in thispattern of policy making is a willingness to accept large economic risks ofhigher rates of inflation, larger external deficits, and increased financialinstability in the future in order to sustain near-term high rates of growth.As long as the foreign exchange resources were available to finance currentaccount deficits and domestic savings deficiencies, this appeared to be theeasiest way to satisfy conflicting pressures and avoid taking hard decisionsto adjust to changing external factors, particularly rising energy prices.In part, this pattern of decision making was also a reflection of the stronggrowth orientation of those with a great deal of influence in shapingeconomic policy.
3.48 Although controlling inflation was nominally a high priority,policy action concentrated on controlling certain highly visible prices
/I These problems are discussed in more detail in a report under prepara-tion, Thailand: Development Management Strategy Review.

- 37 -
rather than restraining aggregate demand, and little attempt was made toeducate the public on the necessity of absorbing external price increases.This has at best delayed price increases and at worst led to increasedstructural distortions. In general, price controls are ineffective as eitheran anti-inflation policy or an income policy. In the case or Thailand, pricecontrols have led to deficit financing in the public sector and to excessdemand, and both of these factors have contributed to overall inflationarypressures on the economy. Controlled prices will have to be raised in anycase. Using price controls as a means of protecting the incomes of the pooris highly inefficient because most of the benefits accrue to the middle andupper classes, who are by far the largest consumers of the goods whose pricesare controlled, e.g., energy, cement. Many of the poor do not even haveaccess to electricity, in part because low power tariffs have reduced thefunds available for extending rural electrification.
3.49 Maintaining internal and external financial stability no longerappears to command the pre-eminent position it once did among Thai policyobjectives. Recent administrations have seemed to prefer specific measuresto reduce the trade deficits by raising import bans, quotas, and tariffs overgeneral macroeconomic measures to restrain demand. Financial stability hasbeen endangered by budgetary deficits and acquiescence to pressures to expandliquidity in support of the speculative expansion of the SET and the financecompanies.
3.50 The Government has placed a high priority on reducing poverty andincome differentials throughout the country, even during the adjustmentprocess. In the past, the Government provided infrastructure and promotedaggregate growth in the express belief that the private sector would be moreeffective than the government in assuring that the benefits of growth werewidely spread. To a large extent this has worked in Thailand, and greatstrides were made in poverty alleviation and raising rural incomes between1962 and 1975./i There is now growing recognition that there are limits tothis strategy, and unaided market factors have not been as effective in areaswith poor potential under existing technology. The modern sector, however,remains concentrated around Bangkok and grows in political as well aseconomic importance. This raises the potential for further "Bangkok bias" ingrowth and decreases the likelihood that as much growth will spread to ruralareas as in the past.
3.51 The emphasis on growth in recent years is not likely to haveproduced the same degree of positive impact in rural areas as was the case inthe past, particularly in the North and Northeast where most of the remainingpoverty is concentrated (see Table 3.13)./2 The South has done relativelywell due to rising tin and rubber prices. The increasing urban bias in growth
/1 See Income Growth and Poverty Alleviation, Report No. 2566-TH,June 20, 1980, for further discussion of these issues.
/2 Regional production data may not accurately reflect relative growth ofper-capita incomes, but until the next Socio-Economic Survey, they arethe only data available.

- 38 -
Table 3.13: GROWTH OF GROSS REGIONAL PRODUCT (GRP)(% p.a.)
EntireNortheast North South Central Bangkok Kingdom
1975-78 /aGRP 4.2 6.0 8.2 9.2 9.4 9.1GRP/cap 1.6 3.7 5.7 6.9 5.0 6.5
1960-76GRP 6.5 6.4 6.9 8.2 8.0 7.6GRP/cap 3.1 3.2 3.2 4.6 3.8 4.2
/a Gross Regional Product Data for 1979 is not yet available.
Source: NESDB.
can be attributable to price controls, which have tended to favor urban areaswhere the controlled items are primarily purchased; demand stimulus, whichhas had a much greater impact on raising modern sector production and incomesin the short run; and protection, which has favored industry and the modernsector at the expense of corsumers and the rural sector. The relativemovements of commodity prices have added to this shift. As measured by GDPdeflators, the agricultural-nonagricultural terms of trade have declined bymore than 1% per year since 1975, which implies a significant redistributionin relative income growth away from agricultural producers. Although directdata is lacking, the indirect evidence of the domestic terms of trade,specific crop prices, and relative growth rates indicates that, despite thehigh aggregate growth rates in the past five years, it is unlikely that muchfurther reduction in poverty has taken place since 1975, except in the Southamong rubber growers and tin miners. Several specific programs have beenundertaken to supplement the traditional indirect mechanisms of reducingpoverty, including the Tambon program, improved extension services,provincial planning funds, etc., but it is too soon to tell whether they havehad a lasting effect in alleviating poverty.
3.52 The undercurrents of increased social tension arising from thedissonance between the effective priorities of the government and the statedobjectives cannot be ignored, and there may be further serious visible mani-festations of discontent from both rural and urban origins. Recent eventshave confirmed the political influence of Bangkok-based interest groups inpromoting what are essentially Bangkok growth-oriented policies. Althoughthe present government has affirmed the high priority it places on equityand raising rural incomes, there is a question of whether it can take thenecessary action to achieve that priority at the expense of Bangkok. Someof the implicit priorities and directions of policies that have evolved overthe past several years in response to the "Bangkok bias" would have to bereversed.

- 39 -
3.53 The problems faced by the economy on entering the 1980's areserious and not likely to submit to easy solutions. There will inevitablybe tradeoffs between different objectives in the adjustment process, and theresulting tensions will test the cohesion of the political economy.Reducing the current account deficit from its estimated level of about 8% ofGDP in 1980 will require major adjustments to reduce the growth in demandfor imports and to sustain or increase recent high export growth rates.Restraining import demand will imply passing on external price increases,particularly for energy, more fully to the economy; reducing the domesticsaving deficit, particularly in the public sector; and slowing someinvestment, particularly in large, capital-intensive projects. Aggregatedemand and the public deficit will have to be reduced by raising taxes togenerate more public saving and to effect the transfer of additionalresources abroad. More domestic savings will also be necessary to servicethe growing volume of external debt. Absorbing external price increaseswill contribute to domestic inflation and slow real income growth, but thiswill be a necessary part of the adjustment process. Price stability cannotbe achieved in the medium term.
3.54 Nevertheless, measures that moderate aggregate demand will havefavorable effects on reducing domestic inflationary pressures. lJnless thefinancial balances can be restored to sustainable levels over the next fiveyears, it will be much more difficult to obtain the necessary externalresources to support efforts to raise production in the longer term. It ishighly unlikely that the economy can make all the necessary adjustmentswithout some reduction in its aggregate growth rate. Because of the natureof the required adjustments, the impact of the decline in growth willprobably fall more heavily on the urban and industrial sectors, and theconflicting claims on incremental income will then become more contentious.
3.55 On the positive side, growth should be aided in the medium term bymeasures to increase production and efficiency and to expand exports.However, even maintaining recent export growth rates will require continuedrapid structural change in the productive sectors and implementing necessarysupporting policy. Yields and productivity in agriculture will have toincrease in order to expand its marketable surplus. These changes areoccurring, but it is doubtful that they will occur fast enough without majormodifications in the government-s and private sector's support and marketingstructures. Industry will have to continue its shift toward labor-intensive,export-oriented production, and price distortions will have to be reduced.This transformation will have to take place while the sector is adjusting tosignificant changes in the relative prices of basic inputs and while thegrowth rates of foreign and domestic demand are declining. Maintaining realper-capita income growth will be easier in the 1980-s because the populationgrowth rate is expected to continue the decline begun in the 1970s.

- 40 -
IV. POLICY OPTIONS FOR STRUCTURAL ADJUSTMENT
4.01 The above analysis of the current economic situation in Thailandindicates the scope and seriousness of the problems facing the Thai economy.Although recent growth rates have been satisfactory, they have been accom-panied by levels of government and current account deficits that cannot besustained. It is imperative that action be taken to reduce these deficitsin the short term. Fiscal, monetary, and energy policy measures will beparticularly important in this regard. There are also underlying structuralissues affecting these deficits that need to be addressed at the same time:increasing the competitiveness and efficiency of industry, accelerating thetransformation to more intensive agricultural techniques, and reducing thelonger-term energy requirements of the economy. The effects of measures toreduce the financial balances should have an immediate impact, while thoseto improve the productivity of the economy will be felt over a period ofyears. Both sets of measures are, however, complementary: productionincreases are necessary to augment the net transfer of goods abroad, whichis the counterpart of increased domestic saving, and rising productionwill reduce the amount of restraint on domestic consumption that will berequired.
4.02 Policy action on both shorter-term financial issues and the longer-term production issues should be initiated immediately, since any delaywould allow the disequilibria to become more severe. External pressures foradjustment, expressed primarily through increasing reluctance by commerciallenders to finance large external deficits, would then force more abrupt anddisruptive short-term adjustments. Major expenditure cuts and other actionswhich would seriously retard development in the productive sectors couldwell be required in such circumstances, with adverse effects on Thailand'sgrowth potential.
4.03 Defining a policy package to effect the adjustment without undulysacrificing other objectives is a demanding task. The policies mustreconcile conflicting domestic interests while maintaining a high degree offlexibility in adapting to changing external circumstances. Coordinatedpolicy action will be required in several broad areas to accomplish thenecessary structural adjustments while maintaining satisfactory growthrates: (a) resource mobilization, particularly in the public sector; (b)monetary policy, external debt management, and financial sector development;(c) energy policy, particularly energy pricing issues; (d) industrialdevelopment policies; and (e) promoting the transformation of agriculture.
4.04 It would be desirable for the adjustment program to be phased overa period of five years. Reasonable targets would be to reduce the currentaccount deficit to about 4% of GDP, to increase public saving so thepublic sector deficit would fall to about 3% of GDP, and to fully absorbenergy price increases. The objective of maintaining growth should not beabandoned, although setting aggregate or sectoral growth targets would notbe wise at this point. The strategy should focus primarily on adjusting
- 41 -
specific disequilibria, but policies should be coordinated to minimize theirnegative impact on growth and to continue progress toward the objectives ofpoverty alleviation and development of the country outside of Bangkok. Thiswill imply some major adjustments in the structure and relative distributionof growth compared to the recent past.
4.05 Among the most important elemenlts of the adjustment program willbe measures reducing the public sector deficit. There is some urgency inrestraining expenditures in the short run, but most of the adjustment in themedium- and longer-term should come from higher tax collections. Higherpublic enterprise tariffs are also required in both the short- andlonger-term. Increasing public and private sector saving will reduceaggregate demand and the savings gap. This will help improve the tradeaccount, which will have to absorb most of the burden of reducing thecurrent account deficit. However, additional measures will be needed toreduce the current account deficit, including adjusting energy prices tocurtail the demand for petroleun imports, promoting industrial andagricultural production and exports, and encouraging efficient importsubstitution. Appropriate price adjustments will be a key element in theprogram. Price increases will be required for energy and energy products,and other price controls should also be reduced or eliminated. Somestructural inflation will be associated with the adjustment process, and itis unlikely that domestic inflation will fall below the projected rate ofinternational inflation in the 1980's, about 8% per annum. However, anydomestic contribution to inflation from excess demand or protectionistpolicies should be curbed to restore as much domestic price stability aspossible and to maintain the economy's external competitiveness.
4.06 The evolution of institutions affecting economic activity willhave to be accelerated in the course of the adjustment process. Privatesector financial institutions will have to adapt to the requirements of theadjustment program. Government institutions will have to be responsive topublic needs throughout the country, but they will also have to set andimplement national priorities for allocating scarce public financialresources and to design and apply a coherent energy policy./l
4.07 Policies that increase agricultural production and exports willaid rural poverty alleviation objectives, and the promotion of manufacturedexports should complement efforts to reduce urban poverty, since most exportindustries are urban based and tend to be labor intensive in Thailand.
/1 More specific recommendations for improving government institutions willbe contained in a report which is currently being prepared on Develop-ment Management in Thailand, and recommendations for the institutionaldevelopment required in the energy sector are contained in Thailand,Energy Issues and Prospects (No. 2813-TH, May 1980, Green Cover).

- 42 -
However, a number of elements in the program may lower GDP and personalincome growth, and this will make these policies difficult to implement.The Government will have to make a strong commitment to a several yearprogram, particularly to the initial fiscal policy and price adjustments,and it will have to educate the public on the necessity of these policies.
The Magnitude of the Required Adjustment
4.08 The extent and magnitudes of the current disequilibria were analyzedin Chapter III. The general direction of the necessary adjustments and theirinterrelations were also discussed in qualitative terms. The rest of thischapter will be devoted to analyzing in greater detail the adjustmentsrequired in the five areas identified above, to suggesting policyalternatives, and to evaluating their impact on achieving the adjustmentobjectives. In order to support the quantitative analysis, a consistentmacroeconomic accounting framework and a simulation model were constructed.A reference simulation was made, including positive assumptions about theeffects of policy actions already taken by the government and the normalresponses of the economy to changes in prices and incomes. This indicatesthe likely prospects for the macroeconomic variables without further policyaction and the magnitude of the remaining adjustments to be accomplished inthe Thai economy if no additional policy measures are initiated and if otherfactors evolve in a relatively favorable manner. Even in this case,significant further adjustment will be required. If the policy actionstaken so far are ineffective, or the Government is unable to slow the growthof the budget deficit, or exogenous factors are less favorable, the economywill indeed reach a crisis before 1985.
4.09 A Social Accounting Matrix (SAM) /1 provides the accountingframework to integrate data from the National Accounts, the input-outputtable, the balance of payments, and the fiscal accounts into a matrix formatthat presents a consistent and unified picture of all the principal flows inthe economy. The macroeconomic simulation model is based on SAM accountingframework and specifies analytical functions for the implicit relationsunderlying the SAM. This analysis uses a highly aggregated, 23-sector SAMbased on 1975 data. The structural parameters were estimated from data forthe period 1960-79.
4.10 The SAM describes the income and production flows that the modelsimulates. Incomes of the institutions (households, companies and thegovernment) are derived from the production activities, tax collections, andtransfers among institutions. Incomes are allocated to saving, transfers,and various categories of consumption demand. This allocation exhausts theresources of each of the agents. The consumption demand for different goods
/1 See Annex I for further explanation of the SAM and its construction andfor the specification of the model.

- 43 -
depends directly on the level of income, and indirectly on relative pricesand historical trends in consumption behavior. Consumption demand plusinvestment demand generate final domestic demand. Intermediate demands arederived directly from the input-output relations and the level of activity,which depends on final demand. Intermediate demand plus final domesticdemand give total domestic demand. The allocation of this demand betweenimported and domestic goods is determined by their relative prices and thedegree of substitution possible between domestic goods and imports. Exportdemand plus the demand for domestic goods determines the level of domesticproduction in the industry, energy, and service sectors. With additionalassumptions about the growth of agricultural output, the level of incomesaccruing to the institutions is determined. Exports of manufactured goodsand services are a function of foreign demand and prices, and exports ofagricultural goods are a function of supplies available after satisfyingdomestic demand. Other transfers and factor service payments betweenThailand and the rest of the world are included to complete the balance onexternal current account. The entire cycle of economic activity is recordedin the SAM and simulated in the model. This framework is a major extensionof input-output analysis to encompass the relations between the income-generating activities, the distribution of that income to institutions, andthe resulting determination of the composition of final demand. Completingthe model in this way includes responses to policy or other changes thatoccur on the demand side and the secondary effects of policies on othervariables.
4.11 The model is used in the following analysis to simulate the effectsof various policy changes on the prospects for the economy. Values for theexogenous factors, such as prices of imports and exports, are assumed andpolicy variables, such as tax rates, are modified. The model then simulatesconsistent evolutions of the economy within the SAM framework and traces theeffects of alternate assumptions about policy actions and external develop-ments. When analyzing the simulation results, it is important to notecertain features of the model:
(a) the a'ctivity level in the agricultural sector (supply)is exogenously specified;
(b) production in the industry, energy, and tertiary sectors is demanddetermined as a function of consumption patterns, incomelevels, relative prices, and external demand for industrial andservice exports. This implicitly assumes that over the mediumterm, the investment levels are sufficient to provide the capacityincreases required to satisfy demand growth;/l
/1 This is a Keynesian assumption in the medium term and states that bothsupply and capacity increments are responsive to demand growth in themedium term. The model does not address short-run stabilizationissues of the availability of excess capacity to meet short-run demandfluctuations.

- 44 -
(c) prices are cost determined;/l
(d) demand for imports is a function of aggregate domestic demandlevels, relative prices, and the degree of substitutability ofdomestic goods and imports;
(e) demand for goods by the public and household sectors is based onEngel curve relations;
(f) investment behavior is exogenous; and
(g) the trade and savings gaps are endogenously equated in arrivingat a solution.
4.12 The reference simulation indicates how the economy would evolveduring the 1980's if no further specific adjustment measures were taken. Itwill provide a measure of the extent to which additional adjustments will berequired and a benchmark to help evaluate quantitatively the effects of thepolicy actions recommended. It should be emphasized, however, that theresults of the model are not predictions; rather, they are internallyconsistent indicators of how the economy would evolve and of the relativemagnitudes of the principal variables, given the specific assumptions thatare made. Because of its fully closed structure, the model includesa number of endogenous adjustments: e.g., the demand for imports falls whentheir prices rise; lower real income growth slows the domestic demand foragricultural production and more is exported; slower domestic inflationincreases the competitiveness of manufactured exports and they rise; andconversely in all cases. The accounting equilibrium generated may be judgednot acceptable or sustainable because of its implications for certainvariables, e.g., external borrowing and debt service payments that are toohigh. Policy parameters can then be varied to simulate policy measures thatshould produce a more acceptable equilibrium in the model.
4.13 Selected indicators from the reference simulation are shown inTable 4.1. In this case, it is assumed that the structural parameters ofthe economy do not change from their current levels; tax rates are notraised, the adjustment to external energy prices remains incomplete, theagricultural growth rate declines somewhat from its rate of the past fiveyears to 4% p.a., export promotion is not accelerated, and current monetaryand exchange policies are continued. World Bank price projections areassumed for imports and exports. Nevertheless, this simulation includes
/1 Hence the model can analyze cost-push and/or imported inflation, but notdemand-pull inflation. This is a drawback, since excess demand isa matter of concern in Thailand; however, price-endogenous models are muchmore complicated to construct and require strong assumptions about priceflexibility, both upward and downward, which may not be valid in thecurrent Thai context.

- 45 -
a number of elements reflecting adjusttnents already made and the endogenousresponses of the economy to price and incone changes. These includeimplicit assumptions that the public sector deficit does not increase aboveabout 6%. of GDP, that domestic energy prices remain above a level that wouldrequire direct subsidies to the sector (but still less than Luill adjustment),and that monetary policy does not allow excess demand to augment domesticinflation and reduce the competitiveness of Thai exports and importsubstitutes. This simulation does make allowances for reactions by thegovernment and other economic agents to deteriorating economic conditions,but not for major new policy initiatives.
4.14 Under these conditions, real GDP growth remains about 6%1, p.a. andreal per capita growth is 3-4% p.a. because of declining population growth.The effects of the energy price increases implemented in 1979-30 have asignificant effect on reducing energy imports, as will the use of domesticnatural gas beginning in 1982. The decline in investment rates noted inlate 1979 and early 1980 is evident. Because of declining growth rates,however, the investment share declines only slightly by 1985. Slowerinvestment growth also reduces import demand. It has been argued that animport-intensive cycle of investments will terminate in the early 1980's,further reducing import demand. As a result of these factors and the effectof rising import prices on the demand for imports, they only grow at 4.7%p.a. in real terms in 1980-85, with an expenditure elasticity with respectto GDP of 0.9. A similar phenomenon occurred in 1970-75 when import growthtrailed overall growth in real terms under comparable circumstances. Realexport growth of 10% p.a. is imnplied in this simulation, implicitly assumingthat the momentum of recent export growth is sustained by continuedagricultural growth and dynamism in the manufactured exports despite slowgrowth abroad. The Thai share of manufactured exports of developingcountries would continue to increase as Thai manufactures would grow at 12%p.a. in 1980-85, compared to a projected 9.5% for all LDCs./l Although taxrates are not changed, public revenues and savings shares increase slightlybecause the shares of industry and services in GDP increase, and thesesectors are relatively more heavily taxed. The private domestic savingsshare also increases, but rising factor service payments abroad (interestpayments) result in a decline in the national savings share, despite theincrease in domestic saving. Cost-based inflation during the 1980s willaverage about 7% p.a., and this will have to be absorbed by the economy. Inmany respects, this simulation shows an economy that is not on the verge ofcollapse. However, despite the significant changes already under way, theadjustments are inadequate to reduce the current account or fiscal deficits.
4.15 Although export and import performances are both very favorable,further deterioration in the terms of trade and rising interest paymentsincrease the current account deficit to $4 billion in 1985, which is still7.3% of GDP. Annual borrowing requirenents in that year reach nearly$6 billion and the debt service ratio is nearly 25%.. The trade and currentaccount balances improve somewhat by 1990, but the debt-service ratiocontinues to climb above 30% and debt accumulation exceeds $42 billion,
/1 Based on the projections of the World Development Report, 1980.

- 46 -
Table 4.1: SELECTED INDICATORS IN THE REFERENCE SIMULATTON
1975-79 1985 1990
GDP growth (% p.a. constant prices) 8.9 5.5 /a 6.0 /a
Investment share (% GDP) 25.8 /f 26.7 25.5Gross national saving (% GDP) 21.0 19.4 20.2Gross domestic saving (% GDP) 22.2 22.9 24.6
General government revenue /d (% GDP) 15.1 15.7 16.2General government expenditure (% GDP) 12.7 13.2 14.2General government saving /d (% GDP) 2.4 2.5 2.0Public sector saving gap (f rGDP) 5.7 5.5 6.0
Export growth (% p.a. constant prices) 15.2 9.9 /a 7.8 IaTmport growth (% p.a. constant prices) 11.6 4.7 7a 5.0 7-aTerms of trade (1975 = 100) 88.5 72.9 70.5Resource balance ($ billion) -0.3 -2.0 0.9
Current account ($ billion) -1.1 -3.9 -4.9Current account (% GDP) /e 5.3 7.3 5.3
Required annual borrowing ($ billion) /g 1.0 5.7 9.9Debt outstanding ($ billion) 3.9 /b 20.2 42.4Debt service ratio (%) /c 15.4 lb 24.4 31.5
/a For periods 1980-85 and 1985-90.lb End 1979.Ic Including private.7v Including central Government plus local jurisdictions, but excluding
public enterprises.
/e Equals total saving-investment gap.If 28% in 1979./g Gross disbursements excluding use of reserves and IMF funds.
a level equal to nearly half of GDP in that year. The current account andfiscal deficits will not be brought under control fast enough to maintain theeconomy's creditworthiness, and foreign financing in the amounts requiredare unlikely to be forthcoming on acceptable terms. Even this simulationis not sustainable, and further adjustments will have to be made.
4.16 This reference simulation may well turn out to be optimistic fora number of reasons. Rising domestic production costs may prevent furtherpenetration of Thai manufactured exports into world markets; agriculturalproduction and export growth may not reach even the rate assumed; the budgetdeficit may continue to grow; continued expansionary deficit financing ofbudget deficits may lead to further excess demand and more inflation thanthat due to rising import costs. A significant shortfall in any of these

areas would severely aggravate the economic situation before 1985 and forcemore abrupt and disruptive adjustment. For example, a decline of one percen-tage point in the export growth rate in conjunction with a one-percentagepoint increase in the import growth rate would add more than $1 billion tothe current account deficit in 1985. An increase of the public sectordeficit by jO% in 1985 would have a similar impact on the current accountdeficit. Recent pressures to increase defense and other expenditures areparticularly worrisome in this regard. In either case, it is unlikely suchdeficits can be financed and some corrective action would become absolutelynecessary.
4.17 By not taking strong adjustment measures, the Government would betaking a highly risky gamble that nothing worse happens than what is impliedin the favorable reference simulation and that financing will continue to beavailable. The economy would be very exposed to adverse circumstances. Thefollowing sections will examine the adjustments that are needed, analyzetheir implications for the economy s prospects, and present appropriatepolicy options.
Policies for Structural Adjustment
4.18 Fiscal Policy and Public Resource Mobilization. The majority ofresource mobilization in Thailand occurs in the private sector, which hastypically generated about 19% of GDP in saving and has invested roughlycomparable amounts. Both saving and investment have proven to be sensitiveto real interest rates. If the financial sector can restore and maintainpositive real interest rates on savings, the private sector should be ableto generate sufficient savings to meet its investment needs, and possiblya small surplus that can be mobilized by the Government.
4.19 Most of the aggregate savings shortfall is due to the publicsector. As discussed above, the central Government's current expendituregrowth /1 has exceeded revenue growth, and budgetary savings have disap-peared. The demands for higher levels of government expenditure for defenseand security, supporting rural development programs, increasing civilservice salaries, providing higher quality social services in rural areas,servicing the growing public debt and maintaining the capital stock that theGovernment has been building over the past 20 years will make it verydifficult to slow expenditure growth in the future. Defense andadministration, transfers to local governments, and interest payments nowcomprise 64% of total central government expenditure, and it is difficultto envisage significant cuts in these areas in the current political andeconomic situation. Capital expenditures have fallen from 26% of governmentexpenditure in 1971 to 19% in 1979 (5.1% and 3.2% of GDP, respectively).Planned development projects in irrigation, transportation, communicationsand other infrastructure will all require continued government capitalexpenditure. While investment in these areas is necessary to supportgrowth and increase production, the investment program must be carefullyevaluated to assure that all projects have sufficiently high economicreturns. Some, such as the airport extension or elevated rail system, may
/1 Including current transfers to local government and public enterprises.
- 48 -
well have to be postponed. However, blanket curtailment of publicinvestment, to solve the short-run savings gap as occurred in 1974, couldhave large long-run costs in terms of forgone future growth. There wouldthen be pressure to catch up on all these investments once the immediatecrisis were past, and this could lead to a "stop-go" cycle that couldfurther disrupt the economy.
4.20 There is not yet a detailed consolidated government or publicsector investment program, and accessible information on current expendituresis not adequate to permit selective reductions to be easily made. It isvery difficult to enforce centrally determined priorities for expenditurecuts by operating agencies with the current planning and budgetingprocesses, and such attempts may result in serious disruptions ofthe development programs. The prima facie discretionary elements in thebudget do not seem to offer much scope for significant reductions ingovernment expenditures. Work is currently under way in the Bureau of theBudget and the Comptroller General's Office to improve the budgeting andmonitoring capabilities of the Government and increase its ability tocontrol expenditures better in the future. These improvements should begiven high priority, and in the meantime, every effort should be made to cutunnecessary expenditures. Reallocation of expenditures to support adjustmentpolicies should also be possible, and the Government is taking initiativesin this direction to support rural development. Nevertheless in theshort run, some expenditure constraint will be necessary as it will taketime to increase the revenue share significantly.Tncreasing revenues in themedium term, however, will constitute a more permanent adjustment to theincreasing demands for defense and public service expenditures being made onthe government.
4.21 These public finance issues have been discussed with Thai authori-ties on a number of occasions and much progress has been achieved. However,it has not resulted in a significant increase in the share of revenues inGDP. Given the severe resource constraints now faced by Thailand, the lackof surplus private sector saving, and the necessity of reducing the aggregatesavings gap, total public sector expenditures should not be allowed to riseabove their current share of about 21% of GDP, including transfers and

- 49 -
capital expenditures of public enterprises. Central-government revenuesshould be increased from the current level of less than 14% of GDP to about17% /1 over a five-year period. Public enterprise tariffs should be allowedto rise to enable them to contribute a larger share of their own investmentprograms. Although different factors will determine the contribution ofeach enterprise, in aggregate they should be able to contribute at leasthalf their investment program, which is expected to run about 3-4% of GDP.This implies a target of public sector resource mobilization of almost 19%of GDP. If this is achieved, the public sector deficit will fall toward3% of GDP by 1985, compared to 6% in 1979 and 1980.
4.22 Achieving the government revenue target will require major effortsin tax policy over the coming five years. These can be separated into(a) increasing collections under existing taxes; (b) increasing rates ofexisting taxes; (c) expanding the tax base covered by existing taxes; and(d) instituting major tax reforms to restructure existing taxes and tointroduce new taxes. There is potential for increasing revenues in all ofthese ways, and a coordinated program should include elements from each.
4.23 Increasing collection rates on existing taxes and selective taxrate increases offer the most immediate opportunities for increasing revenuesin the short run, and they should be pursued immediately. Improving taxadministration and procedures is necessary to any program aimed at raisingthe share of revenues in GDP, and the Thai government is working in thisarea. However, measures to expand tax bases and implement tax reforms willalso be required to achieve the longer-term target and to improve theefficacy and equity of the tax system. Work should begin promptly ondesigning these reforms, which should be implemented over the next fiveyears. They should introduce a greater degree of progressivity into the taxstructure, increase its buoyancy above the current level of about unity, andprovide more equitable treatment of different sources of income. Inaddition to the revenue and equity objectives, the Government should assurethat the tax reforms do not introduce price distortions that adverselyaffect production and private saving decisions.
4.24 The public enterprise investment program is now nearly as largeas that of the Government due to sharply rising costs of capital equipment,expanding coverage throughout the country, and programs to improve serviceof the utilities (e.g., rural electrification, provincial water supplies,improved internal communications). The contribution of the public enter-prises to their investment programs from their own resources has declinedfrom over 50% in 1970-72 to currently less than 25% because of restrictionson tariff increases and large investment programs. They have had tomobilize more resources abroad. The underpricing of their goods and services
/1 This target was established with the Thai authorities in 1974 indiscussions of the Report "A Study of Public Finances in Thailand,"(No. 574-TH, October 31, 1974).

- 50 -
has also increased the level of demand and contributed to higher investmentrequirements. Given the growing constraints on external resources and oncentral-government funds, the public enterprises' difficulties in mobilizingresources will grow. They should make greater use of domestic resources andincrease their contributions to their own investment programs.
4.25 There are several criteria that can be applied to public enterprisetariff structures:/l they can be required to meet quasi-market tests ofearning a designated rate of return on assets; they can be used explicitly tomobilize resources for the public sector where they can exploit monopoly ormonopsony power;/2 or they can be required to maintain specified and usuallylow tariffs in the interests of transferring income (or reducing expenditures)to the users, the majority of whom are assumed to be poor, with any lossesmade up by public subsidies. Various combinations of these criteria occur inThailand, usually as the result of ad hoc decisions and not as part ofa coherent strategy. In view of the importance of public enterprises ina number of key sectors and the impact their tariff policies have on economicactivity, a general policy on public enterprise tariffs, the taxes they paythe Government, and their role in for public resource mobilization should bedeveloped. In any event, reducing the public sector savings deficit will haveto be achieved partly by raising public enterprise tariffs./3
4.26 Several implications of raising public revenues and saving must berecognized. As the investment-saving gap is reduced, disposable income willalso be reduced, which will, ceteris paribus, lower both consumption demandand private savings. This implies disposable income and consumption willhave to grow more slowly than GDP, reversing the recent trends. Theseeffects will differ in impact depending on how various taxes and tariffs areadjusted. Raising public enterprise tariffs and certain indirect taxes willalso temporarily increase the rate of inflation, since they figure in theCPI calculations. Policy measures in other areas may imply lower revenuesfrom some traditional sources, so a larger total effort to raise revenueswill be required to offset revenue losses elsewhere.
/1 Particularly for public utilities where natural or regulatory monopoliesexist.
/2 This can even have a relatively progressive impact when the majority ofthe users of the enterprise's goods or services are in the higher incomegroups.
/3 The details of a number of these tariff issues are being specificallyaddressed in energy, water supply, and transportation, and otherprojects.
- 51 -
4.27 The Government has recognized the necessity of raising revenues andimproving the tax structure, and it has recently taken several steps in thisarea. The IMF is providing technical assistance to improve the tax adminis-tration and collection procedures in the Revenue Department, and this effortis bearing fruit. Reforms announced in 1980 have increased the progressivityof the personal income tax, but they have also reduced rates for lower- andmiddle-income levels and increased standard deductions to help maintain thereal disposable incomes of the middle and lower classes. While this improvesthe nominal income tax structure, it exempts too large a segment of middle-income levels and results in a revenue loss. The corporate income tax ratewas raised from 30% to 35% for SET-listed companies and from 35% to 45% forothers. Following the 1977 shift from progressive to uniform corporate taxrates, this will increase revenues from this source and may offset the losson the personal income tax. Petroleum excise taxes have been converted to advalorem rates, and other excise taxes have been raised. Some business taxrates and public enterprise tariffs have also been increased in the past year.These policy measures move partly in the right direction, and a greatdeal depends on whether the recent changes will become part of an overallreform of the tax system.
4.28 Increasing public sector saving and maintaining private sectorsaving at about its current share should reduce a major source of excessdemand that has contributed to inflation and the large current accountdeficit. Raising taxes above their current share in GDP will reduce thedisposable income of households and companies, reducing their demand for bothdomestic and imported goods and services. But, to reduce total demand, theGovernment's savings behavior must be improved and its expenditure growthrestrained. Without such expenditure constraint, raising taxes will havelittle positive effect, as higher public demand would simply replace theforgone private demand. The simulation model gives some indication of theimpacts on the rest of the economy of increasing government revenues andsavings behavior./1
4.29 In a sensitivity test, the indirect tax rates /2 were raised inrelation to those in the reference simulation to generate general governmentrevenues of about 18.7% of GDP in 1985 and 18.7% in 1990 as shown in Table4.2./3 The growth of total expenditures, including public and publicenterprise investment, was restrained, reaching 21.5% of GDP in 1985 and 22%in 1990. As a result of higher tax rates and lower consumption levels,investment growth was assumed to be slower than in the reference simulation.
/1 The model is not sufficiently disaggreated to analyze the impacts ofincreasing public enterprise tariffs, although it is unlikely theeffects would be very different.
/2 Direct taxes could also be raised with similar results. The majordifference would be a slightly more adverse effect on private saving.
/3 This corresponds to the target of 17% of GDP for central-governmentrevenues.

- 52 -
Table 4.2: IMPACT OF GREATER PUBLIC SECTOR RESOURCE MOBILIZATIONAND SAVING
(use of indirect tax increases)
1975-79 1985 1990
GDP growth (% p.a. constant prices) 8.9 5.4 /a 5.8 /a
Investment share (% GDP) 25.8 /f 26.1 24.7Gross national savings (% GDP) 21.0 19.6 21.4
General government revenues /d (% GDP) 15.1 18.0 18.7General government expenditures /d (% GDP) 12.7 13.5 13.8General government saving /d (% GD?) 2.4 4.5 4.9Public sector saving gap (%. GDP) 5.7 3.5 3.1
Current account ($ billion) -1.1 -3.5 -3.1Current account (% GDP) /e 5.3 6.5 3.3
Debt service ratio (%) /c 15.4 /b 23.5 27.7
/a For periods 1980-85 and 1985-90.lb End 1979.Ic Including private.Id Including central Government plus local jurisdictions, but excluding
public enterprises./e Equals total savings-investment gap.If 28% in 1979.
Source: Mission estimates.
4.30 Under these assumptions, the aggregate growth rate falls below thereference run as a result of increasing public saving and lower aggregatedemand. Some improvement in the current account deficit is evident in 1985,and much more improvement is achieved by 1990. The resource balancebecomes positive in that year, but high interest payments keep the currentaccount in deficit. The cumulative impact of lower external deficits onborrowing requirements, debt service ratios and debt outstanding are clear by1990. The effects are less noticeable in 1985 because of the large size ofthe initial deficit to be reduced. The Government expenditure share in GDPrises slightly compared to the reference run because of the continuation ofcurrent programs and the slower GDP growth. This simulation clearly
/1 Most comparisons in this and subsequent simulations will be in relationto the favorable reference simulation, unless otherwise stated.
- 53 -
indicates that improving public sector saving will have a positive effect onreducing the external deficit, and that effect will grow over time. Therewill, however, be some cost in lower aggregate growth. But fiscal policiesalone are not sufficient to solve the immediate problems unless quite severemeasures are taken. They help reduce the savings gap, but unless measuresare taken at the same time to improve the real transfer of resources, i.e.,raise exports and lower imports, the trade deficit will not be reducedsharply without quite severe measures./l The fiscal measures are necessary,but not sufficient to complete the adjustment. Action will have to be takenin other areas as well.
4.31 Policy Recommendations. These recommendations will focus on meansto achieve the five-year targets of raising the share of central governmentrevenue in GDP to 17% (general government to 18%), of increasing the publicenterprises- contribution to their investment programs, and of restrainingtotal public sector expenditures to about 21% of GDP. Measures to maintainhigh private sector saving will be discussed in the next section. A programof tax and fiscal policy reform should be implemented to achieve thesetargets by 1985, and further improvements should be continued thereafter.This will require careful study and development by the Ministry of Financein consultation with other government agencies, particularly NESDB.However, initial action should be undertaken as soon as possible towardsreducing the large public savings deficit. Because of possible difficultiesin implementing measures to raise taxes, particular emphasis should be givento measures to control expenditures and raise public enterprise tariffs inthe short run. Appropriate public enterprise tariffs are very important inthe energy sector and to assure economic use of public enterprise goods andservices. The Mission recommends consideration be given to:
(a) reviewing government current and capital expenditures toeliminate wasteful or unnecessary expenditures and assure that theremaining ones conform to the government's priorities for develop-ment and adjustment. A comprehensive analysis and review of thepublic investment program and adequate economic evaluation ofpublic and public enterprise investments should be a regularpart of the planning and budgeting exercise;
(b) exerting even more vigorous efforts to increase collections ofexisting taxes through improvements in tax administration for bothdirect and indirect taxes, building on the success of initialprograms in this area;
(c) introducing procedures for more prompt collection of taxliabilities and advance payments of some taxes;
/1 This is equivalent to saying, in Cordon's terminology, that not only mustthe aggregate level of demand be reduced, but also its structuremust be shifted from tradables to nontradables.

- 54 -
(d) discontinuing the present system of treating any corporation asa personal entity for income tax purposes if one of theshareholders owns more than half of the capital;/l
(e) expanding the personal income tax base to include all income fromproperty, capital gains, and eventually gifts and transfers;
(f) simplifying the rate structure of the business tax into threebroad categories with a standard basic rate, reduced rate onessential goods and a higher rate on nonessentials. The basicrate level should be kept high enough to increase revenues signif-icantly, and rates should be applied uniformly to domestic goodsand imports. Consideration should also be given to reforming thebusiness tax into a single point tax (probably at the wholesalelevel) with the possibility of eventually moving to a value addedtax;
(g) implementing proposed reforms of the excise tax structure toconsolidate nine separate excise codes into a single one, tointegrate excises with business taxes on selected commodities, towiden the excise tax base to include luxury commodities such aselectrical appliances, electronic devices, automobiles, watches,cosmetics, etc., and to convert all remaining specific excisetaxes to ad valorem;/2
(h) increasing collections on the existing property tax, which are lowbecause of widespread exemptions, concessional rates, lowassessments, and poor administration. Introducing a new propertytax should also be considered in the longer term;/2
(i) reducing the "standard deductions" for professional incomes orreplacing them with direct accounting of expenses;
(j) introducing frequent and automatic tariff adjustments for publicenterprises based on their operating costs and investment require-ments so that they can cover a larger portion of their investmentprograms; and
(k) issuing government bonds that offer positive real rates ofinterest to the public to reduce reliance on deficit financingfrom the banking system. Public enterprises should also beencouraged to issue bonds to the public.
/1 This would reduce tax avoidance arising from changing the juristic formof an enterprise, particularly in view of the recent reductions in thepersonal income tax and increases in the corporate income tax. Similartreatment should also be considered for some partnerships to increasethe distinction between taxes on enterprises and those on individualsand allow for differential tax treatment.
/2 Legislation for these measures has been introduced and may be passedby Parliament in the near future.
- 55 -
4.32 Monetary Policy, External Balances and Financial Sector Development.The current account deficit is a reflection of the structural disequilibria inthe domestic economy: the savings deficiencies, accommodating monetarypolicy, and inadequate price adjustments. Because of rising interestpayments, the relatively large trade deficits of the past two decades cannotbe continued, and a surplus may be needed on that account. This will requiremeasures to improve domestic resource mobilization, reduce import demand, andincrease exports. Attempts to reduce the deficit directly by quotas, bans,higher tariffs on imports, or by large subsidies to exports will mask ratherthan redress the fundamental imbalances, aggravate distortions in theproductive sectors, and diminish the long-run growth potential of the economy.Thiey should be strictly avoided.
4.33 Monetary policy will have to assume greater responsibility formacroeconomic management of demand, resource mobilization and allocation, andthe balance of payments. Restraint in the rate of credit expansion will benecessary to moderate demand pressure on prices and imports. This shouldcomplement measures to increase public saving discussed above, since therequirement for deficit financing from the Bank of Thailand and commercialbanks should diminish. In addition to the rate of credit creation, interestrate policy will become a more important element in conducting monetary policyand influencing the balance of payments. Maintaining positive real interestrates on time deposits and at least some government securities will encouragemore private saving while discouraging some marginal investment, thus helpingreduce the savings gap. Interest rates are also important in influencingshort-term capital flows in the balance of payments, and they should be kepthigh enough to prevent large interest-sensitive capital outflows, while othermieasures should be implemented to discourage excessive recourse to short-termprivate foreign borrowing to finance domestic credit expansion or the currentaccount deficit. While higher interest rates will increase savings, they willalso raise the debt servicing payments on the government-s domestic debt,which will require more public resource mobilization. However, this isa necessary part of the adjustment process and higher interest rates reflectthe cost of mobilizing domestic saving. Controlling government expendituresis not a sufficient reason for maintaining low interest rates.
4.34 Even with careful macroeconomic management, the magnitudes of theexpected financing requirements pose certain problems for the mechanisms offoreign resource mobilization and domestic financial sector adjustments whichlwill require direct policy action and improved financial intermediation.Careful management of the capital account and coordination of foreignborrowing, particularly by public enterprises and the private sector, will herequired. Annual current account deficits will average about $3 billion peryear throughout most of the 1980Os, even with significant adjustment, andgross annual disbursements of foreign loans will rise from $2.4 billion in1979 to nearly $6 billion in 1985 and possibly as high as $10 billion in 1990.Private sources will be a major source of capital in the 1980-s, andgovernment relations with foreign commercial banks will assume greaterimportance.

- 56 -
The level of medium- and longer-term private sector borrowing abroad shouldalso increase, and the private Thai banks will play a role in mobilizing theseforeign resources.
4.35 Given the size of the external deficit and the dependence on pri-vate commercial markets, it is important that a coherent debt managementprogram be developed for all public foreign borrowing and that all foreigndebt be monitored. The majority of foreign borrowing during the coming fiveyears will be from private, nonconcessionary sources. It will be availableonly if the Thai economy continues to demonstrate its creditworthiness.Judgments about creditworthiness will depend inter alia on the perceivedability of the economy to manage its external borrowing prudently, to keepits inflation rate within acceptable bounds, to mobilize sufficient domesticresources, to generate exports over the long run, and to sustain the growthrates necessary to achieve these and other important goals. The Bank ofThailand will also have to be able to maintain adequate reserves and followsound monetary and exchange rate policies to support the creditworthiness ofthe Thai economy.
4.36 The whole issue of creditworthiness will become more important inworld capital markets in view of the high levels of borrowing expected to beundertaken by LDCs over the next five years. The changes occurring in theworld economy, the large and continued surpluses that will be generated byoil-exporting nations, and the potentially chronic deficits of oil-importingcountries are forcing a re-evaluation of most conventional wisdom on thissubject. Higher levels of debt and debt service will probably be toleratedas the international monetary system continues to adapt to the changingeconomic balances. However, even though the international monetary systemwill be recycling larger volumes of money, that does not necessarily meanthat countries which have large deficits will automatically gain access tothose resources. Debtor countries such as Thailand will still have todemonstrate their creditworthiness. If Thailand is not perceived to haveits current account deficit under control, its creditworthiness will suffer,and it may not be able to continue borrowing the amounts it desires.
4.37 Another objective of the monetary authorities should be tocontinue to support the stability and development of financial institutionsafter the recent difficult period. Several recent actions have increased theBank of Thailand's control over financial sector development. The revisionof the Commercial Banking Act, the Act on Finance Business in 1979, thespecial fund to stabilize the finance companies, and the Capital MarketDevelopment Fund have eased the liquidity situation of finance companies andstabilized the SET. These actions, along with more general credit restraintby the Bank of Thailand and higher interest rates, should help restore thesomewhat shaken stability of the financial sector and reduce the pressure ofexcess demand. The financial sector should now be able to play an important

- 57 -
role in the adjustment process by continuing to facilitate private resourcemobilization and allocation within the framework of appropriate interest-rate and other financial policies.
4.38 The increased integration of Thai financial institutions intointernational money markets has largely been a benefit to the economy. Thebanking system's ability to borrow in foreign exchange has helped balancethe country's current account deficit; in fact, banks have been encouragedto do so on occasion. Such access to international money markets is notwithout cost, however. The magnitude of these short-term, uncoveredliabilities makes the economy much more sensitive to external financialdevelopmenits. The potential volatility of these liabilities and the size ofthe current account deficit increase the difficulty of managing internationalreserves and domestic monetary policy. Rising external interest rates in1979 forcied suspending taxes levied on interest paid on foreign loans, ledto substantial short-term capital flight from early October, and threateneda liquidity squeeze. In January 1980, interest rate ceilings were raised,which relieved these pressures by reducing the domestic demand for funds,encouraging additional domestic saving, and curbing interest sensitivecapital outflows.
4.39 The effects on the balance of payments and external borrowingrequirements of measures to increase private saving or reduce the growth ofaggregate demand through higher interest rates or less credit expansionwill, by themselves, be similar to those of raising public sector saving.There will be some reduction in the growth of imports and some slowing ininvestment rates. In the simulation model, raising private saving by 1% ofCDP compared to the reference simulation reduces the current account deficitto 6.4% of GDP in 1985. The growth rate falls slightly to 5.4% p.a. andpublic saving is little changed. As with the experiment raising publicsaving, tlhe impact of improved savings behavior alone does not have a largeimpact on the external deficit without accompanying action to alter the flowof real resources through the trade balance. Given the magnitude of theadjustment, not only must the level of consumption demand be reduced, butits composition must be shifted away from imports, and the production ofmore exports must be encouraged. These issues will be addressed below.
4.40 Policy Recommendations. Improvements in the current accountdeficit will largely be the result of policies undertaken in other sectors,but appropriate monetary policy and debt management will be necessary tosupport these actions. The Bank of Thailand has adequate tools to pursueprudent monetary policy, to manage external borrowing, and to regulate andsupport financial institutions without having to resort to excessiveliquidity creation. The Bank of Thailand, with the support of othergovernment agencies, must use these tools as part of the overall adjustmentprocess. Reducing the public sector deficit and public borrowing from thebanking system will be major factors in reducing the pressure for monetaryexpansion, thereby helping to ensure adequate availability of bank credit tofinance private sector requirements within an acceptable rate of totalcredit expansion. Assuring that interest rates are not artificially
- 58 -
constrained will be another important element. Stable monetary policyshould reduce domestic inflationary pressures and allow the private sectorto perform its resource mobilization and allocation functions moreeffectively. Supporting policies will be needed to guide institutionaldevelopment with appropriate regulatory action and to assure proper foreigndebt monitoring and capital account management. Action should be consideredto:/l
(a) establish and adhere to guidelines for rates of monetary expansionconsistent with expected real growth plus exogenously generatedprice increases. Interest rates should be allowed to adjust asnecessary (further increases in interest ceilings may be required);
(b) assure that the Bank of Thailand maintains the interest rates thatit regulates positive in real terms, and that other regulatedrates move consistently with the overall rate structure./2
(c) adjust interest-rate, reserve, and other financial policies toassure necessary capital account balances consistent with domesticobjectives of growth and financial stability;
(d) fully implement existing requirements for reporting to the Bank ofThailand all actual and intended foreign borrowing by all agents,public and private, and to develop debt management policies tocoordinate public sector borrowing and provide guidelines forprivate borrowing;
(e) improve financial intermediation by measures to increase creditavailability for agriculture and small-scale industry throughchanges in institutional structures and/or regulations; and
(f) encourage longer-term lending by commercial banks and the creationof specific institutions with long-term intermediation objectives,such as insurance companies and pension funds.
4.41 Energy Policy./3 Thailand's propensity for high and growing energyimports indicates that Thailand has not adequately adjusted domestic prices
/1 Policy measures directly relating to merchandise trade will beaddressed in the following sections.
/2 Exceptions may be made for certain specific rates which are intentionallykept at low levels for other policy objectives, so long as these excep-tions are not widespread.
/3 This section is based on the report Thailand, Energy Issues andProspects, No. 2813-TH, May 1980 (Green Cover). That report has beendiscussed with the Government and presents the analysis and policyrecommendations much more fully.
- 59 -
to the external energy price increases. After initial increases in 1974,energy prices remained roughly constant until 1977 and rose sharply only in1979. This has retarded conservation and reduction of the energy intensityof the Thai economic structure. The combination of continued rapid growth,modernizatior., and a heavy dependence on energy imports has resulted in alarge oil import burden on the balance of payments, particularly after thedoubling of oil import prices in 1979/80. The exceptionally low GDPelasticity energy consumption in 1978 (the last year for which data areavailable) is apparently due to transitory factors of very high agricultureled GDP growth and supply shortages of hydroelectricity and some petroleumproducts. The longer-term trends for higher energy consumption growth arelikely to continue unless further price adjustments are made. Maintaininglow energy prices has also contributed to the fiscal deficit. Adjustmentsin energy price policy will be essential to any satisfactory adjustmentprogram.
4.42 Recent discoveries of natural gas, which will be available in1982, and expanded production capacity of lignite beginning in 1984 willreduce the use of imported energy for power generation through the 1980'sand will lower the economy's dependence on imported energy./l However,even with this substitution, the development of remaining domestic hydropotential, and the possible production of alcohol from sugarcane andcassava, some 50% of total energy requirements would still have to beimported by 1990. Without significant increases in domestic energyreserves, a large portion of incremental demand after 1990 will have tobe satisfied by imports and the import bill could accelerate sharply incomparison to its slow growth in the 1980s. Thailand will not be able tobreak its dependence on imported energy in the foreseeable future, andthus will have to adjust its domestic energy policies to externaldevelopments in energy markets, including both expected price increasesand possible supply shortages./2
/1 There are now indications of significantly larger reserves of bothlignite andf natural gas in Thailand than previously believed. If thisturns out to be the case, they could meet Thailand's power generationrequirements until the year 2000 and supply substantial amountsof energy directly to industry. There is also the possibility ofmeeting a substantial part of Thailand's incremental power generationrequirements by the year 2000 if the potential of the Mlekong andSalaween rivers were to be developed. This would still be quasi-imported energy, as they are international rivers, and there are majorpolitical and social obstacles to be overcome. However, even ifinternational hydro or expanded lignite and natural gas supplies couldmeet all Thailand's power demands, it would still be dependent onimports for liquid fuel after 1990, which amount to about 40% of totalenergy demand.
/2 Intermittent supply shortfalls in recent years have been due more toadministrative problems within the Oil Fuel Organization and theactivities of domestic oil refineries than to external supplyproblems. However, these procedures will have to be improved as well.

- 60 -
4.43 Energy use must be curtailed. The efficiency of energy use shouldbe increased and demand reduced in order to lower the expenditure elasticityof energy demand to a level consistent with balance of payments equilibrium.This will require a number of difficult decisions. Higher consumer pricesare one of the most effective ways of reducing consumption, inducingconservation, and encouraging investment in more energy-efficient equipment,particularly in a market-oriented economy such as Thailand's. However, pricepolicies are also highly visible, and price increases are unpopular with alarge part of the population. This is one reason why the Government hasbeen reluctant to move very fast on this issue. Prices for energy productsshould be adjusted as rapidly as possible to fully reflect the import andprocessing costs of energy and a reasonable tax structure based on balance-of-payments and conservation objectives. Taking account of the 3% p.a.projected relative increases in oil prices, projected internationalinflation of about 9% p.a. between now and 1985, and the current priceshortfall of 30% below "appropriate" levels based on the pre-1973 taxstructure, average annual domestic petroleum price increases of nearly 20%p.a. will be required over the next five years for domestic petroleumprices to catch up with the "appropriate" price level./l More rapid increasesare necessary for fuel oil. Higher rates of increase will be required forelectricity, averaging about 25% p.a., if the 8% rate of return target isto be achieved./2 The recent increases in power tariffs go about halfway toward meeting these objectives of the power sector this year. Energyprice increases are externally generated, and the Thai economy cannotavoid absorbing them for any prolonged period of time. The costs ofdelaying domestic energy price adjustments are larger current accountdeficits, unavailability of certain energy products, incorrect investmentsignals to the energy sector and to energy users, lower governmentrevenues, and, at various times, significant levels of subsidies to energyconsumers.
/1 This "appropriate" level is a first approximation of an appropriatelevel for the 1980's. Further adjustments may be required, dependingon how well these prices slow the growth of energy consumption andimports. It is not yet possible to make more accurate estimates onthe basis of available data in the energy sector.
/2 Current covenants between EGAT and the World Bank call for increases of56% in 1980 and 19% in 1981 to restore the 8% rate of return by the endof 1982, plus further increases to match any additional increases in thecost of primary energy. This is approximately 25% p.a. between now and1985.

- 61 -
4.44 In adjusting petroleum prices, taxes should be increased toachieve at least the pre-1973 real level of taxation as a first approxi-mation (appropriate rates A in Table 3.10, adjusted forward). Furtherrequirements will then be required as the overall energy policy isdeveloped. Subsidies to the sector from the government budget, byguaranteed borrowing through the Oil Fund, or by other means, should beeliminated completely./l As more nonrenewable domestic energy sources (such
as natural gas and lignite) are included in the energy mix, appropriateprice and tax policy will become all the more important. Pressure to lowerprices to levels commensurate with the current cost of production of theseresources must be resisted, and retail prices must be kept high enough toreflect oroperly the depletion of these resources, to contribute anappropriate portion of public revenues, and to encourage conservation andthe further development of alternative domestic energy sources. Thesealternative sources will be economic to develop only if domestic energyprices reflect world price levels.
4.45 Although energy demand is relatively inelastic in the short run,evidence indicates that demand is responsive to price changes in the mediumterm when the structure of investment and consumption can adjust to the newhigher relative price. Since the energy input into almost all productionprocesses is relatively small, less than 10% of total costs, energy costincreases should not have a very large indirect effect on other prices.Rough estimates indicate that a 10% increase in energy prices would lead toabout a 2.3% general price increase. Appropriate energy prices will alsoimprove resource allocation and reduce distortions resulting from low energyprices. Part of the delay in adjusting petroleum product prices has beenaccommodated by squeezing distribution margins, which also have to berestored in the adjustment process.
4.46 Energy price increases will directly reduce the demand for energyand indirectly reduce aggregate demand. Both factors will reduce the importdemand for petroleum and, to the extent energy taxes and tariffs areincreased, public saving can be raised. If demand growth can be slowed, somelarge investments in the power sector can be postponed, reducing futureinvestment demand as well. Since most of the energy used in the economy is bythe better-off groups, the taxes imposed may turn out to be slightly progres-sive on average. Special tariffs, such as lifeline electricity rates, canreasonably be used to mitigate the impact of tariff increases on the poorwithout incurring too great a cost in forgone revenues.
4.47 In addition to price adjustments, domestic energy resources shouldbe developed to substitute for imported energy. This will reduce the burdenon the balance of payments and assure more energy independence for theeconomy. Thailand has already made substantial progress in this direction in
/1 The gross share of petroleum revenues in government revenues was 8.9% in1979. Total subsidies to the sector may have amounted to as much as5% of total revenues in 1979, so the net effect of these measures on thepublic sector deficit would be much larger than just the increase inrevenue.
- 62 -
natural gas and lignite and is actively encouraging more exploration forhydrocarbons. It is also investigating biomass alternatives (e.g., alcohol),but further attention should be directed toward other renewable energyresources.
4.48 At whatever level of prices that obtains, it is essential that therelative prices of different energy products be properly structured to re-flect their relative scarcity and economic costs. Different energy productsare substitutable to some extent, and deliberate policies to maintain lowerprices for certain products to aid certain consumer groups or industriesmay result in excessive and costly shifting of demand,/l e.g., convertingautomobiles to diesel if the price differential between gasoline and dieselfuel is too large, or wasteful adjustments to take advantage of a lower-priced but less energy-efficient fuel. In addition to defeating energyconservation objectives, shifting can become costly if it distorts thestructure of demand too greatly from the structure of supply. Amongpetroleum products, if the demand structure exceeds the possible range ofsupply of the refinery output mix, balance will have to be achieved by tradingin the external spot market, which has proved to be costly. The principalissue at the moment concerns the expansion of the oil refineries. The use ofdomestic energy (gas and lignite) in power generation displaces a large por-tion of fuel oil demand and complicates the issue of balancing supply anddemand of petroleum products. At present there is insufficient refinerycapacity in Thailand, and any proposed expansion must include greatercrackirgcapacity in existing unit to reduce the expected surplus of fueloil.
4.49 Direct energy conservation measures should be employed to complementthe other policies. These should encourage and support retrofitting ofenergy-saving devices in existing facilities and promote energy-efficientdesign in new construction and machinery. Policies should also encourageenergy saving among individual consumers and reduce energy-using activitiesin areas where individual action is not feasible, such as measures toimprove traffic flows in Bangkok. These objectives can be accomplished byregulatory measures in some instances, education and energy audits inothers, and tax or other market incentives in still other cases.
4.50 Thailand has not yet developed a long-run energy strategy forenergy development, pricing, and use. As a result, it faces a continuingperiod of uncertainty about energy, with resulting shortages, contentionover prices, demands for preferential allocations, and distruptive ad hocmeasures to save energy in periods when energy supplies are simply inade-quate, such as the recent measures to reduce electricity demand in Bangkokby restricting the hours of operation of a number of activities. Othercountries have demonstrated that high growth rates can be maintained withlower energy inputs, but this requires long-range planning and a number ofspecific conservation measures. Without significant progress in this area,the availability of energy and its impact on the balance of payments couldbecome the principal structural constraints on Thailand-s future growth.
/1 This should be distinguished from social policies which lower theprice of small amounts of certain energy products to poor consumers,such as "lifeline" electricity rates. By their nature, these policiesdo not permit large shifts in demand.
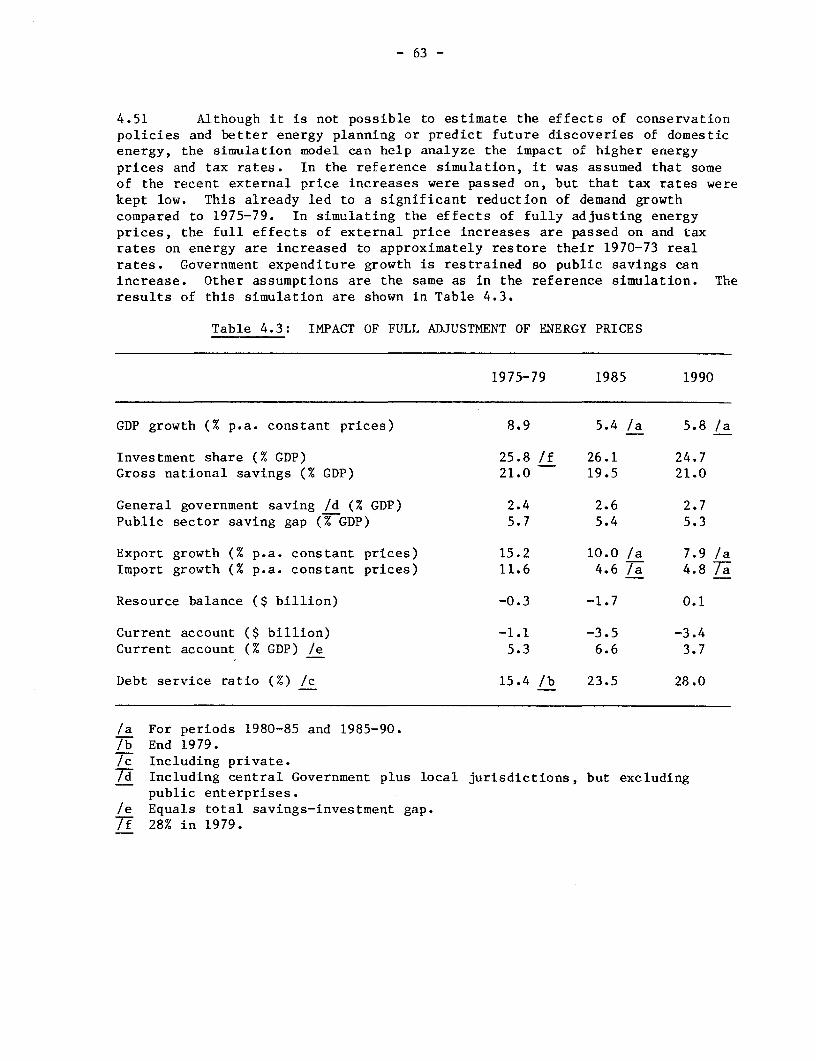
- 63 -
4.51 Although it is not possible to estimate the effects of conservationpolicies and better energy planning or predict future discoveries of domesticenergy, the simulation model can help analyze the impact of higher energyprices and tax rates. In the reference simulation, it was assumed that someof the recent external price increases were passed on, but that tax rates werekept low. This already led to a significant reduction of demand growthcompared to 1975-79. In simulating the effects of fully adjusting energyprices, the full effects of external price increases are passed on and taxrates on energy are increased to approximately restore their 1970-73 realrates. Government expenditure growth is restrained so public savings canincrease. Other assumptions are the same as in the reference simulation. Theresults of this simulation are shown in Table 4.3.
Table 4.3: IMPACT OF FULL ADJUSTMENT OF ENERGY PRICES
1975-79 1985 1990
GDP growth (% p.a. constant prices) 8.9 5.4 /a 5.8 /a
Investment share (% GDP) 25.8 /f 26.1 24.7Gross national savings (% GDP) 21.0 19.5 21.0
General government saving /d (% GDP) 2.4 2.6 2.7Public sector saving gap (% GDP) 5.7 5.4 5.3
Export growth (% p.a. constant prices) 15.2 10.0 /a 7.9 /aImport growth (% p.a. constant prices) 11.6 4.6 7a 4.8 /a
Resource balance ($ billion) -0.3 -1.7 0.1
Current account ($ billion) -1.1 -3.5 -3.4Current account (% GDP) /e 5.3 6.6 3.7
Debt service ratio (%) /c 15.4 /b 23.5 28.0
/a For periods 1980-85 and 1985-90./b End 1979./c Including private.Id Including central Government plus local jurisdictions, but excluding
public enterprises./e Equals total savings-investment gap.If 28% in 1979.
- 64 -
4.52 Raising energy prices and taxes has about the same impact on growthand reducing the current account deficit as improved fiscal policy. This isdue to the direct effect of reducing the demand for energy imports in additionto the indirect effects of lower real aggregate demand. The higher energyprices imply slower growth of real incomes as well as some shift in demandaway from energy. Raising energy taxes also augments government revenues in1985, permitting a higher level of public saving than in the referencesimulation but not as high as in the simulation of greater public resourcemobilization. The impact in 1985 is not yet large because of the lags inresponse to the price changes and the assumed even phasing of the priceincreases over the period 1980-85. As in the previous simulation, theresource balance becomes positive by 1990, but the current account balanceremains negative because of the debt-service payments. The debt-serviceratio, however, remains below 30% and is generally lower than in thereference simulation. This simulation shows the direct effect of raisingenergy prices on reducing energy imports, and indicates that such priceincreases will not seriously retard growth. These policy actions improvethe resource balance by reducing the demand for energy imports, and they arenecessary complements to the policies to raise domestic savings discussedabove. They improve the real transfer process by reducing the economy's useof foreign resources. But increasing energy prices alone is not sufficientto accomplish the entire adjustment.
4.53 Policy Recommendations. Energy is becoming a crucial constraint ondevelopment, particularly for oil-importing countries such as Thailand, andlong-term energy strategies are becoming essential elements in overalldevelopment strategies. The importance of energy planning has become apparentonly in the past few years, as both supplies and prices are becoming more andmore uncertain. Thailand does not have a history of energy planning (neitherdo most countries), and it is imperative that long-range energy planningcapacity be developed and integrated with economic planning. However, in theshort run, policies must be undertaken to achieve the targets of reducing theenergy elasticity, raising energy prices to fully reflect energy import costs,and raising the share of energy taxes in government revenues. The followingrecommendations should be considered:
(a) announcing and implementing a program of regular and automaticadjustments of petroleum and other energy prices and power tariffsin response to changes in external energy costs;
(b) raising excise, business and import taxes on energy products to atleast their real pre-1973 level and higher if necessary to reflectthe scarcity of energy resources and of the foreign exchange used toimport energy;
(c) using substitution or opportunity cost pricing of domestic energyresources to reflect the alternate costs of imports, to discourageinvestment in uneconomic energy-intensive projects and equipment,and to encourage further development of domestic energy resources;
- 65 -
(d) enforcing a pattern of refinery expansion that assures an appro-priate balance of petroleum product supply and demand;
(e) developing adequate consezvait_rn measures for both commercial/industrial and residential/individual uses, including more energy-efficient machinery, retrofitting to reduce energy losses, andimproved energy design in the future; and
(f) improving the capacity of energy sector institutions to influencethe development of the energy sup[ly structure, to manage demand andpurchasing policies of petroleum and product supplies, to developnonconventional sources, and to allocate scarce energy resources ifnecessary.
4.54 Industrial Development Policy./1 Restoring the external and fiscalbalances is a necessary part of the adjustment process in the short term.However, those adjustments should be designed so as not to interfere with theimplementation of policies to raise production and productivity in theindustrial and agricultural sectors./2 As the preceding analysis has shown,unless measures to raise savings are complemented by improvements in theunderlying structure and distribution of output toward more exports and towardreducing import demand, long-term growth and adjustment will be impaired. Thegrowth record of industry over the past several years has been quite good.The sector is not subject to such severe distortions as in many otherdeveloping countries and manufactured exports grew quite rapidly during the1970's. Their share in total exports is now about 20 percent. Although theindustrial share in value added now exceeds that of agriculture, its sharein employment is only about one-tenth that of agriculture. As new land isno longer available, agriculture will be less able to absorb labor forcegrowth, and that burden will fall increasingly on industry.
4.55 After falling for over a decade, levels of protection began risingin the middle 1970's as a result of efforts to improve the balance ofpayments and encourage domestic growth. This has led to more inefficiencyin the industrial sector, higher prices for industrial goods, and less laborabsorption. In addition, recent initiatives to support large,capital-intensive projects threaten to move the economy toward an industrialstructure that is not well suited to Thailand's comparative advantage, thatwould use disproportionate amounts of scarce investment resources, and thatwould tend to reduce its competitiveness abroad. Such action should beavoided. The recent growth of manufactured exports has increased laborabsorption in some export-oriented branches, which are relatively laborintensive, and helped improve industrial efficiency. The Government iscurrently reviewing additional policies to promote exports as part of itsstrategy to reduce the current account deficit.
/1 This section is based largely on the report, An Industrial DevelopmentStrategy for Thailand No. 2804a-TH, June 5, 1980. That report has beendiscussed extensively with the government and presents the analysisand policy recommendations more fully.
/2 Agricultural policy will be discussed in paragraphs 4.62-4.68 below.

- 66 -
4.56 The industrial strategy should concentrate on encouraging efficientdomestic production and increasing exports in addition to other developmentobjectives. It should include measures to reduce protection and pricecontrols, promote manufactured exports, increase labor absorption, and improvethe regional distribution of industry. The value of increasing manufacturedexports to reduce the balance of payments deficit has been widely recognized.Since these industries tend to be relatively labor intensive and userelatively lower amounts of capital per unit of output, they will alsocontribute significantly to job creation and ease the demand for investmentresources per unit of incremental output. The value of lowering protectionand eliminating other price and quantity controls in terms of improvedefficiency and reduced domestic prices and price-related distortions is not sowidely recognized, especially at a time of large balance of payments deficits.Raising protection (including nontariff trade restrictions) may lead to moreimport substitution in some sectors, but it does not necessarily reduce theoverall current account deficit. It may also impair the competitiveness ofexports and retard future industrial growth. Reducing and harmonizing thetariff structure is essential to a medium-term development strategy. Loweringtariffs in the short run, however, may lead to higher import demand andadjustment problems for affected industries. Policy adjustments would have totake this into account.
4.57 Increasing industrial output and exports will require continuedsubstantial investment. The structure and processing of current investmentincentives can be improved in this regard to assure that necessary rates ofinvestment are maintained and directed toward the most efficient uses.However, major investment projects, even in the private sector, should becarefully reviewed for their impacts on foreign exchange requirements,employment creation, export growth, or import reduction. These projects oftenend up placing large demands on public resources or foreign exchange reservesand may well need to be postponed unless there is compelling economicjustification for proceeding at a time when resources are as scarce as theyare now.
4.58 Policies which will raise manufactured exports and improve the effi-ciency of industry will contribute to easing domestic resource constraints onthe economy and to reducing the trade deficit. Improved efficiency will alsoenable the economy to displace some additional imports with comparative domes-tic products. More growth in the industrial sector will help offset thegrowth-depressing impacts of some of the other policies discussed above. Onthe other hand, increased export orientation of nonresource-based industrieswill tend to concentrate export industries in the greater Bangkok area and theEastern Seaboard where they have best access to complementary inputs,communications, and finance.
4.59 The effects of policies to stimulate exports of manufactured goodsand improve efficiency can be estimated with the simulation model. Policyvariables were adjusted to increase the competitiveness of Thai exports, andexternal demand was assumed to increase as a result of increased salesefforts. This implies a growth rate of manufactured exports of about 13.5%
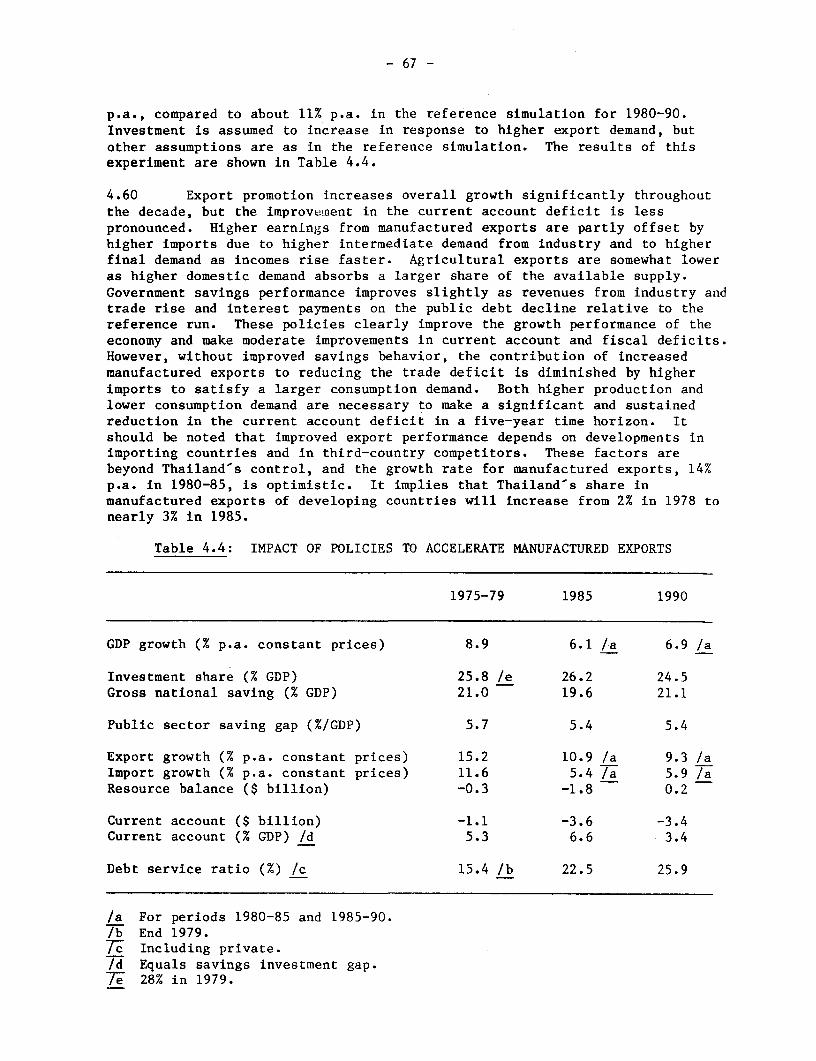
- 67 -
p.a., compared to about 11% p.a. in the reference simulation for 1980-90.Investment is assumed to increase in response to higher export demand, butother assumptions are as in the reference simulation. The results of thisexperiment are shown in Table 4.4.
4.60 Export promotion increases overall growth significantly throughoutthe decade, but the improvement in the current account deficit is lesspronounced. Higher earnings from manufactured exports are partly offset byhigher imports due to higher intermediate demand from industry and to higherfinal demand as incomes rise faster. Agricultural exports are somewhat loweras higher domestic demand absorbs a larger share of the available supply.Government savings performance improves slightly as revenues from industry andtrade rise and interest payments on the public debt decline relative to thereference run. These policies clearly improve the growth performance of theeconomy and make moderate improvements in current account and fiscal deficits.However, without improved savings behavior, the contribution of increasedmanufactured exports to reducing the trade deficit is diminished by higherimports to satisfy a larger consumption demand. Both higher production andlower consumption demand are necessary to make a significant and sustainedreduction in the current account deficit in a five-year time horizon. Itshould be noted that improved export performance depends on developments inimporting countries and in third-country competitors. These factors arebeyond Thailand's control, and the growth rate for manufactured exports, 14%p.a. in 1980-85, is optimistic. It implies that Thailand's share inmanufactured exports of developing countries will increase from 2% in 1978 tonearly 3% in 1985.
Table 4.4: IMPACT OF POLICIES TO ACCELERATE MANUFACTURED EXPORTS
1975-79 1985 1990
GDP growth (% p.a. constant prices) 8.9 6.1 /a 6.9 /a
Investment share (% GDP) 25.8 /e 26.2 24.5Gross national saving (% GDP) 21.0 19.6 21.1
Public sector saving gap (%/GDP) 5.7 5.4 5.4
Export growth (% p.a. constant prices) 15.2 10.9 /a 9.3 /aImport growth (% p.a. constant prices) 11.6 5.4 /a 5.9 /aResource balance ($ billion) -0.3 -1.8 0.2
Current account ($ billion) -1.1 -3.6 -3.4Current account (% GDP) /d 5.3 6.6 3.4
Debt service ratio (%) /c 15.4 /b 22.5 25.9
/a For periods 1980-85 and 1985-90./b End 1979.Th Including private./d Equals savings investment gap.7e 28% in 1979.

- 68 -
4.61 Policy Recommendations. Industrial policy should concentrate onways to increase manufactured exports, improve the efficiency of domesticproduction, and promote investment. Some of these measures may involve somecontraction of the less efficient import-substitution industries, whichwill lead to a gradual restructuring of industry with more orientationtoward trade and competitiveness in world markets. This will increase theimportance of the more labor-intensive industries and augment job creation ifThai wages continue to be relatively low and if capital is not subsidized.This is consistent with the comparative advantage of the economy and willincrease employment and accelerate growth. Consideration should be given to:
(a) implementing measures currently under review to reduce biasesagainst manufactured exports by full and prompt rebate of all taxesand tariffs paid on intermediate imports used directly andindirectly in the production of exports;/l
(b) reducing or eliminating export taxes and other export controls suchas export licenses and minimum prices, except where foreign marketlimitations (e.g., quotas, inelastic demand) require managementof Thai exports. Where licenses allocate foreign quotas, theyshould be easily transferrable among exporters and availableto bona fide new exporters;
(c) improving the export credit and guarantee schemes, simplifying theiradministration, and extending the facilities to cover pre-export andexport investment credit requirements;
(d) expanding institutional promotion measures and making exportpromotion incentives available to all trading firms;
(e) replacing all nontariff restrictions on imports with ad valoremtariffs and moving toward a more homogenous tariff structure byinitially reducing tariffs above 50% to 50% and raising tariffsbelow 10% to 10% as a first step toward a uniform tariff./2Infant industries could be allowed an additional 15%for limited periods of time, and an additional 20% could beimposed on luxury imports;/3
(f) eliminating domestic price controls;
/1 Legislation is currently pending to achieve most of this byeliminating the budget constraint on rebates and specificallyauthorizing calculation of ad valorem rebates by category.
/2 Some ad hoc adjustments in this direction are being made.
/3 If necessary, appropriate transitional arrangement could be made forthose industries seriously threatened by the tariff reform.
- 69 -
(g) establishing an authority for economic evaluation of all largeprojects requiring major public support in the form of equity,credit guarantees, protection, special incentives, or majorspecific infrastructure construction;
(h) granting investment incentives on an automatic basis to allfirms which meet certain stated objective development criteriaexcept for specifically excluded industries;
(i) implementing more effective measures to promote appropriatedevelopment of industry outside of Bangkok; and
(j) developing effective ways to encourage higher employment generationper unit of industrial investment.
4.62 Agricultural Policy. The agricultural sector will remain a keyfactor in Thailand-s development prospects for some time to come. It is animportant source of employment, material, and, of course, foodstuffs for therest of the economy. It is also a major foreign exchange earner. The highgrowth rate of agriculture and agricultural exports was a key factor inforestalling major balance of payments deficits over the past five years. Inthe past, the private sector has been the driving force in Thailand's rapidagricultural growth. But this unfettered development has not been withoutcost. It has led to inappropriate land use and destruction of valuable watersheds (external diseconomies), and it has introduced new techniques with onlyhigh, short-term profits. These factors are becoming increasingly detrimentalto the objectives of growth and poverty alleviation. The Government will haveto take more active measures to reduce external diseconomies and undertakeprograms where the external economies cannot be captured by the private sector(e.g. soil conservation, extension) or where economies of scale or longpayback periods would make private action unlikely (e.g., land development,research and development).
4.63 Although the potential for further expansion of the area undercultivation is rapidly coming to an end, there is still potentially productiveland within holdings that is not regularly cultivated, and there arepossibilities for increasing crop yields. Realizing this potential willrequire greater development of research, extension, and supporting systems ofmarketing and credit; more use of purchased inputs such as fertilizer andpesticides; and better on-farm land development and water use. Appropriateproducer incentives in the form of remunerative prices will also be necessaryto induce greater production of marketable surpluses. In addition, theoverall question of appropriate land classification and use must be faced asland becomes a scarce resource. Many of the necessary support services canand will be provided by the private sector. However, the government will alsohave to establish a viable policy framework which is conducive to sustainedand intensive agricultural development and provide infrastructure, technology,and supplementary credit. In addition to general supporting measures,programs that respond directly to specific local problems will have to bedeveloped, particularly for those areas unlikely to be attractive to privatemarket activity.
- 70 -
4.64 There has been little planning of land use and development as agri-culture expanded into uncultivated areas in the past. Large tracts of landare classified as nonagricultural, although they are, and should remain, underagricultural production. By not placing them in the appropriate classifi-cation, they are often deprived of necessary support services, and clear titlecannot be granted to smallholders. This discourages fixed investments thatwould increase production and productivity. Significant sections of thecountry are also inappropriately cropped in terms of their land capabilities.In some areas, this is due to subsistence requirements of rice production; inothers, to lack of adequate knowledge or adequate market outlets for moresuitable crops. Appropriate land classification and use will greatlyfacilitate measures to implement more modern production techniques and raiseproductivity in agriculture. It will also aid conservation and help presentfurther deforestation. Adjustments to the changing structure ofagricultural production will have major implications for the development ofappropriate agricultural research and extension in Thailand. More effortmust be placed on developing appropriate crops and cropping patterns for allareas of the country (not just the irrigated rice areas) and for rapidly andeffectively extending this knowledge to the farmers.
4.65 The largely private agricultural marketing system in Thailand hasbeen a major factor in stimulating agricultural growth in the past twodecades. Intensification and modernization in the agricultural sector willimpose greater demands on the system, and the government may need to takemeasures to improve the efficacy of the marketing system, reduce priceuncertainties, increase returns to farmers, and assist those parts of thecountry that are not adequately served by the existing systems. Improvingthe efficiency of the marketing system could result in higher producerprices without raising costs elsewhere in the economy, but rising energycosts in transport and handling are likely to absorb a signifiant part ofthese gains within the marketing system itself. Other mechanisms should beinvestigated for raising farmgate prices for various crops, includingreducing and eventually eliminating the rice reserve requirement and therice premium.
4.66 All of these measures will help raise incomes of rural producersand should bring forth a substantial supply response over time.Agricultural products account for 60% of exports, and continued high overallgrowth in the sector will be necessary to supply domestic demand andmaintain the high export growth rate needed to help reduce the currentaccount deficits. To the extent that poor farmers are able to producesurpluses for market, these measures will also help achieve povertyalleviation objectives. On the other hand, policies to promote agriculturalgrowth may result in some reductions in revenue or increases in expenditureby the government. And they will most probably raise prices faced byconsumers of agricultural products. These price increases will be necessaryto shift incomes to agricultural producers in order to increase productionand exports.

- 71 -
4.67 The effects of measures to stimulate agricultural production aresimulated in the model by raising the assumed growth of agricultural outputto 5% p.a., compared to 4% p.a. in the reference simulation. This alsoentails some increase in investment, but other assumptions remain unchanged.Export and GDP growth rates increase, but higher incomes without anyincrease in savings leads to higher import demand, and the current accountdeficit is only moderately diminished in 1985, as shown in Table 4.5. Withthis higher rate of agricultural growth, there is sufficient supply tosustain agricultural export growth throughout the decade. With the lowergrowth rate it began to decline at the end of the decade as a result ofcontinued growth of domestic intermediate and final demand.
Table 4.5: IMPACT OF INCREASED AGRICULTURAL PRODUCTION
1975-79 1985 1990
GDP growth (% p.a. constant prices) 8.9 6.1 /a 6.5 /a
Investment share (% GDP) 25.8 /e 26.3 24.7Gross national saving (% GDP) 21.0 19.7 21.5
Public sector saving gap (% GDP) 5.7 5.4 5.3
Export growth (% p.a. constant prices) 15.2 10.9 /a 8.6 /aImport growth (% p.a. constant prices) 11.6 5.2 /a 5.4 /aResource balance ($ billion) -0.3 -1.8 0.4
Current account ($ billion) -1.1 -3.6 -3.2Current account (% GDP) /d 5.3 6.6 3.2
Debt service ratio /c 15.4 /b 23.1 26.4
/a For periods 1980-85 and 1985-90./b End 1979./c Including private./d Equals savings investment gap./e 28% in 1979.
4.68 Policy Recommendations. Agricultural policy is of majorimportance because of the number of people affected and the key role thesector plays in most economic activity. The transformation to more modernsector production should result in higher growth rates in agriculture anda shift in relative prices between agricultural and industrial output,reversing the decline in terms of trade of agriculture vis-a-visnonagriculture. Supporting agricultural growth will raise rural incomes andmake a positive contribution to further poverty alleviation in rural areas.In the longer run, higher incomes in rural areas will raise the reservationwage and increase wages in the urban areas as well if the labor marketremains free of distortions. Policy should be considered to:

- 72 -
(a) design a national land use and development policy and thenimplement an extensive program to reclassify land based ona national land suitability classification, to expand andcoordinate land settlement and reform in areas reclassified asbeing suitable for agriculture, to improve credit availability forpurchasing and improving land, and to improve accessibility tofull land rights;
(b) increase forest protection, accelerate reforestation in areassuitable only for foresty, and expand land conservation andimprovement programs, especially in areas with low croppingintensities;
(c) make better use of available water resources by further develop-ment of major water control and irrigation schemes, by improvingexisting schemes of on-farm development, by development ofviable medium and small water resource projects, especially in theNortheast, by improving the Royal Irrigation Department'splanning, monitoring and evalution capacities, and by introducingcomprehensive water management systems, including the levying ofwater charges;
(d) coordinate research and extension activities providing appliedtechnology for rainfed agriculture and to encourage changes incropping patterns to achieve improvements in yields and farmincomes;
(e) expand programs of government assistance for specialized cropdevelopment (particularly tree crops), livestock raising, and fishfarming as supplementary sources of income for low-income farmers;
(f) provide adequate institutional credit to farmers through bettercoordination of the government development agencies with thebanking system and more systematic use of the Bank for Agricultureand Agricultural Cooperatives to complement the activities of thecommercial banking and informal credit systems;
(g) improve the efficiency and stability of the agricultural marketingand pricing system in order to increase returns to farmers,by examining the possibility of phasing out the present premia,taxes and reserve requirements for rice exports, reducingwholesale price fluctuations of major crops, and removingrestrictions that introduce inefficiencies in private marketdevelopment, such as limitation on livestock movement;
- 73 -
(h) develop adequate mechanisms for grading and quality controlfor seeds and fertilizers; and
(i) develop programs which respond to the specific problems and needsof different areas of the country, especially those which have beenleft behind in the development process.
4.69 Combined Policy Action. This report has attempted to establishthe extent of the structural disequilibria facing the economy, to emphasizethe importance of undertaking a coordinated adjustment program, and tosuggest appropriate policy measures in five areas of major concern. Thesepolicy suggestions cover both actions which will have an immediate impactand programs which will bear fruit over a longer term. Putting togethera coherent policy package will be a major undertaking and will require makinga number of difficult policy choices. The difficulties stem primarily fromtwo sources: most policies which have beneficial effects in their targetedareas have costs in other areas that will have to be compensated for byother policies or accepted, and the adjustment from a situation ofoverexpansive growth and high imports will require a certain amount ofretrenchment and lowering of expectations, which will not be popular.
4.70 It is clear from the preceeding analysis of policy actions in eachspecific area that implementing measures in one or two areas alone will notbe sufficient to complete the necessary adjustments over even a five-yearperiod. To some extent, this is due to the magnitude of the adjustmentsrequired, to the inherent lags involved in implementing and achievingsignificant structural adjustments, and to the phasing of policies so as notto unduly retard growth by abrupt imposition of severe adjustment measures.However, it is mostly due to the simple economic fact that coordinatedadjustments are needed in several complementary areas in order to effect thenecessary adjustments. Domestic savings, both public and private, must beincreased and investment growth slowed in order to reduce the excess ofdomestic demand over production. At the same time, the structure of domesticproduction and demand must be altered so that the reduction in aggregatedemand can be translated into reductions in the current account deficitthrough higher exports and lower imports. Fiscal and monetary policy shouldaim at improving the savings-investment behavior of the economy in the shortrun while policies for energy, industry and agriculture should accomplishthe adjustment in the real goods flows that will reduce the structuralexternal deficit in the longer run. It is not expected that all the policyrecommendations in the previous sections will be implemented as part of theadjustment program, but significant action does need to be taken in each ofthe principal areas discussed.
- 74 -
4.71 While the impacts of all the policy suggestions discussed abovecannot be represented in the simulation model, it can demonstrate thecombined effects of the various policy measures examined separately in theprevious simulations. This will provide a good indication of the economy sprospects when coordinated policy action is taken. In this case, theindividual assumptions of the previous simulations are implemented togetheras part of a combined strategy, and the model's parameters are adjustedaccordingly./l The effects of these policies and their interactions are shownin Table 4.6. It should be noted that a number of alternative combinationsand levels of the policy variables could also be examined, but the resultswould not be different enough to warrant extensive analysis at this point.In constructing an actual adjustment program, specific policies and thelevels of policy variables would have to be determined as a function of theactual economic and political options and constraints facing the policymakers. That would require much more detailed study by the government.
4.72 With this combination of policies, overall growth is higher than inthe reference simulation or the other simulations. The effect of higheragricultural growth and demand for manufactured exports outweigh the effectsof fiscal restraint and higher energy prices. Overall savings behaviorimproves as well as the savings effort of the public sector. Gross nationalsaving increases as a share of GDP by 1985 as well as gross domestic saving.The resource deficit is reduced to $1 billion by 1985 due to high exportgrowth, but the current account deficit is $2.6 billion because of the highfactor service payments abroad. This is 4.6% of GDP, but falling ina satisfactory way. By 1990 there is a substantial resource surplus, and thecurrent account deficit disappears in that year. After peaking at 21% in1987, the debt-service ratio declines thereafter to 16% in 1990, and thedebt outstanding is substantially lower than in the reference simulation.Most of the investment burden of adjusting lower energy use, more efficientindustrial production, lower import use, and higher export production wouldhave been absorbed by 1985, and thereafter growth could return to nearly itslong-run trend. A larger current account deficit could be sustained if thatwould contribute to higher growth. Although policies in each of the areasdiscussed above contributed only a little to the adjustment by themselves,together they can have a significant impact on effecting a major structuraladjustment.
/1 Because of interaction effects, variance of certain assumptionsabout public saving behavior and investment, and assumedimprovements in private saving. The results of this simulationare different from the sum of the effects of the individualpolicy simulation.

- 75 -
4.73 A review of the policy analysis of this chapter and the results ofthe various simulation experiments points to several important conclusions.First is the difficulty in reducing the level of the current account deficitbetween 1980 and 1985 in comparison to the reference run, even with coordi-nated policy action. Much of what will happen then is already determined bythe events and actions of 1975-79. We have assumed a five-year adjustmenthorizon, which results in substantial external borrowing during theadjustment period. That will be available only if the foreign creditors areare confident that an adequate adjustment program is being implemented.If sufficient foreign resources do not prove to be available, then
Table 4.6: IMPACT OF COORDINATED POLICY ACTION
1975-79 1985 1990
GDP growth (% p.a. constant prices) 8.9 6.5 /a 7.1 /a
Investment share (% GDP) 25.8 /f 25.8 23.5Gross national saving (% GDP) 21.0 21.2 23.7Gross domestic saving (% GDP) 22.2 24.0 25.8
General Government revenue (% GDP) Id 15.1 18.0 18.5General Government expenditures (% GDP) /d 12.7 13.3 14.2General Government saving (% GDP) /d 2.4 4.7 4.3Public sector saving gap (% GDP) 5.7 3.3 3.7
Export growth (% p.a. constant prices) 15.2 12.1 Ia 9.9 /aImport growth (% p.a. constant prices) 11.6 5.9 Ia 6.4 /aResource balance ($ billion) -0.3 -1.0 2.4Terms of Trade (1975=100) 88.5 73.0 70.8
Current account ($ billion) -1.1 -2.6 0.2Current account (% GDP) /e 5.3 4.6 0.2
Required annual borrowing ($ billion) 1.0 /g 4.3 3.3Debt outstanding ($ billion) 3.8 20.1 24.9Debt service ratio (%)lc 15.4 /b 19.4 16.5
/a For periods 1980-85 and 1985-90.7T End 1979.Ic Including private./d Including central government plus local jurisdictions excluding public
enterprises./e Equals savings investment gap./f 28% in 1979.
g Excluding use of reserves and IMF funds.

- 76 -
stronger measures than those assumed in the simulations or more rapidimplementation of measures to reduce the fiscal deficit and increase savingwill be called for, which will imply accepting further reductions in thegrowth rate. Second, any successful adjustment depends critically on theability of the economy to continue export growth rates of 10-11% p.a. whilerestraining import growth to 5-6% p.a. in real terms over the rest of thedecade. This would be a much better sustained trade performance than hasbeen achieved over the past two decades. It is in part necessitated by theincreasing service account deficits. Sustaining these rates will requireefforts both to stimulate production and to assure the competitiveness ofThai products at home and abroad in terms of price and quality. Third, theexternal debt that will be accumulated during the coming decade will besubstantial in any case, and debt-service ratios will rise. Debt managementwill be an important part of overall policy formulation in itself and inrelation to monetary policy. And, finally, it is possible to sustainsatisfactory rates of growth during this adjustment period - at least 4%p.a. real per-capita GDP growth - if a proper mix of policies is pursued,e.g., to increase savings, expand exports, restrain imports, and stimulateproduction in agriculture and industry. It is not a question of whetherappropriate policies exist. They do. It is a question of whether they willbe implemented in a timely fashion.
- 77 -
.Annex I
ANALYTICAL TOOLS:THE SOCIAL ACCOUNTING MATRIX AND THE SIMULATION MODEL
Introduction
A Social Accounting Matrix (SAM) provides the accounting framework
for the simulation model. It integrates national accounts, input-output,
balance of payments and fiscal data into a matrix format that presents a
unified picture of all the principal economic flows in the economy. Factor
incomes are generated by the four production activities of agriculture, manu-
facturing, energy and services and flow to the different institutions:
households, companies, and government. These institutions use their incomes
to pay taxes (households and companies only), to save, to consume, and to
make transfers to other institutions or to the rest of the world. Their
consumption is domestic final demand, and it is added to the intermediate
demand of activities to arrive at total domestic demand. This demand is
satisfied by the supply of goods from the domestic production activities
and by imports. Agriculture, manufacturing and services also export domestic
production. Other transfers and factor service payments between Thailand
and the rest of the world are included to complete the balance on external
current account. In this way, the entire cycle of economic activity is
recorded on a single table and the various interactions shown. Because of
the matrix format, it is easy to check that all accounts balance simultaneously,
and consistency checks are straightforward. The SAM is very much an extension
of an input-output table to include flows between institutions, saving-invest-
ment activities, production activities, and relations with the rest of the world.
It encompasses the important relations between the income generating activities,

- 78 -
the distribution of that income to institutions, and the resulting determination
of the composition of final demand.
For our analysis, a base-year SAM was constructed for 1975 to take
advantage of the data from the input-output table constructed for that year.
This SAM, which has 23 basic accounts, is in fact highly aggregated. There is
one factor of production, three institutions, four activities, three commodities
and the rest of the world. The current accounts of the institutions, households,
companies and government are separated; their capital accounts are consolidated
into a single capital account. Agriculture, manufacturing and services activities
produce domestic goods which are either mixed with imports, resulting in a com-
posite good traded on the domestic market, or which are exported.-/ Energy is
produced domestically and imported, and a composite good is traded on the domestic
market. There is a single rest of the world account for international trade,
net service payments, and transfers. The SAM structure is very flexible however,
and any basic account can be expanded into any desired number of subaccounts,
each balanced within the structure of the other accounts.
The macroeconomic simulation model uses the SAM accounting framework
described above. Its structure derives from that of the SAM, and analytical
functions have been specified for the implicit relations underlying the SAM.
The structural parameters have been estimated from historical data for the period
1960-79, and 1975-79 was used as a reference period to validate the model.
Given these paranmeters and a number of exogenous assumptions about future price
movements, the potential for agricultural growth, and some other structural
variables, the model produces all the elements in the SAM for each year of the
1/ The mix of domestic and imported goods in the composite good is partly afunction of their relative prices and partly a function of the degree ofsubstitutability assumed between imports and domestic production.
- 79 -
simulation. In this way, consistent evolutions of the economy can be traced
under alternate assumptions about policy actions and external developments,
and the results can be compared.
The essential features of the model are that:
(a) the activity level in the agricultural sector is supply determined, and
its growth rate is exogenously specified;
(b) production in the industry, energy, and tertiary sectors is demand deter-
mined as a function of the demand patterns of the institutions, their income
levels, relative prices and external demand for exports of manufactured
goods and services;
(c) prices are fixed in the sense that they do not respond to excess demand,
but are cost determined. Hence the model can analyze cost-push and/or
imported inflation, but not demand-pull inflation;l/
(d) demand for imports is a function of domestic aggregate demand levels and
relative prices, but imports are not perfect substitutes for domestic
goods and domestic and foreign prices will not generally be equal;
(e) demand for goods by the public and household sectors is based on Engel-
curve relations;
(f) indirect tax collections are based on average tax rates applied to the
relevant tax bases, direct taxes are included in the outlay patterns of
households and companies (which is equivalent to assuming the taxes are
imposed on income);
(g) investment behavior is exogenous; and
(h) the trade and savings gaps derive from the structure of the model and are
endogenously balanced in arriving at a solution.
1/ This is a drawback since problems of excess demand are a matter of concernin Thailand. Furthermore, models where prices are fully flexible may notbe relevant for an economy such as Thailand.

- 80 -
The Social Accounting Matrix
A brief description of the SAM
The accounting of an economy is best understood with the use of a
social accounting matrix (SAI).-/ First, a SAM gives a clear and synthetic
picture of the flows in the economy at a point in time. Second, it gives a
consistent accounting framework to serve as the basis for direct analysis or
to support a modeling effort. Table 1 shows a basic SAM for the Thai economy
in the year 1975.
As in all SAMs the figure in any cell represents a payment from the
column to the row account. For example, the figure in the cell at the inter-
section of column 4 and row 5 (6,877 million bahts) is a payment of government
to the consolidated capital account and is thus government savings. Another
accounting feature of SAMs is that all accounts must balance, hence each row
sum has to be equal to the corresponding column sum. For example, the sum of
row 2 gives total receipt of households from all services and the sum of column
2 is the total use of these receipts.
In column 1 the distribution of GNP at factor cost on the different
institutions is shown, while row 1 shows bow GNP at factor cost is generated.
In row 1/columns 6,7,8,9 the value added at factor cost of each activity is
shown, their sum is GDP at factor cost. When net factor income (-219) in row 1/
column 23 is added, we get the GNP at factor cost.
Column 3 distributes the total income of companies. In fact they pay
dividends (1,472), corporate taxes (3,629) and they save (26,175). The total
income of companies is 31,276 million bahts, the sum of row 3, and is constituted
from operating surplus (25,852), interest on consumer debt (1,972) and interest
on public debt (3,452).
1/ For a detailed account of the SAM approach, see Pyatt, Roe and associates(1977), Social Accounting for Development Planning, with Special Referenceto Sri Lanka, Cambridge, Cambridge University Press.

A SOCIAL ACCOWII8II MA4T11 OF THE 7T1R ECO116O4 1975
(to Milli--- of E.ht.)
Current AcCoujnt C... lidAted Producti.o Arti,itLt. A4OlClt.ro 14nufetunlot en.rgy StOIC..
F.c or .ou..- Co tnl,o.. Cove- Cov"Cl Ar Anef- -flonu -S.r, Sfio. fp- 7orts Ct o- tpar-I. IoS- Ce- ftO lOrt. Co- Flod. Lpo0rts Odir- oftrho To-a
holId. SOot Ac oitot uIn 6. 5it. .1t. alt ?-0 World
1 2 3 4 5 ,,j,, a 9 0 ... JL. .. I 12Ai... .. 1L 1.4... is.j, 16 17 la.jj. 19 20 21 222 4
F.cIo., 1 93,628 54.292 6.586 113.191 -21 267.475
2 R-oh. d. 2239.174 1.672 210 1.323 262,129
_ CoupoolCO 3 Z5.852 1.972 3.452 31,776
a CoootnOot 4 2,507 3,639 3.629 31 119 647 41,536
* Cosoldotd 5 0,462 26.175I 6,877 12,253 75.747
AgnIr-lue.- l18.ooo 29,4725 14686Z5
_ vatSponfsItul10 7 168,893 9,13.6 f685 Z106821M 1. 78 1812527
, ong! 8m7°-'- 77.895 IZ2,795
S W * vo- rnl uO 3 16, 835 Z, 7Z0 64 ,06 1 13 149 6 O , 75 1 648 12 * 7V 14 1, 1116 189.861
* -5-L11 t0 711693 9,144 112875 22,105 -- 0- 6,0 121.24 6
L C l7
rort~ 1 32.359 32.30959
IoP-rro 12 1.49S 1,495
C-of7
o..It 13 76,035 2,720 64,061 13,149 62751 648 12 8549 2372012
Eurucro 14 14.139 16.139~~~~~~~~~~~~~~~~~~~~~~~~~~~~~~~~~~~~~~~~~~~~~~~~1,3
IooFF 5 3722 7.551
Cooo-t a 2 16 6.644 831 7,742 3,627 6.541 t6.812 4.1 55 42.601
KopOtt- 17 -0- -0-
oprO 18 16,445 14,445
Cropolt 19 50,715 2 7.4212 26.746 21.28 3,849 47,436 0 8.7
Eota 20 11.316 12.326
loro 21 5.5745.2574
f.in dret T-0 27 852 1.634 394 12.073 471 7.502 312 -0- 114 1,508 -0- .0- 31,119
otof World 72 109 34 1.101 ~ 9.49 16.022 0.574 71.018
24 27 ~~~~~~~148,623 181,957 2184154111273139 t41279Z l,13013.33T0.1. 24 267,67 2J2.17 51,776 1,536 75.147 213318.6 1127 639 .9 2787 23 16,445 1862' 15631,119 171.018
St.~ toi.tfr-I dl1-Nlloan aldodt nvt Fo.4Ia~n.drn

- 82 -,
Government outlays are given in colunmn 4. Reading dow-n the column
we see transfers to households (210), interest on public debt (3,452) govern-
ment savings (6,877), government expenditure on manufactures (2,720), energy
(831) and services (27,412), and transfers abroad (34). Row 4 gives the for-
mation of government revenue from factors (2,502), household taxes (3,639),
corporate taxes (3,629) and net indirect taxes (31,119).
Row and column 5 are, respectively, the receipts and outlays of the
consolidated capital account. Row 5 shows the sources of saving and column 5
shows the investment demand.
The SAM gives the production activities in rows/columns 6 to 9, and
the commodities in rows/columns 10 to 21. The sum of column 6 is the total
expenditure of the agricultural sector, which is equal to its total production
given as the sum of row 6. This total production (148,625) is either delivered
to the domestic market (118,900) or exported (29,725). The deliveries to the
domestic market are then combined with imports of agricultural product (1,495)
plus indirect taxes (852) and that constitutes the total supply of the composite
agricultural good on the domestic market (121,247). This supply is the slim of
column 10 and-is equal to the sum of row 10, which is the aggregate demand for
the composite agricultural good. The other activities and ccmmodities are orga-
nized in the same way except it is assumed there are no energy exports.
Indirect taxes are accounted for in row/column 22. in row 22/colunns
10 to 21, the different sources of indirect taxes are given. They are levied
on either domestically traded goods, or on internationally traded goods. In
the latter case they are tariffs on imports or taxes on exports.
Finally, row 23 gives the flows out of the country whether they are
transfers (columns 2 and 4), or imports (columns 12, 15, 18, 21). Column 23
accounts for the flows from abroad into the country. They are in row 1, net
- 83 -
factor income;-/in rows 2 and 4, the transfers to households and government
respectively; and in rows 11, 14 and 20, exports. The figure in row 5/colunn 23
is the current account deficit which is also equal to the savings gap.
Construction of the SAM
The distinctive features of this particular SLM are:
i) it is consistent with the national accounts figures of 1975;
ii) it distinguishes four activities 2/(sectors of production):
- agriculture,
- manufacturing,
- energy,
- services;
iii) it distinguishes three commodities for each activity:
- composite goods and services traded on the domestic market,
- imported goods,
- exported goods.
The three main sources of data that were used to build the SAM are:
(1) the national accounts figures for 1975, as revised in the 1979 issue of the
National Accounts of Thailand;
(2) the input-output matrix for 1975 published by NESDB. It assumes competitive
imports and is presented in purchasers prices and;
(3) the Statistical Bulletin of the Bank of Thailand.
The main assumptions and procedures used to get a balanced SAM consistent with
the national accounts are described below.
1/ The factor income balance is a deficit one and net factor income is actuallya flow out of the country, that is why it is entered with a negative sign.
2/ Agriculture includes: crops, livestock, forestry and fisheries. Manufac-turing includes all manufacturing (mining and quarrying and constructionincluded); it excludes petroleum products. Energy includes petroleum Pro-ducts and electricity and water supply. Services include wholesale and retailtrade, transportation and communication, banking, insurance and real estateservices, public administration and defense.

- 84 -
There is only one factor of production which receives the value
added created by the four activities (row 1/columns 6, 7, 8 and 9). This
is gross value added at factor cost: it includes depreciation but excludes
indirect taxes. The figures for agriculture and services are those of the
national accounts. The split between manufacturing and energy is based on
the decomposition of GDP at factor cost given in the input-output table.
National accounts do not provide separate constant value GDP at factor cost
for manufacturing and services and appropriate adjustments were made.
Three types of institutions are considered: households (including
private nonprofit institutions); companies and government. Their current
accounts are distinguished while their capital accounts are consolidated.
The three current accounts and the consolidated capital account are given in
rows/columns 2, 3, 4 and 5. Row 2 gives the receipts of households from the
different sources. The figures in all the cells of this row are consistent
with the national accounts figures. Dividends, however, have been taken out
of property income and put as transfer from companies to households (row 2/
column 3). Row 3 gives the receipts of companies. The operating surplus
(including provision for the consumption of fixed capital) appears in cell
(3,1). It is derived residually. Cells (3,2) and (3,4) give the interest
on consumer debt and the interest on public debt, respectively.
In row 4, all receipts of government appear:
i) (4,1) is government income from property and entrepreneurship;
ii) (4,2) is the sum of direct taxes on households and other transfers
from households;
iii) (4,3) is direct taxes on corporations and;
iv) (4,22) is net indirect taxes.
- 85 -
The consolidated capital account is in row 5. All the figures are
from the national accounts and they include:
i) the savings of households and private nonprofit institutions (5,2);
ii) the savings of corporations, including the provision for the consumption
of fixed capital (5,3);
iii) the savings of government (5,4) and;
iv) "foreign savings" (5,23).
Rows 10, 13, 16 and 19 give the aggregate demand for agricultural
commodities, manufacturing, energy and services, respectively. Column 2 in
rows 10, 13, 16 and 19 gives the allocation of private consumption expenditure
between the four sectors considered. We have taken the average propensities
to consume out of total private consumption expenditure given in the I-0 table
and applied them to the figure of total private consumption expenditure given
in the national accounts. This assumes that purchaser prices and market prices
used in the national accounts are the same and that over the interval considered,
average and marginal propensities are equal.
Column 4 in rows 10, 13, 16 and 19 gives the allocation of government
consumption expenditure between the different sectors. The assumptions made are
the same as for private consumption expenditure, except where government con-
sumption of agricultural products has been put to zero. In fact, according to
the I-0 table it appears to be negligible.
Column 5 in rows 10, 13, 16 and 19 gives the distribution of total
gross investment between sectors of origin. The same procedure was used as for
private and government consumption. It was, however, performed separately for
increases in stocks and for fixed capital formation. No fixed investment uses
energy or services production and there is no accumulation of stocks in services.

- 86 -
The last elements in final demand are exports. It is reasonably
assumed that there are no exports of energy.-/ Thus, exports consists of
agricultural, manufactured and service exports. Total exports of goods and
nonfactor services are given in the national accounts as 57,014 million bahts.-
From the Basic Economic Report (September 1, 1978) it is possible to compute
the value of agricultural exports (Tables 3.2 and 3.3 of the Appendix) which
amount to 31,359 million bahts. Manufactured exports are also obtained from
the same source and their value is 14,139 million bahts. Exports of nonfactor
services are computed as the difference between total exports of goods and
services, and agricultural and manufactured exports. Their value is 11,516
million bahts. These three figures of exports appear in (11,23), (14,23) and
(20,23). They include export taxes paid by the rest of the world to exports
3/which repay them to the account of indirect taxes. The export taxes-on agri-
cultural and manufactured exports are assumed to be 1,634 million bahts and
471 million bahts (22,11) and (22,14) respectively. The value of exports from
the agricultural sector is thus 31,359 - 1,634 = 29,725 million bahts, and this
figure enters (6,11). Likewise, the value of manufactured exports from the
manufacturing sector is 25,655 - 471 = 25,184 million bahts, and this figure
enters (7,14). It is assumed that no export taxes are levied on exports of ser-
vices. Hence, the figure in (9,20) is identical with that in (20,23).
To get the aggregate demand for the composite good in the four sectors
one must add intermediate demand to the final domestic demand determined in rows
2, 4 and 5 and of columns 10, 13, 16 and 19 above. This implies the use of the
1/ In fact in 1975, 230 million bahts of petroleum products have been exported,this figure being 98 million bahts in 1976 and negligible afterwards. (SeeBOT Statistical Bulletin, Dec. 1979, p. 54). For 1975 we have considered the230 million bahts to be exports of manufactures.
2/ These exports include export taxes.
3/ See below.

- 87-
interindustrial flows. This requires several steps. First,information on
indirect taxes and imports is needed. Net indirect taxes as given in the
national accounts are 31,119 million bahts. For FY75 import duties are 8,270
and export taxes are 2,105 million bahts (See Table 5.6 of Statistical Appen-
dix). Using these three figures, indirect taxes on domestic trade would be
20,744 million bahts. To allocate these taxes between domestic goods and
imported goods requires further calculation.
For FY75 import duties are allocated according to Table 2 for con-
sistency with the SAM classification, it is assumed that duties on foodstuffs
and on agricultural imports are the same. Likewise, petroleum products are
assumed to cover energy imports. The remaining duties are assumed to fall on
imports of manufacturing products.
Table 2: Import Duties(million bahts)
Petroleum products 374
Foodstuffs 394
Machinery 3,488
Textiles 443
Other 3,571
Total 8,270
Source: Basic Economic Report, Sept. 1, 1978
Import duties on agricultural imports (394) appear in (22,12) of the SAM, those
on manufacturing imports (7,502) in (22,15), and finally import duties on energy
imports (374) are put in (22,18). Figures for export taxes for FY75 are given in
Table 3.

- 88 -
Table 3: Export Taxes(million bahts)
Rice premium 795
Rice duty 514
Rubber 325
Other 471
Total 2,105
Source: Economic mission, Feb. 1980
For consistency with the SAM classification, the rice premium and the rice duty
as well as taxes on rubber are considered as taxes on agricultural exports.
With these approximations, indirect taxes paid on the agricultural
composite good are 852 in (22,10); on the composite manufacturing good, 12,072
in (22,13); on energy, indirect taxes are given in (22,16) with a value of 312;
and finally, on services, indirect taxes are given in (22,19) with a value of
7,508 (all figures are in millions of bahts).
Even excluding "unallocated" imports given by the 1-0 table, total
imports from this source (98,554 million bahts) are still higher than the figure
in the national accounts, which is 70,795 million bahts.-/ Furthermore, according
to the I-0 table, no imports of nonfactor services occur. A first estimate of
imports disaggregated by the four sectors of the SAM is obtained by applying the
shares implicit in the 1-0 table to total imports given in the national accounts
(Table 4).
1/ Does not include import duties.
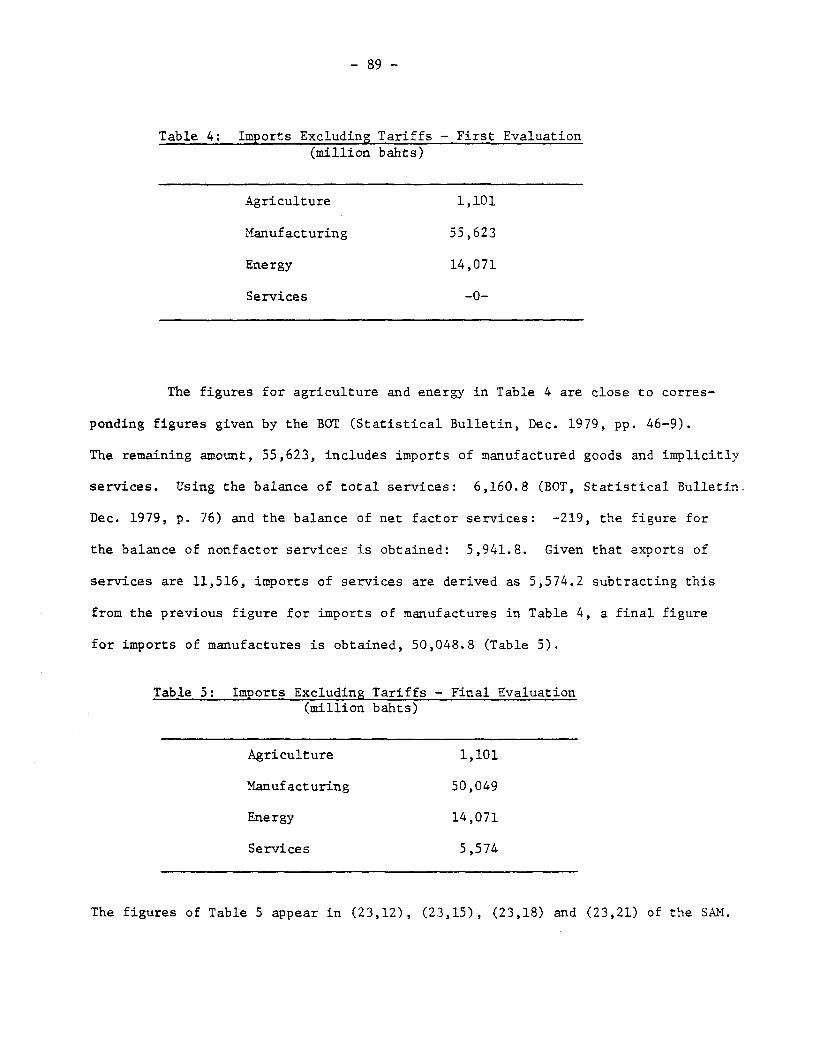
- 89 -
Table 4: Imports Excluding Tariffs - First Evaluation(million bahts)
Agriculture 1,101
Manufacturing 55,623
Energy 14,071
Services -0-
The figures for agriculture and energy in Table 4 are close to corres-
ponding figures given by the BOT (Statistical Bulletin, Dec. 1979, pp. 46-9).
The remaining amount, 55,623, includes imports of manufactured goods and implicitly
services. Using the balance of total services: 6,160.8 (BOT, Statistical Bulletin.
Dec. 1979, p. 76) and the balance of net factor services: -219, the figure for
the balance of nonfactor services is obtained: 5,941.8. Given that exports of
services are 11,516, imports of services are derived as 5,574.2 subtracting this
from the previous figure for imports of manufactures in Table 4, a final figure
for imports of manufactures is obtained, 50,048.8 (Table 5).
Table 5: Imports Excluding Tariffs - Final Evaluation(million bahts)
Agriculture 1,101
Manufacturing 50,049
Energy 14,071
Services 5,574
The figures of Table 5 appear in (23,12), (23,15), (23,18) and (23,21) of the SAM.

- 90 -
Imports are an addition to supply and their value in that respect
has to include import duties. By adding import duties to the value of imports
cif, the value of the supply of imported goods is obtained. In (12,10) the
value of imported agricultural goods including duties is given. For manu-
facturing imports the figure is given in (15,13), for energy imports it is
put in (18,16), and for services it is in (21,19).
Now we return to the derivation of interindustrial flows, aggregate
demand, intermediate demand and gross production. The approach followed is to
obtain, as a first step, good estimates of total intermediate sectoral demands
and total intermediate sectoral costs. A second step is to use these marginals
and estimate a new matrix of interindustrial flows consistent with them by
applying the RAS method.- In fact the procedure involves more than two stages
because of the need to adjust some figures and ratios to information from dif-
ferent sources.
The first step was the aggregation of the (33 x 33) interindustrial
matrix- /into a (4 x 4) matrix. In fact only the (32 x 32) first sectors were
aggregated and the last sectors, "unallocated", was dropped. The matrix obtained
in this way and the implied intermediate demand are given in Table 6.
Table 6: Interindustrial Flows(million bahts)
Agriculture Manufacturing Energy Services Intermediate
Agriculture 17,762 52,595 -0- 5,790 76,147
Manufacturing 28,782 77,176 762 17,341 124,061
Energy 6,306 6,417 17,890 7,594 38,207
Services 15,544 9,456 1,202 17,131 43,333
1/ RAS is a method used to update matrices or to balance them. See Bacharach, M.(1970) Biproportional Matrices and Input-Ouput Change, Cambridge University Press.
2/ NESDB, Input-Output table, Competitive imports 1975.

- 91 -
Table 6 gives a first estimate of total intermediate demand. However, the
fourth column includes the intermediate demand of the wholesale and retail
trade sector, whereas the fourth row does not include any delivery of that
sector to other sectors. In fact, total deliveries of wholesale and retail
trade are lumped together in the published input-output table. Their value is
71,908 million bahts. This figure should be added to the intermediate demand
of services. The figure in the last row and last column of Table 6 which
is total intermediate demand of services, becomes 115,241 (43,333 + 71,980).
Using the above estimate of total intermediate demand and total non-
export final demand, total domestic agg- gate demand for the composite goods are
calculated. These aggregate demands have to be equal to aggregate supplies,
hence, given imports and taxes, one can compute the domestic supply of domestic
goods. With the figures of exports, this allows for computation of the gross
production of each sector. Having determined previously the vector of value added
it is then easy to czmpuze the vector of total intermediate costs (Table 7).
Table 7: Total Intermediate Costs -- First Estimate(million bahts)
Agriculture 90,934
Manufacturing 157,430
Energy 26,681
Services 78,611

- 92 -
The intermediate costs of Table 7 are consistent with the other
figures of the SAM, however, they are not equal to the intermediate costs
obtained by adding up the different columns of Table 6. However, before
applying the RAS method to the data in Tables 6 and 7 to achieve a complete
and balanced SAM, two additional adjustments must be made.
(1) The figure used for agricultural exports before taxes (6,11)
corresponds to the trade classification used by the Bank of Thailand. However,
the class fication underlying the input-output table is the industrial classi-
fication. For the latter classification, any processing of an agricultural
product is an activity of the manufacturing sector. Hence, when an exportable
agriculture good is even slightly processed before export, it becomes a manu-
factured export according to the industrial classification. Thus, the figure
in row 1/column 2 of Table 6 (52,595) contains deliveries of agricultural
goods which are slightly processed by the manufacturing sector and then
exported. But, in fact, these goods are already included in agricultural
exports in (6,11) of the SAM. Consequently, the intermediate demand of agri-
cultural goods as given in Table 6 is an overestimation of actual domestic
intermediate demand.
(2) Imports of energy in (18,16) of the SAM are 14,445 million bahts.
The figure given by the Bank of Thailand (Statistical Bulletin, Dec. 1979, p. 49,
"Fuel and Lubricants") for imports of fuel and lubricants is 14,233 million bahts.
However, imports of-energy reported in the input-output table are 19,588 million
bahts. Given the aggregate demand for energy (obtained by adding final demand
for energy, to intermediate demand), the equality between aggregate demand and
aggregate supply, and the chosen figure of imports (14,445); there would be an
overestimate of domestic demand for domestic energy. Consequently we would over-

- 93 -
estimate domestic production of energy.
In order to take account of the above distortions, a reestimation
of the vectors of intermediate demand and of intermediate costs was under-
taken. The flows of intermediate demand of manufacturing from agriculture
and of energy from energy have also been revised. With the two new marginal
vectors, the RAS method was applied on the modified interindustrial matrix
in order to get a final matrix of interindustrial flows. In that way the
whole SAM is balanced.
The new vectors of intermediate demand and of intermediate costs
are given in Table 8. The basic assumptions underlying them are:
i) Agricultural exports are 20% of gross agricultural production;
this implies a gross production of 148,625 million bahts and a domestic demand
for domestic goods of 118,900. Consequently aggregate supply and aggregate
demand are 121,247 million bahts and total intermediate demand for agricultural
goods is then 40,210 million bahts.
ii) The first row of Table 6 is modified to take account of the
new figure for total intermediate demand. Intermediate demands of agricultural
goods are assumed to be 17,191; 17,473; 5,546 for agriculture, manufacturing and
energy,and service, respectively.
iii) Taking account of the difference between the figure of imports
of energy given in the input-output table (19,588) and the figure chosen in
the SAM (14,445),1'/gross production of energy is estimated to be 27,895 million
bahts.
1/ The 230 million bahts of exports of petroleum products are also taken intoaccount.
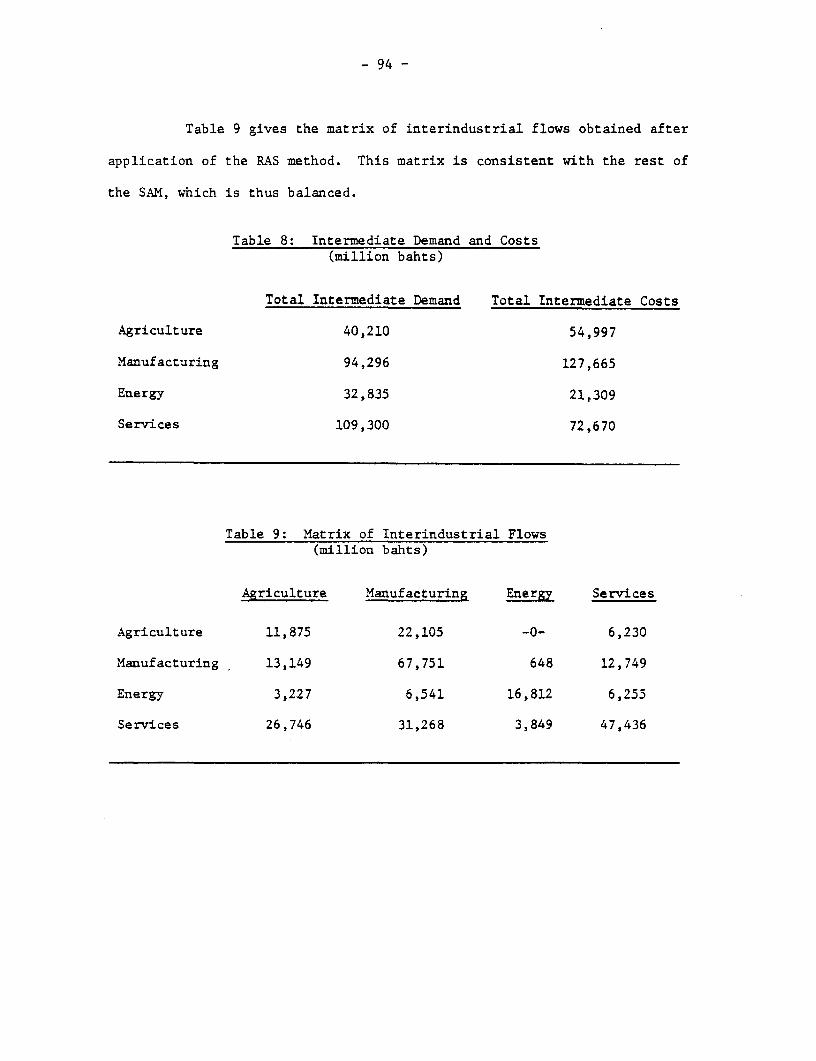
- 94 -
Table 9 gives the matrix of interindustrial flows obtained after
application of the RAS method. This matrix is consistent with the rest of
the SAM, which is thus balanced.
Table 8: Intermediate Demand and Costs(million bahts)
Total Intermediate Demand Total Intermediate Costs
Agriculture 40,210 54,997
Manufacturing 94,296 127,665
Energy 32,835 21,309
Services 109,300 72,670
Table 9: Matrix of Interindustrial Flows(million bahts)
Agriculture Manufacturing Energy Services
Agriculture 11,875 22,105 -0- 6,230
Manufacturing 13,149 67,751 648 12,749
Energy 3,227 6,541 16,812 6,255
Services 26,746 31,268 3,849 47,436

- 95 -
The SIAM1 Model
Economics of the Model
Given the SAM accounting framework defined above, a full model is
obtained by specifying agents'behavior and market adjustments. This model,
SIAMŽ1, is described below. It relies on several behavioral relations within
the accounting structure imposed by the SAM.
Households, companies and government are assumed to allocate their
total receipts across their different expenditure possibilities according to
some utility maximization- /principal assuming unchanged relative prices.
Thus, Engel-curve relations are used to allocate total receipts of each of
these institutions' current account of transfers between institutions, savings
and government and private consumption. Firms are assumed to determine inter-
mediate demands, household and government consumption, and exogenously given
investment, total aggregate demands by sector are thus determined. These are
demands for composite goods as demand baskets are composed of both imports and
domestically produced goods.
Given aggregate demand for the composite goods, the question is then
the determination of its composition between imports and domestically produced
goods. It is assumed that given a level of the aggregate demand for the com-
posite good, the ratio of imports to domestically produced goods is obtained
through cost minimization.-/
Agricultural exports are assumed to be the excess of agricultural
production over the domestic demand for the domestic agricultural products.
Exports of manufactures and services are assumed to be sensitive to the ratio
of the world price of exports to the supply price of the Thai exports. These
1/ For companies and government this is more a convenient allocation rule thana truly behavioral assumption.
2/ This is again a convenient allocation rule and not a behavioral assumption.

- 96 -
are, in fact, demand functions of the rest of the world for Thai manufactures
and services.
We now turn to the assumptions on market adjustments. Factor mar-
kets are not modeled. Net prices or value added coefficients in current prices
in manufacturing, energy, and services are assumed exogenously. Production in
the products markets is demand determined for manufacturing, energy and services.
Agricultural production is assumed exogenous and, for this sector, the model
is supply determined. However, the agricultural net price is endogenous.
SIAM1 is a fixed-price model. Given import prices, tariffs and net
prices in manufacturing, energy and services, domestic prices and prices of the
composite goods are determined on a cost basis. This price assumption does not
mean that prices are constant. It simply means that they do not react to excess
demand; they are purely cost determined. Once the composite goods prices and
domestic prices are determined, they jointly determine the net price of agricul-
ture. The domestic prices of manufactures and services, with export taxes,
determine the supply price of exports of manufactures and services. Subsequently,
the ratio of the world price to the corresponding Thai supply price determines
exports for manufactures and services.
At this stage, prices, investment, exports of manufactures and services
and agricultural production are given. The rest of the model is a form of a
multisectoral Keynesian model. All the remaining variables are determined simul-
taneously in order to find the level of activity which equalizes injections and
leakages. The main features distinguishing SIAM1 from a standard Keynesian model
are the way agriculture is treated and the way imports are modeled.
As mentioned, agriculture is supply determined and is an exception to
the usual assumption of demand driven production. Agricultural exports are not

- 97 -
injections, since they do not contribute to increased aggregate demand and
do not raise the level of activity. They adjust to equalize supply and demand.
On the import side,l/the main difference is that imports are not
considered to be purely competitive. They are not simply added to domestic
output to determine total supply. Rather they are more or less substitutable
to domestic supply depending on whether an elasticity of substitution is close
to infinity or to zero. Furthermore, this specification allows the existence
of a difference between world and domestic prices for traded goods. Hence one
can obtain a relative autonomy of movements of domestic prices vis-a-vis world
prices. This is dependent, however, on the value of the elasticity of substitution.
Structural Relations of SIAM1
The above points give a general feeling of the model and of its working.
In the following, a description of the variables and the relations is given. All
variables with a bar are exogenous variables, and t is the time subscript.
PDt-, i=1,2,3,4 are the prices of domestic goods at time t; V.t, j=1,2,3,4
are the net prices, with Vit endogenous and the others exogenous; and Pit, i=1,2,3,4
are the prices of the composite goods aiW, i,j=1,2,3,4 denoting the input-output
coefficients, and the prices of domestic goods are given by
4lt =Vit+ i il Pit
4 (1)
PD - + iL Z i Pit j_2,3,4
l/ For an account of this approach, see De Melo and Robinson (1978), "Tradabilityin Trade Theory," World Bank; and Dervis, De Melo and Robinson, PlanningModels and Development Policy, Chapter 7, (forthcoming).
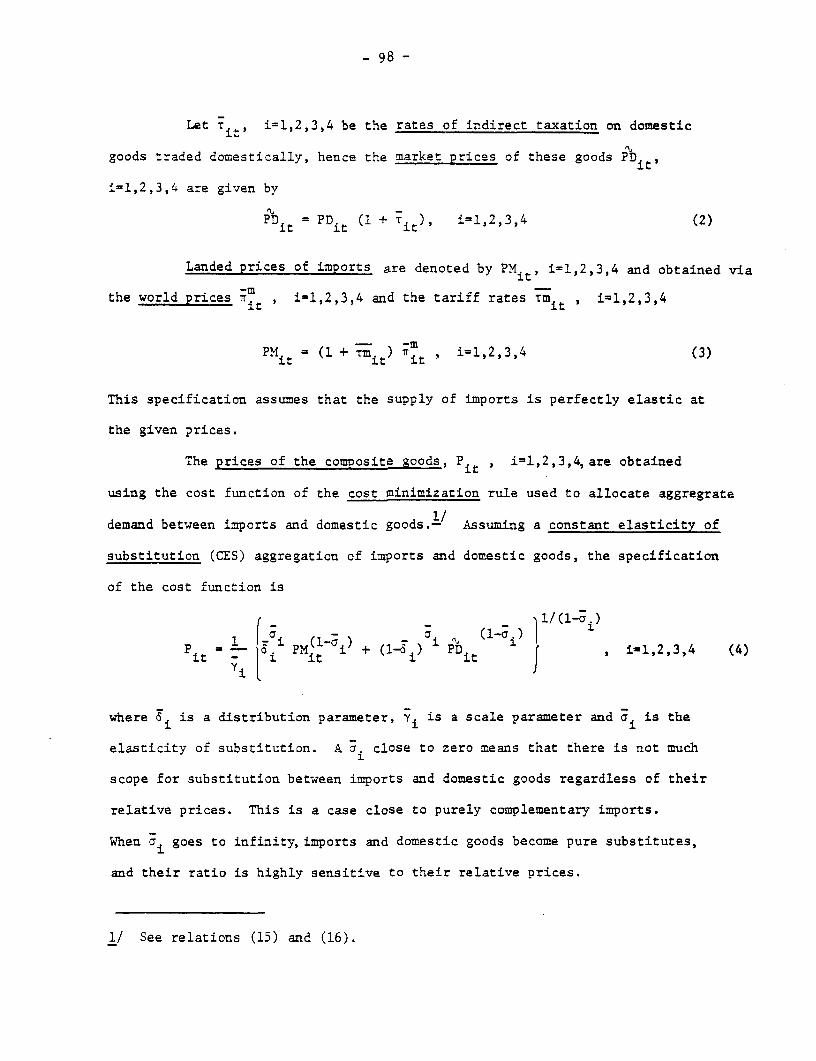
- 98 -
Let r it, i=1,2,3,4 be the rates of indirect taxation on domestic
goods traded domestically, hence the market prices of these goods PDit,
i=1,2,3,4 are given by
11 _
PDit =PDit (1 + Tit), i=1,2,3,4 (2)
Landed prices of imports are denoted by PM t, i=1,2,3,4 and obtained via
the world prices X t, i=i,2,3,4 and the tariff rates Tmit I i=1,2,3,4
-mPMit (1+ Tm it it i=1,2,3,4 (3)
This specification assumes that the supply of imports is perfectly elastic at
the given prices.
The prices of the coumosite goods, Pit , i=1,2,3,4,are obtained
using the cost function of the cost minimization rule used to allocate aggregrate
demand between imports and domestic goods.- Assuming a constant elasticity of
substitution (CES) aggregation of imports and domestic goods, the specification
of the cost function is
p 1 { t6°i PM(1-(i) + (1-d ) I PD i-1,2,3,4 (4)'Y
where i is a distribution parameter, Yi is a scale parameter and ai is the
elasticity of substitution. A ai close to zero means that there is not much
scope for substitution between imports and domestic goods regardless of their
relative prices. This is a case close to purely complementary imports.
When ai goes to infinity,imports and domestic goods become pure substitutes,
and their ratio is highly sensitive to their relative prices.
1/ See relations (15) and (16).

- 99 -
In SIALM1, the domestic price of agricultural goods PDit , is deter-
mined by the exogenous world price of exports of these goods, with an allowance
for exDort taxes. However, because o' lack of market informati:n, it is assumed
that the current domestic price of agriculture PD,t adjusts to both the currentit~~-
world price and the world price of last period. Hence, with xe t , the world
price of agricultural exports and Teit , the export tax on these goods:-
1 ( ee(5)it 2 ( lt + l(t-l)) / + elt) (5)
This specification assumes that Thai exporters of agricultural goods are price
takers, and they bear the burden of any export taxes. One could argue that
Thailand is a major exporter of rice and, hence, can influence its world price.
However, considering agricultural exports as a whole, the price taking assump-
tion seems reasonable.-/
Exports of manufactures and services are assumed to be sensitive to
relative world and Thai prices. World prices are exogenous and the
supplier's prices, PE2t and PE4c' respectively, are linked to the corresponding
domestic prices PD2t and PD4t with an allowance for export taxes:
PE2 t (+e 2 t) PD2 t , PE4 t ' (l + re4t) P3 4t (6)
where re2t and -re4 t are the export tax rates.
All the preceding relations determine prices without any reference
to quantities; this results from the fix-price nature of the model. However,
prices intervene in the determination of quantities produced and incomes earned.
The relations determining these variables are describedbelow.
1/ This is one version of the model. In another the elasticity of the domesticprice with respect to the current world price is assumed to be less than one,
2/ This seems also to be the relevant assumption in "Thailand: Towards aDevelopment Strategy of Full Participation," IBRD.
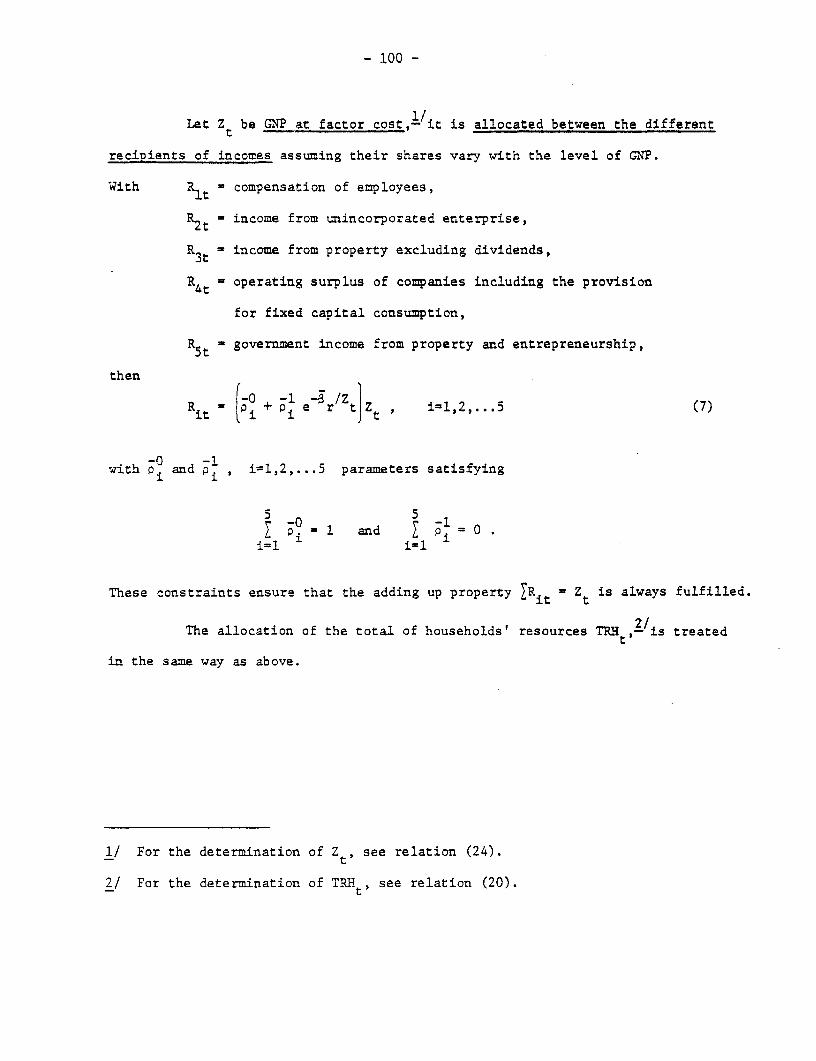
- 100 -
Let Z be GNP at factor cost,- it is allocated between the differentt
recipients of incomes assuming their shares vary with the level of GN?.
With Rlt compensation of employees,
R2t income from unincorporated enterprise,
R3t income from property excluding dividends,
R4 t operating surplus of companies including the provision
for fixed capital consumption,
R3t 'government income from property and entrepreneurship,
then
Rt = i + Pi e r tzt ' i=1,2, .... 5 (7)
with P. and pi , i=1,2,...5 parameters satisfying
Pi = 1 and Pi . 0i=11il
These constraints ensure that the adding up property JRit Zt is always fulfilled.
The allocation of the total of households' resources TRHt ,-/is treated
in the same way as above.
1/ For the determination of Zt, see relation (24).
2/ For the determination of TRHt, see relation (20).

- 101 -
Let Hlt interest on consumers' debt,
H2t = personal taxes and other current transfers to government,
H3t = households' savings,
H4t consumption of the agriculture composite good,
H5t consumption of manufactures,
H6t consumption of energy,
=7t consumption of services,
H8t = current transfers to the rest of the world,
then the allocation relations are
Hit ' + hi e h/ /ItRTHRHt, i=1,2,...8 (8)
with again Jh. = 1 and 0hl = ° in order to ensure that i Hit TRHt always holds.
The same type of relations are used to allocate the total income of
companies-/ TICt. With the notations
clt = dividends,
=2t = corporate taxes,
'3t = corporate savings,
then
it (Ci + Ci e cCt1TICt i, l,2,3 (9)
with ico - 1 and itc = O so that IC TICt.
Finally, total government revenue,--/GREV , is allocated again in
the same way:
1/ For the determination of TIC, see relation (21).
2/ For the determination of GREV t see relation (22).

- 102 -
Let Glt = transfers to households,
G = interest on public debt,
G3t= government savings,
G = government consumption of manufactures,4t
G5t government consumption of energy,
G6t = government consumption of services,
G7t = government transfers to the rest of the world,
then
G = ( + -1 eg/GREV t3GREVt , i=1,2,...7 (10)
with E gi = I and i gi = ° ensuring that iJGit = GREV .2.l i=l
These allocation rules with the above constraints on the parameters do not
imply that the government budget is balanced. GREV is allocated between
current outlays and savings, but government capital expenditure is not included.
Thus, depending on the relative value of government savings and government
investment. there may be either a deficit or a surrlus.
Some comment on the postulated allocation relations is in order here.
First, it is easily seen that the expression between brackets is a budget share
-o -0and that it is dependent on total income (or expenditure). Second, ail Cip
-o -0hi, and Pi have the interpretation of budget shares, for total expenditures
shrinking to zero. Hence, for very low levels of total expenditures,the budget
shares will tend to be very close to the value of these parameters. Third, for
total expenditures becoming very large, the expressions between brackets will
tend towards g+ g., c. + c., h° + h., and ai + -1. Hence, these sums can bei i 1 1
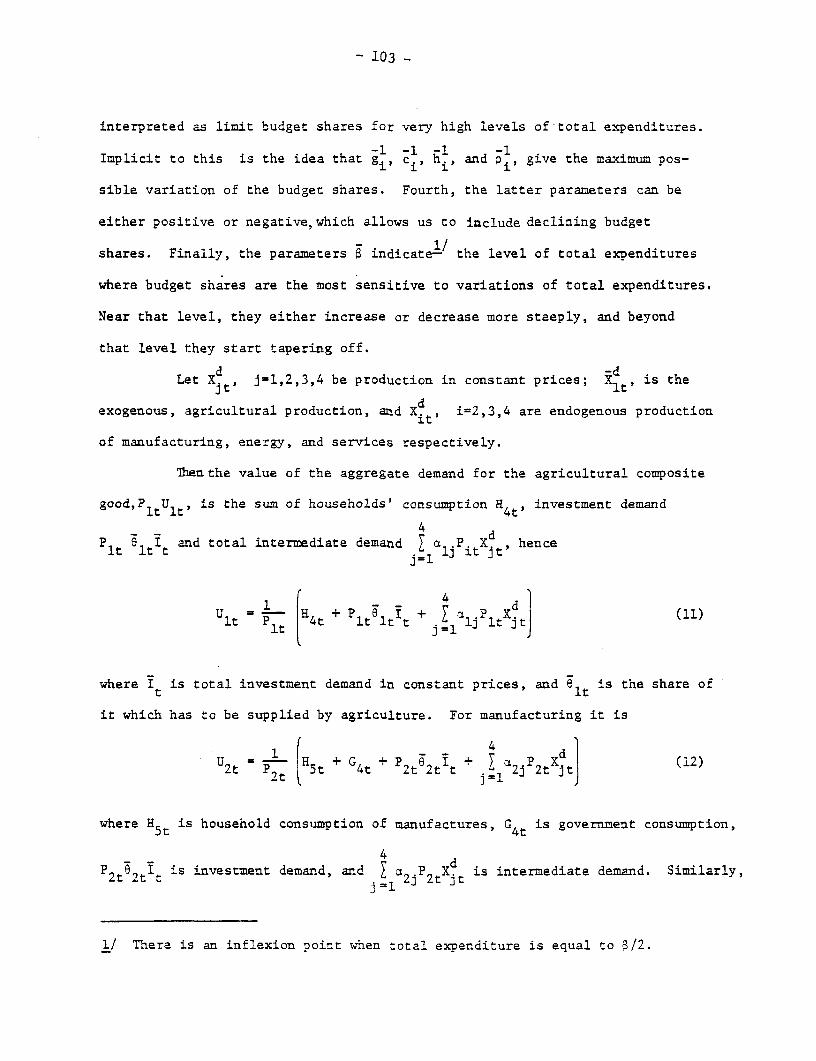
103
interpreted as limit budget shares for very high levels of total expenditures.
Implicit to this is the idea that g , c.,, hi, and Pi, give the maximum pos-
sible variation of the budget shares. Fourth, the latter parameters can be
either positive or negative, which allows us to include declining budget
shares. Finally, the parameters 6 indicatel/ the level of total expenditures
where budget shares are the most sensitive to variations of total expenditures.
Near that level, they either increase or decrease more steeply, and beyond
that level they start tapering off.
Let X.t, j-1,2,3,4 be production in constant prices; Xdt, is the
exogenous, agricultural production, and Xdt, i=2,3,4 are endogenous production
of manufacturing, energy, and services respectively.
Thenthe value of the aggregate demand for the agricultural composite
good,PUitlt, is the sum of households' consumption H4t investment demand
4 ~~dPit ltIt and total intermediate demand i alcPit X. hence
lt Pit 4t it lt t jl lji t it
where I is total investment demand in constant prices, and e is the share oft it -s
it which has to be supplied by agriculture. For manufacturing it is
U = LfH + G+ pet + ai PXd 1122t p9 t5t 4t 2t 2t t jIl 2j 2t itJ (12)
where H5t is household consumption of manufactures, G4 t is government consumption,
P2te tIt is investment demand, and i a2jP2tXjt is intermediate demand. Similarly,j l
1/ There is an inflexion point when total expenditure is equal to aI2.
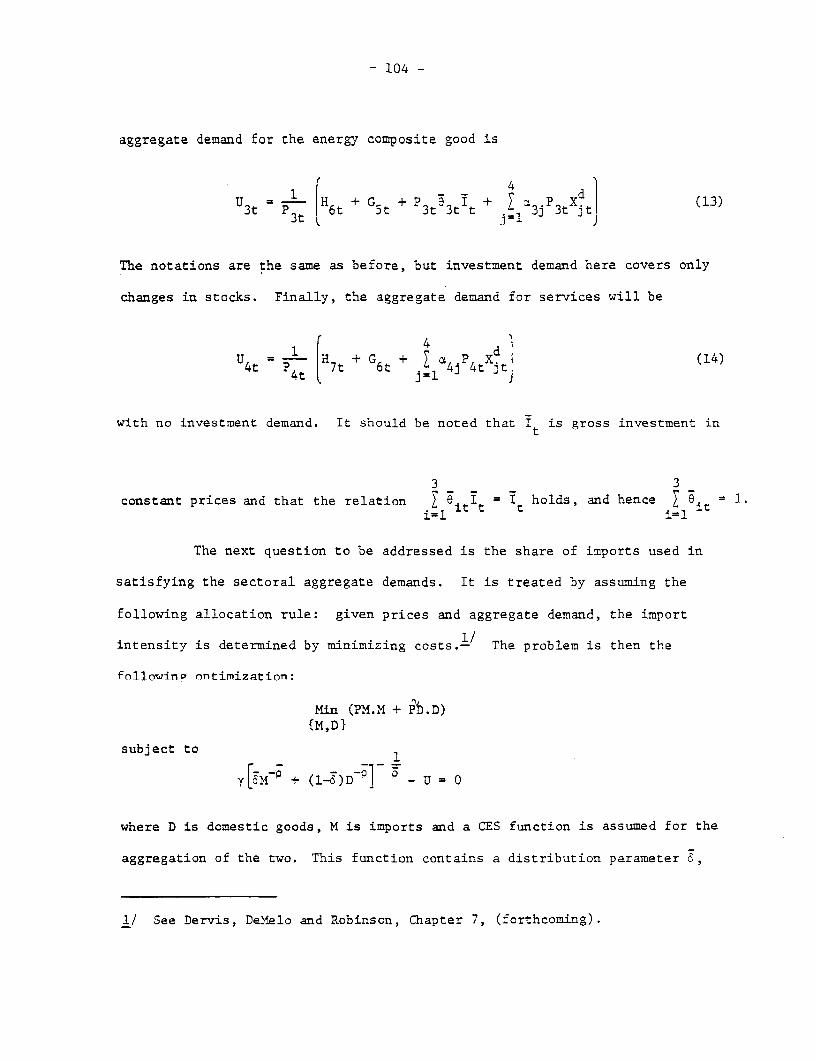
- 104 -
aggregate demand for the energy composite good is
u ~ ~ ~ + 9I+ (~ 13)3t P Nt ' 6t 5t 3Jt 3t t jl3i 3t jt (133t L J 1 j3
The notations are the same as before, but investment demand here covers only
changes in stocks. Finally, the aggregate demand for services will be
U 4 t 5 = H 7 t + G 6 t + a 4JP4tXjt] (14)4t ~~~j=1
with no investment demand. It should be noted that It is gross investment in
3 3
constant prices and that the relation e 9 I = I holds, and hence 9iti=lit i=l
The next question to be addressed is the share of imports used in
satisfying the sectoral aggregate demands. It is treated by assuming the
following allocation rule: given prices and aggregate demand, the import
intensity is determined by minimizing costs.l/ The problem is then the
followirna ontimization:
Min (PM.M + PD.D)(M,D}
subject to 1
Y[6M3 + (1-5)D1] p _ U = 0
where D is domestic goods, M is imports and a CES function is assumed for the
aggregation of the two. This function contains a distribution parameter 6,
1/ See Dervis, DeMelo and Robinson, Chapter 7, (forthcoming).

- 105 -
a scale parameter y and a substitution one p. The elasticity of substitution,
a is defined as 1/(1+P). Solving the above problem leads to the following
allocation relations which determine for each vector of prices and each level
of aggregate demand the amount of imports and domestic demand required:
D i y (1(i (Ft/PD) U (15)
-aiMit = yi (Pi/PMiJ Ui , i-1,2,3,4 (16)
In fact, relation (4) determining the prices of the composite goods is obtained
as the dual of the cost minimization problem considered here, which is why
the parameters used here and there are the same.
Exports of agricultural products are obtained as the excess of produc-
tion over domestic demand for the domestic goods
-dE =X X- (17ilt xit Dit (7
where the three variables are in constant prices.
Exports of manufactures and services are assumed to be sensitive to
the ratio of the world price to the domestic suppliers'price:
Eit i ( it/ it) ' i-2,4 (18)
where w;t is the world price (exogenous), ni is a constant elasticity and
- ~~~~~~~~~~~~~~-eEB is a parameter giving the value of exDorts where r = PE EB mayit it it it M
vary with time in order to catch the movements in the world GDP growth.

- 106 -
Production is demand-determined in manufacturing,
energy and services. It is obtained via the equilibrium condition:
Xdt = E + D i=2,4it it it
=D (19)
3t 3t
These relations simply equate supply to demand.
The remaining relations of the model are accounting relations.
Total households' resources TRHt, are defined as
3
TRH =lRit+C lt +Git 2t (20)
where F2t are current transfers Lrom the rest of the world to households and
are exogenous. This relation states that TREt is equal to factor incomes paid
3to households R Rit, plus dividends Cit, plus transfers from government G,t,
plus transfers from abroad F2t.
Total income of companies TICt, is obtained as the sum of their gross
operating surplus R4t, the interest on consumers' debt Hlt,and the interest on
public debt G2t:
TICt = R4t + Hit + G2t (21)
Government receives a factor income R5t (which is government income
from property and entrepreneurship), direct taxes from households H2 t' corporate
taxes C2 t, net indirect taxes NIT and transfers from abroad F4t Total govern-
ment revenue is thus
t R5t + H2t + C2t + NITt + 4t (22)
F4t is exogenous.
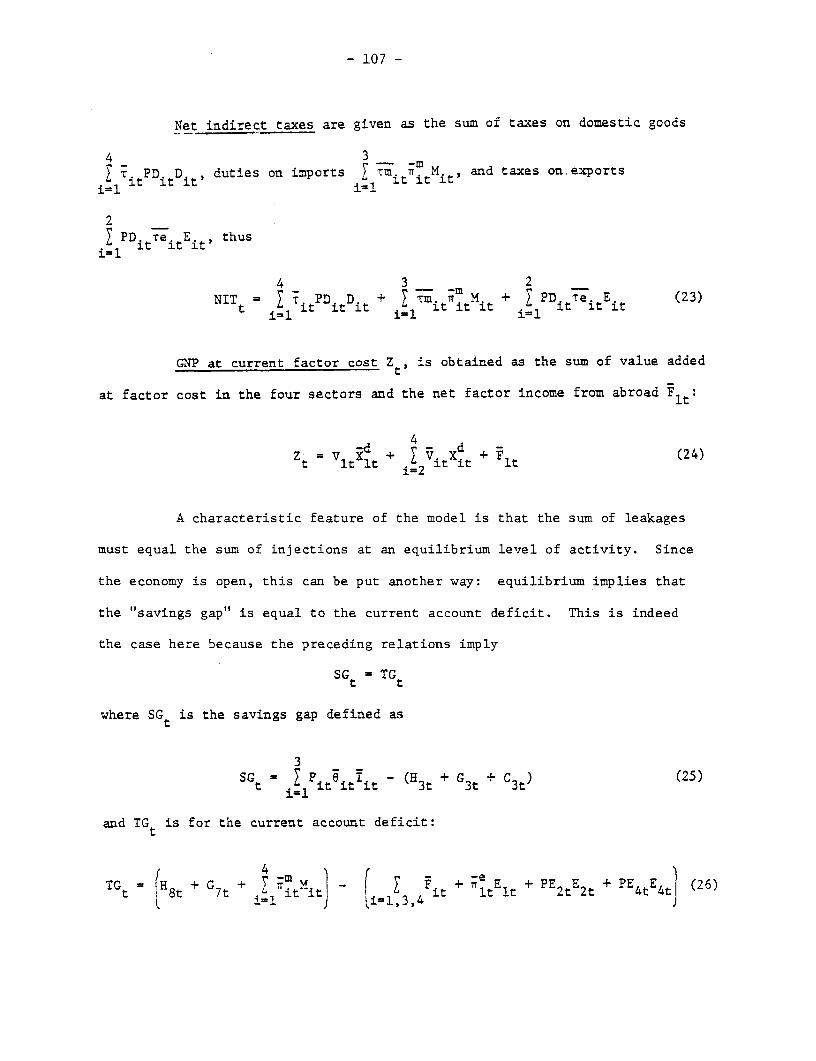
- 107 -
Net indirect taxes are given as the sum of taxes on domestic goods
4 3i T PD D, duties on imports TMTr and taxes on. exports
it it it, iti.it
2PD eE.t thus
i it eit it' t
4 3 21- -M
NIT Pit Dit +it TM it Mit it IP it eitit (23)
GNP at current factor cost Z is obtained as the sum of value added
at factor cost in the four sectors and the net factor income from abroad Fit'
d 4 d(4z~ =v 1 I~ V x it(24)
A characteristic feature of the model is that the sum of leakages
must equal the sum of injections at an equilibrium level of activity. Since
the economy is open, this can be put another way: equilibrium implies that
the "savings gap" is equal to the current account deficit. This is indeed
the case here because the preceding relations imply
SG = TGt t
where SGt is the savings gap defined as
3sGt Pit itit (3t G3t +c G 3 (25)
and TGt is for the current account deficit:
Gt 4H8t 7ii) ii llt ttTG 'H G+ T 0I1 8t +7t' £it-"it + Ft itEit + E2tE2t + E4t 26

- 108 -
Domestic savings are equal to the sum of households savings H3t, government
savings G3t and savings of corporations C3t. Finally, H8t are transfers
from households to the rest of the world and G7t are transfers from govern-
ment to the rest of the world.
Data Base of the Reference Simulation
In order to make a reference simulation on the period 1980-90,
assumptions on four sets of variables and parameters are needed: (1) the
structural parameters; (2) the policy parameters; (3) the rest of the world.
variables; and (4) the domestic variables.
The Structural Parameters. These are mainly behavioral and technical parameters
which can be classified into three groups:
(1) The parameters of the allocation relations 7, 8 and 9. To esti-
mate their order of magnitude, the relations are estimated on time series
-l -Inational account data. The 6's, the p i, i=1,...5, the c., i=1,2,3 and the
h., i=l,...8 are held at their estimated values, and the h, i=1,...8, the
-0 -0c., i=1,2,3 and the p i, i=l,...5 are adjusted (using the appropriate entries
in the SAM of 1975) in order to reproduce the data of that year (see Tables
lOa, lOb, 10c).
(2) The input-output coefficients aij3 i,j=l, 2, 3, 4 in relations
1 and 11 to 14 are obtained from the SAM of 1975 by standard procedures. The
parameters allocating gross investment demand over sectors are also obtained
from the SAM. They are e1, e2, and e3 of the aggregate demand relations 11 to
14.
(3) The parameters of the import demand functions (relations 15
and 16) and of the related price functions (relation 4) are the elasticities

- 109 -
of substitution al. a2, a3 , a4;the share parameters 6 a 2' 6 3' 4; and the scale
parameters y1, Y2, y3, Y4. The elasticities of substitution for the base
scenario were assumed to be .8, 3.0, .15, 3.0 for agriculture, manufacturing,
energy and services respectively. Using 1975 as the base year for prices, and
the imports ratios implicit in the SAM, the elasticities of substitution deter-
mine the share and scale parameters. However, the share parameter for energy
is independently changed in 1982 and onward to take account of the coming on
stream of domestic gas production.
The parameters of the export-demand relations (18) are the elasticities
ni and the scale parameters EB. An estimate for n2 of 2.50 is obtained using
relative price movements on the period 1975-79. EB2 is determined subsequently
using the SAM figure for exports and the ratio of the world price to the Thai
price of exports of manufactures, as observed in 1975. The same procedure is
followed to estimate EB4, but with n4=2.0.
The Policy Parameters. The second set of assumptions is on the policy parameters.
These are, on the one side, the indirect tax rates on domestically and inter-
nationally traded goods and, on the other side, the parameters allocating govern-
ment revenue. Implicit in the SAM of 1975 are all indirect tax rates for that
year. These base-year values are either maintained or lowered to take account
of recent trends (see Table 11).
A first approximation of the parameters allocating government revenue
(relation 10) is obtained by estimating that set of relations using a time series
(1970-79) and nonlinear least squares. The result is a rapidly declining share
of government savings, of transfers to households, and of transfers abroad. For
the base scenario the same trend in the shares is maintained but at a much slower
rate, and the drop is dampened (see Table 12). This assumption leads to a

- 110 -
somewhat optimistic view of the savings gap and hence of the current account
deficit.
The Rest of the World Variables. Linkages between the domestic economy and
the rest of the world are captured through export and import prices, parameters
reflecting the performance of Thai exports of manufactures and services, and
net factor income and other transfers. The import price of agricultural pro-
ducts (Xi1) is obtained in the following way. For 1980-82, 1985 and 1990 it is
assumed to follow the same trend as a Laspeyres index of projected prices of
cereals, fruits and vegetables and coffee, cocoa and tea.l/ Linear interpola-
tions are made for the intervening intervals. On average this implies the
import price of agricultural products grows at a rate between 10% and 11% after
1982 (see Table 13). The import prices of manufactures and services (7 2, Xr2)
are assumed to increase at the same rate as the projected trend in the Inter-
national Price Index (IPI). This is a decreasing rate- /from 10.5% between
1979-80, to 5.7% between 1989-90 (see Table 13). The import price of energy
(T3) is based on the assumption that oil prices will be $28 a barrel in 1980,
$47.3 in 1985, and $73.6 in 1990, or an increase of 63% over the decade- /(see
Table 13).
The export price of agricultural products (1Te) is assumed to follow
the same trend as a Laspeyres index of projected prices of rice, rubber, maize,
jute and other agricultural products- /(see Table 14). The world prices of exports
of manufactures and services (2, we) are assumed to increase at the same rate as
1/ See Report No. 814/80 Price Prospects for Major Primary Commodities, Jan. 1980,Table 5, p. 14.
2/ See Projections of IBRD, Table 16.
3/ See Report No. 814/80, Table 10, p. 19.
4/ See Report No. 814/80, Table 10, p. 19; Table 6, p. 14.

- 111 -
the projected IPI- (see Table 14). In relation (18) the world demand for Thai
exports of manufactures and services are dependent only on relative prices.
However, they should also depend on the overall world activity and on the
success of Thai exporters over and above price changes. In order to catch
these two aspects, the parameters EB. are assumed to grow at an exponential
rate:
EBit = EB i(to)( + ri) , i=2,4
The growth rates in the base scenario are assumed to be 11%.
Net factor income outflow is obtained via a debt model. It is based
on the mission estimates of (a) investment income receipts; (b) interest pay-
ments on medium- and long-term debt; and (c) interest payments on short-term
debt and profit. Inflow of private transfers are assumed to remain at a nominal
value of 300 million bahts. Finally, public transfer nominal inflows are assumed
to grow at 13% annually.
Domestic Variables. The last set of assumptions concerns the domestic trends
within the Thai economy. The relevant variables here are gross investment
demand in constant prices, It, gross agricultural production in constant prices,
-dXt, and the net prices of manufacturing, energy and services, V2t' V3t' VW
respectively. Gross investment demand in constant prices It is assumed to grow
exponentially at an annual rate of 5%. Gross agricultural production in constant
prices Rd is also assumed to grow exponentially but at the lower rate, 4%.
Net prices are defined as the ratio of sectoral GDP at current factor
cost to gross production in constant prices. If L. is employment, K. is capital,
W. is the nominal average wage, and r. is the nominal users cost of capital, then:
1/ See Projections of IBRD, Table 16.

- 112 -
d.. W + r.K. K.=x i iL..z. = _j d d d t r X , j=2, 3, 3
x. x. xi
This means that net prices are determined by the mix of labor-output, the capital-
output, wage, and the cost of capital. A complete set of assumptions on the
trends of the V., j=2,3,4 would require predictions on all of the mentioned
variables, which is not feasible at this point. In the reference simulation
a crude but reasonable "reduced form" assumptions are adopted:
(a) Net prices of manufacturing and services, V2 and V4 are assumed
to grow slower than the GDP deflator for OECD North countries. They move from
86% of the value of that index in 1980 to 78% of its projected value in 1990.
(b) The net price of energy, V3, grows also slower than the GDP
deflator for OECD North countries, being roughly around 88% of the value of
that index over the period 1980-1990. This is lower than the increase in the
import prices of energy to reflect the government's delays in allowing domestic
energy prices to rise, which has squeezed the value added margins of domestic
energy producers. The assumption does roughly allow for the introduction of
domestic production of natural gas (see Table 15).

- 113 -
Table lOa: Parameters of the Allocation Relations
Households: i H + hl ehK TR/ ah= 2,769.10
19 T0-1 9 1 1980 - 981-190 la T-1 h~~~~~ +hh. hi 1
Interest on consumer debt .004 .013 .013 .017
Taxes .012 .012 .012 .024
Savings .120 .010 .02 .14
Coonsumption .863 -.034 -.044 .819
Agriculture (.328) -.209 (-.209) (.119)
Manufacturing (.292) .196 (.186) (.478)
Energy (.033) -.019 (-.019) (.014)
Services (.210) -.002 (-.002) (.208)
Transfers abroad .001 001 -.001 .000

- 114 -
Table lOb: Parameters of the Allocation Relations
Companies: C. {c? + cie TIC 8 = 28240
1 sqan-lqq 99Q :m. (O -c+ C. C. C.+ C.
2. 2 1 1
Dividends .042 .013 .055
Corporate taxes .068 .118 .186
Corporate savings .890 -.131 .759
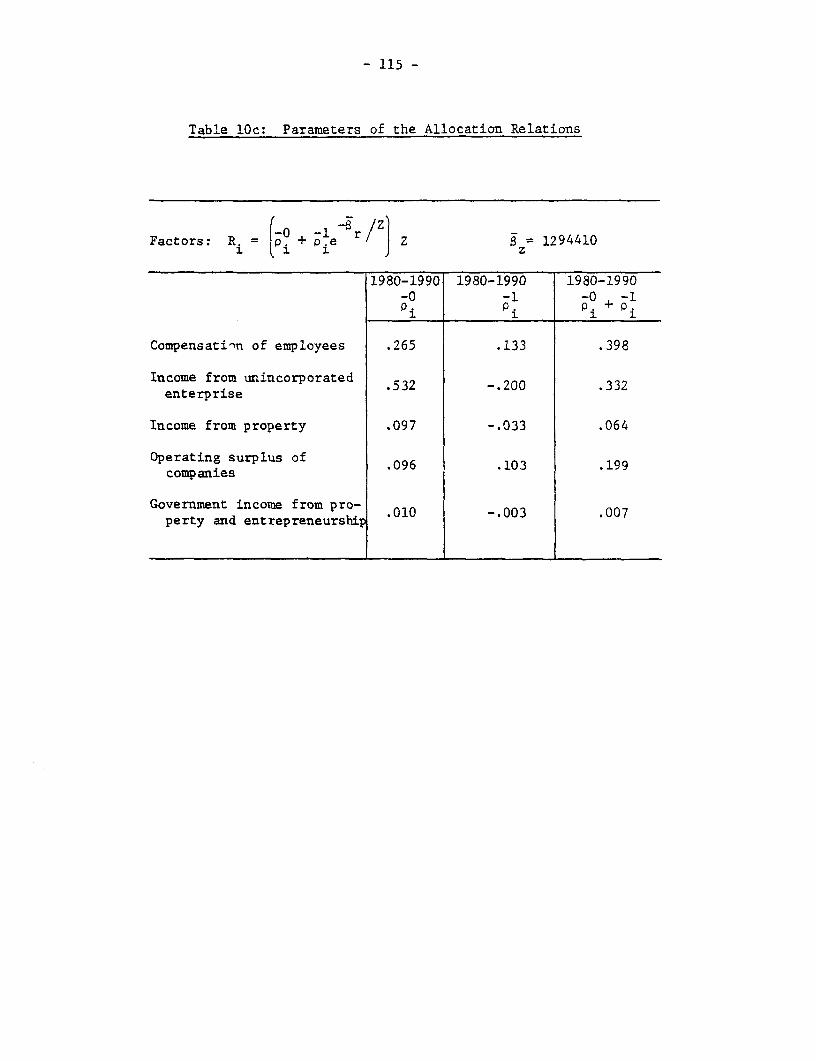
- 115 -
Table lOc: Parameters of the Allocation Relations
Factors: Ri = fPi+Pie r / 1Z 1294410
1980-1990 1980-1990 1980-1990-0 -1 -0 -lPi pi p. + pi
Compensati-n of employees .265 .133 .398
Income from unincorporated .532 -.200 .332enterprise
Income from property .097 -.033 .064
Operating surplus of .096 .103 .199companies
Government income from pro- 010 -.003 .007perty and entrepreneurship
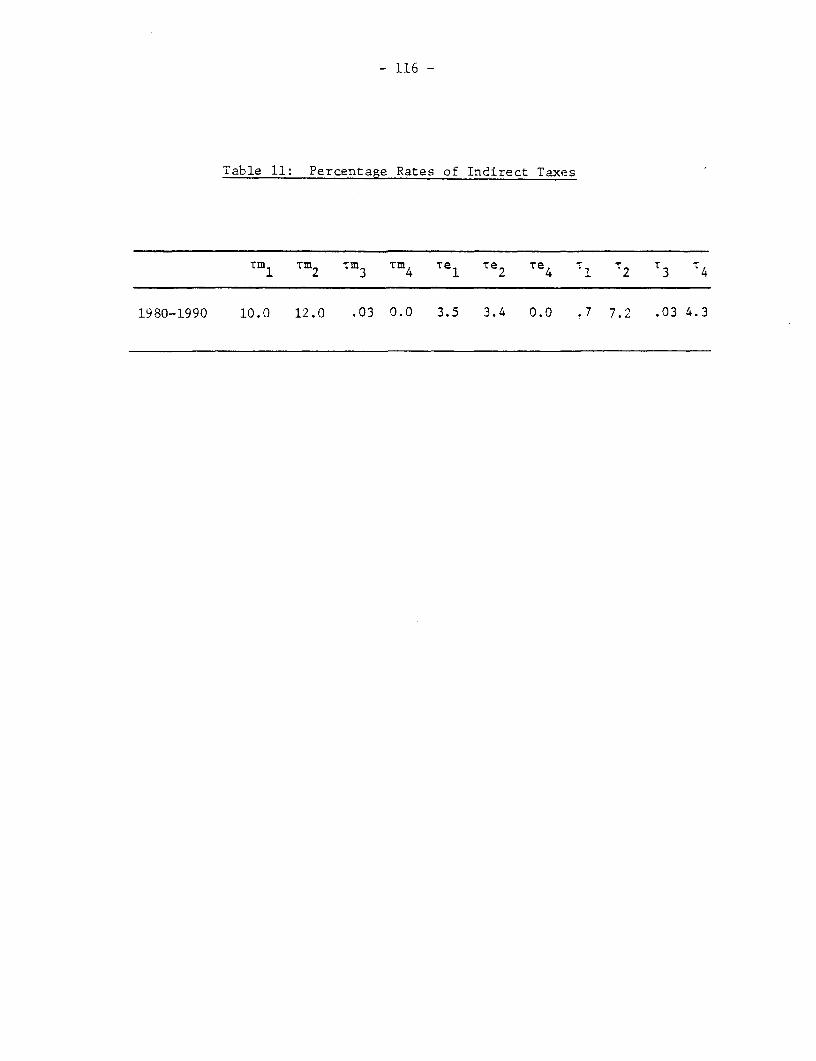
- 116 -
Table 11: Percentage Rates of Indirect Taxes
.1 2 Tm3 TM4 1re Te2 e4 1 2 3 4
1980-1990 10.0 12.0 .03 0.0 3.5 3.4 0.0 .7 7.2 .03 4.3

- 117 -
Table 12: Parameters of the Allocation Relations
Government: G g + e g GRE = 750,000
r9 n-l9qo 1930 *1981-1990 1981-1990-0 - -l -0 -lgi gl gi goi + -gi
Transfers to households .005 -.005 -.005 .000
Interest on public debt .083 .155 .155 .238
Government savings .166 -.800 -.525 -.359
Consumption:
Manufacturing .065 .040 .040 .105
Energy .020 .025 .025 .045
Services .660 .586 .311 .971
Transfers abroad .001 -.001 -.001 .000
I

- 118 -
Table 13: Import Pricesa/(1975 = 1)
-in Manufacturing Tr -mYear Agriculture 7 1 Ma-nc ing 2 Energy ir3
Services 'Tr4
1980 1.377 1.551 2.569
1981 1.417 (2.90) 1.690 (9.00) 2.935 (14.25)
1982 1.654 (16.72) 1.825 (8.00) 3.275 (11.58)
1983 1.779 (7.55) 1.953 (7.00) 3.597 (9.83)
1984 1.913 (7.55) 2.084 (6.75) 3.950 (9.83)
1985 2.057 (7.55) 2.220 (6.50) 4.338 (9.83)
1986 2.185 (6.72) 2.360 (6.30) 4.740 (9.23)
1987 2.321 (6.22) 2.505 (6.15) 5.178 (9.23)
1988 2.463 (6.22) 2.655 (6.00) 5.656 (9.23)
1989 2.615 (6.22) 2.810 (5.85) 6.180 (9.23)
1990 2.777 (6.22) 2.971 (5.70) 6.752 (9.23)
average (7.27) (6.72) (10.14)
growth rat (
a/ Figures between brackets are rates of growth.

- 119 -
Table 14: Export Prices-/(1975 1)
-eYearManufacturing 2
Year | Agriculture Services -e 2
1980 1.208 1.550
1981 1.277 (5.71) 1.690 (9.00)
1982 1.465 (14.72) 1.825 (8.00)
1983 1.581 (7.90) 1.953 (7.00)
1984 1.706 (7.90) 2.084 (6.75)
1985 1.841 (7.90) 2.220 (6.50)
1986 1.965 (6.78) 2.360 (6.30)
1987 2.097 (6.78) 2.505 (6.15)
1988 2.239 (6.78) 2.655 (6.00)
1989 2.391 (6.78) 2.810 (5.85)
1990 2.552 (6.78) 2.970 (5.70)
average (7.77)growth rate (6.72)
a/ Figures between brackets are rates of growth.
-e a eb/ f2 and i-T4 are world prices, not supply prices, of Thai exports.

-120 -
Table 15: Changes in Net Pricesa/(1975 = 1)
Year ~Manufacturing V2 Energy VYear Services V4 3
1980 1.362 1.401
1981 1.442 (5.87) 1.497 (6.85)
1982 1.528 (5.96) 1.1)2 (7.01)
1983 1.619 (5.96) 1.713 (6.93)
1984 1.718 (6.11) 1.834 (7.06)
1985 1.818 (5.82) 1.960 (6.87)
1986 1.921 (5.67) 2.091 (6.68)
1987 2.028 (5.57) 2.227 (6.65)
1988 2.137 (5.37) 2.370 (6.42)
1989 2.250 (5.29) 2.518 (6.24)
1990 2.365 (5.11) 2.673 (6.15)
avg. (5.67) (6.67)growth rate
a/ Figures between brackets are rates of growth ()

- 121 -
Assumptions Underlying Selected Simulations with SIAM1
Simulation 1, PRIRM. The purpose of this simulation is to simulate a change in
the pattern of households' and corporations' savings behavicr. The changes in
parameters are as follows:
1979 1980-83 1984-90
h .010 .030 .043
h 1 .196 .176 .1665
cl .013 .013 .0131c2 1.118 .108 .087
1co 1-.131 -.121 -.100
PRIRM is Private Resource Mobilization
Simulation 2, PRMIT. The purpose of this simulation is the increase in govern-
ment revenue. PRMIT is Public Resource Mobilization through Indirect Taxes.
The modifications in assumptions are:
i) a change in the pattern of government current outlays. This is
1.done by changing the g , i = 1,2, ...7 parameters of relations 10,
in the following way.
1979 1980 1981-90
1g1 -.005 -.005 -.005
g2 .155 .100 +.050
g3 -.800 -.300 +.2001
g4 1.040 -.030 -.050
41cr5 .025 -.020 -.020
g6 1.586 .256 -. 174
g7 1-.001 -. 001 -. 001

- 122 -
ii) an annual 2% increase in tariff rates;
iii) an annual 2% increase in indirect tax rates;
iv) a reduction in the rate of growth of investment in constant prices
from 5.0% to 4.6% is assumed to result from the higher tax measure
beginning in 1979/1980.
Simulation 3, TMED. The purpose of this simulation is to analyze the outcome of
fully passing on the world price increases in energy prices and increasing taxa-
tion of domestic consumption.
The modifications in assumptions are:
i) a change in the pattern of government outlays. This is introduced
in order to dampen the effect of the increase in governemt revenues
on government consumption.
1979 1980 1981-1990
gl -.005 -.005 -.005
1g2 .155 .100 .100
2g I -.800 -.400 .00
g; 1.040 -.035 -.024
g5 .025 -.020 -.020
1
g6 .586 .361 -.0501
-. 001 -. 001 -. 001
i) a rate of growth of investment in constant prices of 4.6% to reflect
the impact of higher energy prices (beginning 1979/80);
iii) a rate of growth of the tariff rate on imports of energy of 6%;
iv) an indirect tax rate on energy growing at 6%.
Simulation 4. EG (Export Growth). In this simulation an optimistic view of the
world demand for Thai nonagricultural exports is taken. It is assumed:
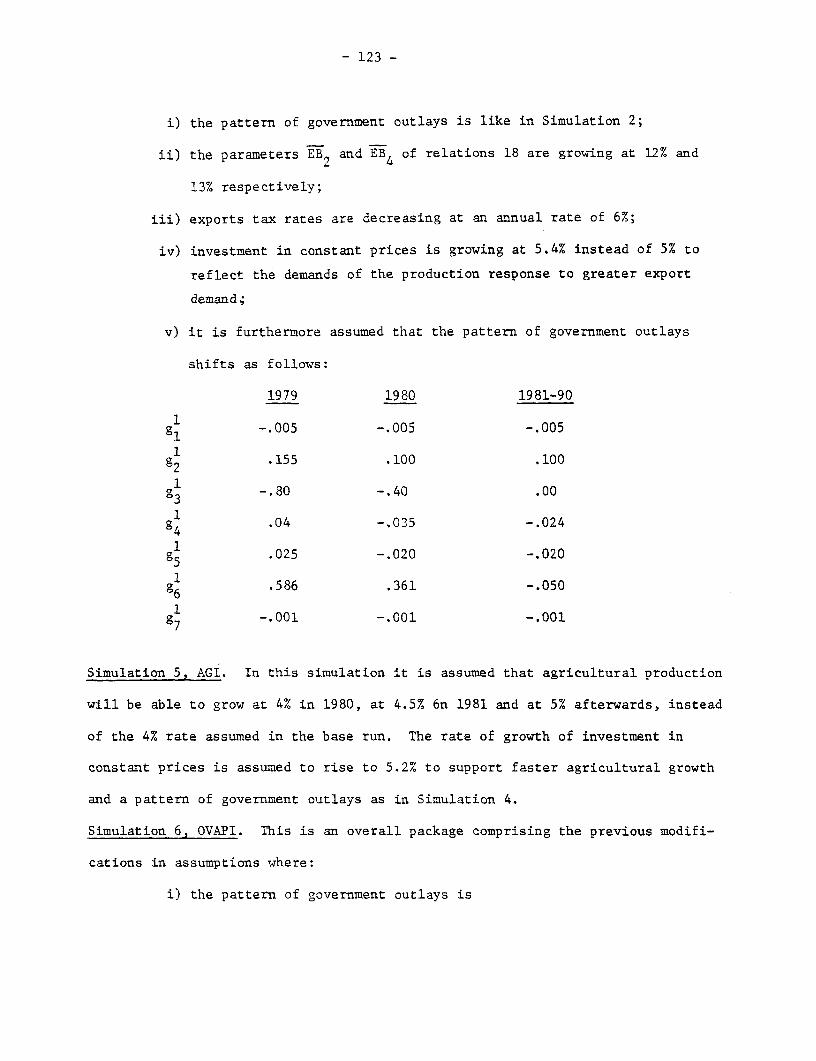
- 123 -
i) the pattern of government outlays is like in Simulation 2;
ii) the parameters EB2 and EB4 of relations 18 are growing at 12% and
13% respectively;
iii) exports tax rates are decreasing at an annual rate of 6%;
iv) investment in constant prices is growing at 5.4% instead of 5% to
reflect the demands of the production response to greater export
demand;
v) it is furthermore assumed that the pattern of government outlays
shifts as follows:
1979 1980 1981-90
1 gi ~-.005 -.005 -.005
g1 .155 .100 .100
1 -.80 -.40 .003̀
1 .04 -.035 -.024
g1 .025 -.020 -.020
g1 .586 .361 -.050g6g1 -.001 -.001 -.001g7
Simulation 5, AGI. In this simulation it is assumed that agricultural production
will be able to grow at 4% in 1980, at 4.5% 6n 1981 and at 5% afterwards, instead
of the 4% rate assumed in the base run. The rate of growth of investment in
constant prices is assumed to rise to 5.2% to support faster agricultural growth
and a pattern of government outlays as in Simulation 4.
Simulation 6, OVAPI. This is an overall package comprising the previous modifi-
cations in assumptions where:
i) the pattern of government outlays is
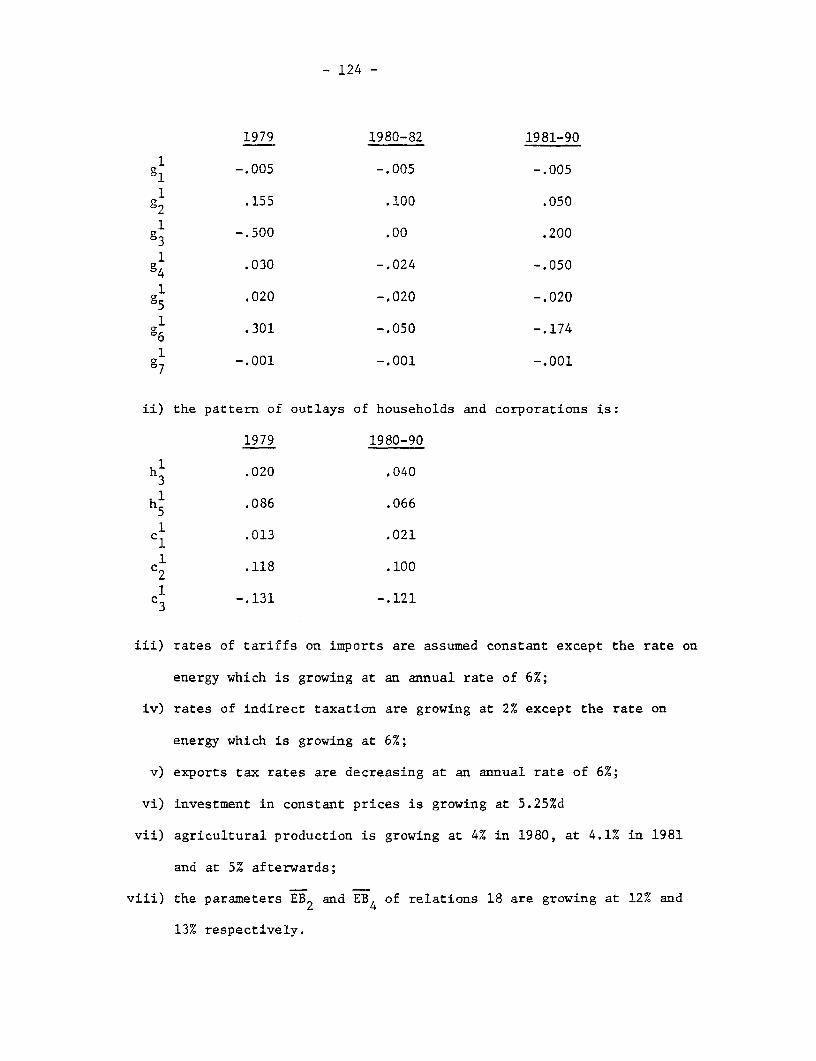
- 124 -
1979 1980-82 1981-90
gl -.005 -.005 -.0051g2l .155 .100 .050
g3 1-.500 .00 .2001g4 1.030 -.024 -.050
4g5 .020 -.020 -.0201g6 .301 -.050 -.1741
glI -. 001 -. 001 -. 001
ii) the pattern of outlays of households and corporations is:
1979 1980-90
h 1 .020 .0403
h .086 .0665
cl .013 .0211c2 1.118 .100
c3 1-.131 -.121
iii) rates of tariffs on imports are assumed constant except the rate on
energy which is growing at an annual rate of 6%;
iv) rates of indirect taxation are growing at 2% except the rate on
energy which is growing at 6%;
v) exports tax rates are decreasing at an annual rate of 6%;
vi) investment in constant prices is growing at 5.25%d
vii) agricultural production is growing at 4% in 1980, at 4.1% in 1981
and at 5% afterwards;
viii) the parameters EB2 and EB4 of relations 18 are growing at 12% and
13% respectively.
- 125 -
ANNEX 2Page 1
THAILAND
COPING WITH STRUCTURAL CHANGE IN A DYNAMIC ECONOMY
Financial Institutions
Introduction
1. This annex will provide a brief history of commercial banks,finance companies, the Securities Exchange of Thailand (SET), and of recentmeasures to stabilize the financial sector. The organized financial sectorin Thailand comprises a variety of institutions, both public and private, asshown in Table 1. The commercial banks and finance companies are theprincipal institutions of interest for monetary policy issues. Assets ofthese institutions account for the bulk of assets in the organized financialsector. Table 2 shows the combined assets of five groups of financialinstitutions and their relative size. The table does not include assets ofthe Government Housing Bank, insurance companies, mutual funds and creditcooperatives./l However, these omissions do not significantly alter theobservation that commercial banks play a dominant role in the organizedfinancial sector and that finance companies are the second largest group offinancial institutions. This is confirmed when looking at advances to theprivate nonbanking sector shown in Table 3.
Commercial Banks
2. The first commercial bank in Thailand opened for business in 1888.This was a foreign bank, as were the next two to be established before 1900.The first Thai bank was established in 1906. Fourteen of the existing banks
were established between 1939 and 1955, and Thai banks began to dominate thesector. By 1978, Thai banks accounted for more than 95% of bank deposits, and16 of 29 commercial banking houses operating in Thailand. The first bankswere established primarily to facilitate the import and export trade ofEuropean merchants. Financing international trade remained the dominantactivity through the pre-World War II period. Lending to other sectors onlytook off in the early 1960s.
3. The bulk of total assets and liabilities of commercial banks areconcentrated in relatively few banks. The share of the largest bank(Bangkok Bank) exceeds one third of the total, while the share of the fivelargest banks approach four-fifths of total assets. Ownership of commercialbanks is also fairly concentrated. Of the 16 Thai commercial banks, 9 hadless than 10 major shareholders controlling 50% of shares.
/1 They are likely to be less than 5% of the total assets of the organizedfinancial sector.
- 126 -
ANNEX 2
Page 2
4. Savings and time deposits constitute the largest source of fundsfor banks, exceeding 60% of total liabilities in the 1975-78 period as shownin Table 4. At the end of 1979, the share fell to 57%. Borrowings fromforeign banks has been the fastest growing source of funds since 1975. Up
from 7% in 1975, such funds comprised 14% of liabilities at the end of 1979.
5. Loans, overdrafts and discounts to the nonbank private sector
accounted for 71% of assets at the end of 1979. This share has risen steadilfrom 64% in 1975. The share of government securities in the portfolio hasdeclined from 15% in 1975 to 9% by end 1979 as the banks expanded credit tomeet rising private demand. Private sector lending is for the most partshort-term. Lending to the trade and other service sectors still dominatesbank lending. There are few term loans, and overdrafts are often used tofinance medium and long-term projects. As indicated by the small volume ofterm loans, collateral requirements tend to discourage the term financing ofmanufacturing investments. The emphasis on collateral is on land and lessweight is given to the future prospects of the enterprise.
6. Commercial banks play a fairly small role in agricultural financingdespite credit allocations. This is due to the high processing cost of agri-cultural loans, which tend to be very small, and to the high risk of default.Commercial banks can satisfy their credit allocation to agriculture of 13% oftotal lending by deposits with the Bank for Agriculture and AgriculturalCooperatives (BAAC), and 2% of the 13% can be satisfied by lending to agro-industries. Most of the allocation requirement is satisfied by deposits withthe BAAC: only 5% of commercial bank lending is directly to agriculture.Lending from informal sources still dominates credit to agriculture./I
Finance Companies
7. The first finance company was started in 1964. However, it was notuntil 1969 that the sector started its rapid growth. By 1973, the number ofcompanies had reached 54; at the beginning of 1979, 113 companies were inoperation. Their combined assets were at that time equal to one fourth ofthose of commercial banks.
8. Finance companies came under formal regulatory control by monetaryauthorities in 1972. They are prohibited from soliciting deposits, and theirmain source of funds is the issuance of promissory notes. These notes arenonnegotiable debt instruments, carrying fixed terms and rates of interest.The rate depends on the maturity offered. Promissory notes constituted two-thirds of all finance company liabilities at the end of 1979, as shown inTable 5. This share has been stable over the last two years.
/1 Details of the informal financial sector are not available, but itsshare in agricultural financing is likely to be quite substantial,perhaps about three fourths of the total.
- 127 -ANNEX 2Page 3
9. Loans to the private sector constitute the major use of funds. Byend 1979, 85% of assets were held in this form, down from 91% at end 1976.This decrase was reflected in increased shares of cash, bank deposits,securities (including government securities) and capital funds. This changewas the result of increased prudential concerns about the companies in theregulatory agencies, resulting in regulatory pressures to strengthen liquidityreserves and capital positions.
10. Stock market related lending caused severe liquidity strains onsome finance companies in 1979. The Raja Finance Company became insolvent,and the government took extraordinary measures to preserve the stability ofthe financial sector in face of this collapse and the possibility that thesame fate would befall other finance companies. The May, 1979 Act onFinance Business, Securities Business and Credit Froncier Business aimed atstrengthening the financial position of finance companies, and circumscribedtheir opportunities to engage in stock market related activities. Companiesnow have to choose one major line of business. They can do business eitherby accepting or guaranteeing commercial bills, by lending medium andlong-term funds for industry and agriculture, by financing consumerdurables, land and housing purchases, or by establishing themselves asbrokers on the SET.
SET and Capital Market Development Fund
11. The Securities Exchange of Thailand (SET) opened for stock tradingin 1975. It grew quickly in the ensuing three years, both in terms of thepaid-up capital of the companies whose shares were traded and in terms ofturn-over or volume of sales. The paid-up capital increased from Baht 90million in 1975 to Baht 2.4 billion in 1978. Market values of the sharesexceeded their original paid-up values by a large amount in 1978, reachingBaht 4.3 billion. Traded volume peaked in October 1978 at Baht 15 billion.For the year as a whole, traded volume reached Baht 57 billion.
12. Influenced by some restriction of money policies and weakeningeconomic conditions in general, prices on the SET started to slide inDecember 1978. By February 1979, the volume traded was down to Baht 0.3 bil-lion. Volume for 1979 as a whole only reached Baht 22 billion. The declineof trade volumes to very low levels squeezed the liquidity of many financecompanies and prompted several government support measures. One government-controlled commercial bank purchased stocks from finance companies to easetheir liquidity position. These purchases were financed by a Baht 2 billionloan from the Bank of Thailand (BOT), and contributed to improvements in theliquidity situation by the end of 1979. A condition stipulating repurchaseof the stocks by the finance companies at the same price and within threeyears was attached to the sales.
13. In addition, the Capital Market Development Fund (CMDF) was estab-lished in August 1979 to buy stocks on the SET on order to support pricesand to motivate other investors to buy stocks. The Ministry of Finance, theGovernment Savings Bank (GSB), the BOT and 16 commercial banks cooperated in
- 128 -
ANNEX 2Page 4
the establishment of the fund. An initial operating fund of Baht 1 billionwas established, with commercial banks, BOT and GSB providing Baht 420million, 300 million and 280 million, respectively. Interest is earned onthese contributions. IFCT acts as secretariat for the CMDF, which is not aseparate juristic entity.
14. By March 1980 about Baht 800 million had been used to purchasestocks and book losses of about Baht 60-70 million were sustained. The CMDFis presently seeking increased funding in the amount of Baht 1 billion. Thepolicy of the CMDF is now not to act vigorously against market trends, butrather to moderate declines. The CMDF also tries to increase the volume ofstocks traded by both buying and selling in the market. It is CMDF policyonly to trade in shares of recognized, substantial companies.
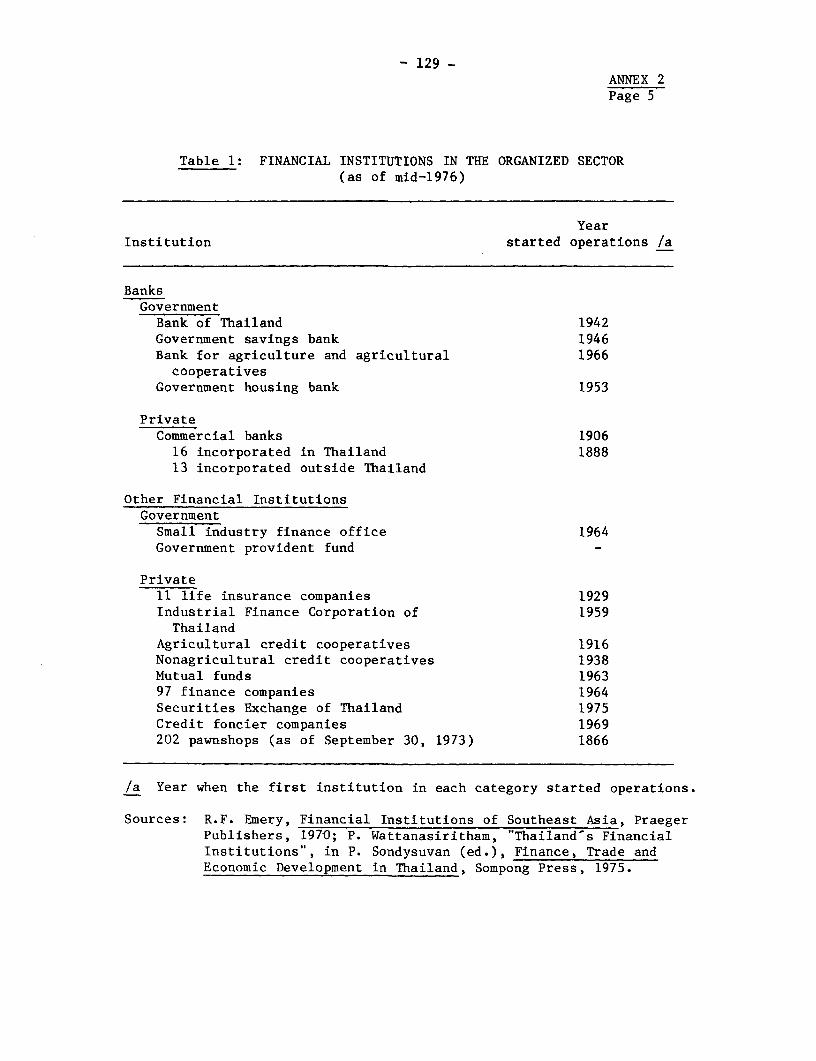
- 129 -ANNEX 2Page 5
Table 1: FINANCIAL INSTITUTIONS IN THE ORGANIZED SECTOR(as of mid-1976)
YearInstitution started operations /a
BanksGovernmentBank of Thailand 1942Government savings bank 1946Bank for agriculture and agricultural 1966cooperatives
Government housing bank 1953
PrivateCommercial banks 190616 incorporated in Thailand 188813 incorporated outside Thailand
Other Financial InstitutionsGovernmentSmall industry finance office 1964Government provident fund
Private11 life insurance companies 1929Industrial Finance Corporation of 1959Thailand
Agricultural credit cooperatives 1916Nonagricultural credit cooperatives 1938Mutual funds 196397 finance companies 1964Securities Exchange of Thailand 1975Credit foncier companies 1969202 pawnshops (as of September 30, 1973) 1866
/a Year when the first institution in each category started operations.
Sources: R.F. Emery, Financial Institutions of Southeast Asia, PraegerPublishers, 1970; P. Wattanasiritham, "Thailand's FinancialInstitutions", in P. Sondysuvan (ed.), Finance, Trade andEconomic Development in Thailand, Sompong Press, 1975.

- 130 -ANNEX 2Page 6
Table 2: MAJOR FINANCIAL INSTITUTIONS: TOTAL ASSETS AND
LIABILITIES(end of year, in % of total for institutions listed)
1976 1977 1978 1979
Commercial banks 73 72 71 73Finance companies 14 16 18 16
GSB 8 7 6 7BAAC 4 4 4 4IFCT 1 1 1 1
Sum, percent 100 100 100 100Sum, Baht billions 192.4 240.9 308.0 356.4
Source: Bank of Thailand (BOT)
Table 3: LOANS, OVERDRAFTS AND DISCOUNTS TO THE PRIVATENONBANKING SECTOR BY MAJOR FINANCIAL INSTITUTIONS
(Outstanding at end of year, as % of total forinstitutions listed)
1976 1977 1978 1979
Commercial banks 72 72 71 76Finance companies 21 21 23 18GSB /a - - - -
BAAC 6 6 5 4IFCT 1 1 1 1
Sum, percent 100 100 100 100Sum, Baht billions 123.2 159.0 210.8 245.7
/a Less than 0.5%.
Source: BOT
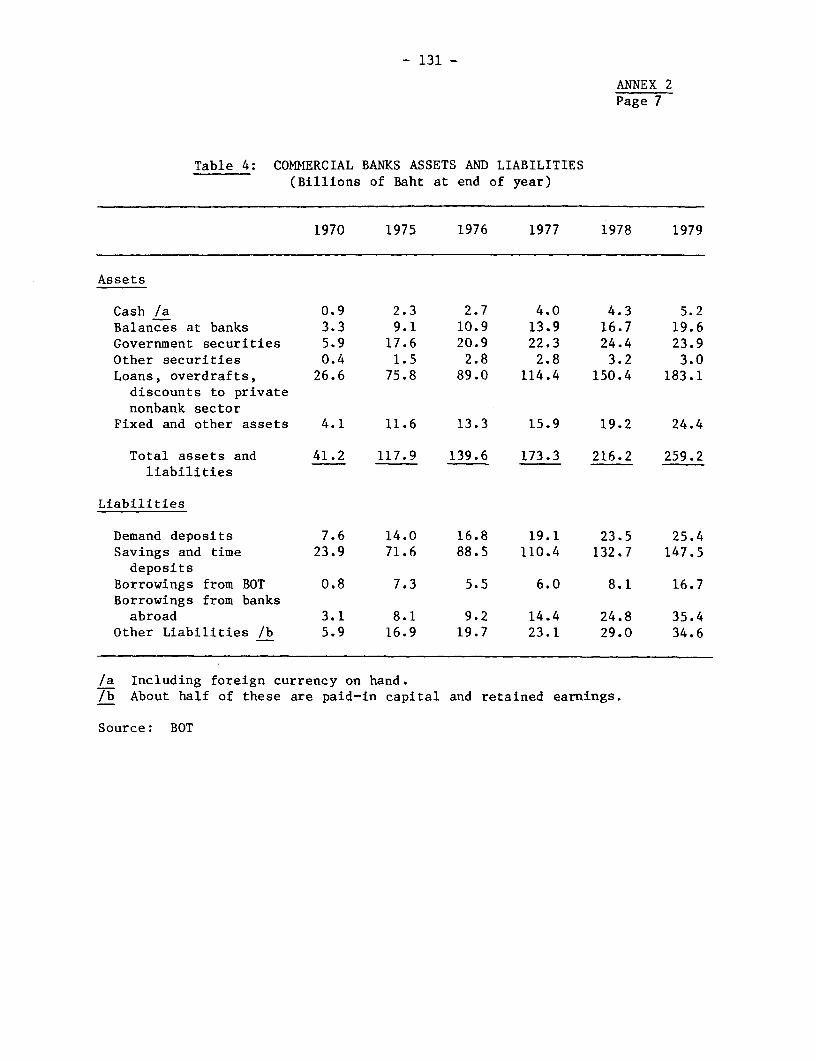
- 131 -
ANNEX 2Page 7
Table 4: COMMERCIAL BANKS ASSETS AND LIABILITIES(Billions of Baht at end of year)
1970 1975 1976 1977 1978 1979
Assets
Cash /a 0.9 2.3 2.7 4.0 4.3 5.2Balances at banks 3.3 9.1 10.9 13.9 16.7 19.6Government securities 5.9 17.6 20.9 22.3 24.4 23.9Other securities 0.4 1.5 2.8 2.8 3.2 3.0Loans, overdrafts, 26.6 75.8 89.0 114.4 150.4 183.1
discounts to privatenonbank sector
Fixed and other assets 4.1 11.6 13.3 15.9 19.2 24.4
Total assets and 41.2 117.9 139.6 173.3 216.2 259.2liabilities
Liabilities
Demand deposits 7.6 14.0 16.8 19.1 23.5 25.4Savings and time 23.9 71.6 88.5 110.4 132.7 147.5deposits
Borrowings from BOT 0.8 7.3 5.5 6.0 8.1 16.7Borrowings from banksabroad 3.1 8.1 9.2 14.4 24.8 35.4
Other Liabilities /b 5.9 16.9 19.7 23.1 29.0 34.6
/a Including foreign currency on hand.lb About half of these are paid-in capital and retained earnings.
Source: BOT
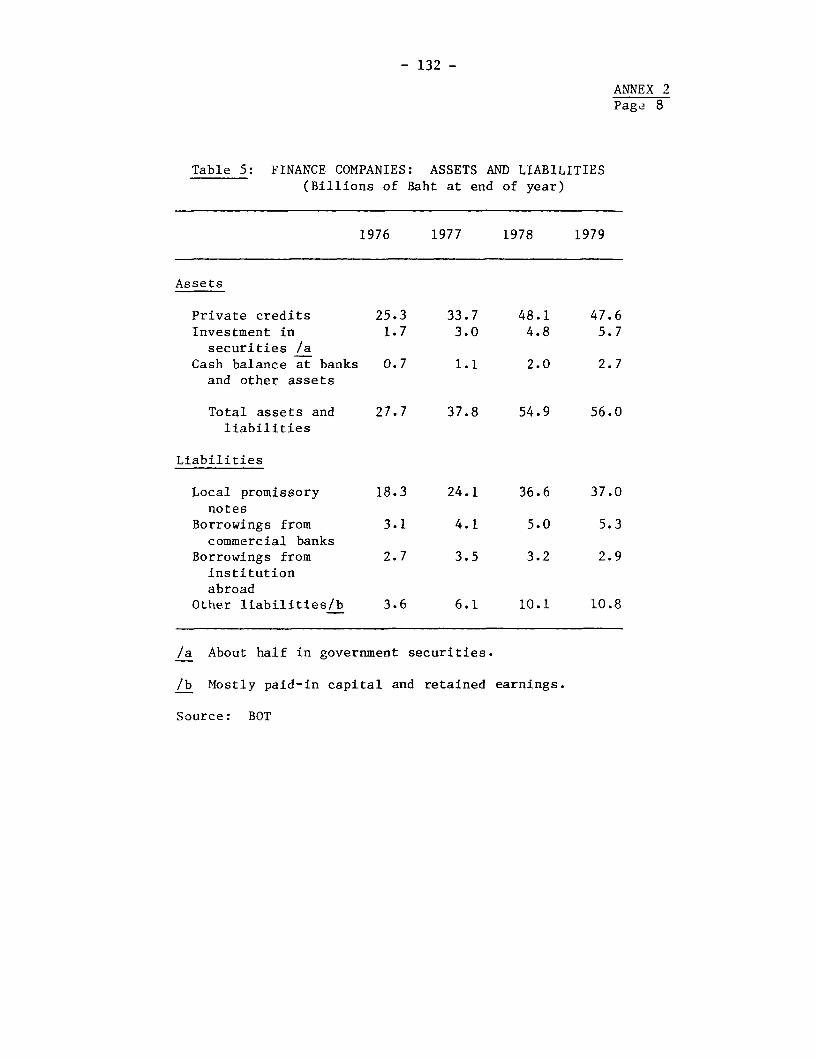
- 132 -
ANNEX 2Page 8
Table 5: FINANCE COMPANIES: ASSETS AND LIABILITIES(Billions of Baht at end of year)
1976 1977 1978 1979
Assets
Private credits 25.3 33.7 48.1 47.6Investment in 1.7 3.0 4.8 5.7securities /a
Cash balance at banks 0.7 1.1 2.0 2.7and other assets
Total assets and 27.7 37.8 54.9 56.0liabilities
Liabilities
Local promissory 18.3 24.1 36.6 37.0notes
Borrowings from 3.1 4.1 5.0 5.3commercial banks
Borrowings from 2.7 3.5 3.2 2.9institutionabroad
Other liabilities/b 3.6 6.1 10.1 10.8
/a About half in government securities.
/b Mostly paid-in capital and retained earnings.
Source: BOT
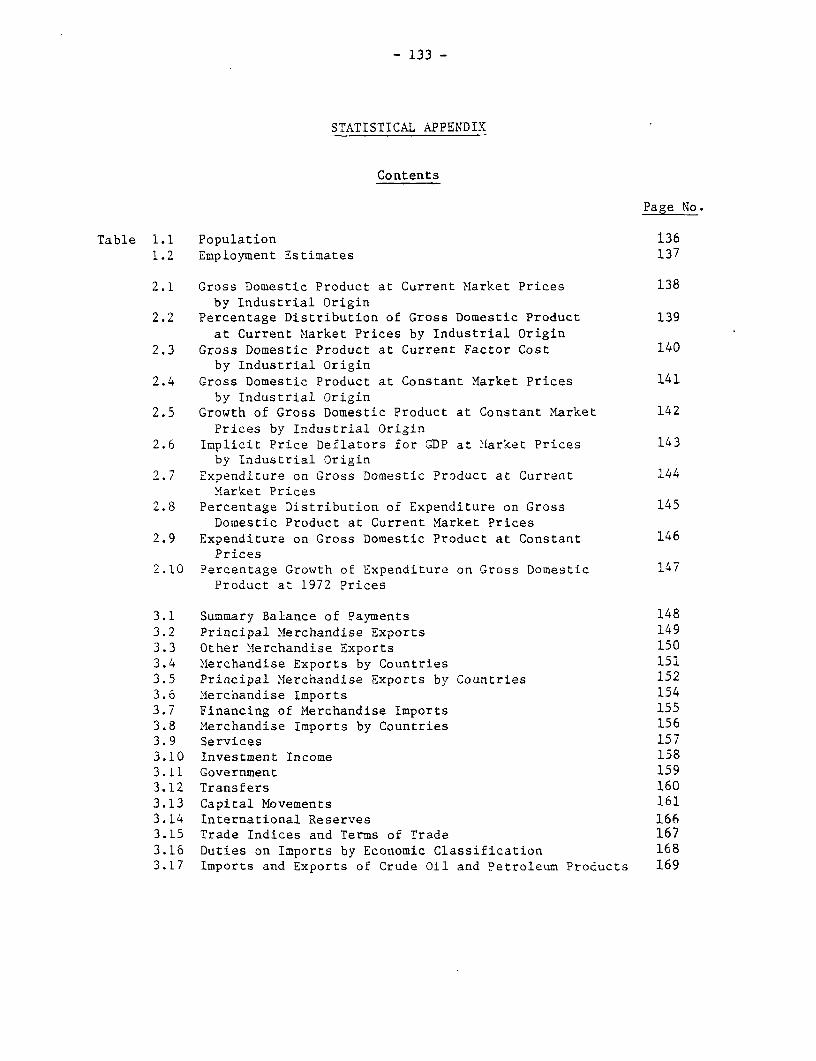
- 133 -
STATISTICAL APPENDIX
Contents
Page No.
Table 1.1 Population 1361.2 Employment Estimates 137
2.1 Gross Domestic Product at Current Market Prices 138by Industrial Origin
2.2 Percentage Distribution of Gross Domestic Product 139at Current Market Prices by Industrial Origin
2.3 Gross Domestic Product at Current Factor Cost 140by Industrial Origin
2.4 Gross Domestic Product at Constant Market Prices 141by Industrial Origin
2.5 Growth of Gross Domestic Product at Constant Market 142Prices by Industrial Origin
2.6 Implicit Price Deflators for GDP at Market Prices 143by Industrial Origin
2.7 Expenditure on Gross Domestic Product at Current 144Mlarket Prices
2.8 Percentage Distribution of Expenditure on Gross 145Domestic Product at Current Market Prices
2.9 Expenditure on Gross Domestic Product at Constant 146Prices
2.10 Percentage Growth of Expenditure on Gross Domestic 147Product at 1972 Prices
3.1 Summary Balance of Payments 1483.2 Principal Merchandise Exports 1493.3 Other Merchandise Exports 1503.4 Merchandise Exports by Countries 1513.5 Principal Merchandise Exports by Countries 1523.6 Merchandise Imports 1543.7 Financing of Merchandise Imports 1553.8 Merchandise Imports by Countries 1563.9 Services 1573.10 Investment Income 1583.11 Government 1593.12 Transfers 1603.13 Capital Movements 1613.14 International Reserves 1663.15 Trade Indices and Terms of Trade 1673.16 Duties on Imports by Economic Classification 1683.17 Imports and Exports of Crude Oil and Petroleum Products 169

- 134 -
Page .No.
Table 4. 1 External Debt and Debt Service Obligations 1704.2 External Public Debt Outstanding Including UJndisbursed 171
as of December 31, 19794.3 Projected Service Payments, Disbursements and 172
Outstanding Amounts of External Public Debtas of December 31, 1979
5.1 Consolidated Public Sector Expenditures 1735.2 Financing of Consolidated Public Sector Expenditures 1745.3 Central Government Expenditures 1755.4 Central Government Revenue 1765.5 Financing of Central Government Expenditures 1775.6 Local Government Accounts 1785.7 State Enterprises Gross Fixed Capital Expenditures 179
and Their Financing5.8 Central Government Receipts, Budget FY77-80 1805.9 Functional Classification of Central Government; 181
Expenditure Budget, FY79/80
6.1 Evaluation of Monetary Situation - Calendar Years 1826.2 Evaluation of Monetary Situation - Quarterly 1836.3 Selected Data of Commercial Banks 1846.4 Bills, Loans and Overdrafts of Commercial Banks 185
Classified by Purpose
7.1 Area Planted, Field and Production of Miajor Crops, 1861959-79
7.2 Proportion of Planted Area in Major Crops 1877.3 Paddy and Rice Supply and Utilization, 1967-80 by 188
Glutinous and Nonglutinous Varieties7.4 Rice Export Premium 1897.5 Export and Domestic Wholesale Prices of Rice for 190
Selected Grades7.6 Average Wholesale Prices (Bankgkok) of Selected 191
Agricultural Commodities7.7 Development of Producer Prices of Miajor Commodities 192
in Thailand, 1968-787.8 Apparent Fertilizer Consumption, 1966-78 1937.9 Fertilizer Use, by Crop and by Region, 1971 and 1975 1947.10 Nutrient to Crop Price Ratios for Selected 195
Fertilizers and Crops, 1968-787.11 Illustration of Yield Response of Ric-e and Economic 196
Returns to Fertilizer, 19787.12 Replanting of Rubber 197

-135-
Page No.
8.1 Production and Capacity of Selected Manufacturing 198Industries
8.2 Gross Domestic Product Originating from Manufacturing 199at Current Market Prices
8.3 Gross Domestic Product Originating from Manufacturing 200at Constant Prices
8.4 Statistics of Promoted Investment 2018.5 Mineral Production 2028.6 Energy Consumption by Source of Energy 2038.7 Tourism - Basic Data 2048.8 Realized Rates of Effective Protection, 1969, 1971, 1974 205
Major Categories and Selected Items
9.1 Price Indices 2069.2 Consumer Price Index for Whole Kingdom 207
Table R1.1 Regional Population 208
R2.1 Gross Regional Product - Bangkok (Current Baht) 209R2.2 Gross Regional Product - Center (Current Baht) 210R2.3 Gross Regional Product - North (Current Baht) 211R2.4 Gross Regional Product - Northeast (Current Baht) 212R2.5 Gross Regional Product - South (Current Baht) 213R2.6 Gross Regional Product - Bangkok (Constant Baht) 214R2.7 Gross Regional Product - Center (Constant Baht) 215R2.8 Gross Regional Product - North (Constant Baht) 216R2.9 Gross Regional Product - Northeast (Constant Baht) 217R2.10 Gross Regional Product - South (Constant Baht) 218
R7.1 Area Planted, Yield and Production of Major Crops, 2191959/60 - 1978/79, Central Region
R7.2 Area Planted, Yield and Production of Major Crops, 2201959/60 - 1978/79, Northern Region
R7.3 Area Planted, Yield and Production of Major Crops, 2211959/60 - 1978/79, Northeastern Region
R7.4 Area Planted, Yield and Production of Major Crops, 2221959/60 - 1978/79, Southern Region
R9.1 Consumer Price Indices by Region 223
oOo

- 136 -
Table 1.1: POPULATION(Millions)
Mid-year Growth rates (%)for 5-year period
1960 26.31970 36.4 3.3 /a
Estimates
1971 37.51972 38.61973 39.71974 40.81975 41.9 2.9 /a1976 43.01977 44.01978 45.01979 45.9
Projections
1980 46.5 2.1 /b1985 51.9 2.21990 57.4 2.01995 62.8 1.8
/a Growth over 10-year period.
lb Fertility decline which began in the late 1960s could not be documenteduntil the mid-1970s when a number of fertility surveys were taken. There-fore, the rate of growth of population between 1970-75 overestimates thereal rate of growth and the whole amount of the fertility decline over the1970s is allocated to the 1975-80 period, probably understating the realrate of growth in this latter period.
Note: The Population and Housing Census taken in April 1970 yielded a popula-tion estimate of 34.4 million. Since the census is believed to be anunderenumeration, the 1970 population estimate was adjusted upwards to36.1 million by the Working Group on the Population Projection of theSubcommittee of Population Policy.
Source: Population and Manpower Planning Division, NESDB.

- 137 -
Table 1.2: EMPLOYMENT ESTIMATES
Thousandsnew jobsadded Composition of
Employment /a ('000) annually work force, 1970
1960 1970 1976 1970-76 % female % age 11-14
Agriculture 11,332 13,202 14,838 273 50 12
Mining and quarrying 30 87 39 -8 27 7
Manufacturing 470 683 1,215 89 43 6
Construction 69 182 255 12 14 3
Electricity, gas, waterand sanitary services 16 25 39 2 13 -
Commerce 779 876 1,392 86 54 4
Transport, storage andcommunication 166 268 353 14 6 -
Services 654 1,184 1,470 48 36 3
Unknown 234 146 n.a. ..
Total 13,749 16,652 19.601 290 47 10
/a Economically active population, age 11 years and older, employed in April.
Note: These figures should be used with caution as the 1970 census, which waspublished in mid-1974, apparently underestimated the population, and per-haps also the work force. The census figures differ significantly fromthose given in the annual labor force surveys for 1969 and 1971. Inaddition, sectoral employment reported in 1969 and 1971 to 1973 surveysshows improbably large annual fluctuations.
Source: Census Reports, 1960, 1970.
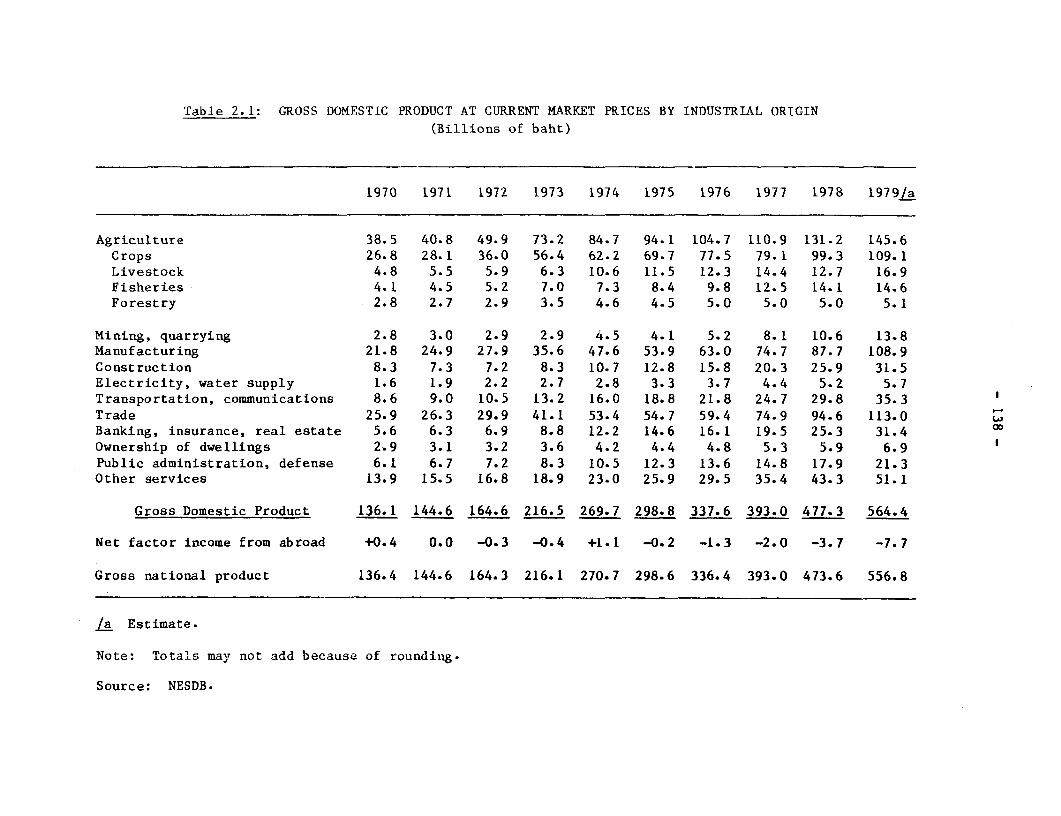
Table 2.1: GROSS DOMESTIC PRODUCT AT CURRENT MARKET PRICES BY INDUSTRIAL ORIGIN(Billions of baht)
1970 1971 1972 1973 1974 1975 1976 1977 1978 1979/a
Agriculture 38.5 40.8 49.9 73.2 84.7 94.1 104.7 110.9 131.2 145.6Crops 26.8 28.1 36.0 56.4 62.2 69.7 77.5 79.1 99.3 109.1Livestock 4.8 5.5 5.9 6.3 10.6 11.5 12.3 14.4 12.7 16.9Fisheries 4.1 4.5 5.2 7.0 7.3 8.4 9.8 12.5 14.1 14.6Forestry 2.8 2.7 2.9 3.5 4.6 4.5 5.0 5.0 5.0 5.1
Mining, quarrying 2.8 3.0 2.9 2.9 4.5 4.1 5.2 8.1 10.6 13.8Manufacturing 21.8 24.9 27.9 35.6 47.6 53.9 63.0 74.7 87.7 108.9Construction 8.3 7.3 7.2 8.3 10.7 12.8 15.8 20.3 25.9 31.5Electricity, water supply 1.6 1.9 2.2 2.7 2.8 3.3 3.7 4.4 5.2 5.7Transportation, communications 8.6 9.0 10.5 13.2 16.0 18.8 21.8 24.7 29.8 35.3 1Trade 25.9 26.3 29.9 41.1 53.4 54.7 59.4 74.9 94.6 113.0Banking, insurance, real estate 5.6 6.3 6.9 8.8 12.2 14.6 16.1 19.5 25.3 31.4 X
Ownership of dwellings 2.9 3.1 3.2 3.6 4.2 4.4 4.8 5.3 5.9 6.9Public administration, defense 6.1 6.7 7.2 8.3 10.5 12.3 13.6 14.8 17.9 21.3Other services 13.9 15.5 16.8 18.9 23.0 25.9 29.5 35.4 43.3 51.1
Gross Domestic Product 136.1 144.6 164.6 216.5 269.7 298.8 337.6 393.0 477.3 564.4
Net factor income from abroad +0.4 0.0 -0.3 -0.4 +1.1 -0.2 -1.3 -2.0 -3.7 -7.7
Gross national product 136.4 144.6 164.3 216.1 270.7 298.6 336.4 393.0 473.6 556.8
/a Estimate.
Note: Totals may not add because of rounding.
Source: NESDB.
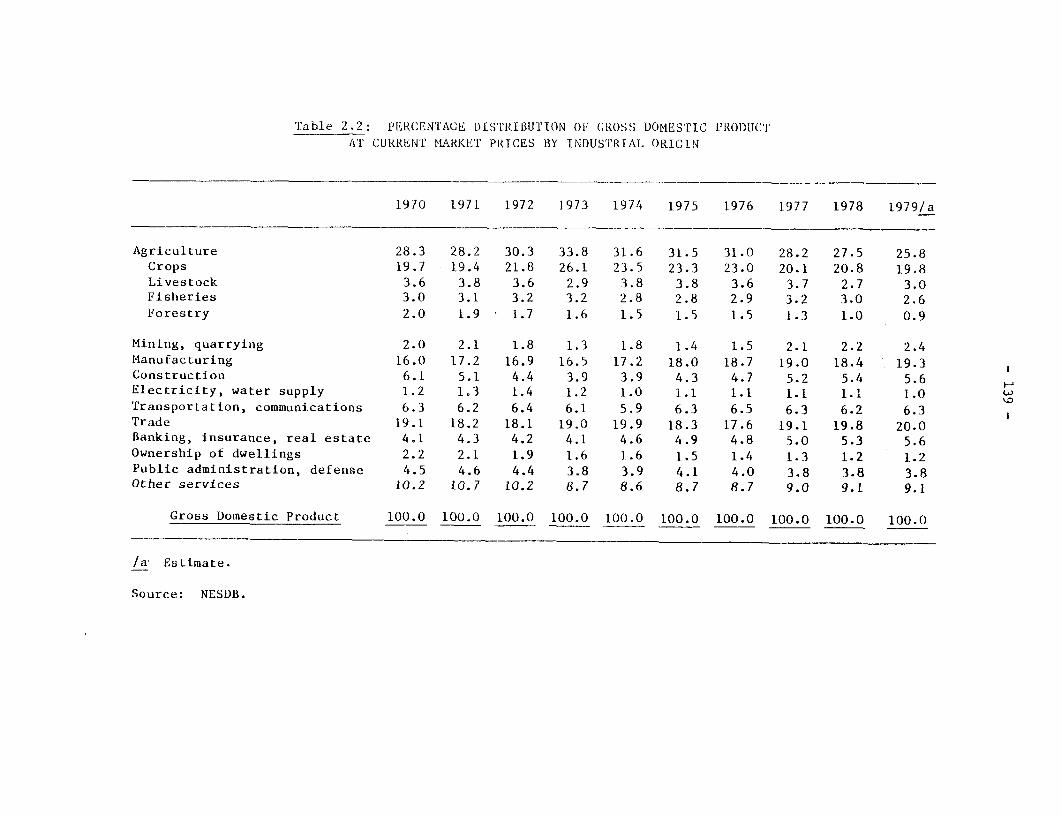
Table 2.2: PERCENTAGE DISTRIBUTION OF CROSS DOMESTIC PRODUCTAT' CURRENT MARKET PItICES BY INDUSTRIAL ORIGIN
1970 1971 1972 1973 1974 1975 1976 1977 1978 1979/a
Agriculture 28.3 28.2 30.3 33.8 31.6 31.5 31.0 28.2 27.5 25.8Crops 19.7 19.4 21.8 26.1 23.5 23.3 23.0 20.1 20.8 19.8Livestock 3.6 3.8 3.6 2.9 3.8 3.8 3.6 3.7 2.7 3.0Fisheries 3.0 3.1 3.2 3.2 2.8 2.8 2.9 3.2 3.0 2.6Forestry 2.0 1.9 1.7 1.6 1.5 1.5 1.5 1.3 1.0 0.9
Mining, quarrying 2.0 2.1 1.8 1.3 1.8 1.4 1.5 2.1 2.2 2.4Manufacturing 16.0 17.2 16.9 16.5 17.2 18.0 18.7 19.0 18.4 19.3 1Construction 6.1 5.1 4.4 3.9 3.9 4.3 4.7 5.2 5.4 5.6Electricity, water supply 1.2 1.3 1.4 1.2 1.0 1.1 1.1 1.1 1.1 1.0 LTransportation, communications 6.3 6.2 6.4 6.1 5.9 6.3 6.5 6.3 6.2 6.3Trade 19.1 18.2 18.1 19.0 19.9 18.3 17.6 19.1 19.8 20.0Banking, insurance, real estate 4.1 4.3 4.2 4.1 4.6 4.9 4.8 5.0 5.3 5.6Ownership of dwellings 2.2 2.1 1.9 1.6 1.6 1.5 1.4 1.3 1.2 1.2Public administration, defense 4.5 4.6 4.4 3.8 3.9 4.1 4.0 3.8 3.8 3.8Other services 10.2 10.7 10.2 8.7 8.6 8.7 8.7 9.0 9.1 9.1
Gross Domestic Product 100.0 100.0 100.0 100.0 100.0 100.0 100.0 100.0 100.0 100.0
/a' Estimate.
Source: NESDB.
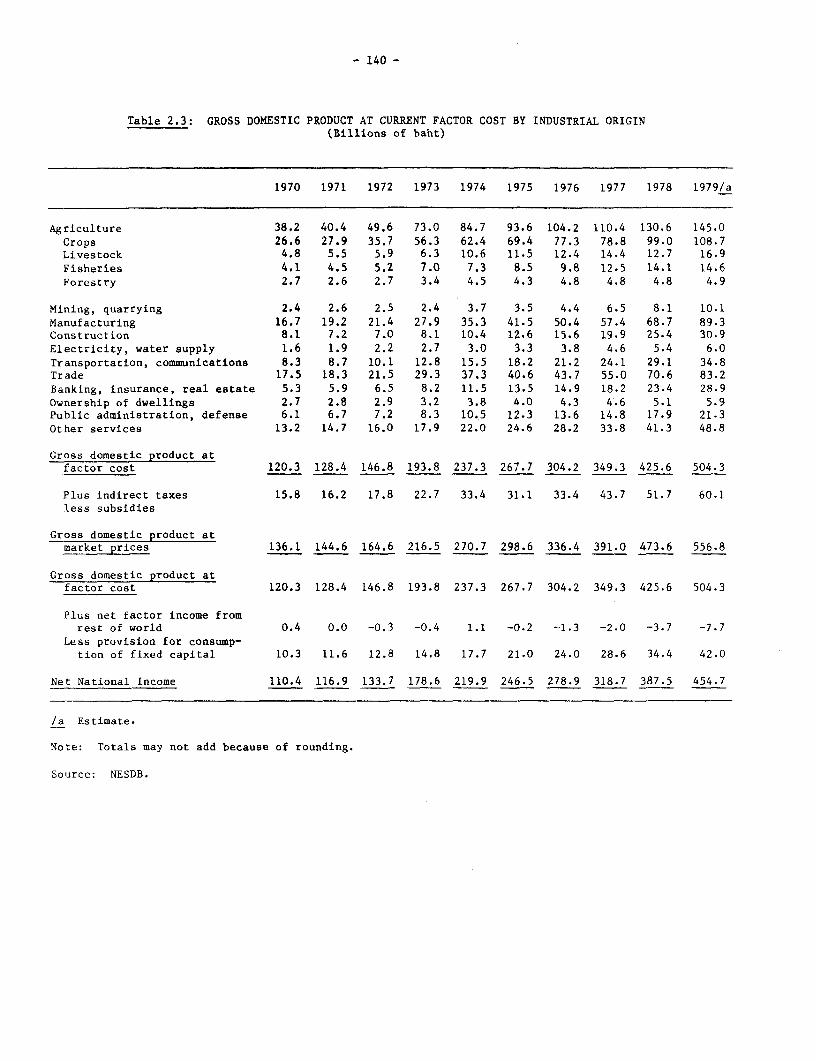
- 140 -
Table 2.3: GROSS DOMESTIC PRODUCT AT CURRENT FACTOR COST BY INDUSTRIAL ORIGIN(Billions of baht)
1970 1971 1972 1973 1974 1975 1976 1977 1978 1979/a
Agriculture 38.2 40.4 49.6 73.0 84.7 93.6 104.2 110.4 130.6 145.0
Crops 26.6 27.9 35.7 56.3 62.4 69.4 77.3 78.8 99.0 108.7Livestock 4.8 5.5 5.9 6.3 10.6 11.5 12.4 14.4 12.7 16.9
Fisheries 4.1 4.5 5.2 7.0 7.3 8.5 9.8 12.5 14.1 14.6Forestry 2.7 2.6 2.7 3.4 4.5 4.3 4.8 4.8 4.8 4.9
Mining, quarrying 2.4 2.6 2.5 2.4 3.7 3.5 4.4 6.5 8.1 10.1Manufacturing 16.7 19.2 21.4 27.9 35.3 41.5 50.4 57.4 68.7 89.3Construction 8.1 7.2 7.0 8.1 10.4 12.6 15.6 19.9 25.4 30.9Electricity, water supply 1.6 1.9 2.2 2.7 3.0 3.3 3.8 4.6 5.4 6.0Transportation, communications 8.3 8.7 10.1 12.8 15.5 18.2 21.2 24.1 29.1 34.8Trade 17.5 18.3 21.5 29.3 37.3 40.6 43.7 55.0 70.6 83.2Banking, insurance, real estate 5.3 5.9 6.5 8.2 11.5 13.5 14.9 18.2 23.4 28.9Ownership of dwellings 2.7 2.8 2.9 3.2 3.8 4.0 4.3 4.6 5.1 5.9Public administration, defense 6.1 6.7 7.2 8.3 10.5 12.3 13.6 14.8 17.9 21.3Other services 13.2 14.7 16.0 17.9 22.0 24.6 28.2 33.8 41.3 48.8
Gross domestic product atfactor cost 120.3 128.4 146.8 193.8 237.3 267.7 304.2 349.3 425.6 504.3
Plus indirect taxes 15.8 16.2 17.8 22.7 33.4 31.1 33.4 43.7 51.7 60.1less subsidies
Gross domestic product atmarket prices 136.1 144.6 164.6 216.5 270.7 298.6 336.4 391.0 473.6 556.8
Gross domestic product atfactor cost 120.3 128.4 146.8 193.8 237.3 267.7 304.2 349.3 425.6 504.3
Plus net factor income fromrest of world 0.4 0.0 -0.3 -0.4 1.1 -0.2 -1.3 -2.0 -3.7 -7.7
Less provision for consump-tion of fixed capital 10.3 11.6 12.8 14.8 17.7 21.0 24.0 28.6 34.4 42.0
Net National Income 110.4 116.9 133.7 178.6 219.9 246.5 278.9 318.7 387.5 454.7
/a Estimate.
Note: Totals may not add because of rounding.
Source: NESDB.

- 141 -
Table 2.4: GROSS DOMESTIC PRODUCT AT CONSTANT tARKET PRICESBY INDUSTRIAL ORIGIN
(Billions of 1972 baht)
1970 1971 1972 1973 1974 1975 1976 1977 1978 1979/a
Agriculture 48.3 50.5 49.9 56.2 57.0 62.1 65.9 65.5 75.1 73.6Crops 373 765 TIE T7 1.8 4T5.6 T9.0 46.8 555 ;54-.Livestock 5.0 5.6 5.9 6.3 6.7 7.4 7.6 8.1 8.2 8.6Fisheries 5.0 5.0 5.2 5.4 5.3 5.7 5.9 7.5 8.4 8.1Forestry 2.8 3.0 2.9 2.9 3.2 3.3 3.4 3.1 2.9 2.9
Nonagriculture 101.8 106.6 114.7 123.9 132.2 141.4 156.6 173.3 191.8 211.1
Mining, quarrying 2.6 2.9 2.9 2.7 2.9 2.5 2.9 3.5 4.1 4.6
Manufacturing 23.3 25.2 27.9 31.5 33.6 36.8 42.5 48.1 52.8 58.0
Construction 8.7 7.7 7.2 7.2 7.5 8.5 10.0 12.0 14.1 15.4
Electricity, water supply 1.6 1.9 2.3 2.6 2.8 3.2 3.6 4.1 4.5 5.1
Transportation, communications 9.2 9.4 10.5 11.3 12.1 13.4 14.6 16.1 18.4 20.8
Trade 26.5 27.2 29.9 33.4 33.7 35.8 38.8 41.2 43.5 47.0
Banking, insurance, real estate 5.8 6.6 6.9 7.6 3.6 9.6 10.2 11.6 13.8 15.3
Ownership of dwellings 3.0 3.1 3.2 3.3 3.5 3.6 3.7 3.8 4.1 4.4
Public administration, defense 6.5 7.0 7.2 7.7 7.9 8.4 8.9 9.6 10.2 11.4
Other services 14.5 15.7 16.8 18.5 19.8 19.7 21.3 23.3 26.3 29.1
Gross domestic product 150.1 157.1 164.6 180.1 189.2 203.5 222.5 238.8 266.8 284.7
Net factor income from abroad 0.3 0.0 -0.3 -0.4 0.9 -0.2 -1.0 -1.6 -2.7 -5.4
Gross national product 150.4 157.1 164.3 179.8 190.1 203.3 221.5 237.3 264.1 279.3
/a Estimate.
Note: Totals may not add because of rounding
Source: NESDB.

- 142 -
Table 2.5: GROWTH OF GROSS DOMESTIC PRODUCT AT CONSTANT MARKET PRICES
BY INDUSTRIAL ORIGIN(1972 Baht, %)
1971 1972 1973 1974 1975 1976 1977 1978 19791a
Agriculture 4.6 -1.2 12.7 1.3 9.0 6.1 -0.5 14.5 -1.9Crops 4.0 -2.7 16.0 0.1 9.3 7.4 -4.5 18.7 -2.7Livestock 11.5 4.8 6.7 6.7 10.1 3.3 6.3 1.2 4.7Fisheries 0.9 4.0 3.0 -1.2 8.6 2.9 27.1 11.9 -3.5
Forestry 6.3 -3.3 0.2 11.8 3.5 1.0 -6.6 -6.5 -1.7
Nonagriculture 4.7 7.7 8.0 7.3 6.8 10.7 10.7 10.7 10.1
Mining, quarrying 11.8 1.1 -7.0 8.8 -14.8 16.9 21.3 16.3 12.8
Manufacturing 8.1 10.6 13.1 9.1 8.0 15.6 13.0 9.7 10.0
Construction -11.6 -6.9 0.7 3.3 14.1 17.7 19.7 17.9 8.7
Electricity, water supply 14.7 19.8 16.7 6.1 13.7 14.5 13.8 8.6 12.4
Transportation, communications 1.9 12.2 7.7 7.0 2.8 9.0 10.2 14.4 13.0
Trade, wholesale and retail 2.5 9.9 5.1 9.1 5.5 8.5 6.2 5.4 8.2
Banking, insurance, real estate 13.0 5.5 10.0 17.4 10.7 6.0 13.4 19.5 10.7
Ownership of dwellings 3.5 3.0 3.6 4.2 3.0 3.1 4.3 6.7 7.3
Public administration, defense 8.0 2.6 7.2 2.3 6.3 6.4 7.4 6.4 12.3
Other services 8.0 7.5 9.7 1.5 18.4 8.0 9.3 13.1 10.5
Gross domestic product 4.7 4.8 9.4 5.4 7.4 9.3 7.3 11.7 6.7
/a Based on preliminary data.
Source: NESDB.

- 143 -
Table 2.6: IMPLICIT PRICE DEFLATORS FOR GDP AT MARKET PRICESBY INDUSTRIAL ORIGIN
(1972 = 100)
1970 1971 1972 1973 1974 1975 1976 1977 1978 1979/a
Agriculture 79.6 80.7 100.0 130.2 148.8 151.5 158.8 169.3 174.8 197.8Crops 75.3 76.0 100.0 135.3 149.1 152.6 158.1 169.0 178.9 201.9Livestock 96.2 97.6 100.0 100.0 158.0 155.5 162.1 177.8 171.9 169.9Fisheries 82.1 89.7 100.0 130.1 137.3 147.4 166.0 166.1 168.0 180.0Forestry 100.3 92.3 100.0 122.9 144.5 134.2 148.6 159.0 170.2 176.3
Nondgriculture 95.9 97.4 100.0 115.7 139.1 144.8 148.8 162.8 180.2 198.4
Mining, quarrying 108.0 103.7 100.0 106.5 155.2 163.5 178.0 230.8 258.6 298.2
Manufacturing 93.5 98.8 100.0 113.0 138.4 146.5 148.2 155.3 166.2 137.6
Construction 94.9 95.3 100.0 115.5 143.5 151.2 157.5 168.8 182.9 204.8
Electricity, water supply 99.2 101.3 100.0 102.1 100.1 103.4 102.8 105.8 114.8 113.2'
Tradisportation, communications 93.4 95.5 100.0 116.9 132.1 139.6 149.0 153.1 161.6 169.5
Trade 97.7 96.6 100.0 130.8 155.8 152.9 153.0 181.8 217.8 246.3
Banking, insurance, real estate 96.9 95.3 100.0 115.5 137.4 151.2 157.5 168.8 182.9 204.3
Ownership of dwellings 97.8 99.8 100.0 107.2 120.9 124.2 132.1 137.8 143.8 157.0
Public administration, defense 94.9 95.3 100.0 107.8 133.9 147.4 152.6 155.0 176.5 186.5
Other services 95.7 98.6 100.0 101.9 122.2 131.3 138.9 152.2 164.7 1
Gross domestic product at marketprices 90.7 92.1 100.0 120.2 142.0 146.8 151.7 164.6 178.9 198.2
Implicit terms of trade -agriculture and nonagriculture 83.0 82.9 100.0 112.5 107.0 104.6 106.7 104.0 97.0 99.7
/a Prelirainary.
Source: NESDB.

- 144 -
Table 2.7: EXPENDITURE ON GROSS DOMESTIC PRODUCT AT CURRENT MARKET PRICES(Billions of baht)
197( 1971 1972 1973 1974 1975 1976 1977 1978 1979/a
Consumption 108.0 116.0 128.1 159.3 203.4 229.5 262.1 302.2 358.2 427.9Private 92.4 99.1 110.3 138.0 177.4 198.5 225.0 260.5 304.6 362.0Durable goods 4.4 4.1 4.6 6.5 9.4 9.8 11.2 15.3 16.4 21.1Nondurable goods 69.8 75.1 84.2 105.8 136.4 152.7 171.3 197.1 232.0 273.4Services 18.2 19.8 21.5 25.8 31.6 36.0 42.5 48.1 56.2 67.5
General government 15.6 17.0 17.9 21.2 26.0 31.0 37.1 41.7 53.6 65.8
Gross investment 35.6 34.9 33.7 51.7 65.9 75.7 78.4 102.2 126.5 157.2Private fixed capital /b 22.2 22.3 23.2 33.5 48.9 50.7 50.1 69.0 79.7 103.0Public fixed capital 10.5 10.4 11.4 10.7 10.2 15.4 23.2 29.7 36.8 43.0Change in stocks 2.9 21 -0.9 7.5 6.8 9.6 5.2 3.6 10.0 11.2
Exports of goods and services 22.7 25.2 31.9 42.5 61.7 57.0 71.2 82.2 99.6 128.3Goods 14.3 16.7 21.8 31.2 49.0 44.5 60.4 70.6 82.3Nonfactor services 8.4 8.5 10.1 11.3 12.7 12.7 10.8 11.2 17.3
Imports of goods and services 29.3 29.7 33.8 46.1 68.4 70.8 79.4 103.4 119.9 163.0Goods 26.5 26.6 30.6 42.1 63.3 64.7 71.4 96.1 110.0Nonfactor services 2.8 3- 1 3.2 4.0 5.1 6.1 8.0 7.3 9.9
Expenditure on gross domesticproduct 137.1 146.4 i59.8 207.4 262.6 291.4 332.4 383.2 464.4 550.4
Statistical discrepancy -1.0 -1.8 4.8 9.1 7.0 7.4 5.2 9.8 12.9 14.0
Gross domestic product 136.1 144.6 164.6 216.5 269.7 298.8 337.6 393.0 477.3 564.4
Memo:
Gross domestic savings 29.1 30.4 31.7 48.1 59.2 61.9 70.3 81.0 106.2 122.5Public 2.9 1.8 2.1 3.8 11.4 6.9 3.5 9.9 9.1 8.7Private 26.2 28.6 29.6 44.3 47.8 55.0 66.8 71.1 97.1 113.8
/a Estimate.
/b Excludes private on-farm investment other than purchases of agricultural machinery.
Note: Totals may not add because of rounding.
Source: NESDB

Table 2.8: PERCENTAGE DISTRIBUTION OF EXPENDITURE ON GROSS DOMESTIC PRODUCTAT CURRENT MARKET PRICES
1970 1971 1972 1973 1974 1975 1976 1977 1978 1979/a
Consumption 79.4 80.2 77.8 73.6 75.4 76.8 77.6 76.9 75.0 75.8Private 67.9 68.5 67.0 63.7 65.8 66.4 66.6 66.3 63.8 64.1General government 11.5 11.8 10.9 29.8 9.6 10.4 11.0 10.6 11.2 11.7
Gross investment 26.2 24.1 20.5 23.9 24.4 25.3 23.2 26.0 26.5 27.9Private fixed capital 16.3 15.4 14.1 15.5 18.1 17.0 14.8 17.6 16.7 18.2Public fixed capital 7.7 7.2 6.9 4.9 3.8 5.2 6.9 7.7 7.7 7.6Change in stocks 2.1 1.5 -0.5 3.5 2.5 3.2 1.5 0.9 2.1 2.0
Exports of goods and services 16.7 17.4 19.4 19.6 22.9 19.1 21.1 20.8 20.9 22.7Goods 10.5 11.5 13.2 14.4 18.2 14.9 17.9 18.0 17.2 18.9Nonfactor services 6.2 5.9 6.1 5.2 4.7 4.3 3.2 2.8 3.6 3.8
Imports of goods and services 21.5 20.5 20.5 21.3 25.4 23.7 23.5 26.3 25.1 28.9Goods 19.5 18.4 18.6 19.4 23.5 21.7 21.1 24.5 23.0 27.2Nonfactor services 2.1 2.1 1.9 1.8 1.9 2.0 2.4 1.9 2.1 1.7
Expenditure on gross domesticproduct 100.7 101.2 97.1 95.8 97.4 97.5 98.5 97.5 97.3 97.5
Statistical discrepancy_/b -0.7 -1.2 2.9 4.2 2.6 2.5 1.5 2.5 2.7 2.5
Gross domestic product 100.0 100.0 100.0 100.0 100.0 10(.0 100.0 100.0 100.0 100.0
Memo:
Gross domestic savings 21.4 21.0 19.3 22.2 22.5 20.7 20.8 20.6 22.3 21.7Public 2.1 1.2 1.3 1.8 4.2 2.3 1.0 2.5 1.9 1.5Private 19.3 19.8 18.0 20.5 18.3 18.4 19.8 18.1 20.3 20.2
Note: Totals may not add up because of rounding.
/a Preliminary.Tb Probably unrecorded private consumption.
Source: NESODB.

Table 2.9: EXPENDITURE ON GROSS DOMESTIC PRODUCT AT CONSTANT PRICES(Billions of 1972 baht)
1970 1971 1972 1973 1974 1975 1976 1977 1978 1979/a
Consumption 114.4 121.2 128.2 139.2 145.5 155.3 171.2 185.7 200.5 219.5Private 98.0 103.7 110.3 119.6 125.7 134.4 146.2 158.5 168.7 183.0General government 16.4 17.5 17.9 19.7 19.8 21.9 25.0 27.3 31.8 36.5
Gross investment 43.0 42.0 32.7 43.2 46.1 50.1 49.5 63.9 66.3 78.6Private fixed capital /b 27.9 27.5 23.2 28.9 35.3 32.9 31.6 43.2 45.5 52.2Public fixed capital 12.1 11.8 11.4 9.0 6.4 9.5 13.5 16.7 19.4 20.1Change in stocks 3.2 2.6 -0.9 5.3 4.0 7.7 4.4 4.0 1.4 6.3
Exports of goods and nonfactor services /c 24.0 26.8 31.9 30.5 30.0 28.9 36.4 40.7 45.8 48.8Goods 14.1 18.3 21.8 20.3 23.1 22.3 31.1 35.6 38.4 41.1Nonfactor services 9.9 8.5 10.1 10.2 7.0 6.6 5.3 5.1 7.4 7.7
Imports of goods and nonfactor services /c 34.4 29.6 33.8 41.7 37.7 36.8 39.2 47.4 51.0 58.6Goods 31.1 26.5 30.6 38.1 34.9 33.7 35.2 44.1 46.8 55.2Nonfactor services 3.3 3.1 3.2 3.6 2.8 3.2 3.9 3.3 4.2 3.4
Expenditure on gross domestic product /c 147.0 160.4 159.0 171.2 183.9 197.5 217.9 242.9 261.6 288.3
Statistical discrepancy 3.1 -3.3 5.6 8.9 6.1 6.0 4.6 -4.1 5.2 -3.6
Gross domestic product 150.1 157.1 164.6 180.1 190.0 203.5 222.5 238.8 266.8 284.7
/a Preliminary./b Excludes private on-farm investment other than purchases of agricultural machinery./c IBRD mission estimates. Derived from Table 2.7 and unit value indices, Table 3.15, assuming deflator for
exports of nonfactor services deflated by import unit value index.
Note: Totals may not add because of rounding.
Source: NESDB and IBRD mission estimates.

Table 2.10: PERCENTAGE GROWTH iE EXPENDITUREON GROSS DOMESTIC PRODUCT ATl 1972 PRICES
1971 1972 1973 1974 1975 1976 1977 1978 1979/a
Consumption 5.9 S.8 8.6 4.5 6.7 10.2 8.5 8.0 9.5Private 5.8 6.4 8.4 5.1 6.9 8.8 8.4 6.4 8.5General government 6.7 2.) 10.1 0.5 10.6 14.2 9.2 16.5 11.9
Gross investment -2. a -19.8 28.2 6.7 8.7 -1.2 29.1 3.8 18.6Private fixed capital - .4 -15.6 24.6 22.1 -6.8 -4.0 36.7 5.3 14.7Public fixed capital -2.5 - 3.4 -21.1 -23.3 37.7 42.1 23.7 16.2 3.6Change in stocks
Exports of goods and nad itorservices 11 1 19.0 -4.4 -i.6 -3.7 26.0 11.8 12.5 6.6Goods 9.8 19.1 -6.1 13.8 -3.5 39.5 14.5 7.9 7.0Nonfactor services -L'.1 18.8 1.0 -31.4 -5.7 -19.7 -3.8 45.1 4.1
Imports of goods and nonfactorservices -14.0 14.2 23.4 -9.6 -2.4 6.5 20.9 7.6 14.9Goods -14.8 15.5 24.5 -8.4 -3.4 4.5 25.3 6.1 17.9Nonfactor services -6.1 3.2 12.5 -22.2 14.3 21.9 -15.4 27.3 -19.0
Expenditure on gross domesticproduct 9.1 -0.9 7.7 7.4 7.4 10.3 11.5 7.7 10.2
Gross domestic product 4.7 4.8 9.4 5.5 7.1 9.3 7.3 11.7 6.7
/a Preliminary
Sources: NESDB a ad IBRD mLssi,)f esLimates.

Table 3.1: SUMMARY BALANCE OF PAYMENTS(Millions of baht)
1970 1971 1972 1973 1974 1975 1976 1977 1978 1979
Merchandise exports, f.o.b. 14,269.7 16,692.1 21,750.2 31,252.5 49,002.4 44,382.4 60,361.2 70,462.8 82,250.8 106,879.0Merchandise imports, c.i.f. 26,406.7 26,606.4 30,634.8 42,054.9 63,304.6 64,527.0 71,446.1 96,004.8 109,956.1 153,463.5Nonmonetary gold imports /a 107.8 26.4 - - - - - 56.8 834.7 470.8
Trade balance -12,244.8 -9,940.9 -8,884.6 -10,802.4 -14,302.2 -20,144.6 -11,084.9 -25,598.8 -28,540.0 -47,055.3
Service receipts 10,094.8 9,899.6 11.322.7 12,723.1 15,634.2 16,551.6 13,993.3 14,771.7 22,123.9 29,815.7Service payments 4,058.6 4,495.5 4,739.7 5,886.7 8,033.5 10,390.8 12,350.8 12,336.5 17,844.8 26,274.5
Net service 6,036.2 5,404.1 6,583.0 6,836.4 7,600.7 6,160.8 1,642.5 2,405.2 4,279.1 3,541.2
Transfers (net) 1,011.7 904.1 1,238.8 2,968.8 4,916.9 1,632.1 464.5 801.9 816.0 1,255.8Private (57.4) (131.1) (630.7) (2,398.9) (4,375.6) (1,134.5) (100.8) (443.3) (128.0) 487.0Government (954.3) (773-0) (608.1) (569.9) (541.3) (497.6) (363.7) (358.6) (688.0) 768.8
Current account balance -5,196.9 -3,632.7 -1,062.8 -997.2 -1,784.6 -12,351.7 -8,977.9 -22,391.7 -23,444.9 -42,258.3
Capital inflow (net) 2,478.8 1,733.1 3,643.2 2,937.6 9,054.7 7,754.7 9,263.6 13,966.9 14,858.3 33,769.1Private sector 2,326.0 1,463.1 3,406.6 1,910.1 ;',801.0 5,696.3 5,060.4 8,360.9 3,595.3 13,077.5
Direct investment (890.5) (808.4) (1,427.1) (1,604.9) (3,836.3) (1,744.8) (1,614.1) (2,163.8) (1,010.8) (1,047.7)Medium & long-term
loans and credits (1,007.7) (397.0) (1,392.5) (-1,199.0) (2,637.1) (1,316.7) (689.3) (867.2) (689.3) (6,314.5)Other (427.8) (257.7) (587.0) (1,504.2) (1,327.6) (2,634.8) (2,757.0) (5,329.9) (1,895.2) (5,715.3)
Public sector 152.8 270.0 236.6 1,027.5 1,253.7 2,058.4 4,203.2 5,606.0 11,263.0 20,691.6Loans to the Central Gov't (445-1) (360.3) (214.7) (387.2) (126.4) (-105.0) (2,157.2) (770.8) (6,057.8) (8,890.8)Loans & credits to state
enterprises (90.7) (60.2) (388.3) (372.7) (1,173.9) (2,203.0) (1,839.3) (4,767.3) (5,170.8) (12,143.6)Other Central and Local Gov't (-383.0) (-96.5) (-316.4) (267.6) (-46.6) (-39.6) (206.7) (67.9) (34-4) (-342.8)
Allocation of SDR - - - - - - - - - 493.6
Errors and omissions 66.1 1,266.2 1,009.3 -1,076.2 741.9 1,739.0 -368.5 886.9 -4,711.4 70.6
Change in reserves (increase = -) 2,652.0 633.4/a -3,670.7/a -864.2/a -8,012.0Ob 2,858.0/b 82.8 7,537.9 13,298.0 7,925.0
/a Including timing adjustments and official gold imports for the minting of commemorative coins.
/b Excluding SDR allocations of $14.3 million (B 298.2 million) in 1971 and $15.4 million (B 320.7 million) in 1972,and reserve valuation adjustments.
Source: Bank of Thailand.
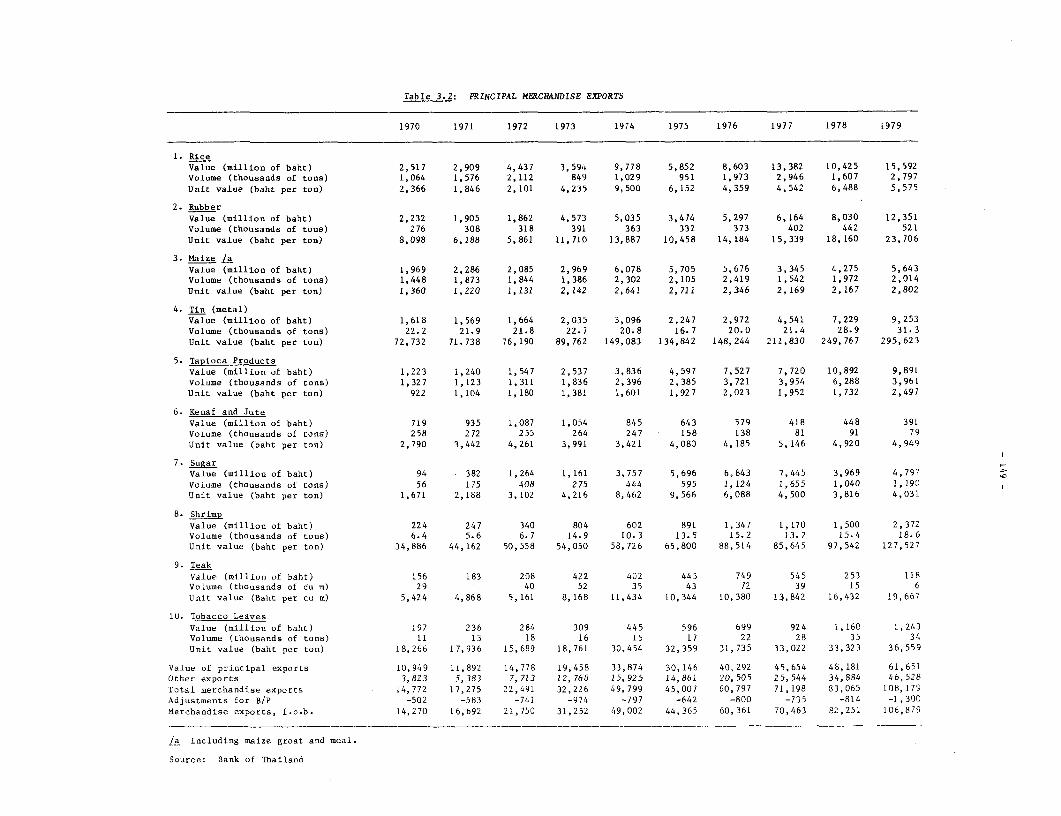
Table 3.2: PRINCIPAL MERCHANDISE EXPORTS
1970 1971 1972 1973 1974 1975 1976 1977 1978 1979
1. Rice
Value (million of baht) 2,517 2,909 4,437 3,594 9,778 5,852 8,603 13,382 10,425 15,592
Volume (thousands of tons) 1,064 1,576 2,112 849 1,029 951 1,973 2,946 1,607 2,797
Unit value (baht per ton) 2,366 1,846 2,101 4,Z35 9,500 6,152 4,359 4,542 6,488 5,575
2. Rubber
Value (million of baht) 2,232 1,905 1,862 4,573 5,035 3,474 5,297 6,164 8,030 12,351
Volume (thousands of tons) 276 308 318 391 363 332 373 402 442 521
Unit value (baht per ton) 8,098 6,188 5,861 11,710 13,887 10,458 14,184 15,339 18,160 23,706
3. Maize /a
Value (million of baht) 1,969 2,286 2,085 2,969 6,078 5,705 5,676 3,345 4,275 5,643
Volume (thousands of tons) 1,448 1,873 1,844 1,386 2,302 2,105 2,419 1,542 1,972 2,014
Unit value (baht per ton) 1,360 1,220 1,131 2,142 2,641 2,711 2,346 2,169 2,167 2,802
4. Tin (metal)
Value (million of baht) 1,618 1,569 1,664 2,035 3,096 2,247 2,972 4,541 7,229 9,253
Volume (thousands of tons) 22.2 21.9 21.8 22.7 20.8 16.7 20.0 21.4 28.9 31.3
Unit value (baht per ton) 72,732 71.738 76,190 89,762 149,083 134,842 148,244 211,830 249,767 295,623
5. Tapioca ProductsValue (million of baht) 1,223 1,240 1,547 2,537 3,836 4,597 7,527 7,720 10,892 9,891
Volume (thousands of tons) 1,327 1,123 1,311 1,836 2,396 2,385 3,721 3,954 6,288 3,961
Unit value (baht per ton) 922 1,104 1,180 1,381 1,601 1,927 2,023 1,952 1,732 2,497
6. Kenaf and Jute
Value (million of baht) 719 935 1,087 1,054 845 643 579 418 448 391Volume (thousands of tons) 258 272 255 264 247 158 138 81 91 79
Unit value (baht per ton) 2,790 3,442 4,261 3,991 3,421 4,080 4,185 5,146 4,920 4,949
7. Sugar
Value (million of baht) 94 382 1,264 1,161 3,757 5,696 6,843 7,445 3,969 4,797
Volume (thousands of tons) 56 175 408 275 444 595 1,124 1,655 1,040 1,190
Unit value (baht per ton) 1,671 2,188 3,102 4,216 8, 462 9,566 6,088 4,500 3,816 4,031
8. Shrimp
Value (million of baht) 224 247 340 804 602 891 1,347 1,170 1,500 2,372Volume (thousands of tons) 6.4 5.6 6.7 14.9 10.3 13.5 15.2 13.7 15.4 18.6
Unit value (baht per ton) 34,886 44,162 50,558 54,050 58,726 65,800 88,514 85,645 97,542 127,527
9. Teak
Value (million of baht) 156 183 208 422 402 445 749 545 253 118Volume (thousands of cu m) 29 40 52 35 43 72 39 15 6
Unit value (Baht per cu m) 5,424 4,868 5,161 8,168 11,434 10,344 10,380 13,842 16,432 19,667
10. Tobacco Leaves
Value (million of baht) 197 236 284 309 445 596 699 924 1,160 1,243Volume (thousands of tons) 11 13 18 16 15 17 22 28 35 34
Unit value (baht per ton) 18,266 17,936 15,689 18,761 30,454 32,359 31,735 33,022 33,323 36,559
Value of principal exports 10,949 11,892 14,778 19,458 33,874 30,146 40,292 45,654 48,181 61,651Other exports 3,823 5,383 7,713 12,768 15,925 14,861 20,505 25,544 34,884 46,528
Total merchandise exports 14,772 17,275 22,491 32,226 49.799 45,007 60,797 71,198 83,065 108,179
AdjtLstments for B/P -502 -583 -741 -974 -797 -642 -800 -735 -814 -1 ,300
Merchandise exports, f.o.b. 14,270 16,692 21,750 31,252 49,002 44,365 60,361 70,463 82,251 106,879
/a Including maize groat and meal.
Source: Bank of Thailand

- 150 -
Table 3.3: OTHER MERCHNNIDSE EXPORTS(Million of baht)
1970 1971 1972 1973 1974 1975 1976 1977 1978 1979
Agricultural Products 1,114 1,301 1,522 2,178 2,542 2,323 3,150 _3,645 4,Ci 4,839Mungbeans and block matpe beans 255 255 277 374 454 464 945 1,058 1,161 1,375Soybeans 16 17 23 76 47 133 49 81 51 68Sorghun 103 157 138 241 426 482 374 300 372 495Kapok fibre 134 141 149 179 195 169 272 245 237 264Castor seeds 93 124 97 272 215 103 251 515 281 205Seedlae and stick lac 36 60 107 191 287 95 91 56 57 86Hides and skins 52 47 102 98 70 34 55 50 76 143Cattle 73 91 115 139 120 111 146 215 251 207Other agricuLltural products 352 409 514 608 728 732 952 1,125 1,515 1,996
Fishery Products 143 249 430 779 786 957 1,360 1,867 2,687 3,481Cuttle fish, fresh t 38 t 96 141 273 340 05 602 622 944 6Cuttle fish, salted in brine t t 68 56 83 102 125 195 301 12Other fishery products 105 153 221 450 363 350 633 1,050 1,442 3,463
Forestry Products 63 83 108 260 214 223 306 240 89 45
Mineral Products 440 795 673 737 1,174 791 1,056 1,267 1,522 1,549Fluorite 2222 311 222 224 289 204 267 229 206 252Tungsten 83 329 322 260 467 376 531 799 1,020 620Iron ores and concentrates 8 1 - - - - - - - -Other mineral products 127 154 129 253 418 211 258 239 296 677
Manufacturing Products 808 1,344 2,618 5,509 6,906 6,423 8,977 10,449 14,853 19,570Pineapple, canned 55 44 51 75 280 346 561 897 n.a. 1,244Garaents 18 67 258 660 795 987 1,535 1,495 2,562 3,541Molasses 45 86 91 312 500 479 498 746 507 528Cement 83 90 218 314 650 506 378 217 33 33Petroleum products 36 132 248 379 303 230 99 1 71 191Spinning 5 27 112 159 166 141 337 618 n.a. 776Silk, fabrics 34 30 29 39 34 26 29 29 34 39Textiles 23 62 271 1,027 787 803 2,040 2,162 n.a. 4,378Jute yarn & jute fabrics, twine
cordage rope, cable of jute 16 63 81 198 485 314 430 308 n.a. 732Gunnv bags 63 178 170 312 330 283 116 159 425 624Iron & steel products 41 46 118 174 335 165 217 235 n.a. 684Household utensils of wool 18 33 72 135 16 205 238 324 n.a. 355Precious stones and jewelry 137 232 383 641 763 768 882 969 1,711 2,753Other manufactuiring products 215 249 516 1,084 1,312 1,170 1,620 2,289 n.a. 3,692
Temporary exports 366 625 916 989 801 858 951 1,389 1,871 2
Re-Exports 522 598 875 I O80 1,161 935 608 801 1,813 1,882
Diplomatic Shipments 63 82 92 165 135 27 23 60 56 112
Personal Houshold Effects 32 53 55 66 74 83 74 110 85 94
Others 272 253 424 1,005 2,132 2,304 4,005 5,716 7,907 12,399
Total 3,823 5,383 7,713 12,768 15,925 14,891 20,510 25,544 34,884 46,528
Source: Bank of Thailand.

- 151 -
Table 3.4: MERCHANIDISE EXPORTS BY COUNTRIES
1970 1971 1972 1973 1974 1975 1976 1977 1978 1979
------------------------ Millions of baht -------------------------------------
Japan 3,770 4,274 4,660 8,410 12,853 12,420 15,686 14,029 16,866 22,901
United States 1,985 2,261 2,834 3,261 3,945 4,968 6,098 6,929 9,153 12,106
Netherlands 1,276 1,386 1,794 2,927 4,328 4,547 8,064 9,564 12,185 12,260
Singapore 1,018 1,225 1,955 2,661 4,142 4,068 4,114 4,505 6,723 9,222
Hong Kong 1,113 1,152 1,674 2,362 3,171 2,716 3,036 3,342 4,436 5,260
Malaysia 830 731 1,120 1,952 2,433 2,099 2,552 3,769 4,296 4;>?
Germany, Fed. Rep. 533 604 556 770 1,115 1,116 1,979 2,491 3,441 4, ,91
Taiwan 720 498 830 1,308 3,316 1,070 1,871 3,167 1,088 1_,!3u5
United Kingdom 305 435 368 622 664 529 980 1,017 1 283 1,98
Other 3,222 4,673 6,700 7,953 13,832 11,474 16,417 22,375 23,594 33,9i6
Total Mechan-dise Exports 14,772 17,275 22,491 32,226 49.799 45,027 60,797 71,198 83,065 108,179
…----------------------Percentage of total --------------------------------
Japan 25.5 24.7 20.7 26.1 25.8 27.6 25.8 19.7 20.3 21.2
United States 13.4 13.1 12.6 10.1 7.9 11.0 10.0 9.8 11.0 11.2
Netherlands 8.6 8.0 8.0 9.1 8.7 10.1 13.3 18.4 14.7 11.3
Singapore 6.9 7.1 8.7 8.3 8.3 9.0 6.8 6.3 8.1 8.5
Hong Kong 7.5 6.7 7.4 7.3 6.4 6.1 5.0 4.7 5.3 4.9
Malaysia 5.6 4.2 5.0 6.0 4.9 4.6 4.2 5.3 5.2 4.4
Germany, Fed. Rep. 3.6 3.7 2.5 2.4 2.2 2.5 3.3 3.5 6.1 4.1
Taiwan 4.9 2.9 3.7 4.1 6.7 2.4 3.1 4.5 1.3 1.3
United Kingdom 2.9 2.5 1.6 1.9 1.3 1.2 1.6 1.4 1.5 1.8
Other 21.9 27.1 29.8 24.7 27.8 25.5 27.0 31.4 28.5 31.4
/a Preliminary.
Source: Bank of Thailand.

- 152 -
Table 3.5: PRINCIPAL MECHANDISE EXPORTS BY COUNTRIES
1970 1971 1972 1973 1974 1975 1976 1977 1978 1979
…---------------------------------- Millions of baht -----------------------------…-----
Rice 2,516 2,909 4,437 3,594 9,778 5.852 8,603 13,382 10,425 15.592Hong Kong 552 482 627 526 1,153 900 654 600 660 723Singapore 392 432 839 438 867 716 906 1,082 1,017 1,324Malaysia 300 210 274 172 748 121 524 881 891 667Indonesia 277 175 371 797 1,168 74 2,243 3,683 813 3,056Saudi Arabia 296 171 61 324 601 317 479 155 298 274India 54 138 184 - - 679 1 - 2 -Philippines - 328 519 91 383 405 278 61 - -Sri Lanka 50 89 - - - 615 328 529 - 2
Japan 66 45 30 78 224 45 20 147 134 69Other 529 839 1,532 1,168 4,634 1,980 3,170 6,244 6,610 9,477
Rubber 2.232 1,905 1,862 4.573 5,035 3,474 5.297 6,164 8,030 12,351Japan 1,153 996 1,091 2,464 2,354 1,923 2,805 3,271 4,391 7,220United States 210 216 162 250 342 312 842 854 910 1,123Singapore 134 138 235 707 1,031 446 619 800 1,515 1,816Malaysia 140 127 190 650 508 296 396 423 501 622Italy 207 124 32 96 118 17 2 10 - -Other 388 304 152 406 682 480 633 806 713 1,570
Maize 1,969 2,286 2,085 2.969 6,078 5,705 5,676 3,345 4,275 5,643Japan 878 1,109 899 966 2,653 2,252 2,226 754 1,068 1,140Taiwan 599 398 570 691 1;39q 355 1,076 804 - 203Singapore 152 204 278 366 722 1,337 839 420 686 778Hong Kong 160 178 155 318 384 355 342 382 411 666Malaysia 130 116 132 248 377 433 296 484 773 1,217Other 50 281 51 350 603 973 897 501 1,337 1,634
Tin (metal) 1,618 1,569 1,664 2,035 3,096 2.247 2,972 4,541 7,229 9,253United States 1,104 1,119 1,003 650 775 1,044 1,064 1,491 1,832 3,185Netherlands 445 405 380 681 1,217 330 983 1,760 3,857 4,341Japan 69 45 281 492 774 780 925 1,290 1,530 1,727Other - - - 212 330 93 0 0 10 -
Tapioca Products 1,223 1,240 1,547 2.537 3,836 4,597 7,527 7,720 10,892 9,891Netherlands 723 827 1,190 1,753 2,483 3,664 6,140 6,216 7,053 6,464Germany, Fed. Rep. 267 126 81 145 167 181 188 345 750 546United States 113 114 89 102 142 115 121 126 117 97Japan 78 93 77 183 538 256 293 313 267 243Other 42 80 110 354 506 381 785 720 2,705 2,541
Kenaf & Jute 719 935 1.087 1.054 845 643 579 418 448 391Japan 207 188 163 116 103 25 66 78 15 24Belgium 71 126 90 71 58 34 25 5 8 3France 56 72 70 56 65 50 37 1 - -United Kindom 54 68 64 25 37 9 10 6 - 4Germany, Fed. Rep. 23 58 40 21 22 13 12 6 5 7United States 21 23 19 42 37 34 48 25 40 29Italy 36 40 10 16 21 8 10 1 2 1Portugal 21 28 32 21 6 6 4 - - -Spain 42 7 51 53 4 2 17 14 13 9Poland 20 24 25 22 18 33 19 19 20 9Other 168 301 523 611 474 429 331 263 345 305
Sugar 94 382 1,264 1,161 3,757 5.696 6,843 7,445 3.969 4,797Malaysia - 11 240 481 131 633 634 695 418 456Viet Nam - 111 178 247 - - - - - I
Japan 62 69 85 - 2,120 3,098 4,243 2,753 1,532 2,740United States 32 59 93 60 156 1,041 427 - 267 129Hong Kong - - 43 - 9 1 1 1 - 38
Other - 76 625 373 1,341 923 1,538 3,996 1,752 1,433

Table 3.Page 2
1970 1971 1972 1973 1974 1975 1976 1977 1978 1979
------------------------------- Thousands of metric tons -----------------
Rice 1.063.6 1,576.1 2,112.1 848.7 1,029.3 951.3 1,973.4 2,946.4 1,606,7 2l96.5,
Hong Kong 195.6 210.3 245.2 97.5 113.9 121.8 125.8 113.6 93.0 109.6
Singapore 139.4 202.4 342.2 84.6 86.5 103.6 178.9 220.3 141.4 192.6Malaysia 127.9 117.5 113.0 38.3 74.3 18.0 120.4 204.6 160.3 103.7
Indonesia 144.0 104.8 164.4 266.9 129.1 11.5 530.2 851.2 170.] 633.2
Saudi Arabia 120.6 95.1 27.3 48.8 73.8 56.5 108.3 26.0 41.4 63.2
India 33.5 78.4 106.6 - - 142.6 0.3 - 0.3 -
Philippines 0.1 213.1 310.0 14.0 47.2 74.8 55.9 19.4 - -
Sri Lanka 22.8 49.2 - - - 103.7 86.2 163.6 - 1.1.
Japan 31.5 30.4 15.6 18.9 23.7 8.4 6.8 42.0 19.0 14.'5
Other 248.1 474.9 787.8 279.7 480.8 310.4 760.6 1,305.7 981.2 1,698.5
Rubber 275.6 307.9 317.7 390.5 362.6 332.2 373.5 401.9 442.2 521.0
Japan 142.8 161.7 189.5 216.1 178.2 185.3 193.3 213.0 246.8 303.4
United States 25.9 34.3 27.4 22.6 23.0 27.7 58.4 55.2 48.5 46.5
Singapore 16.7 22.7 37.8 58.4 72.5 44.3 44.8 53.2 80.3 75.1
Malaysia 17.9 21.7 31.8 53.4 36.0 29.8 29.2 28.2 28.0 27.3
Italy 24.3 19.2 5.7 6.9 7.2 1.7 0.3 0.6 - -Other 48.0 48.3 25.5 33.1 45.7 43.4 46.3 51.7 38.1 67.93
Maize 1,448.0 1,873.5 1,843.6 Li3 8 6 . 4 2,301.6 2,104.7 2,419.2 _L542.0 1,972.4 2,014.0
Japan 649.9 925.3 842.2 468.6 978.4 826.5 989.6 400.0 545.4 468.3
Taiwan 447.3 322.1 502.8 311.2 468.0 119.8 457.9 389.7 - 71.9
Singapore 109.7 169.5 226.0 172.8 351.3 516.4 344.3 176.6 314.8 29Q.3
Hong Kong 112.1 143.8 120.0 147.6 1/9 / 130.8 139.7 158.4 186.6 231.0
Malaysia 92.8 92.8 108.0 121.9 143.3 161.5 120.0 205.2 349.9 411.4
Other 36.2 220.0 44.6 169.3 216.2 349.7 367.7 212.1 575.7 561.5
Tin (metal) 22.2 21.9 21.8 22.7 20.8 16.7 20.0 21.4 28.9 31.3
United States 15.3 15.6 13.2 7.4 5.3 7.8 7.3 7.2 7.2 10.3Netherlands 6.0 5.6 4.9 7.7 8.0 2.4 6.6 8.2 15.6 14.6
Japan 0.9 0.6 3.7 5.4 5.1 5.8 6.1 6.1 6.1 5.8Other - - - 2.2 2.4 0.7 - - -
Tapioca Products 1,326.9 1,123.2 1311.0 1_,836.5 2,395.7 2,385.4 3,720.7 3_954.4 6,288.0 3,961.2
Netherlands 845.9 816.0 1,068.9 1,360.4 1,732.2 1.968.8 3,173.2 3,299.6 4,208.7 2,404.1Germany, Fed. Rep. 308.8 125.4 75.8 114.9 116.3 101.3 93.2 186.6 435.9 223.9
United States 76.7 68.9 49.2 48.2 52.8 35.5 35.2 33.6 33.0 20.8
Japan 57.0 59.0 42.6 82.0 187.2 100.5 94.9 97.0 94.3 56.9Other 38.5 53.8 74.5 231.0 307.2 179.3 320.2 337.6 1,516.1 1,255.5
Kenaf & Jute 257.7 271.7 255.1 264.1 247.0 157.6 138.4 81.2 91.i 79.0Japan 77.6 52.7 39.6 27.3 32.3 5.8 14.3 13.9 2.9 5.5Belgium 25.6 37.8 23.6 18.5 17.0 8.3 5.8 1.3 2.1 0.7France 17.3 21.2 15.6 12.8 16.5 12.3 8.4 0.2 - -United Kindom 18.2 17.4 14.0 6.7 10.4 3.2 2.3 1.2 0.4 1.1Germany, Fed. Rep. 9.4 19.9 11.6 6.3 7.4 3.6 2.6 1.2 1.2 1.4United States 11.6 8.5 6.0 15.8 16.2 12.4 15.8 11.2 17.5 10.9Italy 12.4 12.1 2.5 3.9 6.7 2.2 2.0 0.2 0.4 0.2
Portugal 7.9 7.4 7.2 5.1 1.7 1.5 0.7 - - -
Spain 13.4 1.9 11.5 12.0 1.1 0.4 3.5 2.6 2.0 1.5Poland 6.6 6.4 5.4 5.3 5.0 7.8 4.4 3.6 3.0 1.7
Other 57.7 86.4 118.1 150.4 132.7 100.0 78.6 45.8 61.6 56.0
Sugar 56.2 174.5 407.5 275.4 443.8 595.4 1,124.0 _1,64.6 1,040.1 1,189.8
Malaysia - 5.1 78.8 112.5 26.2 69.6 110.7 173.7 108.4 123.3Viet Nam - 55.3 48.7 54.2 - - - - - 0.2Japan 38.0 32.9 37.4 - 244.5 318.4 693.1 627.1 411.4 657.9United States 18.2 21.0 30.2 17.8 23.7 118.6 66.7 - 65.0 33.8Hong Kong - - 16.3 - 2.7 0.5 0.6 0.7 0.1 9.2Other - 34.6 196.1 91.0 146.7 88.3 252.9 853.1 455.2 365.5
/a Preliminary.
Source: Department of Customs.
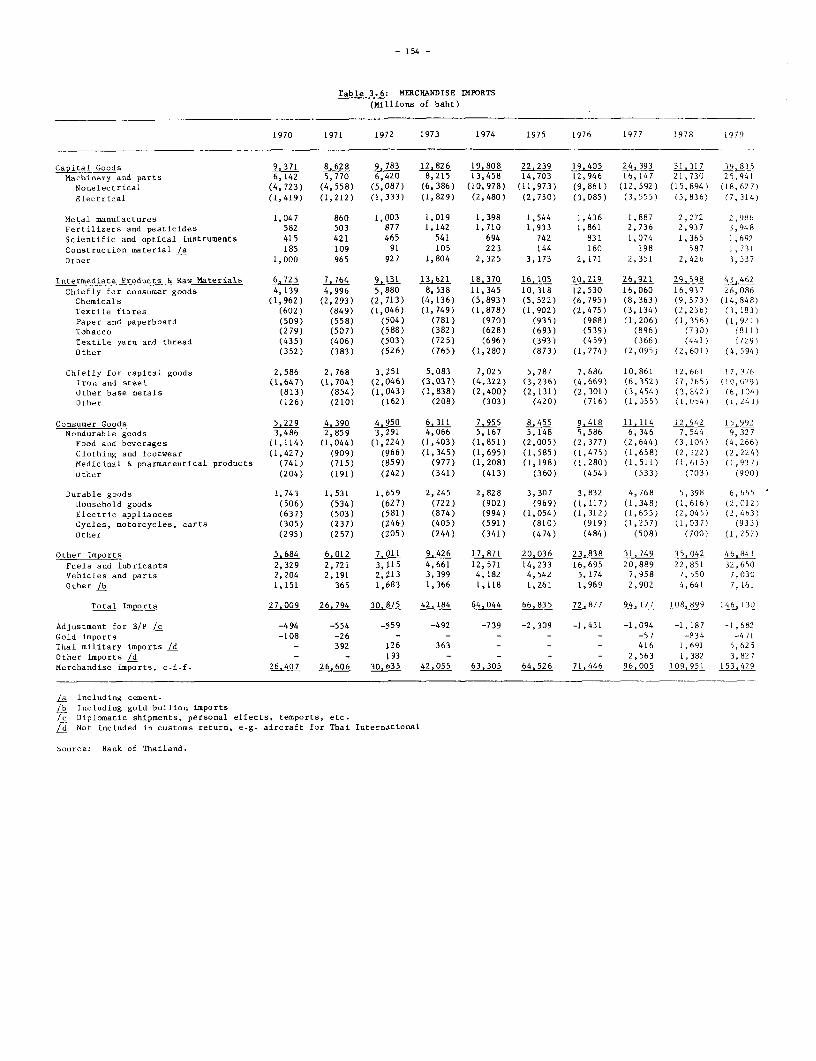
- 154 -
Table 3.6: MERCHANDISE IMPORTS
(Millions of baht)
1970 1971 1972 1973 1974 1975 1976 1977 1978 1979
Capital Goods 9.371 8.628 9,783 12.826 19.808 22,239 19.405 24.393 31,317 39,835
Machinery and parts 6,142 5,770 6,420 8,2L5 13,458 14,703 12,946 L6,147 21,730 25,94L
Nonelectrical (4,723) (4,558) (5,087) (6,386) (10,978) (11,973) (9,861) (12,592) (15,894) (18,627)
glectrical (1,419) (1,212) (1,333) (1,829) (2,480) (2,730) (3,085) (3,555) (5,836) (7,314)
Metal manufactures 1,047 860 1,003 1,019 1,398 1,544 1,436 1,887 2,272 2,986
Fertilizers and pesticides 582 503 877 1,142 1,710 1,933 1,861 2,736 2,937 3,948
Scientific and optical instruments 415 421 465 541 694 742 831 1,074 1,365 1,692
Construction material /a 185 109 91 105 223 144 160 198 587 1,731
Other 1,000 965 927 1,804 2,325 3,173 2,171 2,351 2,426 3,537
Intermediate Products & Raw Materials 6,725 7,764 9_131 13,621 18,370 16,105 20.219 26,921 29,598 43_462
Chiefly for consumer goods 4,139 4,996 5,880 8,538 11,345 10,318 12,530 16,060 16,937 26,086
Chemicals (1,962) (2,293) (2,713) (4,136) (5,893) (5,522) (6,795) (8,363) (9,573) (14,848)
Textile fibres (602) (849) (1,046) (1,749) (1,878) (1,902) (2,475) (3,134) (2,236) (3,183)
Paper and paperboard (509) (558) (504) (781) (970) (935) (988) (1,206) (1,356) (1,921)
Tobacco (279) (507) (588) (382) (628) (693) (539) (896) (730) (811)
Textile yarn and thread (435) (406) (503) (725) (696) (393) (459) (366) (441) (729)
Other (352) (383) (526) (765) (1,280) (873) (1,274) (2,095) (2,601) (4,594)
Chiefly for capital goods 2,586 2,768 3,251 5,083 7,025 5,787 7,686 10,861 12,661 17,376
Iroa and steel (1,647) (1,704) (2,046) (3,037) (4,322) (3,236) (4,669) (6,352) (7,765) (10,029)
Other base metals (813) (854) (1,043) (1,838) (2,400) (2,131) (2,301) (3,454) (3,842) (6,104)
Other (126) (210) (162) (208) (303) (420) (716) (1,055) (1,054) (1,243)
CDnsumer Goods 5,229 4,390 ._295 6.311 7,955 8,455 9,418 151114 12,942 92Nondurable goods 3,486 2,859 3,291 4,066 5,167 5,148 5,586 6,346 7,544 9,327
Food and beverages (1,114) (1,044) (1,224) (1,403) (1,851) (2,005) (2,377) (2,644) (3,104) (4,266)
Clothing and footwear (1,427) (909) (966) (1,345) (1,695) (1,585) (1,475) (1,658) (2,122) (2,224)Medicinal & pharmaceutical products (741) (715) (859) (977) (1,208) (1,198) (1,280) (1,511) (1,615) (1,937)
Other (204) (191) (242) (341) (413) (360) (454) (533) (703) (900)
Durable goods 1,743 1,531 1,659 2,245 2,828 3,307 3,832 4,768 5,398 6,665
Household goods (506) (534) (627) (722) (902) (969) (1,117) (1,348) (1,616) (2,012)
Electric appliances (637) (503) (581) (874) (994) (1,054) (1,312) (1,655) (2,045) (2,463)Cycles, motorcycles, carts (305) (237) (246) (405) (591) (810) (919) (1,257) (1,037) (933)
Other (295) (257) (205) (244) (341) (474) (484) (508) (700) (1,257)
Other Imports 5,684 6,012 7_Q.l 9,426 17.871 20,036 23.838 31,749 35,042 46,841
Fuels and lubricants 2,329 2,721 3,115 4,661 12,571 14,233 16,695 20,889 22,851 32,650Vehicles and parts 2,204 2,191 2,213 3,399 4,182 4,542 5,174 7,958 7,550 7,030
Other /b 1,151 365 L,683 1,366 1,118 L,261 1,969 2,902 4,641 7,161
Total Imports 27,009 26, 794 3 42,184 64,044 66,835 72,877 94.177 108,899 146,130
Adjustment for B/P /c -494 -554 -559 -492 -739 -2,309 -1,431 -1,094 -1,187 -1,682
Gold imports -108 -26 - - - - - -57 -834 -471
Thai military imports /d - 392 126 363 - - - 416 1,691 5,625
Other imports /d - - 193 - - - - 2,563 1,382 3,827
Merchandise imports, c.i.f. 26.407 26,606 30_635 42,055 63,305 64,526 71.446 96,005 109.951 153_429
/a Including cement./b Including gold bullion imports/c Diplomatic shipments, personal effects, temports, etc./7d Not included in customs return, e.g. aircraft for Thai International
Source: Bank of Thailand.
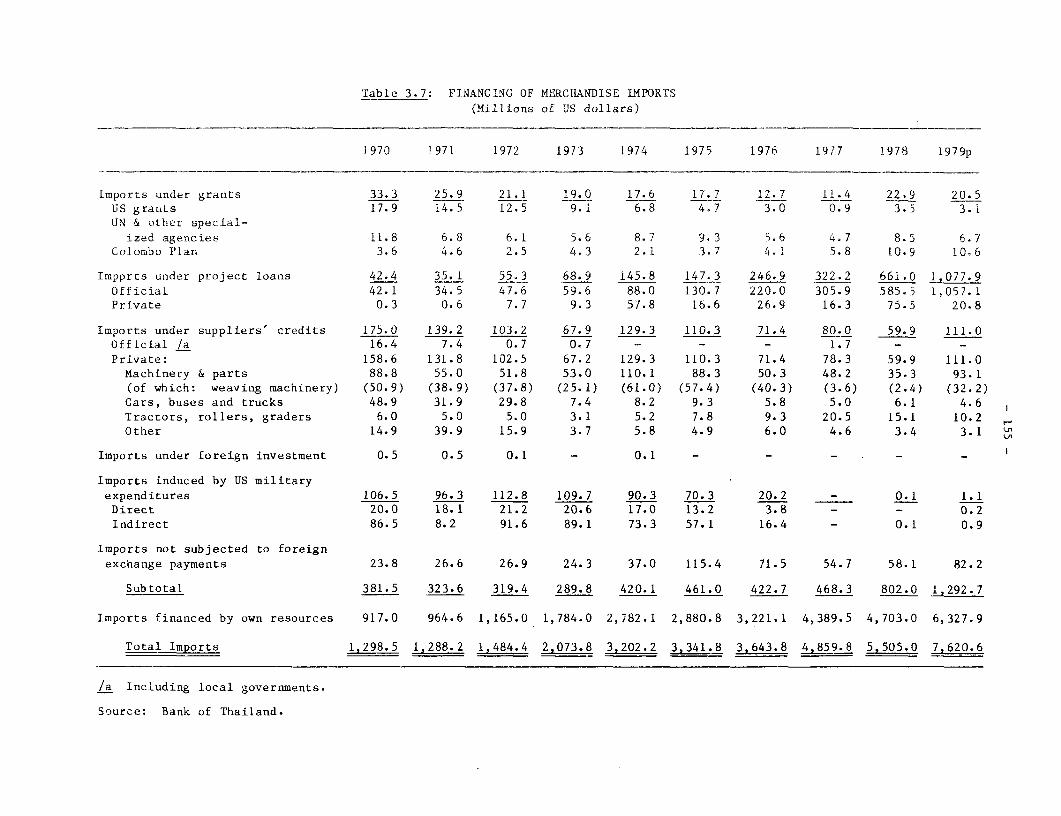
Table 3.7: FINANCING OF MERCHANDISE IMPORTS(Millions of US dollars)
1970 1971 1972 1973 1974 1975 1976 1977 1978 1979p
Imports under grants 33.3 25.9 21.1 19.0 17.6 17.7 12.7 11.4 22.9 20.5US grants 17.9 14.5 12.5 9.1 6.8 4.7 3.0 0.9 3.5 3.1UN & other special-
ized agencies 11.8 6.8 6.1 5.6 8.7 9.3 5.6 4.7 8.5 6.7Colombo Plan 3.6 4.6 2.5 4.3 2.1 3.7 4.1 5.8 10.9 10.6
Impprts under project loans 42.4 35.1 55.3 68.9 145.8 147.3 246.9 322.2 661.0 L077.9Official 42.1 34.5 47.6 59.6 88.0 130.7 220.0 305.9 585.5 1,057.1Private 0.3 0.6 7.7 9.3 57.8 16.6 26.9 16.3 75.5 20.8
Imports under suppliers' credits 175.0 139.2 103.2 67.9 129.3 110.3 71.4 80.0 59.9 111.0Official /a 16.4 7.4 0.7 0.7 - - - 1.7 - -
Private: 158.6 131.8 102.5 67.2 129.3 110.3 71.4 78.3 59.9 111.0Machinery & parts 88.8 55.0 51.8 53.0 110.1 88.3 50.3 48.2 35.3 93.1(of which: weaving machinery) (50.9) (38.9) (37.8) (25.1) (61.0) (57.4) (40.3) (3.6) (2.4) (32.2)Cars, buses and trucks 48.9 31.9 29.8 7.4 8.2 9.3 5.8 5.0 6.1 4.6 1Tractors, rollers, graders 6.0 5.0 5.0 3.1 5.2 7.8 9.3 20.5 15.1 10.2 .
Other 14.9 39.9 15.9 3.7 5.8 4.9 6.0 4.6 3.4 3.1 @
Imports under foreign investment 0.5 0.5 0.1 - 0.1 - - - - -
Imports induced by US militaryexpenditures 106.5 96.3 112.8 109.7 90.3 70.3 20.2 - 0.1 1.1Direct 20.0 18.1 21.2 20.6 17.0 13.2 3.8 - - 0.2
Indirect 86.5 8.2 91.6 89.1 73.3 57.1 16.4 - 0.1 0.9
Imports not subjected to foreignexchange payments 23.8 26.6 26.9 24.3 37.0 115.4 71.5 54.7 58.1 82.2
Subtotal 381.5 323.6 319.4 289.8 420.1 461.0 422.7 468.3 802.0 1,292.7
Imports financed by own resources 917.0 964.6 1,165.0 1,784.0 2,782.1 2,880.8 3,221.1 4,389.5 4,703.0 6,327.9
Total Imports 1,298.5 1,288.2 1,484.4 2,073.8 3,202.2 3,341.8 3,643.8 4,859.8 5,505.0 7.620.6
/a Including local governments.
Source: Bank of Thailand.

- 156 -
Table 3.8: MERCHANDISE IMPORTS BY COUNTRIES
1970 1971 1972 1973 1974 1975 1976 1977 1978 1979
------------------------ Millions of baht -------------------------------------
Japan 10,107 10,093 11,401 15,078 20,102 21,085 23,649 30,469 33,461 37,636United States 4,011 3,807 4,838 5,915 8,642 9,566 9,739 11,570 14,831 22,754Germany, Fed. Rep. 2,288 2,075 2,279 3,211 4,676 .3,482 3,469 5,194 6,300 7,936United Kingdom 2,014 2,054 1,620 2,715 2,970 3,032 2,623 3,808 4,164 4,708Australia 852 864 981 1,392 1,904 1,536 1,560 1,882 2,457 3,268Saudi Arabia 536 752 967 982 3,062 6,012 5,538 7,789 6,076 9,403Taiwan 603 747 1,058 1,383 1,541 1,608 1,759 2,336 3,690 4,027Italy 488 428 475 601 1,105 1,226 940 1,184 1,305 2,182Netherlands 368 316 349 508 743 681 815 1,189 1,314 1,749Hong Kong 374 314 417 589 867 640 756 1,086 1,230 1,546Other 5,368 5,344 6,490 9,810 18,432 17,967 22,029 27,670 34,071 50,952
Total Mechan-dise Imports 27,009 26,794 30,875 42,184 64,044 66,835 72,877 94,177 108,899 146,161
-----------------------Percentage of total ------------------------------------
Japan 37.4 37.7 36.9 35.8 31.4 31.6 32.5 32.4 30.7 25.7United States 14.8 14.2 15.7 14.0 13.5 14.3 13.4 12.3 13.6 15.6Germany, Fed. Rep. 8.5 7.7 7.4 7.6 7.3 5.2 4.8 8.5 5.8 5.4United Kingdom 7.5 7.7 5.3 6.4 4.6 4.5 3.6 4.0 3.8 3.2Australia 3.2 3.2 3.2 3.3 3.0 2.3 2.1 2.0 2.3 2.2Saudi Arabia 2.0 2.8 3.1 2.3 4.8 9.0 7.6 8.3 5.6 6.4Taiwan 2.2 2.8 3.4 3.3 2.4 2.4 2.4 2.5 3.4 2.8Italy 1.8 1.6 1.5 1.4 1.7 1.8 1.3 1.2 1.2 1.5Netherlands 1.4 1.2 1.1 1.2 1.2 1.0 1.1 1.2 1.2 1.2Hong Kong 1.4 1.2 1.4 1.4 1.3 1.0 1.0 1.1 1.1 1.1Other 19.8 19.9 21.0 23.3 28.8 26.9 30.2 29.4 31.3 34.9
/a Preliminary.
Source: Bank of Thailand.

Table 3.9: SERVICES(Millions of baht)
1970 1971 1972 1973 L974 1975 1976 1977 1978 1979/c
Receipts 10,094.8 9,899.6 11,322.7 12,723.1 15,34.2 16.551.6 13,993.3 14,771.7 22,123.9 29,815.7Freight & insurance
on merchandise 313.4 494.2 639.0 925.5 1,453.7 1,229.3 1,604.9 1,730.1 2,144.1 2,593.6Other transportation 298.6 330.8 455.9 513.7 1,200.1 1,269.0 1,131,3 1,468.6 1,384.9 2,343.3Travel 2,170.0 2,208.9 2,718.0 3,393.8 3,B05.1 4,482.2 3,990.0 4,606.9 8,894.5 11,232.1R & R /a (389.8) (239.7) (62.8) (13-3) (10.9) (-) (-) (-) (-) (-)Other /b (1,780.2) (1,969.2) (3,380.5) (3,794.2) (4,482.2) (3,482.2) (3,990.0) (4,606.9) (8,894.5) (11,232.1)
Investment income 1,636.6 1,423.2 1,206.7 1,448.1 2,919.6 3,887.0 3,145.8 3,036.1 3,366.5 4,227.8Government, n.i.e. 4,839.8 4,514.2 5.262.5 5,034.3 4,238.3 3,519.8 2,052.9 1,081.4 1,336.2 2,206.4Other 836.4 928.1 1,040.6 1,407.7 2,017.4 2,164.3 2.069.3 2,848.6 4,997.7 7,212.5Workers' remittances (24.9) (35.7) (29.4) (113.5) (265.0) (375-3) (485.1) (911.7) (2,111.6) (3,818.3)
Payments 4,058.6 4,495.5 4,739.7 5,886.7 8,033.5 10,390.8 12,350.8 12,366.5 17,844.8 26,041.7Freight & insuranceon merchandise 202.9 338.7 431.9 504.1 1,005.0 822.0 1,039.9 1,289.5 1,720.8 2,078.8
Other transportation 186.4 202.8 204.5 386.7 749.0 643.5 544.5 690.0 974.4 1,635.9Travel 1,267.4 1,294.5 1,286.8 1,449.4 1,634.0 2,735.3 3,881.3 3,183.7 3,579.0 4,647.9 @Investment income 1,257.3 1,393.8 1,534.0 1,872.4 2,933.9 3,775.9 3,993.3 4,513.5 8,178.2 13,439.9Government, n.i.e. 395.3 399.0 336.8 444.8 318.5 303.7 457.2 448.4 523.0 563.8Other 749.3 866.7 945.7 1,229.3 1,393.1 2,110.4 2,380.6 2,234.4 2,869.4 7,675.4
Net Services 6,036.2 5,404.1 6,583.0 6,836.4 7,600.7 6,160.8 1,642.5 2,405.2 4,279.1 3,774.0Freight & insuranceon merchandise 110.5 155.5 207.1 421.4 448.7 407.3 510.1 440.6 423.3 314.8
Other transportation 112.2 128.0 251.4 127.0 451.1 625.5 586.8 778.6 410.5 707.4Travel 902.6 914.4 1,431.2 1,944.4 2,171.1 1,746.9 108.7 1,423.2 5,315.5 6,584.2Investment income 379.3 29.6 -327.3 -424.3 -14.3 111.1 -847.5 -1,479.4 -4,811.7 -9,212.1Government, n.i.e. 4,444.5 4,115.2 4,925.7 4,589.5 3,919.8 3,216.1 1,595.7 633.0 813.2 1,642.6Other 87.1 61.4 94.9 178.4 624.3 53.9 -311.3 609.2 2,128.3 3,537.1
/a Estimated expenditures of US soldiers on rest and recreation leave./b Estimated expenditures of other tourists made by the Tourist Organization of Thailand./c Preliminary.
Source: Bank of Thailand.
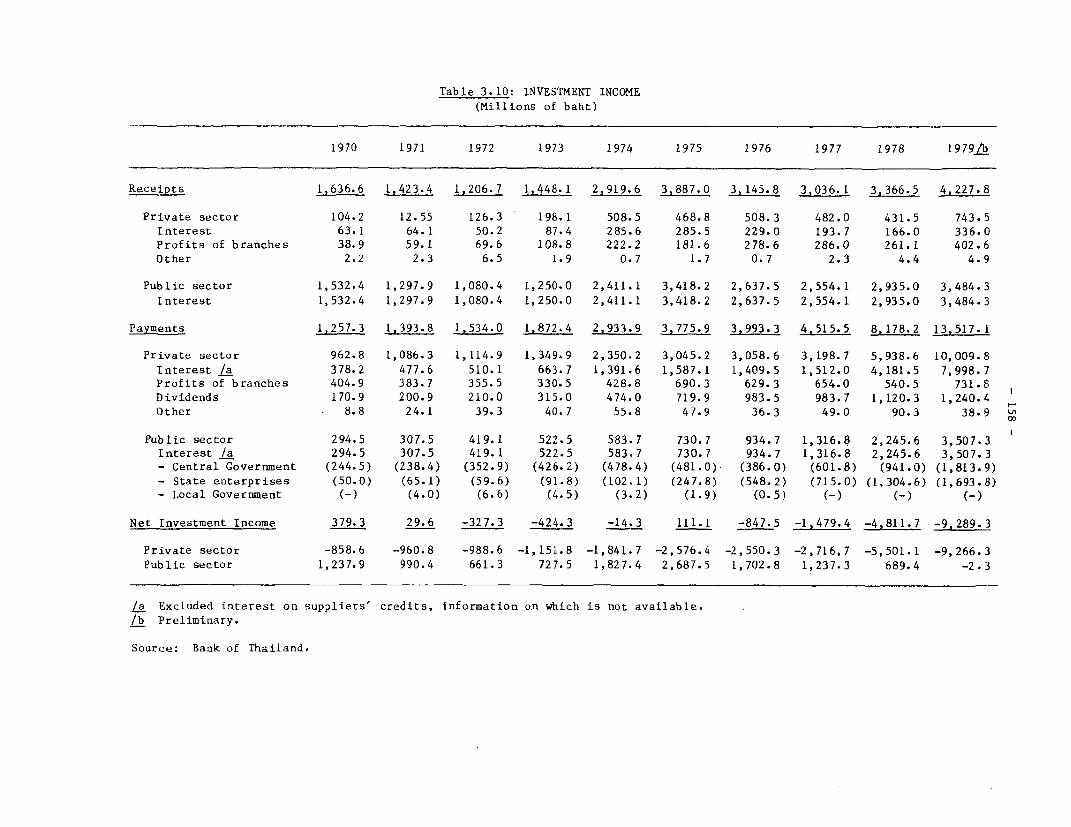
Table 3.10: INVESTMENT INCOME(Millions of baht)
1970 1971 1972 1973 1974 1975 1976 1977 1978 1979 .,
Receipts 1,636.6 1,423.4 1,206.7 1,448.1 2,919.6 3,887.0 3,145.8 3,036.1 3,366.5 4,227.8
Private sector 104.2 12.55 126.3 198.1 508.5 468.8 508.3 482.0 431.5 743.5
Interest 63.1 64.1 50.2 87.4 285.6 285.5 229.0 193.7 166.0 336.0
Profits of branches 38.9 59.1 69.6 108.8 222.2 181.6 278.6 286.0 261.1 402.6
Other 2.2 2.3 6.5 1.9 0.7 1.7 0.7 2.3 4.4 4.9
Public sector 1,532.4 1,297.9 1,080.4 1,250.0 2,411.1 3,418.2 2,637.5 2,554.1 2,935.0 3,484.3
Interest 1,532.4 1,297.9 1,080.4 1,250.0 2,411.1 3,418.2 2,637.5 2,554.1 2,935.0 3,484.3
Payments 1,257.3 1,393.8 1.534.0 1,872.4 2,933.9 3,775.9 3,993.3 4,515.5 8.178.2 13,517.1
Private sector 962.8 1,086.3 1,114.9 1,349.9 2,350.2 3,045.2 3,058.6 3,198.7 5,938.6 10,009.8
Interest /a 378.2 477.6 510.1 663.7 1,391.6 1,587.1 1,409.5 1,512.0 4,181.5 7,998.7
Profits of branches 404.9 383.7 355.5 330.5 428.8 690.3 629.3 654.0 540.5 731.8
Dividends 170.9 200.9 210.0 315.0 474.0 719.9 983.5 983.7 1,120.3 1,240.4
Other 8.8 24.1 39.3 40.7 55.8 47.9 36.3 49.0 90.3 38.9 u
Public sector 294.5 307.5 419.1 522.5 583.7 730.7 934.7 1,316.8 2,245.6 3,507.3Interest /a 294.5 307.5 419.1 522.5 583.7 730.7 934.7 1,316.8 2,245.6 3,507.3- Central Government (244.5) (238.4) (352.9) (426.2) (478.4) (481.0) (386.0) (601.8) (941.0) (1,813.9)
- State enterprises (50.0) (65.1) (59.6) (91.8) (102.1) (247.8) (548.2) (715.0) (1,304.6) (1,693.8)- Local Government (-) (4.0) (6.6) (4-5) (3.2) (1.9) (0.5) (-) (-) (-)
Net Investment Income 379.3 29.6 -327.3 -424.3 -14.3 111.1 -847.5 -1,479.4 -4,811.7 -9.289.3
Private sector -858.6 -960.8 -988.6 -1,151.8 -1,841.7 -2,576.4 -2,550.3 -2,716,7 -5,501.1 -9,266.3
Public sector 1,237.9 990.4 661.3 727.5 1,827.4 2,687.5 1,702.8 1,237.3 689.4 -2.3
/a Excluded interest on suppliers' credits, information on which is not available.
lb Preliminary.
Source: Bank of Thailand.

Table 3.11: GOVERNMENT, n.i.e.(Millions of baht)
1970 1971 1972 1973 1974 1975 1976 1977 1978 1979/a
Receipts 4,839.8 4,514.2 5_,2625 5.034.3 4.238.3 3,519.8 2,052.9 1,081.4 1,336.2 2,206.4
Military 4,192.6 3,788.7 4,413.2 4,210.3 3,393.4 2 643.7 763.2 4.6 5.7 42.8US military person-
nel and agencies (4,159.4) (3,755.1) (4,398.2) (4,130.5) (3,373.5) (3,601.7) (2,601.7) (3.1) (5.7) (41.5)US contractors formilitary projects (4.6) (11.0) (12.7) (74.2) (19.6) (40.8) (1.2) (0.8) (-) (-)
Other military (28.1) (22.6) (2.3) (5.6) (0.3) (1.2) (1.0) (0-7) (-) (-)
Nonmilitary 647.7 725.5 849.3 844.9 876.1 1,844.9 876.1 1,076.8 1,330.5 2,163.6
Payments 395.3 399.0 336.8 444.8 318.5 303.7 457.2 448.4 523.0 563.8
Military 14.9 24.8 2.0 4.0 0.2 0.2 - 28.6 95.3 182.2
Nonmilitary 380.4 374.2 334.8 440.8 315.3 303.5 457.2 419.8 427.7 381.6Services under ai1
programs (193.0) (162.7) (106.2) (113.3) (43.4) (25.3) (17.9) (19.0) (19.9) (13.6)Other (187.4) (211.5) (228.6) (327.5) (271.9) (278.2) (439.3) (400.8) (407.8) (368.0)
Net Government, n.i.e. 4,444.5 4,115.2 4,925.7 4,589.5 3,919.8 3,216.1 1,595.7 633.0 813.2 1,642.6
Military 4,177.2 3,763.9 4,411.2 4,206.3 3,390.2 2,643.5 763.2 -24.0 -79.6 -139.4Nonmilitary 267.3 351.3 514.5 383.2 529.6 572.6 832.5 657.0 898.8 1,782.0
/a Preliminary.
Source: Bank of Thailand.
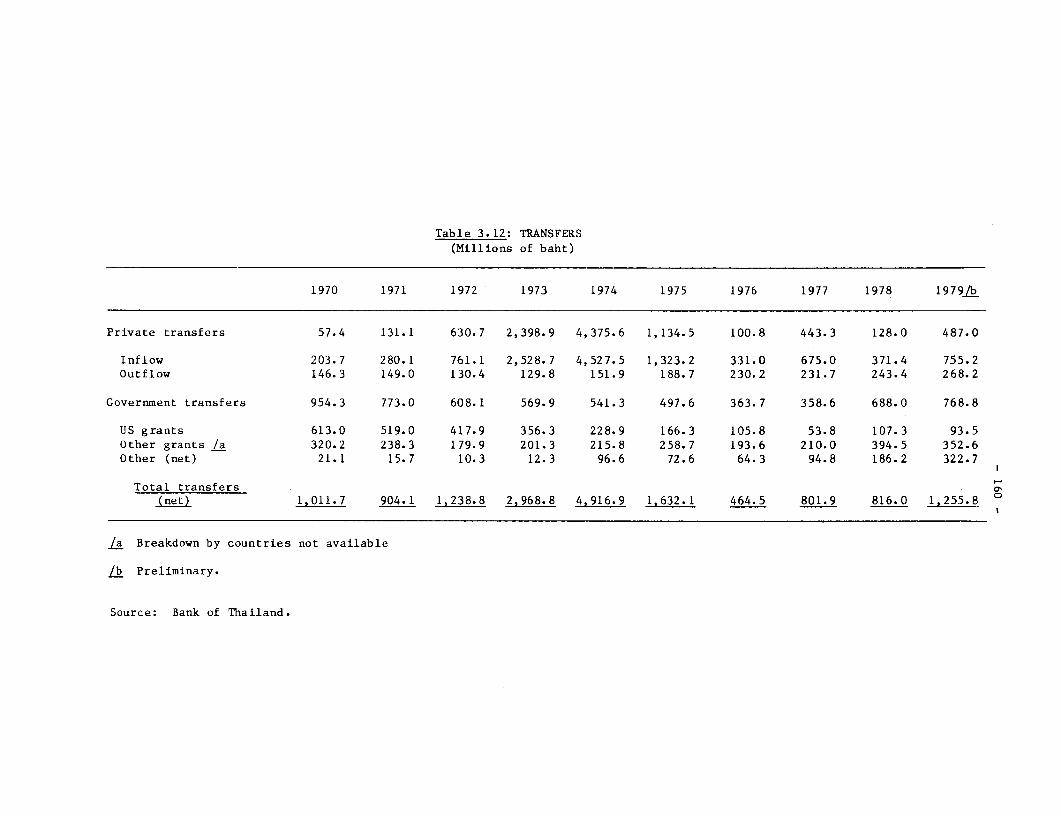
Table 3.12: TRANSFERS(Millions of baht)
1970 1971 1972 1973 1974 1975 1976 1977 1978 1979Ab
Private transfers 57.4 131.1 630.7 2,398.9 4,375.6 1,134.5 100.8 443.3 128.0 487.0
Inflow 203.7 280.1 761.1 2,528.7 4,527.5 1,323.2 331.0 675.0 371.4 755.2Outflow 146.3 149.0 130.4 129.8 151.9 188.7 230.2 231.7 243.4 268.2
Government transfers 954.3 773.0 608.1 569.9 541.3 497.6 363.7 358.6 688.0 768.8
US grants 613.0 519.0 417.9 356.3 228.9 166.3 105.8 53.8 107.3 93.5Other grants /a 320.2 238.3 179.9 201.3 215.8 258.7 193.6 210.0 394.5 352.6Other (net) 21.1 15.7 10.3 12.3 96.6 72.6 64.3 94.8 186.2 322.7
Total transfers a(net) 1,011.7 904.1 1,238.8 2,968.8 4,916.9 1,632.1 464.5 801.9 816.0 1,255.8 C
/a Breakdown by countries not available
lb Preliminary.
Source: Bank of Thailand.
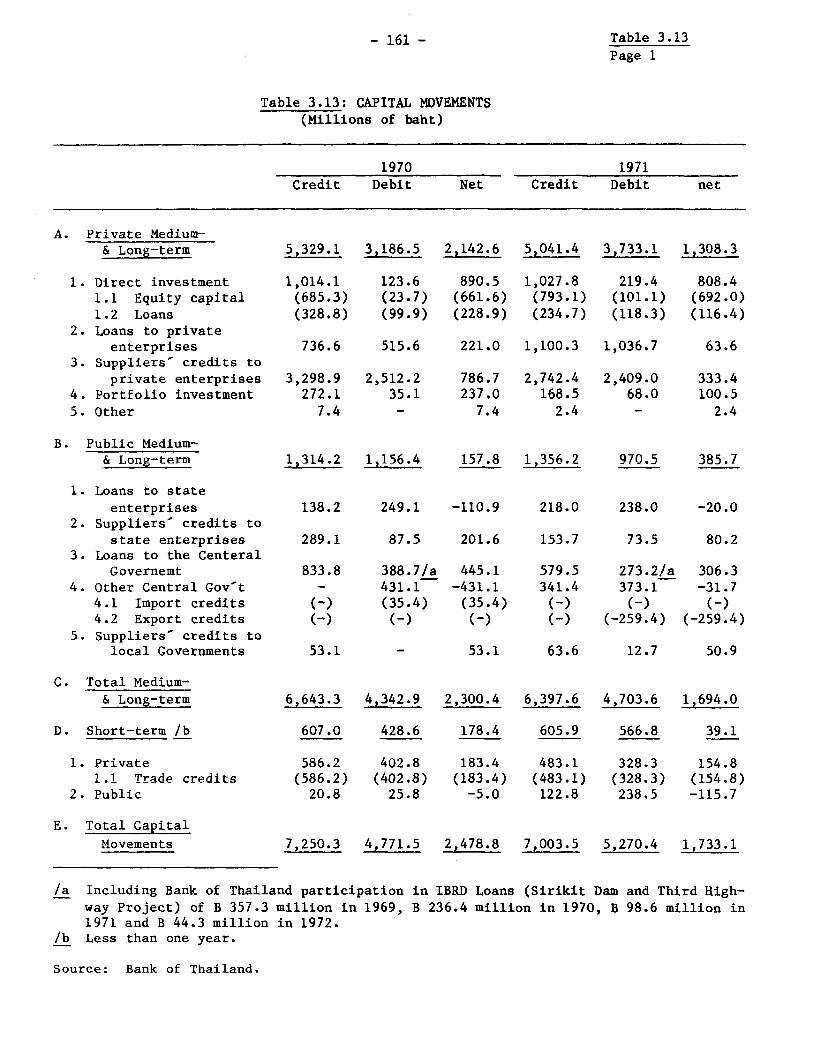
- 161 - Table 3.13Page 1
Table 3.13: CAPITAL MOVEMENTS(Millions of baht)
1970 1971
Credit Debit Net Credit Debit net
A. Private Medium-& Long-term 5,329.1 3,186.5 2,142.6 5,041.4 3,733.1 1,308.3
1. Direct investment 1,014.1 123.6 890.5 1,027.8 219.4 808.41.1 Equity capital (685.3) (23.7) (661.6) (793.1) (101.1) (692.0)1.2 Loans (328.8) (99.9) (228.9) (234.7) (118.3) (116.4)
2. Loans to privateenterprises 736.6 515.6 221.0 1,100.3 1,036.7 63.6
3. Suppliers' credits toprivate enterprises 3,298.9 2,512.2 786.7 2,742.4 2,409.0 333.4
4. Portfolio investment 272.1 35.1 237.0 168.5 68.0 100.55. Other 7.4 - 7.4 2.4 - 2.4
B. Public Medium-& Long-term 1,314.2 1,156.4 157.8 1,356.2 970.5 385.7
1. Loans to stateenterprises 138.2 249.1 -110.9 218.0 238.0 -20.0
2. Suppliers' credits tostate enterprises 289.1 87.5 201.6 153.7 73.5 80.2
3. Loans to the CenteralGovernemt 833.8 388.7/a 445.1 579.5 273.2/a 306.3
4. Other Central Gov't - 431.1 -431.1 341.4 373.1 -31.74.1 Import credits (-) (35.4) (35.4) (-) (-) (-)4.2 Export credits (-) (-) () () (-259.4) (-259.4)
5. Suppliers' credits tolocal Governments 53.1 - 53.1 63.6 12.7 50.9
C. Total Medium-& Long-term 6,643.3 4,342.9 2,300.4 6,397.6 4,703.6 1,694.0
D. Short-term /b 607.0 428.6 178.4 605.9 566.8 39.1
1. Private 586.2 402.8 183.4 483.1 328.3 154.81.1 Trade credits (586.2) (402.8) (183.4) (483.1) (328.3) (154.8)
2. Public 20.8 25.8 -5.0 122.8 238.5 -115.7
E. Total Capital
Movements 7,J250.3 4,771.5 2,478.8 7,003.5 5,270.4 1,733.1
/a Including Bank of Thailand participation in IBRD Loans (Sirikit Dam and Third High-way Project) of B 357.3 million in 1969, B 236.4 million in 1970, B 98.6 million in1971 and B 44.3 million in 1972.
/b Less than one year.
Source: Bank of Thailand.

- 162 - Table 3.13
Page 2
1972 1973
Credit Debit Net Credit Debit Net
A. Private Medium-& Long-term 6,640.5 3,543.0 3,097.5 5,332.5 4,704.8 617.7
1. Direct investment 1,553.9 126.8 1,427.1 2,172.0 567.1 1,604.91.1 Equity capital (1,165.7) (11.0) (1,154.7) (1,408.8) (33.0) (1,375.8)1.2 Loans (388.2) (115.8) (272.4) (763.2) (534.1) (229.1)
2. Loans to privateenterprises 2,622.7 1,142.0 1,480.7 1,516.4 2,030.4 -514.0
3. Suppliers- credits toprivate enterprises 2,132.6 2,220.8 -88.2 1,370.0 2,055.0 -685.0
4. Portfolio investment 330.7 53.4 277.3 263.0 52.0 211.05. Other 0.6 - 0.6 1.1 0.3 0.8
B. Public Medium-& Long-term 1,287.3 1,120.5 166.8 1,750.8 723.3 1,027.5
1. Loans to stateenterprises 661.0 261.4 399.6 763.8 319.5 444.3
2. Suppliers credits tostate enterprises 13.9 75.2 -61.3 13.5 85.1 -71.6
3. Loans to the C-ntralGovernment 437.8/b 223.1/a 214.7 610.1/b 222.9 387.2
4. Other Central Gov't 174.6 535.4 -360.8 363.4 70.3 293.14.1 Import credits (-) (-) (-) (-) (-) (-)4.2 Export credits (-) (-) (-) (-) () ()
5. Suppliers' credits tolocal Governments - 25.4 -25.4 - +25.5 -25.5
C. Total Medium-& Long-term 7,927.8 4,663.5 3,264.3 7,073.3 5,428.1 1,645.2
D. Short-term /c 634.7 255.8 378.9 4,285.6 2,993.2 1,292.4
1. Private 544.8 235.7 309.1 4,285.6 2,993.2 1,292.41.1 Trade credits (544.8) (235.7) (309.1) (4,285.6) (2,993.2) (1,292.4)
2. Public 89.9 20.1 69.8 - - -
E. Total Capital
Movements 8,562.5 4,919.3 3,643.2 11,358.9 8,421.3 2,937.6
/a Including Bank of Thailand participation in IBRD Loans (Sirikit Dam and Third High-way Project) of B 357.3 million in 1969, B 236.4 million in 1970, B 98.6 million in1971 and B 44.3 million in 1972.
/b Including refund from Bank of Thailand participations in IBRD Loans (Third HighwayProjects) of B 1.4 million in 1972, B 18.9 million in 1973 and B 30.9 million in1974.
/c Less than one year.
Source: Bank of Thailand.
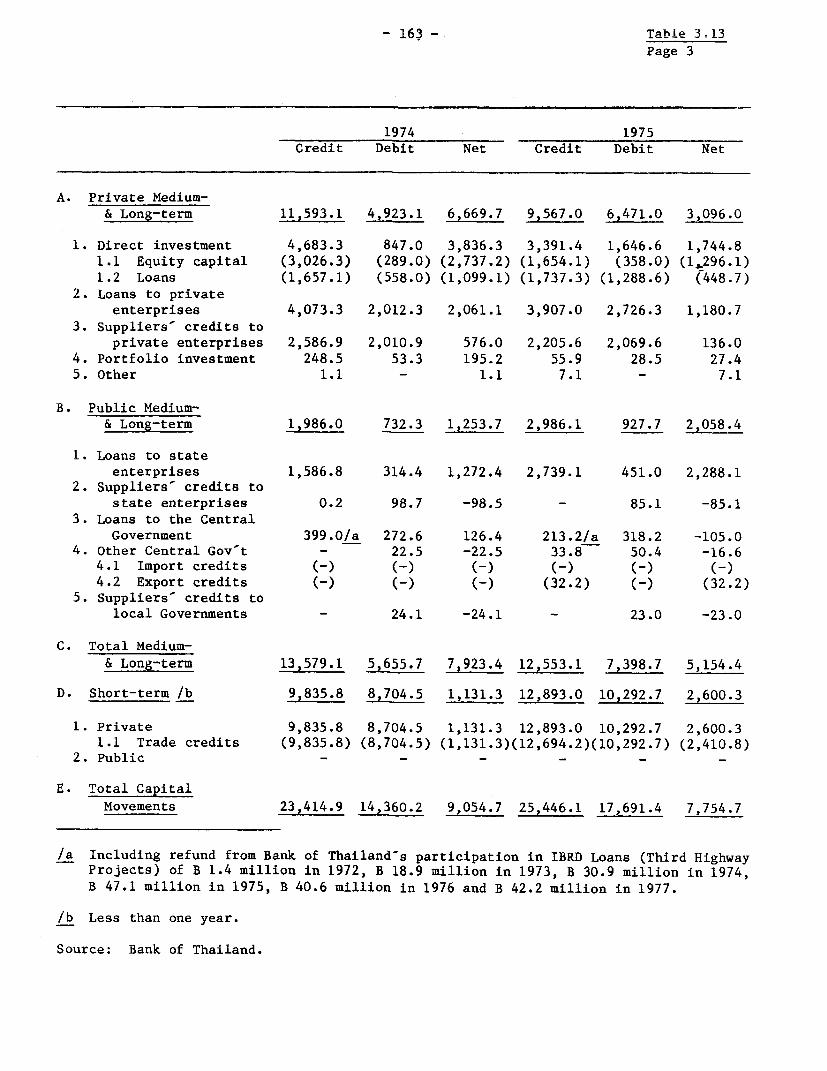
- 163 - Table 3 13Page 3
1974 1975Credit Debit Net Credit Debit Net
A. Private Medium-& Long-term 11,593.1 4,923.1 6,669.7 9,567.0 6,471.0 3,096.0
1. Direct investment 4,683.3 847.0 3,836.3 3,391.4 1,646.6 1,744.81.1 Equity capital (3,026.3) (289.0) (2,737.2) (1,654.1) (358.0) (1,296.1)
1.2 Loans (1,657.1) (558.0) (1,099.1) (1,737.3) (1,288.6) (448.7)
2. Loans to privateenterprises 4,073.3 2,012.3 2,061.1 3,907.0 2,726.3 1,180.7
3. Suppliers' credits toprivate enterprises 2,586.9 2,010.9 576.0 2,205.6 2,069.6 136.0
4. Portfolio investment 248.5 53.3 195.2 55.9 28.5 27.4
5. Other 1.1 - 1.1 7.1 - 7.1
B. Public Medium-& Long-term 1,986.0 732.3 1,253.7 2,986.1 927.7 2,058.4
1. Loans to stateenterprises 1,586.8 314.4 1,272.4 2,739.1 451.0 2,288.1
2. Suppliers- credits tostate enterprises 0.2 98.7 -98.5 - 85.1 -85.1
3. Loans to the CentralGovernment 399.0/a 272.6 126.4 213.2/a 318.2 -105.0
4. Other Central Gov't - 22.5 -22.5 33.8 50.4 -16.64.1 Import credits (-) (-) (-) (-) (-) (-)4.2 Export credits (-) (-) (-) (32.2) (-) (32.2)
5. Suppliers' credits tolocal Governments - 24.1 -24.1 - 23.0 -23.0
C. Total Medium-& Long-term 13,579.1 5,655.7 7,923.4 12,553.1 7,398.7 5,154.4
D. Short-term /b 9,835.8 8,704.5 1,131.3 12,893.0 10,292.7 2,600.3
1. Private 9,835.8 8,704.5 1,131.3 12,893.0 10,292.7 2,600.31.1 Trade credits (9,835.8) (8,704.5) (1,131.3)(12,694.2)(10,292.7) (2,410.8)
2. Public - - - - - -
E. Total Capital
Movements 23,414.9 14,360.2 9,054.7 25,446.1 17,691.4 7,754.7
/a Including refund from Bank of Thailand-s participation in IBRD Loans (Third HighwayProjects) of B 1.4 million in 1972, B 18.9 million in 1973, B 30.9 million in 1974,
B 47.1 million in 1975, B 40.6 million in 1976 and B 42.2 million in 1977.
/b Less than one year.
Source: Bank of Thailand.

- 164 - Table 3.13Page 4
1976 1977Credit Debit Net Credit Debit Net
A. Private Medium-& Long-term 8,834.7 6,552.8 2,281.9 10,646.1 7,511.6 3,134.5
1. Direct investment 3,063.9 1,449.8 1,614.1 4,286.0 2,122.2 2,163.81.1 Equity capital (1,565,5) (238.7) (1,326.8) 1,325.3 209.2 1,116.11.2 Loans (1,498.4) (1,211.1) (287.3) 2,960.7 1,913.0 1,047.7
2. Loans to privateenterprises 4,277.0 2,961.0 1,316.0 4,620.6 3,291.0 1,329.6
3. Suppliers' credits toprivate enterprises 1,428.1 2,054.8 -626.7 1,565.1 2,027.5 -462.4
4. Portfolio investment 65.7 87.2 -21.5 71.4 69.9 1.55. Other - - - 103.0 1.0 102.0
B. Public Medium-& Long-term 5,152.7 949.5 4,203.2 7,396.1 1,790.2 5,606.0
1. Loans to stateenterprises 2,423.4 500.9 1,922.5 5,465.1 648.3 4,816.8
2. Suppliers' credits tostate enterprises - 83.2 -83.2 33.8 83.3 -49.5
3. Loans to the CentralGovernment 2,504.2/a 347.0 2,157.2 1,372.7/a 601.9 770.8
4. Other Central Gov't 225.1 5.3 219.8 524.6 456.7 +69.94.1 Import credits (-) (-) (-) (447.1) (447.1) ()
4.2 Export credits (73.9) (-) (83.9) (74.0) (-) (74.0)5. Suppliers' credits to
local Governments - 13.1 -13.1 - - -
C. Total Medium-& Long-term 13,987.4 7,502.3 6,485.1 18,042.3 9,301.8 8,740.5
D. Short-term /b 16,979.6 14,201.1 2,778.5 21,105.8 15,879.4 5,226.4
1. Private 16,979.6 14,201.1 2,778.5 21,105.8 15,879.4 5,226.41.1 Trade credits 16,477.2)(14,201.1) (2,276.1)(20,248.6)(15,879.4) (4,369.2)
2. Public - - - - -
E. Total CapitalMovements 30,967.0 21,703.4 9,263.6 39,148.1 25,181.2 13,966.9
/a Including refund from Bank of Thailand's participation in IBRD Loans (Third HighwayProjects) of B 1.4 million in 1972, B 18.9 million in 1973, B 30.9 million in 1974,B 47.1 million in 1975, B 40.6 million in 1976 and B 42.2 million in 1977.
/b Less than one year.
Source: Bank of Thailand.
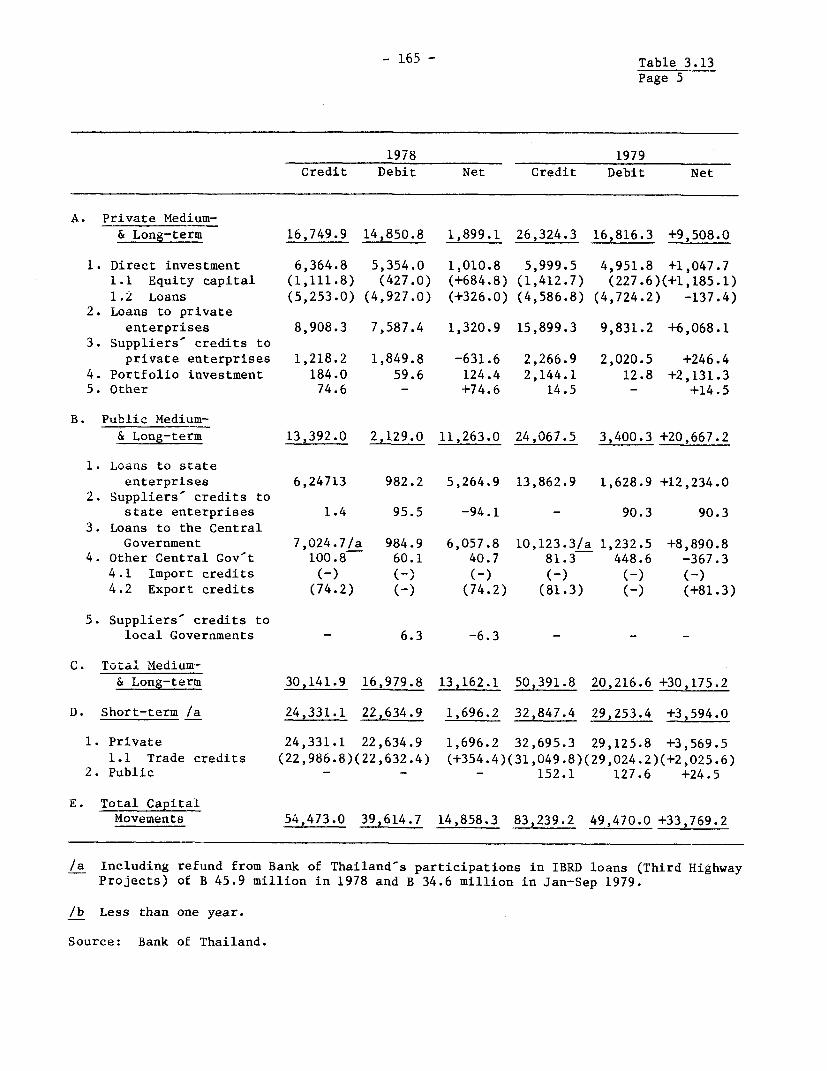
- 165 - Table 3.13
Page 5
1978 1979
Credit Debit Net Credit Debit Net
A. Private Medium-& Long-term 16,749.9 14,850.8 1,899.1 26,324.3 16,816.3 +9,508.0
1. Direct investment 6,364.8 5,354.0 1,010.8 5,999.5 4,951.8 +1,047.71.1 Equity capital (1,111.8) (427.0) (+684.8) (1,412.7) (227.6)(+1,185.1)
1.2 Loans (5,253.0) (4,927.0) (+326.0) (4,586.8) (4,724.2) -137.4)2. Loans to private
enterprises 8,908.3 7,587.4 1,320.9 15,899.3 9,831.2 +6,068.1
3. Suppliers credits toprivate enterprises 1,218.2 1,849.8 -631.6 2,266.9 2,020.5 +246.4
4. Portfolio investment 184.0 59.6 124.4 2,144.1 12.8 +2,131.35. Other 74.6 - +74.6 14.5 - +14.5
B. Public Medium-& Long-term 13,392.0 2,129.0 11,263.0 24,067.5 3,400.3 +20,667.2
1. Loans to stateenterprises 6,24713 982.2 5,264.9 13,862.9 1,628.9 +12,234.0
2. Suppliers' credits tostate enterprises 1.4 95.5 -94.1 - 90.3 90.3
3. Loans to the CentralGovernment 7,024.7/a 984.9 6,057.8 10,123.3/a 1,232.5 +8,890.8
4. Other Central Gov't 100.8 60.1 40.7 81.3 448.6 -367.34.1 Import credits (-) (-) (-) (-) (-) (-)
4.2 Export credits (74.2) (-) (74.2) (81.3) (-) (+81.3)
5. Suppliers' credits tolocal Governments - 6.3 -6.3 - - -
C. Total 'Medium-& Long-term 30,141.9 16,979.8 13,162.1 50,391.8 20,216.6 +30,175.2
D. Short-term /a 24,331.1 22,634.9 1,696.2 32,847.4 29,253.4 +3,594.0
1. Private 24,331.1 22,634.9 1,696.2 32,695.3 29,125.8 +3,569.5
1.1 Trade credits (22,986.8)(22,632.4) (+354.4)(31,049.8)(29,024.2)(+2,025.6)2. Public - - - 152.1 127.6 +24.5
E. Total CapitalMovements 54,473.0 39,614.7 14,858.3 83,239.2 49,470.0 +33,769.2
/a Including refund from Bank of Thailand's participations in IBRD loans (Third HighwayProjects) of B 45.9 million in 1978 and B 34.6 million in Jan-Sep 1979.
/b Less than one year.
Source: Bank of Thailand.
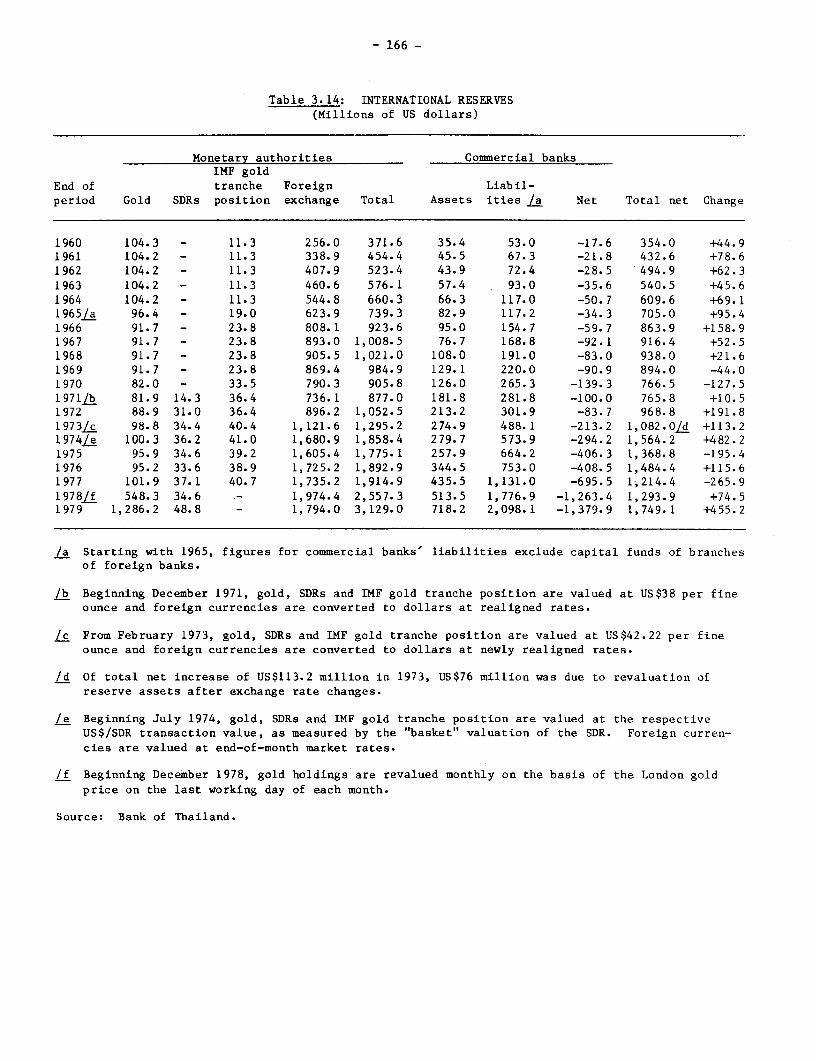
- 166 -
Table 3.14: INTERNATIONAL RESERVES(Millions of US dollars)
Monetary authorities Commercial banksIMF gold
End of tranche Foreign Liabil-period Gold SDRs position exchange Total Assets ities /a Net Total net Change
1960 104.3 - 11.3 256.0 371.6 35.4 53.0 -17.6 354.0 +44.91961 104.2 - 11.3 338.9 454.4 45.5 67.3 -21.8 432.6 +78.61962 104.2 - 11.3 407.9 523.4 43.9 72.4 -28.5 494.9 +62.31963 104.2 - 11.3 460.6 576.1 57.4 93.0 -35.6 540.5 +45.61964 104.2 - 11.3 544.8 660.3 66.3 117.0 -50.7 609.6 +69.11965/a 96.4 - 19.0 623.9 739.3 82.9 117.2 -34.3 705.0 +95.41966 91.7 - 23.8 808.1 923.6 95.0 154.7 -59.7 863.9 +158.91967 91.7 - 23.8 893.0 1,008.5 76.7 168.8 -92.1 916.4 +52.51968 91.7 - 23.8 905.5 1,021.0 108.0 191.0 -83.0 938.0 +21.61969 91.7 - 23.8 869.4 984.9 129.1 220.0 -90.9 894.0 -44.01970 82.0 - 33.5 790.3 905.8 126.0 265.3 -139.3 766.5 -127.51971/b 81.9 14.3 36.4 736.1 877.0 181.8 281.8 -100.0 765.8 +10.51972 88.9 31.0 36.4 896.2 1,052.5 213.2 301.9 -83.7 968.8 +191.81973kc 98.8 34.4 40.4 1,121.6 1,295.2 274.9 488.1 -213.2 1,082.0 d +113.21974/e 100.3 36.2 41.0 1,680.9 1,858.4 279.7 573.9 -294.2 1,564.2 +482.21975 95.9 34.6 39.2 1,605.4 1,775.1 257.9 664.2 -406.3 1,368.8 -195.41976 95.2 33.6 38.9 1,725.2 1,892.9 344.5 753.0 -408.5 1,484.4 +115.61977 101.9 37.1 40.7 1,735.2 1,914.9 435.5 1,131.0 -695.5 1,214.4 -265.91978/f 548.3 34.6 - 1,974.4 2,557.3 513.5 1,776.9 -1,263.4 1,293.9 +74.51979 1,286.2 48.8 - 1,794.0 3,129.0 718.2 2,098.1 -1,379.9 1,749.1 +455.2
/a Starting with 1965, figures for commercial banks' liabilities exclude capital funds of branchesof foreign banks.
/b Beginning December 1971, gold, SDRs and IMF gold tranche position are valued at US$38 per fineounce and foreign currencies are converted to dollars at realigned rates.
/c From February 1973, gold, SDRs and IMF gold tranche position are valued at US$42.22 per fineounce and foreign currencies are converted to dollars at newly realigned rates.
/d Of total net increase of US$113.2 million in 1973, US$76 million was due to revaluation ofreserve assets after exchange rate changes.
/e Beginning July 1974, gold, SDRs and IMF gold tranche position are valued at the respectiveUS$/SDR transaction value, as measured by the "basket" valuation of the SDR. Foreign curren-cies are valued at end-of-month market rates.
/f Beginning December 1978, gold holdings are revalued monthly on the basis of the London goldprice on the last working day of each month.
Source: Bank of Thailand.
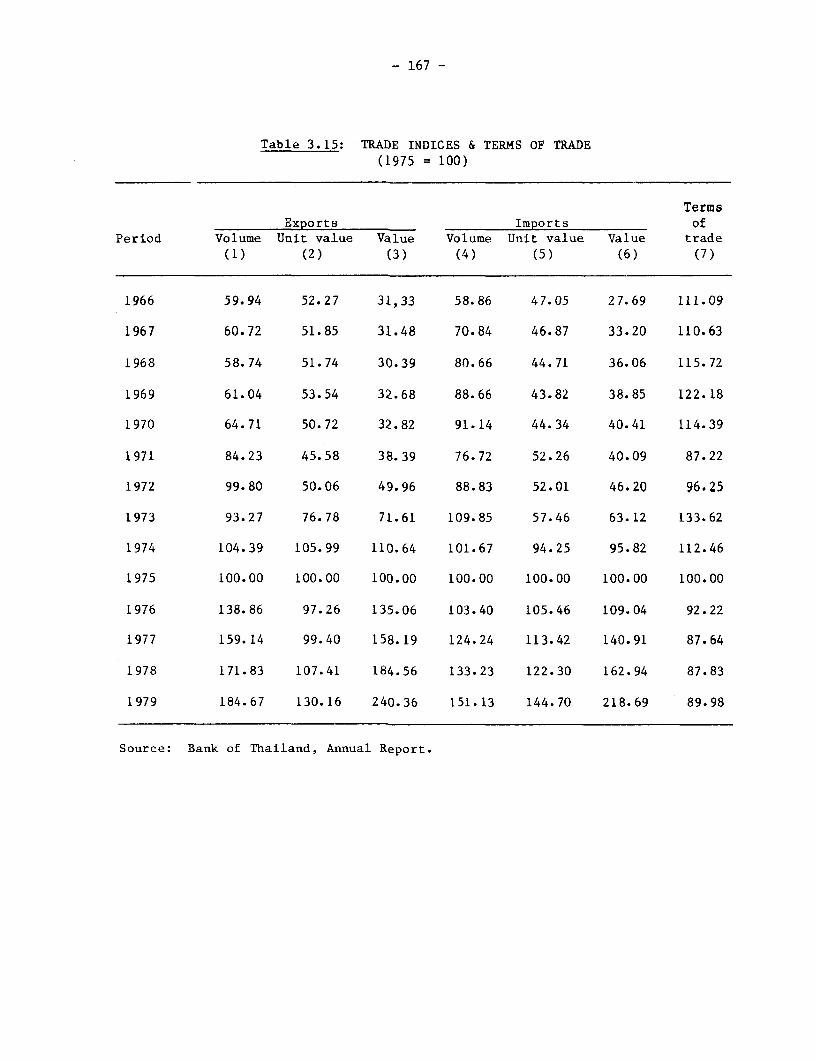
- 167 -
Table 3.15: TRADE INDICES & TERMS OF TRADE(1975 = 100)
TermsExports Imports of
Period Volume Unit value Value Volume Unit value Value trade(1) (2) (3) (4) (5) (6) (7)
1966 59.94 52.27 31,33 58.86 47.05 27.69 111.09
1967 60.72 51.85 31.48 70.84 46.87 33.20 110.63
1968 58.74 51.74 30.39 80.66 44.71 36.06 115.72
1969 61.04 53.54 32.68 88.66 43.82 38.85 122.18
1970 64.71 50.72 32.82 91.14 44.34 40.41 114.39
1971 84.23 45.58 38.39 76.72 52.26 40.09 87.22
1972 99.80 50.06 49.96 88.83 52.01 46.20 96.25
1973 93.27 76.78 71.61 109.85 57.46 63.12 133.62
1974 104.39 105.99 110.64 101.67 94.25 95.82 112.46
1975 100.00 100.00 100.00 100.00 100.00 100.00 100.00
1976 138.86 97.26 135.06 103.40 105.46 109.04 92.22
1977 159.14 99.40 158.19 124.24 113.42 140.91 87.64
1978 171.83 107.41 184.56 133.23 122.30 162.94 87.83
1979 184.67 130.16 240.36 151.13 144.70 218.69 89.98
Source: Bank of Thailand, Annual Report.

- 168 -
Table 3.16: DUTIES ON IMPORTS BY ECONOMIC CLASSIFICATION /a
1970 1971 1972 1973 1974 1975 1976 1977 1978 1979
-------------------- (Receipts in millions of baht) -…-- …-------------
1. Consumer GoodsNondurable 1,188 932 968 1,007 1,026 1,172 1,387 1,571 1,934 1,893Durable 476 429 469 597 799 962 1,165 1,471 1,602 1,581
Subtotal 1,664 1,361 1,437 1,604 1.825 2,134 2,552 3,042 3.536 3,474
2. Intermediate Products andRaw MaterialsChiefly for consumer goods 967 1,272 1,330 1,607 1,867 1,710 2,041 2,639 2,794 3,728Chiefly for capital goods 258 275 269 381 391 314 393 534 559 640
Subtotal 1.225 1,547 1,599 1,988 2.258 2.024 2,434 3.173 3.353 4,368
3. Capital Goods 1,175 1,165 1.327 1,550 2,129 1,893 2.263 3,179 4.009 4,312
4. Other ImportsVehicles and parts 724 787 830 1,298 1,561 1.621 1,642 2,254 2,696 2,221of which: Passenger cars (302) (215) (205) (364) (381) (227) (201) (332) (200) (58)
Buses & trucks (234) (368) (396) (656) (780) (974) (863) (1,169) (1,721) (1,391)Chassis & bodies (148) (175) (206) (254) (366) (394) (537) (697) (731) (729)Tires (40) (29) (23) (24) (34) (26) (41) (56) (44) (43)
Fuels & lubricants 524 257 239 301 451 364 369 531 891 1,138Miscellaneous 33 30 72 28 55 77 148 37 51 51
Subtotal 1,281 1.074 1,141 1.627 2,067 2,062 2,159 2.822 3,638 3,410
Total 5,345 5.147 5,504 6,769 8,279 8,114 9.408 12.216 14,536 15.561
---------------- Receipts as percentage of imports) --------------1. Consumer Goods
Nondurable 34.1 32.6 29.4 24.8 19.9 22.8 24.8 24.8 25.6 22.5Durable 27.3 22.6 19.3 20.0 24.9 26.1 30.4 30.9 29.7 25.7
Subtotal 31.8 28.6 25.1 22.7 21.8 24.2 27.1 27.4 27.3 23.8
2. Intermediate Products andRaw MaterialsChiefly for consumer goods 23.4 25.5 22.6 18.8 16.5 16.6 16.3 16.4 16.5 15.5Chiefly for capital goods 10.0 9.9 8.3 7.5 5.6 5.4 5.1 4.9 4.4 4.0
Subtotal 18.2 19.9 17.5 14.6 12.3 12.6 12.0 11.8 11.3 10.9
3. Capital Goods 12.5 13.5 13.6 12.1 10.7 8.5 11.7 13.0 12.8 11.9
4. Other ImportsVehicles and parts 32.8 35.9 37.5 38.2 37.3 35.8 31.7 28.3 35.7 33.0of which: Passenger cars n.a. (66.4) (65.7) (66.9) (68.0) (72.3) (70.5) (71.7) (93.0) (37.4)
Buses & trucks n.a. (30.6) (38.5) (38.7) (40.8) (40.6) (42.6) (43.1) (53.6) (54.7)Chassis & bodies n.a. (29.0) (25.0) (23.0) (22.5) (22.4) (19.7) (15.1) (18.3) (19.9)Tires n.a. (47.5) (46.9) (41.4) (40.0) (28.9) (31.8) (34.1) (33.9) (27.0)
Fuels & lubricants 22.5 33.0 35.0 27.6 20.6 16.9 13.0 12.0 14.1 13.9Miscellaneous 2.9 4.2 7.9 4.5 7.5 8.9 7.5 1.3 1.1 0.8
Subtotal 22.5 29.2 30.0 31.8 29.1 27.3 21.6 18.4 19.7 16.1
Total 19.8 20.7 19.4 17.5 15.4 14.8 15.9 15.7 15.7 13.9
/a Figures are on calendar year basis.
Source: Bank of Thailand.

Table 3. 17: IMPORTS AND EXPORTS OF CRUDE OIL AND PETROLEUM PRODUCTS
1970 1971 1972 1973 1974 1975 1976 1977 1978 1979
Imports c.i.f.
Crude oilVolume (mn barrels) 27.8 39.6 47.9 56.0 50.2 52.6 55.4 61.0 61.2 64.4Average price (US$/barrel) 2.05 2.33 2.41 3.15 10.33 11.48 12.51 13.22 13.20 17.82Value (mn US$) 57.1 91.4 115.8 175.0 518.6 603.8 692.8 806.3 808.1 1,147.2
Petroleum productsVolume 10.5 7.4 5.4 8.0 6.9 5.5 7.4 11.0 17.7 16.1Average price (US$/barrel) 5.16 5.24 6.15 6.75 11.6 14.89 15.1 14.98 17.47 28.06Value (mn US$) 54.2 38.8 33.2 54.0 79.5 81.9 111.8 164.8 309.2 451.8
Exports f.o.b.
Petroleum productsVolume 0.3 1.3 3.2 4.1 0.9 0.7 0.3 - - -
Average price (US$/barrel) 5.67 4.85 3.69 4.46 15.0 15.9 16.7 - - -
Value (mn US$) 1.7 6.3 11.8 18.3 13.4 11.1 5.0 - - -
Net Imports
Petroleum productsVolume (mn barrel) 10.2 6.1 2.2 3.9 6.0 4.8 7.1 11.0 17.7 16.1Value (mn US$) 52.5 32.5 21.4 35.7 66.1 70.8 106.8 164.8 309.2 451.8
Source: Bank of Thailand.

- 170 -
Table 4.1: EXTERNRL DEBT AND DEBT SERVICE OBLIGATIONS la(US S'000)
1970 1971 1972 1973 1974 1975 1976 1977 1978 1970
PRIVATE SECTORLoans
Disbursements 38,185 47,675 108,556 83,809 214,890 211,661 216.577 2R4,296 522,170 702,267Repayn nts 16,863 39,637 24,282 97,775 56,880 130,191 136,412 165,432 441,204 411,832Interest payments 16,910 21,217 21,091 29,736 57,056 69,277 62,611 65,892 102,037 16R,318Amount disbursed and outstanding 177.074 185,112 269,396 255,430 413,440 494,910 575.075 693,939 774,905 1,065,340
Suppliers' CreditDieburue--eots tb 131,116 111,886 87,199 55,666 109,901 92,328 60,900 64,603 50,659 06,720Repayments lb, /c 90,544 95,847 91,443 85,894 81,102 85,524 92,334 88,715 80,820 74,504Amount disbursed and outstanding 224,159 240,198 235,954 205,726 234,525 241,329 209,995 185,883 1]S,72? 178,438
Loans & Suppliers' CreditsDisbursements 169,301 159,561 195,765 139,475 324,791 303,989 277,477 348,899 572,829 799,087Debt service payments 124,317 156,701 136,816 213,405 195,038 284,992 291,157 320,039 624,061 694,654Amount disbursed and outstanding 401,233 425,310 505,350 461,156 647,965 736,239 785,070 87Q,822 930,627 1,243,378
PUBLIC SECTORCentral Government /e, /f
Disbursements 28,723 23,120 18,709 28,960 18,407 9,386 123,179 66,523 343,698 493,356Repayable in foreign currencies (28,723) (23,120) (18,709) (28,960) (18,407) (8,306) (123,179) (66,523) (343,698) 493,356)Repayable in baht (-) (-1 (-1 (-1 (-1 (") 2-) (' (-' ()
Repoym-nts 9,022 8,396 8,384 10,017 12,086 13.557 15,319 27,984 46,202 57,04nIn foreign currencies (8,916) (8,271) (8,241) (9,854) (11,903) (13,354) (15,094) (27,737) (45,932) (57,646)In baht (106) (125) (143) (163) (183) (203) (225) (247) (270) (294)
Interest payments 7,795 9,368 10,603 12,955 13,727 14,448 16,584 25,287 3R,144 (6n,265)In fureign currencies (7,566) (9,142) (10,381) (12,738) (13,516) (14,244) (16,278) (25,898) (37,964) (69,095)In baht (230) (226) (222) (217) (211) (204) (386) (189) (180) (170)
Amount disbursed and outstanding 176,505 191,229 210,060 /d 238,563 243,819 235,660 348,220 402,187 729,156 1,134,390Repayable in foreign currencies (170,007) (184,856) (203.831)jd(232,497) (237,936) (229,980) (342.764) (396,978) (724,217) 1,129,741,Repayable Rn baht (6,498) (6,373) (6,229) (6,066) (5,883) (5,680) (5,456) (5,209) (4,939) (4,646)
State Enterprises /eDisbursements 0,545 17,871 21,446 37,934 79,348 136,954 211.169 274,947 387,004 678,929
Repayable in foreign currencies (20,545) (17,871) (21,446) (37,934) (79,348) (136,954) (211,169) (274,947) (3n7,004) (678,9291Repayable in baht (-5 (-) (-) (-) (-' '-' (-) (-' (-' '-'
Repayments 16,183 14,976 16,216 19,848 20,655 26.804 29.281 36,583 53,837 84,197In foreign currencies (14,931) (13,677) (14,837) (18,393) (19,120) (25,184) (27,577) (34,956) (51,319) (82,381)In baht (1,252) (1,299) (1,379) (1,455) (1,535) (1,620) (1,624) (1,627) (1,718) 1,814
interest payments 9,497 9,996 10,617 12,833 15,534 22,136 27,412 35,751 64,21I 87,208In foreign currencies (8,699) (9,190) (9,885) (12,177) (14,958) (21,6451 (27,011) (35,438) (63,487) 87,081Tn bt ' (8065 (732) (65' (576) (4.9! (401) (313) (223) 127
Amount disbursed and outstanding L67,849 170,733/d 191,8031d 217,018 282,125 386,635 481,909 748,731 1,059,199 1,578,778Repayable in foreign currencies (152.833) (157,016)/d(179.464)/d(206.135) (272,777) (378.907) (475.806) (744,255) (1,056,441) 1,577,834Repayable in baht (15,016) (13,717) (12,338) (10.883) (9,348) (7,728) (6,103) (4,476) (2,758) (944)
Local Covornnnnt /aDisbursements 2,552 3,060 - - - - - - -Repayments - 611 1,327 1,249 1.204 1,150 656 _ 308Interest payments - 160 315 220 162 93 23 - 126Amount disbursed and outstandinE 3,662 6,111 5,308/d 3,549 2,390 1,031 262 296 - -
Total Public Sector 1eDisbursements 51,820 44,051 51,155 66,894 97.755 145,260 244,348 341,770 650,702 1.'72,285
Repayable in foreign currencies (51,820) (44,051) (51,155) (66,894) (97,755) (145,260) (244,348) (341,770) (650,702) (1,172,285)Repayable in baht (-) (-) (-) (-) (-) (-) (_) (-) (-5 (-5
Repayments 25,205 23,983 25,927 31,114 33,945 41,511 45,176 64,567 99,547 142,137In foreign currescies (23,847) (22,559) (24,405) (29,496) (32,227) (39,6S8) (43,327) (62,693) (97,559) 140,02QIn baht (1,358) (1,424) (1,522) (1,61R) (1,71R) (1,823) (1,849) (1,874) (1,988) 2,108
Interest payments 17,293 19,524 21,535 26,008 29,423 36,677 44,019 61,038 In2,480 156.473In foreign currencies (16,185) (18.492) (20,581) (25,135) (28,636) (35,982) (43.312) (60,536) (102,077) 156,176In baht (1,108) (1,032) (954) (873) (787) (695) (707) (502) (403) (297)
Amount disbursed and outstanding 348,016 368,073Jd 407,171/d 459,130 528,334 623,326 830,391 1,151,214 1,788,355 2,713,168Repayable in foreign currencies (326,502) (347,983)/d(388,605)/d(442,181) (513,103) (609,918) (811,832) (1,141,529) (1,780,658) 2,707,578Pepayable in baht (21,514) (20,090) (18,566) (16,949) (15,231) (13,408) (11,559) (9,685) (7,697) (5,590)
TOTAL EXTERNAL DEBT & DEBT SERVICES /hAoount disbursed and outstanding 727,735 773,293 893,955 903,337 1,161,068 1,346,157 1,603,902 2,021,351 2,711,28S 3,950,956Debt service payments 164,349 197,752 181,802 268,036 255,901 360,662 377,796 443,268 823,697 950.859
Private sector (124,317) (156,701) (136,816) (213,405) (195,038) (284,992) (291,157) (320,039) (624,061) (654,654)Public sector (40.032) (41,051) (44,986) (54,631) (60,863) (75,670) (06,639) (123,229) (199,636) (296,250)
Debt service payments as percentageof eaports L4 13.0 16.3 11.8 12.8 8.3 12.6 10.6 10.8 16.8 14.7
Private sector (11.3) (12.9) (8.9) (10.2) (6.3) (10.0) (8.2) (7-8) (12.7) (10.1)Public sector (3.7) (3.4) (2.9) (2.6) (2.0) (2.6) (2.4) (3.0) (4.1) (4.6)
/a Debt with a maturity of over one year.
/b Net of downpayments and prepayments./c Including interest payments./d Reflects revaluation of lenders' currenries./e Loans and suppliers' credits.If Net of Bank f Thailand perticipatimn in I8RD loans.TR Suppliers' credit./h Repayable in foreign currencies./i Couds and nonfactor services.
Source: bank of Thailand.
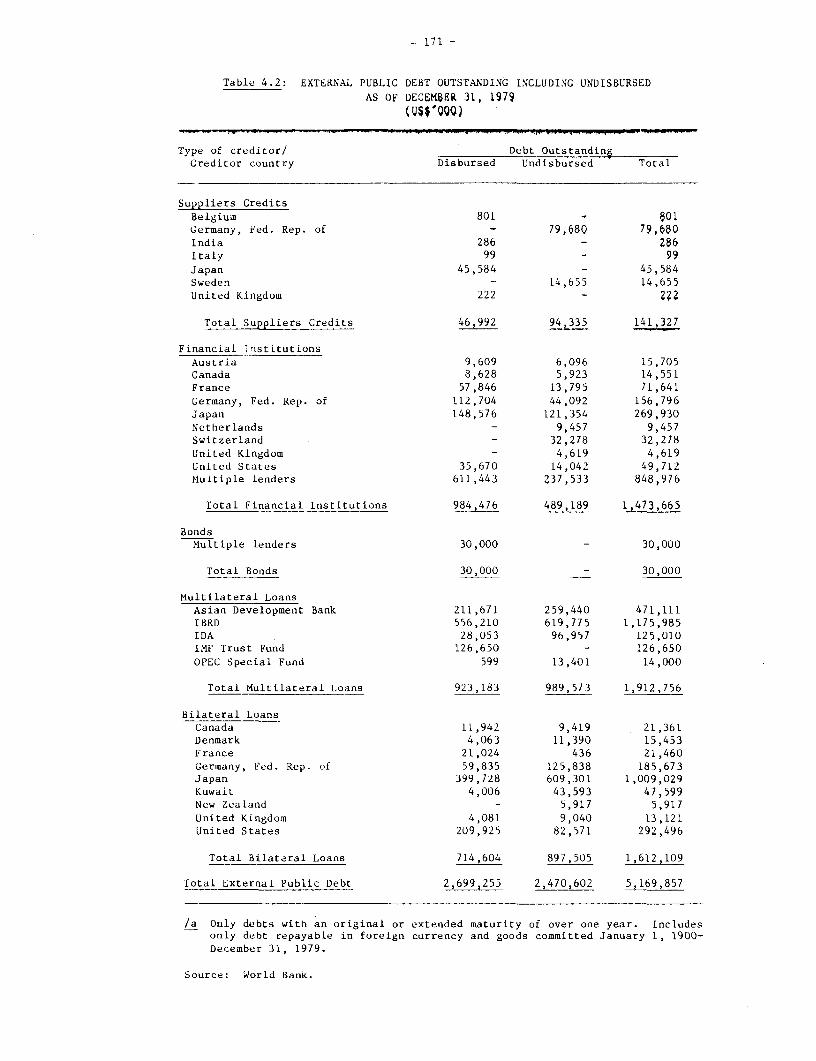
- 171 -
Table 4.2: EXTEPNAL PUBLIC DEBT OUTSTANDING INCLUDING UNDISBURSED
AS OF DECE,BER 31, 1979
(US$QQ0)
Type of creditor/ Debt OutstandinRCreditor country Disbursed Undisbursed Total
Suppliers CreditsBelgium 801 S VIGermany, Fed. Rep. of - 79,680 79,680India 286 - 286Italy 99 99Japan 45,584 - 45,584Sweden - 14,655 14,655
United Kingdom 222 - 2~2
Total Suppliers Credits 46,992 94,335 141,327
Financial 'nstitutionsAustria 9,609 6,096 15,705Canada 8,628 5,923 14,551France 57,846 13,795 71,641Germany, Fed. Rep. of 112,704 44,092 156,796Japan 148,576 121,354 269,930Netherlands - 9,457 9,457Switzerland - 32,278 32,278United Kingdom - 4,619 4,619United States 35,670 14,042 49,712Multiple lenders 611,443 237,533 848,976
Total Financial Institutions 984,476 489,189 1,473,665
BondsMultiple lenders 30,000 - 30,000
Total Bonds 30,000 - 30,000
Multilateral LoansAsian Development Bank 211,671 259,440 471,111IBRD 556,210 619,775 1,175,985IDA 28,053 96,957 125,010IMF Trust Fund 126,650 - 126,650
OPEC Special Fund 599 13,401 14,000
Total Multilateral Loans 923,183 989,573 1,912,756
Bilateral LoansCanada 11,942 9,419 21,361Denmark 4,063 11,390 15,453France 21,024 436 21,460Germany, Fed. Rep. of 59,835 125,838 185,673Japan 399,728 609,301 1,009,029Kuwait 4,006 43,593 47,599New Zealand - 5,917 5,917United Kingdom 4,081 9,040 13,121United States 209,925 82,571 292,496
Total Bilateral Loans 714,604 897,505 1,612,109
Total External Public Debt 2,699,255 2,470,602 5,169,857
La Only debts with an original or extended maturity of over one year. Includesonly debt repayable in foreign currency and goods committed January 1, 1900-December 31, 1979.
Source: World Bank.

- 172 -
Table 4.3: PROJECTED SERVICE PAYMENTS, DISBURSEMENTS AND OUTSTANDING AMOUNTSOF EXTERNAL PUBLIC DEBT AS OF DECEMBER 31, 1979 /a
(US$'000)
Debt outstanding atbeginning of period Total transactions during period Other changes
Disbursed Including Commit- Disburse- Service payments Cancel- Adjust-Year only disbursed ments ments Principal Interest Total lations ment lb
Actual1975 512,799 1,122,060 231,366 150,050 38,705 34,483 73,188 21,079 -12,3801976 615,538 1,281,262 408,986 241,703 43,425 44,263 87,688 - 16,3111977 821,689 1,663,134 793,911 268,415 63,414 58,311 121,725 884 95,7551978 1,067,613 2,488,502 1,109,756 742,606 98,159 96,799 194,958 17,694 169,6721979 1,700,492 3,652,077 1,844,230 1,124,378 132,291 145,695 277,986 1,840 192,3201980 2,699,255 5,169,856
Projected1980 2,699,255 5,169,856 - 737,495 216,187 232,761 448,948 - 51981 3,220,568 4,953,674 - 601,067 248,018 269,386 517,404 - 151982 3,573,625 4,705,671 - 468,627 300,656 282,531 583,187 - 31983 3,741,600 4,405,018 - 310,115 323,189 273,865 597,054 - 51984 3,728,530 4,081,834 - 176,587 395,449 254,270 649,719 - 61985 3,509,672 3,686,391 - 100,217 383,387 226,243 609,630 - 151986 3,226,516 3.303,019 - 47,942 351,311 198;921 550,232 - 41987 3,923,152 2,951,712 - 21,233 317,546 174,375 491,921 - 81988 2,626,845 2,634,174 - 5,676 325,744 150,951 476,695 - 81989 2,306,785 2,308 438 - 15263 304,244 127,707 431,951 - 71990 2,003,816 2,004,201 - 318 218,237 106,484 324,721 - 61991 1,785,903 1,785,970 - 62 203,068 92,827 295,895 - 91992 1,582,906 1,582,911 - 5 189,610 79,908 269,518 - 51993 1,393,306 1,393,306 - - 166,257 68,643 234,900 - 81994 1,227,057 1,227,057 - - 162,831 58,551 221,382 - 101995 1,064,236 1,064,236 - - 150,210 48,799 199,009 - 31996 914,029 914,029 - - 141,531 39,908 181,439 - 41997 772,502 772,502 - - 125,682 31,768 157,448 - 41998 646,824 646,824 - - 117,598 24,563 142,161 - 41999 529,230 529,230 - - 83,898 18,396 102,294 - 5
/a Includes only debt committed January 1, 1900 - December 31, 1979. Debt repayable in foreign currencyand goods.
/b This column shows the amount of arithmetic imbalance in the amount outstanding including undisbursedfrom one year to the next. The most common causes of imbalances are changes in exchange rates andtransfer of debts from one category to another in the table.
Source: World Bank.

- 173 -
Table 5.1: CONSOLIDATED PUBLIC SECTOR EXPENDITURES /a
(Millions of baht)
FY70 FY71 FY72 FY73 FY74 FY75 FY76 FY77 FY78 FY79 FY80Actual Actual Actual Actual Actual ActulnA Actual Actual Actuol Actual Fstimate
Current Expenditures 17,590 19,629 21,972 24,784 29,122 35,955 41,606 48,577 60,950 73,858 96_022
Defense, Admin., etc. 8,836 10 041 10,444 12,513 13,739 16,293 18,709 22,807 30,897 37,381 43,649General admin. /b 1,755 2,128 2,090 2,047 2,464 2,956 3,509 3,456 4,005 5,000 6,876Defense & police 5,241 6,369 6,930 7,340 8,840 10,102 12,480 15,312 20,774 27,128 30,375Pensions 860 580 747 764 908 1,143 1,155 1,421 1,333 1,735 2,845Miscellaneous 980 964 677 2,362 1,527 2,092 1,565 2,618 4,785 3,518 3,553
Economic Services 1,968 2,063 2,031 2,275 2,770 3,332 4,059 4.813 5,103 5,717 7,745Agriculture /c 1,012 1,046 1,003 1,103 1,399 1,671 2,008 2,229 2,667 3,116 4,361
of which: Irrigation (398) (402) (392) (409) (538) (572) (702) (739) (807) (1,049) (1,723)industry and mining 74 76 85 92 129 182 193 213 214 259 396Power 9 17 9 13 18 22 31 82 70 67 87Trans. & Communications 727 781 799 920 1,052 1,262 1,569 1,390 1,584 1,852 2,376
of which: Highways (609) (667) (684) (817) (905) (1,078) (1,112) (1,168) (1,348) (1,568) (1,868)Other economic services 146 143 135 147 172 195 258 899 568 423 525
Social Services 2,481 2,554 3.573 3,254 4,184 5,235 5,955 7,321 8,265 10,388 13,482Education 1,332 1,268 2,202 1,896 2,481 2,991 3,716 4,177 4,827 6,189 8,370Health 638 720 735 825 1,065 1,227 1,657 2,213 2,374 3,025 3,647Other social services 511 566 636 533 638 1,017 582 931 1,064 1,174 1,465
Local Government /d 2,606 2,822 3,150 3,531 4,712 7,195 8,655 8,586 10,041 11,472 19,537TA Trust Fund /d Ie 92 72 67 54 41 28 10 4 1 - -Non-US external grants /d /f 235 287 287 305 332 372 385 369 659 996 1,083
Interest payments 1,372 1,790 2,420 2
,85 3,344 3,501 3,832 4,677 5,984 7,914 10,526Internal debt 1,193 1,590 2,183 2,596 3,072 3,217 3,511 3,827 5,136 6,496 8,249External debt 179 200 237 256 272 284 321 850 848 1,408 2,279
Capital Expenditures 9,525 11.122 11,783 11,546 11.699 14,599 21,027 27,033 35,791 36,645 59,118Agrictulture /c 1,656 1,925 1,440 1,221 1,125 1,379 2,765 3,954 4,614 5,691 7,329
of which: Irrigation (1,368) (1,656) (1,201) (989) (883) (1,128) (2,233) (2,732) (3,281) (3,949) (5,106)Indtustry and mining 127 86 101 136 200 239 293 647 471 442 951Power 1,283 1,476 1,955 2,390 1,991 2,525 3,284 3,666 6,115 4,738 15.199Trans. & Communications 3,561 3,566 5,620 3,236 3,442 4,067 5,546 8,417 10,848 12,498 16,537of which: Highways (2,273) (2,349) (2,845) (2,336) (2,092) (2,551) (3,653) (5,057) (5,025) (5,597) (8,227)
Education 697 1,259 735 974 1,043 671 1, 678 2, 505 3,042 3,192 3,872Health 95 170 224 163 165 160 272 464 792 826 863Water supply & sewerage 283 430 504 555 353 160 497 1,266 2,105 1,580 2,620Miscellaneous 890 956 1,461 1,200 1,407 1,629 1,503 2,457 2,745 3,415 4,610of which: Land settlement (25) (21) (19) (25) (33) (33) (60) (83) (133) (162) (252)
Admin. bldgs. etc. (865) (935) (1,142) (1,175) (1,374) (1,596) (1,443) (2,373) (2,612) (3,253) (4,358)Local Government /d 670 1,020 1,558 1,493 1,765 3,536 4,959 3,445 4,708 3,890 6,496Non-IJS external grants /d _g 670 234 185 178 208 233 230 212 351 373 641
Transfers 433 313 486 430 -1 608 211 1.206 1,660 1,922 -735Central Gov't transfers to
state enterprises to fInanceoperating deficits 433 313 486 430 -1 608 201 1,206 1,545 850 -891
Other - - - - - - - - 115 1.072 156
Ndjustments for doublecounting etc. -13 -16 -8 -15 - - - - - - -
Total Expenditures 27,535 31,048 34I233 36.745 40,820 51,163 62,834 76,816 98,401 112,425 154,405
La Consolidated expenditures of the Central and Local Governments plus gross fixed capital expenditures of state enterprises,including those financed out of external loans and grants. Figures are for disbursements during Thai fiscal years runningfrom October I to September 30. Expenditures financed out of external loans and US grants are entered under the functionalline headings. Local Government expenditures and expenditures financed out of non-!IS external grants are entered asseparate items because no functional breakdown is available.
'b Including Justice.c Including Forestry, Fishing, and Hunting.
/i Funictional breakdown not available./e Expenditure financed ouit of the technical assistance counterpart fund account./f Expenditure on services of experts and technicians, fellowships, foreign voluntary services, and other costs of a current mat,,re.ig Expenditure on equipment imported into Thailand.
Note: Details do not add to total due to rounding.
So)urce: Bank of Thailand.
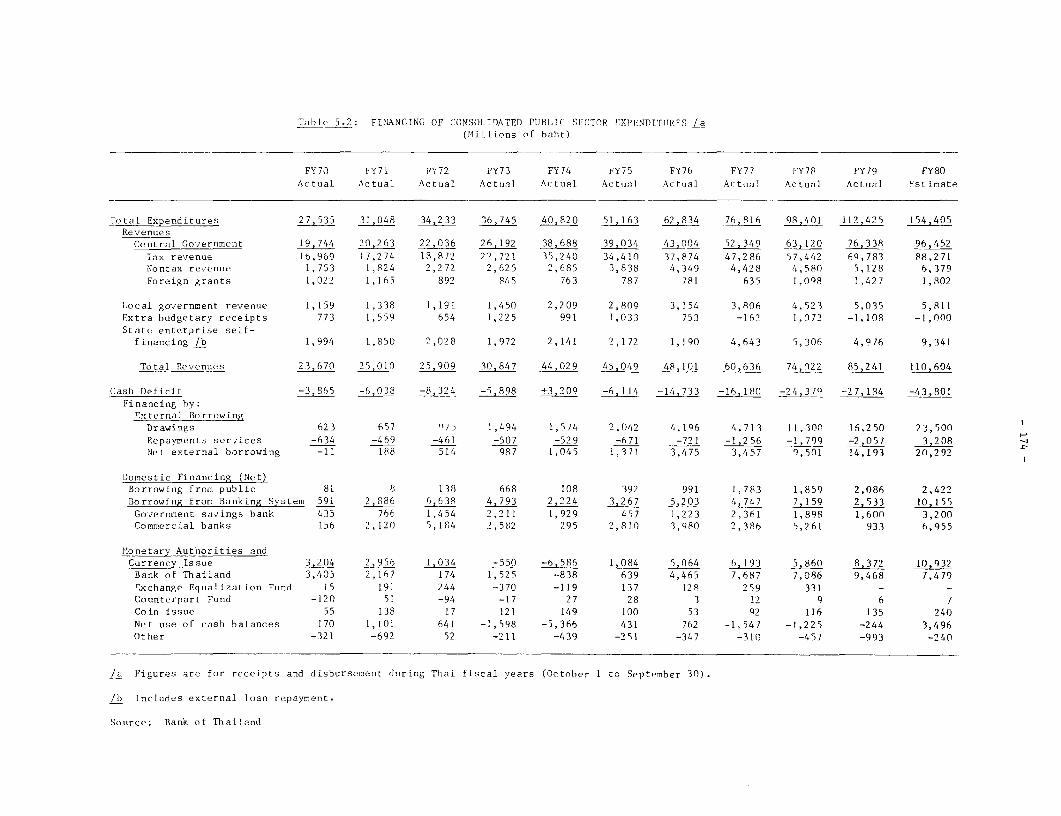
Table 5.2; FINANCING OF CONSOLIDATED PUBLIC SECTTOR EXPFCNDITT¶RFS /a(1Millions of baht)
FY70 FY71 FY72 FY73 FY74 FY75 FY76 FY77 FY78 FY79 FY80
Actual Actual Actual Actuial Actual Actuial ActuJal Actuta1 Actual Actual Fstimate
Total Expenditures 27,535 31,048 34,233 36,745 40,820 51,163 62,834 76,816 98,401 112,425 154,405Revenues
Central Government 19,744 20,263 22,036 26,192 38,688 39,034 43,004 52,349 63,120 76,33 96,452
Tax revenue 16,969 17,274 13,872 22,721 35,240 34,410 37,874 47,286 57,442 69,783 88,271Nontax revenue 1,753 1,824 2,272 2,625 2,685 3,838 4,349 4,428 4,580 5,128 6,379Foreign grants 1,022 1,165 892 845 763 787 781 635 1,098 1,427 1,802
Local government revenuIe 1,159 1,338 1,191 1,450 2,209 2,809 3,154 3,806 4,523 5,035 5,811Extra budgetary receipts 773 1,559 654 1,225 991 1,033 753 -162 1,073 -1,108 -1,000
State enterprise self-financing /b 1,994 1,850 2,028 1,972 2,141 2,172 1,190 4,643 5,306 4,976 9,341
Total Re.venUes 23,670 25,010 25,909 30,847 44,029 45049 48,101 60,636 74,022 85,241 110,604
Cash Deficit -3,865 -6,038 -8,324 -5,898 +3,209 -6,114 -14,733 16,180 -24,379 -27,184 -43,801Financing by:
External BorrowingDrawings 623 657 975 1,494 1,574 2,042 4,196 4,713 11,300 16,250 23,500
Repayments services -634 -469 -461 -507 -529 -671 -721 -1,256 -1,799 -2,_057 3,208Net external borrowing -11 188 514 987 1,045 1,371 3,475 3,457 9,501 14,193 20,292
Domestic Financing (Net)Borrowing from public 81 8 138 668 108 392 991 1,783 1,859 2,086 2,422Borrowing from Banking System 591 2,886 6,638 4,793 2,224 3,267 5,203 4,747 7,159 2,533 10,155
Government savings bank 435 766 1,454 2,211 1,929 457 1,223 2,361 1,898 1,600 3,200Commercial banks 156 2,120 5,184 2,582 295 2,810 3,980 2,386 5,261 933 6,955
Monetary Authorities anidCurrency Issue 3,204 2,956 1,034 -550 -6,586 1,084 5,064 6,193 5,860 8372 ,932Bank of Thailand 3,405 2,167 174 1,525 -838 639 4,465 7,687 7,086 9,468 7,479
Exchange Equalization Fund 15 191 244 -370 -119 137 128 259 331 - -Counterpart Fund -120 51 -94 -17 27 28 3 12 9 6 7Coin issue 55 138 17 121 149 100 53 Q2 116 135 240Net use of cash balances 170 1,101 641 -1,598 -5,366 43-1 762 -1,547 -1,225 -244 3,496Other -321 -692 52 -211 -439 -251 -347 -310 -457 -993 -240
/a Figures are for receipts and disbursement duiring Thai fiscal years (October 1 to September 30).
/b Includes external loan repayment.
Source: Bank of Thailand
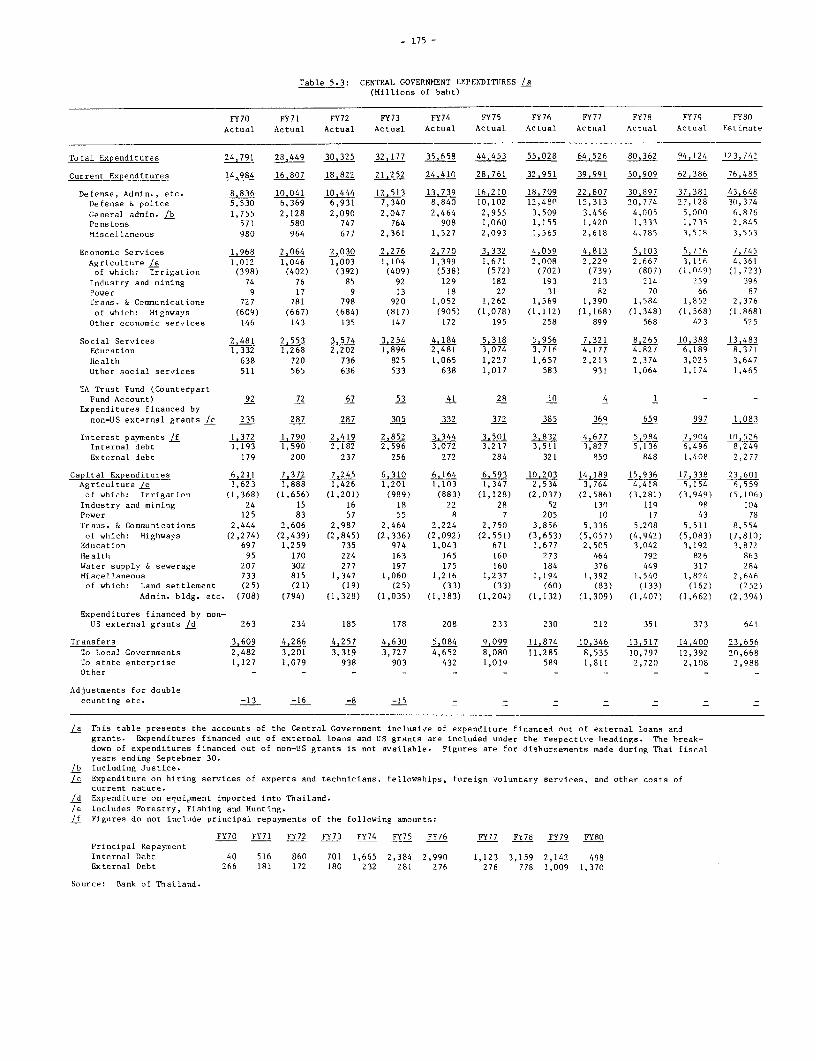
- 175 -
Table 5.3: CENTRAL GOVERNMIENT EXPENDITUJRES /a(Millions of baht)
FY70 FY71 FY72 FY73 FY74 FY75 FY76 FY77 FY78 FY79 FY80Actual Actual Actual Actual Actual Actual Actual Actual Actual Actual Estimate
Total Expenditures 24,791 28,449 30,325 32,177 35,658 44,453 55,028 64,526 80,362 94,124 123,742
Current Expenditures 14,984 16,807 18,822 21.252 24,410 28,761 32,951 39.991 50,909 62,386 76,485
Defense, Admin., etc. 8,836 10,041 10.444 12,513 13.739 16,210 18,709 22,807 30,897 37,381 43,648Defense & police 5,530 6,369 6,931 7,340 8,840 10,102 12,480 15,313 20,774 27,128 30,374
General admin. /b 1,755 2,128 2,090 2,047 2,464 2,955 3,509 3,456 4,005 5,000 6,876Penstons 571 580 747 764 908 1,060 1,155 1,420 1,333 1,735 2,845Miscellaneous 980 964 677 2,361 1,527 2,093 1,565 2,618 4,785 3,518 3,553
Economic Services 1,968 2,064 2,030 2.276 2,770 3,332 4,059 4,813 5,103 5,716 7,745
Agriculture /e 1,012 1,046 1,003 1,104 1,399 1,671 2,008 2,229 2,667 3,116 4,361of which: Irrigation (398) (402) (392) (409) (538) (572) (702) (739) (807) (1.049) (1,723)
Industry and mining 74 76 85 92 129 182 193 213 214 259 396Power 9 17 9 13 18 22 31 82 70 66 87Trans. & Communications 727 781 798 920 1,052 1,262 1,569 1,390 1,584 1,852 2,376of which: Highways (609) (667) (684) (817) (905) (1,078) (1,112) (1,168) (1,348) (1,568) (1.868)
Other economic services 146 143 135 147 172 195 258 899 568 423 525
Social Services 2,481 2,553 3,574 3,254 4,184 5,318 5,956 7,321 8,265 10,388 13,483Education 1,332 1,268 2,202 1,896 2,481 3,074 3,716 4,177 4,827 6,189 8,371Nealth 638 720 736 825 1,065 1,227 1,657 2,213 2,374 3,025 3,647Other social services 511 565 636 533 638 1,017 583 931 1,064 1,174 1,465
TA Trust Fund (CounterpartFund Account) 92 72 67 53 41 28 10 4 1 - -
Expenditures financed bynon-US external grants /c 235 287 287 305 332 372 385 36a 659 997 1,083
Interest payments /f 1,372 1,790 2,419 2,852 3,344 3,501 3,832 4,677 5,984 7,904 10,526Internal debt 1,193 1,590 2,182 2,596 3,072 3,217 3,511 3,827 5,136 6,496 8,249External debt 179 200 237 256 272 284 321 850 848 1,408 2,277
Capital Expenditures 6,211 7.372 7,245 6,310 6,164 6,593 10,203 14,189 15,936 17,338 23,601Agriculture /e 1,623 1,888 1,426 1,201 1,103 1,347 2,534 3,764 4,418 5,154 6,559
of which: Irrigation (1,368) (1,656) (1,201) (989) (883) (1,128) (2,037) (2,586) (3,281) (3,949) (5,106)Industry and mining 24 15 16 18 22 28 52 130 119 OR 104Power 125 83 57 55 8 7 205 10 17 43 78Trans. & Communications 2,444 2,606 2,987 2,464 2,224 2,750n 3,856 5,336 5,208 5,511 8,554
of which: Highways (2,274) (2,439) (2,845) (2,336) (2,092) (2,551) (3,653) (5,057) (4,942) (5,083) (7,810)Education 697 1,259 735 974 1,043 671 1,677 2,505 3,042 3,192 3,872Hlealth 95 170 224 163 165 160 273 464 792 826 863Water supply & sewerage 207 302 277 197 175 160 184 376 449 317 284Miscellaneous 733 815 1,347 1,060 1,216 1,237 1,194 1,392 1,540 1,824 2,646
of which: Land settlement (25) (21) (19) (25) (33) (33) (60) (83) (133) (162) (252)Admin. bldg. etc. (708) (794) (1,328) (1,035) (1,183) (1,204) (1,132) (1,309) (1,407) (1,662) (2,394)
Expenditures financed by non-US external grants /d 263 234 185 178 208 233 230 212 351 373 641
Transfers 3,609 4,286 4,257 4,630 5,084 9,099 11,874 10,346 13,517 14,400 23,656To Local Governments 2,482 3,201 3,319 3,727 4,652 8,080 11,285 8,535 10,797 12,392 20,668To state enterprise 1,127 1,079 938 903 432 1,019 589 1,811 2,720 2,108 2,988Other - - - - - - - - - -
Adjustments for doublecounting etc. -13 -16 -8 -15 --
/a This table presents the accounts of the Central Government inclusive of expenditure financed out of external loans andgrants. Expenditures financed out of external loans and US grants are included under the respective headings. The break-down of expenditures financed out of non-US grants is not available. Figures are for dishursements made during Thai fiscalyears ending Septebmer 30.
/b Including Justice./c Expenditure on hiring services of experts and technicians, fellowships, foreign voluntary services, and other costs of
cuirrent nature./d Expenditure on equipment imported into Thailand./e Includes Forestry, Fishing and Hunting./f Figures do not include principal repayments of the following amounts:
FY70 FY71 FY72 FY73 FY74 FY75 FY76 FY77 FY78 FY79 FY80Principal RepaymentInternal Debt 40 516 860 701 1,665 2,384 2,990 1,123 3,159 2,142 498External Debt 266 181 172 180 232 281 276 276 778 1,009 1,370
Source: Bank of Thailand.

- 176 -
Table 5.4: CENTRAL GOVERNKENT REVENUE /e(Millions of baht)
FY70 FY71 FY72 FY73 FY74 FY75 FY76 FY77 FY78 FY79 FY80Actual Aetuial Actuial Actual Actual Actual Actual Actual Actual Actual Estimate
TOTAL REVENUE 18,722 19.098 21,144 25.346 37,925 38.248 42,223 51,714 62.022 ^74911 94,650
Tax Revenue 16,969 17,274 18,B72 22,721 35,240 34,410 37,874 47,286 57,442 69,783 88,271Taxes on income 2,169 2,363 2,550 3,168 4,729 6.102 6,806 8,163 11,440 13,736 16,780
Personal 1,272 1,407 1,556 1,700 2,045 2,593 3,037 3,605 5,048 6,103 6,780Corporate 897 956 994 1,468 2,684 3,509 3,769 4,558 6,392 7,033 10,000
Taxes on consumption 6,357 7.217 7,839 9.570 13,593 14,761 16.938 20,776 24,022 29,448 39,410Business taxea 3,577 3,927 4,307 5,097 7,288 7,770 8,895 10,973 13,106 14,809 17,500Excise taxes 2,686 3,192 3,413 4,341 6,162 6,810 7,776 9,490 10,548 14,267 21,510
Beverages (647) (716) (874) (1,455) (1,767) (2,262) (2,712) (3,188) (3,828) (4,778) (5,672)Petroleum products (1,066) (1,399) (1,382) (1,625) (2,496) (2,258) (2,204) (3,080) (3,378) (5,669) (10,840)Tobacco and snuff (896) (1,003) (1,082) (1,180) (1,813) (2,200) (2,761) (3,098) (3,208) (3,681) (4,857)Other (77) (74) (75) (81) (86) (90) (99) (124) (134) (139) (141)
Entertainment tax 94 98 119 132 143 181 267 313 368 372 400
Profits of fiscal monopolies 672 748 864 993 1,020 1,370 1,728 2,163 2.088 2,106 2,520Tobacco monopoly 500 579 650 771 795 735 931 1,417 1,292 1,260 1,280State lottery 170 168 211 220 222 628 788 744 783 846 1,240Other 2 1 3 2 3 7 9 2 13 - -
Taxes on international trade 6,440 5,616 6.026 7,187 12,936 10,375 10.342 13.482 15,929 19,242 23,050
Import duties 5,393 5.185 5.617 6.366 8,563 8,270 9,052 11,802 14.154 16,488 19,650Petroleum products 544 275 286 280 529 374 425 509 734 1,124 2,138Foodstuffs 380 399 352 390 358 394 531 656 669 n.a. n.a.Machinery, equip. & vehicles 1,614 1,618 1,830 2,356 3,390 3,488 3,486 4,911 6,159 n.a. n.a.
of which: Passenger cars (326) (204) (221) (279) (441) (259) (201) (332) (200) (n.a.) (n.a.)Textiles, yarn, thread 634 454 394 381 506 443 600 656 841 n.a. n.a.Other 2,221 2,439 2,755 2,959 3,780 3,571 4,010 5,070 5,751 n.a. n.a.
Export taxes 1,047 431 409 821 4,373 2,105 1,290 1,680 1,775 2,754 3,400Rice premium 654 262 163 276 2,752 795 42Rice duty 135 117 192 151 583 514 415 576 524 608 710Rubber 195 22 15 320 817 325 675 1,033 1,177 n.a. n.a.Other 63 30 39 74 221 471 158 71 74 n.a. n.a.
Other taxes 1.331 1,330 1,593 1,803 2,962 1,802 2,060 2,702 3, 963 5,251 6,511Taxes on properties &
property transfers 564 557 744 890 582 617 680 905 1,230 1,504 1,796
Automobile registration /b (239) (262) (416) (468) (6Transfer to immovable ) (-) (-) (-) (-) (-) (-)
properties (201) (172) (188) (271) (407) (433) (470) (638) (839) (1,041) (1,296)
Stamp duty (124) (122) (140) (151) (169) (184) (210) (267) (391) (463) (500)Other () (1 ) (- (- (- (- (- (- () ()()
Royalties 398 411 433 445 798 740 833 1,397 2,297 3,180 3,926Other 369 362 416 468 1,582 445 547 400 436 567 789
Nontax Revenue 1,753 1,824 2,272 2,625 2,685 3,838 4,349 4,428 4,580 5,128 6,379Contribution of Bank of Thailand 300 450 435 450 523 997 1,230 900 722 1,000 1,200
Contribution of State Enterprises/c 313 338 387 442 439 839 868 698 637 758 1,040Other nontax revenue 1,140 1,036 1,450 1,733 1,723 2,002 2,251 2,830 3,221 3,370 4,139
of which: Extraordinary revenue (12) (9) (5) (3) (5) (19) (-519) (4) (-) (-) (-)
/a CollectiDns during the fiscal years ending September 30./b Prior to FY74 these taxes were collected by the Central Government, with part of the proceds earrarked for transfer to
local governments. In FY74 these taxes became a Local Government tax./c Excludes the negative net contribution of public utilities. (Government expenditures on social services have been
increased correspondingly.)
Source: Bank of Thailand.
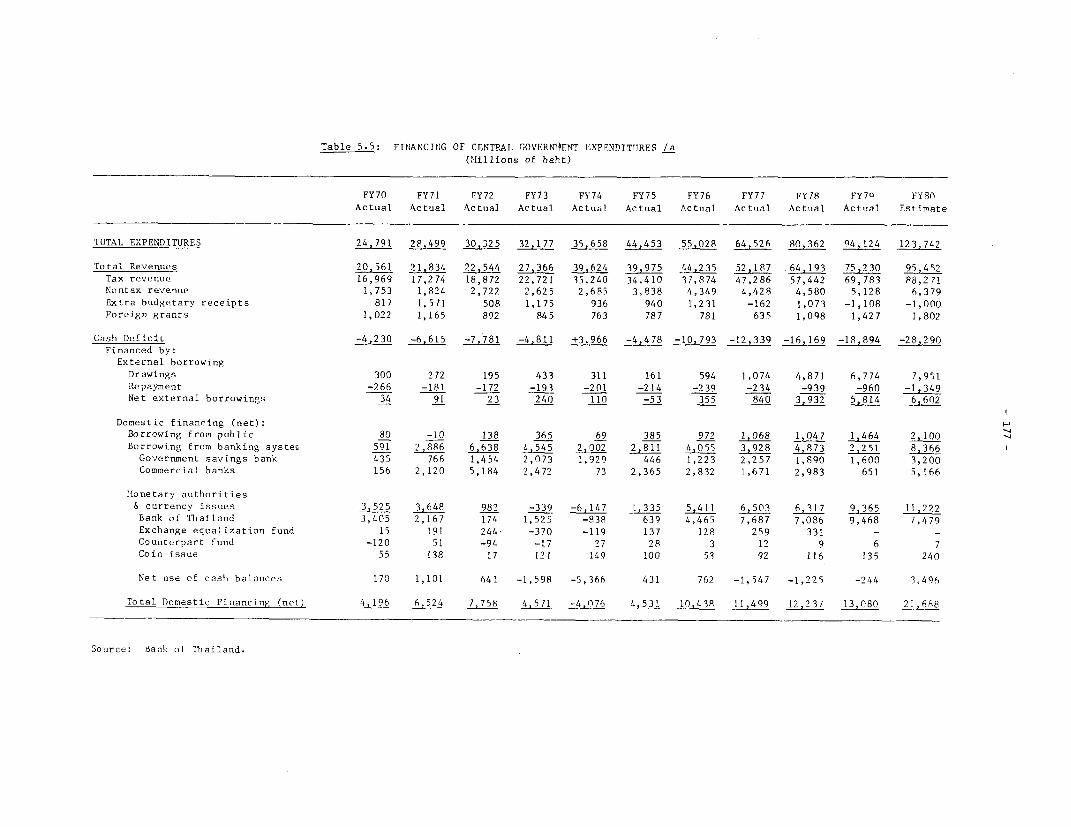
Table 5.5: FINANCING OF CENTRAL GOVERNIAENT EXPENDITTRRES /a(Millions of baht)
FY70 FY71 FY72 FY73 FY74 FY75 FY76 FY77 FY78 FY70
FY80
Actual Actual Actual Actual Actual Actual Actual Actual Actual Actu1al Fstimate
TOTAL EXPENDITURES 24.791 28.499 30,325 32,177 35,658 44,453 55,028 64,526 80,362 94,124 123,742
Total R.evenues ~21,834 22~._544 27,366 39,624 39,975 44,235 52,187 64,193 75,230 95,452
Tax revenue 16,969 17,274 18,872 22,721 35,240 34,410 37,874 47,286 57,442 69,783 88,271
Nontax revenue 1,753 1,824 2,722 2,625 2,685 3,838 4,349 4,428 4,580 5,128 6,379
Extra btudgetary receipts 817 1,571 508 1,175 936 940 1,231 -162 1,073 -1,108 -1,000
Foreign grants 1,022 1,165 892 845 763 787 781 635 1,098 1,427 1,802
Cash Deficit -4,230 -6,615 -7,781 -4,811 ±3966 -4,478 -10,793 -12,339 -16,169 -18,894 -28,290
Financed by:External borrowingDrawings 300 272 195 433 311 161 594 1,074 4,871 6,774 7,951
Repayment -266 -181 -172 -193 -201 -214 -239 -234 -939 -960 -1,349
Net external borrowings 34 91 23 240 110 -53 355 840 3932 5,814 6,602
Domestic financing (net):Borrowing from public 80 -10 138 365 69 385 972 1,068 1,047 1,464 2,100
Borrowing from banking systec 591 6,638 4,545 2,002 2,811 4,055 3,928 4,873 2,251 8366
Government savings bank 435 766 1,454 2,073 1,929 446 1,223 2,257 1,890 1,600 3,200
Commercial banks 156 2,120 5,184 2,472 73 2,365 2,832 1,671 2,983 651 5,166
Mlonetary authorities& currency issues 3,525 3,648 982 -339 -6,147 1,335 5,411 6,503 6,317 9,365 11,222
Bank of Thailand 3,405 2,167 174 1,52'5 -838 639 4,465 7,687 7,086 9,468 7,479
Exchange equalization fund 15 191 244 -370 -119 137 128 259 331 - -
Counterpart fund -120 51 -94 -17 27 28 3 12 9 6 7
Coin issue 55 138 17 121 149 100 53 92 116 135 240
Net use of cash balances 170 1,101 641 -1,598 -5,366 431 762 -1,547 -1,225 -244 3,496
Total Domestic Financing (net) 4,196 6,52 775 411,438 11,499 1, 13,080 21 688
Source: dank of Thailand.
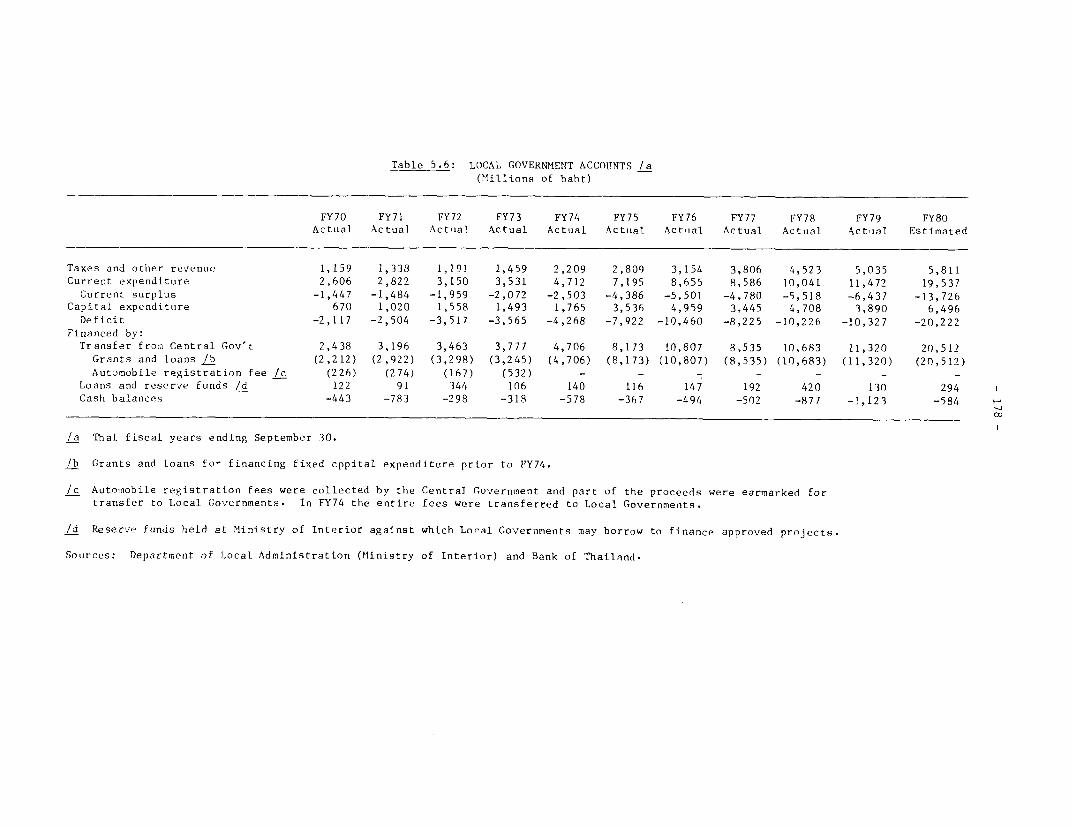
Table 5.6: LOCAL GOVERNMENT ACCOUNTS /a(Millions of baht)
FY70 FY71 FY72 FY73 FY74 FY75 FY76 FY77 FY78 FY79 FY80Actual Actual Actual Actual Actual Actual Actual Actual Actual ActIal Estimated
Taxes and other revenue 1,159 1,338 1,191 1,459 2,209 2,809 3,154 3,806 4,523 5,035 5,811
Current expenditure 2,606 2,822 3,150 3,531 4,712 7,195 8,655 8,586 10,041 11,472 19,537
Current surplus -1,447 -1,484 -1,959 -2,072 -2,503 -4,386 -5,501 -4,780 -5,518 -6,437 -13,726Capital expenditure 670 1,020 1,558 1,493 1,765 3,536 4,959 3,445 4,708 3,890 6,496
Deficit -2,117 -2,504 -3,517 -3,565 -4,268 -7,922 -10,460 -8,225 -10,226 -10,327 -20,222
Financed by:Transfer froma Central Gov't 2,438 3,196 3,463 3,777 4,706 8,173 10,807 8,535 10,683 11,320 20,512
Grants and loans |b (2,212) (2,922) (3,298) (3,245) (4,706) (8,173) (10,807) (8,535) (10,683) (11,320) (20,512)
Automobile registration fee /c (226) (274) (167) (532) - - - - - - -
Loans and reserve funds /d 122 91 344 106 140 116 147 192 420 130 294
Cash balances -443 -783 -298 -313 -578 -367 -494 -502 -877 -1,123 -584 e
cn
/a Thai fiscal years ending September 30.
/b Grants and loans fo- financing fixed cppital expenditure prior to FY74.
/c Automobile registration fees were collected by the Central Government and part of the proceeds were earmarked for
transfer to Local Governmaents. In FY74 the entire fees were transferred to Local Governments.
/d Reserve funds held at Ministry of Interior against which Local Governments may borrow to finance approved projects.
Sources: Department of Local Administration (Ministry of Interior) and Bank of Thailand.

- 179 -
Table 5.7: STATE ENTERPRISES GROSS FIXED CAPITAL EXPENDITURES AND THEIR FINANCING(Millions of baht)
FY70 FY71 FY72 1973 FY74 FY75 FY76 FY77 FY78 FY75 FYP(Actual Actual Actual Actual Actual Actual Actual Actual Actual Prellm. Estim.
Power 1,158 1,393 1.939 2,394 2.014 2,582 3.275 3,655 6.091 5,242 15,625Electricity Generating Authority /a 652 959 1,417 1,971 1,293 1,558 2,043 2,343 4,459 1,022 7,987Iletropolitan Electricity Authority 278 260 323 206 359 560 460 351 549 756 963Provincial Electricity Authority 159 113 158 158 333 400 719 902 1.051 1,319 2,742Petroleum Authority of Thailand /a 69 61 41 59 30 64 53 59 38 145 4,033
Transport and Communications 1,116 960 547 710 1.208 1,305 1.688 3.080 5,744 6,987 7984Airport Authority of Thailand /a - - - - - - - - - - 4.2Thai Airways International Co., Ltd. - - - - - - 423 1,400 3,318 3,835 3,061
Thai Airways Co., Ltd. 83 35 73 1 3 4 3 164 56 73 257State Railways of Thailand 276 251 129 202 471 418 225 182 111 630 651Expressway and Rapid Transit Authority - - - - - - 18 28 173 514 1,017Bangkok 11ass Transit Authority - - - - - - - 402 766 5 13Port Authority of Thailand 125 53 79 178 155 263 139 105 51 125 171telephone Organization of Thailand 306 479 200 231 493 546 800 723 t,162 1,421 1,931Communication Authority of Thailand /a 214 80 - - - - - 31 72 241 253
Ot her 112 62 66 98 86 74 80 45 35 143 218
lanufacturing 103 71 85 119 191 213 241 517 352 344 848Thai Tobacco MIonopoly 49 28 30 55 89 102 71 362 155 42 160Thai Plywood Co., Ltd. 8 7 9 19 6 7 12 18 24 53 136lining Organization - - - - - - 8 8 8 8 10Offshore liining Organization /a - - - 5- 128 236Industrial Estate Authority of Thailand - - - - 1 1 27 26 9 36 151Otrher 46 36 46 44 85 103 123 103 98 77 153
Agriculture 33 37 15 21 20 33 36 44 196 537 770Forest Industry Organization 20 17 10 10 7 7 20 15 87 141 315Cold Storage and Ice Factory - - - - - 10 5 7 13 223 191gubber Estate Organization - - - - - 4 4 8 86 30Other /b 13 20 5 11 13 16 7 18 88 87 234
Others 95 135 241 377 262 244 821 2,102 3,564 2,811 4.300National Housing Authority - - - - 64 93 281 1,016 1,112 1,406 1,644lletropolitan Uater Works Authority - 128 227 358 179 120 312 889 1,657 1,169 ?,001Provincial Waterworks Authority /a - - - - - - 195 146 703 94 334Other 95 7 14 19 19 31 33 51 92 141 321
Total 2,505 2,596 2,827 3,620 3,685 4,377 6.061 9,398 15,947 15,921 29,525
Financed by:Own resources 1,643 1,429 1,052 955 1,467 1,163 1,419 3,410 4,461 3,877 7,482Government grants and loans /c 539 746 449 473 430 408 1,799 709 1.968 1,663 4,383Domestic borrowing /d - 18 273 552 262 463 1,168 1,741 3.089 905 2,111
Government savings banks - - 8 139 - 11 - 104 8 - -
Commercial banks - - 30 110 223 445 1,148 1,423 2,269 282 1,789Other - 18 235 330 39 7 20 214 812 623 322
External grants and loans 323 385 780 1,061 1,264 1,880 507 3,538 6,429 9,476 15,549
/a Yanhee Electricity Authority, Northeast Electricity Authority were merged into the Electricity Authority of Thailand (ECAT) on Ifay 1,1969. Oil Fuel Organization and Natural Gas Organization merged to Petroleum Authority of Thailand on December 2n, 1978. Post andTelegraph had changed its name to be Communication Authority of Thailand on February 25, 1977. Provincial Waterwork Authoritywas established on December 24, 1979. Offshore Mining Organization was established on July 26, 1977.
/b Including expenditures on the Central Government's irrigation project administered by EGAT B 1n5 nillion, 146 million,703 million, 461 million and 157 million in FY 1976-80.
/c Including disbursement from Syndicated loan B 1,104 million, 136 million, 925 million, 562 million and 2,571 million inFY1976-80, of which the Government repaid B 195 million, 371 million, 793 million, 504 million an 1,131 million in FY1976-80.
/d Bonds issued by EGAT for B 50 million in FY1972, B 234 million in FY1973, B241 million in FY1974, B 262 million in FY1975 andB 140 million in FY1976, and by National Housing Authority for B 500 millionin FY1976 and B 500 million in FY1977 and byTelephone Organization of Thailand for B 18 million in FY1976, B 214 million in FY1977, B 216 in FY1978 B0.013 million in FY1979and B 500 million in FY1980.
Source: Bank of Thailand.

Table 5.8: CENTRAL GOVERNMENT RECEIPTS, BUDGET FY 1977-80(Millions of baht)
/c % /c % /c X1977 % 1978 % Change 1979 % Change 1980 % Change
Income 50,372 73 62,000 77 23 72,000 78 16 88,000 81 22
Taxes and duties 43,002 63 54,352 67 27 62,959 68 16 78,878 72 25
Sales of goods & services 1,618 2 1,600 2 -1 2,382 3 49 2,230 2 6
Income from state enterprises /a 3,766 6 3,338 4 -11 3,635 4 9 4,102 4 13
Loans 13,730 20 16,800 21 22 16,700 18 -1 17,500 16 5
Bank of Thailand 7,730 11 8,600 11 11 7,600 8 -12 8,000 7 5
Government Savings Bank 1,700 3 2,400 3 41 2,500 3 4 3,200 3 28Commercial banks, foundations, H
companies, private institutions 4,300 6 5,800 7 35 6,600 7 14 6,300 6 4 X
Treasury Reserves /b 4,590 7 2,200 3 -52 3,300 4 50 3,500 3 6
Total 68.692 100 81,000 100 18 92,000 100 14 109,000 100 18
/a Before netting subsidies to state enterprises budgeted for B 1,020 million in FY77 and 1,093 million in FY78.
/b In 1977 the amounts budgeted were B 2,590 reduction in cash balances and expenditure shortfall of B 2,000.
/c Based on budget estimates.
Source: Bureau of the Budget.

- 181 -
Table 5.9: FUNCTIONAL CLASSIFICATION OF CENTRAL GOVERNMENTEXPENDITURE BUDGET, FY79/80
(Millions of baht)
FY79 FY80Functional classification Capital Current Total Capital Current Total
Economic services 11,903 6,021 17,924 15,773 7,051 22,824
Education 5,340 12,459 17,799 6,779 15,804 22,583
Public health 894 2,986 3,880 1,037 3,503 4,540
Social security and welfare 1,441 4,596 6,037 2,244 5,439 7,683
Defense - 19,001 19,001 - 22,350 22,350
Internal security 647 4,381 5,028 751 5,295 6,046
General administration 405 2,530 2,935 524 2,966 3,490
Debt services - 10,033 10,033 - 12,393 12,393
Miscellaneous 900 8,463 9,363 900 6,191 7,091
Total 21,530 704470 92,000 28.008 80,992 109,000
Source: Bureau of the Budget.
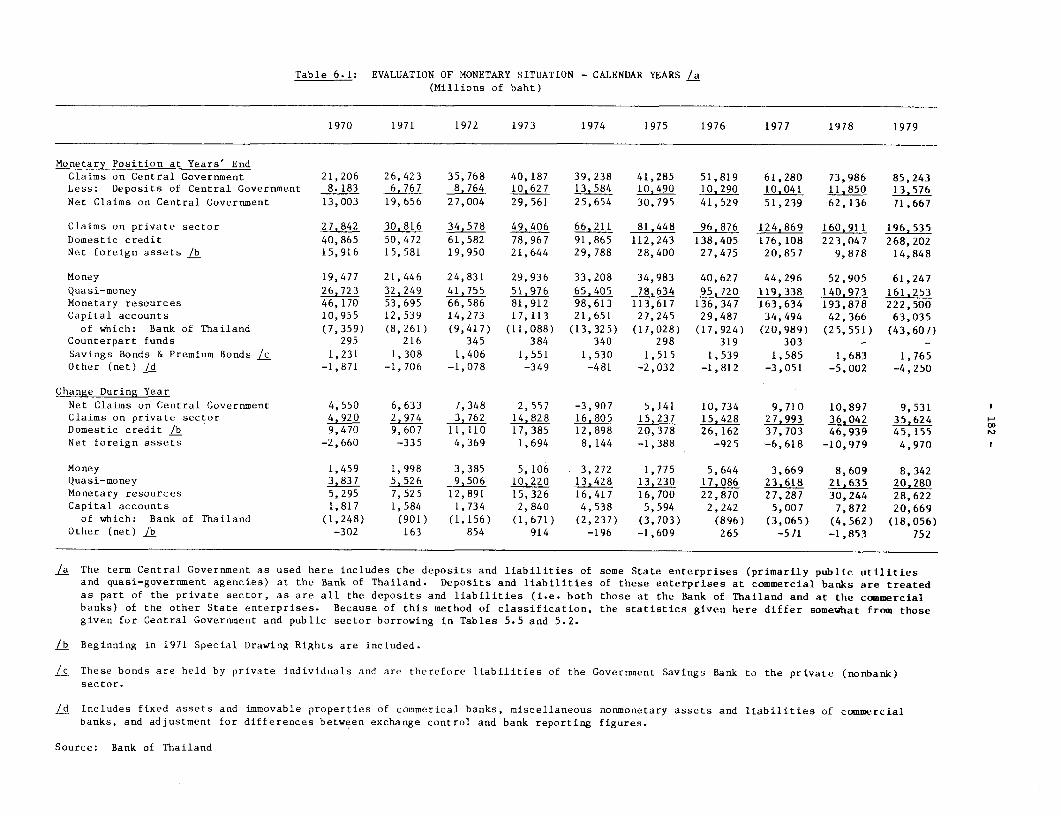
Table 6.1: EVALUATION OF MONETARY SITUATION - CALENDAR YEARS /a(Millions of baht)
1970 1971 1972 1973 1974 1975 1976 1977 1978 1979
Monetary Position at Years' EndClaims on Central Government 21,206 26,423 35,768 40,187 39,238 41,285 51,819 61,280 73,986 85,243Less: Deposits of Central Government 8.183 6,767 8,764 10,627 13,584 10,490 10.,290 10,041 11,850 13,576Net Claims on Central Government 13,003 19,656 27,004 29,561 25,654 30,795 41,529 51,239 62,136 71,667
Claims on private sector 27,842 30.816 34,578 49,406 66,211 81,448 96,876 124,869 160,911 196,535Domestic credit 40,865 50,472 61,582 78,967 91,865 112,243 138,405 176,108 223,047 268,202Net foreign assets /b 15,916 15,581 19,950 21,644 29,788 28,400 27,475 20,857 9,878 14,848
Money 19,477 21,446 24,831 29,936 33,208 34,983 40,627 44,296 52,905 61,247Quasi-money 26.723 32,249 41,755 51,976 65,405 78,634 95,720 119,338 140,973 161,253Monetary resources 46,170 53,695 66,586 81,912 98,613 113,617 136,347 163,634 193,878 222,500Capital accounts 10,955 12,539 14,273 17,113 21,651 27,245 29,487 34,494 42,366 63,035
of which: Bank of Thailand (7,359) (8,261) (9,417) (11,088) (13,325) (17,028) (17,924) (20,989) (25,551) (43,607)Counterpart funds 295 216 345 384 340 298 319 303 - -Savings Bonds & Premium Bonds /c 1,231 1,308 1,406 1,551 1,530 1,515 1,539 1,585 1,683 1,765Other (net) /d -1,871 -1,706 -1,078 -349 -481 -2,032 -1,812 -3,051 -5,002 -4,250
Change During YearNet Claims on Central Government 4,550 6,633 7,348 2,557 -3,907 5,141 10,734 9,710 10,897 9,531 1Claims on private sector 4,920 2,974 3,762 14,828 16,805 15,237 15,428 27,993 36,042 35,624Domestic credit /b 9,470 9,607 11,110 17,385 12,898 20,378 26,162 37,703 46,939 45,155Net foreign assets -2,660 -335 4,369 1,694 8,144 -1,388 -925 -6,618 -10,979 4,970 1
Money 1,459 1,998 3,385 5,106 3,272 1,775 5,644 3,669 8,609 8,342Quasi-money 3,837 5,526 9,506 10,220 13,428 13,230 17,086 23,618 21,635 20.280Monetary resources 5,295 7,525 12,891 15,326 16,417 16,700 22,870 27,287 30,244 28,622Capital accounts 1,817 1,584 1,734 2,840 4,538 5,594 2,242 5,007 7,872 20,669of which: Bank of Thailand (1,248) (901) (1,156) (1,671) (2,237) (3,703) (896) (3,065) (4,562) (18,056)
Other (net) lb -302 163 854 914 -196 -1,609 265 -571 -1,853 752
/a The term Central Government as used here includes the deposits and liabilities of some State enterprises (primarily public utilitiesand quasi-government agencies) at the Bank of Thailand. Deposits and liabilities of these enterprises at commercial banks are treatedas part of the private sector, as are all the deposits and liabilities (i.e. both those at the Bank of Thailand and at the commercialbanks) of the other State enterprises. Because of this method of classification, the statistics given here differ somewhat from thosegiven for Central Government and public sector borrowing in Tables 5.5 and 5.2.
/b Beginning in 1971 Special Drawing Rights are included.
/c These bonds are held by private individuals and are therefore liabilities of the Government Savings Bank to the private (nonbank)sector.
/d Includes fixed assets and immovable properties of commerical banks, miscellaneous nonmonetary assets and liabilities of commercialbanks, and adjustment for differences between exchange control and bank reporting figures.
Source: Bank of Thailand
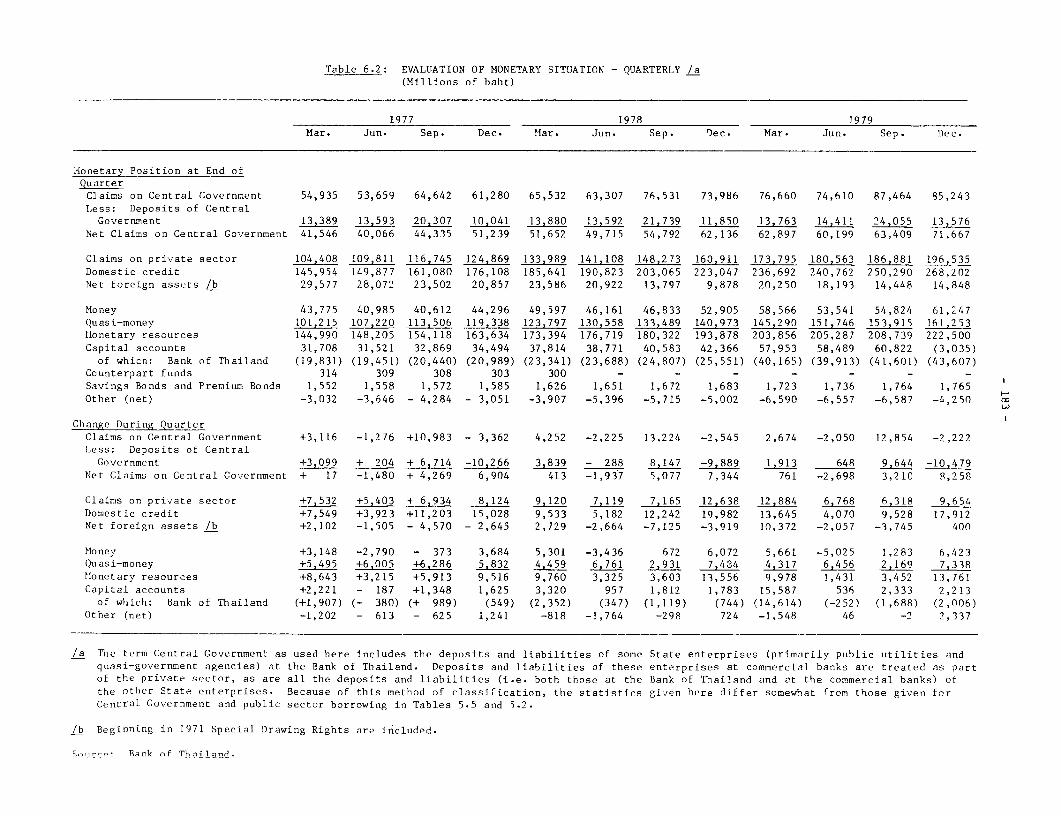
Table 6.2: EVALUATION OF MONETARY SITUATION - QUARTERLY /a(Millions of baht)
1977 1978 1979Mar. Jun. Sep. Dec. Mar. Jun. Sep. Dec. Mar. Jun. Sep. Dec.
Monetary Position at End of
QuarterClaims on Central Government 54,935 53,659 64,642 61,280 65,532 63,307 76,531 73,986 76,660 74,610 87,464 85,243Less: Deposits of CentralGovernment 13,389 13,593 20,307 10,041 13,880 13,592 21,739 11,850 13,763 14,411 24,055 13,576
Net Claims on Central Government 41,546 40,066 44,335 51,239 51,652 49,715 54,792 62,136 62,897 60,199 63,409 71,667
Claims on private sector 104,408 109,811 116,745 124,869 133,989 141,108 148,273 160,911 173,795 180,563 186,881 196,535Domestic credit 145,954 149,877 161,080 176,108 185,641 190,823 203,065 223,047 236,692 240,762 250,290 268,202Net foreign assets /b 29,577 28,072 23,502 20,857 23,586 20,922 13,797 9,878 20,250 18,193 14,448 14,848
Money 43,775 40,985 40,612 44,296 49,597 46,161 46,833 52,905 58,566 53,541 54,824 61,247Quasi-money 101,215 107,220 113,506 119,338 123,797 130,558 133,489 140,973 145,290 151,746 153,915 161,253l1onetary resources 144,990 148,205 154,118 163,634 173,394 176,719 180,322 193,878 203,856 205,287 208,739 222,500Capital accounts 31,708 31,521 32,869 34,494 37,814 38,771 40,583 42,366 57,953 58,489 60,822 (3,035)of which: Bank of Thailand (19,831) (19,451) (20,440) (20,989) (23,341) (23,688) (24,807) (25,551) (40,165) (39,913) (41,601) (43,607)
Counterpart funds 314 309 308 303 300 - - - - - - -
Savings Bonds and Premium Bonds 1,552 1,558 1,572 1,585 1,626 1,651 1,672 1,683 1,723 1,736 1,764 1,765Other (net) -3,032 -3,646 - 4,284 - 3,051 -3,907 -5,396 -5,715 -5,002 -6,590 -6,557 -6,587 -4,250 m
Change During QuarterClaims on Central Government +3,116 -1,276 +10,983 - 3,362 4,252 -2,225 13,224 -2,545 2,674 -2,050 12,854 -2,222Less: Deposits of CentralGovernment +-3,099 + 204 + 6,714 -10,266 3,839 - 288 8,147 -9,889 1,913 648 9,644 -10,479
Net Claims on Central Government + 17 -1,480 + 4,269 6,904 413 -1,937 5,077 7,344 761 -2,698 3,210 8,258
Claims on private sector +7,532 +5,403 + 6,934 8,124 9,120 7,119 7,165 12,638 12,884 6,768 6,318 9,654Domestic credit +7,549 +3,923 +11,203 15,028 9,533 5,182 12,242 19,982 13,645 4,070 9,528 17,912Net foreign assets /b +2,102 -1,505 - 4,570 - 2,645 2,729 -2,664 -7,125 -3,919 10,372 -2,057 -3,745 400
Money +3,148 -2,790 - 373 3,684 5,301 -3,436 672 6,072 5,661 -5,025 1,283 6,423Quasi-money +5,495 +6,005 +6,286 5,832 4,459 6,761 2,931 7,484 4,317 6,456 2,169 7,338Ilonetary resources +8,643 +3,215 +5,913 9,516 9,760 3,325 3,603 13,556 9,978 1,431 3,452 13,761Capital accounts +2,221 - 187 +1,348 1,625 3,320 957 1,812 1,783 15,587 536 2,333 2,213of which: Bank of Thailand (+1,907) (- 380) (+ 989) (549) (2,352) (347) (1,119) (744) (14,614) (-252) (1,688) (2,006)
Other (net) -1,202 - 613 - 625 1,241 -818 -1,764 -298 724 -1,548 46 -2 2,337
/a The term Central Government as used here includes the deposits and liabilities of some State enterprises (primarily public utilities andquasi-government agencies) at the Bank of Thailand. Deposits and liabilities of these enterprises at commercial banks are treated as partof the private sector, as are all the deposits and liabilities (i.e. both those at the Bank of Thailand and at the commercial banks) ofthe other State enterprises. Because of this method of classification, the statistics gi-ven here differ somewhat from those given forCentral Government and public sector borrowing in Tables 5.5 and 5.2.
/b Beginning in 1971 Special Drawing Rights are included.
Sot1rce: Bank nf Thailand.

Table 6.3: FSF1Fr-FFD DACA oP C010F PCS8I RA8VP(Ifi1 lions of haht)
1970 1971 1972 1973 1974 1975 1976 1977 197R 1979
Dec. De. De Doc. Dec. nec. Sec. "at. JIn. Se Ma. ToJ. Sep. lec. Mar. Jun. Sep. Dec.
Total assets - total liabilities 41,187 48,8334 60, 06 78,363 9,7752 117,879 139,631 140,783 159,056 161,285 173.277 196,170 104,Q20 7n2,263 218,241 725,19 712,2325 243,239 252,731
Total deposits /a 31,P85 37,759 47,746 58,372 73.484 P6,55o 106,41P 11 I.977 IP,772 124,364 131,.PO IR,649 141,8l9 149,119 19S8,24 163,732 166,755 166,880 175,625
Time deposits 2, 931 25,771 33,293 3l,741 57,n63 63,R93 70,01,4 83,034 on,073 95,96P 9on,72 103,974 10P,7n3 I11,85n 117,77S 119,782 123,557 174,019 129,364
As perceot of total deposits 65. 0 62.3 69.7 69.8 70.S 73.P 73.n 75.P 79.8 77.? 79.7 74.7 75.1 76.1 74.3 73.7 74.1 74.9 73.7
.orro ..- og froe BOT 797 1,296 1,26.1 2,882 3,985 7,297 5,53n 6,771 6,61, 5,311 5,052 7,665 7,4RO 6,638 R,141 12,744 9,P75 9,875 16,733
As percent of total liobiities 1.9 2.7 2.1 3.7 4.n 6.7 4.9 4.6 4.3 3.3 3.4 4.1 3.8 3.3 3.7 5.4 4.2 4.1 6.6
iorow-ing froe abroad 3,053 3,284 3,486 6,R0n 7,574 8,057 9,205 In,40 In,636 11,475 IA,703 16,003 19,061 21,101 ?4,n05 27,209 34,764 35,675 35,422
As perceot of total liabilities 7.4 67 5.8 P.S 7.7 7.4 6.9 7.1 6.- 7.1 8.5 P., 9.0 I.4 11.7 12.1 15.8 14.7 14.0
Cash and balancea ,,ith POT 2,466 2.9P6 3,456 3,682 5,314 6,953 6,377 6,822 6,897 6,796 7,097 7,294 -,134 7,559 P,594 7,972 7,900 7,377 7,894
As perce-t of total deposits 7.7 7.9 7.2 6.3 7.2 7.6 6.0 5.P 5.8 5.1 5.4 5.3 5.6 5.1 5.4 4.9 4.7 4.4 4.5
Covernsent secrities 5,897 8,261 13,792 14,897 15,772 17,581 28,911 71,573 22,133 22,311 7?,263 24,919 23,776 25,324 24,439 25,854 74,476 22,769 23,862
As percent of total deposits 13.5 21.9 28.9 25.5 21.5 21.3 15.7 15.0 IR.6 17.9 17.0 18P. 16.4 17.0 15.4 15.8 14.7 13.6 13.6
Liquid assets /b 7,732 11,228 17,810 1 7,90 18,828 21,45 20, 662 31,3S 72,091 11,672 32,344 15,059 35,913 35,310 36,283 39,62n 39,415 37,388 38,877
As percent of total deposits 24.2 29.7 37.3 30.6 24.5 24.8 26.9 27.3 26.2 25.4 24.A 79.3 24.8 23.7 22.9 21.8 23.8 22.4 22.1
Loans, overdrafts and disco-nts 28,039 31,564 35,653 51,184 55,065 P1,302 95,145 177,744 107,17c 113,068 1'1,769 131,037 137,402 144,359 158,600 171,087 177,972 184,144 195,072
As percent of total deposits 87.9 83.6 74.7 87.7 92.n 93.9 89.4 90.5 Q0.2 93.8 972. 94.5 94.0 96.8 100.0 I04.5 106.7 110.3 111.1
Capital accounts 3,065 3,602 4,082 5,096 7,195 8,917 I1,094 In,434 10,672 I1,09? 12,n53 12,847 13,445 14,157 14,9P9 15,954 16,724 17,346 18,125
As percent of risk assets In.5 I1.0 11.5 In.S 18.0 11.3 11.7 1n.9 I0.6 10.4 10.7 In.8 In.7 10.7 10.4 10.5 10.6 10.7 10.7
/a Excludes inter-hak deposits
/b Comprises rash in hand, balasce at BO-, halances at other sonco-ercial ban9s in ¶heiland, halseres at ,anb, abroad, p-ld and soonroenot sectirfties other
than those pledged or deposited as guarsntee with the Bank of Thailand.
Source- i3ank of Thailand
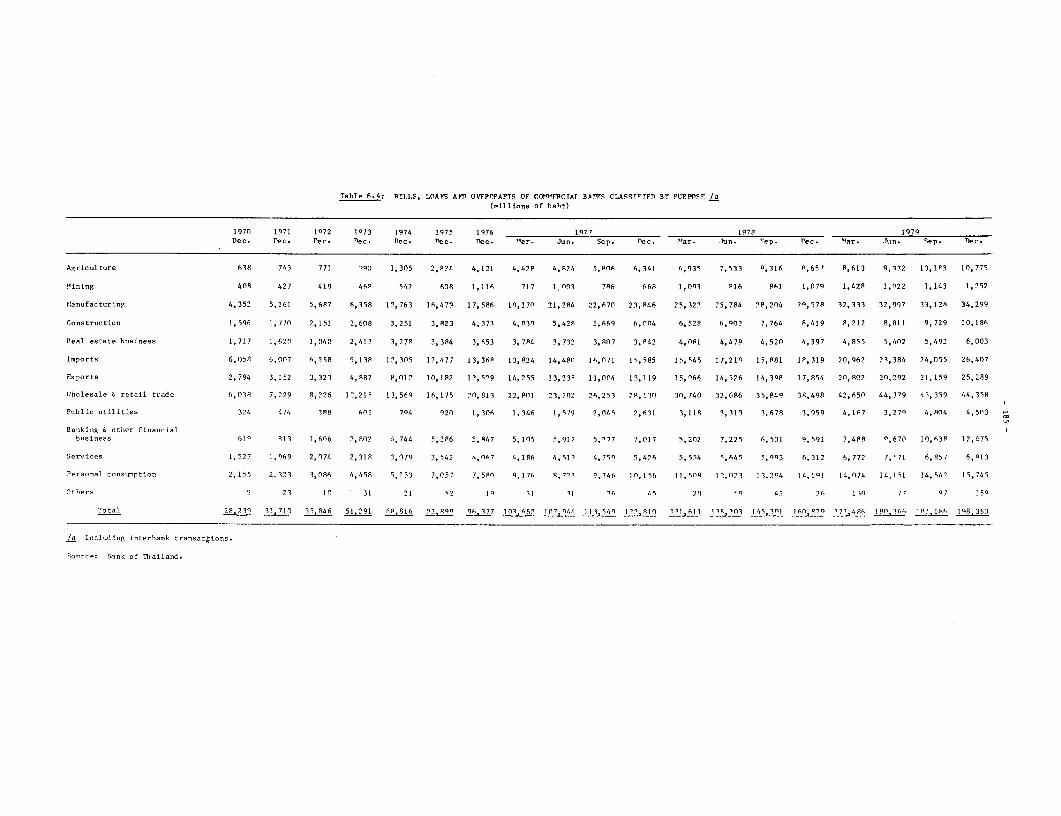
Table 6.4: RILLS, LOAMS A1D OVFPOPAFTS OF COI'?D8D,SIAT BAISS CLASST'TFD BY PUSPPnSF /a
(ri]linns of baht)
1970 1971 172 I173 1974 1975 1976 197' 1978 1979DDec. ec. DDec. ec. Dec. nec. Dec. 'far. Jun. Sep. Dec. bar. Jun. Pep. Dec. Mar. Jun. Sep. T)ec.
Agriculture 638 743 771 ng0 1,305 2,P?4 4,121 4,478 4,8?4 5,8n6 6,341 6,931 7,533 P,116 P,657 P,613 9,112 10,IP3 10,775
Mining 408 427 419 465P 547 608 1,116 717 nO3 786 668 1,0q8 816 861 1,079 1,428 1,022 1,143 1,252
Manufacturing 4,352 5,161 5.687 8,358 12,763 16,479 17, 586 1), 170 21,784 .'2,670 23,R46 25,32' 25,784 2P,204 2°,578 12,333 32,997 33,12A 34.299
Construction 1,596 1,770 2,151 2,608 3,251 3,R23 4,371 4,833 5,428 5,669 6,0n4 6,5?8 6,903 7,764 8, 419 8,212 8,811 9,729 10,186
Real estate business 1,717 1,620 1,548 2,412 3,27R 3,384 3,653 3,784 3,732 3,S07 3,942 4,081 4,47n 4,520 4,397 4,855 5,402 5,492 6,003
Inports 6,050 6,007 6,358 9,138 12,305 17,477 13,368 13,834 14,480 16,071 15,585 15,545 17,21n 15,881 IP,319 20,962 23,384 24,055 26,407
Exports 2,794 3,152 3,323 4,887 8,0l2 10,182 12,579 14,255 13,239 11,004 13,l19 15,n66 14,526 14,308 17,854 2n, 802 2n,292 21,159 25,289
lUholesale 6 retail trade 6,038 7,229 8,226 12,219 13,569 16,175 2n,813 22,801 23,??02 26,253 28,'30 3n,740 32,686 35,840 38,498 42,650 44,379 45,359 44,398
Public utilities 324 474 1R8 605 704 920 1,306 1,346 1,579 2,045 2,631 3,118 3,313 3,678 3,959 4,167 3,279 4,804 4,503
Banking 6 other financialbu1siness 61 8013 1,606 2,R.02 6,744 5,3'6 5,R47 5,105 5,917 5,'77 7,017 5,2n2 7,225 4,501 9,591 7,488 n,677, 10,63P 12,475
Services 1,527 1,969 2,074 2,319 3,079 3,542 4,067 4,186 4,913 4,799 5,476 5,554 ;,640 5,003 6,312 6,772 7,971 6,857 6,-13
Pecronal consunption 2,155 2,373 3,066 4,458 5,153 7,057 7,5Pn q,176 8,777 9,346 In,156 11,90R !',?073 31,24 14,191 14,071 14,91I 14,567 15,745
Others 9 23 In 31 21 92 Iq 11 11 'A 695 ?09 9 47 ?76 13 77 °7 159
Total 28,219 31,71n 39, R46 51,291 6R.816 R12.Rqo 96.377 UIn, 562 ln7,n4lh I I I _4 121,Rl( 1R11611 IIP,?Ol 145,101l 6n,P79 177,4R6 I Sn, 3 6i IP7, 186 19R,363
/a Including interbank trsnsac4ions.
Soecre: Bank of Thailand.
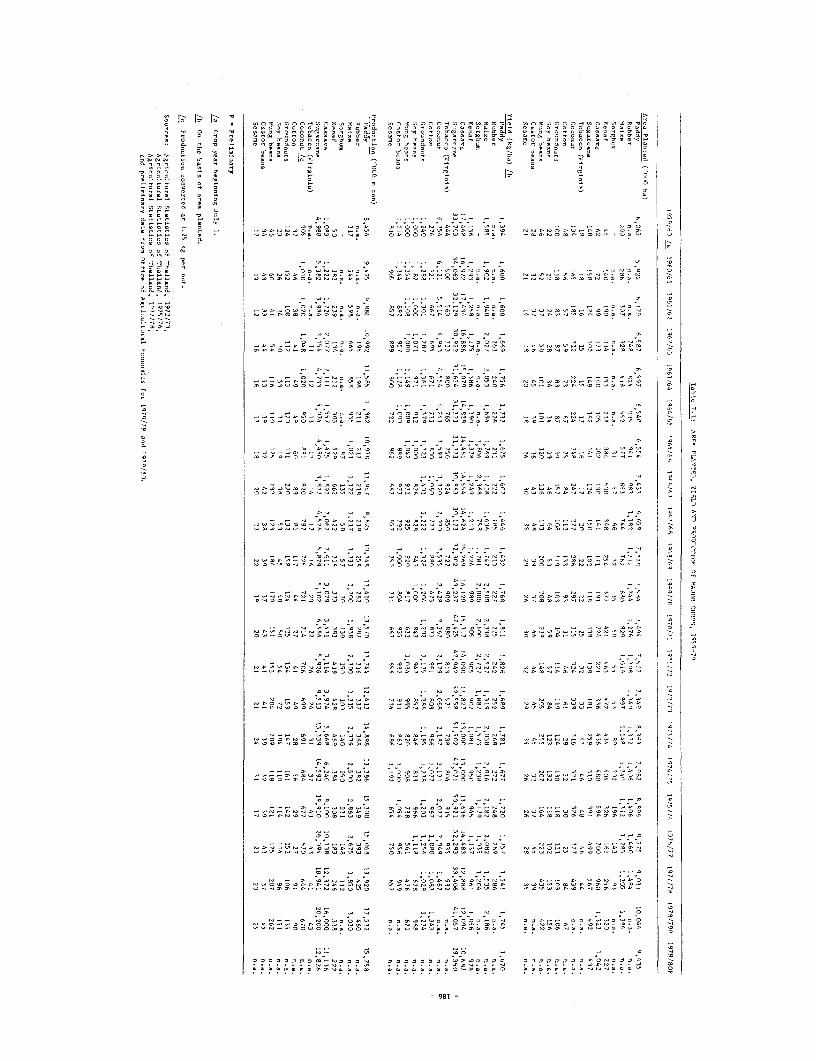
1Ž -<0 N 000 OOOOn 010000000 0,0700 OOln.-00001000 00000 -. on0.o000.0o0�0,"b0 0'010'1 0000000000000000. 0000000000000000.-' 0000000000000000000000000000000000000.0 0000 o00000000000'0- 0000 00000 0000>0.0
0 0 0 00 0'000000000'00'00 00 >000000>00.00.- 00 0000000.0000-0-- 0 - 00000.0000 0�00. 00000.0000< 0 0 0.0000.0000< 0 0
0 0� - 000 000 000 00 000 0000 00>>> 0 0 - 0000 100.000 0000 000 0- 0000 000ogOoOo - 0 0 0 00 0 00 00 0 '0 0 00 0
0000 0 0 0 - 0 - I> -0000000 0 00 0 0 000 - 0 > 0' 0
-0000 0. I -
00000'- 0 -< - - - - - 0
0000 0 - 000000000000.00000 -. 00.,000.0000'000 000000000000,-03.0 '0-> 0000000 00 0 0000>00.00000.0001 -. 000 00000>0.0.000>000> 00000000000000010000 0
0.0.0.0 0 - 0.. .0 �0000�00 >00>000000 0 '0'0>0>0 - - - - . 0'00000 - 00000.-.o0 00 0000-000000000000000' .'0000000000 0 100000000 0 0000>0000000.00000.00.00 0000000000>000' 0' 0000000000>000000.0.00
0000-000 0000.00000.00000. .0' 000000000>0000.0..00000000000000000 00 0. 00 '00
0'-000". . . . . . 00
00c-z-t00-'0 0000�00» 000000000000000000. 0000 00
-'0 >00>000,- 0.-.0'00000000 0000000000000>0000000 0>000000000000000000000 0-
000000000000.0000 00-..0000000000000000 00 000000000000 -0000000000000000000. 000 00000>>0000�00 00.00000000000000000000000.0000.0 '0000>0000000000000 000 0000000000000>000> 00,�0000000000 0000 0' 00
000000000 0000 000000000000000>0000 00 0000000000000 00
00000000000000000000000000-000000000>00 000000000000000000000000 0 -.
00.00 00 0 000000 0 000000-000 00 0 0 000000000.00000 00000000000000000000> 00 00 "00> -000 0
>0000000>0000>000>00000 00000000000000000000000
000000000000000000000000 '0000000000000>000000000 00000000000000000>0000 '00 0
00 oo 0000000>000000 ..
0000000000000000000000000000000000000000 00000000000 >00000000000000000000000000000000000000000000000000>000 00000.00-00000000000000000.000000000,00000.00000 0000000000000>0000000000000000000000
000000000000>00000000070 00000000000000000000000 0> oo00�0-0000-00>
0000000000.000000>000000000000000000> .,,...0 000000 000
0000>00000.00000000000000000000000000> 0000000000 00
000.00000.0000000000000o000000000000000000 000000.>000000000
00-00 >0>0.00000>00000000000000000000000000.000000000>0.0>0 00>000000>000000000>000000000000000.000000000> '000000000000000000000000>000>0>000000000000 000 ooooOo>oo>oooo.0 00
000000 >00000000000 00000000000000000000> 000000 0000000000 0000000>000,00000000 00000000000000000000 ,000000000000000000 '00000000000000000000000000>00000000000000.00>0000 >00000000000>000.00-0>00 00
000000 0 0000000000 >0000000000>000000000 0000 0000000000 00000000000000000000000000000000000000000000000>0000 00000>000000>>>>
000000>0000000>00 00000000000000000000000 00,-'.-.0 00000000000'00000,0000000000000000>000000000000000000000000000000000000>0000000000000000.0000000 0>0000>0000000000000 000000000000>00000000
00 00 0' 000000000 >000>000.0000000000000 0000000.0000 000'000000000000.0000000000000.0000000>0000> 00000. 000000000.00>0-0000000000>000.000000>00000000>00.000000000000.0000 000000000.000>0000000
000000 > 00000000000>000000000000000000.0000000000000
0000000000000000000 000000000000000>00 0000>>00000000000
000000000000000000 000000000>0000> 000000000000 00000000. . 00000. . 0>00.000000000>0000000 0000000000000000 00000000000000000
- gal -

Table 7.2: PROPORTION OF PLANTED AREA IN MAJOR CROPS(in percentages)
1965/66 1966/67 1967/68 1968/69 1969/70 1970/71 1971/72 1972/73 1973/74 1974/75 1975/76 1976/77 1977/78
Paddy 70.0 69.7 66.2 67.4 68.6 66.4 65.3 63.1 64.0 61.5 63.6 62.4 60.5Rubber 10.0 9.2 11.8 11.3 11.2 11.3 11.4 11.5 10.5 10.8 10.1 10.6 9.9Maize 6.1 6.1 6.7 6.3 6.2 7.4 8.8 8.6 8.8 9.6 9.4 9.4 8.1Kenaf 4.1 5.0 3.5 2.4 3.4 3.7 4.0 4.1 3.3 3.1 2.3 1.2 1.7Cassava 1.1 1.2 1.4 1.6 1.7 2.0 1.9 2.9 3.3 3.7 4.3 5.1 6.4Sugarcane 1.5 1.2 1.5 1,7 1.1 1.2 1.2 1.6 2.0 2.4 2.8 3.6 3.8Coconut 2.6 2.3 2.7 2.7 2.7 2.8 2.8 2.9 2.4 2.5 2.3 2.4 2.9Other major crops 4.6 5.3 6.2 6.6 5.1 5.2 4.6 5.3 5.7 6.4 5.2 5.3 6.7 l
Total 100.0 100.0 100.0 100.0 100.0 100.0 100.0 100.0 100.0 100.0 100.0 100.0 100.0
Source: Table 7.1.

Table 7.3: PADDY AND RICE SUPPLY AND UTILIZATION. 1967-S0BY GLUTINOUS AND NONGLUTINOUS VARIETIES
(Million metric tons)
Apparent domestic rice
Milled Stock Exports /d Seed-feed-loss Popul. Rice available for utilization for food +
Crop Paddy Production rice equivalent lb change/c milled rice (15% milled product) mid-year/e food & industry use industry (kilos per
year /a Total Ng. GI. Total Ng. Gl. Total Total Ng. GI. Total Ng. GI. millions Total Ng. Gi. capita) Ng. + G1.
1967/68 9,625 6.80 2.80 6.25 4.05 2.20 -0.10 1.10 1.00 0.10 0.95 0.60 0.35 34.0 4.10 2.35 1.75 120
1968/69 10,430 6.85 3.55 6.80 4.45 2.35 -0.25 1.05 0.95 0.10 1.00 0.65 0.35 35.1 4.50 2.60 1.90 128
1969/70 13,410 8.60 4.85 8.70 5.60 3.10 -0.35 1.10 1.00 0.10 1.30 0.85 0.45 36.4 5.95 3.40 2.55 163
1970/71 13,570 8.40 5.15 8.80 5.45 3.35 +0.30 1.60 1.45 0.15 1.30 0.80 0.50 37.5 6.20 3.50 2.70 165
1971/72 13.744 8.90 4.85 8.95 5.80 3.15 +0.25 2.15 1.95 0.20 1.35 0.85 0.50 38.5 5.70 3.25 2.45 148 1
1972/73 12,413 8.35 4.05 8.05 5.40 2.65 +0.50 0.90 0.80 0.10 1.20 0.80 0.40 39.7 6.45 4.30 2.15 162
1973/74 14,898 10.10 4.80 9.70 6.55 3.15 -0.60 1.05 0.95 0.10 1.45 1.00 0.45 40.8 6.60 4.00 2.60 162 m
1974/75 13,386 9.00 4.40 8.70 5.85 2.85 -0.15 1.00 0.90 0.10 1.30 0.90 0.40 41.9 6.25 3.90 2.35 149
1975/76 15,300 10.10 5.20 9.95 6.55 3.40 +0.35 2.10 1.90 0.20 1.50 1.00 0.50 43.0 6.70 4.00 2.70 156
1976/77 15,070 10.30 4.80 9.80 6.70 3.10 +0.10 3.00 2.80 0.20 1.45 1.00 0.45 44.0 5.45 3.00 2.45 124
1977/78 14,010 10.10 3.90 9.10 6.55 2.55 - 1.60 1.45 0.15 1.35 1.00 0.35 45.1 6.15 4.10 2.05 136
1978/79 17,470 11.85 5.60 11.35 7.70 3.65 -0.10 3.00 2.80 0.20 1.70 1.15 0.55 46.1 6.55 3.65 2.90 142
/a Crop year begins July and ends June 30./b Paddy converted to rice at 0.65 x paddy production.
/c A minus change means a stock build-up during the CY; a plus change means a stock drawclown of nonglutinous rice only.
/d Exports are for calendar year; i.e., 1967/68 - 1968 CY exports; Glut. rice normally is less than 10% of total exports.
/e National Economic and Social Development Board.
Source: Ministry of Agriculture, Projects Division.

- 189 -
Table 7.4: RICE EXPORT PREMIUM(Baht per metric ton)
Mar 22, 1974 Jun 26, 1974 Oct 30, 1974 Dec 25, 1974 Jun 03, 1975 Dec 04, 1975 Jan 22, 1976 Dec 16, 1977to to to to to to to to
Jun 25, 1974 Oct 29, 1974 Dec 22, 1974 Jun 02, 1975 Dec 03, 1975 Jan 21, 1976 Dec 15, 1977 date
White rice 100% 5,100 4,500 3,750 2,100 1,700 1,000 700 900White rice 5% 5,100 4,500 3,750 2,100 1,700 800 700 900White rice 10% 4,600 4,000 3,250 1,700 1,300 700 500 700White rice 15% 4,600 4,000 3,250 1,700 1,300 700 500 700White rice 20% 4,600 4,000 3,250 1,700 1,300 700 500 700White rice, lower than 20% 4,100 3,500 2,750 1,300 .900 500 400 700White broken rice, Al
super spezial 3,400 2,800 2,050 900 500 500 400 600White broken rice, Al super
and special 2,350 2,000 1,250 600 200 200 200 500White broken rice, Al
ordinary 2,350 2,000 1,250 600 200 200 200 500White broken rice, Cl super,
special & ordinary 2,050 1,700 1,000 500 100 100 100 500White broken rice, C3 2,050 1,700 1,000 500 100 100 100 500White broken rice, others - - - - - - - -Glutinous rice, long grain 10% 4,100 3,500 3,000 1,600 1,200 700 400 900Glutinous rice, long grain 15% - - - - - - - 900Glutinous rice, short grain 10% 4,100 3,500 3,000 1,600 1,200 700 400 900Broken glutinous rice,
Al special 2,550 2,200 1,700 750 350 200 200 900Broken glutinous rice,Cl special 2,550 2,200 1,700 750 350 200 200 900
Cargo rice, 100% 4,100 3,500 2,750 1,300 900 700 450 700Cargo rice, 5% 4,100 3,500 2,750 1,300 900 700 450 700Cargo rice, 10%, 15% and 25% 3,800 3,200 2,450 1,100 250 500 400 700Cargo rice, lower than 20% - - - - - - - 700Broken cargo rice of all grades 2,050 1,700 1,000 500 100 100 100 500Parboiled rice, 100% & 5% 3,600 3,000 2,250 1,050 450 400 400 700Parboiled rice, 10% & 15% 3,400 2,800 2,050 1,050 450 200 200 700Parboiled rice, 251' 3,400 2,800 2,050 1,050 450 200 200 700.Parboiled rice, lower than 25X - - - - - - - 700Broken parboiled rice of all
grades 2,050 1,700 1,000 500 100 100 100 700White rice flour 1,150 800 600 500 100 100 100 200Glutinous rice flour:
Fine 1,150 800 600 500 100 100 100 200Ordinatry 1,150 800 600 500 100 100 100 200
Vermicelli made from rice 600 400 300 200 - - - 100
Notes: 1. Since January 22, 1976 the premium on exports of glutinous rice to Laos has been exempted.
2. Exporters were required to reserve rice for sale to the Government (mainly for domestic consumption) at a fixed price.
(a) From December 25, 1974 to November 6, 1975 reserve 100% at B 2,750 per ton for white rice 5% and B 2,650 for white rice 10%.
(b) From November 7, 1975 to December 3, 1975 reserve 50% at B 2,750 per ton for white rice 5% and B 2,650 for white rice 10%.
(c) From December 4, 1975 to January 1, 1976 reserve 50% at B 3,150 per ton for white rice 5% and B 3,050 for white rice 10%.
(d) From January 22, 1976 to October 18, 1976, there were no reserve requirements.
(e) From October 19, 1976 to March 29, 1977 reserve 30% for white rice 100% and 5%, 15% for other rice rice, and 10% for brokenrice to be delivered in the ratio 40% of 5% white rice at B 3,800 per ton and 60% of 15% white rice at B 3,000 per ton.
(f) From March 30, 1977 to July 29, 1977, 20% for white rice 100% and 5%, 10% for others, except 5% for broken rice other thanA-l special delivered in same proportion and prices as (e).
(g) From July 21, 1977 to November 18, 1977, 40% for white rice 100% and 5%, 20% for others except 10% for broken rice other thanA-I special delivered in 15% white rice at B 3,000 per ton.
(h) From November 18 onwards, 50% for white rice 100% and 5%, 30% for other white rice, broken A-I prime -cecial, gltinous rice,d-d 20h of others delivered at 15X white rice at B 3,000 per ton.
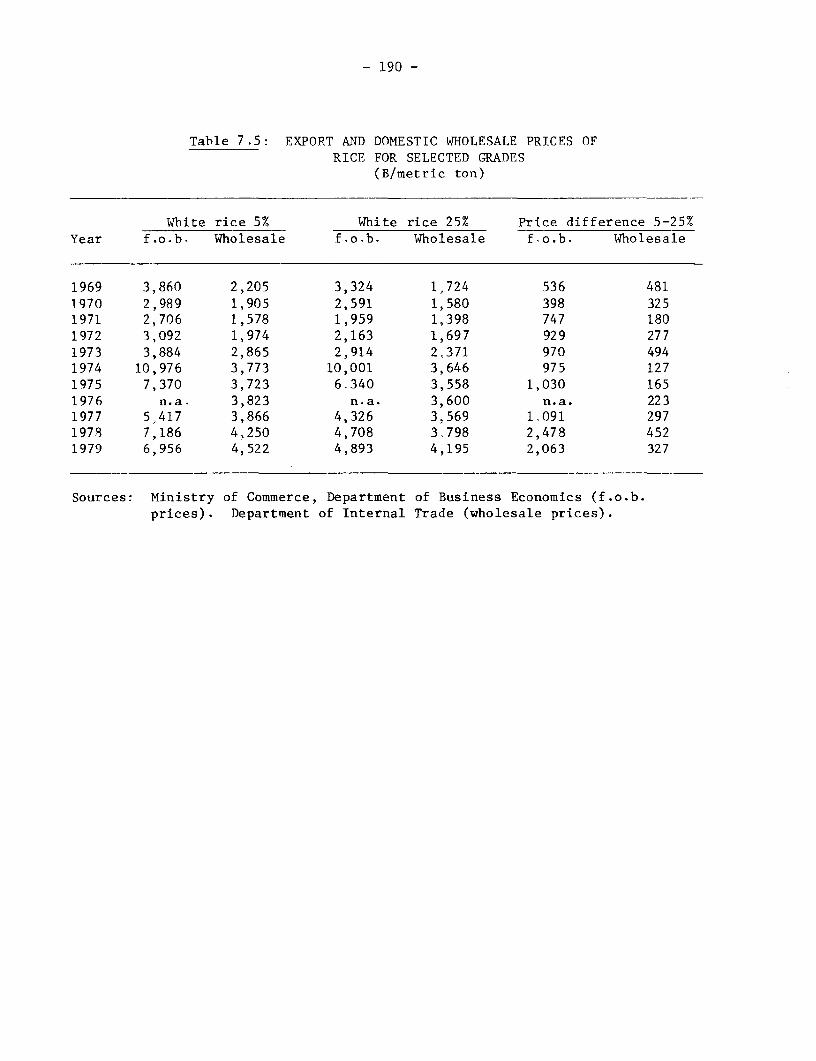
- 190 -
Table 7.5: EXPORT AND DOMESTIC WHOLESALE PRICES OFRICE FOR SELECTED GRADES
(B/metric ton)
White rice 5% White rice 25% Price difference 5-25%Year f.o.b. Wholesale f'o.b. Wholesale f.o.b. Wholesale
1969 3,860 2,205 3,324 1,724 536 4811970 2,989 1,905 2,591 1,580 398 3251971 2,706 1,578 1,959 1,398 747 1801972 3,092 1,974 2,163 1,697 929 2771973 3,884 2,865 2,914 2,371 970 4941974 10,976 3,773 10,001 3,646 975 1271975 7,370 3,723 6.340 3,558 1,030 1651976 n.a. 3,823 n.a. 3,600 n.a. 2231977 5,417 3,866 4,326 3,569 1.091 2971978 7,186 4,250 4,708 3.798 2,478 4521979 6,956 4,522 4,893 4,195 2,063 327
Sources: Ministry of Commerce, Department of Business Economics (f.o.b.prices). Department of Internal Trade (wholesale prices).
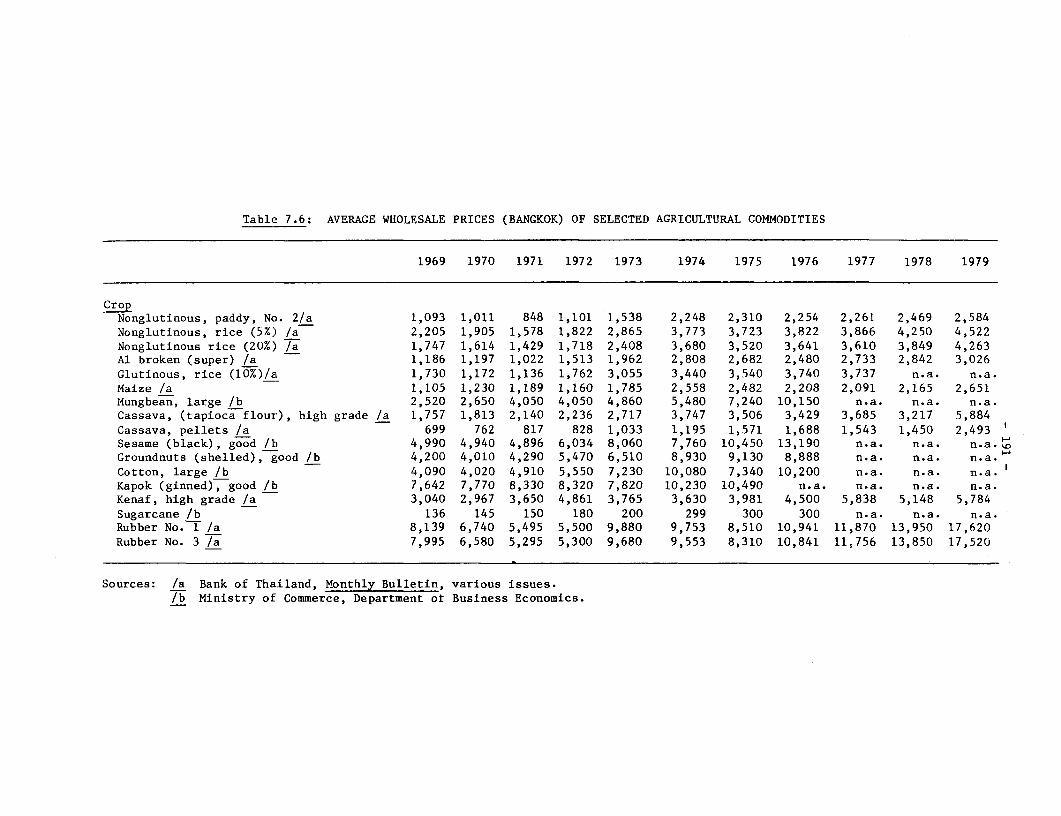
Table 7.6: AVERAGE WHOLESALE PRICES (BANGKOK) OF SELECTED AGRICULTURAL COMMODITIES
1969 1970 1971 1972 1973 1974 1975 1976 1977 1978 1979
CropNonglutinous, paddy, No. 2/a 1,093 1,011 848 1,101 1,538 2,248 2,310 2,254 2,261 2,469 2,584Nonglutinous, rice (5%) /a 2,205 1,905 1,578 1,822 2,865 3,773 3,723 3,822 3,866 4,250 4,522Nonglutinous rice (20%) /a 1,747 1,614 1,429 1,718 2,408 3,680 3,520 3,641 3,610 3,849 4,263Al broken (super) /a 1,186 1,197 1,022 1,513 1,962 2,808 2,682 2,480 2,733 2,842 3,026Glutinous, rice (10%)/a 1,730 1,172 1,136 1,762 3,055 3,440 3,540 3,740 3,737 n.a. n.a.Maize /a 1,105 1,230 1,189 1,160 1,785 2,558 2,482 2,208 2,091 2,165 2,651Mungbean, large /b 2,520 2,650 4,050 4,050 4,860 5,480 7,240 10,150 n.a. n.a. n.a.Cassava, (tapioca flour), high grade /a 1,757 1,813 2,140 2,236 2,717 3,747 3,506 3,429 3,685 3,217 5,884Cassava, pellets /a 699 762 817 828 1,033 1,195 1,571 1,688 1,543 1,450 2,493Sesame (black), good /b 4,990 4,940 4,896 6,034 8,060 7,760 10,450 13,190 n.a. n.a. n.aGroundnuts (shelled), good /b 4,200 4,010 4,290 5,470 6,510 8,930 9,130 8,888 n.a. n.a. n.a.Cotton, large /b 4,090 4,020 4,910 5,550 7,230 10,080 7,340 10,200 n.a. n.a. n.a.Kapok (ginned), good /b 7,642 7,770 8,330 8,320 7,820 10,230 10,490 n.a. n.a. n.a. n.a.Kenaf, high grade /a 3,040 2,967 3,650 4,861 3,765 3,630 3,981 4,500 5,838 5,148 5,784Sugarcane /b 136 145 150 180 200 299 300 300 n.a. n.a. n.a.Rubber No. 1 /a 8,139 6,740 5,495 5,500 9,880 9,753 8,510 10,941 11,870 13,950 17,620Rubber No. 3 /a 7,995 6,580 5,295 5,300 9,680 9,553 8,310 10,841 11,756 13,850 17,520
Sources: /a Bank of Thailand, Monthly Bulletin, various issues./b Ministry of Commerce, Department ot Business Economics.
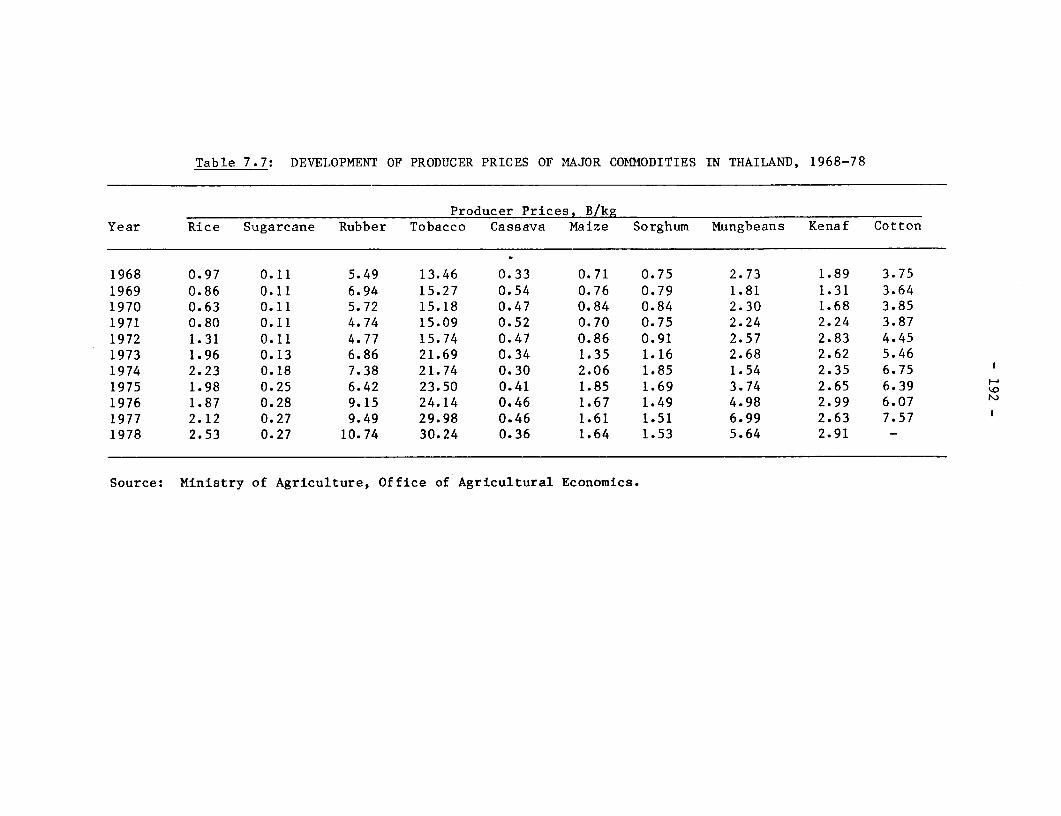
Table 7.7: DEVELOPMENT OF PRODUCER PRICES OF MAJOR COMMODITIES IN THAILAND, 1968-78
Producer Prices, B/kgYear Rice Sugarcane Rubber Tobacco Cassava Maize Sorghum Mungbeans Kenaf Cotton
1968 0.97 0.11 5.49 13.46 0.33 0.71 0.75 2.73 1.89 3.751969 0.86 0.11 6.94 15.27 0.54 0.76 0.79 1.81 1.31 3.641970 0.63 0.11 5.72 15.18 0.47 0.84 0.84 2.30 1.68 3.851971 0.80 0.11 4.74 15.09 0.52 0.70 0.75 2.24 2.24 3.871972 1.31 0.11 4.77 15.74 0.47 0.86 0.91 2.57 2.83 4.451973 1.96 0.13 6.86 21.69 0.34 1.35 1.16 2.68 2.62 5.461974 2.23 0.18 7.38 21.74 0.30 2.06 1.85 1.54 2.35 6.751975 1.98 0.25 6.42 23.50 0.41 1.85 1.69 3.74 2.65 6.391976 1.87 0.28 9.15 24.14 0.46 1.67 1.49 4.98 2.99 6.071977 2.12 0.27 9.49 29.98 0.46 1.61 1.51 6.99 2.63 7.571978 2.53 0.27 10.74 30.24 0.36 1.64 1.53 5.64 2.91 -
Source: Ministry of Agriculture, Office of Agricultural Economics.

Table 7.8: APPARENT FERTILIZER CONSUMPTION, 1966-78
(metric tons)
Opening Domestic Industrial Clos.ing Apparent Nutrient Content
Year inventory /a Imports production /b use inventory /a consumption /c N P2 05 K2 0
1966 n.a. 141,428 20,275 1,383 n.a. 160,320 24,595 16,235 7,7481967 218,244 36,187 1.696 252,738 44,485 28,056 13,152
1968 265,686 28,635 2 939 291,382 47,962 39,010 15,652
1969 265,830 20,049 3,965 281,914 42,839 41.480 20,2721970 249,641 43,522 5,029 288,134 44.097 37,741 27,990
1971 226,544 39,568 7,189 " 258,923 44,242 26,933 21,728
1972 " 383,303 40,762 6,300 417,765 66,617 60,436 25,277
1973 398,863 34,351 7,246 425,968 67,914 62,870 23,7321974 342,934 44,804 8,300 379,438 60,012 52,746 17,433
1975 50,000 465,958 54,695 12,300 125,000 433,353 70,394 56,916 18,996
1976 125,000 679,484 74,192 13,250 250,000 615,426 105,541 73,650 21,565
1977 250,000 952,476 74,211 13,020 400,000 863.667 149,553 110,547 30,402
1978 400,000 846,366 70,558 15,380 337.000 964,544 167,940 134,304 37,423
/a For 1975-78, opening inventory and closing inventory are IFDC estimates.
lb Data include Mae Moh, Bureau of Bangkok Mlunicipal Fertilizer and estimated phosphate rock production.
The years 1975, 1976, 1977 and 1978 include filler (clay) used in granulation plants - estimated at 20,000;
26,000; 25,000; and 33,000 tons, respectively./c No provision is made for product losses in handling in calculating apparent consumption.
Source: Ministry of Agriculture, Office of Agricultural Economics and IFDC estimates.

- 194 -
Table 7.9 FERTILIZER USE, BY CROP AND BY REGION. 1971 AND LQ75('000 metric tons)
Central % of
North Northeast Plain /a South Kingdom Kingdom
Rice1971 4.12 80.61 61-60 16.28 180.25 691975 6.87 86.81 136.91 12 18 242.77 51Annual growth (%) 13.60 1.90 22.10 -7.00 7.70
Field crops /b1971 7.24 7.09 29.57 2.08 51.33 201975 27.71 15.61 73.51 2.06 118.89 25Annual growth (x) 39.90 21.80 25.60 -0.20 23.40
Other /c1971 2.84 0.89 10.03 16.28 29.04 111975 1.94 3.57 56.88 53.97 116.36 24Annual growth (%) -9.10 41.50 54.30 34.90 41.50
Total1971 14.20 88.59 123.20 34.64 260.62 1001975 36.52 105.99 267.30 68.21 478.02 100Annual growth (%) 26.60 4.60 21.40 18.50 16.40
% of Kingdom 5.40 34.00 47.30 13.30 100.00
/a Includes Lower North.
/b Maize, sorghum, sugarcane, cassava, kenaf, cotton, tobacco, mung beans,soybeans, peanuts, watermelon pineapple, yam, sweet potato, potato.
/c Coconut, rubber, oil palm, fruit trees and flowering plants.
Source: Ministry of Agriculture, Office of Agricultural Economics.

Table 7.10: NUTRIENT TO CROP PRICE RATIOS FOR SELECTED FERTILIZERS AND CROPS, 1968-78
Nutrient Price, B/kg Nutrient:Crop Price Ratio16-20-0: 21-0-0: 13-13-21: 21-0-0: 15-15-15:
Year 21-0-0 16-20-0 13-13-21 15-15-15 Rice Sugarcane Sugarcane Cassava Cassava
1968 9.76 6.75 5.62 6.20 6.96 88.73 51.09 29.58 18.791969 8.90 6.39 5.51 6.04 7.43 80.91 50.09 16.48 11.191970 8.90 6.61 5.51 6.04 10.49 80.91 50.09 18.94 12.851971 8.81 6.25 5.64 5.84 7.81 80.09 51.27 16.94 11.231972 8.81 6.72 6.26 6.11 5.13 80.09 56.91 18.74 13.001973 12.14 9.36 8.47 7.76 4.78 93.38 65.15 35.71 22.821974 20.05 15.39 11.17 11.38 6.90 111.39 62.06 66.83 37.931975 18.38 13.89 11.98 12.42 6.51 73.52 47.92 44.83 30.291976 12.00 10.50 10.06 10.40 5.61 42.86 35.93 26.09 22.611977 12.29 10.36 9.66 10.04 4.89 45.52 35.78 26.72 21.831978 14.19 11.11 10.60 10.69 4.39 52.56 39.26 39.42 29.69
Source: Ministry of Agriculture, Office of Agricultural Economics.
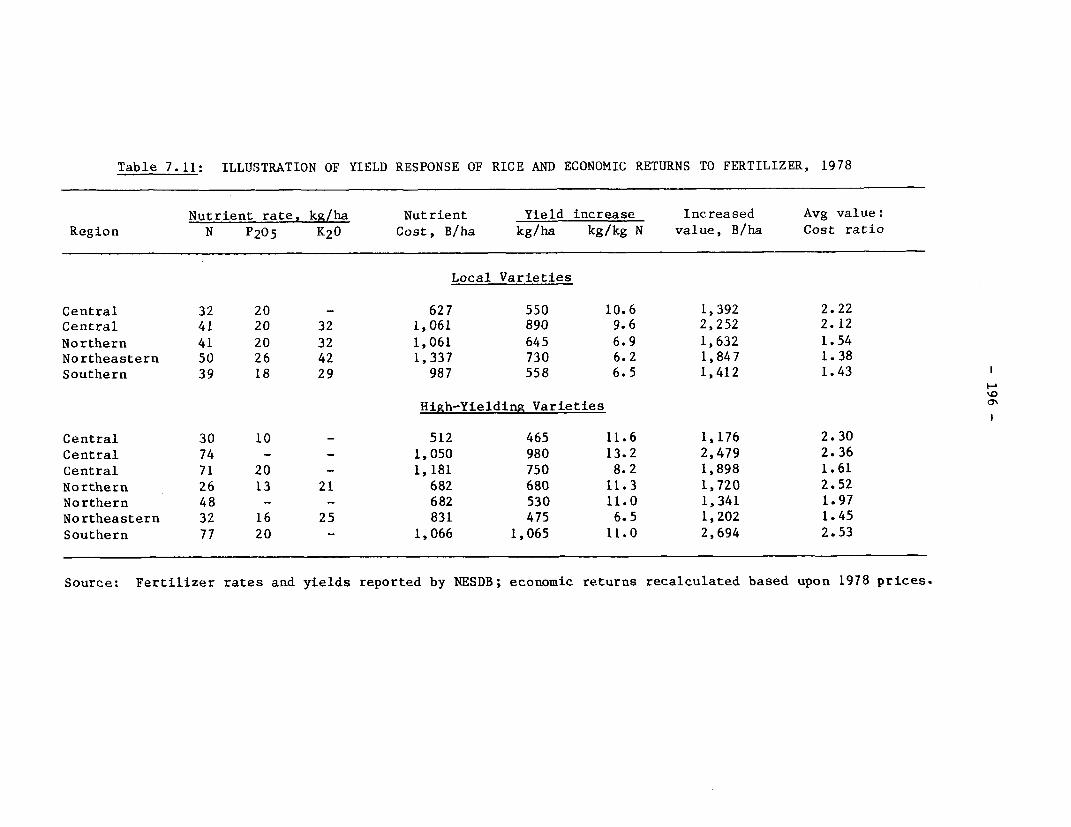
Table 7.11: ILLUSTRATION OF YIELD RESPONSE OF RICE AND ECONOMIC RETURNS TO FERTILIZER, 1978
Nutrient rate, kg/ha Nutrient Yield increase Increased Avg value:Region N P205 K20 Cost, B/ha kg/ha kg/kg N value, B/ha Cost ratio
Local Varieties
Central 32 20 - 627 550 10.6 1,392 2.22Central 41 20 32 1,061 890 9.6 2,252 2.12Northern 41 20 32 1,061 645 6.9 1,632 1.54Northeastern 50 26 42 1,337 730 6.2 1,847 1.38Southern 39 18 29 987 558 6.5 1,412 1.43
High-Yielding Varieties 0
Central 30 10 - 512 465 11.6 1,176 2.30Central 74 - - 1,050 980 13.2 2,479 2.36Central 71 20 - 1,181 750 8.2 1,898 1.61Northern 26 13 21 682 680 11.3 1,720 2.52Northern 48 - - 682 530 11.0 1,341 1.97Northeastern 32 16 25 831 475 6.5 1,202 1.45Southern 77 20 - 1,066 1,065 11.0 2,694 2.53
Source: Fertilizer rates and yields reported by NESDB; economic returns recalculated based upon 1978 prices.
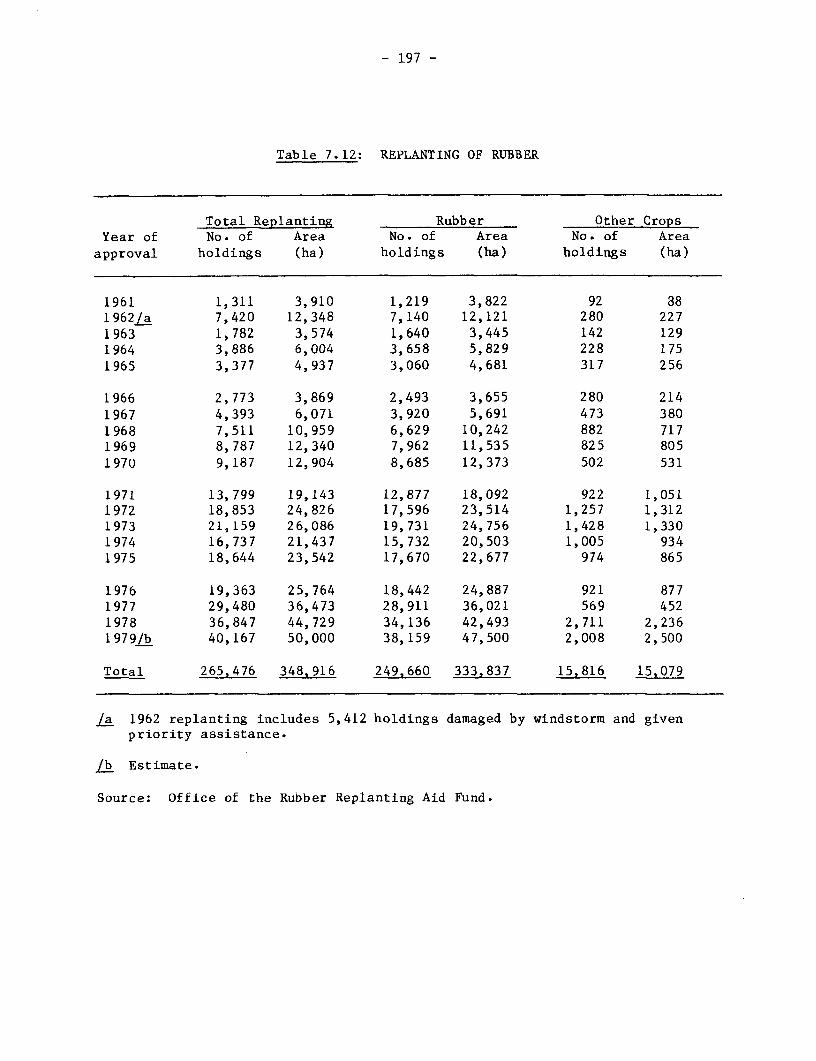
- 197 -
Table 7.12: REPLANTING OF RUBBER
Total Replanting Rubber Other CropsYear of No. of Area No. of Area No. of Areaapproval holdings (ha) holdings (ha) holdings (ha)
1961 1,311 3,910 1,219 3,822 92 881962/a 7,420 12,348 7,140 12,121 280 2271963 1,782 3,574 1,640 3,445 142 1291964 3,886 6,004 3,658 5,829 228 1751965 3,377 4,937 3,060 4,681 317 256
1966 2,773 3,869 2,493 3,655 280 214
1967 4,393 6,071 3,920 5,691 473 3801968 7,511 10,959 6,629 10,242 882 7171969 8,787 12,340 7,962 11,535 825 8051970 9,187 12,904 8,685 12,373 502 531
1971 13,799 19,143 12,877 18,092 922 1,0511972 18,853 24,826 17,596 23,514 1,257 1,3121973 21,159 26,086 19,731 24,756 1,428 1,3301974 16,737 21,437 15,732 20,503 1,005 9341975 18,644 23,542 17,670 22,677 974 865
1976 19,363 25,764 18,442 24,887 921 8771977 29,480 36,473 28,911 36,021 569 4521978 36,847 44,729 34,136 42,493 2,711 2,2361979/b 40,167 50,000 38,159 47,500 2,008 2,500
Total 265,476 348,916 249,660 333,837 15,816 15,079
/a 1962 replanting includes 5,412 holdings damaged by windstorm and givenpriority assistance.
/b Estimate.
Source: Oftice of the Rubber Replanting Aid Fund.
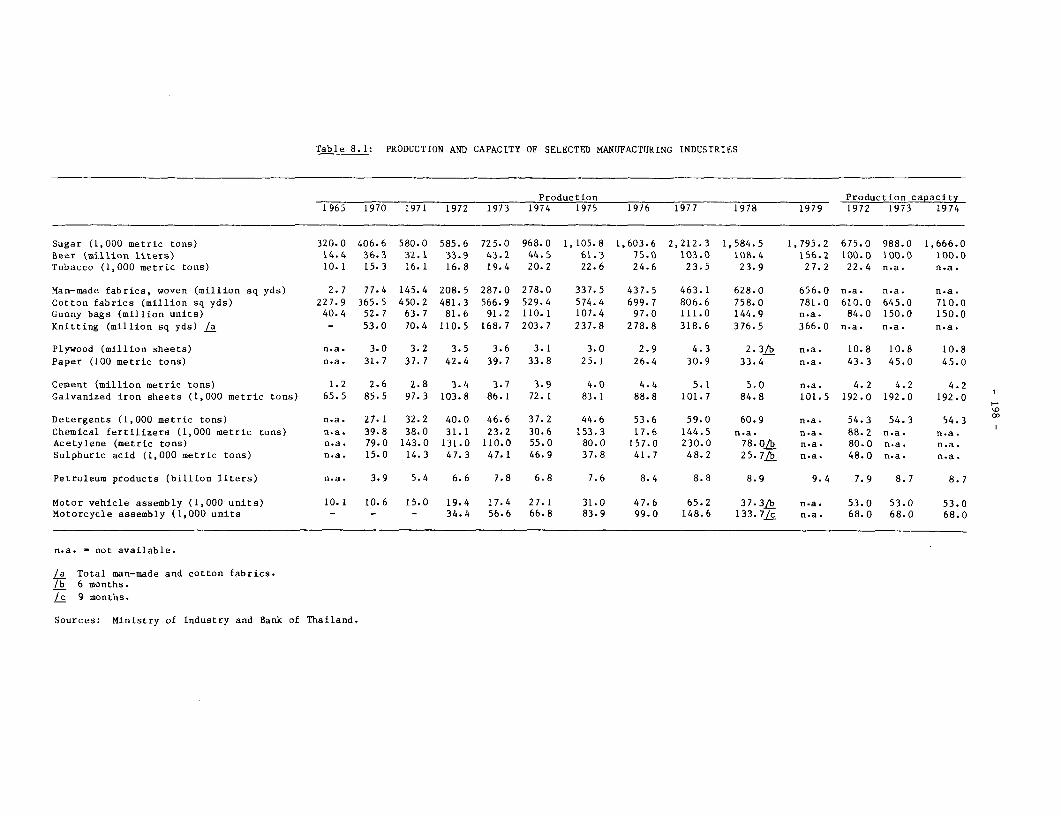
Table 8.1: PRODUCTION AND CAPACITY OF SELECTED MANUFACTURING INDUSTRIES
Production Production capacity1965 1970 1971 1972 1973 1974 1975 1976 1977 1978 1979 1972 1973 1974
Sugar (1,000 metric tons) 320.0 406.6 580.0 585.6 725.0 968.0 1,105.8 1,603.6 2,212.3 1,584.5 1,795.2 675.0 988.0 1,666.0Beer (million liteTs) 14.4 36.3 32.1 33.9 43.2 44.5 61.3 75.0 103.0 108.4 156.2 100.0 100.0 100.0Tobacco (1,000 metric tons) 10.1 15.3 16.1 16.8 19.4 20.2 22.6 24.6 23.5 23.9 27.2 22.4 n.a. n.a.
Man-made fabrics, woven (million sq yds) 2.7 77.4 145.4 208.5 287.0 278.0 337.5 437.5 463.1 628.0 656.0 n.a. n.a. n.a.Cotton fabrics (million sq yds) 227.9 365.5 450.2 481.3 566.9 529.4 574.4 699.7 806.6 758.0 781.0 6lO.0 645.0 710.0Gunny bags (million units) 40.4 52.7 63.7 81.6 91.2 110.1 107.4 97.0 111.0 144.9 n.a. 84.0 150.0 150.0Knitting (million sq yds) /a - 53.0 70.4 110.5 168.7 203.7 237.8 278.8 318.6 376.5 366.0 n.a. n.a. n.a.
Plywood (million sheets) n.a. 3.0 3.2 3.5 3.6 3.1 3.0 2.9 4.3 2.3L/ n.a. 10.8 10.8 10.8
Paper (100 metric tons) n.a. 31.7 37.7 42.4 39.7 33.8 25.1 26.4 30.9 33.4 n.a. 43.3 45.0 45.0
Cement (million metric tons) 1.2 2.6 2.8 3.4 3.7 3.9 4.0 4.4 5.1 5.0 n.a. 4.2 4.2 4.2Galvanized iron sheets (1,000 metric tons) 65.5 85.5 97.3 103.8 86.1 72.1 83.1 88.8 101.7 84.8 101.5 192.0 192.0 192.0
Detergents (1,000 metric tons) n.a. 27.1 32.2 40.0 46.6 37.2 44.6 53.6 59.0 60.9 n.a. 54.3 54.3 54.3
Chemical fertilizers (1,000 metric tons) n.a. 39.8 38.0 31.1 23.2 30.6 153.3 17.6 144.5 n.a. n.a. 88.2 n.a. n.a.Acetylene (metric tons) n.a. 79.0 143.0 131.0 110.0 55.0 80.0 157.0 230.0
78.0 n.a. 80.0 n.a. n.a.
Sulphuric acid (1,000 metric tons) n.a. 15.0 14.3 47.3 47.1 46.9 37.8 41.7 48.2 25. 7jL n.a. 48.0 n.a. n.a.
Petroleum products (billion liters) n.a. 3.9 5.4 6.6 7.8 6.8 7.6 8.4 8.8 8.9 9.4 7.9 8.7 8.7
Motor vehicle assembly (1,000 units) 10.1 10.6 15.0 19.4 17.4 27.1 31.0 47.6 65.2 37.3 n.a. 53.0 53.0 53.0Motorcycle assembly (1,000 units - - - 34.4 56.6 66.8 83.9 99.0 148.6 133.7k n.a. 68.0 68.0 68.0
n.a. = not available.
/a Total man-made and cotton fabrics./b 6 months.
/c 9 months.
Sources: Ministry of Industry and Bank of Thailand.
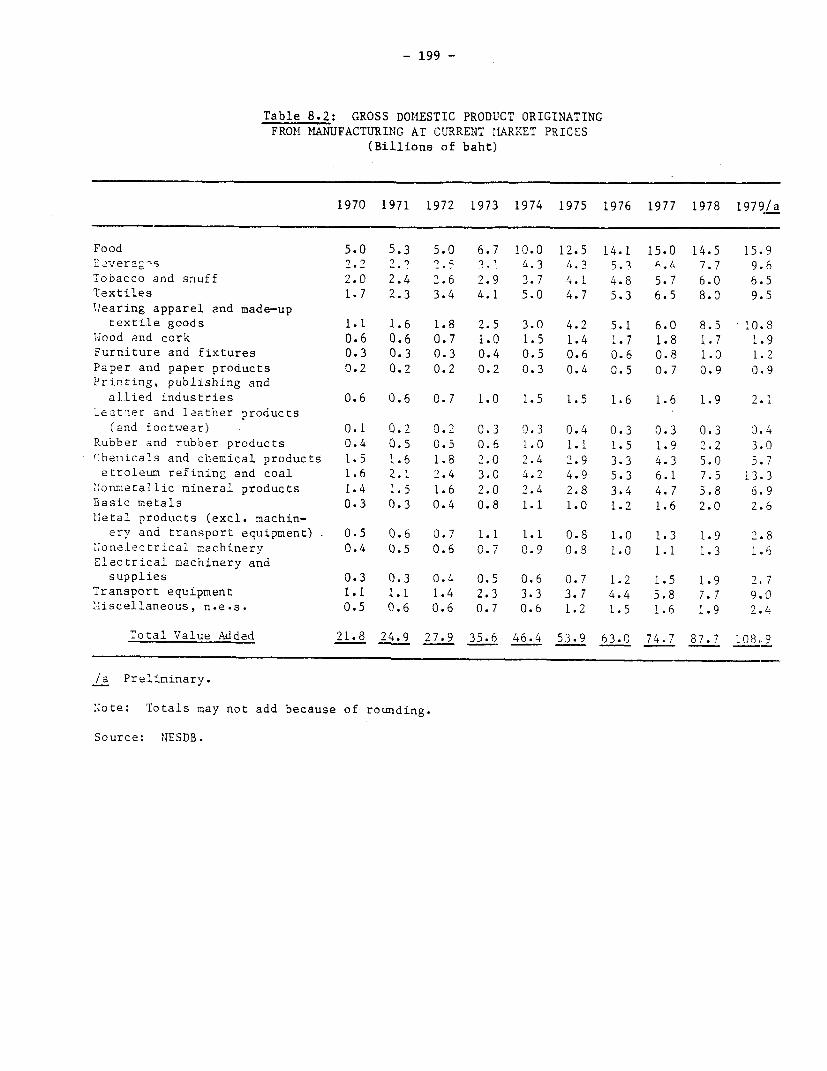
- 199 -
Table 8.2: GROSS DOIMESTIC PRODUCT ORIGINATINGFROM MAN UFACTURING AT CURRENT 'MARKET PRICES
(Billions of baht)
1970 1971 1972 1973 1974 1975 1976 1977 1978 1979/a
Food 5.0 5.3 5.0 6.7 10.0 12.5 14.1 15.0 14.5 15.912cver a Z 2.2 2.? 3.5 32 4.3 4.3 5.3 .A 7.7 9.6Tobacco and snuff 2.0 2.4 2.6 2.9 3.7 4.1 4.8 5.7 6.0 6.5Textiles 1.7 2.3 3.4 4.1 5.0 4.7 5.3 6.5 8.0 9.5
Wearing apparel and made-uptextile goods 1.1 1.6 1.8 2.5 3.0 4.2 5.1 6.0 8.5 10.8
Iiood and cork 0.6 0.6 0.7 1.0 1.5 1.4 1.7 1.8 1.7 1.9
Furniture and fixtures 0.3 0.3 0.3 0.4 0.5 0.6 0.6 0.8 1.0 1.2
Paper and paper products 0.2 0.2 0.2 0.2 0.3 0.4 0.5 0.7 0.9 0.9
Prinrting, publishing andallied industries 0.6 0.6 0.7 1.0 1.5 1.5 1.6 1.6 1.9 2.1
Leat'her and leather products(and footwear) 0.1 0.2 0.2 0.3 0.3 0.4 0.3 0.3 0.3 0.4
Rubber and rubber products 0.4 0.5 0.5 0.6 1.0 1.1 1.5 1.9 2.2 3.0
17heuicals and chemical products 1.5 1.6 1.8 2.0 2.4 2.9 3.3 4.3 5.0 5.7euroleun refining and coal 1.6 2.1 2.4 3.0 4.2 4.9 5.3 6.1 7.5 13.3
,onmetallic mineral products 1.4 1.5 1.6 2.0 2.4 2.8 3.4 4.7 5.8 6.9Basic metals 0.3 0.3 0.4 0.8 1.1 1.0 1.2 1.6 2.0 2.6
11etal products (excl. machin-ery and transport equipment). 0.5 0.6 0.7 1.1 1.1 0.8 1.0 1.3 1.9 29.8
,onelectrical machinery 0.4 0.5 0.6 0.7 0.9 0.8 1.0 1.1 1.3 1.6
Electrical machinery andsupplies 0.3 0.3 0.4 0.5 0.6 0.7 1.2 1.5 1.9 2.7
Transport equipment 1.1 1.1 1.4 2.3 3.3 3.7 4.4 5.8 7.7 9.0
M!iscellaneous, n.e.s. 0.5 0.6 0.6 0.7 0.6 1.2 1.5 1.6 1.9 2.4
Total Value Added 21.8 24.9 27.9 35.6 46.4 53.9 63.0 7477 87.7 108.9
/a Preliminary.
Note: Totals may not add because of rounding.
Source: NESDB.

Table 8.3: GROSS DOMESTIC PRODUCT ORIGINATINGFROM MANUFACTURING AT CONSTANT PRICES
(Billions of 1972 baht)
1970 1971 1972 1973 1974 1975 1976 1977 1978 1979/a)
Food 4.8 5.2 5.2 5.4 6.0 6.3 7.3 8.4 8.6 8.9Beverages 3.0 2.2 2.5 3.0 3.7 3.3 4.0 5.0 5.5 6.7Tobacco and snuff 2.4 2.5 2.6 3.0 3.1 3.4 3.7 3.5 3.6 3.8Textiles 2.2 2.7 3.4 4.2 4.5 5.1 5.7 6.3 7.5 8.3Wearing apparel and made-up
textile goods 1.1 2.5 1.7 1.9 1.9 2.7 3.3 3.6 4.8 5.8Wood and cork 0.7 0.8 0.7 0.8 0.9 0.9 1.0 1.0 0.8 0.8Furniture and fixtures 0.3 0.3 0.3 0.3 0.2 0.3 0.3 0.4 0.4 0.5Paper and paper products 0.2 0.2 0.2 0.2 0.2 0.3 0.5 0.6 0.7 0.7 oPrinting, publishing and
allied industries 0.5 0.6 0.7 0.8 1.0 1.0 1.3 1.3 1.4 1.5Leather and leather products
(and footwear) 0.2 0.3 0.3 0.3 0.3 0.3 0.3 0.3 0.3 0.3Rubber and rubber products 0.4 0.5 0.5 0.6 0.7 0.9 1.0 1.3 1.4 1.5Chemicals and chemical products 1.5 1.5 1.6 1.7 1.6 2.0 2.3 3.1 3.4 3.8Petroleum refining and coal 1.4 2.0 2.4 2.8 2.5 2.8 3.1 3.2 3.3 3.4Nonmetallic mineral products 1.2 1.3 1.6 1.9 2.0 2.2 2.4 2.9 3.2 3.4Basic metals 0.4 0.4 0.5 0.5 0.4 0.4 0.5 0.5 0.6 0.7Metal products (excl. machin-
ery and transport equipment) 0.4 0.5 0.6 0.7 0.6 0.5 0.5 0.5 0.5 0.5Nonelectrical machinery 0.5 0.6 0.6 0.6 0.7 0.6 0.8 0.9 0.9 1.0Electrical machinery and
supplies 0.3 0.3 0.4 0.4 0.4 0.5 0.7 0.8 0.9 1.0Transport equipment 1.2 1.2 1.4 1.8 2.4 2.4 3.0 3.8 4.2 4.5Miscellaneous, n.e.s. 0.5 0.6 0.6 0.6 0.4 0.8 1.0 1.0 1.0 1.2
Total Value Added 23.3 25.2 27.9 31.5 33.6 36.8 42.5 48.1 52.8 58.0
/a Preliminary.
Note: Totals may not add because of rounding.
Source: NESDB.
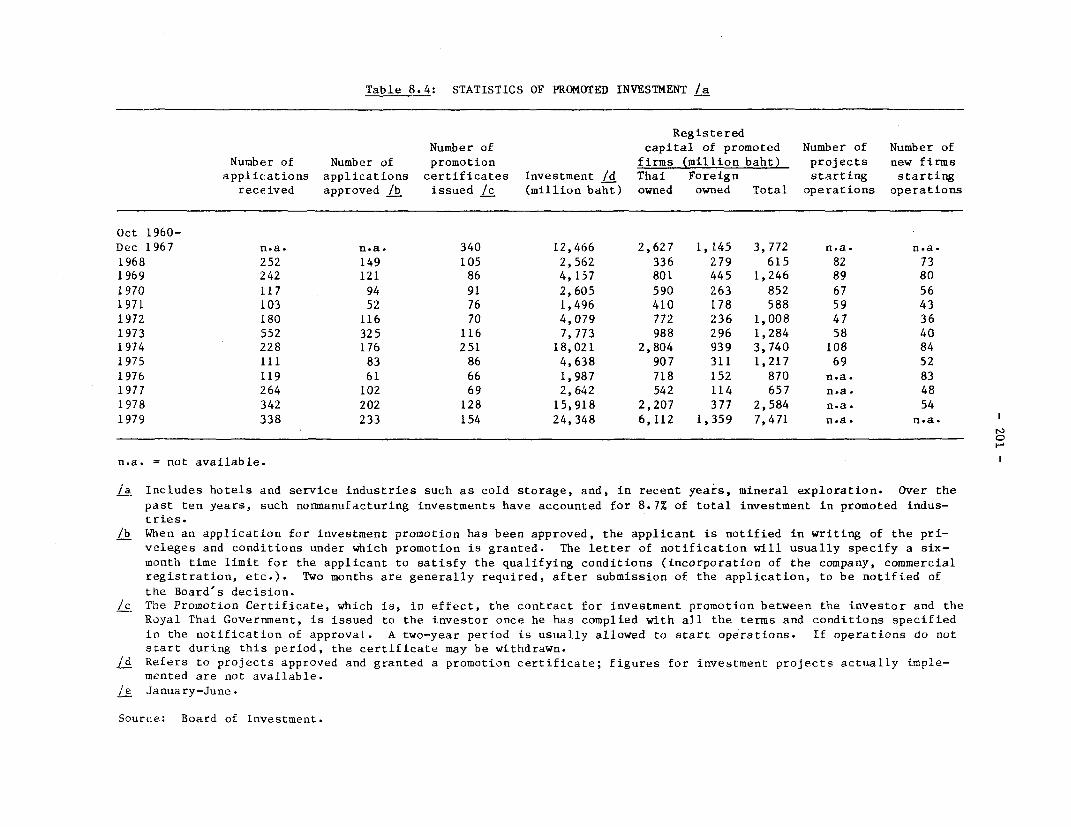
Table 8.4: STATISTICS OF PROMOTED INVESTMENT /a
RegisteredNumber of capital of promoted Number of Number of
Number of Number of promotion firms (million baht) projects new firmsapplications applications certificates Investment /d Thai Foreign starting starting
received approved /b issued /c (million baht) owned owned Total operations operations
Oct 1960-Dec 1967 n.a. n.a. 340 12,466 2,627 1,145 3,772 n.a. n.a.1968 252 149 105 2,562 336 279 615 82 731969 242 121 86 4,157 801 445 1,246 89 801970 117 94 91 2,605 590 263 852 67 561971 103 52 76 1,496 410 178 588 59 431972 180 116 70 4,079 772 236 1,008 47 361973 552 325 116 7,773 988 296 1,284 58 401974 228 176 251 18,021 2,804 939 3,740 108 841975 111 83 86 4,638 907 311 1,217 69 521976 119 61 66 1,987 718 152 870 n.a. 831977 264 102 69 2,642 542 114 657 n.a. 481978 342 202 128 15,918 2,207 377 2,584 n.a. 541979 338 233 154 24,348 6,112 1,359 7,471 n.a. n.a.
_ -
n.a. = not available.
/a Includes hotels and service industries such as cold storage, and, in recent years, mineral exploration. Over thepast ten years, such nonmanufacturing investments have accounted for 8.7% of total investment in promoted indus-tries.
/b When an application for investment promotion has been approved, the applicant is notified in writing of the pri-veleges and conditions under which promotion is granted. The letter of notification will usually specify a six-month time limit for the applicant to satisfy the qualifying conditions (incorporation of the company, commercialregistration, etc.). Two months are generally required, after submission of the application, to be notified ofthe Board's decision.
/c The Promotion Certificate, which is, in effect, the contract for investment promotion between the investor and theRoyal Thai Government, is issued to the investor once he has complied with all the terms and conditions specifiedin the notification of approval. A two-year period is usually allowed to start operations. If operations do notstart during this period, the certificate may be withdrawn.
Id Refers to projects approved and granted a promotion certificate; figures for investment projects actually imple-mented are not available.
/e January-June.
Source: Board of Investment.

Table 8.5: MINERAL PRODUCTION(Thousands of metric tons)
1967 1968 1969 1970 1971 1972 1973 1974 1975 1976 1977 1978 1979
Tin concentrates 31.2 32.8 28.8 29.7 29.6 30.1 28.6 27.8 22.4 27.9 33.0 41.2 46.4
Wolfram ore(tungsten) 0.8 1.0 1.3 1.4 4.9 6.5 5.0 4.3 3.5 4.0 4.3 6.2 3.5
Iron ore 549.2 499.5 477.4 22.5 39.5 27.8 36.3 36.3 32.5 25.0 63.5 88.1 10.3
Lead ore 8.2 6.5 4.2 3.0 5.5 4.3 8.7 3.6 3.6 2.1 1.3 3.9 20.5
Antimony 2.4 0.8 1.7 5.7 5.4 11.3 8.2 10.3 7.7 9.1 6.1 6.8 6.9
Manganese ore 79.1 41.0 29.9 23.9 14.0 19.8 36.3 30.2 25.2 50.2 77.0 67.2 35.3 o
Gypsum 61.7 128.1 92.0 144.2 167.9 87.8 236.3 311.8 255.2 267.8 380.1 280.9 595.4
Lignite 335.3 305.3 347.8 399.9 445.1 345.5 361.0 484.7 462.3 680.3 438.6 638.9 1,536.5
Fluorite ore 133.2 245.1 297.6 317.8 426.5 395.0 398.0 420.2 286.2 200.4 239.8 259.8 236.4
Marl 1,213.6 1,624.2 1,533.9 622.8 489.7 372.2 245.8 226.7 467.5 435.0 584.7 1,459.7 2,261.7
Source: Bank of Thailand.

- 203 -
Table 8.6: ENERGY CONSUMPTION BY SOURCE OF ENERGY(Kilo calories x 1012)
Petroleum Hydro- Fuel PaddyYear products electric Coal wood Charcoal husk Bagasse Total
1967 29.8 4.5 1.2 0.7 0.7 0.5 1.0 38.4
1968 39.4 4.1 1.3 0.7 0.6 0.4 1.9 48.3
1969 42.6 3.1 1.4 0.4 0.5 0.3 2.2 50.6
1970 46.5 5.3 1.5 0.5 0.6 0.4 2.7 57.5
1971 58.4 6.1 1.7 0.6 0.6 0.4 2.6 70.4
1972 68.3 5.6 1.4 0.5 0.4 0.3 3.1 79.6
1973 77.8 6.1 1.4 0.5 0.4 0.4 4.2 90.8
1974 75.4 7.8 2.2 0.4 0.2 0.4 5.6 91.9
1975 78.0 10.6 2.2 0.4 0.1 0.4 5.9 97.6
1976 88.1 11.3 2.5 0.4 0.2 0.4 8.4 111.3
1977 98.6 10.2 2.3 0.4 0.2 0.4 8.3 120.4
1978 106.1 6.9 2.9 0.3 0.2 0.4 10.4 127.3
Source: National Energy Authority.

Table 8.7: TOURISM - BASIC DATA
1965 1969 1970 1971 1972 1973 1974 1975 1976 1977 1978
Foreign visitors(in thousands) 225.0 469.8 628.7 638.7 820.8 1,037.7 1,107.4 1,180.1 1,098.4 1,220.7 1,453.8
NationalityUnited States 73.8 133.3 159.2 147.0 151.6 161.4 156.8 116.2 116.7 124.1 131.4
of which: R&R (15.0) (70.7) (44.3) (26.6) (7.7) (4.4) (3.5) - - - -Japan 17.3 42.9 47.0 55.8 93.5 151.9 132.7 147.0 150.5 174.0 193.7Malaysia 18.4 59.6 105.0 128.9 162.6 190.8 197.5 227.8 161.2 217.4 243.4Germany 7.4 20.2 28.0 35.8 52.7 62.7 69.4 78.1 86.0 79.1 91.5UK 20.3 31.3 37.0 37.7 46.9 58.3 65.4 76.4 72.7 72.0 98.5France 6.7 12.7 21.1 17.9 31.7 45.0 42.6 46.9 48.5 51.1 64.0Australia 10.1 22.2 28.2 26.4 31.9 48.2 75.8 78.9 80.5 69.5 67.5Other 66.5 147.5 203.2 188.6 250.0 319.4 367.2 408.8 382.3 433.5 563.8
Nverage length ofstay (days) 4.8 4.9 4.8 4.9 4.9 4.7 4.8 5.1 5.1 4.5 4.8 >
lotel capacity inBangkok (rooms) 2,469 7,984 8,763 9,127 9,028 9,746 9,861 10,331 10,485 11,104 11,286
Foreign exchangeearnings (millionsof Baht) 506 1,770 2,175 2,214 2,718 3,457 3,852 4,538 3,990 4,607 8,895
of which: R&R ofUS troops (50) (459) (390) (240) (63) (13) (11) - - - -
Source: Tourist Organization of Thailand.

- 205 -
Table 8.8: REALIZED RATES OF EFFECTIVE PROTECTION, 1969, 1971, 1974 /aMAJOR CATEGORIES AND SELECTED ITEMS
(percent)
1969 1971 1974 1978Balassa Corden Balassa Corden Balassa Corden Corden
Processed Food -66.5 -48.3 -10.1 -0.3 - - -Sugar - - -9.8 2.9 -90.4 -84.0 -20.3Sweet ondensed milk - - 3.9 3.4 /b 1,766.1 33.6Wheat flour - - /b 186.6 153.9 30.3 466.6Fruit canning - - -56.7 -28.4 -34.2 -8.0 n.a.Animal feeds - - -10.6 -8.0 -11.0 -8.4 -2.1
Beverages and Tobacco -18.9 -16.5 177.9 107.4 - - -Beer - - 234.3 35.6 115.9 65.3 39.7Cigarettes - - n.a. n.a. -12.2 -12.1 -25.3
Construction Materials -6.9 -5.8 -17.6 -16.1 - - -Cement (Domestic sales) - - -17.6 -16.1 -45.0 -42.9 n.a.
(Export sales) - - -17.6 -16.1 -12.6 -11.7 -
Intermediate Products 1 0.7 0.8 9.9 5.3 - -Veneer and plywood - - 264.2 90.2 144.5 62.7Thread and yarn - - 49.2 39.3 23.6 19.9Glass sheet - - 22.1 18.7 -8.1 -6.8Iron and steel - - 44.0 18.4 97.9 37.7Vegetable fibers - - -1.9 -1.6 -1.6 -1.2
lntermediate Products II 57.5 45.5 72.2 44.9 - -Textile fabrics (noncotton) - - 95.3 64.0 -20.1 -16.0Cotton fabrics - - 10.5 7.5 -33.5 -25.8Rubber tires and tubes - - 44.3 25.2 012.7 -12.7Paints and varnishes - - 70.2 13.7 /b 57.8Chemical products, plastics
and synthetics - - 32.6 25.0 45.4 34.8Finished structural metal - - 29.6. 24.9 58.6 49.1Other metal products - - 19.7 18.6 61.3 57.6
Consumer Nondurables 18.2 13.0 27.7 20.5 - -Clothing - - -10.4 -7.1 11.9 7.3Textile articles - - 63.6 44.1 -5.5 -4.4Shoes - - 77.9 60.1 8.0 6.8Drugs and medicines - - 122.4 48.8 -19.2 -12.9Soap and detergents - - 36.3 20.7 -16.6 -10.6Electric bulbs - - 331.0 121.8 0.0 0.0Flashlight batteries - - - - 29.2 -22.0
Consumer Durables 132.1 69.1 21.4 17.2 - -Motorcycle assembly and
parts - - 78.7 56.3 48.4 36.4TV and household appliances - - 79.8 58.6 /b 830.2
Machinery 43.9 30.6 9.9 7.6 - -Trrctor essembly - - 9.9 7.6 6.6 5.9Sewing machines - - 5.9 5.3 -11.2 -8.2Nonelectrical machinery - - n.a. n.a. 4.0 3.4
Transport Equipment 64.5 34.9 344.1 146.4 - -Car assembly - - /b 236.4 /b 353.9Truck assembly - - 201.3 95.4 219.2 100.6
/a Calculated on the basis of selling market prices in Thailand. In manycases, the nominal tariffs would permit higher selling prices, but domesticcompetition keeps actual prices lower. Thus, the potential effective protectionis higher than what is realized.
lb Very large.
Source: Mission estimates.

Table 9.1: PRICE INDICES (ANNUAL)
Old index (1968=100) New index (1968-100)1969 1970 1971 1972 1973 1974 1975 1976 1977 1978 1979 1974 1975 1976 1977 1978 1979
Wholesale Price Index for Thailand /aAgricultural products 104.5 100.5 98.4 109.4 134.6 170.4 190.0 199.5 204.6 206.6 - 85.4 95.2 100.0 110.0 112.2 118.8Foodstuffs 98.9 93.7 95.1 106.8 134.4 180.1 184.4 192.9 205.2 203.4 - 93.4 95.6 100.0 104.8 115.0 120.3Beverages 99.8 105.4 111.0 113.4 117.2 131.8 142.5 145.0 139.8 149.0 - n.a. n.a. 100.0 101.0 107.3 113.2Textiles and textile products /b 104.6 106.8 107.6 110.9 129.3 160.6 140.9 145.6 155.6 163.9 - 110.3 96.8 100.0 112.5 117.9 135.5Construction materials 103.2 105.7 102.6 106.7 143.3 196.4 199.9 202.8 212.9 220.6 - 96.8 98.6 100.0 108.0 118.4 146.1Chemicals and chemical products /c 108.8 116.1 120.0 127.8 158.0 211.1 217.9 198.9 194.9 204.2 - 106.1 109.5 100.0 106.1 112.2 128.5Petroleum products 99.8 99.1 103.7 104.9 116.7 214.4 219.4 219.1 243.8 262.7 - 97.9 100.1 100.0 108.2 118.4 163.7Paper and paper products 103.8 104.1 105.7 108.0 137.9 181.3 188.7 182.3 183.4 184.9 - 99.4 103.5 100.0 101.0 103.3 119.0Hide and leather products /d 102.1 99.5 98.3 114.5 152.4 160.5 155.5 156.7 165.1 188.2 - 102.4 99.2 100.0 104.1 119.4 165.3Rubber and rubber products 119.2 103.4 88.6 89.3 143.8 147.8 133.0 163.0 168.2 173.8 - 90.7 81.6 100.0 102.0 102.8 117.7Transportation equipment 100.3 108.9 120.0 132.2 155.9 189.7 209.2 216.9 223.2 234.5 - 87.5 96.4 100.0 104.5 120.9 131.2liachinery and equipment 100.4 104.2 106.8 110.2 129.9 158.3 162.2 175.7 199.2 213.9 - 90.1 92.3 100.0 107.0 116.4 119.1Miscellaneous 107.7 117.1 112.1 117.2 134.2 176.5 159.3 170.7 205.3 283.6 - 103.4 93.3 100.0 126.8 165.9 165.1
Special GroupsDomestic commodities 103.3 99.3 98.4 107.8 133.6 175.4 182.6 191.4 202.8 216.7 249.8 - - - - -Imported commodities 103.3 110.8 113.4 118.9 143.9 177.8 182.4 186.0 193.0 192.4 204.4 - - - - - -
Exported commodities 112.5 107.8 103.9 111.7 154.9 195.4 190.4 202.4 218.5 246.3 292.7 - - - - - -
All items 103.3 102.8 103.1 111.2 136.6 176.1 182.6 189.8 199.9 209.4 236.5 92.8 96.2 100.0 107.8 115.8 128.8
/a The new wholesale price index with base year 1968 has been reported by the Department of Business Economics since January 1971. This indexincludes the prices of 256 representative commodities, which are collected from markets in Bangkok-Thonburi and nine major provinces. Thenew series are not available for the years before 1968. The old index with base year 1958 inclitdes the prices of 55 items, of which 21 areagricultural products and foodstuffs. These prices were collected in the Bangkok-Thonburi area.
/b Heading for old index is "Cloth."/c Heading for old index is "Chemical Products."/d Heading for old index is "Leather."/e Weights and selected items are derived from a family expenditure survey conducted in 1962-65 among families of two or more persons in all
occupational groups (except those whose main source of income is from agriculture) with annual income ranging from 3,000 baht to 60,000 baht.
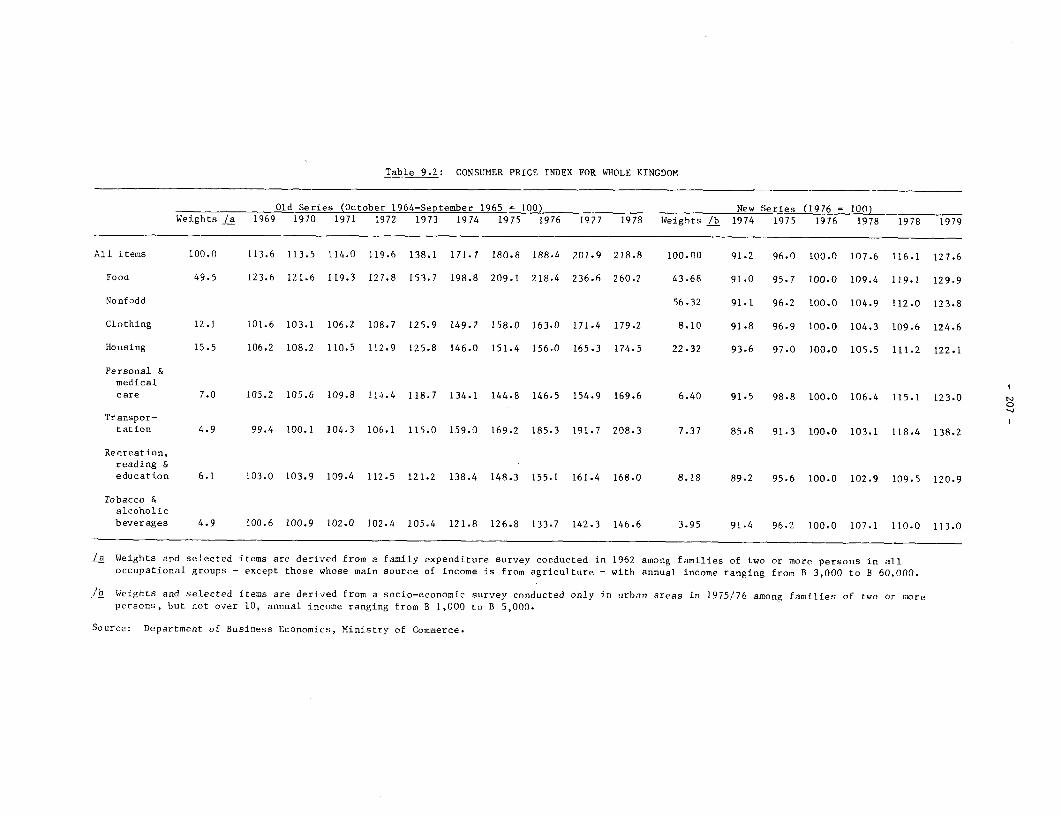
Table 9.2: CONSUMER PRICE INDEX FOR WHOLE KINGDoM
Old Series (October 1964-September 1965 - 100) New Series (1976 = 100)Weights /a 1969 1970 1971 1972 1973 1974 1975 1976 1977 1978 Weights /b 1974 1975 1976 1978 1978 1979
All items 100.0 113.6 113.5 114.0 119.6 138.1 171.7 180.8 188.4 201.9 218.8 100.00 91.2 96.0 100.0 107.6 116.1 127.6
Food 49.5 123.6 121.6 119.3 127.8 153.7 198.8 209.1 218.4 236.6 260.2 43.68 91.0 95.7 100.0 109.4 119.1 129.9
Nonfodd 56.32 91.1 96.2 100.0 104.9 112.0 123.8
Clothing 12.1 101.6 103.1 106.2 108.7 125.9 149.7 158.0 163.0 171.4 179.2 8.10 91.8 96.9 100.0 104.3 109.6 124.6
Housing 15.5 106.2 108.2 110.5 112.9 125.8 146.0 151.4 156.0 165.3 174.5 22-32 93.6 97.0 100.0 105.5 111.2 122.1
Personal &medical
care 7.0 105.2 105.6 109.8 114.4 118.7 134.1 144.8 146.5 154.9 169.6 6.40 91.5 98.8 100.0 106.4 115.1 123.0
Transpor-tation 4.9 99.4 100.1 104.3 106.1 115.0 159.0 169.2 185.3 191.7 208.3 7.37 85.8 91.3 100.0 103.1 118.4 138.2
Recreation,reading &education 6.1 103.0 103.9 109.4 112.5 121.2 138.4 148.3 155.1 161.4 168.0 8.18 89.2 95.6 100.0 102.9 109.5 120.9
Tobacco &alcoholicbeverages 4.9 100.6 100.9 102.0 102.4 105.4 121.8 126.8 133.7 142.3 146.6 3.95 91.4 96.2 100.0 107.1 110.0 113.0
La Weights and selected items are derived from a family expenditure survey conducted in 1962 among families of two or more persons in alloccupational groups - except those whose main source of income is from agriculture - with annual income ranging from B 3,000 to B 60,000.
lb Weights and selected items are derived from a socio-economic survey conducted only in urban areas in 1975/76 among families of two or aorepersons, but not over 10, annual income ranging from B 1,000 to B 5,000.
Source: Department of Business Economics, Ministry of Commerce.
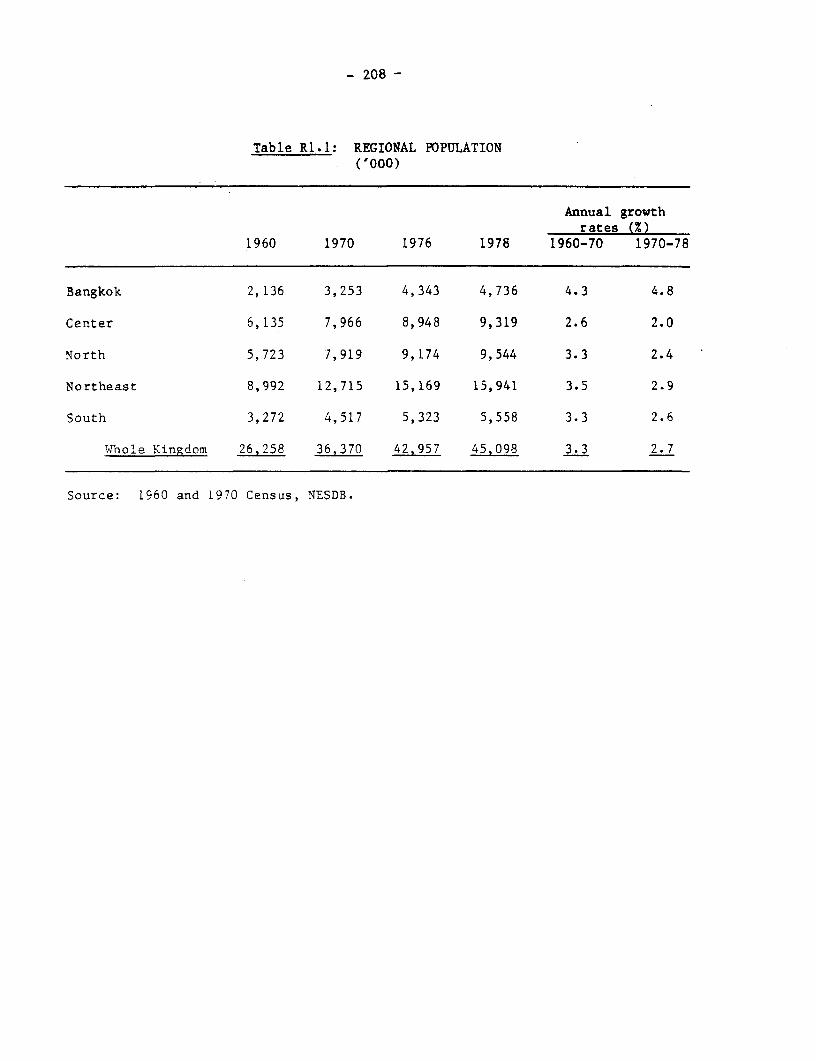
- 208 -
Table Rl.1: REGIONAL POPULATION('000)
Annual growthrates (%)
1960 1970 1976 1978 1960-70 1970-78
Bangkok 2,136 3,253 4,343 4,736 4.3 4.8
Center 6,135 7,966 8,948 9,319 2.6 2.0
North 5,723 7,919 9,174 9,544 3.3 2.4
Northeast 8,992 12,715 15,169 15,941 3.5 2.9
South 3,272 4,517 5,323 5,558 3.3 2.6
Whole Kingdom 26,258 36,370 42,957 45,098 3.3 2.7
Source: 1960 and 1970 Census, NESDB.
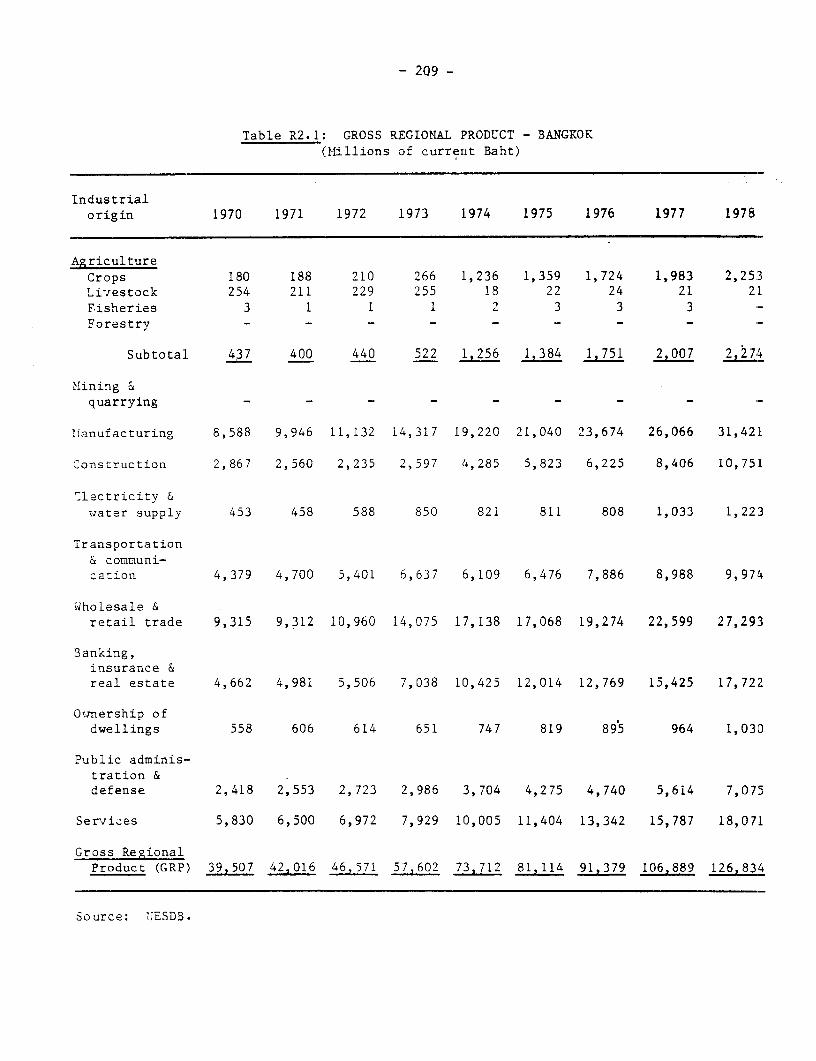
- 209 -
Table R2.1: GROSS REGIONAL PRODUCT - BANGKOK(MLillions of current Baht)
Industrialorigin 1970 1971 1972 1973 1974 1975 1976 1977 1978
AgricultureCrops 180 188 210 266 1,236 1,359 1,724 1,983 2,25:3Livestock 254 211 229 255 18 22 24 21 21Fisheries 3 1 1 1 2 3 3 3Forestry - - - - - - - -
Subtotal 437 400 440 522 1,256 1,384 1,751 2,007 2,274
MIining &quarrying - - - - - - - -
ianufacturing 8,588 9,946 11,132 14,317 19,220 21,040 23,674 26,066 31,421
Construction 2,867 2,560 2,235 2,597 4,285 5,823 6,225 8,406 10,751
Electricity &water supply 453 458 588 850 821 811 808 1,033 1,223
Transportation& communi-cation 4,379 4,700 5,401 6,637 6,109 6,476 7,886 8,988 9,974
Wholesale &retail trade 9,315 9,312 10,960 14,075 17,138 17,068 19,274 22,599 27,293
Banking,insurance &real estate 4,662 4,981 5,506 7,038 10,425 12,014 12,769 15,425 17,722
Ownership ofdwellings 558 606 614 651 747 819 895 964 1,030
Public adminis-tration &defense 2,418 2,553 2,723 2,986 3,704 4,275 4,740 5,614 7,075
Servi_es 5,830 6,500 6,972 7,929 10,005 11,404 13,342 15,787 18,071
Gross RegionalProduct (GRP) 39,507 42,016 46,571 57,602 73,712 81,114 91,379 106,889 126,834
Source: NTESDB.

- 210 -
Table R2.2: GROSS REGIONAL PRODUCT - CENTER(Millions of current Baht)
Industrialorigin 1970 1971 1972 1973 1974 1975 1976 1977 1978
AgricultureCrops 7,427 8,914 11,966 18,948 22,145 22,969 25,682 25,637 29,702Livestock 1,440 1,452 1,483 1,596 3,357 3,723 3,851 4,751 4,750Fisheries 1,975 2,045 2,498 3,223 3,345 3,780 4,473 5,067 5,624Forestry 1,075 825 903 862 964 935 1,052 1,001 973
Subtotal 11,917 13,236 16,850 24,629 29,814 31,407 35,058 36,456 40,869
Mining &quarrying 949 1,034 1,004 978 1,349 1,508 1,756 2,724 3,122
lianufacturing 8,202 9,809 11,132 14,470 21,284 23,258 28,318 33,182 38,224
Construction 2,026 1,596 1,707 2,064 1,970 1,815 2,918 3,408 4,017
El-ectricity &water supply 322 808 932 917 1,039 757 1,039 1,116 1,269
Transportation& comuni-cation 1,655 1,605 1,811 1,988 5,012 5,561 6,102 7,152 8,100
,4holesale &retail trade 6,450 7,069 7,904 10,732 15,002 14,326 17,493 20,621 25,328
Banking,insurance &real estate 307 341 390 533 748 873 1,042 1,206 1,376
Ownership ofdwellings 1,374 1,444 1,501 1,694 2,041 2,149 2,358 2,570 2,837
Public adminis-tration &defense 1,320 1,466 1,592 1,912 2,465 2,911 3,172 3,585 4,260
Services 3,188 3,416 3,810 4,474 3,692 4,250 4,826 5,618 6,166
Gross RegionalProduct (GRP) 37,710 41,824 48,633 64,391 84,415 88,815 104,082 117,638 135,568
Source: NESDB.

- 211 -
Table R2.3: GROSS REGIONAL PRODUCT - NORTH(Millions of current Baht)
Industrialorigin 1970 1971 1.972 1973 1974 1975 1976 1977 1978
AgricultureCrops 7,410 7,984 10,778 16,227 15,722 18,949 19,407 18,975 22;038Livestock 1,038 1,376 1,495 1,614 2,516 2,443 2,614 3,137 2,886Fisheries 134 192 85 183 302 295 304 397 435Forestry 836 983 865 1,230 1,679 1,558 1,872 1,828 1,805
Subtotal 9,418 10,535 13,223 19,254 20,219 23,245 24,197 24,337 2.7164
Mining &quarrying 494 526 479 506 734 552 596 825 972
Manufacturing 1,732 1,741 1,867 2,272 2,858 3,734 4,238 4,810 5,621
Construction 1,257 1,074 1,107 1,264 1,446 1,536 2,027 2,466 2,972
Electricity &water supply 613 453 491 574 674 1,383 1,549 1,797 2,089
Transportation& communi-cation 869 825 1,104 1,608 1,451 1,784 1,915 2,128 2,527
Wholesale &retail trade 3,318 3,110 3,227 4,797 6,843 7,481 8,441 9,346 11,083
Banking,insurance &real estate 244 349 397 451 608 769 934 1,108 1,286
Ownership ofdwellings 277 289 293 326 389 408 448 489 570
Public adminis-tration &defense 800 878 974 1,164 1,504 1,775 1,945 2,191 2,642
Services 1,486 1,567 1,723 1,819 2,633 3,078 3,539 4,091 4,588
Gross RegionalProduct (GRP) 20,508 21,347 24,885 34,035 39,359 45.745 49,829 53,588 61,514
Source: NESDB.

- 212 -
Table R2.4: GROSS REGIONAL PRODUCT - NORTHEAST
(Millions of current Baht)
Industrialorigin 1970 1971 1972 1973 1974 1975 1976 1977 1978
AgricultureCrops 7,415 7,448 8,037 13,371 15,522 18,691 19,831 19,482 22,313Livestock 1,592 1,833 1,966 2,000 3,443 3,745 4,245 4,334 4,408Fisheries 251 246 369 572 910 952 985 1,257 1,290Forestry 551 457 436 498 865 1,018 992 1,183 1,300
Subtotal 9,809 9,984 10,808 16,441 20.740 24,406 26.061 26.556 29.331
Mining &quarrying 207 214 190 178 113 165 320 321 419
Xanufacturing 1,861 1,900 2,081 2,561 3,312 3,576 3,850 4,592 5,145
Construction 1,347 1,320 1,206 1,453 1,861 2,360 2,841 3,646 4,424
ectricity &water supply 105 95 136 207 158 200 208 263 258
Transportation& cormuni-cation 885 979 1,213 1,622 1,764 1,542 1,679 1,827 2,045
Wholesale &
retail trade 3,362 3,205 3,577 5,208 7,102 7,770 8,510 9,529 11,021
Banking,insurance &real estate 200 303 337 413 558 689 806 969 1,111
Ownership ofdwellings 439 461 482 539 611 627 689 757 858
Public adminis-tration &defense 1,050 1,150 1,231 1,432 1,841 2,161 2,391 2,631 3,089
Services 2,163 2,488 2,719 2,940 3,289 3,816 4,209 4,954 5,478
Gross RegionalProduct (GRP) 21,428 22,099 24,060 32,994 41,349 47,312 51,564 56,045 63,159
ource: NESDB.
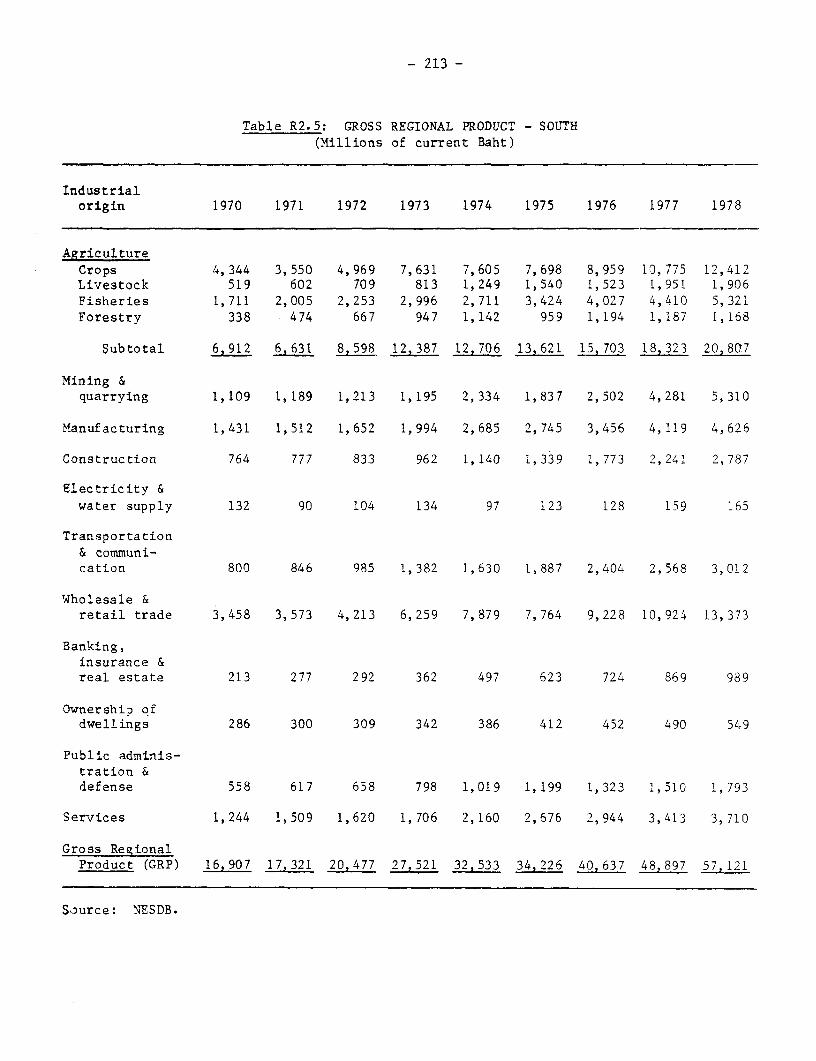
- 213 -
Table R2.5: GROSS REGIONAL PRODUCT - SOUTH(Millions of current Baht)
Industrialorigin 1970 1971 1972 1973 1974 1975 1976 1977 1978
AgricultureCrops 4,344 3,550 4,969 7,631 7,605 7,698 8,959 10,775 12,412Livestock 519 602 709 813 1,249 1,540 1,523 1,951 1,906Fisheries 1,711 2,005 2,253 2,996 2,711 3,424 4,027 4,410 5,321Forestry 338 474 667 947 1,142 959 1,194 1,187 1,168
Subtotal 6,912 6,631 8,598 12,387 12,706 13,621 15,703 18,323 20,807
Mining &quarrying 1,109 1,189 1,213 1,195 2,334 1,837 2,502 4,281 5,310
Manufacturing 1,431 1,512 1,652 1,994 2,685 2,745 3,456 4,119 4,626
Construction 764 777 833 962 1,140 1,339 1,773 2,241 2,787
Electricity &water supply 132 90 104 134 97 123 128 159 165
Transportation& communi-cation 800 846 985 1,382 1,630 1,887 2,404 2,568 3,012
Wholesale &retail trade 3,458 3,573 4,213 6,259 7,879 7,764 9,228 10,924 13,373
Banking,insurance &real estate 213 277 292 362 497 623 724 869 989
Ownership ofdwellings 286 300 309 342 386 412 452 490 549
Public adminis-tration &defense 558 617 658 798 1,019 1,199 1,323 1,510 1,793
Services 1,244 1,509 1,620 1,706 2,160 2,676 2,944 3,413 3,710
Gross RegionalProduct (GRP) 16,907 17,321 20,477 27,521 32,533 34,226 40,637 48,897 57,121
Source: NESDB.
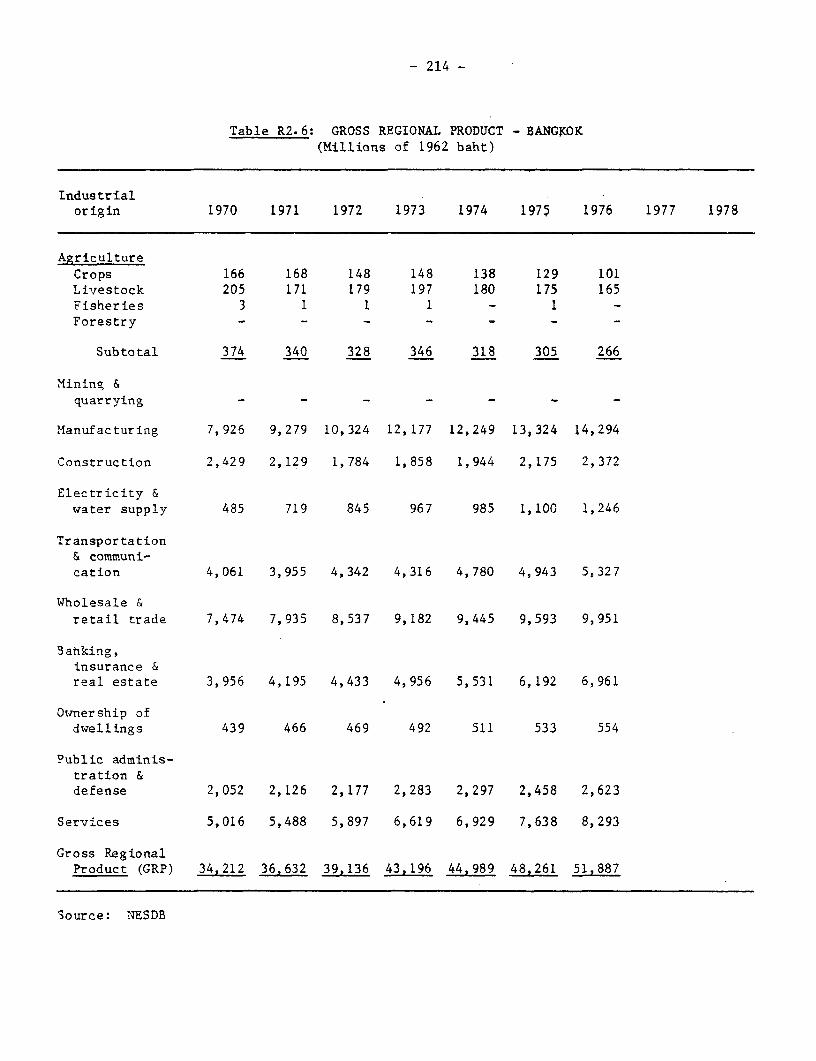
- 214 -
Table R2.6: GROSS REGIONAL PRODUCT - BANGKOK(Millions of 1962 baht)
Industrialorigin 1970 1971 1972 1973 1974 1975 1976 1977 1978
AgricultureCrops 166 168 148 148 138 129 101Livestock 205 171 179 197 180 175 165Fisheries 3 1 1 1 - 1 -Forestry - - - - - - -
Subtotal 374 340 328 346 318 305 266
Mining &quarrying - - - - - - -
Manufacturing 7,926 9,279 10,324 12,177 12,249 13,324 14,294
Construction 2,429 2,129 1,784 1,858 1,944 2,175 2,372
Electricity &water supply 485 719 845 967 985 1,100 1,246
Transportation& communi-cation 4,061 3,955 4,342 4,316 4,780 4,943 5,327
Wholesale &retail trade 7,474 7,935 8,537 9,182 9,445 9,593 9,951
Banking,insurance &real estate 3,956 4,195 4,433 4,956 5,531 6,192 6,961
Omnership ofdwellings 439 466 469 492 511 533 554
Public adminis-tration &defense 2,052 2,126 2,177 2,283 2,297 2,458 2,623
Services 5,016 5,488 5,897 6,619 6,929 7,638 8,293
Gross RegionalProduct (GRP) 34,212 36,632 39,136 43,196 44,989 48,261 51,887
Source: NESDB

- 215 -
Table R2.7: GROSS REGIONAL PRODUCT - CENTER(Millions of 1962 baht)
Industrialorigin 1970 1971 1972 1973 1974 1975 1976 1977 1978
AgricultureCrops 6,677 7,518 7,615 8,795 9,604 10,063 10,542Livestock 1,213 1,240 1,286 1,394 1,545 1,654 1,665Fisheries 2,064 2,119 2,439 2,369 2,129 2,291 2,459Forestry 993 817 814 642 751 668 615
Subtotal 10,947 11,694 12,154 13,200 14,029 14,676 15,281
Mining &quarrying 602 644 632 603 726 634 677
Manufacturing 7,460 9,305 10,502 11,932 12,231 13,354 14,440
Construction 1,692 1,350 1,386 1,431 1,398 1,474 1,599
Electricity &water supply 405 1,232 1,558 1,797 2,065 2,411 2,785
Transportation& communi-cation 1,539 1,543 1,670 1,623 1,829 1,894 2,044
Wholesale &retail trade 5,102 6,126 6,259 6,789 7,017 7,113 7,460
Banking,insurance &real estate 257 292 319 364 423 498 575
Ownership ofdwellings 1,087 1,124 1,176 1,199 1,253 1,295 1,343
Public adminis-tration &defense 1,104 1,241 1,294 1,417 1,449 1,671 1,841
Services 2,706 2,920 3,142 3,606 3,758 4,160 4,526
Gross RegionalProduct (GRP) 32,901 37,471 40,092 43,961 46,178 49,183 52,571
Source: NESDB

- 216 -
Table R2.8: GROSS REGIONAL PRODUCT - NORTH(Millions of 1962 baht)
Industrial
origin 1970 1971 1972 1973 1974 1975 1976 1977 1978
Agriculture
Crops 7,004 6,809 6,257 7,265 7,476 7,406 7,792Livestock 874 1,164 1,237 1,344 1,444 1,673 1,754Fisheries 140 196 83 128 213 163 165Forestry 781 975 751 870 775 797 803
Subtotal 8,799 9,144 8,328 9,607 9,908 10,039 10,514
Mining &
quarrying 317 328 290 296 378 319 281
Manufacturing 1,594 1,655 1,695 1,778 2,042 1,996 2,199
Construction 1,063 910 866 831 785 976 1,069
Electricity &water supply 704 698 776 897 971 987 1,038
Transportation& communi-
cation 775 741 904 1,135 1,099 1,267 1,419
Wlholesale &retail trade 2,655 2,700 2,461 2,877 3,266 3,276 3,389
Banking,insurance &real estate 207 299 313 292 310 329 374
Ownership of
dwellings 231 237 240 247 254 263 271
Public adminis-
tration &defense 677 745 762 819 855 884 954
Services 1,185 1,201 1,291 1,358 1,480 1,518 1,610
Gross Regional
Product (GRP) 18,207 18,658 17,926 20,137 21,348 21,854 23,118
Source: NESDB
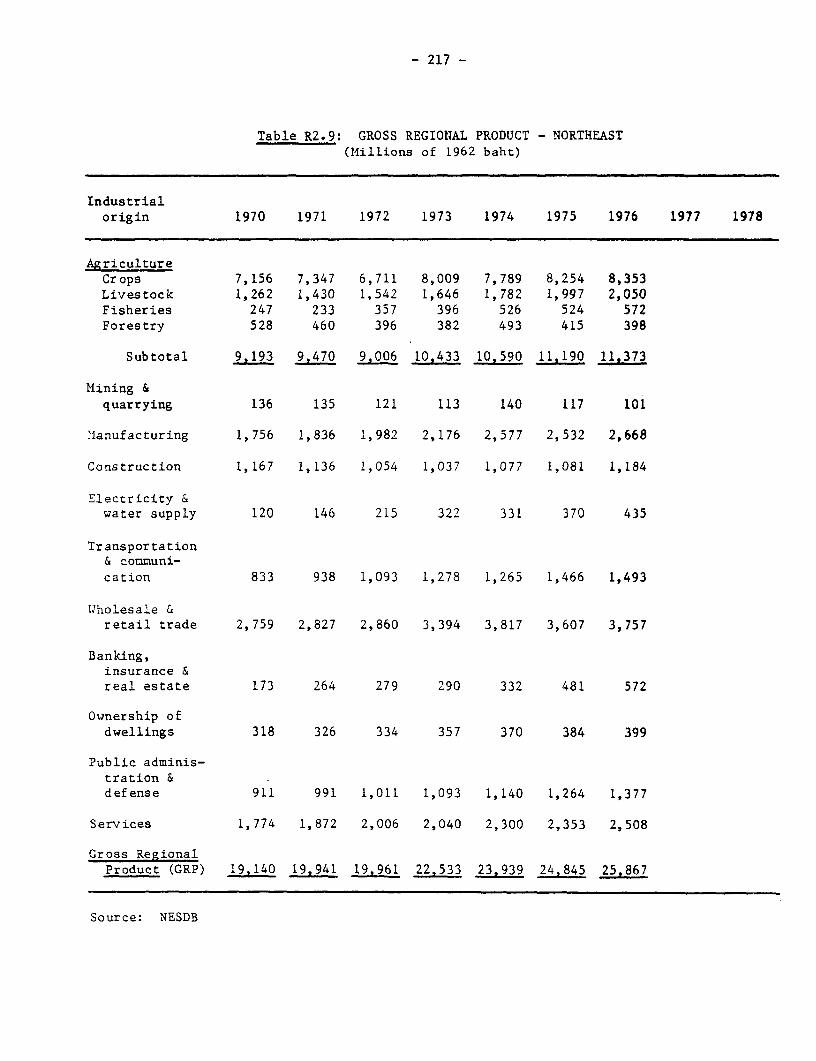
- 217 -
Table R2.9: GROSS REGIONIAL PRODUCT - NORTHEAST(Millions of 1962 baht)
Industrialorigin 1970 1971 1972 1973 1974 1975 1976 1977 1978
AgricultureCrops 7,156 7,347 6,711 8,009 7,789 8,254 8,353Livestock 1,262 1,430 1,542 1,646 1,782 1,997 2,050Fisheries 247 233 357 396 526 524 572Forestry 528 460 396 382 493 415 398
Subtotal 9,193 9,470 9,006 10,433 10,590 11,190 11.373
Mining &quarrying 136 135 121 113 140 117 101
Manufacturing 1,756 1,836 1,982 2,176 2,577 2,532 2,668
Construction 1,167 1,136 1,054 1,037 1,077 1,081 1,184
Electricity &water supply 120 146 215 322 331 370 435
Transportation& communi-cation 833 938 1,093 1,278 1,265 1,466 1,493
Wholesale &retail trade 2,759 2,827 2,860 3,394 3,817 3,607 3,757
Banking,insurance &real estate 173 264 279 290 332 481 572
Ownership ofdwellings 318 326 334 357 370 384 399
Public adminis-tration &defense 911 991 1,011 1,093 1,140 1,264 1,377
Services 1,774 1,872 2,006 2,040 2,300 2,353 2,508
Gross RegionalProduct (GRP) 19,140 19,941 19,961 22,533 23,939 24,845 25,867
Source: NESDB
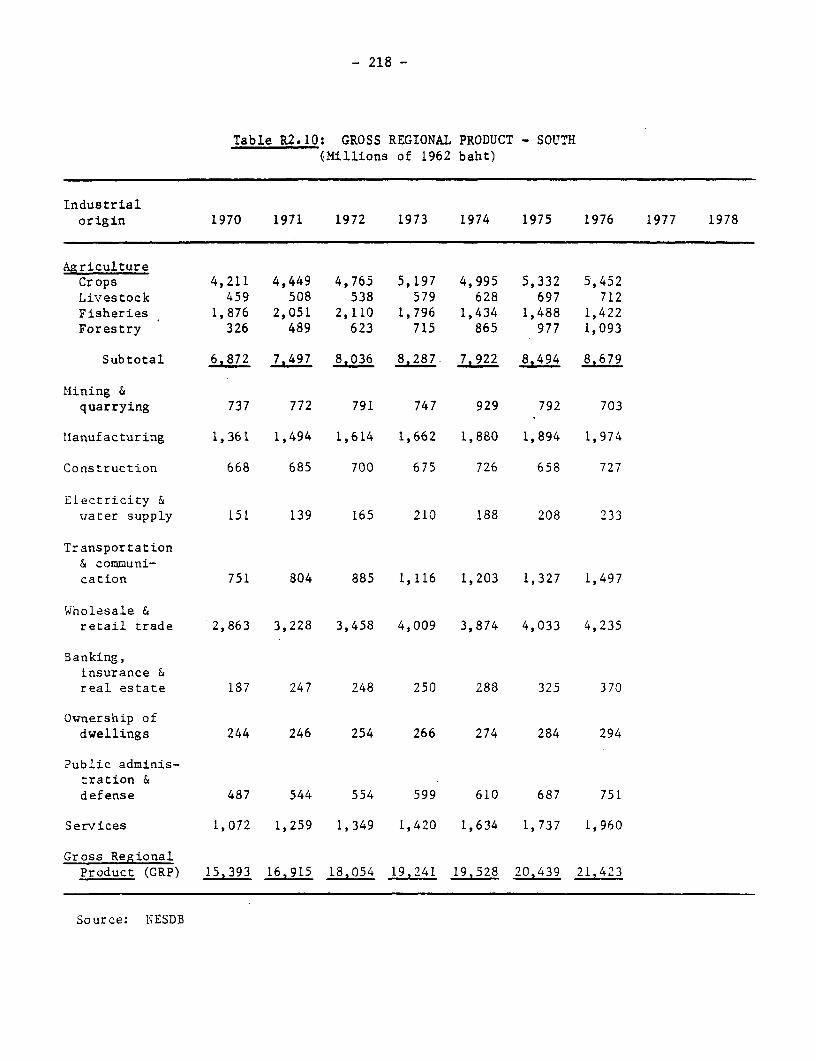
- 218 -
Table R2.10: GROSS REGIONAL PRODUCT - SOUTH(Millions of 1962 baht)
Industrialorigin 1970 1971 1972 1973 1974 1975 1976 1977 1978
AgricultureCrops 4,211 4,449 4,765 5,197 4,995 5,332 5,452Livestock 459 508 538 579 628 697 712Fisheries 1,876 2,051 2,110 1,796 1,434 1,488 1,422Forestry 326 489 623 715 865 977 1,093
Subtotal 6,872 7,497 8,036 8.287 7,922 8,494 8,679
Mining &quarrying 737 772 791 747 929 792 703
Hlanufacturing 1,361 1,494 1,614 1,662 1,880 1,894 1,974
Construction 668 685 700 675 726 658 727
Electricity &uiater supply 151 139 165 210 188 208 233
Transportation& communi-cation 751 804 885 1,116 1,203 1,327 1,497
Wholesale &retail trade 2,863 3,228 3,458 4,009 3,874 4,033 4,235
Banking,insurance &real estate 187 247 248 250 288 325 370
Ownership ofdwellings 244 246 254 266 274 284 294
Public adminis-tration &defense 487 544 554 599 610 687 751
Services 1,072 1,259 1,349 1,420 1,634 1,737 1,960
Gross RegionalProduct (GRP) 15,393 16,915 18,054 19,241 19,528 20,439 21,423
Source: NESDB

Table R7.1: ARrA Pl.ANTFr, YIELD ANT1 PROODICTTON OF MAJnR CROPS,
3959/60-jq7R/79 CFNTRAI. RFrIOnv
1959/60 IQ60/61 1961/62 1962/63 1963/64 1964/55 196S/66 IQ66/67 1067/6A 196R/69 1969/7n 1970/71 1171/7? 1072/73 1q73/74 1974/75 1q7S/76 1976/77 1]77/78 1979/79P IQ79/80P
Area Planted (000 rai)Paddy 12,588 12,563 12,825 12,525 13,225 13 ,477 13,76 13,98 11,789Q 14,194 13,410 13,04n 11 I70 14,963 15,494 14,960 15,055 15,149 15 ,277 17,276 13,699
Rubber n.a. n.a. na. n.a. n.a. n.a. n.a. n.a. n.a. n.a. n.a. n.a. n.a. n.a. n.a. n.a. n.a. n.a n.a n.a n.a.
Malze 412 762 1,(0)11 1,n1 1,088 1,545 1,494 1,694 1,9q9 1,937 n.a. n.a. n.a. n.a. 1,903 2 011 2,'024 1,857 1,581 1,796 n.a.
Sorghae - - - - - 0 123 311 172 74 110 1?6 . Q7 159 349 -S0 61S n.a. n.a. 537 n.a.
Kenaf - 12 24 2 - 2 - 22 7 3 n.a. n.a. n.a. n.a. 51 36 28 - 5 30 17
Cassava 342 376 947 659 738 525 451 619 679 883 n.a. n.a. n.a. n.a. 1,624 1,627 1,888 2,151 2,168 2,426 2,146
Sugarcane 376 462 301 306 564 552 921 458 622 753 n.a. n.a. n.a. n.a. 1,391 1,569 2,029 2,365 2,R03 2,397 2,061Tobacco (Virginia) - - - - - - - - - - - - _ _ _ _ - _ _ _
Coconut n.a. n.a. n.a. n.a. n.a. n.a. n.a. n.a. n.a. n.a. n.a. n.a. n.a. n.a. n.a. n.a. n.a. n.a n.a n.a n.a.
Cotton 33 46 92 86 1n3 45 55 64 101 n.a. n.a. n.a. n.a. n.a. 37 32 29 27 171 130 n.a.
Croundnuts 209 311 141 127 93 97 105 146 125 11 n.a. n.a. n.a. n.a. 146 142 129 118 87 130 n.a.
Soybeans 11 16 19 17 31 25 42 46 23 21 n.a. n.a. n.a. n.a. 86 118 52 15 142 133 n.a.
Mung beans 74 99 9h 75 72 77 144 225 207 166 220 n.a. n.a. n.a. 302 227 302 184 624 503 n.a.
Yield (kg/ral)Paddy 226 277 296 294 322 "39 305 2-8 277 252 209 285 296 312 352 322 309 337 350 351 337
Rubber n.a. n.a. n.a. n.a. n.a. n.a. n.a. n.a. n.a. n.a. n.e. n.a. n.a. n.a. n.a. n.a. n.a. n.a n.a n.a n.a.
Maize 257 314 120 344 135 286 326 247 277 3n2 n.a. n.a. n.a. n.e. 341 134 355 376 179 332 n.a.
Sorghum - - - - - 5R9 402 30S 371 314 287 294 284 229 216 356 754 n.e, n.a. 190 n.a.
Kenaf 193 173 169 190 274 20n 155 149 149 285 n.a. n.e. n.a. n.a. 161 148 167 - 163 189 176 'o
Cassava 2,971 2,933 2,933 2,107 2,542 2,511 2,531 7,52R 7,516 2,5Al n.a- n.a. n.n. n.a. 3,174 ?,165 2,198 2,144 2,341 2,717 1,719
Sugarcane 6,R16 6,593 6,118 6,049 5,556 5,7*? 5,91n 5,737 ,l321 5,839 n.a. n.a. n.a. n.a. 8,477 7,711 9,513 8,698 5,494 6,911 4,Iq3
Tobacco (VirgInia) - - - - - - - - - - - - - - - - - - -
Coconut n.a. n.a. n.a. n.a. n.a. n.a. n.a. n.a. n.a. n.a. n.a. n.a. n.a. n.a. n.a. n.a. n.a. n.a n.a n.e n.a.
Cotton 118 126 RR 106 70 19 13P 199 64 n.a. n.a. n.a. n.a. n.a. 157 20? 144 201 167 192 n.a.
Croundnuts 216 218 215 215 202 215 197 196 lJn 2n3 n.a. n.e. n.a. n.a. tR7 211 19n 191 161 190 n.a.
Soybeans 126 129 135 142 156 15 157 155 144 147 n.a. n.a. n.a. n.a. 141 107 157 161 111 151 n.a.
Mung beans 159 178 169 174 158 159 15F 160 111 171 124 n.a. n.. n.a. 119 163 107 7n 76 92 n.a.
Production (000 tons)
Paddy 2,845 3,476 3,668 3,691 4,265 4,145 4,141 4,r 1 3,819 3,57n 4,n01 3,70 1 ,980 4,491 5,451 4,R29 4,647 5,1 13 5,351 6,059 4,617
Rubber n.a. n.a. n.a. n.a. n.a. n.a. n.a. n.a. n.a. n.a. n.a. n.a. n.a. n.a. n.a. n.a. n.-. n.a n.a n.a. n.a.
Maize 106 239 323 34Q 164 457 487 419 471 555 n.a. n.a. n.a. n.a. *49 671 71R 699 284 596 n.e.
Sorghm - - - - - 5 50 64 64 223 34 17 56 36 76 141 156 n.a. n.a. 102 n.a.
Kenaf - 2 4 - - - - 3 - I n.a. n.a. n.a. n.a. 8 5 5 - 1 6 3
Cassava 1,016 1,104 1,607 1,914 1,877 1,317 1,137 1,S63 1,700 2,282 n.a. n.a. n.a. n.a. 1,531 3,522 4,133 5,044 5 075 6S590 4,033
Sugarcane 2,565 3,047 1, 38R 1,847 3,132 3,179 3,n25 2,619 3,309 4,I97 n.a. n.a. n.a. n.a. 11,714 13,094 17,274 20,S550 15,399 16,563 9,053
Tohacco (VirgInia) - -Coconut n.a. n.a. n.a. n.a. n.a. n.a. n.a. n.a. n.a. n.a. n.a. n.a. n.a. n.a. n.a. n.a. n.a. n.a n.a n.a n.a.
Cotton 4 6 A 9 7 .3 7 12 6 n.a. n.a. n.a. n.a. n.a. 6 6 4 5 29 25 n.a.
Groundnuts 44 69 30 27 Iq 21 21 29 22 24 n.a. n.a. n.a. n.a. 27 30 15 76 14 25 n.a.
Soybeans 1 2 3 2 5 4 7 7 3 3 n.a. n.a. n.a. n.a. 12 13 8 2 16 20 n.a.
Mung beans 12 18 16 13 11 13 23 36 27 2R 28 n.a. n.a. n.a. 39 37 21 13 47 46 n.ae
Source: Office of Agricultural Econonics, MOAC.
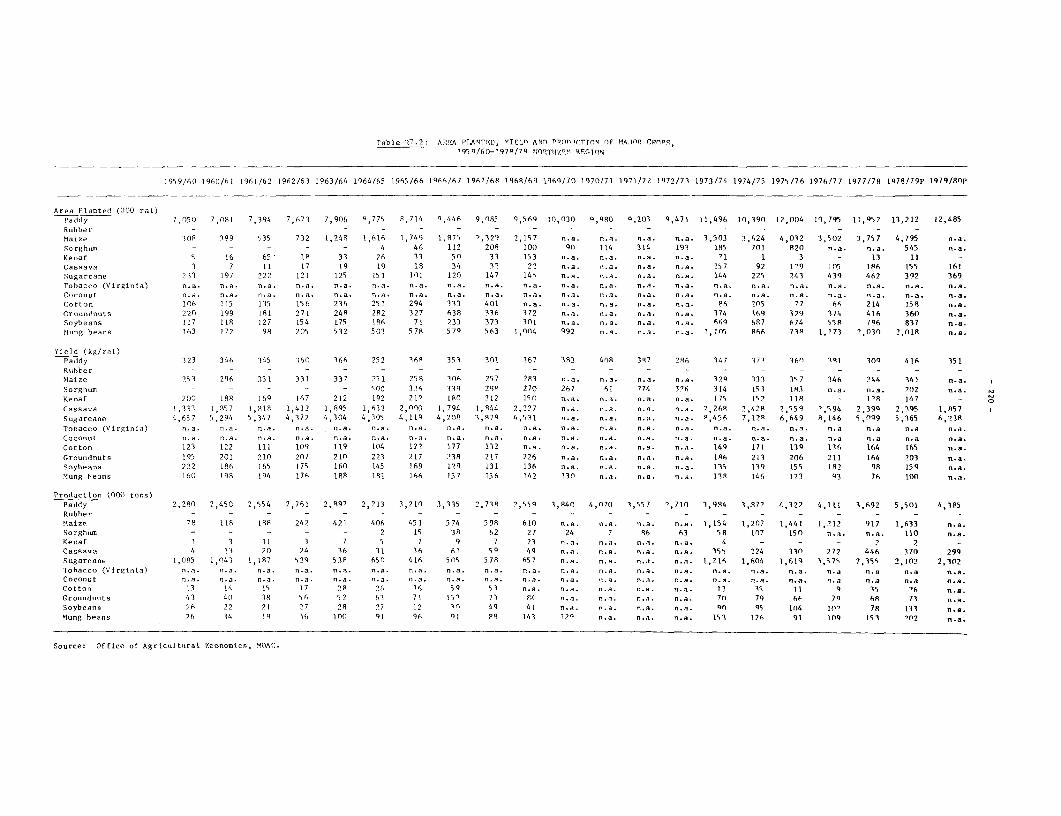
'Table 17 .2 AREA PT.MTIiO, VITILD ANSi PPOnPITCP1 OP M.9105 CPor's
195 9/60-197R/79 IIORT9iPTP REGIOTfN
1 95 9/6 0 1960/6 1 196 1/6 2 1962 /6 3 1963/64 19)64 /65 1 965 /6 6 1966)/6 7 196 7/6 9 1969 /694 19691/70 1970/71 1971/72 1972/73 1973/74 1974/75 1975/76 1976/77 1977/78 1978/79P 1979/8nP
Area Planted (000 rat)Paddy 7,050 7,081 7,394 7,673 7,906 9,775 9,714 n,446 9,095 9,569 10,030 9,990 0,20l3 9,471 11,496 10,390 12,004 10),7 95 11,952 13,212 17 1.85Rabbe r - - - - - - - - - -
Ma ize 308 399 5 35 7 32 L1, 249 1,616 1,749 1,975 7,329 2,157 n.e. n... n.a. n.a. 3,503 3,624 4,032 3,502 3,757 4,795 n.a.So rghnm - - - - - 4 46 112 208 100 g0 114 l1i 193 185 701 820 n.ea. n.e. 545 n.a.Kenaf 5 16 65 19 33 26 33 50 3 3 153 .. a. n.a. n... n.e. 71 1 3 - 13 11 -Casee-a 3 7 11 12 19 19 19 34 33 27 n.a. n.a. n.a. n.a. 157 92 1 S 105 186 1515 161Sugarcane 2733 19 7 2 22 12 1 125 15 1 1 01 1 20 14 7 145 n.e. n.e. n.a. n.e. 144 225 2431 4 39 462 3 92 369Tnbacco (Virginia) n.e. n.e. n.e. n.e. n.a. n.e. n.a. n.a. n.a. n.a. n.e. .. a. n.a. n.a. n.a. n.e. n.e. n.a. n.a. n.e. n.a.C-ennut n.e. n.a. n.a. n.e. n.a. n.a. n.e. n.a. n.a. n.a. n.a. n.a. n.a. n.e. n.a. .. a. .. a. n.a. n.e. n.a. n.a.
nitton 106 1 15 1 35 156 236 25 1 294 3 33 401 n.e. n.a. n.a. n.a. n.e. 96 705 77 66, 214 159 n.a.Cr-nodnuts 770 199 191 2 71 24R 292 327 639 336 372 n.e. n.a. n.a. n.e. 374 369 329 3174 416 360 n.a.Soybeans I117 119 12 7 15 4 175 196 7 1 233 3 73 301I n.e. n. a. n.ea. n.e. 669l 69 7 6 74 558t 796 83 7 n.e.Mang beans 163 1 72 99 705 5 32 5 03 579 5 79 5 63 4,004 492 .. a. n.a. n.e. 1, 1 0 866 7354 1, 173 3, 030 2,01R n.a.
Yield (kg/rai)Paddy 3 23 3 46 3 45 360 36A 25 2 369 35 3 01 267 393 409 397 796 34 7 3 73 3 60 391 309 4 16 35 1Robber - - - - - --- - - - ---
Maize 753 296 35 1 331 3 37 74 1 259 3 06 25 7 7 93 n.e. n.a. n.a. n.e. 379 3331 397 34 6 744 34 1 n.e.Sorghum - - - - - 500 376r 339 799 270 2 67 6 1 7 74 376r 3 14 I1? 18I3 n.e. n.e. 702 n. .a.Kenef 700 199 1 69 16 7 2 12 192 21 1 90lp 712 iSO0 n.a. n.e. I... n.e. 3 75 Is? 118 - 179 14 7-C.ssn-a 1,337 1,95 7 1 , 951 1, 41'2 1,9895 1, 637 2000 1, 7 94 1,8A44 2,2717 n.e. n... n. .. n.e. ,2 69 2,428 7,559 9,94 2,399 2,3'95 1,957Sugarcase 4 ,65 7 5,2 94 5 ,3 47 4 ,3 72 4 ,3 04 4 ,305 4,119 4,209 3,979 4,53 1 n.e. n.ea. n.. n.e -. 8,456 7, 129 6,649 9 ,146 5,099 5,365 6 ,23RTnheres (Virglini) n.a. n.e. n... n.a. n.a. n.e. n.a. n.a. n.a. n.a. n.e. n.a. n.a. n.a. n.a. n.e. n.e. n.a n.e n.e .e.aCoconut n.e. n.a. n.a. n.e. n.a. n.a. n.a. n.a. n.e. n.8. n.e. n.a. n.a. n.a. n.a. n.a. n.e. -ae -. a n.a n.a.Cotton 123 122 111 109 119 104 127 177 132 n.e. n.a. n... n.a. n.e. 149 171 139 13 6 164 165, n.e.Gros,ndnutn 195 201 7 10 20 7 710 2 23 2 17 738 2 17 226 n.ea. n.a. n.a. n.e. 186 2 13 206 2 11 164 203 n.e.Soybeans 7722 196 165 1 79 160 145 169 179 13 1 13 6 n.e. n.e. n.e. n.ea. I-3, 13 9 1591 192 98t 15 9 n.e.Mung heaun 160 199 i94 176 198 191 166 15 7 15 6 142 130 n.ea. n.a. n.e. 138 146 123 93 7 6 100 n.e.
Production (000 inns)Paddy 2,290 2,450 2,554 2,26F,1 2 ,99'7 2,213 3,210 3,335 2,73 7-4F ,959 3,940 4,070 35 57 7,710 3 , 994 3 ,977, 4,322 4,111 3,692 5,501 4,385Rubber - - - - - - - - - - - --------
Maeize 78 119 199 2472 471 406 45 1 574 599 610 n.e. n.e. n.a. n.e. 1,154 1,207 1,441 1,312 917 1,633 n..aSorghum - - - - - 2 15 39 62 2 7 24 7 9t6 63 58 107 150f n.a. n.e. 110 n.e.Kenaf 1 3 11 3 7 5 7 9 7 23 n.e. n.e. n. n. n.. 4 - - - 2 2 -Casse-a 4 13 20 24 36 31 36 61 59 49 n.e. n.e. n.a. n.a. 3 551 224 330 272 446 370 299Sugareene 1,095 1,043 1,197 529 538 650 416 505 579 657 n.e. n.e. n.a. n.e. 1,216, 1,604 1,619 3,579 3,,355, 210' 2,302Toheeco (Virginia) n1.e. n... n.e. n.e. n.e. n-e n.e. n.a. n.e. n.e. -. e. n.e. n.a. n.a. n.e. n.a. n.a. n.a n.. n-e n.e.Coconut n... n.e. n... -. e. n.a. -ae. n.e. n.e. n-e n.e. n. n. n.. n.e. n.e. n.e. n.a. -ae. n.a .. e n.e n.e.Cotton 13 1 4 15l 17 78 74 36 59 53 n.e. -A. .. n-e n.e. 13 351 11 9) 15 96 n.a.Oronundots 4.3 40 39 56 57 631 71 152 73 14 n.e. n... n.e. n.e. 703 79 66; 79 68 73 n.e.Soybeans 7 6 22 7 1 7 7 29 7 7 1 2 0( 4 9 41I n..e. n.ea. n.e. n... Q(3 95 104 107 78 13 3 n.a.bong beans 76 34 1 9 36 10 91 g 96( q I 89 143 129) n.e. n.a. n.e. 153 12 6 91 1094 i 19 '02 n.e.
Source: Office of Agricult,ral Fconomle-, MaOAC.
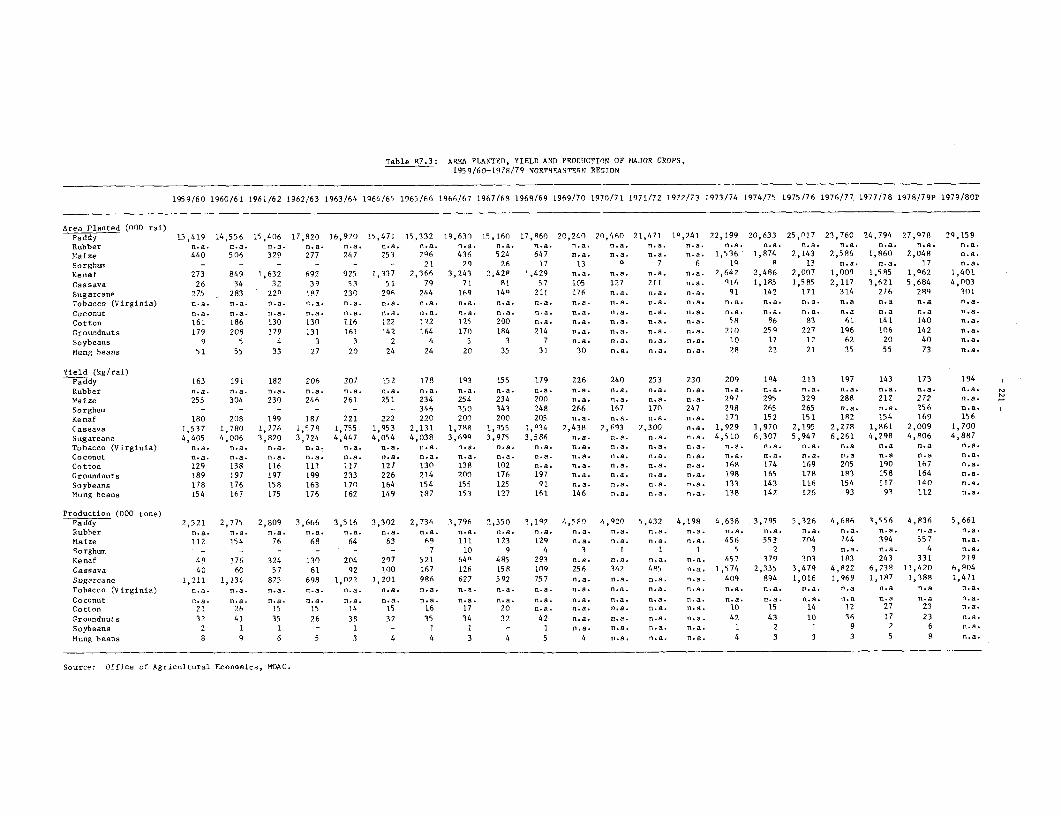
Table R7.3: AREA PLANTED, YIELD AND PROVOCTPIO! OP MfAJOR CRZOPS,
1959/60-1978/79 NO2RTHFA9;TETJIN REGTON
195 9/60 196016 1 1961/62 1962/63 1963/64 1964 /65 1965 /66 1966/67 1967/69 1969/69 1969/70 1970/71 1971/72 1972/73 1Q73/74 1974/75 1975/76 1976/77. 1977/78 1978/79P 1979/SOP
Area Planted (000 rai)Paddy 15,419 14,556 15,406 17,820 16,970 15,471 15,332 16,630 15,160 17,A60 70,240 20,460 21,471 19,741 72,199 20,633 25,017 23,760 24,794 27,q79 2q,159
Rubber n.a. n.9. n.a. n.a. n.a. n.a. 0.a. n.a. n.a. -. a. n.a. n.a. n.a. n.a. n.a. n.a. n.a. n.a. n.9. n.a. n.9.
Maize 440 506 329 277 247 253 296 43-16 524 647 n.a. n.9. n.a. n.a. 1,536 1,974 2,143 2,596 1,960 2,048 n.a.
Sorghum - - - - - 21 26 26 17 13 6 7 6 16 9 13 n.a. n.a. 17 n.a.
Kenaf 273 849 1,632 692 925 1,337 2,366 3,243 2,429t 1,429 n.a. n.a. n.a. n.a. 2,647 2,486 2,007 1,006 1.,585 1,062 1,401
C.assava 26 34 32 39 53 51 79 71 91 57 105 127 211 n.a. 616 1,195 1,9985 2,117 3,621 5,694 4,003
Sugarcane 275 -~293 226 197 230 29)6 244 169 14Q 211 176 n.a. n.a. n.a. 91 142 171 314 276 296 301
Tobacco (Virginia) o.a. n.a. n.a. n.a. n.a. n.9. n.a. n.a. n.a. 0.a. n.a. n.a. o.a. n.a. nl.a. n.a. n. a. n.9 n.9 n.a fl.a.
Coconut n.9. n.a. 0.9. n.a. n.a. n.a. n.a. 0.9. n.a. n.a. n.a. n.a. n.a. n.a. n.a. n.a. n.a. fl.a n.9 n.a 0.9.
Cotton 161 186 130 130 116 122 1?2 135 200 n.a. n.a. n.a. n.a. 0.9. 59 96 83 61 141 140 0.9.
Croundnuts 179 208 1 79 131 161 142 164 170 194 214 n.a. n.a. n.a. n.a. 210 259Q 227 196 106 142 0.9.
Soybeans 9 5 4 3 3 2 4 5 3 7 n.a. n.a. n.a. n.a. 10 17 12 62 20 40 n.a.
Iluflg beans 51 55 33 27 20 24 24 20 35 31 30 0.a. 0.9. 0.9. 29 22 21 35 55 73 n.9.
Yield (kg/rai)Paddy 163 191 182 206 207 152 179 163 155 179 226 240 253 230O 209 164 213 197 143 173 194
Rubber n.a. n.a. n.a. 0.9. 0.9. 0.9. n.a. n.a. n.a. 0.9. 0.a. 0.a. n.a. 0.9. 0.9. 0.9. n.a. n.a. n.a. n.a. n.9. ,
Maize 255 304 230 246 261 25 1 234 254 234 200 n.a. n.a. n.a. o.a. 397 2Z95 329 289 212 272 n.a. .
Sorghum - - - - - - 346 350 343 248 266 167 170 247 298 265 265 n.9. n.a. 256 n.a.
Kenaf 180 208 199 187 221 222 220 200 200 205 0.9. 0.9. n.a. n.a. 173 152 15 1 192 154 169 156
Cassava 1,5 37 1,780 1,776 1,579 1,755 1, 95 3 2,131 1,798 1,955 1,034 7,4 39 2,693 2,300 n.a. 1,929 1,970 2, 195 2 ,2 79 1,961 2,009 1,700Sugarcane 4,405 4,006 3,1920 3,724 4,447 4,054 4,038 3,699) 3 ,6975 3,586 n.a. 0.9. 0.a. 0.9. 4,5 10 6,307 5,947 6,261 4,298 4,806 4,887Tobacco (Virginia) n.a. n.9. n.a. n.a. n.a. n.a. 0.9. 0.9. 0.a. n.a. n.a. 0.9. 0.9. n.a. 0.9. 0.a. n.9. n.9 0.9 n.a 0.9.
Coconut n.a. n.a. n.a. n.a. 0.a. n.9. n.a. n.a. n.9. 0.9. n.a. n.9. n.a. n.a. n.9. n.a. v.a. n.a n.a 0.9 0.9,
Cotton 129 138 116 113 117 127 130 139 102 0.9. 0.9. 0.9. 0.9. n.9. 169 174 169 205 190 167 0.9.
Croundnuts 199 197 197 199 233 226 214 200 176 197 n.a. 0.9. 0.a. n.a. 199 165 179 193 15 8 164 n.a.
Soybeans 178 176 159 163 170 164 154 159 125 91 n.a. n.a. c.9. -.a. 133 143 116 154 117 140 0.a.
M.ng beans 154 167 175 176 162 149 187 153 137 161 146 n.a. n.9. o.a. 139 142 126 93 93 112 n.a.
Production (000 tons)Paddy 2,521 2,775 2,809 34,666 3,516 3,302 2,734 3,796 2,350 3,107 4,590 4,620 5,432 4,198 4,639 3,795 5,326 4,696 3,5 56 4,836 5,661
Rubber n.9. 0.0. n.9. 0.9. n.a. n.a. n.9. 0.9. 0.a. 0.a. 0.9. 0.0. 0.9. 0.9. 0.9. 0.9. n.a. n.9. 0.9. n.a. 0.9.
Maize 112 154 76 68 64 63 69 ill 123 129 n.a. n.9. n.9. 0.9. 456 553 704 744 394 557 0.9.
Sorghum - - - - - - 7 10 9 4 3 1 1 1 5 2 3 n... 0.9. 4 n.a.
Kenaf 46 176 324 1310 204 297 521 646 495 293 0.9. 0.9. n.9. n.9. 457 379 303 183 243 331 219
Cassava 40 60 57 61 92 100 167 126 15 8 106 256 342 495 n.a. 1,574 2,335 3,479 4,922 6,739 11,420 6,904
Sugarcane 1,211 1,134 873 698 1,022 1,201 99 622 592 75 7 0.9. n.9. 0.9. 0.9. 409 994 1,016 1,669 1,197 1,399 1,471
Tobacco (Virginia) n.a. 0.9. 0.a. 0.9. n.9. n.a. n.9. 0.9. 0.9. 0.9. n.9. 0.9. n.9. 0.a. n.9. 0.9. n.a. 0.9 n.9 0.9 n.9.
Coconut n.9. 0.9. n.9. 0.9. n.a. n.9. n.a. 0.9. 0.9. -. 9. n.9. 0.9. n.a. 0.9. 0.9. 0.a. n.9. n.9 0.9 n.a n.9.
Cotton 21 26 15 15 14 15 16 17 20 n.a. o.a. 0.9. 0.9. 0.9. 10 15 14 12 27 23 0.9.
Groundnuts 32 41 35 26 38 32 35 34 32 42 0.9. 0.9. 0.9. 0.9. 42 43 10 36 17 23 n.a.
Soybeans 2 1 1 - I - 1 1 - 1 n.a. 0.9. 0.9. n.a. 1 2 1 9 2 6 n.a.
Miung beans 9 9 6 5 3 4 4 3 4 5 4 0.9. n.a. n.9. 4 3 3 3 5 8 n.a,
Source: Office of Agricultural Economics, MOAC.
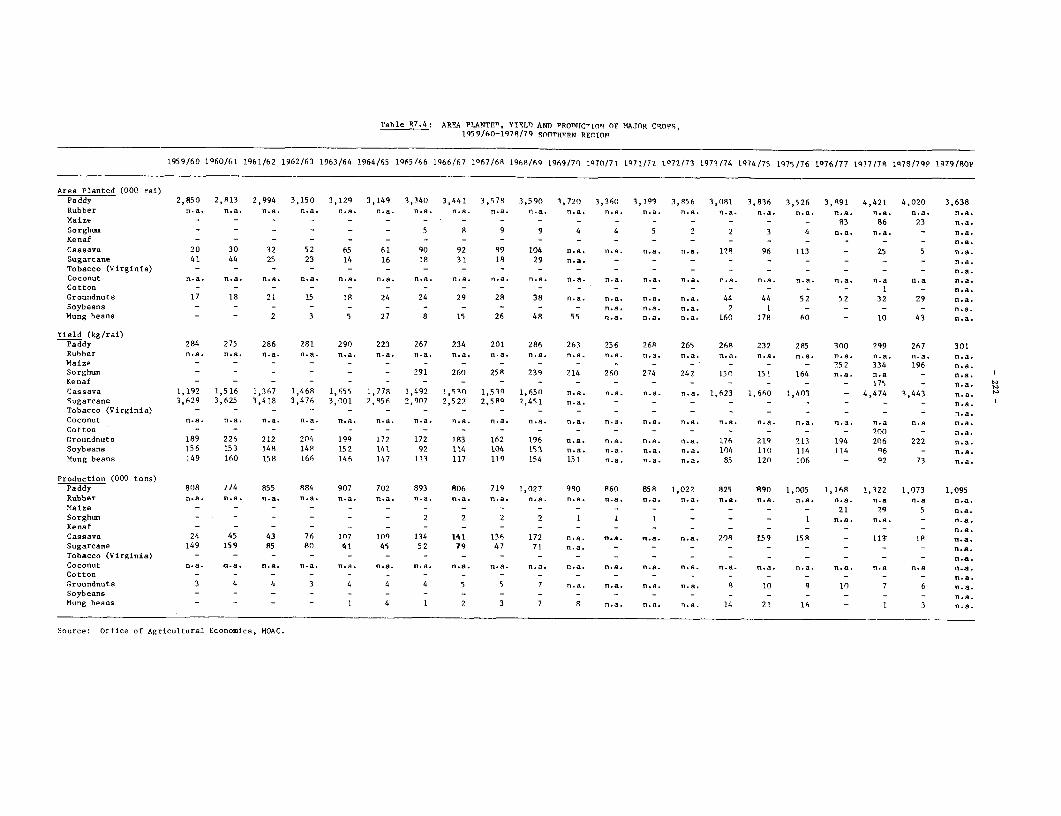
Table R7.4: AREA PLANTEn, YIELTl AND PROOICTC1rtM OF MAJOR CROPS,1959/60-1978/79 SOh!THCRN REriON,
1959/60 1960/61 1961/62 1962/63 1963/64 1964/65 1h65/66 1966/67 1067/68 1968/69 1969/70 1970/71 tQ71/72 1072/73 1971/74 1974/75 1975/76 1976/77 1977/7R IQ78/7mP 1979/gop
Area Planted (000 rai)Paddy 2,850 2,813 2,994 3,150 3,129 3,149 1,340 3,441 3,57R 3,590 1,720 3,360 3,199 3,856 3,081 3,836 3,526 3,R91 4,421 4,020 3,638Rubber n.a. n.a. n.a. n.a. n.a. n.a. n.a. n.a. n.a. n.a. n.a. n.a. n.a. n.a. n.a. n.a. n.a. n.a. n.a. n.a. n.a.Maize - - - - - - - - - - 83 86 23 n.a.Sorghum - - - - - - 5 8 9 9 4 4 5 2 2 3 4 n.a. n.a. - n.a.Kenaf - - - - - - - - - - - - - - - - - - - - n.a.
Cassava 20 30 32 52 65 61 90 92 89 104 n.a. n.a. n.a. n.a. 128 96 113 - 25 5 n.e.Sugarcane 41 44 25 23 14 16 18 31 18 29 n.a. - - - - - - - - - n.a.Tobacco (Virginia) - - - - - - - - - - - - - - - - - - - - n.a.Coconut n.a. n.a. n.a. n.a. n.a. n.a. n.a. n.a. n.a. n.a. n.a. n.a. n.a. n.a. n.a. n.a. n.a. n.a. n.a n.a n.a.Cotton - - - - - - - - - - - - - - - - - - I - n.a.Groundnuts 17 18 21 15 18 24 24 29 28 38 n.a. n.a. n.a. n.a. 44 44 52 52 32 29 n.a.Soybeans - - - - - - - - - - - n.a. n.a. n.a. 2 1 - - - - n.a.Mung beane - - 2 3 5 27 8 15 26 48 55 n.a. n.a. n.a. 160 178 60 - 10 43 n.a.
Yield (kg/rai)Paddy 284 275 286 281 290 223 267 234 201 286 263 256 268 265 268 232 285 300 299 267 301Rubber n.a. n.a. n.a. n.a. n.a. n.a. n.a. n.a. n.a. n.a. n.a. n.a. n.a. n.a. n.a. n.a. n.a. n.a. n.a. n.a. n.a.Maize -- - - 252 334 196 n.a.Sorgbum r - - - - - 291 260 258 239 214 260 274 242 15n 151 164 n.a. n.a - n.a.Kenaf - - 175 - n.a.
Cassava 1,192 1,516 1,367 1,468 1,655 1,778 1, 492 1,510 1,538 1,65n n.a. n.a. n.a. n.a. 1,623 1,660 1,403 - 4,474 3,443 n.a.Sugarcane 3,629 3,625 3,418 3,476 3,001 2,856 2,907 2,527 2,588 7,451 n.a. - - - - - - - - - n.a.Tobacco (Virginia) - - n.e.Coconut n.a. n.a. n.a. n.a. n.a. n.a. n.a. n.a. n.a. n.a. n.a. n.a. n.a. n.a. n.a. n.a. n.a. n.a. n.a n.a n.a.Cotton - - - - - - - - - - - - - - _ - _ - 200 - n.a.
Groundnuts 189 226 212 204 199 172 172 183 162 196 n.a. n.a. n.a. n.a. 176 219 213 194 206 222 n.a.Soybeans 156 153 148 148 152 141 92 114 104 153 n.a. n.a. n.a. n.a. 104 110 114 114 96 - n.a.Mung beans 149 160 158 166 146 147 113 117 119 154 151 n.a. n.a. n.a. 85 120 106 - 92 73 n.a.
Production (000 tons)Paddy 808 774 855 884 907 702 893 806 719 1,027 980 860 858 1,022 825 890 1,005 1,168 1,322 1,073 1,095Rubber n.a. n.a. n.a. n.a. n.a. n.a. n.a. n.a. n.a. n.a. n.a. n.a. n.a. n.a. n.a. n.a. n.a. n.a. n.a n.a n.a.Maize - - - - - - - - - - - - - - - - - 21 29 5 n.a.Sorghum - - - - - - 2 2 2 2 1 1 1 - - - 1 n.a. n.a. - n.a.Kenaf - - - - - - - - - - - - - - - - - - - - n.a.Cassava 24 45 43 76 107 109 134 141 136 172 n.a. n.a. n.a. n.a. 208 159 158 - 11i 18 n.a.Sugarcane 149 159 85 80 41 45 52 79 47 71 n.a. - - - - - - - - - n.a.Tobacco (Virginia) - - - - - - - - - - - - - - - - - - - - n.a.Coconut n.a. n.n. n.a. n.a. n.a. n.a. n.a. n.a. n.a. n.a. n.a. n.a. n.a. n.a. n.a. n.a. n.a. n.a. n.a n.a n.a.Cotton - - - - - - - - - - n.a.Groundnuts 3 4 4 3 4 4 4 5 5 7 n.a. n.a. n.a. n.a. 8 10 9 10 7 6 n.a.Soybeans - - - - - - - - - - - n.e.Mung beans - - - - 1 4 1 2 3 7 8 n.a. n.a. n.a. 14 21 16 - 1 3 n.a.
Source: Office of Agricultural Economics, MOAC.
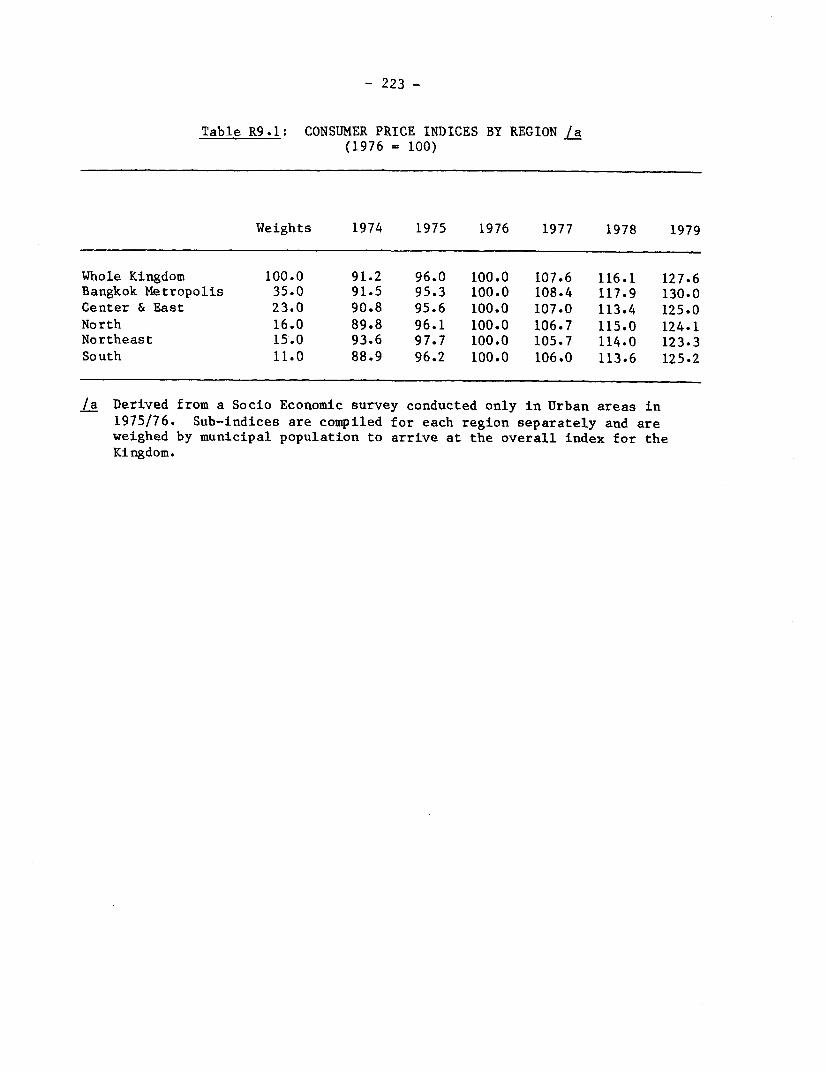
- 223 -
Table R9.1: CONSUMER PRICE INDICES BY REGION /a(1976 = 100)
Weights 1974 1975 1976 1977 1978 1979
Whole Kingdom 100.0 91.2 96.0 100.0 107.6 116.1 127.6Bangkok Metropolis 35.0 91.5 95.3 100.0 108.4 117.9 130.0Center & East 23.0 90.8 95.6 100.0 107.0 113.4 125.0North 16.0 89.8 96.1 100.0 106.7 115.0 124.1Northeast 15.0 93.6 97.7 100.0 105.7 114.0 123.3South 11.0 88.9 96.2 100.0 106.0 113.6 125.2
/a Derived from a Socio Economic survey conducted only in Urban areas in1975/76. Sub-indices are compiled for each region separately and areweighed by municipal population to arrive at the overall index for theKingdom.