Texas Education Agency Growth Model Pilot Application for ...
48
1 TEXAS EDUCATION AGENCY GROWTH MODEL PILOT APPLICATION FOR ADEQUATE YEARLY PROGRESS DETERMINATIONS UNDER THE NO CHILD LEFT BEHIND ACT Revised Proposal Submitted to the U. S. Department of Education January 12, 2009 Abstract Texas proposes to include a student projection measure, called the Texas Projection Measure (TPM), in calculations of Adequate Yearly Progress (AYP) in 2009. The TPM is a method for projecting future student scores in the next high-stakes grade (defined by Texas legislation as grades 5, 8, and 11) using students’ current year scale scores in reading/English language arts and mathematics and average campus scale score in the projection subject (i.e., reading campus mean for reading projections and mathematics campus mean for mathematics projections). Projections are made separately for reading/English language arts and for mathematics. The TPM will be used in 2009 for students taking the Texas Assessment of Knowledge and Skills (TAKS), TAKS (Accommodated), and linguistically accommodated versions of TAKS. Starting in 2010, when academic achievement standards are available for the TAKS–Modified (TAKS–M) and TAKS–Alternate (TAKS–Alt) assessments, Texas proposes to expand the TPM for use with students taking the TAKS–M assessments and implement a transition table approach to growth for students participating in TAKS–Alt. Adding the TPM to AYP calculations will result in one change to the Texas AYP determination process. To meet AYP in Texas under the current process, for all districts and campuses, all students and each student group (African American, Hispanic, white, economically disadvantaged, special education, and limited English proficient) meeting minimum size requirements must meet (1) either the performance standard for percent proficient or performance gains criteria, and (2) the standard for participation in the assessment program. The inclusion of the TPM would impact the way the performance standard for percent proficient is calculated. Students who are projected to meet proficiency with the TPM will be counted in the numerator of the AYP percent proficiency calculation along with students meeting the standard, and this new percentage would be compared with the AYP targets to determine if the performance standard for percent proficient is met. For all students and each student group, AYP performance standard requirements would be met if the percent proficient or projected to be proficient, for grades 3–8 and 10 summed across grades by subject for reading/English language arts and mathematics, meets or exceeds the AYP targets. The inclusion of the TPM in AYP calculations will not change the way the performance gains criteria are applied. Introduction The primary purpose of the Texas Student Assessment Program is to provide an accurate measure of student achievement and student progress in reading/English language arts, writing, mathematics, science, and social studies. Test performance results are also used as an indicator for district and school accountability. To meet AYP in 2008–2009, each student group (African American, Hispanic, white, economically disadvantaged, special education, and limited English proficient) meeting minimum size requirements for a campus or district must meet (1) either the performance standard for percent proficient or performance gains criteria, and (2) the standard for participation in the assessment program. There are no minimum size requirements for All
-
Upload
khangminh22 -
Category
Documents
-
view
2 -
download
0
Transcript of Texas Education Agency Growth Model Pilot Application for ...

1
TEXAS EDUCATION AGENCY GROWTH MODEL PILOT APPLICATION
FOR ADEQUATE YEARLY PROGRESS DETERMINATIONS UNDER THE NO CHILD LEFT
BEHIND ACT
Revised Proposal Submitted to the U. S. Department of Education January 12, 2009
Abstract Texas proposes to include a student projection measure, called the Texas Projection Measure (TPM), in calculations of Adequate Yearly Progress (AYP) in 2009. The TPM is a method for projecting future student scores in the next high-stakes grade (defined by Texas legislation as grades 5, 8, and 11) using students’ current year scale scores in reading/English language arts and mathematics and average campus scale score in the projection subject (i.e., reading campus mean for reading projections and mathematics campus mean for mathematics projections). Projections are made separately for reading/English language arts and for mathematics. The TPM will be used in 2009 for students taking the Texas Assessment of Knowledge and Skills (TAKS), TAKS (Accommodated), and linguistically accommodated versions of TAKS. Starting in 2010, when academic achievement standards are available for the TAKS–Modified (TAKS–M) and TAKS–Alternate (TAKS–Alt) assessments, Texas proposes to expand the TPM for use with students taking the TAKS–M assessments and implement a transition table approach to growth for students participating in TAKS–Alt. Adding the TPM to AYP calculations will result in one change to the Texas AYP determination process. To meet AYP in Texas under the current process, for all districts and campuses, all students and each student group (African American, Hispanic, white, economically disadvantaged, special education, and limited English proficient) meeting minimum size requirements must meet (1) either the performance standard for percent proficient or performance gains criteria, and (2) the standard for participation in the assessment program. The inclusion of the TPM would impact the way the performance standard for percent proficient is calculated. Students who are projected to meet proficiency with the TPM will be counted in the numerator of the AYP percent proficiency calculation along with students meeting the standard, and this new percentage would be compared with the AYP targets to determine if the performance standard for percent proficient is met. For all students and each student group, AYP performance standard requirements would be met if the percent proficient or projected to be proficient, for grades 3–8 and 10 summed across grades by subject for reading/English language arts and mathematics, meets or exceeds the AYP targets. The inclusion of the TPM in AYP calculations will not change the way the performance gains criteria are applied.
Introduction The primary purpose of the Texas Student Assessment Program is to provide an accurate measure of student achievement and student progress in reading/English language arts, writing, mathematics, science, and social studies. Test performance results are also used as an indicator for district and school accountability. To meet AYP in 2008–2009, each student group (African American, Hispanic, white, economically disadvantaged, special education, and limited English proficient) meeting minimum size requirements for a campus or district must meet (1) either the performance standard for percent proficient or performance gains criteria, and (2) the standard for participation in the assessment program. There are no minimum size requirements for All

2
Students. Test results evaluated for calculation of AYP include reading/English language arts and mathematics performance on the following assessments:
Texas Assessment of Knowledge and Skills (TAKS), English and Spanish versions. TAKS (Accommodated), English and Spanish versions, for students served by special
education who meet the eligibility requirements for certain specific accommodations. These assessments are reported on the same measurement scale as TAKS, and the academic achievement standards required for proficiency are also the same as for TAKS.
TAKS–Modified (TAKS–M), an alternate assessment based on modified academic achievement standards designed for students receiving special education services who have a disability that significantly affects academic progress in the grade-level curriculum and precludes the achievement of grade-level proficiency within a school year. Proficient results from the TAKS–M assessments will be subject to the 2% federal cap limit on proficient scores used in AYP in accordance with the United States Department of Education (USDE) final regulations. TAKS–M scores are reported on a measurement scale unique to TAKS–M.
Linguistically accommodated testing (LAT) for recent immigrant English language learners, administered for TAKS, TAKS (Accommodated), and TAKS–M. LAT versions of TAKS (Accommodated) are reported on the same measurement scale as TAKS, and the academic achievement standards required for proficiency are also the same as for TAKS. LAT versions of TAKS–M are reported on a measurement scale unique to TAKS–M.
TAKS–Alternate (TAKS–Alt), the assessment for students receiving special education services who have the most significant cognitive disabilities and are unable to participate in the other statewide assessments even with substantial accommodations and/or modifications. Proficient results from the TAKS–Alt assessments will be subject to the 1% federal cap limit on proficient scores used in AYP in accordance with the USDE final regulations.
Texas English Language Proficiency Assessment System (TELPAS) reading proficiency tests, which measure growth in the state reading standards in a manner that takes second language learning into account. As allowed by federal regulation, the results of English language learners (ELLs) who take TELPAS reading and no other reading/English language arts assessment and who are enrolled in their first school year in a United States school are included in participation rates, but their scores are not used for AYP performance calculations.
Texas proposes to use student data from the assessments listed above for calculating the TPM in the 2008–2009 school year. The assessments that will be used in the TPM calculations in 2008–2009 are those that have received USDE approval based on the USDE Standards and Assessment peer review process.
History of Testing and Measuring Student Growth In 1979 the state of Texas instituted a statewide testing program that, through periodic changes in legislation and policy, has grown in size, scope, and rigor. From 1981 to 1990, as required by state statute, Texas assessed minimum skills in reading, mathematics, and writing with the Texas Assessment of Basic Skills (TABS) tests (1981–1984) and then with the Texas Educational Assessment of Minimum Skills (TEAMS) tests (1985–1990). In 1990 the implementation of another criterion-referenced testing program, the Texas Assessment of Academic Skills (TAAS), shifted the focus of assessment from minimum skills to academic skills. In the 2002–2003 school year, the Texas Assessment of Knowledge and Skills (TAKS) replaced TAAS as the primary statewide assessment program. TAKS is designed by
3
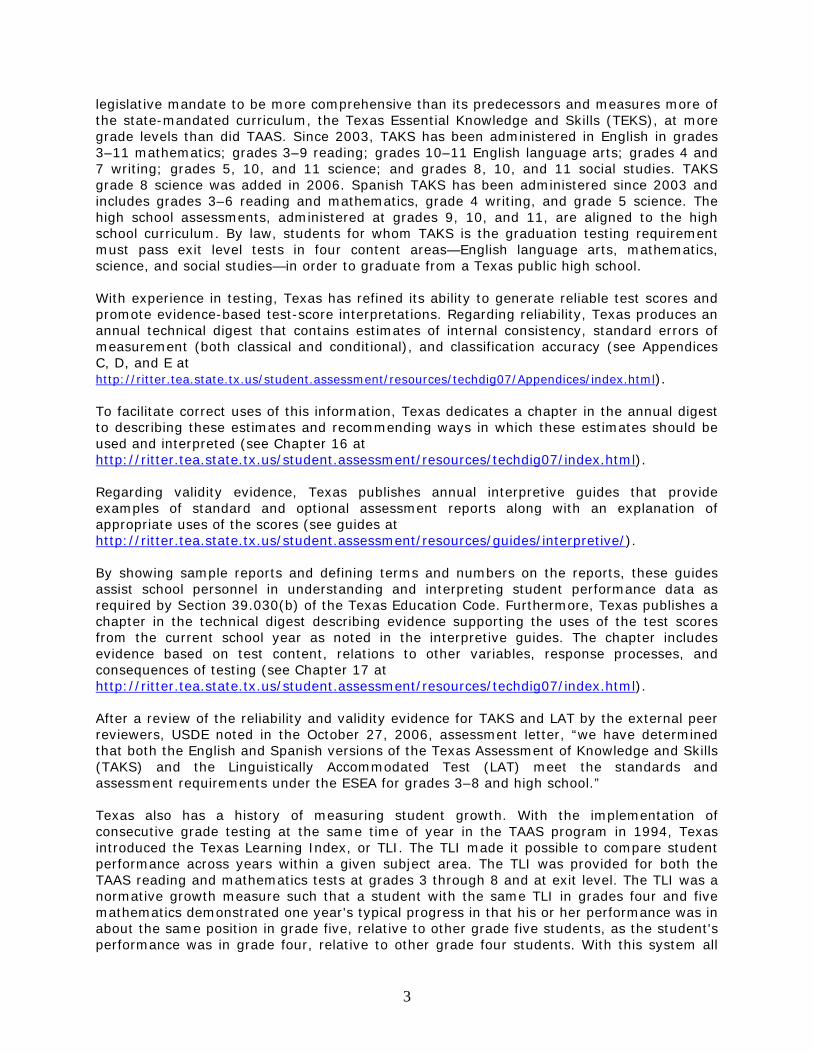
legislative mandate to be more comprehensive than its predecessors and measures more of the state-mandated curriculum, the Texas Essential Knowledge and Skills (TEKS), at more grade levels than did TAAS. Since 2003, TAKS has been administered in English in grades 3–11 mathematics; grades 3–9 reading; grades 10–11 English language arts; grades 4 and 7 writing; grades 5, 10, and 11 science; and grades 8, 10, and 11 social studies. TAKS grade 8 science was added in 2006. Spanish TAKS has been administered since 2003 and includes grades 3–6 reading and mathematics, grade 4 writing, and grade 5 science. The high school assessments, administered at grades 9, 10, and 11, are aligned to the high school curriculum. By law, students for whom TAKS is the graduation testing requirement must pass exit level tests in four content areas—English language arts, mathematics, science, and social studies—in order to graduate from a Texas public high school. With experience in testing, Texas has refined its ability to generate reliable test scores and promote evidence-based test-score interpretations. Regarding reliability, Texas produces an annual technical digest that contains estimates of internal consistency, standard errors of measurement (both classical and conditional), and classification accuracy (see Appendices C, D, and E at http://ritter.tea.state.tx.us/student.assessment/resources/techdig07/Appendices/index.html). To facilitate correct uses of this information, Texas dedicates a chapter in the annual digest to describing these estimates and recommending ways in which these estimates should be used and interpreted (see Chapter 16 at http://ritter.tea.state.tx.us/student.assessment/resources/techdig07/index.html). Regarding validity evidence, Texas publishes annual interpretive guides that provide examples of standard and optional assessment reports along with an explanation of appropriate uses of the scores (see guides at http://ritter.tea.state.tx.us/student.assessment/resources/guides/interpretive/). By showing sample reports and defining terms and numbers on the reports, these guides assist school personnel in understanding and interpreting student performance data as required by Section 39.030(b) of the Texas Education Code. Furthermore, Texas publishes a chapter in the technical digest describing evidence supporting the uses of the test scores from the current school year as noted in the interpretive guides. The chapter includes evidence based on test content, relations to other variables, response processes, and consequences of testing (see Chapter 17 at http://ritter.tea.state.tx.us/student.assessment/resources/techdig07/index.html). After a review of the reliability and validity evidence for TAKS and LAT by the external peer reviewers, USDE noted in the October 27, 2006, assessment letter, “we have determined that both the English and Spanish versions of the Texas Assessment of Knowledge and Skills (TAKS) and the Linguistically Accommodated Test (LAT) meet the standards and assessment requirements under the ESEA for grades 3–8 and high school.” Texas also has a history of measuring student growth. With the implementation of consecutive grade testing at the same time of year in the TAAS program in 1994, Texas introduced the Texas Learning Index, or TLI. The TLI made it possible to compare student performance across years within a given subject area. The TLI was provided for both the TAAS reading and mathematics tests at grades 3 through 8 and at exit level. The TLI was a normative growth measure such that a student with the same TLI in grades four and five mathematics demonstrated one year's typical progress in that his or her performance was in about the same position in grade five, relative to other grade five students, as the student's performance was in grade four, relative to other grade four students. With this system all

4
students, regardless of where they were on the scale, were able to demonstrate progress toward ultimately passing the exit level test. When TAKS was implemented, a new growth measure, the Texas Growth Index (TGI), was introduced. The TGI provides an estimate of a student's academic growth on the TAKS tests, over two consecutive years and in two consecutive grades. This growth index is used at the campus or district level in the state accountability system. The TGI is a linear equating growth measure, such that equating methods set the mean and standard deviations of the distributions of consecutive years equal. A student’s growth is defined as the student’s score in Year 2 minus the student’s projected score for Year 2. A student’s projected score for Year 2 is the score in the distribution at Year 2 that corresponds to the student’s Year 1 score. The linear equating methods result in a function for each grade and subject that is applied year to year. If the student’s score is above the expected score, the student is considered to have grown. If the student’s score is below the expected (projected) score, the student is considered to have regressed. Expected growth is defined as maintaining location in the distribution year to year. Though Texas currently has a growth measure in place, the TGI does not meet the requirements for growth-based accountability for the USDE growth pilot. Therefore, when the USDE pilot growth program was announced and student growth legislation in Texas was passed, Texas initiated three steps that led to the submission of this growth pilot proposal. First, Texas evaluated growth models used in the state and determined that none of them would meet the alignment and foundational elements of No Child Left Behind (NCLB). Second, Texas compared and contrasted several growth models used in other states on practical and psychometric features to identify models that both matched well with Texas data conditions and were likely to meet state and federal requirements. Third, Texas conducted a growth study in which two types of growth models previously approved by USDE (a growth to proficiency model and a regression-based model) in the growth pilot program were compared on policy, psychometric, and practical features. In the study, data from approximately 2.4 million students taking TAKS reading/English language arts, mathematics, science, and social studies in English and Spanish from 2004–2007 were evaluated using the two model types. The model proposed in this application resulted from the Texas growth study and is a variation of the regression-based model. Texas Data System The history of developing Texas’ data system parallels the history of testing in Texas. Since 1979, Texas has been developing and refining the data systems and processes needed to track student progress over time, across campuses and districts, and in reporting groups. The accurate tracking of student data and the archiving of data over years provides the necessary foundation for Texas to report growth and incorporate growth into its state and federal accountability systems. Three elements of the Texas data system that facilitate growth reporting include the careful tracking of current and prior-year testing data in current year data sets, a unique student tracking field, and the sophisticated data quality control procedures that Texas implements annually. The Public Education Information Management System (PEIMS) enrollment record submitted by a district for each student enrolled on the fall snapshot date includes as data elements the district unique identification number and the unique identification number of the campus on which the student is enrolled or on which the student receives the majority of his or her instruction. Current year test answer documents submitted for each student enrolled in the grades tested on the test date also include the district unique identification number and the campus unique identification number. Score data for each student from prior years is included in current year data sets. When current year test score data are merged with

5
current year enrollment information, prior-year test scores are merged as well. Texas has carefully tracked prior-year student scores since the beginning of TAKS administrations. The second element of the Texas data system that facilitates growth reporting is the unique student tracking field. Texas tracks students with a field created from combining four pieces of student information. The variable, a combination of student PEIMS number, last name, first initial, and date of birth, was used starting in 1999 with the TAAS, after analyses showed that combining student identification information into one field provided the capability to accurately identify students over time and across campuses and districts. It is this combined field that is used to match students across time and locations. The third element of the Texas data system that facilitates growth reporting is the sophisticated quality control procedures that Texas implements annually. The Texas Education Agency (TEA) verifies the accuracy of the data produced by the testing contractor, Pearson, through a comprehensive verification system. In addition, Pearson has its own internal quality control system to verify the accuracy of the reports it produces for Texas school districts. TEA’s quality control system includes a number of steps for each test administration:
1. TEA and Pearson prepare answer documents for hundreds of fictitious students who are assigned to a campus in one of three fictitious districts. Pearson grids these students’ answer documents (marks the answer choices and student identification information) using detailed instructions provided by TEA. The answer documents represent real-world scenarios of the numerous correct and incorrect ways answer documents are completed by students and districts.
2. Pearson then processes, scores, and prepares reports for these fictitious students using answer keys, editing rules, and formats approved previously by TEA.
3. TEA simultaneously processes the same student-level information and produces its own reports.
4. When TEA receives Pearson’s reports for the fictitious students and districts, it compares Pearson’s reports with its own reports. In addition to scores, calculations, and other numerical data printed on the reports, all text, formats, and customized messages are verified.
The goal of this part of the quality control process is to verify that changes to the test documents are made properly when the scanner encounters missing or invalid data. Reports are not sent to districts until all discrepancies in the comparative data for the fictitious districts are resolved and the reports generated by TEA and Pearson agree. In addition, the verification system allows TEA to monitor the distribution of all test materials, reports, and information letters. Rationale for Using the Texas Projection Measure The purpose of including the Texas Projection Measure in Texas’ state and federal accountability systems is to offer alternative approaches to demonstrating achievement that meet state and NCLB goals. The intention is not to lower student performance expectations but to hold all students, student groups, public schools, local education agencies, and the state to the same high expectations. Using growth in Texas’ federal accountability system in 2009 is supported by other policy decisions made concerning the Texas assessment program. The first rationale for use of the Texas Projection Measure is that Texas must report student growth in 2008–2009 to meet requirements of two Texas legislative acts, House Bill 1 and Senate Bill 1031. According to House Bill 1 (HB 1), the Commissioner is required to determine a method for measuring annual improvement in student achievement. This

6
requirement is tied to preparation to pass exit-level graduation tests. TEA is required to provide reports to districts on student annual improvement, and districts are required to report this information to teachers and parents. Senate Bill 1031 (SB 1031) also requires the measurement of student growth. The committee on public school accountability created by SB 1031 will review methods available to monitor each public school student, with emphasis on methods that identify demonstrable growth in academic achievement. New end-of-course (EOC) assessments currently being constructed must measure annual improvement. According to SB 1031, the freshman class of 2011–2012 will be the first group of students to take EOC exams for graduation purposes. Furthermore, TEA may consider using an existing instrument to satisfy requirements around developing criterion-referenced or EOC assessments only if that existing instrument allows for the measure of annual improvement. A second reason supporting the inclusion of growth in the Texas federal accountability system is Texas’ history and expertise in measuring and reporting growth. Texas has been reporting student growth using the TLI and TGI since 1994. The third rationale is that Texas has invested significant time and research in selecting the growth model best suited to the state’s data structures, state growth requirements, and federal requirements for including growth in AYP calculations. A study was conducted over the past 18 months and included input from numerous advisory groups (e.g., the Select Committee on Public School Accountability, the Growth Advisory Meeting, the Student Assessment Advisory Committee, Texas Technical Advisory Committee, the Accountability Focus Group, and the District Advisory Committee). The evaluation provided estimates of the percentage of students for whom sufficient data were available in the study for calculating growth for each method and the percentage of students who met growth expectations under each method in 2007. Texas’ preference is to implement the same growth measure for both state and federal purposes. Given the state requirement to report growth in 2009, federal approval of a growth model for use with mathematics and reading in 2009 AYP would allow this dual use of a growth measure to occur. Match Rates and Sufficient Growth Data Texas is able to match student data across subjects, years, and locations because of the three features of the data system described above: the inclusion of prior-year scores in current-year data sets, the unique student identification field, and the quality control system used to verify the accuracy of student assessment data. When evaluating match rates (or the percentage of students with scale scores that can be matched over subjects, campuses, districts, and years) for this proposal, match rates for students within the current year and across subjects will determine the students for whom projections can be made. These are the students for whom the TPM can be reported and added to AYP calculations. In addition, the TPM uses current year reading/English language arts and mathematics scores to project student performance at the next high-stakes grade (i.e., grades used for promotion decisions and for graduation). See page 12 for a summary of the measure and Appendix 1 for technical details on the measure. Table 1 lists the grades from and to which projections will be made. In other words, students with valid reading/English language arts and mathematics scores in the current grade will have their performance projected to the projection grade.

7
Table 1. Current and Projection Grades for the TPM Current Grade Projection Grade
3 5 4 5 5 8 6 8 7 8 8 11 9 11 10 11 11 N/A
Projections are calculated for students with valid scores in both reading/English language arts and mathematics in the current year. However, projection equations are developed using data from the prior year and applied to the current year. Each year, projection equations are updated for use in the following year. See Figure 1 for a graphic illustrating the equation development, application, and testing cycle, or when equations are determined, when they are applied, and when projection accuracy evaluations begin.
Figure 1. Texas Projection Measure Equation Development, Application, and Evaluation Process
Since Texas is proposing to include projections in 2009 AYP calculations, projection equations will be developed using 2008 data. The equations will be applied in 2009, and projection accuracy will begin to be evaluated for applicable grades in 2010. Projection accuracy analyses involve comparing students’ actual performance to their projected performance. These accuracy analyses will be ongoing, such that Texas will be able to evaluate the accuracy of the 2009 projections to some grades in 2010 (i.e., projections from 2009 to 2010 in grades 4 to 5, 7 to 8, 10 to 11), to other grades in 2011 (i.e., grades 3 to 5, 6 to 8, and 9 to 11), and to the remaining grades in 2012 (i.e., grades 5 to 8 and 8 to 11). Given the way that the projections are developed and applied, match rates across subject areas within a year are the rates that determine which students’ projections will be made. In other words, students with these matches will have projections in 2009. Also important for the development of the equations are match rates across years. To develop equations accurately, data are needed from students who are representative of the students for whom the equations will be applied. Therefore, high match rates across years are important. Match Rates Across Subject Areas Within a Year For the application of the projection equations and for reporting projections, the evaluation of matches across subjects within a given year is the focus. Table 2 illustrates the percentages of students taking English versions of tests in 2008 for whom sufficient data
Year X-1 Projection Equations Developed
Year X Projection Equations Applied
Year X+1 Projection Accuracy
Evaluation Begun

8
were matched across subjects for reporting the TPM. Results for approximately 2.3 million students indicate that 98% of students overall had sufficient data in 2008 to obtain a projection in reading/English language arts and 97% had sufficient data to obtain a projection in mathematics. Results for AYP reporting groups indicate that for almost all AYP groups in 2008, cross-subject match rates were high, exceeding 90%. Lower match rates were found for student groups with missing indicator values and for limited English proficient (LEP) students in mathematics. The number of students with missing indicator values is small relative to the student population (less than 0.2% in all cases), so the lower match rate for these groups does not affect many students. For LEP students, the match rate for mathematics was just slightly below 90% at 89.3%. Students excluded from the table are those who did not have a valid score in the English versions of both the reading/English language arts and mathematics assessments in 2008. These excluded students are those who tested in Spanish, took TAKS or TAKS (Accommodated) in one subject and an alternate assessment in the other, or were absent on at least one of the testing days and did not make up the test.
Table 2. Match Rates Across Subjects in 2008 for Making Student Projections READING/ENGLISH LANGUAGE ARTS MATHEMATICS GROUP Number Tested
Percentage Tested
Percentage Matched
Number Tested
Percentage Tested
Percentage Matched
TOTAL 2,250,386 100.0 98.0 2,264,532 100.0 97.4 MALE 1,135,525 50.5 97.9 1,144,734 50.6 97.1 FEMALE 1,113,776 49.5 98.1 1,118,475 49.4 97.7
GENDER
NO INFORMATION PROVIDED
1,085 0.0 75.7 1,323 0.1 62.1
NATIVE AMERICAN
7,972 0.4 97.9 8,071 0.4 96.7
ASIAN 78,465 3.5 99.4 80,944 3.6 96.3 AFRICAN AMERICAN
313,037 13.9 97.8 312,456 13.8 98.0
HISPANIC 1,035,519 46.0 97.5 1,048,081 46.3 96.4 WHITE 814,027 36.2 98.6 813,383 35.9 98.7
ETHNICITY
NO INFORMATION PROVIDED
1,597 0.1 60.1 1,597 0.1 60.1
YES 1,201,997 53.4 97.4 1,213,161 53.6 96.6 NO 1,046,245 46.5 98.7 1,048,805 46.3 98.5
ECONOMIC DISADVAN.
NO INFORMATION PROVIDED
2,144 0.1 78.0 2,566 0.1 65.2
LEP 286,726 12.7 94.8 304,276 13.4 89.3 NON-LEP 1,961,084 87.1 98.5 1,957,412 86.4 98.7
LIMITED ENGLISH PROFICIENT
NO INFORMATION PROVIDED
2,576 0.1 80.6 2,844 0.1 73.0
YES 160,393 7.1 91.0 161,187 7.1 90.6 NO 2,087,552 92.8 98.6 2,100,428 92.8 98.0
SPECIAL EDUCATION
NO INFORMATION PROVIDED
2,441 0.1 82.5 2,917 0.1 69.0
Match Rates Across Years As mentioned above, two types of match rates are important in the development and application of the projection equations. The match rates above are those indicating the

9
numbers of students estimated to have projections in 2009. The other match rates of importance are those that determine which student data are used in the development of the projection equations. Table 3 illustrates the matched scores needed for projections. The equations are developed with data from students who were assessed in the grade from and to which the projections are made. To be most accurate, the equations need to be developed with a sample of students who are representative of the population in which the equations will be applied.
Table 3. Data Needed for Developing Projection Equations Projection Grade in 2008 Valid Scores Needed for Match
Grade 3 to 5 5 Grade 3 Reading and Mathematics Grade 4 to 5 5 Grade 4 Reading and Mathematics Grade 5 to 8 8 Grade 5 Reading and Mathematics Grade 6 to 8 8 Grade 6 Reading and Mathematics Grade 7 to 8 8 Grade 7 Reading and Mathematics Grade 8 to 11 11 Grade 8 Reading and Mathematics Grade 9 to 11 11 Grade 9 Reading and Mathematics Grade 10 to 11 11 Grade 10 English Language Arts and Mathematics Table 4 illustrates the number and percentage of students with sufficient matched data in reading/English language arts and mathematics, respectively, across years to develop projection equations for these two subjects. These values are provided for the 2008 data for English TAKS, TAKS (Accommodated), and LAT versions of TAKS, which are the data that will be used to develop the projection equations for English testers to be applied in 2009 for the Texas Projection Measure. These student numbers and percentages were calculated from the 2008 statewide assessment results. The number tested is the number of students in the projection grade (grades 5, 8, and 11) who tested using the English versions of the TAKS, TAKS (Accommodated), or LAT versions of TAKS. The number matched is the number of these 2008 testers who had valid matched history data in both reading/English language arts and mathematics in the grade from which the projection is made. Matched data results in table 4 indicate that the percentage of matched students for developing equations is above 80% for all students and all student ethnicity groups. This percentage is high, given that matches are made for one, two, and three years. Analyses examining match rates for projections across different numbers of years indicate that for all students in reading/English language arts and mathematics, match rates are 86%, 82%, and 79% for projections across one, two, and three years, respectively.
Table 4. Match Rates Across Years for Projection Equation Development READING/ENGLISH LANGUAGE ARTS MATHEMATICS
Number Tested
Number Matched
Percentage Matched
Number Tested
Number Matched
Percentage Matched
All Students 2,339,378 1,937,065 82.8% 2,332,274 1,928,666 82.7%
African American 329,807 264,986 80.3% 327,009 263,426 80.6% Hispanic 1,008,893 815,002 80.8% 1,009,502 811,016 80.3%
White Students 906,605 781,082 86.2% 901,276 778,278 86.4%
Economically Disadvantaged
1,129,682 898,204 79.5% 1,127,133 893,082 79.2%
Limited English Proficiency
158,329 71,964 45.5% 163,210 71,346 43.7%
Special Education 164,895 53,188 32.3% 156,806 51,505 32.8%

10
For students identified as economically disadvantaged, the percentage of matched data for projection equation development is just under 80%. Since this match rate is slightly lower than the match rate for all students, Texas will carefully monitor match rates in this group. The two AYP reporting student groups with expectedly low match rates for equation development in the English versions of TAKS and TAKS (Accommodated) are students with limited English proficiency (LEP) and students in special education (SPED). In the case of LEP students, match rates are impacted by several factors. First, many LEP students who took the test in English in 2008 were not in the United States in prior years or did not have test data in prior years since they were excluded from testing requirements for first year LEP testers. Second, many LEP students testing in English in 2008 tested in Spanish in prior years. Third, analyses indicate that many LEP students without matched data took a different assessment in prior years (e.g., SDAA II). Texas will likely continue to observe lower match rates for LEP students taking English TAKS, given that LEP students will continue to enter Texas as first year immigrants and many LEP students by design will transition from one language version of the assessment to another (e.g., Spanish to English). Match rates for special education students taking TAKS and TAKS (Accommodated) in English were also expectedly low. The match rates for these students are affected by the change in special education testing requirements to meet federal requirements over the last several years, that is, the change from the State Developed Alternate Assessment II (SDAA II) last administered in spring 2007 to the full implementation of TAKS (Accommodated), TAKS–M, and TAKS–Alt tests in the 2007–2008 school year. For example, based on participation rates for special education students in 2006 and 2007, approximately 62% of the students served in special education programs took the former alternate assessment, SDAA II, while approximately 33% took TAKS during those years. Therefore, the match rate of special education students taking TAKS in 2008 to a prior-year TAKS assessment will not be comparable to the match rate of the other student groups. Based on participation rates for special education students in 2008, these match rates will significantly increase with the transition from the SDAA II assessments to the new assessments for students with disabilities. In 2008, over 60% of the students served in special education programs were tested on either TAKS or TAKS (Accommodated), which is substantially higher than the approximately 33% tested on TAKS in 2006 and 2007. Though match rates for these two student groups are expectedly lower than for other groups, evidence from the projection accuracy study shown in Appendices 1 and 3 suggests that projection accuracy using projection equations with match rates as shown above were similar in accuracy to projections based on equations developed using more students. Furthermore, match rates used to develop projection equations will be closely monitored each year to evaluate whether sufficient numbers of students are available to develop valid and reliable projection equations. Since not all students will be used to generate the projection equations and not all students will have sufficient data to make projections, bias in the model is possible. Texas implemented and will continue to annually implement three techniques to investigate and mitigate any possible bias in the model. The first technique is to investigate the potential for bias due to students with missing history data. Students without scale scores in both reading and mathematics in past years will not be included in the development of projection equations. According to table 4, the two groups of students with the largest amount of missing history data were students in special education (SPED) and students with limited English proficiency (LEP). To investigate potential bias due to these students having missing history data, the cohort of students used to develop the 2008 projection equations for grade 5 was studied. This cohort was chosen because it represented projections made over three

11
years, the maximum number of years proposed. The study involved the 2008 grade 8 students with history data in 2005. The history data for students with grade 8 scale scores in 2008 and grade 5 scale scores in 2005 were used to empirically develop the projection equations. To evaluate potential bias in the equation development process for these students, the study compared features of those students in special education with and without sufficient TAKS data for inclusion in the projection equation development. The evaluation was then repeated focusing on LEP students. Overall, study results indicated that students in these groups with and without missing history data had similar performance levels and ethnic representation. Study results are summarized below. Special Education
The total number of SPED students without matched data was 19,290. A total of 3,857 SPED students with a valid reading scale score in 2008 had a valid
reading scale score in 2005, but not a valid mathematics scale score in 2005. The loss due to a missing mathematics score represents about a 6% loss for this student group.
10,356 (53.7%) of the SPED students without matched data met the TAKS standard. Of all SPED students statewide, 60% met the TAKS standard.
1,563 (8.1%) of the SPED students without matched data were in the Commended Performance level. Of all SPED students statewide, 12% were in the Commended Performance level.
The ethnic distribution of the reading SPED students without matched data was similar to the state percentages.
o Without matched data Hispanic 43.6% African American 19.3% White 35.7%
o Statewide: Hispanic 41.5% African American 18.6% White 38.3%
13,587 (70.4%) of the SPED students without matched data had a reading score code in grade 5 in 2005 indicating that the student took the previous assessment for students with disabilities, or SDAA II. 12,831 (66.5%) of the SPED students without matched data had a mathematics score code in grade 5 in 2005 indicating the same.
Limited English Proficiency
The total number of LEP students without matched data was 12,668. 6,841 (54.0%) of the LEP students without matched data met the TAKS standard.
Of all LEP students statewide, 58% met the TAKS standard. 917 (7.2%) of the LEP students without matched data scored in the Commended
Performance level. Of all LEP students statewide, 8% scored in the Commended Performance level.
11,784 (93%) of the LEP students without matched data were Hispanic. Of all LEP students statewide, 94% were Hispanic.
2,890 (22.8%) of the LEP students without matched data had a reading score code in grade 5 in 2005 indicating that the student took the previous assessment for students with disabilities, or SDAA II. 2,578 (20.4%) of the LEP students without matched data had a mathematics score code in grade 5 in 2005 indicating the same.
3,245 (25.6%) of the LEP students without matched data had a reading score code in grade 5 in 2005 that indicated the student took the Spanish-language

12
version of TAKS. 3,268 (25.8%) of the LEP students without matched data had a mathematics score code in grade 5 in 2005 that indicated the student took the Spanish-language version of TAKS.
The second technique Texas employed and will continue to employ annually to help mitigate possible bias in the models is to update projection equations each year. Results comparing the percentages of students with sufficient data to make projections in 2007 compared with 2008 indicate that, as expected, the percentages of students with sufficient data for making projections is increasing, especially for students in special education. Therefore, by updating the projection equations each year using the most current data and using those updated equations in the following year, Texas will help mitigate model bias. The third technique Texas will employ is annual monitoring of match rates for formula development and for formula application. Each year, as Texas updates the projection equations, the match rates for equation development and application will be calculated and compared with match rates from the prior year. If match rates do not continue to increase, as expected, more in-depth analyses will be conducted to investigate which students do not have matched data and to specify the features of these students. The more in-depth analyses will help identify potential bias in the projection measure. Summary of the Texas Projection Measure and Planned Models for the Alternate Assessments Texas proposes to implement the TPM in 2009 AYP calculations for students taking the general TAKS and TAKS (Accommodated) assessments, including linguistically accommodated test (LAT) versions of TAKS. Once sufficient data are available for the TAKS–Modified alternate assessment, Texas will implement projection equations like those used with the general assessment. For TAKS–Alt, the assessment for students with severe cognitive disabilities, Texas will implement a transition table approach to growth. A summary of the TPM for students taking TAKS and TAKS (Accommodated) is described below. In addition, the plans for the growth models for the alternate assessments are also described. For technical details on the projection measure proposed for TAKS and planned for TAKS–M, see Appendix 1.
Texas Projection Measure for the General Assessment The proposed TPM for TAKS, TAKS (Accommodated), and LAT versions of TAKS is a multi-level regression-based projection model. See Appendix 1 for more details. The model projects student performance separately in reading/English language arts and in mathematics in the next high-stakes grade (defined by Texas legislation as grades 5, 8, and 11) using current year scale scores in both reading/English language arts and mathematics and campus-level mean scores in the projection subject (i.e., reading campus mean for reading projections and mathematics campus mean for mathematics projections). The campus means to be used in the projection equations are the means for each individual school. All students in a campus with a valid score in the subject (e.g., reading) and grade are used to calculate the means used in the projection equations for that school. Projection equations are developed the year before they are applied, so that the formulas can be published and shared across the state before they are used in AYP calculations. For example, projection equations developed in 2008 will be applied in 2009 to project student performance. Students who are projected to meet proficiency will be counted in the numerator of the AYP percentage proficiency calculation along with students meeting the standard, and this new percentage would be compared with the AYP targets to determine if the performance standard for percent proficient is met. Projections will be made for all students each year who have valid scores in reading/English language arts and

13
mathematics. The projection equations will be updated each year after operational testing and will be published before their use the following spring.
The decision to use only current year reading/English language arts and mathematics scores in the projection equations was made to balance transparency and validity, maintain current reporting timelines, and maximize the numbers of students that will receive projections. By using current year scores in the projection equations, Texas is able to publish projection equations before they are applied, making the growth model fully transparent to decision makers. In addition, this allows a student’s projection measure to be reported at the same time Confidential Student Reports (CSRs) are currently received by school districts. Further analyses conducted by Texas indicated that a projection measure using only current year scores produced similar accuracy values when compared with a projection model using all student scores in all subjects across four years (much like the growth models approved by USDE for Tennessee and Ohio). Finally, by using current year scores in the projections, the numbers of students with sufficient information for a projection is greater than if student scores from past years are needed for making projections. Projection Measure for TAKS–M Alternate Assessment Texas proposes to initiate the same type of multi-level regression-based projection model as described above starting in 2010 for students taking the TAKS–M assessment (the 2% assessment). However, to develop the projection equations for this assessment, TAKS–M data for students in both the current and projection grades need to be available. In other words, to project students’ TAKS–M performance in grade 8 from grade 5, data on at least one cohort of students who took TAKS–M in grades 5 and 8 are needed. Because TAKS–M was administered for the first time in 2008, the ability to apply the TPM to this assessment will need to be phased in as the data become available.
Before implementing the projection equations for TAKS–M in 2010, Texas will complete the second operational administration of this assessment in 2009, conduct an empirical analysis of the match rates for this assessment, and evaluate the stability of the projection equations with the population of TAKS–M testers in 2009. Once these activities are completed, Texas will apply the 2009 projection equations to the 2010 TAKS–M scores in grades 4, 7, and 10. Then, once TAKS–M data are available for 2008, 2009, and 2010, projection equations for TAKS–M for grades 4, 7, and 10 will be updated. These new projection equations from 2010 will then be applied in 2011 in grades 3, 6, and 9. This process will continue until projection equations for all TAKS–M grades are available. Table 5 summarizes the schedule for implementing the TPM with the TAKS–M assessment.
Table 5. Schedule for Use of TPM with TAKS-M
Current Grade
Projection Grade
Year Data Available on First
Cohort
First Year Equations Applied
3 5 2010 2011 4 5 2009 2010 5 8 2011 2012 6 8 2010 2011 7 8 2009 2010 8 11 2011 2012 9 11 2010 2011 10 11 2009 2010 11 N/A N/A N/A

14
Growth Model for TAKS–Alt Alternate Assessment For students participating in TAKS–Alt assessment (i.e., the 1% assessment), Texas will implement a transition table growth model similar to the growth model Michigan was approved to use in AYP calculations. The TAKS–Alt growth model will require that Texas subdivide the three proficiency levels (Did Not Meet Standard, Met Standard, and Commended Performance) into three sublevels (low, middle, and high). Once the performance levels are subdivided, Texas will develop a descriptive transition table that describes students’ growth relative to their growth expectations. This descriptive table will describe growth for all students, those in all three proficiency levels. Finally, Texas will set growth targets that require students below proficiency to reach proficiency by the next high-stakes grade (i.e., grades 5, 8, and 11), the same expectations made for students taking other assessments. The growth model for TAKS–Alt will be implemented for the first time in 2010. Since this type of growth model does not require projection equations, this model will be implemented for all grades in reading/English language arts and mathematics in 2010. Table 6 illustrates an example growth target table showing transitions that TAKS–Alt students who did not meet the standard would be required to make in order to meet growth targets each year. These growth requirements would result in students’ meeting the standard by the next high stakes grade. Table 6 shows the growth, or transitions, students in different sublevels in the Did Not Meet Standard category would need to make each year. Depending on the grade in which students are enrolled, students are expected to meet the standard in one (e.g., grade 7 to 8), two (e.g., grade 6 to 8), or three years (e.g., grade 5 to 8). For a student who has one year to meet the standard, that student must make all transitions to meet the standard by the next grade. For example, a student who is in the lowest sublevel of the Did Not Meet Standard level in grade 4 (i.e., Low Did Not Meet Standard) would be expected to make three transitions by grade 5, where the transitions would include:
Low Did Not Meet Standard to Middle Did Not Meet Standard Middle Did Not Meet Standard to High Did Not Meet Standard High Did Not Meet Standard to Met Standard
A student who is in the Low Did Not Meet Standard in a grade for which the student has two years to meet the standard would have different growth targets. For example, a student in the Low Did Not Meet Standard sublevel would need to make three transitions in two years to meet the standard. Since that student has two years to make the transitions, the student would be expected to transition one sub-level in one of the two years and two sub-levels in one of the years. A student who moved two sub-levels in the first year and one sub-level in the second year would meet growth expectations. Similarly, a student who moved one sub-level in the first year and two sub-levels in the second year would also meet growth expectations.

15
Table 6. Example TAKS–Alt Growth Target Table Previous
Performance Number of Years from
Current Grade to Target
High Stakes Grade
Level Sublevel
Number of Sub-Levels of Improvement
Needed to Achieve Proficiency
Number of Years to Achieve
Proficiency
Growth Targets
Low 3 1 Increase 3 sub-levels in a year
Middle 2 1 Increase 2 sub-levels in a year
1 year Did Not Meet
Standard
High 1 1 Increase 1 sub-levels in a year
Low 3 2 Increase 2 sub-levels one year and 1 sub-level the
other. Middle 2 2 Increase 1 sub-level each
year.
2 years Did Not Meet
Standard
High 1 2 Increase 1 sub-level either year.
Low 3 3 Increase 1 sub-level each year.
Middle 2 3 Increase 1 sub-level in 2 of the three years.
3 years Did Not Meet
Standard
High 1 3 Increase 1 sub-level in one of the three years.
Projection Accuracy for the Texas Projection Measure Table 7 provides projection accuracy data for projections made over one, two, and three years using the Texas Projection Measure. Data comparing the TPM and the more complex EVAAS® projection model (i.e., one with predictors from four years and up to four subjects) are only available for the projection over one year. These results indicate that the percentages of students who were accurately projected to meet the standard the next year and who were accurately projected to not meet the standard the next year were similar for the TPM and EVAAS® projection model. Specifically, for the eight comparisons of accurate projection percentages in table 7, three were exactly the same, four differed by one percentage point, and one differed by two percentage points. Two of the five comparisons that differed indicated that the TPM was more accurate than the more complex model. For projections made for two and three years in the future, results indicate that projection accuracy slightly decreases as the number of years in the projection increases. In particular, the percentage accurately projected to meet the standard in reading/English language arts is the same for projections over one, two, and three years. The percentage accurately projected to not meet the standard dropped by one percentage point, from 2% over one year to 1% over two and three years. Results for mathematics were similar. The percentage accurately projected to meet the standard in mathematics dropped by one percentage point (from 73% to 72%) when the number of years in the projection increased from one to two. When the number of years increased from one to three, the projection accuracy in mathematics dropped three percentage points (from 73% to 70%). The percentage accurately projected to not meet the standard in mathematics dropped by one percentage point (from 13% to 12%) when the number of years in the projection increased from one to two. When the number of years increased from one to three, the projection accuracy for students projected to not meet the standard remained the same (13%).

16
Table 7. Projection Accuracy for Projections Over One, Two, and Three Years TEXAS PROJECTION MEASURE MORE COMPLEX EVAAS® MODEL YEARS IN
PROJECTION PROJECTION GRADES AND
SUBJECT N Perfect
Agreement Met
Standard
Perfect Agreement
Did Not Meet
Standard
N Perfect Agreement
Met Standard
Perfect Agreement
Did Not Meet
Standard 1 Grade 7 in 2007
Projected to Grade 8 Reading in 2008
270,700 94% 2% 269,015 94% 2%
1 Grade 10 in 2007 Projected to Grade 11 English Language Arts in 2008
222,603 93% 1% 225,923 92% 3%
1 Grade 7 in 2007 Projected to Grade 8 Mathematics in 2008
269,675 73% 13% 267,540 73% 14%
1 Grade 10 in 2007 Projected to Grade 11 Mathematics in 2008
224,341 79% 10% 228,110 78% 11%
2 Grade 6 in 2006 Projected to Grade 8 Reading in 2008
255,654 94% 1% Data Not Available
Data Not Available
Data Not Available
3 Grade 5 in 2005 Projected to Grade 8 Reading in 2008
244,053 94% 1% Data Not Available
Data Not Available
Data Not Available
2 Grade 6 in 2006 Projected to Grade 8 Mathematics in 2008
256,043 72% 12% Data Not Available
Data Not Available
Data Not Available
3 Grade 5 in 2005 Projected to Grade 8 Mathematics in 2008
245,352 70% 13% Data Not Available
Data Not Available
Data Not Available
Note. These results reflect analyses with an earlier version of the TPM, one with campus mean predictors in both reading/English language arts and mathematics. Results with the current version of the TPM may be slightly different. Reliabilities for all relevant groups of students are presented in Appendix 3. In general, results illustrate that projection accuracy does not vary much for the different groups with the exception of the limited English proficiency (LEP) and special education (SPED) groups. The total percentage of accurate projections in reading drops for the LEP group from 81% to 71% as the number of years in the projection increases from one to three years. In mathematics, the total percentage of accurate projections drops for the LEP group from 75% to 66% as the projection increases from one to three years. For the SPED group, the total percentage of accurate projections in reading drops from 89% to 77% as the number of years in the projection increases from one to three years. In mathematics, the total percentage of accurate projections drops for the SPED group from 79% to 68% as the projection increases from one to three years. Since projection accuracy dropped more for the LEP and SPED groups over time, an evaluation of the types of misclassifications for these groups was conducted. For the LEP group, the types of misclassifications differ for the two subjects. In reading, LEP students are more often projected to meet the standard when they actually do not meet the standard. In other words, LEP students often underperformed in reading assessments relative to their projections. For example, 19% of the 2005 grade 5 LEP students were projected to meet the standard in reading in grade 8 in 2008 and actually did not meet the standard. In contrast, only 10% of the 2005 grade 5 LEP students projected to not meet the reading standard in grade 8 in 2008 actually met the standard. In mathematics, the misclassification was more often due to students performing better than their projections. For example, 7% of the 2005 grade 5 LEP students were projected to meet the mathematics

17
standard in grade 8 in 2008 and actually did not. In contrast, 27% of the 2005 grade 5 LEP students projected to not meet the standard in grade 8 in 2008 actually met the mathematics standard. For the SPED group, the direction of the misclassification is mostly the same for the two subjects. SPED students tend to perform better than their projections. For reading, SPED students are more often projected to not meet the standard when they actually do meet the standard. For example, 13% of the 2005 grade 5 SPED students were projected to not meet the reading standard in grade 8 in 2008 and actually did meet the standard. In contrast, 10% of the 2005 grade 5 SPED students projected to meet the reading standard in grade 8 in 2008 actually did not meet the standard. In mathematics, the discrepancy in misclassification was greater and students more often outperformed their projections. For example, 25% of the 2005 grade 5 SPED students were projected to not meet the mathematics standard in grade 8 in 2008 and actually did. In contrast, 8% of the 2005 grade 5 SPED students projected to meet the standard in grade 8 in 2008 actually did not meet the mathematics standard in 2008. In sum, the two groups of students for whom projection accuracy drops the most as the number of years to the projection increases are the LEP and SPED groups. LEP students tended to perform worse than their projections in reading and better than their projections in mathematics. Students in the SPED group tended to perform better than their projections in both reading and mathematics. Stability of the Assessment System for Using Prior-Year Scores as Predictors Texas will develop projection equations in one year and apply them the next year. To evaluate the stability of results when using projection equations in the prior year versus in the current year, Texas conducted a study in which the projection equations for two different years (2007 and 2008) were applied to student scores in 2008 for one cohort. Table 8 illustrates the mean differences in the projected scores for students in grade 7 in 2008. The mean differences in projection in Table 8 represent student projections from grade 7 in 2008 to grade 8 in 2009 using the 2008 equations minus those students’ projections using the 2007 equations. In other words, projections for students in grade 7 in 2008 were made twice, once using prior-year equations (from 2007) and again using current-year equations (from 2008). The standard deviations represent the standard deviations of the differences. Mean differences in the scale score projections for reading and mathematics were all positive, indicating that projections were higher when the 2008 equations were used. The mean differences in both subjects were found to be small, with mean differences for reading for the total group and other student groups smaller than 30 scale score points and mean differences in mathematics for the total group and all other groups smaller than 20 scale score points. To better understand the magnitude of these differences, two comparisons were made. First, the differences were divided by the standard deviations of students’ 2008 actual scale score points to obtain an effect size. The standard deviations of students’ 2008 actual scale score points for reading and mathematics in 2008 were 185.996 and 183.308, respectively. Therefore, for the total group of students, the effect sizes for reading and mathematics were 0.15 and 0.08, respectively. These effect sizes are small, given that an effect size of 0.20 is typically considered small (Cohen, 1988). The second comparison was to the conditional standard error of measurement, which is an estimate of the error that depends on where a score is in the scale score range. For Grade 8, the conditional standard error of measurement is approximately 50 scale score points in the middle of the scale score range for both reading and mathematics (see Appendix D at http://ritter.tea.state.tx.us/student.assessment/resources/techdig07/Appendices/index.html for the

18
2007 estimates). Comparing the mean differences in projections using prior versus current-year projection equations to the conditional standard error of measurement indicates that the error potentially introduced by using prior-year equations with this cohort is smaller than the amount of error typically found in a current year scale score in the middle of the scale score range. The results of this study support the contention that the Texas assessment system is stable enough to use prior-year equations for projecting student performance. Table 8. Stability of 2008 Projections Using Equations from 2007 and 2008
Projection Grades and
Subject
Group Number of
Students
Mean Difference
in Projection
Standard Deviation
Total 316,573 27.43 2.88 Performance Level in 2008 Did Not Meet Standard 48,633 24.45 2.13 Met Standard 173,370 27.01 2.11 Commended Performance 94,570 29.75 2.65 Ethnicity Native American 1,190 27.83 2.76 Asian 10,739 27.81 3.07 African American 44,711 27.02 2.77 Hispanic 143,816 26.85 2.73 White 115,892 28.28 2.88 Economically Disadvantaged No 150,089 28.20 2.87 Yes 166,134 26.71 2.71 Limited English Proficiency No 293,217 27.60 2.84 Yes 22,928 25.33 2.52 Special Education No 292,893 27.53 2.85
Grade 7 to 8 Reading
Yes 23,312 26.25 3.03
Total 316,809 15.14 6.72 Performance Level in 2008 Did Not Meet Standard 75,392 14.15 6.85 Met Standard 182,519 15.81 6.54 Commended Performance 58,898 14.33 6.87 Ethnicity Native American 1,193 16.45 6.20 Asian 10,776 16.23 6.59 African American 44,697 14.90 6.25 Hispanic 143,983 13.26 6.62 White 115,935 17.45 6.28 Economically Disadvantaged No 150,155 17.25 6.30 Yes 166,300 13.24 6.52 Limited English Proficiency No 293,303 15.59 6.50 Yes 23,075 9.42 6.77 Special Education No 293,144 15.32 6.66
Grade 7 to 8 Mathematics
Yes 23,293 12.94 7.02 Note. These results reflect analyses with an earlier version of the TPM, one with campus mean predictors in both reading/English language arts and mathematics. Results with the current version of the TPM may be slightly different.

19
Evidence Supporting the Use of the Other-Subject Predictor The Texas Projection Measure projects using only three predictors as summarized in Table 9 below.
Table 9. Predictors Used in the Texas Projection Measure
Projection Subject Predictors Used Reading 1. Student Reading Scale Score
2. Student Mathematics Scale Score 3. Mean Campus Scale Score in Reading
Mathematics 1. Student Mathematics Scale Score 2. Student Reading Scale Score 3. Mean Campus Scale Score in Mathematics
Results from analyses indicate that use of student scale scores in a subject other than the subject to which the projection is made (e.g., including mathematics in reading projections) enhances projection accuracy in the Texas Projection Measure. In particular, three sources of evidence were collected with each of two cohorts to support use of the other subject as a predictor. The two cohorts in the analyses included grade 7 students in 2007 projected to grade 8 in 2008, and grade 10 students in 2007 projected to grade 11 in 2008. For each of the cohorts, projections for reading/English language arts and mathematics were evaluated. The first source of information included the percentage of variance in the projected score accounted for by adding students’ scale scores in the other subject. The second source of evidence included the statistical significance of the other-subject predictor. The third source of evidence included the projection accuracy for these cohorts when student scale scores in the other subject were included compared with projections in which the student scale scores in the other subject were not included. Projection accuracy was calculated separately for students projected to meet the standard (Met) and for students projected to not meet the standard (DNM). Note that the number of students projected DNM in reading represents less than 5% of all students; in mathematics the number projected DNM represents between 10% and 15% of all students. Table 10 provides data for these three sources of evidence with respect to the use of the other-subject predictor. Results support the contention that use of the other subject predictor adds to the predictability, that the other-subject predictor is statistically significant, and the projection accuracy with the other-subject predictor tended to be slightly greater overall than without the other-subject predictor.

20
Table 10. Evidence Supporting the Use of the Other-Subject Predictor Projection Accuracy
Without Other Subject Predictor
Projection Accuracy With Other Subject
Predictor
Grade (2007)
Projection Grade (2008)
Projection Subject
Percentage of Variance Accounted for by Other
Subject*
Statistical Significance of Other Subject
Predictor (p-value)
Met DNM Met DNM
7 8 Reading 2.7% < .0001 93.61% 1.93% 93.05% 2.05% 7 8 Mathematics 0.7% < .0001 71.65% 13.76% 71.86% 13.79% 10 11 English
Language Arts 5.2% < .0001 92.54% 1.57% 91.94% 1.89%
10 11 Mathematics 1.0% < .0001 76.79% 11.16% 76.91% 11.18% Note. *Percent of variance accounted for by student scale scores in the other subject was calculated by making two projections, one with the other subject included and one without the other subject. The difference in r-squared indicated the variance accounted for by student scale scores in the other subject. Met=the percentage of students projected to meet the standard in 2008 who actually did meet the standard in 2008. DNM= the percentage of students projected not to meet the standard (Did Not Meet Standard) in 2008 who actually did not meet the standard in 2008. These results reflect analyses with an earlier version of the TPM, one with campus mean predictors in both reading/English language arts and mathematics. Results with the current version of the TPM may be slightly different.
Furthermore, annual evaluations of the Texas Projection Measure will include this type of analysis, so Texas can monitor whether the increased projection accuracy from the other subject predictor continues to be supported by empirical evidence. Application of Projection/Growth Measure for Students Changing Assessments As described above, Texas plans to implement a projection model for all assessments except TAKS–Alt. The same projection approach will be used for English versions of TAKS and TAKS (Accommodated) and LAT versions of TAKS, Spanish versions of TAKS and TAKS (Accommodated), and the TAKS–M tests. However, projections will not be available for students who, in the current year, take different assessments or different language versions of an assessment in reading and mathematics. This is due to the lack of sufficient numbers of students within a school year who take different assessments to develop stable projection equations. For example, a student who takes TAKS reading in Spanish and TAKS mathematics in English or a student who takes TAKS for reading and TAKS–M for mathematics will not have a projection. For these students, the status score would be used in AYP calculations. The following set of general inclusion/exclusion rules will apply to students who do not take the same assessments within the same year:
Students who take different assessments for reading/English language arts and
mathematics in the current year o Projection equations are not planned to be applied if students do not have
both a valid reading/English language arts and mathematics score. Analyses are underway to examine the projection accuracy of equations using only one score, but until evidence supporting the reliability and validity of making projections with only one score is obtained, Texas will not report projections for these students.
Students who take Spanish versions of TAKS or TAKS (Accommodated) o Students taking Spanish versions of TAKS or TAKS (Accommodated) in
grades 3–4 will have projections to grade 5 starting in 2009. o Students taking grades 5 and 6 Spanish-language versions of TAKS will be
projected to grade 8 English-language versions of TAKS, given that all students take TAKS in English in grade 8.
Students who take TAKS or TAKS (Accommodated) in different languages

21
o If students switch the language version in which they test across years, projection equations can still be applied as long as students have a valid reading/English language arts and mathematics score in the same language in the current year. For example, if a student takes Spanish versions of TAKS reading and mathematics in 2008 and English versions in 2009, that student will receive projections in both years.
o For students taking TAKS or TAKS (Accommodated) in different languages across subject areas in the current year, no projections will be made since the numbers of students who would take the assessments in different languages would not support the development of stable projection equations.
Application of Growth/TPM for Students Under Various Circumstances The way in which the TPM will be applied and scores will be interpreted for students under various circumstances is explained below:
A student who changes schools will receive a projection, and the projection will be included in AYP calculations as long as the student has a valid score in reading/English language arts and mathematics in the current grade.
A student who changes LEAs will receive a projection, and the projection will be included in AYP calculations as long as the student has a valid score in reading/English language arts and mathematics in the current grade. Texas will include student projections for students who move from one campus to another or from one district to another in the same way the proficient results are included in the AYP calculations for students who move between schools or districts. Both proficient and projection results for students enrolled in the district and campus on the fall enrollment snapshot date will be considered in district and campus AYP evaluations. The fall enrollment snapshot date is defined in the annual Public Education Information Management System (PEIMS) Data Standards. Fall enrollment records submitted by each district represent students enrolled in the district on the snapshot date. The snapshot date is typically the last Friday in October. The fall enrollment snapshot date is the date the enrollment count is taken for the National Center for Education Statistics (NCES) Common Core of Data (CCD).
A student who is retained will be projected using current year scores. For example, a student in grade 5 in 2009 will be projected to grade 8 using projection equations from 2008. If that student is retained in grade 5 in 2010 and that student has a valid score in both subjects in grade 5 in 2010 that student will be projected to grade 8 using projection equations from 2009.
A student who is new to Texas who obtains a valid score in reading/English language arts and mathematics in the current grade, that student will receive a projection.
A student who makes progress but then falls behind will be identified using the TPM, and this information will be reported to campuses and districts so that interventions can be planned and implemented. When the student is making progress, the student’s projection will indicate that progress. When the student starts to fall behind, the projection will indicate this as well.
A student who is proficient at all times but steadily declining will show declining projections that will be reported to campuses and districts.
The TPM and growth model for TAKS–Alt will provide growth information on all TAKS-Alt students, not just students who are in the Did Not Meet Standard category. As explained in more detail in the section below, Focusing Interventions Using Growth Information, four groups of students will be clearly identified in reports to campuses and districts starting in 2009 including (1) students who meet standard and meet TPM, (2) students who meet standard but not TPM, (3) students who meet TPM but not standard, and (4) students who meet neither standard nor TPM. By

22
distinguishing these four categories for all students and for students in AYP reporting groups, Texas will promote the use of TPM information for all students and not just those who do not meet the standard.
Incorporating End-of-Course (EOC) Assessments into the TPM Table 11 illustrates the current timeline for Texas’ implementation of EOC assessments, phase-out of TAKS at high school, and the year in which EOC assessments will be used for graduation requirements for students entering grade 9. Since 2011–2012 will be the last school year for administration of the TAKS grade 10 assessment, Texas will likely incorporate performance on Algebra I and English II assessments into the AYP calculations for campuses, districts, the State, and required AYP reporting groups starting in 2012–2013. Table 11. Current Texas EOC Assessment Implementation Schedule
EOC Assessment Spring 2007 Spring 2008 Spring 2009 Spring 2010 Spring 2011 Spring 2012** Spring 2013
Algebra I Operational
Geometry Field Test Operational
Biology Field Test Operational
Chemistry Field Test Operational
US History Field Test Operational
Physics Field Test Operational
World Geography Field Test Operational
English I Field Test Operational
Algebra II Field Test Operational
English II Field Test Operational
World History Field Test Operational
English III Field Test Operational
Final TAKS Administration*
Grade 9
Grade 10
Grade 11, Exit Level
Note: *TAKS exit level administrations will continue for out-of-school testers. **Spring 2012 is the first time that EOC assessments will be used for graduation requirements for students in grade 9.
When the EOC assessments are used in AYP calculations, grade 8 students and students taking the Algebra I and English II EOC assessments will likely be impacted by use of the Texas Projection Measure.
For grade 8 students, the proposed Texas Projection Measure currently projects performance to grade 11 TAKS. When the EOC assessments will be used in AYP calculations, it is likely that students in grade 8 will be projected to the courses most commonly taken in grade 11—English III and Algebra II. Projections for grade 8 students will likely be made using student scale scores in TAKS grade 8 reading, student scale scores in TAKS grade 8

23
mathematics, and campus mean scale scores in the TAKS projection subject (reading for English III and mathematics for Algebra II).
For students taking English II and Algebra I, the subjects currently planned for use in AYP calculations, projections will also likely be made to English III and Algebra II. These projections will be used in AYP calculations in the same way that projections have been proposed to be used with TAKS. Projections to English III will be made using scale scores in two subjects at the student level and campus mean scale scores in English II. The two subjects that will likely be used as student-level predictors will include English II and one other subject to be determined empirically. Projections to Algebra II will likely be made using scale scores in two subjects at the student level and campus mean scale scores in Algebra I. Once data are available from administrations that count for students’ graduation, student-level scale scores used in the projection equations in addition to English II and Algebra I will be determined based on scores that provide the highest level of predictability.
Regarding the planned timeline for implementing projections with EOC assessments, projection equations are developed using data on students in the grades from which and to which the projections are made. Then, projections will be implemented the year following the equation development. Because the projection equations will be used for students taking the EOC assessments for graduation purposes, Texas plans to develop the projection equations with student data from administrations with the same high stakes. Based on the schedule in table 11, the first year in which students will take operational administrations of Algebra II and English III for graduation is 2013–2014. In 2013–2014 student data from Algebra II and English III will be available along with these students’ history data in grade 8 reading, grade 8 mathematics, Algebra I, and English II. Therefore, equations for the following four projections can be developed for the first time in 2013–2014 and implemented for the first time in 2014–2015:
• Grade 8 projections to English III • Grade 8 projections to Algebra II • English II projections to English III • Algebra I projections to Algebra II
Fit of the Proposed Texas Projection Measure in the Texas Assessment System Texas chose the TPM because this measure closely fits the context of the state’s existing assessment system. In addition, the assessment and data systems support the use of the TPM. The reasons for this fit include:
1. The TPM projects student performance in grades 5, 8, and 11, grades that are already part of the current high stakes structure in the Texas assessment system. The proposed measure uses students’ current year reading/English language arts and mathematics scores and campus mean scores to project performance to the next high-stakes grade, that is, the next Student Success Initiative (SSI) grade or exit level. The SSI provides a system of academic support to help ensure achievement on grade level in reading and mathematics so that every student can succeed throughout his or her school career. The SSI incorporates a grade advancement component adopted by the Texas Legislature in 1999. The law ties promotion to performance on state-mandated assessments in reading at grade 3, reading and mathematics at grade 5, reading and mathematics at grade 8, and graduation to exit-level performance at grade 11.
2. The TPM balances accuracy and transparency. Texas has a history of using transparent calculations in the state accountability system. Texas districts frequently perform their own accountability calculations at the campus and district level based on transparent methods. By using prior-year equations and publishing them in

24
advance of their application, Texas will maintain the use of transparent calculations for high stakes accountability.
3. The TPM is built to take advantage of prior research and use of a projection measure using Texas assessment results. The Dallas Independent School District has been implementing a projection model using current year scores to project subsequent year scores since 1992. The TPM reflects many of the features of the Dallas ISD regression-based model and therefore takes advantage of the lessons learned by Dallas ISD through long term implementation of a regression-based model using state required assessments.
Proposed Use of TPM Data in AYP Calculations Texas determines AYP for all districts and campuses and for all students and each student group (African American, Hispanic, white, economically disadvantaged, special education, and limited English proficient) meeting minimum size requirements, where minimum size requirements at the student group level are 50 total students in the grades tested (summed across grades 3–8 and 10) and the student group comprises at least ten percent of all test takers in the subject area. There are no minimum size requirements for the All Students group. Steps in determining AYP are listed below. The change to the process introduced by adding the TPM is in bold font. Note that for a student without a projection, the student's actual score is used to determine that student's status in AYP. For a school or district to make AYP, all students and each student group that meets minimum size criteria must
meet or exceed the AYP targets (shown below) on the assessment measure, where the percentage compared with the AYP target is the percentage meeting the standard or projected to be proficient or the performance gains provisions under safe harbor, and
have at least a 95 percent participation rate in the state assessments, and meet the state requirements for performance or performance gains on one other
academic indicator. For districts and campuses with a student group that does not meet minimum size requirements in the grades tested (summed across grades 3–8 and 10) for either reading/English language arts or mathematics, or no students in the grades tested, one or a combination of the methods described below will be used for AYP calculations. The addition of the TPM will result in three changes for AYP calculations for these small districts and campuses. First, the percentage of students compared with the AYP targets is the percentage of students meeting the standard plus the percentage projected to proficiency according to the TPM (or those on track to pass in the transition table approach planned for students participating in TAKS–Alt). Second, Texas currently uses confidence intervals in AYP calculations only for special analysis for small schools. Texas will discontinue the use of confidence intervals in AYP calculations for small schools. Third, Texas currently uses uniform averaging in AYP performance measure calculations only for special analysis for
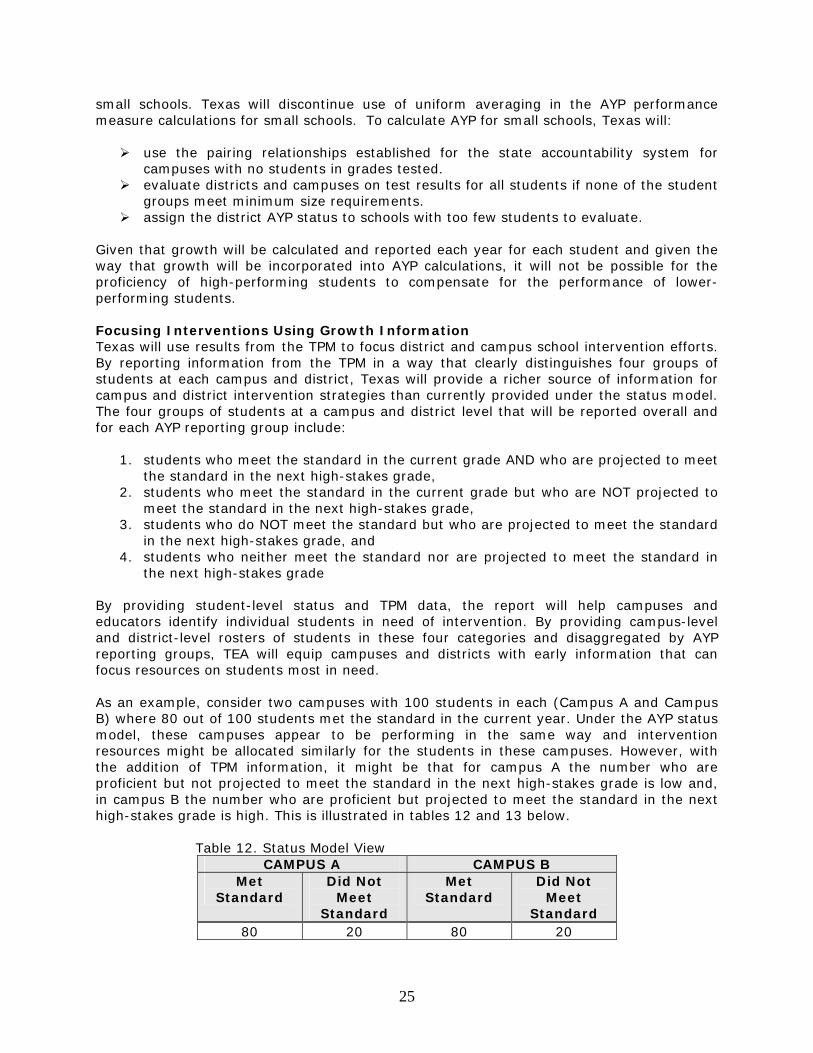
25
small schools. Texas will discontinue use of uniform averaging in the AYP performance measure calculations for small schools. To calculate AYP for small schools, Texas will:
use the pairing relationships established for the state accountability system for campuses with no students in grades tested.
evaluate districts and campuses on test results for all students if none of the student groups meet minimum size requirements.
assign the district AYP status to schools with too few students to evaluate. Given that growth will be calculated and reported each year for each student and given the way that growth will be incorporated into AYP calculations, it will not be possible for the proficiency of high-performing students to compensate for the performance of lower-performing students. Focusing Interventions Using Growth Information Texas will use results from the TPM to focus district and campus school intervention efforts. By reporting information from the TPM in a way that clearly distinguishes four groups of students at each campus and district, Texas will provide a richer source of information for campus and district intervention strategies than currently provided under the status model. The four groups of students at a campus and district level that will be reported overall and for each AYP reporting group include:
1. students who meet the standard in the current grade AND who are projected to meet the standard in the next high-stakes grade,
2. students who meet the standard in the current grade but who are NOT projected to meet the standard in the next high-stakes grade,
3. students who do NOT meet the standard but who are projected to meet the standard in the next high-stakes grade, and
4. students who neither meet the standard nor are projected to meet the standard in the next high-stakes grade
By providing student-level status and TPM data, the report will help campuses and educators identify individual students in need of intervention. By providing campus-level and district-level rosters of students in these four categories and disaggregated by AYP reporting groups, TEA will equip campuses and districts with early information that can focus resources on students most in need. As an example, consider two campuses with 100 students in each (Campus A and Campus B) where 80 out of 100 students met the standard in the current year. Under the AYP status model, these campuses appear to be performing in the same way and intervention resources might be allocated similarly for the students in these campuses. However, with the addition of TPM information, it might be that for campus A the number who are proficient but not projected to meet the standard in the next high-stakes grade is low and, in campus B the number who are proficient but projected to meet the standard in the next high-stakes grade is high. This is illustrated in tables 12 and 13 below.
Table 12. Status Model View CAMPUS A CAMPUS B
Met Standard
Did Not Meet
Standard
Met Standard
Did Not Meet
Standard 80 20 80 20

26
Table 13. Texas Projection Measure View CAMPUS A CAMPUS B
Met Standard Did Not Meet Standard
Met Standard Did Not Meet Standard
80 20 80 20 Met TPM
Did Not Meet TPM
Met TPM
Did Not Meet TPM
Met TPM
Did Not Meet TPM
Met TPM
Did Not Meet TPM
20 60 5 15 60 20 5 15 The added information from the TPM will help these two campuses direct their attentions and resources, so that interventions can be applied differently and effectively for each campus. For example, Campus A will be able to use the TPM information to identify and intervene with students who score high enough in the content area to meet the current-year standard but who are not projected to meet the standard in the future. Full Academic Year (FAY) Definition Used for AYP Calculations The Texas definition of “full academic year” for AYP calculations is linked to the state fall enrollment snapshot date—the last Friday in October.
Districts: Test results for students enrolled in the district on the PEIMS fall enrollment snapshot date are included in the district-level performance measure. Campuses: Test results for students enrolled on the campus on the PEIMS fall enrollment snapshot date are included in the campus-level performance measure.
There are approximately 100 instructional days between the last Friday in October (PEIMS snapshot date) and the primary administration testing dates for TAKS in April. This represents just over half (54%) of the instructional days in the 185-day school year. Compared to most other states, Texas has one of the shortest full academic year definitions in the nation because the state enrollment snapshot date is at the end of October, instead of enrollment at the same campus or district from the testing period of the previous school year. The definition of FAY in Texas does not impact match rates related to the Texas Projection Measure. Impact of the Texas Projection Measure on AYP Calculations Texas conducted two sets of analyses to estimate the impact of the TPM on AYP calculations. The first set of analyses focused on how many and which students would meet AYP due to the addition of the TPM. The second set focused on the numbers of campuses and districts that might be affected by the addition of the TPM. Students Table 14 presents impact data compared with AYP targets showing what would happen if the percentage of students in each district, campus, or student group included students projected to be proficient. The table shows impact data for all students in the 2007 Texas growth study, for students by gender, and for students in each AYP reporting group. For all students in the 2007 study (TOTAL), by gender group, and for each student group, several sources of data are reported in Table 14:
N=total number of students in the 2007 Texas growth study %=percentage of the total number of students in each student group. For each
student group, there were a small number of students who did not have the student group indicator reported. Data for these students is noted in the rows labeled “No

27
Information.” In no student group was the number of students that had no information great enough to round to 1%.
Match=the percentage of students in that group (N) who had sufficient data for the projection.
P=the percentage of students in that group (N) who were projected to be at or above proficiency in the projection year.
MS=the percentage of students in that group (N) who met the standard in the current year, in 2007 for this table.
M/P=the percentage of students in that group (N) who either met the standard or were projected to be proficient.
The impact of adding the TPM to AYP determinations is best evaluated by subtracting the percentage MS from the percentage M/P, since this difference indicates the percentage of students who would be added to the numerator of the percentage compared with the AYP targets due to the inclusion of the TPM. For example, in the first row of the table, the percentage of the 2,354,561 students in the 2007 growth study who met the standard in reading/English language arts was 87%. The percentage of students who were projected to be at or above proficiency in the projection grade was 93%. The percentage of students who either met the standard or were projected to be at or above proficiency was 95%. Therefore, the addition of the TPM increased the percentage of the approximately 2.4 million students who had not met the standard in 2007 but were expected to meet the standard in the next high stakes grade by 8%. For AYP calculations, this additional 8% of students would be counted in the numerator for comparison to AYP targets for all students. For mathematics, 10% of the growth study students who did not meet the standard in 2007 were predicted to be at or above proficiency; therefore, an evaluation of AYP for these students would include 10% more students in the numerator of the percentage compared with the AYP target.

28
Table 14. Estimated Impact of the TPM on AYP Using the 2007 Growth Study Data
Reading/English Language Arts Mathematics
N % Match P MS M/P N % Match P MS M/PTOTAL 2354561 100 98 93 87 95 2347546 100 98 84 75 85
GENDER MALE 1175567 50 98 93 85 94 1173287 50 98 83 76 84 FEMALE 1177773 50 98 94 89 96 1172884 50 99 84 75 85 NO INFORMATION 1221 0 87 76 70 84 1375 0 78 51 48 58
ETHNICITY NATIVE AMERICAN 8447 0 97 94 89 96 8402 0 97 86 77 87 ASIAN 82169 4 99 98 95 99 82457 4 99 95 92 96 AFRICAN AMERICAN 336324 14 97 90 81 92 334524 14 98 73 62 74 HISPANIC 1021395 44 98 92 82 93 1019498 43 98 79 69 80 WHITE 904510 39 98 97 94 98 900651 38 99 92 86 93 NO INFORMATION 1716 0 85 73 69 83 2014 0 72 46 45 53
ECONOMIC YES 1192278 51 98 91 81 93 1188711 51 98 77 68 78DISADVAN. NO 1158287 49 98 96 93 98 1154469 49 99 90 83 91
NO INFORMATION 3996 0 90 83 77 89 4366 0 83 60 55 65
LIMITED LEP 171282 7 98 80 58 81 173752 7 96 62 55 64ENGLISH NON-LEP 2179599 93 98 95 89 96 2169767 92 98 85 77 86PROFICIENT NO INFORMATION 3680 0 88 77 71 84 4027 0 80 51 47 56
SPECIAL YES 98602 4 79 71 71 85 90870 4 86 61 56 67EDUCATION NO 2252373 96 99 95 88 96 2252781 96 99 85 76 85
NO INFORMATION 3586 0 89 78 71 85 3895 0 82 52 48 57
Note. These analyses were conducted with an earlier version of the TPM, one with campus mean predictors in both reading/English language arts and mathematics.
Some of the main findings from this table are that approximately 8-10% of students in each group were projected to meet the standard but failed to do so in the current grade. If projections were included in AYP determinations in 2007, the groups that would be impacted the most would be limited English proficient and special education students in reading/English language arts. Specifically, of the 171,282 limited English proficient students in the 2007 growth study, 23% who did not meet the reading/English language arts standard in 2007 were projected to meet the standard in the future. Of the 98,602 special education students in the growth study, 14% who did not meet the reading/English language arts standard in 2007 were projected to meet the standard in the future. Campus and District Level Texas evaluated the impact of including the TPM in AYP calculations on campuses and districts. The analyses included the calculation of a projection for all students taking TAKS, a linguistically accommodated version of TAKS, or TAKS (Accommodated) in 2008. For each student with sufficient data for a projection, an indicator was calculated, such that the indicator was a 1 if the student was projected to meet or exceed the academic achievement standard in the projection grade and a 0 if the student was projected to score below the academic achievement standard in the projection equation. For students in grades 3, 5, and 8, students’ primary administration and first retest were included, as these scores are the scores used in AYP calculations in 2008. Projections for students with a retest were made

29
using the highest scale scores in each subject area. The 2008 AYP calculations were then repeated with the projection information included in the calculations as proposed. Three sets of data were generated—numbers and percentages of districts and campuses meeting AYP in 2008 without projection information included, numbers and percentages of districts and campuses meeting AYP in 2008 with projections included, and numbers and percentages of districts and campuses meeting AYP using 2009 AYP targets with projections included. Results (see table 15) indicated that according to the preliminary 2008 results without including the proposed projection measure, 66% of districts and 75% of campuses met AYP in 2008. When the projection measure was added to the AYP calculations, 77% of districts and 80% of campuses would have met AYP. The impact of adding the projection equations was that 136 districts (11%) and 411 campuses (5%) would have met AYP due to the projection model. When the 2009 AYP targets were applied to the 2008 AYP calculations with projections included, 68% of districts and 77% of campuses would be expected to meet AYP. Table 15. Impact of the Texas Projection Measure on AYP Calculations in 2008 and 2009
USDE Growth Model Proposal: 2008 AYP Impact Data District AYP Results
AYP Status Preliminary 2008
Results
2008 w/ the Texas Projection Measure Change
2009 w/ the Texas Projection Measure* Change
Meets AYP 816 66% 952 77% 136 833 68% -119 Missed AYP 399 32% 263 21% -136 382 31% 119 Not Evaluated 14 1% 14 1% 0 14 1% 0 TOTAL 1,229 100% 1,229 100% 0 1,229 100% 0 Campus AYP Results (Regular and Charter)
AYP Status Preliminary 2008
Results
2008 w/ the Texas Projection Measure Change
2009 w/ the Texas Projection Measure* Change
Meets AYP 6,122 75% 6,533 80% 411 6,272 77% -261 Missed AYP 1,160 14% 749 9% -411 1010 12% 261 Not Evaluated 913 11% 913 11% 0 913 11% 0 TOTAL 8,195 100% 8,195 100% 0 8,195 100% 0 Note. * The 2009 AYP targets increase to 67% in reading/English language arts, and 58% in mathematics compared to 60% and 50%, respectively, in 2008. These analyses were conducted with an earlier version of the TPM, one with campus mean predictors in both reading/English language arts and mathematics. In addition, these analyses included the use of a confidence interval and uniform averaging for small schools; therefore, results likely overestimate the impact of the TPM on AYP results.
Alignment with the Core Principles Texas’ proposal aligns with all of the seven core principles for the growth model pilot as demonstrated below: 1. Goal of All Students Proficient by 2013–2014; Closing the Achievement Gap
Texas’ proposal aligns with this principle, since all students are expected to become proficient by 2013–2014 or are expected to be projected by the TPM to reach proficiency within no more than three years by 2013–2014.

30
2. Growth Expectations Not Moderated Based on Group or School Characteristics
Texas’ proposal meets this expectation, since the projection equations do not include group or school characteristics. Furthermore, the targets for performance level changes planned for TAKS–Alt growth will not be affected by group or school characteristics.
3. Separate Accountability Determinations Based on Reading/English Language Arts and
Mathematics
The Texas proposal meets this expectation in that separate projection equations are calculated and evaluated for reading/English language arts and mathematics. Furthermore, growth is evaluated separately for reading/English language arts and mathematics for students who will participate in TAKS–Alt assessment.
4. Inclusion of All Students, Schools and Districts; Accountability for Group Performance
The Texas proposal meets this expectation since projections (and growth targets for students participating in TAKS–Alt assessment) are calculated at the individual student level. In addition, almost all Texas students will be given a projection. As described above, Texas will not project student performance only in the rare instances when students take different assessments in the current year for reading/English language arts and mathematics or when data are insufficient to develop projection equations.
5. Two Years of Annual Assessments (Peer-Approved) in Reading/English Language Arts
and Mathematics in Grades 3–8
The Texas proposal meets or will meet this element for all of its assessments by 2009. Texas has been assessing general education students in these subjects and grades since 2003, and TAKS, TAKS (Accommodated), and LAT versions of TAKS assessments in reading/English language arts and mathematics have been fully approved in the Standards and Assessment peer review process. The second operational administration for TAKS–M will occur in 2009, with full approval of this optional assessment expected in 2009. For TAKS-Alt, the assessment for students with severe cognitive disabilities, Texas has entered a Memorandum of Agreement (MOA) with USDE in which Texas is expected to have full approval in 2009 before AYP calculations are completed. Texas is currently fully compliant with the MOA for this assessment.
6. Texas’ Data System and Proposed Growth Model Will Track Individual Students
The Texas data system that will be used in the proposed TPM meets this element since this system has a history of successfully tracking individual students and using student data to evaluate student growth.
7. Student Participation Rates and Achievement on an Additional Academic Indicator
Texas requires schools and districts to meet the participation requirements related to all students in the tested grades. Texas will continue to use the other academic indicators of attendance rates for elementary and middle schools, graduation rates for high schools, and performance gains as required elements of AYP.

31
Alignment with Additional Guiding Principles Texas’ proposal also aligns with the additional guidance provided by USDE over the past few years. The guidance noted below comes from the May 17, 2006, cross-cutting themes document published after the first round of growth pilot peer review and USDE presentations and communications with states. 1. States should incorporate available years of existing achievement data, instead of
relying on only two years of data. The TPM uses only current year achievement data to project student performance. Though USDE has recommended using data from multiple years, Texas uses only current year scores because it:
makes the projection process transparent. By developing formulas in one year, publishing them, and applying the formulas the next year, Texas makes the growth analyses transparent. Texas has a long history of using transparent formulas in the state accountability system, so this approach to the projection equations matches well with the broader Texas assessment and accountability systems.
facilitates the inclusion of as many students as possible. By using only reading/English language arts and mathematics scores, Texas includes almost all students (98% in study) and does not lose projection accuracy.
allows Texas to report student projections on confidential student reports during the regular reporting timeframe. By using prior-year formulas, this approach provides projection feedback to students, parents, educators, campuses, districts, and the state as quickly as possible, so that score users can use the information in planning instructional interventions before the school year ends.
capitalizes on the successful history of using current year scores in the Dallas growth model, which has been used since 1992.
is supported by the projection accuracy study presented in Appendix 1 in which projections using the TPM with current year scores were as accurate as projections using all student scores.
2. States should consider the impact on student growth trajectories of varying school
configurations and of student movement between schools and districts. By projecting to the next high-stakes grade and by using current year scores in the projection equations, the TPM meets this guidance. Most schools in Texas are configured such that students in grades 3–5, 6–8, and 9–12 are in the same school. See Appendix 2 for counts of Texas campuses by different grade configurations. By projecting to grades 5, 8, and 11, campuses and districts are held accountable for the growth of students during the years the students are on the campuses. Furthermore, by using current year scores to make projections, students who move from one campus to the next are not typically excluded from the TPM calculations. 3. States should make growth projections for all students, not just those below proficient. The TPM is used to project performance for all students, regardless of the performance level of the student. 4. States should hold schools accountable for the same groups as they did under status
model.

32
Texas will hold campuses accountable for the same groups as it did under the status model. 5. States should not use wide confidence intervals (USDE has not approved the use of
confidence intervals in any pilot proposal). Texas will not use confidence intervals in the projections for TAKS, TAKS (Accommodated) or TAKS–M. Texas will not use confidence intervals in the growth expectations for students participating in TAKS–Alt. Furthermore, Texas will discontinue using confidence intervals and uniform averaging in AYP calculations for special analysis for small schools. 6. States should not reset growth targets each year. Texas does not propose resetting students’ growth targets each year. However, projections will be recalculated each year and for each student, and the amount of time to reach proficiency (i.e., Met Standard) will not be extended. Annual recalculations allow Texas to update growth trajectories (based on the recalculated scores) to more precisely identify whether students are on track to reach proficiency within the initially identified timeframe. 7. States should not average scores between proficient and non-proficient students. Texas does not propose to average scores for proficient and non-proficient students. Projections and growth evaluations (for TAKS–Alt students) are made for each student. 8. States should not implement a growth model in addition to an index system. Texas does not implement an index system, so this guidance does not apply to Texas. 9. States should not dilute accountability by adding growth to the accountability system. By adding projections to Texas’ state and federal accountability systems, Texas will not dilute accountability. The purpose of including the TPM in Texas’ state and federal accountability systems is to offer alternative approaches to demonstrating achievement that meet both state and NCLB goals. The intention is not to lower student performance expectations but to hold all students, student groups, public schools, local education agencies, and the state to the same high expectations that have been set. 10. States should ensure that all students are included in its growth model proposal to the
extent possible, particularly students with disabilities who take an alternate assessment based on alternate academic achievement standards or an alternate assessment based on modified academic achievement standards.
Texas proposes to report projections or growth on as many students as possible. By projecting proficiency for all students except those with the most severe cognitive disabilities and by applying a transition table approach to those students with the most severe cognitive disabilities, Texas will maximize the number of students for whom growth is reported.

33
11. Growth model information should be freely available for scientific scrutiny to enhance and validate the model.
Texas’ decision to use prior-year formulas and make projections using current year reading/English language arts and mathematics scores allows the projection equations to be published and made publicly available. This practice of making calculations available to those who will use and be held accountable for the results is one Texas has embraced for many years. 12. The growth model should demonstrate maximum transparency and validity. Texas’ approach to measuring student growth was determined so that it maximized transparency without sacrificing validity. The projection accuracy study illustrates this feature; however, the study only evaluated projection accuracy on two grades and subjects. Texas will continue to document student projections, follow cohorts of students, and conduct annual projection accuracy studies as part of its continuous improvement efforts. In these studies, projection accuracy for students in all grades and subjects will be evaluated and reported. 13. An appropriate statistical model is available for the assessment scales. The statistical model, reliability evidence, and validity evidence supporting TAKS and TAKS (Accommodated) reading/English language arts and mathematics assessment scales in Texas have been reviewed and approved through the Standards and Assessment peer review process. Although not yet fully approved through the peer review process, the same rigorous statistical model and psychometric support will apply to the TAKS–M assessments. Due to the difficulty of gathering evidence to support that, TAKS–Alt scales have similar psychometric characteristics as the scales used for the other Texas assessments, Texas proposes a different type of growth model for this assessment, one that does not rely on the same psychometric properties as a projection model. Conclusion Texas proposes to incorporate the Texas Projection Measure in Texas’ AYP calculations starting in 2009 contingent on the state receiving final approval from the Department of Education on TAKS–Alternate, the assessment for students with severe cognitive disabilities. The proposed projection approach meets with the alignment and foundational elements of No Child Left Behind and with state statute, fits well with and enhances the Texas assessment and accountability systems, and includes almost all Texas students. By including a projection measure in AYP calculations, Texas will promote a richer evaluation of student progress than offered currently with the status model and will focus the state’s attention and intervention efforts on the progress each student is making.

34
Appendix 1 Development and Testing of the Texas Projection Measure
Background Texas recently completed a pilot study to evaluate two possible approaches to measuring annual student improvement to satisfy House Bill 1 and Senate Bill 1031. Texas is proposing to use a measure of student growth as a criterion for campuses to meet adequate yearly progress (AYP) for federal reporting purposes in 2009. In addition, Texas will include student growth in the state accountability system for evaluating campuses and districts. The two approaches evaluated in the pilot study included a growth to proficiency model and a complex regression-based model much like the models approved for the USDE growth pilot program in Tennessee and Ohio. The complex regression-based models in the pilot study were the SAS® EVAAS® mixed-model longitudinal methods computed by Dr. Bill Sanders. These two approaches were chosen for the pilot study because they were well matched to the data conditions in Texas, offered the flexibility to potentially satisfy more than one requirement for growth measures, and could be adapted when end-of-course assessments are initiated in the 2011–2012 school year. While the pilot study was being conducted, the Texas Select Committee on Public School Accountability convened two groups of district representatives at its April 2008 and August 2008 meetings. These representatives shared information about ways in which their districts have developed and used student growth measures. After hearing district testimony at the April meeting, the Select Committee expressed interest in using a regression-based model at the state level and questioned whether the state could implement a model like the one developed by the Dallas Independent School District (DISD), one that had been in use since 1992. In summer 2008, the Texas Education Agency (TEA) evaluated a model much like the Dallas model, using a few cohorts from the pilot study. A modified regression model similar to that used by Dallas ISD is the one currently proposed for the USDE pilot program. The purpose of this document is to describe the development and testing of the Texas Projection Measure, a student projection model much like the Dallas ISD model, using a procedure published by Lissitz, et al. (2006). In particular, this document will describe (1) the procedures used to develop the model formulas in mathematics and reading/English language arts using 2006 data predicting 2007 scores, (2) how the formulas were applied in 2007 to predict 2008 scores, (3) the projection accuracy of these models with these cohorts, and (4) how the projection accuracy of these models in 2008 compares with the projection accuracy of the more complex regression-based models for this cohort in 2008. Methods The procedure used to fit Texas’ Projection Measure was one recommended by the Texas Technical Advisory Committee at their July 14–15, 2008, meeting. It consists of two steps and is based on a method described in a paper by Lissitz, et al. (2006). The first step in the process is an ordinary least squares (OLS) multiple regression, which serves to identify variables that potentially significantly affect achievement. The second step is an analysis of the variability that is due to student clustering within schools, which determines whether or not multilevel modeling is justified. Two sets of analyses were conducted. The first set used the 2007 TAKS grade 8 mathematics (TAKS_M07) score as the outcome variable for all analyses. The second set of analyses used TAKS reading (TAKS_R07) scores as the outcome variable. The following section describes the procedures used with the first set of analyses, with the mathematics

35
score as the outcome variable. The procedures were repeated for this cohort using the reading score as the outcome variable and for the grade 10 cohort using the mathematics and English language arts scores as the outcomes, respectively. Note that the procedures and results in this report reflect an earlier version of the Texas Projection Measure, a version in which campus means in both mathematics and reading/English language arts were included as predictors. Through additional analyses conducted subsequent to the submission of the proposal, it was determined that the campus mean in the other subject (e.g., reading campus means for projections to mathematics or mathematics campus means for projections to reading) did not add enough to the projections to justify the added complexity to the model, so the final TPM methodology includes using only the campus mean in the projection subject. Therefore, results in the tables that follow may be slightly different with the current version of the TPM. Procedures With the 2007 TAKS grade 8 mathematics (TAKS_M07) score as the outcome variable, the initial group of student-level predictors entered into the OLS multiple regression included a 2006 TAKS grade 7 reading score (TAKS_R06) and a 2006 TAKS grade 7 mathematics score (TAKS_M06). These variables were aggregated at the campus level and included as predictors in the model as well (MEAN_TAKS_R06, MEAN_TAKS_M06). The results from the initial OLS regression model indicated that the predictor variables accounted for 62.4% of the variance in the dependent variable, TAKS_M07. All predictor variables were significant at an alpha level of 0.05. Thus, all initial predictors were eligible to be included in a multilevel model. The second step of the process involved analyzing the variability of campus-level TAKS scores and the intra-class correlation in order to determine whether or not a multilevel model was justified. This analysis is conducted using what is known as an unconditional multilevel model. The unconditional model at level 1 can be defined as
ijjij rMTAKS += 007_ β (1)
where ijMTAKS 07_ represents the 2007 grade 8 mathematics score for individual i within
school j, j0β represents the mean TAKS_M07 score for school j, and ijr represents the
residual for individual i within school j. The variance of ijr = 2σ .
Level 2 of the unconditional multilevel model can be defined as
jj u0000 += γβ (2)
where 00γ is the grand mean of the TAKS_M07 scores and ju0 is the residual for school j
(i.e., the deviation of school j from the grand mean). The variance of ju0 = 00τ . For the
model under consideration, this variance was statistically significant (Z = 26.54, p < .001), meaning there was significant variability in the mean TAKS_M07 scores among schools. The
intra-class correlation is calculated as ( )20000 / σττρ += ( ) 15.0307585612/5612 =+= ,
meaning 15% of the variance of TAKS_M07 scores is attributable to the effects of students being clustered within schools.

36
Since the unconditional model indicated variability at the school level, a model with school- and student-level predictors was run. The model may be run twice: once with all the student and school-level predictors indicated by the OLS model, and, if necessary, again with variables that were not statistically significant in the multilevel model omitted. The predictor variables in the model under consideration were all statistically significant, resulting in a final level 1 model,
( ) ( ) .06_06_07_ 210 ijjjjjjij rRTAKSMTAKSMTAKS +++= βββ
In multilevel modeling, the level 1 regression coefficients (i.e., the βs) are tested for variability at level 2. If variability at level 2 is indicated, then level 2 predictor variables can be added to the model. After testing the coefficients for variability, and school-level predictor variables for statistical significance, the final level 2 model for the model under consideration was,
( ) ( ) jj uRTAKSMEANMTAKSMEAN 00201000 06__06__ +++= γγγβ (3)
101 γβ =j (4)
202 γβ =j (5)
Equation 3 above illustrates that there is variability among the schools with respect to mean TAKS_M06 scores, and some of that variability is accounted for by the aggregation of the TAKS_M06 and TAKS_R06 at the school level. Another way of stating this is that the achievement level of the school influences student achievement above and beyond what is predicted from the students’ individual scores. Equations 4 and 5 indicate that there is no significant variation among schools with respect to the slopes associated with TAKS_M06 and TAKS_R06. Substituting the level 2 equations into the level 1 equations results in the final multilevel prediction equation,
( ) ( )( ) ( ) ( )ijj
ij
ruRTAKSMTAKS
RTAKSMEANMTAKSMEANMTAKS
+++
+++=
02010
020100
06_06_
06__06__07_
γγ
γγγ
Inserting the regression coefficients from the solution gives the final prediction equation,
).06_(1255.)06_(5006.)06__(07050.)06__(02264.68.57207_
RTAKSMTAKSRTAKSMEANMTAKSMEANMTAKS ij
++
++=
This equation, developed using 2006 scores as predictors, was then used to predict 2008 grade 8 mathematics scores for the 2007 grade 7 cohort. If a student’s predicted score was 2100 (the Met Standard score) or above, that student was classified as meeting growth targets in 2007. If the predicted score was below 2100, that student was classified as not meeting growth targets. Finally, the accuracy of the growth classifications based on predicted scores was assessed by comparing them to the observed 2008 grade 8 results. Results The procedures described above were repeated three times: once to predict grade 8 reading for the grade 7 cohort, once to predict grade 11 mathematics for the grade 10 cohort, and

37
once to predict grade 11 English language arts for the grade 10 cohort. The percentage of variance accounted for by the predictors and the intra-class correlation coefficients are presented in table A1 for the cohorts. The unstandardized regression coefficients and p-values from the multilevel model equations for the two cohorts in both subjects are presented in table A2. The projection accuracy results for all cohorts are contrasted with projection accuracy results from the more complex regression-based EVAAS projection model and presented in summary form in table A3 and in more detail in tables A4 through A11.
Table A1. Texas Projection Measure Results
Projection Grade and Subject
Year Formulas
Developed
Year Formulas Applied
Year Projection Accuracy Evaluated
Percent of Variance
Accounted for by Predictors
Intra-class Correlation Coefficient
Grade 8 Reading 2006 2007 2008 53.4% 0.11 Grade 8 Mathematics 2006 2007 2008 62.4% 0.15
Grade 11 English Language Arts
2006 2007 2008 56.1% 0.16
Grade 11 Mathematics 2006 2007 2008 70.2% 0.18 Note: These results reflect analyses with an earlier version of the TPM, one with campus mean predictors in both reading/English language arts and mathematics. Results with the current version of the TPM may be slightly different.
Table A2. Texas Projection Measure Unstandardized Regression Coefficients and p-values
Grade 7 Reading Grade 10 Mathematics Grade 10 English
Language Arts Indicators Coefficient p-value Coefficient p-value Coefficient p-value
Constant 121.05 < .0001 100.05 0.0007 64.7245 0.0176 Student-level
variables TAKS_R06 0.5867 < .0001 0.1225 < .0001 0.5630 < .0001 TAKS_M06 0.2567 < .0001 0.6962 < .0001 0.2302 < .0001
School-level variables
MEAN_TAKS_R06 0.2306 < .0001 0.03396 0.1375 0.1403 < .0001 MEAN_TAKS_M06 -0.08639 < .0001 0.1211 < .0001 0.06696 < .0001
Note: These results reflect analyses with an earlier version of the TPM, one with campus mean predictors in both reading/English language arts and mathematics. Results with the current version of the TPM may be slightly different.

38
Table A3. Projection Accuracy for the Texas Projection Measure and the EVAAS® Projection Model TEXAS PROJECTION MEASURE EVAAS® PROJECTION MODEL PROJECTION YEAR,
GRADE, AND SUBJECT
N Perfect Agreement
Met Standard
Perfect Agreement
Did Not Meet
Standard
N Perfect Agreement
Met Standard
Perfect Agreement
Did Not Meet
Standard 2008 Grade 8 Reading
270,700 94 2 269,015 94 2
2008 Grade 8 Mathematics
269,675 73 13 267,540 73 14
2008 Grade 11 English Language Arts
222,603 93 1 225,923 92 3
2008 Grade 11 Mathematics
224,341 79 10 228,110 78 11
Note: These results reflect analyses with an earlier version of the TPM, one with campus mean predictors in both reading/English language arts and mathematics. Results with the current version of the TPM may be slightly different. Table A4. Texas Projection Measure Grade 7 Cohort: Grade 8 Reading
Observed Score Did Not Meet
Growth
Observed Score
Met Growth
Total
Projected Did Not Meet
Growth
4474 (1.65)
3192 (1.18)
7666 (2.83)
Projected Met Growth
7822 (2.89)
255212 (94.28)
263034 (97.17)
Total 12296 (4.54)
258404 (95.46)
270700 (100.00)
Note: These results reflect analyses with an earlier version of the TPM, one with campus mean predictors in both reading/English language arts and mathematics. Results with the current version of the TPM may be slightly different. Table A5. EVAAS® Projection Model Grade7 Cohort: Grade 8 Reading
Observed Score Did Not Meet
Growth
Observed Score
Met Growth
Total
Projected Did Not Meet
Growth
5097 (1.89)
3461 (1.29)
8558 (3.18)
Projected Met Growth
7235 (2.69)
253222 (94.13)
260457 (96.82)
Total 12332 (4.58)
256683 (95.42)
269015 (100.00)
Note: These results reflect analyses with an earlier version of the TPM, one with campus mean predictors in both reading/English language arts and mathematics. Results with the current version of the TPM may be slightly different.

39
Table A6. Texas Projection Measure Grade 7 Cohort: Grade 8 Mathematics
Observed Score Did Not Meet
Growth
Observed Score
Met Growth
Total
Projected Did Not Meet
Growth
34632 (12.84)
18853 (6.99)
53485 (19.83)
Projected Met Growth
18393 (6.82)
197797 (73.35)
211345 (80.17)
Total 53025 (19.66)
216650 (80.34)
269675 (100.00)
Note: These results reflect analyses with an earlier version of the TPM, one with campus mean predictors in both reading/English language arts and mathematics. Results with the current version of the TPM may be slightly different. Table A7. EVAAS® Projection Model Grade 7 Cohort: Grade 8 Mathematics
Observed Score Did Not Meet
Growth
Observed Score
Met Growth
Total
Projected Did Not Meet
Growth
37007 (13.83)
19188 (7.17)
56195 (21.00)
Projected Met Growth
15882 (5.94)
195463 (73.06)
211345 (79.00)
Total 52889 (19.77)
214651 (80.23)
267540 (100.00)
Note: These results reflect analyses with an earlier version of the TPM, one with campus mean predictors in both reading/English language arts and mathematics. Results with the current version of the TPM may be slightly different. Table A8. Texas Projection Measure Grade 10 Cohort: Grade 11 English Language Arts
Observed Score Did Not Meet Growth
Observed Score
Met Growth
Total
Projected Did Not Meet
Growth
3056 (1.36)
1037 (0.46)
4093 (1.82)
Projected Met Growth
10889 (4.85)
209359 (93.32)
220248 (98.18)
Total 13945 (6.22)
210396 (93.78)
224341 (100.00)
Note: These results reflect analyses with an earlier version of the TPM, one with campus mean predictors in both reading/English language arts and mathematics. Results with the current version of the TPM may be slightly different.

40
Table A9. EVAAS® Projection Model Grade 10 Cohort: Grade 11 English Language Arts
Observed Score Did Not Meet Growth
Observed Score Met
Growth
Total
Projected Did Not Meet
Growth
6555 (2.87)
3877 (1.70)
10432 (4.57)
Projected Met Growth
8520 (3.74)
209158 (91.69)
217678 (95.43)
Total 15075 (6.61)
213035 (93.39)
228110 (100.00)
Note: These results reflect analyses with an earlier version of the TPM, one with campus mean predictors in both reading/English language arts and mathematics. Results with the current version of the TPM may be slightly different. Table A10. Texas Projection Measure Grade 10 Cohort: Grade 11 Mathematics
Observed Score Did Not Meet Growth
Observed Score Met
Growth
Total
Projected Did Not Meet
Growth
22138 (9.95)
9419 (4.23)
31557 (14.18)
Projected Met Growth
16177 (7.27)
174869 (78.56)
191046 (85.82)
Total 38315 (17.21)
184288 (82.79)
222603 (100.00)
Note: These results reflect analyses with an earlier version of the TPM, one with campus mean predictors in both reading/English language arts and mathematics. Results with the current version of the TPM may be slightly different. Table A11. EVAAS® Projection Model Grade 10 Cohort: Grade 11 Mathematics
Observed Score Did Not Meet Growth
Observed Score Met
Growth
Total
Projected Did Not Meet
Growth
25484 (11.28)
9550 (4.23)
35034 (15.51)
Projected Met Growth
14976 (6.63)
175913 (77.86)
190889 (84.49)
Total 40460 (17.91)
185463 (82.09)
225923 (100.00)
Note: These results reflect analyses with an earlier version of the TPM, one with campus mean predictors in both reading/English language arts and mathematics. Results with the current version of the TPM may be slightly different.

41
Discussion Results from this study indicated that projection accuracy for the Texas Projection Measure was similar to projection accuracy with the more complex models for these cohorts. Thus, the Texas model would appear to share some of the advantages of projection models in general and the EVAAS model in particular. These advantages include that the Texas projection models have evidence supporting their accuracy and reliability, offer the flexibility to be adapted when end-of-course assessments are initiated in the 2011–2012 school year, and would likely be beneficial in the calculation of Adequate Yearly Progress for campuses, districts, and the state. Though the Texas model is similar and produces similar results to the EVAAS model, it is simpler and uses formulas from the prior year, so that the process for predicting student performance as an indicator of student growth is transparent to the state and can be reported on the Confidential Student Report during Texas’ regularly-scheduled reporting timeframe. State law requires that schools receive results from the first administration of TAKS within ten working days of receipt of the test materials by the testing contractor. Because the Texas model is simpler than the EVAAS model, it lacks some of the flexibility of the more complex model in handling missing data. Students must have valid scores in both reading/English language arts and mathematics to be projected in the Texas model. Whereas the simplicity of the model is a disadvantage with regard to missing data, it nevertheless has some advantages over the more complex model. For example, the Texas projection measure is easy to implement using standard statistical software, so the turnaround time between test completion and projection calculation would be relatively short, and student projection results could be reported on the student reports and used in instructional planning as early as possible. Furthermore, the regression coefficients could be made publicly available so that school and district personnel would be able to calculate projected scores relatively easily. Though the intricacies of the development of the multilevel regression equations may be difficult for stakeholders to understand, the basic idea of using students’ current-year test scores to predict future performance is fairly straightforward. A potential disadvantage of any regression-based model is explaining the methodology to stakeholders who do not have a statistical background. In addition, the accuracy and reliability of regression-based models are likely to decrease the closer a student is to the classification cut score, where small errors can mean the difference between being classified correctly and incorrectly. It is also expected that projection accuracy decreases as the time between testing and final growth target increases. Analyses to evaluate projection accuracy for all grades and subjects are planned as annual analyses, so that projection accuracy for students at all score points and those being projected one, two, or three years in the future can be documented and monitored over time.
References Lissitz, R. W., Fan, W., Alban, T., Hislop, B., Strader, D., Wood, C., et al. (March, 2006). The projection of performance on the Maryland high school graduation exam: Magnitude, modeling and reliability of results. A paper presented at the National Council on Measurement in Education, San Francisco.

42
Appendix 2 Grade Configuration of Texas Campuses

43
Appendix 3 Projection Accuracy for the Texas Projection Measure
Total Projection Accuracy
Accurate Classification
Misclassification
Grade and Subject (Grade Projected From
and To)
Group N
Percentage Accurate
Percentage Inaccurate
Did Not Meet
Standard
Met Standard
Met Standard When Projected
Did Not Meet Standard
Did Not Meet Standard When Projected Met
Standard Grade 7 Reading
(7 to 8) Total 271344 96% 4% 2% 94% 1% 3%
Ethnicity Native American 863 97% 3% 1% 97% 1% 2% Asian 9499 99% 1% < 1% 98% < 1% 1% African American 36820 93% 7% 3% 91% 2% 5% Hispanic 119213 94% 6% 2% 92% 1% 4% White 104902 98% 2% < 1% 98% < 1% 2% Economically Disadvantaged No 134900 98% 2% 1% 97% < 1% 2% Yes 136444 94% 6% 3% 91% 2% 5% Limited English Proficiency No 257982 96% 4% 1% 95% 1% 3% Yes 13362 81% 19% 14% 67% 6% 13% Special Education No 263245 96% 4% 2% 94% 1% 3% Yes 7908 89% 11% 5% 85% 3% 8%
Note: These results reflect analyses with an earlier version of the TPM, one with campus mean predictors in both reading/English language arts and mathematics. Results with the current version of the TPM may be slightly different.

44
Total Projection Accuracy
Accurate Classification
Misclassification
Grade and Subject (Grade Projected From
and To)
Group N
Percentage Accurate
Percentage Inaccurate
Did Not Meet
Standard
Met Standard
Met Standard When Projected
Did Not Meet Standard
Did Not Meet Standard When Projected Met
Standard Grade 7
Mathematics (7 to 8)
Total 263430 86% 14% 14% 72% 8% 6%
Ethnicity Native American 830 86% 14% 8% 78% 7% 7% Asian 9267 95% 5% 3% 92% 3% 2% African American 35551 80% 20% 24% 56% 11% 8% Hispanic 115280 82% 18% 19% 64% 11% 7% White 102461 90% 10% 6% 84% 5% 5% Economically Disadvantaged No 131708 90% 10% 7% 83% 5% 5% Yes 131722 81% 19% 20% 61% 11% 7% Limited English Proficiency No 250698 86% 14% 12% 74% 8% 6% Yes 12732 75% 25% 41% 34% 19% 6% Special Education No 255716 86% 14% 13% 72% 8% 6% Yes 7537 79% 21% 30% 49% 14% 8%
Note: These results reflect analyses with an earlier version of the TPM, one with campus mean predictors in both reading/English language arts and mathematics. Results with the current version of the TPM may be slightly different.
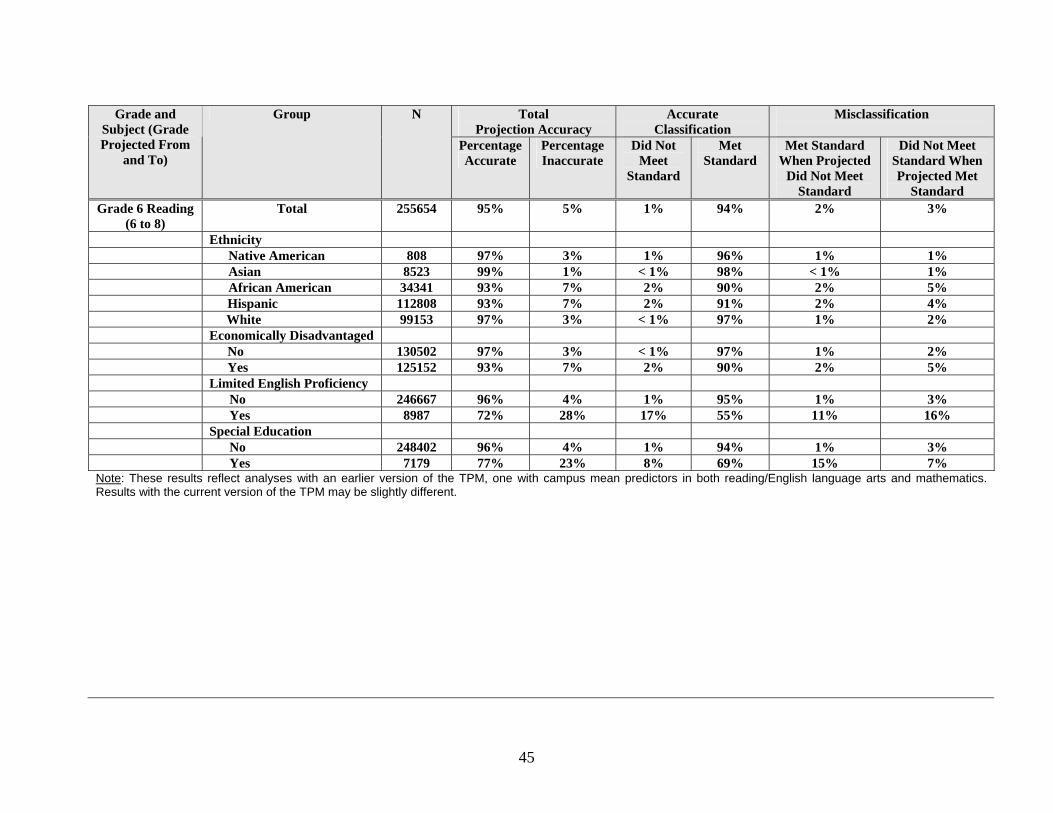
45
Total Projection Accuracy
Accurate Classification
Misclassification
Grade and Subject (Grade Projected From
and To)
Group N
Percentage Accurate
Percentage Inaccurate
Did Not Meet
Standard
Met Standard
Met Standard When Projected
Did Not Meet Standard
Did Not Meet Standard When Projected Met
Standard Grade 6 Reading
(6 to 8) Total 255654 95% 5% 1% 94% 2% 3%
Ethnicity Native American 808 97% 3% 1% 96% 1% 1% Asian 8523 99% 1% < 1% 98% < 1% 1% African American 34341 93% 7% 2% 90% 2% 5% Hispanic 112808 93% 7% 2% 91% 2% 4% White 99153 97% 3% < 1% 97% 1% 2% Economically Disadvantaged No 130502 97% 3% < 1% 97% 1% 2% Yes 125152 93% 7% 2% 90% 2% 5% Limited English Proficiency No 246667 96% 4% 1% 95% 1% 3% Yes 8987 72% 28% 17% 55% 11% 16% Special Education No 248402 96% 4% 1% 94% 1% 3% Yes 7179 77% 23% 8% 69% 15% 7%
Note: These results reflect analyses with an earlier version of the TPM, one with campus mean predictors in both reading/English language arts and mathematics. Results with the current version of the TPM may be slightly different.

46
Total Projection Accuracy
Accurate Classification
Misclassification
Grade and Subject (Grade Projected From
and To)
Group N
Percentage Accurate
Percentage Inaccurate
Did Not Meet
Standard
Met Standard
Met Standard When Projected
Did Not Meet Standard
Did Not Meet Standard When Projected Met
Standard Grade 6
Mathematics (6 to 8)
Total 256043 84% 16% 12% 72% 8% 8%
Ethnicity Native American 814 84% 16% 9% 75% 8% 8% Asian 8567 94% 6% 2% 92% 3% 3% African American 34218 79% 21% 21% 58% 10% 11% Hispanic 113271 81% 19% 17% 64% 10% 9% White 99153 90% 10% 5% 85% 4% 6% Economically Disadvantaged No 130512 89% 11% 6% 83% 5% 6% Yes 125531 79% 21% 18% 61% 11% 10% Limited English Proficiency No 246563 85% 15% 11% 74% 7% 8% Yes 9480 70% 30% 49% 22% 23% 7% Special Education No 248099 85% 15% 11% 74% 7% 8% Yes 7870 68% 32% 36% 32% 25% 8%
Note: These results reflect analyses with an earlier version of the TPM, one with campus mean predictors in both reading/English language arts and mathematics. Results with the current version of the TPM may be slightly different.

47
Total Projection Accuracy
Accurate Classification
Misclassification
Grade and Subject (Grade Projected From
and To)
Group N
Percentage Accurate
Percentage Inaccurate
Did Not Meet
Standard
Met Standard
Met Standard When Projected
Did Not Meet Standard
Did Not Meet Standard When Projected Met
Standard Grade 5 Reading
(5 to 8) Total
244053 95% 5% 1% 94% 2% 3% Ethnicity Native American 758 97% 3% 1% 97% 1% 2% Asian 7724 99% 1% < 1% 99% < 1% 1% African American 32226 92% 8% 2% 90% 3% 5% Hispanic 108851 93% 7% 2% 91% 2% 5% White 94475 97% 3% <1% 97% 1% 2% Economically Disadvantaged No 124267 97% 3% < 1% 97% 1% 2% Yes 119786 92% 8% 2% 90% 3% 5% Limited English Proficiency No 235949 96% 4% 1% 95% 1% 3% Yes 8104 71% 29% 15% 57% 10% 19% Special Education No 236746 96% 4% 1% 94% 1% 3% Yes 7238 77% 23% 10% 67% 13% 10%
Note: These results reflect analyses with an earlier version of the TPM, one with campus mean predictors in both reading/English language arts and mathematics. Results with the current version of the TPM may be slightly different.
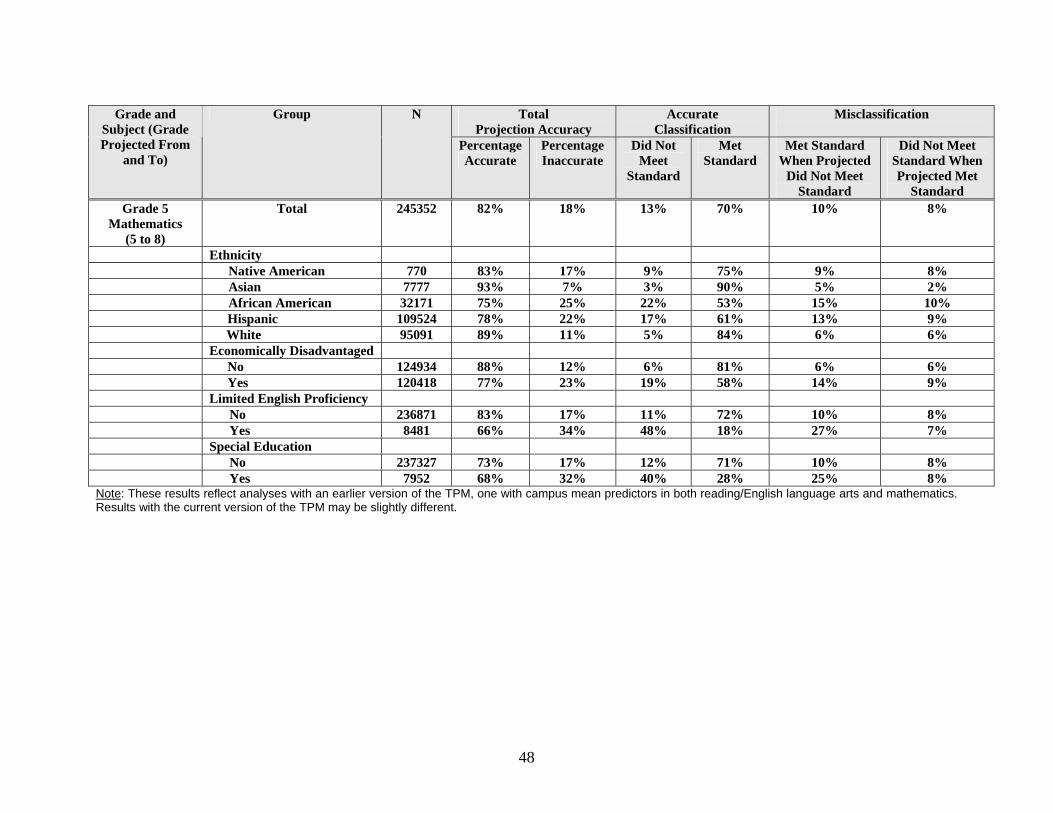
48
Total Projection Accuracy
Accurate Classification
Misclassification
Grade and Subject (Grade Projected From
and To)
Group N
Percentage Accurate
Percentage Inaccurate
Did Not Meet
Standard
Met Standard
Met Standard When Projected
Did Not Meet Standard
Did Not Meet Standard When Projected Met
Standard Grade 5
Mathematics (5 to 8)
Total 245352 82% 18% 13% 70% 10% 8%
Ethnicity Native American 770 83% 17% 9% 75% 9% 8% Asian 7777 93% 7% 3% 90% 5% 2% African American 32171 75% 25% 22% 53% 15% 10% Hispanic 109524 78% 22% 17% 61% 13% 9% White 95091 89% 11% 5% 84% 6% 6% Economically Disadvantaged No 124934 88% 12% 6% 81% 6% 6% Yes 120418 77% 23% 19% 58% 14% 9% Limited English Proficiency No 236871 83% 17% 11% 72% 10% 8% Yes 8481 66% 34% 48% 18% 27% 7% Special Education No 237327 73% 17% 12% 71% 10% 8% Yes 7952 68% 32% 40% 28% 25% 8%
Note: These results reflect analyses with an earlier version of the TPM, one with campus mean predictors in both reading/English language arts and mathematics. Results with the current version of the TPM may be slightly different.