TET1 is a maintenance DNA demethylase that prevents methylation spreading in differentiated cells
16
6956–6971 Nucleic Acids Research, 2014, Vol. 42, No. 11 Published online 29 May 2014 doi: 10.1093/nar/gku372 TET1 is a maintenance DNA demethylase that prevents methylation spreading in differentiated cells Chunlei Jin 1,2,3,4 , Yue Lu 2,5 , Jaroslav Jelinek 2,4 , Shoudan Liang 6 , Marcos R.H. Estecio 2,3,5 , Michelle Craig Barton 3 and Jean-Pierre J. Issa 2,4,* 1 The Graduate School of Biomedical Sciences, The University of Texas Health Science Center at Houston, Houston, TX 77030, USA, 2 Department of Leukemia, The University of Texas M.D.Anderson Cancer Center, Houston, TX 77030, USA, 3 Department of Biochemistry and Molecular Biology, The University of Texas M.D.Anderson Cancer Center, Houston, TX 77030, USA, 4 Fels Institute for Cancer Research and Molecular Biology, Temple University, Philadelphia, PA 19140, USA, 5 Department of Molecular Carcinogenesis, The University of Texas M.D. Anderson Cancer Center, Houston, TX 77030, USA and 6 Department of Bioinformatics and Computational Biology, The University of Texas M.D.Anderson Cancer Center, Houston, TX 77030, USA Received March 18, 2014; Accepted April 16, 2014 ABSTRACT TET1 is a 5-methylcytosine dioxygenase and its DNA demethylating activity has been implicated in pluripotency and reprogramming. However, the pre- cise role of TET1 in DNA methylation regulation out- side of developmental reprogramming is still unclear. Here, we show that overexpression of the TET1 cat- alytic domain but not full length TET1 (TET1-FL) in- duces massive global DNA demethylation in differ- entiated cells. Genome-wide mapping reveals that 5-hydroxymethylcytosine production by TET1-FL is inhibited as DNA methylation increases, which can be explained by the preferential binding of TET1- FL to unmethylated CpG islands (CGIs) through its CXXC domain. TET1-FL specifically accumulates 5- hydroxymethylcytosine at the edges of hypomethy- lated CGIs, while knockdown of endogenous TET1 in- duces methylation spreading from methylated edges into hypomethylated CGIs. We also found that gene expression changes after TET1-FL overexpression are relatively small and independent of its dioxyge- nase function. Thus, our results identify TET1 as a maintenance DNA demethylase that does not pur- posely decrease methylation levels, but specifically prevents aberrant methylation spreading into CGIs in differentiated cells. INTRODUCTION DNA methylation at the C5 position of cytosine (5- methylcytosine, 5mC) is a crucial epigenetic modification that has been implicated in numerous cellular processes in mammals, including embryonic development, transcrip- tion, X chromosome inactivation, genomic imprinting and chromatin structure (1,2). The methylation pattern of the genome is dynamic during normal development, starting from fertilization through embryogenesis and postnatal growth, and abnormal methylation changes are involved in various human diseases, such as cancer (3,4). The pat- terns of DNA methylation in cells are initially established by de novo DNA methyltransferases DNMT3a and DNMT3b, and then faithfully maintained during DNA replication by the maintenance methyltransferase DNMT1 (5–8). In con- trast to the well-defined DNA methyltransferases, the po- tential enzymes that erase DNA methylation are only be- ginning to be understood (9,10). The ten–eleven translocation (TET) family proteins were recently identified as 5mC dioxygenases which can consec- utively convert 5mC into 5-hydroxymethylcytosine (5hmC), 5-formylcytosine and 5-carboxylcytosine and further in- duce passive or active DNA demethylation in genomic DNA (11–20). Tet1, the founding member of the TET fam- ily, has been intensely studied since its dioxygenase cat- alytic function was demonstrated (19,20). Depletion of Tet1 in mouse embryonic stem cells (mESCs) causes decreased 5hmC levels and increased DNA methylation at its target regions, and also affects gene transcription and cell lineage specification (19,21–25). Tet1 was also reported to induce locus-specific demethylation in mouse primordial germ cells and activate some meiotic genes (26–28). Moreover, Tet1- mediated demethylation was observed in the reprogram- ming processes for generation of induced pluripotent stem cells (29,30). However, outside of embryonic development and reprogramming, little is known about the role of TET1 in DNA methylation regulation in differentiated cells where it is commonly expressed (19,31). Previous studies, which reported that overexpression of TET1 in HEK293 cells can * To whom correspondence should be addressed. Tel: +1 215 707 4307; Fax: +1 215 707 1454; Email: [email protected] C The Author(s) 2014. Published by Oxford University Press on behalf of Nucleic Acids Research. This is an Open Access article distributed under the terms of the Creative Commons Attribution License (http://creativecommons.org/licenses/by-nc/3.0/), which permits non-commercial re-use, distribution, and reproduction in any medium, provided the original work is properly cited. For commercial re-use, please contact [email protected]
Transcript of TET1 is a maintenance DNA demethylase that prevents methylation spreading in differentiated cells

6956–6971 Nucleic Acids Research, 2014, Vol. 42, No. 11 Published online 29 May 2014doi: 10.1093/nar/gku372
TET1 is a maintenance DNA demethylase thatprevents methylation spreading in differentiated cellsChunlei Jin1,2,3,4, Yue Lu2,5, Jaroslav Jelinek2,4, Shoudan Liang6, Marcos R.H. Estecio2,3,5,Michelle Craig Barton3 and Jean-Pierre J. Issa2,4,*
1The Graduate School of Biomedical Sciences, The University of Texas Health Science Center at Houston, Houston,TX 77030, USA, 2Department of Leukemia, The University of Texas M.D. Anderson Cancer Center, Houston, TX77030, USA, 3Department of Biochemistry and Molecular Biology, The University of Texas M.D. Anderson CancerCenter, Houston, TX 77030, USA, 4Fels Institute for Cancer Research and Molecular Biology, Temple University,Philadelphia, PA 19140, USA, 5Department of Molecular Carcinogenesis, The University of Texas M.D. AndersonCancer Center, Houston, TX 77030, USA and 6Department of Bioinformatics and Computational Biology, TheUniversity of Texas M.D. Anderson Cancer Center, Houston, TX 77030, USA
Received March 18, 2014; Accepted April 16, 2014
ABSTRACT
TET1 is a 5-methylcytosine dioxygenase and itsDNA demethylating activity has been implicated inpluripotency and reprogramming. However, the pre-cise role of TET1 in DNA methylation regulation out-side of developmental reprogramming is still unclear.Here, we show that overexpression of the TET1 cat-alytic domain but not full length TET1 (TET1-FL) in-duces massive global DNA demethylation in differ-entiated cells. Genome-wide mapping reveals that5-hydroxymethylcytosine production by TET1-FL isinhibited as DNA methylation increases, which canbe explained by the preferential binding of TET1-FL to unmethylated CpG islands (CGIs) through itsCXXC domain. TET1-FL specifically accumulates 5-hydroxymethylcytosine at the edges of hypomethy-lated CGIs, while knockdown of endogenous TET1 in-duces methylation spreading from methylated edgesinto hypomethylated CGIs. We also found that geneexpression changes after TET1-FL overexpressionare relatively small and independent of its dioxyge-nase function. Thus, our results identify TET1 as amaintenance DNA demethylase that does not pur-posely decrease methylation levels, but specificallyprevents aberrant methylation spreading into CGIsin differentiated cells.
INTRODUCTION
DNA methylation at the C5 position of cytosine (5-methylcytosine, 5mC) is a crucial epigenetic modificationthat has been implicated in numerous cellular processes
in mammals, including embryonic development, transcrip-tion, X chromosome inactivation, genomic imprinting andchromatin structure (1,2). The methylation pattern of thegenome is dynamic during normal development, startingfrom fertilization through embryogenesis and postnatalgrowth, and abnormal methylation changes are involvedin various human diseases, such as cancer (3,4). The pat-terns of DNA methylation in cells are initially established byde novo DNA methyltransferases DNMT3a and DNMT3b,and then faithfully maintained during DNA replication bythe maintenance methyltransferase DNMT1 (5–8). In con-trast to the well-defined DNA methyltransferases, the po-tential enzymes that erase DNA methylation are only be-ginning to be understood (9,10).
The ten–eleven translocation (TET) family proteins wererecently identified as 5mC dioxygenases which can consec-utively convert 5mC into 5-hydroxymethylcytosine (5hmC),5-formylcytosine and 5-carboxylcytosine and further in-duce passive or active DNA demethylation in genomicDNA (11–20). Tet1, the founding member of the TET fam-ily, has been intensely studied since its dioxygenase cat-alytic function was demonstrated (19,20). Depletion of Tet1in mouse embryonic stem cells (mESCs) causes decreased5hmC levels and increased DNA methylation at its targetregions, and also affects gene transcription and cell lineagespecification (19,21–25). Tet1 was also reported to inducelocus-specific demethylation in mouse primordial germ cellsand activate some meiotic genes (26–28). Moreover, Tet1-mediated demethylation was observed in the reprogram-ming processes for generation of induced pluripotent stemcells (29,30). However, outside of embryonic developmentand reprogramming, little is known about the role of TET1in DNA methylation regulation in differentiated cells whereit is commonly expressed (19,31). Previous studies, whichreported that overexpression of TET1 in HEK293 cells can
*To whom correspondence should be addressed. Tel: +1 215 707 4307; Fax: +1 215 707 1454; Email: [email protected]
C© The Author(s) 2014. Published by Oxford University Press on behalf of Nucleic Acids Research.This is an Open Access article distributed under the terms of the Creative Commons Attribution License (http://creativecommons.org/licenses/by-nc/3.0/), whichpermits non-commercial re-use, distribution, and reproduction in any medium, provided the original work is properly cited. For commercial re-use, please [email protected]

Nucleic Acids Research, 2014, Vol. 42, No. 11 6957
induce DNA demethylation in exogenous non-replicableDNA reporters and endogenous genomic loci, used overex-pression of the TET1 catalytic domain (TET1-CD) but notfull length TET1 (TET1-FL) (17,32). Given the possibilitythat the residual domains in TET1 may regulate the acces-sibility to its catalytic domain, those results on TET1-CDdo not precisely reveal the function of TET1 in physiologicDNA methylation regulation.
In this report, we systematically investigated the effectof TET1 on DNA methylation in HEK293T cells by over-expression of TET1-FL and knockdown of endogenousTET1. Our results demonstrate that TET1 works as a main-tenance DNA demethylase, which does not change DNAmethylation globally, but specifically maintains the DNAhypomethylation state of CpG islands (CGIs) by prevent-ing methylation spreading from methylated edges.
MATERIALS AND METHODS
DNA construct and overexpression of TET1
To clone the open reading frame (ORF) of human TET1-FL (1–2136 amino acid), we extracted total RNA fromSY5Y cells using TRIzol R© Reagent (Invitrogen). Reversetranscription was performed with a gene-specific primer (5′-TATATACTGCAAGTTGCTAATACTTGAATG-3′) andAccuScript PfuUltra II RT-PCR Kit (Stratagene) accord-ing to the manufacturer’s instructions. After PCR amplifi-cation with AccuPrimeTM Taq DNA Polymerase High Fi-delity (Invitrogen), TET1-FL ORF was cloned into pCR R©-XL-TOPO R© vector (Invitrogen). Finally, the fragment ofTET1-FL ORF was transferred into pIRES-hrGFP II vec-tor (Stratagene) which contains a green fluorescent protein(GFP) reporter and a 3× FLAG tag. The ORF of TET1-CD (1418–2136 amino acid) was amplified from the aboveTET1-FL ORF clone, and it was also inserted into pIRES-hrGFP II vector. Catalytically mutant mTET1-FL andmTET1-CD (H1671D, Y1673A) (20) and CXXC domain-mutated TET1-FL-C594A (22) were generated by site-directed mutagenesis. The sequences of all plasmids werevalidated by Sanger DNA sequencing. Transfection of thoseplasmids into HEK293T cells were carried out with Fu-Gene HD transfection reagent (Roche) according to man-ufacturer’s instructions. GFP-positive cells were collectedby fluorescent activated cell sorting (FACS) at indicatedtime points using Becton Dickinson FACS Calibur FlowCytometer. HEK293T cells were obtained from ATCC,cultured in Dulbecco’s modified Eagle’s medium supple-mented with 10% fetal bovine serum, and tested negativefor mycoplasma contamination.
Western blot and DNA dot blot assays
For western blot assays, protein extraction was performedusing the radio-immunoprecipitation assay (RIPA) buffer(Fisher) supplemented with 1× protease inhibitor cock-tail solution (Roche). The primary antibodies used in-cluded anti-FLAG (Cat. #200471, Stratagene), anti-TET1(GTX124207, GeneTex), anti-Lamin B (AB16048, Abcam)and anti-�-actin (GTX109639, GeneTex). For DNA dotblot assays, different amounts of genomic DNA samples di-luted in 0.4 mM NaOH/10 mM ethylenediaminetetraacetic
acid (EDTA) were denatured at 100◦C for 10 min, followedby rapid chilling on ice. Two microliters of each denaturedDNA was then spotted onto the positively charged nylonmembrane (Roche), and the diameter of each dot was keptto <4 mm. After the membrane became dry, it was rinsedin 2× SSC buffer (0.3 M NaCl, 30 mM sodium citrate) fol-lowed by complete air dry. The dry membrane was wrappedin UV-transparent plastic wrap, and then placed DNA-side-down on a UV transilluminator for 3 min to immo-bilize the DNA. After blocking with 5% non-fat dry milkin PBS, the membrane was immunoblotted using 5hmC an-tibody (Cat. #39769, Active Motif) and HRP-conjugatedanti-rabbit secondary antibody (NA934, GE Healthcare),and finally developed with enhanced chemiluminescencereagents and exposed to X-ray imaging film.
Bisulfite-pyrosequencing and bisulfite-cloning-sequencing
Bisulfite conversion of genomic DNA was done with Epi-Tect bisulfite kits (Qiagen) according to the manufacturer’sinstructions. For bisulfite-pyrosequencing, a two-step poly-merase chain reaction (PCR) for amplification was gener-ally used as previously described (33,34). The results wereanalyzed with Pyro Q-CpG Software (Qiagen) software. Forbisulfite-cloning-sequencing, a similar two-step PCR as thatin bisulfite-pyrosequencing was used but no biotinylatedprimers were included in the second step PCR. The finalPCR product was then cloned into pCR4-TOPO vector (In-vitrogen) and transformed TOP10 chemical competent cells(Invitrogen). After ∼14 h of incubation at 37◦C, individualclones were picked and amplified with PCR using pCR4forward primer (5′-TCTGGAATTGTGAGCGGATA-3′)and reverse primer (5′-GTTTTCCCAGTCACGACGTT-3′). Those PCR products were then sequenced with M13-RV primer. The primers used are listed in SupplementaryTable S1.
HpaII-PCR DNA methylation assay
HpaII-PCR DNA methylation assay was performed as pre-viously described (17). In brief, 500 ng genomic DNA wereincubated with 10 units HpaII (NEB) or in a mock reac-tion without HpaII at 37◦C for 8 h or overnight, followedby 80◦C inactivation for 20 min. The DNA from HpaII di-gestion or mock treatment was tested by qPCR (AppliedBiosystems 7500) using Power SYBR R© Green PCR Mas-ter Mix (Applied Biosystems) and primers flanking specificHpaII digestion sites (CCGG). PCR reaction comprised a10 min activation step at 95◦C, followed by 40 cycles of95◦C for 15 s, and 60◦C for 1 min. DNA methylation ofa CCGG site was calculated by 2Ct(mock) − Ct(HpaII) × 100%.The primers used are listed in Supplementary Table S1.
Chromatin immunoprecipitation and quantitative PCR(ChIP-qPCR)
Cells were fixed with fresh 1% formaldehyde at room tem-perature for 10 min and quenched with 125 mM glycine.The cells were then washed with cold phosphate bufferedsaline (PBS) and resuspended in sodium dodecyl sulphate(SDS) lysis buffer (50 mM Tris pH 8.1, 10 mM EDTA,

6958 Nucleic Acids Research, 2014, Vol. 42, No. 11
1% SDS), followed by sonication with Bioruptor (Diagen-ode) to get an average fragment size of 200–500 bp. Theresultant chromatin samples were 10-fold diluted in ChIPdilution buffer (16.7 mM Tris pH 8.1, 1.2 mM EDTA,167 mM NaCl, 1.1% Triton X-100, 0.01% SDS) and incu-bated with Dynal R©Protein G magnetic beads (Invitrogen)at 4◦C overnight for pre-clearing. At the same time, anti-FLAG or anti-TET1 antibodies described above or controlIgG were pre-crosslinked with Dynal R©Protein G magneticbeads at 4◦C overnight. The pre-cleared chromatin sampleswere then incubated with the antibody-bead complex at 4◦Covernight. The immunoprecipitated chromatin–antibody–bead complexes were extensively washed with RIPA wash-ing buffer (0.5 M EDTA, 5 M LiCl, 1 M HEPES–KOHpH 7.6, 10% NP-40, 10% Na-deoxycholate) and TE buffer(pH 8.0) containing 50 nM NaCl, resuspended in elutionbuffer (50 mM Tris pH 8.1, 10 mM EDTA, 1% SDS), andheated at 65◦C for 15 min to separate chromatin from beads.For reversing crosslinks, the isolated chromatin was incu-bated at 65◦C overnight, followed by digestion with RNaseA and Proteinase K. Finally, the resultant DNA was puri-fied with Qiaquick PCR Purification Kit (Qiagen). Enrich-ment of target regions was determined by qPCR under sim-ilar conditions described in HpaII-PCR DNA methylationassay. The primers used are listed in Supplementary TableS1.
Lentiviral shRNA-mediated TET1 knockdown
Two different TET1 shRNAs in the pTRIPZ vec-tors (shTET1#1: V2THS 141063 and shTET1#2:V2THS 203196, Open Biosystems) were transferredinto MulI and XhoI sites of the pGIPZ vectors (OpenBiosystems). A non-targeting shRNAmir-pGIPZ vectorwas used as a negative control (RHS4743, Open Biosys-tems). To produce lentiviral particles, pGIPZ-shTET1and package plasmids psPAX2 and pMD2.G (Addgene)were transfected into HEK293FT cells (Invitrogen) ata ratio of 1:1:1 using Lipofectamine R©2000 TransfectionReagents (Invitrogen). Two days after transfection, theviral supernatant was collected and filtered with 0.45 �mfilters (Millipore). HEK293T cells were then infected witheach lentivirus supernatant in the presence of 8 �g/mlof polybrene (Sigma). Puromycin selection (1.5 �g/ml,Sigma) began 2 days after infection. Stable knockdowncells were cloned by limiting dilution and selected bywestern blot assay based on TET1 protein level. Theseknockdown cells were subjected to further analyses 3–4months after transfection.
Digital restriction enzyme analysis of methylation (DREAM)
DREAM was performed as previously described (35).Five micrograms of genomic DNA from (m)TET1-FL-or(m)TET1-CD-overexpressing HEK293T cells were firstspiked with 0.05 ng of a set of specific calibrators withdifferent methylation levels. The DNA mixture was thensequentially digested by 5 �l SmaI (3 h at 37◦C, Fermentas)and 50 U XmaI (∼16 h at 37◦C, NEB), resulting in distinctDNA signatures at unmethylated or methylated SmaI sites(CCCGGG). After purification with a QIAquick PCR
purification kit, the digested DNA was heated at 65◦C for3 min followed by snap cooling to create free concatenatedCCGG overhangs. Klenow fragment (3′→5′ exo-) (NEB)and CGA mix (dCTP, dGFP, dATP, 10 mM each) werethen added to fill the overhangs and added ‘A’ tail to 3′ end.The resultant DNA was purified again and then ligatedwith Illumina paired ends adapters (PEA1: 5′-phosphate-GATCGGAAGAGCGGTTCAGCAGGAATGCCGAG-3′, PEA2: 5′-ACACTCTTTCCCTACACGACGCTCTTC-CGATCT-3′) using Quick T4 DNA ligase (Enzymatics).Subsequently, the DNA ligated with adapters was sepa-rated through 2% agarose gel. The gel slice with the size of250–375 bp was cut off and purified with QIAquick GelExtraction Kit (Qiagen). PCR amplification (18 cycles)of the gel-extracted DNA was performed using Illuminapaired end PCR primers and iProof HF master mix(Bio-Rad). Resulting sequencing libraries were purifiedwith Agencourt AMPure PCR Purification Kit (BeckmanCoulter). Then the libraries were sequenced by paired-end36 nt sequencing on Illumina Genome Analyzer II. Thesequencing reads were mapped to SmaI sites in the humangenome hg18 and signatures corresponding to methylatedand unmethylated CpG were enumerated for each SmaIsite. The minimum coverage was set at ≥20 reads unlessotherwise indicated. The methylation value was calculatedas the ratio of the number of methylated tags over totalnumber of tags mapped to a given SmaI/XmaI site. Datahave been deposited in GEO with accession number:GSE44038.
As for the genomic location of SmaI sites, each SmaI sitewas assigned to the gene that has the closest transcriptionstart site (TSS). Then the region was classified by its loca-tion to the gene: upstream (−5 to −1 kb from TSS), pro-moter (−1 to 0.5 kb from TSS), exon, intron, downstream(−0.5 to 1 kb from transcription end site (TES)) and in-tergenic (1 kb from TES to −5 kb of downstream gene).The gene list used to annotate the enriched regions is theRefSeq gene list downloaded from UCSC genome browser(http://genome.ucsc.edu/) in April 2010. The CGI annota-tion was also obtained from the UCSC website.
To analyze the distribution of DNA methylation on genebodies, each SmaI site was classified into bins according toits relative location to the closest gene. Five kilobase up-stream of TSS and 5 kb downstream of TES were subdi-vided into 20 bins, with 500 bp for each bin. The gene bodywas subdivided evenly into 20 bins. The average percentageof methylation for all the SmaI sites in each bin was calcu-lated.
Hydroxymethylated DNA immunoprecipitation combinedwith next generation DNA sequencing (hMeDIP-seq)
Three micrograms of genomic DNA from (m)TET1-FLor (m)TET1-CD-overexpressing HEK293T cells were di-luted in TE buffer (pH 7.6) and sonicated with Bioruptor.The desirable fragment size was 100–500 bp. The resultantDNA was purified with QIAquick PCR purification kit.Five hundred nanograms purified sonicated DNA was usedand spiked with 20 pg of a set of specific calibrators con-taining different 5hmC levels. End repair, addition with ‘A’bases to the 3′ end of the DNA fragments and ligation with

Nucleic Acids Research, 2014, Vol. 42, No. 11 6959
Illumina paired ends adapters were then performed simi-lar to the procedure described in DREAM. The resultantDNA was purified again, diluted in 450 �l TE buffer anddenatured at 95◦C for 10 min, followed by snap chillingin ice. The denatured DNA was subsequently mixed with50 �l 10× IP buffer (1.4 M NaCl, 100 mM Na-phosphate,pH 7.0, 0.5% Triton X-100), followed by incubation with 1�l anti-5hmC antibody described above at 4◦C overnight.Then Dynal R©Protein G magnetic beads were added and in-cubated at 4◦C for 2 h. After extensive washing with 1×IP buffer (140 mM NaCl, 10 mM Na-phosphate, pH 7.0,0.05% Triton X-100), DNA was separated from beads at65◦C for 15 min in elution buffer (10 mM Tris pH 7.6, 1mM EDTA, 1% SDS). The eluted products were size se-lected by electrophoresis in a 2% agarose gel. A slice cor-responding to 300 ± 25 bp size window based on DNAladder was cut out. The DNA extracted from agarose wasamplified with PCR (10–15 cycles) by using Illumina pairedend PCR primers and PhusionTM High-Fidelity DNA Poly-merase (NEB). The resultant sequencing libraries were pu-rified with Agencourt AMPure PCR Purification Kit andsent for single-read sequencing on Illumina Genome An-alyzer II. Sequenced DNA tags were mapped to humangenome hg18 and uniquely mapped tags were kept. For mul-tiple tags that were mapped to the same genomic location,only one was considered in the analysis to avoid PCR bias.CCAT (version 3.0) (36) was used to detect 5hmC peaksin hMeDIP-Seq samples. The window size was set as 500bp. Peaks with FDR ≤0.05 and ≥5 fold enrichment to in-put were deemed as significant. Each peak was assigned tothe gene that has the closest TSS as SmaI sites describedabove. As for landscape of the data, each tag was extendedby 250 bp to its 3′ end. Then the number of overlapped tagsin each genome position was rescaled to normalize the num-ber of background tags to 10 M and averaged over 10 bpresolution. The averaged values were displayed using UCSCgenome browser (http://genome.ucsc.edu/). Data have beendeposited in GEO with accession number: GSE44036.
The distribution of hMeDIP signal on different genomicfeatures was analyzed as follows. Gene body: for each gene,5 kb upstream of TSS and 5 kb downstream of TES weresubdivided into 1 kb bins, and the gene body was subdi-vided evenly into 20 bins. TSS: 10 kb upstream to 10 kbdownstream of the TSS of each gene was subdivided into250 bp bins. Exon: 200% upstream to 200% downstream ofeach exon was subdivided into 25 bins, with each bin 20%of the exon length. Exon–intron boundary: at each exon–intron boundary, 100 bp into exon and 100 bp into intronwere subdivided into 25 bp bins. CGI: 10 kb upstream to10 kb downstream of each CGI was subdivided into 50bins, consisting of 20 bins for upstream or downstream (500bp each) and 10 bins for CGI (10% of the length of CGIseach). In each bin, the number of tags was normalized bythe length of the bin and the total number of backgroundtags in the genome (the number of background tags was cal-culated as total number of tags multiplied by the noise ratefrom CCAT). The normalized tag density of the hMeDIPsample in each bin was then subtracted by that of the corre-sponding input and averaged over all the respective featuresin the genome.
RNA isolation and reverse transcription-qPCR analysis
Total RNA was isolated using TRIzol Reagent as per manu-facturer’s specifications. cDNA was synthesized from 1 �gof DNase-treated total RNA using High-Capacity cDNAreverse transcription kit (Applied Biosystems). qPCR wasperformed under similar conditions described in HpaII-PCR DNA methylation assay. The average threshold (Ct)was determined for each gene and normalized to �-actinas an internal normalization control. The primers used arelisted in Supplementary Table S1.
Whole-genome gene expression microarray analysis
Affymetrix GeneChip R© Whole-Transcript Human Gene2.0 ST Arrays were used for global gene expression analy-sis. RNA samples were labeled and hybridized according tothe manufacturer’s instructions (Affymetrix, Santa Clara,CA, USA). Scanned microarray images were analyzed us-ing the Affymetrix Gene Expression Console with RMA(Robust Multi-array Average) normalization algorithm. Acriterion of 1.5-fold expression change was used to identifydifferentially regulated genes. Hierarchical clustering wasperformed on significant genes using signal intensities afterRMA normalization by hclust function in R. Signal inten-sity values were rescaled to z-scores by row before cluster-ing. Heatmap was generated by heatmap.2 function in R.Data have been deposited in GEO with accession number:GSE50016.
RNA-seq
RNA-seq sequencing libraries were made from 100 ng ofDNase-treated total RNA samples using Encore R© Com-plete RNA-Seq Library System (NuGEN, San Carlos, CA,USA) following the manufacturer’s protocol. The librarieswere sequenced using a 2 × 100 bases paired end pro-tocol on the Illumina HiSeq 2000 instrument at the FoxChase Cancer Center (Philadelphia, PA, USA). Each li-brary was sequenced in a single lane, generating 188–241million reads per sample. The reads were mapped to hu-man genome (hg19) by TopHat (V2.0.5) (37). The numberof fragments in each known gene from the RefSeq database(downloaded from UCSC Genome Browser on 9 March2012) was enumerated using htseq-count from HTSeq pack-age (V0.5.3p9). The differential expression between sam-ples was statistically accessed by R/Bioconductor packageedgeR (V3.0.8) (38) and DESeq (V1.10.1) (39), using thetwo most similar samples (mTET1-FL and TET1-FL) toestimate the biological variation. Genes with FDR ≥0.05by both edgeR and DESeq and fold change ≥2 were calledsignificant.
For the fragments that have both ends mapped, the firstreads were kept. Together with the reads from the fragmentsthat have only one end mapped, every read was extendedto its 3′ end by 200 bp in exon regions. For each read, aweight of 1/n was assigned, where n is the number of po-sitions the read was mapped to. The sum of weights for allthe reads that cover each genomic position was rescaled tonormalize the total number of fragments to 1 M and aver-aged over 10 bp resolution. The averaged values were dis-played using UCSC genome browser (http://genome.ucsc.

6960 Nucleic Acids Research, 2014, Vol. 42, No. 11
edu/). Data have been deposited in GEO with accessionnumber: GSE49833.
Hierarchical clustering was performed on significantgenes from any of the four comparisons (mTET1-CD,TET1-CD, mTET1-FL, TET1-FL versus control) usingtheir FPKM values (fragments per kilobase of exon per mil-lion fragments mapped) by hclust function in R. FPKMvalues were rescaled to z-scores by row before clustering.Heatmap was generated by heatmap.2 function in R.
RESULTS
TET1-FL and TET1-CD display differential ability for5hmC production and DNA demethylation
Overexpression of TET1-CD induces significant DNAdemethylation in selected genomic loci in HEK293 cells(17,32) but it is not known if this is true for TET1-FL. Totest this, HEK293T cells were transiently transfected withTET1-FL or TET1-CD expression plasmids and harvestedfor expressing cells by GFP sorting (Figure 1A and B andSupplementary Figure S1A–C). DNA dot-blot assays con-firmed a dramatic production of 5hmC in cells transfectedwith wild type TET1-FL or TET1-CD but not those trans-fected with catalytically mutant TET1-FL or TET1-CD (re-ferred to as mTET1-FL and mTET1-CD, respectively) 3days after transfection (Supplementary Figure S1D). How-ever, compared with TET1-CD, TET1-FL showed a muchlower 5hmC production (∼1/8 of that by TET1-CD) (Sup-plementary Figure S1D), which may be attributable to itslower expression level (Figure 1B) and/or its possible lowerinherent efficiency for 5hmC production in the genome. Wethus increased the expression time of TET1-FL as a com-pensation for its low expression level, and found >2-foldincrease of 5hmC content from 3 to 5 days after transfec-tion but a slight increase from 5 to 7 days after transfec-tion (Figure 1C). Moreover, given that some 5hmC wouldbe further converted to other types of cytosine (includingunmodified cytosine) during the prolonged expression time,the actual 5hmC production by TET1-FL 7 days after trans-fection should be higher than what we have seen in DNAdot-blot assay results (Figure 1C). Thus, to compare the ef-fects of TET1-CD and TET1-FL on 5hmC production andpotential DNA demethylation in subsequent experiments,we always used the TET1-CD or TET1-FL-overexpressingcells which were collected 3 or 7 days after transfection, re-spectively, unless indicated.
We next examined whether TET1-mediated 5mC oxida-tion leads to DNA demethylation of endogenous genomicDNA. We initially used bisulfite-pyrosequencing for quan-titative analysis of DNA methylation. Although the oxi-dated products of TET1 can interfere with bisulfite analysisin that 5hmC reacts the same as 5mC while 5fC and 5caCreact as unmodified cytosine (15,40,41), the abundance ofthese modified bases is typically one to several orders ofmagnitude lower than that of 5mC (14), suggesting thattheir impact on the final results would be relatively low.We found that overexpression of TET1-CD induced sig-nificant demethylation at randomly selected methylated ge-nomic loci, including long interspersed nucleotide element-1 (LINE-1) and promoters of RASSF1a, OCT4 and PGRgenes (Figure 1D). In marked contrast, TET1-FL had no
measurable effect on DNA methylation in this assay. SinceHpaII digestion is blocked by 5mC and its oxidative deriva-tives (15,17), we also used HpaII-PCR based DNA methyla-tion assays to confirm these results. Here again, only TET1-CD overexpression induced a significant decrease of DNAmethylation at the promoters of INVS1ABP, NPAS3 andPARES1 (Figure 1E). Taken together, the above results atleast suggest that TET1-FL and TET1-CD have differentialability for 5hmC production and DNA demethylation.
Overexpression of TET1-CD but not TET1-FL inducesglobal DNA demethylation
To further characterize the effects of TET1-FL and TET1-CD on DNA methylation, we examined global DNAmethylation changes in transfected HEK293T cells by us-ing DREAM. This method provides quantitative analysisof DNA methylation with high accuracy (35). DNA methy-lation levels of 34,322; 33,395; 43,936 and 42,988 CpGsites were quantified in cells transfected with TET1-CD,mTET1-CD, TET1-FL and mTET1-FL, respectively. Pair-wise comparison of 32,803 common CpGs between TET1-CD and mTET1-CD transfections revealed a massive DNAdemethylation induced by overexpression of TET1-CD(Figure 2A and B), with 2,957 CpGs (∼8.6%) demethylatedby >20% (Figure 2A). These DNA demethylation eventswere the same in CGI and non-CGI DNA, upstream, pro-moter, exons, introns, downstream and intergenic regions,indicating that TET1-CD induces a genome-wide DNAdemethylation without distribution bias (Figure 2C and Dand Supplementary Figure S2A). Very different results wereseen for TET1-FL. Pair-wise comparison of 40,937 com-mon CpGs between TET1-FL and mTET1-FL transfec-tions showed no significant DNA demethylation inducedby TET1-FL overexpression (Figure 2E and F). Giventhat Tet1 specifically binds CpG-rich regions in mESCs(21,22,25), we then asked whether TET1-FL selectively in-duces DNA demethylation in CGIs. However, neither CGIsnor non-CGIs showed significant DNA demethylation in-duced by TET1-FL overexpression (Figure 2G and H). Sim-ilarly, further analyses of upstream, promoter, exons, in-trons, downstream and intergenic regions also did not findany significant demethylation after TET1-FL overexpres-sion (Supplementary Figure S2B). Therefore, unlike TET1-CD, overexpression of TET1-FL in HEK293T cells cannotinduce significant DNA demethylation genome-wide, indi-cating that TET1 is not as efficient a DNA demethylase aspreviously predicted (17,32).
TET1-FL and TET1-CD differentially regulate 5hmC distri-bution patterns
As the primary product of TET-catalyzed 5mC oxidationreaction, 5hmC also serves as a critical intermediate forTET-induced DNA demethylation (13,15,17,18). We there-fore asked whether the differences in demethylation induc-tion between TET1-CD and TET1-FL were due to theirdifferent regulation of 5hmC distribution. We performedgenome-wide mapping of 5hmC in HEK293T cells with5hmC antibody-based hMeDIP-seq (Figure 3A and Sup-plementary Figure S3). Once again, we used as controls

Nucleic Acids Research, 2014, Vol. 42, No. 11 6961
Figure 1. 5hmC production and DNA demethylation induced by TET1 overexpression. (A) Western blot analysis of TET1-FL overexpression in HEK293Tcells with anti-TET1 antibody. The cells were collected by FACS 3 days after transfection. (B) Western blot analysis of overexpression of TET1-FL, TET1-CD and their catalytically mutant controls in HEK293T cells with anti-FLAG antibody. The cells were collected by FACS 3 days after transfection. (C)DNA dot blot analysis of genomic 5hmC level in HEK293T cells overexpressing (m)TET1-FL or (m)TET1-CD. The cells were collected by FACS at theindicated time points after transfection. (D) Bisulfite-pyrosequencing analysis of four methylated endogenous genomic loci in HEK293T cells overexpress-ing (m)TET1-CD or (m)TET1-FL collected by FACS 3 or 7 days after transfection, respectively. Data represent mean ± SD (n = 3). *P < 0.05, **P < 0.01by Student’s t-test compared to mTET1-CD-overexpressing cells. (E) HpaII-PCR based DNA methylation assay of four other endogenous genomic loci inHEK293T cells overexpressing (m)TET1-CD or (m)TET1-FL collected by FACS 3 or 7 days after transfection, respectively. The hypomethylated UBE2Bgene was used as a control for complete digestion of HpaII. Data represent mean ± SD (n = 2). *P < 0.05, **P < 0.01 by Student’s t-test compared tomTET1-CD-overexpressing cells.
mTET1-CD and mTET1-FL, which cannot catalyze 5mCoxidation. In these two control transfections, a similar num-ber of 5hmC peaks and an almost identical distributionpattern were detected (Figure 3B) with 5hmC enrichmentaround promoters but even distribution in exons and in-trons at a relatively low level (Figure 3C and Supplemen-tary Figure S4A and B). The enrichment of 5hmC aroundTSSs is similar to what was previously observed in mESCs(25,42). Interestingly, 5hmC density showed a dip in CGI-overlapped TSSs but peaked at non-CGI-overlapped TSSs(Figure 3D and E).
We next examined the 5hmC distributions in TET1-CD- and TET1-FL-overexpressing cells. Consistent withthe DNA dot blot assays (Figure 1C), TET1-FL markedlyincreased the number of 5hmC peaks (from 75 482 to111 648), with an even greater increase in TET1-CD-overexpressing cells (from 61 095 to 314 557) (Figure 3B).Importantly, TET1-FL and TET1-CD showed very dif-
ferent 5hmC distribution patterns across gene bodies andaround TSSs. While TET1-CD markedly increased 5hmCin gene bodies with higher enrichment in exons than inintrons, TET1-FL resembled the distribution of 5hmC incontrol cells with the highest levels just upstream to TSSs(Figure 3C and Supplementary Figure S4A and B). Thecontrast between TET1-CD and TET1-FL was more ap-parent around CGI-overlapped TSSs. In both cases, 5hmCwas depleted just at TSSs (Figure 3D). However, TET1-CD induced equal accumulation of 5hmC outside of TSSs,while TET1-FL formed two dramatic 5hmC peaks flankingTSSs (Figure 3D). By contrast, the 5hmC increase inducedby TET1-FL was much lower around non-CGI-overlappedTSSs (Figure 3E), suggesting that TET1-FL preferentiallyfunctions in CGIs.
We next directly examined the 5hmC distribution acrossCGIs. Interestingly, the TET1-FL-induced 5hmC peaks de-scribed above (Figure 3D) precisely resided at the edges

6962 Nucleic Acids Research, 2014, Vol. 42, No. 11
Figure 2. Overexpression of TET1-CD but not TET1-FL induces global DNA demethylation. (A, C–E, G and H) Shown are comparisons of % methylationin HEK293T cells overexpressing TET1-CD versus mTET1-CD (A, C and D) and TET1-FL versus mTET1-FL (E, G and H) for thousands of CpG sitesquantitatively analyzed by DREAM (exact number of sites indicated in each graph). (A) and (E) plot all detected sites, (C) and (G) plot sites in CGIs,(D) and (H) plot non-CGI sites. In (A), blue dots and number represent CpG sites with ≥20% demethylation. The CGI annotation was obtained fromthe UCSC website. (B and F) Boxplots of DNA demethylation extent as a function of basal methylation level in HEK293T cells overexpressing TET1-CD(B) or TET1-FL (F). The basal methylation levels (% methylation in corresponding mutant control cells) are grouped in 10% intervals from 0 to 100%methylation. Boxes mark the interquartile range, and whiskers the 2.5th and 97.5th percentiles. The cells overexpressing (m)TET1-CD or (m)TET1-FLwere collected by FACS 3 or 7 days after transfection, respectively.
Nucleic Acids Research, 2014, Vol. 42, No. 11 6963
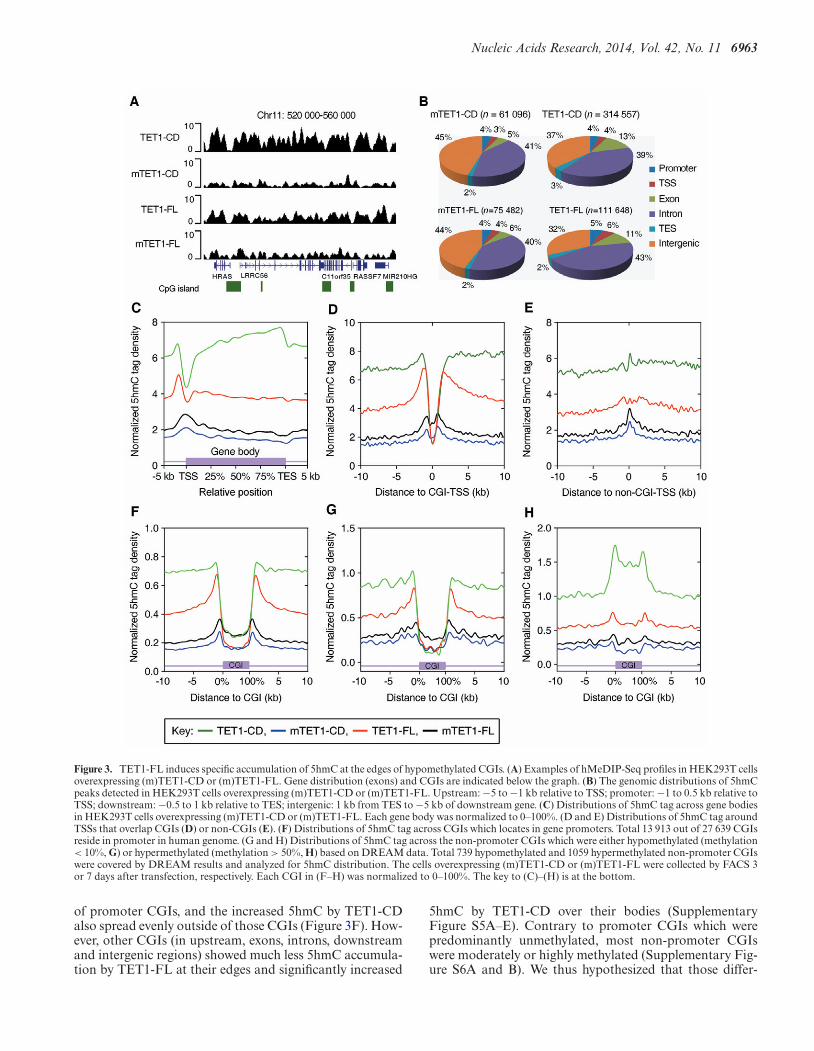
Figure 3. TET1-FL induces specific accumulation of 5hmC at the edges of hypomethylated CGIs. (A) Examples of hMeDIP-Seq profiles in HEK293T cellsoverexpressing (m)TET1-CD or (m)TET1-FL. Gene distribution (exons) and CGIs are indicated below the graph. (B) The genomic distributions of 5hmCpeaks detected in HEK293T cells overexpressing (m)TET1-CD or (m)TET1-FL. Upstream: −5 to −1 kb relative to TSS; promoter: −1 to 0.5 kb relative toTSS; downstream: −0.5 to 1 kb relative to TES; intergenic: 1 kb from TES to −5 kb of downstream gene. (C) Distributions of 5hmC tag across gene bodiesin HEK293T cells overexpressing (m)TET1-CD or (m)TET1-FL. Each gene body was normalized to 0–100%. (D and E) Distributions of 5hmC tag aroundTSSs that overlap CGIs (D) or non-CGIs (E). (F) Distributions of 5hmC tag across CGIs which locates in gene promoters. Total 13 913 out of 27 639 CGIsreside in promoter in human genome. (G and H) Distributions of 5hmC tag across the non-promoter CGIs which were either hypomethylated (methylation< 10%, G) or hypermethylated (methylation > 50%, H) based on DREAM data. Total 739 hypomethylated and 1059 hypermethylated non-promoter CGIswere covered by DREAM results and analyzed for 5hmC distribution. The cells overexpressing (m)TET1-CD or (m)TET1-FL were collected by FACS 3or 7 days after transfection, respectively. Each CGI in (F–H) was normalized to 0–100%. The key to (C)–(H) is at the bottom.
of promoter CGIs, and the increased 5hmC by TET1-CDalso spread evenly outside of those CGIs (Figure 3F). How-ever, other CGIs (in upstream, exons, introns, downstreamand intergenic regions) showed much less 5hmC accumula-tion by TET1-FL at their edges and significantly increased
5hmC by TET1-CD over their bodies (SupplementaryFigure S5A–E). Contrary to promoter CGIs which werepredominantly unmethylated, most non-promoter CGIswere moderately or highly methylated (Supplementary Fig-ure S6A and B). We thus hypothesized that those differ-

6964 Nucleic Acids Research, 2014, Vol. 42, No. 11
ent 5hmC distribution patterns across promoter and non-promoter CGIs are associated with their different basalmethylation levels. As expected, hypomethylated (methy-lation < 10%) non-promoter CGIs exhibited highly sim-ilar 5hmC distribution patterns as promoter CGIs (Fig-ure 3F and G), while methylated (methylation > 50%)non-promoter CGIs showed extremely increased 5hmC byTET1-CD but much less 5hmC enrichment at CGI edgesby TET1-FL (Figure 3H). Thus, these results indicate thatTET1-FL and TET1-CD differentially regulate 5hmC dis-tribution in HEK293T cells, with a marked preference ofTET1-FL toward the edges of hypomethylated CGIs, whileTET1-CD appears to monotonously increase 5hmC levels.
DNA hypermethylation inhibits 5hmC production by TET1-FL
The requirement for pre-existing 5mC in TET-catalyzed5hmC production implies a positive correlation between5hmC and 5mC distributions in genomic DNA. However,5hmC and 5mC actually have distinct genomic distribu-tions in mESCs (22,23,25,42). For example, contrary to5mC, 5hmC is significantly enriched around TSSs but gen-erally not detectable at repetitive elements and minor satel-lite repeats in mESCs (25). To study this issue, we combinedour global DNA methylation and 5hmC distribution dataand analyzed the correlation between 5mC and 5hmC lev-els in TET1-CD- and TET1-FL-overexpressing cells. The5hmC tag density in TET1-CD-overexpressing cells posi-tively correlated with basal DNA methylation (Figure 4A;Pearson r = 0.89, P = 0.0005). By contrast, 5hmC tag den-sity remained at a relatively constant level regardless ofbasal methylation in control cells and also in TET1-FL-overexpressing cells, suggesting that high levels of 5mC ac-tually inhibit TET1-FL catalytic function (Figure 4A). Wenext profiled 5hmC tag density together with DNA methy-lation levels across gene bodies. The basal DNA methyla-tion levels in control cells were lowest at TSSs and grad-ually increased along gene bodies, followed by a dramaticdrop around TESs (Figure 4B and C). The 5hmC distri-bution profile in TET1-CD-overexpressing cells highly re-sembled the basal DNA methylation patterns, further con-firming the positive correlation between 5mC and 5hmCin the setting of TET1-CD overexpression (Figure 4B). In-deed, as the 5hmC density increased toward TESs, the ex-tent of TET1-CD-induced DNA demethylation also in-creased, demonstrating the requirement of high 5hmC pro-duction for significant DNA demethylation by TET-CD. Bycontrast, TET1-FL overexpression failed to produce more5hmC as basal DNA methylation increased along gene bod-ies and also failed to induce DNA demethylation (Fig-ure 4C). Therefore, this divergent distribution of 5hmC byTET1-CD and TET1-FL likely explains their differences ininducing DNA demethylation.
TET1 specifically binds unmethylated CGIs through itsCXXC domain
Considering that a high 5hmC yield depends not only ona high level of substrate 5mC but also on an enrichedamount of TET1 binding, we hypothesized that the grad-ual loss of TET1-FL binding as DNA methylation levels
increase may underlie its inability to demethylate. Indeed,Tet1-bound CGIs have been reported to be associated withlower 5mC levels compared to the CGIs not bound by Tet1in mESCs (21). We next compared TET1-FL occupancyat eight unmethylated (BCL2L11, PACS1, PSEN2 andTTC9) or hypermethylated (BHLHA9, LRRC56, OPALHand SFMBT1) promoter CGIs (methylation levels shownin Supplementary Figure S7A) by ChIP-qPCR. TET1-FL was highly enriched at unmethylated CGI promot-ers but dramatically excluded from hypermethylated ones(Figure 4D). This was also true for endogenous TET1 inHEK293T cells (Supplementary Figure S7B). By contrast,through an unknown mechanism, TET1-CD, which lacksthe CXXC domain previously linked to specific binding toCGIs (22), was extensively bound to both kinds of CGIs,with a preference for hypermethylated CGIs (Figure 4D).The CXXC domain-mutated TET1-FL-C594A completelylost enrichment at unmethylated CGI promoters, confirm-ing the CXXC domain-dependent binding of TET1 to ge-nomic DNA (Figure 4E). As a result of the loss of DNAbinding, a much lower 5hmC yield was detected by overex-pression of TET1-FL-C594A compared to TET1-FL (Sup-plementary Figure S8). Taken together, our data suggestthat the preferential binding of TET1-FL to unmethylatedCGIs through its CXXC domain essentially limits its 5hmCproduction (compared to TET1-CD, seen in Figure 1C) andconsequently leads to its failure to induce significant DNAdemethylation (Figure 2).
TET1-FL decreases DNA methylation levels in sparselymethylated CGIs
The preferential binding of TET1-FL to unmethylatedCGIs further triggered us to ask whether TET1-FL selec-tively induces demethylation in hypomethylated CGIs. Al-though generally referred to as ‘unmethylated’, many CGIsactually have low levels of DNA methylation when care-fully examined by quantitative (and sensitive) methods. Wetherefore re-analyzed the DREAM results of (m)TET1-FLtransfections with a focus on hypomethylated CGI sites forwhich very precise methylation data were available by virtueof having a high level of sequence coverage (≥100 tags).Around 1,100 CpG sites were identified with measurablelow methylation levels (1–20%) and divided into four groupswith basal methylation of 1–5, 5–10, 10–15 and 15–20%, re-spectively. Using pair-wise analysis, we found that TET1-FL overexpression significantly decreased methylation insites with 1–5% (P < 0.0001) and 5–10% (P < 0.0001) basalmethylation, but not those with 10–15 or 15–20% basalmethylation (Figure 5A–D). Therefore, TET1-FL exhibits aspecific demethylating activity in sparsely methylated CGIs.
TET1 prevents DNA methylation spreading into CGIs
In contrast to the sporadically distributed CpGs that areheavily methylated, CGIs are typically unmethylated inmammalian genome (2). The above results that TET1-FLinduces striking 5hmC accumulation at the edges of hy-pomethylated CGIs and specific demethylation in sparselymethylated CGIs in HEK293T cells, suggested that TET1functions primarily to prevent methylation of CGIs rather

Nucleic Acids Research, 2014, Vol. 42, No. 11 6965
Figure 4. The preferential binding of TET1-FL to unmethylated CGIs through its CXXC domain contributes to its limited 5hmC production and failureto induce significant DNA demethylation. (A) Normalized 5hmC tag density as a function of basal DNA methylation level. The basal methylation levels(% methylation in corresponding mutant control cells) were grouped in 10% intervals from 0 to 100% methylation. (B and C) Normalized 5hmC tag density(left axis) and DNA methylation levels (right axis) plotted across gene bodies in HEK293T cells overexpressing (m)TET1-CD (B) or (m)TET1-FL (C).Solid line represents 5hmC tag density and dotted line DNA methylation. (D) FLAG ChIP-qPCR analysis of TET1-CD and TET1-FL occupancy atdifferentially methylated CGIs. Data represent mean ± SD (n = 3). The cells were collected by FACS 3 days after transfection. (E) FLAG ChIP-qPCRanalysis of TET1-FL and the CXXC domain-mutated TET1-FL-C594A occupancy at differentially methylated CGIs. Data represent mean ± SD (n = 3).The cells were collected by FACS 3 days after transfection. Western blot analysis of TET1-FL and TET1-FL-C594A overexpression is also shown in thegraph.
than dynamically switch methylation states in differenti-ated cells. To test this directly, we next established shRNA-mediated TET1 knockdown also in HEK293T cells becauseof their relatively high endogenous TET1 expression (Sup-plementary Figure S9). Knockdown of TET1 in two inde-pendent clones did not change cell morphology but signifi-cantly inhibited cell growth (Figure 6A and SupplementaryFigure S10) as reported in NIH3T3 cells (43). It also ex-pectedly decreased genomic 5hmC content (Figure 6B), aswell as the enrichment of TET1 at the unmethylated pro-moter CGIs of BCL2L11, PACS1, PSEN2 and TTC9 (Fig-ure 6C and Supplementary Figure S11A). We then studiedDNA methylation at both upstream edges and central re-gions of these four CGIs by bisulfite-cloning-sequencing.Among the eight tested regions in control cells, the edge
of BCL2L11 was completely methylated, that of PACS1showed partial methylation and the other regions were al-most unmethylated (Figure 6D and Supplementary FigureS11B–D). TET1 knockdown induced a significant increaseof methylation only at the edge of the PACS1 CGI withno measurable changes in the other tested regions (Figure6D and Supplementary Figure S11B–D), suggesting thatTET1 mainly regulates DNA methylation at the boundarybetween methylated and unmethylated CpG sites close toCGIs. Given that pre-existing DNA methylation could serveas a seed for methylation spreading into nearby unmethy-lated regions (44,45) and the specific accumulation of 5hmCat CGI edges by TET1-FL, it seems plausible that by its5mC dioxygenase function TET1 blocks DNA methylationspreading in this context.

6966 Nucleic Acids Research, 2014, Vol. 42, No. 11
Figure 5. Decreased DNA methylation in sparsely methylated CGIs after TET1-FL overexpression. (A–D) Shown are comparisons of % methylation inHEK293T cells overexpressing TET1-FL versus mTET1-FL for CGI CpG sites with basal DNA methylation levels of 1–5% (A), 5–10% (B), 10–15% (C)or 15–20% (D). The cells were collected by FACS 7 days after transfection. DNA methylation was quantitatively measured by DREAM and only CpGsites with ≥100 tags sequenced were included to ensure accuracy (exact number of sites indicated in each graph). P values were obtained from Wilcoxonpaired signed-rank test.
To confirm these data, we randomly selected four otherunmethylated promoter CGIs (KAZN, MUM1, RFX6 andVAX2) that had methylated edges based on DREAM re-sults (Supplementary Table S2). The specific binding ofTET1 and the methylated edges were further validated foreach CGI (Figure 6C and D). Consistent with the find-ings in the PACS1 CGI, the methylated edges of theseCGIs also showed significant methylation spreading in bothTET1 knockdown clones (Figure 6D). Thus, TET1 knock-down resulted in DNA methylation spreading in all fiveCGIs specifically at their methylated edges, consistent withthe hypothesis that TET1 binds to hypomethylated CGIs(through its CXXC domain) and functions as a ‘mainte-nance’ demethylase that inhibits the spreading of de novoDNA methylation from methylated CGI edges.
Effects of TET1 on gene transcription
DNA methylation of CGI promoters is associated with re-pressed gene transcription (2,46), and TET1 has previouslybeen reported to affect gene expression (21,22,25,28). Wetherefore asked whether TET1 is required for the activetranscription of target genes by preventing de novo DNAmethylation spreading into the CGI promoters. We first an-alyzed the effect of TET1 knockdown on the expressionof target genes previously analyzed. TET1 knockdown re-duced the expression of only three out of five genes forwhich we confirmed DNA methylation spreading into theirpromoter CGIs (Figure 7A), and no or inconsistent expres-sion changes of other three genes that had unchanged DNAmethylation at their promoter CGIs (Figure 7B). We next

Nucleic Acids Research, 2014, Vol. 42, No. 11 6967
Figure 6. TET1 knockdown leads to DNA methylation spreading at methylated CGI edges. (A) Western blot analysis of shRNA-mediated TET1 knock-down in two independent HEK293T clones transfected with different TET1 shRNA. (B) DNA dot blot shows decreased genomic 5hmC level after TET1knockdown. (C) ChIP-qPCR shows decreased occupancy of TET1 at unmethylated CGIs after TET1 knockdown. Data represent mean ± SD (n = 3).*P < 0.05, **P < 0.01 by Student’s t-test compared to shControl clone cells. (D) Bisulfite-sequencing analysis shows increased DNA methylation at themethylated edges of unmethylated CGIs after TET1 knockdown. The top panel contains diagrams of PACS1, KAZN, MUM1, RFX6 and VAX2 CGIpromoters. Horizontal green bars represent CGIs. Red bars show the location of boundary amplicons studied by bisulfite-sequencing. In the lower panel,each line represents a different cloned sequence, with black squares representing methylated CpG sites. The average methylation is shown below each panelas mean ± SD (n = 3). In all cases, boundary methylation increased after TET1 knockdown.
used cDNA microarrays to analyze whole genome gene ex-pression changes after TET1 knockdown. Using a criterionof 1.5-fold expression change, 89 upregulated and 97 down-regulated genes were identified in both TET1 knockdowncell clones (Supplementary Figure S12A), and some of themwere further validated by RT-qPCR (Supplementary FigureS12B and C). Three of these validated downregulated geneswere further proved to be TET1 target genes but did notconsistently gain DNA methylation spreading in their CGIpromoters after TET1 knockdown (Supplementary FigureS12D and E). Thus, consistent with previous results indicat-ing that depletion of Tet1 induces similar gene expressionchanges in wild type and Dnmt TKO mESCs (25), our datasuggest relatively minor effects of TET1 on gene transcrip-tion in HEK293T cells that are both DNA methylation-dependent and -independent.
To more directly determine whether TET1 functionsin gene transcription regulation, we undertook RNA-seqanalysis of HEK293T cells after overexpression of TET1-FL or mTET1-FL. As expected, TET1-FL- and mTET1-FL-overexpressing cells showed an extremely high mRNAlevel of TET1 (∼150-fold increase compared with the vectorcontrol, Figure 7C). Strikingly, TET1-FL and mTET1-FLhad a nearly identical gene expression profile, but both weresignificantly different from the control transfections (Figure7D). Consistent with this, when we computed differentiallyexpressed genes (>2-fold change, FDR < 0.05) in TET1-FLand mTET1-FL compared with control, we found a signif-icant overlap and a strong positive correlation between thegene sets (Figure 7F and G). Thus, overexpression of TET1-FL induces significant expression changes despite its limitedability to increase 5hmC, and these changes are also seenwith an enzymatically dead mutant TET1 vector (mTET1-
FL). Our data do not imply a direct contribution of TET1to gene expression and suggest that the effects observed areindependent of its catalytic activity and of its demethylatingactivity.
Very similar results were seen with TET1-CD. BothTET1-CD and mTET1-CD overexpression changed geneexpression profiles compared with the control, even thoughonly TET1-CD induced massive DNA demethylation (Fig-ure 7C and E). TET1-CD and mTET1-CD also had verysimilar gene expression profiles (Figure 7E) despite the mu-tation in the catalytic domain of mTET1-CD, and their dif-ferentially expressed genes compared to controls also sig-nificantly overlapped and positively correlated (Figure 7Fand G). The differentially expressed genes of (m)TET1-CDoverexpression substantially overlapped and positively cor-related with those of (m)TET1-FL (Figure 7F and G), sug-gesting that the catalytic domain is still important to theobserved gene expression differences, even though this ef-fect is independent of its ability to catalyze 5hmC formationand induce demethylation. The above RNA-seq data werealso confirmed by gene expression microarrays with similarresults (Supplementary Figure S13A and B). Thus, these re-sults conclusively establish that the gene expression changesseen after TET1 overexpression or depletion are separatefrom and independent of its demethylating activity.
DISCUSSION
In this paper, we demonstrate that TET1-FL overexpressionhas minimal effects on global DNA methylation. Rather,TET1 is a critical component of methylation boundariesand serves as a maintenance DNA demethylase that pre-vents aberrant methylation spreading into hypomethylatedCGIs. We also provide evidence that the effects of TET1 on

6968 Nucleic Acids Research, 2014, Vol. 42, No. 11
Figure 7. TET1 regulates gene transcription independent of its demethylating activity. (A and B) Effect of TET1 knockdown on the expressions of itstarget genes with (A) or without (B) increased DNA methylation spreading into their CGI promotes. Data represent mean ± SD (n = 3). *P < 0.05, **P< 0.01 by Student’s t-test compared to shControl cells. (C) RNA-seq transcriptional landscapes of the TET1 gene in the vector control and (m)TET1-FL- or (m)TET1-CD-overexpressing HEK293T cells. The two introduced substitution mutations in mTET1-FL and mTET1-CD were also validatedby RNA-seq. (D and E) Scatter plots comparing the RNA-seq-derived gene expression profiles among the vector control, TET1-FL and mTET1-FLoverexpressions (D), and among the vector control, TET1-CD and mTET1-CD overexpressions (E). Pearson correlation coefficients, r, are listed in eachgraph. (F) Venn diagram showing the overlap of differentially expressed genes (>2-fold change, FDR < 0.05) of TET1-FL, mTET1-FL, TET1-CD andmTET1-CD overexpressions. (G) Heatmap showing hierarchical clustering of differentially expressed genes of TET1-FL, mTET1-FL, TET1-CD andmTET1-CD overexpressions. All cells were collected by FACS 3 days after transfection.
gene transcription observed after overexpression are unre-lated to its 5mC dioxygenase function.
Our results are different from previous studies which in-vestigated the DNA demethylating effects of TET1 usingoverexpression of a truncated catalytic domain-only versionof TET1 (TET1-CD) (17,32). We found that TET1-CD butnot TET1-FL induces genome-wide demethylation. This
difference cannot be simply the result of the lower TET1-FL expression because TET1-FL and TET1-CD had simi-lar mRNA levels by RNA-seq (Figure 7C) and the appar-ent difference in protein expression is likely overestimateddue to their differing membrane transfer efficiency due tothe large difference in protein size. Moreover, increasing ex-pression time significantly compensated for TET1-FL low

Nucleic Acids Research, 2014, Vol. 42, No. 11 6969
expression level in terms of 5hmC production (Figure 1C),and finally, the different regulation patterns of 5hmC dis-tribution (Figure 3C–H) cannot be accounted for by differ-ing expression levels. Conversely, the failure of TET1-FL toinduce genome-wide demethylation can be essentially ex-plained by its DNA CpG motif binding domain, CXXC,which appears to strongly limit the 5hmC production ca-pacity and demethylating potential of TET1 by guiding ittoward hypomethylated DNA.
Previous studies have also shown that Tet1 is predom-inantly enriched at CpG-rich genomic regions (21,22,25),where most CpGs are unmethylated (2,47). We found thatTET1 binds unmethylated but not hypermethylated CGIs(Figure 4E and F). Thus, the CXXC domain and the cat-alytic domain of TET1 form an interesting but conflictingdomain combination: the CXXC domain specifically tar-gets TET1 to hypomethylated regions where its substrate(5mC) is almost depleted and consequently limits 5hmCyield and demethylating activity of the catalytic domainin hypermethylated genomic regions. Therefore, at least inHEK293T cells, TET1-mediated 5mC oxidation is not usedfor global DNA demethylation but rather prevents methy-lation spreading into CGIs. By contrast, the absence of theCXXC domain and the binding to both unmethylated andhypermethylated CGIs (with a preference for the latter, Fig-ure 4D) adequately explain why TET1-CD overexpressionis able to induce massive global DNA demethylation. It isinteresting to note that TET1-FL increases 5hmC by DNAdot blots and hMeDIP-Seq yet fails to affect DNA methyla-tion genome wide. This paradox may be technical in part––it is impossible to relate dot blot 5-hmC levels to actual5-hmC amount/methylated CpG site. Considering that thebasal 5hmC level is extremely low in HEK293 cells (only∼0.35% of 5mC) (14), doubling or tripling this amount maybe detectable by an enrichment method such as hMeDIP-seq but may not be enough to significantly change globalDNA methylation level. Also, the hMeDIP-seq data showthat 5hmC increase with TET-FL is highly concentratedat the edges of hypomethylated CpG islands thus affecting<1% of all CpG sites, which might not result in significantglobal demethylation.
We note that the TET1 CXXC domain was recently re-ported to bind both unmethylated and methylated DNAprobes in in vitro GST pull-down assays (22,32). Still, evenin these studies, the binding of the TET1 CXXC domainto methylated DNA was much lower than that to unmethy-lated DNA probes. Furthermore, this detected binding to amethylated DNA probe may disappear in vivo, in the com-plex chromatin environment in cells. For example, the re-cruitment of endogenous methyl-CpG binding proteins tomethylated CpGs and the densely packed heterochromatinstate in hypermethylated genomic regions both could dra-matically inhibit the access of TET1 to methylated CpGs.Consistent with this, we were unable to detect binding oftransfected or endogenous TET1 to methylated CGIs in ourChIP-qPCR studies.
Our finding that TET1-FL is unable to induce globalDNA demethylation in differentiated cells may providesome mechanistic insight into the recent studies on the roleof TET1 in embryonic development. Although the conver-sion of 5mC to 5hmC underlies global demethylation in
mouse primordial germ cells where Tet1 and Tet2 is highlyexpressed, loss of Tet1 and Tet2 does not greatly affectthis epigenome remodeling (26,28). Moreover, both Tet1-knockout and Tet1/Tet2 double-knockout mice are viable,fertile and grossly normal, though abnormal imprintingof some genes can be detected in a fraction of Tet1/Tet2double-knockout embryos (48,49). Thus, the conflictingcombination of CXXC and catalytic domains may explainwhy Tet1 has a limited role in global demethylation in pri-mordial germ cells. The subtle changes in DNA methylationinduced by TET1 would suggest that this protein may playa greater role in situations where there is a stress on the sys-tem and a pressure to methylate CpG islands, such as duringaging, in inflammatory conditions or in cancer (50–52).
Our observation that TET1-FL induces specific accu-mulation of 5hmC at the edges of hypomethylated CGIs,while TET1 knockdown induces methylation spreading intohypomethylated CGIs also uncovers a DNA demethylase-based mechanism for the immunity of CGIs to DNA methy-lation, which is one of the most striking feature of DNAmethylation patterns in mammals (2). By contrast, all theother known methylation-protecting factors such as bind-ing of transcription factors, high transcription activity, andthe active chromatin mark H3K4me3, protect CGIs from denovo DNA methylation by excluding DNMTs (53). Thus,the demethylase-based mechanism may reasonably coop-erate with the DNMT-exclusion mechanism to provide amore solid protection for hypomethylated CGIs againstmethylation attack. This finding also suggests a possible in-volvement of TET1 in the yet unexplained occurrence ofaberrant CGI hypermethylation in aging and cancer, whichprovides cancer cells with an advantage in cell growth andinvasion (1,54). Indeed, methylation boundaries aroundCGIs become much less well-defined during cancer forma-tion (55), and it would be interesting to see if this is caused inpart by the frequently detected TET1 mutations and down-regulation in neoplastic cells (31,56–59).
One of the paradoxes in the TET protein field has beenthe disconnection between effects on DNA methylation andeffects on gene expression. Recent studies have suggesteda complex function of Tet1 in gene transcription regula-tion in mESCs: Tet1 knockdown induces similar upregula-tion and downregulation of gene transcription in wild typeand Dnmt KO mESCs (25) and, by recruiting PRC2 andSin3a to chromatin, Tet1 has been proposed to repress genetranscription independent of its effects on DNA methyla-tion (21,25). More recent studies also suggested that Tet1regulates gene transcription through its interaction with O-linked N-acetylglucosamine transferase (60–62). However,the lack of a major phenotype in the Tet1-knockout andTet1/Tet2 double-knockout mice suggest that the effectsof Tet1 on transcription may be relatively minor. Here, bycomparing the wild type TET1-FL and its catalytically mu-tant control, we directly demonstrate that the gene expres-sion changes observed after TET1 overexpression are inde-pendent of its enzymatic and demethylating activity. It re-mains to be seen whether these effects are direct or indi-rect, and whether they are physiologically relevant. Thesedata also have implications for understanding the functionof TET2 and TET3 as well. In particular, TET2 mutationsthat are common in myeloid leukemias seem to have lit-

6970 Nucleic Acids Research, 2014, Vol. 42, No. 11
tle effects on CGI DNA methylation (63). Dissecting DNAmethylation-dependent and -independent effects of TET2will be important to understand its role in cancer develop-ment.
In summary, our study demonstrates that in post-development cells TET1 works as a maintenance DNAdemethylase which does not purposely decrease DNAmethylation levels, but rather specifically prevents de novoDNA methylation spreading from methylated CGI edgesinto CGIs using its 5mC dioxygenase catalytic func-tion. These findings support a role for DNA demethy-lation in maintaining normal DNA methylation patternspost-development and have implications for understandingmethylation deregulation in aging and cancer.
SUPPLEMENTARY DATA
Supplementary Data are available at NAR Online.
ACCESSION NUMBERS
GEO accession numbers: GSE44038, GSE44036,GSE50016 and GSE49833.
FUNDING
National Institutes of Health [CA158112 to J.P.I.]; EllisonMedical Foundation (to J.P.I.); F.M. Kirby Foundation (toJ.P.I.). Funding for open access charge: Fels Institute, Tem-ple University.Conflict of interest statement. None declared.
REFERENCES1. Robertson,K.D. (2005) DNA methylation and human disease. Nat.
Rev. Genet., 6, 597–610.2. Bird,A. (2002) DNA methylation patterns and epigenetic memory.
Genes Dev., 16, 6–21.3. Hsieh,C.L. (2000) Dynamics of DNA methylation pattern. Curr.
Opin. Genet. Dev., 10, 224–228.4. Bergman,Y. and Cedar,H. (2013) DNA methylation dynamics in
health and disease. Nat. Struct. Mol. Biol., 20, 274–281.5. Okano,M., Xie,S. and Li,E. (1998) Cloning and characterization of a
family of novel mammalian DNA (cytosine-5) methyltransferases.Nat. Genet., 19, 219–220.
6. Okano,M., Bell,D.W., Haber,D.A. and Li,E. (1999) DNAmethyltransferases Dnmt3a and Dnmt3b are essential for de novomethylation and mammalian development. Cell, 99, 247–257.
7. Bestor,T., Laudano,A., Mattaliano,R. and Ingram,V. (1988) Cloningand sequencing of a cDNA encoding DNA methyltransferase ofmouse cells. The carboxyl-terminal domain of the mammalianenzymes is related to bacterial restriction methyltransferases. J. Mol.Biol., 203, 971–983.
8. Hermann,A., Goyal,R. and Jeltsch,A. (2004) The Dnmt1DNA-(cytosine-C5)-methyltransferase methylates DNA processivelywith high preference for hemimethylated target sites. J. Biol. Chem.,279, 48350–48359.
9. Wu,S.C. and Zhang,Y. (2010) Active DNA demethylation: manyroads lead to Rome. Nat. Rev. Mol. Cell Biol., 11, 607–620.
10. Ooi,S.K. and Bestor,T.H. (2008) The colorful history of active DNAdemethylation. Cell, 133, 1145–1148.
11. Inoue,A. and Zhang,Y. (2011) Replication-dependent loss of5-hydroxymethylcytosine in mouse preimplantation embryos.Science, 334, 194.
12. Inoue,A., Shen,L., Dai,Q., He,C. and Zhang,Y. (2011) Generationand replication-dependent dilution of 5fC and 5caC during mousepreimplantation development. Cell Res., 21, 1670–1676.
13. Valinluck,V. and Sowers,L.C. (2007) Endogenous cytosine damageproducts alter the site selectivity of human DNA maintenancemethyltransferase DNMT1. Cancer Res., 67, 946–950.
14. Ito,S., Shen,L., Dai,Q., Wu,S.C., Collins,L.B., Swenberg,J.A., He,C.and Zhang,Y. (2011) Tet proteins can convert 5-methylcytosine to5-formylcytosine and 5-carboxylcytosine. Science, 333, 1300–1303.
15. He,Y.F., Li,B.Z., Li,Z., Liu,P., Wang,Y., Tang,Q., Ding,J., Jia,Y.,Chen,Z., Li,L. et al. (2011) Tet-mediated formation of5-carboxylcytosine and its excision by TDG in mammalian DNA.Science, 333, 1303–1307.
16. Maiti,A. and Drohat,A.C. (2011) Thymine DNA glycosylase canrapidly excise 5-formylcytosine and 5-carboxylcytosine: potentialimplications for active demethylation of CpG sites. J. Biol. Chem.,286, 35334–35338.
17. Guo,J.U., Su,Y., Zhong,C., Ming,G.L. and Song,H. (2011)Hydroxylation of 5-methylcytosine by TET1 promotes active DNAdemethylation in the adult brain. Cell, 145, 423–434.
18. Wu,H. and Zhang,Y. (2011) Mechanisms and functions of Tetprotein-mediated 5-methylcytosine oxidation. Genes Dev., 25,2436–2452.
19. Ito,S., D’Alessio,A.C., Taranova,O.V., Hong,K., Sowers,L.C. andZhang,Y. (2010) Role of Tet proteins in 5mC to 5hmC conversion,ES-cell self-renewal and inner cell mass specification. Nature, 466,1129–1133.
20. Tahiliani,M., Koh,K.P., Shen,Y., Pastor,W.A., Bandukwala,H.,Brudno,Y., Agarwal,S., Iyer,L.M., Liu,D.R., Aravind,L. et al. (2009)Conversion of 5-methylcytosine to 5-hydroxymethylcytosine inmammalian DNA by MLL partner TET1. Science, 324, 930–935.
21. Wu,H., D’Alessio,A.C., Ito,S., Xia,K., Wang,Z., Cui,K., Zhao,K.,Sun,Y.E. and Zhang,Y. (2011) Dual functions of Tet1 intranscriptional regulation in mouse embryonic stem cells. Nature,473, 389–393.
22. Xu,Y., Wu,F., Tan,L., Kong,L., Xiong,L., Deng,J., Barbera,A.J.,Zheng,L., Zhang,H., Huang,S. et al. (2011) Genome-wide regulationof 5hmC, 5mC, and gene expression by Tet1 hydroxylase in mouseembryonic stem cells. Mol. Cell, 42, 451–464.
23. Ficz,G., Branco,M.R., Seisenberger,S., Santos,F., Krueger,F.,Hore,T.A., Marques,C.J., Andrews,S. and Reik,W. (2011) Dynamicregulation of 5-hydroxymethylcytosine in mouse ES cells and duringdifferentiation. Nature, 473, 398–402.
24. Koh,K.P., Yabuuchi,A., Rao,S., Huang,Y., Cunniff,K., Nardone,J.,Laiho,A., Tahiliani,M., Sommer,C.A., Mostoslavsky,G. et al. (2011)Tet1 and Tet2 regulate 5-hydroxymethylcytosine production and celllineage specification in mouse embryonic stem cells. Cell Stem Cell, 8,200–213.
25. Williams,K., Christensen,J., Pedersen,M.T., Johansen,J.V.,Cloos,P.A., Rappsilber,J. and Helin,K. (2011) TET1 andhydroxymethylcytosine in transcription and DNA methylationfidelity. Nature, 473, 343–348.
26. Vincent,J.J., Huang,Y., Chen,P.Y., Feng,S., Calvopina,J.H., Nee,K.,Lee,S.A., Le,T., Yoon,A.J., Faull,K. et al. (2013) Stage-specific rolesfor tet1 and tet2 in DNA demethylation in primordial germ cells. CellStem Cell, 12, 470–478.
27. Hackett,J.A., Sengupta,R., Zylicz,J.J., Murakami,K., Lee,C.,Down,T.A. and Surani,M.A. (2013) Germline DNA demethylationdynamics and imprint erasure through 5-hydroxymethylcytosine.Science, 339, 448–452.
28. Yamaguchi,S., Hong,K., Liu,R., Shen,L., Inoue,A., Diep,D.,Zhang,K. and Zhang,Y. (2012) Tet1 controls meiosis by regulatingmeiotic gene expression. Nature, 492, 443–447.
29. Piccolo,F.M., Bagci,H., Brown,K.E., Landeira,D., Soza-Ried,J.,Feytout,A., Mooijman,D., Hajkova,P., Leitch,H.G., Tada,T.et al. (2013) Different roles for Tet1 and Tet2 proteins inreprogramming-mediated erasure of imprints induced by EGCfusion. Mol. Cell, 49, 1023–1033.
30. Gao,Y., Chen,J., Li,K., Wu,T., Huang,B., Liu,W., Kou,X., Zhang,Y.,Huang,H., Jiang,Y. et al. (2013) Replacement of Oct4 by Tet1 duringiPSC induction reveals an important role of DNA methylation andhydroxymethylation in reprogramming. Cell Stem Cell, 12, 453–469.
31. Lorsbach,R.B., Moore,J., Mathew,S., Raimondi,S.C., Mukatira,S.T.and Downing,J.R. (2003) TET1, a member of a novel protein family,is fused to MLL in acute myeloid leukemia containing thet(10;11)(q22;q23). Leukemia, 17, 637–641.

Nucleic Acids Research, 2014, Vol. 42, No. 11 6971
32. Zhang,H., Zhang,X., Clark,E., Mulcahey,M., Huang,S. and Shi,Y.G.(2010) TET1 is a DNA-binding protein that modulates DNAmethylation and gene transcription via hydroxylation of5-methylcytosine. Cell Res., 20, 1390–1393.
33. Kroeger,H., Jelinek,J., Estecio,M.R., He,R., Kondo,K., Chung,W.,Zhang,L., Shen,L., Kantarjian,H.M., Bueso-Ramos,C.E. et al. (2008)Aberrant CpG island methylation in acute myeloid leukemia isaccentuated at relapse. Blood, 112, 1366–1373.
34. Colella,S., Shen,L., Baggerly,K.A., Issa,J.P. and Krahe,R. (2003)Sensitive and quantitative universal Pyrosequencing methylationanalysis of CpG sites. Biotechniques, 35, 146–150.
35. Jelinek,J., Liang,S., Lu,Y., He,R., Ramagli,L.S., Shpall,E.J.,Estecio,M.R. and Issa,J.P. (2012) Conserved DNA methylationpatterns in healthy blood cells and extensive changes in leukemiameasured by a new quantitative technique. Epigenetics, 7, 1368–1378.
36. Xu,H., Handoko,L., Wei,X., Ye,C., Sheng,J., Wei,C.L., Lin,F. andSung,W.K. (2010) A signal-noise model for significance analysis ofChIP-seq with negative control. Bioinformatics, 26, 1199–1204.
37. Kim,D., Pertea,G., Trapnell,C., Pimentel,H., Kelley,R. andSalzberg,S.L. (2013) TopHat2: accurate alignment of transcriptomesin the presence of insertions, deletions and gene fusions. GenomeBiol., 14, R36.
38. Robinson,M.D., McCarthy,D.J. and Smyth,G.K. (2010) edgeR: aBioconductor package for differential expression analysis of digitalgene expression data. Bioinformatics, 26, 139–140.
39. Anders,S. and Huber,W. (2010) Differential expression analysis forsequence count data. Genome Biol., 11, R106.
40. Huang,Y., Pastor,W.A., Shen,Y., Tahiliani,M., Liu,D.R. and Rao,A.(2010) The behaviour of 5-hydroxymethylcytosine in bisulfitesequencing. PLoS One, 5, e8888.
41. Booth,M.J., Branco,M.R., Ficz,G., Oxley,D., Krueger,F., Reik,W.and Balasubramanian,S. (2012) Quantitative sequencing of5-methylcytosine and 5-hydroxymethylcytosine at single-baseresolution. Science, 336, 934–937.
42. Wu,H., D’Alessio,A.C., Ito,S., Wang,Z., Cui,K., Zhao,K., Sun,Y.E.and Zhang,Y. (2011) Genome-wide analysis of5-hydroxymethylcytosine distribution reveals its dual function intranscriptional regulation in mouse embryonic stem cells. Genes Dev.,25, 679–684.
43. Huang,S., Zhu,Z., Wang,Y., Xu,L., Chen,X., Xu,Q., Zhang,Q.,Zhao,X., Yu,Y. and Wu,D. (2013) Tet1 is required for Rbphosphorylation during G1/S phase transition. Biochem. Biophys.Res. Commun., 434, 241–244.
44. Song,J.Z., Stirzaker,C., Harrison,J., Melki,J.R. and Clark,S.J. (2002)Hypermethylation trigger of the glutathione-S-transferase gene(GSTP1) in prostate cancer cells. Oncogene, 21, 1048–1061.
45. Turker,M.S. (2002) Gene silencing in mammalian cells and the spreadof DNA methylation. Oncogene, 21, 5388–5393.
46. Jones,P.A. (2012) Functions of DNA methylation: islands, start sites,gene bodies and beyond. Nat. Rev. Genet., 13, 484–492.
47. Bird,A.P. (1986) CpG-rich islands and the function of DNAmethylation. Nature, 321, 209–213.
48. Dawlaty,M.M., Ganz,K., Powell,B.E., Hu,Y.C., Markoulaki,S.,Cheng,A.W., Gao,Q., Kim,J., Choi,S.W., Page,D.C. et al. (2011) Tet1is dispensable for maintaining pluripotency and its loss is compatible
with embryonic and postnatal development. Cell Stem Cell, 9,166–175.
49. Dawlaty,M.M., Breiling,A., Le,T., Raddatz,G., Barrasa,M.I.,Cheng,A.W., Gao,Q., Powell,B.E., Li,Z., Xu,M. et al. (2013)Combined deficiency of Tet1 and Tet2 causes epigenetic abnormalitiesbut is compatible with postnatal development. Dev. Cell, 24, 310–323.
50. Baylin,S.B., Herman,J.G., Graff,J.R., Vertino,P.M. and Issa,J.P.(1998) Alterations in DNA methylation: a fundamental aspect ofneoplasia. Adv. Cancer Res., 72, 141–196.
51. Issa,J.P. (2000) CpG-island methylation in aging and cancer. Curr.Top. Microbiol. Immunol., 249, 101–118.
52. Issa,J.P., Ahuja,N., Toyota,M., Bronner,M.P. and Brentnall,T.A.(2001) Accelerated age-related CpG island methylation in ulcerativecolitis. Cancer Res., 61, 3573–3577.
53. Deaton,A.M. and Bird,A. (2011) CpG islands and the regulation oftranscription. Genes Dev., 25, 1010–1022.
54. Herman,J.G. and Baylin,S.B. (2003) Gene silencing in cancer inassociation with promoter hypermethylation. N. Engl. J. Med., 349,2042–2054.
55. Hansen,K.D., Timp,W., Bravo,H.C., Sabunciyan,S., Langmead,B.,McDonald,O.G., Wen,B., Wu,H., Liu,Y., Diep,D. et al. (2011)Increased methylation variation in epigenetic domains across cancertypes. Nat. Genet., 43, 768–775.
56. Ono,R., Taki,T., Taketani,T., Taniwaki,M., Kobayashi,H. andHayashi,Y. (2002) LCX, leukemia-associated protein with a CXXCdomain, is fused to MLL in acute myeloid leukemia with trilineagedysplasia having t(10;11)(q22;q23). Cancer Res., 62, 4075–4080.
57. Kudo,Y., Tateishi,K., Yamamoto,K., Yamamoto,S., Asaoka,Y.,Ijichi,H., Nagae,G., Yoshida,H., Aburatani,H. and Koike,K. (2012)Loss of 5-hydroxymethylcytosine is accompanied with malignantcellular transformation. Cancer Sci., 103, 670–676.
58. Seshagiri,S., Stawiski,E.W., Durinck,S., Modrusan,Z., Storm,E.E.,Conboy,C.B., Chaudhuri,S., Guan,Y., Janakiraman,V., Jaiswal,B.S.et al. (2012) Recurrent R-spondin fusions in colon cancer. Nature,488, 660–664.
59. Hsu,C.H., Peng,K.L., Kang,M.L., Chen,Y.R., Yang,Y.C., Tsai,C.H.,Chu,C.S., Jeng,Y.M., Chen,Y.T., Lin,F.M. et al. (2012) TET1suppresses cancer invasion by activating the tissue inhibitors ofmetalloproteinases. Cell Rep., 2, 568–579.
60. Chen,Q., Chen,Y., Bian,C., Fujiki,R. and Yu,X. (2013) TET2promotes histone O-GlcNAcylation during gene transcription.Nature, 493, 561–564.
61. Deplus,R., Delatte,B., Schwinn,M.K., Defrance,M., Mendez,J.,Murphy,N., Dawson,M.A., Volkmar,M., Putmans,P., Calonne,E.et al. (2013) TET2 and TET3 regulate GlcNAcylation and H3K4methylation through OGT and SET1/COMPASS. EMBO J., 32,645–655.
62. Vella,P., Scelfo,A., Jammula,S., Chiacchiera,F., Williams,K.,Cuomo,A., Roberto,A., Christensen,J., Bonaldi,T., Helin,K.et al. (2013) Tet proteins connect the O-linked N-acetylglucosaminetransferase Ogt to chromatin in embryonic stem cells. Mol. Cell, 49,645–656.
63. Yamazaki,J., Taby,R., Vasanthakumar,A., Macrae,T., Ostler,K.R.,Shen,L., Kantarjian,H.M., Estecio,M.R., Jelinek,J., Godley,L.A.et al. (2012) Effects of TET2 mutations on DNA methylation inchronic myelomonocytic leukemia. Epigenetics, 7, 201–207.