Testing the role of biological interactions in the evolution of mid-Mesozoic marine benthic...
19
q 2006 The Paleontological Society. All rights reserved. 0094-8373/06/3202-0007/$1.00 Paleobiology, 32(2), 2006, pp. 259–277 Testing the role of biological interactions in the evolution of mid-Mesozoic marine benthic ecosystems Martin Aberhan, Wolfgang Kiessling, and Franz T. Fu ¨ rsich Abstract.—Evaluating the relative importance of biotic versus abiotic factors in governing macro- evolutionary patterns is a central question of paleobiology. Here, we analyzed patterns of changes in global relative abundances and diversity of ecological groups to infer the role of biological in- teractions as driving evolutionary forces in mid-Mesozoic macrobenthic marine ecosystems. Spe- cifically, we tested the hypothesis of escalation, which states that macroevolutionary patterns were controlled by an increasing pressure exerted by enemies on their victims. Associated with evidence of increasing levels of predation and biogenic sediment reworking (bulldozing) is an increasing representation of predation- and disturbance-resistant groups in the fossil record. In particular, we observe increasing proportions of mobile organisms; a decline of vulnerable epifauna living freely on the substrate; and a trend toward infaunalization of the benthos. These trends were most pro- nounced in the paleotropics, i.e., the region where biological activity is thought to have been high- est. The observation that these changes affected several biotic traits and occurred within indepen- dent clades argues against the overriding role of a single key adaptive innovation in causing shifts in ecological abundance. Also, changes in the abiotic environment cannot explain these faunal pat- terns because of lacking cross-correlations with physico-chemical parameters such as global sea level, climate, and seawater chemistry. We conclude that in marine benthic ecosystems of the mid Mesozoic, enemy-driven evolution, or escalation, was a plausible and important factor. Martin Aberhan and Wolfgang Kiessling. Museum fu ¨r Naturkunde, Humboldt University, Invalidenstr. 43, D-10115 Berlin, Germany. E-mail: [email protected] Franz T. Fu ¨rsich. Institut fu ¨r Pala ¨ontologie, Universita ¨t Wu ¨rzburg, Pleicherwall 1, D-97070 Wu ¨rzburg, Germany Accepted: 1 October 2005 Introduction Although the ecological importance of bi- otic interactions such as predation and com- petition is widely recognized, their role in de- termining macroevolutionary trends remains controversial (e.g., Miller 1998). The middle to late Mesozoic was identified as a time in earth history during which predation increased substantially and characteristics that enhance resistance against shell-breaking taxa became more common, a phenomenon that has been referred to as the Mesozoic Marine Revolution (Vermeij 1977, 1987). This was also a time when biological disturbance of marine sedi- ments, or bioturbation, was most pronounced (Thayer 1983). If natural selection due to these biological factors was evolutionarily impor- tant, we anticipate that functional groups that were less affected by predators and biological reworking of sediment should have increased with time, whereas vulnerable groups should not. Herein we (1) briefly summarize the evi- dence of increasing predation and biogenic mixing of sediment in mid-Mesozoic time; (2) formulate predictions about how these chang- es should have affected patterns of diversity and ecological abundance in Jurassic marine communities; (3) analyze quantitative chang- es in the representation of ecological catego- ries, i.e., various life habits, feeding modes, and the mobility of benthic macroinverte- brates; and (4) discuss to what extent emerg- ing trends may reflect intensified biotic inter- actions. Database and Methods Our analysis differs from previous ones by including diversity and abundance informa- tion from all well-represented benthic inver- tebrate groups (i.e., bivalves, gastropods, bra- chiopods, echinoids, corals, and sponges) at a global scale and at a relatively fine temporal resolution. Our data are deposited in the Pa- leobiology Database (PBDB) and are available online (http://paleodb.org). The raw data, as of 19 December 2004, comprise more than
-
Upload
mfn-berlin -
Category
Documents
-
view
2 -
download
0
Transcript of Testing the role of biological interactions in the evolution of mid-Mesozoic marine benthic...
q 2006 The Paleontological Society. All rights reserved. 0094-8373/06/3202-0007/$1.00
Paleobiology, 32(2), 2006, pp. 259–277
Testing the role of biological interactions in the evolution ofmid-Mesozoic marine benthic ecosystems
Martin Aberhan, Wolfgang Kiessling, and Franz T. Fursich
Abstract.—Evaluating the relative importance of biotic versus abiotic factors in governing macro-evolutionary patterns is a central question of paleobiology. Here, we analyzed patterns of changesin global relative abundances and diversity of ecological groups to infer the role of biological in-teractions as driving evolutionary forces in mid-Mesozoic macrobenthic marine ecosystems. Spe-cifically, we tested the hypothesis of escalation, which states that macroevolutionary patterns werecontrolled by an increasing pressure exerted by enemies on their victims. Associated with evidenceof increasing levels of predation and biogenic sediment reworking (bulldozing) is an increasingrepresentation of predation- and disturbance-resistant groups in the fossil record. In particular, weobserve increasing proportions of mobile organisms; a decline of vulnerable epifauna living freelyon the substrate; and a trend toward infaunalization of the benthos. These trends were most pro-nounced in the paleotropics, i.e., the region where biological activity is thought to have been high-est. The observation that these changes affected several biotic traits and occurred within indepen-dent clades argues against the overriding role of a single key adaptive innovation in causing shiftsin ecological abundance. Also, changes in the abiotic environment cannot explain these faunal pat-terns because of lacking cross-correlations with physico-chemical parameters such as global sealevel, climate, and seawater chemistry. We conclude that in marine benthic ecosystems of the midMesozoic, enemy-driven evolution, or escalation, was a plausible and important factor.
Martin Aberhan and Wolfgang Kiessling. Museum fur Naturkunde, Humboldt University, Invalidenstr.43, D-10115 Berlin, Germany. E-mail: [email protected]
Franz T. Fursich. Institut fur Palaontologie, Universitat Wurzburg, Pleicherwall 1, D-97070 Wurzburg,Germany
Accepted: 1 October 2005
Introduction
Although the ecological importance of bi-otic interactions such as predation and com-petition is widely recognized, their role in de-termining macroevolutionary trends remainscontroversial (e.g., Miller 1998). The middle tolate Mesozoic was identified as a time in earthhistory during which predation increasedsubstantially and characteristics that enhanceresistance against shell-breaking taxa becamemore common, a phenomenon that has beenreferred to as the Mesozoic Marine Revolution(Vermeij 1977, 1987). This was also a timewhen biological disturbance of marine sedi-ments, or bioturbation, was most pronounced(Thayer 1983). If natural selection due to thesebiological factors was evolutionarily impor-tant, we anticipate that functional groups thatwere less affected by predators and biologicalreworking of sediment should have increasedwith time, whereas vulnerable groups shouldnot. Herein we (1) briefly summarize the evi-dence of increasing predation and biogenic
mixing of sediment in mid-Mesozoic time; (2)formulate predictions about how these chang-es should have affected patterns of diversityand ecological abundance in Jurassic marinecommunities; (3) analyze quantitative chang-es in the representation of ecological catego-ries, i.e., various life habits, feeding modes,and the mobility of benthic macroinverte-brates; and (4) discuss to what extent emerg-ing trends may reflect intensified biotic inter-actions.
Database and Methods
Our analysis differs from previous ones byincluding diversity and abundance informa-tion from all well-represented benthic inver-tebrate groups (i.e., bivalves, gastropods, bra-chiopods, echinoids, corals, and sponges) at aglobal scale and at a relatively fine temporalresolution. Our data are deposited in the Pa-leobiology Database (PBDB) and are availableonline (http://paleodb.org). The raw data, asof 19 December 2004, comprise more than
260 MARTIN ABERHAN ET AL.
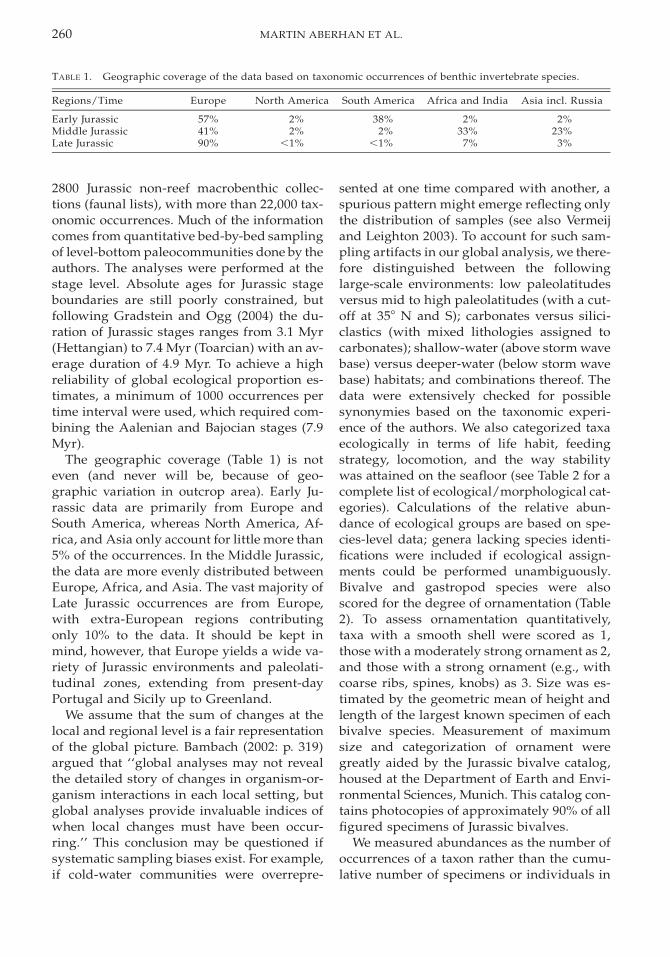
TABLE 1. Geographic coverage of the data based on taxonomic occurrences of benthic invertebrate species.
Regions/Time Europe North America South America Africa and India Asia incl. Russia
Early Jurassic 57% 2% 38% 2% 2%Middle Jurassic 41% 2% 2% 33% 23%Late Jurassic 90% ,1% ,1% 7% 3%
2800 Jurassic non-reef macrobenthic collec-tions (faunal lists), with more than 22,000 tax-onomic occurrences. Much of the informationcomes from quantitative bed-by-bed samplingof level-bottom paleocommunities done by theauthors. The analyses were performed at thestage level. Absolute ages for Jurassic stageboundaries are still poorly constrained, butfollowing Gradstein and Ogg (2004) the du-ration of Jurassic stages ranges from 3.1 Myr(Hettangian) to 7.4 Myr (Toarcian) with an av-erage duration of 4.9 Myr. To achieve a highreliability of global ecological proportion es-timates, a minimum of 1000 occurrences pertime interval were used, which required com-bining the Aalenian and Bajocian stages (7.9Myr).
The geographic coverage (Table 1) is noteven (and never will be, because of geo-graphic variation in outcrop area). Early Ju-rassic data are primarily from Europe andSouth America, whereas North America, Af-rica, and Asia only account for little more than5% of the occurrences. In the Middle Jurassic,the data are more evenly distributed betweenEurope, Africa, and Asia. The vast majority ofLate Jurassic occurrences are from Europe,with extra-European regions contributingonly 10% to the data. It should be kept inmind, however, that Europe yields a wide va-riety of Jurassic environments and paleolati-tudinal zones, extending from present-dayPortugal and Sicily up to Greenland.
We assume that the sum of changes at thelocal and regional level is a fair representationof the global picture. Bambach (2002: p. 319)argued that ‘‘global analyses may not revealthe detailed story of changes in organism-or-ganism interactions in each local setting, butglobal analyses provide invaluable indices ofwhen local changes must have been occur-ring.’’ This conclusion may be questioned ifsystematic sampling biases exist. For example,if cold-water communities were overrepre-
sented at one time compared with another, aspurious pattern might emerge reflecting onlythe distribution of samples (see also Vermeijand Leighton 2003). To account for such sam-pling artifacts in our global analysis, we there-fore distinguished between the followinglarge-scale environments: low paleolatitudesversus mid to high paleolatitudes (with a cut-off at 358 N and S); carbonates versus silici-clastics (with mixed lithologies assigned tocarbonates); shallow-water (above storm wavebase) versus deeper-water (below storm wavebase) habitats; and combinations thereof. Thedata were extensively checked for possiblesynonymies based on the taxonomic experi-ence of the authors. We also categorized taxaecologically in terms of life habit, feedingstrategy, locomotion, and the way stabilitywas attained on the seafloor (see Table 2 for acomplete list of ecological/morphological cat-egories). Calculations of the relative abun-dance of ecological groups are based on spe-cies-level data; genera lacking species identi-fications were included if ecological assign-ments could be performed unambiguously.Bivalve and gastropod species were alsoscored for the degree of ornamentation (Table2). To assess ornamentation quantitatively,taxa with a smooth shell were scored as 1,those with a moderately strong ornament as 2,and those with a strong ornament (e.g., withcoarse ribs, spines, knobs) as 3. Size was es-timated by the geometric mean of height andlength of the largest known specimen of eachbivalve species. Measurement of maximumsize and categorization of ornament weregreatly aided by the Jurassic bivalve catalog,housed at the Department of Earth and Envi-ronmental Sciences, Munich. This catalog con-tains photocopies of approximately 90% of allfigured specimens of Jurassic bivalves.
We measured abundances as the number ofoccurrences of a taxon rather than the cumu-lative number of specimens or individuals in
261BIOLOGICAL INTERACTIONS IN THE MID MESOZOIC
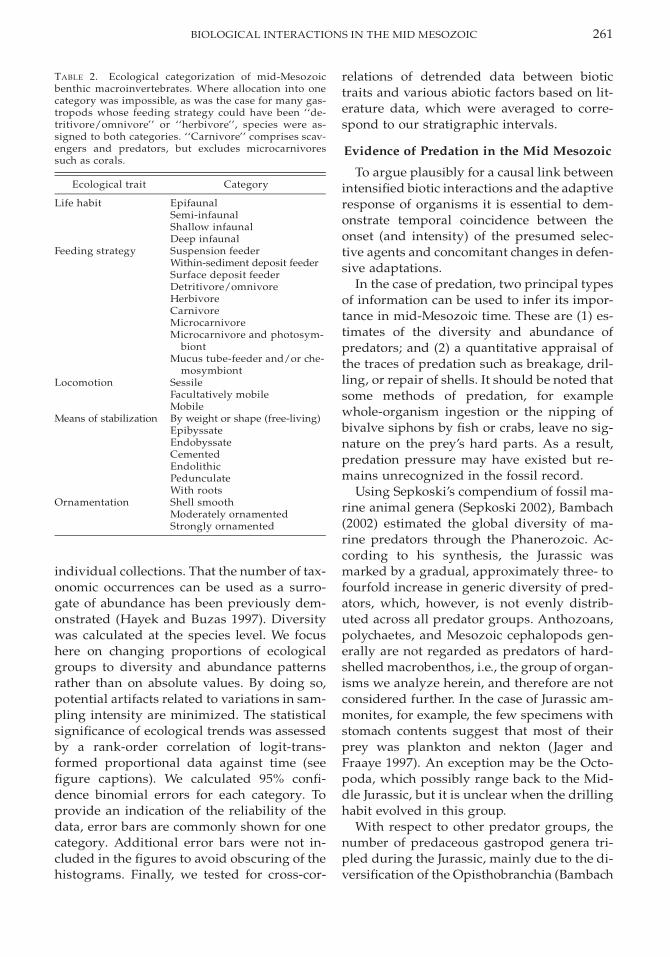
TABLE 2. Ecological categorization of mid-Mesozoicbenthic macroinvertebrates. Where allocation into onecategory was impossible, as was the case for many gas-tropods whose feeding strategy could have been ‘‘de-tritivore/omnivore’’ or ‘‘herbivore’’, species were as-signed to both categories. ‘‘Carnivore’’ comprises scav-engers and predators, but excludes microcarnivoressuch as corals.
Ecological trait Category
Life habit EpifaunalSemi-infaunalShallow infaunalDeep infaunal
Feeding strategy Suspension feederWithin-sediment deposit feederSurface deposit feederDetritivore/omnivoreHerbivoreCarnivoreMicrocarnivoreMicrocarnivore and photosym-
biontMucus tube-feeder and/or che-
mosymbiontLocomotion Sessile
Facultatively mobileMobile
Means of stabilization By weight or shape (free-living)EpibyssateEndobyssateCementedEndolithicPedunculateWith roots
Ornamentation Shell smoothModerately ornamentedStrongly ornamented
individual collections. That the number of tax-onomic occurrences can be used as a surro-gate of abundance has been previously dem-onstrated (Hayek and Buzas 1997). Diversitywas calculated at the species level. We focushere on changing proportions of ecologicalgroups to diversity and abundance patternsrather than on absolute values. By doing so,potential artifacts related to variations in sam-pling intensity are minimized. The statisticalsignificance of ecological trends was assessedby a rank-order correlation of logit-trans-formed proportional data against time (seefigure captions). We calculated 95% confi-dence binomial errors for each category. Toprovide an indication of the reliability of thedata, error bars are commonly shown for onecategory. Additional error bars were not in-cluded in the figures to avoid obscuring of thehistograms. Finally, we tested for cross-cor-
relations of detrended data between biotictraits and various abiotic factors based on lit-erature data, which were averaged to corre-spond to our stratigraphic intervals.
Evidence of Predation in the Mid Mesozoic
To argue plausibly for a causal link betweenintensified biotic interactions and the adaptiveresponse of organisms it is essential to dem-onstrate temporal coincidence between theonset (and intensity) of the presumed selec-tive agents and concomitant changes in defen-sive adaptations.
In the case of predation, two principal typesof information can be used to infer its impor-tance in mid-Mesozoic time. These are (1) es-timates of the diversity and abundance ofpredators; and (2) a quantitative appraisal ofthe traces of predation such as breakage, dril-ling, or repair of shells. It should be noted thatsome methods of predation, for examplewhole-organism ingestion or the nipping ofbivalve siphons by fish or crabs, leave no sig-nature on the prey’s hard parts. As a result,predation pressure may have existed but re-mains unrecognized in the fossil record.
Using Sepkoski’s compendium of fossil ma-rine animal genera (Sepkoski 2002), Bambach(2002) estimated the global diversity of ma-rine predators through the Phanerozoic. Ac-cording to his synthesis, the Jurassic wasmarked by a gradual, approximately three- tofourfold increase in generic diversity of pred-ators, which, however, is not evenly distrib-uted across all predator groups. Anthozoans,polychaetes, and Mesozoic cephalopods gen-erally are not regarded as predators of hard-shelled macrobenthos, i.e., the group of organ-isms we analyze herein, and therefore are notconsidered further. In the case of Jurassic am-monites, for example, the few specimens withstomach contents suggest that most of theirprey was plankton and nekton (Jager andFraaye 1997). An exception may be the Octo-poda, which possibly range back to the Mid-dle Jurassic, but it is unclear when the drillinghabit evolved in this group.
With respect to other predator groups, thenumber of predaceous gastropod genera tri-pled during the Jurassic, mainly due to the di-versification of the Opisthobranchia (Bambach

262 MARTIN ABERHAN ET AL.
2002). An even more prominent diversity risecharacterized predatory marine arthropods(Bambach 2002). Homarid and palinurid lob-sters evolved in the Triassic, and the Jurassicand Early Cretaceous saw the rise of malacos-tracan crustaceans with crushing chelae. Echi-noderms exhibit the steepest diversity in-crease of all groups from virtually no recordsin the Late Triassic to a minimum standing di-versity of 17 predatory genera in the Late Ju-rassic (Bambach 2002). Ophiuroids and echi-noids contributed only little to this pattern,and the majority of predatory echinodermswere asteroid starfish. Although diversifica-tion of modern-type asteroids was underwayduring the Triassic (Blake and Hagdorn 2003),their major adaptive radiation occurred dur-ing the Jurassic (e.g., Donovan and Gale 1990).For example, the family Asteriidae, which con-tains the only living starfish capable of pullingapart the valves of bivalves and brachiopods,apparently originated in the Pliensbachian. Fi-nally, marine vertebrate predators show amoderate increase in diversity, with fishes be-ing the group with the highest diversity. With-in the Chondrichthyes, modern-type bottom-dwelling, shell-crushing neoselachian sharksand rays diversified and increased in abun-dance during the Jurassic, and within the Os-teichthyes the same is true of the pycnodontsand teleosts (J. Kriwet personal communica-tion 2004). Direct evidence, such as gastric res-idues, testifies to the shell-breaking feedinghabits of these groups. The Triassic to EarlyCretaceous diversity of marine predatory rep-tiles was relatively low and fluctuated withouta consistent trend. Jurassic predatory marinereptiles include ichthyosaurs, plesiosaurs, andpliosaurs, but they seem to have fed mainly onpelagic rather than benthic prey (e.g., see re-view by Walker and Brett 2002).
Independent evidence of the importance ofpredation as a selective force comes from therecord of drilling and repaired shell injuries(e.g., Kelley and Hansen 2003; Alexander andDietl 2003). Drilling behavior in gastropods isknown since the Paleozoic, but the primarypredatory drillers of modern molluscs did notbegin to diversify until the Cretaceous. Nev-ertheless, drill holes in bivalves that are rem-iniscent of those produced by naticid and
muricid gastropods were reported from theUpper Triassic (e.g., Fursich and Jablonski1984) and Lower Jurassic (Harper et al. 1998)respectively. Although the producers of theseboreholes remain unknown, Harper et al.(1998) suggested that, at least locally, levels ofboring predation in Pliensbachian bivalveswere as high as those recorded in many Re-cent malacofaunas. In contrast, Kowalewski etal. (1998) concluded that drilling predation inJurassic bivalves and brachiopods occurredonly rarely, albeit continuously, and may havehad little impact on benthic marine commu-nities. Similarly, Harper and Wharton (2000)documented the continuous presence of pred-atory boreholes in Jurassic articulate brachio-pods from northwest Europe, but the numbersof bored specimens are generally low. With re-spect to repaired injuries, the frequency ofshell repair in gastropods increased betweenthe Late Triassic and Late Cretaceous (Vermeijet al. 1981; Vermeij 1987), although it is un-clear exactly when this increase took place. Incontrast to gastropods, a preliminary analysisof bivalved animals failed to reveal any trendin the abundance of repaired injuries overtime (Vermeij 1987). Finally, Kroger (2000)documented sublethal injuries in Jurassic am-monoids, including examples of benthic crus-taceans preying on nektobenthic ammonoids.
In summary, the history of injuries in ben-thic prey provides some support for elevatedpredation pressure in the mid Mesozoic. Also,this interval was characterized by a gradualbut distinct increase in predator diversity, al-beit moderate compared with Late Cretaceousand Cenozoic levels (see Bambach 2002). Ac-cordingly, if predation played a role in theevolution of mid-Mesozoic benthic inverte-brates one would expect moderate and contin-uous trends in prey morphology and behaviorrather than strong and sudden antipredatoryresponses, unless the studied biotic systemsare characterized by threshold effects andnon-linearities.
Evidence of Bioturbation in theMid-Mesozoic
The movement, feeding, and respiration ac-tivities of infaunal animals modify marinesediments in many ways. Bioturbation in-
263BIOLOGICAL INTERACTIONS IN THE MID MESOZOIC
creases the oxygen concentrations within thesediment, which, in turn, affects the biomassof the infauna, the rate of organic matter de-composition, and the recycling of nutrients es-sential for primary productivity (e.g., Solan etal. 2004). It has, however, negative conse-quences for sessile or relatively immobile or-ganisms (e.g., see reviews in McCall and Tev-esz 1982; Thayer 1983). For example, the dis-placement and manipulation of sediment dur-ing burrowing and feeding may result in theexhumation, burial, and/or disorientation ofother animals. Sediment-feeders ‘‘mine’’ thesediment by ingestion and egestion and thusproduce two disturbances that often occur atdifferent places. Resuspension of fine bottomsediment can be another consequence of de-posit feeding with adverse clogging effects onthe filter apparatus of suspension feeders(‘‘trophic group amensalism’’ [Rhoads andYoung 1970]). In the Recent, examples of theexclusion of taxa by bioturbation in unconsol-idated marine sediments can be found in a va-riety of trophic types and in a variety of sub-strates ranging from mud to sand and evengravel (Thayer 1983: Table IV). Thayer (1983)produced a comprehensive review of thePhanerozoic history of sediment-mediated bi-ological interactions. He adopted a stronglyactualistic approach by recording the times offirst appearance of modern bioturbators in thePhanerozoic and by assuming that their inten-sity of bioturbation has remained constantover geologic time. Plotting various measuresof biologic reworking of extant taxa as a func-tion of their time of origin in the fossil recordled him to conclude that post-Paleozoic taxarework sediment faster, feed deeper, and havehigher sediment turnover rates than Paleozoictaxa. His data show a distinct increase in bio-turbation during the Jurassic. In fact, this pe-riod saw the most substantial increase for theentire Phanerozoic in the number of classeswith intensively bioturbating members (de-fined as reworking the sediment at a per ca-pita rate of 10 cm3 per day or higher) and thenumber of classes with deeply bioturbatingmembers (defined as burrowing to a depth of10 cm or more) (Vermeij 1987: Fig. 5.1). Im-portant bioturbators that first appeared and/or radiated in the Late Triassic or Jurassic in-
clude irregular sea urchins, astropectinid star-fish, thalassinidean decapod crustaceans, in-faunal gastropods, heterodont bivalves, rays,and possibly also lugworms.
Further evidence of increasing bioturbationintensities comes from an analysis of secularchanges in the nature of bedding and stormstratification. Generally, in Mesozoic and Ce-nozoic sediments biogenic homogenization ismuch more common and fine bedding is muchmore limited than in Paleozoic sediments, andthe frequency of discrete storm beds de-creased substantially from the Mesozoic on-ward, apparently because of increased de-struction of tempestites by subsequent biotur-bation (Sepkoski et al. 1991). Brandt (1986) re-corded an increase in the minimum beddingthickness of tempestites from a pre-Jurassicvalue of 1 cm to a value of 3 cm in the Jurassicand correlated this observation with an in-crease in mean reworking depth of infaunalorganisms. Studies of burrows also reveal thattheir ‘‘average maximum’’ penetration depthincreased from 10–20 cm in the Paleozoic to100–150 cm in Permian to Early Jurassic times(Kidwell and Brenchley 1996 and referencestherein).
Biotic Interactions and Expected Trends inMid-Mesozoic Macrobenthos
The observed increase in predation inten-sity and bioturbation over the Phanerozoicformed the basis for an important macroecol-ogical hypothesis, Vermeij’s (1987) hypothesisof escalation. The hypothesis of escalationstates that over geological time biological haz-ards such as predation and competition haveincreased and so have taxa with morphologi-cal or behavioral attributes better suited tothese changing environmental conditions.Given the rise of predators during the midMesozoic (see above), we would expect an in-creasing representation of highly escalatedtaxa over this time interval, that is, taxawith characteristics that enhance resistanceagainst, or escape from, shell-breaking taxa.The hypothesis of escalation also includesThayer’s (1979, 1983) bulldozing hypothesis,which claims that the biological disturbanceof marine sediments has increased during thePhanerozoic. Given the record of mid-Meso-
264 MARTIN ABERHAN ET AL.
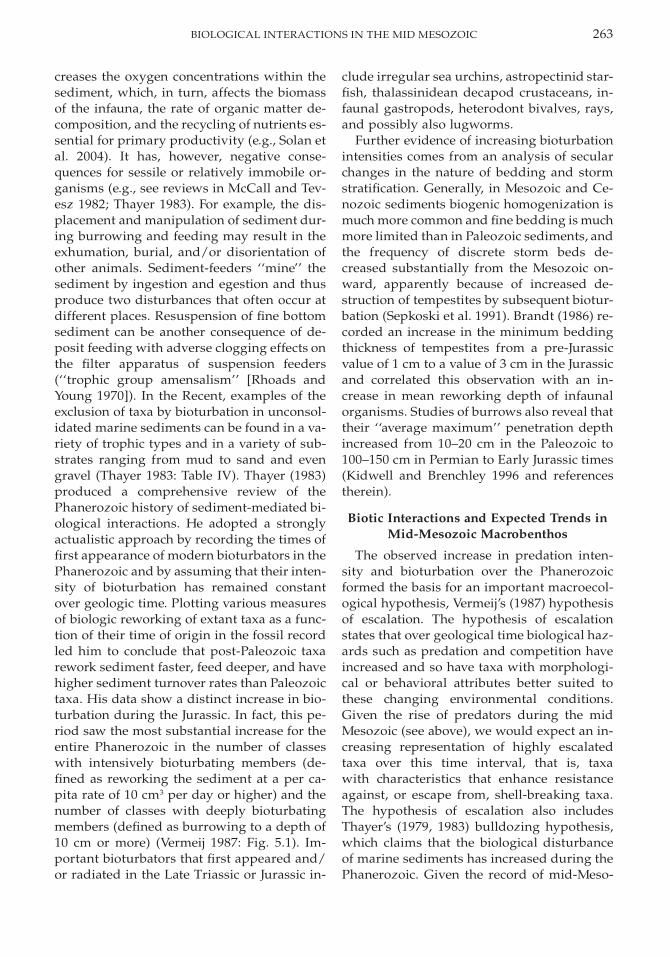
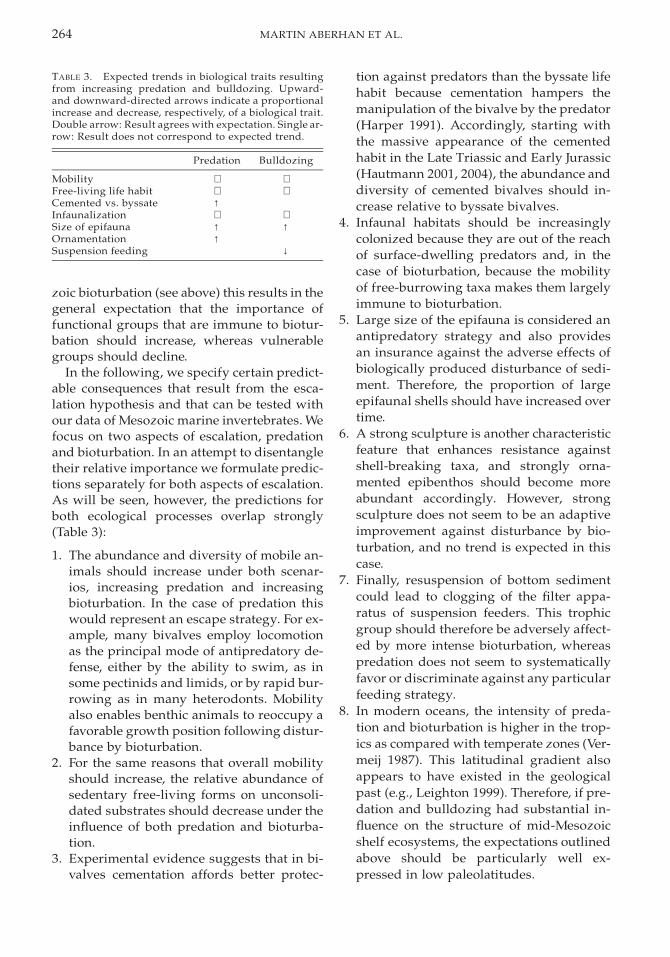
TABLE 3. Expected trends in biological traits resultingfrom increasing predation and bulldozing. Upward-and downward-directed arrows indicate a proportionalincrease and decrease, respectively, of a biological trait.Double arrow: Result agrees with expectation. Single ar-row: Result does not correspond to expected trend.
Predation Bulldozing
Mobility ⇑ ⇑Free-living life habit ⇓ ⇓Cemented vs. byssate ↑Infaunalization ⇑ ⇑Size of epifauna ↑ ↑Ornamentation ↑Suspension feeding ↓
zoic bioturbation (see above) this results in thegeneral expectation that the importance offunctional groups that are immune to biotur-bation should increase, whereas vulnerablegroups should decline.
In the following, we specify certain predict-able consequences that result from the esca-lation hypothesis and that can be tested withour data of Mesozoic marine invertebrates. Wefocus on two aspects of escalation, predationand bioturbation. In an attempt to disentangletheir relative importance we formulate predic-tions separately for both aspects of escalation.As will be seen, however, the predictions forboth ecological processes overlap strongly(Table 3):
1. The abundance and diversity of mobile an-imals should increase under both scenar-ios, increasing predation and increasingbioturbation. In the case of predation thiswould represent an escape strategy. For ex-ample, many bivalves employ locomotionas the principal mode of antipredatory de-fense, either by the ability to swim, as insome pectinids and limids, or by rapid bur-rowing as in many heterodonts. Mobilityalso enables benthic animals to reoccupy afavorable growth position following distur-bance by bioturbation.
2. For the same reasons that overall mobilityshould increase, the relative abundance ofsedentary free-living forms on unconsoli-dated substrates should decrease under theinfluence of both predation and bioturba-tion.
3. Experimental evidence suggests that in bi-valves cementation affords better protec-
tion against predators than the byssate lifehabit because cementation hampers themanipulation of the bivalve by the predator(Harper 1991). Accordingly, starting withthe massive appearance of the cementedhabit in the Late Triassic and Early Jurassic(Hautmann 2001, 2004), the abundance anddiversity of cemented bivalves should in-crease relative to byssate bivalves.
4. Infaunal habitats should be increasinglycolonized because they are out of the reachof surface-dwelling predators and, in thecase of bioturbation, because the mobilityof free-burrowing taxa makes them largelyimmune to bioturbation.
5. Large size of the epifauna is considered anantipredatory strategy and also providesan insurance against the adverse effects ofbiologically produced disturbance of sedi-ment. Therefore, the proportion of largeepifaunal shells should have increased overtime.
6. A strong sculpture is another characteristicfeature that enhances resistance againstshell-breaking taxa, and strongly orna-mented epibenthos should become moreabundant accordingly. However, strongsculpture does not seem to be an adaptiveimprovement against disturbance by bio-turbation, and no trend is expected in thiscase.
7. Finally, resuspension of bottom sedimentcould lead to clogging of the filter appa-ratus of suspension feeders. This trophicgroup should therefore be adversely affect-ed by more intense bioturbation, whereaspredation does not seem to systematicallyfavor or discriminate against any particularfeeding strategy.
8. In modern oceans, the intensity of preda-tion and bioturbation is higher in the trop-ics as compared with temperate zones (Ver-meij 1987). This latitudinal gradient alsoappears to have existed in the geologicalpast (e.g., Leighton 1999). Therefore, if pre-dation and bulldozing had substantial in-fluence on the structure of mid-Mesozoicshelf ecosystems, the expectations outlinedabove should be particularly well ex-pressed in low paleolatitudes.

265BIOLOGICAL INTERACTIONS IN THE MID MESOZOIC
FIGURE 1. Trends in ecological, morphological, andmineralogical traits in Jurassic level-bottom commu-nities based on the number of invertebrate species. Ref-erence to figures showing the trends for occurrences aregiven in brackets. In C, left-hand scale refers to meansize and right hand scale refers to mean ornamentation.Abbreviations of time intervals: Het 5 Hettangian; Sin5 Sinemurian; Plb 5 Pliensbachian; Toa 5 Toarcian;Aal–Baj 5 Aalenian to Bajocian; Bth 5 Bathonian; Clv5 Callovian; Oxf 5 Oxfordian; Kim 5 Kimmeridgian;Tth 5 Tithonian. Timescale based on Gradstein andOgg (2004). Error bars represent 95% confidence inter-vals.
Results
To evaluate the existence of any directionaltrends in the various biotic traits outlinedabove, we calculated their proportional spe-cies diversity (Fig. 1) and proportion of oc-currences (our surrogate for abundance) (Figs.2–9). As a rule, for each specific set of data,both measures covary tightly and show essen-tially the same patterns.
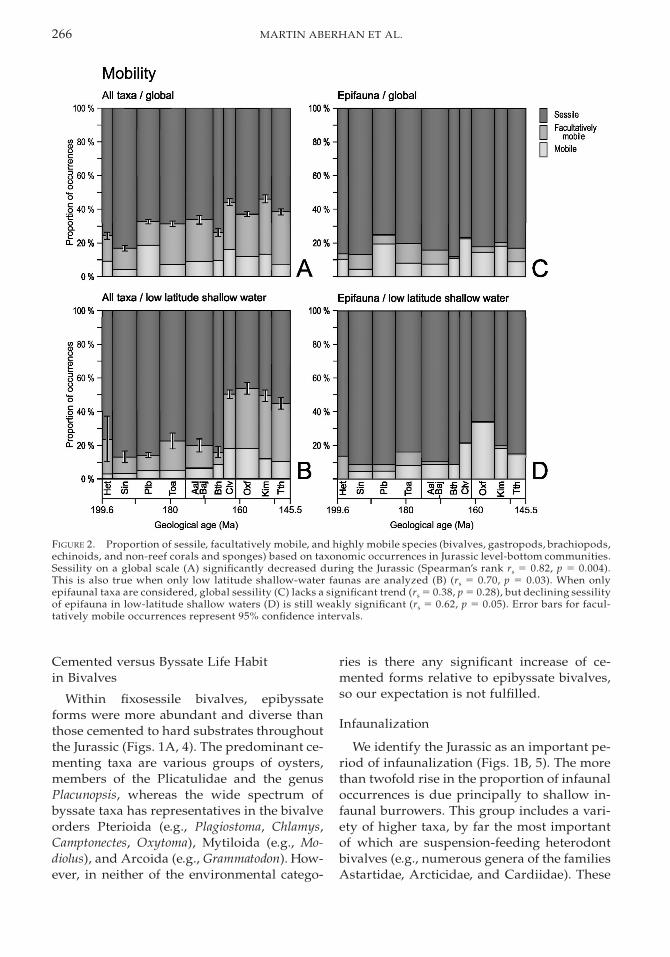
Mobility
In agreement with our prediction, the over-all mobility of benthic macroinvertebrates in-creased over the studied time interval (Figs.1A, 2A). This pattern is most clearly devel-oped in warm shallow waters of low latitudes(Fig. 2B). It holds true for highly mobile taxaand is even more pronounced in those taxacategorized as facultatively mobile. The lattergroup includes shallow infaunal suspension-feeding bivalves as the major contributors. Toinvestigate whether the observed trend to-ward elevated levels of mobility is solely dueto intensified colonization of the infaunal hab-itat, we analyzed the epifauna separately. Thetrend of increasing Jurassic mobility is no lon-ger evident at the global scale (Fig. 2C) but re-mains in low latitudes, shallow-water envi-ronments, carbonate settings, and combina-tions thereof (e.g., Fig. 2D). In fact, in thesehabitats the proportion of the facultativelymobile group, i.e., entoliid, propeamussiid,and pectinid bivalves capable of swimming,declined. However, this is more than compen-sated for by an increase in the proportionalabundance and diversity of highly mobile epi-fauna, which comprises vagile gastropods andregular echinoids.
Free-living Life Habit
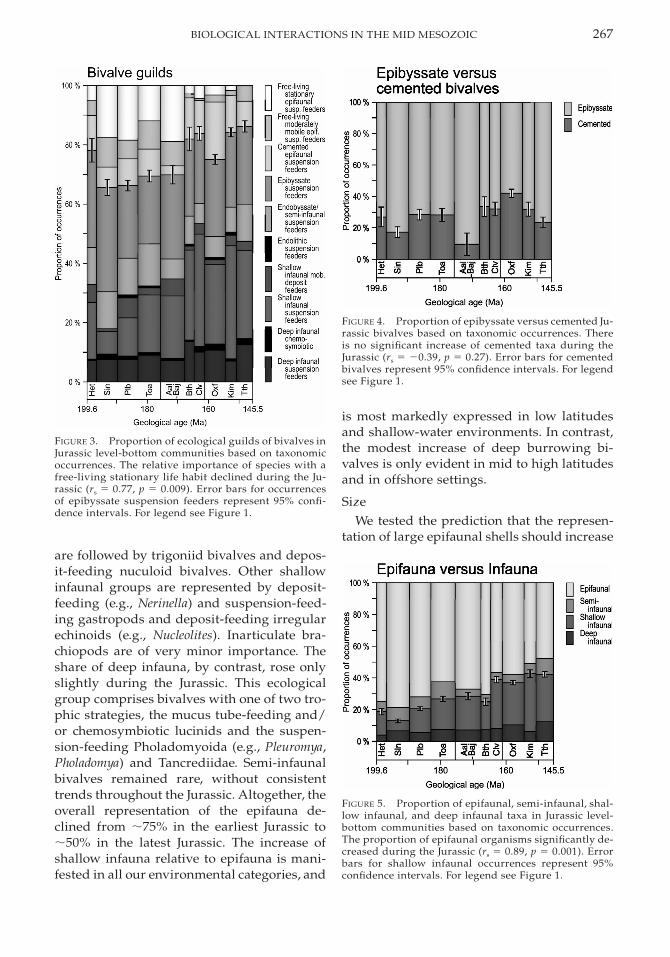
Similarly, our second expectation is met:The guild of sedentary, free-living suspensionfeeders was moderately well represented inpre-Bathonian times, whereas it played a nu-merically negligible role in the later part of theJurassic (Figs. 1A, 3). Apart from a few occur-rences of relatively small solitary scleractiniancorals, all sedentary free-living forms are bi-valves. Most important are various gryphaeidoysters, the large limid Ctenostreon, the neith-eid Weyla, and the posidoniid Bositra.
266 MARTIN ABERHAN ET AL.
FIGURE 2. Proportion of sessile, facultatively mobile, and highly mobile species (bivalves, gastropods, brachiopods,echinoids, and non-reef corals and sponges) based on taxonomic occurrences in Jurassic level-bottom communities.Sessility on a global scale (A) significantly decreased during the Jurassic (Spearman’s rank rs 5 0.82, p 5 0.004).This is also true when only low latitude shallow-water faunas are analyzed (B) (rs 5 0.70, p 5 0.03). When onlyepifaunal taxa are considered, global sessility (C) lacks a significant trend (rs 5 0.38, p 5 0.28), but declining sessilityof epifauna in low-latitude shallow waters (D) is still weakly significant (rs 5 0.62, p 5 0.05). Error bars for facul-tatively mobile occurrences represent 95% confidence intervals.
Cemented versus Byssate Life Habitin Bivalves
Within fixosessile bivalves, epibyssateforms were more abundant and diverse thanthose cemented to hard substrates throughoutthe Jurassic (Figs. 1A, 4). The predominant ce-menting taxa are various groups of oysters,members of the Plicatulidae and the genusPlacunopsis, whereas the wide spectrum ofbyssate taxa has representatives in the bivalveorders Pterioida (e.g., Plagiostoma, Chlamys,Camptonectes, Oxytoma), Mytiloida (e.g., Mo-diolus), and Arcoida (e.g., Grammatodon). How-ever, in neither of the environmental catego-
ries is there any significant increase of ce-mented forms relative to epibyssate bivalves,so our expectation is not fulfilled.
Infaunalization
We identify the Jurassic as an important pe-riod of infaunalization (Figs. 1B, 5). The morethan twofold rise in the proportion of infaunaloccurrences is due principally to shallow in-faunal burrowers. This group includes a vari-ety of higher taxa, by far the most importantof which are suspension-feeding heterodontbivalves (e.g., numerous genera of the familiesAstartidae, Arcticidae, and Cardiidae). These
267BIOLOGICAL INTERACTIONS IN THE MID MESOZOIC
FIGURE 3. Proportion of ecological guilds of bivalves inJurassic level-bottom communities based on taxonomicoccurrences. The relative importance of species with afree-living stationary life habit declined during the Ju-rassic (rs 5 0.77, p 5 0.009). Error bars for occurrencesof epibyssate suspension feeders represent 95% confi-dence intervals. For legend see Figure 1.
FIGURE 4. Proportion of epibyssate versus cemented Ju-rassic bivalves based on taxonomic occurrences. Thereis no significant increase of cemented taxa during theJurassic (rs 5 20.39, p 5 0.27). Error bars for cementedbivalves represent 95% confidence intervals. For legendsee Figure 1.
FIGURE 5. Proportion of epifaunal, semi-infaunal, shal-low infaunal, and deep infaunal taxa in Jurassic level-bottom communities based on taxonomic occurrences.The proportion of epifaunal organisms significantly de-creased during the Jurassic (rs 5 0.89, p 5 0.001). Errorbars for shallow infaunal occurrences represent 95%confidence intervals. For legend see Figure 1.
are followed by trigoniid bivalves and depos-it-feeding nuculoid bivalves. Other shallowinfaunal groups are represented by deposit-feeding (e.g., Nerinella) and suspension-feed-ing gastropods and deposit-feeding irregularechinoids (e.g., Nucleolites). Inarticulate bra-chiopods are of very minor importance. Theshare of deep infauna, by contrast, rose onlyslightly during the Jurassic. This ecologicalgroup comprises bivalves with one of two tro-phic strategies, the mucus tube-feeding and/or chemosymbiotic lucinids and the suspen-sion-feeding Pholadomyoida (e.g., Pleuromya,Pholadomya) and Tancrediidae. Semi-infaunalbivalves remained rare, without consistenttrends throughout the Jurassic. Altogether, theoverall representation of the epifauna de-clined from ;75% in the earliest Jurassic to;50% in the latest Jurassic. The increase ofshallow infauna relative to epifauna is mani-fested in all our environmental categories, and
is most markedly expressed in low latitudesand shallow-water environments. In contrast,the modest increase of deep burrowing bi-valves is only evident in mid to high latitudesand in offshore settings.
SizeWe tested the prediction that the represen-
tation of large epifaunal shells should increase
268 MARTIN ABERHAN ET AL.
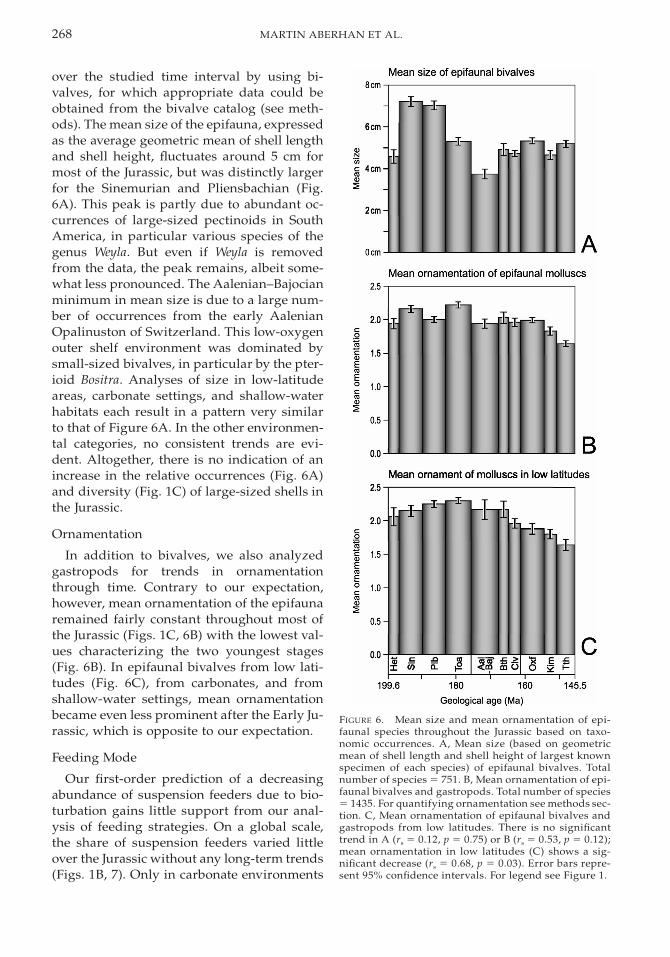
FIGURE 6. Mean size and mean ornamentation of epi-faunal species throughout the Jurassic based on taxo-nomic occurrences. A, Mean size (based on geometricmean of shell length and shell height of largest knownspecimen of each species) of epifaunal bivalves. Totalnumber of species 5 751. B, Mean ornamentation of epi-faunal bivalves and gastropods. Total number of species5 1435. For quantifying ornamentation see methods sec-tion. C, Mean ornamentation of epifaunal bivalves andgastropods from low latitudes. There is no significanttrend in A (rs 5 0.12, p 5 0.75) or B (rs 5 0.53, p 5 0.12);mean ornamentation in low latitudes (C) shows a sig-nificant decrease (rs 5 0.68, p 5 0.03). Error bars repre-sent 95% confidence intervals. For legend see Figure 1.
over the studied time interval by using bi-valves, for which appropriate data could beobtained from the bivalve catalog (see meth-ods). The mean size of the epifauna, expressedas the average geometric mean of shell lengthand shell height, fluctuates around 5 cm formost of the Jurassic, but was distinctly largerfor the Sinemurian and Pliensbachian (Fig.6A). This peak is partly due to abundant oc-currences of large-sized pectinoids in SouthAmerica, in particular various species of thegenus Weyla. But even if Weyla is removedfrom the data, the peak remains, albeit some-what less pronounced. The Aalenian–Bajocianminimum in mean size is due to a large num-ber of occurrences from the early AalenianOpalinuston of Switzerland. This low-oxygenouter shelf environment was dominated bysmall-sized bivalves, in particular by the pter-ioid Bositra. Analyses of size in low-latitudeareas, carbonate settings, and shallow-waterhabitats each result in a pattern very similarto that of Figure 6A. In the other environmen-tal categories, no consistent trends are evi-dent. Altogether, there is no indication of anincrease in the relative occurrences (Fig. 6A)and diversity (Fig. 1C) of large-sized shells inthe Jurassic.
Ornamentation
In addition to bivalves, we also analyzedgastropods for trends in ornamentationthrough time. Contrary to our expectation,however, mean ornamentation of the epifaunaremained fairly constant throughout most ofthe Jurassic (Figs. 1C, 6B) with the lowest val-ues characterizing the two youngest stages(Fig. 6B). In epifaunal bivalves from low lati-tudes (Fig. 6C), from carbonates, and fromshallow-water settings, mean ornamentationbecame even less prominent after the Early Ju-rassic, which is opposite to our expectation.
Feeding Mode
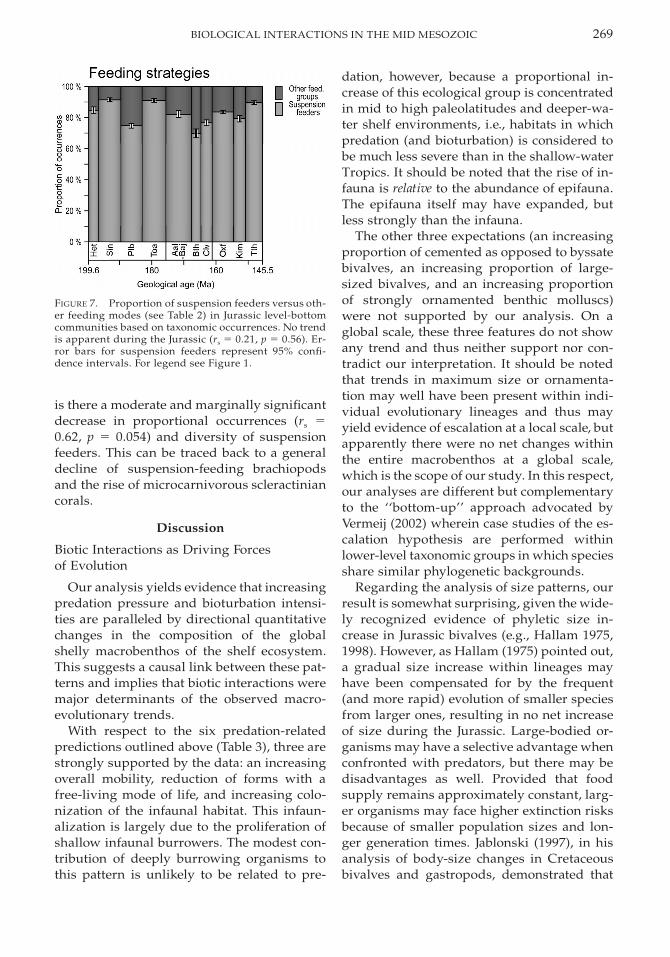
Our first-order prediction of a decreasingabundance of suspension feeders due to bio-turbation gains little support from our anal-ysis of feeding strategies. On a global scale,the share of suspension feeders varied littleover the Jurassic without any long-term trends(Figs. 1B, 7). Only in carbonate environments
269BIOLOGICAL INTERACTIONS IN THE MID MESOZOIC
FIGURE 7. Proportion of suspension feeders versus oth-er feeding modes (see Table 2) in Jurassic level-bottomcommunities based on taxonomic occurrences. No trendis apparent during the Jurassic (rs 5 0.21, p 5 0.56). Er-ror bars for suspension feeders represent 95% confi-dence intervals. For legend see Figure 1.
is there a moderate and marginally significantdecrease in proportional occurrences (rs 50.62, p 5 0.054) and diversity of suspensionfeeders. This can be traced back to a generaldecline of suspension-feeding brachiopodsand the rise of microcarnivorous scleractiniancorals.
Discussion
Biotic Interactions as Driving Forcesof Evolution
Our analysis yields evidence that increasingpredation pressure and bioturbation intensi-ties are paralleled by directional quantitativechanges in the composition of the globalshelly macrobenthos of the shelf ecosystem.This suggests a causal link between these pat-terns and implies that biotic interactions weremajor determinants of the observed macro-evolutionary trends.
With respect to the six predation-relatedpredictions outlined above (Table 3), three arestrongly supported by the data: an increasingoverall mobility, reduction of forms with afree-living mode of life, and increasing colo-nization of the infaunal habitat. This infaun-alization is largely due to the proliferation ofshallow infaunal burrowers. The modest con-tribution of deeply burrowing organisms tothis pattern is unlikely to be related to pre-
dation, however, because a proportional in-crease of this ecological group is concentratedin mid to high paleolatitudes and deeper-wa-ter shelf environments, i.e., habitats in whichpredation (and bioturbation) is considered tobe much less severe than in the shallow-waterTropics. It should be noted that the rise of in-fauna is relative to the abundance of epifauna.The epifauna itself may have expanded, butless strongly than the infauna.
The other three expectations (an increasingproportion of cemented as opposed to byssatebivalves, an increasing proportion of large-sized bivalves, and an increasing proportionof strongly ornamented benthic molluscs)were not supported by our analysis. On aglobal scale, these three features do not showany trend and thus neither support nor con-tradict our interpretation. It should be notedthat trends in maximum size or ornamenta-tion may well have been present within indi-vidual evolutionary lineages and thus mayyield evidence of escalation at a local scale, butapparently there were no net changes withinthe entire macrobenthos at a global scale,which is the scope of our study. In this respect,our analyses are different but complementaryto the ‘‘bottom-up’’ approach advocated byVermeij (2002) wherein case studies of the es-calation hypothesis are performed withinlower-level taxonomic groups in which speciesshare similar phylogenetic backgrounds.
Regarding the analysis of size patterns, ourresult is somewhat surprising, given the wide-ly recognized evidence of phyletic size in-crease in Jurassic bivalves (e.g., Hallam 1975,1998). However, as Hallam (1975) pointed out,a gradual size increase within lineages mayhave been compensated for by the frequent(and more rapid) evolution of smaller speciesfrom larger ones, resulting in no net increaseof size during the Jurassic. Large-bodied or-ganisms may have a selective advantage whenconfronted with predators, but there may bedisadvantages as well. Provided that foodsupply remains approximately constant, larg-er organisms may face higher extinction risksbecause of smaller population sizes and lon-ger generation times. Jablonski (1997), in hisanalysis of body-size changes in Cretaceousbivalves and gastropods, demonstrated that
270 MARTIN ABERHAN ET AL.
directional decreases in sizes were as frequentas directional increases and that multiplepressures operate on body size. If coevolution-ary alternation (Thompson 2005) was a com-mon phenomenon in the Jurassic, the tendencyof attaining large adult size in a species whileunder continuous attack by a predator mayhave been reversed during times when a pred-ator focused its attack on other less defendedspecies, or when natural selection favoredthose predators that preferentially attack theprey species that are currently least protected.Finally, it can be argued that body size, espe-cially of suspension feeders, reflects produc-tivity rather than strict defense against pred-ators, an argument that is in some agreementwith the patterns in our data. Maximum sizewas largest in the Early Jurassic and a largeproportion of our data for this time period arefrom western South America (Table 1). Thisarea had a high probability of conditions fa-vorable for coastal upwelling and thereforehigh productivity (see paleoclimatic modelingmaps of Golonka et al. 1994), but it is under-represented in younger time intervals whendata are dominantly from less productive ar-eas in Europe.
The only pattern that is truly at variancewith expectations from increasing predationpressure concerns ornamentation. Strong ex-ternal sculpture is one out of several morpho-logical traits for resisting shell breakage. Be-sides an increase in size, other antipredatoryskeletal features in bivalves include crenula-tion of the shell margins, high convexity of thevalves, increase in valve thickness, and a tightclosure of the valves (Vermeij 1987). In gastro-pods, such antipredatory features include ahigh-spired shell to allow deep withdrawal ofthe body, a narrowly elongated aperture, pres-ence of teeth in the aperture, and a thick outerlip (Vermeij 1987). Thus, the absence of an ex-pected trend in a single feature that increasesresistance to shell breakage should not beoverinterpreted (see also the above commenton the ‘‘bottom-up’’ versus ‘‘top-down’’ ap-proach). Nevertheless, it is interesting to notethe difference in response intensity betweenmorphological and behavioral attributes, al-though the two are not completely indepen-dent. The latter are expressed by the capability
of regular locomotion such as crawling, bur-rowing, or intermittent swimming, and by theway organisms attain stability on the seafloor,particularly with respect to a free-living lifehabit. In these cases we detected clear tem-poral trends. In contrast, the overall propor-tional representation of attributes related toshell form, such as shell size and ornamenta-tion, remained more or less unchanged or waseven opposite to the prediction.
By comparison with the predation-basedscenario, of the five predictions resulting fromthe mid-Mesozoic rise of biological bulldozers(Table 3), three of them are strongly support-ed by our analysis. Similar to the faunal con-sequences postulated for the predation-basedscenario, overall and epifaunal mobility in-creased, the adoption of a free-living life habitbecame less common, and infaunal forms be-came more widespread. The apparent absenceof any size-related trends has been discussedabove. The lack of a distinct trend in predom-inant feeding strategies may be partly ex-plained by threshold effects. At low concen-trations, benthic organisms may even benefitfrom the resuspension of fine sediment by de-posit feeders and the recycling of food parti-cles into the water column, and the adverseclogging effects occur only at very high con-centrations (Thayer 1983 and references there-in).
A geographic dissection of trends furthercorroborates the hypothesis that predationand bioturbation influenced the evolution anddistribution of Jurassic macrobenthos. Com-parison of data from low paleolatitudes withthose from mid and high paleolatitudes re-veals that the two most distinct features, in-creasing mobility and infaunalization, weremore pronounced in the paleotropics, i.e., theregion where predation pressure and biolog-ical reworking are thought to have been high-est.
Considering the biotic traits investigated inthis study, we are not in a position to performa ranking of the importance of the two selec-tive agents. Under both scenarios, predationand bioturbation, we expect faunal responsesto operate in the same direction, and thosethat are limited to only one process are notvery distinct. This is further complicated by
271BIOLOGICAL INTERACTIONS IN THE MID MESOZOIC
the fact that many predators are importantbioturbators (e.g., many crustaceans, starfish,rays), and within the scope of our analysis itis impossible to separate the biological con-sequences of their disturbance of the sedimentand their predation activities (Thayer 1983).Also, a clear cause-and-effect relationship be-tween infaunalization (which may be due topredation or bioturbation or both and leads tobioturbation) and bioturbation (which in turnmay trigger infaunalization) cannot be estab-lished.
The multitude of adaptive types, includingchemical defenses against enemies (Pawlik1993), prevents us from confidently assessingtrends in the overall escalatory condition of Ju-rassic macroinvertebrates. Nevertheless, ourresults provide evidence that escalation hasoccurred. The concept of escalation regardsthe enemies of an organism as the major agentof natural selection to which organisms areable to respond evolutionarily (Vermeij 1987;Dietl and Kelley 2002). In contrast to coevo-lution, where two or more taxa respond toeach other (Futuyma and Slatkin 1983), in es-calation enemies do not primarily respond totheir prey but more likely respond to theirown enemies. In the context of our study, bothpredators and bioturbators can be conceivedof as enemies. Whereas predators act directlyon prey, the effects of bioturbators are moreindirect via disturbance of substrate. In pred-ator-prey systems the relative role of coevo-lution and escalation is still poorly under-stood and needs to involve all the species thatmay influence a particular interaction in a lo-cal ecosystem (Dietl and Kelley 2002), some-thing we cannot address with our data. Nev-ertheless, Dietl and Kelley (2002: p. 353) con-cluded that ‘‘on the scale of evolutionary time,predators of large effect likely control theoverall directionality of evolution due to theinequalities of predator and prey in control ofresources.’’ In the case of bioturbation, coevo-lution does not seem to play a role. No mech-anism is known to us that would force mobileinfaunal organisms to evolve to higher effi-ciency because ecological groups that are im-mune to bioturbation become relatively moreabundant. Instead, the adoption of a mobileinfaunal life habit (with the inevitably associ-
ated bioturbation) is a highly effective adap-tive response to increasing stress imposed byenemies such as predators and bioturbators.In summary, the large-scale fossil evidencethat can be drawn from the quantitative anal-ysis of Jurassic shelly macrobenthos supportsescalation as a highly plausible evolutionaryprocess responsible for the observed trends.The existence of corresponding trends in en-emies and their prey, however, does not nec-essarily exclude alternative scenarios.
Alternative Explanations
Preservation. We are confident that the ob-served paleoecological patterns reflect astrong biological signal rather than being ar-tifacts of uneven preservation because (1)throughout the analyzed time interval thesame groups of shelly organisms were pre-sent; (2) the analysis is limited to fully marineshelf environments; (3) the trends are also ev-ident within single taxonomic groups forwhich variation in preservability should belimited; (4) preservation of Jurassic benthic in-vertebrates is not biased by lagerstatten ef-fects, as is the case for Jurassic vertebrates (dueto the exceptional preservation, for example,in the Early Jurassic Posidonienschiefer ofHolzmaden or the Late Jurassic Plattenkalk ofSolnhofen); and (5) there is no reason to as-sume that the preservability of whole ecolog-ical groups, which are polyphyletic in com-position, changed systematically to causegradual changes in ecological abundance.However, apart from, or in addition to, esca-lation as an extrinsic, biotic forcing mecha-nism, both intrinsic biological and extrinsicabiotic processes may account for the ob-served patterns.
Intrinsic Biological Control. The possibilityof an intrinsic biological control of the ob-served patterns is discussed in the context ofthe infaunalization trend. Because bivalvesrepresent almost 90% of all infaunal occur-rences, the discussion is focused on thisgroup. Burrowing bivalves experienced aspectacular post-Paleozoic radiation (Stanley1968). It may be that the Jurassic diversifica-tion of this group, and its increase in relativeabundances as documented herein, was large-ly due to the acquisition of key adaptive in-

272 MARTIN ABERHAN ET AL.
FIGURE 8. Proportion of taxonomic occurrences in Ju-rassic level-bottom communities within major bivalveorders. Occurrences of epifaunal and semi-infaunal bi-valves are combined into one category including epifau-nal and semi-infaunal members of the Mytiloida and Ar-coida. Occurrences of infaunal Mytiloida and Arcoidaare shown separately. The Veneroida (rs 5 20.79, p 50.006) and Pholadomyoida (rs 5 20.67, p 5 0.03) showa distinct proportional increase during the Jurassic,whereas such a trend is not evident in the Trigonioida(rs 5 20.47, p 5 0.17) and Myoida (rs 5 20.48, p 5 0.23).Error bars for epifaunal and semi-infaunal occurrencesrepresent 95% confidence intervals. For legend see Fig-ure 1.
novations, such as mantle fusion and siphonformation, in only a single or a few clades. Ifthis were the case, the observed infaunaliza-tion could be explained by intrinsic biologicalmechanisms, which were largely independentof the ecological environment. Alternatively,the proliferation of burrowing bivalves mayhave been more generalized, involving a va-riety of clades (see also Skelton et al. 1990).Such a pattern would favor a more generalcause, such as enemy-induced selection. Todistinguish between these two alternatives,we subdivided the infaunal bivalve data intoorders and families and contrasted those withepifaunal and semi-infaunal occurrences (Fig.8). The heterodont Veneroida show the great-est rise in abundance. Within this order, thediverse families Arcticidae and Cardiidae,both siphonate suspension feeders with eula-mellibranch gills, contributed significantly tothis trend. The Astartidae, which are non-si-phonate burrowers with eulamellibranch gills,increased in abundance from Toarcian times
onward. Similarly, the largely edentulousPholadomyoida were more common after theEarly Jurassic, and the Late Jurassic abun-dance maxima of the Myoida can be tracedback to the Corbulidae. Both orders have well-developed siphons and eulamellibranch gills.The schizodont Trigonioida, Recent forms ofwhich are non-siphonate and filibranchiate,play a minor role in the first two stages of theJurassic but are well represented thereafter.Altogether, the polyphyletic origin of siphonsin bivalves (Miller 1990; Skelton et al. 1990)and the independent expansion of burrowersin groups differing in gill type, degree of man-tle fusion, and type of dentition strongly ar-gue against a purely intrinsic cause. Moreover,the pattern of increasing numbers of Jurassicinfaunal organisms holds true even if bivalvesare excluded from the analysis. In a similarway, the overall increase in mobility is not re-stricted to a single clade but is evident in bi-valves, gastropods, and echinoids. Key inno-vations were certainly necessary to enable or-ganisms to respond to ecological changes, butby themselves they could not have generatedphenomena such as the Mesozoic Marine Rev-olution (see also Vermeij 1995).
Extrinsic Abiotic Control. It has been sug-gested that changes in the abiotic environmentmay produce episodes of escalation. Vermeij(1995) proposed that massive submarine vol-canism and the associated effects of climaticwarming, sea-level rise, and higher productiv-ity contributed to the early Paleozoic and thelatest Triassic to mid-Cretaceous biosphere-scale revolutions. When nutrients and energyare supplied at higher rates, opportunities forinnovation and diversification are enhanced.For example, such conditions would permitorganisms to adopt energy-intensive modes oflife that require high metabolic rates, such ashigh mobility, and would favor enemy-relatedadaptations such as the secretion of heavilycalcified skeletons. In this scenario, ‘‘extrinsiccircumstances . . . trigger a cascade of conse-quences that are controlled by ecological andevolutionary processes intrinsic to organ-isms’’ (Vermeij 1995: p. 146). Here, we explorewhether abiotic changes alone can be directlyresponsible for the observed trends.
Fluctuations in environmental parameters

273BIOLOGICAL INTERACTIONS IN THE MID MESOZOIC
such as water energy, substrate conditions orsalinity, and associated biotic changes regu-larly occur at the local level and over relativelyshort periods of time. Because most environ-mental transitions appear to be random or cy-clic with respect to time, it is unlikely that thesum of local fluctuations generated the globaltrends discussed here. Rather, abiotic changeswould have to be long term (lasting at leastthroughout the more than 50 Myr of the Ju-rassic) and directional. Possible candidates in-clude higher order changes in habitat area, cli-mate, shallow-water productivity, and seawa-ter chemistry.
Jurassic sea-level curves (Hallam 2001) in-dicate a more or less gradual rise during theperiod. In combination with the breakup ofPangaea, this led to an enlargement of shelfareas. Although larger shelf areas might pos-sibly favor the relative expansion of groupswith traits such as infaunal life habits or highmobility, we failed to find any significantcross-correlations between changes in theseecological traits and changes in sea level.
Climatic warming, combined with highproductivity, enables organisms to sustainhigh metabolic rates, which in turn may fosteractive behavior such as burrowing, crawling,or swimming. Broad-scale interpretations ofJurassic climates are based upon various linesof paleobotanical, selected lithological, andoxygen isotope evidence, as well as climatemodeling studies (Rees et al. 2000 and refer-ences therein). Jurassic climate changes havebeen described for Eurasia (e.g., Vakhrameev1991) and North America, but Rees et al.(2000) attributed them to the latitudinal mo-tion of continents through climatic zones rath-er than to a global climate change. On the ba-sis of phytogeographic patterns, these authorsrecognized five main Jurassic climate zones,the boundaries of which remained at near-constant paleolatitudes. This led them to con-clude that net global climate change through-out the Jurassic appears to have been minimal.This view is supported by the distribution ofclimate-sensitive sediments. Although evap-orites became increasingly widespread in theJurassic, this does not necessarily indicate anincrease in aridity. According to Ziegler et al.(2003), this pattern may rather reflect an in-
crease in shallow-water areas due to thespread of epicontinental seas and the openingof the central Atlantic and the west IndianOceans. Finally, if interpreted in terms of pa-leotemperature change, the oxygen isotopeplot for the Jurassic of Eurasia indicates rela-tively high temperatures in Hettangian andEarly Toarcian time and lowest temperaturesin Middle to Late Jurassic time (Veizer et al.1999; Jenkyns et al. 2002). If water temperatureexerted a strong control on the abundance ofphysically active organisms, we would expectjust the opposite pattern, i.e., a decrease inproportional mobility rather than the ob-served increase. Also, we find no significantcross-correlations between changing propor-tions of mobile taxa and changes in d18O.
Evidence of increasing Phanerozoic nutri-ent levels and food availability comes from thesecular record of strontium isotopes, rates oforganic carbon burial, the diversification ofmarine phytoplankton, and changes in the‘‘energetics’’ (the combination of biomass,general physical activity, and metabolic rates;Bambach 1999) of the marine benthos (Martin2003). To avoid circular reasoning we cannotuse the observed proportional increase of en-ergy-intensive modes of life to infer greaterenergy availability. Increased 87Sr/86Sr ratiosgenerally indicate erosion of continental rocksand have been used as an indicator of in-creased nutrient runoff from continents (e.g.,Martin 2003). The high-resolution strontiumisotope curve for the Jurassic (Veizer et al.1999; Jenkyns et al. 2002) shows relatively highvalues in the earliest Jurassic, intermediatevalues from Toarcian to mid-Bajocian time,and lower values thereafter until early Tithon-ian time. Again, there are no significant cross-correlations between changes in proportionsof ecological groups and changes in 87/86Sr. In-terpretation is hampered, however, becausethe strontium isotope ratio is also influencedby other factors, particularly the hydrother-mal input from mid-ocean ridges. As far asthe Jurassic is concerned, changing rates ofseafloor spreading and accompanying hydro-thermal activity are thought to be the mostimportant controlling factor (Jones et al. 1994).If true, this renders the Jurassic strontium iso-tope record an unreliable indicator of nutrient
274 MARTIN ABERHAN ET AL.
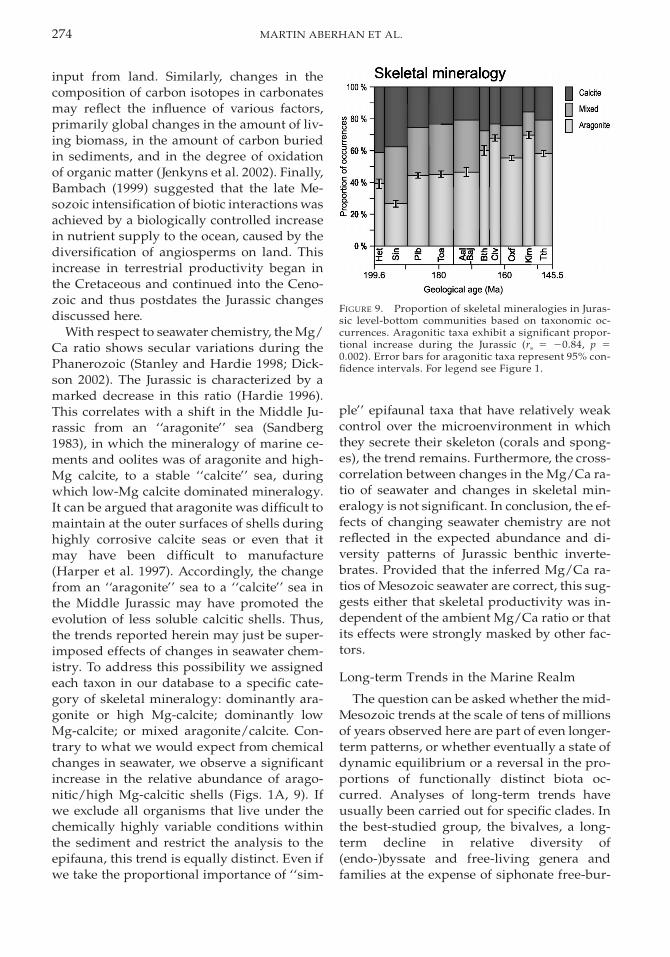
FIGURE 9. Proportion of skeletal mineralogies in Juras-sic level-bottom communities based on taxonomic oc-currences. Aragonitic taxa exhibit a significant propor-tional increase during the Jurassic (rs 5 20.84, p 50.002). Error bars for aragonitic taxa represent 95% con-fidence intervals. For legend see Figure 1.
input from land. Similarly, changes in thecomposition of carbon isotopes in carbonatesmay reflect the influence of various factors,primarily global changes in the amount of liv-ing biomass, in the amount of carbon buriedin sediments, and in the degree of oxidationof organic matter (Jenkyns et al. 2002). Finally,Bambach (1999) suggested that the late Me-sozoic intensification of biotic interactions wasachieved by a biologically controlled increasein nutrient supply to the ocean, caused by thediversification of angiosperms on land. Thisincrease in terrestrial productivity began inthe Cretaceous and continued into the Ceno-zoic and thus postdates the Jurassic changesdiscussed here.
With respect to seawater chemistry, the Mg/Ca ratio shows secular variations during thePhanerozoic (Stanley and Hardie 1998; Dick-son 2002). The Jurassic is characterized by amarked decrease in this ratio (Hardie 1996).This correlates with a shift in the Middle Ju-rassic from an ‘‘aragonite’’ sea (Sandberg1983), in which the mineralogy of marine ce-ments and oolites was of aragonite and high-Mg calcite, to a stable ‘‘calcite’’ sea, duringwhich low-Mg calcite dominated mineralogy.It can be argued that aragonite was difficult tomaintain at the outer surfaces of shells duringhighly corrosive calcite seas or even that itmay have been difficult to manufacture(Harper et al. 1997). Accordingly, the changefrom an ‘‘aragonite’’ sea to a ‘‘calcite’’ sea inthe Middle Jurassic may have promoted theevolution of less soluble calcitic shells. Thus,the trends reported herein may just be super-imposed effects of changes in seawater chem-istry. To address this possibility we assignedeach taxon in our database to a specific cate-gory of skeletal mineralogy: dominantly ara-gonite or high Mg-calcite; dominantly lowMg-calcite; or mixed aragonite/calcite. Con-trary to what we would expect from chemicalchanges in seawater, we observe a significantincrease in the relative abundance of arago-nitic/high Mg-calcitic shells (Figs. 1A, 9). Ifwe exclude all organisms that live under thechemically highly variable conditions withinthe sediment and restrict the analysis to theepifauna, this trend is equally distinct. Even ifwe take the proportional importance of ‘‘sim-
ple’’ epifaunal taxa that have relatively weakcontrol over the microenvironment in whichthey secrete their skeleton (corals and spong-es), the trend remains. Furthermore, the cross-correlation between changes in the Mg/Ca ra-tio of seawater and changes in skeletal min-eralogy is not significant. In conclusion, the ef-fects of changing seawater chemistry are notreflected in the expected abundance and di-versity patterns of Jurassic benthic inverte-brates. Provided that the inferred Mg/Ca ra-tios of Mesozoic seawater are correct, this sug-gests either that skeletal productivity was in-dependent of the ambient Mg/Ca ratio or thatits effects were strongly masked by other fac-tors.
Long-term Trends in the Marine Realm
The question can be asked whether the mid-Mesozoic trends at the scale of tens of millionsof years observed here are part of even longer-term patterns, or whether eventually a state ofdynamic equilibrium or a reversal in the pro-portions of functionally distinct biota oc-curred. Analyses of long-term trends haveusually been carried out for specific clades. Inthe best-studied group, the bivalves, a long-term decline in relative diversity of(endo-)byssate and free-living genera andfamilies at the expense of siphonate free-bur-
275BIOLOGICAL INTERACTIONS IN THE MID MESOZOIC
rowing suspension feeders is well established(e.g., Stanley 1968, 1977; Thayer 1983; Miller1990; Skelton et al. 1990). Within brachiopods,the high percentage of free-living genera inthe Paleozoic was sharply reduced in the Me-sozoic, during which the more bulldozing-re-sistant, pedunculate guilds strongly dominat-ed the group (Thayer 1983). Published analy-ses of the long-term functional diversity ofgastropods and echinoderms are not available.Attempts to analyze the diversity and/orabundance history of ecological groups ofwhole faunas have been limited. With respectto well-skeletonized marine benthic inverte-brates other than bivalves and brachiopods,Thayer (1983) recorded a post-Silurian to Re-cent increase in the percentage of mobile high-er taxa (families to orders). Aberhan (1994)studied quantitatively the relative abundanceof benthic macroinvertebrate species in Me-sozoic paleocommunities and documented in-faunalization. In particular, in shallow shelfsettings a drastic rise of shallow to moderatelydeep infaunal suspension feeders took placefrom Late Jurassic to Early Cretaceous time,and the proportion of this guild remained rel-atively high in Late Cretaceous time. A PBDB-based test of escalation at the scale of thePhanerozoic, including nektonic macroinver-tebrates, demonstrates a general increase inthe proportion of carnivorous invertebrates,associated with progressive infaunality andmobility in non-carnivorous invertebrates(Madin et al. 2004). These results suggest thatthe mid-Mesozoic trends of our study mayrepresent segments of megatrends that extendover hundreds of millions of years and acrossthe globe, and that were possibly driven by es-calation.
Using a different data set (Sepkoski’s genusdatabase as of May 1996), Bambach et al.(2002) calculated proportional diversity ofmajor functional groups through the Phaner-ozoic. They found that the relative represen-tation of mobile marine metazoans was sig-nificantly higher in the Paleogene and Neo-gene as compared to the Late Triassic to LateCretaceous, which in turn shows a higher per-centage of mobile genera as compared to theSilurian to Permian. Within these intervals oftime, however, proportional global diversity
remained stable, despite evolutionary turn-over and changes in total diversity. This con-trasts with our finding that the proportions oftaxonomic occurrences and species of mobiletaxa increased from roughly 20% in the EarlyJurassic to about 40% at the end of the period.It is unclear at present whether this discrep-ancy is due to differences in the databases(genera were used by Bambach et al. whereaswe analyzed species-level data; vertebratesand nekton were included by Bambach et al.but not in our analysis) or whether it repre-sents a decoupling of diversity and abundancemetrics in the database used by Bambach et al.
Conclusions
The evolutionary importance of the ecolog-ical interplay between organisms on largetemporal and geographic scales has rarelybeen tested rigorously. In one of the few at-tempts to study ecosystem-wide faunalchanges in terms of ecological dominance (i.e.,the abundance of functional groups), we pro-vide detailed insight into the dynamics asso-ciated with the Mesozoic Marine Revolution.Our findings of directional trends, e.g., to-ward increasing mobility and infaunality, sug-gest escalation between macrobenthic non-carnivorous invertebrates and their enemies(predators as well as sediment disturbers).Thus, we provide evidence of large-scale en-emy-driven evolution during mid-Mesozoictime, well before escalation appears to havecontinued at an accelerated pace in the Cre-taceous. Our search for alternative explana-tions of the observed biotic changes failed tofind any evidence that factors other than ene-my-induced selection have played a signifi-cant role. Neither intrinsic processes, such asthe acquisition of key adaptive traits, norphysico-chemical factors, such as changes insea level, climate, productivity, and seawaterchemistry, can explain these patterns. Futureresearch will have to combine abundance anddiversity data of ecological groups at thePhanerozoic scale to evaluate the significanceof long-term biosphere-level biotic changes.
Acknowledgments
We thank G. Herbert and G. Vermeij for con-structive reviews of the manuscript. E. Siebert
276 MARTIN ABERHAN ET AL.
drafted the figures. This is Paleobiology Da-tabase publication No. 34.
Literature Cited
Aberhan, M. 1994. Guild-structure and evolution of Mesozoicbenthic shelf communities. Palaios 9:516–545.
Alexander, R. R., and G. P. Dietl. 2003. The fossil record of shell-breaking predation on marine bivalves and gastropods. Pp.141–176 in P. H. Kelley, M. Kowalewski, and T. A. Hansen, eds.Predator-prey interactions in the fossil record. Kluwer Aca-demic/Plenum, New York.
Bambach, R. K. 1999. Energetics in the global marine fauna: aconnection between terrestrial diversification and change inthe marine biosphere. Geobios 32:131–144.
———. 2002. Supporting predators: changes in the global eco-system inferred from changes in predator diversity. Pp. 319–351 in Kowalewski and Kelley 2002.
Bambach, R. K., A. H. Knoll, and J. J. Sepkoski Jr. 2002. Anatom-ical and ecological constraints on Phanerozoic animal diver-sity in the marine realm. Proceedings of the National Acad-emy of Sciences USA 99:6854–6859.
Blake, D. B., and H. Hagdorn. 2003. The Asteroidea (Echinoder-mata) of the Muschelkalk (Middle Triassic of Germany). Pa-laontologische Zeitschrift 77:23–58.
Brandt, D. S. 1986. Preservation of event beds through time. Pa-laios 1:92–96.
Dickson, J. A. D. 2002. Fossil echinoderms as monitor of the Mg/Ca ratio of Phanerozoic oceans. Science 298:1222–1224.
Dietl, G. P., and P. H. Kelley. 2002. The fossil record of predator-prey arms races: coevolution and escalation hypotheses. Pp.353–374 in Kowalewski and Kelley 2002.
Donovan, S. K., and A. S. Gale. 1990. Predatory asteroids andthe decline of the articulate brachiopods. Lethaia 23:77–86.
Fursich, F. T., and D. Jablonski. 1984. Late Triassic naticid drillholes: carnivorous gastropods gain a major adaptation but failto radiate. Science 224:78–80.
Futuyma, D. J., and M. Slatkin. 1983. Introduction. Pp. 1–13 inD. J. Futuyma and M. Slatkin, eds. Coevolution. Sinauer, Sun-derland, Mass.
Golonka, J., M. I. Ross, and C. R. Scotese. 1994. Phanerozoic pa-leogeographic and paleoclimatic modeling maps. In A. F. Em-bry, B. Beauchamp, and D. J. Glass, eds. Pangea. Canadian So-ciety of Petroleum Geologists Memoir 17:1–47.
Gradstein, F. M., and J. G. Ogg. 2004. Geologic time scale 2004—why, how, and where next! Lethaia 37:175–181.
Hallam, A. 1975. Evolutionary size increase and longevity in Ju-rassic bivalves and ammonites. Nature 258:493–496.
———. 1998. Speciation patterns and trends in the fossil record.Geobios 30:921–930.
———. 2001. A review of the broad pattern of Jurassic sea-levelchanges and their possible causes in the light of currentknowledge. Palaeogeography, Palaeoclimatology, Palaeoecol-ogy 167:23–37.
Hardie, L. A. 1996. Secular variation in seawater chemistry: anexplanation for the coupled secular variations in the miner-alogies of marine limestones and potash evaporites over thepast 600 m.y. Geology 24:279–283.
Harper, E. M. 1991. The role of predation in the evolution of ce-mentation in bivalves. Palaeontology 34:455–460.
Harper, E. M., and D. S. Wharton. 2000. Boring predation andMesozoic articulate brachiopods. Palaeogeography, Palaeo-climatology, Palaeoecology 158:15–24.
Harper, E. M., T. J. Palmer, and J. R. Alphey. 1997. Evolutionaryresponse by bivalves to changing Phanerozoic sea-waterchemistry. Geological Magazine 134:403–407.
Harper, E. M., G. T. W. Forsythe, and T. Palmer. 1998. Taphon-
omy and the Mesozoic marine revolution: preservation statemasks the importance of boring predators. Palaios 13:352–360.
Hautmann, M. 2001. Taxonomy and phylogeny of cementingTriassic bivalves (families Prospondylidae, Plicatulidae, Di-myidae and Ostreidae). Palaeontology 44:339–373.
———. 2004. Early Mesozoic evolution of alivincular bivalve lig-aments and its implications for the timing of the ‘‘Mesozoicmarine revolution.’’ Lethaia 37:165–172.
Hayek, L. C., and M. A. Buzas. 1997. Surveying natural popu-lations. Columbia University Press, New York.
Jablonski, D. 1997. Body-size evolution in Cretaceous molluscsand the status of Cope’s rule. Nature 385:250–252.
Jager, M., and R. Fraaye. 1997. The diet of the Early Toarcianammonite Harpoceras falciferum. Palaeontology 40:557–574.
Jenkyns, H. C., C. E. Jones, D. R. Grocke, S. P. Hesselbo, and D.N. Parkinson. 2002. Chemostratigraphy of the Jurassic Sys-tem: applications, limitations and implications for palae-oceanography. Journal of the Geological Society, London 159:351–378.
Jones, C. E., H. C. Jenkyns, and S. P. Hesselbo. 1994. Strontiumisotopes in Early Jurassic seawater. Geochimica et Cosmo-chimica Acta 58:1285–1301.
Kelley, P. H., and T. A. Hansen. 2003. The fossil record of drillingpredation on bivalves and gastropods. Pp. 113–139 in P. H.Kelley, M. Kowalewski, and T. A. Hansen, eds. Predator-preyinteractions in the fossil record. Kluwer Academic/Plenum,New York.
Kidwell, S. M., and P. J. Brenchley. 1996. Evolution of the fossilrecord: thickness trends in marine skeletal accumulations andtheir implications. Pp. 290–336 in D. Jablonski, D. H. Erwin,and J. H. Lipps, eds. Evolutionary paleobiology. University ofChicago Press, Chicago.
Kowalewski, M., and P. H. Kelley, eds. 2002. The fossil record ofpredation. Paleontological Society Papers No. 8.
Kowalewski, M., A. Dulai, and F. T. Fursich. 1998. A fossil recordfull of holes: the Phanerozoic history of drilling predation.Geology 26:1091–1094.
Kroger, B. 2000. Schalenverletzungen an jurassischenAmmoniten—ihre palaobiologische und palaookologischeAussagefahigkeit. Berliner Geowissenschaftliche Abhandlun-gen, Reihe E 33:1–97.
Leighton, L. R. 1999. Possible latitudinal predation gradient inmiddle Paleozoic oceans. Geology 27:47–50.
Madin, J., J. Alroy, M. Aberhan, F. Fursich, W. Kiessling, M. Kos-nik, M. Patzkowsky, and P. Wagner. 2004. On the associationbetween macroecology and macroevolution. Geological So-ciety of America Abstracts with Programs 36(5):19.
Martin, R. E. 2003. The fossil record of biodiversity: nutrients,productivity, habitat area and differential preservation. Le-thaia 26:179–194.
McCall, P. L., and M. J. S. Tevesz, eds. 1982. Animal-sedimentrelations: the biogenic alteration of sediments. Plenum, NewYork.
Miller, A. I. 1990. Bivalves. Pp. 143–161 in K. J. McNamara, ed.Evolutionary trends. Belhaven, London.
———. 1998. Biotic transitions in global marine diversity. Sci-ence 281:1157–1160.
Pawlik, J. R. 1993. Marine invertebrate chemical defenses.Chemical Reviews 93:1911–1922.
Rees, P. M., A. M. Ziegler, and P. J. Valdes. 2000. Jurassic phy-togeography and climates: new data and model comparisons.Pp. 297–318 in B. T. Huber, K. G. MacLeod, and S. L. Wing,eds. Warm climates in earth history. Cambridge UniversityPress, Cambridge.
Rhoads, D. C., and D. K. Young. 1970. The influence of deposit-feeding organisms on sediment stability and community tro-phic structure. Journal of Marine Research 28:150–178.
277BIOLOGICAL INTERACTIONS IN THE MID MESOZOIC
Sandberg, P. A. 1983. An oscillating trend in Phanerozoic non-skeletal carbonate mineralogy. Nature 305:19–22.
Sepkoski, J. J. Jr. 2002. A compendium of fossil marine animalgenera. Bulletins of American Paleontology 363.
Sepkoski, J. J. Jr., R. K. Bambach, and M. L. Droser. 1991. Secularchanges in Phanerozoic event bedding and the biologicaloverprint. Pp. 298–312 in G. Einsele, W. Ricken, and A. Sei-lacher, eds. Cycles and events in stratigraphy. Springer, Ber-lin.
Skelton, P. W., J. A. Crame, N. J. Morris and E. M. Harper. 1990.Adaptive divergence and taxonomic radiation in post-Palaeo-zoic bivalves. In P. D. Taylor and G. P. Larwood, eds. Majorevolutionary radiations. Systematics Association Special Vol-ume 42:91–117. Clarendon, Oxford.
Solan, M., B. J. Cardinale, A. L. Downing, K. A. M. Engelhardt,J. L. Ruesink, and D. S. Srivastava. 2004. Extinction and eco-system function in the marine benthos. Science 306:1177–1180.
Stanley, S. M. 1968. Post-Paleozoic adaptive radiation of infau-nal bivalve molluscs—a consequence of mantle fusion and si-phon formation. Journal of Paleontology 42:214–229.
———. 1977. Trends, rates, and patterns of evolution in the Biv-alvia. Pp. 209–250 in A. Hallam, ed. Patterns of evolution. El-sevier, Amsterdam.
Stanley, S. M., and L. A. Hardie. 1998. Secular oscillations in thecarbonate mineralogy of reef-building and sediment-produc-ing organisms driven by tectonically forced shifts in seawaterchemistry. Palaeogeography, Palaeoclimatology, Palaeoecol-ogy 144:3–19.
Thayer, C. W. 1979. Biological bulldozers and the evolution ofmarine benthic communities. Science 203:458–461.
———. 1983. Sediment-mediated biological disturbance and the
evolution of marine benthos. Pp. 479–625 in M. J. S. Tevesz andP. L. McCall, eds. Biotic interactions in Recent and fossil ben-thic communities. Plenum, New York.
Thompson, J. N. 2005. The geographic mosaic of coevolution.University of Chicago Press, Chicago.
Vakhrameev, V. A. 1991. Jurassic and Cretaceous floras and cli-mates of the earth. Cambridge University Press, Cambridge.
Veizer, J., D. Ala, K. Azmy, P. Bruckschen, D. Buhl, F. Bruhn,G.A.F. Carden, A. Diener, S. Ebneth, Y. Godderis, T. Jasper, C.Korte, F. Pawellek, O. G. Podlaha, and H. Strauss. 1999. 87Sr/86Sr, d13C and d18 evolution of Phanerozoic seawater. ChemicalGeology 161:59–88.
Vermeij, G. J. 1977. The Mesozoic marine revolution: evidencefrom snails, predators, and grazers. Paleobiology 3:245–258.
———. 1987. Evolution and escalation. Princeton UniversityPress, Princeton, N.J.
———. 1995. Economics, volcanoes, and Phanerozoic revolu-tions. Paleobiology 21:125–152.
———. 2002. Evolution in the consumer age: predators and thehistory of life. Pp. 375–393 in Kowalewski and Kelley 2002.
Vermeij, G. J., and L. R. Leighton. 2003. Does global diversitymean anything? Paleobiology 29:3–7.
Vermeij, G. J., D. E. Schindel, and E. Zipser. 1981. Predationthrough geological time: evidence from gastropod shell re-pair. Science 214:1024–1026.
Walker, S. E., and C. E. Brett. 2002. Post-Paleozoic patterns inmarine predation: was there a Mesozoic and Cenozoic marinepredatory revolution? Pp. 119–193 in Kowalewski and Kelley2002.
Ziegler, A. M., G. Eshel, P. M. Rees, T. A. Rothfus, D. B. Rowley,and D. Sunderlin. 2003. Tracing the tropics across land andsea: Permian to present. Lethaia 36:227–254.